UNITED STATES
SECURITIES AND EXCHANGE COMMISSION
Washington, D.C. 20549
FORM N-CSR
CERTIFIED SHAREHOLDER REPORT OF REGISTERED MANAGEMENT INVESTMENT COMPANIES
Investment Company Act file number 811-04087
Manning & Napier Fund, Inc.
(Exact name of registrant as specified in charter)
290 Woodcliff Drive, Fairport, NY 14450
(Address of principal executive offices)(Zip Code)
Michele T. Mosca 290 Woodcliff Drive, Fairport, NY 14450
(Name and address of agent for service)
Registrant’s telephone number, including area code: 585-325-6880
Date of fiscal year end: October 31
Date of reporting period: November 1, 2016 through October 31, 2017
Form N-CSR is to be used by management investment companies to file reports with the Commission not later than 10 days after the transmission to stockholders of any report that is required to be transmitted to stockholders under Rule 30e-1 under the Investment Company Act of 1940 (17 CFR 270.30e-1). The Commission may use the information provided on Form N-CSR in its regulatory, disclosure review, inspection, and policymaking roles.
A registrant is required to disclose the information specified by Form N-CSR, and the Commission will make this information public. A registrant is not required to respond to the collection of information contained in Form N-CSR unless the Form displays a currently valid Office of Management and Budget (“OMB”) control number. Please direct comments concerning the accuracy of the information collection burden estimate and any suggestions for reducing the burden to Secretary, Securities and Exchange Commission, 450 Fifth Street, NW, Washington, DC 20549-0609. The OMB has reviewed this collection of information under the clearance requirements of 44 U.S.C. § 3507.
ITEM 1: REPORTS TO STOCKHOLDERS.

Equity Series
Management Discussion and Analysis
(unaudited)
Dear Shareholders:
Just one year ago, many investors were anticipating a widespread sell-off in domestic equity markets after Donald Trump won the election for the U.S. presidency. Not only did a sell-off fail to materialize, but equities actually moved sharply higher and remained on an upward trajectory throughout the year. The advance in equities was despite ongoing uncertainty surrounding policy implementation and how the new administration’s agenda might ultimately affect U.S. economic growth. For the year ended October 31, 2017, domestic equities were up 23.63%, as measured by the S&P 500 Index. International equities, as measured by the MSCI ACWI ex USA Index, also fared extraordinarily well, up 23.64%. Domestic investment-grade bonds, as measured by the Bloomberg Barclays U.S. Aggregate Bond Index, experienced relatively subdued performance, up 0.90%. Within fixed income, corporate bonds led, with high-yield securities in particular delivering very strong performance.
Much of the move upward in asset markets has been driven by stronger corporate earnings that materialized in early 2017 within both developed and emerging markets, supported by synchronized economic growth across all major global regions. Further, although Federal Reserve (Fed) policymakers continued gradually raising the target range for the federal funds rate and began reducing the Fed’s securities holdings, central bank policies across the globe have remained generally accommodative, providing an additional tailwind for asset prices.
Investors are undoubtedly enjoying the “Goldilocks” state of the economy: not too cold so as to usher in a recession, and not too hot so as to cause runaway inflation. Nonetheless, it is our view that market participants should temper their expectations going forward. The U.S. continues to move along in its economic cycle, and while it is not our view that we are on the cusp of a bear market, the status of our indicators suggest that we are certainly closer to the end of the current bull market than we are to the beginning. Complacency is elevated, there are significantly fewer pockets of cheap valuations remaining compared to the past several years, and U.S. valuations in particular limit upside potential, offering little support for asset prices should volatility in the financial markets materialize. This is surely not the time for investors to chase returns or take on unnecessary risk. Rather, it is our view that current market dynamics are consistent with rising risks that must be actively managed, and investors should maintain allocations consistent with their long-term investment objectives.
With this in mind, we discuss recent fund performance in this report, highlight how we are positioned amid the current economic environment, and provide our outlook of what to expect in financial markets. We hope that you find this information helpful, and look forward to working with you in the years ahead to meet your investment goals.
Thank you for your continued confidence in us.
Sincerely,
Manning & Napier Advisors, LLC
The S&P 500 Total Return Index is an unmanaged, capitalization-weighted measure of 500 widely held common stocks listed on the New York Stock Exchange, American Stock Exchange, and the Over-the-Counter market. The Index returns assume daily reinvestment of dividends and do not reflect any fees or expenses. Index returns provided by Bloomberg. S&P Dow Jones Indices LLC, a subsidiary of the McGraw Hill Financial, Inc., is the publisher of various index based data products and services and has licensed certain of its products and services for use by Manning & Napier. All such content Copyright © 2017 by S&P Dow Jones Indices LLC and/or its affiliates. All rights reserved. Neither S&P Dow Jones Indices LLC, Dow Jones Trademark Holdings LLC, their affiliates nor their third party licensors make any representation or warranty, express or implied, as to the ability of any index to accurately represent the asset class or market sector that it purports to represent and none of these parties shall have any liability for any errors, omissions, or interruptions of any index or the data included therein.
The MSCI ACWI ex USA Index (ACWIxUS) is designed to measure large and mid-cap representation across 22 of 23 Developed Markets countries (excluding the U.S.) and 24 Emerging Markets countries. The Index returns do not reflect any fees or expenses. The Index is denominated in U.S. dollars. The Index returns are net of withholding taxes. They assume daily reinvestment of net dividends thus accounting for any applicable dividend taxation. Index returns provided by Bloomberg.
The Bloomberg Barclays U.S. Aggregate Bond Index is an unmanaged, market-value weighted index of U.S. domestic investment-grade debt issues, including government, corporate, asset-backed, and mortgage-backed securities, with maturities of one year or more. Index returns do not reflect any fees or expenses. Index returns provided by Interactive Data.
1
Equity Series
Fund Commentary
(unaudited)
Investment Objective
To provide long-term growth of capital by investing primarily in common stocks. The Series may invest in large-, mid and small-size companies within the U.S.
Performance Commentary
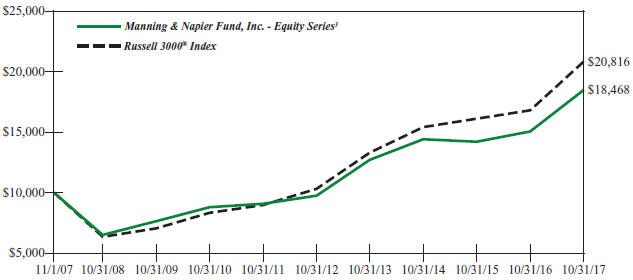
U.S. equity markets delivered very strong absolute returns for the twelve-month period ended October 31, 2017. The Russell 3000 Index returned 23.98%; however, performance varied largely between sectors, with six sectors generating returns of 20% or more, while three sectors generated returns of 4% or less. In general, growth stocks benefitted from increased earnings estimates as global markets rose throughout 2017.
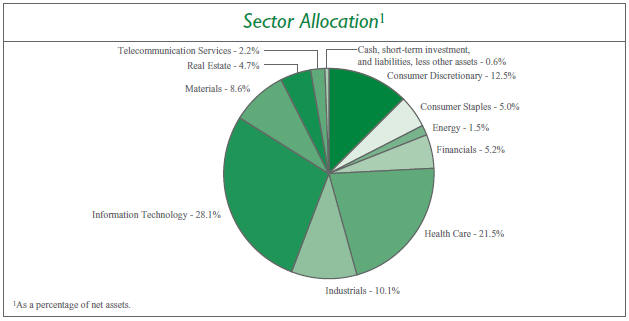
The Equity Series returned 22.68% during the year, slightly underperforming the benchmark on a relative basis. Importantly, the Series has provided robust positive absolute returns over the current stock market cycle, which began in April 2000. The Series’ underperformance relative to the Russell 3000 benchmark during the year was driven by equity selection. Conversely, sector positioning aided relative returns. The most notable detractors from relative performance were equity selection in Consumer Discretionary, Health Care, and Consumer Staples along with an underweight allocation to Financials relative to the benchmark. This was offset by underweight allocations to the Energy and Consumer Staples sectors, an overweight allocation to Information Technology, and strong stock selection in the Real Estate and Information Technology sectors, all of which aided relative returns.
Our focus on growing companies which we believe can control their own destiny has led to meaningful allocations to the Health Care and Information Technology sectors. The Series has relatively little exposure to economically sensitive sectors including Financials and Energy. We have generally found companies within some of the more defensive sectors to be overvalued given the lower growth prospects, which has led to underweight allocations to Utilities and Consumer Staples relative to the benchmark.
As we begin the new fiscal year, broad-based earnings growth, accelerating business activity, and an improving global economic backdrop are supportive of domestic equity prices. However, as markets continue to advance, we believe it is important to express our view that investors should exercise caution and selectivity due to rising risks associated with elevated complacency, stretched valuations, and the inflection in monetary policy to less accommodative conditions. We believe these risk factors reinforce the need for an active, fundamentals-based investment approach, as it will be critical to manage them going forward.
Please see the next page for additional performance information as of October 31, 2017.
Performance data quoted represents past performance and does not guarantee future results. The investment return and principal value of an investment will fluctuate, so that an investor’s shares, when redeemed, may be worth more or less than their original cost. Current performance may be higher or lower than that quoted; investors can obtain the most recent month-end performance at www.manning-napier.com or by calling (800) 466-3863.
All investments involve risks, including possible loss of principal. As with any stock fund, the value of your investment will fluctuate in response to stock market movements. Investing in the Series will also involve a number of other risks, including issuer-specific risk, small-cap/mid-cap risk, and interest rate risk.
2
Equity Series
Performance Update as of October 31, 2017
(unaudited)
| AVERAGE ANNUAL TOTAL RETURNS AS OF OCTOBER 31, 2017 | ||||||||||||||||
| ONE YEAR1 | FIVE YEAR | TEN YEAR | SINCE INCEPTION2 | |||||||||||||
Manning & Napier Fund, Inc. - Equity Series3,4 | 22.68 | % | 13.67 | % | 6.33 | % | 8.17 | % | ||||||||
Russell 3000® Index5 | 23.98 | % | 15.12 | % | 7.61 | % | 6.61 | % | ||||||||
The following graph compares the value of a $10,000 investment in the Manning & Napier Fund, Inc. - Equity Series for the ten years ended October 31, 2017 to the Russell 3000® Index.
1 The returns shown are based on net asset values calculated for shareholder transactions and may differ from the returns shown in the financial highlights, which reflect adjustments made to the net asset values in accordance with accounting principles generally accepted in the United States of America.
2 Performance numbers for the Series and Index are calculated from May 1, 1998, the Collective’s inception date (see Note 4 below).
3 The Series’ performance does not reflect the deduction of taxes that a shareholder would pay on fund distributions or the redemption of shares. The Series’ performance is historical and may not be indicative of future results. The performance returns shown are inclusive of the net expense ratio of the Series. For the year ended October 31, 2017, this net expense ratio was 1.05%. The gross expense ratio, which does not account for any voluntary or contractual waivers currently in effect, was 1.20% for the year ended October 31, 2017.
4 Prior to July 10, 2002, all performance figures reflect the performance of the Exeter Trust Company Group Trust for Employee Benefit Plans: All-Equity Collective Investment Trust (the “Collective”), which was managed by Manning & Napier Advisors, Inc. (predecessor to Manning & Napier Advisors, LLC), an affiliate of the distributor, and reorganized into the Manning & Napier Fund, Inc. Equity Series on July 10, 2002. The Collective was not open to the public generally or registered under the Investment Company Act of 1940 and the fees of the Collective were lower than the Series’ fees. Therefore, historical performance of the Collective would have been lower if the Collective had been subject to the same fees as the Series.
5 The Russell 3000® Index is an unmanaged index that consists of 3,000 of the largest U.S. companies based on total market capitalization. The Index returns are based on a market capitalization-weighted average of relative price changes of the component stocks plus dividends whose reinvestments are compounded daily. The Index returns do not reflect any fees or expenses. Index returns provided by Bloomberg.
3
Equity Series
Shareholder Expense Example
(unaudited)
As a shareholder of the Series, you incur ongoing costs, including management fees, shareholder service fees and other Series expenses. This example is intended to help you understand your ongoing costs (in dollars) of investing in the Series and to compare these costs with the ongoing costs of investing in other mutual funds.
The example is based on an investment of $1,000 invested at the beginning of the period and held for the entire period (May 1, 2017 to October 31, 2017).
Actual Expenses
The first line of the table below provides information about actual account values and actual expenses. You may use the information in this line, together with the amount you invested, to estimate the expenses that you paid over the period. Simply divide your account value by $1,000 (for example, an $8,600 account value divided by $1,000 = 8.6), then multiply the result by the number in the first line under the heading entitled “Expenses Paid During Period” to estimate the expenses you paid on your account during this period.
Hypothetical Example for Comparison Purposes
The second line of the table below provides information about hypothetical account values and hypothetical expenses based on the Series’ actual expense ratio and an assumed rate of return of 5% per year before expenses, which is not the Series’ actual return. The hypothetical account values and expenses may not be used to estimate the actual ending account balance or expenses you paid during the period. You may use this information to compare the ongoing costs of investing in the Series and other funds. To do so, compare this 5% hypothetical example with the 5% hypothetical examples that appear in the shareholder reports of the other funds.
Please note that the expenses shown in the table are meant to highlight your ongoing costs only and do not reflect any transaction costs, such as sales charges (loads), redemption fees, or exchange fees that you may incur in other mutual funds. Therefore, the second line of the table is useful in comparing ongoing costs only, and will not help you determine the relative total costs of owning different funds.
BEGINNING ACCOUNT VALUE 5/1/17 | ENDING ACCOUNT VALUE 10/31/17 | EXPENSES PAID DURING PERIOD* 5/1/17-10/31/17 | ||||
Actual | $1,000.00 | $1,097.70 | $5.55 | |||
Hypothetical | ||||||
(5% return before expenses) | $1,000.00 | $1,019.91 | $5.35 |
*Expenses are equal to the Series’ annualized expense ratio (for the six-month period) of 1.05%, multiplied by the average account value over the period, multiplied by 184/365 (to reflect the one-half year period). Expenses are based on the most recent fiscal half year; therefore, the expense ratios stated above may differ from the expense ratios stated in the financial highlights, which are based on one-year data. The Series’ total return would have been lower had certain expenses not been waived during the period.
4
Equity Series
Portfolio Composition as of October 31, 2017
(unaudited)
5
Equity Series
Investment Portfolio - October 31, 2017
| SHARES | VALUE (NOTE 2) | |||||||
COMMON STOCKS - 99.4% | ||||||||
Consumer Discretionary - 12.5% | ||||||||
Hotels, Restaurants & Leisure - 1.0% | ||||||||
Jack in the Box, Inc. | 8,180 | $ | 846,712 | |||||
|
| |||||||
Internet & Direct Marketing Retail - 4.6% | ||||||||
Amazon.com, Inc.* | 1,460 | 1,613,709 | ||||||
The Priceline Group, Inc.* | 1,165 | 2,227,433 | ||||||
|
| |||||||
| 3,841,142 | ||||||||
|
| |||||||
Specialty Retail - 4.8% | ||||||||
AutoZone, Inc.* | 2,670 | 1,573,965 | ||||||
Dick’s Sporting Goods, Inc. | 31,290 | 765,666 | ||||||
O’Reilly Automotive, Inc.* | 7,690 | 1,622,206 | ||||||
|
| |||||||
| 3,961,837 | ||||||||
|
| |||||||
Textiles, Apparel & Luxury Goods - 2.1% | ||||||||
NIKE, Inc. - Class B | 31,625 | 1,739,059 | ||||||
|
| |||||||
Total Consumer Discretionary | 10,388,750 | |||||||
|
| |||||||
Consumer Staples - 5.0% | ||||||||
Beverages - 1.8% | ||||||||
The Coca-Cola Co. | 32,995 | 1,517,110 | ||||||
|
| |||||||
Food & Staples Retailing - 1.2% | ||||||||
Sprouts Farmers Market, Inc.* | 54,160 | 1,001,418 | ||||||
|
| |||||||
Food Products - 2.0% | ||||||||
Campbell Soup Co. | 34,900 | 1,653,213 | ||||||
|
| |||||||
Total Consumer Staples | 4,171,741 | |||||||
|
| |||||||
Energy - 1.5% | ||||||||
Energy Equipment & Services - 1.5% | ||||||||
Diamond Offshore Drilling, Inc.* | 28,190 | 471,619 | ||||||
Oceaneering International, Inc. | 16,470 | 333,023 | ||||||
Transocean Ltd.* | 39,795 | 417,848 | ||||||
|
| |||||||
Total Energy | 1,222,490 | |||||||
|
| |||||||
Financials - 5.2% | ||||||||
Capital Markets - 5.2% | ||||||||
BlackRock, Inc. | 3,545 | 1,669,092 | ||||||
The Charles Schwab Corp. | 32,330 | 1,449,677 | ||||||
E*TRADE Financial Corp.* | 28,320 | 1,234,469 | ||||||
|
| |||||||
Total Financials | 4,353,238 | |||||||
|
| |||||||
Health Care - 21.5% | ||||||||
Biotechnology - 9.4% | ||||||||
Biogen, Inc.* | 3,975 | 1,238,849 | ||||||
BioMarin Pharmaceutical, Inc.* | 17,690 | 1,452,172 | ||||||
Incyte Corp.* | 10,660 | 1,207,245 | ||||||
Regeneron Pharmaceuticals, Inc.* | 3,710 | 1,493,720 | ||||||
The accompanying notes are an integral part of the financial statements.
6
Equity Series
Investment Portfolio - October 31, 2017
| SHARES | VALUE (NOTE 2) | |||||||
COMMON STOCKS (continued) | ||||||||
Health Care (continued) | ||||||||
Biotechnology (continued) | ||||||||
Seattle Genetics, Inc.* | 20,300 | $ | 1,244,593 | |||||
Vertex Pharmaceuticals, Inc.* | 8,110 | 1,185,925 | ||||||
|
| |||||||
| 7,822,504 | ||||||||
|
| |||||||
Health Care Equipment & Supplies - 1.0% | ||||||||
Intuitive Surgical, Inc.* | 2,325 | 872,712 | ||||||
|
| |||||||
Health Care Providers & Services - 3.8% | ||||||||
DaVita, Inc.* | 32,270 | 1,960,080 | ||||||
Express Scripts Holding Co.* | 19,880 | 1,218,445 | ||||||
|
| |||||||
| 3,178,525 | ||||||||
|
| |||||||
Health Care Technology - 0.8% | ||||||||
Cerner Corp.* | 9,695 | 654,606 | ||||||
|
| |||||||
Life Sciences Tools & Services - 1.5% | ||||||||
Thermo Fisher Scientific, Inc. | 6,470 | 1,254,080 | ||||||
|
| |||||||
Pharmaceuticals - 5.0% | ||||||||
Bristol-Myers Squibb Co. | 25,575 | 1,576,954 | ||||||
Johnson & Johnson | 18,305 | 2,551,900 | ||||||
|
| |||||||
| 4,128,854 | ||||||||
|
| |||||||
Total Health Care | 17,911,281 | |||||||
|
| |||||||
Industrials - 10.1% | ||||||||
Aerospace & Defense - 1.9% | ||||||||
Arconic, Inc. | 62,690 | 1,574,773 | ||||||
|
| |||||||
Air Freight & Logistics - 3.8% | ||||||||
C.H. Robinson Worldwide, Inc. | 10,820 | 849,695 | ||||||
FedEx Corp. | 10,295 | 2,324,714 | ||||||
|
| |||||||
| 3,174,409 | ||||||||
|
| |||||||
Professional Services - 3.4% | ||||||||
Equifax, Inc. | 7,425 | 805,835 | ||||||
Nielsen Holdings plc | 54,230 | 2,010,306 | ||||||
|
| |||||||
| 2,816,141 | ||||||||
|
| |||||||
Road & Rail - 1.0% | ||||||||
Genesee & Wyoming, Inc. - Class A* | 12,405 | 890,431 | ||||||
|
| |||||||
Total Industrials | 8,455,754 | |||||||
|
| |||||||
Information Technology - 28.1% | ||||||||
Internet Software & Services - 6.0% | ||||||||
Alphabet, Inc. - Class A* | 1,045 | 1,079,527 | ||||||
Alphabet, Inc. - Class C* | 1,065 | 1,082,722 | ||||||
Facebook, Inc. - Class A* | 15,700 | 2,826,941 | ||||||
|
| |||||||
| 4,989,190 | ||||||||
|
| |||||||
The accompanying notes are an integral part of the financial statements.
7
Equity Series
Investment Portfolio - October 31, 2017
| SHARES | VALUE (NOTE 2) | |||||||
COMMON STOCKS (continued) | ||||||||
Information Technology (continued) | ||||||||
IT Services - 5.1% | ||||||||
MasterCard, Inc. - Class A | 11,405 | $ | 1,696,722 | |||||
Visa, Inc. - Class A | 23,735 | 2,610,375 | ||||||
|
| |||||||
| 4,307,097 | ||||||||
|
| |||||||
Semiconductors & Semiconductor Equipment - 4.7% | ||||||||
Qorvo, Inc.* | 15,640 | 1,185,668 | ||||||
Skyworks Solutions, Inc. | 16,145 | 1,838,270 | ||||||
Texas Instruments, Inc. | 9,000 | 870,210 | ||||||
|
| |||||||
| 3,894,148 | ||||||||
|
| |||||||
Software - 12.3% | ||||||||
Adobe Systems, Inc.* | 9,735 | 1,705,183 | ||||||
CDK Global, Inc. | 13,050 | 829,458 | ||||||
Electronic Arts, Inc.* | 15,970 | 1,910,012 | ||||||
Microsoft Corp. | 16,410 | 1,364,984 | ||||||
salesforce.com, Inc.* | 17,755 | 1,817,047 | ||||||
ServiceNow, Inc.* | 20,805 | 2,629,128 | ||||||
|
| |||||||
| 10,255,812 | ||||||||
|
| |||||||
Total Information Technology | 23,446,247 | |||||||
|
| |||||||
Materials - 8.6% | ||||||||
Chemicals - 3.6% | ||||||||
Ashland Global Holdings, Inc. | 30,670 | 2,084,947 | ||||||
CF Industries Holdings, Inc. | 24,305 | 923,104 | ||||||
|
| |||||||
| 3,008,051 | ||||||||
|
| |||||||
Containers & Packaging - 2.0% | ||||||||
Ball Corp. | 20,130 | 864,181 | ||||||
Sealed Air Corp. | 18,270 | 808,082 | ||||||
|
| |||||||
| 1,672,263 | ||||||||
|
| |||||||
Metals & Mining - 3.0% | ||||||||
Freeport-McMoRan, Inc.* | 83,305 | 1,164,604 | ||||||
Southern Copper Corp. (Peru) | 30,950 | 1,329,302 | ||||||
|
| |||||||
| 2,493,906 | ||||||||
|
| |||||||
Total Materials | 7,174,220 | |||||||
|
| |||||||
Real Estate - 4.7% | ||||||||
Equity Real Estate Investment Trusts (REITS) - 4.7% | ||||||||
American Tower Corp. | 8,775 | 1,260,704 | ||||||
SBA Communications Corp.* | 8,590 | 1,350,176 | ||||||
Weyerhaeuser Co. | 35,905 | 1,289,349 | ||||||
|
| |||||||
Total Real Estate | 3,900,229 | |||||||
|
| |||||||
The accompanying notes are an integral part of the financial statements.
8
Equity Series
Investment Portfolio - October 31, 2017
| SHARES | VALUE (NOTE 2) | |||||||
COMMON STOCKS (continued) | ||||||||
Telecommunication Services - 2.2% | ||||||||
Diversified Telecommunication Services - 2.2% | ||||||||
Zayo Group Holdings, Inc.* | 49,820 | $ | 1,796,509 | |||||
|
| |||||||
TOTAL COMMON STOCKS | ||||||||
(Identified Cost $69,361,510) | 82,820,459 | |||||||
|
| |||||||
SHORT-TERM INVESTMENT - 1.0% | ||||||||
Dreyfus Government Cash Management1, 0.93% | ||||||||
(Identified Cost $876,059) | 876,059 | 876,059 | ||||||
|
| |||||||
TOTAL INVESTMENTS - 100.4% | ||||||||
(Identified Cost $70,237,569) | 83,696,518 | |||||||
LIABILITIES, LESS OTHER ASSETS - (0.4%) | (341,611 | ) | ||||||
|
| |||||||
NET ASSETS - 100% | $ | 83,354,907 | ||||||
|
| |||||||
|
| |||||||
* Non-income producing security.
1 Rate shown is the current yield as of October 31, 2017.
The Global Industry Classification Standard (GICS) was developed by and is the exclusive property and a service mark of MSCI Inc. (MSCI) and Standard & Poor’s, a division of The McGraw-Hill Companies, Inc. (S&P), and is licensed for use by Manning & Napier when referencing GICS sectors. Neither MSCI, S&P, nor any third party involved in making or compiling the GICS or any GICS classifications makes any express or implied warranties or representations with respect to such standard or classification, nor shall any such party have any liability therefrom.
The accompanying notes are an integral part of the financial statements.
9
Equity Series
Statement of Assets and Liabilities
October 31, 2017
ASSETS: | ||||
Investments, at value (identified cost $70,237,569) (Note 2) | $ | 83,696,518 | ||
Dividends receivable | 20,295 | |||
Receivable for fund shares sold | 38,402 | |||
|
| |||
TOTAL ASSETS | 83,755,215 | |||
|
| |||
LIABILITIES: | ||||
Accrued management fees (Note 3) | 50,144 | |||
Accrued shareholder services fees (Class S) (Note 3) | 17,719 | |||
Accrued fund accounting and administration fees (Note 3) | 13,323 | |||
Accrued Chief Compliance Officer service fees (Note 3) | 306 | |||
Payable for securities purchased | 216,129 | |||
Payable for fund shares repurchased | 46,107 | |||
Audit fees payable | 24,620 | |||
Other payables and accrued expenses | 31,960 | |||
|
| |||
TOTAL LIABILITIES | 400,308 | |||
|
| |||
TOTAL NET ASSETS | $ | 83,354,907 | ||
|
| |||
NET ASSETS CONSIST OF: | ||||
Capital stock | $ | 58,432 | ||
Additional paid-in-capital | 64,248,020 | |||
Accumulated net realized gain on investments | 5,589,506 | |||
Net unrealized appreciation (depreciation) on investments | 13,458,949 | |||
|
| |||
TOTAL NET ASSETS | $ | 83,354,907 | ||
|
| |||
NET ASSET VALUE, OFFERING PRICE AND REDEMPTION PRICE PER SHARE - Class S | $ | 14.27 | ||
|
| |||
The accompanying notes are an integral part of the financial statements.
10
Equity Series
Statement of Operations
For the Year Ended October 31, 2017
INVESTMENT INCOME: | ||||
Dividends | $ | 989,884 | ||
|
| |||
EXPENSES: | ||||
Management fees (Note 3) | 717,867 | |||
Shareholder services fees (Class S)(Note 3) | 139,743 | |||
Transfer agent fees (Note 3) | 44,223 | |||
Fund accounting and administration fees (Note 3) | 40,364 | |||
Directors’ fees (Note 3) | 5,812 | |||
Chief Compliance Officer service fees (Note 3) | 3,899 | |||
Miscellaneous | 79,234 | |||
|
| |||
Total Expenses | 1,031,142 | |||
Less reduction of expenses (Note 3) | (130,652 | ) | ||
|
| |||
Net Expenses | 900,490 | |||
|
| |||
NET INVESTMENT INCOME | 89,394 | |||
|
| |||
REALIZED AND UNREALIZED GAIN (LOSS) ON INVESTMENTS: | ||||
Net realized gain on investments | 7,152,318 | |||
Litigation proceeds (Note 4) | 782,744 | |||
Net change in unrealized appreciation on investments | 9,384,301 | |||
|
| |||
NET REALIZED AND UNREALIZED GAIN (LOSS) ON INVESTMENTS | 17,319,363 | |||
|
| |||
NET INCREASE IN NET ASSETS RESULTING FROM OPERATIONS | $ | 17,408,757 | ||
|
| |||
The accompanying notes are an integral part of the financial statements.
11
Equity Series
Statements of Changes in Net Assets
| FOR THE YEAR ENDED 10/31/17 | FOR THE YEAR ENDED 10/31/16 | |||||||
INCREASE (DECREASE) IN NET ASSETS: | ||||||||
OPERATIONS: | ||||||||
Net investment income (loss) | $ | 89,394 | $ | (784,137 | ) | |||
Net realized gain on investments | 7,935,062 | 13,723,248 | ||||||
Net change in unrealized appreciation (depreciation) on investments | 9,384,301 | (15,730,651 | ) | |||||
|
|
|
| |||||
Net increase (decrease) from operations | 17,408,757 | (2,791,540 | ) | |||||
|
|
|
| |||||
DISTRIBUTIONS TO SHAREHOLDERS (Note 8): | ||||||||
From net investment income (Class S) | — | (42,667 | ) | |||||
From net realized gain on investments (Class S) | (4,244,499 | ) | (57,461,992 | ) | ||||
|
|
|
| |||||
Total distributions to shareholders | (4,244,499 | ) | (57,504,659 | ) | ||||
|
|
|
| |||||
CAPITAL STOCK ISSUED AND REPURCHASED: | ||||||||
Net decrease from capital share transactions (Note 5) | (28,279,625 | ) | (342,179,746 | ) | ||||
|
|
|
| |||||
Net decrease in net assets | (15,115,367 | ) | (402,475,945 | ) | ||||
NET ASSETS: | ||||||||
Beginning of year | 98,470,274 | 500,946,219 | ||||||
|
|
|
| |||||
End of year (including undistributed net investment loss of $0 and $326,267, respectively) | $ | 83,354,907 | $ | 98,470,274 | ||||
|
|
|
| |||||
The accompanying notes are an integral part of the financial statements.
12
Equity Series
Financial Highlights*
| FOR THE YEAR ENDED | ||||||||||||||||||||
| 10/31/17 | 10/31/16 | 10/31/15 | 10/31/14 | 10/31/13 | ||||||||||||||||
Per share data (for a share outstanding throughout each year): | ||||||||||||||||||||
Net asset value - Beginning of year | $ | 12.20 | $ | 16.62 | $ | 21.15 | $ | 21.60 | $ | 19.03 | ||||||||||
|
|
|
|
|
|
|
|
|
| |||||||||||
Income (loss) from investment operations: | ||||||||||||||||||||
Net investment income (loss)1 | 0.01 | (0.07 | ) | 0.01 | (0.00 | )2 | 0.01 | |||||||||||||
Net realized and unrealized gain (loss) on investments | 2.63 | 0.64 | (0.42 | ) | 2.51 | 5.14 | ||||||||||||||
|
|
|
|
|
|
|
|
|
| |||||||||||
Total from investment operations | 2.64 | 0.57 | (0.41 | ) | 2.51 | 5.15 | ||||||||||||||
|
|
|
|
|
|
|
|
|
| |||||||||||
Less distributions to shareholders: | ||||||||||||||||||||
From net investment income | — | (0.00 | )2 | (0.00 | )2 | (0.01 | ) | (0.03 | ) | |||||||||||
From net realized gain on investments | (0.57 | ) | (4.99 | ) | (4.12 | ) | (2.95 | ) | (2.55 | ) | ||||||||||
|
|
|
|
|
|
|
|
|
| |||||||||||
Total distributions to shareholders | (0.57 | ) | (4.99 | ) | (4.12 | ) | (2.96 | ) | (2.58 | ) | ||||||||||
|
|
|
|
|
|
|
|
|
| |||||||||||
Net asset value - End of year | $ | 14.27 | $ | 12.20 | $ | 16.62 | $ | 21.15 | $ | 21.60 | ||||||||||
|
|
|
|
|
|
|
|
|
| |||||||||||
Net assets - End of year (000’s omitted) | $ | 83,355 | $ | 98,470 | $ | 500,946 | $ | 1,290,335 | $ | 1,237,520 | ||||||||||
|
|
|
|
|
|
|
|
|
| |||||||||||
Total return3 | 22.68 | %4 | 6.16 | % | (1.46 | %) | 13.23 | % | 30.61 | % | ||||||||||
Ratios (to average net assets)/Supplemental Data: | ||||||||||||||||||||
Expenses** | 1.05 | % | 1.05 | % | 1.05 | % | 1.05 | % | 1.05 | % | ||||||||||
Net investment income (loss) | 0.10 | % | (0.55 | %) | 0.04 | % | (0.01 | %) | 0.06 | % | ||||||||||
Portfolio turnover | 71 | % | 40 | % | 62 | % | 61 | % | 52 | % | ||||||||||
*Effective March 1, 2017, Class A shares of the Series have been designated as Class S shares. **The investment advisor did not impose all or a portion of its management and/or other fees, and in some years may have paid a portion of the Series’ expenses. If these expenses had been incurred by the Series, the expense ratio (to average net assets) would have increased by the following amounts: |
| |||||||||||||||||||
| 0.15 | % | 0.09 | % | 0.03 | % | 0.02 | % | 0.06 | % | |||||||||||
1 Calculated based on average shares outstanding during the years.
2 Less than $(0.01).
3 Represents aggregate total return for the years indicated, and assumes reinvestment of all distributions. Total return would have been lower had certain expenses not been waived or reimbursed.
4 Includes litigation proceeds (see Statement of Operations). Excluding this amount, the Series’ total return is 21.48%.
The accompanying notes are an integral part of the financial statements.
13
Equity Series
Notes to Financial Statements
| 1. | Organization |
Equity Series (the “Series”) is a no-load diversified series of Manning & Napier Fund, Inc. (the “Fund”). The Fund is organized in Maryland and is registered under the Investment Company Act of 1940, as amended, as an open-end management investment company.
The Series’ investment objective is to provide long-term growth of capital.
The Fund’s Advisor is Manning & Napier Advisors, LLC (the “Advisor”). Shares of the Series are offered to investors, clients and employees of the Advisor and its affiliates. Effective March 1, 2017, Class A shares of the Series have been redesignated as Class S shares. The total authorized capital stock of the Fund consists of 15 billion shares of common stock each having a par value of $0.01. As of October 31, 2017, 10.6 billion shares have been designated in total among 39 series, of which 200 million have been designated as Equity Series Class S common stock.
| 2. | Significant Accounting Policies |
The following is a summary of significant accounting policies followed by the Series. The Series is an investment company and, accordingly, follows the investment company accounting and reporting guidance of the Financial Accounting Standards Board Accounting Standards Codification Topic 946 - Investment Companies, which is part of accounting principles generally accepted in the United States of America (“GAAP”).
Security Valuation
Portfolio securities, including domestic equities, listed on an exchange other than the NASDAQ Stock Market are valued at the latest quoted sales price of the exchange on which the security is primarily traded. Securities not traded on valuation date or securities not listed on an exchange are valued at the latest quoted bid price provided by the Fund’s pricing service. Securities listed on the NASDAQ Stock Market are valued in accordance with the NASDAQ Official Closing Price.
Short-term investments that mature in sixty days or less may be valued at amortized cost, which approximates fair value. Investments in open-end investment companies are valued at their net asset value per share on valuation date.
Volume and level of activity in established markets for an asset or liability are evaluated to determine whether recent transactions and quoted prices are determinative of fair value. Where there have been significant decreases in volume and level of activity, further analysis and adjustment may be necessary to estimate fair value. The Series measures fair value in these instances by the use of inputs and valuation techniques which may be based upon current market prices of securities that are comparable in coupon, rating, maturity and industry and/or expectation of future cash flows. As a result of trading in relatively thin markets and/or markets that experience significant volatility, the prices used by the Series to value these securities may differ from the value that would be realized if these securities were sold, and the differences could be material.
Securities for which representative valuations or prices are not available from the Series’ pricing service may be valued at fair value as determined in good faith by the Advisor under procedures approved by and under the general supervision and responsibility of the Fund’s Board of Directors (the “Board”). Due to the inherent uncertainty of valuations of such securities, the fair value may differ significantly from the values that would have been used had a ready market for such securities existed. If trading or events occurring after the close of the principal market in which securities are traded are expected to materially affect the value of those securities, then they may be valued at their fair value, taking this trading or these events into account.
Various inputs are used in determining the value of the Series’ assets or liabilities carried at fair value. These inputs are summarized in three broad levels. Level 1 includes quoted prices in active markets for identical assets and liabilities. Level 2 includes other significant observable inputs (including quoted prices for similar securities, interest rates, prepayment speeds, credit risk, etc.). Level 3 includes significant unobservable inputs (including the Series’ own assumptions in determining the fair value of investments). A financial instrument’s level within the fair value hierarchy is based on the lowest level of any input both individually and in aggregate that is significant to the fair value measurement. The inputs or methodology used for valuing securities are not necessarily an indication of the risk associated with investing in those securities.
14
Equity Series
Notes to Financial Statements (continued)
| 2. | Significant Accounting Policies (continued) |
Security Valuation (continued)
The following is a summary of the valuation levels used for major security types as of October 31, 2017 in valuing the Series’ assets or liabilities carried at fair value:
| DESCRIPTION | TOTAL | LEVEL 1 | LEVEL 2 | LEVEL 3 | ||||||||||||
Assets: | ||||||||||||||||
Equity securities: | ||||||||||||||||
Consumer Discretionary | $ | 10,388,750 | $ | 10,388,750 | $ | — | $ | — | ||||||||
Consumer Staples | 4,171,741 | 4,171,741 | — | — | ||||||||||||
Energy | 1,222,490 | 1,222,490 | — | — | ||||||||||||
Financials | 4,353,238 | 4,353,238 | — | — | ||||||||||||
Health Care | 17,911,281 | 17,911,281 | — | — | ||||||||||||
Industrials | 8,455,754 | 8,455,754 | — | — | ||||||||||||
Information Technology | 23,446,247 | 23,446,247 | — | — | ||||||||||||
Materials | 7,174,220 | 7,174,220 | — | — | ||||||||||||
Real Estate | 3,900,229 | 3,900,229 | — | — | ||||||||||||
Telecommunication Services | 1,796,509 | 1,796,509 | — | — | ||||||||||||
Mutual Fund | 876,059 | 876,059 | — | — | ||||||||||||
|
|
|
|
|
|
|
| |||||||||
Total assets | $ | 83,696,518 | $ | 83,696,518 | $ | — | $ | — | ||||||||
|
|
|
|
|
|
|
| |||||||||
There were no Level 2 or Level 3 securities held by the Series as of October 31, 2016 or October 31, 2017.
The Fund’s policy is to recognize transfers in and transfers out of the valuation levels as of the beginning of the reporting period. There were no transfers between Level 1 and Level 2 during the year ended October 31, 2017.
New Accounting Guidance
On August 1, 2017, the Fund implemented amendments to Regulation S-X, issued by the Securities and Exchange Commission, which require standardized, enhanced disclosures, particularly related to derivatives, in investment company financial statements. Adoption had no effect on the Fund’s net assets or results of operations.
Security Transactions, Investment Income and Expenses
Security transactions are accounted for on trade date. Dividend income is recorded on the ex-dividend date, except that if the ex-dividend date has passed, certain dividends from foreign securities are recorded as soon as the Series is informed of the ex-dividend date. Non-cash dividends, if any, are recorded at the fair value of the securities received. Interest income, including amortization of premium and accretion of discounts using the effective interest method, is earned from settlement date and accrued daily.
Expenses are recorded on an accrual basis. Most expenses of the Fund can be attributed to a specific series. Expenses which cannot be directly attributed are apportioned among the series in the Fund in such a manner as deemed equitable by the Fund’s Board, taking into consideration, among other things, the nature and type of expense.
The Series uses the identified cost method for determining realized gain or loss on investments for both financial statement and federal income tax reporting purposes.
Federal Taxes
The Series’ policy is to comply with the provisions of the Internal Revenue Code applicable to regulated investment companies. The Series is not subject to federal income tax or excise tax to the extent that the Series distributes to shareholders each year its taxable income, including any net realized gains on investments, in accordance with requirements of the Internal Revenue Code. Accordingly, no provision for federal income tax or excise tax has been made in the financial statements.
Management evaluates its tax positions to determine if the tax positions taken meet the minimum recognition threshold in connection with accounting for uncertainties in income tax positions taken or expected to be taken for the purposes of
15
Equity Series
Notes to Financial Statements (continued)
| 2. | Significant Accounting Policies (continued) |
Federal Taxes (continued)
measuring and recognizing tax liabilities in the financial statements. Recognition of tax benefits of an uncertain tax position is required only when the position is “more likely than not” to be sustained assuming examination by taxing authorities. At October 31, 2017, the Series has recorded no liability for net unrecognized tax benefits relating to uncertain income tax positions taken or expected to be taken in future tax returns.
The Series files income tax returns in the U.S. federal jurisdiction, various states and foreign jurisdictions, as required. No income tax returns are currently under investigation. The statute of limitations on the Series’ tax returns remains open for the years ended October 31, 2014 through October 31, 2017. The Series is not aware of any tax positions for which it is reasonably possible that the total amounts of unrecognized tax benefits will significantly change in the next twelve months.
Foreign Taxes
Based on the Series’ understanding of the tax rules and rates related to income, gains and currency purchase/repatriation transactions for foreign jurisdictions in which it invests, the Series will provide for foreign taxes, and where appropriate, deferred foreign tax.
Distributions of Income and Gains
Distributions to shareholders of net investment income and net realized gains are made annually. An additional distribution may be necessary to avoid taxation of the Series. Distributions are recorded on the ex-dividend date.
Indemnifications
The Fund’s organizational documents provide former and current directors and officers with a limited indemnification against liabilities arising in connection with the performance of their duties to the Fund. In the normal course of business, the Fund may also enter into contracts that provide general indemnifications. The Fund’s maximum exposure under these arrangements is unknown as this would be dependent on future claims that may be made against the Fund. The risk of material loss from such claims is considered remote.
Other
The preparation of financial statements in conformity with GAAP requires management to make estimates and assumptions that affect the reported amounts of assets and liabilities and the disclosure of contingent assets and liabilities at the date of the financial statements and the reported amounts of income and expenses during the reporting period. Actual results could differ from those estimates.
| 3. | Transactions with Affiliates |
The Fund has an Investment Advisory Agreement (the “Agreement”) with the Advisor, for which the Series pays a fee, computed daily and payable monthly, at an annual rate of 0.75% of the Series’ average daily net assets. Prior to March 1, 2017, the amount paid to the Advisor for advisory services was 1.00%.
Under the Agreement, personnel of the Advisor provide the Series with advice and assistance in the choice of investments and the execution of securities transactions, and otherwise maintain the Series’ organization. The Advisor also provides the Fund with necessary office space and fund administration and support services. The salaries of all officers of the Fund (except a percentage of the Fund’s Chief Compliance Officer’s salary, which is paid by the Fund), and of all Directors who are “affiliated persons” of the Fund, or of the Advisor, and all personnel of the Fund, or of the Advisor, performing services relating to research, statistical and investment activities, are paid by the Advisor. Each “non-affiliated” Director receives an annual stipend, which is allocated among all the active series of the Fund. In addition, these Directors also receive a fee per Board meeting attended plus a fee for each committee meeting attended and are reimbursed for travel and other out-of-pocket expenses incurred by them in connection with attending such meetings. The Fund also has an Audit Committee Chair, who receives an additional annual stipend for this role.
Effective March 1, 2017, shares of the Series are subject to a shareholder services fee in accordance with a shareholder services plan adopted by the Board. The shareholder services fee is intended to compensate financial intermediaries, including
16
Equity Series
Notes to Financial Statements (continued)
| 3. | Transactions with Affiliates (continued) |
affiliates of the Fund, in connection with the provision of direct client service, personal services, maintenance of shareholder accounts and reporting services. For these services, Shares of the Series pay a fee, computed daily and payable monthly, at an annual rate of 0.25% of the average daily net assets of shares. The Fund has a Shareholder Services Agreement with the Advisor, for which the Advisor receives the shareholder services fee as stated above.
Effective March 1, 2017, the Advisor has contractually agreed, until at least February 28, 2018, to waive its management fee and, if necessary, pay other operating expenses of the Series, exclusive of shareholder services fees, in order to maintain total direct annual fund operating expenses for the Series at no more than 0.80% of average daily net assets each year. Prior to March 1, 2017, the Advisor had contractually agreed to waive its fee and, if necessary, pay other operating expenses of the series in order to maintain total direct annual fund operating expenses for the Series at no more than 1.05% of average daily net assets. Accordingly, the Advisor waived fees of $130,652 for the year ended October 31, 2017, which is included as a reduction of expenses on the Statement of Operations. The Advisor is not eligible to recoup any expenses that have been waived or reimbursed in prior years.
Manning & Napier Investor Services, Inc., a registered broker-dealer affiliate of the Advisor, acts as distributor for the Fund’s shares. The services of Manning & Napier Investor Services, Inc. are provided at no additional cost to the Series.
Pursuant to a master services agreement effective through February 28, 2017, the Fund paid the Advisor an annual fee related to fund accounting and administration of 0.0085% on the first $25 billion of average daily net assets (excluding Target Series and Strategic Income Series); 0.0075% on the next $15 billion of average daily net assets (excluding Target Series and Strategic Income Series); and 0.0065% of average daily net assets in excess of $40 billion (excluding Target Series and Strategic Income Series); plus a base fee of $30,400 per series. Transfer agent fees were charged to the Fund on a per account basis. Additionally, certain transaction and out-of-pocket expenses, including charges for reporting relating to the Fund’s compliance program, were charged. The Advisor had agreements with BNY Mellon Investment Servicing (U.S.) Inc. (“BNY”) under which BNY served as sub-accountant services agent and sub-transfer agent. Effective March 1, 2017, BNY became the named transfer agent for the Fund. Pursuant to a master services agreement dated March 1, 2017, the Fund continues to pay the Advisor the annual fee related to fund accounting and administration of 0.0085% on the first $25 billion of average daily net assets (excluding Target Series and Strategic Income Series); 0.0075% on the next $15 billion of average daily net assets (excluding Target Series and Strategic Income Series); and 0.0065% of average daily net assets in excess of $40 billion (excluding Target Series and Strategic Income Series); plus the base fee of $30,400 per series. Additionally, certain transaction and out-of-pocket expenses, including charges for reporting relating to the Fund’s compliance program, are charged. The agreement between the Advisor and BNY under which BNY serves as sub-accountant services agent continues to be in effect.
Expenses not directly attributable to a series are allocated based on each series’ relative net assets or number of accounts, depending on the expense.
| 4. | Purchases and Sales of Securities |
For the year ended October 31, 2017, purchases and sales of securities, other than U.S. Government securities and short-term securities, were $60,157,889 and $92,240,186 respectively. There were no purchases or sales of U.S. Government securities. The Series received proceeds from settlement of litigation where they were able to recover a portion of investment losses previously realized by the Series. This amount is shown as litigation proceeds in the Statement of Operations.
17
Equity Series
Notes to Financial Statements (continued)
| 5. | Capital Stock Transactions |
Transactions in Class S shares of Equity Series were:
FOR THE YEAR ENDED 10/31/17 | FOR THE YEAR ENDED 10/31/16 | |||||||||||||||
| SHARES | AMOUNT | SHARES | AMOUNT | |||||||||||||
Sold | 452,939 | $ | 5,772,026 | 1,404,275 | $ | 17,324,767 | ||||||||||
Reinvested | 350,413 | 4,117,356 | 4,999,943 | 55,867,602 | ||||||||||||
Repurchased | (3,033,987 | ) | (38,169,007 | ) | (28,465,188 | ) | (415,372,115 | ) | ||||||||
|
|
|
|
|
|
|
| |||||||||
Total | (2,230,635 | ) | $ | (28,279,625 | ) | (22,060,970 | ) | $ | (342,179,746 | ) | ||||||
|
|
|
|
|
|
|
| |||||||||
At October 31, 2017, the Advisor and its affiliates owned 7.0% of the Series.
| 6. | Financial Instruments |
The Series may trade in instruments including written and purchased options, forward foreign currency exchange contracts and futures contracts and other derivatives in the normal course of investing activities to assist in managing exposure to various market risks. The Series may be subject to various elements of risk, which may involve, to a varying degree, elements of risk in excess of the amounts recognized for financial statement purposes. These risks include: the risk that changes in the value of a derivative may not correlate perfectly with the underlying asset, rate or index; counterparty credit risk related to over the counter derivative counterparties’ failure to perform under contract terms; liquidity risk related to the lack of a liquid market for these contracts allowing the fund to close out its position(s); and documentation risk relating to disagreement over contract terms. No such investments were held by the Series as of October 31, 2017.
| 7. | Foreign Securities |
Investing in securities of foreign companies and foreign governments involves special risks and considerations not typically associated with investing in securities of domestic companies and the U.S. Government. These risks include revaluation of currencies and future adverse political and economic developments. Moreover, securities of foreign companies and foreign governments and their markets may be less liquid and their prices more volatile than those of comparable domestic companies and the U.S. Government.
| 8. | Federal Income Tax Information |
The amount and characterization of certain income and capital gains to be distributed are determined in accordance with federal income tax regulations, which may differ from GAAP. These differences are primarily due to differing book and tax treatments in the timing of the recognition of net investment income or gains and losses, including losses deferred due to wash sales, and the use of equalization. The Series may periodically make reclassifications among its capital accounts to reflect income and gains available for distribution (or available capital loss carryovers) under income tax regulations, without impacting the Series’ net asset value. For the year ended October 31, 2017, amounts were reclassified within the capital accounts to increase Additional Paid in Capital by $509,780, increase Undistributed Net Investment Loss by $236,873 and decrease Accumulated Net Realized Gain on Investments by $746,653. Any such reclassifications are not reflected in the financial highlights.
The tax character of distributions paid were as follows:
| FOR THE YEAR ENDED 10/31/17 | FOR THE YEAR ENDED 10/31/16 | |||||||
Ordinary income | $ | — | $ | 5,545,610 | ||||
Long-term capital gains | 4,244,499 | 51,959,049 | ||||||
18
Equity Series
Notes to Financial Statements (continued)
| 8. | Federal Income Tax Information (continued) |
At October 31, 2017, the tax basis of components of distributable earnings and the net unrealized appreciation based on identified cost of investments for federal income tax purpose were as follows:
Cost for federal income tax purposes | $ | 70,631,537 | ||
Unrealized appreciation | 15,743,999 | |||
Unrealized depreciation | (2,679,018 | ) | ||
|
| |||
Net unrealized appreciation | $ | 13,064,981 | ||
|
| |||
Undistributed ordinary income | $ | 3,065,379 | ||
Undistributed long-term capital gains | $ | 2,918,095 |
19
Equity Series
Report of Independent Registered Public Accounting Firm
To the Board of Directors of Manning & Napier Fund, Inc. and Shareholders of
Equity Series:
In our opinion, the accompanying statement of assets and liabilities, including the investment portfolio, and the related statements of operations and of changes in net assets and the financial highlights present fairly, in all material respects, the financial position of the Equity Series (one of the series constituting Manning & Napier Fund, Inc., hereafter referred to as the “Series”) as of October 31, 2017, the results of its operations for the year then ended, the changes in its net assets for each of the two years in the period then ended and the financial highlights for each of the five years in the period then ended, in conformity with accounting principles generally accepted in the United States of America. These financial statements and financial highlights (hereafter referred to as “financial statements”) are the responsibility of the Series’ management. Our responsibility is to express an opinion on these financial statements based on our audits. We conducted our audits of these financial statements in accordance with the standards of the Public Company Accounting Oversight Board (United States). Those standards require that we plan and perform the audit to obtain reasonable assurance about whether the financial statements are free of material misstatement. An audit includes examining, on a test basis, evidence supporting the amounts and disclosures in the financial statements, assessing the accounting principles used and significant estimates made by management, and evaluating the overall financial statement presentation. We believe that our audits, which included confirmation of securities as of October 31, 2017 by correspondence with the custodian and brokers, provide a reasonable basis for our opinion.

New York, New York
December 18, 2017
20
Equity Series
Supplemental Tax Information
(unaudited)
All reportings are based on financial information available as of the date of this annual report and, accordingly, are subject to change.
For federal income tax purposes, the Series reports for the current fiscal year $81,660 or, if different, the maximum amount allowable under the tax law, as qualified dividend income.
For corporate shareholders, the percentage of investment income (dividend income plus short-term gains, if any) that qualifies for the dividends received deduction for the current fiscal year is 29.33%.
The Series designates $3,325,173 as Long-Term Capital Gain dividends pursuant to Section 852(b) of the Code for the fiscal year ended October 31, 2017.
21
Equity Series
Directors’ and Officers’ Information
(unaudited)
The Statement of Additional Information provides additional information about the Fund’s directors and officers and can be obtained without charge by calling 1-800-466-3863, at www.manning-napier.com, or on the EDGAR Database on the SEC Internet web site (http://www.sec.gov). The following chart shows certain information about the Fund’s directors and officers, including their principal occupations during the last five years. Unless specific dates are provided, the individuals have held the listed positions for longer than five years.
| Interested Director and Officer | ||
| Name: | Michele T. Mosca* | |
| Address: | 290 Woodcliff Drive | |
| Fairport, NY 14450 | ||
| Age: | 45 | |
| Current Position(s) Held with Fund: | Principal Executive Officer, President, Chairman & Director | |
| Term of Office & Length of Time Served: | Indefinite - Chairman and Director since August 20161 | |
| Principal Occupation(s) During Past 5 Years: | Managing Director, Funds Group (since 2009) - Manning & Napier Advisors, LLC; President, Director (since 2015) - Manning & Napier Investor Services, Inc.; Chief Executive Officer, President (since 2016) - Rainier Investment Management Mutual Funds, Inc. | |
| Holds the following title for various subsidiaries and affiliates: President, Director | ||
| Number of Portfolios Overseen within Fund Complex: | 38 | |
| Other Directorships Held Outside Fund Complex During Past 5 Years: | Trustee - Rainier Investment Management Mutual Funds (since 2016) | |
| ||
| Independent Directors | ||
| Name: | Stephen B. Ashley | |
| Address: | 290 Woodcliff Drive | |
| Fairport, NY 14450 | ||
| Age: | 77 | |
| Current Position(s) Held with Fund: | Director, Audit Committee Member, Governance & Nominating Committee Member | |
| Term of Office & Length of Time Served: | Indefinite - Since 1996 | |
| Principal Occupation(s) During Past 5 Years: | Chairman, Director & Chief Executive Officer (1997 to present) - The Ashley Group (property management and investment). Director (1995-2008) and Chairman (non-executive) (2004-2008) - Fannie Mae (mortgage) | |
| Number of Portfolios Overseen within Fund Complex: | 38 | |
| Other Directorships Held Outside Fund Complex During | Fannie Mae (1995-2008) | |
| Past 5 Years: | The Ashley Group (1995-2008) | |
| Genesee Corporation (1987-2007) | ||
| ||
| Name: | Paul A. Brooke | |
| Address: | 290 Woodcliff Drive | |
| Fairport, NY 14450 | ||
| Age: | 72 | |
| Current Position(s) Held with Fund: | Lead Independent Director, Audit Committee Member, Governance & Nominating Committee Chairman | |
| Term of Office & Length of Time Served: | Indefinite - Director, Audit Committee Member, Governance & Nominating Committee Member since 2007; Governance & Nominating Committee Chairman since 2016; Lead Independent Director since 2017 | |
| Principal Occupation(s) During Past 5 Years: | Chairman & CEO (2005-2009) - Ithaka Acquisition Corporation (investments); Chairman (2007-2009) - Alsius Corporation (investments); Managing Member (1991-present) - PMSV Holdings LLC (investments); Managing Member (2010-2016) - Venbio (investments). | |
| Number of Portfolios Overseen within Fund Complex: | 38 | |
| Other Directorships Held Outside Fund Complex During Past 5 Years: | Incyte Corp. (biotech)(2000-present); ViroPharma, Inc. (speciality pharmaceuticals)(2000-2014); HLTH (WebMD)(information)(2000-2010); Cheyne Capital International (investment)(2000-present); GMP Companies (investment)(2000-2011); Cytos Biotechnology Ltd (biotechnology)(2012-2014); Cerus (biomedical) (2016-present); PureEarth(non-profit)(2012-present) | |
| ||
22
Equity Series
| Directors’ and Officers’ Information | ||
(unaudited)
| ||
| Independent Directors (continued) | ||
| Name: | Peter L. Faber | |
| Address: | 290 Woodcliff Drive | |
| Fairport, NY 14450 | ||
| Age: | 79 | |
| Current Position(s) Held with Fund: | Director, Governance & Nominating Committee Member | |
| Term of Office & Length of Time Served: | Indefinite - Since 1987 | |
| Principal Occupation(s) During Past 5 Years: | Senior Counsel (2006-2012), Partner (1995-2006 & 2013-present) - McDermott, Will & Emery LLP (law firm) | |
| Number of Portfolios Overseen within Fund Complex: | 38 | |
| Other Directorships Held Outside Fund Complex During Past 5 Years: | Boston Early Music Festival (non-profit)(2007-present); Amherst Early Music, Inc. (non-profit)(2009-present); Gotham Early Music Scene, Inc. (non-profit)(2009-present); Partnership for New York City, Inc. (non-profit)(1989-2010); New York Collegium (non-profit)(2004-2011) | |
| ||
| Name: | Harris H. Rusitzky | |
| Address: | 290 Woodcliff Drive | |
| Fairport, NY 14450 | ||
| Age: | 82 | |
| Current Position(s) Held with Fund: | Director, Audit Committee Member, Governance & Nominating Committee Member | |
| Term of Office & Length of Time Served: | Indefinite - Since 1985 | |
| Principal Occupation(s) During Past 5 Years: | President (1994-present) - The Greening Group (business consultants); Partner (2006-present) - The Restaurant Group (restaurants) | |
| Number of Portfolios Overseen within Fund Complex: | 38 | |
| Other Directorships Held Outside Fund Complex During Past 5 Years: | Rochester Institute of Technology (university) (1972-present); Culinary Institute of America (non-profit college)(1985-present); George Eastman House (museum)(1988-present); National Restaurant Association (restaurant trade organization)(1978-present) | |
| ||
| Name: | Chester N. Watson | |
| Address: | 290 Woodcliff Drive | |
| Fairport, NY 14450 | ||
| Age: | 67 | |
| Current Position(s) Held with Fund: | Director, Audit Committee Chairman, Governance & Nominating Committee Member | |
| Term of Office & Length of Time Served: | Indefinite - Since 2012 | |
| Principal Occupation(s) During Past 5 Years: | General Auditor (2003-2011) - General Motors Company (auto manufacturer) | |
| Number of Portfolios Overseen within Fund Complex: | 38 | |
| Other Directorships Held Outside Fund Complex During Past 5 Years: | Rochester Institute of Technology (university) (2005-present); Town of Greenburgh, NY Planning Board (municipal government) (2015-present) | |
| ||
Officers: | ||
| Name: | Jeffrey S. Coons, Ph.D., CFA® | |
| Address: | 290 Woodcliff Drive | |
| Fairport, NY 14450 | ||
| Age: | 54 | |
| Current Position(s) Held with Fund: | Vice President | |
| Term of Office1 & Length of Time Served: | Since 2004 | |
| Principal Occupation(s) During Past 5 Years: | President since 2010, Co-Director of Research (2002 - 2015) - Manning & Napier Advisors, LLC | |
| Holds one or more of the following titles for various subsidiaries and affiliates: President, Director, Treasurer, or Senior Trust Officer | ||
| ||
| Name: | Elizabeth Craig | |
| Address: | 290 Woodcliff Drive | |
| Fairport, NY 14450 | ||
| Age: | 30 | |
| Current Position(s) Held with Fund: | Corporate Secretary | |
| Term of Office1 & Length of Time Served: | Since 2016 | |
| Principal Occupation(s) During Past 5 Years: | Fund Administration Manager since 2015; Mutual Fund Compliance Specialist (2009-2015) - Manning & Napier Advisors, LLC; Assistant Corporate Secretary (2011-2016) - Manning & Napier Fund, Inc. | |
| ||
23
Equity Series
| Directors’ and Officers’ Information | ||
(unaudited)
| ||
| Officers: (continued) | ||
| Name: | Christine Glavin | |
| Address: | 290 Woodcliff Drive | |
| Fairport, NY 14450 | ||
| Age: | 51 | |
| Current Position(s) Held with Fund: | Principal Financial Officer, Chief Financial Officer | |
| Term of Office1 & Length of Time Served: | Principal Financial Officer since 2002; Chief Financial Officer since 2001 | |
| Principal Occupation(s) During Past 5 Years: | Director of Fund Reporting since 2011; Fund Reporting Manager (1997-2011) - Manning & Napier Advisors, LLC; Assistant Treasurer since 2008 - Exeter Trust Company; Chief Financial Officer since 2017- Rainier Investment Management Mutual Funds, Inc. | |
| ||
| Name: | Jodi L. Hedberg | |
| Address: | 290 Woodcliff Drive | |
| Fairport, NY 14450 | ||
| Age: | 50 | |
| Current Position(s) Held with Fund: | Chief Compliance Officer, Anti-Money Laundering Compliance Officer | |
| Term of Office1 & Length of Time Served: | Chief Compliance Officer since 2004; Anti-Money Laundering Officer since 2002; Corporate Secretary (1997-2016) - Manning & Napier Fund, Inc.; Chief Compliance Officer and Anti-Money Laundering Officer since 2017 - Rainier Investment Management Mutual Funds, Inc. | |
| Principal Occupation(s) During Past 5 Years: | Director of Compliance since 2005; Compliance Manager (1995-2005) - Manning & Napier Advisors, LLC and affiliates; Corporate Secretary - Manning & Napier Investor Services, Inc. since 2006 | |
| ||
| Name: | Scott Morabito | |
| Address: | 290 Woodcliff Drive | |
| Fairport, NY 14450 | ||
| Age: | 29 | |
| Current Position(s) Held with Fund: | Assistant Vice President | |
| Term of Office1 & Length of Time Served: | Since 2017 | |
| Principal Occupation(s) During Past 5 Years: | Director of Funds Group since 2017; Fund Product and Strategy Manager (2014-2017); Senior Product and Strategy Analyst (2013-2014); Product and Strategy Analyst (2011-2013) - Manning & Napier Advisors, LLC. | |
| ||
| Name: | Amy Williams | |
| Address: | 290 Woodcliff Drive | |
| Fairport, NY 14450 | ||
| Age: | 56 | |
| Current Position(s) Held with Fund: | Assistant Corporate Secretary | |
| Term of Office1 & Length of Time Served: | Since 2016 | |
| Principal Occupation(s) During Past 5 Years: | Director of Fund Documentation - Manning & Napier Advisors, LLC and affiliates since 2009 Holds one or more of the following titles for various affiliates: Director | |
| ||
| Name: | Richard Yates | |
| Address: | 290 Woodcliff Drive | |
| Fairport, NY 14450 | ||
| Age: | 52 | |
| Current Position(s) Held with Fund: | Chief Legal Officer | |
| Term of Office1 & Length of Time Served: | Chief Legal Officer since 2004 | |
| Principal Occupation(s) During Past 5 Years: | Counsel - Manning & Napier Advisors, LLC and affiliates since 2000; Chief Legal Officer since 2016 - Rainier Investment Management, LLC; Chief Legal Officer since 2016 - Rainier Investment Management Mutual Funds, Inc. | |
| Holds one or more of the following titles for various affiliates: Director, Corporate Secretary, Chief Legal Officer | ||
| ||
* Interested Director, within the meaning of the 1940 Act by reason of her positions with the Fund’s investment advisor, Manning & Napier Advisors, LLC and Distributor, Manning & Napier Investor Services, Inc.
1 The term of office of all officers shall be one year and until their respective successors are chosen and qualified, or his or her earlier resignation or removal as provided in the Fund’s By-Laws.
24
{This page intentionally left blank}
25
Equity Series
Literature Requests
Proxy Voting Policies and Procedures
A description of the policies and procedures that the Fund uses to determine how to vote proxies relating to portfolio securities is available, without charge, upon request:
| By phone | 1-800-466-3863 | |||
| On the Securities and Exchange | ||||
| Commission’s (SEC) web site | http://www.sec.gov |
Proxy Voting Record
Information regarding how the Fund voted proxies relating to portfolio securities during the most recent 12-month period ended June 30th is available, without charge, upon request:
| By phone | 1-800-466-3863 | |||
| On the SEC’s web site | http://www.sec.gov |
Quarterly Portfolio Holdings
The Series’ complete schedule of portfolio holdings for the 1st and 3rd quarters of each fiscal year are provided on Form N-Q, and are available, without charge, upon request:
| By phone | 1-800-466-3863 | |||
| On the SEC’s web site | http://www.sec.gov |
The Series’ Form N-Q may be reviewed and copied at the SEC’s Public Reference Room in Washington, D.C. Information on the operation of the Public Reference Room may be obtained by calling 1-800-SEC-0330.
Prospectus and Statement of Additional Information (SAI)
For more information about any of the Manning & Napier Fund, Inc. Series, you may obtain a prospectus and SAI at www.manning-napier.com or by calling (800) 466-3863. Before investing, carefully consider the objectives, risks, charges and expenses of the investment and read the prospectus carefully as it contains this and other information about the investment company. In addition, this information can be found on the SEC’s web site, http://www.sec.gov.
Additional information available at www.manning-napier.com
1. Fund Holdings - Month-End
2. Fund Holdings - Quarter-End
3. Shareholder Report - Annual
4. Shareholder Report - Semi-Annual
The Fund also offers electronic notification or “e-delivery” when certain documents are available on-line to be downloaded or reviewed. Direct shareholders can elect to receive electronic notification when shareholder reports, prospectus updates, and/or statements are available. If you do not currently have on-line access to your account, you can establish access by going to www.manning-napier.com, click on “Login” in the top corner of the page, and follow the prompts to self-enroll. Once enrolled, you can set your electronic notification preferences by clicking on the Account Options tab located within the green toolbar and then select E-Delivery Option. Should you have any questions on either how to establish on-line access or how to update your account settings, please contact Investor Services at 1-800-466-3863.
The Manning & Napier Fund, Inc. is managed by Manning & Napier Advisors, LLC. Manning & Napier Investor Services, Inc., an affiliate of Manning & Napier Advisors, LLC, is the distributor of the Fund shares.
MNEQY-10/17-AR

Management Discussion and Analysis
(unaudited)
Dear Shareholders:
Just one year ago, many investors were anticipating a widespread sell-off in domestic equity markets after Donald Trump won the election for the U.S. presidency. Not only did a sell-off fail to materialize, but equities actually moved sharply higher and remained on an upward trajectory throughout the year. The advance in equities was despite ongoing uncertainty surrounding policy implementation and how the new administration’s agenda might ultimately affect U.S. economic growth. For the year ended October 31, 2017, domestic equities were up 23.63%, as measured by the S&P 500 Index. International equities, as measured by the MSCI ACWI ex USA Index, also fared extraordinarily well, up 23.64%. Domestic investment-grade bonds, as measured by the Bloomberg Barclays U.S. Aggregate Bond Index, experienced relatively subdued performance, up 0.90%. Within fixed income, corporate bonds led, with high-yield securities in particular delivering very strong performance.
Much of the move upward in asset markets has been driven by stronger corporate earnings that materialized in early 2017 within both developed and emerging markets, supported by synchronized economic growth across all major global regions. Further, although Federal Reserve (Fed) policymakers continued gradually raising the target range for the federal funds rate and began reducing the Fed’s securities holdings, central bank policies across the globe have remained generally accommodative, providing an additional tailwind for asset prices.
Investors are undoubtedly enjoying the “Goldilocks” state of the economy: not too cold so as to usher in a recession, and not too hot so as to cause runaway inflation. Nonetheless, it is our view that market participants should temper their expectations going forward. The U.S. continues to move along in its economic cycle, and while it is not our view that we are on the cusp of a bear market, the status of our indicators suggest that we are certainly closer to the end of the current bull market than we are to the beginning. Complacency is elevated, there are significantly fewer pockets of cheap valuations remaining compared to the past several years, and U.S. valuations in particular limit upside potential, offering little support for asset prices should volatility in the financial markets materialize. This is surely not the time for investors to chase returns or take on unnecessary risk. Rather, it is our view that current market dynamics are consistent with rising risks that must be actively managed, and investors should maintain allocations consistent with their long-term investment objectives.
With this in mind, we discuss recent fund performance in this report, highlight how we are positioned amid the current economic environment, and provide our outlook of what to expect in financial markets. We hope that you find this information helpful, and look forward to working with you in the years ahead to meet your investment goals.
Thank you for your continued confidence in us.
Sincerely,
Manning & Napier Advisors, LLC
The S&P 500 Total Return Index is an unmanaged, capitalization-weighted measure of 500 widely held common stocks listed on the New York Stock Exchange, American Stock Exchange, and the Over-the-Counter market. The Index returns assume daily reinvestment of dividends and do not reflect any fees or expenses. Index returns provided by Bloomberg. S&P Dow Jones Indices LLC, a subsidiary of the McGraw Hill Financial, Inc., is the publisher of various index based data products and services and has licensed certain of its products and services for use by Manning & Napier. All such content Copyright © 2017 by S&P Dow Jones Indices LLC and/or its affiliates. All rights reserved. Neither S&P Dow Jones Indices LLC, Dow Jones Trademark Holdings LLC, their affiliates nor their third party licensors make any representation or warranty, express or implied, as to the ability of any index to accurately represent the asset class or market sector that it purports to represent and none of these parties shall have any liability for any errors, omissions, or interruptions of any index or the data included therein.
The MSCI ACWI ex USA Index (ACWIxUS) is designed to measure large and mid-cap representation across 22 of 23 Developed Markets countries (excluding the U.S.) and 24 Emerging Markets countries. The Index returns do not reflect any fees or expenses. The Index is denominated in U.S. dollars. The Index returns are net of withholding taxes. They assume daily reinvestment of net dividends thus accounting for any applicable dividend taxation. Index returns provided by Bloomberg.
The Bloomberg Barclays U.S. Aggregate Bond Index is an unmanaged, market-value weighted index of U.S. domestic investment-grade debt issues, including government, corporate, asset-backed, and mortgage-backed securities, with maturities of one year or more. Index returns do not reflect any fees or expenses. Index returns provided by Interactive Data.
1
Fund Commentary
(unaudited)
Investment Objective
The Blended Asset Series are strategically allocated across stocks, bonds, and cash to balance growth, capital preservation, and income to fit a range of investor risk management priorities.
Performance Commentary
Since the October 13, 2017 inception date for the Blended Asset Series, U.S. equity markets delivered positive absolute returns for the period ended October 31, 2017. The S&P 500 Index gained 0.99% while the Russell 3000 Index earned 0.86%. International equity markets also delivered positive absolute returns, with the broad MSCI ACWI ex USA Index (ACWIxUS) returning 0.13%. Meanwhile, bond markets as represented by the Bloomberg Barclays U.S. Aggregate Bond Index were modestly negative, returning -0.05%. For the period ended October 31, 2017, each Series underperformed its respective blended benchmark since inception.
An overweight to equity holdings relative to the blended benchmarks within the Conservative and Maximum portfolios aided relative returns for those portfolios. Conversely, an underweight to equity holdings relative to the blended benchmarks within the Moderate and Extended portfolios detracted from relative performance within those portfolios.
Our focus on growing companies that we believe can control their own destiny has led to meaningful allocations to the Health Care and Information Technology sectors. The Series contains relatively little exposure to economically sensitive sectors including Financials and Energy. We have generally found companies within some of the more defensive sectors to be overvalued given the lower growth prospects, which has led to underweight allocations to Utilities, Consumer Staples, and Telecommunication Services relative to the blended benchmarks.
With regard to fixed income, we are finding opportunity within securitized fixed income, specifically private student loans, credit card debt, and auto loans, as the risk/reward tradeoff is attractive relative to other sectors. We continue to monitor interest rates as well as credit spreads in order to be in a position to take advantage of opportunities that may present themselves. We remain cognizant that we are in the later years of an economic expansion and could look to reduce corporate bond exposure further if spreads tighten further or economic conditions deteriorate.
As we begin the new fiscal year, earnings growth across major regions, accelerating business activity, and an improving economic backdrop are supportive of global asset prices. However, as markets continue to advance, we believe it is important to express our view that investors should exercise caution and selectivity due to rising risks associated with elevated complacency, valuations across most markets that remain at or somewhat above fair value, and the inflection in global monetary policy to less accommodative conditions. We believe these risk factors reinforce the need for an active, fundamentals-based investment approach, as it will be critical to manage them going forward.
Performance data quoted represents past performance and does not guarantee future results. The investment return and principal value of an investment will fluctuate, so that an investor’s shares, when redeemed, may be worth more or less than their original cost. Current performance may be higher or lower than that quoted; investors can obtain the most recent month-end performance at www.manning-napier.com or by calling (800) 593-4353.
All investments involve risks, including possible loss of principal. Because the fund invests in both stocks and bonds, the value of your investment will fluctuate in response to stock market movements and changes in interest rates. Investing in the fund will also involve a number of other risks, including issuer-specific risk, foreign investment risk, and small-cap/mid-cap risk. Investments in options and futures, like all derivatives, can be highly volatile and involve risks in addition to the risks of the underlying instrument on which the derivative is based, such as counterparty, correlation and liquidity risk. Also, the use of leverage increases exposure to the market and may magnify potential losses.
2
Shareholder Expense Example - Blended Asset Conservative Series
(unaudited)
As a shareholder of the Series, you incur ongoing costs, including management fees, shareholder service fees and other Series expenses. This example is intended to help you understand your ongoing costs (in dollars) of investing in the Series and to compare these costs with the ongoing costs of investing in other mutual funds.
The example is based on an investment of $1,000 invested in each class at the beginning of the period and held for the entire period (October 13, 2017* to October 31, 2017).
Actual Expenses
The Actual lines of the table below provide information about actual account values and actual expenses. You may use the information in these lines, together with the amount you invested, to estimate the expenses that you paid over the period. Simply divide your account value by $1,000 (for example, an $8,600 account value divided by $1,000 = 8.6), then multiply the result by the number in the Actual line for the Class in which you have invested under the heading entitled “Expenses Paid During Period” to estimate the expenses you paid on your account during this period.
Hypothetical Example for Comparison Purposes
The Hypothetical lines of each class in the table below provide information about hypothetical account values and hypothetical expenses based on the Series’ actual expense ratio and an assumed rate of return of 5% per year before expenses, which is not the Series’ actual return. The hypothetical account values and expenses may not be used to estimate the actual ending account balance or expenses you paid during the period. You may use this information to compare the ongoing costs of investing in the Series and other funds. To do so, compare this 5% hypothetical example with the 5% hypothetical examples that appear in the shareholder reports of the other funds.
Please note that the expenses shown in the table are meant to highlight your ongoing costs only and do not reflect any transaction costs such as sales charges (loads), redemption fees, or exchange fees that you may incur in other mutual funds. Therefore, the second line of the table is useful in comparing ongoing costs only, and will not help you determine the relative total costs of owning different funds.
BEGINNING 10/13/17* | ENDING 10/31/17 | EXPENSES PAID 10/13/17*-10/31/17 | ||||
Actual | $1,000.00 | $ 998.20 | $0.22 | |||
Hypothetical | ||||||
(5% return before expenses) | $1,000.00 | $1,002.24 | $0.22 |
*Commencement of operations.
**Expenses are equal to the Series’ annualized expense ratio (for the period October 13, 2017* to October 31, 2017) of 0.45%, multiplied by the average account value over the period, multiplied by 18/365 (to reflect the period since inception). The Series’ total return would have been lower had certain expenses not been waived during the period.
3
Portfolio Composition - Blended Asset Conservative Series
As of October 31, 2017 (unaudited)
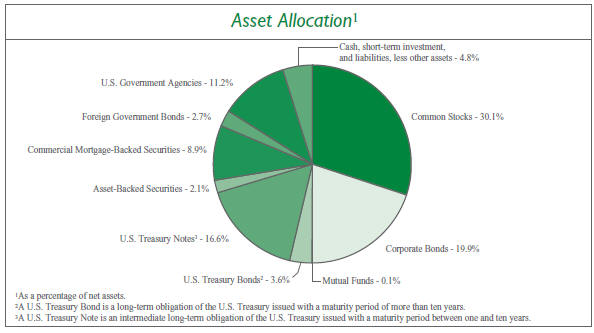
Sector Allocation4
Financials | 8.5% | |||
Information Technology | 8.3% | |||
Health Care | 6.9% | |||
Consumer Discretionary | 4.9% | |||
Energy | 4.5% | |||
Consumer Staples | 3.7% | |||
Materials | 3.5% | |||
Industrials | 3.4% | |||
Real Estate | 3.3% | |||
Telecommunication Services | 1.7% | |||
Utilities | 0.6% |
4Including common stocks and corporate bonds, as a percentage of total investments.
Top Five Stock Holdings5
ServiceNow, Inc. | 1.0% | |||
Facebook, Inc. - Class A | 0.9% | |||
Johnson & Johnson | 0.8% | |||
The Priceline Group, Inc. | 0.8% | |||
Skyworks Solutions, Inc. | 0.7% |
5As a percentage of total investments.
| ||
| Top Five Bond Holdings6 | ||
U.S. Treasury Note, 1.75%, 4/30/2022 | 3.4% | |||
Fannie Mae, 2.625%, 9/6/2024 | 3.3% | |||
U.S. Treasury Note, 1.375%, 4/30/2020 | 3.2% | |||
U.S. Treasury Note, 1.625%, 4/30/2019 | 2.9% | |||
U.S. Treasury Note, 1.375%, 4/30/2021 | 2.8% |
6As a percentage of total investments.
4
Investment Portfolio - October 31, 2017
| BLENDED ASSET CONSERVATIVE SERIES | SHARES | VALUE (NOTE 2) | ||||||
COMMON STOCKS - 30.1% | ||||||||
Consumer Discretionary - 2.3% | ||||||||
Automobiles - 0.1% | ||||||||
Honda Motor Co., Ltd. - ADR (Japan) | 2,255 | $ | 70,108 | |||||
|
| |||||||
Hotels, Restaurants & Leisure - 0.1% | ||||||||
McDonald’s Corp. | 700 | 116,837 | ||||||
|
| |||||||
Internet & Direct Marketing Retail - 1.3% | ||||||||
Amazon.com, Inc.* | 450 | 497,377 | ||||||
The Priceline Group, Inc.* | 408 | 780,080 | ||||||
|
| |||||||
| 1,277,457 | ||||||||
|
| |||||||
Multiline Retail - 0.1% | ||||||||
Dollar General Corp. | 1,340 | 108,326 | ||||||
Target Corp. | 805 | 47,527 | ||||||
|
| |||||||
| 155,853 | ||||||||
|
| |||||||
Specialty Retail - 0.3% | ||||||||
Dick’s Sporting Goods, Inc. | 2,500 | 61,175 | ||||||
The Home Depot, Inc. | 1,135 | 188,160 | ||||||
O’Reilly Automotive, Inc.* | 275 | 58,011 | ||||||
|
| |||||||
| 307,346 | ||||||||
|
| |||||||
Textiles, Apparel & Luxury Goods - 0.4% | ||||||||
lululemon athletica, Inc.* | 5,371 | 330,370 | ||||||
NIKE, Inc. - Class B | 1,085 | 59,664 | ||||||
|
| |||||||
| 390,034 | ||||||||
|
| |||||||
Total Consumer Discretionary | 2,317,635 | |||||||
|
| |||||||
Consumer Staples - 2.6% | ||||||||
Beverages - 1.6% | ||||||||
Ambev S.A. - ADR (Brazil) | 64,700 | 409,551 | ||||||
Anheuser-Busch InBev S.A./N.V. (Belgium)1 | 3,614 | 443,153 | ||||||
Diageo plc (United Kingdom)1 | 15,738 | 537,432 | ||||||
PepsiCo, Inc. | 1,665 | 183,533 | ||||||
|
| |||||||
| 1,573,669 | ||||||||
|
| |||||||
Food & Staples Retailing - 0.3% | ||||||||
CVS Health Corp. | 1,160 | 79,495 | ||||||
Sysco Corp. | 830 | 46,165 | ||||||
Wal-Mart Stores, Inc. | 2,125 | 185,534 | ||||||
|
| |||||||
| 311,194 | ||||||||
|
| |||||||
Food Products - 0.2% | ||||||||
Campbell Soup Co. | 1,425 | 67,502 | ||||||
General Mills, Inc. | 850 | 44,132 | ||||||
J&J Snack Foods Corp. | 385 | 51,270 | ||||||
|
| |||||||
| 162,904 | ||||||||
|
| |||||||
Household Products - 0.1% | ||||||||
Colgate-Palmolive Co. | 1,005 | 70,802 | ||||||
Kimberly-Clark Corp. | 455 | 51,192 | ||||||
|
| |||||||
| 121,994 | ||||||||
|
| |||||||
Personal Products - 0.4% | ||||||||
Unilever plc - ADR (United Kingdom) | 7,109 | 402,725 | ||||||
|
| |||||||
Total Consumer Staples | 2,572,486 | |||||||
|
| |||||||
Energy - 1.7% | ||||||||
Energy Equipment & Services - 0.9% | ||||||||
Diamond Offshore Drilling, Inc.* | 9,055 | 151,490 | ||||||
Oceaneering International, Inc. | 6,555 | 132,542 | ||||||
Schlumberger Ltd. | 6,829 | 437,056 | ||||||
Transocean Ltd.* | 12,877 | 135,208 | ||||||
|
| |||||||
| 856,296 | ||||||||
|
| |||||||
Oil, Gas & Consumable Fuels - 0.8% | ||||||||
BP plc - ADR (United Kingdom) | 3,115 | 126,688 | ||||||
Chevron Corp. | 990 | 114,731 | ||||||
China Petroleum & Chemical Corp. - ADR (China) | 1,210 | 89,104 | ||||||
ConocoPhillips | 1,950 | 99,742 | ||||||
Exxon Mobil Corp. | 1,625 | 135,444 | ||||||
Hess Corp. | 2,160 | 95,386 | ||||||
Royal Dutch Shell plc - Class B - ADR (Netherlands) | 855 | 55,883 | ||||||
TOTAL S.A. (France)1 | 660 | 36,787 | ||||||
Valero Energy Corp. | 680 | 53,645 | ||||||
|
| |||||||
| 807,410 | ||||||||
|
| |||||||
Total Energy | 1,663,706 | |||||||
|
| |||||||
Financials - 1.8% | ||||||||
Banks - 1.4% | ||||||||
Bank of America Corp. | 5,235 | 143,387 | ||||||
BankUnited, Inc. | 715 | 24,918 | ||||||
BB&T Corp. | 1,145 | 56,380 | ||||||
Citigroup, Inc. | 1,995 | 146,632 | ||||||
Fifth Third Bancorp | 1,020 | 29,478 | ||||||
Huntington Bancshares, Inc. | 1,840 | 25,392 | ||||||
JPMorgan Chase & Co. | 3,895 | 391,876 | ||||||
KeyCorp. | 2,740 | 50,005 | ||||||
The PNC Financial Services Group, Inc. | 205 | 28,042 | ||||||
Regions Financial Corp. | 1,720 | 26,626 | ||||||
SunTrust Banks, Inc. | 435 | 26,191 | ||||||
U.S. Bancorp | 1,815 | 98,700 | ||||||
Wells Fargo & Co. | 5,795 | 325,331 | ||||||
|
| |||||||
| 1,372,958 | ||||||||
|
| |||||||
The accompanying notes are an integral part of the financial statements.
5
Investment Portfolio - October 31, 2017
| BLENDED ASSET CONSERVATIVE SERIES | SHARES | VALUE (NOTE 2) | ||||||
COMMON STOCKS (continued) | ||||||||
Financials (continued) | ||||||||
Capital Markets - 0.3% | ||||||||
Apollo Investment Corp. | 2,500 | $ | 14,800 | |||||
Ares Capital Corp. | 1,065 | 17,125 | ||||||
BlackRock, Inc. | 503 | 236,827 | ||||||
Medley Capital Corp. | 2,090 | 12,018 | ||||||
Oaktree Specialty Lending Corp. | 2,585 | 15,019 | ||||||
PennantPark Investment Corp. | 2,005 | 14,977 | ||||||
|
| |||||||
| 310,766 | ||||||||
|
| |||||||
Insurance - 0.1% | ||||||||
The Allstate Corp. | 270 | 25,342 | ||||||
American International Group, Inc. | 400 | 25,844 | ||||||
MetLife, Inc. | 535 | 28,665 | ||||||
Old Republic International Corp. | 1,290 | 26,174 | ||||||
Principal Financial Group, Inc. | 390 | 25,682 | ||||||
|
| |||||||
| 131,707 | ||||||||
|
| |||||||
Total Financials | 1,815,431 | |||||||
|
| |||||||
Health Care - 6.4% | ||||||||
Biotechnology - 2.4% | ||||||||
AbbVie, Inc. | 1,515 | 136,730 | ||||||
Amgen, Inc. | 700 | 122,654 | ||||||
Biogen, Inc.* | 1,061 | 330,671 | ||||||
BioMarin Pharmaceutical, Inc.* | 4,634 | 380,405 | ||||||
Gilead Sciences, Inc. | 1,320 | 98,947 | ||||||
Incyte Corp.* | 2,950 | 334,088 | ||||||
Regeneron Pharmaceuticals, Inc.* | 1,175 | 473,078 | ||||||
Seattle Genetics, Inc.* | 6,277 | 384,843 | ||||||
Vertex Pharmaceuticals, Inc.* | 1,430 | 209,109 | ||||||
|
| |||||||
| 2,470,525 | ||||||||
|
| |||||||
Health Care Equipment & Supplies - 0.7% | ||||||||
Koninklijke Philips N.V. - NY Shares (Netherlands) | 1,380 | 56,290 | ||||||
Medtronic plc | 7,574 | 609,858 | ||||||
|
| |||||||
| 666,148 | ||||||||
|
| |||||||
Health Care Providers & Services - 0.9% | ||||||||
DaVita, Inc.* | 11,322 | 687,698 | ||||||
Express Scripts Holding Co.* | 3,685 | 225,854 | ||||||
|
| |||||||
| 913,552 | ||||||||
|
| |||||||
Pharmaceuticals - 2.4% | ||||||||
Bristol-Myers Squibb Co. | 4,751 | 292,947 | ||||||
Eli Lilly & Co. | 875 | 71,698 | ||||||
GlaxoSmithKline plc (United Kingdom)1 | 2,390 | 42,894 | ||||||
Johnson & Johnson | 5,887 | 820,707 | ||||||
Merck & Co., Inc. | 2,860 | 157,557 | ||||||
Novartis AG - ADR (Switzerland) | 7,033 | 580,785 | ||||||
Perrigo Co. plc | 690 | 55,883 | ||||||
Pfizer, Inc. | 4,990 | 174,949 | ||||||
Roche Holding AG (Switzerland)1 | 300 | 69,339 | ||||||
Sanofi (France)1 | 565 | 53,498 | ||||||
Sanofi - ADR (France) | 2,510 | 118,673 | ||||||
|
| |||||||
| 2,438,930 | ||||||||
|
| |||||||
Total Health Care | 6,489,155 | |||||||
|
| |||||||
Industrials - 3.2% | ||||||||
Aerospace & Defense - 0.7% | ||||||||
Arconic, Inc. | 12,021 | 301,968 | ||||||
The Boeing Co. | 570 | 147,049 | ||||||
Lockheed Martin Corp. | 300 | 92,448 | ||||||
Raytheon Co. | 370 | 66,674 | ||||||
United Technologies Corp. | 805 | 96,407 | ||||||
|
| |||||||
| 704,546 | ||||||||
|
| |||||||
Air Freight & Logistics - 0.6% | ||||||||
FedEx Corp. | 2,050 | 462,910 | ||||||
United Parcel Service, Inc. - Class B | 920 | 108,128 | ||||||
|
| |||||||
| 571,038 | ||||||||
|
| |||||||
Commercial Services & Supplies - 0.2% | ||||||||
Covanta Holding Corp. | 3,810 | 61,341 | ||||||
Waste Management, Inc. | 1,310 | 107,643 | ||||||
|
| |||||||
| 168,984 | ||||||||
|
| |||||||
Construction & Engineering - 0.1% | ||||||||
Comfort Systems USA, Inc. | 1,435 | 63,570 | ||||||
|
| |||||||
Electrical Equipment - 0.2% | ||||||||
ABB Ltd. (Asea Brown Boveri) - ADR (Switzerland) | 2,870 | 74,992 | ||||||
Eaton Corp. plc | 675 | 54,014 | ||||||
Emerson Electric Co. | 895 | 57,692 | ||||||
|
| |||||||
| 186,698 | ||||||||
|
| |||||||
Industrial Conglomerates - 0.3% | ||||||||
3M Co. | 940 | 216,379 | ||||||
General Electric Co. | 1,655 | 33,365 | ||||||
Honeywell International, Inc. | 725 | 104,516 | ||||||
|
| |||||||
| 354,260 | ||||||||
|
| |||||||
Machinery - 0.0%## | ||||||||
Mueller Water Products, Inc. - Class A | 4,625 | 55,222 | ||||||
|
| |||||||
Professional Services - 0.7% | ||||||||
Equifax, Inc. | 2,461 | 267,092 | ||||||
The accompanying notes are an integral part of the financial statements.
6
Investment Portfolio - October 31, 2017
| BLENDED ASSET CONSERVATIVE SERIES | SHARES | VALUE (NOTE 2) | ||||||
COMMON STOCKS (continued) | ||||||||
Industrials (continued) | ||||||||
Professional Services (continued) | ||||||||
Nielsen Holdings plc | 12,705 | $ | 470,974 | |||||
|
| |||||||
| 738,066 | ||||||||
|
| |||||||
Road & Rail - 0.4% | ||||||||
Genesee & Wyoming, Inc. - Class A* | 3,227 | 231,634 | ||||||
Kansas City Southern | 895 | 93,277 | ||||||
Union Pacific Corp. | 910 | 105,369 | ||||||
|
| |||||||
| 430,280 | ||||||||
|
| |||||||
Total Industrials | 3,272,664 | |||||||
|
| |||||||
Information Technology - 7.0% | ||||||||
Communications Equipment - 0.1% | ||||||||
Cisco Systems, Inc. | 4,290 | 146,503 | ||||||
|
| |||||||
Internet Software & Services - 2.0% | ||||||||
Alphabet, Inc. - Class A* | 332 | 342,969 | ||||||
Alphabet, Inc. - Class C* | 340 | 345,659 | ||||||
China Literature Ltd. - Rights (Expires 11/03/2017) (Hong Kong)*2 | 6 | — | ||||||
Facebook, Inc. - Class A* | 5,342 | 961,881 | ||||||
Tencent Holdings Ltd. - Class H (China)1 | 7,400 | 332,594 | ||||||
|
| |||||||
| 1,983,103 | ||||||||
|
| |||||||
IT Services - 1.3% | ||||||||
Automatic Data Processing, Inc. | 560 | 65,106 | ||||||
Broadridge Financial Solutions, Inc. | 630 | 54,130 | ||||||
Infosys Ltd. - ADR (India) | 3,200 | 47,520 | ||||||
International Business Machines Corp. | 865 | 133,262 | ||||||
InterXion Holding N.V. - ADR (Netherlands)* | 605 | 32,301 | ||||||
MasterCard, Inc. - Class A | 3,085 | 458,955 | ||||||
Visa, Inc. - Class A | 4,462 | 490,731 | ||||||
|
| |||||||
| 1,282,005 | ||||||||
|
| |||||||
Semiconductors & Semiconductor Equipment - 1.8% |
| |||||||
Intel Corp. | 5,770 | 262,477 | ||||||
Qorvo, Inc.* | 6,332 | 480,029 | ||||||
QUALCOMM, Inc. | 1,700 | 86,717 | ||||||
Skyworks Solutions, Inc. | 6,047 | 688,511 | ||||||
Taiwan Semiconductor Manufacturing Co. Ltd. - ADR (Taiwan) | 4,010 | 169,743 | ||||||
Texas Instruments, Inc. | 1,925 | 186,128 | ||||||
|
| |||||||
| 1,873,605 | ||||||||
|
| |||||||
Software - 1.7% | ||||||||
Electronic Arts, Inc.* | 2,084 | 249,246 | ||||||
Microsoft Corp. | 5,787 | 481,363 | ||||||
ServiceNow, Inc.* | 7,811 | 987,076 | ||||||
|
| |||||||
| 1,717,685 | ||||||||
|
| |||||||
Technology Hardware, Storage & Peripherals - 0.1% |
| |||||||
Apple, Inc. | 505 | 85,365 | ||||||
|
| |||||||
Total Information Technology | 7,088,266 | |||||||
|
| |||||||
Materials - 1.8% | ||||||||
Chemicals - 0.6% | ||||||||
Ashland Global Holdings, Inc. | 4,371 | 297,140 | ||||||
DowDuPont, Inc. | 1,465 | 105,934 | ||||||
FMC Corp. | 560 | 52,002 | ||||||
LyondellBasell Industries N.V. - Class A | 590 | 61,083 | ||||||
RPM International, Inc. | 1,670 | 89,061 | ||||||
|
| |||||||
| 605,220 | ||||||||
|
| |||||||
Construction Materials - 0.0%## | ||||||||
CRH plc - ADR (Ireland) | 1,315 | 49,339 | ||||||
|
| |||||||
Containers & Packaging - 0.8% | ||||||||
Ball Corp. | 6,443 | 276,598 | ||||||
Graphic Packaging Holding Co. | 6,270 | 97,122 | ||||||
Sealed Air Corp. | 7,604 | 336,325 | ||||||
Sonoco Products Co. | 1,585 | 82,087 | ||||||
|
| |||||||
| 792,132 | ||||||||
|
| |||||||
Metals & Mining - 0.4% | ||||||||
Antofagasta plc (Chile)1 | 6,259 | 79,323 | ||||||
First Quantum Minerals Ltd. (Zambia) | 6,602 | 73,845 | ||||||
Lundin Mining Corp. (Canada) | 11,729 | 89,461 | ||||||
Southern Copper Corp. (Peru) | 3,304 | 141,907 | ||||||
|
| |||||||
| 384,536 | ||||||||
|
| |||||||
Total Materials | 1,831,227 | |||||||
|
| |||||||
Real Estate - 2.7% | ||||||||
Equity Real Estate Investment Trusts (REITS) - 2.7% | ||||||||
Acadia Realty Trust | 435 | 12,246 | ||||||
Agree Realty Corp. | 195 | 9,223 | ||||||
Alexandria Real Estate Equities, Inc. | 395 | 48,965 | ||||||
American Campus Communities, Inc. | 455 | 18,919 | ||||||
American Homes 4 Rent - Class A | 1,640 | 34,899 | ||||||
Apartment Investment & Management Co. - Class A | 925 | 40,681 | ||||||
AvalonBay Communities, Inc. | 275 | 49,866 | ||||||
The accompanying notes are an integral part of the financial statements.
7
Investment Portfolio - October 31, 2017
| BLENDED ASSET CONSERVATIVE SERIES | SHARES | VALUE (NOTE 2) | ||||||
COMMON STOCKS (continued) | ||||||||
Real Estate (continued) | ||||||||
Equity Real Estate Investment Trusts (REITS) (continued) | ||||||||
Axiare Patrimonio SOCIMI S.A. (Spain)1 | 740 | $ | 13,878 | |||||
Bluerock Residential Growth REIT, Inc. | 860 | 9,709 | ||||||
Boston Properties, Inc. | 200 | 24,236 | ||||||
Brandywine Realty Trust | 1,110 | 19,414 | ||||||
Brixmor Property Group, Inc. | 640 | 11,181 | ||||||
Camden Property Trust | 230 | 20,985 | ||||||
CatchMark Timber Trust, Inc. - Class A | 7,685 | 98,368 | ||||||
Cedar Realty Trust, Inc. | 3,320 | 18,061 | ||||||
Chesapeake Lodging Trust | 760 | 21,204 | ||||||
Colony NorthStar, Inc. - Class A | 7,255 | 89,091 | ||||||
Columbia Property Trust, Inc. | 670 | 14,794 | ||||||
Community Healthcare Trust, Inc. | 3,650 | 100,119 | ||||||
CoreCivic, Inc. | 2,755 | 67,938 | ||||||
Cousins Properties, Inc. | 3,355 | 30,262 | ||||||
Crown Castle International Corp. | 710 | 76,027 | ||||||
CubeSmart | 2,295 | 62,470 | ||||||
DDR Corp. | 3,850 | 29,529 | ||||||
Digital Realty Trust, Inc. | 620 | 73,433 | ||||||
Douglas Emmett, Inc. | 535 | 21,288 | ||||||
Education Realty Trust, Inc. | 275 | 9,597 | ||||||
EPR Properties | 140 | 9,685 | ||||||
Equinix, Inc. | 275 | 127,462 | ||||||
Equity Commonwealth* | 655 | 19,683 | ||||||
Equity LifeStyle Properties, Inc. | 215 | 19,023 | ||||||
Equity Residential | 545 | 36,657 | ||||||
Essex Property Trust, Inc. | 35 | 9,185 | ||||||
Extra Space Storage, Inc. | 365 | 29,780 | ||||||
Forest City Realty Trust, Inc. - Class A | 840 | 20,689 | ||||||
Getty Realty Corp. | 535 | 15,199 | ||||||
GGP, Inc. | 905 | 17,611 | ||||||
Global Medical REIT, Inc. | 5,315 | 44,965 | ||||||
HCP, Inc. | 755 | 19,509 | ||||||
Healthcare Trust of America, Inc. - Class A | 750 | 22,537 | ||||||
Hibernia REIT plc (Ireland)1 | 9,760 | 16,769 | ||||||
Host Hotels & Resorts, Inc. | 930 | 18,191 | ||||||
Independence Realty Trust, Inc. | 1,430 | 14,514 | ||||||
Invitation Homes, Inc. | 705 | 15,912 | ||||||
Lamar Advertising Co. - Class A | 560 | 39,446 | ||||||
LaSalle Hotel Properties | 450 | 12,694 | ||||||
Life Storage, Inc. | 250 | 20,205 | ||||||
The Macerich Co. | 165 | 9,009 | ||||||
Mid-America Apartment Communities, Inc. | 330 | 33,776 | ||||||
National Retail Properties, Inc. | 495 | 19,889 | ||||||
Outfront Media, Inc. | 1,615 | 37,872 | ||||||
Physicians Realty Trust | 1,980 | 34,412 | ||||||
Prologis, Inc. | 995 | 64,257 | ||||||
Public Storage | 155 | 32,124 | ||||||
Regency Centers Corp. | 330 | 20,312 | ||||||
Retail Opportunity Investments Corp. | 690 | 12,406 | ||||||
Rexford Industrial Realty, Inc. | 855 | 25,385 | ||||||
Simon Property Group, Inc. | 505 | 78,442 | ||||||
STAG Industrial, Inc. | 1,990 | 54,327 | ||||||
Starwood Waypoint Homes | 435 | 15,795 | ||||||
STORE Capital Corp. | 1,665 | 41,109 | ||||||
Sun Communities, Inc. | 210 | 18,955 | ||||||
Sunstone Hotel Investors, Inc. | 1,170 | 19,094 | ||||||
Terreno Realty Corp. | 690 | 25,337 | ||||||
UDR, Inc. | 690 | 26,765 | ||||||
Unibail-Rodamco S.E. (France)1 | 75 | 18,773 | ||||||
Urban Edge Properties | 1,300 | 30,498 | ||||||
Ventas, Inc. | 630 | 39,532 | ||||||
VEREIT, Inc. | 2,380 | 18,778 | ||||||
Vornado Realty Trust | 510 | 38,179 | ||||||
Welltower, Inc. | 530 | 35,489 | ||||||
Weyerhaeuser Co. | 11,981 | 430,238 | ||||||
|
| |||||||
Total Real Estate | 2,736,852 | |||||||
|
| |||||||
Telecommunication Services - 0.5% | ||||||||
Diversified Telecommunication Services - 0.4% | ||||||||
Zayo Group Holdings, Inc.* | 10,029 | 361,646 | ||||||
|
| |||||||
Wireless Telecommunication Services - 0.1% | ||||||||
NTT DOCOMO, Inc. - ADR (Japan) | 3,960 | 96,267 | ||||||
|
| |||||||
Total Telecommunication Services | 457,913 | |||||||
|
| |||||||
Utilities - 0.1% | ||||||||
Electric Utilities - 0.1% | ||||||||
Eversource Energy | 665 | 41,656 | ||||||
Exelon Corp. | 695 | 27,946 | ||||||
|
| |||||||
| 69,602 | ||||||||
|
| |||||||
Multi-Utilities - 0.0%## | ||||||||
CMS Energy Corp. | 1,010 | 48,853 | ||||||
|
| |||||||
Total Utilities | 118,455 | |||||||
|
| |||||||
TOTAL COMMON STOCKS | ||||||||
(Identified Cost $30,358,281) | 30,363,790 | |||||||
|
| |||||||
The accompanying notes are an integral part of the financial statements.
8
Investment Portfolio - October 31, 2017
| BLENDED ASSET CONSERVATIVE SERIES | PRINCIPAL AMOUNT 3 | VALUE (NOTE 2) | ||||||
CORPORATE BONDS - 19.9% | ||||||||
Non-Convertible Corporate Bonds - 19.9% | ||||||||
Consumer Discretionary - 2.6% | ||||||||
Auto Components - 0.3% | ||||||||
Magna International, Inc. (Canada), 4.15%, 10/1/2025 | 293,000 | $ | 313,503 | |||||
|
| |||||||
Household Durables - 0.5% | ||||||||
Century Communities, Inc.4, 5.875%, 7/15/2025 | 37,000 | 37,370 | ||||||
Meritage Homes Corp., 5.125%, 6/6/2027 | 25,000 | 25,281 | ||||||
NVR, Inc., 3.95%, 9/15/2022 | 362,000 | 380,264 | ||||||
TRI Pointe Group, Inc. - TRI Pointe Homes, Inc., 4.375%, 6/15/2019 | 37,000 | 37,971 | ||||||
TRI Pointe Group, Inc. - TRI Pointe Homes, Inc., 5.875%, 6/15/2024 | 21,000 | 22,732 | ||||||
Weekley Homes LLC - Weekley Finance Corp., 6.00%, 2/1/2023 | 31,000 | 30,380 | ||||||
Weekley Homes LLC - Weekley Finance Corp.4, 6.625%, 8/15/2025 | 35,000 | 34,038 | ||||||
|
| |||||||
| 568,036 | ||||||||
|
| |||||||
Internet & Direct Marketing Retail - 0.8% | ||||||||
Amazon.com, Inc.4, 3.15%, 8/22/2027 | 260,000 | 261,555 | ||||||
The Priceline Group, Inc., 3.60%, 6/1/2026 | 520,000 | 531,496 | ||||||
|
| |||||||
| 793,051 | ||||||||
|
| |||||||
Media - 0.7% | ||||||||
Charter Communications Operating LLC - Charter Communications Operating Capital Corp., 4.464%, 7/23/2022 | 10,000 | 10,561 | ||||||
Comcast Corp., 4.40%, 8/15/2035 | 224,000 | 242,567 | ||||||
CSC Holdings, LLC, 5.25%, 6/1/2024 | 48,000 | 47,790 | ||||||
Discovery Communications LLC, 3.95%, 3/20/2028 | 400,000 | 396,726 | ||||||
DISH DBS Corp., 5.875%, 7/15/2022 | 10,000 | 10,056 | ||||||
|
| |||||||
| 707,700 | ||||||||
|
| |||||||
Multiline Retail - 0.3% | ||||||||
Dollar General Corp., 3.25%, 4/15/2023 | 260,000 | 266,792 | ||||||
|
| |||||||
Total Consumer Discretionary | 2,649,082 | |||||||
|
| |||||||
Consumer Staples - 1.3% | ||||||||
Beverages - 0.8% | ||||||||
Anheuser-Busch InBev Worldwide, Inc. (Belgium), 8.20%, 1/15/2039 | 340,000 | 537,272 | ||||||
PepsiCo, Inc., 3.10%, 7/17/2022 | 260,000 | 268,795 | ||||||
|
| |||||||
| 806,067 | ||||||||
|
| |||||||
Food & Staples Retailing - 0.5% | ||||||||
C&S Group Enterprises LLC4, 5.375%, 7/15/2022 | 49,000 | 47,530 | ||||||
CVS Health Corp., 3.50%, 7/20/2022 | 390,000 | 402,008 | ||||||
|
| |||||||
| 449,538 | ||||||||
|
| |||||||
Total Consumer Staples | 1,255,605 | |||||||
|
| |||||||
Energy - 2.9% | ||||||||
Energy Equipment & Services - 0.1% | ||||||||
McDermott International, Inc.4, 8.00%, 5/1/2021 | 51,000 | 52,658 | ||||||
Trinidad Drilling Ltd. (Canada)4, 6.625%, 2/15/2025 | 36,000 | 35,010 | ||||||
|
| |||||||
| 87,668 | ||||||||
|
| |||||||
Oil, Gas & Consumable Fuels - 2.8% | ||||||||
BP Capital Markets plc (United Kingdom), 3.216%, 11/28/2023 | 114,000 | 117,052 | ||||||
BP Capital Markets plc (United Kingdom), 3.535%, 11/4/2024 | 348,000 | 361,790 | ||||||
Cheniere Energy Partners LP4, 5.25%, 10/1/2025 | 35,000 | 36,050 | ||||||
Columbia Pipeline Group, Inc., 4.50%, 6/1/2025 | 250,000 | 267,938 | ||||||
ConocoPhillips Co., 3.35%, 11/15/2024 | 258,000 | 267,329 | ||||||
ConocoPhillips Co., 3.35%, 5/15/2025 | 49,000 | 50,483 | ||||||
Dynagas LNG Partners LP - Dynagas Finance, Inc. (Monaco), 6.25%, 10/30/2019 | 36,000 | 36,000 | ||||||
Enbridge, Inc. (Canada), 3.70%, 7/15/2027 | 260,000 | 263,396 | ||||||
Enviva Partners LP - Enviva Partners Finance Corp., 8.50%, 11/1/2021 | 34,000 | 36,465 | ||||||
GasLog Ltd. (Monaco), 8.875%, 3/22/2022 | 35,000 | 36,925 | ||||||
Global Ship Lease, Inc. (United Kingdom)4, 9.875%, 11/15/2022 | 45,000 | 45,900 | ||||||
Hilcorp Energy I LP - Hilcorp Finance Co.4, 5.75%, 10/1/2025 | 51,000 | 52,211 | ||||||
Jonah Energy LLC - Jonah Energy Finance Corp.4, 7.25%, 10/15/2025 | 35,000 | 35,000 | ||||||
The accompanying notes are an integral part of the financial statements.
9
Investment Portfolio - October 31, 2017
| BLENDED ASSET CONSERVATIVE SERIES | PRINCIPAL AMOUNT 3 | VALUE (NOTE 2) | ||||||
CORPORATE BONDS (continued) | ||||||||
Non-Convertible Corporate Bonds (continued) | ||||||||
Energy (continued) | ||||||||
Oil, Gas & Consumable Fuels (continued) | ||||||||
Kinder Morgan Energy Partners LP, 4.30%, 5/1/2024 | 463,000 | $ | 485,787 | |||||
PBF Holding Co. LLC - PBF Finance Corp.4, 7.25%, 6/15/2025 | 27,000 | 27,911 | ||||||
Petroleos Mexicanos (Mexico), 6.875%, 8/4/2026 | 240,000 | 269,640 | ||||||
Rockies Express Pipeline, LLC4, 5.625%, 4/15/2020 | 47,000 | 49,820 | ||||||
Sabine Pass Liquefaction LLC, 5.875%, 6/30/2026 | 240,000 | 271,518 | ||||||
SemGroup Corp.4, 6.375%, 3/15/2025 | 34,000 | 33,490 | ||||||
Seven Generations Energy Ltd. (Canada)4, 5.375%, 9/30/2025 | 24,000 | 24,240 | ||||||
Southwestern Energy Co., 6.70%, 1/23/2025 | 27,000 | 27,608 | ||||||
Tallgrass Energy Partners LP - Tallgrass Energy Finance Corp.4, 5.50%, 9/15/2024 | 49,000 | 50,654 | ||||||
|
| |||||||
| 2,847,207 | ||||||||
|
| |||||||
Total Energy | 2,934,875 | |||||||
|
| |||||||
Financials - 6.8% | ||||||||
Banks - 3.5% | ||||||||
Banco Santander S.A. (Spain), 3.50%, 4/11/2022 | 293,000 | 300,227 | ||||||
Bank of America Corp., 4.00%, 1/22/2025 | 390,000 | 403,917 | ||||||
Barclays Bank plc (United Kingdom)4, 10.179%, 6/12/2021 | 181,000 | 223,516 | ||||||
Citigroup, Inc., 3.875%, 3/26/2025 | 520,000 | 533,573 | ||||||
Intesa Sanpaolo S.p.A. (Italy), 3.875%, 1/15/2019 | 218,000 | 222,263 | ||||||
JPMorgan Chase & Co.5, (3 mo. LIBOR US + 0.935%), 2.776%, 4/25/2023 | 483,000 | 484,713 | ||||||
Kreditanstalt fuer Wiederaufbau (Germany), 1.50%, 6/15/2021 | 861,000 | 845,541 | ||||||
Lloyds Banking Group plc (United Kingdom), 4.582%, 12/10/2025 | 468,000 | 493,573 | ||||||
Popular, Inc., 7.00%, 7/1/2019 | 41,000 | 41,922 | ||||||
Royal Bank of Canada (Canada), 3.77%, 3/30/2018 | CAD 31,000 | 24,264 | ||||||
Royal Bank of Scotland Group plc (United Kingdom), 6.10%, 6/10/2023 | 11,000 | 12,249 | ||||||
|
| |||||||
| 3,585,758 | ||||||||
|
| |||||||
Capital Markets - 1.1% | ||||||||
The Goldman Sachs Group, Inc., 4.25%, 10/21/2025 | 260,000 | 271,263 | ||||||
Morgan Stanley6, (3 mo. LIBOR US + 1.220%), 2.617%, 5/8/2024 | 390,000 | 396,544 | ||||||
Morgan Stanley, 5.00%, 11/24/2025 | 370,000 | 403,601 | ||||||
|
| |||||||
| 1,071,408 | ||||||||
|
| |||||||
Consumer Finance - 0.1% | ||||||||
Ally Financial, Inc., 3.50%, 1/27/2019 | 15,000 | 15,184 | ||||||
Navient Corp., 6.125%, 3/25/2024 | 25,000 | 25,656 | ||||||
SLM Corp., 5.125%, 4/5/2022 | 32,000 | 33,160 | ||||||
|
| |||||||
| 74,000 | ||||||||
|
| |||||||
Diversified Financial Services - 0.7% | ||||||||
AerCap Ireland Capital DAC - AerCap Global Aviation Trust (Netherlands), 4.50%, 5/15/2021 | 440,000 | 467,278 | ||||||
E*TRADE Financial Corp., 2.95%, 8/24/2022 | 270,000 | 270,129 | ||||||
LPL Holdings, Inc.4, 5.75%, 9/15/2025 | 24,000 | 24,960 | ||||||
|
| |||||||
| 762,367 | ||||||||
|
| |||||||
Insurance - 1.3% | ||||||||
American International Group, Inc., 4.125%, 2/15/2024 | 380,000 | 404,183 | ||||||
Assured Guaranty US Holdings, Inc., 5.00%, 7/1/2024 | 610,000 | 658,597 | ||||||
Prudential Financial, Inc.5, (3 mo. LIBOR US + 4.175%), 5.875%, 9/15/2042 | 240,000 | 265,200 | ||||||
|
| |||||||
| 1,327,980 | ||||||||
|
| |||||||
Thrifts & Mortgage Finance - 0.1% | ||||||||
Ladder Capital Finance Holdings LLLP - Ladder Capital Finance Corp.4, 5.875%, 8/1/2021 | 60,000 | 61,950 | ||||||
|
| |||||||
Total Financials | 6,883,463 | |||||||
|
| |||||||
Health Care - 0.6% | ||||||||
Biotechnology - 0.4% | ||||||||
AMAG Pharmaceuticals, Inc.4, 7.875%, 9/1/2023 | 27,000 | 27,472 | ||||||
Express Scripts Holding Co., 3.50%, 6/15/2024 | 390,000 | 394,618 | ||||||
|
| |||||||
| 422,090 | ||||||||
|
| |||||||
The accompanying notes are an integral part of the financial statements.
10
Investment Portfolio - October 31, 2017
| BLENDED ASSET CONSERVATIVE SERIES | PRINCIPAL AMOUNT 3 | VALUE (NOTE 2) | ||||||
CORPORATE BONDS (continued) | ||||||||
Non-Convertible Corporate Bonds (continued) | ||||||||
Health Care (continued) | ||||||||
Health Care Equipment & Supplies - 0.1% | ||||||||
Hill-Rom Holdings, Inc.4, 5.00%, 2/15/2025 | 26,000 | $ | 26,585 | |||||
|
| |||||||
Health Care Providers & Services - 0.1% | ||||||||
DaVita, Inc., 5.00%, 5/1/2025 | 35,000 | 34,475 | ||||||
Fresenius Medical Care US Finance II, Inc. (Germany)4, 6.50%, 9/15/2018 | 15,000 | 15,580 | ||||||
HCA Healthcare, Inc., 6.25%, 2/15/2021 | 11,000 | 11,839 | ||||||
HCA, Inc., 3.75%, 3/15/2019 | 11,000 | 11,165 | ||||||
Ortho-Clinical Diagnostics, Inc. - Ortho-Clinical Diagnostics S.A.4, 6.625%, 5/15/2022 | 15,000 | 15,019 | ||||||
Tenet Healthcare Corp., 6.75%, 2/1/2020 | 11,000 | 11,192 | ||||||
|
| |||||||
| 99,270 | ||||||||
|
| |||||||
Total Health Care | 547,945 | |||||||
|
| |||||||
Industrials - 0.2% | ||||||||
Air Freight & Logistics - 0.0%## | ||||||||
Park Aerospace Holdings Ltd. (Ireland)4, 4.50%, 3/15/2023 | 19,000 | 19,024 | ||||||
|
| |||||||
Airlines - 0.1% | ||||||||
Allegiant Travel Co., 5.50%, 7/15/2019 | 26,000 | 26,845 | ||||||
American Airlines Group, Inc.4, 5.50%, 10/1/2019 | 25,000 | 26,000 | ||||||
|
| |||||||
| 52,845 | ||||||||
|
| |||||||
Building Products - 0.1% | ||||||||
Airxcel, Inc.4, 8.50%, 2/15/2022 | 38,000 | 40,280 | ||||||
|
| |||||||
Construction & Engineering - 0.0%## | ||||||||
Tutor Perini Corp.4, 6.875%, 5/1/2025 | 36,000 | 38,835 | ||||||
|
| |||||||
Machinery - 0.0%## | ||||||||
Xerium Technologies, Inc., 9.50%, 8/15/2021 | 27,000 | 27,734 | ||||||
|
| |||||||
Trading Companies & Distributors - 0.0%## | ||||||||
International Lease Finance Corp., 6.25%, 5/15/2019 | 26,000 | 27,571 | ||||||
|
| |||||||
Total Industrials | 206,289 | |||||||
|
| |||||||
Information Technology - 1.4% | ||||||||
Internet Software & Services - 0.4% | ||||||||
Activision Blizzard, Inc., 3.40%, 6/15/2027 | 453,000 | 453,842 | ||||||
|
| |||||||
IT Services - 0.4% | ||||||||
Visa, Inc., 2.80%, 12/14/2022 | 390,000 | 397,337 | ||||||
|
| |||||||
Semiconductors & Semiconductor Equipment - 0.6% |
| |||||||
Applied Materials, Inc., 3.30%, 4/1/2027 | 520,000 | 531,823 | ||||||
MagnaChip Semiconductor Corp. (South Korea), 6.625%, 7/15/2021 | 39,000 | 37,440 | ||||||
|
| |||||||
| 569,263 | ||||||||
|
| |||||||
Total Information Technology | 1,420,442 | |||||||
|
| |||||||
Materials - 1.7% | ||||||||
Chemicals - 0.3% | ||||||||
Kissner Holdings LP - Kissner Milling Co. Ltd. - BSC Holding, Inc. - Kissner USA (Canada)4, 8.375%, 12/1/2022 | 32,000 | 32,320 | ||||||
NOVA Chemicals Corp. (Canada)4, 4.875%, 6/1/2024 | 26,000 | 26,488 | ||||||
Solvay Finance America LLC (Belgium)4, 3.40%, 12/3/2020 | 220,000 | 226,227 | ||||||
|
| |||||||
| 285,035 | ||||||||
|
| |||||||
Metals & Mining - 1.2% | ||||||||
Anglo American Capital plc (United Kingdom)4, 9.375%, 4/8/2019 | 16,000 | 17,606 | ||||||
Anglo American Capital plc (United Kingdom)4, 4.00%, 9/11/2027 | 448,000 | 448,448 | ||||||
Corp Nacional del Cobre de Chile (Chile)4, 3.625%, 8/1/2027 | 450,000 | 452,650 | ||||||
Southern Copper Corp. (Peru), 3.875%, 4/23/2025 | 234,000 | 242,856 | ||||||
Techniplas LLC4, 10.00%, 5/1/2020 | 35,000 | 28,000 | ||||||
|
| |||||||
| 1,189,560 | ||||||||
|
| |||||||
Paper & Forest Products - 0.2% | ||||||||
Domtar Corp., 4.40%, 4/1/2022 | 218,000 | 229,283 | ||||||
|
| |||||||
Total Materials | 1,703,878 | |||||||
|
| |||||||
Real Estate - 0.7% | ||||||||
Equity Real Estate Investment Trusts (REITS) - 0.7% | ||||||||
American Tower Corp., 3.30%, 2/15/2021 | 520,000 | 533,536 | ||||||
GTP Acquisition Partners I LLC4, 2.35%, 6/15/2020 | 95,000 | 94,686 | ||||||
iStar, Inc., 5.25%, 9/15/2022 | 34,000 | 34,850 | ||||||
|
| |||||||
Total Real Estate | 663,072 | |||||||
|
| |||||||
The accompanying notes are an integral part of the financial statements.
11
Investment Portfolio - October 31, 2017
| BLENDED ASSET CONSERVATIVE SERIES | PRINCIPAL AMOUNT 3/ SHARES | VALUE (NOTE 2) | ||||||
CORPORATE BONDS (continued) | ||||||||
Non-Convertible Corporate Bonds (continued) | ||||||||
Telecommunication Services - 1.2% | ||||||||
Diversified Telecommunication Services - 1.2% | ||||||||
AT&T, Inc., 3.90%, 8/14/2027 | 530,000 | $ | 527,881 | |||||
CenturyLink, Inc., 7.50%, 4/1/2024 | 25,000 | 26,562 | ||||||
Frontier Communications Corp., 11.00%, 9/15/2025 | 38,000 | 32,252 | ||||||
Hughes Satellite Systems Corp., 5.25%, 8/1/2026 | 51,000 | 52,152 | ||||||
Inmarsat Finance plc (United Kingdom)4, 4.875%, 5/15/2022 | 100,000 | 102,020 | ||||||
Sprint Communications, Inc.4, 9.00%, 11/15/2018 | 11,000 | 11,674 | ||||||
Sprint Communications, Inc., 7.00%, 8/15/2020 | 11,000 | 11,849 | ||||||
Verizon Communications, Inc., 4.125%, 3/16/2027 | 464,000 | 484,199 | ||||||
|
| |||||||
Total Telecommunication Services | 1,248,589 | |||||||
|
| |||||||
Utilities - 0.5% | ||||||||
Independent Power and Renewable Electricity Producers - 0.5% | ||||||||
American Water Capital Corp., 2.95%, 9/1/2027 | 540,000 | 537,509 | ||||||
|
| |||||||
TOTAL CORPORATE BONDS | ||||||||
(Identified Cost $20,090,363) | 20,050,749 | |||||||
|
| |||||||
MUTUAL FUNDS - 0.1% | ||||||||
iShares Core Dividend Growth ETF | 2,170 | 71,979 | ||||||
Schwab U.S. Dividend Equity ETF | 1,481 | 71,814 | ||||||
|
| |||||||
TOTAL MUTUAL FUNDS | ||||||||
(Identified Cost $143,049) | 143,793 | |||||||
|
| |||||||
U.S. TREASURY SECURITIES - 20.2% | ||||||||
U.S. Treasury Bonds - 3.6% | ||||||||
U.S. Treasury Bond, 6.25%, 5/15/2030 | 702,000 | 991,822 | ||||||
U.S. Treasury Bond, 4.75%, 2/15/2037 | 1,026,000 | 1,356,805 | ||||||
U.S. Treasury Bond, 2.50%, 2/15/2045 | 862,000 | 801,862 | ||||||
U.S. Treasury Inflation Indexed Bond, 0.75%, 2/15/2042 | 467,655 | 452,507 | ||||||
|
| |||||||
Total U.S. Treasury Bonds | ||||||||
(Identified Cost $3,640,565) | 3,602,996 | |||||||
|
| |||||||
U.S. Treasury Notes - 16.6% | ||||||||
U.S. Treasury Inflation Indexed Note, 0.125%, 4/15/2020 | 825,421 | 828,319 | ||||||
U.S. Treasury Inflation Indexed Note, 0.125%, 1/15/2023 | 459,186 | 457,237 | ||||||
U.S. Treasury Note, 1.625%, 4/30/2019 | 2,951,000 | 2,954,804 | ||||||
U.S. Treasury Note, 1.375%, 4/30/2020 | 3,297,000 | 3,272,401 | ||||||
U.S. Treasury Note, 1.375%, 4/30/2021 | 2,937,000 | 2,892,601 | ||||||
U.S. Treasury Note, 1.125%, 7/31/2021 | 2,368,000 | 2,305,285 | ||||||
U.S. Treasury Note, 1.75%, 4/30/2022 | 3,507,000 | 3,473,711 | ||||||
U.S. Treasury Note, 1.625%, 4/30/2023 | 370,000 | 361,082 | ||||||
U.S. Treasury Note, 1.625%, 5/15/2026 | 215,000 | 203,225 | ||||||
|
| |||||||
Total U.S. Treasury Notes | ||||||||
(Identified Cost $16,792,905) | 16,748,665 | |||||||
|
| |||||||
TOTAL U.S. TREASURY SECURITIES | ||||||||
(Identified Cost $20,433,470) | 20,351,661 | |||||||
|
| |||||||
ASSET-BACKED SECURITIES - 2.1% | ||||||||
Chesapeake Funding II LLC, Series 2017-2A, Class A14, 1.99%, 5/15/2029 | 150,000 | 150,041 | ||||||
Colony American Homes, Series 2015-1A, Class A4,6, (1 mo. LIBOR US + 1.200%), 2.437%, 7/17/2032 | 231,924 | 232,336 | ||||||
Credit Acceptance Auto Loan Trust, Series 2017-1A, Class A4, 2.56%, 10/15/2025 | 255,000 | 255,380 | ||||||
Enterprise Fleet Financing LLC, Series 2014-2, Class A34, 1.64%, 3/20/2020 | 213,600 | 213,508 | ||||||
Enterprise Fleet Financing LLC, Series 2015-2, Class A24, 1.59%, 2/22/2021 | 72,121 | 72,106 | ||||||
Invitation Homes Trust, Series 2015-SFR3, Class A4,6, (1 mo. LIBOR US + 1.300%), 2.537%, 8/17/2032 | 259,384 | 261,265 | ||||||
SBA Small Business Investment Companies, Series 2015-10B, Class 1, 2.829%, 9/10/2025 | 549,693 | 561,068 | ||||||
SoFi Professional Loan Program LLC, Series 2017-A, Class A2A4, 1.55%, 3/26/2040 | 115,990 | 115,607 | ||||||
The accompanying notes are an integral part of the financial statements.
12
Investment Portfolio - October 31, 2017
| BLENDED ASSET CONSERVATIVE SERIES | PRINCIPAL AMOUNT 3 | VALUE (NOTE 2) | ||||||
ASSET-BACKED SECURITIES (continued) | ||||||||
Tricon American Homes Trust, Series 2016-SFR1, Class A4, 2.589%, 11/17/2033 | 221,000 | $ | 219,004 | |||||
|
| |||||||
TOTAL ASSET-BACKED SECURITIES | 2,080,315 | |||||||
|
| |||||||
COMMERCIAL MORTGAGE-BACKED SECURITIES - 8.9% | ||||||||
BWAY Mortgage Trust, Series 2015-1740, Class A4, 2.917%, 1/10/2035 | 567,000 | 559,971 | ||||||
Commercial Mortgage Pass-Through Certificates, Series 2015-DC1, Class A5, 3.35%, 2/10/2048 | 545,000 | 558,654 | ||||||
Credit Suisse Mortgage Capital Trust, Series 2013-IVR3, Class A14,7, 2.50%, 5/25/2043 | 169,554 | 161,361 | ||||||
Credit Suisse Mortgage Capital Trust, Series 2013-TH1, Class A14,7, 2.13%, 2/25/2043 | 117,340 | 112,333 | ||||||
Freddie Mac Multifamily Structured Pass-Through Certificates, Series K033, Class A27, 3.06%, 7/25/2023 | 664,000 | 686,212 | ||||||
Freddie Mac Multifamily Structured Pass-Through Certificates, Series K035, Class A27, 3.458%, 8/25/2023 | 727,000 | 766,595 | ||||||
Freddie Mac Multifamily Structured Pass-Through Certificates, Series KJ10, Class A2, 2.912%, 12/25/2023 | 518,000 | 528,911 | ||||||
Freddie Mac Multifamily Structured Pass-Through Certificates, Series KJ13, Class A2, 2.864%, 8/25/2022 | 342,000 | 349,850 | ||||||
FREMF Mortgage Trust, Series 2011-K702, Class B4,7, 4.785%, 4/25/2044 | 136,000 | 136,964 | ||||||
FREMF Mortgage Trust, Series 2013-K712, Class B4,7, 3.365%, 5/25/2045 | 135,000 | 136,954 | ||||||
FREMF Mortgage Trust, Series 2014-K41, Class B4,7, 3.832%, 11/25/2047 | 273,000 | 277,498 | ||||||
FREMF Mortgage Trust, Series 2014-K716, Class B4,7, 3.951%, 8/25/2047 | 451,000 | 466,703 | ||||||
GAHR Commercial Mortgage Trust, Series 2015-NRF, Class BFX4,7, 3.495%, 12/15/2034 | 305,000 | 308,831 | ||||||
GAHR Commercial Mortgage Trust, Series 2015-NRF, Class DFX4,7 , 3.495%, 12/15/2034 | 1,290,000 | 1,299,077 | ||||||
JP Morgan Mortgage Trust, Series 2013-2, Class A24,7, 3.50%, 5/25/2043 | 102,978 | 104,962 | ||||||
JP Morgan Mortgage Trust, Series 2014-2, Class 1A14,7, 3.00%, 6/25/2029 | 141,948 | 143,678 | ||||||
New Residential Mortgage Loan Trust, Series 2014-3A, Class AFX34,7, 3.75%, 11/25/2054 | 127,771 | 131,719 | ||||||
New Residential Mortgage Loan Trust, Series 2015-2A, Class A14,7, 3.75%, 8/25/2055 | 137,873 | 142,193 | ||||||
New Residential Mortgage Loan Trust, Series 2016-4A, Class A14,7, 3.75%, 11/25/2056 | 176,122 | 181,003 | ||||||
SBA Small Business Investment Companies, Series 2015-10A, Class 1, 2.517%, 3/10/2025 | 127,987 | 128,599 | ||||||
SCG Trust, Series 2013-SRP1, Class AJ4,6, (1 mo. LIBOR US + 1.950%), 3.189%, 11/15/2026 | 442,000 | 440,291 | ||||||
Sequoia Mortgage Trust, Series 2013-8, Class A17, 3.00%, 6/25/2043 | 134,644 | 134,194 | ||||||
Starwood Retail Property Trust, Series 2014-STAR, Class A4,6, (1 mo. LIBOR US + 1.220%), 2.459%, 11/15/2027 | 285,000 | 285,198 | ||||||
Towd Point Mortgage Trust, Series 2016-5, Class A14,7, 2.50%, 10/25/2056 | 294,134 | 293,438 | ||||||
WF-RBS Commercial Mortgage Trust, Series 2011-C2, Class A44,7, 4.869%, 2/15/2044 | 359,000 | 383,556 | ||||||
WinWater Mortgage Loan Trust, Series 2015-1, Class A14,7, 3.50%, 1/20/2045 | 146,414 | 148,867 | ||||||
WinWater Mortgage Loan Trust, Series 2015-3, Class A54,7, 3.50%, 3/20/2045 | 137,695 | 139,944 | ||||||
|
| |||||||
TOTAL COMMERCIAL MORTGAGE-BACKED SECURITIES | 9,007,556 | |||||||
|
| |||||||
The accompanying notes are an integral part of the financial statements.
13
Investment Portfolio - October 31, 2017
| BLENDED ASSET CONSERVATIVE SERIES | PRINCIPAL AMOUNT 3 | VALUE (NOTE 2) | ||||||
FOREIGN GOVERNMENT BONDS - 2.7% | ||||||||
Canada Housing Trust No. 1 (Canada)4, 4.10%, 12/15/2018 | CAD | 27,000 | $ | 21,560 | ||||
Canadian Government Bond (Canada), 2.75%, 6/1/2022 | CAD | 33,000 | 26,884 | |||||
Export-Import Bank of Korea (South Korea), 2.625%, 12/30/2020 | 1,000,000 | 998,584 | ||||||
The Korea Development Bank (South Korea), 1.375%, 9/12/2019 | 600,000 | 588,497 | ||||||
Mexican Government Bond (Mexico), 8.00%, 6/11/2020 | MXN | 733,000 | 39,116 | |||||
Mexican Government Bond (Mexico), 6.50%, 6/10/2021 | MXN | 275,000 | 14,090 | |||||
Mexican Government Bond (Mexico), 6.50%, 6/9/2022 | MXN | 504,000 | 25,715 | |||||
Mexican Government Bond (Mexico), 7.75%, 5/29/2031 | MXN | 92,000 | 4,952 | |||||
Province of Ontario (Canada), 2.00%, 9/27/2018 | 211,000 | 211,605 | ||||||
Province of Ontario (Canada), 1.25%, 6/17/2019 | 206,000 | 204,002 | ||||||
Singapore Government Bond (Singapore), 2.50%, 6/1/2019 | SGD | 60,000 | 44,786 | |||||
Svensk Exportkredit AB (Sweden), 1.125%, 8/28/2019 | 504,000 | 497,656 | ||||||
United Kingdom Gilt (United Kingdom), 5.00%, 3/7/2018 | GBP | 33,000 | 44,551 | |||||
|
| |||||||
TOTAL FOREIGN GOVERNMENT BONDS | 2,721,998 | |||||||
|
| |||||||
U.S. GOVERNMENT AGENCIES - 11.2% | ||||||||
Mortgage-Backed Securities - 7.9% | ||||||||
Fannie Mae, Pool #888468, 5.50%, 9/1/2021 | 31,853 | 33,137 | ||||||
Fannie Mae, Pool #888810, 5.50%, 11/1/2022 | 37,673 | 39,129 | ||||||
Fannie Mae, Pool #MA1834, 4.50%, 2/1/2034 | 113,561 | 122,507 | ||||||
Fannie Mae, Pool #MA1903, 4.50%, 5/1/2034 | 108,850 | 117,426 | ||||||
Fannie Mae, Pool #MA2177, 4.00%, 2/1/2035 | 269,447 | 285,428 | ||||||
Fannie Mae, Pool #AB8161, 6.00%, 12/1/2037 | 95,881 | 108,450 | ||||||
Fannie Mae, Pool #995196, 6.00%, 7/1/2038 | 85,991 | 97,479 | ||||||
Fannie Mae, Pool #890294, 5.50%, 1/1/2039 | 109,078 | 121,426 | ||||||
Fannie Mae, Pool #AD0307, 5.50%, 1/1/2039 | 57,483 | 63,912 | ||||||
Fannie Mae, Pool #AE0604, 6.00%, 7/1/2039 | 69,229 | 77,607 | ||||||
Fannie Mae, Pool #MA0258, 4.50%, 12/1/2039 | 133,009 | 142,712 | ||||||
Fannie Mae, Pool #890326, 5.50%, 1/1/2040 | 116,696 | 129,768 | ||||||
Fannie Mae, Pool #AL1595, 6.00%, 1/1/2040 | 89,067 | 101,012 | ||||||
Fannie Mae, Pool #AL0152, 6.00%, 6/1/2040 | 115,725 | 131,071 | ||||||
Fannie Mae, Pool #AL0241, 4.00%, 4/1/2041 | 120,622 | 127,142 | ||||||
Fannie Mae, Pool #AL1410, 4.50%, 12/1/2041 | 179,582 | 193,323 | ||||||
Fannie Mae, Pool #AL7729, 4.00%, 6/1/2043 | 91,813 | 96,752 | ||||||
Fannie Mae, Pool #AX5234, 4.50%, 11/1/2044 | 156,961 | 167,808 | ||||||
Fannie Mae, Pool #AS4103, 4.50%, 12/1/2044 | 154,506 | 166,766 | ||||||
Fannie Mae, Pool #AZ2001, 3.50%, 5/1/2045 | 311,339 | 321,173 | ||||||
Fannie Mae, Pool #AZ9215, 4.00%, 10/1/2045 | 144,617 | 152,103 | ||||||
Fannie Mae, Pool #BC3490, 3.50%, 2/1/2046 | 285,758 | 293,961 | ||||||
Fannie Mae, Pool #BC6764, 3.50%, 4/1/2046 | 229,578 | 236,167 | ||||||
Fannie Mae, Pool #BC2098, 4.00%, 6/1/2046 | 142,573 | 149,718 | ||||||
Fannie Mae, Pool #AS7568, 4.50%, 7/1/2046 | 166,995 | 178,599 | ||||||
Fannie Mae, Pool #BD6987, 4.00%, 10/1/2046 | 154,248 | 162,021 | ||||||
Fannie Mae, Pool #BD6997, 4.00%, 10/1/2046 | 126,177 | 132,536 | ||||||
Fannie Mae, Pool #BE3815, 4.00%, 12/1/2046 | 123,268 | 129,511 | ||||||
Fannie Mae, Pool #BE7845, 4.50%, 2/1/2047 | 172,739 | 185,166 | ||||||
Fannie Mae, Pool #AL8674, 5.659%, 1/1/2049 | 185,587 | 203,796 | ||||||
Freddie Mac, Pool #C91754, 4.50%, 3/1/2034 | 117,764 | 126,886 | ||||||
Freddie Mac, Pool #C91762, 4.50%, 5/1/2034 | 155,901 | 168,136 | ||||||
Freddie Mac, Pool #K92054, 4.00%, 10/1/2034 | 121,308 | 128,641 | ||||||
Freddie Mac, Pool #C91850, 4.00%, 9/1/2035 | 79,600 | 84,552 | ||||||
The accompanying notes are an integral part of the financial statements.
14
Investment Portfolio - October 31, 2017
| BLENDED ASSET CONSERVATIVE SERIES | PRINCIPAL AMOUNT 3 | VALUE (NOTE 2) | ||||||
U.S. GOVERNMENT AGENCIES (continued) | ||||||||
Mortgage-Backed Securities (continued) | ||||||||
Freddie Mac, Pool #C91854, 4.00%, 10/1/2035 | 241,244 | $ | 256,269 | |||||
Freddie Mac, Pool #G03926, 6.00%, 2/1/2038 | 52,002 | 58,728 | ||||||
Freddie Mac, Pool #G05196, 5.50%, 10/1/2038 | 50,069 | 55,595 | ||||||
Freddie Mac, Pool #G05409, 5.50%, 3/1/2039 | 45,099 | 50,123 | ||||||
Freddie Mac, Pool #A92889, 4.50%, 7/1/2040 | 181,524 | 194,611 | ||||||
Freddie Mac, Pool #A93451, 4.50%, 8/1/2040 | 183,139 | 196,316 | ||||||
Freddie Mac, Pool #G60334, 4.50%, 10/1/2041 | 158,157 | 169,502 | ||||||
Freddie Mac, Pool #Q17513, 3.50%, 4/1/2043 | 245,176 | 253,291 | ||||||
Freddie Mac, Pool #Q24752, 3.50%, 2/1/2044 | 207,279 | 214,125 | ||||||
Freddie Mac, Pool #G60183, 4.00%, 12/1/2044 | 171,146 | 180,379 | ||||||
Freddie Mac, Pool #Q37592, 4.00%, 12/1/2045 | 287,062 | 302,806 | ||||||
Freddie Mac, Pool #G60636, 4.00%, 1/1/2046 | 216,748 | 227,510 | ||||||
Freddie Mac, Pool #Q42596, 3.50%, 8/1/2046 | 314,908 | 323,949 | ||||||
Freddie Mac, Pool #G08754, 4.50%, 3/1/2047 | 204,684 | 218,583 | ||||||
Freddie Mac, Pool #G08786, 4.50%, 10/1/2047 | 238,922 | 256,160 | ||||||
|
| |||||||
Total Mortgage-Backed Securities | ||||||||
(Identified Cost $7,967,168) | 7,933,768 | |||||||
|
| |||||||
Other Agencies - 3.3% | ||||||||
Fannie Mae, 2.625%, 9/6/2024 | ||||||||
(Identified Cost $3,369,987) | 3,281,000 | 3,349,310 | ||||||
|
| |||||||
TOTAL U.S. GOVERNMENT AGENCIES | ||||||||
(Identified Cost $11,337,155) | 11,283,078 | |||||||
|
| |||||||
SHORT-TERM INVESTMENT - 6.2% | ||||||||
Dreyfus Government Cash Management8, 0.93%, | ||||||||
(Identified Cost $6,210,595) | 6,210,595 | 6,210,595 | ||||||
|
| |||||||
TOTAL INVESTMENTS - 101.4% | ||||||||
(Identified Cost $102,408,850) | 102,213,535 | |||||||
LIABILITIES, LESS OTHER ASSETS - (1.4%) | (1,437,633 | ) | ||||||
|
| |||||||
NET ASSETS - 100% | $ | 100,775,902 | ||||||
|
| |||||||
ADR - American Depositary Receipt
CAD - Canadian Dollar
ETF - Exchange-traded fund
GBP - British Pound
MXN - Mexican Peso
No. - Number
SGD - Singapore Dollar
*Non-income producing security.
##Less than 0.1%.
1A factor from a third party vendor was applied to determine the security’s fair value following the close of local trading.
2Security has been valued at fair value as determined in good faith by the Advisor and is classified as Level 3 in the fair value hierarchy.
3Amount is stated in USD unless otherwise noted.
4Restricted securities - Investment in securities that are restricted as to public resale under the Securities Act of 1933, as amended. These securities have been sold under Rule 144A and have been determined to be liquid. These securities amount to $10,178,125 or 10.1%, of the Series’ net assets as of October 31, 2017 (see Note 2 to the financial statements).
5Variable rate security. Security may be issued at a fixed coupon rate, which converts to a variable rate at a specified date. Rate shown is the rate in effect as of October 31, 2017.
6Floating rate security. Rate shown is the rate in effect as of October 31, 2017.
7Variable or floating rate security, which interest rate adjusts periodically based on changes in current interest rates and prepayments on the underlying pool of assets. Rate shown is the rate in effect as of October 31, 2017.
8Rate shown is the current yield as of October 31, 2017.
The Global Industry Classification Standard (GICS) was developed by and is the exclusive property and a service mark of MSCI Inc. (MSCI) and Standard & Poor’s, a division of The McGraw-Hill Companies, Inc. (S&P), and is licensed for use by Manning & Napier when referencing GICS sectors. Neither MSCI, S&P, nor any third party involved in making or compiling the GICS or any GICS classifications makes any express or implied warranties or representations with respect to such standard or classification, nor shall any such party have any liability therefrom.
The accompanying notes are an integral part of the financial statements.
15
Statement of Assets and Liabilities - Blended Asset Conservative Series
October 31, 2017
ASSETS: | ||||
Investments, at value (identified cost $102,408,850) (Note 2) | $ | 102,213,535 | ||
Cash | 53,344 | |||
Receivable from investment advisor (Note 3) | 39,575 | |||
Interest receivable | 336,382 | |||
Receivable for securities sold | 30,240 | |||
Foreign tax reclaims receivable | 3,811 | |||
Dividends receivable | 3,764 | |||
Receivable for fund shares sold | 354 | |||
|
| |||
TOTAL ASSETS | 102,681,005 | |||
|
| |||
LIABILITIES: | ||||
Accrued fund accounting and administration fees (Note 3) | 5,609 | |||
Accrued Chief Compliance Officer service fees (Note 3) | 140 | |||
Payable for securities purchased | 1,830,025 | |||
Audit fees payable | 45,884 | |||
Payable for fund shares repurchased | 13,436 | |||
Other payables and accrued expenses | 10,009 | |||
|
| |||
TOTAL LIABILITIES | 1,905,103 | |||
|
| |||
TOTAL NET ASSETS | $ | 100,775,902 | ||
|
| |||
NET ASSETS CONSIST OF: | ||||
Capital stock | $ | 92,863 | ||
Additional paid-in-capital | 100,843,050 | |||
Undistributed net investment income | 48,575 | |||
Accumulated net realized loss on investments, foreign currency and translation of other assets and liabilities | (13,220 | ) | ||
Net unrealized depreciation on investments, foreign currency and translation of other assets and liabilities | (195,366 | ) | ||
|
| |||
TOTAL NET ASSETS | $ | 100,775,902 | ||
|
| |||
NET ASSET VALUE, OFFERING PRICE AND REDEMPTION PRICE PER SHARE - Class R6 ($100,775,902/ 9,286,275 shares) | $ | 10.85 | ||
|
| |||
The accompanying notes are an integral part of the financial statements.
16
Statement of Operations - Blended Asset Conservative Series
For the Period October 13, 20171 to October 31, 2017
INVESTMENT INCOME: | ||||
Interest | $ | 66,978 | ||
Dividends | 3,662 | |||
|
| |||
Total Investment Income | 70,640 | |||
|
| |||
EXPENSES: | ||||
Management fees (Note 3) | 19,615 | |||
Fund accounting and administration fees (Note 3) | 5,609 | |||
Chief Compliance Officer service fees (Note 3) | 140 | |||
Audit fees | 45,884 | |||
Transfer agent fees | 4,219 | |||
Custodian fees | 2,658 | |||
Miscellaneous | 3,132 | |||
|
| |||
Total Expenses | 81,257 | |||
Less reduction of expenses (Note 3) | (59,190 | ) | ||
|
| |||
Net Expenses | 22,067 | |||
|
| |||
NET INVESTMENT INCOME | 48,573 | |||
|
| |||
REALIZED AND UNREALIZED GAIN (LOSS) ON INVESTMENTS AND FOREIGN CURRENCY: | ||||
Net realized loss on- | ||||
Investments | (13,203 | ) | ||
Foreign currency and translation of other assets and liabilities | (15 | ) | ||
|
| |||
| (13,218 | ) | |||
|
| |||
Net change in unrealized appreciation (depreciation) on- | ||||
Investments | (195,315 | ) | ||
Foreign currency and translation of other assets and liabilities | (51 | ) | ||
|
| |||
| (195,366 | ) | |||
|
| |||
NET REALIZED AND UNREALIZED LOSS ON INVESTMENTS AND FOREIGN CURRENCY | (208,584 | ) | ||
|
| |||
NET DECREASE IN NET ASSETS RESULTING FROM OPERATIONS | $ | (160,011 | ) | |
|
| |||
1Commencement of operations.
The accompanying notes are an integral part of the financial statements.
17
Statement of Changes in Net Assets - Blended Asset Conservative Series
| FOR THE PERIOD 10/13/171 TO 10/31/17 | ||||
INCREASE (DECREASE) IN NET ASSETS: | ||||
OPERATIONS: | ||||
Net investment income | $ | 48,573 | ||
Net realized loss on investments and foreign currency | (13,218 | ) | ||
Net change in unrealized appreciation (depreciation) on investments and foreign currency | (195,366 | ) | ||
|
| |||
Net decrease from operations | (160,011 | ) | ||
|
| |||
CAPITAL STOCK ISSUED AND REPURCHASED: | ||||
Net increase from capital share transactions (Note 5) | 100,935,913 | |||
|
| |||
Net increase in net assets | 100,775,902 | |||
NET ASSETS: | ||||
Beginning of period | — | |||
|
| |||
End of period (including undistributed net investment income of $48,575) | $ | 100,775,902 | ||
|
| |||
1Commencement of operations.
The accompanying notes are an integral part of the financial statements.
18
Financial Highlights - Blended Asset Conservative Series - Class R6
| FOR THE PERIOD 10/13/171 TO 10/31/17 | ||||
Per share data (for a share outstanding throughout the period): | ||||
Net asset value - Beginning of period | $ | 10.87 | ||
|
| |||
Income (loss) from investment operations: | ||||
Net investment income2 | 0.01 | |||
Net realized and unrealized loss on investments | (0.03 | ) | ||
|
| |||
Total from investment operations | (0.02 | ) | ||
|
| |||
Net asset value - End of period | $ | 10.85 | ||
|
| |||
Net assets - End of period (000’s omitted) | $ | 100,776 | ||
|
| |||
Total return3 | (0.18 | %) | ||
Ratios (to average net assets)/Supplemental Data: | ||||
Expenses4 | 0.45 | % | ||
Net investment income4 | 0.99 | % | ||
Series portfolio turnover | 5 | % | ||
| *The investment advisor did not impose all or a portion of its management and/or other fees during the period, and may have paid a portion of the Series’ expenses. If these expenses had been incurred by the Series, the expense ratio (to average net assets) would have increased by the following amounts4: | ||||
| 1.21 | % | |||
1Commencement of operations.
2Calculated based on average shares outstanding during the period.
3Represents aggregate total return for the period indicated. Total return would have been lower had certain expenses not been reimbursed during the period. Periods less than one year are not annualized.
4Annualized.
The accompanying notes are an integral part of the financial statements.
19
Shareholder Expense Example - Blended Asset Moderate Series
(unaudited)
As a shareholder of the Series, you incur ongoing costs, including management fees, shareholder service fees and other Series expenses. This example is intended to help you understand your ongoing costs (in dollars) of investing in the Series and to compare these costs with the ongoing costs of investing in other mutual funds.
The example is based on an investment of $1,000 invested in each class at the beginning of the period and held for the entire period (October 13, 2017* to October 31, 2017).
Actual Expenses
The Actual lines of the table below provide information about actual account values and actual expenses. You may use the information in these lines, together with the amount you invested, to estimate the expenses that you paid over the period. Simply divide your account value by $1,000 (for example, an $8,600 account value divided by $1,000 = 8.6), then multiply the result by the number in the Actual line for the Class in which you have invested under the heading entitled “Expenses Paid During Period” to estimate the expenses you paid on your account during this period.
Hypothetical Example for Comparison Purposes
The Hypothetical lines of each class in the table below provide information about hypothetical account values and hypothetical expenses based on the Series’ actual expense ratio and an assumed rate of return of 5% per year before expenses, which is not the Series’ actual return. The hypothetical account values and expenses may not be used to estimate the actual ending account balance or expenses you paid during the period. You may use this information to compare the ongoing costs of investing in the Series and other funds. To do so, compare this 5% hypothetical example with the 5% hypothetical examples that appear in the shareholder reports of the other funds.
Please note that the expenses shown in the table are meant to highlight your ongoing costs only and do not reflect any transaction costs such as sales charges (loads), redemption fees, or exchange fees that you may incur in other mutual funds. Therefore, the second line of the table is useful in comparing ongoing costs only, and will not help you determine the relative total costs of owning different funds.
| BEGINNING ACCOUNT VALUE 10/13/17* | ENDING ACCOUNT VALUE 10/31/17 | EXPENSES PAID DURING PERIOD** 10/13/17*-10/31/17 | ||||
Actual | $1,000.00 | $ 998.10 | $0.25 | |||
Hypothetical | ||||||
(5% return before expenses) | $1,000.00 | $1,002.22 | $0.25 |
*Commencement of operations.
**Expenses are equal to the Series’ annualized expense ratio (for the period October 13, 2017* to October 31, 2017) of 0.50%, multiplied by the average account value over the period, multiplied by 18/365 (to reflect the period since inception). The Series’ total return would have been lower had certain expenses not been waived during the period.
20
Portfolio Composition - Blended Asset Moderate Series
As of October 31, 2017 (unaudited)
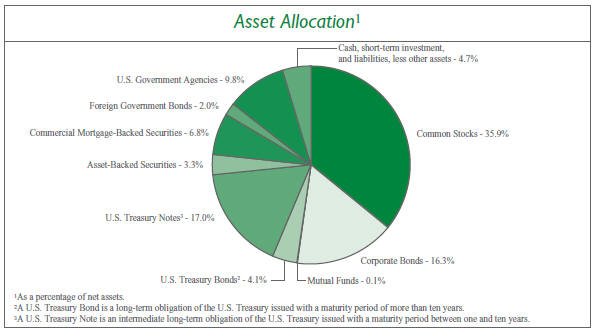
Sector Allocation4 |
| |||
Information Technology | 10.8 | % | ||
Health Care | 8.8 | % | ||
Financials | 6.7 | % | ||
Consumer Discretionary | 5.2 | % | ||
Industrials | 4.0 | % | ||
Energy | 3.9 | % | ||
Consumer Staples | 3.9 | % | ||
Materials | 3.7 | % | ||
Real Estate | 2.7 | % | ||
Telecommunication Services | 1.7 | % | ||
Utilities | 0.5 | % | ||
4Including common stocks and corporate bonds, as a percentage of total investments. | ||||
| Top Ten Stock Holdings5 | ||||
Facebook, Inc. - Class A | 1.7 | % | ||
ServiceNow, Inc. | 1.7 | % | ||
The Priceline Group, Inc. | 1.3 | % | ||
DaVita, Inc. | 1.2 | % | ||
Skyworks Solutions, Inc. | 1.0 | % | ||
Novartis AG - ADR (Switzerland) | 1.0 | % | ||
Medtronic plc | 0.9 | % | ||
FedEx Corp. | 0.8 | % | ||
Amazon.com, Inc. | 0.8 | % | ||
Diageo plc (United Kingdom) | 0.8 | % | ||
| 5As a percentage of total investments. | ||||
21
Investment Portfolio - October 31, 2017
| BLENDED ASSET MODERATE SERIES | SHARES | VALUE (NOTE 2) | ||||||
COMMON STOCKS - 35.9% | ||||||||
Consumer Discretionary - 2.9% | ||||||||
Diversified Consumer Services - 0.0%## | ||||||||
Fu Shou Yuan International Group Ltd. (China)1 | 28,000 | $ | 19,683 | |||||
|
| |||||||
Hotels, Restaurants & Leisure - 0.1% | ||||||||
Accor S.A. (France)1 | 920 | 45,897 | ||||||
Jollibee Foods Corp. (Philippines)1 | 6,050 | 29,215 | ||||||
|
| |||||||
| 75,112 | ||||||||
|
| |||||||
Household Durables - 0.0%## | ||||||||
Kaufman & Broad S.A. (France)1 | 425 | 18,780 | ||||||
|
| |||||||
Internet & Direct Marketing Retail - 2.1% | ||||||||
Amazon.com, Inc.* | 862 | 952,751 | ||||||
Ctrip.com International Ltd. - ADR (China)* | 605 | 28,973 | ||||||
The Priceline Group, Inc.* | 765 | 1,462,649 | ||||||
|
| |||||||
| 2,444,373 | ||||||||
|
| |||||||
Leisure Products - 0.0%## | ||||||||
Trigano S.A. (France)1 | 125 | 20,172 | ||||||
|
| |||||||
Media - 0.0%## | ||||||||
Quebecor, Inc. - Class B (Canada) | 170 | 6,415 | ||||||
Shaw Communications, Inc. - Class B (Canada) | 300 | 6,851 | ||||||
|
| |||||||
| 13,266 | ||||||||
|
| |||||||
Multiline Retail - 0.0%## | ||||||||
Lojas Renner S.A. (Brazil) | 1,705 | 17,929 | ||||||
|
| |||||||
Specialty Retail - 0.0%## | ||||||||
Industria de Diseno Textil S.A. (Spain)1 | 535 | 19,997 | ||||||
|
| |||||||
Textiles, Apparel & Luxury Goods - 0.7% | ||||||||
ANTA Sports Products Ltd. (China)1 | 6,000 | 26,837 | ||||||
lululemon athletica, Inc.* | 11,551 | 710,502 | ||||||
|
| |||||||
| 737,339 | ||||||||
|
| |||||||
Total Consumer Discretionary | 3,366,651 | |||||||
|
| |||||||
Consumer Staples - 2.9% | ||||||||
Beverages - 2.2% | ||||||||
Ambev S.A. - ADR (Brazil) | 132,873 | 841,086 | ||||||
Anheuser-Busch InBev S.A./N.V. (Belgium)1 | 5,460 | 669,512 | ||||||
Diageo plc (United Kingdom)1 | 27,282 | 931,645 | ||||||
Treasury Wine Estates Ltd. (Australia)1 | 3,335 | 40,033 | ||||||
|
| |||||||
| 2,482,276 | ||||||||
|
| |||||||
Food & Staples Retailing - 0.1% | ||||||||
Puregold Price Club, Inc. (Philippines)1 | 29,430 | 29,074 | ||||||
Raia Drogasil S.A. (Brazil) | 1,200 | 28,877 | ||||||
Robinsons Retail Holdings, Inc. | ||||||||
(Philippines)1 | 16,240 | 30,514 | ||||||
|
| |||||||
| 88,465 | ||||||||
|
| |||||||
Food Products - 0.1% | ||||||||
Danone S.A. (France)1 | 385 | 31,467 | ||||||
Kerry Group plc - Class A (Ireland)1 | 395 | 39,782 | ||||||
M Dias Branco S.A. (Brazil) | 1,200 | 17,747 | ||||||
Nestle S.A. (Switzerland)1 | 455 | 38,283 | ||||||
|
| |||||||
| 127,279 | ||||||||
|
| |||||||
Personal Products - 0.5% | ||||||||
Beiersdorf AG (Germany)1 | 215 | 24,185 | ||||||
Unilever plc - ADR (United Kingdom) | 10,669 | 604,399 | ||||||
|
| |||||||
| 628,584 | ||||||||
|
| |||||||
Tobacco - 0.0%## | ||||||||
Japan Tobacco, Inc. (Japan)1 | 1,200 | 39,720 | ||||||
|
| |||||||
Total Consumer Staples | 3,366,324 | |||||||
|
| |||||||
Energy - 1.5% | ||||||||
Energy Equipment & Services - 1.4% | ||||||||
Diamond Offshore Drilling, Inc.* | 18,205 | 304,570 | ||||||
Oceaneering International, Inc. | 11,095 | 224,341 | ||||||
Schlumberger Ltd. | 13,165 | 842,560 | ||||||
Transocean Ltd.* | 25,745 | 270,322 | ||||||
|
| |||||||
| 1,641,793 | ||||||||
|
| |||||||
Oil, Gas & Consumable Fuels - 0.1% | ||||||||
Cameco Corp. (Canada) | 1,425 | 11,600 | ||||||
Galp Energia SGPS S.A. (Portugal)1 | 1,590 | 29,561 | ||||||
Royal Dutch Shell plc - Class B - ADR (Netherlands) | 455 | 29,739 | ||||||
YPF S.A. - ADR (Argentina) | 990 | 24,314 | ||||||
|
| |||||||
| 95,214 | ||||||||
|
| |||||||
Total Energy | 1,737,007 | |||||||
|
| |||||||
Financials - 1.0% | ||||||||
Banks - 0.4% | ||||||||
Banco Macro S.A. - ADR (Argentina) | 205 | 25,814 | ||||||
Bankia S.A. (Spain)1 | 4,750 | 22,668 | ||||||
Banque Cantonale Vaudoise (Switzerland)1 | 25 | 17,980 | ||||||
BNP Paribas S.A. (France)1 | 480 | 37,464 | ||||||
BPER Banca (Italy)1 | 3,865 | 18,814 | ||||||
CaixaBank S.A. (Spain)1 | 4,925 | 23,041 | ||||||
The accompanying notes are an integral part of the financial statements.
22
Investment Portfolio - October 31, 2017
| BLENDED ASSET MODERATE SERIES | SHARES | VALUE (NOTE 2) | ||||||
COMMON STOCKS (continued) | ||||||||
Financials (continued) | ||||||||
Banks (continued) | ||||||||
Credit Agricole S.A. (France)1 | 1,635 | $ | 28,536 | |||||
Danske Bank A/S (Denmark)1 | 740 | 28,241 | ||||||
Erste Group Bank AG (Austria)1 | 440 | 18,887 | ||||||
Eurobank Ergasias S.A. (Greece)*1 | 26,065 | 21,291 | ||||||
FinecoBank Banca Fineco S.p.A. (Italy)1 | 3,320 | 31,052 | ||||||
Grupo Financiero Galicia S.A. - ADR (Argentina) | 410 | 22,509 | ||||||
Grupo Supervielle S.A. - ADR (Argentina) | 730 | 19,571 | ||||||
Itau Unibanco Holding S.A. (Brazil) | 1,400 | 18,064 | ||||||
Jyske Bank A/S (Denmark)1 | 340 | 19,213 | ||||||
KBC Group N.V. (Belgium)1 | 340 | 28,243 | ||||||
Skandinaviska Enskilda Banken A.B. - Class A (Sweden)1 | 1,540 | 18,978 | ||||||
Svenska Handelsbanken A.B. - Class A (Sweden)1 | 1,325 | 18,990 | ||||||
Swedbank A.B. - Class A (Sweden)1 | 775 | 19,234 | ||||||
Sydbank A/S (Denmark)1 | 490 | 19,129 | ||||||
|
| |||||||
| 457,719 | ||||||||
|
| |||||||
Capital Markets - 0.6% | ||||||||
Amundi S.A. (France)1,2 | 350 | 29,663 | ||||||
Banca Generali S.p.A. (Italy)1 | 865 | 28,459 | ||||||
BlackRock, Inc. | 1,073 | 505,201 | ||||||
EFG International AG (Switzerland)1 | 3,215 | 29,421 | ||||||
Euronext N.V. (Netherlands)1,2 | 630 | 37,416 | ||||||
Julius Baer Group Ltd. (Switzerland)1 | 330 | 19,519 | ||||||
Natixis S.A. (France)1 | 4,845 | 37,995 | ||||||
|
| |||||||
| 687,674 | ||||||||
|
| |||||||
Thrifts & Mortgage Finance - 0.0%## | ||||||||
Aareal Bank AG (Germany)1 | 460 | 19,126 | ||||||
|
| |||||||
Total Financials | 1,164,519 | |||||||
|
| |||||||
Health Care - 8.4% | ||||||||
Biotechnology - 3.6% | ||||||||
Biogen, Inc.* | 2,062 | 642,643 | ||||||
BioMarin Pharmaceutical, Inc.* | 9,048 | 742,750 | ||||||
Incyte Corp.* | 5,711 | 646,771 | ||||||
Regeneron Pharmaceuticals, Inc.* | 2,287 | 920,792 | ||||||
Seattle Genetics, Inc.* | 12,593 | 772,077 | ||||||
Vertex Pharmaceuticals, Inc.* | 2,629 | 384,439 | ||||||
|
| |||||||
| 4,109,472 | ||||||||
|
| |||||||
Health Care Equipment & Supplies - 1.0% | ||||||||
Medtronic plc | 13,373 | 1,076,794 | ||||||
Osstem Implant Co. Ltd. (South Korea)*1 | 490 | 31,485 | ||||||
|
| |||||||
| 1,108,279 | ||||||||
|
| |||||||
Health Care Providers & Services - 1.6% | ||||||||
DaVita, Inc.* | 22,193 | 1,348,003 | ||||||
Express Scripts Holding Co.* | 7,272 | 445,701 | ||||||
Fleury S.A. (Brazil) | 3,000 | 26,338 | ||||||
Fresenius Medical Care AG & Co. KGaA (Germany)1 | 465 | 45,022 | ||||||
Orpea (France)1 | 320 | 38,339 | ||||||
|
| |||||||
| 1,903,403 | ||||||||
|
| |||||||
Life Sciences Tools & Services - 0.0%## | ||||||||
QIAGEN N.V. | 540 | 18,284 | ||||||
QIAGEN N.V.1 | 690 | 23,409 | ||||||
Tecan Group AG (Switzerland)1 | 95 | 20,093 | ||||||
|
| |||||||
| 61,786 | ||||||||
|
| |||||||
Pharmaceuticals - 2.2% | ||||||||
Bristol-Myers Squibb Co. | 6,736 | 415,342 | ||||||
Hypermarcas S.A. (Brazil) | 2,700 | 28,318 | ||||||
Johnson & Johnson | 6,480 | 903,377 | ||||||
Kalbe Farma Tbk PT (Indonesia)1 | 237,100 | 27,971 | ||||||
Novartis AG - ADR (Switzerland) | 13,569 | 1,120,528 | ||||||
Perrigo Co. plc | 440 | 35,636 | ||||||
|
| |||||||
| 2,531,172 | ||||||||
|
| |||||||
Total Health Care | 9,714,112 | |||||||
|
| |||||||
Industrials - 3.8% | ||||||||
Aerospace & Defense - 0.6% | ||||||||
Arconic, Inc. | 24,214 | 608,256 | ||||||
LIG Nex1 Co. Ltd. (South Korea)1 | 440 | 28,238 | ||||||
Thales S.A. (France)1 | 455 | 47,417 | ||||||
Ultra Electronics Holdings plc | ||||||||
(United Kingdom)1 | 820 | 19,856 | ||||||
|
| |||||||
| 703,767 | ||||||||
|
| |||||||
Air Freight & Logistics - 0.8% | ||||||||
FedEx Corp. | 4,293 | 969,402 | ||||||
|
| |||||||
Airlines - 0.1% | ||||||||
Azul S.A. - ADR (Brazil)* | 710 | 17,956 | ||||||
Ryanair Holdings plc - ADR (Ireland)* | 460 | 51,571 | ||||||
|
| |||||||
| 69,527 | ||||||||
|
| |||||||
Building Products - 0.1% | ||||||||
Cie de Saint-Gobain (France)1 | 645 | 37,818 | ||||||
The accompanying notes are an integral part of the financial statements.
23
Investment Portfolio - October 31, 2017
| BLENDED ASSET MODERATE SERIES | SHARES | VALUE (NOTE 2) | ||||||
COMMON STOCKS (continued) | ||||||||
Industrials (continued) | ||||||||
Building Products (continued) | ||||||||
Geberit AG (Switzerland)1 | 40 | $ | 18,110 | |||||
|
| |||||||
| 55,928 | ||||||||
|
| |||||||
Commercial Services & Supplies - 0.1% | ||||||||
China Everbright International Ltd. (China)1 | 20,000 | 28,217 | ||||||
Elis S.A. (France)1 | 1,095 | 28,549 | ||||||
SPIE S.A. (France)1 | 1,475 | 38,809 | ||||||
|
| |||||||
| 95,575 | ||||||||
|
| |||||||
Construction & Engineering - 0.1% | ||||||||
Eiffage S.A. (France)1 | 460 | 48,050 | ||||||
Vinci S.A. (France)1 | 680 | 66,625 | ||||||
|
| |||||||
| 114,675 | ||||||||
|
| |||||||
Electrical Equipment - 0.0%## | ||||||||
Legrand S.A. (France)1 | 400 | 29,684 | ||||||
|
| |||||||
Industrial Conglomerates - 0.1% | ||||||||
Siemens AG (Germany)1 | 565 | 81,152 | ||||||
|
| |||||||
Machinery - 0.1% | ||||||||
FANUC Corp. (Japan)1 | 100 | 23,382 | ||||||
Jungheinrich AG (Germany)1 | 645 | 29,375 | ||||||
KION Group AG (Germany)1 | 495 | 39,663 | ||||||
Metso OYJ (Finland)1 | 730 | 26,512 | ||||||
The Weir Group plc (United Kingdom)1 | 1,945 | 50,423 | ||||||
|
| |||||||
| 169,355 | ||||||||
|
| |||||||
Professional Services - 1.2% | ||||||||
Applus Services S.A. (Spain)1 | 3,930 | 54,956 | ||||||
Equifax, Inc. | 4,810 | 522,029 | ||||||
Intertek Group plc (United Kingdom)1 | 565 | 40,703 | ||||||
Nielsen Holdings plc | 19,680 | 729,538 | ||||||
Randstad Holding N.V. | ||||||||
(Netherlands)1 | 475 | 29,223 | ||||||
RELX plc (United Kingdom)1 | 870 | 20,019 | ||||||
SGS S.A. (Switzerland)1 | 15 | 37,043 | ||||||
|
| |||||||
| 1,433,511 | ||||||||
|
| |||||||
Road & Rail - 0.4% | ||||||||
Genesee & Wyoming, Inc. - Class A* | 6,306 | 452,645 | ||||||
|
| |||||||
Trading Companies & Distributors - 0.1% | ||||||||
Ashtead Group plc (United Kingdom)1 | 1,165 | 30,010 | ||||||
Brenntag AG (Germany)1 | 690 | 39,148 | ||||||
Howden Joinery Group plc (United Kingdom)1 | 2,445 | 13,315 | ||||||
|
| |||||||
| 82,473 | ||||||||
|
| |||||||
Transportation Infrastructure - 0.1% | ||||||||
Aena SME S.A. (Spain)1,2 | 520 | 95,406 | ||||||
Grupo Aeroportuario del Centro Norte S.A.B. de C.V. (Mexico) | 1,300 | 6,567 | ||||||
Grupo Aeroportuario del Pacifico S.A.B. de C.V. - ADR (Mexico) | 65 | 6,170 | ||||||
|
| |||||||
| 108,143 | ||||||||
|
| |||||||
Total Industrials | 4,365,837 | |||||||
|
| |||||||
Information Technology - 10.1% | ||||||||
Electronic Equipment, Instruments & Components - 0.1% | ||||||||
Halma plc (United Kingdom)1 | 1,885 | 29,577 | ||||||
Hexagon A.B. - Class B (Sweden)1 | 390 | 19,997 | ||||||
Hitachi Ltd. (Japan)1 | 6,000 | 47,780 | ||||||
Hollysys Automation Technologies | ||||||||
Ltd. (China) | 845 | 18,970 | ||||||
Keyence Corp. (Japan)1 | 100 | 55,522 | ||||||
|
| |||||||
| 171,846 | ||||||||
|
| |||||||
Internet Software & Services - 3.6% | ||||||||
Alibaba Group Holding Ltd. - ADR (China)* | 420 | 77,654 | ||||||
Alphabet, Inc. - Class A* | 670 | 692,137 | ||||||
Alphabet, Inc. - Class C* | 687 | 698,432 | ||||||
China Literature Ltd. - Rights (Expires 11/03/2017) (Hong Kong)*3 | 12 | — | ||||||
Facebook, Inc. - Class A* | 10,785 | 1,941,947 | ||||||
NetEase, Inc. - ADR (China) | 45 | 12,686 | ||||||
Tencent Holdings Ltd. - Class H (China)1 | 16,380 | 736,201 | ||||||
|
| |||||||
| 4,159,057 | ||||||||
|
| |||||||
IT Services - 1.7% | ||||||||
Altran Technologies S.A. (France)1 | 2,050 | 37,914 | ||||||
Amdocs Ltd. | 690 | 44,919 | ||||||
InterXion Holding N.V. - ADR | ||||||||
(Netherlands)* | 610 | 32,568 | ||||||
MasterCard, Inc. - Class A | 6,028 | 896,786 | ||||||
Sopra Steria Group (France)1 | 205 | 38,458 | ||||||
Visa, Inc. - Class A | 8,134 | 894,577 | ||||||
|
| |||||||
| 1,945,222 | ||||||||
|
| |||||||
Semiconductors & Semiconductor Equipment - 1.8% | ||||||||
Qorvo, Inc.* | 12,180 | 923,366 | ||||||
The accompanying notes are an integral part of the financial statements.
24
Investment Portfolio - October 31, 2017
| BLENDED ASSET MODERATE SERIES | SHARES | VALUE (NOTE 2) | ||||||
COMMON STOCKS (continued) | ||||||||
Information Technology (continued) | ||||||||
Semiconductors & Semiconductor Equipment (continued) | ||||||||
Skyworks Solutions, Inc. | 10,346 | $ | 1,177,996 | |||||
|
| |||||||
| 2,101,362 | ||||||||
|
| |||||||
Software - 2.9% | ||||||||
Atlassian Corp. plc - Class A (Australia)* | 325 | 15,720 | ||||||
Dassault Systemes S.E. (France)1 | 375 | 39,809 | ||||||
Electronic Arts, Inc.* | 4,143 | 495,503 | ||||||
Microsoft Corp. | 9,344 | 777,234 | ||||||
ServiceNow, Inc.* | 15,229 | 1,924,489 | ||||||
Sophos Group plc (United Kingdom)1,2 | 2,505 | 20,657 | ||||||
Temenos Group AG (Switzerland)1 | 265 | 30,600 | ||||||
|
| |||||||
| 3,304,012 | ||||||||
|
| |||||||
Total Information Technology | 11,681,499 | |||||||
|
| |||||||
Materials - 2.3% | ||||||||
Chemicals - 0.5% | ||||||||
Akzo Nobel N.V. (Netherlands)1 | 425 | 38,369 | ||||||
Ashland Global Holdings, Inc. | 6,640 | 451,387 | ||||||
Croda International plc (United Kingdom)1 | 570 | 31,678 | ||||||
Mexichem, S.A.B. de C.V. (Mexico) | 5,000 | 12,878 | ||||||
Solvay S.A. (Belgium)1 | 245 | 36,397 | ||||||
|
| |||||||
| 570,709 | ||||||||
|
| |||||||
Construction Materials - 0.0%## | ||||||||
Wienerberger AG (Austria)1 | 1,155 | 29,634 | ||||||
|
| |||||||
Containers & Packaging - 1.0% | ||||||||
Ball Corp. | 13,688 | 587,626 | ||||||
Sealed Air Corp. | 12,692 | 561,367 | ||||||
|
| |||||||
| 1,148,993 | ||||||||
|
| |||||||
Metals & Mining - 0.8% | ||||||||
Antofagasta plc (Chile)1 | 14,303 | 181,270 | ||||||
First Quantum Minerals Ltd. (Zambia) | 16,647 | 186,200 | ||||||
Grupo Mexico, S.A.B. de C.V. - Series B (Mexico) | 11,000 | 35,774 | ||||||
Lundin Mining Corp. (Canada) | 25,351 | 193,360 | ||||||
Southern Copper Corp. (Peru) | 5,763 | 247,521 | ||||||
|
| |||||||
| 844,125 | ||||||||
|
| |||||||
Total Materials | 2,593,461 | |||||||
|
| |||||||
Real Estate - 2.2% | ||||||||
Equity Real Estate Investment Trusts (REITS) - 2.2% | ||||||||
Acadia Realty Trust | 440 | 12,386 | ||||||
Agree Realty Corp. | 195 | 9,222 | ||||||
Alexandria Real Estate Equities, Inc. | 400 | 49,584 | ||||||
American Campus Communities, Inc. | 455 | 18,919 | ||||||
American Homes 4 Rent - Class A | 1,660 | 35,325 | ||||||
Apartment Investment & Management Co. - Class A | 935 | 41,121 | ||||||
AvalonBay Communities, Inc. | 280 | 50,772 | ||||||
Axiare Patrimonio SOCIMI S.A. (Spain)1 | 750 | 14,066 | ||||||
Bluerock Residential Growth REIT, Inc. | 870 | 9,822 | ||||||
Boston Properties, Inc. | 205 | 24,842 | ||||||
Brandywine Realty Trust | 1,125 | 19,676 | ||||||
Brixmor Property Group, Inc. | 650 | 11,356 | ||||||
Camden Property Trust | 230 | 20,985 | ||||||
CatchMark Timber Trust, Inc. - Class A | 1,710 | 21,888 | ||||||
Cedar Realty Trust, Inc. | 3,360 | 18,278 | ||||||
Chesapeake Lodging Trust | 770 | 21,483 | ||||||
Colony NorthStar, Inc. - Class A | 2,610 | 32,051 | ||||||
Columbia Property Trust, Inc. | 680 | 15,014 | ||||||
Community Healthcare Trust, Inc. | 2,150 | 58,974 | ||||||
CoreCivic, Inc. | 1,525 | 37,606 | ||||||
Cousins Properties, Inc. | 3,390 | 30,578 | ||||||
Crown Castle International Corp. | 250 | 26,770 | ||||||
CubeSmart | 1,525 | 41,510 | ||||||
DDR Corp. | 1,155 | 8,859 | ||||||
Digital Realty Trust, Inc. | 380 | 45,007 | ||||||
Douglas Emmett, Inc. | 540 | 21,487 | ||||||
Education Realty Trust, Inc. | 280 | 9,772 | ||||||
EPR Properties | 140 | 9,685 | ||||||
Equinix, Inc. | 215 | 99,652 | ||||||
Equity Commonwealth* | 665 | 19,983 | ||||||
Equity LifeStyle Properties, Inc. | 220 | 19,466 | ||||||
Equity Residential | 550 | 36,993 | ||||||
Essex Property Trust, Inc. | 35 | 9,185 | ||||||
Extra Space Storage, Inc. | 370 | 30,188 | ||||||
Forest City Realty Trust, Inc. - Class A | 850 | 20,936 | ||||||
Getty Realty Corp. | 540 | 15,341 | ||||||
GGP, Inc. | 915 | 17,806 | ||||||
Global Medical REIT, Inc. | 2,495 | 21,108 | ||||||
HCP, Inc. | 760 | 19,638 | ||||||
Healthcare Trust of America, Inc. - Class A | 760 | 22,838 | ||||||
Hibernia REIT plc (Ireland)1 | 9,865 | 16,950 | ||||||
The accompanying notes are an integral part of the financial statements.
25
Investment Portfolio - October 31, 2017
| BLENDED ASSET MODERATE SERIES | SHARES | VALUE (NOTE 2) | ||||||
COMMON STOCKS (continued) | ||||||||
Real Estate (continued) | ||||||||
Equity Real Estate Investment Trusts (REITS) (continued) | ||||||||
Host Hotels & Resorts, Inc. | 940 | $ | 18,386 | |||||
Independence Realty Trust, Inc. | 1,445 | 14,667 | ||||||
Invitation Homes, Inc. | 715 | 16,138 | ||||||
Lamar Advertising Co. - Class A | 250 | 17,610 | ||||||
LaSalle Hotel Properties | 455 | 12,836 | ||||||
Life Storage, Inc. | 255 | 20,609 | ||||||
The Macerich Co. | 165 | 9,009 | ||||||
Mid-America Apartment Communities, Inc. | 335 | 34,287 | ||||||
National Retail Properties, Inc. | 500 | 20,090 | ||||||
Outfront Media, Inc. | 725 | 17,001 | ||||||
Physicians Realty Trust | 2,005 | 34,847 | ||||||
Prologis, Inc. | 1,005 | 64,903 | ||||||
Public Storage | 160 | 33,160 | ||||||
Regency Centers Corp. | 335 | 20,619 | ||||||
Retail Opportunity Investments Corp. | 695 | 12,496 | ||||||
Rexford Industrial Realty, Inc. | 865 | 25,682 | ||||||
Simon Property Group, Inc. | 510 | 79,218 | ||||||
STAG Industrial, Inc. | 1,090 | 29,757 | ||||||
Starwood Waypoint Homes | 440 | 15,976 | ||||||
STORE Capital Corp. | 770 | 19,011 | ||||||
Sun Communities, Inc. | 210 | 18,955 | ||||||
Sunstone Hotel Investors, Inc. | 1,180 | 19,258 | ||||||
Terreno Realty Corp. | 700 | 25,704 | ||||||
UDR, Inc. | 700 | 27,153 | ||||||
Unibail-Rodamco S.E. (France)1 | 130 | 32,540 | ||||||
Urban Edge Properties | 1,315 | 30,850 | ||||||
Ventas, Inc. | 635 | 39,846 | ||||||
VEREIT, Inc. | 2,410 | 19,015 | ||||||
Vornado Realty Trust | 515 | 38,553 | ||||||
Welltower, Inc. | 535 | 35,824 | ||||||
Weyerhaeuser Co. | 17,226 | 618,586 | ||||||
|
| |||||||
| 2,489,708 | ||||||||
|
| |||||||
Real Estate Management & Development - 0.0%## | ||||||||
Aliansce Shopping Centers S.A. (Brazil)* | 3,400 | 18,168 | ||||||
Iguatemi Empresa de Shopping Centers S.A. (Brazil) | 1,500 | 17,626 | ||||||
Nexity S.A. (France)1 | 480 | 29,502 | ||||||
|
| |||||||
| 65,296 | ||||||||
|
| |||||||
Total Real Estate | 2,555,004 | |||||||
|
| |||||||
Telecommunication Services - 0.7% | ||||||||
Diversified Telecommunication Services - 0.7% |
| |||||||
Iliad S.A. (France)1 | 130 | 32,450 | ||||||
Zayo Group Holdings, Inc.* | 20,443 | 737,175 | ||||||
|
| |||||||
Total Telecommunication Services | 769,625 | |||||||
|
| |||||||
Utilities - 0.1% | ||||||||
Electric Utilities - 0.0%## | ||||||||
Pampa Energia S.A. - ADR (Argentina)* | 585 | 39,681 | ||||||
|
| |||||||
Independent Power and Renewable Electricity Producers - 0.1% | ||||||||
China Longyuan Power Group Corp. Ltd. - Class H (China)1 | 36,000 | 26,697 | ||||||
Huaneng Renewables Corp. Ltd. - Class H (China)1 | 82,000 | 28,200 | ||||||
|
| |||||||
| 54,897 | ||||||||
|
| |||||||
Total Utilities | 94,578 | |||||||
|
| |||||||
TOTAL COMMON STOCKS | ||||||||
(Identified Cost $41,456,476) | 41,408,617 | |||||||
|
| |||||||
CORPORATE BONDS - 16.3% | ||||||||
Non-Convertible Corporate Bonds - 16.3% | ||||||||
Consumer Discretionary - 2.3% | ||||||||
Auto Components - 0.3% | ||||||||
Magna International, Inc. (Canada), 4.15%, 10/1/2025 | 332,000 | 355,232 | ||||||
|
| |||||||
Household Durables - 0.5% | ||||||||
Century Communities, Inc.2, 5.875%, 7/15/2025 | 43,000 | 43,430 | ||||||
Meritage Homes Corp., 5.125%, 6/6/2027 | 31,000 | 31,349 | ||||||
NVR, Inc., 3.95%, 9/15/2022 | 371,000 | 389,718 | ||||||
TRI Pointe Group, Inc. - TRI Pointe Homes, Inc., 4.375%, 6/15/2019 | 45,000 | 46,181 | ||||||
TRI Pointe Group, Inc. - TRI Pointe Homes, Inc., 5.875%, 6/15/2024 | 24,000 | 25,980 | ||||||
Weekley Homes LLC - Weekley Finance Corp., 6.00%, 2/1/2023 | 38,000 | 37,240 | ||||||
Weekley Homes LLC - Weekley Finance Corp.2, 6.625%, 8/15/2025 | 39,000 | 37,928 | ||||||
|
| |||||||
| 611,826 | ||||||||
|
| |||||||
Internet & Direct Marketing Retail - 0.7% | ||||||||
Amazon.com, Inc.2, 3.15%, 8/22/2027 | 250,000 | 251,496 | ||||||
The Priceline Group, Inc., 3.60%, 6/1/2026 | 466,000 | 476,302 | ||||||
|
| |||||||
| 727,798 | ||||||||
|
| |||||||
The accompanying notes are an integral part of the financial statements.
26
Investment Portfolio - October 31, 2017
| BLENDED ASSET MODERATE SERIES | PRINCIPAL AMOUNT 4 | VALUE (NOTE 2) | ||||||
CORPORATE BONDS (continued) | ||||||||
Non-Convertible Corporate Bonds (continued) | ||||||||
Consumer Discretionary (continued) | ||||||||
Media - 0.6% | ||||||||
Charter Communications Operating LLC - Charter Communications Operating Capital Corp., 4.464%, 7/23/2022 | 10,000 | $ | 10,561 | |||||
Comcast Corp., 4.40%, 8/15/2035 | 225,000 | 243,650 | ||||||
CSC Holdings, LLC, 5.25%, 6/1/2024 | 54,000 | 53,764 | ||||||
Discovery Communications LLC, 3.95%, 3/20/2028 | 380,000 | 376,889 | ||||||
DISH DBS Corp., 5.875%, 7/15/2022 | 10,000 | 10,056 | ||||||
|
| |||||||
| 694,920 | ||||||||
|
| |||||||
Multiline Retail - 0.2% | ||||||||
Dollar General Corp., 3.25%, 4/15/2023 | 227,000 | 232,930 | ||||||
|
| |||||||
Total Consumer Discretionary | 2,622,706 | |||||||
|
| |||||||
Consumer Staples - 1.0% | ||||||||
Beverages - 0.6% | ||||||||
Anheuser-Busch InBev Worldwide, Inc. (Belgium), 8.20%, 1/15/2039 | 320,000 | 505,668 | ||||||
PepsiCo, Inc., 3.10%, 7/17/2022 | 221,000 | 228,476 | ||||||
|
| |||||||
| 734,144 | ||||||||
|
| |||||||
Food & Staples Retailing - 0.4% | ||||||||
C&S Group Enterprises LLC2 , 5.375%, 7/15/2022 | 60,000 | 58,200 | ||||||
CVS Health Corp., 3.50%, 7/20/2022 | 334,000 | 344,284 | ||||||
|
| |||||||
| 402,484 | ||||||||
|
| |||||||
Total Consumer Staples | 1,136,628 | |||||||
|
| |||||||
Energy - 2.4% | ||||||||
Energy Equipment & Services - 0.1% | ||||||||
McDermott International, Inc.2, 8.00%, 5/1/2021 | 60,000 | 61,950 | ||||||
Trinidad Drilling Ltd. (Canada)2, 6.625%, 2/15/2025 | 44,000 | 42,790 | ||||||
|
| |||||||
| 104,740 | ||||||||
|
| |||||||
Oil, Gas & Consumable Fuels - 2.3% | ||||||||
BP Capital Markets plc (United Kingdom), 3.535%, 11/4/2024 | 464,000 | 482,386 | ||||||
Cheniere Energy Partners LP2 , 5.25%, 10/1/2025 | 39,000 | 40,170 | ||||||
Columbia Pipeline Group, Inc., 4.50%, 6/1/2025 | 209,000 | 223,996 | ||||||
ConocoPhillips Co., 3.35%, 5/15/2025 | 225,000 | 231,811 | ||||||
Dynagas LNG Partners LP - Dynagas Finance, Inc. (Monaco), 6.25%, 10/30/2019 | 44,000 | 44,000 | ||||||
Enbridge, Inc. (Canada), 3.70%, 7/15/2027 | 225,000 | 227,939 | ||||||
Enviva Partners LP - Enviva Partners Finance Corp., 8.50%, 11/1/2021 | 39,000 | 41,827 | ||||||
GasLog Ltd. (Monaco), 8.875%, 3/22/2022 | 43,000 | 45,365 | ||||||
Global Ship Lease, Inc. (United Kingdom)2, 9.875%, 11/15/2022 | 50,000 | 51,000 | ||||||
Hilcorp Energy I LP - Hilcorp Finance Co.2, 5.75%, 10/1/2025 | 61,000 | 62,449 | ||||||
Jonah Energy LLC - Jonah Energy Finance Corp.2 , 7.25%, 10/15/2025 | 39,000 | 39,000 | ||||||
Kinder Morgan Energy Partners LP, 4.30%, 5/1/2024 | 470,000 | 493,132 | ||||||
PBF Holding Co. LLC - PBF Finance Corp.2, 7.25%, 6/15/2025 | 34,000 | 35,148 | ||||||
Petroleos Mexicanos (Mexico), 6.875%, 8/4/2026 | 199,000 | 223,576 | ||||||
Rockies Express Pipeline, LLC2, 5.625%, 4/15/2020 | 53,000 | 56,180 | ||||||
Sabine Pass Liquefaction LLC, 5.875%, 6/30/2026 | 220,000 | 248,892 | ||||||
SemGroup Corp.2, 6.375%, 3/15/2025 | 42,000 | 41,370 | ||||||
Seven Generations Energy Ltd. (Canada)2, 5.375%, 9/30/2025 | 27,000 | 27,270 | ||||||
Southwestern Energy Co., 6.70%, 1/23/2025 | 31,000 | 31,698 | ||||||
Tallgrass Energy Partners LP - Tallgrass Energy Finance Corp.2, 5.50%, 9/15/2024 | 56,000 | 57,890 | ||||||
|
| |||||||
| 2,705,099 | ||||||||
|
| |||||||
Total Energy | 2,809,839 | |||||||
|
| |||||||
Financials - 5.8% | ||||||||
Banks - 3.1% | ||||||||
Banco Santander S.A. (Spain), 3.50%, 4/11/2022 | 298,000 | 305,350 | ||||||
Bank of America Corp., 4.00%, 1/22/2025 | 342,000 | 354,204 | ||||||
Barclays Bank plc (United Kingdom)2, 10.179%, 6/12/2021 | 176,000 | 217,342 | ||||||
Citigroup, Inc., 3.875%, 3/26/2025 | 474,000 | 486,373 | ||||||
The accompanying notes are an integral part of the financial statements.
27
Investment Portfolio - October 31, 2017
| BLENDED ASSET MODERATE SERIES | PRINCIPAL AMOUNT 4 | VALUE (NOTE 2) | ||||||||||
CORPORATE BONDS (continued) | ||||||||||||
Non-Convertible Corporate Bonds (continued) | ||||||||||||
Financials (continued) | ||||||||||||
Banks (continued) | ||||||||||||
Intesa Sanpaolo S.p.A. (Italy), 3.875%, 1/15/2019 | 226,000 | $ | 230,420 | |||||||||
JPMorgan Chase & Co.5, (3 mo. LIBOR US + 0.935%), 2.776%, 4/25/2023 | 470,000 | 471,667 | ||||||||||
Kreditanstalt fuer Wiederaufbau (Germany), 1.50%, 6/15/2021 | 906,000 | 889,733 | ||||||||||
Lloyds Banking Group plc (United Kingdom), 4.582%, 12/10/2025 | 478,000 | 504,120 | ||||||||||
Popular, Inc., 7.00%, 7/1/2019 | 47,000 | 48,058 | ||||||||||
Royal Bank of Canada (Canada), 3.77%, 3/30/2018 | CAD | 60,000 | 46,962 | |||||||||
Royal Bank of Scotland Group plc (United Kingdom), 6.10%, 6/10/2023 | 12,000 | 13,362 | ||||||||||
|
| |||||||||||
| 3,567,591 | ||||||||||||
|
| |||||||||||
Capital Markets - 0.8% | ||||||||||||
The Goldman Sachs Group, Inc., 4.25%, 10/21/2025 | 230,000 | 239,963 | ||||||||||
Morgan Stanley6, (3 mo. LIBOR US + 1.220%), 2.617%, 5/8/2024 | 344,000 | 349,772 | ||||||||||
Morgan Stanley, 5.00%, 11/24/2025 | 350,000 | 381,785 | ||||||||||
|
| |||||||||||
| 971,520 | ||||||||||||
|
| |||||||||||
Consumer Finance - 0.1% | ||||||||||||
Ally Financial, Inc., 3.50%, 1/27/2019 | 17,000 | 17,207 | ||||||||||
Navient Corp., 6.125%, 3/25/2024 | 28,000 | 28,735 | ||||||||||
SLM Corp., 5.125%, 4/5/2022 | 35,000 | 36,269 | ||||||||||
|
| |||||||||||
| 82,211 | ||||||||||||
|
| |||||||||||
Diversified Financial Services - 0.6% | ||||||||||||
AerCap Ireland Capital DAC - AerCap Global Aviation Trust (Netherlands), 4.50%, 5/15/2021 | 404,000 | 429,045 | ||||||||||
E*TRADE Financial Corp., 2.95%, 8/24/2022 | 250,000 | 250,119 | ||||||||||
LPL Holdings, Inc.2, 5.75%, 9/15/2025 | 28,000 | 29,120 | ||||||||||
|
| |||||||||||
| 708,284 | ||||||||||||
|
| |||||||||||
Insurance - 1.1% | ||||||||||||
American International Group, Inc., 4.125%, 2/15/2024 | 325,000 | 345,683 | ||||||||||
Assured Guaranty US Holdings, Inc., 5.00%, 7/1/2024 | 580,000 | 626,207 | ||||||||||
Prudential Financial, Inc.5, (3 mo. LIBOR US + 4.175%), 5.875%, 9/15/2042 | 230,000 | 254,150 | ||||||||||
|
| |||||||||||
| 1,226,040 | ||||||||||||
|
| |||||||||||
Thrifts & Mortgage Finance - 0.1% | ||||||||||||
Ladder Capital Finance Holdings LLLP - Ladder Capital Finance Corp.2, 5.875%, 8/1/2021 | 72,000 | 74,340 | ||||||||||
|
| |||||||||||
Total Financials | 6,629,986 | |||||||||||
|
| |||||||||||
Health Care - 0.4% | ||||||||||||
Biotechnology - 0.3% | ||||||||||||
AMAG Pharmaceuticals, Inc.2, 7.875%, 9/1/2023 | 30,000 | 30,524 | ||||||||||
Express Scripts Holding Co., 3.50%, 6/15/2024 | 333,000 | 336,943 | ||||||||||
|
| |||||||||||
| 367,467 | ||||||||||||
|
| |||||||||||
Health Care Equipment & Supplies - 0.0%## | ||||||||||||
Hill-Rom Holdings, Inc.2, 5.00%, 2/15/2025 | 30,000 | 30,675 | ||||||||||
|
| |||||||||||
Health Care Providers & Services - 0.1% | ||||||||||||
DaVita, Inc., 5.00%, 5/1/2025 | 39,000 | 38,415 | ||||||||||
Fresenius Medical Care US Finance II, Inc. (Germany)2, 6.50%, 9/15/2018 | 17,000 | 17,657 | ||||||||||
HCA Healthcare, Inc., 6.25%, 2/15/2021 | 12,000 | 12,915 | ||||||||||
HCA, Inc., 3.75%, 3/15/2019 | 12,000 | 12,180 | ||||||||||
Ortho-Clinical Diagnostics, Inc. - Ortho-Clinical Diagnostics S.A.2, 6.625%, 5/15/2022 | 15,000 | 15,019 | ||||||||||
Tenet Healthcare Corp., 6.75%, 2/1/2020 | 12,000 | 12,210 | ||||||||||
|
| |||||||||||
| 108,396 | ||||||||||||
|
| |||||||||||
Total Health Care | 506,538 | |||||||||||
|
| |||||||||||
Industrials - 0.2% | ||||||||||||
Air Freight & Logistics - 0.0%## | ||||||||||||
Park Aerospace Holdings Ltd. (Ireland)2, 4.50%, 3/15/2023 | 22,000 | 22,028 | ||||||||||
|
| |||||||||||
Airlines - 0.1% | ||||||||||||
Allegiant Travel Co., 5.50%, 7/15/2019 | 28,000 | 28,910 | ||||||||||
American Airlines Group, Inc.2, 5.50%, 10/1/2019 | 27,000 | 28,080 | ||||||||||
|
| |||||||||||
| 56,990 | ||||||||||||
|
| |||||||||||
The accompanying notes are an integral part of the financial statements.
28
Investment Portfolio - October 31, 2017
| BLENDED ASSET MODERATE SERIES | PRINCIPAL AMOUNT 4 | VALUE (NOTE 2) | ||||||
CORPORATE BONDS (continued) | ||||||||
Non-Convertible Corporate Bonds (continued) | ||||||||
Industrials (continued) | ||||||||
Building Products - 0.1% | ||||||||
Airxcel, Inc.2, 8.50%, 2/15/2022 | 46,000 | $ | 48,760 | |||||
|
| |||||||
Construction & Engineering - 0.0%## | ||||||||
Tutor Perini Corp.2, 6.875%, 5/1/2025 | 44,000 | 47,465 | ||||||
|
| |||||||
Machinery - 0.0%## | ||||||||
Xerium Technologies, Inc., 9.50%, 8/15/2021 | 34,000 | 34,925 | ||||||
|
| |||||||
Trading Companies & Distributors - 0.0%## | ||||||||
International Lease Finance Corp., 6.25%, 5/15/2019 | 31,000 | 32,873 | ||||||
|
| |||||||
Total Industrials | 243,041 | |||||||
|
| |||||||
Information Technology - 0.8% | ||||||||
Internet Software & Services - 0.4% | ||||||||
Activision Blizzard, Inc., 3.40%, 6/15/2027 | 463,000 | 463,860 | ||||||
|
| |||||||
IT Services - 0.3% | ||||||||
Visa, Inc., 2.80%, 12/14/2022 | 343,000 | 349,453 | ||||||
|
| |||||||
Semiconductors & Semiconductor Equipment - 0.1% |
| |||||||
MagnaChip Semiconductor Corp. (South Korea), 6.625%, 7/15/2021 | 43,000 | 41,280 | ||||||
|
| |||||||
Total Information Technology | 854,593 | |||||||
|
| |||||||
Materials - 1.4% | ||||||||
Chemicals - 0.2% | ||||||||
Kissner Holdings LP - Kissner Milling Co. Ltd. - BSC Holding, Inc. - Kissner USA (Canada)2, 8.375%, 12/1/2022 | 38,000 | 38,380 | ||||||
NOVA Chemicals Corp. (Canada)2, 4.875%, 6/1/2024 | 32,000 | 32,600 | ||||||
Solvay Finance America LLC (Belgium)2, 3.40%, 12/3/2020 | 203,000 | 208,746 | ||||||
|
| |||||||
| 279,726 | ||||||||
|
| |||||||
Metals & Mining - 1.0% | ||||||||
Anglo American Capital plc (United Kingdom)2, 9.375%, 4/8/2019 | 19,000 | 20,905 | ||||||
Anglo American Capital plc (United Kingdom)2, 4.00%, 9/11/2027 | 417,000 | 417,417 | ||||||
Corp Nacional del Cobre de Chile (Chile)2, 3.625%, 8/1/2027 | 422,000 | 424,486 | ||||||
Southern Copper Corp. (Peru), 3.875%, 4/23/2025 | 235,000 | 243,894 | ||||||
Techniplas LLC2, 10.00%, 5/1/2020 | 43,000 | 34,400 | ||||||
|
| |||||||
| 1,141,102 | ||||||||
|
| |||||||
Paper & Forest Products - 0.2% | ||||||||
Domtar Corp., 4.40%, 4/1/2022 | 216,000 | 227,180 | ||||||
|
| |||||||
Total Materials | 1,648,008 | |||||||
|
| |||||||
Real Estate - 0.5% | ||||||||
Equity Real Estate Investment Trusts (REITS) - 0.5% |
| |||||||
American Tower Corp., 3.30%, 2/15/2021 | 467,000 | 479,156 | ||||||
GTP Acquisition Partners I LLC2, 2.35%, 6/15/2020 | 92,000 | 91,696 | ||||||
iStar, Inc., 5.25%, 9/15/2022 | 36,000 | 36,900 | ||||||
|
| |||||||
Total Real Estate | 607,752 | |||||||
|
| |||||||
Telecommunication Services - 1.1% | ||||||||
Diversified Telecommunication Services - 1.1% |
| |||||||
AT&T, Inc., 3.90%, 8/14/2027 | 500,000 | 498,000 | ||||||
CenturyLink, Inc., 7.50%, 4/1/2024 | 30,000 | 31,875 | ||||||
Frontier Communications Corp., 11.00%, 9/15/2025 | 46,000 | 39,042 | ||||||
Hughes Satellite Systems Corp., 5.25%, 8/1/2026 | 61,000 | 62,377 | ||||||
Inmarsat Finance plc (United Kingdom)2, 4.875%, 5/15/2022 | 101,000 | 103,040 | ||||||
Sprint Communications, Inc.2, 9.00%, 11/15/2018 | 12,000 | 12,735 | ||||||
Sprint Communications, Inc., 7.00%, 8/15/2020 | 12,000 | 12,926 | ||||||
Verizon Communications, Inc., 4.125%, 3/16/2027 | 434,000 | 452,893 | ||||||
|
| |||||||
Total Telecommunication Services | 1,212,888 | |||||||
|
| |||||||
Utilities - 0.4% | ||||||||
Independent Power and Renewable Electricity Producers - 0.4% |
| |||||||
American Water Capital Corp., 2.95%, 9/1/2027 | 510,000 | 507,648 | ||||||
|
| |||||||
TOTAL CORPORATE BONDS | ||||||||
(Identified Cost $18,818,377) | 18,779,627 | |||||||
|
| |||||||
The accompanying notes are an integral part of the financial statements.
29
Investment Portfolio - October 31, 2017
| BLENDED ASSET MODERATE SERIES | SHARES/ PRINCIPAL AMOUNT 4 | VALUE (NOTE 2) | ||||||
MUTUAL FUNDS - 0.1% | ||||||||
Global X MSCI Greece ETF | 3,165 | $ | 29,340 | |||||
iShares MSCI Eurozone ETF | 1,775 | 77,798 | ||||||
|
| |||||||
TOTAL MUTUAL FUNDS | ||||||||
(Identified Cost $106,929) | 107,138 | |||||||
|
| |||||||
U.S. TREASURY SECURITIES - 21.1% | ||||||||
U.S. Treasury Bonds - 4.1% | ||||||||
U.S. Treasury Bond, 6.25%, 5/15/2030 | 879,000 | 1,241,897 | ||||||
U.S. Treasury Bond, 4.75%, 2/15/2037 | 1,406,000 | 1,859,325 | ||||||
U.S. Treasury Bond, 2.50%, 2/15/2045 | 1,027,000 | 955,351 | ||||||
U.S. Treasury Inflation Indexed Bond, 0.75%, 2/15/2042 | 616,840 | 596,860 | ||||||
|
| |||||||
Total U.S. Treasury Bonds | ||||||||
(Identified Cost $4,701,917) | 4,653,433 | |||||||
|
| |||||||
U.S. Treasury Notes - 17.0% | ||||||||
U.S. Treasury Inflation Indexed Note, 0.125%, 4/15/2020 | 931,416 | 934,685 | ||||||
U.S. Treasury Inflation Indexed Note, 0.125%, 1/15/2023 | 593,953 | 591,432 | ||||||
U.S. Treasury Note, 1.375%, 4/30/2020 | 2,867,000 | 2,845,609 | ||||||
U.S. Treasury Note, 1.375%, 4/30/2021 | 3,055,000 | 3,008,817 | ||||||
U.S. Treasury Note, 1.75%, 4/30/2022 | 2,796,000 | 2,769,460 | ||||||
U.S. Treasury Note, 2.00%, 7/31/2022 | 3,042,000 | 3,042,594 | ||||||
U.S. Treasury Note, 1.625%, 4/30/2023 | 3,045,000 | 2,971,611 | ||||||
U.S. Treasury Note, 1.625%, 5/15/2026 | 1,338,000 | 1,264,724 | ||||||
U.S. Treasury Note, 2.375%, 5/15/2027 | 2,220,000 | 2,221,041 | ||||||
|
| |||||||
Total U.S. Treasury Notes | ||||||||
(Identified Cost $19,716,475) | 19,649,973 | |||||||
|
| |||||||
TOTAL U.S. TREASURY SECURITIES | ||||||||
(Identified Cost $24,418,392) | 24,303,406 | |||||||
|
| |||||||
ASSET-BACKED SECURITIES - 3.3% | ||||||||
BMW Vehicle Owner Trust, Series 2016-A, Class A3, 1.16%, 11/25/2020 | 420,000 | 417,284 | ||||||
Chesapeake Funding II LLC, Series 2017-2A, Class A12, 1.99%, 5/15/2029 | 678,000 | 678,190 | ||||||
Colony American Homes, Series 2015-1A, Class A2,6, (1 mo. LIBOR US + 1.200%), 2.437%, 7/17/2032 | 200,428 | 200,784 | ||||||
Credit Acceptance Auto Loan Trust, Series 2017-1A, Class A2, 2.56%, 10/15/2025 | 255,000 | 255,380 | ||||||
Enterprise Fleet Financing LLC, Series 2015-2, Class A22, 1.59%, 2/22/2021 | 159,280 | 159,246 | ||||||
Home Partners of America Trust, Series 2016-1, Class A2,6, (1 mo. LIBOR US + 1.650%), 2.887%, 3/17/2033 | 146,729 | 147,917 | ||||||
Honda Auto Receivables Owner Trust, Series 2016-4, Class A2, 1.04%, 4/18/2019 | 341,047 | 340,555 | ||||||
Hyundai Auto Lease Securitization Trust, Series 2017-B, Class A32, 1.97%, 7/15/2020 | 550,000 | 550,442 | ||||||
Invitation Homes Trust, Series 2015-SFR3, Class A2,6, (1 mo. LIBOR US + 1.300%), 2.537%, 8/17/2032 | 385,262 | 388,056 | ||||||
SoFi Consumer Loan Program LLC, Series 2016-1, Class A2, 3.26%, 8/25/2025 | 317,195 | 321,718 | ||||||
SoFi Professional Loan Program LLC, Series 2017-A, Class A2A2, 1.55%, 3/26/2040 | 165,285 | 164,739 | ||||||
Tricon American Homes Trust, Series 2016-SFR1, Class A2, 2.589%, 11/17/2033 | 230,000 | 227,923 | ||||||
|
| |||||||
TOTAL ASSET-BACKED SECURITIES | ||||||||
(Identified Cost $3,851,349) | 3,852,234 | |||||||
|
| |||||||
COMMERCIAL MORTGAGE-BACKED SECURITIES - 6.8% |
| |||||||
BWAY Mortgage Trust, Series 2015-1740, Class A2, 2.917%, 1/10/2035 | 541,000 | 534,293 | ||||||
Credit Suisse Mortgage Capital Trust, Series 2013-IVR3, Class A12,7, 2.50%, 5/25/2043 | 204,920 | 195,018 | ||||||
Credit Suisse Mortgage Capital Trust, Series 2013-TH1, Class A12,7, 2.13%, 2/25/2043 | 147,787 | 141,481 | ||||||
Freddie Mac Multifamily Structured Pass-Through Certificates, Series K009, Class X1 (IO)7, 1.304%, 8/25/2020 | 2,556,553 | 77,699 | ||||||
The accompanying notes are an integral part of the financial statements.
30
Investment Portfolio - October 31, 2017
| BLENDED ASSET MODERATE SERIES | PRINCIPAL AMOUNT4 | VALUE (NOTE 2) | ||||||
COMMERCIAL MORTGAGE-BACKED SECURITIES (continued) | ||||||||
Freddie Mac Multifamily Structured Pass-Through Certificates, Series K021, Class X1 (IO)7, 1.468%, 6/25/2022 | 1,950,438 | $ | 109,220 | |||||
Freddie Mac Multifamily Structured Pass-Through Certificates, Series K029, Class A27, 3.32%, 2/25/2023 | 469,000 | 490,792 | ||||||
Freddie Mac Multifamily Structured Pass-Through Certificates, Series K030, Class X1 (IO)7, 0.208%, 4/25/2023 | 10,105,566 | 99,642 | ||||||
Freddie Mac Multifamily Structured Pass-Through Certificates, Series K033, Class A27, 3.06%, 7/25/2023 | 765,000 | 790,591 | ||||||
Freddie Mac Multifamily Structured Pass-Through Certificates, Series K035, Class A27, 3.458%, 8/25/2023 | 697,000 | 734,961 | ||||||
Freddie Mac Multifamily Structured Pass-Through Certificates, Series KJ10, Class A2, 2.912%, 12/25/2023 | 590,000 | 602,428 | ||||||
Freddie Mac Multifamily Structured Pass-Through Certificates, Series KJ13, Class A2, 2.864%, 8/25/2022 | 369,000 | 377,470 | ||||||
FREMF Mortgage Trust, Series 2013-K28, Class X2A (IO)2, 0.10%, 6/25/2046 | 25,005,467 | 106,013 | ||||||
FREMF Mortgage Trust, Series 2013-K712, Class B2,7, 3.365%, 5/25/2045 | 143,000 | 145,070 | ||||||
FREMF Mortgage Trust, Series 2014-K37, Class B2,7, 4.558%, 1/25/2047 | 320,000 | 340,332 | ||||||
GAHR Commercial Mortgage Trust, Series 2015-NRF, Class BFX2,7, 3.495%, 12/15/2034 | 372,000 | 376,673 | ||||||
JP Morgan Mortgage Trust, Series 2013-2, Class A22,7, 3.50%, 5/25/2043 | 124,257 | 126,650 | ||||||
JP Morgan Mortgage Trust, Series 2014-2, Class 1A12,7, 3.00%, 6/25/2029 | 170,065 | 172,138 | ||||||
New Residential Mortgage Loan Trust, Series 2014-3A, Class AFX32,7, 3.75%, 11/25/2054 | 141,774 | 146,156 | ||||||
New Residential Mortgage Loan Trust, Series 2015-2A, Class A12,7, 3.75%, 8/25/2055 | 178,563 | 184,157 | ||||||
New Residential Mortgage Loan Trust, Series 2016-4A, Class A12,7, 3.75%, 11/25/2056 | 182,305 | 187,359 | ||||||
SCG Trust, Series 2013-SRP1, Class AJ2,6, (1 mo. LIBOR US + 1.950%), 3.189%, 11/15/2026 | 574,000 | 571,780 | ||||||
Sequoia Mortgage Trust, Series 2013-2, Class A7, 1.874%, 2/25/2043 | 132,923 | 125,721 | ||||||
Sequoia Mortgage Trust, Series 2013-8, Class A17, 3.00%, 6/25/2043 | 161,920 | 161,380 | ||||||
Starwood Retail Property Trust, Series 2014-STAR, Class A2,6, (1 mo. LIBOR US + 1.220%), 2.459%, 11/15/2027 | 342,000 | 342,238 | ||||||
Towd Point Mortgage Trust, Series 2016-5, Class A12,7, 2.50%, 10/25/2056 | 328,981 | 328,202 | ||||||
WinWater Mortgage Loan Trust, Series 2015-1, Class A12,7, 3.50%, 1/20/2045 | 179,509 | 182,517 | ||||||
WinWater Mortgage Loan Trust, Series 2015-3, Class A52,7, 3.50%, 3/20/2045 | 166,935 | 169,661 | ||||||
|
| |||||||
TOTAL COMMERCIAL MORTGAGE-BACKED SECURITIES | ||||||||
(Identified Cost $7,838,089) | 7,819,642 | |||||||
|
| |||||||
FOREIGN GOVERNMENT BONDS - 2.0% | ||||||||
Canada Housing Trust No. 1 (Canada)2, 4.10%, 12/15/2018 | CAD | 52,000 | 41,523 | |||||
Canadian Government Bond (Canada), 2.75%, 6/1/2022 | CAD | 67,000 | 54,582 | |||||
Export-Import Bank of Korea (South Korea), 2.625%, 12/30/2020 | 500,000 | 499,292 | ||||||
The Korea Development Bank (South Korea), 1.375%, 9/12/2019 | 500,000 | 490,415 | ||||||
Mexican Government Bond (Mexico), 8.00%, 6/11/2020 | MXN | 1,338,000 | 71,401 | |||||
Mexican Government Bond (Mexico), 6.50%, 6/10/2021 | MXN | 540,000 | 27,667 | |||||
Mexican Government Bond (Mexico), 6.50%, 6/9/2022 | MXN | 879,000 | 44,848 | |||||
Mexican Government Bond (Mexico), 7.75%, 5/29/2031 | MXN | 169,000 | 9,097 | |||||
Province of Ontario (Canada), 2.00%, 9/27/2018 | 230,000 | 230,659 | ||||||
Province of Ontario (Canada), 1.25%, 6/17/2019 | 203,000 | 201,031 | ||||||
The accompanying notes are an integral part of the financial statements.
31
Investment Portfolio - October 31, 2017
| BLENDED ASSET MODERATE SERIES | PRINCIPAL AMOUNT4 | VALUE (NOTE 2) | ||||||
FOREIGN GOVERNMENT BONDS (continued) | ||||||||
Singapore Government Bond (Singapore), 2.50%, 6/1/2019 | SGD | 116,000 | $ | 86,586 | ||||
Svensk Exportkredit AB (Sweden), 1.125%, 8/28/2019 | 500,000 | 493,706 | ||||||
United Kingdom Gilt (United Kingdom), 5.00%, 3/7/2018 | GBP | 64,000 | 86,402 | |||||
|
| |||||||
TOTAL FOREIGN GOVERNMENT BONDS | ||||||||
(Identified Cost $2,345,931) | 2,337,209 | |||||||
|
| |||||||
U.S. GOVERNMENT AGENCIES - 9.8% | ||||||||
Mortgage-Backed Securities - 7.3% | ||||||||
Fannie Mae, Pool #888468, 5.50%, 9/1/2021 | 53,037 | 55,175 | ||||||
Fannie Mae, Pool #888810, 5.50%, 11/1/2022 | 63,104 | 65,543 | ||||||
Fannie Mae, Pool #MA1834, 4.50%, 2/1/2034 | 150,026 | 161,845 | ||||||
Fannie Mae, Pool #MA1903, 4.50%, 5/1/2034 | 115,707 | 124,822 | ||||||
Fannie Mae, Pool #MA2177, 4.00%, 2/1/2035 | 225,226 | 238,584 | ||||||
Fannie Mae, Pool #AZ3376, 4.00%, 7/1/2035 | 457,432 | 484,649 | ||||||
Fannie Mae, Pool #745418, 5.50%, 4/1/2036 | 112,614 | 125,682 | ||||||
Fannie Mae, Pool #AB8161, 6.00%, 12/1/2037 | 135,735 | 153,529 | ||||||
Fannie Mae, Pool #995196, 6.00%, 7/1/2038 | 213,861 | 242,432 | ||||||
Fannie Mae, Pool #MA0258, 4.50%, 12/1/2039 | 178,639 | 191,670 | ||||||
Fannie Mae, Pool #AL0152, 6.00%, 6/1/2040 | 163,838 | 185,564 | ||||||
Fannie Mae, Pool #AL0241, 4.00%, 4/1/2041 | 196,838 | 207,477 | ||||||
Fannie Mae, Pool #AL1410, 4.50%, 12/1/2041 | 344,479 | 370,838 | ||||||
Fannie Mae, Pool #AL7068, 4.50%, 9/1/2042 | 372,337 | 398,991 | ||||||
Fannie Mae, Pool #AL7729, 4.00%, 6/1/2043 | 175,748 | 185,201 | ||||||
Fannie Mae, Pool #AX5234, 4.50%, 11/1/2044 | 233,111 | 249,220 | ||||||
Fannie Mae, Pool #AZ9215, 4.00%, 10/1/2045 | 170,737 | 179,575 | ||||||
Fannie Mae, Pool #BC3490, 3.50%, 2/1/2046 | 444,640 | 457,402 | ||||||
Fannie Mae, Pool #BC6764, 3.50%, 4/1/2046 | 265,023 | 272,630 | ||||||
Fannie Mae, Pool #BD1381, 3.50%, 6/1/2046 | 150,121 | 154,430 | ||||||
Fannie Mae, Pool #BE7845, 4.50%, 2/1/2047 | 128,942 | 138,219 | ||||||
Fannie Mae, Pool #AL8674, 5.659%, 1/1/2049 | 382,301 | 419,809 | ||||||
Freddie Mac, Pool #C91754, 4.50%, 3/1/2034 | 126,061 | 135,825 | ||||||
Freddie Mac, Pool #C91762, 4.50%, 5/1/2034 | 169,364 | 182,656 | ||||||
Freddie Mac, Pool #C91850, 4.00%, 9/1/2035 | 278,452 | 295,775 | ||||||
Freddie Mac, Pool #C91854, 4.00%, 10/1/2035 | 200,385 | 212,865 | ||||||
Freddie Mac, Pool #G03926, 6.00%, 2/1/2038 | 48,321 | 54,571 | ||||||
Freddie Mac, Pool #G04731, 5.50%, 4/1/2038 | 48,845 | 54,282 | ||||||
Freddie Mac, Pool #G08273, 5.50%, 6/1/2038 | 59,510 | 66,113 | ||||||
Freddie Mac, Pool #A92889, 4.50%, 7/1/2040 | 355,606 | 381,245 | ||||||
Freddie Mac, Pool #G60183, 4.00%, 12/1/2044 | 206,366 | 217,499 | ||||||
Freddie Mac, Pool #Q37592, 4.00%, 12/1/2045 | 382,101 | 403,058 | ||||||
Freddie Mac, Pool #Q42596, 3.50%, 8/1/2046 | 287,065 | 295,306 | ||||||
Freddie Mac, Pool #Q45199, 4.00%, 1/1/2047 | 148,241 | 155,605 | ||||||
Freddie Mac, Pool #Q45210, 4.00%, 1/1/2047 | 148,831 | 156,224 | ||||||
Freddie Mac, Pool #G08754, 4.50%, 3/1/2047 | 318,244 | 339,854 | ||||||
Freddie Mac, Pool #G08786, 4.50%, 10/1/2047 | 438,025 | 469,628 | ||||||
|
| |||||||
Total Mortgage-Backed Securities | ||||||||
(Identified Cost $8,518,569) | 8,483,793 | |||||||
|
| |||||||
Other Agencies - 2.5% | ||||||||
Fannie Mae, 2.625%, 9/6/2024 | ||||||||
(Identified Cost $2,887,240) | 2,811,000 | 2,869,525 | ||||||
|
| |||||||
TOTAL U.S. GOVERNMENT AGENCIES | ||||||||
(Identified Cost $11,405,809) | 11,353,318 | |||||||
|
| |||||||
The accompanying notes are an integral part of the financial statements.
32
Investment Portfolio - October 31, 2017
| BLENDED ASSET MODERATE SERIES | SHARES | VALUE (NOTE 2) | ||||||
SHORT-TERM INVESTMENT - 5.1% | ||||||||
Dreyfus Government Cash Management8, 0.93%, (Identified Cost $5,922,166) | 5,922,166 | $ | 5,922,166 | |||||
|
| |||||||
TOTAL INVESTMENTS - 100.4% | 115,883,357 | |||||||
LIABILITIES, LESS OTHER ASSETS - (0.4%) | (512,056 | ) | ||||||
|
| |||||||
NET ASSETS - 100% | $ | 115,371,301 | ||||||
|
| |||||||
ADR - American Depositary Receipt
CAD - Canadian Dollar
ETF - Exchange-traded fund
GBP - British Pound
IO - Interest only
MXN - Mexican Peso
No. - Number
SGD - Singapore Dollar
USD - U.S. Dollar
*Non-income producing security.
##Less than 0.1%.
1A factor from a third party vendor was applied to determine the security’s fair value following the close of local trading.
2Restricted securities - Investment in securities that are restricted as to public resale under the Securities Act of 1933, as amended. These securities have been sold under Rule 144A and have been determined to be liquid. These securities amount to $10,420,484 or 9.0%, of the Series’ net assets as of October 31, 2017 (see Note 2 to the financial statements).
3Security has been valued at fair value as determined in good faith by the Advisor and is classified as Level 3 in the fair value hierarchy.
4Amount is stated in USD unless otherwise noted.
5Variable rate security. Security may be issued at a fixed coupon rate, which converts to a variable rate at a specified date. Rate shown is the rate in effect as of October 31, 2017.
6Floating rate security. Rate shown is the rate in effect as of October 31, 2017.
7Variable or floating rate security, which interest rate adjusts periodically based on changes in current interest rates and prepayments on the underlying pool of assets. Rate shown is the rate in effect as of October 31, 2017.
8Rate shown is the current yield as of October 31, 2017.
The Global Industry Classification Standard (GICS) was developed by and is the exclusive property and a service mark of MSCI Inc. (MSCI) and Standard &Poor, a division of The McGraw-Hill Companies, Inc. (S&P), and is licensed for use by Manning & Napier when referencing GICS sectors. Neither MSCI, S&P, nor any third party involved in making or compiling the GICS or any GICS classifications makes any express or implied warranties or representations with respect to such standard or classification, nor shall any such party have any liability therefrom.
The accompanying notes are an integral part of the financial statements.
33
Statement of Assets and Liabilities - Blended Asset Moderate Series
October 31, 2017
ASSETS: | ||||
Investments, at value (identified cost $116,163,518) (Note 2) | $ | 115,883,357 | ||
Receivable from investment advisor (Note 3) | 30,669 | |||
Interest receivable | 381,678 | |||
Receivable for securities sold | 277,693 | |||
Receivable for fund shares sold | 21,060 | |||
Foreign tax reclaims receivable | 3,778 | |||
Dividends receivable | 1,662 | |||
|
| |||
TOTAL ASSETS | 116,599,897 | |||
|
| |||
LIABILITIES: | ||||
Due to Custodian | 18,332 | |||
Accrued fund accounting and administration fees (Note 3) | 5,236 | |||
Accrued Chief Compliance Officer service fees (Note 3) | 140 | |||
Payable for securities purchased | 1,085,512 | |||
Payable for fund shares repurchased | 65,798 | |||
Audit fees payable | 43,521 | |||
Other payables and accrued expenses | 10,057 | |||
|
| |||
TOTAL LIABILITIES | 1,228,596 | |||
|
| |||
TOTAL NET ASSETS | $ | 115,371,301 | ||
|
| |||
NET ASSETS CONSIST OF: | ||||
Capital stock | $ | 107,558 | ||
Additional paid-in-capital | 115,513,108 | |||
Undistributed net investment income | 48,576 | |||
Accumulated net realized loss on investments, foreign currency and translation of other assets and liabilities | (17,678 | ) | ||
Net unrealized appreciation (depreciation) on investments, foreign currency and translation of other assets and liabilities | (280,263 | ) | ||
|
| |||
TOTAL NET ASSETS | $ | 115,371,301 | ||
|
| |||
NET ASSET VALUE, OFFERING PRICE AND REDEMPTION PRICE PER SHARE - Class R6 ($115,371,301/ 10,755,813 shares) | $ | 10.73 | ||
|
| |||
The accompanying notes are an integral part of the financial statements.
34
Statement of Operations - Blended Asset Moderate Series
For the Period October 13, 20171 to October 31, 2017
INVESTMENT INCOME: | ||||
Interest | $ | 74,971 | ||
Dividends (net of foreign taxes withheld, $149) | 1,602 | |||
|
| |||
Total Investment Income | 76,573 | |||
|
| |||
EXPENSES: | ||||
Management fees (Note 3) | 25,456 | |||
Fund accounting and administration fees (Note 3) | 5,236 | |||
Chief Compliance Officer service fees (Note 3) | 140 | |||
Audit fees | 43,521 | |||
Custodian fees | 2,993 | |||
Miscellaneous | 7,064 | |||
|
| |||
Total Expenses | 84,410 | |||
Less reduction of expenses (Note 3) | (56,125 | ) | ||
|
| |||
Net Expenses | 28,285 | |||
|
| |||
NET INVESTMENT INCOME | 48,288 | |||
|
| |||
REALIZED AND UNREALIZED GAIN (LOSS) ON INVESTMENTS AND FOREIGN CURRENCY: | ||||
Net realized loss on- | ||||
Investments | (17,607 | ) | ||
Foreign currency and translation of other assets and liabilities | 217 | |||
|
| |||
| (17,390 | ) | |||
|
| |||
Net change in unrealized appreciation (depreciation) on- | ||||
Investments | (280,161 | ) | ||
Foreign currency and translation of other assets and liabilities | (102 | ) | ||
|
| |||
| (280,263 | ) | |||
|
| |||
NET REALIZED AND UNREALIZED GAIN (LOSS) ON INVESTMENTS AND FOREIGN CURRENCY | (297,653 | ) | ||
|
| |||
NET DECREASE IN NET ASSETS RESULTING FROM OPERATIONS | $ | (249,365 | ) | |
|
| |||
1Commencement of operations.
The accompanying notes are an integral part of the financial statements.
35
Statement of Changes in Net Assets - Blended Asset Moderate Series
| FOR THE PERIOD 10/13/171 TO 10/31/17 | ||||
INCREASE (DECREASE) IN NET ASSETS: | ||||
OPERATIONS: | ||||
Net investment income | $ | 48,288 | ||
Net realized loss on investments and foreign currency | (17,390 | ) | ||
Net change in unrealized appreciation (depreciation) on investments and foreign currency | (280,263 | ) | ||
|
| |||
Net decrease from operations | (249,365 | ) | ||
|
| |||
CAPITAL STOCK ISSUED AND REPURCHASED: | ||||
Net increase from capital share transactions (Note 5) | 115,620,666 | |||
|
| |||
Net increase in net assets | 115,371,301 | |||
NET ASSETS: | ||||
Beginning of period | — | |||
|
| |||
End of period (including undistributed net investment income of $48,576) | $ | 115,371,301 | ||
|
| |||
1Commencement of operations.
The accompanying notes are an integral part of the financial statements.
36
Financial Highlights - Blended Asset Moderate Series - Class R6
| FOR THE PERIOD 10/13/171 TO 10/31/17 | ||||
Per share data (for a share outstanding throughout the period): | ||||
Net asset value - Beginning of period | $ | 10.75 | ||
|
| |||
Income (loss) from investment operations: | ||||
Net investment income (loss)2 | 0.00 | 3 | ||
Net realized and unrealized loss on investments | (0.02 | ) | ||
|
| |||
Total from investment operations | (0.02 | ) | ||
|
| |||
Net asset value - End of period | $ | 10.73 | ||
|
| |||
Net assets - End of period (000’s omitted) | $ | 115,371 | ||
|
| |||
Total return4 | (0.19 | %) | ||
Ratios (to average net assets)/Supplemental Data: | ||||
Expenses5 | 0.50 | % | ||
Net investment income5 | 0.85 | % | ||
Series portfolio turnover | 4 | % | ||
| *The investment advisor did not impose all or a portion of its management and/or other fees during the period, and may have paid a portion of the Series’ expenses. If these expenses had been incurred by the Series, the expense ratio (to average net assets) would have increased by the following amounts5: | ||||
| 0.99 | % | |||
1Commencement of operations.
2Calculated based on average shares outstanding during the period.
3Less than $0.01.
4Represents aggregate total return for the period indicated. Total return would have been lower had certain expenses not been reimbursed during the period. Periods less than one year are not annualized.
5Annualized.
The accompanying notes are an integral part of the financial statements.
37
Shareholder Expense Example - Blended Asset Extended Series
(unaudited)
As a shareholder of the Series, you incur ongoing costs, including management fees, shareholder service fees and other Series expenses. This example is intended to help you understand your ongoing costs (in dollars) of investing in the Series and to compare these costs with the ongoing costs of investing in other mutual funds.
The example is based on an investment of $1,000 invested in each class at the beginning of the period and held for the entire period (October 13, 2017* to October 31, 2017).
Actual Expenses
The Actual lines of the table below provide information about actual account values and actual expenses. You may use the information in these lines, together with the amount you invested, to estimate the expenses that you paid over the period. Simply divide your account value by $1,000 (for example, an $8,600 account value divided by $1,000 = 8.6), then multiply the result by the number in the Actual line for the Class in which you have invested under the heading entitled “Expenses Paid During Period” to estimate the expenses you paid on your account during this period.
Hypothetical Example for Comparison Purposes
The Hypothetical lines of each class in the table below provide information about hypothetical account values and hypothetical expenses based on the Series’ actual expense ratio and an assumed rate of return of 5% per year before expenses, which is not the Series’ actual return. The hypothetical account values and expenses may not be used to estimate the actual ending account balance or expenses you paid during the period. You may use this information to compare the ongoing costs of investing in the Series and other funds. To do so, compare this 5% hypothetical example with the 5% hypothetical examples that appear in the shareholder reports of the other funds.
Please note that the expenses shown in the table are meant to highlight your ongoing costs only and do not reflect any transaction costs such as sales charges (loads), redemption fees, or exchange fees that you may incur in other mutual funds. Therefore, the second line of the table is useful in comparing ongoing costs only, and will not help you determine the relative total costs of owning different funds.
| BEGINNING ACCOUNT VALUE 10/13/17* | ENDING ACCOUNT VALUE 10/31/17 | EXPENSES PAID DURING PERIOD** 10/13/2017*-10/31/17 | ||||
Actual | $1,000.00 | $ 998.10 | $0.27 | |||
Hypothetical | ||||||
(5% return before expenses) | $1,000.00 | $1,002.19 | $0.27 |
*Commencement of operations
**Expenses are equal to the Series’ annualized expense ratio (for the period October 13, 2017* to October 31, 2017) of 0.55%, multiplied by the average account value over the period, multiplied by 18/365 (to reflect the period since inception). The Series’ total return would have been lower had certain expenses not been waived during the period.
38
Portfolio Composition - Blended Asset Extended Series
As of October 31, 2017 (unaudited)
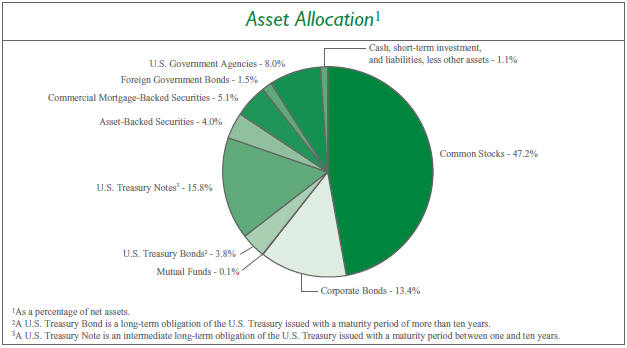
Sector Allocation4 | ||||
Information Technology | 14.3 | % | ||
Health Care | 11.5 | % | ||
Financials | 5.5 | % | ||
Consumer Discretionary | 5.5 | % | ||
Industrials | 5.4 | % | ||
Consumer Staples | 4.6 | % | ||
Materials | 4.1 | % | ||
Energy | 3.9 | % | ||
Real Estate | 3.0 | % | ||
Telecommunication Services | 1.8 | % | ||
Utilities | 0.5 | % | ||
| 4Including common stocks and corporate bonds, as a percentage of total investments. | ||||
Top Ten Stock Holdings5 | ||||
ServiceNow, Inc. | 2.2% | |||
Facebook, Inc. - Class A | 2.2% | |||
The Priceline Group, Inc. | 1.6% | |||
DaVita, Inc. | 1.5% | |||
Skyworks Solutions, Inc. | 1.3% | |||
Novartis AG - ADR (Switzerland) | 1.3% | |||
Medtronic plc | 1.2% | |||
MasterCard, Inc. - Class A | 1.2% | |||
Visa, Inc. - Class A | 1.1% | |||
Diageo plc (United Kingdom) | 1.1% | |||
| 5As a percentage of total investments. | ||||
39
Investment Portfolio - October 31, 2017
| BLENDED ASSET EXTENDED SERIES | SHARES | VALUE (NOTE 2) | ||||||
COMMON STOCKS - 47.2% | ||||||||
Consumer Discretionary - 3.8% | ||||||||
Diversified Consumer Services - 0.0%## | ||||||||
Fu Shou Yuan International Group Ltd. (China)1 | 67,000 | $ | 47,100 | |||||
|
| |||||||
Hotels, Restaurants & Leisure - 0.1% | ||||||||
Accor S.A. (France)1 | 2,180 | 108,755 | ||||||
Jollibee Foods Corp. (Philippines)1 | 14,410 | 69,584 | ||||||
|
| |||||||
| 178,339 | ||||||||
|
| |||||||
Household Durables - 0.0%## | ||||||||
Kaufman & Broad S.A. (France)1 | 1,020 | 45,072 | ||||||
|
| |||||||
Internet & Direct Marketing Retail - 2.8% | ||||||||
Amazon.com, Inc.* | 1,996 | 2,206,139 | ||||||
Ctrip.com International Ltd. - ADR (China)* | 1,440 | 68,961 | ||||||
The Priceline Group, Inc.* | 1,782 | 3,407,113 | ||||||
|
| |||||||
| 5,682,213 | ||||||||
|
| |||||||
Leisure Products - 0.0%## | ||||||||
Trigano S.A. (France)1 | 300 | 48,412 | ||||||
|
| |||||||
Media - 0.0%## | ||||||||
Quebecor, Inc. - Class B (Canada) | 410 | 15,471 | ||||||
Shaw Communications, Inc. - Class B (Canada) | 720 | 16,441 | ||||||
|
| |||||||
| 31,912 | ||||||||
|
| |||||||
Multiline Retail - 0.0%## | ||||||||
Lojas Renner S.A. (Brazil) | 4,070 | 42,799 | ||||||
|
| |||||||
Specialty Retail - 0.0%## | ||||||||
Industria de Diseno Textil S.A. (Spain)1 | 1,275 | 47,657 | ||||||
|
| |||||||
Textiles, Apparel & Luxury Goods - 0.9% | ||||||||
ANTA Sports Products Ltd. (China)1 | 16,000 | 71,566 | ||||||
lululemon athletica, Inc.* | 26,900 | 1,654,619 | ||||||
|
| |||||||
| 1,726,185 | ||||||||
|
| |||||||
Total Consumer Discretionary | 7,849,689 | |||||||
|
| |||||||
Consumer Staples - 3.9% | ||||||||
Beverages - 2.9% | ||||||||
Ambev S.A. - ADR (Brazil) | 316,717 | 2,004,818 | ||||||
Anheuser-Busch InBev S.A./N.V. (Belgium)1 | 13,088 | 1,604,866 | ||||||
Diageo plc (United Kingdom)1 | 65,411 | 2,233,701 | ||||||
Treasury Wine Estates Ltd. (Australia)1 | 7,950 | 95,432 | ||||||
|
| |||||||
| 5,938,817 | ||||||||
|
| |||||||
Food & Staples Retailing - 0.1% | ||||||||
Puregold Price Club, Inc. (Philippines)1 | 70,080 | 69,232 | ||||||
Raia Drogasil S.A. (Brazil) | 2,900 | 69,785 | ||||||
Robinsons Retail Holdings, Inc. (Philippines)1 | 38,675 | 72,668 | ||||||
|
| |||||||
| 211,685 | ||||||||
|
| |||||||
Food Products - 0.2% | ||||||||
Danone S.A. (France)1 | 915 | 74,784 | ||||||
Kerry Group plc - Class A (Ireland)1 | 940 | 94,670 | ||||||
M Dias Branco S.A. (Brazil) | 3,000 | 44,368 | ||||||
Nestle S.A. (Switzerland)1 | 1,080 | 90,870 | ||||||
|
| |||||||
| 304,692 | ||||||||
|
| |||||||
Personal Products - 0.7% | ||||||||
Beiersdorf AG (Germany)1 | 510 | 57,370 | ||||||
Unilever plc - ADR (United Kingdom) | 24,919 | 1,411,661 | ||||||
|
| |||||||
| 1,469,031 | ||||||||
|
| |||||||
Tobacco - 0.0%## | ||||||||
Japan Tobacco, Inc. (Japan)1 | 2,900 | 95,990 | ||||||
|
| |||||||
Total Consumer Staples | 8,020,215 | |||||||
|
| |||||||
Energy - 1.9% | ||||||||
Energy Equipment & Services - 1.8% | ||||||||
Diamond Offshore Drilling, Inc.* | 42,745 | 715,124 | ||||||
Oceaneering International, Inc. | 26,060 | 526,933 | ||||||
Schlumberger Ltd. | 29,038 | 1,858,432 | ||||||
Transocean Ltd.* | 60,450 | 634,725 | ||||||
|
| |||||||
| 3,735,214 | ||||||||
|
| |||||||
Oil, Gas & Consumable Fuels - 0.1% | ||||||||
Cameco Corp. (Canada) | 3,390 | 27,595 | ||||||
Galp Energia SGPS S.A. (Portugal)1 | 3,785 | 70,371 | ||||||
Royal Dutch Shell plc - Class B - ADR (Netherlands) | 1,090 | 71,242 | ||||||
YPF S.A. - ADR (Argentina) | 2,355 | 57,839 | ||||||
|
| |||||||
| 227,047 | ||||||||
|
| |||||||
Total Energy | 3,962,261 | |||||||
|
| |||||||
Financials - 1.4% | ||||||||
Banks - 0.6% | ||||||||
Banco Macro S.A. - ADR (Argentina) | 495 | 62,331 | ||||||
Bankia S.A. (Spain)1 | 11,350 | 54,165 | ||||||
Banque Cantonale Vaudoise (Switzerland)1 | 65 | 46,747 | ||||||
BNP Paribas S.A. (France)1 | 1,150 | 89,757 | ||||||
BPER Banca (Italy)1 | 9,200 | 44,784 | ||||||
CaixaBank S.A. (Spain)1 | 11,740 | 54,924 | ||||||
The accompanying notes are an integral part of the financial statements.
40
Investment Portfolio - October 31, 2017
| VALUE | ||||||||
| BLENDED ASSET EXTENDED SERIES | SHARES | (NOTE 2) | ||||||
COMMON STOCKS (continued) | ||||||||
Financials (continued) | ||||||||
Banks (continued) | ||||||||
Credit Agricole S.A. (France)1 | 3,890 | $ | 67,893 | |||||
Danske Bank A/S (Denmark)1 | 1,770 | 67,549 | ||||||
Erste Group Bank AG (Austria)1 | 1,050 | 45,071 | ||||||
Eurobank Ergasias S.A. (Greece)*1 | 62,065 | 50,696 | ||||||
FinecoBank Banca Fineco S.p.A. (Italy)1 | 7,895 | 73,842 | ||||||
Grupo Financiero Galicia S.A. - ADR (Argentina) | 980 | 53,802 | ||||||
Grupo Supervielle S.A. - ADR (Argentina) | 1,745 | 46,783 | ||||||
Itau Unibanco Holding S.A. (Brazil) | 3,400 | 43,871 | ||||||
Jyske Bank A/S (Denmark)1 | 810 | 45,772 | ||||||
KBC Group N.V. (Belgium)1 | 810 | 67,286 | ||||||
Skandinaviska Enskilda Banken A.B. - Class A (Sweden)1 | 3,675 | 45,289 | ||||||
Svenska Handelsbanken A.B. - Class A (Sweden)1 | 3,160 | 45,290 | ||||||
Swedbank A.B. - Class A (Sweden)1 | 1,850 | 45,913 | ||||||
Sydbank A/S (Denmark)1 | 1,170 | 45,675 | ||||||
|
| |||||||
| 1,097,440 | ||||||||
|
| |||||||
Capital Markets - 0.8% | ||||||||
Amundi S.A. (France)1,2 | 840 | 71,191 | ||||||
Banca Generali S.p.A. (Italy)1 | 2,065 | 67,941 | ||||||
BlackRock, Inc. | 2,492 | 1,173,308 | ||||||
EFG International AG (Switzerland)1 | 7,660 | 70,098 | ||||||
Euronext N.V. (Netherlands)1,2 | 1,500 | 89,086 | ||||||
Julius Baer Group Ltd. (Switzerland)1 | 785 | 46,431 | ||||||
Natixis S.A. (France)1 | 11,515 | 90,302 | ||||||
|
| |||||||
| 1,608,357 | ||||||||
|
| |||||||
Thrifts & Mortgage Finance - 0.0%## | ||||||||
Aareal Bank AG (Germany)1 | 1,105 | 45,943 | ||||||
|
| |||||||
Total Financials | 2,751,740 | |||||||
|
| |||||||
Health Care - 11.2% | ||||||||
Biotechnology - 4.8% | ||||||||
Biogen, Inc.* | 4,828 | 1,504,695 | ||||||
BioMarin Pharmaceutical, Inc.* | 24,110 | 1,979,190 | ||||||
Incyte Corp.* | 13,599 | 1,540,087 | ||||||
Regeneron Pharmaceuticals, Inc.* | 5,440 | 2,190,253 | ||||||
Seattle Genetics, Inc.* | 28,444 | 1,743,902 | ||||||
Vertex Pharmaceuticals, Inc.* | 6,276 | 917,739 | ||||||
|
| |||||||
| 9,875,866 | ||||||||
|
| |||||||
Health Care Equipment & Supplies - 1.2% | ||||||||
Medtronic plc | 31,075 | 2,502,159 | ||||||
Osstem Implant Co. Ltd. (South Korea)*1 | 1,170 | 75,178 | ||||||
|
| |||||||
| 2,577,337 | ||||||||
|
| |||||||
Health Care Providers & Services - 2.2% | ||||||||
DaVita, Inc.* | 52,607 | 3,195,349 | ||||||
Express Scripts Holding Co.* | 17,501 | 1,072,636 | ||||||
Fleury S.A. (Brazil) | 7,300 | 64,090 | ||||||
Fresenius Medical Care AG & Co. KGaA (Germany)1 | 1,115 | 107,956 | ||||||
Orpea (France)1 | 765 | 91,654 | ||||||
|
| |||||||
| 4,531,685 | ||||||||
|
| |||||||
Life Sciences Tools & Services - 0.1% | ||||||||
QIAGEN N.V. | 1,285 | 43,510 | ||||||
QIAGEN N.V.1 | 1,650 | 55,979 | ||||||
Tecan Group AG (Switzerland)1 | 230 | 48,647 | ||||||
|
| |||||||
| 148,136 | ||||||||
|
| |||||||
Pharmaceuticals - 2.9% | ||||||||
Bristol-Myers Squibb Co. | 16,018 | 987,670 | ||||||
Hypermarcas S.A. (Brazil) | 6,600 | 69,222 | ||||||
Johnson & Johnson | 15,140 | 2,110,667 | ||||||
Kalbe Farma Tbk PT (Indonesia)1 | 564,600 | 66,607 | ||||||
Novartis AG - ADR (Switzerland) | 31,559 | 2,606,142 | ||||||
Perrigo Co. plc | 1,045 | 84,635 | ||||||
|
| |||||||
| 5,924,943 | ||||||||
|
| |||||||
Total Health Care | 23,057,967 | |||||||
|
| |||||||
Industrials - 4.9% | ||||||||
Aerospace & Defense - 0.8% | ||||||||
Arconic, Inc. | 56,331 | 1,415,035 | ||||||
LIG Nex1 Co. Ltd. (South Korea)1 | 1,050 | 67,385 | ||||||
Thales S.A. (France)1 | 1,085 | 113,072 | ||||||
Ultra Electronics Holdings plc (United Kingdom)1 | 1,950 | 47,219 | ||||||
|
| |||||||
| 1,642,711 | ||||||||
|
| |||||||
Air Freight & Logistics - 1.1% | ||||||||
FedEx Corp. | 9,667 | 2,182,905 | ||||||
|
| |||||||
Airlines - 0.1% | ||||||||
Azul S.A. - ADR (Brazil)* | 1,690 | 42,740 | ||||||
Ryanair Holdings plc - ADR (Ireland)* | 1,100 | 123,321 | ||||||
|
| |||||||
| 166,061 | ||||||||
|
| |||||||
Building Products - 0.1% | ||||||||
Cie de Saint-Gobain (France)1 | 1,535 | 90,002 | ||||||
The accompanying notes are an integral part of the financial statements.
41
Investment Portfolio - October 31, 2017
| VALUE | ||||||||
| BLENDED ASSET EXTENDED SERIES | SHARES | (NOTE 2) | ||||||
COMMON STOCKS (continued) | ||||||||
Industrials (continued) | ||||||||
Building Products (continued) | ||||||||
Geberit AG (Switzerland)1 | 95 | $ | 43,012 | |||||
|
| |||||||
| 133,014 | ||||||||
|
| |||||||
Commercial Services & Supplies - 0.1% | ||||||||
China Everbright International Ltd. (China)1 | 48,000 | 67,721 | ||||||
Elis S.A. (France)1 | 2,610 | 68,048 | ||||||
SPIE S.A. (France)1 | 3,515 | 92,485 | ||||||
|
| |||||||
| 228,254 | ||||||||
|
| |||||||
Construction & Engineering - 0.1% | ||||||||
Eiffage S.A. (France)1 | 1,095 | 114,379 | ||||||
Vinci S.A. (France)1 | 1,620 | 158,724 | ||||||
|
| |||||||
| 273,103 | ||||||||
|
| |||||||
Electrical Equipment - 0.0%## | ||||||||
Legrand S.A. (France)1 | 955 | 70,871 | ||||||
|
| |||||||
Industrial Conglomerates - 0.1% | ||||||||
Siemens AG (Germany)1 | 1,350 | 193,904 | ||||||
|
| |||||||
Machinery - 0.2% | ||||||||
FANUC Corp. (Japan)1 | 300 | 70,147 | ||||||
Jungheinrich AG (Germany)1 | 1,545 | 70,362 | ||||||
KION Group AG (Germany)1 | 1,185 | 94,951 | ||||||
Metso OYJ (Finland)1 | 1,740 | 63,194 | ||||||
The Weir Group plc (United Kingdom)1 | 4,625 | 119,901 | ||||||
|
| |||||||
| 418,555 | ||||||||
|
| |||||||
Professional Services - 1.6% | ||||||||
Applus Services S.A. (Spain)1 | 9,360 | 130,887 | ||||||
Equifax, Inc. | 11,388 | 1,235,940 | ||||||
Intertek Group plc (United Kingdom)1 | 1,350 | 97,255 | ||||||
Nielsen Holdings plc | 44,607 | 1,653,581 | ||||||
Randstad Holding N.V. (Netherlands)1 | 1,135 | 69,828 | ||||||
RELX plc (United Kingdom)1 | 2,080 | 47,862 | ||||||
SGS S.A. (Switzerland)1 | 35 | 86,434 | ||||||
|
| |||||||
| 3,321,787 | ||||||||
|
| |||||||
Road & Rail - 0.5% | ||||||||
Genesee & Wyoming, Inc. - Class A* | 15,135 | 1,086,390 | ||||||
|
| |||||||
Trading Companies & Distributors - 0.1% | ||||||||
Ashtead Group plc (United Kingdom)1 | 2,770 | 71,354 | ||||||
Brenntag AG (Germany)1 | 1,640 | 93,047 | ||||||
Howden Joinery Group plc (United Kingdom)1 | 5,830 | 31,750 | ||||||
|
| |||||||
| 196,151 | ||||||||
|
| |||||||
Transportation Infrastructure - 0.1% | ||||||||
Aena SME S.A. (Spain)1,2 | 1,235 | 226,590 | ||||||
Grupo Aeroportuario del Centro Norte S.A.B. de C.V. (Mexico) | 3,000 | 15,155 | ||||||
Grupo Aeroportuario del Pacifico S.A.B. de C.V. - ADR (Mexico) | 160 | 15,187 | ||||||
|
| |||||||
| 256,932 | ||||||||
|
| |||||||
Total Industrials | 10,170,638 | |||||||
|
| |||||||
Information Technology - 13.5% | ||||||||
Electronic Equipment, Instruments & Components - 0.2% | ||||||||
Halma plc (United Kingdom)1 | 4,495 | 70,530 | ||||||
Hexagon A.B. - Class B (Sweden)1 | 935 | 47,942 | ||||||
Hitachi Ltd. (Japan)1 | 15,000 | 119,450 | ||||||
Hollysys Automation Technologies Ltd. (China) | 2,020 | 45,349 | ||||||
Keyence Corp. (Japan)1 | 300 | 166,567 | ||||||
|
| |||||||
| 449,838 | ||||||||
|
| |||||||
Internet Software & Services - 4.7% | ||||||||
Alibaba Group Holding Ltd. - ADR (China)* | 1,005 | 185,814 | ||||||
Alphabet, Inc. - Class A* | 1,550 | 1,601,212 | ||||||
Alphabet, Inc. - Class C* | 1,585 | 1,611,375 | ||||||
China Literature Ltd. - Rights (Expires 11/03/2017) (Hong Kong)*3 | 27 | — | ||||||
Facebook, Inc. - Class A* | 25,180 | 4,533,911 | ||||||
NetEase, Inc. - ADR (China) | 110 | 31,011 | ||||||
Tencent Holdings Ltd. - Class H (China)1 | 38,470 | 1,729,038 | ||||||
|
| |||||||
| 9,692,361 | ||||||||
|
| |||||||
IT Services - 2.5% | ||||||||
Altran Technologies S.A. (France)1 | 4,885 | 90,347 | ||||||
Amdocs Ltd. | 1,645 | 107,090 | ||||||
InterXion Holding N.V. - ADR (Netherlands)* | 1,245 | 66,471 | ||||||
MasterCard, Inc. - Class A | 16,051 | 2,387,907 | ||||||
Sopra Steria Group (France)1 | 495 | 92,862 | ||||||
Visa, Inc. - Class A | 20,962 | 2,305,401 | ||||||
|
| |||||||
| 5,050,078 | ||||||||
|
| |||||||
Semiconductors & Semiconductor Equipment - 2.4% | ||||||||
Qorvo, Inc.* | 28,917 | 2,192,198 | ||||||
The accompanying notes are an integral part of the financial statements.
42
Investment Portfolio - October 31, 2017
| VALUE | ||||||||
| BLENDED ASSET EXTENDED SERIES | SHARES | (NOTE 2) | ||||||
COMMON STOCKS (continued) | ||||||||
Information Technology (continued) | ||||||||
Semiconductors & Semiconductor Equipment (continued) | ||||||||
Skyworks Solutions, Inc. | 24,079 | $ | 2,741,635 | |||||
|
| |||||||
| 4,933,833 | ||||||||
|
| |||||||
Software - 3.7% | ||||||||
Atlassian Corp. plc - Class A (Australia)* | 775 | 37,487 | ||||||
Dassault Systemes S.E. (France)1 | 900 | 95,541 | ||||||
Electronic Arts, Inc.* | 9,657 | 1,154,977 | ||||||
Microsoft Corp. | 20,949 | 1,742,538 | ||||||
ServiceNow, Inc.* | 35,995 | 4,548,688 | ||||||
Sophos Group plc (United Kingdom)1,2 | 5,965 | 49,188 | ||||||
Temenos Group AG (Switzerland)1 | 635 | 73,324 | ||||||
|
| |||||||
| 7,701,743 | ||||||||
|
| |||||||
Total Information Technology | 27,827,853 | |||||||
|
| |||||||
Materials - 3.0% | ||||||||
Chemicals - 0.7% | ||||||||
Akzo Nobel N.V. (Netherlands)1 | 1,020 | 92,086 | ||||||
Ashland Global Holdings, Inc. | 15,457 | 1,050,767 | ||||||
Croda International plc (United Kingdom)1 | 1,360 | 75,581 | ||||||
Mexichem, S.A.B. de C.V. (Mexico) | 11,800 | 30,393 | ||||||
Solvay S.A. (Belgium)1 | 580 | 86,164 | ||||||
|
| |||||||
| 1,334,991 | ||||||||
|
| |||||||
Construction Materials - 0.0%## | ||||||||
Wienerberger AG (Austria)1 | 2,750 | 70,558 | ||||||
|
| |||||||
Containers & Packaging - 1.3% | ||||||||
Ball Corp. | 31,385 | 1,347,358 | ||||||
Sealed Air Corp. | 29,102 | 1,287,182 | ||||||
|
| |||||||
| 2,634,540 | ||||||||
|
| |||||||
Metals & Mining - 1.0% | ||||||||
Antofagasta plc (Chile)1 | 36,370 | 460,938 | ||||||
First Quantum Minerals Ltd. (Zambia) | 41,215 | 460,997 | ||||||
Grupo Mexico, S.A.B. de C.V. - Series B (Mexico) | 26,200 | 85,207 | ||||||
Lundin Mining Corp. (Canada) | 61,508 | 469,141 | ||||||
Southern Copper Corp. (Peru) | 14,620 | 627,929 | ||||||
|
| |||||||
| 2,104,212 | ||||||||
|
| |||||||
Total Materials | 6,144,301 | |||||||
|
| |||||||
Real Estate - 2.6% | ||||||||
Equity Real Estate Investment Trusts (REITS) - 2.5% | ||||||||
Acadia Realty Trust | 895 | 25,194 | ||||||
Agree Realty Corp. | 405 | 19,152 | ||||||
Alexandria Real Estate Equities, Inc. | 815 | 101,028 | ||||||
American Campus Communities, Inc. | 930 | 38,670 | ||||||
American Homes 4 Rent - Class A | 3,380 | 71,926 | ||||||
Apartment Investment & Management Co. - Class A | 1,905 | 83,782 | ||||||
AvalonBay Communities, Inc. | 570 | 103,358 | ||||||
Axiare Patrimonio SOCIMI S.A. (Spain)1 | 1,530 | 28,694 | ||||||
Bluerock Residential Growth REIT, Inc. | 1,775 | 20,040 | ||||||
Boston Properties, Inc. | 415 | 50,290 | ||||||
Brandywine Realty Trust | 2,290 | 40,052 | ||||||
Brixmor Property Group, Inc. | 1,325 | 23,148 | ||||||
Camden Property Trust | 475 | 43,339 | ||||||
CatchMark Timber Trust, Inc. - Class A | 3,485 | 44,608 | ||||||
Cedar Realty Trust, Inc. | 6,840 | 37,210 | ||||||
Chesapeake Lodging Trust | 1,565 | 43,664 | ||||||
Colony NorthStar, Inc. - Class A | 5,315 | 65,268 | ||||||
Columbia Property Trust, Inc. | 1,385 | 30,581 | ||||||
Community Healthcare Trust, Inc. | 4,380 | 120,143 | ||||||
CoreCivic, Inc. | 3,105 | 76,569 | ||||||
Cousins Properties, Inc. | 6,905 | 62,283 | ||||||
Crown Castle International Corp. | 510 | 54,611 | ||||||
CubeSmart. | 3,105 | 84,518 | ||||||
DDR Corp. | 2,355 | 18,063 | ||||||
Digital Realty Trust, Inc. | 775 | 91,791 | ||||||
Douglas Emmett, Inc. | 1,100 | 43,769 | ||||||
Education Realty Trust, Inc. | 565 | 19,719 | ||||||
EPR Properties | 290 | 20,062 | ||||||
Equinix, Inc. | 440 | 203,940 | ||||||
Equity Commonwealth* | 1,355 | 40,718 | ||||||
Equity LifeStyle Properties, Inc. | 450 | 39,816 | ||||||
Equity Residential | 1,125 | 75,668 | ||||||
Essex Property Trust, Inc. | 75 | 19,682 | ||||||
Extra Space Storage, Inc. | 755 | 61,600 | ||||||
Forest City Realty Trust, Inc. - Class A | 1,735 | 42,733 | ||||||
Getty Realty Corp. | 1,105 | 31,393 | ||||||
GGP, Inc. | 1,870 | 36,390 | ||||||
Global Medical REIT, Inc. | 5,085 | 43,019 | ||||||
HCP, Inc. | 1,550 | 40,052 | ||||||
Healthcare Trust of America, Inc. - Class A | 1,550 | 46,578 | ||||||
Hibernia REIT plc (Ireland)1 | 20,085 | 34,509 | ||||||
The accompanying notes are an integral part of the financial statements.
43
Investment Portfolio - October 31, 2017
| SHARES/ | ||||||||
| PRINCIPAL | VALUE | |||||||
| BLENDED ASSET EXTENDED SERIES | AMOUNT4 | (NOTE 2) | ||||||
COMMON STOCKS (continued) | ||||||||
Real Estate (continued) | ||||||||
Equity Real Estate Investment Trusts (REITS) (continued) | ||||||||
Host Hotels & Resorts, Inc. | 1,915 | $ | 37,457 | |||||
Independence Realty Trust, Inc. | 2,945 | 29,892 | ||||||
Invitation Homes, Inc. | 1,455 | 32,839 | ||||||
Lamar Advertising Co. - Class A | 515 | 36,277 | ||||||
LaSalle Hotel Properties | 930 | 26,235 | ||||||
Life Storage, Inc. | 520 | 42,026 | ||||||
The Macerich Co. | 340 | 18,564 | ||||||
Mid-America Apartment Communities, Inc. | 680 | 69,598 | ||||||
National Retail Properties, Inc. | 1,020 | 40,984 | ||||||
Outfront Media, Inc. | 1,480 | 34,706 | ||||||
Physicians Realty Trust | 4,080 | 70,910 | ||||||
Prologis, Inc. | 2,050 | 132,389 | ||||||
Public Storage | 325 | 67,356 | ||||||
Regency Centers Corp. | 680 | 41,854 | ||||||
Retail Opportunity Investments Corp. | 1,420 | 25,532 | ||||||
Rexford Industrial Realty, Inc. | 1,760 | 52,254 | ||||||
Simon Property Group, Inc. | 1,045 | 162,320 | ||||||
STAG Industrial, Inc. | 2,225 | 60,742 | ||||||
Starwood Waypoint Homes | 900 | 32,679 | ||||||
STORE Capital Corp. | 1,575 | 38,887 | ||||||
Sun Communities, Inc. | 435 | 39,263 | ||||||
Sunstone Hotel Investors, Inc. | 2,410 | 39,331 | ||||||
Terreno Realty Corp. | 1,430 | 52,510 | ||||||
UDR, Inc. | 1,425 | 55,276 | ||||||
Unibail-Rodamco S.E. (France)1 | 280 | 70,086 | ||||||
Urban Edge Properties | 2,680 | 62,873 | ||||||
Ventas, Inc. | 1,300 | 81,575 | ||||||
VEREIT, Inc. | 4,905 | 38,700 | ||||||
Vornado Realty Trust | 1,055 | 78,977 | ||||||
Welltower, Inc. | 1,090 | 72,986 | ||||||
Weyerhaeuser Co. | 39,892 | 1,432,522 | ||||||
|
| |||||||
| 5,255,230 | ||||||||
|
| |||||||
Real Estate Management & Development - 0.1% | ||||||||
Aliansce Shopping Centers S.A. (Brazil)* | 8,200 | 43,816 | ||||||
Iguatemi Empresa de Shopping Centers S.A. (Brazil) | 3,700 | 43,478 | ||||||
Nexity S.A. (France)1 | 1,145 | 70,374 | ||||||
|
| |||||||
| 157,668 | ||||||||
|
| |||||||
Total Real Estate | 5,412,898 | |||||||
|
| |||||||
Telecommunication Services - 0.9% | ||||||||
Diversified Telecommunication Services - 0.9% | ||||||||
Iliad S.A. (France)1 | 305 | 76,134 | ||||||
Zayo Group Holdings, Inc.* | 49,403 | 1,781,472 | ||||||
|
| |||||||
Total Telecommunication Services | 1,857,606 | |||||||
|
| |||||||
Utilities - 0.1% | ||||||||
Electric Utilities - 0.0%## | ||||||||
Pampa Energia S.A. - ADR (Argentina)* | 1,395 | 94,623 | ||||||
|
| |||||||
Independent Power and Renewable Electricity Producers - 0.1% | ||||||||
China Longyuan Power Group Corp. Ltd. - Class H (China)1 | 87,000 | 64,518 | ||||||
Huaneng Renewables Corp. Ltd. - Class H (China)1 | 198,000 | 68,093 | ||||||
|
| |||||||
| 132,611 | ||||||||
|
| |||||||
Total Utilities | 227,234 | |||||||
|
| |||||||
TOTAL COMMON STOCKS | ||||||||
(Identified Cost $97,416,736) | 97,282,402 | |||||||
|
| |||||||
CORPORATE BONDS - 13.4% | ||||||||
Non-Convertible Corporate Bonds - 13.4% | ||||||||
Consumer Discretionary - 1.7% | ||||||||
Auto Components - 0.2% | ||||||||
Magna International, Inc. (Canada), 4.15%, 10/1/2025 | 444,000 | 475,069 | ||||||
|
| |||||||
Household Durables - 0.4% | ||||||||
Century Communities, Inc.2, 5.875%, 7/15/2025 | 75,000 | 75,749 | ||||||
Meritage Homes Corp., 5.125%, 6/6/2027 | 53,000 | 53,596 | ||||||
NVR, Inc., 3.95%, 9/15/2022 | 438,000 | 460,098 | ||||||
TRI Pointe Group, Inc. - TRI Pointe Homes, Inc., 4.375%, 6/15/2019 | 81,000 | 83,126 | ||||||
TRI Pointe Group, Inc. - TRI Pointe Homes, Inc., 5.875%, 6/15/2024 | 43,000 | 46,547 | ||||||
Weekley Homes LLC - Weekley Finance Corp., 6.00%, 2/1/2023 | 68,000 | 66,640 | ||||||
Weekley Homes LLC - Weekley Finance Corp.2, 6.625%, 8/15/2025 | 70,000 | 68,075 | ||||||
|
| |||||||
| 853,831 | ||||||||
|
| |||||||
Internet & Direct Marketing Retail - 0.5% | ||||||||
Amazon.com, Inc.2, 3.15%, 8/22/2027 | 330,000 | 331,975 | ||||||
The Priceline Group, Inc., 3.60%, 6/1/2026 | 631,000 | 644,950 | ||||||
|
| |||||||
| 976,925 | ||||||||
|
| |||||||
The accompanying notes are an integral part of the financial statements.
44
Investment Portfolio - October 31, 2017
| BLENDED ASSET EXTENDED SERIES | PRINCIPAL AMOUNT4 | VALUE (NOTE 2) | ||||||
CORPORATE BONDS (continued) | ||||||||
Non-Convertible Corporate Bonds (continued) | ||||||||
Consumer Discretionary (continued) | ||||||||
Media - 0.5% | ||||||||
Charter Communications Operating LLC - Charter Communications Operating Capital Corp., 4.464%, 7/23/2022 | 25,000 | $ | 26,402 | |||||
Comcast Corp., 4.40%, 8/15/2035 | 297,000 | 321,618 | ||||||
CSC Holdings, LLC, 5.25%, 6/1/2024 | 96,000 | 95,580 | ||||||
Discovery Communications LLC, 3.95%, 3/20/2028 | 510,000 | 505,825 | ||||||
DISH DBS Corp., 5.875%, 7/15/2022 | 25,000 | 25,141 | ||||||
|
| |||||||
| 974,566 | ||||||||
|
| |||||||
Multiline Retail - 0.1% | ||||||||
Dollar General Corp., 3.25%, 4/15/2023 | 299,000 | 306,811 | ||||||
|
| |||||||
Total Consumer Discretionary | 3,587,202 | |||||||
|
| |||||||
Consumer Staples - 0.8% | ||||||||
Beverages - 0.5% | ||||||||
Anheuser-Busch InBev Worldwide, Inc. (Belgium), 8.20%, 1/15/2039 | 430,000 | 679,491 | ||||||
PepsiCo, Inc., 3.10%, 7/17/2022 | 297,000 | 307,047 | ||||||
|
| |||||||
| 986,538 | ||||||||
|
| |||||||
Food & Staples Retailing - 0.3% | ||||||||
C&S Group Enterprises LLC2, 5.375%, 7/15/2022 | 104,000 | 100,880 | ||||||
CVS Health Corp., 3.50%, 7/20/2022 | 445,000 | 458,701 | ||||||
|
| |||||||
| 559,581 | ||||||||
|
| |||||||
Total Consumer Staples | 1,546,119 | |||||||
|
| |||||||
Energy - 2.1% | ||||||||
Energy Equipment & Services - 0.1% | ||||||||
McDermott International, Inc.2, 8.00%, 5/1/2021 | 111,000 | 114,608 | ||||||
Trinidad Drilling Ltd. (Canada)2, 6.625%, 2/15/2025 | 76,000 | 73,910 | ||||||
|
| |||||||
| 188,518 | ||||||||
|
| |||||||
Oil, Gas & Consumable Fuels - 2.0% | ||||||||
BP Capital Markets plc (United Kingdom), 3.535%, 11/4/2024 | 626,000 | 650,806 | ||||||
Cheniere Corpus Christi Holdings, LLC, 7.00%, 6/30/2024 | 100,000 | 114,125 | ||||||
Cheniere Energy Partners LP2, 5.25%, 10/1/2025 | 70,000 | 72,100 | ||||||
Columbia Pipeline Group, Inc., 4.50%, 6/1/2025 | 293,000 | 314,023 | ||||||
ConocoPhillips Co., 3.35%, 5/15/2025 | 284,000 | 292,596 | ||||||
Dynagas LNG Partners LP - Dynagas Finance, Inc. (Monaco), 6.25%, 10/30/2019 | 78,000 | 78,000 | ||||||
Enbridge, Inc. (Canada), 3.70%, 7/15/2027 | 330,000 | 334,311 | ||||||
Enviva Partners LP - Enviva Partners Finance Corp., 8.50%, 11/1/2021 | 74,000 | 79,365 | ||||||
GasLog Ltd. (Monaco), 8.875%, 3/22/2022 | 73,000 | 77,015 | ||||||
Global Ship Lease, Inc. (United Kingdom)2, 9.875%, 11/15/2022 | 100,000 | 102,000 | ||||||
Hilcorp Energy I LP - Hilcorp Finance Co.2, 5.75%, 10/1/2025 | 110,000 | 112,613 | ||||||
Jonah Energy LLC - Jonah Energy Finance Corp.2, 7.25%, 10/15/2025 | 70,000 | 70,000 | ||||||
Kinder Morgan Energy Partners LP, 4.30%, 5/1/2024 | 589,000 | 617,988 | ||||||
PBF Holding Co. LLC - PBF Finance Corp.2, 7.25%, 6/15/2025 | 57,000 | 58,924 | ||||||
Petroleos Mexicanos (Mexico), 6.875%, 8/4/2026 | 300,000 | 337,050 | ||||||
Rockies Express Pipeline, LLC2, 5.625%, 4/15/2020 | 94,000 | 99,640 | ||||||
Sabine Pass Liquefaction LLC, 5.875%, 6/30/2026 | 300,000 | 339,398 | ||||||
SemGroup Corp.2, 6.375%, 3/15/2025 | 73,000 | 71,905 | ||||||
Seven Generations Energy Ltd. (Canada)2, 5.375%, 9/30/2025 | 49,000 | 49,490 | ||||||
Southwestern Energy Co., 6.70%, 1/23/2025 | 56,000 | 57,260 | ||||||
Tallgrass Energy Partners LP - Tallgrass Energy Finance Corp.2, 5.50%, 9/15/2024 | 99,000 | 102,341 | ||||||
|
| |||||||
| 4,030,950 | ||||||||
|
| |||||||
Total Energy | 4,219,468 | |||||||
|
| |||||||
Financials - 4.2% | ||||||||
Banks - 2.2% | ||||||||
Banco Santander S.A. (Spain), 3.50%, 4/11/2022 | 421,000 | 431,384 | ||||||
Bank of America Corp., 4.00%, 1/22/2025 | 461,000 | 477,450 | ||||||
Barclays Bank plc (United Kingdom)2, 10.179%, 6/12/2021 | 235,000 | 290,200 | ||||||
The accompanying notes are an integral part of the financial statements.
45
Investment Portfolio - October 31, 2017
| BLENDED ASSET EXTENDED SERIES | PRINCIPAL AMOUNT4 | VALUE (NOTE 2) | ||||||
CORPORATE BONDS (continued) | ||||||||
Non-Convertible Corporate Bonds (continued) | ||||||||
Financials (continued) | ||||||||
Banks (continued) | ||||||||
Citigroup, Inc., 3.875%, 3/26/2025 | 640,000 | $ | 656,706 | |||||
Intesa Sanpaolo S.p.A. (Italy), 3.875%, 1/15/2019 | 285,000 | 290,574 | ||||||
JPMorgan Chase & Co.5, (3 mo. LIBOR US + 0.935%), 2.776%, 4/25/2023 | 605,000 | 607,146 | ||||||
Kreditanstalt fuer Wiederaufbau (Germany), 1.50%, 6/15/2021 | 1,087,000 | 1,067,484 | ||||||
Lloyds Banking Group plc (United Kingdom), 4.582%, 12/10/2025 | 577,000 | 608,530 | ||||||
Popular, Inc., 7.00%, 7/1/2019 | 76,000 | 77,710 | ||||||
Royal Bank of Canada (Canada), 3.77%, 3/30/2018 | CAD | 99,000 | 77,488 | |||||
Royal Bank of Scotland Group plc (United Kingdom), 6.10%, 6/10/2023 | 22,000 | 24,498 | ||||||
|
| |||||||
| 4,609,170 | ||||||||
|
| |||||||
Capital Markets - 0.6% | ||||||||
The Goldman Sachs Group, Inc., 4.25%, 10/21/2025 | 293,000 | 305,692 | ||||||
Morgan Stanley6, (3 mo. LIBOR US + 1.220%), 2.617%, 5/8/2024 | 477,000 | 485,004 | ||||||
Morgan Stanley, 5.00%, 11/24/2025 | 438,000 | 477,777 | ||||||
|
| |||||||
| 1,268,473 | ||||||||
|
| |||||||
Consumer Finance - 0.1% | ||||||||
Ally Financial, Inc., 3.50%, 1/27/2019 | 30,000 | 30,366 | ||||||
Navient Corp., 6.125%, 3/25/2024 | 49,000 | 50,286 | ||||||
SLM Corp., 5.125%, 4/5/2022 | 65,000 | 67,356 | ||||||
|
| |||||||
| 148,008 | ||||||||
|
| |||||||
Diversified Financial Services - 0.4% | ||||||||
AerCap Ireland Capital DAC - AerCap Global Aviation Trust (Netherlands), 4.50%, 5/15/2021 | 527,000 | 559,670 | ||||||
E*TRADE Financial Corp., 2.95%, 8/24/2022 | 330,000 | 330,157 | ||||||
LPL Holdings, Inc.2, 5.75%, 9/15/2025 | 52,000 | 54,080 | ||||||
|
| |||||||
| 943,907 | ||||||||
|
| |||||||
Insurance - 0.8% | ||||||||
American International Group, Inc., 4.125%, 2/15/2024 | 435,000 | 462,683 | ||||||
Assured Guaranty US Holdings, Inc., 5.00%, 7/1/2024 | 770,000 | 831,344 | ||||||
Prudential Financial, Inc.5, (3 mo. LIBOR US + 4.175%), 5.875%, 9/15/2042 | 288,000 | 318,240 | ||||||
|
| |||||||
| 1,612,267 | ||||||||
|
| |||||||
Thrifts & Mortgage Finance - 0.1% | ||||||||
Ladder Capital Finance Holdings LLLP - Ladder Capital Finance Corp.2, 5.875%, 8/1/2021 | 132,000 | 136,290 | ||||||
|
| |||||||
Total Financials | 8,718,115 | |||||||
|
| |||||||
Health Care - 0.4% | ||||||||
Biotechnology - 0.3% | ||||||||
AMAG Pharmaceuticals, Inc.2, 7.875%, 9/1/2023 | 54,000 | 54,945 | ||||||
Express Scripts Holding Co., 3.50%, 6/15/2024 | 500,000 | 505,920 | ||||||
|
| |||||||
| 560,865 | ||||||||
|
| |||||||
Health Care Equipment & Supplies - 0.0%## | ||||||||
Hill-Rom Holdings, Inc.2, 5.00%, 2/15/2025 | 54,000 | 55,215 | ||||||
|
| |||||||
Health Care Providers & Services - 0.1% | ||||||||
DaVita, Inc., 5.00%, 5/1/2025 | 70,000 | 68,950 | ||||||
Fresenius Medical Care US Finance II, Inc. (Germany)2, 6.50%, 9/15/2018 | 30,000 | 31,160 | ||||||
HCA Healthcare, Inc., 6.25%, 2/15/2021 | 22,000 | 23,678 | ||||||
HCA, Inc., 3.75%, 3/15/2019 | 22,000 | 22,330 | ||||||
Ortho-Clinical Diagnostics, Inc. - Ortho-Clinical Diagnostics S.A.2, 6.625%, 5/15/2022 | 30,000 | 30,037 | ||||||
Tenet Healthcare Corp., 6.75%, 2/1/2020 | 22,000 | 22,385 | ||||||
|
| |||||||
| 198,540 | ||||||||
|
| |||||||
Total Health Care | 814,620 | |||||||
|
| |||||||
Industrials - 0.5% | ||||||||
Air Freight & Logistics - 0.0%## | ||||||||
Park Aerospace Holdings Ltd. (Ireland)2, 4.50%, 3/15/2023 | 39,000 | 39,049 | ||||||
|
| |||||||
Airlines - 0.1% | ||||||||
Allegiant Travel Co., 5.50%, 7/15/2019 | 50,000 | 51,625 | ||||||
American Airlines Group, Inc.2, 5.50%, 10/1/2019 | 52,000 | 54,080 | ||||||
|
| |||||||
| 105,705 | ||||||||
|
| |||||||
The accompanying notes are an integral part of the financial statements.
46
Investment Portfolio - October 31, 2017
| BLENDED ASSET EXTENDED SERIES | PRINCIPAL AMOUNT4 | VALUE (NOTE 2) | ||||||
CORPORATE BONDS (continued) | ||||||||
Non-Convertible Corporate Bonds (continued) | ||||||||
Industrials (continued) | ||||||||
Building Products - 0.1% | ||||||||
Airxcel, Inc.2, 8.50%, 2/15/2022 | 81,000 | $ | 85,860 | |||||
|
| |||||||
Construction & Engineering - 0.0%## | ||||||||
Tutor Perini Corp.2, 6.875%, 5/1/2025 | 79,000 | 85,221 | ||||||
|
| |||||||
Industrial Conglomerates - 0.3% | ||||||||
General Electric Co.6, (3 mo. LIBOR US + 0.380%), 1.771%, 5/5/2026 | 609,000 | 589,868 | ||||||
|
| |||||||
Machinery - 0.0%## | ||||||||
Xerium Technologies, Inc., 9.50%, 8/15/2021 | 59,000 | 60,605 | ||||||
|
| |||||||
Trading Companies & Distributors - 0.0%## | ||||||||
International Lease Finance Corp., 6.25%, 5/15/2019 | 57,000 | 60,444 | ||||||
|
| |||||||
Total Industrials | 1,026,752 | |||||||
|
| |||||||
Information Technology - 0.9% | ||||||||
Internet Software & Services - 0.3% | ||||||||
Activision Blizzard, Inc., 3.40%, 6/15/2027 | 603,000 | 604,120 | ||||||
|
| |||||||
IT Services - 0.2% | ||||||||
Visa, Inc., 2.80%, 12/14/2022 | 460,000 | 468,654 | ||||||
|
| |||||||
Semiconductors & Semiconductor Equipment - 0.4% | ||||||||
Applied Materials, Inc., 3.30%, 4/1/2027 | 650,000 | 664,779 | ||||||
MagnaChip Semiconductor Corp. (South Korea), 6.625%, 7/15/2021 | 78,000 | 74,880 | ||||||
|
| |||||||
| 739,659 | ||||||||
|
| |||||||
Total Information Technology | 1,812,433 | |||||||
|
| |||||||
Materials - 1.1% | ||||||||
Chemicals - 0.2% | ||||||||
Kissner Holdings LP - Kissner Milling Co. Ltd. - BSC Holding, Inc. - Kissner USA (Canada)2, 8.375%, 12/1/2022 | 68,000 | 68,680 | ||||||
NOVA Chemicals Corp. (Canada)2, 4.875%, 6/1/2024 | 57,000 | 58,069 | ||||||
Solvay Finance America LLC (Belgium)2, 3.40%, 12/3/2020 | 311,000 | 319,803 | ||||||
|
| |||||||
| 446,552 | ||||||||
|
| |||||||
Metals & Mining - 0.8% | ||||||||
Anglo American Capital plc (United Kingdom)2, 9.375%, 4/8/2019 | 32,000 | 35,209 | ||||||
Anglo American Capital plc (United Kingdom)2, 4.00%, 9/11/2027 | 560,000 | 560,561 | ||||||
Corp Nacional del Cobre de Chile (Chile)2, 3.625%, 8/1/2027 | 557,000 | 560,281 | ||||||
Southern Copper Corp. (Peru), 3.875%, 4/23/2025 | 308,000 | 319,657 | ||||||
Techniplas LLC2, 10.00%, 5/1/2020 | 78,000 | 62,400 | ||||||
|
| |||||||
| 1,538,108 | ||||||||
|
| |||||||
Paper & Forest Products - 0.1% | ||||||||
Domtar Corp., 4.40%, 4/1/2022 | 283,000 | 297,647 | ||||||
|
| |||||||
Total Materials | 2,282,307 | |||||||
|
| |||||||
Real Estate - 0.4% | ||||||||
Equity Real Estate Investment Trusts (REITS) - 0.4% | ||||||||
American Tower Corp., 3.30%, 2/15/2021 | 631,000 | 647,425 | ||||||
GTP Acquisition Partners I LLC2, 2.35%, 6/15/2020 | 123,000 | 122,594 | ||||||
iStar, Inc., 5.25%, 9/15/2022 | 57,000 | 58,425 | ||||||
|
| |||||||
Total Real Estate | 828,444 | |||||||
|
| |||||||
Telecommunication Services - 0.9% | ||||||||
Diversified Telecommunication Services - 0.9% | ||||||||
AT&T, Inc., 3.90%, 8/14/2027 | 670,000 | 667,320 | ||||||
CenturyLink, Inc., 7.50%, 4/1/2024 | 52,000 | 55,250 | ||||||
Frontier Communications Corp., 11.00%, 9/15/2025 | 82,000 | 69,597 | ||||||
Hughes Satellite Systems Corp., 5.25%, 8/1/2026 | 110,000 | 112,484 | ||||||
Inmarsat Finance plc (United Kingdom)2, 4.875%, 5/15/2022 | 160,000 | 163,232 | ||||||
Sprint Communications, Inc.2, 9.00%, 11/15/2018 | 22,000 | 23,348 | ||||||
Sprint Communications, Inc., 7.00%, 8/15/2020 | 22,000 | 23,698 | ||||||
Verizon Communications, Inc., 4.125%, 3/16/2027 | 640,000 | 667,861 | ||||||
|
| |||||||
Total Telecommunication Services | 1,782,790 | |||||||
|
| |||||||
Utilities - 0.4% | ||||||||
Independent Power and Renewable Electricity Producers - 0.4% | ||||||||
American Water Capital Corp., 2.95%, 9/1/2027 | 680,000 | 676,864 | ||||||
Atlantica Yield plc (Spain)2, 7.00%, 11/15/2019 | 204,000 | 218,280 | ||||||
|
| |||||||
Total Utilities | 895,144 | |||||||
|
| |||||||
TOTAL CORPORATE BONDS | ||||||||
(Identified Cost $27,567,085) | 27,513,394 | |||||||
|
| |||||||
The accompanying notes are an integral part of the financial statements.
47
Investment Portfolio - October 31, 2017
| SHARES/ | ||||||||
| PRINCIPAL | VALUE | |||||||
| BLENDED ASSET EXTENDED SERIES | AMOUNT4 | (NOTE 2) | ||||||
MUTUAL FUNDS - 0.1% | ||||||||
Global X MSCI Greece ETF | 7,535 | $ | 69,850 | |||||
iShares MSCI Eurozone ETF | 4,235 | 185,620 | ||||||
|
| |||||||
TOTAL MUTUAL FUNDS | ||||||||
(Identified Cost $254,966) | 255,470 | |||||||
|
| |||||||
U.S. TREASURY SECURITIES - 19.6% | ||||||||
U.S. Treasury Bonds - 3.8% | ||||||||
U.S. Treasury Bond, 6.25%, 5/15/2030 | 1,576,000 | 2,226,654 | ||||||
U.S. Treasury Bond, 4.75%, 2/15/2037 | 2,331,000 | 3,082,565 | ||||||
U.S. Treasury Bond, 2.50%, 2/15/2045 | 1,687,000 | 1,569,306 | ||||||
U.S. Treasury Inflation Indexed Bond, 0.75%, 2/15/2042 | 1,077,650 | 1,042,744 | ||||||
|
| |||||||
Total U.S. Treasury Bonds | ||||||||
(Identified Cost $8,003,383) | 7,921,269 | |||||||
|
| |||||||
U.S. Treasury Notes - 15.8% | ||||||||
U.S. Treasury Inflation Indexed Note, 0.125%, 4/15/2020 | 1,034,686 | 1,038,317 | ||||||
U.S. Treasury Inflation Indexed Note, 0.125%, 1/15/2023 | 1,028,675 | 1,024,309 | ||||||
U.S. Treasury Note, 1.375%, 4/30/2021 | 5,036,000 | 4,959,870 | ||||||
U.S. Treasury Note, 1.75%, 4/30/2022 | 4,937,000 | 4,890,137 | ||||||
U.S. Treasury Note, 2.00%, 7/31/2022 | 6,946,000 | 6,947,357 | ||||||
U.S. Treasury Note, 1.625%, 4/30/2023 | 5,270,000 | 5,142,985 | ||||||
U.S. Treasury Note, 1.25%, 7/31/2023 | 2,574,000 | 2,453,645 | ||||||
U.S. Treasury Note, 1.625%, 5/15/2026 | 2,176,000 | 2,056,830 | ||||||
U.S. Treasury Note, 2.375%, 5/15/2027 | 3,986,000 | 3,987,868 | ||||||
|
| |||||||
Total U.S. Treasury Notes | ||||||||
(Identified Cost $32,624,937) | 32,501,318 | |||||||
|
| |||||||
TOTAL U.S. TREASURY SECURITIES | ||||||||
(Identified Cost $40,628,320) | 40,422,587 | |||||||
|
| |||||||
ASSET-BACKED SECURITIES - 4.0% | ||||||||
Chesapeake Funding II LLC2, 2.11%, 3/15/2028 | 168,438 | 168,822 | ||||||
Chesapeake Funding II LLC, Series 2017-2A, Class A12, 1.99%, 5/15/2029 | 1,000,000 | 1,000,280 | ||||||
Credit Acceptance Auto Loan Trust, Series 2017-1A, Class A2, 2.56%, 10/15/2025 | 451,000 | 451,672 | ||||||
Enterprise Fleet Financing LLC, Series 2015-2, Class A22, 1.59%, 2/22/2021 | 206,849 | 206,805 | ||||||
Enterprise Fleet Financing LLC, Series 2016-2, Class A22, 1.74%, 2/22/2022 | 158,502 | 158,383 | ||||||
Home Partners of America Trust, Series 2016-1, Class A2,6, (1 mo. LIBOR US + 1.650%), 2.887%, 3/17/2033 | 185,384 | 186,885 | ||||||
Honda Auto Receivables Owner Trust, Series 2016-4, Class A2, 1.04%, 4/18/2019 | 407,942 | 407,354 | ||||||
Hyundai Auto Lease Securitization Trust, Series 2017-B, Class A32, 1.97%, 7/15/2020 | 800,000 | 800,643 | ||||||
Invitation Homes Trust, Series 2015-SFR3, Class A2,6, (1 mo. LIBOR US + 1.300%), 2.537%, 8/17/2032 | 410,056 | 413,030 | ||||||
SoFi Consumer Loan Program LLC, Series 2016-2, Class A2, 3.09%, 10/27/2025 | 510,771 | 515,238 | ||||||
SoFi Professional Loan Program LLC, Series 2017-A, Class A2A2, 1.55%, 3/26/2040 | 1,328,806 | 1,324,419 | ||||||
SoFi Professional Loan Program LLC, Series 2017-C, Class A2A2, 1.75%, 7/25/2040 | 1,781,652 | 1,778,271 | ||||||
South Carolina Student Loan Corp., Series 2005, Class A36, (3 mo. LIBOR US + 0.140%), 1.456%, 12/1/2023 | 458,138 | 457,977 | ||||||
Tax Ease Funding LLC, Series 2016-1A, Class A2, 3.131%, 6/15/2028 | 122,259 | 122,811 | ||||||
Tricon American Homes Trust, Series 2016-SFR1, Class A2, 2.589%, 11/17/2033 | 323,000 | 320,083 | ||||||
|
| |||||||
TOTAL ASSET-BACKED SECURITIES | ||||||||
(Identified Cost $8,312,128) | 8,312,673 | |||||||
|
| |||||||
The accompanying notes are an integral part of the financial statements.
48
Investment Portfolio - October 31, 2017
| BLENDED ASSET EXTENDED SERIES | PRINCIPAL AMOUNT4 | VALUE (NOTE 2) | ||||||
COMMERCIAL MORTGAGE-BACKED SECURITIES - 5.1% | ||||||||
BWAY Mortgage Trust, Series 2015-1740, Class A2, 2.917%, 1/10/2035 | 889,000 | $ | 877,978 | |||||
Credit Suisse Mortgage Capital Trust, Series 2013-IVR3, Class A12,7, 2.50%, 5/25/2043 | 240,673 | 229,044 | ||||||
Freddie Mac Multifamily Structured Pass-Through Certificates, Series K017, Class X1 (IO)7, 1.353%, 12/25/2021 | 6,203,230 | 284,468 | ||||||
Freddie Mac Multifamily Structured Pass-Through Certificates, Series K029, Class A27, 3.32%, 2/25/2023 | 794,000 | 830,894 | ||||||
Freddie Mac Multifamily Structured Pass-Through Certificates, Series K035, Class A27, 3.458%, 8/25/2023 | 969,000 | 1,021,775 | ||||||
Freddie Mac Multifamily Structured Pass-Through Certificates, Series KJ10, Class A2, 2.912%, 12/25/2023 | 942,000 | 961,843 | ||||||
Freddie Mac Multifamily Structured Pass-Through Certificates, Series KJ13, Class A2, 2.864%, 8/25/2022 | 673,000 | 688,447 | ||||||
Freddie Mac Multifamily Structured Pass-Through Certificates, Series K-P01, Class A2, 1.72%, 1/25/2019 | 212,823 | 212,773 | ||||||
FREMF Mortgage Trust, Series 2013-K712, Class B2,7, 3.365%, 5/25/2045 | 283,000 | 287,096 | ||||||
FREMF Mortgage Trust, Series 2014-K41, Class B2,7, 3.832%, 11/25/2047 | 485,000 | 492,992 | ||||||
FREMF Mortgage Trust, Series 2014-K715, Class B2,7, 3.979%, 2/25/2046 | 471,000 | 487,927 | ||||||
GAHR Commercial Mortgage Trust, Series 2015-NRF, Class BFX2,7, 3.495%, 12/15/2034 | 565,000 | 572,097 | ||||||
JP Morgan Mortgage Trust, Series 2013-2, Class A22,7, 3.50%, 5/25/2043 | 146,282 | 149,099 | ||||||
JP Morgan Mortgage Trust, Series 2014-2, Class 1A12,7, 3.00%, 6/25/2029 | 250,883 | 253,941 | ||||||
New Residential Mortgage Loan Trust, Series 2014-3A, Class AFX32,7, 3.75%, 11/25/2054 | 188,413 | 194,236 | ||||||
New Residential Mortgage Loan Trust, Series 2015-2A, Class A12,7, 3.75%, 8/25/2055 | 279,417 | 288,171 | ||||||
New Residential Mortgage Loan Trust, Series 2016-4A, Class A12,7, 3.75%, 11/25/2056 | 276,349 | 284,010 | ||||||
SCG Trust, Series 2013-SRP1, Class AJ2,6, (1 mo. LIBOR US + 1.950%), 3.189%, 11/15/2026 | 700,000 | 697,293 | ||||||
Sequoia Mortgage Trust, Series 2013-2, Class A7, 1.874%, 2/25/2043 | 174,890 | 165,415 | ||||||
Sequoia Mortgage Trust, Series 2013-8, Class A17, 3.00%, 6/25/2043 | 192,912 | 192,267 | ||||||
Starwood Retail Property Trust, Series 2014-STAR, Class A2,6, (1 mo. LIBOR US + 1.220%), 2.459%, 11/15/2027 | 404,000 | 404,281 | ||||||
Towd Point Mortgage Trust, Series 2016-5, Class A12,7, 2.50%, 10/25/2056 | 492,585 | 491,420 | ||||||
WinWater Mortgage Loan Trust, Series 2015-1, Class A12,7, 3.50%, 1/20/2045 | 205,290 | 208,730 | ||||||
WinWater Mortgage Loan Trust, Series 2015-3, Class A52,7, 3.50%, 3/20/2045 | 194,646 | 197,824 | ||||||
|
| |||||||
TOTAL COMMERCIAL MORTGAGE-BACKED SECURITIES | ||||||||
(Identified Cost $10,498,772) | 10,474,021 | |||||||
|
| |||||||
FOREIGN GOVERNMENT BONDS - 1.5% | ||||||||
Canada Housing Trust No. 1 (Canada)2, 4.10%, 12/15/2018 | CAD | 86,000 | 68,672 | |||||
Canadian Government Bond (Canada), 2.75%, 6/1/2022 | CAD | 102,000 | 83,095 | |||||
Export-Import Bank of Korea (South Korea), 2.625%, 12/30/2020 | 500,000 | 499,292 | ||||||
The Korea Development Bank (South Korea), 1.375%, 9/12/2019 | 900,000 | 882,746 | ||||||
Mexican Government Bond (Mexico), 8.00%, 6/11/2020 | MXN | 2,087,000 | 111,371 | |||||
Mexican Government Bond (Mexico), 6.50%, 6/10/2021 | MXN | 888,000 | 45,497 | |||||
Mexican Government Bond (Mexico), 6.50%, 6/9/2022 | MXN | 1,443,000 | 73,625 | |||||
Mexican Government Bond (Mexico), 7.75%, 5/29/2031 | MXN | 278,000 | 14,964 | |||||
Province of Ontario (Canada), 2.00%, 9/27/2018 | 268,000 | 268,768 | ||||||
Province of Ontario (Canada), 1.25%, 6/17/2019 | 223,000 | 220,837 | ||||||
Singapore Government Bond (Singapore), 2.50%, 6/1/2019 | SGD | 188,000 | 140,329 | |||||
The accompanying notes are an integral part of the financial statements.
49
Investment Portfolio - October 31, 2017
| BLENDED ASSET EXTENDED SERIES | PRINCIPAL AMOUNT4/ SHARES | VALUE (NOTE 2) | ||||||
FOREIGN GOVERNMENT BONDS (continued) | ||||||||
Svensk Exportkredit AB (Sweden), 1.125%, 8/28/2019 | 621,000 | $ | 613,184 | |||||
United Kingdom Gilt (United Kingdom), 5.00%, 3/7/2018 | GBP | 105,000 | 141,753 | |||||
|
| |||||||
TOTAL FOREIGN GOVERNMENT BONDS | ||||||||
(Identified Cost $3,177,265) | 3,164,133 | |||||||
|
| |||||||
U.S. GOVERNMENT AGENCIES - 8.0% | ||||||||
Mortgage-Backed Securities - 5.6% | ||||||||
Fannie Mae, Pool #888468, 5.50%, 9/1/2021 | 67,654 | 70,381 | ||||||
Fannie Mae, Pool #888810, 5.50%, 11/1/2022 | 80,520 | 83,632 | ||||||
Fannie Mae, Pool #MA1834, 4.50%, 2/1/2034 | 335,671 | 362,116 | ||||||
Fannie Mae, Pool #MA2177, 4.00%, 2/1/2035 | 333,174 | 352,935 | ||||||
Fannie Mae, Pool #AY8263, 3.00%, 5/1/2035 | 555,802 | 560,488 | ||||||
Fannie Mae, Pool #AB8161, 6.00%, 12/1/2037 | 158,232 | 178,974 | ||||||
Fannie Mae, Pool #AD0207, 6.00%, 10/1/2038 | 275,432 | 311,875 | ||||||
Fannie Mae, Pool #AD0307, 5.50%, 1/1/2039 | 169,872 | 188,871 | ||||||
Fannie Mae, Pool #MA0258, 4.50%, 12/1/2039 | 210,899 | 226,284 | ||||||
Fannie Mae, Pool #AL1595, 6.00%, 1/1/2040 | 146,988 | 166,700 | ||||||
Fannie Mae, Pool #AL0241, 4.00%, 4/1/2041 | 329,913 | 347,746 | ||||||
Fannie Mae, Pool #AL1410, 4.50%, 12/1/2041 | 572,253 | 616,040 | ||||||
Fannie Mae, Pool #AL7729, 4.00%, 6/1/2043 | 290,308 | 305,923 | ||||||
Fannie Mae, Pool #AS4103, 4.50%, 12/1/2044 | 343,363 | 370,608 | ||||||
Fannie Mae, Pool #AZ9215, 4.00%, 10/1/2045 | 263,320 | 276,950 | ||||||
Fannie Mae, Pool #BC3490, 3.50%, 2/1/2046 | 706,987 | 727,280 | ||||||
Fannie Mae, Pool #BE3812, 4.00%, 12/1/2046 | 366,559 | 385,124 | ||||||
Fannie Mae, Pool #BE3815, 4.00%, 12/1/2046 | 397,515 | 417,648 | ||||||
Fannie Mae, Pool #BE7845, 4.50%, 2/1/2047 | 438,371 | 469,909 | ||||||
Fannie Mae, Pool #AL8674, 5.659%, 1/1/2049 | 608,017 | 667,671 | ||||||
Freddie Mac, Pool #C91754, 4.50%, 3/1/2034 | 163,774 | 176,459 | ||||||
Freddie Mac, Pool #C91762, 4.50%, 5/1/2034 | 210,749 | 227,289 | ||||||
Freddie Mac, Pool #C91771, 4.50%, 6/1/2034 | 189,030 | 204,558 | ||||||
Freddie Mac, Pool #C91780, 4.50%, 7/1/2034 | 218,190 | 235,314 | ||||||
Freddie Mac, Pool #C91850, 4.00%, 9/1/2035 | 638,583 | 678,311 | ||||||
Freddie Mac, Pool #G04601, 5.50%, 7/1/2038 | 267,866 | 298,008 | ||||||
Freddie Mac, Pool #G04587, 5.50%, 8/1/2038 | 227,476 | 252,586 | ||||||
Freddie Mac, Pool #A92889, 4.50%, 7/1/2040 | 590,622 | 633,206 | ||||||
Freddie Mac, Pool #G60183, 4.00%, 12/1/2044 | 318,473 | 335,655 | ||||||
Freddie Mac, Pool #Q33778, 4.00%, 6/1/2045 | 314,567 | 330,637 | ||||||
Freddie Mac, Pool #G08754, 4.50%, 3/1/2047 | 463,818 | 495,313 | ||||||
Freddie Mac, Pool #G08786, 4.50%, 10/1/2047 | 477,845 | 512,321 | ||||||
|
| |||||||
Total Mortgage-Backed Securities | ||||||||
(Identified Cost $11,514,159) | 11,466,812 | |||||||
|
| |||||||
Other Agencies - 2.4% | ||||||||
Fannie Mae, 2.625%, 9/6/2024 (Identified Cost $4,986,677) | 4,855,000 | 4,956,081 | ||||||
|
| |||||||
TOTAL U.S. GOVERNMENT AGENCIES | ||||||||
(Identified Cost $16,500,836) | 16,422,893 | |||||||
|
| |||||||
SHORT-TERM INVESTMENT - 1.8% | ||||||||
Dreyfus Government Cash Management8, 0.93%, (Identified Cost $3,712,227) | 3,712,227 | 3,712,227 | ||||||
|
| |||||||
TOTAL INVESTMENTS - 100.7% | ||||||||
(Identified Cost $208,068,335) | 207,559,800 | |||||||
LIABILITIES, LESS OTHER ASSETS - (0.7%) | (1,380,334 | ) | ||||||
|
| |||||||
NET ASSETS - 100% | $ | 206,179,466 | ||||||
|
| |||||||
The accompanying notes are an integral part of the financial statements.
50
Investment Portfolio - October 31, 2017
ADR - American Depositary Receipt
CAD - Canadian Dollar
ETF - Exchange-traded fund
GBP - British Pound
MXN - Mexican Peso
No. - Number
SGD - Singapore Dollar
*Non-income producing security.
##Less than 0.1%.
1A factor from a third party vendor was applied to determine the security’s fair value following the close of local trading.
2Restricted securities - Investment in securities that are restricted as to public resale under the Securities Act of 1933, as amended. These securities have been sold under Rule 144A and have been determined to be liquid. These securities amount to $18,681,012 or 9.1%, of the Series’ net assets as of October 31, 2017 (see Note 2 to the financial statements).
3Security has been valued at fair value as determined in good faith by the Advisor and is classified as Level 3 in the fair value hierarchy.
4Amount is stated in USD unless otherwise noted.
5Variable rate security. Security may be issued at a fixed coupon rate, which converts to a variable rate at a specified date. Rate shown is the rate in effect as of October 31, 2017.
6Floating rate security. Rate shown is the rate in effect as of October 31, 2017.
7Variable or floating rate security, which interest rate adjusts periodically based on changes in current interest rates and prepayments on the underlying pool of assets. Rate shown is the rate in effect as of October 31, 2017.
8Rate shown is the current yield as of October 31, 2017.
The Global Industry Classification Standard (GICS) was developed by and is the exclusive property and a service mark of MSCI Inc. (MSCI) and Standard & Poor’s, a division of The McGraw-Hill Companies, Inc. (S&P), and is licensed for use by Manning & Napier when referencing GICS sectors. Neither MSCI, S&P, nor any third party involved in making or compiling the GICS or any GICS classifications makes any express or implied warranties or representations with respect to such standard or classification, nor shall any such party have any liability therefrom.
The accompanying notes are an integral part of the financial statements.
51
Statement of Assets and Liabilities - Blended Asset Extended Series
October 31, 2017
ASSETS: | ||||
Investments, at value (identified cost $208,068,335) (Note 2) | $ | 207,559,800 | ||
Cash | 168,294 | |||
Receivable from investment advisor (Note 3) | 3,658 | |||
Interest receivable | 596,727 | |||
Receivable for securities sold | 92,851 | |||
Receivable for fund shares sold | 64,833 | |||
Foreign tax reclaims receivable | 4,790 | |||
Dividends receivable | 3,670 | |||
|
| |||
TOTAL ASSETS | 208,494,623 | |||
|
| |||
LIABILITIES: | ||||
Accrued fund accounting and administration fees (Note 3) | 5,510 | |||
Accrued Chief Compliance Officer service fees (Note 3) | 140 | |||
Payable for securities purchased | 2,206,412 | |||
Payable for fund shares repurchased | 49,661 | |||
Audit fees payable | 41,166 | |||
Other payables and accrued expenses | 12,268 | |||
|
| |||
TOTAL LIABILITIES | 2,315,157 | |||
|
| |||
TOTAL NET ASSETS | $ | 206,179,466 | ||
|
| |||
NET ASSETS CONSIST OF: | ||||
Capital stock | $ | 200,061 | ||
Additional paid-in-capital | 206,451,557 | |||
Undistributed net investment income | 61,856 | |||
Accumulated net realized loss on investments, foreign currency and translation of other assets and liabilities | (25,306 | ) | ||
Net unrealized depreciation on investments, foreign currency and translation of other assets and liabilities | (508,702 | ) | ||
|
| |||
TOTAL NET ASSETS | $ | 206,179,466 | ||
|
| |||
NET ASSET VALUE, OFFERING PRICE AND REDEMPTION PRICE PER SHARE - Class R6 | $ | 10.31 | ||
|
| |||
The accompanying notes are an integral part of the financial statements.
52
Statement of Operations - Blended Asset Extended Series
For the Period October 13, 20171 to October 31, 2017
INVESTMENT INCOME: | ||||
Interest | $ | 112,993 | ||
Dividends (net of foreign taxes withheld, $354) | 3,623 | |||
|
| |||
Total Investment Income | 116,616 | |||
|
| |||
EXPENSES: | ||||
Management fees (Note 3) | 50,387 | |||
Fund accounting and administration fees (Note 3) | 5,510 | |||
Chief Compliance Officer service fees (Note 3) | 140 | |||
Audit fees | 41,166 | |||
Custodian fees | 3,346 | |||
Miscellaneous | 8,922 | |||
|
| |||
Total Expenses | 109,471 | |||
Less reduction of expenses (Note 3) | (54,045 | ) | ||
|
| |||
Net Expenses | 55,426 | |||
|
| |||
NET INVESTMENT INCOME | 61,190 | |||
|
| |||
REALIZED AND UNREALIZED GAIN (LOSS) ON INVESTMENTS AND FOREIGN CURRENCY: | ||||
Net realized loss on- | ||||
Investments | (25,203 | ) | ||
Foreign currency and translation of other assets and liabilities | 563 | |||
|
| |||
| (24,640 | ) | |||
|
| |||
Net change in unrealized appreciation (depreciation) on- | ||||
Investments | (508,535 | ) | ||
Foreign currency and translation of other assets and liabilities | (167 | ) | ||
|
| |||
| (508,702 | ) | |||
|
| |||
NET REALIZED AND UNREALIZED GAIN (LOSS) ON INVESTMENTS AND FOREIGN CURRENCY | (533,342 | ) | ||
|
| |||
NET DECREASE IN NET ASSETS RESULTING FROM OPERATIONS | $ | (472,152 | ) | |
|
| |||
1Commencement of operations.
The accompanying notes are an integral part of the financial statements.
53
Statement of Changes in Net Assets - Blended Asset Extended Series
| FOR THE PERIOD 10/13/171 TO 10/31/17 | ||||
INCREASE (DECREASE) IN NET ASSETS: | ||||
OPERATIONS: | ||||
Net investment income | $ | 61,190 | ||
Net realized loss on investments and foreign currency | (24,640 | ) | ||
Net change in unrealized appreciation (depreciation) on investments and foreign currency | (508,702 | ) | ||
|
| |||
Net decrease from operations | (472,152 | ) | ||
|
| |||
CAPITAL STOCK ISSUED AND REPURCHASED: | ||||
Net increase from capital share transactions (Note 5) | 206,651,618 | |||
|
| |||
Net increase in net assets | 206,179,466 | |||
NET ASSETS: | ||||
Beginning of period | — | |||
|
| |||
End of period (including undistributed net investment income of $61,856) | $ | 206,179,466 | ||
|
| |||
1Commencement of operations.
The accompanying notes are an integral part of the financial statements.
54
Financial Highlights - Blended Asset Extended Series - Class R6
| FOR THE PERIOD | ||||
| 10/13/171 TO 10/31/17 | ||||
Per share data (for a share outstanding throughout the period): | ||||
Net asset value - Beginning of period | $ | 10.33 | ||
|
| |||
Income (loss) from investment operations: | ||||
Net investment income (loss)2 | 0.00 | 3 | ||
Net realized and unrealized loss on investments | (0.02 | ) | ||
|
| |||
Total from investment operations | (0.02 | ) | ||
|
| |||
Net asset value - End of period | $ | 10.31 | ||
|
| |||
Net assets - End of period (000’s omitted) | $ | 206,179 | ||
|
| |||
Total return4 | (0.19 | %) | ||
Ratios (to average net assets)/Supplemental Data: | ||||
Expenses5 | 0.55 | % | ||
Net investment income5 | 0.61 | % | ||
Series portfolio turnover | 4 | % | ||
*The investment advisor did not impose all or a portion of its management and/or other fees during the period, and may have paid a portion of the Series’ expenses. If these expenses had been incurred by the Series, the expense ratio (to average net assets) would have increased by the following amounts5: |
| |||
| 0.54 | % | |||
1Commencement of operations.
2Calculated based on average shares outstanding during the period.
3Less than $0.01.
4Represents aggregate total return for the period indicated. Total return would have been lower had certain expenses not been reimbursed during the period. Periods less than one year are not annualized.
5Annualized.
The accompanying notes are an integral part of the financial statements.
55
Shareholder Expense Example - Blended Asset Maximum Series
(unaudited)
As a shareholder of the Series, you incur ongoing costs, including management fees, shareholder service fees and other Series expenses. This example is intended to help you understand your ongoing costs (in dollars) of investing in the Series and to compare these costs with the ongoing costs of investing in other mutual funds.
The example is based on an investment of $1,000 invested in each class at the beginning of the period and held for the entire period (October 13, 2017* to October 31, 2017).
Actual Expenses
The Actual lines of the table below provide information about actual account values and actual expenses. You may use the information in these lines, together with the amount you invested, to estimate the expenses that you paid over the period. Simply divide your account value by $1,000 (for example, an $8,600 account value divided by $1,000 = 8.6), then multiply the result by the number in the Actual line for the Class in which you have invested under the heading entitled “Expenses Paid During Period” to estimate the expenses you paid on your account during this period.
Hypothetical Example for Comparison Purposes
The Hypothetical lines of each class in the table below provide information about hypothetical account values and hypothetical expenses based on the Series’ actual expense ratio and an assumed rate of return of 5% per year before expenses, which is not the Series’ actual return. The hypothetical account values and expenses may not be used to estimate the actual ending account balance or expenses you paid during the period. You may use this information to compare the ongoing costs of investing in the Series and other funds. To do so, compare this 5% hypothetical example with the 5% hypothetical examples that appear in the shareholder reports of the other funds.
Please note that the expenses shown in the table are meant to highlight your ongoing costs only and do not reflect any transaction costs such as sales charges (loads), redemption fees, or exchange fees that you may incur in other mutual funds. Therefore, the second line of the table is useful in comparing ongoing costs only, and will not help you determine the relative total costs of owning different funds.
BEGINNING ACCOUNT VALUE 10/13/17* | ENDING ACCOUNT VALUE 10/31/17 | EXPENSES PAID DURING PERIOD** | ||||
Actual | $1,000.00 | $1,000.90 | $0.27 | |||
Hypothetical | ||||||
(5% return before expenses) | $1,000.00 | $1,002.19 | $0.27 |
*Commencement of operations.
**Expenses are equal to the Series’ annualized expense ratio (for the period October 13, 2017* to October 31, 2017) of 0.55%, multiplied by the average account value over the period, multiplied by 18/365 (to reflect the period since inception). The Series’ total return would have been lower had certain expenses not been waived during the period.
56
Portfolio Composition - Blended Asset Maximum Series
As of October 31, 2017 (unaudited)
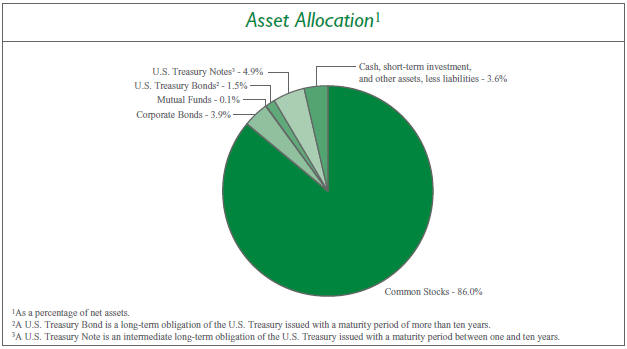
Sector Allocation4 |
| |||
Information Technology | 20.5 | % | ||
Health Care | 19.1 | % | ||
Consumer Staples | 10.6 | % | ||
Consumer Discretionary | 9.3 | % | ||
Industrials | 8.3 | % | ||
Materials | 6.8 | % | ||
Financials | 6.3 | % | ||
Real Estate | 4.5 | % | ||
Energy | 3.0 | % | ||
Telecommunication Services | 1.7 | % | ||
Utilities | 0.2 | % | ||
| 4Including common stocks and corporate bonds, as a percentage of total investments. | ||||
Top Ten Stock Holdings5 |
| |||
ServiceNow, Inc. | 2.8 | % | ||
Facebook, Inc. - Class A | 2.6 | % | ||
Medtronic plc | 2.1 | % | ||
FedEx Corp. | 1.7 | % | ||
The Priceline Group, Inc. | 1.7 | % | ||
DaVita, Inc. | 1.6 | % | ||
Skyworks Solutions, Inc. | 1.4 | % | ||
The Charles Schwab Corp. | 1.4 | % | ||
Campbell Soup Co. | 1.4 | % | ||
Perrigo Co. plc | 1.4 | % | ||
| 5As a percentage of total investments. | ||||
57
Investment Portfolio - October 31, 2017
| BLENDED ASSET MAXIMUM SERIES | SHARES | VALUE (NOTE 2) | ||||||
COMMON STOCKS - 86.0% | ||||||||
Consumer Discretionary - 8.7% | ||||||||
Diversified Consumer Services - 0.0%## | ||||||||
Fu Shou Yuan International Group Ltd. (China)1 | 44,000 | $ | 30,931 | |||||
|
| |||||||
Hotels, Restaurants & Leisure - 0.1% | ||||||||
Accor S.A. (France)1 | 1,695 | 84,560 | ||||||
Jollibee Foods Corp. (Philippines)1 | 9,515 | 45,947 | ||||||
|
| |||||||
| 130,507 | ||||||||
|
| |||||||
Household Durables - 0.0%## | ||||||||
Kaufman & Broad S.A. (France)1 | 670 | 29,606 | ||||||
|
| |||||||
Internet & Direct Marketing Retail - 3.0% | ||||||||
Amazon.com, Inc.* | 1,670 | 1,845,818 | ||||||
Ctrip.com International Ltd. - ADR (China)* | 950 | 45,494 | ||||||
The Priceline Group, Inc.* | 1,355 | 2,590,706 | ||||||
|
| |||||||
| 4,482,018 | ||||||||
|
| |||||||
Leisure Products - 0.0%## | ||||||||
Trigano S.A. (France)1 | 195 | 31,468 | ||||||
|
| |||||||
Media - 0.4% | ||||||||
Quebecor, Inc. - Class B (Canada) | 320 | 12,075 | ||||||
Shaw Communications, Inc. - Class B (Canada) | 24,210 | 552,846 | ||||||
|
| |||||||
| 564,921 | ||||||||
|
| |||||||
Multiline Retail - 0.0%## | ||||||||
Lojas Renner S.A. (Brazil) | 2,685 | 28,235 | ||||||
|
| |||||||
Specialty Retail - 3.3% | ||||||||
AutoZone, Inc.* | 3,215 | 1,895,242 | ||||||
Dick’s Sporting Goods, Inc. | 50,115 | 1,226,314 | ||||||
Industria de Diseno Textil S.A. (Spain)1 | 840 | 31,398 | ||||||
O’Reilly Automotive, Inc.* | 8,876 | 1,872,392 | ||||||
|
| |||||||
| 5,025,346 | ||||||||
|
| |||||||
Textiles, Apparel & Luxury Goods - 1.9% | ||||||||
ANTA Sports Products Ltd. (China)1 | 10,000 | 44,729 | ||||||
lululemon athletica, Inc.* | 22,610 | 1,390,741 | ||||||
NIKE, Inc. - Class B | 25,210 | 1,386,298 | ||||||
|
| |||||||
| 2,821,768 | ||||||||
|
| |||||||
Total Consumer Discretionary | 13,144,800 | |||||||
|
| |||||||
Consumer Staples - 10.3% | ||||||||
Beverages - 5.0% | ||||||||
Ambev S.A. - ADR (Brazil) | 296,376 | 1,876,060 | ||||||
Anheuser-Busch InBev S.A./N.V. (Belgium)1 | 16,691 | 2,046,670 | ||||||
The Coca-Cola Co. | 30,883 | 1,420,000 | ||||||
Diageo plc (United Kingdom)1 | 60,580 | 2,068,728 | ||||||
Treasury Wine Estates Ltd. (Australia)1 | 5,245 | 62,961 | ||||||
|
| |||||||
| 7,474,419 | ||||||||
|
| |||||||
Food & Staples Retailing - 0.7% | ||||||||
Puregold Price Club, Inc. (Philippines)1 | 46,265 | 45,705 | ||||||
Raia Drogasil S.A. (Brazil) | 1,900 | 45,721 | ||||||
Robinsons Retail Holdings, Inc. (Philippines)1 | 25,535 | 47,979 | ||||||
Sprouts Farmers Market, Inc.* | 53,395 | 987,274 | ||||||
|
| |||||||
| 1,126,679 | ||||||||
|
| |||||||
Food Products - 2.4% | ||||||||
Campbell Soup Co. | 44,285 | 2,097,780 | ||||||
Danone S.A. (France)1 | 710 | 58,029 | ||||||
Kerry Group plc - Class A (Ireland)1 | 620 | 62,442 | ||||||
M Dias Branco S.A. (Brazil) | 1,900 | 28,100 | ||||||
Nestle S.A. (Switzerland)1 | 15,908 | 1,338,476 | ||||||
|
| |||||||
| 3,584,827 | ||||||||
|
| |||||||
Personal Products - 2.2% | ||||||||
Beiersdorf AG (Germany)1 | 12,594 | 1,416,706 | ||||||
Unilever plc - ADR (United Kingdom) | 32,845 | 1,860,669 | ||||||
|
| |||||||
| 3,277,375 | ||||||||
|
| |||||||
Tobacco - 0.0%## | ||||||||
Japan Tobacco, Inc. (Japan)1 | 2,200 | 72,820 | ||||||
|
| |||||||
Total Consumer Staples | 15,536,120 | |||||||
|
| |||||||
Energy - 2.4% | ||||||||
Energy Equipment & Services - 2.3% | ||||||||
Diamond Offshore Drilling, Inc.* | 33,495 | 560,371 | ||||||
Oceaneering International, Inc. | 20,420 | 412,892 | ||||||
Schlumberger Ltd. | 31,035 | 1,986,240 | ||||||
Transocean Ltd.* | 46,503 | 488,282 | ||||||
|
| |||||||
| 3,447,785 | ||||||||
|
| |||||||
Oil, Gas & Consumable Fuels - 0.1% | ||||||||
Cameco Corp. (Canada) | 2,640 | 21,490 | ||||||
Galp Energia SGPS S.A. (Portugal)1 | 2,495 | 46,387 | ||||||
Royal Dutch Shell plc - Class B - ADR (Netherlands) | 720 | 47,059 | ||||||
YPF S.A. - ADR (Argentina) | 1,550 | 38,068 | ||||||
|
| |||||||
| 153,004 | ||||||||
|
| |||||||
Total Energy | 3,600,789 | |||||||
|
| |||||||
The accompanying notes are an integral part of the financial statements.
58
Investment Portfolio - October 31, 2017
| BLENDED ASSET MAXIMUM SERIES | SHARES | VALUE (NOTE 2) | ||||||
COMMON STOCKS (continued) | ||||||||
Financials - 5.2% | ||||||||
Banks - 1.6% | ||||||||
Banco Macro S.A. - ADR (Argentina) | 325 | $ | 40,924 | |||||
Bankia S.A. (Spain)1 | 140,166 | 668,907 | ||||||
Banque Cantonale Vaudoise (Switzerland)1 | 40 | 28,768 | ||||||
BNP Paribas S.A. (France)1 | 755 | 58,927 | ||||||
BPER Banca (Italy)1 | 6,075 | 29,570 | ||||||
CaixaBank S.A. (Spain)1 | 227,650 | 1,065,036 | ||||||
Credit Agricole S.A. (France)1 | 2,560 | 44,680 | ||||||
Danske Bank A/S (Denmark)1 | 1,165 | 44,460 | ||||||
Erste Group Bank AG (Austria)1 | 695 | 29,833 | ||||||
Eurobank Ergasias S.A. (Greece)*1 | 40,975 | 33,470 | ||||||
FinecoBank Banca Fineco S.p.A. (Italy)1 | 5,190 | 48,542 | ||||||
Grupo Financiero Galicia S.A. - ADR (Argentina) | 640 | 35,136 | ||||||
Grupo Supervielle S.A. - ADR (Argentina) | 1,150 | 30,831 | ||||||
Itau Unibanco Holding S.A. (Brazil) | 2,200 | 28,387 | ||||||
Jyske Bank A/S (Denmark)1 | 535 | 30,232 | ||||||
KBC Group N.V. (Belgium)1 | 535 | 44,442 | ||||||
Skandinaviska Enskilda Banken A.B. - Class A (Sweden)1 | 2,425 | 29,885 | ||||||
Svenska Handelsbanken A.B. - Class A (Sweden)1 | 2,085 | 29,883 | ||||||
Swedbank A.B. - Class A (Sweden)1 | 1,220 | 30,278 | ||||||
Sydbank A/S (Denmark)1 | 770 | 30,060 | ||||||
|
| |||||||
| 2,382,251 | ||||||||
|
| |||||||
Capital Markets - 3.6% | ||||||||
Amundi S.A. (France)1,2 | 555 | 47,037 | ||||||
Banca Generali S.p.A. (Italy)1 | 1,360 | 44,745 | ||||||
BlackRock, Inc. | 3,088 | 1,453,923 | ||||||
The Charles Schwab Corp. | 47,069 | 2,110,574 | ||||||
E*TRADE Financial Corp.* | 35,805 | 1,560,740 | ||||||
EFG International AG (Switzerland)1 | 5,055 | 46,259 | ||||||
Euronext N.V. (Netherlands)1,2 | 990 | 58,797 | ||||||
Julius Baer Group Ltd. (Switzerland)1 | 520 | 30,757 | ||||||
Natixis S.A. (France)1 | 7,570 | 59,365 | ||||||
|
| |||||||
| 5,412,197 | ||||||||
|
| |||||||
Thrifts & Mortgage Finance - 0.0%## | ||||||||
Aareal Bank AG (Germany)1 | 730 | 30,352 | ||||||
|
| |||||||
Total Financials | 7,824,800 | |||||||
|
| |||||||
Health Care - 18.9% | ||||||||
Biotechnology - 5.7% | ||||||||
Biogen, Inc.* | 3,887 | 1,211,422 | ||||||
BioMarin Pharmaceutical, Inc.* | 23,165 | 1,901,615 | ||||||
Incyte Corp.* | 11,050 | 1,251,412 | ||||||
Regeneron Pharmaceuticals, Inc.* | 3,865 | 1,556,126 | ||||||
Seattle Genetics, Inc.* | 24,663 | 1,512,089 | ||||||
Vertex Pharmaceuticals, Inc.* | 7,873 | 1,151,269 | ||||||
|
| |||||||
| 8,583,933 | ||||||||
|
| |||||||
Health Care Equipment & Supplies - 2.9% | ||||||||
Intuitive Surgical, Inc.* | 2,774 | 1,041,249 | ||||||
Medtronic plc | 39,730 | 3,199,060 | ||||||
Osstem Implant Co. Ltd. (South Korea)*1 | 770 | 49,476 | ||||||
|
| |||||||
| 4,289,785 | ||||||||
|
| |||||||
Health Care Providers & Services - 3.5% | ||||||||
DaVita, Inc.* | 40,590 | 2,465,438 | ||||||
Express Scripts Holding Co.* | 11,375 | 697,174 | ||||||
Fleury S.A. (Brazil) | 4,800 | 42,141 | ||||||
Fresenius Medical Care AG & Co. KGaA (Germany)1 | 21,403 | 2,072,280 | ||||||
Orpea (France)1 | 505 | 60,503 | ||||||
|
| |||||||
| 5,337,536 | ||||||||
|
| |||||||
Health Care Technology - 0.4% | ||||||||
Cerner Corp.* | 9,265 | 625,573 | ||||||
|
| |||||||
Life Sciences Tools & Services - 1.6% | ||||||||
QIAGEN N.V | 46,574 | 1,576,996 | ||||||
QIAGEN N.V.1 | 1,285 | 43,596 | ||||||
Tecan Group AG (Switzerland)1 | 150 | 31,726 | ||||||
Thermo Fisher Scientific, Inc. | 3,857 | 747,602 | ||||||
|
| |||||||
| 2,399,920 | ||||||||
|
| |||||||
Pharmaceuticals - 4.8% | ||||||||
Bristol-Myers Squibb Co. | 19,197 | 1,183,687 | ||||||
Hypermarcas S.A. (Brazil) | 4,300 | 45,099 | ||||||
Johnson & Johnson | 13,330 | 1,858,335 | ||||||
Kalbe Farma Tbk PT (Indonesia)1 | 372,700 | 43,968 | ||||||
Novartis AG - ADR (Switzerland) | 24,324 | 2,008,676 | ||||||
Perrigo Co. plc | 25,675 | 2,079,418 | ||||||
|
| |||||||
| 7,219,183 | ||||||||
|
| |||||||
Total Health Care | 28,455,930 | |||||||
|
| |||||||
Industrials - 8.0% | ||||||||
Aerospace & Defense - 1.4% | ||||||||
Arconic, Inc. | 81,409 | 2,044,994 | ||||||
LIG Nex1 Co. Ltd. (South Korea)1 | 690 | 44,282 | ||||||
Thales S.A. (France)1 | 715 | 74,513 | ||||||
The accompanying notes are an integral part of the financial statements.
59
Investment Portfolio - October 31, 2017
| BLENDED ASSET MAXIMUM SERIES | SHARES | VALUE (NOTE 2) | ||||||
COMMON STOCKS (continued) | ||||||||
Industrials (continued) | ||||||||
Aerospace & Defense (continued) | ||||||||
Ultra Electronics Holdings plc (United Kingdom)1 | 1,285 | $ | 31,116 | |||||
|
| |||||||
| 2,194,905 | ||||||||
|
| |||||||
Air Freight & Logistics - 2.5% | ||||||||
C.H. Robinson Worldwide, Inc. | 14,068 | 1,104,760 | ||||||
FedEx Corp. | 11,610 | 2,621,654 | ||||||
|
| |||||||
| 3,726,414 | ||||||||
|
| |||||||
Airlines - 0.1% | ||||||||
Azul S.A. - ADR (Brazil)* | 1,115 | 28,198 | ||||||
Ryanair Holdings plc - ADR (Ireland)* | 775 | 86,885 | ||||||
|
| |||||||
| 115,083 | ||||||||
|
| |||||||
Building Products - 0.1% | ||||||||
Cie de Saint-Gobain (France)1 | 1,015 | 59,512 | ||||||
Geberit AG (Switzerland)1 | 65 | 29,429 | ||||||
|
| |||||||
| 88,941 | ||||||||
|
| |||||||
Commercial Services & Supplies - 0.1% | ||||||||
China Everbright International Ltd. (China)1 | 31,000 | 43,737 | ||||||
Elis S.A. (France)1 | 1,720 | 44,844 | ||||||
SPIE S.A. (France)1 | 2,320 | 61,042 | ||||||
|
| |||||||
| 149,623 | ||||||||
|
| |||||||
Construction & Engineering - 1.0% | ||||||||
Eiffage S.A. (France)1 | 720 | 75,208 | ||||||
Vinci S.A. (France)1 | 14,914 | 1,461,239 | ||||||
|
| |||||||
| 1,536,447 | ||||||||
|
| |||||||
Electrical Equipment - 0.0%## | ||||||||
Legrand S.A. (France)1 | 630 | 46,753 | ||||||
|
| |||||||
Industrial Conglomerates - 0.1% | ||||||||
Siemens AG (Germany)1 | 890 | 127,833 | ||||||
|
| |||||||
Machinery - 0.2% | ||||||||
FANUC Corp. (Japan)1 | 200 | 46,765 | ||||||
Jungheinrich AG (Germany)1 | 1,020 | 46,453 | ||||||
KION Group AG (Germany)1 | 780 | 62,500 | ||||||
Metso OYJ (Finland)1 | 1,195 | 43,400 | ||||||
The Weir Group plc (United Kingdom)1 | 3,285 | 85,162 | ||||||
|
| |||||||
| 284,280 | ||||||||
|
| |||||||
Professional Services - 1.7% | ||||||||
Applus Services S.A. (Spain)1 | 6,175 | 86,349 | ||||||
Equifax, Inc. | 8,971 | 973,623 | ||||||
Intertek Group plc (United Kingdom)1 | 890 | 64,116 | ||||||
Nielsen Holdings plc | 35,445 | 1,313,946 | ||||||
Randstad Holding N.V. (Netherlands)1 | 745 | 45,834 | ||||||
RELX plc (United Kingdom)1 | 1,370 | 31,525 | ||||||
SGS S.A. (Switzerland)1 | 25 | 61,739 | ||||||
|
| |||||||
| 2,577,132 | ||||||||
|
| |||||||
Road & Rail - 0.6% | ||||||||
Genesee & Wyoming, Inc. - Class A* | 13,075 | 938,523 | ||||||
|
| |||||||
Trading Companies & Distributors - 0.1% | ||||||||
Ashtead Group plc (United Kingdom)1 | 1,825 | 47,011 | ||||||
Brenntag AG (Germany)1 | 1,280 | 72,622 | ||||||
Howden Joinery Group plc (United Kingdom)1 | 4,540 | 24,724 | ||||||
|
| |||||||
| 144,357 | ||||||||
|
| |||||||
Transportation Infrastructure - 0.1% | ||||||||
Aena SME S.A. (Spain)1,2 | 890 | 163,292 | ||||||
Grupo Aeroportuario del Centro | ||||||||
Norte S.A.B. de C.V. (Mexico) | 2,300 | 11,619 | ||||||
Grupo Aeroportuario del Pacifico | ||||||||
S.A.B. de C.V. - ADR (Mexico) | 125 | 11,865 | ||||||
|
| |||||||
| 186,776 | ||||||||
|
| |||||||
Total Industrials | 12,117,067 | |||||||
|
| |||||||
Information Technology - 20.2% | ||||||||
Electronic Equipment, Instruments & Components - 0.2% | ||||||||
Halma plc (United Kingdom)1 | 2,970 | 46,602 | ||||||
Hexagon A.B. - Class B (Sweden)1 | 620 | 31,791 | ||||||
Hitachi Ltd. (Japan)1 | 10,000 | 79,634 | ||||||
Hollysys Automation Technologies Ltd. (China) | 1,335 | 29,971 | ||||||
Keyence Corp. (Japan)1 | 200 | 111,045 | ||||||
|
| |||||||
| 299,043 | ||||||||
|
| |||||||
Internet Software & Services - 5.3% | ||||||||
Alibaba Group Holding Ltd. - ADR (China)* | 705 | 130,347 | ||||||
Alphabet, Inc. - Class A* | 1,184 | 1,223,118 | ||||||
Alphabet, Inc. - Class C* | 1,211 | 1,231,151 | ||||||
China Literature Ltd. - Rights | ||||||||
(Expires 11/03/2017) (Hong Kong)*3 | 24 | — | ||||||
Facebook, Inc. - Class A* | 21,400 | 3,853,284 | ||||||
NetEase, Inc. - ADR (China) | 85 | 23,963 | ||||||
The accompanying notes are an integral part of the financial statements.
60
Investment Portfolio - October 31, 2017
| BLENDED ASSET MAXIMUM SERIES | SHARES | VALUE (NOTE 2) | ||||||
COMMON STOCKS (continued) | ||||||||
Information Technology (continued) | ||||||||
Internet Software & Services (continued) | ||||||||
Tencent Holdings Ltd. - Class H (China)1 | 32,995 | $ | 1,482,964 | |||||
|
| |||||||
| 7,944,827 | ||||||||
|
| |||||||
IT Services - 3.7% | ||||||||
Altran Technologies S.A. (France)1 | 3,225 | 59,646 | ||||||
Amdocs Ltd. | 21,410 | 1,393,791 | ||||||
InterXion Holding N.V. - ADR (Netherlands)* | 485 | 25,894 | ||||||
MasterCard, Inc. - Class A | 13,502 | 2,008,693 | ||||||
Sopra Steria Group (France)1 | 325 | 60,970 | ||||||
Visa, Inc. - Class A | 18,362 | 2,019,453 | ||||||
|
| |||||||
| 5,568,447 | ||||||||
|
| |||||||
Semiconductors & Semiconductor Equipment - 3.2% | ||||||||
Qorvo, Inc.* | 21,690 | 1,644,319 | ||||||
Skyworks Solutions, Inc. | 18,617 | 2,119,732 | ||||||
Texas Instruments, Inc. | 10,460 | 1,011,377 | ||||||
|
| |||||||
| 4,775,428 | ||||||||
|
| |||||||
Software - 7.8% | ||||||||
Adobe Systems, Inc.* | 11,766 | 2,060,933 | ||||||
Atlassian Corp. plc - Class A (Australia)* | 28,275 | 1,367,662 | ||||||
CDK Global, Inc. | 15,278 | 971,070 | ||||||
Dassault Systemes S.E. (France)1 | 595 | 63,163 | ||||||
Electronic Arts, Inc.* | 13,475 | 1,611,607 | ||||||
Microsoft Corp. | 17,731 | 1,474,865 | ||||||
ServiceNow, Inc.* | 32,705 | 4,132,931 | ||||||
Sophos Group plc (United Kingdom)1,2 | 3,935 | 32,448 | ||||||
Temenos Group AG (Switzerland)1 | 415 | 47,921 | ||||||
|
| |||||||
| 11,762,600 | ||||||||
|
| |||||||
Total Information Technology | 30,350,345 | |||||||
|
| |||||||
Materials - 6.4% | ||||||||
Chemicals - 3.0% | ||||||||
Akzo Nobel N.V. (Netherlands)1 | 21,475 | 1,938,782 | ||||||
Ashland Global Holdings, Inc. | 14,872 | 1,010,999 | ||||||
CF Industries Holdings, Inc. | 35,380 | 1,343,732 | ||||||
Croda International plc (United Kingdom)1 | 895 | 49,739 | ||||||
Mexichem, S.A.B. de C.V. (Mexico) | 9,200 | 23,696 | ||||||
Solvay S.A. (Belgium)1 | 455 | 67,594 | ||||||
|
| |||||||
| 4,434,542 | ||||||||
|
| |||||||
Wienerberger AG (Austria)1 | 1,815 | 46,568 | ||||||
|
| |||||||
Containers & Packaging - 1.3% | ||||||||
Ball Corp. | 23,248 | 998,036 | ||||||
Sealed Air Corp. | 21,567 | 953,908 | ||||||
|
| |||||||
| 1,951,944 | ||||||||
|
| |||||||
Metals & Mining - 2.1% | ||||||||
Antofagasta plc (Chile)1 | 29,497 | 373,832 | ||||||
First Quantum Minerals Ltd. (Zambia) | 33,416 | 373,765 | ||||||
Freeport-McMoRan, Inc.* | 79,016 | 1,104,644 | ||||||
Grupo Mexico, S.A.B. de C.V. - Series B (Mexico) | 17,900 | 58,214 | ||||||
Lundin Mining Corp. (Canada) | 52,304 | 398,939 | ||||||
Southern Copper Corp. (Peru) | 19,059 | 818,584 | ||||||
|
| |||||||
| 3,127,978 | ||||||||
|
| |||||||
Total Materials | 9,561,032 | |||||||
|
| |||||||
Real Estate - 4.4% | ||||||||
Equity Real Estate Investment Trusts (REITS) - 4.3% | ||||||||
Acadia Realty Trust | 350 | 9,852 | ||||||
Agree Realty Corp. | 155 | 7,330 | ||||||
Alexandria Real Estate Equities, Inc. | 320 | 39,667 | ||||||
American Campus Communities, Inc. | 365 | 15,177 | ||||||
American Homes 4 Rent - Class A | 1,320 | 28,090 | ||||||
American Tower Corp. | 11,995 | 1,723,322 | ||||||
Apartment Investment & Management Co. - Class A | 745 | 32,765 | ||||||
AvalonBay Communities, Inc. | 220 | 39,893 | ||||||
Axiare Patrimonio SOCIMI S.A. (Spain)1 | 595 | 11,159 | ||||||
Bluerock Residential Growth REIT, Inc. | 695 | 7,847 | ||||||
Boston Properties, Inc. | 160 | 19,389 | ||||||
Brandywine Realty Trust | 895 | 15,654 | ||||||
Brixmor Property Group, Inc. | 515 | 8,997 | ||||||
Camden Property Trust | 185 | 16,879 | ||||||
CatchMark Timber Trust, Inc. - Class A | 1,360 | 17,408 | ||||||
Cedar Realty Trust, Inc. | 2,675 | 14,552 | ||||||
Chesapeake Lodging Trust | 610 | 17,019 | ||||||
Colony NorthStar, Inc. - Class A | 2,080 | 25,542 | ||||||
Columbia Property Trust, Inc. | 540 | 11,923 | ||||||
Community Healthcare Trust, Inc. | 1,710 | 46,905 | ||||||
CoreCivic, Inc. | 1,215 | 29,963 | ||||||
Cousins Properties, Inc. | 2,700 | 24,354 | ||||||
Crown Castle International Corp. | 200 | 21,416 | ||||||
CubeSmart | 1,210 | 32,936 | ||||||
DDR Corp. | 920 | 7,056 | ||||||
The accompanying notes are an integral part of the financial statements.
61
Investment Portfolio - October 31, 2017
| BLENDED ASSET MAXIMUM SERIES | SHARES/ PRINCIPAL AMOUNT 4 | VALUE (NOTE 2) | ||||||
COMMON STOCKS (continued) | ||||||||
Real Estate (continued) | ||||||||
Equity Real Estate Investment Trusts (REITS) (continued) | ||||||||
Digital Realty Trust, Inc. | 300 | $ | 35,532 | |||||
Douglas Emmett, Inc. | 430 | 17,110 | ||||||
Education Realty Trust, Inc. | 225 | 7,852 | ||||||
EPR Properties | 110 | 7,610 | ||||||
Equinix, Inc. | 170 | 78,795 | ||||||
Equity Commonwealth* | 530 | 15,926 | ||||||
Equity LifeStyle Properties, Inc. | 175 | 15,484 | ||||||
Equity Residential | 440 | 29,594 | ||||||
Essex Property Trust, Inc. | 30 | 7,873 | ||||||
Extra Space Storage, Inc. | 295 | 24,069 | ||||||
Forest City Realty Trust, Inc. - Class A | 680 | 16,748 | ||||||
Getty Realty Corp. | 430 | 12,216 | ||||||
GGP, Inc. | 730 | 14,206 | ||||||
Global Medical REIT, Inc. | 1,990 | 16,835 | ||||||
HCP, Inc. | 605 | 15,633 | ||||||
Healthcare Trust of America, Inc. - Class A | 605 | 18,180 | ||||||
Hibernia REIT plc (Ireland)1 | 7,860 | 13,505 | ||||||
Host Hotels & Resorts, Inc. | 745 | 14,572 | ||||||
Independence Realty Trust, Inc. | 1,150 | 11,672 | ||||||
Invitation Homes, Inc. | 570 | 12,865 | ||||||
Lamar Advertising Co. - Class A | 200 | 14,088 | ||||||
LaSalle Hotel Properties | 360 | 10,156 | ||||||
Life Storage, Inc. | 200 | 16,164 | ||||||
The Macerich Co. | 130 | 7,098 | ||||||
Mid-America Apartment Communities, Inc. | 265 | 27,123 | ||||||
National Retail Properties, Inc. | 395 | 15,871 | ||||||
Outfront Media, Inc. | 575 | 13,484 | ||||||
Physicians Realty Trust | 1,595 | 27,721 | ||||||
Prologis, Inc. | 800 | 51,664 | ||||||
Public Storage | 125 | 25,906 | ||||||
Regency Centers Corp. | 265 | 16,311 | ||||||
Retail Opportunity Investments Corp. | 555 | 9,979 | ||||||
Rexford Industrial Realty, Inc. | 690 | 20,486 | ||||||
SBA Communications Corp.* | 10,911 | 1,714,991 | ||||||
Simon Property Group, Inc. | 410 | 63,685 | ||||||
STAG Industrial, Inc. | 870 | 23,751 | ||||||
Starwood Waypoint Homes | 350 | 12,708 | ||||||
STORE Capital Corp. | 615 | 15,184 | ||||||
Sun Communities, Inc. | 170 | 15,344 | ||||||
Sunstone Hotel Investors, Inc. | 940 | 15,341 | ||||||
Terreno Realty Corp. | 555 | 20,380 | ||||||
UDR, Inc. | 555 | 21,528 | ||||||
Unibail-Rodamco S.E. (France)1 | 160 | 40,049 | ||||||
Urban Edge Properties | 1,045 | 24,516 | ||||||
Ventas, Inc. | 505 | 31,689 | ||||||
VEREIT, Inc. | 1,920 | 15,149 | ||||||
Vornado Realty Trust | 410 | 30,693 | ||||||
Welltower, Inc. | 425 | 28,458 | ||||||
Weyerhaeuser Co. | 44,245 | 1,588,838 | ||||||
|
| |||||||
| 6,529,727 | ||||||||
|
| |||||||
Real Estate Management & Development - 0.1% | ||||||||
Aliansce Shopping Centers S.A. (Brazil)* | 5,400 | 28,855 | ||||||
Iguatemi Empresa de Shopping Centers S.A. (Brazil) | 2,400 | 28,202 | ||||||
Nexity S.A. (France)1 | 755 | 46,404 | ||||||
|
| |||||||
| 103,461 | ||||||||
|
| |||||||
Total Real Estate | 6,633,188 | |||||||
|
| |||||||
Telecommunication Services - 1.4% | ||||||||
Diversified Telecommunication Services - 1.4% | ||||||||
Iliad S.A. (France)1 | 240 | 59,909 | ||||||
Zayo Group Holdings, Inc.* | 56,471 | 2,036,344 | ||||||
|
| |||||||
Total Telecommunication Services | 2,096,253 | |||||||
|
| |||||||
Utilities - 0.1% | ||||||||
Electric Utilities - 0.0%## | ||||||||
Pampa Energia S.A. - ADR (Argentina)* | 915 | 62,064 | ||||||
|
| |||||||
Independent Power and Renewable Electricity Producers - 0.1% | ||||||||
China Longyuan Power Group Corp. Ltd. - Class H (China)1 | 57,000 | 42,271 | ||||||
Huaneng Renewables Corp. Ltd. - Class H (China)1 | 130,000 | 44,708 | ||||||
|
| |||||||
| 86,979 | ||||||||
|
| |||||||
Total Utilities | 149,043 | |||||||
|
| |||||||
TOTAL COMMON STOCKS | ||||||||
(Identified Cost $129,355,945) | 129,469,367 | |||||||
|
| |||||||
CORPORATE BONDS - 3.9% | ||||||||
Non-Convertible Corporate Bonds - 3.9% | ||||||||
Consumer Discretionary - 0.5% | ||||||||
Auto Components - 0.1% | ||||||||
Magna International, Inc. (Canada), 4.15%, 10/1/2025 | 80,000 | 85,598 | ||||||
|
| |||||||
Household Durables - 0.2% | ||||||||
Century Communities, Inc.2, 5.875%, 7/15/2025 | 26,000 | 26,260 | ||||||
The accompanying notes are an integral part of the financial statements.
62
Investment Portfolio - October 31, 2017
| BLENDED ASSET MAXIMUM SERIES | PRINCIPAL AMOUNT 4 | VALUE (NOTE 2) | ||||||
CORPORATE BONDS (continued) | ||||||||
Non-Convertible Corporate Bonds (continued) | ||||||||
Consumer Discretionary (continued) | ||||||||
Household Durables (continued) | ||||||||
Meritage Homes Corp., 5.125%, 6/6/2027 | 20,000 | $ | 20,225 | |||||
NVR, Inc., 3.95%, 9/15/2022 | 83,000 | 87,188 | ||||||
TRI Pointe Group, Inc. - TRI Pointe Homes, Inc., 4.375%, 6/15/2019 | 28,000 | 28,735 | ||||||
TRI Pointe Group, Inc. - TRI Pointe Homes, Inc., 5.875%, 6/15/2024 | 16,000 | 17,320 | ||||||
Weekley Homes LLC - Weekley Finance Corp., 6.00%, 2/1/2023 | 24,000 | 23,520 | ||||||
Weekley Homes LLC - Weekley Finance Corp.2, 6.625%, 8/15/2025 | 26,000 | 25,285 | ||||||
|
| |||||||
| 228,533 | ||||||||
|
| |||||||
Internet & Direct Marketing Retail - 0.1% | ||||||||
Amazon.com, Inc.2, 3.15%, 8/22/2027 | 60,000 | 60,359 | ||||||
The Priceline Group, Inc., 3.60%, 6/1/2026 | 130,000 | 132,874 | ||||||
|
| |||||||
| 193,233 | ||||||||
|
| |||||||
Media - 0.1% | ||||||||
Charter Communications Operating | ||||||||
LLC - Charter Communications | ||||||||
Operating Capital Corp., 4.464%, 7/23/2022 | 10,000 | 10,561 | ||||||
Comcast Corp., 4.40%, 8/15/2035 | 55,000 | 59,559 | ||||||
CSC Holdings, LLC, 5.25%, 6/1/2024 | 33,000 | 32,856 | ||||||
Discovery Communications LLC, 3.95%, 3/20/2028 | 100,000 | 99,181 | ||||||
DISH DBS Corp., 5.875%, 7/15/2022 | 10,000 | 10,056 | ||||||
|
| |||||||
| 212,213 | ||||||||
|
| |||||||
Multiline Retail - 0.0%## | ||||||||
Dollar General Corp., 3.25%, 4/15/2023 | 67,000 | 68,750 | ||||||
|
| |||||||
Total Consumer Discretionary | 788,327 | |||||||
|
| |||||||
Consumer Staples - 0.2% | ||||||||
Beverages - 0.1% | ||||||||
Anheuser-Busch InBev Worldwide, Inc. (Belgium), 8.20%, 1/15/2039 | 80,000 | 126,417 | ||||||
PepsiCo, Inc., 3.10%, 7/17/2022 | 60,000 | 62,030 | ||||||
|
| |||||||
| 188,447 | ||||||||
|
| |||||||
Food & Staples Retailing - 0.1% | ||||||||
C&S Group Enterprises LLC2, 5.375%, 7/15/2022 | 38,000 | 36,860 | ||||||
CVS Health Corp., 3.50%, 7/20/2022 | 89,000 | 91,740 | ||||||
|
| |||||||
| 128,600 | ||||||||
|
| |||||||
Total Consumer Staples | 317,047 | |||||||
|
| |||||||
Energy - 0.6% | ||||||||
McDermott International, Inc.2, 8.00%, 5/1/2021 | 39,000 | 40,267 | ||||||
Trinidad Drilling Ltd. (Canada)2, 6.625%, 2/15/2025 | 28,000 | 27,230 | ||||||
|
| |||||||
| 67,497 | ||||||||
|
| |||||||
Oil, Gas & Consumable Fuels - 0.6% | ||||||||
BP Capital Markets plc (United Kingdom), 3.535%, 11/4/2024 | 111,000 | 115,398 | ||||||
Cheniere Energy Partners LP2, 5.25%, 10/1/2025 | 24,000 | 24,720 | ||||||
Columbia Pipeline Group, Inc., 4.50%, 6/1/2025 | 63,000 | 67,520 | ||||||
Dynagas LNG Partners LP - Dynagas Finance, Inc. (Monaco), 6.25%, 10/30/2019 | 28,000 | 28,000 | ||||||
Enbridge, Inc. (Canada), 3.70%, 7/15/2027 | 58,000 | 58,758 | ||||||
Enviva Partners LP - Enviva Partners Finance Corp., 8.50%, 11/1/2021 | 24,000 | 25,740 | ||||||
GasLog Ltd. (Monaco), 8.875%, 3/22/2022 | 26,000 | 27,430 | ||||||
Global Ship Lease, Inc. (United Kingdom)2, 9.875%, 11/15/2022 | 30,000 | 30,600 | ||||||
Hilcorp Energy I LP - Hilcorp Finance Co.2, 5.75%, 10/1/2025 | 39,000 | 39,926 | ||||||
Jonah Energy LLC - Jonah Energy Finance Corp.2, 7.25%, 10/15/2025 | 24,000 | 24,000 | ||||||
Kinder Morgan Energy Partners LP, 4.30%, 5/1/2024 | 111,000 | 116,464 | ||||||
PBF Holding Co. LLC - PBF Finance Corp.2, 7.25%, 6/15/2025 | 21,000 | 21,709 | ||||||
Petroleos Mexicanos (Mexico), 6.875%, 8/4/2026 | 60,000 | 67,410 | ||||||
Rockies Express Pipeline, LLC2, 5.625%, 4/15/2020 | 34,000 | 36,040 | ||||||
Sabine Pass Liquefaction LLC, 5.875%, 6/30/2026 | 60,000 | 67,880 | ||||||
SemGroup Corp.2, 6.375%, 3/15/2025 | 26,000 | 25,610 | ||||||
The accompanying notes are an integral part of the financial statements.
63
Investment Portfolio - October 31, 2017
| BLENDED ASSET MAXIMUM SERIES | PRINCIPAL AMOUNT 4 | VALUE (NOTE 2) | ||||||
CORPORATE BONDS (continued) | ||||||||
Non-Convertible Corporate Bonds (continued) | ||||||||
Energy (continued) | ||||||||
Oil, Gas & Consumable Fuels (continued) | ||||||||
Seven Generations Energy Ltd. (Canada)2, 5.375%, 9/30/2025 | 18,000 | $ | 18,180 | |||||
Southwestern Energy Co., 6.70%, 1/23/2025 | 21,000 | 21,472 | ||||||
Tallgrass Energy Partners LP - Tallgrass Energy Finance Corp.2, 5.50%, 9/15/2024 | 36,000 | 37,215 | ||||||
|
| |||||||
| 854,072 | ||||||||
|
| |||||||
Total Energy | 921,569 | |||||||
|
| |||||||
Financials - 1.1% | ||||||||
Banks - 0.5% | ||||||||
Bank of America Corp., 4.00%, 1/22/2025 | 89,000 | 92,177 | ||||||
Barclays Bank plc (United Kingdom)2, 10.179%, 6/12/2021 | 80,000 | 98,792 | ||||||
Citigroup, Inc., 3.875%, 3/26/2025 | 130,000 | 133,393 | ||||||
JPMorgan Chase & Co.5, (3 mo. LIBOR US + 0.935%), 2.776%, 4/25/2023 | 130,000 | 130,461 | ||||||
Lloyds Banking Group plc (United Kingdom), 4.582%, 12/10/2025 | 200,000 | 210,929 | ||||||
Popular, Inc., 7.00%, 7/1/2019 | 55,000 | 56,238 | ||||||
Royal Bank of Scotland Group plc (United Kingdom), 6.10%, 6/10/2023 | 8,000 | 8,908 | ||||||
|
| |||||||
| 730,898 | ||||||||
|
| |||||||
Capital Markets - 0.2% | ||||||||
The Goldman Sachs Group, Inc., 4.25%, 10/21/2025 | 67,000 | 69,902 | ||||||
Morgan Stanley6, (3 mo. LIBOR US + 1.220%), 2.617%, 5/8/2024 | 100,000 | 101,678 | ||||||
Morgan Stanley, 5.00%, 11/24/2025 | 89,000 | 97,082 | ||||||
|
| |||||||
| 268,662 | ||||||||
|
| |||||||
Consumer Finance - 0.0%## | ||||||||
Ally Financial, Inc., 3.50%, 1/27/2019 | 12,000 | 12,146 | ||||||
Navient Corp., 6.125%, 3/25/2024 | 18,000 | 18,472 | ||||||
SLM Corp., 5.125%, 4/5/2022 | 22,000 | 22,798 | ||||||
|
| |||||||
| 53,416 | ||||||||
|
| |||||||
Diversified Financial Services - 0.2% | ||||||||
AerCap Ireland Capital DAC - AerCap Global Aviation Trust (Netherlands), 4.50%, 5/15/2021 | 154,000 | 163,547 | ||||||
E*TRADE Financial Corp., 2.95%, 8/24/2022 | 70,000 | 70,033 | ||||||
LPL Holdings, Inc.2, 5.75%, 9/15/2025 | 19,000 | 19,760 | ||||||
|
| |||||||
| 253,340 | ||||||||
|
| |||||||
Insurance - 0.2% | ||||||||
American International Group, Inc., 4.125%, 2/15/2024 | 89,000 | 94,664 | ||||||
Assured Guaranty US Holdings, Inc., 5.00%, 7/1/2024 | 150,000 | 161,950 | ||||||
Prudential Financial, Inc.5, (3 mo. LIBOR US + 4.175%), 5.875%, 9/15/2042 | 60,000 | 66,300 | ||||||
|
| |||||||
| 322,914 | ||||||||
|
| |||||||
Thrifts & Mortgage Finance - 0.0%## | ||||||||
Ladder Capital Finance Holdings LLLP - Ladder Capital Finance Corp.2, 5.875%, 8/1/2021 | 46,000 | 47,495 | ||||||
|
| |||||||
Total Financials | 1,676,725 | |||||||
|
| |||||||
Health Care - 0.1% | ||||||||
Biotechnology - 0.1% | ||||||||
AMAG Pharmaceuticals, Inc.2, 7.875%, 9/1/2023 | 19,000 | 19,332 | ||||||
Express Scripts Holding Co., 3.50%, 6/15/2024 | 100,000 | 101,185 | ||||||
|
| |||||||
| 120,517 | ||||||||
|
| |||||||
Health Care Equipment & Supplies - 0.0%## | ||||||||
Hill-Rom Holdings, Inc.2, 5.00%, 2/15/2025 | 19,000 | 19,427 | ||||||
|
| |||||||
Health Care Providers & Services - 0.0%## | ||||||||
DaVita, Inc., 5.00%, 5/1/2025 | 26,000 | 25,610 | ||||||
Fresenius Medical Care US Finance II, Inc. (Germany)2, 6.50%, 9/15/2018 | 12,000 | 12,464 | ||||||
HCA Healthcare, Inc., 6.25%, 2/15/2021 | 8,000 | 8,610 | ||||||
HCA, Inc., 3.75%, 3/15/2019 | 8,000 | 8,120 | ||||||
Ortho-Clinical Diagnostics, Inc. - Ortho-Clinical Diagnostics S.A.2, 6.625%, 5/15/2022 | 10,000 | 10,012 | ||||||
Tenet Healthcare Corp., 6.75%, 2/1/2020 | 8,000 | 8,140 | ||||||
|
| |||||||
| 72,956 | ||||||||
|
| |||||||
Total Health Care | 212,900 | |||||||
|
| |||||||
The accompanying notes are an integral part of the financial statements.
64
Investment Portfolio - October 31, 2017
| BLENDED ASSET MAXIMUM SERIES | PRINCIPAL AMOUNT 4 | VALUE (NOTE 2) | ||||||
CORPORATE BONDS (continued) | ||||||||
Non-Convertible Corporate Bonds (continued) | ||||||||
Industrials - 0.2% | ||||||||
Air Freight & Logistics - 0.0%## | ||||||||
Park Aerospace Holdings Ltd. (Ireland)2, 4.50%, 3/15/2023 | 14,000 | $ | 14,018 | |||||
|
| |||||||
Airlines - 0.1% | ||||||||
Allegiant Travel Co., 5.50%, 7/15/2019 | 18,000 | 18,585 | ||||||
American Airlines Group, Inc.2, 5.50%, 10/1/2019 | 19,000 | 19,760 | ||||||
|
| |||||||
| 38,345 | ||||||||
|
| |||||||
Building Products - 0.0%## | ||||||||
Airxcel, Inc.2, 8.50%, 2/15/2022 | 28,000 | 29,680 | ||||||
|
| |||||||
Tutor Perini Corp.2, 6.875%, 5/1/2025 | 28,000 | 30,205 | ||||||
|
| |||||||
Industrial Conglomerates - 0.1% | ||||||||
General Electric Co.6, (3 mo. LIBOR | ||||||||
US + 0.380%), 1.771%, 5/5/2026 | 128,000 | 123,979 | ||||||
|
| |||||||
Xerium Technologies, Inc., 9.50%, 8/15/2021 | 21,000 | 21,571 | ||||||
|
| |||||||
International Lease Finance Corp., 6.25%, 5/15/2019 | 20,000 | 21,208 | ||||||
|
| |||||||
Total Industrials | 279,006 | |||||||
|
| |||||||
Information Technology - 0.3% | ||||||||
Internet Software & Services - 0.1% | ||||||||
Activision Blizzard, Inc., 3.40%, 6/15/2027 | 115,000 | 115,214 | ||||||
|
| |||||||
IT Services - 0.1% | ||||||||
Visa, Inc., 2.80%, 12/14/2022 | 100,000 | 101,881 | ||||||
|
| |||||||
Semiconductors & Semiconductor Equipment - 0.1% | ||||||||
Applied Materials, Inc., 3.30%, 4/1/2027 | 130,000 | 132,956 | ||||||
MagnaChip Semiconductor Corp. (South Korea), 6.625%, 7/15/2021 | 28,000 | 26,880 | ||||||
|
| |||||||
| 159,836 | ||||||||
|
| |||||||
Total Information Technology | 376,931 | |||||||
|
| |||||||
Materials - 0.4% | ||||||||
Kissner Holdings LP - Kissner Milling | ||||||||
Co. Ltd. - BSC Holding, Inc. - Kissner USA (Canada)2, 8.375%, 12/1/2022 | 24,000 | 24,240 | ||||||
NOVA Chemicals Corp. (Canada)2, 4.875%, 6/1/2024 | 21,000 | 21,394 | ||||||
|
| |||||||
| 45,634 | ||||||||
|
| |||||||
Metals & Mining - 0.3% | ||||||||
Anglo American Capital plc (United Kingdom)2, 4.00%, 9/11/2027 | 200,000 | 200,200 | ||||||
Corp Nacional del Cobre de Chile (Chile)2, 3.625%, 8/1/2027 | 200,000 | 201,178 | ||||||
Southern Copper Corp. (Peru), 3.875%, 4/23/2025 | 63,000 | 65,384 | ||||||
Techniplas LLC2, 10.00%, 5/1/2020 | 28,000 | 22,400 | ||||||
|
| |||||||
| 489,162 | ||||||||
|
| |||||||
Paper & Forest Products - 0.1% | ||||||||
Domtar Corp., 4.40%, 4/1/2022 | 50,000 | 52,588 | ||||||
|
| |||||||
Total Materials | 587,384 | |||||||
|
| |||||||
Real Estate - 0.1% | ||||||||
Equity Real Estate Investment Trusts (REITS) - 0.1% | ||||||||
American Tower Corp., 3.30%, 2/15/2021 | 130,000 | 133,384 | ||||||
iStar, Inc., 5.25%, 9/15/2022 | 20,000 | 20,500 | ||||||
|
| |||||||
Total Real Estate | 153,884 | |||||||
|
| |||||||
Telecommunication Services - 0.3% | ||||||||
Diversified Telecommunication Services - 0.3% | ||||||||
AT&T, Inc., 3.90%, 8/14/2027. | 130,000 | 129,480 | ||||||
CenturyLink, Inc., 7.50%, 4/1/2024 | 19,000 | 20,187 | ||||||
Frontier Communications Corp., 11.00%, 9/15/2025 | 29,000 | 24,614 | ||||||
Hughes Satellite Systems Corp., 5.25%, 8/1/2026 | 39,000 | 39,881 | ||||||
Inmarsat Finance plc (United Kingdom)2, 4.875%, 5/15/2022 | 102,000 | 104,060 | ||||||
Sprint Communications, Inc.2, 9.00%, 11/15/2018 | 8,000 | 8,490 | ||||||
Sprint Communications, Inc., 7.00%, 8/15/2020 | 8,000 | 8,618 | ||||||
Verizon Communications, Inc., 4.125%, 3/16/2027 | 120,000 | 125,224 | ||||||
|
| |||||||
Total Telecommunication Services | 460,554 | |||||||
|
| |||||||
Utilities - 0.1% | ||||||||
Independent Power and Renewable Electricity Producers - 0.1% | ||||||||
American Water Capital Corp., 2.95%, 9/1/2027 | 130,000 | 129,400 | ||||||
|
| |||||||
TOTAL CORPORATE BONDS | ||||||||
(Identified Cost $5,911,803) | 5,903,727 | |||||||
|
| |||||||
The accompanying notes are an integral part of the financial statements.
65
Investment Portfolio - October 31, 2017
| BLENDED ASSET MAXIMUM SERIES | SHARES/ PRINCIPAL AMOUNT4 | VALUE (NOTE 2) | ||||||
MUTUAL FUNDS - 0.1% | ||||||||
Global X MSCI Greece ETF | 4,975 | $ | 46,118 | |||||
iShares MSCI Eurozone ETF | 2,795 | 122,505 | ||||||
|
| |||||||
TOTAL MUTUAL FUNDS | ||||||||
(Identified Cost $168,288) | 168,623 | |||||||
|
| |||||||
U.S. TREASURY SECURITIES - 6.4% | ||||||||
U.S. Treasury Bonds - 1.5% | ||||||||
U.S. Treasury Bond, 6.25%, 5/15/2030 | 557,000 | 786,959 | ||||||
U.S. Treasury Bond, 4.75%, 2/15/2037 | 904,000 | 1,195,469 | ||||||
U.S. Treasury Inflation Indexed Bond, 0.75%, 2/15/2042 | 393,552 | 380,804 | ||||||
|
| |||||||
Total U.S. Treasury Bonds | ||||||||
(Identified Cost $2,386,631) | 2,363,232 | |||||||
|
| |||||||
U.S. Treasury Notes - 4.9% | ||||||||
U.S. Treasury Inflation Indexed Note, 0.125%, 4/15/2020 | 376,383 | 377,704 | ||||||
U.S. Treasury Inflation Indexed Note, 0.125%, 1/15/2023 | 381,645 | 380,025 | ||||||
U.S. Treasury Note, 1.25%, 7/31/2023 | 5,388,000 | 5,136,069 | ||||||
U.S. Treasury Note, 2.375%, 5/15/2027 | 1,444,000 | 1,444,677 | ||||||
|
| |||||||
Total U.S. Treasury Notes | ||||||||
(Identified Cost $7,369,463) | 7,338,475 | |||||||
|
| |||||||
TOTAL U.S. TREASURY SECURITIES | 9,701,707 | |||||||
|
| |||||||
SHORT-TERM INVESTMENT - 3.1% | ||||||||
Dreyfus Government Cash Management7, 0.93%, | 4,636,169 | 4,636,169 | ||||||
|
| |||||||
TOTAL INVESTMENTS - 99.5% | ||||||||
(Identified Cost $149,828,299) | 149,879,593 | |||||||
OTHER ASSETS, LESS LIABILITIES - 0.5% | 699,714 | |||||||
|
| |||||||
NET ASSETS - 100% | $ | 150,579,307 | ||||||
|
| |||||||
ADR - American Depositary Receipt
ETF - Exchange-traded fund
*Non-income producing security.
##Less than 0.1%.
1A factor from a third party vendor was applied to determine the security’s fair value following the close of local trading.
2Restricted securities - Investment in securities that are restricted as to public resale under the Securities Act of 1933, as amended. These securities have been sold under Rule 144A and have been determined to be liquid. These securities amount to $1,678,742 or 1.1%, of the Series’ net assets as of October 31, 2017 (see Note 2 to the Financial statements).
3Security has been valued at fair value as determined in good faith by the Advisor and is classified as Level 3 in the fair value hierarchy.
4Amount is stated in USD unless otherwise noted.
5Variable rate security. Security may be issued at a fixed coupon rate, which converts to a variable rate at a specified date. Rate shown is the rate in effect as of October 31, 2017.
6Floating rate security. Rate shown is the rate in effect as of October 31, 2017.
7Rate shown is the current yield as of October 31, 2017.
The Global Industry Classification Standard (GICS) was developed by and is the exclusive property and a service mark of MSCI Inc. (MSCI) and Standard & Poor’s, a division of The McGraw-Hill Companies, Inc. (S&P), and is licensed for use by Manning & Napier when referencing GICS sectors. Neither MSCI, S&P, nor any third party involved in making or compiling the GICS or any GICS classifications makes any express or implied warranties or representations with respect to such standard or classification, nor shall any such party have any liability therefrom.
The accompanying notes are an integral part of the financial statements.
66
Statement of Assets and Liabilities - Blended Asset Maximum Series
October 31, 2017
ASSETS: | ||||
Investments, at value (identified cost $149,828,299) (Note 2) | $ | 149,879,593 | ||
Cash | 77,096 | |||
Receivable from investment advisor (Note 3) | 11,558 | |||
Receivable for securities sold | 2,238,881 | |||
Receivable for fund shares sold | 238,024 | |||
Interest receivable | 128,479 | |||
Dividends receivable | 28,030 | |||
Foreign tax reclaims receivable | 1,395 | |||
|
| |||
TOTAL ASSETS | 152,603,056 | |||
|
| |||
LIABILITIES: | ||||
Accrued fund accounting and administration fees (Note 3) | 3,570 | |||
Accrued Chief Compliance Officer service fees (Note 3) | 140 | |||
Payable for securities purchased | 1,949,948 | |||
Audit fees payable | 36,459 | |||
Payable for fund shares repurchased | 21,999 | |||
Other payables and accrued expenses | 11,633 | |||
|
| |||
TOTAL LIABILITIES | 2,023,749 | |||
|
| |||
TOTAL NET ASSETS | $ | 150,579,307 | ||
|
| |||
NET ASSETS CONSIST OF: | ||||
Capital stock | $ | 129,830 | ||
Additional paid-in-capital | 150,337,261 | |||
Undistributed net investment income | 8,026 | |||
Accumulated net realized gain on investments, foreign currency and translation of other assets and liabilities | 53,106 | |||
Net unrealized appreciation (depreciation) on investments, foreign currency and translation of other assets and liabilities | 51,084 | |||
|
| |||
TOTAL NET ASSETS | $ | 150,579,307 | ||
|
| |||
NET ASSET VALUE, OFFERING PRICE AND REDEMPTION PRICE PER SHARE - Class R6 ($150,579,307/12,982,981 shares) | $ | 11.60 | ||
|
| |||
The accompanying notes are an integral part of the financial statements.
67
Statement of Operations - Blended Asset Maximum Series
For the Period October 13, 20171 to October 31, 2017
INVESTMENT INCOME: | ||||
Dividends (net of foreign taxes withheld, $4,998) | $ | 28,953 | ||
Interest | 18,999 | |||
|
| |||
Total Investment Income | 47,952 | |||
|
| |||
EXPENSES: | ||||
Management fees (Note 3) | 36,586 | |||
Fund accounting and administration fees (Note 3) | 3,570 | |||
Chief Compliance Officer service fees (Note 3) | 140 | |||
Audit fees | 36,459 | |||
Custodian fees | 2,679 | |||
Miscellaneous | 8,954 | |||
|
| |||
Total Expenses | 88,388 | |||
Less reduction of expenses (Note 3) | (48,144 | ) | ||
|
| |||
Net Expenses | 40,244 | |||
|
| |||
NET INVESTMENT INCOME | 7,708 | |||
|
| |||
REALIZED AND UNREALIZED GAIN (LOSS) ON INVESTMENTS AND FOREIGN CURRENCY: | ||||
Net realized gain (loss) on- | 53,106 | |||
Foreign currency and translation of other assets and liabilities | 318 | |||
|
| |||
| 53,424 | ||||
|
| |||
Net change in unrealized appreciation (depreciation) on- | ||||
Investments | 51,294 | |||
Foreign currency and translation of other assets and liabilities | (210 | ) | ||
|
| |||
| 51,084 | ||||
|
| |||
NET REALIZED AND UNREALIZED GAIN (LOSS) ON INVESTMENTS AND FOREIGN CURRENCY | 104,508 | |||
|
| |||
NET INCREASE IN NET ASSETS RESULTING FROM OPERATIONS | $ | 112,216 | ||
|
| |||
1Commencement of operations.
The accompanying notes are an integral part of the financial statements.
68
Statement of Changes in Net Assets - Blended Asset Maximum Series
| FOR THE PERIOD 10/13/171 TO 10/31/17 | ||||
INCREASE IN NET ASSETS: | ||||
OPERATIONS: | ||||
Net investment income | $ | 7,708 | ||
Net realized gain on investments and foreign currency | 53,424 | |||
Net change in unrealized appreciation (depreciation) on investments and foreign currency | 51,084 | |||
|
| |||
Net increase from operations | 112,216 | |||
|
| |||
CAPITAL STOCK ISSUED AND REPURCHASED: | ||||
Net increase from capital share transactions (Note 5) | 150,467,091 | |||
|
| |||
Net increase in net assets | 150,579,307 | |||
NET ASSETS: | ||||
Beginning of period | — | |||
|
| |||
End of period (including undistributed net investment income of $8,026) | $ | 150,579,307 | ||
|
| |||
1Commencement of operations.
The accompanying notes are an integral part of the financial statements.
69
Financial Highlights - Blended Asset Maximum Series - Class R6
| FOR THE PERIOD 10/13/171 TO 10/31/17 | ||||||
Per share data (for a share outstanding throughout the period): | ||||||
Net asset value - Beginning of period | $ | 11.59 | ||||
|
| |||||
Income (loss) from investment operations: | ||||||
Net investment loss2 | (0.00 | )3 | ||||
Net realized and unrealized gain on investments | 0.01 | |||||
|
| |||||
Total from investment operations | 0.01 | |||||
|
| |||||
Net asset value - End of period | $ | 11.60 | ||||
|
| |||||
Net assets - End of period (000’s omitted) | $ | 150,579 | ||||
|
| |||||
Total return4 | 0.09 | % | ||||
Ratios (to average net assets)/Supplemental Data: | ||||||
Expenses5 | 0.55 | % | ||||
Net investment income (loss)5 | 0.11 | % | ||||
Series portfolio turnover | 4 | % | ||||
| *The investment advisor did not impose all or a portion of its management and/or other fees during the period, and may have paid a portion of the Series’ expenses. If these expenses had been incurred by the Series, the expense ratio (to average net assets) would have increased by the following amounts5: | ||||||
| 0.66 | % | |||||
1Commencement of operations.
2Calculated based on average shares outstanding during the period.
3Less than $(0.01).
4Represents aggregate total return for the period indicated. Total return would have been lower had certain expenses not been reimbursed during the period. Periods less than one year are not annualized.
5Annualized.
The accompanying notes are an integral part of the financial statements.
70
Notes to Financial Statements
| 1. | Organization |
Blended Asset Conservative Series, Blended Asset Moderate Series, Blended Asset Extended Series and Blended Asset Maximum Series (each the “Series”) are no-load diversified series of Manning & Napier Fund, Inc. (the “Fund”). The Fund is organized in Maryland and is registered under the Investment Company Act of 1940 (the “1940 Act”), as amended, as an open-end management investment company.
The Series are asset allocation funds. Each invests in a combination of stocks, bonds and cash and is managed according to specific objectives. The objectives are as follows: Blended Asset Conservative Series - primary objective is to provide current income and its secondary objectives are to provide preservation of capital and long-term growth of capital; secondary objective is to provide income and long-term growth of capital. Blended Asset Moderate Series - equal emphasis on long-term growth of capital and preservation of capital. Blended Asset Extended Series - primary objective is long-term growth of capital; secondary objective is preservation of capital. Blended Asset Maximum Series - primary objective is long-term growth of capital.
The Fund’s Advisor is Manning & Napier Advisors, LLC (the “Advisor”). The Series are offered exclusively to other funds managed by the Advisor. The total authorized capital stock of the Fund consists of 15 billion shares of common stock each having a par value of $0.01. As of October 31, 2017, 10.6 billion shares have been designated in total among 39 series, of which 100 million have been designated in each of the Series for Class R6 common stock.
| 2. | Significant Accounting Policies |
The following is a summary of significant accounting policies followed by the Series. Each Series is an investment company and, accordingly, follows the investment company accounting and reporting guidance of the Financial Accounting Standards Board Accounting Standards Codification Topic 946 - Investment Companies, which is part of accounting principles generally accepted in the United States of America (“GAAP”).
Security Valuation
Portfolio securities, including domestic equities, foreign equities, warrants and options, listed on an exchange other than the NASDAQ Stock Market are valued at the latest quoted sales price of the exchange on which the security is primarily traded. Securities not traded on valuation date or securities not listed on an exchange are valued at the latest quoted bid price provided by the Fund’s pricing service. Securities listed on the NASDAQ Stock Market are valued in accordance with the NASDAQ Official Closing Price.
Debt securities, including government bonds, foreign bonds, asset-backed securities, structured notes, supranational obligations, sovereign bonds, corporate bonds and mortgage-backed securities will normally be valued on the basis of evaluated bid prices provided directly by an independent pricing service. The pricing services use multiple valuation techniques to determine fair value. In instances where sufficient market activity exists, the pricing services may utilize a market-based approach through which quotes from market makers are used to determine fair value. In instances where sufficient market activity may not exist or is limited, the pricing services also utilize proprietary valuation models which may consider market characteristics such as benchmark yield curves, option-adjusted spreads, credit spreads, estimated defaulted rates, coupon rates, anticipated timing of principal repayments, underlying collateral and other unique security features in order to estimate the relevant cash flows, which are then discounted to calculate the fair value. Certain investments in securities held by the Series may be valued on a basis of a price provided directly by a principal market maker. These prices may differ from the value that would have been used had a broader market for securities existed.
Short-term investments that mature in sixty days or less may be valued at amortized cost, which approximates fair value. Investments in open-end investment companies are valued at their net asset value per share on valuation date.
Volume and level of activity in established markets for an asset or liability are evaluated to determine whether recent transactions and quoted prices are determinative of fair value. Where there have been significant decreases in volume and level of activity, further analysis and adjustment may be necessary to estimate fair value. The Series measure fair value in these instances by the use of inputs and valuation techniques which may be based upon current market prices of securities that are comparable in coupon, rating, maturity and industry and/or expectation of future cash flows. As a result of trading in relatively
71
Notes to Financial Statements (continued)
| 2. | Significant Accounting Policies (continued) |
Security Valuation (continued)
thin markets and/or markets that experience significant volatility, the prices used by the Series to value these securities may differ from the value that would be realized if these securities were sold, and the differences could be material.
Securities for which representative valuations or prices are not available from the Series’ pricing service may be valued at fair value as determined in good faith by the Advisor under procedures approved by and under the general supervision and responsibility of the Fund’s Board of Directors (the “Board”). Due to the inherent uncertainty of valuations of such securities, the fair value may differ significantly from the values that would have been used had a ready market for such securities existed. If trading or events occurring after the close of the principal market in which securities are traded are expected to materially affect the value of those securities, then they may be valued at their fair value, taking this trading or these events into account. In accordance with the procedures approved by the Board, the values of certain securities trading outside the U.S. were adjusted following the close of local trading using a factor from a third party vendor. The third party vendor uses statistical analyses and quantitative models, which consider among other things subsequent movement and changes in the prices of indices, securities and exchange rates in other markets, to determine the factors which are used to adjust local market prices. The value of securities used for net asset value calculation under these procedures may differ from published prices for the same securities. It is the Fund’s policy to classify each foreign equity security where a factor from a third party vendor is provided as a Level 2 security.
Various inputs are used in determining the value of the Series’ assets or liabilities carried at fair value. These inputs are summarized in three broad levels. Level 1 includes quoted prices in active markets for identical assets and liabilities. Level 2 includes other significant observable inputs (including quoted prices for similar securities, interest rates, prepayment speeds, credit risk, etc.). Level 3 includes significant unobservable inputs (including the Series’ own assumptions in determining the fair value of investments). A financial instruments’ level within the fair value hierarchy is based on the lowest level of any input both individually and in aggregate that is significant to their fair value measure. The inputs or methodology used for valuing securities are not necessarily an indication of the risk associated with investing in those securities.
The following is a summary of the valuation levels used for major security types as of October 31, 2017 in valuing the Series’ assets or liabilities carried at fair value:
| BLENDED ASSET CONSERVATIVE SERIES | ||||||||||||||||
| DESCRIPTION | TOTAL | LEVEL 1 | LEVEL 2 | LEVEL 3 | ||||||||||||
Assets: | ||||||||||||||||
Equity securities: | ||||||||||||||||
Consumer Discretionary | $ | 2,317,635 | $ | 2,317,635 | $ | — | $ | — | ||||||||
Consumer Staples | 2,572,486 | 1,591,901 | 980,585 | — | ||||||||||||
Energy | 1,663,706 | 1,626,919 | 36,787 | — | ||||||||||||
Financials | 1,815,431 | 1,815,431 | — | — | ||||||||||||
Health Care | 6,489,155 | 6,323,424 | 165,731 | — | ||||||||||||
Industrials | 3,272,664 | 3,272,664 | — | — | ||||||||||||
Information Technology | 7,088,266 | 6,755,672 | 332,594 | — | * | |||||||||||
Materials | 1,831,227 | 1,751,904 | 79,323 | — | ||||||||||||
Real Estate | 2,736,852 | 2,687,432 | 49,420 | — | ||||||||||||
Telecommunication Services | 457,913 | 457,913 | — | — | ||||||||||||
Utilities | 118,455 | 118,455 | — | — | ||||||||||||
Debt securities: | ||||||||||||||||
U.S. Treasury and other | 31,634,739 | — | 31,634,739 | — | ||||||||||||
Corporate debt: | ||||||||||||||||
Consumer Discretionary | 2,649,082 | — | 2,649,082 | — | ||||||||||||
Consumer Staples | 1,255,605 | — | 1,255,605 | — | ||||||||||||
Energy | 2,934,875 | — | 2,934,875 | — | ||||||||||||
Financials | 6,883,463 | — | 6,883,463 | — | ||||||||||||
72
Notes to Financial Statements (continued)
| 2. | Significant Accounting Policies (continued) |
Security Valuation (continued)
| BLENDED ASSET CONSERVATIVE SERIES | ||||||||||||||||
| DESCRIPTION | TOTAL | LEVEL 1 | LEVEL 2 | LEVEL 3 | ||||||||||||
Health Care | $ | 547,945 | $ | — | $ | 547,945 | $ | — | ||||||||
Industrials | 206,289 | — | 206,289 | — | ||||||||||||
Information Technology | 1,420,442 | — | 1,420,442 | — | ||||||||||||
Materials | 1,703,878 | — | 1,703,878 | — | ||||||||||||
Real Estate | 663,072 | — | 663,072 | — | ||||||||||||
Telecommunication Services | 1,248,589 | — | 1,248,589 | — | ||||||||||||
Utilities | 537,509 | — | 537,509 | — | ||||||||||||
Asset-backed securities | 2,080,315 | — | 2,080,315 | — | ||||||||||||
Commercial mortgage-backed securities | 9,007,556 | — | 9,007,556 | — | ||||||||||||
Foreign government bonds | 2,721,998 | — | 2,721,998 | — | ||||||||||||
Mutual funds | 6,354,388 | 6,354,388 | — | — | ||||||||||||
|
|
|
|
|
|
|
| |||||||||
Total assets | $ | 102,213,535 | $ | 35,073,738 | $ | 67,139,797 | $ | — | ||||||||
|
|
|
|
|
|
|
| |||||||||
| BLENDED ASSET MODERATE SERIES | ||||||||||||||||
| DESCRIPTION | TOTAL | LEVEL 1 | LEVEL 2 | LEVEL 3 | ||||||||||||
Assets: | ||||||||||||||||
Equity securities: | ||||||||||||||||
Consumer Discretionary | $ | 3,366,651 | $ | 3,186,070 | $ | 180,581 | $ | — | ||||||||
Consumer Staples | 3,366,324 | 1,492,109 | 1,874,215 | — | ||||||||||||
Energy | 1,737,007 | 1,707,446 | 29,561 | — | ||||||||||||
Financials | 1,164,519 | 591,159 | 573,360 | — | ||||||||||||
Health Care | 9,714,112 | 9,527,793 | 186,319 | — | ||||||||||||
Industrials | 4,365,837 | 3,364,134 | 1,001,703 | — | ||||||||||||
Information Technology | 11,681,499 | 10,624,984 | 1,056,515 | — | * | |||||||||||
Materials | 2,593,461 | 2,276,113 | 317,348 | — | ||||||||||||
Real Estate | 2,555,004 | 2,461,946 | 93,058 | — | ||||||||||||
Telecommunication Services | 769,625 | 737,175 | 32,450 | — | ||||||||||||
Utilities | 94,578 | 39,681 | 54,897 | — | ||||||||||||
Debt securities: | ||||||||||||||||
U.S. Treasury and other | 35,656,724 | — | 35,656,724 | — | ||||||||||||
Corporate debt: | ||||||||||||||||
Consumer Discretionary | 2,622,706 | — | 2,622,706 | — | ||||||||||||
Consumer Staples | 1,136,628 | — | 1,136,628 | — | ||||||||||||
Energy | 2,809,839 | — | 2,809,839 | — | ||||||||||||
Financials | 6,629,986 | — | 6,629,986 | — | ||||||||||||
Health Care | 506,538 | — | 506,538 | — | ||||||||||||
Industrials | 243,041 | — | 243,041 | — | ||||||||||||
Information Technology | 854,593 | — | 854,593 | — | ||||||||||||
Materials | 1,648,008 | — | 1,648,008 | — | ||||||||||||
Real Estate | 607,752 | — | 607,752 | — | ||||||||||||
Telecommunication Services | 1,212,888 | — | 1,212,888 | — | ||||||||||||
Utilities | 507,648 | — | 507,648 | — | ||||||||||||
Asset-backed securities | 3,852,234 | — | 3,852,234 | — | ||||||||||||
Commercial mortgage-backed securities | 7,819,642 | — | 7,819,642 | — | ||||||||||||
Foreign government bonds | 2,337,209 | — | 2,337,209 | — | ||||||||||||
Mutual funds | 6,029,304 | 6,029,304 | — | — | ||||||||||||
|
|
|
|
|
|
|
| |||||||||
Total assets | $ | 115,883,357 | $ | 42,037,914 | $ | 73,845,443 | $ | — | ||||||||
|
|
|
|
|
|
|
| |||||||||
73
Notes to Financial Statements (continued)
| 2. | Significant Accounting Policies (continued) |
Security Valuation (continued)
| BLENDED ASSET EXTENDED SERIES | ||||||||||||||||
| DESCRIPTION | TOTAL | LEVEL 1 | LEVEL 2 | LEVEL 3 | ||||||||||||
Assets: | ||||||||||||||||
Equity securities: | ||||||||||||||||
Consumer Discretionary | $ | 7,849,689 | $ | 7,411,543 | $ | 438,146 | $ | — | ||||||||
Consumer Staples | 8,020,215 | 3,530,632 | 4,489,583 | — | ||||||||||||
Energy | 3,962,261 | 3,891,890 | 70,371 | — | ||||||||||||
Financials | 2,751,740 | 1,380,095 | 1,371,645 | — | ||||||||||||
Health Care | 23,057,967 | 22,611,946 | 446,021 | — | ||||||||||||
Industrials | 10,170,638 | 7,770,254 | 2,400,384 | — | ||||||||||||
Information Technology | 27,827,853 | 25,293,064 | 2,534,789 | — | * | |||||||||||
Materials | 6,144,301 | 5,358,974 | 785,327 | — | ||||||||||||
Real Estate | 5,412,898 | 5,209,235 | 203,663 | — | ||||||||||||
Telecommunication Services | 1,857,606 | 1,781,472 | 76,134 | — | ||||||||||||
Utilities | 227,234 | 94,623 | 132,611 | — | ||||||||||||
Debt securities: | ||||||||||||||||
U.S. Treasury and other U.S. | ||||||||||||||||
Government agencies | 56,845,480 | — | 56,845,480 | — | ||||||||||||
Corporate debt: | �� | |||||||||||||||
Consumer Discretionary | 3,587,202 | — | 3,587,202 | — | ||||||||||||
Consumer Staples | 1,546,119 | — | 1,546,119 | — | ||||||||||||
Energy | 4,219,468 | — | 4,219,468 | — | ||||||||||||
Financials | 8,718,115 | — | 8,718,115 | — | ||||||||||||
Health Care | 814,620 | — | 814,620 | — | ||||||||||||
Industrials | 1,026,752 | — | 1,026,752 | — | ||||||||||||
Information Technology | 1,812,433 | — | 1,812,433 | — | ||||||||||||
Materials | 2,282,307 | — | 2,282,307 | — | ||||||||||||
Real Estate | 828,444 | — | 828,444 | — | ||||||||||||
Telecommunication Services | 1,782,790 | — | 1,782,790 | — | ||||||||||||
Utilities | 895,144 | — | 895,144 | — | ||||||||||||
Asset-backed securities | 8,312,673 | — | 8,312,673 | — | ||||||||||||
Commercial mortgage-backed securities | 10,474,021 | — | 10,474,021 | — | ||||||||||||
Foreign government bonds | 3,164,133 | — | 3,164,133 | — | ||||||||||||
Mutual funds | 3,967,697 | 3,967,697 | — | — | ||||||||||||
|
|
|
|
|
|
|
| |||||||||
Total assets | $ | 207,559,800 | $ | 88,301,425 | $ | 119,258,375 | $ | — | ||||||||
|
|
|
|
|
|
|
| |||||||||
| BLENDED ASSET MAXIMUM SERIES | ||||||||||||||||
| DESCRIPTION | TOTAL | LEVEL 1 | LEVEL 2 | LEVEL 3 | ||||||||||||
Assets: | ||||||||||||||||
Equity securities: | ||||||||||||||||
Consumer Discretionary | $ | 13,144,800 | $ | 12,846,161 | $ | 298,639 | $ | — | ||||||||
Consumer Staples | 15,536,120 | 8,315,604 | 7,220,516 | — | ||||||||||||
Energy | 3,600,789 | 3,554,402 | 46,387 | — | ||||||||||||
Financials | 7,824,800 | 5,260,515 | 2,564,285 | — | ||||||||||||
Health Care | 28,455,930 | 26,154,381 | 2,301,549 | — | ||||||||||||
Industrials | 12,117,067 | 9,136,067 | 2,981,000 | — | ||||||||||||
Information Technology | 30,350,345 | 28,334,161 | 2,016,184 | — | * | |||||||||||
Materials | 9,561,032 | 7,084,517 | 2,476,515 | — | ||||||||||||
Real Estate | 6,633,188 | 6,522,071 | 111,117 | — | ||||||||||||
Telecommunication Services | 2,096,253 | 2,036,344 | 59,909 | — | ||||||||||||
Utilities | 149,043 | 62,064 | 86,979 | — | ||||||||||||
74
Notes to Financial Statements (continued)
| 2. | Significant Accounting Policies (continued) |
Security Valuation (continued)
| BLENDED ASSET MAXIMUM SERIES | ||||||||||||||||
| DESCRIPTION | TOTAL | LEVEL 1 | LEVEL 2 | LEVEL 3 | ||||||||||||
Debt securities: | ||||||||||||||||
U.S. Treasury and other U.S. | ||||||||||||||||
Government agencies | $ | 9,701,707 | $ | — | $ | 9,701,707 | $ | — | ||||||||
Corporate debt: | ||||||||||||||||
Consumer Discretionary | 788,327 | — | 788,327 | — | ||||||||||||
Consumer Staples | 317,047 | — | 317,047 | — | ||||||||||||
Energy | 921,569 | — | 921,569 | — | ||||||||||||
Financials | 1,676,725 | — | 1,676,725 | — | ||||||||||||
Health Care | 212,900 | — | 212,900 | — | ||||||||||||
Industrials | 279,006 | — | 279,006 | — | ||||||||||||
Information Technology | 376,931 | — | 376,931 | — | ||||||||||||
Materials | 587,384 | — | 587,384 | — | ||||||||||||
Real Estate | 153,884 | — | 153,884 | — | ||||||||||||
Telecommunication Services | 460,554 | — | 460,554 | — | ||||||||||||
Utilities | 129,400 | — | 129,400 | — | ||||||||||||
Mutual funds | 4,804,792 | 4,804,792 | — | — | ||||||||||||
|
|
|
|
|
|
|
| |||||||||
Total assets | $ | 149,879,593 | $ | 114,111,079 | $ | 35,768,514 | $ | — | ||||||||
|
|
|
|
|
|
|
| |||||||||
*China literature ltd. - right is a Level 3 security as of October 31, 2017. However, there is no value for this security reported in the financial statements.
Please see the Investment Portfolio for each of the Series for foreign securities where a factor from a third party vendor was applied to determine the securities’ fair value following the close of local trading. Such securities are included in Level 2 in the table above.
The Fund’s policy is to recognize transfers in and transfers out of the valuation levels as of the beginning of the reporting period. There were no transfers between levels during the period ended October 31, 2017.
New Accounting Guidance
On August 1, 2017, the Fund implemented amendments to Regulation S-X, issued by the Securities and Exchange Commission, which require standardized, enhanced disclosures, particularly related to derivatives, in investment company financial statements. Adoption had no effect on the Fund’s net assets or results of operations.
Security Transactions, Investment Income and Expenses
Security transactions are accounted for on trade date. Dividend income is recorded on the ex-dividend date, except that if the ex-dividend date has passed, certain dividends from foreign securities are recorded as soon as the Series is informed of the ex-dividend date. Non-cash dividends, if any, are recorded at the fair value of the securities received. Interest income, including amortization of premium and accretion of discounts using the effective interest method, is earned from settlement date and accrued daily.
Expenses are recorded on an accrual basis. Most expenses of the Fund can be attributed to a specific series. Expenses which cannot be directly attributed are apportioned among the series in the Fund in such a manner as deemed equitable by the Fund’s Board, taking into consideration, among other things, the nature and type of expense.
Income, expenses (other than class specific expenses), and realized and unrealized gains and losses are prorated among the classes based on the relative net assets of each class. Class specific expenses are directly charged to that Class.
The Series use the identified cost method for determining realized gain or loss on investments for both financial statement and federal income tax reporting purposes.
75
Notes to Financial Statements (continued)
| 2. | Significant Accounting Policies (continued) |
Foreign Currency Translation
The books and records of the Series are maintained in U.S. dollars. Foreign currencies, investments and other assets and liabilities are translated into U.S. dollars at the current exchange rates. Purchases and sales of investment securities and income and expenses are translated on the respective dates of such transactions. The Series do not isolate realized and unrealized gains and losses attributable to changes in the exchange rates from gains and losses that arise from changes in the fair value of investments. Such fluctuations are included with net realized and unrealized gain or loss on investments. Net realized foreign currency gains and losses represent foreign currency gains and losses between trade date and settlement date on securities transactions, gains and losses on disposition of foreign currencies and the difference between the amount of income and foreign withholding taxes recorded on the books of the Series and the amounts actually received or paid.
Option Contracts
The Series may write (sell) or buy call or put options on securities and other financial instruments. When a Series writes a call, the Series gives the purchaser the right to buy the underlying security from the Series at the price specified in the option contract (the “exercise price”) at any time during the option period. When a Series writes a put option, the Series gives the purchaser the right to sell to the Series the underlying security at the exercise price at any time during the option period. The Series will only write options on a “covered basis.” This means that the Series will own the underlying security when the Series writes a call or the Series will put aside cash, U.S. Government securities, or other liquid assets in an amount not less than the exercise price at all times the put option is outstanding.
When a Series writes an option, an amount equal to the premium received is reflected as a liability and is subsequently marked-to-market to reflect the current market value of the option. The Series, as a writer of an option, has no control over whether the underlying security or financial instrument may be sold (call) or purchased (put) and, as a result, bears the market risk of an unfavorable change in the price of the security or financial instrument underlying the written option. There is a risk that the Series may not be able to enter into a closing transaction because of an illiquid market.
Each Series may also purchase options in an attempt to hedge against fluctuations in the value of its portfolio and to protect against declines in the value of the securities. The premium paid by a Series for the purchase of an option is reflected as an investment and subsequently marked-to-market to reflect the current market value of the option. The risk associated with purchasing options is limited to the premium paid.
When a security is purchased or sold through an exercise of an option, the related premium paid (or received) is added to (or deducted from) the basis of the security acquired or deducted from (or added to) the proceeds of the security sold. When an option expires (or a Series enters into a closing transaction), the Series realizes a gain or loss on the option to the extent of the premium received or paid (or gain or loss to the extent the cost of the closing transaction exceeds the premium paid or received). At October 31, 2017, the Series did not hold any option contracts.
Inflation-Indexed Bonds
Each Series may invest in inflation-indexed bonds. Inflation-indexed bonds are fixed income securities whose principal value is periodically adjusted according to the rate of inflation. If the index measuring inflation rises or falls, the principal value of inflation-indexed bonds will be adjusted upward or downward, and consequently the interest payable on these securities (calculated with respect to a larger or smaller principal amount) will be increased or reduced, respectively. Any upward or downward adjustment in the principal amount of an inflation-indexed bond will be included as interest income in the Statements of Operations, even though investors do not receive their principal until maturity. Repayment of the original bond principal upon maturity (as adjusted for inflation) is guaranteed in the case of U.S. Treasury inflation-indexed bonds. For bonds that do not provide a similar guarantee, the adjusted principal value of the bond repaid at maturity may be less than the original principal.
Securities Purchased on a When-Issued Basis or Forward Commitment
Each Series may purchase securities on a when-issued basis or forward commitment. These transactions involve a commitment by the Series to purchase securities for a predetermined price with payment and delivery taking place beyond the customary settlement period. When such purchases are outstanding, the Series will designate liquid assets in an amount sufficient to meet the purchase price. When purchasing a security on a delayed delivery basis, the Fund assumes the rights and risks of
76
Notes to Financial Statements (continued)
| 2. | Significant Accounting Policies (continued) |
Securities Purchased on a When-Issued Basis or Forward Commitment (continued)
ownership of the security, including the risk of price and yield fluctuations, and takes such fluctuations into account when determining their net asset value. The Series may sell the when-issued securities before they are delivered, which may result in a capital gain or loss. No such investments were held by the Series on October 31, 2017.
In connection with their ability to purchase or sell securities on a forward commitment basis, the Series may enter into forward roll transactions principally using To Be Announced (TBA) securities. Forward roll transactions require the sale of securities for delivery in the current month, and a simultaneous agreement to repurchase substantially similar (same type, coupon and maturity) securities on a specified future date. Risks of entering into forward roll transactions include the potential inability of the counterparty to meet the terms of the agreement; the potential of the Series to receive inferior securities at redelivery as compared to the securities sold to the counterparty; counterparty credit risk; and the potential pay down speed variance between the mortgage-backed pools. During the roll period, the Series forgoes principal and interest paid on the securities. The Series accounts for such dollar rolls as purchases and sales. No such investments were held by the Series on October 31, 2017.
Interest Only Securities
The Series may invest in stripped mortgage-backed securities issued by the U.S. government, its agencies and instrumentalities. Stripped mortgage-backed securities are usually structured with two classes that receive different proportions of the interest and principal distributions on a pool of mortgage assets. In certain cases, one class will receive all of the interest (the interest-only or “IO” class), while the other class will receive all of the principal (the principal-only or “PO” class). The yield to maturity on IOs is sensitive to the rate of principal repayments (including prepayments) on the related underlying mortgage assets, and principal payments may have a material effect on yield to maturity. If the underlying mortgage assets experience greater than anticipated prepayments of principal, a Series may not fully recoup its initial investment in IOs.
Restricted Securities
Restricted securities are purchased in private placement transactions, are not registered under the Securities Act of 1933, as amended, and may have contractual restrictions on resale. Information regarding restricted securities is included at the end of each applicable Series’ Investment Portfolio.
Federal Taxes
Each Series’ policy is to comply with the provisions of the Internal Revenue Code applicable to regulated investment companies. The Series are not subject to federal income tax or excise tax to the extent that each Series distributes to shareholders each year its taxable income, including any net realized gains on investments, in accordance with requirements of the Internal Revenue Code. Accordingly, no provision for federal income tax or excise tax has been made in the financial statements.
Management evaluates its tax positions to determine if the tax positions taken meet the minimum recognition threshold in connection with accounting for uncertainties in income tax positions taken or expected to be taken for the purposes of measuring and recognizing tax liabilities in the financial statements. Recognition of tax benefits of an uncertain tax position is required only when the position is “more likely than not” to be sustained assuming examination by taxing authorities. At October 31, 2017, the Series have recorded no liability for net unrecognized tax benefits relating to uncertain income tax positions taken or expected to be taken in future tax returns.
The Series file income tax returns in the U.S. federal jurisdiction, various states and foreign jurisdictions, as required. No income tax returns are currently under investigation. The statute of limitations on the Series’ tax returns remains open for the period ended October 31, 2017. The Fund is not aware of any tax positions for which it is reasonably possible that the total amounts of unrecognized tax benefits will significantly change in the next twelve months.
Foreign Taxes
Based on the Series’ understanding of the tax rules and rates related to income, gains and currency purchase/repatriation transactions for foreign jurisdictions in which they invest, the Series will provide for foreign taxes, and where appropriate, deferred foreign tax.
77
Notes to Financial Statements (continued)
| 2. | Significant Accounting Policies (continued) |
Distributions of Income and Gains
Distributions to shareholders of net investment income are made semi-annually. Distributions of net realized gains are made annually. An additional distribution may be necessary to avoid taxation of a Series. Distributions are recorded on the ex-dividend date.
Indemnifications
The Fund’s organizational documents provide former and current directors and officers with a limited indemnification against liabilities arising in connection with the performance of their duties to the Fund. In the normal course of business, the Fund may also enter into contracts that provide general indemnifications. The Fund’s maximum exposure under these arrangements is unknown as this would be dependent on future claims that may be made against the Fund. The risk of material loss from such claims is considered remote.
Other
The preparation of financial statements in conformity with GAAP requires management to make estimates and assumptions that affect the reported amounts of assets and liabilities and the disclosure of contingent assets and liabilities at the date of the financial statements and the reported amounts of income and expenses during the reporting period. Actual results could differ from those estimates.
| 3. | Transactions with Affiliates |
The Fund has an Investment Advisory Agreement (the “Agreement”) with the Advisor, for which each Series pays a fee, computed daily and payable monthly, at an annual rate of 0.40% for Blended Asset Conservative Term Series, 0.45% for Blended Asset Moderate Series, and 0.50% for Blended Asset Extended Series and Blended Asset Maximum Series, of the Series’ average daily net assets.
Under the Agreement, personnel of the Advisor provide the Series with advice and assistance in the choice of investments and the execution of securities transactions, and otherwise maintain the Series’ organization. The Advisor also provides the Fund with necessary office space and fund administration and support services. The salaries of all officers of the Fund (except a percentage of the Fund’s Chief Compliance Officer’s salary, which is paid by the Fund), and of all Directors who are “affiliated persons” of the Fund, or of the Advisor, and all personnel of the Fund, or of the Advisor, performing services relating to research, statistical and investment activities, are paid by the Advisor. Each “non-affiliated” Director receives an annual stipend, which is allocated among all the active series of the Fund. In addition, these Directors also receive a fee per Board meeting attended plus a fee for each committee meeting attended and are reimbursed for travel and other out-of-pocket expenses incurred by them in connection with attending such meetings. The Fund also has an Audit Committee Chair, who receives an additional annual stipend for this role.
The Advisor has contractually agreed, until at least February 29, 2028, to waive its management fee and, if necessary, pay other operating expenses of the Series in order to maintain total direct annual fund operating expenses for the Series, at no more than the amounts presented in the following table, of average daily net assets each year.
| SERIES/CLASS | EXPENSE LIMIT | |||
Blended Asset Conservative Series | 0.45 | % | ||
Blended Asset Moderate Series | 0.50 | % | ||
Blended Asset Extended Series | 0.55 | % | ||
Blended Asset Maximum Series | 0.55 | % | ||
78
Notes to Financial Statements (continued)
| 3. | Transactions with Affiliates (continued) |
For the period ended October 31, 2017, the Advisor waived the following amounts which are included as a reduction of expenses on the Statements of Operations:
| SERIES/CLASS | WAIVER AMOUNT | |||
Blended Asset Conservative Series Class R6 | $ | 59,190 | ||
Blended Asset Moderate Series Class R6 | 56,125 | |||
Blended Asset Extended Series Class R6 | 54,045 | |||
Blended Asset Maximum Series Class R6 | 48,144 | |||
The Advisor is not eligible to recoup any expenses that have been waived or reimbursed.
Manning & Napier Investor Services, Inc., a registered broker-dealer affiliate of the Advisor, acts as distributor for the Fund’s shares. The services of Manning & Napier Investor Services, Inc. are provided at no additional cost to the Series.
Pursuant to a master services agreement dated March 1, 2017, the Fund pays the Advisor the annual fee related to fund accounting and administration of 0.0085% on the first $25 billion of average daily net assets (excluding Target Series and Strategic Income Series); 0.0075% on the next $15 billion of average daily net assets (excluding Target Series and Strategic Income Series); and 0.0065% of average daily net assets in excess of $40 billion (excluding Target Series and Strategic Income Series); plus the base fee of $30,400 per series. Additionally, certain transaction and out-of-pocket expenses, including charges for reporting relating to the Fund’s compliance program, are charged. The Advisor has an agreement with BNY Mellon Investment Servicing (U.S.) Inc. (“BNY”) under which BNY serves as sub-accountant services agent.
Expenses not directly attributable to a series are allocated based on each series’ relative net assets or number of accounts, depending on the expense.
| 4. | Purchases and Sales of Securities |
For the period ended October 31, 2017, purchases and sales of securities, other than short-term securities, were as follows:
PURCHASES OTHER | SALES OTHER | |||||||||||
| SERIES | ISSUERS | GOVERNMENT | ISSUERS | GOVERNMENT | ||||||||
Blended Asset Conservative Series | $ | 16,534,178 | $ 256,711 | $ | 2,282,795 | $ — | ||||||
Blended Asset Moderate Series | 10,652,191 | 2,692,024 | 2,450,463 | — | ||||||||
Blended Asset Extended Series | 26,220,110 | 4,501,913 | 3,998,176 | — | ||||||||
Blended Asset Maximum Series | 17,247,771 | 1,444,902 | 3,203,819 | — | ||||||||
| 5. | Capital Stock Transactions |
Transactions in Class R6 shares of each Series were:
| BLENDED CONSERVATIVE | FOR THE PERIOD 10/13/171 TO 10/31/17 | |||||||
| SERIES CLASS R6: | SHARES | AMOUNT | ||||||
Sold | 9,394,967 | $ | 102,115,609 | |||||
Reinvested | — | — | ||||||
Repurchased | (108,692 | ) | (1,179,696 | ) | ||||
|
|
|
| |||||
Total | 9,286,275 | $ | 100,935,913 | |||||
|
|
|
| |||||
79
Notes to Financial Statements (continued)
| 5. | Capital Stock Transactions (continued) |
| BLENDED ASSET MODERATE | FOR THE PERIOD 10/13/171 TO 10/31/17 | |||||||
| SERIES CLASS R6: | SHARES | AMOUNT | ||||||
Sold | 10,782,412 | $ | 115,906,022 | |||||
Reinvested | — | — | ||||||
Repurchased | (26,599 | ) | (285,356 | ) | ||||
|
|
|
| |||||
Total | 10,755,813 | $ | 115,620,666 | |||||
|
|
|
| |||||
| BLENDED ASSET EXTENDED | FOR THE PERIOD 10/13/171 TO 10/31/17 | |||||||
| SERIES CLASS R6: | SHARES | AMOUNT | ||||||
Sold | 20,139,692 | $ | 208,028,941 | |||||
Reinvested | — | — | ||||||
Repurchased | (133,620 | ) | (1,377,323 | ) | ||||
|
|
|
| |||||
Total | 20,006,072 | $ | 206,651,618 | |||||
|
|
|
| |||||
| BLENDED ASSET MAXIMUM | FOR THE PERIOD 10/13/171 TO 10/31/17 | |||||||
| SERIES CLASS R6: | SHARES | AMOUNT | ||||||
Sold | 13,013,587 | $ | 150,821,798 | |||||
Reinvested | — | — | ||||||
Repurchased | (30,606 | ) | (354,707 | ) | ||||
|
|
|
| |||||
Total | 12,982,981 | $ | 150,467,091 | |||||
|
|
|
| |||||
1Commencement of operations.
At October 31, 2017, The Target Income Series, another series of the Fund, owned 98.3% of Blended Asset Conservative Term Series. The Target 2020 Series and Target 2025 Series, other series of the Fund, owned 83.9% and 13.7%, respectively, of Blended Asset Moderate Term Series. The Target 2025 Series, Target 2030 Series, and Target 2040 Series, other series of the Fund, owned 11.8%, 57.8%, and 13.6%, respectively, of Blended Asset Extended Term Series. The Target 2030 Series, Target 2040 Series, and Target 2050 Series, other series of the Fund, owned 15.0%, 37.2%, and 23.5%, respectively, of Blended Asset Maximum Term Series. Investment activities of these shareholders may have a material effect on the respective Series.
| 6. | Financial Instruments and Loan Assignments |
The Series may trade in instruments including written and purchased options, forward foreign currency exchange contracts and futures contracts and other derivatives in the normal course of investing activities to assist in managing exposure to various market risks. The Series may be subject to various elements of risk which may involve, to a varying degree, elements of risk in excess of the amounts recognized for financial statement purposes. These risks include: the risk that changes in the value of a derivative may not correlate perfectly with the underlying asset, rate or index; counterparty credit risk related to over the counter derivative counterparties’ failure to perform under contract terms; liquidity risk related to the lack of a liquid market for these contracts allowing the fund to close out its position(s); and documentation risk relating to disagreement over contract terms. At October 31, 2017, Blended Asset Conservative Series, Blended Asset Moderate Series and Blended Asset Extended Series did not invest in options contracts (equity risk).
The Series may invest in a loan assignment of all or a portion of the loans. The Series has direct rights against the borrower on a loan when it purchases an assignment; however, the Series’ rights may be more limited than the lender from which it acquired the assignment and the Series may be able to enforce its rights only through an administrative agent. Loan assignments are vulnerable to market conditions and may become illiquid due to economic conditions or other events may reduce the demand for loan assignments and certain loan assignments which were liquid when purchased may become illiquid. At October 31, 2017, the Series did not hold any loan assignments.
80
Notes to Financial Statements (continued)
| 7. | Foreign Securities |
Investing in securities of foreign companies and foreign governments involves special risks and considerations not typically associated with investing in securities of domestic companies and the U.S. Government. These risks include revaluation of currencies and future adverse political and economic developments. Moreover, securities of foreign companies and foreign governments and their markets may be less liquid and their prices more volatile than those of comparable domestic companies and the U.S. Government.
| 8. | Federal Income Tax Information |
The amount and characterization of certain income and capital gains to be distributed are determined in accordance with federal income tax regulations, which may differ from GAAP. These differences are primarily due to differing book and tax treatments in the timing of the recognition on net investment income or gains and losses, including foreign currency gains and losses, losses deferred due to wash sales, investments in passive foreign investment companies (PFICs), real estate investment trusts and the realization for tax purposes of unrealized gains/losses on certain futures. Each Series may periodically make reclassifications among its capital accounts to reflect income and gains available for distribution (or available capital loss carryovers) under income tax regulations, without impacting the Series’ net asset value. For the period ended October 31, 2017, $2, $288, $666 and $318 was reclassified within the capital accounts from Accumulated Net Realized Gain (Loss) on Investments to Undistributed Net Investment Income for Blended Asset Conservative Series, Blended Asset Moderate Series, Blended Asset Extended Series and Blended Asset Maximum Series. Any such reclassifications are not reflected in the financial highlights
At October 31, 2017, the tax basis of components of distributable earnings and the net unrealized appreciation based on the identified cost of investments for federal income tax purposes were as follows:
| BLENDED ASSET CONSERVATIVE SERIES | BLENDED ASSET MODERATE SERIES | BLENDED ASSET EXTENDED SERIES | BLENDED ASSET MAXIMUM SERIES | |||||||||||||
Cost for federal income tax purposes | $ | 102,411,870 | $ | 116,170,351 | $ | 208,084,634 | $ | 149,844,597 | ||||||||
Unrealized appreciation | 637,717 | 852,962 | 1,983,396 | 2,509,649 | ||||||||||||
Unrealized depreciation | (836,052 | ) | (1,139,956 | ) | (2,508,230 | ) | (2,474,653 | ) | ||||||||
|
|
|
|
|
|
|
| |||||||||
Net unrealized appreciation (depreciation) | $ | (198,335 | ) | $ | (286,994 | ) | $ | (524,834 | ) | $ | 34,996 | |||||
|
|
|
|
|
|
|
| |||||||||
Undistributed ordinary income | $ | 48,575 | $ | 48,576 | $ | 61,856 | $ | 77,430 | ||||||||
Capital loss carryforwards | $ | (10,200 | ) | $ | (10,845 | ) | $ | (9,007 | ) | $ | — | |||||
At October 31, 2017, Blended Asset Conservative Series, Blended Asset Moderate Series and Blended Asset Extended Series had net short-term capital loss carryforwards of $10,200, $10,845 and $9,007, respectively, which may be carried forward indefinitely.
81
Report of Independent Registered Public Accounting Firm
To the Board of Directors of Manning & Napier Fund, Inc. and Shareholders of Blended Asset Conservative Series, Blended Asset Moderate Series, Blended Asset Extended Series and Blended Asset Maximum Series:
In our opinion, the accompanying statements of assets and liabilities, including the investment portfolios, and the related statements of operations and of changes in net assets and the financial highlights present fairly, in all material respects, the financial position of the Blended Asset Conservative Series, Blended Asset Moderate Series, Blended Asset Extended Series and Blended Asset Maximum Series (four of the series constituting Manning & Napier Fund, Inc., hereafter referred to as the “Series”) as of October 31, 2017, and the results of each of their operations, the changes in each of their net assets and the financial highlights for the period October 13, 2017 (commencement of operations) through October 31, 2017, in conformity with accounting principles generally accepted in the United States of America. These financial statements and financial highlights (hereafter referred to as “financial statements”) are the responsibility of the Series’ management. Our responsibility is to express an opinion on these financial statements based on our audit. We conducted our audit of these financial statements in accordance with the standards of the Public Company Accounting Oversight Board (United States). Those standards require that we plan and perform the audit to obtain reasonable assurance about whether the financial statements are free of material misstatement. An audit includes examining, on a test basis, evidence supporting the amounts and disclosures in the financial statements, assessing the accounting principles used and significant estimates made by management, and evaluating the overall financial statement presentation. We believe that our audit, which included confirmation of securities as of October 31, 2017 by correspondence with the custodian and brokers, provides a reasonable basis for our opinion.

New York, New York
December 18, 2017
82
Directors’ and Officers’ Information
(unaudited)
The Statement of Additional Information provides additional information about the Fund’s directors and officers and can be obtained without charge by calling 1-800-466-3863, at www.manning-napier.com, or on the EDGAR Database on the SEC Internet web site (http://www.sec.gov). The following chart shows certain information about the Fund’s directors and officers, including their principal occupations during the last five years. Unless specific dates are provided, the individuals have held the listed positions for longer than five years.
Interested Director and Officer
| Name: | Michele T. Mosca* | |
| Address: | 290 Woodcliff Drive Fairport, NY 14450 | |
| Age: | 45 | |
| Current Position(s) Held with Fund: | Principal Executive Officer, President, Chairman & Director | |
| Term of Office & Length of Time Served: | Indefinite – Chairman and Director since August 20161 | |
| Principal Occupation(s) During Past 5 Years: | Managing Director, Funds Group (since 2009) - Manning & Napier Advisors, LLC; President, Director (since 2015) - Manning & Napier Investor Services, Inc.; Chief Executive Officer, President (since 2016) - Rainier Investment Management Mutual Funds, Inc. Holds the following title for various subsidiaries and affiliates: President, Director | |
| Number of Portfolios Overseen within Fund Complex: | 38 | |
| Other Directorships Held Outside Fund Complex During Past 5 Years: | Trustee - Rainier Investment Management Mutual Funds (since 2016) | |
| Independent Directors | ||
| Name: | Stephen B. Ashley | |
| Address: | 290 Woodcliff Drive Fairport, NY 14450 | |
| Age: | 77 | |
| Current Position(s) Held with Fund: | Director, Audit Committee Member, Governance & Nominating Committee Member | |
| Term of Office & Length of Time Served: | Indefinite – Since 1996 | |
| Principal Occupation(s) During Past 5 Years: | Chairman, Director & Chief Executive Officer (1997 to present) - The Ashley Group (property management and investment). Director (1995-2008) and Chairman (non-executive) (2004-2008) - Fannie Mae (mortgage) | |
| Number of Portfolios Overseen within Fund Complex: | 38 | |
Other Directorships Held Outside Fund Complex During Past 5 Years: | Fannie Mae (1995-2008) The Ashley Group (1995-2008) Genesee Corporation (1987-2007) | |
| Name: | Paul A. Brooke | |
| Address: | 290 Woodcliff Drive Fairport, NY 14450 | |
| Age: | 72 | |
| Current Position(s) Held with Fund: | Lead Independent Director, Audit Committee Member, Governance & Nominating Committee Chairman | |
| Term of Office & Length of Time Served: | Indefinite – Director, Audit Committee Member, Governance & Nominating Committee Member since 2007; Governance & Nominating Committee | |
| Principal Occupation(s) During Past 5 Years: | Chairman since 2016; Lead Independent Director since 2017 Chairman & CEO (2005-2009) - Ithaka Acquisition Corporation (investments); Chairman (2007-2009) - Alsius Corporation (investments); Managing Member (1991-present) - PMSV Holdings LLC (investments); Managing Member (2010-2016) - Venbio (investments). | |
| Number of Portfolios Overseen within Fund Complex: | 38 | |
| Other Directorships Held Outside Fund Complex During Past 5 Years: | Incyte Corp. (biotech)(2000-present); ViroPharma, Inc. (speciality pharmaceuticals)(2000-2014); HLTH (WebMD)(information)(2000-2010); Cheyne Capital International (investment)(2000-present); GMP Companies (investment)(2000-2011); Cytos Biotechnology Ltd (biotechnology)(2012-2014); Cerus (biomedical)(2016-present); PureEarth(non-profit)(2012-present) | |
83
Directors’ and Officers’ Information
(unaudited)
| Independent | Directors (continued) |
| Name: | Peter L. Faber | |
| Address: | 290 Woodcliff Drive | |
| Fairport, NY 14450 | ||
| Age: | 79 | |
| Current Position(s) Held with Fund: | Director, Governance & Nominating Committee Member | |
| Term of Office & Length of Time Served: | Indefinite – Since 1987 | |
| Principal Occupation(s) During Past 5 Years: | Senior Counsel (2006-2012), Partner (1995-2006 & 2013-present) - McDermott, Will & Emery LLP (law firm) | |
| Number of Portfolios Overseen within Fund Complex: | 38 | |
| Other Directorships Held Outside Fund Complex During Past 5 Years: | Boston Early Music Festival (non-profit)(2007-present); Amherst Early Music, Inc. (non-profit)(2009-present); Gotham Early Music Scene, Inc. (non-profit)(2009-present); Partnership for New York City, Inc. (non-profit)(1989-2010); New York Collegium (non-profit)(2004-2011) | |
| Name: | Harris H. Rusitzky | |
| Address: | 290 Woodcliff Drive | |
| Fairport, NY 14450 | ||
| Age: | 82 | |
| Current Position(s) Held with Fund: | Director, Audit Committee Member, Governance & Nominating Committee Member | |
| Term of Office & Length of Time Served: | Indefinite – Since 1985 | |
| Principal Occupation(s) During Past 5 Years: | President (1994- present) - The Greening Group (business consultants); Partner (2006-present) - The Restaurant Group (restaurants) | |
| Number of Portfolios Overseen within Fund Complex: | 38 | |
| Other Directorships Held Outside Fund Complex During Past 5 Years: | Rochester Institute of Technology (university)(1972-present); Culinary Institute of America (non-profit college)(1985-present); George Eastman House (museum)(1988-present); National Restaurant Association (restaurant trade organization)(1978-present) | |
| Name: | Chester N. Watson | |
| Address: | 290 Woodcliff Drive | |
| Fairport, NY 14450 | ||
| Age: | 67 | |
| Current Position(s) Held with Fund: | Director, Audit Committee Chairman, Governance & Nominating Committee Member | |
| Term of Office & Length of Time Served: | Indefinite – Since 2012 | |
| Principal Occupation(s) During Past 5 Years: | General Auditor (2003-2011) - General Motors Company (auto manufacturer) | |
| Number of Portfolios Overseen within Fund Complex: | 38 | |
| Other Directorships Held Outside Fund Complex During Past 5 Years: | Rochester Institute of Technology (university)(2005-present); Town of Greenburgh, NY Planning Board (municipal government) (2015-present) | |
| Officers: | ||
| Name: | Jeffrey S. Coons, Ph.D., CFA® | |
| Address: | 290 Woodcliff Drive | |
| Fairport, NY 14450 | ||
| Age: | 54 | |
| Current Position(s) Held with Fund: | Vice President | |
| Term of Office1 & Length of Time Served: | Since 2004 | |
| Principal Occupation(s) During Past 5 Years: | President since 2010, Co-Director of Research (2002 - 2015) -Manning & Napier Advisors, LLC | |
| Holds one or more of the following titles for various subsidiaries and affiliates: President, Director, Treasurer, or Senior Trust Officer | ||
| Name: | Elizabeth Craig | |
| Address: | 290 Woodcliff Drive | |
| Fairport, NY 14450 | ||
| Age: | 30 | |
| Current Position(s) Held with Fund: | Corporate Secretary | |
| Term of Office1 & Length of Time Served: | Since 2016 | |
| Principal Occupation(s) During Past 5 Years: | Fund Administration Manager since 2015; Mutual Fund Compliance Specialist (2009-2015) - Manning & Napier Advisors, LLC; Assistant Corporate Secretary (2011-2016) - Manning & Napier Fund, Inc. | |
84
Directors’ and Officers’ Information
(unaudited)
| Officers: | (continued) |
| Name: | Christine Glavin | |
| Address: | 290 Woodcliff Drive | |
| Fairport, NY 14450 | ||
| Age: | 51 | |
| Current Position(s) Held with Fund: | Principal Financial Officer, Chief Financial Officer | |
Term of Office1 & Length of Time Served: Principal Occupation(s) During Past 5 Years: | Principal Financial Officer since 2002; Chief Financial Officer since 2001 Director of Fund Reporting since 2011; Fund Reporting Manager (1997-2011) Manning & Napier Advisors, LLC; Assistant Treasurer since 2008 - Exeter Trust Company; Chief Financial Officer since 2017- Rainier Investment Management Mutual Funds, Inc. | |
| Name: | Jodi L. Hedberg | |
| Address: | 290 Woodcliff Drive | |
| Fairport, NY 14450 | ||
| Age: | 50 | |
Current Position(s) Held with Fund: Term of Office1 & Length of Time Served: | Chief Compliance Officer, Anti-Money Laundering Compliance Officer Chief Compliance Officer since 2004; Anti-Money Laundering Officer since 2002; Corporate Secretary (1997-2016)- Manning & Napier Fund, Inc.; Chief Compliance Officer and Anti-Money Laundering Officer since 2017 – Rainier Investment Management Mutual Funds, Inc. | |
| Principal Occupation(s) During Past 5 Years: | Director of Compliance since 2005; Compliance Manager (1995-2005) – Manning & Napier Advisors, LLC and affiliates; Corporate Secretary – Manning & Napier Investor Services, Inc. since 2006 | |
| Name: | Scott Morabito | |
| Address: | 290 Woodcliff Drive | |
| Fairport, NY 14450 | ||
| Age: | 29 | |
| Current Position(s) Held with Fund: | Assistant Vice President | |
| Term of Office1 & Length of Time Served: | Since 2017 | |
| Principal Occupation(s) During Past 5 Years: | Director of Funds Group since 2017; Fund Product and Strategy Manager (2014-2017); Senior Product and Strategy Analyst (2013-2014); Product and Strategy Analyst (2011-2013) - Manning & Napier Advisors, LLC. | |
| Name: | Amy Williams | |
| Address: | 290 Woodcliff Drive | |
| Fairport, NY 14450 | ||
| Age: | 56 | |
| Current Position(s) Held with Fund: | Assistant Corporate Secretary | |
| Term of Office1 & Length of Time Served: | Since 2016 | |
| Principal Occupation(s) During Past 5 Years: | Director of Fund Documentation - Manning & Napier Advisors, LLC and affiliates since 2009 Holds one or more of the following titles for various affiliates: Director | |
| Name: | Richard Yates | |
| Address: | 290 Woodcliff Drive | |
| Fairport, NY 14450 | ||
| Age: | 52 | |
| Current Position(s) Held with Fund: | Chief Legal Officer | |
| Term of Office1 & Length of Time Served: | Chief Legal Officer since 2004 | |
| Principal Occupation(s) During Past 5 Years: | Counsel - Manning & Napier Advisors, LLC and affiliates since 2000; Chief Legal Officer since 2016 - Rainier Investment Management, LLC; Chief Legal Officer since 2016 - Rainier Investment Management Mutual Funds, Inc. | |
| Holds one or more of the following titles for various affiliates: Director, Corporate Secretary, Chief Legal Officer |
*Interested Director, within the meaning of the 1940 Act by reason of her positions with the Fund’s investment advisor, Manning & Napier Advisors, LLC and Distributor, Manning & Napier Investor Services, Inc.
1The term of office of all officers shall be one year and until their respective successors are chosen and qualified, or his or her earlier resignation or removal as provided in the Fund’s By-Laws.
85
Literature Requests
(unaudited)
Proxy Voting Policies and Procedures
A description of the policies and procedures that the Fund uses to determine how to vote proxies relating to portfolio securities is available, without charge, upon request:
| By phone | 1-800-466-3863 | |||
| On the Securities and Exchange | ||||
| Commission’s (SEC) web site | http://www.sec.gov |
Proxy Voting Record
Information regarding how the Fund voted proxies relating to portfolio securities during the most recent 12-month period ended June 30th is available, without charge, upon request:
| By phone | 1-800-466-3863 | |||
| On the SEC’s web site | http://www.sec.gov |
Quarterly Portfolio Holdings
The Series’ complete schedule of portfolio holdings for the 1st and 3rd quarters of each fiscal year are provided on Form N-Q, and are available, without charge, upon request:
| By phone | 1-800-466-3863 | |||
| On the SEC’s web site | http://www.sec.gov |
The Series’ Form N-Q may be reviewed and copied at the SEC’s Public Reference Room in Washington, D.C. Information on the operation of the Public Reference Room may be obtained by calling 1-800-SEC-0330.
Prospectus and Statement of Additional Information (SAI)
For more information about any of the Manning & Napier Fund, Inc. Series, you may obtain a prospectus and SAI at www.manning-napier.com or by calling (800) 466-3863. Before investing, carefully consider the objectives, risks, charges and expenses of the investment and read the prospectus carefully as it contains this and other information about the investment company. In addition, this information can be found on the SEC’s web site, http://www.sec.gov.
Additional information available at www.manning-napier.com
1. Fund Holdings - Month-End
2. Fund Holdings - Quarter-End
3. Shareholder Report - Annual
4. Shareholder Report - Semi-Annual
The Fund also offers electronic notification or “e-delivery” when certain documents are available on-line to be downloaded or reviewed. Direct shareholders can elect to receive electronic notification when shareholder reports, prospectus updates, and/or quarterly statements are available. If you do not currently have on-line access to your account, you can establish access by going to www.manning-napier.com, click on “Login” in the top corner of the page, and follow the prompts to self-enroll. Once enrolled, you can set your electronic notification preferences by clicking on the Account Options tab located within the green toolbar and then select E-Delivery Option. Should you have any questions on either how to establish on-line access or how to update your account settings, please contact Investor Services at 1-800-466-3863.
The Manning & Napier Fund, Inc. is managed by Manning & Napier Advisors, LLC. Manning & Napier Investor Services, Inc., an affiliate of Manning & Napier Advisors, LLC, is the distributor of the Fund shares.
MNBLA-10/17-AR
Management Discussion and Analysis
(unaudited)
Dear Shareholders:
Just one year ago, many investors were anticipating a widespread sell-off in domestic equity markets after Donald Trump won the election for the U.S. presidency. Not only did a sell-off fail to materialize, but equities actually moved sharply higher and remained on an upward trajectory throughout the year. The advance in equities was despite ongoing uncertainty surrounding policy implementation and how the new administration’s agenda might ultimately affect U.S. economic growth. For the year ended October 31, 2017, domestic equities were up 23.63%, as measured by the S&P 500 Index. International equities, as measured by the MSCI ACWI ex USA Index, also fared extraordinarily well, up 23.64%. Domestic investment-grade bonds, as measured by the Bloomberg Barclays U.S. Aggregate Bond Index, experienced relatively subdued performance, up 0.90%. Within fixed income, corporate bonds led, with high-yield securities in particular delivering very strong performance.
Much of the move upward in asset markets has been driven by stronger corporate earnings that materialized in early 2017 within both developed and emerging markets, supported by synchronized economic growth across all major global regions. Further, although Federal Reserve (Fed) policymakers continued gradually raising the target range for the federal funds rate and began reducing the Fed’s securities holdings, central bank policies across the globe have remained generally accommodative, providing an additional tailwind for asset prices.
Investors are undoubtedly enjoying the “Goldilocks” state of the economy: not too cold so as to usher in a recession, and not too hot so as to cause runaway inflation. Nonetheless, it is our view that market participants should temper their expectations going forward. The U.S. continues to move along in its economic cycle, and while it is not our view that we are on the cusp of a bear market, the status of our indicators suggest that we are certainly closer to the end of the current bull market than we are to the beginning. Complacency is elevated, there are significantly fewer pockets of cheap valuations remaining compared to the past several years, and U.S. valuations in particular limit upside potential, offering little support for asset prices should volatility in the financial markets materialize. This is surely not the time for investors to chase returns or take on unnecessary risk. Rather, it is our view that current market dynamics are consistent with rising risks that must be actively managed, and investors should maintain allocations consistent with their long-term investment objectives.
With this in mind, we discuss recent fund performance in this report, highlight how we are positioned amid the current economic environment, and provide our outlook of what to expect in financial markets. We hope that you find this information helpful, and look forward to working with you in the years ahead to meet your investment goals.
Thank you for your continued confidence in us.
Sincerely,
Manning & Napier Advisors, LLC
The S&P 500 Total Return Index is an unmanaged, capitalization-weighted measure of 500 widely held common stocks listed on the New York Stock Exchange, American Stock Exchange, and the Over-the-Counter market. The Index returns assume daily reinvestment of dividends and do not reflect any fees or expenses. Index returns provided by Bloomberg. S&P Dow Jones Indices LLC, a subsidiary of the McGraw Hill Financial, Inc., is the publisher of various index based data products and services and has licensed certain of its products and services for use by Manning & Napier. All such content Copyright © 2017 by S&P Dow Jones Indices LLC and/or its affiliates. All rights reserved. Neither S&P Dow Jones Indices LLC, Dow Jones Trademark Holdings LLC, their affiliates nor their third party licensors make any representation or warranty, express or implied, as to the ability of any index to accurately represent the asset class or market sector that it purports to represent and none of these parties shall have any liability for any errors, omissions, or interruptions of any index or the data included therein.
The MSCI ACWI ex USA Index (ACWIxUS) is designed to measure large and mid-cap representation across 22 of 23 Developed Markets countries (excluding the U.S.) and 24 Emerging Markets countries. The Index returns do not reflect any fees or expenses. The Index is denominated in U.S. dollars. The Index returns are net of withholding taxes. They assume daily reinvestment of net dividends thus accounting for any applicable dividend taxation. Index returns provided by Bloomberg.
The Bloomberg Barclays U.S. Aggregate Bond Index is an unmanaged, market-value weighted index of U.S. domestic investment-grade debt issues, including government, corporate, asset-backed, and mortgage-backed securities, with maturities of one year or more. Index returns do not reflect any fees or expenses. Index returns provided by Interactive Data.
1
Fund Commentary
(unaudited)
Investment Objective
To provide capital growth and manage risk for investors planning to retire (or meet another investment goal) in or around the year indicated in the fund’s name.
The Target Series include eleven distinct mutual funds, each of which is managed to a designated target date. The investment objective of each Series is strategically allocated to become increasingly conservative as the specified target date approaches. The Target 2050, 2040, 2030, 2020, and Target Income Series were launched on March 28, 2008; the Target 2055, 2045, 2035, 2025 and Target 2015 Series were launched on June 25, 2012; and the Target 2060 Series was launched on September 21, 2015.
Performance Commentary
U.S. equity markets delivered positive absolute returns for the twelve-month period ended October 31, 2017. The S&P 500 Index gained 23.63% while the Russell 3000 Index earned 23.98%. International equity markets also delivered positive absolute returns, with the broad MSCI ACWI ex USA Index (ACWIxUS) returning 23.64%. Meanwhile, bond markets as represented by the Bloomberg Barclays U.S. Aggregate Bond Index were modestly positive, returning 0.90%. Each of the Target Series delivered positive absolute returns during the one-year period. However, with the exception of the Class I and Class R6 shares of the Target Income Series, they each underperformed their respective blended benchmarks on a relative basis.
Stock selection challenged relative returns and was the primary contributor to the Series’ underperformance. Specifically, selection in the Health Care, Consumer Discretionary, and Energy sectors detracted from relative returns across all portfolios. In addition, the Series’ overweight to Health Care as well as an underweight to Financials, detracted from relative returns.
Offsetting a portion of the relative performance headwind was the aggregate effect of sector allocations, which aided relative returns. Each Series’ overweight to Information Technology and Materials compared to the blended benchmark, as well as an underweight to Energy, aided relative returns as well. In addition, broad fixed income exposure aided relative returns.
Our focus on growing companies that we believe can control their own destiny has led to meaningful allocations to the Health Care and Information Technology sectors. The Series have relatively little exposure to economically sensitive sectors including Financials and Energy. We have generally found companies within some of the more defensive sectors to be overvalued given the lower growth prospects, which has led to underweight allocations to Utilities, Consumer Staples, and Telecommunication Services as compared to the benchmark.
Regarding fixed income, with the exception of the Target 2035 through Target 2060 Series, we modestly increased duration over the last year when rates rose and value came into the longer end of the yield curve. While we still feel corporate credit continues to adequately compensate investors on a fundamental basis, the Series’ allocation to corporate credit was reduced when corporate credit spreads tightened. Additionally, a notable allocation to securitized fixed income (i.e., asset-backed and commercial mortgage backed securities) can be found in the Series (with the exception of the 2040 - 2060 portfolios) as we view the risk/reward trade-off to be attractive in these sectors. We continue to monitor interest rates as well as credit spreads in order to be in a position to take advantage of opportunities that may present themselves.
As we begin the new fiscal year, earnings growth across major regions, accelerating business activity, and an improving economic backdrop are supportive of global asset prices. However, as markets continue to advance, we believe it is important to express our view that investors should exercise caution and selectivity due to rising risks associated with elevated complacency, valuations across most markets that remain at or somewhat above fair value, and the inflection in global monetary policy to less accommodative conditions. We believe these risk factors reinforce the need for an active, fundamentals-based investment approach, as it will be critical to manage them going forward.
Performance data quoted represents past performance and does not guarantee future results. The investment return and principal value of an investment will fluctuate, so that an investor’s shares, when redeemed, may be worth more or less than their original
2
Fund Commentary
(unaudited)
Performance Commentary (continued)
cost. Current performance may be higher or lower than that quoted; investors can obtain the most recent month-end performance at www.manning-napier.com or by calling (800) 466-3863.
Each Manning & Napier Fund, Inc. Target Series is invested in one or two of four proprietary lifestyle funds based on the Target Series becoming increasingly conservative over time. Because the underlying funds invest in both stocks and bonds, the value of your investment will fluctuate in response to stock market movements and changes in interest rates. Investing in target date funds will also involve a number of other risks, including issuer-specific risk, foreign investment risk, and small-cap/mid-cap risk, as the underlying investments change over time. Investments in options and futures, like all derivatives, can be highly volatile and involve risks in addition to the risks of the underlying instrument on which the derivative is based, such as counterparty, correlation and liquidity risk. Also, the use of leverage increases exposure to the market and may magnify potential losses. Principal value is not guaranteed at any time, including at the target date (the approximate year when an investor plans to stop contributions and start periodic withdrawals).
3
Performance Update as of October 31, 2017 - Target Income Series
(unaudited)
AVERAGE ANNUAL TOTAL RETURNS AS OF OCTOBER 31, 2017 | ||||||||||||
| ONE YEAR1 | FIVE YEAR | SINCE INCEPTION2 | ||||||||||
Manning & Napier Fund, Inc. - Target Income Series - Class K3 | 6.85 | % | 4.27 | % | 4.79% | |||||||
Manning & Napier Fund, Inc. - Target Income Series - Class R3 | 6.68 | % | 3.98 | % | 4.52% | |||||||
Manning & Napier Fund, Inc. - Target Income Series - Class I3 | 7.20 | % | 4.52 | % | 5.06% | |||||||
Manning & Napier Fund, Inc. - Target Income Series - Class R63,4 | 7.20 | % | 4.52 | % | 5.06% | |||||||
Standard & Poor’s (S&P) Target Date Retirement Income Index5 | 7.20 | % | 4.81 | % | 4.40% | |||||||
Income Composite Benchmark6 | 7.18 | % | 5.12 | % | 5.17% | |||||||
The following graph compares the value of a $10,000 investment in the Manning & Napier Fund, Inc. - Target Income Series - Class K from its inception2 (3/28/08) to present (10/31/17) to the S&P Target Date Retirement Income Index and the Income Composite Benchmark.
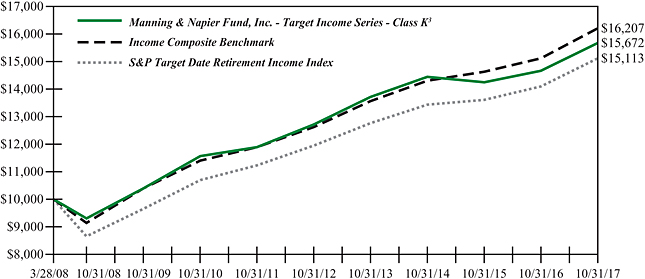
1The returns shown are based on net asset values calculated for shareholder transactions and may differ from the returns shown in the financial highlights, which reflect adjustments made to the net asset values in accordance with accounting principles generally accepted in the United States of America.
2Performance numbers for the Series and the S&P Target Date Index are calculated from March 28, 2008, the Series’ inception date. Performance numbers for the Target Composite Benchmark are calculated from April 1, 2008.
3The Series’ performance does not reflect the deduction of taxes that a shareholder would pay on fund distributions or the redemption of shares. The Series’ performance is historical and may not be indicative of future results. The performance returns shown are inclusive of the net expense ratio of the Series. For the year ended October 31, 2017, this net expense ratio was 0.31% for Class K, 0.55% for Class R, 0.06% for Class I and 0.05% for Class R6. The gross expense ratio, which does not account for any voluntary or contractual waivers currently in effect, was 0.46% for Class K, 0.70% for Class R, 0.21% for Class I and 0.20% for Class R6 for the year ended October 31, 2017.
4For periods prior to the inception of Class R6 on October 16, 2017, the performance figures are hypothetical and reflect the performance of the Manning & Napier, Inc. - Target Series - Class I
5The S&P Target Date Index Series is a series of unmanaged indices that reflect the market consensus for asset allocations for different target date horizons. Asset class weights are established annually and rebalanced monthly. Prior to 02/26/2010, the indices were rebalanced annually. All returns prior to 05/31/2007 are back-tested. Index returns assume daily reinvestment of dividends. Beginning 06/01/2017, the asset class exposure for each index is represented by indices and returns do not reflect any fees or expenses. Prior to 06/01/2017, the asset class exposure for each index is represented by exchange traded funds (ETFs) and returns are net of ETF expenses. Index returns provided by Bloomberg. S&P Dow Jones Indices LLC, a subsidiary of the McGraw Hill Financial, Inc., is the publisher of various index based data products and services and has licensed certain of its products and services for use by Manning & Napier. All such content Copyright © 2017 by S&P Dow Jones Indices LLC and/or its affiliates. All rights reserved. Neither S&P Dow Jones Indices LLC, Dow Jones Trademark Holdings LLC, their affiliates nor their third party licensors make any representation or warranty, express or implied, as to the ability of
4
Performance Update as of October 31, 2017 - Target Income Series
(unaudited)
any index to accurately represent the asset class or market sector that it purports to represent and none of these parties shall have any liability for any errors, omissions, or interruptions of any index or the data included therein.
6The Target Composite Benchmark represents the performance of the target date fund’s asset classes according to their respective weightings, as adjusted over time to reflect the target date fund’s increasingly conservative asset allocations. The following indices are used to calculate the Target Composite Benchmarks: Russell 3000® Index (Russell 3000), MSCI ACWI ex USA Index (ACWIxUS), and Bloomberg Barclays U.S. Aggregate Bond Index (BAB) and/or Bloomberg Barclays U.S. Intermediate Aggregate Bond Index (BIAB). Russell 3000 is an unmanaged index that consists of 3,000 of the largest U.S. companies based on total market capitalization. Index returns are based on a market capitalization-weighted average of relative price changes of the component stocks plus dividends whose reinvestments are compounded daily. Index returns provided by Bloomberg. ACWIxUS is designed to measure large and mid-cap representation across 22 of 23 Developed Markets countries (excluding the U.S.) and 24 Emerging Markets countries. The Index is denominated in U.S. dollars. The Index returns assume daily investment of gross dividends (which do not account for applicable dividend taxation) prior to 12/31/1998, as net returns were not available. Subsequent to 12/31/1998, the Index returns are net of withholding taxes. They assume daily reinvestment of net dividends thus accounting for any applicable dividend taxation. Index returns provided by Bloomberg. BAB and BIAB are both unmanaged, market value-weighted indices of U.S. domestic investment-grade debt issues, including government, corporate, asset-backed and mortgage-backed securities. BAB includes maturities of one year or more; BIAB includes maturities of greater than one year but less than ten years. BAB and BIAB returns provided by Interactive Data. Indices returns do not reflect any fees or expenses. Returns provided are calculated monthly using a blended allocation. Because the target date fund’s asset allocation will vary over time, the composition of the target date portfolio may not match the composition of the comparative Target Composite Benchmark. Mid-month performance is not available for the Composite Benchmark. Performance shown is from the first of the month following the corresponding Fund’s inception date.
5
Performance Update as of October 31, 2017 - Target 2015 Series
(unaudited)
AVERAGE ANNUAL TOTAL RETURNS AS OF OCTOBER 31, 2017 | ||||||||||||
| ONE YEAR1 | FIVE YEAR | SINCE INCEPTION2 | ||||||||||
Manning & Napier Fund, Inc. - Target 2015 - Class K3 | 7.70 | % | 5.30 | % | 6.07 | % | ||||||
Manning & Napier Fund, Inc. - Target 2015 - Class R3 | 7.47 | % | 5.07 | % | 5.86 | % | ||||||
Manning & Napier Fund, Inc. - Target 2015 - Class I3 | 8.03 | % | 5.57 | % | 6.37 | % | ||||||
Manning & Napier Fund, Inc. - Target 2015 - Class R63,4 | 8.03 | % | 5.57 | % | 6.37 | % | ||||||
S&P Target Date 2015 Index5 | 10.93 | % | 7.04 | % | 7.65 | % | ||||||
2015 Composite Benchmark6 | 8.69 | % | 6.41 | % | 6.64 | % | ||||||
The following graph compares the value of a $10,000 investment in the Manning & Napier Fund, Inc. - Target 2015 Series - Class K from its inception2 (6/25/12) to present (10/31/17) to the S&P Target Date 2015 Index and the 2015 Composite Benchmark.
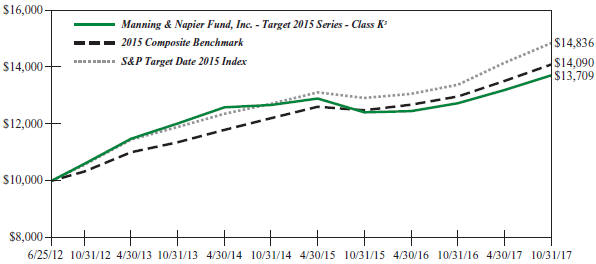
1The returns shown are based on net asset values calculated for shareholder transactions and may differ from the returns shown in the financial highlights, which reflect adjustments made to the net asset values in accordance with accounting principles generally accepted in the United States of America.
2Performance numbers for the Series and the S&P Target Date Index are calculated from June 25, 2012, the Series’ inception date. Performance numbers for the Target Composite Benchmark are calculated from July 1, 2012.
3The Series’ performance does not reflect the deduction of taxes that a shareholder would pay on fund distributions or the redemption of shares. The Series’ performance is historical and may not be indicative of future results. The performance returns shown are inclusive of the net expense ratio of the Series. For the year ended October 31, 2017, this net expense ratio was 0.31% for Class K, 0.55% for Class R, 0.05% for Class I and 0.05% for Class R6. The gross expense ratio, which does not account for any voluntary or contractual waivers currently in effect, was 2.70% for Class K, 2.94% for Class R, 2.44% for Class I and 2.44% for Class R6 for the year ended October 31, 2017.
4For periods prior to the inception of Class R6 on October 16, 2017, the performance figures are hypothetical and reflect the performance of the Manning & Napier, Inc. - Target Series - Class I
5The S&P Target Date Index Series is a series of unmanaged indices that reflect the market consensus for asset allocations for different target date horizons. Asset class weights are established annually and rebalanced monthly. Prior to 02/26/2010, the indices were rebalanced annually. All returns prior to 05/31/2007 are back-tested. Index returns assume daily reinvestment of dividends. Beginning 06/01/2017, the asset class exposure for each index is represented by indices and returns do not reflect any fees or expenses. Prior to 06/01/2017, the asset class exposure for each index is represented by exchange traded funds (ETFs) and returns are net of ETF expenses. Index returns provided by Bloomberg. S&P Dow Jones Indices LLC, a subsidiary of the McGraw Hill Financial, Inc., is the publisher of various index based data products and services and has licensed certain of its products and services for use by Manning & Napier. All such content Copyright © 2017 by S&P Dow Jones Indices LLC and/or its affiliates. All rights reserved. Neither S&P Dow Jones Indices LLC, Dow Jones Trademark Holdings LLC, their affiliates nor their third party licensors make any representation or warranty, express or implied, as to the ability of
6
Performance Update as of October 31, 2017 - Target 2015 Series
(unaudited)
any index to accurately represent the asset class or market sector that it purports to represent and none of these parties shall have any liability for any errors, omissions, or interruptions of any index or the data included therein.
6The Target Composite Benchmark represents the performance of the target date fund’s asset classes according to their respective weightings, as adjusted over time to reflect the target date fund’s increasingly conservative asset allocations. The following indices are used to calculate the Target Composite Benchmarks: Russell 3000® Index (Russell 3000), MSCI ACWI ex USA Index (ACWIxUS), and Bloomberg Barclays U.S. Aggregate Bond Index (BAB) and/or Bloomberg Barclays U.S. Intermediate Aggregate Bond Index (BIAB). Russell 3000 is an unmanaged index that consists of 3,000 of the largest U.S. companies based on total market capitalization. Index returns are based on a market capitalization-weighted average of relative price changes of the component stocks plus dividends whose reinvestments are compounded daily. Index returns provided by Bloomberg. ACWIxUS is designed to measure large and mid-cap representation across 22 of 23 Developed Markets countries (excluding the U.S.) and 24 Emerging Markets countries. The Index is denominated in U.S. dollars. The Index returns assume daily investment of gross dividends (which do not account for applicable dividend taxation) prior to 12/31/1998, as net returns were not available. Subsequent to 12/31/1998, the Index returns are net of withholding taxes. They assume daily reinvestment of net dividends thus accounting for any applicable dividend taxation. Index returns provided by Bloomberg. BAB and BIAB are both unmanaged, market value-weighted indices of U.S. domestic investment-grade debt issues, including government, corporate, asset-backed and mortgage-backed securities. BAB includes maturities of one year or more; BIAB includes maturities of greater than one year but less than ten years. BAB and BIAB returns provided by Interactive Data. Indices returns do not reflect any fees or expenses. Returns provided are calculated monthly using a blended allocation. Because the target date fund’s asset allocation will vary over time, the composition of the target date portfolio may not match the composition of the comparative Target Composite Benchmark. Mid-month performance is not available for the Composite Benchmark. Performance shown is from the first of the month following the corresponding Fund’s inception date.
7
Performance Update as of October 31, 2017 - Target 2020 Series
(unaudited)
AVERAGE ANNUAL TOTAL RETURNS AS OF OCTOBER 31, 2017 | ||||||||||||
| ONE YEAR1 | FIVE YEAR | SINCE INCEPTION2 | ||||||||||
Manning & Napier Fund, Inc. - Target 2020 Series - Class K3 | 8.91 | % | 6.05 | % | 5.16 | % | ||||||
Manning & Napier Fund, Inc. - Target 2020 Series - Class R3 | 8.69 | % | 5.79 | % | 4.88 | % | ||||||
Manning & Napier Fund, Inc. - Target 2020 Series - Class I3 | 9.28 | % | 6.32 | % | 5.42 | % | ||||||
Manning & Napier Fund, Inc. - Target 2020 Series - Class R63,4 | 9.28 | % | 6.32 | % | 5.42 | % | ||||||
S&P Target Date 2020 Index5 | 12.69 | % | 7.99 | % | 5.92 | % | ||||||
2020 Composite Benchmark6 | 10.42 | % | 7.10 | % | 5.87 | % | ||||||
The following graph compares the value of a $10,000 investment in the Manning & Napier Fund, Inc. - Target 2020 Series - Class K from its inception2 (3/28/08) to present (10/31/17) to the S&P Target Date 2020 Index and the 2020 Composite Benchmark.
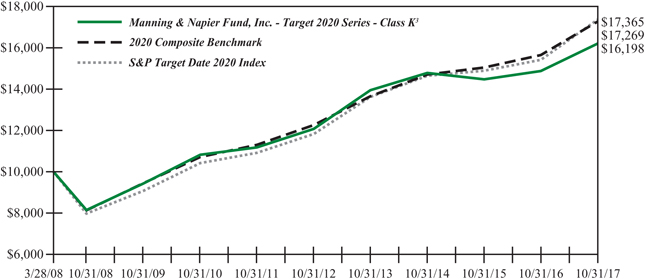
1The returns shown are based on net asset values calculated for shareholder transactions and may differ from the returns shown in the financial highlights, which reflect adjustments made to the net asset values in accordance with accounting principles generally accepted in the United States of America.
2Performance numbers for the Series and the S&P Target Date Index are calculated from March 28, 2008, the Series’ inception date. Performance numbers for the Target Composite Benchmark are calculated from April 1, 2008.
3The Series’ performance does not reflect the deduction of taxes that a shareholder would pay on fund distributions or the redemption of shares. The Series’ performance is historical and may not be indicative of future results. The performance returns shown are inclusive of the net expense ratio of the Series. For the year ended October 31, 2017, this net expense ratio was 0.31% for Class K, 0.56% for Class R, 0.06% for Class I and 0.05% for Class R6. The gross expense ratio, which does not account for any voluntary or contractual waivers currently in effect, was 0.40% for Class K, 0.65% for Class R, 0.15% for Class I and 0.14% for Class R6 for the year ended October 31, 2017.
4For periods prior to the inception of Class R6 on October 16, 2017, the performance figures are hypothetical and reflect the performance of the Manning & Napier, Inc. - Target Series - Class I
5The S&P Target Date Index Series is a series of unmanaged indices that reflect the market consensus for asset allocations for different target date horizons. Asset class weights are established annually and rebalanced monthly. Prior to 02/26/2010, the indices were rebalanced annually. All returns prior to 05/31/2007 are back-tested. Index returns assume daily reinvestment of dividends. Beginning 06/01/2017, the asset class exposure for each index is represented by indices and returns do not reflect any fees or expenses. Prior to 06/01/2017, the asset class exposure for each index is represented by exchange traded funds (ETFs) and returns are net of ETF expenses. Index returns provided by Bloomberg. S&P Dow Jones Indices LLC, a subsidiary of the McGraw Hill Financial, Inc., is the publisher of various index based data products and services and has licensed certain of its products and services for use by Manning & Napier. All such content Copyright © 2017 by S&P Dow Jones Indices LLC and/or its affiliates. All rights reserved. Neither S&P Dow Jones Indices LLC, Dow Jones Trademark Holdings LLC, their affiliates nor their third party licensors make any representation or warranty, express or implied, as to the ability of
8
Performance Update as of October 31, 2017 - Target 2020 Series
(unaudited)
any index to accurately represent the asset class or market sector that it purports to represent and none of these parties shall have any liability for any errors, omissions, or interruptions of any index or the data included therein.
6The Target Composite Benchmark represents the performance of the target date fund’s asset classes according to their respective weightings, as adjusted over time to reflect the target date fund’s increasingly conservative asset allocations. The following indices are used to calculate the Target Composite Benchmarks: Russell 3000® Index (Russell 3000), MSCI ACWI ex USA Index (ACWIxUS), and Bloomberg Barclays U.S. Aggregate Bond Index (BAB) and/or Bloomberg Barclays U.S. Intermediate Aggregate Bond Index (BIAB). Russell 3000 is an unmanaged index that consists of 3,000 of the largest U.S. companies based on total market capitalization. Index returns are based on a market capitalization-weighted average of relative price changes of the component stocks plus dividends whose reinvestments are compounded daily. Index returns provided by Bloomberg. ACWIxUS is designed to measure large and mid-cap representation across 22 of 23 Developed Markets countries (excluding the U.S.) and 24 Emerging Markets countries. The Index is denominated in U.S. dollars. The Index returns assume daily investment of gross dividends (which do not account for applicable dividend taxation) prior to 12/31/1998, as net returns were not available. Subsequent to 12/31/1998, the Index returns are net of withholding taxes. They assume daily reinvestment of net dividends thus accounting for any applicable dividend taxation. Index returns provided by Bloomberg. BAB and BIAB are both unmanaged, market value-weighted indices of U.S. domestic investment-grade debt issues, including government, corporate, asset-backed and mortgage-backed securities. BAB includes maturities of one year or more; BIAB includes maturities of greater than one year but less than ten years. BAB and BIAB returns provided by Interactive Data. Indices returns do not reflect any fees or expenses. Returns provided are calculated monthly using a blended allocation. Because the target date fund’s asset allocation will vary over time, the composition of the target date portfolio may not match the composition of the comparative Target Composite Benchmark. Mid-month performance is not available for the Composite Benchmark. Performance shown is from the first of the month following the corresponding Fund’s inception date.
9
Performance Update as of October 31, 2017 - Target 2025 Series
(unaudited)
AVERAGE ANNUAL TOTAL RETURNS AS OF OCTOBER 31, 2017 | ||||||||||||
| ONE YEAR1 | FIVE YEAR | SINCE INCEPTION2 | ||||||||||
Manning & Napier Fund, Inc. - Target 2025 Series - Class K3 | 10.23 | % | 7.05 | % | 8.06 | % | ||||||
Manning & Napier Fund, Inc. - Target 2025 Series - Class R3 | 9.94 | % | 6.87 | % | 7.86 | % | ||||||
Manning & Napier Fund, Inc. - Target 2025 Series - Class I3 | 10.52 | % | 7.25 | % | 8.25 | % | ||||||
Manning & Napier Fund, Inc. - Target 2025 Series - Class R63,4 | 10.52 | % | 7.25 | % | 8.25 | % | ||||||
S&P Target Date 2025 Index5 | 14.63 | % | 8.84 | % | 9.60 | % | ||||||
2025 Composite Benchmark6 | 11.56 | % | 7.79 | % | 8.03 | % | ||||||
The following graph compares the value of a $10,000 investment in the Manning & Napier Fund, Inc. - Target 2025 Series - Class K from its inception2 (6/25/12) to present (10/31/17) to the 2025 Composite Benchmark, and S&P Target Date 2025 Index.
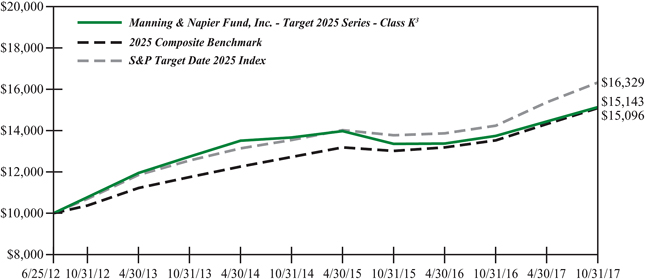
1The returns shown are based on net asset values calculated for shareholder transactions and may differ from the returns shown in the financial highlights, which reflect adjustments made to the net asset values in accordance with accounting principles generally accepted in the United States of America.
2Performance numbers for the Series and the S&P Target Date Index are calculated from June 25, 2012, the Series’ inception date. Performance numbers for the Target Composite Benchmark are calculated from July 1, 2012.
3The Series’ performance does not reflect the deduction of taxes that a shareholder would pay on fund distributions or the redemption of shares. The Series’ performance is historical and may not be indicative of future results. The performance returns shown are inclusive of the net expense ratio of the Series. For the year ended October 31, 2017, this net expense ratio was 0.31% for Class K, 0.55% for Class R, 0.05% for Class I and 0.05% for Class R6. The gross expense ratio, which does not account for any voluntary or contractual waivers currently in effect, was 0.74% for Class K, 0.99% for Class R, 0.48% for Class I and 0.48% for Class R6 for the year ended October 31, 2017.
4For periods prior to the inception of Class R6 on October 16, 2017, the performance figures are hypothetical and reflect the performance of the Manning & Napier, Inc. - Target Series - Class I
5The S&P Target Date Index Series is a series of unmanaged indices that reflect the market consensus for asset allocations for different target date horizons. Asset class weights are established annually and rebalanced monthly. Prior to 02/26/2010, the indices were rebalanced annually. All returns prior to 05/31/2007 are back-tested. Index returns assume daily reinvestment of dividends. Beginning 06/01/2017, the asset class exposure for each index is represented by indices and returns do not reflect any fees or expenses. Prior to 06/01/2017, the asset class exposure for each index is represented by exchange traded funds (ETFs) and returns are net of ETF expenses. Index returns provided by Bloomberg. S&P Dow Jones Indices LLC, a subsidiary of the McGraw Hill Financial, Inc., is the publisher of various index based data products and services and has licensed certain of its products and services for use by Manning & Napier. All such content Copyright © 2017 by S&P Dow Jones Indices LLC and/or its affiliates. All rights reserved. Neither S&P Dow Jones Indices LLC, Dow Jones Trademark Holdings LLC, their affiliates nor their third party licensors make any representation or warranty, express or implied, as to the ability of
10
Performance Update as of October 31, 2017 - Target 2025 Series
(unaudited)
any index to accurately represent the asset class or market sector that it purports to represent and none of these parties shall have any liability for any errors, omissions, or interruptions of any index or the data included therein.
6The Target Composite Benchmark represents the performance of the target date fund’s asset classes according to their respective weightings, as adjusted over time to reflect the target date fund’s increasingly conservative asset allocations. The following indices are used to calculate the Target Composite Benchmarks: Russell 3000® Index (Russell 3000), MSCI ACWI ex USA Index (ACWIxUS), and Bloomberg Barclays U.S. Aggregate Bond Index (BAB) and/or Bloomberg Barclays U.S. Intermediate Aggregate Bond Index (BIAB). Russell 3000 is an unmanaged index that consists of 3,000 of the largest U.S. companies based on total market capitalization. Index returns are based on a market capitalization-weighted average of relative price changes of the component stocks plus dividends whose reinvestments are compounded daily. Index returns provided by Bloomberg. ACWIxUS is designed to measure large and mid-cap representation across 22 of 23 Developed Markets countries (excluding the U.S.) and 24 Emerging Markets countries. The Index is denominated in U.S. dollars. The Index returns assume daily investment of gross dividends (which do not account for applicable dividend taxation) prior to 12/31/1998, as net returns were not available. Subsequent to 12/31/1998, the Index returns are net of withholding taxes. They assume daily reinvestment of net dividends thus accounting for any applicable dividend taxation. Index returns provided by Bloomberg. BAB and BIAB are both unmanaged, market value-weighted indices of U.S. domestic investment-grade debt issues, including government, corporate, asset-backed and mortgage-backed securities. BAB includes maturities of one year or more; BIAB includes maturities of greater than one year but less than ten years. BAB and BIAB returns provided by Interactive Data. Indices returns do not reflect any fees or expenses. Returns provided are calculated monthly using a blended allocation. Because the target date fund’s asset allocation will vary over time, the composition of the target date portfolio may not match the composition of the comparative Target Composite Benchmark. Mid-month performance is not available for the Composite Benchmark. Performance shown is from the first of the month following the corresponding Fund’s inception date.
11
Performance Update as of October 31, 2017 - Target 2030 Series
(unaudited)
AVERAGE ANNUAL TOTAL RETURNS AS OF OCTOBER 31, 2017 | ||||||||||||
| ONE YEAR1 | FIVE YEAR | SINCE INCEPTION2 | ||||||||||
Manning & Napier Fund, Inc. - Target 2030 Series - Class K3 | 12.49 | % | 8.02 | % | 5.99 | % | ||||||
Manning & Napier Fund, Inc. - Target 2030 Series - Class R3 | 12.07 | % | 7.73 | % | 5.74 | % | ||||||
Manning & Napier Fund, Inc. - Target 2030 Series - Class I3 | 12.76 | % | 8.29 | % | 6.28 | % | ||||||
Manning & Napier Fund, Inc. - Target 2030 Series - Class R63,4 | 12.64 | % | 8.27 | % | 6.27 | % | ||||||
S&P Target Date 2030 Index5 | 16.41 | % | 9.65 | % | 6.52 | % | ||||||
2030 Composite Benchmark6 | 13.44 | % | 8.84 | % | 6.34 | % | ||||||
The following graph compares the value of a $10,000 investment in the Manning & Napier Fund, Inc. - Target 2030 Series - Class K from its inception2 (3/28/08) to present (10/31/17) to the 2030 Composite Benchmark and S&P Target Date 2030 Index.
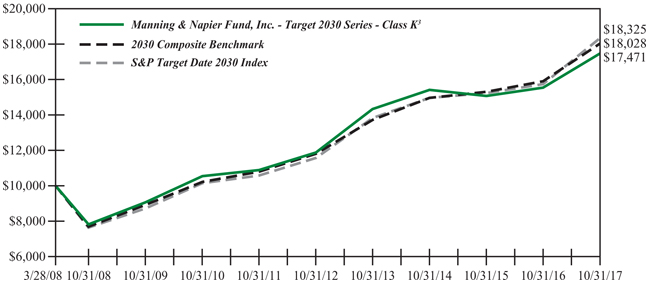
1The returns shown are based on net asset values calculated for shareholder transactions and may differ from the returns shown in the financial highlights, which reflect adjustments made to the net asset values in accordance with accounting principles generally accepted in the United States of America.
2Performance numbers for the Series and the S&P Target Date Index are calculated from March 28, 2008, the Series’ inception date. Performance numbers for the Target Composite Benchmark are calculated from April 1, 2008.
3The Series’ performance does not reflect the deduction of taxes that a shareholder would pay on fund distributions or the redemption of shares. The Series’ performance is historical and may not be indicative of future results. The performance returns shown are inclusive of the net expense ratio of the Series. For the year ended October 31, 2017, this net expense ratio was 0.31% for Class K, 0.56% for Class R, 0.06% for Class I and 0.05% for Class R6. The gross expense ratio, which does not account for any voluntary or contractual waivers currently in effect, was 0.39% for Class K, 0.64% for Class R, 0.14% for Class I and 0.13% for Class R6 for the year ended October 31, 2017.
4For periods prior to the inception of Class R6 on October 16, 2017, the performance figures are hypothetical and reflect the performance of the Manning & Napier, Inc. - Target Series - Class I
5The S&P Target Date Index Series is a series of unmanaged indices that reflect the market consensus for asset allocations for different target date horizons. Asset class weights are established annually and rebalanced monthly. Prior to 02/26/2010, the indices were rebalanced annually. All returns prior to 05/31/2007 are back-tested. Index returns assume daily reinvestment of dividends. Beginning 06/01/2017, the asset class exposure for each index is represented by indices and returns do not reflect any fees or expenses. Prior to 06/01/2017, the asset class exposure for each index is represented by exchange traded funds (ETFs) and returns are net of ETF expenses. Index returns provided by Bloomberg. S&P Dow Jones Indices LLC, a subsidiary of the McGraw Hill Financial, Inc., is the publisher of various index based data products and services and has licensed certain of its products and services for use by Manning & Napier. All such content Copyright © 2017 by S&P Dow Jones Indices LLC and/or its affiliates. All rights reserved. Neither S&P Dow Jones Indices LLC, Dow Jones Trademark Holdings LLC, their affiliates nor their third party licensors make any representation or warranty, express or implied, as to the ability of
12
Performance Update as of October 31, 2017 - Target 2030 Series
(unaudited)
any index to accurately represent the asset class or market sector that it purports to represent and none of these parties shall have any liability for any errors, omissions, or interruptions of any index or the data included therein.
6The Target Composite Benchmark represents the performance of the target date fund’s asset classes according to their respective weightings, as adjusted over time to reflect the target date fund’s increasingly conservative asset allocations. The following indices are used to calculate the Target Composite Benchmarks: Russell 3000® Index (Russell 3000), MSCI ACWI ex USA Index (ACWIxUS), and Bloomberg Barclays U.S. Aggregate Bond Index (BAB) and/or Bloomberg Barclays U.S. Intermediate Aggregate Bond Index (BIAB). Russell 3000 is an unmanaged index that consists of 3,000 of the largest U.S. companies based on total market capitalization. Index returns are based on a market capitalization-weighted average of relative price changes of the component stocks plus dividends whose reinvestments are compounded daily. Index returns provided by Bloomberg. ACWIxUS is designed to measure large and mid-cap representation across 22 of 23 Developed Markets countries (excluding the U.S.) and 24 Emerging Markets countries. The Index is denominated in U.S. dollars. The Index returns assume daily investment of gross dividends (which do not account for applicable dividend taxation) prior to 12/31/1998, as net returns were not available. Subsequent to 12/31/1998, the Index returns are net of withholding taxes. They assume daily reinvestment of net dividends thus accounting for any applicable dividend taxation. Index returns provided by Bloomberg. BAB and BIAB are both unmanaged, market value-weighted indices of U.S. domestic investment-grade debt issues, including government, corporate, asset-backed and mortgage-backed securities. BAB includes maturities of one year or more; BIAB includes maturities of greater than one year but less than ten years. BAB and BIAB returns provided by Interactive Data. Indices returns do not reflect any fees or expenses. Returns provided are calculated monthly using a blended allocation. Because the target date fund’s asset allocation will vary over time, the composition of the target date portfolio may not match the composition of the comparative Target Composite Benchmark. Mid-month performance is not available for the Composite Benchmark. Performance shown is from the first of the month following the corresponding Fund’s inception date.
13
Performance Update as of October 31, 2017 - Target 2035 Series
(unaudited)
AVERAGE ANNUAL TOTAL RETURNS AS OF OCTOBER 31, 2017 | ||||||||||||
| ONE YEAR1 | FIVE YEAR | SINCE INCEPTION2 | ||||||||||
Manning & Napier Fund, Inc. - Target 2035 Series - Class K3 | 14.22 | % | 8.83 | % | 10.02 | % | ||||||
Manning & Napier Fund, Inc. - Target 2035 Series - Class R3 | 13.85 | % | 8.61 | % | 9.79 | % | ||||||
Manning & Napier Fund, Inc. - Target 2035 Series - Class I3 | 14.53 | % | 9.11 | % | 10.29 | % | ||||||
Manning & Napier Fund, Inc. - Target 2035 Series - Class R63,4 | 14.53 | % | 9.11 | % | 10.29 | % | ||||||
S&P Target Date 2035 Index5 | 18.18 | % | 10.35 | % | 11.21 | % | ||||||
2035 Composite Benchmark6 | 15.86 | % | 9.89 | % | 10.13 | % | ||||||
The following graph compares the value of a $10,000 investment in the Manning & Napier Fund, Inc. - Target 2035 Series - Class K from its inception2 (6/25/12) to present (10/31/17) to the 2035 Composite Benchmark and S&P Target Date 2035 Index.
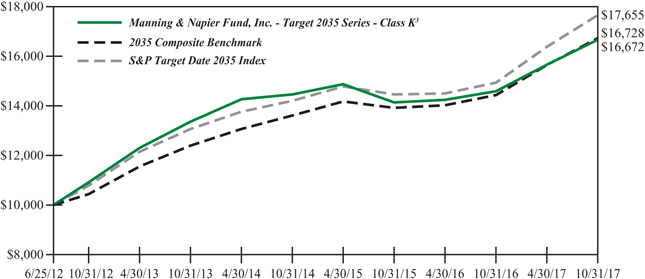
1The returns shown are based on net asset values calculated for shareholder transactions and may differ from the returns shown in the financial highlights, which reflect adjustments made to the net asset values in accordance with accounting principles generally accepted in the United States of America. Performance numbers for the S&P Target Date Index and Target Composite Benchmark are calculated from July 1, 2012.
2Performance numbers for the Series and the S&P Target Date Index are calculated from June 25, 2012, the Series’ inception date. Performance numbers for the Target Composite Benchmark are calculated from July 1, 2012.
3The Series’ performance does not reflect the deduction of taxes that a shareholder would pay on fund distributions or the redemption of shares. The Series’ performance is historical and may not be indicative of future results. The performance returns shown are inclusive of the net expense ratio of the Series. For the year ended October 31, 2017, this net expense ratio was 0.31% for Class K, 0.55% for Class R, 0.05% for Class I and 0.05% for Class R6. The gross expense ratio, which does not account for any voluntary or contractual waivers currently in effect, was 0.85% for Class K, 1.09% for Class R, 0.59% for Class I and 0.59% for Class R6 for the year ended October 31, 2017.
4For periods prior to the inception of Class R6 on October 16, 2017, the performance figures are hypothetical and reflect the performance of the Manning & Napier, Inc. - Target Series - Class I
5The S&P Target Date Index Series is a series of unmanaged indices that reflect the market consensus for asset allocations for different target date horizons. Asset class weights are established annually and rebalanced monthly. Prior to 02/26/2010, the indices were rebalanced annually. All returns prior to 05/31/2007 are back-tested. Index returns assume daily reinvestment of dividends. Beginning 06/01/2017, the asset class exposure for each index is represented by indices and returns do not reflect any fees or expenses. Prior to 06/01/2017, the asset class exposure for each index is represented by exchange traded funds (ETFs) and returns are net of ETF expenses. Index returns provided by Bloomberg. S&P Dow Jones Indices LLC, a subsidiary of the McGraw Hill Financial, Inc., is the publisher of various index based data products and services and has licensed certain of its products and services for use by Manning & Napier. All such content Copyright © 2017 by S&P Dow Jones Indices LLC and/or its affiliates. All rights reserved. Neither S&P Dow Jones Indices LLC, Dow Jones Trademark Holdings LLC, their affiliates nor their third party licensors make any representation or warranty, express or implied, as to the ability of
14
Performance Update as of October 31, 2017 - Target 2035 Series
(unaudited)
any index to accurately represent the asset class or market sector that it purports to represent and none of these parties shall have any liability for any errors, omissions, or interruptions of any index or the data included therein.
6The Target Composite Benchmark represents the performance of the target date fund’s asset classes according to their respective weightings, as adjusted over time to reflect the target date fund’s increasingly conservative asset allocations. The following indices are used to calculate the Target Composite Benchmarks: Russell 3000® Index (Russell 3000), MSCI ACWI ex USA Index (ACWIxUS), and Bloomberg Barclays U.S. Aggregate Bond Index (BAB) and/or Bloomberg Barclays U.S. Intermediate Aggregate Bond Index (BIAB). Russell 3000 is an unmanaged index that consists of 3,000 of the largest U.S. companies based on total market capitalization. Index returns are based on a market capitalization-weighted average of relative price changes of the component stocks plus dividends whose reinvestments are compounded daily. Index returns provided by Bloomberg. ACWIxUS is designed to measure large and mid-cap representation across 22 of 23 Developed Markets countries (excluding the U.S.) and 24 Emerging Markets countries. The Index is denominated in U.S. dollars. The Index returns assume daily investment of gross dividends (which do not account for applicable dividend taxation) prior to 12/31/1998, as net returns were not available. Subsequent to 12/31/1998, the Index returns are net of withholding taxes. They assume daily reinvestment of net dividends thus accounting for any applicable dividend taxation. Index returns provided by Bloomberg. BAB and BIAB are both unmanaged, market value-weighted indices of U.S. domestic investment-grade debt issues, including government, corporate, asset-backed and mortgage-backed securities. BAB includes maturities of one year or more; BIAB includes maturities of greater than one year but less than ten years. BAB and BIAB returns provided by Interactive Data. Indices returns do not reflect any fees or expenses. Returns provided are calculated monthly using a blended allocation. Because the target date fund’s asset allocation will vary over time, the composition of the target date portfolio may not match the composition of the comparative Target Composite Benchmark. Mid-month performance is not available for the Composite Benchmark. Performance shown is from the first of the month following the corresponding Fund’s inception date.
15
Performance Update as of October 31, 2017 - Target 2040 Series
(unaudited)
AVERAGE ANNUAL TOTAL RETURNS AS OF OCTOBER 31, 2017 | ||||||||||||
| ONE YEAR1 | FIVE YEAR | SINCE INCEPTION2 | ||||||||||
Manning & Napier Fund, Inc. - Target 2040 - Class K3 | 16.08 | % | 9.68 | % | 6.52 | % | ||||||
Manning & Napier Fund, Inc. - Target 2040 - Class R3 | 15.70 | % | 9.40 | % | 6.27 | % | ||||||
Manning & Napier Fund, Inc. - Target 2040 - Class I3 | 16.36 | % | 9.96 | % | 6.81 | % | ||||||
Manning & Napier Fund, Inc. - Target 2040 - Class R63,4 | 16.36 | % | 9.96 | % | 6.81 | % | ||||||
S&P Target Date 2040 Index5 | 19.39 | % | 10.84 | % | 6.92 | % | ||||||
2040 Composite Benchmark6 | 17.67 | % | 10.62 | % | 7.09 | % | ||||||
The following graph compares the value of a $10,000 investment in the Manning & Napier Fund, Inc. - Target 2040 Series - Class K from its inception2 (3/28/08) to present (10/31/17) to the S&P Target Date 2040 Index and the 2040 Composite Benchmark.
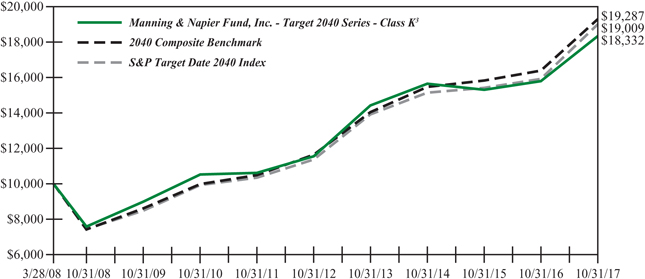
1The returns shown are based on net asset values calculated for shareholder transactions and may differ from the returns shown in the financial highlights, which reflect adjustments made to the net asset values in accordance with accounting principles generally accepted in the United States of America.
2Performance numbers for the Series and the S&P Target Date Index are calculated from March 28, 2008, the Series’ inception date. Performance numbers for the Target Composite Benchmark are calculated from April 1, 2008.
3The Series’ performance does not reflect the deduction of taxes that a shareholder would pay on fund distributions or the redemption of shares. The Series’ performance is historical and may not be indicative of future results. The performance returns shown are inclusive of the net expense ratio of the Series. For the year ended October 31, 2017, this net expense ratio was 0.31% for Class K, 0.56% for Class R, 0.06% for Class I and 0.05% for Class R6. The gross expense ratio, which does not account for any voluntary or contractual waivers currently in effect, was 0.45% for Class K, 0.70% for Class R, 0.20% for Class I and 0.19% for Class R6 for the year ended October 31, 2017.
4For periods prior to the inception of Class R6 on October 16, 2017, the performance figures are hypothetical and reflect the performance of the Manning & Napier, Inc. - Target Series - Class I
5The S&P Target Date Index Series is a series of unmanaged indices that reflect the market consensus for asset allocations for different target date horizons. Asset class weights are established annually and rebalanced monthly. Prior to 02/26/2010, the indices were rebalanced annually. All returns prior to 05/31/2007 are back-tested. Index returns assume daily reinvestment of dividends. Beginning 06/01/2017, the asset class exposure for each index is represented by indices and returns do not reflect any fees or expenses. Prior to 06/01/2017, the asset class exposure for each index is represented by exchange traded funds (ETFs) and returns are net of ETF expenses. Index returns provided by Bloomberg. S&P Dow Jones Indices LLC, a subsidiary of the McGraw Hill Financial, Inc., is the publisher of various index based data products and services and has licensed certain of its products and services for use by Manning & Napier. All such content Copyright © 2017 by S&P Dow Jones Indices LLC and/or its affiliates. All rights reserved. Neither S&P Dow Jones Indices LLC, Dow Jones Trademark Holdings LLC, their affiliates nor their third party licensors make any representation or warranty, express or implied, as to the ability of
16
Performance Update as of October 31, 2017 - Target 2040 Series
(unaudited)
any index to accurately represent the asset class or market sector that it purports to represent and none of these parties shall have any liability for any errors, omissions, or interruptions of any index or the data included therein.
6The Target Composite Benchmark represents the performance of the target date fund’s asset classes according to their respective weightings, as adjusted over time to reflect the target date fund’s increasingly conservative asset allocations. The following indices are used to calculate the Target Composite Benchmarks: Russell 3000® Index (Russell 3000), MSCI ACWI ex USA Index (ACWIxUS), and Bloomberg Barclays U.S. Aggregate Bond Index (BAB) and/or Bloomberg Barclays U.S. Intermediate Aggregate Bond Index (BIAB). Russell 3000 is an unmanaged index that consists of 3,000 of the largest U.S. companies based on total market capitalization. Index returns are based on a market capitalization-weighted average of relative price changes of the component stocks plus dividends whose reinvestments are compounded daily. Index returns provided by Bloomberg. ACWIxUS is designed to measure large and mid-cap representation across 22 of 23 Developed Markets countries (excluding the U.S.) and 24 Emerging Markets countries. The Index is denominated in U.S. dollars. The Index returns assume daily investment of gross dividends (which do not account for applicable dividend taxation) prior to 12/31/1998, as net returns were not available. Subsequent to 12/31/1998, the Index returns are net of withholding taxes. They assume daily reinvestment of net dividends thus accounting for any applicable dividend taxation. Index returns provided by Bloomberg. BAB and BIAB are both unmanaged, market value-weighted indices of U.S. domestic investment-grade debt issues, including government, corporate, asset-backed and mortgage-backed securities. BAB includes maturities of one year or more; BIAB includes maturities of greater than one year but less than ten years. BAB and BIAB returns provided by Interactive Data. Indices returns do not reflect any fees or expenses. Returns provided are calculated monthly using a blended allocation. Because the target date fund’s asset allocation will vary over time, the composition of the target date portfolio may not match the composition of the comparative Target Composite Benchmark. Mid-month performance is not available for the Composite Benchmark. Performance shown is from the first of the month following the corresponding Fund’s inception date.
17
Performance Update as of October 31, 2017 - Target 2045 Series
(unaudited)
AVERAGE ANNUAL TOTAL RETURNS AS OF OCTOBER 31, 2017 | ||||||||||||
| ONE YEAR1 | FIVE YEAR | SINCE INCEPTION2 | ||||||||||
Manning & Napier Fund, Inc. - Target 2045 - Class K3 | 17.77 | % | 10.20 | % | 11.49 | % | ||||||
Manning & Napier Fund, Inc. - Target 2045 - Class R3 | 17.42 | % | 9.91 | % | 11.18 | % | ||||||
Manning & Napier Fund, Inc. - Target 2045 - Class I3 | 18.08 | % | 10.48 | % | 11.75 | % | ||||||
Manning & Napier Fund, Inc. - Target 2045 - Class R63,4 | 18.08 | % | 10.48 | % | 11.75 | % | ||||||
S&P Target Date 2045 Index5 | 19.13 | % | 11.15 | % | 11.36 | % | ||||||
2045 Composite Benchmark6 | 20.28 | % | 11.21 | % | 12.15 | % | ||||||
The following graph compares the value of a $10,000 investment in the Manning & Napier Fund, Inc. - Target 2045 Series - Class K from its inception2 (6/25/12) to present (10/31/17) to the S&P Target Date 2045 Index and the 2045 Composite Benchmark.
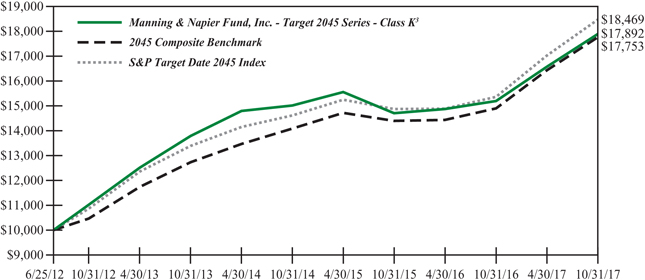
1The returns shown are based on net asset values calculated for shareholder transactions and may differ from the returns shown in the financial highlights, which reflect adjustments made to the net asset values in accordance with accounting principles generally accepted in the United States of America.
2Performance numbers for the Series and the S&P Target Date Index are calculated from June 25, 2012, the Series’ inception date. Performance numbers for the Target Composite Benchmark are calculated from July 1, 2012.
3The Series’ performance does not reflect the deduction of taxes that a shareholder would pay on fund distributions or the redemption of shares. The Series’ performance is historical and may not be indicative of future results. The performance returns shown are inclusive of the net expense ratio of the Series. For the year ended October 31, 2017, this net expense ratio was 0.31% for Class K, 0.55% for Class R, 0.05% for Class I and 0.05% for Class R6. The gross expense ratio, which does not account for any voluntary or contractual waivers currently in effect, was 1.28% for Class K, 1.52% for Class R, 1.02% for Class I and 1.02% for Class R6 for the year ended October 31, 2017.
4For periods prior to the inception of Class R6 on October 16, 2017, the performance figures are hypothetical and reflect the performance of the Manning & Napier, Inc. - Target Series - Class I
5The S&P Target Date Index Series is a series of unmanaged indices that reflect the market consensus for asset allocations for different target date horizons. Asset class weights are established annually and rebalanced monthly. Prior to 02/26/2010, the indices were rebalanced annually. All returns prior to 05/31/2007 are back-tested. Index returns assume daily reinvestment of dividends. Beginning 06/01/2017, the asset class exposure for each index is represented by indices and returns do not reflect any fees or expenses. Prior to 06/01/2017, the asset class exposure for each index is represented by exchange traded funds (ETFs) and returns are net of ETF expenses. Index returns provided by Bloomberg. S&P Dow Jones Indices LLC, a subsidiary of the McGraw Hill Financial, Inc., is the publisher of various index based data products and services and has licensed certain of its products and services for use by Manning & Napier. All such content Copyright © 2017 by S&P Dow Jones Indices LLC and/or its affiliates. All rights reserved. Neither S&P Dow Jones Indices LLC, Dow Jones Trademark Holdings LLC, their affiliates nor their third party licensors make any representation or warranty, express or implied, as to the ability of
18
Performance Update as of October 31, 2017 - Target 2045 Series
(unaudited)
any index to accurately represent the asset class or market sector that it purports to represent and none of these parties shall have any liability for any errors, omissions, or interruptions of any index or the data included therein.
6The Target Composite Benchmark represents the performance of the target date fund’s asset classes according to their respective weightings, as adjusted over time to reflect the target date fund’s increasingly conservative asset allocations. The following indices are used to calculate the Target Composite Benchmarks: Russell 3000® Index (Russell 3000), MSCI ACWI ex USA Index (ACWIxUS), and Bloomberg Barclays U.S. Aggregate Bond Index (BAB) and/or Bloomberg Barclays U.S. Intermediate Aggregate Bond Index (BIAB). Russell 3000 is an unmanaged index that consists of 3,000 of the largest U.S. companies based on total market capitalization. Index returns are based on a market capitalization-weighted average of relative price changes of the component stocks plus dividends whose reinvestments are compounded daily. Index returns provided by Bloomberg. ACWIxUS is designed to measure large and mid-cap representation across 22 of 23 Developed Markets countries (excluding the U.S.) and 24 Emerging Markets countries. The Index is denominated in U.S. dollars. The Index returns assume daily investment of gross dividends (which do not account for applicable dividend taxation) prior to 12/31/1998, as net returns were not available. Subsequent to 12/31/1998, the Index returns are net of withholding taxes. They assume daily reinvestment of net dividends thus accounting for any applicable dividend taxation. Index returns provided by Bloomberg. BAB and BIAB are both unmanaged, market value-weighted indices of U.S. domestic investment-grade debt issues, including government, corporate, asset-backed and mortgage-backed securities. BAB includes maturities of one year or more; BIAB includes maturities of greater than one year but less than ten years. BAB and BIAB returns provided by Interactive Data. Indices returns do not reflect any fees or expenses. Returns provided are calculated monthly using a blended allocation. Because the target date fund’s asset allocation will vary over time, the composition of the target date portfolio may not match the composition of the comparative Target Composite Benchmark. Mid-month performance is not available for the Composite Benchmark. Performance shown is from the first of the month following the corresponding Fund’s inception date.
19
Performance Update as of October 31, 2017 - Target 2050 Series
(unaudited)
AVERAGE ANNUAL TOTAL RETURNS AS OF OCTOBER 31, 2017 | ||||||||||||
| ONE YEAR1 | FIVE YEAR | SINCE INCEPTION2 | ||||||||||
Manning & Napier Fund, Inc. - Target 2050 - Class K3 | 18.43 | % | 10.46 | % | 7.14 | % | ||||||
Manning & Napier Fund, Inc. - Target 2050 - Class R3 | 18.22 | % | 10.19 | % | 6.88 | % | ||||||
Manning & Napier Fund, Inc. - Target 2050 - Class I3 | 18.79 | % | 10.74 | % | 7.42 | % | ||||||
Manning & Napier Fund, Inc. - Target 2050 - Class R63,4 | 18.79 | % | 10.74 | % | 7.42 | % | ||||||
S&P Target Date 2050 Index5 | 21.09 | % | 11.54 | % | 7.14 | % | ||||||
2050 Composite Benchmark6 | 19.76 | % | 11.26 | % | 7.43 | % | ||||||
The following graph compares the value of a $10,000 investment in the Manning & Napier Fund, Inc. - Target 2050 Series - Class K from its inception2 (3/28/08) to present (10/31/17) to the S&P Target Date 2050 Index and the 2050 Composite Benchmark.
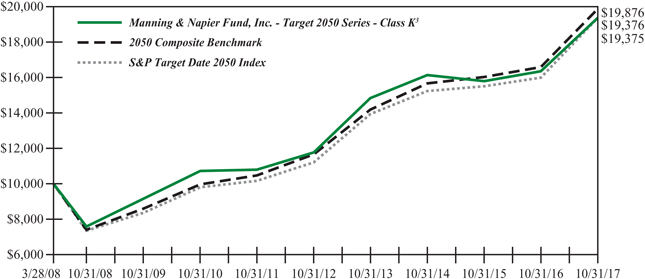
1The returns shown are based on net asset values calculated for shareholder transactions and may differ from the returns shown in the financial highlights, which reflect adjustments made to the net asset values in accordance with accounting principles generally accepted in the United States of America.
2Performance numbers for the Series and the S&P Target Date Index are calculated from March 28, 2008, the Series’ inception date. Performance numbers for the Target Composite Benchmark are calculated from April 1, 2008.
3The Series’ performance does not reflect the deduction of taxes that a shareholder would pay on fund distributions or the redemption of shares. The Series’ performance is historical and may not be indicative of future results. The performance returns shown are inclusive of the net expense ratio of the Series. For the year ended October 31, 2017, this net expense ratio was 0.31% for Class K, 0.56% for Class R, 0.06% for Class I and 0.05% for Class R6. The gross expense ratio, which does not account for any voluntary or contractual waivers currently in effect, was 0.72% for Class K, 0.97% for Class R, 0.47% for Class I and 0.46% for Class R6 for the year ended October 31, 2017.
4For periods prior to the inception of Class R6 on October 16, 2017, the performance figures are hypothetical and reflect the performance of the Manning & Napier, Inc. - Target Series - Class I
5The S&P Target Date Index Series is a series of unmanaged indices that reflect the market consensus for asset allocations for different target date horizons. Asset class weights are established annually and rebalanced monthly. Prior to 02/26/2010, the indices were rebalanced annually. All returns prior to 05/31/2007 are back-tested. New Target Date indices are launched with five years of historical returns matching those of the closest dated index. Historical returns from 05/31/2007 to 5/31/2011 for the S&P Target Date 2050 Index are identical to the returns of the S&P Target Date 2045 Index and were not calculated using back-tested proforma data. Index returns assume daily reinvestment of dividends. Beginning 06/01/2017, the asset class exposure for each index is represented by indices and returns do not reflect any fees or expenses. Prior to 06/01/2017, the asset class exposure for each index is represented by exchange traded funds (ETFs) and returns are net of ETF expenses. Index returns provided by Bloomberg. S&P Dow Jones Indices LLC, a subsidiary of the McGraw Hill Financial, Inc., is the publisher of various index based data products and services and has licensed certain of its products and services for use by Manning & Napier. All such content Copyright © 2017 by S&P Dow Jones Indices LLC and/or its affiliates. All rights reserved. Neither S&P Dow Jones Indices
20
Performance Update as of October 31, 2017 - Target 2050 Series
(unaudited)
LLC, Dow Jones Trademark Holdings LLC, their affiliates nor their third party licensors make any representation or warranty, express or implied, as to the ability of any index to accurately represent the asset class or market sector that it purports to represent and none of these parties shall have any liability for any errors, omissions, or interruptions of any index or the data included therein.
6The Target Composite Benchmark represents the performance of the target date fund’s asset classes according to their respective weightings, as adjusted over time to reflect the target date fund’s increasingly conservative asset allocations. The following indices are used to calculate the Target Composite Benchmarks: Russell 3000® Index (Russell 3000), MSCI ACWI ex USA Index (ACWIxUS), and Bloomberg Barclays U.S. Aggregate Bond Index (BAB) and/or Bloomberg Barclays U.S. Intermediate Aggregate Bond Index (BIAB). Russell 3000 is an unmanaged index that consists of 3,000 of the largest U.S. companies based on total market capitalization. Index returns are based on a market capitalization-weighted average of relative price changes of the component stocks plus dividends whose reinvestments are compounded daily. Index returns provided by Bloomberg. ACWIxUS is designed to measure large and mid-cap representation across 22 of 23 Developed Markets countries (excluding the U.S.) and 24 Emerging Markets countries. The Index is denominated in U.S. dollars. The Index returns assume daily investment of gross dividends (which do not account for applicable dividend taxation) prior to 12/31/1998, as net returns were not available. Subsequent to 12/31/1998, the Index returns are net of withholding taxes. They assume daily reinvestment of net dividends thus accounting for any applicable dividend taxation. Index returns provided by Bloomberg. BAB and BIAB are both unmanaged, market value-weighted indices of U.S. domestic investment-grade debt issues, including government, corporate, asset-backed and mortgage-backed securities. BAB includes maturities of one year or more; BIAB includes maturities of greater than one year but less than ten years. BAB and BIAB returns provided by Interactive Data. Indices returns do not reflect any fees or expenses. Returns provided are calculated monthly using a blended allocation. Because the target date fund’s asset allocation will vary over time, the composition of the target date portfolio may not match the composition of the comparative Target Composite Benchmark. Mid-month performance is not available for the Composite Benchmark. Performance shown is from the first of the month following the corresponding Fund’s inception date.
21
Performance Update as of October 31, 2017 - Target 2055 Series
(unaudited)
AVERAGE ANNUAL TOTAL RETURNS AS OF OCTOBER 31, 2017 | ||||||||||||
| ONE YEAR1 | FIVE YEAR | SINCE INCEPTION2 | ||||||||||
Manning & Napier Fund, Inc. - Target 2055 - Class K3 | 18.41 | % | 10.39 | % | 11.72 | % | ||||||
Manning & Napier Fund, Inc. - Target 2055 - Class R3 | 18.18 | % | 10.03 | % | 11.36 | % | ||||||
Manning & Napier Fund, Inc. - Target 2055 - Class I3 | 18.77 | % | 10.76 | % | 12.09 | % | ||||||
Manning & Napier Fund, Inc. - Target 2055 - Class R63,4 | 18.77 | % | 10.76 | % | 12.09 | % | ||||||
S&P Target Date 2055 Index5 | 21.57 | % | 11.80 | % | 12.78 | % | ||||||
2055 Composite Benchmark6 | 19.76 | % | 11.26 | % | 11.47 | % | ||||||
The following graph compares the value of a $10,000 investment in the Manning & Napier Fund, Inc. - Target 2055 Series - Class K from its inception2 (6/25/12) to present (10/31/17) to the S&P Target Date 2055 Index and the 2055 Composite Benchmark.
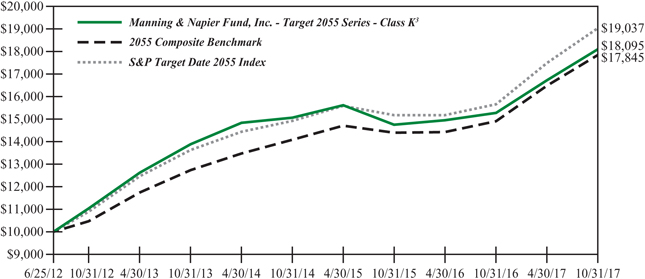
1The returns shown are based on net asset values calculated for shareholder transactions and may differ from the returns shown in the financial highlights, which reflect adjustments made to the net asset values in accordance with accounting principles generally accepted in the United States of America.
2Performance numbers for the Series and the S&P Target Date Index are calculated from June 25, 2012, the Series’ inception date. Performance numbers for the Target Composite Benchmark are calculated from July 1, 2012.
3The Series’ performance does not reflect the deduction of taxes that a shareholder would pay on fund distributions or the redemption of shares. The Series’ performance is historical and may not be indicative of future results. The performance returns shown are inclusive of the net expense ratio of the Series. For the year ended October 31, 2017, this net expense ratio was 0.31% for Class K, 0.55% for Class R, 0.05% for Class I and 0.05% for Class R6. The gross expense ratio, which does not account for any voluntary or contractual waivers currently in effect, was 2.46% for Class K, 2.70% for Class R, 2.20% for Class I and 2.20% for Class R6 for the year ended October 31, 2017.
4For periods prior to the inception of Class R6 on October 16, 2017, the performance figures are hypothetical and reflect the performance of the Manning & Napier, Inc. - Target Series - Class I
5The S&P Target Date Index Series is a series of unmanaged indices that reflect the market consensus for asset allocations for different target date horizons. Asset class weights are established annually and rebalanced monthly. Prior to 02/26/2010, the indices were rebalanced annually. All returns prior to 05/31/2007 are back-tested. New Target Date indices are launched with five years of historical returns matching those of the closest dated index. Historical returns from 05/31/2007 to 05/31/2012 for the S&P Target Date 2055 Index are identical to the returns of the S&P Target Date 2050 Index and were not calculated using back-tested proforma data. Index returns assume daily reinvestment of dividends. Beginning 06/01/2017, the asset class exposure for each index is represented by indices and returns do not reflect any fees or expenses. Prior to 06/01/2017, the asset class exposure for each index is represented by exchange traded funds (ETFs) and returns are net of ETF expenses. Index returns provided by Bloomberg. S&P Dow Jones Indices LLC, a subsidiary of the McGraw Hill Financial, Inc., is the publisher of various index based data products and services and has licensed certain of its products and services for use by Manning & Napier. All such content Copyright © 2017 by S&P Dow Jones Indices LLC and/or its affiliates. All rights reserved. Neither S&P Dow Jones Indices
22
Performance Update as of October 31, 2017 - Target 2055 Series
(unaudited)
LLC, Dow Jones Trademark Holdings LLC, their affiliates nor their third party licensors make any representation or warranty, express or implied, as to the ability of any index to accurately represent the asset class or market sector that it purports to represent and none of these parties shall have any liability for any errors, omissions, or interruptions of any index or the data included therein.
6The Target Composite Benchmark represents the performance of the target date fund’s asset classes according to their respective weightings, as adjusted over time to reflect the target date fund’s increasingly conservative asset allocations. The following indices are used to calculate the Target Composite Benchmarks: Russell 3000® Index (Russell 3000), MSCI ACWI ex USA Index (ACWIxUS), and Bloomberg Barclays U.S. Aggregate Bond Index (BAB) and/or Bloomberg Barclays U.S. Intermediate Aggregate Bond Index (BIAB). Russell 3000 is an unmanaged index that consists of 3,000 of the largest U.S. companies based on total market capitalization. Index returns are based on a market capitalization-weighted average of relative price changes of the component stocks plus dividends whose reinvestments are compounded daily. Index returns provided by Bloomberg. ACWIxUS is designed to measure large and mid-cap representation across 22 of 23 Developed Markets countries (excluding the U.S.) and 24 Emerging Markets countries. The Index is denominated in U.S. dollars. The Index returns assume daily investment of gross dividends (which do not account for applicable dividend taxation) prior to 12/31/1998, as net returns were not available. Subsequent to 12/31/1998, the Index returns are net of withholding taxes. They assume daily reinvestment of net dividends thus accounting for any applicable dividend taxation. Index returns provided by Bloomberg. BAB and BIAB are both unmanaged, market value-weighted indices of U.S. domestic investment-grade debt issues, including government, corporate, asset-backed and mortgage-backed securities. BAB includes maturities of one year or more; BIAB includes maturities of greater than one year but less than ten years. BAB and BIAB returns provided by Interactive Data. Indices returns do not reflect any fees or expenses. Returns provided are calculated monthly using a blended allocation. Because the target date fund’s asset allocation will vary over time, the composition of the target date portfolio may not match the composition of the comparative Target Composite Benchmark. Mid-month performance is not available for the Composite Benchmark. Performance shown is from the first of the month following the corresponding Fund’s inception date.
23
Performance Update as of October 31, 2017 - Target 2060 Series
(unaudited)
AVERAGE ANNUAL TOTAL RETURNS AS OF OCTOBER 31, 2017 | ||||||||
ONE YEAR1 | SINCE INCEPTION2 | |||||||
Manning & Napier Fund, Inc. - Target 2060 - Class K3 | 18.45 | % | 12.02 | % | ||||
Manning & Napier Fund, Inc. - Target 2060 - Class R3 | 18.18 | % | 11.76 | % | ||||
Manning & Napier Fund, Inc. - Target 2060 - Class I3 | 18.69 | % | 12.26 | % | ||||
Manning & Napier Fund, Inc. - Target 2060 - Class R63,4 | 18.69 | % | 12.26 | % | ||||
S&P Target Date 2060+ Index5 | 21.94 | % | 13.61 | % | ||||
2060 Composite Benchmark6 | 19.76 | % | 14.25 | % | ||||
The following graph compares the value of a $10,000 investment in the Manning & Napier Fund, Inc. - Target 2060 Series - Class K from its inception2 (9/21/15) to present (10/31/17) to the S&P Target Date 2060+ Index and the 2060 Composite Benchmark.
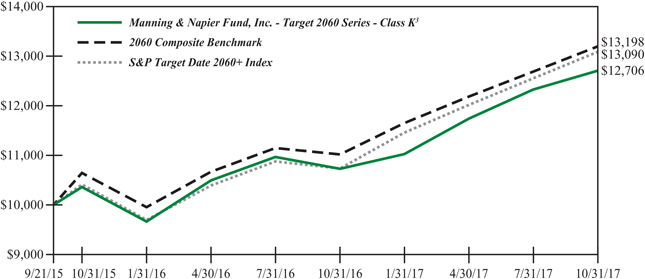
1The returns shown are based on net asset values calculated for shareholder transactions and may differ from the returns shown in the financial highlights, which reflect adjustments made to the net asset values in accordance with accounting principles generally accepted in the United States of America.
2Performance numbers for the Series and the S&P Target Date Index are calculated from September 21, 2015, the Series’ inception date. Performance numbers for the Target Composite Benchmark are calculated from October 1, 2015.
3The Series’ performance does not reflect the deduction of taxes that a shareholder would pay on fund distributions or the redemption of shares. The Series’ performance is historical and may not be indicative of future results. The performance returns shown are inclusive of the net expense ratio of the Series. For the year ended October 31, 2017, this annualized net expense ratio was 0.31% for Class K, 0.55% for Class R, 0.05% for Class I and 0.05% for Class R6. The annualized gross expense ratio, which does not account for any voluntary or contractual waivers currently in effect, was 5.57% for Class K, 5.81% for Class R, 5.31% for Class I and 5.31% for Class R6 for the year ended October 31, 2017.
4For periods prior to the inception of Class R6 on October 16, 2017, the performance figures are hypothetical and reflect the performance of the Manning & Napier, Inc. - Target Series - Class I
5The S&P Target Date Index Series is a series of unmanaged indices that reflect the market consensus for asset allocations for different target date horizons. Asset class weights are established annually and rebalanced monthly. Prior to 02/26/2010, the indices were rebalanced annually. All returns prior to 05/31/2007 are back-tested. New Target Date indices are launched with five years of historical returns matching those of the closest dated index. Historical returns from 05/28/2010 to 05/29/2015 for the S&P Target Date 2060+ Index are identical to the returns of the S&P Target Date 2055 Index and were not calculated using back-tested proforma data. Index returns assume daily reinvestment of dividends. Beginning 06/01/2017, the asset class exposure for each index is represented by indices and returns do not reflect any fees or expenses. Prior to 06/01/2017, the asset class exposure for each index is represented by exchange traded funds (ETFs) and returns are net of ETF expenses. Index returns provided by Bloomberg. S&P Dow Jones
24
Performance Update as of October 31, 2017 - Target 2060 Series
(unaudited)
Indices LLC, a subsidiary of the McGraw Hill Financial, Inc., is the publisher of various index based data products and services and has licensed certain of its products and services for use by Manning & Napier. All such content Copyright © 2017 by S&P Dow Jones Indices LLC and/or its affiliates. All rights reserved. Neither S&P Dow Jones Indices LLC, Dow Jones Trademark Holdings LLC, their affiliates nor their third party licensors make any representation or warranty, express or implied, as to the ability of any index to accurately represent the asset class or market sector that it purports to represent and none of these parties shall have any liability for any errors, omissions, or interruptions of any index or the data included therein.
6The Target Composite Benchmark represents the performance of the target date fund’s asset classes according to their respective weightings, as adjusted over time to reflect the target date fund’s increasingly conservative asset allocations. The following indices are used to calculate the Target Composite Benchmarks: Russell 3000® Index (Russell 3000), MSCI ACWI ex USA Index (ACWIxUS), and Bloomberg Barclays U.S. Aggregate Bond Index (BAB) and/or Bloomberg Barclays U.S. Intermediate Aggregate Bond Index (BIAB). Russell 3000 is an unmanaged index that consists of 3,000 of the largest U.S. companies based on total market capitalization. Index returns are based on a market capitalization-weighted average of relative price changes of the component stocks plus dividends whose reinvestments are compounded daily. Index returns provided by Bloomberg. ACWIxUS is designed to measure large and mid-cap representation across 22 of 23 Developed Markets countries (excluding the U.S.) and 24 Emerging Markets countries. The Index is denominated in U.S. dollars. The Index returns assume daily investment of gross dividends (which do not account for applicable dividend taxation) prior to 12/31/1998, as net returns were not available. Subsequent to 12/31/1998, the Index returns are net of withholding taxes. They assume daily reinvestment of net dividends thus accounting for any applicable dividend taxation. Index returns provided by Bloomberg. BAB and BIAB are both unmanaged, market value-weighted indices of U.S. domestic investment-grade debt issues, including government, corporate, asset-backed and mortgage-backed securities. BAB includes maturities of one year or more; BIAB includes maturities of greater than one year but less than ten years. BAB and BIAB returns provided by Interactive Data. Indices returns do not reflect any fees or expenses. Returns provided are calculated monthly using a blended allocation. Because the target date fund’s asset allocation will vary over time, the composition of the target date portfolio may not match the composition of the comparative Target Composite Benchmark. Mid-month performance is not available for the Composite Benchmark. Performance shown is from the first of the month following the corresponding Fund’s inception date.
25
Shareholder Expense Example
(unaudited)
As a shareholder of the Series, you incur ongoing costs, including management fees, shareholder service fees and other Series expenses. This example is intended to help you understand your ongoing costs (in dollars) of investing in the Series and to compare these costs with the ongoing costs of investing in other mutual funds.
The example is based on an investment of $1,000 invested at the beginning of the period and held for the entire period (May 1, 2017 to October 31, 2017).
Actual Expenses
The Actual lines of the tables below provide information about actual account values and actual expenses. You may use the information in these lines, together with the amount you invested, to estimate the expenses that you paid over the period. Simply divide your account value by $1,000 (for example, an $8,600 account value divided by $1,000 = 8.6), then multiply the result by the number in the Actual line for the Series and Class in which you have invested under the heading entitled “Expenses Paid During Period” to estimate the expenses you paid on your account during this period.
Hypothetical Example for Comparison Purposes
The Hypothetical lines of the tables below provide information about hypothetical account values and hypothetical expenses based on the Class’ actual expense ratio and an assumed rate of return of 5% per year before expenses, which is not the Class’ actual return. The hypothetical account values and expenses may not be used to estimate the actual ending account balance or expenses you paid during the period. You may use this information to compare the ongoing costs of investing in a Class of the Series and other funds. To do so, compare this 5% hypothetical example for the Series and Class in which you have invested with the 5% hypothetical examples that appear in the shareholder reports of the other funds.
Please note that the expenses shown in the tables are meant to highlight your ongoing costs only and do not reflect any transaction costs, such as sales charges (loads), redemption fees, or exchange fees that you may incur in other mutual funds. Therefore, the Hypothetical lines of the tables are useful in comparing ongoing costs only, and will not help you determine the relative total costs of owning different funds.
| BEGINNING ACCOUNT VALUE 5/1/171 | ENDING ACCOUNT VALUE 10/31/17 | EXPENSES PAID DURING PERIOD 5/1/17-10/31/172 | ANNUALIZED EXPENSE RATIO3 | |||||
Target Income | ||||||||
Actual (Class K) | $1,000.00 | $1,033.70 | $1.59 | 0.31% | ||||
Hypothetical4 | $1,000.00 | $1,023.64 | $1.58 | 0.31% | ||||
Actual (Class R) | $1,000.00 | $1,033.30 | $2.82 | 0.55% | ||||
Hypothetical4 | $1,000.00 | $1,022.43 | $2.80 | 0.55% | ||||
Actual (Class I) | $1,000.00 | $1,035.80 | $0.31 | 0.06% | ||||
Hypothetical4 | $1,000.00 | $1,024.90 | $0.31 | 0.06% | ||||
Actual (Class R6) | $1,000.00 | $ 999.00 | $0.02 | 0.05% | ||||
Hypothetical4 | $1,000.00 | $1,002.03 | $0.02 | 0.05% | ||||
26
Shareholder Expense Example
(unaudited)
| BEGINNING ACCOUNT VALUE 5/1/171 | ENDING ACCOUNT VALUE 10/31/17 | EXPENSES PAID DURING PERIOD 5/1/17-10/31/172 | ANNUALIZED EXPENSE RATIO3 | |||||
Target 2015 | ||||||||
Actual (Class K) | $1,000.00 | $1,039.20 | $1.59 | 0.31% | ||||
Hypothetical4 | $1,000.00 | $1,023.64 | $1.58 | 0.31% | ||||
Actual (Class R) | $1,000.00 | $1,037.70 | $2.93 | 0.57% | ||||
Hypothetical4 | $1,000.00 | $1,022.33 | $2.91 | 0.57% | ||||
Actual (Class I) | $1,000.00 | $1,041.20 | $0.26 | 0.05% | ||||
Hypothetical4 | $1,000.00 | $1,024.95 | $0.26 | 0.05% | ||||
Actual (Class R6) | $1,000.00 | $ 999.10 | $0.02 | 0.05% | ||||
Hypothetical4 | $1,000.00 | $1,002.03 | $0.02 | 0.05% | ||||
| BEGINNING ACCOUNT VALUE 5/1/17 | ENDING ACCOUNT VALUE 10/31/17 | EXPENSES PAID DURING PERIOD 5/1/17-10/31/172 | ANNUALIZED EXPENSE RATIO3 | |||||
Target 2020 | ||||||||
Actual (Class K) | $1,000.00 | $1,044.50 | $1.60 | 0.31% | ||||
Hypothetical4 | $1,000.00 | $1,023.64 | $1.58 | 0.31% | ||||
Actual (Class R) | $1,000.00 | $1,043.70 | $2.88 | 0.56% | ||||
Hypothetical4 | $1,000.00 | $1,022.38 | $2.85 | 0.56% | ||||
Actual (Class I) | $1,000.00 | $1,045.60 | $0.31 | 0.06% | ||||
Hypothetical4 | $1,000.00 | $1,024.90 | $0.31 | 0.06% | ||||
Actual (Class R6) | $1,000.00 | $ 998.90 | $0.02 | 0.05% | ||||
Hypothetical4 | $1,000.00 | $1,002.03 | $0.02 | 0.05% | ||||
| BEGINNING ACCOUNT VALUE 5/1/171 | ENDING ACCOUNT VALUE 10/31/17 | EXPENSES PAID DURING PERIOD 5/1/17-10/31/172 | ANNUALIZED EXPENSE RATIO3 | |||||
Target 2025 | ||||||||
Actual (Class K) | $1,000.00 | $1,049.00 | $1.60 | 0.31% | ||||
Hypothetical4 | $1,000.00 | $1,023.64 | $1.58 | 0.31% | ||||
Actual (Class R) | $1,000.00 | $1,047.10 | $2.84 | 0.55% | ||||
Hypothetical4 | $1,000.00 | $1,022.43 | $2.80 | 0.55% | ||||
Actual (Class I) | $1,000.00 | $1,050.10 | $0.26 | 0.05% | ||||
Hypothetical4 | $1,000.00 | $1,024.95 | $0.26 | 0.05% | ||||
Actual (Class R6) | $1,000.00 | $ 999.20 | $0.02 | 0.05% | ||||
Hypothetical4 | $1,000.00 | $1,002.03 | $0.02 | 0.05% | ||||
27
Shareholder Expense Example
(unaudited)
| BEGINNING ACCOUNT VALUE 5/1/171 | ENDING ACCOUNT VALUE 10/31/17 | EXPENSES PAID DURING PERIOD 5/1/17-10/31/172 | ANNUALIZED EXPENSE RATIO3 | |||||
Target 2030 | ||||||||
Actual (Class K) | $1,000.00 | $1,058.30 | $1.61 | 0.31% | ||||
Hypothetical4 | $1,000.00 | $1,023.64 | $1.58 | 0.31% | ||||
Actual (Class R) | $1,000.00 | $1,055.80 | $2.90 | 0.56% | ||||
Hypothetical4 | $1,000.00 | $1,022.38 | $2.85 | 0.56% | ||||
Actual (Class I) | $1,000.00 | $1,058.90 | $0.31 | 0.06% | ||||
Hypothetical4 | $1,000.00 | $1,024.90 | $0.31 | 0.06% | ||||
Actual (Class R6) | $1,000.00 | $ 999.00 | $0.02 | 0.05% | ||||
Hypothetical4 | $1,000.00 | $1,002.03 | $0.02 | 0.05% | ||||
| BEGINNING ACCOUNT VALUE 5/1/171 | ENDING ACCOUNT VALUE 10/31/17 | EXPENSES PAID DURING PERIOD 5/1/17-10/31/172 | ANNUALIZED EXPENSE RATIO3 | |||||
Target 2035 | ||||||||
Actual (Class K) | $1,000.00 | $1,064.90 | $1.61 | 0.31% | ||||
Hypothetical4 | $1,000.00 | $1,023.64 | $1.58 | 0.31% | ||||
Actual (Class R) | $1,000.00 | $1,063.60 | $2.91 | 0.56% | ||||
Hypothetical4 | $1,000.00 | $1,022.38 | $2.85 | 0.56% | ||||
Actual (Class I) | $1,000.00 | $1,066.70 | $0.26 | 0.05% | ||||
Hypothetical4 | $1,000.00 | $1,024.95 | $0.26 | 0.05% | ||||
Actual (Class R6) | $1,000.00 | $1,000.00 | $0.02 | 0.05% | ||||
Hypothetical4 | $1,000.00 | $1,002.03 | $0.02 | 0.05% | ||||
| BEGINNING ACCOUNT VALUE 5/1/171 | ENDING ACCOUNT VALUE 10/31/17 | EXPENSES PAID DURING PERIOD 5/1/17-10/31/172 | ANNUALIZED EXPENSE RATIO3 | |||||
Target 2040 | ||||||||
Actual (Class K) | $1,000.00 | $1,072.00 | $1.62 | 0.31% | ||||
Hypothetical4 | $1,000.00 | $1,023.64 | $1.58 | 0.31% | ||||
Actual (Class R) | $1,000.00 | $1,070.60 | $2.92 | 0.56% | ||||
Hypothetical4 | $1,000.00 | $1,022.38 | $2.85 | 0.56% | ||||
Actual (Class I) | $1,000.00 | $1,073.90 | $0.31 | 0.06% | ||||
Hypothetical4 | $1,000.00 | $1,024.90 | $0.31 | 0.06% | ||||
Actual (Class R6) | $1,000.00 | $1,001.00 | $0.02 | 0.05% | ||||
Hypothetical4 | $1,000.00 | $1,002.03 | $0.02 | 0.05% | ||||
28
Shareholder Expense Example
(unaudited)
| BEGINNING ACCOUNT VALUE 5/1/171 | ENDING ACCOUNT VALUE 10/31/17 | EXPENSES PAID DURING PERIOD 5/1/17-10/31/172 | ANNUALIZED EXPENSE RATIO3 | |||||
Target 2045 | ||||||||
Actual (Class K) | $1,000.00 | $1,079.80 | $1.63 | 0.31% | ||||
Hypothetical4 | $1,000.00 | $1,023.64 | $1.58 | 0.31% | ||||
Actual (Class R) | $1,000.00 | $1,077.40 | $2.93 | 0.56% | ||||
Hypothetical4 | $1,000.00 | $1,022.38 | $2.85 | 0.56% | ||||
Actual (Class I) | $1,000.00 | $1,081.50 | $0.26 | 0.05% | ||||
Hypothetical4 | $1,000.00 | $1,024.95 | $0.26 | 0.05% | ||||
Actual (Class R6) | $1,000.00 | $1,001.50 | $0.02 | 0.05% | ||||
Hypothetical4 | $1,000.00 | $1,002.03 | $0.02 | 0.05% | ||||
| BEGINNING ACCOUNT VALUE 5/1/171 | ENDING ACCOUNT VALUE 10/31/17 | EXPENSES PAID DURING PERIOD 5/1/17-10/31/172 | ANNUALIZED EXPENSE RATIO3 | |||||
Target 2050 | ||||||||
Actual (Class K) | $1,000.00 | $1,082.10 | $1.63 | 0.31% | ||||
Hypothetical4 | $1,000.00 | $1,023.64 | $1.58 | 0.31% | ||||
Actual (Class R) | $1,000.00 | $1,081.60 | $2.94 | 0.56% | ||||
Hypothetical4 | $1,000.00 | $1,022.38 | $2.85 | 0.56% | ||||
Actual (Class I) | $1,000.00 | $1,083.60 | $0.32 | 0.06% | ||||
Hypothetical4 | $1,000.00 | $1,024.90 | $0.31 | 0.06% | ||||
Actual (Class R6) | $1,000.00 | $1,001.80 | $0.02 | 0.05% | ||||
Hypothetical4 | $1,000.00 | $1,002.03 | $0.02 | 0.05% | ||||
| BEGINNING ACCOUNT VALUE 5/1/171 | ENDING ACCOUNT VALUE 10/31/17 | EXPENSES PAID DURING PERIOD 5/1/17-10/31/172 | ANNUALIZED EXPENSE RATIO3 | |||||
Target 2055 | ||||||||
Actual (Class K) | $1,000.00 | $1,082.40 | $1.63 | 0.31% | ||||
Hypothetical4 | $1,000.00 | $1,023.64 | $1.58 | 0.31% | ||||
Actual (Class R) | $1,000.00 | $1,081.30 | $2.94 | 0.56% | ||||
Hypothetical4 | $1,000.00 | $1,022.38 | $2.85 | 0.56% | ||||
Actual (Class I) | $1,000.00 | $1,083.60 | $0.26 | 0.05% | ||||
Hypothetical4 | $1,000.00 | $1,024.95 | $0.26 | 0.05% | ||||
Actual (Class R6) | $1,000.00 | $1,001.50 | $0.02 | 0.05% | ||||
Hypothetical4 | $1,000.00 | $1,002.03 | $0.02 | 0.05% | ||||
29
Shareholder Expense Example
(unaudited)
| BEGINNING ACCOUNT VALUE 5/1/171 | ENDING ACCOUNT VALUE 10/31/17 | EXPENSES PAID DURING PERIOD 5/1/17-10/31/172 | ANNUALIZED EXPENSE RATIO3 | |||||
Target 2060 | ||||||||
Actual (Class K) | $1,000.00 | $1,082.40 | $1.68 | 0.32% | ||||
Hypothetical4 | $1,000.00 | $1,023.59 | $1.63 | 0.32% | ||||
Actual (Class R) | $1,000.00 | $1,081.50 | $2.89 | 0.55% | ||||
Hypothetical4 | $1,000.00 | $1,022.43 | $2.80 | 0.55% | ||||
Actual (Class I) | $1,000.00 | $1,083.40 | $0.26 | 0.05% | ||||
Hypothetical4 | $1,000.00 | $1,024.95 | $0.26 | 0.05% | ||||
Actual (Class R6) | $1,000.00 | $1,001.60 | $0.02 | 0.05% | ||||
Hypothetical4 | $1,000.00 | $1,002.03 | $0.02 | 0.05% | ||||
1Class R6 inception date was October 16, 2017.
2Expenses are equal to each Class’ annualized expense ratio (for the six-month period), multiplied by the average account value over the period, multiplied by 184/365 (to reflect the one-half year period) (except for the Series’ Class R6 Actual and Hypothetical return information, which reflects the 15 day period ended October 31, 2017 due to its inception date of October 16, 2017). Expenses are based on the most recent fiscal half year; therefore, the expense ratios stated above may differ from the expense ratios stated in the financial highlights, which are based on one-year data (except Class R6 expense ratios which are based on a 15 day period). The Class’ total return would have been lower had certain expenses not been waived during the period.
3Expense ratios of the Class do not include fees and expenses indirectly incurred by the underlying funds. If these expenses were included, the expense ratios would have been higher.
4Assumes 5% annual return before expenses.
30
Portfolio Composition as of October 31, 2017 - Asset Allocation1
(unaudited)
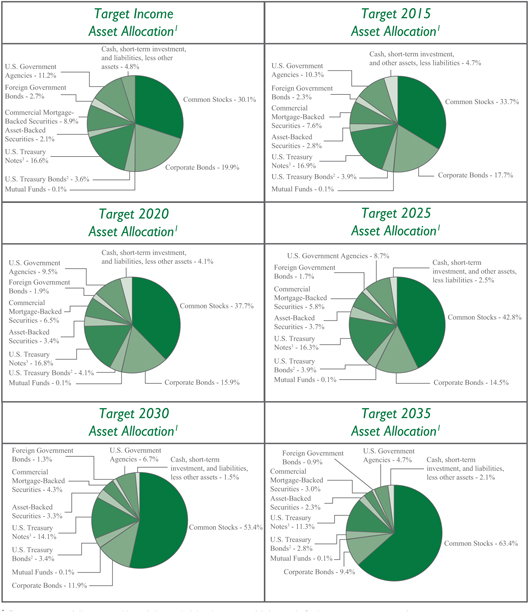
1 Represents portfolio composition of the underlying investment(s) for each Series as a percentage of net assets.
2 A U.S. Treasury Bond is a long-term obligation of the U.S. Treasury issued with a maturity period of more than ten years.
3 A U.S. Treasury Note is an intermediate-term obligation of the U.S. Treasury issued with a maturity period between one and ten years.
31
Portfolio Composition as of October 31, 2017 - Asset Allocation1
(unaudited)
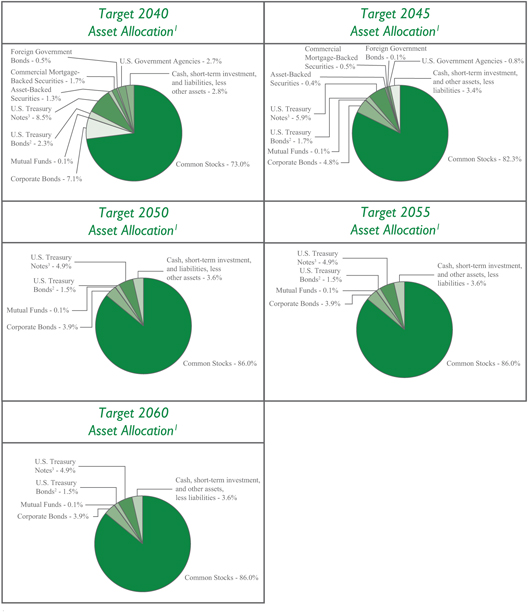
1 Represents portfolio composition of the underlying investment(s) for each Series as a percentage of net assets.
2 A U.S. Treasury Bond is a long-term obligation of the U.S. Treasury issued with a maturity period of more than ten years.
3 A U.S. Treasury Note is an intermediate-term obligation of the U.S. Treasury issued with a maturity period between one and ten years.
32
Investment Portfolios - October 31, 2017
| TARGET INCOME SERIES | SHARES | VALUE (NOTE 2) | ||||||||||
AFFILIATED INVESTMENT COMPANIES - 100.0% | ||||||||||||
Manning & Napier Blended Asset Conservative Series - Class R6 | 9,123,477 | $ | 98,989,721 | |||||||||
|
| |||||||||||
TOTAL AFFILIATED INVESTMENT COMPANIES | ||||||||||||
(Identified Cost $99,164,525) | 98,989,721 | |||||||||||
LIABILITIES, LESS OTHER ASSETS - (0.0%)## | (28,822 | ) | ||||||||||
|
| |||||||||||
NET ASSETS - 100% | $ | 98,960,899 | ||||||||||
|
| |||||||||||
##Less than (0.1%). | ||||||||||||
| TARGET 2015 SERIES | SHARES | VALUE (NOTE 2) | ||||||||||
AFFILIATED INVESTMENT COMPANIES - 99.8% | ||||||||||||
Manning & Napier Blended Asset Conservative Series - Class R6 | 162,798 | $ | 1,766,362 | |||||||||
Manning & Napier Blended Asset Moderate Series - Class R6 | 260,206 | 2,792,015 | ||||||||||
|
| |||||||||||
TOTAL AFFILIATED INVESTMENT COMPANIES | ||||||||||||
(Identified Cost $4,566,801) | 4,558,377 | |||||||||||
OTHER ASSETS, LESS LIABILITIES - 0.2% | 7,335 | |||||||||||
|
| |||||||||||
NET ASSETS - 100% | $ | 4,565,712 | ||||||||||
|
| |||||||||||
| TARGET 2020 SERIES | SHARES | VALUE (NOTE 2) | ||||||||||
AFFILIATED INVESTMENT COMPANIES - 100.0% | ||||||||||||
Manning & Napier Blended Asset Extended Series - Class R6 | 1,723,607 | $17,770,393 | ||||||||||
Manning & Napier Blended Asset Moderate Series - Class R6 | 9,021,970 | 96,805,738 | ||||||||||
|
| |||||||||||
TOTAL AFFILIATED INVESTMENT COMPANIES | ||||||||||||
(Identified Cost $114,787,018) | 114,576,131 | |||||||||||
LIABILITIES, LESS OTHER ASSETS - (0.0%)## | (32,494 | ) | ||||||||||
|
| |||||||||||
NET ASSETS - 100% | $ | 114,543,637 | ||||||||||
|
| |||||||||||
##Less than (0.1%). | ||||||||||||
The accompanying notes are an integral part of the financial statements.
33
Investment Portfolios - October 31, 2017
| TARGET 2025 SERIES | SHARES | VALUE (NOTE 2) | ||||||
AFFILIATED INVESTMENT COMPANIES - 99.6% | ||||||||
Manning & Napier Blended Asset Extended Series - Class R6 | 2,369,434 | $ | 24,428,863 | |||||
Manning & Napier Blended Asset Moderate Series - Class R6 | 1,473,636 | 15,812,118 | ||||||
|
| |||||||
TOTAL AFFILIATED INVESTMENT COMPANIES | ||||||||
(Identified Cost $40,313,908) | 40,240,981 | |||||||
OTHER ASSETS, LESS LIABILITIES - 0.4% | 171,811 | |||||||
|
| |||||||
NET ASSETS - 100% | $ | 40,412,792 | ||||||
|
| |||||||
| TARGET 2030 SERIES | SHARES | VALUE (NOTE 2) | ||||||
AFFILIATED INVESTMENT COMPANIES - 100.0% | ||||||||
Manning & Napier Blended Asset Extended Series - Class R6 | 11,555,674 | $ | 119,139,003 | |||||
Manning & Napier Blended Asset Maximum Series - Class R6 | 1,943,669 | 22,546,555 | ||||||
|
| |||||||
TOTAL AFFILIATED INVESTMENT COMPANIES | ||||||||
(Identified Cost $141,889,900) | 141,685,558 | |||||||
LIABILITIES, LESS OTHER ASSETS - (0.0%)## | (53,299 | ) | ||||||
|
| |||||||
NET ASSETS - 100% | $ | 141,632,259 | ||||||
|
| |||||||
##Less than (0.1%). | ||||||||
| TARGET 2035 SERIES | SHARES | VALUE (NOTE 2) | ||||||
AFFILIATED INVESTMENT COMPANIES - 100.0% | ||||||||
Manning & Napier Blended Asset Extended Series - Class R6 | 1,490,358 | $ | 15,365,587 | |||||
Manning & Napier Blended Asset Maximum Series - Class R6 | 944,105 | 10,951,620 | ||||||
|
| |||||||
TOTAL AFFILIATED INVESTMENT COMPANIES | ||||||||
(Identified Cost $26,334,544) | 26,317,207 | |||||||
LIABILITIES, LESS OTHER ASSETS - (0.0%)## | (323 | ) | ||||||
|
| |||||||
NET ASSETS - 100% | $ | 26,316,884 | ||||||
|
| |||||||
##Less than (0.1%). | ||||||||
The accompanying notes are an integral part of the financial statements.
34
Investment Portfolios - October 31, 2017
| TARGET 2040 SERIES | SHARES | VALUE (NOTE 2) | ||||||
AFFILIATED INVESTMENT COMPANIES - 100.0% | ||||||||
Manning & Napier Blended Asset Extended Series - Class R6 | 2,722,164 | $ | 28,065,508 | |||||
Manning & Napier Blended Asset Maximum Series - Class R6 | 4,824,370 | 55,962,686 | ||||||
|
| |||||||
TOTAL AFFILIATED INVESTMENT COMPANIES | ||||||||
(Identified Cost $84,030,740) | 84,028,194 | |||||||
LIABILITIES, LESS OTHER ASSETS - (0.0%)## | (24,570 | ) | ||||||
|
| |||||||
NET ASSETS - 100% | $ | 84,003,624 | ||||||
|
| |||||||
##Less than (0.1%). | ||||||||
| TARGET 2045 SERIES | SHARES | VALUE (NOTE 2) | ||||||
AFFILIATED INVESTMENT COMPANIES - 100.0% | ||||||||
Manning & Napier Blended Asset Extended Series - Class R6 | 144,835 | $ | 1,493,246 | |||||
Manning & Napier Blended Asset Maximum Series - Class R6 | 1,241,161 | 14,397,470 | ||||||
|
| |||||||
TOTAL AFFILIATED INVESTMENT COMPANIES | ||||||||
(Identified Cost $15,880,904) | 15,890,716 | |||||||
OTHER ASSETS, LESS LIABILITIES - 0.0%## | 3,032 | |||||||
|
| |||||||
NET ASSETS - 100% | $ | 15,893,748 | ||||||
|
| |||||||
##Less than 0.1%. | ||||||||
| TARGET 2050 SERIES | SHARES | VALUE (NOTE 2) | ||||||
AFFILIATED INVESTMENT COMPANIES - 100.0% | ||||||||
Manning & Napier Blended Asset Maximum Series - Class R6 | 3,050,798 | $ | 35,389,255 | |||||
|
| |||||||
TOTAL AFFILIATED INVESTMENT COMPANIES | ||||||||
(Identified Cost $35,356,792) | 35,389,255 | |||||||
LIABILITIES, LESS OTHER ASSETS - (0.0%)## | (8,400 | ) | ||||||
|
| |||||||
NET ASSETS - 100% | $ | 35,380,855 | ||||||
|
| |||||||
##Less than (0.1%). | ||||||||
The accompanying notes are an integral part of the financial statements.
35
Investment Portfolios - October 31, 2017
| TARGET 2055 SERIES | SHARES | VALUE (NOTE 2) | ||||||
AFFILIATED INVESTMENT COMPANIES - 99.9% | ||||||||
Manning & Napier Blended Asset Maximum Series - Class R6 | 580,717 | $ | 6,736,319 | |||||
|
| |||||||
TOTAL AFFILIATED INVESTMENT COMPANIES | ||||||||
(Identified Cost $6,730,303) | 6,736,319 | |||||||
OTHER ASSETS, LESS LIABILITIES - 0.1% | 7,503 | |||||||
|
| |||||||
NET ASSETS - 100% | $ | 6,743,822 | ||||||
|
| |||||||
| TARGET 2060 SERIES | SHARES | VALUE (NOTE 2) | ||||||
AFFILIATED INVESTMENT COMPANIES - 99.7% | ||||||||
Manning & Napier Blended Asset Maximum Series - Class R6 | 398,162 | $ | 4,618,675 | |||||
|
| |||||||
TOTAL AFFILIATED INVESTMENT COMPANIES | ||||||||
(Identified Cost $4,614,492) | 4,618,675 | |||||||
OTHER ASSETS, LESS LIABILITIES - 0.3% | 15,797 | |||||||
|
| |||||||
NET ASSETS - 100% | $ | 4,634,472 | ||||||
|
| |||||||
The accompanying notes are an integral part of the financial statements.
36
Statements of Assets and Liabilities
October 31, 2017
| TARGET INCOME | TARGET 2015 | TARGET 2020 | TARGET 2025 | TARGET 2030 | ||||||||||||||||
ASSETS: | ||||||||||||||||||||
Total investments in Underlying Series: | ||||||||||||||||||||
At value* | $ | 98,989,721 | $ | 4,558,377 | $ | 114,576,131 | $ | 40,240,981 | $ | 141,685,558 | ||||||||||
Receivable from Advisor (Note 3) | 24,106 | 24,556 | 22,677 | 28,211 | 21,830 | |||||||||||||||
Receivable for shares of Underlying Series sold | 13,436 | — | 77,409 | — | 42,524 | |||||||||||||||
Receivable for fund shares sold | 81,076 | 1,435 | 9,339 | 226,071 | 70,357 | |||||||||||||||
Prepaid expenses | 12,744 | 16,180 | 12,442 | 19,936 | 11,955 | |||||||||||||||
|
|
|
|
|
|
|
|
|
| |||||||||||
TOTAL ASSETS | 99,121,083 | 4,600,548 | 114,697,998 | 40,515,199 | 141,832,224 | |||||||||||||||
|
|
|
|
|
|
|
|
|
| |||||||||||
LIABILITIES: | ||||||||||||||||||||
Accrued distribution and service (Rule 12b-1) fees (Note 3) | 20,810 | 905 | 19,315 | 10,423 | 24,504 | |||||||||||||||
Accrued fund accounting and administration fees (Note 3) | 16,463 | 15,787 | 16,668 | 16,026 | 16,830 | |||||||||||||||
Accrued Chief Compliance Officer service fees (Note 3) | 306 | 306 | 306 | 306 | 306 | |||||||||||||||
Payable for fund shares repurchased | 94,512 | 30 | 86,071 | 379 | 121,494 | |||||||||||||||
Audit fees payable | 13,460 | 13,460 | 13,460 | 13,460 | 13,460 | |||||||||||||||
Accrued sub transfer agent fees | 5,600 | 323 | 7,378 | 1,342 | 9,325 | |||||||||||||||
Accrued transfer agent fees | 4,906 | 435 | 4,262 | 5,175 | 6,300 | |||||||||||||||
Custodian fees payable | 1,152 | 2,376 | 2,328 | 2,376 | 2,328 | |||||||||||||||
Payable for shares of Underlying Series purchased | — | 884 | — | 51,324 | — | |||||||||||||||
Other payables and accrued expenses | 2,975 | 330 | 4,573 | 1,596 | 5,418 | |||||||||||||||
|
|
|
|
|
|
|
|
|
| |||||||||||
TOTAL LIABILITIES | 160,184 | 34,836 | 154,361 | 102,407 | 199,965 | |||||||||||||||
|
|
|
|
|
|
|
|
|
| |||||||||||
TOTAL NET ASSETS | $ | 98,960,899 | $ | 4,565,712 | $ | 114,543,637 | $ | 40,412,792 | $ | 141,632,259 | ||||||||||
|
|
|
|
|
|
|
|
|
| |||||||||||
NET ASSETS CONSIST OF: | ||||||||||||||||||||
Capital stock | 100,241 | 4,096 | 121,795 | 33,745 | 148,550 | |||||||||||||||
Additional paid-in-capital | 99,373,535 | 4,996,728 | 116,866,757 | 40,411,797 | 143,199,983 | |||||||||||||||
Undistributed net investment income | 69,715 | 5,301 | 95,605 | 16,400 | 113,350 | |||||||||||||||
Accumulated net realized gain (loss) on Underlying Series | (407,788 | ) | (431,989 | ) | (2,329,633 | ) | 23,777 | (1,625,282 | ) | |||||||||||
Net unrealized appreciation (depreciation) on Underlying Series | (174,804 | ) | (8,424 | ) | (210,887 | ) | (72,927 | ) | (204,342 | ) | ||||||||||
|
|
|
|
|
|
|
|
|
| |||||||||||
TOTAL NET ASSETS | $ | 98,960,899 | $ | 4,565,712 | $ | 114,543,637 | $ | 40,412,792 | $ | 141,632,259 | ||||||||||
|
|
|
|
|
|
|
|
|
| |||||||||||
Class K | ||||||||||||||||||||
Net Assets | $ | 80,785,776 | $ | 4,196,276 | $ | 70,631,657 | $ | 25,591,490 | $ | 89,017,581 | ||||||||||
Shares Outstanding | 8,175,715 | 376,579 | 7,510,795 | 2,138,362 | 9,354,881 | |||||||||||||||
Net Asset Value, Offering Price, and Redemption Price per share | $ | 9.88 | $ | 11.14 | $ | 9.40 | $ | 11.97 | $ | 9.52 | ||||||||||
Class R | ||||||||||||||||||||
Net Assets | $ | 9,910,109 | $ | 40,188 | $ | 10,850,735 | $ | 12,693,242 | $ | 14,499,730 | ||||||||||
Shares Outstanding | 1,015,300 | 3,559 | 1,169,244 | 1,057,829 | 1,537,170 | |||||||||||||||
Net Asset Value, Offering Price, and Redemption Price per share | $ | 9.76 | $ | 11.29 | $ | 9.28 | $ | 12.00 | $ | 9.43 | ||||||||||
Class I | ||||||||||||||||||||
Net Assets | $ | 8,260,019 | $ | 324,253 | $ | 33,056,250 | $ | 2,123,065 | $ | 38,109,951 | ||||||||||
Shares Outstanding | 832,535 | 28,975 | 3,498,933 | 177,861 | 3,962,473 | |||||||||||||||
Net Asset Value, Offering Price, and Redemption Price per share | $ | 9.92 | $ | 11.19 | $ | 9.45 | $ | 11.94 | $ | 9.62 | ||||||||||
Class R6 | ||||||||||||||||||||
Net Assets | $ | 4,995 | $ | 4,995 | $ | 4,995 | $ | 4,995 | $ | 4,997 | ||||||||||
Shares Outstanding | 504 | 446 | 529 | 418 | 520 | |||||||||||||||
Net Asset Value, Offering Price, and Redemption Price per share | $ | 9.92 | 1 | $ | 11.19 | 1 | $ | 9.45 | 1 | $ | 11.94 | 1 | $ | 9.61 | ||||||
*At identified cost | $ | 99,164,525 | $ | 4,566,801 | $ | 114,787,018 | $ | 40,313,908 | $ | 141,889,900 | ||||||||||
|
|
|
|
|
|
|
|
|
| |||||||||||
1 The net asset values of the Class R6 Shares of the Manning & Napier Target Income Series, Target 2015 Series, Target 2020 Series & Target 2025 Series’ net asset value were calculated using unrounded net assets of $4,995.32, $4,995.28, $4,995.23 & $4,995.11 divided by the unrounded shares outstanding of 503.525, 446.429, 528.541 & 418.410, respectively.
The accompanying notes are an integral part of the financial statements.
37
Statements of Assets and Liabilities
October 31, 2017
| TARGET 2035 | TARGET 2040 | TARGET 2045 | TARGET 2050 | TARGET 2055 | TARGET 2060 | |||||||||||||||||||
ASSETS: | ||||||||||||||||||||||||
Total investments in Underlying Series: | ||||||||||||||||||||||||
At value* | $ | 26,317,207 | $ | 84,028,194 | $ | 15,890,716 | $ | 35,389,255 | $ | 6,736,319 | $ | 4,618,675 | ||||||||||||
Receivable from Advisor (Note 3) | 27,215 | 23,712 | 26,921 | 24,666 | 26,867 | 27,753 | ||||||||||||||||||
Receivable for shares of Underlying Series sold | 3,174 | — | — | 14,350 | — | — | ||||||||||||||||||
Receivable for fund shares sold | 18,978 | 96,429 | 23,062 | 34,847 | 33,218 | 127,742 | ||||||||||||||||||
Prepaid expenses | 17,053 | 11,322 | 16,369 | 11,113 | 16,274 | 21,510 | ||||||||||||||||||
|
|
|
|
|
|
|
|
|
|
|
| |||||||||||||
TOTAL ASSETS | 26,383,627 | 84,159,657 | 15,957,068 | 35,474,231 | 6,812,678 | 4,795,680 | ||||||||||||||||||
|
|
|
|
|
|
|
|
|
|
|
| |||||||||||||
LIABILITIES: | ||||||||||||||||||||||||
Accrued fund accounting and administration fees (Note 3) | 15,939 | 16,390 | 15,864 | 16,014 | 15,798 | 15,776 | ||||||||||||||||||
Accrued distribution and service (Rule 12b-1) fees (Note 3) | 6,590 | 14,173 | 3,946 | 5,187 | 1,811 | 1,137 | ||||||||||||||||||
Accrued Chief Compliance Officer service fees (Note 3). | 306 | 306 | 306 | 306 | 306 | 306 | ||||||||||||||||||
Payable for fund shares repurchased | 21,696 | 5,098 | 107 | 48,449 | 87 | — | ||||||||||||||||||
Audit fees payable | 13,460 | 13,460 | 13,460 | 13,460 | 13,460 | 13,460 | ||||||||||||||||||
Accrued transfer agent fees | 3,871 | 4,139 | 3,525 | 4,344 | 3,333 | 2,699 | ||||||||||||||||||
Custodian fees payable | 2,376 | 2,376 | 2,400 | 1,165 | 1,164 | — | ||||||||||||||||||
Payable for shares of Underlying Series purchased | — | 90,984 | 21,938 | — | 31,943 | 127,197 | ||||||||||||||||||
Accrued sub transfer agent fees | 1,167 | 5,631 | 822 | 2,435 | 299 | 221 | ||||||||||||||||||
Other payables and accrued expenses | 1,338 | 3,476 | 952 | 2,016 | 655 | 412 | ||||||||||||||||||
|
|
|
|
|
|
|
|
|
|
|
| |||||||||||||
TOTAL LIABILITIES | 66,743 | 156,033 | 63,320 | 93,376 | 68,856 | 161,208 | ||||||||||||||||||
|
|
|
|
|
|
|
|
|
|
|
| |||||||||||||
TOTAL NET ASSETS | $ | 26,316,884 | $ | 84,003,624 | $ | 15,893,748 | $ | 35,380,855 | $ | 6,743,822 | $ | 4,634,472 | ||||||||||||
|
|
|
|
|
|
|
|
|
|
|
| |||||||||||||
NET ASSETS CONSIST OF: | ||||||||||||||||||||||||
Capital stock | 20,771 | 83,776 | 11,842 | 32,006 | 4,987 | 3,724 | ||||||||||||||||||
Additional paid-in-capital | 25,925,752 | 82,241,919 | 14,981,860 | 32,652,572 | 6,104,498 | 4,089,376 | ||||||||||||||||||
Undistributed net investment income | 19,131 | 60,344 | 10,829 | 27,627 | 4,964 | 524 | ||||||||||||||||||
Accumulated net realized gain on Underlying Series | 368,567 | 1,620,131 | 879,405 | 2,636,187 | 623,357 | 536,665 | ||||||||||||||||||
Net unrealized appreciation (depreciation) on Underlying | ||||||||||||||||||||||||
Series | (17,337 | ) | (2,546 | ) | 9,812 | 32,463 | 6,016 | 4,183 | ||||||||||||||||
|
|
|
|
|
|
|
|
|
|
|
| |||||||||||||
TOTAL NET ASSETS | $ | 26,316,884 | $ | 84,003,624 | $ | 15,893,748 | $ | 35,380,855 | $ | 6,743,822 | $ | 4,634,472 | ||||||||||||
|
|
|
|
|
|
|
|
|
|
|
| |||||||||||||
Class K | ||||||||||||||||||||||||
Net Assets | $ | 18,235,206 | $ | 52,396,619 | $ | 9,794,824 | $ | 18,666,810 | $ | 4,141,045 | $ | 3,283,562 | ||||||||||||
Shares Outstanding | 1,440,935 | 5,234,090 | 728,668 | 1,691,795 | 305,184 | 263,757 | ||||||||||||||||||
Net Asset Value, Offering Price, and Redemption Price per share | $ | 12.66 | $ | 10.01 | $ | 13.44 | $ | 11.03 | $ | 13.57 | $ | 12.45 | ||||||||||||
Class R | ||||||||||||||||||||||||
Net Assets | $ | 7,112,482 | $ | 7,946,098 | $ | 4,732,735 | $ | 3,344,561 | $ | 2,388,008 | $ | 1,242,319 | ||||||||||||
Shares Outstanding | 559,934 | 800,162 | 354,153 | 306,551 | 177,857 | 99,954 | ||||||||||||||||||
Net Asset Value, Offering Price, and Redemption Price per share | $ | 12.70 | $ | 9.93 | $ | 13.36 | $ | 10.91 | $ | 13.43 | $ | 12.43 | ||||||||||||
Class I | ||||||||||||||||||||||||
Net Assets | $ | 964,195 | $ | 23,655,903 | $ | 1,361,182 | $ | 13,364,476 | $ | 209,760 | $ | 103,582 | ||||||||||||
Shares Outstanding | 75,866 | 2,342,859 | 101,010 | 1,201,785 | 15,313 | 8,312 | ||||||||||||||||||
Net Asset Value, Offering Price, and Redemption Price per share | $ | 12.71 | $ | 10.10 | $ | 13.48 | $ | 11.12 | $ | 13.70 | $ | 12.46 | ||||||||||||
Class R6 | ||||||||||||||||||||||||
Net Assets | $ | 5,001 | $ | 5,004 | $ | 5,007 | $ | 5,008 | $ | 5,009 | $ | 5,009 | ||||||||||||
Shares Outstanding | 393 | 496 | 371 | 451 | 365 | 402 | ||||||||||||||||||
Net Asset Value, Offering Price, and Redemption Price per share | $ | 12.71 | 1 | $ | 10.10 | 1 | $ | 13.48 | 1 | $ | 11.12 | 1 | $ | 13.70 | 1 | $ | 12.46 | |||||||
*At identified cost | $ | 26,334,544 | $ | 84,030,740 | $ | 15,880,904 | $ | 35,356,792 | $ | 6,730,303 | $ | 4,614,492 | ||||||||||||
|
|
|
|
|
|
|
|
|
|
|
| |||||||||||||
1 The net asset values of the Class R6 Shares of the Manning & Napier Target 2035 Series, Target 2040 Series, Target 2045 Series, Target 2050 Series & Target 2055 Series’ net asset value were calculated using unrounded net assets of $5,000.65, $5,004.05, $5,007.25, $5,008.54 & $5,008.55 divided by the unrounded shares outstanding of 393.391, 495.540, 371.471, 450.450 & 365.497, respectively.
The accompanying notes are an integral part of the financial statements.
38
Statements of Operations
For the Year Ended October 31, 2017
| TARGET INCOME | TARGET 2015 | TARGET 2020 | TARGET 2025 | TARGET 2030 | ||||||||||||||||
INVESTMENT INCOME: | ||||||||||||||||||||
Income distributions from Underlying Series | $ | 1,464,538 | $ | 91,094 | $ | 1,746,903 | $ | 425,057 | $ | 1,742,845 | ||||||||||
|
|
|
|
|
|
|
|
|
| |||||||||||
EXPENSES: | ||||||||||||||||||||
Distribution and services (Rule 12b-1) fees (Class K)(Note 3) | 172,002 | 9,029 | 191,799 | 41,441 | 205,310 | |||||||||||||||
Distribution and services (Rule 12b-1) fees (Class R) (Note 3) | 17,563 | 432 | 31,767 | 22,774 | 44,455 | |||||||||||||||
Fund accounting and administration fees (Note 3) | 49,190 | 47,152 | 50,626 | 47,915 | 50,910 | |||||||||||||||
Transfer agent fees (Note 3) | 8,207 | 1,182 | 7,948 | 7,515 | 12,577 | |||||||||||||||
Sub transfer agent fees (Note 3) | 5,601 | 323 | 7,378 | 1,341 | 9,324 | |||||||||||||||
Directors’ fees (Note 3) | 5,261 | 321 | 8,412 | 1,700 | 9,123 | |||||||||||||||
Chief Compliance Officer service fees (Note 3) | 3,897 | 3,887 | 3,905 | 3,891 | 3,907 | |||||||||||||||
Registration and filing fees | 56,387 | 54,684 | 57,378 | 56,778 | 57,381 | |||||||||||||||
Audit fees | 19,472 | 19,224 | 19,769 | 19,326 | 19,809 | |||||||||||||||
Custodian fees | 2,264 | 3,847 | 4,617 | 4,031 | 4,753 | |||||||||||||||
Miscellaneous | 16,935 | 8,073 | 20,561 | 12,334 | 24,536 | |||||||||||||||
|
|
|
|
|
|
|
|
|
| |||||||||||
Total Expenses | 356,779 | 148,154 | 404,160 | 219,046 | 442,085 | |||||||||||||||
Less reduction of expenses (Note 3) | (120,287 | ) | (135,553 | ) | (110,510 | ) | (137,471 | ) | (113,862 | ) | ||||||||||
|
|
|
|
|
|
|
|
|
| |||||||||||
Net Expenses | 236,492 | 12,601 | 293,650 | 81,575 | 328,223 | |||||||||||||||
|
|
|
|
|
|
|
|
|
| |||||||||||
NET INVESTMENT INCOME | 1,228,046 | 78,493 | 1,453,253 | 343,482 | 1,414,622 | |||||||||||||||
|
|
|
|
|
|
|
|
|
| |||||||||||
REALIZED AND UNREALIZED GAIN (LOSS) ON UNDERLYING SERIES: | ||||||||||||||||||||
Net realized gain (loss) on Underlying Series | 1,566,264 | 367,523 | 3,855,178 | 2,781,375 | 5,442,759 | |||||||||||||||
Distributions of realized gains from Underlying Series | 177,420 | 96,932 | 2,459,609 | 509,957 | 2,854,246 | |||||||||||||||
Net change in unrealized appreciation (depreciation) on Underlying Series | 2,571,384 | (112,149 | ) | 3,295,573 | (498,082 | ) | 6,774,360 | |||||||||||||
|
|
|
|
|
|
|
|
|
| |||||||||||
NET REALIZED AND UNREALIZED GAIN (LOSS) ON UNDERLYING SERIES | 4,315,068 | 352,306 | 9,610,360 | 2,793,250 | 15,071,365 | |||||||||||||||
|
|
|
|
|
|
|
|
|
| |||||||||||
NET INCREASE IN NET ASSETS RESULTING FROM OPERATIONS | $ | 5,543,114 | $ | 430,799 | $ | 11,063,613 | $ | 3,136,732 | $ | 16,485,987 | ||||||||||
|
|
|
|
|
|
|
|
|
| |||||||||||
The accompanying notes are an integral part of the financial statements.
39
Statements of Operations
For the Year Ended October 31, 2017
| TARGET 2035 | TARGET 2040 | TARGET 2045 | TARGET 2050 | TARGET 2055 | TARGET 2060 | |||||||||||||||||||
INVESTMENT INCOME: | ||||||||||||||||||||||||
Income distributions from Underlying Series | $ | 281,885 | $ | 770,748 | $ | 114,356 | $ | 239,964 | $ | 50,878 | $ | 17,357 | ||||||||||||
|
|
|
|
|
|
|
|
|
|
|
| |||||||||||||
EXPENSES: | ||||||||||||||||||||||||
Distribution and services (Rule 12b-1) fees (Class K) (Note 3) | 35,323 | 138,222 | 19,580 | 41,830 | 7,552 | 5,258 | ||||||||||||||||||
Distribution and services (Rule 12b-1) fees (Class R) (Note 3) | 13,483 | 26,098 | 9,937 | 12,313 | 4,757 | 1,931 | ||||||||||||||||||
Fund accounting and administration fees (Note 3) | 47,770 | 49,502 | 47,503 | 47,933 | 47,317 | 47,116 | ||||||||||||||||||
Transfer agent fees (Note 3) | 5,922 | 8,133 | 5,589 | 8,889 | 5,270 | 3,652 | ||||||||||||||||||
Chief Compliance Officer service fees (Note 3) | 3,890 | 3,898 | 3,888 | 3,891 | 3,887 | 3,878 | ||||||||||||||||||
Directors’ fees (Note 3) | 1,383 | 5,778 | 781 | 2,138 | 339 | 146 | ||||||||||||||||||
Sub transfer agent fees (Note 3) | 1,167 | 5,632 | 822 | 2,435 | 299 | 220 | ||||||||||||||||||
Registration and filing fees | 55,446 | 56,918 | 54,861 | 56,079 | 54,625 | 54,538 | ||||||||||||||||||
Audit fees | 19,307 | 19,598 | 19,256 | 19,325 | 19,224 | 19,147 | ||||||||||||||||||
Custodian fees | 3,839 | 4,562 | 3,840 | 2,171 | 1,773 | 20 | ||||||||||||||||||
Miscellaneous | 11,583 | 17,026 | �� | 10,432 | 13,155 | 9,364 | 8,017 | |||||||||||||||||
|
|
|
|
|
|
|
|
|
|
|
| |||||||||||||
Total Expenses | 199,113 | 335,367 | 176,489 | 210,159 | 154,407 | 143,923 | ||||||||||||||||||
Less reduction of expenses (Note 3) | (136,425 | ) | (122,063 | ) | (138,965 | ) | (137,237 | ) | (138,577 | ) | (135,235 | ) | ||||||||||||
|
|
|
|
|
|
|
|
|
|
|
| |||||||||||||
Net Expenses | 62,688 | 213,304 | 37,524 | 72,922 | 15,830 | 8,688 | ||||||||||||||||||
|
|
|
|
|
|
|
|
|
|
|
| |||||||||||||
NET INVESTMENT INCOME | 219,197 | 557,444 | 76,832 | 167,042 | 35,048 | 8,669 | ||||||||||||||||||
|
|
|
|
|
|
|
|
|
|
|
| |||||||||||||
REALIZED AND UNREALIZED GAIN (LOSS) ON UNDERLYING SERIES: | ||||||||||||||||||||||||
Net realized gain (loss) on Underlying Series | 1,504,119 | 7,527,200 | 1,738,410 | 4,841,813 | 965,931 | 490,147 | ||||||||||||||||||
Distributions of realized gains from Underlying Series | 629,154 | 2,704,575 | 478,562 | 1,133,284 | 217,817 | 59,549 | ||||||||||||||||||
Net change in unrealized appreciation (depreciation) on Underlying Series | 1,183,536 | 2,613,161 | 119,733 | (353,000 | ) | (62,324 | ) | (117,924 | ) | |||||||||||||||
|
|
|
|
|
|
|
|
|
|
|
| |||||||||||||
NET REALIZED AND UNREALIZED GAIN (LOSS) ON UNDERLYING SERIES | 3,316,809 | 12,844,936 | 2,336,705 | 5,622,097 | 1,121,424 | 431,772 | ||||||||||||||||||
|
|
|
|
|
|
|
|
|
|
|
| |||||||||||||
NET INCREASE IN NET ASSETS RESULTING FROM OPERATIONS | $ | 3,536,006 | $ | 13,402,380 | $ | 2,413,537 | $ | 5,789,139 | $ | 1,156,472 | $ | 440,441 | ||||||||||||
|
|
|
|
|
|
|
|
|
|
|
| |||||||||||||
The accompanying notes are an integral part of the financial statements.
40
Statements of Changes in Net Assets
TARGET INCOME YEAR ENDED | FOR THE YEAR ENDED 10/31/16 | TARGET 2015 FOR THE YEAR ENDED 10/31/17 | FOR THE YEAR ENDED 10/31/16 | |||||||||||||
INCREASE (DECREASE) IN NET ASSETS: | ||||||||||||||||
OPERATIONS: | ||||||||||||||||
Net investment income | $ | 1,228,046 | $ | 1,671,089 | $ | 78,493 | $ | 90,745 | ||||||||
Net realized gain (loss) on Underlying Series | 1,566,264 | (1,950,268 | ) | 367,523 | (702,369 | ) | ||||||||||
Distributions of realized gains from Underlying Series | 177,420 | — | 96,932 | 29,656 | ||||||||||||
Net change in unrealized appreciation (depreciation) on Underlying Series | 2,571,384 | 2,394,966 | (112,149 | ) | 698,809 | |||||||||||
|
|
|
|
|
|
|
| |||||||||
Net increase (decrease) from operations | 5,543,114 | 2,115,787 | 430,799 | 116,841 | ||||||||||||
|
|
|
|
|
|
|
| |||||||||
DISTRIBUTIONS TO SHAREHOLDERS (Note 8): | ||||||||||||||||
From net investment income (Class K) | (995,759 | ) | (1,177,084 | ) | (47,515 | ) | (36,105 | ) | ||||||||
From net investment income (Class R) | (26,587 | ) | (29,658 | ) | (72 | ) | (7,147 | ) | ||||||||
From net investment income (Class I) | (212,436 | ) | (439,125 | ) | (42,420 | ) | (49,708 | ) | ||||||||
From net realized gain on investments (Class K) | — | (2,870,405 | ) | — | (238,125 | ) | ||||||||||
From net realized gain on investments (Class R) | — | (90,931 | ) | — | (59,085 | ) | ||||||||||
From net realized gain on investments (Class I) | — | (1,015,587 | ) | — | (289,064 | ) | ||||||||||
|
|
|
|
|
|
|
| |||||||||
Total distributions to shareholders | (1,234,782 | ) | (5,622,790 | ) | (90,007 | ) | (679,234 | ) | ||||||||
|
|
|
|
|
|
|
| |||||||||
CAPITAL STOCK ISSUED AND REPURCHASED: | ||||||||||||||||
Net increase (decrease) from capital share | 16,826,923 | (14,457,731 | ) | (2,508,194 | ) | (2,171,713 | ) | |||||||||
|
|
|
|
|
|
|
| |||||||||
Net increase (decrease) in net assets | 21,135,255 | (17,964,734 | ) | (2,167,402 | ) | (2,734,106 | ) | |||||||||
NET ASSETS: | ||||||||||||||||
Beginning of year | 77,825,644 | 95,790,378 | 6,733,114 | 9,467,220 | ||||||||||||
|
|
|
|
|
|
|
| |||||||||
End of year1 | $ | 98,960,899 | $ | 77,825,644 | $ | 4,565,712 | $ | 6,733,114 | ||||||||
|
|
|
|
|
|
|
| |||||||||
1 Including undistributed net investment income: | $ | 69,715 | $ | 76,451 | $ | 5,301 | $ | 4,188 | ||||||||
The accompanying notes are an integral part of the financial statements.
41
Statements of Changes in Net Assets
TARGET 2020 FOR THE | FOR THE | TARGET 2025 FOR THE | FOR THE | TARGET 2030 FOR THE | FOR THE | |||||||||||||||||||
| YEAR ENDED 10/31/17 | YEAR ENDED 10/31/16 | YEAR ENDED 10/31/17 | YEAR ENDED 10/31/16 | YEAR ENDED 10/31/17 | YEAR ENDED 10/31/16 | |||||||||||||||||||
INCREASE (DECREASE) IN NET ASSETS: | ||||||||||||||||||||||||
OPERATIONS: | ||||||||||||||||||||||||
Net investment income | $ | 1,453,253 | $ | 1,861,659 | $ | 343,482 | $ | 361,841 | $ | 1,414,622 | $ | 1,725,773 | ||||||||||||
Net realized gain (loss) on Underlying Series | 3,855,178 | (8,267,474 | ) | 2,781,375 | (3,094,830 | ) | 5,442,759 | (11,760,790 | ) | |||||||||||||||
Distributions of realized gains from Underlying Series | 2,459,609 | 1,398,360 | 509,957 | 674,326 | 2,854,246 | 3,660,337 | ||||||||||||||||||
Net change in unrealized appreciation (depreciation) on Underlying Series | 3,295,573 | 8,448,277 | (498,082 | ) | 3,035,783 | 6,774,360 | 10,871,121 | |||||||||||||||||
|
|
|
|
|
|
|
|
|
|
|
| |||||||||||||
Net increase (decrease) from operations | 11,063,613 | 3,440,822 | 3,136,732 | 977,120 | 16,485,987 | 4,496,441 | ||||||||||||||||||
|
|
|
|
|
|
|
|
|
|
|
| |||||||||||||
DISTRIBUTIONS TO SHAREHOLDERS | ||||||||||||||||||||||||
From net investment income (Class K) | (1,051,197 | ) | (859,530 | ) | (204,189 | ) | (134,175 | ) | (1,172,112 | ) | (760,569 | ) | ||||||||||||
From net investment income (Class R) | (56,852 | ) | (59,142 | ) | (27,133 | ) | (18,283 | ) | (87,689 | ) | (73,121 | ) | ||||||||||||
From net investment income (Class I) | (750,355 | ) | (956,387 | ) | (244,222 | ) | (212,332 | ) | (903,645 | ) | (914,051 | ) | ||||||||||||
From net realized gain on investments (Class K) | — | (6,912,732 | ) | — | (918,204 | ) | — | (10,610,704 | ) | |||||||||||||||
From net realized gain on investments (Class R) | — | (656,604 | ) | — | (162,864 | ) | — | (1,437,863 | ) | |||||||||||||||
From net realized gain on investments (Class I) | — | (6,366,878 | ) | — | (1,221,422 | ) | — | (10,036,065 | ) | |||||||||||||||
|
|
|
|
|
|
|
|
|
|
|
| |||||||||||||
Total distributions to shareholders | (1,858,404 | ) | (15,811,273 | ) | (475,544 | ) | (2,667,280 | ) | (2,163,446 | ) | (23,832,373 | ) | ||||||||||||
|
|
|
|
|
|
|
|
|
|
|
| |||||||||||||
CAPITAL STOCK ISSUED AND REPURCHASED: | ||||||||||||||||||||||||
Net increase (decrease) from capital share transactions (Note 6) | (24,644,386 | ) | (20,792,232 | ) | 7,316,471 | 2,590,046 | (13,600,340 | ) | (5,908,398 | ) | ||||||||||||||
|
|
|
|
|
|
|
|
|
|
|
| |||||||||||||
Net increase (decrease) in net assets | (15,439,177 | ) | (33,162,683 | ) | 9,977,659 | 899,886 | 722,201 | (25,244,330 | ) | |||||||||||||||
NET ASSETS: | ||||||||||||||||||||||||
Beginning of year | 129,982,814 | 163,145,497 | 30,435,133 | 29,535,247 | 140,910,058 | 166,154,388 | ||||||||||||||||||
|
|
|
|
|
|
|
|
|
|
|
| |||||||||||||
End of year1 | $ | 114,543,637 | $ | 129,982,814 | $ | 40,412,792 | $ | 30,435,133 | $ | 141,632,259 | $ | 140,910,058 | ||||||||||||
|
|
|
|
|
|
|
|
|
|
|
| |||||||||||||
1 Including undistributed net investment income: | $ | 95,605 | $ | 97,424 | $ | 16,400 | $ | 19,131 | $ | 113,350 | $ | 93,068 | ||||||||||||
The accompanying notes are an integral part of the financial statements.
42
Statements of Changes in Net Assets
TARGET 2035 FOR | FOR THE YEAR | TARGET 2040 FOR | FOR THE YEAR | TARGET 2045 FOR | FOR THE YEAR | |||||||||||||||||||
| ENDED 10/31/17 | ENDED | ENDED 10/31/17 | ENDED | ENDED 10/31/17 | ENDED | |||||||||||||||||||
INCREASE (DECREASE) IN NET ASSETS: | ||||||||||||||||||||||||
OPERATIONS: | ||||||||||||||||||||||||
Net investment income | $ | 219,197 | $ | 192,030 | $ | 557,444 | $ | 693,353 | $ | 76,832 | $ | 50,135 | ||||||||||||
Net realized gain (loss) on Underlying Series | 1,504,119 | (1,120,019 | ) | 7,527,200 | (8,297,269 | ) | 1,738,410 | (819,492 | ) | |||||||||||||||
Distributions of realized gains from Underlying Series | 629,154 | 465,095 | 2,704,575 | 2,016,154 | 478,562 | 185,038 | ||||||||||||||||||
Net change in unrealized appreciation (depreciation) on Underlying Series | 1,183,536 | 1,273,030 | 2,613,161 | 8,501,568 | 119,733 | 1,068,995 | ||||||||||||||||||
|
|
|
|
|
|
|
|
|
|
|
| |||||||||||||
Net increase (decrease) from operations | 3,536,006 | 810,136 | 13,402,380 | 2,913,806 | 2,413,537 | 484,676 | ||||||||||||||||||
|
|
|
|
|
|
|
|
|
|
|
| |||||||||||||
DISTRIBUTIONS TO SHAREHOLDERS | ||||||||||||||||||||||||
From net investment income (Class K) | (164,395 | ) | (75,719 | ) | (675,356 | ) | (321,268 | ) | (80,909 | ) | (18,391 | ) | ||||||||||||
From net investment income (Class R) | (15,877 | ) | (12,767 | ) | (47,294 | ) | (16,732 | ) | (10,534 | ) | (3,973 | ) | ||||||||||||
From net investment income (Class I) | (181,228 | ) | (108,923 | ) | (418,483 | ) | (374,152 | ) | (76,897 | ) | (30,663 | ) | ||||||||||||
From net realized gain on investments (Class K) | (79,142 | ) | (911,580 | ) | — | (8,092,254 | ) | (91,638 | ) | (375,447 | ) | |||||||||||||
From net realized gain on investments (Class R) | (8,675 | ) | (233,282 | ) | — | (775,713 | ) | (14,335 | ) | (169,076 | ) | |||||||||||||
From net realized gain on investments (Class I) | (76,653 | ) | (1,053,646 | ) | — | (6,693,299 | ) | (76,758 | ) | (455,910 | ) | |||||||||||||
|
|
|
|
|
|
|
|
|
|
|
| |||||||||||||
Total distributions to shareholders | (525,970 | ) | (2,395,917 | ) | (1,141,133 | ) | (16,273,418 | ) | (351,071 | ) | (1,053,460 | ) | ||||||||||||
|
|
|
|
|
|
|
|
|
|
|
| |||||||||||||
CAPITAL STOCK ISSUED AND REPURCHASED: | ||||||||||||||||||||||||
Net increase (decrease) from capital share transactions (Note 6) | (1,949,831 | ) | 4,533,222 | (16,725,799 | ) | 1,118,466 | (241,049 | ) | 4,703,817 | |||||||||||||||
|
|
|
|
|
|
|
|
|
|
|
| |||||||||||||
Net increase (decrease) in net assets | 1,060,205 | 2,947,441 | (4,464,552 | ) | (12,241,146 | ) | 1,821,417 | 4,135,033 | ||||||||||||||||
NET ASSETS: | ||||||||||||||||||||||||
Beginning of year | 25,256,679 | 22,309,238 | 88,468,176 | 100,709,322 | 14,072,331 | 9,937,298 | ||||||||||||||||||
|
|
|
|
|
|
|
|
|
|
|
| |||||||||||||
End of year1 | $ | 26,316,884 | $ | 25,256,679 | $ | 84,003,624 | $ | 88,468,176 | $ | 15,893,748 | $ | 14,072,331 | ||||||||||||
|
|
|
|
|
|
|
|
|
|
|
| |||||||||||||
1 Including undistributed net investment income: | $ | 19,131 | $ | 9,712 | $ | 60,344 | $ | 42,048 | $ | 10,829 | $ | 2,372 | ||||||||||||
The accompanying notes are an integral part of the financial statements.
43
Statements of Changes in Net Assets
| TARGET 2050 FOR THE YEAR ENDED 10/31/17 | FOR THE YEAR ENDED 10/31/16 | TARGET 2055 FOR THE YEAR ENDED 10/31/17 | FOR THE YEAR ENDED 10/31/16 | TARGET 2060 FOR THE YEAR ENDED 10/31/17 | FOR THE YEAR ENDED 10/31/16 | |||||||||||||||||||
INCREASE (DECREASE) IN NET ASSETS: | ||||||||||||||||||||||||
OPERATIONS: | ||||||||||||||||||||||||
Net investment income | $ | 167,042 | $ | 169,851 | $ | 35,048 | $ | 18,214 | $ | 8,669 | $ | 1,351 | ||||||||||||
Net realized gain (loss) on Underlying Series | 4,841,813 | (2,957,734 | ) | 965,931 | (263,082 | ) | 490,147 | 4,565 | ||||||||||||||||
Distributions of realized gains from Underlying Series | 1,133,284 | 613,752 | 217,817 | 63,005 | 59,549 | 3,288 | ||||||||||||||||||
Net change in unrealized appreciation (depreciation) on Underlying Series | (353,000 | ) | 3,227,687 | (62,324 | ) | 360,723 | (117,924 | ) | 116,616 | |||||||||||||||
|
|
|
|
|
|
|
|
|
|
|
| |||||||||||||
Net increase (decrease) from operations | 5,789,139 | 1,053,556 | 1,156,472 | 178,860 | 440,441 | 125,820 | ||||||||||||||||||
|
|
|
|
|
|
|
|
|
|
|
| |||||||||||||
DISTRIBUTIONS TO SHAREHOLDERS | ||||||||||||||||||||||||
From net investment income (Class K) | (179,577 | ) | (59,486 | ) | (28,911 | ) | (5,175 | ) | (17,972 | ) | (841 | ) | ||||||||||||
From net investment income (Class R) | (21,593 | ) | (3,714 | ) | (5,418 | ) | (988 | ) | (1,517 | ) | (231 | ) | ||||||||||||
From net investment income (Class I) | (190,175 | ) | (108,099 | ) | (41,404 | ) | (12,933 | ) | (933 | ) | (303 | ) | ||||||||||||
From net realized gain on investments (Class K) | — | (2,778,003 | ) | (28,665 | ) | (100,952 | ) | (7,607 | ) | — | ||||||||||||||
From net realized gain on investments (Class R) | — | (407,411 | ) | (5,623 | ) | (39,465 | ) | (613 | ) | — | ||||||||||||||
From net realized gain on investments (Class I) | — | (2,969,532 | ) | (34,348 | ) | (162,891 | ) | (329 | ) | — | ||||||||||||||
|
|
|
|
|
|
|
|
|
|
|
| |||||||||||||
Total distributions to shareholders | (391,345 | ) | (6,326,245 | ) | (144,369 | ) | (322,404 | ) | (28,971 | ) | (1,375 | ) | ||||||||||||
|
|
|
|
|
|
|
|
|
|
|
| |||||||||||||
CAPITAL STOCK ISSUED AND REPURCHASED: | ||||||||||||||||||||||||
Net increase from capital share transactions (Note 6) | (251,583 | ) | 2,460,812 | 50,202 | 2,616,602 | 2,578,695 | 1,360,441 | |||||||||||||||||
|
|
|
|
|
|
|
|
|
|
|
| |||||||||||||
Net increase (decrease) in net assets | 5,146,211 | (2,811,877 | ) | 1,062,305 | 2,473,058 | 2,990,165 | 1,484,886 | |||||||||||||||||
NET ASSETS: | ||||||||||||||||||||||||
Beginning of year | 30,234,644 | 33,046,521 | 5,681,517 | 3,208,459 | 1,644,307 | 159,421 | ||||||||||||||||||
|
|
|
|
|
|
|
|
|
|
|
| |||||||||||||
End of year1 | $ | 35,380,855 | $ | 30,234,644 | $ | 6,743,822 | $ | 5,681,517 | $ | 4,634,472 | $ | 1,644,307 | ||||||||||||
|
|
|
|
|
|
|
|
|
|
|
| |||||||||||||
1 Including undistributed net investment income: | $ | 27,627 | $ | 17,881 | $ | 4,964 | $ | 686 | $ | 524 | $ | — | ||||||||||||
The accompanying notes are an integral part of the financial statements.
44
Financial Highlights
| FOR THE YEAR ENDED | ||||||||||||||||||||
| TARGET INCOME SERIES CLASS K | 10/31/17 | 10/31/16 | 10/31/15 | 10/31/14 | 10/31/13 | |||||||||||||||
Per share data (for a share outstanding throughout each year): | ||||||||||||||||||||
Net asset value - Beginning of year | $ | 9.39 | $ | 9.72 | $ | 10.84 | $ | 11.00 | $ | 10.86 | ||||||||||
|
|
|
|
|
|
|
|
|
| |||||||||||
Income (loss) from investment operations: | ||||||||||||||||||||
Net investment income1,2 | 0.14 | 0.17 | 0.15 | 0.18 | 0.18 | |||||||||||||||
Net realized and unrealized gain (loss) on investments | 0.49 | 0.09 | (0.29 | ) | 0.37 | 0.63 | ||||||||||||||
|
|
|
|
|
|
|
|
|
| |||||||||||
Total from investment operations | 0.63 | 0.26 | (0.14 | ) | 0.55 | 0.81 | ||||||||||||||
|
|
|
|
|
|
|
|
|
| |||||||||||
Less distributions to shareholders: | ||||||||||||||||||||
From net investment income | (0.14 | ) | (0.17 | ) | (0.28 | ) | (0.29 | ) | (0.24 | ) | ||||||||||
From net realized gain on investments | — | (0.42 | ) | (0.70 | ) | (0.42 | ) | (0.43 | ) | |||||||||||
|
|
|
|
|
|
|
|
|
| |||||||||||
Total distributions to shareholders | (0.14 | ) | (0.59 | ) | (0.98 | ) | (0.71 | ) | (0.67 | ) | ||||||||||
|
|
|
|
|
|
|
|
|
| |||||||||||
Net asset value - End of year | $ | 9.88 | $ | 9.39 | $ | 9.72 | $ | 10.84 | $ | 11.00 | ||||||||||
|
|
|
|
|
|
|
|
|
| |||||||||||
Net assets - End of year (000’s omitted) | $ | 80,786 | $ | 64,297 | $ | 67,322 | $ | 52,442 | $ | 47,676 | ||||||||||
|
|
|
|
|
|
|
|
|
| |||||||||||
Total return3 | 6.85 | % | 2.97 | % | (1.38 | %) | 5.35 | % | 7.83 | % | ||||||||||
Ratios (to average net assets)/Supplemental Data: | ||||||||||||||||||||
Expenses* | 0.31 | %4 | 0.30 | %5 | 0.30 | %6 | 0.30 | %5 | 0.30 | %5 | ||||||||||
Net investment income2 | 1.45 | % | 1.84 | % | 1.54 | % | 1.63 | % | 1.69 | % | ||||||||||
Series portfolio turnover7 | 133 | % | 6 | % | 16 | % | 15 | % | 14 | % | ||||||||||
| *The investment advisor paid a portion of the Series’ expenses. If these expenses had been incurred by the Series, the expense ratios (to average net assets) would have been increased by the following amounts: | ||||||||||||||||||||
|
| 0.15%4
|
|
| 0.12
| %5
|
| 0.16
| %6
|
| 0.12
| %5
|
| 0.16
| %5
| ||||||
| FOR THE YEAR ENDED | ||||||||||||||||||||
| TARGET INCOME SERIES CLASS R | 10/31/17 | 10/31/16 | 10/31/15 | 10/31/14 | 10/31/13 | |||||||||||||||
Per share data (for a share outstanding throughout each year): Net asset value - Beginning of year | $ | 9.28 | $ | 9.61 | $ | 10.71 | $ | 10.89 | $ | 10.76 | ||||||||||
|
|
|
|
|
|
|
|
|
| |||||||||||
Income (loss) from investment operations: | ||||||||||||||||||||
Net investment income1,2 | 0.05 | 0.19 | 0.21 | 0.15 | 0.07 | |||||||||||||||
Net realized and unrealized gain (loss) on investments | 0.56 | 0.04 | (0.38 | ) | 0.36 | 0.70 | ||||||||||||||
|
|
|
|
|
|
|
|
|
| |||||||||||
Total from investment operations | 0.61 | 0.23 | (0.17 | ) | 0.51 | 0.77 | ||||||||||||||
|
|
|
|
|
|
|
|
|
| |||||||||||
Less distributions to shareholders: | ||||||||||||||||||||
From net investment income | (0.13 | ) | (0.14 | ) | (0.23 | ) | (0.27 | ) | (0.21 | ) | ||||||||||
From net realized gain on investments | — | (0.42 | ) | (0.70 | ) | (0.42 | ) | (0.43 | ) | |||||||||||
|
|
|
|
|
|
|
|
|
| |||||||||||
Total distributions to shareholders | (0.13 | ) | (0.56 | ) | (0.93 | ) | (0.69 | ) | (0.64 | ) | ||||||||||
|
|
|
|
|
|
|
|
|
| |||||||||||
Net asset value - End of year | $ | 9.76 | $ | 9.28 | $ | 9.61 | $ | 10.71 | $ | 10.89 | ||||||||||
|
|
|
|
|
|
|
|
|
| |||||||||||
Net assets - End of year (000’s omitted) | $ | 9,910 | $ | 1,148 | $ | 2,468 | $ | 13,406 | $ | 13,475 | ||||||||||
|
|
|
|
|
|
|
|
|
| |||||||||||
Total return3 | 6.68 | % | 2.69 | % | (1.70 | %) | 5.00 | % | 7.52 | % | ||||||||||
Ratios (to average net assets)/Supplemental Data: | ||||||||||||||||||||
Expenses* | 0.55 | %4 | 0.55 | %5 | 0.55 | %6 | 0.55 | %5 | 0.55 | %5 | ||||||||||
Net investment income2 | 0.57 | % | 2.07 | % | 2.05 | % | 1.40 | % | 0.66 | % | ||||||||||
Series portfolio turnover7 | 133 | % | 6 | % | 16 | % | 15 | % | 14 | % | ||||||||||
| *The investment advisor paid a portion of the Series’ expenses. If these expenses had been incurred by the Series, the expense ratios (to average net assets) would have been increased by the following amounts: | ||||||||||||||||||||
| 0.15 | %4 | 0.12 | %5 | 0.16 | %6 | 0.12 | %5 | 0.14 | %5 | |||||||||||
1Calculated based on average shares outstanding during the years.
2Net investment income is affected by the timing of distributions from the Underlying Series in which the Series invest. The ratios do not include net investment income of the Underlying Series in which the Series invests.
3Represents aggregate total return for the years indicated, and assumes reinvestment of all distributions. Total return would have been lower had certain expenses not been waived or reimbursed.
4Expense ratios do not include expenses of the Underlying Series in which the Series invests. The expense ratio of the Underlying Series was 0.67% for Manning & Napier Pro-Blend® Conservative Term Series - Class I and 0.45% for Manning & Napier Blended Asset Conservative Series - Class R6.
5Expense ratios do not include expenses of the Underlying Series in which the Series invests. The expense ratio of the Underlying Series was 0.67%.
6Expense ratios do not include expenses of the Underlying Series in which the Series invests. The expense ratio of the Underlying Series was 0.68%.
7Reflects activity of the Series and does not include the activity of the Underlying Series.
The accompanying notes are an integral part of the financial statements.
45
Financial Highlights
| FOR THE YEAR ENDED | ||||||||||||||||||||
| TARGET INCOME SERIES CLASS I | 10/31/17 | 10/31/16 | 10/31/15 | 10/31/14 | 10/31/13 | |||||||||||||||
Per share data (for a share outstanding throughout each year): | ||||||||||||||||||||
Net asset value - Beginning of year | $ | 9.42 | $ | 9.75 | $ | 10.88 | $ | 11.04 | $ | 10.90 | ||||||||||
|
|
|
|
|
|
|
|
|
| |||||||||||
Income (loss) from investment operations: | ||||||||||||||||||||
Net investment income1,2 | 0.19 | 0.24 | 0.16 | 0.21 | 0.19 | |||||||||||||||
Net realized and unrealized gain (loss) on investments | 0.48 | 0.04 | (0.28 | ) | 0.37 | 0.65 | ||||||||||||||
|
|
|
|
|
|
|
|
|
| |||||||||||
Total from investment operations | 0.67 | 0.28 | (0.12 | ) | 0.58 | 0.84 | ||||||||||||||
|
|
|
|
|
|
|
|
|
| |||||||||||
Less distributions to shareholders: | ||||||||||||||||||||
From net investment income | (0.17 | ) | (0.19 | ) | (0.31 | ) | (0.32 | ) | (0.27 | ) | ||||||||||
From net realized gain on investments | — | (0.42 | ) | (0.70 | ) | (0.42 | ) | (0.43 | ) | |||||||||||
|
|
|
|
|
|
|
|
|
| |||||||||||
Total distributions to shareholders | (0.17 | ) | (0.61 | ) | (1.01 | ) | (0.74 | ) | (0.70 | ) | ||||||||||
|
|
|
|
|
|
|
|
|
| |||||||||||
Net asset value - End of year | $ | 9.92 | $ | 9.42 | $ | 9.75 | $ | 10.88 | $ | 11.04 | ||||||||||
|
|
|
|
|
|
|
|
|
| |||||||||||
Net assets - End of year (000’s omitted) | $ | 8,260 | $ | 12,380 | $ | 26,000 | $ | 11,610 | $ | 11,271 | ||||||||||
|
|
|
|
|
|
|
|
|
| |||||||||||
Total return3 | 7.20 | % | 3.20 | % | (1.21 | %) | 5.59 | % | 8.09 | % | ||||||||||
Ratios (to average net assets)/Supplemental Data: | ||||||||||||||||||||
Expenses* | 0.06 | %4 | 0.05 | %5 | 0.05 | %6 | 0.05 | %5 | 0.05 | %5 | ||||||||||
Net investment income2 | 2.02 | % | 2.61 | % | 1.65 | % | 1.92 | % | 1.76 | % | ||||||||||
Series portfolio turnover7 | 133 | % | 6 | % | 16 | % | 15 | % | 14 | % | ||||||||||
| *The investment advisor paid a portion of the Series’ expenses. If these expenses had been incurred by the Series, the expense ratios (to average net assets) would have been increased by the following amounts: | ||||||||||||||||||||
|
| 0.15%4
|
|
| 0.12
| %5
|
| 0.16
| %6
|
| 0.12
| %5
|
| 0.16
| %5
| ||||||
| FOR THE PERIOD | ||||
| TARGET INCOME SERIES CLASS R6 | 10/16/178 TO 10/31/17 | |||
Per share data (for a share outstanding throughout the period): Net asset value - Beginning of period | $ | 9.93 | ||
|
| |||
Income (loss) from investment operations: | ||||
Net investment income (loss)9 | — | |||
Net realized and unrealized gain on Underlying Series | (0.01 | ) | ||
|
| |||
Total from investment operations | (0.01 | ) | ||
|
| |||
Net asset value - End of period | $ | 9.92 | ||
|
| |||
Net assets - End of period (000’s omitted) | $ | 5 | ||
|
| |||
Total return10 | (0.10 | %) | ||
Ratios (to average net assets)/Supplemental Data: | ||||
Expenses* | 0.05 | %4,11 | ||
Net investment loss | (0.05 | %)4,11 | ||
Series portfolio turnover7 | 133 | % | ||
| *The investment advisor paid a portion of the Series’ expenses. If these expenses had been incurred by the Series, the expense ratios (to average net assets) would have been increased by the following amounts: | ||||
| 0.15 | %11 | |||
1Calculated based on average shares outstanding during the years.
2Net investment income is affected by the timing of distributions from the Underlying Series in which the Series invest. The ratios do not include net investment income of the Underlying Series in which the Series invests.
3Represents aggregate total return for the years indicated, and assumes reinvestment of all distributions. Total return would have been lower had certain expenses not been waived or reimbursed.
4Expense ratios do not include expenses of the Underlying Series in which the Series invests. The expense ratio of the Underlying Series was 0.67% for Manning & Napier Pro-Blend® Conservative Term Series - Class I and 0.45% for Manning & Napier Blended Asset Conservative Series - Class R6.
5Expense ratios do not include expenses of the Underlying Series in which the Series invests. The expense ratio of the Underlying Series was 0.67%.
6Expense ratios do not include expenses of the Underlying Series in which the Series invests. The expense ratio of the Underlying Series was 0.68%.
7Reflects activity of the Series and does not include the activity of the Underlying Series.
8Commencement of operations.
9Calculated based on average shares outstanding during the period.
10Represents aggregate total return for the period indicated. Total return would have been lower had certain expenses not been reimbursed during the period. Periods less than one year are not annualized.
11Annualized.
The accompanying notes are an integral part of the financial statements.
46
Financial Highlights
| FOR THE YEAR ENDED | ||||||||||||||||||||
| TARGET 2015 SERIES CLASS K | 10/31/17 | 10/31/16 | 10/31/15 | 10/31/14 | 10/31/13 | |||||||||||||||
Per share data (for a share outstanding throughout each year): | ||||||||||||||||||||
Net asset value - Beginning of year | $ | 10.49 | $ | 11.17 | $ | 12.07 | $ | 11.79 | $ | 10.59 | ||||||||||
|
|
|
|
|
|
|
|
|
| |||||||||||
Income (loss) from investment operations: | ||||||||||||||||||||
Net investment income (loss)1,2 | 0.12 | 0.11 | 0.12 | 0.10 | 0.15 | |||||||||||||||
Net realized and unrealized gain (loss) on investments | 0.68 | 0.13 | (0.35 | ) | 0.53 | 1.25 | ||||||||||||||
|
|
|
|
|
|
|
|
|
| |||||||||||
Total from investment operations | 0.80 | 0.24 | (0.23 | ) | 0.63 | 1.40 | ||||||||||||||
|
|
|
|
|
|
|
|
|
| |||||||||||
Less distributions to shareholders: | ||||||||||||||||||||
From net investment income | (0.15 | ) | (0.12 | ) | (0.28 | ) | (0.26 | ) | (0.20 | ) | ||||||||||
From net realized gain on investments | — | (0.80 | ) | (0.39 | ) | (0.09 | ) | — | ||||||||||||
|
|
|
|
|
|
|
|
|
| |||||||||||
Total distributions to shareholders | (0.15 | ) | (0.92 | ) | (0.67 | ) | (0.35 | ) | (0.20 | ) | ||||||||||
|
|
|
|
|
|
|
|
|
| |||||||||||
Net asset value - End of year | $ | 11.14 | $ | 10.49 | $ | 11.17 | $ | 12.07 | $ | 11.79 | ||||||||||
|
|
|
|
|
|
|
|
|
| |||||||||||
Net assets - End of year (000’s omitted) | $ | 4,196 | $ | 3,274 | $ | 3,500 | $ | 3,200 | $ | 1,019 | ||||||||||
|
|
|
|
|
|
|
|
|
| |||||||||||
Total return3 | 7.70 | % | 2.58 | % | (2.04 | %) | 5.45 | % | 13.45 | % | ||||||||||
Ratios (to average net assets)/Supplemental Data: | ||||||||||||||||||||
Expenses* | 0.31 | %4 | 0.30 | %5 | 0.30 | %6 | 0.30 | %7 | 0.30 | %7 | ||||||||||
Net investment income (loss)2 | 1.11 | % | 1.09 | % | 1.01 | % | 0.80 | % | 1.34 | % | ||||||||||
Series portfolio turnover8 | 139 | % | 49 | % | 46 | % | 46 | % | 50 | % | ||||||||||
| *The investment advisor paid a portion of the Series’ expenses. If these expenses had been incurred by the Series, the expense ratios (to average net assets) would have been increased by the following amounts: | ||||||||||||||||||||
|
| 2.39%4
|
|
| 1.51
| %5
|
| 1.14
| %6
|
| 1.41
| %7
|
| 6.06
| %7
| ||||||
| FOR THE YEAR ENDED | ||||||||||||||||||||
| TARGET 2015 SERIES CLASS R | 10/31/17 | 10/31/16 | 10/31/15 | 10/31/14 | 10/31/13 | |||||||||||||||
Per share data (for a share outstanding throughout each year): Net asset value - Beginning of year | $ | 10.51 | $ | 11.19 | $ | 12.09 | $ | 11.81 | $ | 10.59 | ||||||||||
|
|
|
|
|
|
|
|
|
| |||||||||||
Income (loss) from investment operations: | ||||||||||||||||||||
Net investment income (loss)1,2 | 0.13 | 0.09 | 0.12 | 0.07 | 0.01 | |||||||||||||||
Net realized and unrealized gain (loss) on investments | 0.66 | 0.13 | (0.39 | ) | 0.53 | 1.39 | ||||||||||||||
|
|
|
|
|
|
|
|
|
| |||||||||||
Total from investment operations | 0.79 | 0.22 | (0.27 | ) | 0.60 | 1.40 | ||||||||||||||
|
|
|
|
|
|
|
|
|
| |||||||||||
Less distributions to shareholders: | ||||||||||||||||||||
From net investment income | (0.01 | ) | (0.10 | ) | (0.24 | ) | (0.23 | ) | (0.18 | ) | ||||||||||
From net realized gain on investments | — | (0.80 | ) | (0.39 | ) | (0.09 | ) | — | ||||||||||||
|
|
|
|
|
|
|
|
|
| |||||||||||
Total distributions to shareholders | (0.01 | ) | (0.90 | ) | (0.63 | ) | (0.32 | ) | (0.18 | ) | ||||||||||
|
|
|
|
|
|
|
|
|
| |||||||||||
Net asset value - End of year | $ | 11.29 | $ | 10.51 | $ | 11.19 | $ | 12.09 | $ | 11.81 | ||||||||||
|
|
|
|
|
|
|
|
|
| |||||||||||
Net assets - End of year (000’s omitted) | $ | 40 | $ | 802 | $ | 839 | $ | 1,587 | $ | 1,015 | ||||||||||
|
|
|
|
|
|
|
|
|
| |||||||||||
Total return9 | 7.47 | % | 2.34 | % | (2.37 | %) | 5.22 | % | 13.36 | % | ||||||||||
Ratios (to average net assets)/Supplemental Data: | ||||||||||||||||||||
Expenses* | 0.55 | %4 | 0.55 | %5 | 0.55 | %6 | 0.55 | %7 | 0.55 | %7 | ||||||||||
Net investment income (loss)2 | 1.21 | % | 0.86 | % | 1.07 | % | 0.60 | % | 0.11 | % | ||||||||||
Series portfolio turnover8 | 139 | % | 49 | % | 46 | % | 46 | % | 50 | % | ||||||||||
| *The investment advisor paid a portion of the Series’ expenses. If these expenses had been incurred by the Series, the expense ratios (to average net assets) would have been increased by the following amounts: | ||||||||||||||||||||
| 2.39 | %4 | 1.51 | %5 | 1.14 | %6 | 1.47 | %7 | 3.45 | %7 | |||||||||||
1Calculated based on average shares outstanding during the years.
2Net investment income is affected by the timing of distributions from the Underlying Series in which the Series invest. The ratios do not include net investment income of the Underlying Series in which the Series invests.
3Represents aggregate total return for the years indicated, and assumes reinvestment of all distributions. Total return would have been lower had certain expenses not been waived or reimbursed.
4Expense ratios do not include expenses of the Underlying Series in which the Series invests. The expense ratios of the Underlying Series were 0.67% for Manning & Napier Pro-Blend® Conservative Term Series - Class I, 0.83% for Manning & Napier Pro-Blend® Moderate Term Series - Class I, 0.45% for Manning & Napier Blended Asset Conservative Series - Class R6 and 0.50% for Manning & Napier Blended Asset Moderate Series - Class R6.
5Expense ratios do not include expenses of the Underlying Series in which the Series invests. The expense ratios of the Underlying Series were 0.67% for Manning & Napier Pro-Blend® Conservative Term Series - Class I and 0.82% for Manning & Napier Pro-Blend® Moderate Term Series - Class I.
6Expense ratios do not include expenses of the Underlying Series in which the Series invests. The expense ratios of the Underlying Series were 0.81% for Manning & Napier Pro-Blend® Moderate Term Series - Class I and 0.82% for Manning & Napier Pro-Blend® Extended Term Series - Class I.
7Expense ratios do not include expenses of the Underlying Series in which the Series invests. The expense ratios of the Underlying Series were 0.81% for Manning & Napier Pro-Blend® Moderate Term Series - Class I and 0.81% for Manning & Napier Pro-Blend® Extended Term Series - Class I.
8Reflects activity of the Series and does not include the activity of the Underlying Series.
9Represents aggregate total return for the year indicated, and assumes reinvestment of all distributions. Total return would have been lower had certain expenses not been waived or reimbursed.
The accompanying notes are an integral part of the financial statements.
47
Financial Highlights
| FOR THE YEAR ENDED | ||||||||||||||||||||
| TARGET 2015 SERIES CLASS I | 10/31/17 | 10/31/16 | 10/31/15 | 10/31/14 | 10/31/13 | |||||||||||||||
Per share data (for a share outstanding throughout each year): | ||||||||||||||||||||
Net asset value - Beginning of year | $ | 10.53 | $ | 11.21 | $ | 12.11 | $ | 11.83 | $ | 10.61 | ||||||||||
|
|
|
|
|
|
|
|
|
| |||||||||||
Income (loss) from investment operations: | ||||||||||||||||||||
Net investment income1,2 | 0.20 | 0.16 | 0.15 | 0.14 | 0.11 | |||||||||||||||
Net realized and unrealized gain (loss) on investments | 0.63 | 0.11 | (0.35 | ) | 0.51 | 1.32 | ||||||||||||||
|
|
|
|
|
|
|
|
|
| |||||||||||
Total from investment operations | 0.83 | 0.27 | (0.20 | ) | 0.65 | 1.43 | ||||||||||||||
|
|
|
|
|
|
|
|
|
| |||||||||||
Less distributions to shareholders: | ||||||||||||||||||||
From net investment income | (0.17 | ) | (0.15 | ) | (0.31 | ) | (0.28 | ) | (0.21 | ) | ||||||||||
From net realized gain on investments | — | (0.80 | ) | (0.39 | ) | (0.09 | ) | — | ||||||||||||
|
|
|
|
|
|
|
|
|
| |||||||||||
Total distributions to shareholders | (0.17 | ) | (0.95 | ) | (0.70 | ) | (0.37 | ) | (0.21 | ) | ||||||||||
|
|
|
|
|
|
|
|
|
| |||||||||||
Net asset value - End of year | $ | 11.19 | $ | 10.53 | $ | 11.21 | $ | 12.11 | $ | 11.83 | ||||||||||
|
|
|
|
|
|
|
|
|
| |||||||||||
Net assets - End of year (000’s omitted) | $ | 324 | $ | 2,657 | $ | 5,129 | $ | 4,785 | $ | 3,619 | ||||||||||
|
|
|
|
|
|
|
|
|
| |||||||||||
Total return3 | 8.03 | % | 2.85 | % | (1.78 | %) | 5.67 | % | 13.71 | % | ||||||||||
Ratios (to average net assets)/Supplemental Data: | ||||||||||||||||||||
Expenses* | 0.05 | %4 | 0.05 | %5 | 0.05 | %6 | 0.05 | %7 | 0.05 | %7 | ||||||||||
Net investment income (loss)2 | 1.88 | % | 1.53 | % | 1.28 | % | 1.12 | % | 1.01 | % | ||||||||||
Series portfolio turnover8 | 139 | % | 49 | % | 46 | % | 46 | % | 50 | % | ||||||||||
| *The investment advisor paid a portion of the Series’ expenses. If these expenses had been incurred by the Series, the expense ratios (to average net assets) would have been increased by the following amounts: | ||||||||||||||||||||
|
| 2.39%4
|
|
| 1.51
| %5
|
| 1.14
| %6
|
| 1.46
| %7
|
| 4.09
| %7
| ||||||
| FOR THE PERIOD | ||||
| TARGET 2015 SERIES CLASS R6 | 10/16/179 TO 10/31/17 | |||
Per share data (for a share outstanding throughout the period): | ||||
Net asset value - Beginning of period | $ | 11.20 | ||
|
| |||
Income (loss) from investment operations: | ||||
Net investment income (loss)10 | — | |||
Net realized and unrealized gain on Underlying Series | (0.01 | ) | ||
|
| |||
Total from investment operations | (0.01 | ) | ||
|
| |||
Net asset value - End of period | $ | 11.19 | ||
|
| |||
Net assets - End of period (000’s omitted) | $ | 5 | ||
|
| |||
Total return11 | (0.09 | %) | ||
Ratios (to average net assets)/Supplemental Data: | ||||
Expenses* | 0.05 | %4,12 | ||
Net investment loss | (0.05 | %)12 | ||
Series portfolio turnover8 | 139 | % | ||
| *The investment advisor paid a portion of the Series’ expenses. If these expenses had been incurred by the Series, the expense ratios (to average net assets) would have been increased by the following amounts: | ||||
| 2.39 | %4,12 | |||
1Calculated based on average shares outstanding during the years.
2Net investment income is affected by the timing of distributions from the Underlying Series in which the Series invest. The ratios do not include net investment income of the Underlying Series in which the Series invests.
3Represents aggregate total return for the years indicated, and assumes reinvestment of all distributions. Total return would have been lower had certain expenses not been waived or reimbursed.
4Expense ratios do not include expenses of the Underlying Series in which the Series invests. The expense ratios of the Underlying Series were 0.67% for Manning & Napier Pro-Blend® Conservative Term Series - Class I, 0.83% for Manning & Napier Pro-Blend® Moderate Term Series - Class I, 0.45% for Manning & Napier Blended Asset Conservative Series - Class R6 and 0.50% for Manning & Napier Blended Asset Moderate Series - Class R6.
5Expense ratios do not include expenses of the Underlying Series in which the Series invests. The expense ratios of the Underlying Series were 0.67% for Manning & Napier Pro-Blend® Conservative Term Series - Class I and 0.82% for Manning & Napier Pro-Blend® Moderate Term Series - Class I.
6Expense ratios do not include expenses of the Underlying Series in which the Series invests. The expense ratios of the Underlying Series were 0.81% for Manning & Napier Pro-Blend® Moderate Term Series - Class I and 0.82% for Manning & Napier Pro-Blend® Extended Term Series - Class I.
7Expense ratios do not include expenses of the Underlying Series in which the Series invests. The expense ratios of the Underlying Series were 0.81% for Manning & Napier Pro-Blend® Moderate Term Series - Class I and 0.81% for Manning & Napier Pro-Blend® Extended Term Series - Class I.
8Reflects activity of the Series and does not include the activity of the Underlying Series.
9Commencement of operations.
10Calculated based on average shares outstanding during the period.
11Represents aggregate total return for the period indicated. Total return would have been lower had certain expenses not been reimbursed during the period. Periods less than one year are not annualized.
12Annualized.
The accompanying notes are an integral part of the financial statements.
48
Financial Highlights
| FOR THE YEAR ENDED | ||||||||||||||||||||
| TARGET 2020 SERIES CLASS K | 10/31/17 | 10/31/16 | 10/31/15 | 10/31/14 | 10/31/13 | |||||||||||||||
Per share data (for a share outstanding throughout each year): | ||||||||||||||||||||
Net asset value - Beginning of year | $ | 8.75 | $ | 9.45 | $ | 10.77 | $ | 10.79 | $ | 9.89 | ||||||||||
|
|
|
|
|
|
|
|
|
| |||||||||||
Income (loss) from investment operations: | ||||||||||||||||||||
Net investment income1,2 | 0.09 | 0.09 | 0.11 | 0.11 | 0.12 | |||||||||||||||
Net realized and unrealized gain (loss) on investments | 0.68 | 0.12 | (0.33 | ) | 0.51 | 1.33 | ||||||||||||||
|
|
|
|
|
|
|
|
|
| |||||||||||
Total from investment operations | 0.77 | 0.21 | (0.22 | ) | 0.62 | 1.45 | ||||||||||||||
|
|
|
|
|
|
|
|
|
| |||||||||||
Less distributions to shareholders: | ||||||||||||||||||||
From net investment income | (0.12 | ) | (0.10 | ) | (0.28 | ) | (0.25 | ) | (0.20 | ) | ||||||||||
From net realized gain on investments | — | (0.81 | ) | (0.82 | ) | (0.39 | ) | (0.35 | ) | |||||||||||
|
|
|
|
|
|
|
|
|
| |||||||||||
Total distributions to shareholders | (0.12 | ) | (0.91 | ) | (1.10 | ) | (0.64 | ) | (0.55 | ) | ||||||||||
|
|
|
|
|
|
|
|
|
| |||||||||||
Net asset value - End of year | $ | 9.40 | $ | 8.75 | $ | 9.45 | $ | 10.77 | $ | 10.79 | ||||||||||
|
|
|
|
|
|
|
|
|
| |||||||||||
Net assets - End of year (000’s omitted) | $ | 70,632 | $ | 79,236 | $ | 80,006 | $ | 95,364 | $ | 82,841 | ||||||||||
|
|
|
|
|
|
|
|
|
| |||||||||||
Total return3 | 8.91 | % | 2.83 | % | (2.24 | %) | 6.14 | % | 15.43 | % | ||||||||||
Ratios (to average net assets)/Supplemental Data: | ||||||||||||||||||||
Expenses* | 0.31 | %4 | 0.30 | %5 | 0.30 | %6 | 0.30 | %7 | 0.30 | %7 | ||||||||||
Net investment income2 | 1.04 | % | 1.08 | % | 1.17 | % | 1.06 | % | 1.20 | % | ||||||||||
Series portfolio turnover8 | 118 | % | 16 | % | 42 | % | 37 | % | 19 | % | ||||||||||
| *The investment advisor paid a portion of the Series’ expenses. If these expenses had been incurred by the Series, the expense ratios (to average net assets) would have been increased by the following amounts: | ||||||||||||||||||||
|
| 0.09%4
|
|
| 0.06
| %5
|
| 0.04
| %6
|
| 0.03
| %7
|
| 0.05
| %7
| ||||||
| FOR THE YEAR ENDED | ||||||||||||||||||||
| TARGET 2020 SERIES CLASS R | 10/31/17 | 10/31/16 | 10/31/15 | 10/31/14 | 10/31/13 | |||||||||||||||
Per share data (for a share outstanding throughout each year): Net asset value - Beginning of year | $ | 8.64 | $ | 9.34 | $ | 10.60 | $ | 10.66 | $ | 9.78 | ||||||||||
|
|
|
|
|
|
|
|
|
| |||||||||||
Income (loss) from investment operations: | ||||||||||||||||||||
Net investment income1,2 | 0.06 | 0.09 | 0.12 | 0.09 | 0.09 | |||||||||||||||
Net realized and unrealized gain (loss) on investments | 0.68 | 0.09 | (0.32 | ) | 0.47 | 1.32 | ||||||||||||||
|
|
|
|
|
|
|
|
|
| |||||||||||
Total from investment operations | 0.74 | 0.18 | �� | (0.20 | ) | 0.56 | 1.41 | |||||||||||||
|
|
|
|
|
|
|
|
|
| |||||||||||
Less distributions to shareholders: | ||||||||||||||||||||
From net investment income | (0.10 | ) | (0.07 | ) | (0.24 | ) | (0.23 | ) | (0.18 | ) | ||||||||||
From net realized gain on investments | — | (0.81 | ) | (0.82 | ) | (0.39 | ) | (0.35 | ) | |||||||||||
|
|
|
|
|
|
|
|
|
| |||||||||||
Total distributions to shareholders | (0.10 | ) | (0.88 | ) | (1.06 | ) | (0.62 | ) | (0.53 | ) | ||||||||||
|
|
|
|
|
|
|
|
|
| |||||||||||
Net asset value - End of year | $ | 9.28 | $ | 8.64 | $ | 9.34 | $ | 10.60 | $ | 10.66 | ||||||||||
|
|
|
|
|
|
|
|
|
| |||||||||||
Net assets - End of year (000’s omitted) | $ | 10,851 | $ | 4,553 | $ | 8,193 | $ | 22,564 | $ | 30,393 | ||||||||||
|
|
|
|
|
|
|
|
|
| |||||||||||
Total return3 | 8.69 | % | 2.56 | % | (2.13 | %) | 5.55 | % | 15.07 | % | ||||||||||
Ratios (to average net assets)/Supplemental Data: | ||||||||||||||||||||
Expenses* | 0.56 | %4 | 0.55 | %5 | 0.55 | %6 | 0.55 | %7 | 0.55 | %7 | ||||||||||
Net investment income2 | 0.63 | % | 1.04 | % | 1.24 | % | 0.83 | % | 0.85 | % | ||||||||||
Series portfolio turnover8 | 118 | % | 16 | % | 42 | % | 37 | % | 19 | % | ||||||||||
| *The investment advisor paid a portion of the Series’ expenses. If these expenses had been incurred by the Series, the expense ratios (to average net assets) would have been increased by the following amounts: | ||||||||||||||||||||
| 0.09 | %4 | 0.06 | %5 | 0.04 | %6 | 0.03 | %7 | 0.05 | %7 | |||||||||||
1Calculated based on average shares outstanding during the years.
2Net investment income is affected by the timing of distributions from the Underlying Series in which the Series invest. The ratios do not include net investment income of the Underlying Series in which the Series invests.
3Represents aggregate total return for the years indicated, and assumes reinvestment of all distributions. Total return would have been lower had certain expenses not been waived or reimbursed.
4Expense ratios do not include expenses of the Underlying Series in which the Series invests. The expense ratios of the Underlying Series were 0.83% for Manning & Napier Pro-Blend® Extended Term Series - Class I, 0.83% for Manning & Napier Pro-Blend® Moderate Term Series - Class I, 0.55% for Manning & Napier Blended Asset Extended Series - Class R6 and 0.50% for Manning & Napier Blended Asset Moderate Series - Class R6.
5Expense ratios do not include expenses of the Underlying Series in which the Series invests. The expense ratios of the Underlying Series were 0.82% for Manning & Napier Pro-Blend® Moderate Term Series - Class I and 0.82% for Manning & Napier Pro-Blend® Extended Term Series - Class I.
6Expense ratios do not include expenses of the Underlying Series in which the Series invests. The expense ratios of the Underlying Series were 0.81% for Manning & Napier Pro-Blend® Moderate Term Series - Class I and 0.82% for Manning & Napier Pro-Blend® Extended Term Series - Class I.
7Expense ratios do not include expenses of the Underlying Series in which the Series invests. The expense ratios of the Underlying Series were 0.81% for Manning & Napier Pro-Blend® Moderate Term Series - Class I and 0.81% for Manning & Napier Pro-Blend® Extended Term Series - Class I.
8Reflects activity of the Series and does not include the activity of the Underlying Series.
The accompanying notes are an integral part of the financial statements.
49
Financial Highlights
| FOR THE YEAR ENDED | ||||||||||||||||||||
| TARGET 2020 SERIES CLASS I | 10/31/17 | 10/31/16 | 10/31/15 | 10/31/14 | 10/31/13 | |||||||||||||||
Per share data (for a share outstanding throughout each year): | ||||||||||||||||||||
Net asset value - Beginning of year | $ | 8.79 | $ | 9.50 | $ | 10.81 | $ | 10.83 | $ | 9.93 | ||||||||||
|
|
|
|
|
|
|
|
|
| |||||||||||
Income (loss) from investment operations: | ||||||||||||||||||||
Net investment income1,2 | 0.13 | 0.13 | 0.13 | 0.16 | 0.14 | |||||||||||||||
Net realized and unrealized gain (loss) on investments | 0.67 | 0.09 | (0.31 | ) | 0.49 | 1.34 | ||||||||||||||
|
|
|
|
|
|
|
|
|
| |||||||||||
Total from investment operations | 0.80 | 0.22 | (0.18 | ) | 0.65 | 1.48 | ||||||||||||||
|
|
|
|
|
|
|
|
|
| |||||||||||
Less distributions to shareholders: | ||||||||||||||||||||
From net investment income | (0.14 | ) | (0.12 | ) | (0.31 | ) | (0.28 | ) | (0.23 | ) | ||||||||||
From net realized gain on investments | — | (0.81 | ) | (0.82 | ) | (0.39 | ) | (0.35 | ) | |||||||||||
|
|
|
|
|
|
|
|
|
| |||||||||||
Total distributions to shareholders | (0.14 | ) | (0.93 | ) | (1.13 | ) | (0.67 | ) | (0.58 | ) | ||||||||||
|
|
|
|
|
|
|
|
|
| |||||||||||
Net asset value - End of year | $ | 9.45 | $ | 8.79 | $ | 9.50 | $ | 10.81 | $ | 10.83 | ||||||||||
|
|
|
|
|
|
|
|
|
| |||||||||||
Net assets - End of year (000’s omitted) | $ | 33,056 | $ | 46,194 | $ | 74,947 | $ | 61,673 | $ | 70,556 | ||||||||||
|
|
|
|
|
|
|
|
|
| |||||||||||
Total return3 | 9.28 | % | 2.97 | % | (1.87 | %) | 6.37 | % | 15.65 | % | ||||||||||
Ratios (to average net assets)/Supplemental Data: | ||||||||||||||||||||
Expenses* | 0.06 | %4 | 0.05 | %5 | 0.05 | %6 | 0.05 | %7 | 0.05 | %7 | ||||||||||
Net investment income2 | 1.44 | % | 1.55 | % | 1.33 | % | 1.48 | % | 1.34 | % | ||||||||||
Series portfolio turnover8 | 118 | % | 16 | % | 42 | % | 37 | % | 19 | % | ||||||||||
| *The investment advisor paid a portion of the Series’ expenses. If these expenses had been incurred by the Series, the expense ratios (to average net assets) would have been increased by the following amounts: | ||||||||||||||||||||
|
| 0.09%4
|
|
| 0.06
| %5
|
| 0.04
| %6
|
| 0.03
| %7
|
| 0.05
| %7
| ||||||
| FOR THE PERIOD | ||||
| TARGET 2020 SERIES CLASS R6 | 10/16/179 TO10/31/17 | |||
Per share data (for a share outstanding throughout the period): Net asset value - Beginning of period | $ | 9.46 | ||
|
| |||
Income from investment operations: | ||||
Net investment income10 | — | |||
Net realized and unrealized gain on Underlying Series | (0.01 | ) | ||
|
| |||
Total from investment operations | (0.01 | ) | ||
|
| |||
Net asset value - End of period | $ | 9.45 | ||
|
| |||
Net assets - End of period (000’s omitted) | $ | 5 | ||
|
| |||
Total return11 | (0.11 | %) | ||
Ratios (to average net assets)/Supplemental Data: | ||||
Expenses* | 0.05 | %4,12 | ||
Net investment loss | (0.05 | %)12 | ||
Series portfolio turnover8 | 118 | % | ||
| *The investment advisor paid a portion of the Series’ expenses. If these expenses had been incurred by the Series, the expense ratios (to average net assets) would have been increased by the following amounts: | ||||
| 0.09 | %4,12 | |||
1Calculated based on average shares outstanding during the years.
2Net investment income is affected by the timing of distributions from the Underlying Series in which the Series invest. The ratios do not include net investment income of the Underlying Series in which the Series invests.
3Represents aggregate total return for the years indicated, and assumes reinvestment of all distributions. Total return would have been lower had certain expenses not been waived or reimbursed.
4Expense ratios do not include expenses of the Underlying Series in which the Series invests. The expense ratios of the Underlying Series were 0.83% for Manning & Napier Pro-Blend® Extended Term Series - Class I, 0.83% for Manning & Napier Pro-Blend® Moderate Term Series - Class I, 0.55% for Manning & Napier Blended Asset Extended Series - Class R6 and 0.50% for Manning & Napier Blended Asset Moderate Series - Class R6.
5Expense ratios do not include expenses of the Underlying Series in which the Series invests. The expense ratios of the Underlying Series were 0.82% for Manning & Napier Pro-Blend�� Moderate Term Series - Class I and 0.82% for Manning & Napier Pro-Blend® Extended Term Series - Class I.
6Expense ratios do not include expenses of the Underlying Series in which the Series invests. The expense ratios of the Underlying Series were 0.81% for Manning & Napier Pro-Blend® Moderate Term Series - Class I and 0.82% for Manning & Napier Pro-Blend® Extended Term Series - Class I.
7Expense ratios do not include expenses of the Underlying Series in which the Series invests. The expense ratios of the Underlying Series were 0.81% for Manning & Napier Pro-Blend® Moderate Term Series - Class I and 0.81% for Manning & Napier Pro-Blend® Extended Term Series - Class I.
8Reflects activity of the Series and does not include the activity of the Underlying Series.
9Commencement of operations.
10Calculated based on average shares outstanding during the period.
11Represents aggregate total return for the period indicated. Total return would have been lower had certain expenses not been reimbursed during the period. Periods less than one year are not annualized.
12Annualized.
The accompanying notes are an integral part of the financial statements.
50
Financial Highlights
| FOR THE YEAR ENDED | ||||||||||||||||||||
| TARGET 2025 SERIES CLASS K | 10/31/17 | 10/31/16 | 10/31/15 | 10/31/14 | 10/31/13 | |||||||||||||||
Per share data (for a share outstanding throughout each year): | ||||||||||||||||||||
Net asset value - Beginning of year | $ | 11.02 | $ | 11.82 | $ | 13.01 | $ | 12.50 | $ | 10.77 | ||||||||||
|
|
|
|
|
|
|
|
|
| |||||||||||
Income (loss) from investment operations: | ||||||||||||||||||||
Net investment income1,2 | 0.10 | 0.12 | 0.12 | 0.09 | 0.09 | |||||||||||||||
Net realized and unrealized gain (loss) on investments | 1.01 | 0.15 | (0.40 | ) | 0.80 | 1.85 | ||||||||||||||
|
|
|
|
|
|
|
|
|
| |||||||||||
Total from investment operations | 1.11 | 0.27 | (0.28 | ) | 0.89 | 1.94 | ||||||||||||||
|
|
|
|
|
|
|
|
|
| |||||||||||
Less distributions to shareholders: | ||||||||||||||||||||
From net investment income | (0.16 | ) | (0.13 | ) | (0.43 | ) | (0.34 | ) | (0.21 | ) | ||||||||||
From net realized gain on investments | — | (0.94 | ) | (0.48 | ) | (0.04 | ) | — | ||||||||||||
|
|
|
|
|
|
|
|
|
| |||||||||||
Total distributions to shareholders | (0.16 | ) | (1.07 | ) | (0.91 | ) | (0.38 | ) | (0.21 | ) | ||||||||||
|
|
|
|
|
|
|
|
|
| |||||||||||
Net asset value - End of year | $ | 11.97 | $ | 11.02 | $ | 11.82 | $ | 13.01 | $ | 12.50 | ||||||||||
|
|
|
|
|
|
|
|
|
| |||||||||||
Net assets - End of year (000’s omitted) | $ | 25,591 | $ | 13,381 | $ | 11,896 | $ | 7,501 | $ | 710 | ||||||||||
|
|
|
|
|
|
|
|
|
| |||||||||||
Total return3 | 10.23 | % | 2.86 | % | (2.31 | %) | 7.28 | % | 18.32 | % | ||||||||||
Ratios (to average net assets)/Supplemental Data: | ||||||||||||||||||||
Expenses* | 0.31 | %4 | 0.30 | %5 | 0.30 | %6 | 0.30 | %7 | 0.30 | %7 | ||||||||||
Net investment income (loss)2 | 0.86 | % | 1.08 | % | 1.01 | % | 0.66 | % | 0.80 | % | ||||||||||
Series portfolio turnover8 | 208 | % | 51 | % | 27 | % | 30 | % | 22 | % | ||||||||||
| *The investment advisor paid a portion of the Series’ expenses. If these expenses had been incurred by the Series, the expense ratios (to average net assets) would have been increased by the following amounts: | ||||||||||||||||||||
|
| 0.43%4
|
|
| 0.33
| %5
|
| 0.39
| %6
|
| 0.59
| %7
|
| 10.70
| %7
| ||||||
| FOR THE YEAR ENDED | ||||||||||||||||||||
| TARGET 2025 SERIES CLASS R | 10/31/17 | 10/31/16 | 10/31/15 | 10/31/14 | 10/31/13 | |||||||||||||||
Per share data (for a share outstanding throughout each year): Net asset value - Beginning of year | $ | 11.05 | $ | 11.86 | $ | 13.02 | $ | 12.53 | $ | 10.75 | ||||||||||
|
|
|
|
|
|
|
|
|
| |||||||||||
Income (loss) from investment operations: | ||||||||||||||||||||
Net investment income (loss)1,2 | 0.04 | 0.09 | 0.13 | 0.10 | (0.01 | ) | ||||||||||||||
Net realized and unrealized gain (loss) on investments | 1.04 | 0.14 | (0.43 | ) | 0.75 | 1.98 | ||||||||||||||
|
|
|
|
|
|
|
|
|
| |||||||||||
Total from investment operations | 1.08 | 0.23 | (0.30 | ) | 0.85 | 1.97 | ||||||||||||||
|
|
|
|
|
|
|
|
|
| |||||||||||
Less distributions to shareholders: | ||||||||||||||||||||
From net investment income | (0.13 | ) | (0.10 | ) | (0.38 | ) | (0.32 | ) | (0.19 | ) | ||||||||||
From net realized gain on investments | — | (0.94 | ) | (0.48 | ) | (0.04 | ) | — | ||||||||||||
|
|
|
|
|
|
|
|
|
| |||||||||||
Total distributions to shareholders | (0.13 | ) | (1.04 | ) | (0.86 | ) | (0.36 | ) | (0.19 | ) | ||||||||||
|
|
|
|
|
|
|
|
|
| |||||||||||
Net asset value - End of year | $ | 12.00 | $ | 11.05 | $ | 11.86 | $ | 13.02 | $ | 12.53 | ||||||||||
|
|
|
|
|
|
|
|
|
| |||||||||||
Net assets - End of year (000’s omitted) | $ | 12,693 | $ | 1,671 | $ | 2,101 | $ | 3,799 | $ | 1,540 | ||||||||||
|
|
|
|
|
|
|
|
|
| |||||||||||
Total return9 | 9.94 | % | 2.50 | % | (2.44 | %) | 6.93 | % | 18.61 | % | ||||||||||
Ratios (to average net assets)/Supplemental Data: | ||||||||||||||||||||
Expenses* | 0.55 | %4 | 0.55 | %5 | 0.55 | %6 | 0.55 | %7 | 0.55 | %7 | ||||||||||
Net investment income (loss)2 | 0.30 | % | 0.87 | % | 1.07 | % | 0.75 | % | (0.10 | %) | ||||||||||
Series portfolio turnover8 | 208 | % | 51 | % | 27 | % | 30 | % | 22 | % | ||||||||||
| *The investment advisor paid a portion of the Series’ expenses. If these expenses had been incurred by the Series, the expense ratios (to average net assets) would have been increased by the following amounts: | ||||||||||||||||||||
| 0.43 | %4 | 0.33 | %5 | 0.39 | %6 | 0.62 | %7 | 1.75 | %7 | |||||||||||
1Calculated based on average shares outstanding during the years.
2Net investment income is affected by the timing of distributions from the Underlying Series in which the Series invest. The ratios do not include net investment income of the Underlying Series in which the Series invests.
3Represents aggregate total return for the years indicated, and assumes reinvestment of all distributions. Total return would have been lower had certain expenses not been waived or reimbursed.
4Expense ratios do not include expenses of the Underlying Series in which the Series invests. The expense ratios of the Underlying Series were 0.83% for Manning & Napier Pro-Blend® Extended Term Series - Class I, 0.83% for Manning & Napier Pro-Blend® Moderate Term Series - Class I, 0.55% for Manning & Napier Blended Asset Extended Series - Class R6 and 0.50% for Manning & Napier Blended Asset Moderate Series - Class R6.
5Expense ratios do not include expenses of the Underlying Series in which the Series invests. The expense ratios of the Underlying Series were 0.82% for Manning & Napier Pro-Blend® Moderate Term Series - Class I and 0.82% for Manning & Napier Pro-Blend® Extended Term Series - Class I.
6Expense ratios do not include expenses of the Underlying Series in which the Series invests. The expense ratios of the Underlying Series were 0.82% for Manning & Napier Pro-Blend® Extended Term Series - Class I and 0.83% for Manning & Napier Pro-Blend® Maximum Term Series - Class I.
7Expense ratios do not include expenses of the Underlying Series in which the Series invests. The expense ratios of the Underlying Series were 0.81% for Manning & Napier Pro-Blend® Extended Term Series - Class I and 0.82% for Manning & Napier Pro-Blend® Maximum Term Series - Class I.
8Reflects activity of the Series and does not include the activity of the Underlying Series.
9Represents aggregate total return for the year indicated, and assumes reinvestment of all distributions. Total return would have been lower had certain expenses not been waived or reimbursed.
The accompanying notes are an integral part of the financial statements.
51
Financial Highlights
| FOR THE YEAR ENDED | ||||||||||||||||||||
| TARGET 2025 SERIES CLASS I | 10/31/17 | 10/31/16 | 10/31/15 | 10/31/14 | 10/31/13 | |||||||||||||||
Per share data (for a share outstanding throughout each year): | ||||||||||||||||||||
Net asset value - Beginning of year | $ | 10.99 | $ | 11.80 | $ | 12.98 | $ | 12.47 | $ | 10.77 | ||||||||||
|
|
|
|
|
|
|
|
|
| |||||||||||
Income (loss) from investment operations: | ||||||||||||||||||||
Net investment income1,2 | 0.19 | 0.15 | 0.16 | 0.16 | 0.12 | |||||||||||||||
Net realized and unrealized gain (loss) on investments | 0.95 | 0.14 | (0.40 | ) | 0.75 | 1.81 | ||||||||||||||
|
|
|
|
|
|
|
|
|
| |||||||||||
Total from investment operations | 1.14 | 0.29 | (0.24 | ) | 0.91 | 1.93 | ||||||||||||||
|
|
|
|
|
|
|
|
|
| |||||||||||
Less distributions to shareholders: | ||||||||||||||||||||
From net investment income | (0.19 | ) | (0.16 | ) | (0.46 | ) | (0.36 | ) | (0.23 | ) | ||||||||||
From net realized gain on investments | — | (0.94 | ) | (0.48 | ) | (0.04 | ) | — | ||||||||||||
|
|
|
|
|
|
|
|
|
| |||||||||||
Total distributions to shareholders | (0.19 | ) | (1.10 | ) | (0.94 | ) | (0.40 | ) | (0.23 | ) | ||||||||||
|
|
|
|
|
|
|
|
|
| |||||||||||
Net asset value - End of year | $ | 11.94 | $ | 10.99 | $ | 11.80 | $ | 12.98 | $ | 12.47 | ||||||||||
|
|
|
|
|
|
|
|
|
| |||||||||||
Net assets - End of year (000’s omitted) | $ | 2,123 | $ | 15,384 | $ | 15,539 | $ | 13,046 | $ | 9,373 | ||||||||||
|
|
|
|
|
|
|
|
|
| |||||||||||
Total return3 | 10.52 | % | 3.04 | % | (2.00 | %) | 7.51 | % | 18.26 | % | ||||||||||
Ratios (to average net assets)/Supplemental Data: | ||||||||||||||||||||
Expenses* | 0.05 | %4 | 0.05 | %5 | 0.05 | %6 | 0.05 | %7 | 0.05 | %7 | ||||||||||
Net investment income (loss)2 | 1.71 | % | 1.38 | % | 1.29 | % | 1.22 | % | 1.03 | % | ||||||||||
Series portfolio turnover8 | 208 | % | 51 | % | 27 | % | 30 | % | 22 | % | ||||||||||
| *The investment advisor paid a portion of the Series’ expenses. If these expenses had been incurred by the Series, the expense ratios (to average net assets) would have been increased by the following amounts: | ||||||||||||||||||||
|
| 0.43%4
|
|
| 0.33
| %5
|
| 0.39
| %6
|
| 0.64
| %7
|
| 1.43
| %7
| ||||||
| FOR THE PERIOD | ||||
| TARGET 2025 SERIES CLASS R6 | 10/16/179 TO 10/31/17 | |||
Per share data (for a share outstanding throughout the period): | ||||
Net asset value - Beginning of period | $ | 11.95 | ||
|
| |||
Income (loss) from investment operations: | ||||
Net investment income (loss)10 | — | |||
Net realized and unrealized gain on Underlying Series | (0.01 | ) | ||
|
| |||
Total from investment operations | (0.01 | ) | ||
|
| |||
Net asset value - End of period | $ | 11.94 | ||
|
| |||
Net assets - End of period (000’s omitted) | $ | 5 | ||
|
| |||
Total return11 | (0.08 | %) | ||
Ratios (to average net assets)/Supplemental Data: | ||||
Expenses* | 0.05 | %4,12 | ||
Net investment loss | (0.05 | %)12 | ||
Series portfolio turnover8 | 208 | % | ||
| *The investment advisor paid a portion of the Series’ expenses. If these expenses had been incurred by the Series, the expense ratios (to average net assets) would have been increased by the following amounts: | ||||
| 0.43 | %4,12 | |||
1Calculated based on average shares outstanding during the years.
2Net investment income is affected by the timing of distributions from the Underlying Series in which the Series invest. The ratios do not include net investment income of the Underlying Series in which the Series invests.
3Represents aggregate total return for the years indicated, and assumes reinvestment of all distributions. Total return would have been lower had certain expenses not been waived or reimbursed.
4Expense ratios do not include expenses of the Underlying Series in which the Series invests. The expense ratios of the Underlying Series were 0.83% for Manning & Napier Pro-Blend® Extended Term Series - Class I, 0.83% for Manning & Napier Pro-Blend® Moderate Term Series - Class I, 0.55% for Manning & Napier Blended Asset Extended Series - Class R6 and 0.50% for Manning & Napier Blended Asset Moderate Series - Class R6.
5Expense ratios do not include expenses of the Underlying Series in which the Series invests. The expense ratios of the Underlying Series were 0.82% for Manning & Napier Pro-Blend® Moderate Term Series - Class I and 0.82% for Manning & Napier Pro-Blend® Extended Term Series - Class I.
6Expense ratios do not include expenses of the Underlying Series in which the Series invests. The expense ratios of the Underlying Series were 0.82% for Manning & Napier Pro-Blend® Extended Term Series - Class I and 0.83% for Manning & Napier Pro-Blend® Maximum Term Series - Class I.
7Expense ratios do not include expenses of the Underlying Series in which the Series invests. The expense ratios of the Underlying Series were 0.81% for Manning & Napier Pro-Blend® Extended Term Series - Class I and 0.82% for Manning & Napier Pro-Blend® Maximum Term Series - Class I.
8Reflects activity of the Series and does not include the activity of the Underlying Series.
9Commencement of operations.
10Calculated based on average shares outstanding during the period.
11Represents aggregate total return for the period indicated. Total return would have been lower had certain expenses not been reimbursed during the period. Periods less than one year are not annualized.
12Annualized.
The accompanying notes are an integral part of the financial statements.
52
Financial Highlights
| FOR THE YEAR ENDED | ||||||||||||||||||||
| TARGET 2030 SERIES CLASS K | 10/31/17 | 10/31/16 | 10/31/15 | 10/31/14 | 10/31/13 | |||||||||||||||
Per share data (for a share outstanding throughout each year): | ||||||||||||||||||||
Net asset value - Beginning of year | $ | 8.59 | $ | 9.78 | $ | 11.52 | $ | 11.40 | $ | 9.94 | ||||||||||
|
|
|
|
|
|
|
|
|
| |||||||||||
Income (loss) from investment operations: | ||||||||||||||||||||
Net investment income1,2 | 0.08 | 0.08 | 0.11 | 0.10 | 0.10 | |||||||||||||||
Net realized and unrealized gain (loss) on investments | 0.98 | 0.13 | (0.34 | ) | 0.73 | 1.86 | ||||||||||||||
|
|
|
|
|
|
|
|
|
| |||||||||||
Total from investment operations | 1.06 | 0.21 | (0.23 | ) | 0.83 | 1.96 | ||||||||||||||
|
|
|
|
|
|
|
|
|
| |||||||||||
Less distributions to shareholders: | ||||||||||||||||||||
From net investment income | (0.13 | ) | (0.09 | ) | (0.44 | ) | (0.35 | ) | (0.15 | ) | ||||||||||
From net realized gain on investments | — | (1.31 | ) | (1.07 | ) | (0.36 | ) | (0.35 | ) | |||||||||||
|
|
|
|
|
|
|
|
|
| |||||||||||
Total distributions to shareholders | (0.13 | ) | (1.40 | ) | (1.51 | ) | (0.71 | ) | (0.50 | ) | ||||||||||
|
|
|
|
|
|
|
|
|
| |||||||||||
Net asset value - End of year | $ | 9.52 | $ | 8.59 | $ | 9.78 | $ | 11.52 | $ | 11.40 | ||||||||||
|
|
|
|
|
|
|
|
|
| |||||||||||
Net assets - End of year (000’s omitted) | $ | 89,018 | $ | 79,527 | $ | 79,169 | $ | 118,788 | $ | 91,676 | ||||||||||
|
|
|
|
|
|
|
|
|
| |||||||||||
Total return3 | 12.49 | % | 3.12 | % | (2.33 | %) | 7.67 | % | 20.56 | % | ||||||||||
Ratios (to average net assets)/Supplemental Data: | ||||||||||||||||||||
Expenses* | 0.31 | %4 | 0.30 | %5 | 0.30 | %5 | 0.30 | %6 | 0.30 | %6 | ||||||||||
Net investment income2 | 0.89 | % | 0.94 | % | 1.11 | % | 0.87 | % | 0.90 | % | ||||||||||
Series portfolio turnover7 | 130 | % | 22 | % | 38 | % | 27 | % | 9 | % | ||||||||||
| *The investment advisor paid a portion of the Series’ expenses. If these expenses had been incurred by the Series, the expense ratios (to average net assets) would have been increased by the following amounts: | ||||||||||||||||||||
|
| 0.08
| %4
|
| 0.06
| %5
|
| 0.04
| %5
|
| 0.03
| %6
|
| 0.05
| %6
| ||||||
| FOR THE YEAR ENDED | ||||||||||||||||||||
| TARGET 2030 SERIES CLASS R | 10/31/17 | 10/31/16 | 10/31/15 | 10/31/14 | 10/31/13 | |||||||||||||||
Per share data (for a share outstanding throughout each year): | ||||||||||||||||||||
Net asset value - Beginning of year | $ | 8.51 | $ | 9.70 | $ | 11.37 | $ | 11.31 | $ | 9.87 | ||||||||||
|
|
|
|
|
|
|
|
|
| |||||||||||
Income (loss) from investment operations: | ||||||||||||||||||||
Net investment income1,2 | 0.05 | 0.07 | 0.10 | 0.07 | 0.07 | |||||||||||||||
Net realized and unrealized gain (loss) on investments | 0.98 | 0.12 | (0.30 | ) | 0.67 | 1.85 | ||||||||||||||
|
|
|
|
|
|
|
|
|
| |||||||||||
Total from investment operations | 1.03 | 0.19 | (0.20 | ) | 0.74 | 1.92 | ||||||||||||||
|
|
|
|
|
|
|
|
|
| |||||||||||
Less distributions to shareholders: | ||||||||||||||||||||
From net investment income | (0.11 | ) | (0.07 | ) | (0.40 | ) | (0.32 | ) | (0.13 | ) | ||||||||||
From net realized gain on investments | — | (1.31 | ) | (1.07 | ) | (0.36 | ) | (0.35 | ) | |||||||||||
|
|
|
|
|
|
|
|
|
| |||||||||||
Total distributions to shareholders | (0.11 | ) | (1.38 | ) | (1.47 | ) | (0.68 | ) | (0.48 | ) | ||||||||||
|
|
|
|
|
|
|
|
|
| |||||||||||
Net asset value - End of year | $ | 9.43 | $ | 8.51 | $ | 9.70 | $ | 11.37 | $ | 11.31 | ||||||||||
|
|
|
|
|
|
|
|
|
| |||||||||||
Net assets - End of year (000’s omitted) | $ | 14,500 | $ | 7,832 | $ | 11,115 | $ | 20,894 | $ | 28,034 | ||||||||||
|
|
|
|
|
|
|
|
|
| |||||||||||
Total return3 | 12.20 | % | 2.85 | % | (2.11 | %) | 6.90 | % | 20.19 | % | ||||||||||
Ratios (to average net assets)/Supplemental Data: | ||||||||||||||||||||
Expenses* | 0.56 | %4 | 0.55 | %5 | 0.55 | %5 | 0.55 | %6 | 0.55 | %6 | ||||||||||
Net investment income2 | 0.59 | % | 0.84 | % | 0.95 | % | 0.62 | % | 0.63 | % | ||||||||||
Series portfolio turnover7 | 130 | % | 22 | % | 38 | % | 27 | % | 9 | % | ||||||||||
| *The investment advisor paid a portion of the Series’ expenses. If these expenses had been incurred by the Series, the expense ratios (to average net assets) would have been increased by the following amounts: | ||||||||||||||||||||
| 0.08 | %4 | 0.06 | %5 | 0.04 | %5 | 0.03 | %6 | 0.05 | %6 | |||||||||||
1Calculated based on average shares outstanding during the years.
2Net investment income is affected by the timing of distributions from the Underlying Series in which the Series invest. The ratios do not include net investment income of the Underlying Series in which the Series invests.
3Represents aggregate total return for the years indicated, and assumes reinvestment of all distributions. Total return would have been lower had certain expenses not been waived or reimbursed.
4Expense ratios do not include expenses of the Underlying Series in which the Series invests. The expense ratios of the Underlying Series were 0.83% for Manning & Napier Pro-Blend® Extended Term Series - Class I, 0.85% for Manning & Napier Pro-Blend® Maximum Term Series - Class I, 0.55% for Manning & Napier Blended Asset Extended Series - Class R6 and 0.55% for Manning & Napier Blended Asset Maximum Series - Class R6.
5Expense ratios do not include expenses of the Underlying Series in which the Series invests. The expense ratios of the Underlying Series were 0.82% for Manning & Napier Pro-Blend® Extended Term Series - Class I and 0.83% for Manning & Napier Pro-Blend® Maximum Term Series - Class I.
6Expense ratios do not include expenses of the Underlying Series in which the Series invests. The expense ratios of the Underlying Series were 0.81% for Manning & Napier Pro-Blend® Extended Term Series - Class I and 0.82% for Manning & Napier Pro-Blend® Maximum Term Series - Class I.
7Reflects activity of the Series and does not include the activity of the Underlying Series.
The accompanying notes are an integral part of the financial statements.
53
Financial Highlights
| FOR THE YEAR ENDED | ||||||||||||||||||||
| TARGET 2030 SERIES CLASS I | 10/31/17 | 10/31/16 | 10/31/15 | 10/31/14 | 10/31/13 | |||||||||||||||
Per share data (for a share outstanding throughout each year): | ||||||||||||||||||||
Net asset value - Beginning of year | $ | 8.68 | $ | 9.87 | $ | 11.61 | $ | 11.48 | $ | 10.01 | ||||||||||
|
|
|
|
|
|
|
|
|
| |||||||||||
Income (loss) from investment operations: | ||||||||||||||||||||
Net investment income1,2 | 0.12 | 0.12 | 0.12 | 0.14 | 0.12 | |||||||||||||||
Net realized and unrealized gain (loss) on investments | 0.97 | 0.11 | (0.32 | ) | 0.73 | 1.88 | ||||||||||||||
|
|
|
|
|
|
|
|
|
| |||||||||||
Total from investment operations | 1.09 | 0.23 | (0.20 | ) | 0.87 | 2.00 | ||||||||||||||
|
|
|
|
|
|
|
|
|
| |||||||||||
Less distributions to shareholders: | ||||||||||||||||||||
From net investment income | (0.15 | ) | (0.11 | ) | (0.47 | ) | (0.38 | ) | (0.18 | ) | ||||||||||
From net realized gain on investments | — | (1.31 | ) | (1.07 | ) | (0.36 | ) | (0.35 | ) | |||||||||||
|
|
|
|
|
|
|
|
|
| |||||||||||
Total distributions to shareholders | (0.15 | ) | (1.42 | ) | (1.54 | ) | (0.74 | ) | (0.53 | ) | ||||||||||
|
|
|
|
|
|
|
|
|
| |||||||||||
Net asset value - End of year | $ | 9.62 | $ | 8.68 | $ | 9.87 | $ | 11.61 | $ | 11.48 | ||||||||||
|
|
|
|
|
|
|
|
|
| |||||||||||
Net assets - End of year (000’s omitted) | $ | 38,110 | $ | 53,551 | $ | 75,870 | $ | 58,075 | $ | 63,662 | ||||||||||
|
|
|
|
|
|
|
|
|
| |||||||||||
Total return3 | 12.76 | % | 3.38 | % | (2.02 | %) | 7.95 | % | 20.81 | % | ||||||||||
Ratios (to average net assets)/Supplemental Data: | ||||||||||||||||||||
Expenses* | 0.06 | %4 | 0.05 | %5 | 0.05 | %5 | 0.05 | %6 | 0.05 | %6 | ||||||||||
Net investment income2 | 1.30 | % | 1.36 | % | 1.22 | % | 1.23 | % | 1.14 | % | ||||||||||
Series portfolio turnover7 | 130 | % | 22 | % | 38 | % | 27 | % | 9 | % | ||||||||||
| *The investment advisor paid a portion of the Series’ expenses. If these expenses had been incurred by the Series, the expense ratios (to average net assets) would have been increased by the following amounts: | ||||||||||||||||||||
|
| 0.08
| %4
|
| 0.06
| %5
|
| 0.04
| %5
|
| 0.03
| %6
|
| 0.05
| %6
| ||||||
| FOR THE PERIOD | ||||
| TARGET 2030 SERIES CLASS R6 | 10/16/178 TO 10/31/17 | |||
Per share data (for a share outstanding throughout the period): | ||||
Net asset value - Beginning of period | $ | 9.62 | ||
|
| |||
Income (loss) from investment operations: | ||||
Net investment income (loss)9 | — | |||
Net realized and unrealized gain on Underlying Series | (0.01 | ) | ||
|
| |||
Total from investment operations | (0.01 | ) | ||
|
| |||
Net asset value - End of period | $ | 9.61 | ||
|
| |||
Net assets - End of period (000’s omitted) | $ | 5 | ||
|
| |||
Total return10 | (0.10 | %) | ||
Ratios (to average net assets)/Supplemental Data: | ||||
Expenses* | 0.05 | %4,11 | ||
Net investment loss | (0.05 | %)11 | ||
Series portfolio turnover7 | 130 | % | ||
| *The investment advisor paid a portion of the Series’ expenses. If these expenses had been incurred by the Series, the expense ratios (to average net assets) would have been increased by the following amounts: | ||||
| 0.08 | %4,11 | |||
1Calculated based on average shares outstanding during the years.
2Net investment income is affected by the timing of distributions from the Underlying Series in which the Series invest. The ratios do not include net investment income of the Underlying Series in which the Series invests.
3Represents aggregate total return for the years indicated, and assumes reinvestment of all distributions. Total return would have been lower had certain expenses not been waived or reimbursed.
4Expense ratios do not include expenses of the Underlying Series in which the Series invests. The expense ratios of the Underlying Series were 0.83% for Manning & Napier Pro-Blend® Extended Term Series - Class I, 0.85% for Manning & Napier Pro-Blend® Maximum Term Series - Class I, 0.55% for Manning & Napier Blended Asset Extended Series - Class R6 and 0.55% for Manning & Napier Blended Asset Maximum Series - Class R6.
5Expense ratios do not include expenses of the Underlying Series in which the Series invests. The expense ratios of the Underlying Series were 0.82% for Manning & Napier Pro-Blend® Extended Term Series - Class I and 0.83% for Manning & Napier Pro-Blend® Maximum Term Series - Class I.
6Expense ratios do not include expenses of the Underlying Series in which the Series invests. The expense ratios of the Underlying Series were 0.81% for Manning & Napier Pro-Blend® Extended Term Series - Class I and 0.82% for Manning & Napier Pro-Blend® Maximum Term Series - Class I.
7Reflects activity of the Series and does not include the activity of the Underlying Series.
8Commencement of operations.
9Calculated based on average shares outstanding during the period.
10Represents aggregate total return for the period indicated. Total return would have been lower had certain expenses not been reimbursed during the period. Periods less than one year are not annualized.
11Annualized.
The accompanying notes are an integral part of the financial statements.
54
Financial Highlights
| FOR THE YEAR ENDED | ||||||||||||||||||||
| TARGET 2035 SERIES CLASS K | 10/31/17 | 10/31/16 | 10/31/15 | 10/31/14 | 10/31/13 | |||||||||||||||
Per share data (for a share outstanding throughout each year): | ||||||||||||||||||||
Net asset value - Beginning of year | $ | 11.30 | $ | 12.32 | $ | 13.71 | $ | 13.22 | $ | 10.92 | ||||||||||
|
|
|
|
|
|
|
|
|
| |||||||||||
Income (loss) from investment operations: | ||||||||||||||||||||
Net investment income (loss)1,2 | 0.08 | 0.08 | 0.11 | 0.06 | 0.08 | |||||||||||||||
Net realized and unrealized gain (loss) on investments | 1.50 | 0.21 | (0.38 | ) | 0.99 | 2.35 | ||||||||||||||
|
|
|
|
|
|
|
|
|
| |||||||||||
Total from investment operations | 1.58 | 0.29 | (0.27 | ) | 1.05 | 2.43 | ||||||||||||||
|
|
|
|
|
|
|
|
|
| |||||||||||
Less distributions to shareholders: | ||||||||||||||||||||
From net investment income | (0.15 | ) | (0.10 | ) | (0.61 | ) | (0.46 | ) | (0.13 | ) | ||||||||||
From net realized gain on investments | (0.07 | ) | (1.21 | ) | (0.51 | ) | (0.10 | ) | — | |||||||||||
|
|
|
|
|
|
|
|
|
| |||||||||||
Total distributions to shareholders | (0.22 | ) | (1.31 | ) | (1.12 | ) | (0.56 | ) | (0.13 | ) | ||||||||||
|
|
|
|
|
|
|
|
|
| |||||||||||
Net asset value - End of year | $ | 12.66 | $ | 11.30 | $ | 12.32 | $ | 13.71 | $ | 13.22 | ||||||||||
|
|
|
|
|
|
|
|
|
| |||||||||||
Net assets - End of year (000’s omitted) | $ | 18,235 | $ | 11,745 | $ | 8,979 | $ | 5,378 | $ | 465 | ||||||||||
|
|
|
|
|
|
|
|
|
| |||||||||||
Total return3 | 14.32 | % | 3.13 | % | (2.20 | %) | 8.17 | % | 22.42 | % | ||||||||||
Ratios (to average net assets)/Supplemental Data: | ||||||||||||||||||||
Expenses* | 0.31 | %4 | 0.30 | %5 | 0.30 | %5 | 0.30 | %6 | 0.30 | %6 | ||||||||||
Net investment income (loss)2 | 0.67 | % | 0.71 | % | 0.86 | % | 0.44 | % | 0.66 | % | ||||||||||
Series portfolio turnover7 | 173 | % | 22 | % | 26 | % | 24 | % | 18 | % | ||||||||||
| *The investment advisor paid a portion of the Series’ expenses. If these expenses had been incurred by the Series, the expense ratios (to average net assets) would have been increased by the following amounts: | ||||||||||||||||||||
| | 0.54 | %4 | | 0.43 | %5 | | 0.52 | %5 | | 0.83 | %6 | | 9.70 | %6 | ||||||
| FOR THE YEAR ENDED | ||||||||||||||||||||
| TARGET 2035 SERIES CLASS R | 10/31/17 | 10/31/16 | 10/31/15 | 10/31/14 | 10/31/13 | |||||||||||||||
Per share data (for a share outstanding throughout each year): | ||||||||||||||||||||
Net asset value - Beginning of year | $ | 11.33 | $ | 12.34 | $ | 13.72 | $ | 13.25 | $ | 10.91 | ||||||||||
|
|
|
|
|
|
|
|
|
| |||||||||||
Income (loss) from investment operations: | ||||||||||||||||||||
Net investment income (loss)1,2 | 0.03 | 0.06 | 0.08 | 0.07 | — | 8 | ||||||||||||||
Net realized and unrealized gain (loss) on investments | 1.52 | 0.21 | (0.38 | ) | 0.93 | 2.44 | ||||||||||||||
|
|
|
|
|
|
|
|
|
| |||||||||||
Total from investment operations | 1.55 | 0.27 | (0.30 | ) | 1.00 | 2.44 | ||||||||||||||
|
|
|
|
|
|
|
|
|
| |||||||||||
Less distributions to shareholders: | ||||||||||||||||||||
From net investment income | (0.11 | ) | (0.07 | ) | (0.57 | ) | (0.43 | ) | (0.10 | ) | ||||||||||
From net realized gain on investments | (0.07 | ) | (1.21 | ) | (0.51 | ) | (0.10 | ) | — | |||||||||||
|
|
|
|
|
|
|
|
|
| |||||||||||
Total distributions to shareholders | (0.18 | ) | (1.28 | ) | (1.08 | ) | (0.53 | ) | (0.10 | ) | ||||||||||
|
|
|
|
|
|
|
|
|
| |||||||||||
Net asset value - End of year | $ | 12.70 | $ | 11.33 | $ | 12.34 | $ | 13.72 | $ | 13.25 | ||||||||||
|
|
|
|
|
|
|
|
|
| |||||||||||
Net assets - End of year (000’s omitted) | $ | 7,112 | $ | 2,057 | $ | 2,337 | $ | 2,911 | $ | 1,172 | ||||||||||
|
|
|
|
|
|
|
|
|
| |||||||||||
Total return3 | 13.96 | % | 2.92 | % | (2.44 | %) | 7.82 | % | 22.50 | % | ||||||||||
Ratios (to average net assets)/Supplemental Data: | ||||||||||||||||||||
Expenses* | 0.55 | %4 | 0.55 | %5 | 0.55 | %5 | 0.55 | %6 | 0.55 | %6 | ||||||||||
Net investment income (loss)2 | 0.23 | % | 0.50 | % | 0.66 | % | 0.49 | % | 0.17 | % | ||||||||||
Series portfolio turnover7 | 173 | % | 22 | % | 26 | % | 24 | % | 18 | % | ||||||||||
| *The investment advisor paid a portion of the Series’ expenses. If these expenses had been incurred by the Series, the expense ratios (to average net assets) would have been increased by the following amounts: | ||||||||||||||||||||
| 0.54 | %4 | 0.43 | %5 | 0.52 | %5 | 0.88 | %6 | 2.38 | %6 | |||||||||||
1Calculated based on average shares outstanding during the years.
2Net investment income is affected by the timing of distributions from the Underlying Series in which the Series invest. The ratios do not include net investment income of the Underlying Series in which the Series invests.
3Represents aggregate total return for the years indicated, and assumes reinvestment of all distributions. Total return would have been lower had certain expenses not been waived or reimbursed.
4Expense ratios do not include expenses of the Underlying Series in which the Series invests. The expense ratios of the Underlying Series were 0.83% for Manning & Napier Pro-Blend® Extended Term Series - Class I, 0.85% for Manning & Napier Pro-Blend® Maximum Term Series - Class I, 0.55% for Manning & Napier Blended Asset Extended Series - Class R6 and 0.55% for Manning & Napier Blended Asset Maximum Series - Class R6.
5Expense ratios do not include expenses of the Underlying Series in which the Series invests. The expense ratios of the Underlying Series were 0.82% for Manning & Napier Pro-Blend® Extended Term Series - Class I and 0.83% for Manning & Napier Pro-Blend® Maximum Term Series - Class I.
6Expense ratios do not include expenses of the Underlying Series in which the Series invests. The expense ratios of the Underlying Series were 0.81% for Manning & Napier Pro-Blend® Extended Term Series - Class I and 0.82% for Manning & Napier Pro-Blend® Maximum Term Series - Class I.
7Reflects activity of the Series and does not include the activity of the Underlying Series.
8Less than $0.01.
The accompanying notes are an integral part of the financial statements.
55
Financial Highlights
| FOR THE YEAR ENDED | ||||||||||||||||||||
| TARGET 2035 SERIES CLASS I | 10/31/17 | 10/31/16 | 10/31/15 | 10/31/14 | 10/31/13 | |||||||||||||||
Per share data (for a share outstanding throughout each year): | ||||||||||||||||||||
Net asset value - Beginning of year | $ | 11.35 | $ | 12.36 | $ | 13.75 | $ | 13.25 | $ | 10.92 | ||||||||||
|
|
|
|
|
|
|
|
|
| |||||||||||
Income (loss) from investment operations: | ||||||||||||||||||||
Net investment income1,2 | 0.16 | 0.11 | 0.14 | 0.12 | 0.09 | |||||||||||||||
Net realized and unrealized gain (loss) on investments | 1.45 | 0.21 | (0.38 | ) | 0.96 | 2.38 | ||||||||||||||
|
|
|
|
|
|
|
|
|
| |||||||||||
Total from investment operations | 1.61 | 0.32 | (0.24 | ) | 1.08 | 2.47 | ||||||||||||||
|
|
|
|
|
|
|
|
|
| |||||||||||
Less distributions to shareholders: | ||||||||||||||||||||
From net investment income | (0.18 | ) | (0.12 | ) | (0.64 | ) | (0.48 | ) | (0.14 | ) | ||||||||||
From net realized gain on investments | (0.07 | ) | (1.21 | ) | (0.51 | ) | (0.10 | ) | — | |||||||||||
|
|
|
|
|
|
|
|
|
| |||||||||||
Total distributions to shareholders | (0.25 | ) | (1.33 | ) | (1.15 | ) | (0.58 | ) | (0.14 | ) | ||||||||||
|
|
|
|
|
|
|
|
|
| |||||||||||
Net asset value - End of year | $ | 12.71 | $ | 11.35 | $ | 12.36 | $ | 13.75 | $ | 13.25 | ||||||||||
|
|
|
|
|
|
|
|
|
| |||||||||||
Net assets - End of year (000’s omitted) | $ | 964 | $ | 11,455 | $ | 10,993 | $ | 9,487 | $ | 6,322 | ||||||||||
|
|
|
|
|
|
|
|
|
| |||||||||||
Total return3 | 14.53 | % | 3.45 | % | (1.98 | %) | 8.43 | % | 22.81 | % | ||||||||||
Ratios (to average net assets)/Supplemental Data: | ||||||||||||||||||||
Expenses* | 0.05 | %4 | 0.05 | %5 | 0.05 | %5 | 0.05 | %6 | 0.05 | %6 | ||||||||||
Net investment income (loss)2 | 1.37 | % | 1.01 | % | 1.07 | % | 0.88 | % | 0.75 | % | ||||||||||
Series portfolio turnover7 | 173 | % | 22 | % | 26 | % | 24 | % | 18 | % | ||||||||||
| *The investment advisor paid a portion of the Series’ expenses. If these expenses had been incurred by the Series, the expense ratios (to average net assets) would have been increased by the following amounts: | ||||||||||||||||||||
|
| 0.54
| %4
|
| 0.43
| %5
|
| 0.52
| %5
|
| 0.91
| %6
|
| 2.40
| %6
| ||||||
| FOR THE PERIOD | ||||
| TARGET 2035 SERIES CLASS R6 | 10/16/178 TO 10/31/17 | |||
Per share data (for a share outstanding throughout the period): | ||||
Net asset value - Beginning of period | $ | 12.71 | ||
|
| |||
Income (loss) from investment operations: | ||||
Net investment loss9 | — | |||
Net realized and unrealized gain on Underlying Series | — | |||
|
| |||
Total from investment operations | — | |||
|
| |||
Net asset value - End of period | $ | 12.71 | ||
|
| |||
Net assets - End of period (000’s omitted) | $ | 5 | ||
|
| |||
Total return10 | 0.00 | % | ||
Ratios (to average net assets)/Supplemental Data: | ||||
Expenses* | 0.05 | %4,11 | ||
Net investment loss | (0.05 | %)11 | ||
Series portfolio turnover7 | 173 | % | ||
| *The investment advisor paid a portion of the Series’ expenses. If these expenses had been incurred by the Series, the expense ratios (to average net assets) would have been increased by the following amounts: | ||||
| 0.54 | %4,11 | |||
1Calculated based on average shares outstanding during the years.
2Net investment income is affected by the timing of distributions from the Underlying Series in which the Series invest. The ratios do not include net investment income of the Underlying Series in which the Series invests.
3Represents aggregate total return for the years indicated, and assumes reinvestment of all distributions. Total return would have been lower had certain expenses not been waived or reimbursed.
4Expense ratios do not include expenses of the Underlying Series in which the Series invests. The expense ratios of the Underlying Series were 0.83% for Manning & Napier Pro-Blend® Extended Term Series - Class I, 0.85% for Manning & Napier Pro-Blend® Maximum Term Series - Class I, 0.55% for Manning & Napier Blended Asset Extended Series - Class R6 and 0.55% for Manning & Napier Blended Asset Maximum Series - Class R6.
5Expense ratios do not include expenses of the Underlying Series in which the Series invests. The expense ratios of the Underlying Series were 0.82% for Manning & Napier Pro-Blend® Extended Term Series - Class I and 0.83% for Manning & Napier Pro-Blend® Maximum Term Series - Class I.
6Expense ratios do not include expenses of the Underlying Series in which the Series invests. The expense ratios of the Underlying Series were 0.81% for Manning & Napier Pro-Blend® Extended Term Series - Class I and 0.82% for Manning & Napier Pro-Blend® Maximum Term Series - Class I.
7Reflects activity of the Series and does not include the activity of the Underlying Series.
8Commencement of operations.
9Calculated based on average shares outstanding during the period.
10Represents aggregate total return for the period indicated. Total return would have been lower had certain expenses not been reimbursed during the period. Periods less than one year are not annualized.
11Annualized.
The accompanying notes are an integral part of the financial statements.
56
Financial Highlights
| FOR THE YEAR ENDED | ||||||||||||||||||||
| TARGET 2040 SERIES CLASS K | 10/31/17 | 10/31/16 | 10/31/15 | 10/31/14 | 10/31/13 | |||||||||||||||
Per share data (for a share outstanding throughout each year): | ||||||||||||||||||||
Net asset value - Beginning of year | $ | 8.73 | $ | 10.13 | $ | 12.50 | $ | 12.47 | $ | 10.29 | ||||||||||
|
|
|
|
|
|
|
|
|
| |||||||||||
Income (loss) from investment operations: | ||||||||||||||||||||
Net investment income1,2 | 0.05 | 0.05 | 0.09 | 0.07 | 0.06 | |||||||||||||||
Net realized and unrealized gain (loss) on investments | 1.34 | 0.16 | (0.32 | ) | 0.94 | 2.43 | ||||||||||||||
|
|
|
|
|
|
|
|
|
| |||||||||||
Total from investment operations | 1.39 | 0.21 | (0.23 | ) | 1.01 | 2.49 | ||||||||||||||
|
|
|
|
|
|
|
|
|
| |||||||||||
Less distributions to shareholders: | ||||||||||||||||||||
From net investment income | (0.11 | ) | (0.06 | ) | (0.61 | ) | (0.48 | ) | (0.07 | ) | ||||||||||
From net realized gain on investments | — | (1.55 | ) | (1.53 | ) | (0.50 | ) | (0.24 | ) | |||||||||||
|
|
|
|
|
|
|
|
|
| |||||||||||
Total distributions to shareholders | (0.11 | ) | (1.61 | ) | (2.14 | ) | (0.98 | ) | (0.31 | ) | ||||||||||
|
|
|
|
|
|
|
|
|
| |||||||||||
Net asset value - End of year | $ | 10.01 | $ | 8.73 | $ | 10.13 | $ | 12.50 | $ | 12.47 | ||||||||||
|
|
|
|
|
|
|
|
|
| |||||||||||
Net assets - End of year (000’s omitted) | $ | 52,397 | $ | 55,920 | $ | 51,931 | $ | 83,655 | $ | 67,576 | ||||||||||
|
|
|
|
|
|
|
|
|
| |||||||||||
Total return3 | 16.08 | % | 3.24 | % | (2.30 | %) | 8.61 | % | 24.81 | % | ||||||||||
Ratios (to average net assets)/Supplemental Data: | ||||||||||||||||||||
Expenses* | 0.31 | %4 | 0.30 | %5 | 0.30 | %5 | 0.30 | %6 | 0.30 | %6 | ||||||||||
Net investment income2 | 0.54 | % | 0.57 | % | 0.80 | % | 0.54 | % | 0.49 | % | ||||||||||
Series portfolio turnover7 | 127 | % | 26 | % | 45 | % | 22 | % | 13 | % | ||||||||||
| *The investment advisor paid a portion of the Series’ expenses. If these expenses had been incurred by the Series, the expense ratios (to average net assets) would have been increased by the following amounts: | ||||||||||||||||||||
| | 0.14 | %4 | | 0.10 | %5 | | 0.08 | %5 | | 0.06 | %6 | | 0.09 | %6 | ||||||
| FOR THE YEAR ENDED | ||||||||||||||||||||
| TARGET 2040 SERIES CLASS R | 10/31/17 | 10/31/16 | 10/31/15 | 10/31/14 | 10/31/13 | |||||||||||||||
Per share data (for a share outstanding throughout each year): | ||||||||||||||||||||
Net asset value - Beginning of year | $ | 8.66 | $ | 10.06 | $ | 12.33 | $ | 12.39 | $ | 10.22 | ||||||||||
|
|
|
|
|
|
|
|
|
| |||||||||||
Income (loss) from investment operations: | ||||||||||||||||||||
Net investment income1,2 | 0.02 | 0.03 | 0.07 | 0.03 | 0.02 | |||||||||||||||
Net realized and unrealized gain (loss) on investments | 1.34 | 0.15 | (0.24 | ) | 0.86 | 2.42 | ||||||||||||||
|
|
|
|
|
|
|
|
|
| |||||||||||
Total from investment operations | 1.36 | 0.18 | (0.17 | ) | 0.89 | 2.44 | ||||||||||||||
|
|
|
|
|
|
|
|
|
| |||||||||||
Less distributions to shareholders: | ||||||||||||||||||||
From net investment income | (0.09 | ) | (0.03 | ) | (0.57 | ) | (0.45 | ) | (0.03 | ) | ||||||||||
From net realized gain on investments | — | (1.55 | ) | (1.53 | ) | (0.50 | ) | (0.24 | ) | |||||||||||
|
|
|
|
|
|
|
|
|
| |||||||||||
Total distributions to shareholders | (0.09 | ) | (1.58 | ) | (2.10 | ) | (0.95 | ) | (0.27 | ) | ||||||||||
|
|
|
|
|
|
|
|
|
| |||||||||||
Net asset value - End of year | $ | 9.93 | $ | 8.66 | $ | 10.06 | $ | 12.33 | $ | 12.39 | ||||||||||
|
|
|
|
|
|
|
|
|
| |||||||||||
Net assets - End of year (000’s omitted) | $ | 7,946 | $ | 4,653 | $ | 5,226 | $ | 10,469 | $ | 15,993 | ||||||||||
|
|
|
|
|
|
|
|
|
| |||||||||||
Total return3 | 15.83 | % | 2.94 | % | (1.91 | %) | 7.60 | % | 24.50 | % | ||||||||||
Ratios (to average net assets)/Supplemental Data: | ||||||||||||||||||||
Expenses* | 0.56 | %4 | 0.55 | %5 | 0.55 | %5 | 0.55 | %6 | 0.55 | %6 | ||||||||||
Net investment income2 | 0.25 | % | 0.36 | % | 0.62 | % | 0.23 | % | 0.20 | % | ||||||||||
Series portfolio turnover7 | 127 | % | 26 | % | 45 | % | 22 | % | 13 | % | ||||||||||
| *The investment advisor paid a portion of the Series’ expenses. If these expenses had been incurred by the Series, the expense ratios (to average net assets) would have been increased by the following amounts: | ||||||||||||||||||||
| 0.14 | %4 | 0.10 | %5 | 0.08 | %5 | 0.06 | %6 | 0.09 | %6 | |||||||||||
1Calculated based on average shares outstanding during the years.
2Net investment income is affected by the timing of distributions from the Underlying Series in which the Series invest. The ratios do not include net investment income of the Underlying Series in which the Series invests.
3Represents aggregate total return for the years indicated, and assumes reinvestment of all distributions. Total return would have been lower had certain expenses not been waived or reimbursed.
4Expense ratios do not include expenses of the Underlying Series in which the Series invests. The expense ratios of the Underlying Series were 0.83% for Manning & Napier Pro-Blend® Extended Term Series - Class I, 0.85% for Manning & Napier Pro-Blend® Maximum Term Series - Class I, 0.55% for Manning & Napier Blended Asset Extended Series - Class R6 and 0.55% for Manning & Napier Blended Asset Maximum Series - Class R6.
5Expense ratios do not include expenses of the Underlying Series in which the Series invests. The expense ratios of the Underlying Series were 0.82% for Manning & Napier Pro-Blend® Extended Term Series - Class I and 0.83% for Manning & Napier Pro-Blend® Maximum Term Series - Class I.
6Expense ratios do not include expenses of the Underlying Series in which the Series invests. The expense ratios of the Underlying Series were 0.81% for Manning & Napier Pro-Blend® Extended Term Series - Class I and 0.82% for Manning & Napier Pro-Blend® Maximum Term Series - Class I.
7Reflects activity of the Series and does not include the activity of the Underlying Series.
The accompanying notes are an integral part of the financial statements.
57
Financial Highlights
| FOR THE YEAR ENDED | ||||||||||||||||||||
| TARGET 2040 SERIES CLASS I | 10/31/17 | 10/31/16 | 10/31/15 | 10/31/14 | 10/31/13 | |||||||||||||||
Per share data (for a share outstanding throughout each year): | ||||||||||||||||||||
Net asset value - Beginning of year | $ | 8.81 | $ | 10.20 | $ | 12.58 | $ | 12.55 | $ | 10.35 | ||||||||||
|
|
|
|
|
|
|
|
|
| |||||||||||
Income (loss) from investment operations: | ||||||||||||||||||||
Net investment income1,2 | 0.09 | 0.09 | 0.10 | 0.10 | 0.08 | |||||||||||||||
Net realized and unrealized gain (loss) on investments | 1.33 | 0.15 | (0.30 | ) | 0.94 | 2.45 | ||||||||||||||
|
|
|
|
|
|
|
|
|
| |||||||||||
Total from investment operations | 1.42 | 0.24 | (0.20 | ) | 1.04 | 2.53 | ||||||||||||||
|
|
|
|
|
|
|
|
|
| |||||||||||
Less distributions to shareholders: | ||||||||||||||||||||
From net investment income | (0.13 | ) | (0.08 | ) | (0.65 | ) | (0.51 | ) | (0.09 | ) | ||||||||||
From net realized gain on investments | — | (1.55 | ) | (1.53 | ) | (0.50 | ) | (0.24 | ) | |||||||||||
|
|
|
|
|
|
|
|
|
| |||||||||||
Total distributions to shareholders | (0.13 | ) | (1.63 | ) | (2.18 | ) | (1.01 | ) | (0.33 | ) | ||||||||||
|
|
|
|
|
|
|
|
|
| |||||||||||
Net asset value - End of year | $ | 10.10 | $ | 8.81 | $ | 10.20 | $ | 12.58 | $ | 12.55 | ||||||||||
|
|
|
|
|
|
|
|
|
| |||||||||||
Net assets - End of year (000’s omitted) | $ | 23,656 | $ | 27,895 | $ | 43,552 | $ | 32,952 | $ | 33,545 | ||||||||||
|
|
|
|
|
|
|
|
|
| |||||||||||
Total return3 | 16.36 | % | 3.60 | % | (2.08 | %) | 8.81 | % | 25.16 | % | ||||||||||
Ratios (to average net assets)/Supplemental Data: | ||||||||||||||||||||
Expenses* | 0.06 | %4 | 0.05 | %5 | 0.05 | %5 | 0.05 | %6 | 0.05 | %6 | ||||||||||
Net investment income2 | 0.91 | % | 0.99 | % | 0.96 | % | 0.79 | % | 0.71 | % | ||||||||||
Series portfolio turnover7 | 127 | % | 26 | % | 45 | % | 22 | % | 13 | % | ||||||||||
| *The investment advisor paid a portion of the Series’ expenses. If these expenses had been incurred by the Series, the expense ratios (to average net assets) would have been increased by the following amounts: | ||||||||||||||||||||
|
| 0.14
| %4
|
| 0.10
| %5
|
| 0.08
| %5
|
| 0.06
| %6
|
| 0.09
| %6
| ||||||
| FOR THE PERIOD | ||||
| TARGET 2040 SERIES CLASS R6 | 10/16/178 TO 10/31/17 | |||
Per share data (for a share outstanding throughout the period): | ||||
Net asset value - Beginning of period | $ | 10.09 | ||
|
| |||
Income (loss) from investment operations: | ||||
Net investment income (loss)9 | — | |||
Net realized and unrealized gain (loss) on Underlying Series | 0.01 | |||
|
| |||
Total from investment operations | 0.01 | |||
|
| |||
Net asset value - End of period | $ | 10.10 | ||
|
| |||
Net assets - End of period (000’s omitted) | $ | 5 | ||
|
| |||
Total return10 | 0.10 | % | ||
Ratios (to average net assets)/Supplemental Data: | ||||
Expenses* | 0.05 | %4,11 | ||
Net investment loss | (0.05 | %)11 | ||
Series portfolio turnover7 | 127 | % | ||
| *The investment advisor paid a portion of the Series’ expenses. If these expenses had been incurred by the Series, the expense ratios (to average net assets) would have been increased by the following amounts: | ||||
| 0.14 | %4,11 | |||
1Calculated based on average shares outstanding during the years.
2Net investment income is affected by the timing of distributions from the Underlying Series in which the Series invest. The ratios do not include net investment income of the Underlying Series in which the Series invests.
3Represents aggregate total return for the years indicated, and assumes reinvestment of all distributions. Total return would have been lower had certain expenses not been waived or reimbursed.
4Expense ratios do not include expenses of the Underlying Series in which the Series invests. The expense ratios of the Underlying Series were 0.83% for Manning & Napier Pro-Blend® Extended Term Series - Class I, 0.85% for Manning & Napier Pro-Blend® Maximum Term Series - Class I, 0.55% for Manning & Napier Blended Asset Extended Series - Class R6 and 0.55% for Manning & Napier Blended Asset Maximum Series - Class R6.
5Expense ratios do not include expenses of the Underlying Series in which the Series invests. The expense ratios of the Underlying Series were 0.82% for Manning & Napier Pro-Blend® Extended Term Series - Class I and 0.83% for Manning & Napier Pro-Blend® Maximum Term Series - Class I.
6Expense ratios do not include expenses of the Underlying Series in which the Series invests. The expense ratios of the Underlying Series were 0.81% for Manning & Napier Pro-Blend® Extended Term Series - Class I and 0.82% for Manning & Napier Pro-Blend® Maximum Term Series - Class I.
7Reflects activity of the Series and does not include the activity of the Underlying Series.
8Commencement of operations.
9Calculated based on average shares outstanding during the period.
10Represents aggregate total return for the period indicated. Total return would have been lower had certain expenses not been reimbursed during the period. Periods less than one year are not annualized.
11Annualized.
The accompanying notes are an integral part of the financial statements.
58
Financial Highlights
| FOR THE YEAR ENDED | ||||||||||||||||||||
| TARGET 2045 SERIES CLASS K | 10/31/17 | 10/31/16 | 10/31/15 | 10/31/14 | 10/31/13 | |||||||||||||||
Per share data (for a share outstanding throughout each year): | ||||||||||||||||||||
Net asset value - Beginning of year | $ | 11.69 | $ | 12.71 | $ | 14.32 | $ | 13.73 | $ | 11.01 | ||||||||||
|
|
|
|
|
|
|
|
|
| |||||||||||
Income (loss) from investment operations: | ||||||||||||||||||||
Net investment income (loss)1,2 | 0.05 | 0.04 | 0.08 | 0.03 | 0.03 | |||||||||||||||
Net realized and unrealized gain (loss) on investments | 1.99 | 0.28 | (0.34 | ) | 1.15 | 2.74 | ||||||||||||||
|
|
|
|
|
|
|
|
|
| |||||||||||
Total from investment operations | 2.04 | 0.32 | (0.26 | ) | 1.18 | 2.77 | ||||||||||||||
|
|
|
|
|
|
|
|
|
| |||||||||||
Less distributions to shareholders: | ||||||||||||||||||||
From net investment income | (0.13 | ) | (0.06 | ) | (0.77 | ) | (0.52 | ) | (0.05 | ) | ||||||||||
From net realized gain on investments | (0.16 | ) | (1.28 | ) | (0.58 | ) | (0.07 | ) | — | |||||||||||
|
|
|
|
|
|
|
|
|
| |||||||||||
Total distributions to shareholders | (0.29 | ) | (1.34 | ) | (1.35 | ) | (0.59 | ) | (0.05 | ) | ||||||||||
|
|
|
|
|
|
|
|
|
| |||||||||||
Net asset value - End of year | $ | 13.44 | $ | 11.69 | $ | 12.71 | $ | 14.32 | $ | 13.73 | ||||||||||
|
|
|
|
|
|
|
|
|
| |||||||||||
Net assets - End of year (000’s omitted) | $ | 9,795 | $ | 6,793 | $ | 3,812 | $ | 3,041 | $ | 234 | ||||||||||
|
|
|
|
|
|
|
|
|
| |||||||||||
Total return3 | 17.87 | % | 3.26 | % | (2.10 | %) | 8.90 | % | 25.23 | % | ||||||||||
Ratios (to average net assets)/Supplemental Data: | ||||||||||||||||||||
Expenses* | 0.31 | %4 | 0.30 | %5 | 0.30 | %6 | 0.30 | %7 | 0.30 | %7 | ||||||||||
Net investment income (loss)2 | 0.43 | % | 0.33 | % | 0.58 | % | 0.23 | % | 0.26 | % | ||||||||||
Series portfolio turnover8 | 175 | % | 26 | % | 28 | % | 48 | % | 20 | % | ||||||||||
| *The investment advisor paid a portion of the Series’ expenses. If these expenses had been incurred by the Series, the expense ratios (to average net assets) would have been increased by the following amounts: | ||||||||||||||||||||
|
| 0.97%4
|
|
| 0.89
| %5
|
| 1.21
| %6
|
| 1.95
| %7
|
| 17.80
| %7
| ||||||
| FOR THE YEAR ENDED | ||||||||||||||||||||
| TARGET 2045 SERIES CLASS R | 10/31/17 | 10/31/16 | 10/31/15 | 10/31/14 | 10/31/13 | |||||||||||||||
Per share data (for a share outstanding throughout each year): | ||||||||||||||||||||
Net asset value - Beginning of year | $ | 11.62 | $ | 12.64 | $ | 14.25 | $ | 13.66 | $ | 10.99 | ||||||||||
|
|
|
|
|
|
|
|
|
| |||||||||||
Income (loss) from investment operations: | ||||||||||||||||||||
Net investment income (loss)1,2 | 0.01 | 0.02 | 0.05 | 0.02 | 0.01 | |||||||||||||||
Net realized and unrealized gain (loss) on investments | 1.99 | 0.27 | (0.35 | ) | 1.13 | 2.71 | ||||||||||||||
|
|
|
|
|
|
|
|
|
| |||||||||||
Total from investment operations | 2.00 | 0.29 | (0.30 | ) | 1.15 | 2.72 | ||||||||||||||
|
|
|
|
|
|
|
|
|
| |||||||||||
Less distributions to shareholders: | ||||||||||||||||||||
From net investment income | (0.10 | ) | (0.03 | ) | (0.73 | ) | (0.49 | ) | (0.05 | ) | ||||||||||
From net realized gain on investments | (0.16 | ) | (1.28 | ) | (0.58 | ) | (0.07 | ) | — | |||||||||||
|
|
|
|
|
|
|
|
|
| |||||||||||
Total distributions to shareholders | (0.26 | ) | (1.31 | ) | (1.31 | ) | (0.56 | ) | (0.05 | ) | ||||||||||
|
|
|
|
|
|
|
|
|
| |||||||||||
Net asset value - End of year | $ | 13.36 | $ | 11.62 | $ | 12.64 | $ | 14.25 | $ | 13.66 | ||||||||||
|
|
|
|
|
|
|
|
|
| |||||||||||
Net assets - End of year (000’s omitted) | $ | 4,733 | $ | 1,731 | $ | 1,631 | $ | 1,825 | $ | 618 | ||||||||||
|
|
|
|
|
|
|
|
|
| |||||||||||
Total return3 | 17.52 | % | 3.04 | % | (2.41 | %) | 8.71 | % | 24.87 | % | ||||||||||
Ratios (to average net assets)/Supplemental Data: | ||||||||||||||||||||
Expenses* | 0.55 | %4 | 0.55 | %5 | 0.55 | %6 | 0.55 | %7 | 0.55 | %7 | ||||||||||
Net investment income (loss)2 | 0.10 | % | 0.14 | % | 0.36 | % | 0.12 | % | 0.11 | % | ||||||||||
Series portfolio turnover8 | 175 | % | 26 | % | 28 | % | 48 | % | 20 | % | ||||||||||
| *The investment advisor paid a portion of the Series’ expenses. If these expenses had been incurred by the Series, the expense ratios (to average net assets) would have been increased by the following amounts: | ||||||||||||||||||||
| 0.97 | %4 | 0.89 | %5 | 1.21 | %6 | 2.06 | %7 | 9.07 | %7 | |||||||||||
1Calculated based on average shares outstanding during the years.
2Net investment income is affected by the timing of distributions from the Underlying Series in which the Series invest. The ratios do not include net investment income of the Underlying Series in which the Series invests.
3Represents aggregate total return for the years indicated, and assumes reinvestment of all distributions. Total return would have been lower had certain expenses not been waived or reimbursed.
4Expense ratios do not include expenses of the Underlying Series in which the Series invests. The expense ratios of the Underlying Series were 0.83% for Manning & Napier Pro-Blend® Extended Term Series - Class I, 0.85% for Manning & Napier Pro-Blend® Maximum Term Series - Class I, 0.55% for Manning & Napier Blended Asset Extended Series -Class R6 and 0.55% for Manning & Napier Blended Asset Maximum Series - Class R6.
5Expense ratios do not include expenses of the Underlying Series in which the Series invests. The expense ratios of the Underlying Series were 0.82% for Manning & Napier Pro-Blend® Extended Term Series - Class I and 0.83% for Manning & Napier Pro-Blend® Maximum Term Series - Class I.
6Expense ratios do not include expenses of the Underlying Series in which the Series invests. The expense ratio of the Underlying Series was 0.83%.
7Expense ratios do not include expenses of the Underlying Series in which the Series invests. The expense ratio of the Underlying Series was 0.82%.
8Reflects activity of the Series and does not include the activity of the Underlying Series.
The accompanying notes are an integral part of the financial statements.
59
Financial Highlights
| FOR THE YEAR ENDED | ||||||||||||||||||||
| TARGET 2045 SERIES CLASS I | 10/31/17 | 10/31/16 | 10/31/15 | 10/31/14 | 10/31/13 | |||||||||||||||
Per share data (for a share outstanding throughout each year): | ||||||||||||||||||||
Net asset value - Beginning of year | $ | 11.71 | $ | 12.73 | $ | 14.35 | $ | 13.75 | $ | 11.01 | ||||||||||
|
|
|
|
|
|
|
|
|
| |||||||||||
Income (loss) from investment operations: | ||||||||||||||||||||
Net investment income1,2 | 0.11 | 0.07 | 0.11 | 0.08 | 0.06 | |||||||||||||||
Net realized and unrealized gain (loss) on investments | 1.98 | 0.99 | (0.35 | ) | 1.14 | 2.74 | ||||||||||||||
|
|
|
|
|
|
|
|
|
| |||||||||||
Total from investment operations | 2.09 | 1.06 | (0.24 | ) | 1.22 | 2.80 | ||||||||||||||
|
|
|
|
|
|
|
|
|
| |||||||||||
Less distributions to shareholders: | ||||||||||||||||||||
From net investment income | (0.16 | ) | (0.80 | ) | (0.80 | ) | (0.55 | ) | (0.06 | ) | ||||||||||
From net realized gain on investments | (0.16 | ) | (1.28 | ) | (0.58 | ) | (0.07 | ) | — | |||||||||||
|
|
|
|
|
|
|
|
|
| |||||||||||
Total distributions to shareholders | (0.32 | ) | (2.08 | ) | (1.38 | ) | (0.62 | ) | (0.06 | ) | ||||||||||
|
|
|
|
|
|
|
|
|
| |||||||||||
Net asset value - End of year | $ | 13.48 | $ | 11.71 | $ | 12.73 | $ | 14.35 | $ | 13.75 | ||||||||||
|
|
|
|
|
|
|
|
|
| |||||||||||
Net assets - End of year (000’s omitted) | $ | 1,361 | $ | 5,548 | $ | 4,494 | $ | 2,894 | $ | 1,983 | ||||||||||
|
|
|
|
|
|
|
|
|
| |||||||||||
Total return3 | 18.29 | % | 3.49 | % | (1.92 | %) | 9.15 | % | 25.58 | % | ||||||||||
Ratios (to average net assets)/Supplemental Data: | ||||||||||||||||||||
Expenses* | 0.05 | %4 | 0.05 | %5 | 0.05 | %6 | 0.05 | %7 | 0.05 | %7 | ||||||||||
Net investment income (loss)2 | 0.90 | % | 0.64 | % | 0.86 | % | 0.57 | % | 0.46 | % | ||||||||||
Series portfolio turnover8 | 175 | % | 26 | % | 28 | % | 48 | % | 20 | % | ||||||||||
| *The investment advisor paid a portion of the Series’ expenses. If these expenses had been incurred by the Series, the expense ratios (to average net assets) would have been increased by the following amounts: | ||||||||||||||||||||
|
| 0.97
| %4
|
| 0.89
| %5
|
| 1.21
| %6
|
| 2.14
| %7
|
| 6.82
| %7
| ||||||
| FOR THE PERIOD | ||||||||||||||||||||
| TARGET 2045 SERIES CLASS R6 | 10/16/179 TO 10/31/17 | |||||||||||||||||||
Per share data (for a share outstanding throughout the period): |
| |||||||||||||||||||
Net asset value - Beginning of period |
| $ | 13.46 | |||||||||||||||||
|
| |||||||||||||||||||
Income (loss) from investment operations: |
| |||||||||||||||||||
Net investment loss10 |
| — | ||||||||||||||||||
Net realized and unrealized gain on Underlying Series |
| 0.02 | ||||||||||||||||||
|
| |||||||||||||||||||
Total from investment operations |
| 0.02 | ||||||||||||||||||
|
| |||||||||||||||||||
Net asset value - End of period |
| $ | 13.48 | |||||||||||||||||
|
| |||||||||||||||||||
Net assets - End of period (000’s omitted) |
| $ | 5 | |||||||||||||||||
|
| |||||||||||||||||||
Total return11 |
| 0.15 | % | |||||||||||||||||
Ratios (to average net assets)/Supplemental Data: |
| |||||||||||||||||||
Expenses* |
| 0.05 | %4,12 | |||||||||||||||||
Net investment loss |
| (0.05 | %)12 | |||||||||||||||||
Series portfolio turnover8 |
| 175 | % | |||||||||||||||||
| *The investment advisor paid a portion of the Series’ expenses. If these expenses had been incurred by the Series, the expense ratios (to average net assets) would have been increased by the following amounts: | ||||||||||||||||||||
| 0.97 | %4,12 | |||||||||||||||||||
1Calculated based on average shares outstanding during the years.
2Net investment income is affected by the timing of distributions from the Underlying Series in which the Series invest. The ratios do not include net investment income of the Underlying Series in which the Series invests.
3Represents aggregate total return for the years indicated, and assumes reinvestment of all distributions. Total return would have been lower had certain expenses not been waived or reimbursed.
4Expense ratios do not include expenses of the Underlying Series in which the Series invests. The expense ratios of the Underlying Series were 0.83% for Manning & Napier Pro-Blend® Extended Term Series - Class I, 0.85% for Manning & Napier Pro-Blend® Maximum Term Series - Class I, 0.55% for Manning & Napier Blended Asset Extended Series -Class R6 and 0.55% for Manning & Napier Blended Asset Maximum Series - Class R6.
5Expense ratios do not include expenses of the Underlying Series in which the Series invests. The expense ratios of the Underlying Series were 0.82% for Manning & Napier Pro-Blend® Extended Term Series - Class I and 0.83% for Manning & Napier Pro-Blend® Maximum Term Series - Class I.
6Expense ratios do not include expenses of the Underlying Series in which the Series invests. The expense ratio of the Underlying Series was 0.83%.
7Expense ratios do not include expenses of the Underlying Series in which the Series invests. The expense ratio of the Underlying Series was 0.82%.
8Reflects activity of the Series and does not include the activity of the Underlying Series.
9Commencement of operations.
10Calculated based on average shares outstanding during the period.
11Represents aggregate total return for the period indicated. Total return would have been lower had certain expenses not been reimbursed during the period. Periods less than one year are not annualized.
12Annualized.
The accompanying notes are an integral part of the financial statements.
60
Financial Highlights
| FOR THE YEAR ENDED | ||||||||||||||||||||
| TARGET 2050 SERIES CLASS K | 10/31/17 | 10/31/16 | 10/31/15 | 10/31/14 | 10/31/13 | |||||||||||||||
Per share data (for a share outstanding throughout each year): | ||||||||||||||||||||
Net asset value - Beginning of year | $ | 9.41 | $ | 11.35 | $ | 13.73 | $ | 13.52 | $ | 10.81 | ||||||||||
|
|
|
|
|
|
|
|
|
| |||||||||||
Income (loss) from investment operations: | ||||||||||||||||||||
Net investment income1,2 | 0.04 | 0.04 | 0.09 | 0.05 | 0.05 | |||||||||||||||
Net realized and unrealized gain (loss) on investments | 1.69 | 0.18 | (0.32 | ) | 1.07 | 2.74 | ||||||||||||||
|
|
|
|
|
|
|
|
|
| |||||||||||
Total from investment operations | 1.73 | 0.22 | (0.23 | ) | 1.12 | 2.79 | ||||||||||||||
|
|
|
|
|
|
|
|
|
| |||||||||||
Less distributions to shareholders: | ||||||||||||||||||||
From net investment income | (0.11 | ) | (0.04 | ) | (0.72 | ) | (0.54 | ) | (0.05 | ) | ||||||||||
From net realized gain on investments | — | (2.12 | ) | (1.43 | ) | (0.37 | ) | (0.03 | ) | |||||||||||
|
|
|
|
|
|
|
|
|
| |||||||||||
Total distributions to shareholders | (0.11 | ) | (2.16 | ) | (2.15 | ) | (0.91 | ) | (0.08 | ) | ||||||||||
|
|
|
|
|
|
|
|
|
| |||||||||||
Net asset value - End of year | $ | 11.03 | $ | 9.41 | $ | 11.35 | $ | 13.73 | $ | 13.52 | ||||||||||
|
|
|
|
|
|
|
|
|
| |||||||||||
Net assets - End of year (000’s omitted) | $ | 18,667 | $ | 14,874 | $ | 15,144 | $ | 47,531 | $ | 36,591 | ||||||||||
|
|
|
|
|
|
|
|
|
| |||||||||||
Total return3 | 18.55 | % | 3.43 | % | (2.15 | %) | 8.80 | % | 25.99 | % | ||||||||||
Ratios (to average net assets)/Supplemental Data: | ||||||||||||||||||||
Expenses* | 0.31 | %4 | 0.30 | %5 | 0.30 | %5 | 0.30 | %6 | 0.30 | %6 | ||||||||||
Net investment income2 | 0.39 | % | 0.40 | % | 0.72 | % | 0.40 | % | 0.37 | % | ||||||||||
Series portfolio turnover7 | 139 | % | 31 | % | 49 | % | 13 | % | 5 | % | ||||||||||
| *The investment advisor paid a portion of the Series’ expenses. If these expenses had been incurred by the Series, the expense ratios (to average net assets) would have been increased by the following amounts: | ||||||||||||||||||||
|
| 0.41%4
|
|
| 0.37
| %5
|
| 0.26
| %5
|
| 0.18
| %6
|
| 0.26
| %6
| ||||||
| FOR THE YEAR ENDED | ||||||||||||||||||||
| TARGET 2050 SERIES CLASS R | 10/31/17 | 10/31/16 | 10/31/15 | 10/31/14 | 10/31/13 | |||||||||||||||
Per share data (for a share outstanding throughout each year): | ||||||||||||||||||||
Net asset value - Beginning of year | $ | 9.30 | $ | 11.25 | $ | 13.60 | $ | 13.43 | $ | 10.74 | ||||||||||
|
|
|
|
|
|
|
|
|
| |||||||||||
Income (loss) from investment operations: | ||||||||||||||||||||
Net investment income2,8 | 0.01 | 0.01 | 0.06 | 0.01 | 0.01 | |||||||||||||||
Net realized and unrealized gain (loss) on investments | 1.68 | 0.18 | (0.29 | ) | 1.04 | 2.73 | ||||||||||||||
|
|
|
|
|
|
|
|
|
| |||||||||||
Total from investment operations | 1.69 | 0.19 | (0.23 | ) | 1.05 | 2.74 | ||||||||||||||
|
|
|
|
|
|
|
|
|
| |||||||||||
Less distributions to shareholders: | ||||||||||||||||||||
From net investment income | (0.08 | ) | (0.02 | ) | (0.69 | ) | (0.51 | ) | (0.02 | ) | ||||||||||
From net realized gain on investments | — | (2.12 | ) | (1.43 | ) | (0.37 | ) | (0.03 | ) | |||||||||||
|
|
|
|
|
|
|
|
|
| |||||||||||
Total distributions to shareholders | (0.08 | ) | (2.14 | ) | (2.12 | ) | (0.88 | ) | (0.05 | ) | ||||||||||
|
|
|
|
|
|
|
|
|
| |||||||||||
Net asset value - End of year | $ | 10.91 | $ | 9.30 | $ | 11.25 | $ | 13.60 | $ | 13.43 | ||||||||||
|
|
|
|
|
|
|
|
|
| |||||||||||
Net assets - End of year (000’s omitted) | $ | 3,345 | $ | 2,433 | $ | 2,215 | $ | 5,140 | $ | 5,022 | ||||||||||
|
|
|
|
|
|
|
|
|
| |||||||||||
Total return9 | 18.35 | % | 3.09 | % | (2.17 | %) | 8.28 | % | 25.69 | % | ||||||||||
Ratios (to average net assets)/Supplemental Data: | ||||||||||||||||||||
Expenses* | 0.56 | %4 | 0.55 | %5 | 0.55 | %5 | 0.55 | %6 | 0.55 | %6 | ||||||||||
Net investment income2 | 0.07 | % | 0.12 | % | 0.54 | % | 0.10 | % | 0.11 | % | ||||||||||
Series portfolio turnover7 | 139 | % | 31 | % | 49 | % | 13 | % | 5 | % | ||||||||||
| *The investment advisor paid a portion of the Series’ expenses. If these expenses had been incurred by the Series, the expense ratios (to average net assets) would have been increased by the following amounts: | ||||||||||||||||||||
| 0.41 | %4 | 0.37 | %5 | 0.26 | %5 | 0.18 | %6 | 0.26 | %6 | |||||||||||
1Calculated based on average shares outstanding during the years.
2Net investment income is affected by the timing of distributions from the Underlying Series in which the Series invest. The ratios do not include net investment income of the Underlying Series in which the Series invests.
3Represents aggregate total return for the years indicated, and assumes reinvestment of all distributions. Total return would have been lower had certain expenses not been waived or reimbursed.
4Expense ratios do not include expenses of the Underlying Series in which the Series invests. The expense ratio of the Underlying Series was 0.85% for Manning & Napier Pro-Blend® Maximum Term Series - Class I and 0.55% for Manning & Napier Blended Asset Maximum Series - Class R6.
5Expense ratios do not include expenses of the Underlying Series in which the Series invests. The expense ratio of the Underlying Series was 0.83%.
6Expense ratios do not include expenses of the Underlying Series in which the Series invests. The expense ratio of the Underlying Series was 0.82%.
7Reflects activity of the Series and does not include the activity of the Underlying Series.
8Calculated based on average shares outstanding during the periods.
9Represents aggregate total return for the periods indicated, and assumes reinvestment of all distributions. Total return would have been lower had certain expenses not been reimbursed during the periods. Periods less than one year are not annualized.
The accompanying notes are an integral part of the financial statements.
61
Financial Highlights
| FOR THE YEAR ENDED | ||||||||||||||||||||
| TARGET 2050 SERIES CLASS I | 10/31/17 | 10/31/16 | 10/31/15 | 10/31/14 | 10/31/13 | |||||||||||||||
Per share data (for a share outstanding throughout each year): | ||||||||||||||||||||
Net asset value - Beginning of year | $ | 9.48 | $ | 11.43 | $ | 13.82 | $ | 13.60 | $ | 10.88 | ||||||||||
|
|
|
|
|
|
|
|
|
| |||||||||||
Income (loss) from investment operations: | ||||||||||||||||||||
Net investment income1,2 | 0.07 | 0.07 | 0.10 | 0.08 | 0.07 | |||||||||||||||
Net realized and unrealized gain (loss) on investments | 1.70 | 0.17 | (0.29 | ) | 1.08 | 2.76 | ||||||||||||||
|
|
|
|
|
|
|
|
|
| |||||||||||
Total from investment operations | 1.77 | 0.24 | (0.19 | ) | 1.16 | 2.83 | ||||||||||||||
|
|
|
|
|
|
|
|
|
| |||||||||||
Less distributions to shareholders: | ||||||||||||||||||||
From net investment income | (0.13 | ) | (0.07 | ) | (0.77 | ) | (0.57 | ) | (0.08 | ) | ||||||||||
From net realized gain on investments | — | (2.12 | ) | (1.43 | ) | (0.37 | ) | (0.03 | ) | |||||||||||
|
|
|
|
|
|
|
|
|
| |||||||||||
Total distributions to shareholders | (0.13 | ) | (2.19 | ) | (2.20 | ) | (0.94 | ) | (0.11 | ) | ||||||||||
|
|
|
|
|
|
|
|
|
| |||||||||||
Net asset value - End of year | $ | 11.12 | $ | 9.48 | $ | 11.43 | $ | 13.82 | $ | 13.60 | ||||||||||
|
|
|
|
|
|
|
|
|
| |||||||||||
Net assets - End of year (000’s omitted) | $ | 13,364 | $ | 12,928 | $ | 15,688 | $ | 12,077 | $ | 9,042 | ||||||||||
|
|
|
|
|
|
|
|
|
| |||||||||||
Total return3 | 18.91 | % | 3.61 | % | (1.82 | %) | 9.07 | % | 26.21 | % | ||||||||||
Ratios (to average net assets)/Supplemental Data: | ||||||||||||||||||||
Expenses* | 0.06 | %4 | 0.05 | %5 | 0.05 | %5 | 0.05 | %6 | 0.05 | %6 | ||||||||||
Net investment income2 | 0.71 | % | 0.73 | % | 0.84 | % | 0.62 | % | 0.57 | % | ||||||||||
Series portfolio turnover7 | 139 | % | 31 | % | 49 | % | 13 | % | 5 | % | ||||||||||
| *The investment advisor paid a portion of the Series’ expenses. If these expenses had been incurred by the Series, the expense ratios (to average net assets) would have been increased by the following amounts: | ||||||||||||||||||||
|
| 0.41%4
|
|
| 0.37
| %5
|
| 0.26
| %5
|
| 0.18
| %6
|
| 0.26
| %6
| ||||||
| FOR THE PERIOD | ||||||||||||||||||||
| TARGET 2050 SERIES CLASS R6 | 10/16/178 TO 10/31/17 | |||||||||||||||||||
Per share data (for a share outstanding throughout the period): |
| |||||||||||||||||||
Net asset value - Beginning of period |
| $ | 11.10 | |||||||||||||||||
|
| |||||||||||||||||||
Income (loss) from investment operations: |
| |||||||||||||||||||
Net investment income (loss)9 |
| — | ||||||||||||||||||
Net realized and unrealized gain (loss) on Underlying Series |
| 0.02 | ||||||||||||||||||
|
| |||||||||||||||||||
Total from investment operations |
| 0.02 | ||||||||||||||||||
|
| |||||||||||||||||||
Net asset value - End of period |
| $ | 11.12 | |||||||||||||||||
|
| |||||||||||||||||||
Net assets - End of period (000’s omitted) |
| $ | 5 | |||||||||||||||||
|
| |||||||||||||||||||
Total return10 |
| 0.18 | % | |||||||||||||||||
Ratios (to average net assets)/Supplemental Data: |
| |||||||||||||||||||
Expenses* |
| 0.05 | %4,11 | |||||||||||||||||
Net investment loss |
| (0.05 | %)11 | |||||||||||||||||
Series portfolio turnover7 |
| 139 | % | |||||||||||||||||
| *The investment advisor paid a portion of the Series’ expenses. If these expenses had been incurred by the Series, the expense ratios (to average net assets) would have been increased by the following amounts: | ||||||||||||||||||||
| 0.41 | %4,11 | |||||||||||||||||||
1Calculated based on average shares outstanding during the years.
2Net investment income is affected by the timing of distributions from the Underlying Series in which the Series invest. The ratios do not include net investment income of the Underlying Series in which the Series invests.
3Represents aggregate total return for the years indicated, and assumes reinvestment of all distributions. Total return would have been lower had certain expenses not been waived or reimbursed.
4Expense ratios do not include expenses of the Underlying Series in which the Series invests. The expense ratio of the Underlying Series was 0.85% for Manning & Napier Pro-Blend® Maximum Term Series - Class I and 0.55% for Manning & Napier Blended Asset Maximum Series - Class R6.
5Expense ratios do not include expenses of the Underlying Series in which the Series invests. The expense ratio of the Underlying Series was 0.83%.
6Expense ratios do not include expenses of the Underlying Series in which the Series invests. The expense ratio of the Underlying Series was 0.82%.
7Reflects activity of the Series and does not include the activity of the Underlying Series.
8Commencement of operations.
9Calculated based on average shares outstanding during the period.
10Represents aggregate total return for the period indicated. Total return would have been lower had certain expenses not been reimbursed during the period. Periods less than one year are not annualized.
11Annualized.
The accompanying notes are an integral part of the financial statements.
62
Financial Highlights
| FOR THE YEAR ENDED | ||||||||||||||||||||
| TARGET 2055 SERIES CLASS K | 10/31/17 | 10/31/16 | 10/31/15 | 10/31/14 | 10/31/13 | |||||||||||||||
Per share data (for a share outstanding throughout each year): | ||||||||||||||||||||
Net asset value - Beginning of year | $ | 11.70 | $ | 12.56 | $ | 13.94 | $ | 13.85 | $ | 11.04 | ||||||||||
|
|
|
|
|
|
|
|
|
| |||||||||||
Income (loss) from investment operations: | ||||||||||||||||||||
Net investment income (loss)1,2 | 0.05 | 0.03 | 0.09 | 0.06 | (0.02 | ) | ||||||||||||||
Net realized and unrealized gain (loss) on investments | 2.08 | 0.30 | (0.35 | ) | 1.05 | 2.86 | ||||||||||||||
|
|
|
|
|
|
|
|
|
| |||||||||||
Total from investment operations | 2.13 | 0.33 | (0.26 | ) | 1.11 | 2.84 | ||||||||||||||
|
|
|
|
|
|
|
|
|
| |||||||||||
Less distributions to shareholders: | ||||||||||||||||||||
From net investment income | (0.13 | ) | (0.05 | ) | (0.74 | ) | (0.55 | ) | (0.03 | ) | ||||||||||
From net realized gain on investments | (0.13 | ) | (1.14 | ) | (0.38 | ) | (0.47 | ) | — | |||||||||||
|
|
|
|
|
|
|
|
|
| |||||||||||
Total distributions to shareholders | (0.26 | ) | (1.19 | ) | (1.12 | ) | (1.02 | ) | (0.03 | ) | ||||||||||
|
|
|
|
|
|
|
|
|
| |||||||||||
Net asset value - End of year | $ | 13.57 | $ | 11.70 | $ | 12.56 | $ | 13.94 | $ | 13.85 | ||||||||||
|
|
|
|
|
|
|
|
|
| |||||||||||
Net assets - End of year (000’s omitted) | $ | 4,141 | $ | 2,380 | $ | 1,142 | $ | 1,777 | $ | 208 | ||||||||||
|
|
|
|
|
|
|
|
|
| |||||||||||
Total return3 | 18.61 | % | 3.38 | % | (2.06 | %) | 8.50 | % | 25.79 | % | ||||||||||
Ratios (to average net assets)/Supplemental Data: | ||||||||||||||||||||
Expenses* | 0.31 | %4 | 0.30 | %5 | 0.30 | %5 | 0.30 | %6 | 0.30 | %6 | ||||||||||
Net investment income (loss)2 | 0.37 | % | 0.30 | % | 0.68 | % | 0.43 | % | (0.17 | %) | ||||||||||
Series portfolio turnover7 | 186 | % | 30 | % | 55 | % | 63 | % | 605 | % | ||||||||||
| *The investment advisor paid a portion of the Series’ expenses. If these expenses had been incurred by the Series, the expense ratios (to average net assets) would have been increased by the following amounts: | ||||||||||||||||||||
|
| 2.15%4
|
|
| 2.44
| %5
|
| 3.68
| %5
|
| 4.79
| %6
|
| 62.25
| %6
| ||||||
| FOR THE YEAR ENDED | ||||||||||||||||||||
| TARGET 2055 SERIES CLASS R | 10/31/17 | 10/31/16 | 10/31/15 | 10/31/14 | 10/31/13 | |||||||||||||||
Per share data (for a share outstanding throughout each year): | ||||||||||||||||||||
Net asset value - Beginning of year | $ | 11.59 | $ | 12.45 | $ | 13.83 | $ | 13.77 | $ | 11.03 | ||||||||||
|
|
|
|
|
|
|
|
|
| |||||||||||
Income (loss) from investment operations: | ||||||||||||||||||||
Net investment income (loss)1,2 | 0.01 | 0.01 | 0.05 | 0.03 | (0.01 | ) | ||||||||||||||
Net realized and unrealized gain (loss) on investments | 2.07 | 0.30 | (0.34 | ) | 1.04 | 2.77 | ||||||||||||||
|
|
|
|
|
|
|
|
|
| |||||||||||
Total from investment operations | 2.08 | 0.31 | (0.29 | ) | 1.07 | 2.76 | ||||||||||||||
|
|
|
|
|
|
|
|
|
| |||||||||||
Less distributions to shareholders: | ||||||||||||||||||||
From net investment income | (0.11 | ) | (0.03 | ) | (0.71 | ) | (0.54 | ) | (0.02 | ) | ||||||||||
From net realized gain on investments | (0.13 | ) | (1.14 | ) | (0.38 | ) | (0.47 | ) | — | |||||||||||
|
|
|
|
|
|
|
|
|
| |||||||||||
Total distributions to shareholders | (0.24 | ) | (1.17 | ) | (1.09 | ) | (1.01 | ) | (0.02 | ) | ||||||||||
|
|
|
|
|
|
|
|
|
| |||||||||||
Net asset value - End of year | $ | 13.43 | $ | 11.59 | $ | 12.45 | $ | 13.83 | $ | 13.77 | ||||||||||
|
|
|
|
|
|
|
|
|
| |||||||||||
Net assets - End of year (000’s omitted) | $ | 2,388 | $ | 519 | $ | 409 | $ | 515 | $ | 51 | ||||||||||
|
|
|
|
|
|
|
|
|
| |||||||||||
Total return3 | 18.28 | % | 3.18 | % | (2.32 | %) | 8.21 | % | 25.01 | % | ||||||||||
Ratios (to average net assets)/Supplemental Data: | ||||||||||||||||||||
Expenses* | 0.55 | %4 | 0.55 | %5 | 0.55 | %5 | 0.55 | %6 | 0.55 | %6 | ||||||||||
Net investment income (loss)2 | 0.04 | % | 0.11 | % | 0.39 | % | 0.24 | % | (0.07 | %) | ||||||||||
Series portfolio turnover7 | 186 | % | 30 | % | 55 | % | 63 | % | 605 | % | ||||||||||
| *The investment advisor paid a portion of the Series’ expenses. If these expenses had been incurred by the Series, the expense ratios (to average net assets) would have been increased by the following amounts: | ||||||||||||||||||||
| 2.15%4 | 2.44 | %5 | 3.68 | %5 | 5.39 | %6 | 129.56 | %6 | ||||||||||||
1Calculated based on average shares outstanding during the years.
2Net investment income is affected by the timing of distributions from the Underlying Series in which the Series invest. The ratios do not include net investment income of the Underlying Series in which the Series invests.
3Represents aggregate total return for the years indicated, and assumes reinvestment of all distributions. Total return would have been lower had certain expenses not been waived or reimbursed.
4Expense ratios do not include expenses of the Underlying Series in which the Series invests. The expense ratio of the Underlying Series was 0.85% for Manning & Napier Pro-Blend® Maximum Term Series - Class I and 0.55% for Manning & Napier Blended Asset Maximum Series - Class R6.
5Expense ratios do not include expenses of the Underlying Series in which the Series invests. The expense ratio of the Underlying Series was 0.83%.
6Expense ratios do not include expenses of the Underlying Series in which the Series invests. The expense ratio of the Underlying Series was 0.82%.
7Reflects activity of the Series and does not include the activity of the Underlying Series.
The accompanying notes are an integral part of the financial statements.
63
Financial Highlights
| FOR THE YEAR ENDED | ||||||||||||||||||||
| TARGET 2055 SERIES CLASS I | 10/31/17 | 10/31/16 | 10/31/15 | 10/31/14 | 10/31/13 | |||||||||||||||
Per share data (for a share outstanding throughout each year): | ||||||||||||||||||||
Net asset value - Beginning of year | $ | 11.81 | $ | 12.66 | $ | 14.05 | $ | 13.94 | $ | 11.05 | ||||||||||
|
|
|
|
|
|
|
|
|
| |||||||||||
Income (loss) from investment operations: | ||||||||||||||||||||
Net investment income1,2 | 0.12 | 0.07 | 0.10 | 0.08 | — | 3 | ||||||||||||||
Net realized and unrealized gain (loss) on investments | 2.06 | 0.30 | (0.33 | ) | 1.07 | 2.94 | ||||||||||||||
|
|
|
|
|
|
|
|
|
| |||||||||||
Total from investment operations | 2.18 | 0.37 | (0.23 | ) | 1.15 | 2.94 | ||||||||||||||
|
|
|
|
|
|
|
|
|
| |||||||||||
Less distributions to shareholders: | ||||||||||||||||||||
From net investment income | (0.16 | ) | (0.08 | ) | (0.78 | ) | (0.57 | ) | (0.05 | ) | ||||||||||
From net realized gain on investments | (0.13 | ) | (1.14 | ) | (0.38 | ) | (0.47 | ) | — | |||||||||||
|
|
|
|
|
|
|
|
|
| |||||||||||
Total distributions to shareholders | (0.29 | ) | (1.22 | ) | (1.16 | ) | (1.04 | ) | (0.05 | ) | ||||||||||
|
|
|
|
|
|
|
|
|
| |||||||||||
Net asset value - End of year | $ | 13.70 | $ | 11.81 | $ | 12.66 | $ | 14.05 | $ | 13.94 | ||||||||||
|
|
|
|
|
|
|
|
|
| |||||||||||
Net assets - End of year (000’s omitted) | $ | 210 | $ | 2,783 | $ | 1,658 | $ | 872 | $ | 366 | ||||||||||
|
|
|
|
|
|
|
|
|
| |||||||||||
Total return4 | 18.87 | % | 3.69 | % | (1.83 | %) | 8.75 | % | 26.67 | % | ||||||||||
Ratios (to average net assets)/Supplemental Data: | ||||||||||||||||||||
Expenses* | 0.05 | %5 | 0.05 | %6 | 0.05 | %6 | 0.05 | %7 | 0.05 | %7 | ||||||||||
Net investment income (loss)2 | 0.95 | % | 0.58 | % | 0.80 | % | 0.57 | % | (0.03 | %) | ||||||||||
Series portfolio turnover8 | 186 | % | 30 | % | 55 | % | 63 | % | 605 | % | ||||||||||
| *The investment advisor paid a portion of the Series’ expenses. If these expenses had been incurred by the Series, the expense ratios (to average the expense ratios (to average net assets) would have been increased by the following amount: | ||||||||||||||||||||
|
| 2.15%5
|
|
| 2.44
| %6
|
| 3.68
| %6
|
| 7.80
| %7
|
| 8.21
| %7
| ||||||
| FOR THE PERIOD | ||||||||||||||||||||
| TARGET 2055 SERIES CLASS R6 | 10/16/179 TO 10/31/17 | |||||||||||||||||||
Per share data (for a share outstanding throughout the period): |
| |||||||||||||||||||
Net asset value - Beginning of period |
| $ | 13.68 | |||||||||||||||||
|
| |||||||||||||||||||
Income (loss) from investment operations: |
| |||||||||||||||||||
Net investment loss10 |
| — | ||||||||||||||||||
Net realized and unrealized gain on Underlying Series |
| 0.02 | ||||||||||||||||||
|
| |||||||||||||||||||
Total from investment operations |
| 0.02 | ||||||||||||||||||
|
| |||||||||||||||||||
Net asset value - End of period |
| $ | 13.70 | |||||||||||||||||
|
| |||||||||||||||||||
Net assets - End of period (000’s omitted) |
| $ | 5 | |||||||||||||||||
|
| |||||||||||||||||||
Total return11 |
| 0.15 | % | |||||||||||||||||
Ratios (to average net assets)/Supplemental Data: |
| |||||||||||||||||||
Expenses* |
| 0.05 | %5 | |||||||||||||||||
Net investment loss |
| (0.05 | %)12 | |||||||||||||||||
Series portfolio turnover8 |
| 186 | % | |||||||||||||||||
| *The investment advisor paid a portion of the Series’ expenses. If these expenses had been incurred by the Series, the expense ratios (to average net assets) would have been increased by the following amounts: | ||||||||||||||||||||
| 2.15 | %5 | |||||||||||||||||||
1Calculated based on average shares outstanding during the years.
2Net investment income is affected by the timing of distributions from the Underlying Series in which the Series invest. The ratios do not include net investment income of the Underlying Series in which the Series invests.
3Less than $0.01.
4Represents aggregate total return for the years indicated, and assumes reinvestment of all distributions. Total return would have been lower had certain expenses not been waived or reimbursed.
5Expense ratios do not include expenses of the Underlying Series in which the Series invests. The expense ratio of the Underlying Series was 0.85% for Manning & Napier Pro-Blend® Maximum Term Series - Class I and 0.55% for Manning & Napier Blended Asset Maximum Series - Class R6.
6Expense ratios do not include expenses of the Underlying Series in which the Series invests. The expense ratio of the Underlying Series was 0.83%.
7Expense ratios do not include expenses of the Underlying Series in which the Series invests. The expense ratio of the Underlying Series was 0.82%.
8Reflects activity of the Series and does not include the activity of the Underlying Series.
9Commencement of operations.
10Calculated based on average shares outstanding during the period.
11Represents aggregate total return for the period indicated. Total return would have been lower had certain expenses not been reimbursed during the period. Periods less than one year are not annualized.
12Annualized.
The accompanying notes are an integral part of the financial statements.
64
Financial Highlights
| FOR THE YEAR ENDED | FOR THE PERIOD | |||||||||||
| TARGET 2060 SERIES CLASS K | 10/31/17 | 10/31/16 | 9/21/151 TO 10/31/15 | |||||||||
Per share data (for a share outstanding throughout each period): | ||||||||||||
Net asset value - Beginning of period | $ | 10.67 | $ | 10.36 | $ | 10.00 | ||||||
|
|
|
|
|
| |||||||
Income (loss) from investment operations: | ||||||||||||
Net investment income (loss)2,3 | 0.04 | 0.01 | (0.00 | )4 | ||||||||
Net realized and unrealized gain on investments | 1.91 | 0.34 | 0.36 | |||||||||
|
|
|
|
|
| |||||||
Total from investment operations | 1.95 | 0.35 | 0.36 | |||||||||
|
|
|
|
|
| |||||||
Less distributions to shareholders: | ||||||||||||
From net investment income | (0.12 | ) | (0.04 | ) | — | |||||||
From net realized gain on investments | (0.05 | ) | — | — | ||||||||
|
|
|
|
|
| |||||||
Total distributions to shareholders | (0.17 | ) | (0.04 | ) | — | |||||||
|
|
|
|
|
| |||||||
Net asset value - End of period | $ | 12.45 | $ | 10.67 | $ | 10.36 | ||||||
|
|
|
|
|
| |||||||
Net assets - End of period (000’s omitted) | $ | 3,284 | $ | 1,407 | $ | 52 | ||||||
|
|
|
|
|
| |||||||
Total return5 | 18.56 | % | 3.45 | % | 3.60 | % | ||||||
Ratios (to average net assets)/Supplemental Data: | ||||||||||||
Expenses* | 0.31 | %6 | 0.30 | %7 | 0.30 | %8,9 | ||||||
Net investment income (loss)3 | 0.39 | % | 0.10 | % | (0.30 | %)8 | ||||||
Series portfolio turnover10 | 173 | % | 14 | % | 4 | % | ||||||
| *The investment advisor paid a portion of the Series’ expenses. If these expenses had been incurred by the Series, the expense ratios (to average net assets) would have been increased by the following amounts: | ||||||||||||
|
| 5.26
| %6
|
| 9.37
| %7
|
| 151.35
| %8,9,11
| ||||
| FOR THE YEAR ENDED | FOR THE PERIOD | |||||||||||
| TARGET 2060 SERIES CLASS R | 10/31/17 | 10/31/16 | 9/21/151 TO 10/31/15 | |||||||||
Per share data (for a share outstanding throughout each period): | ||||||||||||
Net asset value - Beginning of period | $ | 10.65 | $ | 10.36 | $ | 10.00 | ||||||
|
|
|
|
|
| |||||||
Income (loss) from investment operations: | ||||||||||||
Net investment income (loss)2,3 | — | 4 | 0.01 | (0.01 | )4 | |||||||
Net realized and unrealized gain on investments | 1.92 | 0.31 | 0.37 | |||||||||
|
|
|
|
|
| |||||||
Total from investment operations | 1.92 | 0.32 | 0.36 | |||||||||
|
|
|
|
|
| |||||||
Less distributions to shareholders: | ||||||||||||
From net investment income | (0.09 | ) | (0.03 | ) | — | |||||||
From net realized gain on investments | (0.05 | ) | — | — | ||||||||
|
|
|
|
|
| |||||||
Total distributions to shareholders | (0.14 | ) | (0.03 | ) | — | |||||||
|
|
|
|
|
| |||||||
Net asset value - End of period | $ | 12.43 | $ | 10.65 | $ | 10.36 | ||||||
|
|
|
|
|
| |||||||
Net assets - End of period (000’s omitted) | $ | 1,242 | $ | 182 | $ | 56 | ||||||
|
|
|
|
|
| |||||||
Total return5 | 18.29 | % | 3.16 | % | 3.60 | % | ||||||
Ratios (to average net assets)/Supplemental Data: | ||||||||||||
Expenses* | 0.55 | %6 | 0.55 | %7 | 0.55 | %8,9 | ||||||
Net investment income (loss)3 | (0.01 | %) | 0.09 | % | (0.55 | %)8 | ||||||
Series portfolio turnover10 | 173 | % | 14 | % | 4 | % | ||||||
| *The investment advisor paid a portion of the Series’ expenses. If these expenses had been incurred by the Series, the expense ratios (to average net assets) would have been increased by the following amounts: | ||||||||||||
| 5.26 | %6 | 9.37 | %7 | 151.35 | %8,9,11 | |||||||
1Commencement of operations.
2Calculated based on average shares outstanding during the periods.
3Net investment income is affected by the timing of distributions from the Underlying Series in which the Series invest. The ratios do not include net investment income of the Underlying Series in which the Series invests.
4Less than $(0.01) .
5Represents aggregate total return for the periods indicated, and assumes reinvestment of all distributions. Total return would have been lower had certain expenses not been reimbursed during the periods. Periods less than one year are not annualized.
6Expense ratios do not include expenses of the Underlying Series in which the Series invests. The expense ratio of the Underlying Series was 0.85% for Manning & Napier Pro-Blend® Maximum Term Series - Class I and 0.55% for Manning & Napier Blended Asset Maximum Series - Class R6.
7Expense ratios do not include expenses of the Underlying Series in which the Series invests. The expense ratio of the Underlying Series was 0.84% . 8Annualized.
9Expense ratios do not include expenses of the Underlying Series in which the Series invests. The expense ratio of the Underlying Series was 0.83% .
10Reflects activity of the Series and does not include the activity of the Underlying Series.
11The increase to the expense ratios (to average net assets) is largely due to the small net assets in each class.
The accompanying notes are an integral part of the financial statements.
65
Financial Highlights
| FOR THE YEAR ENDED | FOR THE PERIOD | |||||||||||
| TARGET 2060 SERIES CLASS I | 10/31/17 | 10/31/16 | 9/21/151 TO 10/31/15 | |||||||||
Per share data (for a share outstanding throughout each period): | ||||||||||||
Net asset value - Beginning of period | $ | 10.68 | $ | 10.36 | $ | 10.00 | ||||||
|
|
|
|
|
| |||||||
Income (loss) from investment operations: | ||||||||||||
Net investment income (loss)2,3 | 0.08 | 0.07 | (0.00 | )4 | ||||||||
Net realized and unrealized gain on investments | 1.89 | 0.31 | 0.36 | |||||||||
|
|
|
|
|
| |||||||
Total from investment operations | 1.97 | 0.38 | 0.36 | |||||||||
|
|
|
|
|
| |||||||
Less distributions to shareholders: | ||||||||||||
From net investment income | (0.14 | ) | (0.06 | ) | — | |||||||
From net realized gain on investments | (0.05 | ) | — | — | ||||||||
|
|
|
|
|
| |||||||
Total distributions to shareholders | (0.19 | ) | (0.06 | ) | — | |||||||
|
|
|
|
|
| |||||||
Net asset value - End of period | $ | 12.46 | $ | 10.68 | $ | 10.36 | ||||||
|
|
|
|
|
| |||||||
Net assets - End of period (000’s omitted) | $ | 104 | $ | 56 | $ | 52 | ||||||
|
|
|
|
|
| |||||||
Total return5 | 18.80 | % | 3.71 | % | 3.60 | % | ||||||
Ratios (to average net assets)/Supplemental Data: | ||||||||||||
Expenses* | 0.05 | %6 | 0.05 | %7 | 0.05 | %8,9 | ||||||
Net investment income (loss)3 | 0.72 | % | 0.65 | % | (0.05 | %)8 | ||||||
Series portfolio turnover10 | 173 | % | 14 | % | 4 | % | ||||||
| *The investment advisor paid a portion of the Series’ expenses. If these expenses had been incurred by the Series, the expense ratios (to average net assets) would have been increased by the following amounts:: | ||||||||||||
|
| 5.26
| %6
|
| 9.37
| %7
|
| 151.34
| %8,9,11
| ||||
| FOR THE PERIOD | ||||||||||||
| TARGET 2060 SERIES CLASS R6 | 10/16/171 TO 10/31/17 | |||||||||||
Per share data (for a share outstanding throughout the period): | ||||||||||||
Net asset value - Beginning of period | $ | 12.44 | ||||||||||
|
| |||||||||||
Income (loss) from investment operations: | ||||||||||||
Net investment loss12 | — | |||||||||||
Net realized and unrealized gain on Underlying Series | 0.02 | |||||||||||
|
| |||||||||||
Total from investment operations | 0.02 | |||||||||||
|
| |||||||||||
Net asset value - End of period | $ | 12.46 | ||||||||||
|
| |||||||||||
Net assets - End of period (000’s omitted) | $ | 5 | ||||||||||
|
| |||||||||||
Total return13 | 0.16 | % | ||||||||||
Ratios (to average net assets)/Supplemental Data: | ||||||||||||
Expenses* | 0.05 | %6,8 | ||||||||||
Net investment loss | (0.05 | %)8 | ||||||||||
Series portfolio turnover10 | 173 | % | ||||||||||
| *The investment advisor paid a portion of the Series’ expenses. If these expenses had been incurred by the Series, the expense ratios (to average net assets) would have been increased by the following amounts: | ||||||||||||
| 5.26 | %6,8 | |||||||||||
1Commencement of operations.
2Calculated based on average shares outstanding during the periods.
3Net investment income is affected by the timing of distributions from the Underlying Series in which the Series invest. The ratios do not include net investment income of the Underlying Series in which the Series invests.
4Less than $(0.01) .
5Represents aggregate total return for the periods indicated, and assumes reinvestment of all distributions. Total return would have been lower had certain expenses not been reimbursed during the periods. Periods less than one year are not annualized.
6Expense ratios do not include expenses of the Underlying Series in which the Series invests. The expense ratio of the Underlying Series was 0.85% for Manning & Napier Pro-Blend® Maximum Term Series - Class I and 0.55% for Manning & Napier Blended Asset Maximum Series - Class R6.
7Expense ratios do not include expenses of the Underlying Series in which the Series invests. The expense ratio of the Underlying Series was 0.84% . 8Annualized.
9Expense ratios do not include expenses of the Underlying Series in which the Series invests. The expense ratio of the Underlying Series was 0.83% .
10Reflects activity of the Series and does not include the activity of the Underlying Series.
11The increase to the expense ratios (to average net assets) is largely due to the small net assets in each class.
12Calculated based on average shares outstanding during the period.
13Represents aggregate total return for the period indicated. Total return would have been lower had certain expenses not been reimbursed during the period. Periods less than one year are not annualized.
The accompanying notes are an integral part of the financial statements.
66
Notes to Financial Statements
| 1. | Organization |
Target Income Series, Target 2015 Series, Target 2020 Series, Target 2025 Series, Target 2030 Series, Target 2035 Series, Target 2040 Series, Target 2045 Series, Target 2050 Series, Target 2055 Series and Target 2060 Series (each the “Series”) are no-load diversified series of Manning & Napier Fund, Inc. (the “Fund”). The Fund is organized in Maryland and is registered under the Investment Company Act of 1940 (the “1940 Act”), as amended, as an open-end management investment company.
Each Series seeks to achieve its investment objectives by investing in a combination of other Manning & Napier mutual funds (the “Underlying Series”) according to a target asset allocation strategy. The Series are designed to provide single investment portfolios that adjust over time to meet the changing risk and return objectives of investors over their expected investment horizon. As the target retirement date approaches, the Series’ portfolios become more conservative with a larger fixed-income investment component. The financial statements of the Underlying Series should be read in conjunction with the Series’ financial statements.
Each Series is authorized to issue four classes of shares (Class K, R, I and R6). Each class of shares is substantially the same, except that class-specific distribution and shareholder servicing expenses are borne by the specific class of shares to which they relate.
The Fund’s Advisor is Manning & Napier Advisors, LLC (the “Advisor”). Shares of each Series are offered to investors and employees of the Advisor and its affiliates. The total authorized capital stock of the Fund consists of 15 billion shares of common stock each having a par value of $0.01. As of October 31, 2017, 10.6 billion shares have been designated in total among 39 series, of which 40 million have been designated in each of the Series for Class K and R common stock, 100 million have been designated in each of the Series for Class I common stock and 40 million have been designated in each of the Series for Class R6 common stock.
| 2. | Significant Accounting Policies |
The following is a summary of significant accounting policies followed by the Series. Each Series is an investment company and, accordingly, follows the investment company accounting and reporting guidance of the Financial Accounting Standards Board Accounting Standards Codification Topic 946 - Investment Companies, which is part of accounting principles generally accepted in the United States of America (“GAAP”).
Security Valuation
Investments in the Underlying Series are valued at their net asset value per share on valuation date. In the absence of the availability of a net asset value per share on the Underlying Series, security valuations may be determined in good faith by the Advisor under procedures approved by and under the general supervision and responsibility of the Fund’s Board of Directors (the “Board”).
Volume and level of activity in established markets for an asset or liability are evaluated to determine whether recent transactions and quoted prices are determinative of fair value. Where there have been significant decreases in volume and level of activity, further analysis and adjustment may be necessary to estimate fair value. The Series measure fair value in these instances by the use of inputs and valuation techniques which may be based upon current market prices of securities that are comparable in coupon, rating, maturity and industry and/or expectation of future cash flows. As a result of trading in relatively thin markets and/or markets that experience significant volatility, the prices used by the Series to value these securities may differ from the value that would be realized if these securities were sold, and the differences could be material.
Securities for which representative valuations or prices are not available from the Series’ pricing service may be valued at fair value as determined in good faith by the Advisor under procedures approved by and under the general supervision and responsibility of the Board. Due to the inherent uncertainty of valuations of such securities, the fair value may differ significantly from the values that would have been used had a ready market for such securities existed. If trading or events occurring after the close of the principal market in which securities are traded are expected to materially affect the value of those securities, then they may be valued at their fair value, taking this trading or these events into account.
67
Notes to Financial Statements (continued)
| 2. | Significant Accounting Policies (continued) |
Security Valuation (continued)
Various inputs are used in determining the value of the Series’ assets or liabilities carried at fair value. These inputs are summarized in three broad levels. Level 1 includes quoted prices in active markets for identical assets and liabilities. Level 2 includes other significant observable inputs (including quoted prices for similar securities, interest rates, prepayment speeds, credit risk, etc.). Level 3 includes significant unobservable inputs (including the Series’ own assumptions in determining the fair value of investments). A financial instrument’s level within the fair value hierarchy is based on the lowest level on any input both individually and in aggregate that is significant to the fair value measurement. The inputs or methodology used for valuing securities are not necessarily an indication of the risk associated with investing in those securities.
The following is a summary of the valuation levels used for major security types as of October 31, 2017 in valuing the Series’ assets or liabilities carried at fair value:
| TARGET INCOME SERIES | ||||||||||||||||
| DESCRIPTION | TOTAL | LEVEL 1 | LEVEL 2 | LEVEL 3 | ||||||||||||
Assets: | ||||||||||||||||
Mutual fund | $ | 98,989,721 | $ | 98,989,721 | $ | — | $ | — | ||||||||
|
|
|
|
|
|
|
| |||||||||
Total assets | $ | 98,989,721 | $ | 98,989,721 | $ | — | $ | — | ||||||||
|
|
|
|
|
|
|
| |||||||||
| TARGET 2015 SERIES | ||||||||||||||||
| DESCRIPTION | TOTAL | LEVEL 1 | LEVEL 2 | LEVEL 3 | ||||||||||||
Assets: | ||||||||||||||||
Mutual funds | $ | 4,558,377 | $ | 4,558,377 | $ | — | $ | — | ||||||||
|
|
|
|
|
|
|
| |||||||||
Total assets | $ | 4,558,377 | $ | 4,558,377 | $ | — | $ | — | ||||||||
|
|
|
|
|
|
|
| |||||||||
| TARGET 2020 SERIES | ||||||||||||||||
| DESCRIPTION | TOTAL | LEVEL 1 | LEVEL 2 | LEVEL 3 | ||||||||||||
Assets: | ||||||||||||||||
Mutual funds | $ | 114,576,131 | $ | 114,576,131 | $ | — | $ | — | ||||||||
|
|
|
|
|
|
|
| |||||||||
Total assets | $ | 114,576,131 | $ | 114,576,131 | $ | — | $ | — | ||||||||
|
|
|
|
|
|
|
| |||||||||
| TARGET 2025 SERIES | ||||||||||||||||
| DESCRIPTION | TOTAL | LEVEL 1 | LEVEL 2 | LEVEL 3 | ||||||||||||
Assets: | ||||||||||||||||
Mutual funds | $ | 40,240,981 | $ | 40,240,981 | $ | — | $ | — | ||||||||
|
|
|
|
|
|
|
| |||||||||
Total assets | $ | 40,240,981 | $ | 40,240,981 | $ | — | $ | — | ||||||||
|
|
|
|
|
|
|
| |||||||||
| TARGET 2030 SERIES | ||||||||||||||||
| DESCRIPTION | TOTAL | LEVEL 1 | LEVEL 2 | LEVEL 3 | ||||||||||||
Assets: | ||||||||||||||||
Mutual funds | $ | 141,685,558 | $ | 141,685,558 | $ | — | $ | — | ||||||||
|
|
|
|
|
|
|
| |||||||||
Total assets | $ | 141,685,558 | $ | 141,685,558 | $ | — | $ | — | ||||||||
|
|
|
|
|
|
|
| |||||||||
| TARGET 2035 SERIES | ||||||||||||||||
| DESCRIPTION | TOTAL | LEVEL 1 | LEVEL 2 | LEVEL 3 | ||||||||||||
Assets: | ||||||||||||||||
Mutual funds | $ | 26,317,207 | $ | 26,317,207 | $ | — | $ | — | ||||||||
|
|
|
|
|
|
|
| |||||||||
Total assets | $ | 26,317,207 | $ | 26,317,207 | $ | — | $ | — | ||||||||
|
|
|
|
|
|
|
| |||||||||
68
Notes to Financial Statements (continued)
| 2. | Significant Accounting Policies (continued) |
Security Valuation (continued)
| TARGET 2040 SERIES | ||||||||||||||||
| DESCRIPTION | TOTAL | LEVEL 1 | LEVEL 2 | LEVEL 3 | ||||||||||||
Assets: | ||||||||||||||||
Mutual funds | $ | 84,028,194 | $ | 84,028,194 | $ | — | $ | — | ||||||||
|
|
|
|
|
|
|
| |||||||||
Total assets | $ | 84,028,194 | $ | 84,028,194 | $ | — | $ | — | ||||||||
|
|
|
|
|
|
|
| |||||||||
| TARGET 2045 SERIES | ||||||||||||||||
| DESCRIPTION | TOTAL | LEVEL 1 | LEVEL 2 | LEVEL 3 | ||||||||||||
Assets: | ||||||||||||||||
Mutual funds | $ | 15,890,716 | $ | 15,890,716 | $ | — | $ | — | ||||||||
|
|
|
|
|
|
|
| |||||||||
Total assets | $ | 15,890,716 | $ | 15,890,716 | $ | — | $ | — | ||||||||
|
|
|
|
|
|
|
| |||||||||
| TARGET 2050 SERIES | ||||||||||||||||
| DESCRIPTION | TOTAL | LEVEL 1 | LEVEL 2 | LEVEL 3 | ||||||||||||
Assets: | ||||||||||||||||
Mutual fund | $ | 35,389,255 | $ | 35,389,255 | $ | — | $ | — | ||||||||
|
|
|
|
|
|
|
| |||||||||
Total assets | $ | 35,389,255 | $ | 35,389,255 | $ | — | $ | — | ||||||||
|
|
|
|
|
|
|
| |||||||||
| TARGET 2055 SERIES | ||||||||||||||||
| DESCRIPTION | TOTAL | LEVEL 1 | LEVEL 2 | LEVEL 3 | ||||||||||||
Assets: | ||||||||||||||||
Mutual fund | $ | 6,736,319 | $ | 6,736,319 | $ | — | $ | — | ||||||||
|
|
|
|
|
|
|
| |||||||||
Total assets | $ | 6,736,319 | $ | 6,736,319 | $ | — | $ | — | ||||||||
|
|
|
|
|
|
|
| |||||||||
| TARGET 2060 SERIES | ||||||||||||||||
| DESCRIPTION | TOTAL | LEVEL 1 | LEVEL 2 | LEVEL 3 | ||||||||||||
Assets: | ||||||||||||||||
Mutual fund | $ | 4,618,675 | $ | 4,618,675 | $ | — | $ | — | ||||||||
|
|
|
|
|
|
|
| |||||||||
Total assets | $ | 4,618,675 | $ | 4,618,675 | $ | — | $ | — | ||||||||
|
|
|
|
|
|
|
| |||||||||
There were no Level 2 or Level 3 securities held by any of the Series as of October 31, 2016 or October 31, 2017.
The Fund’s policy is to recognize transfers in and transfers out of the valuation levels as of the beginning of the reporting period. There were no transfers between Level 1 and Level 2 during the year ended October 31, 2017.
New Accounting Guidance
On August 1, 2017, the Fund implemented amendments to Regulation S-X, issued by the Securities and Exchange Commission, which require standardized, enhanced disclosures, particularly related to derivatives, in investment company financial statements. Adoption had no effect on the Fund’s net assets or results of operations.
Security Transactions, Investment Income and Expenses
Security transactions are accounted for on trade date. Dividend income is recorded on the ex-dividend date. Non-cash dividends, if any, are recorded at the fair value of the securities received. Income and capital gains distributions from the Underlying Series, if any, are recorded on the ex-dividend date.
Expenses are recorded on an accrual basis. Most expenses of the Fund can be attributed to a specific series. Expenses which cannot be directly attributed are apportioned among the series in the Fund in such a manner as deemed equitable by the Fund’s Board, taking into consideration, among other things, the nature and type of expense. Expenses included in the accompanying statements of operations do not include any expense of the Underlying Series.
69
Notes to Financial Statements (continued)
| 2. | Significant Accounting Policies (continued) |
Security Transactions, Investment Income and Expenses (continued)
Income, expenses (other than class specific expenses), and realized and unrealized gains and losses are prorated among the classes based on the relative net assets of each class. Class specific expenses are directly charged to that Class.
The Series use the identified cost method for determining realized gain or loss on investments for both financial statement and federal income tax reporting purposes.
Federal Taxes
Each Series’ policy is to comply with the provisions of the Internal Revenue Code applicable to regulated investment companies. The Series are not subject to federal income tax or excise tax to the extent that each Series distributes to shareholders each year its taxable income, including any net realized gains on investments, in accordance with requirements of the Internal Revenue Code. Accordingly, no provision for federal income tax or excise tax has been made in the financial statements.
Management evaluates its tax positions to determine if the tax positions taken meet the minimum recognition threshold in connection with accounting for uncertainties in income tax positions taken or expected to be taken for the purposes of measuring and recognizing tax liabilities in the financial statements. Recognition of tax benefits of an uncertain tax position is required only when the position is “more likely than not” to be sustained assuming examination by taxing authorities. At October 31, 2017, the Series have recorded no liability for net unrecognized tax benefits relating to uncertain income tax positions taken or expected to be taken in future tax returns.
The Series file income tax returns in the U.S. federal jurisdiction, various states and foreign jurisdictions, as required. No income tax returns are currently under investigation. The statute of limitations on Target Income Series, Target 2015 Series, Target 2020 Series, Target 2025 Series, Target 2030 Series, Target 2035 Series, Target 2040 Series, Target 2045 Series, Target 2050 Series and Target 2055 Series tax returns remains open for the years ended October 31, 2014 through October 31, 2017. The statute of limitations on Target 2060 Series remains open for the period ended October 31, 2015 and the years ended October 31, 2016 through 2017. The Series are not aware of any tax positions for which it is reasonably possible that the total amounts of unrecognized tax benefits will significantly change in the next twelve months.
Foreign Taxes
Based on the Series’ understanding of the tax rules and rates related to income, gains and currency purchase/ repatriation transactions for foreign jurisdictions in which they invest, the Series will provide for foreign taxes, and where appropriate, deferred foreign tax.
Distributions of Income and Gains
Distributions to shareholders of net investment income are made semi-annually. Distributions of net realized gains are made annually. An additional distribution may be necessary to avoid taxation of a Series. Distributions are recorded on the ex-dividend date.
Indemnifications
The Fund’s organizational documents provide former and current directors and officers with a limited indemnification against liabilities arising in connection with the performance of their duties to the Fund. In the normal course of business, the Fund may also enter into contracts that provide general indemnifications. The Fund’s maximum exposure under these arrangements is unknown as this would be dependent on future claims that may be made against the Fund. The risk of material loss from such claims is considered remote.
Other
The preparation of financial statements in conformity with GAAP requires management to make estimates and assumptions that affect the reported amounts of assets and liabilities and the disclosure of contingent assets and liabilities at the date of the financial statements and the reported amounts of income and expenses during the reporting period. Actual results could differ from those estimates.
70
Notes to Financial Statements (continued)
| 3. | Transactions with Affiliates |
The Fund has an Investment Advisory Agreement (the “Agreement”) with the Advisor, for which the Advisor does not receive a fee for the services it performs for the Series. However, the Advisor is entitled to receive the management fee from each of the Underlying Series in which the Series invest.
Under the Agreement, personnel of the Advisor provide the Series with advice and assistance in the choice of investments and the execution of securities transactions, and otherwise maintain the Series’ organization. The Advisor also provides the Fund with necessary office space and fund administration and support services. The salaries of all officers of the Fund (except a percentage of the Fund’s Chief Compliance Officer’s salary, which is paid by the Fund), and of all Directors who are “affiliated persons” of the Fund, or of the Advisor, and all personnel of the Fund, or of the Advisor, performing services relating to research, statistical and investment activities, are paid by the Advisor. Each “non-affiliated” Director receives an annual stipend, which is allocated among all the active series of the Fund. In addition, these Directors also receive a fee per Board meeting attended plus a fee for each committee meeting attended and are reimbursed for travel and other out-of-pocket expenses incurred by them in connection with attending such meetings. The Fund also has an Audit Committee Chair, who receives an additional annual stipend for this role.
The Fund may enter into agreements with financial intermediaries pursuant to which the Fund may pay financial intermediaries for non-distribution related sub-transfer agency, administrative, sub-accounting, and other shareholder services in an amount not to exceed 0.15% of the average daily net assets of the Class K, Class R and Class I shares. Payments made pursuant to such agreements are generally based on the current assets and/or number of accounts of the Series attributable to the financial intermediary. Any payments made pursuant to such agreements may be in addition to, rather than in lieu of, any Distribution and Shareholder Services Fee payable under the Rule 12b-1 plan of the Fund.
Prior to August 21, 2017, the Advisor has contractually agreed, until at least February 28, 2020 for Target Income Series, Target 2020 Series, Target 2030 Series, Target 2040 Series, Target 2050 Series, until at least February 28, 2023 for Target 2015 Series, Target 2025 Series, Target 2035 Series, Target 2045 Series and Target 2055 Series and until at least February 28, 2026 for Target 2060 Series, to limit each class’ total direct annual fund operating expenses for the Series at no more than 0.05% for each class, exclusive of distribution and service fees, of average daily net assets each year. The Advisor’s agreement to limit each class’ operating expenses was limited to direct operating expenses and, therefore, did not apply to the indirect expenses incurred by the Series through their investments in the Underlying Series. Effective August 21, 2017, the Advisor has contractually agreed, until at least February 29, 2028 to limit its fees and reimburse expenses to the extent necessary so that the total direct annual fund operating expenses of each Class, exclusive of Distribution and Service (12b-1) Fees, do not exceed 0.20% of the average daily net assets of the Class I, Class K, and Class R shares, and 0.05% of the average daily net assets of the Class R6 shares. The Advisor’s agreement to limit each class’ operating expenses is limited to direct operating expenses and, therefore, does not apply to the indirect expenses incurred by the Series through their investments in the Underlying Series. For the year ended October 31, 2017, the Advisor reimbursed expenses of $120,287 for Target Income Series, $135,553 for Target 2015 Series, $110,510 for Target 2020 Series, $137,471 for Target 2025 Series, $113,862 for Target 2030 Series, $136,425 Target 2035 Series, $122,063 for Target 2040 Series, $138,965 for Target 2045 Series, $137,237 for Target 2050 Series, $138,577 for Target 2055 series and $135,235 for Target 2060 Series, which is included as a reduction of expenses on the Statements of Operations. The Advisor is not eligible to recoup any expenses that have been reimbursed in prior years.
Manning & Napier Investor Services, Inc., a registered broker-dealer affiliate of the Advisor, acts as distributor for the Fund’s shares. Each Series compensates the distributor for distributing and servicing the Series’ Class K and Class R shares pursuant to a distribution plan adopted under Rule 12b-1 of the 1940 Act, regardless of expenses actually incurred. Under the agreement, each Series pays distribution and services fees to the distributor at an annual rate of 0.25% of average daily net assets attributable to Class K shares and 0.50% of average daily net assets attributable to Class R shares. There are no distribution and services fees on Class I and Class R6 shares of each Series. The fees are accrued daily and paid monthly.
Pursuant to a master services agreement effective through February 28, 2017, the Fund paid the Advisor an annual fee related to fund accounting and administration of 0.00225% of average daily net assets of the Target Series with an annual base fee of $40,000 per Target series. Transfer agent fees were charged to the Fund on a per account basis. Additionally, certain
71
Notes to Financial Statements (continued)
| 3. | Transactions with Affiliates (continued) |
transaction and out-of-pocket expenses, including charges for reporting relating to the Fund’s compliance program, were charged. The Advisor had agreements with BNY Mellon Investment Servicing (U.S.) Inc. (“BNY”) under which BNY served as sub-accountant services agent and sub-transfer agent. Effective March 1, 2017, BNY became the named transfer agent for the Fund. Pursuant to a master services agreement dated March 1, 2017, the Fund continues to pay the Advisor the annual fee related to fund accounting and administration of 0.00225% of average daily net assets of the Target Series with an annual base fee of $40,000 per Target series. Additionally, certain transaction and out-of-pocket expenses, including charges for reporting relating to the Fund’s compliance program, are charged. The agreement between the Advisor and BNY under which BNY serves as sub-accountant services agent continues to be in effect.
Expenses not directly attributable to a series are allocated based on each series’ relative net assets or number of accounts, depending on the expense.
| 4. | Purchases and Sales of Securities |
For the year ended October 31, 2017, purchases and sales of Underlying Series were as follows:
| SERIES | PURCHASES | SALES | ||||||
Target Income Series | $ | 127,959,902 | $ | 110,967,965 | ||||
Target 2015 Series | $ | 7,836,223 | $ | 10,278,881 | ||||
Target 2020 Series | $ | 148,298,962 | $ | 170,910,439 | ||||
Target 2025 Series | $ | 73,921,987 | $ | 66,420,276 | ||||
Target 2030 Series | $ | 180,597,606 | $ | 192,097,603 | ||||
Target 2035 Series | $ | 43,591,007 | $ | 45,240,035 | ||||
Target 2040 Series | $ | 109,965,656 | $ | 124,588,735 | ||||
Target 2045 Series | $ | 25,066,163 | $ | 25,124,432 | ||||
Target 2050 Series | $ | 46,511,730 | $ | 45,872,244 | ||||
Target 2055 Series | $ | 11,980,333 | $ | 11,846,113 | ||||
Target 2060 Series | $ | 7,162,675 | $ | 4,550,514 | ||||
| 5. | Investments in Affiliated Issuers |
A summary of the Series’ transactions in the shares of affiliated issuers of Manning & Napier during the year ended October 31, 2017 is set forth below:
TARGET INCOME SERIES | VALUE AT 10/31/16 | PURCHASE COST | SALES PROCEEDS | VALUE AT 10/31/17 | SHARES HELD 10/31/17 | DIVIDEND INCOME | DISTRIBUTIONS AND NET REALIZED GAIN OR LOSS | CHANGE IN UNREALIZED APPRECIATION (DEPRECIATION) | ||||||||||||||||||||||||
Pro-Blend® Conservative Term Series - Class I | $ | 77,860,136 | $ | 27,615,050 | $ | 109,789,417 | $ | — | — | $ | 1,464,538 | $ | 1,745,463 | $ | 2,746,188 | |||||||||||||||||
Blended Asset Conservative Series - Class R6 | — | 100,344,852 | 1,178,548 | 98,989,721 | 9,123,477 | — | (1,779 | ) | (174,804 | ) | ||||||||||||||||||||||
|
|
|
|
|
|
|
|
|
|
|
|
|
|
|
| |||||||||||||||||
| $ | 77,860,136 | $ | 127,959,902 | $ | 110,967,965 | $ | 98,989,721 | $ | 1,464,538 | $ | 1,743,684 | $ | 2,571,384 | |||||||||||||||||||
|
|
|
|
|
|
|
|
|
|
|
|
|
| |||||||||||||||||||
72
Notes to Financial Statements (continued)
| 5. | Investments in Affiliated Issuers (continued) |
TARGET 2015 SERIES | VALUE AT 10/31/16 | PURCHASE COST | SALES PROCEEDS | VALUE AT 10/31/17 | SHARES HELD 10/31/17 | DIVIDEND INCOME | DISTRIBUTIONS AND NET REALIZED GAIN OR LOSS | CHANGE IN UNREALIZED APPRECIATION (DEPRECIATION) | ||||||||||||||||||||||||
Pro-Blend® Conservative Term Series - Class I | $ | 1,492,103 | $ | 1,859,024 | $ | 3,474,210 | $ | — | — | $ | 31,951 | $ | 204,680 | $ | (78,231 | ) | ||||||||||||||||
Pro-Blend® Moderate Term Series - Class I | 5,253,558 | 1,407,519 | 6,801,801 | — | — | 59,143 | 259,784 | (25,494 | ) | |||||||||||||||||||||||
Blended Asset Conservative Series - Class R6 | — | 1,770,757 | 1,148 | 1,766,362 | 162,798 | — | (3 | ) | (3,244 | ) | ||||||||||||||||||||||
Blended Asset Moderate Series - Class R6 | — | 2,798,923 | 1,722 | 2,792,015 | 260,206 | — | (6 | ) | (5,180 | ) | ||||||||||||||||||||||
|
|
|
|
|
|
|
|
|
|
|
|
|
|
|
| |||||||||||||||||
| $ | 6,745,661 | $ | 7,836,223 | $ | 10,278,881 | $ | 4,558,377 | $ | 91,094 | $ | 464,455 | $ | (112,149 | ) | ||||||||||||||||||
|
|
|
|
|
|
|
|
|
|
|
|
|
| |||||||||||||||||||
TARGET 2020 SERIES | VALUE AT 10/31/16 | PURCHASE COST | SALES PROCEEDS | VALUE AT 10/31/17 | SHARES HELD 10/31/17 | DIVIDEND INCOME | DISTRIBUTIONS AND NET REALIZED GAIN OR LOSS | CHANGE IN UNREALIZED APPRECIATION (DEPRECIATION) | ||||||||||||||||||||||||
Pro-Blend® Extended Term Series - Class I | $ | 25,895,822 | $ | 4,319,261 | $ | 31,661,060 | $ | — | — | $ | 314,876 | $ | 180,828 | $ | 1,690,286 | |||||||||||||||||
Pro-Blend® Moderate Term Series - Class I | 104,141,036 | 28,859,812 | 138,917,166 | — | — | 1,432,027 | 6,134,617 | 1,816,174 | ||||||||||||||||||||||||
Blended Asset Extended Series - Class R6 | — | 17,854,122 | 49,832 | 17,770,393 | 1,723,607 | — | (88 | ) | (33,809 | ) | ||||||||||||||||||||||
Blended Asset Moderate Series - Class R6 | — | 97,265,767 | 282,381 | 96,805,738 | 9,021,970 | — | (570 | ) | (177,078 | ) | ||||||||||||||||||||||
|
|
|
|
|
|
|
|
|
|
|
|
|
|
|
| |||||||||||||||||
| $ | 130,036,858 | $ | 148,298,962 | $ | 170,910,439 | $ | 114,576,131 | $ | 1,746,903 | $ | 6,314,787 | $ | 3,295,573 | |||||||||||||||||||
|
|
|
|
|
|
|
|
|
|
|
|
|
| |||||||||||||||||||
TARGET 2025 SERIES | VALUE AT 10/31/16 | PURCHASE COST | SALES PROCEEDS | VALUE AT 10/31/17 | SHARES HELD 10/31/17 | DIVIDEND INCOME | DISTRIBUTIONS AND NET REALIZED GAIN OR LOSS | CHANGE IN UNREALIZED APPRECIATION (DEPRECIATION) | ||||||||||||||||||||||||
Pro-Blend® Extended Term Series - Class I | $ | 22,562,748 | $ | 18,053,499 | $ | 42,138,118 | $ | — | — | $ | 290,338 | $ | 1,810,744 | $ | 70,545 | |||||||||||||||||
Pro-Blend® Moderate Term Series - Class I | 7,893,230 | 15,551,431 | 24,279,026 | — | — | 134,719 | 1,480,604 | (495,700 | ) | |||||||||||||||||||||||
Blended Asset Extended Series - Class R6 | — | 24,475,725 | 1,879 | 24,428,863 | 2,369,434 | — | (10 | ) | (44,972 | ) | ||||||||||||||||||||||
Blended Asset Moderate Series - Class R6 | — | 15,841,332 | 1,253 | 15,812,118 | 1,473,636 | — | (6 | ) | (27,955 | ) | ||||||||||||||||||||||
|
|
|
|
|
|
|
|
|
|
|
|
|
|
|
| |||||||||||||||||
| $ | 30,455,978 | $ | 73,921,987 | $ | 66,420,276 | $ | 40,240,981 | $ | 425,057 | $ | 3,291,332 | $ | (498,082 | ) | ||||||||||||||||||
|
|
|
|
|
|
|
|
|
|
|
|
|
| |||||||||||||||||||
73
Notes to Financial Statements (continued)
| 5. | Investments in Affiliated Issuers (continued) |
TARGET 2030 SERIES | VALUE AT 10/31/16 | PURCHASE COST | SALES PROCEEDS | VALUE AT 10/31/17 | SHARES HELD 10/31/17 | DIVIDEND INCOME | DISTRIBUTIONS AND NET REALIZED GAIN OR LOSS | CHANGE IN UNREALIZED APPRECIATION (DEPRECIATION) | ||||||||||||||||||||||||
Pro-Blend® Extended Term Series - Class I | $ | 113,170,271 | $ | 32,290,550 | $ | 155,222,071 | $ | — | — | $ | — | $ | 6,106,670 | $ | 5,507,781 | |||||||||||||||||
Pro-Blend® Maximum Term Series - Class I | 27,798,164 | 4,951,181 | 35,411,645 | — | — | — | 2,192,424 | 1,470,921 | ||||||||||||||||||||||||
Blended Asset Extended Series - Class R6 | — | 120,610,340 | 1,244,304 | 119,139,003 | 11,555,674 | 1,578,166 | (2,451 | ) | (224,583 | ) | ||||||||||||||||||||||
Blended Asset Maximum Series - Class R6 | — | 22,745,535 | 219,583 | 22,546,555 | 1,943,669 | 164,679 | 362 | 20,241 | ||||||||||||||||||||||||
|
|
|
|
|
|
|
|
|
|
|
|
|
|
|
| |||||||||||||||||
| $ | 140,968,435 | $ | 180,597,606 | $ | 192,097,603 | $ | 141,685,558 | $ | 1,742,845 | $ | 8,297,005 | $ | 6,774,360 | |||||||||||||||||||
|
|
|
|
|
|
|
|
|
|
|
|
|
| |||||||||||||||||||
TARGET 2035 SERIES | VALUE AT 10/31/16 | PURCHASE COST | SALES PROCEEDS | VALUE AT 10/31/17 | SHARES HELD 10/31/17 | DIVIDEND INCOME | DISTRIBUTIONS AND NET REALIZED GAIN OR LOSS | CHANGE IN UNREALIZED APPRECIATION (DEPRECIATION) | ||||||||||||||||||||||||
Pro-Blend® Extended Term Series - Class I | $ | 13,951,289 | $ | 10,667,495 | $ | 25,929,646 | $ | — | — | $ | 202,228 | $ | 974,867 | $ | 562,048 | |||||||||||||||||
Pro-Blend® Maximum Term Series - Class I | 11,327,290 | 6,486,509 | 19,208,447 | — | — | 79,657 | 1,158,923 | 638,825 | ||||||||||||||||||||||||
Blended Asset Extended Series - Class R6 | — | 15,454,403 | 61,165 | 15,365,587 | 1,490,358 | — | (339 | ) | (27,311 | ) | ||||||||||||||||||||||
Blended Asset Maximum Series - Class R6 | — | 10,982,600 | 40,777 | 10,951,620 | 944,105 | — | (178 | ) | 9,974 | |||||||||||||||||||||||
|
|
|
|
|
|
|
|
|
|
|
|
|
|
|
| |||||||||||||||||
| $ | 25,278,579 | $ | 43,591,007 | $ | 45,240,035 | $ | 26,317,207 | $ | 281,885 | $ | 2,133,273 | $ | 1,183,536 | |||||||||||||||||||
|
|
|
|
|
|
|
|
|
|
|
|
|
| |||||||||||||||||||
TARGET 2040 SERIES | VALUE AT 10/31/16 | PURCHASE COST | SALES PROCEEDS | VALUE AT 10/31/17 | SHARES HELD 10/31/17 | DIVIDEND INCOME | DISTRIBUTIONS AND NET REALIZED GAIN OR LOSS | CHANGE IN UNREALIZED APPRECIATION (DEPRECIATION) | ||||||||||||||||||||||||
Pro-Blend® Extended Term Series - Class I | $ | 26,725,527 | $ | 11,475,556 | $ | 40,787,148 | $ | — | — | $ | 373,931 | $ | 3,354,274 | $ | (323,961 | ) | ||||||||||||||||
Pro-Blend® Maximum Term Series - Class I | 61,785,384 | 14,413,777 | 83,756,113 | — | — | 396,817 | 6,877,610 | 2,939,668 | ||||||||||||||||||||||||
Blended Asset Extended Series - Class R6 | — | 28,134,042 | 15,916 | 28,065,508 | 2,722,164 | — | (66 | ) | (52,552 | ) | ||||||||||||||||||||||
Blended Asset Maximum Series - Class R6 | — | 55,942,281 | 29,558 | 55,962,686 | 4,824,370 | — | (43 | ) | 50,006 | |||||||||||||||||||||||
|
|
|
|
|
|
|
|
|
|
|
|
|
|
|
| |||||||||||||||||
| $ | 88,510,911 | $ | 109,965,656 | 124,588,735 | $ | 84,028,194 | $ | 770,748 | $ | 10,231,775 | $ | 2,613,161 | ||||||||||||||||||||
|
|
|
|
|
|
|
|
|
|
|
|
|
| |||||||||||||||||||
74
Notes to Financial Statements (continued)
| 5. | Investments in Affiliated Issuers (continued) |
TARGET 2045 SERIES | VALUE AT 10/31/16 | PURCHASE COST | SALES PROCEEDS | VALUE AT 10/31/17 | SHARES HELD 10/31/17 | DIVIDEND INCOME | DISTRIBUTIONS AND NET REALIZED GAIN OR LOSS | CHANGE IN UNREALIZED APPRECIATION (DEPRECIATION) | ||||||||||||||||||||||||
Pro-Blend® Extended Term Series - Class I | $ | 723,592 | $ | 1,434,672 | $ | 2,289,296 | $ | — | — | $ | 14,472 | $ | 188,585 | $ | (45,868 | ) | ||||||||||||||||
Pro-Blend® Maximum Term Series - Class I | 13,367,251 | 7,708,181 | 22,792,873 | — | — | 99,884 | 2,028,529 | 155,789 | ||||||||||||||||||||||||
Blended Asset Extended Series - Class R6 | — | 1,500,310 | 4,226 | 1,493,246 | 144,835 | — | (22 | ) | (2,815 | ) | ||||||||||||||||||||||
Blended Asset Extended Series - Class R6 | — | 14,423,000 | 38,037 | 14,397,470 | 1,241,161 | — | (120 | ) | 12,627 | |||||||||||||||||||||||
|
|
|
|
|
|
|
|
|
|
|
|
|
|
|
| |||||||||||||||||
| $ | 14,090,843 | $ | 25,066,163 | $ | 25,124,432 | $ | 15,890,716 | $ | 114,356 | $ | 2,216,972 | $ | 119,733 | |||||||||||||||||||
|
|
|
|
|
|
|
|
|
|
|
|
|
| |||||||||||||||||||
TARGET 2050 SERIES | VALUE AT 10/31/16 | PURCHASE COST | SALES PROCEEDS | VALUE AT 10/31/17 | SHARES HELD 10/31/17 | DIVIDEND INCOME | DISTRIBUTIONS AND NET REALIZED GAIN | CHANGE IN UNREALIZED APPRECIATION (DEPRECIATION) | ||||||||||||||||||||||||
Pro-Blend® Maximum Term Series - Class I | $ | 30,260,955 | $ | 11,136,994 | $ | 45,854,294 | $ | — | — | $ | 239,964 | $ | 5,975,091 | $ | (385,463 | ) | ||||||||||||||||
Blended Asset Maximum Series - Class R6 | — | 35,374,736 | 17,950 | 35,389,255 | 3,050,798 | 6 | 32,463 | |||||||||||||||||||||||||
|
|
|
|
|
|
|
|
|
|
|
|
|
|
|
| |||||||||||||||||
| $ | 30,260,955 | $ | 46,511,730 | $ | 45,872,244 | $ | 35,389,255 | $ | 239,964 | $ | 5,975,097 | $ | (353,000 | ) | ||||||||||||||||||
|
|
|
|
|
|
|
|
|
|
|
|
|
| |||||||||||||||||||
TARGET 2055 SERIES | VALUE AT 10/31/16 | PURCHASE COST | SALES PROCEEDS | VALUE AT 10/31/17 | SHARES HELD 10/31/17 | DIVIDEND INCOME | DISTRIBUTIONS AND NET REALIZED GAIN OR LOSS | CHANGE IN UNREALIZED APPRECIATION (DEPRECIATION) | ||||||||||||||||||||||||
Pro-Blend® Maximum Term Series - Class I | $ | 5,698,492 | $ | 5,242,520 | $ | 11,838,649 | $ | — | — | $ | 50,878 | $ | 1,183,794 | $ | (68,340 | ) | ||||||||||||||||
Blended Asset Maximum Series - Class R6 | — | 6,737,813 | 7,464 | 6,736,319 | 580,717 | (46 | ) | 6,016 | ||||||||||||||||||||||||
|
|
|
|
|
|
|
|
|
|
|
|
|
|
|
| |||||||||||||||||
| $ | 5,698,492 | $ | 11,980,333 | $ | 11,846,113 | $ | 6,736,319 | $ | 50,878 | $ | 1,183,748 | $ | (62,324 | ) | ||||||||||||||||||
|
|
|
|
|
|
|
|
|
|
|
|
|
| |||||||||||||||||||
TARGET 2060 SERIES | VALUE AT 10/31/16 | PURCHASE COST | SALES PROCEEDS | VALUE AT 10/31/17 | SHARES HELD 10/31/17 | DIVIDEND INCOME | DISTRIBUTIONS AND NET REALIZED GAIN OR LOSS | CHANGE IN UNREALIZED APPRECIATION (DEPRECIATION) | ||||||||||||||||||||||||
Pro-Blend® Maximum Term Series - Class I | $ | 1,634,290 | $ | 2,546,843 | $ | 4,549,177 | $ | — | ��� | $ | 17,357 | $ | 549,700 | $ | (122,107 | ) | ||||||||||||||||
Blended Asset Maximum Series - Class R6 | — | 4,615,832 | 1,337 | 4,618,675 | 398,162 | — | (4 | ) | 4,183 | |||||||||||||||||||||||
|
|
|
|
|
|
|
|
|
|
|
|
|
|
|
| |||||||||||||||||
| $ | 1,634,290 | $ | 7,162,675 | $ | 4,550,514 | $ | 4,618,675 | $ | 17,357 | $ | 549,696 | $ | (117,924 | ) | ||||||||||||||||||
|
|
|
|
|
|
|
|
|
|
|
|
|
| |||||||||||||||||||
75
Notes to Financial Statements (continued)
| 6. | Capital Stock Transactions |
Transactions in Class K, Class R, Class I and Class R6 shares:
TARGET INCOME SERIES: | FOR THE YEAR ENDED 10/31/17 | FOR THE YEAR ENDED 10/31/16 | FOR THE YEAR ENDED 10/31/17 | FOR THE YEAR ENDED 10/31/16 | ||||||||||||||||||||||||||||
| CLASS K | CLASS K | CLASS R | CLASS R | |||||||||||||||||||||||||||||
| SHARES | AMOUNTS | SHARES | AMOUNTS | SHARES | AMOUNTS | SHARES | AMOUNTS | |||||||||||||||||||||||||
Sold | 2,337,440 | $ | 22,659,341 | 291,450 | $ | 2,699,840 | 1,017,890 | $ | 9,772,506 | 27,173 | $ | 249,188 | ||||||||||||||||||||
Reinvested | 106,700 | 992,014 | 451,377 | 4,034,189 | 2,785 | 26,048 | 13,197 | 116,622 | ||||||||||||||||||||||||
Repurchased | (1,119,121 | ) | (10,770,060 | ) | (820,747 | ) | (7,551,216 | ) | (129,081 | ) | (1,229,453 | ) | (173,347 | ) | (1,566,756 | ) | ||||||||||||||||
|
|
|
|
|
|
|
|
|
|
|
|
|
|
|
| |||||||||||||||||
Total | 1,325,019 | $ | 12,881,295 | (77,920 | ) | $ | (817,187 | ) | 891,594 | $ | 8,569,101 | (132,977 | ) | $ | (1,200,946 | ) | ||||||||||||||||
|
|
|
|
|
|
|
|
|
|
|
|
|
|
|
| |||||||||||||||||
TARGET INCOME SERIES: | FOR THE YEAR ENDED 10/31/17 | FOR THE YEAR ENDED 10/31/16 | FOR THE PERIOD 10/16/171 TO 10/31/17 | |||||||||||||||||||||||||||||
| CLASS I | CLASS I | CLASS R6 | ||||||||||||||||||||||||||||||
| SHARES | AMOUNTS | SHARES | AMOUNTS | SHARES | AMOUNTS | |||||||||||||||||||||||||||
Sold | 131,766 | $ | 1,259,979 | 347,344 | $ | 3,194,089 | 504 | $ | 5,000 | |||||||||||||||||||||||
Reinvested | 21,427 | 199,890 | 152,209 | 1,362,864 | — | — | ||||||||||||||||||||||||||
Repurchased | (634,616 | ) | (6,088,342 | ) | (1,851,774 | ) | (16,996,551 | ) | — | — | ||||||||||||||||||||||
|
|
|
|
|
|
|
|
|
|
|
| |||||||||||||||||||||
Total | (481,423 | ) | $ | (4,628,473 | ) | (1,352,221 | ) | $ | (12,439,598 | ) | 504 | $ | 5,000 | |||||||||||||||||||
|
|
|
|
|
|
|
|
|
|
|
| |||||||||||||||||||||
TARGET 2015 SERIES: | FOR THE YEAR ENDED 10/31/17 | FOR THE YEAR ENDED 10/31/16 | FOR THE YEAR ENDED 10/31/17 | FOR THE YEAR ENDED 10/31/16 | ||||||||||||||||||||||||||||
| CLASS K | CLASS K | CLASS R | CLASS R | |||||||||||||||||||||||||||||
| SHARES | AMOUNTS | SHARES | AMOUNTS | SHARES | AMOUNTS | SHARES | AMOUNTS | |||||||||||||||||||||||||
Sold | 127,914 | $ | 1,381,081 | 62,583 | $ | 642,540 | 1,512 | $ | 15,971 | 18,594 | $ | 194,143 | ||||||||||||||||||||
Reinvested | 4,600 | 47,515 | 27,544 | 274,036 | 7 | 72 | 6,640 | 66,231 | ||||||||||||||||||||||||
Repurchased | (68,059 | ) | (726,662 | ) | (91,358 | ) | (958,718 | ) | (74,290 | ) | (780,760 | ) | (23,850 | ) | (246,457 | ) | ||||||||||||||||
|
|
|
|
|
|
|
|
|
|
|
|
|
|
|
| |||||||||||||||||
Total | 64,455 | $ | 701,934 | (1,231 | ) | $ | (42,142 | ) | (72,771 | ) | $ | (764,717 | ) | 1,384 | $ | 13,917 | ||||||||||||||||
|
|
|
|
|
|
|
|
|
|
|
|
|
|
|
| |||||||||||||||||
TARGET 2015 SERIES: | FOR THE YEAR ENDED 10/31/17 | FOR THE YEAR ENDED 10/31/16 | FOR THE PERIOD 10/16/171 TO 10/31/17 | |||||||||||||||||||||||||||||
| CLASS I | CLASS I | CLASS R6 | ||||||||||||||||||||||||||||||
| SHARES | AMOUNTS | SHARES | AMOUNTS | SHARES | AMOUNTS | |||||||||||||||||||||||||||
Sold | 71,237 | $ | 759,360 | 116,263 | $ | 1,214,003 | 446 | $ | 5,000 | |||||||||||||||||||||||
Reinvested | 3,867 | 40,103 | 32,415 | 323,149 | — | — | ||||||||||||||||||||||||||
Repurchased | (298,585 | ) | (3,249,874 | ) | (353,871 | ) | (3,680,640 | ) | — | — | ||||||||||||||||||||||
|
|
|
|
|
|
|
|
|
|
|
| |||||||||||||||||||||
Total | (223,481 | ) | $ | (2,450,411 | ) | (205,193 | ) | $ | (2,143,488 | ) | 446 | $ | 5,000 | |||||||||||||||||||
|
|
|
|
|
|
|
|
|
|
|
| |||||||||||||||||||||
TARGET 2020 SERIES: | FOR THE YEAR ENDED 10/31/17 | FOR THE YEAR ENDED 10/31/16 | FOR THE YEAR ENDED 10/31/17 | FOR THE YEAR ENDED 10/31/16 | ||||||||||||||||||||||||||||
| CLASS K | CLASS K | CLASS R | CLASS R | |||||||||||||||||||||||||||||
| SHARES | AMOUNTS | SHARES | AMOUNTS | SHARES | AMOUNTS | SHARES | AMOUNTS | |||||||||||||||||||||||||
Sold | 2,172,901 | $ | 19,607,802 | 1,305,446 | $ | 11,225,249 | 886,323 | $ | 8,009,764 | 120,070 | $ | 1,035,174 | ||||||||||||||||||||
Reinvested | 121,288 | 1,040,715 | 930,849 | 7,694,487 | 6,480 | 55,423 | 82,322 | 671,918 | ||||||||||||||||||||||||
Repurchased | (3,836,660 | ) | (34,880,548 | ) | (1,645,190 | ) | (13,965,905 | ) | (250,464 | ) | (2,227,372 | ) | (552,566 | ) | (4,681,053 | ) | ||||||||||||||||
|
|
|
|
|
|
|
|
|
|
|
|
|
|
|
| |||||||||||||||||
Total | (1,542,471 | ) | $ | (14,232,031 | ) | 591,105 | $ | 4,953,831 | 642,339 | $ | 5,837,815 | (350,174 | ) | $ | (2,973,961 | ) | ||||||||||||||||
|
|
|
|
|
|
|
|
|
|
|
|
|
|
|
| |||||||||||||||||
76
Notes to Financial Statements (continued)
| 6. | Capital Stock Transactions (continued) |
TARGET 2020 SERIES: | FOR THE YEAR ENDED 10/31/17 | FOR THE YEAR ENDED 10/31/16 | FOR THE PERIOD 10/16/171 TO 10/31/17 | |||||||||||||||||||||||||||||
| CLASS I | CLASS I | CLASS R6 | ||||||||||||||||||||||||||||||
| SHARES | AMOUNTS | SHARES | AMOUNTS | SHARES | AMOUNTS | |||||||||||||||||||||||||||
Sold | 682,033 | $ | 6,089,825 | 1,286,155 | $ | 11,021,607 | 529 | $ | 5,000 | |||||||||||||||||||||||
Reinvested | 80,657 | 698,280 | 844,057 | 7,001,908 | — | — | ||||||||||||||||||||||||||
Repurchased | (2,516,290 | ) | (23,043,275 | ) | (4,770,059 | ) | (40,795,617 | ) | — | — | ||||||||||||||||||||||
|
|
|
|
|
|
|
|
|
|
|
| |||||||||||||||||||||
Total | (1,753,600 | ) | $ | (16,255,170 | ) | (2,639,847 | ) | $ | (22,772,102 | ) | 529 | $ | 5,000 | |||||||||||||||||||
|
|
|
|
|
|
|
|
|
|
|
| |||||||||||||||||||||
TARGET 2025 SERIES: | FOR THE YEAR ENDED 10/31/17 | FOR THE YEAR ENDED 10/31/16 | FOR THE YEAR ENDED 10/31/17 | FOR THE YEAR ENDED 10/31/16 | ||||||||||||||||||||||||||||
| CLASS K | CLASS K | CLASS R | CLASS R | |||||||||||||||||||||||||||||
| SHARES | AMOUNTS | SHARES | AMOUNTS | SHARES | AMOUNTS | SHARES | AMOUNTS | |||||||||||||||||||||||||
Sold | 1,510,708 | $ | 17,519,643 | 467,793 | $ | 4,994,054 | 1,041,870 | $ | 12,170,838 | 54,859 | $ | 593,336 | ||||||||||||||||||||
Reinvested | 18,798 | 204,099 | 101,304 | 1,050,543 | 2,406 | 26,982 | 17,327 | 180,276 | ||||||||||||||||||||||||
Repurchased | (605,174 | ) | (6,888,059 | ) | (361,044 | ) | (3,915,258 | ) | (137,641 | ) | (1,565,471 | ) | (98,175 | ) | (1,083,882 | ) | ||||||||||||||||
|
|
|
|
|
|
|
|
|
|
|
|
|
|
|
| |||||||||||||||||
Total | 924,332 | $ | 10,835,683 | 208,053 | $ | 2,129,339 | 906,635 | $ | 10,632,349 | (25,989 | ) | $ | (310,270 | ) | ||||||||||||||||||
|
|
|
|
|
|
|
|
|
|
|
|
|
|
|
| |||||||||||||||||
TARGET 2025 SERIES: | FOR THE YEAR ENDED 10/31/17 | FOR THE YEAR ENDED 10/31/16 | FOR THE PERIOD 10/16/171 TO 10/31/17 | |||||||||||||||||||||||||||||
| CLASS I | CLASS I | CLASS R6 | ||||||||||||||||||||||||||||||
| SHARES | AMOUNTS | SHARES | AMOUNTS | SHARES | AMOUNTS | |||||||||||||||||||||||||||
Sold | 370,555 | $ | 4,134,606 | 517,067 | $ | 5,465,046 | 418 | $ | 5,000 | |||||||||||||||||||||||
Reinvested | 19,004 | 205,945 | 115,478 | 1,193,313 | — | — | ||||||||||||||||||||||||||
Repurchased | (1,611,229 | ) | (18,497,112 | ) | (550,169 | ) | (5,887,382 | ) | — | — | ||||||||||||||||||||||
|
|
|
|
|
|
|
|
|
|
|
| |||||||||||||||||||||
Total | (1,221,670 | ) | $ | (14,156,561 | ) | 82,376 | $ | 770,977 | 418 | $ | 5,000 | |||||||||||||||||||||
|
|
|
|
|
|
|
|
|
|
|
| |||||||||||||||||||||
TARGET 2030 SERIES: | FOR THE YEAR ENDED 10/31/17 | FOR THE YEAR ENDED 10/31/16 | FOR THE YEAR ENDED 10/31/17 | FOR THE YEAR ENDED 10/31/16 | ||||||||||||||||||||||||||||
| CLASS K | CLASS K | CLASS R | CLASS R | |||||||||||||||||||||||||||||
| SHARES | AMOUNTS | SHARES | AMOUNTS | SHARES | AMOUNTS | SHARES | AMOUNTS | |||||||||||||||||||||||||
Sold | 2,778,652 | $ | 25,188,374 | 1,694,389 | $ | 14,348,192 | 1,104,982 | $ | 10,086,182 | 250,656 | $ | 2,128,933 | ||||||||||||||||||||
Reinvested | 134,225 | 1,140,501 | 1,374,384 | 11,055,567 | 10,235 | 86,458 | 188,656 | 1,503,830 | ||||||||||||||||||||||||
Repurchased | (2,812,564 | ) | (25,309,781 | ) | (1,907,673 | ) | (16,100,675 | ) | (497,936 | ) | (4,376,457 | ) | (664,989 | ) | (5,538,279 | ) | ||||||||||||||||
|
|
|
|
|
|
|
|
|
|
|
|
|
|
|
| |||||||||||||||||
Total | 100,313 | $ | 1,019,094 | 1,161,100 | $ | 9,303,084 | 617,281 | $ | 5,796,183 | (225,677 | ) | $ | (1,905,516 | ) | ||||||||||||||||||
|
|
|
|
|
|
|
|
|
|
|
|
|
|
|
| |||||||||||||||||
TARGET 2030 SERIES: | FOR THE YEAR ENDED 10/31/17 | FOR THE YEAR ENDED 10/31/16 | FOR THE PERIOD 10/16/171 TO 10/31/17 | |||||||||||||||||||||||||||||
| CLASS I | CLASS I | CLASS R6 | ||||||||||||||||||||||||||||||
| SHARES | AMOUNTS | SHARES | AMOUNTS | SHARES | AMOUNTS | |||||||||||||||||||||||||||
Sold | 758,409 | $ | 6,802,909 | 2,094,466 | $ | 17,737,192 | 520 | $ | 5,000 | |||||||||||||||||||||||
Reinvested | 97,154 | 836,401 | 1,283,151 | 10,415,335 | — | — | ||||||||||||||||||||||||||
Repurchased | (3,060,611 | ) | (28,059,927 | ) | (4,895,870 | ) | (41,458,493 | ) | — | — | ||||||||||||||||||||||
|
|
|
|
|
|
|
|
|
|
|
| |||||||||||||||||||||
Total | (2,205,048 | ) | $ | (20,420,617 | ) | (1,518,253 | ) | $ | (13,305,966 | ) | 520 | $ | 5,000 | |||||||||||||||||||
|
|
|
|
|
|
|
|
|
|
|
| |||||||||||||||||||||
77
Notes to Financial Statements (continued)
| 6. | Capital Stock Transactions (continued) |
TARGET 2035 SERIES: | FOR THE YEAR ENDED 10/31/17 | FOR THE YEAR ENDED 10/31/16 | FOR THE YEAR ENDED 10/31/17 | FOR THE YEAR ENDED 10/31/16 | ||||||||||||||||||||||||||||
| CLASS K | CLASS K | CLASS R | CLASS R | |||||||||||||||||||||||||||||
| SHARES | AMOUNTS | SHARES | AMOUNTS | SHARES | AMOUNTS | SHARES | AMOUNTS | |||||||||||||||||||||||||
Sold | 814,585 | $ | 9,738,361 | 351,735 | $ | 3,894,983 | 544,941 | $ | 6,670,222 | 59,111 | $ | 661,176 | ||||||||||||||||||||
Reinvested | 21,885 | 243,472 | 93,428 | 986,375 | 2,155 | 24,341 | 23,231 | 246,041 | ||||||||||||||||||||||||
Repurchased | (434,491 | ) | (5,179,247 | ) | (135,108 | ) | (1,515,115 | ) | (168,720 | ) | (1,949,856 | ) | (90,137 | ) | (1,026,108 | ) | ||||||||||||||||
|
|
|
|
|
|
|
|
|
|
|
|
|
|
|
| |||||||||||||||||
Total | 401,979 | $ | 4,802,586 | 310,055 | $ | 3,366,243 | 378,376 | $ | 4,744,707 | (7,795 | ) | $ | (118,891 | ) | ||||||||||||||||||
|
|
|
|
|
|
|
|
|
|
|
|
|
|
|
| |||||||||||||||||
TARGET 2035 SERIES: | FOR THE YEAR ENDED 10/31/17 | FOR THE YEAR ENDED 10/31/16 | FOR THE PERIOD 10/16/171 TO 10/31/17 | |||||||||||||||||||||||||||||
| CLASS I | CLASS I | CLASS R6 | ||||||||||||||||||||||||||||||
| SHARES | AMOUNTS | SHARES | AMOUNTS | SHARES | AMOUNTS | |||||||||||||||||||||||||||
Sold | 234,658 | $ | 2,741,000 | 319,194 | $ | 3,547,836 | 393 | $ | 5,000 | |||||||||||||||||||||||
Reinvested | 21,053 | 235,530 | 98,371 | 1,041,834 | — | — | ||||||||||||||||||||||||||
Repurchased | (1,189,172 | ) | (14,478,654 | ) | (297,550 | ) | (3,303,800 | ) | — | — | ||||||||||||||||||||||
|
|
|
|
|
|
|
|
|
|
|
| |||||||||||||||||||||
Total | (933,461 | ) | $ | (11,502,124 | ) | 120,015 | $ | 1,285,870 | 393 | $ | 5,000 | |||||||||||||||||||||
|
|
|
|
|
|
|
|
|
|
|
| |||||||||||||||||||||
TARGET 2040 SERIES: | FOR THE YEAR ENDED 10/31/17 | FOR THE YEAR ENDED 10/31/16 | FOR THE YEAR ENDED 10/31/17 | FOR THE YEAR ENDED 10/31/16 | ||||||||||||||||||||||||||||
| CLASS K | CLASS K | CLASS R | CLASS R | |||||||||||||||||||||||||||||
| SHARES | AMOUNTS | SHARES | AMOUNTS | SHARES | AMOUNTS | SHARES | AMOUNTS | |||||||||||||||||||||||||
Sold | 1,845,055 | $ | 17,096,157 | 1,554,166 | $ | 13,422,232 | 619,963 | $ | 5,888,746 | 153,036 | $ | 1,314,309 | ||||||||||||||||||||
Reinvested | 74,153 | 646,006 | 988,495 | 8,039,047 | 5,183 | 44,814 | 95,772 | 773,837 | ||||||||||||||||||||||||
Repurchased | (3,091,920 | ) | (29,044,040 | ) | (1,262,302 | ) | (10,771,998 | ) | (362,011 | ) | (3,348,998 | ) | (231,078 | ) | (1,973,607 | ) | ||||||||||||||||
|
|
|
|
|
|
|
|
|
|
|
|
|
|
|
| |||||||||||||||||
Total | (1,172,712 | ) | $ | (11,301,877 | ) | 1,280,359 | $ | 10,689,281 | 263,135 | $ | 2,584,562 | 17,730 | $ | 114,539 | ||||||||||||||||||
|
|
|
|
|
|
|
|
|
|
|
|
|
|
|
| |||||||||||||||||
TARGET 2040 SERIES: | FOR THE YEAR ENDED 10/31/17 | FOR THE YEAR ENDED 10/31/16 | FOR THE PERIOD 10/16/171 TO 10/31/17 | |||||||||||||||||||||||||||||
| CLASS I | CLASS I | CLASS R6 | ||||||||||||||||||||||||||||||
| SHARES | AMOUNTS | SHARES | AMOUNTS | SHARES | AMOUNTS | |||||||||||||||||||||||||||
Sold | 457,484 | $ | 4,244,538 | 1,256,700 | $ | 10,855,100 | 496 | $ | 5,000 | |||||||||||||||||||||||
Reinvested | 45,229 | 401,029 | 837,290 | 6,857,643 | — | — | ||||||||||||||||||||||||||
Repurchased | (1,327,779 | ) | (12,659,051 | ) | (3,193,800 | ) | (27,398,097 | ) | — | — | ||||||||||||||||||||||
|
|
|
|
|
|
|
|
|
|
|
| |||||||||||||||||||||
Total | (825,066 | ) | $ | (8,013,484 | ) | (1,099,810 | ) | $ | (9,685,354 | ) | 496 | $ | 5,000 | |||||||||||||||||||
|
|
|
|
|
|
|
|
|
|
|
| |||||||||||||||||||||
TARGET 2045 SERIES: | FOR THE YEAR ENDED 10/31/17 | FOR THE YEAR ENDED 10/31/16 | FOR THE YEAR ENDED 10/31/17 | FOR THE YEAR ENDED 10/31/16 | ||||||||||||||||||||||||||||
| CLASS K | CLASS K | CLASS R | CLASS R | |||||||||||||||||||||||||||||
| SHARES | AMOUNTS | SHARES | AMOUNTS | SHARES | AMOUNTS | SHARES | AMOUNTS | |||||||||||||||||||||||||
Sold | 289,509 | $ | 3,610,585 | 359,766 | $ | 4,060,529 | 309,595 | $ | 3,960,365 | 50,566 | $ | 574,273 | ||||||||||||||||||||
Reinvested | 14,998 | 172,547 | 36,161 | 392,942 | 2,194 | 24,869 | 16,008 | 173,049 | ||||||||||||||||||||||||
Repurchased | (157,105 | ) | (1,895,184 | ) | (114,721 | ) | (1,348,393 | ) | (106,658 | ) | (1,260,324 | ) | (46,586 | ) | (520,816 | ) | ||||||||||||||||
|
|
|
|
|
|
|
|
|
|
|
|
|
|
|
| |||||||||||||||||
Total | 147,402 | $ | 1,887,948 | 281,206 | $ | 3,105,078 | 205,131 | $ | 2,724,910 | 19,988 | $ | 226,506 | ||||||||||||||||||||
|
|
|
|
|
|
|
|
|
|
|
|
|
|
|
| |||||||||||||||||
78
Notes to Financial Statements (continued)
| 6. | Capital Stock Transactions (continued) |
TARGET 2045 SERIES: | FOR THE YEAR ENDED 10/31/17 | FOR THE YEAR ENDED 10/31/16 | FOR THE PERIOD 10/16/171 TO 10/31/17 | |||||||||||||||||||||||||||||
| CLASS I | CLASS I | CLASS R6 | ||||||||||||||||||||||||||||||
| SHARES | AMOUNTS | SHARES | AMOUNTS | SHARES | AMOUNTS | |||||||||||||||||||||||||||
Sold | 187,597 | $ | 2,278,160 | 233,312 | $ | 2,675,671 | 371 | $ | 5,000 | |||||||||||||||||||||||
Reinvested | 11,904 | 137,492 | 40,647 | 442,586 | — | — | ||||||||||||||||||||||||||
Repurchased | (572,125 | ) | (7,274,559 | ) | (153,290 | ) | (1,746,024 | ) | — | — | ||||||||||||||||||||||
|
|
|
|
|
|
|
|
|
|
|
| |||||||||||||||||||||
Total | (372,624 | ) | $ | (4,858,907 | ) | 120,669 | $ | 1,372,233 | 371 | $ | 5,000 | |||||||||||||||||||||
|
|
|
|
|
|
|
|
|
|
|
| |||||||||||||||||||||
TARGET 2050 SERIES: | FOR THE YEAR ENDED 10/31/17 | FOR THE YEAR ENDED 10/31/16 | FOR THE YEAR ENDED 10/31/17 | FOR THE YEAR ENDED 10/31/16 | ||||||||||||||||||||||||||||
| CLASS K | CLASS K | CLASS R | CLASS R | |||||||||||||||||||||||||||||
| SHARES | AMOUNTS | SHARES | AMOUNTS | SHARES | AMOUNTS | SHARES | AMOUNTS | |||||||||||||||||||||||||
Sold | 719,001 | $ | 7,297,415 | 615,347 | $ | 5,742,120 | 254,979 | $ | 2,619,581 | 108,335 | $ | 1,007,919 | ||||||||||||||||||||
Reinvested | 18,205 | 173,482 | 310,802 | 2,716,712 | 2,280 | 21,200 | 46,733 | 404,245 | ||||||||||||||||||||||||
Repurchased | (626,193 | ) | (6,386,413 | ) | (679,051 | ) | (6,294,490 | ) | (212,192 | ) | (2,122,025 | ) | (90,474 | ) | (867,198 | ) | ||||||||||||||||
|
|
|
|
|
|
|
|
|
|
|
|
|
|
|
| |||||||||||||||||
Total | 111,013 | $ | 1,084,484 | 247,098 | $ | 2,164,342 | 45,067 | $ | 518,756 | 64,594 | $ | 544,966 | ||||||||||||||||||||
|
|
|
|
|
|
|
|
|
|
|
|
|
|
|
| |||||||||||||||||
TARGET 2050 SERIES: | FOR THE YEAR ENDED 10/31/17 | FOR THE YEAR ENDED 10/31/16 | FOR THE PERIOD 10/16/171 TO 10/31/17 | |||||||||||||||||||||||||||||
| CLASS I | CLASS I | CLASS R6 | ||||||||||||||||||||||||||||||
| SHARES | AMOUNTS | SHARES | AMOUNTS | SHARES | AMOUNTS | |||||||||||||||||||||||||||
Sold | 449,709 | $ | 4,542,067 | 807,462 | $ | 7,577,254 | 451 | $ | 5,000 | |||||||||||||||||||||||
Reinvested | 18,875 | 182,278 | 337,574 | 2,961,455 | — | — | ||||||||||||||||||||||||||
Repurchased | (630,302 | ) | (6,584,168 | ) | (1,154,509 | ) | (10,787,205 | ) | — | — | ||||||||||||||||||||||
|
|
|
|
|
|
|
|
|
|
|
| |||||||||||||||||||||
Total | (161,718 | ) | $ | (1,859,823 | ) | (9,473 | ) | $ | (248,496 | ) | 451 | $ | 5,000 | |||||||||||||||||||
|
|
|
|
|
|
|
|
|
|
|
| |||||||||||||||||||||
TARGET 2055 SERIES: | FOR THE YEAR ENDED 10/31/17 | FOR THE YEAR ENDED 10/31/16 | FOR THE YEAR ENDED 10/31/17 | FOR THE YEAR ENDED 10/31/16 | ||||||||||||||||||||||||||||
| CLASS K | CLASS K | CLASS R | CLASS R | |||||||||||||||||||||||||||||
| SHARES | AMOUNTS | SHARES | AMOUNTS | SHARES | AMOUNTS | SHARES | AMOUNTS | |||||||||||||||||||||||||
Sold | 183,894 | $ | 2,305,123 | 148,413 | $ | 1,727,779 | 166,456 | $ | 2,131,519 | 23,384 | $ | 266,230 | ||||||||||||||||||||
Reinvested | 4,973 | 57,576 | 9,758 | 106,036 | 955 | 11,041 | 3,757 | 40,453 | ||||||||||||||||||||||||
Repurchased | (86,995 | ) | (1,064,756 | ) | (45,778 | ) | (535,658 | ) | (34,345 | ) | (418,012 | ) | (15,214 | ) | (174,567 | ) | ||||||||||||||||
|
|
|
|
|
|
|
|
|
|
|
|
|
|
|
| |||||||||||||||||
Total | 101,872 | $ | 1,297,943 | 112,393 | $ | 1,298,157 | 133,066 | $ | 1,724,548 | 11,927 | $ | 132,116 | ||||||||||||||||||||
|
|
|
|
|
|
|
|
|
|
|
|
|
|
|
| |||||||||||||||||
TARGET 2055 SERIES: | FOR THE YEAR ENDED 10/31/17 | FOR THE YEAR ENDED 10/31/16 | FOR THE PERIOD 10/16/171 TO 10/31/17 | |||||||||||||||||||||||||||||
| CLASS I | CLASS I | CLASS R6 | ||||||||||||||||||||||||||||||
| SHARES | AMOUNTS | SHARES | AMOUNTS | SHARES | AMOUNTS | |||||||||||||||||||||||||||
Sold | 141,581 | $ | 1,738,110 | 184,679 | $ | 2,129,798 | 365 | $ | 5,000 | |||||||||||||||||||||||
Reinvested | 5,949 | 69,828 | 14,516 | 159,002 | — | — | ||||||||||||||||||||||||||
Repurchased | (367,843 | ) | (4,785,227 | ) | (94,535 | ) | (1,102,471 | ) | — | — | ||||||||||||||||||||||
|
|
|
|
|
|
|
|
|
|
|
| |||||||||||||||||||||
Total | (220,313 | ) | $ | (2,977,289 | ) | 104,660 | $ | 1,186,329 | 365 | $ | 5,000 | |||||||||||||||||||||
|
|
|
|
|
|
|
|
|
|
|
| |||||||||||||||||||||
79
Notes to Financial Statements (continued)
| 6. | Capital Stock Transactions (continued) |
TARGET 2060 SERIES: | FOR THE YEAR ENDED 10/31/17 | FOR THE YEAR ENDED 10/31/16 | FOR THE YEAR ENDED 10/31/17 | FOR THE YEAR ENDED 10/31/16 | ||||||||||||||||||||||||||||
| CLASS K | CLASS K | CLASS R | CLASS R | |||||||||||||||||||||||||||||
| SHARES | AMOUNTS | SHARES | AMOUNTS | SHARES | AMOUNTS | SHARES | AMOUNTS | |||||||||||||||||||||||||
Sold | 134,187 | $ | 1,564,437 | 129,353 | $ | 1,262,758 | 97,802 | $ | 1,164,532 | 13,406 | $ | 140,049 | ||||||||||||||||||||
Reinvested | 2,389 | 25,579 | 82 | 841 | 196 | 2,130 | 23 | 231 | ||||||||||||||||||||||||
Repurchased | (4,631 | ) | (53,278 | ) | (2,623 | ) | (27,435 | ) | (15,100 | ) | (164,344 | ) | (1,763 | ) | (18,680 | ) | ||||||||||||||||
|
|
|
|
|
|
|
|
|
|
|
|
|
|
|
| |||||||||||||||||
Total | 131,945 | $ | 1,536,738 | 126,812 | $ | 1,236,164 | 82,898 | $ | 1,002,318 | 11,666 | $ | 121,600 | ||||||||||||||||||||
|
|
|
|
|
|
|
|
|
|
|
|
|
|
|
| |||||||||||||||||
TARGET 2060 SERIES: | FOR THE YEAR ENDED 10/31/17 | FOR THE YEAR ENDED 10/31/16 | FOR THE PERIOD 10/16/171 TO 10/31/17 | |||||||||||||||||||||||||||||
| CLASS I | CLASS I | CLASS R6 | ||||||||||||||||||||||||||||||
| SHARES | AMOUNTS | SHARES | AMOUNTS | SHARES | AMOUNTS | |||||||||||||||||||||||||||
Sold | 4,721 | $ | 53,596 | 494 | $ | 5,214 | 402 | $ | 5,000 | |||||||||||||||||||||||
Reinvested | 108 | 1,164 | 30 | 302 | — | — | ||||||||||||||||||||||||||
Repurchased | (1,774 | ) | (20,121 | ) | (267 | ) | (2,839 | ) | — | — | ||||||||||||||||||||||
|
|
|
|
|
|
|
|
|
|
|
| |||||||||||||||||||||
Total | 3,055 | $ | 34,639 | 257 | $ | 2,677 | 402 | $ | 5,000 | |||||||||||||||||||||||
|
|
|
|
|
|
|
|
|
|
|
| |||||||||||||||||||||
1Commencement of operations.
The following table represents instances at October 31, 2017, where a shareholder account owned greater than 10% of a Series:
| SERIES | NUMBER OF ACCOUNTS OVER 10% | PERCENTAGE OF THE SERIES | ||||||
Target Income Series | 1 | 55.4 | % | |||||
Target 2015 Series | 3 | 40.6 | % | |||||
Target 2020 Series | 2 | 61.7 | % | |||||
Target 2030 Series | 2 | 58.1 | % | |||||
Target 2035 Series | 1 | 22.3 | % | |||||
Target 2040 Series | 2 | 56.9 | % | |||||
Target 2045 Series | 1 | 22.6 | % | |||||
Target 2050 Series | 2 | 53.9 | % | |||||
Target 2055 Series | 1 | 12.4 | % | |||||
Target 2060 Series | 1 | 57.2 | % | |||||
At October 31, 2017, the Advisor and its affiliates owned 4.2% of the Target 2060 Series and 0.1% or less of each remaining Series. Investment activities of these shareholders may have a material effect on the Series.
| 7. | Financial Instruments |
The Underlying Series may trade in instruments including written and purchased options, forward foreign currency exchange contracts and futures contracts and other derivatives in the normal course of investing activities to assist in managing exposure to various market risks. The Underlying Series may be subject to various elements of risk which may involve, to a varying degree, elements of risk in excess of the amounts recognized for financial statement purposes. These risks include: the risk that changes in the value of a derivative may not correlate perfectly with the underlying asset, rate or index; counterparty credit risk related to over the counter derivative counterparties’ failure to perform under contract terms; liquidity risk related to the lack of a liquid market for these contracts allowing the fund to close out its position(s); and documentation risk relating to disagreement over contract terms. No such investments were directly held by the Series as of October 31, 2017.
80
Notes to Financial Statements (continued)
| 8. | Federal Income Tax Information |
The amount and characterization of certain income and capital gains to be distributed are determined in accordance with federal income tax regulations, which may differ from GAAP. The differences are primarily due to differing book and tax treatment in the timing and recognition on net investment income or gains and losses, including losses deferred due to wash sales. Each Series may periodically make reclassifications among its capital accounts to reflect income and gains available for distribution (or available capital loss carryovers) under income tax regulations, without impacting the Series’ net asset value. For the fiscal year ended October 31, 2017, the reclassifications were as follows:
| SERIES | FROM ACCUMULATED NET REALIZED GAIN (LOSS) ON INVESTMENTS | TO UNDISTRIBUTED NET INVESTMENT INCOME | ||
Target 2015 Series | $(12,627) | $12,627 | ||
Target 2020 Series | $(403,332) | $403,332 | ||
Target 2025 Series | $(129,331) | $129,331 | ||
Target 2030 Series | $(769,106) | $769,106 | ||
Target 2035 Series | $(151,722) | $151,722 | ||
Target 2040 Series | $(601,985) | $601,985 | ||
Target 2045 Series | $(99,965) | $99,965 | ||
Target 2050 Series | $(234,049) | $234,049 | ||
Target 2055 Series | $(44,963) | $44,963 | ||
Target 2060 Series | $(12,277) | $12,277 |
The reclassifications relate primarily to distributions from investments in the Underlying Series. Any such reclassifications are not reflected in the financial highlights.
The tax character of distributions paid were as follows:
| TARGET INCOME SERIES | TARGET 2015 SERIES | TARGET 2020 SERIES | TARGET 2025 SERIES | TARGET 2030 SERIES | ||||||||||||||||
Ordinary income (2017) | $ | 1,234,782 | $ | 90,007 | $ | 1,858,404 | $ | 475,544 | $ | 2,163,446 | ||||||||||
Ordinary income (2016) | $ | 1,645,777 | $ | 93,014 | $ | 1,874,595 | $ | 364,967 | $ | 1,748,667 | ||||||||||
Long-term capital gain (2016) | $ | 3,977,013 | $ | 586,220 | $ | 13,936,678 | $ | 2,302,313 | $ | 22,083,706 | ||||||||||
| TARGET 2035 SERIES | TARGET 2040 SERIES | TARGET 2045 SERIES | TARGET 2050 SERIES | TARGET 2055 SERIES | TARGET 2060 SERIES | |||||||||||||||||||
Ordinary income (2017) | $ | 361,500 | $ | 1,141,133 | $ | 174,047 | $ | 391,345 | $ | 75,733 | $ | 24,681 | ||||||||||||
Ordinary income (2016) | $ | 197,409 | $ | 708,610 | $ | 53,027 | $ | 163,983 | $ | 19,089 | $ | 1,375 | ||||||||||||
Long-term capital gain (2017) | $ | 164,470 | $ | — | $ | 177,024 | $ | — | $ | 68,636 | $ | 4,290 | ||||||||||||
Long-term capital gain (2016) | $ | 2,198,508 | $ | 15,564,808 | $ | 1,000,433 | $ | 6,162,262 | $ | 303,315 | $ | — | ||||||||||||
At October 31, 2017, the tax basis of components of distributable earnings and the net unrealized appreciation (depreciation) based on the identified cost of investments for federal income tax purposes were as follows:
| TARGET INCOME SERIES | TARGET 2015 SERIES | TARGET 2020 SERIES | TARGET 2025 SERIES | TARGET 2030 SERIES | ||||||||||||||||
Cost for federal income tax purposes | $ | 99,166,304 | $ | 4,566,810 | $ | 114,787,676 | $ | 40,313,924 | $ | 141,892,358 | ||||||||||
Unrealized appreciation | — | — | — | — | 20,241 | |||||||||||||||
Unrealized depreciation | (176,583 | ) | (8,433 | ) | (211,545 | ) | (72,943 | ) | (227,041 | ) | ||||||||||
|
|
|
|
|
|
|
|
|
| |||||||||||
Net unrealized depreciation | $ | (176,583 | ) | $ | (8,433 | ) | $ | (211,545 | ) | $ | (72,943 | ) | $ | (206,800 | ) | |||||
|
|
|
|
|
|
|
|
|
| |||||||||||
Undistributed ordinary income | $ | 69,715 | $ | 5,301 | $ | 95,605 | $ | 40,193 | $ | 113,350 | ||||||||||
Capital loss carryforward | $ | (406,009 | ) | $ | (431,980 | ) | $ | (2,328,975 | ) | $ | — | $ | (1,622,824 | ) | ||||||
81
Notes to Financial Statements (continued)
| 8. | Federal Income Tax Information (continued) |
| TARGET 2035 SERIES | TARGET 2040 SERIES | TARGET 2045 SERIES | TARGET 2050 SERIES | TARGET 2055 SERIES | TARGET 2060 SERIES | |||||||||||||||||||
Cost for federal income tax purposes | $ | 26,335,062 | $ | 84,030,849 | $ | 15,881,046 | $ | 35,356,798 | $ | 6,730,348 | $ | 4,614,496 | ||||||||||||
Unrealized appreciation | 9,974 | 50,006 | 12,626 | 32,463 | 6,016 | 4,183 | ||||||||||||||||||
Unrealized depreciation | (27,829 | ) | (52,661 | ) | (2,956 | ) | (6 | ) | (45 | ) | (4 | ) | ||||||||||||
|
|
|
|
|
|
|
|
|
|
|
| |||||||||||||
Net unrealized appreciation (depreciation) | $ | (17,855 | ) | $ | (2,655 | ) | $ | 9,670 | $ | 32,457 | $ | 5,971 | $ | 4,179 | ||||||||||
|
|
|
|
|
|
|
|
|
|
|
| |||||||||||||
Undistributed ordinary income | $ | 293,859 | $ | 1,100,601 | $ | 309,091 | $ | 1,050,862 | $ | 299,907 | $ | 186,504 | ||||||||||||
Undistributed long-term capital gains | $ | 94,357 | $ | 579,983 | $ | 581,285 | $ | 1,612,958 | $ | 328,459 | $ | 350,689 | ||||||||||||
At October 31, 2017, Target Income Series, Target 2015 Series, Target 2020 Series and Target 2030 Series had net long-term capital loss carryforwards of $406,009, $431,980, $2,328,975 and $1,622,824, respectively, which may be carried forward indefinitely.
As of October 31, 2017, the capital loss carryover utilized in the current year for Target Income Series, Target 2015 Series, Target 2020 Series, Target 2025 Series, Target 2030 Series, Target 2040 Series and Target 2050 Series was $1,193,298, $142,952, $1,532,299, $919,183, $2,645,205, $2,229,560 and $439,584, respectively.
82
Report of Independent Registered Public Accounting Firm
To the Board of Directors of Manning & Napier Fund, Inc. and Shareholders of Target Income Series, Target 2015 Series, Target 2020 Series, Target 2025 Series, Target 2030 Series, Target 2035 Series, Target 2040 Series, Target 2045 Series, Target 2050 Series, Target 2055 Series and Target 2060 Series:
In our opinion, the accompanying statements of assets and liabilities, including the investment portfolios, and the related statements of operations and of changes in net assets and the financial highlights present fairly, in all material respects, the financial position of the Target Income Series, Target 2015 Series, Target 2020 Series, Target 2025 Series, Target 2030 Series, Target 2035 Series, Target 2040 Series, Target 2045 Series, Target 2050 Series, Target 2055 Series and Target 2060 Series (eleven of the series constituting Manning & Napier Fund, Inc., hereafter referred to as the “Series”) as of October 31, 2017, the results of each of their operations for the year then ended, the changes in each of their net assets for each of the two years in the period then ended and the financial highlights for each of the periods presented, in conformity with accounting principles generally accepted in the United States of America. These financial statements and financial highlights (hereafter referred to as “financial statements”) are the responsibility of the Series’ management. Our responsibility is to express an opinion on these financial statements based on our audits. We conducted our audits of these financial statements in accordance with the standards of the Public Company Accounting Oversight Board (United States). Those standards require that we plan and perform the audit to obtain reasonable assurance about whether the financial statements are free of material misstatement. An audit includes examining, on a test basis, evidence supporting the amounts and disclosures in the financial statements, assessing the accounting principles used and significant estimates made by management, and evaluating the overall financial statement presentation. We believe that our audits, which included confirmation of securities as of October 31, 2017 by correspondence with the transfer agent, custodian and brokers, provide a reasonable basis for our opinion.

New York, New York
December 18, 2017
83
Supplemental Tax Information
(unaudited)
All reportings are based on financial information available as of the date of this annual report and, accordingly, are subject to change.
For federal income tax purposes, each of the Series reports for the current fiscal year the amount disclosed below or, if different, the maximum amount allowable under the tax law, as qualified dividend income (“QDI”).
| Series | QDI | |||
Target Income Series | $ | 469,107 | ||
Target 2015 Series | 33,896 | |||
Target 2020 Series | 748,102 | |||
Target 2025 Series | 200,207 | |||
Target 2030 Series | 1,048,188 | |||
Target 2035 Series | 115,541 | |||
Target 2040 Series | 382,413 | |||
Target 2045 Series | 49,357 | |||
Target 2050 Series | 88,327 | |||
Target 2055 Series | 11,559 | |||
Target 2060 Series | 5,125 | |||
For corporate shareholders, the percentage of investment income (dividend income plus short-term gain, if any) that qualifies for the dividends received deduction (DRD) for the current fiscal year is as follows:
| Series | DRD% | |||
Target Income Series | 28.84 | % | ||
Target 2015 Series | 23.64 | % | ||
Target 2020 Series | 23.14 | % | ||
Target 2025 Series | 24.19 | % | ||
Target 2030 Series | 28.63 | % | ||
Target 2035 Series | 19.63 | % | ||
Target 2040 Series | 21.72 | % | ||
Target 2045 Series | 19.81 | % | ||
Target 2050 Series | 16.15 | % | ||
Target 2055 Series | 10.14 | % | ||
Target 2060 Series | 15.73 | % | ||
The Series designate Long-Term Capital Gain dividends pursuant to Section 852(b)(3) of the Code for the fiscal year ended October 31, 2017 as follows:
| Series | ||||
Target 2035 Series | $ | 99,299 | ||
Target 2040 Series | 608,982 | |||
Target 2045 Series | 610,349 | |||
Target 2050 Series | 1,693,606 | |||
Target 2055 Series | 344,928 | |||
Target 2060 Series | 368,231 | |||
84
Directors’ and Officers’ Information
(unaudited)
The Statement of Additional Information provides additional information about the Fund’s directors and officers and can be obtained without charge by calling 1-800-466-3863, at www.manning-napier.com, or on the EDGAR Database on the SEC Internet web site (http://www.sec.gov). The following chart shows certain information about the Fund’s directors and officers, including their principal occupations during the last five years. Unless specific dates are provided, the individuals have held the listed positions for longer than five years.
Interested Director and Officer
| Name: | Michele T. Mosca* | |
| Address: | 290 Woodcliff Drive | |
| Fairport, NY 14450 | ||
| Age: | 45 | |
| Current Position(s) Held with Fund: | Principal Executive Officer, President, Chairman & Director | |
| Term of Office & Length of Time Served: | Indefinite - Chairman and Director since August 20161 | |
| Principal Occupation(s) During Past 5 Years: | Managing Director, Funds Group (since 2009) - Manning & Napier Advisors, LLC; President, Director (since 2015) - Manning & Napier Investor Services, Inc.; Chief Executive Officer, President (since 2016) - Rainier Investment Management Mutual Funds, Inc. | |
| Holds the following title for various subsidiaries and affiliates: President, Director | ||
| Number of Portfolios Overseen within Fund Complex: | 38 | |
| Other Directorships Held Outside Fund Complex During Past 5 Years: | Trustee - Rainier Investment Management Mutual Funds (since 2016) | |
| Independent Directors | ||
| Name: | Stephen B. Ashley | |
| Address: | 290 Woodcliff Drive | |
| Fairport, NY 14450 | ||
| Age: | 77 | |
| Current Position(s) Held with Fund: | Director, Audit Committee Member, Governance & Nominating Committee Member | |
| Term of Office & Length of Time Served: | Indefinite - Since 1996 | |
| Principal Occupation(s) During Past 5 Years: | Chairman, Director & Chief Executive Officer (1997 to present) - The Ashley Group (property management and investment). Director (1995-2008) and Chairman (non-executive) (2004-2008) - Fannie Mae (mortgage) | |
| Number of Portfolios Overseen within Fund Complex: | 38 | |
| Other Directorships Held Outside Fund Complex During | Fannie Mae (1995-2008) | |
| Past 5 Years: | The Ashley Group (1995-2008) | |
| Genesee Corporation (1987-2007) | ||
| Name: | Paul A. Brooke | |
| Address: | 290 Woodcliff Drive | |
| Fairport, NY 14450 | ||
| Age: | 72 | |
| Current Position(s) Held with Fund: | Lead Independent Director, Audit Committee Member, Governance & Nominating Committee Chairman | |
| Term of Office & Length of Time Served: | Indefinite - Director, Audit Committee Member, Governance & Nominating Committee Member since 2007; Governance & Nominating Committee Chairman since 2016; Lead Independent Director since 2017 | |
| Principal Occupation(s) During Past 5 Years: | Chairman & CEO (2005-2009) - Ithaka Acquisition Corporation (investments); Chairman (2007-2009) - Alsius Corporation (investments); Managing Member (1991-present) - PMSV Holdings LLC (investments); Managing Member (2010-2016) - Venbio (investments). | |
| Number of Portfolios Overseen within Fund Complex: | 38 | |
| Other Directorships Held Outside Fund Complex During Past 5 Years: | Incyte Corp. (biotech)(2000-present); ViroPharma, Inc. (speciality pharmaceuticals)(2000-2014); HLTH (WebMD)(information)(2000-2010); Cheyne Capital International (investment)(2000-present); GMP Companies (investment)(2000-2011); Cytos Biotechnology Ltd (biotechnology)(2012-2014); Cerus (biomedical)(2016-present); PureEarth(non-profit)(2012-present)
| |
85
Directors’ and Officers’ Information
(unaudited)
Independent Directors (continued)
| Name: | Peter L. Faber | |
| Address: | 290 Woodcliff Drive | |
| Fairport, NY 14450 | ||
| Age: | 79 | |
| Current Position(s) Held with Fund: | Director, Governance & Nominating Committee Member | |
| Term of Office & Length of Time Served: | Indefinite - Since 1987 | |
| Principal Occupation(s) During Past 5 Years: | Senior Counsel (2006-2012), Partner (1995-2006 & 2013-present) - McDermott, Will & Emery LLP (law firm) | |
| Number of Portfolios Overseen within Fund Complex: | 38 | |
| Other Directorships Held Outside Fund Complex During | Boston Early Music Festival (non-profit)(2007-present); | |
| Past 5 Years: | Amherst Early Music, Inc. (non-profit)(2009-present); | |
| Gotham Early Music Scene, Inc. (non-profit)(2009-present); Partnership for New York City, Inc. Gotham Early Music Scene, Inc. (non-profit)(1989-2010); | ||
| New York Collegium (non-profit)(2004-2011) | ||
| Name: | Harris H. Rusitzky | |
| Address: | 290 Woodcliff Drive | |
| Fairport, NY 14450 | ||
| Age: | 82 | |
| Current Position(s) Held with Fund: | Director, Audit Committee Member, Governance & Nominating Committee Member | |
| Term of Office & Length of Time Served: | Indefinite - Since 1985 | |
| Principal Occupation(s) During Past 5 Years: | President (1994- present) - The Greening Group (business consultants); | |
| Partner (2006-present) - The Restaurant Group (restaurants) | ||
| Number of Portfolios Overseen within Fund Complex: | 38 | |
| Other Directorships Held Outside Fund Complex During Past 5 Years: | Rochester Institute of Technology (university)(1972-present); Culinary Institute of America (non-profit college)(1985-present); George Eastman House | |
| (museum)(1988-present); National Restaurant Association (restaurant trade organization)(1978-present) | ||
| Name: | Chester N. Watson | |
| Address: | 290 Woodcliff Drive | |
| Fairport, NY 14450 | ||
| Age: | 67 | |
| Current Position(s) Held with Fund: | Director, Audit Committee Chairman, Governance & Nominating Committee Member | |
| Term of Office & Length of Time Served: | Indefinite - Since 2012 | |
| Principal Occupation(s) During Past 5 Years: | General Auditor (2003-2011) - General Motors Company (auto manufacturer) | |
| Number of Portfolios Overseen within Fund Complex: | 38 | |
| Other Directorships Held Outside Fund Complex During Past 5 Years: | Rochester Institute of Technology (university)(2005-present); Town of Greenburgh, NY Planning Board (municipal government) (2015-present) | |
| Officers: | ||
| Name: | Jeffrey S. Coons, Ph.D., CFA® | |
| Address: | 290 Woodcliff Drive | |
| Fairport, NY 14450 | ||
| Age: | 54 | |
| Current Position(s) Held with Fund: | Vice President | |
| Term of Office1 & Length of Time Served: | Since 2004 | |
| Principal Occupation(s) During Past 5 Years: | President since 2010, Co-Director of Research (2002 - 2015) -Manning & Napier Advisors, LLC | |
| Holds one or more of the following titles for various subsidiaries and affiliates: President, Director, Treasurer, or Senior Trust Officer | ||
| Name: | Elizabeth Craig | |
| Address: | 290 Woodcliff Drive | |
| Fairport, NY 14450 | ||
| Age: | 30 | |
| Current Position(s) Held with Fund: | Corporate Secretary | |
| Term of Office1 & Length of Time Served: | Since 2016 | |
| Principal Occupation(s) During Past 5 Years: | Fund Administration Manager since 2015; Mutual Fund | |
| Compliance Specialist (2009-2015) - Manning & Napier Advisors, LLC; Assistant Corporate Secretary | ||
| (2011-2016) - Manning & Napier Fund, Inc. | ||
86
Directors’ and Officers’ Information
(unaudited)
Officers: (continued)
| Name: | Christine Glavin | |
| Address: | 290 Woodcliff Drive | |
| Fairport, NY 14450 | ||
| Age: | 51 | |
| Current Position(s) Held with Fund: | Principal Financial Officer, Chief Financial Officer | |
| Term of Office1 & Length of Time Served: | Principal Financial Officer since 2002; Chief Financial Officer since 2001 | |
| Principal Occupation(s) During Past 5 Years: | Director of Fund Reporting since 2011; Fund Reporting | |
| Manager (1997-2011) - Manning & Napier Advisors, LLC; Assistant Treasurer since 2008 - Exeter Trust Company; Chief Financial Officer since 2017- Rainier | ||
| Investment Management Mutual Funds, Inc. | ||
| Name: | Jodi L. Hedberg | |
| Address: | 290 Woodcliff Drive | |
| Fairport, NY 14450 | ||
| Age: | 50 | |
| Current Position(s) Held with Fund: | Chief Compliance Officer, Anti-Money Laundering Compliance Officer | |
| Term of Office1 & Length of Time Served: | Chief Compliance Officer since 2004; Anti-Money Laundering Officer since 2002; Corporate Secretary (1997-2016)- Manning & Napier Fund, Inc.; Chief Compliance Officer and Anti-Money Laundering Officer since 2017 - Rainier Investment Management Mutual Funds, Inc. | |
| Principal Occupation(s) During Past 5 Years: | Director of Compliance since 2005; Compliance Manager (1995-2005) - Manning & Napier Advisors, LLC and affiliates; Corporate Secretary - Manning & | |
| Napier Investor Services, Inc. since 2006 | ||
| Name: | Scott Morabito | |
| Address: | 290 Woodcliff Drive | |
| Fairport, NY 14450 | ||
| Age: | 29 | |
| Current Position(s) Held with Fund: | Assistant Vice President | |
| Term of Office1 & Length of Time Served: | Since 2017 | |
| Principal Occupation(s) During Past 5 Years: | Director of Funds Group since 2017; Fund Product and Strategy Manager (2014-2017); Senior Product and Strategy Analyst (2013-2014); Product and Strategy | |
| Analyst (2011-2013) - Manning & Napier Advisors, LLC. | ||
| Name: | Amy Williams | |
| Address: | 290 Woodcliff Drive | |
| Fairport, NY 14450 | ||
| Age: | 56 | |
| Current Position(s) Held with Fund: | Assistant Corporate Secretary | |
| Term of Office1 & Length of Time Served: | Since 2016 | |
| Principal Occupation(s) During Past 5 Years: | Director of Fund Documentation - Manning & Napier Advisors, LLC and affiliates since 2009 | |
| Holds one or more of the following titles for various affiliates: Director | ||
| Name: | Richard Yates | |
| Address: | 290 Woodcliff Drive | |
| Fairport, NY 14450 | ||
| Age: | 52 | |
| Current Position(s) Held with Fund: | Chief Legal Officer | |
| Term of Office1 & Length of Time Served: | Chief Legal Officer since 2004 | |
| Principal Occupation(s) During Past 5 Years: | Counsel - Manning & Napier Advisors, LLC and affiliates since 2000; Chief Legal Officer since 2016 - Rainier Investment Management, LLC; Chief Legal Officer since 2016 - Rainier Investment Management Mutual Funds, Inc. Holds one or more of the following titles for various affiliates: Director, Corporate Secretary | |
| Chief Legal Officer | ||
*Interested Director, within the meaning of the 1940 Act by reason of her positions with the Fund’s investment advisor, Manning & Napier Advisors, LLC and Distributor, Manning & Napier Investor Services, Inc.
1 The term of office of all officers shall be one year and until their respective successors are chosen and qualified, or his or her earlier resignation or removal as provided in the Fund’s By-Laws.
87
{This page intentionally left blank}
88
{This page intentionally left blank}
89
Literature Requests
(unaudited)
Proxy Voting Policies and Procedures
A description of the policies and procedures that the Fund uses to determine how to vote proxies relating to portfolio securities is available, without charge, upon request:
| By phone | 1-800-466-3863 | |||
| On the Securities and Exchange | ||||
| Commission’s (SEC) web site | http://www.sec.gov |
Proxy Voting Record
Information regarding how the Fund voted proxies relating to portfolio securities during the most recent 12-month period ended June 30th is available, without charge, upon request:
| By phone | 1-800-466-3863 | |||
| On the SEC’s web site | http://www.sec.gov |
Quarterly Portfolio Holdings
The Series’ complete schedule of portfolio holdings for the 1st and 3rd quarters of each fiscal year are provided on Form N-Q, and are available, without charge, upon request:
| By phone | 1-800-466-3863 | |||
| On the SEC’s web site | http://www.sec.gov |
The Series’ Form N-Q may be reviewed and copied at the SEC’s Public Reference Room in Washington, D.C. Information on the operation of the Public Reference Room may be obtained by calling 1-800-SEC-0330.
Prospectus and Statement of Additional Information (SAI)
For more information about any of the Manning & Napier Fund, Inc. Series, you may obtain a prospectus and SAI at www.manning-napier.com or by calling (800) 466-3863. Before investing, carefully consider the objectives, risks, charges and expenses of the investment and read the prospectus carefully as it contains this and other information about the investment company. In addition, this information can be found on the SEC’s web site, http://www.sec.gov.
Additional information available at www.manning-napier.com
1. Fund Holdings - Month-End
2. Fund Holdings - Quarter-End
3. Shareholder Report - Annual
4. Shareholder Report - Semi-Annual
The Fund also offers electronic notification or “e-delivery” when certain documents are available on-line to be downloaded or reviewed. Direct shareholders can elect to receive electronic notification when shareholder reports, prospectus updates, and/or statements are available. If you do not currently have on-line access to your account, you can establish access by going to www.manning-napier.com, click on “Login” in the top corner of the page, and follow the prompts to self-enroll. Once enrolled, you can set your electronic notification preferences by clicking on the Account Options tab located within the green toolbar and then select E-Delivery Option. Should you have any questions on either how to establish on-line access or how to update your account settings, please contact Investor Services at 1-800-466-3863.
The Manning & Napier Fund, Inc. is managed by Manning & Napier Advisors, LLC. Manning & Napier Investor Services, Inc., an affiliate of Manning & Napier Advisors, LLC, is the distributor of the Fund shares.
MNTGT-10/17-AR

Disciplined Value Series
Management Discussion and Analysis
(unaudited)
Dear Shareholders:
Just one year ago, many investors were anticipating a widespread sell-off in domestic equity markets after Donald Trump won the election for the U.S. presidency. Not only did a sell-off fail to materialize, but equities actually moved sharply higher and remained on an upward trajectory throughout the year. The advance in equities was despite ongoing uncertainty surrounding policy implementation and how the new administration’s agenda might ultimately affect U.S. economic growth. For the year ended October 31, 2017, domestic equities were up 23.63%, as measured by the S&P 500 Index. International equities, as measured by the MSCI ACWI ex USA Index, also fared extraordinarily well, up 23.64%. Domestic investment-grade bonds, as measured by the Bloomberg Barclays U.S. Aggregate Bond Index, experienced relatively subdued performance, up 0.90%. Within fixed income, corporate bonds led, with high-yield securities in particular delivering very strong performance.
Much of the move upward in asset markets has been driven by stronger corporate earnings that materialized in early 2017 within both developed and emerging markets, supported by synchronized economic growth across all major global regions. Further, although Federal Reserve (Fed) policymakers continued gradually raising the target range for the federal funds rate and began reducing the Fed’s securities holdings, central bank policies across the globe have remained generally accommodative, providing an additional tailwind for asset prices.
Investors are undoubtedly enjoying the “Goldilocks” state of the economy: not too cold so as to usher in a recession, and not too hot so as to cause runaway inflation. Nonetheless, it is our view that market participants should temper their expectations going forward. The U.S. continues to move along in its economic cycle, and while it is not our view that we are on the cusp of a bear market, the status of our indicators suggest that we are certainly closer to the end of the current bull market than we are to the beginning. Complacency is elevated, there are significantly fewer pockets of cheap valuations remaining compared to the past several years, and U.S. valuations in particular limit upside potential, offering little support for asset prices should volatility in the financial markets materialize. This is surely not the time for investors to chase returns or take on unnecessary risk. Rather, it is our view that current market dynamics are consistent with rising risks that must be actively managed, and investors should maintain allocations consistent with their long-term investment objectives.
With this in mind, we discuss recent fund performance in the this report, highlight how we are positioned amid the current economic environment, and provide our outlook of what to expect in financial markets. We hope that you find this information helpful, and look forward to working with you in the years ahead to meet your investment goals.
Thank you for your continued confidence in us.
Sincerely,
Manning & Napier Advisors, LLC
The S&P 500 Total Return Index is an unmanaged, capitalization-weighted measure of 500 widely held common stocks listed on the New York Stock Exchange, American Stock Exchange, and the Over-the-Counter market. The Index returns assume daily reinvestment of dividends and do not reflect any fees or expenses. Index returns provided by Bloomberg. S&P Dow Jones Indices LLC, a subsidiary of the McGraw Hill Financial, Inc., is the publisher of various index based data products and services and has licensed certain of its products and services for use by Manning & Napier. All such content Copyright © 2017 by S&P Dow Jones Indices LLC and/or its affiliates. All rights reserved. Neither S&P Dow Jones Indices LLC, Dow Jones Trademark Holdings LLC, their affiliates nor their third party licensors make any representation or warranty, express or implied, as to the ability of any index to accurately represent the asset class or market sector that it purports to represent and none of these parties shall have any liability for any errors, omissions, or interruptions of any index or the data included therein.
The MSCI ACWI ex USA Index (ACWIxUS) is designed to measure large and mid-cap representation across 22 of 23 Developed Markets countries (excluding the U.S.) and 24 Emerging Markets countries. The Index returns do not reflect any fees or expenses. The Index is denominated in U.S. dollars. The Index returns are net of withholding taxes. They assume daily reinvestment of net dividends thus accounting for any applicable dividend taxation. Index returns provided by Bloomberg.
The Bloomberg Barclays U.S. Aggregate Bond Index is an unmanaged, market-value weighted index of U.S. domestic investment-grade debt issues, including government, corporate, asset-backed, and mortgage-backed securities, with maturities of one year or more. Index returns do not reflect any fees or expenses. Index returns provided by Interactive Data.
1
Disciplined Value Series
Fund Commentary
(unaudited)
| Investment | Objective |
To provide competitive returns consistent with the broad equity market while also providing a level of capital protection during market downturns. The Series is designed to offer a diversified portfolio of dividend-paying U.S. equity securities. Using a systematic process with a focus on mid- to large-capitalization U.S. companies, securities are selected based on factors such as free cash flow generation and earnings power, minimum dividend yield, dividend sustainability, and financial health.
| Performance | Commentary |
U.S. equity markets generally delivered positive absolute returns for the twelve-month period ended October 31, 2017, as the S&P 500 Index returned 23.63%. Value stocks underperformed growth stocks during the period as the Russell 1000 Value Index returned 17.78% while the Russell 1000 Growth Index returned 29.71%. The Disciplined Value Series outperformed the Russell 1000 Value Index as well as its blended benchmark over the period.
The Series’ sector allocations and stock selection are a product of the Strategy’s systematic screens, and both contributed to relative performance over the last twelve months, with selection contributing to a greater degree. In particular, the Series’ screening process had the most positive effect on relative performance within the Industrials sector, while selection was also strong in Healthcare. The Series’ underweight to Energy and overweight to Information Technology compared to the benchmark were the largest contributors to relative performance from a sector perspective.
Offsetting a portion of the relative performance tailwind were the Series’ underweight to Financials and overweight to Consumer Staples compared to the benchmark, which challenged relative returns. Selection within Information Technology also detracted from relative returns.
Within the Series, through our disciplined screening process, we pursue opportunities to generate stable income with the potential for capital appreciation. Importantly, our approach emphasizes risk management as a critical component in managing the Series. Despite today’s challenging slow economic growth environment, we believe that this approach can help our shareholders to achieve their long-term investment objectives.
As we begin the new fiscal year, broad-based earnings growth, accelerating business activity, and an improving global economic backdrop are supportive of domestic equity prices. However, as markets continue to advance, we believe it is important to express our view that investors should exercise caution and selectivity due to rising risks associated with elevated complacency, stretched valuations, and the inflection in monetary policy to less accommodative conditions. We believe these risk factors reinforce the need for a disciplined investment approach, as it will be critical to manage them going forward.
Please see the next page for additional performance information as of October 31, 2017.
Performance data quoted represents past performance and does not guarantee future results. The investment return and principal value of an investment will fluctuate, so that an investor’s shares, when redeemed, may be worth more or less than their original cost. Current performance may be higher or lower than that quoted; investors can obtain the most recent month-end performance at www.manning-napier.com or by calling (800) 466-3863.
All investments involve risks, including possible loss of principal. As with any stock fund, the value of your investment will fluctuate in response to stock market movements. Investing in the Series will also involve a number of other risks, including issuer-specific risk and mid-cap risk. The Series invests primarily in dividend-paying equity securities, with a focus on mid-to-large cap companies. There is no assurance or guarantee that such companies will declare, continue to pay, or increase dividends. Stocks of mid-cap companies tend to be more volatile than those of large-cap companies, as midcap companies tend to be more susceptible to adverse business or economic events than larger, more established companies. In addition, because the Advisor manages the Series using a disciplined screening process, the Series is subject to the additional risk that the investment approach may not be successful. Further, the Advisor does not intend to make frequent changes to the Series’ portfolio in response to market movements.
The Russell 1000® Growth Index is an unmanaged, market capitalization-weighted index consisting of those Russell 1000® Index companies with higher price-to-book ratios and higher forecasted growth values. The Index returns are based on a market capitalization-weighted average of relative price changes of the component stocks plus dividends whose reinvestments are compounded daily. The Index returns do not reflect any fees or expenses. Index returns provided by Bloomberg.
2
Disciplined Value Series
Performance Update as of October 31, 2017
(unaudited)
AVERAGE ANNUAL TOTAL RETURNS AS OF OCTOBER 31, 2017 | ||||||
| ONE YEAR1 | FIVE YEAR | SINCE INCEPTION2 | ||||
Manning & Napier Fund, Inc. - Disciplined Value Series - Class I3 | 21.86% | 13.00% | 12.81% | |||
Manning & Napier Fund, Inc. - Disciplined Value Series - Class S3,4 | 21.52% | 12.70% | 12.51% | |||
Russell 1000® Value Index5 | 17.78% | 13.48% | 12.78% | |||
75/25 Blended Index6 | 18.83% | 11.67% | 11.55% | |||
The following graph compares the value of a $1,000,000 investment in the Manning & Napier Fund, Inc. - Disciplined Value Series - Class I from its inception2 (November 7, 2008) to present (October 31, 2017) to the Russell 1000® Value Index and 75/25 Blended Index.
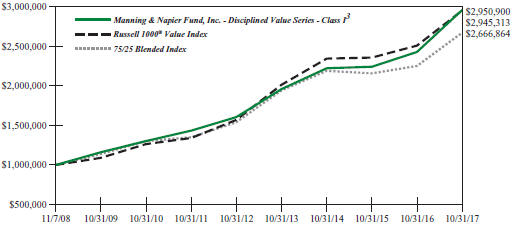
1The returns shown are based on net asset values calculated for shareholder transactions and may differ from the returns shown in the financial highlights, which reflect adjustments made to the net asset values in accordance with accounting principles generally accepted in the United States of America.
2Performance numbers for the Series and Index are calculated from November 7, 2008, the Series’ Class I inception date.
3The Series’ performance does not reflect the deduction of taxes that a shareholder would pay on fund distributions or the redemption of shares. The Series’ performance is historical and may not be indicative of future results. The performance returns shown are inclusive of the net expense ratio of the Series. For the year ended October 31, 2017, the net expense ratio was 0.82% for Class S and 0.57% for Class I. The annualized gross expense ratio, which does not account for any voluntary or contractual waivers currently in effect, was 0.82% for Class S and 0.57% for Class I for the year ended October 31, 2017.
4For periods through March 1, 2012 (the inception date of the Class S shares), performance for the Class S shares is hypothetical and is based on the historical performance of the Class I shares adjusted for the Class S shares’ charges and expenses.
5The Russell 1000® Value Index is an unmanaged, market capitalization-weighted index consisting of those Russell 1000® companies with lower price-to-book ratios and lower forecasted growth values. The Index returns are based on a market capitalization-weighted average of relative price changes of the component stocks plus dividends whose reinvestments are compounded daily. The Index returns do not reflect any fees or expenses. Index returns provided by Bloomberg.
6The 75/25 Blended Index is 75% Russell 1000® Value and 25% S&P ADR Index (S&P ADR). S&P ADR is an unmanaged, capitalization-weighted measure of non-U.S. companies within the S&P Global 1200 Index which are listed as Level I or Level II ADRs, or ordinary shares in the U.S. The S&P Global 1200 Index is designed to measure the performance of the global equity market and is a composite of seven headline indices provided by S&P. The Index returns assume daily reinvestment of dividends. Index returns provided by Bloomberg. S&P Dow Jones Indices LLC, a subsidiary of the McGraw Hill Financial, Inc., is the publisher of various index based data products and services and has licensed certain of its products and services for use by Manning & Napier. All such content Copyright © 2016 by S&P Dow Jones Indices LLC and/or its affiliates. All rights
3
Disciplined Value Series
Performance Update as of October 31, 2017
(unaudited)
reserved. Neither S&P Dow Jones Indices LLC, Dow Jones Trademark Holdings LLC, their affiliates nor their third party licensors make any representation or warranty, express or implied, as to the ability of any index to accurately represent the asset class or market sector that it purports to represent and none of these parties shall have any liability for any errors, omissions, or interruptions of any index or the data included therein. The returns of the indices do not reflect any fees or expenses. Returns provided are calculated monthly using a blended allocation. Because the fund’s asset allocation will vary over time, the composition of the fund’s portfolio may not match the composition of the comparative indices.
4
Disciplined Value Series
Shareholder Expense Example
(unaudited)
As a shareholder of the Series, you incur ongoing costs, including management fees, shareholder service fees and other Series expenses. This example is intended to help you understand your ongoing costs (in dollars) of investing in the Series and to compare these costs with the ongoing costs of investing in other mutual funds.
The example is based on an investment of $1,000 invested in each class at the beginning of the period and held for the entire period (May 1, 2017 to October 31, 2017).
Actual Expenses
The Actual lines of the table below provide information about actual account values and actual expenses. You may use the information in this line, together with the amount you invested, to estimate the expenses that you paid over the period. Simply divide your account value by $1,000 (for example, an $8,600 account value divided by $1,000 = 8.6), then multiply the result by the number in the Actual line for the Class in which you have invested under the heading entitled “Expenses Paid During Period” to estimate the expenses you paid on your account during this period.
Hypothetical Example for Comparison Purposes
The Hypothetical lines of each Class in the table below provide information about hypothetical account values and hypothetical expenses based on the Class’ actual expense ratio and an assumed rate of return of 5% per year before expenses, which is not the Class’ actual return. The hypothetical account values and expenses may not be used to estimate the actual ending account balance or expenses you paid during the period. You may use this information to compare the ongoing costs of investing in a class of the Series and other funds. To do so, compare this 5% hypothetical example for the Class in which you have invested with the 5% hypothetical examples that appear in the shareholder reports of the other funds.
Please note that the expenses shown in the table are meant to highlight your ongoing costs only and do not reflect any transaction costs, such as sales charges (loads), redemption fees, or exchange fees that you may incur in other mutual funds. Therefore, the second line of the table is useful in comparing ongoing costs only, and will not help you determine the relative total costs of owning different funds.
| BEGINNING ACCOUNT VALUE 5/1/17 | ENDING ACCOUNT VALUE 10/31/17 | EXPENSES PAID DURING PERIOD* 5/1/17-10/31/17 | ANNUALIZED EXPENSE RATIO | |||||||||||||
Class S | ||||||||||||||||
Actual | $1,000.00 | $1,082.40 | $4.30 | 0.82% | ||||||||||||
Hypothetical (5% return before expenses) | $1,000.00 | $1,021.07 | $4.18 | 0.82% | ||||||||||||
Class I | ||||||||||||||||
Actual | $1,000.00 | $1,083.70 | $2.99 | 0.57% | ||||||||||||
Hypothetical (5% return before expenses) | $1,000.00 | $1,022.33 | $2.91 | 0.57% | ||||||||||||
*Expenses are equal to each Class’ annualized expense ratio (for the six-month period), multiplied by the average account value over the period, multiplied by 184/365 (to reflect the one-half year period). Expenses are based on the most recent fiscal half year: therefore, the expense ratios stated above may differ from the expense ratios stated in the financial highlights, which are based on one-year data.
5
Disciplined Value Series
Portfolio Composition as of October 31, 2017
(unaudited)
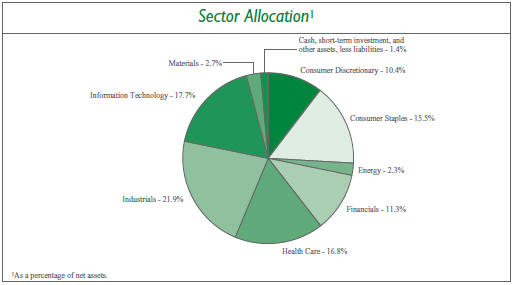
6
Disciplined Value Series
Investment Portfolio - October 31, 2017
| SHARES | VALUE (NOTE 2) | |||||||
COMMON STOCKS - 98.6% | ||||||||
Consumer Discretionary - 10.4% | ||||||||
Automobiles - 0.4% | ||||||||
Harley-Davidson, Inc. | 11,833 | $ | 560,174 | |||||
|
| |||||||
Distributors - 0.5% | ||||||||
Genuine Parts Co. | 8,822 | 778,365 | ||||||
|
| |||||||
Hotels, Restaurants & Leisure - 2.4% | ||||||||
Darden Restaurants, Inc. | 6,689 | 550,304 | ||||||
McDonald’s Corp. | 17,728 | 2,958,980 | ||||||
|
| |||||||
| 3,509,284 | ||||||||
|
| |||||||
Household Durables - 0.4% | ||||||||
Whirlpool Corp. | 3,553 | 582,443 | ||||||
|
| |||||||
Leisure Products - 0.4% | ||||||||
Hasbro, Inc. | 6,537 | 605,261 | ||||||
|
| |||||||
Multiline Retail - 1.7% | ||||||||
Kohl’s Corp. | 18,646 | 778,657 | ||||||
Macy’s, Inc. | 20,176 | 378,502 | ||||||
Target Corp. | 23,396 | 1,381,300 | ||||||
|
| |||||||
| 2,538,459 | ||||||||
|
| |||||||
Specialty Retail - 3.9% | ||||||||
Best Buy Co., Inc. | 10,879 | 609,006 | ||||||
The Gap, Inc. | 23,979 | 623,214 | ||||||
The Home Depot, Inc. | 27,207 | 4,510,376 | ||||||
|
| |||||||
| 5,742,596 | ||||||||
|
| |||||||
Textiles, Apparel & Luxury Goods - 0.7% | ||||||||
VF Corp. | 15,960 | 1,111,614 | ||||||
|
| |||||||
Total Consumer Discretionary | 15,428,196 | |||||||
|
| |||||||
Consumer Staples - 15.5% | ||||||||
Beverages - 3.5% | ||||||||
Dr. Pepper Snapple Group, Inc. | 9,485 | 812,485 | ||||||
PepsiCo, Inc. | 39,253 | 4,326,858 | ||||||
|
| |||||||
| 5,139,343 | ||||||||
|
| |||||||
Food & Staples Retailing - 6.0% | ||||||||
CVS Health Corp. | 27,037 | 1,852,846 | ||||||
Sysco Corp. | 22,339 | 1,242,495 | ||||||
Wal-Mart Stores, Inc. | 67,393 | 5,884,083 | ||||||
|
| |||||||
| 8,979,424 | ||||||||
|
| |||||||
Food Products - 3.1% | ||||||||
Archer-Daniels-Midland Co. | 23,829 | 973,891 | ||||||
Campbell Soup Co. | 13,831 | 655,174 | ||||||
General Mills, Inc. | 24,737 | 1,284,345 | ||||||
The accompanying notes are an integral part of the financial statements.
7
Disciplined Value Series
Investment Portfolio - October 31, 2017
| VALUE | ||||||||
| SHARES | (NOTE 2) | |||||||
COMMON STOCKS (continued) | ||||||||
Consumer Staples (continued) | ||||||||
Food Products (continued) | ||||||||
The Hershey Co. | 8,779 | $ | 932,154 | |||||
The J.M. Smucker Co. | 6,463 | 685,401 | ||||||
|
| |||||||
| 4,530,965 | ||||||||
|
| |||||||
Household Products - 2.9% | ||||||||
The Clorox Co. | 6,503 | 822,825 | ||||||
Colgate-Palmolive Co. | 29,017 | 2,044,248 | ||||||
Kimberly-Clark Corp. | 13,257 | 1,491,545 | ||||||
|
| |||||||
| 4,358,618 | ||||||||
|
| |||||||
Total Consumer Staples | 23,008,350 | |||||||
|
| |||||||
Energy - 2.3% | ||||||||
Oil, Gas & Consumable Fuels - 2.3% | ||||||||
Andeavor | 6,488 | 689,285 | ||||||
Marathon Petroleum Corp. | 21,196 | 1,266,249 | ||||||
Valero Energy Corp. | 18,640 | 1,470,510 | ||||||
|
| |||||||
Total Energy | 3,426,044 | |||||||
|
| |||||||
Financials - 11.3% | ||||||||
Banks - 11.3% | ||||||||
BB&T Corp. | 31,075 | 1,530,133 | ||||||
Fifth Third Bancorp | 36,881 | 1,065,861 | ||||||
JPMorgan Chase & Co. | 58,469 | 5,882,566 | ||||||
U.S. Bancorp | 48,710 | 2,648,850 | ||||||
Wells Fargo & Co. | 100,294 | 5,630,505 | ||||||
|
| |||||||
Total Financials | 16,757,915 | |||||||
|
| |||||||
Health Care - 16.8% | ||||||||
Biotechnology - 6.0% | ||||||||
AbbVie, Inc. | 36,521 | 3,296,020 | ||||||
Amgen, Inc. | 18,299 | 3,206,351 | ||||||
Gilead Sciences, Inc. | 32,582 | 2,442,347 | ||||||
|
| |||||||
| 8,944,718 | ||||||||
|
| |||||||
Health Care Providers & Services - 0.6% | ||||||||
Cardinal Health, Inc. | 14,594 | 903,369 | ||||||
|
| |||||||
Pharmaceuticals - 10.2% | ||||||||
Johnson & Johnson | 42,844 | 5,972,882 | ||||||
Merck & Co., Inc. | 79,854 | 4,399,157 | ||||||
Pfizer, Inc. | 135,150 | 4,738,359 | ||||||
|
| |||||||
| 15,110,398 | ||||||||
|
| |||||||
Total Health Care | 24,958,485 | |||||||
|
| |||||||
The accompanying notes are an integral part of the financial statements.
8
Disciplined Value Series
Investment Portfolio - October 31, 2017
| VALUE | ||||||||
| SHARES | (NOTE 2) | |||||||
COMMON STOCKS (continued) | ||||||||
Industrials - 21.9% | ||||||||
Aerospace & Defense - 7.2% | ||||||||
The Boeing Co. | 14,338 | $ | 3,698,917 | |||||
Lockheed Martin Corp. | 8,248 | 2,541,704 | ||||||
Raytheon Co. | 10,663 | 1,921,473 | ||||||
United Technologies Corp. | 21,355 | 2,557,475 | ||||||
|
| |||||||
| 10,719,569 | ||||||||
|
| |||||||
Air Freight & Logistics - 2.4% | ||||||||
C.H. Robinson Worldwide, Inc. | 7,946 | 623,999 | ||||||
United Parcel Service, Inc. - Class B | 25,324 | 2,976,330 | ||||||
|
| |||||||
| 3,600,329 | ||||||||
|
| |||||||
Commercial Services & Supplies - 1.7% | ||||||||
Republic Services, Inc. | 14,480 | 942,214 | ||||||
Waste Management, Inc. | 19,105 | 1,569,858 | ||||||
|
| |||||||
| 2,512,072 | ||||||||
|
| |||||||
Electrical Equipment - 2.1% | ||||||||
Eaton Corp. plc | 18,548 | 1,484,211 | ||||||
Emerson Electric Co. | 25,416 | 1,638,315 | ||||||
|
| |||||||
| 3,122,526 | ||||||||
|
| |||||||
Industrial Conglomerates - 4.3% | ||||||||
3M Co. | 16,095 | 3,704,908 | ||||||
Honeywell International, Inc. | 18,282 | 2,635,533 | ||||||
|
| |||||||
| 6,340,441 | ||||||||
|
| |||||||
Machinery - 1.3% | ||||||||
Cummins, Inc. | 7,052 | 1,247,358 | ||||||
Dover Corp. | 7,806 | 745,395 | ||||||
|
| |||||||
| 1,992,753 | ||||||||
|
| |||||||
Road & Rail - 1.9% | ||||||||
Union Pacific Corp. | 23,917 | 2,769,349 | ||||||
|
| |||||||
Trading Companies & Distributors - 1.0% | ||||||||
Fastenal Co. | 17,607 | 827,001 | ||||||
W.W. Grainger, Inc. | 3,033 | 599,624 | ||||||
|
| |||||||
| 1,426,625 | ||||||||
|
| |||||||
Total Industrials | 32,483,664 | |||||||
|
| |||||||
Information Technology - 17.7% | ||||||||
Communications Equipment - 3.6% | ||||||||
Cisco Systems, Inc. | 136,313 | 4,655,089 | ||||||
Motorola Solutions, Inc. | 7,686 | 695,890 | ||||||
|
| |||||||
| 5,350,979 | ||||||||
|
| |||||||
The accompanying notes are an integral part of the financial statements.
9
Disciplined Value Series
Investment Portfolio - October 31, 2017
| VALUE | ||||||||
| SHARES | (NOTE 2) | |||||||
COMMON STOCKS (continued) | ||||||||
Information Technology (continued) | ||||||||
Electronic Equipment, Instruments & Components - 0.7% | ||||||||
Corning, Inc. | 34,201 | $ | 1,070,833 | |||||
|
| |||||||
IT Services - 4.3% | ||||||||
Automatic Data Processing, Inc. | 16,161 | 1,878,878 | ||||||
International Business Machines Corp. | 22,364 | 3,445,398 | ||||||
Paychex, Inc. | 16,065 | 1,024,786 | ||||||
|
| |||||||
| 6,349,062 | ||||||||
|
| |||||||
Semiconductors & Semiconductor Equipment - 7.5% | ||||||||
Intel Corp. | 117,073 | 5,325,651 | ||||||
KLA-Tencor Corp. | 6,530 | 711,052 | ||||||
QUALCOMM, Inc. | 42,554 | 2,170,680 | ||||||
Texas Instruments, Inc. | 29,159 | 2,819,384 | ||||||
|
| |||||||
| 11,026,767 | ||||||||
|
| |||||||
Software - 0.5% | ||||||||
CA, Inc. | 22,796 | 738,134 | ||||||
|
| |||||||
Technology Hardware, Storage & Peripherals - 1.1% | ||||||||
Western Digital Corp. | 12,281 | 1,096,325 | ||||||
Xerox Corp. | 17,626 | 534,244 | ||||||
|
| |||||||
| 1,630,569 | ||||||||
|
| |||||||
Total Information Technology | 26,166,344 | |||||||
|
| |||||||
Materials - 2.7% | ||||||||
Chemicals - 1.7% | ||||||||
Eastman Chemical Co. | 7,620 | 691,972 | ||||||
LyondellBasell Industries N.V. - Class A | 17,181 | 1,778,749 | ||||||
|
| |||||||
| 2,470,721 | ||||||||
|
| |||||||
Containers & Packaging - 0.4% | ||||||||
Packaging Corp. of America | 4,809 | 559,142 | ||||||
|
| |||||||
Metals & Mining - 0.6% | ||||||||
Nucor Corp. | 15,326 | 886,303 | ||||||
|
| |||||||
Total Materials | 3,916,166 | |||||||
|
| |||||||
TOTAL COMMON STOCKS | ||||||||
(Identified Cost $122,733,777) | 146,145,164 | |||||||
|
| |||||||
The accompanying notes are an integral part of the financial statements.
10
Disciplined Value Series
Investment Portfolio - October 31, 2017
| VALUE | ||||||||
| SHARES | (NOTE 2) | |||||||
SHORT-TERM INVESTMENT - 1.4% | ||||||||
Dreyfus Government Cash Management1, 0.93% | ||||||||
(Identified Cost $ 2,123,173) | 2,123,173 | $ | 2,123,173 | |||||
|
| |||||||
TOTAL INVESTMENTS - 100.0% | ||||||||
(Identified Cost $ 124,856,950) | 148,268,337 | |||||||
OTHER ASSETS, LESS LIABILITIES - 0.0%* | 28,132 | |||||||
|
| |||||||
NET ASSETS - 100% | $ | 148,296,469 | ||||||
|
| |||||||
*Less than 0.1%.
1Rate shown is the current yield as of October 31, 2017.
The Global Industry Classification Standard (GICS) was developed by and is the exclusive property and a service mark of MSCI Inc. (MSCI) and Standard & Poor’s, a division of The McGraw-Hill Companies, Inc. (S&P), and is licensed for use by Manning & Napier when referencing GICS sectors. Neither MSCI, S&P, nor any third party involved in making or compiling the GICS or any GICS classifications makes any express or implied warranties or representations with respect to such standard or classification, nor shall any such party have any liability therefrom.
The accompanying notes are an integral part of the financial statements.
11
Disciplined Value Series
Statement of Assets and Liabilities
October 31, 2017
| ASSETS: | ||||
Investments, at value (identified cost $124,856,950) (Note 2) | $ | 148,268,337 | ||
Dividends receivable | 122,259 | |||
Receivable for fund shares sold | 105,006 | |||
Foreign tax reclaims receivable | 62,964 | |||
Prepaid and other expenses | 13,090 | |||
|
| |||
TOTAL ASSETS | 148,571,656 | |||
|
| |||
LIABILITIES: | ||||
Accrued management fees (Note 3) | 58,285 | |||
Accrued fund accounting and administration fees (Note 3) | 18,503 | |||
Accrued shareholder services fees (Class S) (Note 3) | 6,401 | |||
Accrued Chief Compliance Officer service fees (Note 3) | 306 | |||
Payable for fund shares repurchased | 148,068 | |||
Audit fees payable | 21,945 | |||
Other payables and accrued expenses | 21,679 | |||
|
| |||
TOTAL LIABILITIES | 275,187 | |||
|
| |||
TOTAL NET ASSETS | $ | 148,296,469 | ||
|
| |||
NET ASSETS CONSIST OF: | ||||
Capital stock | $ | 97,096 | ||
Additional paid-in-capital | 103,250,151 | |||
Undistributed net investment income | 374,233 | |||
Accumulated net realized gain on investments | 21,163,602 | |||
Net unrealized appreciation on investments | 23,411,387 | |||
|
| |||
TOTAL NET ASSETS | $ | 148,296,469 | ||
|
| |||
NET ASSET VALUE, OFFERING PRICE AND REDEMPTION PRICE PER SHARE - Class S | ||||
($30,939,813/2,708,080 shares) | $ | 11.42 | ||
|
| |||
NET ASSET VALUE, OFFERING PRICE AND REDEMPTION PRICE PER SHARE - Class I | ||||
($117,356,656/7,001,557 shares) | $ | 16.76 | ||
|
| |||
The accompanying notes are an integral part of the financial statements.
12
Disciplined Value Series
Statement of Operations
For the Year Ended October 31, 2017
INVESTMENT INCOME: | ||||
Dividends (net of foreign taxes withheld, $4,780) | $ | 4,725,612 | ||
|
| |||
EXPENSES: | ||||
Management fees (Note 3) | 761,176 | |||
Shareholder services fees (Class S)(Note 3) | 63,977 | |||
Fund accounting and administration fees (Note 3) | 54,923 | |||
Transfer agent fees (Note 3) | 19,048 | |||
Directors’ fees (Note 3) | 11,137 | |||
Chief Compliance Officer service fees (Note 3) | 3,912 | |||
Custodian fees | 9,860 | |||
Miscellaneous | 96,433 | |||
|
| |||
Total Expenses | 1,020,466 | |||
|
| |||
NET INVESTMENT INCOME | 3,705,146 | |||
|
| |||
REALIZED AND UNREALIZED GAIN (LOSS) ON INVESTMENTS: | ||||
Net realized gain (loss) on investments | 25,969,874 | |||
Net change in unrealized appreciation (depreciation) on investments | 3,802,331 | |||
|
| |||
NET REALIZED AND UNREALIZED GAIN (LOSS) ON INVESTMENTS | 29,772,205 | |||
|
| |||
NET INCREASE IN NET ASSETS RESULTING FROM OPERATIONS | $ | 33,477,351 | ||
|
| |||
The accompanying notes are an integral part of the financial statements.
13
Disciplined Value Series
Statements of Changes in Net Assets
FOR THE YEAR ENDED | FOR THE YEAR ENDED | |||||||
INCREASE (DECREASE) IN NET ASSETS: | ||||||||
OPERATIONS: | ||||||||
Net investment income | $ | 3,705,146 | $ | 4,023,406 | ||||
Net realized gain (loss) on investments | 25,969,874 | 5,452,900 | ||||||
Net change in unrealized appreciation (depreciation) on investments | 3,802,331 | 3,486,139 | ||||||
|
|
|
| |||||
Net increase from operations | 33,477,351 | 12,962,445 | ||||||
|
|
|
| |||||
DISTRIBUTIONS TO SHAREHOLDERS (Note 7): | ||||||||
From net investment income (Class S) | (747,820 | ) | (428,816 | ) | ||||
From net investment income (Class I) | (3,303,961 | ) | (3,516,142 | ) | ||||
From net realized gain on investments (Class S) | (892,572 | ) | (2,478,979 | ) | ||||
From net realized gain on investments (Class I) | (4,593,947 | ) | (18,818,161 | ) | ||||
|
|
|
| |||||
Total distributions to shareholders | (9,538,300 | ) | (25,242,098 | ) | ||||
|
|
|
| |||||
CAPITAL STOCK ISSUED AND REPURCHASED: | ||||||||
Net increase (decrease) from capital share transactions (Note 5) | (43,416,296 | ) | 3,583,814 | |||||
|
|
|
| |||||
Net decrease in net assets | (19,477,245 | ) | (8,695,839 | ) | ||||
NET ASSETS: | ||||||||
Beginning of year | 167,773,714 | 176,469,553 | ||||||
|
|
|
| |||||
End of year (including undistributed net investment income of $374,233 and $800,366, respectively) | $ | 148,296,469 | $ | 167,773,714 | ||||
|
|
|
| |||||
The accompanying notes are an integral part of the financial statements.
14
Disciplined Value Series
Financial Highlights - Class S
| FOR THE YEAR ENDED | ||||||||||||||||||||
| 10/31/17 | 10/31/16 | 10/31/15 | 10/31/14 | 10/31/13 | ||||||||||||||||
Per share data (for a share outstanding throughout each year): | ||||||||||||||||||||
Net asset value - Beginning of year | $ | 10.16 | $ | 11.64 | $ | 12.75 | $ | 11.88 | $ | 10.14 | ||||||||||
|
|
|
|
|
|
|
|
|
| |||||||||||
Income from investment operations: | ||||||||||||||||||||
Net investment income1 | 0.20 | 0.22 | 0.26 | 0.26 | 0.26 | |||||||||||||||
Net realized and unrealized gain (loss) on investments | 1.89 | 0.53 | (0.21 | ) | 1.25 | 1.89 | ||||||||||||||
|
|
|
|
|
|
|
|
|
| |||||||||||
Total from investment operations | 2.09 | 0.75 | 0.05 | 1.51 | 2.15 | |||||||||||||||
|
|
|
|
|
|
|
|
|
| |||||||||||
Less distributions to shareholders: | ||||||||||||||||||||
From net investment income | (0.33 | ) | (0.32 | ) | (0.36 | ) | (0.34 | ) | (0.35 | ) | ||||||||||
From net realized gain on investments | (0.50 | ) | (1.91 | ) | (0.80 | ) | (0.30 | ) | (0.06 | ) | ||||||||||
|
|
|
|
|
|
|
|
|
| |||||||||||
Total distributions to shareholders | (0.83 | ) | (2.23 | ) | (1.16 | ) | (0.64 | ) | (0.41 | ) | ||||||||||
|
|
|
|
|
|
|
|
|
| |||||||||||
Net asset value - End of year | $ | 11.42 | $ | 10.16 | $ | 11.64 | $ | 12.75 | $ | 11.88 | ||||||||||
|
|
|
|
|
|
|
|
|
| |||||||||||
Net assets - End of year (000’s omitted) | $ | 30,940 | $ | 15,022 | $ | 15,471 | $ | 13,716 | $ | 10,667 | ||||||||||
|
|
|
|
|
|
|
|
|
| |||||||||||
Total return2 | 21.52 | % | 7.99 | % | 0.63 | % | 13.12 | % | 21.70 | % | ||||||||||
Ratios (to average net assets)/Supplemental Data: | ||||||||||||||||||||
Expenses | 0.82 | % | 0.82 | % | 0.79 | % | 0.79 | % | 0.81 | % | ||||||||||
Net investment income | 1.91 | % | 2.19 | % | 2.14 | % | 2.11 | % | 2.31 | % | ||||||||||
Portfolio turnover | 34 | % | 39 | % | 49 | % | 23 | % | 19 | % | ||||||||||
1Calculated based on average shares outstanding during the years.
2Represents aggregate total return for the years indicated, and assumes reinvestment of all distributions.
The accompanying notes are an integral part of the financial statements.
15
Disciplined Value Series
Financial Highlights - Class I
| FOR THE YEAR ENDED | ||||||||||||||||||||
| 10/31/17 | 10/31/16 | 10/31/15 | 10/31/14 | 10/31/13 | ||||||||||||||||
Per share data (for a share outstanding throughout each year): | ||||||||||||||||||||
Net asset value - Beginning of year | $ | 14.54 | $ | 15.69 | $ | 16.76 | $ | 15.41 | $ | 13.03 | ||||||||||
|
|
|
|
|
|
|
|
|
| |||||||||||
Income from investment operations: | ||||||||||||||||||||
Net investment income1 | 0.35 | 0.35 | 0.39 | 0.38 | 0.37 | |||||||||||||||
Net realized and unrealized gain (loss) on investments | 2.73 | 0.75 | (0.27 | ) | 1.64 | 2.45 | ||||||||||||||
|
|
|
|
|
|
|
|
|
| |||||||||||
Total from investment operations | 3.08 | 1.10 | 0.12 | 2.02 | 2.82 | |||||||||||||||
|
|
|
|
|
|
|
|
|
| |||||||||||
Less distributions to shareholders: | ||||||||||||||||||||
From net investment income | (0.36 | ) | (0.34 | ) | (0.39 | ) | (0.37 | ) | (0.38 | ) | ||||||||||
From net realized gain on investments | (0.50 | ) | (1.91 | ) | (0.80 | ) | (0.30 | ) | (0.06 | ) | ||||||||||
|
|
|
|
|
|
|
|
|
| |||||||||||
Total distributions to shareholders | (0.86 | ) | (2.25 | ) | (1.19 | ) | (0.67 | ) | (0.44 | ) | ||||||||||
|
|
|
|
|
|
|
|
|
| |||||||||||
Net asset value - End of year | $ | 16.76 | $ | 14.54 | $ | 15.69 | $ | 16.76 | $ | 15.41 | ||||||||||
|
|
|
|
|
|
|
|
|
| |||||||||||
Net assets - End of year (000’s omitted) | $ | 117,357 | $ | 152,751 | $ | 160,999 | $ | 191,337 | $ | 158,989 | ||||||||||
|
|
|
|
|
|
|
|
|
| |||||||||||
Total return2 | 21.86 | % | 8.24 | % | 0.91 | % | 13.44 | % | 22.02 | % | ||||||||||
Ratios (to average net assets)/Supplemental Data: | ||||||||||||||||||||
Expenses | 0.57 | % | 0.57 | % | 0.54 | % | 0.54 | % | 0.56 | % | ||||||||||
Net investment income | 2.24 | % | 2.46 | % | 2.44 | % | 2.38 | % | 2.63 | % | ||||||||||
Portfolio turnover | 34 | % | 39 | % | 49 | % | 23 | % | 19 | % | ||||||||||
1Calculated based on average shares outstanding during the years.
2Represents aggregate total return for the years indicated, and assumes reinvestment of all distributions.
The accompanying notes are an integral part of the financial statements.
16
Disciplined Value Series
Notes to Financial Statements
| 1. | Organization |
Disciplined Value Series (the “Series”) is a no-load diversified series of Manning & Napier Fund, Inc. (the “Fund”). The Fund is organized in Maryland and is registered under the Investment Company Act of 1940, as amended, as an open-end management investment company.
The Series’ investment objective is to provide competitive returns consistent with the broad equity market while providing a level of capital protection during market downturns.
The Fund’s Advisor is Manning & Napier Advisors, LLC (the “Advisor”). Shares of the Series are offered to investors, clients and employees of the Advisor and its affiliates. The total authorized capital stock of the Fund consists of 15 billion shares of common stock each having a par value of $0.01. As of October 31, 2017, 10.6 billion shares have been designated in total among 39 series, of which 100 million have been designated as Disciplined Value Series Class I common stock and 100 million have been designated as Disciplined Value Series Class S common stock.
| 2. | Significant Accounting Policies |
The following is a summary of significant accounting policies followed by the Series. The Series is an investment company and, accordingly, follows the investment company accounting and reporting guidance of the Financial Accounting Standards Board Accounting Standards Codification Topic 946 - Investment Companies, which is part of accounting principles generally accepted in the United States of America (“GAAP”).
Security Valuation
Portfolio securities, including domestic equities, foreign equities, warrants and options, listed on an exchange other than the NASDAQ Stock Market are valued at the latest quoted sales price of the exchange on which the security is primarily traded. Securities not traded on valuation date or securities not listed on an exchange are valued at the latest quoted bid price provided by the Fund’s pricing service. Securities listed on the NASDAQ Stock Market are valued in accordance with the NASDAQ Official Closing Price.
Short-term investments that mature in sixty days or less may be valued at amortized cost, which approximates fair value. Investments in open-end investment companies are valued at their net asset value per share on valuation date.
Volume and level of activity in established markets for an asset or liability are evaluated to determine whether recent transactions and quoted prices are determinative of fair value. Where there have been significant decreases in volume and level of activity, further analysis and adjustment may be necessary to estimate fair value. The Series measures fair value in these instances by the use of inputs and valuation techniques which may be based upon current market prices of securities that are comparable in coupon, rating, maturity and industry and/or expectation of future cash flows. As a result of trading in relatively thin markets and/or markets that experience significant volatility, the prices used by the Series to value these securities may differ from the value that would be realized if these securities were sold, and the differences could be material.
Securities for which representative valuations or prices are not available from the Series’ pricing service may be valued at fair value as determined in good faith by the Advisor under procedures approved by and under the general supervision and responsibility of the Fund’s Board of Directors (the “Board”). Due to the inherent uncertainty of valuations of such securities, the fair value may differ significantly from the values that would have been used had a ready market for such securities existed. If trading or events occurring after the close of the principal market in which securities are traded are expected to materially affect the value of those securities, then they may be valued at their fair value, taking this trading or these events into account.
Various inputs are used in determining the value of the Series’ assets or liabilities carried at fair value. These inputs are summarized in three broad levels. Level 1 includes quoted prices in active markets for identical assets and liabilities. Level 2 includes other significant observable inputs (including quoted prices for similar securities, interest rates, prepayment speeds, credit risk, etc.). Level 3 includes significant unobservable inputs (including the Series’ own assumptions in determining the fair value of investments). A financial instrument’s level within the fair value hierarchy is based on the lowest level of any input both
17
Disciplined Value Series
Notes to Financial Statements (continued)
| 2. | Significant Accounting Policies (continued) |
Security Valuation (continued)
individually and in aggregate that is significant to the fair value measurement. The inputs or methodology used for valuing securities are not necessarily an indication of the risk associated with investing in those securities.
The following is a summary of the valuation levels used for major security types as of October 31, 2017 in valuing the Series’ assets or liabilities carried at fair value:
| DESCRIPTION | TOTAL | LEVEL 1 | LEVEL 2 | LEVEL 3 | ||||||||||||
Assets: | ||||||||||||||||
Equity securities: | ||||||||||||||||
Consumer Discretionary | $ | 15,428,196 | $ | 15,428,196 | $ | — | $ | — | ||||||||
Consumer Staples | 23,008,350 | 23,008,350 | — | — | ||||||||||||
Energy | 3,426,044 | 3,426,044 | — | — | ||||||||||||
Financials | 16,757,915 | 16,757,915 | — | — | ||||||||||||
Health Care | 24,958,485 | 24,958,485 | — | — | ||||||||||||
Industrials | 32,483,664 | 32,483,664 | — | — | ||||||||||||
Information Technology | 26,166,344 | 26,166,344 | — | — | ||||||||||||
Materials | 3,916,166 | 3,916,166 | — | — | ||||||||||||
Mutual Fund | 2,123,173 | 2,123,173 | — | — | ||||||||||||
|
|
|
|
|
|
|
| |||||||||
Total assets | $ | 148,268,337 | $ | 148,268,337 | $ | — | $ | — | ||||||||
|
|
|
|
|
|
|
| |||||||||
There were no Level 2 or Level 3 securities held by the Series as of October 31, 2016 or October 31, 2017.
The Fund’s policy is to recognize transfers in and transfers out of the valuation levels as of the beginning of the reporting period. There were no transfers between Level 1 and Level 2 during the year ended October 31, 2017.
New Accounting Guidance
On August 1, 2017, the Fund implemented amendments to Regulation S-X, issued by the Securities and Exchange Commission, which require standardized, enhanced disclosures, particularly related to derivatives, in investment company financial statements. Adoption had no effect on the Fund’s net assets or results of operations.
Security Transactions, Investment Income and Expenses
Security transactions are accounted for on trade date. Dividend income is recorded on the ex-dividend date, except that if the ex-dividend date has passed, certain dividends from foreign securities are recorded as soon as the Series is informed of the ex-dividend date. Non-cash dividends, if any, are recorded at the fair value of the securities received. Interest income, including amortization of premium and accretion of discounts using the effective interest method, is earned from settlement date and accrued daily.
Expenses are recorded on an accrual basis. Most expenses of the Fund can be attributed to a specific series. Expenses which cannot be directly attributed are apportioned among the series in the Fund in such a manner as deemed equitable by the Fund’s Board, taking into consideration, among other things, the nature and type of expense. Income, expenses (other than class specific expenses), and realized and unrealized gains and losses are prorated among the classes based on the relative net assets of each class. Class specific expenses are directly charged to that class.
The Series uses the identified cost method for determining realized gain or loss on investments for both financial statement and federal income tax reporting purposes.
Federal Taxes
The Series’ policy is to comply with the provisions of the Internal Revenue Code applicable to regulated investment companies. The Series is not subject to federal income or excise tax to the extent that the Series distributes to shareholders each year its taxable income, including any net realized gains on investments, in accordance with requirements of the Internal Revenue Code. Accordingly, no provision for federal income tax or excise tax has been made in the financial statements.
18
Disciplined Value Series
Notes to Financial Statements (continued)
| 2. | Significant Accounting Policies (continued) |
Federal Taxes (continued)
Management evaluates its tax positions to determine if the tax positions taken meet the minimum recognition threshold in connection with accounting for uncertainties in income tax positions taken or expected to be taken for the purposes of measuring and recognizing tax liabilities in the financial statements. Recognition of tax benefits of an uncertain tax position is required only when the position is “more likely than not” to be sustained assuming examination by taxing authorities. At October 31, 2017, the Series has recorded no liability for net unrecognized tax benefits relating to uncertain income tax positions taken or expected to be taken in future tax returns.
The Series files income tax returns in the U.S. federal jurisdiction, various states and foreign jurisdictions, as required. No income tax returns are currently under investigation. The statute of limitations on the Series’ tax returns remains open for the years ended October 31, 2014 through October 31, 2017. The Series is not aware of any tax positions for which it is reasonably possible that the total amounts of unrecognized tax benefits will significantly change in the next twelve months.
Foreign Taxes
Based on the Series’ understanding of the tax rules and rates related to income, gains and currency purchase/repatriation transactions for foreign jurisdictions in which it invests, the Series will provide for foreign taxes, and where appropriate, deferred foreign tax.
Distributions of Income and Gains
Distributions to shareholders of net investment income are made quarterly. Distributions of net realized gains are made annually. An additional distribution may be necessary to avoid taxation of the Series. Distributions are recorded on the ex-dividend date.
Indemnifications
The Fund’s organizational documents provide former and current directors and officers with a limited indemnification against liabilities arising in connection with the performance of their duties to the Fund. In the normal course of business, the Fund may also enter into contracts that provide general indemnifications. The Fund’s maximum exposure under these arrangements is unknown as this would be dependent on future claims that may be made against the Fund. The risk of material loss from such claims is considered remote.
Other
The preparation of financial statements in conformity with GAAP requires management to make estimates and assumptions that affect the reported amounts of assets and liabilities and the disclosure of contingent assets and liabilities at the date of the financial statements and the reported amounts of income and expenses during the reporting period. Actual results could differ from those estimates.
| 3. | Transactions with Affiliates |
The Fund has an Investment Advisory Agreement (the “Agreement”) with the Advisor, for which the Series pays a fee, computed daily and payable monthly, at an annual rate of 0.45% of the Series’ average daily net assets.
Under the Agreement, personnel of the Advisor provide the Series with advice and assistance in the choice of investments and the execution of securities transactions, and otherwise maintain the Series’ organization. The Advisor also provides the Fund with necessary office space and fund administration and support services. The salaries of all officers of the Fund (except a percentage of the Fund’s Chief Compliance Officer’s salary, which is paid by the Fund), and of all Directors who are “affiliated persons” of the Fund, or of the Advisor, and all personnel of the Fund, or of the Advisor, performing services relating to research, statistical and investment activities, are paid by the Advisor. Each “non-affiliated” Director receives an annual stipend, which is allocated among all the active series of the Fund. In addition, these Directors also receive a fee per Board meeting attended plus a fee for each committee meeting attended and are reimbursed for travel and other out-of-pocket expenses incurred by them in connection with attending such meetings. The Fund also has an Audit Committee Chair, who receives an additional annual stipend for this role.
19
Disciplined Value Series
Notes to Financial Statements (continued)
| 3. | Transactions with Affiliates (continued) |
The Class S shares of the Series are subject to a shareholder services fee in accordance with a shareholder services plan adopted by the Fund’s Board. The shareholder services fee is intended to compensate financial intermediaries, including affiliates of the Fund, in connection with the provision of direct client service, personal services, maintenance of shareholder accounts and reporting services. For these services, the Class S shares of the Series pay a fee, computed daily and payable monthly, at an annual rate of 0.25% of the average daily net assets of Class S. The Fund has a Shareholder Services Agreement with the Advisor, for which the Advisor receives the shareholder services fee as stated above.
The Advisor has contractually agreed, until at least February 28, 2018, to waive its management fee and, if necessary, pay other operating expenses of the Series in order to maintain total direct annual fund operating expenses for the Series, exclusive of shareholder service fees, at no more than 0.60% of average daily net assets each year. For the year ended October 31, 2017, the Advisor did not waive fees or reimburse expenses for the Series. The Advisor is not eligible to recoup any expenses that have been waived or reimbursed in prior years.
Manning & Napier Investor Services, Inc., a registered broker-dealer affiliate of the Advisor, acts as distributor for the Fund’s shares. The services of Manning & Napier Investor Services, Inc. are provided at no additional cost to the Series.
Pursuant to a master services agreement effective through February 28, 2017, the Fund paid the Advisor an annual fee related to fund accounting and administration of 0.0085% on the first $25 billion of average daily net assets (excluding Target Series and Strategic Income Series); 0.0075% on the next $15 billion of average daily net assets (excluding Target Series and Strategic Income Series); and 0.0065% of average daily net assets in excess of $40 billion (excluding Target Series and Strategic Income Series); plus a base fee of $30,400 per series. Transfer agent fees were charged to the Fund on a per account basis. Additionally, certain transaction and out-of-pocket expenses, including charges for reporting relating to the Fund’s compliance program, were charged. The Advisor had agreements with BNY Mellon Investment Servicing (U.S.) Inc. (“BNY”) under which BNY served as sub-accountant services agent and sub-transfer agent. Effective March 1, 2017, BNY became the named transfer agent for the Fund. Pursuant to a master services agreement dated March 1, 2017, the Fund continues to pay the Advisor the annual fee related to fund accounting and administration of 0.0085% on the first $25 billion of average daily net assets (excluding Target Series and Strategic Income Series); 0.0075% on the next $15 billion of average daily net assets (excluding Target Series and Strategic Income Series); and 0.0065% of average daily net assets in excess of $40 billion (excluding Target Series and Strategic Income Series); plus the base fee of $30,400 per series. Additionally, certain transaction and out-of-pocket expenses, including charges for reporting relating to the Fund’s compliance program, are charged. The agreement between the Advisor and BNY under which BNY serves as sub-accountant services agent continues to be in effect.
Expenses not directly attributable to a series are allocated based on each series’ relative net assets or number of accounts, depending on the expense.
| 4. | Purchases and Sales of Securities |
For the year ended October 31, 2017, purchases and sales of securities, other than U.S. Government securities and short-term securities, were $56,915,328 and $106,894,493, respectively. There were no purchases or sales of U.S. Government securities.
20
Disciplined Value Series
Notes to Financial Statements (continued)
| 5. | Capital Stock Transactions |
Transactions in Class S and I shares of Disciplined Value Series were:
| CLASS S | FOR THE YEAR ENDED 10/31/17 | FOR THE YEAR ENDED 10/31/16 | ||||||||||||||
| SHARES | AMOUNT | SHARES | AMOUNT | |||||||||||||
Sold | 1,545,061 | $ | 16,323,508 | 506,341 | $ | 5,119,278 | ||||||||||
Reinvested | 156,422 | 1,637,234 | 303,546 | 2,901,921 | ||||||||||||
Repurchased | (471,810 | ) | (5,038,973 | ) | (660,648 | ) | (6,498,990 | ) | ||||||||
|
|
|
|
|
|
|
| |||||||||
Total | 1,229,673 | $ | 12,921,769 | 149,239 | $ | 1,522,209 | ||||||||||
|
|
|
|
|
|
|
| |||||||||
| CLASS I | FOR THE YEAR ENDED 10/31/17 | FOR THE YEAR ENDED 10/31/16 | ||||||||||||||
| SHARES | AMOUNT | SHARES | AMOUNT | |||||||||||||
Sold | 1,890,531 | $ | 29,193,940 | 1,657,230 | $ | 23,170,514 | ||||||||||
Reinvested | 285,798 | 4,347,380 | 791,422 | 10,754,253 | ||||||||||||
Repurchased | (5,679,847 | ) | (89,879,385 | ) | (2,205,722 | ) | (31,863,162 | ) | ||||||||
|
|
|
|
|
|
|
| |||||||||
Total | (3,503,518 | ) | $ | (56,338,065 | ) | 242,930 | $ | 2,061,605 | ||||||||
|
|
|
|
|
|
|
| |||||||||
At October 31, 2017, one shareholder account owned 17.7% of the Series. Investment activities of these shareholders may have a material effect on the Series.
| 6. | Financial Instruments |
The Series may trade in instruments including written and purchased options, forward foreign currency exchange contracts and futures contracts and other derivatives in the normal course of investing activities to assist in managing exposure to various market risks. The Series may be subject to various elements of risk which may involve, to a varying degree, elements of risk in excess of the amounts recognized for financial statement purposes. These risks include: the risk that changes in the value of a derivative may not correlate perfectly with the underlying asset, rate or index; counterparty credit risk related to over the counter derivative counterparties’ failure to perform under contract terms; liquidity risk related to the lack of a liquid market for these contracts allowing the fund to close out its position(s); and documentation risk relating to disagreement over contract terms. No such investments were held by the Series as of October 31, 2017.
| 7. | Federal Income Tax Information |
The amount and characterization of certain income and capital gains to be distributed are determined in accordance with federal income tax regulations, which may differ from GAAP. These differences are primarily due to differing book and tax treatment in the timing of recognition of net investment income, or gains and losses, including losses deferred due to wash sales and the use of equalization. The Series may periodically make reclassifications among its capital accounts to reflect income and gains available for distribution (or available capital loss carryovers) under income tax regulations, without impacting the Series’ net asset value. For the year ended October 31, 2017, amounts were reclassified within the capital accounts to decrease Undistributed Net Investment Income by $79,498, increase Additional Paid in Capital by $4,617,662, and decrease Accumulated Net Realized Gain on Investments by $4,538,164. Any such reclassifications are not reflected in the financial highlights.
21
Disciplined Value Series
Notes to Financial Statements (continued)
| 7. | Federal Income Tax Information (continued) |
The tax character of distributions paid were as follows:
| FOR THE YEAR ENDED 10/31/17 | FOR THE YEAR ENDED 10/31/16 | |||||||
Ordinary income | $ | 4,505,240 | $ | 4,100,118 | ||||
Long-term capital gains | 5,033,060 | 21,141,980 | ||||||
At October 31, 2017, the tax basis of components of distributable earnings and the net unrealized appreciation based on identified cost of investments for federal income tax purposes were as follows:
Cost for federal income tax purposes | $ | 125,056,560 | ||
Unrealized appreciation | 25,820,611 | |||
Unrealized depreciation | (2,608,834 | ) | ||
|
| |||
Net unrealized appreciation | $ | 23,211,777 | ||
|
| |||
Undistributed ordinary income | $ | 1,777,866 | ||
Undistributed long-term capital gains | $ | 19,959,579 |
22
Disciplined Value Series
Report of Independent Registered Public Accounting Firm
To the Board of Directors of Manning & Napier Fund, Inc. and Shareholders of Disciplined Value Series:
In our opinion, the accompanying statement of assets and liabilities, including the investment portfolio, and the related statements of operations and of changes in net assets and the financial highlights present fairly, in all material respects, the financial position of the Disciplined Value Series (one of the series constituting Manning & Napier Fund, Inc., hereafter referred to as the “Series”) as of October 31, 2017, the results of its operations for the year then ended, the changes in its net assets for each of the two years in the period then ended and the financial highlights for each of the five years in the period then ended, in conformity with accounting principles generally accepted in the United States of America. These financial statements and financial highlights (hereafter referred to as “financial statements”) are the responsibility of the Series’ management. Our responsibility is to express an opinion on these financial statements based on our audits. We conducted our audits of these financial statements in accordance with the standards of the Public Company Accounting Oversight Board (United States). Those standards require that we plan and perform the audit to obtain reasonable assurance about whether the financial statements are free of material misstatement. An audit includes examining, on a test basis, evidence supporting the amounts and disclosures in the financial statements, assessing the accounting principles used and significant estimates made by management, and evaluating the overall financial statement presentation. We believe that our audits, which included confirmation of securities as of October 31, 2017 by correspondence with the custodian and brokers, provide a reasonable basis for our opinion.

New York, New York
December 18, 2017
23
Disciplined Value Series
Supplemental Tax Information
(unaudited)
All reportings are based on financial information available as of the date of this annual report and, accordingly, are subject to change.
For federal income tax purposes, the Series reports for the current fiscal year $4,407,136 or, if different, the maximum amount allowable under the tax law, as qualified dividend income.
For corporate shareholders, the percentage of investment income (dividend income plus short-term gains, if any) that qualifies for the dividends received deduction for the current fiscal year is 84.51%.
The Series designates $25,409,952 as Long-Term Capital Gain dividends pursuant to Section 852(b) of the Code for the fiscal year ended October 31, 2017.
24
Disciplined Value Series
Directors’ and Officers’ Information
(unaudited)
The Statement of Additional Information provides additional information about the Fund’s directors and officers and can be obtained without charge by calling 1-800-466-3863, at www.manning-napier.com, or on the EDGAR Database on the SEC Internet web site (http://www.sec.gov). The following chart shows certain information about the Fund’s directors and officers, including their principal occupations during the last five years. Unless specific dates are provided, the individuals have held the listed positions for longer than five years.
| Interested | Director and Officer |
Name: | Michele T. Mosca* | |
Address: | 290 Woodcliff Drive Fairport, NY 14450 | |
Age: | 45 | |
Current Position(s) Held with Fund: | Principal Executive Officer, President, Chairman & Director | |
Term of Office & Length of Time Served: | Indefinite – Chairman and Director since August 20161 | |
Principal Occupation(s) During Past 5 Years: | Managing Director, Funds Group (since 2009) - Manning & Napier Advisors, LLC; President, Director (since 2015) - Manning & Napier Investor Services, Inc.; Chief Executive Officer, President (since 2016) - Rainier Investment Management Mutual Funds, Inc. Holds the following title for various subsidiaries and affiliates: President, Director | |
Number of Portfolios Overseen within Fund Complex: | 38 | |
Other Directorships Held Outside Fund Complex During Past 5 Years: | Trustee - Rainier Investment Management Mutual Funds (since 2016) |
| Independent | Directors |
Name: | Stephen B. Ashley | |
Address: | 290 Woodcliff Drive Fairport, NY 14450 | |
Age: | 77 | |
Current Position(s) Held with Fund: | Director, Audit Committee Member, Governance & Nominating Committee Member | |
Term of Office & Length of Time Served: | Indefinite – Since 1996 | |
Principal Occupation(s) During Past 5 Years: | Chairman, Director & Chief Executive Officer (1997 to present) - The Ashley Group (property management and investment). Director (1995-2008) and Chairman (non-executive) (2004-2008) - Fannie Mae (mortgage) | |
Number of Portfolios Overseen within Fund Complex: | 38 | |
Other Directorships Held Outside Fund Complex During Past 5 Years: | Fannie Mae (1995-2008) The Ashley Group (1995-2008) Genesee Corporation (1987-2007) | |
Name: | Paul A. Brooke | |
Address: | 290 Woodcliff Drive | |
| Fairport, NY 14450 | ||
Age: | 72 | |
Current Position(s) Held with Fund: | Lead Independent Director, Audit Committee Member, Governance & Nominating Committee Chairman | |
Term of Office & Length of Time Served: | Indefinite – Director, Audit Committee Member, Governance & Nominating Committee Member since 2007; Governance & Nominating Committee Chairman since 2016; Lead Independent Director since 2017 | |
Principal Occupation(s) During Past 5 Years: | Chairman & CEO (2005-2009) - Ithaka Acquisition Corporation (investments); Chairman (2007-2009) - Alsius Corporation (investments); Managing Member (1991-present) PMSV Holdings LLC (investments); Managing Member (2010-2016) - Venbio (investments). | |
Number of Portfolios Overseen within Fund Complex: | 38 | |
Other Directorships Held Outside Fund Complex During Past 5 Years: | Incyte Corp. (biotech)(2000-present); ViroPharma, Inc. (speciality pharmaceuticals)(2000-2014); HLTH (WebMD)(information)(2000-2010); Cheyne Capital International (investment)(2000-present); GMP Companies (investment)(2000-2011); Cytos Biotechnology Ltd (biotechnology)(2012-2014); Cerus (biomedical)(2016-present); PureEarth(non-profit)(2012-present) | |
25
Disciplined Value Series
Directors’ and Officers’ Information
(unaudited)
| Independent | Directors (continued) |
Name: | Peter L. Faber | |
Address: | 290 Woodcliff Drive | |
| Fairport, NY 14450 | ||
Age: | 79 | |
Current Position(s) Held with Fund: | Director, Governance & Nominating Committee Member | |
Term of Office & Length of Time Served: | Indefinite – Since 1987 | |
Principal Occupation(s) During Past 5 Years: | Senior Counsel (2006-2012), Partner (1995-2006 & 2013-present) - McDermott, Will & Emery LLP (law firm) | |
Number of Portfolios Overseen within Fund Complex: | 38 | |
Other Directorships Held Outside Fund Complex During Past 5 Years: | Boston Early Music Festival (non-profit)(2007-present); Amherst Early Music, Inc. (non-profit)(2009-present); Gotham Early Music Scene, Inc. (non-profit)(2009-present); Partnership for New York City, Inc. (non-profit)(1989-2010); New York Collegium (non-profit)(2004-2011) | |
Name: | Harris H. Rusitzky | |
Address: | 290 Woodcliff Drive | |
| Fairport, NY 14450 | ||
Age: | 82 | |
Current Position(s) Held with Fund: | Director, Audit Committee Member, Governance & Nominating Committee Member | |
Term of Office & Length of Time Served: | Indefinite – Since 1985 | |
Principal Occupation(s) During Past 5 Years: | President (1994- present) - The Greening Group (business consultants); Partner (2006-present) - The Restaurant Group (restaurants) | |
Number of Portfolios Overseen within Fund Complex: | 38 | |
Other Directorships Held Outside Fund Complex During Past 5 Years: | Rochester Institute of Technology (university)(1972-present); Culinary Institute of America (non-profit college)(1985-present); George Eastman House (museum)(1988-present); National Restaurant Association (restaurant trade organization)(1978-present) | |
Name: | Chester N. Watson | |
Address: | 290 Woodcliff Drive | |
| Fairport, NY 14450 | ||
Age: | 67 | |
Current Position(s) Held with Fund: | Director, Audit Committee Chairman, Governance & Nominating Committee Member | |
Term of Office & Length of Time Served: | Indefinite – Since 2012 | |
Principal Occupation(s) During Past 5 Years: | General Auditor (2003-2011) - General Motors Company (auto manufacturer) | |
Number of Portfolios Overseen within Fund Complex: | 38 | |
Other Directorships Held Outside Fund Complex During Past 5 Years: | Rochester Institute of Technology (university)(2005-present); Town of Greenburgh, NY Planning Board (municipal government) (2015-present) | |
Officers:
| ||
Name: | Jeffrey S. Coons, Ph.D., CFA® | |
Address: | 290 Woodcliff Drive | |
| Fairport, NY 14450 | ||
Age: | 54 | |
Current Position(s) Held with Fund: | Vice President | |
Term of Office1 & Length of Time Served: | Since 2004 | |
Principal Occupation(s) During Past 5 Years: | President since 2010, Co-Director of Research (2002 – 2015) - Manning & Napier Advisors, LLC Holds one or more of the following titles for various subsidiaries and affiliates: President, Director, Treasurer, or Senior Trust Officer | |
Name: | Elizabeth Craig | |
Address: | 290 Woodcliff Drive | |
| Fairport, NY 14450 | ||
Age: | 30 | |
Current Position(s) Held with Fund: | Corporate Secretary | |
Term of Office1 & Length of Time Served: | Since 2016 | |
Principal Occupation(s) During Past 5 Years: | Fund Administration Manager since 2015; Mutual Fund Compliance Specialist (2009-2015) - Manning & Napier Advisors, LLC; Assistant Corporate Secretary (2011-2016) - Manning & Napier Fund, Inc. | |
26
Disciplined Value Series
Directors’ and Officers’ Information
(unaudited)
| Officers | (continued) |
Name: | Christine Glavin | |
Address: | 290 Woodcliff Drive | |
| Fairport, NY 14450 | ||
Age: | 51 | |
Current Position(s) Held with Fund: | Principal Financial Officer, Chief Financial Officer | |
Term of Office1 & Length of Time Served: | Principal Financial Officer since 2002; Chief Financial Officer since 2001 | |
Principal Occupation(s) During Past 5 Years: | Director of Fund Reporting since 2011; Fund Reporting Manager (1997-2011) - Manning & Napier Advisors, LLC; Assistant Treasurer since 2008 - Exeter Trust Company; Chief Financial Officer since 2017- Rainier Investment Management Mutual Funds, Inc. | |
Name: | Jodi L. Hedberg | |
Address: | 290 Woodcliff Drive | |
| Fairport, NY 14450 | ||
Age: | 50 | |
Current Position(s) Held with Fund: | Chief Compliance Officer, Anti-Money Laundering Compliance Officer | |
Term of Office1 & Length of Time Served: | Chief Compliance Officer since 2004; Anti-Money Laundering Officer since 2002; Corporate Secretary (1997-2016)- Manning & Napier Fund, Inc.; Chief Compliance Officer and Anti-Money Laundering Officer since 2017 – Rainier Investment Management Mutual Funds, Inc. | |
Principal Occupation(s) During Past 5 Years: | Director of Compliance since 2005; Compliance Manager (1995-2005) – Manning & Napier Advisors, LLC and affiliates; Corporate Secretary – Manning & Napier Investor Services, Inc. since 2006 | |
Name: | Scott Morabito | |
Address: | 290 Woodcliff Drive | |
| Fairport, NY 14450 | ||
Age: | 29 | |
Current Position(s) Held with Fund: | Assistant Vice President | |
Term of Office1 & Length of Time Served: | Since 2017 | |
Principal Occupation(s) During Past 5 Years: | Director of Funds Group since 2017; Fund Product and Strategy Manager (2014-2017); Senior Product and Strategy Analyst (2013-2014); Product and Strategy Analyst (2011-2013) - Manning & Napier Advisors, LLC. | |
Name: | Amy Williams | |
Address: | 290 Woodcliff Drive | |
| Fairport, NY 14450 | ||
Age: | 56 | |
Current Position(s) Held with Fund: | Assistant Corporate Secretary | |
Term of Office1 & Length of Time Served: | Since 2016 | |
Principal Occupation(s) During Past 5 Years: | Director of Fund Documentation - Manning & Napier Advisors, LLC and affiliates since 2009 Holds one or more of the following titles for various affiliates: Director | |
Name: | Richard Yates | |
Address: | 290 Woodcliff Drive | |
| Fairport, NY 14450 | ||
Age: | 52 | |
Current Position(s) Held with Fund: | Chief Legal Officer | |
Term of Office1 & Length of Time Served: | Chief Legal Officer since 2004 | |
Principal Occupation(s) During Past 5 Years: | Counsel - Manning & Napier Advisors, LLC and affiliates since 2000; Chief Legal Officer since 2016 - Rainier Investment Management, LLC; Chief Legal Officer since 2016 - Rainier Investment Management Mutual Funds, Inc. Holds one or more of the following titles for various affiliates: Director, Corporate Secretary, Chief Legal Officer | |
*Interested Director, within the meaning of the 1940 Act by reason of her positions with the Fund’s investment advisor, Manning & Napier Advisors, LLC and Distributor, Manning & Napier Investor Services, Inc.
1The term of office of all officers shall be one year and until their respective successors are chosen and qualified, or his or her earlier resignation or removal as provided in the Fund’s By-Laws.
27
{This page intentionally left blank}
28
{This page intentionally left blank}
29
Disciplined Value Series
Literature Requests
(unaudited)
| Proxy | Voting Policies and Procedures |
A description of the policies and procedures that the Fund uses to determine how to vote proxies relating to portfolio securities is available, without charge, upon request:
| By phone | 1-800-466-3863 | |||
| On the Securities and Exchange | ||||
| Commission’s (SEC) web site | http://www.sec.gov |
| Proxy | Voting Record |
Information regarding how the Fund voted proxies relating to portfolio securities during the most recent 12-month period ended June 30th is available, without charge, upon request:
| By phone | 1-800-466-3863 | |||
| On the SEC’s web site | http://www.sec.gov |
| Quarterly | Portfolio Holdings |
The Series’ complete schedule of portfolio holdings for the 1st and 3rd quarters of each fiscal year are provided on Form N-Q, and are available, without charge, upon request:
| By phone | 1-800-466-3863 | |||
| On the SEC’s web site | http://www.sec.gov |
The Series’ Form N-Q may be reviewed and copied at the SEC’s Public Reference Room in Washington, D.C. Information on the operation of the Public Reference Room may be obtained by calling 1-800-SEC-0330.
| Prospectus | and Statement of Additional Information (SAI) |
For more information about any of the Manning & Napier Fund, Inc. Series, you may obtain a prospectus and SAI at www.manning-napier.com or by calling (800) 466-3863. Before investing, carefully consider the objectives, risks, charges and expenses of the investment and read the prospectus carefully as it contains this and other information about the investment company. In addition, this information can be found on the SEC’s web site, http://www.sec.gov.
| Additional | information available at www.manning-napier.com |
1. Fund Holdings - Month-End
2. Fund Holdings - Quarter-End
3. Shareholder Report - Annual
4. Shareholder Report - Semi-Annual
The Fund also offers electronic notification or “e-delivery” when certain documents are available on-line to be downloaded or reviewed. Direct shareholders can elect to receive electronic notification when shareholder reports, prospectus updates, and/or statements are available. If you do not currently have on-line access to your account, you can establish access by going to www.manning-napier.com, click on “Login” in the top corner of the page, and follow the prompts to self-enroll. Once enrolled, you can set your electronic notification preferences by clicking on the Account Options tab located within the green toolbar and then select E-Delivery Option. Should you have any questions on either how to establish on-line access or how to update your account settings, please contact Investor Services at 1-800-466-3863.
The Manning & Napier Fund, Inc. is managed by Manning & Napier Advisors, LLC. Manning & Napier Investor Services, Inc., an affiliate of Manning & Napier Advisors, LLC, is the distributor of the Fund shares.
MNDIV-10/17-AR
Overseas Series
Management Discussion and Analysis
(unaudited)
Dear Shareholders:
Just one year ago, many investors were anticipating a widespread sell-off in domestic equity markets after Donald Trump won the election for the U.S. presidency. Not only did a sell-off fail to materialize, but equities actually moved sharply higher and remained on an upward trajectory throughout the year. The advance in equities was despite ongoing uncertainty surrounding policy implementation and how the new administration’s agenda might ultimately affect U.S. economic growth. For the year ended October 31, 2017, domestic equities were up 23.63%, as measured by the S&P 500 Index. International equities, as measured by the MSCI ACWI ex USA Index, also fared extraordinarily well, up 23.64%. Domestic investment-grade bonds, as measured by the Bloomberg Barclays U.S. Aggregate Bond Index, experienced relatively subdued performance, up 0.90%. Within fixed income, corporate bonds led, with high-yield securities in particular delivering very strong performance.
Much of the move upward in asset markets has been driven by stronger corporate earnings that materialized in early 2017 within both developed and emerging markets, supported by synchronized economic growth across all major global regions. Further, although Federal Reserve (Fed) policymakers continued gradually raising the target range for the federal funds rate and began reducing the Fed’s securities holdings, central bank policies across the globe have remained generally accommodative, providing an additional tailwind for asset prices.
Investors are undoubtedly enjoying the “Goldilocks” state of the economy: not too cold so as to usher in a recession, and not too hot so as to cause runaway inflation. Nonetheless, it is our view that market participants should temper their expectations going forward. The U.S. continues to move along in its economic cycle, and while it is not our view that we are on the cusp of a bear market, the status of our indicators suggest that we are certainly closer to the end of the current bull market than we are to the beginning. Complacency is elevated, there are significantly fewer pockets of cheap valuations remaining compared to the past several years, and U.S. valuations in particular limit upside potential, offering little support for asset prices should volatility in the financial markets materialize. This is surely not the time for investors to chase returns or take on unnecessary risk. Rather, it is our view that current market dynamics are consistent with rising risks that must be actively managed, and investors should maintain allocations consistent with their long-term investment objectives.
With this in mind, we discuss recent fund performance in this report, highlight how we are positioned amid the current economic environment, and provide our outlook of what to expect in financial markets. We hope that you find this information helpful, and look forward to working with you in the years ahead to meet your investment goals.
Thank you for your continued confidence in us.
Sincerely,
Manning & Napier Advisors, LLC
The S&P 500 Total Return Index is an unmanaged, capitalization-weighted measure of 500 widely held common stocks listed on the New York Stock Exchange, American Stock Exchange, and the Over-the-Counter market. The Index returns assume daily reinvestment of dividends and do not reflect any fees or expenses. Index returns provided by Bloomberg. S&P Dow Jones Indices LLC, a subsidiary of the McGraw Hill Financial, Inc., is the publisher of various index based data products and services and has licensed certain of its products and services for use by Manning & Napier. All such content Copyright © 2017 by S&P Dow Jones Indices LLC and/or its affiliates. All rights reserved. Neither S&P Dow Jones Indices LLC, Dow Jones Trademark Holdings LLC, their affiliates nor their third party licensors make any representation or warranty, express or implied, as to the ability of any index to accurately represent the asset class or market sector that it purports to represent and none of these parties shall have any liability for any errors, omissions, or interruptions of any index or the data included therein.
The MSCI ACWI ex USA Index (ACWIxUS) is designed to measure large and mid-cap representation across 22 of 23 Developed Markets countries (excluding the U.S.) and 24 Emerging Markets countries. The Index returns do not reflect any fees or expenses. The Index is denominated in U.S. dollars. The Index returns are net of withholding taxes. They assume daily reinvestment of net dividends thus accounting for any applicable dividend taxation. Index returns provided by Bloomberg.
The Bloomberg Barclays U.S. Aggregate Bond Index is an unmanaged, market-value weighted index of U.S. domestic investment-grade debt issues, including government, corporate, asset-backed, and mortgage-backed securities, with maturities of one year or more. Index returns do not reflect any fees or expenses. Index returns provided by Interactive Data.
1
Overseas Series
Fund Commentary
(unaudited)
Investment Objective
To maximize long-term growth by investing principally in the common stocks of companies located around the world. The Series invests primarily in foreign companies, including those in developed and emerging markets.
Performance Commentary
International equity markets generally delivered very strong absolute returns for the twelve-month period ended October 31, 2017. The broad MSCI ACWI ex USA Index (ACWIxUS) returned 23.64%. Emerging market equities generally outperformed developed markets during the period, and the U.S. dollar generally depreciated during the year which supported international equity returns for U.S.-based investors.
Although the Overseas Series returned 20.49% during the year, it underperformed the benchmark on a relative basis. Importantly, the Series has provided robust positive absolute returns over the current international stock market cycle, which began in April 2003. The Series’ underperformance relative to the ACWIxUS benchmark during the year was driven by sector positioning. Conversely, stock selection aided relative returns. The most notable detractors from relative performance were overweight allocations relative to the benchmark to Consumer Staples and Health Care, an underweight allocation to Financials, and equity selection in Consumer Discretionary and Energy. This was offset with strong stock selection in the Consumer Staples, Telecommunication Services, and Materials sectors. From a country basis, equity selection in the Netherlands, Germany, Japan, and Ireland provided the biggest headwinds to relative performance while an underweight to Japan was a positive contributor.
Our focus on growing companies which we believe can control their own destiny has led to meaningful allocations to the Consumer Staples and Health Care sectors. The Series has relatively little exposure to economically sensitive sectors like Financials, Energy, or Consumer Discretionary. We have generally found companies within some of the more defensive sectors to be overvalued given the lower growth prospects, which has resulted in underweight allocations to the Utilities, Telecommunication Services, and Real Estate segments. Regionally, approximately 75% of the Series is allocated to Europe, 11% to Emerging Markets, and 5% to the Americas, with the remaining assets allocated to the Pacific region.
As we begin the new fiscal year, earnings growth across major global regions, accelerating business activity, and an improving economic backdrop are supportive of international equity prices. However, as markets continue to advance, we believe it is important to express our view that investors should exercise caution and selectivity due to rising risks associated with elevated complacency, valuations across most markets that remain at or somewhat above fair value, and the inflection in global monetary policy to less accommodative conditions. We believe these risk factors reinforce the need for an active, fundamentals-based investment approach, as it will be critical to manage them going forward.
Please see the next page for additional performance information as of October 31, 2017.
Performance data quoted represents past performance and does not guarantee future results. The investment return and principal value of an investment will fluctuate, so that an investor’s shares, when redeemed, may be worth more or less than their original cost. Current performance may be higher or lower than that quoted; investors can obtain the most recent month-end performance at www.manning-napier.com or by calling (800) 466-3863.
Allocation data is based on country of incorporation.
All investments involve risks, including possible loss of principal. Funds whose investments are concentrated in foreign countries may be subject to fluctuating currency values, different accounting standards, and economic and political instability. The value of the Series may be affected by changes in exchange rates between foreign currencies and the U.S. dollar. Investments in emerging markets may be more volatile than investments in more developed markets.
2
Overseas Series
Performance Update as of October 31, 2017
(unaudited)
AVERAGE ANNUAL TOTAL RETURNS AS OF OCTOBER 31, 2017 | ||||||||||||||||
ONE YEAR1 | FIVE YEAR | TEN YEAR | SINCE INCEPTION2 | |||||||||||||
Manning & Napier Fund, Inc. - Overseas Series3,4 | 20.49 | % | 6.25 | % | 1.21 | % | 7.94 | % | ||||||||
MSCI ACWI ex USA Index5 | 23.64 | % | 7.29 | % | 0.92 | % | 6.11 | % | ||||||||
The following graph compares the value of a $1,000,000 investment in the Manning & Napier Fund, Inc. - Overseas Series for the ten years ended October 31, 2017 to the MSCI ACWI ex USA Index.
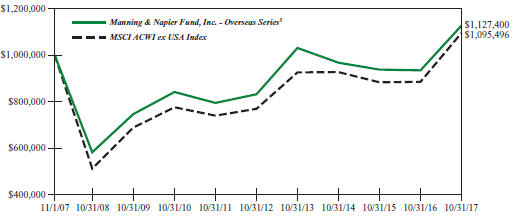
1The returns shown are based on net asset values calculated for shareholder transactions and may differ from the returns shown in the financial highlights, which reflect adjustments made to the net asset values in accordance with accounting principles generally accepted in the United States of America.
2Performance numbers for the Series are calculated from September 23, 1998, the Collective’s inception date (see Note 4 below). Prior to 2001, the MSCI ACWI ex USA only published month-end numbers; therefore, performance numbers for the Index are calculated from September 30, 1998.
3The Series’ performance does not reflect the deduction of taxes that a shareholder would pay on fund distributions or the redemption of shares. The Series’ performance is historical and may not be indicative of future results. The performance returns shown are inclusive of the net expense ratio of the Series. For the year ended October 31, 2017, this net expense ratio was 0.75%. The gross expense ratio, which does not account for any voluntary or contractual waivers currently in effect, was 0.77% for the year ended October 31, 2017.
4Prior to July 10, 2002, all performance figures reflect the performance of the Exeter Trust Company Group Trust for Employee Benefit Plans: International Collective Investment Trust (the “Collective”), which was managed by Manning & Napier Advisors, Inc. (predecessor to Manning & Napier Advisors, LLC), an affiliate of the distributor, and reorganized into the Manning & Napier Fund, Inc. Overseas Series on July 10, 2002. The Collective was not open to the public generally or registered under the Investment Company Act of 1940 and the fees of the Collective were lower than the Series’ fees. Therefore, the historical performance of the Collective would have been lower if the Collective had been subject to the same fees as the Series.
5The MSCI ACWI ex USA Index (ACWIxUS) is designed to measure large and mid-cap representation across 22 of 23 Developed Markets countries (excluding the U.S.) and 24 Emerging Markets countries. The Index returns do not reflect any fees or expenses. The Index is denominated in U.S. dollars. The Index returns assume daily investment of gross dividends (which do not account for applicable dividend taxation) prior to 12/31/1998, as net returns were not available. Subsequent to 12/31/1998, the Index returns are net of withholding taxes. They assume daily reinvestment of net dividends thus accounting for any applicable dividend taxation. Index returns provided by Bloomberg.
3
Overseas Series
Shareholder Expense Example
(unaudited)
As a shareholder of the Series, you incur ongoing costs, including management fees, shareholder service fees and other Series expenses. This example is intended to help you understand your ongoing costs (in dollars) of investing in the Series and to compare these costs with the ongoing costs of investing in other mutual funds.
The example is based on an investment of $1,000 invested at the beginning of the period and held for the entire period (May 1, 2017 to October 31, 2017).
Actual Expenses
The first line of the table below provides information about actual account values and actual expenses. You may use the information in this line, together with the amount you invested, to estimate the expenses that you paid over the period. Simply divide your account value by $1,000 (for example, an $8,600 account value divided by $1,000 = 8.6), then multiply the result by the number in the first line under the heading entitled “Expenses Paid During Period” to estimate the expenses you paid on your account during this period.
Hypothetical Example for Comparison Purposes
The second line of the table below provides information about hypothetical account values and hypothetical expenses based on the Series’ actual expense ratio and an assumed rate of return of 5% per year before expenses, which is not the Series’ actual return. The hypothetical account values and expenses may not be used to estimate the actual ending account balance or expenses you paid during the period. You may use this information to compare the ongoing costs of investing in the Series and other funds. To do so, compare this 5% hypothetical example with the 5% hypothetical examples that appear in the shareholder reports of the other funds.
Please note that the expenses shown in the table are meant to highlight your ongoing costs only and do not reflect any transaction costs, such as sales charges (loads), redemption fees, or exchange fees that you may incur in other mutual funds. Therefore, the second line of the table is useful in comparing ongoing costs only, and will not help you determine the relative total costs of owning different funds.
BEGINNING ACCOUNT VALUE 5/1/17 | ENDING ACCOUNT VALUE 10/31/17 | EXPENSES PAID DURING PERIOD* 5/1/17-10/31/17 | ||||
Actual | $1,000.00 | $1,083.20 | $3.94 | |||
Hypothetical | ||||||
(5% return before expenses) | $1,000.00 | $1,021.42 | $3.82 |
*Expenses are equal to the Series’ annualized expense ratio (for the six-month period) of 0.75%, multiplied by the average account value over the period, multiplied by 184/365 (to reflect the one-half year period). Expenses are based on the most recent fiscal half year; therefore, the expense ratios stated above may differ from the expense ratios stated in the financial highlights, which are based on one-year data. The Series’ total return would have been lower had certain expenses not been waived during the period.
4
Overseas Series
Portfolio Composition as of October 31, 2017
(unaudited)
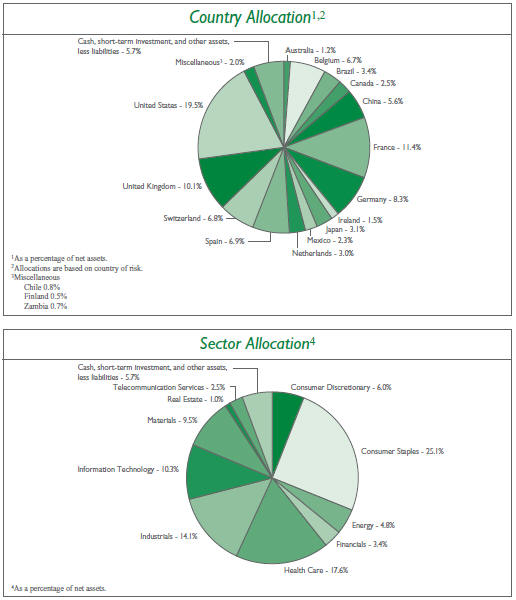
5
Overseas Series
Investment Portfolio - October 31, 2017
| VALUE | ||||||||
| SHARES | (NOTE 2) | |||||||
COMMON STOCKS - 94.3% | ||||||||
Consumer Discretionary - 6.0% | ||||||||
Hotels, Restaurants & Leisure - 3.6% | ||||||||
Accor S.A. (France)1 | 538,815 | $ | 26,880,330 | |||||
|
| |||||||
Media - 0.6% | ||||||||
Quebecor, Inc. - Class B (Canada) | 26,167 | 987,373 | ||||||
Shaw Communications, Inc. - Class B (Canada) | 174,350 | 3,981,359 | ||||||
|
| |||||||
| 4,968,732 | ||||||||
|
| |||||||
Textiles, Apparel & Luxury Goods - 1.8% | ||||||||
lululemon athletica, Inc. (United States)* | 219,015 | 13,471,613 | ||||||
|
| |||||||
Total Consumer Discretionary | 45,320,675 | |||||||
|
| |||||||
Consumer Staples - 25.1% | ||||||||
Beverages - 10.7% | ||||||||
Ambev S.A. - ADR (Brazil) | 4,090,400 | 25,892,232 | ||||||
Anheuser-Busch InBev S.A./N.V. (Belgium)1 | 238,480 | 29,242,702 | ||||||
Diageo plc (United Kingdom)1 | 763,080 | 26,058,191 | ||||||
|
| |||||||
| 81,193,125 | ||||||||
|
| |||||||
Food Products - 5.4% | ||||||||
Danone S.A. (France)1 | 223,490 | 18,266,092 | ||||||
Nestle S.A. (Switzerland)1 | 263,045 | 22,132,221 | ||||||
|
| |||||||
| 40,398,313 | ||||||||
|
| |||||||
Personal Products - 5.9% | ||||||||
Beiersdorf AG (Germany)1 | 124,915 | 14,051,748 | ||||||
Unilever plc - ADR (United Kingdom) | 538,940 | 30,530,951 | ||||||
|
| |||||||
| 44,582,699 | ||||||||
|
| |||||||
Tobacco - 3.1% | ||||||||
Japan Tobacco, Inc. (Japan)1 | 708,100 | 23,438,253 | ||||||
|
| |||||||
Total Consumer Staples | 189,612,390 | |||||||
|
| |||||||
Energy - 4.8% | ||||||||
Energy Equipment & Services - 3.9% | ||||||||
Schlumberger Ltd. (United States) | 458,195 | 29,324,480 | ||||||
|
| |||||||
Oil, Gas & Consumable Fuels - 0.9% | ||||||||
Cameco Corp. (Canada) | 809,975 | 6,593,197 | ||||||
|
| |||||||
Total Energy | 35,917,677 | |||||||
|
| |||||||
Financials - 3.4% | ||||||||
Banks - 3.4% | ||||||||
Bankia S.A. (Spain)1 | 2,775,825 | 13,246,917 | ||||||
CaixaBank S.A. (Spain)1 | 2,725,115 | 12,749,163 | ||||||
|
| |||||||
Total Financials | 25,996,080 | |||||||
|
| |||||||
The accompanying notes are an integral part of the financial statements.
6
Overseas Series
Investment Portfolio - October 31, 2017
| VALUE | ||||||||
| SHARES | (NOTE 2) | |||||||
COMMON STOCKS (continued) | ||||||||
Health Care - 17.6% | ||||||||
Health Care Equipment & Supplies - 4.3% | ||||||||
Medtronic plc (United States) | 404,160 | $ | 32,542,963 | |||||
|
| |||||||
Health Care Providers & Services - 3.4% | ||||||||
Fresenius Medical Care AG & Co. KGaA (Germany)1 | 260,795 | 25,250,680 | ||||||
|
| |||||||
Life Sciences Tools & Services - 3.2% | ||||||||
QIAGEN N.V. (United States) | 316,566 | 10,718,925 | ||||||
QIAGEN N.V. (United States)1 | 396,974 | 13,468,023 | ||||||
|
| |||||||
| 24,186,948 | ||||||||
|
| |||||||
Pharmaceuticals - 6.7% | ||||||||
Novartis AG - ADR (Switzerland) | 352,845 | 29,137,940 | ||||||
Perrigo Co. plc (United States) | 265,205 | 21,478,953 | ||||||
|
| |||||||
| 50,616,893 | ||||||||
|
| |||||||
Total Health Care | 132,597,484 | |||||||
|
| |||||||
Industrials - 14.1% | ||||||||
Airlines - 1.5% | ||||||||
Ryanair Holdings plc - ADR (Ireland)* | 100,852 | 11,306,518 | ||||||
|
| |||||||
Construction & Engineering - 1.9% | ||||||||
Vinci S.A. (France)1 | 149,890 | 14,685,869 | ||||||
|
| |||||||
Machinery - 2.1% | ||||||||
Metso OYJ (Finland)1 | 106,005 | 3,849,919 | ||||||
The Weir Group plc (United Kingdom)1 | 458,265 | 11,880,327 | ||||||
|
| |||||||
| 15,730,246 | ||||||||
|
| |||||||
Trading Companies & Distributors - 4.1% | ||||||||
Brenntag AG (Germany)1 | 413,139 | 23,439,740 | ||||||
Howden Joinery Group plc (United Kingdom)1 | 1,376,500 | 7,496,301 | ||||||
|
| |||||||
| 30,936,041 | ||||||||
|
| |||||||
Transportation Infrastructure - 4.5% | ||||||||
Aena SME S.A. (Spain)1,2 | 143,800 | 26,383,513 | ||||||
Grupo Aeroportuario del Centro Norte S.A.B. de C.V. (Mexico) | 730,400 | 3,689,764 | ||||||
Grupo Aeroportuario del Pacifico S.A.B. de C.V. - ADR (Mexico) | 38,550 | 3,659,166 | ||||||
|
| |||||||
| 33,732,443 | ||||||||
|
| |||||||
Total Industrials | 106,391,117 | |||||||
|
| |||||||
Information Technology - 10.3% | ||||||||
Internet Software & Services - 5.6% | ||||||||
Alibaba Group Holding Ltd. - ADR (China)* | 83,980 | 15,527,062 | ||||||
China Literature Ltd. - Rights (Expires 11/03/2017) (Hong Kong)*3 | 341 | — | ||||||
NetEase, Inc. - ADR (China) | 27,355 | 7,711,922 | ||||||
Tencent Holdings Ltd. - Class H (China)1 | 428,690 | 19,267,518 | ||||||
|
| |||||||
| 42,506,502 | ||||||||
|
| |||||||
The accompanying notes are an integral part of the financial statements.
7
Overseas Series
Investment Portfolio - October 31, 2017
| VALUE | ||||||||
| SHARES | (NOTE 2) | |||||||
COMMON STOCKS (continued) | ||||||||
Information Technology (continued) | ||||||||
IT Services - 3.5% | ||||||||
Amdocs Ltd. (United States) | 402,139 | $ | 26,179,249 | |||||
|
| |||||||
Software - 1.2% | ||||||||
Atlassian Corp. plc - Class A (Australia)* | 191,282 | 9,252,310 | ||||||
|
| |||||||
Total Information Technology | 77,938,061 | |||||||
|
| |||||||
Materials - 9.5% | ||||||||
Chemicals - 6.6% | ||||||||
Akzo Nobel N.V. (Netherlands)1 | 246,250 | 22,231,667 | ||||||
Mexichem, S.A.B. de C.V. (Mexico) | 2,511,650 | 6,469,168 | ||||||
Solvay S.A. (Belgium)1 | 144,175 | 21,418,392 | ||||||
|
| |||||||
| 50,119,227 | ||||||||
|
| |||||||
Metals & Mining - 2.9% | ||||||||
Antofagasta plc (Chile)1 | 444,475 | 5,633,084 | ||||||
First Quantum Minerals Ltd. (Zambia) | 467,200 | 5,225,716 | ||||||
Grupo Mexico, S.A.B. de C.V. - Series B (Mexico) | 1,160,400 | 3,773,830 | ||||||
Lundin Mining Corp. (Canada) | 968,743 | 7,388,909 | ||||||
|
| |||||||
| 22,021,539 | ||||||||
|
| |||||||
Total Materials | 72,140,766 | |||||||
|
| |||||||
Real Estate - 1.0% | ||||||||
Equity Real Estate Investment Trusts (REITS) - 1.0% | ||||||||
Unibail-Rodamco S.E. (France)1 | 30,620 | 7,664,404 | ||||||
|
| |||||||
Telecommunication Services - 2.5% | ||||||||
Diversified Telecommunication Services - 2.5% | ||||||||
Iliad S.A. (France)1 | 74,505 | 18,597,860 | ||||||
|
| |||||||
TOTAL COMMON STOCKS | ||||||||
(Identified Cost $638,562,944) | 712,176,514 | |||||||
|
| |||||||
SHORT-TERM INVESTMENT - 3.6% | ||||||||
Dreyfus Government Cash Management4, 0.93% | ||||||||
(Identified Cost $27,483,479) | 27,483,479 | 27,483,479 | ||||||
|
| |||||||
TOTAL INVESTMENTS - 97.9% | ||||||||
(Identified Cost $666,046,423) | 739,659,993 | |||||||
OTHER ASSETS, LESS LIABILITIES - 2.1% | 15,821,756 | |||||||
|
| |||||||
NET ASSETS - 100% | $ | 755,481,749 | ||||||
|
| |||||||
The accompanying notes are an integral part of the financial statements.
8
Overseas Series
Investment Portfolio - October 31, 2017
ADR - American Depositary Receipt
*Non-income producing security.
1A factor from a third party vendor was applied to determine the security’s fair value following the close of local trading.
2Restricted securities - Investment in securities that are restricted as to public resale under the Securities Act of 1933, as amended. These securities have been sold under rule 144A and have been determined to be liquid under guidelines established by the Board of Directors. These securities amount to $26,383,513 or 3.5% of the Series’ net assets as of October 31, 2017.
3Security has been valued at fair value as determined in good faith by the Advisor and is classified as Level 3 in the fair value hierarchy.
4Rate shown is the current yield as of October 31, 2017.
The Series’ portfolio holds, as a percentage of net assets, greater than 10% in the following countries: United States - 19.5%; France - 11.4%; United Kingdom - 10.1%.
The Global Industry Classification Standard (GICS) was developed by and is the exclusive property and a service mark of MSCI Inc. (MSCI) and Standard & Poor’s, a division of The McGraw-Hill Companies, Inc. (S&P), and is licensed for use by Manning & Napier when referencing GICS sectors. Neither MSCI, S&P, nor any third party involved in making or compiling the GICS or any GICS classifications makes any express or implied warranties or representations with respect to such standard or classification, nor shall any such party have any liability therefrom.
The accompanying notes are an integral part of the financial statements.
9
Overseas Series
Statement of Assets & Liabilities
October 31, 2017
ASSETS: | ||||
Investments, at value (identified cost $666,046,423) (Note 2) | $ | 739,659,993 | ||
Receivable for securities sold | 12,331,357 | |||
Foreign tax reclaims receivable | 4,431,190 | |||
Dividends receivable | 542,560 | |||
Receivable for fund shares sold | 152,688 | |||
|
| |||
TOTAL ASSETS | 757,117,788 | |||
|
| |||
LIABILITIES: | ||||
Accrued management fees (Note 3) | 413,287 | |||
Accrued fund accounting and administration fees (Note 3) | 38,632 | |||
Accrued Chief Compliance Officer service fees (Note 3) | 306 | |||
Payable for securities purchased | 1,035,563 | |||
Payable for fund shares repurchased | 96,228 | |||
Other payables and accrued expenses | 52,023 | |||
|
| |||
TOTAL LIABILITIES | 1,636,039 | |||
|
| |||
TOTAL NET ASSETS | $ | 755,481,749 | ||
|
| |||
NET ASSETS CONSIST OF: | ||||
Capital stock | $ | 305,506 | ||
Additional paid-in-capital | 800,901,803 | |||
Undistributed net investment income | 8,968,747 | |||
Accumulated net realized loss on investments, foreign currency and translation of other assets and liabilities | (128,128,662 | ) | ||
Net unrealized appreciation (depreciation) on investments, foreign currency and translation of other assets and liabilities | 73,434,355 | |||
|
| |||
TOTAL NET ASSETS | $ | 755,481,749 | ||
|
| |||
NET ASSET VALUE, OFFERING PRICE AND REDEMPTION PRICE PER SHARE - Class I | ||||
($755,481,749/30,550,616 shares) | $ | 24.73 | ||
|
| |||
The accompanying notes are an integral part of the financial statements.
10
Overseas Series
Statement of Operations
For the Year Ended October 31, 2017
INVESTMENT INCOME: | ||||
Dividends (net of foreign taxes withheld, $1,784,432) | $ | 16,944,562 | ||
|
| |||
EXPENSES: | ||||
Management fees (Note 3) | 6,225,558 | |||
Fund accounting and administration fees (Note 3) | 122,557 | |||
Directors’ fees (Note 3) | 60,658 | |||
Transfer agent fees (Note 3) | 4,996 | |||
Chief Compliance Officer service fees (Note 3) | 4,037 | |||
Custodian fees | 148,537 | |||
Miscellaneous | 271,522 | |||
|
| |||
Total Expenses | 6,837,865 | |||
Less reduction of expenses (Note 3) | (167,624 | ) | ||
|
| |||
Net Expenses | 6,670,241 | |||
|
| |||
NET INVESTMENT INCOME | 10,274,321 | |||
|
| |||
REALIZED AND UNREALIZED GAIN (LOSS) ON INVESTMENTS AND FOREIGN CURRENCY: | ||||
Net realized gain (loss) on- | ||||
Investments (net of foreign capital gains tax of $5,046) | 56,160,662 | |||
Litigation proceeds (Note 4) | 2,316,585 | |||
Foreign currency and translation of other assets and liabilities | (373,065 | ) | ||
|
| |||
| 58,104,182 | ||||
|
| |||
Net change in unrealized appreciation (depreciation) on- | ||||
Investments (net of decrease in accrued foreign capital gains tax of $1,062) | 101,260,636 | |||
Foreign currency and translation of other assets and liabilities | 206,823 | |||
|
| |||
| 101,467,459 | ||||
|
| |||
NET REALIZED AND UNREALIZED GAIN (LOSS) ON INVESTMENTS AND FOREIGN CURRENCY | 159,571,641 | |||
|
| |||
NET INCREASE IN NET ASSETS RESULTING FROM OPERATIONS | $ | 169,845,962 | ||
|
| |||
The accompanying notes are an integral part of the financial statements.
11
Overseas Series
Statements of Changes in Net Assets
FOR THE YEAR 10/31/17 | FOR THE YEAR 10/31/16 | |||||||
INCREASE (DECREASE) IN NET ASSETS: | ||||||||
OPERATIONS: | ||||||||
Net investment income | $ | 10,274,321 | $ | 18,871,060 | ||||
Net realized gain (loss) on investments and foreign currency | 58,104,182 | (90,237,207 | ) | |||||
Net change in unrealized appreciation on investments and foreign currency | 101,467,459 | 57,079,534 | ||||||
|
|
|
| |||||
Net increase (decrease) from operations | 169,845,962 | (14,286,613 | ) | |||||
|
|
|
| |||||
DISTRIBUTIONS TO SHAREHOLDERS (Note 8): | ||||||||
From net investment income | (15,662,741 | ) | (27,334,427 | ) | ||||
|
|
|
| |||||
CAPITAL STOCK ISSUED AND REPURCHASED: | ||||||||
Net decrease from capital share transactions (Note 5) | (332,306,533 | ) | (750,051,441 | ) | ||||
|
|
|
| |||||
Net decrease in net assets | (178,123,312 | ) | (791,672,481 | ) | ||||
NET ASSETS: | ||||||||
Beginning of year | 933,605,061 | 1,725,277,542 | ||||||
|
|
|
| |||||
End of year (including undistributed net investment income of $8,968,747 and | $ | 755,481,749 | $ | 933,605,061 | ||||
|
|
|
| |||||
The accompanying notes are an integral part of the financial statements.
12
Overseas Series
Financial Highlights*
| FOR THE YEAR ENDED | ||||||||||||||||||||
| 10/31/17 | 10/31/16 | 10/31/15 | 10/31/14 | 10/31/13 | ||||||||||||||||
Per share data (for a share | ||||||||||||||||||||
Net asset value - Beginning of year | $ | 20.88 | $ | 21.34 | $ | 24.31 | $ | 27.39 | $ | 22.47 | ||||||||||
|
|
|
|
|
|
|
|
|
| |||||||||||
Income (loss) from investment operations: | ||||||||||||||||||||
Net investment income1 | 0.26 | 0.32 | 0.32 | 0.36 | 0.41 | |||||||||||||||
Net realized and unrealized gain (loss) on investments | 3.94 | (0.41 | ) | (1.14 | ) | (1.98 | ) | 4.88 | ||||||||||||
|
|
|
|
|
|
|
|
|
| |||||||||||
Total from investment operations | 4.20 | (0.09 | ) | (0.82 | ) | (1.62 | ) | 5.29 | ||||||||||||
|
|
|
|
|
|
|
|
|
| |||||||||||
Less distributions to shareholders: | ||||||||||||||||||||
From net investment income | (0.35 | ) | (0.37 | ) | (0.36 | ) | (0.37 | ) | (0.37 | ) | ||||||||||
From net realized gain on investments | — | — | (1.79 | ) | (1.09 | ) | — | |||||||||||||
|
|
|
|
|
|
|
|
|
| |||||||||||
Total distributions to shareholders | (0.35 | ) | (0.37 | ) | (2.15 | ) | (1.46 | ) | (0.37 | ) | ||||||||||
|
|
|
|
|
|
|
|
|
| |||||||||||
Net asset value - End of year | $ | 24.73 | $ | 20.88 | $ | 21.34 | $ | 24.31 | $ | 27.39 | ||||||||||
|
|
|
|
|
|
|
|
|
| |||||||||||
Net assets - End of year (000’s omitted) | $ | 755,482 | $ | 933,605 | $ | 1,725,278 | $ | 2,652,308 | $ | 2,661,662 | ||||||||||
|
|
|
|
|
|
|
|
|
| |||||||||||
Total return2 | 20.49 | %3 | (0.35 | %) | (3.02 | %) | (6.13 | %) | 23.87 | % | ||||||||||
Ratios (to average net assets)/Supplemental Data: | ||||||||||||||||||||
Expenses** | 0.75 | % | 0.75 | % | 0.74 | % | 0.74 | % | 0.75 | % | ||||||||||
Net investment income | 1.16 | % | 1.54 | % | 1.41 | % | 1.37 | % | 1.65 | % | ||||||||||
Portfolio turnover | 44 | % | 37 | % | 59 | % | 39 | % | 43 | % | ||||||||||
| *Effective March 1, 2017, Class A shares of the Series have been redesignated as Class I shares. | ||||||||||||||||||||
| **The investment advisor did not impose all or a portion of its management and/or other fees, and in some years may have paid a portion of the Series’ expenses. If these expenses had been incurred by the Series, the expense ratio (to average net assets) would have increased by the following amounts: | ||||||||||||||||||||
| 0.02 | % | N/A | N/A | N/A | N/A | |||||||||||||||
1Calculated based on average shares outstanding during the years.
2Represents aggregate total return for the years indicated, and assumes reinvestment of all distributions. Total return would have been lower had certain expenses not been waived or reimbursed during certain years.
3Includes litigation proceeds (see Statement of Operations). Excluding this amount, the Series’ total return is 20.10%.
The accompanying notes are an integral part of the financial statements.
13
Overseas Series
Notes to Financial Statements
| 1. | Organization |
Overseas Series (the “Series”) is a no-load diversified series of Manning & Napier Fund, Inc. (the “Fund”). The Fund is organized in Maryland and is registered under the Investment Company Act of 1940, as amended, as an open-end management investment company.
The Series’ investment objective is to provide long-term growth.
The Fund’s Advisor is Manning & Napier Advisors, LLC (the “Advisor”). Shares of the Series are offered to investors, clients and employees of the Advisor and its affiliates. Effective March 1, 2017, Class A shares of the Series have been redesignated as Class I shares. The total authorized capital stock of the Fund consists of 15 billion shares of common stock each having a par value of $0.01. As of October 31, 2017, 10.6 billion shares have been designated in total among 39 series, of which 200 million have been designated as Overseas Series Class I common stock.
| 2. | Significant Accounting Policies |
The following is a summary of significant accounting policies followed by the Series. The Series is an investment company and, accordingly, follows the investment company accounting and reporting guidance of the Financial Accounting Standards Board Accounting Standards Codification Topic 946 - Investment Companies, which is part of accounting principles generally accepted in the United States of America (“GAAP”).
Security Valuation
Portfolio securities, including domestic equities, foreign equities, warrants and options, listed on an exchange other than the NASDAQ Stock Market are valued at the latest quoted sales price of the exchange on which the security is primarily traded. Securities not traded on valuation date or securities not listed on an exchange are valued at the latest quoted bid price provided by the Fund’s pricing service. Securities listed on the NASDAQ Stock Market are valued in accordance with the NASDAQ Official Closing Price.
Short-term investments that mature in sixty days or less may be valued at amortized cost, which approximates fair value. Investments in open-end investment companies are valued at their net asset value per share on valuation date.
Volume and level of activity in established markets for an asset or liability are evaluated to determine whether recent transactions and quoted prices are determinative of fair value. Where there have been significant decreases in volume and level of activity, further analysis and adjustment may be necessary to estimate fair value. The Series measures fair value in these instances by the use of inputs and valuation techniques which may be based upon current market prices of securities that are comparable in coupon, rating, maturity and industry and/or expectation of future cash flows. As a result of trading in relatively thin markets and/or markets that experience significant volatility, the prices used by the Series to value these securities may differ from the value that would be realized if these securities were sold, and the differences could be material.
Securities for which representative valuations or prices are not available from the Series’ pricing service may be valued at fair value as determined in good faith by the Advisor under procedures approved by and under the general supervision and responsibility of the Fund’s Board of Directors (the “Board”). Due to the inherent uncertainty of valuations of such securities, the fair value may differ significantly from the values that would have been used had a ready market for such securities existed. If trading or events occurring after the close of the principal market in which securities are traded are expected to materially affect the value of those securities, then they may be valued at their fair value, taking this trading or these events into account. In accordance with the procedures approved by the Board, the values of certain securities trading outside the U.S. were adjusted following the close of local trading using a factor from a third party vendor. The third party vendor uses statistical analyses and quantitative models, which consider among other things subsequent movement and changes in the prices of indices, securities and exchange rates in other markets, to determine the factors which are used to adjust local market prices. The value of securities used for net asset value calculation under these procedures may differ from published prices for the same securities. It is the Fund’s policy to classify each foreign equity security where a factor from a third party vendor is provided as a Level 2 security.
14
Overseas Series
Notes to Financial Statements (continued)
| 2. | Significant Accounting Policies (continued) |
Security Valuation (continued)
Various inputs are used in determining the value of the Series’ assets or liabilities carried at fair value. These inputs are summarized in three broad levels. Level 1 includes quoted prices in active markets for identical assets and liabilities. Level 2 includes other significant observable inputs (including quoted prices for similar securities, interest rates, prepayment speeds, credit risk, etc.). Level 3 includes significant unobservable inputs (including the Series’ own assumptions in determining the fair value of investments). A financial instrument’s level within the fair value hierarchy is based on the lowest level of any input both individually and in aggregate that is significant to the fair value measurement. The inputs or methodology used for valuing securities are not necessarily an indication of the risk associated with investing in those securities.
The following is a summary of the valuation levels used for major security types as of October 31, 2017 in valuing the Series’ assets or liabilities carried at fair value:
| DESCRIPTION | TOTAL | LEVEL 1 | LEVEL 2 | LEVEL 3 | ||||||||||||
Assets: | ||||||||||||||||
Equity securities: | ||||||||||||||||
Consumer Discretionary | $ | 45,320,675 | $ | 18,440,345 | $ | 26,880,330 | $ | — | ||||||||
Consumer Staples | 189,612,390 | 56,423,183 | 133,189,207 | — | ||||||||||||
Energy | 35,917,677 | 35,917,677 | — | — | ||||||||||||
Financials | 25,996,080 | — | 25,996,080 | — | ||||||||||||
Health Care | 132,597,484 | 93,878,781 | 38,718,703 | — | ||||||||||||
Industrials | 106,391,117 | 18,655,448 | 87,735,669 | — | ||||||||||||
Information Technology | 77,938,061 | 58,670,543 | 19,267,518 | — | * | |||||||||||
Materials | 72,140,766 | 22,857,623 | 49,283,143 | — | ||||||||||||
Real Estate | 7,664,404 | — | 7,664,404 | — | ||||||||||||
Telecommunication Services | 18,597,860 | — | 18,597,860 | — | ||||||||||||
Mutual Fund | 27,483,479 | 27,483,479 | — | — | ||||||||||||
|
|
|
|
|
|
|
| |||||||||
Total assets | $ | 739,659,993 | $ | 332,327,079 | $ | 407,332,914 | $ | — | ||||||||
|
|
|
|
|
|
|
| |||||||||
*China Literature Ltd. - Rights (Expires 11/03/2017) (Hong Kong) is a Level 3 security as of October 31, 2017. However, there is no value for this security reported in the financial statements.
Please see the Investment Portfolio for foreign securities where a factor from a third party vendor was applied to determine the security’s fair value following the close of local trading. Such securities are included in Level 2 in the table above.
There were no Level 3 securities held by the Series as of October 31, 2016.
The Fund’s policy is to recognize transfers in and transfers out of the valuation levels as of the beginning of the reporting period. There were no transfers between levels during the year ended October 31, 2017.
New Accounting Guidance
On August 1, 2017, the Fund implemented amendments to Regulation S-X, issued by the Securities and Exchange Commission, which require standardized, enhanced disclosures, particularly related to derivatives, in investment company financial statements. Adoption had no effect on the Fund’s net assets or results of operations.
Security Transactions, Investment Income and Expenses
Security transactions are accounted for on trade date. Dividend income is recorded on the ex-dividend date, except that if the ex-dividend date has passed, certain dividends from foreign securities are recorded as soon as the Series is informed of the ex-dividend date. Non-cash dividends, if any, are recorded at the fair value of the securities received. Interest income, including amortization of premium and accretion of discounts using the effective interest method, is earned from settlement date and accrued daily.
15
Overseas Series
Notes to Financial Statements (continued)
| 2. | Significant Accounting Policies (continued) |
Security Transactions, Investment Income and Expenses (continued)
Expenses are recorded on an accrual basis. Most expenses of the Fund can be attributed to a specific series. Expenses which cannot be directly attributed are apportioned among the series in the Fund in such a manner as deemed equitable by the Fund’s Board, taking into consideration, among other things, the nature and type of expense.
The Series uses the identified cost method for determining realized gain or loss on investments for both financial statement and federal income tax reporting purposes.
Foreign Currency Translation
The books and records of the Series are maintained in U.S. dollars. Foreign currencies, investments and other assets and liabilities are translated into U.S. dollars at the current exchange rates. Purchases and sales of investment securities and income and expenses are translated on the respective dates of such transactions. The Series does not isolate realized and unrealized gains and losses attributable to changes in the exchange rates from gains and losses that arise from changes in the fair value of investments. Such fluctuations are included with net realized and unrealized gain or loss on investments. Net realized foreign currency gains and losses represent foreign currency gains and losses between trade date and settlement date on securities transactions, gains and losses on disposition of foreign currencies and the difference between the amount of income and foreign withholding taxes recorded on the books of the Series and the amounts actually received or paid.
Federal Taxes
The Series’ policy is to comply with the provisions of the Internal Revenue Code applicable to regulated investment companies. The Series is not subject to federal income tax or excise tax to the extent that the Series distributes to shareholders each year its taxable income, including any net realized gains on investments, in accordance with requirements of the Internal Revenue Code. Accordingly, no provision for federal income tax or excise tax has been made in the financial statements.
Management evaluates its tax positions to determine if the tax positions taken meet the minimum recognition threshold in connection with accounting for uncertainties in income tax positions taken or expected to be taken for the purposes of measuring and recognizing tax liabilities in the financial statements. Recognition of tax benefits of an uncertain tax position is required only when the position is “more likely than not” to be sustained assuming examination by taxing authorities. At October 31, 2017, the Series has recorded no liability for net unrecognized tax benefits relating to uncertain income tax positions taken or expected to be taken in future tax returns.
The Series files income tax returns in the U.S. federal jurisdiction, various states and foreign jurisdictions, as required. No income tax returns are currently under investigation. The statute of limitations on the Series’ tax returns remains open for the years ended October 31, 2014 through October 31, 2017. The Series is not aware of any tax positions for which it is reasonably possible that the total amounts of unrecognized tax benefits will significantly change in the next twelve months.
Foreign Taxes
Based on the Series’ understanding of the tax rules and rates related to income, gains and currency purchase/repatriation transactions for foreign jurisdictions in which it invests, the Series will provide for foreign taxes, and where appropriate, deferred foreign tax.
Distributions of Income and Gains
Distributions to shareholders of net investment income and net realized gains are made annually. An additional distribution may be necessary to avoid taxation of the Series. Distributions are recorded on the ex-dividend date.
Indemnifications
The Fund’s organizational documents provide former and current directors and officers with a limited indemnification against liabilities arising in connection with the performance of their duties to the Fund. In the normal course of business, the Fund may also enter into contracts that provide general indemnifications. The Fund’s maximum exposure under these arrangements is unknown as this would be dependent on future claims that may be made against the Fund. The risk of material loss from such claims is considered remote.
16
Overseas Series
Notes to Financial Statements (continued)
| 2. | Significant Accounting Policies (continued) |
Other
The preparation of financial statements in conformity with GAAP requires management to make estimates and assumptions that affect the reported amounts of assets and liabilities and the disclosure of contingent assets and liabilities at the date of the financial statements and the reported amounts of income and expenses during the reporting period. Actual results could differ from those estimates.
| 3. | Transactions with Affiliates |
The Fund has an Investment Advisory Agreement (the “Agreement”) with the Advisor, for which the Series pays a fee, computed daily and payable monthly, at an annual rate of 0.70% of the Series’ average daily net assets.
Under the Agreement, personnel of the Advisor provide the Series with advice and assistance in the choice of investments and the execution of securities transactions, and otherwise maintain the Series’ organization. The Advisor also provides the Fund with necessary office space and fund administration and support services. The salaries of all officers of the Fund (except a percentage of the Fund’s Chief Compliance Officer’s salary, which is paid by the Fund), and of all Directors who are “affiliated persons” of the Fund, or of the Advisor, and all personnel of the Fund, or of the Advisor, performing services relating to research, statistical and investment activities, are paid by the Advisor. Each “non-affiliated” Director receives an annual stipend, which is allocated among all the active series of the Fund. In addition, these Directors also receive a fee per Board meeting attended plus a fee for each committee meeting attended and are reimbursed for travel and other out-of-pocket expenses incurred by them in connection with attending such meetings. The Fund also has an Audit Committee Chair, who receives an additional annual stipend for this role.
The Advisor has contractually agreed, until at least February 28, 2018, to waive its management fee and, if necessary, pay other operating expenses of the Series in order to maintain total direct annual fund operating expenses for the Series at no more than 0.75% of average daily net assets each year. Accordingly, the Advisor waived fees of $167,624 for the year ended October 31, 2017, which is included as a reduction of expenses on the Statement of Operations. The Advisor is not eligible to recoup any expenses that have been waived or reimbursed in prior years.
Manning & Napier Investor Services, Inc., a registered broker-dealer affiliate of the Advisor, acts as distributor for the Fund’s shares. The services of Manning & Napier Investor Services, Inc. are provided at no additional cost to the Series.
Pursuant to a master services agreement effective through February 28, 2017, the Fund paid the Advisor an annual fee related to fund accounting and administration of 0.0085% on the first $25 billion of average daily net assets (excluding Target Series and Strategic Income Series); 0.0075% on the next $15 billion of average daily net assets (excluding Target Series and Strategic Income Series); and 0.0065% of average daily net assets in excess of $40 billion (excluding Target Series and Strategic Income Series); plus a base fee of $30,400 per series. Transfer agent fees were charged to the Fund on a per account basis. Additionally, certain transaction and out-of-pocket expenses, including charges for reporting relating to the Fund’s compliance program, were charged. The Advisor had agreements with BNY Mellon Investment Servicing (U.S.) Inc. (“BNY”) under which BNY served as sub-accountant services agent and sub-transfer agent. Effective March 1, 2017, BNY became the named transfer agent for the Fund. Pursuant to a master services agreement dated March 1, 2017, the Fund continues to pay the Advisor the annual fee related to fund accounting and administration of 0.0085% on the first $25 billion of average daily net assets (excluding Target Series and Strategic Income Series); 0.0075% on the next $15 billion of average daily net assets (excluding Target Series and Strategic Income Series); and 0.0065% of average daily net assets in excess of $40 billion (excluding Target Series and Strategic Income Series); plus the base fee of $30,400 per series. Additionally, certain transaction and out-of-pocket expenses, including charges for reporting relating to the Fund’s compliance program, are charged. The agreement between the Advisor and BNY under which BNY serves as sub-accountant services agent continues to be in effect.
Expenses not directly attributable to a series are allocated based on each series’ relative net assets or number of accounts, depending on the expense.
17
Overseas Series
Notes to Financial Statements (continued)
| 4. | Purchases and Sales of Securities |
For the year ended October 31, 2017, purchases and sales of securities, other than U.S. Government securities and short-term securities, were $372,607,858 and $731,420,687 respectively. There were no purchases or sales of U.S. Government securities. The Series received proceeds from settlement of litigation where they were able to recover a portion of investment losses previously realized by the Series. This amount is shown as litigation proceeds in the Statement of Operations.
| 5. | Capital Stock Transactions |
Transactions in Class I shares of Overseas Series were:
FOR THE YEAR ENDED 10/31/2017 | FOR THE YEAR ENDED 10/31/2016 | |||||||||||||||
| SHARES | AMOUNT | SHARES | AMOUNT | |||||||||||||
Sold | 4,379,024 | $ | 98,607,521 | 5,020,767 | $ | 98,878,846 | ||||||||||
Reinvested | 686,873 | 13,936,654 | 1,253,129 | 25,137,767 | ||||||||||||
Repurchased | (19,225,166 | ) | (444,850,708 | ) | (42,419,827 | ) | (874,068,054 | ) | ||||||||
|
|
|
|
|
|
|
| |||||||||
Total | (14,159,269 | ) | $ | (332,306,533 | ) | (36,145,931 | ) | $ | (750,051,441 | ) | ||||||
|
|
|
|
|
|
|
| |||||||||
At October 31, 2017, one shareholder account owned 11.2% of the Series. In addition, the Advisor and its affiliates owned 0.7% of the Series. Investment activities of these shareholders may have a material effect on the Series.
| 6. | Financial Instruments |
The Series may trade in instruments including written and purchased options, forward foreign currency exchange contracts and futures contracts and other derivatives in the normal course of investing activities to assist in managing exposure to various market risks. The Series may be subject to various elements of risk, which may involve, to a varying degree, elements of risk in excess of the amounts recognized for financial statement purposes. These risks include: the risk that changes in the value of a derivative may not correlate perfectly with the underlying asset, rate or index; counterparty credit risk related to over the counter derivative counterparties’ failure to perform under contract terms; liquidity risk related to the lack of a liquid market for these contracts allowing the fund to close out its position(s); and documentation risk relating to disagreement over contract terms. No such investments were held by the Series as of October 31, 2017.
| 7. | Foreign Securities |
Investing in securities of foreign companies and foreign governments involves special risks and considerations not typically associated with investing in securities of domestic companies and the U.S. Government. These risks include revaluation of currencies and future adverse political and economic developments. Moreover, securities of foreign companies and foreign governments and their markets may be less liquid and their prices more volatile than those of comparable domestic companies and the U.S. Government.
| 8. | Federal Income Tax Information |
The amount and characterization of certain income and capital gains to be distributed are determined in accordance with federal income tax regulations, which may differ from GAAP. These differences are primarily due to differing book and tax treatments in the timing of the recognition of net investment income or gains and losses, including losses deferred due to wash sales and foreign currency gains and losses. The Series may periodically make reclassifications among its capital accounts to reflect income and gains available for distribution (or available capital loss carryovers) under income tax regulations, without impacting the Series’ net asset value. For the year ended October 31, 2017, amounts were reclassified within the capital accounts to increase Undistributed Net Investment Income by $35,269, and decrease Accumulated Net Realized Loss on Investments by $35,269. Any such reclassifications are not reflected in the financial highlights.
18
Overseas Series
Notes to Financial Statements (continued)
| 8. | Federal Income Tax Information (continued) |
The tax character of distributions paid were as follows:
FOR THE YEAR 10/31/17 | FOR THE YEAR 10/31/16 | |||||||
Ordinary income | $ | 15,662,741 | $ | 27,334,427 | ||||
At October 31, 2017, the tax basis of components of distributable earnings and the net unrealized appreciation based on the identified cost for federal income tax purposes were as follows:
Cost for federal income tax purposes | $ | 682,013,086 | ||
Unrealized appreciation | 89,177,183 | |||
Unrealized depreciation | (31,530,276 | ) | ||
|
| |||
Net unrealized appreciation | $ | 57,646,907 | ||
|
| |||
Undistributed ordinary income | $ | 8,968,747 | ||
Capital loss carryforward | $ | (112,161,999 | ) |
At October 31, 2017, the Series had net short-term capital loss carryforwards of $8,167,191 and net long-term capital loss carryforwards of $103,994,808, which may be carried forward indefinitely.
As of October 31, 2017, the capital loss carryover utilized in the current year was $36,489,043.
19
Overseas Series
Report of Independent Registered Public Accounting Firm
To the Board of Directors of Manning & Napier Fund, Inc. and Shareholders of Overseas Series:
In our opinion, the accompanying statement of assets and liabilities, including the investment portfolio, and the related statements of operations and of changes in net assets and the financial highlights present fairly, in all material respects, the financial position of the Overseas Series (one of the series constituting Manning & Napier Fund, Inc., hereafter referred to as the “Series”) as of October 31, 2017, the results of its operations for the year then ended, the changes in its net assets for each of the two years in the period then ended and the financial highlights for each of the five years in the period then ended, in conformity with accounting principles generally accepted in the United States of America. These financial statements and financial highlights (hereafter referred to as “financial statements”) are the responsibility of the Series’ management. Our responsibility is to express an opinion on these financial statements based on our audits. We conducted our audits of these financial statements in accordance with the standards of the Public Company Accounting Oversight Board (United States). Those standards require that we plan and perform the audit to obtain reasonable assurance about whether the financial statements are free of material misstatement. An audit includes examining, on a test basis, evidence supporting the amounts and disclosures in the financial statements, assessing the accounting principles used and significant estimates made by management, and evaluating the overall financial statement presentation. We believe that our audits, which included confirmation of securities as of October 31, 2017 by correspondence with the custodian and brokers, provide a reasonable basis for our opinion.

New York, New York
December 18, 2017
20
Overseas Series
Supplemental Tax Information
(unaudited)
All reportings are based on financial information available as of the date of this annual report and, accordingly, are subject to change.
For federal income tax purposes, the Series reports for the current fiscal year $17,043,763 or, if different, the maximum amount allowable under the tax law, as qualified dividend income.
The Series has elected to pass through to its shareholders, foreign source income of $18,580,572 and foreign taxes paid of $1,381,022 for the year ended October 31, 2017.
21
Overseas Series
Directors’ and Officers’ Information
(unaudited)
The Statement of Additional Information provides additional information about the Fund’s directors and officers and can be obtained without charge by calling 1-800-466-3863, at www.manning-napier.com, or on the EDGAR Database on the SEC Internet web site (http://www.sec.gov). The following chart shows certain information about the Fund’s directors and officers, including their principal occupations during the last five years. Unless specific dates are provided, the individuals have held the listed positions for longer than five years.
| Interested Director and Officer | ||
| Name: | Michele T. Mosca* | |
| Address: | 290 Woodcliff Drive | |
| Fairport, NY 14450 | ||
| Age: | 45 | |
| Current Position(s) Held with Fund: | Principal Executive Officer, President, Chairman & Director | |
| Term of Office & Length of Time Served: | Indefinite – Chairman and Director since August 20161 | |
| Principal Occupation(s) During Past 5 Years: | Managing Director, Funds Group (since 2009) - Manning & Napier Advisors, LLC; President, Director (since 2015) - Manning & Napier Investor Services, Inc.; Chief Executive Officer, President (since 2016) - Rainier Investment Management Mutual Funds, Inc. Holds the following title for various subsidiaries and affiliates: President, Director | |
| Number of Portfolios Overseen within Fund Complex: | 38 | |
| Other Directorships Held Outside Fund Complex During Past 5 Years: | Trustee - Rainier Investment Management Mutual Funds (since 2016) | |
| Independent Directors | ||
| Name: | Stephen B. Ashley | |
| Address: | 290 Woodcliff Drive | |
| Fairport, NY 14450 | ||
| Age: | 77 | |
| Current Position(s) Held with Fund: | Director, Audit Committee Member, Governance & Nominating Committee Member | |
| Term of Office & Length of Time Served: | Indefinite – Since 1996 | |
| Principal Occupation(s) During Past 5 Years: | Chairman, Director & Chief Executive Officer (1997 to present) - The Ashley Group (property management and investment). Director (1995-2008) and Chairman (non-executive) (2004-2008) - Fannie Mae (mortgage) | |
| Number of Portfolios Overseen within Fund Complex: | 38 | |
| Other Directorships Held Outside Fund Complex During Past 5 Years: | Fannie Mae (1995-2008) The Ashley Group (1995-2008) Genesee Corporation (1987-2007) | |
| Name: | Paul A. Brooke | |
| Address: | 290 Woodcliff Drive | |
| Fairport, NY 14450 | ||
| Age: | 72 | |
| Current Position(s) Held with Fund: | Lead Independent Director, Audit Committee Member, Governance & Nominating Committee Chairman | |
| Term of Office & Length of Time Served: | Indefinite – Director, Audit Committee Member, Governance & Nominating Committee Member since 2007; Governance & Nominating Committee Chairman since 2016; Lead Independent Director since 2017 | |
| Principal Occupation(s) During Past 5 Years: | Chairman & CEO (2005-2009) - Ithaka Acquisition Corporation (investments); Chairman (2007-2009) - Alsius Corporation (investments); Managing Member (1991-present) - PMSV Holdings LLC (investments); Managing Member (2010-2016) - Venbio (investments). | |
| Number of Portfolios Overseen within Fund Complex: | 38 | |
| Other Directorships Held Outside Fund Complex During Past 5 Years: | Incyte Corp. (biotech) (2000-present); ViroPharma, Inc. (speciality pharmaceuticals) (2000-2014); HLTH (WebMD) (information) (2000-2010); Cheyne Capital International (investment)(2000-present); GMP Companies (investment) (2000-2011); Cytos Biotechnology Ltd (biotechnology) (2012-2014); Cerus (biomedical) (2016-present); PureEarth(non-profit) (2012-present) | |
22
Overseas Series
Directors’ and Officers’ Information
(unaudited)
| Independent Directors (continued) | ||
| Name: | Peter L. Faber | |
| Address: | 290 Woodcliff Drive | |
| Fairport, NY 14450 | ||
| Age: | 79 | |
| Current Position(s) Held with Fund: | Director, Governance & Nominating Committee Member | |
| Term of Office & Length of Time Served: | Indefinite - Since 1987 | |
| Principal Occupation(s) During Past 5 Years: | Senior Counsel (2006-2012), Partner (1995-2006 & 2013-present) - McDermott, Will & Emery LLP (law firm) | |
| Number of Portfolios Overseen within Fund Complex: | 38 | |
| Other Directorships Held Outside Fund Complex During Past 5 Years: | Boston Early Music Festival (non-profit)(2007-present); Amherst Early Music, Inc. (non-profit)(2009-present); Gotham Early Music Scene, Inc. (non-profit)(2009-present); Partnership for New York City, Inc. (non-profit)(1989-2010); New York Collegium (non-profit)(2004-2011) | |
| Name: | Harris H. Rusitzky | |
| Address: | 290 Woodcliff Drive | |
| Fairport, NY 14450 | ||
| Age: | 82 | |
| Current Position(s) Held with Fund: | Director, Audit Committee Member, Governance & Nominating Committee Member | |
| Term of Office & Length of Time Served: | Indefinite - Since 1985 | |
| Principal Occupation(s) During Past 5 Years: | President (1994-present) - The Greening Group (business consultants); Partner (2006-present) - The Restaurant Group (restaurants) | |
| Number of Portfolios Overseen within Fund Complex: | 38 | |
| Other Directorships Held Outside Fund Complex During Past 5 Years: | Rochester Institute of Technology (university)(1972-present); Culinary Institute of America (non-profit college)(1985-present); George Eastman House (museum)(1988-present); National Restaurant Association (restaurant trade organization)(1978-present) | |
| Name: | Chester N. Watson | |
| Address: | 290 Woodcliff Drive | |
| Fairport, NY 14450 | ||
| Age: | 67 | |
| Current Position(s) Held with Fund: | Director, Audit Committee Chairman, Governance & Nominating Committee Member | |
| Term of Office & Length of Time Served: | Indefinite - Since 2012 | |
| Principal Occupation(s) During Past 5 Years: | General Auditor (2003-2011) - General Motors Company (auto manufacturer) | |
| Number of Portfolios Overseen within Fund Complex: | 38 | |
| Other Directorships Held Outside Fund Complex During Past 5 Years: | Rochester Institute of Technology (university)(2005-present); Town of Greenburgh, NY Planning Board (municipal government) (2015-present) | |
| Officers: | ||
| Name: | Jeffrey S. Coons, Ph.D., CFA® | |
| Address: | 290 Woodcliff Drive | |
| Fairport, NY 14450 | ||
| Age: | 54 | |
| Current Position(s) Held with Fund: | Vice President | |
| Term of Office1 & Length of Time Served: | Since 2004 | |
| Principal Occupation(s) During Past 5 Years: | President since 2010, Co-Director of Research (2002 - 2015) - Manning & Napier Advisors, LLC | |
| Holds one or more of the following titles for various subsidiaries and affiliates: President, Director, Treasurer, or Senior Trust Officer | ||
| Name: | Elizabeth Craig | |
| Address: | 290 Woodcliff Drive | |
| Fairport, NY 14450 | ||
| Age: | 30 | |
| Current Position(s) Held with Fund: | Corporate Secretary | |
| Term of Office1 & Length of Time Served: | Since 2016 | |
| Principal Occupation(s) During Past 5 Years: | Fund Administration Manager since 2015; Mutual Fund Compliance Specialist (2009-2015) - Manning & Napier Advisors, LLC; Assistant Corporate Secretary (2011-2016) - Manning & Napier Fund, Inc. | |
23
Overseas Series
Directors’ and Officers’ Information
(unaudited)
| Officers: (continued) | ||
| Name: | Christine Glavin | |
| Address: | 290 Woodcliff Drive | |
| Fairport, NY 14450 | ||
| Age: | 51 | |
| Current Position(s) Held with Fund: | Principal Financial Officer, Chief Financial Officer | |
| Term of Office1 & Length of Time Served: | Principal Financial Officer since 2002; Chief Financial Officer since 2001 | |
| Principal Occupation(s) During Past 5 Years: | Director of Fund Reporting since 2011; Fund Reporting Manager (1997-2011) - Manning & Napier Advisors, LLC; Assistant Treasurer since 2008 - Exeter Trust Company; Chief Financial Officer since 2017 - Rainier Investment Management Mutual Funds, Inc. | |
| Name: | Jodi L. Hedberg | |
| Address: | 290 Woodcliff Drive | |
| Fairport, NY 14450 | ||
| Age: | 50 | |
| Current Position(s) Held with Fund: | Chief Compliance Officer, Anti-Money Laundering Compliance Officer | |
| Term of Office1 & Length of Time Served: | Chief Compliance Officer since 2004; Anti-Money Laundering Officer since 2002; Corporate Secretary (1997-2016)- Manning & Napier Fund, Inc.; Chief Compliance Officer and Anti-Money Laundering Officer since 2017 - Rainier Investment Management Mutual Funds, Inc. | |
| Principal Occupation(s) During Past 5 Years: | Director of Compliance since 2005; Compliance Manager (1995-2005) - Manning & Napier Advisors, LLC and affiliates; Corporate Secretary - Manning & Napier Investor Services, Inc. since 2006 | |
| Name: | Scott Morabito | |
| Address: | 290 Woodcliff Drive | |
| Fairport, NY 14450 | ||
| Age: | 29 | |
| Current Position(s) Held with Fund: | Assistant Vice President | |
| Term of Office1 & Length of Time Served: | Since 2017 | |
| Principal Occupation(s) During Past 5 Years: | Director of Funds Group since 2017; Fund Product and Strategy Manager (2014-2017); Senior Product and Strategy Analyst (2013-2014); Product and Strategy Analyst (2011-2013) - Manning & Napier Advisors, LLC. | |
| Name: | Amy Williams | |
| Address: | 290 Woodcliff Drive | |
| Fairport, NY 14450 | ||
| Age: | 56 | |
| Current Position(s) Held with Fund: | Assistant Corporate Secretary | |
| Term of Office1 & Length of Time Served: | Since 2016 | |
| Principal Occupation(s) During Past 5 Years: | Director of Fund Documentation - Manning & Napier Advisors, LLC and affiliates since 2009 | |
| Holds one or more of the following titles for various affiliates: Director | ||
| Name: | Richard Yates | |
| Address: | 290 Woodcliff Drive | |
| Fairport, NY 14450 | ||
| Age: | 52 | |
| Current Position(s) Held with Fund: | Chief Legal Officer | |
| Term of Office1 & Length of Time Served: | Chief Legal Officer since 2004 | |
| Principal Occupation(s) During Past 5 Years: | Counsel - Manning & Napier Advisors, LLC and affiliates since 2000; Chief Legal Officer since 2016 - Rainier Investment Management, LLC; Chief Legal Officer since 2016 - Rainier Investment Management Mutual Funds, Inc. | |
| Holds one or more of the following titles for various affiliates: Director, Corporate Secretary, Chief Legal Officer | ||
*Interested Director, within the meaning of the 1940 Act by reason of her positions with the Fund’s investment advisor, Manning & Napier Advisors, LLC and Distributor, Manning & Napier Investor Services, Inc.
1The term of office of all officers shall be one year and until their respective successors are chosen and qualified, or his or her earlier resignation or removal as provided in the Fund’s By-Laws.
24
{This page intentionally left blank}
25
Overseas Series
Literature Requests
Proxy Voting Policies and Procedures
A description of the policies and procedures that the Fund uses to determine how to vote proxies relating to portfolio securities is available, without charge, upon request:
| By phone | 1-800-466-3863 | |||
| On the Securities and Exchange | ||||
| Commission’s (SEC) web site | http://www.sec.gov |
Proxy Voting Record
Information regarding how the Fund voted proxies relating to portfolio securities during the most recent 12-month period ended June 30th is available, without charge, upon request:
| By phone | 1-800-466-3863 | |||
| On the SEC’s web site | http://www.sec.gov |
Quarterly Portfolio Holdings
The Series’ complete schedule of portfolio holdings for the 1st and 3rd quarters of each fiscal year are provided on Form N-Q, and are available, without charge, upon request:
| By phone | 1-800-466-3863 | |||
| On the SEC’s web site | http://www.sec.gov |
The Series’ Form N-Q may be reviewed and copied at the SEC’s Public Reference Room in Washington, D.C. Information on the operation of the Public Reference Room may be obtained by calling 1-800-SEC-0330.
Prospectus and Statement of Additional Information (SAI)
For more information about any of the Manning & Napier Fund, Inc. Series, you may obtain a prospectus and SAI at www.manning-napier.com or by calling (800) 466-3863. Before investing, carefully consider the objectives, risks, charges and expenses of the investment and read the prospectus carefully as it contains this and other information about the investment company. In addition, this information can be found on the SEC’s web site, http://www.sec.gov.
Additional information available at www.manning-napier.com
1. Fund Holdings - Month-End
2. Fund Holdings - Quarter-End
3. Shareholder Report - Annual
4. Shareholder Report - Semi-Annual
The Fund also offers electronic notification or “e-delivery” when certain documents are available on-line to be downloaded or reviewed. Direct shareholders can elect to receive electronic notification when shareholder reports, prospectus updates, and/or statements are available. If you do not currently have on-line access to your account, you can establish access by going to www.manning-napier.com, click on “Login” in the top corner of the page, and follow the prompts to self-enroll. Once enrolled, you can set your electronic notification preferences by clicking on the Account Options tab located within the green toolbar and then select E-Delivery Option. Should you have any questions on either how to establish on-line access or how to update your account settings, please contact Investor Services at 1-800-466-3863.
The Manning & Napier Fund, Inc. is managed by Manning & Napier Advisors, LLC. Manning & Napier Investor Services, Inc., an affiliate of Manning & Napier Advisors, LLC, is the distributor of the Fund shares.
MNOVS-10/17-AR
Management Discussion and Analysis
(unaudited)
Dear Shareholders:
Just one year ago, many investors were anticipating a widespread sell-off in domestic equity markets after Donald Trump won the election for the U.S. presidency. Not only did a sell-off fail to materialize, but equities actually moved sharply higher and remained on an upward trajectory throughout the year. The advance in equities was despite ongoing uncertainty surrounding policy implementation and how the new administration’s agenda might ultimately affect U.S. economic growth. For the year ended October 31, 2017, domestic equities were up 23.63%, as measured by the S&P 500 Index. International equities, as measured by the MSCI ACWI ex USA Index, also fared extraordinarily well, up 23.64%. Domestic investment-grade bonds, as measured by the Bloomberg Barclays U.S. Aggregate Bond Index, experienced relatively subdued performance, up 0.90%. Within fixed income, corporate bonds led, with high-yield securities in particular delivering very strong performance.
Much of the move upward in asset markets has been driven by stronger corporate earnings that materialized in early 2017 within both developed and emerging markets, supported by synchronized economic growth across all major global regions. Further, although Federal Reserve (Fed) policymakers continued gradually raising the target range for the federal funds rate and began reducing the Fed’s securities holdings, central bank policies across the globe have remained generally accommodative, providing an additional tailwind for asset prices.
Investors are undoubtedly enjoying the “Goldilocks” state of the economy: not too cold so as to usher in a recession, and not too hot so as to cause runaway inflation. Nonetheless, it is our view that market participants should temper their expectations going forward. The U.S. continues to move along in its economic cycle, and while it is not our view that we are on the cusp of a bear market, the status of our indicators suggest that we are certainly closer to the end of the current bull market than we are to the beginning. Complacency is elevated, there are significantly fewer pockets of cheap valuations remaining compared to the past several years, and U.S. valuations in particular limit upside potential, offering little support for asset prices should volatility in the financial markets materialize. This is surely not the time for investors to chase returns or take on unnecessary risk. Rather, it is our view that current market dynamics are consistent with rising risks that must be actively managed, and investors should maintain allocations consistent with their long-term investment objectives.
With this in mind, we discuss recent fund performance in this report, highlight how we are positioned amid the current economic environment, and provide our outlook of what to expect in financial markets. We hope that you find this information helpful, and look forward to working with you in the years ahead to meet your investment goals.
Thank you for your continued confidence in us.
Sincerely,
Manning & Napier Advisors, LLC
The S&P 500 Total Return Index is an unmanaged, capitalization-weighted measure of 500 widely held common stocks listed on the New York Stock Exchange, American Stock Exchange, and the Over-the-Counter market. The Index returns assume daily reinvestment of dividends and do not reflect any fees or expenses. Index returns provided by Bloomberg. S&P Dow Jones Indices LLC, a subsidiary of the McGraw Hill Financial, Inc., is the publisher of various index based data products and services and has licensed certain of its products and services for use by Manning & Napier. All such content Copyright © 2017 by S&P Dow Jones Indices LLC and/or its affiliates. All rights reserved. Neither S&P Dow Jones Indices LLC, Dow Jones Trademark Holdings LLC, their affiliates nor their third party licensors make any representation or warranty, express or implied, as to the ability of any index to accurately represent the asset class or market sector that it purports to represent and none of these parties shall have any liability for any errors, omissions, or interruptions of any index or the data included therein.
The MSCI ACWI ex USA Index (ACWIxUS) is designed to measure large and mid-cap representation across 22 of 23 Developed Markets countries (excluding the U.S.) and 24 Emerging Markets countries. The Index returns do not reflect any fees or expenses. The Index is denominated in U.S. dollars. The Index returns are net of withholding taxes. They assume daily reinvestment of net dividends thus accounting for any applicable dividend taxation. Index returns provided by Bloomberg.
The Bloomberg Barclays U.S. Aggregate Bond Index is an unmanaged, market-value weighted index of U.S. domestic investment-grade debt issues, including government, corporate, asset-backed, and mortgage-backed securities, with maturities of one year or more. Index returns do not reflect any fees or expenses. Index returns provided by Interactive Data.
1
Fund Commentary
(unaudited)
Investment Objective
The Pro-Blend® Series are strategically allocated across stocks, bonds, and cash to balance growth, capital preservation, and income to fit a range of investor risk management priorities.
Performance Commentary
Both domestic and international equity markets delivered positive absolute returns for the twelve-month period ended October 31, 2017, and the domestic bond market was modestly positive. Each of the Pro-Blend Series delivered positive absolute returns during the one-year period. However, with the exception of the Class I shares of the Pro-Blend Conservative Term Series, they each underperformed their respective blended benchmarks on a relative basis.
Stock selection challenged relative returns and was the primary contributor to the Series’ underperformance. Specifically, selection in the Health Care, Consumer Discretionary, and Energy sectors detracted from relative returns across all portfolios. In addition, the Series’ overweight to Health Care as well as an underweight to Financials, detracted from relative returns.
Offsetting a portion of the relative performance headwind was the aggregate effect of sector allocations, which aided relative returns. Each Series’ overweight to Information Technology and Materials compared to the blended benchmark, as well as an underweight to Energy, aided relative returns as well. In addition, broad fixed income exposure aided relative returns.
Our focus on growing companies that we believe can control their own destiny has led to meaningful allocations to the Health Care and Information Technology sectors. The Series have relatively little exposure to economically sensitive sectors including Financials and Energy. We have generally found companies within some of the more defensive sectors to be overvalued given the lower growth prospects, which has led to underweight allocations to Utilities, Consumer Staples, and Telecommunication Services as compared to the blended benchmarks.
Regarding fixed income, with the exception of the Maximum Term Series, we modestly increased duration over the last year when rates rose and value came into the longer end of the yield curve. While we still feel corporate credit continues to adequately compensate investors on a fundamental basis, the Series’ allocation to corporate credit was reduced when corporate credit spreads tightened. Additionally, a notable allocation to securitized fixed income (i.e., asset-backed and commercial mortgage backed securities) can be found in the Series (with the exception of the Maximum Term portfolio) as we view the risk/reward trade-off to be attractive in these sectors. We continue to monitor interest rates as well as credit spreads in order to be in a position to take advantage of opportunities that may present themselves.
As we begin the new fiscal year, earnings growth across major regions, accelerating business activity, and an improving economic backdrop are supportive of global asset prices. However, as markets continue to advance, we believe it is important to express our view that investors should exercise caution and selectivity due to rising risks associated with elevated complacency, valuations across most markets that remain at or somewhat above fair value, and the inflection in global monetary policy to less accommodative conditions. We believe these risk factors reinforce the need for an active, fundamentals-based investment approach, as it will be critical to manage them going forward.
Performance data quoted represents past performance and does not guarantee future results. The investment return and principal value of an investment will fluctuate, so that an investor’s shares, when redeemed, may be worth more or less than their original cost. Current performance may be higher or lower than that quoted; investors can obtain the most recent month-end performance at www.manning-napier.com or by calling (800) 593-4353.
All investments involve risks, including possible loss of principal. Because the fund invests in both stocks and bonds, the value of your investment will fluctuate in response to stock market movements and changes in interest rates. Investing in the fund will also involve a number of other risks, including issuer-specific risk, foreign investment risk, and small-cap/mid-cap risk. Investments in options and futures, like all derivatives, can be highly volatile and involve risks in addition to the risks of the underlying instrument on which the derivative is based, such as counterparty, correlation and liquidity risk. Also, the use of leverage increases exposure to the market and may magnify potential losses.
2
Performance Update as of October 31, 2017 - Pro-Blend® Conservative Term Series
(unaudited)
| AVERAGE ANNUAL TOTAL RETURNS AS OF OCTOBER 31, 2017 | ||||||||
| ONE YEAR1 | FIVE YEAR | TEN YEAR | SINCE INCEPTION2 | |||||
Manning & Napier Fund, Inc. - Pro-Blend® Conservative Term | ||||||||
Series - Class S3 | 7.02% | 4.38% | 4.62% | 5.70% | ||||
Manning & Napier Fund, Inc. - Pro-Blend® Conservative Term | ||||||||
Series - Class I3,4 | 7.25% | 4.58% | 4.80% | 5.79% | ||||
Manning & Napier Fund, Inc. - Pro-Blend® Conservative Term | ||||||||
Series - Class R3,5 | 6.72% | 4.07% | 4.34% | 5.46% | ||||
Manning & Napier Fund, Inc. - Pro-Blend® Conservative Term | ||||||||
Series - Class R23,5 | 6.13% | 3.53% | 3.79% | 4.92% | ||||
Bloomberg Barclays U.S. Intermediate Aggregate Bond Index6 | 0.61% | 1.74% | 3.75% | 4.89% | ||||
Conservative Term Composite Benchmark7 | 7.18% | 5.12% | 5.05% | 6.12% | ||||
The following graph compares the value of a $10,000 investment in the Manning & Napier Fund, Inc. - Pro-Blend® Conservative Term Series - Class S for the ten years ended October 31, 2017 to the Bloomberg Barclays U.S. Intermediate Aggregate Bond Index and Conservative Term Composite Benchmark.
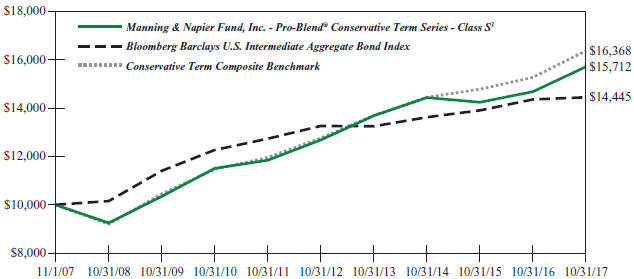
1The returns shown are based on net asset values calculated for shareholder transactions and may differ from the returns shown in the financial highlights, which reflect adjustments made to the net asset values in accordance with accounting principles generally accepted in the United States of America.
2Performance numbers for the Series and Indices are calculated from November 1, 1995, the Class S inception date.
3The Series’ performance does not reflect the deduction of taxes that a shareholder would pay on fund distributions or the redemption of shares. The Series’ performance is historical and may not be indicative of future results. The performance returns shown are inclusive of the net expense ratio of the Series. For the year ended October 31, 2017, this net expense ratio was 0.87% for Class S, 0.67% for Class I, 1.17% for Class R and 1.67% for Class R2. The gross expense ratio, which does not account for any voluntary or contractual waivers currently in effect, was 0.87% for Class S, 0.67% for Class I, 1.17% for Class R and 1.67% for Class R2 for the year ended October 31, 2017.
4For the periods through the inception of Class I on March 28, 2008, performance is based on the hypothetical performance of Class S shares. Because Class I shares invest in the same portfolio of securities as Class S, performance will only be different to the extent that the Class S shares have a higher expense ratio.
3
Performance Update as of October 31, 2017 - Pro-Blend® Conservative Term Series
(unaudited)
5For periods through the inception of Class R2 on January 4, 2010 and Class R on June 30, 2010, the performance figures are hypothetical and reflect the performance of Class S shares adjusted for expense differences.
6The Bloomberg Barclays U.S Intermediate Aggregate Bond Index is an unmanaged, market-value weighted index of U.S. domestic investment-grade debt issues, including government, corporate, asset-backed and mortgage-backed securities, with maturities greater than one year but less than ten years. Index returns do not reflect any fees or expenses. Index returns provided by Interactive Data.
7The Conservative Term Composite Benchmark is a blend of the Russell 3000® Index (Russell 3000), MSCI ACWI ex USA Index (ACWIxUS), and Bloomberg Barclays U.S. Intermediate Aggregate Bond Index (BIAB) in the following weightings: 15% Russell 3000, 5% ACWIxUS, and 80% BIAB through 05/31/2012; and 22% Russell 3000, 8% ACWIxUS, and 70% BIAB beginning 06/01/2012. Russell 3000 is an unmanaged index that consists of 3,000 of the largest U.S. companies based on total market capitalization. Index returns are based on a market capitalization-weighted average of relative price changes of the component stocks plus dividends whose reinvestments are compounded daily. Index returns provided by Bloomberg. ACWIxUS is designed to measure large and mid-cap representation across 22 of 23 Developed Markets countries (excluding the U.S.) and 24 Emerging Markets countries. The Index is denominated in U.S. dollars. The Index returns assume daily investment of gross dividends (which do not account for applicable dividend taxation) prior to 12/31/1998, as net returns were not available. Subsequent to 12/31/1998, the Index returns are net of withholding taxes. They assume daily reinvestment of net dividends thus accounting for any applicable dividend taxation. Index returns provided by Bloomberg. BIAB is an unmanaged, market value-weighted index of U.S. domestic investment-grade debt issues, including government, corporate, asset-backed, and mortgage-backed securities with maturities of greater than one year but less than ten years. Index returns provided by Interactive Data. The returns of the indices do not reflect any fees or expenses. Returns provided are calculated monthly using a blended allocation. Because the fund’s asset allocation will vary over time, the composition of the fund’s portfolio may not match the composition of the Conservative Term Composite Benchmark.
4
Shareholder Expense Example - Pro-Blend® Conservative Term Series
(unaudited)
As a shareholder of the Series, you incur ongoing costs, including management fees, shareholder service fees and other Series expenses. This example is intended to help you understand your ongoing costs (in dollars) of investing in the Series and to compare these costs with the ongoing costs of investing in other mutual funds.
The example is based on an investment of $1,000 invested in each class at the beginning of the period and held for the entire period (May 1, 2017 to October 31, 2017).
Actual Expenses
The Actual lines of the table below provide information about actual account values and actual expenses. You may use the information in these lines, together with the amount you invested, to estimate the expenses that you paid over the period. Simply divide your account value by $1,000 (for example, an $8,600 account value divided by $1,000 = 8.6), then multiply the result by the number in the Actual line for the Class in which you have invested under the heading entitled “Expenses Paid During Period” to estimate the expenses you paid on your account during this period.
Hypothetical Example for Comparison Purposes
The Hypothetical lines of each class in the table below provide information about hypothetical account values and hypothetical expenses based on the Class’ actual expense ratio and an assumed rate of return of 5% per year before expenses, which is not the Class’ actual return. The hypothetical account values and expenses may not be used to estimate the actual ending account balance or expenses you paid during the period. You may use this information to compare the ongoing costs of investing in a class of the Series and other funds. To do so, compare this 5% hypothetical example for the Class in which you have invested with the 5% hypothetical examples that appear in the shareholder reports of the other funds.
Please note that the expenses shown in the table are meant to highlight your ongoing costs only and do not reflect any transaction costs such as sales charges (loads), redemption fees, or exchange fees that you may incur in other mutual funds. Therefore, the second line of the table is useful in comparing ongoing costs only, and will not help you determine the relative total costs of owning different funds.
| BEGINNING ACCOUNT VALUE 5/1/17 | ENDING ACCOUNT VALUE 10/31/17 | EXPENSES PAID DURING PERIOD 5/1/17-10/31/17* | ANNUALIZED EXPENSE RATIO | |||||
Class S | ||||||||
Actual | $1,000.00 | $1,034.60 | $4.41 | 0.86% | ||||
Hypothetical (5% return before expenses) | $1,000.00 | $1,020.87 | $4.38 | 0.86% | ||||
Class I | ||||||||
Actual | $1,000.00 | $1,035.70 | $3.44 | 0.67% | ||||
Hypothetical (5% return before expenses) | $1,000.00 | $1,021.83 | $3.41 | 0.67% | ||||
Class R | ||||||||
Actual | $1,000.00 | $1,032.80 | $5.94 | 1.16% | ||||
Hypothetical (5% return before expenses) | $1,000.00 | $1,019.36 | $5.90 | 1.16% | ||||
Class R2 | ||||||||
Actual | $1,000.00 | $1,030.60 | $8.50 | 1.66% | ||||
Hypothetical (5% return before expenses) | $1,000.00 | $1,016.84 | $8.44 | 1.66% |
*Expenses are equal to the Class’ annualized expense ratio (for the six-month period), multiplied by the average account value over the period, multiplied by 184/365 (to reflect the one-half year period). Expenses are based on the most recent fiscal half year; therefore, the expense ratios stated above may differ from the expense ratios stated in the financial highlights, which are based on one-year data.
5
Portfolio Composition - Pro-Blend® Conservative Term Series
As of October 31, 2017 (unaudited)
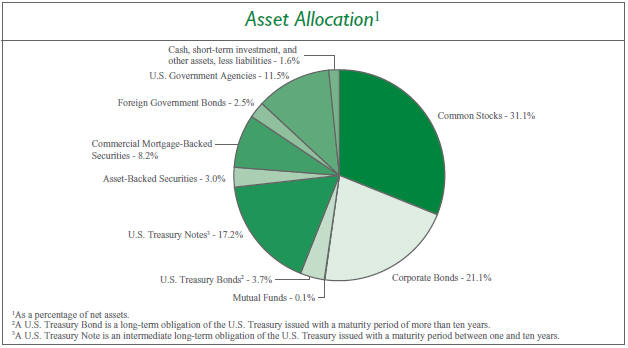
Sector Allocation4 |
| |||
Financials | 8.9 | % | ||
Information Technology | 8.6 | % | ||
Health Care | 7.2 | % | ||
Consumer Discretionary | 5.1 | % | ||
Energy | 4.8 | % | ||
Industrials | 4.1 | % | ||
Consumer Staples | 3.9 | % | ||
Materials | 3.8 | % | ||
Real Estate | 3.5 | % | ||
Telecommunication Services | 1.7 | % | ||
Utilities | 0.7 | % | ||
4Including common stocks and corporate bonds, as a percentage of total investments. | ||||
Top Five Stock Holdings5 |
| |||
Facebook, Inc. - Class A | 1.0 | % | ||
ServiceNow, Inc. | 0.9 | % | ||
Johnson & Johnson | 0.9 | % | ||
The Priceline Group, Inc. | 0.8 | % | ||
Skyworks Solutions, Inc. | 0.7 | % | ||
| 5As a percentage of total investments. | ||||
Top Five Bond Holdings6 |
| |||
U.S. Treasury Note, 1.75%, 4/30/2022 | 3.6 | % | ||
U.S. Treasury Note, 1.375%, 4/30/2020 | 3.4 | % | ||
U.S. Treasury Note, 1.625%, 4/30/2019 | 3.0 | % | ||
U.S. Treasury Note, 1.375%, 4/30/2021 | 3.0 | % | ||
U.S. Treasury Note, 1.125%, 7/31/2021 | 2.4 | % | ||
| 6As a percentage of total investments. | ||||
6
Investment Portfolio - October 31, 2017
| PRO-BLEND® CONSERVATIVE TERM SERIES | SHARES | VALUE (NOTE 2) | ||||||
COMMON STOCKS - 31.1% | ||||||||
Consumer Discretionary - 2.4% | ||||||||
Automobiles - 0.1% | ||||||||
Honda Motor Co., Ltd. - ADR (Japan) | 22,350 | $ | 694,862 | |||||
|
| |||||||
Hotels, Restaurants & Leisure - 0.1% | ||||||||
McDonald’s Corp. | 7,639 | 1,275,025 | ||||||
|
| |||||||
Internet & Direct Marketing Retail - 1.3% | ||||||||
Amazon.com, Inc.* | 4,460 | 4,929,548 | ||||||
The Priceline Group, Inc.* | 4,042 | 7,728,142 | ||||||
|
| |||||||
| 12,657,690 | ||||||||
|
| |||||||
Multiline Retail - 0.2% | ||||||||
Dollar General Corp. | 13,895 | 1,123,272 | ||||||
Target Corp. | 7,921 | 467,656 | ||||||
|
| |||||||
| 1,590,928 | ||||||||
|
| |||||||
Specialty Retail - 0.3% | ||||||||
Dick’s Sporting Goods, Inc. | 24,140 | 590,706 | ||||||
The Home Depot, Inc. | 11,052 | 1,832,201 | ||||||
O’Reilly Automotive, Inc.* | 2,840 | 599,098 | ||||||
|
| |||||||
| 3,022,005 | ||||||||
|
| |||||||
Textiles, Apparel & Luxury Goods - 0.4% | ||||||||
lululemon athletica, Inc.* | 53,269 | 3,276,576 | ||||||
NIKE, Inc. - Class B | 11,130 | 612,039 | ||||||
|
| |||||||
| 3,888,615 | ||||||||
|
| |||||||
Total Consumer Discretionary | 23,129,125 | |||||||
|
| |||||||
Consumer Staples - 2.7% | ||||||||
Beverages - 1.6% | ||||||||
Ambev S.A. - ADR (Brazil) | 641,730 | 4,062,151 | ||||||
Anheuser-Busch InBev S.A./N.V. (Belgium)1 | 35,846 | 4,395,479 | ||||||
Diageo plc (United Kingdom)1 | 156,703 | 5,351,204 | ||||||
PepsiCo, Inc. | 17,149 | 1,890,334 | ||||||
|
| |||||||
| 15,699,168 | ||||||||
|
| |||||||
Food & Staples Retailing - 0.3% | ||||||||
CVS Health Corp. | 9,913 | 679,338 | ||||||
Sysco Corp. | 8,537 | 474,828 | ||||||
Wal-Mart Stores, Inc. | 22,975 | 2,005,947 | ||||||
|
| |||||||
| 3,160,113 | ||||||||
|
| |||||||
Food Products - 0.2% | ||||||||
Campbell Soup Co. | 14,450 | 684,497 | ||||||
General Mills, Inc. | 8,270 | 429,378 | ||||||
J&J Snack Foods Corp. | 3,882 | 516,966 | ||||||
|
| |||||||
| 1,630,841 | ||||||||
|
| |||||||
Household Products - 0.2% | ||||||||
Colgate-Palmolive Co. | 10,392 | 732,116 | ||||||
Kimberly-Clark Corp. | 4,698 | 528,572 | ||||||
|
| |||||||
| 1,260,688 | ||||||||
|
| |||||||
Personal Products - 0.4% | ||||||||
Unilever plc - ADR (United Kingdom) | 71,824 | 4,068,830 | ||||||
|
| |||||||
Total Consumer Staples | 25,819,640 | |||||||
|
| |||||||
Energy - 1.7% | ||||||||
Energy Equipment & Services - 0.9% | ||||||||
Diamond Offshore Drilling, Inc.* | 88,155 | 1,474,833 | ||||||
Oceaneering International, Inc. | 64,970 | 1,313,693 | ||||||
Schlumberger Ltd. | 67,731 | 4,334,784 | ||||||
Transocean Ltd.* | 127,718 | 1,341,039 | ||||||
|
| |||||||
| 8,464,349 | ||||||||
|
| |||||||
Oil, Gas & Consumable Fuels - 0.8% | ||||||||
BP plc - ADR (United Kingdom) | 31,229 | 1,270,083 | ||||||
Chevron Corp. | 10,186 | 1,180,456 | ||||||
China Petroleum & Chemical Corp. - ADR (China) | 12,116 | 892,222 | ||||||
ConocoPhillips | 19,850 | 1,015,328 | ||||||
Exxon Mobil Corp. | 17,968 | 1,497,633 | ||||||
Hess Corp. | 22,626 | 999,164 | ||||||
Royal Dutch Shell plc - Class B - ADR (Netherlands) | 8,610 | 562,750 | ||||||
TOTAL S.A. (France)1 | 6,773 | 377,514 | ||||||
Valero Energy Corp. | 7,047 | 555,938 | ||||||
|
| |||||||
| 8,351,088 | ||||||||
|
| |||||||
Total Energy | 16,815,437 | |||||||
|
| |||||||
Financials - 1.9% | ||||||||
Banks - 1.5% | ||||||||
Bank of America Corp. | 53,755 | 1,472,349 | ||||||
BankUnited, Inc. | 7,270 | 253,360 | ||||||
BB&T Corp. | 12,508 | 615,894 | ||||||
Citigroup, Inc. | 19,563 | 1,437,881 | ||||||
Fifth Third Bancorp | 10,110 | 292,179 | ||||||
Huntington Bancshares, Inc. | 18,760 | 258,888 | ||||||
JPMorgan Chase & Co. | 40,652 | 4,089,998 | ||||||
KeyCorp | 27,173 | 495,907 | ||||||
The PNC Financial Services Group, Inc. | 2,049 | 280,283 | ||||||
Regions Financial Corp. | 17,170 | 265,792 | ||||||
SunTrust Banks, Inc. | 4,390 | 264,322 | ||||||
U.S. Bancorp | 18,452 | 1,003,420 | ||||||
Wells Fargo & Co. | 57,137 | 3,207,671 | ||||||
|
| |||||||
| 13,937,944 | ||||||||
|
| |||||||
The accompanying notes are an integral part of the financial statements.
7
Investment Portfolio - October 31, 2017
| PRO-BLEND® CONSERVATIVE TERM SERIES | SHARES | VALUE (NOTE 2) | ||||||
COMMON STOCKS (continued) | ||||||||
Financials (continued) | ||||||||
Capital Markets - 0.3% | ||||||||
Apollo Investment Corp. | 25,511 | $ | 151,025 | |||||
Ares Capital Corp. | 11,017 | 177,153 | ||||||
BlackRock, Inc. | 4,992 | 2,350,383 | ||||||
Medley Capital Corp. | 20,270 | 116,552 | ||||||
Oaktree Specialty Lending Corp. | 27,551 | 160,071 | ||||||
PennantPark Investment Corp. | 19,529 | 145,882 | ||||||
|
| |||||||
| 3,101,066 | ||||||||
|
| |||||||
Insurance - 0.1% | ||||||||
The Allstate Corp. | 2,710 | 254,360 | ||||||
American International Group, Inc. | 4,185 | 270,393 | ||||||
MetLife, Inc. | 5,285 | 283,170 | ||||||
Old Republic International Corp. | 13,185 | 267,524 | ||||||
Principal Financial Group, Inc. | 3,956 | 260,503 | ||||||
|
| |||||||
| 1,335,950 | ||||||||
|
| |||||||
Total Financials | 18,374,960 | |||||||
|
| |||||||
Health Care - 6.6% | ||||||||
Biotechnology - 2.5% | ||||||||
AbbVie, Inc. | 13,857 | 1,250,593 | ||||||
Amgen, Inc. | 6,723 | 1,178,004 | ||||||
Biogen, Inc.* | 10,519 | 3,278,352 | ||||||
BioMarin Pharmaceutical, Inc.* | 45,966 | 3,773,349 | ||||||
Gilead Sciences, Inc. | 13,076 | 980,177 | ||||||
Incyte Corp.* | 29,255 | 3,313,129 | ||||||
Regeneron Pharmaceuticals, Inc.* | 11,650 | 4,690,523 | ||||||
Seattle Genetics, Inc.* | 51,060 | 3,130,489 | ||||||
Vertex Pharmaceuticals, Inc.* | 14,180 | 2,073,541 | ||||||
|
| |||||||
| 23,668,157 | ||||||||
|
| |||||||
Health Care Equipment & Supplies - 0.7% | ||||||||
Koninklijke Philips N.V. - NY Shares (Netherlands) | 12,590 | 513,546 | ||||||
Medtronic plc | 75,047 | 6,042,784 | ||||||
|
| |||||||
| 6,556,330 | ||||||||
|
| |||||||
Health Care Providers & Services - 0.9% | ||||||||
DaVita, Inc.* | 110,213 | 6,694,338 | ||||||
Express Scripts Holding Co.*2 | 35,825 | 2,195,714 | ||||||
|
| |||||||
| 8,890,052 | ||||||||
|
| |||||||
Pharmaceuticals - 2.5% | ||||||||
Bristol-Myers Squibb Co. | 47,194 | 2,909,982 | ||||||
Eli Lilly & Co. | 8,802 | 721,236 | ||||||
GlaxoSmithKline plc (United Kingdom)1 | 23,955 | 429,927 | ||||||
Johnson & Johnson | 59,692 | 8,321,662 | ||||||
Merck & Co., Inc. | 27,269 | 1,502,249 | ||||||
Novartis AG - ADR (Switzerland) | 69,977 | 5,778,701 | ||||||
Perrigo Co. plc | 7,076 | 573,085 | ||||||
Pfizer, Inc. | 48,988 | 1,717,519 | ||||||
Roche Holding AG (Switzerland)1 | 3,047 | 704,257 | ||||||
Sanofi (France)1 | 5,643 | 534,317 | ||||||
Sanofi - ADR (France) | 25,494 | 1,205,356 | ||||||
|
| |||||||
| 24,398,291 | ||||||||
|
| |||||||
Total Health Care | 63,512,830 | |||||||
|
| |||||||
Industrials - 3.4% | ||||||||
Aerospace & Defense - 0.7% | ||||||||
Arconic, Inc. | 119,229 | 2,995,032 | ||||||
The Boeing Co. | 5,744 | 1,481,837 | ||||||
Lockheed Martin Corp. | 3,166 | 975,635 | ||||||
Raytheon Co. | 3,870 | 697,374 | ||||||
United Technologies Corp. | 8,898 | 1,065,624 | ||||||
|
| |||||||
| 7,215,502 | ||||||||
|
| |||||||
Air Freight & Logistics - 0.6% | ||||||||
FedEx Corp. | 20,330 | 4,590,717 | ||||||
United Parcel Service, Inc. - Class B | 9,030 | 1,061,296 | ||||||
|
| |||||||
| 5,652,013 | ||||||||
|
| |||||||
Commercial Services & Supplies - 0.2% | ||||||||
Covanta Holding Corp. | 39,355 | 633,616 | ||||||
Waste Management, Inc. | 13,102 | 1,076,591 | ||||||
|
| |||||||
| 1,710,207 | ||||||||
|
| |||||||
Construction & Engineering - 0.1% | ||||||||
Comfort Systems USA, Inc. | 13,965 | 618,650 | ||||||
|
| |||||||
Electrical Equipment - 0.2% | ||||||||
ABB Ltd. (Asea Brown Boveri) - ADR (Switzerland) | 28,035 | 732,556 | ||||||
Eaton Corp. plc | 6,516 | 521,410 | ||||||
Emerson Electric Co. | 8,821 | 568,602 | ||||||
|
| |||||||
| 1,822,568 | ||||||||
|
| |||||||
Industrial Conglomerates - 0.4% | ||||||||
3M Co. | 9,574 | 2,203,839 | ||||||
General Electric Co. | 16,636 | 335,382 | ||||||
Honeywell International, Inc. | 7,496 | 1,080,623 | ||||||
|
| |||||||
| 3,619,844 | ||||||||
|
| |||||||
Machinery - 0.0%## | ||||||||
Mueller Water Products, Inc. - Class A | 44,960 | 536,822 | ||||||
|
| |||||||
Professional Services - 0.8% | ||||||||
Equifax, Inc. | 24,414 | 2,649,651 | ||||||
The accompanying notes are an integral part of the financial statements.
8
Investment Portfolio - October 31, 2017
| PRO-BLEND® CONSERVATIVE TERM SERIES | SHARES | VALUE (NOTE 2) | ||||||
COMMON STOCKS (continued) | ||||||||
Industrials (continued) | ||||||||
Professional Services (continued) | ||||||||
Nielsen Holdings plc | 126,163 | $ | 4,676,862 | |||||
|
| |||||||
| 7,326,513 | ||||||||
|
| |||||||
Road & Rail - 0.4% | ||||||||
Genesee & Wyoming, Inc. - Class A* | 32,003 | 2,297,175 | ||||||
Kansas City Southern | 8,749 | 911,821 | ||||||
Union Pacific Corp. | 8,352 | 967,078 | ||||||
|
| |||||||
| 4,176,074 | ||||||||
|
| |||||||
Total Industrials | 32,678,193 | |||||||
|
| |||||||
Information Technology - 7.2% | ||||||||
Communications Equipment - 0.2% | ||||||||
Cisco Systems, Inc. | 43,391 | 1,481,803 | ||||||
|
| |||||||
Internet Software & Services - 2.0% | ||||||||
Alphabet, Inc. - Class A* | 3,298 | 3,406,966 | ||||||
Alphabet, Inc. - Class C* | 3,370 | 3,426,076 | ||||||
China Literature Ltd. - Rights (Expires 11/03/2017) (Hong Kong)*3 | 58 | — | ||||||
Facebook, Inc. - Class A* | 52,988 | 9,541,019 | ||||||
Tencent Holdings Ltd. - Class H (China)1 | 73,330 | 3,295,825 | ||||||
|
| |||||||
| 19,669,886 | ||||||||
|
| |||||||
IT Services - 1.3% | ||||||||
Automatic Data Processing, Inc. | 5,917 | 687,910 | ||||||
Broadridge Financial Solutions, Inc. | 6,511 | 559,425 | ||||||
Infosys Ltd. - ADR (India) | 33,489 | 497,312 | ||||||
International Business Machines Corp. | 8,642 | 1,331,387 | ||||||
InterXion Holding N.V. - ADR (Netherlands)* | 5,990 | 319,806 | ||||||
MasterCard, Inc. - Class A2 | 30,595 | 4,551,618 | ||||||
Visa, Inc. - Class A2 | 39,540 | 4,348,609 | ||||||
|
| |||||||
| 12,296,067 | ||||||||
|
| |||||||
Semiconductors & Semiconductor Equipment - 2.0% | ||||||||
Intel Corp. | 59,479 | 2,705,700 | ||||||
Qorvo, Inc.* | 62,803 | 4,761,095 | ||||||
QUALCOMM, Inc. | 17,680 | 901,857 | ||||||
Skyworks Solutions, Inc. | 60,398 | 6,876,916 | ||||||
Taiwan Semiconductor Manufacturing Co. Ltd. - ADR (Taiwan) | 44,820 | 1,897,231 | ||||||
Texas Instruments, Inc. | 20,382 | 1,970,736 | ||||||
|
| |||||||
| 19,113,535 | ||||||||
|
| |||||||
Software - 1.6% | ||||||||
Electronic Arts, Inc.* | 20,666 | 2,471,654 | ||||||
Microsoft Corp. | 58,025 | 4,826,520 | ||||||
ServiceNow, Inc.* | 67,790 | 8,566,622 | ||||||
|
| |||||||
| 15,864,796 | ||||||||
|
| |||||||
Technology Hardware, Storage & Peripherals - 0.1% | ||||||||
Apple, Inc. | 5,329 | 900,814 | ||||||
|
| |||||||
Total Information Technology | 69,326,901 | |||||||
|
| |||||||
Materials - 1.8% | ||||||||
Chemicals - 0.6% | ||||||||
Ashland Global Holdings, Inc. | 43,699 | 2,970,658 | ||||||
DowDuPont, Inc. | 14,605 | 1,056,088 | ||||||
FMC Corp. | 5,920 | 549,731 | ||||||
LyondellBasell Industries N.V. - Class A | 5,727 | 592,916 | ||||||
RPM International, Inc. | 16,901 | 901,330 | ||||||
|
| |||||||
| 6,070,723 | ||||||||
|
| |||||||
Construction Materials - 0.1% | ||||||||
CRH plc - ADR (Ireland) | 13,356 | 501,117 | ||||||
|
| |||||||
Containers & Packaging - 0.8% | ||||||||
Ball Corp. | 63,907 | 2,743,528 | ||||||
Graphic Packaging Holding Co. | 62,616 | 969,922 | ||||||
Sealed Air Corp. | 75,686 | 3,347,592 | ||||||
Sonoco Products Co. | 16,182 | 838,066 | ||||||
|
| |||||||
| 7,899,108 | ||||||||
|
| |||||||
Metals & Mining - 0.3% | ||||||||
Antofagasta plc (Chile)1 | 62,076 | 786,724 | ||||||
First Quantum Minerals Ltd. (Zambia) | 65,478 | 732,383 | ||||||
Lundin Mining Corp. (Canada) | 91,740 | 699,730 | ||||||
Southern Copper Corp. (Peru) | 25,940 | 1,114,123 | ||||||
|
| |||||||
| 3,332,960 | ||||||||
|
| |||||||
Total Materials | 17,803,908 | |||||||
|
| |||||||
Real Estate - 2.8% | ||||||||
Equity Real Estate Investment Trusts (REITS) - 2.8% | ||||||||
Acadia Realty Trust | 4,240 | 119,357 | ||||||
Agree Realty Corp. | 2,150 | 101,674 | ||||||
Alexandria Real Estate Equities, Inc. | 3,845 | 476,626 | ||||||
American Campus Communities, Inc. | 4,350 | 180,873 | ||||||
American Homes 4 Rent - Class A | 16,015 | 340,799 | ||||||
Apartment Investment & Management Co. - Class A | 8,890 | 390,982 | ||||||
AvalonBay Communities, Inc. | 2,725 | 494,124 | ||||||
The accompanying notes are an integral part of the financial statements.
9
Investment Portfolio - October 31, 2017
| PRO-BLEND® CONSERVATIVE TERM SERIES | SHARES | VALUE (NOTE 2) | ||||||
COMMON STOCKS (continued) | ||||||||
Real Estate (continued) | ||||||||
Equity Real Estate Investment Trusts (REITS) (continued) | ||||||||
Axiare Patrimonio SOCIMI S.A. (Spain)1 | 7,255 | $ | 136,061 | |||||
Bluerock Residential Growth REIT, Inc. | 9,325 | 105,279 | ||||||
Boston Properties, Inc. | 1,960 | 237,513 | ||||||
Brandywine Realty Trust | 11,930 | 208,656 | ||||||
Brixmor Property Group, Inc. | 6,215 | 108,576 | ||||||
Camden Property Trust | 2,245 | 204,834 | ||||||
CatchMark Timber Trust, Inc. - Class A | 85,606 | 1,095,757 | ||||||
Cedar Realty Trust, Inc. | 31,290 | 170,218 | ||||||
Chesapeake Lodging Trust | 7,565 | 211,064 | ||||||
Colony NorthStar, Inc. - Class A | 73,298 | 900,099 | ||||||
Columbia Property Trust, Inc. | 6,655 | 146,942 | ||||||
Community Healthcare Trust, Inc. | 35,972 | 986,712 | ||||||
CoreCivic, Inc. | 28,315 | 698,248 | ||||||
Cousins Properties, Inc. | 32,660 | 294,593 | ||||||
Crown Castle International Corp. | 7,168 | 767,549 | ||||||
CubeSmart | 22,425 | 610,409 | ||||||
DDR Corp. | 36,980 | 283,637 | ||||||
Digital Realty Trust, Inc. | 6,365 | 753,871 | ||||||
Douglas Emmett, Inc. | 5,815 | 231,379 | ||||||
Education Realty Trust, Inc. | 2,650 | 92,485 | ||||||
EPR Properties | 1,385 | 95,814 | ||||||
Equinix, Inc. | 2,855 | 1,323,293 | ||||||
Equity Commonwealth* | 6,285 | 188,864 | ||||||
Equity LifeStyle Properties, Inc. | 2,130 | 188,462 | ||||||
Equity Residential | 5,375 | 361,523 | ||||||
Essex Property Trust, Inc. | 415 | 108,908 | ||||||
Extra Space Storage, Inc. | 3,655 | 298,211 | ||||||
Forest City Realty Trust, Inc. - Class A | 8,130 | 200,242 | ||||||
Getty Realty Corp. | 5,300 | 150,573 | ||||||
GGP, Inc. | 8,800 | 171,248 | ||||||
Global Medical REIT, Inc. | 53,090 | 449,141 | ||||||
HCP, Inc. | 7,400 | 191,216 | ||||||
Healthcare Trust of America, Inc. - Class A | 7,450 | 223,872 | ||||||
Hibernia REIT plc (Ireland)1 | 96,180 | 165,252 | ||||||
Host Hotels & Resorts, Inc. | 9,375 | 183,375 | ||||||
Independence Realty Trust, Inc. | 15,120 | 153,468 | ||||||
Invitation Homes, Inc. | 7,025 | 158,554 | ||||||
Lamar Advertising Co. - Class A | 5,655 | 398,338 | ||||||
LaSalle Hotel Properties | 4,460 | 125,817 | ||||||
Life Storage, Inc. | 2,410 | 194,776 | ||||||
The Macerich Co. | 1,605 | 87,633 | ||||||
Mid-America Apartment Communities, Inc. | 3,515 | 359,760 | ||||||
National Retail Properties, Inc. | 4,870 | 195,677 | ||||||
Outfront Media, Inc. | 16,490 | 386,690 | ||||||
Physicians Realty Trust | 19,815 | 344,385 | ||||||
Plymouth Industrial REIT, Inc. | 2,685 | 48,598 | ||||||
Prologis, Inc. | 9,545 | 616,416 | ||||||
Public Storage | 1,540 | 319,165 | ||||||
Regency Centers Corp. | 3,213 | 197,760 | ||||||
Retail Opportunity Investments Corp. | 6,625 | 119,118 | ||||||
Rexford Industrial Realty, Inc. | 9,105 | 270,327 | ||||||
Simon Property Group, Inc. | 4,935 | 766,554 | ||||||
STAG Industrial, Inc. | 19,845 | 541,768 | ||||||
Starwood Waypoint Homes | 4,350 | 157,948 | ||||||
STORE Capital Corp. | 17,197 | 424,594 | ||||||
Sun Communities, Inc. | 2,055 | 185,484 | ||||||
Sunstone Hotel Investors, Inc. | 11,830 | 193,066 | ||||||
Terreno Realty Corp. | 7,335 | 269,341 | ||||||
UDR, Inc. | 6,850 | 265,712 | ||||||
Unibail-Rodamco S.E. (France)1 | 755 | 188,982 | ||||||
Urban Edge Properties | 12,555 | 294,540 | ||||||
Ventas, Inc. | 6,160 | 386,540 | ||||||
VEREIT, Inc. | 23,125 | 182,456 | ||||||
Vornado Realty Trust | 5,430 | 406,490 | ||||||
Welltower, Inc. | 5,230 | 350,201 | ||||||
Weyerhaeuser Co. | 120,050 | 4,310,996 | ||||||
|
| |||||||
Total Real Estate | 27,549,465 | |||||||
|
| |||||||
Telecommunication Services - 0.5% | ||||||||
Diversified Telecommunication Services - 0.4% | ||||||||
Zayo Group Holdings, Inc.* | 99,471 | 3,586,924 | ||||||
|
| |||||||
Wireless Telecommunication Services - 0.1% | ||||||||
NTT DOCOMO, Inc. - ADR (Japan) | 41,040 | 997,683 | ||||||
|
| |||||||
Total Telecommunication Services | 4,584,607 | |||||||
|
| |||||||
Utilities - 0.1% | ||||||||
Electric Utilities - 0.1% | ||||||||
Eversource Energy | 6,811 | 426,641 | ||||||
Exelon Corp. | 7,250 | 291,523 | ||||||
|
| |||||||
| 718,164 | ||||||||
|
| |||||||
Multi-Utilities - 0.0%## | ||||||||
CMS Energy Corp. | 10,356 | 500,919 | ||||||
|
| |||||||
Total Utilities | 1,219,083 | |||||||
|
| |||||||
TOTAL COMMON STOCKS | 300,814,149 | |||||||
|
| |||||||
The accompanying notes are an integral part of the financial statements.
10
Investment Portfolio - October 31, 2017
| PRO-BLEND® CONSERVATIVE TERM SERIES | PRINCIPAL AMOUNT 4 | VALUE (NOTE 2) | ||||||
CORPORATE BONDS - 21.1% | ||||||||
Non-Convertible Corporate Bonds - 21.1% | ||||||||
Consumer Discretionary - 2.7% | ||||||||
Auto Components - 0.3% | ||||||||
Magna International, Inc. (Canada), 4.15%, 10/1/2025 | 2,902,000 | $ | 3,105,068 | |||||
|
| |||||||
Household Durables - 0.6% | ||||||||
Century Communities, Inc.5, 5.875%, 7/15/2025 | 368,000 | 371,676 | ||||||
Meritage Homes Corp., 5.125%, 6/6/2027 | 245,000 | 247,756 | ||||||
NVR, Inc., 3.95%, 9/15/2022 | 3,588,000 | 3,769,023 | ||||||
TRI Pointe Group, Inc. - TRI Pointe Homes, Inc., 4.375%, 6/15/2019 | 368,000 | 377,660 | ||||||
TRI Pointe Group, Inc. - TRI Pointe Homes, Inc., 5.875%, 6/15/2024 | 209,000 | 226,242 | ||||||
Weekley Homes LLC - Weekley Finance Corp., 6.00%, 2/1/2023 | 309,000 | 302,820 | ||||||
Weekley Homes LLC - Weekley Finance Corp.5, 6.625%, 8/15/2025 | 350,000 | 340,375 | ||||||
|
| |||||||
| 5,635,552 | ||||||||
|
| |||||||
Internet & Direct Marketing Retail - 0.8% | ||||||||
Amazon.com, Inc.5, 3.15%, 8/22/2027 | 2,560,000 | 2,575,321 | ||||||
The Priceline Group, Inc., 3.60%, 6/1/2026 | 4,619,000 | 4,721,112 | ||||||
|
| |||||||
| 7,296,433 | ||||||||
|
| |||||||
Media - 0.8% | ||||||||
Charter Communications Operating LLC - Charter Communications Operating Capital Corp., 4.464%, 7/23/2022 | 100,000 | 105,607 | ||||||
Comcast Corp., 4.40%, 8/15/2035 | 2,216,000 | 2,399,684 | ||||||
CSC Holdings, LLC, 5.25%, 6/1/2024 | 472,000 | 469,935 | ||||||
Discovery Communications LLC, 3.95%, 3/20/2028 | 3,890,000 | 3,858,158 | ||||||
DISH DBS Corp., 5.875%, 7/15/2022 | 100,000 | 100,563 | ||||||
UPCB Finance IV Ltd. (Netherlands)5, 5.375%, 1/15/2025 | 525,000 | 536,812 | ||||||
VTR Finance B.V. (Chile)5, 6.875%, 1/15/2024 | 345,000 | 365,786 | ||||||
|
| |||||||
| 7,836,545 | ||||||||
|
| |||||||
Multiline Retail - 0.2% | ||||||||
Dollar General Corp., 3.25%, 4/15/2023 | 2,285,000 | 2,344,693 | ||||||
|
| |||||||
Total Consumer Discretionary | 26,218,291 | |||||||
|
| |||||||
Consumer Staples - 1.3% | ||||||||
Beverages - 0.8% | ||||||||
Anheuser-Busch InBev Worldwide, Inc. (Belgium), 8.20%, 1/15/2039 | 3,280,000 | 5,183,094 | ||||||
PepsiCo, Inc., 3.10%, 7/17/2022 | 2,490,000 | 2,574,231 | ||||||
|
| |||||||
| 7,757,325 | ||||||||
|
| |||||||
Food & Staples Retailing - 0.5% | ||||||||
C&S Group Enterprises LLC5, 5.375%, 7/15/2022 | 481,000 | 466,570 | ||||||
CVS Health Corp., 3.50%, 7/20/2022 | 3,740,000 | 3,855,154 | ||||||
|
| |||||||
| 4,321,724 | ||||||||
|
| |||||||
Total Consumer Staples | 12,079,049 | |||||||
|
| |||||||
Energy - 3.0% | ||||||||
Energy Equipment & Services - 0.1% | ||||||||
McDermott International, Inc.5, 8.00%, 5/1/2021 | 509,000 | 525,542 | ||||||
Trinidad Drilling Ltd. (Canada)5, 6.625%, 2/15/2025 | 359,000 | 349,128 | ||||||
|
| |||||||
| 874,670 | ||||||||
|
| |||||||
Oil, Gas & Consumable Fuels - 2.9% | ||||||||
BP Capital Markets plc (United Kingdom), 3.216%, 11/28/2023 | 1,131,000 | 1,161,277 | ||||||
BP Capital Markets plc (United Kingdom), 3.535%, 11/4/2024 | 3,452,000 | 3,588,788 | ||||||
Cheniere Corpus Christi Holdings, LLC, 7.00%, 6/30/2024 | 490,000 | 559,213 | ||||||
Cheniere Energy Partners LP5, 5.25%, 10/1/2025 | 345,000 | 355,350 | ||||||
Columbia Pipeline Group, Inc., 4.50%, 6/1/2025 | 2,400,000 | 2,572,206 | ||||||
ConocoPhillips Co., 3.35%, 11/15/2024 | 2,562,000 | 2,654,638 | ||||||
ConocoPhillips Co., 3.35%, 5/15/2025 | 491,000 | 505,862 | ||||||
Dynagas LNG Partners LP - Dynagas Finance, Inc. (Monaco), 6.25%, 10/30/2019 | 359,000 | 359,000 | ||||||
Enbridge, Inc. (Canada), 3.70%, 7/15/2027 | 2,540,000 | 2,573,179 | ||||||
Enviva Partners LP - Enviva Partners Finance Corp., 8.50%, 11/1/2021 | 351,000 | 376,448 | ||||||
GasLog Ltd. (Monaco), 8.875%, 3/22/2022 | 345,000 | 363,975 | ||||||
Global Ship Lease, Inc. (United Kingdom)5, 9.875%, 11/15/2022 | 495,000 | 504,900 | ||||||
The accompanying notes are an integral part of the financial statements.
11
Investment Portfolio - October 31, 2017
| PRO-BLEND® CONSERVATIVE TERM SERIES | PRINCIPAL AMOUNT 4 | VALUE (NOTE 2) | ||||||
CORPORATE BONDS (continued) | ||||||||
Non-Convertible Corporate Bonds (continued) | ||||||||
Energy (continued) | ||||||||
Oil, Gas & Consumable Fuels (continued) | ||||||||
Hilcorp Energy I LP - Hilcorp Finance Co.5, 5.75%, 10/1/2025 | 504,000 | $ | 515,970 | |||||
Jonah Energy LLC - Jonah Energy Finance Corp.5, 7.25%, 10/15/2025 | 350,000 | 350,000 | ||||||
Kinder Morgan Energy Partners LP, 4.30%, 5/1/2024 | 4,587,000 | 4,812,755 | ||||||
PBF Holding Co. LLC - PBF Finance Corp.5, 7.25%, 6/15/2025 | 263,000 | 271,876 | ||||||
Petroleos Mexicanos (Mexico), 6.875%, 8/4/2026 | 2,290,000 | 2,572,815 | ||||||
Rockies Express Pipeline, LLC5, 5.625%, 4/15/2020 | 468,000 | 496,080 | ||||||
Sabine Pass Liquefaction LLC, 5.875%, 6/30/2026 | 2,280,000 | 2,579,425 | ||||||
SemGroup Corp.5, 6.375%, 3/15/2025 | 341,000 | 335,885 | ||||||
Seven Generations Energy Ltd. (Canada)5, 5.375%, 9/30/2025 | 241,000 | 243,410 | ||||||
Southwestern Energy Co., 6.70%, 1/23/2025 | 263,000 | 268,918 | ||||||
Tallgrass Energy Partners LP - Tallgrass Energy Finance Corp.5, 5.50%, 9/15/2024 | 481,000 | 497,234 | ||||||
|
| |||||||
| 28,519,204 | ||||||||
|
| |||||||
Total Energy | 29,393,874 | |||||||
|
| |||||||
Financials - 7.0% | ||||||||
Banks - 3.7% | ||||||||
Banco Santander S.A. (Spain), 3.50%, 4/11/2022 | 3,507,000 | 3,593,504 | ||||||
Bank of America Corp., 4.00%, 1/22/2025 | 3,361,000 | 3,480,933 | ||||||
Barclays Bank plc (United Kingdom)5, 10.179%, 6/12/2021 | 2,080,000 | 2,568,582 | ||||||
Citigroup, Inc., 3.875%, 3/26/2025 | 4,606,000 | 4,726,228 | ||||||
Intesa Sanpaolo S.p.A. (Italy), 3.875%, 1/15/2019 | 2,520,000 | 2,569,282 | ||||||
JPMorgan Chase & Co.6, (3 mo. LIBOR US + 0.935%), 2.776%, 4/25/2023 | 4,787,000 | 4,803,977 | ||||||
Kreditanstalt fuer Wiederaufbau (Germany), 1.50%, 6/15/2021 | 8,539,000 | 8,385,689 | ||||||
Lloyds Banking Group plc (United Kingdom), 4.582%, 12/10/2025 | 4,637,000 | 4,890,383 | ||||||
Popular, Inc., 7.00%, 7/1/2019 | 394,000 | 402,865 | ||||||
Royal Bank of Canada (Canada), 3.77%, 3/30/2018 | CAD | 309,000 | 241,856 | |||||
Royal Bank of Scotland Group plc (United Kingdom), 6.10%, 6/10/2023 | 104,000 | 115,808 | ||||||
|
| |||||||
| 35,779,107 | ||||||||
|
| |||||||
Capital Markets - 1.1% | ||||||||
The Goldman Sachs Group, Inc., 4.25%, 10/21/2025 | 2,470,000 | 2,576,996 | ||||||
Morgan Stanley7, (3 mo. LIBOR US + 1.220%), 2.617%, 5/8/2024 | 3,790,000 | 3,853,596 | ||||||
Morgan Stanley, 5.00%, 11/24/2025 | 3,560,000 | 3,883,297 | ||||||
|
| |||||||
| 10,313,889 | ||||||||
|
| |||||||
Consumer Finance - 0.1% | ||||||||
Ally Financial, Inc., 3.50%, 1/27/2019 | 150,000 | 151,830 | ||||||
Navient Corp., 6.125%, 3/25/2024 | 250,000 | 256,562 | ||||||
SLM Corp., 5.125%, 4/5/2022 | 318,000 | 329,528 | ||||||
|
| |||||||
| 737,920 | ||||||||
|
| |||||||
Diversified Financial Services - 0.8% | ||||||||
AerCap Ireland Capital DAC - AerCap Global Aviation Trust (Netherlands), 4.50%, 5/15/2021 | 4,360,000 | 4,630,287 | ||||||
E*TRADE Financial Corp., 2.95%, 8/24/2022 | 2,570,000 | 2,571,224 | ||||||
LPL Holdings, Inc.5, 5.75%, 9/15/2025 | 236,000 | 245,440 | ||||||
|
| |||||||
| 7,446,951 | ||||||||
|
| |||||||
Insurance - 1.3% | ||||||||
American International Group, Inc., 4.125%, 2/15/2024 | 3,630,000 | 3,861,013 | ||||||
Assured Guaranty US Holdings, Inc., 5.00%, 7/1/2024 | 5,930,000 | 6,402,431 | ||||||
Prudential Financial, Inc.6, (3 mo. LIBOR US + 4.175%), 5.875%, 9/15/2042 | 2,330,000 | 2,574,650 | ||||||
|
| |||||||
| 12,838,094 | ||||||||
|
| |||||||
Thrifts & Mortgage Finance - 0.0%## | ||||||||
Ladder Capital Finance Holdings LLLP - Ladder Capital Finance Corp.5, 5.875%, 8/1/2021 | 590,000 | 609,175 | ||||||
|
| |||||||
Total Financials | 67,725,136 | |||||||
|
| |||||||
Health Care - 0.6% | ||||||||
Biotechnology - 0.5% | ||||||||
AMAG Pharmaceuticals, Inc.5, 7.875%, 9/1/2023 | 268,000 | 272,689 | ||||||
The accompanying notes are an integral part of the financial statements.
12
Investment Portfolio - October 31, 2017
| PRO-BLEND® CONSERVATIVE TERM SERIES | PRINCIPAL AMOUNT 4 | VALUE (NOTE 2) | ||||||
CORPORATE BONDS (continued) | ||||||||
Non-Convertible Corporate Bonds (continued) | ||||||||
Health Care (continued) | ||||||||
Biotechnology (continued) | ||||||||
Express Scripts Holding Co., 3.50%, 6/15/2024 | 3,820,000 | $ | 3,865,229 | |||||
Horizon Pharma, Inc. - Horizon Pharma USA, Inc.5, 8.75%, 11/1/2024 | 400,000 | 419,000 | ||||||
|
| |||||||
| 4,556,918 | ||||||||
|
| |||||||
Health Care Equipment & Supplies - 0.0%## | ||||||||
Hill-Rom Holdings, Inc.5, 5.00%, 2/15/2025 | 254,000 | 259,715 | ||||||
|
| |||||||
Health Care Providers & Services - 0.1% | ||||||||
DaVita, Inc., 5.00%, 5/1/2025 | 345,000 | 339,825 | ||||||
Fresenius Medical Care US Finance II, Inc. (Germany)5, 6.50%, 9/15/2018 | 150,000 | 155,798 | ||||||
HCA Healthcare, Inc., 6.25%, 2/15/2021 | 104,000 | 111,930 | ||||||
HCA, Inc., 3.75%, 3/15/2019 | 104,000 | 105,560 | ||||||
Ortho-Clinical Diagnostics, Inc. - Ortho-Clinical Diagnostics S.A.5, 6.625%, 5/15/2022 | 135,000 | 135,169 | ||||||
Tenet Healthcare Corp., 6.75%, 2/1/2020 | 104,000 | 105,820 | ||||||
|
| |||||||
| 954,102 | ||||||||
|
| |||||||
Total Health Care | 5,770,735 | |||||||
|
| |||||||
Industrials - 0.7% | ||||||||
Arconic, Inc., 5.87%, 2/23/2022 | 265,000 | 289,513 | ||||||
|
| |||||||
Air Freight & Logistics - 0.0%## | ||||||||
Park Aerospace Holdings Ltd. (Ireland)5, 4.50%, 3/15/2023 | 191,000 | 191,239 | ||||||
|
| |||||||
Airlines - 0.1% | ||||||||
Allegiant Travel Co., 5.50%, 7/15/2019 | 254,000 | 262,255 | ||||||
American Airlines Group, Inc.5, 5.50%, 10/1/2019 | 245,000 | 254,800 | ||||||
|
| |||||||
| 517,055 | ||||||||
|
| |||||||
Building Products - 0.1% | ||||||||
Airxcel, Inc.5, 8.50%, 2/15/2022 | 377,000 | 399,619 | ||||||
|
| |||||||
Construction & Engineering - 0.1% | ||||||||
Tutor Perini Corp.5, 6.875%, 5/1/2025 | 359,000 | 387,271 | ||||||
|
| |||||||
Industrial Conglomerates - 0.4% | ||||||||
General Electric Co.7, (3 mo. LIBOR US + 0.380%), 1.771%, 5/5/2026 | 4,273,000 | 4,138,765 | ||||||
|
| |||||||
Machinery - 0.0%## | ||||||||
Xerium Technologies, Inc., 9.50%, 8/15/2021 | 268,000 | 275,290 | ||||||
|
| |||||||
Trading Companies & Distributors - 0.0%## | ||||||||
International Lease Finance Corp., 6.25%, 5/15/2019 | 254,000 | 269,346 | ||||||
|
| |||||||
Total Industrials | 6,468,098 | |||||||
|
| |||||||
Information Technology - 1.4% | ||||||||
Internet Software & Services - 0.4% | ||||||||
Activision Blizzard, Inc., 3.40%, 6/15/2027 | 4,487,000 | 4,495,336 | ||||||
|
| |||||||
IT Services - 0.4% | ||||||||
Visa, Inc., 2.80%, 12/14/2022 | 3,790,000 | 3,861,304 | ||||||
|
| |||||||
Semiconductors & Semiconductor Equipment - 0.6% | ||||||||
Applied Materials, Inc., 3.30%, 4/1/2027 | 5,020,000 | 5,134,136 | ||||||
MagnaChip Semiconductor Corp. (South Korea), 6.625%, 7/15/2021 | 386,000 | 370,560 | ||||||
|
| |||||||
| 5,504,696 | ||||||||
|
| |||||||
Total Information Technology | 13,861,336 | |||||||
|
| |||||||
Materials - 2.0% | ||||||||
Chemicals - 0.3% | ||||||||
Kissner Holdings LP - Kissner Milling Co. Ltd. - BSC Holding, Inc. - Kissner USA (Canada)5, 8.375%, 12/1/2022 | 318,000 | 321,180 | ||||||
NOVA Chemicals Corp. (Canada)5, 4.875%, 6/1/2024 | 259,000 | 263,856 | ||||||
Solvay Finance America LLC (Belgium)5, 3.40%, 12/3/2020 | 2,490,000 | 2,560,482 | ||||||
|
| |||||||
| 3,145,518 | ||||||||
|
| |||||||
Metals & Mining - 1.4% | ||||||||
Anglo American Capital plc (United Kingdom)5, 9.375%, 4/8/2019 | 164,000 | 180,447 | ||||||
Anglo American Capital plc (United Kingdom)5, 4.00%, 9/11/2027 | 5,160,000 | 5,165,163 | ||||||
Corp Nacional del Cobre de Chile (Chile)5, 3.625%, 8/1/2027 | 4,460,000 | 4,486,269 | ||||||
Ferroglobe plc - Globe Specialty Metals, Inc.5, 9.375%, 3/1/2022 | 395,000 | 429,563 | ||||||
Northwest Acquisitions ULC - Dominion Finco, Inc.5, 7.125%, 11/1/2022 | 660,000 | 681,450 | ||||||
Petra Diamonds US Treasury plc (South Africa)5, 7.25%, 5/1/2022 | 200,000 | 198,600 | ||||||
The accompanying notes are an integral part of the financial statements.
13
Investment Portfolio - October 31, 2017
| PRO-BLEND® CONSERVATIVE TERM SERIES | SHARES/ PRINCIPAL AMOUNT4 | VALUE (NOTE 2) | ||||||
CORPORATE BONDS (continued) | ||||||||
Non-Convertible Corporate Bonds (continued) | ||||||||
Materials (continued) | ||||||||
Metals & Mining (continued) | ||||||||
Southern Copper Corp. (Peru), 3.875%, 4/23/2025 | 2,318,000 | $ | 2,405,732 | |||||
Techniplas LLC5, 10.00%, 5/1/2020 | 345,000 | 276,000 | ||||||
|
| |||||||
| 13,823,224 | ||||||||
|
| |||||||
Paper & Forest Products - 0.3% | ||||||||
Domtar Corp., 4.40%, 4/1/2022 | 2,161,000 | 2,272,847 | ||||||
|
| |||||||
Total Materials | 19,241,589 | |||||||
|
| |||||||
Real Estate - 0.6% | ||||||||
Equity Real Estate Investment Trusts (REITS) - 0.6% | ||||||||
American Tower Corp., 3.30%, 2/15/2021 | 4,633,000 | 4,753,600 | ||||||
GTP Acquisition Partners I LLC5, 2.35%, 6/15/2020 | 945,000 | 941,879 | ||||||
iStar, Inc., 5.25%, 9/15/2022 | 336,000 | 344,400 | ||||||
|
| |||||||
Total Real Estate | 6,039,879 | |||||||
|
| |||||||
Telecommunication Services - 1.2% | ||||||||
Diversified Telecommunication Services - 1.2% | ||||||||
AT&T, Inc., 3.90%, 8/14/2027 | 4,669,000 | 4,650,324 | ||||||
CenturyLink, Inc., 7.50%, 4/1/2024 | 245,000 | 260,313 | ||||||
Frontier Communications Corp., 11.00%, 9/15/2025 | 377,000 | 319,979 | ||||||
Hughes Satellite Systems Corp., 5.25%, 8/1/2026 | 509,000 | 520,493 | ||||||
Inmarsat Finance plc (United Kingdom)5, 4.875%, 5/15/2022 | 590,000 | 601,918 | ||||||
Sprint Communications, Inc.5, 9.00%, 11/15/2018 | 104,000 | 110,370 | ||||||
Sprint Communications, Inc., 7.00%, 8/15/2020 | 104,000 | 112,029 | ||||||
Verizon Communications, Inc., 4.125%, 3/16/2027 | 4,606,000 | 4,806,514 | ||||||
|
| |||||||
Total Telecommunication Services | 11,381,940 | |||||||
|
| |||||||
Utilities - 0.6% | ||||||||
Independent Power and Renewable Electricity Producers - 0.6% | ||||||||
American Water Capital Corp., 2.95%, 9/1/2027 | 5,200,000 | 5,176,015 | ||||||
Atlantica Yield plc (Spain)5, 7.00%, 11/15/2019 | 740,000 | 791,800 | ||||||
|
| |||||||
Total Utilities | 5,967,815 | |||||||
|
| |||||||
TOTAL CORPORATE BONDS | 204,147,742 | |||||||
|
| |||||||
MUTUAL FUNDS - 0.1% | ||||||||
iShares Core Dividend Growth ETF | 21,965 | 728,579 | ||||||
Schwab U.S. Dividend Equity ETF | 15,079 | 731,181 | ||||||
|
| |||||||
TOTAL MUTUAL FUNDS | 1,459,760 | |||||||
|
| |||||||
U.S. TREASURY SECURITIES - 20.9% | ||||||||
U.S. Treasury Bonds - 3.7% | ||||||||
U.S. Treasury Bond, 6.25%, 5/15/2030 | 6,958,000 | 9,830,621 | ||||||
U.S. Treasury Bond, 4.75%, 2/15/2037 | 10,174,000 | 13,454,320 | ||||||
U.S. Treasury Bond, 2.50%, 2/15/2045 | 8,548,000 | 7,951,643 | ||||||
U.S. Treasury Inflation Indexed Bond, 0.75%, 2/15/2042 | 4,644,609 | 4,494,164 | ||||||
|
| |||||||
Total U.S. Treasury Bonds | 35,730,748 | |||||||
|
| |||||||
U.S. Treasury Notes - 17.2% | ||||||||
U.S. Treasury Inflation Indexed Note, 0.125%, 4/15/2020 | 8,198,015 | 8,226,789 | ||||||
U.S. Treasury Inflation Indexed Note, 0.125%, 1/15/2023 | 4,561,336 | 4,541,977 | ||||||
U.S. Treasury Note, 1.625%, 4/30/2019 | 29,269,000 | 29,306,730 | ||||||
U.S. Treasury Note, 1.375%, 4/30/2020 | 32,700,500 | 32,456,524 | ||||||
U.S. Treasury Note, 1.375%, 4/30/2021 | 29,123,000 | 28,682,742 | ||||||
U.S. Treasury Note, 1.125%, 7/31/2021 | 23,482,000 | 22,860,094 | ||||||
U.S. Treasury Note, 1.75%, 4/30/2022 | 34,781,300 | 34,451,149 | ||||||
U.S. Treasury Note, 1.625%, 4/30/2023 | 3,670,000 | 3,581,547 | ||||||
U.S. Treasury Note, 1.625%, 5/15/2026 | 2,135,000 | 2,018,075 | ||||||
|
| |||||||
Total U.S. Treasury Notes | 166,125,627 | |||||||
|
| |||||||
TOTAL U.S. TREASURY SECURITIES | 201,856,375 | |||||||
|
| |||||||
The accompanying notes are an integral part of the financial statements.
14
Investment Portfolio - October 31, 2017
| PRO-BLEND® CONSERVATIVE TERM SERIES | PRINCIPAL AMOUNT 4 | VALUE (NOTE 2) | ||||||
ASSET-BACKED SECURITIES - 3.0% | ||||||||
CarMax Auto Owner Trust, Series 2016-4, Class A2, 1.21%, 11/15/2019 | 2,012,281 | $ | 2,009,522 | |||||
Cazenovia Creek Funding I LLC, Series 2015-1A, Class A5, 2.00%, 12/10/2023 | 370,696 | 369,769 | ||||||
Chesapeake Funding II LLC, Series 2017-2A, Class A15, 1.99%, 5/15/2029 | 6,370,000 | 6,371,780 | ||||||
Colony American Homes, Series 2015-1A, Class A5,7, (1 mo. LIBOR US + 1.200%), 2.437%, 7/17/2032 | 1,901,203 | 1,904,581 | ||||||
Credit Acceptance Auto Loan Trust, Series 2017-1A, Class A5, 2.56%, 10/15/2025 | 1,445,000 | 1,447,155 | ||||||
Enterprise Fleet Financing LLC, Series 2014-2, Class A35, 1.64%, 3/20/2020 | 1,748,541 | 1,747,785 | ||||||
Enterprise Fleet Financing LLC, Series 2015-2, Class A25, 1.59%, 2/22/2021 | 649,087 | 648,951 | ||||||
Enterprise Fleet Financing LLC, Series 2016-2, Class A25, 1.74%, 2/22/2022 | 194,164 | 194,019 | ||||||
Enterprise Fleet Financing LLC, Series 2016-2, Class A35, 2.04%, 2/22/2022 | 980,000 | 980,529 | ||||||
Home Partners of America Trust, Series 2016-1, Class A5,7, (1 mo. LIBOR US + 1.650%), 2.887%, 3/17/2033 | 962,418 | 970,211 | ||||||
Hyundai Auto Lease Securitization Trust, Series 2017-B, Class A35, 1.97%, 7/15/2020 | 3,900,000 | 3,903,136 | ||||||
Invitation Homes Trust, Series 2015-SFR3, Class A5,7, (1 mo. LIBOR US + 1.300%), 2.537%, 8/17/2032 | 2,124,660 | 2,140,069 | ||||||
SoFi Consumer Loan Program LLC, Series 2017-4, Class A5, 2.50%, 5/26/2026 | 974,972 | 973,659 | ||||||
SoFi Consumer Loan Program LLC, Series 2017-5, Class A15, 2.14%, 9/25/2026 | 1,552,150 | 1,550,812 | ||||||
SoFi Professional Loan Program LLC, Series 2017-A, Class A2A5, 1.55%, 3/26/2040 | 991,711 | 988,437 | ||||||
SoFi Professional Loan Program LLC, Series 2017-C, Class A2A5, 1.75%, 7/25/2040 | 275,601 | 275,078 | ||||||
Tax Ease Funding LLC, Series 2016-1A, Class A5, 3.131%, 6/15/2028 | 644,159 | 647,067 | ||||||
Tricon American Homes Trust, Series 2016-SFR1, Class A5, 2.589%, 11/17/2033 | 1,809,000 | 1,792,663 | ||||||
|
| |||||||
TOTAL ASSET-BACKED SECURITIES | 28,915,223 | |||||||
|
| |||||||
COMMERCIAL MORTGAGE-BACKED SECURITIES - 8.2% | ||||||||
Americold LLC Trust, Series 2010-ARTA, Class A15, 3.847%, 1/14/2029 | 190,297 | 195,447 | ||||||
BWAY Mortgage Trust, Series 2015-1740, Class A5, 2.917%, 1/10/2035 | 4,633,000 | 4,575,561 | ||||||
Commercial Mortgage Pass-Through Certificates, Series 2015-3BP, Class A5, 3.178%, 2/10/2035 | 500,000 | 506,268 | ||||||
Commercial Mortgage Pass-Through Certificates, Series 2015-DC1, Class A5, 3.35%, 2/10/2048 | 4,455,000 | 4,566,617 | ||||||
Credit Suisse Mortgage Capital Trust, Series 2013-IVR3, Class A15,8, 2.50%, 5/25/2043 | 1,402,295 | 1,334,536 | ||||||
Credit Suisse Mortgage Capital Trust, Series 2013-TH1, Class A15,8, 2.13%, 2/25/2043 | 980,982 | 939,124 | ||||||
FDIC Trust, Series 2011-R1, Class A5, 2.672%, 7/25/2026 | 263,291 | 264,030 | ||||||
Freddie Mac Multifamily Structured Pass-Through Certificates, Series K009, Class X1 | 20,869,218 | 634,257 | ||||||
Freddie Mac Multifamily Structured Pass-Through Certificates, Series K014, Class X1 | 2,769,718 | 96,542 | ||||||
Freddie Mac Multifamily Structured Pass-Through Certificates, Series K016, Class X1 | 6,799,839 | 340,288 | ||||||
Freddie Mac Multifamily Structured Pass-Through Certificates, Series K017, Class X1 | 8,401,643 | 385,283 | ||||||
Freddie Mac Multifamily Structured Pass-Through Certificates, Series K021, Class X1 | 15,386,126 | 861,591 | ||||||
Freddie Mac Multifamily Structured Pass-Through Certificates, Series K029, Class A28, 3.32%, 2/25/2023 | 3,470,000 | 3,631,236 | ||||||
The accompanying notes are an integral part of the financial statements.
15
Investment Portfolio - October 31, 2017
| PRO-BLEND® CONSERVATIVE TERM SERIES | PRINCIPAL AMOUNT 4 | VALUE (NOTE 2) | ||||||||||
COMMERCIAL MORTGAGE-BACKED SECURITIES (continued) | ||||||||||||
Freddie Mac Multifamily Structured Pass-Through Certificates, Series K030, | 77,270,484 | $ | 761,895 | |||||||||
Freddie Mac Multifamily Structured Pass-Through Certificates, Series K032, | 48,013,040 | 279,532 | ||||||||||
Freddie Mac Multifamily Structured Pass-Through Certificates, Series K033, | 5,431,000 | 5,612,677 | ||||||||||
Freddie Mac Multifamily Structured Pass-Through Certificates, Series K035, | 5,688,000 | 5,997,791 | ||||||||||
Freddie Mac Multifamily Structured Pass-Through Certificates, Series K055, | 343,188 | 341,230 | ||||||||||
Freddie Mac Multifamily Structured Pass-Through Certificates, Series K706, | 10,108,152 | 115,492 | ||||||||||
Freddie Mac Multifamily Structured Pass-Through Certificates, Series KJ10, | 4,232,000 | 4,321,144 | ||||||||||
Freddie Mac Multifamily Structured Pass-Through Certificates, Series KJ13, | 2,798,000 | 2,862,221 | ||||||||||
FREMF Mortgage Trust, Series 2011-K701, Class B5,8, 4.058%, 7/25/2048 | 875,000 | 873,674 | ||||||||||
FREMF Mortgage Trust, Series 2011-K702, Class B5,8, 4.785%, 4/25/2044 | 1,114,000 | 1,121,900 | ||||||||||
FREMF Mortgage Trust, Series 2013-K28, Class X2A (IO)5, 0.10%, 6/25/2046 | 204,085,558 | 865,241 | ||||||||||
FREMF Mortgage Trust, Series 2013-K712, Class B5,8, 3.365%, 5/25/2045 | 1,025,000 | 1,039,835 | ||||||||||
FREMF Mortgage Trust, Series 2014-K41, Class B5,8, 3.832%, 11/25/2047 | 2,227,000 | 2,263,696 | ||||||||||
FREMF Mortgage Trust, Series 2014-K716, Class B5,8, 3.951%, 8/25/2047 | 2,624,000 | 2,715,360 | ||||||||||
FREMF Mortgage Trust, Series 2015-K42, Class B5,8, 3.852%, 12/25/2024 | 490,000 | 502,662 | ||||||||||
FREMF Mortgage Trust, Series 2015-K43, Class B5,8, 3.735%, 2/25/2048 | 500,000 | 508,913 | ||||||||||
FREMF Mortgage Trust, Series 2015-K720, Class B5,8, 3.389%, 7/25/2022 | 270,000 | 268,160 | ||||||||||
GAHR Commercial Mortgage Trust, Series 2015-NRF, Class BFX5,8, 3.495%, 12/15/2034 | 2,495,000 | 2,526,342 | ||||||||||
GS Mortgage Securities Trust, Series 2010-C2, Class A15, 3.849%, 12/10/2043 | 104,503 | 107,412 | ||||||||||
JP Morgan Mortgage Trust, Series 2013-1, Class 1A25,8, 3.00%, 3/25/2043 | 768,671 | 768,101 | ||||||||||
JP Morgan Mortgage Trust, Series 2013-2, Class A25,8, 3.50%, 5/25/2043 | 854,175 | 870,624 | ||||||||||
JP Morgan Mortgage Trust, Series 2014-2, Class 1A15,8, 3.00%, 6/25/2029 | 1,190,511 | 1,205,021 | ||||||||||
LSTAR Commercial Mortgage Trust, Series 2014-2, Class A25, 2.767%, 1/20/2041 | 69,366 | 69,302 | ||||||||||
New Residential Mortgage Loan Trust, Series 2014-3A, Class AFX35,8, 3.75%, 11/25/2054 | 1,078,056 | 1,111,374 | ||||||||||
New Residential Mortgage Loan Trust, Series 2015-2A, Class A15,8, 3.75%, 8/25/2055 | 1,153,132 | 1,189,260 | ||||||||||
New Residential Mortgage Loan Trust, Series 2016-4A, Class A15,8, 3.75%, 11/25/2056 | 1,470,249 | 1,511,003 | ||||||||||
SBA Small Business Investment Companies, Series 2015-10A, Class 1, 2.517%, 3/10/2025 | 1,067,190 | 1,072,289 | ||||||||||
SBA Small Business Investment Companies, Series 2015-10B, Class 1, 2.829%, 9/10/2025 | 4,681,106 | 4,777,972 | ||||||||||
SCG Trust, Series 2013-SRP1, Class AJ5,7, (1 mo. LIBOR US + 1.950%), 3.189%, 11/15/2026 | 3,608,000 | 3,594,046 | ||||||||||
Sequoia Mortgage Trust, Series 2013-2, Class A8, 1.874%, 2/25/2043 | 946,922 | 895,618 | ||||||||||
Sequoia Mortgage Trust, Series 2013-7, Class A28, 3.00%, 6/25/2043 | 925,829 | 924,021 | ||||||||||
Sequoia Mortgage Trust, Series 2013-8, Class A18, 3.00%, 6/25/2043 | 1,128,220 | 1,124,451 | ||||||||||
The accompanying notes are an integral part of the financial statements.
16
Investment Portfolio - October 31, 2017
| PRO-BLEND® CONSERVATIVE TERM SERIES | PRINCIPAL AMOUNT 4 | VALUE (NOTE 2) | ||||||||||||||
COMMERCIAL MORTGAGE-BACKED SECURITIES (continued) | ||||||||||||||||
Starwood Retail Property Trust, Series 2014-STAR, Class A5,7, (1 mo. LIBOR US + 1.220%), 2.459%, 11/15/2027 | 2,330,000 | $ | 2,331,621 | |||||||||||||
Towd Point Mortgage Trust, Series 2016-5, Class A15,8, 2.50%, 10/25/2056 | 2,448,077 | 2,442,285 | ||||||||||||||
Vornado DP LLC Trust, Series 2010-VNO, Class A2FX5, 4.004%, 9/13/2028 | 155,000 | 161,790 | ||||||||||||||
Wells Fargo Commercial Mortgage Trust, Series 2010-C1, Class A25, 4.393%, 11/15/2043 | 265,000 | 279,855 | ||||||||||||||
WF-RBS Commercial Mortgage Trust, Series 2011-C2, Class A45,8, 4.869%, 2/15/2044 | 866,000 | 925,236 | ||||||||||||||
WinWater Mortgage Loan Trust, Series 2015-1, Class A15,8, 3.50%, 1/20/2045 | 1,224,929 | 1,245,456 | ||||||||||||||
WinWater Mortgage Loan Trust, Series 2015-3, Class A55,8, 3.50%, 3/20/2045 | 1,167,651 | 1,186,716 | ||||||||||||||
|
| |||||||||||||||
TOTAL COMMERCIAL MORTGAGE-BACKED SECURITIES | ||||||||||||||||
(Identified Cost $78,250,604) | 79,101,998 | |||||||||||||||
|
| |||||||||||||||
FOREIGN GOVERNMENT BONDS - 2.5% | ||||||||||||||||
Bonos de la Tesoreria de la Republica en pesos (Chile), 6.00%, 1/1/2018 | CLP | 330,000,000 | 521,290 | |||||||||||||
Canada Housing Trust No. 1 (Canada)5, 4.10%, 12/15/2018 | CAD | 268,000 | 214,001 | |||||||||||||
Canadian Government Bond (Canada), 2.75%, 6/1/2022 | CAD | 327,000 | 266,393 | |||||||||||||
Export-Import Bank of Korea (South Korea), 2.625%, 12/30/2020 | 8,725,000 | 8,712,645 | ||||||||||||||
The Korea Development Bank (South Korea), 1.375%, 9/12/2019 | 200,000 | 196,166 | ||||||||||||||
The Korea Development Bank (South Korea)7, (3 mo. LIBOR US + 0.680%), 1.999%, 9/19/2020 | 3,000,000 | 2,997,802 | ||||||||||||||
Korea Treasury Bond (South Korea), 2.00%, 12/10/2017 | KRW | 380,000,000 | 339,374 | |||||||||||||
Mexican Government Bond (Mexico), 8.00%, 6/11/2020 | MXN | 7,267,000 | 387,796 | |||||||||||||
Mexican Government Bond (Mexico), 6.50%, 6/10/2021 | MXN | 2,725,000 | 139,618 | |||||||||||||
Mexican Government Bond (Mexico), 6.50%, 6/9/2022 | MXN | 4,996,000 | 254,906 | |||||||||||||
Mexican Government Bond (Mexico), 7.75%, 5/29/2031 | MXN | 908,000 | 48,876 | |||||||||||||
Province of Ontario (Canada), 2.00%, 9/27/2018 | 2,089,000 | 2,094,988 | ||||||||||||||
Province of Ontario (Canada), 1.25%, 6/17/2019 | 2,044,000 | 2,024,173 | ||||||||||||||
Singapore Government Bond (Singapore), 2.50%, 6/1/2019 | SGD | 590,000 | 440,394 | |||||||||||||
Svensk Exportkredit AB (Sweden), 1.125%, 8/28/2019 | 4,996,000 | 4,933,119 | ||||||||||||||
United Kingdom Gilt (United Kingdom), 5.00%, 3/7/2018 | GBP | 332,000 | 448,211 | |||||||||||||
|
| |||||||||||||||
TOTAL FOREIGN GOVERNMENT BONDS | ||||||||||||||||
(Identified Cost $24,910,611) | 24,019,752 | |||||||||||||||
|
| |||||||||||||||
U.S. GOVERNMENT AGENCIES - 11.5% | ||||||||||||||||
Mortgage-Backed Securities - 8.1% | ||||||||||||||||
Fannie Mae, Pool #888468, 5.50%, 9/1/2021 | 261,345 | 271,880 | ||||||||||||||
Fannie Mae, Pool #995233, 5.50%, 10/1/2021 | 23,035 | 23,781 | ||||||||||||||
Fannie Mae, Pool #888017, 6.00%, 11/1/2021 | 39,353 | 41,342 | ||||||||||||||
Fannie Mae, Pool #995329, 5.50%, 12/1/2021 | 204,121 | 212,534 | ||||||||||||||
Fannie Mae, Pool #888136, 6.00%, 12/1/2021 | 49,006 | 51,578 | ||||||||||||||
Fannie Mae, Pool #888815, 4.50%, 11/1/2022 | 33,979 | 34,892 | ||||||||||||||
Fannie Mae, Pool #888810, 5.50%, 11/1/2022 | 309,116 | 321,060 | ||||||||||||||
Fannie Mae, Pool #AA1563, 4.50%, 2/1/2024 | 33,302 | 34,813 | ||||||||||||||
Fannie Mae, Pool #AC1557, 4.50%, 9/1/2024 | 78,903 | 82,737 | ||||||||||||||
Fannie Mae, Pool #AD0462, 5.50%, 10/1/2024 | 33,797 | 36,007 | ||||||||||||||
Fannie Mae, Pool #MA1834, 4.50%, 2/1/2034 | 931,908 | 1,005,326 | ||||||||||||||
Fannie Mae, Pool #MA1903, 4.50%, 5/1/2034 | 893,105 | 963,466 | ||||||||||||||
Fannie Mae, Pool #MA2177, 4.00%, 2/1/2035 | 2,210,951 | 2,342,086 | ||||||||||||||
Fannie Mae, Pool #745418, 5.50%, 4/1/2036 | 572,897 | 639,377 | ||||||||||||||
Fannie Mae, Pool #886904, 6.50%, 9/1/2036 | 61,470 | 68,667 | ||||||||||||||
Fannie Mae, Pool #909786, 5.50%, 3/1/2037 | 175,035 | 194,285 | ||||||||||||||
Fannie Mae, Pool #918516, 5.50%, 6/1/2037 | 88,765 | 98,634 | ||||||||||||||
The accompanying notes are an integral part of the financial statements.
17
Investment Portfolio - October 31, 2017
| PRO-BLEND® CONSERVATIVE TERM SERIES | PRINCIPAL AMOUNT 4 | VALUE (NOTE 2) | ||||||||||||||
U.S. GOVERNMENT AGENCIES (continued) | ||||||||||||||||
Mortgage-Backed Securities (continued) | ||||||||||||||||
Fannie Mae, Pool #995050, 6.00%, 9/1/2037 | 240,175 | $ | 273,205 | |||||||||||||
Fannie Mae, Pool #AB8161, 6.00%, 12/1/2037 | 786,666 | 889,787 | ||||||||||||||
Fannie Mae, Pool #933521, 5.00%, 1/1/2038 | 12,862 | 13,960 | ||||||||||||||
Fannie Mae, Pool #889260, 5.00%, 4/1/2038 | 24,242 | 26,348 | ||||||||||||||
Fannie Mae, Pool #933731, 5.50%, 4/1/2038 | 303,073 | 334,767 | ||||||||||||||
Fannie Mae, Pool #889576, 6.00%, 4/1/2038 | 521,910 | 591,690 | ||||||||||||||
Fannie Mae, Pool #912948, 5.00%, 5/1/2038 | 8,870 | 9,622 | ||||||||||||||
Fannie Mae, Pool #975840, 5.00%, 5/1/2038 | 56,293 | 61,055 | ||||||||||||||
Fannie Mae, Pool #889624, 5.50%, 5/1/2038 | 447,137 | 496,289 | ||||||||||||||
Fannie Mae, Pool #995196, 6.00%, 7/1/2038 | 705,550 | 799,808 | ||||||||||||||
Fannie Mae, Pool #986458, 6.00%, 8/1/2038 | 9,486 | 10,655 | ||||||||||||||
Fannie Mae, Pool #987831, 6.00%, 9/1/2038 | 24,867 | 27,877 | ||||||||||||||
Fannie Mae, Pool #990897, 6.00%, 9/1/2038 | 74,105 | 83,118 | ||||||||||||||
Fannie Mae, Pool #AD0220, 6.00%, 10/1/2038 | 91,034 | 103,279 | ||||||||||||||
Fannie Mae, Pool #993920, 6.00%, 11/1/2038 | 84,007 | 94,173 | ||||||||||||||
Fannie Mae, Pool #257497, 6.00%, 12/1/2038 | 21,523 | 24,154 | ||||||||||||||
Fannie Mae, Pool #AA0675, 6.00%, 12/1/2038 | 21,833 | 24,475 | ||||||||||||||
Fannie Mae, Pool #971022, 5.00%, 1/1/2039 | 44,716 | 48,620 | ||||||||||||||
Fannie Mae, Pool #AA1810, 5.00%, 1/1/2039 | 86,320 | 93,847 | ||||||||||||||
Fannie Mae, Pool #890294, 5.50%, 1/1/2039 | 894,989 | 996,302 | ||||||||||||||
Fannie Mae, Pool #AD0307, 5.50%, 1/1/2039 | 471,642 | 524,392 | ||||||||||||||
Fannie Mae, Pool #983686, 5.00%, 2/1/2039 | 68,992 | 74,830 | ||||||||||||||
Fannie Mae, Pool #AD0527, 5.50%, 6/1/2039 | 200,120 | 222,285 | ||||||||||||||
Fannie Mae, Pool #AE0604, 6.00%, 7/1/2039 | 568,001 | 636,736 | ||||||||||||||
Fannie Mae, Pool #AA6788, 6.00%, 8/1/2039 | 168,835 | 189,274 | ||||||||||||||
Fannie Mae, Pool #AC0463, 5.00%, 11/1/2039 | 80,697 | 87,614 | ||||||||||||||
Fannie Mae, Pool #AC5111, 5.00%, 11/1/2039 | 146,977 | 159,699 | ||||||||||||||
Fannie Mae, Pool #MA0258, 4.50%, 12/1/2039 | 1,091,371 | 1,170,984 | ||||||||||||||
Fannie Mae, Pool #MA0259, 5.00%, 12/1/2039 | 65,856 | 71,542 | ||||||||||||||
Fannie Mae, Pool #AC8573, 5.00%, 1/1/2040 | 105,680 | 114,808 | ||||||||||||||
Fannie Mae, Pool #890326, 5.50%, 1/1/2040 | 957,447 | 1,064,695 | ||||||||||||||
Fannie Mae, Pool #AL1595, 6.00%, 1/1/2040 | 730,797 | 828,800 | ||||||||||||||
Fannie Mae, Pool #AE0061, 6.00%, 2/1/2040 | 269,196 | 304,346 | ||||||||||||||
Fannie Mae, Pool #AL0152, 6.00%, 6/1/2040 | 949,495 | 1,075,406 | ||||||||||||||
Fannie Mae, Pool #AL0241, 4.00%, 4/1/2041 | 989,526 | 1,043,013 | ||||||||||||||
Fannie Mae, Pool #AI5172, 4.00%, 8/1/2041 | 634,777 | 669,006 | ||||||||||||||
Fannie Mae, Pool #AL1410, 4.50%, 12/1/2041 | 1,473,550 | 1,586,302 | ||||||||||||||
Fannie Mae, Pool #AB4300, 3.50%, 1/1/2042 | 305,280 | 315,248 | ||||||||||||||
Fannie Mae, Pool #AL7729, 4.00%, 6/1/2043 | 753,250 | 793,767 | ||||||||||||||
Fannie Mae, Pool #AX5234, 4.50%, 11/1/2044 | 1,287,762 | 1,376,751 | ||||||||||||||
Fannie Mae, Pool #AS4103, 4.50%, 12/1/2044 | 1,267,607 | 1,368,189 | ||||||||||||||
Fannie Mae, Pool #AZ2001, 3.50%, 5/1/2045 | 2,554,624 | 2,635,313 | ||||||||||||||
Fannie Mae, Pool #AZ9215, 4.00%, 10/1/2045 | 1,186,682 | 1,248,107 | ||||||||||||||
Fannie Mae, Pool #BC3490, 3.50%, 2/1/2046 | 2,344,728 | 2,412,028 | ||||||||||||||
Fannie Mae, Pool #BC6764, 3.50%, 4/1/2046 | 1,883,365 | 1,937,423 | ||||||||||||||
Fannie Mae, Pool #BC8677, 4.00%, 5/1/2046 | 664,737 | 698,012 | ||||||||||||||
Fannie Mae, Pool #BC2098, 4.00%, 6/1/2046 | 1,170,099 | 1,228,740 | ||||||||||||||
Fannie Mae, Pool #BD2179, 4.00%, 7/1/2046 | 265,299 | 278,598 | ||||||||||||||
Fannie Mae, Pool #AS7568, 4.50%, 7/1/2046 | 1,370,008 | 1,465,200 | ||||||||||||||
Fannie Mae, Pool #BD6987, 4.00%, 10/1/2046 | 1,265,759 | 1,329,540 | ||||||||||||||
The accompanying notes are an integral part of the financial statements.
18
Investment Portfolio - October 31, 2017
| PRO-BLEND® CONSERVATIVE TERM SERIES | PRINCIPAL AMOUNT 4 | VALUE (NOTE 2) | ||||||
U.S. GOVERNMENT AGENCIES (continued) | ||||||||
Mortgage-Backed Securities (continued) | ||||||||
Fannie Mae, Pool #BD6997, 4.00%, 10/1/2046 | 1,035,037 | $ | 1,087,193 | |||||
Fannie Mae, Pool #BE3812, 4.00%, 12/1/2046 | 909,351 | 955,407 | ||||||
Fannie Mae, Pool #BE3815, 4.00%, 12/1/2046 | 1,011,088 | 1,062,298 | ||||||
Fannie Mae, Pool #BE7845, 4.50%, 2/1/2047 | 1,417,631 | 1,519,619 | ||||||
Fannie Mae, Pool #AL8674, 5.659%, 1/1/2049 | 1,522,677 | 1,672,068 | ||||||
Freddie Mac, Pool #G11850, 5.50%, 7/1/2020 | 74,716 | 76,555 | ||||||
Freddie Mac, Pool #G12610, 6.00%, 3/1/2022 | 51,791 | 54,676 | ||||||
Freddie Mac, Pool #G12655, 6.00%, 5/1/2022 | 36,388 | 38,356 | ||||||
Freddie Mac, Pool #G13078, 6.00%, 3/1/2023 | 48,979 | 51,831 | ||||||
Freddie Mac, Pool #C91746, 4.50%, 12/1/2033 | 163,814 | 176,660 | ||||||
Freddie Mac, Pool #C91754, 4.50%, 3/1/2034 | 973,969 | 1,049,405 | ||||||
Freddie Mac, Pool #C91762, 4.50%, 5/1/2034 | 1,310,617 | 1,413,474 | ||||||
Freddie Mac, Pool #K92054, 4.00%, 10/1/2034 | 999,934 | 1,060,381 | ||||||
Freddie Mac, Pool #C91850, 4.00%, 9/1/2035 | 662,939 | 704,182 | ||||||
Freddie Mac, Pool #C91854, 4.00%, 10/1/2035 | 2,004,570 | 2,129,418 | ||||||
Freddie Mac, Pool #G07655, 5.50%, 12/1/2035 | 147,589 | 165,050 | ||||||
Freddie Mac, Pool #G08216, 5.50%, 8/1/2037 | 368,958 | 409,854 | ||||||
Freddie Mac, Pool #G03926, 6.00%, 2/1/2038 | 436,407 | 492,855 | ||||||
Freddie Mac, Pool #G04731, 5.50%, 4/1/2038 | 324,411 | 360,524 | ||||||
Freddie Mac, Pool #G04176, 5.50%, 5/1/2038 | 149,817 | 166,576 | ||||||
Freddie Mac, Pool #A78227, 5.50%, 6/1/2038 | 175,187 | 194,474 | ||||||
Freddie Mac, Pool #G08273, 5.50%, 6/1/2038 | 395,179 | 439,025 | ||||||
Freddie Mac, Pool #G04471, 5.50%, 7/1/2038 | 48,960 | 54,374 | ||||||
Freddie Mac, Pool #G04776, 5.50%, 7/1/2038 | 333,700 | 370,548 | ||||||
Freddie Mac, Pool #G05196, 5.50%, 10/1/2038 | 425,437 | 472,398 | ||||||
Freddie Mac, Pool #G05409, 5.50%, 3/1/2039 | 379,012 | 421,238 | ||||||
Freddie Mac, Pool #G05923, 5.50%, 2/1/2040 | 253,756 | 282,106 | ||||||
Freddie Mac, Pool #G05906, 6.00%, 4/1/2040 | 83,990 | 95,251 | ||||||
Freddie Mac, Pool #G07104, 5.50%, 5/1/2040 | 287,333 | 319,438 | ||||||
Freddie Mac, Pool #G06789, 6.00%, 5/1/2040 | 366,436 | 414,447 | ||||||
Freddie Mac, Pool #A92889, 4.50%, 7/1/2040 | 1,525,386 | 1,635,366 | ||||||
Freddie Mac, Pool #A93451, 4.50%, 8/1/2040 | 1,536,616 | 1,647,181 | ||||||
Freddie Mac, Pool #G60334, 4.50%, 10/1/2041 | 1,324,186 | 1,419,174 | ||||||
Freddie Mac, Pool #Q17513, 3.50%, 4/1/2043 | 2,017,171 | 2,083,931 | ||||||
Freddie Mac, Pool #Q24752, 3.50%, 2/1/2044 | 1,737,608 | 1,794,990 | ||||||
Freddie Mac, Pool #G60183, 4.00%, 12/1/2044 | 1,440,622 | 1,518,344 | ||||||
Freddie Mac, Pool #Q37592, 4.00%, 12/1/2045 | 2,432,798 | 2,566,229 | ||||||
Freddie Mac, Pool #G60636, 4.00%, 1/1/2046 | 1,814,438 | 1,904,530 | ||||||
Freddie Mac, Pool #Q38388, 4.00%, 1/1/2046 | 373,983 | 395,137 | ||||||
Freddie Mac, Pool #Q42596, 3.50%, 8/1/2046 | 2,620,678 | 2,695,912 | ||||||
Freddie Mac, Pool #G08754, 4.50%, 3/1/2047 | 1,736,878 | 1,854,819 | ||||||
Freddie Mac, Pool #G08786, 4.50%, 10/1/2047 | 2,289,674 | 2,454,873 | ||||||
Ginnie Mae, Pool #671161, 5.50%, 11/15/2037 | 46,923 | 51,971 | ||||||
|
| |||||||
Total Mortgage-Backed Securities | ||||||||
(Identified Cost $77,734,619) | 78,068,282 | |||||||
|
| |||||||
Other Agencies - 3.4% | ||||||||
Fannie Mae, 2.625%, 9/6/2024 | ||||||||
(Identified Cost $32,895,705) | 32,543,000 | 33,220,545 | ||||||
|
| |||||||
TOTAL U.S. GOVERNMENT AGENCIES | ||||||||
(Identified Cost $110,630,324) | 111,288,827 | |||||||
|
| |||||||
The accompanying notes are an integral part of the financial statements.
19
Investment Portfolio - October 31, 2017
| PRO-BLEND® CONSERVATIVE TERM SERIES | SHARES | VALUE (NOTE 2) | ||||||
SHORT-TERM INVESTMENT - 1.1% | ||||||||
Dreyfus Government Cash Management9, 0.93%, | ||||||||
(Identified Cost $10,995,031) | 10,995,031 | $ | 10,995,031 | |||||
|
| |||||||
TOTAL INVESTMENTS IN SECURITIES - 99.5% | ||||||||
(Identified Cost $913,003,896) | 962,598,857 | |||||||
|
| |||||||
TOTAL OPTIONS WRITTEN - 0.0%## | ||||||||
(Premiums Received $104,669) | (73,138 | ) | ||||||
|
| |||||||
TOTAL INVESTMENTS - 99.5% | 962,525,719 | |||||||
OTHER ASSETS, LESS LIABILITIES - 0.5% | 5,159,131 | |||||||
|
| |||||||
NET ASSETS - 100% | $ | 967,684,850 | ||||||
|
| |||||||
ADR - American Depositary Receipt
CAD - Canadian Dollar
CLP - Chilean Peso
ETF - Exchange-traded fund
GBP - British Pound
IO - Interest only
KRW - South Korean Won
MXN - Mexican Peso
No. - Number
SGD - Singapore Dollar
| EXCHANGE-TRADED OPTIONS WRITTEN | ||||||||||||||||||||
| DESCRIPTION | NUMBER OF CONTRACTS | EXPIRATION DATE | EXERCISE PRICE | NOTIONAL (000) | VALUE | |||||||||||||||
Call | ||||||||||||||||||||
Lululemon Athletica, Inc. | 179 | 11/10/17 | $ | 67.00 | 1,101 | $ | (895 | ) | ||||||||||||
|
| |||||||||||||||||||
Put | ||||||||||||||||||||
Arconic, Inc. | 474 | 11/17/17 | 23.00 | 1,191 | (4,740 | ) | ||||||||||||||
Facebook, Inc. | 77 | 11/17/17 | 160.00 | 1,386 | (4,774 | ) | ||||||||||||||
Medtronic plc | 153 | 12/1/17 | 77.50 | 1,232 | (9,027 | ) | ||||||||||||||
Regeneron Pharmaceuticals, Inc. | 28 | 11/17/17 | 385.00 | 1,127 | (15,680 | ) | ||||||||||||||
The Priceline Group, Inc. | 6 | 11/17/17 | 1,750.00 | 1,147 | (6,672 | ) | ||||||||||||||
Vertex Pharmaceuticals, Inc. | 75 | 11/17/17 | 145.00 | 1,097 | (31,350 | ) | ||||||||||||||
|
| |||||||||||||||||||
| (72,243 | ) | |||||||||||||||||||
TOTAL EXCHANGE-TRADED OPTIONS WRITTEN | $ | (73,138 | ) | |||||||||||||||||
|
| |||||||||||||||||||
*Non-income producing security.
##Less than 0.1%.
1A factor from a third party vendor was applied to determine the security’s fair value following the close of local trading.
2A portion of this security is designated with the broker as collateral for options contracts written. As of October 31, 2017, the total value of such securities was $9,318,175.
3Security has been valued at fair value as determined in good faith by the Advisor and is classified as Level 3 in the fair value hierarchy.
4Amount is stated in USD unless otherwise noted.
5Restricted securities - Investment in securities that are restricted as to public resale under the Securities Act of 1933, as amended. These securities have been sold under Rule 144A and have been determined to be liquid. These securities amount to $98,628,942 or 10.2%, of the Series’ net assets as of October 31, 2017 (see Note 2 to the financial statements).
6Variable rate security. Security may be issued at a fixed coupon rate, which converts to a variable rate at a specified date. Rate shown is the rate in effect as of October 31, 2017.
7Floating rate security. Rate shown is the rate in effect as of October 31, 2017.
8Variable or floating rate security, which interest rate adjusts periodically based on changes in current interest rates and prepayments on the underlying pool of assets. Rate shown is the rate in effect as of October 31, 2017.
9Rate shown is the current yield as of October 31, 2017.
The Global Industry Classification Standard (GICS) was developed by and is the exclusive property and a service mark of MSCI Inc. (MSCI) and Standard & Poor’s, a division of The McGraw-Hill Companies, Inc. (S&P), and is licensed for use by Manning & Napier when referencing GICS sectors. Neither MSCI, S&P, nor any third party involved in making or compiling the GICS or any GICS classifications makes any express or implied warranties or representations with respect to such standard or classification, nor shall any such party have any liability therefrom.
The accompanying notes are an integral part of the financial statements.
20
Statement of Assets and Liabilities - Pro-Blend® Conservative Term Series
October 31, 2017
ASSETS: | ||||
Investments in securities, at value (identified cost $913,003,896) (Note 2) | $ | 962,598,857 | ||
Receivable for securities sold | 3,051,581 | |||
Interest receivable | 3,529,499 | |||
Receivable for fund shares sold | 650,077 | |||
Foreign tax reclaims receivable | 120,821 | |||
Dividends receivable | 95,367 | |||
Prepaid and other expenses | 15,489 | |||
|
| |||
TOTAL ASSETS | 970,061,691 | |||
|
| |||
LIABILITIES: | ||||
Due to Custodian | 3,226 | |||
Accrued management fees (Note 3) | 514,165 | |||
Accrued shareholder services fees (Class S) (Note 3) | 106,662 | |||
Accrued distribution and service (Rule 12b-1) fees (Class R) (Class R2) (Note 3) | 101,488 | |||
Accrued fund accounting and administration fees (Note 3) | 82,268 | |||
Accrued Chief Compliance Officer service fees (Note 3) | 306 | |||
Options written, at value (premiums received $104,669) (Note 2) | 73,138 | |||
Payable for securities purchased | 999,652 | |||
Payable for fund shares repurchased | 327,820 | |||
Other payables and accrued expenses | 168,116 | |||
|
| |||
TOTAL LIABILITIES | 2,376,841 | |||
|
| |||
TOTAL NET ASSETS | $ | 967,684,850 | ||
|
| |||
NET ASSETS CONSIST OF: | ||||
Capital stock | $ | 763,535 | ||
Additional paid-in-capital | 881,848,221 | |||
Undistributed net investment income | 5,449,663 | |||
Accumulated net realized gain on investments, foreign currency and translation of other assets and liabilities | 30,004,372 | |||
Net unrealized appreciation (depreciation) on investments, foreign currency and translation of other assets and liabilities | 49,619,059 | |||
|
| |||
TOTAL NET ASSETS | $ | 967,684,850 | ||
|
| |||
The accompanying notes are an integral part of the financial statements.
21
Statement of Assets and Liabilities - Pro-Blend® Conservative Term Series
October 31, 2017
NET ASSET VALUE, OFFERING PRICE AND REDEMPTION PRICE PER SHARE - Class S | $ | 14.10 | ||
|
| |||
NET ASSET VALUE, OFFERING PRICE AND REDEMPTION PRICE PER SHARE - Class I | $ | 10.85 | ||
|
| |||
NET ASSET VALUE, OFFERING PRICE AND REDEMPTION PRICE PER SHARE - Class R | $ | 10.42 | ||
|
| |||
NET ASSET VALUE, OFFERING PRICE AND REDEMPTION PRICE PER SHARE - Class R2 | $ | 10.40 | ||
|
|
The accompanying notes are an integral part of the financial statements.
22
Statement of Operations - Pro-Blend® Conservative Term Series
For the Year Ended October 31, 2017
INVESTMENT INCOME: | ||||
Interest | $ | 18,015,244 | ||
Dividends (net of foreign taxes withheld, $129,341) | 6,816,323 | |||
|
| |||
Total Investment Income | 24,831,567 | |||
|
| |||
EXPENSES: | ||||
Management fees (Note 3) | 6,499,537 | |||
Shareholder services fees (Class S) (Note 3) | 1,321,862 | |||
Distribution and service (Rule 12b-1) fees (Class R2) (Note 3) | 1,172,707 | |||
Distribution and service (Rule 12b-1) fees (Class R) (Note 3) | 76,603 | |||
Fund accounting and administration fees (Note 3) | 216,428 | |||
Transfer agent fees (Note 3) | 189,837 | |||
Directors’ fees (Note 3) | 71,834 | |||
Chief Compliance Officer service fees (Note 3) | 4,049 | |||
Custodian fees | 66,345 | |||
Miscellaneous | 248,231 | |||
|
| |||
Total Expenses | 9,867,433 | |||
|
| |||
NET INVESTMENT INCOME | 14,964,134 | |||
|
| |||
REALIZED AND UNREALIZED GAIN (LOSS) ON INVESTMENTS AND FOREIGN CURRENCY: | ||||
Net realized gain (loss) on- | ||||
Investments in securities | 36,192,443 | |||
In-kind redemptions (Note 2) | 3,897,625 | |||
Options written | 1,099,812 | |||
Foreign currency and translation of other assets and liabilities | 15,727 | |||
|
| |||
| 41,205,607 | ||||
|
| |||
Net change in unrealized appreciation (depreciation) on- | ||||
Investments in securities (net of decrease in accrued foreign capital gains tax of $141) | 16,996,080 | |||
Options written | 5,181 | |||
Foreign currency and translation of other assets and liabilities | 12,740 | |||
|
| |||
| 17,014,001 | ||||
|
| |||
NET REALIZED AND UNREALIZED GAIN (LOSS) ON INVESTMENTS AND FOREIGN CURRENCY | 58,219,608 | |||
|
| |||
NET INCREASE IN NET ASSETS RESULTING FROM OPERATIONS | $ | 73,183,742 | ||
|
| |||
The accompanying notes are an integral part of the financial statements.
23
Statements of Changes in Net Assets - Pro-Blend® Conservative Term Series
FOR THE 10/31/17 | FOR THE 10/31/16 | |||||||
INCREASE (DECREASE) IN NET ASSETS: | ||||||||
OPERATIONS: | ||||||||
Net investment income | $ | 14,964,134 | $ | 18,069,521 | ||||
Net realized gain (loss) on investments and foreign currency | 37,307,982 | 6,804,163 | ||||||
Net realized gain (loss) from in-kind redemptions | 3,897,625 | — | ||||||
Net change in unrealized appreciation (depreciation) on investments and foreign currency | 17,014,001 | 8,738,093 | ||||||
|
|
|
| |||||
Net increase from operations | 73,183,742 | 33,611,777 | ||||||
|
|
|
| |||||
DISTRIBUTIONS TO SHAREHOLDERS (Note 8): | ||||||||
From net investment income (Class S) | (8,240,473 | ) | (12,113,006 | ) | ||||
From net investment income (Class I) | (5,354,879 | ) | (6,560,592 | ) | ||||
From net investment income (Class R) | (219,383 | ) | (729,050 | ) | ||||
From net investment income (Class R2) | (1,063,946 | ) | (1,585,137 | ) | ||||
From net realized gain on investments (Class S) | (1,231,640 | ) | — | |||||
From net realized gain on investments (Class I) | (661,927 | ) | — | |||||
From net realized gain on investments (Class R) | (40,435 | ) | — | |||||
From net realized gain on investments (Class R2) | (292,777 | ) | — | |||||
|
|
|
| |||||
Total distributions to shareholders | (17,105,460 | ) | (20,987,785 | ) | ||||
|
|
|
| |||||
CAPITAL STOCK ISSUED AND REPURCHASED: | ||||||||
Net decrease from capital share transactions (Note 5) | (250,449,181 | ) | (281,237,096 | ) | ||||
|
|
|
| |||||
Net decrease in net assets | (194,370,899 | ) | (268,613,104 | ) | ||||
NET ASSETS: | ||||||||
Beginning of year | 1,162,055,749 | 1,430,668,853 | ||||||
|
|
|
| |||||
End of year (including undistributed net investment income of $ 5,449,663 and $ 6,938,681, respectively) | $ | 967,684,850 | $ | 1,162,055,749 | ||||
|
|
|
| |||||
The accompanying notes are an integral part of the financial statements.
24
Financial Highlights - Pro-Blend® Conservative Term Series - Class S
| FOR THE YEAR ENDED | ||||||||||||||||||||
| 10/31/17 | 10/31/16 | 10/31/15 | 10/31/14 | 10/31/13 | ||||||||||||||||
Per share data (for a share outstanding throughout each year): | ||||||||||||||||||||
Net asset value - Beginning of year | $ | 13.36 | $ | 13.15 | $ | 14.13 | $ | 14.18 | $ | 13.62 | ||||||||||
|
|
|
|
|
|
|
|
|
| |||||||||||
Income (loss) from investment operations: | ||||||||||||||||||||
Net investment income1 | 0.19 | 0.19 | 0.22 | 0.22 | 0.22 | |||||||||||||||
Net realized and unrealized gain (loss) on investments | 0.73 | 0.21 | (0.41 | ) | 0.52 | 0.83 | ||||||||||||||
|
|
|
|
|
|
|
|
|
| |||||||||||
Total from investment operations | 0.92 | 0.40 | (0.19 | ) | 0.74 | 1.05 | ||||||||||||||
|
|
|
|
|
|
|
|
|
| |||||||||||
Less distributions to shareholders: | ||||||||||||||||||||
From net investment income | (0.16 | ) | (0.19 | ) | (0.18 | ) | (0.20 | ) | (0.20 | ) | ||||||||||
From net realized gain on investments | (0.02 | ) | — | (0.61 | ) | (0.59 | ) | (0.29 | ) | |||||||||||
|
|
|
|
|
|
|
|
|
| |||||||||||
Total distributions to shareholders | (0.18 | ) | (0.19 | ) | (0.79 | ) | (0.79 | ) | (0.49 | ) | ||||||||||
|
|
|
|
|
|
|
|
|
| |||||||||||
Net asset value - End of year | $ | 14.10 | $ | 13.36 | $ | 13.15 | $ | 14.13 | $ | 14.18 | ||||||||||
|
|
|
|
|
|
|
|
|
| |||||||||||
Net assets - End of year (000’s omitted) | $ | 627,523 | $ | 724,270 | $ | 911,956 | $ | 1,124,851 | $ | 1,027,160 | ||||||||||
|
|
|
|
|
|
|
|
|
| |||||||||||
Total return2 | 7.02 | % | 3.07 | % | (1.33 | %) | 5.46 | % | 7.93 | % | ||||||||||
Ratios (to average net assets)/Supplemental Data: | ||||||||||||||||||||
Expenses | 0.87 | % | 0.87 | % | 0.88 | % | 0.87 | % | 0.87 | % | ||||||||||
Net investment income | 1.42 | % | 1.47 | % | 1.60 | % | 1.57 | % | 1.58 | % | ||||||||||
Series portfolio turnover | 58 | % | 65 | % | 51 | % | 45 | % | 54 | % | ||||||||||
1Calculated based on average shares outstanding during the years.
2Represents aggregate total return for the years indicated, and assumes reinvestment of all distributions.
The accompanying notes are an integral part of the financial statements.
25
Financial Highlights - Pro-Blend® Conservative Term Series - Class I
| FOR THE YEAR ENDED | ||||||||||||||||||||
| 10/31/17 | 10/31/16 | 10/31/15 | 10/31/14 | 10/31/13 | ||||||||||||||||
Per share data (for a share outstanding throughout each year): | ||||||||||||||||||||
Net asset value - Beginning of year | $ | 10.33 | $ | 10.22 | $ | 11.17 | $ | 11.38 | $ | 11.03 | ||||||||||
|
|
|
|
|
|
|
|
|
| |||||||||||
Income (loss) from investment operations: | ||||||||||||||||||||
Net investment income1 | 0.17 | 0.17 | 0.19 | 0.20 | 0.20 | |||||||||||||||
Net realized and unrealized gain (loss) on investments | 0.56 | 0.15 | (0.32 | ) | 0.40 | 0.66 | ||||||||||||||
|
|
|
|
|
|
|
|
|
| |||||||||||
Total from investment operations | 0.73 | 0.32 | (0.13 | ) | 0.60 | 0.86 | ||||||||||||||
|
|
|
|
|
|
|
|
|
| |||||||||||
Less distributions to shareholders: | ||||||||||||||||||||
From net investment income | (0.19 | ) | (0.21 | ) | (0.21 | ) | (0.22 | ) | (0.22 | ) | ||||||||||
From net realized gain on investments | (0.02 | ) | — | (0.61 | ) | (0.59 | ) | (0.29 | ) | |||||||||||
|
|
|
|
|
|
|
|
|
| |||||||||||
Total distributions to shareholders | (0.21 | ) | (0.21 | ) | (0.82 | ) | (0.81 | ) | (0.51 | ) | ||||||||||
|
|
|
|
|
|
|
|
|
| |||||||||||
Net asset value - End of year | $ | 10.85 | $ | 10.33 | $ | 10.22 | $ | 11.17 | $ | 11.38 | ||||||||||
|
|
|
|
|
|
|
|
|
| |||||||||||
Net assets - End of year (000’s omitted) | $ | 213,824 | $ | 291,632 | $ | 325,700 | $ | 353,538 | $ | 318,106 | ||||||||||
|
|
|
|
|
|
|
|
|
| |||||||||||
Total return2 | 7.25 | % | 3.26 | % | (1.15 | %) | 5.66 | % | 8.15 | % | ||||||||||
Ratios (to average net assets)/Supplemental Data: | ||||||||||||||||||||
Expenses | 0.67 | % | 0.67 | % | 0.68 | % | 0.67 | % | 0.67 | % | ||||||||||
Net investment income | 1.62 | % | 1.66 | % | 1.81 | % | 1.77 | % | 1.77 | % | ||||||||||
Series portfolio turnover | 58 | % | 65 | % | 51 | % | 45 | % | 54 | % | ||||||||||
1Calculated based on average shares outstanding during the years.
2Represents aggregate total return for the years indicated, and assumes reinvestment of all distributions.
The accompanying notes are an integral part of the financial statements.
26
Financial Highlights - Pro-Blend® Conservative Term Series - Class R
| FOR THE YEAR ENDED | ||||||||||||||||||||
| 10/31/17 | 10/31/16 | 10/31/15 | 10/31/14 | 10/31/13 | ||||||||||||||||
Per share data (for a share outstanding throughout each year): | ||||||||||||||||||||
Net asset value - Beginning of year | $ | 9.92 | $ | 9.81 | $ | 10.75 | $ | 10.99 | $ | 10.67 | ||||||||||
|
|
|
|
|
|
|
|
|
| |||||||||||
Income (loss) from investment operations: | ||||||||||||||||||||
Net investment income1 | 0.11 | 0.12 | 0.13 | 0.14 | 0.14 | |||||||||||||||
Net realized and unrealized gain (loss) on investments | 0.54 | 0.15 | (0.30 | ) | 0.38 | 0.64 | ||||||||||||||
|
|
|
|
|
|
|
|
|
| |||||||||||
Total from investment operations | 0.65 | 0.27 | (0.17 | ) | 0.52 | 0.78 | ||||||||||||||
|
|
|
|
|
|
|
|
|
| |||||||||||
Less distributions to shareholders: | ||||||||||||||||||||
From net investment income | (0.13 | ) | (0.16 | ) | (0.16 | ) | (0.17 | ) | (0.17 | ) | ||||||||||
From net realized gain on investments | (0.02 | ) | — | (0.61 | ) | (0.59 | ) | (0.29 | ) | |||||||||||
|
|
|
|
|
|
|
|
|
| |||||||||||
Total distributions to shareholders | (0.15 | ) | (0.16 | ) | (0.77 | ) | (0.76 | ) | (0.46 | ) | ||||||||||
|
|
|
|
|
|
|
|
|
| |||||||||||
Net asset value - End of year | $ | 10.42 | $ | 9.92 | $ | 9.81 | $ | 10.75 | $ | 10.99 | ||||||||||
|
|
|
|
|
|
|
|
|
| |||||||||||
Net assets - End of year (000’s omitted) | $ | 13,672 | $ | 19,054 | $ | 55,315 | $ | 59,101 | $ | 48,272 | ||||||||||
|
|
|
|
|
|
|
|
|
| |||||||||||
Total return2 | 6.72 | % | 2.79 | % | (1.60 | %) | 5.08 | % | 7.64 | % | ||||||||||
Ratios (to average net assets)/Supplemental Data: | ||||||||||||||||||||
Expenses | 1.17 | % | 1.17 | % | 1.18 | % | 1.17 | % | 1.17 | % | ||||||||||
Net investment income | 1.12 | % | 1.19 | % | 1.30 | % | 1.27 | % | 1.28 | % | ||||||||||
Series portfolio turnover | 58 | % | 65 | % | 51 | % | 45 | % | 54 | % | ||||||||||
1Calculated based on average shares outstanding during the years.
2Represents aggregate total return for the years indicated, and assumes reinvestment of all distributions.
The accompanying notes are an integral part of the financial statements.
27
Financial Highlights - Pro-Blend® Conservative Term Series - Class R2*
| FOR THE YEAR ENDED | ||||||||||||||||||||
| 10/31/17 | 10/31/16 | 10/31/15 | 10/31/14 | 10/31/13 | ||||||||||||||||
Per share data (for a share outstanding throughout each year): | ||||||||||||||||||||
Net asset value - Beginning of year | $ | 9.91 | $ | 9.81 | $ | 10.75 | $ | 10.99 | $ | 10.68 | ||||||||||
|
|
|
|
|
|
|
|
|
| |||||||||||
Income (loss) from investment operations: | ||||||||||||||||||||
Net investment income1 | 0.06 | 0.06 | 0.08 | 0.08 | 0.08 | |||||||||||||||
Net realized and unrealized gain (loss) on investments | 0.54 | 0.15 | (0.31 | ) | 0.39 | 0.65 | ||||||||||||||
|
|
|
|
|
|
|
|
|
| |||||||||||
Total from investment operations | 0.60 | 0.21 | (0.23 | ) | 0.47 | 0.73 | ||||||||||||||
|
|
|
|
|
|
|
|
|
| |||||||||||
Less distributions to shareholders: | ||||||||||||||||||||
From net investment income | (0.09 | ) | (0.11 | ) | (0.10 | ) | (0.12 | ) | (0.13 | ) | ||||||||||
From net realized gain on investments | (0.02 | ) | — | (0.61 | ) | (0.59 | ) | (0.29 | ) | |||||||||||
|
|
|
|
|
|
|
|
|
| |||||||||||
Total distributions to shareholders | (0.11 | ) | (0.11 | ) | (0.71 | ) | (0.71 | ) | (0.42 | ) | ||||||||||
|
|
|
|
|
|
|
|
|
| |||||||||||
Net asset value - End of year | $ | 10.40 | $ | 9.91 | $ | 9.81 | $ | 10.75 | $ | 10.99 | ||||||||||
|
|
|
|
|
|
|
|
|
| |||||||||||
Net assets - End of year (000’s omitted) | $ | 112,666 | $ | 127,100 | $ | 137,697 | $ | 139,291 | $ | 102,919 | ||||||||||
|
|
|
|
|
|
|
|
|
| |||||||||||
Total return2 | 6.13 | % | 2.24 | % | (2.10 | %) | 4.58 | % | 7.06 | % | ||||||||||
Ratios (to average net assets)/Supplemental Data: | ||||||||||||||||||||
Expenses | 1.67 | % | 1.67 | % | 1.68 | % | 1.67 | % | 1.67 | % | ||||||||||
Net investment income | 0.62 | % | 0.66 | % | 0.81 | % | 0.77 | % | 0.78 | % | ||||||||||
Series portfolio turnover | 58 | % | 65 | % | 51 | % | 45 | % | 54 | % | ||||||||||
*Effective March 1, 2017, Class C shares of the Series have been redesignated as Class R2 Shares.
1Calculated based on average shares outstanding during the years.
2Represents aggregate total return for the years indicated, and assumes reinvestment of all distributions.
The accompanying notes are an integral part of the financial statements.
28
Performance Update as of October 31, 2017 - Pro-Blend® Moderate Term Series
(unaudited)
| AVERAGE ANNUAL TOTAL RETURNS AS OF OCTOBER 31, 2017 | ||||||||||||||||
ONE YEAR1 | FIVE YEAR | TEN YEAR | SINCE INCEPTION2 | |||||||||||||
Manning & Napier Fund, Inc. - Pro-Blend® Moderate Term | 8.46 | % | 5.43 | % | 4.09 | % | 6.63 | % | ||||||||
Manning & Napier Fund, Inc. - Pro-Blend® Moderate Term | 8.72 | % | 5.70 | % | 4.34 | % | 6.74 | % | ||||||||
Manning & Napier Fund, Inc. - Pro-Blend® Moderate Term | 8.21 | % | 5.17 | % | 3.81 | % | 6.41 | % | ||||||||
Manning & Napier Fund, Inc. - Pro-Blend® Moderate Term | 7.71 | % | 4.65 | % | 3.32 | % | 5.90 | % | ||||||||
Bloomberg Barclays U.S. Aggregate Bond Index6 | 0.90 | % | 2.04 | % | 4.19 | % | 5.27 | % | ||||||||
30/10/60 Blended Index7 | 9.64 | % | 6.49 | % | 5.24 | % | 6.91 | % | ||||||||
The following graph compares the value of a $10,000 investment in the Manning & Napier Fund, Inc. - Pro-Blend® Moderate Term Series - Class S for the ten years ended October 31, 2017 to the Bloomberg Barclays U.S. Aggregate Bond Index and the 30/10/60 Blended Index.
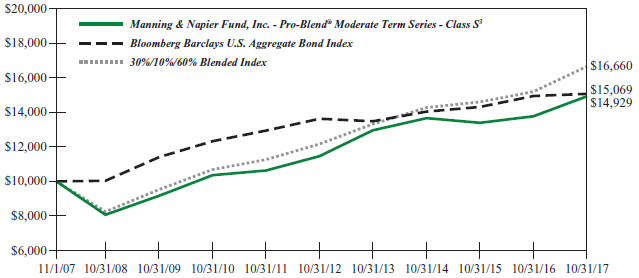
1The returns shown are based on net asset values calculated for shareholder transactions and may differ from the returns shown in the financial highlights, which reflect adjustments made to the net asset values in accordance with accounting principles generally accepted in the United States of America.
2Performance numbers for the Series are calculated from September 15, 1993, the Class S inception date. The Bloomberg Barclays U.S. Aggregate Bond Index only publishes month-end numbers; therefore, performance numbers for the Indices are calculated from September 30, 1993.
3The Series’ performance does not reflect the deduction of taxes that a shareholder would pay on fund distributions or the redemption of shares. The Series’ performance is historical and may not be indicative of future results. The performance returns shown are inclusive of the net expense ratio of the Series. For the year ended October 31, 2017, this net expense ratio was 1.08% for Class S, 0.83% for Class I, 1.33% for Class R and 1.83% for Class R2. The gross expense ratio, which does not account for any voluntary or contractual waivers currently in effect, was 1.08% for Class S, 0.83% for Class I, 1.33% for Class R and 1.83% for Class R2 for the year ended October 31, 2017.
4For the periods through the inception of Class I on March 28, 2008, performance is based on the hypothetical performance of Class S shares. Because Class I shares invest in the same portfolio of securities as Class S, performance will only be different to the extent that the Class S shares have a higher expense ratio.
5For periods through the inception of Class R2 on January 4, 2010 and Class R on June 30, 2010, the performance figures are hypothetical and reflect the performance of Class S shares adjusted for expense differences.
6The Bloomberg Barclays U.S. Aggregate Bond Index is an unmanaged, market-value weighted index of U.S. domestic investment-grade debt issues, including government, corporate, asset-backed, and mortgage-backed securities, with maturities of one year or more. Index returns do not reflect any fees or expenses. Index returns provided by Interactive Data.
29
Performance Update as of October 31, 2017 - Pro-Blend® Moderate Term Series
(unaudited)
7The 30/10/60 Blended Index is 30% Russell 3000® Index (Russell 3000), 10% MSCI ACWI ex USA Index (ACWIxUS), and 60% Bloomberg Barclays U.S. Aggregate Bond Index (BAB). Russell 3000 is an unmanaged index that consists of 3,000 of the largest U.S. companies based on total market capitalization. Index returns are based on a market capitalization-weighted average of relative price changes of the component stocks plus dividends whose reinvestments are compounded daily. Index returns provided by Bloomberg. ACWIxUS is designed to measure large and mid-cap representation across 22 of 23 Developed Markets countries (excluding the U.S.) and 24 Emerging Markets countries. The Index is denominated in U.S. dollars. The Index returns assume daily investment of gross dividends (which do not account for applicable dividend taxation) prior to 12/31/1998, as net returns were not available. Subsequent to 12/31/1998, the Index returns are net of withholding taxes. They assume daily reinvestment of net dividends thus accounting for any applicable dividend taxation. Index returns provided by Bloomberg. BAB is an unmanaged, market value-weighted index of U.S. domestic investment-grade debt issues, including government, corporate, asset-backed and mortgage-backed securities with maturities of one year or more. Index returns provided by Interactive Data. The returns of the indices do not reflect any fees or expenses. Returns provided are calculated monthly using a blended allocation. Because the fund’s asset allocation will vary over time, the composition of the fund’s portfolio may not match the composition of the comparative Indices. Mid-month performance may not be available for all indices within the blended index. Where applicable, performance for those indices is included from the first of the month following the corresponding Fund’s inception date.
30
Shareholder Expense Example - Pro-Blend® Moderate Term Series
(unaudited)
As a shareholder of the Series, you incur ongoing costs, including management fees, shareholder service fees and other Series expenses. This example is intended to help you understand your ongoing costs (in dollars) of investing in the Series and to compare these costs with the ongoing costs of investing in other mutual funds.
The example is based on an investment of $1,000 invested in each class at the beginning of the period and held for the entire period (May 1, 2017 to October 31, 2017).
Actual Expenses
The Actual lines of the table below provide information about actual account values and actual expenses. You may use the information in these lines, together with the amount you invested, to estimate the expenses that you paid over the period. Simply divide your account value by $1,000 (for example, an $8,600 account value divided by $1,000 = 8.6), then multiply the result by the number in the Actual line for the Class in which you have invested under the heading entitled “Expenses Paid During Period” to estimate the expenses you paid on your account during this period.
Hypothetical Example for Comparison Purposes
The Hypothetical lines of each class in the table below provide information about hypothetical account values and hypothetical expenses based on the Class’ actual expense ratio and an assumed rate of return of 5% per year before expenses, which is not the Class’ actual return. The hypothetical account values and expenses may not be used to estimate the actual ending account balance or expenses you paid during the period. You may use this information to compare the ongoing costs of investing in a class of the Series and other funds. To do so, compare this 5% hypothetical example for the Class in which you have invested with the 5% hypothetical examples that appear in the shareholder reports of the other funds.
Please note that the expenses shown in the table are meant to highlight your ongoing costs only and do not reflect any transaction costs such as sales charges (loads), redemption fees, or exchange fees that you may incur in other mutual funds. Therefore, the second line of the table is useful in comparing ongoing costs only, and will not help you determine the relative total costs of owning different funds.
BEGINNING ACCOUNT VALUE 5/1/17 | ENDING ACCOUNT VALUE 10/31/17 | EXPENSES PAID DURING PERIOD 5/1/17-10/31/17* | ANNUALIZED EXPENSE RATIO | |||||
Class S | ||||||||
Actual | $1,000.00 | $1,042.10 | $5.51 | 1.07% | ||||
Hypothetical (5% return before expenses) | $1,000.00 | $1,019.81 | $5.45 | 1.07% | ||||
Class I | ||||||||
Actual | $1,000.00 | $1,043.60 | $4.22 | 0.82% | ||||
Hypothetical (5% return before expenses) | $1,000.00 | $1,021.07 | $4.18 | 0.82% | ||||
Class R | ||||||||
Actual | $1,000.00 | $1,040.20 | $6.79 | 1.32% | ||||
Hypothetical (5% return before expenses) | $1,000.00 | $1,018.55 | $6.72 | 1.32% | ||||
Class R2 | ||||||||
Actual | $1,000.00 | $1,038.50 | $9.35 | 1.82% | ||||
Hypothetical (5% return before expenses) | $1,000.00 | $1,016.03 | $9.25 | 1.82% |
*Expenses are equal to the Class’ annualized expense ratio (for the six-month period), multiplied by the average account value over the period, multiplied by 184/365 (to reflect the one-half year period). Expenses are based on the most recent fiscal half year; therefore, the expense ratios stated above may differ from the expense ratios stated in the financial highlights, which are based on one-year data.
31
Portfolio Composition - Pro-Blend® Moderate Term Series
As of October 31, 2017 (unaudited)
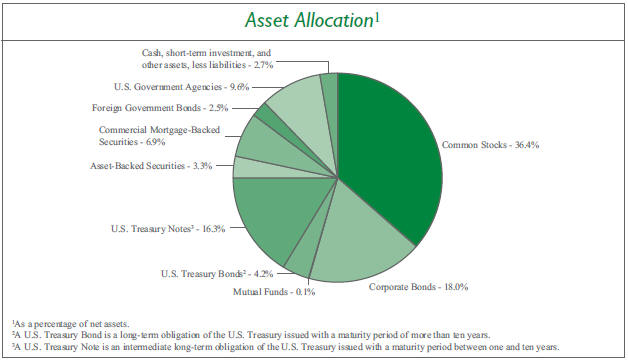
Sector Allocation4 |
| |||
Information Technology | 11.3 | % | ||
Health Care | 9.1 | % | ||
Financials | 6.9 | % | ||
Consumer Discretionary | 5.5 | % | ||
Industrials | 4.4 | % | ||
Energy | 4.2 | % | ||
Materials | 4.0 | % | ||
Consumer Staples | 4.0 | % | ||
Real Estate | 2.9 | % | ||
Telecommunication Services | 1.6 | % | ||
Utilities | 0.6 | % | ||
4Including common stocks and corporate bonds, as a percentage of total investments. |
| |||
Top Ten Stock Holdings5 |
| |||
Facebook, Inc. - Class A | 1.8 | % | ||
ServiceNow, Inc. | 1.5 | % | ||
The Priceline Group, Inc. | 1.3 | % | ||
DaVita, Inc. | 1.2 | % | ||
Skyworks Solutions, Inc. | 1.1 | % | ||
Novartis AG - ADR (Switzerland) | 1.0 | % | ||
Medtronic plc | 1.0 | % | ||
Amazon.com, Inc. | 0.9 | % | ||
Diageo plc (United Kingdom) | 0.8 | % | ||
Qorvo, Inc. | 0.8 | % | ||
| 5As a percentage of total investments. | ||||
32
Investment Portfolio - October 31, 2017
| PRO-BLEND® MODERATE TERM SERIES | SHARES | VALUE (NOTE 2) | ||||||
COMMON STOCKS - 36.4% | ||||||||
Consumer Discretionary - 3.0% | ||||||||
Diversified Consumer Services - 0.0%## | ||||||||
Fu Shou Yuan International Group Ltd. (China)1 | 170,640 | $ | 119,956 | |||||
|
| |||||||
Hotels, Restaurants & Leisure - 0.1% | ||||||||
Accor S.A. (France)1 | 6,035 | 301,073 | ||||||
Jollibee Foods Corp. (Philippines)1 | 37,125 | 179,271 | ||||||
|
| |||||||
| 480,344 | ||||||||
|
| |||||||
Household Durables - 0.0%## | ||||||||
Kaufman & Broad S.A. (France)1 | 2,530 | 111,797 | ||||||
|
| |||||||
Internet & Direct Marketing Retail - 2.2% | ||||||||
Amazon.com, Inc.* | 5,508 | 6,087,882 | ||||||
Ctrip.com International Ltd. - ADR (China)* | 3,370 | 161,389 | ||||||
The Priceline Group, Inc.* | 4,895 | 9,359,044 | ||||||
|
| |||||||
| 15,608,315 | ||||||||
|
| |||||||
Leisure Products - 0.0%## | ||||||||
Trigano S.A. (France)1 | 775 | 125,064 | ||||||
|
| |||||||
Multiline Retail - 0.0%## | ||||||||
Lojas Renner S.A. (Brazil) | 10,880 | 114,411 | ||||||
|
| |||||||
Specialty Retail - 0.0%## | ||||||||
Industria de Diseno Textil S.A. (Spain)1 | 3,205 | 119,797 | ||||||
|
| |||||||
Textiles, Apparel & Luxury Goods - 0.7% | ||||||||
ANTA Sports Products Ltd. (China)1 | 40,180 | 179,720 | ||||||
lululemon athletica, Inc.* | 73,674 | 4,531,688 | ||||||
|
| |||||||
| 4,711,408 | ||||||||
|
| |||||||
Total Consumer Discretionary | 21,391,092 | |||||||
|
| |||||||
Consumer Staples - 3.0% | ||||||||
Beverages - 2.2% | ||||||||
Ambev S.A. - ADR (Brazil) | 849,553 | 5,377,670 | ||||||
Anheuser-Busch InBev S.A./N.V. (Belgium)1 | 34,925 | 4,282,545 | ||||||
Diageo plc (United Kingdom)1 | 174,196 | 5,948,567 | ||||||
Treasury Wine Estates Ltd. (Australia)1 | 19,881 | 238,651 | ||||||
|
| |||||||
| 15,847,433 | ||||||||
|
| |||||||
Food & Staples Retailing - 0.1% | ||||||||
Puregold Price Club, Inc. (Philippines)1 | 182,870 | 180,656 | ||||||
Raia Drogasil S.A. (Brazil) | 7,365 | 177,230 | ||||||
Robinsons Retail Holdings, Inc. (Philippines)1 | 98,765 | 185,573 | ||||||
|
| |||||||
| 543,459 | ||||||||
|
| |||||||
Food Products - 0.1% | ||||||||
Danone S.A. (France)1 | 2,496 | 204,001 | ||||||
Kerry Group plc - Class A (Ireland)1 | 2,355 | 237,179 | ||||||
M Dias Branco S.A. (Brazil) | 7,100 | 105,004 | ||||||
Nestle S.A. (Switzerland)1 | 2,914 | 245,180 | ||||||
|
| |||||||
| 791,364 | ||||||||
|
| |||||||
Personal Products - 0.6% | ||||||||
Beiersdorf AG (Germany)1 | 1,285 | 144,550 | ||||||
Unilever plc - ADR (United Kingdom) | 67,885 | 3,845,685 | ||||||
|
| |||||||
| 3,990,235 | ||||||||
|
| |||||||
Tobacco - 0.0%## | ||||||||
Japan Tobacco, Inc. (Japan)1 | 7,700 | 254,872 | ||||||
|
| |||||||
Total Consumer Staples | 21,427,363 | |||||||
|
| |||||||
Energy - 1.6% | ||||||||
Energy Equipment & Services - 1.5% | ||||||||
Diamond Offshore Drilling, Inc.* | 112,905 | 1,888,901 | ||||||
Oceaneering International, Inc. | 68,835 | 1,391,844 | ||||||
Schlumberger Ltd. | 84,158 | 5,386,112 | ||||||
Transocean Ltd.* | 159,680 | 1,676,640 | ||||||
|
| |||||||
| 10,343,497 | ||||||||
|
| |||||||
Oil, Gas & Consumable Fuels - 0.1% | ||||||||
Cameco Corp. (Canada) | 9,384 | 76,386 | ||||||
Galp Energia SGPS S.A. (Portugal)1 | 9,885 | 183,782 | ||||||
Royal Dutch Shell plc - Class B - ADR (Netherlands) | 2,830 | 184,969 | ||||||
YPF S.A. - ADR (Argentina) | 5,845 | 143,553 | ||||||
|
| |||||||
| 588,690 | ||||||||
|
| |||||||
Total Energy | 10,932,187 | |||||||
|
| |||||||
Financials - 1.0% | ||||||||
Banks - 0.4% | ||||||||
Banco Macro S.A. - ADR (Argentina) | 1,235 | 155,511 | ||||||
Bankia S.A. (Spain)1 | 29,053 | 138,646 | ||||||
Banque Cantonale Vaudoise (Switzerland)1 | 165 | 118,666 | ||||||
BNP Paribas S.A. (France)1 | 2,985 | 232,978 | ||||||
BPER Banca (Italy)1 | 21,050 | 102,467 | ||||||
CaixaBank S.A. (Spain)1 | 32,440 | 151,767 | ||||||
Credit Agricole S.A. (France)1 | 9,790 | 170,867 | ||||||
Danske Bank A/S (Denmark)1 | 4,585 | 174,979 | ||||||
Erste Group Bank AG (Austria)1 | 2,710 | 116,327 | ||||||
Eurobank Ergasias S.A. (Greece)*1 | 125,420 | 102,447 | ||||||
The accompanying notes are an integral part of the financial statements.
33
Investment Portfolio - October 31, 2017
| PRO-BLEND® MODERATE TERM SERIES | SHARES | VALUE (NOTE 2) | ||||||
COMMON STOCKS (continued) | ||||||||
Financials (continued) | ||||||||
Banks (continued) | ||||||||
FinecoBank Banca Fineco S.p.A. (Italy)1 | 19,220 | $ | 179,764 | |||||
Grupo Financiero Galicia S.A. - ADR (Argentina) | 2,570 | 141,093 | ||||||
Grupo Supervielle S.A. - ADR (Argentina) | 4,595 | 123,192 | ||||||
Itau Unibanco Holding S.A. (Brazil) | 9,000 | 116,128 | ||||||
Jyske Bank A/S (Denmark)1 | 2,060 | 116,407 | ||||||
KBC Group N.V. (Belgium)1 | 2,125 | 176,522 | ||||||
Skandinaviska Enskilda Banken A.B. - Class A (Sweden)1 | 9,180 | 113,131 | ||||||
Svenska Handelsbanken A.B. - Class A (Sweden)1 | 7,990 | 114,515 | ||||||
Swedbank A.B. - Class A (Sweden)1 | 4,345 | 107,833 | ||||||
Sydbank A/S (Denmark)1 | 2,985 | 116,530 | ||||||
|
| |||||||
| 2,769,770 | ||||||||
|
| |||||||
Capital Markets - 0.6% | ||||||||
Amundi S.A. (France)1,2 | 2,180 | 184,757 | ||||||
Banca Generali S.p.A. (Italy)1 | 5,260 | 173,060 | ||||||
BlackRock, Inc. | 5,710 | 2,688,439 | ||||||
EFG International AG (Switzerland)1 | 19,055 | 174,374 | ||||||
Euronext N.V. (Netherlands)1,2 | 3,730 | 221,527 | ||||||
Julius Baer Group Ltd. (Switzerland)1 | 2,010 | 118,887 | ||||||
Natixis S.A. (France)1 | 29,925 | 234,676 | ||||||
|
| |||||||
| 3,795,720 | ||||||||
|
| |||||||
Thrifts & Mortgage Finance - 0.0%##7 | ||||||||
Aareal Bank AG (Germany)1 | 2,855 | 118,704 | ||||||
|
| |||||||
Total Financials | 6,684,194 | |||||||
|
| |||||||
Health Care - 8.5% | ||||||||
Biotechnology - 3.6% | ||||||||
Biogen, Inc.* | 13,188 | 4,110,172 | ||||||
BioMarin Pharmaceutical, Inc.* | 57,882 | 4,751,533 | ||||||
Incyte Corp.* | 36,539 | 4,138,042 | ||||||
Regeneron Pharmaceuticals, Inc.* | 14,628 | 5,889,525 | ||||||
Seattle Genetics, Inc.* | 64,490 | 3,953,882 | ||||||
Vertex Pharmaceuticals, Inc.* | 16,821 | 2,459,735 | ||||||
|
| |||||||
| 25,302,889 | ||||||||
|
| |||||||
Health Care Equipment & Supplies - 1.0% | ||||||||
Medtronic plc | 85,412 | 6,877,374 | ||||||
Osstem Implant Co. Ltd. (South Korea)*1 | 2,775 | 178,308 | ||||||
|
| |||||||
| 7,055,682 | ||||||||
|
| |||||||
Health Care Providers & Services - 1.7% | ||||||||
DaVita, Inc.* | 137,157 | 8,330,916 | ||||||
Express Scripts Holding Co.*3 | 44,933 | 2,753,944 | ||||||
Fleury S.A. (Brazil) | 18,670 | 163,911 | ||||||
Fresenius Medical Care AG & Co. KGaA (Germany)1 | 2,945 | 285,141 | ||||||
Orpea (France)1 | 1,890 | 226,439 | ||||||
|
| |||||||
| 11,760,351 | ||||||||
|
| |||||||
Life Sciences Tools & Services - 0.0%## | ||||||||
QIAGEN N.V. | 3,591 | 121,591 | ||||||
QIAGEN N.V.1 | 4,642 | 157,488 | ||||||
Tecan Group AG (Switzerland)1 | 585 | 123,732 | ||||||
|
| |||||||
| 402,811 | ||||||||
|
| |||||||
Pharmaceuticals - 2.2% | ||||||||
Bristol-Myers Squibb Co. | 43,094 | 2,657,176 | ||||||
Hypermarcas S.A. (Brazil) | 16,700 | 175,153 | ||||||
Johnson & Johnson | 38,190 | 5,324,068 | ||||||
Kalbe Farma Tbk PT (Indonesia)1 | 1,369,710 | 161,588 | ||||||
Novartis AG - ADR (Switzerland) | 86,716 | 7,161,007 | ||||||
Perrigo Co. plc | 2,735 | 221,508 | ||||||
|
| |||||||
| 15,700,500 | ||||||||
|
| |||||||
Total Health Care | 60,222,233 | |||||||
|
| |||||||
Industrials - 3.7% | ||||||||
Aerospace & Defense - 0.6% | ||||||||
Arconic, Inc. | 154,906 | 3,891,239 | ||||||
LIG Nex1 Co. Ltd. (South Korea)1 | 2,590 | 166,217 | ||||||
Thales S.A. (France)1 | 2,660 | 277,208 | ||||||
Ultra Electronics Holdings plc (United Kingdom)1 | 5,000 | 121,073 | ||||||
|
| |||||||
| 4,455,737 | ||||||||
|
| |||||||
Air Freight & Logistics - 0.8% | ||||||||
FedEx Corp. | 23,870 | 5,390,085 | ||||||
|
| |||||||
Airlines - 0.1% | ||||||||
Azul S.A. - ADR (Brazil)* | 4,380 | 110,770 | ||||||
Ryanair Holdings plc - ADR (Ireland)* | 2,809 | 314,917 | ||||||
|
| |||||||
| 425,687 | ||||||||
|
| |||||||
Building Products - 0.0%## | ||||||||
Cie de Saint-Gobain (France)1 | 3,965 | 232,479 | ||||||
Geberit AG (Switzerland)1 | 255 | 115,452 | ||||||
|
| |||||||
| 347,931 | ||||||||
|
| |||||||
Commercial Services & Supplies - 0.1% | ||||||||
China Everbright International Ltd. (China)1 | 122,280 | 172,519 | ||||||
Elis S.A. (France)1 | 6,855 | 178,725 | ||||||
The accompanying notes are an integral part of the financial statements.
34
Investment Portfolio - October 31, 2017
| PRO-BLEND® MODERATE TERM SERIES | SHARES | VALUE (NOTE 2) | ||||||
COMMON STOCKS (continued) | ||||||||
Industrials (continued) | ||||||||
Commercial Services & Supplies (continued) | ||||||||
SPIE S.A. (France)1 | 8,435 | $ | 221,937 | |||||
|
| |||||||
| 573,181 | ||||||||
|
| |||||||
Construction & Engineering - 0.1% | ||||||||
Eiffage S.A. (France)1 | 2,780 | 290,387 | ||||||
Vinci S.A. (France)1 | 4,100 | 401,708 | ||||||
|
| |||||||
| 692,095 | ||||||||
|
| |||||||
Electrical Equipment - 0.0%## | ||||||||
Legrand S.A. (France)1 | 2,465 | 182,929 | ||||||
|
| |||||||
Industrial Conglomerates - 0.1% | ||||||||
Siemens AG (Germany)1 | 3,365 | 483,324 | ||||||
|
| |||||||
Machinery - 0.1% | ||||||||
FANUC Corp. (Japan)1 | 899 | 210,208 | ||||||
Jungheinrich AG (Germany)1 | 3,800 | 173,060 | ||||||
KION Group AG (Germany)1 | 2,935 | 235,175 | ||||||
Metso OYJ (Finland)1 | 3,320 | 120,577 | ||||||
The Weir Group plc (United Kingdom)1 | 11,540 | 299,170 | ||||||
|
| |||||||
| 1,038,190 | ||||||||
|
| |||||||
Professional Services - 1.2% | ||||||||
Applus Services S.A. (Spain)1 | 24,155 | 337,776 | ||||||
Equifax, Inc. | 30,775 | 3,340,011 | ||||||
Intertek Group plc (United Kingdom)1 | 60 | 4,322 | ||||||
Nielsen Holdings plc | 125,900 | 4,667,113 | ||||||
Randstad Holding N.V. (Netherlands)1 | 2,905 | 178,722 | ||||||
RELX plc (United Kingdom)1 | 5,255 | 120,922 | ||||||
SGS S.A. (Switzerland)1 | 100 | 246,954 | ||||||
|
| |||||||
| 8,895,820 | ||||||||
|
| |||||||
Road & Rail - 0.4% | ||||||||
Genesee & Wyoming, Inc. - Class A* | 36,760 | 2,638,633 | ||||||
|
| |||||||
Trading Companies & Distributors - 0.1% | ||||||||
Ashtead Group plc (United Kingdom)1 | 6,965 | 179,414 | ||||||
Brenntag AG (Germany)1 | 4,543 | 257,750 | ||||||
Howden Joinery Group plc (United Kingdom)1 | 14,785 | 80,518 | ||||||
|
| |||||||
| 517,682 | ||||||||
|
| |||||||
Transportation Infrastructure - 0.1% | ||||||||
Aena SME S.A. (Spain)1,2 | 3,130 | 574,272 | ||||||
Grupo Aeroportuario del Centro Norte S.A.B. de C.V. (Mexico) | 8,900 | 44,960 | ||||||
Grupo Aeroportuario del Pacifico S.A.B. de C.V. - ADR (Mexico) | 475 | 45,087 | ||||||
|
| |||||||
| 664,319 | ||||||||
|
| |||||||
Total Industrials | 26,305,613 | |||||||
|
| |||||||
Information Technology - 10.3% | ||||||||
Electronic Equipment, Instruments & Components - 0.2% | ||||||||
Halma plc (United Kingdom)1 | 11,495 | 180,366 | ||||||
Hexagon A.B. - Class B (Sweden)1 | 2,350 | 120,497 | ||||||
Hitachi Ltd. (Japan)1 | 39,660 | 315,826 | ||||||
Hollysys Automation Technologies Ltd. (China) | 5,115 | 114,832 | ||||||
Keyence Corp. (Japan)1 | 906 | 503,034 | ||||||
|
| |||||||
| 1,234,555 | ||||||||
|
| |||||||
Internet Software & Services - 3.8% | ||||||||
Alibaba Group Holding Ltd. - ADR (China)* | 2,655 | 490,883 | ||||||
Alphabet, Inc. - Class A*3 | 4,290 | 4,431,742 | ||||||
Alphabet, Inc. - Class C* | 4,393 | 4,466,100 | ||||||
China Literature Ltd. - Rights (Expires 11/03/2017) (Hong Kong)*4 | 84 | — | ||||||
Facebook, Inc. - Class A* | 68,995 | 12,423,240 | ||||||
NetEase, Inc. - ADR (China) | 300 | 84,576 | ||||||
Tencent Holdings Ltd. - Class H (China)1 | 104,718 | 4,706,562 | ||||||
|
| |||||||
| 26,603,103 | ||||||||
|
| |||||||
IT Services - 1.7% | ||||||||
Altran Technologies S.A. (France)1 | 12,655 | 234,052 | ||||||
Amdocs Ltd. | 4,475 | 291,322 | ||||||
InterXion Holding N.V. - ADR (Netherlands)* | 3,860 | 206,085 | ||||||
MasterCard, Inc. - Class A | 38,562 | 5,736,869 | ||||||
Sopra Steria Group (France)1 | 1,260 | 236,375 | ||||||
Visa, Inc. - Class A3 | 52,036 | 5,722,919 | ||||||
|
| |||||||
| 12,427,622 | ||||||||
|
| |||||||
Semiconductors & Semiconductor Equipment - 1.9% | ||||||||
Qorvo, Inc.* | 77,925 | 5,907,494 | ||||||
Skyworks Solutions, Inc. | 66,184 | 7,535,710 | ||||||
|
| |||||||
| 13,443,204 | ||||||||
|
| |||||||
Software - 2.7% | ||||||||
Atlassian Corp. plc - Class A (Australia)* | 2,058 | 99,545 | ||||||
Dassault Systemes S.E. (France)1 | 2,260 | 239,913 | ||||||
Electronic Arts, Inc.* | 26,507 | 3,170,237 | ||||||
The accompanying notes are an integral part of the financial statements.
35
Investment Portfolio - October 31, 2017
| PRO-BLEND® MODERATE TERM SERIES | SHARES | VALUE (NOTE 2) | ||||||
COMMON STOCKS (continued) | ||||||||
Information Technology (continued) | ||||||||
Software (continued) | ||||||||
Microsoft Corp. | 51,140 | $ | 4,253,825 | |||||
ServiceNow, Inc.* | 85,580 | 10,814,745 | ||||||
Sophos Group plc (United Kingdom)1,2 | 14,855 | 122,496 | ||||||
Temenos Group AG (Switzerland)1 | 1,570 | 181,290 | ||||||
|
| |||||||
| 18,882,051 | ||||||||
|
| |||||||
Total Information Technology | 72,590,535 | |||||||
|
| |||||||
Materials - 2.3% | ||||||||
Chemicals - 0.5% | ||||||||
Akzo Nobel N.V. (Netherlands)1 | 2,625 | 236,987 | ||||||
Ashland Global Holdings, Inc. | 42,480 | 2,887,791 | ||||||
Croda International plc (United Kingdom)1 | 3,410 | 189,509 | ||||||
Mexichem, S.A.B. de C.V. (Mexico) | 34,500 | 88,860 | ||||||
Solvay S.A. (Belgium)1 | 1,470 | 218,381 | ||||||
|
| |||||||
| 3,621,528 | ||||||||
|
| |||||||
Construction Materials - 0.0%## | ||||||||
Wienerberger AG (Austria)1 | 6,970 | 178,833 | ||||||
|
| |||||||
Containers & Packaging - 1.0% | ||||||||
Ball Corp. | 79,040 | 3,393,187 | ||||||
Sealed Air Corp. | 81,193 | 3,591,166 | ||||||
|
| |||||||
| 6,984,353 | ||||||||
|
| |||||||
Metals & Mining - 0.8% | ||||||||
Antofagasta plc (Chile)1 | 91,687 | 1,162,001 | ||||||
First Quantum Minerals Ltd. (Zambia) | 106,948 | 1,196,233 | ||||||
Grupo Mexico, S.A.B. de C.V. - Series B (Mexico) | 68,320 | 222,189 | ||||||
Lundin Mining Corp. (Canada) | 162,679 | 1,240,804 | ||||||
Southern Copper Corp. (Peru) | 36,867 | 1,583,438 | ||||||
|
| |||||||
| 5,404,665 | ||||||||
|
| |||||||
Total Materials | 16,189,379 | |||||||
|
| |||||||
Real Estate - 2.3% | ||||||||
Equity Real Estate Investment Trusts (REITS) - 2.2% | ||||||||
Acadia Realty Trust | 2,730 | 76,849 | ||||||
Agree Realty Corp. | 1,435 | 67,861 | ||||||
Alexandria Real Estate Equities, Inc. | 2,465 | 305,561 | ||||||
American Campus Communities, Inc. | 2,785 | 115,800 | ||||||
American Homes 4 Rent - Class A | 10,310 | 219,397 | ||||||
Apartment Investment & Management Co. - Class A | 5,725 | 251,786 | ||||||
AvalonBay Communities, Inc. | 1,755 | 318,234 | ||||||
Axiare Patrimonio SOCIMI S.A. (Spain)1 | 4,670 | 87,582 | ||||||
Bluerock Residential Growth REIT, Inc. | 6,210 | 70,111 | ||||||
Boston Properties, Inc. | 1,260 | 152,687 | ||||||
Brandywine Realty Trust | 7,955 | 139,133 | ||||||
Brixmor Property Group, Inc. | 4,000 | 69,880 | ||||||
Camden Property Trust | 1,445 | 131,842 | ||||||
CatchMark Timber Trust, Inc. - Class A | 15,375 | 196,800 | ||||||
Cedar Realty Trust, Inc. | 20,140 | 109,562 | ||||||
Chesapeake Lodging Trust | 4,870 | 135,873 | ||||||
Colony NorthStar, Inc. - Class A | 16,448 | 201,981 | ||||||
Columbia Property Trust, Inc. | 4,285 | 94,613 | ||||||
Community Healthcare Trust, Inc. | 13,315 | 365,230 | ||||||
CoreCivic, Inc. | 9,810 | 241,915 | ||||||
Cousins Properties, Inc. | 21,025 | 189,645 | ||||||
Crown Castle International Corp. | 1,570 | 168,116 | ||||||
CubeSmart | 9,365 | 254,915 | ||||||
DDR Corp. | 6,915 | 53,038 | ||||||
Digital Realty Trust, Inc. | 2,440 | 288,994 | ||||||
Douglas Emmett, Inc. | 3,875 | 154,186 | ||||||
Education Realty Trust, Inc. | 1,698 | 59,260 | ||||||
EPR Properties | 890 | 61,570 | ||||||
Equinix, Inc. | 1,380 | 639,630 | ||||||
Equity Commonwealth* | 4,045 | 121,552 | ||||||
Equity LifeStyle Properties, Inc. | 1,375 | 121,660 | ||||||
Equity Residential | 3,460 | 232,720 | ||||||
Essex Property Trust, Inc. | 275 | 72,168 | ||||||
Extra Space Storage, Inc. | 2,355 | 192,144 | ||||||
Forest City Realty Trust, Inc. - Class A | 5,235 | 128,938 | ||||||
Getty Realty Corp. | 3,410 | 96,878 | ||||||
GGP, Inc. | 5,665 | 110,241 | ||||||
Global Medical REIT, Inc. | 15,530 | 131,384 | ||||||
HCP, Inc. | 4,765 | 123,128 | ||||||
Healthcare Trust of America, Inc. - Class A | 4,795 | 144,090 | ||||||
Hibernia REIT plc (Ireland)1 | 61,910 | 106,371 | ||||||
Host Hotels & Resorts, Inc. | 6,035 | 118,045 | ||||||
Independence Realty Trust, Inc. | 10,070 | 102,210 | ||||||
Invitation Homes, Inc. | 4,520 | 102,016 | ||||||
Lamar Advertising Co. - Class A | 1,575 | 110,943 | ||||||
LaSalle Hotel Properties | 2,870 | 80,963 | ||||||
Life Storage, Inc. | 1,550 | 125,271 | ||||||
The Macerich Co. | 1,035 | 56,511 | ||||||
The accompanying notes are an integral part of the financial statements.
36
Investment Portfolio - October 31, 2017
| PRO-BLEND® MODERATE TERM SERIES | SHARES/ PRINCIPAL | VALUE (NOTE 2) | ||||||
COMMON STOCKS (continued) | ||||||||
Real Estate (continued) | ||||||||
Equity Real Estate Investment Trusts (REITS) (continued) | ||||||||
Mid-America Apartment Communities, Inc. | 2,340 | $ | 239,499 | |||||
National Retail Properties, Inc. | 3,135 | 125,964 | ||||||
Outfront Media, Inc. | 5,142 | 120,580 | ||||||
Physicians Realty Trust | 12,755 | 221,682 | ||||||
Prologis, Inc. | 6,145 | 396,844 | ||||||
Public Storage | 995 | 206,214 | ||||||
Regency Centers Corp. | 2,071 | 127,470 | ||||||
Retail Opportunity Investments Corp. | 4,265 | 76,685 | ||||||
Rexford Industrial Realty, Inc. | 6,205 | 184,226 | ||||||
Simon Property Group, Inc. | 3,180 | 493,949 | ||||||
STAG Industrial, Inc. | 6,815 | 186,050 | ||||||
Starwood Waypoint Homes | 2,800 | 101,668 | ||||||
STORE Capital Corp. | 4,980 | 122,956 | ||||||
Sun Communities, Inc. | 1,325 | 119,594 | ||||||
Sunstone Hotel Investors, Inc. | 7,615 | 124,277 | ||||||
Terreno Realty Corp. | 4,995 | 183,416 | ||||||
UDR, Inc. | 4,410 | 171,064 | ||||||
Unibail-Rodamco S.E. (France)1 | 810 | 202,749 | ||||||
Urban Edge Properties | 8,080 | 189,557 | ||||||
Ventas, Inc. | 3,965 | 248,804 | ||||||
VEREIT, Inc. | 14,890 | 117,482 | ||||||
Vornado Realty Trust | 3,620 | 270,993 | ||||||
Welltower, Inc. | 3,370 | 225,655 | ||||||
Weyerhaeuser Co. | 110,026 | 3,951,034 | ||||||
|
| |||||||
| 15,907,696 | ||||||||
|
| |||||||
Real Estate Management & Development - 0.1% |
| |||||||
Aliansce Shopping Centers S.A. (Brazil)* | 21,875 | 116,888 | ||||||
Iguatemi Empresa de Shopping Centers S.A. (Brazil) | 9,990 | 117,389 | ||||||
Nexity S.A. (France)1 | 2,955 | 181,621 | ||||||
|
| |||||||
| 415,898 | ||||||||
|
| |||||||
Total Real Estate | 16,323,594 | |||||||
|
| |||||||
Telecommunication Services - 0.6% | ||||||||
Diversified Telecommunication Services - 0.6% | ||||||||
Iliad S.A. (France)1 | 810 | 202,191 | ||||||
Zayo Group Holdings, Inc.* | 112,450 | 4,054,947 | ||||||
|
| |||||||
Total Telecommunication Services | 4,257,138 | |||||||
|
| |||||||
Utilities - 0.1% | ||||||||
Electric Utilities - 0.0%## | ||||||||
Pampa Energia S.A. - ADR (Argentina)* | 3,470 | 235,370 | ||||||
|
| |||||||
Independent Power and Renewable Electricity Producers - 0.1% |
| |||||||
China Longyuan Power Group Corp. Ltd. - Class H (China)1 | 220,000 | 163,150 | ||||||
Huaneng Renewables Corp. Ltd. - Class H (China)1 | 500,000 | 171,952 | ||||||
|
| |||||||
| 335,102 | ||||||||
|
| |||||||
Total Utilities | 570,472 | |||||||
|
| |||||||
TOTAL COMMON STOCKS | ||||||||
(Identified Cost $215,770,745) | 256,893,800 | |||||||
|
| |||||||
CORPORATE BONDS - 18.0% | ||||||||
Non-Convertible Corporate Bonds - 18.0% | ||||||||
Consumer Discretionary - 2.5% | ||||||||
Auto Components - 0.3% | ||||||||
Magna International, Inc. (Canada), 4.15%, 10/1/2025 | 2,118,000 | 2,266,208 | ||||||
|
| |||||||
Household Durables - 0.6% | ||||||||
Century Communities, Inc.2, 5.875%, 7/15/2025 | 272,000 | 274,717 | ||||||
Meritage Homes Corp., 5.125%, 6/6/2027 | 199,000 | 201,239 | ||||||
NVR, Inc., 3.95%, 9/15/2022 | 2,377,000 | 2,496,925 | ||||||
TRI Pointe Group, Inc. - TRI Pointe Homes, Inc., 4.375%, 6/15/2019 | 290,000 | 297,613 | ||||||
TRI Pointe Group, Inc. - TRI Pointe Homes, Inc., 5.875%, 6/15/2024 | 156,000 | 168,870 | ||||||
Weekley Homes LLC - Weekley Finance Corp., 6.00%, 2/1/2023 | 242,000 | 237,160 | ||||||
Weekley Homes LLC - Weekley Finance Corp.2, 6.625%, 8/15/2025 | 256,000 | 248,960 | ||||||
|
| |||||||
| 3,925,484 | ||||||||
|
| |||||||
Internet & Direct Marketing Retail - 0.7% | ||||||||
Amazon.com, Inc.2, 3.15%, 8/22/2027 | 1,530,000 | 1,539,155 | ||||||
The Priceline Group, Inc., 3.60%, 6/1/2026 | 2,984,000 | 3,049,967 | ||||||
|
| |||||||
| 4,589,122 | ||||||||
|
| |||||||
Media - 0.7% | ||||||||
Charter Communications Operating LLC - Charter Communications Operating Capital Corp., 4.464%, 7/23/2022 | 75,000 | 79,206 | ||||||
Comcast Corp., 4.40%, 8/15/2035 | 1,435,000 | 1,553,947 | ||||||
CSC Holdings, LLC, 5.25%, 6/1/2024 | 346,000 | 344,486 | ||||||
The accompanying notes are an integral part of the financial statements.
37
Investment Portfolio - October 31, 2017
| PRO-BLEND® MODERATE TERM SERIES | PRINCIPAL AMOUNT 5 | VALUE (NOTE 2) | ||||||
CORPORATE BONDS (continued) | ||||||||
Non-Convertible Corporate Bonds (continued) | ||||||||
Consumer Discretionary (continued) | ||||||||
Media (continued) | ||||||||
Discovery Communications LLC, 3.95%, 3/20/2028 | 2,320,000 | $ | 2,301,009 | |||||
DISH DBS Corp., 5.875%, 7/15/2022 | 75,000 | 75,422 | ||||||
UPCB Finance IV Ltd. (Netherlands)2, 5.375%, 1/15/2025 | 285,000 | 291,412 | ||||||
VTR Finance B.V. (Chile)2, 6.875%, 1/15/2024 | 485,000 | 514,221 | ||||||
|
| |||||||
| 5,159,703 | ||||||||
|
| |||||||
Multiline Retail - 0.2% | ||||||||
Dollar General Corp., 3.25%, 4/15/2023 | 1,453,000 | 1,490,958 | ||||||
|
| |||||||
Total Consumer Discretionary | 17,431,475 | |||||||
|
| |||||||
Consumer Staples - 1.0% | ||||||||
Beverages - 0.6% | ||||||||
Anheuser-Busch InBev Worldwide, Inc. (Belgium), 8.20%, 1/15/2039 | 1,778,000 | 2,809,617 | ||||||
PepsiCo, Inc., 3.10%, 7/17/2022 | 1,414,000 | 1,461,832 | ||||||
|
| |||||||
| 4,271,449 | ||||||||
|
| |||||||
Food & Staples Retailing - 0.4% | ||||||||
C&S Group Enterprises LLC2, 5.375%, 7/15/2022 | 385,000 | 373,450 | ||||||
CVS Health Corp., 3.50%, 7/20/2022 | 2,136,000 | 2,201,767 | ||||||
|
| |||||||
| 2,575,217 | ||||||||
|
| |||||||
Total Consumer Staples | 6,846,666 | |||||||
|
| |||||||
Energy - 2.6% | ||||||||
Energy Equipment & Services - 0.1% | ||||||||
McDermott International, Inc.2, 8.00%, 5/1/2021 | 390,000 | 402,675 | ||||||
Trinidad Drilling Ltd. (Canada)2, 6.625%, 2/15/2025 | 281,000 | 273,272 | ||||||
|
| |||||||
| 675,947 | ||||||||
|
| |||||||
Oil, Gas & Consumable Fuels - 2.5% | ||||||||
BP Capital Markets plc (United Kingdom), 3.535%, 11/4/2024 | 2,966,000 | 3,083,530 | ||||||
Cheniere Corpus Christi Holdings, LLC, 7.00%, 6/30/2024 | 355,000 | 405,144 | ||||||
Cheniere Energy Partners LP2, 5.25%, 10/1/2025 | 251,000 | 258,530 | ||||||
Columbia Pipeline Group, Inc., 4.50%, 6/1/2025 | 1,331,000 | 1,426,503 | ||||||
ConocoPhillips Co., 3.35%, 5/15/2025 | 1,435,000 | 1,478,436 | ||||||
Dynagas LNG Partners LP - Dynagas Finance, Inc. (Monaco), 6.25%, 10/30/2019 | 286,000 | 286,000 | ||||||
Enbridge, Inc. (Canada), 3.70%, 7/15/2027 | 1,435,000 | 1,453,745 | ||||||
Enviva Partners LP - Enviva Partners Finance Corp., 8.50%, 11/1/2021 | 251,000 | 269,197 | ||||||
GasLog Ltd. (Monaco), 8.875%, 3/22/2022 | 272,000 | 286,960 | ||||||
Global Ship Lease, Inc. (United Kingdom)2, 9.875%, 11/15/2022 | 350,000 | 357,000 | ||||||
Hilcorp Energy I LP - Hilcorp Finance Co.2, 5.75%, 10/1/2025 | 394,000 | 403,357 | ||||||
Jonah Energy LLC - Jonah Energy Finance Corp.2, 7.25%, 10/15/2025 | 251,000 | 251,000 | ||||||
Kinder Morgan Energy Partners LP, 4.30%, 5/1/2024 | 3,005,000 | 3,152,895 | ||||||
PBF Holding Co. LLC - PBF Finance Corp.2, 7.25%, 6/15/2025 | 211,000 | 218,121 | ||||||
Petroleos Mexicanos (Mexico), 6.875%, 8/4/2026 | 1,276,000 | 1,433,586 | ||||||
Rockies Express Pipeline, LLC2, 5.625%, 4/15/2020 | 342,000 | 362,520 | ||||||
Sabine Pass Liquefaction LLC, 5.875%, 6/30/2026 | 1,360,000 | 1,538,605 | ||||||
SemGroup Corp.2, 6.375%, 3/15/2025 | 263,000 | 259,055 | ||||||
Seven Generations Energy Ltd. (Canada)2, 5.375%, 9/30/2025 | 173,000 | 174,730 | ||||||
Southwestern Energy Co., 6.70%, 1/23/2025 | 204,000 | 208,590 | ||||||
Tallgrass Energy Partners LP - Tallgrass Energy Finance Corp.2, 5.50%, 9/15/2024 | 354,000 | 365,948 | ||||||
|
| |||||||
| 17,673,452 | ||||||||
|
| |||||||
Total Energy | 18,349,399 | |||||||
|
| |||||||
Financials - 6.0% | ||||||||
Banks - 3.2% | ||||||||
Banco Santander S.A. (Spain), 3.50%, 4/11/2022 | 1,902,000 | 1,948,915 | ||||||
Bank of America Corp., 4.00%, 1/22/2025 | 2,188,000 | 2,266,076 | ||||||
Barclays Bank plc (United Kingdom)2, 10.179%, 6/12/2021 | 1,250,000 | 1,543,619 | ||||||
Citigroup, Inc., 3.875%, 3/26/2025 | 3,031,000 | 3,110,117 | ||||||
The accompanying notes are an integral part of the financial statements.
38
Investment Portfolio - October 31, 2017
| PRO-BLEND® MODERATE TERM SERIES | PRINCIPAL AMOUNT 5 | VALUE (NOTE 2) | ||||||||||
CORPORATE BONDS (continued) | ||||||||||||
Non-Convertible Corporate Bonds (continued) | ||||||||||||
Financials (continued) | ||||||||||||
Banks (continued) | ||||||||||||
Intesa Sanpaolo S.p.A. (Italy), 3.875%, 1/15/2019 | 1,444,000 | $ | 1,472,239 | |||||||||
JPMorgan Chase & Co.6, (3 mo. LIBOR US + 0.935%), 2.776%, 4/25/2023 | 3,005,000 | 3,015,657 | ||||||||||
Kreditanstalt fuer Wiederaufbau (Germany), 1.50%, 6/15/2021 | 5,794,000 | 5,689,973 | ||||||||||
Lloyds Banking Group plc (United Kingdom), 4.582%, 12/10/2025 | 3,053,000 | 3,219,827 | ||||||||||
Popular, Inc., 7.00%, 7/1/2019 | 283,000 | 289,368 | ||||||||||
Royal Bank of Canada (Canada), 3.77%, 3/30/2018 | CAD | 390,000 | 305,256 | |||||||||
Royal Bank of Scotland Group plc (United Kingdom), 6.10%, 6/10/2023 | 73,000 | 81,289 | ||||||||||
|
| |||||||||||
| 22,942,336 | ||||||||||||
|
| |||||||||||
Capital Markets - 0.8% | ||||||||||||
The Goldman Sachs Group, Inc., 4.25%, 10/21/2025 | 1,465,000 | 1,528,461 | ||||||||||
Morgan Stanley7, (3 mo. LIBOR US + 1.220%), 2.617%, 5/8/2024 |
| 2,206,000 | 2,243,017 | |||||||||
Morgan Stanley, 5.00%, 11/24/2025 |
| 2,002,000 | 2,183,809 | |||||||||
|
| |||||||||||
| 5,955,287 | ||||||||||||
|
| |||||||||||
Consumer Finance - 0.1% | ||||||||||||
Ally Financial, Inc., 3.50%, 1/27/2019 | 108,000 | 109,318 | ||||||||||
Navient Corp., 6.125%, 3/25/2024 | 177,000 | 181,646 | ||||||||||
SLM Corp., 5.125%, 4/5/2022 | 225,000 | 233,156 | ||||||||||
|
| |||||||||||
| 524,120 | ||||||||||||
|
| |||||||||||
Diversified Financial Services - 0.7% |
| |||||||||||
AerCap Ireland Capital DAC - AerCap Global Aviation Trust (Netherlands), 4.50%, 5/15/2021 | 2,890,000 | 3,069,157 | ||||||||||
E*TRADE Financial Corp., 2.95%, 8/24/2022 | 1,540,000 | 1,540,734 | ||||||||||
LPL Holdings, Inc.2, 5.75%, 9/15/2025 | 182,000 | 189,280 | ||||||||||
|
| |||||||||||
| 4,799,171 | ||||||||||||
|
| |||||||||||
Insurance - 1.1% | ||||||||||||
American International Group, Inc., 4.125%, 2/15/2024 | 2,075,000 | 2,207,053 | ||||||||||
Assured Guaranty US Holdings, Inc., 5.00%, 7/1/2024 | 3,540,000 | 3,822,025 | ||||||||||
Prudential Financial, Inc.6, (3 mo. LIBOR US + 4.175%), 5.875%, 9/15/2042 | 1,288,000 | 1,423,240 | ||||||||||
|
| |||||||||||
| 7,452,318 | ||||||||||||
|
| |||||||||||
Thrifts & Mortgage Finance - 0.1% | ||||||||||||
Ladder Capital Finance Holdings LLLP - Ladder Capital Finance Corp.2, 5.875%, 8/1/2021 | 463,000 | 478,047 | ||||||||||
|
| |||||||||||
Total Financials | 42,151,279 | |||||||||||
|
| |||||||||||
Health Care - 0.5% | ||||||||||||
Biotechnology - 0.4% | ||||||||||||
AMAG Pharmaceuticals, Inc.2, 7.875%, 9/1/2023 | 195,000 | 198,413 | ||||||||||
Express Scripts Holding Co., 3.50%, 6/15/2024 | 2,132,000 | 2,157,243 | ||||||||||
Horizon Pharma, Inc. - Horizon Pharma USA, Inc.2, 8.75%, 11/1/2024 | 330,000 | 345,675 | ||||||||||
|
| |||||||||||
| 2,701,331 | ||||||||||||
|
| |||||||||||
Health Care Equipment & Supplies - 0.0%## |
| |||||||||||
Hill-Rom Holdings, Inc.2, 5.00%, 2/15/2025 | 195,000 | 199,387 | ||||||||||
|
| |||||||||||
Health Care Providers & Services - 0.1% | ||||||||||||
DaVita, Inc., 5.00%, 5/1/2025 | 251,000 | 247,235 | ||||||||||
Fresenius Medical Care US Finance II, Inc. (Germany)2, 6.50%, 9/15/2018 | 108,000 | 112,174 | ||||||||||
HCA Healthcare, Inc., 6.25%, 2/15/2021 | 73,000 | 78,566 | ||||||||||
HCA, Inc., 3.75%, 3/15/2019 | 73,000 | 74,095 | ||||||||||
Ortho-Clinical Diagnostics, Inc. - Ortho-Clinical Diagnostics S.A.2, 6.625%, 5/15/2022 | 100,000 | 100,125 | ||||||||||
Tenet Healthcare Corp., 6.75%, 2/1/2020 | 73,000 | 74,278 | ||||||||||
|
| |||||||||||
| 686,473 | ||||||||||||
|
| |||||||||||
Total Health Care | 3,587,191 | |||||||||||
|
| |||||||||||
Industrials - 0.7% | ||||||||||||
Aerospace & Defense - 0.0%## | ||||||||||||
Arconic, Inc., 5.87%, 2/23/2022 | 205,000 | 223,963 | ||||||||||
|
| |||||||||||
Air Freight & Logistics - 0.0%## | ||||||||||||
Park Aerospace Holdings Ltd. (Ireland)2, 4.50%, 3/15/2023 | 138,000 | 138,173 | ||||||||||
|
| |||||||||||
The accompanying notes are an integral part of the financial statements.
39
Investment Portfolio - October 31, 2017
| PRO-BLEND® MODERATE TERM SERIES | PRINCIPAL AMOUNT 5 | VALUE (NOTE 2) | ||||||
CORPORATE BONDS (continued) | ||||||||
Non-Convertible Corporate Bonds (continued) | ||||||||
Industrials (continued) | ||||||||
Airlines - 0.1% | ||||||||
Allegiant Travel Co., 5.50%, 7/15/2019 | 182,000 | $ | 187,915 | |||||
American Airlines Group, Inc.2, 5.50%, 10/1/2019 | 173,000 | 179,920 | ||||||
|
| |||||||
| 367,835 | ||||||||
|
| |||||||
Building Products - 0.1% | ||||||||
Airxcel, Inc.2, 8.50%, 2/15/2022 | 294,000 | 311,640 | ||||||
|
| |||||||
Construction & Engineering - 0.1% |
| |||||||
Tutor Perini Corp.2, 6.875%, 5/1/2025 | 286,000 | 308,522 | ||||||
|
| |||||||
Industrial Conglomerates - 0.4% | ||||||||
General Electric Co.7, (3 mo. LIBOR US + 0.380%), 1.771%, 5/5/2026 | 3,208,000 | 3,107,222 | ||||||
|
| |||||||
Machinery - 0.0%## | ||||||||
Xerium Technologies, Inc., 9.50%, 8/15/2021 | 211,000 | 216,739 | ||||||
|
| |||||||
Trading Companies & Distributors - 0.0%## |
| |||||||
International Lease Finance Corp., 6.25%, 5/15/2019 | 199,000 | 211,023 | ||||||
|
| |||||||
Total Industrials | 4,885,117 | |||||||
|
| |||||||
Information Technology - 1.0% | ||||||||
Internet Software & Services - 0.4% |
| |||||||
Activision Blizzard, Inc., 3.40%, 6/15/2027 | 2,957,000 | 2,962,493 | ||||||
|
| |||||||
IT Services - 0.3% | ||||||||
Visa, Inc., 2.80%, 12/14/2022 | 2,197,000 | 2,238,334 | ||||||
|
| |||||||
Semiconductors & Semiconductor Equipment - 0.3% |
| |||||||
Applied Materials, Inc., 3.30%, 4/1/2027 | 1,460,000 | 1,493,195 | ||||||
MagnaChip Semiconductor Corp. (South Korea), 6.625%, 7/15/2021 | 277,000 | 265,920 | ||||||
|
| |||||||
| 1,759,115 | ||||||||
|
| |||||||
Total Information Technology | 6,959,942 | |||||||
|
| |||||||
Materials - 1.7% | ||||||||
Chemicals - 0.3% | ||||||||
Kissner Holdings LP - Kissner Milling Co. Ltd. - BSC Holding, Inc. - Kissner USA (Canada)2, 8.375%, 12/1/2022 | 247,000 | 249,470 | ||||||
NOVA Chemicals Corp. (Canada)2, 4.875%, 6/1/2024 | 208,000 | 211,900 | ||||||
Solvay Finance America LLC (Belgium)2, 3.40%, 12/3/2020 | 1,490,000 | 1,532,176 | ||||||
|
| |||||||
| 1,993,546 | ||||||||
|
| |||||||
Metals & Mining - 1.2% | ||||||||
Anglo American Capital plc (United Kingdom)2, 9.375%, 4/8/2019 | 116,000 | 127,634 | ||||||
Anglo American Capital plc (United Kingdom)2, 4.00%, 9/11/2027 | 3,080,000 | 3,083,082 | ||||||
Corp Nacional del Cobre de Chile (Chile)2, 3.625%, 8/1/2027 | 2,703,000 | 2,718,921 | ||||||
Ferroglobe plc - Globe Specialty Metals, Inc.2, 9.375%, 3/1/2022 | 175,000 | 190,312 | ||||||
Northwest Acquisitions ULC - Dominion Finco, Inc.2, 7.125%, 11/1/2022 | 495,000 | 511,087 | ||||||
Petra Diamonds US Treasury plc (South Africa)2, 7.25%, 5/1/2022 | 325,000 | 322,725 | ||||||
Southern Copper Corp. (Peru), 3.875%, 4/23/2025 | 1,505,000 | 1,561,961 | ||||||
Techniplas LLC2, 10.00%, 5/1/2020 | 272,000 | 217,600 | ||||||
|
| |||||||
| 8,733,322 | ||||||||
|
| |||||||
Paper & Forest Products - 0.2% | ||||||||
Domtar Corp., 4.40%, 4/1/2022 | 1,379,000 | 1,450,373 | ||||||
|
| |||||||
Total Materials | 12,177,241 | |||||||
|
| |||||||
Real Estate - 0.5% | ||||||||
Equity Real Estate Investment Trusts (REITS) - 0.5% | ||||||||
American Tower Corp., 3.30%, 2/15/2021 | 2,988,000 | 3,065,780 | ||||||
GTP Acquisition Partners I LLC2, 2.35%, 6/15/2020 | 589,000 | 587,055 | ||||||
iStar, Inc., 5.25%, 9/15/2022 | 229,000 | 234,725 | ||||||
|
| |||||||
Total Real Estate | 3,887,560 | |||||||
|
| |||||||
Telecommunication Services - 1.0% | ||||||||
Diversified Telecommunication Services - 1.0% | ||||||||
AT&T, Inc., 3.90%, 8/14/2027 | 2,811,000 | 2,799,756 | ||||||
CenturyLink, Inc., 7.50%, 4/1/2024 | 190,000 | 201,875 | ||||||
Frontier Communications Corp., 11.00%, 9/15/2025 | 299,000 | 253,776 | ||||||
Hughes Satellite Systems Corp., 5.25%, 8/1/2026 | 394,000 | 402,897 | ||||||
Inmarsat Finance plc (United Kingdom)2, 4.875%, 5/15/2022 | 354,000 | 361,151 | ||||||
Sprint Communications, Inc.2, 9.00%, 11/15/2018 | 73,000 | 77,471 | ||||||
Sprint Communications, Inc., 7.00%, 8/15/2020 | 73,000 | 78,636 | ||||||
The accompanying notes are an integral part of the financial statements.
40
Investment Portfolio - October 31, 2017
| PRO-BLEND® MODERATE TERM SERIES | PRINCIPAL AMOUNT 5 / SHARES | VALUE (NOTE 2) | ||||||
CORPORATE BONDS (continued) | ||||||||
Non-Convertible Corporate Bonds (continued) | ||||||||
Telecommunication Services (continued) | ||||||||
Diversified Telecommunication Services (continued) | ||||||||
Verizon Communications, Inc., 4.125%, 3/16/2027 | 2,776,000 | $ | 2,896,848 | |||||
|
| |||||||
Total Telecommunication Services | 7,072,410 | |||||||
|
| |||||||
Utilities - 0.5% | ||||||||
Independent Power and Renewable Electricity Producers - 0.5% | ||||||||
American Water Capital Corp., 2.95%, 9/1/2027 | 3,110,000 | 3,095,655 | ||||||
Atlantica Yield plc (Spain)2, 7.00%, 11/15/2019 | 645,000 | 690,150 | ||||||
|
| |||||||
Total Utilities | 3,785,805 | |||||||
|
| |||||||
TOTAL CORPORATE BONDS | ||||||||
(Identified Cost $125,377,410) | 127,134,085 | |||||||
|
| |||||||
MUTUAL FUNDS - 0.1% | ||||||||
Global X MSCI Greece ETF | 18,085 | 167,648 | ||||||
iShares MSCI Eurozone ETF | 10,935 | 479,281 | ||||||
|
| |||||||
TOTAL MUTUAL FUNDS | ||||||||
(Identified Cost $599,777) | 646,929 | |||||||
|
| |||||||
U.S. TREASURY SECURITIES - 20.5% | ||||||||
U.S. Treasury Bonds - 4.2% | ||||||||
U.S. Treasury Bond, 6.25%, 5/15/2030 | 5,621,000 | 7,941,639 | ||||||
U.S. Treasury Bond, 4.75%, 2/15/2037 | 8,994,000 | 11,893,862 | ||||||
U.S. Treasury Bond, 2.50%, 2/15/2045 | 6,573,000 | 6,114,431 | ||||||
U.S. Treasury Inflation Indexed Bond, 0.75%, 2/15/2042 | 3,946,712 | 3,818,872 | ||||||
|
| |||||||
Total U.S. Treasury Bonds | ||||||||
(Identified Cost $30,362,593) | 29,768,804 | |||||||
|
| |||||||
U.S. Treasury Notes - 16.3% | ||||||||
U.S. Treasury Inflation Indexed Note, 0.125%, 4/15/2020 | 5,970,542 | 5,991,498 | ||||||
U.S. Treasury Inflation Indexed Note, 0.125%, 1/15/2023 | 3,802,620 | 3,786,481 | ||||||
U.S. Treasury Note, 1.375%, 4/30/2020 | 18,342,000 | 18,205,151 | ||||||
U.S. Treasury Note, 1.375%, 4/30/2021 | 19,545,000 | 19,249,534 | ||||||
U.S. Treasury Note, 1.75%, 4/30/2022 | 17,878,000 | 17,708,299 | ||||||
U.S. Treasury Note, 2.00%, 7/31/2022 | 9,217,000 | 9,218,800 | ||||||
U.S. Treasury Note, 1.625%, 4/30/2023 | 19,480,000 | 19,010,502 | ||||||
U.S. Treasury Note, 1.625%, 5/15/2026 | 8,562,000 | 8,093,097 | ||||||
U.S. Treasury Note, 2.375%, 5/15/2027 | 13,758,000 | 13,764,449 | ||||||
|
| |||||||
Total U.S. Treasury Notes | ||||||||
(Identified Cost $115,676,386) | 115,027,811 | |||||||
|
| |||||||
TOTAL U.S. TREASURY SECURITIES | ||||||||
(Identified Cost $146,038,979) | 144,796,615 | |||||||
|
| |||||||
ASSET-BACKED SECURITIES - 3.3% | ||||||||
BMW Vehicle Owner Trust, Series 2016-A, Class A3, 1.16%, 11/25/2020 | 2,180,000 | 2,165,900 | ||||||
Cazenovia Creek Funding I LLC, Series 2015-1A, Class A2, 2.00%, 12/10/2023 | 334,432 | 333,596 | ||||||
Chesapeake Funding II LLC, Series 2017-2A, Class A12, 1.99%, 5/15/2029 | 4,322,000 | 4,323,208 | ||||||
Colony American Homes, Series 2015-1A, Class A2,7, (1 mo. LIBOR US + 1.200%), 2.437%, 7/17/2032 | 1,040,317 | 1,042,166 | ||||||
Credit Acceptance Auto Loan Trust, Series 2017-1A, Class A2, 2.56%, 10/15/2025 | 1,320,000 | 1,321,968 | ||||||
Enterprise Fleet Financing LLC, Series 2015-2, Class A22, 1.59%, 2/22/2021 | 914,860 | 914,668 | ||||||
Enterprise Fleet Financing LLC, Series 2017-1, Class A22, 2.13%, 7/20/2022 | 800,000 | 801,888 | ||||||
Home Partners of America Trust, Series 2016-1, Class A2,7, (1 mo. LIBOR US + 1.650%), 2.887%, 3/17/2033 | 772,301 | 778,555 | ||||||
Honda Auto Receivables Owner Trust, Series 2016-4, Class A2, 1.04%, 4/18/2019 | 1,988,346 | 1,985,479 | ||||||
Hyundai Auto Lease Securitization Trust, Series 2017-B, Class A32, 1.97%, 7/15/2020 | 3,400,000 | 3,402,734 | ||||||
Invitation Homes Trust, Series 2015-SFR3, Class A2,7, (1 mo. LIBOR US + 1.300%), 2.537%, 8/17/2032 | 1,998,783 | 2,013,279 | ||||||
SoFi Consumer Loan Program LLC, Series 2017-5, Class A12, 2.14%, 9/25/2026 | 1,892,865 | 1,891,234 | ||||||
The accompanying notes are an integral part of the financial statements.
41
Investment Portfolio - October 31, 2017
| PRO-BLEND® MODERATE TERM SERIES | PRINCIPAL AMOUNT 5 | VALUE (NOTE 2) | ||||||
ASSET-BACKED SECURITIES (continued) | ||||||||
SoFi Professional Loan Program LLC, Series 2017-A, Class A2A2, 1.55%, 3/26/2040 | 900,369 | $ | 897,397 | |||||
Tax Ease Funding LLC, Series 2016-1A, Class A2, 3.131%, 6/15/2028 | 515,985 | 518,314 | ||||||
Tricon American Homes Trust, Series 2016-SFR1, Class A2, 2.589%, 11/17/2033 | 1,190,000 | 1,179,253 | ||||||
|
| |||||||
TOTAL ASSET-BACKED SECURITIES | ||||||||
(Identified Cost $23,560,977) | 23,569,639 | |||||||
|
| |||||||
COMMERCIAL MORTGAGE-BACKED SECURITIES - 6.9% | ||||||||
Americold LLC Trust, Series 2010-ARTA, Class A12, 3.847%, 1/14/2029 | 157,947 | 162,220 | ||||||
BWAY Mortgage Trust, Series 2015-1740, Class A2, 2.917%, 1/10/2035 | 2,809,000 | 2,774,174 | ||||||
Credit Suisse Mortgage Capital Trust, Series 2013-IVR3, Class A12,8, 2.50%, 5/25/2043 | 1,138,238 | 1,083,238 | ||||||
Credit Suisse Mortgage Capital Trust, Series 2013-TH1, Class A12,8, 2.13%, 2/25/2043 | 830,044 | 794,626 | ||||||
FDIC Trust, Series 2011-R1, Class A2, 2.672%, 7/25/2026 | 278,534 | 279,316 | ||||||
Freddie Mac Multifamily Structured Pass-Through Certificates, Series K009, Class X1 (IO)8, 1.304%, 8/25/2020 | 13,288,017 | 403,850 | ||||||
Freddie Mac Multifamily Structured Pass-Through Certificates, Series K014, Class X1 (IO)8, 1.187%, 4/25/2021 | 8,331,974 | 290,420 | ||||||
Freddie Mac Multifamily Structured Pass-Through Certificates, Series K016, Class X1 (IO)8, 1.527%, 10/25/2021 | 5,609,468 | 280,717 | ||||||
Freddie Mac Multifamily Structured Pass-Through Certificates, Series K017, Class X1 (IO)8, 1.353%, 12/25/2021 | 8,370,795 | 383,869 | ||||||
Freddie Mac Multifamily Structured Pass-Through Certificates, Series K021, Class X1 (IO)8, 1.468%, 6/25/2022 | 10,138,937 | 567,759 | ||||||
Freddie Mac Multifamily Structured Pass-Through Certificates, Series K029, Class A28, 3.32%, 2/25/2023 | 2,431,000 | 2,543,958 | ||||||
Freddie Mac Multifamily Structured Pass-Through Certificates, Series K030, Class X1 (IO)8, 0.208%, 4/25/2023 | 52,524,856 | 517,900 | ||||||
Freddie Mac Multifamily Structured Pass-Through Certificates, Series K032, Class X1 (IO)8, 0.111%, 5/25/2023 | 39,607,938 | 230,598 | ||||||
Freddie Mac Multifamily Structured Pass-Through Certificates, Series K033, Class A28, 3.06%, 7/25/2023 | 3,970,000 | 4,102,804 | ||||||
Freddie Mac Multifamily Structured Pass-Through Certificates, Series K035, Class A28, 3.458%, 8/25/2023 | 3,613,000 | 3,809,778 | ||||||
Freddie Mac Multifamily Structured Pass-Through Certificates, Series K706, Class X1 (IO)8, 1.546%, 10/25/2018 | 8,191,584 | 93,594 | ||||||
Freddie Mac Multifamily Structured Pass-Through Certificates, Series KJ10, Class A2, 2.912%, 12/25/2023 | 3,060,000 | 3,124,457 | ||||||
Freddie Mac Multifamily Structured Pass-Through Certificates, Series KJ13, Class A2, 2.864%, 8/25/2022 | 1,911,000 | 1,954,862 | ||||||
FREMF Mortgage Trust, Series 2011-K701, Class B2,8, 4.058%, 7/25/2048 | 750,000 | 748,864 | ||||||
FREMF Mortgage Trust, Series 2011-K702, Class B2,8, 4.785%, 4/25/2044 | 885,000 | 891,276 | ||||||
FREMF Mortgage Trust, Series 2013-K28, Class X2A (IO)2, 0.10%, 6/25/2046 | 129,942,740 | 550,905 | ||||||
FREMF Mortgage Trust, Series 2013-K712, Class B2,8, 3.365%, 5/25/2045 | 742,000 | 752,739 | ||||||
FREMF Mortgage Trust, Series 2014-K37, Class B2,8, 4.558%, 1/25/2047 | 1,657,000 | 1,762,280 | ||||||
GAHR Commercial Mortgage Trust, Series 2015-NRF, Class BFX2,8, 3.495%, 12/15/2034 | 1,928,000 | 1,952,220 | ||||||
GAHR Commercial Mortgage Trust, Series 2015-NRF, Class DFX2,8, 3.495%, 12/15/2034 | 1,000,000 | 1,007,036 | ||||||
GS Mortgage Securities Trust, Series 2010-C2, Class A12, 3.849%, 12/10/2043 | 98,114 | 100,845 | ||||||
The accompanying notes are an integral part of the financial statements.
42
Investment Portfolio - October 31, 2017
| PRO-BLEND® MODERATE TERM SERIES | PRINCIPAL AMOUNT 5 | VALUE (NOTE 2) | ||||||||||
COMMERCIAL MORTGAGE-BACKED SECURITIES (continued) |
| |||||||||||
JP Morgan Mortgage Trust, Series 2013-1, Class 1A22,8, 3.00%, 3/25/2043 | 684,345 | $ | 683,837 | |||||||||
JP Morgan Mortgage Trust, Series 2013-2, Class A22,8, 3.50%, 5/25/2043 | 692,346 | 705,679 | ||||||||||
JP Morgan Mortgage Trust, Series 2014-2, Class 1A12,8, 3.00%, 6/25/2029 | 958,445 | 970,127 | ||||||||||
New Residential Mortgage Loan Trust, Series 2014-3A, Class AFX32,8, 3.75%, 11/25/2054 | 804,215 | 829,069 | ||||||||||
New Residential Mortgage Loan Trust, Series 2015-2A, Class A12,8, 3.75%, 8/25/2055 | 1,003,562 | 1,035,004 | ||||||||||
New Residential Mortgage Loan Trust, Series 2016-4A, Class A12,8, 3.75%, 11/25/2056 | 1,022,356 | 1,050,695 | ||||||||||
OBP Depositor LLC Trust, Series 2010-OBP, Class A2, 4.646%, 7/15/2045 | 115,000 | 121,003 | ||||||||||
SCG Trust, Series 2013-SRP1, Class AJ2,7, (1 mo. LIBOR US + 1.950%), 3.189%, 11/15/2026 | 2,976,000 | 2,964,491 | ||||||||||
Sequoia Mortgage Trust, Series 2013-2, Class A8, 1.874%, 2/25/2043 | 743,296 | 703,025 | ||||||||||
Sequoia Mortgage Trust, Series 2013-7, Class A28, 3.00%, 6/25/2043 | 791,056 | 789,512 | ||||||||||
Sequoia Mortgage Trust, Series 2013-8, Class A18, 3.00%, 6/25/2043 | 911,745 | 908,700 | ||||||||||
Starwood Retail Property Trust, Series 2014-STAR, Class A2,7, (1 mo. LIBOR US + 1.220%), 2.459%, 11/15/2027 | 1,774,000 | 1,775,234 | ||||||||||
Towd Point Mortgage Trust, Series 2016-5, Class A12,8, 2.50%, 10/25/2056 | 1,839,475 | 1,835,123 | ||||||||||
Vornado DP LLC Trust, Series 2010-VNO, Class A2FX2, 4.004%, 9/13/2028 | 350,000 | 365,332 | ||||||||||
Wells Fargo Commercial Mortgage Trust, Series 2010-C1, Class A22, 4.393%, 11/15/2043 | 545,000 | 575,552 | ||||||||||
WinWater Mortgage Loan Trust, Series 2015-1, Class A12,8, 3.50%, 1/20/2045 | 1,008,988 | 1,025,897 | ||||||||||
WinWater Mortgage Loan Trust, Series 2015-3, Class A52,8, 3.50%, 3/20/2045 | 951,933 | 967,476 | ||||||||||
|
| |||||||||||
TOTAL COMMERCIAL MORTGAGE-BACKED SECURITIES |
| |||||||||||
(Identified Cost $47,796,756) | 48,470,061 | |||||||||||
|
| |||||||||||
FOREIGN GOVERNMENT BONDS - 2.5% |
| |||||||||||
Bonos de la Tesoreria de la Republica en pesos (Chile), 6.00%, 1/1/2018 | CLP | 790,000,000 | 1,247,937 | |||||||||
Canada Housing Trust No. 1 (Canada)2, 4.10%, 12/15/2018 | CAD | 338,000 | 269,897 | |||||||||
Canadian Government Bond (Canada), 2.75%, 6/1/2022 | CAD | 433,000 | 352,747 | |||||||||
Export-Import Bank of Korea (South Korea), 2.625%, 12/30/2020 | 6,700,000 | 6,690,513 | ||||||||||
The Korea Development Bank (South Korea), 1.375%, 9/12/2019 | 400,000 | 392,332 | ||||||||||
Korea Treasury Bond (South Korea), 2.00%, 12/10/2017 | KRW | 480,000,000 | 428,683 | |||||||||
Mexican Government Bond (Mexico), 8.00%, 6/11/2020 | MXN | 8,562,000 | 456,902 | |||||||||
Mexican Government Bond (Mexico), 6.50%, 6/10/2021 | MXN | 3,460,000 | 177,276 | |||||||||
Mexican Government Bond (Mexico), 6.50%, 6/9/2022 | MXN | 5,621,000 | 286,794 | |||||||||
Mexican Government Bond (Mexico), 7.75%, 5/29/2031 | MXN | 1,081,000 | 58,189 | |||||||||
Province of Ontario (Canada), 2.00%, 9/27/2018 | 1,470,000 | 1,474,214 | ||||||||||
Province of Ontario (Canada), 1.25%, 6/17/2019 | 1,297,000 | 1,284,419 | ||||||||||
Singapore Government Bond (Singapore), 2.50%, 6/1/2019 | SGD | 739,000 | 551,612 | |||||||||
Svensk Exportkredit AB (Sweden), 1.125%, 8/28/2019 | 3,200,000 | 3,159,724 | ||||||||||
United Kingdom Gilt (United Kingdom), 5.00%, 3/7/2018 | GBP | 411,000 | 554,863 | |||||||||
|
| |||||||||||
TOTAL FOREIGN GOVERNMENT BONDS |
| |||||||||||
(Identified Cost $18,612,978) | 17,386,102 | |||||||||||
|
| |||||||||||
The accompanying notes are an integral part of the financial statements.
43
Investment Portfolio - October 31, 2017
| PRO-BLEND® MODERATE TERM SERIES | PRINCIPAL AMOUNT 5 | VALUE (NOTE 2) | ||||||
U.S. GOVERNMENT AGENCIES - 9.6% | ||||||||
Mortgage-Backed Securities - 7.0% | ||||||||
Fannie Mae, Pool #888468, 5.50%, 9/1/2021 | 292,108 | $ | 303,883 | |||||
Fannie Mae, Pool #995233, 5.50%, 10/1/2021 | 21,660 | 22,362 | ||||||
Fannie Mae, Pool #888017, 6.00%, 11/1/2021 | 36,697 | 38,553 | ||||||
Fannie Mae, Pool #995329, 5.50%, 12/1/2021 | 241,607 | 251,565 | ||||||
Fannie Mae, Pool #888136, 6.00%, 12/1/2021 | 45,619 | 48,013 | ||||||
Fannie Mae, Pool #888810, 5.50%, 11/1/2022 | 347,549 | 360,978 | ||||||
Fannie Mae, Pool #AD0462, 5.50%, 10/1/2024 | 31,553 | 33,616 | ||||||
Fannie Mae, Pool #MA1834, 4.50%, 2/1/2034 | 826,274 | 891,370 | ||||||
Fannie Mae, Pool #MA1903, 4.50%, 5/1/2034 | 637,340 | 687,551 | ||||||
Fannie Mae, Pool #MA2177, 4.00%, 2/1/2035 | 1,240,631 | 1,314,215 | ||||||
Fannie Mae, Pool #AZ3376, 4.00%, 7/1/2035 | 2,519,305 | 2,669,205 | ||||||
Fannie Mae, Pool #745418, 5.50%, 4/1/2036 | 620,243 | 692,217 | ||||||
Fannie Mae, Pool #995050, 6.00%, 9/1/2037 | 240,392 | 273,453 | ||||||
Fannie Mae, Pool #AB8161, 6.00%, 12/1/2037 | 747,612 | 845,613 | ||||||
Fannie Mae, Pool #889576, 6.00%, 4/1/2038 | 522,383 | 592,226 | ||||||
Fannie Mae, Pool #995196, 6.00%, 7/1/2038 | 1,177,863 | 1,335,219 | ||||||
Fannie Mae, Pool #AD0207, 6.00%, 10/1/2038 | 179,596 | 203,358 | ||||||
Fannie Mae, Pool #AD0220, 6.00%, 10/1/2038 | 60,141 | 68,230 | ||||||
Fannie Mae, Pool #AD0527, 5.50%, 6/1/2039 | 157,647 | 175,107 | ||||||
Fannie Mae, Pool #MA0258, 4.50%, 12/1/2039 | 983,902 | 1,055,675 | ||||||
Fannie Mae, Pool #AL1595, 6.00%, 1/1/2040 | 820,608 | 930,655 | ||||||
Fannie Mae, Pool #AL0152, 6.00%, 6/1/2040 | 902,348 | 1,022,007 | ||||||
Fannie Mae, Pool #AL0241, 4.00%, 4/1/2041 | 1,084,102 | 1,142,701 | ||||||
Fannie Mae, Pool #AI5172, 4.00%, 8/1/2041 | 860,672 | 907,083 | ||||||
Fannie Mae, Pool #AL1410, 4.50%, 12/1/2041 | 1,897,174 | 2,042,341 | ||||||
Fannie Mae, Pool #AL7068, 4.50%, 9/1/2042 | 2,050,626 | 2,197,423 | ||||||
Fannie Mae, Pool #AL7729, 4.00%, 6/1/2043 | 967,947 | 1,020,013 | ||||||
Fannie Mae, Pool #AX5234, 4.50%, 11/1/2044 | 1,283,796 | 1,372,511 | ||||||
Fannie Mae, Pool #AZ9215, 4.00%, 10/1/2045 | 940,388 | 989,065 | ||||||
Fannie Mae, Pool #BC3490, 3.50%, 2/1/2046 | 2,448,895 | 2,519,185 | ||||||
Fannie Mae, Pool #BC6764, 3.50%, 4/1/2046 | 1,459,828 | 1,501,729 | ||||||
Fannie Mae, Pool #BD1381, 3.50%, 6/1/2046 | 826,591 | 850,317 | ||||||
Fannie Mae, Pool #AS7568, 4.50%, 7/1/2046 | 937,572 | 1,002,717 | ||||||
Fannie Mae, Pool #BE7845, 4.50%, 2/1/2047 | 709,899 | 760,970 | ||||||
Fannie Mae, Pool #AL8674, 5.659%, 1/1/2049 | 2,105,548 | 2,312,127 | ||||||
Freddie Mac, Pool #G11850, 5.50%, 7/1/2020 | 88,210 | 90,381 | ||||||
Freddie Mac, Pool #G12610, 6.00%, 3/1/2022 | 48,276 | 50,964 | ||||||
Freddie Mac, Pool #G12655, 6.00%, 5/1/2022 | 33,964 | 35,801 | ||||||
Freddie Mac, Pool #G12988, 6.00%, 1/1/2023 | 25,836 | 27,403 | ||||||
Freddie Mac, Pool #G13078, 6.00%, 3/1/2023 | 45,687 | 48,347 | ||||||
Freddie Mac, Pool #G13331, 5.50%, 10/1/2023 | 20,767 | 21,926 | ||||||
Freddie Mac, Pool #C91754, 4.50%, 3/1/2034 | 694,457 | 748,243 | ||||||
Freddie Mac, Pool #C91762, 4.50%, 5/1/2034 | 932,834 | 1,006,042 | ||||||
Freddie Mac, Pool #C91850, 4.00%, 9/1/2035 | 1,533,552 | 1,628,958 | ||||||
Freddie Mac, Pool #C91854, 4.00%, 10/1/2035 | 1,103,637 | 1,172,373 | ||||||
Freddie Mac, Pool #G03696, 5.50%, 1/1/2038 | 1,764 | 1,961 | ||||||
Freddie Mac, Pool #G03781, 6.00%, 1/1/2038 | 262,630 | 295,723 | ||||||
Freddie Mac, Pool #G03926, 6.00%, 2/1/2038 | 266,127 | 300,551 | ||||||
Freddie Mac, Pool #G04731, 5.50%, 4/1/2038 | 269,026 | 298,974 | ||||||
Freddie Mac, Pool #G08273, 5.50%, 6/1/2038 | 327,768 | 364,134 | ||||||
The accompanying notes are an integral part of the financial statements.
44
Investment Portfolio - October 31, 2017
| PRO-BLEND® MODERATE TERM SERIES | PRINCIPAL SHARES | VALUE (NOTE 2) | ||||||
U.S. GOVERNMENT AGENCIES (continued) | ||||||||
Mortgage-Backed Securities (continued) | ||||||||
Freddie Mac, Pool #G05923, 5.50%, 2/1/2040 | 162,706 | $ | 180,884 | |||||
Freddie Mac, Pool #G05900, 6.00%, 3/1/2040 | 208,517 | 236,002 | ||||||
Freddie Mac, Pool #G05906, 6.00%, 4/1/2040 | 195,240 | 221,417 | ||||||
Freddie Mac, Pool #A92889, 4.50%, 7/1/2040 | 1,958,574 | 2,099,787 | ||||||
Freddie Mac, Pool #G60183, 4.00%, 12/1/2044 | 1,136,774 | 1,198,103 | ||||||
Freddie Mac, Pool #Q37592, 4.00%, 12/1/2045 | 2,104,627 | 2,220,059 | ||||||
Freddie Mac, Pool #Q42596, 3.50%, 8/1/2046 | 1,581,036 | 1,626,424 | ||||||
Freddie Mac, Pool #Q45199, 4.00%, 1/1/2047 | 816,354 | 856,905 | ||||||
Freddie Mac, Pool #Q45210, 4.00%, 1/1/2047 | 819,793 | 860,516 | ||||||
Freddie Mac, Pool #G08754, 4.50%, 3/1/2047 | 1,752,756 | 1,871,775 | ||||||
Ginnie Mae, Pool #263096, 9.50%, 3/15/2020 | 524 | 526 | ||||||
|
| |||||||
Total Mortgage-Backed Securities | ||||||||
(Identified Cost $49,723,735) | 49,897,432 | |||||||
|
| |||||||
Other Agencies - 2.6% | ||||||||
Fannie Mae, 2.625%, 9/6/2024 | ||||||||
(Identified Cost $18,873,355) | 17,974,000 | 18,348,219 | ||||||
|
| |||||||
TOTAL U.S. GOVERNMENT AGENCIES | ||||||||
(Identified Cost $68,597,090) | 68,245,651 | |||||||
|
| |||||||
SHORT-TERM INVESTMENT - 2.4% | ||||||||
Dreyfus Government Cash Management9, 0.93%, | ||||||||
(Identified Cost $17,376,776) | 17,376,776 | 17,376,776 | ||||||
|
| |||||||
TOTAL INVESTMENTS IN SECURITIES - 99.7% | ||||||||
(Identified Cost $663,731,488) | 704,519,658 | |||||||
|
| |||||||
TOTAL OPTIONS WRITTEN - 0.0%## | ||||||||
(Premiums Received $129,126) | (89,122 | ) | ||||||
|
| |||||||
TOTAL INVESTMENTS - 99.7% | 704,430,536 | |||||||
OTHER ASSETS, LESS LIABILITIES - 0.3% | 2,087,089 | |||||||
|
| |||||||
NET ASSETS - 100% | $ | 706,517,625 | ||||||
|
| |||||||
| ADR - American Depositary Receipt |
| CAD - Canadian Dollar |
| CLP - Chilean Peso |
| ETF - Exchange-traded fund |
| GBP - British Pound |
| IO - Interest only |
| KRW - South Korean Won |
| MXN - Mexican Peso |
| No. - Number |
| SGD - Singapore Dollar |
The accompanying notes are an integral part of the financial statements.
45
Investment Portfolio - October 31, 2017
| EXCHANGE-TRADED OPTIONS WRITTEN | ||||||||||||||||||||
| DESCRIPTION | NUMBER OF CONTRACTS | EXPIRATION DATE | EXERCISE PRICE | NOTIONAL AMOUNT (000) | VALUE | |||||||||||||||
Call | ||||||||||||||||||||
Lululemon Athletica, Inc. | 229 | 11/10/17 | $ | 67.00 | 1,409 | $ | (1,145 | ) | ||||||||||||
|
| |||||||||||||||||||
Put | ||||||||||||||||||||
Arconic, Inc. | 571 | 11/17/17 | 23.00 | 1,434 | (5,710 | ) | ||||||||||||||
Facebook, Inc. | 100 | 11/17/17 | 160.00 | 1,801 | (6,200 | ) | ||||||||||||||
Medtronic plc | 197 | 12/01/17 | 77.50 | 1,586 | (11,623 | ) | ||||||||||||||
Regeneron Pharmaceuticals, Inc. | 34 | 11/17/17 | 385.00 | 1,369 | (19,040 | ) | ||||||||||||||
The Priceline Group, Inc. | 7 | 11/17/17 | 1,750.00 | 1,338 | (7,784 | ) | ||||||||||||||
Vertex Pharmaceuticals, Inc. | 90 | 11/17/17 | 145.00 | 1,316 | (37,620 | ) | ||||||||||||||
|
| |||||||||||||||||||
| (87,977 | ) | |||||||||||||||||||
TOTAL EXCHANGE-TRADED OPTIONS WRITTEN | $ | (89,122 | ) | |||||||||||||||||
|
| |||||||||||||||||||
*Non-income producing security.
##Less than 0.1%.
1A factor from a third party vendor was applied to determine the security’s fair value following the close of local trading.
2Restricted securities - Investment in securities that are restricted as to public resale under the Securities Act of 1933, as amended. These securities have been sold under Rule 144A and have been determined to be liquid. These securities amount to $70,109,299 or 9.9%, of the Series’ net assets as of October 31, 2017 (see Note 2 to the Financial statements).
3A portion of this security is designated with the broker as collateral for options contracts written. As of October 31, 2017, the total value of such securities was $11,863,752.
4Security has been valued at fair value as determined in good faith by the Advisor and is classified as Level 3 in the fair value hierarchy.
5Amount is stated in USD unless otherwise noted.
6Variable rate security. Security may be issued at a fixed coupon rate, which converts to a variable rate at a specified date. Rate shown is the rate in effect as of October 31, 2017.
7Floating rate security. Rate shown is the rate in effect as of October 31, 2017.
8Variable or floating rate security, which interest rate adjusts periodically based on changes in current interest rates and prepayments on the underlying pool of assets. Rate shown is the rate in effect as of October 31, 2017.
9Rate shown is the current yield as of October 31, 2017.
The Global Industry Classification Standard (GICS) was developed by and is the exclusive property and a service mark of MSCI Inc. (MSCI) and Standard & Poor, a division of The McGraw-Hill Companies, Inc. (S&P), and is licensed for use by Manning & Napier when referencing GICS sectors. Neither MSCI, S&P, nor any third party involved in making or compiling the GICS or any GICS classifications makes any express or implied warranties or representations with respect to such standard or classification, nor shall any such party have any liability therefrom.
The accompanying notes are an integral part of the financial statements.
46
Statement of Assets and Liabilities - Pro-Blend® Moderate Term Series
October 31, 2017
ASSETS: | ||||
Investments in securities, at value (identified cost $663,731,488) (Note 2) | $ | 704,519,658 | ||
Receivable for securities sold | 2,005,307 | |||
Interest receivable | 2,576,156 | |||
Receivable for fund shares sold | 280,193 | |||
Foreign tax reclaims receivable | 323,326 | |||
Dividends receivable | 51,569 | |||
Prepaid expenses | 400 | |||
|
| |||
TOTAL ASSETS | 709,756,609 | |||
|
| |||
LIABILITIES: | ||||
Due to custodian | 6,321 | |||
Accrued management fees (Note 3) | 483,070 | |||
Accrued distribution and service (Rule 12b-1) fees (Class R) (Class R2) (Note 3) | 109,190 | |||
Accrued shareholder services fees (Class S) (Note 3) | 91,372 | |||
Accrued fund accounting and administration fees (Note 3) | 71,396 | |||
Accrued Chief Compliance Officer service fees (Note 3) | 306 | |||
Options written, at value (premiums received $129,126) (Note 2) | 89,122 | |||
Payable for securities purchased | 1,729,048 | |||
Payable for fund shares repurchased | 513,863 | |||
Other payables and accrued expenses | 145,296 | |||
|
| |||
TOTAL LIABILITIES | 3,238,984 | |||
|
| |||
TOTAL NET ASSETS | $ | 706,517,625 | ||
|
| |||
NET ASSETS CONSIST OF: | ||||
Capital stock | $ | 560,037 | ||
Additional paid-in-capital | 624,840,797 | |||
Undistributed net investment income | 2,398,334 | |||
Accumulated net realized gain on investments, foreign currency and translation of other assets and liabilities | 37,909,498 | |||
Net unrealized appreciation (depreciation) on investments, foreign currency and translation of other assets and liabilities | 40,808,959 | |||
|
| |||
TOTAL NET ASSETS | $ | 706,517,625 | ||
|
| |||
The accompanying notes are an integral part of the financial statements.
47
Statement of Assets and Liabilities - Pro-Blend® Moderate Term Series
October 31, 2017
NET ASSET VALUE, OFFERING PRICE AND REDEMPTION PRICE PER SHARE - Class S | $ | 14.17 | ||
|
| |||
NET ASSET VALUE, OFFERING PRICE AND REDEMPTION PRICE PER SHARE - Class I | $ | 10.72 | ||
|
| |||
NET ASSET VALUE, OFFERING PRICE AND REDEMPTION PRICE PER SHARE - Class R | $ | 11.25 | ||
|
| |||
NET ASSET VALUE, OFFERING PRICE AND REDEMPTION PRICE PER SHARE - Class R2 | $ | 10.83 | ||
|
| |||
The accompanying notes are an integral part of the financial statements.
48
Statement of Operations - Pro-Blend® Moderate Term Series
For the Year Ended October 31, 2017
INVESTMENT INCOME: | ||||
Interest | $ | 13,008,354 | ||
Dividends (net of foreign taxes withheld, $185,545) | 5,179,918 | |||
|
| |||
Total Investment Income | 18,188,272 | |||
|
| |||
EXPENSES: | ||||
Management fees (Note 3) | 6,623,097 | |||
Distribution and service (Rule 12b-1) fees (Class R2) (Note 3) | 1,210,416 | |||
Distribution and service (Rule 12b-1) fees (Class R) (Note 3) | 132,922 | |||
Shareholder services fees (Class S) (Note 3) | 1,155,079 | |||
Fund accounting and administration fees (Note 3) | 188,146 | |||
Transfer agent fees (Note 3) | 152,560 | |||
Directors’ fees (Note 3) | 59,459 | |||
Chief Compliance Officer service fees (Note 3) | 4,023 | |||
Custodian fees | 71,381 | |||
Miscellaneous | 220,852 | |||
|
| |||
Total Expenses | 9,817,935 | |||
|
| |||
NET INVESTMENT INCOME | 8,370,337 | |||
|
| |||
REALIZED AND UNREALIZED GAIN (LOSS) ON INVESTMENTS AND FOREIGN CURRENCY: | ||||
Net realized gain (loss) on- | ||||
Investments in securities | 49,543,449 | |||
In-kind redemptions (Note 2) | 7,226,146 | |||
Options written | 1,487,584 | |||
Foreign currency and translation of other assets and liabilities | (21,581 | ) | ||
|
| |||
| 58,235,598 | ||||
|
| |||
Net change in unrealized appreciation (depreciation) on- | ||||
Investments in securities (net of decrease in accrued foreign capital gains tax of $178) | 4,759,572 | |||
Options written | 3,558 | |||
Foreign currency and translation of other assets and liabilities | 25,405 | |||
|
| |||
| 4,788,535 | ||||
|
| |||
NET REALIZED AND UNREALIZED GAIN (LOSS) ON INVESTMENTS AND FOREIGN CURRENCY | 63,024,133 | |||
|
| |||
NET INCREASE IN NET ASSETS RESULTING FROM OPERATIONS | $ | 71,394,470 | ||
|
| |||
The accompanying notes are an integral part of the financial statements.
49
Statements of Changes in Net Assets - Pro-Blend® Moderate Term Series
FOR THE YEAR 10/31/17 | FOR THE YEAR 10/31/16 | |||||||
INCREASE (DECREASE) IN NET ASSETS: | ||||||||
OPERATIONS: | ||||||||
Net investment income | $ | 8,370,337 | $ | 12,773,276 | ||||
Net realized gain on investments and foreign currency | 51,009,452 | 12,442,255 | ||||||
Net realized gain (loss) from in-kind redemption transactions and foreign currency | 7,226,146 | — | ||||||
Net change in unrealized appreciation (depreciation) on investments and foreign currency | 4,788,535 | 1,485,694 | ||||||
|
|
|
| |||||
Net increase from operations | 71,394,470 | 26,701,225 | ||||||
|
|
|
| |||||
DISTRIBUTIONS TO SHAREHOLDERS (Note 8): | ||||||||
From net investment income (Class S) | (3,749,931 | ) | (4,729,271 | ) | ||||
From net investment income (Class I) | (3,924,939 | ) | (9,622,576 | ) | ||||
From net investment income (Class R) | (214,584 | ) | (270,283 | ) | ||||
From net investment income (Class R2) | (398,551 | ) | (429,546 | ) | ||||
From net realized gain on investments (Class S) | (7,418,323 | ) | (1,848,286 | ) | ||||
From net realized gain on investments (Class I) | (5,643,924 | ) | (2,787,665 | ) | ||||
From net realized gain on investments (Class R) | (516,632 | ) | (137,520 | ) | ||||
From net realized gain on investments (Class R2) | (2,434,960 | ) | (532,912 | ) | ||||
|
|
|
| |||||
Total distributions to shareholders | (24,301,844 | ) | (20,358,059 | ) | ||||
|
|
|
| |||||
CAPITAL STOCK ISSUED AND REPURCHASED: | ||||||||
Net decrease from capital share transactions (Note 5) | (309,336,437 | ) | (649,253,761 | ) | ||||
|
|
|
| |||||
Net decrease in net assets | (262,243,811 | ) | (642,910,595 | ) | ||||
NET ASSETS: | ||||||||
Beginning of year | 968,761,436 | 1,611,672,031 | ||||||
|
|
|
| |||||
End of year (including undistributed net investment income of $2,398,334 and $3,744,257, respectively) | $ | 706,517,625 | $ | 968,761,436 | ||||
|
|
|
| |||||
The accompanying notes are an integral part of the financial statements.
50
Financial Highlights - Pro-Blend® Moderate Term Series - Class S
| FOR THE YEAR ENDED | ||||||||||||||||||||
| 10/31/17 | 10/31/16 | 10/31/15 | 10/31/14 | 10/31/13 | ||||||||||||||||
Per share data (for a share outstanding throughout each year): | ||||||||||||||||||||
Net asset value - Beginning of year | $ | 13.37 | $ | 13.15 | $ | 14.53 | $ | 14.52 | $ | 13.28 | ||||||||||
|
|
|
|
|
|
|
|
|
| |||||||||||
Income (loss) from investment operations: | ||||||||||||||||||||
Net investment income1 | 0.13 | 0.13 | 0.15 | 0.16 | 0.14 | |||||||||||||||
Net realized and unrealized gain (loss) on investments | 0.97 | 0.23 | (0.44 | ) | 0.59 | 1.55 | ||||||||||||||
|
|
|
|
|
|
|
|
|
| |||||||||||
Total from investment operations | 1.10 | 0.36 | (0.29 | ) | 0.75 | 1.69 | ||||||||||||||
|
|
|
|
|
|
|
|
|
| |||||||||||
Less distributions to shareholders: | ||||||||||||||||||||
From net investment income | (0.10 | ) | (0.10 | ) | (0.12 | ) | (0.12 | ) | (0.13 | ) | ||||||||||
From net realized gain on investments | (0.20 | ) | (0.04 | ) | (0.97 | ) | (0.62 | ) | (0.32 | ) | ||||||||||
|
|
|
|
|
|
|
|
|
| |||||||||||
Total distributions to shareholders | (0.30 | ) | (0.14 | ) | (1.09 | ) | (0.74 | ) | (0.45 | ) | ||||||||||
|
|
|
|
|
|
|
|
|
| |||||||||||
Net asset value - End of year | $ | 14.17 | $ | 13.37 | $ | 13.15 | $ | 14.53 | $ | 14.52 | ||||||||||
|
|
|
|
|
|
|
|
|
| |||||||||||
Net assets - End of year (000’s omitted) | $ | 426,426 | $ | 511,577 | $ | 683,089 | $ | 788,276 | $ | 793,812 | ||||||||||
|
|
|
|
|
|
|
|
|
| |||||||||||
Total return2 | 8.46 | % | 2.77 | % | (1.99 | %) | 5.47 | % | 13.07 | % | ||||||||||
Ratios (to average net assets)/Supplemental Data: | ||||||||||||||||||||
Expenses | 1.08 | % | 1.07 | % | 1.06 | % | 1.06 | % | 1.06 | % | ||||||||||
Net investment income | 0.98 | % | 0.97 | % | 1.08 | % | 1.12 | % | 1.04 | % | ||||||||||
Series portfolio turnover | 68 | % | 67 | % | 56 | % | 53 | % | 52 | % | ||||||||||
1Calculated based on average shares outstanding during the years.
2Represents aggregate total return for the years indicated, and assumes reinvestment of all distributions.
The accompanying notes are an integral part of the financial statements.
51
Financial Highlights - Pro-Blend® Moderate Term Series - Class I
| FOR THE YEAR ENDED | ||||||||||||||||||||
| 10/31/17 | 10/31/16 | 10/31/15 | 10/31/14 | 10/31/13 | ||||||||||||||||
Per share data (for a share outstanding throughout each year): | ||||||||||||||||||||
Net asset value - Beginning of year | $ | 10.20 | $ | 10.07 | $ | 11.40 | $ | 11.56 | $ | 10.67 | ||||||||||
|
|
|
|
|
|
|
|
|
| |||||||||||
Income (loss) from investment operations: | ||||||||||||||||||||
Net investment income1 | 0.13 | 0.12 | 0.14 | 0.16 | 0.14 | |||||||||||||||
Net realized and unrealized gain (loss) on investments | 0.73 | 0.18 | (0.35 | ) | 0.46 | 1.23 | ||||||||||||||
|
|
|
|
|
|
|
|
|
| |||||||||||
Total from investment operations | 0.86 | 0.30 | (0.21 | ) | 0.62 | 1.37 | ||||||||||||||
|
|
|
|
|
|
|
|
|
| |||||||||||
Less distributions to shareholders: | ||||||||||||||||||||
From net investment income | (0.14 | ) | (0.13 | ) | (0.15 | ) | (0.16 | ) | (0.16 | ) | ||||||||||
From net realized gain on investments | (0.20 | ) | (0.04 | ) | (0.97 | ) | (0.62 | ) | (0.32 | ) | ||||||||||
|
|
|
|
|
|
|
|
|
| |||||||||||
Total distributions to shareholders | (0.34 | ) | (0.17 | ) | (1.12 | ) | (0.78 | ) | (0.48 | ) | ||||||||||
|
|
|
|
|
|
|
|
|
| |||||||||||
Net asset value - End of year | $ | 10.72 | $ | 10.20 | $ | 10.07 | $ | 11.40 | $ | 11.56 | ||||||||||
|
|
|
|
|
|
|
|
|
| |||||||||||
Net assets - End of year (000’s omitted) | $ | 140,706 | $ | 299,009 | $ | 740,524 | $ | 719,847 | $ | 614,016 | ||||||||||
|
|
|
|
|
|
|
|
|
| |||||||||||
Total return2 | 8.72 | % | 3.08 | % | (1.76 | %) | 5.73 | % | 13.34 | % | ||||||||||
Ratios (to average net assets)/Supplemental Data: | ||||||||||||||||||||
Expenses | 0.83 | % | 0.82 | % | 0.81 | % | 0.81 | % | 0.81 | % | ||||||||||
Net investment income | 1.24 | % | 1.24 | % | 1.33 | % | 1.37 | % | 1.28 | % | ||||||||||
Series portfolio turnover | 68 | % | 67 | % | 56 | % | 53 | % | 52 | % | ||||||||||
1Calculated based on average shares outstanding during the years.
2Represents aggregate total return for the years indicated, and assumes reinvestment of all distributions.
The accompanying notes are an integral part of the financial statements.
52
Financial Highlights - Pro-Blend® Moderate Term Series - Class R
| FOR THE YEAR ENDED | ||||||||||||||||||||
| 10/31/17 | 10/31/16 | 10/31/15 | 10/31/14 | 10/31/13 | ||||||||||||||||
Per share data (for a share outstanding throughout each year): | ||||||||||||||||||||
Net asset value - Beginning of year | $ | 10.68 | $ | 10.53 | $ | 11.87 | $ | 12.00 | $ | 11.06 | ||||||||||
|
|
|
|
|
|
|
|
|
| |||||||||||
Income (loss) from investment operations: | ||||||||||||||||||||
Net investment income1 | 0.08 | 0.07 | 0.09 | 0.10 | 0.09 | |||||||||||||||
Net realized and unrealized gain (loss) on investments | 0.77 | 0.20 | (0.36 | ) | 0.49 | 1.28 | ||||||||||||||
|
|
|
|
|
|
|
|
|
| |||||||||||
Total from investment operations | 0.85 | 0.27 | (0.27 | ) | 0.59 | 1.37 | ||||||||||||||
|
|
|
|
|
|
|
|
|
| |||||||||||
Less distributions to shareholders: | ||||||||||||||||||||
From net investment income | (0.08 | ) | (0.08 | ) | (0.10 | ) | (0.10 | ) | (0.11 | ) | ||||||||||
From net realized gain on investments | (0.20 | ) | (0.04 | ) | (0.97 | ) | (0.62 | ) | (0.32 | ) | ||||||||||
|
|
|
|
|
|
|
|
|
| |||||||||||
Total distributions to shareholders | (0.28 | ) | (0.12 | ) | (1.07 | ) | (0.72 | ) | (0.43 | ) | ||||||||||
|
|
|
|
|
|
|
|
|
| |||||||||||
Net asset value - End of year | $ | 11.25 | $ | 10.68 | $ | 10.53 | $ | 11.87 | $ | 12.00 | ||||||||||
|
|
|
|
|
|
|
|
|
| |||||||||||
Net assets - End of year (000’s omitted) | $ | 22,662 | $ | 29,499 | $ | 39,917 | $ | 47,180 | $ | 50,280 | ||||||||||
|
|
|
|
|
|
|
|
|
| |||||||||||
Total return2 | 8.21 | % | 2.55 | % | (2.30 | %) | 5.24 | % | 12.77 | % | ||||||||||
Ratios (to average net assets)/Supplemental Data: | ||||||||||||||||||||
Expenses | 1.33 | % | 1.32 | % | 1.31 | % | 1.31 | % | 1.31 | % | ||||||||||
Net investment income | 0.73 | % | 0.72 | % | 0.83 | % | 0.87 | % | 0.80 | % | ||||||||||
Series portfolio turnover | 68 | % | 67 | % | 56 | % | 53 | % | 52 | % | ||||||||||
1Calculated based on average shares outstanding during the years.
2Represents aggregate total return for the years indicated, and assumes reinvestment of all distributions.
The accompanying notes are an integral part of the financial statements.
53
Financial Highlights - Pro-Blend® Moderate Term Series - Class R2*
| FOR THE YEAR ENDED | ||||||||||||||||||||
| 10/31/17 | 10/31/16 | 10/31/15 | 10/31/14 | 10/31/13 | ||||||||||||||||
Per share data (for a share outstanding throughout each year): | ||||||||||||||||||||
Net asset value - Beginning of year | $ | 10.29 | $ | 10.16 | $ | 11.49 | $ | 11.65 | $ | 10.75 | ||||||||||
|
|
|
|
|
|
|
|
|
| |||||||||||
Income (loss) from investment operations: | ||||||||||||||||||||
Net investment income1 | 0.02 | 0.02 | 0.03 | 0.04 | 0.03 | |||||||||||||||
Net realized and unrealized gain (loss) on investments | 0.75 | 0.18 | (0.35 | ) | 0.47 | 1.25 | ||||||||||||||
|
|
|
|
|
|
|
|
|
| |||||||||||
Total from investment operations | 0.77 | 0.20 | (0.32 | ) | 0.51 | 1.28 | ||||||||||||||
|
|
|
|
|
|
|
|
|
| |||||||||||
Less distributions to shareholders: | ||||||||||||||||||||
From net investment income | (0.03 | ) | (0.03 | ) | (0.04 | ) | (0.05 | ) | (0.06 | ) | ||||||||||
From net realized gain on investments | (0.20 | ) | (0.04 | ) | (0.97 | ) | (0.62 | ) | (0.32 | ) | ||||||||||
|
|
|
|
|
|
|
|
|
| |||||||||||
Total distributions to shareholders | (0.23 | ) | (0.07 | ) | (1.01 | ) | (0.67 | ) | (0.38 | ) | ||||||||||
|
|
|
|
|
|
|
|
|
| |||||||||||
Net asset value - End of year | $ | 10.83 | $ | 10.29 | $ | 10.16 | $ | 11.49 | $ | 11.65 | ||||||||||
|
|
|
|
|
|
|
|
|
| |||||||||||
Net assets - End of year (000’s omitted) | $ | 116,724 | $ | 128,677 | $ | 148,143 | $ | 150,654 | $ | 112,601 | ||||||||||
|
|
|
|
|
|
|
|
|
| |||||||||||
Total return2 | 7.71 | % | 1.98 | % | (2.77 | %) | 4.69 | % | 12.27 | % | ||||||||||
Ratios (to average net assets)/Supplemental Data: | ||||||||||||||||||||
Expenses | 1.83 | % | 1.82 | % | 1.81 | % | 1.81 | % | 1.81 | % | ||||||||||
Net investment income | 0.23 | % | 0.22 | % | 0.33 | % | 0.37 | % | 0.29 | % | ||||||||||
Series portfolio turnover | 68 | % | 67 | % | 56 | % | 53 | % | 52 | % | ||||||||||
*Effective March 1, 2017, Class C shares of the Series have been redesignated as Class R2 Shares.
1Calculated based on average shares outstanding during the years.
2Represents aggregate total return for the years indicated, and assumes reinvestment of all distributions.
The accompanying notes are an integral part of the financial statements.
54
Performance Update as of October 31, 2017 - Pro-Blend® Extended Term Series
(unaudited)
| AVERAGE ANNUAL TOTAL RETURNS AS OF OCTOBER 31, 2017 | ||||||||||||||||
ONE YEAR1 | FIVE YEAR | TEN YEAR | SINCE INCEPTION2 | |||||||||||||
Manning & Napier Fund, Inc. - Pro-Blend® Extended Term Series - Class S3 | 11.26 | % | 7.19 | % | 4.57 | % | 8.23 | % | ||||||||
Manning & Napier Fund, Inc. - Pro-Blend® Extended Term Series - Class I3,4 | 11.56 | % | 7.45 | % | 4.81 | % | 8.34 | % | ||||||||
Manning & Napier Fund, Inc. - Pro-Blend® Extended Term Series - Class R3,5 | 10.97 | % | 6.91 | % | 4.29 | % | 8.00 | % | ||||||||
Manning & Napier Fund, Inc. - Pro-Blend® Extended Term Series - Class R23,5 | 10.31 | % | 6.36 | % | 3.79 | % | 7.47 | % | ||||||||
Bloomberg Barclays U.S. Aggregate Bond Index6 | 0.90 | % | 2.04 | % | 4.19 | % | 5.25 | % | ||||||||
40/15/45 Blended Index7 | 13.08 | % | 8.07 | % | 5.44 | % | 7.36 | % | ||||||||
The following graph compares the value of a $10,000 investment in the Manning & Napier Fund, Inc. - Pro-Blend® Extended Term Series - Class S for the ten years ended October 31, 2017 to the Bloomberg Barclays U.S. Aggregate Bond Index and the 40/15/45 Blended Index.
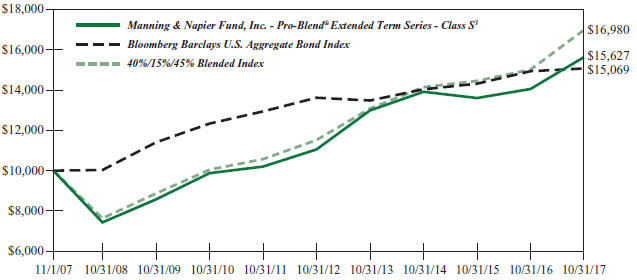
1The returns shown are based on net asset values calculated for shareholder transactions and may differ from the returns shown in the financial highlights, which reflect adjustments made to the net asset values in accordance with accounting principles generally accepted in the United States of America.
2Performance numbers for the Series are calculated from October 12, 1993, the Class S inception date. The Bloomberg Barclays U.S. Aggregate Bond Index only publishes month-end numbers; therefore, performance numbers for the Indices are calculated from October 31, 1993.
3The Series’ performance does not reflect the deduction of taxes that a shareholder would pay on fund distributions or the redemption of shares. The Series’ performance is historical and may not be indicative of future results. The performance returns shown are inclusive of the net expense ratio of the Series. For the year ended October 31, 2017, this net expense ratio was 1.08% for Class S, 0.83% for Class I, 1.33% for Class R and 1.83% for Class R2. The gross expense ratio, which does not account for any voluntary or contractual waivers currently in effect, was 1.08% for Class S, 0.83% for Class I, 1.33% for Class R and 1.83% for Class R2 for the year ended October 31, 2017.
4For the periods through the inception of Class I on March 28, 2008, performance is based on the hypothetical performance of Class S shares. Because Class I shares invest in the same portfolio of securities as Class S, performance will only be different to the extent that the Class S shares have a higher expense ratio.
5For periods through the inception of Class R2 on January 4, 2010, and Class R on June 30, 2010, the performance figures are hypothetical and reflect the performance of Class S shares adjusted for expense differences.
55
Performance Update as of October 31, 2017 - Pro-Blend® Extended Term Series
(unaudited)
6The Bloomberg Barclays U.S. Aggregate Bond Index is an unmanaged, market-value weighted index of U.S. domestic investment-grade debt issues, including government, corporate, asset-backed, and mortgage-backed securities, with maturities of one year or more. Index returns do not reflect any fees or expenses. Index returns provided by Interactive Data.
7The 40/15/45 Blended Index is 40% Russell 3000® Index (Russell 3000), 15% MSCI ACWI ex USA Index (ACWIxUS), and 45% Bloomberg Barclays U.S. Aggregate Bond Index (BAB). Russell 3000 is an unmanaged index that consists of 3,000 of the largest U.S. companies based on total market capitalization. Index returns are based on a market capitalization weighted average of relative price changes of the component stocks plus dividends whose reinvestments are compounded daily. Index returns provided by Bloomberg. ACWIxUS is designed to measure large and mid-cap representation across 22 of 23 Developed Markets countries (excluding the U.S.) and 24 Emerging Markets countries. The Index is denominated in U.S. dollars. The Index returns assume daily investment of gross dividends (which do not account for applicable dividend taxation) prior to 12/31/1998, as net returns were not available. Subsequent to 12/31/1998, the Index returns are net of withholding taxes. They assume daily reinvestment of net dividends thus accounting for any applicable dividend taxation. Index returns provided by Bloomberg. Index returns provided by Bloomberg. BAB is an unmanaged, market value-weighted index of U.S. domestic investment-grade debt issues, including government, corporate, asset-backed and mortgage-backed securities with maturities of one year or more. Index returns provided by Interactive Data. The returns of the indices do not reflect any fees or expenses. Returns provided are calculated monthly using a blended allocation. Because the fund’s asset allocation will vary over time, the composition of the fund’s portfolio may not match the composition of the comparative Indices. Mid-month performance may not be available for all indices within the blended index. Where applicable, performance for those indices is included from the first of the month following the corresponding Fund’s inception date.
56
Shareholder Expense Example - Pro-Blend® Extended Term Series
(unaudited)
As a shareholder of the Series, you incur ongoing costs, including management fees, shareholder service fees and other Series expenses. This example is intended to help you understand your ongoing costs (in dollars) of investing in the Series and to compare these costs with the ongoing costs of investing in other mutual funds.
The example is based on an investment of $1,000 invested in each class at the beginning of the period and held for the entire period (May 1, 2017 to October 31, 2017).
Actual Expenses
The Actual lines of the table below provide information about actual account values and actual expenses. You may use the information in these lines, together with the amount you invested, to estimate the expenses that you paid over the period. Simply divide your account value by $1,000 (for example, an $8,600 account value divided by $1,000 = 8.6), then multiply the result by the number in the Actual line for the Class in which you have invested under the heading entitled “Expenses Paid During Period” to estimate the expenses you paid on your account during this period.
Hypothetical Example for Comparison Purposes
The Hypothetical lines of each class in the table below provide information about hypothetical account values and hypothetical expenses based on the Class’ actual expense ratio and an assumed rate of return of 5% per year before expenses, which is not the Class’ actual return. The hypothetical account values and expenses may not be used to estimate the actual ending account balance or expenses you paid during the period. You may use this information to compare the ongoing costs of investing in a class of the Series and other funds. To do so, compare this 5% hypothetical example for the Class in which you have invested with the 5% hypothetical examples that appear in the shareholder reports of the other funds.
Please note that the expenses shown in the table are meant to highlight your ongoing costs only and do not reflect any transaction costs such as sales charges (loads), redemption fees, or exchange fees that you may incur in other mutual funds. Therefore, the second line of the table is useful in comparing ongoing costs only, and will not help you determine the relative total costs of owning different funds.
| BEGINNING ACCOUNT VALUE 5/1/17 | ENDING ACCOUNT VALUE 10/31/17 | EXPENSES PAID DURING PERIOD 5/1/17-10/31/17* | ANNUALIZED EXPENSE RATIO | |||||
Class S | ||||||||
Actual | $1,000.00 | $1,053.20 | $5.59 | 1.08% | ||||
Hypothetical (5% return before expenses) | $1,000.00 | $1,019.76 | $5.50 | 1.08% | ||||
Class I | ||||||||
Actual | $1,000.00 | $1,054.20 | $4.30 | 0.83% | ||||
Hypothetical (5% return before expenses) | $1,000.00 | $1,021.02 | $4.23 | 0.83% | ||||
Class R | ||||||||
Actual | $1,000.00 | $1,052.20 | $6.88 | 1.33% | ||||
Hypothetical (5% return before expenses) | $1,000.00 | $1,018.50 | $6.77 | 1.33% | ||||
Class R2 | ||||||||
Actual | $1,000.00 | $1,048.70 | $9.45 | 1.83% | ||||
Hypothetical (5% return before expenses) | $1,000.00 | $1,015.98 | $9.30 | 1.83% |
*Expenses are equal to the Class’ annualized expense ratio (for the six-month period), multiplied by the average account value over the period, multiplied by 184/365 (to reflect the one-half year period). Expenses are based on the most recent fiscal half year; therefore, the expense ratios stated above may differ from the expense ratios stated in the financial highlights, which are based on one-year data.
57
Portfolio Composition - Pro-Blend® Extended Term Series
As of October 31, 2017 (unaudited)
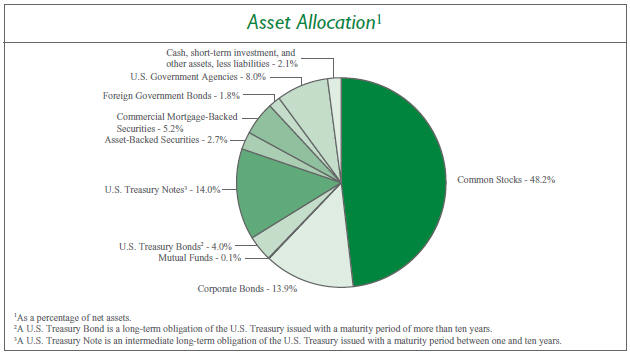
Sector Allocation4 |
| |||
Information Technology | 14.6 | % | ||
Health Care | 11.9 | % | ||
Consumer Discretionary | 5.8 | % | ||
Financials | 5.7 | % | ||
Industrials | 5.3 | % | ||
Consumer Staples | 4.8 | % | ||
Materials | 4.4 | % | ||
Energy | 4.1 | % | ||
Real Estate | 3.2 | % | ||
Telecommunication Services | 1.6 | % | ||
Utilities | 0.5 | % | ||
| 4Including common stocks and corporate bonds, as a percentage of total investments. | ||||
| Top Ten Stock Holdings5 | ||||
ServiceNow, Inc. | 2.3 | % | ||
Facebook, Inc. - Class A | 2.3 | % | ||
The Priceline Group, Inc. | 1.7 | % | ||
DaVita, Inc. | 1.6 | % | ||
Skyworks Solutions, Inc. | 1.4 | % | ||
Novartis AG - ADR (Switzerland) | 1.3 | % | ||
Medtronic plc | 1.3 | % | ||
Diageo plc (United Kingdom) | 1.1 | % | ||
Amazon.com, Inc. | 1.1 | % | ||
Qorvo, Inc. | 1.1 | % | ||
| 5As a percentage of total investments. | ||||
58
Investment Portfolio - October 31, 2017
| PRO-BLEND® EXTENDED TERM SERIES | SHARES | VALUE (NOTE 2) | ||||||
COMMON STOCKS - 48.2% | ||||||||
Consumer Discretionary - 3.9% | ||||||||
Diversified Consumer Services - 0.0%## | ||||||||
Fu Shou Yuan International Group Ltd. (China)1 | 223,000 | $ | 156,764 | |||||
|
| |||||||
Hotels, Restaurants & Leisure - 0.1% | ||||||||
Accor S.A. (France)1 | 7,935 | 395,860 | ||||||
Jollibee Foods Corp. (Philippines)1 | 48,750 | 235,407 | ||||||
|
| |||||||
| 631,267 | ||||||||
|
| |||||||
Household Durables - 0.0%## | ||||||||
Kaufman & Broad S.A. (France)1 | 3,293 | 145,513 | ||||||
|
| |||||||
Internet & Direct Marketing Retail - 2.9% | ||||||||
Amazon.com, Inc.* | 6,994 | 7,730,328 | ||||||
Ctrip.com International Ltd. - ADR (China)* | 4,385 | 209,998 | ||||||
The Priceline Group, Inc.* | 6,238 | 11,926,806 | ||||||
|
| |||||||
| 19,867,132 | ||||||||
|
| |||||||
Leisure Products - 0.0%## | ||||||||
Trigano S.A. (France)1 | 1,020 | 164,600 | ||||||
|
| |||||||
Multiline Retail - 0.0%## | ||||||||
Lojas Renner S.A. (Brazil) | 14,285 | 150,217 | ||||||
|
| |||||||
Specialty Retail - 0.0%## | ||||||||
Industria de Diseno Textil S.A. (Spain)1 | 4,190 | 156,614 | ||||||
|
| |||||||
Textiles, Apparel & Luxury Goods - 0.9% | ||||||||
ANTA Sports Products Ltd. (China)1 | 53,000 | 237,062 | ||||||
lululemon athletica, Inc.* | 93,999 | 5,781,879 | ||||||
|
| |||||||
| 6,018,941 | ||||||||
|
| |||||||
Total Consumer Discretionary | 27,291,048 | |||||||
|
| |||||||
Consumer Staples - 4.0% | ||||||||
Beverages - 3.0% | ||||||||
Ambev S.A. - ADR (Brazil) | 1,109,476 | 7,022,983 | ||||||
Anheuser-Busch InBev S.A./N.V. (Belgium)1 | 45,896 | 5,627,822 | ||||||
Diageo plc (United Kingdom)1 | 228,819 | 7,813,872 | ||||||
Treasury Wine Estates Ltd. (Australia)1 | 26,014 | 312,267 | ||||||
|
| |||||||
| 20,776,944 | ||||||||
|
| |||||||
Food & Staples Retailing - 0.1% | ||||||||
Puregold Price Club, Inc. (Philippines)1 | 240,120 | 237,213 | ||||||
Raia Drogasil S.A. (Brazil) | 9,555 | 229,930 | ||||||
Robinsons Retail Holdings, Inc. (Philippines)1 | 129,680 | 243,660 | ||||||
|
| |||||||
| 710,803 | ||||||||
|
| |||||||
Food Products - 0.2% | ||||||||
Danone S.A. (France)1 | 3,288 | 268,733 | ||||||
Kerry Group plc - Class A (Ireland)1 | 3,085 | 310,699 | ||||||
M Dias Branco S.A. (Brazil) | 10,300 | 152,329 | ||||||
Nestle S.A. (Switzerland)1 | 3,831 | 322,335 | ||||||
|
| |||||||
| 1,054,096 | ||||||||
|
| |||||||
Personal Products - 0.7% | ||||||||
Beiersdorf AG (Germany)1 | 1,680 | 188,984 | ||||||
Unilever plc - ADR (United Kingdom) | 86,870 | 4,921,186 | ||||||
|
| |||||||
| 5,110,170 | ||||||||
|
| |||||||
Tobacco - 0.0%## | ||||||||
Japan Tobacco, Inc. (Japan)1 | 10,200 | 337,622 | ||||||
|
| |||||||
Total Consumer Staples | 27,989,635 | |||||||
|
| |||||||
Energy - 2.0% | ||||||||
Energy Equipment & Services - 1.9% | ||||||||
Diamond Offshore Drilling, Inc.* | 146,485 | 2,450,694 | ||||||
Oceaneering International, Inc. | 89,305 | 1,805,747 | ||||||
Schlumberger Ltd. | 101,303 | 6,483,392 | ||||||
Transocean Ltd.* | 207,170 | 2,175,285 | ||||||
|
| |||||||
| 12,915,118 | ||||||||
|
| |||||||
Oil, Gas & Consumable Fuels - 0.1% | ||||||||
Cameco Corp. (Canada) | 11,891 | 96,793 | ||||||
Galp Energia SGPS S.A. (Portugal)1 | 12,980 | 241,325 | ||||||
Royal Dutch Shell plc - Class B - ADR (Netherlands) | 3,715 | 242,812 | ||||||
YPF S.A. - ADR (Argentina) | 7,670 | 188,375 | ||||||
|
| |||||||
| 769,305 | ||||||||
|
| |||||||
Total Energy | 13,684,423 | |||||||
|
| |||||||
Financials - 1.3% | ||||||||
Banks - 0.5% | ||||||||
Banco Macro S.A. - ADR (Argentina) | 1,620 | 203,990 | ||||||
Bankia S.A. (Spain)1 | 38,074 | 181,697 | ||||||
Banque Cantonale Vaudoise (Switzerland)1 | 210 | 151,030 | ||||||
BNP Paribas S.A. (France)1 | 3,915 | 305,564 | ||||||
BPER Banca (Italy)1 | 27,415 | 133,450 | ||||||
CaixaBank S.A. (Spain)1 | 39,470 | 184,656 | ||||||
Credit Agricole S.A. (France)1 | 12,750 | 222,529 | ||||||
Danske Bank A/S (Denmark)1 | 5,970 | 227,836 | ||||||
Erste Group Bank AG (Austria)1 | 3,530 | 151,525 | ||||||
Eurobank Ergasias S.A. (Greece)*1 | 163,355 | 133,433 | ||||||
The accompanying notes are an integral part of the financial statements.
59
Investment Portfolio - October 31, 2017
| PRO-BLEND® EXTENDED TERM SERIES | SHARES | VALUE (NOTE 2) | ||||||
COMMON STOCKS (continued) | ||||||||
Financials (continued) | ||||||||
Banks (continued) | ||||||||
FinecoBank Banca Fineco S.p.A. (Italy)1 | 25,235 | $ | 236,023 | |||||
Grupo Financiero Galicia S.A. - ADR (Argentina) | 3,375 | 185,287 | ||||||
Grupo Supervielle S.A. - ADR (Argentina) | 6,030 | 161,664 | ||||||
Itau Unibanco Holding S.A. (Brazil) | 11,900 | 153,547 | ||||||
Jyske Bank A/S (Denmark)1 | 2,685 | 151,724 | ||||||
KBC Group N.V. (Belgium)1 | 2,765 | 229,686 | ||||||
Skandinaviska Enskilda Banken A.B. - Class A (Sweden)1 | 11,955 | 147,329 | ||||||
Svenska Handelsbanken A.B. - Class A (Sweden)1 | 10,405 | 149,128 | ||||||
Swedbank A.B. - Class A (Sweden)1 | 5,660 | 140,469 | ||||||
Sydbank A/S (Denmark)1 | 3,890 | 151,860 | ||||||
|
| |||||||
| 3,602,427 | ||||||||
|
| |||||||
Capital Markets - 0.7% | ||||||||
Amundi S.A. (France)1,2 | 2,860 | 242,388 | ||||||
Banca Generali S.p.A. (Italy)1 | 6,850 | 225,372 | ||||||
BlackRock, Inc. | 7,330 | 3,451,184 | ||||||
EFG International AG (Switzerland)1 | 24,930 | 228,137 | ||||||
Euronext N.V. (Netherlands)1,2 | 4,880 | 289,827 | ||||||
Julius Baer Group Ltd. (Switzerland)1 | 2,635 | 155,854 | ||||||
Natixis S.A. (France)1 | 39,290 | 308,118 | ||||||
|
| |||||||
| 4,900,880 | ||||||||
|
| |||||||
Thrifts & Mortgage Finance - 0.1% | ||||||||
Aareal Bank AG (Germany)1 | 3,715 | 154,460 | ||||||
|
| |||||||
Total Financials | 8,657,767 | |||||||
|
| |||||||
Health Care - 11.4% | ||||||||
Biotechnology - 4.8% | ||||||||
Biogen, Inc.* | 16,912 | 5,270,794 | ||||||
BioMarin Pharmaceutical, Inc.* | 84,470 | 6,934,142 | ||||||
Incyte Corp.* | 47,646 | 5,395,909 | ||||||
Regeneron Pharmaceuticals, Inc.* | 19,065 | 7,675,950 | ||||||
Seattle Genetics, Inc.* | 82,960 | 5,086,278 | ||||||
Vertex Pharmaceuticals, Inc.* | 21,994 | 3,216,183 | ||||||
|
| |||||||
| 33,579,256 | ||||||||
|
| |||||||
Health Care Equipment & Supplies - 1.3% | ||||||||
Medtronic plc | 108,580 | 8,742,862 | ||||||
Osstem Implant Co. Ltd. (South Korea)*1 | 3,640 | 233,889 | ||||||
|
| |||||||
| 8,976,751 | ||||||||
|
| |||||||
Health Care Providers & Services - 2.2% | ||||||||
DaVita, Inc.* | 178,623 | 10,849,561 | ||||||
Express Scripts Holding Co.*3 | 59,409 | 3,641,178 | ||||||
Fleury S.A. (Brazil) | 24,260 | 212,988 | ||||||
Fresenius Medical Care AG & Co. KGaA (Germany)1 | 3,775 | 365,503 | ||||||
Orpea (France)1 | 2,460 | 294,730 | ||||||
|
| |||||||
| 15,363,960 | ||||||||
|
| |||||||
Life Sciences Tools & Services - 0.1% | ||||||||
Life Sciences Tools & Services - 0.0%## | ||||||||
QIAGEN N.V. | 4,757 | 161,072 | ||||||
QIAGEN N.V.1 | 6,119 | 207,597 | ||||||
Tecan Group AG (Switzerland)1 | 760 | 160,746 | ||||||
|
| |||||||
| 529,415 | ||||||||
|
| |||||||
Pharmaceuticals - 3.0% | ||||||||
Bristol-Myers Squibb Co. | 56,122 | 3,460,482 | ||||||
Hypermarcas S.A. (Brazil) | 21,800 | 228,642 | ||||||
Johnson & Johnson3 | 53,040 | 7,394,306 | ||||||
Kalbe Farma Tbk PT (Indonesia)1 | 1,783,960 | 210,458 | ||||||
Novartis AG - ADR (Switzerland) | 110,501 | 9,125,173 | ||||||
Perrigo Co. plc | 3,610 | 292,374 | ||||||
|
| |||||||
| 20,711,435 | ||||||||
|
| |||||||
Total Health Care | 79,160,817 | |||||||
|
| |||||||
Industrials - 5.1% | ||||||||
Aerospace & Defense - 0.8% | ||||||||
Arconic, Inc. | 197,359 | 4,957,658 | ||||||
LIG Nex1 Co. Ltd. (South Korea)1 | 3,400 | 218,200 | ||||||
Thales S.A. (France)1 | 3,480 | 362,663 | ||||||
Ultra Electronics Holdings plc (United Kingdom)1 | 6,510 | 157,637 | ||||||
|
| |||||||
| 5,696,158 | ||||||||
|
| |||||||
Air Freight & Logistics - 1.1% | ||||||||
FedEx Corp. | 33,873 | 7,648,862 | ||||||
|
| |||||||
Airlines - 0.1% | ||||||||
Azul S.A. - ADR (Brazil)* | 5,730 | 144,912 | ||||||
Ryanair Holdings plc - ADR (Ireland)* | 3,701 | 414,919 | ||||||
|
| |||||||
| 559,831 | ||||||||
|
| |||||||
Building Products - 0.1% | ||||||||
Cie de Saint-Gobain (France)1 | 5,210 | 305,478 | ||||||
Geberit AG (Switzerland)1 | 330 | 149,409 | ||||||
|
| |||||||
| 454,887 | ||||||||
|
| |||||||
Commercial Services & Supplies - 0.1% | ||||||||
China Everbright International Ltd. (China)1 | 160,000 | 225,737 | ||||||
The accompanying notes are an integral part of the financial statements.
60
Investment Portfolio - October 31, 2017
| PRO-BLEND® EXTENDED TERM SERIES | SHARES | VALUE (NOTE 2) | ||||||
COMMON STOCKS (continued) | ||||||||
Industrials (continued) | ||||||||
Commercial Services & Supplies (continued) | ||||||||
Elis S.A. (France)1 | 9,000 | $ | 234,649 | |||||
SPIE S.A. (France)1 | 10,985 | 289,031 | ||||||
|
| |||||||
| 749,417 | ||||||||
|
| |||||||
Construction & Engineering - 0.1% | ||||||||
Eiffage S.A. (France)1 | 3,640 | 380,219 | ||||||
Vinci S.A. (France)1 | 5,455 | 534,468 | ||||||
|
| |||||||
| 914,687 | ||||||||
|
| |||||||
Electrical Equipment - 0.0%## | ||||||||
Legrand S.A. (France)1 | 3,235 | 240,071 | ||||||
|
| |||||||
Industrial Conglomerates - 0.1% | ||||||||
Siemens AG (Germany)1 | 4,380 | 629,111 | ||||||
|
| |||||||
Machinery - 0.2% | ||||||||
FANUC Corp. (Japan)1 | 1,070 | 250,191 | ||||||
Jungheinrich AG (Germany)1 | 4,950 | 225,433 | ||||||
KION Group AG (Germany)1 | 3,845 | 308,091 | ||||||
Metso OYJ (Finland)1 | 5,925 | 215,186 | ||||||
The Weir Group plc (United Kingdom)1 | 15,145 | 392,628 | ||||||
|
| |||||||
| 1,391,529 | ||||||||
|
| |||||||
Professional Services - 1.7% | ||||||||
Applus Services S.A. (Spain)1 | 31,730 | 443,703 | ||||||
Equifax, Inc. | 39,902 | 4,330,564 | ||||||
Intertek Group plc (United Kingdom)1 | 4,475 | 322,382 | ||||||
Nielsen Holdings plc | 156,283 | 5,793,411 | ||||||
Randstad Holding N.V. (Netherlands)1 | 3,785 | 232,861 | ||||||
RELX plc (United Kingdom)1 | 6,900 | 158,775 | ||||||
SGS S.A. (Switzerland)1 | 130 | 321,041 | ||||||
|
| |||||||
| 11,602,737 | ||||||||
|
| |||||||
Road & Rail - 0.6% | ||||||||
Genesee & Wyoming, Inc. - Class A* | 53,030 | 3,806,493 | ||||||
|
| |||||||
Trading Companies & Distributors - 0.1% | ||||||||
Ashtead Group plc (United Kingdom)1 | 9,140 | 235,441 | ||||||
Brenntag AG (Germany)1 | 5,992 | 339,960 | ||||||
Howden Joinery Group plc (United Kingdom)1 | 19,560 | 106,522 | ||||||
|
| |||||||
| 681,923 | ||||||||
|
| |||||||
Transportation Infrastructure - 0.1% | ||||||||
Aena SME S.A. (Spain)1,2 | 4,180 | 766,920 | ||||||
Grupo Aeroportuario del Centro Norte S.A.B. de C.V. (Mexico) | 10,400 | 52,538 | ||||||
Grupo Aeroportuario del Pacifico S.A.B. de C.V. - ADR (Mexico) | 555 | 52,681 | ||||||
|
| |||||||
| 872,139 | ||||||||
|
| |||||||
Total Industrials | 35,247,845 | |||||||
|
| |||||||
Information Technology - 13.7% | ||||||||
Electronic Equipment, Instruments & Components - 0.2% | ||||||||
Halma plc (United Kingdom)1 | 15,090 | 236,775 | ||||||
Hexagon A.B. - Class B (Sweden)1 | 3,060 | 156,902 | ||||||
Hitachi Ltd. (Japan)1 | 51,000 | 406,131 | ||||||
Hollysys Automation Technologies Ltd. (China) | 6,695 | 150,303 | ||||||
Keyence Corp. (Japan)1 | 1,218 | 676,264 | ||||||
|
| |||||||
| 1,626,375 | ||||||||
|
| |||||||
Internet Software & Services - 4.9% | ||||||||
Alibaba Group Holding Ltd. - ADR (China)* | 3,490 | 645,266 | ||||||
Alphabet, Inc. - Class A*3 | 5,430 | 5,609,407 | ||||||
Alphabet, Inc. - Class C* | 5,555 | 5,647,435 | ||||||
China Literature Ltd. - Rights (Expires 11/03/2017) (Hong Kong)*4 | 110 | — | ||||||
Facebook, Inc. - Class A* | 88,220 | 15,884,893 | ||||||
NetEase, Inc. - ADR (China) | 400 | 112,768 | ||||||
Tencent Holdings Ltd. - Class H (China)1 | 135,045 | 6,069,612 | ||||||
| 33,969,381 | ||||||||
IT Services - 2.2% | ||||||||
Altran Technologies S.A. (France)1 | 16,615 | 307,291 | ||||||
Amdocs Ltd. | 5,890 | 383,439 | ||||||
InterXion Holding N.V. - ADR (Netherlands)* | 4,305 | 229,844 | ||||||
MasterCard, Inc. - Class A | 47,530 | 7,071,038 | ||||||
Sopra Steria Group (France)1 | 1,640 | 307,662 | ||||||
Visa, Inc. - Class A3 | 64,020 | 7,040,920 | ||||||
|
| |||||||
| 15,340,194 | ||||||||
|
| |||||||
Semiconductors & Semiconductor Equipment - 2.5% | ||||||||
Qorvo, Inc.* | 101,308 | 7,680,160 | ||||||
Skyworks Solutions, Inc. | 84,361 | 9,605,343 | ||||||
|
| |||||||
| 17,285,503 | ||||||||
|
| |||||||
Software - 3.9% | ||||||||
Atlassian Corp. plc - Class A (Australia)* | 3,237 | 156,574 | ||||||
Dassault Systemes S.E. (France)1 | 2,965 | 314,753 | ||||||
Electronic Arts, Inc.* | 33,833 | 4,046,427 | ||||||
The accompanying notes are an integral part of the financial statements.
61
Investment Portfolio - October 31, 2017
| PRO-BLEND® EXTENDED TERM SERIES | SHARES | VALUE (NOTE 2) | ||||||
COMMON STOCKS (continued) | ||||||||
Information Technology (continued) | ||||||||
Software (continued) | ||||||||
Microsoft Corp. | 73,401 | $ | 6,105,495 | |||||
ServiceNow, Inc.* | 126,110 | 15,936,521 | ||||||
Sophos Group plc (United Kingdom)1,2 | 19,505 | 160,840 | ||||||
Temenos Group AG (Switzerland)1 | 2,060 | 237,871 | ||||||
|
| |||||||
| 26,958,481 | ||||||||
|
| |||||||
Total Information Technology | 95,179,934 | |||||||
|
| |||||||
Materials - 3.1% | ||||||||
Chemicals - 0.7% | ||||||||
Akzo Nobel N.V. (Netherlands)1 | 3,455 | 311,920 | ||||||
Ashland Global Holdings, Inc. | 54,153 | 3,681,321 | ||||||
Croda International plc (United Kingdom)1 | 4,475 | 248,696 | ||||||
Mexichem, S.A.B. de C.V. (Mexico) | 40,200 | 103,542 | ||||||
Solvay S.A. (Belgium)1 | 1,925 | 285,975 | ||||||
|
| |||||||
| 4,631,454 | ||||||||
|
| |||||||
Construction Materials - 0.1% | ||||||||
Wienerberger AG (Austria)1 | 9,120 | 233,996 | ||||||
|
| |||||||
Containers & Packaging - 1.3% | ||||||||
Ball Corp. | 109,965 | 4,720,797 | ||||||
Sealed Air Corp. | 101,963 | 4,509,823 | ||||||
|
| |||||||
| 9,230,620 | ||||||||
|
| |||||||
Metals & Mining - 1.0% | ||||||||
Antofagasta plc (Chile)1 | 127,720 | 1,618,668 | ||||||
First Quantum Minerals Ltd. (Zambia) | 145,010 | 1,621,963 | ||||||
Grupo Mexico, S.A.B. de C.V. - Series B (Mexico) | 87,970 | 286,094 | ||||||
Lundin Mining Corp. (Canada) | 216,337 | 1,650,071 | ||||||
Southern Copper Corp. (Peru) | 41,950 | 1,801,753 | ||||||
|
| |||||||
| 6,978,549 | ||||||||
|
| |||||||
Total Materials | 21,074,619 | |||||||
|
| |||||||
Real Estate - 2.8% | ||||||||
Equity Real Estate Investment Trusts (REITS) - 2.7% | ||||||||
Acadia Realty Trust | 3,050 | 85,857 | ||||||
Agree Realty Corp. | 1,815 | 85,831 | ||||||
Alexandria Real Estate Equities, Inc. | 2,765 | 342,749 | ||||||
American Campus Communities, Inc. | 3,130 | 130,145 | ||||||
American Homes 4 Rent - Class A | 11,510 | 244,933 | ||||||
Apartment Investment & Management Co. - Class A | 6,390 | 281,032 | ||||||
AvalonBay Communities, Inc. | 1,960 | 355,407 | ||||||
Axiare Patrimonio SOCIMI S.A. (Spain)1 | 5,215 | 97,803 | ||||||
Bluerock Residential Growth REIT, Inc. | 7,865 | 88,796 | ||||||
Boston Properties, Inc. | 1,410 | 170,864 | ||||||
Brandywine Realty Trust | 10,065 | 176,037 | ||||||
Brixmor Property Group, Inc. | 4,465 | 78,004 | ||||||
Camden Property Trust | 1,615 | 147,353 | ||||||
CatchMark Timber Trust, Inc. - Class A | 19,425 | 248,640 | ||||||
Cedar Realty Trust, Inc. | 22,485 | 122,318 | ||||||
Chesapeake Lodging Trust | 5,435 | 151,636 | ||||||
Colony NorthStar, Inc. - Class A | 18,365 | 225,522 | ||||||
Columbia Property Trust, Inc. | 4,780 | 105,542 | ||||||
Community Healthcare Trust, Inc. | 14,865 | 407,747 | ||||||
CoreCivic, Inc. | 10,950 | 270,027 | ||||||
Cousins Properties, Inc. | 23,470 | 211,699 | ||||||
Crown Castle International Corp. | 1,750 | 187,390 | ||||||
CubeSmart | 10,455 | 284,585 | ||||||
DDR Corp. | 7,725 | 59,251 | ||||||
Digital Realty Trust, Inc. | 2,720 | 322,157 | ||||||
Douglas Emmett, Inc. | 4,645 | 184,825 | ||||||
Education Realty Trust, Inc. | 1,906 | 66,519 | ||||||
EPR Properties | 995 | 68,834 | ||||||
Equinix, Inc. | 1,545 | 716,107 | ||||||
Equity Commonwealth* | 4,515 | 135,676 | ||||||
Equity LifeStyle Properties, Inc. | 1,535 | 135,817 | ||||||
Equity Residential | 3,865 | 259,960 | ||||||
Essex Property Trust, Inc. | 350 | 91,850 | ||||||
Extra Space Storage, Inc. | 2,625 | 214,174 | ||||||
Forest City Realty Trust, Inc. - Class A | 5,840 | 143,839 | ||||||
Getty Realty Corp. | 3,810 | 108,242 | ||||||
GGP, Inc. | 6,325 | 123,084 | ||||||
Global Medical REIT, Inc. | 17,340 | 146,696 | ||||||
HCP, Inc. | 5,320 | 137,469 | ||||||
Healthcare Trust of America, Inc. - Class A | 5,355 | 160,918 | ||||||
Hibernia REIT plc (Ireland)1 | 69,120 | 118,759 | ||||||
Host Hotels & Resorts, Inc. | 6,740 | 131,834 | ||||||
Independence Realty Trust, Inc. | 12,755 | 129,463 | ||||||
Invitation Homes, Inc. | 5,050 | 113,979 | ||||||
Lamar Advertising Co. - Class A | 1,755 | 123,622 | ||||||
LaSalle Hotel Properties | 3,205 | 90,413 | ||||||
Life Storage, Inc. | 1,730 | 139,819 | ||||||
The Macerich Co. | 1,155 | 63,063 | ||||||
The accompanying notes are an integral part of the financial statements.
62
Investment Portfolio - October 31, 2017
| PRO-BLEND® EXTENDED TERM SERIES | SHARES/ PRINCIPAL | VALUE (NOTE 2) | ||||||
COMMON STOCKS (continued) | ||||||||
Real Estate (continued) | ||||||||
Equity Real Estate Investment Trusts (REITS) (continued) | ||||||||
Mid-America Apartment | ||||||||
Communities, Inc. | 2,815 | $ | 288,115 | |||||
National Retail Properties, Inc. | 3,500 | 140,630 | ||||||
Outfront Media, Inc. | 6,115 | 143,397 | ||||||
Physicians Realty Trust | 14,240 | 247,491 | ||||||
Prologis, Inc. | 6,860 | 443,019 | ||||||
Public Storage | 1,110 | 230,048 | ||||||
Regency Centers Corp. | 2,313 | 142,365 | ||||||
Retail Opportunity Investments Corp. | 4,765 | 85,675 | ||||||
Rexford Industrial Realty, Inc. | 7,505 | 222,823 | ||||||
Simon Property Group, Inc. | 3,550 | 551,422 | ||||||
STAG Industrial, Inc. | 7,610 | 207,753 | ||||||
Starwood Waypoint Homes | 3,125 | 113,469 | ||||||
STORE Capital Corp. | 5,560 | 137,276 | ||||||
Sun Communities, Inc. | 1,475 | 133,134 | ||||||
Sunstone Hotel Investors, Inc. | 8,500 | 138,720 | ||||||
Terreno Realty Corp. | 6,165 | 226,379 | ||||||
UDR, Inc. | 4,925 | 191,041 | ||||||
Unibail-Rodamco S.E. (France)1 | 975 | 244,049 | ||||||
Urban Edge Properties | 9,020 | 211,609 | ||||||
Ventas, Inc. | 4,425 | 277,669 | ||||||
VEREIT, Inc. | 16,620 | 131,132 | ||||||
Vornado Realty Trust | 4,585 | 343,233 | ||||||
Welltower, Inc. | 3,760 | 251,770 | ||||||
Weyerhaeuser Co. | 139,563 | 5,011,707 | ||||||
|
| |||||||
| 18,600,213 | ||||||||
|
| |||||||
Real Estate Management & Development - 0.1% | ||||||||
Aliansce Shopping Centers S.A. (Brazil)* | 28,715 | 153,437 | ||||||
Iguatemi Empresa de Shopping Centers S.A. (Brazil) | 13,045 | 153,288 | ||||||
Nexity S.A. (France)1 | 3,875 | 238,166 | ||||||
|
| |||||||
| 544,891 | ||||||||
|
| |||||||
Total Real Estate | 19,145,104 | |||||||
|
| |||||||
Telecommunication Services - 0.8% | ||||||||
Diversified Telecommunication Services - 0.8% | ||||||||
Iliad S.A. (France)1 | 1,000 | 249,619 | ||||||
Zayo Group Holdings, Inc.* | 144,630 | 5,215,358 | ||||||
|
| |||||||
Total Telecommunication Services | 5,464,977 | |||||||
|
| |||||||
Utilities - 0.1% | ||||||||
Electric Utilities - 0.0%## | ||||||||
Pampa Energia S.A. - ADR (Argentina)* | 4,555 | 308,966 | ||||||
|
| |||||||
Independent Power and Renewable Electricity Producers - 0.1% | ||||||||
China Longyuan Power Group Corp. Ltd. - Class H (China)1 | 287,000 | 212,837 | ||||||
Huaneng Renewables Corp. Ltd. - Class H (China)1 | 654,000 | 224,913 | ||||||
|
| |||||||
| 437,750 | ||||||||
|
| |||||||
Total Utilities | 746,716 | |||||||
|
| |||||||
TOTAL COMMON STOCKS | 333,642,885 | |||||||
|
| |||||||
CORPORATE BONDS - 13.9% | ||||||||
Non-Convertible Corporate Bonds - 13.9% | ||||||||
Consumer Discretionary - 1.9% | ||||||||
Auto Components - 0.2% | ||||||||
Magna International, Inc. (Canada), 4.15%, 10/1/2025 | 1,556,000 | 1,664,882 | ||||||
|
| |||||||
Household Durables - 0.4% | ||||||||
Century Communities, Inc.2, 5.875%, 7/15/2025 | 260,000 | 262,597 | ||||||
Meritage Homes Corp., 5.125%, 6/6/2027 | 187,000 | 189,104 | ||||||
NVR, Inc., 3.95%, 9/15/2022 | 1,532,000 | 1,609,293 | ||||||
TRI Pointe Group, Inc. - TRI Pointe Homes, Inc., 4.375%, 6/15/2019 | 284,000 | 291,455 | ||||||
TRI Pointe Group, Inc. - TRI Pointe Homes, Inc., 5.875%, 6/15/2024 | 147,000 | 159,128 | ||||||
Weekley Homes LLC - Weekley Finance Corp., 6.00%, 2/1/2023 | 242,000 | 237,160 | ||||||
Weekley Homes LLC - Weekley Finance Corp.2, 6.625%, 8/15/2025 | 250,000 | 243,125 | ||||||
|
| |||||||
| 2,991,862 | ||||||||
|
| |||||||
Internet & Direct Marketing Retail - 0.5% | ||||||||
Amazon.com, Inc.2, 3.15%, 8/22/2027 | 1,130,000 | 1,136,762 | ||||||
The Priceline Group, Inc., 3.60%, 6/1/2026 | 2,209,000 | 2,257,834 | ||||||
|
| |||||||
| 3,394,596 | ||||||||
|
| |||||||
Media - 0.6% | ||||||||
Charter Communications Operating LLC - Charter Communications Operating Capital Corp., 4.464%, 7/23/2022 | 75,000 | 79,206 | ||||||
Comcast Corp., 4.40%, 8/15/2035 | 1,043,000 | 1,129,454 | ||||||
CSC Holdings, LLC, 5.25%, 6/1/2024 | 339,000 | 337,517 | ||||||
The accompanying notes are an integral part of the financial statements.
63
Investment Portfolio - October 31, 2017
| PRO-BLEND® EXTENDED TERM SERIES | PRINCIPAL AMOUNT 5 | VALUE (NOTE 2) | ||||||
CORPORATE BONDS (continued) |
| |||||||
Non-Convertible Corporate Bonds (continued) | ||||||||
Consumer Discretionary (continued) | ||||||||
Media (continued) | ||||||||
Discovery Communications LLC, 3.95%, 3/20/2028 | 1,710,000 | $ | 1,696,002 | |||||
DISH DBS Corp., 5.875%, 7/15/2022 | 75,000 | 75,422 | ||||||
UPCB Finance IV Ltd. (Netherlands)2, 5.375%, 1/15/2025 | 320,000 | 327,200 | ||||||
VTR Finance B.V. (Chile)2, 6.875%, 1/15/2024 | 315,000 | 333,979 | ||||||
|
| |||||||
| 3,978,780 | ||||||||
|
| |||||||
Multiline Retail - 0.2% | ||||||||
Dollar General Corp., 3.25%, 4/15/2023 | 1,046,000 | 1,073,325 | ||||||
|
| |||||||
Total Consumer Discretionary | 13,103,445 | |||||||
|
| |||||||
Consumer Staples - 0.8% | ||||||||
Beverages - 0.5% | ||||||||
Anheuser-Busch InBev Worldwide, | ||||||||
Inc. (Belgium), 8.20%, 1/15/2039 | 1,450,000 | 2,291,307 | ||||||
PepsiCo, Inc., 3.10%, 7/17/2022 | 1,043,000 | 1,078,282 | ||||||
|
| |||||||
| 3,369,589 | ||||||||
|
| |||||||
Food & Staples Retailing - 0.3% | ||||||||
C&S Group Enterprises LLC2, 5.375%, 7/15/2022 | 366,000 | 355,020 | ||||||
CVS Health Corp., 3.50%, 7/20/2022 | 1,565,000 | 1,613,186 | ||||||
| 1,968,206 | ||||||||
|
| |||||||
Total Consumer Staples | 5,337,795 | |||||||
|
| |||||||
Energy - 2.1% | ||||||||
Energy Equipment & Services - 0.1% | ||||||||
McDermott International, Inc.2, 8.00%, 5/1/2021 | 389,000 | 401,642 | ||||||
Trinidad Drilling Ltd. (Canada)2, 6.625%, 2/15/2025 | 264,000 | 256,740 | ||||||
|
| |||||||
| 658,382 | ||||||||
|
| |||||||
Oil, Gas & Consumable Fuels - 2.0% | ||||||||
BP Capital Markets plc (United Kingdom), 3.535%, 11/4/2024 | 2,194,000 | 2,280,939 | ||||||
Cheniere Corpus Christi Holdings, LLC, 7.00%, 6/30/2024 | 290,000 | 330,962 | ||||||
Cheniere Energy Partners LP2, 5.25%, 10/1/2025 | 250,000 | 257,500 | ||||||
Columbia Pipeline Group, Inc., 4.50%, 6/1/2025 | 1,027,000 | 1,100,690 | ||||||
ConocoPhillips Co., 3.35%, 5/15/2025 | 996,000 | 1,026,148 | ||||||
Dynagas LNG Partners LP - Dynagas Finance, Inc. (Monaco), 6.25%, 10/30/2019 | 272,000 | 272,000 | ||||||
Enbridge, Inc. (Canada), 3.70%, 7/15/2027 | 1,018,000 | 1,031,298 | ||||||
Enviva Partners LP - Enviva Partners Finance Corp., 8.50%, 11/1/2021 | 246,000 | 263,835 | ||||||
GasLog Ltd. (Monaco), 8.875%, 3/22/2022 | 257,000 | 271,135 | ||||||
Global Ship Lease, Inc. (United Kingdom)2, 9.875%, 11/15/2022 | 345,000 | 351,900 | ||||||
Hilcorp Energy I LP - Hilcorp Finance Co.2, 5.75%, 10/1/2025 | 385,000 | 394,144 | ||||||
Jonah Energy LLC - Jonah Energy Finance Corp.2, 7.25%, 10/15/2025 | 245,000 | 245,000 | ||||||
Kinder Morgan Energy Partners LP, 4.30%, 5/1/2024 | 2,061,000 | 2,162,435 | ||||||
PBF Holding Co. LLC - PBF Finance Corp.2, 7.25%, 6/15/2025 | 198,000 | 204,682 | ||||||
Petroleos Mexicanos (Mexico), 6.875%, 8/4/2026 | 1,010,000 | 1,134,735 | ||||||
Rockies Express Pipeline, LLC2, 5.625%, 4/15/2020 | 336,000 | 356,160 | ||||||
Sabine Pass Liquefaction LLC, 5.875%, 6/30/2026 | 1,010,000 | 1,142,640 | ||||||
SemGroup Corp.2, 6.375%, 3/15/2025 | 257,000 | 253,145 | ||||||
Seven Generations Energy Ltd. (Canada)2, 5.375%, 9/30/2025 | 166,000 | 167,660 | ||||||
Southwestern Energy Co., 6.70%, 1/23/2025 | 194,000 | 198,365 | ||||||
Tallgrass Energy Partners LP - Tallgrass Energy Finance Corp.2, 5.50%, 9/15/2024 | 346,000 | 357,678 | ||||||
|
| |||||||
| 13,803,051 | ||||||||
|
| |||||||
Total Energy | 14,461,433 | |||||||
|
| |||||||
Financials - 4.5% | ||||||||
Banks - 2.4% | ||||||||
Banco Santander S.A. (Spain), 3.50%, 4/11/2022 | 1,479,000 | 1,515,481 | ||||||
Bank of America Corp., 4.00%, 1/22/2025 | 1,619,000 | 1,676,772 | ||||||
Barclays Bank plc (United Kingdom)2, 10.179%, 6/12/2021 | 920,000 | 1,136,104 | ||||||
Citigroup, Inc., 3.875%, 3/26/2025 | 2,240,000 | 2,298,470 | ||||||
The accompanying notes are an integral part of the financial statements.
64
Investment Portfolio - October 31, 2017
| PRO-BLEND® EXTENDED TERM SERIES | PRINCIPAL AMOUNT 5 | VALUE (NOTE 2) | ||||||
CORPORATE BONDS (continued) | ||||||||
Non-Convertible Corporate Bonds (continued) | ||||||||
Financials (continued) | ||||||||
Banks (continued) | ||||||||
Intesa Sanpaolo S.p.A. (Italy), 3.875%, 1/15/2019 | 1,005,000 | $ | 1,024,654 | |||||
JPMorgan Chase & Co.6, (3 mo. LIBOR US + 0.935%), 2.776%, 4/25/2023 | 2,120,000 | 2,127,518 | ||||||
Kreditanstalt fuer Wiederaufbau (Germany), 1.50%, 6/15/2021 | 3,813,000 | 3,744,541 | ||||||
Lloyds Banking Group plc (United Kingdom), 4.582%, 12/10/2025 | 2,023,000 | 2,133,544 | ||||||
Popular, Inc., 7.00%, 7/1/2019 | 279,000 | 285,277 | ||||||
Royal Bank of Canada (Canada), 3.77%, 3/30/2018 | CAD | 346,000 | 270,817 | |||||
Royal Bank of Scotland Group plc (United Kingdom), 6.10%, 6/10/2023 | 73,000 | 81,289 | ||||||
|
| |||||||
| 16,294,467 | ||||||||
|
| |||||||
Capital Markets - 0.6% | ||||||||
The Goldman Sachs Group, Inc., 4.25%, 10/21/2025 | 1,022,000 | 1,066,271 | ||||||
Morgan Stanley7, (3 mo. LIBOR US + 1.220%), 2.617%, 5/8/2024 | 1,673,000 | 1,701,073 | ||||||
Morgan Stanley, 5.00%, 11/24/2025 | 1,532,000 | 1,671,127 | ||||||
|
| |||||||
| 4,438,471 | ||||||||
|
| |||||||
Consumer Finance - 0.1% | ||||||||
Ally Financial, Inc., 3.50%, 1/27/2019 | 105,000 | 106,281 | ||||||
Navient Corp., 6.125%, 3/25/2024 | 171,000 | 175,489 | ||||||
SLM Corp., 5.125%, 4/5/2022 | 220,000 | 227,975 | ||||||
|
| |||||||
| 509,745 | ||||||||
|
| |||||||
Diversified Financial Services - 0.5% | ||||||||
AerCap Ireland Capital DAC - AerCap Global Aviation Trust (Netherlands), 4.50%, 5/15/2021 | 2,140,000 | 2,272,663 | ||||||
E*TRADE Financial Corp., 2.95%, 8/24/2022 | 1,140,000 | 1,140,543 | ||||||
LPL Holdings, Inc.2, 5.75%, 9/15/2025 | 178,000 | 185,120 | ||||||
|
| |||||||
| 3,598,326 | ||||||||
|
| |||||||
Insurance - 0.8% | ||||||||
American International Group, Inc., 4.125%, 2/15/2024 | 1,524,000 | 1,620,987 | ||||||
Assured Guaranty US Holdings, Inc., 5.00%, 7/1/2024 | 2,620,000 | 2,828,730 | ||||||
Prudential Financial, Inc.6, (3 mo. LIBOR US + 4.175%), 5.875%, 9/15/2042 | 1,012,000 | 1,118,260 | ||||||
|
| |||||||
| 5,567,977 | ||||||||
|
| |||||||
Thrifts & Mortgage Finance - 0.1% | ||||||||
Ladder Capital Finance Holdings LLLP - Ladder Capital Finance Corp.2, 5.875%, 8/1/2021 | 458,000 | 472,885 | ||||||
|
| |||||||
Total Financials | 30,881,871 | |||||||
|
| |||||||
Health Care - 0.4% | ||||||||
Biotechnology - 0.3% | ||||||||
AMAG Pharmaceuticals, Inc.2, 7.875%, 9/1/2023 | 191,000 | 194,341 | ||||||
Express Scripts Holding Co., 3.50%, 6/15/2024 | 1,680,000 | 1,699,891 | ||||||
Horizon Pharma, Inc. - Horizon Pharma USA, Inc.2, 8.75%, 11/1/2024 | 350,000 | 366,625 | ||||||
|
| |||||||
| 2,260,857 | ||||||||
|
| |||||||
Health Care Equipment & Supplies - 0.0%## |
| |||||||
Hill-Rom Holdings, Inc.2, 5.00%, 2/15/2025 | 191,000 | 195,298 | ||||||
|
| |||||||
Health Care Providers & Services - 0.1% | ||||||||
DaVita, Inc., 5.00%, 5/1/2025 | 250,000 | 246,250 | ||||||
Fresenius Medical Care US Finance II, Inc. (Germany)2, 6.50%, 9/15/2018 | 105,000 | 109,058 | ||||||
HCA Healthcare, Inc., 6.25%, 2/15/2021 | 73,000 | 78,566 | ||||||
HCA, Inc., 3.75%, 3/15/2019 | 73,000 | 74,095 | ||||||
Ortho-Clinical Diagnostics, Inc. - Ortho-Clinical Diagnostics S.A2, 6.625%, 5/15/2022 | 100,000 | 100,125 | ||||||
Tenet Healthcare Corp., 6.75%, 2/1/2020 | 73,000 | 74,278 | ||||||
|
| |||||||
| 682,372 | ||||||||
|
| |||||||
Total Health Care | 3,138,527 | |||||||
|
| |||||||
Industrials - 0.3% | ||||||||
Aerospace & Defense - 0.0%## | ||||||||
Arconic, Inc., 5.87%, 2/23/2022 | 220,000 | 240,350 | ||||||
|
| |||||||
Air Freight & Logistics - 0.0%## | ||||||||
Park Aerospace Holdings Ltd. (Ireland)2, 4.50%, 3/15/2023 | 136,000 | 136,170 | ||||||
|
| |||||||
The accompanying notes are an integral part of the financial statements.
65
Investment Portfolio - October 31, 2017
| PRO-BLEND® EXTENDED TERM SERIES | PRINCIPAL AMOUNT 5 | VALUE (NOTE 2) | ||||||
CORPORATE BONDS (continued) | ||||||||
Non-Convertible Corporate Bonds (continued) | ||||||||
Industrials (continued) | ||||||||
Airlines - 0.1% | ||||||||
Allegiant Travel Co., 5.50%, 7/15/2019 | 175,000 | $ | 180,687 | |||||
American Airlines Group, Inc.2, 5.50%, 10/1/2019 | 178,000 | 185,120 | ||||||
|
| |||||||
| 365,807 | ||||||||
|
| |||||||
Building Products - 0.1% | ||||||||
Airxcel, Inc.2, 8.50%, 2/15/2022 | 284,000 | 301,040 | ||||||
|
| |||||||
Construction & Engineering - 0.1% | ||||||||
Tutor Perini Corp.2, 6.875%, 5/1/2025 | 276,000 | 297,735 | ||||||
|
| |||||||
Machinery - 0.0%## | ||||||||
Xerium Technologies, Inc., 9.50%, 8/15/2021 | 211,000 | 216,739 | ||||||
|
| |||||||
Trading Companies & Distributors - 0.0%## | ||||||||
International Lease Finance Corp., 6.25%, 5/15/2019 | 198,000 | 209,963 | ||||||
|
| |||||||
Total Industrials | 1,767,804 | |||||||
|
| |||||||
Information Technology - 0.9% | ||||||||
Internet Software & Services - 0.3% | ||||||||
Activision Blizzard, Inc., 3.40%, 6/15/2027 | 2,112,000 | 2,115,924 | ||||||
|
| |||||||
IT Services - 0.2% | ||||||||
Visa, Inc., 2.80%, 12/14/2022 | 1,610,000 | 1,640,290 | ||||||
|
| |||||||
Semiconductors & Semiconductor Equipment - 0.4% | ||||||||
Applied Materials, Inc., 3.30%, 4/1/2027 | 2,220,000 | 2,270,474 | ||||||
MagnaChip Semiconductor Corp. (South Korea), 6.625%, 7/15/2021 | 267,000 | 256,320 | ||||||
|
| |||||||
| 2,526,794 | ||||||||
|
| |||||||
Total Information Technology | 6,283,008 | |||||||
|
| |||||||
Materials - 1.4% | ||||||||
Chemicals - 0.2% | ||||||||
Kissner Holdings LP - Kissner Milling Co. Ltd. - BSC Holding, Inc. - Kissner USA (Canada)2, 8.375%, 12/1/2022 | 242,000 | 244,420 | ||||||
NOVA Chemicals Corp. (Canada)2, 4.875%, 6/1/2024 | 198,000 | 201,712 | ||||||
Solvay Finance America LLC (Belgium)2, 3.40%, 12/3/2020 | 1,089,000 | 1,119,825 | ||||||
|
| |||||||
| 1,565,957 | ||||||||
|
| |||||||
Metals & Mining - 1.0% | ||||||||
Anglo American Capital plc (United Kingdom)2, 9.375%, 4/8/2019 | 113,000 | 124,333 | ||||||
Anglo American Capital plc (United Kingdom)2, 4.00%, 9/11/2027 | 2,270,000 | 2,272,271 | ||||||
Corp Nacional del Cobre de Chile (Chile)2, 3.625%, 8/1/2027 | 1,958,000 | 1,969,533 | ||||||
Ferroglobe plc - Globe Specialty Metals, Inc.2, 9.375%, 3/1/2022 | 205,000 | 222,938 | ||||||
Northwest Acquisitions ULC - Dominion Finco, Inc.2, 7.125%, 11/1/2022 | 540,000 | 557,550 | ||||||
Petra Diamonds US Treasury plc (South Africa)2, 7.25%, 5/1/2022 | 325,000 | 322,725 | ||||||
Southern Copper Corp. (Peru), 3.875%, 4/23/2025 | 1,082,000 | 1,122,952 | ||||||
Techniplas LLC2, 10.00%, 5/1/2020 | 272,000 | 217,600 | ||||||
|
| |||||||
| 6,809,902 | ||||||||
|
| |||||||
Paper & Forest Products - 0.2% | ||||||||
Domtar Corp., 4.40%, 4/1/2022 | 987,000 | 1,038,084 | ||||||
|
| |||||||
Total Materials | 9,413,943 | |||||||
|
| |||||||
Real Estate - 0.4% | ||||||||
Equity Real Estate Investment Trusts (REITS) - 0.4% |
| |||||||
American Tower Corp., 3.30%, 2/15/2021 | 2,209,000 | 2,266,502 | ||||||
GTP Acquisition Partners I LLC2, 2.35%, 6/15/2020 | 427,000 | 425,590 | ||||||
iStar, Inc., 5.25%, 9/15/2022 | 198,000 | 202,950 | ||||||
|
| |||||||
Total Real Estate | 2,895,042 | |||||||
|
| |||||||
Telecommunication Services - 0.8% | ||||||||
Diversified Telecommunication Services - 0.8% |
| |||||||
AT&T, Inc., 3.90%, 8/14/2027 | 2,280,000 | 2,270,880 | ||||||
CenturyLink, Inc., 7.50%, 4/1/2024 | 183,000 | 194,437 | ||||||
Frontier Communications Corp., 11.00%, 9/15/2025 | 288,000 | 244,440 | ||||||
Hughes Satellite Systems Corp., 5.25%, 8/1/2026 | 385,000 | 393,693 | ||||||
Inmarsat Finance plc (United Kingdom)2, 4.875%, 5/15/2022 | 560,000 | 571,312 | ||||||
Sprint Communications, Inc.2, 9.00%, 11/15/2018 | 73,000 | 77,471 | ||||||
Sprint Communications, Inc., 7.00%, 8/15/2020 | 73,000 | 78,636 | ||||||
Verizon Communications, Inc., 4.125%, 3/16/2027 | 1,968,000 | 2,053,674 | ||||||
|
| |||||||
Total Telecommunication Services | 5,884,543 | |||||||
|
| |||||||
The accompanying notes are an integral part of the financial statements.
66
Investment Portfolio - October 31, 2017
| PRO-BLEND® EXTENDED TERM SERIES | PRINCIPAL AMOUNT 5 / SHARES | VALUE (NOTE 2) | ||||||
CORPORATE BONDS (continued) | ||||||||
Non-Convertible Corporate Bonds (continued) |
| |||||||
Utilities - 0.4% | ||||||||
Independent Power and Renewable Electricity Producers - 0.4% |
| |||||||
American Water Capital Corp., 2.95%, 9/1/2027 | 2,290,000 | $ | 2,279,437 | |||||
Atlantica Yield plc (Spain)2, 7.00%, 11/15/2019 | 506,000 | 541,420 | ||||||
|
| |||||||
Total Utilities | 2,820,857 | |||||||
|
| |||||||
TOTAL CORPORATE BONDS | 95,988,268 | |||||||
|
| |||||||
| MUTUAL FUNDS - 0.1% | ||||||||
Global X MSCI Greece ETF | 23,555 | 218,355 | ||||||
iShares MSCI Eurozone ETF | 14,360 | 629,399 | ||||||
|
| |||||||
TOTAL MUTUAL FUNDS | 847,754 | |||||||
|
| |||||||
| U.S. TREASURY SECURITIES - 18.0% | ||||||||
U.S. Treasury Bonds - 4.0% | ||||||||
U.S. Treasury Bond, 6.25%, 5/15/2030 | 5,524,000 | 7,804,592 | ||||||
U.S. Treasury Bond, 4.75%, 2/15/2037 | 8,169,000 | 10,802,864 | ||||||
U.S. Treasury Bond, 2.50%, 2/15/2045 | 5,913,000 | 5,500,476 | ||||||
U.S. Treasury Inflation Indexed Bond, 0.75%, 2/15/2042 | 3,779,273 | 3,656,857 | ||||||
|
| |||||||
Total U.S. Treasury Bonds | 27,764,789 | |||||||
|
| |||||||
| U.S. Treasury Notes - 14.0% | ||||||||
U.S. Treasury Inflation Indexed Note, 0.125%, 4/15/2020 | 3,626,380 | 3,639,108 | ||||||
U.S. Treasury Inflation Indexed Note, 0.125%, 1/15/2023 | 3,613,606 | 3,598,270 | ||||||
U.S. Treasury Note, 1.375%, 4/30/2021 | 17,644,000 | 17,377,272 | ||||||
U.S. Treasury Note, 1.75%, 4/30/2022 | 17,301,000 | 17,136,776 | ||||||
U.S. Treasury Note, 2.00%, 7/31/2022 | 7,580,000 | 7,581,480 | ||||||
U.S. Treasury Note, 1.625%, 4/30/2023 | 18,470,000 | 18,024,844 | ||||||
U.S. Treasury Note, 1.25%, 7/31/2023 | 9,026,000 | 8,603,964 | ||||||
U.S. Treasury Note, 1.625%, 5/15/2026 | 7,624,000 | 7,206,467 | ||||||
U.S. Treasury Note, 2.375%, 5/15/2027 | 13,515,000 | 13,521,335 | ||||||
|
| |||||||
Total U.S. Treasury Notes | 96,689,516 | |||||||
|
| |||||||
TOTAL U.S. TREASURY SECURITIES | 124,454,305 | |||||||
|
| |||||||
ASSET-BACKED SECURITIES - 2.7% | ||||||||
Cazenovia Creek Funding I LLC, Series 2015-1A, Class A2, 2.00%, 12/10/2023 | 249,817 | 249,192 | ||||||
Chesapeake Funding II LLC, Series 2017-2A, Class A12, 1.99%, 5/15/2029 | 6,940,000 | 6,941,940 | ||||||
Credit Acceptance Auto Loan Trust, Series 2017-1A, Class A2, 2.56%, 10/15/2025 | 1,224,000 | 1,225,825 | ||||||
Enterprise Fleet Financing LLC, Series 2015-2, Class A22, 1.59%, 2/22/2021 | 629,446 | 629,314 | ||||||
Home Partners of America Trust, Series 2016-1, Class A2,7, (1 mo. LIBOR US + 1.650%), 2.887%, 3/17/2033 | 512,764 | 516,916 | ||||||
Honda Auto Receivables Owner Trust, Series 2016-4, Class A2, 1.04%, 4/18/2019 | 1,264,442 | 1,262,619 | ||||||
Hyundai Auto Lease Securitization Trust, Series 2017-B, Class A32, 1.97%, 7/15/2020 | 1,650,000 | 1,651,327 | ||||||
Invitation Homes Trust, Series 2015-SFR3, Class A2,7, (1 mo. LIBOR US + 1.300%), 2.537%, 8/17/2032 | 1,115,733 | 1,123,824 | ||||||
SoFi Consumer Loan Program LLC, Series 2017-5, Class A12, 2.14%, 9/25/2026 | 2,082,152 | 2,080,358 | ||||||
SoFi Professional Loan Program LLC, Series 2017-A, Class A2A2, 1.55%, 3/26/2040 | 860,498 | 857,657 | ||||||
South Carolina Student Loan Corp., Series 2005, Class A37, (3 mo. LIBOR US + 0.140%), 1.456%, 12/1/2023 | 1,243,633 | 1,243,197 | ||||||
Tax Ease Funding LLC, Series 2016-1A, Class A2, 3.131%, 6/15/2028 | 331,282 | 332,777 | ||||||
The accompanying notes are an integral part of the financial statements.
67
Investment Portfolio - October 31, 2017
| PRO-BLEND® EXTENDED TERM SERIES | PRINCIPAL AMOUNT 5 | VALUE (NOTE 2) | ||||||
ASSET-BACKED SECURITIES (continued) | ||||||||
Tricon American Homes Trust, Series 2016-SFR1, Class A2, 2.589%, 11/17/2033 | 877,000 | $ | 869,080 | |||||
|
| |||||||
TOTAL ASSET-BACKED SECURITIES | 18,984,026 | |||||||
|
| |||||||
| COMMERCIAL MORTGAGE-BACKED SECURITIES - 5.2% | ||||||||
Americold LLC Trust, Series 2010-ARTA, Class A12, 3.847%, 1/14/2029 | 119,887 | 123,131 | ||||||
BWAY Mortgage Trust, Series 2015-1740, Class A2, 2.917%, 1/10/2035 | 2,411,000 | 2,381,108 | ||||||
Credit Suisse Mortgage Capital Trust, Series 2013-IVR3, Class A12,8, 2.50%, 5/25/2043 | 661,207 | 629,258 | ||||||
Credit Suisse Mortgage Capital Trust, Series 2013-TH1, Class A12,8, 2.13%, 2/25/2043 | 653,432 | 625,550 | ||||||
FDIC Trust, Series 2011-R1, Class A2, 2.672%, 7/25/2026 | 292,669 | 293,491 | ||||||
Freddie Mac Multifamily Structured Pass-Through Certificates, Series K009, Class X1 (IO)8, 1.304%, 8/25/2020 | 8,125,420 | 246,948 | ||||||
Freddie Mac Multifamily Structured Pass-Through Certificates, Series K014, Class X1 (IO)8, 1.187%, 4/25/2021 | 9,548,728 | 332,831 | ||||||
Freddie Mac Multifamily Structured Pass-Through Certificates, Series K016, Class X1 (IO)8, 1.527%, 10/25/2021 | 4,102,464 | 205,302 | ||||||
Freddie Mac Multifamily Structured Pass-Through Certificates, Series K017, Class X1 (IO)8, 1.353%, 12/25/2021 | 16,871,627 | 773,701 | ||||||
Freddie Mac Multifamily Structured Pass-Through Certificates, Series K021, Class X1 (IO)8, 1.468%, 6/25/2022 | 11,219,929 | 628,292 | ||||||
Freddie Mac Multifamily Structured Pass-Through Certificates, Series K029, Class A28, 3.32%, 2/25/2023 | 2,156,000 | 2,256,180 | ||||||
Freddie Mac Multifamily Structured Pass-Through Certificates, Series K030, Class X1 (IO)8, 0.208%, 4/25/2023 | 45,050,331 | 444,201 | ||||||
Freddie Mac Multifamily Structured Pass-Through Certificates, Series K032, Class X1 (IO)8, 0.111%, 5/25/2023 | 28,967,133 | 168,647 | ||||||
Freddie Mac Multifamily Structured Pass-Through Certificates, Series K035, Class A28, 3.458%, 8/25/2023 | 2,631,000 | 2,774,295 | ||||||
Freddie Mac Multifamily Structured Pass-Through Certificates, Series K706, Class X1 (IO)8, 1.546%, 10/25/2018 | 5,577,359 | 63,725 | ||||||
Freddie Mac Multifamily Structured Pass-Through Certificates, Series KJ10, Class A2, 2.912%, 12/25/2023 | 2,558,000 | 2,611,882 | ||||||
Freddie Mac Multifamily Structured Pass-Through Certificates, Series KJ13, Class A2, 2.864%, 8/25/2022 | 1,827,000 | 1,868,934 | ||||||
Freddie Mac Multifamily Structured Pass-Through Certificates, Series K-P01, Class A2, 1.72%, 1/25/2019 | 668,396 | 668,241 | ||||||
FREMF Mortgage Trust, Series 2011-K701, Class B2,8, 4.058%, 7/25/2048 | 550,000 | 549,167 | ||||||
FREMF Mortgage Trust, Series 2011-K702, Class B2,8, 4.785%, 4/25/2044 | 675,000 | 679,787 | ||||||
FREMF Mortgage Trust, Series 2013-K28, Class X2A (IO)2, 0.10%, 6/25/2046 | 79,460,619 | 336,881 | ||||||
FREMF Mortgage Trust, Series 2013-K712, Class B2,8, 3.365%, 5/25/2045 | 767,000 | 778,101 | ||||||
FREMF Mortgage Trust, Series 2014-K41, Class B2,8, 3.832%, 11/25/2047 | 1,315,000 | 1,336,668 | ||||||
FREMF Mortgage Trust, Series 2014-K715, Class B2,8, 3.979%, 2/25/2046 | 1,279,000 | 1,324,966 | ||||||
GAHR Commercial Mortgage Trust, Series 2015-NRF, Class BFX2,8, 3.495%, 12/15/2034 | 1,535,000 | 1,554,283 | ||||||
GS Mortgage Securities Trust, Series 2010-C2, Class A12, 3.849%, 12/10/2043 | 68,452 | 70,357 | ||||||
JP Morgan Mortgage Trust, Series 2013-1, Class 1A22,8, 3.00%, 3/25/2043 | 457,311 | 456,972 | ||||||
JP Morgan Mortgage Trust, Series 2013-2, Class A22,8, 3.50%, 5/25/2043 | 403,355 | 411,123 | ||||||
JP Morgan Mortgage Trust, Series 2014-2, Class 1A12,8, 3.00%, 6/25/2029 | 700,873 | 709,415 | ||||||
The accompanying notes are an integral part of the financial statements.
68
Investment Portfolio - October 31, 2017
| PRO-BLEND® EXTENDED TERM SERIES | PRINCIPAL AMOUNT 5 | VALUE (NOTE 2) | ||||||
COMMERCIAL MORTGAGE-BACKED SECURITIES (continued) |
| |||||||
LSTAR Commercial Mortgage Trust, Series 2014-2, Class A22, 2.767%, 1/20/2041 | 260,122 | $ | 259,882 | |||||
New Residential Mortgage Loan Trust, Series 2014-3A, Class AFX32,8, 3.75%, 11/25/2054 | 530,374 | 546,765 | ||||||
New Residential Mortgage Loan Trust, Series 2015-2A, Class A12,8, 3.75%, 8/25/2055 | 778,274 | 802,658 | ||||||
New Residential Mortgage Loan Trust, Series 2016-4A, Class A12,8, 3.75%, 11/25/2056 | 767,691 | 788,970 | ||||||
OBP Depositor LLC Trust, Series 2010-OBP, Class A2, 4.646%, 7/15/2045 | 115,000 | 121,003 | ||||||
SCG Trust, Series 2013-SRP1, Class AJ2,7, (1 mo. LIBOR US + 1.950%), 3.189%, 11/15/2026 | 1,900,000 | 1,892,652 | ||||||
Sequoia Mortgage Trust, Series 2013-2, Class A8, 1.874%, 2/25/2043 | 484,168 | 457,936 | ||||||
Sequoia Mortgage Trust, Series 2013-7, Class A28, 3.00%, 6/25/2043 | 530,301 | 529,265 | ||||||
Sequoia Mortgage Trust, Series 2013-8, Class A18, 3.00%, 6/25/2043 | 538,342 | 536,544 | ||||||
Starwood Retail Property Trust, Series 2014-STAR, Class A2,7, (1 mo. LIBOR US + 1.220%), 2.459%, 11/15/2027 | 1,096,000 | 1,096,762 | ||||||
Towd Point Mortgage Trust, Series 2016-5, Class A12,8, 2.50%, 10/25/2056 | 1,363,680 | 1,360,454 | ||||||
Vornado DP LLC Trust, Series 2010-VNO, Class A2FX2, 4.004%, 9/13/2028 | 350,000 | 365,332 | ||||||
Wells Fargo Commercial Mortgage Trust, Series 2010-C1, Class A22, 4.393%, 11/15/2043 | 600,000 | 633,635 | ||||||
WinWater Mortgage Loan Trust, Series 2015-1, Class A12,8, 3.50%, 1/20/2045 | 571,804 | 581,386 | ||||||
WinWater Mortgage Loan Trust, Series 2015-3, Class A52,8, 3.50%, 3/20/2045 | 551,266 | 560,267 | ||||||
|
| |||||||
TOTAL COMMERCIAL MORTGAGE-BACKED SECURITIES | 35,836,948 | |||||||
|
| |||||||
FOREIGN GOVERNMENT BONDS - 1.8% | ||||||||
Bonos de la Tesoreria de la Republica en pesos (Chile), 6.00%, 1/1/2018 | CLP | 805,000,000 | 1,271,632 | |||||
Canada Housing Trust No. 1 (Canada)2, 4.10%, 12/15/2018 | CAD | 299,000 | 238,755 | |||||
Canadian Government Bond (Canada), 2.75%, 6/1/2022 | CAD | 358,000 | 291,647 | |||||
Export-Import Bank of Korea (South Korea), 2.625%, 12/30/2020 | 4,625,000 | 4,618,451 | ||||||
Korea Treasury Bond (South Korea), 2.00%, 12/10/2017 | KRW | 470,000,000 | 419,753 | |||||
Mexican Government Bond (Mexico), 8.00%, 6/11/2020 | MXN | 7,313,000 | 390,250 | |||||
Mexican Government Bond (Mexico), 6.50%, 6/10/2021 | MXN | 3,112,000 | 159,446 | |||||
Mexican Government Bond (Mexico), 6.50%, 6/9/2022 | MXN | 5,057,000 | 258,018 | |||||
Mexican Government Bond (Mexico), 7.75%, 5/29/2031 | MXN | 972,000 | 52,322 | |||||
Province of Ontario (Canada), 2.00%, 9/27/2018 | 932,000 | 934,671 | ||||||
Province of Ontario (Canada), 1.25%, 6/17/2019 | 777,000 | 769,463 | ||||||
Singapore Government Bond (Singapore), 2.50%, 6/1/2019 | SGD | 657,000 | 490,405 | |||||
Svensk Exportkredit AB (Sweden), 1.125%, 8/28/2019 | 2,179,000 | 2,151,575 | ||||||
United Kingdom Gilt (United Kingdom), 5.00%, 3/7/2018 | GBP | 370,000 | 499,512 | |||||
|
| |||||||
TOTAL FOREIGN GOVERNMENT BONDS | 12,545,900 | |||||||
|
| |||||||
U.S. GOVERNMENT AGENCIES - 8.0% | ||||||||
| Mortgage-Backed Securities - 5.5% | ||||||||
Fannie Mae, Pool #888468, 5.50%, 9/1/2021 | 184,074 | 191,494 | ||||||
Fannie Mae, Pool #995233, 5.50%, 10/1/2021 | 15,704 | 16,212 | ||||||
Fannie Mae, Pool #888017, 6.00%, 11/1/2021 | 26,757 | 28,110 | ||||||
Fannie Mae, Pool #995329, 5.50%, 12/1/2021 | 176,216 | 183,479 | ||||||
Fannie Mae, Pool #888136, 6.00%, 12/1/2021 | 33,334 | 35,084 | ||||||
Fannie Mae, Pool #888810, 5.50%, 11/1/2022 | 219,082 | 227,547 | ||||||
Fannie Mae, Pool #990895, 5.50%, 10/1/2023 | 29,466 | 31,088 | ||||||
Fannie Mae, Pool #AD0462, 5.50%, 10/1/2024 | 22,999 | 24,503 | ||||||
The accompanying notes are an integral part of the financial statements.
69
Investment Portfolio - October 31, 2017
| PRO-BLEND® EXTENDED TERM SERIES | PRINCIPAL AMOUNT 5 | VALUE (NOTE 2) | ||||||
U.S. GOVERNMENT AGENCIES (continued) | ||||||||
Mortgage-Backed Securities (continued) | ||||||||
Fannie Mae, Pool #MA1834, 4.50%, 2/1/2034 | 913,183 | $ | 985,126 | |||||
Fannie Mae, Pool #MA1903, 4.50%, 5/1/2034 | 535,750 | 577,958 | ||||||
Fannie Mae, Pool #MA2177, 4.00%, 2/1/2035 | 906,543 | 960,311 | ||||||
Fannie Mae, Pool #AY8263, 3.00%, 5/1/2035 | 1,512,242 | 1,524,989 | ||||||
Fannie Mae, Pool #909786, 5.50%, 3/1/2037 | 128,167 | 142,263 | ||||||
Fannie Mae, Pool #995050, 6.00%, 9/1/2037 | 160,216 | 182,250 | ||||||
Fannie Mae, Pool #AB8161, 6.00%, 12/1/2037 | 430,498 | 486,930 | ||||||
Fannie Mae, Pool #889576, 6.00%, 4/1/2038 | 348,156 | 394,705 | ||||||
Fannie Mae, Pool #889579, 6.00%, 5/1/2038 | 302,533 | 342,329 | ||||||
Fannie Mae, Pool #995196, 6.00%, 7/1/2038 | 17,806 | 20,184 | ||||||
Fannie Mae, Pool #AD0207, 6.00%, 10/1/2038 | 749,399 | 848,552 | ||||||
Fannie Mae, Pool #AD0220, 6.00%, 10/1/2038 | 29,145 | 33,066 | ||||||
Fannie Mae, Pool #AD0307, 5.50%, 1/1/2039 | 462,188 | 513,882 | ||||||
Fannie Mae, Pool #AD0527, 5.50%, 6/1/2039 | 101,377 | 112,606 | ||||||
Fannie Mae, Pool #MA0258, 4.50%, 12/1/2039 | 573,816 | 615,674 | ||||||
Fannie Mae, Pool #AL1595, 6.00%, 1/1/2040 | 399,927 | 453,559 | ||||||
Fannie Mae, Pool #AL0152, 6.00%, 6/1/2040 | 710,587 | 804,817 | ||||||
Fannie Mae, Pool #AL0241, 4.00%, 4/1/2041 | 897,654 | 946,175 | ||||||
Fannie Mae, Pool #AI5172, 4.00%, 8/1/2041 | 817,516 | 861,599 | ||||||
Fannie Mae, Pool #AL1410, 4.50%, 12/1/2041 | 1,556,970 | 1,676,105 | ||||||
Fannie Mae, Pool #AL7729, 4.00%, 6/1/2043 | 789,848 | 832,334 | ||||||
Fannie Mae, Pool #AX5234, 4.50%, 11/1/2044 | 752,394 | 804,387 | ||||||
Fannie Mae, Pool #AS4103, 4.50%, 12/1/2044 | 934,134 | 1,008,256 | ||||||
Fannie Mae, Pool #AZ9215, 4.00%, 10/1/2045 | 716,522 | 753,611 | ||||||
Fannie Mae, Pool #BC3490, 3.50%, 2/1/2046 | 1,923,499 | 1,978,709 | ||||||
Fannie Mae, Pool #BC6764, 3.50%, 4/1/2046 | 862,426 | 887,180 | ||||||
Fannie Mae, Pool #BD6997, 4.00%, 10/1/2046 | 982,690 | 1,032,208 | ||||||
Fannie Mae, Pool #BE3812, 4.00%, 12/1/2046 | 997,467 | 1,047,986 | ||||||
Fannie Mae, Pool #BE3815, 4.00%, 12/1/2046 | 1,081,702 | 1,136,488 | ||||||
Fannie Mae, Pool #BE7845, 4.50%, 2/1/2047 | 1,192,777 | 1,278,588 | ||||||
Fannie Mae, Pool #AL8674, 5.659%, 1/1/2049 | 1,654,338 | 1,816,648 | ||||||
Freddie Mac, Pool #G11850, 5.50%, 7/1/2020 | 64,327 | 65,910 | ||||||
Freddie Mac, Pool #G12610, 6.00%, 3/1/2022 | 35,204 | 37,165 | ||||||
Freddie Mac, Pool #G12655, 6.00%, 5/1/2022 | 24,773 | 26,113 | ||||||
Freddie Mac, Pool #G12988, 6.00%, 1/1/2023 | 18,841 | 19,984 | ||||||
Freddie Mac, Pool #G13078, 6.00%, 3/1/2023 | 33,308 | 35,247 | ||||||
Freddie Mac, Pool #G13331, 5.50%, 10/1/2023 | 14,073 | 14,859 | ||||||
Freddie Mac, Pool #C91754, 4.50%, 3/1/2034 | 445,543 | 480,051 | ||||||
Freddie Mac, Pool #C91762, 4.50%, 5/1/2034 | 573,405 | 618,406 | ||||||
Freddie Mac, Pool #C91771, 4.50%, 6/1/2034 | 514,396 | 556,652 | ||||||
Freddie Mac, Pool #C91780, 4.50%, 7/1/2034 | 593,679 | 640,275 | ||||||
Freddie Mac, Pool #K92054, 4.00%, 10/1/2034 | 662,067 | 702,089 | ||||||
Freddie Mac, Pool #C91850, 4.00%, 9/1/2035 | 1,737,541 | 1,845,638 | ||||||
Freddie Mac, Pool #G03926, 6.00%, 2/1/2038 | 157,224 | 177,561 | ||||||
Freddie Mac, Pool #G04731, 5.50%, 4/1/2038 | 240,055 | 266,778 | ||||||
Freddie Mac, Pool #G08273, 5.50%, 6/1/2038 | 292,470 | 324,920 | ||||||
Freddie Mac, Pool #G04601, 5.50%, 7/1/2038 | 728,811 | 810,822 | ||||||
Freddie Mac, Pool #G04587, 5.50%, 8/1/2038 | 618,912 | 687,231 | ||||||
Freddie Mac, Pool #G05923, 5.50%, 2/1/2040 | 81,353 | 90,442 | ||||||
Freddie Mac, Pool #G05906, 6.00%, 4/1/2040 | 180,222 | 204,385 | ||||||
The accompanying notes are an integral part of the financial statements.
70
Investment Portfolio - October 31, 2017
| PRO-BLEND® EXTENDED TERM SERIES | PRINCIPAL SHARES | VALUE (NOTE 2) | ||||||
U.S. GOVERNMENT AGENCIES (continued) | ||||||||
Mortgage-Backed Securities (continued) | ||||||||
Freddie Mac, Pool #A92889, 4.50%, 7/1/2040 | 1,606,979 | $ | 1,722,841 | |||||
Freddie Mac, Pool #G60183, 4.00%, 12/1/2044 | 866,474 | 913,221 | ||||||
Freddie Mac, Pool #Q33778, 4.00%, 6/1/2045 | 855,758 | 899,478 | ||||||
Freddie Mac, Pool #G08754, 4.50%, 3/1/2047 | 1,262,015 | 1,347,711 | ||||||
|
| |||||||
Total Mortgage-Backed Securities | 38,284,771 | |||||||
|
| |||||||
Other Agencies - 2.5% | ||||||||
Fannie Mae, 2.625%, 9/6/2024 (Identified Cost $17,386,136) | 17,011,000 | 17,365,169 | ||||||
|
| |||||||
TOTAL U.S. GOVERNMENT AGENCIES | 55,649,940 | |||||||
|
| |||||||
SHORT-TERM INVESTMENT - 2.1% | ||||||||
Dreyfus Government Cash Management9, 0.93%, (Identified Cost $14,897,694) | 14,897,694 | 14,897,694 | ||||||
|
| |||||||
TOTAL INVESTMENTS IN SECURITIES - 100.0% | 692,847,720 | |||||||
|
| |||||||
TOTAL OPTIONS WRITTEN - 0.0%## | ||||||||
(Premiums Received $174,530) | (118,118 | ) | ||||||
|
| |||||||
TOTAL INVESTMENTS - 100.0% | 692,729,602 | |||||||
OTHER ASSETS, LESS LIABILITIES - 0.0%## | 131,409 | |||||||
|
| |||||||
NET ASSETS - 100% | $ | 692,861,011 | ||||||
|
| |||||||
| ADR - American Depositary Receipt |
| CAD - Canadian Dollar |
| CLP - Chilean Peso |
| ETF - Exchange-traded fund |
| GBP - British Pound |
| IO - Interest only |
| KRW - South Korean Won |
| MXN - Mexican Peso |
| No. - Number |
| SGD - Singapore Dollar |
The accompanying notes are an integral part of the financial statements.
71
Investment Portfolio - October 31, 2017
| EXCHANGE-TRADED OPTION PURCHSED | ||||||||||||||||||||
| DESCRIPTION | NUMBER OF CONTRACTS | EXPIRATION DATE | EXERCISE PRICE | NOTIONAL (000) | VALUE | |||||||||||||||
Call | ||||||||||||||||||||
Lululemon Athletica, Inc. | 330 | 11/10/17 | $ | 67.00 | 2,030 | $ | (1,650 | ) | ||||||||||||
Put | ||||||||||||||||||||
Arconic, Inc. | 741 | 11/17/17 | 23.00 | 1,861 | (7,410 | ) | ||||||||||||||
Facebook, Inc. | 143 | 11/17/17 | 160.00 | 2,575 | (8,866 | ) | ||||||||||||||
Medtronic plc | 282 | 12/01/17 | 77.50 | 2,271 | (16,638 | ) | ||||||||||||||
Regeneron Pharmaceuticals, Inc. | 44 | 11/17/17 | 385.00 | 1,771 | (24,640 | ) | ||||||||||||||
The Priceline Group, Inc. | 9 | 11/17/17 | 1,750.00 | 1,721 | (10,008 | ) | ||||||||||||||
Vertex Pharmaceuticals, Inc. | 117 | 11/17/17 | 145.00 | $ | 1,711 | (48,906 | ) | |||||||||||||
|
| |||||||||||||||||||
| (116,468 | ) | |||||||||||||||||||
TOTAL EXCHANGE-TRADED OPTIONS WRITTEN |
| $ | (118,118 | ) | ||||||||||||||||
|
| |||||||||||||||||||
*Non-income producing security.
##Less than 0.1%.
1A factor from a third party vendor was applied to determine the security’s fair value following the close of local trading.
2Restricted securities—Investment in securities that are restricted as to public resale under the Securities Act of 1933, as amended. These securities have been sold under Rule 144A and have been determined to be liquid. These securities amount to $57,900,219 or 8.4%, of the Series’ net assets as of October 31, 2017 (see Note 2 to the financial statements).
3A portion of this security is designated with the broker as collateral for options contracts written. As of October 31, 2017, the total value of such securities was $17,481,140. 4Security has been valued at fair value as determined in good faith by the Advisor and is classified as Level 3 in the fair value hierarchy.
5Amount is stated in USD unless otherwise noted.
6Variable rate security. Security may be issued at a fixed coupon rate, which converts to a variable rate at a specified date. Rate shown is the rate in effect as of October 31, 2017.
7Floating rate security. Rate shown is the rate in effect as of October 31, 2017.
8Variable or floating rate security, which interest rate adjusts periodically based on changes in current interest rates and prepayments on the underlying pool of assets. Rate shown is the rate in effect as of October 31, 2017.
9Rate shown is the current yield as of October 31, 2017.
The Global Industry Classification Standard (GICS) was developed by and is the exclusive property and a service mark of MSCI Inc. (MSCI) and Standard & Poor’s, a division of The McGraw-Hill Companies, Inc. (S&P), and is licensed for use by Manning & Napier when referencing GICS sectors. Neither MSCI, S&P, nor any third party involved in making or compiling the GICS or any GICS classifications makes any express or implied warranties or representations with respect to such standard or classification, nor shall any such party have any liability therefrom.
The accompanying notes are an integral part of the financial statements.
72
Statement of Assets and Liabilities - Pro-Blend® Extended Term Series
October 31, 2017
ASSETS: | ||||
Investments in securities, at value (identified cost $638,648,447) (Note 2) | $ | 692,847,720 | ||
Receivable for securities sold | 3,825,089 | |||
Interest receivable | 2,158,869 | |||
Receivable for fund shares sold | 677,809 | |||
Foreign tax reclaims receivable | 438,557 | |||
Dividends receivable | 72,533 | |||
Prepaid and other expenses | 11,652 | |||
|
| |||
TOTAL ASSETS | 700,032,229 | |||
|
| |||
LIABILITIES: | ||||
Due to custodian | 887 | |||
Accrued management fees (Note 3) | 498,058 | |||
Accrued distribution and service (Rule 12b-1) fees (Class R) (Class R2) (Note 3) | 117,223 | |||
Accrued shareholder services fees (Class S) (Note 3) | 85,910 | |||
Accrued fund accounting and administration fees (Note 3) | 72,970 | |||
Accrued Chief Compliance Officer service fees (Note 3) | 306 | |||
Options written, at value (premiums received $174,530) (Note 2) | 118,118 | |||
Payable for fund shares repurchased | 3,483,234 | |||
Payable for securities purchased | 2,630,463 | |||
Other payables and accrued expenses | 164,049 | |||
|
| |||
TOTAL LIABILITIES | 7,171,218 | |||
|
| |||
TOTAL NET ASSETS | $ | 692,861,011 | ||
|
| |||
NET ASSETS CONSIST OF: | ||||
Capital stock | $ | 493,192 | ||
Additional paid-in-capital | 588,457,301 | |||
Undistributed net investment income | 1,944,989 | |||
Accumulated net realized gain on investments, foreign currency and translation of other assets and liabilities | 47,732,746 | |||
Net unrealized appreciation (depreciation) on investments, foreign currency and translation of other assets and liabilities | 54,232,783 | |||
|
| |||
TOTAL NET ASSETS | $ | 692,861,011 | ||
|
| |||
The accompanying notes are an integral part of the financial statements.
73
Statement of Assets and Liabilities - Pro-Blend® Extended Term Series
October 31, 2017
NET ASSET VALUE, OFFERING PRICE AND REDEMPTION PRICE PER SHARE - Class S | $ | 18.22 | ||
|
| |||
NET ASSET VALUE, OFFERING PRICE AND REDEMPTION PRICE PER SHARE - Class I | $ | 10.31 | ||
|
| |||
NET ASSET VALUE, OFFERING PRICE AND REDEMPTION PRICE PER SHARE - Class R | $ | 11.82 | ||
|
| |||
NET ASSET VALUE, OFFERING PRICE AND REDEMPTION PRICE PER SHARE - Class R2 | $ | 11.05 | ||
|
| |||
The accompanying notes are an integral part of the financial statements.
74
Statement of Operations - Pro-Blend® Extended Term Series
For the Year Ended October 31, 2017
INVESTMENT INCOME: | ||||
Interest | $ | 11,309,865 | ||
Dividends (net of foreign taxes withheld, $267,836) | 7,379,109 | |||
|
| |||
Total Investment Income | 18,688,974 | |||
|
| |||
EXPENSES: | ||||
Management fees (Note 3) | 7,102,620 | |||
Distribution and service (Rule 12b-1) fees (Class R2) (Note 3) | 1,362,149 | |||
Distribution and service (Rule 12b-1) fees (Class R) (Note 3) | 100,891 | |||
Shareholder services fees (Class S) (Note 3) | 1,083,649 | |||
Fund accounting and administration fees (Note 3) | 194,639 | |||
Transfer agent fees (Note 3) | 205,526 | |||
Directors’ fees (Note 3) | 63,804 | |||
Chief Compliance Officer service fees (Note 3) | 4,030 | |||
Custodian fees | 89,284 | |||
Miscellaneous | 218,236 | |||
|
| |||
Total Expenses | 10,424,828 | |||
|
| |||
NET INVESTMENT INCOME | 8,264,146 | |||
|
| |||
REALIZED AND UNREALIZED GAIN (LOSS) ON INVESTMENTS AND FOREIGN CURRENCY: | ||||
Net realized gain (loss) on- | ||||
Investments in securities | 69,604,440 | |||
In-kind redemptions (Note 2) | 17,004,207 | |||
Options written | 2,177,143 | |||
Foreign currency and translation of other assets and liabilities | (22,984 | ) | ||
|
| |||
| 88,762,806 | ||||
|
| |||
Net change in unrealized appreciation (depreciation) on- | ||||
Investments in securities (net of decrease in accrued foreign capital gains tax of $174) | 3,674,789 | |||
Options written | 2,127 | |||
Foreign currency and translation of other assets and liabilities | 31,651 | |||
|
| |||
| 3,708,567 | ||||
|
| |||
NET REALIZED AND UNREALIZED GAIN (LOSS) ON INVESTMENTS AND FOREIGN CURRENCY | 92,471,373 | |||
|
| |||
NET INCREASE IN NET ASSETS RESULTING FROM OPERATIONS | $ | 100,735,519 | ||
|
| |||
The accompanying notes are an integral part of the financial statements.
75
Statements of Changes in Net Assets - Pro-Blend® Extended Term Series
FOR THE YEAR ENDED | FOR THE YEAR ENDED 10/31/16 | |||||||
INCREASE (DECREASE) IN NET ASSETS: | ||||||||
OPERATIONS: | ||||||||
Net investment income | $ | 8,264,146 | $ | 10,779,505 | ||||
Net realized gain (loss) on investments and foreign currency | 71,758,599 | 10,022,758 | ||||||
Net realized gain (loss) from in-kind redemptions | 17,004,207 | — | ||||||
Net change in unrealized appreciation (depreciation) on investments and foreign currency | 3,708,567 | 12,068,214 | ||||||
|
|
|
| |||||
Net increase from operations | 100,735,519 | 32,870,477 | ||||||
|
|
|
| |||||
DISTRIBUTIONS TO SHAREHOLDERS (Note 8): | ||||||||
From net investment income (Class S) | (2,292,566 | ) | (3,603,129 | ) | ||||
From net investment income (Class I) | (5,110,490 | ) | (7,296,287 | ) | ||||
From net investment income (Class R) | (145,224 | ) | (236,226 | ) | ||||
From net investment income (Class R2) | (329,287 | ) | (518,657 | ) | ||||
From net realized gain on investments (Class S) | (4,529,115 | ) | (9,325,002 | ) | ||||
From net realized gain on investments (Class I) | (6,215,832 | ) | (12,363,383 | ) | ||||
From net realized gain on investments (Class R) | (338,171 | ) | (789,144 | ) | ||||
From net realized gain on investments (Class R2) | (2,211,856 | ) | (3,605,757 | ) | ||||
|
|
|
| |||||
Total distributions to shareholders | (21,172,541 | ) | (37,737,585 | ) | ||||
|
|
|
| |||||
CAPITAL STOCK ISSUED AND REPURCHASED: | ||||||||
Net decrease from capital share transactions (Note 5) | (443,218,271 | ) | (409,275,083 | ) | ||||
|
|
|
| |||||
Net decrease in net assets | (363,655,293 | ) | (414,142,191 | ) | ||||
NET ASSETS: | ||||||||
Beginning of year | 1,056,516,304 | 1,470,658,495 | ||||||
|
|
|
| |||||
End of year (including undistributed net investment income of $ 1,944,989 and $ 3,183,057, respectively) | $ | 692,861,011 | $ | 1,056,516,304 | ||||
|
|
|
| |||||
The accompanying notes are an integral part of the financial statements.
76
Financial Highlights - Pro-Blend® Extended Term Series - Class S
| FOR THE YEAR ENDED | ||||||||||||||||||||
| 10/31/17 | 10/31/16 | 10/31/15 | 10/31/14 | 10/31/13 | ||||||||||||||||
Per share data (for a share outstanding throughout each year): | ||||||||||||||||||||
Net asset value - Beginning of year | $ | 16.62 | $ | 16.42 | $ | 18.28 | $ | 18.10 | $ | 16.01 | ||||||||||
|
|
|
|
|
|
|
|
|
| |||||||||||
Income (loss) from investment operations: | ||||||||||||||||||||
Net investment income1 | 0.15 | 0.14 | 0.16 | 0.19 | 0.17 | |||||||||||||||
Net realized and unrealized gain (loss) on investments | 1.70 | 0.37 | (0.56 | ) | 1.02 | 2.56 | ||||||||||||||
|
|
|
|
|
|
|
|
|
| |||||||||||
Total from investment operations | 1.85 | 0.51 | (0.40 | ) | 1.21 | 2.73 | ||||||||||||||
|
|
|
|
|
|
|
|
|
| |||||||||||
Less distributions to shareholders: | ||||||||||||||||||||
From net investment income | (0.09 | ) | (0.09 | ) | (0.11 | ) | (0.13 | ) | (0.14 | ) | ||||||||||
From net realized gain on investments | (0.16 | ) | (0.22 | ) | (1.35 | ) | (0.90 | ) | (0.50 | ) | ||||||||||
|
|
|
|
|
|
|
|
|
| |||||||||||
Total distributions to shareholders | (0.25 | ) | (0.31 | ) | (1.46 | ) | (1.03 | ) | (0.64 | ) | ||||||||||
|
|
|
|
|
|
|
|
|
| |||||||||||
Net asset value - End of year | $ | 18.22 | $ | 16.62 | $ | 16.42 | $ | 18.28 | $ | 18.10 | ||||||||||
|
| �� |
|
|
|
|
|
|
|
| ||||||||||
Net assets - End of year (000’s omitted) | $ | 400,117 | $ | 498,344 | $ | 718,811 | $ | 872,014 | $ | 820,370 | ||||||||||
|
|
|
|
|
|
|
|
|
| |||||||||||
Total return2 | 11.26 | % | 3.23 | % | (2.16 | %) | 7.08 | % | 17.56 | % | ||||||||||
Ratios (to average net assets)/Supplemental Data: | ||||||||||||||||||||
Expenses | 1.08 | % | 1.07 | % | 1.07 | % | 1.06 | % | 1.06 | % | ||||||||||
Net investment income | 0.89 | % | 0.86 | % | 0.96 | % | 1.04 | % | 1.03 | % | ||||||||||
Series portfolio turnover | 79 | % | 63 | % | 66 | % | 65 | % | 64 | % | ||||||||||
1Calculated based on average shares outstanding during the years.
2Represents aggregate total return for the years indicated, and assumes reinvestment of all distributions.
The accompanying notes are an integral part of the financial statements.
77
Financial Highlights - Pro-Blend® Extended Term Series - Class I
| FOR THE YEAR ENDED | ||||||||||||||||||||
| 10/31/17 | 10/31/16 | 10/31/15 | 10/31/14 | 10/31/13 | ||||||||||||||||
Per share data (for a share outstanding throughout each year): | ||||||||||||||||||||
Net asset value - Beginning of year | $ | 9.53 | $ | 9.57 | $ | 11.30 | $ | 11.60 | $ | 10.50 | ||||||||||
|
|
|
|
|
|
|
|
|
| |||||||||||
Income (loss) from investment operations: | ||||||||||||||||||||
Net investment income1 | 0.11 | 0.10 | 0.12 | 0.15 | 0.14 | |||||||||||||||
Net realized and unrealized gain (loss) on investments | 0.96 | 0.21 | (0.34 | ) | 0.62 | 1.64 | ||||||||||||||
|
|
|
|
|
|
|
|
|
| |||||||||||
Total from investment operations | 1.07 | 0.31 | (0.22 | ) | 0.77 | 1.78 | ||||||||||||||
|
|
|
|
|
|
|
|
|
| |||||||||||
Less distributions to shareholders: | ||||||||||||||||||||
From net investment income | (0.13 | ) | (0.13 | ) | (0.16 | ) | (0.17 | ) | (0.18 | ) | ||||||||||
From net realized gain on investments | (0.16 | ) | (0.22 | ) | (1.35 | ) | (0.90 | ) | (0.50 | ) | ||||||||||
|
|
|
|
|
|
|
|
|
| |||||||||||
Total distributions to shareholders | (0.29 | ) | (0.35 | ) | (1.51 | ) | (1.07 | ) | (0.68 | ) | ||||||||||
|
|
|
|
|
|
|
|
|
| |||||||||||
Net asset value - End of year | $ | 10.31 | $ | 9.53 | $ | 9.57 | $ | 11.30 | $ | 11.60 | ||||||||||
|
|
|
|
|
|
|
|
|
| |||||||||||
Net assets - End of year (000’s omitted) | $ | 147,257 | $ | 386,926 | $ | 545,570 | $ | 659,331 | $ | 547,522 | ||||||||||
|
|
|
|
|
|
|
|
|
| |||||||||||
Total return2 | 11.56 | % | 3.52 | % | (1.91 | %) | 7.32 | % | 17.80 | % | ||||||||||
Ratios (to average net assets)/Supplemental Data: | ||||||||||||||||||||
Expenses | 0.83 | % | 0.82 | % | 0.82 | % | 0.81 | % | 0.81 | % | ||||||||||
Net investment income | 1.15 | % | 1.12 | % | 1.22 | % | 1.29 | % | 1.27 | % | ||||||||||
Series portfolio turnover | 79 | % | 63 | % | 66 | % | 65 | % | 64 | % | ||||||||||
1Calculated based on average shares outstanding during the years.
2Represents aggregate total return for the years indicated, and assumes reinvestment of all distributions.
The accompanying notes are an integral part of the financial statements.
78
Financial Highlights - Pro-Blend® Extended Term Series - Class R
| FOR THE YEAR ENDED | ||||||||||||||||||||
| 10/31/17 | 10/31/16 | 10/31/15 | 10/31/14 | 10/31/13 | ||||||||||||||||
Per share data (for a share outstanding throughout each year): | ||||||||||||||||||||
Net asset value - Beginning of year | $ | 10.88 | $ | 10.87 | $ | 12.62 | $ | 12.83 | $ | 11.54 | ||||||||||
|
|
|
|
|
|
|
|
|
| |||||||||||
Income (loss) from investment operations: | ||||||||||||||||||||
Net investment income1 | 0.07 | 0.06 | 0.08 | 0.10 | 0.09 | |||||||||||||||
Net realized and unrealized gain (loss) on investments | 1.10 | 0.24 | (0.38 | ) | 0.70 | 1.82 | ||||||||||||||
|
|
|
|
|
|
|
|
|
| |||||||||||
Total from investment operations | 1.17 | 0.30 | (0.30 | ) | 0.80 | 1.91 | ||||||||||||||
|
|
|
|
|
|
|
|
|
| |||||||||||
Less distributions to shareholders: | ||||||||||||||||||||
From net investment income | (0.07 | ) | (0.07 | ) | (0.10 | ) | (0.11 | ) | (0.12 | ) | ||||||||||
From net realized gain on investments | (0.16 | ) | (0.22 | ) | (1.35 | ) | (0.90 | ) | (0.50 | ) | ||||||||||
|
|
|
|
|
|
|
|
|
| |||||||||||
Total distributions to shareholders | (0.23 | ) | (0.29 | ) | (1.45 | ) | (1.01 | ) | (0.62 | ) | ||||||||||
|
|
|
|
|
|
|
|
|
| |||||||||||
Net asset value - End of year | $ | 11.82 | $ | 10.88 | $ | 10.87 | $ | 12.62 | $ | 12.83 | ||||||||||
|
|
|
|
|
|
|
|
|
| |||||||||||
Net assets - End of year (000’s omitted) | $ | 15,358 | $ | 24,692 | $ | 40,379 | $ | 65,563 | $ | 58,700 | ||||||||||
|
|
|
|
|
|
|
|
|
| |||||||||||
Total return2 | 10.97 | % | 2.93 | % | (2.39 | %) | 6.81 | % | 17.28 | % | ||||||||||
Ratios (to average net assets)/Supplemental Data: | ||||||||||||||||||||
Expenses | 1.33 | % | 1.32 | % | 1.32 | % | 1.31 | % | 1.31 | % | ||||||||||
Net investment income | 0.65 | % | 0.61 | % | 0.71 | % | 0.79 | % | 0.77 | % | ||||||||||
Series portfolio turnover | 79 | % | 63 | % | 66 | % | 65 | % | 64 | % | ||||||||||
1Calculated based on average shares outstanding during the years.
2Represents aggregate total return for the years indicated, and assumes reinvestment of all distributions.
The accompanying notes are an integral part of the financial statements.
79
Financial Highlights - Pro-Blend® Extended Term Series - Class R2*
| FOR THE YEAR ENDED | ||||||||||||||||||||
| 10/31/17 | 10/31/16 | 10/31/15 | 10/31/14 | 10/31/13 | ||||||||||||||||
Per share data (for a share outstanding throughout each year): | ||||||||||||||||||||
Net asset value - Beginning of year | $ | 10.19 | $ | 10.21 | $ | 11.95 | $ | 12.21 | $ | 11.02 | ||||||||||
|
|
|
|
|
|
|
|
|
| |||||||||||
Income (loss) from investment operations: | ||||||||||||||||||||
Net investment income1 | 0.01 | 0.01 | 0.02 | 0.03 | 0.03 | |||||||||||||||
Net realized and unrealized gain (loss) on investments | 1.03 | 0.22 | (0.36 | ) | 0.67 | 1.73 | ||||||||||||||
|
|
|
|
|
|
|
|
|
| |||||||||||
Total from investment operations | 1.04 | 0.23 | (0.34 | ) | 0.70 | 1.76 | ||||||||||||||
|
|
|
|
|
|
|
|
|
| |||||||||||
Less distributions to shareholders: | ||||||||||||||||||||
From net investment income | (0.02 | ) | (0.03 | ) | (0.05 | ) | (0.06 | ) | (0.07 | ) | ||||||||||
From net realized gain on investments | (0.16 | ) | (0.22 | ) | (1.35 | ) | (0.90 | ) | (0.50 | ) | ||||||||||
|
|
|
|
|
|
|
|
|
| |||||||||||
Total distributions to shareholders | (0.18 | ) | (0.25 | ) | (1.40 | ) | (0.96 | ) | (0.57 | ) | ||||||||||
|
|
|
|
|
|
|
|
|
| |||||||||||
Net asset value - End of year | $ | 11.05 | $ | 10.19 | $ | 10.21 | $ | 11.95 | $ | 12.21 | ||||||||||
|
|
|
|
|
|
|
|
|
| |||||||||||
Net assets - End of year (000’s omitted) | $ | 130,130 | $ | 146,554 | $ | 165,898 | $ | 164,191 | $ | 124,854 | ||||||||||
|
|
|
|
|
|
|
|
|
| |||||||||||
Total return2 | 10.42 | % | 2.43 | % | (2.91 | %) | 6.28 | % | 16.65 | % | ||||||||||
Ratios (to average net assets)/Supplemental Data: | ||||||||||||||||||||
Expenses | 1.83 | % | 1.82 | % | 1.82 | % | 1.81 | % | 1.81 | % | ||||||||||
Net investment income | 0.14 | % | 0.11 | % | 0.21 | % | 0.29 | % | 0.27 | % | ||||||||||
Series portfolio turnover | 79 | % | 63 | % | 66 | % | 65 | % | 64 | % | ||||||||||
*Effective March 1, 2017, Class C shares of the Series have been redesignated as Class R2 shares.
1Calculated based on average shares outstanding during the years.
2Represents aggregate total return for the years indicated, and assumes reinvestment of all distributions.
The accompanying notes are an integral part of the financial statements.
80
Performance Update as of October 31, 2017 - Pro-Blend® Maximum Term Series
(unaudited)
| AVERAGE ANNUAL TOTAL RETURNS AS OF OCTOBER 31, 2017 | ||||||||||||||||
ONE YEAR1 | FIVE YEAR | TEN YEAR | SINCE INCEPTION2 | |||||||||||||
Manning & Napier Fund, Inc. - Pro-Blend® Maximum Term | 18.60 | % | 10.53 | % | 5.09 | % | 9.03 | % | ||||||||
Manning & Napier Fund, Inc. - Pro-Blend® Maximum Term | 18.85 | % | 10.79 | % | 5.33 | % | 9.14 | % | ||||||||
Manning & Napier Fund, Inc. - Pro-Blend® Maximum Term | 18.21 | % | 10.25 | % | 4.84 | % | 8.81 | % | ||||||||
Manning & Napier Fund, Inc. - Pro-Blend® Maximum Term | 17.78 | % | 9.71 | % | 4.31 | % | 8.27 | % | ||||||||
Russell 3000® Index6 | 23.98 | % | 15.12 | % | 7.61 | % | 9.10 | % | ||||||||
65/20/15 Blended Index7 | 20.25 | % | 11.60 | % | 5.97 | % | 8.05 | % | ||||||||
The following graph compares the value of a $10,000 investment in the Manning & Napier Fund, Inc. - Pro-Blend® Maximum Term Series - Class S for the ten years ended October 31, 2017 to the Russell 3000® Index and the 65/20/15 Blended Index.
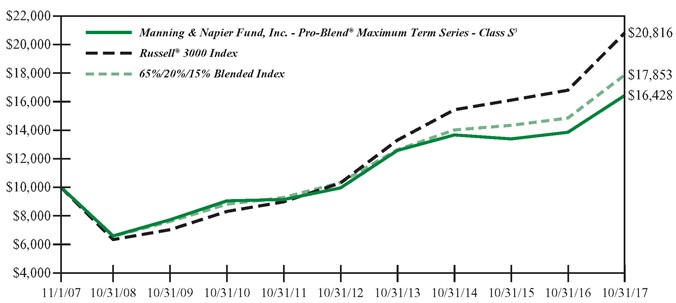
1The returns shown are based on net asset values calculated for shareholder transactions and may differ from the returns shown in the financial highlights, which reflect adjustments made to the net asset values in accordance with accounting principles generally accepted in the United States of America.
2Performance numbers for the Series and Indices are calculated from November 1, 1995, the Class S inception date.
3The Series’ performance does not reflect the deduction of taxes that a shareholder would pay on fund distributions or the redemption of shares. The Series’ performance is historical and may not be indicative of future results. The performance returns shown are inclusive of the net expense ratio of the Series. For the year ended October 31, 2017, this net expense ratio was 1.10% for Class S, 0.85% for Class I, 1.35% for Class R and 1.85% for Class R2. The gross expense ratio, which does not account for any voluntary or contractual waivers currently in effect, was 1.10% for Class S, 0.85% for Class I, 1.35% for Class R and 1.85% for Class R2 for the year ended October 31, 2017.
4For the periods through the inception of Class I on March 28, 2008, performance is based on the hypothetical performance of Class S shares. Because Class I shares invest in the same portfolio of securities as Class S, performance will only be different to the extent that the Class S shares have a higher expense ratio.
5For periods through the inception of Class R2 on January 4, 2010 and Class R on June 30, 2010, the performance figures are hypothetical and reflect the performance of Class S shares adjusted for expense differences.
6The Russell 3000® Index is an unmanaged index that consists of 3,000 of the largest U.S. companies based on total market capitalization. The Index returns are based on a market capitalization-weighted average of relative price changes of the component stocks plus dividends whose reinvestments are compounded daily. The Index returns do not reflect any fees or expenses. Index returns provided by Bloomberg.
81
Performance Update as of October 31, 2017 - Pro-Blend® Maximum Term Series
(unaudited)
7The 65/20/15 Blended Index is 65% Russell 3000® Index (Russell 3000), 20% MSCI ACWI ex USA Index (ACWIxUS), and 15% Bloomberg Barclays U.S. Aggregate Bond Index (BAB). Russell 3000 is an unmanaged index that consists of 3,000 of the largest U.S. companies based on total market capitalization. The Index returns are based on a market capitalization-weighted average of relative price changes of the component stocks plus dividends whose reinvestments are compounded daily. Index returns provided by Bloomberg. ACWIxUS is designed to measure large and mid-cap representation across 22 of 23 Developed Markets countries (excluding the U.S.) and 24 Emerging Markets countries. The Index is denominated in U.S. dollars. The Index returns assume daily investment of gross dividends (which do not account for applicable dividend taxation) prior to 12/31/1998, as net returns were not available. Subsequent to 12/31/1998, the Index returns are net of withholding taxes. They assume daily reinvestment of net dividends thus accounting for any applicable dividend taxation. Index returns provided by Bloomberg. BAB is an unmanaged, market value-weighted index of U.S. domestic investment-grade debt issues, including government, corporate, asset-backed, and mortgage-backed securities with maturities of one year or more. Index returns provided by Interactive Data. The returns of the indices do not reflect any fees or expenses. Returns provided are calculated monthly using a blended allocation. Because the fund’s asset allocation will vary over time, the composition of the fund’s portfolio may not match the composition of the comparative Indices.
82
Shareholder Expense Example - Pro-Blend® Maximum Term Series
(unaudited)
As a shareholder of the Series, you incur ongoing costs, including management fees, shareholder service fees and other Series expenses. This example is intended to help you understand your ongoing costs (in dollars) of investing in the Series and to compare these costs with the ongoing costs of investing in other mutual funds.
The example is based on an investment of $1,000 invested in each class at the beginning of the period and held for the entire period (May 1, 2017 to October 31, 2017).
Actual Expenses
The Actual lines of the table below provide information about actual account values and actual expenses. You may use the information in these lines, together with the amount you invested, to estimate the expenses that you paid over the period. Simply divide your account value by $1,000 (for example, an $8,600 account value divided by $1,000 = 8.6), then multiply the result by the number in the Actual line for the Class in which you have invested under the heading entitled “Expenses Paid During Period” to estimate the expenses you paid on your account during this period.
Hypothetical Example for Comparison Purposes
The Hypothetical lines of each class in the table below provide information about hypothetical account values and hypothetical expenses based on the Class’ actual expense ratio and an assumed rate of return of 5% per year before expenses, which is not the Class’ actual return. The hypothetical account values and expenses may not be used to estimate the actual ending account balance or expenses you paid during the period. You may use this information to compare the ongoing costs of investing in a class of the Series and other funds. To do so, compare this 5% hypothetical example for the Class in which you have invested with the 5% hypothetical examples that appear in the shareholder reports of the other funds.
Please note that the expenses shown in the table are meant to highlight your ongoing costs only and do not reflect any transaction costs such as sales charges (loads), redemption fees, or exchange fees that you may incur in other mutual funds. Therefore, the second line of the table is useful in comparing ongoing costs only, and will not help you determine the relative total costs of owning different funds.
| BEGINNING ACCOUNT VALUE 5/1/17 | ENDING ACCOUNT VALUE 10/31/17 | EXPENSES PAID DURING PERIOD 5/1/17-10/31/17* | ANNUALIZED EXPENSE RATIO | |||||
Class S | ||||||||
Actual | $1,000.00 | $1,082.20 | $5.72 | 1.09% | ||||
Hypothetical (5% return before expenses) | $1,000.00 | $1,019.71 | $5.55 | 1.09% | ||||
Class I | ||||||||
Actual | $1,000.00 | $1,084.30 | $4.41 | 0.84% | ||||
Hypothetical (5% return before expenses) | $1,000.00 | $1,020.97 | $4.28 | 0.84% | ||||
Class R | ||||||||
Actual | $1,000.00 | $1,080.50 | $7.03 | 1.34% | ||||
Hypothetical (5% return before expenses) | $1,000.00 | $1,018.45 | $6.82 | 1.34% | ||||
Class R2 | ||||||||
Actual | $1,000.00 | $1,078.50 | $9.64 | 1.84% | ||||
Hypothetical (5% return before expenses) | $1,000.00 | $1,015.93 | $9.35 | 1.84% |
*Expenses are equal to the Class’ annualized expense ratio (for the six-month period), multiplied by the average account value over the period, multiplied by 184/365 (to reflect the one-half year period). Expenses are based on the most recent fiscal half year; therefore, the expense ratios stated above may differ from the expense ratios stated in the financial highlights, which are based on one-year data.
83
Portfolio Composition - Pro-Blend® Maximum Term Series
As of October 31, 2017 (unaudited)
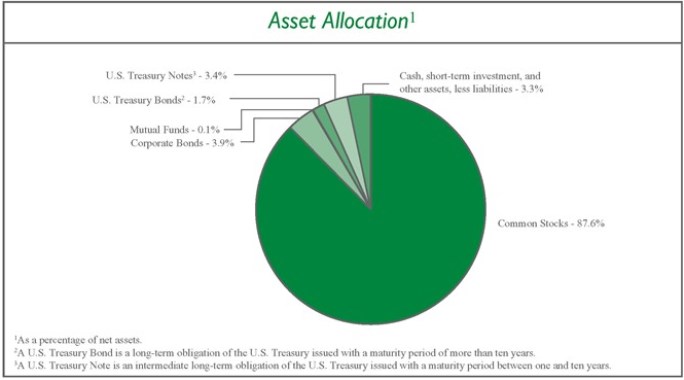
Sector Allocation4 |
| |||
Information Technology | 20.7% | |||
Health Care | 19.5% | |||
Consumer Staples | 10.6% | |||
Consumer Discretionary | 9.6% | |||
Industrials | 8.5% | |||
Materials | 7.1% | |||
Financials | 6.1% | |||
Real Estate | 4.7% | |||
Energy | 3.1% | |||
Telecommunication Services | 1.7% | |||
Utilities | 0.2% | |||
| 4Including common stocks and corporate bonds, as a percentage of total investments. | ||||
Top Ten Stock Holdings5 |
| |||
ServiceNow, Inc. | 2.6% | |||
Facebook, Inc. - Class A | 2.6% | |||
Medtronic plc | 2.1% | |||
FedEx Corp. | 1.9% | |||
The Priceline Group, Inc. | 1.9% | |||
DaVita, Inc. | 1.7% | |||
Skyworks Solutions, Inc. | 1.5% | |||
Perrigo Co. plc | 1.5% | |||
Fresenius Medical Care AG & Co. KGaA | ||||
(Germany) | 1.5% | |||
Diageo plc (United Kingdom) | 1.5% | |||
| 5As a percentage of total investments. | ||||
84
Investment Portfolio - October 31, 2017
| PRO-BLEND® MAXIMUM TERM SERIES | SHARES | VALUE (NOTE 2) | ||||||||||
COMMON STOCKS - 87.6% | ||||||||||||
Consumer Discretionary - 9.0% | ||||||||||||
Diversified Consumer Services - 0.0%## | ||||||||||||
Fu Shou Yuan International Group Ltd. (China)1 | 144,000 | $ | 101,229 | |||||||||
|
| |||||||||||
Hotels, Restaurants & Leisure - 0.1% | ||||||||||||
Accor S.A. (France)1 | 6,075 | 303,069 | ||||||||||
Jollibee Foods Corp. (Philippines)1 | 31,485 | 152,037 | ||||||||||
|
| |||||||||||
| 455,106 | ||||||||||||
|
| |||||||||||
Household Durables - 0.0%## | ||||||||||||
Kaufman & Broad S.A. (France)1 | 2,120 | 93,680 | ||||||||||
|
| |||||||||||
Internet & Direct Marketing Retail - 3.2% | ||||||||||||
Amazon.com, Inc.* | 5,910 | 6,532,205 | ||||||||||
Ctrip.com International Ltd. - ADR (China)* | 2,825 | 135,289 | ||||||||||
The Priceline Group, Inc.* | 4,785 | 9,148,729 | ||||||||||
|
| |||||||||||
| 15,816,223 | ||||||||||||
|
| |||||||||||
Leisure Products - 0.0%## | ||||||||||||
Trigano S.A. (France)1 | 660 | 106,506 | ||||||||||
|
| |||||||||||
Media - 0.4% | ||||||||||||
Shaw Communications, Inc. - Class B (Canada) | 78,590 | 1,794,637 | ||||||||||
|
| |||||||||||
Multiline Retail - 0.0%## | ||||||||||||
Lojas Renner S.A. (Brazil) | 9,225 | 97,007 | ||||||||||
|
| |||||||||||
Specialty Retail - 3.4% | ||||||||||||
AutoZone, Inc.* | 11,370 | 6,702,615 | ||||||||||
Dick’s Sporting Goods, Inc. | 128,055 | 3,133,506 | ||||||||||
Industria de Diseno Textil S.A. (Spain)1 | 2,710 | 101,294 | ||||||||||
O’Reilly Automotive, Inc.* | 31,379 | 6,619,400 | ||||||||||
|
| |||||||||||
| 16,556,815 | ||||||||||||
|
| |||||||||||
Textiles, Apparel & Luxury Goods - 1.9% | ||||||||||||
ANTA Sports Products Ltd. (China)1 | 34,000 | 152,077 | ||||||||||
lululemon athletica, Inc.* | 79,636 | 4,898,410 | ||||||||||
NIKE, Inc. - Class B | 78,215 | 4,301,043 | ||||||||||
|
| |||||||||||
| 9,351,530 | ||||||||||||
|
| |||||||||||
Total Consumer Discretionary | 44,372,733 | |||||||||||
|
| |||||||||||
Consumer Staples - 10.3% | ||||||||||||
Beverages - 5.3% | ||||||||||||
Ambev S.A. - ADR (Brazil) | 1,046,521 | 6,624,478 | ||||||||||
Anheuser-Busch InBev S.A./N.V. (Belgium)1 | 58,967 | 7,230,604 | ||||||||||
The Coca-Cola Co. | 109,177 | 5,019,958 | ||||||||||
Diageo plc (United Kingdom)1 | 213,485 | 7,290,235 | ||||||||||
Treasury Wine Estates Ltd. (Australia)1 | 16,839 | 202,135 | ||||||||||
|
| |||||||||||
| 26,367,410 | ||||||||||||
|
| |||||||||||
Food & Staples Retailing - 0.6% | ||||||||||||
Puregold Price Club, Inc. (Philippines)1 | 155,070 | 153,193 | ||||||||||
Raia Drogasil S.A. (Brazil) | 6,170 | 148,474 | ||||||||||
Robinsons Retail Holdings, Inc. (Philippines)1 | 83,750 | 157,361 | ||||||||||
Sprouts Farmers Market, Inc.* | 144,822 | 2,677,759 | ||||||||||
|
| |||||||||||
| 3,136,787 | ||||||||||||
|
| |||||||||||
Food Products - 2.3% | ||||||||||||
Campbell Soup Co. | 124,461 | 5,895,718 | ||||||||||
Danone S.A. (France)1 | 2,511 | 205,227 | ||||||||||
Kerry Group plc - Class A (Ireland)1 | 1,995 | 200,922 | ||||||||||
M Dias Branco S.A. (Brazil) | 6,600 | 97,609 | ||||||||||
Nestle S.A. (Switzerland)1 | 56,202 | 4,728,754 | ||||||||||
|
| |||||||||||
| 11,128,230 | ||||||||||||
|
| |||||||||||
Personal Products - 2.0% | ||||||||||||
Beiersdorf AG (Germany)1 | 44,406 | 4,995,252 | ||||||||||
Unilever plc - ADR (United Kingdom) | 90,634 | 5,134,416 | ||||||||||
|
| |||||||||||
| 10,129,668 | ||||||||||||
|
| |||||||||||
Tobacco - 0.1% | ||||||||||||
Japan Tobacco, Inc. (Japan)1 | 7,800 | 258,181 | ||||||||||
|
| |||||||||||
Total Consumer Staples | 51,020,276 | |||||||||||
|
| |||||||||||
Energy - 2.4% | ||||||||||||
Energy Equipment & Services - 2.3% | ||||||||||||
Diamond Offshore Drilling, Inc.* | 112,875 | 1,888,399 | ||||||||||
Oceaneering International, Inc. | 68,815 | 1,391,439 | ||||||||||
Schlumberger Ltd. | 99,483 | 6,366,912 | ||||||||||
Transocean Ltd.* | 164,387 | 1,726,063 | ||||||||||
|
| |||||||||||
| 11,372,813 | ||||||||||||
|
| |||||||||||
Oil, Gas & Consumable Fuels - 0.1% | ||||||||||||
Cameco Corp. (Canada) | 9,085 | 73,952 | ||||||||||
Galp Energia SGPS S.A. (Portugal)1 | 8,385 | 155,895 | ||||||||||
Royal Dutch Shell plc - Class B - ADR (Netherlands) | 2,400 | 156,864 | ||||||||||
YPF S.A. - ADR (Argentina) | 4,955 | 121,695 | ||||||||||
|
| |||||||||||
| 508,406 | ||||||||||||
|
| |||||||||||
Total Energy | 11,881,219 | |||||||||||
|
| |||||||||||
Financials - 5.0% | ||||||||||||
Banks - 1.5% | ||||||||||||
Banco Macro S.A. - ADR (Argentina) | 1,050 | 132,216 | ||||||||||
Bankia S.A. (Spain)1 | 493,323 | 2,354,258 | ||||||||||
Banque Cantonale Vaudoise (Switzerland)1 | 135 | 97,091 | ||||||||||
BNP Paribas S.A. (France)1 | 2,530 | 197,465 | ||||||||||
BPER Banca (Italy)1 | 17,655 | 85,941 | ||||||||||
CaixaBank S.A. (Spain)1 | 673,805 | 3,152,326 | ||||||||||
Credit Agricole S.A. (France)1 | 8,210 | 143,291 | ||||||||||
The accompanying notes are an integral part of the financial statements.
85
Investment Portfolio - October 31, 2017
| PRO-BLEND® MAXIMUM TERM SERIES | SHARES | VALUE (NOTE 2) | ||||||||||
COMMON STOCKS (continued) | ||||||||||||
Financials (continued) | ||||||||||||
Banks (continued) | ||||||||||||
Danske Bank A/S (Denmark)1 | 3,845 | $ | 146,738 | |||||||||
Erste Group Bank AG (Austria)1 | 2,275 | 97,654 | ||||||||||
Eurobank Ergasias S.A. (Greece)*1 | 105,190 | 85,922 | ||||||||||
FinecoBank Banca Fineco S.p.A. (Italy)1 | 16,300 | 152,454 | ||||||||||
Grupo Financiero Galicia S.A. - ADR (Argentina) | 2,180 | 119,682 | ||||||||||
Grupo Supervielle S.A. - ADR (Argentina) | 3,895 | 104,425 | ||||||||||
Itau Unibanco Holding S.A. (Brazil) | 7,700 | 99,354 | ||||||||||
Jyske Bank A/S (Denmark)1 | 1,730 | 97,759 | ||||||||||
KBC Group N.V. (Belgium)1 | 1,780 | 147,863 | ||||||||||
Skandinaviska Enskilda Banken A.B. - Class A (Sweden)1 | 7,700 | 94,892 | ||||||||||
Svenska Handelsbanken A.B. - Class A (Sweden)1 | 6,700 | 96,027 | ||||||||||
Swedbank A.B. - Class A (Sweden)1 | 3,645 | 90,461 | ||||||||||
Sydbank A/S (Denmark)1 | 2,505 | 97,791 | ||||||||||
|
| |||||||||||
| 7,593,610 | ||||||||||||
|
| |||||||||||
Capital Markets - 3.5% | ||||||||||||
Amundi S.A. (France)1,2 | 1,845 | 156,366 | ||||||||||
Banca Generali S.p.A. (Italy)1 | 4,410 | 145,094 | ||||||||||
BlackRock, Inc. | 9,385 | 4,418,739 | ||||||||||
The Charles Schwab Corp. | 148,955 | 6,679,142 | ||||||||||
E*TRADE Financial Corp.* | 115,645 | 5,040,965 | ||||||||||
EFG International AG (Switzerland)1 | 16,135 | 147,653 | ||||||||||
Euronext N.V. (Netherlands)1,2 | 3,160 | 187,675 | ||||||||||
Julius Baer Group Ltd. (Switzerland)1 | 1,705 | 100,847 | ||||||||||
Natixis S.A. (France)1 | 25,375 | 198,994 | ||||||||||
|
| |||||||||||
| 17,075,475 | ||||||||||||
|
| |||||||||||
Thrifts & Mortgage Finance - 0.0%## | ||||||||||||
Aareal Bank AG (Germany)1 | 2,395 | 99,578 | ||||||||||
|
| |||||||||||
Total Financials | 24,768,663 | |||||||||||
|
| |||||||||||
Health Care - 19.3% | ||||||||||||
Biotechnology - 5.6% | ||||||||||||
Biogen, Inc.* | 13,738 | 4,281,585 | ||||||||||
BioMarin Pharmaceutical, Inc.* | 71,748 | 5,889,793 | ||||||||||
Incyte Corp.* | 39,060 | 4,423,545 | ||||||||||
Regeneron Pharmaceuticals, Inc.* | 12,562 | 5,057,712 | ||||||||||
Seattle Genetics, Inc.* | 67,620 | 4,145,782 | ||||||||||
Vertex Pharmaceuticals, Inc.* | 27,837 | 4,070,604 | ||||||||||
|
| |||||||||||
| 27,869,021 | ||||||||||||
|
| |||||||||||
Health Care Equipment & Supplies - 2.8% | ||||||||||||
Intuitive Surgical, Inc.* | 8,990 | 3,374,486 | ||||||||||
Medtronic plc | 126,021 | 10,147,211 | ||||||||||
Osstem Implant Co. Ltd. (South Korea)*1 | 2,355 | 151,321 | ||||||||||
|
| |||||||||||
| 13,673,018 | ||||||||||||
|
| |||||||||||
Health Care Providers & Services - 3.7% | ||||||||||||
DaVita, Inc.* | 135,213 | 8,212,838 | ||||||||||
Express Scripts Holding Co.* | 37,895 | 2,322,585 | ||||||||||
Fleury S.A. (Brazil) | 15,680 | 137,661 | ||||||||||
Fresenius Medical Care AG & Co. KGaA (Germany)1 | 75,480 | 7,308,121 | ||||||||||
Orpea (France)1 | 1,585 | 189,897 | ||||||||||
|
| |||||||||||
| 18,171,102 | ||||||||||||
|
| |||||||||||
Health Care Technology - 0.4% | ||||||||||||
Cerner Corp.* | 32,745 | 2,210,942 | ||||||||||
|
| |||||||||||
Life Sciences Tools & Services - 1.7% | ||||||||||||
QIAGEN N.V. | 164,724 | 5,577,555 | ||||||||||
QIAGEN N.V.1 | 4,683 | 158,879 | ||||||||||
Tecan Group AG (Switzerland)1 | 490 | 103,639 | ||||||||||
Thermo Fisher Scientific, Inc. | 13,633 | 2,642,484 | ||||||||||
|
| |||||||||||
| 8,482,557 | ||||||||||||
|
| |||||||||||
Pharmaceuticals - 5.1% | ||||||||||||
Bristol-Myers Squibb Co. | 67,868 | 4,184,741 | ||||||||||
Hypermarcas S.A. (Brazil) | 14,100 | 147,883 | ||||||||||
Johnson & Johnson | 43,405 | 6,051,091 | ||||||||||
Kalbe Farma Tbk PT (Indonesia)1 | 1,148,775 | 135,524 | ||||||||||
Novartis AG - ADR (Switzerland) | 85,836 | 7,088,337 | ||||||||||
Perrigo Co. plc | 90,630 | 7,340,124 | ||||||||||
|
| |||||||||||
| 24,947,700 | ||||||||||||
|
| |||||||||||
Total Health Care | 95,354,340 | |||||||||||
|
| |||||||||||
Industrials - 8.3% | ||||||||||||
Aerospace & Defense - 1.5% | ||||||||||||
Arconic, Inc. | 269,266 | 6,763,962 | ||||||||||
LIG Nex1 Co. Ltd. (South Korea)1 | 2,195 | 140,867 | ||||||||||
Thales S.A. (France)1 | 2,255 | 235,001 | ||||||||||
Ultra Electronics Holdings plc (United Kingdom)1 | 4,195 | �� | 101,580 | |||||||||
|
| |||||||||||
| 7,241,410 | ||||||||||||
|
| |||||||||||
Air Freight & Logistics - 2.5% | ||||||||||||
C.H. Robinson Worldwide, Inc. | 42,265 | 3,319,071 | ||||||||||
FedEx Corp. | 41,040 | 9,267,243 | ||||||||||
|
| |||||||||||
| 12,586,314 | ||||||||||||
|
| |||||||||||
Airlines - 0.1% | ||||||||||||
Azul S.A. - ADR (Brazil)* | 3,705 | 93,699 | ||||||||||
The accompanying notes are an integral part of the financial statements.
86
Investment Portfolio - October 31, 2017
| PRO-BLEND® MAXIMUM TERM SERIES | SHARES | VALUE (NOTE 2) | ||||||||||
COMMON STOCKS (continued) | ||||||||||||
Industrials (continued) | ||||||||||||
Airlines (continued) | ||||||||||||
Ryanair Holdings plc - ADR (Ireland)* | 2,555 | $ | 286,441 | |||||||||
|
| |||||||||||
| 380,140 | ||||||||||||
|
| |||||||||||
Building Products - 0.0%## | ||||||||||||
Cie de Saint-Gobain (France)1 | 3,365 | 197,300 | ||||||||||
Geberit AG (Switzerland)1 | 210 | 95,078 | ||||||||||
|
| |||||||||||
| 292,378 | ||||||||||||
|
| |||||||||||
Commercial Services & Supplies - 0.1% | ||||||||||||
China Everbright International Ltd. (China)1 | 103,000 | 145,318 | ||||||||||
Elis S.A. (France)1 | 5,815 | 151,610 | ||||||||||
SPIE S.A. (France)1 | 7,075 | 186,153 | ||||||||||
|
| |||||||||||
| 483,081 | ||||||||||||
|
| |||||||||||
Construction & Engineering - 1.1% | ||||||||||||
Eiffage S.A. (France)1 | 2,355 | 245,993 | ||||||||||
Vinci S.A. (France)1 | 52,456 | 5,139,515 | ||||||||||
|
| |||||||||||
| 5,385,508 | ||||||||||||
|
| |||||||||||
Electrical Equipment - 0.0%## | ||||||||||||
Legrand S.A. (France)1 | 2,090 | 155,100 | ||||||||||
|
| |||||||||||
Industrial Conglomerates - 0.1% | ||||||||||||
Siemens AG (Germany)1 | 2,820 | 405,044 | ||||||||||
|
| |||||||||||
Machinery - 0.2% | ||||||||||||
FANUC Corp. (Japan)1 | 691 | 161,572 | ||||||||||
Jungheinrich AG (Germany)1 | 3,185 | 145,051 | ||||||||||
KION Group AG (Germany)1 | 2,485 | 199,117 | ||||||||||
Metso OYJ (Finland)1 | 2,815 | 102,236 | ||||||||||
The Weir Group plc (United Kingdom)1 | 10,570 | 274,023 | ||||||||||
|
| |||||||||||
| 881,999 | ||||||||||||
|
| |||||||||||
Professional Services - 1.8% | ||||||||||||
Applus Services S.A. (Spain)1 | 20,430 | 285,687 | ||||||||||
Equifax, Inc. | 31,714 | 3,441,921 | ||||||||||
Intertek Group plc (United Kingdom)1 | 2,900 | 208,918 | ||||||||||
Nielsen Holdings plc | 116,925 | 4,334,410 | ||||||||||
Randstad Holding N.V. (Netherlands)1 | 2,440 | 150,114 | ||||||||||
RELX plc (United Kingdom)1 | 4,455 | 102,513 | ||||||||||
SGS S.A. (Switzerland)1 | 85 | 209,911 | ||||||||||
|
| |||||||||||
| 8,733,474 | ||||||||||||
|
| |||||||||||
Road & Rail - 0.7% | ||||||||||||
Genesee & Wyoming, Inc. - Class A* | 46,225 | 3,318,030 | ||||||||||
|
| |||||||||||
Trading Companies & Distributors - 0.1% | ||||||||||||
Ashtead Group plc (United Kingdom)1 | 5,905 | 152,109 | ||||||||||
Brenntag AG (Germany)1 | 4,592 | 260,531 | ||||||||||
Howden Joinery Group plc (United Kingdom)1 | 14,890 | 81,090 | ||||||||||
|
| |||||||||||
| 493,730 | ||||||||||||
|
| |||||||||||
Transportation Infrastructure - 0.1% | ||||||||||||
Aena SME S.A. (Spain)1,2 | 2,940 | 539,413 | ||||||||||
Grupo Aeroportuario del Centro Norte S.A.B. de C.V. (Mexico) | 8,000 | 40,414 | ||||||||||
Grupo Aeroportuario del Pacifico S.A.B. de C.V. - ADR (Mexico) | 425 | 40,341 | ||||||||||
|
| |||||||||||
| 620,168 | ||||||||||||
|
| |||||||||||
Total Industrials | 40,976,376 | |||||||||||
|
| |||||||||||
Information Technology - 20.4% | ||||||||||||
Electronic Equipment, Instruments & Components - 0.2% | ||||||||||||
Halma plc (United Kingdom)1 | 9,745 | 152,907 | ||||||||||
Hexagon A.B. - Class B (Sweden)1 | 1,970 | 101,012 | ||||||||||
Hitachi Ltd. (Japan)1 | 33,000 | 262,791 | ||||||||||
Hollysys Automation Technologies Ltd. (China) | 4,335 | 97,321 | ||||||||||
Keyence Corp. (Japan)1 | 792 | 439,738 | ||||||||||
|
| |||||||||||
| 1,053,769 | ||||||||||||
|
| |||||||||||
Internet Software & Services - 5.5% | ||||||||||||
Alibaba Group Holding Ltd. - ADR (China)* | 2,395 | 442,812 | ||||||||||
Alphabet, Inc. - Class A* | 4,186 | 4,324,305 | ||||||||||
Alphabet, Inc. - Class C* | 4,284 | 4,355,286 | ||||||||||
China Literature Ltd. - Rights (Expires 11/03/2017) (Hong Kong)*3 | 94 | — | ||||||||||
Facebook, Inc. - Class A* | 70,699 | 12,730,062 | ||||||||||
NetEase, Inc. - ADR (China) | 305 | 85,986 | ||||||||||
Tencent Holdings Ltd. - Class H (China)1 | 116,254 | 5,225,048 | ||||||||||
|
| |||||||||||
| 27,163,499 | ||||||||||||
|
| |||||||||||
IT Services - 4.0% | ||||||||||||
Altran Technologies S.A. (France)1 | 10,730 | 198,449 | ||||||||||
Amdocs Ltd. | 75,650 | 4,924,815 | ||||||||||
InterXion Holding N.V. - ADR (Netherlands)* | 1,650 | 88,094 | ||||||||||
MasterCard, Inc. - Class A | 47,733 | 7,101,238 | ||||||||||
Sopra Steria Group (France)1 | 1,055 | 197,917 | ||||||||||
Visa, Inc. - Class A | 64,908 | 7,138,582 | ||||||||||
|
| |||||||||||
| 19,649,095 | ||||||||||||
|
| |||||||||||
Semiconductors & Semiconductor Equipment - 3.3% | ||||||||||||
Qorvo, Inc.* | 70,454 | 5,341,118 | ||||||||||
Skyworks Solutions, Inc. | 65,813 | 7,493,468 | ||||||||||
Texas Instruments, Inc. | 34,510 | 3,336,772 | ||||||||||
|
| |||||||||||
| 16,171,358 | ||||||||||||
|
| |||||||||||
The accompanying notes are an integral part of the financial statements.
87
Investment Portfolio - October 31, 2017
| PRO-BLEND® MAXIMUM TERM SERIES | SHARES | VALUE (NOTE 2) | ||||||||||
COMMON STOCKS (continued) | ||||||||||||
Information Technology (continued) | ||||||||||||
Software - 7.4% | ||||||||||||
Adobe Systems, Inc.* | 39,394 | $ | 6,900,253 | |||||||||
Atlassian Corp. plc - Class A (Australia)* | 70,995 | 3,434,028 | ||||||||||
CDK Global, Inc. | 50,240 | 3,193,254 | ||||||||||
Dassault Systemes S.E. (France)1 | 1,915 | 203,289 | ||||||||||
Electronic Arts, Inc.* | 43,312 | 5,180,115 | ||||||||||
Microsoft Corp. | 56,170 | 4,672,221 | ||||||||||
ServiceNow, Inc.* | 102,665 | 12,973,776 | ||||||||||
Sophos Group plc (United Kingdom)1,2 | 12,595 | 103,859 | ||||||||||
Temenos Group AG (Switzerland)1 | 1,330 | 153,577 | ||||||||||
|
| |||||||||||
| 36,814,372 | ||||||||||||
|
| |||||||||||
Total Information Technology | 100,852,093 | |||||||||||
|
| |||||||||||
Materials - 6.8% | ||||||||||||
Chemicals - 3.2% | ||||||||||||
Akzo Nobel N.V. (Netherlands)1 | 75,735 | 6,837,423 | ||||||||||
Ashland Global Holdings, Inc. | 52,568 | 3,573,572 | ||||||||||
CF Industries Holdings, Inc. | 125,065 | 4,749,969 | ||||||||||
Croda International plc (United Kingdom)1 | 2,890 | 160,610 | ||||||||||
Mexichem, S.A.B. de C.V. (Mexico) | 30,700 | 79,073 | ||||||||||
Solvay S.A. (Belgium)1 | 1,470 | 218,381 | ||||||||||
|
| |||||||||||
| 15,619,028 | ||||||||||||
|
| |||||||||||
Construction Materials - 0.0%## | ||||||||||||
Wienerberger AG (Austria)1 | 5,905 | 151,507 | ||||||||||
|
| |||||||||||
Containers & Packaging - 1.4% | ||||||||||||
Ball Corp. | 82,177 | 3,527,858 | ||||||||||
Sealed Air Corp. | 76,238 | 3,372,007 | ||||||||||
|
| |||||||||||
| 6,899,865 | ||||||||||||
|
| |||||||||||
Metals & Mining - 2.2% | ||||||||||||
Antofagasta plc (Chile)1 | 104,018 | 1,318,279 | ||||||||||
First Quantum Minerals Ltd. (Zambia) | 118,024 | 1,320,120 | ||||||||||
Freeport-McMoRan, Inc.* | 279,319 | 3,904,880 | ||||||||||
Grupo Mexico, S.A.B. de C.V. - Series B(Mexico) | 58,710 | 190,936 | ||||||||||
Lundin Mining corp. (Canada) | 170,720 | 1,302,135 | ||||||||||
Southern Copper Corp. (Peru) | 59,510 | 2,555,954 | ||||||||||
|
| |||||||||||
| 10,592,304 | ||||||||||||
|
| |||||||||||
Total Materials | 33,262,704 | |||||||||||
|
| |||||||||||
Real Estate - 4.6% | ||||||||||||
Equity Real Estate Investment Trusts (REITS) - 4.5% | ||||||||||||
Acadia Realty Trust | 1,170 | 32,935 | ||||||||||
Agree Realty Corp. | 695 | 32,867 | ||||||||||
Alexandria Real Estate Equities, Inc. | 1,045 | 129,538 | ||||||||||
American Campus Communities, Inc. | 1,205 | 50,104 | ||||||||||
American Homes 4 Rent - Class A | 4,410 | 93,845 | ||||||||||
American Tower Corp. | 39,377 | 5,657,294 | ||||||||||
Apartment Investment & Management Co. - Class A | 2,450 | 107,751 | ||||||||||
AvalonBay Communities, Inc. | 750 | 135,997 | ||||||||||
Axiare Patrimonio SOCIMI S.A. (Spain)1 | 2,000 | 37,508 | ||||||||||
Bluerock Residential Growth REIT, Inc. | 3,005 | 33,926 | ||||||||||
Boston Properties, Inc. | 540 | 65,437 | ||||||||||
Brandywine Realty Trust | 3,860 | 67,511 | ||||||||||
Brixmor Property Group, Inc. | 1,715 | 29,961 | ||||||||||
Camden Property Trust | 620 | 56,569 | ||||||||||
CatchMark Timber Trust, Inc. - Class A | 7,440 | 95,232 | ||||||||||
Cedar Realty Trust, Inc. | 8,615 | 46,866 | ||||||||||
Chesapeake Lodging Trust | 2,085 | 58,171 | ||||||||||
Colony NorthStar, Inc. - Class A | 7,037 | 86,414 | ||||||||||
Columbia Property Trust, Inc. | 1,835 | 40,517 | ||||||||||
Community Healthcare Trust, Inc. | 5,695 | 156,214 | ||||||||||
CoreCivic, Inc. | 4,195 | 103,449 | ||||||||||
Cousins Properties, Inc. | 8,995 | 81,135 | ||||||||||
Crown Castle International Corp. | 670 | 71,744 | ||||||||||
CubeSmart | 4,005 | 109,016 | ||||||||||
DDR Corp. | 2,960 | 22,703 | ||||||||||
Digital Realty Trust, Inc. | 1,045 | 123,770 | ||||||||||
Douglas Emmett, Inc. | 1,780 | 70,826 | ||||||||||
Education Realty Trust, Inc. | 736 | 25,686 | ||||||||||
EPR Properties | 385 | 26,634 | ||||||||||
Equinix, Inc. | 595 | 275,782 | ||||||||||
Equity Commonwealth* | 1,730 | 51,986 | ||||||||||
Equity LifeStyle Properties, Inc. | 590 | 52,203 | ||||||||||
Equity Residential | 1,480 | 99,545 | ||||||||||
Essex Property Trust, Inc. | 135 | 35,428 | ||||||||||
Extra Space Storage, Inc. | 1,010 | 82,406 | ||||||||||
Forest City Realty Trust, Inc. - Class A | 2,240 | 55,171 | ||||||||||
Getty Realty Corp. | 1,460 | 41,479 | ||||||||||
GGP, Inc. | 2,425 | 47,190 | ||||||||||
Global Medical REIT, Inc. | 6,645 | 56,217 | ||||||||||
HCP, Inc. | 2,040 | 52,714 | ||||||||||
Healthcare Trust of America, Inc. - Class A | 2,055 | 61,753 | ||||||||||
Hibernia REIT plc (Ireland)1 | 26,485 | 45,505 | ||||||||||
Host Hotels & Resorts, Inc. | 2,585 | 50,563 | ||||||||||
Independence Realty Trust, Inc. | 4,875 | 49,481 | ||||||||||
Invitation Homes, Inc. | 1,935 | 43,673 | ||||||||||
Lamar Advertising Co. - Class A | 675 | 47,547 | ||||||||||
LaSalle Hotel Properties | 1,230 | 34,698 | ||||||||||
Life Storage, Inc. | 665 | 53,745 | ||||||||||
The Macerich Co. | 445 | 24,297 | ||||||||||
The accompanying notes are an integral part of the financial statements.
88
Investment Portfolio - October 31, 2017
| PRO-BLEND® MAXIMUM TERM SERIES | SHARES | VALUE (NOTE 2) | ||||||||||
COMMON STOCKS (continued) | ||||||||||||
Real Estate (continued) | ||||||||||||
Equity Real Estate Investment Trusts (REITS) (continued) | ||||||||||||
Mid-America Apartment Communities, Inc. | 1,080 | $ | 110,538 | |||||||||
National Retail Properties, Inc. | 1,345 | 54,042 | ||||||||||
Outfront Media, Inc. | 2,345 | 54,990 | ||||||||||
Physicians Realty Trust | 5,460 | 94,895 | ||||||||||
Prologis, Inc. | 2,630 | 169,846 | ||||||||||
Public Storage | 425 | 88,081 | ||||||||||
Regency Centers Corp. | 889 | 54,718 | ||||||||||
Retail Opportunity Investments Corp. | 1,825 | 32,814 | ||||||||||
Rexford Industrial Realty, Inc. | 2,875 | 85,359 | ||||||||||
SBA Communications Corp.* | 38,569 | 6,062,276 | ||||||||||
Simon Property Group, Inc. | 1,360 | 211,249 | ||||||||||
STAG Industrial, Inc. | 2,915 | 79,580 | ||||||||||
Starwood Waypoint Homes | 1,200 | 43,572 | ||||||||||
STORE Capital Corp. | 2,130 | 52,590 | ||||||||||
Sun Communities, Inc. | 565 | 50,997 | ||||||||||
Sunstone Hotel Investors, Inc. | 3,260 | 53,203 | ||||||||||
Terreno Realty Corp. | 2,365 | 86,843 | ||||||||||
UDR, Inc. | 1,890 | 73,313 | ||||||||||
Unibail-RodamCo S.E. (France)1 | 540 | 135,166 | ||||||||||
Urban Edge Properties | 3,460 | 81,172 | ||||||||||
Ventas, Inc. | 1,700 | 106,675 | ||||||||||
VEREIT, Inc. | 6,370 | 50,259 | ||||||||||
Vornado Realty Trust | 1,755 | 131,379 | ||||||||||
Welltower, Inc. | 1,440 | 96,422 | ||||||||||
Weyerhaeuser Co. | 145,972 | 5,241,855 | ||||||||||
|
| |||||||||||
| 22,212,837 | ||||||||||||
|
| |||||||||||
Real Estate Management & Development - 0.1% | ||||||||||||
Aliansce Shopping Centers S.A. (Brazil)* | 18,565 | 99,201 | ||||||||||
Iguatemi Empresa de Shopping Centers S.A. (Brazil) | 8,425 | 98,999 | ||||||||||
Nexity S.A. (France)1 | 2,505 | 153,963 | ||||||||||
|
| |||||||||||
| 352,163 | ||||||||||||
|
| |||||||||||
Total Real Estate | 22,565,000 | |||||||||||
|
| |||||||||||
Telecommunication Services - 1.4% | ||||||||||||
Diversified Telecommunication Services - 1.4% | ||||||||||||
Iliad S.A. (France)1 | 765 | 190,958 | ||||||||||
Zayo Group Holdings, Inc.* | 186,185 | 6,713,832 | ||||||||||
|
| |||||||||||
Total Telecommunication Services | 6,904,790 | |||||||||||
|
| |||||||||||
Utilities - 0.1% | ||||||||||||
Electric Utilities - 0.0%## | ||||||||||||
Pampa Energia S.A. - ADR (Argentina)* | 2,940 | 199,420 | ||||||||||
|
| |||||||||||
Independent Power and Renewable Electricity Producers - 0.1% | ||||||||||||
China Longyuan Power Group Corp. Ltd. - Class H (China)1 | 186,000 | 137,936 | ||||||||||
Huaneng Renewables Corp. Ltd. - Class H (China)1 | 424,000 | 145,816 | ||||||||||
|
| |||||||||||
| 283,752 | ||||||||||||
|
| |||||||||||
Total Utilities | 483,172 | |||||||||||
|
| |||||||||||
TOTAL COMMON STOCKS | 432,441,366 | |||||||||||
|
| |||||||||||
CORPORATE BONDS - 3.9% | ||||||||||||
Non-Convertible Corporate Bonds - 3.9% | ||||||||||||
Consumer Discretionary - 0.5% | ||||||||||||
Auto Components - 0.1% | ||||||||||||
Magna International, Inc. (Canada), 4.15%, 10/1/2025 | 285,000 | 304,943 | ||||||||||
|
| |||||||||||
Household Durables - 0.2% | ||||||||||||
Century Communities, Inc.2, 5.875%, 7/15/2025 | 94,000 | 94,939 | ||||||||||
Meritage Homes Corp., 5.125%, 6/6/2027 | 70,000 | 70,787 | ||||||||||
NVR, Inc., 3.95%, 9/15/2022 | 292,000 | 306,732 | ||||||||||
TRI Pointe Group, Inc. - TRI Pointe Homes, Inc., 4.375%, 6/15/2019 | 102,000 | 104,678 | ||||||||||
TRI Pointe Group, Inc. - TRI Pointe Homes, Inc., 5.875%, 6/15/2024 | 54,000 | 58,455 | ||||||||||
Weekley Homes LLC - Weekley Finance Corp., 6.00%, 2/1/2023 | 86,000 | 84,280 | ||||||||||
Weekley Homes LLC - Weekley Finance Corp.2, 6.625%, 8/15/2025 | 89,000 | 86,552 | ||||||||||
|
| |||||||||||
| 806,423 | ||||||||||||
|
| |||||||||||
Internet & Direct Marketing Retail - 0.1% | ||||||||||||
Amazon.com, Inc.2, 3.15%, 8/22/2027 | 210,000 | 211,257 | ||||||||||
The Priceline Group, Inc., 3.60%, 6/1/2026 | 389,000 | 397,599 | ||||||||||
|
| |||||||||||
| 608,856 | ||||||||||||
|
| |||||||||||
Media - 0.1% | ||||||||||||
Charter Communications Operating LLC - Charter Communications | ||||||||||||
Operating Capital Corp., 4.464%, 7/23/2022 | 25,000 | 26,402 | ||||||||||
Comcast Corp., 4.40%, 8/15/2035 | 195,000 | 211,164 | ||||||||||
CSC Holdings, LLC, 5.25%, 6/1/2024 | 117,000 | 116,488 | ||||||||||
Discovery Communications LLC, 3.95%, 3/20/2028 | 330,000 | 327,299 | ||||||||||
DISH DBS Corp., 5.875%, 7/15/2022 | �� | 25,000 | 25,141 | |||||||||
|
| |||||||||||
| 706,494 | ||||||||||||
|
| |||||||||||
The accompanying notes are an integral part of the financial statements.
89
Investment Portfolio - October 31, 2017
| PRO-BLEND® MAXIMUM TERM SERIES | PRINCIPAL AMOUNT 4 | VALUE (NOTE 2) | ||||||||||
CORPORATE BONDS (continued) | ||||||||||||
Non-Convertible Corporate Bonds (continued) | ||||||||||||
Consumer Discretionary (continued) | ||||||||||||
Multiline Retail - 0.0%## | ||||||||||||
Dollar General Corp., 3.25%, 4/15/2023 | 233,000 | $ | 239,087 | |||||||||
|
| |||||||||||
Total Consumer Discretionary | 2,665,803 | |||||||||||
|
| |||||||||||
Consumer Staples - 0.2% | ||||||||||||
Beverages - 0.1% | ||||||||||||
Anheuser-Busch InBev Worldwide, Inc. (Belgium), 8.20%, 1/15/2039 | 280,000 | 442,459 | ||||||||||
PepsiCo, Inc., 3.10%, 7/17/2022 | 210,000 | 217,104 | ||||||||||
|
| |||||||||||
| 659,563 | ||||||||||||
|
| |||||||||||
Food & Staples Retailing - 0.1% | ||||||||||||
C&S Group Enterprises LLC2, 5.375%, 7/15/2022 | 132,000 | 128,040 | ||||||||||
CVS Health Corp., 3.50%, 7/20/2022 | 311,000 | 320,576 | ||||||||||
|
| |||||||||||
| 448,616 | ||||||||||||
|
| |||||||||||
Total Consumer Staples | 1,108,179 | |||||||||||
|
| |||||||||||
Energy - 0.7% | ||||||||||||
Energy Equipment & Services - 0.1% | ||||||||||||
McDermott International, Inc.2, 8.00%, 5/1/2021 | 136,000 | 140,420 | ||||||||||
Trinidad Drilling Ltd. (Canada)2, 6.625%, 2/15/2025 | 97,000 | 94,332 | ||||||||||
|
| |||||||||||
| 234,752 | ||||||||||||
|
| |||||||||||
Oil, Gas & Consumable Fuels - 0.6% | ||||||||||||
BP Capital Markets plc (United Kingdom), 3.535%, 11/4/2024 | 389,000 | 404,415 | ||||||||||
Cheniere Corpus Christi Holdings, LLC, 7.00%, 6/30/2024 | 170,000 | 194,012 | ||||||||||
Cheniere Energy Partners LP2, 5.25%, 10/1/2025 | 86,000 | 88,580 | ||||||||||
Columbia Pipeline Group, Inc., 4.50%, 6/1/2025 | 217,000 | 232,571 | ||||||||||
Dynagas LNG Partners LP - Dynagas Finance, Inc. (Monaco), 6.25%, 10/30/2019 | 102,000 | 102,000 | ||||||||||
Enbridge, Inc. (Canada), 3.70%, 7/15/2027 | 197,000 | 199,574 | ||||||||||
Enviva Partners LP - Enviva Partners Finance Corp., 8.50%, 11/1/2021 | 86,000 | 92,235 | ||||||||||
GasLog Ltd. (Monaco), 8.875%, 3/22/2022 | 94,000 | 99,170 | ||||||||||
Global Ship Lease, Inc. (United Kingdom)2, 9.875%, 11/15/2022 | 120,000 | 122,400 | ||||||||||
Hilcorp Energy I LP - Hilcorp Finance Co.2, 5.75%, 10/1/2025 | 136,000 | 139,230 | ||||||||||
Jonah Energy LLC - Jonah Energy Finance Corp.2 , 7.25%, 10/15/2025 | 86,000 | 86,000 | ||||||||||
Kinder Morgan Energy Partners LP, 4.30%, 5/1/2024 | 389,000 | 408,145 | ||||||||||
PBF Holding Co. LLC - PBF Finance Corp.2, 7.25%, 6/15/2025 | 74,000 | 76,497 | ||||||||||
Petroleos Mexicanos (Mexico), 6.875%, 8/4/2026 | 175,000 | 196,612 | ||||||||||
Rockies Express Pipeline, LLC2, 5.625%, 4/15/2020 | 121,000 | 128,260 | ||||||||||
Sabine Pass Liquefaction LLC, 5.875%, 6/30/2026 | 190,000 | 214,952 | ||||||||||
SemGroup Corp.2, 6.375%, 3/15/2025 | 94,000 | 92,590 | ||||||||||
Seven Generations Energy Ltd. (Canada)2, 5.375%, 9/30/2025 | 62,000 | 62,620 | ||||||||||
Southwestern Energy Co., 6.70%, 1/23/2025 | 74,000 | 75,665 | ||||||||||
Tallgrass Energy Partners LP - Tallgrass Energy Finance Corp.2, 5.50%, 9/15/2024 | 124,000 | 128,185 | ||||||||||
|
| |||||||||||
| 3,143,713 | ||||||||||||
|
| |||||||||||
Total Energy | 3,378,465 | |||||||||||
|
| |||||||||||
Financials - 1.1% | ||||||||||||
Banks - 0.5% | ||||||||||||
Banco Santander S.A. (Spain), 3.50%, 4/11/2022 | 400,000 | 409,866 | ||||||||||
Bank of America Corp., 4.00%, 1/22/2025 | 311,000 | 322,098 | ||||||||||
Barclays Bank plc (United Kingdom)2, 10.179%, 6/12/2021 | 120,000 | 148,187 | ||||||||||
Citigroup, Inc., 3.875%, 3/26/2025 | 389,000 | 399,154 | ||||||||||
Intesa Sanpaolo S.p.A. (Italy), 3.875%, 1/15/2019 | 290,000 | 295,671 | ||||||||||
JPMorgan Chase & Co.5, (3mo. LIBOR US + 0.935%), 2.776%, 4/25/2023 | 405,000 | 406,436 | ||||||||||
Lloyds Banking Group plc (United Kingdom), 4.582%, 12/10/2025 | 291,000 | 306,901 | ||||||||||
Popular, Inc., 7.00%, 7/1/2019 | 95,000 | 97,137 | ||||||||||
Royal Bank of Scotland Group plc (United Kingdom), 6.10%, 6/10/2023 . | 27,000 | 30,066 | ||||||||||
|
| |||||||||||
| 2,415,516 | ||||||||||||
|
| |||||||||||
Capital Markets - 0.2% | ||||||||||||
The Goldman Sachs Group, Inc., 4.25%, 10/21/2025 | 233,000 | 243,093 | ||||||||||
Morgan Stanley6, (3mo. LIBOR US + 1.220%), 2.617%, 5/8/2024 | 311,000 | 316,218 | ||||||||||
Morgan Stanley, 5.00%, 11/24/2025 | 311,000 | 339,243 | ||||||||||
|
| |||||||||||
| 898,554 | ||||||||||||
|
| |||||||||||
Consumer Finance - 0.1% | ||||||||||||
Ally Financial, Inc., 3.50%, 1/27/2019 | 38,000 | 38,464 | ||||||||||
Navient Corp., 6.125%, 3/25/2024 | 62,000 | 63,628 | ||||||||||
The accompanying notes are an integral part of the financial statements.
90
Investment Portfolio - October 31, 2017
| PRO-BLEND® MAXIMUM TERM SERIES | PRINCIPAL AMOUNT 4 | VALUE (NOTE 2) | ||||||||||
CORPORATE BONDS (continued) | ||||||||||||
Non-Convertible Corporate Bonds (continued) | ||||||||||||
Financials (continued) | ||||||||||||
Consumer Finance (continued) | ||||||||||||
SLM Corp., 5.125%, 4/5/2022 | 78,000 | $ | 80,828 | |||||||||
|
| |||||||||||
| 182,920 | ||||||||||||
|
| |||||||||||
Diversified Financial Services - 0.1% | ||||||||||||
AerCap Ireland Capital DAC - AerCap Global Aviation Trust (Netherlands), 4.50%, 5/15/2021 | 301,000 | 319,660 | ||||||||||
E*TRADE Financial Corp., 2.95%, 8/24/2022 | 220,000 | 220,105 | ||||||||||
LPL Holdings, Inc.2, 5.75%, 9/15/2025 | 66,000 | 68,640 | ||||||||||
|
| |||||||||||
| 608,405 | ||||||||||||
|
| |||||||||||
Insurance - 0.2% | ||||||||||||
American International Group, Inc., 4.125%, 2/15/2024 | 311,000 | 330,792 | ||||||||||
Assured Guaranty US Holdings, Inc., 5.00%, 7/1/2024 | 500,000 | 539,834 | ||||||||||
Prudential Financial, Inc.5, (3mo. LIBOR US + 4.175%), 5.875%, 9/15/2042 | 200,000 | 221,000 | ||||||||||
|
| |||||||||||
| 1,091,626 | ||||||||||||
|
| |||||||||||
Thrifts & Mortgage Finance - 0.0%## | ||||||||||||
Ladder Capital Finance Holdings LLLP - Ladder Capital Finance Corp.2, 5.875%, 8/1/2021 | 164,000 | 169,330 | ||||||||||
|
| |||||||||||
Total Financials | 5,366,351 | |||||||||||
|
| |||||||||||
Health Care - 0.1% | ||||||||||||
Biotechnology - 0.1% | ||||||||||||
AMAG Pharmaceuticals, Inc.2, 7.875%, 9/1/2023 | 66,000 | 67,155 | ||||||||||
Express Scripts Holding Co., 3.50%, 6/15/2024 | 297,000 | 300,516 | ||||||||||
|
| |||||||||||
| 367,671 | ||||||||||||
|
| |||||||||||
Health Care Equipment & Supplies - 0.0%## | ||||||||||||
Hill-Rom Holdings, Inc.2, 5.00%, 2/15/2025 | 66,000 | 67,485 | ||||||||||
|
| |||||||||||
Health Care Providers & Services - 0.0%## | ||||||||||||
DaVita, Inc., 5.00%, 5/1/2025 | 94,000 | 92,590 | ||||||||||
Fresenius Medical Care US Finance II, Inc. (Germany)2, 6.50%, 9/15/2018 | 38,000 | 39,469 | ||||||||||
HCA Healthcare, Inc., 6.25%, 2/15/2021 | 27,000 | 29,059 | ||||||||||
HCA, Inc., 3.75%, 3/15/2019 | 27,000 | 27,405 | ||||||||||
Ortho-Clinical Diagnostics, Inc. - Ortho-Clinical Diagnostics S.A.2, 6.625%, 5/15/2022 | 35,000 | 35,044 | ||||||||||
Tenet Healthcare Corp., 6.75%, 2/1/2020 | 27,000 | 27,472 | ||||||||||
|
| |||||||||||
| 251,039 | ||||||||||||
|
| |||||||||||
Total Health Care | 686,195 | |||||||||||
|
| |||||||||||
Industrials - 0.2% | ||||||||||||
Aerospace & Defense - 0.0%## | ||||||||||||
Arconic, Inc., 5.87%, 2/23/2022 | 85,000 | 92,862 | ||||||||||
|
| |||||||||||
Air Freight & Logistics - 0.0%## | ||||||||||||
Park Aerospace Holdings Ltd. (Ireland)2, 4.50%, 3/15/2023 | 51,000 | 51,064 | ||||||||||
|
| |||||||||||
Airlines - 0.1% | ||||||||||||
Allegiant Travel Co., 5.50%, 7/15/2019 | 62,000 | 64,015 | ||||||||||
American Airlines Group, Inc.2, 5.50%, 10/1/2019 | 66,000 | 68,640 | ||||||||||
|
| |||||||||||
| 132,655 | ||||||||||||
|
| |||||||||||
Building Products - 0.0%## | ||||||||||||
Airxcel, Inc.2, 8.50%, 2/15/2022 | 102,000 | 108,120 | ||||||||||
|
| |||||||||||
Construction & Engineering - 0.0%## | ||||||||||||
Tutor Perini Corp.2, 6.875%, 5/1/2025 | 97,000 | 104,639 | ||||||||||
|
| |||||||||||
Industrial Conglomerates - 0.1% | ||||||||||||
General Electric Co.6, (3 mo. LIBOR US + 0.380%), 1.771%, 5/5/2026 | 447,000 | 432,958 | ||||||||||
|
| |||||||||||
Machinery - 0.0%## | ||||||||||||
Xerium Technologies, Inc., 9.50%, 8/15/2021 | 74,000 | 76,013 | ||||||||||
|
| |||||||||||
Trading Companies & Distributors - 0.0%## | ||||||||||||
International Lease Finance Corp., 6.25%, 5/15/2019 | 70,000 | 74,229 | ||||||||||
|
| |||||||||||
Total Industrials | 1,072,540 | |||||||||||
|
| |||||||||||
Information Technology - 0.2% | ||||||||||||
Internet Software & Services - 0.1% | ||||||||||||
Activision Blizzard, Inc., 3.40%, 6/15/2027 | 405,000 | 405,752 | ||||||||||
|
| |||||||||||
IT Services - 0.1% | ||||||||||||
Visa, Inc., 2.80%, 12/14/2022 | 311,000 | 316,851 | ||||||||||
|
| |||||||||||
Semiconductors & Semiconductor Equipment - 0.0%## |
| |||||||||||
MagnaChip Semiconductor Corp. (South Korea), 6.625%, 7/15/2021 | 97,000 | 93,120 | ||||||||||
|
| |||||||||||
Total Information Technology | 815,723 | |||||||||||
|
| |||||||||||
Materials - 0.4% | ||||||||||||
Chemicals - 0.1% | ||||||||||||
Kissner Holdings LP - Kissner Milling Co. Ltd. - BSC Holding, Inc. - Kissner USA (Canada)2, 8.375%, 12/1/2022 | 86,000 | 86,860 | ||||||||||
NOVA Chemicals Corp. (Canada)2, 4.875%, 6/1/2024 | 74,000 | 75,387 | ||||||||||
The accompanying notes are an integral part of the financial statements.
91
Investment Portfolio - October 31, 2017
| PRO-BLEND® MAXIMUM TERM SERIES | PRINCIPAL AMOUNT 4 / SHARES | VALUE (NOTE 2) | ||||||||||
CORPORATE BONDS (continued) | ||||||||||||
Non-Convertible Corporate Bonds (continued) | ||||||||||||
Materials (continued) | ||||||||||||
Chemicals (continued) | ||||||||||||
Solvay Finance America LLC (Belgium)2, 3.40%, 12/3/2020 | 210,000 | $ | 215,944 | |||||||||
|
| |||||||||||
| 378,191 | ||||||||||||
|
| |||||||||||
Metals & Mining - 0.3% | ||||||||||||
Anglo American Capital plc (United Kingdom)2, 4.00%, 9/11/2027 | 275,000 | 275,275 | ||||||||||
Corp Nacional del Cobre de Chile (Chile)2, 3.625%, 8/1/2027 | 275,000 | 276,620 | ||||||||||
Northwest Acquisitions ULC - Dominion Finco, Inc.2, 7.125%, 11/1/2022 | 190,000 | 196,175 | ||||||||||
Petra Diamonds US Treasury plc (South Africa)2, 7.25%, 5/1/2022 | 200,000 | 198,600 | ||||||||||
Southern Copper Corp. (Peru), 3.875%, 4/23/2025 | 217,000 | 225,213 | ||||||||||
Techniplas LLC2, 10.00%, 5/1/2020 | 97,000 | 77,600 | ||||||||||
|
| |||||||||||
| 1,249,483 | ||||||||||||
|
| |||||||||||
Paper & Forest Products - 0.0%## | ||||||||||||
Domtar Corp., 4.40%, 4/1/2022 | 170,000 | 178,799 | ||||||||||
|
| |||||||||||
Total Materials | 1,806,473 | |||||||||||
|
| |||||||||||
Real Estate - 0.1% | ||||||||||||
Equity Real Estate Investment Trusts (REITS) - 0.1% | ||||||||||||
American Tower Corp., 3.30%, 2/15/2021 | 389,000 | 399,126 | ||||||||||
iStar, Inc., 5.25%, 9/15/2022 | 70,000 | 71,750 | ||||||||||
|
| |||||||||||
Total Real Estate | 470,876 | |||||||||||
|
| |||||||||||
Telecommunication Services - 0.3% | ||||||||||||
Diversified Telecommunication Services - 0.3% | ||||||||||||
AT&T, Inc., 3.90%, 8/14/2027 | 389,000 | 387,444 | ||||||||||
CenturyLink, Inc., 7.50%, 4/1/2024 | 66,000 | 70,125 | ||||||||||
Frontier Communications Corp., 11.00%, 9/15/2025 | 106,000 | 89,967 | ||||||||||
Hughes Satellite Systems Corp., 5.25%, 8/1/2026 | 136,000 | 139,071 | ||||||||||
Inmarsat Finance plc (United Kingdom)2, 4.875%, 5/15/2022 | 153,000 | 156,091 | ||||||||||
Sprint Communications, Inc.2, 9.00%, 11/15/2018 | 27,000 | 28,654 | ||||||||||
Sprint Communications, Inc., 7.00%, 8/15/2020 | 27,000 | 29,084 | ||||||||||
Verizon Communications, Inc., 4.125%, 3/16/2027 | 371,000 | 387,151 | ||||||||||
|
| |||||||||||
Total Telecommunication Services | 1,287,587 | |||||||||||
|
| |||||||||||
Utilities - 0.1% | ||||||||||||
Independent Power and Renewable Electricity Producers - 0.1% | ||||||||||||
American Water Capital Corp., 2.95%, 9/1/2027 | 440,000 | 437,971 | ||||||||||
Atlantica Yield plc (Spain)2, 7.00%, 11/15/2019. | 215,000 | 230,050 | ||||||||||
|
| |||||||||||
Total Utilities | 668,021 | |||||||||||
|
| |||||||||||
TOTAL CORPORATE BONDS | 19,326,213 | |||||||||||
|
| |||||||||||
MUTUAL FUNDS - 0.1% | ||||||||||||
Global X MSCI Greece ETF | 15,170 | 140,626 | ||||||||||
iShares MSCI Eurozone ETF | 9,250 | 405,427 | ||||||||||
|
| |||||||||||
TOTAL MUTUAL FUNDS | 546,053 | |||||||||||
|
| |||||||||||
U.S. TREASURY SECURITIES - 5.1% | ||||||||||||
U.S. Treasury Bonds - 1.7% | ||||||||||||
U.S. Treasury Bond, 6.25%, 5/15/2030 | 1,973,000 | 2,787,556 | ||||||||||
U.S. Treasury Bond, 4.75%, 2/15/2037 | 3,196,000 | 4,226,460 | ||||||||||
U.S. Treasury Inflation Indexed Bond, 0.75%, 2/15/2042 | 1,393,839 | 1,348,691 | ||||||||||
|
| |||||||||||
Total U.S. Treasury Bonds | 8,362,707 | |||||||||||
|
| |||||||||||
U.S. Treasury Notes - 3.4% | ||||||||||||
U.S. Treasury Inflation Indexed Note, 0.125%, 4/15/2020 | 1,332,542 | 1,337,219 | ||||||||||
U.S. Treasury Inflation Indexed Note, 0.125%, 1/15/2023 | 1,352,137 | 1,346,399 | ||||||||||
U.S. Treasury Note, 1.25%, 7/31/2023 | 9,967,000 | 9,500,965 | ||||||||||
U.S. Treasury Note, 2.375%, 5/15/2027 | 4,828,000 | 4,830,263 | ||||||||||
|
| |||||||||||
Total U.S. Treasury Notes | 17,014,846 | |||||||||||
|
| |||||||||||
TOTAL U.S. TREASURY SECURITIES | 25,377,553 | |||||||||||
|
| |||||||||||
SHORT-TERM INVESTMENT - 2.9% | ||||||||||||
Dreyfus Government Cash Management7, 0.93%, | 14,460,543 | 14,460,543 | ||||||||||
|
| |||||||||||
TOTAL INVESTMENTS - 99.6% | 492,151,728 | |||||||||||
OTHER ASSETS, LESS LIABILITIES - 0.4% | 1,739,160 | |||||||||||
|
| |||||||||||
NET ASSETS - 100% | $ | 493,890,888 | ||||||||||
|
| |||||||||||
The accompanying notes are an integral part of the financial statements.
92
Investment Portfolio - October 31, 2017
ADR - American Depositary Receipt
ETF - Exchange-traded fund
*Non-income producing security.
##Less than 0.1%.
1A factor from a third party vendor was applied to determine the security’s fair value following the close of local trading.
2Restricted securities - Investment in securities that are restricted as to public resale under the Securities Act of 1933, as amended. These securities have been sold under Rule 144A and have been determined to be liquid. These securities amount to $5,412,244 or 1.1%, of the Series’ net assets as of October 31, 2017.
3Security has been valued at fair value as determined in good faith by the Advisor and is classified as Level 3 in the fair value hierarchy.
4Amount is stated in USD unless otherwise noted.
5Variable rate security. Security may be issued at a fixed coupon rate, which converts to a variable rate at a specified date. Rate shown is the rate in effect as of October 31, 2017.
6Floating rate security. Rate shown is the rate in effect as of October 31, 2017.
7Rate shown is the current yield as of October 31, 2017.
The Global Industry Classification Standard (GICS) was developed by and is the exclusive property and a service mark of MSCI Inc. (MSCI) and Standard & Poor’s, a division of The McGraw-Hill Companies, Inc. (S&P), and is licensed for use by Manning & Napier when referencing GICS sectors. Neither MSCI, S&P, nor any third party involved in making or compiling the GICS or any GICS classifications makes any express or implied warranties or representations with respect to such standard or classification, nor shall any such party have any liability therefrom.
The accompanying notes are an integral part of the financial statements.
93
Statement of Assets and Liabilities - Pro-Blend® Maximum Term Series
October 31, 2017
ASSETS: | ||||
Investments, at value (identified cost $431,559,451) (Note 2) | $ | 492,151,728 | ||
Receivable for securities sold | 8,354,165 | |||
Foreign tax reclaims receivable | 612,091 | |||
Interest receivable | 417,375 | |||
Dividends receivable | 148,465 | |||
Receivable for fund shares sold | 94,473 | |||
Prepaid expenses | 6,171 | |||
|
| |||
TOTAL ASSETS | 501,784,468 | |||
|
| |||
LIABILITIES: | ||||
Accrued management fees (Note 3) | 355,002 | |||
Accrued shareholder services fees (Class S) (Note 3) | 65,566 | |||
Accrued distribution and service (Rule 12b-1) fees (Class R) (Class R2)(Note 3) | 54,947 | |||
Accrued fund accounting and administration fees (Note 3) | 46,899 | |||
Accrued Chief Compliance Officer service fees (Note 3) | 306 | |||
Payable for securities purchased | 5,954,236 | |||
Payable for fund shares repurchased | 1,263,756 | |||
Other payables and accrued expenses | 152,868 | |||
|
| |||
TOTAL LIABILITIES | 7,893,580 | |||
|
| |||
TOTAL NET ASSETS | $ | 493,890,888 | ||
|
| |||
NET ASSETS CONSIST OF: | ||||
Capital stock | $ | 298,021 | ||
Additional paid-in-capital | 388,742,554 | |||
Undistributed net investment income | 668,961 | |||
Accumulated net realized gain on investments, foreign currency and translation of other assets and liabilities | 43,609,020 | |||
Net unrealized appreciation (depreciation) on investments, foreign currency and translation of other assets and liabilities | 60,572,332 | |||
|
| |||
TOTAL NET ASSETS | $ | 493,890,888 | ||
|
| |||
The accompanying notes are an integral part of the financial statements.
94
Statement of Assets and Liabilities - Pro-Blend® Maximum Term Series
October 31, 2017
NET ASSET VALUE, OFFERING PRICE AND REDEMPTION PRICE PER SHARE - Class S | $ | 21.71 | ||
|
| |||
NET ASSET VALUE, OFFERING PRICE AND REDEMPTION PRICE PER SHARE - Class I | $ | 11.60 | ||
|
| |||
NET ASSET VALUE, OFFERING PRICE AND REDEMPTION PRICE PER SHARE - Class R | $ | 14.28 | ||
|
| |||
NET ASSET VALUE, OFFERING PRICE AND REDEMPTION PRICE PER SHARE - Class R2 | $ | 12.13 | ||
|
| |||
The accompanying notes are an integral part of the financial statements.
95
Statement of Operations - Pro-Blend® Maximum Term Series
For the Year Ended October 31, 2017
INVESTMENT INCOME: | ||||
Dividends (net of foreign taxes withheld, $346,428) | $ | 8,737,435 | ||
Interest | 1,794,083 | |||
|
| |||
Total Investment Income | 10,531,518 | |||
|
| |||
EXPENSES: | ||||
Management fees (Note 3) | 5,083,894 | |||
Shareholder services fees (Class S) (Note 3) | 816,595 | |||
Distribution and service (Rule 12b-1) fees (Class R2) (Note 3) | 540,880 | |||
Distribution and service (Rule 12b-1) fees (Class R) (Note 3) | 100,955 | |||
Transfer agent fees (Note 3) | 187,717 | |||
Fund accounting and administration fees (Note 3) | 133,604 | |||
Directors’ fees (Note 3) | 45,830 | |||
Chief Compliance Officer service fees (Note 3) | 3,991 | |||
Custodian fees | 76,205 | |||
Miscellaneous | 197,312 | |||
|
| |||
Total Expenses | 7,186,983 | |||
|
| |||
NET INVESTMENT INCOME | 3,344,535 | |||
|
| |||
REALIZED AND UNREALIZED GAIN (LOSS) ON INVESTMENTS AND FOREIGN CURRENCY: | ||||
Net realized gain (loss) on- | ||||
Investments | 69,852,809 | |||
In-kind redemptions (Note 2) | 19,818,286 | |||
Foreign currency and translation of other assets and liabilities | (26,178 | ) | ||
|
| |||
| 89,644,917 | ||||
|
| |||
Net change in unrealized appreciation (depreciation) on- | ||||
Investments | 23,269,603 | |||
Foreign currency and translation of other assets and liabilities | 18,555 | |||
|
| |||
| 23,288,158 | ||||
|
| |||
NET REALIZED AND UNREALIZED GAIN (LOSS) ON INVESTMENTS AND FOREIGN CURRENCY | 112,933,075 | |||
|
| |||
NET INCREASE IN NET ASSETS RESULTING FROM OPERATIONS | $ | 116,277,610 | ||
|
| |||
The accompanying notes are an integral part of the financial statements.
96
Statements of Changes in Net Assets - Pro-Blend® Maximum Term Series
| FOR THE YEAR ENDED 10/31/17 | FOR THE YEAR ENDED 10/31/16 | |||||||
INCREASE (DECREASE) IN NET ASSETS: | ||||||||
OPERATIONS: | ||||||||
Net investment income | $ | 3,344,535 | $ | 1,631,301 | ||||
Net realized gain (loss) on investments and foreign currency | 69,826,631 | 18,712,844 | ||||||
Net realized gain (loss) from In-kind redemption transactions | 19,818,286 | — | ||||||
Net change in unrealized appreciation (depreciation) on investments and foreign currency | 23,288,158 | 3,782,579 | ||||||
|
|
|
| |||||
Net increase from operations | 116,277,610 | 24,126,724 | ||||||
|
|
|
| |||||
DISTRIBUTIONS TO SHAREHOLDERS (Note 8): | ||||||||
From net investment income (Class S) | (600,809 | ) | (504,835 | ) | ||||
From net investment income (Class I) | (2,056,295 | ) | (2,578,578 | ) | ||||
From net investment income (Class R) | (53,919 | ) | (2,397 | ) | ||||
From net investment income (Class R2) | (55,249 | ) | — | |||||
From net realized gain on investments (Class S) | (6,955,479 | ) | (4,922,030 | ) | ||||
From net realized gain on investments (Class I) | (10,738,795 | ) | (7,283,833 | ) | ||||
From net realized gain on investments (Class R) | (651,177 | ) | (432,975 | ) | ||||
From net realized gain on investments (Class R2) | (1,850,870 | ) | (1,010,562 | ) | ||||
|
|
|
| |||||
Total distributions to shareholders | (22,962,593 | ) | (16,735,210 | ) | ||||
|
|
|
| |||||
CAPITAL STOCK ISSUED AND REPURCHASED: | ||||||||
Net decrease from capital share transactions (Note 5) | (345,403,390 | ) | (244,745,906 | ) | ||||
|
|
|
| |||||
Net decrease in net assets | (252,088,373 | ) | (237,354,392 | ) | ||||
NET ASSETS: | ||||||||
Beginning of year | 745,979,261 | 983,333,653 | ||||||
|
|
|
| |||||
End of year (including undistributed net investment income of $668,961 and distributions in excess of net investment income of $1,884, respectively) | $ | 493,890,888 | $ | 745,979,261 | ||||
|
|
|
| |||||
The accompanying notes are an integral part of the financial statements.
97
Financial Highlights - Pro-Blend® Maximum Term Series - Class S
| FOR THE YEAR ENDED | ||||||||||||||||||||
| 10/31/17 | 10/31/16 | 10/31/15 | 10/31/14 | 10/31/13 | ||||||||||||||||
Per share data (for a share outstanding throughout each year): | ||||||||||||||||||||
Net asset value - Beginning of year | $ | 18.71 | $ | 18.30 | $ | 20.86 | $ | 21.01 | $ | 17.00 | ||||||||||
|
|
|
|
|
|
|
|
|
| |||||||||||
Income (loss) from investment operations: | ||||||||||||||||||||
Net investment income1 | 0.09 | 0.03 | 0.09 | 0.09 | 0.08 | |||||||||||||||
Net realized and unrealized gain (loss) on investments | 3.32 | 0.59 | (0.54 | ) | 1.60 | 4.29 | ||||||||||||||
|
|
|
|
|
|
|
|
|
| |||||||||||
Total from investment operations | 3.41 | 0.62 | (0.45 | ) | 1.69 | 4.37 | ||||||||||||||
|
|
|
|
|
|
|
|
|
| |||||||||||
Less distributions to shareholders: | ||||||||||||||||||||
From net investment income | (0.04 | ) | (0.02 | ) | (0.05 | ) | (0.04 | ) | (0.04 | ) | ||||||||||
From net realized gain on investments | (0.37 | ) | (0.19 | ) | (2.06 | ) | (1.80 | ) | (0.32 | ) | ||||||||||
|
|
|
|
|
|
|
|
|
| |||||||||||
Total distributions to shareholders | (0.41 | ) | (0.21 | ) | (2.11 | ) | (1.84 | ) | (0.36 | ) | ||||||||||
|
|
|
|
|
|
|
|
|
| |||||||||||
Net asset value - End of year | $ | 21.71 | $ | 18.71 | $ | 18.30 | $ | 20.86 | $ | 21.01 | ||||||||||
|
|
|
|
|
|
|
|
|
| |||||||||||
Net assets - End of year (000’s omitted) | $ | 306,055 | $ | 367,227 | $ | 503,378 | $ | 597,578 | $ | 530,510 | ||||||||||
|
|
|
|
|
|
|
|
|
| |||||||||||
Total return2 | 18.60 | % | 3.45 | % | (2.03 | %) | 8.80 | % | 26.13 | % | ||||||||||
Ratios (to average net assets)/Supplemental Data: | ||||||||||||||||||||
Expenses | 1.10 | % | 1.08 | % | 1.08 | % | 1.07 | % | 1.07 | % | ||||||||||
Net investment income | 0.45 | % | 0.15 | % | 0.45 | % | 0.45 | % | 0.43 | % | ||||||||||
Series portfolio turnover | 85 | % | 49 | % | 59 | % | 74 | % | 67 | % | ||||||||||
1Calculated based on average shares outstanding during the years.
2Represents aggregate total return for the years indicated, and assumes reinvestment of all distributions.
The accompanying notes are an integral part of the financial statements.
98
Financial Highlights - Pro-Blend® Maximum Term Series - Class I
| FOR THE YEAR ENDED | ||||||||||||||||||||
| 10/31/17 | 10/31/16 | 10/31/15 | 10/31/14 | 10/31/13 | ||||||||||||||||
Per share data (for a share outstanding throughout each year): | ||||||||||||||||||||
Net asset value - Beginning of year | $ | 10.19 | $ | 10.09 | $ | 12.51 | $ | 13.35 | $ | 10.95 | ||||||||||
|
|
|
|
|
|
|
|
|
| |||||||||||
Income (loss) from investment operations: | ||||||||||||||||||||
Net investment income1 | 0.08 | 0.04 | 0.08 | 0.09 | 0.08 | |||||||||||||||
Net realized and unrealized gain (loss) on investments | 1.78 | 0.32 | (0.33 | ) | 0.96 | 2.72 | ||||||||||||||
|
|
|
|
|
|
|
|
|
| |||||||||||
Total from investment operations | 1.86 | 0.36 | (0.25 | ) | 1.05 | 2.80 | ||||||||||||||
|
|
|
|
|
|
|
|
|
| |||||||||||
Less distributions to shareholders: | ||||||||||||||||||||
From net investment income | (0.08 | ) | (0.07 | ) | (0.11 | ) | (0.09 | ) | (0.08 | ) | ||||||||||
From net realized gain on investments | (0.37 | ) | (0.19 | ) | (2.06 | ) | (1.80 | ) | (0.32 | ) | ||||||||||
|
|
|
|
|
|
|
|
|
| |||||||||||
Total distributions to shareholders | (0.45 | ) | (0.26 | ) | (2.17 | ) | (1.89 | ) | (0.40 | ) | ||||||||||
|
|
|
|
|
|
|
|
|
| |||||||||||
Net asset value - End of year | $ | 11.60 | $ | 10.19 | $ | 10.09 | $ | 12.51 | $ | 13.35 | ||||||||||
|
|
|
|
|
|
|
|
|
| |||||||||||
Net assets - End of year (000’s omitted) | $ | 114,391 | $ | 301,846 | $ | 390,931 | $ | 504,866 | $ | 418,785 | ||||||||||
|
|
|
|
|
|
|
|
|
| |||||||||||
Total return2 | 18.97 | % | 3.69 | % | (1.82 | %) | 9.10 | % | 26.35 | % | ||||||||||
Ratios (to average net assets)/Supplemental Data: | ||||||||||||||||||||
Expenses | 0.85 | % | 0.83 | % | 0.83 | % | 0.82 | % | 0.82 | % | ||||||||||
Net investment income | 0.72 | % | 0.40 | % | 0.71 | % | 0.70 | % | 0.66 | % | ||||||||||
Series portfolio turnover | 85 | % | 49 | % | 59 | % | 74 | % | 67 | % | ||||||||||
1Calculated based on average shares outstanding during the years.
2Represents aggregate total return for the years indicated, and assumes reinvestment of all distributions.
The accompanying notes are an integral part of the financial statements.
99
Financial Highlights - Pro-Blend® Maximum Term Series - Class R
| FOR THE YEAR ENDED | ||||||||||||||||||||
| 10/31/17 | 10/31/16 | 10/31/15 | 10/31/14 | 10/31/13 | ||||||||||||||||
Per share data (for a share outstanding throughout each year): | ||||||||||||||||||||
Net asset value - Beginning of year | $ | 12.48 | $ | 12.28 | $ | 14.73 | $ | 15.39 | $ | 12.56 | ||||||||||
|
|
|
|
|
|
|
|
|
| |||||||||||
Income (loss) from investment operations: | ||||||||||||||||||||
Net investment income (loss)1 | 0.03 | (0.01 | ) | 0.03 | 0.03 | 0.02 | ||||||||||||||
Net realized and unrealized gain (loss) on investments | 2.17 | 0.40 | (0.38 | ) | 1.13 | 3.15 | ||||||||||||||
|
|
|
|
|
|
|
|
|
| |||||||||||
Total from investment operations | 2.20 | 0.39 | (0.35 | ) | 1.16 | 3.17 | ||||||||||||||
|
|
|
|
|
|
|
|
|
| |||||||||||
Less distributions to shareholders: | ||||||||||||||||||||
From net investment income | (0.03 | ) | (0.00 | )2 | (0.04 | ) | (0.02 | ) | (0.02 | ) | ||||||||||
From net realized gain on investments | (0.37 | ) | (0.19 | ) | (2.06 | ) | (1.80 | ) | (0.32 | ) | ||||||||||
|
|
|
|
|
|
|
|
|
| |||||||||||
Total distributions to shareholders | (0.40 | ) | (0.19 | ) | (2.10 | ) | (1.82 | ) | (0.34 | ) | ||||||||||
|
|
|
|
|
|
|
|
|
| |||||||||||
Net asset value - End of year | $ | 14.28 | $ | 12.48 | $ | 12.28 | $ | 14.73 | $ | 15.39 | ||||||||||
|
|
|
|
|
|
|
|
|
| |||||||||||
Net assets - End of year (000’s omitted) | $ | 17,404 | $ | 22,153 | $ | 31,517 | $ | 38,166 | $ | 33,162 | ||||||||||
|
|
|
|
|
|
|
|
|
| |||||||||||
Total return3 | 18.21 | % | 3.26 | % | (2.28 | %) | 8.53 | % | 25.81 | % | ||||||||||
Ratios (to average net assets)/Supplemental Data: | ||||||||||||||||||||
Expenses | 1.35 | % | 1.33 | % | 1.33 | % | 1.32 | % | 1.32 | % | ||||||||||
Net investment income (loss) | 0.22 | % | (0.10 | %) | 0.20 | % | 0.20 | % | 0.14 | % | ||||||||||
Series portfolio turnover | 85 | % | 49 | % | 59 | % | 74 | % | 67 | % | ||||||||||
1Calculated based on average shares outstanding during the years.
2Less than $0.01.
3Represents aggregate total return for the years indicated, and assumes reinvestment of all distributions.
The accompanying notes are an integral part of the financial statements.
100
Financial Highlights - Pro-Blend® Maximum Term Series - Class R2*
| FOR THE YEAR ENDED | ||||||||||||||||||||
| 10/31/17 | 10/31/16 | 10/31/15 | 10/31/14 | 10/31/13 | ||||||||||||||||
Per share data (for a share outstanding throughout | ||||||||||||||||||||
Net asset value - Beginning of year | $ | 10.68 | $ | 10.60 | $ | 13.03 | $ | 13.86 | $ | 11.38 | ||||||||||
|
|
|
|
|
|
|
|
|
| |||||||||||
Income (loss) from investment operations: | ||||||||||||||||||||
Net investment loss1 | (0.03 | ) | (0.06 | ) | (0.03 | ) | (0.04 | ) | (0.04 | ) | ||||||||||
Net realized and unrealized gain (loss) on investments | 1.86 | 0.33 | (0.34 | ) | 1.01 | 2.84 | ||||||||||||||
|
|
|
|
|
|
|
|
|
| |||||||||||
Total from investment operations | 1.83 | 0.27 | (0.37 | ) | 0.97 | 2.80 | ||||||||||||||
|
|
|
|
|
|
|
|
|
| |||||||||||
Less distributions to shareholders: | ||||||||||||||||||||
From net investment income | (0.01 | ) | — | (0.00 | )2 | (0.00 | )2 | — | ||||||||||||
From net realized gain on investments | (0.37 | ) | (0.19 | ) | (2.06 | ) | (1.80 | ) | (0.32 | ) | ||||||||||
|
|
|
|
|
|
|
|
|
| |||||||||||
Total distributions to shareholders | (0.38 | ) | (0.19 | ) | (2.06 | ) | (1.80 | ) | (0.32 | ) | ||||||||||
|
|
|
|
|
|
|
|
|
| |||||||||||
Net asset value - End of year | $ | 12.13 | $ | 10.68 | $ | 10.60 | $ | 13.03 | $ | 13.86 | ||||||||||
|
|
|
|
|
|
|
|
|
| |||||||||||
Net assets - End of year (000’s omitted) | $ | 56,040 | $ | 54,753 | $ | 57,507 | $ | 55,781 | $ | 36,989 | ||||||||||
|
|
|
|
|
|
|
|
|
| |||||||||||
Total return3 | 17.78 | % | 2.62 | % | (2.76 | %) | 8.06 | % | 25.17 | % | ||||||||||
Ratios (to average net assets)/Supplemental Data: | ||||||||||||||||||||
Expenses | 1.85 | % | 1.83 | % | 1.83 | % | 1.82 | % | 1.82 | % | ||||||||||
Net investment loss | (0.31 | %) | (0.61 | %) | (0.30 | %) | (0.30 | %) | (0.35 | %) | ||||||||||
Series portfolio turnover | 85 | % | 49 | % | 59 | % | 74 | % | 67 | % | ||||||||||
*Effective March 1, 2017, Class C shares of the Series have been redesignated as Class R2 shares.
1Calculated based on average shares outstanding during the years.
2Less than $0.01.
3Represents aggregate total return for the years indicated, and assumes reinvestment of all distributions.
The accompanying notes are an integral part of the financial statements.
101
Notes to Financial Statements
| 1. | Organization |
Pro-Blend® Conservative Term Series, Pro-Blend® Moderate Term Series, Pro-Blend® Extended Term Series and Pro-Blend® Maximum Term Series (each the “Series”) are no-load diversified series of Manning & Napier Fund, Inc. (the “Fund”). The Fund is organized in Maryland and is registered under the Investment Company Act of 1940 (the “1940 Act”), as amended, as an open-end management investment company.
The Series are asset allocation funds. Each invests in a combination of stocks, bonds and cash and is managed according to specific objectives. The objectives are as follows: Pro-Blend® Conservative Term Series - primary objective is preservation of capital; secondary objective is to provide income and long-term growth of capital. Pro-Blend® Moderate Term Series - equal emphasis on long-term growth of capital and preservation of capital. Pro-Blend® Extended Term Series - primary objective is long-term growth of capital; secondary objective is preservation of capital. Pro-Blend® Maximum Term Series - primary objective is long-term growth of capital.
Each Series is authorized to issue four classes of shares (Class S, I, R and R2). Each class of shares is substantially the same, except that class-specific distribution and shareholder servicing expenses are borne by the specific class of shares to which they relate.
The Fund’s Advisor is Manning & Napier Advisors, LLC (the “Advisor”). Shares of each Series are offered to investors and employees of the Advisor and its affiliates. Effective March 1, 2017, Class C shares of each Series have been redesignated as Class R2 shares. The total authorized capital stock of the Fund consists of 15 billion shares of common stock each having a par value of $0.01. As of October 31, 2017, 10.6 billion shares have been designated in total among 39 series, of which 162.5 million have been designated as Pro-Blend® Conservative Term Series Class S common stock, 75 million have been designated as Pro-Blend® Conservative Term Series Class I common stock, 125 million each have been designated as Class S common stock and Class I common stock for Pro-Blend® Moderate Term Series, 125 million each have been designated as Class S common stock for Pro-Blend® Extended Term Series and Pro-Blend® Maximum Term Series, 200 million each have been designated as Class I common stock for Pro-Blend® Extended Term Series and Pro-Blend® Maximum Term Series, 52.5 million have been designated in each of the Series as Class R common stock, and 25 million have been designated in each of the Series as Class R2 common stock.
| 2. | Significant Accounting Policies |
The following is a summary of significant accounting policies followed by the Series. Each Series is an investment company and, accordingly, follows the investment company accounting and reporting guidance of the Financial Accounting Standards Board Accounting Standards Codification Topic 946 - Investment Companies, which is part of accounting principles generally accepted in the United States of America (“GAAP”).
Security Valuation
Portfolio securities, including domestic equities, foreign equities, warrants and options, listed on an exchange other than the NASDAQ Stock Market are valued at the latest quoted sales price of the exchange on which the security is primarily traded. Securities not traded on valuation date or securities not listed on an exchange are valued at the latest quoted bid price provided by the Fund’s pricing service. Securities listed on the NASDAQ Stock Market are valued in accordance with the NASDAQ Official Closing Price.
Debt securities, including government bonds, foreign bonds, asset-backed securities, structured notes, supranational obligations, sovereign bonds, corporate bonds and mortgage-backed securities will normally be valued on the basis of evaluated bid prices provided directly by an independent pricing service. The pricing services use multiple valuation techniques to determine fair value. In instances where sufficient market activity exists, the pricing services may utilize a market-based approach through which quotes from market makers are used to determine fair value. In instances where sufficient market activity may not exist or is limited, the pricing services also utilize proprietary valuation models which may consider market characteristics such as benchmark yield curves, option-adjusted spreads, credit spreads, estimated defaulted rates, coupon rates, anticipated timing of principal repayments, underlying collateral and other unique security features in order to estimate the relevant cash flows, which are then discounted to calculate the fair value. Certain investments in securities held by the Series may be valued on a
102
Notes to Financial Statements (continued)
| 2. | Significant Accounting Policies (continued) |
Security Valuation (continued)
basis of a price provided directly by a principal market maker. These prices may differ from the value that would have been used had a broader market for securities existed.
Short-term investments that mature in sixty days or less may be valued at amortized cost, which approximates fair value. Investments in open-end investment companies are valued at their net asset value per share on valuation date.
Volume and level of activity in established markets for an asset or liability are evaluated to determine whether recent transactions and quoted prices are determinative of fair value. Where there have been significant decreases in volume and level of activity, further analysis and adjustment may be necessary to estimate fair value. The Series measure fair value in these instances by the use of inputs and valuation techniques which may be based upon current market prices of securities that are comparable in coupon, rating, maturity and industry and/or expectation of future cash flows. As a result of trading in relatively thin markets and/or markets that experience significant volatility, the prices used by the Series to value these securities may differ from the value that would be realized if these securities were sold, and the differences could be material.
Securities for which representative valuations or prices are not available from the Series’ pricing service may be valued at fair value as determined in good faith by the Advisor under procedures approved by and under the general supervision and responsibility of the Fund’s Board of Directors (the “Board”). Due to the inherent uncertainty of valuations of such securities, the fair value may differ significantly from the values that would have been used had a ready market for such securities existed. If trading or events occurring after the close of the principal market in which securities are traded are expected to materially affect the value of those securities, then they may be valued at their fair value, taking this trading or these events into account. In accordance with the procedures approved by the Board, the values of certain securities trading outside the U.S. were adjusted following the close of local trading using a factor from a third party vendor. The third party vendor uses statistical analyses and quantitative models, which consider among other things subsequent movement and changes in the prices of indices, securities and exchange rates in other markets, to determine the factors which are used to adjust local market prices. The value of securities used for net asset value calculation under these procedures may differ from published prices for the same securities. It is the Fund’s policy to classify each foreign equity security where a factor from a third party vendor is provided as a Level 2 security.
Various inputs are used in determining the value of the Series’ assets or liabilities carried at fair value. These inputs are summarized in three broad levels. Level 1 includes quoted prices in active markets for identical assets and liabilities. Level 2 includes other significant observable inputs (including quoted prices for similar securities, interest rates, prepayment speeds, credit risk, etc.). Level 3 includes significant unobservable inputs (including the Series’ own assumptions in determining the fair value of investments). A financial instruments’ level within the fair value hierarchy is based on the lowest level of any input both individually and in aggregate that is significant to their fair value measure. The inputs or methodology used for valuing securities are not necessarily an indication of the risk associated with investing in those securities.
The following is a summary of the valuation levels used for major security types as of October 31, 2017 in valuing the Series’ assets or liabilities carried at fair value:
| PRO-BLEND® CONSERVATIVE TERM SERIES | ||||||||||||||||
| DESCRIPTION | TOTAL | LEVEL 1 | LEVEL 2 | LEVEL 3 | ||||||||||||
Assets: | ||||||||||||||||
Equity securities: | ||||||||||||||||
Consumer Discretionary | $ | 23,129,125 | $ | 23,129,125 | $ | — | $ | — | ||||||||
Consumer Staples | 25,819,640 | 16,072,957 | 9,746,683 | — | ||||||||||||
Energy | 16,815,437 | 16,437,923 | 377,514 | — | ||||||||||||
Financials | 18,374,960 | 18,374,960 | — | — | ||||||||||||
Health Care | 63,512,830 | 61,844,329 | 1,668,501 | — | ||||||||||||
Industrials | 32,678,193 | 32,678,193 | — | — | ||||||||||||
Information Technology | 69,326,901 | 66,031,076 | 3,295,825 | — | * | |||||||||||
103
Notes to Financial Statements (continued)
| 2. | Significant Accounting Policies (continued) |
Security Valuation (continued)
| PRO-BLEND® CONSERVATIVE TERM SERIES | ||||||||||||||||
| DESCRIPTION | TOTAL | LEVEL 1 | LEVEL 2 | LEVEL 3 | ||||||||||||
Materials | $ | 17,803,908 | $ | 17,017,184 | $ | 786,724 | $ | — | ||||||||
Real Estate | 27,549,465 | 27,059,170 | 490,295 | — | ||||||||||||
Telecommunication Services | 4,584,607 | 4,584,607 | — | — | ||||||||||||
Utilities | 1,219,083 | 1,219,083 | — | — | ||||||||||||
Debt securities: | ||||||||||||||||
U.S. Treasury and other U.S. | ||||||||||||||||
Government agencies | 313,145,202 | — | 313,145,202 | — | ||||||||||||
Corporate debt: | ||||||||||||||||
Consumer Discretionary | 26,218,291 | — | 26,218,291 | — | ||||||||||||
Consumer Staples | 12,079,049 | — | 12,079,049 | — | ||||||||||||
Energy | 29,393,874 | — | 29,393,874 | — | ||||||||||||
Financials | 67,725,136 | — | 67,725,136 | — | ||||||||||||
Health Care | 5,770,735 | — | 5,770,735 | — | ||||||||||||
Industrials | 6,468,098 | — | 6,468,098 | — | ||||||||||||
Information Technology | 13,861,336 | — | 13,861,336 | — | ||||||||||||
Materials | 19,241,589 | — | 19,241,589 | — | ||||||||||||
Real Estate | 6,039,879 | — | 6,039,879 | — | ||||||||||||
Telecommunication Services | 11,381,940 | — | 11,381,940 | — | ||||||||||||
Utilities | 5,967,815 | — | 5,967,815 | — | ||||||||||||
Asset-backed securities | 28,915,223 | — | 28,915,223 | — | ||||||||||||
Commercial mortgage-backed securities | 79,101,998 | — | 79,101,998 | — | ||||||||||||
Foreign government bonds | 24,019,752 | — | 24,019,752 | — | ||||||||||||
Mutual funds | 12,454,791 | 12,454,791 | — | — | ||||||||||||
|
|
|
|
|
|
|
| |||||||||
Total assets | 962,598,857 | 296,903,398 | 665,695,459 | — | ||||||||||||
|
|
|
|
|
|
|
| |||||||||
Liabilities: | ||||||||||||||||
Other financial instruments**: | ||||||||||||||||
Equity contracts | (73,138 | ) | (47,536 | ) | (25,602 | ) | — | |||||||||
|
|
|
|
|
|
|
| |||||||||
Total liabilities | (73,138 | ) | (47,536 | ) | (25,602 | ) | — | |||||||||
|
|
|
|
|
|
|
| |||||||||
Total | $ | 962,525,719 | $ | 296,855,862 | $ | 665,669,857 | $ | — | ||||||||
|
|
|
|
|
|
|
| |||||||||
| PRO-BLEND® MODERATE TERM SERIES | ||||||||||||||||
| DESCRIPTION | TOTAL | LEVEL 1 | LEVEL 2 | LEVEL 3 | ||||||||||||
Assets: | ||||||||||||||||
Equity securities: | ||||||||||||||||
Consumer Discretionary | $ | 21,391,092 | $ | 20,254,414 | $ | 1,136,678 | $ | — | ||||||||
Consumer Staples | 21,427,363 | 9,505,589 | 11,921,774 | — | ||||||||||||
Energy | 10,932,187 | 10,748,405 | 183,782 | — | ||||||||||||
Financials | 6,684,194 | 3,224,363 | 3,459,831 | — | ||||||||||||
Health Care | 60,222,233 | 59,089,537 | 1,132,696 | — | ||||||||||||
Industrials | 26,305,613 | 20,442,815 | 5,862,798 | — | ||||||||||||
Information Technology | 72,590,535 | 65,750,124 | 6,840,411 | — | * | |||||||||||
Materials | 16,189,379 | 14,203,668 | 1,985,711 | — | ||||||||||||
Real Estate | 16,323,594 | 15,745,271 | 578,323 | — | ||||||||||||
Telecommunication Services | 4,257,138 | 4,054,947 | 202,191 | — | ||||||||||||
Utilities | 570,472 | 235,370 | 335,102 | — | ||||||||||||
Debt securities: | ||||||||||||||||
U.S. Treasury and other U.S. | ||||||||||||||||
Government agencies | 213,042,266 | — | 213,042,266 | — | ||||||||||||
104
Notes to Financial Statements (continued)
| 2. | Significant Accounting Policies (continued) |
Security Valuation (continued)
| PRO-BLEND® MODERATE TERM SERIES | ||||||||||||||||
| DESCRIPTION | TOTAL | LEVEL 1 | LEVEL 2 | LEVEL 3 | ||||||||||||
Corporate debt: | ||||||||||||||||
Consumer Discretionary | $ | 17,431,475 | $ | — | $ | 17,431,475 | $ | — | ||||||||
Consumer Staples | 6,846,666 | — | 6,846,666 | — | ||||||||||||
Energy | 18,349,399 | — | 18,349,399 | — | ||||||||||||
Financials | 42,151,279 | — | 42,151,279 | — | ||||||||||||
Health Care | 3,587,191 | — | 3,587,191 | — | ||||||||||||
Industrials | 4,885,117 | ��� | 4,885,117 | — | ||||||||||||
Information Technology | 6,959,942 | — | 6,959,942 | — | ||||||||||||
Materials | 12,177,241 | — | 12,177,241 | — | ||||||||||||
Real Estate | 3,887,560 | — | 3,887,560 | — | ||||||||||||
Telecommunication Services | 7,072,410 | — | 7,072,410 | — | ||||||||||||
Utilities | 3,785,805 | — | 3,785,805 | — | ||||||||||||
Asset-backed securities | 23,569,639 | — | 23,569,639 | — | ||||||||||||
Commercial mortgage-backed securities | 48,470,061 | — | 48,470,061 | — | ||||||||||||
Foreign government bonds | 17,386,102 | — | 17,386,102 | — | ||||||||||||
Mutual funds | 18,023,705 | 18,023,705 | — | — | ||||||||||||
|
|
|
|
|
|
|
| |||||||||
Total assets | 704,519,658 | 241,278,208 | 463,241,450 | — | ||||||||||||
|
|
|
|
|
|
|
| |||||||||
Liabilities: | ||||||||||||||||
Other financial instruments**: | ||||||||||||||||
Equity contracts | (89,122 | ) | (57,314 | ) | (31,808 | ) | — | |||||||||
|
|
|
|
|
|
|
| |||||||||
Total liabilities | (89,122 | ) | (57,314 | ) | (31,808 | ) | — | |||||||||
|
|
|
|
|
|
|
| |||||||||
Total | $ | 704,430,536 | $ | 241,220,894 | $ | 463,209,642 | $ | — | ||||||||
|
|
|
|
|
|
|
| |||||||||
| PRO-BLEND® EXTENDED TERM SERIES | ||||||||||||||||
| DESCRIPTION | TOTAL | LEVEL 1 | LEVEL 2 | LEVEL 3 | ||||||||||||
Assets: | ||||||||||||||||
Equity securities: | ||||||||||||||||
Consumer Discretionary | $ | 27,291,048 | $ | 25,799,228 | $ | 1,491,820 | $ | — | ||||||||
Consumer Staples | 27,989,635 | 12,326,428 | 15,663,207 | — | ||||||||||||
Energy | 13,684,423 | 13,443,098 | 241,325 | — | ||||||||||||
Financials | 8,657,767 | 4,155,672 | 4,502,095 | — | ||||||||||||
Health Care | 79,160,817 | 77,687,894 | 1,472,923 | — | ||||||||||||
Industrials | 35,247,845 | 27,202,038 | 8,045,807 | — | ||||||||||||
Information Technology | 95,179,934 | 86,305,833 | 8,874,101 | — | * | |||||||||||
Materials | 21,074,619 | 18,375,364 | 2,699,255 | — | ||||||||||||
Real Estate | 19,145,104 | 18,446,327 | 698,777 | — | ||||||||||||
Telecommunication Services | 5,464,977 | 5,215,358 | 249,619 | — | ||||||||||||
Utilities | 746,716 | 308,966 | 437,750 | — | ||||||||||||
Debt securities: | ||||||||||||||||
U.S. Treasury and other U.S. | ||||||||||||||||
Government agencies | 180,104,245 | — | 180,104,245 | — | ||||||||||||
Corporate debt: | ||||||||||||||||
Consumer Discretionary | 13,103,445 | — | 13,103,445 | — | ||||||||||||
Consumer Staples | 5,337,795 | — | 5,337,795 | — | ||||||||||||
Energy | 14,461,433 | — | 14,461,433 | — | ||||||||||||
Financials | 30,881,871 | — | 30,881,871 | — | ||||||||||||
Health Care | 3,138,527 | — | 3,138,527 | — | ||||||||||||
Industrials | 1,767,804 | — | 1,767,804 | — | ||||||||||||
Information Technology | 6,283,008 | — | 6,283,008 | — | ||||||||||||
105
Notes to Financial Statements (continued)
| 2. | Significant Accounting Policies (continued) |
Security Valuation (continued)
| PRO-BLEND® EXTENDED TERM SERIES | ||||||||||||||||
| DESCRIPTION | TOTAL | LEVEL 1 | LEVEL 2 | LEVEL 3 | ||||||||||||
Materials | $ | 9,413,943 | $ | — | $ | 9,413,943 | $ | — | ||||||||
Real Estate | 2,895,042 | — | 2,895,042 | — | ||||||||||||
Telecommunication Services | 5,884,543 | — | 5,884,543 | — | ||||||||||||
Utilities | 2,820,857 | — | 2,820,857 | — | ||||||||||||
Asset-backed securities | 18,984,026 | — | 18,984,026 | — | ||||||||||||
Commercial mortgage-backed securities | 35,836,948 | — | 35,836,948 | — | ||||||||||||
Foreign government bonds | 12,545,900 | — | 12,545,900 | — | ||||||||||||
Mutual funds | 15,745,448 | 15,745,448 | — | — | ||||||||||||
|
|
|
|
|
|
|
| |||||||||
Total assets | 692,847,720 | 305,011,654 | 387,836,066 | — | ||||||||||||
|
|
|
|
|
|
|
| |||||||||
Liabilities: | ||||||||||||||||
Other financial instruments** | ||||||||||||||||
Equity contracts | (118,118 | ) | (75,190 | ) | (42,928 | ) | — | |||||||||
|
|
|
|
|
|
|
| |||||||||
Total liabilities | (118,118 | ) | (75,190 | ) | (42,928 | ) | — | |||||||||
|
|
|
|
|
|
|
| |||||||||
Total | $ | 692,729,602 | $ | 304,936,464 | $ | 387,793,138 | $ | — | ||||||||
|
|
|
|
|
|
|
| |||||||||
| PRO-BLEND® MAXIMUM TERM SERIES | ||||||||||||||||
| DESCRIPTION | TOTAL | LEVEL 1 | LEVEL 2 | LEVEL 3 | ||||||||||||
Assets: | ||||||||||||||||
Equity securities: | ||||||||||||||||
Consumer Discretionary | $ | 44,372,733 | $ | 43,362,841 | $ | 1,009,892 | $ | — | ||||||||
Consumer Staples | 51,020,276 | 25,598,412 | 25,421,864 | — | ||||||||||||
Energy | 11,881,219 | 11,725,324 | 155,895 | — | ||||||||||||
Financials | 24,768,663 | 16,594,523 | 8,174,140 | — | ||||||||||||
Health Care | 95,354,340 | 87,306,959 | 8,047,381 | — | ||||||||||||
Industrials | 40,976,376 | 30,905,532 | 10,070,844 | — | ||||||||||||
Information Technology | 100,852,093 | 93,813,506 | 7,038,587 | — | * | |||||||||||
Materials | 33,262,704 | 24,576,504 | 8,686,200 | — | ||||||||||||
Real Estate | 22,565,000 | 22,192,858 | 372,142 | — | ||||||||||||
Telecommunication Services | 6,904,790 | 6,713,832 | 190,958 | — | ||||||||||||
Utilities | 483,172 | 199,420 | 283,752 | — | ||||||||||||
Debt securities: | ||||||||||||||||
U.S. Treasury and other U.S. | ||||||||||||||||
Government agencies | 25,377,553 | — | 25,377,553 | — | ||||||||||||
Corporate debt: | ||||||||||||||||
Consumer Discretionary | 2,665,803 | — | 2,665,803 | — | ||||||||||||
Consumer Staples | 1,108,179 | — | 1,108,179 | — | ||||||||||||
Energy | 3,378,465 | — | 3,378,465 | — | ||||||||||||
Financials | 5,366,351 | — | 5,366,351 | — | ||||||||||||
Health Care | 686,195 | — | 686,195 | — | ||||||||||||
Industrials | 1,072,540 | — | 1,072,540 | — | ||||||||||||
Information Technology | 815,723 | — | 815,723 | — | ||||||||||||
Materials | 1,806,473 | — | 1,806,473 | — | ||||||||||||
Real Estate | 470,876 | — | 470,876 | — | ||||||||||||
Telecommunication Services | 1,287,587 | — | 1,287,587 | — | ||||||||||||
Utilities | 668,021 | — | 668,021 | — | ||||||||||||
Mutual funds | 15,006,596 | 15,006,596 | — | — | ||||||||||||
|
|
|
|
|
|
|
| |||||||||
Total assets | $ | 492,151,728 | $ | 377,996,307 | $ | 114,155,421 | $ | — | ||||||||
|
|
|
|
|
|
|
| |||||||||
106
Notes to Financial Statements (continued)
| 2. | Significant Accounting Policies (continued) |
Security Valuation (continued)
Please see the Investment Portfolio for each of the Series for foreign securities where a factor from a third party vendor was applied to determine the securities’ fair value following the close of local trading. Such securities are included in Level 2 in the table above.
There were no Level 3 securities held by any of the Pro-Blend® Series as of October 31, 2016.
*China literature ltd. - right is a Level 3 security as of October 31, 2017. However, there is no value for this security reported in the financial statements.
**Other financial instruments are exchange traded options (Level 1 and Level 2).
The Fund’s policy is to recognize transfers in and transfers out of the valuation levels as of the beginning of the reporting period. There were no transfers between levels during the year ended October 31, 2017.
In-Kind Redemptions
Each Series transferred securities and cash to shareholders in connection with an in-kind redemption transaction. For financial reporting purposes, these transactions were treated as a sale of securities and the resulting gains and losses were recognized based on the market value of the securities on the date of the redemption. During the year ended October 31, 2017, Pro-Blend® Conservative Term Series realized $3,897,625 of net gains on $83,007,579 of in-kind redemptions, Pro-Blend® Moderate Term Series realized $7,226,146 of net gains on $101,076,202 of in-kind redemptions, Pro-Blend® Extended Term Series realized $17,004,207 of net gain on $179,938,066 of in-kind redemptions and Pro-Blend® Maximum Term Series realized $19,818,286 of net gain on $129,806,330 of in-kind redemptions. Gains and losses realized on in-kind redemptions are not recognized for tax purposes and are reclassified from undistributed realized gain (loss) to paid-in capital. Net gains and losses resulting from such in-kind redemptions are shown in the Statement of Operations.
New Accounting Guidance
On August 1, 2017, the Fund implemented amendments to Regulation S-X, issued by the Securities and Exchange Commission, which require standardized, enhanced disclosures, particularly related to derivatives, in investment company financial statements. Adoption had no effect on the Fund’s net assets or results of operations.
Security Transactions, Investment Income and Expenses
Security transactions are accounted for on trade date. Dividend income is recorded on the ex-dividend date, except that if the ex-dividend date has passed, certain dividends from foreign securities are recorded as soon as the Series is informed of the ex-dividend date. Non-cash dividends, if any, are recorded at the fair value of the securities received. Interest income, including amortization of premium and accretion of discounts using the effective interest method, is earned from settlement date and accrued daily.
Expenses are recorded on an accrual basis. Most expenses of the Fund can be attributed to a specific series. Expenses which cannot be directly attributed are apportioned among the series in the Fund in such a manner as deemed equitable by the Fund’s Board, taking into consideration, among other things, the nature and type of expense.
Income, expenses (other than class specific expenses), and realized and unrealized gains and losses are prorated among the classes based on the relative net assets of each class. Class specific expenses are directly charged to that Class.
The Series use the identified cost method for determining realized gain or loss on investments for both financial statement and federal income tax reporting purposes.
Foreign Currency Translation
The books and records of the Series are maintained in U.S. dollars. Foreign currencies, investments and other assets and liabilities are translated into U.S. dollars at the current exchange rates. Purchases and sales of investment securities and
107
Notes to Financial Statements (continued)
| 2. | Significant Accounting Policies (continued) |
Foreign Currency Translation (continued)
income and expenses are translated on the respective dates of such transactions. The Series do not isolate realized and unrealized gains and losses attributable to changes in the exchange rates from gains and losses that arise from changes in the fair value of investments. Such fluctuations are included with net realized and unrealized gain or loss on investments. Net realized foreign currency gains and losses represent foreign currency gains and losses between trade date and settlement date on securities transactions, gains and losses on disposition of foreign currencies and the difference between the amount of income and foreign withholding taxes recorded on the books of the Series and the amounts actually received or paid.
Option Contracts
The Series may write (sell) or buy call or put options on securities and other financial instruments. When a Series writes a call, the Series gives the purchaser the right to buy the underlying security from the Series at the price specified in the option contract (the “exercise price”) at any time during the option period. When a Series writes a put option, the Series gives the purchaser the right to sell to the Series the underlying security at the exercise price at any time during the option period. The Series will only write options on a “covered basis.” This means that the Series will own the underlying security when the Series writes a call or the Series will put aside cash, U.S. Government securities, or other liquid assets in an amount not less than the exercise price at all times the put option is outstanding.
When a Series writes an option, an amount equal to the premium received is reflected as a liability and is subsequently marked-to-market to reflect the current market value of the option. The Series, as a writer of an option, has no control over whether the underlying security or financial instrument may be sold (call) or purchased (put) and, as a result, bears the market risk of an unfavorable change in the price of the security or financial instrument underlying the written option. There is a risk that the Series may not be able to enter into a closing transaction because of an illiquid market.
Each Series may also purchase options in an attempt to hedge against fluctuations in the value of its portfolio and to protect against declines in the value of the securities. The premium paid by a Series for the purchase of an option is reflected as an investment and subsequently marked-to-market to reflect the current market value of the option. The risk associated with purchasing options is limited to the premium paid.
When a security is purchased or sold through an exercise of an option, the related premium paid (or received) is added to (or deducted from) the basis of the security acquired or deducted from (or added to) the proceeds of the security sold. When an option expires (or a Series enters into a closing transaction), the Series realizes a gain or loss on the option to the extent of the premium received or paid (or gain or loss to the extent the cost of the closing transaction exceeds the premium paid or received).
The measurement of the risks associated with option contracts is meaningful only when all related and offsetting transactions are considered. The counterparty for the Series’ written options contracts outstanding during the year ended October 31, 2017 is Pershing LLC, a BNY Mellon Company.
Futures
Each Series may purchase or sell exchange-traded futures contracts, which are contracts that obligate the Series to make or take delivery of a financial instrument or the cash value of a security index at a specified future date at a specified price. The Series may use futures contracts to manage exposure to the stock and bond markets or changes in interest rates and currency values, or for gaining exposure to markets. Risks of entering into futures contracts include the possibility that there may be an illiquid market at the time the Advisor to the Series may be attempting to sell some or all the Series’ holdings or that a change in the value of the contract may not correlate with changes in the value of the underlying securities. Upon entering into a futures contract, a Series is required to deposit either cash or securities (initial margin). Subsequent payments (variation margin) are made or received by the Series, generally on a daily basis. The variation margin payments are equal to the daily changes in the contract value and are recorded as unrealized gains or losses. The Series recognize a realized gain or loss when the contract is closed or expires.
108
Notes to Financial Statements (continued)
| 2. | Significant Accounting Policies (continued) |
Futures (continued)
Futures transactions involve minimal counterparty risk since futures contracts are guaranteed against default by the exchange on which they trade. The Series’ futures contracts are not subject to master netting arrangements (the right to close out all transactions traded with a counterparty, and net amounts owed or due across transactions). At October 31, 2017, the Series did not hold any futures contracts.
The following table presents the present value of derivatives held at October 31, 2017 as reflected on the Statement of Assets and Liabilities, and the effect of the derivative instruments on the Statement of Operations:
| PRO-BLEND® CONSERVATIVE TERM SERIES | ||||||
| STATEMENT OF ASSETS AND LIABILITIES | ||||||
Derivative | Liabilities Location | |||||
Equity contracts | Options written, at value | $ | (73,138 | ) | ||
| STATEMENT OF OPERATIONS | ||||||
Derivative | Location of Gain or (Loss) on Derivatives | | Realized Gain (Loss) on Derivatives | | ||
Equity contracts | Net realized gain (loss) on options written | $ | 1,099,812 | |||
Derivative | Location of Appreciation (Depreciation) on Derivatives | | Unrealized Appreciation (Depreciation) on Derivatives | | ||
Equity contracts | Net change in unrealized appreciation (depreciation) on options written | $ | 5,181 | |||
| PRO-BLEND® MODERATE TERM SERIES | ||||||
| STATEMENT OF ASSETS AND LIABILITIES | ||||||
Derivative | Liabilities Location | |||||
Equity contracts | Options written, at value | $ | (89,122 | ) | ||
| STATEMENT OF OPERATIONS | ||||||
Derivative | Location of Gain or (Loss) on Derivatives | | Realized Gain (Loss) on Derivatives | | ||
Equity contracts | Net realized gain (loss) on options written | $ | 1,487,584 | |||
Derivative | Location of Appreciation (Depreciation) on Derivatives | | Unrealized Appreciation (Depreciation) on Derivatives | | ||
Equity contracts | Net change in unrealized appreciation (depreciation) on options written | $ | 3,558 | |||
109
Notes to Financial Statements (continued)
| 2. | Significant Accounting Policies (continued) |
| PRO-BLEND® EXTENDED TERM SERIES | ||||||
| STATEMENT OF ASSETS AND LIABILITIES | ||||||
Derivative | Liabilities Location | |||||
Equity contracts | Options written, at value | $ | (118,118 | ) | ||
| STATEMENT OF OPERATIONS | ||||||
Derivative | Location of Gain or (Loss) on Derivatives | | Realized Gain (Loss) on Derivatives | | ||
Equity contracts | Net realized gain (loss) on options written | $ | 2,177,143 | |||
Derivative | Location of Appreciation (Depreciation) on Derivatives | | Unrealized Appreciation (Depreciation) on Derivatives | | ||
Equity contracts | Net change in unrealized appreciation (depreciation) on options written | $ | 2,127 | |||
The average month-end balances for the year ended October 31, 2017, the period in which such derivatives were outstanding, were as follows:
| PRO-BLEND® CONSERVATIVE TERM SERIES | PRO-BLEND® MODERATE TERM SERIES | PRO-BLEND® EXTENDED TERM SERIES | ||||||||||
Options: |
| |||||||||||
Average number of option contracts written | 1,176 | 1,570 | 2,265 | |||||||||
Average notional value of option contracts written | $ | 9,141,986 | $ | 12,260,726 | $ | 17,786,343 | ||||||
Inflation-Indexed Bonds
Each Series may invest in inflation-indexed bonds. Inflation-indexed bonds are fixed income securities whose principal value is periodically adjusted according to the rate of inflation. If the index measuring inflation rises or falls, the principal value of inflation-indexed bonds will be adjusted upward or downward, and consequently the interest payable on these securities (calculated with respect to a larger or smaller principal amount) will be increased or reduced, respectively. Any upward or downward adjustment in the principal amount of an inflation-indexed bond will be included as interest income in the Statements of Operations, even though investors do not receive their principal until maturity. Repayment of the original bond principal upon maturity (as adjusted for inflation) is guaranteed in the case of U.S. Treasury inflation-indexed bonds. For bonds that do not provide a similar guarantee, the adjusted principal value of the bond repaid at maturity may be less than the original principal.
Securities Purchased on a When-Issued Basis or Forward Commitment
Each Series may purchase securities on a when-issued basis or forward commitment. These transactions involve a commitment by the Series to purchase securities for a predetermined price with payment and delivery taking place beyond the customary settlement period. When such purchases are outstanding, the Series will designate liquid assets in an amount sufficient to meet the purchase price. When purchasing a security on a delayed delivery basis, the Series assumes the rights and risks of ownership of the security, including the risk of price and yield fluctuations, and take such fluctuations into account when determining their net asset value. The Series may sell the when-issued securities before they are delivered, which may result in a capital gain or loss.
In connection with their ability to purchase or sell securities on a forward commitment basis, the Series may enter into forward roll transactions principally using To Be Announced (TBA) securities. Forward roll transactions require the sale of securities for delivery in the current month, and a simultaneous agreement to repurchase substantially similar (same type, coupon and maturity) securities on a specified future date. Risks of entering into forward roll transactions include the potential inability of the
110
Notes to Financial Statements (continued)
| 2. | Significant Accounting Policies (continued) |
Securities Purchased on a When-Issued Basis or Forward Commitment (continued)
counterparty to meet the terms of the agreement; the potential of the Series to receive inferior securities at redelivery as compared to the securities sold to the counterparty; counterparty credit risk; and the potential pay down speed variance between the mortgage-backed pools. During the roll period, the Series forgoes principal and interest paid on the securities. The Series accounts for such dollar rolls as purchases and sales. No such investments were held by the Series on October 31, 2017.
Interest Only Securities
The Series may invest in stripped mortgage-backed securities issued by the U.S. government, its agencies and instrumentalities. Stripped mortgage-backed securities are usually structured with two classes that receive different proportions of the interest and principal distributions on a pool of mortgage assets. In certain cases, one class will receive all of the interest (the interest-only or “IO” class), while the other class will receive all of the principal (the principal-only or “PO” class). The yield to maturity on IOs is sensitive to the rate of principal repayments (including prepayments) on the related underlying mortgage assets, and principal payments may have a material effect on yield to maturity. If the underlying mortgage assets experience greater than anticipated prepayments of principal, a Series may not fully recoup its initial investment in IOs.
Restricted Securities
Restricted securities are purchased in private placement transactions, are not registered under the Securities Act of 1933, as amended, and may have contractual restrictions on resale. Information regarding restricted securities is included at the end of each applicable Series’ Investment Portfolio.
Federal Taxes
Each Series’ policy is to comply with the provisions of the Internal Revenue Code applicable to regulated investment companies. The Series are not subject to federal income tax or excise tax to the extent that each Series distributes to shareholders each year its taxable income, including any net realized gains on investments, in accordance with requirements of the Internal Revenue Code. Accordingly, no provision for federal income tax or excise tax has been made in the financial statements.
Management evaluates its tax positions to determine if the tax positions taken meet the minimum recognition threshold in connection with accounting for uncertainties in income tax positions taken or expected to be taken for the purposes of measuring and recognizing tax liabilities in the financial statements. Recognition of tax benefits of an uncertain tax position is required only when the position is “more likely than not” to be sustained assuming examination by taxing authorities. At October 31, 2017, the Series have recorded no liability for net unrecognized tax benefits relating to uncertain income tax positions taken or expected to be taken in future tax returns.
The Series file income tax returns in the U.S. federal jurisdiction, various states and foreign jurisdictions, as required. No income tax returns are currently under investigation. The statute of limitations on the Series’ tax returns remains open for the years ended October 31, 2014 through October 31, 2017. The Fund is not aware of any tax positions for which it is reasonably possible that the total amounts of unrecognized tax benefits will significantly change in the next twelve months.
Foreign Taxes
Based on the Series’ understanding of the tax rules and rates related to income, gains and currency purchase/repatriation transactions for foreign jurisdictions in which they invest, the Series will provide for foreign taxes, and where appropriate, deferred foreign tax.
Distributions of Income and Gains
Distributions to shareholders of net investment income are made semi-annually. Distributions of net realized gains are made annually. An additional distribution may be necessary to avoid taxation of a Series. Distributions are recorded on the ex-dividend date.
Indemnifications
The Fund’s organizational documents provide former and current directors and officers with a limited indemnification against liabilities arising in connection with the performance of their duties to the Fund. In the normal course of business, the Fund may
111
Notes to Financial Statements (continued)
| 2. | Significant Accounting Policies (continued) |
Indemnifications (continued)
also enter into contracts that provide general indemnifications. The Fund’s maximum exposure under these arrangements is unknown as this would be dependent on future claims that may be made against the Fund. The risk of material loss from such claims is considered remote.
Other
The preparation of financial statements in conformity with GAAP requires management to make estimates and assumptions that affect the reported amounts of assets and liabilities and the disclosure of contingent assets and liabilities at the date of the financial statements and the reported amounts of income and expenses during the reporting period. Actual results could differ from those estimates.
| 3. | Transactions with Affiliates |
The Fund has an Investment Advisory Agreement (the “Agreement”) with the Advisor, for which each Series pays a fee, computed daily and payable monthly, at an annual rate of 0.60% for Pro-Blend® Conservative Term Series and 0.75% for Pro-Blend® Moderate Term Series, Pro-Blend® Extended Term Series and Pro-Blend® Maximum Term Series, of the Series’ average daily net assets.
Under the Agreement, personnel of the Advisor provide the Series with advice and assistance in the choice of investments and the execution of securities transactions, and otherwise maintain the Series’ organization. The Advisor also provides the Fund with necessary office space and fund administration and support services. The salaries of all officers of the Fund (except a percentage of the Fund’s Chief Compliance Officer’s salary, which is paid by the Fund), and of all Directors who are “affiliated persons” of the Fund, or of the Advisor, and all personnel of the Fund, or of the Advisor, performing services relating to research, statistical and investment activities, are paid by the Advisor. Each “non-affiliated” Director receives an annual stipend, which is allocated among all the active series of the Fund. In addition, these Directors also receive a fee per Board meeting attended plus a fee for each committee meeting attended and are reimbursed for travel and other out-of-pocket expenses incurred by them in connection with attending such meetings. The Fund also has an Audit Committee Chair, who receives an additional annual stipend for this role.
Class S shares of each Series are subject to a shareholder services fee in accordance with a shareholder services plan adopted by the Fund’s Board. The shareholder services fee is intended to compensate financial intermediaries, including affiliates of the Fund, in connection with the provision of direct client service, personal services, maintenance of shareholder accounts and reporting services. For these services, Class S of each Series pays a fee, computed daily and payable monthly, at an annual rate of 0.20% for Pro-Blend® Conservative Term Series Class S and 0.25% for Pro-Blend® Moderate Term Series Class S, Pro-Blend® Extended Term Series Class S and Pro-Blend® Maximum Term Series Class S, of the Class’ average daily net assets. The Fund has a Shareholder Services Agreement with the Advisor, for which the Advisor receives the shareholder services fee as stated above.
The Advisor has contractually agreed, until at least February 28, 2018, to waive its management fee and, if necessary, pay other operating expenses of the Series in order to maintain total direct annual fund operating expenses for the Series, exclusive of shareholder services fees and distribution and service fees (12b-1), at no more than the amounts presented in the following table, of average daily net assets each year.
| SERIES/CLASS | EXPENSE LIMIT | |||
Pro-Blend® Conservative Term Series | 0.70 | % | ||
Pro-Blend® Moderate Term Series | 0.85 | % | ||
Pro-Blend® Extended Term Series | 0.85 | % | ||
Pro-Blend® Maximum Term Series | 0.85 | % | ||
The Advisor is not eligible to recoup any expenses that have been waived or reimbursed in prior years.
112
Notes to Financial Statements (continued)
| 3. | Transactions with Affiliates (continued) |
During the year ended October 31, 2017, a trade processing error was discovered for which it was determined that the Advisor would reimburse the Series. The Advisor contributed $28,933 to Pro-Blend® Conservative Term Series, $24,934 to Pro-Blend® Extended Term Series, $28,933 to Pro-Blend® Moderate Term Series, and $9,644 to Pro-Blend® Maximum Term Series. The impact of the Advisor’s contribution on each Series’ total return was immaterial. As of October 31, 2017, the respective amounts are included in the capital shares transactions on the Statement of Changes in Net Assets.
Manning & Napier Investor Services, Inc., a registered broker-dealer affiliate of the Advisor, acts as distributor for the Fund’s shares. Each Series compensates the distributor for distributing and servicing the Series’ Class R2 and Class R shares pursuant to a distribution plan adopted under Rule 12b-1 of the 1940 Act, regardless of expenses actually incurred. Under the agreement, each Series pays distribution and services fees to the distributor at an annual rate of 1.00% of average daily net assets attributable to Class R2 shares and an annual rate of 0.50% of daily net assets attributable to Class R shares. There are no distribution and services fees on the Class S or Class I shares of each Series. The fees are accrued daily and paid monthly.
Pursuant to a master services agreement effective through February 28, 2017, the Fund paid the Advisor an annual fee related to fund accounting and administration of 0.0085% on the first $25 billion of average daily net assets (excluding Target Series and Strategic Income Series); 0.0075% on the next $15 billion of average daily net assets (excluding Target Series and Strategic Income Series); and 0.0065% of average daily net assets in excess of $40 billion (excluding Target Series and Strategic Income Series); plus a base fee of $30,400 per series. Transfer agent fees were charged to the Fund on a per account basis. Additionally, certain transaction and out-of-pocket expenses, including charges for reporting relating to the Fund’s compliance program, were charged. The Advisor had agreements with BNY Mellon Investment Servicing (U.S.) Inc. (“BNY”) under which BNY served as sub-accountant services agent and sub-transfer agent. Effective March 1, 2017, BNY became the named transfer agent for the Fund. Pursuant to a master services agreement dated March 1, 2017, the Fund continues to pay the Advisor the annual fee related to fund accounting and administration of 0.0085% on the first $25 billion of average daily net assets (excluding Target Series and Strategic Income Series); 0.0075% on the next $15 billion of average daily net assets (excluding Target Series and Strategic Income Series); and 0.0065% of average daily net assets in excess of $40 billion (excluding Target Series and Strategic Income Series); plus the base fee of $30,400 per series. Additionally, certain transaction and out-of-pocket expenses, including charges for reporting relating to the Fund’s compliance program, are charged. The agreement between the Advisor and BNY under which BNY serves as sub-accountant services agent continues to be in effect.
Expenses not directly attributable to a series are allocated based on each series’ relative net assets or number of accounts, depending on the expense.
| 4. | Purchases and Sales of Securities |
For the year ended October 31, 2017, purchases and sales of securities, other than short-term securities, were as follows:
SERIES | PURCHASES OTHER | SALES OTHER | ||||||||||||||
| ISSUERS | GOVERNMENT | ISSUERS | GOVERNMENT | |||||||||||||
Pro-Blend® Conservative Term Series | $ | 351,067,292 | $ | 270,954,777 | $ | 497,762,542 | $ | 271,032,690 | ||||||||
Pro-Blend® Moderate Term Series | 323,238,345 | 261,448,651 | 559,331,247 | 257,247,165 | ||||||||||||
Pro-Blend® Extended Term Series | 400,698,105 | 331,744,194 | 718,960,699 | 288,156,824 | ||||||||||||
Pro-Blend® Maximum Term Series | 392,471,754 | 173,652,165 | 629,327,081 | 179,695,026 | ||||||||||||
113
Notes to Financial Statements (continued)
| 5. | Capital Stock Transactions |
Transactions in Class S, Class I, Class R and Class R2 shares:
| PRO-BLEND® CONSERVATIVE | FOR THE YEAR ENDED 10/31/17 | FOR THE YEAR ENDED 10/31/16 | ||||||||||||||
| TERM SERIES CLASS S: | SHARES | AMOUNT | SHARES | AMOUNT | ||||||||||||
Sold | 9,432,882 | $ | 126,733,906 | 8,137,879 | $ | 105,720,605 | ||||||||||
Reinvested | 690,857 | 9,178,179 | 911,739 | 11,734,285 | ||||||||||||
Repurchased | (19,846,186 | ) | (267,809,092 | ) | (24,175,034 | ) | (314,759,139 | ) | ||||||||
|
|
|
|
|
|
|
| |||||||||
Total | (9,722,447 | ) | $ | (131,897,007 | ) | (15,125,416 | ) | $ | (197,304,249 | ) | ||||||
|
|
|
|
|
|
|
| |||||||||
| PRO-BLEND® CONSERVATIVE | FOR THE YEAR ENDED 10/31/17 | FOR THE YEAR ENDED 10/31/16 | ||||||||||||||
| TERM SERIES CLASS I: | SHARES | AMOUNT | SHARES | AMOUNT | ||||||||||||
Sold | 8,379,550 | $ | 88,182,073 | 7,100,011 | $ | 71,403,391 | ||||||||||
Reinvested | 409,762 | 4,197,197 | 439,714 | 4,382,195 | ||||||||||||
Repurchased | (17,312,832 | ) | (184,806,157 | ) | (11,174,099 | ) | (112,468,497 | ) | ||||||||
|
|
|
|
|
|
|
| |||||||||
Total | (8,523,520 | ) | $ | (92,426,887 | ) | (3,634,374 | ) | $ | (36,682,911 | ) | ||||||
|
|
|
|
|
|
|
| |||||||||
| PRO-BLEND® CONSERVATIVE | FOR THE YEAR ENDED 10/31/17 | FOR THE YEAR ENDED 10/31/16 | ||||||||||||||
| TERM SERIES CLASS R: | SHARES | AMOUNT | SHARES | AMOUNT | ||||||||||||
Sold | 327,790 | $ | 3,312,044 | 463,382 | $ | 4,508,100 | ||||||||||
Reinvested | 25,987 | 255,488 | 75,394 | 718,758 | ||||||||||||
Repurchased | (962,879 | ) | (9,662,205 | ) | (4,257,298 | ) | (40,644,504 | ) | ||||||||
|
|
|
|
|
|
|
| |||||||||
Total | (609,102 | ) | $ | (6,094,673 | ) | (3,718,522 | ) | $ | (35,417,646 | ) | ||||||
|
|
|
|
|
|
|
| |||||||||
| PRO-BLEND® CONSERVATIVE | FOR THE YEAR ENDED 10/31/17 | FOR THE YEAR ENDED 10/31/16 | ||||||||||||||
| TERM SERIES CLASS R2: | SHARES | AMOUNT | SHARES | AMOUNT | ||||||||||||
Sold | 1,461,640 | $ | 14,777,472 | 2,177,798 | $ | 21,116,472 | ||||||||||
Reinvested | 135,249 | 1,328,023 | 161,781 | 1,548,910 | ||||||||||||
Repurchased | (3,596,927 | ) | (36,136,109 | ) | (3,550,180 | ) | (34,497,672 | ) | ||||||||
|
|
|
|
|
|
|
| |||||||||
Total | (2,000,038 | ) | $ | (20,030,614 | ) | (1,210,601 | ) | $ | (11,832,290 | ) | ||||||
|
|
|
|
|
|
|
| |||||||||
| PRO-BLEND® MODERATE | FOR THE YEAR ENDED 10/31/17 | FOR THE YEAR ENDED 10/31/16 | ||||||||||||||
| TERM SERIES CLASS S: | SHARES | AMOUNT | SHARES | AMOUNT | ||||||||||||
Sold | 3,606,565 | $ | 48,643,819 | 11,782,569 | $ | 148,005,042 | ||||||||||
Reinvested | 850,374 | 11,009,876 | 504,854 | 6,470,329 | ||||||||||||
Repurchased | (12,633,045 | ) | (170,384,253 | ) | (25,984,722 | ) | (331,641,148 | ) | ||||||||
|
|
|
|
|
|
|
| |||||||||
Total | (8,176,106 | ) | $ | (110,730,558 | ) | (13,697,299 | ) | $ | (177,165,777 | ) | ||||||
|
|
|
|
|
|
|
| |||||||||
| PRO-BLEND® MODERATE | FOR THE YEAR ENDED 10/31/17 | FOR THE YEAR ENDED 10/31/16 | ||||||||||||||
| TERM SERIES CLASS I: | SHARES | AMOUNT | SHARES | AMOUNT | ||||||||||||
Sold | 8,503,985 | $ | 87,481,428 | 12,184,271 | $ | 120,189,097 | ||||||||||
Reinvested | 572,660 | 5,623,868 | 1,031,526 | 10,090,970 | ||||||||||||
Repurchased | (25,268,653 | ) | (265,560,412 | ) | (57,444,748 | ) | (570,637,608 | ) | ||||||||
|
|
|
|
|
|
|
| |||||||||
Total | (16,192,008 | ) | $ | (172,455,116 | ) | (44,228,951 | ) | $ | (440,357,541 | ) | ||||||
|
|
|
|
|
|
|
| |||||||||
114
Notes to Financial Statements (continued)
| 5. | Capital Stock Transactions (continued) |
| PRO-BLEND® MODERATE | FOR THE YEAR ENDED 10/31/17 | FOR THE YEAR ENDED 10/31/16 | ||||||||||||||
| TERM SERIES CLASS R: | SHARES | AMOUNT | SHARES | AMOUNT | ||||||||||||
Sold | 344,032 | $ | 3,699,735 | 591,654 | $ | 6,162,155 | ||||||||||
Reinvested | 70,612 | 727,384 | 39,632 | 406,221 | ||||||||||||
Repurchased | (1,162,387 | ) | (12,606,863 | ) | (1,659,349 | ) | (17,374,159 | ) | ||||||||
|
|
|
|
|
|
|
| |||||||||
Total | (747,743 | ) | $ | (8,179,744 | ) | (1,028,063 | ) | $ | (10,805,783 | ) | ||||||
|
|
|
|
|
|
|
| |||||||||
| PRO-BLEND® MODERATE | FOR THE YEAR ENDED 10/31/17 | FOR THE YEAR ENDED 10/31/16 | ||||||||||||||
| TERM SERIES CLASS R2: | SHARES | AMOUNT | SHARES | AMOUNT | ||||||||||||
Sold | 1,039,576 | $ | 10,760,838 | 1,552,417 | $ | 15,565,660 | ||||||||||
Reinvested | 283,529 | 2,803,766 | 96,547 | 953,121 | ||||||||||||
Repurchased | (3,046,835 | ) | (31,535,623 | ) | (3,731,569 | ) | (37,443,441 | ) | ||||||||
|
|
|
|
|
|
|
| |||||||||
Total | (1,723,730 | ) | $ | (17,971,019 | ) | (2,082,605 | ) | $ | (20,924,660 | ) | ||||||
|
|
|
|
|
|
|
| |||||||||
| PRO-BLEND® EXTENDED | FOR THE YEAR ENDED 10/31/17 | FOR THE YEAR ENDED 10/31/16 | ||||||||||||||
| TERM SERIES CLASS S: | SHARES | AMOUNT | SHARES | AMOUNT | ||||||||||||
Sold | 2,255,438 | $ | 38,747,349 | 3,508,597 | $ | 56,162,543 | ||||||||||
Reinvested | 412,975 | 6,726,540 | 813,262 | 12,791,402 | ||||||||||||
Repurchased | (10,683,421 | ) | (181,791,515 | ) | (18,119,243 | ) | (288,294,721 | ) | ||||||||
|
|
|
|
|
|
|
| |||||||||
Total | (8,015,008 | ) | $ | (136,317,626 | ) | (13,797,384 | ) | $ | (219,340,776 | ) | ||||||
|
|
|
|
|
|
|
| |||||||||
| PRO-BLEND® EXTENDED | FOR THE YEAR ENDED 10/31/17 | FOR THE YEAR ENDED 10/31/16 | ||||||||||||||
| TERM SERIES CLASS I: | SHARES | AMOUNT | SHARES | AMOUNT | ||||||||||||
Sold | 12,201,332 | $ | 118,655,981 | 15,549,258 | $ | 139,601,163 | ||||||||||
Reinvested | 558,278 | 5,174,249 | 1,212,119 | 10,957,758 | ||||||||||||
Repurchased | (39,058,958 | ) | (392,590,574 | ) | (33,161,451 | ) | (306,200,411 | ) | ||||||||
|
|
|
|
|
|
|
| |||||||||
Total | (26,299,348 | ) | $ | (268,760,344 | ) | (16,400,074 | ) | $ | (155,641,490 | ) | ||||||
|
|
|
|
|
|
|
| |||||||||
| PRO-BLEND® EXTENDED | FOR THE YEAR ENDED 10/31/17 | FOR THE YEAR ENDED 10/31/16 | ||||||||||||||
| TERM SERIES CLASS R: | SHARES | AMOUNT | SHARES | AMOUNT | ||||||||||||
Sold | 294,649 | $ | 3,282,693 | 479,395 | $ | 5,008,522 | ||||||||||
Reinvested | 45,566 | 483,306 | 99,071 | 1,022,269 | ||||||||||||
Repurchased | (1,310,115 | ) | (14,697,871 | ) | (2,025,605 | ) | (21,565,560 | ) | ||||||||
|
|
|
|
|
|
|
| |||||||||
Total | (969,900 | ) | $ | (10,931,872 | ) | (1,447,139 | ) | $ | (15,534,769 | ) | ||||||
|
|
|
|
|
|
|
| |||||||||
| PRO-BLEND® EXTENDED | FOR THE YEAR ENDED 10/31/17 | FOR THE YEAR ENDED 10/31/16 | ||||||||||||||
| TERM SERIES CLASS R2: | SHARES | AMOUNT | SHARES | AMOUNT | ||||||||||||
Sold | 1,175,907 | $ | 12,218,413 | 1,781,008 | $ | 17,596,311 | ||||||||||
Reinvested | 255,457 | 2,523,716 | 423,056 | 4,097,847 | ||||||||||||
Repurchased | (4,032,929 | ) | (41,950,558 | ) | (4,078,435 | ) | (40,452,206 | ) | ||||||||
|
|
|
|
|
|
|
| |||||||||
Total | (2,601,565 | ) | $ | (27,208,429 | ) | (1,874,371 | ) | $ | (18,758,048 | ) | ||||||
|
|
|
|
|
|
|
| |||||||||
115
Notes to Financial Statements (continued)
| 5. | Capital Stock Transactions (continued) |
| PRO-BLEND® MAXIMUM | FOR THE YEAR ENDED 10/31/17 | FOR THE YEAR ENDED 10/31/16 | ||||||||||||||
| TERM SERIES CLASS S: | SHARES | AMOUNT | SHARES | AMOUNT | ||||||||||||
Sold | 1,435,686 | $ | 28,284,671 | 1,928,894 | $ | 34,381,606 | ||||||||||
Reinvested | 404,158 | 7,421,754 | 304,037 | 5,358,978 | ||||||||||||
Repurchased | (7,367,075 | ) | (144,168,928 | ) | (10,119,249 | ) | (181,878,418 | ) | ||||||||
|
|
|
|
|
|
|
| |||||||||
Total | (5,527,231 | ) | $ | (108,462,503 | ) | (7,886,318 | ) | $ | (142,137,834 | ) | ||||||
|
|
|
|
|
|
|
| |||||||||
| PRO-BLEND® MAXIMUM | FOR THE YEAR ENDED 10/31/17 | FOR THE YEAR ENDED 10/31/16 | ||||||||||||||
| TERM SERIES CLASS I: | SHARES | AMOUNT | SHARES | AMOUNT | ||||||||||||
Sold | 7,931,943 | $ | 83,927,061 | 8,025,547 | $ | 78,995,481 | ||||||||||
Reinvested | 626,789 | 6,190,476 | 559,592 | 5,385,479 | ||||||||||||
Repurchased | (28,303,596 | ) | (314,016,017 | ) | (17,718,494 | ) | (173,868,245 | ) | ||||||||
|
|
|
|
|
|
|
| |||||||||
Total | (19,744,864 | ) | $ | (223,898,480 | ) | (9,133,355 | ) | $ | (89,487,285 | ) | ||||||
|
|
|
|
|
|
|
| |||||||||
| PRO-BLEND® MAXIMUM | FOR THE YEAR ENDED 10/31/17 | FOR THE YEAR ENDED 10/31/16 | ||||||||||||||
| TERM SERIES CLASS R: | SHARES | AMOUNT | SHARES | AMOUNT | ||||||||||||
Sold | 334,618 | $ | 4,472,264 | 398,944 | $ | 4,781,313 | ||||||||||
Reinvested | 58,144 | 704,274 | 37,016 | 435,094 | ||||||||||||
Repurchased | (950,033 | ) | (12,610,442 | ) | (1,226,472 | ) | (15,023,263 | ) | ||||||||
|
|
|
|
|
|
|
| |||||||||
Total | (557,271 | ) | $ | (7,433,904 | ) | (790,512 | ) | $ | (9,806,856 | ) | ||||||
|
|
|
|
|
|
|
| |||||||||
| PRO-BLEND® MAXIMUM | FOR THE YEAR ENDED 10/31/17 | FOR THE YEAR ENDED 10/31/16 | ||||||||||||||
| TERM SERIES CLASS R2: | SHARES | AMOUNT | SHARES | AMOUNT | ||||||||||||
Sold | 664,356 | $ | 7,380,136 | 848,247 | $ | 8,735,126 | ||||||||||
Reinvested | 185,278 | 1,900,023 | 99,480 | 1,005,922 | ||||||||||||
Repurchased | (1,352,932 | ) | (14,888,662 | ) | (1,250,355 | ) | (13,054,979 | ) | ||||||||
|
|
|
|
|
|
|
| |||||||||
Total | (503,298 | ) | $ | (5,608,503 | ) | (302,628 | ) | $ | (3,313,931 | ) | ||||||
|
|
|
|
|
|
|
| |||||||||
At October 31, 2017, one shareholder owned 16.4% of Pro-Blend® Moderate Term Series. Investment activities of these shareholders may have a material effect on the respective Series.
| 6. | Financial Instruments and Loan Assignments |
The Series may trade in instruments including written and purchased options, forward foreign currency exchange contracts and futures contracts and other derivatives in the normal course of investing activities to assist in managing exposure to various market risks. The Series may be subject to various elements of risk which may involve, to a varying degree, elements of risk in excess of the amounts recognized for financial statement purposes. These risks include: the risk that changes in the value of a derivative may not correlate perfectly with the underlying asset, rate or index; counterparty credit risk related to over the counter derivative counterparties’ failure to perform under contract terms; liquidity risk related to the lack of a liquid market for these contracts allowing the fund to close out its position(s); and documentation risk relating to disagreement over contract terms. At October 31, 2017, Pro-Blend® Conservative Term Series, Pro-Blend® Moderate Term Series and Pro-Blend® Extended Term Series invested in options contracts (equity risk).
The Series may invest in a loan assignment of all or a portion of the loans. The Series has direct rights against the borrower on a loan when it purchases an assignment; however, the Series’ rights may be more limited than the lender from which it acquired the assignment and the Series may be able to enforce its rights only through an administrative agent. Loan assignments are vulnerable to market conditions and may become illiquid due to economic conditions or other events may reduce the demand
116
Notes to Financial Statements (continued)
| 6. | Financial Instruments and Loan Assignments (continued) |
for loan assignments and certain loan assignments which were liquid when purchased may become illiquid. At October 31, 2017, the Series did not hold any loan assignments.
| 7. | Foreign Securities |
Investing in securities of foreign companies and foreign governments involves special risks and considerations not typically associated with investing in securities of domestic companies and the U.S. Government. These risks include revaluation of currencies and future adverse political and economic developments. Moreover, securities of foreign companies and foreign governments and their markets may be less liquid and their prices more volatile than those of comparable domestic companies and the U.S. Government.
| 8. | Federal Income Tax Information |
The amount and characterization of certain income and capital gains to be distributed are determined in accordance with federal income tax regulations, which may differ from GAAP. These differences are primarily due to differing book and tax treatments in the timing of the recognition on net investment income or gains and losses, including foreign currency gains and losses, losses deferred due to wash sales, investments in passive foreign investment companies (PFICs), real estate investment trusts and In-Kind Distributions for Shareholder Redemptions. Each Series may periodically make reclassifications among its capital accounts to reflect income and gains available for distribution (or available capital loss carryovers) under income tax regulations without impacting the Series’ net asset value. For the fiscal year ended October 31, 2017, amounts were reclassified within the capital accounts to increase Additional Paid in Capital by $11,134,164, $20,225,707 and $40,967,514, decrease Undistributed Net Investment Income by $1,574,471, $1,428,255 and $1,624,647, and decrease Accumulated Net Realized Gain on Investments by $9,559,693, $18,797,452 and $39,342,867 for Pro-Blend® Conservative Term Series, Pro-Blend® Moderate Term Series, and Pro-Blend® Extended Term Series, respectively. For the fiscal year ended October 31, 2017, amounts were reclassified within the capital accounts to increase Additional Paid in Capital by $42,361,194, increase Undistributed Net Investment Income by $92,582, and decrease Accumulated Net Realized Gain on Investments by $42,453,776 for Pro-Blend® Maximum Term Series. Any such reclassifications are not reflected in the financial highlights.
The tax character of distributions paid were as follows:
| PRO-BLEND® CONSERVATIVE TERM SERIES | PRO-BLEND® MODERATE TERM SERIES | |||||||||||||||
| FOR THE YEAR ENDED 10/31/17 | FOR THE YEAR ENDED 10/31/16 | FOR THE YEAR ENDED 10/31/17 | FOR THE YEAR ENDED 10/31/16 | |||||||||||||
Ordinary income | $ | 14,878,681 | $ | 20,987,785 | $ | 10,444,582 | $ | 15,051,676 | ||||||||
Long-term capital gains | 2,226,779 | — | 13,857,262 | 5,306,383 | ||||||||||||
| PRO-BLEND® EXTENDED TERM SERIES | PRO-BLEND® MAXIMUM TERM SERIES | |||||||||||||||
| FOR THE YEAR ENDED 10/31/17 | FOR THE YEAR ENDED 10/31/16 | FOR THE YEAR ENDED 10/31/17 | FOR THE YEAR ENDED 10/31/16 | |||||||||||||
Ordinary income | $ | 11,918,950 | $ | 11,654,299 | $ | 6,939,426 | $ | 3,085,810 | ||||||||
Long-term capital gains | 9,253,591 | 26,083,286 | 16,023,167 | 13,649,400 | ||||||||||||
117
Notes to Financial Statements (continued)
| 8. | Federal Income Tax Information (continued) |
At October 31, 2017, the tax basis of components of distributable earnings and the net unrealized appreciation based on the identified cost of investments for federal income tax purposes were as follows:
| PRO-BLEND® CONSERVATIVE TERM SERIES | PRO-BLEND® MODERATE TERM SERIES | PRO-BLEND® EXTENDED TERM SERIES | PRO-BLEND® MAXIMUM TERM SERIES | |||||||||||||
Cost for federal income tax purposes | $ | 914,288,578 | $ | 664,206,514 | $ | 639,225,758 | $ | 432,408,872 | ||||||||
Unrealized appreciation | 62,211,625 | 52,158,176 | 65,698,297 | 72,149,736 | ||||||||||||
Unrealized depreciation | (13,974,484 | ) | (11,934,154 | ) | (12,194,453 | ) | (12,406,880 | ) | ||||||||
|
|
|
|
|
|
|
| |||||||||
Net unrealized appreciation | $ | 48,237,141 | $ | 40,224,022 | $ | 53,503,844 | $ | 59,742,856 | ||||||||
|
|
|
|
|
|
|
| |||||||||
Undistributed ordinary income | $ | 13,970,841 | $ | 15,023,866 | $ | 18,438,009 | $ | 13,713,321 | ||||||||
Undistributed long-term gains | $ | 22,872,545 | $ | 25,888,118 | $ | 31,991,567 | $ | 31,414,081 | ||||||||
118
Report of Independent Registered Public Accounting Firm
To the Board of Directors of Manning & Napier Fund, Inc. and Shareholders of Pro-Blend® Conservative Term Series, Pro-Blend® Moderate Term Series, Pro-Blend® Extended Term Series and Pro-Blend® Maximum Term Series:
In our opinion, the accompanying statements of assets and liabilities, including the investment portfolios, and the related statements of operations and of changes in net assets and the financial highlights present fairly, in all material respects, the financial position of the Pro-Blend® Conservative Term Series, Pro-Blend® Moderate Term Series, Pro-Blend® Extended Term Series and Pro-Blend® Maximum Term Series (four of the series constituting Manning & Napier Fund, Inc., hereafter referred to as the “Series”) as of October 31, 2017, the results of each of their operations for the year then ended, the changes in each of their net assets for each of the two years in the period then ended and the financial highlights for each of the five years in the period then ended, in conformity with accounting principles generally accepted in the United States of America. These financial statements and financial highlights (hereafter referred to as “financial statements”) are the responsibility of the Series’ management. Our responsibility is to express an opinion on these financial statements based on our audits. We conducted our audits of these financial statements in accordance with the standards of the Public Company Accounting Oversight Board (United States). Those standards require that we plan and perform the audit to obtain reasonable assurance about whether the financial statements are free of material misstatement. An audit includes examining, on a test basis, evidence supporting the amounts and disclosures in the financial statements, assessing the accounting principles used and significant estimates made by management, and evaluating the overall financial statement presentation. We believe that our audits, which included confirmation of securities as of October 31, 2017 by correspondence with the custodian and brokers, provide a reasonable basis for our opinion.
New York, New York
December 18, 2017
119
Supplemental Tax Information
(unaudited)
All reportings are based on financial information available as of the date of this annual report and, accordingly, are subject to change.
For federal income tax purposes, each of the Series reports for the current fiscal year the amount disclosed below or, if different, the maximum amount allowable under the tax law as qualified dividend income (“QDI”).
| Series | QDI | |||
Pro-Blend® Conservative Term Series | $5,558,972 | |||
Pro-Blend® Moderate Term Series | 4,946,893 | |||
Pro-Blend® Extended Term Series | 7,829,682 | |||
Pro-Blend® Maximum Term Series | 7,840,085 | |||
For corporate shareholders, the percentage of investment income (dividend income plus short-term gain, if any) that qualifies for the dividends received deduction (DRD) for the current fiscal year is as follows:
| Series | DRD% | |||
Pro-Blend® Conservative Term Series | 23.93% | |||
Pro-Blend® Moderate Term Series | 18.55% | |||
Pro-Blend® Extended Term Series | 21.49% | |||
Pro-Blend® Maximum Term Series | 36.45% | |||
The Series designate Long-Term Capital Gain dividends pursuant to Section 852(b)(3) of the Code for the fiscal year ended October 31, 2017 as follows:
| Series | ||||
Pro-Blend® Conservative Term Series | $28,781,772 | |||
Pro-Blend® Moderate Term Series | 35,868,812 | |||
Pro-Blend® Extended Term Series | 49,777,053 | |||
Pro-Blend® Maximum Term Series | 49,565,223 | |||
120
Directors’ and Officers’ Information
(unaudited)
The Statement of Additional Information provides additional information about the Fund’s directors and officers and can be obtained without charge by calling 1-800-466-3863, at www.manning-napier.com, or on the EDGAR Database on the SEC Internet web site (http://www.sec.gov). The following chart shows certain information about the Fund’s directors and officers, including their principal occupations during the last five years. Unless specific dates are provided, the individuals have held the listed positions for longer than five years.
Interested Director and Officer
Name: | Michele T. Mosca* | |
| Address: | 290 Woodcliff Drive | |
| Fairport, NY 14450 | ||
| Age: | 45 | |
| Current Position(s) Held with Fund: | Principal Executive Officer, President, Chairman & Director | |
| Term of Office & Length of Time Served: | Indefinite - Chairman and Director since August 20161 | |
| Principal Occupation(s) During Past 5 Years: | Managing Director, Funds Group (since 2009) - Manning & Napier Advisors, LLC; President, Director (since 2015) - Manning & Napier Investor Services, Inc.; Chief Executive Officer, President (since 2016) - Rainier Investment Management Mutual Funds, Inc. | |
| Holds the following title for various subsidiaries and affiliates: President, Director | ||
| Number of Portfolios Overseen within Fund Complex: | 38 | |
| Other Directorships Held Outside Fund Complex During Past 5 Years: | Trustee - Rainier Investment Management Mutual Funds (since 2016) | |
| Independent Directors | ||
| Name: | Stephen B. Ashley | |
| Address: | 290 Woodcliff Drive | |
| Fairport, NY 14450 | ||
| Age: | 77 | |
| Current Position(s) Held with Fund: | Director, Audit Committee Member, Governance & Nominating Committee Member | |
| Term of Office & Length of Time Served: | Indefinite - Since 1996 | |
| Principal Occupation(s) During Past 5 Years: | Chairman, Director & Chief Executive Officer (1997 to present) - The Ashley Group (property management and investment). Director (1995-2008) and Chairman (non-executive) (2004-2008) - Fannie Mae (mortgage) | |
| Number of Portfolios Overseen within Fund Complex: | 38 | |
| Other Directorships Held Outside Fund Complex During | Fannie Mae (1995-2008) | |
| Past 5 Years: | The Ashley Group (1995-2008) | |
| Genesee Corporation (1987-2007) | ||
| Name: | Paul A. Brooke | |
| Address: | 290 Woodcliff Drive Fairport, NY 14450 | |
| Age: | 72 | |
| Current Position(s) Held with Fund: | Lead Independent Director, Audit Committee Member, Governance & Nominating Committee Chairman | |
| Term of Office & Length of Time Served: | Indefinite - Director, Audit Committee Member, Governance & Nominating Committee Member since 2007; Governance & Nominating Committee Chairman since 2016; Lead Independent Director since 2017 | |
| Principal Occupation(s) During Past 5 Years: | Chairman & CEO (2005-2009) - Ithaka Acquisition Corporation (investments); Chairman (2007-2009) - Alsius Corporation (investments); Managing Member (1991-present) - PMSV Holdings LLC (investments); Managing Member (2010-2016) - Venbio (investments). | |
| Number of Portfolios Overseen within Fund Complex: | 38 | |
| Other Directorships Held Outside Fund Complex During Past 5 Years: | Incyte Corp. (biotech) (2000-present); ViroPharma, Inc. (speciality pharmaceuticals) (2000-2014); HLTH (WebMD) (information) (2000-2010); Cheyne Capital International (investment) (2000-present); GMP Companies (investment) (2000-2011); Cytos Biotechnology Ltd (biotechnology) (2012-2014); Cerus (biomedical) (2016-present); PureEarth (non-profit) (2012-present) | |
121
Directors’ and Officers’ Information
(unaudited)
Independent Directors (continued)
| Name: | Peter L. Faber | |
| Address: | 290 Woodcliff Drive | |
| Fairport, NY 14450 | ||
| Age: | 79 | |
| Current Position(s) Held with Fund: | Director, Governance & Nominating Committee Member | |
| Term of Office & Length of Time Served: | Indefinite - Since 1987 | |
| Principal Occupation(s) During Past 5 Years: | Senior Counsel (2006-2012), Partner (1995-2006 & 2013-present) - McDermott, Will & Emery LLP (law firm) | |
| Number of Portfolios Overseen within Fund Complex: | 38 | |
| Other Directorships Held Outside Fund Complex During Past 5 Years: | Boston Early Music Festival (non-profit) (2007-present); Amherst Early Music, Inc. (non-profit) (2009-present); Gotham Early Music Scene, Inc. (non-profit) (2009-present); Partnership for New York City, Inc. (non-profit) (1989-2010); New York Collegium (non-profit) (2004-2011) | |
| Name: | Harris H. Rusitzky | |
| Address: | 290 Woodcliff Drive Fairport, NY 14450 | |
| Age: | 82 | |
| Current Position(s) Held with Fund: | Director, Audit Committee Member, Governance & Nominating Committee Member | |
| Term of Office & Length of Time Served: | Indefinite - Since 1985 | |
| Principal Occupation(s) During Past 5 Years: | President (1994- present) - The Greening Group (business consultants); Partner (2006-present) - The Restaurant Group (restaurants) | |
| Number of Portfolios Overseen within Fund Complex: | 38 | |
| Other Directorships Held Outside Fund Complex During Past 5 Years: | Rochester Institute of Technology (university) (1972-present); Culinary Institute of America (non-profit college) (1985-present); George Eastman House (museum) (1988-present); National Restaurant Association (restaurant trade organization) (1978-present) | |
| Name: | Chester N. Watson | |
| Address: | 290 Woodcliff Drive Fairport, NY 14450 | |
| Age: | 67 | |
| Current Position(s) Held with Fund: | Director, Audit Committee Chairman, Governance & Nominating Committee Member | |
| Term of Office & Length of Time Served: | Indefinite - Since 2012 | |
| Principal Occupation(s) During Past 5 Years: | General Auditor (2003-2011) - General Motors Company (auto manufacturer) | |
| Number of Portfolios Overseen within Fund Complex: | 38 | |
| Other Directorships Held Outside Fund Complex During Past 5 Years: | Rochester Institute of Technology (university) (2005-present); Town of Greenburgh, NY Planning Board (municipal government) (2015-present) | |
| Officers: | ||
| Name: | Jeffrey S. Coons, Ph.D., CFA® | |
| Address: | 290 Woodcliff Drive Fairport, NY 14450 | |
| Age: | 54 | |
| Current Position(s) Held with Fund: | Vice President | |
| Term of Office1 & Length of Time Served: | Since 2004 | |
| Principal Occupation(s) During Past 5 Years: | President since 2010, Co-Director of Research (2002 - 2015) - Manning & Napier Advisors, LLC Holds one or more of the following titles for various subsidiaries and affiliates: President, Director, Treasurer, or Senior Trust Officer | |
| Name: | Elizabeth Craig | |
| Address: | 290 Woodcliff Drive Fairport, NY 14450 | |
| Age: | 30 | |
| Current Position(s) Held with Fund: | Corporate Secretary | |
| Term of Office1 & Length of Time Served: | Since 2016 | |
| Principal Occupation(s) During Past 5 Years: | Fund Administration Manager since 2015; Mutual Fund Compliance Specialist (2009-2015) - Manning & Napier Advisors, LLC; Assistant Corporate Secretary (2011-2016) - Manning & Napier Fund, Inc. | |
122
Directors’ and Officers’ Information
(unaudited)
Officers (continued)
| Name: | Christine Glavin | |
| Address: | 290 Woodcliff Drive | |
| Fairport, NY 14450 | ||
| Age: | 51 | |
| Current Position(s) Held with Fund: | Principal Financial Officer, Chief Financial Officer | |
| Term of Office1 & Length of Time Served: | Principal Financial Officer since 2002; Chief Financial Officer since 2001 | |
| Principal Occupation(s) During Past 5 Years: | Director of Fund Reporting since 2011; Fund Reporting Manager (1997-2011) - Manning & Napier Advisors, LLC; Assistant Treasurer since 2008 Exeter Trust Company; Chief Financial Officer since 2017 - Rainier Investment Management Mutual Funds, Inc. | |
| Name: | Jodi L. Hedberg | |
| Address: | 290 Woodcliff Drive | |
| Fairport, NY 14450 | ||
| Age: | 50 | |
| Current Position(s) Held with Fund: | Chief Compliance Officer, Anti-Money Laundering Compliance Officer | |
| Term of Office1 & Length of Time Served: | Chief Compliance Officer since 2004; Anti-Money Laundering Officer since 2002; Corporate Secretary (1997-2016) - Manning & Napier Fund, Inc.; Chief Compliance Officer and Anti-Money Laundering Officer since 2017 - Rainier Investment Management Mutual Funds, Inc. | |
| Principal Occupation(s) During Past 5 Years: | Director of Compliance since 2005; Compliance Manager (1995-2005) - Manning & Napier Advisors, LLC and affiliates; Corporate Secretary - Manning & Napier Investor Services, Inc. since 2006 | |
| Name: | Scott Morabito | |
| Address: | 290 Woodcliff Drive | |
| Fairport, NY 14450 | ||
| Age: | 29 | |
| Current Position(s) Held with Fund: | Assistant Vice President | |
| Term of Office1 & Length of Time Served: | Since 2017 | |
| Principal Occupation(s) During Past 5 Years: | Director of Funds Group since 2017; Fund Product and Strategy Manager (2014-2017); Senior Product and Strategy Analyst (2013-2014); Product and Strategy Analyst (2011-2013) - Manning & Napier Advisors, LLC. | |
| Name: | Amy Williams | |
| Address: | 290 Woodcliff Drive | |
| Fairport, NY 14450 | ||
| Age: | 56 | |
| Current Position(s) Held with Fund: | Assistant Corporate Secretary | |
| Term of Office1 & Length of Time Served: | Since 2016 | |
| Principal Occupation(s) During Past 5 Years: | Director of Fund Documentation - Manning & Napier Advisors, LLC and affiliates since 2009 | |
| Holds one or more of the following titles for various affiliates: Director | ||
| Name: | Richard Yates | |
| Address: | 290 Woodcliff Drive | |
| Fairport, NY 14450 | ||
| Age: | 52 | |
| Current Position(s) Held with Fund: | Chief Legal Officer | |
| Term of Office1 & Length of Time Served: | Chief Legal Officer since 2004 | |
| Principal Occupation(s) During Past 5 Years: | Counsel - Manning & Napier Advisors, LLC and affiliates since 2000; Chief Legal Officer since 2016 - Rainier Investment Management, LLC; Chief Legal Officer since 2016 - Rainier Investment Management Mutual Funds, Inc. | |
| Holds one or more of the following titles for various affiliates: Director, Corporate Secretary, Chief Legal Officer |
*Interested Director, within the meaning of the 1940 Act by reason of her positions with the Fund’s investment advisor, Manning & Napier Advisors, LLC and Distributor, Manning & Napier Investor Services, Inc.
1The term of office of all officers shall be one year and until their respective successors are chosen and qualified, or his or her earlier resignation or removal as provided in the
Fund’s By-Laws.
123
{This page intentionally left blank}
124
{This page intentionally left blank}
125
Literature Requests
(unaudited)
Proxy Voting Policies and Procedures
A description of the policies and procedures that the Fund uses to determine how to vote proxies relating to portfolio securities is available, without charge, upon request:
| By phone | 1-800-466-3863 | |||
| On the Securities and Exchange | ||||
| Commission’s (SEC) web site | http://www.sec.gov |
Proxy Voting Record
Information regarding how the Fund voted proxies relating to portfolio securities during the most recent 12-month period ended June 30th is available, without charge, upon request:
| By phone | 1-800-466-3863 | |||
| On the SEC’s web site | http://www.sec.gov |
Quarterly Portfolio Holdings
The Series’ complete schedule of portfolio holdings for the 1st and 3rd quarters of each fiscal year are provided on Form N-Q, and are available, without charge, upon request:
| By phone | 1-800-466-3863 | |||
| On the SEC’s web site | http://www.sec.gov |
The Series’ Form N-Q may be reviewed and copied at the SEC’s Public Reference Room in Washington, D.C. Information on the operation of the Public Reference Room may be obtained by calling 1-800-SEC-0330.
Prospectus and Statement of Additional Information (SAI)
For more information about any of the Manning & Napier Fund, Inc. Series, you may obtain a prospectus and SAI at www.manning-napier.com or by calling (800) 466-3863. Before investing, carefully consider the objectives, risks, charges and expenses of the investment and read the prospectus carefully as it contains this and other information about the investment company. In addition, this information can be found on the SEC’s web site, http://www.sec.gov.
Additional information available at www.manning-napier.com
1. Fund Holdings - Month-End
2. Fund Holdings - Quarter-End
3. Shareholder Report - Annual
4. Shareholder Report - Semi-Annual
The Fund also offers electronic notification or “e-delivery” when certain documents are available on-line to be downloaded or reviewed. Direct shareholders can elect to receive electronic notification when shareholder reports, prospectus updates, and/or quarterly statements are available. If you do not currently have on-line access to your account, you can establish access by going to www.manning-napier.com, click on “Login” in the top corner of the page, and follow the prompts to self-enroll. Once enrolled, you can set your electronic notification preferences by clicking on the Account Options tab located within the green toolbar and then select E-Delivery Option. Should you have any questions on either how to establish on-line access or how to update your account settings, please contact Investor Services at 1-800-466-3863.
The Manning & Napier Fund, Inc. is managed by Manning & Napier Advisors, LLC. Manning & Napier Investor Services, Inc., an affiliate of Manning & Napier Advisors, LLC, is the distributor of the Fund shares.
MNPRO-10/17-AR

Quality Equity Series
Management Discussion and Analysis
(unaudited)
Dear Shareholders:
Just one year ago, many investors were anticipating a widespread sell-off in domestic equity markets after Donald Trump won the election for the U.S. presidency. Not only did a sell-off fail to materialize, but equities actually moved sharply higher and remained on an upward trajectory throughout the year. The advance in equities was despite ongoing uncertainty surrounding policy implementation and how the new administration’s agenda might ultimately affect U.S. economic growth. For the year ended October 31, 2017, domestic equities were up 23.63%, as measured by the S&P 500 Index. International equities, as measured by the MSCI ACWI ex USA Index, also fared extraordinarily well, up 23.64%. Domestic investment-grade bonds, as measured by the Bloomberg Barclays U.S. Aggregate Bond Index, experienced relatively subdued performance, up 0.90%. Within fixed income, corporate bonds led, with high-yield securities in particular delivering very strong performance.
Much of the move upward in asset markets has been driven by stronger corporate earnings that materialized in early 2017 within both developed and emerging markets, supported by synchronized economic growth across all major global regions. Further, although Federal Reserve (Fed) policymakers continued gradually raising the target range for the federal funds rate and began reducing the Fed’s securities holdings, central bank policies across the globe have remained generally accommodative, providing an additional tailwind for asset prices.
Investors are undoubtedly enjoying the “Goldilocks” state of the economy: not too cold so as to usher in a recession, and not too hot so as to cause runaway inflation. Nonetheless, it is our view that market participants should temper their expectations going forward. The U.S. continues to move along in its economic cycle, and while it is not our view that we are on the cusp of a bear market, the status of our indicators suggest that we are certainly closer to the end of the current bull market than we are to the beginning. Complacency is elevated, there are significantly fewer pockets of cheap valuations remaining compared to the past several years, and U.S. valuations in particular limit upside potential, offering little support for asset prices should volatility in the financial markets materialize. This is surely not the time for investors to chase returns or take on unnecessary risk. Rather, it is our view that current market dynamics are consistent with rising risks that must be actively managed, and investors should maintain allocations consistent with their long-term investment objectives.
With this in mind, we discuss recent fund performance in this report, highlight how we are positioned amid the current economic environment, and provide our outlook of what to expect in financial markets. We hope that you find this information helpful, and look forward to working with you in the years ahead to meet your investment goals.
Thank you for your continued confidence in us.
Sincerely,
Manning & Napier Advisors, LLC
The S&P 500 Total Return Index is an unmanaged, capitalization-weighted measure of 500 widely held common stocks listed on the New York Stock Exchange, American Stock Exchange, and the Over-the-Counter market. The Index returns assume daily reinvestment of dividends and do not reflect any fees or expenses. Index returns provided by Bloomberg. S&P Dow Jones Indices LLC, a subsidiary of the McGraw Hill Financial, Inc., is the publisher of various index based data products and services and has licensed certain of its products and services for use by Manning & Napier. All such content Copyright © 2017 by S&P Dow Jones Indices LLC and/or its affiliates. All rights reserved. Neither S&P Dow Jones Indices LLC, Dow Jones Trademark Holdings LLC, their affiliates nor their third party licensors make any representation or warranty, express or implied, as to the ability of any index to accurately represent the asset class or market sector that it purports to represent and none of these parties shall have any liability for any errors, omissions, or interruptions of any index or the data included therein.
The MSCI ACWI ex USA Index (ACWIxUS) is designed to measure large and mid-cap representation across 22 of 23 Developed Markets countries (excluding the U.S.) and 24 Emerging Markets countries. The Index returns do not reflect any fees or expenses. The Index is denominated in U.S. dollars. The Index returns are net of withholding taxes. They assume daily reinvestment of net dividends thus accounting for any applicable dividend taxation. Index returns provided by Bloomberg.
The Bloomberg Barclays U.S. Aggregate Bond Index is an unmanaged, market-value weighted index of U.S. domestic investment-grade debt issues, including government, corporate, asset-backed, and mortgage-backed securities, with maturities of one year or more. Index returns do not reflect any fees or expenses. Index returns provided by Interactive Data.
1
Quality Equity Series
Fund Commentary
(unaudited)
Investment Objective
Through a combination of quantitative and fundamental analysis, the Series seeks to maximize long-term growth. The Series uses a disciplined screening process to identify companies with characteristics that are consistent with stable businesses and then conducts fundamental analysis of the identified companies. The Series primarily invests in stocks of large- and mid-size companies with strong competitive positions, high free cash flow yields, and consistent financial characteristics in order to build a concentrated portfolio of high quality stocks.
Performance Commentary
Broad developed equity markets, as represented by the MSCI World Index (MSCI World) posted meaningfully positive returns for the year ending October 31, 2017, returning 22.77%. Those returns were spread rather evenly throughout the year, as the MSCI World generated positive returns in each month from November 2016 through October 2017. While both developed and emerging markets generated strong absolute returns, emerging markets slightly outperformed, with the MSCI EM Index posting a 26.45% return for the year.
The Quality Equity Series Class I shares returned 12.70% and the Class S shares returned 12.31% during the year, generating positive returns but underperforming the Series’ MSCI World benchmark on a relative basis.
The Series’ underperformance relative to the MSCI World during the year was driven primarily by individual security selection and sector positioning, while country positioning was a positive contributor to relative returns. While not owning any Energy, Real Estate, or Utilities stocks was a positive driver, the Series’ overweight allocation to Consumer Staples and underweight to Financials relative to the benchmark were meaningful detractors. Likewise, stock selection within the Health Care, Industrials, and Consumer Discretionary sectors generally detracted from performance on a relative basis. From a country perspective, an underweight to Japan and an overweight to France relative to the benchmark contributed positively, while overweight allocations to Ireland and Switzerland detracted.
The Series’ focus continues to be on owning stable, cash-flow-generating companies that can maintain that stability through various market environments. This approach lends itself to investing in companies that the management team believes can deliver stable growth and profitability over the long term. The resulting portfolio currently reflects significant allocations to consumer-oriented areas of the market such as the Consumer Discretionary, Consumer Staples, and Health Care sectors (approximately 64% of the portfolio in total), and underweight allocations to more cyclically-driven sectors like Financials, Energy, and Materials (approximately 4% of the portfolio, compared to approximately 29% of the benchmark).
As we begin the new fiscal year, earnings growth across major regions, accelerating business activity, and an improving economic backdrop are supportive of global equity prices. However, as markets continue to advance, we believe it is important to express our view that investors should exercise caution and selectivity due to rising risks associated with elevated complacency, valuations across most markets that remain at or somewhat above fair value, and the inflection in global monetary policy to less accommodative conditions. We believe these risk factors reinforce the need for an active, fundamentals-based investment approach, as it will be critical to manage them going forward.
Please see the next page for additional performance information as of October 31, 2017.
Performance data quoted represents past performance and does not guarantee future results. The investment return and principal value of an investment will fluctuate, so that an investor’s shares, when redeemed, may be worth more or less than their original cost. Current performance may be higher or lower than that quoted; investors can obtain the most recent month-end performance at www.manning-napier.com or by calling (800) 466-3863.
All investments involve risks, including possible loss of principal. As with any stock fund, the value of your investment will fluctuate in response to stock market movements. Investing in the Series will also involve a number of other risks, including issuer-specific risk, mid-cap risk, and the risk that the investment approach may not be
2
Quality Equity Series
Fund Commentary
(unaudited)
Performance Commentary (continued)
successful. Funds that invest in foreign countries may be subject to fluctuating currency values, different accounting standards, and economic and political instability. The value of the Series may be affected by changes in exchange rates between foreign currencies and the U.S. dollar.
The MSCI Emerging Markets Index (MSCI EM) is a free float-adjusted market capitalization index designed to measure large and mid-cap representation across 24 Emerging Markets countries. The Index returns do not reflect any fees or expenses. The Index is denominated in U.S. dollars. The Index returns are net of withholding taxes. They assume daily reinvestment of net dividends thus accounting for any applicable dividend taxation. Index returns provided by Bloomberg.
3
Quality Equity Series
Performance Update as of October 31, 2017
(unaudited)
| AVERAGE ANNUAL TOTAL RETURNS AS OF OCTOBER 31, 2017 | ||||||||
ONE YEAR1 | TOTAL RETURN SINCE INCEPTION2 | |||||||
Manning & Napier Fund, Inc. - Quality Equity Series - Class S3 | 12.31 | % | 4.49 | % | ||||
Manning & Napier Fund, Inc. - Quality Equity Series - Class I3 | 12.70 | % | 4.78 | % | ||||
MSCI World Index4 | 22.77 | % | 7.80 | % | ||||
The following graph compares the value of a $10,000 investment in the Manning & Napier Fund, Inc. - Quality Equity Series - Class S from its inception2 (June 1, 2015) to present (October 31, 2017) to the MSCI World Index.
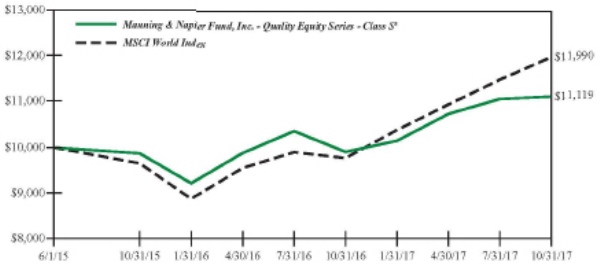
1 The returns shown are based on net asset values calculated for shareholder transactions and may differ from the returns shown in the financial highlights, which reflect adjustments made to the net asset values in accordance with accounting principles generally accepted in the United States of America.
2 Performance numbers for the Series and the Index are calculated from June 1, 2015, the Series’ inception date.
3 The Series’ performance does not reflect the deduction of taxes that a shareholder would pay on fund distributions or the redemption of shares. The Series’ performance is historical and may not be indicative of future results. The performance returns shown are inclusive of the net expense ratio of the Series. For the year end October 31, 2017, this annualized net expense ratio was 0.95% for Class S and 0.70% for Class I. The annualized gross expense ratio, which does not account for any voluntary or contractual waivers currently in effect, was 7.33% for Class S and 7.08% for Class I for the year ended October 31, 2017.
4 The MSCI World Index is a free float-adjusted market capitalization index that is designed to measure global developed market equity performance and consists of 23 developed market country indices. The Index returns do not reflect any fees or expenses. The Index is denominated in U.S. dollars. The Index returns are net of withholding taxes. They assume daily reinvestment of net dividends thus accounting for any applicable dividend taxation. Index returns provided by Bloomberg.
4
Quality Equity Series
Shareholder Expense Example
(unaudited)
As a shareholder of the Series, you incur ongoing costs, including management fees, shareholder service fees and other Series expenses. This example is intended to help you understand your ongoing costs (in dollars) of investing in the Series and to compare these costs with the ongoing costs of investing in other mutual funds.
The example is based on an investment of $1,000 invested at the beginning of the period and held for the entire period (May 1, 2017 to October 31, 2017).
Actual Expenses
The Actual lines of the table below provide information about actual account values and actual expenses. You may use the information in this line, together with the amount you invested, to estimate the expenses that you paid over the period. Simply divide your account value by $1,000 (for example, an $8,600 account value divided by $1,000 = 8.6), then multiply the result by the number in the Actual line for the Class in which you have invested under the heading entitled “Expenses Paid During Period” to estimate the expenses you paid on your account during this period.
Hypothetical Example for Comparison Purposes
The Hypothetical lines of each Class in the table below provide information about hypothetical account values and hypothetical expenses based on the Class’ actual expense ratio and an assumed rate of return of 5% per year before expenses, which is not the Class’ actual return. The hypothetical account values and expenses may not be used to estimate the actual ending account balance or expenses you paid during the period. You may use this information to compare the ongoing costs of investing in a Class in the Series and other funds. To do so, compare this 5% hypothetical example for the Class in which you have invested with the 5% hypothetical examples that appear in the shareholder reports of the other funds.
Please note that the expenses shown in the table are meant to highlight your ongoing costs only and do not reflect any transaction costs, such as sales charges (loads), redemption fees, or exchange fees that you may incur in other mutual funds. Therefore, the second line of the table is useful in comparing ongoing costs only, and will not help you determine the relative total costs of owning different funds.
BEGINNING ACCOUNT VALUE | ENDING ACCOUNT VALUE | EXPENSES PAID DURING PERIOD* | ANNUALIZED EXPENSE RATIO | |||||
Class S | ||||||||
Actual | $1,000.00 | $1,035.10 | $4.87 | 0.95% | ||||
Hypothetical (5% return before expenses) | $1,000.00 | $1,020.42 | $4.84 | 0.95% | ||||
Class I | ||||||||
Actual | $1,000.00 | $1,036.90 | $3.59 | 0.70% | ||||
Hypothetical (5% return before expenses) | $1,000.00 | $1,021.68 | $3.57 | 0.70% |
*Expenses are equal to the Class’ annualized expense ratio (for the six-month period), multiplied by the average account value over the period, multiplied by 184/365 (to reflect the one-half year period). Expenses are based on the most recent fiscal half year; therefore, the expense ratios stated above may differ from the expense ratios stated in the financial highlights, which are based on one-year data. The Class’ total return would have been lower had certain expenses not been waived during the period.
5
Quality Equity Series
Portfolio Composition as of October 31, 2017
(unaudited)
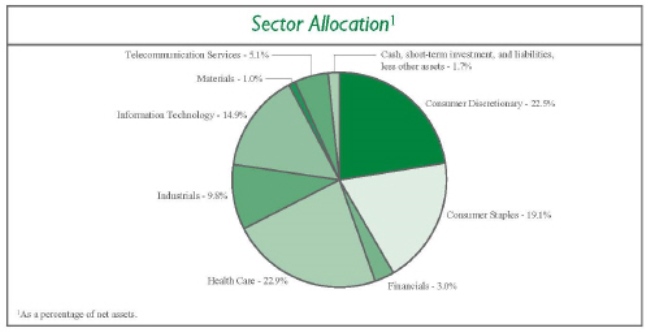
6
Quality Equity Series
Investment Portfolio - October 31, 2017
| SHARES | VALUE (NOTE 2) | |||||||
COMMON STOCKS - 98.3% | ||||||||
Consumer Discretionary - 22.5% | ||||||||
Internet & Direct Marketing Retail - 1.6% | ||||||||
The Priceline Group, Inc.* | 20 | $ | 38,239 | |||||
|
| |||||||
Media - 1.9% | ||||||||
WPP plc (United Kingdom)1 | 2,525 | 44,640 | ||||||
|
| |||||||
Multiline Retail - 3.4% | ||||||||
Dollar General Corp. | 975 | 78,819 | ||||||
|
| |||||||
Specialty Retail - 8.3% | ||||||||
AutoZone, Inc.* | 105 | 61,897 | ||||||
Fast Retailing Co. Ltd. (Japan)1 | 75 | 25,093 | ||||||
O’Reilly Automotive, Inc.* | 285 | 60,121 | ||||||
The TJX Cos, Inc. | 640 | 44,672 | ||||||
|
| |||||||
| 191,783 | ||||||||
|
| |||||||
Textiles, Apparel & Luxury Goods - 7.3% | ||||||||
Kering (France)1 | 60 | 27,516 | ||||||
LVMH Moet Hennessy Louis Vuitton SE (France)1 | 135 | 40,266 | ||||||
NIKE, Inc. - Class B | 895 | 49,216 | ||||||
VF Corp. | 755 | 52,586 | ||||||
|
| |||||||
| 169,584 | ||||||||
|
| |||||||
Total Consumer Discretionary | 523,065 | |||||||
|
| |||||||
Consumer Staples - 19.1% | ||||||||
Beverages - 8.7% | ||||||||
Diageo plc (United Kingdom)1 | 2,085 | 71,200 | ||||||
PepsiCo, Inc. | 505 | 55,666 | ||||||
Pernod Ricard S.A. (France)1 | 510 | 76,471 | ||||||
|
| |||||||
| 203,337 | ||||||||
|
| |||||||
Food Products - 1.0% | ||||||||
Nestle S.A. (Switzerland)1 | 280 | 23,559 | ||||||
|
| |||||||
Household Products - 1.9% | ||||||||
Kimberly-Clark Corp. | 385 | 43,316 | ||||||
|
| |||||||
Personal Products - 7.5% | ||||||||
Beiersdorf AG (Germany)1 | 440 | 49,496 | ||||||
Kao Corp. (Japan)1 | 900 | 54,392 | ||||||
L’Oreal S.A. (France)1 | 220 | 48,964 | ||||||
Unilever N.V. (United Kingdom)1 | 380 | 22,074 | ||||||
|
| |||||||
| 174,926 | ||||||||
|
| |||||||
Total Consumer Staples | 445,138 | |||||||
|
| |||||||
Financials - 3.0% | ||||||||
Capital Markets - 3.0% | ||||||||
The Charles Schwab Corp. | 1,550 | 69,502 | ||||||
|
| |||||||
The accompanying notes are an integral part of the financial statements.
7
Quality Equity Series
Investment Portfolio - October 31, 2017
| SHARES | VALUE (NOTE 2) | |||||||
COMMON STOCKS (continued) | ||||||||
Health Care - 22.9% | ||||||||
Health Care Equipment & Supplies - 3.0% | ||||||||
Medtronic plc | 855 | $ | 68,845 | |||||
|
| |||||||
Health Care Providers & Services - 6.7% | ||||||||
AmerisourceBergen Corp. | 580 | 44,631 | ||||||
Express Scripts Holding Co.* | 1,130 | 69,257 | ||||||
McKesson Corp. | 310 | 42,743 | ||||||
|
| |||||||
| 156,631 | ||||||||
|
| |||||||
Pharmaceuticals - 13.2% | ||||||||
Allergan plc | 265 | 46,966 | ||||||
Johnson & Johnson | 265 | 36,944 | ||||||
Merck & Co., Inc. | 695 | 38,288 | ||||||
Novartis AG (Switzerland)1 | 835 | 68,870 | ||||||
Perrigo Co. plc | 585 | 47,379 | ||||||
Roche Holding AG (Switzerland)1 | 300 | 69,339 | ||||||
|
| |||||||
| 307,786 | ||||||||
|
| |||||||
Total Health Care | 533,262 | |||||||
|
| |||||||
Industrials - 9.8% | ||||||||
Machinery - 1.6% | ||||||||
Flowserve Corp. | 850 | 37,460 | ||||||
|
| |||||||
Professional Services - 3.5% | ||||||||
Nielsen Holdings plc | 2,205 | 81,739 | ||||||
|
| |||||||
Road & Rail - 2.4% | ||||||||
Central Japan Railway Co. (Japan)1 | 300 | 54,494 | ||||||
|
| |||||||
Trading Companies & Distributors - 2.3% | ||||||||
W.W. Grainger, Inc. | 275 | 54,367 | ||||||
|
| |||||||
Total Industrials | 228,060 | |||||||
|
| |||||||
Information Technology - 14.9% | ||||||||
Communications Equipment - 2.7% | ||||||||
Cisco Systems, Inc. | 1,830 | 62,494 | ||||||
|
| |||||||
Internet Software & Services - 2.0% | ||||||||
VeriSign, Inc.* | 445 | 47,846 | ||||||
|
| |||||||
IT Services - 4.8% | ||||||||
MasterCard, Inc. - Class A | 385 | 57,277 | ||||||
Visa, Inc. - Class A | 495 | 54,440 | ||||||
|
| |||||||
| 111,717 | ||||||||
|
| |||||||
The accompanying notes are an integral part of the financial statements.
8
Quality Equity Series
Investment Portfolio - October 31, 2017
| SHARES | VALUE (NOTE 2) | |||||||
COMMON STOCKS (continued) | ||||||||
Information Technology (continued) | ||||||||
Software - 5.4% | ||||||||
Microsoft Corp. | 460 | $ | 38,263 | |||||
Oracle Corp. | 1,215 | 61,844 | ||||||
SAP SE (Germany)1 | 220 | 25,138 | ||||||
|
| |||||||
| 125,245 | ||||||||
|
| |||||||
Total Information Technology | 347,302 | |||||||
|
| |||||||
Materials - 1.0% | ||||||||
Chemicals - 1.0% | ||||||||
Givaudan S.A. (Switzerland)1 | 10 | 22,333 | ||||||
|
| |||||||
Telecommunication Services - 5.1% | ||||||||
Diversified Telecommunication Services - 2.0% | ||||||||
Singapore Telecommunications Ltd. (Singapore)1 | 16,880 | 46,453 | ||||||
|
| |||||||
Wireless Telecommunication Services - 3.1% | ||||||||
KDDI Corp. (Japan)1 | 1,300 | 34,636 | ||||||
NTT DOCOMO, Inc. (Japan)1 | 1,500 | 36,328 | ||||||
|
| |||||||
| 70,964 | ||||||||
|
| |||||||
Total Telecommunication Services | 117,417 | |||||||
|
| |||||||
TOTAL COMMON STOCKS | ||||||||
(Identified Cost $2,096,531) | 2,286,079 | |||||||
|
| |||||||
SHORT-TERM INVESTMENT - 2.5% | ||||||||
Dreyfus Government Cash Management2, 0.93% | ||||||||
(Identified Cost $57,203) | 57,203 | 57,203 | ||||||
|
| |||||||
TOTAL INVESTMENTS - 100.8% | ||||||||
(Identified Cost $2,153,734) | 2,343,282 | |||||||
LIABILITIES, LESS OTHER ASSETS - (0.8%) | (17,692 | ) | ||||||
|
| |||||||
NET ASSETS - 100% | $ | 2,325,590 | ||||||
|
| |||||||
* Non-income producing security.
1 A factor from a third party vendor was applied to determine the security’s fair value following the close of local trading.
2 Rate shown is the current yield as of October 31, 2017.
The Global Industry Classification Standard (GICS) was developed by and is the exclusive property and a service mark of MSCI Inc. (MSCI) and Standard & Poor’s, a division of The McGraw-Hill Companies, Inc. (S&P), and is licensed for use by Manning & Napier when referencing GICS sectors. Neither MSCI, S&P, nor any third party involved in making or compiling the GICS or any GICS classifications makes any express or implied warranties or representations with respect to such standard or classification, nor shall any such party have any liability therefrom.
The accompanying notes are an integral part of the financial statements.
9
Quality Equity Series
Statement of Assets & Liabilities
October 31, 2017
ASSETS: | ||||
Investments, at value (identified cost $2,153,734) (Note 2) | $ | 2,343,282 | ||
Receivable from investment advisor | 11,675 | |||
Dividends receivable | 2,127 | |||
Foreign tax reclaims receivable | 1,621 | |||
Prepaid expenses | 11,172 | |||
|
| |||
TOTAL ASSETS | 2,369,877 | |||
|
| |||
LIABILITIES: | ||||
Accrued fund accounting and administration fees (Note 3) | 14,821 | |||
Accrued Chief Compliance Officer service fees (Note 3) | 306 | |||
Accrued shareholder services fees (Class S) (Note 3) | 378 | |||
Audit fees payable | 23,121 | |||
Accrued printing and postage | 4,436 | |||
Other payables and accrued expenses | 1,225 | |||
|
| |||
TOTAL LIABILITIES | 44,287 | |||
|
| |||
TOTAL NET ASSETS | $ | 2,325,590 | ||
|
| |||
NET ASSETS CONSIST OF: | ||||
Capital stock | $ | 2,129 | ||
Additional paid-in-capital | 2,116,879 | |||
Undistributed net investment income | 16,130 | |||
Accumulated net realized gain on investments, foreign currency and translation of other assets and liabilities | 921 | |||
Net unrealized appreciation on investments, foreign currency and translation of other assets and liabilities | 189,531 | |||
|
| |||
TOTAL NET ASSETS | $ | 2,325,590 | ||
|
| |||
NET ASSET VALUE, OFFERING PRICE AND REDEMPTION PRICE PER SHARE - Class S ($1,766,031/161,803 shares) | $ | 10.91 | ||
|
| |||
NET ASSET VALUE, OFFERING PRICE AND REDEMPTION PRICE PER SHARE - Class I ($559,559/51,122 shares) | $ | 10.95 | ||
|
| |||
The accompanying notes are an integral part of the financial statements.
10
Quality Equity Series
Statement of Operations
For the Year Ended October 31, 2017
INVESTMENT INCOME: | ||||
Dividends (net of foreign taxes withheld, $2,380) | $ | 38,227 | ||
|
| |||
EXPENSES: | ||||
Fund accounting and administration fees (Note 3) | 42,213 | |||
Management fees (Note 3) | 11,825 | |||
Shareholder services fees (Class S)(Note 3) | 4,043 | |||
Chief Compliance Officer service fees (Note 3) | 3,886 | |||
Transfer agent fees (Note 3) | 481 | |||
Directors’ fees (Note 3) | 115 | |||
Audit fees | 36,660 | |||
Registration fees | 29,454 | |||
Printing and postage fees | 16,580 | |||
Custodian fees | 3,373 | |||
Miscellaneous | 7,554 | |||
|
| |||
Total Expenses | 156,184 | |||
Less reduction of expenses (Note 3) | (137,091 | ) | ||
|
| |||
Net Expenses | 19,093 | |||
|
| |||
NET INVESTMENT INCOME | 19,134 | |||
|
| |||
REALIZED AND UNREALIZED GAIN ON INVESTMENTS AND FOREIGN CURRENCY: | ||||
Net realized gain on- | ||||
Investments | 25,895 | |||
Foreign currency and translation of other assets and liabilities | 16 | |||
|
| |||
| 25,911 | ||||
|
| |||
Net change in unrealized appreciation (depreciation) on- | ||||
Investments | 199,735 | |||
Foreign currency and translation of other assets and liabilities | 18 | |||
|
| |||
| 199,753 | ||||
|
| |||
NET REALIZED AND UNREALIZED GAIN (LOSS) ON INVESTMENTS AND FOREIGN CURRENCY | 225,664 | |||
|
| |||
NET INCREASE IN NET ASSETS RESULTING FROM OPERATIONS | $ | 244,798 | ||
|
| |||
The accompanying notes are an integral part of the financial statements.
11
Quality Equity Series
Statements of Changes in Net Assets
| FOR THE YEAR ENDED 10/31/17 | FOR THE YEAR ENDED 10/31/16 | |||||||
INCREASE (DECREASE) IN NET ASSETS: | ||||||||
OPERATIONS: | ||||||||
Net investment income | $ | 19,134 | $ | 17,429 | ||||
Net realized loss on investments and foreign currency | 25,911 | (1,948 | ) | |||||
Net change in unrealized appreciation (depreciation) on investments and foreign currency | 199,753 | (12,385 | ) | |||||
|
|
|
| |||||
Net increase from operations | 244,798 | 3,096 | ||||||
|
|
|
| |||||
DISTRIBUTIONS TO SHAREHOLDERS (Note 8): | ||||||||
From net investment income (Class S) | (12,520 | ) | (3,654 | ) | ||||
From net investment income (Class I) | (5,264 | ) | (3,100 | ) | ||||
From net realized gain on investments (Class S) | (7,219 | ) | — | |||||
From net realized gain on investments (Class I) | (2,501 | ) | — | |||||
|
|
|
| |||||
Total distributions to shareholders | (27,504 | ) | (6,754 | ) | ||||
|
|
|
| |||||
CAPITAL STOCK ISSUED AND REPURCHASED: | ||||||||
Net increase from capital share transactions (Note 5) | 195,533 | 689,076 | ||||||
|
|
|
| |||||
Net increase in net assets | 412,827 | 685,418 | ||||||
NET ASSETS: | ||||||||
Beginning of year | 1,912,763 | 1,227,345 | ||||||
|
|
|
| |||||
End of year (including undistributed net investment income of $16,130 and | $ | 2,325,590 | $ | 1,912,763 | ||||
|
|
|
| |||||
The accompanying notes are an integral part of the financial statements.
12
Quality Equity Series
Financial Highlights - Class S
| FOR THE YEAR ENDED | FOR THE PERIOD 6/01/151 TO | |||||||||||
| 10/31/17 | 10/31/16 | |||||||||||
Per share data (for a share outstanding throughout each period): | ||||||||||||
Net asset value - Beginning of period | $ | 9.85 | $ | 9.87 | $ | 10.00 | ||||||
|
|
|
|
|
| |||||||
Income (loss) from investment operations: | ||||||||||||
Net investment income2 | 0.09 | 0.11 | 0.03 | |||||||||
Net realized and unrealized gain (loss) on investments | 1.11 | (0.08 | ) | (0.16 | ) | |||||||
|
|
|
|
|
| |||||||
Total from investment operations | 1.20 | 0.03 | (0.13 | ) | ||||||||
|
|
|
|
|
| |||||||
Less distributions to shareholders: | ||||||||||||
From net investment income | (0.09 | ) | (0.05 | ) | — | |||||||
From net realized gain on investments | (0.05 | ) | — | — | ||||||||
|
|
|
|
|
| |||||||
Total distributions to shareholders | (0.14 | ) | (0.05 | ) | — | |||||||
|
|
|
|
|
| |||||||
Net asset value - End of period | $ | 10.91 | $ | 9.85 | $ | 9.87 | ||||||
|
|
|
|
|
| |||||||
Net assets - End of period (000’s omitted) | $ | 1,766 | $ | 1,416 | $ | 733 | ||||||
|
|
|
|
|
| |||||||
Total return3 | 12.31 | % | 0.31 | % | (1.30 | %) | ||||||
Ratios (to average net assets)/Supplemental Data: | ||||||||||||
Expenses* | 0.95 | % | 0.95 | % | 0.95 | %4 | ||||||
Net investment income | 0.83 | % | 1.11 | % | 0.81 | %4 | ||||||
Portfolio turnover | 47 | % | 43 | % | 26 | % | ||||||
* The investment advisor did not impose all or a portion of its management and/or other fees, and in some periods may have paid a portion of the Series’ expenses. If these expenses had been incurred by the Class, the expense ratio (to average net assets) would have increased by the following amount:
|
| |||||||||||
| 6.38 | % | 7.58 | % | 14.21 | %4 | |||||||
1 Commencement of operations.
2 Calculated based on average shares outstanding during the periods.
3 Represents aggregate total return for the periods indicated, and assumes reinvestment of all distributions. Total return would have been lower had certain expenses not been reimbursed during the periods. Periods less than one year are not annualized.
4 Annualized.
The accompanying notes are an integral part of the financial statements.
13
Quality Equity Series
Financial Highlights - Class I
| FOR THE YEAR ENDED | FOR THE PERIOD 10/31/15 | |||||||||||
| 10/31/17 | 10/31/16 | |||||||||||
Per share data (for a share outstanding throughout each period): | ||||||||||||
Net asset value - Beginning of period | $ | 9.87 | $ | 9.88 | $ | 10.00 | ||||||
|
|
|
|
|
| |||||||
Income (loss) from investment operations: | ||||||||||||
Net investment income2 | 0.11 | 0.14 | 0.04 | |||||||||
Net realized and unrealized gain (loss) on investments | 1.12 | (0.09 | ) | (0.16 | ) | |||||||
| �� |
|
|
|
|
|
| ||||||
Total from investment operations | 1.23 | 0.05 | (0.12 | ) | ||||||||
|
|
|
|
|
| |||||||
Less distributions to shareholders: | ||||||||||||
From net investment income | (0.10 | ) | (0.06 | ) | — | |||||||
From net realized gain on investments | (0.05 | ) | — | — | ||||||||
|
|
|
|
|
| |||||||
Total distributions to shareholders | (0.15 | ) | (0.06 | ) | — | |||||||
|
|
|
|
|
| |||||||
Net asset value - End of period | $ | 10.95 | $ | 9.87 | $ | 9.88 | ||||||
|
|
|
|
|
| |||||||
Net assets - End of period (000’s omitted) | $ | 560 | $ | 497 | $ | 494 | ||||||
|
|
|
|
|
| |||||||
Total return3 | 12.70 | % | 0.55 | % | (1.20 | %) | ||||||
Ratios (to average net assets)/Supplemental Data: | ||||||||||||
Expenses* | 0.70 | % | 0.70 | % | 0.70 | %4 | ||||||
Net investment income | 1.08 | % | 1.41 | % | 1.07 | %4 | ||||||
Portfolio turnover | 47 | % | 43 | % | 26 | % | ||||||
* The investment advisor did not impose all or a portion of its management and/or other fees, and in some periods may have paid a portion of the Series’ expenses. If these expenses had been incurred by the Class, the expense ratio (to average net assets) would have increased by the following amount:
|
| |||||||||||
| 6.38 | % | 7.58 | % | 14.21 | %4 | |||||||
1 Commencement of operations.
2 Calculated based on average shares outstanding during the periods.
3 Represents aggregate total return for the periods indicated, and assumes reinvestment of all distributions. Total return would have been lower had certain expenses not been reimbursed during the periods. Periods less than one year are not annualized.
4 Annualized.
The accompanying notes are an integral part of the financial statements.
14
Quality Equity Series
Notes to Financial Statements
| 1. | Organization |
Quality Equity Series (the “Series”) is a no-load diversified series of Manning & Napier Fund, Inc. (the “Fund”). The Fund is organized in Maryland and is registered under the Investment Company Act of 1940, as amended, as an open-end management investment company.
The Series’ primary investment objective is to provide long-term growth.
The Fund’s advisor is Manning & Napier Advisors, LLC (the “Advisor”). Shares of the Series are offered to investors, clients and employees of the Advisor and its affiliates. The Series is authorized to issue two classes of shares (Class S and Class I). Each class of shares is substantially the same, except that Class S shares bear shareholder services fees. The total authorized capital stock of the Fund consists of 15 billion shares of common stock each having a par value of $0.01. As of October 31, 2017, 10.6 billion shares have been designated in total among 39 series, of which 100 million have been designated as Quality Equity Series Class S common stock, and 100 million have been designated as Quality Equity Series Class I common stock.
| 2. | Significant Accounting Policies |
The following is a summary of significant accounting policies followed by the Series. The Series is an investment company and, accordingly, follows the investment company accounting and reporting guidance of the Financial Accounting Standards Board Accounting Standards Codification Topic 946 — Investment Companies, which is part of accounting principles generally accepted in the United States of America (“GAAP”).
Security Valuation
Portfolio securities, including domestic equities, foreign equities, warrants and options, listed on an exchange other than the NASDAQ Stock Market are valued at the latest quoted sales price of the exchange on which the security is primarily traded. Securities not traded on valuation date or securities not listed on an exchange are valued at the latest quoted bid price provided by the Fund’s pricing service. Securities listed on the NASDAQ Stock Market are valued in accordance with the NASDAQ Official Closing Price.
Short-term investments that mature in sixty days or less may be valued at amortized cost, which approximates fair value. Investments in open-end investment companies are valued at their net asset value per share on valuation date.
Volume and level of activity in established markets for an asset or liability are evaluated to determine whether recent transactions and quoted prices are determinative of fair value. Where there have been significant decreases in volume and level of activity, further analysis and adjustment may be necessary to estimate fair value. The Series measures fair value in these instances by the use of inputs and valuation techniques which may be based upon current market prices of securities that are comparable in coupon, rating, maturity and industry and/or expectation of future cash flows. As a result of trading in relatively thin markets and/or markets that experience significant volatility, the prices used by the Series to value these securities may differ from the value that would be realized if these securities were sold, and the differences could be material.
Securities for which representative valuations or prices are not available from the Series’ pricing service may be valued at fair value as determined in good faith by the Advisor under procedures approved by and under the general supervision and responsibility of the Fund’s Board of Directors (the “Board”). Due to the inherent uncertainty of valuations of such securities, the fair value may differ significantly from the values that would have been used had a ready market for such securities existed. If trading or events occurring after the close of the principal market in which securities are traded are expected to materially affect the value of those securities, then they may be valued at their fair value, taking this trading or these events into account. In accordance with the procedures approved by the Board, the values of certain securities trading outside the U.S. were adjusted following the close of local trading using a factor from a third party vendor. The third party vendor uses statistical analyses and quantitative models, which consider among other things subsequent movement and changes in the prices of indices, securities and exchange rates in other markets, to determine the factors which are used to adjust local market prices. The value of securities used for net asset value calculation under these procedures may differ from published prices for the same securities. It is the Fund’s policy to classify each foreign equity security where a factor from a third party vendor is provided as a Level 2 security.
15
Quality Equity Series
Notes to Financial Statements (continued)
| 2. | Significant Accounting Policies (continued) |
Security Valuation (continued)
Various inputs are used in determining the value of the Series’ assets or liabilities carried at fair value. These inputs are summarized in three broad levels. Level 1 includes quoted prices in active markets for identical assets and liabilities. Level 2 includes other significant observable inputs (including quoted prices for similar securities, interest rates, prepayment speeds, credit risk, etc.). Level 3 includes significant unobservable inputs (including the Series’ own assumptions in determining the fair value of investments). A financial instrument’s level within the fair value hierarchy is based on the lowest level of any input both individually and in aggregate that is significant to the fair value measurement. The inputs or methodology used for valuing securities are not necessarily an indication of the risk associated with investing in those securities.
The following is a summary of the valuation levels used for major security types as of October 31, 2017 in valuing the Series’ assets or liabilities carried at fair value:
| DESCRIPTION | TOTAL | LEVEL 1 | LEVEL 2 | LEVEL 3 | ||||||||||||
Assets: | ||||||||||||||||
Equity securities: | ||||||||||||||||
Consumer Discretionary | $ | 523,065 | $ | 385,550 | $ | 137,515 | $ | — | ||||||||
Consumer Staples | 445,138 | 98,982 | 346,156 | — | ||||||||||||
Financials | 69,502 | 69,502 | — | — | ||||||||||||
Health Care | 533,262 | 395,053 | 138,209 | — | ||||||||||||
Industrials | 228,060 | 173,566 | 54,494 | — | ||||||||||||
Information Technology | 347,302 | 322,164 | 25,138 | — | ||||||||||||
Materials | 22,333 | — | 22,333 | — | ||||||||||||
Telecommunication Services | 117,417 | — | 117,417 | — | ||||||||||||
Mutual fund | 57,203 | 57,203 | — | — | ||||||||||||
|
|
|
|
|
|
|
| |||||||||
Total assets | $ | 2,343,282 | $ | 1,502,020 | $ | 841,262 | $ | — | ||||||||
|
|
|
|
|
|
|
| |||||||||
Please see the Investment Portfolio for foreign securities where a factor from a third party vendor was applied to determine the securities’ fair value following the close of local trading. Such securities are included in Level 2 in the table above.
There were no Level 3 securities held by the Series as of October 31, 2016 or October 31, 2017.
The Fund’s policy is to recognize transfers in and transfers out of the valuation levels as of the beginning of the reporting period. There were no transfers between Level 1 and Level 2 during the year ended October 31, 2017.
New Accounting Guidance
On August 1, 2017, the Fund implemented amendments to Regulation S-X, issued by the Securities and Exchange Commission, which require standardized, enhanced disclosures, particularly related to derivatives, in investment company financial statements. Adoption had no effect on the Fund’s net assets or results of operations.
Security Transactions, Investment Income and Expenses
Security transactions are accounted for on trade date. Dividend income is recorded on the ex-dividend date, except that if the ex-dividend date has passed, certain dividends from foreign securities are recorded as soon as the Series is informed of the ex-dividend date. Non-cash dividends, if any, are recorded at the fair value of the securities received. Interest income, including amortization of premium and accretion of discounts using the effective interest method, is earned from settlement date and accrued daily.
Expenses are recorded on an accrual basis. Most expenses of the Fund can be attributed to a specific series. Expenses which cannot be directly attributed are apportioned among the series in the Fund in such a manner as deemed equitable by the Fund’s Board, taking into consideration, among other things, the nature and type of expense. Income, expenses (other than shareholder services fees), and realized and unrealized gains and losses are prorated among the classes based on the relative net assets of each class. Class specific expenses are directly charged to that class.
16
Quality Equity Series
Notes to Financial Statements (continued)
| 2. | Significant Accounting Policies (continued) |
Security Transactions, Investment Income and Expenses (continued)
The Series uses the identified cost method for determining realized gain or loss on investments for both financial statement and federal income tax reporting purposes.
Foreign Currency Translation
The books and records of the Series are maintained in U.S. dollars. Foreign currencies, investments and other assets and liabilities are translated into U.S. dollars at the current exchange rates. Purchases and sales of investment securities and income and expenses are translated on the respective dates of such transactions. The Series does not isolate realized and unrealized gains and losses attributable to changes in the exchange rates from gains and losses that arise from changes in the fair value of investments. Such fluctuations are included with net realized and unrealized gain or loss on investments. Net realized foreign currency gains and losses represent foreign currency gains and losses between trade date and settlement date on securities transactions, gains and losses on disposition of foreign currencies and the difference between the amount of income and foreign withholding taxes recorded on the books of the Series and the amounts actually received or paid.
Federal Taxes
The Series’ policy is to comply with the provisions of the Internal Revenue Code applicable to regulated investment companies. The Series is not subject to federal income tax or excise tax to the extent that the Series distributes to shareholders each year its taxable income, including any net realized gains on investments, in accordance with requirements of the Internal Revenue Code. Accordingly, no provision for federal income tax or excise tax has been made in the financial statements.
Management evaluates its tax positions to determine if the tax positions taken meet the minimum recognition threshold in connection with accounting for uncertainties in income tax positions taken or expected to be taken for the purposes of measuring and recognizing tax liabilities in the financial statements. Recognition of tax benefits of an uncertain tax position is required only when the position is “more likely than not” to be sustained assuming examination by taxing authorities. At October 31, 2017, the Series has recorded no liability for net unrecognized tax benefits relating to uncertain income tax positions taken or expected to be taken in future tax returns.
The Series files income tax returns in the U.S. federal jurisdiction, various states and foreign jurisdictions, as required. No income tax returns are currently under investigation. The statute of limitations on the Series’ tax returns remains open for the period ended October 31, 2015 and for the years ended October 31, 2016 through October 31, 2017. The Series is not aware of any tax positions for which it is reasonably possible that the total amounts of unrecognized tax benefits will significantly change in the next twelve months.
Foreign Taxes
Based on the Series’ understanding of the tax rules and rates related to income, gains and currency purchase/repatriation transactions for foreign jurisdictions in which it invests, the Series will provide for foreign taxes, and where appropriate, deferred foreign tax.
Distributions of Income and Gains
Distributions to shareholders of net investment income and net realized gains are made annually. An additional distribution may be necessary to avoid taxation of the Series. Distributions are recorded on the ex-dividend date.
Indemnifications
The Fund’s organizational documents provide former and current directors and officers with a limited indemnification against liabilities arising in connection with the performance of their duties to the Fund. In the normal course of business, the Fund may also enter into contracts that provide general indemnifications. The Fund’s maximum exposure under these arrangements is unknown as this would be dependent on future claims that may be made against the Fund. The risk of material loss from such claims is considered remote.
Other
The preparation of financial statements in conformity with GAAP requires management to make estimates and assumptions that affect the reported amounts of assets and liabilities and the disclosure of contingent assets and liabilities at the date of the
17
Quality Equity Series
Notes to Financial Statements (continued)
| 2. | Significant Accounting Policies (continued) |
Other (continued)
financial statements and the reported amounts of income and expenses during the reporting period. Actual results could differ from those estimates.
| 3. | Transactions with Affiliates |
The Fund has an Investment Advisory Agreement (the “Agreement”) with the Advisor for which the Series pays a fee, computed daily and payable monthly, at an annual rate of 0.55% of the Series’ average daily net assets.
Under the Agreement, personnel of the Advisor provide the Series with advice and assistance in the choice of investments and the execution of securities transactions, and otherwise maintain the Series’ organization. The Advisor also provides the Fund with necessary office space and fund administration and support services. The salaries of all officers of the Fund (except a percentage of the Fund’s Chief Compliance Officer’s salary, which is paid by the Fund), and of all Directors who are “affiliated persons” of the Fund, or of the Advisor, and all personnel of the Fund, or of the Advisor, performing services relating to research, statistical and investment activities, are paid by the Advisor. Each “non-affiliated” Director receives an annual stipend, which is allocated among all the active series of the Fund. In addition, these Directors also receive a fee per Board meeting attended plus a fee for each committee meeting attended and are reimbursed for travel and other out-of-pocket expenses incurred by them in connection with attending such meetings. The Fund also has an Audit Committee Chair, who receives an additional annual stipend for this role.
The Class S shares of the Series are subject to a shareholder services fee in accordance with a shareholder services plan adopted by the Fund’s Board. The shareholder services fee is intended to compensate financial intermediaries, including affiliates of the Fund, in connection with the provision of direct client service, personal services, maintenance of shareholder accounts and reporting services. For these services, Class S of the Series pays a fee, computed daily and payable monthly, at an annual rate of 0.25% of the average daily net assets of Class S. The Fund has a Shareholder Services Agreement with the Advisor, for which the Advisor receives the shareholder services fee as stated above.
The Advisor has contractually agreed, until at least February 28, 2018, to waive its fee and, if necessary, pay other operating expenses of the Series in order to maintain total direct annual fund operating expenses for the Series exclusive of each share class’ shareholder services fee, at no more than 0.70% of average daily net assets. Accordingly, the Advisor waived fees of $137,091 for the year ended October 31, 2017, which is included as a reduction of expenses on the Statement of Operations. The Advisor is not eligible to recoup any expenses that have been waived or reimbursed in prior years.
Manning & Napier Investor Services, Inc., a registered broker-dealer affiliate of the Advisor, acts as distributor for the Fund’s shares. The services of Manning & Napier Investor Services, Inc. are provided at no additional cost to the Series.
Pursuant to a master services agreement effective through February 28, 2017, the Fund paid the Advisor an annual fee related to fund accounting and administration of 0.0085% on the first $25 billion of average daily net assets (excluding Target Series and Strategic Income Series); 0.0075% on the next $15 billion of average daily net assets (excluding Target Series and Strategic Income Series); and 0.0065% of average daily net assets in excess of $40 billion (excluding Target Series and Strategic Income Series); plus a base fee of $30,400 per series. Transfer agent fees were charged to the Fund on a per account basis. Additionally, certain transaction and out-of-pocket expenses, including charges for reporting relating to the Fund’s compliance program, were charged. The Advisor had agreements with BNY Mellon Investment Servicing (U.S.) Inc. (“BNY”) under which BNY served as sub-accountant services agent and sub-transfer agent. Effective March 1, 2017, BNY became the named transfer agent for the Fund. Pursuant to a master services agreement dated March 1, 2017, the Fund continues to pay the Advisor the annual fee related to fund accounting and administration of 0.0085% on the first $25 billion of average daily net assets (excluding Target Series and Strategic Income Series); 0.0075% on the next $15 billion of average daily net assets (excluding Target Series and Strategic Income Series); and 0.0065% of average daily net assets in excess of $40 billion (excluding Target Series and Strategic Income Series); plus the base fee of $30,400 per series. Additionally, certain transaction and out-of-pocket expenses, including charges for reporting relating to the Fund’s compliance program, are charged. The agreement between the Advisor and BNY under which BNY serves as sub-accountant services agent continues to be in effect.
18
Quality Equity Series
Notes to Financial Statements (continued)
| 3. | Transactions with Affiliates (continued) |
Expenses not directly attributable to a series are allocated based on each series’ relative net assets or number of accounts, depending on the expense.
| 4. | Purchases and Sales of Securities |
For the year ended October 31, 2017, purchases and sales of securities, other than U.S. Government securities and short-term securities, were $1,186,364 and $994,259, respectively. There were no purchases or sales of U.S. Government securities.
| 5. | Capital Stock Transactions |
Transactions in shares of Class S and Class I of Quality Equity Series were:
| CLASS S: | FOR THE YEAR ENDED 10/31/17 | FOR THE YEAR ENDED 10/31/16 | ||||||||||||||
| SHARES | AMOUNT | SHARES | AMOUNT | |||||||||||||
Sold | 38,847 | $ | 405,474 | 78,329 | $ | 771,528 | ||||||||||
Reinvested | 1,989 | 19,397 | 385 | 3,654 | ||||||||||||
Repurchased | (22,877 | ) | (237,104 | ) | (9,121 | ) | (89,206 | ) | ||||||||
|
|
|
|
|
|
|
| |||||||||
Total | 17,959 | $ | 187,767 | 69,593 | $ | 685,976 | ||||||||||
|
|
|
|
|
|
|
| |||||||||
| CLASS I: | FOR THE YEAR ENDED 10/31/17 | FOR THE YEAR ENDED 10/31/16 | ||||||||||||||
| SHARES | AMOUNT | SHARES | AMOUNT | |||||||||||||
Sold | — | — | — | — | ||||||||||||
Reinvested | 796 | $ | 7,766 | 326 | $ | 3,100 | ||||||||||
Repurchased | — | — | — | — | ||||||||||||
|
|
|
|
|
|
|
| |||||||||
Total | 796 | $ | 7,766 | 326 | $ | 3,100 | ||||||||||
|
|
|
|
|
|
|
| |||||||||
At October 31, 2017, the Advisor and its affiliates owned less than 48% of the Series. Investment activities of these shareholders may have a material effect on the Series.
| 6. | Financial Instruments |
The Series may trade in instruments including written and purchased options, forward foreign currency exchange contracts and futures contracts and other derivatives in the normal course of investing activities to assist in managing exposure to various market risks. The Series may be subject to various elements of risk, which may involve, to a varying degree, elements of risk in excess of the amounts recognized for financial statement purposes. These risks include: the risk that changes in the value of a derivative may not correlate perfectly with the underlying asset, rate or index; counterparty credit risk related to over the counter derivative counterparties’ failure to perform under contract terms; liquidity risk related to the lack of a liquid market for these contracts allowing the fund to close out its position(s); and documentation risk relating to disagreement over contract terms. No such investments were held by the Series as of October 31, 2017.
| 7. | Foreign Securities |
Investing in securities of foreign companies and foreign governments involves special risks and considerations not typically associated with investing in securities of domestic companies and the U.S. Government. These risks include revaluation of currencies and future adverse political and economic developments. Moreover, securities of foreign companies and foreign governments and their markets may be less liquid and their prices more volatile than those of comparable domestic companies and the U.S. Government.
19
Quality Equity Series
Notes to Financial Statements (continued)
| 8. | Federal Income Tax Information |
The amount and characterization of certain income and capital gains to be distributed are determined in accordance with federal income tax regulations, which may differ from GAAP. These differences are primarily due to differing book and tax treatments in the timing of the recognition of net investment income or gains and losses, including losses deferred due to wash sales and foreign currency gains and losses. The Series may periodically make reclassifications among its capital accounts to reflect income and gains available for distribution (or available capital loss carryovers) under income tax regulations, without impacting the Series’ net asset value. For the year ended October 31, 2017, amounts were reclassified within the capital accounts to increase Undistributed Net Investment Income by $279, and decrease Accumulated Net Realized Gain on Investments by $279. Any such reclassifications are not reflected in the financial highlights.
The tax character of distributions paid were as follows:
| FOR THE YEAR ENDED 10/31/17 | FOR THE YEAR ENDED 10/31/16 | |||||||
Ordinary income | $ | 17,784 | $ | 6,754 | ||||
Long-term capital gains | 9,720 | — | ||||||
At October 31, 2017,the tax basis of components of distributable earnings and the net unrealized appreciation based on identified cost of investments for federal tax purposes were as follows:
Cost for federal income tax purposes | $ | 2,166,674 | ||
Unrealized appreciation | 280,570 | |||
Unrealized depreciation | (103,962 | ) | ||
|
| |||
Net unrealized appreciation | $ | 176,608 | ||
|
| |||
Undistributed ordinary income | $ | 16,130 | ||
Undistributed long-term capital gains | $ | 13,861 |
20
Quality Equity Series
Report of Independent Registered Public Accounting Firm
To the Board of Directors of Manning & Napier Fund, Inc. and Shareholders of Quality Equity Series:
In our opinion, the accompanying statement of assets and liabilities, including the investment portfolio, and the related statements of operations and of changes in net assets and the financial highlights present fairly, in all material respects, the financial position of the Quality Equity Series (one of the series constituting Manning & Napier Fund, Inc., hereafter referred to as the “Series”) as of October 31, 2017, the results of its operations for the year then ended, the changes in its net assets for each of the two years in the period then ended and the financial highlights for each of the periods presented, in conformity with accounting principles generally accepted in the United States of America. These financial statements and financial highlights (hereafter referred to as “financial statements”) are the responsibility of the Series’ management. Our responsibility is to express an opinion on these financial statements based on our audits. We conducted our audits of these financial statements in accordance with the standards of the Public Company Accounting Oversight Board (United States). Those standards require that we plan and perform the audit to obtain reasonable assurance about whether the financial statements are free of material misstatement. An audit includes examining, on a test basis, evidence supporting the amounts and disclosures in the financial statements, assessing the accounting principles used and significant estimates made by management, and evaluating the overall financial statement presentation. We believe that our audits, which included confirmation of securities as of October 31, 2017 by correspondence with the custodian and brokers, provide a reasonable basis for our opinion.
New York, New York
December 18, 2017
21
Quality Equity Series
Supplemental Tax Information
(unaudited)
All reportings are based on financial information available as of the date of this annual report and, accordingly are subject to change.
For federal income tax purposes, the Series reports for the current fiscal year $17,784 or, if different, the maximum amount allowable under the tax law as qualified dividend income.
For corporate shareholders, the percentage of investment income (dividend income plus short-term gains, if any) that qualifies for the dividends received deduction for the current fiscal year is 79.24%.
The Series designates $14,573 as Long-Term Capital Gain dividends pursuant to Section 852(b) of the Code for the fiscal year ended October 31, 2017.
22
Quality Equity Series
Directors’ and Officers’ Information
(unaudited)
The Statement of Additional Information provides additional information about the Fund’s directors and officers and can be obtained without charge by calling 1-800-466-3863, at www.manning-napier.com, or on the EDGAR Database on the SEC Internet web site (http://www.sec.gov). The following chart shows certain information about the Fund’s directors and officers, including their principal occupations during the last five years. Unless specific dates are provided, the individuals have held the listed positions for longer than five years.
| Interested Director and Officer | ||
| Name: | Michele T. Mosca* | |
| Address: | 290 Woodcliff Drive | |
| Fairport, NY 14450 | ||
| Age: | 45 | |
| Current Position(s) Held with Fund: | Principal Executive Officer, President, Chairman & Director | |
| Term of Office & Length of Time Served: | Indefinite – Chairman and Director since August 20161 | |
| Principal Occupation(s) During Past 5 Years: | Managing Director, Funds Group (since 2009) - Manning & Napier Advisors, LLC; President, Director (since 2015) - Manning & Napier Investor Services, Inc.; Chief Executive Officer, President (since 2016) - Rainier Investment Management Mutual Funds, Inc. Holds the following title for various subsidiaries and affiliates: President, Director | |
| Number of Portfolios Overseen within Fund Complex: | 38 | |
| Other Directorships Held Outside Fund Complex During Past 5 Years: | Trustee - Rainier Investment Management Mutual Funds (since 2016) | |
| Independent Directors | ||
| Name: | Stephen B. Ashley | |
| Address: | 290 Woodcliff Drive | |
| Fairport, NY 14450 | ||
| Age: | 77 | |
| Current Position(s) Held with Fund: | Director, Audit Committee Member, Governance & Nominating Committee Member | |
| Term of Office & Length of Time Served: | Indefinite - Since 1996 | |
| Principal Occupation(s) During Past 5 Years: | Chairman, Director & Chief Executive Officer (1997 to present) - The Ashley Group (property management and investment). Director (1995-2008) and Chairman (non-executive) (2004-2008) - Fannie Mae (mortgage) | |
| Number of Portfolios Overseen within Fund Complex: | 38 | |
| Other Directorships Held Outside Fund Complex During Past 5 Years: | Fannie Mae (1995-2008) The Ashley Group (1995-2008) Genesee Corporation (1987-2007) | |
| Name: | Paul A. Brooke | |
| Address: | 290 Woodcliff Drive | |
| Fairport, NY 14450 | ||
| Age: | 72 | |
| Current Position(s) Held with Fund: | Lead Independent Director, Audit Committee Member, Governance & Nominating Committee Chairman | |
| Term of Office & Length of Time Served: | Indefinite - Director, Audit Committee Member, Governance & Nominating Committee Member since 2007; Governance & Nominating Committee Chairman since 2016; Lead Independent Director since 2017 | |
| Principal Occupation(s) During Past 5 Years: | Chairman & CEO (2005-2009) - Ithaka Acquisition Corporation (investments); Chairman (2007-2009) - Alsius Corporation (investments); Managing Member (1991-present) - PMSV Holdings LLC (investments); Managing Member (2010-2016) - Venbio (investments). | |
| Number of Portfolios Overseen within Fund Complex: | 38 | |
| Other Directorships Held Outside Fund Complex During Past 5 Years: | Incyte Corp. (biotech) (2000-present); ViroPharma, Inc. (speciality pharmaceuticals) (2000-2014); HLTH (WebMD) (information) (2000-2010); Cheyne Capital International (investment) (2000-present); GMP Companies (investment) (2000-2011); Cytos Biotechnology Ltd (biotechnology) (2012-2014); Cerus (biomedical) (2016-present); PureEarth (non-profit) (2012-present) | |
23
Quality Equity Series
Directors’ and Officers’ Information
(unaudited)
| Independent Directors (continued) | ||
| Name: | Peter L. Faber | |
| Address: | 290 Woodcliff Drive | |
| Fairport, NY 14450 | ||
| Age: | 79 | |
| Current Position(s) Held with Fund: | Director, Governance & Nominating Committee Member | |
| Term of Office & Length of Time Served: | Indefinite - Since 1987 | |
| Principal Occupation(s) During Past 5 Years: | Senior Counsel (2006-2012), Partner (1995-2006 & 2013-present) - McDermott, Will & Emery LLP (law firm) | |
| Number of Portfolios Overseen within Fund Complex: | 38 | |
| Other Directorships Held Outside Fund Complex During Past 5 Years: | Boston Early Music Festival (non-profit) (2007-present); Amherst Early Music, Inc. (non-profit) (2009-present); Gotham Early Music Scene, Inc. (non-profit) (2009-present); Partnership for New York City, Inc. (non-profit) (1989-2010); New York Collegium (non-profit) (2004-2011) | |
| Name: | Harris H. Rusitzky | |
| Address: | 290 Woodcliff Drive | |
| Fairport, NY 14450 | ||
| Age: | 82 | |
| Current Position(s) Held with Fund: | Director, Audit Committee Member, Governance & Nominating Committee Member | |
| Term of Office & Length of Time Served: | Indefinite - Since 1985 | |
| Principal Occupation(s) During Past 5 Years: | President (1994- present) - The Greening Group (business consultants); Partner (2006-present) - The Restaurant Group (restaurants) | |
| Number of Portfolios Overseen within Fund Complex: | 38 | |
| Other Directorships Held Outside Fund Complex During Past 5 Years: | Rochester Institute of Technology (university) (1972-present); Culinary Institute of America (non-profit college) (1985-present); George Eastman House (museum) (1988-present); National Restaurant Association (restaurant trade organization) (1978-present) | |
| Name: | Chester N. Watson | |
| Address: | 290 Woodcliff Drive | |
| Fairport, NY 14450 | ||
| Age: | 67 | |
| Current Position(s) Held with Fund: | Director, Audit Committee Chairman, Governance & Nominating Committee Member | |
| Term of Office & Length of Time Served: | Indefinite - Since 2012 | |
| Principal Occupation(s) During Past 5 Years: | General Auditor (2003-2011) - General Motors Company (auto manufacturer) | |
| Number of Portfolios Overseen within Fund Complex: | 38 | |
| Other Directorships Held Outside Fund Complex During Past 5 Years: | Rochester Institute of Technology (university) (2005-present); Town of Greenburgh, NY Planning Board (municipal government) (2015-present) | |
| Officers: | ||
| Name: | Jeffrey S. Coons, Ph.D., CFA® | |
| Address: | 290 Woodcliff Drive | |
| Fairport, NY 14450 | ||
| Age: | 54 | |
| Current Position(s) Held with Fund: | Vice President | |
| Term of Office1 & Length of Time Served: | Since 2004 | |
| Principal Occupation(s) During Past 5 Years: | President since 2010, Co-Director of Research (2002-2015) - Manning & Napier Advisors, LLC Holds one or more of the following titles for various subsidiaries and affiliates: President, Director, Treasurer, or Senior Trust Officer | |
| Name: | Elizabeth Craig | |
| Address: | 290 Woodcliff Drive | |
| Fairport, NY 14450 | ||
| Age: | 30 | |
| Current Position(s) Held with Fund: | Corporate Secretary | |
| Term of Office1 & Length of Time Served: | Since 2016 | |
| Principal Occupation(s) During Past 5 Years: | Fund Administration Manager since 2015; Mutual Fund Compliance Specialist (2009-2015) - Manning & Napier Advisors, LLC; Assistant Corporate Secretary (2011-2016) - Manning & Napier Fund, Inc. | |
24
Quality Equity Series
Directors’ and Officers’ Information
(unaudited)
| Officers: (continued) | ||
| Name: | Christine Glavin | |
| Address: | 290 Woodcliff Drive | |
| Fairport, NY 14450 | ||
| Age: | 51 | |
| Current Position(s) Held with Fund: | Principal Financial Officer, Chief Financial Officer | |
| Term of Office1 & Length of Time Served: | Principal Financial Officer since 2002; Chief Financial Officer since 2001 | |
| Principal Occupation(s) During Past 5 Years: | Director of Fund Reporting since 2011; Fund Reporting Manager (1997-2011) - Manning & Napier Advisors, LLC; Assistant Treasurer since 2008 - Exeter Trust Company; Chief Financial Officer since 2017- Rainier Investment Management Mutual Funds, Inc. | |
| Name: | Jodi L. Hedberg | |
| Address: | 290 Woodcliff Drive | |
| Fairport, NY 14450 | ||
| Age: | 50 | |
| Current Position(s) Held with Fund: | Chief Compliance Officer, Anti-Money Laundering Compliance Officer | |
| Term of Office1 & Length of Time Served: | Chief Compliance Officer since 2004; Anti-Money Laundering Officer since 2002; Corporate Secretary (1997-2016)- Manning & Napier Fund, Inc.; Chief Compliance Officer and Anti-Money Laundering Officer since 2017 - Rainier Investment Management Mutual Funds, Inc. | |
| Principal Occupation(s) During Past 5 Years: | Director of Compliance since 2005; Compliance Manager (1995-2005) - Manning & Napier Advisors, LLC and affiliates; Corporate Secretary - Manning & Napier Investor Services, Inc. since 2006 | |
| Name: | Scott Morabito | |
| Address: | 290 Woodcliff Drive | |
| Fairport, NY 14450 | ||
| Age: | 29 | |
| Current Position(s) Held with Fund: | Assistant Vice President | |
| Term of Office1 & Length of Time Served: | Since 2017 | |
| Principal Occupation(s) During Past 5 Years: | Director of Funds Group since 2017; Fund Product and Strategy Manager (2014-2017); Senior Product and Strategy Analyst (2013-2014); Product and Strategy Analyst (2011-2013) - Manning & Napier Advisors, LLC. | |
| Name: | Amy Williams | |
| Address: | 290 Woodcliff Drive | |
| Fairport, NY 14450 | ||
| Age: | 56 | |
| Current Position(s) Held with Fund: | Assistant Corporate Secretary | |
| Term of Office1 & Length of Time Served: | Since 2016 | |
| Principal Occupation(s) During Past 5 Years: | Director of Fund Documentation - Manning & Napier Advisors, LLC and affiliates since 2009 Holds one or more of the following titles for various affiliates: Director | |
| Name: | Richard Yates | |
| Address: | 290 Woodcliff Drive | |
| Fairport, NY 14450 | ||
| Age: | 52 | |
| Current Position(s) Held with Fund: | Chief Legal Officer | |
| Term of Office1 & Length of Time Served: | Chief Legal Officer since 2004 | |
| Principal Occupation(s) During Past 5 Years: | Counsel - Manning & Napier Advisors, LLC and affiliates since 2000; Chief Legal Officer since 2016 - Rainier Investment Management, LLC; Chief Legal Officer since 2016 - Rainier Investment Management Mutual Funds, Inc. Holds one or more of the following titles for various affiliates: Director, Corporate Secretary, Chief Legal Officer | |
*Interested Director, within the meaning of the 1940 Act by reason of her positions with the Fund’s investment advisor, Manning & Napier Advisors, LLC and Distributor, Manning & Napier Investor Services, Inc.
1 The term of office of all officers shall be one year and until their respective successors are chosen and qualified, or his or her earlier resignation or removal as provided in the Fund’s By-Laws.
25
Quality Equity Series
Literature Requests
(unaudited)
Proxy Voting Policies and Procedures
A description of the policies and procedures that the Fund uses to determine how to vote proxies relating to portfolio securities is available, without charge, upon request:
| By phone | 1-800-466-3863 | |||
| On the Securities and Exchange | ||||
| Commission’s (SEC) web site | http://www.sec.gov |
Proxy Voting Record
Information regarding how the Fund voted proxies relating to portfolio securities during the most recent 12-month period ended June 30th is available, without charge, upon request:
| By phone | 1-800-466-3863 | |||
| On the SEC’s web site | http://www.sec.gov |
Quarterly Portfolio Holdings
The Series’ complete schedule of portfolio holdings for the 1st and 3rd quarters of each fiscal year are provided on Form N-Q, and are available, without charge, upon request:
| By phone | 1-800-466-3863 | |||
| On the SEC’s web site | http://www.sec.gov |
The Series’ Form N-Q may be reviewed and copied at the SEC’s Public Reference Room in Washington, D.C. Information on the operation of the Public Reference Room may be obtained by calling 1-800-SEC-0330.
Prospectus and Statement of Additional Information (SAI)
For more information about any of the Manning & Napier Fund, Inc. Series, you may obtain a prospectus and SAI at www.manning-napier.com or by calling (800) 466-3863. Before investing, carefully consider the objectives, risks, charges and expenses of the investment and read the prospectus carefully as it contains this and other information about the investment company. In addition, this information can be found on the SEC’s web site, http://www.sec.gov.
Additional information available at www.manning-napier.com
1. Fund Holdings - Month-End
2. Fund Holdings - Quarter-End
3. Shareholder Report - Annual
4. Shareholder Report - Semi-Annual
The Fund also offers electronic notification or “e-delivery” when certain documents are available on-line to be downloaded or reviewed. Direct shareholders can elect to receive electronic notification when shareholder reports, prospectus updates, and/or statements are available. If you do not currently have on-line access to your account, you can establish access by going to www.manning-napier.com, click on “Login” in the top corner of the page, and follow the prompts to self-enroll. Once enrolled, you can set your electronic notification preferences by clicking on the Account Options tab located within the green toolbar and then select E-Delivery Option. Should you have any questions on either how to establish on-line access or how to update your account settings, please contact Investor Services at 1-800-466-3863.
The Manning & Napier Fund, Inc. is managed by Manning & Napier Advisors, LLC. Manning & Napier Investor Services, Inc., an affiliate of Manning & Napier Advisors, LLC, is the distributor of the Fund shares.
MNQEQ-10/17-AR

Rainier International Discovery Series
Management Discussion and Analysis
(unaudited)
Dear Shareholders:
Just one year ago, many investors were anticipating a widespread sell-off in domestic equity markets after Donald Trump won the election for the U.S. presidency. Not only did a sell-off fail to materialize, but equities actually moved sharply higher and remained on an upward trajectory throughout the year. The advance in equities was despite ongoing uncertainty surrounding policy implementation and how the new administration’s agenda might ultimately affect U.S. economic growth. For the year ended October 31, 2017, domestic equities were up 23.63%, as measured by the S&P 500 Index. International equities, as measured by the MSCI ACWI ex USA Index, also fared extraordinarily well, up 23.64%. Domestic investment-grade bonds, as measured by the Bloomberg Barclays U.S. Aggregate Bond Index, experienced relatively subdued performance, up 0.90%. Within fixed income, corporate bonds led, with high-yield securities in particular delivering very strong performance.
Much of the move upward in asset markets has been driven by stronger corporate earnings that materialized in early 2017 within both developed and emerging markets, supported by synchronized economic growth across all major global regions. Further, although Federal Reserve (Fed) policymakers continued gradually raising the target range for the federal funds rate and began reducing the Fed’s securities holdings, central bank policies across the globe have remained generally accommodative, providing an additional tailwind for asset prices.
Investors are undoubtedly enjoying the “Goldilocks” state of the economy: not too cold so as to usher in a recession, and not too hot so as to cause runaway inflation. Nonetheless, it is our view that market participants should temper their expectations going forward. The U.S. continues to move along in its economic cycle, and while it is not our view that we are on the cusp of a bear market, the status of our indicators suggest that we are certainly closer to the end of the current bull market than we are to the beginning. Complacency is elevated, there are significantly fewer pockets of cheap valuations remaining compared to the past several years, and U.S. valuations in particular limit upside potential, offering little support for asset prices should volatility in the financial markets materialize. This is surely not the time for investors to chase returns or take on unnecessary risk. Rather, it is our view that current market dynamics are consistent with rising risks that must be actively managed, and investors should maintain allocations consistent with their long-term investment objectives.
With this in mind, we discuss recent fund performance in this report, highlight how we are positioned amid the current economic environment, and provide our outlook of what to expect in financial markets. We hope that you find this information helpful, and look forward to working with you in the years ahead to meet your investment goals.
Thank you for your continued confidence in us.
Sincerely,
Manning & Napier Advisors, LLC
The S&P 500 Total Return Index is an unmanaged, capitalization-weighted measure of 500 widely held common stocks listed on the New York Stock Exchange, American Stock Exchange, and the Over-the-Counter market. The Index returns assume daily reinvestment of dividends and do not reflect any fees or expenses. Index returns provided by Bloomberg. S&P Dow Jones Indices LLC, a subsidiary of the McGraw Hill Financial, Inc., is the publisher of various index based data products and services and has licensed certain of its products and services for use by Manning & Napier. All such content Copyright © 2017 by S&P Dow Jones Indices LLC and/or its affiliates. All rights reserved. Neither S&P Dow Jones Indices LLC, Dow Jones Trademark Holdings LLC, their affiliates nor their third party licensors make any representation or warranty, express or implied, as to the ability of any index to accurately represent the asset class or market sector that it purports to represent and none of these parties shall have any liability for any errors, omissions, or interruptions of any index or the data included therein.
The MSCI ACWI ex USA Index (ACWIxUS) is designed to measure large and mid-cap representation across 22 of 23 Developed Markets countries (excluding the U.S.) and 24 Emerging Markets countries. The Index returns do not reflect any fees or expenses. The Index is denominated in U.S. dollars. The Index returns are net of withholding taxes. They assume daily reinvestment of net dividends thus accounting for any applicable dividend taxation. Index returns provided by Bloomberg.
The Bloomberg Barclays U.S. Aggregate Bond Index is an unmanaged, market-value weighted index of U.S. domestic investment-grade debt issues, including government, corporate, asset-backed, and mortgage-backed securities, with maturities of one year or more. Index returns do not reflect any fees or expenses. Index returns provided by Interactive Data.
1
Rainier International Discovery Series
Fund Commentary
(unaudited)
Investment Objective
To seek long-term capital appreciation. The Series invests primarily in equity securities of foreign developed and emerging market companies that are small- to mid-sized at the time of purchase.
Performance Commentary
Broad international equity markets, as represented by the MSCI ACWI ex USA Index (ACWIxUS) posted meaningfully positive returns for the year ending October 31, 2017, returning 23.64%. International small cap stocks slightly outperformed the broad market, with the MSCI ACWI ex USA Small Cap Index (ACWIxUS Small Cap) returning 24.70% for the year. Within the international small cap market, developed markets outperformed emerging markets, as the MSCI EAFE Small Cap Index outperformed the MSCI EM Small Cap Index.
The International Discovery Series experienced solid returns for the year and outperformed its benchmark (ACWIxUS Small Cap) by more than 5% on a relative basis.
The Series’ outperformance relative to the ACWIxUS Small Cap during the year was driven primarily by individual stock selection, but country and sector allocations also positively impacted relative returns. From a country perspective, overweight allocations relative to the benchmark to Switzerland, Denmark, France, and Italy were all positive contributors, while an underweight to Japan impacted returns negatively. A slight underweight to Emerging Markets in general was also a positive factor. At the sector level, a meaningful underweight to Real Estate contributed most positively on a relative basis.
From an individual stock perspective, selection within the Industrials sector (Daifuku Co.; Harmonic Drive Systems), the Health Care sector (Ambu A/S; Dechra Pharmaceuticals), and the Information Technology sector (Sunny Optical; Yaskawa Electric Corporation) were the largest drivers of outperformance. Within specific countries, security selection in Japan, China, the United Kingdom, and Hong Kong all contributed positively to relative performance.
The Series’ focus continues to be on owning well-established companies with dominant market positions and meaningful growth potential. The Series’ portfolio will generally be well-diversified amongst sectors, countries, and regions, with the primary focus of portfolio construction being on bottom-up security selection. As of October 31, 2017, the portfolio reflects overweight allocations to the Health Care and Industrials sectors relative to the benchmark (approximately 44% of the portfolio in total) and underweight allocations to Real Estate and Materials (approximately 7% of the portfolio compared to approximately 21% of the benchmark). From a country perspective, the portfolio is overweight to Denmark, France, and Switzerland, and underweight to Japan, Taiwan, and the United Kingdom, relative to the benchmark.
The past fiscal year has seen significant absolute returns, both for the Series and broadly in the international small cap market. However, despite these gains, the management team continues to find investment opportunities with growth potential at attractive valuations. The international small cap asset class, given its vast size and relatively limited information availability, provides an ideal environment for dedicated, experienced, active management to add value. The Series will continue to invest in dominant companies that have a clear catalyst for continued growth and are trading at attractive valuations. The team believes that this investment approach in the international small cap market has the ability to continue to add value over the long term.
Performance data quoted represents past performance and does not guarantee future results. The investment return and principal value of an investment will fluctuate, so that an investor’s shares, when redeemed, may be worth more or less than their original cost. Current performance may be higher or lower than that quoted; investors can obtain the most recent month-end performance at www.manning-napier.com or by calling (800) 466-3863. Performance for the Rainier International Discovery Series Class K shares is provided above. Performance for the Class I shares will be higher based on the Class’ lower expenses.
Please see the next page for additional performance information as of October 31, 2017.
Allocation data is based on country of incorporation.
All investments involve risks, including possible loss of principal. As with any stock fund, the value of your investment will fluctuate in response to stock market movements. Small- and medium-capitalization companies tend to have limited liquidity and greater price volatility than large-capitalization companies. Funds whose investments are concentrated in foreign and emerging market countries may be subject to fluctuating currency values, different accounting standards, and economic and political instability. The value of the Series may be affected by changes in exchange rates between foreign currencies and the U.S. dollar. Investments in emerging markets may be more
2
Rainier International Discovery Series
Fund Commentary
(unaudited)
Performance Commentary (continued)
volatile than investments in more developed markets. Additionally, the Series is subject to portfolio turnover risk as it may buy and sell investments frequently, which may result in higher expenses and an increase in realized capital gains and potential tax implications for shareholders.
The MSCI EAFE Small Cap Index is a free float-adjusted market capitalization index designed to measure small-cap representation across 21 Developed Markets countries (excluding the U.S. and Canada). The Index returns do not reflect any fees or expenses. The Index is denominated in U.S. dollars. The Index returns are net of withholding taxes. They assume daily reinvestment of net dividends thus accounting for any applicable dividend taxation. Index returns provided by Bloomberg.
The MSCI Emerging Markets Small Cap Index is a free float-adjusted market capitalization index designed to measure small- cap representation across 24 Emerging Markets countries. The Index returns do not reflect any fees or expenses. The Index is denominated in U.S. dollars. The Index returns are net of withholding taxes. They assume daily reinvestment of net dividends thus accounting for any applicable dividend taxation. Index returns provided by Morningstar.
3
Rainier International Discovery Series
Performance Update as of October 31, 2017
(unaudited)
| AVERAGE ANNUAL TOTAL RETURNS AS OF OCTOBER 31, 2017 | ||||||||||||
| ONE YEAR1 | FIVE YEAR | SINCE INCEPTION2 | ||||||||||
Manning & Napier Fund, Inc. - Rainier International Discovery Series - Class K3,4 | 29.87 | % | 15.27 | % | 15.25 | % | ||||||
Manning & Napier Fund, Inc. - Rainier International Discovery Series - Class I3,4 | 30.21 | % | 15.54 | % | 15.53 | % | ||||||
Manning & Napier Fund, Inc. - Rainier International Discovery Series - Class R63,4 | 30.21 | % | 15.54 | % | 15.53 | % | ||||||
MSCI ACWI ex USA Small Cap Index5 | 24.70 | % | 10.08 | % | 8.76 | % | ||||||
The following graph compares the value of a $1,000,000 investment in the Manning & Napier Fund, Inc. - Rainier International Discovery Series - Class I from its inception2 (March 28, 2012) to present (October 31, 2017) to the MSCI ACWI ex USA Small Cap Index.
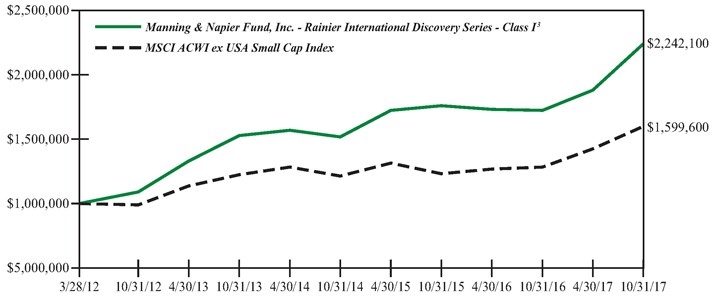
1The returns shown are based on net asset values calculated for shareholder transactions and may differ from the returns shown in the financial highlights, which reflect adjustments made to the net asset values in accordance with accounting principles generally accepted in the United States of America.
2Performance numbers for the Series and the MSCI ACWI ex USA Small Cap Index are calculated from March 28, 2012, the Class I inception date.
3The Series’ performance does not reflect the deduction of taxes that a shareholder would pay on fund distributions or the redemption of shares. The Series’ performance is historical and may not be indicative of future results. The performance returns shown are inclusive of the net expense ratio of the Series. For the period ended October 31, 2017, this net expense ratio was 1.49% for Class K, 1.24% for Class I and 1.00% for Class R6. The gross expense ratio, which does not account for any voluntary or contractual waivers currently in effect, was 1.70% for Class K, 1.36% for Class I and 1.17% for Class R6 for the period ended October 31, 2017.
4The Rainier International Discovery Fund (Predecessor Fund), which was managed by Rainier Investment Management, LLC, was reorganized into the Manning & Napier Fund, Inc. Rainier International Discovery Series on 08/21/2017. For periods prior to 08/21/2017, performance for the Class I and R6 Shares is based on the historical performance of the Predecessor Fund’s Institutional Shares, and will differ to the extent that the Predecessor Fund’s Institutional Shares had a higher expense ratio. For periods between 11/30/ 2012 and 08/21/2017, performance for Class K is based on the historical performance of the Predecessor Fund’s Class A Shares; performance prior to 11/30/2012 is based on the historical performance of the Predecessor Fund’s Institutional Shares and adjusted for the Predecessor Fund’s Class A Shares expenses. If the sales charges were reflected or if performance had been adjusted to reflect the Class K Shares’ expenses, the performance would have been different depending on total expenses incurred by the Predecessor Fund.
5The MSCI ACWI ex USA Small Cap Index is designed to measure a small cap representation across 22 of 23 Developed Markets countries (excluding the U.S.) and 24 Emerging Markets countries. The Index returns do not reflect any fees or expenses. The Index is denominated in U.S. dollars. The Index returns are net of withholding taxes. They assume daily reinvestment of net dividends thus accounting for any applicable dividend taxation. Index returns provided by Bloomberg.
4
Rainier International Discovery Series
Shareholder Expense Example
(unaudited)
As a shareholder of the Series, you incur ongoing costs, including management fees, shareholder service fees and other Series expenses. This example is intended to help you understand your ongoing costs (in dollars) of investing in the Series and to compare these costs with the ongoing costs of investing in other mutual funds.
The example is based on an investment of $1,000 invested in each class at the beginning of the period and held for the entire period (May 1, 2017 to October 31, 2017).
Actual Expenses
The Actual lines of the table below provide information about actual account values and actual expenses. You may use the information in this line, together with the amount you invested, to estimate the expenses that you paid over the period. Simply divide your account value by $1,000 (for example, an $8,600 account value divided by $1,000 = 8.6), then multiply the result by the number in the Actual line for the Class in which you have invested under the heading entitled “Expenses Paid During Period” to estimate the expenses you paid on your account during this period.
Hypothetical Example for Comparison Purposes
The Hypothetical lines of each Class in the table below provide information about hypothetical account values and hypothetical expenses based on the Class’ actual expense ratio and an assumed rate of return of 5% per year before expenses, which is not the Class’ actual return. The hypothetical account values and expenses may not be used to estimate the actual ending account balance or expenses you paid during the period. You may use this information to compare the ongoing costs of investing in a class of the Series and other funds. To do so, compare this 5% hypothetical example for the class in which you have invested with the 5% hypothetical examples that appear in the shareholder reports of the other funds.
Please note that the expenses shown in the table are meant to highlight your ongoing costs only and do not reflect any transaction costs, such as sales charges (loads), redemption fees, or exchange fees that you may incur in other mutual funds. Therefore, the second line of the table is useful in comparing ongoing costs only, and will not help you determine the relative total costs of owning different funds.
| BEGINNING ACCOUNT VALUE 5/1/17* | ENDING ACCOUNT VALUE 10/31/17 | EXPENSES PAID 5/1/17-10/31/17 | ANNUALIZED EXPENSE RATIO | |||||
Class K | ||||||||
Actual | $1,000.00 | $1,190.00 | $8.06 | 1.46% | ||||
Hypothetical (5% return before expenses) | $1,000.00 | $1,017.85 | $7.43 | 1.46% | ||||
Class I | ||||||||
Actual | $1,000.00 | $1,191.80 | $6.68 | 1.21% | ||||
Hypothetical (5% return before expenses) | $1,000.00 | $1,019.11 | $6.16 | 1.21% | ||||
Class R6 | ||||||||
Actual | $1,000.00 | $1,073.20 | $2.02 | 1.00% | ||||
Hypothetical (5% return before expenses) | $1,000.00 | $1,007.78 | $1.95 | 1.00% |
*Class R6 inception date was August 21, 2017.
**Expenses are equal to each Class’ annualized expense ratio (for the six-month period), multiplied by the average account value over the period, multiplied by 184/365 (to reflect the one-half year period) (except for the Series’ Class R6 Actual and Hypothetical return information, which reflects the 71 day period ended October 31, 2017 due to its inception date of August 21, 2017). Expenses are based on the most recent fiscal half year; therefore, the expense ratios stated above may differ from the expense ratios stated in the financial highlights, which are based on seven month data (except for Class R6 expense ratios which are based on a 71 day period). The Class’ total return would have been lower had certain expenses not been waived during the period.
5
Rainier International Discovery Series
Portfolio Composition as of October 31, 2017
(unaudited)
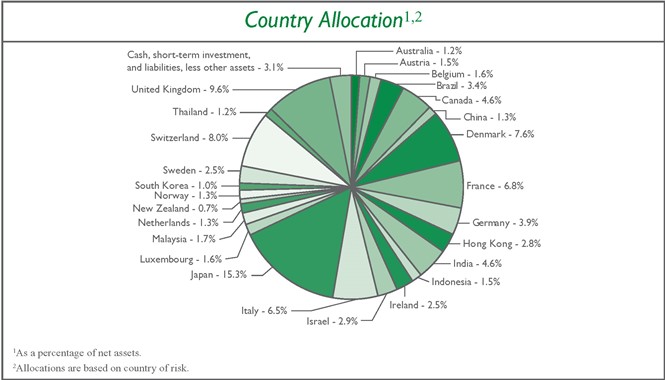
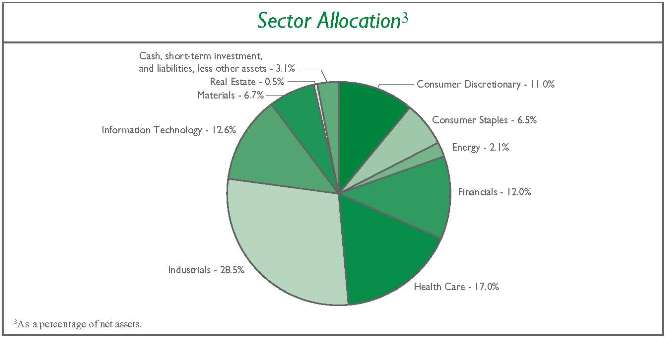
6
Rainier International Discovery Series
Investment Portfolio - October 31, 2017
| SHARES | VALUE (NOTE 2) | |||||||||||
COMMON STOCKS - 96.9% | ||||||||||||
Consumer Discretionary - 11.0% | ||||||||||||
Auto Components - 1.4% | ||||||||||||
Brembo SpA (Italy) | 260,150 | $ | 4,297,045 | |||||||||
|
| |||||||||||
Hotels, Restaurants & Leisure - 1.2% | ||||||||||||
Corporate Travel Management Ltd. (Australia) | 200,960 | 3,697,471 | ||||||||||
|
| |||||||||||
Household Durables - 2.8% | ||||||||||||
Techtronic Industries Co. Ltd. (Hong Kong) | 1,491,500 | 8,746,651 | ||||||||||
|
| |||||||||||
Multiline Retail - 3.3% | ||||||||||||
Dollarama, Inc. (Canada) | 20,040 | 2,230,791 | ||||||||||
Seria Co. Ltd. (Japan) | 144,600 | 8,215,259 | ||||||||||
|
| |||||||||||
| 10,446,050 | ||||||||||||
|
| |||||||||||
Specialty Retail - 0.8% | ||||||||||||
Ace Hardware Indonesia Tbk PT (Indonesia) | 26,474,500 | 2,449,806 | ||||||||||
|
| |||||||||||
Textiles, Apparel & Luxury Goods - 1.5% | ||||||||||||
Moncler SpA (Italy) | 163,200 | 4,634,722 | ||||||||||
|
| |||||||||||
Total Consumer Discretionary | 34,271,745 | |||||||||||
|
| |||||||||||
Consumer Staples - 6.5% | ||||||||||||
Beverages - 1.5% | ||||||||||||
Royal Unibrew A/S (Denmark) | 83,450 | 4,804,588 | ||||||||||
|
| |||||||||||
Food & Staples Retailing - 1.1% | ||||||||||||
Raia Drogasil S.A. (Brazil) | 139,800 | 3,364,123 | ||||||||||
|
| |||||||||||
Food Products - 1.3% | ||||||||||||
Wessanen (Netherlands) | 206,070 | 3,913,861 | ||||||||||
|
| |||||||||||
Household Products - 2.6% | ||||||||||||
Lion Corp. (Japan) | 168,300 | 3,220,798 | ||||||||||
Pigeon Corp. (Japan) | 139,700 | 4,920,615 | ||||||||||
|
| |||||||||||
| 8,141,413 | ||||||||||||
|
| |||||||||||
Total Consumer Staples | 20,223,985 | |||||||||||
|
| |||||||||||
Energy - 2.1% | ||||||||||||
Oil, Gas & Consumable Fuels - 2.1% | ||||||||||||
Aker BP ASA (Norway) | 175,780 | 4,041,563 | ||||||||||
Petronet LNG Ltd. (India) | 607,240 | 2,436,132 | ||||||||||
|
| |||||||||||
Total Energy | 6,477,695 | |||||||||||
|
| |||||||||||
Financials - 12.0% | ||||||||||||
Banks - 6.1% | ||||||||||||
Federal Bank Ltd. (India) | 1,631,060 | 3,065,890 | ||||||||||
FinecoBank Banca Fineco S.p.A. (Italy) | 479,730 | 4,487,270 | ||||||||||
Raiffeisen Bank International AG (Austria)* | 132,660 | 4,621,961 | ||||||||||
Tisco Financial Group PCL (Thailand) | 1,282,900 | 3,388,756 | ||||||||||
Tisco Financial Group PCL (Thailand) | 118,200 | 312,223 | ||||||||||
The accompanying notes are an integral part of the financial statements.
7
Rainier International Discovery Series
Investment Portfolio - October 31, 2017
| SHARES | VALUE (NOTE 2) | |||||||||||
COMMON STOCKS (continued) | ||||||||||||
Financials (continued) | ||||||||||||
Banks (continued) | ||||||||||||
Unione di Banche Italiane SpA (Italy) | 631,430 | $ | 2,965,620 | |||||||||
|
| |||||||||||
| 18,841,720 | ||||||||||||
|
| |||||||||||
Capital Markets - 5.0% | ||||||||||||
Edelweiss Financial Services Ltd. (India) | 608,320 | 2,643,328 | ||||||||||
St James’s Place plc (United Kingdom) | 259,770 | 4,060,793 | ||||||||||
TP ICAP plc (United Kingdom) | 649,440 | 4,696,586 | ||||||||||
Vontobel Holding AG (Switzerland) | 68,580 | 4,265,413 | ||||||||||
|
| |||||||||||
| 15,666,120 | ||||||||||||
|
| |||||||||||
Thrifts & Mortgage Finance - 0.9% | ||||||||||||
Indiabulls Housing Finance Ltd. (India) | 140,780 | 2,703,937 | ||||||||||
|
| |||||||||||
Total Financials | 37,211,777 | |||||||||||
|
| |||||||||||
Health Care - 17.0% | ||||||||||||
Biotechnology - 1.1% | ||||||||||||
Abcam plc (United Kingdom) | 247,580 | 3,271,780 | ||||||||||
|
| |||||||||||
Health Care Equipment & Supplies - 7.2% | ||||||||||||
Ambu A/S (Denmark) | 55,140 | 5,083,937 | ||||||||||
BioMerieux (France) | 60,330 | 4,732,344 | ||||||||||
Carl Zeiss Meditec AG (Germany) | 66,910 | 3,566,538 | ||||||||||
DiaSorin SpA (Italy) | 41,460 | 3,771,813 | ||||||||||
Fisher & Paykel Healthcare Corp. Ltd. (New Zealand) | 234,560 | 2,126,746 | ||||||||||
Sartorius AG (Germany) | 32,450 | 3,024,327 | ||||||||||
|
| |||||||||||
| 22,305,705 | ||||||||||||
|
| |||||||||||
Health Care Providers & Services - 4.4% | ||||||||||||
Attendo AB (Sweden)1 | 180,520 | 2,122,902 | ||||||||||
Chartwell Retirement Residences (Canada) | 159,221 | 1,894,459 | ||||||||||
Fleury S.A. (Brazil) | 395,200 | 3,469,613 | ||||||||||
Orpea (France) | 52,120 | 6,244,225 | ||||||||||
|
| |||||||||||
| 13,731,199 | ||||||||||||
|
| |||||||||||
Life Sciences Tools & Services - 2.3% | ||||||||||||
Bachem Holding AG (Switzerland) | 17,060 | 2,154,623 | ||||||||||
Eurofins Scientific SE (Luxembourg) | 8,145 | 5,094,895 | ||||||||||
|
| |||||||||||
| 7,249,518 | ||||||||||||
|
| |||||||||||
Pharmaceuticals - 2.0% | ||||||||||||
Dechra Pharmaceuticals plc (United Kingdom) | 154,660 | 4,223,247 | ||||||||||
Kalbe Farma Tbk PT (Indonesia) | 17,851,000 | 2,105,924 | ||||||||||
|
| |||||||||||
| 6,329,171 | ||||||||||||
|
| |||||||||||
Total Health Care | 52,887,373 | |||||||||||
|
| |||||||||||
The accompanying notes are an integral part of the financial statements.
8
Rainier International Discovery Series
Investment Portfolio - October 31, 2017
| SHARES | VALUE (NOTE 2) | |||||||||||
COMMON STOCKS (continued) | ||||||||||||
Industrials - 28.5% | ||||||||||||
Aerospace & Defense - 3.7% | ||||||||||||
Elbit Systems Ltd. (Israel) | 38,490 | $ | 5,720,384 | |||||||||
Saab AB (Sweden) | 112,050 | 5,725,871 | ||||||||||
|
| |||||||||||
| 11,446,255 | ||||||||||||
|
| |||||||||||
Building Products - 2.6% | ||||||||||||
Kingspan Group plc (Ireland) | 112,900 | 4,721,263 | ||||||||||
Rockwool International A/S (Denmark) | 12,030 | 3,267,257 | ||||||||||
|
| |||||||||||
| 7,988,520 | ||||||||||||
|
| |||||||||||
Construction & Engineering - 1.4% | ||||||||||||
FLSmidth & Co. A/S (Denmark) | 62,810 | 4,306,466 | ||||||||||
|
| |||||||||||
Machinery - 12.0% | ||||||||||||
Daifuku Co. Ltd. (Japan) | 62,700 | 3,038,362 | ||||||||||
Harmonic Drive Systems, Inc. (Japan) | 80,400 | 4,157,706 | ||||||||||
KION Group AG (Germany) | 20,240 | 1,619,945 | ||||||||||
Nissei ASB Machine Co. Ltd. (Japan) | 47,700 | 2,110,118 | ||||||||||
OC Oerlikon Corp. AG (Switzerland) | 332,740 | 5,336,381 | ||||||||||
Rotork plc (United Kingdom) | 892,920 | 3,115,430 | ||||||||||
Stabilus SA (Germany) | 42,260 | 3,838,686 | ||||||||||
THK Co. Ltd. (Japan) | 115,000 | 4,166,923 | ||||||||||
VAT Group AG (Switzerland)1 | 41,640 | 5,421,777 | ||||||||||
The Weir Group plc (United Kingdom) | 166,230 | 4,311,785 | ||||||||||
|
| |||||||||||
| 37,117,113 | ||||||||||||
|
| |||||||||||
Professional Services - 5.5% | ||||||||||||
Nihon M&A Center, Inc. (Japan) | 85,600 | 4,072,785 | ||||||||||
Persol Holdings Co. Ltd. (Japan) | 215,400 | 5,308,041 | ||||||||||
Teleperformance (France) | 53,130 | 7,760,812 | ||||||||||
|
| |||||||||||
| 17,141,638 | ||||||||||||
|
| |||||||||||
Road & Rail - 1.2% | ||||||||||||
Localiza Rent a Car SA (Brazil) | 210,590 | 3,704,782 | ||||||||||
|
| |||||||||||
Trading Companies & Distributors - 1.3% | ||||||||||||
MISUMI Group, Inc. (Japan) | 150,100 | 4,092,256 | ||||||||||
|
| |||||||||||
Transportation Infrastructure - 0.8% | ||||||||||||
Malaysia Airports Holdings Berhad (Malaysia) | 1,301,200 | 2,544,924 | ||||||||||
|
| |||||||||||
Total Industrials | 88,341,954 | |||||||||||
|
| |||||||||||
Information Technology - 12.6% | ||||||||||||
Electronic Equipment, Instruments & Components - 2.5% | ||||||||||||
Halma plc (United Kingdom) | 216,540 | 3,399,390 | ||||||||||
Yaskawa Electric Corp. (Japan) | 118,600 | 4,213,922 | ||||||||||
|
| |||||||||||
| 7,613,312 | ||||||||||||
|
| |||||||||||
The accompanying notes are an integral part of the financial statements.
9
Rainier International Discovery Series
Investment Portfolio - October 31, 2017
| SHARES | VALUE (NOTE 2) | |||||||||||
COMMON STOCKS (continued) | ||||||||||||
Information Technology (continued) | ||||||||||||
IT Services - 5.1% | ||||||||||||
Alten S.A. (France) | 28,100 | $ | 2,459,830 | |||||||||
Keywords Studios plc (Ireland) | 141,340 | 2,999,765 | ||||||||||
My EG Services Bhd (Malaysia) | 5,319,400 | 2,751,739 | ||||||||||
TravelSky Technology Ltd. (China) | 1,576,000 | 4,080,704 | ||||||||||
Vakrangee Ltd. (India) | 402,110 | 3,490,846 | ||||||||||
|
| |||||||||||
| 15,782,884 | ||||||||||||
|
| |||||||||||
Semiconductors & Semiconductor Equipment - 2.5% | ||||||||||||
Koh Young Technology, Inc. (South Korea) | 43,350 | 2,971,643 | ||||||||||
Melexis NV (Belgium) | 48,400 | 4,849,133 | ||||||||||
|
| |||||||||||
| 7,820,776 | ||||||||||||
|
| |||||||||||
Software - 1.5% | ||||||||||||
Temenos Group AG (Switzerland) | 41,200 | 4,757,420 | ||||||||||
|
| |||||||||||
Technology Hardware, Storage & Peripherals - 1.0% | ||||||||||||
Logitech International SA (Switzerland) | 86,020 | 3,072,974 | ||||||||||
|
| |||||||||||
Total Information Technology | 39,047,366 | |||||||||||
|
| |||||||||||
Materials - 6.7% | ||||||||||||
Chemicals - 4.0% | ||||||||||||
Chr. Hansen Holding A/S (Denmark) | 71,520 | 6,258,315 | ||||||||||
Elementis plc (United Kingdom) | 690,350 | 2,606,703 | ||||||||||
Frutarom Industries Ltd. (Israel) | 41,990 | 3,456,983 | ||||||||||
|
| |||||||||||
| 12,322,001 | ||||||||||||
|
| |||||||||||
Containers & Packaging - 1.6% | ||||||||||||
CCL Industries, Inc. (Canada) | 104,600 | 5,041,491 | ||||||||||
|
| |||||||||||
Metals & Mining - 1.1% | ||||||||||||
Lundin Mining Corp. (Canada) | 456,500 | 3,481,870 | ||||||||||
|
| |||||||||||
Total Materials | 20,845,362 | |||||||||||
|
| |||||||||||
Real Estate - 0.5% | ||||||||||||
Equity Real Estate Investment Trusts (REITS) - 0.5% | ||||||||||||
NorthWest Healthcare Properties Real Estate Investment Trust (Canada) | 180,380 | 1,589,738 | ||||||||||
|
| |||||||||||
TOTAL COMMON STOCKS | 300,896,995 | |||||||||||
|
| |||||||||||
The accompanying notes are an integral part of the financial statements.
10
Rainier International Discovery Series
Investment Portfolio - October 31, 2017
| SHARES | VALUE (NOTE 2) | |||||||||||
SHORT-TERM INVESTMENT - 5.3% | ||||||||||||
Dreyfus Government Cash Management2 , 0.93%, | 16,361,708 | $ | 16,361,708 | |||||||||
|
| |||||||||||
TOTAL INVESTMENTS - 102.2% | 317,258,703 | |||||||||||
LIABILITIES, LESS OTHER ASSETS - (2.2%) | (6,883,726 | ) | ||||||||||
|
| |||||||||||
NET ASSETS - 100% | $ | 310,374,977 | ||||||||||
|
| |||||||||||
*Non-income producing security.
1Restricted securities - Investment in securities that are restricted as to public resale under the Securities Act of 1933, as amended. These securities have been sold under rule 144A and have been determined to be liquid under guidelines established by the Board of Directors. These securities amount to $7,544,679 or 2.4% of the Series’ net assets as of October 31, 2017 (See Note 2 to the financial statements).
2Rate shown is the current yield as of October 31, 2017.
The Series’ portfolio holds, as a percentage of net assets, greater than 10% in the following country:
Japan 15.3%.
The Global Industry Classification Standard (GICS) was developed by and is the exclusive property and a service mark of MSCI Inc. (MSCI) and Standard & Poor’s, a division of The McGraw-Hill Companies, Inc. (S&P), and is licensed for use by Manning & Napier when referencing GICS sectors. Neither MSCI, S&P, nor any third party involved in making or compiling the GICS or any GICS classifications makes any express or implied warranties or representations with respect to such standard or classification, nor shall any such party have any liability therefrom.
The accompanying notes are an integral part of the financial statements.
11
Rainier International Discovery Series
Statement of Assets & Liabilities
October 31, 2017
ASSETS: | ||||
Investments, at value (identified cost $243,823,414) (Note 2) | $ | 317,258,703 | ||
Foreign currency, at value (cost $66,795) | 66,865 | |||
Receivable for fund shares sold | 904,083 | |||
Foreign tax reclaims receivable | 188,872 | |||
Dividends receivable | 241,551 | |||
|
| |||
TOTAL ASSETS | 318,660,074 | |||
|
| |||
LIABILITIES: | ||||
Accrued management fees (Note 3) | 200,141 | |||
Accrued distribution and service (Rule 12b-1) fees (Note 3) | 40,324 | |||
Accrued fund accounting and administration fees (Note 3) | 20,190 | |||
Accrued Chief Compliance Officer service fees (Note 3) | 331 | |||
Accrued foreign capital gains tax (Note 2) | 412,202 | |||
Payable for securities purchased | 7,149,767 | |||
Payable for fund shares repurchased | 244,532 | |||
Other payables and accrued expenses | 217,610 | |||
|
| |||
TOTAL LIABILITIES | 8,285,097 | |||
|
| |||
TOTAL NET ASSETS | $ | 310,374,977 | ||
|
| |||
NET ASSETS CONSIST OF: | ||||
Capital stock | $ | 149,684 | ||
Additional paid-in-capital | 240,836,125 | |||
Undistributed net investment income | 269,662 | |||
Accumulated net realized loss on investments, foreign currency and translation of other assets and liabilities | (3,909,568 | ) | ||
Net unrealized appreciation on investments (net of foreign capital gains tax of $412,202), foreign currency and translation of other assets and liabilities | 73,029,074 | |||
|
| |||
TOTAL NET ASSETS | $ | 310,374,977 | ||
|
| |||
NET ASSET VALUE, OFFERING PRICE AND REDEMPTION PRICE PER SHARE - Class K | $ | 20.61 | ||
|
| |||
NET ASSET VALUE, OFFERING PRICE AND REDEMPTION PRICE PER SHARE - Class I | $ | 20.81 | ||
|
| |||
NET ASSET VALUE, OFFERING PRICE AND REDEMPTION PRICE PER SHARE - Class R6 | $ | 20.82 | ||
|
| |||
The accompanying notes are an integral part of the financial statements.
12
Rainier International Discovery Series
Statements of Operations
| FOR THE PERIOD 4/1/17 TO 10/31/17 | FOR THE YEAR ENDED 3/31/17 | |||||||
INVESTMENT INCOME: | ||||||||
Dividends (net of foreign taxes withheld, $257,157, and $286,266, respectively) | $ | 2,516,711 | $ | 2,676,233 | ||||
Interest | — | 24,821 | ||||||
|
|
|
| |||||
Total Investment Income | 2,516,711 | 2,701,054 | ||||||
|
|
|
| |||||
EXPENSES: | ||||||||
Management fees (Note 3) | 1,455,208 | 2,026,263 | ||||||
Distribution and service (Rule 12b-1) fees (Class K and Class A formerly Original shares, respectively) (Note 3) | 155,176 | 261,039 | ||||||
Sub Register and Transfer agent Fees (Note 3) | 133,526 | 192,633 | ||||||
Administration fees | — | 247,604 | ||||||
Fund accounting and administration fees (Note 3) | 96,672 | — | ||||||
Directors’ fees (Note 3) | 31,240 | 40,706 | ||||||
Transfer agent fees (Note 3) | 24,658 | — | ||||||
Chief Compliance Officer service fees (Note 3) | 10,045 | 26,778 | ||||||
Reorganization expense (Note 1) | 37,986 | — | ||||||
Custodian fees | 69,983 | — | ||||||
Miscellaneous | 247,657 | 235,079 | ||||||
|
|
|
| |||||
Total Expenses | 2,262,151 | 3,030,102 | ||||||
Less reduction of expenses (Note 3) | (235,589 | ) | (212,943 | ) | ||||
|
|
|
| |||||
Net Expenses | 2,026,562 | 2,817,159 | ||||||
|
|
|
| |||||
NET INVESTMENT INCOME (LOSS) | 490,149 | (116,105 | ) | |||||
|
|
|
| |||||
REALIZED AND UNREALIZED GAIN (LOSS) ON INVESTMENTS AND FOREIGN CURRENCY: | ||||||||
Net realized gain (loss) on- | ||||||||
Net realized gain (loss) on investments | 11,884,479 | (11,520,040 | ) | |||||
Foreign currency and translation of other assets and liabilities | 21,412 | (162,211 | ) | |||||
|
|
|
| |||||
| 11,905,891 | (11,682,251 | ) | ||||||
|
|
|
| |||||
Net change in unrealized appreciation (depreciation) on- | ||||||||
Investments (net of increase in accrued foreign capital gains tax of $412,202) | 44,077,507 | 14,918,576 | ||||||
Foreign currency and translation of other assets and liabilities | 8,878 | 14,462 | ||||||
|
|
|
| |||||
| 44,086,385 | 14,933,038 | |||||||
|
|
|
| |||||
NET REALIZED AND UNREALIZED GAIN (LOSS) ON INVESTMENTS AND FOREIGN CURRENCY | 55,992,276 | 3,250,787 | ||||||
|
|
|
| |||||
NET INCREASE IN NET ASSETS RESULTING FROM OPERATIONS | $ | 56,482,425 | $ | 3,134,682 | ||||
|
|
|
| |||||
The accompanying notes are an integral part of the financial statements.
13
Rainier International Discovery Series
Statements of Changes in Net Assets
| FOR THE PERIOD 4/1/17 TO 10/31/17 | FOR THE YEAR ENDED 3/31/17 | FOR THE YEAR ENDED 3/31/16 | ||||||||||
INCREASE (DECREASE) IN NET ASSETS: | ||||||||||||
OPERATIONS: | ||||||||||||
Net investment income (loss) | $ | 490,149 | $ | (116,105 | ) | $ | (250,314 | ) | ||||
Net realized gain (loss) on investments and foreign currency | 11,905,891 | (11,682,251 | ) | (4,203,255 | ) | |||||||
Net change in unrealized appreciation (depreciation) on investments and foreign currency | 44,086,385 | 14,933,038 | 5,468,116 | |||||||||
|
|
|
|
|
| |||||||
Net increase from operations | 56,482,425 | 3,134,682 | 1,014,547 | |||||||||
|
|
|
|
|
| |||||||
DISTRIBUTIONS TO SHAREHOLDERS (Note 9): | ||||||||||||
From net investment income (Class I formerly Institutional shares) | — | — | (36,790 | ) | ||||||||
From net investment income (Class K formerly Class A shares) | — | — | (18,881 | ) | ||||||||
|
|
|
|
|
| |||||||
Total distributions to shareholders | — | — | (55,671 | ) | ||||||||
|
|
|
|
|
| |||||||
CAPITAL STOCK ISSUED AND REPURCHASED: | ||||||||||||
Net increase from capital share transactions (Note 5) | 61,145,797 | 13,043,608 | 131,195,606 | |||||||||
|
|
|
|
|
| |||||||
Net increase in net assets | 117,628,222 | 16,178,290 | 132,154,482 | |||||||||
NET ASSETS: | ||||||||||||
Beginning of period | 192,746,755 | 176,568,465 | 44,413,983 | |||||||||
|
|
|
|
|
| |||||||
End of period (including undistributed net investment income of $269,662, $25,773 and accumulated undistributed net investment loss of $94,821, respectively) | $ | 310,374,977 | $ | 192,746,755 | $ | 176,568,465 | ||||||
|
|
|
|
|
| |||||||
The accompanying notes are an integral part of the financial statements.
14
Rainier International Discovery Series
Financial Highlights - Class K1
| FOR THE PERIOD 4/1/17 TO 10/31/17 | FOR THE YEARS ENDED | FOR THE PERIOD 11/30/122 TO 3/31/13 | ||||||||||||||||||||||
| 3/31/17 | 3/31/16 | 3/31/15 | 3/31/14 | |||||||||||||||||||||
Per share data (for a share outstanding throughout each period): | ||||||||||||||||||||||||
Net asset value - Beginning of period | $ | 16.44 | $ | 15.93 | $ | 15.45 | $ | 15.56 | $ | 12.89 | $ | 11.21 | ||||||||||||
|
|
|
|
|
|
|
|
|
|
|
| |||||||||||||
Income (loss) from investment operations: | ||||||||||||||||||||||||
Net investment income (loss)3 | 0.02 | (0.02 | ) | (0.09 | ) | 0.01 | (0.10 | ) | 0.04 | |||||||||||||||
Net realized and unrealized gain on investments | 4.15 | 0.53 | 0.58 | 0.61 | 3.03 | 1.67 | ||||||||||||||||||
|
|
|
|
|
|
|
|
|
|
|
| |||||||||||||
Total from investment operations | 4.17 | 0.51 | 0.49 | 0.62 | 2.93 | 1.71 | ||||||||||||||||||
|
|
|
|
|
|
|
|
|
|
|
| |||||||||||||
Less distributions to shareholders: | ||||||||||||||||||||||||
From net investment income | — | — | — | — | (0.00 | )4 | (0.03 | ) | ||||||||||||||||
From net realized gain on investments | — | — | (0.01 | ) | (0.73 | ) | (0.26 | ) | — | |||||||||||||||
|
|
|
|
|
|
|
|
|
|
|
| |||||||||||||
Total distributions to shareholders | — | — | (0.01 | ) | (0.73 | ) | (0.26 | ) | (0.03 | ) | ||||||||||||||
|
|
|
|
|
|
|
|
|
|
|
| |||||||||||||
Net asset value - End of period | $ | 20.61 | $ | 16.44 | $ | 15.93 | $ | 15.45 | $ | 15.56 | $ | 12.89 | ||||||||||||
|
|
|
|
|
|
|
|
|
|
|
| |||||||||||||
Net assets - End of period (000’s omitted) | $ | 120,399 | $ | 78,260 | $ | 99,944 | $ | 4,058 | $ | 2,939 | $ | 65 | ||||||||||||
|
|
|
|
|
|
|
|
|
|
|
| |||||||||||||
Total return5 | 25.36 | % | 3.14 | % | 3.22 | % | 4.55 | % | 22.91 | % | 15.28 | % | ||||||||||||
Ratios (to average net assets)/Supplemental Data: | ||||||||||||||||||||||||
Expenses* | 1.49 | %6,7 | 1.51 | %7 | 1.50 | % | 1.50 | % | 1.50 | % | 1.50 | %6 | ||||||||||||
Net investment income (loss) | 0.20 | %6 | (0.12 | %) | (0.56 | %) | 0.06 | % | (66.00 | %) | 0.89 | %6 | ||||||||||||
Portfolio turnover | 46 | % | 123 | % | 93 | % | 111 | % | 80 | % | 78 | % | ||||||||||||
*The investment advisor did not impose all or a portion of its management and/or other fees during the period, and may have paid a portion of the Series’ expenses. If these expenses had been incurred by the Class, the expense ratio (to average net assets) would have increased by the following amounts:
|
| |||||||||||||||||||||||
| 0.21 | %6 | 0.14 | % | 0.14 | % | 0.32 | % | 0.33 | % | 1.28 | %6 | |||||||||||||
1Rainier International Discovery Fund (“the Predecessor Fund”) transferred its assets and liabilities to the Series at the close of business on August 21, 2017. Because the Series had no investment operations prior to the Reorganization, and based on the similarity of the Series to the Predecessor Fund, the Predecessor Fund is treated as the survivor for accounting and performance reporting purposes. This is formerly Class A shares in the Predecessor Fund.
2Commencement of operations.
3Calculated based on average shares outstanding during the periods.
4Less than $0.01.
5Represents aggregate total return for the periods indicated, and assumes reinvestment of all distributions. Total return would have been lower had certain expenses not been reimbursed during the periods. Periods less than one year are not annualized.
6Annualized.
7Expense ratio exceeds expense limitation due to recognition of expenses related to the Reorganization of the Fund. See Note 1 to the financial statements.
The accompanying notes are an integral part of the financial statements.
15
Rainier International Discovery Series
Financial Highlights - Class I1
FOR THE PERIOD 4/1/17 TO 10/31/17 | FOR THE YEARS ENDED | |||||||||||||||||||||||
| 3/31/17 | 3/31/16 | 3/31/15 | 3/31/14 | 3/31/13 | ||||||||||||||||||||
Per share data (for a share outstanding throughout eachperiod): | ||||||||||||||||||||||||
Net asset value - Beginning of period | $ | 16.58 | $ | 16.02 | $ | 15.50 | $ | 15.58 | $ | 12.89 | $ | 10.02 | ||||||||||||
|
|
|
|
|
|
|
|
|
|
|
| |||||||||||||
Income (loss) from investment operations: | ||||||||||||||||||||||||
Net investment income (loss) | 0.05 | 2 | 0.00 | 2,3 | (0.03 | )2 | 0.04 | 2 | 0.01 | 2 | 0.02 | |||||||||||||
Net realized and unrealized gain on investments | 4.18 | 0.56 | 0.56 | 0.62 | 2.95 | 2.88 | ||||||||||||||||||
|
|
|
|
|
|
|
|
|
|
|
| |||||||||||||
Total from investment operations | 4.23 | 0.56 | 0.53 | 0.66 | 2.96 | 2.90 | ||||||||||||||||||
|
|
|
|
|
|
|
|
|
|
|
| |||||||||||||
Less distributions to shareholders: | ||||||||||||||||||||||||
From net investment income | — | — | — | (0.01 | ) | (0.01 | ) | (0.03 | ) | |||||||||||||||
From net realized gain on investments | — | — | (0.01 | ) | (0.73 | ) | (0.26 | ) | — | |||||||||||||||
|
|
|
|
|
|
|
|
|
|
|
| |||||||||||||
Total distributions to shareholders | — | — | (0.01 | ) | (0.74 | ) | (0.27 | ) | (0.03 | ) | ||||||||||||||
|
|
|
|
|
|
|
|
|
|
|
| |||||||||||||
Net asset value - End of period | $ | 20.81 | $ | 16.58 | $ | 16.02 | $ | 15.50 | $ | 15.58 | $ | 12.89 | ||||||||||||
|
|
|
|
|
|
|
|
|
|
|
| |||||||||||||
Net assets - End of period (000’s omitted) | $ | 189,955 | $ | 114,487 | $ | 76,624 | $ | 40,356 | $ | 30,323 | $ | 20,376 | ||||||||||||
|
|
|
|
|
|
|
|
|
|
|
| |||||||||||||
Total return4 | 25.51 | % | 3.43 | % | 3.47 | % | 4.81 | % | 23.15 | % | 29.00 | % | ||||||||||||
Ratios (to average net assets)/Supplemental Data: | ||||||||||||||||||||||||
Expenses* | 1.24 | %5,6 | 1.26 | %6 | 1.25 | % | 1.25 | % | 1.25 | % | 1.25 | % | ||||||||||||
Net investment income (loss) | 0.41 | %5 | 0.01 | % | (0.19 | %) | 0.40 | % | 0.08 | % | 0.18 | % | ||||||||||||
Portfolio turnover | 46 | % | 123 | % | 93 | % | 111 | % | 80 | % | 78 | % | ||||||||||||
*The investment advisor did not impose all or a portion of its management and/or other fees during the period, and may have paid a portion of the Series’ expenses. If these expenses had been incurred by the Class, the expense ratio (to average net assets) would have increased by the following amounts:
|
| |||||||||||||||||||||||
| 0.11 | %5 | 0.07 | % | 0.06 | % | 0.27 | % | 0.36 | % | 1.17 | % | |||||||||||||
1Rainier International Discovery Fund (“the Predecessor Fund”) transferred its assets and liabilities to the Series at the close of business on August 21, 2017. Because the Series had no investment operations prior to the Reorganization, and based on the similarity of the Series to the Predecessor Fund, the Predecessor Fund is treated as the survivor for accounting and performance reporting purposes. This is formerly Institutional shares in the Predecessor Fund.
2Calculated based on average shares outstanding during the periods.
3Less than $0.01.
4Represents aggregate total return for the periods indicated, and assumes reinvestment of all distributions. Total return would have been lower had certain expenses not been reimbursed during the periods. Periods less than one year are not annualized.
5Annualized.
6Expense ratio exceeds expense limitation due to recognition of expenses related to the Reorganization of the Fund. See Note 1 to the financial statements.
The accompanying notes are an integral part of the financial statements.
16
Rainier International Discovery Series
Financial Highlights - Class R6
| FOR THE PERIOD 8/21/171 TO 10/31/17 | ||||
Per share data (for a share outstanding throughout the period): | ||||
Net asset value - Beginning of period | $ | 19.40 | ||
|
| |||
Income (loss) from investment operations: | ||||
Net investment income (loss)2 | 0.01 | |||
Net realized and unrealized gain (loss) on investments | 1.41 | |||
|
| |||
Total from investment operations | 1.42 | |||
|
| |||
Net asset value - End of period | $ | 20.82 | ||
|
| |||
Net assets - End of period (000’s omitted) | $ | 21 | ||
|
| |||
Total return3 | 7.32 | % | ||
Ratios (to average net assets)/Supplemental Data: | ||||
Expenses*4 | 1.00 | % | ||
Net investment income4 | 0.14 | % | ||
Portfolio turnover | 46 | % | ||
| *The investment advisor did not impose all or a portion of its management and/or other fees during the period, and may have paid a portion of the Series’ expenses. If these expenses had been incurred by the Class, the expense ratio (to average net assets) would have increased by the following amounts4 : | ||||
| 0.17 | % | |||
1Commencement of operations.
2Calculated based on average shares outstanding during the period.
3Represents aggregate total return for the period indicated, and assumes reinvestment of all distributions. Total return would have been lower had certain expenses not been reimbursed during the period. Periods less than one year are not annualized.
4Annualized.
The accompanying notes are an integral part of the financial statements.
17
Rainier International Discovery Series
Notes to Financial Statements
| 1. | Organization |
Rainier International Discovery Series (the “Series”) is a no-load diversified series of Manning & Napier Fund, Inc. (the “Fund”). The Fund is organized in Maryland and is registered under the Investment Company Act of 1940, as amended, as an open-end management investment company.
The Series’ investment objective is to seek long-term capital appreciation.
The Fund’s advisor is Manning & Napier Advisors, LLC (the “Advisor”). Shares of the Series are offered to investors, clients and employees of the Advisor and its affiliates. The Series is authorized to issue three classes of shares (Class K, Class I and Class R6). Class R6 shares of the Series were issued on August 21, 2017. Each class of shares is substantially the same, except that Class K shares bear shareholder services fees. The total authorized capital stock of the Fund consists of 15 billion shares of common stock each having a par value of $0.01. As of October 31, 2017, 10.6 billion shares have been designated in total among 39 series, of which 100 million have been designated as Rainier International Discovery Series Class K common stock, 100 million have been designated as Rainier International Discovery Series Class I common stock and 100 million have been designated as Rainier International Discovery Series Class R6 common stock.
Reorganization
The Series is the successor in interest to the Rainier International Discovery Fund (the “Predecessor Fund”), which had the same investment objective and was included as a series of another investment company, Rainier Investment Management Mutual Funds (“Predecessor Trust”), that was advised by Rainier Investment Management, LLC (an affiliated advisor of the Fund). The shareholders of the Predecessor Fund approved the reorganization of the Institutional shares and Class A shares of the Predecessor Fund with and into the Class I and Class K shares of the Series, respectively. Effective as of the close of business on August 21, 2017 (the “merger date”), the assets and liabilities of the Predecessor Fund were transferred to the Series.
The investment portfolio of the Predecessor Fund, with fair value of $271,784,669 and identified cost of $213,126,044 on August 21, 2017 was the principal asset acquired. Net assets and shares outstanding on August 21, 2017 were $163,001,355 and 8,409,569 for Institutional shares and $111,408,266 and 5,801,583 for Class A shares, respectively, all of which were transferred by a tax-free exchange into the Fund at Net Asset Value at the close of business on August 21, 2017. For financial reporting purposes, assets received and shares issued by the Series were recorded at fair value; however, the cost basis of the investments received from the Predecessor Fund was carried forward to align ongoing reporting of the Series’ realized and unrealized gains and losses with amounts distributable to shareholders for tax purposes.
As the Series was a shell fund prior to the merger date, the results of operations for the year ended October 31, 2017 represents the pro-forma results. Because the combined investment portfolios have been managed as a single integrated portfolio since the acquisition date, it is not practicable to separate the amounts of revenue and earnings of the Predecessor Fund that have been included in the Series’ Statement of Operations since the merger date, August 21, 2017.
The majority of the expenses incurred by the Series in connection with the reorganization were paid by the Advisor. The Series paid certain expenses, including half of the cost of the proxy, such as printing and solicitation, and all of the legal fees incurred in connection to the reorganization. The fiscal year end of the Predecessor Fund was March 31, 2017. Operations prior to August 21, 2017 were for the Predecessor Fund. The Series changed its fiscal year end to October 31, 2017 to reflect the fiscal year end of the Fund.
| 2. | Significant Accounting Policies |
The following is a summary of significant accounting policies followed by the Series. The Series is an investment company and, accordingly, follows the investment company accounting and reporting guidance of the Financial Accounting Standards Board Accounting Standards Codification Topic 946 - Investment Companies, which is part of accounting principles generally accepted in the United States of America (“GAAP”).
18
Rainier International Discovery Series
Notes to Financial Statements (continued)
| 2. | Significant Accounting Policies (continued) |
Security Valuation
Portfolio securities, including domestic equities, foreign equities, warrants and options, listed on an exchange other than the NASDAQ Stock Market are valued at the latest quoted sales price of the exchange on which the security is primarily traded. Securities not traded on valuation date or securities not listed on an exchange are valued at the latest quoted bid price provided by the Fund’s pricing service. Securities listed on the NASDAQ Stock Market are valued in accordance with the NASDAQ Official Closing Price.
Short-term investments that mature in sixty days or less may be valued at amortized cost, which approximates fair value. Investments in open-end investment companies are valued at their net asset value per share on valuation date.
Volume and level of activity in established markets for an asset or liability are evaluated to determine whether recent transactions and quoted prices are determinative of fair value. Where there have been significant decreases in volume and level of activity, further analysis and adjustment may be necessary to estimate fair value. The Series measures fair value in these instances by the use of inputs and valuation techniques which may be based upon current market prices of securities that are comparable in coupon, rating, maturity and industry and/or expectation of future cash flows. As a result of trading in relatively thin markets and/or markets that experience significant volatility, the prices used by the Series to value these securities may differ from the value that would be realized if these securities were sold, and the differences could be material.
Securities for which representative valuations or prices are not available from the Series’ pricing service may be valued at fair value as determined in good faith by the Advisor under procedures approved by and under the general supervision and responsibility of the Fund’s Board of Directors (the “Board”). Due to the inherent uncertainty of valuations of such securities, the fair value may differ significantly from the values that would have been used had a ready market for such securities existed. If trading or events occurring after the close of the principal market in which securities are traded are expected to materially affect the value of those securities, then they may be valued at their fair value, taking this trading or these events into account. In accordance with the procedures approved by the Board, the values of certain securities trading outside the U.S. were adjusted following the close of local trading using a factor from a third party vendor. The third party vendor uses statistical analyses and quantitative models, which consider among other things subsequent movement and changes in the prices of indices, securities and exchange rates in other markets, to determine the factors which are used to adjust local market prices. The value of securities used for net asset value calculation under these procedures may differ from published prices for the same securities. It is the Fund’s policy to classify each foreign equity security where a factor from a third party vendor is applied as a Level 2 security.
Various inputs are used in determining the value of the Series’ assets or liabilities carried at fair value. These inputs are summarized in three broad levels. Level 1 includes quoted prices in active markets for identical assets and liabilities. Level 2 includes other significant observable inputs (including quoted prices for similar securities, interest rates, prepayment speeds, credit risk, etc.). Level 3 includes significant unobservable inputs (including the Series’ own assumptions in determining the fair value of investments). A financial instrument’s level within the fair value hierarchy is based on the lowest level of any input both individually and in aggregate that is significant to the fair value measurement. The inputs or methodology used for valuing securities are not necessarily an indication of the risk associated with investing in those securities.
The following is a summary of the valuation levels used for major security types as of October 31, 2017 in valuing the Series’ assets or liabilities carried at fair value:
| DESCRIPTION | TOTAL | LEVEL 1 | LEVEL 2 | LEVEL 3 | ||||||||||||
Assets: | ||||||||||||||||
Equity securities: | ||||||||||||||||
Consumer Discretionary | $ | 34,271,745 | $ | 34,271,745 | $ | — | $ | — | ||||||||
Consumer Staples | 20,223,985 | 20,223,985 | — | — | ||||||||||||
Energy | 6,477,695 | 6,477,695 | — | — | ||||||||||||
Financials | 37,211,777 | 37,211,777 | — | — | ||||||||||||
Health Care | 52,887,373 | 52,887,373 | — | — | ||||||||||||
19
Rainier International Discovery Series
Notes to Financial Statements (continued)
| 2. | Significant Accounting Policies (continued) |
Security Valuation (continued)
| DESCRIPTION | TOTAL | LEVEL 1 | LEVEL 2 | LEVEL 3 | ||||||||||||
Industrials | $ | 88,341,954 | $ | 88,341,954 | $ | — | $ | — | ||||||||
Information Technology | 39,047,366 | 39,047,366 | — | — | ||||||||||||
Materials | 20,845,362 | 20,845,362 | — | — | ||||||||||||
Real Estate | 1,589,738 | 1,589,738 | — | — | ||||||||||||
Mutual fund | 16,361,708 | 16,361,708 | — | — | ||||||||||||
|
|
|
|
|
|
|
| |||||||||
Total assets | $ | 317,258,703 | $ | 317,258,703 | $ | — | $ | — | ||||||||
|
|
|
|
|
|
|
| |||||||||
There were no Level 2 or Level 3 securities held by the Series as of October 31, 2017.
The Fund’s policy is to recognize transfers in and transfers out of the valuation levels as of the beginning of the reporting period. There were no transfers between Level 1 and Level 2 during the period ended October 31, 2017.
New Accounting Guidance
On August 1, 2017, the Fund implemented amendments to Regulation S-X, issued by the Securities and Exchange Commission, which require standardized, enhanced disclosures, particularly related to derivatives, in investment company financial statements. Adoption had no effect on the Fund’s net assets or results of operations.
Security Transactions, Investment Income and Expenses
Security transactions are accounted for on trade date. Dividend income is recorded on the ex-dividend date, except that if the ex-dividend date has passed, certain dividends from foreign securities are recorded as soon as the Series is informed of the ex-dividend date. Non-cash dividends, if any, are recorded at the fair value of the securities received. Interest income, including amortization of premium and accretion of discounts using the effective interest method, is earned from settlement date and accrued daily.
Expenses are recorded on an accrual basis. Most expenses of the Fund can be attributed to a specific series. Expenses which cannot be directly attributed are apportioned among the series in the Fund in such a manner as deemed equitable by the Fund’s Board, taking into consideration, among other things, the nature and type of expense. Income, expenses (other than shareholder services fees), and realized and unrealized gains and losses are prorated among the classes based on the relative net assets of each class. Class specific expenses are directly charged to that class.
The Series uses the identified cost method for determining realized gain or loss on investments for both financial statement and federal income tax reporting purposes.
Foreign Currency Translation
The books and records of the Series are maintained in U.S. dollars. Foreign currencies, investments and other assets and liabilities are translated into U.S. dollars at the current exchange rates. Purchases and sales of investment securities and income and expenses are translated on the respective dates of such transactions. The Series does not isolate realized and unrealized gains and losses attributable to changes in the exchange rates from gains and losses that arise from changes in the fair value of investments. Such fluctuations are included with net realized and unrealized gain or loss on investments. Net realized foreign currency gains and losses represent foreign currency gains and losses between trade date and settlement date on securities transactions, gains and losses on disposition of foreign currencies and the difference between the amount of income and foreign withholding taxes recorded on the books of the Series and the amounts actually received or paid.
Forward Foreign Currency Exchange Contracts
The Series may purchase or sell forward foreign currency exchange contracts in order to hedge a portfolio position or specific transaction. Risks may arise if the counterparties to a contract are unable to meet the terms of the contract or if the value of the foreign currency moves unfavorably.
20
Rainier International Discovery Series
Notes to Financial Statements (continued)
| 2. | Significant Accounting Policies (continued) |
Forward Foreign Currency Exchange Contracts (continued)
All forward foreign currency exchange contracts are adjusted daily by the exchange rate of the underlying currency and, for financial statement purposes, any gain or loss is recorded as unrealized gain or loss until a contract has been closed.
The Series may regularly trade forward foreign currency exchange contracts with off-balance sheet risk in the normal course of its investing activities to assist in managing exposure to changes in foreign currency exchange rates.
As of October 31, 2017, no investments in forward foreign currency exchange contracts were held by the Series.
Restricted Securities
Restricted securities are purchased in private placement transactions, are not registered under the Securities Act of 1933, as amended, and may have contractual restrictions on resale. Information regarding restricted securities is included at the end of the Investment Portfolio.
Federal Taxes
The Series’ policy is to comply with the provisions of the Internal Revenue Code applicable to regulated investment companies. The Series is not subject to federal income tax or excise tax to the extent that the Series distributes to shareholders each year its taxable income, including any net realized gains on investments, in accordance with requirements of the Internal Revenue Code. Accordingly, no provision for federal income tax or excise tax has been made in the financial statements.
Management evaluates its tax positions to determine if the tax positions taken meet the minimum recognition threshold in connection with accounting for uncertainties in income tax positions taken or expected to be taken for the purposes of measuring and recognizing tax liabilities in the financial statements. Recognition of tax benefits of an uncertain tax position is required only when the position is “more likely than not” to be sustained assuming examination by taxing authorities. At October 31, 2017, the Series has recorded no liability for net unrecognized tax benefits relating to uncertain income tax positions taken or expected to be taken in future tax returns.
The Series files income tax returns in the U.S. federal jurisdiction, various states and foreign jurisdictions, as required. No income tax returns are currently under investigation. The statute of limitations on the Series’ tax returns remains open for the three years ended March 31, 2014 through March 31, 2017 and period ended October 31, 2017. The Series is not aware of any tax positions for which it is reasonably possible that the total amounts of unrecognized tax benefits will significantly change in the next twelve months.
Foreign Taxes
Based on the Series’ understanding of the tax rules and rates related to income, gains and currency purchase/repatriation transactions for foreign jurisdictions in which it invests, the Series will provide for foreign taxes, and where appropriate, deferred foreign tax. The Series is subject to a tax imposed on short term capital gains on securities of issuers domiciled in India. The Series records an estimated deferred tax liability for securities that have been held for less than a year at the end of the reporting period, assuming those positions were disposed of at the end of the period. This amount is reported in Accrued foreign capital gains tax in the accompanying Statement of Assets and Liabilities. Realized losses on the sale of securities of issuers domiciled in India can be carried forward for eight years to offset potential future short term realized capital gains.
Distributions of Income and Gains
Distributions to shareholders of net investment income and net realized gains are made annually. An additional distribution may be necessary to avoid taxation of the Series. Distributions are recorded on the ex-dividend date.
Indemnifications
The Fund’s organizational documents provide former and current directors and officers with a limited indemnification against liabilities arising in connection with the performance of their duties to the Fund. In the normal course of business, the Fund may also enter into contracts that provide general indemnifications. The Fund’s maximum exposure under these arrangements is unknown as this would be dependent on future claims that may be made against the Fund. The risk of material loss from such claims is considered remote.
21
Rainier International Discovery Series
Notes to Financial Statements (continued)
| 2. | Significant Accounting Policies (continued) |
Other
The preparation of financial statements in conformity with GAAP requires management to make estimates and assumptions that affect the reported amounts of assets and liabilities and the disclosure of contingent assets and liabilities at the date of the financial statements and the reported amounts of income and expenses during the reporting period. Actual results could differ from those estimates.
| 3. | Transactions with Affiliates |
The Fund has an Investment Advisory Agreement (the “Agreement”) with the Advisor, for which the Series pays a fee, computed daily and payable monthly, at an annual rate of 0.90% of the Series’ average daily net assets. The investment sub-advisor of the Series is Rainier Investment Management, LLC (“Rainier” or the “Sub-Advisor”). The Advisor pays the Sub-Advisor out of the fee received from the Series at an annual rate of 0.70% of the Series’ average daily net assets. Prior to August 21, 2017, the Predecessor Fund paid a fee to Rainier, computed daily and payable monthly at an annual rate of 1.00%, which amounted to $936,990 and is included in Management Fees on the Statement of Operations.
Under the Agreement, personnel of the Advisor provide the Series with advice and assistance in the choice of investments and the execution of securities transactions, and otherwise maintain the Series’ organization. The Advisor also provides the Fund with necessary office space and fund administration and support services. The salaries of all officers of the Fund (except a percentage of the Fund’s Chief Compliance Officer’s salary, which is paid by the Fund), and of all Directors who are “affiliated persons” of the Fund, or of the Advisor, and all personnel of the Fund, or of the Advisor, performing services relating to research, statistical and investment activities, are paid by the Advisor and/or Sub-Advisor. Each “non-affiliated” Director receives an annual stipend, which is allocated among all the active series of the Fund. In addition, these Directors also receive a fee per Board meeting attended plus a fee for each committee meeting attended and are reimbursed for travel and other out-of-pocket expenses incurred by them in connection with attending such meetings. The Fund also has an Audit Committee Chair and Governance & Nominating Committee Chair, who each receive an additional annual stipend for each role.
The Fund may enter into agreements with financial intermediaries pursuant to which the Fund may pay financial intermediaries for non-distribution related sub-transfer agency, administrative, sub-accounting, and other shareholder services in an amount not to exceed 0.15% of the average daily net assets of the Class K shares and Class I shares. Payments made pursuant to such agreements are generally based on the current assets and/or number of accounts of the Series attributable to the financial intermediary. Any payments made pursuant to such agreements may be in addition to, rather than in lieu of, any Distribution and Shareholder Services Fee payable under the Rule 12b-1 plan of the Fund.
The Advisor has contractually agreed, until at least February 28, 2019, to waive its management fee and, if necessary, pay other operating expenses of the Series in order to maintain total direct annual fund operating expenses for the Series, exclusive of each share class’ shareholder services fee and distribution and service (12b-1) fees, at no more than 1.15% of the average daily net assets of the Class K and Class I shares, and 1.00% of the average daily net assets of the Class R6 shares. Accordingly, the Advisor waived fees of $235,589 for the period ended October 31, 2017, which is included as a reduction of expenses on the Statement of Operations. The Advisor is not eligible to recoup any expenses that have been waived or reimbursed in prior years. Prior to August 21, 2017, Rainier had contractually agreed to limit expenses to 1.50% for Class A and 1.25% for Class I, which amounted to $163,714 and is included in reduction of expenses on the Statement of Operations.
Manning & Napier Investor Services, Inc., a registered broker-dealer affiliate of the Advisor, acts as distributor for the Fund’s shares. The Series compensates the distributor for distributing and servicing the Series’ Class K shares pursuant to a distribution plan adopted under Rule 12b-1 of the 1940 Act, regardless of expenses actually incurred. Under the agreement, the Series pays distribution and services fees to the distributor at an annual rate of 0.25% of average daily net assets attributable to Class K shares. There are no distribution and services fees on the Class I or Class R6 shares. The fees are accrued daily and paid monthly.
Pursuant to a master services agreement dated March 1, 2017, the Fund pays the Advisor an annual fee related to fund accounting and administration of 0.0085% on the first $25 billion of average daily net assets (excluding Target Series and
22
Rainier International Discovery Series
Notes to Financial Statements (continued)
| 3. | Transactions with Affiliates (continued) |
Strategic Income Series); 0.0075% on the next $15 billion of average daily net assets (excluding Target Series and Strategic Income Series); and 0.0065% of average daily net assets in excess of $40 billion (excluding Target Series and Strategic Income Series); plus the base fee of $30,400 per series. Additionally, certain transaction and out-of-pocket expenses, including charges for reporting relating to the Fund’s compliance program, are charged. The Advisor has an agreement with BNY Mellon Investment Servicing (U.S.) Inc. (“BNY”) under which BNY serves as sub-accountant services agent. Prior to August 21, 2017, U.S. Bancorp Fund Services, LLC served as administrator, transfer agent and fund accountant with U.S. Bank, N.A. serving as custodian. The fees for these services amounted to $158,184 and are included in the Statement of Operations.
Expenses not directly attributable to a series are allocated based on each series’ relative net assets or number of accounts, depending on the expense.
| 4. | Purchases and Sales of Securities |
For the period ended October 31, 2017, purchases and sales of securities, other than U.S. Government securities and short-term securities, were $171,563,089 and $115,273,410 respectively. There were no purchases or sales of U.S. Government securities.
| 5. | Capital Stock Transactions |
Transactions in shares of Class K, Class I and Class R6 shares of Rainier International Discovery Series were:
| FOR THE PERIOD 4/1/17 TO 10/31/171 | FOR THE YEAR ENDED 3/31/17 | FOR THE YEAR ENDED 3/31/16 | ||||||||||||||||||||||
| CLASS K | SHARES | AMOUNT | SHARES | AMOUNT | SHARES | AMOUNT | ||||||||||||||||||
Sold | 2,331,969 | $ | 42,030,540 | 3,301,733 | $ | 52,333,976 | 7,140,810 | $ | 112,992,149 | |||||||||||||||
Reinvested | — | — | — | — | 1,185 | 18,715 | ||||||||||||||||||
Repurchased | (1,251,334 | ) | (23,258,210 | ) | (4,816,056 | ) | (74,302,136 | ) | (1,129,470 | ) | (17,402,545 | ) | ||||||||||||
| �� |
|
|
|
|
|
|
|
|
|
|
|
| ||||||||||||
Total | 1,080,635 | $ | 18,772,330 | (1,514,323 | ) | $ | (21,968,160 | ) | 6,012,525 | $ | 95,608,319 | |||||||||||||
|
|
|
|
|
|
|
|
|
|
|
| |||||||||||||
| FOR THE PERIOD 4/1/17 TO 10/31/171 | FOR THE YEAR ENDED 3/31/17 | FOR THE YEAR ENDED 3/31/16 | ||||||||||||||||||||||
| CLASS I | SHARES | AMOUNT | SHARES | AMOUNT | SHARES | AMOUNT | ||||||||||||||||||
Sold | 3,005,098 | $ | 56,814,033 | 4,535,287 | $ | 73,098,443 | 3,471,861 | $ | 55,577,422 | |||||||||||||||
Reinvested | — | — | — | — | 1,540 | 24,445 | ||||||||||||||||||
Repurchased | (786,025 | ) | (14,460,565 | ) | (2,411,693 | ) | (38,086,675 | ) | (1,292,931 | ) | (20,014,580 | ) | ||||||||||||
|
|
|
|
|
|
|
|
|
|
|
| |||||||||||||
Total | 2,219,073 | $ | 42,353,468 | 2,123,594 | $ | 35,011,768 | 2,180,470 | $ | 35,587,287 | |||||||||||||||
|
|
|
|
|
|
|
|
|
|
|
| |||||||||||||
| FOR THE PERIOD 8/21/17 (COMMENCEMENT OF OPERATIONS) TO 10/31/17 | ||||||||||||||||||||||||
| CLASS R6 | SHARES | AMOUNT | ||||||||||||||||||||||
Sold | 1,045 | $ | 20,286 | |||||||||||||||||||||
Reinvested | — | — | ||||||||||||||||||||||
Repurchased | (14 | ) | (287 | ) | ||||||||||||||||||||
|
|
|
| |||||||||||||||||||||
Total | 1,031 | $ | 19,999 | |||||||||||||||||||||
|
|
|
| |||||||||||||||||||||
1Includes capital stock transactions for the predecessor fund, Rainier International Discovery Fund.
At October 31, 2017, one shareholder account owned 17.7% of the Series. In addition, the Advisor and its affiliates owned less than 0.1% of the Series. Investment activities of these shareholders may have a material effect on the Series.
23
Rainier International Discovery Series
Notes to Financial Statements (continued)
| 6. | Line of Credit |
Prior to August 21, 2017, the Predecessor Fund had access to a $100 million unsecured line of credit with U.S. Bank, N.A., intended to provide short-term financing, if necessary, subject to certain restrictions, in connection with shareholder redemptions. The Series did not borrow under the line of credit during the period ended October 31, 2017. The line of Credit was closed prior to the Reorganization.
| 7. | Financial Instruments |
The Series may trade in instruments including written and purchased options, forward foreign currency exchange contracts and futures contracts and other derivatives in the normal course of investing activities to assist in managing exposure to various market risks. The Series may be subject to various elements of risk, which may involve, to a varying degree, elements of risk in excess of the amounts recognized for financial statement purposes. These risks include: the risk that changes in the value of a derivative may not correlate perfectly with the underlying asset, rate or index; counterparty credit risk related to over the counter derivative counterparties’ failure to perform under contract terms; liquidity risk related to the lack of a liquid market for these contracts allowing the fund to close out its position(s); and documentation risk relating to disagreement over contract terms. No such investments were held by the Series as of October 31, 2017.
| 8. | Foreign Securities |
Investing in securities of foreign companies and foreign governments involves special risks and considerations not typically associated with investing in securities of domestic companies and the U.S. Government. These risks include revaluation of currencies and future adverse political and economic developments. Moreover, securities of foreign companies and foreign governments and their markets may be less liquid and their prices more volatile than those of comparable domestic companies and the U.S. Government.
| 9. | Federal Income Tax Information |
The amount and characterization of certain income and capital gains to be distributed are determined in accordance with federal income tax regulations, which may differ from GAAP. These differences are primarily due to differing book and tax treatments in the timing and/or treatment of the recognition of net investment income or gains and losses, including foreign currency gains and losses, wash sales, foreign taxes and qualified late-year losses. The Series may periodically make reclassifications among its capital accounts to reflect income and gains available for distribution (or available capital loss carryovers) under income tax regulations without impacting the Series’ net asset value. For the period ended October 31, 2017, amounts were reclassified within the capital accounts to decrease Undistributed Net Investment Income by $246,260, decrease Additional Paid in Capital by $151,267, and increase Accumulated Net Realized Loss on Investments by $397,527. Any such reclassifications are not reflected in the financial highlights.
The tax character of distributions paid were as follows:
| FOR THE PERIOD 4/1/17 TO 10/31/17 | FOR THE YEAR ENDED 3/31/17 | FOR THE YEAR ENDED 3/31/16 | ||||||||||
Ordinary income | — | — | $ | 55,671 | ||||||||
At October 31, 2017, the tax basis of components of distributable earnings and the net unrealized appreciation based on the identified cost of investments for federal income tax purposes were as follows:
Cost for federal income tax purposes | $ | 244,876,637 | ||
Unrealized appreciation | 73,783,554 | |||
Unrealized depreciation | (1,401,488 | ) | ||
|
| |||
Net unrealized appreciation | $ | 72,382,066 | ||
|
| |||
Undistributed ordinary income | $ | 267,903 | ||
Capital loss carryforward | $ | (2,856,345 | ) |
24
Rainier International Discovery Series
Notes to Financial Statements (continued)
| 9. | Federal Income Tax Information (continued) |
As of October 31, 2017, the capital loss carryover utilized in the current year was $11,321,331.
At October 31, 2017, the Series had net short-term capital loss carryforwards of $2,856,345 carryforwards, which may be carried forward indefinitely.
25
Rainier International Discovery Series
Report of Independent Registered Public Accounting Firm
To the Board of Directors of Manning & Napier Fund, Inc. and Shareholders of Rainier International Discovery Series:
In our opinion, the accompanying statement of assets and liabilities, including the investment portfolio, and the related statements of operations and of changes in net assets and the financial highlights present fairly, in all material respects, the financial position of Rainier International Discovery Series (one of the series constituting Manning & Napier Fund, Inc., hereafter referred to as the “Series”) as of October 31, 2017, and the results of its operations, the changes in its net assets and the financial highlights for the period April 1, 2017 through October 31, 2017, in conformity with accounting principles generally accepted in the United States of America. These financial statements and financial highlights (hereafter referred to as “financial statements”) are the responsibility of the Series’ management. Our responsibility is to express an opinion on these financial statements based on our audit. We conducted our audit of these financial statements in accordance with the standards of the Public Company Accounting Oversight Board (United States). Those standards require that we plan and perform the audit to obtain reasonable assurance about whether the financial statements are free of material misstatement. An audit includes examining, on a test basis, evidence supporting the amounts and disclosures in the financial statements, assessing the accounting principles used and significant estimates made by management, and evaluating the overall financial statement presentation. We believe that our audit, which included confirmation of securities at October 31, 2017 by correspondence with the custodian and brokers, provides a reasonable basis for our opinion. The financial statements of the Series as of and for the years or periods ended on or prior to March 31, 2017 and the financial highlights for each of the years or periods ended on or prior to March 31, 2017 (not presented herein other than the statement of operations, statement of changes in net assets and the financial highlights) were audited by other auditors whose report dated May 22, 2017 expressed an unqualified opinion on those financial statements and financial highlights.
New York, New York
December 18, 2017
26
Rainier International Discovery Series
Approval of the Investment Advisory Agreement and Sub-Advisory Agreement
(unaudited)
At the meeting of the Manning & Napier Fund, Inc. (the “Fund”) Board of Directors (the “Board”) held on February 16, 2017, the Directors considered the approval of an Investment Advisory Agreement between the Fund and Manning & Napier Advisors, LLC (the “Advisor”) and a Sub-Advisory Agreement (collectively, the “Agreements”) between the Advisor and Rainier Investment Management LLC (the “Sub-Advisor” or “Rainier”) for the Rainier International Discovery Series.
At the Board meeting, representatives of the Advisor explained that the Board was being asked to consider establishing a new series of the Fund, the Rainier International Discovery Series (the “Acquiring Series”), in order to adopt the Rainier International Discovery Fund (the “Predecessor Fund”) into the Fund complex. The newly formed Acquiring Series would be the surviving entity following a merger with the Predecessor Fund. The Predecessor Fund’s investment advisor, Rainier, an affiliate of the Advisor, would then become the Sub-Advisor for the Acquiring Series.
In connection with the decision whether to approve the Agreements, a variety of material was provided to the Board in advance of the meeting for their review and consideration, including, but not limited to: (i) a memorandum regarding the proposed adoption of the Acquiring Series from the Predecessor fund, and the expected benefits of the transaction (ii) information regarding the investment results, philosophy and investment process of the Predecessor fund, and (iii) the expected cost of services for the Advisor and Sub-Advisor based on the nature, extent and quality of services that would be performed by each, respectively. In addition to the information furnished by representatives of the Advisor, the Board was provided with a legal memorandum discussing their fiduciary duties related to the approval of the proposed transaction.
Representatives of the Advisor attended the meeting and presented additional oral and written information to assist the Board in its considerations. The discussion immediately below outlines the materials and information presented to the Board in connection with the consideration of the Agreements and the conclusions made by the Directors when determining to approve the Agreements. The summary describes the most important, but not all, of the factors, considered by the Board.
| • | The adoption would be achieved via a fund merger, subject to the vote of the Predecessor Fund’s Board of Trustees and shareholders. Representatives of the Advisor explained that the Acquiring Series would employ substantially the same investment policies and the same processes and portfolio management team as the Predecessor Fund. |
| • | The Board considered the services provided by the Advisor under the proposed Investment Advisory Agreement including, among others: administering the affairs of the Fund (including the books and records of the Fund not maintained by third party service providers such as the custodian or transfer agent); arranging for the insurance coverage for the Fund; and supervising the preparation of tax returns, SEC filings (including registration statements), reports to shareholders for the Fund and oversight of the sub-advisor. The Board also considered the nature and quality of such services provided under the proposed Investment Advisory Agreement in light of the Advisor’s services provided to the other series of the Fund for approximately 30 years under an existing investment advisory agreement. The Board had discussed the quality of these services with representatives from the Advisor in November 2016 and concluded the Advisor was performing its services to the Fund required under the existing investment advisory agreement in a reasonable manner. |
| • | The Board also considered the services that would be provided by the Sub-Advisor under the proposed Sub-Advisory Agreement, including among others: deciding what securities to purchase and sell for the Series; arranging for the purchase and sale of such securities by placing orders with broker-dealers; monitoring portfolio and prospectus compliance; exercising proxy voting rights; and providing advice and support on security valuations. |
| • | The Board considered due diligence performed by Advisor on the proposed Sub-Advisor, that determined that the Sub-Advisor had appropriate compliance and operational controls in place to prevent violations of the federal securities laws with respect to the services it would provide to the Acquiring Series. |
| • | The Board also considered the nature and quality of such services that the proposed Sub-Advisor has provided to the Predecessor Fund since its inception, and the services that would be provided under the proposed sub-advisory agreement. The Board reviewed the performance of the Predecessor Fund since its inception and over a three year time period. Returns for the established benchmark indices for the Predecessor Fund were provided. In addition, the Board considered the Predecessor Fund’s investment objective, investment process and the experience of the investment team. The Board |
27
Rainier International Discovery Series
Approval of the Investment Advisory Agreement and Sub-Advisory Agreement
(unaudited)
| discussed the performance with representatives from the Advisor and concluded that the services outlined in the proposed Sub-Advisory agreement were reasonable. |
| • | The Board considered the proposed fees and expenses of the Acquiring Series. The Advisor presented the proposed advisory fee and total expenses ratios for the Acquiring Series, including the advisory fee adjusted for any contractual expense waivers or reimbursements paid by the Advisor. The advisory fee and net expense ratios of the Acquiring Series was compared and ranked (on a median basis) against funds of a similar size and with similar investment objectives and expense characteristics as disclosed on the Morningstar database. Representatives of the Advisor discussed with the Board the comparisons and rankings of the advisory fee and net expense ratios for the Acquiring Series and the methodology behind the comparison, noting that the proposed advisory fee was at or below the median compared to peers. The Board considered the proposed payment of intermediary sub-transfer agency fees (“sub-TA fees”), which would be borne by the Fund and paid to intermediaries for the performance of non-distribution shareholder and/or administrative services. The sub-TA fees would be included in the operating expenses of the Acquiring Series. The Board considered the proposed multi-tier limit on Fund sub-TA expenses at both the individual broker-dealer and aggregate share class level, and the fact that fees in excess of the limits would be paid out of the Advisor’s profits. Based on their review of the information provided, the Board concluded that the proposed fees and expenses of the Acquiring Series were reasonable on a comparative basis. |
| • | The Board considered the proposed advisory fee split between the Advisor and Sub-Advisor. Considering the nature and quality of the services provided by the Advisor and Sub-Advisor, the Board concluded that the advisory fee split was reasonable. |
| • | The Board considered whether economies of scale were being achieved by the Advisor and/or Sub-Advisor with respect to the services provided to the Acquiring Series. The Board concluded that the Acquiring Series would benefit from lower shareholder expenses derived from being part of a larger fund complex. |
| • | In addition to the factors described above, the Board considered other benefits that the Advisor and/or Sub-Advisor may derive from their relationship with the Acquiring Series, which included leveraging the Advisor’s large distribution team and marketing experience. The Board concluded that these additional benefits to the Advisor and/or Sub-Advisor were reasonable. |
Based on the Board’s deliberations and their evaluation of the information described above, the Board, including a majority of Directors that are not “interested persons” as defined in the Investment Company Act of 1940, concluded that the compensation under the proposed Advisory and Sub-Advisory Agreements were fair and reasonable in light of the services and expenses and such other matters as the Directors considered to be relevant in the exercise of their reasonable judgment. Accordingly, the Board voted unanimously to approve the Advisory and Sub-Advisory Agreements for the Rainier International Discovery Series. In the course of their deliberations, the Directors did not identify any particular information that was all important or controlling.
28
Rainier International Discovery Series
Directors’ and Officers’ Information
(unaudited)
The Statement of Additional Information provides additional information about the Fund’s directors and officers and can be obtained without charge by calling 1-800-466-3863, at www.manning-napier.com, or on the EDGAR Database on the SEC Internet web site (http://www.sec.gov). The following chart shows certain information about the Fund’s directors and officers, including their principal occupations during the last five years. Unless specific dates are provided, the individuals have held the listed positions for longer than five years.
Interested Director and Officer
Name: | Michele T. Mosca* | |
| Address: | 290 Woodcliff Drive Fairport, NY 14450 | |
| Age: | 45 | |
| Current Position(s) Held with Fund: | Principal Executive Officer, President, Chairman & Director | |
| Term of Office & Length of Time Served: | Indefinite - Chairman and Director since August 20161 | |
| Principal Occupation(s) During Past 5 Years: | Managing Director, Funds Group (since 2009) - Manning & Napier Advisors, LLC; President, Director (since 2015) - Manning & Napier Investor Services, Inc.; Chief Executive Officer, President (since 2016) - Rainier Investment Management Mutual Funds, Inc. Holds the following title for various subsidiaries and affiliates: President, Director | |
| Number of Portfolios Overseen within Fund Complex: | 38 | |
| Other Directorships Held Outside Fund Complex During Past 5 Years: | Trustee - Rainier Investment Management Mutual Funds (since 2016) | |
| Independent Directors | ||
| Name: | Stephen B. Ashley | |
| Address: | 290 Woodcliff Drive Fairport, NY 14450 | |
| Age: | 77 | |
| Current Position(s) Held with Fund: | Director, Audit Committee Member, Governance & Nominating Committee Member | |
| Term of Office & Length of Time Served: | Indefinite - Since 1996 | |
| Principal Occupation(s) During Past 5 Years: | Chairman, Director & Chief Executive Officer (1997 to present) - The Ashley Group (property management and investment). Director (1995-2008) and Chairman (non-executive) (2004-2008) - Fannie Mae (mortgage) | |
| Number of Portfolios Overseen within Fund Complex: | 38 | |
| Other Directorships Held Outside Fund Complex During Past 5 Years: | Fannie Mae (1995-2008) The Ashley Group (1995-2008) Genesee Corporation (1987-2007) | |
| Name: | Paul A. Brooke | |
| Address: | 290 Woodcliff Drive Fairport, NY 14450 | |
| Age: | 72 | |
| Current Position(s) Held with Fund: | Lead Independent Director, Audit Committee Member, Governance & Nominating Committee Chairman | |
| Term of Office & Length of Time Served: | Indefinite - Director, Audit Committee Member, Governance & Nominating Committee Member since 2007; Governance & Nominating Committee Chairman since 2016; Lead Independent Director since 2017 | |
| Principal Occupation(s) During Past 5 Years: | Chairman & CEO (2005-2009) - Ithaka Acquisition Corporation (investments); Chairman (2007-2009) - Alsius Corporation (investments); Managing Member (1991-present) - PMSV Holdings LLC (investments); Managing Member (2010-2016) - Venbio (investments). | |
| Number of Portfolios Overseen within Fund Complex: | 38 | |
| Other Directorships Held Outside Fund Complex During Past 5 Years: | Incyte Corp. (biotech) (2000-present); ViroPharma, Inc. (speciality pharmaceuticals) (2000-2014); HLTH (WebMD) (information) (2000-2010); Cheyne Capital International (investment) (2000-present); GMP Companies (investment) (2000-2011); Cytos Biotechnology Ltd (biotechnology) (2012-2014); Cerus (biomedical) (2016-present); PureEarth (non-profit) (2012-present) | |
29
Rainier International Discovery Series
Directors’ and Officers’ Information
(unaudited)
| Independent | Directors (continued) |
| Name: | Peter L. Faber | |
| Address: | 290 Woodcliff Drive Fairport, NY 14450 | |
| Age: | 79 | |
| Current Position(s) Held with Fund: | Director, Governance & Nominating Committee Member | |
| Term of Office & Length of Time Served: | Indefinite - Since 1987 | |
| Principal Occupation(s) During Past 5 Years: | Senior Counsel (2006-2012), Partner (1995-2006 & 2013-present) - McDermott, Will & Emery LLP (law firm) | |
| Number of Portfolios Overseen within Fund Complex: | 38 | |
| Other Directorships Held Outside Fund Complex During Past 5 Years: | Boston Early Music Festival (non-profit) (2007-present); Amherst Early Music, Inc. (non-profit) (2009-present); Gotham Early Music Scene, Inc. (non-profit) (2009-present); Partnership for New York City, Inc. (non-profit) (1989-2010); New York Collegium (non-profit) (2004-2011) | |
| Name: | Harris H. Rusitzky | |
| Address: | 290 Woodcliff Drive Fairport, NY 14450 | |
| Age: | 82 | |
| Current Position(s) Held with Fund: | Director, Audit Committee Member, Governance & Nominating Committee Member | |
| Term of Office & Length of Time Served: | Indefinite - Since 1985 | |
| Principal Occupation(s) During Past 5 Years: | President (1994-present) - The Greening Group (business consultants); Partner (2006-present) - The Restaurant Group (restaurants) | |
| Number of Portfolios Overseen within Fund Complex: | 38 | |
| Other Directorships Held Outside Fund Complex During Past 5 Years: | Rochester Institute of Technology (university) (1972-present); Culinary Institute of America (non-profit college) (1985-present); George Eastman House (museum) (1988-present); National Restaurant Association (restaurant trade organization) (1978-present) | |
| Name: | Chester N. Watson | |
| Address: | 290 Woodcliff Drive Fairport, NY 14450 | |
| Age: | 67 | |
| Current Position(s) Held with Fund: | Director, Audit Committee Chairman, Governance & Nominating Committee Member | |
| Term of Office & Length of Time Served: | Indefinite - Since 2012 | |
| Principal Occupation(s) During Past 5 Years: | General Auditor (2003-2011) - General Motors Company (auto manufacturer) | |
| Number of Portfolios Overseen within Fund Complex: | 38 | |
| Other Directorships Held Outside Fund Complex During Past 5 Years: | Rochester Institute of Technology (university) (2005-present); Town of Greenburgh, NY Planning Board (municipal government) (2015-present) | |
| Officers: | ||
| Name: | Jeffrey S. Coons, Ph.D., CFA® | |
| Address: | 290 Woodcliff Drive Fairport, NY 14450 | |
| Age: | 54 | |
| Current Position(s) Held with Fund: | Vice President | |
| Term of Office1 & Length of Time Served: | Since 2004 | |
| Principal Occupation(s) During Past 5 Years: | President since 2010, Co-Director of Research (2002 - 2015) - Manning & Napier Advisors, LLC | |
| Holds one or more of the following titles for various subsidiaries and affiliates: President, Director, Treasurer, or Senior Trust Officer | ||
| Name: | Elizabeth Craig | |
| Address: | 290 Woodcliff Drive Fairport, NY 14450 | |
| Age: | 30 | |
| Current Position(s) Held with Fund: | Corporate Secretary | |
| Term of Office1 & Length of Time Served: | Since 2016 | |
| Principal Occupation(s) During Past 5 Years: | Fund Administration Manager since 2015; Mutual Fund Compliance Specialist (2009-2015) - Manning & Napier Advisors, LLC; Assistant Corporate Secretary (2011-2016) - Manning & Napier Fund, Inc. | |
30
Rainier International Discovery Series
Directors’ and Officers’ Information
(unaudited)
| Officers: | (continued) |
| Name: | Christine Glavin | |
| Address: | 290 Woodcliff Drive Fairport, NY 14450 | |
| Age: | 51 | |
| Current Position(s) Held with Fund: | Principal Financial Officer, Chief Financial Officer | |
| Term of Office1 & Length of Time Served: | Principal Financial Officer since 2002; Chief Financial Officer since 2001 | |
| Principal Occupation(s) During Past 5 Years: | Director of Fund Reporting since 2011; Fund Reporting Manager (1997-2011) - Manning & Napier Advisors, LLC; Assistant Treasurer since 2008 - Exeter Trust Company; Chief Financial Officer since 2017- Rainier Investment Management Mutual Funds, Inc. | |
| Name: | Jodi L. Hedberg | |
| Address: | 290 Woodcliff Drive Fairport, NY 14450 | |
| Age: | 50 | |
| Current Position(s) Held with Fund: | Chief Compliance Officer, Anti-Money Laundering Compliance Officer | |
| Term of Office1 & Length of Time Served: | Chief Compliance Officer since 2004; Anti-Money Laundering Officer since 2002; Corporate Secretary (1997-2016) - Manning & Napier Fund, Inc.; Chief Compliance Officer and Anti-Money Laundering Officer since 2017-– Rainier Investment Management Mutual Funds, Inc. | |
| Principal Occupation(s) During Past 5 Years: | Director of Compliance since 2005; Compliance Manager (1995-2005) - Manning & Napier Advisors, LLC and affiliates; Corporate Secretary - Manning & Napier Investor Services, Inc. since 2006 | |
| Name: | Scott Morabito | |
| Address: | 290 Woodcliff Drive Fairport, NY 14450 | |
| Age: | 29 | |
| Current Position(s) Held with Fund: | Assistant Vice President | |
| Term of Office1 & Length of Time Served: | Since 2017 | |
| Principal Occupation(s) During Past 5 Years: | Director of Funds Group since 2017; Fund Product and Strategy Manager (2014-2017); Senior Product and Strategy Analyst (2013-2014); Product and Strategy Analyst (2011-2013) - Manning & Napier Advisors, LLC. | |
| Name: | Amy Williams | |
| Address: | 290 Woodcliff Drive Fairport, NY 14450 | |
| Age: | 56 | |
| Current Position(s) Held with Fund: | Assistant Corporate Secretary | |
| Term of Office1 & Length of Time Served: | Since 2016 | |
| Principal Occupation(s) During Past 5 Years: | Director of Fund Documentation - Manning & Napier Advisors, LLC and affiliates since 2009 Holds one or more of the following titles for various affiliates: Director | |
| Name: | Richard Yates | |
| Address: | 290 Woodcliff Drive Fairport, NY 14450 | |
| Age: | 52 | |
| Current Position(s) Held with Fund: | Chief Legal Officer | |
| Term of Office1 & Length of Time Served: | Chief Legal Officer since 2004 | |
| Principal Occupation(s) During Past 5 Years: | Counsel - Manning & Napier Advisors, LLC and affiliates since 2000; Chief Legal Officer since 2016 Rainier Investment Management, LLC; Chief Legal Officer since 2016 - Rainier Investment Management Mutual Funds, Inc. Holds one or more of the following titles for various affiliates: Director, Corporate Secretary, Chief Legal Officer |
*Interested Director, within the meaning of the 1940 Act by reason of her positions with the Fund’s investment advisor, Manning & Napier Advisors, LLC and Distributor, Manning & Napier Investor Services, Inc.
1The term of office of all officers shall be one year and until their respective successors are chosen and qualified, or his or her earlier resignation or removal as provided in the Fund’s By-Laws.
31
{This page intentionally left blank}
32
{This page intentionally left blank}
33
Rainier International Discovery Series
Literature Requests
(unaudited)
Proxy Voting Policies and Procedures
A description of the policies and procedures that the Fund uses to determine how to vote proxies relating to portfolio securities is available, without charge, upon request:
| By phone | 1-800-466-3863 | |||
| On the Securities and Exchange | ||||
| Commission’s (SEC) web site | http://www.sec.gov |
Proxy Voting Record
Information regarding how the Fund voted proxies relating to portfolio securities during the most recent 12-month period ended June 30th is available, without charge, upon request:
| By phone | 1-800-466-3863 | |||
| On the SEC’s web site | http://www.sec.gov |
Quarterly Portfolio Holdings
The Series’ complete schedule of portfolio holdings for the 1st and 3rd quarters of each fiscal year are provided on Form N-Q, and are available, without charge, upon request:
| By phone | 1-800-466-3863 | |||
| On the SEC’s web site | http://www.sec.gov |
The Series’ Form N-Q may be reviewed and copied at the SEC’s Public Reference Room in Washington, D.C. Information on the operation of the Public Reference Room may be obtained by calling 1-800-SEC-0330.
Prospectus and Statement of Additional Information (SAI)
For more information about any of the Manning & Napier Fund, Inc. Series, you may obtain a prospectus and SAI at www.manning-napier.com or by calling (800) 466-3863. Before investing, carefully consider the objectives, risks, charges and expenses of the investment and read the prospectus carefully as it contains this and other information about the investment company. In addition, this information can be found on the SEC’s web site, http://www.sec.gov.
Additional information available at www.manning-napier.com
1. Fund Holdings Month-End
2. Fund Holdings - Quarter-End
3. Shareholder Report - Annual
4. Shareholder Report - Semi-Annual
The Fund also offers electronic notification or “e-delivery” when certain documents are available on-line to be downloaded or reviewed. Direct shareholders can elect to receive electronic notification when shareholder reports, prospectus updates, and/or statements are available. If you do not currently have on-line access to your account, you can establish access by going to www.manning-napier.com, click on “Login” in the top corner of the page, and follow the prompts to self-enroll. Once enrolled, you can set your electronic notification preferences by clicking on the Account Options tab located within the green toolbar and then select E-Delivery Option. Should you have any questions on either how to establish on-line access or how to update your account settings, please contact Investor Services at 1-800-466-3863.
The Manning & Napier Fund, Inc. is managed by Manning & Napier Advisors, LLC. Manning & Napier Investor Services, Inc., an affiliate of Manning & Napier Advisors, LLC, is the distributor of the Fund shares.
MNIDS-10/17-AR
ITEM 2: CODE OF ETHICS
| (a) | The registrant has adopted a code of ethics that applies to its principal executive officer, principal financial officer and principal accounting officer. A copy of the registrant’s code of ethics is filed herewith as Exhibit 13(a)(1). |
| (b) | During the period covered by this report, no amendments were made to the provisions of the code of ethics adopted in 2 (a) above. |
| (c) | During the period covered by this report, no implicit or explicit waivers to the provisions of the code of ethics adopted in 2 (a) above were granted. |
| (d) | Not applicable to the registrant due to the response given in 2 (c) above. |
ITEM 3: AUDIT COMMITTEE FINANCIAL EXPERT
All of the members of the Audit committee have been determined by the Registrant’s Board of Directors to be Audit Committee Financial Experts as defined in this item. The current members of the Audit Committee are: Stephen B. Ashley, Paul A. Brooke, Harris H. Rusitzky, and Chester N. Watson. All Audit Committee members are independent under applicable rules. This designation will not increase the designee’s duties, obligations or liability as compared to their duties, obligations and liability as a member of the Audit Committee and of the Board.
ITEM 4: PRINCIPAL ACCOUNTANT FEES AND SERVICES
Principal Accountant Fees and Services
Aggregate fees for professional services rendered for the Manning & Napier Fund, Inc. (Pro-Blend® Conservative Term Series, Pro-Blend® Moderate Term Series, Pro-Blend® Extended Term Series, Pro-Blend® Maximum Term Series, Blended Asset Conservative Series, Blended Asset Moderate Series, Blended Asset Extended Series, Blended Asset Maximum Series, Tax Managed Series, Equity Series, Overseas Series, Disciplined Value Series, Quality Equity Series, Rainier International Discovery Series, Target Income Series, Target 2015 Series, Target 2020 Series, Target 2025 Series, Target 2030 Series, Target 2035 Series, Target 2040 Series, Target 2045 Series, Target 2050 Series, Target 2055 Series, and Target 2060 Series collectively the “Fund”) by PricewaterhouseCoopers LLP (“PwC”) as of and for the years ended October 31, 2017 and 2016 were:
| 2017 | 2016 | |||||||
Audit Fees (a) | $ | 608,260 | $ | 463,551 | ||||
Audit Related Fees (b) | $28,000 | $0 | ||||||
Tax Fees (c) | $ | 201,660 | $ | 142,180 | ||||
All Other Fees (d) | $0 | $0 | ||||||
| $ | 837,920 | $ | 605,731 | |||||
| (a) | Audit Fees |
These fees relate to professional services rendered by PwC for the audit of the Fund’s annual financial statements or services normally provided by the accountant in connection with statutory and regulatory filing or engagements. These services include the audits of the financial statements of the Fund, issuance of consents, income tax provision procedures and assistance with review of documents filed with the SEC. The 2017 audit fees include fees relating to audit procedures performed for the Rainier International Discovery Series’ reorganization as well as the creation of the Blended Asset Series. The 2016 audit fees did not include such one-time related fees.
| (b) | Audit-Related Fees |
These fees relate to assurance and related services by PwC that are reasonably related to the performance of the audit of the Fund’s financial statements and are not reported under “Audit Fees” above.
| (c) | Tax Fees |
These fees relate to professional services rendered by PwC for tax compliance, tax advice and tax planning. The tax services provided by PwC related to the review of the Fund’s federal and state income tax returns, excise tax calculations and returns, a review of the Fund’s calculations of capital gain and income distributions, and additional tax research for compliance purposes.
| (d) | All Other Fees |
These fees relate to products and services provided by PwC other than those reported above under “Audit Fees,” “Audit-Related Fees,” and “Tax Fees” above.
There were no amounts that were approved by the Audit Committee pursuant to the de minimus exception (Rule 2-01(c)(7) of Regulation S-X) for the fiscal years ended October 31, 2017 and 2016.
Non-Audit Services to the Fund’s Service Affiliates that were Pre-Approved by the Fund’s Audit Committee
The Fund’s Audit Committee is required to pre-approve non-audit services which meet both the following criteria:
| i) | Directly relate to the Fund’s operations and financial reporting; and |
| ii) | Rendered by PwC to the Fund’s advisor, Manning & Napier Advisors, LLC, and entities in a control relationship with the advisor (“service affiliate”) that provide ongoing services to the Fund. For purposes of disclosure, Manning & Napier Investor Services, Inc. is considered to be a service affiliate. |
| 2017 | 2016 | |||||||
Audit Related Fees | $1,944 | $1,944 | ||||||
Tax Fees | $0 | $0 | ||||||
| $1,944 | $1,944 | |||||||
The Audit Related fees for the years ended October 31, 2017 and 2016 were for a license for proprietary authoritative financial reporting and assurance literature library software.
There were no amounts that were approved by the Audit Committee pursuant to the de minimus exception (Rule 2-01(c)(7) of Regulation S-X) for the fiscal years ended October 31, 2017 and 2016.
Aggregate Fees
Aggregate fees billed to the Fund for non-audit services for 2017 and 2016 were $837,920 and $605,731, respectively. Aggregate fees billed to the Fund’s advisor and service affiliates for non-audit services were $1,944 and $1,944, respectively. These amounts include fees for non-audit services required to be pre-approved and fees for non-audit services that did not require pre-approval since they did not relate to the Fund’s operations and financial reporting.
The Fund’s Audit Committee has considered whether the provisions for non-audit services to the Fund’s advisor and service affiliates, which did not require pre-approval, are compatible with maintaining PwC’s independence.
ITEM 5: AUDIT COMMITTEE OF LISTED REGISTRANTS
Not applicable.
ITEM 6: INVESTMENTS
| (a) | See Investment Portfolios under Item 1 on this Form N-CSR. |
| (b) | Not applicable. |
| ITEM 7: | DISCLOSURE OF PROXY VOTING POLICIES AND PROCEDURES FOR CLOSED- END MANAGEMENT INVESTMENT COMPANIES |
Not applicable.
| ITEM 8: | PORTFOLIO MANAGERS OF CLOSED-END MANAGEMENT INVESTMENT COMPANIES |
Not applicable.
| ITEM 9: | PURCHASES OF EQUITY SECURITIES BY CLOSED-END MANAGEMENT INVESTMENT COMPANY AND AFFILIATED PURCHASERS |
Not applicable.
| ITEM 10: | SUBMISSION OF MATTERS TO A VOTE OF SECURITY HOLDERS |
There have been no material changes to the procedure by which shareholders may recommend nominees to the registrant’s board of directors.
| ITEM 11: | CONTROLS AND PROCEDURES |
(a) Based on their evaluation of the Funds’ disclosure controls and procedures, as of a date within 90 days of the filing date, the Funds’ Principal Executive Officer and Principal Financial Officer have concluded that the Funds’ disclosure controls and procedures are: (i) reasonably designed to ensure that information required to be disclosed in this report is appropriately communicated to the Funds’ officers to allow timely decisions regarding disclosures required in this report; (ii) reasonably designed to ensure that information required to be disclosed in this report is recorded, processed, summarized and reported in a timely manner; and (iii) are effective in achieving the goals described in (i) and (ii) above.
(b) During the second fiscal quarter of the period covered by this report, there have been no changes in the Funds’ internal control over financial reporting that the above officers believe to have materially affected, or to be reasonably likely to materially affect, the Funds’ internal control over financial reporting.
[Note that until the date that the registrant has filed its first report on Form N-PORT (17 CFR 270.150), the registrant’s disclosures required by this Item are limited to any change in the registrant’s internal control over financial reporting that occurred during the registrant’s last fiscal quarter that has materially affected or is reasonably likely to materially affect the registrant’s internal control over financial reporting.]
| ITEM 12: | DISCLOSURE OF SECURITIES LENDING ACTIVITIES FOR CLOSED-END MANAGEMENT INVESTMENT COMPANIES. |
Not applicable.
| ITEM 13: | EXHIBITS |
| (a)(1) | Code of ethics that is subject to the disclosure of Item 2 above. |
| (a)(2) | Separate certifications for the Registrant’s principal executive officer and principal financial officer, as required by Section 302 of the Sarbanes-Oxley Act of 2002 and Rule 30a-2(a) under the Investment Company Act of 1940, are attached as EX-99.CERT. |
[Note that until the date that the registrant has filed its first report on Form N-PORT (17 CFR 270.150), in the certification required by Item 13(a)(2), the registrant’s certifying officers must certify that they have disclosed in the report any change in the registrant’s internal control over financial reporting that occurred during the registrant’s most recent fiscal quarter that has materially affected, or is reasonably likely to materially affect the registrant’s internal control over financial reporting.]
| (a)(3) | Not applicable. |
| (a)(4) | Not applicable. |
| (b) | A certification of the Registrant’s principal executive officer and principal financial officer, as required by 18 U.S.C Section 1350, as adopted pursuant to Section 906 of the Sarbanes-Oxley Act of 2002, and Rule 30a-2(b) under the Investment Company Act of 1940, is attached as EX- 99.906CERT. The certification furnished pursuant to this paragraph is not deemed to be “filed” for purposes of Section 18 of the Securities Exchange Act of 1934, or otherwise subject to the liability of that section. Such certification is not deemed to be incorporated by reference into any filing under the Securities Act of 1933 or the Securities Exchange Act of 1934, except to the extent that the Registrant specifically incorporates them by reference. |
SIGNATURES
Pursuant to the requirements of the Securities Exchange Act of 1934 and the Investment Company Act of 1940, the registrant has duly caused this report to be signed on its behalf by the undersigned, thereunto duly authorized.
Manning & Napier Fund, Inc.
| /s/ Michele T. Mosca | ||
| Michele T. Mosca | ||
| President & Principal Executive Officer of Manning & Napier Fund, Inc. | ||
| Date: 12/18/2017 | ||
Pursuant to the requirements of the Securities Exchange Act of 1934 and the Investment Company Act of 1940, this report has been signed below by the following persons on behalf of the registrant and in the capacities and on the dates indicated.
| /s/ Michele T. Mosca | ||
| Michele T. Mosca | ||
| President & Principal Executive Officer of Manning & Napier Fund, Inc. | ||
| Date: 12/18/2017 | ||
| /s/ Christine Glavin | ||
| Christine Glavin | ||
| Chief Financial Officer & Principal Financial Officer of Manning & Napier Fund, Inc. | ||
| Date: 12/18/2017 | ||