UNITED STATES
SECURITIES AND EXCHANGE COMMISSION
Washington, D.C. 20549
FORM N-CSR
CERTIFIED SHAREHOLDER REPORT OF REGISTERED MANAGEMENT INVESTMENT COMPANIES
Investment Company Act file number 811-04087
Manning & Napier Fund, Inc.
(Exact name of registrant as specified in charter)
290 Woodcliff Drive, Fairport, NY 14450
(Address of principal executive offices)(Zip Code)
Paul J. Battaglia 290 Woodcliff Drive, Fairport, NY 14450
(Name and address of agent for service)
Registrant’s telephone number, including area code: 585-325-6880
Date of fiscal year end: October 31
Date of reporting period: November 1, 2017 through October 31, 2018
Form N-CSR is to be used by management investment companies to file reports with the Commission not later than 10 days after the transmission to stockholders of any report that is required to be transmitted to stockholders under Rule 30e-1 under the Investment Company Act of 1940 (17 CFR 270.30e-1). The Commission may use the information provided on Form N-CSR in its regulatory, disclosure review, inspection, and policymaking roles.
A registrant is required to disclose the information specified by Form N-CSR, and the Commission will make this information public. A registrant is not required to respond to the collection of information contained in Form N-CSR unless the Form displays a currently valid Office of Management and Budget (“OMB”) control number. Please direct comments concerning the accuracy of the information collection burden estimate and any suggestions for reducing the burden to Secretary, Securities and Exchange Commission, 450 Fifth Street, NW, Washington, DC 20549-0609. The OMB has reviewed this collection of information under the clearance requirements of 44 U.S.C. § 3507.
ITEM 1: REPORTS TO STOCKHOLDERS.

Equity Series
Management Discussion and Analysis
(unaudited)
Dear Shareholders:
The investment environment witnessed over the past twelve months was more volatile and bifurcated than what was experienced in prior years. For the fiscal year ending on October 31, 2018, US equities posted strong gains, with the S&P 500 Total Return Index up 7.35%.
Going forward, we believe the volatility experienced in October, as well as during the first few months of 2018, is likely to be reflective of what investors should come to expect going forward. While we do not anticipate an imminent recession, we see recent developments within the US and abroad as an indication that we are entering a higher risk regime for risk assets over the next twelve months.
The US is likely approaching a period of peak growth and continues to show signs of progressing further into late cycle territory. At the same time, key global risks are rising, including trade tensions, global growth concerns, and geopolitical uncertainty, all of which have continued escalating throughout 2018.
We are approaching the ten-year anniversary of the bull market, and while bull markets do not necessarily die of old age, they cannot extend indefinitely either. As the economy continues to move into later cycle territory, we believe investors should temper their expectations as the extraordinary returns experienced over the past several years are unlikely to persist.
Given our updated outlook, we are reviewing late cycle risks in current and prospective investments and have adjusted our positioning across many of our portfolios. Going forward, we will continue to follow our disciplines, choosing to be selective in our investment decisions and seeking to avoid overvalued areas of the market.
With this in mind, we discuss recent fund performance in the enclosed, highlight how we are positioned amid the current economic environment, and provide our outlook of what to expect in financial markets.
We hope that you find this information helpful, and look forward to working with you in the years ahead to help you meet your investment goals.
Sincerely,
Manning & Napier Advisors, LLC
The S&P 500 Total Return Index is an unmanaged, capitalization-weighted measure comprised of 500 leading U.S. companies to gauge U.S. large cap equities. The Index returns do not reflect any fees or expenses. The index accounts for the reinvestment of regular cash dividends, but not for the withholding of taxes. Index returns provided by Morningstar. S&P Dow Jones Indices LLC, a subsidiary of the McGraw Hill Financial, Inc., is the publisher of various index based data products and services and has licensed certain of its products and services for use by Manning & Napier. All such content Copyright © 2018 by S&P Dow Jones Indices LLC and/or its affiliates. All rights reserved. Neither S&P Dow Jones Indices LLC, Dow Jones Trademark Holdings LLC, their affiliates nor their third party licensors make any representation or warranty, express or implied, as to the ability of any index to accurately represent the asset class or market sector that it purports to represent and none of these parties shall have any liability for any errors, omissions, or interruptions of any index or the data included therein.
©2018 Morningstar, Inc. All rights reserved. The information contained herein: (1) is proprietary to Morningstar and/or its content providers; (2) may not be copied, adapted or distributed; and (3) is not warranted to be accurate, complete or timely. Neither Morningstar nor its content providers are responsible for any damages or losses arising from any use of this information, except where such damages or losses cannot be limited or excluded by law in your jurisdiction. Past financial performance is no guarantee of future results.
1
Equity Series
Fund Commentary
(unaudited)
Investment Objective
To provide long-term growth of capital by investing primarily in common stocks. The Series may invest in large-, mid- and small-size companies within the US.
Performance Commentary
US equity markets delivered positive absolute returns for the twelve-month period ended October 31, 2018. The Russell 3000 Index returned 6.60%; however, performance varied largely between sectors, with five sectors generating returns of 6% or more, while the remaining six sectors generated returns of 2.3% or less. In general, growth stocks benefitted from increased earnings estimates as the domestic markets rose throughout most of 2018.
The Equity Series Class S returned 7.67% during the year, outperforming the Russell 3000 Index on a relative basis. Importantly, the Series has provided robust positive absolute returns over the current stock market cycle, which began in April 2000.
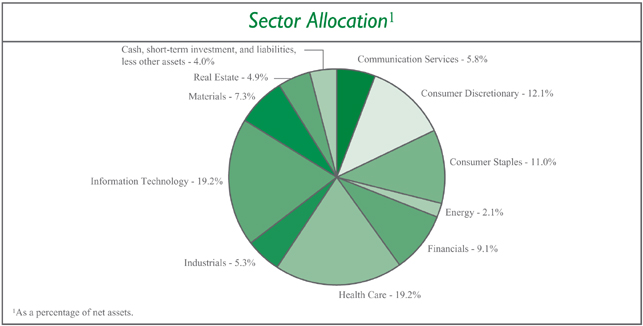
Both stock selection and sector positioning contributed to the Series’ outperformance relative to the Russell 3000 Index during the year. The most notable contributors to relative performance were stock selection in Consumer Discretionary, Financials, Materials, and Information Technology along with underweight allocations to Financials and Industrials. This was offset by an overweight allocation to Materials, and stock selection in Communication Services and Health Care, all of which detracted from relative returns.
Our increased concern for US growth and view that we are moving into late cycle territory has led to meaningful allocations to Health Care and Consumer Staples. The Series’ largest relative underweights are to some of the more economically sensitive sectors like Financials, Energy, and Industrials. We have generally found the more yield-oriented segments to be overvalued given the lower growth prospects, which has led to underweight allocations to the Utilities sector.
Please see the next page for additional performance information as of October 31, 2018.
Performance data quoted represents past performance and does not guarantee future results. The investment return and principal value of an investment will fluctuate, so that an investor’s shares, when redeemed, may be worth more or less than their original cost. Current performance may be higher or lower than that quoted; investors can obtain the most recent month-end performance at www.manning-napier.com or by calling (800) 466-3863.
All investments involve risks, including possible loss of principal. As with any stock fund, the value of your investment will fluctuate in response to stock market movements. Investing in the Series will also involve a number of other risks, including issuer-specific risk, small-cap/mid-cap risk, and interest rate risk.
Commentary prepared using data provided by FactSet. Analysis Manning & Napier. Commentary presented is relative to the Russell 3000® Index. Additional information and associated disclosures can be found on the Performance Update page of this report.
2
Equity Series
Performance Update as of October 31, 2018
(unaudited)
AVERAGE ANNUAL TOTAL RETURNS AS OF OCTOBER 31, 2018 | ||||||||||||
ONE YEAR1 | FIVE YEAR | TEN YEAR | ||||||||||
Manning & Napier Fund, Inc. - Equity Series2 | 7.67 | % | 9.37 | % | 11.85 | % | ||||||
Russell 3000® Index3 | 6.60 | % | 10.81 | % | 13.35 | % | ||||||
The following graph compares the value of a $10,000 investment in the Manning & Napier Fund, Inc. - Equity Series for the ten years ended October 31, 2018 to the Russell 3000® Index.
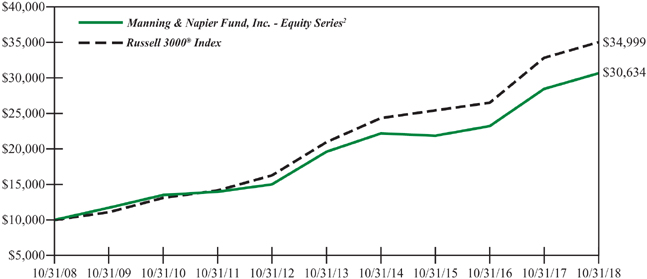
1 The returns shown are based on net asset values calculated for shareholder transactions and may differ from the returns shown in the financial highlights, which reflect adjustments made to the net asset values in accordance with accounting principles generally accepted in the United States of America.
2 The Series’ performance does not reflect the deduction of taxes that a shareholder would pay on fund distributions or the redemption of shares. The Series’ performance is historical and may not be indicative of future results. The performance returns shown are inclusive of the net expense ratio of the Series. For the year ended October 31, 2018, this net expense ratio was 1.05%. The gross expense ratio, which does not account for any voluntary or contractual waivers currently in effect, was 1.22% for the year ended October 31, 2018.
3 The Russell 3000® Index is an unmanaged index that consists of 3,000 of the largest U.S. companies based on total market capitalization. The Index returns are based on a market capitalization-weighted average of relative price changes of the component stocks plus dividends whose reinvestments are compounded daily. The Index returns do not reflect any fees or expenses. Index returns provided by Bloomberg.
3
Equity Series
Shareholder Expense Example
(unaudited)
As a shareholder of the Series, you incur ongoing costs, including management fees, shareholder service fees and other Series expenses. This example is intended to help you understand your ongoing costs (in dollars) of investing in the Series and to compare these costs with the ongoing costs of investing in other mutual funds.
The example is based on an investment of $1,000 invested at the beginning of the period and held for the entire period (May 1, 2018 to October 31, 2018).
Actual Expenses
The first line of the table below provides information about actual account values and actual expenses. You may use the information in this line, together with the amount you invested, to estimate the expenses that you paid over the period. Simply divide your account value by $1,000 (for example, an $8,600 account value divided by $1,000 = 8.6), then multiply the result by the number in the first line under the heading entitled “Expenses Paid During Period” to estimate the expenses you paid on your account during this period.
Hypothetical Example for Comparison Purposes
The second line of the table below provides information about hypothetical account values and hypothetical expenses based on the Series’ actual expense ratio and an assumed rate of return of 5% per year before expenses, which is not the Series’ actual return. The hypothetical account values and expenses may not be used to estimate the actual ending account balance or expenses you paid during the period. You may use this information to compare the ongoing costs of investing in the Series and other funds. To do so, compare this 5% hypothetical example with the 5% hypothetical examples that appear in the shareholder reports of the other funds.
Please note that the expenses shown in the table are meant to highlight your ongoing costs only and do not reflect any transaction costs, such as sales charges (loads), redemption fees, or exchange fees that you may incur in other mutual funds. Therefore, the second line of the table is useful in comparing ongoing costs only, and will not help you determine the relative total costs of owning different funds.
| BEGINNING ACCOUNT VALUE ��5/1/18 | ENDING ACCOUNT VALUE 10/31/18 | EXPENSES PAID DURING PERIOD* 5/1/18-10/30/18 | ||||
Actual | $1,000.00 | $1,025.13 | $5.36 | |||
Hypothetical | ||||||
(5% return before expenses) | $1,000.00 | $1,019.91 | $5.35 |
*Expenses are equal to the Series’ annualized expense ratio (for the six-month period) of 1.05%, multiplied by the average account value over the period, multiplied by 184/365 (to reflect the one-half year period). Expenses are based on the most recent fiscal half year; therefore, the expense ratios stated above may differ from the expense ratios stated in the financial highlights, which are based on one-year data. The Series’ total return would have been lower had certain expenses not been waived during the period.
4
Equity Series
Portfolio Composition as of October 31, 2018
(unaudited)
5
Equity Series
Investment Portfolio - October 31, 2018
| �� | SHARES | VALUE (NOTE 2) | ||||||
COMMON STOCKS - 96.0% | ||||||||
Communication Services - 5.8% | ||||||||
Diversified Telecommunication Services - 1.9% | ||||||||
Zayo Group Holdings, Inc.* | 45,260 | $ | 1,352,369 | |||||
|
| |||||||
Entertainment - 1.9% | ||||||||
Electronic Arts, Inc.* | 14,240 | 1,295,555 | ||||||
|
| |||||||
Interactive Media & Services - 2.0% | ||||||||
Alphabet, Inc. - Class A* | 650 | 708,877 | ||||||
Alphabet, Inc. - Class C* | 655 | 705,284 | ||||||
|
| |||||||
| 1,414,161 | ||||||||
|
| |||||||
Total Communication Services | 4,062,085 | |||||||
|
| |||||||
Consumer Discretionary - 12.1% | ||||||||
Internet & Direct Marketing Retail - 5.2% | ||||||||
Amazon.com, Inc.* | 1,080 | 1,725,851 | ||||||
Booking Holdings, Inc.* | 1,010 | 1,893,326 | ||||||
|
| |||||||
| 3,619,177 | ||||||||
|
| |||||||
Specialty Retail - 5.4% | ||||||||
AutoZone, Inc.* | 1,890 | 1,386,258 | ||||||
Dick’s Sporting Goods, Inc. | 31,405 | 1,110,795 | ||||||
O’Reilly Automotive, Inc.* | 2,145 | 688,009 | ||||||
Ulta Beauty, Inc.* | 1,955 | 536,686 | ||||||
|
| |||||||
| 3,721,748 | ||||||||
|
| |||||||
Textiles, Apparel & Luxury Goods - 1.5% | ||||||||
NIKE, Inc. - Class B | 14,225 | 1,067,444 | ||||||
|
| |||||||
Total Consumer Discretionary | 8,408,369 | |||||||
|
| |||||||
Consumer Staples - 11.0% | ||||||||
Beverages - 4.0% | ||||||||
The Coca-Cola Co. | 36,445 | 1,744,987 | ||||||
PepsiCo, Inc. | 9,000 | 1,011,420 | ||||||
|
| |||||||
| 2,756,407 | ||||||||
|
| |||||||
Food Products - 3.4% | ||||||||
Campbell Soup Co. | 25,785 | 964,617 | ||||||
Mondelez International, Inc. - Class A | 33,770 | 1,417,665 | ||||||
|
| |||||||
| 2,382,282 | ||||||||
|
| |||||||
Household Products - 1.1% | ||||||||
Colgate-Palmolive Co. | 12,155 | 723,830 | ||||||
|
| |||||||
Tobacco - 2.5% | ||||||||
Altria Group, Inc. | 11,860 | 771,374 | ||||||
The accompanying notes are an integral part of the financial statements.
6
Equity Series
Investment Portfolio - October 31, 2018
| VALUE | ||||||||
| SHARES | (NOTE 2) | |||||||
COMMON STOCKS (continued) | ||||||||
Consumer Staples (continued) | ||||||||
Tobacco (continued) | ||||||||
Philip Morris International, Inc. | 11,230 | $ | 989,026 | |||||
|
| |||||||
| 1,760,400 | ||||||||
|
| |||||||
Total Consumer Staples | 7,622,919 | |||||||
|
| |||||||
Energy - 2.1% | ||||||||
Energy Equipment & Services - 2.1% | ||||||||
Diamond Offshore Drilling, Inc.* | 27,875 | 395,268 | ||||||
Ensco plc - Class A | 62,580 | 446,821 | ||||||
Transocean Ltd.* | 59,280 | 652,673 | ||||||
|
| |||||||
Total Energy | 1,494,762 | |||||||
|
| |||||||
Financials - 9.1% | ||||||||
Capital Markets - 7.5% | ||||||||
BlackRock, Inc. | 3,775 | 1,553,110 | ||||||
Cboe Global Markets, Inc. | 7,090 | 800,107 | ||||||
The Charles Schwab Corp. | 20,000 | 924,800 | ||||||
CME Group, Inc. | 3,760 | 688,982 | ||||||
E*TRADE Financial Corp. | 10,930 | 540,161 | ||||||
Intercontinental Exchange, Inc. | 9,465 | 729,184 | ||||||
|
| |||||||
| 5,236,344 | ||||||||
|
| |||||||
Diversified Financial Services - 1.6% | ||||||||
Berkshire Hathaway, Inc. - Class B* | 5,240 | 1,075,667 | ||||||
|
| |||||||
Total Financials | 6,312,011 | |||||||
|
| |||||||
Health Care - 19.2% | ||||||||
Biotechnology - 8.1% | ||||||||
BioMarin Pharmaceutical, Inc.* | 12,670 | 1,167,794 | ||||||
Incyte Corp.* | 38,990 | 2,527,332 | ||||||
Regeneron Pharmaceuticals, Inc.* | 2,100 | 712,404 | ||||||
Seattle Genetics, Inc.* | 14,110 | 791,994 | ||||||
Vertex Pharmaceuticals, Inc.* | 2,615 | 443,138 | ||||||
|
| |||||||
| 5,642,662 | ||||||||
|
| |||||||
Health Care Equipment & Supplies - 1.2% | ||||||||
Intuitive Surgical, Inc.* | 1,640 | 854,735 | ||||||
|
| |||||||
Health Care Providers & Services - 1.2% | ||||||||
DaVita, Inc.* | 12,650 | 851,851 | ||||||
|
| |||||||
Life Sciences Tools & Services - 1.9% | ||||||||
Thermo Fisher Scientific, Inc. | 5,465 | 1,276,897 | ||||||
|
| |||||||
Pharmaceuticals - 6.8% | ||||||||
Bristol-Myers Squibb Co. | 13,080 | 661,063 | ||||||
Johnson & Johnson | 18,125 | 2,537,319 | ||||||
Merck & Co., Inc. | 15,715 | 1,156,781 | ||||||
The accompanying notes are an integral part of the financial statements.
7
Equity Series
Investment Portfolio - October 31, 2018
| VALUE | ||||||||
| SHARES | (NOTE 2) | |||||||
COMMON STOCKS (continued) | ||||||||
Health Care (continued) | ||||||||
Pharmaceuticals (continued) | ||||||||
Mylan N.V.* | 10,950 | $ | 342,188 | |||||
|
| |||||||
| 4,697,351 | ||||||||
|
| |||||||
Total Health Care | 13,323,496 | |||||||
|
| |||||||
Industrials - 5.3% | ||||||||
Air Freight & Logistics - 2.1% | ||||||||
FedEx Corp. | 6,595 | 1,453,142 | ||||||
|
| |||||||
Commercial Services & Supplies - 1.7% | ||||||||
Advanced Disposal Services, Inc.* | 43,440 | 1,176,790 | ||||||
|
| |||||||
Professional Services - 0.6% | ||||||||
Equifax, Inc. | 4,550 | 461,552 | ||||||
|
| |||||||
Road & Rail - 0.9% | ||||||||
Genesee & Wyoming, Inc. - Class A* | 7,755 | 614,429 | ||||||
|
| |||||||
Total Industrials | 3,705,913 | |||||||
|
| |||||||
Information Technology - 19.2% | ||||||||
Electronic Equipment, Instruments & Components - 0.5% | ||||||||
Cognex Corp. | 8,025 | 343,791 | ||||||
|
| |||||||
IT Services - 7.7% | ||||||||
LiveRamp Holdings, Inc.* | 23,445 | 1,070,968 | ||||||
Mastercard, Inc. - Class A | 9,180 | 1,814,611 | ||||||
Visa, Inc. - Class A | 18,060 | 2,489,571 | ||||||
|
| |||||||
| 5,375,150 | ||||||||
|
| |||||||
Semiconductors & Semiconductor Equipment - 4.3% | ||||||||
NVIDIA Corp. | 1,710 | 360,519 | ||||||
Qorvo, Inc.* | 26,265 | 1,930,740 | ||||||
Skyworks Solutions, Inc. | 8,365 | 725,747 | ||||||
|
| |||||||
| 3,017,006 | ||||||||
|
| |||||||
Software - 6.7% | ||||||||
Adobe, Inc.* | 4,155 | 1,021,133 | ||||||
Microsoft Corp. | 19,400 | 2,072,114 | ||||||
ServiceNow, Inc.* | 8,435 | 1,527,072 | ||||||
|
| |||||||
| 4,620,319 | ||||||||
|
| |||||||
Total Information Technology | 13,356,266 | |||||||
|
| |||||||
Materials - 7.3% | ||||||||
Chemicals - 3.1% | ||||||||
Axalta Coating Systems Ltd.* | 35,290 | 870,957 | ||||||
CF Industries Holdings, Inc. | 18,885 | 907,046 | ||||||
Olin Corp. | 17,015 | 343,703 | ||||||
|
| |||||||
| 2,121,706 | ||||||||
|
| |||||||
The accompanying notes are an integral part of the financial statements.
8
Equity Series
Investment Portfolio - October 31, 2018
| VALUE | ||||||||
| SHARES | (NOTE 2) | |||||||
COMMON STOCKS (continued) | ||||||||
Materials (continued) | ||||||||
Containers & Packaging - 3.2% | ||||||||
Ball Corp. | 21,920 | $ | 982,016 | |||||
Crown Holdings, Inc.* | 7,540 | 318,867 | ||||||
Sealed Air Corp. | 29,505 | 954,782 | ||||||
|
| |||||||
| 2,255,665 | ||||||||
|
| |||||||
Metals & Mining - 1.0% | ||||||||
Freeport-McMoRan, Inc. | 30,535 | 355,733 | ||||||
Southern Copper Corp. (Peru) | 9,440 | 361,929 | ||||||
|
| |||||||
| 717,662 | ||||||||
|
| |||||||
Total Materials | 5,095,033 | |||||||
|
| |||||||
Real Estate - 4.9% | ||||||||
Equity Real Estate Investment Trusts (REITS) - 4.9% | ||||||||
American Tower Corp. | 10,185 | 1,586,925 | ||||||
Equinix, Inc. | 1,775 | 672,263 | ||||||
SBA Communications Corp.* | 7,000 | 1,135,190 | ||||||
|
| |||||||
Total Real Estate | 3,394,378 | |||||||
|
| |||||||
TOTAL COMMON STOCKS | ||||||||
(Identified Cost $57,440,869) | 66,775,232 | |||||||
|
| |||||||
SHORT-TERM INVESTMENT - 4.2% | ||||||||
Dreyfus Government Cash Management, Institutional Shares1, 2.05% | ||||||||
(Identified Cost $2,898,725) | 2,898,725 | 2,898,725 | ||||||
|
| |||||||
TOTAL INVESTMENTS - 100.2% | ||||||||
(Identified Cost $60,339,594) | 69,673,957 | |||||||
LIABILITIES, LESS OTHER ASSETS - (0.2%) | (112,302 | ) | ||||||
|
| |||||||
NET ASSETS - 100% | $ | 69,561,655 | ||||||
|
| |||||||
* Non-income producing security.
1 Rate shown is the current yield as of October 31, 2018.
The Global Industry Classification Standard (GICS) was developed by and is the exclusive property and a service mark of MSCI Inc. (MSCI) and Standard & Poor’s, a division of The McGraw-Hill Companies, Inc. (S&P), and is licensed for use by Manning & Napier when referencing GICS sectors. Neither MSCI, S&P, nor any third party involved in making or compiling the GICS or any GICS classifications makes any express or implied warranties or representations with respect to such standard or classification, nor shall any such party have any liability therefrom.
The accompanying notes are an integral part of the financial statements.
9
Equity Series
Statement of Assets and Liabilities
October 31, 2018
ASSETS: | ||||
Investments, at value (identified cost $60,339,594) (Note 2) | $ | 69,673,957 | ||
Receivable for securities sold | 1,272,362 | |||
Dividends receivable | 17,414 | |||
Receivable for fund shares sold | 1,789 | |||
Interest receivable | 3,460 | |||
Prepaid expenses | 6,589 | |||
|
| |||
TOTAL ASSETS | 70,975,571 | |||
|
| |||
LIABILITIES: | ||||
Accrued management fees (Note 3) | 35,792 | |||
Accrued shareholder services fees (Class S) (Note 3) | 15,491 | |||
Accrued fund accounting and administration fees (Note 3) | 13,913 | |||
Accrued Chief Compliance Officer service fees (Note 3) | 402 | |||
Payable for securities purchased | 1,237,522 | |||
Payable for fund shares repurchased | 68,967 | |||
Other payables and accrued expenses | 41,829 | |||
|
| |||
TOTAL LIABILITIES | 1,413,916 | |||
|
| |||
TOTAL NET ASSETS | $ | 69,561,655 | ||
|
| |||
NET ASSETS CONSIST OF: | ||||
Capital stock | $ | 48,710 | ||
Additional paid-in-capital | 49,661,998 | |||
Total distributable earnings | 19,850,947 | |||
|
| |||
TOTAL NET ASSETS | $ | 69,561,655 | ||
|
| |||
NET ASSET VALUE, OFFERING PRICE AND REDEMPTION PRICE PER SHARE - Class S | $ | 14.28 | ||
|
| |||
The accompanying notes are an integral part of the financial statements.
10
Equity Series
Statement of Operations
For the Year Ended October 31, 2018
INVESTMENT INCOME: | ||||
Dividends | $ | 688,054 | ||
Interest | 17,194 | |||
|
| |||
Total Investment Income | 705,248 | |||
|
| |||
EXPENSES: | ||||
Management fees (Note 3) | 598,559 | |||
Shareholder services fees (Class S) (Note 3) | 199,520 | |||
Fund accounting and administration fees (Note 3) | 43,921 | |||
Directors’ fees (Note 3) | 6,200 | |||
Chief Compliance Officer service fees (Note 3) | 4,385 | |||
Miscellaneous | 121,428 | |||
|
| |||
Total Expenses | 974,013 | |||
Less reduction of expenses (Note 3) | (136,030 | ) | ||
|
| |||
Net Expenses | 837,983 | |||
|
| |||
NET INVESTMENT LOSS | (132,735 | ) | ||
|
| |||
REALIZED AND UNREALIZED GAIN (LOSS) ON INVESTMENTS: | ||||
Net realized gain (loss) on investments | 11,047,143 | |||
Net change in unrealized appreciation (depreciation) on investments | (4,124,586 | ) | ||
|
| |||
NET REALIZED AND UNREALIZED GAIN (LOSS) ON INVESTMENTS | 6,922,557 | |||
|
| |||
NET INCREASE IN NET ASSETS RESULTING FROM OPERATIONS | $ | 6,789,822 | ||
|
| |||
The accompanying notes are an integral part of the financial statements.
11
Equity Series
Statements of Changes in Net Assets
| FOR THE YEAR ENDED 10/31/18 | FOR THE YEAR ENDED 10/31/17 | |||||||
INCREASE (DECREASE) IN NET ASSETS: | ||||||||
OPERATIONS: | ||||||||
Net investment income (loss) | $ | (132,735 | ) | $ | 89,394 | |||
Net realized gain (loss) on investments | 11,047,143 | 7,935,062 | ||||||
Net change in unrealized appreciation (depreciation) on investments | (4,124,586 | ) | 9,384,301 | |||||
|
|
|
| |||||
Net increase from operations | 6,789,822 | 17,408,757 | ||||||
|
|
|
| |||||
DISTRIBUTIONS TO SHAREHOLDERS (Note 9): | ||||||||
Class S | (5,983,527 | ) | (4,244,499 | )* | ||||
|
|
|
| |||||
CAPITAL STOCK ISSUED AND REPURCHASED: | ||||||||
Net decrease from capital share transactions (Note 5) | (14,599,547 | ) | (28,279,625 | ) | ||||
|
|
|
| |||||
Net decrease in net assets | (13,793,252 | ) | (15,115,367 | ) | ||||
NET ASSETS: | ||||||||
Beginning of year | 83,354,907 | 98,470,274 | ||||||
|
|
|
| |||||
End of year | $ | 69,561,655 | $ | 83,354,907 | ||||
|
|
|
| |||||
* For the year ended October 31, 2017, the distributions to shareholders from net realized gain on investments for Class S was $4,244,499.
The accompanying notes are an integral part of the financial statements.
12
Equity Series
Financial Highlights - Class S*
| FOR THE YEAR ENDED | ||||||||||||||||||||
| 10/31/18 | 10/31/17 | 10/31/16 | 10/31/15 | 10/31/14 | ||||||||||||||||
Per share data (for a share outstanding throughout each year): | ||||||||||||||||||||
Net asset value - Beginning of year | $ | 14.27 | $ | 12.20 | $ | 16.62 | $ | 21.15 | $ | 21.60 | ||||||||||
|
|
|
|
|
|
|
|
|
| |||||||||||
Income (loss) from investment operations: | ||||||||||||||||||||
Net investment income (loss)1 | (0.02 | ) | 0.01 | (0.07 | ) | 0.01 | (0.00 | )2 | ||||||||||||
Net realized and unrealized gain (loss) on investments | 1.07 | 2.63 | 0.64 | (0.42 | ) | 2.51 | ||||||||||||||
|
|
|
|
|
|
|
|
|
| |||||||||||
Total from investment operations | 1.05 | 2.64 | 0.57 | (0.41 | ) | 2.51 | ||||||||||||||
|
|
|
|
|
|
|
|
|
| |||||||||||
Less distributions to shareholders: | ||||||||||||||||||||
From net investment income | — | — | (0.00 | )2 | (0.00 | )2 | (0.01 | ) | ||||||||||||
From net realized gain on investments | (1.04 | ) | (0.57 | ) | (4.99 | ) | (4.12 | ) | (2.95 | ) | ||||||||||
|
|
|
|
|
|
|
|
|
| |||||||||||
Total distributions to shareholders | (1.04 | ) | (0.57 | ) | (4.99 | ) | (4.12 | ) | (2.96 | ) | ||||||||||
|
|
|
|
|
|
|
|
|
| |||||||||||
Net asset value - End of year | $ | 14.28 | $ | 14.27 | $ | 12.20 | $ | 16.62 | $ | 21.15 | ||||||||||
|
|
|
|
|
|
|
|
|
| |||||||||||
Net assets - End of year (000’s omitted) | $ | 69,562 | $ | 83,355 | $ | 98,470 | $ | 500,946 | $ | 1,290,335 | ||||||||||
|
|
|
|
|
|
|
|
|
| |||||||||||
Total return3 | 7.67 | % | 22.68 | %4 | 6.16 | % | (1.46 | %) | 13.23 | % | ||||||||||
Ratios (to average net assets)/Supplemental Data: | ||||||||||||||||||||
Expenses** | 1.05 | % | 1.05 | % | 1.05 | % | 1.05 | % | 1.05 | % | ||||||||||
Net investment income (loss) | (0.17 | %) | 0.10 | % | (0.55 | %) | 0.04 | % | (0.01 | %) | ||||||||||
Portfolio turnover | 45 | % | 71 | % | 40 | % | 62 | % | 61 | % | ||||||||||
| *Effective March 1, 2017, Class A shares of the Series have been designated as Class S shares. |
| |||||||||||||||||||
| **The investment advisor did not impose all or a portion of its management and/or other fees, and in some years may have paid a portion of the Series’ expenses. If these expenses had been incurred by the Series, the expense ratio (to average net assets) would have increased by the following amounts: |
| |||||||||||||||||||
| 0.17 | % | 0.15 | % | 0.09 | % | 0.03 | % | 0.02 | % | |||||||||||
1 Calculated based on average shares outstanding during the years.
2 Less than $(0.01).
3 Represents aggregate total return for the years indicated, and assumes reinvestment of all distributions. Total return would have been lower had certain expenses not been waived or reimbursed.
4 Includes litigation proceeds. Excluding this amount, the Series’ total return is 21.48%.
The accompanying notes are an integral part of the financial statements.
13
Equity Series
Notes to Financial Statements
| 1. | Organization |
Equity Series (the “Series”) is a no-load diversified series of Manning & Napier Fund, Inc. (the “Fund”). The Fund is organized in Maryland and is registered under the Investment Company Act of 1940, as amended, as an open-end management investment company.
The Series’ investment objective is to provide long-term growth of capital.
The Fund’s Advisor is Manning & Napier Advisors, LLC (the “Advisor”). Shares of the Series are offered to investors, clients and employees of the Advisor and its affiliates. The total authorized capital stock of the Fund consists of 15 billion shares of common stock each having a par value of $0.01. As of October 31, 2018, 13.4 billion shares have been designated in total among 38 series, of which 200 million have been designated as Equity Series Class S common stock and 100 million have been designated as Equity Series Class W common stock. Class W common stock is not currently offered for sale.
| 2. | Significant Accounting Policies |
The following is a summary of significant accounting policies followed by the Series. The Series is an investment company and, accordingly, follows the investment company accounting and reporting guidance of the Financial Accounting Standards Board Accounting Standards Codification Topic 946 - Investment Companies, which is part of accounting principles generally accepted in the United States of America (“GAAP”).
Security Valuation
Portfolio securities, including domestic equities, listed on an exchange other than the NASDAQ Stock Market are valued at the latest quoted sales price of the exchange on which the security is primarily traded. Securities not traded on valuation date or securities not listed on an exchange are valued at the latest quoted bid price provided by the Fund’s pricing service. Securities listed on the NASDAQ Stock Market are valued in accordance with the NASDAQ Official Closing Price.
Short-term investments that mature in sixty days or less may be valued at amortized cost, which approximates fair value. Investments in open-end investment companies are valued at their net asset value per share on valuation date.
Volume and level of activity in established markets for an asset or liability are evaluated to determine whether recent transactions and quoted prices are determinative of fair value. Where there have been significant decreases in volume and level of activity, further analysis and adjustment may be necessary to estimate fair value. The Series measures fair value in these instances by the use of inputs and valuation techniques which may be based upon current market prices of securities that are comparable in coupon, rating, maturity and industry and/or expectation of future cash flows. As a result of trading in relatively thin markets and/or markets that experience significant volatility, the prices used by the Series to value these securities may differ from the value that would be realized if these securities were sold, and the differences could be material.
Securities for which representative valuations or prices are not available from the Series’ pricing service may be valued at fair value as determined in good faith by the Advisor under procedures approved by and under the general supervision and responsibility of the Fund’s Board of Directors (the “Board”). Due to the inherent uncertainty of valuations of such securities, the fair value may differ significantly from the values that would have been used had a ready market for such securities existed. If trading or events occurring after the close of the principal market in which securities are traded are expected to materially affect the value of those securities, then they may be valued at their fair value, taking this trading or these events into account.
Various inputs are used in determining the value of the Series’ assets or liabilities carried at fair value. These inputs are summarized in three broad levels. Level 1 includes quoted prices in active markets for identical assets and liabilities. Level 2 includes other significant observable inputs (including quoted prices for similar securities, interest rates, prepayment speeds, credit risk, etc.). Level 3 includes significant unobservable inputs (including the Series’ own assumptions in determining the fair value of investments). A financial instrument’s level within the fair value hierarchy is based on the lowest level of any input both individually and in aggregate that is significant to the fair value measurement. The inputs or methodology used for valuing securities are not necessarily an indication of the risk associated with investing in those securities.
14
Equity Series
Notes to Financial Statements (continued)
| 2. | Significant Accounting Policies (continued) |
Security Valuation (continued)
The following is a summary of the valuation levels used for major security types as of October 31, 2018 in valuing the Series’ assets or liabilities carried at fair value:
| DESCRIPTION | TOTAL | LEVEL 1 | LEVEL 2 | LEVEL 3 | ||||||||||||
Assets: | ||||||||||||||||
Equity Securities: | ||||||||||||||||
Communication Services | $ | 4,062,085 | $ | 4,062,085 | $ | — | $ | — | ||||||||
Consumer Discretionary | 8,408,369 | 8,408,369 | — | — | ||||||||||||
Consumer Staples | 7,622,919 | 7,622,919 | — | — | ||||||||||||
Energy | 1,494,762 | 1,494,762 | — | — | ||||||||||||
Financials | 6,312,011 | 6,312,011 | — | — | ||||||||||||
Health Care | 13,323,496 | 13,323,496 | — | — | ||||||||||||
Industrials | 3,705,913 | 3,705,913 | — | — | ||||||||||||
Information Technology | 13,356,266 | 13,356,266 | — | — | ||||||||||||
Materials | 5,095,033 | 5,095,033 | — | — | ||||||||||||
Real Estate | 3,394,378 | 3,394,378 | — | — | ||||||||||||
Mutual Fund | 2,898,725 | 2,898,725 | — | — | ||||||||||||
|
|
|
|
|
|
|
| |||||||||
Total assets | $ | 69,673,957 | $ | 69,673,957 | $ | — | $ | — | ||||||||
|
|
|
|
|
|
|
| |||||||||
There were no Level 2 or Level 3 securities held by the Series as of October 31, 2017 or October 31, 2018.
New Accounting Pronouncements
The Securities and Exchange Commission (SEC) adopted changes to Regulation S-X to simplify the reporting of information by registered investment companies in financial statements. The amendments require presentation of the total, rather than the components, of distributable earnings on the Statement of Assets and Liabilities and also require presentation of the total, rather than the components, of distributions to shareholders, except for tax return of capital distributions, if any, on the Statement of Changes in Net Assets. The amendments also removed the requirement for parenthetical disclosure of undistributed net investment income on the Statement of Changes in Net Assets. These Regulation S-X amendments are reflected in the Series financial statements for the year ended October 31, 2018. As a result of adopting these amendments, the distributions to shareholders in the October 31, 2017 Statement of Changes in Net Assets presented herein have been reclassified to conform to the current year presentation.
On August 28, 2018, the FASB issued ASU 2018-13, “Disclosure Framework – Changes to the Disclosure Requirements for Fair Value Measurement,” which amends the fair value measurement disclosure requirements under U.S. GAAP. The amendments of ASU 2018-13 include new, eliminated, and modified disclosure requirements. In addition, the amendments clarify that materiality is an appropriate consideration of entities when evaluating disclosure requirements. The ASU is effective for all entities for fiscal years beginning after December 15, 2019, including interim periods therein. An entity is permitted to early adopt any eliminated or modified disclosures upon issuance of this ASU and delay adoption of the new disclosures until their effective date. As such, the Series has early adopted the eliminated and modified disclosures, as permitted by this ASU.
Security Transactions, Investment Income and Expenses
Security transactions are accounted for on trade date. Dividend income is recorded on the ex-dividend date, except that if the ex-dividend date has passed, certain dividends from foreign securities are recorded as soon as the Series is informed of the ex-dividend date. Non-cash dividends, if any, are recorded at the fair value of the securities received. Interest income, including amortization of premium and accretion of discounts using the effective interest method, is earned from settlement date and accrued daily.
Expenses are recorded on an accrual basis. Most expenses of the Fund can be attributed to a specific series. Expenses which cannot be directly attributed are apportioned among the series in the Fund in such a manner as deemed equitable by the Fund’s Board, taking into consideration, among other things, the nature and type of expense.
15
Equity Series
Notes to Financial Statements (continued)
| 2. | Significant Accounting Policies (continued) |
Security Transactions, Investment Income and Expenses (continued)
The Series uses the identified cost method for determining realized gain or loss on investments for both financial statement and federal income tax reporting purposes.
Federal Taxes
The Series’ policy is to comply with the provisions of the Internal Revenue Code applicable to regulated investment companies. The Series is not subject to federal income tax or excise tax to the extent that the Series distributes to shareholders each year its taxable income, including any net realized gains on investments, in accordance with requirements of the Internal Revenue Code. Accordingly, no provision for federal income tax or excise tax has been made in the financial statements.
Management evaluates its tax positions to determine if the tax positions taken meet the minimum recognition threshold in connection with accounting for uncertainties in income tax positions taken or expected to be taken for the purposes of measuring and recognizing tax liabilities in the financial statements. Recognition of tax benefits of an uncertain tax position is required only when the position is “more likely than not” to be sustained assuming examination by taxing authorities. At October 31, 2018, the Series has recorded no liability for net unrecognized tax benefits relating to uncertain income tax positions taken or expected to be taken in future tax returns.
The Series files income tax returns in the U.S. federal jurisdiction, various states and foreign jurisdictions, as required. No income tax returns are currently under investigation. The statute of limitations on the Series’ tax returns remains open for the years ended October 31, 2015 through October 31, 2018. The Series is not aware of any tax positions for which it is reasonably possible that the total amounts of unrecognized tax benefits will significantly change in the next twelve months.
Foreign Taxes
Based on the Series’ understanding of the tax rules and rates related to income, gains and currency purchase/repatriation transactions for foreign jurisdictions in which it invests, the Series will provide for foreign taxes, and where appropriate, deferred foreign tax.
Distributions of Income and Gains
Distributions to shareholders of net investment income and net realized gains are made annually. An additional distribution may be necessary to avoid taxation of the Series. Distributions are recorded on the ex-dividend date.
Indemnifications
The Fund’s organizational documents provide former and current directors and officers with a limited indemnification against liabilities arising in connection with the performance of their duties to the Fund. In the normal course of business, the Fund may also enter into contracts that provide general indemnifications. The Fund’s maximum exposure under these arrangements is unknown as this would be dependent on future claims that may be made against the Fund. The risk of material loss from such claims is considered remote.
Other
The preparation of financial statements in conformity with GAAP requires management to make estimates and assumptions that affect the reported amounts of assets and liabilities and the disclosure of contingent assets and liabilities at the date of the financial statements and the reported amounts of income and expenses during the reporting period. Actual results could differ from those estimates.
| 3. | Transactions with Affiliates |
The Fund has an Investment Advisory Agreement (the “Agreement”) with the Advisor, for which the Series pays a fee, computed daily and payable monthly, at an annual rate of 0.75% of the Series’ average daily net assets.
Under the Agreement, personnel of the Advisor provide the Series with advice and assistance in the choice of investments and the execution of securities transactions, and otherwise maintain the Series’ organization. The Advisor also provides the Fund with necessary office space and fund administration and support services. The salaries of all officers of the Fund (except a
16
Equity Series
Notes to Financial Statements (continued)
| 3. | Transactions with Affiliates (continued) |
percentage of the Fund’s Chief Compliance Officer’s salary, which is paid by the Fund), and of all Directors who are “affiliated persons” of the Fund, or of the Advisor, and all personnel of the Fund, or of the Advisor, performing services relating to research, statistical and investment activities, are paid by the Advisor. Each “non-affiliated” Director receives an annual stipend, which is allocated among all the active series of the Fund. In addition, these Directors also receive a fee per Board meeting attended plus a fee for each committee meeting attended and are reimbursed for travel and other out-of-pocket expenses incurred by them in connection with attending such meetings. The Fund also has an Audit Committee Chair, Governance & Nominating Committee Chair and Lead Independent Director who each receive an additional annual stipend for these roles.
Shares of the Series are subject to a shareholder services fee in accordance with a shareholder services plan adopted by the Board. The shareholder services fee is intended to compensate financial intermediaries, including affiliates of the Fund, in connection with the provision of direct client service, personal services, maintenance of shareholder accounts and reporting services. For these services, Shares of the Series pay a fee, computed daily and payable monthly, at an annual rate of 0.25% of the average daily net assets of shares. The Fund has a Shareholder Services Agreement with the Advisor, for which the Advisor receives the shareholder services fee as stated above.
The Advisor has contractually agreed, until at least February 28, 2019, to waive its management fee and, if necessary, pay other operating expenses of the Series, exclusive of shareholder services fees, in order to maintain total direct annual fund operating expenses for the Series at no more than 0.80% of average daily net assets each year. Accordingly, the Advisor waived fees of $136,030 for the year ended October 31, 2018, which is included as a reduction of expenses on the Statement of Operations. The Advisor is not eligible to recoup any expenses that have been waived or reimbursed in prior years.
Manning & Napier Investor Services, Inc., a registered broker-dealer affiliate of the Advisor, acts as distributor for the Fund’s shares. The services of Manning & Napier Investor Services, Inc. are provided at no additional cost to the Series.
Pursuant to a master services agreement dated March 1, 2017, the Fund pays the Advisor an annual fee related to fund accounting and administration of 0.0085% on the first $25 billion of average daily net assets (excluding Target Series and Income Series); 0.0075% on the next $15 billion of average daily net assets (excluding Target Series and Income Series); and 0.0065% of average daily net assets in excess of $40 billion (excluding Target Series and Income Series); plus a base fee of $30,400 per series. Additionally, certain transaction and out-of-pocket expenses, including charges for reporting relating to the Fund’s compliance program, are charged. The Advisor has agreements with BNY Mellon Investment Servicing (U.S.) Inc. (“BNY”) under which BNY serves as sub-accountant services agent.
| 4. | Purchases and Sales of Securities |
For the year ended October 31, 2018, purchases and sales of securities, other than U.S. Government securities and short-term securities, were $34,512,089 and $57,385,504, respectively. There were no purchases or sales of U.S. Government securities.
| 5. | Capital Stock Transactions |
Transactions in Class S shares of Equity Series were:
FOR THE YEAR ENDED 10/31/18 | FOR THE YEAR ENDED 10/31/17 | |||||||||||||||
| SHARES | AMOUNT | SHARES | AMOUNT | |||||||||||||
Sold | 282,300 | $ | 4,076,767 | 452,939 | $ | 5,772,026 | ||||||||||
Reinvested | 426,205 | 5,860,318 | 350,413 | 4,117,356 | ||||||||||||
Repurchased | (1,680,674 | ) | (24,536,632 | ) | (3,033,987 | ) | (38,169,007 | ) | ||||||||
|
|
|
|
|
|
|
| |||||||||
Total | (972,169 | ) | $ | (14,599,547 | ) | (2,230,635 | ) | $ | (28,279,625 | ) | ||||||
|
|
|
|
|
|
|
| |||||||||
At October 31, 2018, the Advisor and its affiliates owned 8.2% of the Series.
17
Equity Series
Notes to Financial Statements (continued)
| 6. | Line of Credit |
The Fund has entered into a 364-day, $25 million credit agreement (the “line of credit”) with Bank of New York Mellon. Each series of the Fund may borrow under the line of credit for temporary or emergency purposes, including funding shareholder redemptions and other short-term liquidity purposes. The Fund pays an annual fee on the unused commitment amount, payable quarterly, and is allocated among all the series of the Fund and included in miscellaneous expenses in the Statement of Operations for each series. The line of credit expires in August 2019 unless extended or renewed. During the year ended October 31, 2018, the Series did not borrow under the line of credit.
| 7. | Financial Instruments |
The Series may trade in instruments including written and purchased options, forward foreign currency exchange contracts and futures contracts and other derivatives in the normal course of investing activities to assist in managing exposure to various market risks. The Series may be subject to various elements of risk, which may involve, to a varying degree, elements of risk in excess of the amounts recognized for financial statement purposes. These risks include: the risk that changes in the value of a derivative may not correlate perfectly with the underlying asset, rate or index; counterparty credit risk related to over the counter derivative counterparties’ failure to perform under contract terms; liquidity risk related to the lack of a liquid market for these contracts allowing the fund to close out its position(s); and documentation risk relating to disagreement over contract terms. No such investments were held by the Series as of October 31, 2018.
| 8. | Foreign Securities |
Investing in securities of foreign companies and foreign governments involves special risks and considerations not typically associated with investing in securities of domestic companies and the U.S. Government. These risks include revaluation of currencies and future adverse political and economic developments. Moreover, securities of foreign companies and foreign governments and their markets may be less liquid and their prices more volatile than those of comparable domestic companies and the U.S. Government.
| 9. | Federal Income Tax Information |
The amount and characterization of certain income and capital gains to be distributed are determined in accordance with federal income tax regulations, which may differ from GAAP. These differences are primarily due to differing book and tax treatments in the timing of the recognition of net investment income or gains and losses, including losses deferred due to wash sales, and the use of equalization. The Series may periodically make reclassifications among its capital accounts to reflect income and gains available for distribution (or available capital loss carryovers) under income tax regulations, without impacting the Series’ net asset value. For the year ended October 31, 2018, amounts were reclassified within the capital accounts to increase Additional Paid in Capital by $3,803 and decrease Total Distributable Earnings by $3,803. Any such reclassifications are not reflected in the financial highlights.
The tax character of distributions paid were as follows:
| FOR THE YEAR ENDED 10/31/18 | FOR THE YEAR ENDED 10/31/17 | |||||||
Ordinary income | $ | 3,065,404 | $ | — | ||||
Long-term capital gains | 2,918,123 | 4,244,499 | ||||||
At October 31, 2018, the tax basis of components of distributable earnings and the net unrealized appreciation based on identified cost of investments for federal income tax purpose were as follows:
Cost for federal income tax purposes | $ | 60,664,648 | ||
Unrealized appreciation | 11,888,239 | |||
Unrealized depreciation | (2,878,930 | ) | ||
|
| |||
Net unrealized appreciation | $ | 9,009,309 | ||
|
| |||
Undistributed ordinary income | $ | 3,085,493 | ||
Undistributed long-term capital gains | $ | 7,756,145 |
18
Equity Series
Report of Independent Registered Public Accounting Firm
To the Board of Directors of Manning & Napier Fund, Inc. and Shareholders of Equity Series
Opinion on the Financial Statements
We have audited the accompanying statement of assets and liabilities, including the investment portfolio, of Equity Series (one of the series constituting Manning & Napier Fund, Inc., referred to hereafter as the “Fund”) as of October 31, 2018, the related statement of operations for the year ended October 31, 2018, the statement of changes in net assets for each of the two years in the period ended October 31, 2018, including the related notes, and the financial highlights for each of the five years in the period ended October 31, 2018 (collectively referred to as the “financial statements”). In our opinion, the financial statements present fairly, in all material respects, the financial position of the Fund as of October 31, 2018, the results of its operations for the year then ended, the changes in its net assets for each of the two years in the period ended October 31, 2018 and the financial highlights for each of the five years in the period ended October 31, 2018 in conformity with accounting principles generally accepted in the United States of America.
Basis for Opinion
These financial statements are the responsibility of the Fund’s management. Our responsibility is to express an opinion on the Fund’s financial statements based on our audits. We are a public accounting firm registered with the Public Company Accounting Oversight Board (United States) (“PCAOB”) and are required to be independent with respect to the Fund in accordance with the U.S. federal securities laws and the applicable rules and regulations of the Securities and Exchange Commission and the PCAOB.
We conducted our audits of these financial statements in accordance with the standards of the PCAOB. Those standards require that we plan and perform the audit to obtain reasonable assurance about whether the financial statements are free of material misstatement, whether due to error or fraud.
Our audits included performing procedures to assess the risks of material misstatement of the financial statements, whether due to error or fraud, and performing procedures that respond to those risks. Such procedures included examining, on a test basis, evidence regarding the amounts and disclosures in the financial statements. Our audits also included evaluating the accounting principles used and significant estimates made by management, as well as evaluating the overall presentation of the financial statements. Our procedures included confirmation of securities owned as of October 31, 2018 by correspondence with the custodian and brokers; when replies were not received from brokers, we performed other auditing procedures. We believe that our audits provide a reasonable basis for our opinion.

New York, New York
December 14, 2018
We have served as the auditor of one or more investment companies in Manning & Napier Mutual Funds since 1992.
19
Equity Series
Supplemental Tax Information
(unaudited)
All reportings are based on financial information available as of the date of this annual report and, accordingly, are subject to change.
For federal income tax purposes, the Series reports for the current fiscal year $959,389 or, if different, the maximum amount allowable under the tax law, as qualified dividend income.
For corporate shareholders, the percentage of investment income (dividend income plus short-term gains, if any) that qualifies for the dividends received deduction for the current fiscal year is 29.36%.
The Series designates $8,143,952 as Long-Term Capital Gain dividends pursuant to Section 852(b) of the Code for the fiscal year ended October 31, 2018.
20
Equity Series
Directors’ and Officers’ Information
(unaudited)
The Statement of Additional Information provides additional information about the Fund’s directors and officers and can be obtained without charge by calling 1-800-466-3863, at www.manning-napier.com, or on the EDGAR Database on the SEC Internet web site (http://www.sec.gov). The following chart shows certain information about the Fund’s directors and officers, including their principal occupations during the last five years. Unless specific dates are provided, the individuals have held the listed positions for longer than five years.
| Interested Director and Officer | ||
| Name: | Paul Battaglia* | |
| Address: | 290 Woodcliff Drive | |
| Fairport, NY 14450 | ||
| Age: | 40 | |
| Current Position(s) Held with Fund: | Principal Executive Officer, President, Chairman & Director | |
| Term of Office & Length of Time Served: | Indefinite - Chairman and Director since November 20181 | |
| Principal Occupation(s) During Past 5 Years: | Chief Financial Officer (2018-Present); Vice President of Finance (2016-2018); Director of Finance (2011-2016); Financial Analyst/Internal Auditor (2004-2006) - Manning & Napier Advisors, LLC and affiliates Holds one or more of the following titles for various affiliates: Chief Financial Officer | |
| Number of Portfolios Overseen within Fund Complex: | 36 | |
| Other Directorships Held Outside Fund Complex During Past 5 Years: | N/A | |
| ||
| Independent Directors | ||
| Name: | Stephen B. Ashley | |
| Address: | 290 Woodcliff Drive | |
| Fairport, NY 14450 | ||
| Age: | 78 | |
| Current Position(s) Held with Fund: | Director, Audit Committee Member, Governance & Nominating Committee Member | |
| Term of Office & Length of Time Served: | Indefinite - Since 1996 | |
| Principal Occupation(s) During Past 5 Years: | Chairman, Director & Chief Executive Officer (1997 to present) - The Ashley Group (property management and investment). Director (1995-2008) and Chairman (non-executive) (2004-2008) - Fannie Mae (mortgage) | |
| Number of Portfolios Overseen within Fund Complex: | 36 | |
| Other Directorships Held Outside Fund Complex During Past 5 Years: | Fannie Mae (1995-2008) The Ashley Group (1995-2008) | |
| Genesee Corporation (1987-2007) | ||
| ||
| Name: | Paul A. Brooke | |
| Address: | 290 Woodcliff Drive | |
| Fairport, NY 14450 | ||
| Age: | 72 | |
| Current Position(s) Held with Fund: | Lead Independent Director, Audit Committee Member, Governance & Nominating Committee Chairman | |
| Term of Office & Length of Time Served: | Indefinite - Director, Audit Committee Member, Governance & Nominating Committee Member since 2007; Governance & Nominating Committee Chairman since 2016; Lead Independent Director since 2017 | |
| Principal Occupation(s) During Past 5 Years: | Chairman & CEO (2005-2009) - Ithaka Acquisition Corporation (investments); Chairman (2007-2009) - Alsius Corporation (investments); Managing Member (1991-present) - PMSV Holdings LLC (investments); Managing Member (2010-2016) - Venbio (investments). | |
| Number of Portfolios Overseen within Fund Complex: | 36 | |
| Other Directorships Held Outside Fund Complex During Past 5 Years: | Incyte Corp. (biotech)(2000-present); ViroPharma, Inc. (speciality pharmaceuticals)(2000-2014); HLTH (WebMD)(information)(2000-2010); Cheyne Capital International (investment)(2000-2017); GMP Companies (investment)(2000-2011); Cytos Biotechnology Ltd (biotechnology)(2012-2014); Cerus (biomedical)(2016-present); PureEarth(non-profit)(2012-present) | |
| ||
21
Equity Series
| Directors’ and Officers’ Information | ||
(unaudited)
| ||
| Independent Directors (continued) | ||
| Name: | Peter L. Faber | |
| Address: | 290 Woodcliff Drive | |
| Fairport, NY 14450 | ||
| Age: | 80 | |
| Current Position(s) Held with Fund: | Director, Governance & Nominating Committee Member | |
| Term of Office & Length of Time Served: | Indefinite - Since 1987 | |
| Principal Occupation(s) During Past 5 Years: | Senior Counsel (2006-2012), Partner (1995-2006 & 2013-present) - McDermott, Will & Emery LLP (law firm) | |
| Number of Portfolios Overseen within Fund Complex: | 36 | |
| Other Directorships Held Outside Fund Complex During Past 5 Years: | Boston Early Music Festival (non-profit)(2007-present); Amherst Early Music, Inc. (non-profit)(2009-present); Gotham Early Music Scene, Inc. (non-profit)(2009-present); Partnership for New York City, Inc. (non-profit)(1989-2010); New York Collegium (non-profit)(2004-2011) | |
| ||
| Name: | Harris H. Rusitzky | |
| Address: | 290 Woodcliff Drive | |
| Fairport, NY 14450 | ||
| Age: | 83 | |
| Current Position(s) Held with Fund: | Director, Audit Committee Member, Governance & Nominating Committee Member | |
| Term of Office & Length of Time Served: | Indefinite - Since 1985 | |
| Principal Occupation(s) During Past 5 Years: | President (1994-present) - The Greening Group (business consultants); Partner (2006-present) - The Restaurant Group (restaurants) | |
| Number of Portfolios Overseen within Fund Complex: | 36 | |
| Other Directorships Held Outside Fund Complex During Past 5 Years: | Rochester Institute of Technology (university)(1972-present); Culinary Institute of America (non-profit college)(1985-present); George Eastman House (museum)(1988-present); National Restaurant Association (restaurant trade organization)(1978-present) | |
| ||
| Name: | Chester N. Watson | |
| Address: | 290 Woodcliff Drive | |
| Fairport, NY 14450 | ||
| Age: | 68 | |
| Current Position(s) Held with Fund: | Director, Audit Committee Chairman, Governance & Nominating Committee Member | |
| Term of Office & Length of Time Served: | Indefinite - Director, Audit Committee Member, Governance & Nominating Committee Member Since 2012; Audit Committee Chairman since 2013 | |
| Principal Occupation(s) During Past 5 Years: | General Auditor (2003-2011) - General Motors Company (auto manufacturer) | |
| Number of Portfolios Overseen within Fund Complex: | 36 | |
| Other Directorships Held Outside Fund Complex During Past 5 Years: | Rochester Institute of Technology (university)(2005-present); Town of Greenburgh, NY Planning Board (municipal government) (2015-present) | |
| ||
Officers: | ||
| Name: | Jeffrey S. Coons, Ph.D., CFA® | |
| Address: | 290 Woodcliff Drive | |
| Fairport, NY 14450 | ||
| Age: | 55 | |
| Current Position(s) Held with Fund: | Vice President | |
| Term of Office1 & Length of Time Served: | Since 2004 | |
| Principal Occupation(s) During Past 5 Years: | President since 2010, Co-CEO since 2018, Co-Director of Research (2002-2015) - Manning & Napier Advisors, LLC Holds one or more of the following titles for various subsidiaries and affiliates: President, Director, Treasurer, or Senior Trust Officer | |
| ||
| Name: | Elizabeth Craig | |
| Address: | 290 Woodcliff Drive | |
| Fairport, NY 14450 | ||
| Age: | 31 | |
| Current Position(s) Held with Fund: | Corporate Secretary | |
| Term of Office1 & Length of Time Served: | Since 2016 | |
| Principal Occupation(s) During Past 5 Years: | Fund Administration Manager since 2015; Mutual Fund Compliance Specialist (2009-2015) - Manning & Napier Advisors, LLC; Assistant Corporate Secretary (2011-2016) - Manning & Napier Fund, Inc. | |
| ||
22
Equity Series
| Directors’ and Officers’ Information | ||
(unaudited)
| ||
| Officers: (continued) | ||
| Name: | Christine Glavin | |
| Address: | 290 Woodcliff Drive | |
| Fairport, NY 14450 | ||
| Age: | 52 | |
| Current Position(s) Held with Fund: | Principal Financial Officer, Chief Financial Officer | |
| Term of Office1 & Length of Time Served: | Principal Financial Officer since 2002; Chief Financial Officer since 2001 | |
| Principal Occupation(s) During Past 5 Years: | Director of Fund Reporting since 2011; Fund Reporting Manager (1997-2011) - Manning & Napier Advisors, LLC; Assistant Treasurer since 2008 - Exeter Trust Company; Chief Financial Officer (2017-2018) - Rainier Investment Management Mutual Funds, Inc. | |
| ||
| Name: | Jodi L. Hedberg | |
| Address: | 290 Woodcliff Drive | |
| Fairport, NY 14450 | ||
| Age: | 50 | |
| Current Position(s) Held with Fund: | Chief Compliance Officer, Anti-Money Laundering Compliance Officer | |
| Term of Office1 & Length of Time Served: | Chief Compliance Officer since 2004; Anti-Money Laundering Officer since 2002; Corporate Secretary (1997-2016) - Manning & Napier Fund, Inc.; Chief Compliance Officer and Anti-Money Laundering Officer (2017-2018) - Rainier Investment Management Mutual Funds, Inc. | |
| Principal Occupation(s) During Past 5 Years: | Managing Director, Compliance & Regulatory Affairs since 2018; Director of Compliance (2005-2018); Compliance Manager (1995-2005) - Manning & Napier Advisors, LLC and affiliates; Corporate Secretary - Manning & Napier Investor Services, Inc. since 2006 | |
| ||
| Name: | Scott Morabito | |
| Address: | 290 Woodcliff Drive | |
| Fairport, NY 14450 | ||
| Age: | 30 | |
| Current Position(s) Held with Fund: | Assistant Vice President | |
| Term of Office1 & Length of Time Served: | Since 2017 | |
| Principal Occupation(s) During Past 5 Years: | Director of Funds Group since 2017; Fund Product and Strategy Manager (2014-2017); Senior Product and Strategy Analyst (2013-2014); Product and Strategy Analyst (2011-2013) - Manning & Napier Advisors, LLC. | |
| ||
| Name: | Sarah Turner | |
| Address: | 290 Woodcliff Drive | |
| Fairport, NY 14450 | ||
| Age: | 36 | |
| Current Position(s) Held with Fund: | Chief Legal Officer; Assistant Corporate Secretary | |
| Term of Office1 & Length of Time Served: | Since 2018 | |
| Principal Occupation(s) During Past 5 Years: | General Counsel since 2018 - Manning & Napier Advisors, LLC and affiliates; Counsel (2017-2018) - Harter Secrest and Emery LLP; Legal Counsel (2010-2017) - Manning & Napier Advisors, LLC and affiliates Holds one or more of the following titles for various affiliates: Corporate Secretary, General Counsel | |
| ||
| Name: | Amy Williams | |
| Address: | 290 Woodcliff Drive | |
| Fairport, NY 14450 | ||
| Age: | 56 | |
| Current Position(s) Held with Fund: | Assistant Corporate Secretary | |
| Term of Office1 & Length of Time Served: | Since 2016 | |
| Principal Occupation(s) During Past 5 Years: | Director of Fund Documentation - Manning & Napier Advisors, LLC since 2009 Holds one or more of the following titles for various affiliates: Director | |
| ||
*At a meeting of the Board of Directors held on November 15, 2018, the Board accepted the resignation of Michele T. Mosca from her positions as Principal Executive Officer, President, Chair and Interested Director of the Fund and appointed Paul J. Battaglia to each of the resigned positions effective immediately. Interested Director, within the meaning of the 1940 Act by reason of his positions with the Fund’s investment advisor, Manning & Napier Advisors, LLC.
1 The term of office of all officers shall be one year and until their respective successors are chosen and qualified, or his or her earlier resignation or removal as provided in the Fund’s By-Laws.
23
{This page intentionally left blank}
24
{This page intentionally left blank}
25
Equity Series
Literature Requests
Proxy Voting Policies and Procedures
A description of the policies and procedures that the Fund uses to determine how to vote proxies relating to portfolio securities is available, without charge, upon request:
| By phone | 1-800-466-3863 | |||
| On the Securities and Exchange | ||||
| Commission’s (SEC) web site | http://www.sec.gov |
Proxy Voting Record
Information regarding how the Fund voted proxies relating to portfolio securities during the most recent 12-month period ended June 30th is available, without charge, upon request:
| By phone | 1-800-466-3863 | |||
| On the SEC’s web site | http://www.sec.gov |
Quarterly Portfolio Holdings
The Series’ complete schedule of portfolio holdings for the 1st and 3rd quarters of each fiscal year are provided on Form N-Q, and are available, without charge, upon request:
| By phone | 1-800-466-3863 | |||
| On the SEC’s web site | http://www.sec.gov |
The Series’ Form N-Q may be reviewed and copied at the SEC’s Public Reference Room in Washington, D.C. Information on the operation of the Public Reference Room may be obtained by calling 1-800-SEC-0330.
Prospectus and Statement of Additional Information (SAI)
For more information about any of the Manning & Napier Fund, Inc. Series, you may obtain a prospectus and SAI at www.manning-napier.com or by calling (800) 466-3863. Before investing, carefully consider the objectives, risks, charges and expenses of the investment and read the prospectus carefully as it contains this and other information about the investment company. In addition, this information can be found on the SEC’s web site, http://www.sec.gov.
Additional information available at www.manning-napier.com
1. Fund Holdings - Month-End
2. Fund Holdings - Quarter-End
3. Shareholder Report - Annual
4. Shareholder Report - Semi-Annual
The Fund also offers electronic notification or “e-delivery” when certain documents are available on-line to be downloaded or reviewed. Direct shareholders can elect to receive electronic notification when shareholder reports, prospectus updates, and/or statements are available. If you do not currently have on-line access to your account, you can establish access by going to www.manning-napier.com, click on “Login” in the top corner of the page, and follow the prompts to self-enroll. Once enrolled, you can set your electronic notification preferences by clicking on the Account Options tab located within the green toolbar and then select E-Delivery Option. Should you have any questions on either how to establish on-line access or how to update your account settings, please contact Investor Services at 1-800-466-3863.
The Manning & Napier Fund, Inc. is managed by Manning & Napier Advisors, LLC. Manning & Napier Investor Services, Inc., an affiliate of Manning & Napier Advisors, LLC, is the distributor of the Fund shares.
MNEQY-10/18-AR

Management Discussion and Analysis
(unaudited)
Dear Shareholders:
The investment environment witnessed over the past twelve months was more volatile and bifurcated than what was experienced in prior years across both equities and fixed income, as well as between domestic and international investing.
For the fiscal year ending on October 31, 2018, US equities posted strong gains, with the S&P 500 Total Return Index up 7.35%. On the other hand, international equity performance was decidedly poor as the MSCI ACWI ex USA Index fell 8.24%. Regarding fixed income, domestic investment-grade bonds, as measured by the Bloomberg Barclays U.S. Aggregate Bond Index, fell 2.05% as rising interest rates weighed on returns.
Going forward, we believe the volatility experienced in October, as well as during the first few months of 2018, is likely to be reflective of what investors should come to expect going forward. While we do not anticipate an imminent recession, we see recent developments within the US and abroad as an indication that we are entering a higher risk regime for risk assets over the next twelve months.
The US is likely approaching a period of peak growth and continues to show signs of progressing further into late cycle territory. At the same time, key global risks are rising, including trade tensions, global growth concerns, and geopolitical uncertainty, all of which have continued escalating throughout 2018.
We are approaching the ten-year anniversary of the bull market, and while bull markets do not necessarily die of old age, they cannot extend indefinitely either. As the economy continues to move into later cycle territory, we believe investors should temper their expectations as the strong returns experienced over the past several years are unlikely to persist.
Given our updated outlook, we are reviewing late cycle risks in current and prospective investments and have adjusted our positioning across many of our portfolios. Going forward, we will continue to follow our disciplines, choosing to be selective in our investment decisions and seeking to avoid overvalued areas of the market.
With this in mind, we discuss recent fund performance in the enclosed, highlight how we are positioned amid the current economic environment, and provide our outlook of what to expect in financial markets.
We hope that you find this information helpful, and look forward to working with you in the years ahead to help you meet your investment goals.
Sincerely,
Manning & Napier Advisors, LLC
The S&P 500 Total Return Index is an unmanaged, capitalization-weighted measure comprised of 500 leading U.S. companies to gauge U.S. large cap equities. The Index returns do not reflect any fees or expenses. The index accounts for the reinvestment of regular cash dividends, but not for the withholding of taxes. Index returns provided by Morningstar. S&P Dow Jones Indices LLC, a subsidiary of the McGraw Hill Financial, Inc., is the publisher of various index based data products and services and has licensed certain of its products and services for use by Manning & Napier. All such content Copyright © 2018 by S&P Dow Jones Indices LLC and/or its affiliates. All rights reserved. Neither S&P Dow Jones Indices LLC, Dow Jones Trademark Holdings LLC, their affiliates nor their third party licensors make any representation or warranty, express or implied, as to the ability of any index to accurately represent the asset class or market sector that it purports to represent and none of these parties shall have any liability for any errors, omissions, or interruptions of any index or the data included therein.
The MSCI ACWI ex USA Index is designed to measure large and mid-cap representation across 22 of 23 Developed Markets countries (excluding the U.S.) and 24 Emerging Markets countries. The Index returns do not reflect any fees or expenses. The Index is denominated in U.S. dollars. The Index returns are net of withholding taxes. They assume daily reinvestment of net dividends thus accounting for any applicable dividend taxation. Index returns provided by Morningstar.
The Bloomberg Barclays U.S. Aggregate Bond Index is an unmanaged, market value-weighted index of U.S. domestic investment-grade debt issues, including government, corporate, asset-backed, and mortgage-backed securities with maturities of one year or more. Index returns provided by Morningstar.
©2018 Morningstar, Inc. All rights reserved. The information contained herein: (1) is proprietary to Morningstar and/or its content providers; (2) may not be copied, adapted or distributed; and (3) is not warranted to be accurate, complete or timely. Neither Morningstar nor its content providers are responsible for any damages or losses arising from any use of this information, except where such damages or losses cannot be limited or excluded by law in your jurisdiction. Past financial performance is no guarantee of future results.
1
Fund Commentary
(unaudited)
Investment Objective
The Blended Asset Series are strategically allocated across stocks, bonds, and cash to balance growth, capital preservation, and income to fit a range of investor risk management priorities.
Performance Commentary
In absolute terms, the performance results were mixed as the Blended Asset Maximum portfolio delivered positive returns while the Blended Asset Conservative, Moderate, and Extended portfolios experienced negative returns during the one-year period. Similarly, Maximum Term outperformed its blended benchmark while Conservative, Moderate, and Extended portfolios trailed their respective blended benchmarks over the one-year period.
The Blended Asset Maximum portfolio was modestly overweight in equities as compared to its blended benchmark, contributing to relative performance, as equities outperformed fixed income during the one-year period. Conversely, an equity underweight, to varying degrees, in the Conservative, Moderate, and Extended portfolios detracted from relative performance.
Stock selection challenged relative returns and was the primary contributor to the respective Series’ underperformance. Specifically, selection in the Consumer Staples, Communication Services, and Health Care sectors detracted from relative returns across all portfolios.
Offsetting a portion of the relative performance headwind was the aggregate effect of sector allocations, which aided relative returns. Each Series’ overweight to Health Care, and underweight to Financials and Industrials, aided relative returns. Within fixed income, with the exception of the Conservative Series, the portfolios benefitted from a slightly shorter duration as rates generally rose over the course of the year.
In general, we believe that we are entering a higher risk regime for equities and credit, and that the US is likely approaching a period of peak growth. This could result in lower returns as the economy is moving into late cycle territory as supply begins to become a binding constraint for growth. Given this outlook, we believe that the equity section of each Series should focus on higher quality businesses and reasonably priced growth companies that tend to perform well later cycle and have historically provided some degree of downside protection in higher risk market environments.
Regarding fixed income, we continue to view corporate bonds as moderately attractive as they continue to adequately compensate investors on a fundamental basis. That said, we are aware that we are in the later stages of an economic expansion and we may look to reduce exposure if spreads tighten or if economic conditions deteriorate. Each Series also has a notable allocation to U.S. Treasury securities. With the exception of the Blended Asset Maximum Series, each Series holds Agencies as well as pass-through securities, which include asset-backed and commercial mortgage backed securities.
Additionally, we believe that domestic conditions argue for higher interest rates across the curve and expect the yield curve to flatten. While at the early stages of policy normalization, we expect European and Japanese interest rates to remain very low for an extended period of time, keeping US yields at lower levels than domestic conditions alone would argue for.
We think the Fed will remain opportunistic, looking to hike the federal funds target rate as economic conditions allow, while also remaining sensitive to domestic and global market conditions as they continue to reduce the size of their balance sheet by decreasing reinvestment of principal in Treasuries and agency mortgage-backed securities.
Performance data quoted represents past performance and does not guarantee future results. The investment return and principal value of an investment will fluctuate, so that an investor’s shares, when redeemed, may be worth more or less than their original cost. Current performance may be higher or lower than that quoted; investors can obtain the most recent month-end performance at www.manning-napier.com or by calling (800) 466-3863.
All investments involve risks, including possible loss of principal. Because the fund invests in both stocks and bonds, the value of your investment will fluctuate in response to stock market movements and changes in interest rates. Investing in the fund will also involve a number of other risks, including issuer-specific risk, foreign investment risk, and small-cap/mid-cap risk. Investments in options and futures, like all derivatives, can be highly volatile and involve risks in addition to the risks of the underlying instrument on which the derivative is based, such as counterparty, correlation and liquidity risk. Also, the use of leverage increases exposure to the market and may magnify potential losses.
Commentary prepared using data provided by FactSet. Analysis Manning & Napier. Commentary presented is relative to each Series’ respective blended benchmark. Additional information and associated disclosures can be found on the Performance Update pages contained in this report.
2
Performance Update as of October 31, 2018 - Blended Asset Conservative Series
(unaudited)
| AVERAGE ANNUAL TOTAL RETURN AS OF OCTOBER 31, 2018 | ||||||||
ONE YEAR1 | SINCE INCEPTION2 | |||||||
Manning & Napier Fund, Inc. - Blended Asset Conservative Series - Class R63 | -0.62 | % | -0.76 | % | ||||
Bloomberg Barclays U.S. Intermediate Aggregate Bond Index4 | -1.23 | % | -1.38 | % | ||||
Conservative Term Composite Benchmark5 | 0.01 | % | 0.01 | % | ||||
The following graph compares the value of a $10,000 investment in the Manning & Napier Fund, Inc. - Blended Asset Conservative Series - Class R6 from its inception2 (October 13, 2017) to present (October 31, 2018) to the Bloomberg Barclays U.S. Intermediate Aggregate Bond Index and Conservative Term Composite Benchmark.
1 The returns shown are based on net asset values calculated for shareholder transactions and may differ from the returns shown in the financial highlights, which reflect adjustments made to the net asset values in accordance with accounting principles generally accepted in the United States of America.
2 Performance numbers for the Series and Indices are calculated from October 13, 2017, the Series’ inception date.
3 The Series’ performance does not reflect the deduction of taxes that a shareholder would pay on fund distributions or the redemption of shares. The Series’ performance is historical and may not be indicative of future results. The performance returns shown are inclusive of the net expense ratio of the Series. For the year ended October 31, 2018, this net expense ratio was 0.45% for Class R6. The gross expense ratio, which does not account for any voluntary or contractual waivers currently in effect, was 0.56% for Class R6 for the year ended October 31, 2018.
4 The Bloomberg Barclays U.S Intermediate Aggregate Bond Index is an unmanaged, market-value weighted index of U.S. domestic investment-grade debt issues, including government, corporate, asset-backed and mortgage-backed securities, with maturities greater than one year but less than ten years. Index returns do not reflect any fees or expenses. Index returns provided by Interactive Data.
5 The Conservative Term Composite Benchmark is a blend of the Russell 3000® Index (Russell 3000), MSCI ACWI ex USA Index (ACWIxUS), and Bloomberg Barclays U.S. Intermediate Aggregate Bond Index (BIAB) in the following weightings: 15% Russell 3000, 5% ACWIxUS, and 80% BIAB through 05/31/2012; and 22% Russell 3000, 8% ACWIxUS, and 70% BIAB beginning 06/01/2012. Russell 3000 is an unmanaged index that consists of 3,000 of the largest U.S. companies based on total market capitalization. Index returns are based on a market capitalization-weighted average of relative price changes of the component stocks plus dividends whose reinvestments are compounded daily. Index returns provided by Bloomberg. ACWIxUS is designed to measure large and mid-cap representation across 22 of 23 Developed Markets countries (excluding the U.S.) and 24 Emerging Markets countries. The Index is denominated in U.S. dollars. The Index returns are net of withholding taxes. They assume daily reinvestment of net dividends thus accounting for any applicable dividend taxation. Index returns provided by Bloomberg. BIAB is an unmanaged, market value-weighted index of U.S. domestic investment-grade debt issues, including government, corporate, asset-backed, and mortgage-backed securities with maturities of greater than one year but less than ten years. Index returns provided by Interactive Data. The returns of the indices do not reflect any fees or expenses. Returns provided are calculated monthly using a blended allocation. Because the fund’s asset allocation will vary over time, the composition of the fund’s portfolio may not match the composition of the Conservative Term Composite Benchmark.
3
Shareholder Expense Example - Blended Asset Conservative Series
(unaudited)
As a shareholder of the Series, you incur ongoing costs, including management fees, shareholder service fees and other Series expenses. This example is intended to help you understand your ongoing costs (in dollars) of investing in the Series and to compare these costs with the ongoing costs of investing in other mutual funds.
The example is based on an investment of $1,000 invested in each class at the beginning of the period and held for the entire period (May 1, 2018 to October 31, 2018).
Actual Expenses
The Actual lines of the table below provide information about actual account values and actual expenses. You may use the information in these lines, together with the amount you invested, to estimate the expenses that you paid over the period. Simply divide your account value by $1,000 (for example, an $8,600 account value divided by $1,000 = 8.6), then multiply the result by the number in the Actual line for the Class in which you have invested under the heading entitled “Expenses Paid During Period” to estimate the expenses you paid on your account during this period.
Hypothetical Example for Comparison Purposes
The Hypothetical lines of each class in the table below provide information about hypothetical account values and hypothetical expenses based on the Series’ actual expense ratio and an assumed rate of return of 5% per year before expenses, which is not the Series’ actual return. The hypothetical account values and expenses may not be used to estimate the actual ending account balance or expenses you paid during the period. You may use this information to compare the ongoing costs of investing in the Series and other funds. To do so, compare this 5% hypothetical example with the 5% hypothetical examples that appear in the shareholder reports of the other funds.
Please note that the expenses shown in the table are meant to highlight your ongoing costs only and do not reflect any transaction costs such as sales charges (loads), redemption fees, or exchange fees that you may incur in other mutual funds. Therefore, the second line of the table is useful in comparing ongoing costs only, and will not help you determine the relative total costs of owning different funds.
| BEGINNING ACCOUNT VALUE 5/1/18 | ENDING ACCOUNT VALUE 10/31/18 | EXPENSES PAID DURING PERIOD* 5/1/18-10/31/18 | ||||||||||
Actual | $1,000.00 | $1,002.22 | $2.27 | |||||||||
Hypothetical | ||||||||||||
(5% return before expenses) | $1,000.00 | $1,022.94 | $2.29 | |||||||||
*Expenses are equal to the Series’ annualized expense ratio (for the six-month period) of 0.45%, multiplied by the average account value over the period, multiplied by 184/365 (to reflect the one-half year period). Expenses are based on the most recent fiscal half year; therefore, the expense ratios stated above may differ from the expense ratios stated in the financial highlights, which are based on one-year data. The Series’ total return would have been lower had certain expenses not been waived during the period.
4
Portfolio Composition - Blended Asset Conservative Series
As of October 31, 2018 (unaudited)
Sector Allocation4 |
| |||
Financials | 8.4 | % | ||
Health Care | 7.0 | % | ||
Energy | 5.1 | % | ||
Consumer Discretionary | 4.6 | % | ||
Information Technology | 4.4 | % | ||
Communication Services | 4.2 | % | ||
Industrials | 4.1 | % | ||
Real Estate | 3.6 | % | ||
Consumer Staples | 3.3 | % | ||
Materials | 1.8 | % | ||
Utilities | 0.2 | % | ||
| 4Including common stocks and corporate bonds, as a percentage of total investments. | ||||
Top Five Stock Holdings5 |
| |||
Johnson & Johnson | 0.7 | % | ||
Medtronic plc | 0.6 | % | ||
Microsoft Corp. | 0.6 | % | ||
Qorvo, Inc. | 0.6 | % | ||
Mastercard, Inc. - Class A | 0.6 | % | ||
| 5As a percentage of total investments. | ||||
Top Five Bond Holdings6 |
| |||
U.S. Treasury Note, 1.625%, 4/30/2019 | 6.0 | % | ||
U.S. Treasury Inflation Indexed Note, 0.125%, 4/15/2020 | 5.0 | % | ||
U.S. Treasury Note, 2.00%, 7/31/2022 | 3.5 | % | ||
U.S. Treasury Note, 2.125%, 5/15/2025 | 2.0 | % | ||
U.S. Treasury Note, 1.625%, 5/15/2026 | 2.0 | % | ||
| 6As a percentage of total investments. | ||||
5
Investment Portfolio - October 31, 2018
| BLENDED ASSET CONSERVATIVE SERIES | SHARES | VALUE (NOTE 2) | ||||||
COMMON STOCKS - 27.9% | ||||||||
Communication Services - 1.8% | ||||||||
Diversified Telecommunication Services - 0.4% | ||||||||
Verizon Communications, Inc. | 2,120 | $ | 121,031 | |||||
Zayo Group Holdings, Inc.* | 11,860 | 354,377 | ||||||
|
| |||||||
| 475,408 | ||||||||
|
| |||||||
Entertainment - 0.3% | ||||||||
Electronic Arts, Inc.* | 3,630 | 330,257 | ||||||
|
| |||||||
Interactive Media & Services - 0.8% | ||||||||
Alphabet, Inc. - Class A* | 220 | 239,928 | ||||||
Alphabet, Inc. - Class C* | 330 | 355,334 | ||||||
Tencent Holdings Ltd. - Class H (China) | 13,780 | 472,093 | ||||||
|
| |||||||
| 1,067,355 | ||||||||
|
| |||||||
Media - 0.3% | ||||||||
Comcast Corp. - Class A | 3,685 | 140,546 | ||||||
Quebecor, Inc. - Class B (Canada) | 5,850 | 114,738 | ||||||
Shaw Communications, Inc. - Class B (Canada) | 6,160 | 114,688 | ||||||
|
| |||||||
| 369,972 | ||||||||
|
| |||||||
Total Communication Services | 2,242,992 | |||||||
|
| |||||||
Consumer Discretionary - 2.2% | ||||||||
Automobiles - 0.1% | ||||||||
Honda Motor Co., Ltd. - ADR (Japan) | 2,571 | 73,274 | ||||||
|
| |||||||
Hotels, Restaurants & Leisure - 0.1% | ||||||||
McDonald’s Corp. | 889 | 157,264 | ||||||
|
| |||||||
Household Durables - 0.1% | ||||||||
Newell Brands, Inc. | 4,480 | 71,142 | ||||||
|
| |||||||
Internet & Direct Marketing Retail - 1.0% | ||||||||
Alibaba Group Holding Ltd. - ADR (China)* | 2,510 | 357,123 | ||||||
Amazon.com, Inc.* | 130 | 207,741 | ||||||
Booking Holdings, Inc.* | 380 | 712,340 | ||||||
|
| |||||||
| 1,277,204 | ||||||||
|
| |||||||
Multiline Retail - 0.1% | ||||||||
Dollar General Corp. | 985 | 109,709 | ||||||
Target Corp. | 917 | 76,689 | ||||||
|
| |||||||
| 186,398 | ||||||||
|
| |||||||
Specialty Retail - 0.5% | ||||||||
Dick’s Sporting Goods, Inc. | 1,750 | 61,897 | ||||||
The Home Depot, Inc. | 1,103 | 193,996 | ||||||
Industria de Diseno Textil S.A. (Spain) | 10,470 | 295,092 | ||||||
O’Reilly Automotive, Inc.* | 205 | 65,754 | ||||||
|
| |||||||
| 616,739 | ||||||||
|
| |||||||
Textiles, Apparel & Luxury Goods - 0.3% | ||||||||
lululemon athletica, Inc.* | 3,160 | 444,707 | ||||||
|
| |||||||
Total Consumer Discretionary | 2,826,728 | |||||||
|
| |||||||
Consumer Staples - 3.3% | ||||||||
Beverages - 1.7% | ||||||||
Ambev S.A. - ADR (Brazil) | 58,980 | 255,383 | ||||||
Anheuser-Busch InBev S.A./N.V. (Belgium) | 7,960 | 588,729 | ||||||
The Coca-Cola Co. | 5,220 | 249,934 | ||||||
Diageo plc (United Kingdom) | 15,565 | 538,106 | ||||||
Molson Coors Brewing Co. - Class B | 585 | 37,440 | ||||||
PepsiCo, Inc. | 4,495 | 505,148 | ||||||
|
| |||||||
| 2,174,740 | ||||||||
|
| |||||||
Food & Staples Retailing - 0.3% | ||||||||
Walgreens Boots Alliance, Inc. | 1,079 | 86,072 | ||||||
Walmart, Inc. | 2,597 | 260,427 | ||||||
|
| |||||||
| 346,499 | ||||||||
|
| |||||||
Food Products - 0.7% | ||||||||
J&J Snack Foods Corp. | 570 | 89,011 | ||||||
The Kraft Heinz Co. | 1,286 | 70,692 | ||||||
Mondelez International, Inc. - Class A | 12,291 | 515,976 | ||||||
Nestle S.A. (Switzerland) | 2,970 | 250,737 | ||||||
|
| |||||||
| 926,416 | ||||||||
|
| |||||||
Household Products - 0.1% | ||||||||
Colgate-Palmolive Co. | 2,191 | 130,474 | ||||||
|
| |||||||
Personal Products - 0.5% | ||||||||
Unilever plc - ADR (United Kingdom) | 10,632 | 563,283 | ||||||
|
| |||||||
Total Consumer Staples | 4,141,412 | |||||||
|
| |||||||
Energy - 1.5% | ||||||||
Energy Equipment & Services - 0.8% | ||||||||
Diamond Offshore Drilling, Inc.* | 10,260 | 145,487 | ||||||
Ensco plc - Class A | 22,075 | 157,616 | ||||||
Schlumberger Ltd. | 9,110 | 467,434 | ||||||
Transocean Ltd.* | 21,540 | 237,155 | ||||||
|
| |||||||
| 1,007,692 | ||||||||
|
| |||||||
Oil, Gas & Consumable Fuels - 0.7% | ||||||||
BP plc - ADR (United Kingdom) | 3,085 | 133,797 | ||||||
Chevron Corp. | 1,010 | 112,767 | ||||||
China Petroleum & Chemical Corp. - ADR (China) | 1,395 | 112,521 | ||||||
Exxon Mobil Corp. | 3,855 | 307,166 | ||||||
Hess Corp. | 1,255 | 72,037 | ||||||
The accompanying notes are an integral part of the financial statements.
6
Investment Portfolio - October 31, 2018
| BLENDED ASSET CONSERVATIVE SERIES | SHARES | VALUE (NOTE 2) | ||||||
COMMON STOCKS (continued) | ||||||||
Energy (continued) | ||||||||
Oil, Gas & Consumable Fuels (continued) | ||||||||
Marathon Petroleum Corp. | 783 | $ | 55,162 | |||||
Royal Dutch Shell plc - Class B - ADR (Netherlands) | 1,010 | 66,367 | ||||||
Valero Energy Corp. | 660 | 60,119 | ||||||
|
| |||||||
| 919,936 | ||||||||
|
| |||||||
Total Energy | 1,927,628 | |||||||
|
| |||||||
Financials - 2.7% | ||||||||
Banks - 1.3% | ||||||||
Bank of America Corp. | 7,890 | 216,975 | ||||||
BankUnited, Inc. | 685 | 22,673 | ||||||
Citigroup, Inc. | 2,870 | 187,870 | ||||||
Fifth Third Bancorp | 875 | 23,616 | ||||||
Huntington Bancshares, Inc. | 1,620 | 23,215 | ||||||
JPMorgan Chase & Co. | 4,471 | 487,428 | ||||||
KeyCorp. | 3,975 | 72,186 | ||||||
The PNC Financial Services Group, Inc. | 300 | 38,547 | ||||||
Regions Financial Corp. | 2,535 | 43,019 | ||||||
SunTrust Banks, Inc. | 640 | 40,102 | ||||||
U.S. Bancorp | 2,092 | 109,349 | ||||||
Wells Fargo & Co. | 6,917 | 368,192 | ||||||
|
| |||||||
| 1,633,172 | ||||||||
|
| |||||||
Capital Markets - 1.0% | ||||||||
Apollo Global Management LLC - Class A | 1,745 | 51,338 | ||||||
Ares Management LP | 1,730 | 33,925 | ||||||
BlackRock, Inc. | 985 | 405,249 | ||||||
The Blackstone Group LP | 1,710 | 55,336 | ||||||
Cboe Global Markets, Inc. | 1,170 | 132,035 | ||||||
The Charles Schwab Corp. | 5,075 | 234,668 | ||||||
CME Group, Inc. | 660 | 120,938 | ||||||
E*TRADE Financial Corp. | 2,360 | 116,631 | ||||||
Intercontinental Exchange, Inc. | 1,620 | 124,805 | ||||||
|
| |||||||
| 1,274,925 | ||||||||
|
| |||||||
Diversified Financial Services - 0.2% | ||||||||
Berkshire Hathaway, Inc. - Class B* | 1,140 | 234,019 | ||||||
|
| |||||||
Insurance - 0.2% | ||||||||
The Allstate Corp. | 395 | 37,809 | ||||||
Arthur J. Gallagher & Co. | 620 | 45,886 | ||||||
Chubb Ltd. | 405 | 50,589 | ||||||
Lincoln National Corp. | 525 | 31,600 | ||||||
Old Republic International Corp. | 1,900 | 41,895 | ||||||
Principal Financial Group, Inc. | 580 | 27,301 | ||||||
Willis Towers Watson plc | 260 | 37,222 | ||||||
|
| |||||||
| 272,302 | ||||||||
|
| |||||||
Total Financials | 3,414,418 | |||||||
|
| |||||||
Health Care - 5.8% | ||||||||
Biotechnology - 1.8% | ||||||||
AbbVie, Inc. | 1,694 | 131,878 | ||||||
Amgen, Inc. | 778 | 149,991 | ||||||
BioMarin Pharmaceutical, Inc.* | 4,110 | 378,819 | ||||||
Gilead Sciences, Inc. | 1,616 | 110,179 | ||||||
Incyte Corp.* | 11,040 | 715,613 | ||||||
Regeneron Pharmaceuticals, Inc.* | 910 | 308,708 | ||||||
Seattle Genetics, Inc.* | 5,770 | 323,870 | ||||||
Vertex Pharmaceuticals, Inc.* | 1,030 | 174,544 | ||||||
|
| |||||||
| 2,293,602 | ||||||||
|
| |||||||
Health Care Equipment & Supplies - 0.7% | ||||||||
Koninklijke Philips N.V. (Netherlands) | 1,571 | 58,488 | ||||||
Medtronic plc1 | 8,929 | 802,003 | ||||||
|
| |||||||
| 860,491 | ||||||||
|
| |||||||
Health Care Providers & Services - 0.4% | ||||||||
CVS Health Corp. | 1,339 | 96,930 | ||||||
DaVita, Inc.*1 | 5,430 | 365,656 | ||||||
|
| |||||||
| 462,586 | ||||||||
|
| |||||||
Pharmaceuticals - 2.9% | ||||||||
AstraZeneca plc (United Kingdom) | 1,130 | 86,433 | ||||||
Bristol-Myers Squibb Co. | 8,110 | 409,880 | ||||||
Eli Lilly & Co. | 1,994 | 216,229 | ||||||
Johnson & Johnson | 6,730 | 942,133 | ||||||
Merck & Co., Inc. | 9,007 | 663,005 | ||||||
Merck KGaA (Germany) | 2,300 | 246,106 | ||||||
Novartis AG - ADR (Switzerland) | 7,605 | 665,133 | ||||||
Pfizer, Inc. | 5,491 | 236,443 | ||||||
Sanofi (France) | 1,180 | 105,445 | ||||||
Sanofi - ADR (France) | 3,046 | 136,217 | ||||||
|
| |||||||
| 3,707,024 | ||||||||
|
| |||||||
Total Health Care | 7,323,703 | |||||||
|
| |||||||
Industrials - 2.0% | ||||||||
Aerospace & Defense - 0.3% | ||||||||
The Boeing Co. | 563 | 199,786 | ||||||
Lockheed Martin Corp. | 342 | 100,497 | ||||||
United Technologies Corp. | 973 | 120,856 | ||||||
|
| |||||||
| 421,139 | ||||||||
|
| |||||||
The accompanying notes are an integral part of the financial statements.
7
Investment Portfolio - October 31, 2018
| BLENDED ASSET CONSERVATIVE SERIES | SHARES | VALUE (NOTE 2) | ||||||
COMMON STOCKS (continued) | ||||||||
Industrials (continued) | ||||||||
Air Freight & Logistics - 0.4% | ||||||||
FedEx Corp. | 1,690 | $ | 372,375 | |||||
United Parcel Service, Inc. - Class B | 1,074 | 114,424 | ||||||
|
| |||||||
| 486,799 | ||||||||
|
| |||||||
Airlines - 0.1% | ||||||||
Delta Air Lines, Inc. | 955 | 52,267 | ||||||
Southwest Airlines Co. | 880 | 43,208 | ||||||
|
| |||||||
| 95,475 | ||||||||
|
| |||||||
Building Products - 0.0%## | ||||||||
Johnson Controls International plc | 1,915 | 61,223 | ||||||
Resideo Technologies, Inc.* | 143 | 3,010 | ||||||
|
| |||||||
| 64,233 | ||||||||
|
| |||||||
Commercial Services & Supplies - 0.2% | ||||||||
Covanta Holding Corp. | 5,780 | 84,908 | ||||||
Waste Management, Inc. | 1,550 | 138,679 | ||||||
|
| |||||||
| 223,587 | ||||||||
|
| |||||||
Construction & Engineering - 0.0%## | ||||||||
Comfort Systems USA, Inc. | 980 | 52,410 | ||||||
|
| |||||||
Electrical Equipment - 0.1% | ||||||||
ABB Ltd. (Asea Brown Boveri) - ADR (Switzerland) | 3,174 | 63,670 | ||||||
Emerson Electric Co. | 1,002 | 68,016 | ||||||
|
| |||||||
| 131,686 | ||||||||
|
| |||||||
Industrial Conglomerates - 0.2% | ||||||||
3M Co. | 973 | 185,123 | ||||||
Honeywell International, Inc. | 860 | 124,545 | ||||||
|
| |||||||
| 309,668 | ||||||||
|
| |||||||
Machinery - 0.1% | ||||||||
Caterpillar, Inc. | 569 | 69,031 | ||||||
Mueller Water Products, Inc. - Class A | 4,810 | 49,351 | ||||||
|
| |||||||
| 118,382 | ||||||||
|
| |||||||
Professional Services - 0.2% | ||||||||
Equifax, Inc. | 2,280 | 231,283 | ||||||
|
| |||||||
Road & Rail - 0.4% | ||||||||
Genesee & Wyoming, Inc. - Class A* | 2,940 | 232,936 | ||||||
Kansas City Southern | 1,085 | 110,627 | ||||||
Union Pacific Corp. | 931 | 136,131 | ||||||
|
| |||||||
| 479,694 | ||||||||
|
| |||||||
Total Industrials | 2,614,356 | |||||||
|
| |||||||
Information Technology - 4.3% | ||||||||
Communications Equipment - 0.2% | ||||||||
Cisco Systems, Inc. | 4,532 | 207,339 | ||||||
|
| |||||||
IT Services - 1.7% | ||||||||
Automatic Data Processing, Inc. | 668 | 96,245 | ||||||
International Business Machines Corp. | 1,024 | 118,200 | ||||||
InterXion Holding N.V. (Netherlands)* | 5,125 | 301,709 | ||||||
LiveRamp Holdings, Inc.* | 7,615 | 347,853 | ||||||
Mastercard, Inc. - Class A | 3,700 | 731,379 | ||||||
Visa, Inc. - Class A | 4,630 | 638,246 | ||||||
|
| |||||||
| 2,233,632 | ||||||||
|
| |||||||
Semiconductors & Semiconductor Equipment - 1.5% |
| |||||||
Broadcom, Inc. | 393 | 87,832 | ||||||
Intel Corp. | 9,240 | 433,171 | ||||||
Qorvo, Inc.* | 10,140 | 745,391 | ||||||
Skyworks Solutions, Inc. | 3,970 | 344,437 | ||||||
Taiwan Semiconductor Manufacturing Co. Ltd. - ADR (Taiwan) | 5,180 | 197,358 | ||||||
Texas Instruments, Inc. | 1,231 | 114,274 | ||||||
|
| |||||||
| 1,922,463 | ||||||||
|
| |||||||
Software - 0.8% | ||||||||
Microsoft Corp. | 7,190 | 767,964 | ||||||
ServiceNow, Inc.* | 1,440 | 260,698 | ||||||
|
| |||||||
| 1,028,662 | ||||||||
|
| |||||||
Technology Hardware, Storage & Peripherals - 0.1% |
| |||||||
Apple, Inc. | 590 | 129,127 | ||||||
|
| |||||||
Total Information Technology | 5,521,223 | |||||||
|
| |||||||
Materials - 1.2% | ||||||||
Chemicals - 0.2% | ||||||||
DowDuPont, Inc. | 1,640 | 88,429 | ||||||
FMC Corp. | 1,385 | 108,141 | ||||||
LyondellBasell Industries N.V. - Class A | 635 | 56,686 | ||||||
|
| |||||||
| 253,256 | ||||||||
|
| |||||||
Containers & Packaging - 0.9% | ||||||||
Ball Corp. | 10,378 | 464,934 | ||||||
Graphic Packaging Holding Co. | 10,620 | 116,926 | ||||||
Sealed Air Corp. | 11,735 | 379,745 | ||||||
Sonoco Products Co. | 2,735 | 149,276 | ||||||
|
| |||||||
| 1,110,881 | ||||||||
|
| |||||||
Metals & Mining - 0.1% | ||||||||
BHP Billiton Ltd. - ADR (Australia) | 2,196 | 101,411 | ||||||
The accompanying notes are an integral part of the financial statements.
8
Investment Portfolio - October 31, 2018
| BLENDED ASSET CONSERVATIVE SERIES | SHARES | VALUE (NOTE 2) | ||||||
COMMON STOCKS (continued) | ||||||||
Materials (continued) | ||||||||
Metals & Mining (continued) | ||||||||
Rio Tinto plc - ADR (Australia) | 1,633 | $ | 80,491 | |||||
|
| |||||||
| 181,902 | ||||||||
|
| |||||||
Total Materials | 1,546,039 | |||||||
|
| |||||||
Real Estate - 2.9% | ||||||||
Equity Real Estate Investment Trusts (REITS) - 2.9% |
| |||||||
Acadia Realty Trust | 455 | 12,667 | ||||||
Agree Realty Corp. | 260 | 14,890 | ||||||
Alexandria Real Estate Equities, Inc. | 100 | 12,223 | ||||||
American Campus Communities, Inc. | 340 | 13,433 | ||||||
American Homes 4 Rent - Class A | 2,485 | 52,359 | ||||||
American Tower Corp. | 1,555 | 242,285 | ||||||
Americold Realty Trust | 470 | 11,632 | ||||||
Apartment Investment & Management Co. - Class A | 945 | 40,673 | ||||||
Apple Hospitality REIT, Inc. | 1,315 | 21,264 | ||||||
AvalonBay Communities, Inc. | 585 | 102,597 | ||||||
Boston Properties, Inc. | 620 | 74,871 | ||||||
Brandywine Realty Trust | 3,315 | 46,609 | ||||||
CatchMark Timber Trust, Inc. - Class A | 3,275 | 28,984 | ||||||
Chesapeake Lodging Trust | 690 | 20,279 | ||||||
Colony Capital, Inc. | 9,955 | 58,436 | ||||||
Community Healthcare Trust, Inc. | 3,085 | 91,686 | ||||||
CoreCivic, Inc. | 2,960 | 66,482 | ||||||
Cousins Properties, Inc. | 5,390 | 44,791 | ||||||
Crown Castle International Corp. | 1,285 | 139,731 | ||||||
CubeSmart | 360 | 10,433 | ||||||
Digital Realty Trust, Inc. | 1,050 | 108,423 | ||||||
EastGroup Properties, Inc. | 115 | 11,016 | ||||||
Equinix, Inc. | 1,270 | 481,000 | ||||||
Equity LifeStyle Properties, Inc. | 280 | 26,513 | ||||||
Equity Residential | 1,235 | 80,226 | ||||||
Essex Property Trust, Inc. | 205 | 51,410 | ||||||
Extra Space Storage, Inc. | 285 | 25,667 | ||||||
Federal Realty Investment Trust | 105 | 13,025 | ||||||
First Industrial Realty Trust, Inc. | 665 | 20,415 | ||||||
Getty Realty Corp. | 805 | 21,598 | ||||||
HCP, Inc. | 1,415 | 38,983 | ||||||
Healthcare Realty Trust, Inc. | 895 | 24,935 | ||||||
Healthcare Trust of America, Inc. - Class A | 1,050 | 27,573 | ||||||
Hibernia REIT plc (Ireland) | 14,495 | 22,821 | ||||||
Host Hotels & Resorts, Inc. | 2,725 | 52,075 | ||||||
Independence Realty Trust, Inc. | 2,335 | 23,140 | ||||||
Invitation Homes, Inc. | 2,177 | 47,633 | ||||||
Jernigan Capital, Inc. | 3,360 | 65,755 | ||||||
Kimco Realty Corp. | 1,210 | 19,469 | ||||||
Lamar Advertising Co. - Class A | 690 | 50,591 | ||||||
Lexington Realty Trust | 2,390 | 18,570 | ||||||
Liberty Property Trust | 1,015 | 42,498 | ||||||
The Macerich Co. | 180 | 9,292 | ||||||
Mid-America Apartment Communities, Inc. | 425 | 41,527 | ||||||
National Retail Properties, Inc. | 425 | 19,869 | ||||||
National Storage Affiliates Trust | 395 | 10,519 | ||||||
Outfront Media, Inc. | 2,070 | 36,680 | ||||||
Physicians Realty Trust | 3,105 | 51,481 | ||||||
Plymouth Industrial REIT, Inc. | 1,880 | 26,320 | ||||||
Prologis, Inc. | 1,565 | 100,896 | ||||||
Public Storage | 320 | 65,750 | ||||||
Realty Income Corp. | 215 | 12,958 | ||||||
SBA Communications Corp.* | 1,490 | 241,633 | ||||||
Simon Property Group, Inc. | 775 | 142,228 | ||||||
STAG Industrial, Inc. | 2,370 | 62,710 | ||||||
STORE Capital Corp. | 440 | 12,773 | ||||||
Sun Communities, Inc. | 525 | 52,747 | ||||||
Sunstone Hotel Investors, Inc. | 2,160 | 31,255 | ||||||
Tier REIT, Inc. | 2,045 | 44,315 | ||||||
UDR, Inc. | 1,315 | 51,535 | ||||||
UMH Properties, Inc. | 1,000 | 14,330 | ||||||
Unibail-Rodamco-Westfield (France) | 165 | 29,858 | ||||||
Urban Edge Properties | 2,205 | 45,180 | ||||||
Ventas, Inc. | 425 | 24,667 | ||||||
VEREIT, Inc. | 4,725 | 34,634 | ||||||
Vornado Realty Trust | 730 | 49,698 | ||||||
Weingarten Realty Investors | 1,135 | 31,916 | ||||||
Welltower, Inc. | 510 | 33,696 | ||||||
|
| |||||||
| 3,658,128 | ||||||||
|
| |||||||
Real Estate Management & Development - 0.0%## | ||||||||
StorageVault Canada, Inc. (Canada) | 3,410 | 6,683 | ||||||
|
| |||||||
Total Real Estate | 3,664,811 | |||||||
|
| |||||||
Utilities - 0.2% | ||||||||
Electric Utilities - 0.0%## | ||||||||
Exelon Corp. | 1,080 | 47,315 | ||||||
|
| |||||||
Independent Power and Renewable Electricity Producers - 0.1% | ||||||||
Boralex, Inc. - Class A (Canada) | 2,080 | 26,860 | ||||||
Innergex Renewable Energy, Inc. (Canada) | 3,415 | 31,674 | ||||||
The accompanying notes are an integral part of the financial statements.
9
Investment Portfolio - October 31, 2018
| BLENDED ASSET CONSERVATIVE SERIES | SHARES/ PRINCIPAL | VALUE (NOTE 2) | ||||||
COMMON STOCKS (continued) | ||||||||
Utilities (continued) | ||||||||
Independent Power and Renewable Electricity Producers (continued) |
| |||||||
Northland Power, Inc. (Canada) | 1,920 | $ | 29,534 | |||||
Pattern Energy Group, Inc. - Class A | 1,940 | 34,765 | ||||||
|
| |||||||
| 122,833 | ||||||||
|
| |||||||
Multi-Utilities - 0.1% | ||||||||
CMS Energy Corp. | 1,540 | 76,260 | ||||||
|
| |||||||
Total Utilities | 246,408 | |||||||
|
| |||||||
TOTAL COMMON STOCKS | 35,469,718 | |||||||
|
| |||||||
CORPORATE BONDS - 18.8% | ||||||||
Non-Convertible Corporate Bonds - 18.8% | ||||||||
Communication Services - 2.4% | ||||||||
Diversified Telecommunication Services - 1.5% |
| |||||||
AT&T, Inc., 4.25%, 3/1/2027 | 800,000 | 775,810 | ||||||
Verizon Communications, Inc., 5.50%, 3/16/2047 | 1,080,000 | 1,125,331 | ||||||
|
| |||||||
| 1,901,141 | ||||||||
|
| |||||||
Media - 0.8% | ||||||||
CCO Holdings LLC - CCO Holdings Capital Corp.3, 5.50%, 5/1/2026 | 40,000 | 39,000 | ||||||
Discovery Communications LLC, 5.20%, 9/20/2047 | 800,000 | 739,910 | ||||||
Telenet Finance Luxembourg Notes S.A.R.L (Belgium)3, 5.50%, 3/1/2028 | 200,000 | 185,500 | ||||||
|
| |||||||
| 964,410 | ||||||||
|
| |||||||
Wireless Telecommunication Services - 0.1% | ||||||||
Hughes Satellite Systems Corp., 5.25%, 8/1/2026 | 61,000 | 57,950 | ||||||
Inmarsat Finance plc (United Kingdom)3, 4.875%, 5/15/2022 | 100,000 | 97,952 | ||||||
Sprint Communications, Inc.3, 9.00%, 11/15/2018 | 11,000 | 11,022 | ||||||
Sprint Communications, Inc.3, 7.00%, 3/1/2020 | 11,000 | 11,399 | ||||||
|
| |||||||
| 178,323 | ||||||||
|
| |||||||
Total Communication Services | 3,043,874 | |||||||
|
| |||||||
| PRINCIPAL AMOUNT 2 | VALUE (NOTE 2) | |||||||
Consumer Discretionary - 2.4% | ||||||||
Auto Components - 0.1% | ||||||||
Techniplas LLC3, 10.00%, 5/1/2020 | 35,000 | 32,900 | ||||||
|
| |||||||
Automobiles - 0.6% | ||||||||
General Motors Co.4, (3 mo. LIBOR US + 0.900%), 3.227%, 9/10/2021 | 790,000 | 788,858 | ||||||
|
| |||||||
Household Durables - 0.2% | ||||||||
Century Communities, Inc., 5.875%, 7/15/2025 | 57,000 | 51,585 | ||||||
LGI Homes, Inc.3, 6.875%, 7/15/2026 | 50,000 | 47,500 | ||||||
Meritage Homes Corp., 5.125%, 6/6/2027 | 30,000 | 26,400 | ||||||
TRI Pointe Group, Inc. - TRI Pointe Homes, Inc., 4.375%, 6/15/2019 | 50,000 | 50,000 | ||||||
TRI Pointe Group, Inc. - TRI Pointe Homes, Inc., 5.875%, 6/15/2024 | 40,000 | 37,350 | ||||||
Weekley Homes LLC - Weekley Finance Corp., 6.00%, 2/1/2023 | 24,000 | 23,040 | ||||||
Weekley Homes LLC - Weekley Finance Corp., 6.625%, 8/15/2025 | 35,000 | 33,075 | ||||||
|
| |||||||
| 268,950 | ||||||||
|
| |||||||
Internet & Direct Marketing Retail - 0.9% | ||||||||
Booking Holdings, Inc., 3.60%, 6/1/2026 | 1,220,000 | 1,165,148 | ||||||
|
| |||||||
Multiline Retail - 0.6% | ||||||||
Macy’s Retail Holdings, Inc., 7.00%, 2/15/2028 | 370,000 | 390,725 | ||||||
Macy’s Retail Holdings, Inc., 6.90%, 4/1/2029 | 370,000 | 388,125 | ||||||
|
| |||||||
| 778,850 | ||||||||
|
| |||||||
Total Consumer Discretionary | 3,034,706 | |||||||
|
| |||||||
Consumer Staples - 0.0%## | ||||||||
Food & Staples Retailing - 0.0%## | ||||||||
C&S Group Enterprises LLC3, 5.375%, 7/15/2022 | 25,000 | 24,125 | ||||||
|
| |||||||
Household Products - 0.0%## | ||||||||
First Quality Finance Co., Inc.3, 5.00%, 7/1/2025 | 35,000 | 32,200 | ||||||
|
| |||||||
Total Consumer Staples | 56,325 | |||||||
|
| |||||||
Energy - 3.6% | ||||||||
Energy Equipment & Services - 0.1% | ||||||||
Shelf Drilling Holdings Ltd. (United Arab Emirates)3, 8.25%, 2/15/2025 | 30,000 | 30,075 | ||||||
The accompanying notes are an integral part of the financial statements.
10
Investment Portfolio - October 31, 2018
| BLENDED ASSET CONSERVATIVE SERIES | PRINCIPAL AMOUNT2 | VALUE (NOTE 2) | ||||||
CORPORATE BONDS (continued) | ||||||||
Non-Convertible Corporate Bonds (continued) | ||||||||
Energy (continued) | ||||||||
Energy Equipment & Services (continued) | ||||||||
TerraForm Power Operating, LLC3, 5.00%, 1/31/2028 | 25,000 | $ | 22,344 | |||||
|
| |||||||
| 52,419 | ||||||||
|
| |||||||
Oil, Gas & Consumable Fuels - 3.5% | ||||||||
American Midstream Partners LP - American Midstream Finance Corp.3, 9.50%, 12/15/2021 | 40,000 | 39,200 | ||||||
Boardwalk Pipelines LP, 5.95%, 6/1/2026 | 1,110,000 | 1,159,852 | ||||||
DCP Midstream Operating LP3, 5.35%, 3/15/2020 | 25,000 | 25,281 | ||||||
Dynagas LNG Partners LP - Dynagas Finance, Inc. (Monaco), 6.25%, 10/30/2019 | 36,000 | 35,910 | ||||||
GasLog Ltd. (Monaco), 8.875%, 3/22/2022 | 60,000 | 62,100 | ||||||
Genesis Energy LP - Genesis Energy Finance Corp., 5.625%, 6/15/2024 | 30,000 | 27,150 | ||||||
Jonah Energy LLC - Jonah Energy Finance Corp.3, 7.25%, 10/15/2025 | 55,000 | 43,725 | ||||||
Kinder Morgan Energy Partners LP, 6.95%, 1/15/2038 | 1,010,000 | 1,156,853 | ||||||
Rockies Express Pipeline, LLC3, 5.625%, 4/15/2020 | 25,000 | 25,542 | ||||||
Sabine Pass Liquefaction LLC, 5.875%, 6/30/2026 | 1,100,000 | 1,167,786 | ||||||
SemGroup Corp., 6.375%, 3/15/2025 | 25,000 | 24,188 | ||||||
Seven Generations Energy Ltd. (Canada)3, 5.375%, 9/30/2025 | 24,000 | 22,380 | ||||||
Southwestern Energy Co.5, 6.20%, 1/23/2025 | 27,000 | 26,258 | ||||||
Tallgrass Energy Partners LP - Tallgrass Energy Finance Corp.3, 5.50%, 9/15/2024 | 25,000 | 25,156 | ||||||
W&T Offshore, Inc.3, 9.75%, 11/1/2023 | 40,000 | 38,708 | ||||||
The Williams Companies, Inc., 3.75%, 6/15/2027 | 620,000 | 577,306 | ||||||
|
| |||||||
| 4,457,395 | ||||||||
|
| |||||||
Total Energy | 4,509,814 | |||||||
|
| |||||||
Financials - 5.7% | ||||||||
Banks - 3.4% | ||||||||
Bank of America Corp., 4.00%, 1/22/2025 | 1,200,000 | 1,168,606 | ||||||
Citigroup, Inc., 8.125%, 7/15/2039 | 830,000 | 1,158,884 | ||||||
JPMorgan Chase & Co., 6.30%, 4/23/2019 | 1,160,000 | 1,178,786 | ||||||
Popular, Inc., 6.125%, 9/14/2023 | 40,000 | 40,472 | ||||||
Santander Holdings USA, Inc., 4.50%, 7/17/2025 | 790,000 | 772,498 | ||||||
|
| |||||||
| 4,319,246 | ||||||||
|
| |||||||
Capital Markets - 0.9% | ||||||||
LPL Holdings, Inc.3, 5.75%, 9/15/2025 | 45,000 | 43,706 | ||||||
Morgan Stanley4, (3 mo. LIBOR US + 1.220%), 3.563%, 5/8/2024 | 1,160,000 | 1,172,238 | ||||||
|
| |||||||
| 1,215,944 | ||||||||
|
| |||||||
Consumer Finance - 0.1% | ||||||||
Ally Financial, Inc., 3.50%, 1/27/2019 | 30,000 | 29,962 | ||||||
Navient Corp., 7.25%, 9/25/2023 | 30,000 | 31,050 | ||||||
SLM Corp., 5.125%, 4/5/2022 | 40,000 | 39,800 | ||||||
|
| |||||||
| 100,812 | ||||||||
|
| |||||||
Diversified Financial Services - 0.7% | ||||||||
AerCap Ireland Capital DAC - AerCap Global Aviation Trust (Ireland), 4.45%, 10/1/2025 | 790,000 | 771,428 | ||||||
FS Energy & Power Fund3, 7.50%, 8/15/2023 | 45,000 | 45,630 | ||||||
Oxford Finance, LLC - Oxford Finance Co.- Issuer II, Inc.3, 6.375%, 12/15/2022 | 45,000 | 45,619 | ||||||
|
| |||||||
| 862,677 | ||||||||
|
| |||||||
Insurance - 0.6% | ||||||||
Prudential Financial, Inc.6, (3 mo. LIBOR US + 4.175%), 5.875%, 9/15/2042 | 740,000 | 769,970 | ||||||
|
| |||||||
Thrifts & Mortgage Finance - 0.0%## | ||||||||
Ladder Capital Finance Holdings LLLP - Ladder Capital Finance Corp.3 , 5.875%, 8/1/2021 | 30,000 | 30,225 | ||||||
|
| |||||||
Total Financials | 7,298,874 | |||||||
|
| |||||||
Health Care - 1.2% | ||||||||
Health Care Providers & Services - 1.2% | ||||||||
DaVita, Inc., 5.00%, 5/1/2025 | 40,000 | 37,800 | ||||||
Fresenius Medical Care US Finance II, Inc. (Germany)3, 5.625%, 7/31/2019 | 1,425,000 | 1,447,232 | ||||||
HCA, Inc., 5.375%, 9/1/2026 | 35,000 | 34,738 | ||||||
The accompanying notes are an integral part of the financial statements.
11
Investment Portfolio - October 31, 2018
| BLENDED ASSET CONSERVATIVE SERIES | PRINCIPAL AMOUNT2 | VALUE (NOTE 2) | ||||||
CORPORATE BONDS (continued) | ||||||||
Non-Convertible Corporate Bonds (continued) | ||||||||
Health Care (continued) | ||||||||
Health Care Providers & Services (continued) | ||||||||
Ortho-Clinical Diagnostics, Inc. - Ortho-Clinical Diagnostics S.A.3, 6.625%, 5/15/2022 | 25,000 | $ | 24,025 | |||||
|
| |||||||
Total Health Care | 1,543,795 | |||||||
|
| |||||||
Industrials - 2.1% | ||||||||
Airlines - 0.0%## | ||||||||
Allegiant Travel Co., 5.50%, 7/15/2019 | 26,000 | 26,130 | ||||||
American Airlines Group, Inc.3, 5.50%, 10/1/2019 | 30,000 | 30,328 | ||||||
|
| |||||||
| 56,458 | ||||||||
|
| |||||||
Commercial Services & Supplies - 0.1% | ||||||||
The ADT Security Corp., 5.25%, 3/15/2020 | 25,000 | 25,250 | ||||||
Covanta Holding Corp., 6.00%, 1/1/2027 | 35,000 | 33,775 | ||||||
W/S Packaging Holdings, Inc.3, 9.00%, 4/15/2023 | 45,000 | 45,900 | ||||||
|
| |||||||
| 104,925 | ||||||||
|
| |||||||
Construction & Engineering - 0.0%## | ||||||||
Tutor Perini Corp.3, 6.875%, 5/1/2025 | 36,000 | 36,045 | ||||||
|
| |||||||
Industrial Conglomerates - 0.5% | ||||||||
General Electric Co.6,7, (3 mo. LIBOR US + 3.330%), 5.00% | 640,000 | 592,800 | ||||||
|
| |||||||
Machinery - 0.6% | ||||||||
CNH Industrial Capital LLC, 3.375%, 7/15/2019 | 790,000 | 789,289 | ||||||
|
| |||||||
Marine - 0.0%## | ||||||||
Global Ship Lease, Inc. (United Kingdom)3, 9.875%, 11/15/2022 | 45,000 | 42,863 | ||||||
|
| |||||||
Trading Companies & Distributors - 0.7% | ||||||||
Aircastle Ltd., 6.25%, 12/1/2019 | 15,000 | 15,415 | ||||||
Fortress Transportation & Infrastructure Investors, LLC3, 6.50%, 10/1/2025 | 35,000 | 34,387 | ||||||
International Lease Finance Corp., 6.25%, 5/15/2019 | 716,000 | 727,420 | ||||||
Park Aerospace Holdings Ltd. (Ireland)3, 4.50%, 3/15/2023 | 44,000 | 41,861 | ||||||
|
| |||||||
| 819,083 | ||||||||
|
| |||||||
Transportation Infrastructure - 0.2% | ||||||||
Eagle Bulk Shipco, LLC, 8.25%, 11/28/2022 | 200,000 | 205,500 | ||||||
|
| |||||||
Total Industrials | 2,646,963 | |||||||
|
| |||||||
Information Technology - 0.0%## | ||||||||
Semiconductors & Semiconductor Equipment - 0.0%## | ||||||||
MagnaChip Semiconductor Corp. (South Korea), 6.625%, 7/15/2021 | 39,000 | 36,660 | ||||||
|
| |||||||
Materials - 0.6% | ||||||||
Chemicals - 0.1% | ||||||||
LSB Industries, Inc. 3 , 9.625%, 5/1/2023 | 45,000 | 46,688 | ||||||
|
| |||||||
Metals & Mining - 0.5% | ||||||||
Corp Nacional del Cobre de Chile (Chile)3, 5.625%, 9/21/2035 | 475,000 | 503,438 | ||||||
Mountain Province Diamonds, Inc. (Canada)3, 8.00%, 12/15/2022 | 65,000 | 65,975 | ||||||
Northwest Acquisitions ULC - Dominion Finco, Inc.3, 7.125%, 11/1/2022 | 65,000 | 65,445 | ||||||
Southern Copper Corp. (Peru), 5.375%, 4/16/2020 | 30,000 | 30,815 | ||||||
|
| |||||||
| 665,673 | ||||||||
|
| |||||||
Total Materials | 712,361 | |||||||
|
| |||||||
Real Estate - 0.7% | ||||||||
Equity Real Estate Investment Trusts (REITS) - 0.7% | ||||||||
American Homes 4 Rent LP, 4.25%, 2/15/2028 | 820,000 | 775,093 | ||||||
Greystar Real Estate Partners, LLC3, 5.75%, 12/1/2025 | 40,000 | 38,800 | ||||||
GTP Acquisition Partners I LLC3, 2.35%, 6/15/2020 | 95,000 | 92,883 | ||||||
iStar, Inc., 5.25%, 9/15/2022 | 34,000 | 32,895 | ||||||
|
| |||||||
Total Real Estate | 939,671 | |||||||
|
| |||||||
Utilities - 0.1% | ||||||||
Gas Utilities - 0.1% | ||||||||
NGL Energy Partners LP - NGL Energy Finance Corp., 6.125%, 3/1/2025 | 40,000 | 36,400 | ||||||
|
| |||||||
The accompanying notes are an integral part of the financial statements.
12
Investment Portfolio - October 31, 2018
| BLENDED ASSET CONSERVATIVE SERIES | PRINCIPAL AMOUNT2/ | VALUE (NOTE 2) | ||||||
CORPORATE BONDS (continued) | ||||||||
Non-Convertible Corporate Bonds (continued) | ||||||||
Utilities (continued) | ||||||||
Independent Power and Renewable Electricity Producers - 0.0%## | ||||||||
Clearway Energy Operating, LLC, 5.00%, 9/15/2026 | 25,000 | $ | 23,250 | |||||
|
| |||||||
Total Utilities | 59,650 | |||||||
|
| |||||||
TOTAL CORPORATE BONDS | ||||||||
(Identified Cost $24,608,086) | 23,882,693 | |||||||
|
| |||||||
MUTUAL FUNDS - 0.7% | ||||||||
iShares iBoxx High Yield Corporate Bond ETF | 7,110 | 599,729 | ||||||
iShares Russell 1000 Value ETF | 1,500 | 180,135 | ||||||
iShares U.S. Real Estate ETF | 500 | 39,055 | ||||||
|
| |||||||
TOTAL MUTUAL FUNDS | ||||||||
(Identified Cost $833,827) | 818,919 | |||||||
|
| |||||||
U.S. TREASURY SECURITIES - 26.4% | ||||||||
U.S. Treasury Bonds - 3.7% | ||||||||
U.S. Treasury Bond, 6.25%, 5/15/2030 | 1,009,000 | 1,306,300 | ||||||
U.S. Treasury Bond, 4.75%, 2/15/2037 | 1,504,000 | 1,810,793 | ||||||
U.S. Treasury Bond, 2.50%, 2/15/2045 | 1,172,000 | 987,822 | ||||||
U.S. Treasury Inflation Indexed Bond, 0.75%, 2/15/2042 | 728,000 | 646,640 | ||||||
|
| |||||||
Total U.S. Treasury Bonds | ||||||||
(Identified Cost $5,157,621) | 4,751,555 | |||||||
|
| |||||||
U.S. Treasury Notes - 22.7% | ||||||||
U.S. Treasury Inflation Indexed Note, 0.125%, 4/15/2020 | 6,486,484 | 6,375,927 | ||||||
U.S. Treasury Inflation Indexed Note, 0.125%, 1/15/2023 | 712,996 | 686,442 | ||||||
U.S. Treasury Note, 1.625%, 4/30/2019 | 7,601,000 | 7,568,636 | ||||||
U.S. Treasury Note, 1.125%, 7/31/2021 | 2,183,000 | 2,079,478 | ||||||
U.S. Treasury Note, 2.00%, 7/31/2022 | 4,620,000 | 4,462,451 | ||||||
U.S. Treasury Note, 1.625%, 4/30/2023 | 2,665,000 | 2,513,324 | ||||||
U.S. Treasury Note, 2.125%, 5/15/2025 | 2,725,000 | 2,572,570 | ||||||
U.S. Treasury Note, 1.625%, 5/15/2026 | 2,835,000 | 2,555,487 | ||||||
|
| |||||||
Total U.S. Treasury Notes | ||||||||
(Identified Cost $29,035,803) | 28,814,315 | |||||||
|
| |||||||
TOTAL U.S. TREASURY SECURITIES | ||||||||
(Identified Cost $34,193,424) | 33,565,870 | |||||||
|
| |||||||
PRINCIPAL AMOUNT2 | VALUE (NOTE 2) | |||||||
ASSET-BACKED SECURITIES - 3.5% | ||||||||
Capital One Multi-Asset Execution Trust, Series 2016-A4, Class A4, 1.33%, 6/15/2022 | 200,000 | 197,495 | ||||||
Cazenovia Creek Funding II LLC, Series 2018-1A, Class A3 , 3.561%, 7/15/2030 | 337,593 | 336,093 | ||||||
Chesapeake Funding II LLC, Series 2016-2A, Class A13, 1.88%, 6/15/2028 | 174,957 | 174,082 | ||||||
Chesapeake Funding II LLC, Series 2017-2A, Class A13, 1.99%, 5/15/2029 | 109,905 | 108,786 | ||||||
Chesapeake Funding II LLC, Series 2017-4A, Class A13, 2.12%, 11/15/2029 | 288,436 | 284,594 | ||||||
Colony American Homes, Series 2015-1A, Class A3,4, (1 mo. LIBOR US + 1.200%), 3.487%, 7/17/2032 | 222,210 | 222,210 | ||||||
Credit Acceptance Auto Loan Trust, Series 2017-1A, Class A3, 2.56%, 10/15/2025 | 255,000 | 253,659 | ||||||
GM Financial Automobile Leasing Trust, Series 2016-3, Class A4, 1.78%, 5/20/2020 | 225,000 | 223,931 | ||||||
Invitation Homes Trust, Series 2017-SFR2, Class A3,4, (1 mo. LIBOR US + 0.850%), 3.14%, 12/17/2036 | 79,410 | 79,484 | ||||||
Invitation Homes Trust, Series 2017-SFR2, Class B3,4, (1 mo. LIBOR US + 1.150%), 3.44%, 12/17/2036 | 60,000 | 60,395 | ||||||
Progress Residential Trust, Series 2017-SFR2, Class A3, 2.897%, 12/1/2034 | 150,000 | 144,576 | ||||||
SBA Small Business Investment Companies, Series 2015-10B, Class 1, 2.829%, 9/1/2025 | 477,360 | 464,131 | ||||||
SoFi Consumer Loan Program LLC, Series 2016-5, Class A3, 3.06%, 9/25/2028 | 181,436 | 180,660 | ||||||
The accompanying notes are an integral part of the financial statements.
13
Investment Portfolio - October 31, 2018
| BLENDED ASSET CONSERVATIVE SERIES | PRINCIPAL AMOUNT2 | VALUE (NOTE 2) | ||||||||||
ASSET-BACKED SECURITIES (continued) | ||||||||||||
SoFi Consumer Loan Program LLC, Series 2017-5, Class A13, 2.14%, 9/25/2026 | 101,929 | $ | 101,452 | |||||||||
SoFi Professional Loan Program LLC, Series 2015-D, Class A23, 2.72%, 10/27/2036 | 101,052 | 99,262 | ||||||||||
SoFi Professional Loan Program LLC, Series 2016-B, Class A2B3, 2.74%, 10/25/2032 | 87,832 | 86,349 | ||||||||||
SoFi Professional Loan Program LLC, Series 2016-E, Class A2B3, 2.49%, 1/25/2036 | 280,000 | 273,138 | ||||||||||
SoFi Professional Loan Program LLC, Series 2017-A, Class A2A3, 1.55%, 3/26/2040 | 44,460 | 44,107 | ||||||||||
SoFi Professional Loan Program LLC, Series 2017-F, Class A1FX3, 2.05%, 1/25/2041 | 66,693 | 66,001 | ||||||||||
SoFi Professional Loan Program LLC, Series 2017-F, Class A2FX3, 2.84%, 1/25/2041 | 75,000 | 72,717 | ||||||||||
SoFi Professional Loan Program LLC, Series 2018-A, Class A2A3, 2.39%, 2/25/2042 | 131,997 | 130,622 | ||||||||||
SoFi Professional Loan Program LLC, Series 2018-C, Class A1FX3, 3.08%, 1/25/2048 | 423,595 | 422,351 | ||||||||||
Tricon American Homes Trust, Series 2016-SFR1, Class A3, 2.589%, 11/1/2033 | 220,054 | 211,898 | ||||||||||
Tricon American Homes Trust, Series 2017-SFR2, Class A3, 2.928%, 1/1/2036 | 199,787 | 190,664 | ||||||||||
World Omni Automobile Lease Securitization Trust, Series 2016-A, Class A3, 1.45%, 8/15/2019 | 47,320 | 47,219 | ||||||||||
|
| |||||||||||
TOTAL ASSET-BACKED SECURITIES | 4,475,876 | |||||||||||
|
| |||||||||||
COMMERCIAL MORTGAGE-BACKED SECURITIES - 8.1% | ||||||||||||
BWAY Mortgage Trust, Series 2015-1740, Class A3, 2.917%, 1/1/2035 | 567,000 | 540,992 | ||||||||||
Caesars Palace Las Vegas Trust, Series 2017-VICI, Class A3, 3.531%, 10/1/2034 | 260,000 | 259,424 | ||||||||||
Commercial Mortgage Pass-Through Certificates, Series 2015-DC1, Class A5, 3.35%, 2/1/2048 | 545,000 | 528,676 | ||||||||||
Credit Suisse Mortgage Capital Trust, Series 2013-IVR3, Class A13,8, 2.50%, 5/1/2043 | 155,769 | 143,619 | ||||||||||
Credit Suisse Mortgage Capital Trust, Series 2013-TH1, Class A13,8, 2.13%, 2/1/2043 | 100,827 | 91,385 | ||||||||||
Fannie Mae REMICS, Series 2018-31, Class KP, 3.50%, 7/1/2047 | 324,518 | 320,218 | ||||||||||
Freddie Mac REMICS, Series 4791, Class BA, 4.00%, 3/1/2044 | 403,681 | 409,303 | ||||||||||
Freddie Mac REMICS, Series 4801, Class BA, 4.50%, 5/1/2044 | 422,687 | 434,922 | ||||||||||
FREMF Mortgage Trust, Series 2011-K13, Class B3,8 , 4.768%, 1/1/2048 | 321,504 | 328,556 | ||||||||||
FREMF Mortgage Trust, Series 2013-K712, Class B3,8, 3.358%, 5/1/2045 | 135,000 | 134,778 | ||||||||||
FREMF Mortgage Trust, Series 2013-K713, Class B3,8, 3.263%, 4/1/2046 | 300,000 | 298,750 | ||||||||||
FREMF Mortgage Trust, Series 2014-K41, Class B3,8, 3.832%, 11/1/2047 | 273,000 | 267,352 | ||||||||||
FREMF Mortgage Trust, Series 2014-K503, Class B3,8, 3.139%, 10/1/2047 | 300,000 | 298,992 | ||||||||||
FREMF Mortgage Trust, Series 2014-K716, Class B3,8, 3.949%, 8/1/2047 | 451,000 | 453,827 | ||||||||||
GAHR Commercial Mortgage Trust, Series 2015-NRF, Class BFX3,8, 3.495%, 12/1/2034 | 305,000 | 304,056 | ||||||||||
GAHR Commercial Mortgage Trust, Series 2015-NRF, Class DFX3,8, 3.495%, 12/1/2034 | 1,290,000 | 1,280,431 | ||||||||||
Government National Mortgage Association, Series 2012-113, Class PY, 2.50%, 9/1/2042 | 250,000 | 219,630 | ||||||||||
Government National Mortgage Association, Series 2017-54, Class AH, 2.60%, 12/1/2056 | 323,177 | 296,067 | ||||||||||
JP Morgan Mortgage Trust, Series 2013-2, Class A23,8, 3.50%, 5/1/2043 | 87,007 | 83,964 | ||||||||||
JP Morgan Mortgage Trust, Series 2014-2, Class 1A13,8, 3.00%, 6/1/2029 | 114,130 | 111,798 | ||||||||||
JP Morgan Mortgage Trust, Series 2017-2, Class A53,8, 3.50%, 5/1/2047 | 328,224 | 321,338 | ||||||||||
The accompanying notes are an integral part of the financial statements.
14
Investment Portfolio - October 31, 2018
| BLENDED ASSET CONSERVATIVE SERIES | PRINCIPAL AMOUNT2 | VALUE (NOTE 2) | ||||||||||||||
COMMERCIAL MORTGAGE-BACKED SECURITIES (continued) | ||||||||||||||||
JP Morgan Mortgage Trust, Series 2017-2, Class A63,8, 3.00%, 5/1/2047 | 352,536 | $ | 338,105 | |||||||||||||
JP Morgan Mortgage Trust, Series 2017-3, Class 1A33,8, 3.50%, 8/1/2047 | 328,439 | 315,533 | ||||||||||||||
JP Morgan Mortgage Trust, Series 2017-3, Class 1A53,8, 3.50%, 8/1/2047 | 418,805 | 410,282 | ||||||||||||||
JP Morgan Mortgage Trust, Series 2017-6, Class A33,8, 3.50%, 12/1/2048 | 229,613 | 220,447 | ||||||||||||||
JP Morgan Mortgage Trust, Series 2017-6, Class A53,8, 3.50%, 12/1/2048 | 269,420 | 263,769 | ||||||||||||||
New Residential Mortgage Loan Trust, Series 2014-3A, Class AFX33,8, 3.75%, 11/1/2054 | 98,947 | 98,433 | ||||||||||||||
New Residential Mortgage Loan Trust, Series 2015-2A, Class A13,8, 3.75%, 8/1/2055 | 109,067 | 108,392 | ||||||||||||||
New Residential Mortgage Loan Trust, Series 2016-4A, Class A13,8, 3.75%, 11/1/2056 | 142,839 | 141,765 | ||||||||||||||
SBA Small Business Investment Companies, Series 2015-10A, Class 1, 2.517%, 3/1/2025 | 104,485 | 100,720 | ||||||||||||||
Sequoia Mortgage Trust, Series 2013-8, Class A18, 3.00%, 6/1/2043 | 121,117 | 113,485 | ||||||||||||||
Starwood Retail Property Trust, Series 2014-STAR, Class A3,4, (1 mo. LIBOR US + 1.220%), 3.50%, 11/15/2027 | 259,773 | 259,808 | ||||||||||||||
Towd Point Mortgage Trust, Series 2016-5, Class A13,8, 2.50%, 10/1/2056 | 233,450 | 226,644 | ||||||||||||||
WF-RBS Commercial Mortgage Trust, Series 2011-C2, Class A43,8, 4.869%, 2/1/2044 | 346,980 | 355,733 | ||||||||||||||
WinWater Mortgage Loan Trust, Series 2015-1, Class A13,8, 3.50%, 1/1/2045 | 120,742 | 117,559 | ||||||||||||||
WinWater Mortgage Loan Trust, Series 2015-3, Class A53,8, 3.50%, 3/1/2045 | 101,502 | 101,236 | ||||||||||||||
|
| |||||||||||||||
TOTAL COMMERCIAL MORTGAGE-BACKED SECURITIES | 10,299,989 | |||||||||||||||
|
| |||||||||||||||
FOREIGN GOVERNMENT BONDS - 1.9% | ||||||||||||||||
Canada Housing Trust No. 1 (Canada)3, 4.10%, 12/15/2018 | CAD | 27,000 | 20,561 | |||||||||||||
Canadian Government Bond (Canada), 2.75%, 6/1/2022 | CAD | 33,000 | 25,357 | |||||||||||||
Export-Import Bank of Korea (South Korea), 2.625%, 12/30/2020 | 1,000,000 | 983,540 | ||||||||||||||
The Korea Development Bank (South Korea), 1.375%, 9/12/2019 | 600,000 | 591,309 | ||||||||||||||
Mexican Government Bond (Mexico), 8.00%, 6/11/2020 | MXN | 733,000 | 35,746 | |||||||||||||
Mexican Government Bond (Mexico), 6.50%, 6/10/2021 | MXN | 275,000 | 12,868 | |||||||||||||
Mexican Government Bond (Mexico), 6.50%, 6/9/2022 | MXN | 504,000 | 23,164 | |||||||||||||
Mexican Government Bond (Mexico), 7.75%, 5/29/2031 | MXN | 92,000 | 4,128 | |||||||||||||
Province of Ontario (Canada), 1.25%, 6/17/2019 | 206,000 | 204,043 | ||||||||||||||
Singapore Government Bond (Singapore), 2.50%, 6/1/2019 | SGD | 60,000 | 43,446 | |||||||||||||
Svensk Exportkredit AB (Sweden), 1.125%, 8/28/2019 | 504,000 | 497,051 | ||||||||||||||
|
| |||||||||||||||
TOTAL FOREIGN GOVERNMENT BONDS | 2,441,213 | |||||||||||||||
|
| |||||||||||||||
U.S. GOVERNMENT AGENCIES - 11.1% | ||||||||||||||||
Mortgage-Backed Securities - 11.1% | ||||||||||||||||
Fannie Mae, Pool #888468, 5.50%, 9/1/2021 | 17,611 | 17,911 | ||||||||||||||
Fannie Mae, Pool #888810, 5.50%, 11/1/2022 | 21,257 | 21,621 | ||||||||||||||
Fannie Mae, Pool #MA3463, 4.00%, 9/1/2033 | 365,989 | 372,979 | ||||||||||||||
Fannie Mae, Pool #MA1834, 4.50%, 2/1/2034 | 90,788 | 93,425 | ||||||||||||||
Fannie Mae, Pool #MA1903, 4.50%, 5/1/2034 | 89,673 | 92,280 | ||||||||||||||
Fannie Mae, Pool #995196, 6.00%, 7/1/2038 | 68,984 | 75,306 | ||||||||||||||
Fannie Mae, Pool #890294, 5.50%, 1/1/2039 | 87,775 | 93,983 | ||||||||||||||
Fannie Mae, Pool #AD0307, 5.50%, 1/1/2039 | 45,745 | 48,947 | ||||||||||||||
Fannie Mae, Pool #AE0604, 6.00%, 7/1/2039 | 50,264 | 54,740 | ||||||||||||||
Fannie Mae, Pool #MA0258, 4.50%, 12/1/2039 | 110,774 | 114,714 | ||||||||||||||
Fannie Mae, Pool #890326, 5.50%, 1/1/2040 | 92,117 | 98,590 | ||||||||||||||
The accompanying notes are an integral part of the financial statements.
15
Investment Portfolio - October 31, 2018
| BLENDED ASSET CONSERVATIVE SERIES | PRINCIPAL AMOUNT2 | VALUE (NOTE 2) | ||||||||||||||
U.S. GOVERNMENT AGENCIES (continued) | ||||||||||||||||
Mortgage-Backed Securities (continued) | ||||||||||||||||
Fannie Mae, Pool #AL1595, 6.00%, 1/1/2040 | 64,935 | $ | 70,652 | |||||||||||||
Fannie Mae, Pool #AL0152, 6.00%, 6/1/2040 | 89,601 | 97,748 | ||||||||||||||
Fannie Mae, Pool #AL1410, 4.50%, 12/1/2041 | 142,133 | 146,996 | ||||||||||||||
Fannie Mae, Pool #AL7729, 4.00%, 6/1/2043 | 78,086 | 78,677 | ||||||||||||||
Fannie Mae, Pool #AS3622, 3.50%, 10/1/2044 | 659,533 | 644,775 | ||||||||||||||
Fannie Mae, Pool #AS4103, 4.50%, 12/1/2044 | 120,622 | 124,698 | ||||||||||||||
Fannie Mae, Pool #AZ2001, 3.50%, 5/1/2045 | 304,712 | 297,950 | ||||||||||||||
Fannie Mae, Pool #AZ9215, 4.00%, 10/1/2045 | 111,754 | 112,097 | ||||||||||||||
Fannie Mae, Pool #BC3490, 3.50%, 2/1/2046 | 255,240 | 249,527 | ||||||||||||||
Fannie Mae, Pool #BC6764, 3.50%, 4/1/2046 | 200,237 | 195,693 | ||||||||||||||
Fannie Mae, Pool #BC2098, 4.00%, 6/1/2046 | 123,356 | 123,491 | ||||||||||||||
Fannie Mae, Pool #AS7800, 3.00%, 8/1/2046 | 558,078 | 528,498 | ||||||||||||||
Fannie Mae, Pool #MA2705, 3.00%, 8/1/2046 | 327,281 | 309,968 | ||||||||||||||
Fannie Mae, Pool #BD6987, 4.00%, 10/1/2046 | 142,240 | 142,345 | ||||||||||||||
Fannie Mae, Pool #BD6997, 4.00%, 10/1/2046 | 97,494 | 97,568 | ||||||||||||||
Fannie Mae, Pool #BE7845, 4.50%, 2/1/2047 | 133,372 | 137,565 | ||||||||||||||
Fannie Mae, Pool #MA3148, 3.50%, 10/1/2047 | 722,264 | 703,551 | ||||||||||||||
Fannie Mae, Pool #BJ1323, 3.50%, 11/1/2047 | 615,098 | 599,608 | ||||||||||||||
Fannie Mae, Pool #MA3184, 4.50%, 11/1/2047 | 492,182 | 504,391 | ||||||||||||||
Fannie Mae, Pool #MA3334, 4.50%, 4/1/2048 | 514,463 | 527,241 | ||||||||||||||
Fannie Mae, Pool #CA1720, 5.00%, 5/1/2048 | 726,938 | 759,579 | ||||||||||||||
Fannie Mae, Pool #CA1922, 5.00%, 6/1/2048 | 731,020 | 763,770 | ||||||||||||||
Fannie Mae, Pool #BM4322, 4.00%, 7/1/2048 | 622,024 | 623,124 | ||||||||||||||
Fannie Mae, Pool #CA2056, 4.50%, 7/1/2048 | 739,233 | 757,829 | ||||||||||||||
Fannie Mae, Pool #BK9366, 4.50%, 8/1/2048
|
| 146,272
|
|
| 149,905
|
| ||||||||||
PRINCIPAL SHARES | VALUE (NOTE 2) | |||||||||||||||
U.S. GOVERNMENT AGENCIES (continued) | ||||||||||||||||
Mortgage-Backed Securities (continued) | ||||||||||||||||
Fannie Mae, Pool #CA2219, 5.00%, 8/1/2048 | 283,118 | 295,788 | ||||||||||||||
Fannie Mae, Pool #MA3527, 5.00%, 11/1/2048 | 622,000 | 649,804 | ||||||||||||||
Fannie Mae, Pool #AL8674, 5.654%, 1/1/2049 | 158,901 | 169,198 | ||||||||||||||
Freddie Mac, Pool #C91762, 4.50%, 5/1/2034 | 120,092 | 123,672 | ||||||||||||||
Freddie Mac, Pool #G03926, 6.00%, 2/1/2038 | 42,128 | 46,315 | ||||||||||||||
Freddie Mac, Pool #G05196, 5.50%, 10/1/2038 | 40,057 | 42,989 | ||||||||||||||
Freddie Mac, Pool #G05409, 5.50%, 3/1/2039 | 35,904 | 38,507 | ||||||||||||||
Freddie Mac, Pool #A92889, 4.50%, 7/1/2040 | 157,490 | 163,188 | ||||||||||||||
Freddie Mac, Pool #A93451, 4.50%, 8/1/2040 | 159,046 | 164,794 | ||||||||||||||
Freddie Mac, Pool #G60334, 4.50%, 10/1/2041 | 132,848 | 137,647 | ||||||||||||||
Freddie Mac, Pool #Q17513, 3.50%, 4/1/2043 | 229,561 | 225,502 | ||||||||||||||
Freddie Mac, Pool #Q24752, 3.50%, 2/1/2044 | 184,461 | 181,180 | ||||||||||||||
Freddie Mac, Pool #G60183, 4.00%, 12/1/2044 | 126,107 | 126,356 | ||||||||||||||
Freddie Mac, Pool #Q37592, 4.00%, 12/1/2045 | 237,242 | 237,580 | ||||||||||||||
Freddie Mac, Pool #G60636, 4.00%, 1/1/2046 | 180,514 | 180,854 | ||||||||||||||
Freddie Mac, Pool #Q42596, 3.50%, 8/1/2046 | 273,098 | 266,708 | ||||||||||||||
Freddie Mac, Pool #Q45878, 3.00%, 12/1/2046 | 325,175 | 308,028 | ||||||||||||||
Freddie Mac, Pool #G08786, 4.50%, 10/1/2047 | 203,818 | 209,653 | ||||||||||||||
Freddie Mac, Pool #Q55506, 4.50%, 4/1/2048 | 721,059 | 738,896 | ||||||||||||||
|
| |||||||||||||||
TOTAL U.S. GOVERNMENT AGENCIES | 14,138,401 | |||||||||||||||
|
| |||||||||||||||
SHORT-TERM INVESTMENT - 1.4% | ||||||||||||||||
Dreyfus Government Cash Management, Institutional Shares9, 2.05%, | ||||||||||||||||
(Identified Cost $1,770,901) | 1,770,901 | 1,770,901 | ||||||||||||||
|
| |||||||||||||||
The accompanying notes are an integral part of the financial statements.
16
Investment Portfolio - October 31, 2018
| BLENDED ASSET CONSERVATIVE SERIES | VALUE (NOTE 2) | |||||||||||||||
TOTAL INVESTMENTS IN SECURITIES - 99.8% | $ | 126,863,580 | ||||||||||||||
|
| |||||||||||||||
TOTAL OPTIONS WRITTEN - 0.0%## | (29,378 | ) | ||||||||||||||
|
| |||||||||||||||
TOTAL INVESTMENTS - 99.8% | 126,834,202 | |||||||||||||||
OTHER ASSETS, LESS LIABILITIES - 0.2% | 212,125 | |||||||||||||||
|
| |||||||||||||||
NET ASSETS - 100% | $ | 127,046,327 | ||||||||||||||
|
| |||||||||||||||
ADR - American Depositary Receipt
CAD - Canadian Dollar
ETF - Exchange-traded fund
MXN - Mexican Peso
No. - Number
SGD - Singapore Dollar
| EXCHANGE-TRADED OPTIONS WRITTEN | |||||||||||||||||||||||||
| DESCRIPTION | NUMBER OF | EXPIRATION DATE | EXERCISE PRICE | NOTIONAL (000) | VALUE | ||||||||||||||||||||
Call | |||||||||||||||||||||||||
Booking Holdings, Inc. | 1 | 11/09/2018 | $ | 1,960.00 | 187 | $ | (4,000 | ) | |||||||||||||||||
Qorvo, Inc. | 18 | 11/16/2018 | 77.50 | 132 | (3,870 | ) | |||||||||||||||||||
Alphabet, Inc. - Class C | 1 | 11/23/2018 | 1,110.00 | 108 | (2,200 | ) | |||||||||||||||||||
|
| ||||||||||||||||||||||||
| (10,070 | ) | ||||||||||||||||||||||||
|
| ||||||||||||||||||||||||
Put | |||||||||||||||||||||||||
lululemon Athletica, Inc. | 9 | 11/09/2018 | 149.00 | 127 | (7,335 | ) | |||||||||||||||||||
Mastercard, Inc. - Class A | 9 | 11/09/2018 | 197.50 | 178 | (3,510 | ) | |||||||||||||||||||
Medtronic plc | 21 | 11/16/2018 | 90.00 | 189 | (3,045 | ) | |||||||||||||||||||
Microsoft Corp. | 18 | 11/16/2018 | 100.00 | 192 | (1,638 | ) | |||||||||||||||||||
Qorvo, Inc. | 27 | 11/16/2018 | 67.50 | 198 | (3,780 | ) | |||||||||||||||||||
|
| ||||||||||||||||||||||||
| (19,308 | ) | ||||||||||||||||||||||||
TOTAL EXCHANGE-TRADED OPTIONS WRITTEN |
| $ | (29,378 | ) | |||||||||||||||||||||
|
| ||||||||||||||||||||||||
* Non-income producing security.
## Less than 0.1%.
1 A portion of this security is designated with the broker as collateral for options contracts written. As of October 31, 2018, the total value of such securities was $909,568.
2 Amount is stated in USD unless otherwise noted.
3 Restricted securities - Investment in securities that are restricted as to public resale under the Securities Act of 1933, as amended. These securities have been sold under Rule 144A and have been determined to be liquid under guidelines established by the Board of Directors. These securities amount to $14,875,688, or 11.7% of the Series’ net assets as of October 31, 2018.
4 Floating rate security. Rate shown is the rate in effect as of October 31, 2018.
5 Step coupon rate security - Rate steps up/down by 25 basis points upon rating downgrade/upgrade by Moody’s and S&P rating agencies (Subject to a maximum of 100 basis points per agency, 200 basis points maximum).
6 Variable rate security. Security may be issued at a fixed coupon rate, which converts to a variable rate at a specified date. Rate shown is the rate in effect as of October 31, 2018.
7 Security is perpetual in nature and has no stated maturity date.
8 Variable or floating rate security, the interest rate of which adjusts periodically based on changes in current interest rates and prepayments on the underlying pool of assets. Rate shown is the rate in effect as of October 31, 2018.
9 Rate shown is the current yield as of October 31, 2018.
The accompanying notes are an integral part of the financial statements.
17
Investment Portfolio - October 31, 2018
The Global Industry Classification Standard (GICS) was developed by and is the exclusive property and a service mark of MSCI Inc. (MSCI) and Standard & Poor’s, a division of The McGraw-Hill Companies, Inc. (S&P), and is licensed for use by Manning & Napier when referencing GICS sectors. Neither MSCI, S&P, nor any third party involved in making or compiling the GICS or any GICS classifications makes any express or implied warranties or representations with respect to such standard or classification, nor shall any such party have any liability therefrom.
The accompanying notes are an integral part of the financial statements.
18
Statement of Assets and Liabilities - Blended Asset Conservative Series
October 31, 2018
ASSETS: | ||||
Investments in securities, at value (identified cost $129,111,771) (Note 2) | $ | 126,863,580 | ||
Receivable for securities sold | 1,846,602 | |||
Interest receivable | 545,154 | |||
Receivable for fund shares sold | 75,336 | |||
Dividends receivable | 17,731 | |||
Foreign tax reclaims receivable | 7,331 | |||
Prepaid and other expenses | 168 | |||
|
| |||
TOTAL ASSETS | 129,355,902 | |||
|
| |||
LIABILITIES: | ||||
Accrued fund accounting and administration fees (Note 3) | 28,273 | |||
Accrued management fees (Note 3) | 12,429 | |||
Accrued Chief Compliance Officer service fees (Note 3) | 401 | |||
Options written, at value (premiums received $19,579) (Note 2) | 29,378 | |||
Payable for securities purchased | 2,189,595 | |||
Payable for fund shares repurchased | 563 | |||
Other payables and accrued expenses | 48,936 | |||
|
| |||
TOTAL LIABILITIES | 2,309,575 | |||
|
| |||
TOTAL NET ASSETS | $ | 127,046,327 | ||
|
| |||
NET ASSETS CONSIST OF: | ||||
Capital stock | $ | 119,012 | ||
Additional paid-in-capital | 129,163,072 | |||
Total distributable earnings (loss) | (2,235,757 | ) | ||
|
| |||
TOTAL NET ASSETS | $ | 127,046,327 | ||
|
| |||
NET ASSET VALUE, OFFERING PRICE AND REDEMPTION PRICE PER SHARE - Class R6 ($127,046,327/ 11,901,155 shares) | $ | 10.68 | ||
|
| |||
The accompanying notes are an integral part of the financial statements.
19
Statement of Operations - Blended Asset Conservative Series
For the Year Ended October 31, 2018
INVESTMENT INCOME: | ||||
Interest | $ | 2,406,794 | ||
Dividends (net of foreign taxes withheld, $18,368) | 645,178 | |||
|
| |||
Total Investment Income | 3,051,972 | |||
|
| |||
EXPENSES: | ||||
Management fees (Note 3) | 473,129 | |||
Fund accounting and administration fees (Note 3) | 85,075 | |||
Directors’ fees (Note 3) | 8,858 | |||
Chief Compliance Officer service fees (Note 3) | 4,394 | |||
Audit fees | 45,501 | |||
Custodian fees | 22,270 | |||
Miscellaneous | 23,404 | |||
|
| |||
Total Expenses | 662,631 | |||
Less reduction of expenses (Note 3) | (130,360 | ) | ||
|
| |||
Net Expenses | 532,271 | |||
|
| |||
NET INVESTMENT INCOME | 2,519,701 | |||
|
| |||
REALIZED AND UNREALIZED GAIN (LOSS) ON INVESTMENTS AND FOREIGN CURRENCY: | ||||
Net realized gain (loss) on- | ||||
Investments in securities | (1,376,062 | ) | ||
Options written | 84,764 | |||
Foreign currency and translation of other assets and liabilities | (733 | ) | ||
|
| |||
| (1,292,031 | ) | |||
|
| |||
Net change in unrealized appreciation (depreciation) on- | ||||
Investments in securities | (2,052,876 | ) | ||
Options written | (9,799 | ) | ||
Foreign currency and translation of other assets and liabilities | (96 | ) | ||
|
| |||
| (2,062,771 | ) | |||
|
| |||
NET REALIZED AND UNREALIZED GAIN (LOSS) ON INVESTMENTS AND FOREIGN CURRENCY | (3,354,802 | ) | ||
|
| |||
NET DECREASE IN NET ASSETS RESULTING FROM OPERATIONS | $ | (835,101 | ) | |
|
| |||
The accompanying notes are an integral part of the financial statements.
20
Statements of Changes in Net Assets - Blended Asset Conservative Series
| FOR THE YEAR ENDED 10/31/18 | FOR THE PERIOD 10/13/171 TO 10/31/17 | |||||||
INCREASE (DECREASE) IN NET ASSETS: | ||||||||
OPERATIONS: | ||||||||
Net investment income | $ | 2,519,701 | $ | 48,573 | ||||
Net realized gain (loss) on investments and foreign currency | (1,292,031 | ) | (13,218 | ) | ||||
Net change in unrealized appreciation (depreciation) on investments and foreign currency | (2,062,771 | ) | (195,366 | ) | ||||
|
|
|
| |||||
Net decrease from operations | (835,101 | ) | (160,011 | ) | ||||
|
|
|
| |||||
DISTRIBUTIONS TO SHAREHOLDERS (Note 9): | ||||||||
Class R6 | (1,240,645 | ) | — | |||||
|
|
|
| |||||
CAPITAL STOCK ISSUED AND REPURCHASED: | ||||||||
Net increase from capital share transactions (Note 5) | 28,346,171 | 100,935,913 | ||||||
|
|
|
| |||||
Net increase in net assets | 26,270,425 | 100,775,902 | ||||||
NET ASSETS: | ||||||||
Beginning of period | 100,775,902 | — | ||||||
|
|
|
| |||||
End of period | $ | 127,046,327 | $ | 100,775,902 | ||||
|
|
|
| |||||
1 Commencement of operations.
The accompanying notes are an integral part of the financial statements.
21
Financial Highlights - Blended Asset Conservative Series - Class R6
| FOR THE YEAR ENDED 10/31/18 | FOR THE PERIOD 10/13/171 TO 10/31/17 | |||||||
Per share data (for a share outstanding throughout each period): | ||||||||
Net asset value - Beginning of period | $ | 10.85 | $ | 10.87 | ||||
Income (loss) from investment operations: | ||||||||
Net investment income2 | 0.23 | 0.01 | ||||||
Net realized and unrealized loss on investments | (0.29 | ) | (0.03 | ) | ||||
|
|
|
| |||||
Total from investment operations | (0.06 | ) | (0.02 | ) | ||||
|
|
|
| |||||
Less distributions to shareholders: | ||||||||
From net investment income | (0.11 | ) | — | |||||
|
|
|
| |||||
Net asset value - End of period | $ | 10.68 | $ | 10.85 | ||||
|
|
|
| |||||
Net assets - End of period (000’s omitted) | $ | 127,046 | $ | 100,776 | ||||
|
|
|
| |||||
Total return3 | (0.52 | %) | (0.18 | %) | ||||
Ratios (to average net assets)/Supplemental Data: | ||||||||
Expenses | 0.45 | % | 0.45 | %4 | ||||
Net investment income | 2.13 | % | 0.99 | %4 | ||||
Series portfolio turnover | 71 | % | 5 | % | ||||
| *The investment advisor did not impose all or a portion of its management and/or other fees during the period, and may have paid a portion of the Series’ expenses. If these expenses had been incurred by the Series, the expense ratio (to average net assets) would have increased by the following amounts: |
| |||||||
| 0.11 | % | 1.21 | %4 | |||||
1 Commencement of operations.
2 Calculated based on average shares outstanding during the periods.
3 Represents aggregate total return for the periods indicated, and assumes reinvestment of all distributions. Total return would have been lower had certain expenses not been waived during the periods. Periods less than one year are not annualized.
4 Annualized.
The accompanying notes are an integral part of the financial statements.
22
Performance Update as of October 31, 2018 - Blended Asset Moderate Series
(unaudited)
AVERAGE ANNUAL TOTAL RETURN AS OF OCTOBER 31, 2018 | ||||||||
ONE YEAR1 | SINCE INCEPTION2 | |||||||
Manning & Napier Fund, Inc. - Blended Moderate Series - Class R63 | -1.25 | % | -1.37 | % | ||||
Bloomberg Barclays U.S. Aggregate Bond Index4 | -2.05 | % | -2.21 | % | ||||
30/10/60 Blended Index5 | -0.01 | % | 0.04 | % | ||||
The following graph compares the value of a $10,000 investment in the Manning & Napier Fund, Inc. - Blended Asset Moderate Series - Class R6 from its inception2 (October 13, 2017) to present (October 31, 2018) to the Bloomberg Barclays U.S. Aggregate Bond Index and the 30/10/60 Blended Index.
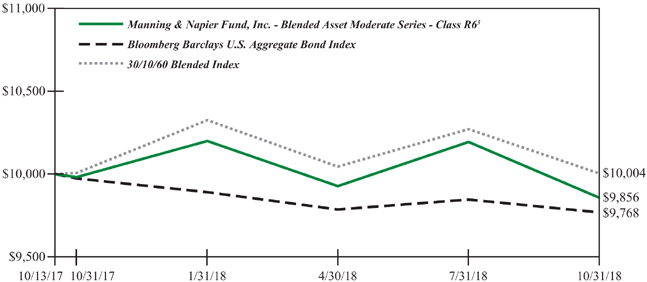
1 The returns shown are based on net asset values calculated for shareholder transactions and may differ from the returns shown in the financial highlights, which reflect adjustments made to the net asset values in accordance with accounting principles generally accepted in the United States of America.
2 Performance numbers for the Series and Indices are calculated from October 13, 2017, the Series’ inception date.
3 The Series’ performance does not reflect the deduction of taxes that a shareholder would pay on fund distributions or the redemption of shares. The Series’ performance is historical and may not be indicative of future results. The performance returns shown are inclusive of the net expense ratio of the Series. For the year ended October 31, 2018, this net expense ratio was 0.50% for Class R6. The gross expense ratio, which does not account for any voluntary or contractual waivers currently in effect, was 0.62% for Class R for the year ended October 31, 2018.
4 The Bloomberg Barclays U.S. Aggregate Bond Index is an unmanaged, market-value weighted index of U.S. domestic investment-grade debt issues, including government, corporate, asset-backed, and mortgage-backed securities, with maturities of one year or more. Index returns do not reflect any fees or expenses. Index returns provided by Interactive Data.
5 The 30/10/60 Blended Index is 30% Russell 3000® Index (Russell 3000), 10% MSCI ACWI ex USA Index (ACWIxUS), and 60% Bloomberg Barclays U.S. Aggregate Bond Index (BAB). Russell 3000 is an unmanaged index that consists of 3,000 of the largest U.S. companies based on total market capitalization. Index returns are based on a market capitalization-weighted average of relative price changes of the component stocks plus dividends whose reinvestments are compounded daily. Index returns provided by Bloomberg. ACWIxUS is designed to measure large and mid-cap representation across 22 of 23 Developed Markets countries (excluding the U.S.) and 24 Emerging Markets countries. The Index is denominated in U.S. dollars. The Index returns are net of withholding taxes. They assume daily reinvestment of net dividends thus accounting for any applicable dividend taxation. Index returns provided by Bloomberg. BAB is an unmanaged, market value-weighted index of U.S. domestic investment-grade debt issues, including government, corporate, asset-backed and mortgage-backed securities with maturities of one year or more. Index returns provided by Interactive Data. The returns of the indices do not reflect any fees or expenses. Returns provided are calculated monthly using a blended allocation. Because the fund’s asset allocation will vary over time, the composition of the fund’s portfolio may not match the composition of the comparative Indices. Mid-month performance may not be available for all indices within the blended index. Where applicable, performance for those indices is included from the first of the month following the corresponding Fund’s inception date.
23
Shareholder Expense Example - Blended Asset Moderate Series
(unaudited)
As a shareholder of the Series, you incur ongoing costs, including management fees, shareholder service fees and other Series expenses. This example is intended to help you understand your ongoing costs (in dollars) of investing in the Series and to compare these costs with the ongoing costs of investing in other mutual funds.
The example is based on an investment of $1,000 invested in each class at the beginning of the period and held for the entire period (May 1, 2018 to October 31, 2018).
Actual Expenses
The Actual lines of the table below provide information about actual account values and actual expenses. You may use the information in these lines, together with the amount you invested, to estimate the expenses that you paid over the period. Simply divide your account value by $1,000 (for example, an $8,600 account value divided by $1,000 = 8.6), then multiply the result by the number in the Actual line for the Class in which you have invested under the heading entitled “Expenses Paid During Period” to estimate the expenses you paid on your account during this period.
Hypothetical Example for Comparison Purposes
The Hypothetical lines of each class in the table below provide information about hypothetical account values and hypothetical expenses based on the Series’ actual expense ratio and an assumed rate of return of 5% per year before expenses, which is not the Series’ actual return. The hypothetical account values and expenses may not be used to estimate the actual ending account balance or expenses you paid during the period. You may use this information to compare the ongoing costs of investing in the Series and other funds. To do so, compare this 5% hypothetical example with the 5% hypothetical examples that appear in the shareholder reports of the other funds.
Please note that the expenses shown in the table are meant to highlight your ongoing costs only and do not reflect any transaction costs such as sales charges (loads), redemption fees, or exchange fees that you may incur in other mutual funds. Therefore, the second line of the table is useful in comparing ongoing costs only, and will not help you determine the relative total costs of owning different funds.
| BEGINNING ACCOUNT VALUE 5/1/18 | ENDING ACCOUNT VALUE 10/31/18 | EXPENSES PAID DURING PERIOD* 5/1/18-10/31/18 | ||||
Actual | $1,000.00 | $992.86 | $2.51 | |||
Hypothetical (5% return before expenses) | $1,000.00 | $1,022.68 | $2.55 |
*Expenses are equal to the Series’ annualized expense ratio (for the six-month period) of 0.50%, multiplied by the average account value over the period, multiplied by 184/365 (to reflect the one-half year period). Expenses are based on the most recent fiscal half year; therefore, the expense ratios stated above may differ from the expense ratios stated in the financial highlights, which are based on one-year data. The Series’ total return would have been lower had certain expenses not been waived during the period.
24
Portfolio Composition - Blended Asset Moderate Series
As of October 31, 2018 (unaudited)
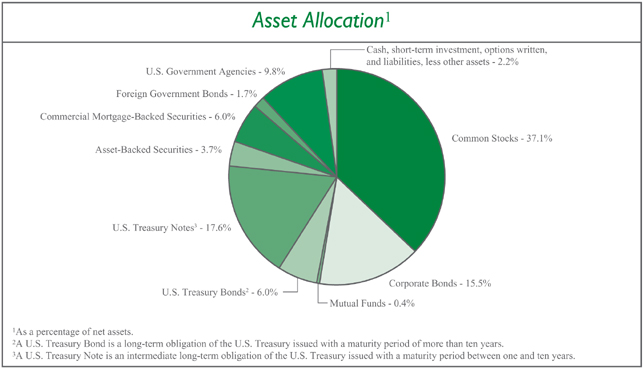
Sector Allocation4 |
| |||
Health Care | 8.5% | |||
Financials | 7.2% | |||
Information Technology | 6.3% | |||
Consumer Discretionary | 5.6% | |||
Communication Services | 5.3% | |||
Consumer Staples | 5.1% | |||
Energy | 4.9% | |||
Industrials | 3.7% | |||
Real Estate | 3.6% | |||
Materials | 2.0% | |||
Utilities | 0.1% | |||
| 4Including common stocks and corporate bonds, as a percentage of total investments. | ||||
| Top Ten Stock Holdings5 | ||||
Qorvo, Inc. | 1.2% | |||
Incyte Corp. | 1.1% | |||
Booking Holdings, Inc. | 1.1% | |||
Medtronic plc | 1.1% | |||
Mastercard, Inc. - Class A | 1.1% | |||
Visa, Inc. - Class A | 1.0% | |||
Microsoft Corp. | 1.0% | |||
Anheuser-Busch InBev S.A./N.V. (Belgium) | 1.0% | |||
Novartis AG - ADR (Switzerland) | 1.0% | |||
Tencent Holdings Ltd. - Class H (China) | 0.8% | |||
| 5As a percentage of total investments. |
| |||
25
Investment Portfolio - October 31, 2018
| BLENDED ASSET MODERATE SERIES | SHARES | VALUE (NOTE 2) | ||||||
COMMON STOCKS - 37.1% | ||||||||
Communication Services - 3.3% | ||||||||
Diversified Telecommunication Services - 0.6% | ||||||||
Orange S.A. (France) | 485 | $ | 7,570 | |||||
Telefonica Brasil S.A. (Brazil) | 500 | 5,789 | ||||||
Zayo Group Holdings, Inc.* | 21,540 | 643,615 | ||||||
|
| |||||||
| 656,974 | ||||||||
|
| |||||||
Entertainment - 0.6% | ||||||||
Electronic Arts, Inc.*1 | 6,610 | 601,378 | ||||||
NetEase, Inc. - ADR (China) | 95 | 19,746 | ||||||
Nexon Co. Ltd. (Japan)* | 1,730 | 19,735 | ||||||
Toho Co. Ltd. -Tokyo (Japan) | 300 | 9,788 | ||||||
Vivendi S.A. (France) | 240 | 5,788 | ||||||
|
| |||||||
| 656,435 | ||||||||
|
| |||||||
Interactive Media & Services - 1.7% | ||||||||
Alphabet, Inc. - Class A* | 390 | 425,326 | ||||||
Alphabet, Inc. - Class C* | 590 | 635,293 | ||||||
Tencent Holdings Ltd. - Class H (China) | 27,053 | 926,816 | ||||||
|
| |||||||
| 1,987,435 | ||||||||
|
| |||||||
Media - 0.4% | ||||||||
Hakuhodo DY Holdings, Inc. (Japan) | 600 | 10,007 | ||||||
Quebecor, Inc. - Class B (Canada) | 11,650 | 228,496 | ||||||
Shaw Communications, Inc. - Class B (Canada) | 12,355 | 230,029 | ||||||
|
| |||||||
| 468,532 | ||||||||
|
| |||||||
Wireless Telecommunication Services - 0.0%## | ||||||||
KDDI Corp. (Japan) | 900 | 21,780 | ||||||
NTT DOCOMO, Inc. (Japan) | 800 | 19,839 | ||||||
|
| |||||||
| 41,619 | ||||||||
|
| |||||||
Total Communication Services | 3,810,995 | |||||||
|
| |||||||
Consumer Discretionary - 3.7% | ||||||||
Auto Components - 0.0%## | ||||||||
Nemak S.A.B. de C.V. (Mexico)2 | 21,100 | 15,238 | ||||||
NGK Spark Plug Co. Ltd. (Japan) | 500 | 10,118 | ||||||
|
| |||||||
| 25,356 | ||||||||
|
| |||||||
Automobiles - 0.1% | ||||||||
Geely Automobile Holdings Ltd. (China) | 9,000 | 17,343 | ||||||
Isuzu Motors Ltd. (Japan) | 800 | 10,488 | ||||||
Peugeot S.A. (France) | 125 | 2,971 | ||||||
Renault S.A. (France) | 60 | 4,480 | ||||||
Suzuki Motor Corp. (Japan) | 500 | 24,933 | ||||||
|
| |||||||
| 60,215 | ||||||||
|
| |||||||
Diversified Consumer Services - 0.1% | ||||||||
China Maple Leaf Educational Systems Ltd. (China) | 26,000 | 11,284 | ||||||
China Yuhua Education Corp. Ltd. (China)2 | 40,000 | 16,129 | ||||||
Fu Shou Yuan International Group Ltd. (China) | 33,000 | 25,361 | ||||||
New Oriental Education & Technology Group, Inc. - ADR (China)* | 395 | 23,111 | ||||||
TAL Education Group - ADR (China)* | 305 | 8,839 | ||||||
Wisdom Education International Holdings Co. Ltd. (China) | 26,000 | 11,701 | ||||||
|
| |||||||
| 96,425 | ||||||||
|
| |||||||
Hotels, Restaurants & Leisure - 0.0%## | ||||||||
Accor S.A. (France) | 515 | 23,531 | ||||||
Basic-Fit N.V. (Netherlands)*2 | 520 | 14,972 | ||||||
|
| |||||||
| 38,503 | ||||||||
|
| |||||||
Household Durables - 0.0%## | ||||||||
Sekisui Chemical Co. Ltd. (Japan) | 700 | 11,008 | ||||||
Techtronic Industries Co. Ltd. (Hong Kong) | 2,500 | 11,772 | ||||||
|
| |||||||
| 22,780 | ||||||||
|
| |||||||
Internet & Direct Marketing Retail - 2.1% | ||||||||
Alibaba Group Holding Ltd. - ADR (China)* | 4,990 | 709,981 | ||||||
Amazon.com, Inc.* | 240 | 383,522 | ||||||
Booking Holdings, Inc.* | 700 | 1,312,206 | ||||||
Despegar.com Corp. (Argentina)* | 430 | 6,910 | ||||||
|
| |||||||
| 2,412,619 | ||||||||
|
| |||||||
Leisure Products - 0.1% | ||||||||
Bandai Namco Holdings, Inc. (Japan) | 600 | 21,345 | ||||||
Yamaha Corp. (Japan) | 500 | 21,972 | ||||||
|
| |||||||
| 43,317 | ||||||||
|
| |||||||
Multiline Retail - 0.0%## | ||||||||
El Puerto de Liverpool SAB de C.V. (Mexico) | 1,440 | 9,145 | ||||||
Lojas Americanas S.A. (Brazil) | 1,000 | 5,001 | ||||||
Lojas Renner S.A. (Brazil) | 630 | 6,379 | ||||||
Magazine Luiza S.A. (Brazil) | 100 | 4,525 | ||||||
Next plc (United Kingdom) | 155 | 10,297 | ||||||
|
| |||||||
| 35,347 | ||||||||
|
| |||||||
The accompanying notes are an integral part of the financial statements.
26
Investment Portfolio - October 31, 2018
| BLENDED ASSET MODERATE SERIES | SHARES | VALUE (NOTE 2) | ||||||
COMMON STOCKS (continued) | ||||||||
Consumer Discretionary (continued) | ||||||||
Specialty Retail - 0.5% | ||||||||
Industria de Diseno Textil S.A. (Spain) | 18,100 | $ | 510,140 | |||||
Nitori Holdings Co. Ltd. (Japan) | 100 | 13,057 | ||||||
USS Co. Ltd. (Japan) | 600 | 10,819 | ||||||
|
| |||||||
| 534,016 | ||||||||
|
| |||||||
Textiles, Apparel & Luxury Goods - 0.8% | ||||||||
ANTA Sports Products Ltd. (China) | 4,000 | 16,514 | ||||||
Burberry Group plc (United Kingdom) | 465 | 10,760 | ||||||
Hermes International (France) | 20 | 11,418 | ||||||
Kering S.A. (France) | 20 | 8,890 | ||||||
lululemon athletica, Inc.* | 6,200 | 872,526 | ||||||
LVMH Moet Hennessy Louis Vuitton SE (France) | 70 | 21,238 | ||||||
Moncler S.p.A (Italy) | 305 | 10,592 | ||||||
|
| |||||||
| 951,938 | ||||||||
|
| |||||||
Total Consumer Discretionary | 4,220,516 | |||||||
|
| |||||||
Consumer Staples - 5.1% | ||||||||
Beverages - 3.0% | ||||||||
Ambev S.A. - ADR (Brazil) | 113,415 | 491,086 | ||||||
Ambev S.A. (Brazil) | 3,600 | 15,710 | ||||||
Anheuser-Busch InBev S.A./N.V. (Belgium) | 15,230 | 1,126,425 | ||||||
The Coca-Cola Co. | 9,620 | 460,606 | ||||||
Diageo plc (United Kingdom) | 25,810 | 892,291 | ||||||
Fomento Economico Mexicano SAB de C.V. (Mexico) | 1,100 | 9,370 | ||||||
PepsiCo, Inc. | 4,070 | 457,387 | ||||||
Pernod Ricard S.A. (France) | 60 | 9,149 | ||||||
Treasury Wine Estates Ltd. (Australia) | 3,230 | 34,766 | ||||||
|
| |||||||
| 3,496,790 | ||||||||
|
| |||||||
Food & Staples Retailing - 0.1% | ||||||||
Atacadao Distribuicao Comercio e Industria Ltda. (Brazil) | 1,200 | 4,892 | ||||||
Matsumotokiyoshi Holdings Co. Ltd. (Japan) | 400 | 14,462 | ||||||
Tsuruha Holdings, Inc. (Japan) | 100 | 10,437 | ||||||
Wal-Mart de Mexico S.A.B. de C.V. (Mexico) | 7,100 | 18,154 | ||||||
Wesfarmers Ltd. (Australia) | 325 | 10,763 | ||||||
|
| |||||||
| 58,708 | ||||||||
|
| |||||||
Food Products - 1.2% | ||||||||
Barry Callebaut AG (Switzerland) | 5 | 9,773 | ||||||
Chocoladefabriken Lindt & Spruengli AG (Switzerland) | 3 | 20,683 | ||||||
Danone S.A. (France) | 605 | 42,842 | ||||||
Grupo Bimbo S.A.B. de C.V. - Series A(Mexico) | 3,935 | 7,357 | ||||||
Kerry Group plc - Class A (Ireland) | 300 | 30,700 | ||||||
Kikkoman Corp. (Japan) | 400 | 21,915 | ||||||
Mondelez International, Inc. - Class A | 15,875 | 666,432 | ||||||
Nestle S.A. (Switzerland) | 6,590 | 556,348 | ||||||
|
| |||||||
| 1,356,050 | ||||||||
|
| |||||||
Household Products - 0.0%## | ||||||||
Henkel AG & Co. KGaA (Germany) | 105 | 10,286 | ||||||
Kimberly-Clark de Mexico S.A.B. de C.V. - Class A (Mexico) | 9,900 | 14,265 | ||||||
Lion Corp. (Japan) | 800 | 15,041 | ||||||
|
| |||||||
| 39,592 | ||||||||
|
| |||||||
Personal Products - 0.8% | ||||||||
Beiersdorf AG (Germany) | 425 | 43,944 | ||||||
Kao Corp. (Japan) | 200 | 13,304 | ||||||
Kobayashi Pharmaceutical Co. Ltd. (Japan) | 200 | 13,044 | ||||||
L’Oreal S.A. (France) | 100 | 22,531 | ||||||
Unilever plc - ADR (United Kingdom) | 14,755 | 781,720 | ||||||
|
| |||||||
| 874,543 | ||||||||
|
| |||||||
Tobacco - 0.0%## | ||||||||
British American Tobacco plc - ADR (United Kingdom) | 570 | 24,738 | ||||||
KT&G Corp. (South Korea) | 120 | 10,701 | ||||||
Swedish Match AB (Sweden) | 215 | 10,952 | ||||||
|
| |||||||
| 46,391 | ||||||||
|
| |||||||
Total Consumer Staples | 5,872,074 | |||||||
|
| |||||||
Energy - 2.0% | ||||||||
Energy Equipment & Services - 1.7% | ||||||||
Core Laboratories N.V | 175 | 14,917 | ||||||
Diamond Offshore Drilling, Inc.* | 17,630 | 249,993 | ||||||
Ensco plc - Class A | 40,035 | 285,850 | ||||||
Schlumberger Ltd.1 | 17,615 | 903,826 | ||||||
Transocean Ltd.* | 41,350 | 455,264 | ||||||
|
| |||||||
| 1,909,850 | ||||||||
|
| |||||||
Oil, Gas & Consumable Fuels - 0.3% | ||||||||
Cameco Corp. (Canada) | 1,315 | 14,096 | ||||||
Canadian Natural Resources Ltd. (Canada) | 800 | 21,950 | ||||||
The accompanying notes are an integral part of the financial statements.
27
Investment Portfolio - October 31, 2018
| BLENDED ASSET MODERATE SERIES | SHARES | VALUE (NOTE 2) | ||||||
COMMON STOCKS (continued) | ||||||||
Energy (continued) | ||||||||
Oil, Gas & Consumable Fuels (continued) | ||||||||
China Petroleum & Chemical Corp. - Class H (China) | 28,000 | $ | 22,808 | |||||
Eni S.p.A. (Italy) | 1,285 | 22,821 | ||||||
Galp Energia SGPS S.A. (Portugal) | 2,585 | 44,948 | ||||||
Repsol S.A. (Spain) | 2,160 | 38,597 | ||||||
Royal Dutch Shell plc - Class B - ADR (Netherlands) | 705 | 46,326 | ||||||
SK Innovation Co. Ltd. (South Korea) | 95 | 17,829 | ||||||
Suncor Energy, Inc. (Canada) | 620 | 20,798 | ||||||
TOTAL S.A. (France) | 645 | 37,845 | ||||||
Vermilion Energy, Inc. (Canada) | 830 | 22,010 | ||||||
Woodside Petroleum Ltd. (Australia) . | 940 | 23,143 | ||||||
|
| |||||||
| 333,171 | ||||||||
|
| |||||||
Total Energy | 2,243,021 | |||||||
|
| |||||||
Financials - 2.5% | ||||||||
Banks - 0.3% | ||||||||
Banco Bradesco S.A. (Brazil) | 1,700 | 15,577 | ||||||
Banco Comercial Portugues S.A. (Portugal)* | 59,645 | 16,044 | ||||||
Banco do Brasil S.A. (Brazil) | 700 | 8,022 | ||||||
Banco Santander Brasil S.A. (Brazil) | 600 | 6,804 | ||||||
The Bank Of N.T. Butterfield & Son Ltd. (Bermuda) | 340 | 13,699 | ||||||
Bankia S.A. (Spain) | 7,185 | 22,568 | ||||||
Bankinter S.A. (Spain) | 2,885 | 23,637 | ||||||
BNP Paribas S.A. (France) | 305 | 15,895 | ||||||
CaixaBank S.A. (Spain) | 9,510 | 38,484 | ||||||
Credit Agricole S.A. (France) | 350 | 4,483 | ||||||
Erste Group Bank AG (Austria) | 375 | 15,265 | ||||||
FinecoBank Banca Fineco S.p.A. (Italy) | 3,090 | 32,295 | ||||||
Itau Unibanco Holding S.A. (Brazil) | 1,200 | 15,845 | ||||||
Itausa - Investimentos Itau S.A. (Brazil) | 2,500 | 7,524 | ||||||
Jyske Bank A/S (Denmark) | 335 | 13,678 | ||||||
KBC Group N.V. (Belgium) | 220 | 15,161 | ||||||
Societe Generale S.A. (France) | 200 | 7,332 | ||||||
Sydbank A/S (Denmark) | 490 | 11,318 | ||||||
|
| |||||||
| 283,631 | ||||||||
|
| |||||||
Capital Markets - 1.8% | ||||||||
B3 S.A. - Brasil Bolsa Balcao (Brazil) | 1,100 | 7,889 | ||||||
BlackRock, Inc | 1,590 | 654,157 | ||||||
Cboe Global Markets, Inc | 2,160 | 243,756 | ||||||
The Charles Schwab Corp | 9,455 | 437,199 | ||||||
CME Group, Inc | 1,230 | 225,385 | ||||||
E*TRADE Financial Corp | 4,360 | 215,471 | ||||||
Intercontinental Exchange, Inc | 2,990 | 230,350 | ||||||
Japan Exchange Group, Inc. (Japan) | 900 | 16,120 | ||||||
Julius Baer Group Ltd. (Switzerland) | 1,280 | 58,374 | ||||||
|
| |||||||
| 2,088,701 | ||||||||
|
| |||||||
Diversified Financial Services - 0.4% | ||||||||
Berkshire Hathaway, Inc. - Class B* | 2,090 | 429,035 | ||||||
|
| |||||||
Insurance - 0.0%## | ||||||||
Admiral Group plc (United Kingdom) | 415 | 10,668 | ||||||
AXA S.A. (France) | 535 | 13,389 | ||||||
BB Seguridade Participacoes S.A. (Brazil) | 800 | 5,725 | ||||||
|
| |||||||
| 29,782 | ||||||||
|
| |||||||
Thrifts & Mortgage Finance - 0.0%## | ||||||||
Aareal Bank AG (Germany) | 405 | 15,066 | ||||||
|
| |||||||
Total Financials | 2,846,215 | |||||||
|
| |||||||
Health Care - 7.9% | ||||||||
Biotechnology - 3.0% | ||||||||
BioMarin Pharmaceutical, Inc.* | 7,215 | 665,007 | ||||||
Incyte Corp.* | 20,320 | 1,317,142 | ||||||
Regeneron Pharmaceuticals, Inc.* | 1,675 | 568,227 | ||||||
Seattle Genetics, Inc.* | 10,380 | 582,629 | ||||||
Vertex Pharmaceuticals, Inc.* | 1,855 | 314,348 | ||||||
|
| |||||||
| 3,447,353 | ||||||||
|
| |||||||
Health Care Equipment & Supplies - 1.2% | ||||||||
Coloplast A/S - Class B (Denmark) | 220 | 20,529 | ||||||
EssilorLuxottica (France) | 150 | 20,487 | ||||||
Hoya Corp. (Japan) | 200 | 11,315 | ||||||
Medtronic plc | 13,790 | 1,238,618 | ||||||
Shandong Weigao Group Medical Polymer Co. Ltd. - Class H (China) | 16,000 | 14,332 | ||||||
Smith & Nephew plc (United Kingdom) | 640 | 10,403 | ||||||
Sonova Holding AG (Switzerland) | 65 | 10,600 | ||||||
Terumo Corp. (Japan) | 400 | 21,593 | ||||||
William Demant Holding A/S (Denmark)* | 320 | 10,519 | ||||||
|
| |||||||
| 1,358,396 | ||||||||
|
| |||||||
Health Care Providers & Services - 0.6% | ||||||||
DaVita, Inc.* | 10,240 | 689,562 | ||||||
|
| |||||||
The accompanying notes are an integral part of the financial statements.
28
Investment Portfolio - October 31, 2018
| BLENDED ASSET MODERATE SERIES | SHARES | VALUE (NOTE 2) | ||||||
COMMON STOCKS (continued) | ||||||||
Health Care (continued) | ||||||||
Life Sciences Tools & Services - 0.0%## | ||||||||
QIAGEN N.V.* | 360 | $ | 13,068 | |||||
QIAGEN N.V.* | 520 | 18,875 | ||||||
Tecan Group AG (Switzerland) | 35 | 7,896 | ||||||
|
| |||||||
| 39,839 | ||||||||
|
| |||||||
Pharmaceuticals - 3.1% | ||||||||
Astellas Pharma, Inc. (Japan) | 700 | 10,815 | ||||||
Bristol-Myers Squibb Co.1 | 8,710 | 440,203 | ||||||
Chugai Pharmaceutical Co. Ltd. (Japan) | 400 | 23,419 | ||||||
Johnson & Johnson | 6,220 | 870,738 | ||||||
Merck & Co., Inc. | 7,410 | 545,450 | ||||||
Merck KGaA (Germany) | 4,455 | 476,697 | ||||||
Novartis AG - ADR (Switzerland) | 12,575 | 1,099,810 | ||||||
Novartis AG (Switzerland) | 460 | 40,283 | ||||||
Novo Nordisk A/S - Class B (Denmark) | 240 | 10,365 | ||||||
Perrigo Co. plc | 555 | 39,016 | ||||||
Sanofi (France) | 280 | 25,021 | ||||||
|
| |||||||
| 3,581,817 | ||||||||
|
| |||||||
Total Health Care | 9,116,967 | |||||||
|
| |||||||
Industrials - 1.8% | ||||||||
Aerospace & Defense - 0.1% | ||||||||
Airbus S.E. (France) | 150 | 16,577 | ||||||
BAE Systems plc (United Kingdom) . | 3,830 | 25,681 | ||||||
MTU Aero Engines AG (Germany) | 50 | 10,617 | ||||||
Safran S.A. (France) | 85 | 10,984 | ||||||
Thales S.A. (France) | 25 | 3,193 | ||||||
|
| |||||||
| 67,052 | ||||||||
|
| |||||||
Air Freight & Logistics - 0.6% | ||||||||
FedEx Corp.1 | 3,070 | 676,444 | ||||||
|
| |||||||
Airlines - 0.0%## | ||||||||
Ryanair Holdings plc - ADR (Ireland)* | 155 | 12,834 | ||||||
|
| |||||||
Building Products - 0.0%## | ||||||||
Cie de Saint-Gobain (France) | 120 | 4,521 | ||||||
TOTO Ltd. (Japan) | 300 | 10,733 | ||||||
|
| |||||||
| 15,254 | ||||||||
|
| |||||||
Commercial Services & Supplies - 0.0%## | ||||||||
China Everbright International Ltd. (China) | 1,296 | 1,037 | ||||||
Secom Co. Ltd. (Japan) | 100 | 8,187 | ||||||
|
| |||||||
| 9,224 | ||||||||
|
| |||||||
Construction & Engineering - 0.0%## | ||||||||
FLSmidth & Co. A/S (Denmark) | 60 | 3,148 | ||||||
Vinci S.A. (France) | 430 | 38,270 | ||||||
|
| |||||||
| 41,418 | ||||||||
|
| |||||||
Electrical Equipment - 0.0%## | ||||||||
Schneider Electric SE (France) | 145 | 10,485 | ||||||
|
| |||||||
Industrial Conglomerates - 0.0%## | ||||||||
Siemens AG (Germany) | 260 | 29,886 | ||||||
|
| |||||||
Machinery - 0.2% | ||||||||
Epiroc AB - Class A (Sweden)* | 2,100 | 18,441 | ||||||
FANUC Corp. (Japan) | 100 | 17,397 | ||||||
Hoshizaki Corp. (Japan) | 200 | 16,144 | ||||||
Hyundai Heavy Industries Co. Ltd. (South Korea)* | 145 | 15,950 | ||||||
Hyundai Mipo Dockyard Co. Ltd. (South Korea)* | 190 | 15,759 | ||||||
Jungheinrich AG (Germany) | 455 | 15,075 | ||||||
KION Group AG (Germany) | 395 | 23,082 | ||||||
Kone OYJ - Class B (Finland) | 215 | 10,465 | ||||||
Makita Corp. (Japan) | 300 | 10,372 | ||||||
Metso OYJ (Finland) | 585 | 18,469 | ||||||
MISUMI Group, Inc. (Japan) | 500 | 10,020 | ||||||
Samsung Heavy Industries Co. Ltd. (South Korea)* | 1,275 | 7,822 | ||||||
Schindler Holding AG (Switzerland) | 105 | 22,141 | ||||||
WEG S.A. (Brazil) | 1,000 | 4,839 | ||||||
The Weir Group plc (United Kingdom) | 2,180 | 44,116 | ||||||
|
| |||||||
| 250,092 | ||||||||
|
| |||||||
Professional Services - 0.4% | ||||||||
Equifax, Inc. | 4,150 | 420,976 | ||||||
Experian plc (United Kingdom) | 455 | 10,465 | ||||||
Recruit Holdings Co. Ltd. (Japan) | 900 | 24,156 | ||||||
Teleperformance (France) | 60 | 9,881 | ||||||
Wolters Kluwer N.V. (Netherlands) | 175 | 9,928 | ||||||
|
| |||||||
| 475,406 | ||||||||
|
| |||||||
Road & Rail - 0.4% | ||||||||
Canadian National Railway Co. (Canada) | 130 | 11,113 | ||||||
Genesee & Wyoming, Inc. - Class A* | 5,640 | 446,857 | ||||||
|
| |||||||
| 457,970 | ||||||||
|
| |||||||
Trading Companies & Distributors - 0.1% | ||||||||
Ashtead Group plc (United Kingdom) | 620 | 15,307 | ||||||
Brenntag AG (Germany) | 250 | 13,056 | ||||||
The accompanying notes are an integral part of the financial statements.
29
Investment Portfolio - October 31, 2018
| BLENDED ASSET MODERATE SERIES | SHARES | VALUE (NOTE 2) | ||||||
COMMON STOCKS (continued) | ||||||||
Industrials (continued) | ||||||||
Trading Companies & Distributors (continued) | ||||||||
Kanamoto Co. Ltd. (Japan) | 500 | $ | 16,708 | |||||
|
| |||||||
| 45,071 | ||||||||
|
| |||||||
Transportation Infrastructure - 0.0%## | ||||||||
Grupo Aeroportuario del Centro Norte S.A.B. de C.V. (Mexico) | 1,800 | 9,427 | ||||||
Grupo Aeroportuario del Pacifico S.A.B. de C.V. - ADR (Mexico) | 105 | 8,702 | ||||||
|
| |||||||
| 18,129 | ||||||||
|
| |||||||
Total Industrials | 2,109,265 | |||||||
|
| |||||||
Information Technology - 6.3% | ||||||||
Electronic Equipment, Instruments & Components -0.1% | ||||||||
Halma plc (United Kingdom) | 930 | 15,784 | ||||||
Hexagon A.B. - Class B (Sweden) | 465 | 22,759 | ||||||
Keyence Corp. (Japan) | 100 | 48,852 | ||||||
Yokogawa Electric Corp. (Japan) | 500 | 9,817 | ||||||
|
| |||||||
| 97,212 | ||||||||
|
| |||||||
IT Services - 3.2% | ||||||||
Amadeus IT Group S.A. (Spain) | 130 | 10,468 | ||||||
Amdocs Ltd. | 730 | 46,187 | ||||||
Capgemini SE (France) | 40 | 4,884 | ||||||
InterXion Holding N.V. (Netherlands)* | 8,445 | 497,157 | ||||||
LiveRamp Holdings, Inc.* | 14,040 | 641,347 | ||||||
Mastercard, Inc. - Class A | 6,220 | 1,229,507 | ||||||
Nomura Research Institute Ltd. (Japan) | 500 | 22,167 | ||||||
Obic Co. Ltd. (Japan) | 300 | 27,312 | ||||||
Otsuka Corp. (Japan) | 300 | 9,951 | ||||||
Visa, Inc. - Class A | 8,650 | 1,192,402 | ||||||
|
| |||||||
| 3,681,382 | ||||||||
|
| |||||||
Semiconductors & Semiconductor Equipment - 1.6% | ||||||||
Qorvo, Inc.* | 18,510 | 1,360,670 | ||||||
Skyworks Solutions, Inc. | 5,320 | 461,563 | ||||||
|
| |||||||
| 1,822,233 | ||||||||
|
| |||||||
Software - 1.4% | ||||||||
Check Point Software Technologies Ltd. (Israel)* | 195 | 21,645 | ||||||
Dassault Systemes S.E. (France) | 35 | 4,381 | ||||||
Microsoft Corp. | 11,090 | 1,184,523 | ||||||
Oracle Corp. (Japan) | 200 | 13,538 | ||||||
SAP SE (Germany) | 100 | 10,707 | ||||||
ServiceNow, Inc.* | 2,375 | 429,970 | ||||||
Trend Micro, Inc. (Japan) | 400 | 23,026 | ||||||
|
| |||||||
| 1,687,790 | ||||||||
|
| |||||||
Total Information Technology | 7,288,617 | |||||||
|
| |||||||
Materials - 1.6% | ||||||||
Chemicals - 0.2% | ||||||||
Air Liquide S.A. (France) | 110 | 13,297 | ||||||
Akzo Nobel N.V. (Netherlands) | 460 | 38,624 | ||||||
Asahi Kasei Corp. (Japan) | 900 | 10,799 | ||||||
Croda International plc (United Kingdom) | 366 | 22,544 | ||||||
FUCHS PETROLUB S.E. (Germany) | 9 | 417 | ||||||
Givaudan S.A. (Switzerland) | 5 | 12,120 | ||||||
Mexichem S.A.B. de C.V. (Mexico) | 6,950 | 18,178 | ||||||
Nissan Chemical Corp. (Japan) | 200 | 9,430 | ||||||
Novozymes A/S - Class B (Denmark) | 220 | 10,865 | ||||||
Solvay S.A. (Belgium) | 315 | 35,881 | ||||||
|
| |||||||
| 172,155 | ||||||||
|
| |||||||
Containers & Packaging - 1.3% | ||||||||
Ball Corp | 20,260 | 907,648 | ||||||
DS Smith plc (United Kingdom) | 4,627 | 23,216 | ||||||
Sealed Air Corp. | 17,590 | 569,212 | ||||||
|
| |||||||
| 1,500,076 | ||||||||
|
| |||||||
Metals & Mining - 0.1% | ||||||||
Antofagasta plc (Chile) | 3,760 | 37,637 | ||||||
First Quantum Minerals Ltd. (Zambia) | 2,415 | 24,105 | ||||||
Lundin Mining Corp. (Chile) | 5,380 | 22,109 | ||||||
Southern Copper Corp. (Peru) | 605 | 23,196 | ||||||
|
| |||||||
| 107,047 | ||||||||
|
| |||||||
Total Materials | 1,779,278 | |||||||
|
| |||||||
Real Estate - 2.9% | ||||||||
Equity Real Estate Investment Trusts (REITS) - 2.9% | ||||||||
Acadia Realty Trust | 365 | 10,164 | ||||||
Agree Realty Corp. | 205 | 11,740 | ||||||
Alexandria Real Estate Equities Inc. | 85 | 10,390 | ||||||
American Campus Communities Inc. | 270 | 10,668 | ||||||
American Homes 4 Rent - Class A | 1,935 | 40,770 | ||||||
American Tower Corp. | 2,975 | 463,535 | ||||||
Americold Realty Trust | 365 | 9,034 | ||||||
Apartment Investment & Management Co. - Class A | 735 | 31,634 | ||||||
The accompanying notes are an integral part of the financial statements.
30
Investment Portfolio - October 31, 2018
| BLENDED ASSET MODERATE SERIES | SHARES | VALUE (NOTE 2) | ||||||
COMMON STOCKS (continued) | ||||||||
Real Estate (continued) | ||||||||
Equity Real Estate Investment Trusts (REITS) (continued) | ||||||||
Apple Hospitality REIT, Inc. | 1,040 | $ | 16,817 | |||||
AvalonBay Communities, Inc. | 450 | 78,921 | ||||||
Boston Properties, Inc. | 505 | 60,984 | ||||||
Brandywine Realty Trust | 2,505 | 35,220 | ||||||
CatchMark Timber Trust, Inc. - Class A | 1,277 | 11,301 | ||||||
Chesapeake Lodging Trust | 545 | 16,018 | ||||||
Colony Capital, Inc. | 2,270 | 13,325 | ||||||
Community Healthcare Trust, Inc. | 615 | 18,278 | ||||||
CoreCivic, Inc. | 1,215 | 27,289 | ||||||
Cousins Properties, Inc. | 4,370 | 36,315 | ||||||
Crown Castle International Corp. | 275 | 29,904 | ||||||
CubeSmart | 290 | 8,404 | ||||||
Digital Realty Trust, Inc. | 510 | 52,663 | ||||||
EastGroup Properties, Inc. | 90 | 8,621 | ||||||
Equinix, Inc. | 1,625 | 615,452 | ||||||
Equity LifeStyle Properties, Inc. | 225 | 21,305 | ||||||
Equity Residential | 985 | 63,986 | ||||||
Essex Property Trust, Inc. | 165 | 41,379 | ||||||
Extra Space Storage, Inc. | 230 | 20,714 | ||||||
Federal Realty Investment Trust | 80 | 9,924 | ||||||
First Industrial Realty Trust, Inc. | 520 | 15,964 | ||||||
Getty Realty Corp. | 605 | 16,232 | ||||||
HCP, Inc. | 1,155 | 31,820 | ||||||
Healthcare Realty Trust, Inc. | 725 | 20,198 | ||||||
Healthcare Trust of America, Inc. - Class A | 830 | 21,796 | ||||||
Hibernia REIT plc (Ireland) | 11,455 | 18,034 | ||||||
Host Hotels & Resorts, Inc. | 2,150 | 41,086 | ||||||
Independence Realty Trust, Inc. | 1,865 | 18,482 | ||||||
Invitation Homes, Inc. | 1,685 | 36,868 | ||||||
Jernigan Capital, Inc. | 1,050 | 20,548 | ||||||
Kimco Realty Corp | 960 | 15,446 | ||||||
Lamar Advertising Co. - Class A | 185 | 13,564 | ||||||
Lexington Realty Trust | 1,920 | 14,918 | ||||||
Liberty Property Trust | 820 | 34,333 | ||||||
The Macerich Co. | 145 | 7,485 | ||||||
Mid-America Apartment Communities, Inc. | 340 | 33,221 | ||||||
National Retail Properties, Inc. | 360 | 16,830 | ||||||
National Storage Affiliates Trust | 315 | 8,388 | ||||||
Outfront Media, Inc. | 575 | 10,189 | ||||||
Physicians Realty Trust | 2,535 | 42,030 | ||||||
Plymouth Industrial REIT, Inc. | 765 | 10,710 | ||||||
Prologis, Inc. | 1,260 | 81,232 | ||||||
Public Storage | 250 | 51,368 | ||||||
Realty Income Corp. | 175 | 10,547 | ||||||
SBA Communications Corp.* | 2,850 | 462,184 | ||||||
Simon Property Group, Inc. | 615 | 112,865 | ||||||
STAG Industrial, Inc. | 815 | 21,565 | ||||||
STORE Capital Corp. | 350 | 10,160 | ||||||
Sun Communities, Inc. | 430 | 43,202 | ||||||
Sunstone Hotel Investors, Inc | 1,705 | 24,671 | ||||||
Tier REIT, Inc. | 1,555 | 33,697 | ||||||
UDR, Inc. | 1,050 | 41,150 | ||||||
UMH Properties, Inc. | 790 | 11,321 | ||||||
Unibail-Rodamco-Westfield (France) | 245 | 44,335 | ||||||
Urban Edge Properties | 1,745 | 35,755 | ||||||
Ventas, Inc. | 335 | 19,443 | ||||||
VEREIT, Inc. | 3,770 | 27,634 | ||||||
Vornado Realty Trust | 575 | 39,146 | ||||||
Weingarten Realty Investors | 905 | 25,449 | ||||||
Welltower, Inc. | 405 | 26,758 | ||||||
|
| |||||||
| 3,345,379 | ||||||||
|
| |||||||
Real Estate Management & Development - 0.0%## | ||||||||
Daito Trust Construction Co. Ltd. (Japan) | 100 | 13,184 | ||||||
StorageVault Canada, Inc. (Canada) | 2,770 | 5,429 | ||||||
|
| |||||||
| 18,613 | ||||||||
|
| |||||||
Total Real Estate | 3,363,992 | |||||||
|
| |||||||
Utilities - 0.0%## | ||||||||
Independent Power and Renewable Electricity Producers - 0.0%## | ||||||||
China Longyuan Power Group Corp. Ltd. - Class H (China) | 6,000 | 4,566 | ||||||
Engie Brasil Energia S.A. (Brazil) | 400 | 4,278 | ||||||
Huaneng Renewables Corp. Ltd. - Class H (China) | 43,767 | 11,265 | ||||||
|
| |||||||
| 20,109 | ||||||||
|
| |||||||
Multi-Utilities - 0.0%## | ||||||||
Engie S.A. (France) | 460 | 6,112 | ||||||
|
| |||||||
Water Utilities - 0.0%## | ||||||||
Guangdong Investment Ltd. (China) | 12,000 | 21,483 | ||||||
|
| |||||||
Total Utilities | 47,704 | |||||||
|
| |||||||
TOTAL COMMON STOCKS (Identified Cost $43,143,556) | 42,698,644 | |||||||
|
| |||||||
The accompanying notes are an integral part of the financial statements.
31
Investment Portfolio - October 31, 2018
| BLENDED ASSET MODERATE SERIES | PRINCIPAL AMOUNT3 | VALUE (NOTE 2) | ||||||
CORPORATE BONDS - 15.5% | ||||||||
Non-Convertible Corporate Bonds - 15.5% | ||||||||
Communication Services - 2.0% | ||||||||
Diversified Telecommunication Services - 1.2% | ||||||||
AT&T, Inc., 4.25%, 3/1/2027 | 590,000 | $ | 572,160 | |||||
Verizon Communications, Inc., 5.50%, 3/16/2047 | 800,000 | 833,579 | ||||||
|
| |||||||
| 1,405,739 | ||||||||
|
| |||||||
Media - 0.7% | ||||||||
CCO Holdings LLC - CCO Holdings Capital Corp.2, 5.50%, 5/1/2026 | 35,000 | 34,125 | ||||||
Discovery Communications LLC, 5.20%, 9/20/2047 | 590,000 | 545,683 | ||||||
Telenet Finance Luxembourg Notes S.A.R.L (Belgium)2, 5.50%, 3/1/2028 | 200,000 | 185,500 | ||||||
|
| |||||||
| 765,308 | ||||||||
|
| |||||||
Wireless Telecommunication Services - 0.1% | ||||||||
Hughes Satellite Systems Corp., 5.25%, 8/1/2026 | 60,000 | 57,000 | ||||||
Inmarsat Finance plc (United Kingdom)2, 4.875%, 5/15/2022 | 101,000 | 98,932 | ||||||
Sprint Communications, Inc.2, 9.00%, 11/15/2018 | 12,000 | 12,024 | ||||||
Sprint Communications, Inc.2, 7.00%, 3/1/2020 | 12,000 | 12,435 | ||||||
|
| |||||||
| 180,391 | ||||||||
|
| |||||||
Total Communication Services | 2,351,438 | |||||||
|
| |||||||
Consumer Discretionary - 2.0% | ||||||||
Auto Components - 0.0%## | ||||||||
Techniplas LLC2, 10.00%, 5/1/2020 | 35,000 | 32,900 | ||||||
|
| |||||||
Automobiles - 0.5% | ||||||||
General Motors Co.4, (3 mo. LIBOR US + 0.900%), 3.227%, 9/10/2021 | 580,000 | 579,161 | ||||||
|
| |||||||
Household Durables - 0.2% | ||||||||
Century Communities, Inc., 5.875%, 7/15/2025 | 58,000 | 52,490 | ||||||
LGI Homes, Inc.2, 6.875%, 7/15/2026 | 45,000 | 42,750 | ||||||
Meritage Homes Corp., 5.125%, 6/6/2027 | 25,000 | 22,000 | ||||||
TRI Pointe Group, Inc. - TRI Pointe Homes, Inc., 4.375%, 6/15/2019 | 45,000 | 45,000 | ||||||
TRI Pointe Group, Inc. - TRI Pointe Homes, Inc., 5.875%, 6/15/2024 | 35,000 | 32,681 | ||||||
Weekley Homes LLC - Weekley Finance Corp., 6.00%, 2/1/2023 | 25,000 | 24,000 | ||||||
Weekley Homes LLC - Weekley Finance Corp., 6.625%, 8/15/2025 | 39,000 | 36,855 | ||||||
|
| |||||||
| 255,776 | ||||||||
|
| |||||||
Internet & Direct Marketing Retail - 0.8% | ||||||||
Booking Holdings, Inc., 3.60%, 6/1/2026 | 900,000 | 859,536 | ||||||
|
| |||||||
Multiline Retail - 0.5% | ||||||||
Macy’s Retail Holdings, Inc., 7.00%, 2/15/2028 | 270,000 | 285,124 | ||||||
Macy’s Retail Holdings, Inc., 6.90%, 4/1/2029 | 270,000 | 283,226 | ||||||
|
| |||||||
| 568,350 | ||||||||
|
| |||||||
Total Consumer Discretionary | 2,295,723 | |||||||
|
| |||||||
Consumer Staples - 0.0%## | ||||||||
Food & Staples Retailing - 0.0%## | ||||||||
C&S Group Enterprises LLC2, 5.375%, 7/15/2022 | 25,000 | 24,126 | ||||||
|
| |||||||
Household Products - 0.0%## | ||||||||
First Quality Finance Co., Inc.2, 5.00%, 7/1/2025 | 30,000 | 27,600 | ||||||
|
| |||||||
Total Consumer Staples | 51,726 | |||||||
|
| |||||||
Energy - 3.0% | ||||||||
Energy Equipment & Services - 0.1% | ||||||||
Shelf Drilling Holdings Ltd. (United Arab Emirates)2 , 8.25%, 2/15/2025 | 35,000 | 35,088 | ||||||
TerraForm Power Operating, LLC2, 5.00%, 1/31/2028 | 25,000 | 22,344 | ||||||
|
| |||||||
| 57,432 | ||||||||
|
| |||||||
Oil, Gas & Consumable Fuels - 2.9% | ||||||||
American Midstream Partners LP - American Midstream Finance Corp. 2, 9.50%, 12/15/2021 | 35,000 | 34,300 | ||||||
Boardwalk Pipelines LP1, 5.95%, 6/1/2026 | 820,000 | 856,825 | ||||||
DCP Midstream Operating LP2, 5.35%, 3/15/2020 | 20,000 | 20,225 | ||||||
Dynagas LNG Partners LP - Dynagas Finance, Inc. (Monaco), 6.25%, 10/30/2019. | 44,000 | 43,890 | ||||||
GasLog Ltd. (Monaco), 8.875%, 3/22/2022 | 55,000 | 56,925 | ||||||
Genesis Energy LP - Genesis Energy Finance Corp., 5.625%, 6/15/2024 | 30,000 | 27,150 | ||||||
Jonah Energy LLC - Jonah Energy Finance Corp.2, 7.25%, 10/15/2025 | 60,000 | 47,700 | ||||||
Kinder Morgan Energy Partners LP, 6.95%, 1/15/2038 | 740,000 | 847,596 | ||||||
Rockies Express Pipeline, LLC2, 5.625%, 4/15/2020 | 25,000 | 25,542 | ||||||
Sabine Pass Liquefaction LLC, 5.875%, 6/30/2026 | 810,000 | 859,915 | ||||||
SemGroup Corp., 6.375%, 3/15/2025 | 25,000 | 24,188 | ||||||
Seven Generations Energy Ltd. (Canada)2, 5.375%, 9/30/2025 | 27,000 | 25,178 | ||||||
Southwestern Energy Co.5, 6.20%, 1/23/2025 | 31,000 | 30,148 | ||||||
The accompanying notes are an integral part of the financial statements.
32
Investment Portfolio - October 31, 2018
| BLENDED ASSET MODERATE SERIES | PRINCIPAL AMOUNT3 | VALUE (NOTE 2) | ||||||
CORPORATE BONDS (continued) | ||||||||
Non-Convertible Corporate Bonds (continued) | ||||||||
Energy (continued) | ||||||||
Oil, Gas & Consumable Fuels (continued) | ||||||||
Tallgrass Energy Partners LP - Tallgrass Energy Finance Corp.2, 5.50%, 9/15/2024 | 25,000 | $ | 25,156 | |||||
W&T Offshore, Inc.2, 9.75%, 11/1/2023 | 35,000 | 33,870 | ||||||
The Williams Companies, Inc., 3.75%, 6/15/2027 | 460,000 | 428,324 | ||||||
|
| |||||||
| 3,386,932 | ||||||||
|
| |||||||
Total Energy | 3,444,364 | |||||||
|
| |||||||
Financials - 4.8% | ||||||||
Banks - 2.8% | ||||||||
Bank of America Corp., 4.00%, 1/22/2025 | 890,000 | 866,716 | ||||||
Citigroup, Inc., 8.125%, 7/15/2039 | 610,000 | 851,710 | ||||||
JPMorgan Chase & Co., 6.30%, 4/23/2019 | 860,000 | 873,928 | ||||||
Popular, Inc., 6.125%, 9/14/2023 | 35,000 | 35,413 | ||||||
Santander Holdings USA, Inc., 4.50%, 7/17/2025 | 590,000 | 576,929 | ||||||
|
| |||||||
| 3,204,696 | ||||||||
|
| |||||||
Capital Markets - 0.8% | ||||||||
LPL Holdings, Inc.2, 5.75%, 9/15/2025 | 45,000 | 43,706 | ||||||
Morgan Stanley4, (3 mo. LIBOR US + 1.220%), 3.563%, 5/8/2024 | 860,000 | 869,073 | ||||||
|
| |||||||
| 912,779 | ||||||||
|
| |||||||
Consumer Finance - 0.1% | ||||||||
Ally Financial, Inc., 3.50%, 1/27/2019 | 30,000 | 29,961 | ||||||
Navient Corp., 7.25%, 9/25/2023 | 25,000 | 25,875 | ||||||
SLM Corp., 5.125%, 4/5/2022 | 40,000 | 39,800 | ||||||
|
| |||||||
| 95,636 | ||||||||
|
| |||||||
Diversified Financial Services - 0.6% | ||||||||
AerCap Ireland Capital DAC - AerCap Global Aviation Trust (Ireland), 4.45%, 10/1/2025 | 590,000 | 576,130 | ||||||
FS Energy & Power Fund2, 7.50%, 8/15/2023 | 40,000 | 40,560 | ||||||
Oxford Finance, LLC - Oxford Finance Co.- Issuer II, Inc.2, 6.375%, 12/15/2022 | 40,000 | 40,550 | ||||||
|
| |||||||
| 657,240 | ||||||||
|
| |||||||
Insurance - 0.5% | ||||||||
Prudential Financial, Inc.6, (3 mo. LIBOR US + 4.175%), 5.875%, 9/15/2042 | 550,000 | 572,275 | ||||||
|
| |||||||
Financials (continued) | ||||||||
Thrifts & Mortgage Finance - 0.0%## | ||||||||
Ladder Capital Finance Holdings LLLP - Ladder Capital Finance Corp.2, 5.875%, 8/1/2021 | 25,000 | 25,188 | ||||||
|
| |||||||
Total Financials | 5,467,814 | |||||||
|
| |||||||
Health Care - 0.6% | ||||||||
Health Care Providers & Services - 0.6% | ||||||||
DaVita, Inc., 5.00%, 5/1/2025 | 35,000 | 33,075 | ||||||
Fresenius Medical Care US Finance II, Inc. (Germany)2, 5.625%, 7/31/2019 | 543,000 | 551,472 | ||||||
HCA, Inc., 5.375%, 9/1/2026 | 35,000 | 34,738 | ||||||
Ortho-Clinical Diagnostics, Inc. - Ortho-Clinical Diagnostics S.A.2, 6.625%, 5/15/2022 | 30,000 | 28,829 | ||||||
|
| |||||||
Total Health Care. | 648,114 | |||||||
|
| |||||||
Industrials - 1.8% | ||||||||
Airlines - 0.0%## | ||||||||
Allegiant Travel Co., 5.50%, 7/15/2019 . | 28,000 | 28,140 | ||||||
American Airlines Group, Inc.2, 5.50%, 10/1/2019 | 30,000 | 30,328 | ||||||
|
| |||||||
| 58,468 | ||||||||
|
| |||||||
Commercial Services & Supplies - 0.1% | ||||||||
The ADT Security Corp., 5.25%, 3/15/2020 | 20,000 | 20,200 | ||||||
Covanta Holding Corp., 6.00%, 1/1/2027 | 35,000 | 33,775 | ||||||
W/S Packaging Holdings, Inc.2, 9.00%, 4/15/2023 | 40,000 | 40,800 | ||||||
|
| |||||||
| 94,775 | ||||||||
|
| |||||||
Construction & Engineering - 0.0%## | ||||||||
Tutor Perini Corp.2, 6.875%, 5/1/2025 | 44,000 | 44,055 | ||||||
|
| |||||||
Industrial Conglomerates - 0.4% | ||||||||
General Electric Co.6,7, (3 mo. LIBOR US + 3.330%), 5.00% | 460,000 | 426,075 | ||||||
|
| |||||||
Machinery - 0.5% | ||||||||
CNH Industrial Capital LLC, 3.375%, 7/15/2019 | 580,000 | 579,478 | ||||||
|
| |||||||
Marine - 0.0%## | ||||||||
Global Ship Lease, Inc. (United Kingdom)2, 9.875%, 11/15/2022 | 50,000 | 47,625 | ||||||
|
| |||||||
Trading Companies & Distributors - 0.6% | ||||||||
Aircastle Ltd., 6.25%, 12/1/2019 | 15,000 | 15,416 | ||||||
Fortress Transportation & Infrastructure Investors, LLC2, 6.50%, 10/1/2025 | 30,000 | 29,475 | ||||||
International Lease Finance Corp., 6.25%, 5/15/2019 | 571,000 | 580,107 | ||||||
The accompanying notes are an integral part of the financial statements.
33
Investment Portfolio - October 31, 2018
| BLENDED ASSET MODERATE SERIES | PRINCIPAL AMOUNT3 | VALUE (NOTE 2) | ||||||
CORPORATE BONDS (continued) | ||||||||
Non-Convertible Corporate Bonds (continued) | ||||||||
Industrials (continued) | ||||||||
Trading Companies & Distributors (continued) | ||||||||
Park Aerospace Holdings Ltd. (Ireland)2, 4.50%, 3/15/2023 | 42,000 | $ | 39,958 | |||||
|
| |||||||
| 664,956 | ||||||||
|
| |||||||
Transportation Infrastructure - 0.2% |
| |||||||
Eagle Bulk Shipco, LLC, 8.25%, 11/28/2022 | 200,000 | 205,500 | ||||||
|
| |||||||
Total Industrials | 2,120,932 | |||||||
|
| |||||||
Information Technology - 0.0%## | ||||||||
Semiconductors & Semiconductor Equipment - 0.0%## |
| |||||||
MagnaChip Semiconductor Corp. | ||||||||
(South Korea), 6.625%, 7/15/2021 | 43,000 | 40,420 | ||||||
|
| |||||||
Materials - 0.5% | ||||||||
LSB Industries, Inc.2, 9.625%, 5/1/2023 | 40,000 | 41,500 | ||||||
|
| |||||||
Metals & Mining - 0.5% | ||||||||
Corp Nacional del Cobre de Chile (Chile)2, 5.625%, 9/21/2035 | 375,000 | 397,451 | ||||||
Mountain Province Diamonds, Inc. (Canada)2, 8.00%, 12/15/2022 | 60,000 | 60,900 | ||||||
Northwest Acquisitions ULC - Dominion Finco, Inc.2, 7.125%, 11/1/2022 | 60,000 | 60,411 | ||||||
|
| |||||||
| 518,762 | ||||||||
|
| |||||||
Total Materials. | 560,262 | |||||||
|
| |||||||
Real Estate - 0.7% | ||||||||
Equity Real Estate Investment Trusts (REITS) - 0.7% |
| |||||||
American Homes 4 Rent LP, 4.25%, 2/15/2028 | 610,000 | 576,593 | ||||||
Greystar Real Estate Partners, LLC2, 5.75%, 12/1/2025 | 45,000 | 43,650 | ||||||
GTP Acquisition Partners I LLC2, 2.35%, 6/15/2020 | 92,000 | 89,950 | ||||||
iStar, Inc., 5.25%, 9/15/2022 | 36,000 | 34,830 | ||||||
|
| |||||||
| 745,023 | ||||||||
|
| |||||||
Total Real Estate | 745,023 | |||||||
|
| |||||||
Utilities - 0.1% | ||||||||
Gas Utilities - 0.1% | ||||||||
NGL Energy Partners LP - NGL Energy Finance Corp., 6.125%, 3/1/2025 | 40,000 | 36,400 | ||||||
|
| |||||||
Independent Power and Renewable Electricity Producers - 0.0%## | ||||||||
Clearway Energy Operating, LLC, 5.00%, 9/15/2026 | 25,000 | 23,250 | ||||||
|
| |||||||
Total Utilities | 59,650 | |||||||
|
| |||||||
TOTAL CORPORATE BONDS (Identified Cost $18,368,498) | 17,785,466 | |||||||
|
| |||||||
SHARES/ PRINCIPAL | VALUE (NOTE 2) | |||||||
MUTUAL FUNDS - 0.4% | ||||||||
iShares iBoxx High Yield Corporate Bond ETF | 4,755 | $ | 401,084 | |||||
iShares MSCI Thailand ETF | 710 | 61,557 | ||||||
iShares U.S. Real Estate ETF | 395 | 30,854 | ||||||
|
| |||||||
TOTAL MUTUAL FUNDS | ||||||||
(Identified Cost $503,834) | 493,495 | |||||||
|
| |||||||
U.S. TREASURY SECURITIES - 23.6% | ||||||||
U.S. Treasury Bonds - 6.0% | ||||||||
U.S. Treasury Bond, 6.25%, 5/15/2030 | 872,000 | 1,128,933 | ||||||
U.S. Treasury Bond, 4.75%, 2/15/2037 | 1,466,000 | 1,765,041 | ||||||
U.S. Treasury Bond, 2.50%, 2/15/2045 | 2,027,000 | 1,708,460 | ||||||
U.S. Treasury Bond, 3.00%, 5/15/2047 | 1,852,000 | 1,715,343 | ||||||
U.S. Treasury Inflation Indexed Bond, 0.75%, 2/15/2042 | 633,485 | 562,688 | ||||||
|
| |||||||
Total U.S. Treasury Bonds | ||||||||
(Identified Cost $7,381,071) | 6,880,465 | |||||||
|
| |||||||
U.S. Treasury Notes - 17.6% | ||||||||
U.S. Treasury Inflation Indexed Note, 0.125%, 4/15/2020 | 5,186,991 | 5,098,582 | ||||||
U.S. Treasury Inflation Indexed Note, 0.125%, 1/15/2023 | 609,985 | 587,267 | ||||||
U.S. Treasury Note, 1.625%, 4/30/2019 | 2,385,000 | 2,374,845 | ||||||
U.S. Treasury Note, 1.25%, 7/31/2023 | 3,153,000 | 2,911,845 | ||||||
U.S. Treasury Note, 2.125%, 5/15/2025 | 2,445,000 | 2,308,233 | ||||||
U.S. Treasury Note, 1.625%, 5/15/2026 | 2,583,000 | 2,328,332 | ||||||
U.S. Treasury Note, 2.375%, 5/15/2027 | 2,419,000 | 2,283,215 | ||||||
U.S. Treasury Note, 2.75%, 2/15/2028 | 2,445,000 | 2,366,111 | ||||||
|
| |||||||
Total U.S. Treasury Notes | ||||||||
(Identified Cost $20,553,414) | 20,258,430 | |||||||
|
| |||||||
TOTAL U.S. TREASURY SECURITIES | ||||||||
(Identified Cost $27,934,485) | 27,138,895 | |||||||
|
| |||||||
ASSET-BACKED SECURITIES - 3.7% | ||||||||
CarMax Auto Owner Trust, Series 2017-1, Class A3, 1.98%, 11/15/2021 | 225,000 | 223,019 | ||||||
The accompanying notes are an integral part of the financial statements.
34
Investment Portfolio - October 31, 2018
| BLENDED ASSET MODERATE SERIES | PRINCIPAL AMOUNT3 | VALUE (NOTE 2) | ||||||
ASSET-BACKED SECURITIES (continued) | ||||||||
Cazenovia Creek Funding II LLC, | ||||||||
Series 2018-1A, Class A2, 3.561%, 7/15/2030 | 310,941 | $ | 309,559 | |||||
Chesapeake Funding II LLC, Series 2017-2A, Class A12, 1.99%, 5/15/2029 | 496,771 | 491,711 | ||||||
Chesapeake Funding II LLC, Series 2017-4A, Class A12, 2.12%, 11/15/2029 | 266,585 | 263,034 | ||||||
Colony American Homes, Series 2015-1A, Class A2,4, (1 mo. | ||||||||
LIBOR US + 1.200%), 3.487%, 7/17/2032 | 192,033 | 192,033 | ||||||
Credit Acceptance Auto Loan Trust, Series 2017-1A, Class A2, 2.56%, 10/15/2025 | 255,000 | 253,659 | ||||||
Enterprise Fleet Financing LLC, Series 2017-2, Class A22, 1.97%, 1/20/2023 | 351,241 | 348,573 | ||||||
Invitation Homes Trust, Series 2017-SFR2, Class A2,4, (1 mo. LIBOR US + 0.850%), 3.14%, 12/17/2036 | 89,336 | 89,420 | ||||||
Invitation Homes Trust, Series 2017-SFR2, Class B2,4, (1 mo. LIBOR US + 1.150%), 3.44%, 12/17/2036 | 65,000 | 65,428 | ||||||
SoFi Consumer Loan Program LLC, Series 2016-1, Class A2, 3.26%, 8/25/2025 | 201,415 | 200,814 | ||||||
SoFi Consumer Loan Program LLC, Series 2016-5, Class A2, 3.06%, 9/25/2028 | 196,556 | 195,715 | ||||||
SoFi Professional Loan Program LLC, Series 2016-E, Class A2B2, 2.49%, 1/25/2036 | 430,000 | 419,462 | ||||||
SoFi Professional Loan Program LLC, Series 2017-A, Class A2A2, 1.55%, 3/26/2040 | 63,356 | 62,853 | ||||||
SoFi Professional Loan Program LLC, Series 2017-F, Class A1FX2, 2.05%, 1/25/2041 | 66,693 | 66,001 | ||||||
SoFi Professional Loan Program LLC, Series 2017-F, Class A2FX2, 2.84%, 1/25/2041 | 75,000 | 72,717 | ||||||
SoFi Professional Loan Program LLC, Series 2018-A, Class A2A2, 2.39%, 2/25/2042 | 150,853 | 149,283 | ||||||
SoFi Professional Loan Program LLC, Series 2018-C, Class A1FX2, 3.08%, 1/25/2048 | 389,900 | 388,755 | ||||||
Tricon American Homes Trust, Series 2016-SFR1, Class A2, 2.589%, 11/1/2033 | 229,015 | 220,527 | ||||||
Tricon American Homes Trust, Series 2017-SFR2, Class A2, 2.928%, 1/1/2036 | 239,744 | 228,797 | ||||||
|
| |||||||
TOTAL ASSET-BACKED SECURITIES | ||||||||
(Identified Cost $4,285,506) | 4,241,360 | |||||||
|
| |||||||
COMMERCIAL MORTGAGE-BACKED SECURITIES - 6.0% | ||||||||
BWAY Mortgage Trust, Series 2015-1740, Class A2, 2.917%, 1/1/2035 | 541,000 | 516,183 | ||||||
Caesars Palace Las Vegas Trust, Series 2017-VICI, Class A2, 3.531%, 10/1/2034 | 300,000 | 299,336 | ||||||
Credit Suisse Mortgage Capital Trust, Series 2013-IVR3, Class A12,8, 2.50%, 5/1/2043 | 188,260 | 173,576 | ||||||
Credit Suisse Mortgage Capital Trust, Series 2013-TH1, Class A12,8, 2.13%, 2/1/2043 | 126,989 | 115,097 | ||||||
Credit Suisse Mortgage Capital Trust, Series 2014-IVR3, Class A12,8, 3.50%, 7/1/2044 | 308,854 | 299,227 | ||||||
Fannie Mae REMICS, Series 2018-31, Class KP, 3.50%, 7/1/2047 | 245,847 | 242,589 | ||||||
Freddie Mac Multifamily Structured Pass-Through Certificates, Series K009, Class X1 | 2,494,102 | 44,945 | ||||||
Freddie Mac Multifamily Structured Pass-Through Certificates, Series K021, Class X1 | 1,899,578 | 82,096 | ||||||
Freddie Mac Multifamily Structured Pass-Through Certificates, Series K030, Class X1 | 9,865,981 | 76,221 | ||||||
Freddie Mac REMICS, Series 4791, Class BA, 4.00%, 3/1/2044 | 303,695 | 307,925 | ||||||
Freddie Mac REMICS, Series 4801, Class BA, 4.50%, 5/1/2044 | 318,203 | 327,413 | ||||||
FREMF Mortgage Trust, Series 2012-K711, Class B2,8, 3.57%, 8/1/2045 | 175,000 | 174,997 | ||||||
FREMF Mortgage Trust, Series 2013-K28, Class X2A (IO)2, 0.10%, 6/1/2046 | 24,446,486 | 83,265 | ||||||
FREMF Mortgage Trust, Series 2013-K712, Class B2,8, 3.358%, 5/1/2045 | 143,000 | 142,765 | ||||||
The accompanying notes are an integral part of the financial statements.
35
Investment Portfolio - October 31, 2018
| BLENDED ASSET MODERATE SERIES | PRINCIPAL AMOUNT3 | VALUE (NOTE 2) | ||||||||||||||
COMMERCIAL MORTGAGE-BACKED SECURITIES (continued) | ||||||||||||||||
FREMF Mortgage Trust, Series 2013-K713, Class B2,8, 3.263%, 4/1/2046 | 300,000 | $ | 298,750 | |||||||||||||
FREMF Mortgage Trust, Series 2014-K37, Class B2,8, 4.714%, 1/1/2047 | 320,000 | 329,150 | ||||||||||||||
FREMF Mortgage Trust, Series 2014-K503, Class B2,8, 3.139%, 10/1/2047 | 300,000 | 298,992 | ||||||||||||||
GAHR Commercial Mortgage Trust, Series 2015-NRF, Class BFX2,8, 3.495%, 12/1/2034 | 372,000 | 370,848 | ||||||||||||||
Government National Mortgage Association, Series 2017-54, Class AH, 2.60%, 12/1/2056 | 304,709 | 279,149 | ||||||||||||||
JP Morgan Mortgage Trust, Series 2013-2, Class A22,8, 3.50%, 5/1/2043 | 104,986 | 101,314 | ||||||||||||||
JP Morgan Mortgage Trust, Series 2014-2, Class 1A12,8, 3.00%, 6/1/2029 | 136,737 | 133,944 | ||||||||||||||
JP Morgan Mortgage Trust, Series 2017-3, Class 1A52,8, 3.50%, 8/1/2047 | 319,815 | 313,306 | ||||||||||||||
JP Morgan Mortgage Trust, Series 2017-6, Class A52,8, 3.50%, 12/1/2048 | 381,679 | 373,672 | ||||||||||||||
New Residential Mortgage Loan Trust, Series 2014-3A, Class AFX32,8, 3.75%, 11/1/2054 | 109,792 | 109,222 | ||||||||||||||
New Residential Mortgage Loan Trust, Series 2015-2A, Class A12,8, 3.75%, 8/1/2055 | 141,255 | 140,382 | ||||||||||||||
New Residential Mortgage Loan Trust, Series 2016-4A, Class A12,8, 3.75%, 11/1/2056 | 147,855 | 146,743 | ||||||||||||||
Sequoia Mortgage Trust, Series 2013-2, Class A8, 1.874%, 2/1/2043 | 116,850 | 101,810 | ||||||||||||||
Sequoia Mortgage Trust, Series 2013-8, Class A18, 3.00%, 6/1/2043 | 145,653 | 136,476 | ||||||||||||||
Starwood Retail Property Trust, Series 2014-STAR, Class A2,4, (1 mo. LIBOR US + 1.220%), 3.50%, 11/15/2027 | 311,727 | 311,769 | ||||||||||||||
Towd Point Mortgage Trust, Series 2016-5, Class A12,8, 2.50%, 10/1/2056 | 261,108 | 253,495 | ||||||||||||||
WinWater Mortgage Loan Trust, Series 2015-1, Class A12,8, 3.50%, 1/1/2045 | 148,034 | 144,131 | ||||||||||||||
WinWater Mortgage Loan Trust, Series 2015-3, Class A52,8, 3.50%, 3/1/2045 | 123,056 | 122,734 | ||||||||||||||
|
| |||||||||||||||
TOTAL COMMERCIAL MORTGAGE-BACKED SECURITIES | ||||||||||||||||
(Identified Cost $6,991,562) | 6,851,522 | |||||||||||||||
|
| |||||||||||||||
FOREIGN GOVERNMENT BONDS - 1.7% | ||||||||||||||||
Canada Housing Trust No. 1 (Canada)2, 4.10%, 12/15/2018 | CAD | 52,000 | 39,599 | |||||||||||||
Canadian Government Bond (Canada), 2.75%, 6/1/2022 | CAD | 67,000 | 51,483 | |||||||||||||
Export-Import Bank of Korea (South Korea), 2.625%, 12/30/2020 | 500,000 | 491,770 | ||||||||||||||
The Korea Development Bank (South Korea), 1.375%, 9/12/2019 | 500,000 | 492,758 | ||||||||||||||
Mexican Government Bond (Mexico), 8.00%, 6/11/2020 | MXN | 1,338,000 | 65,250 | |||||||||||||
Mexican Government Bond (Mexico), 6.50%, 6/10/2021 | MXN | 540,000 | 25,267 | |||||||||||||
Mexican Government Bond (Mexico), 6.50%, 6/9/2022 | MXN | 879,000 | 40,399 | |||||||||||||
Mexican Government Bond (Mexico), 7.75%, 5/29/2031 | MXN | 169,000 | 7,584 | |||||||||||||
Province of Ontario (Canada), 1.25%, 6/17/2019 | 203,000 | 201,072 | ||||||||||||||
Singapore Government Bond (Singapore), 2.50%, 6/1/2019 | SGD | 116,000 | 83,995 | |||||||||||||
Svensk Exportkredit AB (Sweden), 1.125%, 8/28/2019 | 500,000 | 493,106 | ||||||||||||||
|
| |||||||||||||||
TOTAL FOREIGN GOVERNMENT BONDS | ||||||||||||||||
(Identified Cost $2,034,545) | 1,992,283 | |||||||||||||||
|
| |||||||||||||||
U.S. GOVERNMENT AGENCIES - 9.8% | ||||||||||||||||
Mortgage-Backed Securities - 9.8% | ||||||||||||||||
Fannie Mae, Pool #888468, 5.50%, 9/1/2021 | 29,323 | 29,824 | ||||||||||||||
Fannie Mae, Pool #888810, 5.50%, 11/1/2022 | 35,606 | 36,216 | ||||||||||||||
Fannie Mae, Pool #MA3463, 4.00%, 9/1/2033 | 336,710 | 343,141 | ||||||||||||||
Fannie Mae, Pool #MA1834, 4.50%, 2/1/2034 | 119,941 | 123,424 | ||||||||||||||
Fannie Mae, Pool #MA1903, 4.50%, 5/1/2034 | 95,321 | 98,092 | ||||||||||||||
Fannie Mae, Pool #745418, 5.50%, 4/1/2036 | 90,303 | 96,819 | ||||||||||||||
The accompanying notes are an integral part of the financial statements.
36
Investment Portfolio - October 31, 2018
| BLENDED ASSET MODERATE SERIES | PRINCIPAL AMOUNT3 | VALUE (NOTE 2) | ||||||||||
U.S. GOVERNMENT AGENCIES (continued) | ||||||||||||
Mortgage-Backed Securities (continued) | ||||||||||||
Fannie Mae, Pool #995196, 6.00%, 7/1/2038 | 171,564 | $ | 187,288 | |||||||||
Fannie Mae, Pool #MA0258, 4.50%, 12/1/2039 | 148,776 | 154,067 | ||||||||||
Fannie Mae, Pool #AL0152, 6.00%, 6/1/2040 | 126,853 | 138,386 | ||||||||||
Fannie Mae, Pool #AL0241, 4.00%, 4/1/2041 | 174,897 | 176,223 | ||||||||||
Fannie Mae, Pool #AL1410, 4.50%, 12/1/2041 | 272,643 | 281,972 | ||||||||||
Fannie Mae, Pool #AL7068, 4.50%, 9/1/2042 | 304,989 | 315,834 | ||||||||||
Fannie Mae, Pool #AL7729, 4.00%, 6/1/2043 | 149,471 | 150,602 | ||||||||||
Fannie Mae, Pool #AS3622, 3.50%, 10/1/2044 | 608,799 | 595,176 | ||||||||||
Fannie Mae, Pool #BC3490, 3.50%, 2/1/2046 | 397,153 | 388,264 | ||||||||||
Fannie Mae, Pool #BC6764, 3.50%, 4/1/2046 | 231,153 | 225,907 | ||||||||||
Fannie Mae, Pool #BD1381, 3.50%, 6/1/2046 | 147,295 | 143,845 | ||||||||||
Fannie Mae, Pool #MA2705, 3.00%, 8/1/2046 | 233,772 | 221,406 | ||||||||||
Fannie Mae, Pool #MA3148, 3.50%, 10/1/2047 | 661,305 | 644,172 | ||||||||||
Fannie Mae, Pool #BJ1323, 3.50%, 11/1/2047 | 575,353 | 560,864 | ||||||||||
Fannie Mae, Pool #MA3184, 4.50%, 11/1/2047 | 284,277 | 291,329 | ||||||||||
Fannie Mae, Pool #CA1720, 5.00%, 5/1/2048 | 438,089 | 457,760 | ||||||||||
Fannie Mae, Pool #CA1922, 5.00%, 6/1/2048 | 676,318 | 706,618 | ||||||||||
Fannie Mae, Pool #BM4322, 4.00%, 7/1/2048 | 582,215 | 583,244 | ||||||||||
Fannie Mae, Pool #CA2056, 4.50%, 7/1/2048 | 448,468 | 459,750 | ||||||||||
Fannie Mae, Pool #BK9366, 4.50%, 8/1/2048 | 139,647 | 143,116 | ||||||||||
Fannie Mae, Pool #CA2219, 5.00%, 8/1/2048 | 258,283 | 269,841 | ||||||||||
Fannie Mae, Pool #MA3527, 5.00%, 11/1/2048 | 574,000 | 599,658 | ||||||||||
Fannie Mae, Pool #AL8674, 5.654%, 1/1/2049 | 327,328 | 348,539 | ||||||||||
Freddie Mac, Pool #C91762, 4.50%, 5/1/2034 | 130,463 | 134,352 | ||||||||||
Freddie Mac, Pool #G03926, 6.00%, 2/1/2038
|
| 39,145
|
|
| 43,038
|
| ||||||
PRINCIPAL SHARES | VALUE (NOTE 2) | |||||||||||
U.S. GOVERNMENT AGENCIES (continued) | ||||||||||||
Mortgage-Backed Securities (continued) | ||||||||||||
Freddie Mac, Pool #G04731, 5.50%, 4/1/2038 | 39,011 | $ | 41,867 | |||||||||
Freddie Mac, Pool #G08273, 5.50%, 6/1/2038 | 49,237 | 52,700 | ||||||||||
Freddie Mac, Pool #Q37592, 4.00%, 12/1/2045 | 315,788 | 316,237 | ||||||||||
Freddie Mac, Pool #Q42596, 3.50%, 8/1/2046 | 248,951 | 243,126 | ||||||||||
Freddie Mac, Pool #Q45878, 3.00%, 12/1/2046 | 456,793 | 432,706 | ||||||||||
Freddie Mac, Pool #G08786, 4.50%, 10/1/2047 | 373,666 | 384,363 | ||||||||||
Freddie Mac, Pool #Q55506, 4.50%, 4/1/2048 | 791,226 | 810,799 | ||||||||||
|
| |||||||||||
TOTAL U.S. GOVERNMENT AGENCIES | ||||||||||||
(Identified Cost $11,509,532) | 11,230,565 | |||||||||||
|
| |||||||||||
SHORT-TERM INVESTMENT - 2.7% | ||||||||||||
Dreyfus Government Cash Management, Institutional Shares9, 2.05%, | ||||||||||||
(Identified Cost $3,142,560) | 3,142,560 | 3,142,560 | ||||||||||
|
| |||||||||||
TOTAL INVESTMENTS IN SECURITIES - 100.5% | ||||||||||||
(Identified Cost $117,914,078) | 115,574,790 | |||||||||||
|
| |||||||||||
TOTAL OPTIONS | ||||||||||||
WRITTEN - 0.0%## | ||||||||||||
(Premiums Received $29,748) | (43,858 | ) | ||||||||||
|
| |||||||||||
TOTAL INVESTMENTS - 100.5% | 115,530,932 | |||||||||||
LIABILITIES, LESS OTHER ASSETS - (0.5%) | (558,852 | ) | ||||||||||
|
| |||||||||||
NET ASSETS - 100% | $ | 114,972,080 | ||||||||||
|
|
|
| |||||||||
The accompanying notes are an integral part of the financial statements.
37
Investment Portfolio - October 31, 2018
ADR - American Depositary Receipt
CAD - Canadian Dollar
ETF - Exchange-traded fund
IO - Interest only
MXN - Mexican Peso
No. - Number
SGD - Singapore Dollar
| EXCHANGE-TRADED OPTIONS WRITTEN | |||||||||||||||||||||||||
| DESCRIPTION | NUMBER OF CONTRACTS | EXPIRATION DATE | EXERCISE PRICE | NOTIONAL AMOUNT3 (000) | VALUE | ||||||||||||||||||||
Call | |||||||||||||||||||||||||
Booking Holdings, Inc. | 1 | 11/09/18 | $ | 1,960.00 | 187 | $ | (4,000 | ) | |||||||||||||||||
Qorvo, Inc. | 27 | 11/16/18 | 77.50 | 198 | (5,805 | ) | |||||||||||||||||||
Alphabet, Inc. - Class C | 2 | 11/23/18 | 1,110.00 | 215 | (4,400 | ) | |||||||||||||||||||
|
| ||||||||||||||||||||||||
| (14,205 | ) | ||||||||||||||||||||||||
|
| ||||||||||||||||||||||||
Put | |||||||||||||||||||||||||
lululemon Athletica, Inc. | 14 | 11/09/18 | 149.00 | 197 | (11,410 | ) | |||||||||||||||||||
Mastercard, Inc. - Class A | 14 | 11/09/18 | 197.50 | 277 | (5,460 | ) | |||||||||||||||||||
Medtronic plc | 31 | 11/16/18 | 90.00 | 278 | (4,495 | ) | |||||||||||||||||||
Microsoft Corp. | 28 | 11/16/18 | 100.00 | 299 | (2,548 | ) | |||||||||||||||||||
Qorvo, Inc. | 41 | 11/16/18 | 67.50 | 301 | (5,740 | ) | |||||||||||||||||||
|
| ||||||||||||||||||||||||
| (29,653 | ) | ||||||||||||||||||||||||
TOTAL EXCHANGE-TRADED OPTIONS WRITTEN |
| $ | (43,858 | ) | |||||||||||||||||||||
|
| ||||||||||||||||||||||||
*Non-income producing security.
## Less than 0.1%.
1A portion of this security is deposited with the broker as collateral for options contracts written. As of October 31, 2018, the total value of such securities was $1,601,090.
2Restricted securities - Investment in securities that are restricted as to public resale under the Securities Act of 1933, as amended. These securities have been sold under Rule 144A and have been determined to be liquid under guidelines established by the Board of Directors. These securities amount to $11,753,380, or 10.2% of the Series’ net assets as of October 31, 2018.
3Amount is stated in USD unless otherwise noted.
4Floating rate security. Rate shown is the rate in effect as of October 31, 2018.
5Step coupon rate security - Rate steps up/down by 25 basis points upon rating downgrade/upgrade by Moody’s and S&P rating agencies (Subject to a maximum of 100 basis points per agency, 200 basis points maximum).
6Variable rate security. Security may be issued at a fixed coupon rate, which converts to a variable rate at a specified date. Rate shown is the rate in effect as of October 31, 2018.
7Security is perpetual in nature and has no stated maturity date.
8Variable or floating rate security, the interest rate of which adjusts periodically based on changes in current interest rates and prepayments on the underlying pool of assets. Rate shown is the rate in effect as of October 31, 2018.
9Rate shown is the current yield as of October 31, 2018.
The Global Industry Classification Standard (GICS) was developed by and is the exclusive property and a service mark of MSCI Inc. (MSCI) and Standard &Poor, a division of The McGraw-Hill Companies, Inc. (S&P), and is licensed for use by Manning & Napier when referencing GICS sectors. Neither MSCI, S&P, nor any third party involved in making or compiling the GICS or any GICS classifications makes any express or implied warranties or representations with respect to such standard or classification, nor shall any such party have any liability therefrom.
The accompanying notes are an integral part of the financial statements.
38
Statement of Assets and Liabilities - Blended Asset Moderate Series
October 31, 2018
ASSETS: | ||||
Investments in securities, at value (identified cost $117,914,078) (Note 2) | $ | 115,574,790 | ||
Foreign currency, at value (identified cost $113) | 114 | |||
Receivable for securities sold | 943,141 | |||
Interest receivable | 493,814 | |||
Receivable for fund shares sold | 24,940 | |||
Dividends receivable | 18,981 | |||
Foreign tax reclaims receivable | 10,528 | |||
Prepaid expenses | 168 | |||
|
| |||
TOTAL ASSETS | 117,066,476 | |||
|
| |||
LIABILITIES: | ||||
Accrued fund accounting and administration fees (Note 3) | 27,699 | |||
Accrued management fees (Note 3) | 12,137 | |||
Accrued Chief Compliance Officer service fees (Note 3) | 401 | |||
Options written, at value (premiums received $29,748) (Note 2) | 43,858 | |||
Payable for securities purchased | 1,939,582 | |||
Payable for fund shares repurchased | 16,935 | |||
Other payables and accrued expenses | 53,784 | |||
|
| |||
TOTAL LIABILITIES | 2,094,396 | |||
|
| |||
TOTAL NET ASSETS | $ | 114,972,080 | ||
|
| |||
NET ASSETS CONSIST OF: | ||||
Capital stock | $ | 109,490 | ||
Additional paid-in-capital | 117,316,802 | |||
Total distributable earnings (loss) | (2,454,212 | ) | ||
|
| |||
TOTAL NET ASSETS | $ | 114,972,080 | ||
|
| |||
NET ASSET VALUE, OFFERING PRICE AND REDEMPTION PRICE PER SHARE - Class R6 | $ | 10.50 | ||
|
| |||
The accompanying notes are an integral part of the financial statements.
39
Statement of Operations - Blended Asset Moderate Series
For the Year Ended October 31, 2018
INVESTMENT INCOME: | ||||
Interest | $ | 2,058,279 | ||
Dividends (net of foreign taxes withheld, $27,909) | 557,602 | |||
|
| |||
Total Investment Income | 2,615,881 | |||
|
| |||
EXPENSES: | ||||
Management fees (Note 3) | 519,481 | |||
Fund accounting and administration fees (Note 3) | 84,830 | |||
Directors’ fees (Note 3) | 9,040 | |||
Chief Compliance Officer service fees (Note 3) | 4,394 | |||
Audit fees | 38,108 | |||
Custodian fees | 33,734 | |||
Miscellaneous | 24,181 | |||
|
| |||
Total Expenses | 713,768 | |||
Less reduction of expenses (Note 3) | (136,567 | ) | ||
|
| |||
Net Expenses | 577,201 | |||
|
| |||
NET INVESTMENT INCOME | 2,038,680 | |||
|
| |||
REALIZED AND UNREALIZED GAIN (LOSS) ON INVESTMENTS AND FOREIGN CURRENCY: | ||||
Net realized gain (loss) on- | ||||
Investments in securities | (1,250,170 | ) | ||
Options written | 127,967 | |||
Foreign currency and translation of other assets and liabilities | (4,372 | ) | ||
|
| |||
| (1,126,575 | ) | |||
|
| |||
Net change in unrealized appreciation (depreciation) on- | ||||
Investments in securities | (2,059,127 | ) | ||
Options written | (14,110 | ) | ||
Foreign currency and translation of other assets and liabilities | (402 | ) | ||
|
| |||
| (2,073,639 | ) | |||
|
| |||
NET REALIZED AND UNREALIZED GAIN (LOSS) ON INVESTMENTS AND FOREIGN CURRENCY | (3,200,214 | ) | ||
|
| |||
NET DECREASE IN NET ASSETS RESULTING FROM OPERATIONS | $ | (1,161,534 | ) | |
|
| |||
The accompanying notes are an integral part of the financial statements.
40
Statements of Changes in Net Assets - Blended Asset Moderate Series
|
| |||||||||
FOR THE YEAR ENDED 10/31/18 | FOR THE PERIOD 10/13/171 TO 10/31/17 | |||||||||
INCREASE (DECREASE) IN NET ASSETS: | ||||||||||
OPERATIONS: | ||||||||||
Net investment income | $ | 2,038,680 | $ | 48,288 | ||||||
Net realized gain (loss) on investments and foreign currency | (1,126,575 | ) | (17,390 | ) | ||||||
Net change in unrealized depreciation on investments and foreign currency | (2,073,639 | ) | (280,263 | ) | ||||||
|
|
|
| |||||||
Net decrease from operations | (1,161,534 | ) | (249,365 | ) | ||||||
|
|
|
| |||||||
DISTRIBUTIONS TO SHAREHOLDERS (Note 9): | ||||||||||
Class R6 | (1,043,313 | ) | — | |||||||
|
|
|
| |||||||
CAPITAL STOCK ISSUED AND REPURCHASED: | ||||||||||
Net increase from capital share transactions (Note 5) | 1,805,626 | 115,620,666 | ||||||||
|
|
|
| |||||||
Net increase (decrease) in net assets | (399,221 | ) | 115,371,301 | |||||||
NET ASSETS: | ||||||||||
Beginning of period | 115,371,301 | — | ||||||||
|
|
|
| |||||||
End of period | $ | 114,972,080 | $ | 115,371,301 | ||||||
|
|
|
| |||||||
1 Commencement of operations. | ||||||||||
The accompanying notes are an integral part of the financial statements.
41
Financial Highlights - Blended Asset Moderate Series - Class R6
FOR THE YEAR ENDED 10/31/18 | FOR THE PERIOD 10/13/171 TO 10/31/17 | |||||||
Per share data (for a share outstanding throughout each period): | ||||||||
Net asset value - Beginning of period | $ | 10.73 | $ | 10.75 | ||||
|
|
|
| |||||
Income (loss) from investment operations: | ||||||||
Net investment income (loss)2 | 0.19 | 0.00 | 3 | |||||
Net realized and unrealized loss on investments | (0.32 | ) | (0.02 | ) | ||||
|
|
|
| |||||
Total from investment operations | (0.13 | ) | (0.02 | ) | ||||
|
|
|
| |||||
Less distributions to shareholders: | ||||||||
From net investment income | (0.10 | ) | — | |||||
|
|
|
| |||||
Net asset value - End of period | $ | 10.50 | $ | 10.73 | ||||
|
|
|
| |||||
Net assets - End of period (000’s omitted) | $ | 114,972 | $ | 115,371 | ||||
|
|
|
| |||||
Total return4 | (1.25 | %) | (0.19 | %) | ||||
Ratios (to average net assets)/Supplemental Data: |
| |||||||
Expenses | 0.50 | % | 0.50 | %5 | ||||
Net investment income | 1.77 | % | 0.85 | %5 | ||||
Series portfolio turnover | 91 | % | 4 | % | ||||
*The investment advisor did not impose all or a portion of its management and/or other fees during the period, and may have paid a portion of the Series’ expenses. If these expenses had been incurred by the Series, the expense ratio (to average net assets) would have increased by the following amounts:
|
| |||||||
| 0.12 | % | 0.99 | %5 | |||||
1Commencement of operations.
2Calculated based on average shares outstanding during the periods.
3Less than $0.01.
4Represents aggregate total return for the periods indicated, and assumes reinvestment of all distributions. Total return would have been lower had certain expenses not been waived during the periods. Periods less than one year are not annualized.
5Annualized.
The accompanying notes are an integral part of the financial statements.
42
Performance Update as of October 31, 2018 - Blended Asset Extended Series
(unaudited)
AVERAGE ANNUAL TOTAL RETURNS AS OF OCTOBER 31, 2018 | ||||||||
| ONE YEAR1 | SINCE INCEPTION2 | |||||||
Manning & Napier Fund, Inc. - Blended Asset Extended Series - Class R63 | -1.06 | % | -1.19 | % | ||||
Bloomberg Barclays U.S. Aggregate Bond Index4 | -2.05 | % | -2.21 | % | ||||
40/15/45 Blended Index5 | 0.53 | % | 0.66 | % | ||||
The following graph compares the value of a $10,000 investment in the Manning & Napier Fund, Inc. - Blended Asset
Extended Series - Class R6 from its inception2 (October 13, 2017) to present (October 31, 2018) to the Bloomberg Barclays U.S. Aggregate Bond Index and the 40/15/45 Blended Index.
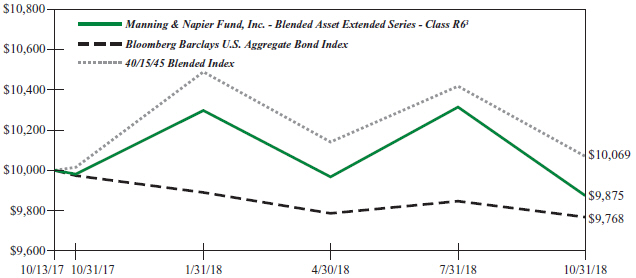
1The returns shown are based on net asset values calculated for shareholder transactions and may differ from the returns shown in the financial highlights, which reflect adjustments made to the net asset values in accordance with accounting principles generally accepted in the United States of America.
2Performance numbers for the Series and Indices are calculated from October 13, 2017, the Series’ inception date.
3The Series’ performance does not reflect the deduction of taxes that a shareholder would pay on fund distributions or the redemption of shares. The Series’ performance is historical and may not be indicative of future results. The performance returns shown are inclusive of the net expense ratio of the Series. For the year ended October 31, 2018, this net expense ratio was 0.55% for Class R6. The gross expense ratio, which does not account for any voluntary or contractual waivers currently in effect, was 0.62% for Class R6 for the year ended October 31, 2018.
4The Bloomberg Barclays U.S. Aggregate Bond Index is an unmanaged, market-value weighted index of U.S. domestic investment-grade debt issues, including government, corporate, asset-backed, and mortgage-backed securities, with maturities of one year or more. Index returns do not reflect any fees or expenses. Index returns provided by Interactive Data.
5The 40/15/45 Blended Index is 40% Russell 3000® Index (Russell 3000), 15% MSCI ACWI ex USA Index (ACWIxUS), and 45% Bloomberg Barclays U.S. Aggregate Bond Index (BAB). Russell 3000 is an unmanaged index that consists of 3,000 of the largest U.S. companies based on total market capitalization. Index returns are based on a market capitalization weighted average of relative price changes of the component stocks plus dividends whose reinvestments are compounded daily. Index returns provided by Bloomberg. ACWIxUS is designed to measure large and mid-cap representation across 22 of 23 Developed Markets countries (excluding the U.S.) and 24 Emerging Markets countries. The Index is denominated in U.S. dollars. The Index returns are net of withholding taxes. They assume daily reinvestment of net dividends thus accounting for any applicable dividend taxation. Index returns provided by Bloomberg. Index returns provided by Bloomberg. BAB is an unmanaged, market value-weighted index of U.S. domestic investment-grade debt issues, including government, corporate, asset-backed and mortgage-backed securities with maturities of one year or more. Index returns provided by Interactive Data. The returns of the indices do not reflect any fees or expenses. Returns provided are calculated monthly using a blended allocation. Because the fund’s asset allocation will vary over time, the composition of the fund’s portfolio may not match the composition of the comparative Indices. Mid-month performance may not be available for all indices within the blended index. Where applicable, performance for those indices is included from the first of the month following the corresponding Fund’s inception date.
43
Shareholder Expense Example - Blended Asset Extended Series
(unaudited)
As a shareholder of the Series, you incur ongoing costs, including management fees, shareholder service fees and other Series expenses. This example is intended to help you understand your ongoing costs (in dollars) of investing in the Series and to compare these costs with the ongoing costs of investing in other mutual funds.
The example is based on an investment of $1,000 invested in each class at the beginning of the period and held for the entire period (May 1, 2018 to October 31, 2018).
Actual Expenses
The Actual lines of the table below provide information about actual account values and actual expenses. You may use the information in these lines, together with the amount you invested, to estimate the expenses that you paid over the period. Simply divide your account value by $1,000 (for example, an $8,600 account value divided by $1,000 = 8.6), then multiply the result by the number in the Actual line for the Class in which you have invested under the heading entitled “Expenses Paid During Period” to estimate the expenses you paid on your account during this period.
Hypothetical Example for Comparison Purposes
The Hypothetical lines of each class in the table below provide information about hypothetical account values and hypothetical expenses based on the Series’ actual expense ratio and an assumed rate of return of 5% per year before expenses, which is not the Series’ actual return. The hypothetical account values and expenses may not be used to estimate the actual ending account balance or expenses you paid during the period. You may use this information to compare the ongoing costs of investing in the Series and other funds. To do so, compare this 5% hypothetical example with the 5% hypothetical examples that appear in the shareholder reports of the other funds.
Please note that the expenses shown in the table are meant to highlight your ongoing costs only and do not reflect any transaction costs such as sales charges (loads), redemption fees, or exchange fees that you may incur in other mutual funds. Therefore, the second line of the table is useful in comparing ongoing costs only, and will not help you determine the relative total costs of owning different funds.
BEGINNING ACCOUNT VALUE 5/1/18 | ENDING ACCOUNT VALUE 10/31/18 | EXPENSES PAID DURING PERIOD* 5/1/2018-10/31/18 | ||||
Actual | $1,000.00 | $990.77 | $2.76 | |||
Hypothetical (5% return before expenses) | $1,000.00 | $1,022.43 | $2.80 |
*Expenses are equal to the Series’ annualized expense ratio (for the six-month period) of 0.55% , multiplied by the average account value over the period, multiplied by 184/365 to reflect the one-half year period. Expenses are based on the most recent fiscal half year; therefore, the expense ratios stated above may differ from the expense ratios stated in the financial highlights, which are based on one-year data. The Series’ total return would have been lower had certain expenses not been reimbursed during the period.
44
Portfolio Composition - Blended Asset Extended Series
As of October 31, 2018 (unaudited)
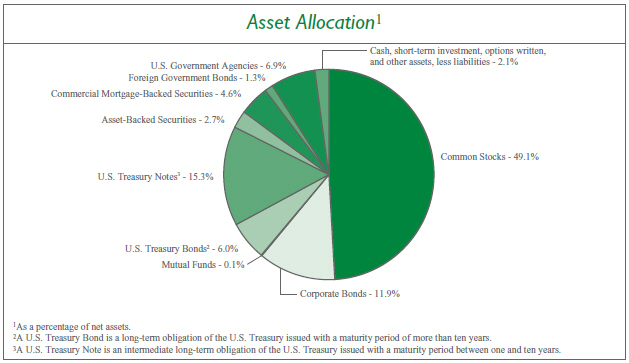
Sector Allocation4 |
| |||||||
Health Care | 10.7% | |||||||
Information Technology | 8.6% | |||||||
Consumer Staples | 7.0% | |||||||
Financials | 7.0% | |||||||
Consumer Discretionary | 6.6% | |||||||
Communication Services | 6.1% | |||||||
Energy | 4.9% | |||||||
Real Estate | 4.1% | |||||||
Industrials | 4.0% | |||||||
Materials | 2.7% | |||||||
Utilities | 0.3% | |||||||
| 4 Including common stocks and corporate bonds, as a percentage of total investments. | ||||||||
Top Ten Stock Holdings5 |
| |||
Booking Holdings, Inc. | 1.6 | % | ||
Mastercard, Inc. - Class A | 1.6 | % | ||
Incyte Corp. | 1.6 | % | ||
Qorvo, Inc. | 1.5 | % | ||
Medtronic plc | 1.5 | % | ||
Visa, Inc. - Class A | 1.4 | % | ||
Anheuser-Busch InBev S.A./N.V. (Belgium) | 1.3 | % | ||
Microsoft Corp. | 1.3 | % | ||
Novartis AG - ADR (Switzerland) | 1.3 | % | ||
Ball Corp. | 1.2 | % | ||
| 5 As a percentage of total investments. | ||||
45
Investment Portfolio - October 31, 2018
| BLENDED ASSET EXTENDED SERIES | SHARES | VALUE (NOTE 2) | ||||||
COMMON STOCKS - 49.1% | ||||||||
Communication Services - 4.5% | ||||||||
Diversified Telecommunication Services - 0.8% | ||||||||
Orange S.A. (France) | 1,170 | $ | 18,262 | |||||
Telefonica Brasil S.A. (Brazil) | 1,300 | 15,052 | ||||||
Zayo Group Holdings, Inc.*1 | 51,000 | 1,523,880 | ||||||
|
| |||||||
| 1,557,194 | ||||||||
|
| |||||||
Entertainment - 0.8% | ||||||||
Electronic Arts, Inc.* | 15,730 | 1,431,115 | ||||||
NetEase, Inc. - ADR (China) | 225 | 46,766 | ||||||
Nexon Co. Ltd. (Japan)* | 4,132 | 47,135 | ||||||
Toho Co. Ltd. -Tokyo (Japan) | 800 | 26,100 | ||||||
Vivendi S.A. (France) | 565 | 13,627 | ||||||
|
| |||||||
| 1,564,743 | ||||||||
|
| |||||||
Interactive Media & Services - 2.4% | ||||||||
Alphabet, Inc. - Class A* | 910 | 992,428 | ||||||
Alphabet, Inc. - Class C* | 1,510 | 1,625,923 | ||||||
Tencent Holdings Ltd. - Class H (China) | 64,228 | 2,200,404 | ||||||
|
| |||||||
| 4,818,755 | ||||||||
|
| |||||||
Media - 0.5% | ||||||||
Hakuhodo DY Holdings, Inc. (Japan) | 1,500 | 25,018 | ||||||
Quebecor, Inc. - Class B (Canada) | 26,285 | 515,537 | ||||||
Shaw Communications, Inc. - Class B (Canada) | 29,245 | 544,491 | ||||||
|
| |||||||
| 1,085,046 | ||||||||
|
| |||||||
Wireless Telecommunication Services - 0.0%## | ||||||||
KDDI Corp. (Japan) | 2,000 | 48,400 | ||||||
NTT DOCOMO, Inc. (Japan) | 2,000 | 49,597 | ||||||
|
| |||||||
| 97,997 | ||||||||
|
| |||||||
Total Communication Services | 9,123,735 | |||||||
|
| |||||||
Consumer Discretionary - 5.0% | ||||||||
Auto Components - 0.0%## | ||||||||
Nemak S.A.B. de C.V. (Mexico)2 | 50,800 | 36,687 | ||||||
NGK Spark Plug Co. Ltd. (Japan) | 1,300 | 26,306 | ||||||
|
| |||||||
| 62,993 | ||||||||
|
| |||||||
Automobiles - 0.1% | ||||||||
Geely Automobile Holdings Ltd. (China) | 21,000 | 40,467 | ||||||
Isuzu Motors Ltd. (Japan) | 2,000 | 26,221 | ||||||
Peugeot S.A. (France) | 295 | 7,012 | ||||||
Renault S.A. (France) | 140 | 10,454 | ||||||
Suzuki Motor Corp. (Japan) | 1,100 | 54,853 | ||||||
|
| |||||||
| 139,007 | ||||||||
|
| |||||||
Diversified Consumer Services - 0.1% | ||||||||
China Maple Leaf Educational Systems Ltd. (China) | 62,000 | 26,908 | ||||||
China Yuhua Education Corp. Ltd. (China)2 | 94,000 | 37,903 | ||||||
Fu Shou Yuan International Group Ltd. (China) | 78,000 | 59,944 | ||||||
New Oriental Education & Technology Group, Inc. - ADR (China)* | 960 | 56,170 | ||||||
TAL Education Group - ADR (China)* | 725 | 21,010 | ||||||
Wisdom Education International Holdings Co. Ltd. (China) | 58,000 | 26,102 | ||||||
|
| |||||||
| 228,037 | ||||||||
|
| |||||||
Hotels, Restaurants & Leisure - 0.1% | ||||||||
Accor S.A. (France) | 1,170 | 53,460 | ||||||
Basic-Fit N.V. (Netherlands)*2 | 1,250 | 35,989 | ||||||
|
| |||||||
| 89,449 | ||||||||
|
| |||||||
Household Durables - 0.0%## | ||||||||
Sekisui Chemical Co. Ltd. (Japan) | 1,600 | 25,161 | ||||||
Techtronic Industries Co. Ltd. (Hong Kong) | 5,500 | 25,898 | ||||||
|
| |||||||
| 51,059 | ||||||||
|
| |||||||
Internet & Direct Marketing Retail - 2.8% | ||||||||
Alibaba Group Holding Ltd. - ADR (China)* | 11,755 | 1,672,502 | ||||||
Amazon.com, Inc.* | 560 | 894,886 | ||||||
Booking Holdings, Inc.* | 1,680 | 3,149,295 | ||||||
Despegar.com Corp. (Argentina)* | 950 | 15,266 | ||||||
|
| |||||||
| 5,731,949 | ||||||||
|
| |||||||
Leisure Products - 0.1% | ||||||||
Bandai Namco Holdings, Inc. (Japan) | 1,500 | 53,362 | ||||||
Yamaha Corp. (Japan) | 1,200 | 52,733 | ||||||
|
| |||||||
| 106,095 | ||||||||
|
| |||||||
Multiline Retail - 0.0%## | ||||||||
El Puerto de Liverpool SAB de C.V. (Mexico) | 3,280 | 20,830 | ||||||
Lojas Americanas S.A. (Brazil) | 2,300 | 11,502 | ||||||
Lojas Renner S.A. (Brazil) | 1,485 | 15,036 | ||||||
Magazine Luiza S.A. (Brazil) | 200 | 9,051 | ||||||
Next plc (United Kingdom) | 375 | 24,912 | ||||||
|
| |||||||
| 81,331 | ||||||||
|
| |||||||
The accompanying notes are an integral part of the financial statements.
46
Investment Portfolio - October 31, 2018
| BLENDED ASSET EXTENDED SERIES | SHARES | VALUE (NOTE 2) | ||||||
COMMON STOCKS (continued) | ||||||||
Consumer Discretionary (continued) | ||||||||
Specialty Retail - 0.7% | ||||||||
Industria de Diseno Textil S.A. (Spain) | 46,585 | $ | 1,312,977 | |||||
Nitori Holdings Co. Ltd. (Japan) | 200 | 26,115 | ||||||
USS Co. Ltd. (Japan) | 1,400 | 25,245 | ||||||
|
| |||||||
| 1,364,337 | ||||||||
|
| |||||||
Textiles, Apparel & Luxury Goods - 1.1% | ||||||||
ANTA Sports Products Ltd. (China) | 10,000 | 41,285 | ||||||
Burberry Group plc (United Kingdom) | 1,125 | 26,032 | ||||||
Hermes International (France) | 45 | 25,691 | ||||||
Kering S.A. (France) | 50 | 22,224 | ||||||
lululemon athletica, Inc.* | 14,740 | 2,074,360 | ||||||
LVMH Moet Hennessy Louis Vuitton SE (France) | 165 | 50,062 | ||||||
Moncler S.p.A (Italy) | 730 | 25,351 | ||||||
|
| |||||||
| 2,265,005 | ||||||||
|
| |||||||
Total Consumer Discretionary | 10,119,262 | |||||||
|
| |||||||
Consumer Staples - 6.8% | ||||||||
Beverages - 4.0% | ||||||||
Ambev S.A. - ADR (Brazil) | 269,460 | 1,166,762 | ||||||
Ambev S.A. (Brazil) | 8,500 | 37,093 | ||||||
Anheuser-Busch InBev S.A./N.V. (Belgium) | 36,170 | 2,675,168 | ||||||
The Coca-Cola Co. | 22,840 | 1,093,579 | ||||||
Diageo plc (United Kingdom) | 61,025 | 2,109,727 | ||||||
Fomento Economico Mexicano SAB de C.V. (Mexico) | 2,800 | 23,850 | ||||||
PepsiCo, Inc. | 9,660 | 1,085,591 | ||||||
Pernod Ricard S.A. (France) | 140 | 21,348 | ||||||
Treasury Wine Estates Ltd. (Australia) | 7,780 | 83,740 | ||||||
|
| |||||||
| 8,296,858 | ||||||||
|
| |||||||
Food & Staples Retailing - 0.1% | ||||||||
Atacadao Distribuicao Comercio e Industria Ltda. (Brazil) | 2,700 | 11,006 | ||||||
Matsumotokiyoshi Holdings Co. Ltd. (Japan) | 1,000 | 36,154 | ||||||
Tsuruha Holdings, Inc. (Japan) | 300 | 31,311 | ||||||
Wal-Mart de Mexico S.A.B. de C.V. (Mexico) | 16,820 | 43,008 | ||||||
Wesfarmers Ltd. (Australia) | 775 | 25,666 | ||||||
|
| |||||||
| 147,145 | ||||||||
|
| |||||||
Food Products - 1.6% | ||||||||
Barry Callebaut AG (Switzerland) | 15 | 29,319 | ||||||
Chocoladefabriken Lindt & Spruengli AG (Switzerland) | 7 | 48,260 | ||||||
Danone S.A. (France) | 1,460 | 103,387 | ||||||
Grupo Bimbo S.A.B. de C.V. - Series A(Mexico) | 9,145 | 17,098 | ||||||
Kerry Group plc - Class A (Ireland) | 700 | 71,634 | ||||||
Kikkoman Corp. (Japan) | 900 | 49,308 | ||||||
Mondelez International, Inc. - Class A | 37,005 | 1,553,470 | ||||||
Nestle S.A. (Switzerland) | 15,615 | 1,318,267 | ||||||
|
| |||||||
| 3,190,743 | ||||||||
|
| |||||||
Household Products - 0.0%## | ||||||||
Henkel AG & Co. KGaA (Germany) | 260 | 25,469 | ||||||
Kimberly-Clark de Mexico S.A.B. de C.V. - Class A (Mexico) | 23,900 | 34,438 | ||||||
Lion Corp. (Japan) | 1,900 | 35,722 | ||||||
|
| |||||||
| 95,629 | ||||||||
|
| |||||||
Personal Products - 1.0% | ||||||||
Beiersdorf AG (Germany) | 970 | 100,295 | ||||||
Kao Corp. (Japan) | 400 | 26,609 | ||||||
Kobayashi Pharmaceutical Co. Ltd. (Japan) | 400 | 26,089 | ||||||
L’Oreal S.A. (France) | 235 | 52,947 | ||||||
Unilever plc - ADR (United Kingdom) | 36,265 | 1,921,320 | ||||||
|
| |||||||
| 2,127,260 | ||||||||
|
| |||||||
Tobacco - 0.1% | ||||||||
British American Tobacco plc - ADR (United Kingdom) | 1,325 | 57,505 | ||||||
KT&G Corp. (South Korea) | 290 | 25,860 | ||||||
Swedish Match AB (Sweden) | 490 | 24,960 | ||||||
|
| |||||||
| 108,325 | ||||||||
|
| |||||||
Total Consumer Staples | 13,965,960 | |||||||
|
| |||||||
Energy - 2.5% | ||||||||
Energy Equipment & Services - 2.1% | ||||||||
Core Laboratories N.V | 415 | 35,375 | ||||||
Diamond Offshore Drilling, Inc.* | 44,250 | 627,465 | ||||||
Ensco plc - Class A | 92,990 | 663,949 | ||||||
Schlumberger Ltd. | 41,600 | 2,134,496 | ||||||
Transocean Ltd.* | 84,110 | 926,051 | ||||||
|
| |||||||
| 4,387,336 | ||||||||
|
| |||||||
Oil, Gas & Consumable Fuels - 0.4% | ||||||||
Cameco Corp. (Canada)1 | 3,120 | 33,446 | ||||||
Canadian Natural Resources Ltd. (Canada) | 1,925 | 52,817 | ||||||
The accompanying notes are an integral part of the financial statements.
47
Investment Portfolio - October 31, 2018
| BLENDED ASSET EXTENDED SERIES | SHARES | VALUE (NOTE 2) | ||||||
COMMON STOCKS (continued) | ||||||||
Energy (continued) | ||||||||
Oil, Gas & Consumable Fuels (continued) | ||||||||
China Petroleum & Chemical Corp. - Class H (China) | 66,000 | $ | 53,762 | |||||
Eni S.p.A. (Italy) | 3,100 | 55,055 | ||||||
Galp Energia SGPS S.A. (Portugal) | 6,230 | 108,328 | ||||||
Repsol S.A. (Spain) | 5,195 | 92,828 | ||||||
Royal Dutch Shell plc - Class B - ADR (Netherlands)1 | 1,700 | 111,707 | ||||||
SK Innovation Co. Ltd. (South Korea) | 215 | 40,349 | ||||||
Suncor Energy, Inc. (Canada) | 1,495 | 50,149 | ||||||
TOTAL S.A. (France) | 1,550 | 90,946 | ||||||
Vermilion Energy, Inc. (Canada) | 2,000 | 53,037 | ||||||
Woodside Petroleum Ltd. (Australia) | 2,260 | 55,642 | ||||||
|
| |||||||
| 798,066 | ||||||||
|
| |||||||
Total Energy | 5,185,402 | |||||||
|
| |||||||
Financials - 3.3% | ||||||||
Banks - 0.3% | ||||||||
Banco Bradesco S.A. (Brazil) | 3,900 | 35,736 | ||||||
Banco Comercial Portugues S.A. (Portugal)* | 143,700 | 38,653 | ||||||
Banco do Brasil S.A. (Brazil) | 1,600 | 18,336 | ||||||
Banco Santander Brasil S.A. (Brazil) | 1,500 | 17,009 | ||||||
The Bank Of N.T. Butterfield & Son Ltd. (Bermuda) | 775 | 31,225 | ||||||
Bankia S.A. (Spain) | 16,425 | 51,592 | ||||||
Bankinter S.A. (Spain) | 6,595 | 54,033 | ||||||
BNP Paribas S.A. (France) | 735 | 38,304 | ||||||
CaixaBank S.A. (Spain) | 22,225 | 89,938 | ||||||
Credit Agricole S.A. (France) | 840 | 10,758 | ||||||
Erste Group Bank AG (Austria) | 895 | 36,433 | ||||||
FinecoBank Banca Fineco S.p.A. (Italy) | 7,255 | 75,826 | ||||||
Itau Unibanco Holding S.A. (Brazil) | 2,700 | 35,652 | ||||||
Itausa - Investimentos Itau S.A. (Brazil) | 6,000 | 18,057 | ||||||
Jyske Bank A/S (Denmark) | 805 | 32,869 | ||||||
KBC Group N.V. (Belgium) | 510 | 35,147 | ||||||
Societe Generale S.A. (France) | 485 | 17,779 | ||||||
Sydbank A/S (Denmark) | 1,185 | 27,370 | ||||||
|
| |||||||
| 664,717 | ||||||||
|
| |||||||
Capital Markets - 2.4% | ||||||||
B3 S.A. - Brasil Bolsa Balcao (Brazil) | 2,600 | 18,647 | ||||||
BlackRock, Inc. | 3,810 | 1,567,510 | ||||||
Cboe Global Markets, Inc. | 5,110 | 576,663 | ||||||
The Charles Schwab Corp. | 22,335 | 1,032,770 | ||||||
CME Group, Inc. | 2,920 | 535,061 | ||||||
E*TRADE Financial Corp. | 10,340 | 511,003 | ||||||
Intercontinental Exchange, Inc. | 7,120 | 548,525 | ||||||
Japan Exchange Group, Inc. (Japan) | 2,200 | 39,404 | ||||||
Julius Baer Group Ltd. (Switzerland) | 3,010 | 137,270 | ||||||
|
| |||||||
| 4,966,853 | ||||||||
|
| |||||||
Diversified Financial Services - 0.5% | ||||||||
Berkshire Hathaway, Inc. - Class B* | 4,960 | 1,018,189 | ||||||
|
| |||||||
Insurance - 0.1% | ||||||||
Admiral Group plc (United Kingdom) | 1,005 | 25,835 | ||||||
AXA S.A. (France) | 1,295 | 32,409 | ||||||
BB Seguridade Participacoes S.A. (Brazil) | 1,800 | 12,880 | ||||||
|
| |||||||
| 71,124 | ||||||||
|
| |||||||
Thrifts & Mortgage Finance - 0.0%## | ||||||||
Aareal Bank AG (Germany) | 980 | 36,457 | ||||||
|
| |||||||
Total Financials | 6,757,340 | |||||||
|
| |||||||
Health Care - 10.4% | ||||||||
Biotechnology - 3.9% | ||||||||
BioMarin Pharmaceutical, Inc.* | 16,670 | 1,536,474 | ||||||
Incyte Corp.* | 48,110 | 3,118,490 | ||||||
Regeneron Pharmaceuticals, Inc.* | 3,700 | 1,255,188 | ||||||
Seattle Genetics, Inc.* | 24,680 | 1,385,289 | ||||||
Vertex Pharmaceuticals, Inc.* | 4,390 | 743,929 | ||||||
|
| |||||||
| 8,039,370 | ||||||||
|
| |||||||
Health Care Equipment & Supplies - 1.6% | ||||||||
Coloplast A/S - Class B (Denmark) | 535 | 49,923 | ||||||
EssilorLuxottica (France) | 350 | 47,802 | ||||||
Hoya Corp. (Japan) | 500 | 28,288 | ||||||
Medtronic plc1 | 32,750 | 2,941,605 | ||||||
Shandong Weigao Group Medical Polymer Co. Ltd. - Class H (China) | 31,510 | 28,225 | ||||||
Smith & Nephew plc (United Kingdom) | 1,535 | 24,951 | ||||||
Sonova Holding AG (Switzerland) | 155 | 25,278 | ||||||
Terumo Corp. (Japan) | 1,000 | 53,982 | ||||||
William Demant Holding A/S (Denmark)* | 760 | 24,982 | ||||||
|
| |||||||
| 3,225,036 | ||||||||
|
| |||||||
Health Care Providers & Services - 0.8% | ||||||||
DaVita, Inc.* | 22,925 | 1,543,769 | ||||||
|
| |||||||
The accompanying notes are an integral part of the financial statements.
48
Investment Portfolio - October 31, 2018
| BLENDED ASSET EXTENDED SERIES | SHARES | VALUE (NOTE 2) | ||||||
COMMON STOCKS (continued) | ||||||||
Health Care (continued) | ||||||||
Life Sciences Tools & Services - 0.0%## | ||||||||
QIAGEN N.V.* | 830 | $ | 30,129 | |||||
QIAGEN N.V.* | 1,185 | 43,014 | ||||||
Tecan Group AG (Switzerland) | 80 | 18,047 | ||||||
|
| |||||||
| 91,190 | ||||||||
|
| |||||||
Pharmaceuticals - 4.1% | ||||||||
Astellas Pharma, Inc. (Japan) | 1,700 | 26,265 | ||||||
Bristol-Myers Squibb Co. | 20,790 | 1,050,727 | ||||||
Chugai Pharmaceutical Co. Ltd. (Japan) | 800 | 46,838 | ||||||
Johnson & Johnson | 13,920 | 1,948,661 | ||||||
Merck & Co., Inc. | 17,420 | 1,282,286 | ||||||
Merck KGaA (Germany) | 10,440 | 1,117,108 | ||||||
Novartis AG - ADR (Switzerland) | 29,535 | 2,583,131 | ||||||
Novartis AG (Switzerland) | 1,085 | 95,016 | ||||||
Novo Nordisk A/S - Class B (Denmark) | 570 | 24,616 | ||||||
Perrigo Co. plc. | 1,305 | 91,742 | ||||||
Sanofi (France) | 675 | 60,318 | ||||||
|
| |||||||
| 8,326,708 | ||||||||
|
| |||||||
Total Health Care | 21,226,073 | |||||||
|
| |||||||
Industrials - 2.4% | ||||||||
Aerospace & Defense - 0.1% | ||||||||
Airbus S.E. (France) | 360 | 39,785 | ||||||
BAE Systems plc (United Kingdom) | 8,760 | 58,738 | ||||||
MTU Aero Engines AG (Germany) | 115 | 24,418 | ||||||
Safran S.A. (France) | 195 | 25,199 | ||||||
Thales S.A. (France) | 55 | 7,024 | ||||||
|
| |||||||
| 155,164 | ||||||||
|
| |||||||
Air Freight & Logistics - 0.8% | ||||||||
FedEx Corp. | 7,280 | 1,604,075 | ||||||
|
| |||||||
Airlines - 0.0%## | ||||||||
Ryanair Holdings plc - ADR (Ireland)* | 370 | 30,636 | ||||||
|
| |||||||
Building Products - 0.0%## | ||||||||
Cie de Saint-Gobain (France) | 290 | 10,925 | ||||||
TOTO Ltd. (Japan) | 700 | 25,043 | ||||||
|
| |||||||
| 35,968 | ||||||||
|
| |||||||
Commercial Services & Supplies - 0.0%## | ||||||||
Secom Co. Ltd. (Japan) | 300 | 24,561 | ||||||
|
| |||||||
Construction & Engineering - 0.0%## | ||||||||
FLSmidth & Co. A/S (Denmark) | 145 | 7,608 | ||||||
Vinci S.A. (France) | 1,000 | 88,999 | ||||||
|
| |||||||
| 96,607 | ||||||||
|
| |||||||
Electrical Equipment - 0.0%## | ||||||||
Schneider Electric SE (France) | 340 | 24,586 | ||||||
|
| |||||||
Industrial Conglomerates - 0.0%## | ||||||||
Siemens AG (Germany) | 625 | 71,841 | ||||||
|
| |||||||
Machinery - 0.3% | ||||||||
Epiroc AB - Class A (Sweden)* | 5,050 | 44,346 | ||||||
FANUC Corp. (Japan) | 200 | 34,793 | ||||||
Hoshizaki Corp. (Japan) | 500 | 40,360 | ||||||
Hyundai Heavy Industries Co. Ltd. (South Korea)* | 355 | 39,051 | ||||||
Hyundai Mipo Dockyard Co. Ltd. (South Korea)* | 460 | 38,153 | ||||||
Jungheinrich AG (Germany) | 1,100 | 36,445 | ||||||
KION Group AG (Germany) | 960 | 56,098 | ||||||
Kone OYJ - Class B (Finland) | 520 | 25,311 | ||||||
Makita Corp. (Japan) | 600 | 20,743 | ||||||
Metso OYJ (Finland) | 1,400 | 44,201 | ||||||
MISUMI Group, Inc. (Japan) | 1,300 | 26,053 | ||||||
Samsung Heavy Industries Co. Ltd. (South Korea)* | 3,075 | 18,866 | ||||||
Schindler Holding AG (Switzerland) | 245 | 51,662 | ||||||
WEG S.A. (Brazil) | 2,200 | 10,647 | ||||||
The Weir Group plc (United Kingdom) | 5,085 | 102,903 | ||||||
|
| |||||||
| 589,632 | ||||||||
|
| |||||||
Professional Services - 0.6% | ||||||||
Equifax, Inc. | 9,860 | 1,000,199 | ||||||
Experian plc (United Kingdom) | 1,065 | 24,494 | ||||||
Recruit Holdings Co. Ltd. (Japan) | 2,100 | 56,363 | ||||||
Teleperformance (France) | 145 | 23,880 | ||||||
Wolters Kluwer N.V. (Netherlands) | 415 | 23,545 | ||||||
|
| |||||||
| 1,128,481 | ||||||||
|
| |||||||
Road & Rail - 0.5% | ||||||||
Canadian National Railway Co. (Canada) | 305 | �� | 26,074 | |||||
Genesee & Wyoming, Inc. - Class A* | 13,270 | 1,051,382 | ||||||
|
| |||||||
| 1,077,456 | ||||||||
|
| |||||||
Trading Companies & Distributors - 0.1% | ||||||||
Ashtead Group plc (United Kingdom) | 1,490 | 36,784 | ||||||
Brenntag AG (Germany) | 570 | 29,768 | ||||||
Kanamoto Co. Ltd. (Japan) | 1,100 | 36,757 | ||||||
|
| |||||||
| 103,309 | ||||||||
|
| |||||||
The accompanying notes are an integral part of the financial statements.
49
Investment Portfolio - October 31, 2018
| BLENDED ASSET EXTENDED SERIES | SHARES | VALUE (NOTE 2) | ||||||
COMMON STOCKS (continued) | ||||||||
Industrials (continued) | ||||||||
Transportation Infrastructure - 0.0%## | ||||||||
Grupo Aeroportuario del Centro Norte S.A.B. de C.V. (Mexico) | 4,200 | $ | 21,997 | |||||
Grupo Aeroportuario del Pacifico S.A.B. de C.V. - ADR (Mexico) | 255 | 21,135 | ||||||
|
| |||||||
| 43,132 | ||||||||
|
| |||||||
Total Industrials | 4,985,448 | |||||||
|
| |||||||
Information Technology - 8.4% | ||||||||
Electronic Equipment, Instruments & Components -0.1% | ||||||||
Halma plc (United Kingdom) | 2,140 | 36,316 | ||||||
Hexagon A.B. - Class B (Sweden) | 1,115 | 54,572 | ||||||
Keyence Corp. (Japan) | 300 | 146,556 | ||||||
Yokogawa Electric Corp. (Japan) | 1,300 | 25,524 | ||||||
|
| |||||||
| 262,968 | ||||||||
|
| |||||||
IT Services - 4.4% | ||||||||
Amadeus IT Group S.A. (Spain) | 315 | 25,365 | ||||||
Amdocs Ltd.1 | 1,680 | 106,294 | ||||||
Capgemini SE (France) | 95 | 11,600 | ||||||
InterXion Holding N.V. (Netherlands)* | 19,580 | 1,152,675 | ||||||
LiveRamp Holdings, Inc.* | 32,965 | 1,505,841 | ||||||
Mastercard, Inc. - Class A | 15,930 | 3,148,883 | ||||||
Nomura Research Institute Ltd. (Japan) | 1,200 | 53,200 | ||||||
Obic Co. Ltd. (Japan) | 600 | 54,624 | ||||||
Otsuka Corp. (Japan) | 800 | 26,535 | ||||||
Visa, Inc. - Class A | 20,450 | 2,819,032 | ||||||
|
| |||||||
| 8,904,049 | ||||||||
|
| |||||||
Semiconductors & Semiconductor Equipment - 2.0% |
| |||||||
Qorvo, Inc.* | 41,450 | 3,046,990 | ||||||
Skyworks Solutions, Inc. | 12,650 | 1,097,514 | ||||||
|
| |||||||
| 4,144,504 | ||||||||
|
| |||||||
Software - 1.9% | ||||||||
Check Point Software Technologies | ||||||||
Ltd. (Israel)* | 470 | 52,170 | ||||||
Dassault Systemes S.E. (France) | 90 | 11,267 | ||||||
Microsoft Corp. | 24,680 | 2,636,071 | ||||||
Oracle Corp. (Japan) | 400 | 27,076 | ||||||
SAP SE (Germany) | 235 | 25,162 | ||||||
ServiceNow, Inc.* | 6,130 | 1,109,775 | ||||||
Trend Micro, Inc. (Japan) | 900 | 51,809 | ||||||
|
| |||||||
| 3,913,330 | ||||||||
|
| |||||||
Total Information Technology | 17,224,851 | |||||||
|
| |||||||
Materials - 2.2% | ||||||||
Chemicals - 0.2% | ||||||||
Air Liquide S.A. (France) | 265 | 32,034 | ||||||
Akzo Nobel N.V. (Netherlands) | 1,065 | 89,422 | ||||||
Asahi Kasei Corp. (Japan) | 2,200 | 26,397 | ||||||
Croda International plc (United Kingdom) | 881 | 54,266 | ||||||
FUCHS PETROLUB S.E. (Germany) | 296 | 13,702 | ||||||
Givaudan S.A. (Switzerland) | 10 | 24,239 | ||||||
Mexichem S.A.B. de C.V. (Mexico) | 16,585 | 43,379 | ||||||
Nissan Chemical Corp. (Japan) | 500 | 23,576 | ||||||
Novozymes A/S - Class B (Denmark) | 525 | 25,927 | ||||||
Solvay S.A. (Belgium) | 730 | 83,152 | ||||||
|
| |||||||
| 416,094 | ||||||||
|
| |||||||
Containers & Packaging - 1.9% | ||||||||
Ball Corp. | 53,470 | 2,395,456 | ||||||
DS Smith plc (United Kingdom) | 11,147 | 55,931 | ||||||
Sealed Air Corp. | 41,940 | 1,357,178 | ||||||
|
| |||||||
| 3,808,565 | ||||||||
|
| |||||||
Metals & Mining - 0.1% | ||||||||
Antofagasta plc (Chile) | 8,780 | 87,888 | ||||||
First Quantum Minerals Ltd. (Zambia) | 5,720 | 57,093 | ||||||
Lundin Mining Corp. (Chile) | 12,750 | 52,397 | ||||||
Southern Copper Corp. (Peru) | 1,450 | 55,593 | ||||||
|
| |||||||
| 252,971 | ||||||||
|
| |||||||
Total Materials | 4,477,630 | |||||||
|
| |||||||
Real Estate - 3.5% | ||||||||
Equity Real Estate Investment Trusts (REITS) - 3.5% |
| |||||||
Acadia Realty Trust | 745 | 20,741 | ||||||
Agree Realty Corp. | 405 | 23,194 | ||||||
Alexandria Real Estate Equities, Inc. | 160 | 19,557 | ||||||
American Campus Communities, Inc. | 550 | 21,730 | ||||||
American Homes 4 Rent - Class A | 3,970 | 83,648 | ||||||
American Tower Corp. | 6,940 | 1,081,322 | ||||||
Americold Realty Trust | 755 | 18,686 | ||||||
Apartment Investment & Management Co. - Class A | 1,470 | 63,269 | ||||||
Apple Hospitality REIT, Inc. | 2,100 | 33,957 | ||||||
AvalonBay Communities, Inc. | 930 | 163,104 | ||||||
Boston Properties, Inc. | 1,020 | 123,175 | ||||||
Brandywine Realty Trust | 5,285 | 74,307 | ||||||
CatchMark Timber Trust, Inc. - Class A | 2,582 | 22,851 | ||||||
The accompanying notes are an integral part of the financial statements.
50
Investment Portfolio - October 31, 2018
| BLENDED ASSET EXTENDED SERIES | SHARES | VALUE (NOTE 2) | ||||||
COMMON STOCKS (continued) | ||||||||
Real Estate (continued) | ||||||||
Equity Real Estate Investment Trusts (REITS) (continued) | ||||||||
Chesapeake Lodging Trust | 1,100 | $ | 32,329 | |||||
Colony Capital, Inc. | 4,585 | 26,914 | ||||||
Community Healthcare Trust, Inc. | 1,215 | 36,110 | ||||||
CoreCivic, Inc. | 2,445 | 54,915 | ||||||
Cousins Properties, Inc. | 8,630 | 71,715 | ||||||
Crown Castle International Corp. | 575 | 62,525 | ||||||
CubeSmart | 590 | 17,098 | ||||||
Digital Realty Trust, Inc. | 1,050 | 108,423 | ||||||
EastGroup Properties, Inc. | 185 | 17,721 | ||||||
Equinix, Inc. | 3,670 | 1,389,976 | ||||||
Equity LifeStyle Properties, Inc. | 435 | 41,190 | ||||||
Equity Residential | 2,015 | 130,894 | ||||||
Essex Property Trust, Inc. | 340 | 85,265 | ||||||
Extra Space Storage, Inc. | 460 | 41,428 | ||||||
Federal Realty Investment Trust | 170 | 21,088 | ||||||
First Industrial Realty Trust, Inc. | 1,020 | 31,314 | ||||||
Getty Realty Corp. | 1,290 | 34,611 | ||||||
HCP, Inc. | 2,220 | 61,161 | ||||||
Healthcare Realty Trust, Inc. | 1,425 | 39,700 | ||||||
Healthcare Trust of America, Inc. - Class A | 1,680 | 44,117 | ||||||
Hibernia REIT plc (Ireland) | 23,120 | 36,400 | ||||||
Host Hotels & Resorts, Inc. | 4,345 | 83,033 | ||||||
Independence Realty Trust, Inc. | 3,810 | 37,757 | ||||||
Invitation Homes, Inc. | 3,477 | 76,077 | ||||||
Jernigan Capital, Inc. | 2,140 | 41,880 | ||||||
Kimco Realty Corp. | 1,935 | 31,134 | ||||||
Lamar Advertising Co. - Class A | 375 | 27,495 | ||||||
Lexington Realty Trust | 3,880 | 30,148 | ||||||
Liberty Property Trust | 1,625 | 68,039 | ||||||
The Macerich Co. | 295 | 15,228 | ||||||
Mid-America Apartment Communities, Inc. | 690 | 67,420 | ||||||
National Retail Properties, Inc. | 720 | 33,660 | ||||||
National Storage Affiliates Trust | 640 | 17,043 | ||||||
Outfront Media, Inc. | 1,170 | 20,732 | ||||||
Physicians Realty Trust | 4,880 | 80,910 | ||||||
Plymouth Industrial REIT, Inc. | 1,545 | 21,630 | ||||||
Prologis, Inc. | 2,485 | 160,208 | ||||||
Public Storage | 510 | 104,790 | ||||||
Realty Income Corp. | 355 | 21,396 | ||||||
SBA Communications Corp.* | 6,650 | 1,078,430 | ||||||
Simon Property Group, Inc. | 1,245 | 228,482 | ||||||
STAG Industrial, Inc. | 1,610 | 42,601 | ||||||
STORE Capital Corp. | 720 | 20,902 | ||||||
Sun Communities, Inc. | 860 | 86,404 | ||||||
| SHARES/ PRINCIPAL AMOUNT3 | VALUE (NOTE 2) | |||||||
COMMON STOCKS (continued) | ||||||||
Real Estate (continued) | ||||||||
Equity Real Estate Investment Trusts (REITS) (continued) | ||||||||
Sunstone Hotel Investors, Inc. | 3,445 | $ | 49,849 | |||||
Tier REIT, Inc. | 3,130 | 67,827 | ||||||
UDR, Inc. | 2,145 | 84,063 | ||||||
UMH Properties, Inc. | 1,595 | 22,856 | ||||||
Unibail-Rodamco-Westfield (France) | 525 | 95,003 | ||||||
Urban Edge Properties | 3,520 | 72,125 | ||||||
Ventas, Inc. | 680 | 39,467 | ||||||
VEREIT, Inc. | 7,665 | 56,184 | ||||||
Vornado Realty Trust | 1,165 | 79,313 | ||||||
Weingarten Realty Investors | 1,855 | 52,163 | ||||||
Welltower, Inc. | 820 | 54,177 | ||||||
|
| |||||||
| 7,202,861 | ||||||||
|
| |||||||
Real Estate Management & Development - 0.0%## | ||||||||
Daito Trust Construction Co. Ltd. (Japan) | 200 | 26,368 | ||||||
StorageVault Canada, Inc. (Canada) | 5,525 | 10,828 | ||||||
|
| |||||||
| 37,196 | ||||||||
|
| |||||||
Total Real Estate | 7,240,057 | |||||||
|
| |||||||
Utilities - 0.1% | ||||||||
Independent Power and Renewable Electricity Producers - 0.1% | ||||||||
China Longyuan Power Group Corp. Ltd. - Class H (China) | 17,000 | 12,937 | ||||||
Engie Brasil Energia S.A. (Brazil) | 1,000 | 10,695 | ||||||
Huaneng Renewables Corp. Ltd. - Class H (China) | 145,670 | 37,492 | ||||||
|
| |||||||
| 61,124 | ||||||||
|
| |||||||
Multi-Utilities - 0.0%## | ||||||||
Engie S.A. (France) | 1,105 | 14,682 | ||||||
|
| |||||||
Water Utilities - 0.0%## | ||||||||
Guangdong Investment Ltd. (China) | 28,000 | 50,127 | ||||||
|
| |||||||
Total Utilities | 125,933 | |||||||
|
| |||||||
TOTAL COMMON STOCKS | ||||||||
(Identified Cost $102,041,025) | 100,431,691 | |||||||
|
| |||||||
CORPORATE BONDS - 11.9% | ||||||||
Non-Convertible Corporate Bonds - 11.9% | ||||||||
Communication Services - 1.6% | ||||||||
Diversified Telecommunication Services - 0.9% | ||||||||
AT&T, Inc., 4.25%, 3/1/2027 | 780,000 | 756,415 | ||||||
Verizon Communications, Inc., 5.50%, 3/16/2047 | 1,060,000 | 1,104,492 | ||||||
|
| |||||||
| 1,860,907 | ||||||||
|
| |||||||
The accompanying notes are an integral part of the financial statements.
51
Investment Portfolio - October 31, 2018
| BLENDED ASSET EXTENDED SERIES | PRINCIPAL AMOUNT3 | VALUE (NOTE 2) | ||||||
CORPORATE BONDS (continued) | ||||||||
Non-Convertible Corporate Bonds (continued) | ||||||||
Communication Services (continued) | ||||||||
Media - 0.6% | ||||||||
CCO Holdings LLC - CCO Holdings Capital Corp.2, 5.50%, 5/1/2026 | 65,000 | $ | 63,375 | |||||
Cequel Communications Holdings I LLC - Cequel Capital Corp.2, 7.50%, 4/1/2028 | 200,000 | 207,294 | ||||||
Discovery Communications LLC, 5.20%, 9/20/2047 | 780,000 | 721,412 | ||||||
Telenet Finance Luxembourg Notes S.A.R.L (Belgium)2, 5.50%, 3/1/2028 | 200,000 | 185,500 | ||||||
|
| |||||||
| 1,177,581 | ||||||||
|
| |||||||
Wireless Telecommunication Services - 0.1% | ||||||||
Hughes Satellite Systems Corp., 5.25%, 8/1/2026 | 105,000 | 99,750 | ||||||
Inmarsat Finance plc (United Kingdom)2, 4.875%, 5/15/2022 | 40,000 | 39,181 | ||||||
Sprint Communications, Inc.2, 9.00%, 11/15/2018 | 22,000 | 22,044 | ||||||
Sprint Communications, Inc.2, 7.00%, 3/1/2020 | 22,000 | 22,798 | ||||||
|
| |||||||
| 183,773 | ||||||||
|
| |||||||
Total Communication Services | 3,222,261 | |||||||
|
| |||||||
Consumer Discretionary - 1.5% | ||||||||
Auto Components - 0.0%## | ||||||||
Techniplas LLC2, 10.00%, 5/1/2020 | 60,000 | 56,400 | ||||||
|
| |||||||
Automobiles - 0.4% | ||||||||
General Motors Co.4, (3 mo. LIBOR US + 0.900%), 3.227%, 9/10/2021 | 770,000 | 768,886 | ||||||
|
| |||||||
Household Durables - 0.2% | ||||||||
Century Communities, Inc., 5.875%, 7/15/2025 | 110,000 | 99,550 | ||||||
LGI Homes, Inc.2, 6.875%, 7/15/2026 | 75,000 | 71,250 | ||||||
Meritage Homes Corp., 5.125%, 6/6/2027 | 45,000 | 39,600 | ||||||
TRI Pointe Group, Inc. - TRI Pointe Homes, Inc., 4.375%, 6/15/2019 | 75,000 | 75,000 | ||||||
TRI Pointe Group, Inc. - TRI Pointe Homes, Inc., 5.875%, 6/15/2024 | 60,000 | 56,025 | ||||||
Weekley Homes LLC - Weekley Finance Corp., 6.00%, 2/1/2023 | 45,000 | 43,200 | ||||||
Weekley Homes LLC - Weekley Finance Corp., 6.625%, 8/15/2025 | 70,000 | 66,150 | ||||||
|
| |||||||
| 450,775 | ||||||||
|
| |||||||
Internet & Direct Marketing Retail - 0.5% | ||||||||
Booking Holdings, Inc., 3.60%, 6/1/2026 | 1,190,000 | 1,136,497 | ||||||
|
| |||||||
Multiline Retail - 0.4% | ||||||||
Macy’s Retail Holdings, Inc., 7.00%, 2/15/2028 | 360,000 | 380,165 | ||||||
Macy’s Retail Holdings, Inc., 6.90%, 4/1/2029 | 360,000 | 377,635 | ||||||
|
| |||||||
| 757,800 | ||||||||
|
| |||||||
Total Consumer Discretionary | 3,170,358 | |||||||
|
| |||||||
Consumer Staples - 0.0%## | ||||||||
Food & Staples Retailing - 0.0%## | ||||||||
C&S Group Enterprises LLC2, 5.375%, 7/15/2022 | 40,000 | 38,600 | ||||||
|
| |||||||
Household Products - 0.0%## | ||||||||
First Quality Finance Co., Inc.2, 5.00%, 7/1/2025 | 50,000 | 46,000 | ||||||
|
| |||||||
Total Consumer Staples | 84,600 | |||||||
|
| |||||||
Energy - 2.3% | ||||||||
Energy Equipment & Services - 0.0%## | ||||||||
Shelf Drilling Holdings Ltd. (United Arab Emirates)2, 8.25%, 2/15/2025 | 60,000 | 60,150 | ||||||
TerraForm Power Operating, LLC2, 5.00%, 1/31/2028 | 40,000 | 35,750 | ||||||
|
| |||||||
| 95,900 | ||||||||
|
| |||||||
Oil, Gas & Consumable Fuels - 2.3% |
| |||||||
American Midstream Partners LP - American Midstream Finance Corp.2, 9.50%, 12/15/2021 | 65,000 | 63,700 | ||||||
Boardwalk Pipelines LP, 5.95%, 6/1/2026 | 1,090,000 | 1,138,954 | ||||||
DCP Midstream Operating LP2, 5.35%, 3/15/2020 | 40,000 | 40,450 | ||||||
Dynagas LNG Partners LP - Dynagas Finance, Inc. (Monaco), 6.25%, 10/30/2019 | 78,000 | 77,805 | ||||||
GasLog Ltd. (Monaco), 8.875%, 3/22/2022 | 95,000 | 98,325 | ||||||
Genesis Energy LP - Genesis Energy Finance Corp., 5.625%, 6/15/2024 | 50,000 | 45,250 | ||||||
Jonah Energy LLC - Jonah Energy Finance Corp.2, 7.25%, 10/15/2025 | 105,000 | 83,475 | ||||||
Kinder Morgan Energy Partners LP, 6.95%, 1/15/2038 | 980,000 | 1,122,492 | ||||||
The accompanying notes are an integral part of the financial statements.
52
Investment Portfolio - October 31, 2018
| BLENDED ASSET EXTENDED SERIES | PRINCIPAL AMOUNT3 | VALUE (NOTE 2) | ||||||
CORPORATE BONDS (continued) | ||||||||
Non-Convertible Corporate Bonds (continued) | ||||||||
Energy (continued) | ||||||||
Oil, Gas & Consumable Fuels (continued) | ||||||||
Rockies Express Pipeline, LLC2, 5.625%, 4/15/2020 | 40,000 | $ | 40,868 | |||||
Sabine Pass Liquefaction LLC, 5.875%, 6/30/2026 | 1,070,000 | 1,135,937 | ||||||
SemGroup Corp., 6.375%, 3/15/2025 | 40,000 | 38,700 | ||||||
Seven Generations Energy Ltd. (Canada)2 , 5.375%, 9/30/2025 | 49,000 | 45,692 | ||||||
Southwestern Energy Co.5, 6.20%, 1/23/2025 | 56,000 | 54,460 | ||||||
Tallgrass Energy Partners LP - Tallgrass Energy Finance Corp.2, 5.50%, 9/15/2024 | 40,000 | 40,250 | ||||||
W&T Offshore, Inc.2, 9.75%, 11/1/2023 | 60,000 | 58,062 | ||||||
The Williams Companies, Inc., 3.75%, 6/15/2027 | 610,000 | 567,995 | ||||||
|
| |||||||
| 4,652,415 | ||||||||
|
| |||||||
Total Energy | 4,748,315 | |||||||
|
| |||||||
Financials - 3.6% | ||||||||
Banks - 2.1% | ||||||||
Bank of America Corp., 4.00%, 1/22/2025 | 1,170,000 | 1,139,390 | ||||||
Citigroup, Inc., 8.125%, 7/15/2039 | 810,000 | 1,130,959 | ||||||
JPMorgan Chase & Co., 6.30%, 4/23/2019 | 1,130,000 | 1,148,300 | ||||||
Popular, Inc., 6.125%, 9/14/2023 | 60,000 | 60,708 | ||||||
Santander Holdings USA, Inc., 4.50%, 7/17/2025 | 770,000 | 752,941 | ||||||
|
| |||||||
| 4,232,298 | ||||||||
|
| |||||||
Capital Markets - 0.6% | ||||||||
LPL Holdings, Inc.2, 5.75%, 9/15/2025 | 70,000 | 67,988 | ||||||
Morgan Stanley4 , (3 mo. LIBOR US + 1.220%), 3.563%, 5/8/2024 | 1,130,000 | 1,141,922 | ||||||
|
| |||||||
| 1,209,910 | ||||||||
|
| |||||||
Consumer Finance - 0.1% | ||||||||
Ally Financial, Inc., 3.50%, 1/27/2019 | 50,000 | 49,937 | ||||||
Navient Corp., 7.25%, 9/25/2023 | 40,000 | 41,400 | ||||||
SLM Corp., 5.125%, 4/5/2022 | 65,000 | 64,675 | ||||||
|
| |||||||
| 156,012 | ||||||||
|
| |||||||
Diversified Financial Services - 0.4% | ||||||||
AerCap Ireland Capital DAC - | ||||||||
AerCap Global Aviation Trust | ||||||||
(Ireland), 4.45%, 10/1/2025 | 770,000 | 751,898 | ||||||
FS Energy & Power Fund2, 7.50%, 8/15/2023 | 70,000 | 70,980 | ||||||
Oxford Finance, LLC - Oxford Finance Co.- Issuer II, Inc.2, 6.375%, 12/15/2022 | 70,000 | 70,962 | ||||||
|
| |||||||
| 893,840 | ||||||||
|
| |||||||
Insurance - 0.4% | ||||||||
Prudential Financial, Inc.6, (3mo. LIBOR US + 4.175%), 5.875%, 9/15/2042 | 720,000 | 749,160 | ||||||
|
| |||||||
Thrifts & Mortgage Finance - 0.0%## | ||||||||
Ladder Capital Finance Holdings LLLP - Ladder Capital Finance Corp.2, 5.875%, 8/1/2021 | 45,000 | 45,338 | ||||||
|
| |||||||
Total Financials | 7,286,558 | |||||||
|
| |||||||
Health Care - 0.1% | ||||||||
Health Care Providers & Services - 0.1% | ||||||||
DaVita, Inc., 5.00%, 5/1/2025 | 65,000 | 61,425 | ||||||
HCA, Inc., 5.375%, 9/1/2026 | 55,000 | 54,587 | ||||||
Ortho-Clinical Diagnostics, Inc. - Ortho-Clinical Diagnostics S.A.2, 6.625%, 5/15/2022 | 55,000 | 52,856 | ||||||
|
| |||||||
Total Health Care | 168,868 | |||||||
|
| |||||||
Industrials - 1.5% | ||||||||
Airlines - 0.0%## | ||||||||
Allegiant Travel Co., 5.50%, 7/15/2019 | 50,000 | 50,250 | ||||||
American Airlines Group, Inc.2, 5.50%, 10/1/2019 | 50,000 | 50,547 | ||||||
|
| |||||||
| 100,797 | ||||||||
|
| |||||||
Commercial Services & Supplies - 0.1% | ||||||||
The ADT Security Corp., 5.25%, 3/15/2020 | 40,000 | 40,400 | ||||||
Covanta Holding Corp., 6.00%, 1/1/2027 | 60,000 | 57,900 | ||||||
W/S Packaging Holdings, Inc.2, 9.00%, 4/15/2023 | 60,000 | 61,200 | ||||||
|
| |||||||
| 159,500 | ||||||||
|
| |||||||
Construction & Engineering - 0.0%## | ||||||||
Tutor Perini Corp.2, 6.875%, 5/1/2025 | 79,000 | 79,099 | ||||||
|
| |||||||
The accompanying notes are an integral part of the financial statements.
53
Investment Portfolio - October 31, 2018
| BLENDED ASSET EXTENDED SERIES | PRINCIPAL AMOUNT3 | VALUE (NOTE 2) | ||||||
CORPORATE BONDS (continued) | ||||||||
Non-Convertible Corporate Bonds (continued) | ||||||||
Industrials (continued) | ||||||||
Industrial Conglomerates - 0.3% | ||||||||
General Electric Co.6,7,(3mo. LIBOR US + 3.330%), 5.00% | 620,000 | $ | 574,275 | |||||
|
| |||||||
Machinery - 0.4% | ||||||||
CNH Industrial Capital LLC, 3.375%, 7/15/2019 | 770,000 | 769,307 | ||||||
|
| |||||||
Marine - 0.1% | ||||||||
Borealis Finance, LLC2, 7.50%, 11/16/2022 | 200,000 | 196,000 | ||||||
Global Ship Lease, Inc. (United Kingdom)2 , 9.875%, 11/15/2022 | 100,000 | 95,250 | ||||||
|
| |||||||
| 291,250 | ||||||||
|
| |||||||
Trading Companies & Distributors - 0.5% | ||||||||
Aircastle Ltd., 6.25%, 12/1/2019 | 30,000 | 30,831 | ||||||
Fortress Transportation & Infrastructure Investors, LLC2, 6.50%, 10/1/2025 | 60,000 | 58,950 | ||||||
International Lease Finance Corp., 6.25%, 5/15/2019 | 777,000 | 789,393 | ||||||
Park Aerospace Holdings Ltd. (Ireland)2 , 4.50%, 3/15/2023 | 74,000 | 70,402 | ||||||
|
| |||||||
| 949,576 | ||||||||
|
| |||||||
Transportation Infrastructure - 0.1% | ||||||||
Eagle Bulk Shipco, LLC, 8.25%, 11/28/2022 | 200,000 | 205,500 | ||||||
|
| |||||||
Total Industrials | 3,129,304 | |||||||
|
| |||||||
Semiconductors & Semiconductor Equipment - 0.0%## | ||||||||
MagnaChip Semiconductor Corp. (South Korea), 6.625%, 7/15/2021 | 78,000 | 73,320 | ||||||
|
| |||||||
Materials - 0.5% | ||||||||
Chemicals - 0.0%## | ||||||||
LSB Industries, Inc.2, 9.625%, 5/1/2023 | 70,000 | 72,625 | ||||||
|
| |||||||
Containers & Packaging - 0.1% | ||||||||
Ardagh Packaging Finance plc - Ardagh Holdings USA, Inc. (Ireland)2 , 6.00%, 2/15/2025 | 200,000 | 187,500 | ||||||
|
| |||||||
Metals & Mining - 0.4% | ||||||||
Corp Nacional del Cobre de Chile (Chile)2 , 5.625%, 9/21/2035 | 490,000 | 519,336 | ||||||
Mountain Province Diamonds, Inc. (Canada)2 , 8.00%, 12/15/2022 | 100,000 | 101,500 | ||||||
Northwest Acquisitions ULC - Dominion Finco, Inc.2 , 7.125%, 11/1/2022 | 100,000 | 100,685 | ||||||
|
| |||||||
| 721,521 | ||||||||
|
| |||||||
Total Materials | 981,646 | |||||||
|
| |||||||
Real Estate - 0.5% | ||||||||
Equity Real Estate Investment Trusts (REITS) - 0.5% |
| |||||||
American Homes 4 Rent LP, 4.25%, 2/15/2028 | 800,000 | 756,188 | ||||||
Greystar Real Estate Partners, LLC2 , 5.75%, 12/1/2025 | 75,000 | 72,750 | ||||||
GTP Acquisition Partners I LLC2 , 2.35%, 6/15/2020 | 123,000 | 120,260 | ||||||
iStar, Inc., 5.25%, 9/15/2022 | 57,000 | 55,147 | ||||||
|
| |||||||
| 1,004,345 | ||||||||
|
| |||||||
Total Real Estate | 1,004,345 | |||||||
|
| |||||||
Utilities - 0.3% | ||||||||
Gas Utilities - 0.1% | ||||||||
NGL Energy Partners LP - NGL Energy Finance Corp., 6.125%, 3/1/2025 | 65,000 | 59,150 | ||||||
|
| |||||||
Independent Power and Renewable Electricity Producers - 0.2% | ||||||||
Atlantica Yield plc (Spain)2 , 7.00%, 11/15/2019 | 204,000 | 210,120 | ||||||
Clearway Energy Operating, LLC, 5.00%, 9/15/2026 | 45,000 | 41,850 | ||||||
Drax Finco plc (United Kingdom)2 , 6.625%, 11/1/2025 | 200,000 | 199,500 | ||||||
|
| |||||||
Total Utilities | 510,620 | |||||||
|
| |||||||
TOTAL CORPORATE BONDS | 24,380,195 | |||||||
|
| |||||||
The accompanying notes are an integral part of the financial statements.
54
Investment Portfolio - October 31, 2018
| BLENDED ASSET EXTENDED SERIES | SHARES/ PRINCIPAL AMOUNT3 | VALUE (NOTE 2) | ||||||
MUTUAL FUNDS - 0.1% | ||||||||
iShares MSCI Thailand ETF | 1,714 | $ | 148,604 | |||||
iShares U.S. Real Estate ETF | 805 | 62,878 | ||||||
|
| |||||||
TOTAL MUTUAL FUNDS | 211,482 | |||||||
|
| |||||||
U.S. TREASURY SECURITIES - 21.3% | ||||||||
U.S. Treasury Bonds - 6.0% | ||||||||
U.S. Treasury Bond, 6.25%, 5/15/2030 | 1,546,000 | 2,001,526 | ||||||
U.S. Treasury Bond, 4.75%, 2/15/2037 | 2,666,000 | 3,209,822 | ||||||
U.S. Treasury Bond, 2.50%, 2/15/2045 | 3,627,000 | 3,057,023 | ||||||
U.S. Treasury Bond, 3.00%, 5/15/2047 | 3,260,000 | 3,019,448 | ||||||
U.S. Treasury Inflation Indexed Bond, 0.75%, 2/15/2042 | 1,103,382 | 980,070 | ||||||
|
| |||||||
Total U.S. Treasury Bonds | 12,267,889 | |||||||
|
| |||||||
U.S. Treasury Notes - 15.3% | ||||||||
U.S. Treasury Inflation Indexed Note, 0.125%, 4/15/2020 | 6,301,934 | 6,194,523 | ||||||
U.S. Treasury Inflation Indexed Note, 0.125%, 1/15/2023 | 1,056,441 | 1,017,095 | ||||||
U.S. Treasury Note, 1.625%, 4/30/2019 | 2,100,000 | 2,091,058 | ||||||
U.S. Treasury Note, 2.00%, 7/31/2022 | 1,000 | 966 | ||||||
U.S. Treasury Note, 1.625%, 4/30/2023 | 2,185,000 | 2,060,643 | ||||||
U.S. Treasury Note, 2.125%, 7/31/2024 | 3,777,000 | 3,596,412 | ||||||
U.S. Treasury Note, 2.125%, 5/15/2025 | 4,305,000 | 4,064,189 | ||||||
U.S. Treasury Note, 1.625%, 5/15/2026 | 4,601,000 | 4,147,370 | ||||||
U.S. Treasury Note, 2.375%, 5/15/2027 | 4,211,000 | 3,974,625 | ||||||
U.S. Treasury Note, 2.75%, 2/15/2028 | 4,345,000 | 4,204,806 | ||||||
|
| |||||||
Total U.S. Treasury Notes | 31,351,687 | |||||||
|
| |||||||
TOTAL U.S. TREASURY SECURITIES | 43,619,576 | |||||||
|
| |||||||
PRINCIPAL AMOUNT3 | VALUE (NOTE 2) | |||||||
ASSET-BACKED SECURITIES - 2.7% | ||||||||
Cazenovia Creek Funding II LLC, Series 2018-1A, Class A2 , 3.561%, 7/15/2030 | 457,527 | $ | 455,494 | |||||
Chesapeake Funding II LLC, Series 2016-1A, Class A12 , 2.11%, 3/15/2028 | 73,987 | 73,779 | ||||||
Chesapeake Funding II LLC, Series 2017-2A, Class A12 , 1.99%, 5/15/2029 | 732,701 | 725,238 | ||||||
Chesapeake Funding II LLC, Series 2017-4A, Class A12 , 2.12%, 11/15/2029 | 463,246 | 457,076 | ||||||
Credit Acceptance Auto Loan Trust, Series 2017-1A, Class A2 , 2.56%, 10/15/2025 | 451,000 | 448,628 | ||||||
Enterprise Fleet Financing LLC, Series 2016-2, Class A22 , 1.74%, 2/22/2022 | 69,574 | 69,304 | ||||||
Invitation Homes Trust, Series 2017-SFR2, Class A2,4 ,(1mo. LIBOR US + 0.850%), 3.14%, 12/17/2036 | 163,783 | 163,937 | ||||||
Invitation Homes Trust, Series 2017-SFR2, Class B2,4 ,(1mo. LIBOR US + 1.150%), 3.44%, 12/17/2036 | 120,000 | 120,790 | ||||||
SoFi Consumer Loan Program LLC, Series 2016-2, Class A2 , 3.09%, 10/27/2025 | 268,064 | 267,170 | ||||||
SoFi Professional Loan Program LLC, Series 2017-A, Class A2A2 , 1.55%, 3/26/2040 | 509,350 | 505,304 | ||||||
SoFi Professional Loan Program LLC, Series 2017-C, Class A2A2 , 1.75%, 7/25/2040 | 803,142 | 795,821 | ||||||
SoFi Professional Loan Program LLC, Series 2018-C, Class A1FX2 , 3.08%, 1/25/2048 | 673,901 | 671,923 | ||||||
South Carolina Student Loan Corp., Series 2005, Class A34 ,(3mo. LIBOR US + 0.140%), 2.461%, 12/1/2023 | 53,101 | 53,100 | ||||||
Tax Ease Funding LLC, Series 2016-1A, Class A2 , 3.131%, 6/15/2028 | 83,559 | 83,270 | ||||||
Tricon American Homes Trust, Series 2016-SFR1, Class A2 , 2.589%, 11/1/2033 | 321,617 | 309,697 | ||||||
Tricon American Homes Trust, Series 2017-SFR2, Class A2 , 2.928%, 1/1/2036 | 299,680 | 285,996 | ||||||
|
| |||||||
TOTAL ASSET-BACKED SECURITIES | 5,486,527 | |||||||
|
| |||||||
The accompanying notes are an integral part of the financial statements.
55
Investment Portfolio - October 31, 2018
| BLENDED ASSET EXTENDED SERIES | PRINCIPAL AMOUNT3 | VALUE (NOTE 2) | ||||||||||
COMMERCIAL MORTGAGE-BACKED SECURITIES - 4.6% | ||||||||||||
BWAY Mortgage Trust, Series 2015-1740, Class A2, 2.917%, 1/1/2035 | 889,000 | $ | 848,222 | |||||||||
Credit Suisse Mortgage Capital Trust, Series 2013-IVR3, Class A12,8 , 2.50%, 5/1/2043 | 221,106 | 203,860 | ||||||||||
Credit Suisse Mortgage Capital Trust, Series 2014-IVR3, Class A12,8 , 3.50%, 7/1/2044 | 403,886 | 391,296 | ||||||||||
Fannie Mae REMICS, Series 2018-31, Class KP, 3.50%, 7/1/2047 | 304,850 | 300,811 | ||||||||||
Freddie Mac Multifamily Structured Pass-Through Certificates, Series K017, Class X1 (IO)8, 1.452%, 12/1/2021 | 5,937,099 | 198,002 | ||||||||||
Freddie Mac Multifamily Structured Pass-Through Certificates, Series KP01, Class A2, 1.72%, 1/1/2019 . | 7,675 | 7,661 | ||||||||||
Freddie Mac REMICS, Series 4791, Class BA, 4.00%, 3/1/2044 | 384,992 | 390,354 | ||||||||||
Freddie Mac REMICS, Series 4801, Class BA, 4.50%, 5/1/2044 | 398,941 | 410,488 | ||||||||||
FREMF Mortgage Trust, Series 2013-K712, Class B2,8, 3.358%, 5/1/2045 | 283,000 | 282,535 | ||||||||||
FREMF Mortgage Trust, Series 2013-K713, Class B2,8, 3.263%, 4/1/2046 | 500,000 | 497,917 | ||||||||||
FREMF Mortgage Trust, Series 2014-K41, Class B2,8, 3.832%, 11/1/2047 | 485,000 | 474,967 | ||||||||||
FREMF Mortgage Trust, Series 2014-K503, Class B2,8, 3.139%, 10/1/2047 | 500,000 | 498,320 | ||||||||||
FREMF Mortgage Trust, Series 2014-K715, Class B2,8, 3.978%, 2/1/2046 | 471,000 | 474,552 | ||||||||||
GAHR Commercial Mortgage Trust, Series 2015-NRF, Class BFX2,8, 3.495%, 12/1/2034 | 565,000 | 563,251 | ||||||||||
Government National Mortgage Association, Series 2017-54, Class AH, 2.60%, 12/1/2056 | 489,382 | 448,330 | ||||||||||
JP Morgan Mortgage Trust, Series 2013-2, Class A22,8, 3.50%, 5/1/2043 | 123,594 | 119,272 | ||||||||||
JP Morgan Mortgage Trust, Series 2014-2, Class 1A12,8, 3.00%, 6/1/2029 | 201,717 | 197,596 | ||||||||||
JP Morgan Mortgage Trust, Series 2017-3, Class 1A52,8, 3.50%, 8/1/2047 | 403,576 | 395,363 | ||||||||||
JP Morgan Mortgage Trust, Series 2017-6, Class A32,8, 3.50%, 12/1/2048 | 367,382 | 352,715 | ||||||||||
JP Morgan Mortgage Trust, Series 2017-6, Class A52,8, 3.50%, 12/1/2048 | 493,937 | 483,576 | ||||||||||
New Residential Mortgage Loan Trust, Series 2014-3A, Class AFX32,8 , 3.75%, 11/1/2054 | 145,910 | 145,152 | ||||||||||
New Residential Mortgage Loan Trust, Series 2015-2A, Class A12,8 , 3.75%, 8/1/2055 | 221,038 | 219,670 | ||||||||||
New Residential Mortgage Loan Trust, Series 2016-4A, Class A12,8 , 3.75%, 11/1/2056 | 224,127 | 222,441 | ||||||||||
Sequoia Mortgage Trust, Series 2013-2, Class A8 , 1.874%, 2/1/2043 | 153,742 | 133,954 | ||||||||||
Sequoia Mortgage Trust, Series 2013-8, Class A18 , 3.00%, 6/1/2043 | 173,531 | 162,597 | ||||||||||
Starwood Retail Property Trust, Series 2014-STAR, Class A2,4 ,(1 mo. LIBOR US + 1.220%), 3.50%, 11/15/2027 | 368,239 | 368,289 | ||||||||||
Towd Point Mortgage Trust, Series 2016-5, Class A12,8 , 2.50%, 10/1/2056 | 390,958 | 379,560 | ||||||||||
WinWater Mortgage Loan Trust, Series 2015-1, Class A12,8 , 3.50%, 1/1/2045 | 169,295 | 164,832 | ||||||||||
WinWater Mortgage Loan Trust, Series 2015-3, Class A52,8 , 3.50%, 3/1/2045 | 143,482 | 143,108 | ||||||||||
|
| |||||||||||
TOTAL COMMERCIAL MORTGAGE-BACKED SECURITIES | 9,478,691 | |||||||||||
|
| |||||||||||
FOREIGN GOVERNMENT BONDS - 1.3% | ||||||||||||
Canada Housing Trust No. 1 (Canada)2 , 4.10%, 12/15/2018 | CAD | 86,000 | 65,491 | |||||||||
Canadian Government Bond (Canada), 2.75%, 6/1/2022 | CAD | 102,000 | 78,378 | |||||||||
Export-Import Bank of Korea (South Korea), 2.625%, 12/30/2020 | 500,000 | 491,770 | ||||||||||
The Korea Development Bank (South Korea), 1.375%, 9/12/2019 | 900,000 | 886,964 | ||||||||||
Mexican Government Bond (Mexico), 8.00%, 6/11/2020 | MXN | 2,087,000 | 101,776 | |||||||||
Mexican Government Bond (Mexico), 6.50%, 6/10/2021 | MXN | 888,000 | 41,551 | |||||||||
The accompanying notes are an integral part of the financial statements.
56
Investment Portfolio - October 31, 2018
| BLENDED ASSET EXTENDED SERIES | PRINCIPAL AMOUNT3 | VALUE (NOTE 2) | ||||||||||
FOREIGN GOVERNMENT BONDS (continued) | ||||||||||||
Mexican Government Bond (Mexico), 6.50%, 6/9/2022 | MXN | 1,443,000 | $ | 66,320 | ||||||||
Mexican Government Bond (Mexico), 7.75%, 5/29/2031 | MXN | 278,000 | 12,475 | |||||||||
Province of Ontario (Canada), 1.25%, 6/17/2019 | 223,000 | 220,882 | ||||||||||
Singapore Government Bond (Singapore), 2.50%, 6/1/2019 | SGD | 188,000 | 136,130 | |||||||||
Svensk Exportkredit AB (Sweden), 1.125%, 8/28/2019 | 621,000 | 612,437 | ||||||||||
|
| |||||||||||
TOTAL FOREIGN GOVERNMENT BONDS | 2,714,174 | |||||||||||
|
| |||||||||||
U.S. GOVERNMENT AGENCIES - 6.9% | ||||||||||||
Mortgage-Backed Securities - 6.9% | ||||||||||||
Fannie Mae, Pool #888468, 5.50%, 9/1/2021 | 37,404 | 38,043 | ||||||||||
Fannie Mae, Pool #888810, 5.50%, 11/1/2022 | 45,433 | 46,211 | ||||||||||
Fannie Mae, Pool #MA1834, 4.50%, 2/1/2034 | 268,359 | 276,153 | ||||||||||
Fannie Mae, Pool #AD0207, 6.00%, 10/1/2038 | 215,798 | 235,432 | ||||||||||
Fannie Mae, Pool #AD0307, 5.50%, 1/1/2039 | 135,184 | 144,646 | ||||||||||
Fannie Mae, Pool #MA0258, 4.50%, 12/1/2039 | 175,644 | 181,890 | ||||||||||
Fannie Mae, Pool #AL1595, 6.00%, 1/1/2040 | 107,162 | 116,597 | ||||||||||
Fannie Mae, Pool #AL0241, 4.00%, 4/1/2041 | 293,138 | 295,362 | ||||||||||
Fannie Mae, Pool #AL1410, 4.50%, 12/1/2041 | 452,919 | 468,415 | ||||||||||
Fannie Mae, Pool #AL7729, 4.00%, 6/1/2043 | 246,902 | 248,770 | ||||||||||
Fannie Mae, Pool #AS3622, 3.50%, 10/1/2044 | 1,065,400 | 1,041,560 | ||||||||||
Fannie Mae, Pool #AS4103, 4.50%, 12/1/2044 | 268,061 | 277,120 | ||||||||||
Fannie Mae, Pool #BC3490, 3.50%, 2/1/2046 | 631,482 | 617,348 | ||||||||||
Fannie Mae, Pool #MA2705, 3.00%, 8/1/2046 | 327,281 | 309,968 | ||||||||||
Fannie Mae, Pool #BE3812, 4.00%, 12/1/2046 | 347,055 | 347,302 | ||||||||||
Fannie Mae, Pool #MA3148, 3.50%, 10/1/2047 | 602,194 | 586,593 | ||||||||||
Fannie Mae, Pool #BJ1323, 3.50%, 11/1/2047 | 1,003,083 | 977,823 | ||||||||||
Fannie Mae, Pool #MA3184, 4.50%, 11/1/2047 | 369,136 | 378,293 | ||||||||||
Fannie Mae, Pool #CA1720, 5.00%, 5/1/2048 | 582,514 | 608,669 | ||||||||||
Fannie Mae, Pool #CA1922, 5.00%, 6/1/2048 | 571,886 | 597,508 | ||||||||||
Fannie Mae, Pool #BM4322, 4.00%, 7/1/2048 | 1,010,167 | 1,011,954 | ||||||||||
Fannie Mae, Pool #CA2056, 4.50%, 7/1/2048 | 591,386 | 606,264 | ||||||||||
Fannie Mae, Pool #BK9366, 4.50%, 8/1/2048 | 249,370 | 255,564 | ||||||||||
Fannie Mae, Pool #CA2219, 5.00%, 8/1/2048 | 451,995 | 472,223 | ||||||||||
Fannie Mae, Pool #MA3527, 5.00%, 11/1/2048 | 1,004,000 | 1,048,880 | ||||||||||
Fannie Mae, Pool #AL8674, 5.654%, 1/1/2049 | 520,587 | 554,322 | ||||||||||
Freddie Mac, Pool #C91762, 4.50%, 5/1/2034 | 162,342 | 167,182 | ||||||||||
Freddie Mac, Pool #C91771, 4.50%, 6/1/2034 | 150,120 | 155,635 | ||||||||||
Freddie Mac, Pool #C91780, 4.50%, 7/1/2034 | 175,107 | 180,286 | ||||||||||
Freddie Mac, Pool #G04601, 5.50%, 7/1/2038 | 204,038 | 217,893 | ||||||||||
Freddie Mac, Pool #G04587, 5.50%, 8/1/2038 | 187,242 | 200,233 | ||||||||||
Freddie Mac, Pool #Q33778, 4.00%, 6/1/2045 | 248,615 | 249,278 | ||||||||||
Freddie Mac, Pool #G08786, 4.50%, 10/1/2047 | 407,635 | 419,305 | ||||||||||
Freddie Mac, Pool #Q55506, 4.50%, 4/1/2048 | 774,608 | 793,769 | ||||||||||
|
| |||||||||||
TOTAL U.S. GOVERNMENT AGENCIES | 14,126,491 | |||||||||||
|
| |||||||||||
The accompanying notes are an integral part of the financial statements.
57
Investment Portfolio - October 31, 2018
| BLENDED ASSET EXTENDED SERIES | SHARES | VALUE (NOTE 2) | ||||||
SHORT-TERM INVESTMENT - 0.2% | ||||||||
Dreyfus Government Cash Management, Institutional Shares9, 2.05%, | ||||||||
(Identified Cost $460,479) | 460,479 | $ | 460,479 | |||||
|
| |||||||
TOTAL INVESTMENTS IN SECURITIES - 98.1% | ||||||||
(Identified Cost $205,397,142) | 200,909,306 | |||||||
|
| |||||||
VALUE (NOTE 2) | ||||||||
TOTAL OPTIONS WRITTEN - (0.1)% | $ | (108,563 | ) | |||||
|
| |||||||
TOTAL INVESTMENTS - 98.0% | 200,800,743 | |||||||
OTHER ASSETS, LESS LIABILITIES -2.0% | 4,005,623 | |||||||
|
| |||||||
NET ASSETS - 100% | $ | 204,806,366 | ||||||
|
| |||||||
ADR - American Depositary Receipt
CAD - Canadian Dollar
ETF - Exchange-traded fund
IO - Interest only
MXN - Mexican Peso
No. - Number
SGD - Singapore Dollar
| EXCHANGE-TRADED OPTIONS WRITTEN | ||||||||||||||||||||
| DESCRIPTION | NUMBER OF CONTRACTS | EXPIRATION DATE | EXERCISE PRICE | NOTIONAL AMOUNT3 (000) | VALUE | |||||||||||||||
Call | ||||||||||||||||||||
Booking Holdings, Inc. | 2 | 11/09/18 | $ | 1,960.00 | 375 | $ | (8,000 | ) | ||||||||||||
Qorvo, Inc. | 65 | 11/16/18 | 77.50 | 478 | (13,975 | ) | ||||||||||||||
Alphabet, Inc. - Class C | 6 | 11/23/18 | 1,110.00 | 646 | (13,200 | ) | ||||||||||||||
|
| |||||||||||||||||||
| (35,175 | ) | |||||||||||||||||||
|
| |||||||||||||||||||
Put | ||||||||||||||||||||
lululemon athletica, Inc. | 35 | 11/09/18 | 149.00 | 492 | (28,525 | ) | ||||||||||||||
Mastercard, Inc. - Class A | 35 | 11/09/18 | 197.50 | 692 | (13,650 | ) | ||||||||||||||
Medtronic plc | 77 | 11/16/18 | 90.00 | 692 | (11,165 | ) | ||||||||||||||
Microsoft Corp. | 68 | 11/16/18 | 100.00 | 726 | (6,188 | ) | ||||||||||||||
Qorvo, Inc. | 99 | 11/16/18 | 67.50 | 728 | (13,860 | ) | ||||||||||||||
|
| |||||||||||||||||||
| (73,388 | ) | |||||||||||||||||||
TOTAL EXCHANGE-TRADED OPTIONS WRITTEN |
| $ | (108,563 | ) | ||||||||||||||||
|
| |||||||||||||||||||
*Non-income producing security.
## Less than 0.1%.
1A portion of this security is designated with the broker as collateral for options contracts written. As of October 31, 2018, the total value of such securities was $3,894,133.
2Restricted securities - Investment in securities that are restricted as to public resale under the Securities Act of 1933, as amended. These securities have been sold under Rule 144A and have been determined to be liquid under guidelines established by the Board of Directors. These securities amount to $16,760,678, or 8.2% of the Series’ net assets as of October 31, 2018 (see Note 2 to the financial statements).
3Amount is stated in USD unless otherwise noted.
4Floating rate security. Rate shown is the rate in effect as of October 31, 2018.
5Step coupon rate security - Rate steps up/down by 25 basis points upon rating downgrade/upgrade by Moody’s and S&P rating agencies (Subject to a maximum of 100 basis points per agency, 200 basis points maximum).
6Variable rate security. Security may be issued at a fixed coupon rate, which converts to a variable rate at a specified date. Rate shown is the rate in effect as of October 31, 2018.
7Security is perpetual in nature and has no stated maturity date.
8Variable or floating rate security, the interest rate of which adjusts periodically based on changes in current interest rates and prepayments on the underlying pool of assets. Rate shown is the rate in effect as of October 31, 2018.
9Rate shown is the current yield as of October 31, 2018.
The accompanying notes are an integral part of the financial statements.
58
Investment Portfolio - October 31, 2018
The Global Industry Classification Standard (GICS) was developed by and is the exclusive property and a service mark of MSCI Inc. (MSCI) and Standard & Poor’s, a division of The McGraw-Hill Companies, Inc. (S&P), and is licensed for use by Manning & Napier when referencing GICS sectors. Neither MSCI, S&P, nor any third party involved in making or compiling the GICS or any GICS classifications makes any express or implied warranties or representations with respect to such standard or classification, nor shall any such party have any liability therefrom.
The accompanying notes are an integral part of the financial statements.
59
Statement of Assets and Liabilities - Blended Asset Extended Series
October 31, 2018
ASSETS: | ||||
Investments in securities, at value (identified cost $205,397,142) (Note 2) | $ | 200,909,306 | ||
Foreign currency, at value (identified cost $4,952) | 4,946 | |||
Interest receivable | 754,211 | |||
Receivable for securities sold | 6,134,466 | |||
Receivable for fund shares sold | 247,372 | |||
Foreign tax reclaims receivable | 24,898 | |||
Dividends receivable | 46,299 | |||
Prepaid and other expenses | 168 | |||
|
| |||
TOTAL ASSETS | 208,121,666 | |||
|
| |||
LIABILITIES: | ||||
Accrued management fees (Note 3) | 55,651 | |||
Accrued fund accounting and administration fees (Note 3) | 29,367 | |||
Accrued Chief Compliance Officer service fees (Note 3) | 401 | |||
Options written, at value (premiums received $74,300) (Note 2) | 108,563 | |||
Payable for securities purchased | 3,039,342 | |||
Payable for fund shares repurchased | 17,378 | |||
Other payables and accrued expenses | 64,598 | |||
|
| |||
TOTAL LIABILITIES | 3,315,300 | |||
|
| |||
TOTAL NET ASSETS | $ | 204,806,366 | ||
|
| |||
NET ASSETS CONSIST OF: | ||||
Capital stock | $ | 202,295 | ||
Additional paid-in-capital | 208,002,017 | |||
Total distributable earnings (loss) | (3,397,946 | ) | ||
|
| |||
TOTAL NET ASSETS | $ | 204,806,366 | ||
|
| |||
NET ASSET VALUE, OFFERING PRICE AND REDEMPTION PRICE PER SHARE - Class R6 ($204,806,366/ 20,229,522 shares) | $ | 10.12 | ||
|
| |||
The accompanying notes are an integral part of the financial statements.
60
Statement of Operations - Blended Asset Extended Series
For the Year Ended October 31, 2018
INVESTMENT INCOME: | ||||
Interest | $ | 2,950,550 | ||
Dividends (net of foreign taxes withheld, $73,579) | 1,261,891 | |||
|
| |||
Total Investment Income | 4,212,441 | |||
|
| |||
EXPENSES: | ||||
Management fees (Note 3) | 1,010,540 | |||
Fund accounting and administration fees (Note 3) | 92,140 | |||
Directors’ fees (Note 3) | 15,733 | |||
Chief Compliance Officer service fees (Note 3) | 4,394 | |||
Custodian fees | 42,121 | |||
Miscellaneous | 83,844 | |||
|
| |||
Total Expenses | 1,248,772 | |||
Less reduction of expenses (Note 3) | (137,179 | ) | ||
|
| |||
Net Expenses | 1,111,593 | |||
|
| |||
NET INVESTMENT INCOME | 3,100,848 | |||
|
| |||
REALIZED AND UNREALIZED GAIN (LOSS) ON INVESTMENTS AND FOREIGN CURRENCY: | ||||
Net realized gain (loss) on- | ||||
Investments in securities | (707,017 | ) | ||
Options written | 312,756 | |||
Foreign currency and translation of other assets and liabilities | (10,593 | ) | ||
|
| |||
| (404,854 | ) | |||
|
| |||
Net change in unrealized appreciation (depreciation) on- | ||||
Investments | (3,979,301 | ) | ||
Options written | (34,263 | ) | ||
Foreign currency and translation of other assets and liabilities | (1,085 | ) | ||
|
| |||
| (4,014,649 | ) | |||
|
| |||
NET REALIZED AND UNREALIZED GAIN (LOSS) ON INVESTMENTS AND FOREIGN CURRENCY | (4,419,503 | ) | ||
|
| |||
NET DECREASE IN NET ASSETS RESULTING FROM OPERATIONS | $ | (1,318,655 | ) | |
|
| |||
The accompanying notes are an integral part of the financial statements.
61
Statements of Changes in Net Assets - Blended Asset Extended Series
| FOR THE YEAR ENDED 10/31/18 | FOR THE PERIOD 10/13/171 TO 10/31/17 | |||||||
INCREASE (DECREASE) IN NET ASSETS: | ||||||||
OPERATIONS: | ||||||||
Net investment income | $ | 3,100,848 | $ | 61,190 | ||||
Net realized loss on investments and foreign currency | (404,854 | ) | (24,640 | ) | ||||
Net change in unrealized appreciation (depreciation) on investments and foreign currency | (4,014,649 | ) | (508,702 | ) | ||||
|
|
|
| |||||
Net decrease from operations | (1,318,655 | ) | (472,152 | ) | ||||
|
|
|
| |||||
DISTRIBUTIONS TO SHAREHOLDERS (Note 9): | ||||||||
Class R6 | (1,607,139 | ) | — | |||||
|
|
|
| |||||
CAPITAL STOCK ISSUED AND REPURCHASED: | ||||||||
Net increase from capital share transactions (Note 5) | 1,552,694 | 206,651,618 | ||||||
|
|
|
| |||||
Net decrease in net assets | (1,373,100 | ) | 206,179,466 | |||||
NET ASSETS: | ||||||||
Beginning of period | 206,179,466 | — | ||||||
|
|
|
| |||||
End of period | $ | 204,806,366 | $ | 206,179,466 | ||||
|
|
|
| |||||
1 Commencement of operations.
The accompanying notes are an integral part of the financial statements.
62
Financial Highlights - Blended Asset Extended Series - Class R6
| FOR THE YEAR ENDED | FOR THE PERIOD | |||||||
| 10/31/18 | 10/13/171 TO 10/31/17 | |||||||
Per share data (for a share outstanding throughout each period): | ||||||||
Net asset value - Beginning of period | $ | 10.31 | $ | 10.33 | ||||
|
|
|
| |||||
Income (loss) from investment operations: | ||||||||
Net investment income (loss)2 | 0.16 | 0.00 | 3 | |||||
Net realized and unrealized loss on investments | (0.27 | ) | (0.02 | ) | ||||
|
|
|
| |||||
Total from investment operations | (0.11 | ) | (0.02 | ) | ||||
|
|
|
| |||||
Less distributions to shareholders: | ||||||||
From net investment income | (0.08 | ) | — | |||||
|
|
|
| |||||
Net asset value - End of period | $ | 10.12 | $ | 10.31 | ||||
|
|
|
| |||||
Net assets - End of period (000’s omitted) | $ | 204,806 | $ | 206,179 | ||||
|
|
|
| |||||
Total return4 | (1.06 | %) | (0.19 | %) | ||||
Ratios (to average net assets)/Supplemental Data: | ||||||||
Expenses | 0.55 | % | 0.55 | %5 | ||||
Net investment income | 1.53 | % | 0.61 | %5 | ||||
Series portfolio turnover | 99 | % | 4 | % | ||||
*The investment advisor did not impose all or a portion of its management and/or other fees during the period, and may have paid a portion of the Series’ expenses. If these expenses had been incurred by the Series, the expense ratio (to average net assets) would have increased by the following amounts: |
| |||||||
| 0.07 | % | 0.54 | %5 | |||||
1 Commencement of operations.
2 Calculated based on average shares outstanding during the periods.
3 Less than $0.01.
4 Represents aggregate total return for the periods indicated, and assumes reinvestment of all distributions. Total return would have been lower had certain expenses not been
reimbursed during the periods. Periods less than one year are not annualized.
5 Annualized.
The accompanying notes are an integral part of the financial statements.
63
Performance Update as of October 31, 2018 - Blended Asset Maximum Series
(unaudited)
AVERAGE ANNUAL TOTAL RETURN AS OF OCTOBER 31, 2018 | ||||||||
ONE YEAR1 | SINCE INCEPTION2 | |||||||
Manning & Napier Fund, Inc. - Blended Maximum Series - Class R63 | 2.77 | % | 2.72 | % | ||||
Russell 3000® Index4 | 6.60 | % | 7.09 | % | ||||
65/20/15 Blended Index5 | 2.28 | % | 2.59 | % | ||||
The following graph compares the value of a $10,000 investment in the Manning & Napier Fund, Inc. - Pro-Blend® Maximum Term Series - Class R6 from its inception2 (October 13, 2017) to present (October 31, 2018) to the Russell 3000® Index and the 65/20/15 Blended Index.
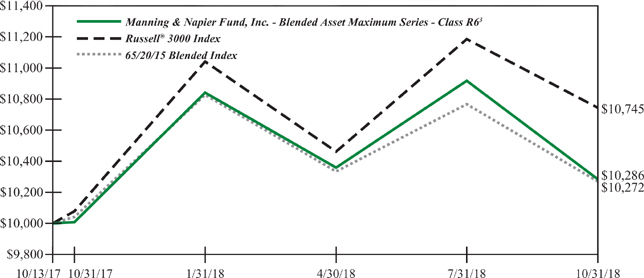
1 The returns shown are based on net asset values calculated for shareholder transactions and may differ from the returns shown in the financial highlights, which reflect adjustments made to the net asset values in accordance with accounting principles generally accepted in the United States of America.
2 Performance numbers for the Series and Indices are calculated from October 13, 2017, the Series’ inception date.
3 The Series’ performance does not reflect the deduction of taxes that a shareholder would pay on fund distributions or the redemption of shares. The Series’ performance is historical and may not be indicative of future results. The performance returns shown are inclusive of the net expense ratio of the Series. For the year ended October 31, 2018, this net expense ratio was 0.55% for Class R6. The gross expense ratio, which does not account for any voluntary or contractual waivers currently in effect, was 0.65% for Class R6 for the year ended October 31, 2018.
4 The Russell 3000® Index is an unmanaged index that consists of 3,000 of the largest U.S. companies based on total market capitalization. The Index returns are based on a market capitalization-weighted average of relative price changes of the component stocks plus dividends whose reinvestments are compounded daily. The Index returns do not reflect any fees or expenses. Index returns provided by Bloomberg.
5 The 65/20/15 Blended Index is 65% Russell 3000® Index (Russell 3000), 20% MSCI ACWI ex USA Index (ACWIxUS), and 15% Bloomberg Barclays U.S. Aggregate Bond Index (BAB). Russell 3000 is an unmanaged index that consists of 3,000 of the largest U.S. companies based on total market capitalization. The Index returns are based on a market capitalization-weighted average of relative price changes of the component stocks plus dividends whose reinvestments are compounded daily. Index returns provided by Bloomberg. ACWIxUS is designed to measure large and mid-cap representation across 22 of 23 Developed Markets countries (excluding the U.S.) and 24 Emerging Markets countries. The Index is denominated in U.S. dollars. The Index returns are net of withholding taxes. They assume daily reinvestment of net dividends thus accounting for any applicable dividend taxation. Index returns provided by Bloomberg. BAB is an unmanaged, market value-weighted index of U.S. domestic investment-grade debt issues, including government, corporate, asset-backed, and mortgage-backed securities with maturities of one year or more. Index returns provided by Interactive Data. The returns of the indices do not reflect any fees or expenses. Returns provided are calculated monthly using a blended allocation. Because the fund’s asset allocation will vary over time, the composition of the fund’s portfolio may not match the composition of the comparative Indices.
64
Shareholder Expense Example - Blended Asset Maximum Series
(unaudited)
As a shareholder of the Series, you incur ongoing costs, including management fees, shareholder service fees and other Series expenses. This example is intended to help you understand your ongoing costs (in dollars) of investing in the Series and to compare these costs with the ongoing costs of investing in other mutual funds.
The example is based on an investment of $1,000 invested in each class at the beginning of the period and held for the entire period (May 1, 2018 to October 31, 2018).
Actual Expenses
The Actual lines of the table below provide information about actual account values and actual expenses. You may use the information in these lines, together with the amount you invested, to estimate the expenses that you paid over the period. Simply divide your account value by $1,000 (for example, an $8,600 account value divided by $1,000 = 8.6), then multiply the result by the number in the Actual line for the Class in which you have invested under the heading entitled “Expenses Paid During Period” to estimate the expenses you paid on your account during this period.
Hypothetical Example for Comparison Purposes
The Hypothetical lines of each class in the table below provide information about hypothetical account values and hypothetical expenses based on the Series’ actual expense ratio and an assumed rate of return of 5% per year before expenses, which is not the Series’ actual return. The hypothetical account values and expenses may not be used to estimate the actual ending account balance or expenses you paid during the period. You may use this information to compare the ongoing costs of investing in the Series and other funds. To do so, compare this 5% hypothetical example with the 5% hypothetical examples that appear in the shareholder reports of the other funds.
Please note that the expenses shown in the table are meant to highlight your ongoing costs only and do not reflect any transaction costs such as sales charges (loads), redemption fees, or exchange fees that you may incur in other mutual funds. Therefore, the second line of the table is useful in comparing ongoing costs only, and will not help you determine the relative total costs of owning different funds.
| BEGINNING ACCOUNT VALUE 5/1/18 | ENDING ACCOUNT VALUE 10/31/18 | EXPENSES PAID DURING PERIOD* 5/1/18-10/31/18 | ||||||||||
Actual | $1,000.00 | $992.90 | $2.76 | |||||||||
Hypothetical | ||||||||||||
(5% return before expenses) | $1,000.00 | $1,022.43 | $2.80 | |||||||||
*Expenses are equal to the Series’ annualized expense ratio (for the six-month period) of 0.55%, multiplied by the average account value over the period, multiplied by 184/365 (to reflect the period since inception). Expenses are based on the most recent fiscal half year; therefore, the expense ratios stated above may differ from the expense ratios stated in the financial highlights, which are based on one-year data. The Series’ total return would have been lower had certain expenses not been waived during the period.
65
Portfolio Composition - Blended Asset Maximum Series
As of October 31, 2018 (unaudited)
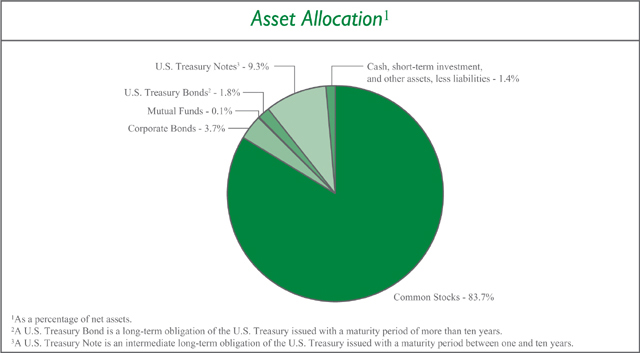
Sector Allocation4 |
| |||
Health Care | 15.1% | |||
Consumer Staples | 13.2% | |||
Information Technology | 12.0% | |||
Consumer Discretionary | 11.6% | |||
Financials | 8.5% | |||
Communication Services | 7.5% | |||
Materials | 6.6% | |||
Industrials | 5.1% | |||
Real Estate | 4.1% | |||
Energy | 3.8% | |||
Utilities | 0.1% | |||
| 4Including common stocks and corporate bonds, as a percentage of total investments. |
| |||
Top Ten Stock Holdings5 |
| |||
Booking Holdings, Inc. | 1.8% | |||
Incyte Corp. | 1.8% | |||
Mastercard, Inc. - Class A | 1.8% | |||
Qorvo, Inc. | 1.8% | |||
Medtronic plc | 1.7% | |||
lululemon athletica, Inc. | 1.6% | |||
The Coca-Cola Co. | 1.6% | |||
Visa, Inc. - Class A | 1.6% | |||
Novartis AG - ADR (Switzerland) | 1.6% | |||
Tencent Holdings Ltd. - Class H (China) | 1.4% | |||
| 5As a percentage of total investments. |
| |||
66
Investment Portfolio - October 31, 2018
| BLENDED ASSET MAXIMUM SERIES | SHARES | VALUE (NOTE 2) | ||||||
COMMON STOCKS - 83.7% | ||||||||
Communication Services - 6.9% | ||||||||
Diversified Telecommunication Services - 1.3% | ||||||||
Orange S.A. (France) | 795 | $ | 12,409 | |||||
Telefonica Brasil S.A. (Brazil) | 900 | 10,421 | ||||||
Zayo Group Holdings, Inc.* | 61,100 | 1,825,668 | ||||||
|
| |||||||
| 1,848,498 | ||||||||
|
| |||||||
Entertainment - 1.0% | ||||||||
Electronic Arts, Inc.* | 14,525 | 1,321,484 | ||||||
NetEase, Inc. - ADR (China) | 175 | 36,374 | ||||||
Nexon Co. Ltd. (Japan)* | 2,774 | 31,644 | ||||||
Toho Co. Ltd. -Tokyo (Japan) | 500 | 16,313 | ||||||
Vivendi S.A. (France) | 410 | 9,888 | ||||||
|
| |||||||
| 1,415,703 | ||||||||
|
| |||||||
Interactive Media & Services - 3.1% | ||||||||
Alphabet, Inc. - Class A* | 1,085 | 1,183,279 | ||||||
Alphabet, Inc. - Class C* | 1,140 | 1,227,518 | ||||||
Tencent Holdings Ltd. - Class H (China) | 58,359 | 1,999,336 | ||||||
|
| |||||||
| 4,410,133 | ||||||||
|
| |||||||
Media - 1.4% | ||||||||
Hakuhodo DY Holdings, Inc. (Japan) | 1,100 | 18,346 | ||||||
Quebecor, Inc. - Class B (Canada) | 49,165 | 964,291 | ||||||
Shaw Communications, Inc. - Class B (Canada) | 52,050 | 969,080 | ||||||
|
| |||||||
| 1,951,717 | ||||||||
|
| |||||||
Wireless Telecommunication Services - 0.1% | ||||||||
KDDI Corp. (Japan) | 1,400 | 33,880 | ||||||
NTT DOCOMO, Inc. (Japan) | 1,400 | 34,718 | ||||||
|
| |||||||
| 68,598 | ||||||||
|
| |||||||
Total Communication Services | 9,694,649 | |||||||
|
| |||||||
Consumer Discretionary - 11.0% | ||||||||
Auto Components - 0.0%## | ||||||||
Nemak S.A.B. de C.V. (Mexico)1 | 36,500 | 26,360 | ||||||
NGK Spark Plug Co. Ltd. (Japan) | 900 | 18,212 | ||||||
|
| |||||||
| 44,572 | ||||||||
|
| |||||||
Automobiles - 0.1% | ||||||||
Geely Automobile Holdings Ltd. (China) | 15,000 | 28,905 | ||||||
Isuzu Motors Ltd. (Japan) | 1,400 | 18,355 | ||||||
Peugeot S.A. (France) | 215 | 5,111 | ||||||
Renault S.A. (France) | 105 | 7,841 | ||||||
Suzuki Motor Corp. (Japan) | 800 | 39,893 | ||||||
|
| |||||||
| 100,105 | ||||||||
|
| |||||||
Diversified Consumer Services - 0.1% | ||||||||
China Maple Leaf Educational Systems Ltd. (China) | 44,000 | 19,096 | ||||||
China Yuhua Education Corp. Ltd. (China)1 | 68,000 | 27,419 | ||||||
Fu Shou Yuan International Group Ltd. (China) | 56,000 | 43,037 | ||||||
New Oriental Education & Technology Group, Inc. - ADR (China)* | 690 | 40,372 | ||||||
TAL Education Group - ADR (China)* | 500 | 14,490 | ||||||
Wisdom Education International Holdings Co. Ltd. (China) | 42,000 | 18,901 | ||||||
|
| |||||||
| 163,315 | ||||||||
|
| |||||||
Hotels, Restaurants & Leisure - 0.0%## | ||||||||
Accor S.A. (France) | 865 | 39,524 | ||||||
Basic-Fit N.V. (Netherlands)*1 | 895 | 25,768 | ||||||
|
| |||||||
| 65,292 | ||||||||
|
| |||||||
Household Durables - 0.0%## | ||||||||
Sekisui Chemical Co. Ltd. (Japan) | 1,200 | 18,871 | ||||||
Techtronic Industries Co. Ltd. (Hong Kong) | 4,000 | 18,835 | ||||||
|
| |||||||
| 37,706 | ||||||||
|
| |||||||
Internet & Direct Marketing Retail - 4.2% | ||||||||
Alibaba Group Holding Ltd. - ADR (China)* | 13,695 | 1,948,524 | ||||||
Amazon.com, Inc.* | 865 | 1,382,279 | ||||||
Booking Holdings, Inc.* | 1,360 | 2,549,429 | ||||||
Despegar.com Corp. (Argentina)* | 700 | 11,249 | ||||||
|
| |||||||
| 5,891,481 | ||||||||
|
| |||||||
Leisure Products - 0.1% | ||||||||
Bandai Namco Holdings, Inc. (Japan) | 1,100 | 39,132 | ||||||
Yamaha Corp. (Japan) | 900 | 39,550 | ||||||
|
| |||||||
| 78,682 | ||||||||
|
| |||||||
Multiline Retail - 0.0%## | ||||||||
El Puerto de Liverpool SAB de C.V. (Mexico) | 2,315 | 14,702 | ||||||
Lojas Americanas S.A. (Brazil) | 1,600 | 8,001 | ||||||
Lojas Renner S.A. (Brazil) | 1,060 | 10,732 | ||||||
Magazine Luiza S.A. (Brazil) | 200 | 9,051 | ||||||
Next plc (United Kingdom) | 270 | 17,937 | ||||||
|
| |||||||
| 60,423 | ||||||||
|
| |||||||
Specialty Retail - 4.2% | ||||||||
AutoZone, Inc.* | 2,525 | 1,852,012 | ||||||
The accompanying notes are an integral part of the financial statements.
67
Investment Portfolio - October 31, 2018
| BLENDED ASSET MAXIMUM SERIES | SHARES | VALUE (NOTE 2) | ||||||
COMMON STOCKS (continued) | ||||||||
Consumer Discretionary (continued) | ||||||||
Specialty Retail (continued) | ||||||||
Dick’s Sporting Goods, Inc | 37,010 | $ | 1,309,044 | |||||
Industria de Diseno Textil S.A. (Spain) | 31,870 | 898,242 | ||||||
Nitori Holdings Co. Ltd. (Japan) | 100 | 13,057 | ||||||
O’Reilly Automotive, Inc.* | 2,790 | 894,892 | ||||||
Ulta Beauty, Inc.* | 3,410 | 936,113 | ||||||
USS Co. Ltd. (Japan) | 1,000 | 18,032 | ||||||
|
| |||||||
| 5,921,392 | ||||||||
|
| |||||||
Textiles, Apparel & Luxury Goods - 2.3% | ||||||||
ANTA Sports Products Ltd. (China) | 7,000 | 28,900 | ||||||
Burberry Group plc (United Kingdom) | 810 | 18,743 | ||||||
Hermes International (France) | 30 | 17,127 | ||||||
Kering S.A. (France) | 35 | 15,557 | ||||||
lululemon athletica, Inc.* | 16,255 | 2,287,566 | ||||||
LVMH Moet Hennessy Louis Vuitton SE (France) | 115 | 34,891 | ||||||
Moncler S.p.A (Italy) | 520 | 18,058 | ||||||
NIKE, Inc. - Class B | 11,145 | 836,321 | ||||||
|
| |||||||
| 3,257,163 | ||||||||
|
| |||||||
Total Consumer Discretionary | 15,620,131 | |||||||
|
| |||||||
Consumer Staples - 13.2% | ||||||||
Beverages - 5.3% | ||||||||
Ambev S.A. - ADR (Brazil) | 300,825 | 1,302,572 | ||||||
Ambev S.A. (Brazil) | 6,000 | 26,183 | ||||||
Anheuser-Busch InBev S.A./N.V. (Belgium) | 18,025 | 1,333,146 | ||||||
The Coca-Cola Co. | 46,570 | 2,229,772 | ||||||
Diageo plc (United Kingdom) | 30,880 | 1,067,569 | ||||||
Fomento Economico Mexicano SAB de C.V. (Mexico) | 1,900 | 16,184 | ||||||
PepsiCo, Inc. | 12,330 | 1,385,645 | ||||||
Pernod Ricard S.A. (France) | 100 | 15,249 | ||||||
Treasury Wine Estates Ltd. (Australia) | 5,595 | 60,222 | ||||||
|
| |||||||
| 7,436,542 | ||||||||
|
| |||||||
Food & Staples Retailing - 0.1% | ||||||||
Atacadao Distribuicao Comercio e Industria Ltda. (Brazil) | 1,900 | 7,745 | ||||||
Matsumotokiyoshi Holdings Co. Ltd. (Japan) | 700 | 25,308 | ||||||
Tsuruha Holdings, Inc. (Japan) | 200 | 20,874 | ||||||
Wal-Mart de Mexico S.A.B. de C.V. (Mexico) | 12,250 | 31,323 | ||||||
Wesfarmers Ltd. (Australia) | 555 | 18,380 | ||||||
|
| |||||||
| 103,630 | ||||||||
|
| |||||||
Food Products - 3.3% | ||||||||
Barry Callebaut AG (Switzerland) | 15 | 29,319 | ||||||
Campbell Soup Co | 29,820 | 1,115,566 | ||||||
Chocoladefabriken Lindt & Spruengli AG (Switzerland) | 5 | 34,471 | ||||||
Danone S.A. (France) | 1,045 | 74,000 | ||||||
Grupo Bimbo S.A.B. de C.V. - Series A(Mexico) | 6,555 | 12,256 | ||||||
Kerry Group plc - Class A (Ireland) | 475 | 48,609 | ||||||
Kikkoman Corp. (Japan) | 600 | 32,872 | ||||||
Mondelez International, Inc. - Class A | 42,260 | 1,774,075 | ||||||
Nestle S.A. (Switzerland) | 17,760 | 1,499,354 | ||||||
|
| |||||||
| 4,620,522 | ||||||||
|
| |||||||
Household Products - 0.6% | ||||||||
Colgate-Palmolive Co | 14,225 | 847,099 | ||||||
Henkel AG & Co. KGaA (Germany) | 175 | 17,143 | ||||||
Kimberly-Clark de Mexico S.A.B. de C.V. - Class A (Mexico) | 17,200 | 24,784 | ||||||
Lion Corp. (Japan) | 1,400 | 26,321 | ||||||
|
| |||||||
| 915,347 | ||||||||
|
| |||||||
Personal Products - 2.1% | ||||||||
Beiersdorf AG (Germany) | 12,115 | 1,252,652 | ||||||
Kao Corp. (Japan) | 300 | 19,957 | ||||||
Kobayashi Pharmaceutical Co. Ltd. (Japan) | 300 | 19,567 | ||||||
L’Oreal S.A. (France) | 170 | 38,302 | ||||||
Unilever plc - ADR (United Kingdom) | 32,230 | 1,707,545 | ||||||
|
| |||||||
| 3,038,023 | ||||||||
|
| |||||||
Tobacco - 1.8% | ||||||||
Altria Group, Inc | 16,740 | 1,088,770 | ||||||
British American Tobacco plc - ADR (United Kingdom) | 1,060 | 46,004 | ||||||
KT&G Corp. (South Korea) | 195 | 17,388 | ||||||
Philip Morris International, Inc. | 15,385 | 1,354,957 | ||||||
Swedish Match AB (Sweden) | 355 | 18,083 | ||||||
|
| |||||||
| 2,525,202 | ||||||||
|
| |||||||
Total Consumer Staples | 18,639,266 | |||||||
|
| |||||||
Energy - 3.0% | ||||||||
Energy Equipment & Services - 2.6% | ||||||||
Core Laboratories N.V | 300 | 25,572 | ||||||
The accompanying notes are an integral part of the financial statements.
68
Investment Portfolio - October 31, 2018
| BLENDED ASSET MAXIMUM SERIES | SHARES |
VALUE (NOTE 2) | ||||||||||
COMMON STOCKS (continued) | ||||||||||||
Energy (continued) | ||||||||||||
Energy Equipment & Services (continued) | ||||||||||||
Diamond Offshore Drilling, Inc.* | 31,190 | $ | 442,274 | |||||||||
Ensco plc - Class A | 110,330 | 787,756 | ||||||||||
Schlumberger Ltd | 33,175 | 1,702,209 | ||||||||||
Transocean Ltd.* | 62,220 | 685,042 | ||||||||||
|
| |||||||||||
| 3,642,853 | ||||||||||||
|
| |||||||||||
Oil, Gas & Consumable Fuels - 0.4% | ||||||||||||
Cameco Corp. (Canada) | 2,365 | 25,354 | ||||||||||
Canadian Natural Resources Ltd. (Canada) | 1,385 | 38,001 | ||||||||||
China Petroleum & Chemical Corp. - Class H (China) | 46,000 | 37,471 | ||||||||||
Eni S.p.A. (Italy) | 2,230 | 39,604 | ||||||||||
Galp Energia SGPS S.A. (Portugal) | 4,480 | 77,899 | ||||||||||
Repsol S.A. (Spain) | 3,735 | 66,740 | ||||||||||
Royal Dutch Shell plc - Class B - ADR (Netherlands) | 1,220 | 80,166 | ||||||||||
SK Innovation Co. Ltd. (South Korea) | 150 | 28,150 | ||||||||||
Suncor Energy, Inc. (Canada) | 1,080 | 36,228 | ||||||||||
TOTAL S.A. (France) | 1,115 | 65,423 | ||||||||||
Vermilion Energy, Inc. (Canada) | 1,440 | 38,186 | ||||||||||
Woodside Petroleum Ltd. (Australia) | 1,620 | 39,885 | ||||||||||
|
| |||||||||||
| 573,107 | ||||||||||||
|
| |||||||||||
Total Energy | 4,215,960 | |||||||||||
|
| |||||||||||
Financials - 7.5% | ||||||||||||
Banks - 2.2% | ||||||||||||
Banco Bradesco S.A. (Brazil) | 2,800 | 25,656 | ||||||||||
Banco Comercial Portugues S.A. (Portugal)* | 103,325 | 27,793 | ||||||||||
Banco do Brasil S.A. (Brazil) | 1,100 | 12,606 | ||||||||||
Banco Santander Brasil S.A. (Brazil) | 1,100 | 12,473 | ||||||||||
The Bank Of N.T. Butterfield & Son Ltd. (Bermuda) | 540 | 21,757 | ||||||||||
Bankia S.A. (Spain) | 210,650 | 661,660 | ||||||||||
Bankinter S.A. (Spain) | 4,465 | 36,582 | ||||||||||
BNP Paribas S.A. (France) | 530 | 27,620 | ||||||||||
CaixaBank S.A. (Spain) | 254,875 | 1,031,400 | ||||||||||
Credit Agricole S.A. (France) | 605 | 7,748 | ||||||||||
Erste Group Bank AG (Austria) | 645 | 26,256 | ||||||||||
FinecoBank Banca Fineco S.p.A. (Italy) | 96,640 | 1,010,040 | ||||||||||
Itau Unibanco Holding S.A. (Brazil) | 1,900 | 25,088 | ||||||||||
Itausa - Investimentos Itau S.A. (Brazil) | 4,300 | 12,941 | ||||||||||
Jyske Bank A/S (Denmark) | 580 | 23,682 | ||||||||||
KBC Group N.V. (Belgium) | 375 | 25,843 | ||||||||||
Societe Generale S.A. (France) | 350 | 12,830 | ||||||||||
Sydbank A/S (Denmark) | 850 | 19,633 | ||||||||||
|
| |||||||||||
| 3,021,608 | ||||||||||||
|
| |||||||||||
Capital Markets - 4.3% | ||||||||||||
B3 S.A. - Brasil Bolsa Balcao (Brazil) | 1,900 | 13,626 | ||||||||||
BlackRock, Inc. | 4,800 | 1,974,816 | ||||||||||
Cboe Global Markets, Inc. | 3,155 | 356,042 | ||||||||||
The Charles Schwab Corp. | 27,205 | 1,257,959 | ||||||||||
CME Group, Inc. | 1,795 | 328,916 | ||||||||||
E*TRADE Financial Corp. | 14,750 | 728,945 | ||||||||||
Intercontinental Exchange, Inc. | 4,020 | 309,701 | ||||||||||
Japan Exchange Group, Inc. (Japan) | 1,500 | 26,866 | ||||||||||
Julius Baer Group Ltd. (Switzerland) | 23,825 | 1,086,534 | ||||||||||
|
| |||||||||||
| 6,083,405 | ||||||||||||
|
| |||||||||||
Diversified Financial Services - 1.0% | ||||||||||||
Berkshire Hathaway, Inc. - Class B* | 6,945 | 1,425,671 | ||||||||||
|
| |||||||||||
Insurance - 0.0%## | ||||||||||||
Admiral Group plc (United Kingdom) | 720 | 18,508 | ||||||||||
AXA S.A. (France) | 930 | 23,275 | ||||||||||
BB Seguridade Participacoes S.A. (Brazil) | 1,300 | 9,302 | ||||||||||
|
| |||||||||||
| 51,085 | ||||||||||||
|
| |||||||||||
Thrifts & Mortgage Finance - 0.0%## | ||||||||||||
Aareal Bank AG (Germany) | 705 | 26,227 | ||||||||||
|
| |||||||||||
Total Financials | 10,607,996 | |||||||||||
|
| |||||||||||
Health Care - 15.0% | ||||||||||||
Biotechnology - 4.5% | ||||||||||||
BioMarin Pharmaceutical, Inc.* | 16,580 | 1,528,178 | ||||||||||
Incyte Corp.* | 39,295 | 2,547,102 | ||||||||||
Regeneron Pharmaceuticals, Inc.* | 2,420 | 820,961 | ||||||||||
Seattle Genetics, Inc.* | 15,260 | 856,544 | ||||||||||
Vertex Pharmaceuticals, Inc.* | 3,660 | 620,224 | ||||||||||
|
| |||||||||||
| 6,373,009 | ||||||||||||
|
| |||||||||||
Health Care Equipment & Supplies - 2.9% | ||||||||||||
Coloplast A/S - Class B (Denmark) | 365 | 34,059 | ||||||||||
EssilorLuxottica (France) | 255 | 34,827 | ||||||||||
Hoya Corp. (Japan) | 300 | 16,973 | ||||||||||
Intuitive Surgical, Inc.* | 2,765 | 1,441,063 | ||||||||||
Medtronic plc | 27,385 | 2,459,721 | ||||||||||
The accompanying notes are an integral part of the financial statements.
69
Investment Portfolio - October 31, 2018
| BLENDED ASSET MAXIMUM SERIES | SHARES |
VALUE (NOTE 2) | ||||||||||
COMMON STOCKS (continued) | ||||||||||||
Health Care (continued) | ||||||||||||
Health Care Equipment & Supplies (continued) | ||||||||||||
Shandong Weigao Group Medical Polymer Co. Ltd. - Class H (China) | 27,510 | $ | 24,642 | |||||||||
Smith & Nephew plc (United Kingdom) | 1,105 | 17,962 | ||||||||||
Sonova Holding AG (Switzerland) | 110 | 17,939 | ||||||||||
Terumo Corp. (Japan) | 700 | 37,787 | ||||||||||
William Demant Holding A/S (Denmark)* | 550 | 18,079 | ||||||||||
|
| |||||||||||
| 4,103,052 | ||||||||||||
|
| |||||||||||
Health Care Providers & Services - 0.7% | ||||||||||||
DaVita, Inc.* | 15,690 | 1,056,565 | ||||||||||
|
| |||||||||||
Life Sciences Tools & Services - 1.3% | ||||||||||||
QIAGEN N.V.* | 26,785 | 972,296 | ||||||||||
QIAGEN N.V.* | 885 | 32,124 | ||||||||||
Tecan Group AG (Switzerland) | 55 | 12,407 | ||||||||||
Thermo Fisher Scientific, Inc. | 3,295 | 769,877 | ||||||||||
|
| |||||||||||
| 1,786,704 | ||||||||||||
|
| |||||||||||
Pharmaceuticals - 5.6% | ||||||||||||
Astellas Pharma, Inc. (Japan) | 1,300 | 20,085 | ||||||||||
Bristol-Myers Squibb Co. | 11,985 | 605,722 | ||||||||||
Chugai Pharmaceutical Co. Ltd. (Japan) | 600 | 35,128 | ||||||||||
Johnson & Johnson | 12,825 | 1,795,372 | ||||||||||
Merck & Co., Inc. | 8,915 | 656,233 | ||||||||||
Merck KGaA (Germany) | 6,705 | 717,453 | ||||||||||
Mylan N.V.* | 15,400 | 481,250 | ||||||||||
Novartis AG - ADR (Switzerland) | 25,270 | 2,210,114 | ||||||||||
Novartis AG (Switzerland) | 750 | 65,679 | ||||||||||
Novo Nordisk A/S - Class B (Denmark) | 415 | 17,922 | ||||||||||
Perrigo Co. plc | 18,065 | 1,269,970 | ||||||||||
Sanofi (France) | 460 | 41,106 | ||||||||||
|
| |||||||||||
| 7,916,034 | ||||||||||||
|
| |||||||||||
Total Health Care | 21,235,364 | |||||||||||
|
| |||||||||||
Industrials - 4.7% | ||||||||||||
Aerospace & Defense - 0.1% | ||||||||||||
Airbus S.E. (France) | 245 | 27,076 | ||||||||||
BAE Systems plc (United Kingdom) | 6,075 | 40,735 | ||||||||||
MTU Aero Engines AG (Germany) | 85 | 18,048 | ||||||||||
Safran S.A. (France) | 140 | 18,092 | ||||||||||
Thales S.A. (France) | 40 | 5,109 | ||||||||||
|
| |||||||||||
| 109,060 | ||||||||||||
|
| |||||||||||
Air Freight & Logistics - 1.0% | ||||||||||||
FedEx Corp | 6,635 | 1,461,956 | ||||||||||
|
| |||||||||||
Airlines - 0.0%## | ||||||||||||
Ryanair Holdings plc - ADR (Ireland)* | 280 | 23,184 | ||||||||||
|
| |||||||||||
Building Products - 0.0%## | ||||||||||||
Cie de Saint-Gobain (France) | 210 | 7,911 | ||||||||||
TOTO Ltd. (Japan) | 500 | 17,888 | ||||||||||
|
| |||||||||||
| 25,799 | ||||||||||||
|
| |||||||||||
Commercial Services & Supplies - 1.0% | ||||||||||||
Advanced Disposal Services, Inc.* | 49,260 | 1,334,453 | ||||||||||
China Everbright International Ltd. (China) | 3,000 | 2,400 | ||||||||||
Secom Co. Ltd. (Japan) | 200 | 16,374 | ||||||||||
|
| |||||||||||
| 1,353,227 | ||||||||||||
|
| |||||||||||
Construction & Engineering - 0.9% | ||||||||||||
FLSmidth & Co. A/S (Denmark) | 105 | 5,509 | ||||||||||
Vinci S.A. (France) | 13,900 | 1,237,085 | ||||||||||
|
| |||||||||||
| 1,242,594 | ||||||||||||
|
| |||||||||||
Electrical Equipment - 0.0%## | ||||||||||||
Schneider Electric SE (France) | 245 | 17,716 | ||||||||||
|
| |||||||||||
Industrial Conglomerates - 0.0%## | ||||||||||||
Siemens AG (Germany) | 450 | 51,726 | ||||||||||
|
| |||||||||||
Machinery - 0.3% | ||||||||||||
Epiroc AB - Class A (Sweden)* | 3,650 | 32,052 | ||||||||||
FANUC Corp. (Japan) | 200 | 34,793 | ||||||||||
Hoshizaki Corp. (Japan) | 400 | 32,288 | ||||||||||
Hyundai Heavy Industries Co. Ltd. (South Korea)* | 255 | 28,051 | ||||||||||
Hyundai Mipo Dockyard Co. Ltd. (South Korea)* | 330 | 27,370 | ||||||||||
Jungheinrich AG (Germany) | 790 | 26,174 | ||||||||||
KION Group AG (Germany) | 690 | 40,321 | ||||||||||
Kone OYJ - Class B (Finland) | 355 | 17,279 | ||||||||||
Makita Corp. (Japan) | 400 | 13,829 | ||||||||||
Metso OYJ (Finland) | 1,010 | 31,887 | ||||||||||
MISUMI Group, Inc. (Japan) | 900 | 18,037 | ||||||||||
Samsung Heavy Industries Co. Ltd. (South Korea)* | 2,215 | 13,590 | ||||||||||
Schindler Holding AG (Switzerland) | 175 | 36,901 | ||||||||||
WEG S.A. (Brazil) | 1,600 | 7,743 | ||||||||||
The Weir Group plc (United Kingdom) | 3,545 | 71,739 | ||||||||||
|
| |||||||||||
| 432,054 | ||||||||||||
|
| |||||||||||
Professional Services - 0.6% | ||||||||||||
Equifax, Inc. | 7,145 | 724,789 | ||||||||||
Experian plc (United Kingdom) | 750 | 17,249 | ||||||||||
The accompanying notes are an integral part of the financial statements.
70
Investment Portfolio - October 31, 2018
| BLENDED ASSET MAXIMUM SERIES | SHARES |
VALUE (NOTE 2) | ||||||||||
COMMON STOCKS (continued) | ||||||||||||
Industrials (continued) | ||||||||||||
Professional Services (continued) | ||||||||||||
Recruit Holdings Co. Ltd. (Japan) | 1,500 | $ | 40,259 | |||||||||
Teleperformance (France) | 105 | 17,293 | ||||||||||
Wolters Kluwer N.V. (Netherlands) | 300 | 17,020 | ||||||||||
|
| |||||||||||
| 816,610 | ||||||||||||
|
| |||||||||||
Road & Rail - 0.7% | ||||||||||||
Canadian National Railway Co. (Canada) | 225 | 19,235 | ||||||||||
Genesee & Wyoming, Inc. - Class A* | 12,350 | 978,490 | ||||||||||
|
| |||||||||||
| 997,725 | ||||||||||||
|
| |||||||||||
Trading Companies & Distributors - 0.1% | ||||||||||||
Ashtead Group plc (United Kingdom) | 1,075 | 26,539 | ||||||||||
Brenntag AG (Germany) | 420 | 21,934 | ||||||||||
Kanamoto Co. Ltd. (Japan) | 800 | 26,733 | ||||||||||
|
| |||||||||||
| 75,206 | ||||||||||||
|
| |||||||||||
Transportation Infrastructure - 0.0%## | ||||||||||||
Grupo Aeroportuario del Centro Norte S.A.B. de C.V. (Mexico) | 3,200 | 16,760 | ||||||||||
Grupo Aeroportuario del Pacifico | ||||||||||||
S.A.B. de C.V. - ADR (Mexico) | 180 | 14,918 | ||||||||||
|
| |||||||||||
| 31,678 | ||||||||||||
|
| |||||||||||
Total Industrials | 6,638,535 | |||||||||||
|
| |||||||||||
Information Technology - 11.9% | ||||||||||||
Electronic Equipment, Instruments & Components - 1.0% | ||||||||||||
Cognex Corp. | 15,085 | 646,241 | ||||||||||
Halma plc (United Kingdom) | 1,570 | 26,644 | ||||||||||
Hexagon A.B. - Class B (Sweden) | 800 | 39,155 | ||||||||||
Keyence Corp. (Japan) | 1,570 | 766,976 | ||||||||||
Yokogawa Electric Corp. (Japan) | 900 | 17,671 | ||||||||||
|
| |||||||||||
| 1,496,687 | ||||||||||||
|
| |||||||||||
IT Services - 4.9% | ||||||||||||
Amadeus IT Group S.A. (Spain) | 230 | 18,521 | ||||||||||
Amdocs Ltd. | 20,750 | 1,312,853 | ||||||||||
Capgemini SE (France) | 65 | 7,937 | ||||||||||
InterXion Holding N.V. (Netherlands)* | 11,505 | 677,299 | ||||||||||
Mastercard, Inc. - Class A | 12,880 | 2,545,990 | ||||||||||
Nomura Research Institute Ltd. (Japan) | 800 | 35,467 | ||||||||||
Obic Co. Ltd. (Japan) | 500 | 45,520 | ||||||||||
Otsuka Corp. (Japan) | 600 | 19,901 | ||||||||||
Visa, Inc. - Class A | 16,100 | 2,219,385 | ||||||||||
|
| |||||||||||
| 6,882,873 | ||||||||||||
|
| |||||||||||
Semiconductors & Semiconductor Equipment - 2.3% | ||||||||||||
Qorvo, Inc.* | 34,090 | 2,505,956 | ||||||||||
Skyworks Solutions, Inc. | 9,095 | 789,082 | ||||||||||
|
| |||||||||||
| 3,295,038 | ||||||||||||
|
| |||||||||||
Software - 3.7% | ||||||||||||
Adobe, Inc.* | 4,845 | 1,190,706 | ||||||||||
Check Point Software Technologies Ltd. (Israel)* | 335 | 37,185 | ||||||||||
Dassault Systemes S.E. (France) | 60 | 7,511 | ||||||||||
Microsoft Corp | 17,710 | 1,891,605 | ||||||||||
Oracle Corp. (Japan) | 300 | 20,307 | ||||||||||
SAP SE (Germany) | 170 | 18,202 | ||||||||||
ServiceNow, Inc.* | 10,900 | 1,973,336 | ||||||||||
Trend Micro, Inc. (Japan) | 600 | 34,539 | ||||||||||
|
| |||||||||||
| 5,173,391 | ||||||||||||
|
| |||||||||||
Total Information Technology | 16,847,989 | |||||||||||
|
| |||||||||||
Materials - 6.4% | ||||||||||||
Chemicals - 2.7% | ||||||||||||
Air Liquide S.A. (France) | 180 | 21,759 | ||||||||||
Akzo Nobel N.V. (Netherlands) | 15,745 | 1,322,022 | ||||||||||
Asahi Kasei Corp. (Japan) | 1,600 | 19,198 | ||||||||||
Axalta Coating Systems Ltd.* | 29,295 | 723,001 | ||||||||||
CF Industries Holdings, Inc. | 20,595 | 989,178 | ||||||||||
Croda International plc (United Kingdom) | 634 | 39,052 | ||||||||||
FUCHS PETROLUB S.E. (Germany) | 169 | 7,823 | ||||||||||
Givaudan S.A. (Switzerland) | 5 | 12,120 | ||||||||||
Mexichem S.A.B. de C.V. (Mexico) | 12,140 | 31,753 | ||||||||||
Nissan Chemical Corp. (Japan) | 400 | 18,861 | ||||||||||
Novozymes A/S - Class B (Denmark) | 375 | 18,519 | ||||||||||
Olin Corp. | 31,165 | 629,533 | ||||||||||
Solvay S.A. (Belgium) | 540 | 61,510 | ||||||||||
|
| |||||||||||
| 3,894,329 | ||||||||||||
|
| |||||||||||
Containers & Packaging - 2.1% | ||||||||||||
Ball Corp. | 26,700 | 1,196,159 | ||||||||||
Crown Holdings, Inc.* | 11,285 | 477,243 | ||||||||||
DS Smith plc (United Kingdom) | 8,021 | 40,245 | ||||||||||
Sealed Air Corp. | 37,415 | 1,210,749 | ||||||||||
|
| |||||||||||
| 2,924,396 | ||||||||||||
|
| |||||||||||
Metals & Mining - 1.6% | ||||||||||||
Antofagasta plc (Chile) | 38,845 | 388,839 | ||||||||||
First Quantum Minerals Ltd. (Zambia) | 4,085 | 40,774 | ||||||||||
Freeport-McMoRan, Inc. | 52,190 | 608,014 | ||||||||||
The accompanying notes are an integral part of the financial statements.
71
Investment Portfolio - October 31, 2018
| BLENDED ASSET MAXIMUM SERIES | SHARES |
VALUE | ||||||||||
COMMON STOCKS (continued) | ||||||||||||
Materials (continued) | ||||||||||||
Metals & Mining (continued) | ||||||||||||
Lundin Mining Corp. (Chile) | 90,855 | $ | 373,372 | |||||||||
Southern Copper Corp. (Peru) | 21,180 | 812,041 | ||||||||||
|
| |||||||||||
| 2,223,040 | ||||||||||||
|
| |||||||||||
Total Materials | 9,041,765 | |||||||||||
|
| |||||||||||
Real Estate - 4.0% | ||||||||||||
Equity Real Estate Investment Trusts (REITS) - 4.0% | ||||||||||||
Acadia Realty Trust | 285 | 7,933 | ||||||||||
Agree Realty Corp. | 150 | 8,590 | ||||||||||
Alexandria Real Estate Equities, Inc. | 60 | 7,334 | ||||||||||
American Campus Communities, Inc. | 210 | 8,297 | ||||||||||
American Homes 4 Rent - Class A | 1,455 | 30,657 | ||||||||||
American Tower Corp. | 10,745 | 1,674,178 | ||||||||||
Americold Realty Trust | 275 | 6,806 | ||||||||||
Apartment Investment & Management Co. - Class A | 550 | 23,672 | ||||||||||
Apple Hospitality REIT, Inc. | 765 | 12,370 | ||||||||||
AvalonBay Communities, Inc. | 340 | 59,629 | ||||||||||
Boston Properties, Inc. | 375 | 45,285 | ||||||||||
Brandywine Realty Trust | 1,945 | 27,347 | ||||||||||
CatchMark Timber Trust, Inc. - Class A | 946 | 8,372 | ||||||||||
Chesapeake Lodging Trust | 400 | 11,756 | ||||||||||
Colony Capital, Inc. | 1,675 | 9,832 | ||||||||||
Community Healthcare Trust, Inc. | 460 | 13,671 | ||||||||||
CoreCivic, Inc. | 915 | 20,551 | ||||||||||
Cousins Properties, Inc. | 3,320 | 27,589 | ||||||||||
Crown Castle International Corp. | 210 | 22,835 | ||||||||||
CubeSmart | 225 | 6,521 | ||||||||||
Digital Realty Trust, Inc. | 395 | 40,788 | ||||||||||
EastGroup Properties, Inc. | 65 | 6,226 | ||||||||||
Equinix, Inc. | 2,465 | 933,594 | ||||||||||
Equity LifeStyle Properties, Inc. | 155 | 14,677 | ||||||||||
Equity Residential | 765 | 49,694 | ||||||||||
Essex Property Trust, Inc. | 130 | 32,601 | ||||||||||
Extra Space Storage, Inc. | 170 | 15,310 | ||||||||||
Federal Realty Investment Trust | 65 | 8,063 | ||||||||||
First Industrial Realty Trust, Inc. | 385 | 11,820 | ||||||||||
Getty Realty Corp. | 470 | 12,610 | ||||||||||
HCP, Inc. | 840 | 23,142 | ||||||||||
Healthcare Realty Trust, Inc. | 545 | 15,184 | ||||||||||
Healthcare Trust of America, Inc. - Class A | 610 | 16,019 | ||||||||||
Hibernia REIT plc (Ireland) | 8,480 | 13,351 | ||||||||||
Host Hotels & Resorts, Inc. | 1,590 | 30,385 | ||||||||||
Independence Realty Trust, Inc. | 1,445 | 14,320 | ||||||||||
Invitation Homes, Inc. | 1,274 | 27,875 | ||||||||||
Jernigan Capital, Inc. | 815 | 15,950 | ||||||||||
Kimco Realty Corp. | 710 | 11,424 | ||||||||||
Lamar Advertising Co. - Class A | 130 | 9,532 | ||||||||||
Lexington Realty Trust | 1,460 | 11,344 | ||||||||||
Liberty Property Trust | 580 | 24,285 | ||||||||||
The Macerich Co. | 115 | 5,936 | ||||||||||
Mid-America Apartment Communities, Inc. | 260 | 25,405 | ||||||||||
National Retail Properties, Inc. | 260 | 12,155 | ||||||||||
National Storage Affiliates Trust | 245 | 6,524 | ||||||||||
Outfront Media, Inc. | 430 | 7,620 | ||||||||||
Physicians Realty Trust | 1,880 | 31,170 | ||||||||||
Plymouth Industrial REIT, Inc. | 565 | 7,910 | ||||||||||
Prologis, Inc. | 910 | 58,668 | ||||||||||
Public Storage | 185 | 38,012 | ||||||||||
Realty Income Corp. | 135 | 8,136 | ||||||||||
SBA Communications Corp.* | 10,190 | 1,652,512 | ||||||||||
Simon Property Group, Inc. | 445 | 81,666 | ||||||||||
STAG Industrial, Inc. | 580 | 15,347 | ||||||||||
STORE Capital Corp. | 275 | 7,983 | ||||||||||
Sun Communities, Inc. | 310 | 31,146 | ||||||||||
Sunstone Hotel Investors, Inc. | 1,265 | 18,305 | ||||||||||
Tier REIT, Inc. | 1,170 | 25,354 | ||||||||||
UDR, Inc. | 805 | 31,548 | ||||||||||
UMH Properties, Inc. | 585 | 8,383 | ||||||||||
Unibail-Rodamco-Westfield (France) | 270 | 48,859 | ||||||||||
Urban Edge Properties | 1,290 | 26,432 | ||||||||||
Ventas, Inc. | 245 | 14,220 | ||||||||||
VEREIT, Inc. | 2,905 | 21,294 | ||||||||||
Vornado Realty Trust | 420 | 28,594 | ||||||||||
Weingarten Realty Investors | 705 | 19,825 | ||||||||||
Welltower, Inc. | 295 | 19,491 | ||||||||||
|
| |||||||||||
| 5,623,914 | ||||||||||||
|
| |||||||||||
Real Estate Management & Development - 0.0%## | ||||||||||||
Daito Trust Construction Co. Ltd. (Japan) | 100 | 13,184 | ||||||||||
StorageVault Canada, Inc. (Canada). | 2,045 | 4,008 | ||||||||||
|
| |||||||||||
| 17,192 | ||||||||||||
|
| |||||||||||
Total Real Estate | 5,641,106 | |||||||||||
|
| |||||||||||
Utilities - 0.1% | ||||||||||||
Independent Power and Renewable Electricity Producers - 0.1% | ||||||||||||
China Longyuan Power Group Corp. Ltd. - Class H (China) | 12,000 | 9,132 | ||||||||||
Engie Brasil Energia S.A. (Brazil) | 700 | 7,486 | ||||||||||
The accompanying notes are an integral part of the financial statements.
72
Investment Portfolio - October 31, 2018
| BLENDED ASSET MAXIMUM SERIES |
SHARES/ PRINCIPAL AMOUNT2 | VALUE (NOTE 2) | ||||||
COMMON STOCKS (continued) | ||||||||
Utilities (continued) | ||||||||
Independent Power and Renewable Electricity Producers (continued) | ||||||||
Huaneng Renewables Corp. Ltd. - Class H (China) | 95,522 | $ | 24,585 | |||||
|
| |||||||
| 41,203 | ||||||||
|
| |||||||
Multi-Utilities - 0.0%## | ||||||||
Engie S.A. (France) | 795 | 10,564 | ||||||
|
| |||||||
Water Utilities - 0.0%## | ||||||||
Guangdong Investment Ltd. (China) | 20,000 | 35,806 | ||||||
|
| |||||||
Total Utilities | 87,573 | |||||||
|
| |||||||
TOTAL COMMON STOCKS | ||||||||
(Identified Cost $119,313,294) | 118,270,334 | |||||||
|
| |||||||
CORPORATE BONDS - 3.7% | ||||||||
Non-Convertible Corporate Bonds - 3.7% | ||||||||
Communication Services - 0.6% | ||||||||
Diversified Telecommunication Services - 0.3% | ||||||||
AT&T, Inc., 4.25%, 3/1/2027 | 140,000 | 135,766 | ||||||
Verizon Communications, Inc., 5.50%, 3/16/2047 | 200,000 | 208,395 | ||||||
|
| |||||||
| 344,161 | ||||||||
|
| |||||||
Media - 0.2% | ||||||||
CCO Holdings LLC - CCO Holdings Capital Corp.1, 5.50%, 5/1/2026 | 25,000 | 24,375 | ||||||
Discovery Communications LLC, 5.20%, 9/20/2047 | 140,000 | 129,484 | ||||||
Telenet Finance Luxembourg Notes S.A.R.L (Belgium)1, 5.50%, 3/1/2028 | 200,000 | 185,500 | ||||||
|
| |||||||
| 339,359 | ||||||||
|
| |||||||
Wireless Telecommunication Services - 0.1% | ||||||||
Hughes Satellite Systems Corp., 5.25%, 8/1/2026 | 45,000 | 42,750 | ||||||
Inmarsat Finance plc (United Kingdom)1, 4.875%, 5/15/2022 | 102,000 | 99,911 | ||||||
Sprint Communications, Inc.1, 9.00%, 11/15/2018 | 8,000 | 8,016 | ||||||
Sprint Communications, Inc.1, 7.00%, 3/1/2020 | 8,000 | 8,290 | ||||||
|
| |||||||
| 158,967 | ||||||||
|
| |||||||
Total Communication Services | 842,487 | |||||||
|
| |||||||
Consumer Discretionary - 0.5% | ||||||||
Auto Components - 0.0%## | ||||||||
Techniplas LLC1 , 10.00%, 5/1/2020 | 20,000 | 18,800 | ||||||
|
| |||||||
PRINCIPAL AMOUNT2 | VALUE (NOTE 2) | |||||||
CORPORATE BONDS (continued) | ||||||||
Non-Convertible Corporate Bonds (continued) | ||||||||
Consumer Discretionary (continued) | ||||||||
Automobiles - 0.1% | ||||||||
General Motors Co.3, (3 mo. LIBOR US + 0.900%), 3.227%, 9/10/2021 | 140,000 | $ | 139,798 | |||||
|
| |||||||
Household Durables - 0.2% | ||||||||
Century Communities, Inc., 5.875%, 7/15/2025 | 106,000 | 95,930 | ||||||
LGI Homes, Inc.1, 6.875%, 7/15/2026 | 25,000 | 23,750 | ||||||
Meritage Homes Corp., 5.125%, 6/6/2027 | 20,000 | 17,600 | ||||||
TRI Pointe Group, Inc. - TRI Pointe Homes, Inc., 4.375%, 6/15/2019 | 30,000 | 30,000 | ||||||
TRI Pointe Group, Inc. - TRI Pointe Homes, Inc., 5.875%, 6/15/2024 | 25,000 | 23,344 | ||||||
Weekley Homes LLC - Weekley Finance Corp., 6.00%, 2/1/2023 | 15,000 | 14,400 | ||||||
Weekley Homes LLC - Weekley Finance Corp., 6.625%, 8/15/2025 | 26,000 | 24,570 | ||||||
|
| |||||||
| 229,594 | ||||||||
|
| |||||||
Internet & Direct Marketing Retail - 0.1% | ||||||||
Booking Holdings, Inc., 3.60%, 6/1/2026 | 220,000 | 210,109 | ||||||
|
| |||||||
Multiline Retail - 0.1% | ||||||||
Macy’s Retail Holdings, Inc., 7.00%, 2/15/2028 | 70,000 | 73,921 | ||||||
Macy’s Retail Holdings, Inc., 6.90%, 4/1/2029 | 70,000 | 73,429 | ||||||
|
| |||||||
| 147,350 | ||||||||
|
| |||||||
Total Consumer Discretionary | 745,651 | |||||||
|
| |||||||
Consumer Staples - 0.0%## | ||||||||
Food & Staples Retailing - 0.0%## | ||||||||
C&S Group Enterprises LLC1, 5.375%, 7/15/2022 | 20,000 | 19,300 | ||||||
|
| |||||||
Household Products - 0.0%## | ||||||||
First Quality Finance Co., Inc.1, 5.00%, 7/1/2025 | 15,000 | 13,800 | ||||||
|
| |||||||
Total Consumer Staples | 33,100 | |||||||
|
| |||||||
Energy - 0.8% | ||||||||
Energy Equipment & Services - 0.0%## | ||||||||
Shelf Drilling Holdings Ltd. (United Arab Emirates)1, 8.25%, 2/15/2025 | 20,000 | 20,050 | ||||||
The accompanying notes are an integral part of the financial statements.
73
Investment Portfolio - October 31, 2018
| BLENDED ASSET MAXIMUM SERIES |
PRINCIPAL | VALUE (NOTE 2) | ||||||
CORPORATE BONDS (continued) | ||||||||
Non-Convertible Corporate Bonds (continued) | ||||||||
Energy (continued) | ||||||||
Energy Equipment & Services (continued) | ||||||||
TerraForm Power Operating, LLC1, 5.00%, 1/31/2028 | 20,000 | $ | 17,875 | |||||
|
| |||||||
| 37,925 | ||||||||
|
| |||||||
Oil, Gas & Consumable Fuels - 0.8% | ||||||||
American Midstream Partners LP - American Midstream | 25,000 | 24,501 | ||||||
Boardwalk Pipelines LP, 5.95%, 6/1/2026 | 200,000 | 208,982 | ||||||
DCP Midstream Operating LP1, 5.35%, 3/15/2020 | 15,000 | 15,169 | ||||||
Dynagas LNG Partners LP - Dynagas Finance, Inc. | 28,000 | 27,930 | ||||||
GasLog Ltd. (Monaco), 8.875%, 3/22/2022 | 30,000 | 31,050 | ||||||
Genesis Energy LP - Genesis Energy Finance Corp., 5.625%, 6/15/2024 | 20,000 | 18,100 | ||||||
Jonah Energy LLC - Jonah Energy Finance Corp.1, 7.25%, 10/15/2025 | 109,000 | 86,655 | ||||||
Kinder Morgan Energy Partners LP, 6.95%, 1/15/2038 | 180,000 | 206,172 | ||||||
Rockies Express Pipeline, LLC1, 5.625%, 4/15/2020 | 10,000 | 10,217 | ||||||
Sabine Pass Liquefaction LLC, 5.875%, 6/30/2026 | 200,000 | 212,325 | ||||||
SemGroup Corp., 6.375%, 3/15/2025 | 20,000 | 19,350 | ||||||
Seven Generations Energy Ltd. (Canada)1, 5.375%, 9/30/2025 | 18,000 | 16,785 | ||||||
Southwestern Energy Co.4, 6.20%, 1/23/2025 | 21,000 | 20,422 | ||||||
Tallgrass Energy Partners LP - Tallgrass Energy | 15,000 | 15,094 | ||||||
W&T Offshore, Inc.1, 9.75%, 11/1/2023 | 25,000 | 24,192 | ||||||
The Williams Companies, Inc., 3.75%, 6/15/2027 | 110,000 | 102,425 | ||||||
|
| |||||||
| 1,039,369 | ||||||||
|
| |||||||
Total Energy | 1,077,294 | |||||||
|
| |||||||
Financials - 1.0% | ||||||||
Banks - 0.6% | ||||||||
Bank of America Corp., 4.00%, 1/22/2025 | 220,000 | 214,244 | ||||||
Citigroup, Inc., 8.125%, 7/15/2039 | 150,000 | 209,437 | ||||||
JPMorgan Chase & Co., 6.30%, 4/23/2019 | 210,000 | 213,401 | ||||||
Popular, Inc., 6.125%, 9/14/2023 | 25,000 | 25,295 | ||||||
Santander Holdings USA, Inc., 4.50%, 7/17/2025 | 140,000 | 136,898 | ||||||
|
| |||||||
| 799,275 | ||||||||
|
| |||||||
Capital Markets - 0.2% | ||||||||
LPL Holdings, Inc.1, 5.75%, 9/15/2025 | 25,000 | 24,281 | ||||||
Morgan Stanley3 , (3 mo. LIBOR US + 1.220%), 3.563%, 5/8/2024 | 210,000 | 212,216 | ||||||
|
| |||||||
| 236,497 | ||||||||
|
| |||||||
Consumer Finance - 0.0%## | ||||||||
Ally Financial, Inc., 3.50%, 1/27/2019 | 15,000 | 14,981 | ||||||
Navient Corp., 7.25%, 9/25/2023 | 15,000 | 15,525 | ||||||
SLM Corp., 5.125%, 4/5/2022 | 30,000 | 29,850 | ||||||
|
| |||||||
| 60,356 | ||||||||
|
| |||||||
Diversified Financial Services - 0.1% | ||||||||
AerCap Ireland Capital DAC - AerCap Global Aviation | 140,000 | 136,710 | ||||||
FS Energy & Power Fund1, 7.50%, 8/15/2023 | 30,000 | 30,420 | ||||||
Oxford Finance, LLC - Oxford Finance Co.- Issuer II, Inc.1, 6.375%, 12/15/2022 | 20,000 | 20,275 | ||||||
|
| |||||||
| 187,405 | ||||||||
|
| |||||||
Insurance - 0.1% | ||||||||
Prudential Financial, Inc.5, (3mo. LIBOR US + 4.175%), 5.875%, 9/15/2042 | 130,000 | 135,265 | ||||||
|
| |||||||
Thrifts & Mortgage Finance - 0.0%## | ||||||||
Ladder Capital Finance Holdings LLLP - Ladder Capital Finance Corp1, 5.875%, 8/1/2021 | 15,000 | 15,112 | ||||||
|
| |||||||
Total Financials | 1,433,910 | |||||||
|
| |||||||
Health Care - 0.1% | ||||||||
Health Care Providers & Services - 0.1% | ||||||||
DaVita, Inc., 5.00%, 5/1/2025 | 30,000 | 28,350 | ||||||
Fresenius Medical Care US Finance II, Inc. (Germany)1, 5.625%, 7/31/2019 | 18,000 | 18,281 | ||||||
HCA, Inc., 5.375%, 9/1/2026 | 25,000 | 24,812 | ||||||
The accompanying notes are an integral part of the financial statements.
74
Investment Portfolio - October 31, 2018
| BLENDED ASSET MAXIMUM SERIES |
PRINCIPAL AMOUNT2 | VALUE (NOTE 2) | ||||||||||
CORPORATE BONDS (continued) | ||||||||||||
Non-Convertible Corporate Bonds (continued) | ||||||||||||
Health Care (continued) | ||||||||||||
Health Care Providers & Services (continued) | ||||||||||||
Ortho-Clinical Diagnostics, Inc. - Ortho-Clinical Diagnostics S.A.1, 6.625%, 5/15/2022 | 20,000 | $ | 19,220 | |||||||||
|
| |||||||||||
Total Health Care | 90,663 | |||||||||||
|
| |||||||||||
Industrials - 0.4% | ||||||||||||
Allegiant Travel Co., 5.50%, 7/15/2019 | 18,000 | 18,090 | ||||||||||
American Airlines Group, Inc.1, 5.50%, 10/1/2019 | 20,000 | 20,219 | ||||||||||
|
| |||||||||||
| 38,309 | ||||||||||||
|
| |||||||||||
Commercial Services & Supplies - 0.0%## | ||||||||||||
The ADT Security Corp., 5.25%, 3/15/2020 | 15,000 | 15,150 | ||||||||||
Covanta Holding Corp., 6.00%, 1/1/2027 | 30,000 | 28,950 | ||||||||||
W/S Packaging Holdings, Inc.1, 9.00%, 4/15/2023 | 20,000 | 20,400 | ||||||||||
|
| |||||||||||
| 64,500 | ||||||||||||
|
| |||||||||||
Construction & Engineering - 0.0%## | ||||||||||||
Tutor Perini Corp.1, 6.875%, 5/1/2025 | 28,000 | 28,035 | ||||||||||
|
| |||||||||||
Industrial Conglomerates - 0.0%## | ||||||||||||
General Electric Co.5,6, (3mo. LIBOR US + 3.330%), 5.00% | 110,000 | 101,888 | ||||||||||
|
| |||||||||||
Machinery - 0.1% | ||||||||||||
CNH Industrial Capital LLC, 3.375%, 7/15/2019 | 140,000 | 139,874 | ||||||||||
|
| |||||||||||
Marine - 0.0%## | ||||||||||||
Global Ship Lease, Inc. (United Kingdom)1, 9.875%, 11/15/2022 | 30,000 | 28,575 | ||||||||||
|
| |||||||||||
Trading Companies & Distributors - 0.2% | ||||||||||||
Aircastle Ltd., 6.25%, 12/1/2019 | 10,000 | 10,277 | ||||||||||
Fortress Transportation & Infrastructure Investors, LLC1, 6.50%, 10/1/2025 | 25,000 | 24,562 | ||||||||||
International Lease Finance Corp., 6.25%, 5/15/2019 | 150,000 | 152,392 | ||||||||||
Park Aerospace Holdings Ltd. (Ireland)1, 4.50%, 3/15/2023 | 24,000 | 22,833 | ||||||||||
|
| |||||||||||
| 210,064 | ||||||||||||
|
| |||||||||||
Total Industrials | 611,245 | |||||||||||
|
| |||||||||||
Information Technology - 0.0% | ||||||||||||
Semiconductors & Semiconductor Equipment - 0.0%## | ||||||||||||
MagnaChip Semiconductor Corp. (South Korea), 6.625%, 7/15/2021 | 28,000 | 26,320 | ||||||||||
|
| |||||||||||
Materials - 0.2% | ||||||||||||
Chemicals - 0.0%## | ||||||||||||
LSB Industries, Inc.1, 9.625%, 5/1/2023 | 30,000 | 31,125 | ||||||||||
|
| |||||||||||
Metals & Mining - 0.2% | ||||||||||||
Corp Nacional del Cobre de Chile (Chile)1 , 5.625%, 9/21/2035 | 90,000 | 95,389 | ||||||||||
Mountain Province Diamonds, Inc. (Canada)1, 8.00%, 12/15/2022 | 40,000 | 40,600 | ||||||||||
Northwest Acquisitions ULC - Dominion Finco, Inc.1, 7.125%, 11/1/2022 | 45,000 | 45,308 | ||||||||||
|
| |||||||||||
| 181,297 | ||||||||||||
|
| |||||||||||
Total Materials | 212,422 | |||||||||||
|
| |||||||||||
Real Estate - 0.1% | ||||||||||||
Equity Real Estate Investment Trusts (REITS) - 0.1%## |
| |||||||||||
American Homes 4 Rent LP, 4.25%, 2/15/2028 | 150,000 | 141,785 | ||||||||||
Greystar Real Estate Partners, LLC1, 5.75%, 12/1/2025 | 30,000 | 29,100 | ||||||||||
iStar, Inc., 5.25%, 9/15/2022 | 20,000 | 19,350 | ||||||||||
|
| |||||||||||
Total Real Estate | 190,235 | |||||||||||
|
| |||||||||||
Utilities - 0.0%## | ||||||||||||
Gas Utilities - 0.0%## | ||||||||||||
NGL Energy Partners LP - NGL Energy Finance Corp., 6.125%, 3/1/2025 | 30,000 | 27,300 | ||||||||||
|
| |||||||||||
Independent Power and Renewable Electricity Producers - 0.0%## |
| |||||||||||
Clearway Energy Operating, LLC, 5.00%, 9/15/2026 | 20,000 | 18,600 | ||||||||||
|
| |||||||||||
Total Utilities | 45,900 | |||||||||||
|
| |||||||||||
TOTAL CORPORATE BONDS | 5,309,227 | |||||||||||
|
| |||||||||||
75
Investment Portfolio - October 31, 2018
| BLENDED ASSET MAXIMUM SERIES |
SHARES/ PRINCIPAL AMOUNT2 | VALUE (NOTE 2) | ||||||||||
MUTUAL FUNDS - 0.1% | ||||||||||||
iShares MSCI Thailand ETF | 1,228 | $ | 106,468 | |||||||||
iShares U.S. Real Estate ETF | 300 | 23,433 | ||||||||||
|
| |||||||||||
TOTAL MUTUAL FUNDS | ||||||||||||
(Identified Cost $132,588) | 129,901 | |||||||||||
|
| |||||||||||
U.S. TREASURY SECURITIES - 11.1% | ||||||||||||
U.S. Treasury Bonds - 1.8% | ||||||||||||
U.S. Treasury Bond, 6.25%, 5/15/2030 | 572,000 | 740,539 | ||||||||||
U.S. Treasury Bond, 4.75%, 2/15/2037 | 840,000 | 1,011,347 | ||||||||||
U.S. Treasury Bond, 3.00%, 5/15/2047 | 440,000 | 407,533 | ||||||||||
U.S. Treasury Inflation Indexed Bond, 0.75%, 2/15/2042 | 404,172 | 359,002 | ||||||||||
|
| |||||||||||
Total U.S. Treasury Bonds | ||||||||||||
(Identified Cost $2,714,908) | 2,518,421 | |||||||||||
|
| |||||||||||
U.S. Treasury Notes - 9.3% | ||||||||||||
U.S. Treasury Inflation Indexed Note, 0.125%, 4/15/2020 | 1,549,400 | 1,522,992 | ||||||||||
U.S. Treasury Inflation Indexed Note, 0.125%, 1/15/2023 | 391,946 | 377,348 | ||||||||||
U.S. Treasury Note, 1.625%, 4/30/2019 | 1,400,000 | 1,394,039 | ||||||||||
U.S. Treasury Note, 2.125%, 7/31/2024 | 5,762,000 | 5,486,505 | ||||||||||
U.S. Treasury Note, 1.625%, 5/15/2026
|
| 1,660,000
|
|
| 1,496,334
|
| ||||||
PRINCIPAL AMOUNT2 / SHARES | VALUE (NOTE 2) | |||||||||||
U.S. TREASURY SECURITIES (continued) | ||||||||||||
U.S. Treasury Notes (continued) | ||||||||||||
U.S. Treasury Note, 2.375%, 5/15/2027 | 1,433,000 | $ | 1,352,562 | |||||||||
U.S. Treasury Note, 2.75%, 2/15/2028 | 1,550,000 | 1,499,988 | ||||||||||
|
| |||||||||||
Total U.S. Treasury Notes | ||||||||||||
(Identified Cost $13,337,311) | 13,129,768 | |||||||||||
|
| |||||||||||
TOTAL U.S. TREASURY SECURITIES | ||||||||||||
(Identified Cost $16,052,219) | 15,648,189 | |||||||||||
|
| |||||||||||
SHORT-TERM INVESTMENT - 1.2% | ||||||||||||
Dreyfus Government Cash Management, Institutional Shares7 , 2.05%, | ||||||||||||
(Identified Cost $1,706,948) | 1,706,948 | 1,706,948 | ||||||||||
|
| |||||||||||
TOTAL INVESTMENTS - 99.8% | ||||||||||||
(Identified Cost $142,711,440) | 141,064,599 | |||||||||||
OTHER ASSETS, LESS LIABILITIES - 0.2% | 231,817 | |||||||||||
|
| |||||||||||
NET ASSETS - 100% | $ | 141,296,416 | ||||||||||
|
| |||||||||||
ADR - American Depositary Receipt
ETF - Exchange-traded fund
*Non-income producing security.
## Less than 0.1%.
1Restricted securities - Investment in securities that are restricted as to public resale under the Securities Act of 1933, as amended. These securities have been sold under Rule 144A and have been determined to be liquid under guidelines established by the Board of Directors. These securities amount to $1,225,562, or 0.9% of the Series’ net assets as of October 31, 2018 (see Note 2 to the financial statements).
2Amount is stated in USD unless otherwise noted.
3Floating rate security. Rate shown is the rate in effect as of October 31, 2018.
4Step coupon rate security - Rate steps up/down by 25 basis points upon rating downgrade/upgrade by Moody’s and S&P rating agencies (Subject to a maximum of 100 basis points per agency, 200 basis points maximum).
5Variable rate security. Security may be issued at a fixed coupon rate, which converts to a variable rate at a specified date. Rate shown is the rate in effect as of October 31, 2018.
6Security is perpetual in nature and has no stated maturity date.
7Rate shown is the current yield as of October 31, 2018.
The Global Industry Classification Standard (GICS) was developed by and is the exclusive property and a service mark of MSCI Inc. (MSCI) and Standard & Poor’s, a division of The McGraw-Hill Companies, Inc. (S&P), and is licensed for use by Manning & Napier when referencing GICS sectors. Neither MSCI, S&P, nor any third party involved in making or compiling the GICS or any GICS classifications makes any express or implied warranties or representations with respect to such standard or classification, nor shall any such party have any liability therefrom.
The accompanying notes are an integral part of the financial statements.
76
Statement of Assets and Liabilities - Blended Asset Maximum Series
October 31, 2018
ASSETS: | ||||
Investments, at value (identified cost $142,711,440) (Note 2) | $ | 141,064,599 | ||
Foreign currency, at value (identified cost $1,300) | 1,300 | |||
Interest receivable | 178,692 | |||
Dividends receivable | 38,896 | |||
Receivable for fund shares sold | 102,603 | |||
Receivable for securities sold | 2,393,990 | |||
Foreign tax reclaims receivable | 25,308 | |||
Prepaid expenses | 168 | |||
|
| |||
TOTAL ASSETS | 143,805,556 | |||
|
| |||
LIABILITIES: | ||||
Accrued management fees (Note 3) | 21,250 | |||
Accrued fund accounting and administration fees (Note 3) | 22,543 | |||
Accrued Chief Compliance Officer service fees (Note 3) | 401 | |||
Payable for securities purchased | 2,397,696 | |||
Accrued custodian fees | 32,642 | |||
Payable for fund shares repurchased | 1,732 | |||
Other payables and accrued expenses | 32,876 | |||
|
| |||
TOTAL LIABILITIES | 2,509,140 | |||
|
| |||
TOTAL NET ASSETS | $ | 141,296,416 | ||
|
| |||
NET ASSETS CONSIST OF: | ||||
Capital stock | $ | 119,261 | ||
Additional paid-in-capital | 136,227,572 | |||
Total distributable earnings | 4,949,583 | |||
|
| |||
TOTAL NET ASSETS | $ | 141,296,416 | ||
|
| |||
NET ASSET VALUE, OFFERING PRICE AND REDEMPTION PRICE PER SHARE - Class R6 ($141,296,416/11,926,079 shares) | $ | 11.85 | ||
|
| |||
The accompanying notes are an integral part of the financial statements.
77
Statement of Operations - Blended Asset Maximum Series
For the Year Ended October 31, 2018
INVESTMENT INCOME: | ||||
Dividends (net of foreign taxes withheld, $95,545) | $ | 1,530,838 | ||
Interest | 567,480 | |||
|
| |||
Total Investment Income | 2,098,318 | |||
|
| |||
EXPENSES: | ||||
Management fees (Note 3) | 693,306 | |||
Fund accounting and administration fees (Note 3) | 69,913 | |||
Directors’ fees (Note 3) | 10,700 | |||
Chief Compliance Officer service fees (Note 3) | 4,394 | |||
Custodian fees | 47,451 | |||
Audit fees | 45,529 | |||
Miscellaneous | 36,975 | |||
|
| |||
Total Expenses | 908,268 | |||
Less reduction of expenses (Note 3) | (145,632 | ) | ||
|
| |||
Net Expenses | 762,636 | |||
|
| |||
NET INVESTMENT INCOME | 1,335,682 | |||
|
| |||
REALIZED AND UNREALIZED GAIN (LOSS) ON INVESTMENTS AND FOREIGN CURRENCY: | ||||
Net realized gain (loss) on- | ||||
Investments | 6,063,591 | |||
Foreign currency and translation of other assets and liabilities | (7,650 | ) | ||
|
| |||
| 6,055,941 | ||||
|
| |||
Net change in unrealized appreciation (depreciation) on- | ||||
Investments | (1,698,135 | ) | ||
Foreign currency and translation of other assets and liabilities | (1,299 | ) | ||
|
| |||
| (1,699,434 | ) | |||
|
| |||
NET REALIZED AND UNREALIZED GAIN (LOSS) ON INVESTMENTS AND FOREIGN CURRENCY | 4,356,507 | |||
|
| |||
NET INCREASE IN NET ASSETS RESULTING FROM OPERATIONS | $ | 5,692,189 | ||
|
| |||
The accompanying notes are an integral part of the financial statements.
78
Statements of Changes in Net Assets - Blended Asset Maximum Series
FOR THE YEAR ENDED 10/31/18 | FOR THE PERIOD 10/13/171 TO 10/31/17 | |||||||
INCREASE IN NET ASSETS: | ||||||||
OPERATIONS: | ||||||||
Net investment income | $ | 1,335,682 | $ | 7,708 | ||||
Net realized gain on investments and foreign currency | 6,055,941 | 53,424 | ||||||
Net change in unrealized appreciation (depreciation) on investments and foreign currency | (1,699,434) | 51,084 | ||||||
|
|
|
| |||||
Net increase from operations | 5,692,189 | 112,216 | ||||||
|
|
|
| |||||
DISTRIBUTIONS TO SHAREHOLDERS (Note 9): | ||||||||
Class R6 | (855,074) | — | ||||||
|
|
|
| |||||
CAPITAL STOCK ISSUED AND REPURCHASED: | ||||||||
Net increase (decrease) from capital share transactions (Note 5) | (14,120,006) | 150,467,091 | ||||||
|
|
|
| |||||
Net increase (decrease) in net assets | (9,282,891) | 150,579,307 | ||||||
NET ASSETS: | ||||||||
Beginning of period | 150,579,307 | — | ||||||
|
|
|
| |||||
End of period | $ | 141,296,416 | $ | 150,579,307 | ||||
|
|
|
| |||||
1 Commencement of operations
The accompanying notes are an integral part of the financial statements.
79
Financial Highlights - Blended Asset Maximum Series - Class R6
FOR THE YEAR ENDED 10/31/18 | FOR THE PERIOD 10/13/171 TO 10/31/17 | |||||||
Per share data (for a share outstanding throughout each period): | ||||||||
Net asset value - Beginning of period | $ | 11.60 | $ | 11.59 | ||||
|
|
|
| |||||
Income (loss) from investment operations: | ||||||||
Net investment income (loss)2 | 0.12 | (0.00 | )3 | |||||
Net realized and unrealized gain on investments | 0.21 | 0.01 | ||||||
|
|
|
| |||||
Total from investment operations | 0.33 | 0.01 | ||||||
|
|
|
| |||||
Less distributions to shareholders: | ||||||||
From net investment income | (0.07 | ) | — | |||||
From net realized gain on investments | (0.01 | ) | — | |||||
|
|
|
| |||||
Total distributions to shareholders | (0.08 | ) | — | |||||
|
|
|
| |||||
Net asset value - End of period | $ | 11.85 | $ | 11.60 | ||||
|
|
|
| |||||
Net assets - End of period (000’s omitted) | $ | 141,296 | $ | 150,579 | ||||
|
|
|
| |||||
Total return4 | 2.77 | % | 0.09 | % | ||||
Ratios (to average net assets)/Supplemental Data: | ||||||||
Expenses | 0.55 | % | 0.55 | %5 | ||||
Net investment income (loss) | 0.96 | % | 0.11 | %5 | ||||
Series portfolio turnover | 85 | % | 4 | % | ||||
*The investment advisor did not impose all or a portion of its management and/or other fees during the period, and may have paid a portion of the Series’ expenses. If these expenses had been incurred by the Series, the expense ratio (to average net assets) would have increased by the following amounts:
|
| |||||||
| 0.10 | % | 0.66 | %5 | |||||
1Commencement of operations.
2Calculated based on average shares outstanding during the periods.
3Less than $(0.01).
4Represents aggregate total return for the periods indicated, and assumes reinvestment of all distributions. Total return would have been lower had certain expenses not been reimbursed during the periods. Periods less than one year are not annualized.
5Annualized.
The accompanying notes are an integral part of the financial statements.
80
Notes to Financial Statements
| 1. | Organization |
Blended Asset Conservative Series, Blended Asset Moderate Series, Blended Asset Extended Series and Blended Asset Maximum Series (each the “Series”) are no-load diversified series of Manning & Napier Fund, Inc. (the “Fund”). The Fund is organized in Maryland and is registered under the Investment Company Act of 1940 (the “1940 Act”), as amended, as an open-end management investment company.
The Series are asset allocation funds. Each invests in a combination of stocks, bonds and cash and is managed according to specific objectives. The objectives are as follows: Blended Asset Conservative Series - primary objective is to provide current income and its secondary objectives are to provide preservation of capital and long-term growth of capital; secondary objective is to provide income and long-term growth of capital. Blended Asset Moderate Series - equal emphasis on long-term growth of capital and preservation of capital. Blended Asset Extended Series - primary objective is long-term growth of capital; secondary objective is preservation of capital. Blended Asset Maximum Series - primary objective is long-term growth of capital.
The Fund’s Advisor is Manning & Napier Advisors, LLC (the “Advisor”). The Series are offered exclusively to other funds managed by the Advisor. The total authorized capital stock of the Fund consists of 15 billion shares of common stock each having a par value of $0.01. As of October 31, 2018, 13.4 billion shares have been designated in total among 38 series, of which 100 million have been designated in each of the Series for Class R6 common stock.
| 2. | Significant Accounting Policies |
The following is a summary of significant accounting policies followed by the Series. Each Series is an investment company and, accordingly, follows the investment company accounting and reporting guidance of the Financial Accounting Standards Board Accounting Standards Codification Topic 946 - Investment Companies, which is part of accounting principles generally accepted in the United States of America (“GAAP”).
Security Valuation
Portfolio securities, including domestic equities, foreign equities, warrants and options, listed on an exchange other than the NASDAQ Stock Market are valued at the latest quoted sales price of the exchange on which the security is primarily traded. Securities not traded on valuation date or securities not listed on an exchange are valued at the latest quoted bid price provided by the Fund’s pricing service. Securities listed on the NASDAQ Stock Market are valued in accordance with the NASDAQ Official Closing Price.
Debt securities, including government bonds, foreign bonds, asset-backed securities, structured notes, supranational obligations, sovereign bonds, corporate bonds and mortgage-backed securities will normally be valued on the basis of evaluated bid prices provided directly by an independent pricing service. The pricing services use multiple valuation techniques to determine fair value. In instances where sufficient market activity exists, the pricing services may utilize a market-based approach through which quotes from market makers are used to determine fair value. In instances where sufficient market activity may not exist or is limited, the pricing services also utilize proprietary valuation models which may consider market characteristics such as benchmark yield curves, option-adjusted spreads, credit spreads, estimated defaulted rates, coupon rates, anticipated timing of principal repayments, underlying collateral and other unique security features in order to estimate the relevant cash flows, which are then discounted to calculate the fair value. Certain investments in securities held by the Series may be valued on a basis of a price provided directly by a principal market maker. These prices may differ from the value that would have been used had a broader market for securities existed.
Short-term investments that mature in sixty days or less may be valued at amortized cost, which approximates fair value. Investments in open-end investment companies are valued at their net asset value per share on valuation date.
Volume and level of activity in established markets for an asset or liability are evaluated to determine whether recent transactions and quoted prices are determinative of fair value. Where there have been significant decreases in volume and level of activity, further analysis and adjustment may be necessary to estimate fair value. The Series measure fair value in these instances by the use of inputs and valuation techniques which may be based upon current market prices of securities that are comparable in coupon, rating, maturity and industry and/or expectation of future cash flows. As a result of trading in relatively
81
Notes to Financial Statements (continued)
| 2. | Significant Accounting Policies (continued) |
Security Valuation (continued)
thin markets and/or markets that experience significant volatility, the prices used by the Series to value these securities may differ from the value that would be realized if these securities were sold, and the differences could be material.
Securities for which representative valuations or prices are not available from the Series’ pricing service may be valued at fair value as determined in good faith by the Advisor under procedures approved by and under the general supervision and responsibility of the Fund’s Board of Directors (the “Board”). Due to the inherent uncertainty of valuations of such securities, the fair value may differ significantly from the values that would have been used had a ready market for such securities existed. If trading or events occurring after the close of the principal market in which securities are traded are expected to materially affect the value of those securities, then they may be valued at their fair value, taking this trading or these events into account. In accordance with the procedures approved by the Board, the values of certain securities trading outside the U.S. were adjusted following the close of local trading using a factor from a third party vendor. The third party vendor uses statistical analyses and quantitative models, which consider among other things subsequent movement and changes in the prices of indices, securities and exchange rates in other markets, to determine the factors which are used to adjust local market prices. The value of securities used for net asset value calculation under these procedures may differ from published prices for the same securities. It is the Fund’s policy to classify each foreign equity security where a factor from a third party vendor is provided as a Level 2 security.
Various inputs are used in determining the value of the Series’ assets or liabilities carried at fair value. These inputs are summarized in three broad levels. Level 1 includes quoted prices in active markets for identical assets and liabilities. Level 2 includes other significant observable inputs (including quoted prices for similar securities, interest rates, prepayment speeds, credit risk, etc.). Level 3 includes significant unobservable inputs (including the Series’ own assumptions in determining the fair value of investments). A financial instrument’s level within the fair value hierarchy is based on the lowest level of any input both individually and in aggregate that is significant to their fair value measure. The inputs or methodology used for valuing securities are not necessarily an indication of the risk associated with investing in those securities.
The following is a summary of the valuation levels used for major security types as of October 31, 2018 in valuing the Series’ assets or liabilities carried at fair value:
| BLENDED ASSET CONSERVATIVE SERIES | ||||||||||||||||
| DESCRIPTION | TOTAL | LEVEL 1 | LEVEL 2 | LEVEL 3 | ||||||||||||
Assets: | ||||||||||||||||
Equity securities: | ||||||||||||||||
Communication Services | $ | 2,242,992 | $ | 1,770,899 | $ | 472,093 | # | $ | — | |||||||
Consumer Discretionary | 2,826,728 | 2,531,636 | 295,092 | # | — | |||||||||||
Consumer Staples | 4,141,412 | 2,763,840 | 1,377,572 | # | — | |||||||||||
Energy | 1,927,628 | 1,927,628 | — | — | ||||||||||||
Financials | 3,414,418 | 3,414,418 | — | — | ||||||||||||
Health Care | 7,323,703 | 6,885,719 | 437,984 | # | — | |||||||||||
Industrials | 2,614,356 | 2,614,356 | — | — | ||||||||||||
Information Technology | 5,521,223 | 5,521,223 | — | — | ||||||||||||
Materials | 1,546,039 | 1,546,039 | — | — | ||||||||||||
Real Estate | 3,664,811 | 3,612,132 | 52,679 | # | — | |||||||||||
Utilities | 246,408 | 246,408 | — | — | ||||||||||||
Debt securities: | ||||||||||||||||
U.S. Treasury and other U.S. Government agencies | 47,704,271 | — | 47,704,271 | — | ||||||||||||
Corporate debt: | ||||||||||||||||
Communication Services | 3,043,874 | — | 3,043,874 | — | ||||||||||||
Consumer Discretionary | 3,034,706 | — | 3,034,706 | — | ||||||||||||
Consumer Staples | 56,325 | — | 56,325 | — | ||||||||||||
Energy | 4,509,814 | — | 4,509,814 | — | ||||||||||||
82
Notes to Financial Statements (continued)
| 2. | Significant Accounting Policies (continued) |
Security Valuation (continued)
| BLENDED ASSET CONSERVATIVE SERIES | ||||||||||||||||
| DESCRIPTION | TOTAL | LEVEL 1 | LEVEL 2 | LEVEL 3 | ||||||||||||
Financials | $ | 7,298,874 | $ | — | $ | 7,298,874 | $ | — | ||||||||
Health Care | 1,543,795 | — | 1,543,795 | — | ||||||||||||
Industrials | 2,646,963 | — | 2,646,963 | — | ||||||||||||
Information Technology | 36,660 | — | 36,660 | — | ||||||||||||
Materials | 712,361 | — | 712,361 | — | ||||||||||||
Real Estate | 939,671 | — | 939,671 | — | ||||||||||||
Utilities | 59,650 | — | 59,650 | — | ||||||||||||
Asset-backed securities | 4,475,876 | — | 4,475,876 | — | ||||||||||||
Commercial mortgage-backed securities | 10,299,989 | — | 10,299,989 | — | ||||||||||||
Foreign government bonds | 2,441,213 | — | 2,441,213 | — | ||||||||||||
Mutual funds | 2,589,820 | 2,589,820 | — | — | ||||||||||||
|
|
|
|
|
|
|
| |||||||||
Total assets | 126,863,580 | 35,424,118 | 91,439,462 | — | ||||||||||||
|
|
|
|
|
|
|
| |||||||||
Liabilities: | ||||||||||||||||
Other financial instruments*: | ||||||||||||||||
Equity contracts | (29,378 | ) | (22,043 | ) | (7,335 | ) | — | |||||||||
|
|
|
|
|
|
|
| |||||||||
Total liabilities | (29,378 | ) | (22,043 | ) | (7,335 | ) | — | |||||||||
|
|
|
|
|
|
|
| |||||||||
Total | $ | 126,834,202 | $ | 35,402,075 | $ | 91,432,127 | $ | — | ||||||||
|
|
|
|
|
|
|
| |||||||||
| BLENDED ASSET MODERATE SERIES | ||||||||||||||||
| DESCRIPTION | TOTAL | LEVEL 1 | LEVEL 2 | LEVEL 3 | ||||||||||||
Assets: | ||||||||||||||||
Equity securities: | ||||||||||||||||
Communication Services | $ | 3,810,995 | $ | 2,789,672 | $ | 1,021,323 | # | $ | — | |||||||
Consumer Discretionary | 4,220,516 | 3,357,383 | 863,133 | # | — | |||||||||||
Consumer Staples | 5,872,074 | 2,951,717 | 2,920,357 | # | — | |||||||||||
Energy | 2,243,021 | 2,035,030 | 207,991 | # | — | |||||||||||
Financials | 2,846,215 | 2,516,438 | 329,777 | # | — | |||||||||||
Health Care | 9,116,967 | 8,383,818 | 733,149 | # | — | |||||||||||
Industrials | 2,109,265 | 1,591,192 | 518,073 | # | — | |||||||||||
Information Technology | 7,288,617 | 7,064,971 | 223,646 | # | — | |||||||||||
Materials | 1,779,278 | 1,564,448 | 214,830 | # | — | |||||||||||
Real Estate | 3,363,992 | 3,288,439 | 75,553 | # | — | |||||||||||
Utilities | 47,704 | 4,278 | 43,426 | # | — | |||||||||||
Debt securities: | ||||||||||||||||
U.S. Treasury and other U.S. Government agencies | 38,369,460 | — | 38,369,460 | — | ||||||||||||
Corporate debt: | ||||||||||||||||
Communication Services | 2,351,438 | — | 2,351,438 | — | ||||||||||||
Consumer Discretionary | 2,295,723 | — | 2,295,723 | — | ||||||||||||
Consumer Staples | 51,726 | — | 51,726 | — | ||||||||||||
Energy | 3,444,364 | — | 3,444,364 | — | ||||||||||||
Financials | 5,467,814 | �� | — | 5,467,814 | — | |||||||||||
Health Care | 648,114 | — | 648,114 | — | ||||||||||||
Industrials | 2,120,932 | — | 2,120,932 | — | ||||||||||||
Information Technology | 40,420 | — | 40,420 | — | ||||||||||||
Materials | 560,262 | — | 560,262 | — | ||||||||||||
Real Estate | 745,023 | — | 745,023 | — | ||||||||||||
Utilities | 59,650 | — | 59,650 | — | ||||||||||||
83
Notes to Financial Statements (continued)
| 2. | Significant Accounting Policies (continued) |
Security Valuation (continued)
| BLENDED ASSET MODERATE SERIES | ||||||||||||||||
| DESCRIPTION | TOTAL | LEVEL 1 | LEVEL 2 | LEVEL 3 | ||||||||||||
Asset-backed securities | $ | 4,241,360 | $ | — | $ | 4,241,360 | $ | — | ||||||||
Commercial mortgage-backed securities | 6,851,522 | — | 6,851,522 | — | ||||||||||||
Foreign government bonds | 1,992,283 | — | 1,992,283 | — | ||||||||||||
Mutual funds | 3,636,055 | 3,636,055 | — | — | ||||||||||||
|
|
|
|
|
|
|
| |||||||||
Total assets | 115,574,790 | 39,183,441 | 76,391,349 | — | ||||||||||||
|
|
|
|
|
|
|
| |||||||||
Liabilities: | ||||||||||||||||
Other financial instruments*: | ||||||||||||||||
Equity contracts | (43,858 | ) | (32,448 | ) | (11,410 | ) | — | |||||||||
|
|
|
|
|
|
|
| |||||||||
Total liabilities | (43,858 | ) | (32,448 | ) | (11,410 | ) | — | |||||||||
|
|
|
|
|
|
|
| |||||||||
Total | $ | 115,530,932 | $ | 39,150,993 | $ | 76,379,939 | $ | — | ||||||||
|
|
|
|
|
|
|
| |||||||||
| BLENDED ASSET EXTENDED SERIES | ||||||||||||||||
| DESCRIPTION | TOTAL | LEVEL 1 | LEVEL 2 | LEVEL 3 | ||||||||||||
Assets: | ||||||||||||||||
Equity securities: | ||||||||||||||||
Communication Services | $ | 9,123,735 | $ | 6,695,192 | $ | 2,428,543 | # | $ | — | |||||||
Consumer Discretionary | 10,119,262 | 7,976,595 | 2,142,667 | # | — | |||||||||||
Consumer Staples | 13,965,960 | 7,044,720 | 6,921,240 | # | — | |||||||||||
Energy | 5,185,402 | 4,688,492 | 496,910 | # | — | |||||||||||
Financials | 6,757,340 | 5,977,263 | 780,077 | # | — | |||||||||||
Health Care | 21,226,073 | 19,511,420 | 1,714,653 | # | — | |||||||||||
Industrials | 4,985,448 | 3,766,145 | 1,219,303 | # | — | |||||||||||
Information Technology | 17,224,851 | 16,675,245 | 549,606 | # | — | |||||||||||
Materials | 4,477,630 | 3,961,096 | 516,534 | # | — | |||||||||||
Real Estate | 7,240,057 | 7,082,286 | 157,771 | # | — | |||||||||||
Utilities | 125,933 | 10,695 | 115,238 | # | — | |||||||||||
Debt securities: | ||||||||||||||||
U.S. Treasury and other U.S. | ||||||||||||||||
Government agencies | 57,746,067 | — | 57,746,067 | — | ||||||||||||
Corporate debt: | ||||||||||||||||
Communication Services | 3,222,261 | — | 3,222,261 | — | ||||||||||||
Consumer Discretionary | 3,170,358 | — | 3,170,358 | — | ||||||||||||
Consumer Staples | 84,600 | — | 84,600 | — | ||||||||||||
Energy | 4,748,315 | — | 4,748,315 | — | ||||||||||||
Financials | 7,286,558 | — | 7,286,558 | — | ||||||||||||
Health Care | 168,868 | — | 168,868 | — | ||||||||||||
Industrials | 3,129,304 | — | 3,129,304 | — | ||||||||||||
Information Technology | 73,320 | — | 73,320 | — | ||||||||||||
Materials | 981,646 | — | 981,646 | — | ||||||||||||
Real Estate | 1,004,345 | — | 1,004,345 | — | ||||||||||||
Utilities | 510,620 | — | 510,620 | — | ||||||||||||
Asset-backed securities | 5,486,527 | — | 5,486,527 | — | ||||||||||||
Commercial mortgage-backed securities | 9,478,691 | — | 9,478,691 | — | ||||||||||||
Foreign government bonds | 2,714,174 | — | 2,714,174 | — | ||||||||||||
Mutual funds | 671,961 | 671,961 | — | — | ||||||||||||
|
|
|
|
|
|
|
| |||||||||
Total assets | 200,909,306 | 84,061,110 | 116,848,196 | — | ||||||||||||
|
|
|
|
|
|
|
| |||||||||
84
Notes to Financial Statements (continued)
| 2. | Significant Accounting Policies (continued) |
Security Valuation (continued)
| BLENDED ASSET EXTENDED SERIES | ||||||||||||||||
| DESCRIPTION | TOTAL | LEVEL 1 | LEVEL 2 | LEVEL 3 | ||||||||||||
Liabilities: | ||||||||||||||||
Other financial instruments*: | ||||||||||||||||
Equity contracts | $ | (108,563 | ) | $ | (80,038 | ) | $ | (28,525 | ) | $ | — | |||||
|
|
|
|
|
|
|
| |||||||||
Total liabilities | (108,563 | ) | (80,038 | ) | (28,525 | ) | — | |||||||||
|
|
|
|
|
|
|
| |||||||||
Total | $ | 200,800,743 | $ | 83,981,072 | $ | 116,819,671 | $ | — | ||||||||
|
|
|
|
|
|
|
| |||||||||
| BLENDED ASSET MAXIMUM SERIES | ||||||||||||||||
| DESCRIPTION | TOTAL | LEVEL 1 | LEVEL 2 | LEVEL 3 | ||||||||||||
Assets: | ||||||||||||||||
Equity securities: | ||||||||||||||||
Communication Services | $ | 9,694,649 | $ | 7,538,115 | $ | 2,156,534 | # | $ | — | |||||||
Consumer Discretionary | 15,620,131 | 14,131,137 | 1,488,994 | # | — | |||||||||||
Consumer Staples | 18,639,266 | 12,970,480 | 5,668,786 | # | — | |||||||||||
Energy | 4,215,960 | 3,860,788 | 355,172 | # | — | |||||||||||
Financials | 10,607,996 | 6,515,499 | 4,092,497 | # | — | |||||||||||
Health Care | 21,235,364 | 20,091,192 | 1,144,172 | # | — | |||||||||||
Industrials | 6,638,535 | 4,581,528 | 2,057,007 | # | — | |||||||||||
Information Technology | 16,847,989 | 15,789,638 | 1,058,351 | # | — | |||||||||||
Materials | 9,041,765 | 7,091,817 | 1,949,948 | # | — | |||||||||||
Real Estate | 5,641,106 | 5,565,712 | 75,394 | # | — | |||||||||||
Utilities | 87,573 | 7,486 | 80,087 | # | — | |||||||||||
Debt securities: | ||||||||||||||||
U.S. Treasury and other U.S. | ||||||||||||||||
Government agencies | 15,648,189 | — | 15,648,189 | — | ||||||||||||
Corporate debt: | ||||||||||||||||
Communication Services | 842,487 | — | 842,487 | — | ||||||||||||
Consumer Discretionary | 745,651 | — | 745,651 | — | ||||||||||||
Consumer Staples | 33,100 | — | 33,100 | — | ||||||||||||
Energy | 1,077,294 | — | 1,077,294 | — | ||||||||||||
Financials | 1,433,910 | — | 1,433,910 | — | ||||||||||||
Health Care | 90,663 | — | 90,663 | — | ||||||||||||
Industrials | 611,245 | — | 611,245 | — | ||||||||||||
Information Technology | 26,320 | — | 26,320 | — | ||||||||||||
Materials | 212,422 | — | 212,422 | — | ||||||||||||
Real Estate | 190,235 | — | 190,235 | — | ||||||||||||
Utilities | 45,900 | — | 45,900 | — | ||||||||||||
Mutual funds | 1,836,849 | 1,836,849 | — | — | ||||||||||||
|
|
|
|
|
|
|
| |||||||||
Total assets | $ | 141,064,599 | $ | 99,980,241 | $ | 41,084,358 | $ | — | ||||||||
|
|
|
|
|
|
|
| |||||||||
#Consists of certain foreign securities for which a factor from a third party vendor was applied to determine the securities’ fair value following the close of local trading.
*Other financial instruments are exchange traded options (Level 1 and Level 2).
There were no Level 3 securities held by any of the Blended Asset Series as of October 31, 2018.
China literature ltd. - right was a Level 3 security held as of October 31, 2017. However, this security is no longer held by the Series.
85
Notes to Financial Statements (continued)
| 2. | Significant Accounting Policies (continued) |
New Accounting Guidance
The Securities and Exchange Commission (SEC) adopted changes to Regulation S-X to simplify the reporting of information by registered investment companies in financial statements. The amendments require presentation of the total, rather than the components, of distributable earnings on the Statement of Assets and Liabilities and also require presentation of the total, rather than the components, of distributions to shareholders, except for tax return of capital distributions, if any, on the Statement of Changes in Net Assets. The amendments also removed the requirement for parenthetical disclosure of undistributed net investment income on the Statement of Changes in Net Assets. These Regulation S-X amendments are reflected in the Series financial statements for the year ended October 31, 2018. As a result of adopting these amendments, the distributions to shareholders in the October 31, 2017 Statement of Changes in Net Assets presented herein have been reclassified to conform to the current year presentation.
In March 2017, the Financial Accounting Standards Board issued Accounting Standards Update No 2017-08, Receivables -Nonrefundable Fees and Other Costs (Subtopic 310-20): “Premium Amortization of Purchased Callable Debt Securities” which amends the amortization period for certain purchased callable debt securities. Under the new guidance, the premium amortization of purchased callable debt securities that have explicit, non-contingent call features and are callable at fixed prices will be amortized to the earliest call date. The guidance does not require an accounting change for securities held at a discount; which continue to be amortized to maturity. The guidance will be applied on a modified retrospective basis and is effective for fiscal years, and their interim periods, beginning after December 15, 2018. Management is currently evaluating the impact of this guidance to the Series.
On August 28, 2018, the FASB issued ASU 2018-13, “Disclosure Framework – Changes to the Disclosure Requirements for Fair Value Measurement,” which amends the fair value measurement disclosure requirements under U.S. GAAP. The amendments of ASU 2018-13 include new, eliminated, and modified disclosure requirements. In addition, the amendments clarify that materiality is an appropriate consideration of entities when evaluating disclosure requirements. The ASU is effective for all entities for fiscal years beginning after December 15, 2019, including interim periods therein. An entity is permitted to early adopt any eliminated or modified disclosures upon issuance of this ASU and delay adoption of the new disclosures until their effective date. As such, each Series has early adopted the eliminated and modified disclosures, as permitted by this ASU.
Security Transactions, Investment Income and Expenses
Security transactions are accounted for on trade date. Dividend income is recorded on the ex-dividend date, except that if the ex-dividend date has passed, certain dividends from foreign securities are recorded as soon as the Series is informed of the ex-dividend date. Non-cash dividends, if any, are recorded at the fair value of the securities received. Interest income, including amortization of premium and accretion of discounts using the effective interest method, is earned from settlement date and accrued daily.
Expenses are recorded on an accrual basis. Most expenses of the Fund can be attributed to a specific series. Expenses which cannot be directly attributed are apportioned among the series in the Fund in such a manner as deemed equitable by the Fund’s Board, taking into consideration, among other things, the nature and type of expense.
Income, expenses (other than class specific expenses), and realized and unrealized gains and losses are prorated among the classes based on the relative net assets of each class. Class specific expenses are directly charged to that Class.
The Series use the identified cost method for determining realized gain or loss on investments for both financial statement and federal income tax reporting purposes.
Foreign Currency Translation
The books and records of the Series are maintained in U.S. dollars. Foreign currencies, investments and other assets and liabilities are translated into U.S. dollars at the current exchange rates. Purchases and sales of investment securities and income and expenses are translated on the respective dates of such transactions. The Series do not isolate realized and unrealized gains and losses attributable to changes in the exchange rates from gains and losses that arise from changes in the fair value of investments. Such fluctuations are included with net realized and unrealized gain or loss on investments. Net
86
Notes to Financial Statements (continued)
| 2. | Significant Accounting Policies (continued) |
Foreign Currency Translation (continued)
realized foreign currency gains and losses represent foreign currency gains and losses between trade date and settlement date on securities transactions, gains and losses on disposition of foreign currencies and the difference between the amount of income and foreign withholding taxes recorded on the books of the Series and the amounts actually received or paid.
Option Contracts
The Series may write (sell) or buy call or put options on securities and other financial instruments. When a Series writes a call, the Series gives the purchaser the right to buy the underlying security from the Series at the price specified in the option contract (the “exercise price”) at any time during the option period. When a Series writes a put option, the Series gives the purchaser the right to sell to the Series the underlying security at the exercise price at any time during the option period. The Series will only write options on a “covered basis.” This means that the Series will own the underlying security when the Series writes a call or the Series will put aside cash, U.S. Government securities, or other liquid assets in an amount not less than the exercise price at all times the put option is outstanding.
When a Series writes an option, an amount equal to the premium received is reflected as a liability and is subsequently marked-to-market to reflect the current market value of the option. The Series, as a writer of an option, has no control over whether the underlying security or financial instrument may be sold (call) or purchased (put) and, as a result, bears the market risk of an unfavorable change in the price of the security or financial instrument underlying the written option. There is a risk that the Series may not be able to enter into a closing transaction because of an illiquid market.
Each Series may also purchase options in an attempt to hedge against fluctuations in the value of its portfolio and to protect against declines in the value of the securities. The premium paid by a Series for the purchase of an option is reflected as an investment and subsequently marked-to-market to reflect the current market value of the option. The risk associated with purchasing options is limited to the premium paid.
When a security is purchased or sold through an exercise of an option, the related premium paid (or received) is added to (or deducted from) the basis of the security acquired or deducted from (or added to) the proceeds of the security sold. When an option expires (or a Series enters into a closing transaction), the Series realizes a gain or loss on the option to the extent of the premium received or paid (or gain or loss to the extent the cost of the closing transaction exceeds the premium paid or received).
The measurement of the risks associated with option contracts is meaningful only when all related and offsetting transactions are considered. The counterparty for the Series’ written options contracts outstanding during the year ended October 31, 2018 is Pershing LLC, a BNY Mellon Company.
The following table presents the present value of derivatives held at October 31, 2018 as reflected on the Statement of Assets and Liabilities, and the effect of the derivative instruments on the Statement of Operations:
BLENDED ASSET CONSERVATIVE SERIES | ||||||
| STATEMENT OF ASSETS AND LIABILITIES | ||||||
Derivative | Liabilities Location | |||||
Equity contracts | Options written, at value | $ | (29,378 | ) | ||
| STATEMENT OF OPERATIONS | ||||||
Derivative | Location of Gain or (Loss) on Derivatives | | Realized Gain (Loss) on Derivatives | | ||
Equity contracts | Net realized gain (loss) on options written | $ | 84,764 | |||
87
Notes to Financial Statements (continued)
| 2. | Significant Accounting Policies (continued) |
Option Contracts (continued)
| STATEMENT OF OPERATIONS | ||||||
Derivative | Location of Appreciation (Depreciation) on Derivatives | | Unrealized Appreciation (Depreciation) on Derivatives | | ||
Equity contracts | Net change in unrealized appreciation (depreciation) on options written | $ | (9,799) | |||
| BLENDED ASSET MODERATE SERIES | ||||||
| STATEMENT OF ASSETS AND LIABILITIES | ||||||
Derivative | Liabilities Location | |||||
Equity contracts | Options written, at value | $ | (43,858 | ) | ||
| STATEMENT OF OPERATIONS | ||||||
Derivative | Location of Gain or (Loss) on Derivatives | | Realized Gain (Loss) on Derivatives | | ||
Equity contracts | Net realized gain (loss) on options written | $ | 127,967 | |||
Derivative | Location of Appreciation (Depreciation) on Derivatives | | Unrealized Appreciation (Depreciation) on Derivatives | | ||
Equity contracts | Net change in unrealized appreciation (depreciation) on options written | $ | (14,110 | ) | ||
| BLENDED ASSET EXTENDED SERIES | ||||||
| STATEMENT OF ASSETS AND LIABILITIES | ||||||
Derivative | Liabilities Location | |||||
Equity contracts | Options written, at value | $ | (108,563 | ) | ||
| STATEMENT OF OPERATIONS | ||||||
Derivative | Location of Gain or (Loss) on Derivatives | | Realized Gain (Loss) on Derivatives | | ||
Equity contracts | Net realized gain (loss) on options written | $ | 312,756 | |||
Derivative | Location of Appreciation (Depreciation) on Derivatives | | Unrealized Appreciation (Depreciation) on Derivatives | | ||
Equity contracts | Net change in unrealized appreciation (depreciation) on options written | $ | (34,263) | |||
88
Notes to Financial Statements (continued)
| 2. | Significant Accounting Policies (continued) |
Option Contracts (continued)
The average month-end balances for the year ended October 31, 2018, the year in which such derivatives were outstanding, were as follows:
| BLENDED ASSET CONSERVATIVE SERIES | BLENDED ASSET MODERATE SERIES | BLENDED ASSET EXTENDED SERIES | ||||||||||
Options: | ||||||||||||
Average number of option contracts written | 81 | 132 | 312 | |||||||||
Average notional value of option contracts written | $ | 812,308 | $ | 1,307,609 | $ | 3,158,216 | ||||||
Asset-Backed Securities
Each Series may invest in asset-backed securities. Asset-backed securities are generally issued as pass-through certificates or as debt instruments. Asset-backed securities issued as pass-through certificates represent undivided fractional ownership interests in an underlying pool of assets. Asset-backed securities issued as debt instruments, which are also known as collateralized obligations, are typically issued as the debt of a special purpose entity organized solely for the purpose of owning such assets and issuing such debt. Asset-backed securities are often backed by a pool of assets representing the obligations of a number of different parties. The yield characteristics of certain asset-backed securities may differ from traditional debt securities. One such major difference is that all or a principal part of the obligations may be prepaid at any time because the underlying assets (i.e. loans) may be prepaid at any time. As a result, a decrease in interest rates in the market may result in increases in the level of prepayments as borrowers, particularly mortgagors, refinance and repay their loans. An increased prepayment rate with respect to an asset-backed security will have the effect of shortening the maturity of the security. In addition, a Series may subsequently have to reinvest the proceeds at lower interest rates. If a Series has purchased such an asset-backed security at a premium, a faster than anticipated prepayment rate could result in a loss of principal to the extent of the premium paid.
Mortgage-Backed Securities
Each Series may invest in mortgage-backed securities (”MBS“ or pass-through certificates) that represent an interest in a pool of specific underlying mortgage loans and entitle a Series to the periodic payments of principal and interest from those mortgages. MBS may be issued by government agencies or corporations, or private issuers. Most MBS issued by government agencies are guaranteed; however, the degree of protection differs based on the issuer. For MBS there are a number of important differences among the agencies and instrumentalities of the U.S. Government that issue mortgage-related securities and among the securities that they issue. For example, mortgage-related securities guaranteed by Ginnie Mae are guaranteed as to the timely payment of principal and interest by Ginnie Mae and such guarantee is backed by the full faith and credit of the United States. However, mortgage-related securities issued by Freddie Mac and Fannie Mae, including Freddie Mac and Fannie Mae guaranteed mortgage pass-through certificates, which are solely the obligations of Freddie Mac and Fannie Mae, are not backed by or entitled to the full faith and credit of the United States, but are supported by the right of the issuer to borrow from the U.S. Treasury. Non-agency mortgage-backed securities are securities issued by non-governmental issuers and have no direct or indirect government guarantees of payment and are subject to various risks. Non-agency mortgage loans are obligations of the borrowers thereunder only and are not typically insured or guaranteed by any other person or entity. The ability of a borrower to repay a loan is dependent upon the income or assets of the borrower. A number of factors, including a general economic downturn, acts of God, terrorism, social unrest and civil disturbances, may impair a borrower’s ability to repay its loans.
Inflation-Indexed Bonds
Each Series may invest in inflation-indexed bonds. Inflation-indexed bonds are fixed income securities whose principal value is periodically adjusted according to the rate of inflation. If the index measuring inflation rises or falls, the principal value of inflation-indexed bonds will be adjusted upward or downward, and consequently the interest payable on these securities (calculated with respect to a larger or smaller principal amount) will be increased or reduced, respectively. Any upward or downward adjustment in the principal amount of an inflation-indexed bond will be included as interest income in the Statements of Operations, even though investors do not receive their principal until maturity. Repayment of the original bond principal upon
89
Notes to Financial Statements (continued)
| 2. | Significant Accounting Policies (continued) |
Inflation-Indexed Bonds (continued)
maturity (as adjusted for inflation) is guaranteed in the case of U.S. Treasury inflation-indexed bonds. For bonds that do not provide a similar guarantee, the adjusted principal value of the bond repaid at maturity may be less than the original principal.
Securities Purchased on a When-Issued Basis or Forward Commitment
Each Series may purchase securities on a when-issued basis or forward commitment. These transactions involve a commitment by the Series to purchase securities for a predetermined price with payment and delivery taking place beyond the customary settlement period. When such purchases are outstanding, the Series will designate liquid assets in an amount sufficient to meet the purchase price. When purchasing a security on a delayed delivery basis, the Fund assumes the rights and risks of ownership of the security, including the risk of price and yield fluctuations, and takes such fluctuations into account when determining their net asset value. The Series may sell the when-issued securities before they are delivered, which may result in a capital gain or loss. No such investments were held by the Series on October 31, 2018.
In connection with their ability to purchase or sell securities on a forward commitment basis, the Series may enter into forward roll transactions principally using To Be Announced (TBA) securities. Forward roll transactions require the sale of securities for delivery in the current month, and a simultaneous agreement to repurchase substantially similar (same type, coupon and maturity) securities on a specified future date. Risks of entering into forward roll transactions include the potential inability of the counterparty to meet the terms of the agreement; the potential of the Series to receive inferior securities at redelivery as compared to the securities sold to the counterparty; counterparty credit risk; and the potential pay down speed variance between the mortgage-backed pools. During the roll period, the Series forgoes principal and interest paid on the securities. The Series accounts for such dollar rolls as purchases and sales. No such investments were held by the Series on October 31, 2018.
Interest Only Securities
The Series may invest in stripped mortgage-backed securities issued by the U.S. government, its agencies and instrumentalities. Stripped mortgage-backed securities are usually structured with two classes that receive different proportions of the interest and principal distributions on a pool of mortgage assets. In certain cases, one class will receive all of the interest (the interest-only or “IO” class), while the other class will receive all of the principal (the principal-only or “PO” class). The yield to maturity on IOs is sensitive to the rate of principal repayments (including prepayments) on the related underlying mortgage assets, and principal payments may have a material effect on yield to maturity. If the underlying mortgage assets experience greater than anticipated prepayments of principal, a Series may not fully recoup its initial investment in IOs.
Restricted Securities
Restricted securities are purchased in private placement transactions, are not registered under the Securities Act of 1933, as amended, and may have contractual restrictions on resale. Information regarding restricted securities is included at the end of each applicable Series’ Investment Portfolio.
Illiquid Securities
A security may be considered illiquid if so deemed in good faith by the Advisor under procedures approved by and under the general supervision and responsibility of the Fund’s Board. Securities that are illiquid are marked with the applicable footnote at the end of each applicable Series’ Investment Portfolio.
Federal Taxes
Each Series’ policy is to comply with the provisions of the Internal Revenue Code applicable to regulated investment companies. The Series are not subject to federal income tax or excise tax to the extent that each Series distributes to shareholders each year its taxable income, including any net realized gains on investments, in accordance with requirements of the Internal Revenue Code. Accordingly, no provision for federal income tax or excise tax has been made in the financial statements.
Management evaluates its tax positions to determine if the tax positions taken meet the minimum recognition threshold in connection with accounting for uncertainties in income tax positions taken or expected to be taken for the purposes of measuring and recognizing tax liabilities in the financial statements. Recognition of tax benefits of an uncertain tax position is required only when the position is “more likely than not” to be sustained assuming examination by taxing authorities. At October
90
Notes to Financial Statements (continued)
| 2. | Significant Accounting Policies (continued) |
Federal Taxes (continued)
31, 2018, the Series have recorded no liability for net unrecognized tax benefits relating to uncertain income tax positions taken or expected to be taken in future tax returns.
The Series file income tax returns in the U.S. federal jurisdiction, various states and foreign jurisdictions, as required. No income tax returns are currently under investigation. The statute of limitations on the Series’ tax returns remains open for the period ended October 31, 2017 and the year ended October 31, 2018. The Fund is not aware of any tax positions for which it is reasonably possible that the total amounts of unrecognized tax benefits will significantly change in the next twelve months.
Foreign Taxes
Based on the Series’ understanding of the tax rules and rates related to income, gains and currency purchase/repatriation transactions for foreign jurisdictions in which they invest, the Series will provide for foreign taxes, and where appropriate, deferred foreign tax.
Distributions of Income and Gains
Distributions to shareholders of net investment income are made semi-annually. Distributions of net realized gains are made annually. An additional distribution may be necessary to avoid taxation of a Series. Distributions are recorded on the ex-dividend date.
Indemnifications
The Fund’s organizational documents provide former and current directors and officers with a limited indemnification against liabilities arising in connection with the performance of their duties to the Fund. In the normal course of business, the Fund may also enter into contracts that provide general indemnifications. The Fund’s maximum exposure under these arrangements is unknown as this would be dependent on future claims that may be made against the Fund. The risk of material loss from such claims is considered remote.
Other
The preparation of financial statements in conformity with GAAP requires management to make estimates and assumptions that affect the reported amounts of assets and liabilities and the disclosure of contingent assets and liabilities at the date of the financial statements and the reported amounts of income and expenses during the reporting period. Actual results could differ from those estimates.
| 3. | Transactions with Affiliates |
The Fund has an Investment Advisory Agreement (the “Agreement”) with the Advisor, for which each Series pays a fee, computed daily and payable monthly, at an annual rate of 0.40% for Blended Asset Conservative Term Series, 0.45% for Blended Asset Moderate Series, and 0.50% for Blended Asset Extended Series and Blended Asset Maximum Series, of the Series’ average daily net assets.
Under the Agreement, personnel of the Advisor provide the Series with advice and assistance in the choice of investments and the execution of securities transactions, and otherwise maintain the Series’ organization. The Advisor also provides the Fund with necessary office space and fund administration and support services. The salaries of all officers of the Fund (except a percentage of the Fund’s Chief Compliance Officer’s salary, which is paid by the Fund), and of all Directors who are “affiliated persons” of the Fund, or of the Advisor, and all personnel of the Fund, or of the Advisor, performing services relating to research, statistical and investment activities, are paid by the Advisor. Each ”non-affiliated“ Director receives an annual stipend, which is allocated among all the active series of the Fund. In addition, these Directors also receive a fee per Board meeting attended plus a fee for each committee meeting attended and are reimbursed for travel and other out-of-pocket expenses incurred by them in connection with attending such meetings. The Fund also has an Audit Committee Chair, Governance & Nominating Committee Chair and Lead Independent Director who each receive an additional annual stipend for these roles.
91
Notes to Financial Statements (continued)
| 3. | Transactions with Affiliates (continued) |
The Advisor has contractually agreed, until at least February 29, 2028, to waive its management fee and, if necessary, pay other operating expenses of the Series in order to maintain total direct annual fund operating expenses for the Series, at no more than the amounts presented in the following table, of average daily net assets each year.
| SERIES/CLASS | EXPENSE LIMIT | |||
Blended Asset Conservative Series | 0.45 | % | ||
Blended Asset Moderate Series | 0.50 | % | ||
Blended Asset Extended Series | 0.55 | % | ||
Blended Asset Maximum Series | 0.55 | % | ||
For the year ended October 31, 2018, the Advisor waived the following amounts which are included as a reduction of expenses on the Statements of Operations:
| SERIES/CLASS | WAIVER AMOUNT | |||
Blended Asset Conservative Series Class R6 | $ | 130,360 | ||
Blended Asset Moderate Series Class R6 | 136,567 | |||
Blended Asset Extended Series Class R6 | 137,179 | |||
Blended Asset Maximum Series Class R6 | 145,632 | |||
The Advisor is not eligible to recoup any expenses that have been waived or reimbursed.
Manning & Napier Investor Services, Inc., a registered broker-dealer affiliate of the Advisor, acts as distributor for the Fund’s shares. The services of Manning & Napier Investor Services, Inc. are provided at no additional cost to the Series.
Pursuant to a master services agreement dated March 1, 2017, the Fund pays the Advisor an annual fee related to fund accounting and administration of 0.0085% on the first $25 billion of average daily net assets (excluding Target Series and Income Series); 0.0075% on the next $15 billion of average daily net assets (excluding Target Series and Income Series); and 0.0065% of average daily net assets in excess of $40 billion (excluding Target Series and Income Series); plus a base fee of $30,400 per series. Additionally, certain transaction and out-of-pocket expenses, including charges for reporting relating to the Fund’s compliance program, are charged. The Advisor has agreements with BNY Mellon Investment Servicing (U.S.) Inc. (”BNY“) under which BNY serves as sub-accountant services agent.
| 4. | Purchases and Sales of Securities |
For the year ended October 31, 2018, purchases and sales of securities, including paydowns and other than short-term securities, were as follows:
| PURCHASES | SALES | |||||||||||||||
| SERIES | OTHER ISSUERS | GOVERNMENT | OTHER ISSUERS | GOVERNMENT | ||||||||||||
Blended Asset Conservative Series | $ | 61,305,228 | $ | 50,389,557 | $ | 46,369,948 | $ | 33,180,590 | ||||||||
Blended Asset Moderate Series | 62,258,749 | 45,168,385 | 59,446,322 | 41,827,379 | ||||||||||||
Blended Asset Extended Series | 115,882,540 | 78,800,981 | 116,580,954 | 76,552,311 | ||||||||||||
Blended Asset Maximum Series | 90,474,696 | 25,367,834 | 107,346,667 | 20,220,138 | ||||||||||||
92
Notes to Financial Statements (continued)
| 5. | Capital Stock Transactions |
Transactions in Class R6 shares of each Series were:
| BLENDED CONSERVATIVE | FOR THE YEAR ENDED 10/31/18 | FOR THE PERIOD 10/13/171 TO 10/31/17 | ||||||||||||||
| SERIES CLASS R6: | SHARES | AMOUNT | SHARES | AMOUNT | ||||||||||||
Sold | 3,757,705 | $ | 40,809,799 | 9,394,967 | $ | 102,115,609 | ||||||||||
Repurchased | (1,142,825 | ) | (12,463,628 | ) | (108,692 | ) | (1,179,696 | ) | ||||||||
|
|
|
|
|
|
|
| |||||||||
Total | 2,614,880 | $ | 28,346,171 | 9,286,275 | $ | 100,935,913 | ||||||||||
|
|
|
|
|
|
|
| |||||||||
| BLENDED ASSET MODERATE | FOR THE YEAR ENDED 10/31/18 | FOR THE PERIOD 10/13/171 TO 10/31/17 | ||||||||||||||
| SERIES CLASS R6: | SHARES | AMOUNT | SHARES | AMOUNT | ||||||||||||
Sold | 4,058,746 | $ | 43,857,457 | 10,782,412 | $ | 115,906,022 | ||||||||||
Repurchased | (3,865,514 | ) | (42,051,831 | ) | (26,599 | ) | (285,356 | ) | ||||||||
|
|
|
|
|
|
|
| |||||||||
Total | 193,232 | $ | 1,805,626 | 10,755,813 | $ | 115,620,666 | ||||||||||
|
|
|
|
|
|
|
| |||||||||
| BLENDED ASSET EXTENDED | FOR THE YEAR ENDED 10/31/18 | FOR THE PERIOD 10/13/171 TO 10/31/17 | ||||||||||||||
| SERIES CLASS R6: | SHARES | AMOUNT | SHARES | AMOUNT | ||||||||||||
Sold | 8,029,832 | $ | 83,952,516 | 20,139,692 | $ | 208,028,941 | ||||||||||
Repurchased | (7,806,382 | ) | (82,399,822 | ) | (133,620 | ) | (1,377,323 | ) | ||||||||
|
|
|
|
|
|
|
| |||||||||
Total | 223,450 | $ | 1,552,694 | 20,006,072 | $ | 206,651,618 | ||||||||||
|
|
|
|
|
|
|
| |||||||||
| BLENDED ASSET MAXIMUM | FOR THE YEAR ENDED 10/31/18 | FOR THE PERIOD 10/13/171 TO 10/31/17 | ||||||||||||||
| SERIES CLASS R6: | SHARES | AMOUNT | SHARES | AMOUNT | ||||||||||||
Sold | 4,814,424 | $ | 58,687,962 | 13,013,587 | $ | 150,821,798 | ||||||||||
Repurchased | (5,871,326 | ) | (72,807,968 | ) | (30,606 | ) | (354,707 | ) | ||||||||
|
|
|
|
|
|
|
| |||||||||
Total | (1,056,902 | ) | $ | (14,120,006 | ) | 12,982,981 | $ | 150,467,091 | ||||||||
|
|
|
|
|
|
|
| |||||||||
1 Commencement of operations.
At October 31, 2018, the Target Income Series, another series of the Fund, owned 99.0% of Blended Asset Conservative Series. The Target 2020 Series and Target 2025 Series, other series of the Fund, owned 73.4% and 25.9%, respectively, of Blended Asset Moderate Series. The Target 2025 Series, Target 2030 Series, Target 2035 Series, and Target 2040 Series, other series of the Fund, owned 14.5%, 53.4%, 11.9% and 14.2%, respectively, of Blended Asset Extended Series. The Target 2040 Series, Target 2045 Series, and Target 2050 Series, other series of the Fund, owned 31.1%, 12.3%, and 23.4%, respectively, of Blended Asset Maximum Series. Investment activities of these shareholders may have a material effect on the respective Series.
| 6. | Line of Credit |
The Fund has entered into a 364-day, $25 million credit agreement (the “line of credit”) with Bank of New York Mellon. Each series of the Fund may borrow under the line of credit for temporary or emergency purposes, including funding shareholder redemptions and other short-term liquidity purposes. The Fund pays an annual fee on the unused commitment amount, payable quarterly, and is allocated among all the series of the Fund and included in miscellaneous expenses in the Statement of Operations for each series. The line of credit expires in August 2019 unless extended or renewed. During the year ended October 31, 2018, none of the Series borrowed under the line of credit.
93
Notes to Financial Statements (continued)
| 7. | Financial Instruments and Loan Assignments |
The Series may trade in instruments including written and purchased options, forward foreign currency exchange contracts and futures contracts and other derivatives in the normal course of investing activities to assist in managing exposure to various market risks. The Series may be subject to various elements of risk which may involve, to a varying degree, elements of risk in excess of the amounts recognized for financial statement purposes. These risks include: the risk that changes in the value of a derivative may not correlate perfectly with the underlying asset, rate or index; counterparty credit risk related to over the counter derivative counterparties’ failure to perform under contract terms; liquidity risk related to the lack of a liquid market for these contracts allowing the fund to close out its position(s); and documentation risk relating to disagreement over contract terms. At October 31, 2018, Blended Asset Conservative Series, Blended Asset Moderate Series and Blended Asset Extended Series invested in options contracts (equity risk).
The Series may invest in a loan assignment of all or a portion of the loans. A Series has direct rights against the borrower on a loan when it purchases an assignment; however, the Series’ rights may be more limited than the lender from which it acquired the assignment and the Series may be able to enforce its rights only through an administrative agent. Loan assignments are vulnerable to market conditions and may become illiquid due to economic conditions or other events may reduce the demand for loan assignments and certain loan assignments which were liquid when purchased may become illiquid. At October 31, 2018, none of the Series held any loan assignments.
| 8. | Foreign Securities |
Investing in securities of foreign companies and foreign governments involves special risks and considerations not typically associated with investing in securities of domestic companies and the U.S. Government. These risks include revaluation of currencies and future adverse political and economic developments. Moreover, securities of foreign companies and foreign governments and their markets may be less liquid and their prices more volatile than those of comparable domestic companies and the U.S. Government.
| 9. | Federal Income Tax Information |
The amount and characterization of certain income and capital gains to be distributed are determined in accordance with federal income tax regulations, which may differ from GAAP. These differences are primarily due to differing book and tax treatments in the timing of the recognition on net investment income or gains and losses, including foreign currency gains and losses, losses deferred due to wash sales, investments in passive foreign investment companies (PFICs) and real estate investment trusts. Each Series may periodically make reclassifications among its capital accounts to reflect income and gains available for distribution (or available capital loss carryovers) under income tax regulations, without impacting the Series’ net asset value. For the period ended October 31, 2018, $252 was reclassified within the capital accounts from Paid in Capital to Total Distributable Earnings for Blended Asset Maximum Series. Any such reclassifications are not reflected in the financial highlights
The tax character of distributions paid were as follows:
| BLENDED ASSET CONSERVATIVE SERIES | BLENDED ASSET MODERATE SERIES | BLENDED ASSET EXTENDED SERIES | BLENDED ASSET MAXIMUM SERIES | |||||||||||||
Ordinary income | $ | 1,240,645 | $ | 1,043,313 | $ | 1,607,139 | $ | 854,993 | ||||||||
Long-term capital gains | — | — | — | 81 | ||||||||||||
94
Notes to Financial Statements (continued)
| 9. | Federal Income Tax Information (continued) |
At October 31, 2018, the tax basis of components of distributable earnings and the net unrealized depreciation based on the identified cost of investments for federal income tax purposes were as follows:
| BLENDED ASSET CONSERVATIVE SERIES | BLENDED ASSET MODERATE SERIES | BLENDED ASSET EXTENDED SERIES | BLENDED ASSET MAXIMUM SERIES | |||||||||||||
Cost for federal income tax purposes | $ | 129,267,864 | $ | 118,306,095 | $ | 206,412,341 | $ | 143,769,895 | ||||||||
Unrealized appreciation | 1,949,896 | 2,511,837 | 5,199,055 | 7,365,453 | ||||||||||||
Unrealized depreciation | (4,383,558 | ) | (5,287,677 | ) | (10,812,474 | ) | (10,072,049 | ) | ||||||||
|
|
|
|
|
|
|
| |||||||||
Net unrealized depreciation | $ | (2,433,662 | ) | $ | (2,775,840 | ) | $ | (5,613,419 | ) | $ | (2,706,596 | ) | ||||
|
|
|
|
|
|
|
| |||||||||
Undistributed ordinary income | $ | 1,324,644 | $ | 1,038,470 | $ | 2,214,904 | $ | 7,582,331 | ||||||||
Undistributed long-term gains | $ | — | $ | — | $ | — | $ | 74,057 | ||||||||
Capital loss carryforwards | $ | (1,126,592 | ) | $ | (717,015 | ) | $ | — | $ | — | ||||||
At October 31, 2018, Blended Asset Conservative Series and Blended Asset Moderate Series had net short-term capital loss carryforwards of $930,649 and $290,393 and long-term capital loss carryforwards of $195,943 and $426,622, respectively, which may be carried forward indefinitely.
At October 31, 2018, capital loss carryover utilized in the current year for Blended Asset Extended Series was $8,758.
95
Report of Independent Registered Public Accounting Firm
To the Board of Directors of Manning & Napier Fund, Inc. and Shareholders of Blended Asset Conservative Series, Blended Asset Moderate Series, Blended Asset Extended Series and Blended Asset Maximum Series
Opinions on the Financial Statements
We have audited the accompanying statements of assets and liabilities, including the investment portfolios, of Blended Asset Conservative Series, Blended Asset Moderate Series, Blended Asset Extended Series and Blended Asset Maximum Series (four of the series constituting Manning & Napier Fund, Inc., hereafter collectively referred to as the “Funds”) as of October 31, 2018, the related statements of operations for the year ended October 31, 2018 and the statements of changes in net assets and the financial highlights for the year ended October 31, 2018 and for the period October 13, 2017 (commencement of operations) through October 31, 2017, including the related notes (collectively referred to as the “financial statements”). In our opinion, the financial statements present fairly, in all material respects, the financial position of each of the Funds as of October 31, 2018, the results of each of their operations for the year ended October 31, 2018, and the changes in their net assets and each of the financial highlights for the year ended October 31, 2018 and for the period October 13, 2017 (commencement of operations) through October 31, 2017 in conformity with accounting principles generally accepted in the United States of America.
Basis for Opinions
These financial statements are the responsibility of the Funds’ management. Our responsibility is to express an opinion on the Funds’ financial statements based on our audits. We are a public accounting firm registered with the Public Company Accounting Oversight Board (United States) (“PCAOB”) and are required to be independent with respect to the Funds in accordance with the U.S. federal securities laws and the applicable rules and regulations of the Securities and Exchange Commission and the PCAOB.
We conducted our audits of these financial statements in accordance with the standards of the PCAOB. Those standards require that we plan and perform the audit to obtain reasonable assurance about whether the financial statements are free of material misstatement, whether due to error or fraud.
Our audits included performing procedures to assess the risks of material misstatement of the financial statements, whether due to error or fraud, and performing procedures that respond to those risks. Such procedures included examining, on a test basis, evidence regarding the amounts and disclosures in the financial statements. Our audits also included evaluating the accounting principles used and significant estimates made by management, as well as evaluating the overall presentation of the financial statements. Our procedures included confirmation of securities owned as of October 31, 2018 by correspondence with the custodian and brokers; when replies were not received from brokers, we performed other auditing procedures. We believe that our audits provide a reasonable basis for our opinions.

New York, New York
December 14, 2018
We have served as the auditor of one or more investment companies in Manning & Napier Mutual Funds since 1992.
96
Supplemental Tax Information
(unaudited)
All reportings are based on financial information available as of the date of this annual report and, accordingly, are subject to change.
For federal income tax purposes, each of the Series reports for the current fiscal year the amount disclosed below or, if different, the maximum amount allowable under the tax law as qualified dividend income (“QDI”).
| Series | QDI | |||
Blended Asset Conservative Series | $265,025 | |||
Blended Asset Moderate Series | 245,343 | |||
Blended Asset Extended Series | 476,688 | |||
Blended Asset Maximum Series | 172,339 | |||
For corporate shareholders, the percentage of investment income (dividend income plus short-term gain, if any) that qualifies for the dividends received deduction (DRD) for the current fiscal year is as follows:
| Series | DRD% | |||
Blended Asset Conservative Series | 13.91 | % | ||
Blended Asset Moderate Series | 8.76 | % | ||
Blended Asset Extended Series | 10.84 | % | ||
Blended Asset Maximum Series | 6.72 | % | ||
The Series designate Long-Term Capital Gain dividends pursuant to Section 852(b)(3) of the Code for the fiscal year ended October 31, 2018 as follows:
| Series | ||||
Blended Asset Maximum Series | $77,760 | |||
97
Directors’ and Officers’ Information
(unaudited)
The Statement of Additional Information provides additional information about the Fund’s directors and officers and can be obtained without charge by calling 1-800-466-3863, at www.manning-napier.com, or on the EDGAR Database on the SEC Internet web site (http://www.sec.gov). The following chart shows certain information about the Fund’s directors and officers, including their principal occupations during the last five years. Unless specific dates are provided, the individuals have held the listed positions for longer than five years.
| Interested Director and Officer | ||
Name: | Paul Battaglia* | |
| Address: | 290 Woodcliff Drive | |
| Fairport, NY 14450 | ||
| Age: | 40 | |
| Current Position(s) Held with Fund: | Principal Executive Officer, President, Chairman & Director | |
| Term of Office & Length of Time Served: | Indefinite - Chairman and Director since November 20181 | |
| Principal Occupation(s) During Past 5 Years: | Chief Financial Officer (2018-Present); Vice President of Finance (2016-2018); Director of Finance (2011-2016); Financial Analyst/Internal Auditor (2004-2006) - Manning & Napier Advisors, LLC and affiliates Holds one or more of the following titles for various affiliates: Chief Financial Officer | |
| Number of Portfolios Overseen within Fund Complex: | 36 | |
| Other Directorships Held Outside Fund Complex During Past 5 Years: | N/A | |
| Independent Directors | ||
| Name: | Stephen B. Ashley | |
| Address: | 290 Woodcliff Drive | |
| Fairport, NY 14450 | ||
| Age: | 78 | |
| Current Position(s) Held with Fund: | Director, Audit Committee Member, Governance & Nominating Committee | |
| Member | ||
| Term of Office & Length of Time Served: | Indefinite-Since 1996 | |
| Principal Occupation(s) During Past 5 Years: | Chairman, Director & Chief Executive Officer (1997 to present) - The Ashley Group (property management and investment). Director (1995-2008) and Chairman (non-executive) (2004-2008) - Fannie Mae (mortgage) | |
| Number of Portfolios Overseen within Fund Complex: | 36 | |
| Other Directorships Held Outside Fund Complex During Past 5 Years: | Fannie Mae (1995-2008) The Ashley Group (1995-2008) Genesee Corporation (1987-2007) | |
| Name: | Paul A. Brooke | |
| Address: | 290 Woodcliff Drive | |
| Fairport, NY 14450 | ||
| Age: | 72 | |
| Current Position(s) Held with Fund: | Lead Independent Director, Audit Committee Member, Governance & Nominating Committee Chairman | |
| Term of Office & Length of Time Served: | Indefinite - Director, Audit Committee Member, Governance & Nominating Committee Member since 2007; Governance & Nominating Committee Chairman since 2016; Lead Independent Director since 2017 | |
| Principal Occupation(s) During Past 5 Years: | Chairman & CEO (2005-2009) - Ithaka Acquisition Corporation (investments); Chairman (2007-2009) - Alsius Corporation (investments); Managing Member (1991-present) - PMSV Holdings LLC (investments); Managing Member (2010-2016) - Venbio (investments). | |
| Number of Portfolios Overseen within Fund Complex: | 36 | |
| Other Directorships Held Outside Fund Complex During Past 5 Years: | Incyte Corp. (biotech)(2000-present); ViroPharma, Inc. (speciality pharmaceuticals)(2000-2014); HLTH (WebMD)(information)(2000-2010); Cheyne Capital International (investment)(2000-2017); GMP Companies (investment)(2000-2011); Cytos Biotechnology Ltd (biotechnology)(2012-2014); Cerus (biomedical)(2016-present); PureEarth(non-profit)(2012-present) | |
98
Notes to Financial Statements (continued)
(unaudited)
| Independent Directors (continued) | ||
| Name: | Peter L. Faber | |
| Address: | 290 Woodcliff Drive | |
| Fairport, NY 14450 | ||
| Age: | 80 | |
| Current Position(s) Held with Fund: | Director, Governance & Nominating Committee Member | |
| Term of Office & Length of Time Served: | Indefinite - Since 1987 | |
| Principal Occupation(s) During Past 5 Years: | Senior Counsel (2006-2012), Partner (1995-2006 & 2013 - present) - McDermott, Will & Emery LLP (law firm) | |
| Number of Portfolios Overseen within Fund Complex: | 36 | |
| Other Directorships Held Outside Fund Complex During Past 5 Years: | Boston Early Music Festival (non-profit)(2007-present); Amherst Early Music, Inc. (non-profit)(2009-present); Gotham Early Music Scene, Inc. (non-profit)(2009-present); Partnership for New York City, Inc. (non-profit)(1989-2010); New York Collegium (non-profit)(2004-2011) | |
| Name: | Harris H. Rusitzky | |
| Address: | 290 Woodcliff Drive | |
| Fairport, NY 14450 | ||
| Age: | 83 | |
| Current Position(s) Held with Fund: | Director, Audit Committee Member, Governance & Nominating Committee | |
| Member | ||
| Term of Office & Length of Time Served: | Indefinite - Since 1985 | |
| Principal Occupation(s) During Past 5 Years: | President (1994-present) - The Greening Group (business consultants); | |
| Partner (2006-present) - The Restaurant Group (restaurants) | ||
| Number of Portfolios Overseen within Fund Complex: | 36 | |
| Other Directorships Held Outside Fund Complex During Past 5 Years: | Rochester Institute of Technology (university)(1972-present); Culinary Institute of America (non-profit college)(1985-present); George Eastman House (museum)(1988-present); National Restaurant Association (restaurant trade organization)(1978-present) | |
| Name: | Chester N. Watson | |
| Address: | 290 Woodcliff Drive | |
| Fairport, NY 14450 | ||
| Age: | 68 | |
| Current Position(s) Held with Fund: | Director, Audit Committee Chairman, Governance & Nominating | |
| Committee Member | ||
| Term of Office & Length of Time Served: | Indefinite - Director, Audit Committee Member, Governance & Nominating | |
| Committee Member Since 2012; Audit Committee Chairman since 2013 | ||
| Principal Occupation(s) During Past 5 Years: | General Auditor (2003-2011) - General Motors Company (auto manufacturer) | |
| Number of Portfolios Overseen within Fund Complex: | 36 | |
| Other Directorships Held Outside Fund Complex During Past 5 Years: | Rochester Institute of Technology (university)(2005-present); Town of Greenburgh, NY Planning Board (municipal government) (2015-present) | |
| Officers: | ||
| Name: | Jeffrey S. Coons, Ph.D., CFA® | |
| Address: | 290 Woodcliff Drive | |
| Fairport, NY 14450 | ||
| Age: | 55 | |
| Current Position(s) Held with Fund: | Vice President | |
| Term of Office1 & Length of Time Served: | Since 2004 | |
| Principal Occupation(s) During Past 5 Years: | President since 2010, Co-CEO since 2018, Co-Director of Research (2002-2015) - Manning & Napier Advisors, LLC Holds one or more of the following titles for various subsidiaries and affiliates: President, Director, Treasurer, or Senior Trust Officer | |
| Name: | Elizabeth Craig | |
| Address: | 290 Woodcliff Drive | |
| Fairport, NY 14450 | ||
| Age: | 31 | |
| Current Position(s) Held with Fund: | Corporate Secretary | |
| Term of Office1 & Length of Time Served: | Since 2016 | |
| Principal Occupation(s) During Past 5 Years: | Fund Administration Manager since 2015; Mutual Fund Compliance Specialist (2009-2015) - Manning & Napier Advisors, LLC; Assistant Corporate Secretary (2011-2016) - Manning & Napier Fund, Inc. | |
99
Directors’ and Officers’ Information
(unaudited)
Officers: (continued)
| Name: | Christine Glavin | |
| Address: | 290 Woodcliff Drive Fairport, NY 14450 | |
| Age: | 52 | |
| Current Position(s) Held with Fund: | Principal Financial Officer, Chief Financial Officer | |
| Term of Office1 & Length of Time Served: | Principal Financial Officer since 2002; Chief Financial Officer since 2001 | |
| Principal Occupation(s) During Past 5 Years: | Director of Fund Reporting since 2011; Fund Reporting Manager (1997-2011) - Manning & Napier Advisors, LLC; Assistant Treasurer since 2008-Exeter Trust Company; Chief Financial Officer (2017-2018) - Rainier Investment Management Mutual Funds, Inc. | |
| Name: | Jodi L. Hedberg | |
| Address: | 290 Woodcliff Drive Fairport, NY 14450 | |
| Age: | 50 | |
| Current Position(s) Held with Fund: | Chief Compliance Officer, Anti-Money Laundering Compliance Officer | |
| Term of Office1 & Length of Time Served: | Chief Compliance Officer since 2004; Anti-Money Laundering Officer since 2002; Corporate Secretary (1997-2016)-Manning & Napier Fund, Inc.; Chief Compliance Officer and Anti-Money Laundering Officer (2017-2018) - Rainier Investment Management Mutual Funds, Inc. | |
| Principal Occupation(s) During Past 5 Years: | Managing Director, Compliance & Regulatory Affairs since 2018; Director of Compliance (2005-2018); Compliance Manager (1995-2005) - Manning & Napier Advisors, LLC and affiliates; Corporate Secretary - Manning & Napier Investor Services, Inc. since 2006 | |
| Name: | Scott Morabito | |
| Address: | 290 Woodcliff Drive Fairport, NY 14450 | |
| Age: | 30 | |
| Current Position(s) Held with Fund: | Assistant Vice President | |
| Term of Office1 & Length of Time Served: | Since 2017 | |
| Principal Occupation(s) During Past 5 Years: | Director of Funds Group since 2017; Fund Product and Strategy Manager (2014-2017); Senior Product and Strategy Analyst (2013-2014); Product and Strategy Analyst (2011-2013) - Manning & Napier Advisors, LLC. | |
| Name: | Sarah Turner | |
| Address: | 290 Woodcliff Drive Fairport, NY 14450 | |
| Age: | 36 | |
| Current Position(s) Held with Fund: | Chief Legal Officer; Assistant Corporate Secretary | |
| Term of Office1 & Length of Time Served: | Since 2018 | |
| Principal Occupation(s) During Past 5 Years: | General Counsel since 2018 - Manning & Napier Advisors, LLC and affiliates; Counsel (2017-2018) - Harter Secrest and Emery LLP; Legal Counsel (2010-2017) - Manning & Napier Advisors, LLC and affiliates Holds one or more of the following titles for various affiliates: Corporate Secretary, General Counsel | |
| Name: | Amy Williams | |
| Address: | 290 Woodcliff Drive Fairport, NY 14450 | |
| Age: | 56 | |
| Current Position(s) Held with Fund: | Assistant Corporate Secretary | |
| Term of Office1 & Length of Time Served: | Since 2016 | |
| Principal Occupation(s) During Past 5 Years: | Director of Fund Documentation - Manning & Napier Advisors, LLC since 2009 Holds one or more of the following titles for various affiliates: Director |
*At a meeting of the Board of Directors held on November 15, 2018, the Board accepted the resignation of Michele T. Mosca from her positions as Principal Executive Officer, President, Chair and Interested Director of the Fund and appointed Paul J. Battaglia to each of the resigned positions effective immediately. Interested Director, within the meaning of the 1940 Act by reason of his positions with the Fund’s investment advisor, Manning & Napier Advisors, LLC.
1The term of office of all officers shall be one year and until their respective successors are chosen and qualified, or his or her earlier resignation or removal as provided in the Fund’s By-Laws.
100
{This page intentionally left blank}
101
Literature Requests
(unaudited)
Proxy Voting Policies and Procedures
A description of the policies and procedures that the Fund uses to determine how to vote proxies relating to portfolio securities is available, without charge, upon request:
| By phone | 1-800-466-3863 | |||
| On the Securities and Exchange | ||||
| Commission’s (SEC) web site | http://www.sec.gov |
Proxy Voting Record
Information regarding how the Fund voted proxies relating to portfolio securities during the most recent 12-month period ended June 30th is available, without charge, upon request:
| By phone | 1-800-466-3863 | |||
| On the SEC’s web site | http://www.sec.gov |
Quarterly Portfolio Holdings
The Series’ complete schedule of portfolio holdings for the 1st and 3rd quarters of each fiscal year are provided on Form N-Q, and are available, without charge, upon request:
| By phone | 1-800-466-3863 | |||
| On the SEC’s web site | http://www.sec.gov |
The Series’ Form N-Q may be reviewed and copied at the SEC’s Public Reference Room in Washington, D.C. Information on the operation of the Public Reference Room may be obtained by calling 1-800-SEC-0330.
Prospectus and Statement of Additional Information (SAI)
For more information about any of the Manning & Napier Fund, Inc. Series, you may obtain a prospectus and SAI at www.manning-napier.com or by calling (800) 466-3863. Before investing, carefully consider the objectives, risks, charges and expenses of the investment and read the prospectus carefully as it contains this and other information about the investment company. In addition, this information can be found on the SEC’s web site, http://www.sec.gov.
Additional information available at www.manning-napier.com
1. Fund Holdings - Month-End
2. Fund Holdings - Quarter-End
3. Shareholder Report - Annual
4. Shareholder Report - Semi-Annual
The Fund also offers electronic notification or “e-delivery” when certain documents are available on-line to be downloaded or reviewed. Direct shareholders can elect to receive electronic notification when shareholder reports, prospectus updates, and/or quarterly statements are available. If you do not currently have on-line access to your account, you can establish access by going to www.manning-napier.com, click on “Login” in the top corner of the page, and follow the prompts to self-enroll. Once enrolled, you can set your electronic notification preferences by clicking on the Account Options tab located within the green toolbar and then select E-Delivery Option. Should you have any questions on either how to establish on-line access or how to update your account settings, please contact Investor Services at 1-800-466-3863.
The Manning & Napier Fund, Inc. is managed by Manning & Napier Advisors, LLC. Manning & Napier Investor Services, Inc., an affiliate of Manning & Napier Advisors, LLC, is the distributor of the Fund shares.
MNBLA-10/18-AR
Management Discussion and Analysis
(unaudited)
Dear Shareholders:
The investment environment witnessed over the past twelve months was more volatile and bifurcated than what was experienced in prior years across both equities and fixed income, as well as between domestic and international investing.
For the fiscal year ending on October 31, 2018, US equities posted strong gains, with the S&P 500 Total Return Index up 7.35%. On the other hand, international equity performance was decidedly poor as the MSCI ACWI ex USA Index fell 8.24%. Regarding fixed income, domestic investment-grade bonds, as measured by the Bloomberg Barclays U.S. Aggregate Bond Index, fell 2.05% as rising interest rates weighed on returns.
Going forward, we believe the volatility experienced in October, as well as during the first few months of 2018, is likely to be reflective of what investors should come to expect going forward. While we do not anticipate an imminent recession, we see recent developments within the US and abroad as an indication that we are entering a higher risk regime for risk assets over the next twelve months.
The US is likely approaching a period of peak growth and continues to show signs of progressing further into late cycle territory. At the same time, key global risks are rising, including trade tensions, global growth concerns, and geopolitical uncertainty, all of which have continued escalating throughout 2018.
We are approaching the ten-year anniversary of the bull market, and while bull markets do not necessarily die of old age, they cannot extend indefinitely either. As the economy continues to move into later cycle territory, we believe investors should temper their expectations as the strong returns experienced over the past several years are unlikely to persist.
Given our updated outlook, we are reviewing late cycle risks in current and prospective investments and have adjusted our positioning across many of our portfolios. Going forward, we will continue to follow our disciplines, choosing to be selective in our investment decisions and seeking to avoid overvalued areas of the market.
With this in mind, we discuss recent fund performance in the enclosed, highlight how we are positioned amid the current economic environment, and provide our outlook of what to expect in financial markets.
We hope that you find this information helpful, and look forward to working with you in the years ahead to help you meet your investment goals.
Sincerely,
Manning & Napier Advisors, LLC
The S&P 500 Total Return Index is an unmanaged, capitalization-weighted measure comprised of 500 leading U.S. companies to gauge U.S. large cap equities. The Index returns do not reflect any fees or expenses. The index accounts for the reinvestment of regular cash dividends, but not for the withholding of taxes. Index returns provided by Morningstar. S&P Dow Jones Indices LLC, a subsidiary of the McGraw Hill Financial, Inc., is the publisher of various index based data products and services and has licensed certain of its products and services for use by Manning & Napier. All such content Copyright © 2018 by S&P Dow Jones Indices LLC and/or its affiliates. All rights reserved. Neither S&P Dow Jones Indices LLC, Dow Jones Trademark Holdings LLC, their affiliates nor their third party licensors make any representation or warranty, express or implied, as to the ability of any index to accurately represent the asset class or market sector that it purports to represent and none of these parties shall have any liability for any errors, omissions, or interruptions of any index or the data included therein.
The MSCI ACWI ex USA Index is designed to measure large and mid-cap representation across 22 of 23 Developed Markets countries (excluding the U.S.) and 24 Emerging Markets countries. The Index returns do not reflect any fees or expenses. The Index is denominated in U.S. dollars. The Index returns are net of withholding taxes. They assume daily reinvestment of net dividends thus accounting for any applicable dividend taxation. Index returns provided by Morningstar.
The Bloomberg Barclays U.S. Aggregate Bond Index is an unmanaged, market value-weighted index of U.S. domestic investment-grade debt issues, including government, corporate, asset-backed, and mortgage-backed securities with maturities of one year or more. Index returns provided by Morningstar.
©2018 Morningstar, Inc. All rights reserved. The information contained herein: (1) is proprietary to Morningstar and/or its content providers; (2) may not be copied, adapted or distributed; and (3) is not warranted to be accurate, complete or timely. Neither Morningstar nor its content providers are responsible for any damages or losses arising from any use of this information, except where such damages or losses cannot be limited or excluded by law in your jurisdiction. Past financial performance is no guarantee of future results.
1
Fund Commentary
(unaudited)
Investment Objective
To provide capital growth and manage risk for investors planning to retire (or meet another investment goal) in or around the year indicated in the fund’s name.
The Target Series include eleven distinct mutual funds, each of which is managed to a designated target date. The portfolios of each Series are strategically allocated to become increasingly conservative as the specified target date approaches.
Performance Commentary
In absolute terms, the performance for the Class K shares mixed as the longer-dated vintages (2040 and up) delivered positive returns while the remaining vintages (2035-Income) experienced negative returns during the one-year period. Similarly, longer-dated vintages (2035 and up) outperformed, while the shorter-dated vintages (2030-Income) trailed their respective blended benchmarks over the one-year period.
Stock selection challenged relative returns and was the primary contributor to the respective Series’ underperformance. Specifically, selection in the Consumer Staples, Communication Services, and Health Care sectors detracted from relative returns across all vintages.
Offsetting a portion of the relative performance headwind was the aggregate effect of sector allocations, which aided relative returns. Each Series’ overweight to Health Care, and underweight to Financials and Industrials, aided relative returns. Within fixed income, with the exception of the Target Income Series, the vintages benefitted from a slightly shorter duration as rates generally rose over the course of the year.
In general, we believe that we are entering a higher risk regime for equities and credit, and that the US is likely approaching a period of peak growth. This could result in lower returns as the economy is moving into late cycle territory as supply begins to become a binding constraint for growth. Given this outlook, we believe that the equity section of each Series should focus on higher quality businesses and reasonably priced growth companies that tend to perform well later cycle and have provided some degree of downside protection in higher risk market environments.
Regarding fixed income, we continue to view corporate bonds as moderately attractive as they continue to adequately compensate investors on a fundamental basis. That said, we are aware that we are in the later stages of an economic expansion and we may look to reduce exposure if spreads tighten or if economic conditions deteriorate. Each Series also has a notable allocation to U.S. Treasury securities. With the exception of the less conservative Series, each Series holds Agencies as well as pass-through securities, which include asset-backed and commercial mortgage-backed securities.
Additionally, we believe that domestic conditions argue for higher interest rates across the curve and expect the yield curve to flatten. While at the early stages of policy normalization, we expect European and Japanese interest rates to remain very low for an extended period of time, keeping US yields at lower levels than domestic conditions alone would argue for.
We think the Fed will remain opportunistic, looking to hike the federal funds target rate as economic conditions allow, while also remaining sensitive to domestic and global market conditions as they continue to reduce the size of their balance sheet by decreasing reinvestment of principal in Treasuries and agency mortgage-backed securities.
Performance data quoted represents past performance and does not guarantee future results. The investment return and principal value of an investment will fluctuate, so that an investor’s shares, when redeemed, may be worth more or less than their original cost. Current performance may be higher or lower than that quoted; investors can obtain the most recent month-end performance at www.manning-napier.com or by calling (800) 466-3863.
2
Fund Commentary
(unaudited)
Performance Commentary (continued)
Each Manning & Napier Fund, Inc. Target Series is invested in one or two of four proprietary risk-based funds based on the Target Series becoming increasingly conservative over time. Because the underlying funds invest in both stocks and bonds, the value of your investment will fluctuate in response to stock market movements and changes in interest rates. Investing in target date funds will also involve a number of other risks, including issuer-specific risk, foreign investment risk, and small-cap/mid-cap risk, as the underlying investments change over time. Investments in options and futures, like all derivatives, can be highly volatile and involve risks in addition to the risks of the underlying instrument on which the derivative is based, such as counterparty, correlation and liquidity risk. Also, the use of leverage increases exposure to the market and may magnify potential losses. Principal value is not guaranteed at any time, including at the target date (the approximate year when an investor plans to stop contributions and start periodic withdrawals).
Commentary prepared using data provided by FactSet. Analysis Manning & Napier. Commentary presented is relative to each Series’ respective blended benchmark. Additional information and associated disclosures can be found on the Performance Update pages contained in this report.
3
Performance Update as of October 31, 2018 - Target Income Series
(unaudited)
| AVERAGE ANNUAL TOTAL RETURNS AS OF OCTOBER 31, 2018 | ||||||||||||
ONE YEAR1 | FIVE YEAR | TEN YEAR | ||||||||||
Manning & Napier Fund, Inc. - Target Income Series - Class K2 | -1.03 | % | 2.50 | % | 5.25 | % | ||||||
Manning & Napier Fund, Inc. - Target Income Series - Class R2 | -1.32 | % | 2.22 | % | 4.97 | % | ||||||
Manning & Napier Fund, Inc. - Target Income Series - Class I2 | -0.80 | % | 2.74 | % | 5.50 | % | ||||||
Manning & Napier Fund, Inc. - Target Income Series - Class R62,3 | -0.62 | % | 2.78 | % | 5.52 | % | ||||||
Standard & Poor’s (S&P) Target Date Retirement Income Index4 | -0.04 | % | 3.42 | % | 5.73 | % | ||||||
Income Composite Benchmark5 | 0.01 | % | 3.64 | % | 5.89 | % | ||||||
The following graph compares the value of a $10,000 investment in the Manning & Napier Fund, Inc. - Target Income Series - Class K for the ten years ended October 31, 2018 to the S&P Target Date Retirement Income Index and the Income Composite Benchmark.
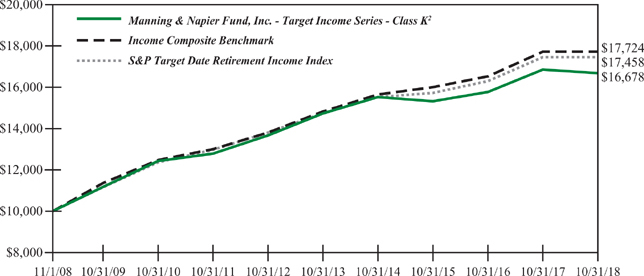
1The returns shown are based on net asset values calculated for shareholder transactions and may differ from the returns shown in the financial highlights, which reflect adjustments made to the net asset values in accordance with accounting principles generally accepted in the United States of America.
2The Series’ performance does not reflect the deduction of taxes that a shareholder would pay on fund distributions or the redemption of shares. The Series’ performance is historical and may not be indicative of future results. The performance returns shown are inclusive of the net expense ratio of the Series. For the year ended October 31, 2018, this net expense ratio was 0.45% for Class K, 0.70% for Class R, 0.20% for Class I and 0.05% for Class R6. The gross expense ratio, which does not account for any voluntary or contractual waivers currently in effect, was 0.55% for Class K, 0.70% for Class R, 0.36% for Class I and 0.19% for Class R6 for the year ended October 31, 2018.
3For periods prior to the inception of Class R6 on October 16, 2017, the performance is based on the historical performance of the Class I shares. Because the Class R6 shares invest in the same portfolio of securities as the Class I shares, performance will be different only to the extent that the Class I shares have a higher expense ratio.
4The S&P Target Date Index Series is a series of unmanaged indices that reflect the market consensus for asset allocations for different target date horizons. Asset class weights are established annually and rebalanced monthly. Prior to 02/26/2010, the indices were rebalanced annually. Index returns assume daily reinvestment of dividends. Beginning 06/ 01/2017, the asset class exposure for each index is represented by indices and returns do not reflect any fees or expenses. Prior to 06/01/2017, the asset class exposure for each index is represented by exchange traded funds (ETFs) and returns are net of ETF expenses. Index returns provided by Bloomberg. S&P Dow Jones Indices LLC, a subsidiary of the McGraw Hill Financial, Inc., is the publisher of various index based data products and services and has licensed certain of its products and services for use by Manning & Napier. All such content Copyright © 2017 by S&P Dow Jones Indices LLC and/or its affiliates. All rights reserved. Neither S&P Dow Jones Indices LLC, Dow Jones Trademark Holdings LLC, their affiliates nor their third party licensors make any representation or warranty, express or implied, as to the ability of any index to accurately represent the asset class or market sector that it purports to represent and none of these parties shall have any liability for any errors, omissions, or interruptions of any index or the data included therein.
4
Performance Update as of October 31, 2018 - Target Income Series
(unaudited)
5The Target Composite Benchmark represents the performance of the target date fund’s asset classes according to their respective weightings, as adjusted over time to reflect the target date fund’s increasingly conservative asset allocations. The following indices are used to calculate the Target Composite Benchmarks: Russell 3000® Index (Russell 3000), MSCI ACWI ex USA Index (ACWIxUS), and Bloomberg Barclays U.S. Aggregate Bond Index (BAB) and/or Bloomberg Barclays U.S. Intermediate Aggregate Bond Index (BIAB). Russell 3000 is an unmanaged index that consists of 3,000 of the largest U.S. companies based on total market capitalization. Index returns are based on a market capitalization-weighted average of relative price changes of the component stocks plus dividends whose reinvestments are compounded daily. Index returns provided by Bloomberg. ACWIxUS is designed to measure large and mid-cap representation across 22 of 23 Developed Markets countries (excluding the U.S.) and 24 Emerging Markets countries. The Index is denominated in U.S. dollars. The Index returns are net of withholding taxes. They assume daily reinvestment of net dividends thus accounting for any applicable dividend taxation. Index returns provided by Bloomberg. BAB and BIAB are both unmanaged, market value-weighted indices of U.S. domestic investment-grade debt issues, including government, corporate, asset-backed and mortgage-backed securities. BAB includes maturities of one year or more; BIAB includes maturities of greater than one year but less than ten years. BAB and BIAB returns provided by Interactive Data. Indices returns do not reflect any fees or expenses. Returns provided are calculated monthly using a blended allocation. Because the target date fund’s asset allocation will vary over time, the composition of the target date portfolio may not match the composition of the comparative Target Composite Benchmark. Mid-month performance is not available for the Composite Benchmark. Performance shown is from the first of the month following the corresponding Fund’s inception date.
5
Performance Update as of October 31, 2018 - Target 2015 Series
(unaudited)
| AVERAGE ANNUAL TOTAL RETURNS AS OF OCTOBER 31, 2018 | ||||||||||||
ONE YEAR1 | FIVE YEAR | SINCE INCEPTION2 | ||||||||||
Manning & Napier Fund, Inc. - Target 2015 - Class K3 | -1.25 | % | 2.42 | % | 4.88 | % | ||||||
Manning & Napier Fund, Inc. - Target 2015 - Class R3 | -1.50 | % | 2.16 | % | 4.67 | % | ||||||
Manning & Napier Fund, Inc. - Target 2015 - Class I3 | -1.03 | % | 2.68 | % | 5.17 | % | ||||||
Manning & Napier Fund, Inc. - Target 2015 - Class R63,4 | -0.93 | % | 2.70 | % | 5.18 | % | ||||||
S&P Target Date 2015 Index5 | 0.17 | % | 4.55 | % | 6.43 | % | ||||||
2015 Composite Benchmark6 | 0.09 | % | 4.43 | % | 5.58 | % | ||||||
The following graph compares the value of a $10,000 investment in the Manning & Napier Fund, Inc. - Target 2015 Series - Class K from its inception2 (6/25/12) to present (10/31/18) to the S&P Target Date 2015 Index and the 2015 Composite Benchmark.
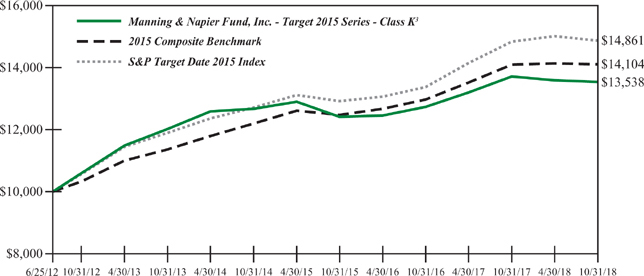
1The returns shown are based on net asset values calculated for shareholder transactions and may differ from the returns shown in the financial highlights, which reflect adjustments made to the net asset values in accordance with accounting principles generally accepted in the United States of America.
2Performance numbers for the Series and the S&P Target Date Index are calculated from June 25, 2012, the Series’ inception date. Performance numbers for the Target Composite Benchmark are calculated from June 30, 2012.
3The Series’ performance does not reflect the deduction of taxes that a shareholder would pay on fund distributions or the redemption of shares. The Series’ performance is historical and may not be indicative of future results. The performance returns shown are inclusive of the net expense ratio of the Series. For the year ended October 31, 2018, this net expense ratio was 0.45% for Class K, 0.70% for Class R, 0.20% for Class I and 0.05% for Class R6. The gross expense ratio, which does not account for any voluntary or contractual waivers currently in effect, was 4.26% for Class K, 4.50% for Class R, 4.01% for Class I and 3.86% for Class R6 for the year ended October 31, 2018.
4For periods prior to the inception of Class R6 on October 16, 2017, the performance is based on the historical performance of the Class I shares. Because the Class R6 shares invest in the same portfolio of securities as the Class I shares, performance will be different only to the extent that the Class I shares have a higher expense ratio.
5The S&P Target Date Index Series is a series of unmanaged indices that reflect the market consensus for asset allocations for different target date horizons. Asset class weights are established annually and rebalanced monthly. Prior to 02/26/2010, the indices were rebalanced annually. Index returns assume daily reinvestment of dividends. Beginning 06/ 01/2017, the asset class exposure for each index is represented by indices and returns do not reflect any fees or expenses. Prior to 06/01/2017, the asset class exposure for each index is represented by exchange traded funds (ETFs) and returns are net of ETF expenses. Index returns provided by Bloomberg. S&P Dow Jones Indices LLC, a subsidiary of the McGraw Hill Financial, Inc., is the publisher of various index based data products and services and has licensed certain of its products and services for use by Manning & Napier. All such content Copyright © 2017 by S&P Dow Jones Indices LLC and/or its affiliates. All rights reserved. Neither S&P Dow Jones Indices LLC, Dow Jones
6
Performance Update as of October 31, 2018 - Target 2015 Series
(unaudited)
Trademark Holdings LLC, their affiliates nor their third party licensors make any representation or warranty, express or implied, as to the ability of any index to accurately represent the asset class or market sector that it purports to represent and none of these parties shall have any liability for any errors, omissions, or interruptions of any index or the data included therein.
6The Target Composite Benchmark represents the performance of the target date fund’s asset classes according to their respective weightings, as adjusted over time to reflect the target date fund’s increasingly conservative asset allocations. The following indices are used to calculate the Target Composite Benchmarks: Russell 3000® Index (Russell 3000), MSCI ACWI ex USA Index (ACWIxUS), and Bloomberg Barclays U.S. Aggregate Bond Index (BAB) and/or Bloomberg Barclays U.S. Intermediate Aggregate Bond Index (BIAB). Russell 3000 is an unmanaged index that consists of 3,000 of the largest U.S. companies based on total market capitalization. Index returns are based on a market capitalization-weighted average of relative price changes of the component stocks plus dividends whose reinvestments are compounded daily. Index returns provided by Bloomberg. ACWIxUS is designed to measure large and mid-cap representation across 22 of 23 Developed Markets countries (excluding the U.S.) and 24 Emerging Markets countries. The Index is denominated in U.S. dollars. The Index returns are net of withholding taxes. They assume daily reinvestment of net dividends thus accounting for any applicable dividend taxation. Index returns provided by Bloomberg. BAB and BIAB are both unmanaged, market value-weighted indices of U.S. domestic investment-grade debt issues, including government, corporate, asset-backed and mortgage-backed securities. BAB includes maturities of one year or more; BIAB includes maturities of greater than one year but less than ten years. BAB and BIAB returns provided by Interactive Data. Indices returns do not reflect any fees or expenses. Returns provided are calculated monthly using a blended allocation. Because the target date fund’s asset allocation will vary over time, the composition of the target date portfolio may not match the composition of the comparative Target Composite Benchmark. Mid-month performance is not available for the Composite Benchmark. Performance shown is from the first of the month following the corresponding Fund’s inception date.
7
Performance Update as of October 31, 2018 - Target 2020 Series
(unaudited)
| AVERAGE ANNUAL TOTAL RETURNS AS OF OCTOBER 31, 2018 | ||||||||||||
ONE YEAR1 | FIVE YEAR | TEN YEAR | ||||||||||
Manning & Napier Fund, Inc. - Target 2020 Series - Class K2 | -1.58 | % | 2.72 | % | 6.95 | % | ||||||
Manning & Napier Fund, Inc. - Target 2020 Series - Class R2 | -1.85 | % | 2.48 | % | 6.67 | % | ||||||
Manning & Napier Fund, Inc. - Target 2020 Series - Class I2 | -1.43 | % | 2.98 | % | 7.21 | % | ||||||
Manning & Napier Fund, Inc. - Target 2020 Series - Class R62,3 | -1.24 | % | 3.01 | % | 7.23 | % | ||||||
S&P Target Date 2020 Index4 | 0.27 | % | 5.04 | % | 8.14 | % | ||||||
2020 Composite Benchmark5 | 0.05 | % | 4.83 | % | 7.84 | % | ||||||
The following graph compares the value of a $10,000 investment in the Manning & Napier Fund, Inc. - Target 2020 Series - Class K for the ten years ended October 31, 2018 to the S&P Target Date 2020 Index and the 2020 Composite Benchmark.
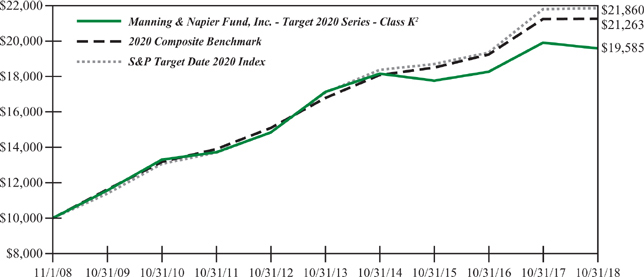
1The returns shown are based on net asset values calculated for shareholder transactions and may differ from the returns shown in the financial highlights, which reflect adjustments made to the net asset values in accordance with accounting principles generally accepted in the United States of America.
2The Series’ performance does not reflect the deduction of taxes that a shareholder would pay on fund distributions or the redemption of shares. The Series’ performance is historical and may not be indicative of future results. The performance returns shown are inclusive of the net expense ratio of the Series. For the year ended October 31, 2018, this net expense ratio was 0.45% for Class K, 0.70% for Class R, 0.20% for Class I and 0.05% for Class R6. The gross expense ratio, which does not account for any voluntary or contractual waivers currently in effect, was 0.59% for Class K, 0.74% for Class R, 0.37% for Class I and 0.20% for Class R6 for the year ended October 31, 2018.
3For periods prior to the inception of Class R6 on October 16, 2017, the performance is based on the historical performance of the Class I shares. Because the Class R6 shares invest in the same portfolio of securities as the Class I shares, performance will be different only to the extent that the Class I shares have a higher expense ratio.
4The S&P Target Date Index Series is a series of unmanaged indices that reflect the market consensus for asset allocations for different target date horizons. Asset class weights are established annually and rebalanced monthly. Prior to 02/26/2010, the indices were rebalanced annually. Index returns assume daily reinvestment of dividends. Beginning 06/ 01/2017, the asset class exposure for each index is represented by indices and returns do not reflect any fees or expenses. Prior to 06/01/2017, the asset class exposure for each index is represented by exchange traded funds (ETFs) and returns are net of ETF expenses. Index returns provided by Bloomberg. S&P Dow Jones Indices LLC, a subsidiary of the McGraw Hill Financial, Inc., is the publisher of various index based data products and services and has licensed certain of its products and services for use by Manning & Napier. All such content Copyright © 2017 by S&P Dow Jones Indices LLC and/or its affiliates. All rights reserved. Neither S&P Dow Jones Indices LLC, Dow Jones Trademark Holdings LLC, their affiliates nor their third party licensors make any representation or warranty, express or implied, as to the ability of any index to accurately represent the asset class or market sector that it purports to represent and none of these parties shall have any liability for any errors, omissions, or interruptions of any index or the data included therein.
8
Performance Update as of October 31, 2018 - Target 2020 Series
(unaudited)
5The Target Composite Benchmark represents the performance of the target date fund’s asset classes according to their respective weightings, as adjusted over time to reflect the target date fund’s increasingly conservative asset allocations. The following indices are used to calculate the Target Composite Benchmarks: Russell 3000® Index (Russell 3000), MSCI ACWI ex USA Index (ACWIxUS), and Bloomberg Barclays U.S. Aggregate Bond Index (BAB) and/or Bloomberg Barclays U.S. Intermediate Aggregate Bond Index (BIAB). Russell 3000 is an unmanaged index that consists of 3,000 of the largest U.S. companies based on total market capitalization. Index returns are based on a market capitalization-weighted average of relative price changes of the component stocks plus dividends whose reinvestments are compounded daily. Index returns provided by Bloomberg. ACWIxUS is designed to measure large and mid-cap representation across 22 of 23 Developed Markets countries (excluding the U.S.) and 24 Emerging Markets countries. The Index is denominated in U.S. dollars. The Index returns are net of withholding taxes. They assume daily reinvestment of net dividends thus accounting for any applicable dividend taxation. Index returns provided by Bloomberg. BAB and BIAB are both unmanaged, market value-weighted indices of U.S. domestic investment-grade debt issues, including government, corporate, asset-backed and mortgage-backed securities. BAB includes maturities of one year or more; BIAB includes maturities of greater than one year but less than ten years. BAB and BIAB returns provided by Interactive Data. Indices returns do not reflect any fees or expenses. Returns provided are calculated monthly using a blended allocation. Because the target date fund’s asset allocation will vary over time, the composition of the target date portfolio may not match the composition of the comparative Target Composite Benchmark. Mid-month performance is not available for the Composite Benchmark. Performance shown is from the first of the month following the corresponding Fund’s inception date.
9
Performance Update as of October 31, 2018 - Target 2025 Series
(unaudited)
| AVERAGE ANNUAL TOTAL RETURNS AS OF OCTOBER 31, 2018 | ||||||||||||
| ONE YEAR1 | FIVE YEAR | SINCE INCEPTION2 | ||||||||||
Manning & Napier Fund, Inc. - Target 2025 Series - Class K3 | -1.58 | % | 3.18 | % | 6.49 | % | ||||||
Manning & Napier Fund, Inc. - Target 2025 Series - Class R3 | -1.78 | % | 2.92 | % | 6.28 | % | ||||||
Manning & Napier Fund, Inc. - Target 2025 Series - Class I3 | -1.33 | % | 3.43 | % | 6.68 | % | ||||||
Manning & Napier Fund, Inc. - Target 2025 Series - Class R63,4 | -1.15 | % | 3.47 | % | 6.71 | % | ||||||
S&P Target Date 2025 Index5 | 0.40 | % | 5.48 | % | 8.09 | % | ||||||
2025 Composite Benchmark6 | 0.33 | % | 5.21 | % | 6.77 | % | ||||||
The following graph compares the value of a $10,000 investment in the Manning & Napier Fund, Inc. - Target 2025 Series - Class K from its inception2 (6/25/12) to present (10/31/18) to the 2025 Composite Benchmark, and S&P Target Date 2025 Index.
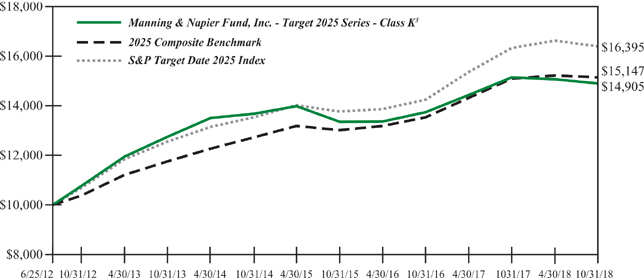
1The returns shown are based on net asset values calculated for shareholder transactions and may differ from the returns shown in the financial highlights, which reflect adjustments made to the net asset values in accordance with accounting principles generally accepted in the United States of America.
2Performance numbers for the Series and the S&P Target Date Index are calculated from June 25, 2012, the Series’ inception date. Performance numbers for the Target Composite Benchmark are calculated from June 30, 2012.
3The Series’ performance does not reflect the deduction of taxes that a shareholder would pay on fund distributions or the redemption of shares. The Series’ performance is historical and may not be indicative of future results. The performance returns shown are inclusive of the net expense ratio of the Series. For the year ended October 31, 2018, this net expense ratio was 0.45% for Class K, 0.70% for Class R, 0.20% for Class I and 0.05% for Class R6. The gross expense ratio, which does not account for any voluntary or contractual waivers currently in effect, was 0.73% for Class K, 0.94% for Class R, 0.57% for Class I and 0.43% for Class R6 for the year ended October 31, 2018.
4For periods prior to the inception of Class R6 on October 16, 2017, the performance is based on the historical performance of the Class I shares. Because the Class R6 shares invest in the same portfolio of securities as the Class I shares, performance will be different only to the extent that the Class I shares have a higher expense ratio.
5The S&P Target Date Index Series is a series of unmanaged indices that reflect the market consensus for asset allocations for different target date horizons. Asset class weights are established annually and rebalanced monthly. Prior to 02/26/2010, the indices were rebalanced annually. Index returns assume daily reinvestment of dividends. Beginning 06/ 01/2017, the asset class exposure for each index is represented by indices and returns do not reflect any fees or expenses. Prior to 06/01/2017, the asset class exposure for each index is represented by exchange traded funds (ETFs) and returns are net of ETF expenses. Index returns provided by Bloomberg. S&P Dow Jones Indices LLC, a subsidiary of the McGraw Hill Financial, Inc., is the publisher of various index based data products and services and has licensed certain of its products and services for use by Manning & Napier. All such content Copyright © 2017 by S&P Dow Jones Indices LLC and/or its affiliates. All rights reserved. Neither S&P Dow Jones Indices LLC, Dow Jones
10
Performance Update as of October 31, 2018 - Target 2025 Series
(unaudited)
Trademark Holdings LLC, their affiliates nor their third party licensors make any representation or warranty, express or implied, as to the ability of any index to accurately represent the asset class or market sector that it purports to represent and none of these parties shall have any liability for any errors, omissions, or interruptions of any index or the data included therein.
6The Target Composite Benchmark represents the performance of the target date fund’s asset classes according to their respective weightings, as adjusted over time to reflect the target date fund’s increasingly conservative asset allocations. The following indices are used to calculate the Target Composite Benchmarks: Russell 3000® Index (Russell 3000), MSCI ACWI ex USA Index (ACWIxUS), and Bloomberg Barclays U.S. Aggregate Bond Index (BAB) and/or Bloomberg Barclays U.S. Intermediate Aggregate Bond Index (BIAB). Russell 3000 is an unmanaged index that consists of 3,000 of the largest U.S. companies based on total market capitalization. Index returns are based on a market capitalization-weighted average of relative price changes of the component stocks plus dividends whose reinvestments are compounded daily. Index returns provided by Bloomberg. ACWIxUS is designed to measure large and mid-cap representation across 22 of 23 Developed Markets countries (excluding the U.S.) and 24 Emerging Markets countries. The Index is denominated in U.S. dollars. The Index returns are net of withholding taxes. They assume daily reinvestment of net dividends thus accounting for any applicable dividend taxation. Index returns provided by Bloomberg. BAB and BIAB are both unmanaged, market value-weighted indices of U.S. domestic investment-grade debt issues, including government, corporate, asset-backed and mortgage-backed securities. BAB includes maturities of one year or more; BIAB includes maturities of greater than one year but less than ten years. BAB and BIAB returns provided by Interactive Data. Indices returns do not reflect any fees or expenses. Returns provided are calculated monthly using a blended allocation. Because the target date fund’s asset allocation will vary over time, the composition of the target date portfolio may not match the composition of the comparative Target Composite Benchmark. Mid-month performance is not available for the Composite Benchmark. Performance shown is from the first of the month following the corresponding Fund’s inception date.
11
Performance Update as of October 31, 2018 - Target 2030 Series
(unaudited)
| AVERAGE ANNUAL TOTAL RETURNS AS OF OCTOBER 31, 2018 | ||||||||||||
ONE YEAR1 | FIVE YEAR | TEN YEAR | ||||||||||
Manning & Napier Fund, Inc. - Target 2030 Series - Class K2 | -0.93 | % | 3.86 | % | 8.28 | % | ||||||
Manning & Napier Fund, Inc. - Target 2030 Series - Class R2 | -1.15 | % | 3.60 | % | 8.04 | % | ||||||
Manning & Napier Fund, Inc. - Target 2030 Series - Class I2 | -0.65 | % | 4.14 | % | 8.59 | % | ||||||
Manning & Napier Fund, Inc. - Target 2030 Series - Class R62,3 | -0.48 | % | 4.15 | % | 8.59 | % | ||||||
S&P Target Date 2030 Index4 | 0.49 | % | 5.91 | % | 9.21 | % | ||||||
2030 Composite Benchmark5 | 0.67 | % | 5.76 | % | 8.96 | % | ||||||
The following graph compares the value of a $10,000 investment in the Manning & Napier Fund, Inc. - Target 2030 Series - Class K for the ten years ended October 31, 2018 to the 2030 Composite Benchmark and S&P Target Date 2030 Index.
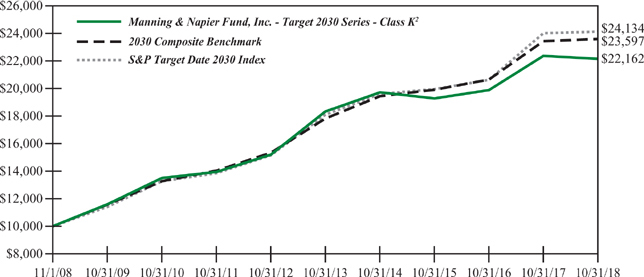
1The returns shown are based on net asset values calculated for shareholder transactions and may differ from the returns shown in the financial highlights, which reflect adjustments made to the net asset values in accordance with accounting principles generally accepted in the United States of America.
2The Series’ performance does not reflect the deduction of taxes that a shareholder would pay on fund distributions or the redemption of shares. The Series’ performance is historical and may not be indicative of future results. The performance returns shown are inclusive of the net expense ratio of the Series. For the year ended October 31, 2018, this net expense ratio was 0.45% for Class K, 0.70% for Class R, 0.20% for Class I and 0.05% for Class R6. The gross expense ratio, which does not account for any voluntary or contractual waivers currently in effect, was 0.58% for Class K, 0.73% for Class R, 0.35% for Class I and 0.19% for Class R6 for the year ended October 31, 2018.
3For periods prior to the inception of Class R6 on October 16, 2017, the performance is based on the historical performance of the Class I shares. Because the Class R6 shares invest in the same portfolio of securities as the Class I shares, performance will be different only to the extent that the Class I shares have a higher expense ratio.
4The S&P Target Date Index Series is a series of unmanaged indices that reflect the market consensus for asset allocations for different target date horizons. Asset class weights are established annually and rebalanced monthly. Prior to 02/26/2010, the indices were rebalanced annually. Index returns assume daily reinvestment of dividends. Beginning 06/ 01/2017, the asset class exposure for each index is represented by indices and returns do not reflect any fees or expenses. Prior to 06/01/2017, the asset class exposure for each index is represented by exchange traded funds (ETFs) and returns are net of ETF expenses. Index returns provided by Bloomberg. S&P Dow Jones Indices LLC, a subsidiary of the McGraw Hill Financial, Inc., is the publisher of various index based data products and services and has licensed certain of its products and services for use by Manning & Napier. All such content Copyright © 2017 by S&P Dow Jones Indices LLC and/or its affiliates. All rights reserved. Neither S&P Dow Jones Indices LLC, Dow Jones Trademark Holdings LLC, their affiliates nor their third party licensors make any representation or warranty, express or implied, as to the ability of any index to accurately represent the asset class or market sector that it purports to represent and none of these parties shall have any liability for any errors, omissions, or interruptions of any index or the data included therein.
12
Performance Update as of October 31, 2018 - Target 2030 Series
(unaudited)
5The Target Composite Benchmark represents the performance of the target date fund’s asset classes according to their respective weightings, as adjusted over time to reflect the target date fund’s increasingly conservative asset allocations. The following indices are used to calculate the Target Composite Benchmarks: Russell 3000® Index (Russell 3000), MSCI ACWI ex USA Index (ACWIxUS), and Bloomberg Barclays U.S. Aggregate Bond Index (BAB) and/or Bloomberg Barclays U.S. Intermediate Aggregate Bond Index (BIAB). Russell 3000 is an unmanaged index that consists of 3,000 of the largest U.S. companies based on total market capitalization. Index returns are based on a market capitalization-weighted average of relative price changes of the component stocks plus dividends whose reinvestments are compounded daily. Index returns provided by Bloomberg. ACWIxUS is designed to measure large and mid-cap representation across 22 of 23 Developed Markets countries (excluding the U.S.) and 24 Emerging Markets countries. The Index is denominated in U.S. dollars. The Index returns are net of withholding taxes. They assume daily reinvestment of net dividends thus accounting for any applicable dividend taxation. Index returns provided by Bloomberg. BAB and BIAB are both unmanaged, market value-weighted indices of U.S. domestic investment-grade debt issues, including government, corporate, asset-backed and mortgage-backed securities. BAB includes maturities of one year or more; BIAB includes maturities of greater than one year but less than ten years. BAB and BIAB returns provided by Interactive Data. Indices returns do not reflect any fees or expenses. Returns provided are calculated monthly using a blended allocation. Because the target date fund’s asset allocation will vary over time, the composition of the target date portfolio may not match the composition of the comparative Target Composite Benchmark. Mid-month performance is not available for the Composite Benchmark. Performance shown is from the first of the month following the corresponding Fund’s inception date.
13
Performance Update as of October 31, 2018 - Target 2035 Series
(unaudited)
| AVERAGE ANNUAL TOTAL RETURNS AS OF OCTOBER 31, 2018 | ||||||||||||
ONE YEAR1 | FIVE YEAR | SINCE INCEPTION2 | ||||||||||
Manning & Napier Fund, Inc. - Target 2035 Series - Class K3 | -0.01 | % | 4.51 | % | 8.38 | % | ||||||
Manning & Napier Fund, Inc. - Target 2035 Series - Class R3 | -0.18 | % | 4.25 | % | 8.16 | % | ||||||
Manning & Napier Fund, Inc. - Target 2035 Series - Class I3 | 0.27 | % | 4.78 | % | 8.65 | % | ||||||
Manning & Napier Fund, Inc. - Target 2035 Series - Class R63,4 | 0.44 | % | 4.81 | % | 8.68 | % | ||||||
S&P Target Date 2035 Index5 | 0.55 | % | 6.31 | % | 9.46 | % | ||||||
2035 Composite Benchmark6 | 1.21 | % | 6.42 | % | 8.67 | % | ||||||
The following graph compares the value of a $10,000 investment in the Manning & Napier Fund, Inc. - Target 2035 Series - Class K from its inception2 (6/25/12) to present (10/31/18) to the 2035 Composite Benchmark and S&P Target Date 2035 Index.
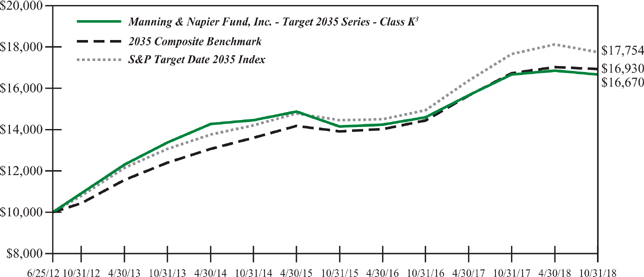
1The returns shown are based on net asset values calculated for shareholder transactions and may differ from the returns shown in the financial highlights, which reflect adjustments made to the net asset values in accordance with accounting principles generally accepted in the United States of America.
2Performance numbers for the Series and the S&P Target Date Index are calculated from June 25, 2012, the Series’ inception date. Performance numbers for the Target Composite Benchmark are calculated from June 30, 2012.
3The Series’ performance does not reflect the deduction of taxes that a shareholder would pay on fund distributions or the redemption of shares. The Series’ performance is historical and may not be indicative of future results. The performance returns shown are inclusive of the net expense ratio of the Series. For the year ended October 31, 2018, this net expense ratio was 0.45% for Class K, 0.70% for Class R, 0.20% for Class I and 0.05% for Class R6. The gross expense ratio, which does not account for any voluntary or contractual waivers currently in effect, was 0.94% for Class K, 1.13% for Class R, 0.76% for Class I and 0.61% for Class R6 for the year ended October 31, 2018.
4For periods prior to the inception of Class R6 on October 16, 2017, the performanceis based on the historical performance of the Class I shares. Because the Class R6 shares invest in the same portfolio of securities as the Class I shares, performance will be different only to the extent that the Class I shares have a higher expense ratio.
5The S&P Target Date Index Series is a series of unmanaged indices that reflect the market consensus for asset allocations for different target date horizons. Asset class weights are established annually and rebalanced monthly. Prior to 02/26/2010, the indices were rebalanced annually. Index returns assume daily reinvestment of dividends. Beginning 06/ 01/2017, the asset class exposure for each index is represented by indices and returns do not reflect any fees or expenses. Prior to 06/01/2017, the asset class exposure for each index is represented by exchange traded funds (ETFs) and returns are net of ETF expenses. Index returns provided by Bloomberg. S&P Dow Jones Indices LLC, a subsidiary of the McGraw Hill Financial, Inc., is the publisher of various index based data products and services and has licensed certain of its products and services for use by Manning & Napier. All such content Copyright © 2017 by S&P Dow Jones Indices LLC and/or its affiliates. All rights reserved. Neither S&P Dow Jones Indices LLC, Dow Jones
14
Performance Update as of October 31, 2018 - Target 2035 Series
(unaudited)
Trademark Holdings LLC, their affiliates nor their third party licensors make any representation or warranty, express or implied, as to the ability of any index to accurately represent the asset class or market sector that it purports to represent and none of these parties shall have any liability for any errors, omissions, or interruptions of any index or the data included therein.
6The Target Composite Benchmark represents the performance of the target date fund’s asset classes according to their respective weightings, as adjusted over time to reflect the target date fund’s increasingly conservative asset allocations. The following indices are used to calculate the Target Composite Benchmarks: Russell 3000® Index (Russell 3000), MSCI ACWI ex USA Index (ACWIxUS), and Bloomberg Barclays U.S. Aggregate Bond Index (BAB) and/or Bloomberg Barclays U.S. Intermediate Aggregate Bond Index (BIAB). Russell 3000 is an unmanaged index that consists of 3,000 of the largest U.S. companies based on total market capitalization. Index returns are based on a market capitalization-weighted average of relative price changes of the component stocks plus dividends whose reinvestments are compounded daily. Index returns provided by Bloomberg. ACWIxUS is designed to measure large and mid-cap representation across 22 of 23 Developed Markets countries (excluding the U.S.) and 24 Emerging Markets countries. The Index is denominated in U.S. dollars. The Index returns are net of withholding taxes. They assume daily reinvestment of net dividends thus accounting for any applicable dividend taxation. Index returns provided by Bloomberg. BAB and BIAB are both unmanaged, market value-weighted indices of U.S. domestic investment-grade debt issues, including government, corporate, asset-backed and mortgage-backed securities. BAB includes maturities of one year or more; BIAB includes maturities of greater than one year but less than ten years. BAB and BIAB returns provided by Interactive Data. Indices returns do not reflect any fees or expenses. Returns provided are calculated monthly using a blended allocation. Because the target date fund’s asset allocation will vary over time, the composition of the target date portfolio may not match the composition of the comparative Target Composite Benchmark. Mid-month performance is not available for the Composite Benchmark. Performance shown is from the first of the month following the corresponding Fund’s inception date.
15
Performance Update as of October 31, 2018 - Target 2040 Series
(unaudited)
| AVERAGE ANNUAL TOTAL RETURNS AS OF OCTOBER 31, 2018 | ||||||||||||
ONE YEAR1 | FIVE YEAR | TEN YEAR | ||||||||||
Manning & Napier Fund, Inc. - Target 2040 - Class K2 | 1.01 | % | 5.13 | % | 9.34 | % | ||||||
Manning & Napier Fund, Inc. - Target 2040 - Class R2 | 0.82 | % | 4.88 | % | 9.07 | % | ||||||
Manning & Napier Fund, Inc. - Target 2040 - Class I2 | 1.26 | % | 5.40 | % | 9.63 | % | ||||||
Manning & Napier Fund, Inc. - Target 2040 - Class R62,3 | 1.45 | % | 5.44 | % | 9.65 | % | ||||||
S&P Target Date 2040 Index4 | 0.63 | % | 6.59 | % | 9.92 | % | ||||||
2040 Composite Benchmark5 | 1.62 | % | 6.91 | % | 10.22 | % | ||||||
The following graph compares the value of a $10,000 investment in the Manning & Napier Fund, Inc. - Target 2040 Series - Class K for the ten years ended October 31, 2018 to the S&P Target Date 2040 Index and the 2040 Composite Benchmark.
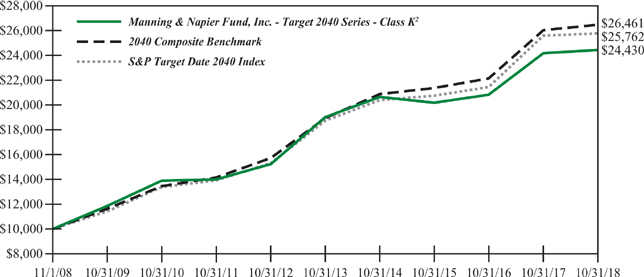
1The returns shown are based on net asset values calculated for shareholder transactions and may differ from the returns shown in the financial highlights, which reflect adjustments made to the net asset values in accordance with accounting principles generally accepted in the United States of America.
2The Series’ performance does not reflect the deduction of taxes that a shareholder would pay on fund distributions or the redemption of shares. The Series’ performance is historical and may not be indicative of future results. The performance returns shown are inclusive of the net expense ratio of the Series. For the year ended October 31, 2018, this net expense ratio was 0.45% for Class K, 0.70% for Class R, 0.20% for Class I and 0.05% for Class R6. The gross expense ratio, which does not account for any voluntary or contractual waivers currently in effect, was 0.67% for Class K, 0.81% for Class R, 0.44% for Class I and 0.28% for Class R6 for the year ended October 31, 2018.
3For periods prior to the inception of Class R6 on October 16, 2017, the performance is based on the historical performance of the Class I shares. Because the Class R6 shares invest in the same portfolio of securities as the Class I shares, performance will be different only to the extent that the Class I shares have a higher expense ratio.
4The S&P Target Date Index Series is a series of unmanaged indices that reflect the market consensus for asset allocations for different target date horizons. Asset class weights are established annually and rebalanced monthly. Prior to 02/26/2010, the indices were rebalanced annually. Index returns assume daily reinvestment of dividends. Beginning 06/ 01/2017, the asset class exposure for each index is represented by indices and returns do not reflect any fees or expenses. Prior to 06/01/2017, the asset class exposure for each index is represented by exchange traded funds (ETFs) and returns are net of ETF expenses. Index returns provided by Bloomberg. S&P Dow Jones Indices LLC, a subsidiary of the McGraw Hill Financial, Inc., is the publisher of various index based data products and services and has licensed certain of its products and services for use by Manning & Napier. All such content Copyright © 2017 by S&P Dow Jones Indices LLC and/or its affiliates. All rights reserved. Neither S&P Dow Jones Indices LLC, Dow Jones Trademark Holdings LLC, their affiliates nor their third party licensors make any representation or warranty, express or implied, as to the ability of any index to accurately represent the asset class or market sector that it purports to represent and none of these parties shall have any liability for any errors, omissions, or interruptions of any index or the data included therein.
16
Performance Update as of October 31, 2018 - Target 2040 Series
(unaudited)
5The Target Composite Benchmark represents the performance of the target date fund’s asset classes according to their respective weightings, as adjusted over time to reflect the target date fund’s increasingly conservative asset allocations. The following indices are used to calculate the Target Composite Benchmarks: Russell 3000® Index (Russell 3000), MSCI ACWI ex USA Index (ACWIxUS), and Bloomberg Barclays U.S. Aggregate Bond Index (BAB) and/or Bloomberg Barclays U.S. Intermediate Aggregate Bond Index (BIAB). Russell 3000 is an unmanaged index that consists of 3,000 of the largest U.S. companies based on total market capitalization. Index returns are based on a market capitalization-weighted average of relative price changes of the component stocks plus dividends whose reinvestments are compounded daily. Index returns provided by Bloomberg. ACWIxUS is designed to measure large and mid-cap representation across 22 of 23 Developed Markets countries (excluding the U.S.) and 24 Emerging Markets countries. The Index is denominated in U.S. dollars. The Index returns are net of withholding taxes. They assume daily reinvestment of net dividends thus accounting for any applicable dividend taxation. Index returns provided by Bloomberg. BAB and BIAB are both unmanaged, market value-weighted indices of U.S. domestic investment-grade debt issues, including government, corporate, asset-backed and mortgage-backed securities. BAB includes maturities of one year or more; BIAB includes maturities of greater than one year but less than ten years. BAB and BIAB returns provided by Interactive Data. Indices returns do not reflect any fees or expenses. Returns provided are calculated monthly using a blended allocation. Because the target date fund’s asset allocation will vary over time, the composition of the target date portfolio may not match the composition of the comparative Target Composite Benchmark. Mid-month performance is not available for the Composite Benchmark. Performance shown is from the first of the month following the corresponding Fund’s inception date.
17
Performance Update as of October 31, 2018 - Target 2045 Series
(unaudited)
AVERAGE ANNUAL TOTAL RETURNS AS OF OCTOBER 31, 2018 | ||||||||||||
ONE YEAR1 | FIVE YEAR | SINCE INCEPTION2 | ||||||||||
Manning & Napier Fund, Inc. - Target 2045 - Class K3 | 1.93 | % | 5.75 | % | 9.92 | % | ||||||
Manning & Napier Fund, Inc. - Target 2045 - Class R3 | 1.64 | % | 5.48 | % | 9.62 | % | ||||||
Manning & Napier Fund, Inc. - Target 2045 - Class I3 | 2.13 | % | 6.00 | % | 10.18 | % | ||||||
Manning & Napier Fund, Inc. - Target 2045 - Class R63,4 | 2.32 | % | 6.04 | % | 10.21 | % | ||||||
S&P Target Date 2045 Index5 | 0.59 | % | 6.76 | % | 10.24 | % | ||||||
2045 Composite Benchmark6 | 1.83 | % | 7.26 | % | 9.80 | % | ||||||
The following graph compares the value of a $10,000 investment in the Manning & Napier Fund, Inc. - Target 2045 Series - Class K from its inception2 (6/25/12) to present (10/31/18) to the S&P Target Date 2045 Index and the 2045 Composite Benchmark.
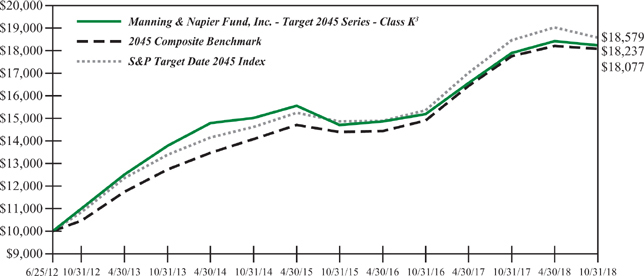
1The returns shown are based on net asset values calculated for shareholder transactions and may differ from the returns shown in the financial highlights, which reflect adjustments made to the net asset values in accordance with accounting principles generally accepted in the United States of America.
2Performance numbers for the Series and the S&P Target Date Index are calculated from June 25, 2012, the Series’ inception date. Performance numbers for the Target Composite Benchmark are calculated from June 30, 2012.
3The Series’ performance does not reflect the deduction of taxes that a shareholder would pay on fund distributions or the redemption of shares. The Series’ performance is historical and may not be indicative of future results. The performance returns shown are inclusive of the net expense ratio of the Series. For the year ended October 31, 2018, this net expense ratio was 0.45% for Class K, 0.70% for Class R, 0.20% for Class I and 0.05% for Class R6. The gross expense ratio, which does not account for any voluntary or contractual waivers currently in effect, was 1.34% for Class K, 1.51% for Class R, 1.14% for Class I and 0.99% for Class R6 for the year ended October 31, 2018.
4For periods prior to the inception of Class R6 on October 16, 2017, the performance is based on the historical performance of the Class I shares. Because the Class R6 shares invest in the same portfolio of securities as the Class I shares, performance will be different only to the extent that the Class I shares have a higher expense ratio.
5The S&P Target Date Index Series is a series of unmanaged indices that reflect the market consensus for asset allocations for different target date horizons. Asset class weights are established annually and rebalanced monthly. Prior to 02/26/2010, the indices were rebalanced annually. Index returns assume daily reinvestment of dividends. Beginning 06/ 01/2017, the asset class exposure for each index is represented by indices and returns do not reflect any fees or expenses. Prior to 06/01/2017, the asset class exposure for each index is represented by exchange traded funds (ETFs) and returns are net of ETF expenses. Index returns provided by Bloomberg. S&P Dow Jones Indices LLC, a subsidiary of the McGraw Hill Financial, Inc., is the publisher of various index based data products and services and has licensed certain of its products and services for use by Manning & Napier. All such content Copyright © 2017 by S&P Dow Jones Indices LLC and/or its affiliates. All rights reserved. Neither S&P Dow Jones Indices LLC, Dow Jones
18
Performance Update as of October 31, 2018 - Target 2045 Series
(unaudited)
Trademark Holdings LLC, their affiliates nor their third party licensors make any representation or warranty, express or implied, as to the ability of any index to accurately represent the asset class or market sector that it purports to represent and none of these parties shall have any liability for any errors, omissions, or interruptions of any index or the data included therein.
6The Target Composite Benchmark represents the performance of the target date fund’s asset classes according to their respective weightings, as adjusted over time to reflect the target date fund’s increasingly conservative asset allocations. The following indices are used to calculate the Target Composite Benchmarks: Russell 3000® Index (Russell 3000), MSCI ACWI ex USA Index (ACWIxUS), and Bloomberg Barclays U.S. Aggregate Bond Index (BAB) and/or Bloomberg Barclays U.S. Intermediate Aggregate Bond Index (BIAB). Russell 3000 is an unmanaged index that consists of 3,000 of the largest U.S. companies based on total market capitalization. Index returns are based on a market capitalization-weighted average of relative price changes of the component stocks plus dividends whose reinvestments are compounded daily. Index returns provided by Bloomberg. ACWIxUS is designed to measure large and mid-cap representation across 22 of 23 Developed Markets countries (excluding the U.S.) and 24 Emerging Markets countries. The Index is denominated in U.S. dollars. The Index returns are net of withholding taxes. They assume daily reinvestment of net dividends thus accounting for any applicable dividend taxation. Index returns provided by Bloomberg. BAB and BIAB are both unmanaged, market value-weighted indices of U.S. domestic investment-grade debt issues, including government, corporate, asset-backed and mortgage-backed securities. BAB includes maturities of one year or more; BIAB includes maturities of greater than one year but less than ten years. BAB and BIAB returns provided by Interactive Data. Indices returns do not reflect any fees or expenses. Returns provided are calculated monthly using a blended allocation. Because the target date fund’s asset allocation will vary over time, the composition of the target date portfolio may not match the composition of the comparative Target Composite Benchmark. Mid-month performance is not available for the Composite Benchmark. Performance shown is from the first of the month following the corresponding Fund’s inception date.
19
Performance Update as of October 31, 2018 - Target 2050 Series
(unaudited)
| AVERAGE ANNUAL TOTAL RETURNS AS OF OCTOBER 31, 2018 | ||||||||||||
ONE YEAR1 | FIVE YEAR | TEN YEAR | ||||||||||
Manning & Napier Fund, Inc. - Target 2050 - Class K2 | 2.32 | % | 5.96 | % | 10.09 | % | ||||||
Manning & Napier Fund, Inc. - Target 2050 - Class R2 | 2.07 | % | 5.69 | % | 9.81 | % | ||||||
Manning & Napier Fund, Inc. - Target 2050 - Class I2 | 2.53 | % | 6.23 | % | 10.36 | % | ||||||
Manning & Napier Fund, Inc. - Target 2050 - Class R62,3 | 2.75 | % | 6.27 | % | 10.39 | % | ||||||
S&P Target Date 2050 Index4 | 0.62 | % | 6.94 | % | 10.24 | % | ||||||
2050 Composite Benchmark5 | 1.97 | % | 7.40 | % | 10.59 | % | ||||||
The following graph compares the value of a $10,000 investment in the Manning & Napier Fund, Inc. - Target 2050 Series - Class K for the ten years ended October 31, 2018 to the S&P Target Date 2050 Index and the 2050 Composite Benchmark.
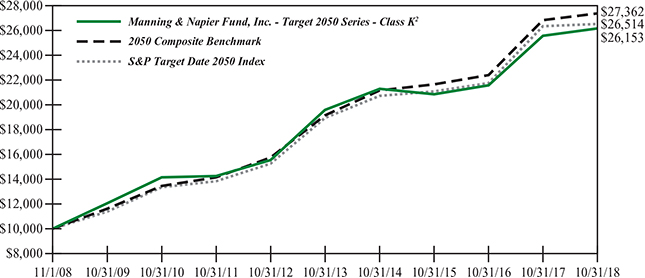
1The returns shown are based on net asset values calculated for shareholder transactions and may differ from the returns shown in the financial highlights, which reflect adjustments made to the net asset values in accordance with accounting principles generally accepted in the United States of America.
2The Series’ performance does not reflect the deduction of taxes that a shareholder would pay on fund distributions or the redemption of shares. The Series’ performance is historical and may not be indicative of future results. The performance returns shown are inclusive of the net expense ratio of the Series. For the year ended October 31, 2018, this net expense ratio was 0.45% for Class K, 0.70% for Class R, 0.20% for Class I and 0.05% for Class R6. The gross expense ratio, which does not account for any voluntary or contractual waivers currently in effect, was 0.97% for Class K, 1.11% for Class R, 0.74% for Class I and 0.57% for Class R6 for the year ended October 31, 2018.
3For periods prior to the inception of Class R6 on October 16, 2017, the performance is based on the historical performance of the Class I shares. Because the Class R6 shares invest in the same portfolio of securities as the Class I shares, performance will be different only to the extent that the Class I shares have a higher expense ratio.
4The S&P Target Date Index Series is a series of unmanaged indices that reflect the market consensus for asset allocations for different target date horizons. Asset class weights are established annually and rebalanced monthly. Prior to 02/26/2010, the indices were rebalanced annually. Historical returns for the S&P Target Date 2050 Index prior to 5/31/2011 (the index launch date) are identical to the returns of the S&P Target Date 2045 Index, the closest dated target date index as of the launch date. Index returns assume daily reinvestment of dividends. Beginning 06/01/2017, the asset class exposure for each index is represented by indices and returns do not reflect any fees or expenses. Prior to 06/01/2017, the asset class exposure for each index is represented by exchange traded funds (ETFs) and returns are net of ETF expenses. Index returns provided by Bloomberg. S&P Dow Jones Indices LLC, a subsidiary of the McGraw Hill Financial, Inc., is the publisher of various index based data products and services and has licensed certain of its products and services for use by Manning & Napier. All such content Copyright © 2017 by S&P Dow Jones Indices LLC and/or its affiliates. All rights reserved. Neither S&P Dow Jones Indices LLC, Dow Jones Trademark Holdings LLC, their affiliates nor their third party licensors make any representation or warranty, express or implied, as to the ability of any index to accurately represent the asset class or market sector that it purports to represent and none of these parties shall have any liability for any errors, omissions, or interruptions of any index or the data included therein.
20
Performance Update as of October 31, 2018 - Target 2050 Series
(unaudited)
5The Target Composite Benchmark represents the performance of the target date fund’s asset classes according to their respective weightings, as adjusted over time to reflect the target date fund’s increasingly conservative asset allocations. The following indices are used to calculate the Target Composite Benchmarks: Russell 3000® Index (Russell 3000), MSCI ACWI ex USA Index (ACWIxUS), and Bloomberg Barclays U.S. Aggregate Bond Index (BAB) and/or Bloomberg Barclays U.S. Intermediate Aggregate Bond Index (BIAB). Russell 3000 is an unmanaged index that consists of 3,000 of the largest U.S. companies based on total market capitalization. Index returns are based on a market capitalization-weighted average of relative price changes of the component stocks plus dividends whose reinvestments are compounded daily. Index returns provided by Bloomberg. ACWIxUS is designed to measure large and mid-cap representation across 22 of 23 Developed Markets countries (excluding the U.S.) and 24 Emerging Markets countries. The Index is denominated in U.S. dollars. The Index returns are net of withholding taxes. They assume daily reinvestment of net dividends thus accounting for any applicable dividend taxation. Index returns provided by Bloomberg. BAB and BIAB are both unmanaged, market value-weighted indices of U.S. domestic investment-grade debt issues, including government, corporate, asset-backed and mortgage-backed securities. BAB includes maturities of one year or more; BIAB includes maturities of greater than one year but less than ten years. BAB and BIAB returns provided by Interactive Data. Indices returns do not reflect any fees or expenses. Returns provided are calculated monthly using a blended allocation. Because the target date fund’s asset allocation will vary over time, the composition of the target date portfolio may not match the composition of the comparative Target Composite Benchmark. Mid-month performance is not available for the Composite Benchmark. Performance shown is from the first of the month following the corresponding Fund’s inception date.
21
Performance Update as of October 31, 2018 - Target 2055 Series
(unaudited)
AVERAGE ANNUAL TOTAL RETURNS AS OF OCTOBER 31, 2018 | ||||||||||||
| ONE YEAR1 | FIVE YEAR | SINCE INCEPTION2 | ||||||||||
Manning & Napier Fund, Inc. - Target 2055 - Class K3 | 2.26 | % | 5.91 | % | 10.17 | % | ||||||
Manning & Napier Fund, Inc. - Target 2055 - Class R3 | 2.00 | % | 5.64 | % | 9.83 | % | ||||||
Manning & Napier Fund, Inc. - Target 2055 - Class I3 | 2.52 | % | 6.17 | % | 10.53 | % | ||||||
Manning & Napier Fund, Inc. - Target 2055 - Class R63,4 | 2.71 | % | 6.21 | % | 10.56 | % | ||||||
S&P Target Date 2055 Index5 | 0.63 | % | 7.04 | % | 10.78 | % | ||||||
2055 Composite Benchmark6 | 1.97 | % | 7.40 | % | 9.91 | % | ||||||
The following graph compares the value of a $10,000 investment in the Manning & Napier Fund, Inc. - Target 2055 Series - Class K from its inception2 (6/25/12) to present (10/31/18) to the S&P Target Date 2055 Index and the 2055 Composite Benchmark.
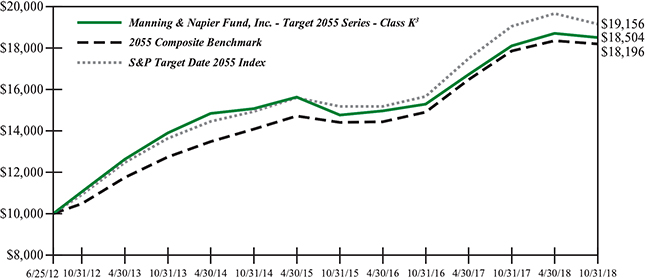
1The returns shown are based on net asset values calculated for shareholder transactions and may differ from the returns shown in the financial highlights, which reflect adjustments made to the net asset values in accordance with accounting principles generally accepted in the United States of America.
2Performance numbers for the Series and the S&P Target Date Index are calculated from June 25, 2012, the Series’ inception date. Performance numbers for the Target Composite Benchmark are calculated from June 30, 2012.
3The Series’ performance does not reflect the deduction of taxes that a shareholder would pay on fund distributions or the redemption of shares. The Series’ performance is historical and may not be indicative of future results. The performance returns shown are inclusive of the net expense ratio of the Series. For the year ended October 31, 2018, this net expense ratio was 0.45% for Class K, 0.70% for Class R, 0.20% for Class I and 0.05% for Class R6. The gross expense ratio, which does not account for any voluntary or contractual waivers currently in effect, was 2.32% for Class K, 2.47% for Class R, 2.10% for Class I and 1.95% for Class R6 for the year ended October 31, 2018.
4For periods prior to the inception of Class R6 on October 16, 2017, the performance is based on the historical performance of the Class I shares. Because the Class R6 shares invest in the same portfolio of securities as the Class I shares, performance will be different only to the extent that the Class I shares have a higher expense ratio.
5The S&P Target Date Index Series is a series of unmanaged indices that reflect the market consensus for asset allocations for different target date horizons. Asset class weights are established annually and rebalanced monthly. Prior to 02/26/2010, the indices were rebalanced annually. Beginning 06/01/2017, the asset class exposure for each index is represented by indices and returns do not reflect any fees or expenses. Prior to 06/01/2017, the asset class exposure for each index is represented by exchange traded funds (ETFs) and returns are net of ETF expenses. Index returns provided by Bloomberg. S&P Dow Jones Indices LLC, a subsidiary of the McGraw Hill Financial, Inc., is the publisher of various index based data products and services and has licensed certain of its products and services for use by Manning & Napier. All such content Copyright © 2017 by S&P Dow Jones Indices LLC and/or its affiliates. All rights reserved. Neither S&P Dow Jones Indices LLC, Dow Jones Trademark Holdings LLC, their affiliates nor their third party licensors make any representation or warranty, express or implied, as to the ability of any index to accurately represent the asset class or market sector that it purports to represent and none of these parties shall have any liability for any errors, omissions, or interruptions of any index or the data included therein.
22
Performance Update as of October 31, 2018 - Target 2055 Series
(unaudited)
6The Target Composite Benchmark represents the performance of the target date fund’s asset classes according to their respective weightings, as adjusted over time to reflect the target date fund’s increasingly conservative asset allocations. The following indices are used to calculate the Target Composite Benchmarks: Russell 3000® Index (Russell 3000), MSCI ACWI ex USA Index (ACWIxUS), and Bloomberg Barclays U.S. Aggregate Bond Index (BAB) and/or Bloomberg Barclays U.S. Intermediate Aggregate Bond Index (BIAB). Russell 3000 is an unmanaged index that consists of 3,000 of the largest U.S. companies based on total market capitalization. Index returns are based on a market capitalization-weighted average of relative price changes of the component stocks plus dividends whose reinvestments are compounded daily. Index returns provided by Bloomberg. ACWIxUS is designed to measure large and mid-cap representation across 22 of 23 Developed Markets countries (excluding the U.S.) and 24 Emerging Markets countries. The Index is denominated in U.S. dollars. The Index returns are net of withholding taxes. They assume daily reinvestment of net dividends thus accounting for any applicable dividend taxation. Index returns provided by Bloomberg. BAB and BIAB are both unmanaged, market value-weighted indices of U.S. domestic investment-grade debt issues, including government, corporate, asset-backed and mortgage-backed securities. BAB includes maturities of one year or more; BIAB includes maturities of greater than one year but less than ten years. BAB and BIAB returns provided by Interactive Data. Indices returns do not reflect any fees or expenses. Returns provided are calculated monthly using a blended allocation. Because the target date fund’s asset allocation will vary over time, the composition of the target date portfolio may not match the composition of the comparative Target Composite Benchmark. Mid-month performance is not available for the Composite Benchmark. Performance shown is from the first of the month following the corresponding Fund’s inception date.
23
Performance Update as of October 31, 2018 - Target 2060 Series
(unaudited)
AVERAGE ANNUAL TOTAL RETURNS AS OF OCTOBER 31, 2018 | ||||||||
ONE YEAR1 | SINCE INCEPTION2 | |||||||
Manning & Napier Fund, Inc. - Target 2060 - Class K3 | 2.32 | % | 8.81 | % | ||||
Manning & Napier Fund, Inc. - Target 2060 - Class R3 | 2.11 | % | 8.56 | % | ||||
Manning & Napier Fund, Inc. - Target 2060 - Class I3 | 2.55 | % | 9.04 | % | ||||
Manning & Napier Fund, Inc. - Target 2060 - Class R63,4 | 2.74 | % | 9.11 | % | ||||
S&P Target Date 2060+ Index5 | 0.81 | % | 9.33 | % | ||||
2060 Composite Benchmark6 | 1.97 | % | 10.11 | % | ||||
The following graph compares the value of a $10,000 investment in the Manning & Napier Fund, Inc. - Target 2060 Series - Class K from its inception2 (9/21/15) to present (10/31/18) to the S&P Target Date 2060+ Index and the 2060 Composite Benchmark.

1The returns shown are based on net asset values calculated for shareholder transactions and may differ from the returns shown in the financial highlights, which reflect adjustments made to the net asset values in accordance with accounting principles generally accepted in the United States of America.
2Performance numbers for the Series and the S&P Target Date Index are calculated from September 21, 2015, the Series’ inception date. Performance numbers for the Target Composite Benchmark are calculated from September 30, 2015.
3The Series’ performance does not reflect the deduction of taxes that a shareholder would pay on fund distributions or the redemption of shares. The Series’ performance is historical and may not be indicative of future results. The performance returns shown are inclusive of the net expense ratio of the Series. For the year ended October 31, 2018, this annualized net expense ratio was 0.45% for Class K, 0.70% for Class R, 0.20% for Class I and 0.05% for Class R6. The annualized gross expense ratio, which does not account for any voluntary or contractual waivers currently in effect, was 2.74% for Class K, 2.86% for Class R, 2.43% for Class I and 2.36% for Class R6 for the year ended October 31, 2018.
4For periods prior to the inception of Class R6 on October 16, 2017, the performance is based on the historical performance of the Class I shares. Because the Class R6 shares invest in the same portfolio of securities as the Class I shares, performance will be different only to the extent that the Class I shares have a higher expense ratio.
5The S&P Target Date Index Series is a series of unmanaged indices that reflect the market consensus for asset allocations for different target date horizons. Asset class weights are established annually and rebalanced monthly. Prior to 02/26/2010, the indices were rebalanced annually. Index returns assume daily reinvestment of dividends. Beginning 06/ 01/2017, the asset class exposure for each index is represented by indices and returns do not reflect any fees or expenses. Prior to 06/01/2017, the asset class exposure for each index is represented by exchange traded funds (ETFs) and returns are net of ETF expenses. Index returns provided by Bloomberg. S&P Dow Jones Indices LLC, a subsidiary of the McGraw Hill Financial, Inc., is the publisher of various index based data products and services and has licensed certain of its products and services for use by Manning & Napier. All such content Copyright © 2017 by S&P Dow Jones Indices LLC and/or its affiliates. All rights reserved. Neither S&P Dow Jones Indices LLC, Dow Jones
24
Performance Update as of October 31, 2018 - Target 2060 Series
(unaudited)
Trademark Holdings LLC, their affiliates nor their third party licensors make any representation or warranty, express or implied, as to the ability of any index to accurately represent the asset class or market sector that it purports to represent and none of these parties shall have any liability for any errors, omissions, or interruptions of any index or the data included therein.
6The Target Composite Benchmark represents the performance of the target date fund’s asset classes according to their respective weightings, as adjusted over time to reflect the target date fund’s increasingly conservative asset allocations. The following indices are used to calculate the Target Composite Benchmarks: Russell 3000® Index (Russell 3000), MSCI ACWI ex USA Index (ACWIxUS), and Bloomberg Barclays U.S. Aggregate Bond Index (BAB) and/or Bloomberg Barclays U.S. Intermediate Aggregate Bond Index (BIAB). Russell 3000 is an unmanaged index that consists of 3,000 of the largest U.S. companies based on total market capitalization. Index returns are based on a market capitalization-weighted average of relative price changes of the component stocks plus dividends whose reinvestments are compounded daily. Index returns provided by Bloomberg. ACWIxUS is designed to measure large and mid-cap representation across 22 of 23 Developed Markets countries (excluding the U.S.) and 24 Emerging Markets countries. The Index is denominated in U.S. dollars. The Index returns are net of withholding taxes. They assume daily reinvestment of net dividends thus accounting for any applicable dividend taxation. Index returns provided by Bloomberg. BAB and BIAB are both unmanaged, market value-weighted indices of U.S. domestic investment-grade debt issues, including government, corporate, asset-backed and mortgage-backed securities. BAB includes maturities of one year or more; BIAB includes maturities of greater than one year but less than ten years. BAB and BIAB returns provided by Interactive Data. Indices returns do not reflect any fees or expenses. Returns provided are calculated monthly using a blended allocation. Because the target date fund’s asset allocation will vary over time, the composition of the target date portfolio may not match the composition of the comparative Target Composite Benchmark. Mid-month performance is not available for the Composite Benchmark. Performance shown is from the first of the month following the corresponding Fund’s inception date.
25
Shareholder Expense Example
(unaudited)
As a shareholder of the Series, you incur ongoing costs, including management fees, shareholder service fees and other Series expenses. This example is intended to help you understand your ongoing costs (in dollars) of investing in the Series and to compare these costs with the ongoing costs of investing in other mutual funds.
The example is based on an investment of $1,000 invested at the beginning of the period and held for the entire period (May 1, 2018 to October 31, 2018).
Actual Expenses
The Actual lines of the tables below provide information about actual account values and actual expenses. You may use the information in these lines, together with the amount you invested, to estimate the expenses that you paid over the period. Simply divide your account value by $1,000 (for example, an $8,600 account value divided by $1,000 = 8.6), then multiply the result by the number in the Actual line for the Series and Class in which you have invested under the heading entitled “Expenses Paid During Period” to estimate the expenses you paid on your account during this period.
Hypothetical Example for Comparison Purposes
The Hypothetical lines of the tables below provide information about hypothetical account values and hypothetical expenses based on the Class’ actual expense ratio and an assumed rate of return of 5% per year before expenses, which is not the Class’ actual return. The hypothetical account values and expenses may not be used to estimate the actual ending account balance or expenses you paid during the period. You may use this information to compare the ongoing costs of investing in a Class of the Series and other funds. To do so, compare this 5% hypothetical example for the Series and Class in which you have invested with the 5% hypothetical examples that appear in the shareholder reports of the other funds.
Please note that the expenses shown in the tables are meant to highlight your ongoing costs only and do not reflect any transaction costs, such as sales charges (loads), redemption fees, or exchange fees that you may incur in other mutual funds. Therefore, the Hypothetical lines of the tables are useful in comparing ongoing costs only, and will not help you determine the relative total costs of owning different funds.
| BEGINNING ACCOUNT VALUE 5/1/18 | ENDING ACCOUNT VALUE 10/31/18 | EXPENSES PAID DURING PERIOD | ANNUALIZED EXPENSE RATIO2 | |||||
Target Income | ||||||||
Actual (Class K) | $1,000.00 | $1,000.38 | $2.27 | 0.45% | ||||
Hypothetical3 | $1,000.00 | $1,022.94 | $2.29 | 0.45% | ||||
Actual (Class R) | $1,000.00 | $ 999.00 | $3.48 | 0.69% | ||||
Hypothetical3 | $1,000.00 | $1,021.73 | $3.52 | 0.69% | ||||
Actual (Class I) | $1,000.00 | $1,001.55 | $1.01 | 0.20% | ||||
Hypothetical3 | $1,000.00 | $1,024.20 | $1.02 | 0.20% | ||||
Actual (Class R6) | $1,000.00 | $1,001.94 | $0.25 | 0.05% | ||||
Hypothetical3 | $1,000.00 | $1,024.95 | $0.26 | 0.05% | ||||
26
Shareholder Expense Example
(unaudited)
BEGINNING 5/1/18 | ENDING ACCOUNT VALUE 10/31/18 | EXPENSES PAID DURING PERIOD 5/1/18-10/31/181 | ANNUALIZED RATIO2 | |||||
Target 2015 | ||||||||
Actual (Class K) | $1,000.00 | $ 996.42 | $2.26 | 0.45% | ||||
Hypothetical3 | $1,000.00 | $1,022.94 | $2.29 | 0.45% | ||||
Actual (Class R) | $1,000.00 | $ 994.93 | $3.52 | 0.70% | ||||
Hypothetical3 | $1,000.00 | $1,021.68 | $3.57 | 0.70% | ||||
Actual (Class I) | $1,000.00 | $ 997.14 | $1.01 | 0.20% | ||||
Hypothetical3 | $1,000.00 | $1,024.20 | $1.02 | 0.20% | ||||
Actual (Class R6) | $1,000.00 | $ 997.81 | $0.25 | 0.05% | ||||
Hypothetical3 | $1,000.00 | $1,024.95 | $0.26 | 0.05% | ||||
BEGINNING 5/1/18 | ENDING ACCOUNT VALUE 10/31/18 | EXPENSES PAID DURING PERIOD 5/1/18-10/31/181 | ANNUALIZED RATIO2 | |||||
Target 2020 | ||||||||
Actual (Class K) | $1,000.00 | $ 990.98 | $2.26 | 0.45% | ||||
Hypothetical3 | $1,000.00 | $1,022.94 | $2.29 | 0.45% | ||||
Actual (Class R) | $1,000.00 | $ 990.15 | $3.51 | 0.70% | ||||
Hypothetical3 | $1,000.00 | $1,021.68 | $3.57 | 0.70% | ||||
Actual (Class I) | $1,000.00 | $ 991.18 | $1.00 | 0.20% | ||||
Hypothetical3 | $1,000.00 | $1,024.20 | $1.02 | 0.20% | ||||
Actual (Class R6) | $1,000.00 | $ 992.72 | $0.25 | 0.05% | ||||
Hypothetical3 | $1,000.00 | $1,024.95 | $0.26 | 0.05% | ||||
BEGINNING 5/1/18 | ENDING 10/31/18 | EXPENSES PAID DURING PERIOD 5/1/18-10/31/181 | ANNUALIZED EXPENSE RATIO2 | |||||
Target 2025 | ||||||||
Actual (Class K) | $1,000.00 | $ 988.80 | $2.26 | 0.45% | ||||
Hypothetical3 | $1,000.00 | $1,022.94 | $2.29 | 0.45% | ||||
Actual (Class R) | $1,000.00 | $ 988.23 | $3.51 | 0.70% | ||||
Hypothetical3 | $1,000.00 | $1,021.68 | $3.57 | 0.70% | ||||
Actual (Class I) | $1,000.00 | $ 990.28 | $1.00 | 0.20% | ||||
Hypothetical3 | $1,000.00 | $1,024.20 | $1.02 | 0.20% | ||||
Actual (Class R6) | $1,000.00 | $ 991.77 | $0.25 | 0.05% | ||||
Hypothetical3 | $1,000.00 | $1,024.95 | $0.26 | 0.05% | ||||
27
Shareholder Expense Example
(unaudited)
BEGINNING 5/1/18 | ENDING ACCOUNT VALUE 10/31/18 | EXPENSES PAID 5/1/18-10/31/181 | ANNUALIZED RATIO2 | |||||
Target 2030 | ||||||||
Actual (Class K) | $1,000.00 | $ 989.47 | $2.26 | 0.45% | ||||
Hypothetical3 | $1,000.00 | $1,022.94 | $2.29 | 0.45% | ||||
Actual (Class R) | $1,000.00 | $ 986.98 | $3.51 | 0.70% | ||||
Hypothetical3 | $1,000.00 | $1,021.68 | $3.57 | 0.70% | ||||
Actual (Class I) | $1,000.00 | $ 990.02 | $1.00 | 0.20% | ||||
Hypothetical3 | $1,000.00 | $1,024.20 | $1.02 | 0.20% | ||||
Actual (Class R6) | $1,000.00 | $ 990.34 | $0.25 | 0.05% | ||||
Hypothetical3 | $1,000.00 | $1,024.95 | $0.26 | 0.05% | ||||
BEGINNING 5/1/18 | ENDING ACCOUNT VALUE 10/31/18 | EXPENSES PAID 5/1/18-10/31/181 | ANNUALIZED RATIO2 | |||||
Target 2035 | ||||||||
Actual (Class K) | $1,000.00 | $ 989.41 | $2.26 | 0.45% | ||||
Hypothetical3 | $1,000.00 | $1,022.94 | $2.29 | 0.45% | ||||
Actual (Class R) | $1,000.00 | $ 988.40 | $3.51 | 0.70% | ||||
Hypothetical3 | $1,000.00 | $1,021.68 | $3.57 | 0.70% | ||||
Actual (Class I) | $1,000.00 | $ 990.36 | $1.00 | 0.20% | ||||
Hypothetical3 | $1,000.00 | $1,024.20 | $1.02 | 0.20% | ||||
Actual (Class R6) | $1,000.00 | $ 991.01 | $0.25 | 0.05% | ||||
Hypothetical3 | $1,000.00 | $1,024.95 | $0.26 | 0.05% | ||||
BEGINNING 5/1/18 | ENDING 10/31/18 | EXPENSES PAID 5/1/18-10/31/181 | ANNUALIZED EXPENSE RATIO2 | |||||
Target 2040 | ||||||||
Actual (Class K) | $1,000.00 | $ 989.39 | $2.26 | 0.45% | ||||
Hypothetical3 | $1,000.00 | $1,022.94 | $2.29 | 0.45% | ||||
Actual (Class R) | $1,000.00 | $ 989.09 | $3.51 | 0.70% | ||||
Hypothetical3 | $1,000.00 | $1,021.68 | $3.57 | 0.70% | ||||
Actual (Class I) | $1,000.00 | $ 991.68 | $1.00 | 0.20% | ||||
Hypothetical3 | $1,000.00 | $1,024.20 | $1.02 | 0.20% | ||||
Actual (Class R6) | $1,000.00 | $ 992.26 | $0.25 | 0.05% | ||||
Hypothetical3 | $1,000.00 | $1,024.95 | $0.26 | 0.05% | ||||
28
Shareholder Expense Example
(unaudited)
BEGINNING 5/1/18 | ENDING 10/31/18 | EXPENSES PAID 5/1/18-10/31/181 | ANNUALIZED EXPENSE RATIO2 | |||||
Target 2045 | ||||||||
Actual (Class K) | $1,000.00 | $ 990.07 | $2.26 | 0.45% | ||||
Hypothetical3 | $1,000.00 | $1,022.94 | $2.29 | 0.45% | ||||
Actual (Class R) | $1,000.00 | $ 988.46 | $3.51 | 0.70% | ||||
Hypothetical3 | $1,000.00 | $1,021.68 | $3.57 | 0.70% | ||||
Actual (Class I) | $1,000.00 | $ 991.62 | $1.00 | 0.20% | ||||
Hypothetical3 | $1,000.00 | $1,024.20 | $1.02 | 0.20% | ||||
Actual (Class R6) | $1,000.00 | $ 992.38 | $0.25 | 0.05% | ||||
Hypothetical3 | $1,000.00 | $1,024.95 | $0.26 | 0.05% | ||||
BEGINNING 5/1/18 | ENDING 10/31/18 | EXPENSES PAID 5/1/18-10/31/181 | ANNUALIZED RATIO2 | |||||
Target 2050 | ||||||||
Actual (Class K) | $1,000.00 | $ 990.55 | $2.26 | 0.45% | ||||
Hypothetical3 | $1,000.00 | $1,022.94 | $2.29 | 0.45% | ||||
Actual (Class R) | $1,000.00 | $ 989.48 | $3.51 | 0.70% | ||||
Hypothetical3 | $1,000.00 | $1,021.68 | $3.57 | 0.70% | ||||
Actual (Class I) | $1,000.00 | $ 991.57 | $1.00 | 0.20% | ||||
Hypothetical3 | $1,000.00 | $1,024.20 | $1.02 | 0.20% | ||||
Actual (Class R6) | $1,000.00 | $ 993.44 | $0.25 | 0.05% | ||||
Hypothetical3 | $1,000.00 | $1,024.95 | $0.26 | 0.05% | ||||
BEGINNING 5/1/18 | ENDING 10/31/18 | EXPENSES PAID 5/1/18-10/31/181 | ANNUALIZED RATIO2 | |||||
Target 2055 | ||||||||
Actual (Class K) | $1,000.00 | $ 989.88 | $2.26 | 0.45% | ||||
Hypothetical3 | $1,000.00 | $1,022.94 | $2.29 | 0.45% | ||||
Actual (Class R) | $1,000.00 | $ 988.97 | $3.51 | 0.70% | ||||
Hypothetical3 | $1,000.00 | $1,021.68 | $3.57 | 0.70% | ||||
Actual (Class I) | $1,000.00 | $ 991.53 | $1.00 | 0.20% | ||||
Hypothetical3 | $1,000.00 | $1,024.20 | $1.02 | 0.20% | ||||
Actual (Class R6) | $1,000.00 | $ 992.31 | $0.25 | 0.05% | ||||
Hypothetical3 | $1,000.00 | $1,024.95 | $0.26 | 0.05% | ||||
29
Shareholder Expense Example
(unaudited)
BEGINNING 5/1/18 | ENDING 10/31/18 | EXPENSES PAID 5/1/18-10/31/181 | ANNUALIZED RATIO2 | |||||
Target 2060 | ||||||||
Actual (Class K) | $1,000.00 | $ 990.48 | $2.26 | 0.45% | ||||
Hypothetical3 | $1,000.00 | $1,022.94 | $2.29 | 0.45% | ||||
Actual (Class R) | $1,000.00 | $ 990.44 | $3.51 | 0.70% | ||||
Hypothetical3 | $1,000.00 | $1,021.68 | $3.57 | 0.70% | ||||
Actual (Class I) | $1,000.00 | $ 991.35 | $1.00 | 0.20% | ||||
Hypothetical3 | $1,000.00 | $1,024.20 | $1.02 | 0.20% | ||||
Actual (Class R6) | $1,000.00 | $ 993.08 | $0.25 | 0.05% | ||||
Hypothetical3 | $1,000.00 | $1,024.95 | $0.26 | 0.05% | ||||
1Expenses are equal to each Class’ annualized expense ratio (for the six-month period), multiplied by the average account value over the period, multiplied by 184/365 (to reflect the one-half year period). Expenses are based on the most recent fiscal half year; therefore, the expense ratios stated above may differ from the expense ratios stated in the financial highlights, which are based on one-year data. The Class’ total return would have been lower had certain expenses not been waived during the period.
2Expense ratios of the Class do not include fees and expenses indirectly incurred by the underlying funds. If these expenses were included, the expense ratios would have been higher.
3Assumes 5% annual return before expenses.
30
Portfolio Composition as of October 31, 2018 - Asset Allocation1
(unaudited)
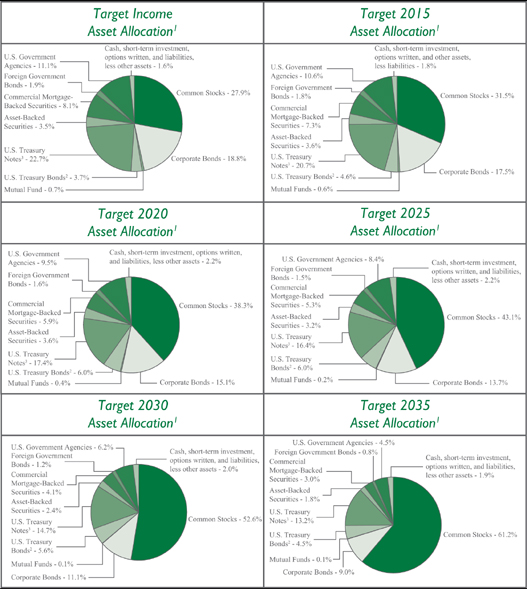
1 Represents portfolio composition of the underlying investment(s) for each Series as a percentage of net assets.
2 A U.S. Treasury Bond is a long-term obligation of the U.S. Treasury issued with a maturity period of more than ten years.
3 A U.S. Treasury Note is an intermediate-term obligation of the U.S. Treasury issued with a maturity period between one and ten years.
31
Portfolio Composition as of October 31, 2018 - Asset Allocation1
(unaudited)
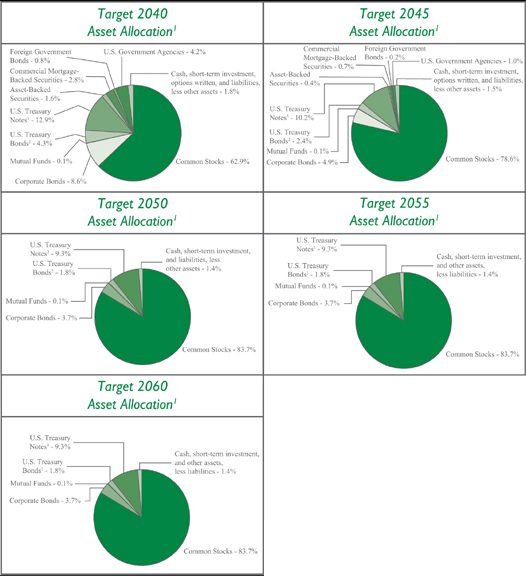
1 Represents portfolio composition of the underlying investment(s) for each Series as a percentage of net assets.
2 A U.S. Treasury Bond is a long-term obligation of the U.S. Treasury issued with a maturity period of more than ten years.
3 A U.S. Treasury Note is an intermediate-term obligation of the U.S. Treasury issued with a maturity period between one and ten years.
32
Investment Portfolios - October 31, 2018
| TARGET INCOME SERIES | SHARES | VALUE (NOTE 2) | ||||||||||
AFFILIATED INVESTMENT COMPANIES - 100.1% | ||||||||||||
Manning & Napier Blended Asset Conservative Series - Class R6 | 11,781,309 | $ | 125,824,382 | |||||||||
|
| |||||||||||
TOTAL AFFILIATED INVESTMENT COMPANIES | ||||||||||||
(Identified Cost $128,010,053) | 125,824,382 | |||||||||||
LIABILITIES, LESS OTHER ASSETS - (0.1%) | (78,390 | ) | ||||||||||
|
| |||||||||||
NET ASSETS - 100% | $ | 125,745,992 | ||||||||||
|
| |||||||||||
| TARGET 2015 SERIES | SHARES | VALUE (NOTE 2) | ||||||||||
AFFILIATED INVESTMENT COMPANIES - 99.9% | ||||||||||||
Manning & Napier Blended Asset Conservative Series - Class R6 | 119,845 | $ | 1,279,950 | |||||||||
Manning & Napier Blended Asset Moderate Series - Class R6 | 80,458 | 844,809 | ||||||||||
|
| |||||||||||
TOTAL AFFILIATED INVESTMENT COMPANIES | ||||||||||||
(Identified Cost $2,177,285) | 2,124,759 | |||||||||||
OTHER ASSETS, LESS LIABILITIES - 0.1% | 2,497 | |||||||||||
|
| |||||||||||
NET ASSETS - 100% | $ | 2,127,256 | ||||||||||
|
| |||||||||||
| TARGET 2020 SERIES | SHARES | VALUE (NOTE 2) | ||||||||||
AFFILIATED INVESTMENT COMPANIES - 100.1% | ||||||||||||
Manning & Napier Blended Asset Extended Series - Class R6 | 924,741 | $ | 9,358,378 | |||||||||
Manning & Napier Blended Asset Moderate Series - Class R6 | 8,034,639 | 84,363,708 | ||||||||||
|
| |||||||||||
TOTAL AFFILIATED INVESTMENT COMPANIES | ||||||||||||
(Identified Cost $96,074,317) | 93,722,086 | |||||||||||
LIABILITIES, LESS OTHER ASSETS - (0.1%) | (65,470 | ) | ||||||||||
|
| |||||||||||
NET ASSETS - 100% | $ | 93,656,616 | ||||||||||
|
| |||||||||||
The accompanying notes are an integral part of the financial statements.
33
Investment Portfolios - October 31, 2018
| TARGET 2025 SERIES | SHARES | VALUE (NOTE 2) | ||||||
AFFILIATED INVESTMENT COMPANIES - 100.0% | ||||||||
Manning & Napier Blended Asset Extended Series - Class R6 | 2,927,766 | $ | 29,628,989 | |||||
Manning & Napier Blended Asset Moderate Series - Class R6 | 2,833,948 | 29,756,456 | ||||||
|
| |||||||
TOTAL AFFILIATED INVESTMENT COMPANIES | ||||||||
(Identified Cost $60,918,363) | 59,385,445 | |||||||
LIABILITIES, LESS OTHER ASSETS - (0.0%)## | (18,659 | ) | ||||||
|
| |||||||
NET ASSETS - 100% | $ | 59,366,786 | ||||||
|
| |||||||
## Less than (0.1%). | ||||||||
| TARGET 2030 SERIES | SHARES | VALUE (NOTE 2) | ||||||
AFFILIATED INVESTMENT COMPANIES - 100.1% | ||||||||
Manning & Napier Blended Asset Extended Series - Class R6 | 10,805,093 | $ | 109,347,539 | |||||
Manning & Napier Blended Asset Maximum Series - Class R6 | 1,031,474 | 12,222,962 | ||||||
|
| |||||||
TOTAL AFFILIATED INVESTMENT COMPANIES | ||||||||
(Identified Cost $124,144,659) | 121,570,501 | |||||||
LIABILITIES, LESS OTHER ASSETS - (0.1%) | (85,575 | ) | ||||||
|
| |||||||
NET ASSETS - 100% | $ | 121,484,926 | ||||||
|
| |||||||
| TARGET 2035 SERIES | SHARES | VALUE (NOTE 2) | ||||||
AFFILIATED INVESTMENT COMPANIES - 100.0% | ||||||||
Manning & Napier Blended Asset Extended Series - Class R6 | 2,396,383 | $ | 24,251,400 | |||||
Manning & Napier Blended Asset Maximum Series - Class R6 | 1,103,351 | 13,074,707 | ||||||
|
| |||||||
TOTAL AFFILIATED INVESTMENT COMPANIES | ||||||||
(Identified Cost $38,053,170) | 37,326,107 | |||||||
LIABILITIES, LESS OTHER ASSETS - (0.0%)## | (11,974 | ) | ||||||
|
| |||||||
NET ASSETS - 100% | $ | 37,314,133 | ||||||
|
| |||||||
## Less than (0.1%). | ||||||||
The accompanying notes are an integral part of the financial statements.
34
Investment Portfolios - October 31, 2018
| TARGET 2040 SERIES | SHARES | VALUE (NOTE 2) | ||||||
AFFILIATED INVESTMENT COMPANIES - 100.1% | ||||||||
Manning & Napier Blended Asset Extended Series - Class R6 | 2,872,407 | $ | 29,068,763 | |||||
Manning & Napier Blended Asset Maximum Series - Class R6 | 3,705,895 | 43,914,852 | ||||||
|
| |||||||
TOTAL AFFILIATED INVESTMENT COMPANIES | ||||||||
(Identified Cost $73,461,774) | 72,983,615 | |||||||
LIABILITIES, LESS OTHER ASSETS - (0.1%) | (50,361 | ) | ||||||
|
| |||||||
NET ASSETS - 100% | $ | 72,933,254 | ||||||
|
| |||||||
| TARGET 2045 SERIES | SHARES | VALUE (NOTE 2) | ||||||
AFFILIATED INVESTMENT COMPANIES - 100.0% | ||||||||
Manning & Napier Blended Asset Extended Series - Class R6 | 303,132 | $ | 3,067,693 | |||||
Manning & Napier Blended Asset Maximum Series - Class R6 | 1,472,131 | 17,444,750 | ||||||
|
| |||||||
TOTAL AFFILIATED INVESTMENT COMPANIES | ||||||||
(Identified Cost $20,687,629) | 20,512,443 | |||||||
LIABILITIES, LESS OTHER ASSETS - (0.0%)## | (2,016 | ) | ||||||
|
| |||||||
NET ASSETS - 100% | $ | 20,510,427 | ||||||
|
| |||||||
## Less than (0.1%). | ||||||||
| TARGET 2050 SERIES | SHARES | VALUE (NOTE 2) | ||||||
AFFILIATED INVESTMENT COMPANIES - 100.1% | ||||||||
Manning & Napier Blended Asset Maximum Series - Class R6 | 2,788,998 | $ | 33,049,623 | |||||
|
| |||||||
TOTAL AFFILIATED INVESTMENT COMPANIES | ||||||||
(Identified Cost $32,969,296) | 33,049,623 | |||||||
LIABILITIES, LESS OTHER ASSETS - (0.1%) | (19,402 | ) | ||||||
|
| |||||||
NET ASSETS - 100% | $ | 33,030,221 | ||||||
|
| |||||||
The accompanying notes are an integral part of the financial statements.
35
Investment Portfolios - October 31, 2018
| TARGET 2055 SERIES | SHARES | VALUE (NOTE 2) | ||||||
AFFILIATED INVESTMENT COMPANIES - 100.0% | ||||||||
Manning & Napier Blended Asset Maximum Series - Class R6 | 862,758 | $ | 10,223,687 | |||||
|
| |||||||
TOTAL AFFILIATED INVESTMENT COMPANIES | ||||||||
(Identified Cost $10,253,669) | 10,223,687 | |||||||
OTHER ASSETS, LESS LIABILITIES - 0.0%## | 3,364 | |||||||
|
| |||||||
NET ASSETS - 100% | $ | 10,227,051 | ||||||
|
| |||||||
## Less than 0.1%. | ||||||||
| TARGET 2060 SERIES | SHARES | VALUE (NOTE 2) | ||||||
AFFILIATED INVESTMENT COMPANIES - 99.9% | ||||||||
Manning & Napier Blended Asset Maximum Series - Class R6 | 961,473 | $ | 11,393,453 | |||||
|
| |||||||
TOTAL AFFILIATED INVESTMENT COMPANIES | ||||||||
(Identified Cost $11,562,075) | 11,393,453 | |||||||
OTHER ASSETS, LESS LIABILITIES - 0.1% | 8,834 | |||||||
|
| |||||||
NET ASSETS - 100% | $ | 11,402,287 | ||||||
|
| |||||||
The accompanying notes are an integral part of the financial statements.
36
Statements of Assets and Liabilities
October 31, 2018
| TARGET INCOME | TARGET 2015 | TARGET 2020 | TARGET 2025 | TARGET 2030 | ||||||||||||||||
ASSETS: | ||||||||||||||||||||
Total investments in Underlying Series: | ||||||||||||||||||||
At value* | $ | 125,824,382 | $ | 2,124,759 | $ | 93,722,086 | $ | 59,385,445 | $ | 121,570,501 | ||||||||||
Receivable from Advisor (Note 3) | 20,376 | 13,090 | 20,785 | 29,096 | 27,690 | |||||||||||||||
Receivable for fund shares sold | 74,801 | 985 | 29,966 | 11,358 | 199,690 | |||||||||||||||
Receivable for shares of Underlying Series sold | 270 | 487 | 498 | 32,584 | 493 | |||||||||||||||
Prepaid expenses | 17,635 | 20,474 | 18,017 | 22,073 | 18,105 | |||||||||||||||
|
|
|
|
|
|
|
|
|
| |||||||||||
TOTAL ASSETS | 125,937,464 | 2,159,795 | 93,791,352 | 59,480,556 | 121,816,479 | |||||||||||||||
|
|
|
|
|
|
|
|
|
| |||||||||||
LIABILITIES: | ||||||||||||||||||||
Accrued sub-transfer agent fees (Note 3) | 36,983 | 1,526 | 37,356 | 6,816 | 50,882 | |||||||||||||||
Accrued distribution and service (Rule 12b-1) fees (Note 3) | 30,631 | 500 | 22,249 | 17,332 | 29,477 | |||||||||||||||
Accrued fund accounting and administration fees (Note 3) | 13,851 | 13,125 | 13,675 | 13,789 | 13,833 | |||||||||||||||
Accrued Chief Compliance Officer service fees (Note 3) | 401 | 401 | 401 | 401 | 401 | |||||||||||||||
Payable for shares of Underlying Series purchased | 74,749 | 979 | 27,276 | — | 171,147 | |||||||||||||||
Accrued transfer agent fees | 10,989 | 203 | 7,471 | 12,134 | 12,471 | |||||||||||||||
Accrued printing and postage fees | 10,616 | 1,185 | 8,584 | 6,480 | 11,189 | |||||||||||||||
Audit fees payable | 10,605 | 10,605 | 10,605 | 10,605 | 10,605 | |||||||||||||||
Custodian fees payable | 2,151 | 3,806 | 3,930 | 3,945 | 3,920 | |||||||||||||||
Payable for fund shares repurchased | 52 | 7 | 2,691 | 41,918 | 27,071 | |||||||||||||||
Other payables and accrued expenses | 444 | 202 | 498 | 350 | 557 | |||||||||||||||
|
|
|
|
|
|
|
|
|
| |||||||||||
TOTAL LIABILITIES | 191,472 | 32,539 | 134,736 | 113,770 | 331,553 | |||||||||||||||
|
|
|
|
|
|
|
|
|
| |||||||||||
TOTAL NET ASSETS | $ | 125,745,992 | $ | 2,127,256 | $ | 93,656,616 | $ | 59,366,786 | $ | 121,484,926 | ||||||||||
|
|
|
|
|
|
|
|
|
| |||||||||||
NET ASSETS CONSIST OF: | ||||||||||||||||||||
Capital stock | 129,543 | 1,942 | 101,893 | 50,565 | 129,468 | |||||||||||||||
Additional paid-in-capital | 128,091,994 | 2,615,358 | 97,464,466 | 60,711,747 | 123,612,860 | |||||||||||||||
Total distributable earnings (loss) | (2,475,545 | ) | (490,044 | ) | (3,909,743 | ) | (1,395,526 | ) | (2,257,402 | ) | ||||||||||
|
|
|
|
|
|
|
|
|
| |||||||||||
TOTAL NET ASSETS | $ | 125,745,992 | $ | 2,127,256 | $ | 93,656,616 | $ | 59,366,786 | $ | 121,484,926 | ||||||||||
|
|
|
|
|
|
|
|
|
| |||||||||||
Class K | ||||||||||||||||||||
Net Assets | $ | 105,985,916 | $ | 1,801,554 | $ | 75,843,829 | $ | 34,659,092 | $ | 93,345,817 | ||||||||||
Shares Outstanding | 10,895,895 | 164,597 | 8,235,398 | 2,953,615 | 9,934,557 | |||||||||||||||
Net Asset Value, Offering Price, and Redemption Price per share | $ | 9.73 | $ | 10.95 | $ | 9.21 | $ | 11.73 | $ | 9.40 | ||||||||||
Class R | ||||||||||||||||||||
Net Assets | $ | 18,769,027 | $ | 37,886 | $ | 13,813,670 | $ | 23,316,601 | $ | 22,412,980 | ||||||||||
Shares Outstanding | 1,957,006 | 3,418 | 1,522,137 | 1,984,122 | 2,409,821 | |||||||||||||||
Net Asset Value, Offering Price, and Redemption Price per share | $ | 9.59 | $ | 11.08 | $ | 9.08 | $ | 11.75 | $ | 9.30 | ||||||||||
Class I | ||||||||||||||||||||
Net Assets | $ | 986,082 | $ | 282,862 | $ | 3,994,183 | $ | 1,386,154 | $ | 5,721,158 | ||||||||||
Shares Outstanding | 100,843 | 25,748 | 431,278 | 118,344 | 601,852 | |||||||||||||||
Net Asset Value, Offering Price, and Redemption Price per share | $ | 9.78 | $ | 10.99 | $ | 9.26 | $ | 11.71 | $ | 9.51 | ||||||||||
Class R6 | ||||||||||||||||||||
Net Assets | $ | 4,967 | $ | 4,954 | $ | 4,934 | $ | 4,939 | $ | 4,971 | ||||||||||
Shares Outstanding | 508 | 451 | 533 | 421 | 523 | |||||||||||||||
Net Asset Value, Offering Price, and Redemption Price per share | $ | 9.78 | $ | 10.99 | 1 | $ | 9.26 | $ | 11.72 | 1 | $ | 9.50 | ||||||||
*At identified cost | $ | 128,010,053 | $ | 2,177,285 | $ | 96,074,317 | $ | 60,918,363 | $ | 124,144,659 | ||||||||||
|
|
|
|
|
|
|
|
|
| |||||||||||
1 The net asset value of the Class R6 Shares of the Manning & Napier Target 2015 Series and Target 2025 Series’ net asset value were calculated using unrounded net assets of $4,953.99 and $4,938.83 divided by the unrounded shares outstanding of 450.736 and 421.376, respectively.
The accompanying notes are an integral part of the financial statements.
37
Statements of Assets and Liabilities
October 31, 2018
TARGET 2035 | TARGET 2040 | TARGET 2045 | TARGET 2050 | TARGET 2055 | TARGET 2060 | |||||||||||||||||||
ASSETS: | ||||||||||||||||||||||||
Total investments in Underlying Series: | ||||||||||||||||||||||||
At value* | $ | 37,326,107 | $ | 72,983,615 | $ | 20,512,443 | $ | 33,049,623 | $ | 10,223,687 | $ | 11,393,453 | ||||||||||||
Receivable from Advisor (Note 3) | 28,070 | 27,389 | 27,086 | 24,249 | 26,182 | 29,855 | ||||||||||||||||||
Receivable for fund shares sold | 118,475 | 33,561 | 4,523 | 26,397 | 6,020 | 10,895 | ||||||||||||||||||
Receivable for shares of Underlying Series sold | 497 | 493 | 488 | 270 | 270 | 259 | ||||||||||||||||||
Prepaid expenses | 20,980 | 17,394 | 20,529 | 16,677 | 20,488 | 24,684 | ||||||||||||||||||
|
|
|
|
|
|
|
|
|
|
|
| |||||||||||||
TOTAL ASSETS | 37,494,129 | 73,062,452 | 20,565,069 | 33,117,216 | 10,276,647 | 11,459,146 | ||||||||||||||||||
|
|
|
|
|
|
|
|
|
|
|
| |||||||||||||
LIABILITIES: | ||||||||||||||||||||||||
Accrued fund accounting and administration fees (Note 3) | 13,659 | 13,546 | 13,563 | 13,303 | 13,502 | 13,170 | ||||||||||||||||||
Accrued distribution and service (Rule 12b-1) fees (Note 3) | 11,122 | 18,237 | 6,087 | 8,287 | 3,202 | 3,241 | ||||||||||||||||||
Accrued sub-transfer agent fees (Note 3) | 5,493 | 29,832 | 3,919 | 13,385 | 2,239 | 2,554 | ||||||||||||||||||
Accrued Chief Compliance Officer service fees (Note 3) | 402 | 401 | 401 | 401 | 402 | 401 | ||||||||||||||||||
Payable for shares of Underlying Series purchased | 118,330 | 33,227 | 2,718 | 5,163 | 5,918 | 10,745 | ||||||||||||||||||
Accrued transfer agent fees | 10,992 | 11,006 | 9,282 | 9,408 | 8,279 | 10,571 | ||||||||||||||||||
Audit fees payable | 10,605 | 10,605 | 10,605 | 10,605 | 10,605 | 10,605 | ||||||||||||||||||
Accrued printing and postage fees | 4,992 | 7,654 | 3,788 | 4,566 | 2,929 | 3,171 | ||||||||||||||||||
Custodian fees payable | 3,930 | 3,905 | 3,896 | 2,159 | 2,151 | 2,119 | ||||||||||||||||||
Payable for fund shares repurchased | 145 | 335 | 92 | 19,395 | 102 | — | ||||||||||||||||||
Other payables and accrued expenses | 326 | 450 | 291 | 323 | 267 | 282 | ||||||||||||||||||
|
|
|
|
|
|
|
|
|
|
|
| |||||||||||||
TOTAL LIABILITIES | 179,996 | 129,198 | 54,642 | 86,995 | 49,596 | 56,859 | ||||||||||||||||||
|
|
|
|
|
|
|
|
|
|
|
| |||||||||||||
TOTAL NET ASSETS | $ | 37,314,133 | $ | 72,933,254 | $ | 20,510,427 | $ | 33,030,221 | $ | 10,227,051 | $ | 11,402,287 | ||||||||||||
|
|
|
|
|
|
|
|
|
|
|
| |||||||||||||
NET ASSETS CONSIST OF: | ||||||||||||||||||||||||
Capital stock | 29,912 | 73,783 | 15,880 | 31,598 | 8,083 | 9,982 | ||||||||||||||||||
Additional paid-in-capital | 37,697,114 | 71,169,121 | 20,299,923 | 31,679,789 | 10,149,302 | 11,547,562 | ||||||||||||||||||
Total distributable earnings (loss) | (412,893 | ) | 1,690,350 | 194,624 | 1,318,834 | 69,666 | (155,257 | ) | ||||||||||||||||
|
|
|
|
|
|
|
|
|
|
|
| |||||||||||||
TOTAL NET ASSETS | $ | 37,314,133 | $ | 72,933,254 | $ | 20,510,427 | $ | 33,030,221 | $ | 10,227,051 | $ | 11,402,287 | ||||||||||||
|
|
|
|
|
|
|
|
|
|
|
| |||||||||||||
Class K | ||||||||||||||||||||||||
Net Assets | $ | 20,917,917 | $ | 55,270,941 | $ | 10,367,486 | $ | 23,352,935 | $ | 4,771,239 | $ | 6,894,683 | ||||||||||||
Shares Outstanding | 1,678,590 | 5,582,709 | 799,670 | 2,228,010 | 374,670 | 602,771 | ||||||||||||||||||
Net Asset Value, Offering Price, and Redemption Price per share | $ | 12.46 | $ | 9.90 | $ | 12.96 | $ | 10.48 | $ | 12.73 | $ | 11.44 | ||||||||||||
Class R | ||||||||||||||||||||||||
Net Assets | $ | 15,631,193 | $ | 14,955,997 | $ | 9,384,189 | $ | 7,812,829 | $ | 5,135,583 | $ | 4,360,347 | ||||||||||||
Shares Outstanding | 1,251,570 | 1,524,903 | 730,025 | 755,652 | 408,756 | 382,589 | ||||||||||||||||||
Net Asset Value, Offering Price, and Redemption Price per share | $ | 12.49 | $ | 9.81 | $ | 12.85 | $ | 10.34 | $ | 12.56 | $ | 11.40 | ||||||||||||
Class I | ||||||||||||||||||||||||
Net Assets | $ | 760,000 | $ | 2,701,241 | $ | 753,628 | $ | 1,859,312 | $ | 315,084 | $ | 142,112 | ||||||||||||
Shares Outstanding | 60,683 | 270,198 | 57,935 | 175,664 | 24,457 | 12,396 | ||||||||||||||||||
Net Asset Value, Offering Price, and Redemption Price per share | $ | 12.52 | $ | 10.00 | $ | 13.01 | $ | 10.58 | $ | 12.88 | $ | 11.46 | ||||||||||||
Class R6 | ||||||||||||||||||||||||
Net Assets | $ | 5,023 | $ | 5,075 | $ | 5,124 | $ | 5,145 | $ | 5,145 | $ | 5,145 | ||||||||||||
Shares Outstanding | 401 | 508 | 393 | 486 | 399 | 448 | ||||||||||||||||||
Net Asset Value, Offering Price, and Redemption Price per share | $ | 12.53 | $ | 10.00 | 1 | $ | 13.03 | 1 | $ | 10.60 | 1 | $ | 12.90 | 1 | $ | 11.48 | ||||||||
*At identified cost | $ | 38,053,170 | $ | 73,461,774 | $ | 20,687,629 | $ | 32,969,296 | $ | 10,253,669 | $ | 11,562,075 | ||||||||||||
|
|
|
|
|
|
|
|
|
|
|
| |||||||||||||
1 The net asset values of the Class R6 Shares of the Manning & Napier Target 2040 Series, Target 2045 Series, Target 2050 Series and Target 2055 Series’ net asset value were calculated using unrounded net assets of $5,074.86, $5,124.04, $5,144.70 and $5,144.41 divided by the unrounded shares outstanding of 507.738, 393.216, 485.554 and 398.66, respectively.
The accompanying notes are an integral part of the financial statements.
38
Statements of Operations
For the Year Ended October 31, 2018
| TARGET INCOME | TARGET 2015 | TARGET 2020 | TARGET 2025 | TARGET 2030 | ||||||||||||||||
INVESTMENT INCOME: | ||||||||||||||||||||
Income distributions from Underlying Series | $ | 1,222,572 | $ | 32,838 | $ | 909,592 | $ | 429,964 | $ | 978,557 | ||||||||||
|
|
|
|
|
|
|
|
|
| |||||||||||
EXPENSES: | ||||||||||||||||||||
Distribution and services (Rule 12b-1) fees (Class K)(Note 3) | 243,262 | 7,681 | 188,568 | 75,008 | 231,374 | |||||||||||||||
Distribution and services (Rule 12b-1) fees (Class R) (Note 3) | 80,208 | 208 | 67,014 | 97,024 | 96,194 | |||||||||||||||
Sub-transfer agent fees (Note 3) | 111,660 | 5,420 | 126,066 | 21,029 | 166,264 | |||||||||||||||
Fund accounting and administration fees (Note 3) | 48,268 | 45,630 | 47,898 | 47,073 | 48,511 | |||||||||||||||
Directors’ fees (Note 3) | 8,701 | 282 | 8,016 | 3,749 | 10,035 | |||||||||||||||
Chief Compliance Officer service fees (Note 3) | 4,385 | 4,385 | 4,386 | 4,385 | 4,385 | |||||||||||||||
Registration and filing fees | 52,064 | 47,232 | 50,643 | 55,736 | 50,814 | |||||||||||||||
Transfer agent fees | 49,325 | 877 | 34,627 | 56,599 | 56,840 | |||||||||||||||
Audit fees | 20,769 | 20,217 | 20,709 | 20,447 | 20,847 | |||||||||||||||
Custodian fees | 2,843 | 4,974 | 5,198 | 5,216 | 5,126 | |||||||||||||||
Miscellaneous | 35,538 | 9,725 | 30,880 | 26,556 | 38,798 | |||||||||||||||
|
|
|
|
|
|
|
|
|
| |||||||||||
Total Expenses | 657,023 | 146,631 | 584,005 | 412,822 | 729,188 | |||||||||||||||
Less reduction of expenses (Note 3) | (101,514 | ) | (131,830 | ) | (127,737 | ) | (138,212 | ) | (148,802 | ) | ||||||||||
|
|
|
|
|
|
|
|
|
| |||||||||||
Net Expenses | 555,509 | 14,801 | 456,268 | 274,610 | 580,386 | |||||||||||||||
|
|
|
|
|
|
|
|
|
| |||||||||||
NET INVESTMENT INCOME (LOSS) | 667,063 | 18,037 | 453,324 | 155,354 | 398,171 | |||||||||||||||
|
|
|
|
|
|
|
|
|
| |||||||||||
REALIZED AND UNREALIZED GAIN (LOSS) ON UNDERLYING SERIES: | ||||||||||||||||||||
Net realized gain (loss) on Underlying Series | 53,511 | (7,271 | ) | 735,124 | 126,048 | 1,916,331 | ||||||||||||||
Distributions of realized gains from Underlying Series | — | — | — | — | 10,343 | |||||||||||||||
Net change in unrealized appreciation (depreciation) on Underlying Series | (2,010,867 | ) | (44,102 | ) | (2,141,344 | ) | (1,459,991 | ) | (2,369,816 | ) | ||||||||||
|
|
|
|
|
|
|
|
|
| |||||||||||
NET REALIZED AND UNREALIZED GAIN (LOSS) ON UNDERLYING SERIES | (1,957,356 | ) | (51,373 | ) | (1,406,220 | ) | (1,333,943 | ) | (443,142 | ) | ||||||||||
|
|
|
|
|
|
|
|
|
| |||||||||||
NET INCREASE (DECREASE) IN NET ASSETS RESULTING FROM OPERATIONS | $ | (1,290,293 | ) | $ | (33,336 | ) | $ | (952,896 | ) | $ | (1,178,589 | ) | $ | (44,971 | ) | |||||
|
|
|
|
|
|
|
|
|
| |||||||||||
The accompanying notes are an integral part of the financial statements.
39
Statements of Operations
For the Year Ended October 31, 2018
| TARGET 2035 | TARGET 2040 | TARGET 2045 | TARGET 2050 | TARGET 2055 | TARGET 2060 | |||||||||||||||||||
INVESTMENT INCOME: | ||||||||||||||||||||||||
Income distributions from Underlying Series | $ | 225,143 | $ | 493,946 | $ | 109,623 | $ | 182,596 | $ | 49,766 | $ | 41,273 | ||||||||||||
|
|
|
|
|
|
|
|
|
|
|
| |||||||||||||
EXPENSES: | ||||||||||||||||||||||||
Distribution and services (Rule 12b-1) fees (Class R) (Note 3) | 59,302 | 60,872 | 37,194 | 28,699 | 20,307 | 13,494 | ||||||||||||||||||
Distribution and services (Rule 12b-1) fees (Class K) (Note 3) | 48,720 | 137,170 | 24,403 | 53,718 | 11,622 | 12,390 | ||||||||||||||||||
Fund accounting and administration fees (Note 3) | 46,632 | 47,323 | 46,315 | 46,304 | 46,088 | 45,726 | ||||||||||||||||||
Sub-transfer agent fees (Note 3) | 17,896 | 97,962 | 13,023 | 43,306 | 6,637 | 6,416 | ||||||||||||||||||
Chief Compliance Officer service fees (Note 3) | 4,386 | 4,385 | 4,385 | 4,385 | 4,385 | 4,385 | ||||||||||||||||||
Directors’ fees (Note 3) | 2,349 | 6,027 | 1,383 | 2,575 | 658 | 533 | ||||||||||||||||||
Registration and filing fees | 49,830 | 48,321 | 47,908 | 46,646 | 47,446 | 48,417 | ||||||||||||||||||
Transfer agent fees | 47,663 | 48,341 | 41,386 | 40,370 | 38,160 | 43,768 | ||||||||||||||||||
Audit fees | 20,360 | 20,588 | 20,293 | 20,353 | 20,241 | 20,229 | ||||||||||||||||||
Custodian fees | 5,183 | 5,154 | 5,132 | 2,895 | 2,880 | 2,598 | ||||||||||||||||||
Miscellaneous | 22,462 | 29,780 | 19,277 | 21,119 | 17,000 | 18,125 | ||||||||||||||||||
|
|
|
|
|
|
|
|
|
|
|
| |||||||||||||
Total Expenses | 324,783 | 505,923 | 260,699 | 310,370 | 215,424 | 216,081 | ||||||||||||||||||
Less reduction of expenses (Note 3) | (152,024 | ) | (156,015 | ) | (161,618 | ) | (163,040 | ) | (165,409 | ) | (174,617 | ) | ||||||||||||
|
|
|
|
|
|
|
|
|
|
|
| |||||||||||||
Net Expenses | 172,759 | 349,908 | 99,081 | 147,330 | 50,015 | 41,464 | ||||||||||||||||||
|
|
|
|
|
|
|
|
|
|
|
| |||||||||||||
NET INVESTMENT INCOME (LOSS) | 52,384 | 144,038 | 10,542 | 35,266 | (249 | ) | (191 | ) | ||||||||||||||||
|
|
|
|
|
|
|
|
|
|
|
| |||||||||||||
REALIZED AND UNREALIZED GAIN (LOSS) ON UNDERLYING SERIES: | ||||||||||||||||||||||||
Net realized gain (loss) on Underlying Series | 316,861 | 2,168,815 | 376,331 | 1,246,629 | 106,996 | 18,505 | ||||||||||||||||||
Distributions of realized gains from Underlying Series | 5,262 | 25,801 | 6,666 | 16,583 | 3,330 | 2,316 | ||||||||||||||||||
Net change in unrealized appreciation (depreciation) on Underlying Series | (709,726 | ) | (475,613 | ) | (184,998 | ) | 47,864 | (35,998 | ) | (172,805 | ) | |||||||||||||
|
|
|
|
|
|
|
|
|
|
|
| |||||||||||||
NET REALIZED AND UNREALIZED GAIN (LOSS) ON UNDERLYING SERIES | (387,603 | ) | 1,719,003 | 197,999 | 1,311,076 | 74,328 | (151,984 | ) | ||||||||||||||||
|
|
|
|
|
|
|
|
|
|
|
| |||||||||||||
NET INCREASE IN NET ASSETS RESULTING FROM OPERATIONS | $ | (335,219 | ) | $ | 1,863,041 | $ | 208,541 | $ | 1,346,342 | $ | 74,079 | $ | (152,175 | ) | ||||||||||
|
|
|
|
|
|
|
|
|
|
|
| |||||||||||||
The accompanying notes are an integral part of the financial statements.
40
Statements of Changes in Net Assets
| TARGET INCOME | TARGET 2015 | |||||||||||||||
FOR THE YEAR ENDED | FOR THE YEAR ENDED 10/31/17 | FOR THE YEAR ENDED 10/31/18 | FOR THE YEAR ENDED 10/31/17 | |||||||||||||
INCREASE (DECREASE) IN NET ASSETS: | ||||||||||||||||
OPERATIONS: | ||||||||||||||||
Net investment income | $ | 667,063 | $ | 1,228,046 | $ | 18,037 | $ | 78,493 | ||||||||
Net realized gain (loss) on Underlying Series | 53,511 | 1,566,264 | (7,271 | ) | 367,523 | |||||||||||
Distributions of realized gains from Underlying Series | — | 177,420 | — | 96,932 | ||||||||||||
Net change in unrealized appreciation (depreciation) on Underlying Series | (2,010,867 | ) | 2,571,384 | (44,102 | ) | (112,149 | ) | |||||||||
|
|
|
|
|
|
|
| |||||||||
Net increase (decrease) from operations | (1,290,293 | ) | 5,543,114 | (33,336 | ) | 430,799 | ||||||||||
|
|
|
|
|
|
|
| |||||||||
DISTRIBUTIONS TO SHAREHOLDERS (Note 9): | ||||||||||||||||
Class K | (551,937 | ) | (995,759 | ) | (18,450 | ) | (47,515 | ) | ||||||||
Class R | (79,029 | ) | (26,587 | ) | (150 | ) | (72 | ) | ||||||||
Class I | (41,364 | ) | (212,436 | ) | (2,948 | ) | (42,420 | ) | ||||||||
Class R6 | (45 | ) | — | (48 | ) | — | ||||||||||
|
|
|
|
|
|
|
| |||||||||
Total distributions to shareholders | (672,375 | ) | (1,234,782 | )* | (21,596 | ) | (90,007 | )* | ||||||||
|
|
|
|
|
|
|
| |||||||||
CAPITAL STOCK ISSUED AND REPURCHASED: | ||||||||||||||||
Net increase (decrease) from capital share transactions (Note 6) | 28,747,761 | 16,826,923 | (2,383,524 | ) | (2,508,194 | ) | ||||||||||
|
|
|
|
|
|
|
| |||||||||
Net increase (decrease) in net assets | 26,785,093 | 21,135,255 | (2,438,456 | ) | (2,167,402 | ) | ||||||||||
NET ASSETS: | ||||||||||||||||
Beginning of year | 98,960,899 | 77,825,644 | 4,565,712 | 6,733,114 | ||||||||||||
|
|
|
|
|
|
|
| |||||||||
End of year | $ | 125,745,992 | $ | 98,960,899 | $ | 2,127,256 | $ | 4,565,712 | ||||||||
|
|
|
|
|
|
|
| |||||||||
* For the year ended October 31, 2017, the distributions to shareholders from net investment income for Target Income and Target 2015 for Class K was $995,759 and $47,515; for Class R was $26,587 and $72; for Class I was $212,436 and $42,420, respectively.
The accompanying notes are an integral part of the financial statements.
41
Statements of Changes in Net Assets
| TARGET 2020 | TARGET 2025 | TARGET 2030 | ||||||||||||||||||||||
| FOR THE YEAR ENDED 10/31/18 | FOR THE YEAR ENDED 10/31/17 | FOR THE YEAR ENDED 10/31/18 | FOR THE YEAR ENDED 10/31/17 | FOR THE YEAR ENDED 10/31/18 | FOR THE YEAR ENDED 10/31/17 | |||||||||||||||||||
INCREASE (DECREASE) IN NET ASSETS: | ||||||||||||||||||||||||
OPERATIONS: | ||||||||||||||||||||||||
Net investment income (loss) | $ | 453,324 | $ | 1,453,253 | $ | 155,354 | $ | 343,482 | $ | 398,171 | $ | 1,414,622 | ||||||||||||
Net realized gain (loss) on Underlying Series | 735,124 | 3,855,178 | 126,048 | 2,781,375 | 1,916,331 | 5,442,759 | ||||||||||||||||||
Distributions of realized gains from Underlying Series | — | 2,459,609 | — | 509,957 | 10,343 | 2,854,246 | ||||||||||||||||||
Net change in unrealized appreciation (depreciation) on Underlying Series | (2,141,344 | ) | 3,295,573 | (1,459,991 | ) | (498,082 | ) | (2,369,816 | ) | 6,774,360 | ||||||||||||||
|
|
|
|
|
|
|
|
|
|
|
| |||||||||||||
Net increase (decrease) from operations | (952,896 | ) | 11,063,613 | (1,178,589 | ) | 3,136,732 | (44,971 | ) | 16,485,987 | |||||||||||||||
|
|
|
|
|
|
|
|
|
|
|
| |||||||||||||
DISTRIBUTIONS TO SHAREHOLDERS (Note 9): | ||||||||||||||||||||||||
Class K | (333,197 | ) | (1,051,197 | ) | (120,108 | ) | (204,189 | ) | (308,506 | ) | (1,172,112 | ) | ||||||||||||
Class R | (38,502 | ) | (56,852 | ) | (51,904 | ) | (27,133 | ) | (40,634 | ) | (87,689 | ) | ||||||||||||
Class I | (140,194) | (750,355) | (12,139) | (244,222) | (146,983) | (903,645) | ||||||||||||||||||
Class R6 | (39 | ) | — | (36 | ) | — | (34 | ) | — | |||||||||||||||
|
|
|
|
|
|
|
|
|
|
|
| |||||||||||||
Total distribution to shareholders | (511,932 | ) | (1,858,404 | )* | (184,187 | ) | (475,544 | )* | (496,157 | ) | (2,163,446 | )* | ||||||||||||
|
|
|
|
|
|
|
|
|
|
|
| |||||||||||||
CAPITAL STOCK ISSUED AND REPURCHASED: | ||||||||||||||||||||||||
Net increase (decrease) from capital share transactions (Note 6) | (19,422,193 | ) | (24,644,386 | ) | 20,316,770 | 7,316,471 | (19,606,205 | ) | (13,600,340 | ) | ||||||||||||||
|
|
|
|
|
|
|
|
|
|
|
| |||||||||||||
Net increase (decrease) in net assets | (20,887,021 | ) | (15,439,177 | ) | 18,953,994 | 9,977,659 | (20,147,333 | ) | 722,201 | |||||||||||||||
NET ASSETS: | ||||||||||||||||||||||||
Beginning of year | 114,543,637 | 129,982,814 | 40,412,792 | 30,435,133 | 141,632,259 | 140,910,058 | ||||||||||||||||||
|
|
|
|
|
|
|
|
|
|
|
| |||||||||||||
End of year | $ | 93,656,616 | $ | 114,543,637 | $ | 59,366,786 | $ | 40,412,792 | $ | 121,484,926 | $ | 141,632,259 | ||||||||||||
|
|
|
|
|
|
|
|
|
|
|
| |||||||||||||
* For the year ended October 31, 2017, the distributions to shareholders from net investment income for Target 2020, Target 2025, and Target 2030 for Class K was $1,051,197, $204,189, and $1,172,112; for Class R was $56,852, $27,133, and $87,689; for Class I was $750,355, $244,222, and $903,645, respectively.
The accompanying notes are an integral part of the financial statements.
42
Statements of Changes in Net Assets
| TARGET 2035 | TARGET 2040 | TARGET 2045 | ||||||||||||||||||||||
FOR THE YEAR | FOR THE YEAR ENDED 10/31/17 | FOR THE YEAR ENDED 10/31/18 | FOR THE YEAR ENDED 10/31/17 | FOR THE YEAR ENDED 10/31/18 | FOR THE YEAR ENDED 10/31/17 | |||||||||||||||||||
INCREASE (DECREASE) IN NET ASSETS: | ||||||||||||||||||||||||
OPERATIONS: | ||||||||||||||||||||||||
Net investment income (loss) | $ | 52,384 | $ | 219,197 | $ | 144,038 | $ | 557,444 | $ | 10,542 | $ | 76,832 | ||||||||||||
Net realized gain (loss) on Underlying Series | 316,861 | 1,504,119 | 2,168,815 | 7,527,200 | 376,331 | 1,738,410 | ||||||||||||||||||
Distributions of realized gains from Underlying Series | 5,262 | 629,154 | 25,801 | 2,704,575 | 6,666 | 478,562 | ||||||||||||||||||
Net change in unrealized appreciation (depreciation) on Underlying Series | (709,726 | ) | 1,183,536 | (475,613 | ) | 2,613,161 | (184,998 | ) | 119,733 | |||||||||||||||
|
|
|
|
|
|
|
|
|
|
|
| |||||||||||||
Net increase (decrease) from operations | (335,219 | ) | 3,536,006 | 1,863,041 | 13,402,380 | 208,541 | 2,413,537 | |||||||||||||||||
|
|
|
|
|
|
|
|
|
|
|
| |||||||||||||
DISTRIBUTIONS TO SHAREHOLDERS (Note 9): | ||||||||||||||||||||||||
Class K | (309,933 | ) | (243,537 | ) | (1,134,887 | ) | (675,356 | ) | (552,542 | ) | (172,547 | ) | ||||||||||||
Class R | (119,611 | ) | (24,552 | ) | (173,383 | ) | (47,294 | ) | (274,363 | ) | (24,869 | ) | ||||||||||||
Class I | (18,396 | ) | (257,881 | ) | (542,227 | ) | (418,483 | ) | (86,775 | ) | (153,655 | ) | ||||||||||||
Class R6 | (95 | ) | — | (123 | ) | — | (283 | ) | — | |||||||||||||||
|
|
|
|
|
|
|
|
|
|
|
| |||||||||||||
Total distributions to shareholders | (448,035 | ) | (525,970 | )* | (1,850,620 | ) | (1,141,133 | )* | (913,963 | ) | (351,071 | )* | ||||||||||||
|
|
|
|
|
|
|
|
|
|
|
| |||||||||||||
CAPITAL STOCK ISSUED AND REPURCHASED: | ||||||||||||||||||||||||
Net increase (decrease) from capital share transactions (Note 6) | 11,780,503 | (1,949,831 | ) | (11,082,791 | ) | (16,725,799 | ) | 5,322,101 | (241,049 | ) | ||||||||||||||
|
|
|
|
|
|
|
|
|
|
|
| |||||||||||||
Net increase (decrease) in net assets | 10,997,249 | 1,060,205 | (11,070,370 | ) | (4,464,552 | ) | 4,616,679 | 1,821,417 | ||||||||||||||||
NET ASSETS: | ||||||||||||||||||||||||
Beginning of year | 26,316,884 | 25,256,679 | 84,003,624 | 88,468,176 | 15,893,748 | 14,072,331 | ||||||||||||||||||
|
|
|
|
|
|
|
|
|
|
|
| |||||||||||||
End of year | $ | 37,314,133 | $ | 26,316,884 | $ | 72,933,254 | $ | 84,003,624 | $ | 20,510,427 | $ | 15,893,748 | ||||||||||||
|
|
|
|
|
|
|
|
|
|
|
| |||||||||||||
* For the year ended October 31, 2017, the distributions to shareholders from net investment income for Target 2035, Target 2040, and Target 2045 for Class K was $164,395, $675,356, and $80,909; for Class R was $15,877, $47,294, and $10,534; for Class I was $181,228, $418,483, and $76,897, respectively. The distributions to shareholders from net realized gain on investments for Target 2035, Target 2040, and Target 2045 for Class K was $79,142, $0, and $91,638; for Class R was $8,675, $0, and $14,335; for Class I was $76,653, $0, and $76,758, respectively.
The accompanying notes are an integral part of the financial statements.
43
Statements of Changes in Net Assets
| TARGET 2050 | TARGET 2055 | TARGET 2060 | ||||||||||||||||||||||
| FOR THE YEAR ENDED 10/31/18 | FOR THE YEAR ENDED 10/31/17 | FOR THE YEAR ENDED 10/31/18 | FOR THE YEAR ENDED 10/31/17 | FOR THE YEAR ENDED 10/31/18 | FOR THE YEAR ENDED 10/31/17 | |||||||||||||||||||
INCREASE (DECREASE) IN NET ASSETS: | ||||||||||||||||||||||||
OPERATIONS: | ||||||||||||||||||||||||
Net investment income (loss). | $ | 35,266 | $ | 167,042 | $ | (249 | ) | $ | 35,048 | $ | (191 | ) | $ | 8,669 | ||||||||||
Net realized gain (loss) on Underlying Series | 1,246,629 | 4,841,813 | 106,996 | 965,931 | 18,505 | 490,147 | ||||||||||||||||||
Distributions of realized gains from Underlying Series | 16,583 | 1,133,284 | 3,330 | 217,817 | 2,316 | 59,549 | ||||||||||||||||||
Net change in unrealized appreciation (depreciation) on Underlying Series | 47,864 | (353,000 | ) | (35,998 | ) | (62,324 | ) | (172,805 | ) | (117,924 | ) | |||||||||||||
|
|
|
|
|
|
|
|
|
|
|
| |||||||||||||
Net increase from operations. | 1,346,342 | 5,789,139 | 74,079 | 1,156,472 | (152,175 | ) | 440,441 | |||||||||||||||||
|
|
|
|
|
|
|
|
|
|
|
| |||||||||||||
DISTRIBUTIONS TO SHAREHOLDERS (Note 9): | ||||||||||||||||||||||||
Class K | (1,432,399 | ) | (179,577 | ) | (374,095 | ) | (57,576 | ) | (379,653 | ) | (25,579 | ) | ||||||||||||
Class R | (264,695 | ) | (21,593 | ) | (242,383 | ) | (11,041 | ) | (152,746 | ) | (2,130 | ) | ||||||||||||
Class I | (1,026,318 | ) | (190,175 | ) | (21,844 | ) | (75,752 | ) | (11,524 | ) | (1,262 | ) | ||||||||||||
Class R6 | (373 | ) | — | (428 | ) | — | (531 | ) | — | |||||||||||||||
|
|
|
|
|
|
|
|
|
|
|
| |||||||||||||
Total distributions to shareholders | (2,723,785 | ) | (391,345 | )* | (638,750 | ) | (144,369 | )* | (544,454 | ) | (28,971 | )* | ||||||||||||
|
|
|
|
|
|
|
|
|
|
|
| |||||||||||||
CAPITAL STOCK ISSUED AND REPURCHASED: | ||||||||||||||||||||||||
Net increase (decrease) from capital share transactions (Note 6) | (973,191 | ) | (251,583 | ) | 4,047,900 | 50,202 | 7,464,444 | 2,578,695 | ||||||||||||||||
|
|
|
|
|
|
|
|
|
|
|
| |||||||||||||
Net increase (decrease) in net assets | (2,350,634 | ) | 5,146,211 | 3,483,229 | 1,062,305 | 6,767,815 | 2,990,165 | |||||||||||||||||
NET ASSETS: | ||||||||||||||||||||||||
Beginning of year | 35,380,855 | 30,234,644 | 6,743,822 | 5,681,517 | 4,634,472 | 1,644,307 | ||||||||||||||||||
|
|
|
|
|
|
|
|
|
|
|
| |||||||||||||
End of year | $ | 33,030,221 | $ | 35,380,855 | $ | 10,227,051 | $ | 6,743,822 | $ | 11,402,287 | $ | 4,634,472 | ||||||||||||
|
|
|
|
|
|
|
|
|
|
|
| |||||||||||||
* For the year ended October 31, 2017, the distributions to shareholders from net investment income for Target 2050, Target 2055, and Target 2060 for Class K was $179,577, $28,911, and $17,972; for Class R was $21,593, $5,418, and $1,517; for Class I was $190,175, $41,404, and $933, respectively. The distributions to shareholders from net realized gain on investments for Target 2050, Target 2055, and Target 2060 for Class K was $0, $28,665, and $7,607; for Class R was $0, $5,623, and $613; for Class I was $0, $34,348, and $329, respectively.
The accompanying notes are an integral part of the financial statements.
44
Financial Highlights
TARGET INCOME SERIES CLASS K | FOR THE YEAR ENDED | |||||||||||||||||||
| 10/31/18 | 10/31/17 | 10/31/16 | 10/31/15 | 10/31/14 | ||||||||||||||||
Per share data (for a share outstanding throughout each year): | ||||||||||||||||||||
Net asset value - Beginning of year | $ | 9.88 | $ | 9.39 | $ | 9.72 | $ | 10.84 | $ | 11.00 | ||||||||||
|
|
|
|
|
|
|
|
|
| |||||||||||
Income (loss) from investment operations: | ||||||||||||||||||||
Net investment income1,2 | 0.06 | 0.14 | 0.17 | 0.15 | 0.18 | |||||||||||||||
Net realized and unrealized gain (loss) on investments | (0.15 | ) | 0.49 | 0.09 | (0.29 | ) | 0.37 | |||||||||||||
|
|
|
|
|
|
|
|
|
| |||||||||||
Total from investment operations | (0.09 | ) | 0.63 | 0.26 | (0.14 | ) | 0.55 | |||||||||||||
|
|
|
|
|
|
|
|
|
| |||||||||||
Less distributions to shareholders: | ||||||||||||||||||||
From net investment income | (0.06 | ) | (0.14 | ) | (0.17 | ) | (0.28 | ) | (0.29 | ) | ||||||||||
From net realized gain on investments | — | — | (0.42 | ) | (0.70 | ) | (0.42 | ) | ||||||||||||
|
|
|
|
|
|
|
|
|
| |||||||||||
Total distributions to shareholders | (0.06 | ) | (0.14 | ) | (0.59 | ) | (0.98 | ) | (0.71 | ) | ||||||||||
|
|
|
|
|
|
|
|
|
| |||||||||||
Net asset value - End of year | $ | 9.73 | $ | 9.88 | $ | 9.39 | $ | 9.72 | $ | 10.84 | ||||||||||
|
|
|
|
|
|
|
|
|
| |||||||||||
Net assets - End of year (000’s omitted) | $ | 105,986 | $ | 80,786 | $ | 64,297 | $ | 67,322 | $ | 52,442 | ||||||||||
|
|
|
|
|
|
|
|
|
| |||||||||||
Total return3 | (0.93 | %) | 6.85 | % | 2.97 | % | (1.38 | %) | 5.35 | % | ||||||||||
Ratios (to average net assets)/Supplemental Data: | ||||||||||||||||||||
Expenses* | 0.45 | %4 | 0.31 | %5 | 0.30 | %6 | 0.30 | %7 | 0.30 | %6 | ||||||||||
Net investment income2 | 0.59 | % | 1.45 | % | 1.84 | % | 1.54 | % | 1.63 | % | ||||||||||
Series portfolio turnover8 | 9 | % | 133 | % | 6 | % | 16 | % | 15 | % | ||||||||||
| *The investment advisor paid a portion of the Series’ expenses. If these expenses had been incurred by the Series, the expense ratios (to average net assets) would have been increased by the following amounts: |
| |||||||||||||||||||
|
| 0.10
| %4
|
| 0.15
| %5
|
| 0.12
| %6
|
| 0.16
| %7
|
| 0.12
| %6
| ||||||
TARGET INCOME SERIES CLASS R | FOR THE YEAR ENDED | |||||||||||||||||||
| 10/31/18 | 10/31/17 | 10/31/16 | 10/31/15 | 10/31/14 | ||||||||||||||||
Per share data (for a share outstanding throughout each year): Net asset value - Beginning of year | $ | 9.76 | $ | 9.28 | $ | 9.61 | $ | 10.71 | $ | 10.89 | ||||||||||
|
|
|
|
|
|
|
|
|
| |||||||||||
Income (loss) from investment operations: | ||||||||||||||||||||
Net investment income1,2 | 0.04 | 0.05 | 0.19 | 0.21 | 0.15 | |||||||||||||||
Net realized and unrealized gain (loss) on investments | (0.16 | ) | 0.56 | 0.04 | (0.38 | ) | 0.36 | |||||||||||||
|
|
|
|
|
|
|
|
|
| |||||||||||
Total from investment operations | (0.12 | ) | 0.61 | 0.23 | (0.17 | ) | 0.51 | |||||||||||||
|
|
|
|
|
|
|
|
|
| |||||||||||
Less distributions to shareholders: | ||||||||||||||||||||
From net investment income (loss) | (0.05 | ) | (0.13 | ) | (0.14 | ) | (0.23 | ) | (0.27 | ) | ||||||||||
From net realized gain on investments | — | — | (0.42 | ) | (0.70 | ) | (0.42 | ) | ||||||||||||
|
|
|
|
|
|
|
|
|
| |||||||||||
Total distributions to shareholders | (0.05 | ) | (0.13 | ) | (0.56 | ) | (0.93 | ) | (0.69 | ) | ||||||||||
|
|
|
|
|
|
|
|
|
| |||||||||||
Net asset value - End of year | $ | 9.59 | $ | 9.76 | $ | 9.28 | $ | 9.61 | $ | 10.71 | ||||||||||
|
|
|
|
|
|
|
|
|
| |||||||||||
Net assets - End of year (000’s omitted) | $ | 18,769 | $ | 9,910 | $ | 1,148 | $ | 2,468 | $ | 13,406 | ||||||||||
|
|
|
|
|
|
|
|
|
| |||||||||||
Total return3 | (1.21 | %) | 6.68 | % | 2.69 | % | (1.70 | %) | 5.00 | % | ||||||||||
Ratios (to average net assets)/Supplemental Data: | ||||||||||||||||||||
Expenses* | 0.70 | %4 | 0.55 | %5 | 0.55 | %6 | 0.55 | %7 | 0.55 | %6 | ||||||||||
Net investment income2 | 0.37 | % | 0.57 | % | 2.07 | % | 2.05 | % | 1.40 | % | ||||||||||
Series portfolio turnover8 | 9 | % | 133 | % | 6 | % | 16 | % | 15 | % | ||||||||||
| *For certain periods presented, the investment advisor paid a portion of the Series’ expenses. If these expenses had been incurred by the Series, the expense ratios (to average net assets) would have been increased by the following amounts: |
| |||||||||||||||||||
| 0.00 | %4 | 0.15 | %5 | 0.12 | %6 | 0.16 | %7 | 0.12 | %6 | |||||||||||
1Calculated based on average shares outstanding during the years.
2Net investment income is affected by the timing of distributions from the Underlying Series in which the Series invest. The ratios do not include net investment income of the Underlying Series in which the Series invests.
3Represents aggregate total return for the years indicated, and assumes reinvestment of all distributions. Total return would have been lower had certain expenses not been waived or reimbursed.
4Expense ratios do not include expenses of the Underlying Series in which the Series invests. The expense ratio of the Underlying Series was 0.45% for Manning & Napier Blended Asset Conservative Series - Class R6.
5Expense ratios do not include expenses of the Underlying Series in which the Series invests. The expense ratio of the Underlying Series was 0.67% for Manning & Napier Pro-Blend® Conservative Term Series - Class I and 0.45% for Manning & Napier Blended Asset Conservative Series - Class R6.
6Expense ratios do not include expenses of the Underlying Series in which the Series invests. The average expense ratio of the Underlying Series was 0.67%.
7Expense ratios do not include expenses of the Underlying Series in which the Series invests. The expense ratio of the Underlying Series was 0.68%.
8Reflects activity of the Series and does not include the activity of the Underlying Series.
The accompanying notes are an integral part of the financial statements.
45
Financial Highlights
| TARGET INCOME SERIES CLASS I | FOR THE YEAR ENDED | |||||||||||||||||||
| 10/31/18 | 10/31/17 | 10/31/16 | 10/31/15 | 10/31/14 | ||||||||||||||||
Per share data (for a share outstanding throughout each year): | ||||||||||||||||||||
Net asset value - Beginning of year | $ | 9.92 | $ | 9.42 | $ | 9.75 | $ | 10.88 | $ | 11.04 | ||||||||||
|
|
|
|
|
|
|
|
|
| |||||||||||
Income (loss) from investment operations: | ||||||||||||||||||||
Net investment income1,2 | 0.11 | 0.19 | 0.24 | 0.16 | 0.21 | |||||||||||||||
Net realized and unrealized gain (loss) on investments | (0.18 | ) | 0.48 | 0.04 | (0.28 | ) | 0.37 | |||||||||||||
|
|
|
|
|
|
|
|
|
| |||||||||||
Total from investment operations | (0.07 | ) | 0.67 | 0.28 | (0.12 | ) | 0.58 | |||||||||||||
|
|
|
|
|
|
|
|
|
| |||||||||||
Less distributions to shareholders: | ||||||||||||||||||||
From net investment income | (0.07 | ) | (0.17 | ) | (0.19 | ) | (0.31 | ) | (0.32 | ) | ||||||||||
From net realized gain on investments | — | — | (0.42 | ) | (0.70 | ) | (0.42 | ) | ||||||||||||
|
|
|
|
|
|
|
|
|
| |||||||||||
Total distributions to shareholders | (0.07 | ) | (0.17 | ) | (0.61 | ) | (1.01 | ) | (0.74 | ) | ||||||||||
|
|
|
|
|
|
|
|
|
| |||||||||||
Net asset value - End of year | $ | 9.78 | $ | 9.92 | $ | 9.42 | $ | 9.75 | $ | 10.88 | ||||||||||
|
|
|
|
|
|
|
|
|
| |||||||||||
Net assets - End of year (000’s omitted) | $ | 986 | $ | 8,260 | $ | 12,380 | $ | 26,000 | $ | 11,610 | ||||||||||
|
|
|
|
|
|
|
|
|
| |||||||||||
Total return3 | (0.70 | %) | 7.20 | % | 3.20 | % | (1.21 | %) | 5.59 | % | ||||||||||
Ratios (to average net assets)/Supplemental Data: | ||||||||||||||||||||
Expenses* | 0.20 | %4 | 0.06 | %5 | 0.05 | %6 | 0.05 | %7 | 0.05 | %6 | ||||||||||
Net investment income2 | 1.10 | % | 2.02 | % | 2.61 | % | 1.65 | % | 1.92 | % | ||||||||||
Series portfolio turnover8 | 9 | % | 133 | % | 6 | % | 16 | % | 15 | % | ||||||||||
| *The investment advisor paid a portion of the Series’ expenses. If these expenses had been incurred by the Series, the expense ratios (to average net assets) would have been increased by the following amounts: |
| |||||||||||||||||||
|
| 0.16
| %4
|
| 0.15
| %5
|
| 0.12
| %6
|
| 0.16
| %7
|
| 0.12
| %6
| ||||||
| TARGET INCOME SERIES CLASS R6 |
FOR THE YEAR ENDED 10/31/18 | FOR THE PERIOD 10/16/179 TO 10/31/17 | ||||||||
Per share data (for a share outstanding throughout each period): | ||||||||||
Net asset value - Beginning of period | $ | 9.92 | $ | 9.93 | ||||||
|
|
|
| |||||||
Income (loss) from investment operations: | ||||||||||
Net investment income1,2 | 0.10 | — | ||||||||
Net realized and unrealized gain (loss) on investments | (0.15 | ) | (0.01 | ) | ||||||
|
|
|
| |||||||
Total from investment operations | (0.05 | ) | (0.01 | ) | ||||||
|
|
|
| |||||||
Less distributions to shareholders: | ||||||||||
From net investment income | (0.09 | ) | — | |||||||
|
|
|
| |||||||
Total distributions to shareholders | (0.09 | ) | — | |||||||
|
|
|
| |||||||
Net asset value - End of period | $ | 9.78 | $ | 9.92 | ||||||
|
|
|
| |||||||
Net assets - End of period (000’s omitted) | $ | 5 | $ | 5 | ||||||
|
|
|
| |||||||
Total return10 | (0.52 | %) | (0.10 | %) | ||||||
Ratios (to average net assets)/Supplemental Data: | ||||||||||
Expenses* | 0.05 | %4 | 0.05 | %5,11 | ||||||
Net investment income (loss)2 | 1.01 | % | (0.05 | %)5,11 | ||||||
Series portfolio turnover8 | 9 | % | 133 | % | ||||||
| *The investment advisor paid a portion of the Series’ expenses. If these expenses had been incurred by the Series, the expense ratios (to average net assets) would have been increased by the following amounts: |
| |||||||||
| 0.14 | %4 | 0.15 | %5 | |||||||
1Calculated based on average shares outstanding during the years.
2Net investment income is affected by the timing of distributions from the Underlying Series in which the Series invest. The ratios do not include net investment income of the Underlying Series in which the Series invests.
3Represents aggregate total return for the years indicated, and assumes reinvestment of all distributions. Total return would have been lower had certain expenses not been waived or reimbursed.
4Expense ratios do not include expenses of the Underlying Series in which the Series invests. The expense ratio of the Underlying Series was 0.45% for Manning & Napier Blended Asset Conservative Series - Class R6.
5Expense ratios do not include expenses of the Underlying Series in which the Series invests. The expense ratio of the Underlying Series was 0.67% for Manning & Napier Pro-Blend® Conservative Term Series - Class I and 0.45% for Manning & Napier Blended Asset Conservative Series - Class R6.
6Expense ratios do not include expenses of the Underlying Series in which the Series invests. The average expense ratio of the Underlying Series was 0.67%.
7Expense ratios do not include expenses of the Underlying Series in which the Series invests. The expense ratio of the Underlying Series was 0.68%.
8Reflects activity of the Series and does not include the activity of the Underlying Series.
9Commencement of operations.
10Represents aggregate total return for the periods indicated, and assumes reinvestment of all distributions. Total return would have been lower had certain expenses not been reimbursed during the periods. Periods less than one year are not annualized.
11Annualized.
The accompanying notes are an integral part of the financial statements.
46
Financial Highlights
TARGET 2015 SERIES CLASS K | FOR THE YEAR ENDED | |||||||||||||||||||
| 10/31/18 | 10/31/17 | 10/31/16 | 10/31/15 | 10/31/14 | ||||||||||||||||
Per share data (for a share outstanding throughout each year): | ||||||||||||||||||||
Net asset value - Beginning of year | $ | 11.14 | $ | 10.49 | $ | 11.17 | $ | 12.07 | $ | 11.79 | ||||||||||
|
|
|
|
|
|
|
|
|
| |||||||||||
Income (loss) from investment operations: | ||||||||||||||||||||
Net investment income1,2 | 0.05 | 0.12 | 0.11 | 0.12 | 0.10 | |||||||||||||||
Net realized and unrealized gain (loss) on investments | (0.18 | ) | 0.68 | 0.13 | (0.35 | ) | 0.53 | |||||||||||||
|
|
|
|
|
|
|
|
|
| |||||||||||
Total from investment operations | (0.13 | ) | 0.80 | 0.24 | (0.23 | ) | 0.63 | |||||||||||||
|
|
|
|
|
|
|
|
|
| |||||||||||
Less distributions to shareholders: | ||||||||||||||||||||
From net investment income | (0.06 | ) | (0.15 | ) | (0.12 | ) | (0.28 | ) | (0.26 | ) | ||||||||||
From net realized gain on investments | — | — | (0.80 | ) | (0.39 | ) | (0.09 | ) | ||||||||||||
|
|
|
|
|
|
|
|
|
| |||||||||||
Total distributions to shareholders | (0.06 | ) | (0.15 | ) | (0.92 | ) | (0.67 | ) | (0.35 | ) | ||||||||||
|
|
|
|
|
|
|
|
|
| |||||||||||
Net asset value - End of year | $ | 10.95 | $ | 11.14 | $ | 10.49 | $ | 11.17 | $ | 12.07 | ||||||||||
|
|
|
|
|
|
|
|
|
| |||||||||||
Net assets - End of year (000’s omitted) | $ | 1,802 | $ | 4,196 | $ | 3,274 | $ | 3,500 | $ | 3,200 | ||||||||||
|
|
|
|
|
|
|
|
|
| |||||||||||
Total return3 | (1.16 | %) | 7.70 | % | 2.58 | % | (2.04 | %) | 5.45 | % | ||||||||||
Ratios (to average net assets)/Supplemental Data: | ||||||||||||||||||||
Expenses* | 0.45 | %4 | 0.31 | %5 | 0.30 | %6 | 0.30 | %7 | 0.30 | %8 | ||||||||||
Net investment income2 | 0.49 | % | 1.11 | % | 1.09 | % | 1.01 | % | 0.80 | % | ||||||||||
Series portfolio turnover9 | 46 | % | 139 | % | 49 | % | 46 | % | 46 | % | ||||||||||
| *The investment advisor paid a portion of the Series’ expenses. If these expenses had been incurred by the Series, the expense ratios (to average net assets) would have been increased by the following amounts: |
| |||||||||||||||||||
|
| 3.81
| %4
|
| 2.39
| %5
|
| 1.51
| %6
|
| 1.14
| %7
|
| 1.41
| %8
| ||||||
TARGET 2015 SERIES CLASS R | FOR THE YEAR ENDED | |||||||||||||||||||
| 10/31/18 | 10/31/17 | 10/31/16 | 10/31/15 | 10/31/14 | ||||||||||||||||
Per share data (for a share outstanding throughout each year): | ||||||||||||||||||||
Net asset value - Beginning of year | $ | 11.29 | $ | 10.51 | $ | 11.19 | $ | 12.09 | $ | 11.81 | ||||||||||
|
|
|
|
|
|
|
|
|
| |||||||||||
Income (loss) from investment operations: | ||||||||||||||||||||
Net investment income (loss)1,2 | 0.03 | 0.13 | 0.09 | 0.12 | 0.07 | |||||||||||||||
Net realized and unrealized gain (loss) on investments | (0.20 | ) | 0.66 | 0.13 | (0.39 | ) | 0.53 | |||||||||||||
|
|
|
|
|
|
|
|
|
| |||||||||||
Total from investment operations | (0.17 | ) | 0.79 | 0.22 | (0.27 | ) | 0.60 | |||||||||||||
|
|
|
|
|
|
|
|
|
| |||||||||||
Less distributions to shareholders: | ||||||||||||||||||||
From net investment income | (0.04 | ) | (0.01 | ) | (0.10 | ) | (0.24 | ) | (0.23 | ) | ||||||||||
From net realized gain on investments | — | — | (0.80 | ) | (0.39 | ) | (0.09 | ) | ||||||||||||
|
|
|
|
|
|
|
|
|
| |||||||||||
Total distributions to shareholders | (0.04 | ) | (0.01 | ) | (0.90 | ) | (0.63 | ) | (0.32 | ) | ||||||||||
|
|
|
|
|
|
|
|
|
| |||||||||||
Net asset value - End of year | $ | 11.08 | $ | 11.29 | $ | 10.51 | $ | 11.19 | $ | 12.09 | ||||||||||
|
|
|
|
|
|
|
|
|
| |||||||||||
Net assets - End of year (000’s omitted) | $ | 38 | $ | 40 | $ | 802 | $ | 839 | $ | 1,587 | ||||||||||
|
|
|
|
|
|
|
|
|
| |||||||||||
Total return3 | (1.50 | %) | 7.47 | % | 2.34 | % | (2.37 | %) | 5.22 | % | ||||||||||
Ratios (to average net assets)/Supplemental Data: | ||||||||||||||||||||
Expenses* | 0.70 | %4 | 0.55 | %5 | 0.55 | %6 | 0.55 | %7 | 0.55 | %8 | ||||||||||
Net investment income2 | 0.28 | % | 1.21 | % | 0.86 | % | 1.07 | % | 0.60 | % | ||||||||||
Series portfolio turnover9 | 46 | % | 139 | % | 49 | % | 46 | % | 46 | % | ||||||||||
| *The investment advisor paid a portion of the Series’ expenses. If these expenses had been incurred by the Series, the expense ratios (to average net assets) would have been increased by the following amounts: |
| |||||||||||||||||||
| 3.80 | %4 | 2.39 | %5 | 1.51 | %6 | 1.14 | %7 | 1.47 | %8 | |||||||||||
1Calculated based on average shares outstanding during the years.
2Net investment income is affected by the timing of distributions from the Underlying Series in which the Series invest. The ratios do not include net investment income of the Underlying Series in which the Series invests.
3Represents aggregate total return for the years indicated, and assumes reinvestment of all distributions. Total return would have been lower had certain expenses not been waived or reimbursed.
4Expense ratios do not include expenses of the Underlying Series in which the Series invests. The expense ratios of the Underlying Series were 0.45% for Manning & Napier Blended Asset Conservative Series - Class R6 and 0.50% for Manning & Napier Blended Asset Moderate Series - Class R6.
5Expense ratios do not include expenses of the Underlying Series in which the Series invests. The expense ratios of the Underlying Series were 0.67% for Manning & Napier Pro-Blend® Conservative Term Series - Class I, 0.83% for Manning & Napier Pro-Blend® Moderate Term Series - Class I, 0.45% for Manning & Napier Blended Asset Conservative Series - Class R6 and 0.50% for Manning & Napier Blended Asset Moderate Series - Class R6.
6Expense ratios do not include expenses of the Underlying Series in which the Series invests. The expense ratios of the Underlying Series were 0.67% for Manning & Napier Pro-Blend® Conservative Term Series - Class I and 0.82% for Manning & Napier Pro-Blend® Moderate Term Series - Class I.
7Expense ratios do not include expenses of the Underlying Series in which the Series invests. The expense ratios of the Underlying Series were 0.81% for Manning & Napier Pro-Blend® Moderate Term Series - Class I and 0.82% for Manning & Napier Pro-Blend® Extended Term Series - Class I.
8Expense ratios do not include expenses of the Underlying Series in which the Series invests. The expense ratios of the Underlying Series were 0.81% for Manning & Napier Pro-Blend® Moderate Term Series - Class I and 0.81% for Manning & Napier Pro-Blend® Extended Term Series - Class I.
9Reflects activity of the Series and does not include the activity of the Underlying Series.
The accompanying notes are an integral part of the financial statements.
47
Financial Highlights
| TARGET 2015 SERIES CLASS I | FOR THE YEAR ENDED | |||||||||||||||||||
| 10/31/18 | 10/31/17 | 10/31/16 | 10/31/15 | 10/31/14 | ||||||||||||||||
Per share data (for a share outstanding throughout each year): | ||||||||||||||||||||
Net asset value - Beginning of year | $ | 11.19 | $ | 10.53 | $ | 11.21 | $ | 12.11 | $ | 11.83 | ||||||||||
|
|
|
|
|
|
|
|
|
| |||||||||||
Income (loss) from investment operations: | ||||||||||||||||||||
Net investment income1,2 | 0.09 | 0.20 | 0.16 | 0.15 | 0.14 | |||||||||||||||
Net realized and unrealized gain (loss) on investments | (0.19 | ) | 0.63 | 0.11 | (0.35 | ) | 0.51 | |||||||||||||
|
|
|
|
|
|
|
|
|
| |||||||||||
Total from investment operations | (0.10 | ) | 0.83 | 0.27 | (0.20 | ) | 0.65 | |||||||||||||
|
|
|
|
|
|
|
|
|
| |||||||||||
Less distributions to shareholders: | ||||||||||||||||||||
From net investment income | (0.10 | ) | (0.17 | ) | (0.15 | ) | (0.31 | ) | (0.28 | ) | ||||||||||
From net realized gain on investments | — | — | (0.80 | ) | (0.39 | ) | (0.09 | ) | ||||||||||||
|
|
|
|
|
|
|
|
|
| |||||||||||
Total distributions to shareholders | (0.10 | ) | (0.17 | ) | (0.95 | ) | (0.70 | ) | (0.37 | ) | ||||||||||
|
|
|
|
|
|
|
|
|
| |||||||||||
Net asset value - End of year | $ | 10.99 | $ | 11.19 | $ | 10.53 | $ | 11.21 | $ | 12.11 | ||||||||||
|
|
|
|
|
|
|
|
|
| |||||||||||
Net assets - End of year (000’s omitted) | $ | 283 | $ | 324 | $ | 2,657 | $ | 5,129 | $ | 4,785 | ||||||||||
|
|
|
|
|
|
|
|
|
| |||||||||||
Total return3 | (0.94 | %) | 8.03 | % | 2.85 | % | (1.78 | %) | 5.67 | % | ||||||||||
Ratios (to average net assets)/Supplemental Data: | ||||||||||||||||||||
Expenses* | 0.20 | %4 | 0.05 | %5 | 0.05 | %6 | 0.05 | %7 | 0.05 | %8 | ||||||||||
Net investment income2 | 0.83 | % | 1.88 | % | 1.53 | % | 1.28 | % | 1.12 | % | ||||||||||
Series portfolio turnover9 | 46 | % | 139 | % | 49 | % | 46 | % | 46 | % | ||||||||||
| *The investment advisor paid a portion of the Series’ expenses. If these expenses had been incurred by the Series, the expense ratios (to average net assets) would have been increased by the following amounts: |
| |||||||||||||||||||
| 3.81 | %4 | 2.39 | %5 | 1.51 | %6 | 1.14 | %7 | 1.46 | %8 | |||||||||||
| TARGET 2015 SERIES CLASS R6 |
FOR THE YEAR ENDED 10/31/18 | FOR THE PERIOD 10/16/1710 TO 10/31/17 | ||||||||
Per share data (for a share outstanding throughout each year): | ||||||||||
Net asset value - Beginning of year | $ | 11.19 | $ | 11.20 | ||||||
|
|
|
| |||||||
Income (loss) from investment operations: | ||||||||||
Net investment income (loss)1,2 | 0.10 | — | ||||||||
Net realized and unrealized gain (loss) on investments | (0.19 | ) | (0.01 | ) | ||||||
|
|
|
| |||||||
Total from investment operations | (0.09 | ) | (0.01 | ) | ||||||
|
|
|
| |||||||
Less distributions to shareholders: | ||||||||||
From net investment income | (0.11 | ) | — | |||||||
|
|
|
| |||||||
Total distributions to shareholders | (0.11 | ) | — | |||||||
|
|
|
| |||||||
Net asset value - End of year | $ | 10.99 | $ | 11.19 | ||||||
|
|
|
| |||||||
Net assets - End of year (000’s omitted) | $ | 5 | $ | 5 | ||||||
|
|
|
| |||||||
Total return11 | (0.84 | %) | (0.09 | %) | ||||||
Ratios (to average net assets)/Supplemental Data: | ||||||||||
Expenses* | 0.05 | %4 | 0.05 | %5,12 | ||||||
Net investment income (loss)2 | 0.93 | % | (0.05 | %)12 | ||||||
Series portfolio turnover9 | 46 | % | 139 | % | ||||||
| *The investment advisor paid a portion of the Series’ expenses. If these expenses had been incurred by the Series, the expense ratios (to average net assets) would have been increased by the following amounts: |
| |||||||||
| 3.81 | %4 | 2.39 | %5,12 | |||||||
1Calculated based on average shares outstanding during the years.
2Net investment income is affected by the timing of distributions from the Underlying Series in which the Series invest. The ratios do not include net investment income of the Underlying Series in which the Series invests.
3Represents aggregate total return for the years indicated, and assumes reinvestment of all distributions. Total return would have been lower had certain expenses not been waived or reimbursed.
4Expense ratios do not include expenses of the Underlying Series in which the Series invests. The expense ratios of the Underlying Series were 0.45% for Manning & Napier Blended Asset Conservative Series - Class R6 and 0.50% for Manning & Napier Blended Asset Moderate Series - Class R6.
5Expense ratios do not include expenses of the Underlying Series in which the Series invests. The expense ratios of the Underlying Series were 0.67% for Manning & Napier Pro-Blend® Conservative Term Series - Class I, 0.83% for Manning & Napier Pro-Blend® Moderate Term Series - Class I, 0.45% for Manning & Napier Blended Asset Conservative Series - Class R6 and 0.50% for Manning & Napier Blended Asset Moderate Series - Class R6.
6Expense ratios do not include expenses of the Underlying Series in which the Series invests. The expense ratios of the Underlying Series were 0.67% for Manning & Napier Pro-Blend® Conservative Term Series - Class I and 0.82% for Manning & Napier Pro-Blend® Moderate Term Series - Class I.
7Expense ratios do not include expenses of the Underlying Series in which the Series invests. The expense ratios of the Underlying Series were 0.81% for Manning & Napier Pro-Blend® Moderate Term Series - Class I and 0.82% for Manning & Napier Pro-Blend® Extended Term Series - Class I.
8Expense ratios do not include expenses of the Underlying Series in which the Series invests. The expense ratios of the Underlying Series were 0.81% for Manning & Napier Pro-Blend® Moderate Term Series - Class I and 0.81% for Manning & Napier Pro-Blend® Extended Term Series - Class I.
9Reflects activity of the Series and does not include the activity of the Underlying Series.
10Commencement of operations.
11Represents aggregate total return for the periods indicated, and assumes reinvestment of all distributions. Total return would have been lower had certain expenses not been waived during the periods. Periods less than one year are not annualized.
12Annualized.
The accompanying notes are an integral part of the financial statements.
48
Financial Highlights
TARGET 2020 SERIES CLASS K | FOR THE YEAR ENDED | |||||||||||||||||||
| 10/31/18 | 10/31/17 | 10/31/16 | 10/31/15 | 10/31/14 | ||||||||||||||||
Per share data (for a share outstanding throughout each year): | ||||||||||||||||||||
Net asset value - Beginning of year | $ | 9.40 | $ | 8.75 | $ | 9.45 | $ | 10.77 | $ | 10.79 | ||||||||||
|
|
|
|
|
|
|
|
|
| |||||||||||
Income (loss) from investment operations: | ||||||||||||||||||||
Net investment income1,2 | 0.04 | 0.09 | 0.09 | 0.11 | 0.11 | |||||||||||||||
Net realized and unrealized gain on investments | (0.19 | ) | 0.68 | 0.12 | (0.33 | ) | 0.51 | |||||||||||||
|
|
|
|
|
|
|
|
|
| |||||||||||
Total from investment operations | (0.15 | ) | 0.77 | 0.21 | (0.22 | ) | 0.62 | |||||||||||||
|
|
|
|
|
|
|
|
|
| |||||||||||
Less distributions to shareholders: | ||||||||||||||||||||
From net investment income | (0.04 | ) | (0.12 | ) | (0.10 | ) | (0.28 | ) | (0.25 | ) | ||||||||||
From net realized gain on investments | — | — | (0.81 | ) | (0.82 | ) | (0.39 | ) | ||||||||||||
|
|
|
|
|
|
|
|
|
| |||||||||||
Total distributions to shareholders | (0.04 | ) | (0.12 | ) | (0.91 | ) | (1.10 | ) | (0.64 | ) | ||||||||||
|
|
|
|
|
|
|
|
|
| |||||||||||
Net asset value - End of year | $ | 9.21 | $ | 9.40 | $ | 8.75 | $ | 9.45 | $ | 10.77 | ||||||||||
|
|
|
|
|
|
|
|
|
| |||||||||||
Net assets - End of year (000’s omitted) | $ | 75,844 | $ | 70,632 | $ | 79,236 | $ | 80,006 | $ | 95,364 | ||||||||||
|
|
|
|
|
|
|
|
|
| |||||||||||
Total return3 | (1.58 | %) | 8.91 | % | 2.83 | % | (2.24 | %) | 6.14 | % | ||||||||||
Ratios (to average net assets)/Supplemental Data: | ||||||||||||||||||||
Expenses* | 0.45 | %4 | 0.31 | %5 | 0.30 | %6 | 0.30 | %7 | 0.30 | %8 | ||||||||||
Net investment income2 | 0.44 | % | 1.04 | % | 1.08 | % | 1.17 | % | 1.06 | % | ||||||||||
Series portfolio turnover9 | 27 | % | 118 | % | 16 | % | 42 | % | 37 | % | ||||||||||
| *The investment advisor paid a portion of the Series’ expenses. If these expenses had been incurred by the Series, the expense ratios (to average net assets) would have been increased by the following amounts: |
| |||||||||||||||||||
| 0.14 | %4 | 0.09 | %5 | 0.06 | %6 | 0.04 | %7 | 0.03 | %8 | |||||||||||
TARGET 2020 SERIES CLASS R | FOR THE YEAR ENDED | |||||||||||||||||||
| 10/31/18 | 10/31/17 | 10/31/16 | 10/31/15 | 10/31/14 | ||||||||||||||||
Per share data (for a share outstanding throughout each year): | ||||||||||||||||||||
Net asset value - Beginning of year | $ | 9.28 | $ | 8.64 | $ | 9.34 | $ | 10.60 | $ | 10.66 | ||||||||||
|
|
|
|
|
|
|
|
|
| |||||||||||
Income (loss) from investment operations: | ||||||||||||||||||||
Net investment income (loss)1,2 | 0.02 | 0.06 | 0.09 | 0.12 | 0.09 | |||||||||||||||
Net realized and unrealized gain on investments | (0.19 | ) | 0.68 | 0.09 | (0.32 | ) | 0.47 | |||||||||||||
|
|
|
|
|
|
|
|
|
| |||||||||||
Total from investment operations | (0.17 | ) | 0.74 | 0.18 | (0.20 | ) | 0.56 | |||||||||||||
|
|
|
|
|
|
|
|
|
| |||||||||||
Less distributions to shareholders: | ||||||||||||||||||||
From net investment income | (0.03 | ) | (0.10 | ) | (0.07 | ) | (0.24 | ) | (0.23 | ) | ||||||||||
From net realized gain on investments | — | — | (0.81 | ) | (0.82 | ) | (0.39 | ) | ||||||||||||
|
|
|
|
|
|
|
|
|
| |||||||||||
Total distributions to shareholders | (0.03 | ) | (0.10 | ) | (0.88 | ) | (1.06 | ) | (0.62 | ) | ||||||||||
|
|
|
|
|
|
|
|
|
| |||||||||||
Net asset value - End of year | $ | 9.08 | $ | 9.28 | $ | 8.64 | $ | 9.34 | $ | 10.60 | ||||||||||
|
|
|
|
|
|
|
|
|
| |||||||||||
Net assets - End of year (000’s omitted) | $ | 13,814 | $ | 10,851 | $ | 4,553 | $ | 8,193 | $ | 22,564 | ||||||||||
|
|
|
|
|
|
|
|
|
| |||||||||||
Total return3 | (1.85 | %) | 8.69 | % | 2.56 | % | (2.13 | %) | 5.55 | % | ||||||||||
Ratios (to average net assets)/Supplemental Data: | ||||||||||||||||||||
Expenses* | 0.70 | %4 | 0.56 | %5 | 0.55 | %6 | 0.55 | %7 | 0.55 | %8 | ||||||||||
Net investment income2 | 0.17 | % | 0.63 | % | 1.04 | % | 1.24 | % | 0.83 | % | ||||||||||
Series portfolio turnover9 | 27 | % | 118 | % | 16 | % | 42 | % | 37 | % | ||||||||||
| *The investment advisor paid a portion of the Series’ expenses. If these expenses had been incurred by the Series, the expense ratios (to average net assets) would have been increased by the following amounts: |
| |||||||||||||||||||
| 0.04 | %4 | 0.09 | %5 | 0.06 | %6 | 0.04 | %7 | 0.03 | %8 | |||||||||||
1Calculated based on average shares outstanding during the years.
2Net investment income is affected by the timing of distributions from the Underlying Series in which the Series invest. The ratios do not include net investment income of the Underlying Series in which the Series invests.
3Represents aggregate total return for the years indicated, and assumes reinvestment of all distributions. Total return would have been lower had certain expenses not been waived or reimbursed.
4Expense ratios do not include expenses of the Underlying Series in which the Series invests. The expense ratios of the Underlying Series were 0.55% for Manning & Napier Blended Asset Extended Series - Class R6 and 0.50% for Manning & Napier Blended Asset Moderate Series - Class R6.
5Expense ratios do not include expenses of the Underlying Series in which the Series invests. The expense ratios of the Underlying Series were 0.83% for Manning & Napier Pro-Blend® Extended Term Series - Class I, 0.83% for Manning & Napier Pro-Blend® Moderate Term Series - Class I, 0.55% for Manning & Napier Blended Asset Extended Series -Class R6 and 0.50% for Manning & Napier Blended Asset Moderate Series - Class R6.
6Expense ratios do not include expenses of the Underlying Series in which the Series invests. The expense ratios of the Underlying Series were 0.82% for Manning & Napier Pro-Blend® Moderate Term Series - Class I and 0.82% for Manning & Napier Pro-Blend® Extended Term Series - Class I.
7Expense ratios do not include expenses of the Underlying Series in which the Series invests. The expense ratios of the Underlying Series were 0.81% for Manning & Napier Pro-Blend® Moderate Term Series - Class I and 0.82% for Manning & Napier Pro-Blend® Extended Term Series - Class I.
8Expense ratios do not include expenses of the Underlying Series in which the Series invests. The expense ratios of the Underlying Series were 0.81% for Manning & Napier Pro-Blend® Moderate Term Series - Class I and 0.81% for Manning & Napier Pro-Blend® Extended Term Series - Class I.
9Reflects activity of the Series and does not include the activity of the Underlying Series.
The accompanying notes are an integral part of the financial statements.
49
Financial Highlights
TARGET 2020 SERIES CLASS I | FOR THE YEAR ENDED | |||||||||||||||||||
| 10/31/18 | 10/31/17 | 10/31/16 | 10/31/15 | 10/31/14 | ||||||||||||||||
Per share data (for a share outstanding throughout each year): | ||||||||||||||||||||
Net asset value - Beginning of year | $ | 9.45 | $ | 8.79 | $ | 9.50 | $ | 10.81 | $ | 10.83 | ||||||||||
|
|
|
|
|
|
|
|
|
| |||||||||||
Income (loss) from investment operations: | ||||||||||||||||||||
Net investment income1,2 | 0.08 | 0.13 | 0.13 | 0.13 | 0.16 | |||||||||||||||
Net realized and unrealized gain on investments | (0.21 | ) | 0.67 | 0.09 | (0.31 | ) | 0.49 | |||||||||||||
|
|
|
|
|
|
|
|
|
| |||||||||||
Total from investment operations | (0.13 | ) | 0.80 | 0.22 | (0.18 | ) | 0.65 | |||||||||||||
|
|
|
|
|
|
|
|
|
| |||||||||||
Less distributions to shareholders: | ||||||||||||||||||||
From net investment income | (0.06 | ) | (0.14 | ) | (0.12 | ) | (0.31 | ) | (0.28 | ) | ||||||||||
From net realized gain on investments | — | — | (0.81 | ) | (0.82 | ) | (0.39 | ) | ||||||||||||
|
|
|
|
|
|
|
|
|
| |||||||||||
Total distributions to shareholders | (0.06 | ) | (0.14 | ) | (0.93 | ) | (1.13 | ) | (0.67 | ) | ||||||||||
|
|
|
|
|
|
|
|
|
| |||||||||||
Net asset value - End of year | $ | 9.26 | $ | 9.45 | $ | 8.79 | $ | 9.50 | $ | 10.81 | ||||||||||
|
|
|
|
|
|
|
|
|
| |||||||||||
Net assets - End of year (000’s omitted) | $ | 3,994 | $ | 33,056 | $ | 46,194 | $ | 74,947 | $ | 61,673 | ||||||||||
|
|
|
|
|
|
|
|
|
| |||||||||||
Total return3 | (1.43 | %) | 9.28 | % | 2.97 | % | (1.87 | %) | 6.37 | % | ||||||||||
Ratios (to average net assets)/Supplemental Data: | ||||||||||||||||||||
Expenses* | 0.20 | %4 | 0.06 | %5 | 0.05 | %6 | 0.05 | %7 | 0.05 | %8 | ||||||||||
Net investment income2 | 0.84 | % | 1.44 | % | 1.55 | % | 1.33 | % | 1.48 | % | ||||||||||
Series portfolio turnover9 | 27 | % | 118 | % | 16 | % | 42 | % | 37 | % | ||||||||||
| *The investment advisor paid a portion of the Series’ expenses. If these expenses had been incurred by the Series, the expense ratios (to average net assets) would have been increased by the following amounts: |
| |||||||||||||||||||
| 0.17 | %4 | 0.09 | %5 | 0.06 | %6 | 0.04 | %7 | 0.03 | %8 | |||||||||||
| TARGET 2020 SERIES CLASS R6 |
FOR THE YEAR ENDED 10/31/18 | FOR THE PERIOD 10/16/1710 TO 10/31/17 | ||||||||
Per share data (for a share outstanding throughout each period): | ||||||||||
Net asset value - Beginning of period | $ | 9.45 | $ | 9.46 | ||||||
|
|
|
| |||||||
Income (loss) from investment operations: | ||||||||||
Net investment income1,2 | 0.08 | — | ||||||||
Net realized and unrealized gain (loss) on investments | (0.20 | ) | (0.01 | ) | ||||||
|
|
|
| |||||||
Total from investment operations | (0.12 | ) | (0.01 | ) | ||||||
|
|
|
| |||||||
Less distributions to shareholders: | ||||||||||
From net investment income | (0.07 | ) | — | |||||||
|
|
|
| |||||||
Total distributions to shareholders | (0.07 | ) | — | |||||||
|
|
|
| |||||||
Net asset value - End of period | $ | 9.26 | $ | 9.45 | ||||||
|
|
|
| |||||||
Net assets - End of period (000’s omitted) | $ | 5 | $ | 5 | ||||||
|
|
|
| |||||||
Total return11 | (1.24 | %) | (0.11 | %) | ||||||
Ratios (to average net assets)/Supplemental Data: | ||||||||||
Expenses* | 0.05 | %4 | 0.05 | %5,12 | ||||||
Net investment income (loss)2 | 0.84 | % | (0.05 | %)12 | ||||||
Series portfolio turnover9 | 27 | % | 118 | % | ||||||
| *The investment advisor paid a portion of the Series’ expenses. If these expenses had been incurred by the Series, the expense ratios (to average net assets) would have been increased by the following amounts : |
| |||||||||
| 0.15 | %4 | 0.09 | %5,12 | |||||||
1Calculated based on average shares outstanding during the years.
2Net investment income is affected by the timing of distributions from the Underlying Series in which the Series invest. The ratios do not include net investment income of the Underlying Series in which the Series invests.
3Represents aggregate total return for the years indicated, and assumes reinvestment of all distributions. Total return would have been lower had certain expenses not been waived or reimbursed.
4Expense ratios do not include expenses of the Underlying Series in which the Series invests. The expense ratios of the Underlying Series were 0.55% for Manning & Napier Blended Asset Extended Series - Class R6 and 0.50% for Manning & Napier Blended Asset Moderate Series - Class R6.
5Expense ratios do not include expenses of the Underlying Series in which the Series invests. The expense ratios of the Underlying Series were 0.83% for Manning & Napier Pro-Blend® Extended Term Series - Class I, 0.83% for Manning & Napier Pro-Blend® Moderate Term Series - Class I, 0.55% for Manning & Napier Blended Asset Extended Series -Class R6 and 0.50% for Manning & Napier Blended Asset Moderate Series - Class R6.
6Expense ratios do not include expenses of the Underlying Series in which the Series invests. The expense ratios of the Underlying Series were 0.82% for Manning & Napier Pro-Blend® Moderate Term Series - Class I and 0.82% for Manning & Napier Pro-Blend® Extended Term Series - Class I.
7Expense ratios do not include expenses of the Underlying Series in which the Series invests. The expense ratios of the Underlying Series were 0.81% for Manning & Napier Pro-Blend® Moderate Term Series - Class I and 0.82% for Manning & Napier Pro-Blend® Extended Term Series - Class I.
8Expense ratios do not include expenses of the Underlying Series in which the Series invests. The expense ratios of the Underlying Series were 0.81% for Manning & Napier Pro-Blend® Moderate Term Series - Class I and 0.81% for Manning & Napier Pro-Blend® Extended Term Series - Class I.
9Reflects activity of the Series and does not include the activity of the Underlying Series.
10Commencement of operations.
11Represents aggregate total return for the periods indicated, and assumes reinvestment of all distributions. Total return would have been lower had certain expenses not been reimbursed during the periods. Periods less than one year are not annualized.
12Annualized.
The accompanying notes are an integral part of the financial statements.
50
Financial Highlights
TARGET 2025 SERIES CLASS K | FOR THE YEAR ENDED | |||||||||||||||||||
| 10/31/18 | 10/31/17 | 10/31/16 | 10/31/15 | 10/31/14 | ||||||||||||||||
Per share data (for a share outstanding throughout each year): | ||||||||||||||||||||
Net asset value - Beginning of year | $ | 11.97 | $ | 11.02 | $ | 11.82 | $ | 13.01 | $ | 12.50 | ||||||||||
|
|
|
|
|
|
|
|
|
| |||||||||||
Income (loss) from investment operations: | ||||||||||||||||||||
Net investment income1,2 | 0.04 | 0.10 | 0.12 | 0.12 | 0.09 | |||||||||||||||
Net realized and unrealized gain (loss) on investments | (0.22 | ) | 1.01 | 0.15 | (0.40 | ) | 0.80 | |||||||||||||
|
|
|
|
|
|
|
|
|
| |||||||||||
Total from investment operations | (0.18 | ) | 1.11 | 0.27 | (0.28 | ) | 0.89 | |||||||||||||
|
|
|
|
|
|
|
|
|
| |||||||||||
Less distributions to shareholders: | ||||||||||||||||||||
From net investment income | (0.05 | ) | (0.16 | ) | (0.13 | ) | (0.43 | ) | (0.34 | ) | ||||||||||
From net realized gain on investments | (0.01 | ) | — | (0.94 | ) | (0.48 | ) | (0.04 | ) | |||||||||||
|
|
|
|
|
|
|
|
|
| |||||||||||
Total distributions to shareholders | (0.06 | ) | (0.16 | ) | (1.07 | ) | (0.91 | ) | (0.38 | ) | ||||||||||
|
|
|
|
|
|
|
|
|
| |||||||||||
Net asset value - End of year | $ | 11.73 | $ | 11.97 | $ | 11.02 | $ | 11.82 | $ | 13.01 | ||||||||||
|
|
|
|
|
|
|
|
|
| |||||||||||
Net assets - End of year (000’s omitted) | $ | 34,659 | $ | 25,591 | $ | 13,381 | $ | 11,896 | $ | 7,501 | ||||||||||
|
|
|
|
|
|
|
|
|
| |||||||||||
Total return3 | (1.58 | %) | 10.23 | % | 2.86 | % | (2.31 | %) | 7.28 | % | ||||||||||
Ratios (to average net assets)/Supplemental Data: | ||||||||||||||||||||
Expenses* | 0.45 | %4 | 0.31 | %5 | 0.30 | %6 | 0.30 | %7 | 0.30 | %8 | ||||||||||
Net investment income2 | 0.37 | % | 0.86 | % | 1.08 | % | 1.01 | % | 0.66 | % | ||||||||||
Series portfolio turnover9 | 25 | % | 208 | % | 51 | % | 27 | % | 30 | % | ||||||||||
| .*The investment advisor paid a portion of the Series’ expenses. If these expenses had been incurred by the Series, the expense ratios (to average net assets) would have been increased by the following amounts: |
| |||||||||||||||||||
| 0.28 | %4 | 0.43 | %5 | 0.33 | %6 | 0.39 | %7 | 0.59 | %8 | |||||||||||
TARGET 2025 SERIES CLASS R | FOR THE YEAR ENDED | |||||||||||||||||||
| 10/31/18 | 10/31/17 | 10/31/16 | 10/31/15 | 10/31/14 | ||||||||||||||||
Per share data (for a share outstanding throughout each year): | ||||||||||||||||||||
Net asset value - Beginning of year | $ | 12.00 | $ | 11.05 | $ | 11.86 | $ | 13.02 | $ | 12.53 | ||||||||||
|
|
|
|
|
|
|
|
|
| |||||||||||
Income (loss) from investment operations: | ||||||||||||||||||||
Net investment income (loss)1,2 | 0.02 | 0.04 | 0.09 | 0.13 | 0.10 | |||||||||||||||
Net realized and unrealized gain (loss) on investments | (0.23 | ) | 1.04 | 0.14 | (0.43 | ) | 0.75 | |||||||||||||
|
|
|
|
|
|
|
|
|
| |||||||||||
Total from investment operations | (0.21 | ) | 1.08 | 0.23 | (0.30 | ) | 0.85 | |||||||||||||
|
|
|
|
|
|
|
|
|
| |||||||||||
Less distributions to shareholders: | ||||||||||||||||||||
From net investment income | (0.03 | ) | (0.13 | ) | (0.10 | ) | (0.38 | ) | (0.32 | ) | ||||||||||
From net realized gain on investments | (0.01 | ) | — | (0.94 | ) | (0.48 | ) | (0.04 | ) | |||||||||||
|
|
|
|
|
|
|
|
|
| |||||||||||
Total distributions to shareholders | (0.04 | ) | (0.13 | ) | (1.04 | ) | (0.86 | ) | (0.36 | ) | ||||||||||
|
|
|
|
|
|
|
|
|
| |||||||||||
Net asset value - End of year | $ | 11.75 | $ | 12.00 | $ | 11.05 | $ | 11.86 | $ | 13.02 | ||||||||||
|
|
|
|
|
|
|
|
|
| |||||||||||
Net assets - End of year (000’s omitted) | $ | 23,317 | $ | 12,693 | $ | 1,671 | $ | 2,101 | $ | 3,799 | ||||||||||
|
|
|
|
|
|
|
|
|
| |||||||||||
Total return3 | (1.78 | %) | 9.94 | % | 2.50 | % | (2.44 | %) | 6.93 | % | ||||||||||
Ratios (to average net assets)/Supplemental Data: | ||||||||||||||||||||
Expenses* | 0.70 | %4 | 0.55 | %5 | 0.55 | %6 | 0.55 | %7 | 0.55 | %8 | ||||||||||
Net investment income2 | 0.16 | % | 0.30 | % | 0.87 | % | 1.07 | % | 0.75 | % | ||||||||||
Series portfolio turnover9 | 25 | % | 208 | % | 51 | % | 27 | % | 30 | % | ||||||||||
| *The investment advisor paid a portion of the Series’ expenses. If these expenses had been incurred by the Series, the expense ratios (to average net assets) would have been increased by the following amounts: |
| |||||||||||||||||||
| 0.24 | %4 | 0.43 | %5 | 0.33 | %6 | 0.39 | %7 | 0.62 | %8 | |||||||||||
1Calculated based on average shares outstanding during the years.
2Net investment income is affected by the timing of distributions from the Underlying Series in which the Series invest. The ratios do not include net investment income of the Underlying Series in which the Series invests.
3Represents aggregate total return for the years indicated, and assumes reinvestment of all distributions. Total return would have been lower had certain expenses not been waived or reimbursed.
4Expense ratios do not include expenses of the Underlying Series in which the Series invests. The expense ratios of the Underlying Series were 0.55% for Manning & Napier Blended Asset Extended Series - Class R6 and 0.50% for Manning & Napier Blended Asset Moderate Series - Class R6.
5Expense ratios do not include expenses of the Underlying Series in which the Series invests. The expense ratios of the Underlying Series were 0.83% for Manning & Napier Pro-Blend® Extended Term Series - Class I, 0.83% for Manning & Napier Pro-Blend® Moderate Term Series - Class I, 0.55% for Manning & Napier Blended Asset Extended Series -Class R6 and 0.50% for Manning & Napier Blended Asset Moderate Series - Class R6.
6Expense ratios do not include expenses of the Underlying Series in which the Series invests. The expense ratios of the Underlying Series were 0.82% for Manning & Napier Pro-Blend® Moderate Term Series - Class I and 0.82% for Manning & Napier Pro-Blend® Extended Term Series - Class I.
7Expense ratios do not include expenses of the Underlying Series in which the Series invests. The expense ratios of the Underlying Series were 0.82% for Manning & Napier Pro-Blend® Extended Term Series - Class I and 0.83% for Manning & Napier Pro-Blend® Maximum Term Series - Class I.
8Expense ratios do not include expenses of the Underlying Series in which the Series invests. The expense ratios of the Underlying Series were 0.81% for Manning & Napier Pro-Blend® Extended Term Series - Class I and 0.82% for Manning & Napier Pro-Blend® Maximum Term Series - Class I.
9Reflects activity of the Series and does not include the activity of the Underlying Series.
The accompanying notes are an integral part of the financial statements.
51
Financial Highlights
| TARGET 2025 SERIES CLASS I |
FOR THE YEAR ENDED | |||||||||||||||||||
| 10/31/18 | 10/31/17 | 10/31/16 | 10/31/15 | 10/31/14 | ||||||||||||||||
Per share data (for a share outstanding throughout each year): | ||||||||||||||||||||
Net asset value - Beginning of year | $ | 11.94 | $ | 10.99 | $ | 11.80 | $ | 12.98 | $ | 12.47 | ||||||||||
|
|
|
|
|
|
|
|
|
| |||||||||||
Income (loss) from investment operations: | ||||||||||||||||||||
Net investment income1,2 | 0.08 | 0.19 | 0.15 | 0.16 | 0.16 | |||||||||||||||
Net realized and unrealized gain (loss) on investments | (0.23 | ) | 0.95 | 0.14 | (0.40 | ) | 0.75 | |||||||||||||
|
|
|
|
|
|
|
|
|
| |||||||||||
Total from investment operations | (0.15 | ) | 1.14 | 0.29 | (0.24 | ) | 0.91 | |||||||||||||
|
|
|
|
|
|
|
|
|
| |||||||||||
Less distributions to shareholders: | ||||||||||||||||||||
From net investment income | (0.07 | ) | (0.19 | ) | (0.16 | ) | (0.46 | ) | (0.36 | ) | ||||||||||
From net realized gain on investments | (0.01 | ) | — | (0.94 | ) | (0.48 | ) | (0.04 | ) | |||||||||||
|
|
|
|
|
|
|
|
|
| |||||||||||
Total distributions to shareholders | (0.08 | ) | (0.19 | ) | (1.10 | ) | (0.94 | ) | (0.40 | ) | ||||||||||
|
|
|
|
|
|
|
|
|
| |||||||||||
Net asset value - End of year | $ | 11.71 | $ | 11.94 | $ | 10.99 | $ | 11.80 | $ | 12.98 | ||||||||||
|
|
|
|
|
|
|
|
|
| |||||||||||
Net assets - End of year (000’s omitted) | $ | 1,386 | $ | 2,123 | $ | 15,384 | $ | 15,539 | $ | 13,046 | ||||||||||
|
|
|
|
|
|
|
|
|
| |||||||||||
Total return3 | (1.33 | %) | 10.52 | % | 3.04 | % | (2.00 | %) | 7.51 | % | ||||||||||
Ratios (to average net assets)/Supplemental Data: | ||||||||||||||||||||
Expenses* | 0.20 | %4 | 0.05 | %5 | 0.05 | %6 | 0.05 | %7 | 0.05 | %8 | ||||||||||
Net investment income2 | 0.69 | % | 1.71 | % | 1.38 | % | 1.29 | % | 1.22 | % | ||||||||||
Series portfolio turnover9 | 25 | % | 208 | % | 51 | % | 27 | % | 30 | % | ||||||||||
| *The investment advisor paid a portion of the Series’ expenses. If these expenses had been incurred by the Series, the expense ratios (to average net assets) would have been increased by the following amounts: |
| |||||||||||||||||||
| 0.37 | %4 | 0.43 | %5 | 0.33 | %6 | 0.39 | %7 | 0.64 | %8 | |||||||||||
| TARGET 2025 SERIES CLASS R6 |
FOR THE YEAR ENDED 10/31/18 | FOR THE PERIOD 10/16/1710 TO 10/31/17 | ||||||||
Per share data (for a share outstanding throughout each period): | ||||||||||
Net asset value - Beginning of period | $ | 11.94 | $ | 11.95 | ||||||
|
|
|
| |||||||
Income (loss) from investment operations: | ||||||||||
Net investment income1,2 | 0.10 | — | ||||||||
Net realized and unrealized gain (loss) on investments | (0.23 | ) | (0.01 | ) | ||||||
|
|
|
| |||||||
Total from investment operations | (0.13 | ) | (0.01 | ) | ||||||
|
|
|
| |||||||
Less distributions to shareholders: | ||||||||||
From net investment income | (0.08 | ) | — | |||||||
From net realized gain on investments | (0.01 | ) | — | |||||||
|
|
|
| |||||||
Total distributions to shareholders | (0.09 | ) | — | |||||||
|
|
|
| |||||||
Net asset value - End of period | $ | 11.72 | $ | 11.94 | ||||||
|
|
|
| |||||||
Net assets - End of period (000’s omitted) | $ | 5 | $ | 5 | ||||||
|
|
|
| |||||||
Total return11 | (1.15 | %) | (0.08 | %) | ||||||
Ratios (to average net assets)/Supplemental Data: | ||||||||||
Expenses* | 0.05 | %4 | 0.05 | %5,12 | ||||||
Net investment income (loss)2 | 0.80 | % | (0.05 | %)12 | ||||||
Series portfolio turnover9 | 25 | % | 208 | % | ||||||
| *The investment advisor paid a portion of the Series’ expenses. If these expenses had been incurred by the Series, the expense ratios (to average net assets) would have been increased by the following amounts: |
| |||||||||
| 0.38 | %4 | 0.43 | %5,12 | |||||||
1Calculated based on average shares outstanding during the years.
2Net investment income is affected by the timing of distributions from the Underlying Series in which the Series invest. The ratios do not include net investment income of the Underlying Series in which the Series invests.
3Represents aggregate total return for the years indicated, and assumes reinvestment of all distributions. Total return would have been lower had certain expenses not been waived or reimbursed.
4Expense ratios do not include expenses of the Underlying Series in which the Series invests. The expense ratios of the Underlying Series were 0.55% for Manning & Napier Blended Asset Extended Series - Class R6 and 0.50% for Manning & Napier Blended Asset Moderate Series - Class R6.
5Expense ratios do not include expenses of the Underlying Series in which the Series invests. The expense ratios of the Underlying Series were 0.83% for Manning & Napier Pro-Blend® Extended Term Series - Class I, 0.83% for Manning & Napier Pro-Blend® Moderate Term Series - Class I, 0.55% for Manning & Napier Blended Asset Extended Series -Class R6 and 0.50% for Manning & Napier Blended Asset Moderate Series - Class R6.
6Expense ratios do not include expenses of the Underlying Series in which the Series invests. The expense ratios of the Underlying Series were 0.82% for Manning & Napier Pro-Blend® Moderate Term Series - Class I and 0.82% for Manning & Napier Pro-Blend® Extended Term Series - Class I.
7Expense ratios do not include expenses of the Underlying Series in which the Series invests. The expense ratios of the Underlying Series were 0.82% for Manning & Napier Pro-Blend® Extended Term Series - Class I and 0.83% for Manning & Napier Pro-Blend® Maximum Term Series - Class I.
8Expense ratios do not include expenses of the Underlying Series in which the Series invests. The expense ratios of the Underlying Series were 0.81% for Manning & Napier Pro-Blend® Extended Term Series - Class I and 0.82% for Manning & Napier Pro-Blend® Maximum Term Series - Class I.
9Reflects activity of the Series and does not include the activity of the Underlying Series.
10Commencement of operations.
11Represents aggregate total return for the periods indicated, and assumes reinvestment of all distributions. Total return would have been lower had certain expenses not been reimbursed during the periods. Periods less than one year are not annualized.
12Annualized.
The accompanying notes are an integral part of the financial statements.
52
Financial Highlights
TARGET 2030 SERIES CLASS K | FOR THE YEAR ENDED | |||||||||||||||||||
| 10/31/18 | 10/31/17 | 10/31/16 | 10/31/15 | 10/31/14 | ||||||||||||||||
Per share data (for a share outstanding throughout each year): | ||||||||||||||||||||
Net asset value - Beginning of year | $ | 9.52 | $ | 8.59 | $ | 9.78 | $ | 11.52 | $ | 11.40 | ||||||||||
|
|
|
|
|
|
|
|
|
| |||||||||||
Income (loss) from investment operations: | ||||||||||||||||||||
Net investment income1,2 | 0.03 | 0.08 | 0.08 | 0.11 | 0.10 | |||||||||||||||
Net realized and unrealized gain (loss) on investments | (0.12 | ) | 0.98 | 0.13 | (0.34 | ) | 0.73 | |||||||||||||
|
|
|
|
|
|
|
|
|
| |||||||||||
Total from investment operations | (0.09 | ) | 1.06 | 0.21 | (0.23 | ) | 0.83 | |||||||||||||
|
|
|
|
|
|
|
|
|
| |||||||||||
Less distributions to shareholders: | ||||||||||||||||||||
From net investment income | (0.03 | ) | (0.13 | ) | (0.09 | ) | (0.44 | ) | (0.35 | ) | ||||||||||
From net realized gain on investments | — | — | (1.31 | ) | (1.07 | ) | (0.36 | ) | ||||||||||||
|
|
|
|
|
|
|
|
|
| |||||||||||
Total distributions to shareholders | (0.03 | ) | (0.13 | ) | (1.40 | ) | (1.51 | ) | (0.71 | ) | ||||||||||
|
|
|
|
|
|
|
|
|
| |||||||||||
Net asset value - End of year | $ | 9.40 | $ | 9.52 | $ | 8.59 | $ | 9.78 | $ | 11.52 | ||||||||||
|
|
|
|
|
|
|
|
|
| |||||||||||
Net assets - End of year (000’s omitted) | $ | 93,346 | $ | 89,018 | $ | 79,527 | $ | 79,169 | $ | 118,788 | ||||||||||
|
|
|
|
|
|
|
|
|
| |||||||||||
Total return3 | (0.93 | %) | 12.49 | % | 3.12 | % | (2.33 | %) | 7.67 | % | ||||||||||
Ratios (to average net assets)/Supplemental Data: | ||||||||||||||||||||
Expenses* | 0.45 | %4 | 0.31 | %5 | 0.30 | %6 | 0.30 | %6 | 0.30 | %7 | ||||||||||
Net investment income2 | 0.31 | % | 0.89 | % | 0.94 | % | 1.11 | % | 0.87 | % | ||||||||||
Series portfolio turnover8 | 29 | % | 130 | % | 22 | % | 38 | % | 27 | % | ||||||||||
| *The investment advisor paid a portion of the Series’ expenses. If these expenses had been incurred by the Series, the expense ratios (to average net assets) would have been increased by the following amounts: |
| |||||||||||||||||||
| 0.13 | %4 | 0.08 | %5 | 0.06 | %6 | 0.04 | %6 | 0.03 | %7 | |||||||||||
TARGET 2030 SERIES CLASS R | FOR THE YEAR ENDED | |||||||||||||||||||
| 10/31/18 | 10/31/17 | 10/31/16 | 10/31/15 | 10/31/14 | ||||||||||||||||
Per share data (for a share outstanding throughout each year): | ||||||||||||||||||||
Net asset value - Beginning of year | $ | 9.43 | $ | 8.51 | $ | 9.70 | $ | 11.37 | $ | 11.31 | ||||||||||
|
|
|
|
|
|
|
|
|
| |||||||||||
Income (loss) from investment operations: | ||||||||||||||||||||
Net investment income (loss)1,2 | 0.01 | 0.05 | 0.07 | 0.10 | 0.07 | |||||||||||||||
Net realized and unrealized gain (loss) on investments | (0.12 | ) | 0.98 | 0.12 | (0.30 | ) | 0.67 | |||||||||||||
|
|
|
|
|
|
|
|
|
| |||||||||||
Total from investment operations | (0.11 | ) | 1.03 | 0.19 | (0.20 | ) | 0.74 | |||||||||||||
|
|
|
|
|
|
|
|
|
| |||||||||||
Less distributions to shareholders: | ||||||||||||||||||||
From net investment income | (0.02 | ) | (0.11 | ) | (0.07 | ) | (0.40 | ) | (0.32 | ) | ||||||||||
From net realized gain on investments | — | — | (1.31 | ) | (1.07 | ) | (0.36 | ) | ||||||||||||
|
|
|
|
|
|
|
|
|
| |||||||||||
Total distributions to shareholders | (0.02 | ) | (0.11 | ) | (1.38 | ) | (1.47 | ) | (0.68 | ) | ||||||||||
|
|
|
|
|
|
|
|
|
| |||||||||||
Net asset value - End of year | $ | 9.30 | $ | 9.43 | $ | 8.51 | $ | 9.70 | $ | 11.37 | ||||||||||
|
|
|
|
|
|
|
|
|
| |||||||||||
Net assets - End of year (000’s omitted) | $ | 22,413 | $ | 14,500 | $ | 7,832 | $ | 11,115 | $ | 20,894 | ||||||||||
|
|
|
|
|
|
|
|
|
| |||||||||||
Total return3 | (1.15 | %) | 12.20 | % | 2.85 | % | (2.11 | %) | 6.90 | % | ||||||||||
Ratios (to average net assets)/Supplemental Data: | ||||||||||||||||||||
Expenses* | 0.70 | %4 | 0.56 | %5 | 0.55 | %6 | 0.55 | %6 | 0.55 | %7 | ||||||||||
Net investment income2 | 0.08 | % | 0.59 | % | 0.84 | % | 0.95 | % | 0.62 | % | ||||||||||
Series portfolio turnover8 | 29 | % | 130 | % | 22 | % | 38 | % | 27 | % | ||||||||||
| *The investment advisor paid a portion of the Series’ expenses. If these expenses had been incurred by the Series, the expense ratios (to average net assets) would have been increased by the following amounts: |
| |||||||||||||||||||
| 0.03 | %4 | 0.08 | %5 | 0.06 | %6 | 0.04 | %6 | 0.03 | %7 | |||||||||||
1Calculated based on average shares outstanding during the years.
2Net investment income is affected by the timing of distributions from the Underlying Series in which the Series invest. The ratios do not include net investment income of the Underlying Series in which the Series invests.
3Represents aggregate total return for the years indicated, and assumes reinvestment of all distributions. Total return would have been lower had certain expenses not been waived or reimbursed.
4Expense ratios do not include expenses of the Underlying Series in which the Series invests. The expense ratios of the Underlying Series were 0.55% for Manning & Napier Blended Asset Extended Series - Class R6 and 0.55% for Manning & Napier Blended Asset Maximum Series - Class R6.
5Expense ratios do not include expenses of the Underlying Series in which the Series invests. The expense ratios of the Underlying Series were 0.83% for Manning & Napier Pro-Blend® Extended Term Series - Class I, 0.85% for Manning & Napier Pro-Blend® Maximum Term Series - Class I, 0.55% for Manning & Napier Blended Asset Extended Series -Class R6 and 0.55% for Manning & Napier Blended Asset Maximum Series - Class R6.
6Expense ratios do not include expenses of the Underlying Series in which the Series invests. The expense ratios of the Underlying Series were 0.82% for Manning & Napier Pro-Blend® Extended Term Series - Class I and 0.83% for Manning & Napier Pro-Blend® Maximum Term Series - Class I.
7Expense ratios do not include expenses of the Underlying Series in which the Series invests. The expense ratios of the Underlying Series were 0.81% for Manning & Napier Pro-Blend® Extended Term Series - Class I and 0.82% for Manning & Napier Pro-Blend® Maximum Term Series - Class I.
8Reflects activity of the Series and does not include the activity of the Underlying Series.
The accompanying notes are an integral part of the financial statements.
53
Financial Highlights
| TARGET 2030 SERIES CLASS I | FOR THE YEAR ENDED | |||||||||||||||||||
| 10/31/18 | 10/31/17 | 10/31/16 | 10/31/15 | 10/31/14 | ||||||||||||||||
Per share data (for a share outstanding throughout each year): | ||||||||||||||||||||
Net asset value - Beginning of year | $ | 9.62 | $ | 8.68 | $ | 9.87 | $ | 11.61 | $ | 11.48 | ||||||||||
|
|
|
|
|
|
|
|
|
| |||||||||||
Income (loss) from investment operations: | ||||||||||||||||||||
Net investment income1,2 | 0.06 | 0.12 | 0.12 | 0.12 | 0.14 | |||||||||||||||
Net realized and unrealized gain (loss) on investments | (0.12 | ) | 0.97 | 0.11 | (0.32 | ) | 0.73 | |||||||||||||
|
|
|
|
|
|
|
|
|
| |||||||||||
Total from investment operations | (0.06 | ) | 1.09 | 0.23 | (0.20 | ) | 0.87 | |||||||||||||
|
|
|
|
|
|
|
|
|
| |||||||||||
Less distributions to shareholders: | ||||||||||||||||||||
From net investment income | (0.05 | ) | (0.15 | ) | (0.11 | ) | (0.47 | ) | (0.38 | ) | ||||||||||
From net realized gain on investments | — | — | (1.31 | ) | (1.07 | ) | (0.36 | ) | ||||||||||||
|
|
|
|
|
|
|
|
|
| |||||||||||
Total distributions to shareholders | (0.05 | ) | (0.15 | ) | (1.42 | ) | (1.54 | ) | (0.74 | ) | ||||||||||
|
|
|
|
|
|
|
|
|
| |||||||||||
Net asset value - End of year | $ | 9.51 | $ | 9.62 | $ | 8.68 | $ | 9.87 | $ | 11.61 | ||||||||||
|
|
|
|
|
|
|
|
|
| |||||||||||
Net assets - End of year (000’s omitted) | $ | 5,721 | $ | 38,110 | $ | 53,551 | $ | 75,870 | $ | 58,075 | ||||||||||
|
|
|
|
|
|
|
|
|
| |||||||||||
Total return3 | (0.65 | %) | 12.76 | % | 3.38 | % | (2.02 | %) | 7.95 | % | ||||||||||
Ratios (to average net assets)/Supplemental Data: | ||||||||||||||||||||
Expenses* | 0.20 | %4 | 0.06 | %5 | 0.05 | %6 | 0.05 | %6 | 0.05 | %7 | ||||||||||
Net investment income2 | 0.66 | % | 1.30 | % | 1.36 | % | 1.22 | % | 1.23 | % | ||||||||||
Series portfolio turnover8 | 29 | % | 130 | % | 22 | % | 38 | % | 27 | % | ||||||||||
| *The investment advisor paid a portion of the Series’ expenses. If these expenses had been incurred by the Series, the expense ratios (to average net assets) would have been increased by the following amounts: |
| |||||||||||||||||||
| 0.15 | %4 | 0.08 | %5 | 0.06 | %6 | 0.04 | %6 | 0.03 | %7 | |||||||||||
| TARGET 2030 SERIES CLASS R6 |
FOR THE YEAR ENDED 10/31/18 | FOR THE PERIOD 10/16/179 TO 10/31/17 | ||||||||
Per share data (for a share outstanding throughout each period): | ||||||||||
Net asset value - Beginning of period | $ | 9.61 | $ | 9.62 | ||||||
|
|
|
| |||||||
Income (loss) from investment operations: | ||||||||||
Net investment income1,2 | 0.07 | — | ||||||||
Net realized and unrealized gain (loss) on investments | (0.11 | ) | (0.01 | ) | ||||||
|
|
|
| |||||||
Total from investment operations | (0.04 | ) | (0.01 | ) | ||||||
|
|
|
| |||||||
Less distributions to shareholders: | ||||||||||
From net investment income | (0.07 | ) | — | |||||||
|
|
|
| |||||||
Total distributions to shareholders | (0.07 | ) | — | |||||||
|
|
|
| |||||||
Net asset value - End of period | $ | 9.50 | $ | 9.61 | ||||||
|
|
|
| |||||||
Net assets - End of period (000’s omitted) | $ | 5 | $ | 5 | ||||||
|
|
|
| |||||||
Total return10 | (0.48 | %) | (0.10 | %) | ||||||
Ratios (to average net assets)/Supplemental Data: | ||||||||||
Expenses* | | 0.05 | %4 | | 0.05 | %5,11 | ||||
Net investment income (loss) | 0.72 | % | | (0.05 | %)11 | |||||
Series portfolio turnover8 | 29 | % | 130 | % | ||||||
| *The investment advisor paid a portion of the Series’ expenses. If these expenses had been incurred by the Series, the expense ratios (to average net assets) would have been increased by the following amount: |
| |||||||||
| 0.14%4 | 0.08%5,11 | |||||||||
1Calculated based on average shares outstanding during the years.
2Net investment income is affected by the timing of distributions from the Underlying Series in which the Series invest. The ratios do not include net investment income of the Underlying Series in which the Series invests.
3Represents aggregate total return for the years indicated, and assumes reinvestment of all distributions. Total return would have been lower had certain expenses not been waived or reimbursed.
4Expense ratios do not include expenses of the Underlying Series in which the Series invests. The expense ratios of the Underlying Series were 0.55% for Manning & Napier Blended Asset Extended Series - Class R6 and 0.55% for Manning & Napier Blended Asset Maximum Series - Class R6.
5Expense ratios do not include expenses of the Underlying Series in which the Series invests. The expense ratios of the Underlying Series were 0.83% for Manning & Napier Pro-Blend® Extended Term Series - Class I, 0.85% for Manning & Napier Pro-Blend® Maximum Term Series - Class I, 0.55% for Manning & Napier Blended Asset Extended Series -Class R6 and 0.55% for Manning & Napier Blended Asset Maximum Series - Class R6.
6Expense ratios do not include expenses of the Underlying Series in which the Series invests. The expense ratios of the Underlying Series were 0.82% for Manning & Napier Pro-Blend® Extended Term Series - Class I and 0.83% for Manning & Napier Pro-Blend® Maximum Term Series - Class I.
7Expense ratios do not include expenses of the Underlying Series in which the Series invests. The expense ratios of the Underlying Series were 0.81% for Manning & Napier Pro-Blend® Extended Term Series - Class I and 0.82% for Manning & Napier Pro-Blend® Maximum Term Series - Class I.
8Reflects activity of the Series and does not include the activity of the Underlying Series.
9Commencement of operations.
10Represents aggregate total return for the periods indicated, and assumes reinvestment of all distributions. Total return would have been lower had certain expenses not been reimbursed during the periods. Periods less than one year are not annualized.
11Annualized.
The accompanying notes are an integral part of the financial statements.
54
Financial Highlights
TARGET 2035 SERIES CLASS K | FOR THE YEAR ENDED | |||||||||||||||||||
| 10/31/18 | 10/31/17 | 10/31/16 | 10/31/15 | 10/31/14 | ||||||||||||||||
Per share data (for a share outstanding throughout each year): | ||||||||||||||||||||
Net asset value - Beginning of year | $ | 12.66 | $ | 11.30 | $ | 12.32 | $ | 13.71 | $ | 13.22 | ||||||||||
|
|
|
|
|
|
|
|
|
| |||||||||||
Income (loss) from investment operations: | ||||||||||||||||||||
Net investment income1,2 | 0.03 | 0.08 | 0.08 | 0.11 | 0.06 | |||||||||||||||
Net realized and unrealized gain (loss) on investments | (0.03 | ) | 1.50 | 0.21 | (0.38 | ) | 0.99 | |||||||||||||
|
|
|
|
|
|
|
|
|
| |||||||||||
Total from investment operations | — | 3 | 1.58 | 0.29 | (0.27 | ) | 1.05 | |||||||||||||
|
|
|
|
|
|
|
|
|
| |||||||||||
Less distributions to shareholders: | ||||||||||||||||||||
From net investment income | (0.04 | ) | (0.15 | ) | (0.10 | ) | (0.61 | ) | (0.46 | ) | ||||||||||
From net realized gain on investments | (0.16 | ) | (0.07 | ) | (1.21 | ) | (0.51 | ) | (0.10 | ) | ||||||||||
|
|
|
|
|
|
|
|
|
| |||||||||||
Total distributions to shareholders | (0.20 | ) | (0.22 | ) | (1.31 | ) | (1.12 | ) | (0.56 | ) | ||||||||||
|
|
|
|
|
|
|
|
|
| |||||||||||
Net asset value - End of year | $ | 12.46 | $ | 12.66 | $ | 11.30 | $ | 12.32 | $ | 13.71 | ||||||||||
|
|
|
|
|
|
|
|
|
| |||||||||||
Net assets - End of year (000’s omitted) | $ | 20,918 | $ | 18,235 | $ | 11,745 | $ | 8,979 | $ | 5,378 | ||||||||||
|
|
|
|
|
|
|
|
|
| |||||||||||
Total return4 | (0.01 | %) | 14.32 | % | 3.13 | % | (2.20 | %) | 8.17 | % | ||||||||||
Ratios (to average net assets)/Supplemental Data: | ||||||||||||||||||||
Expenses* | 0.45 | %5 | 0.31 | %6 | 0.30 | %7 | 0.30 | %7 | 0.30 | %8 | ||||||||||
Net investment income2 | 0.23 | % | 0.67 | % | 0.71 | % | 0.86 | % | 0.44 | % | ||||||||||
Series portfolio turnover9 | 32 | % | 173 | % | 22 | % | 26 | % | 24 | % | ||||||||||
| *The investment advisor paid a portion of the Series’ expenses. If these expenses had been incurred by the Series, the expense ratios (to average net assets) would have been increased by the following amounts: |
| |||||||||||||||||||
| 0.49 | %5 | 0.54 | %6 | 0.43 | %7 | 0.52 | %7 | 0.83 | %8 | |||||||||||
TARGET 2035 SERIES CLASS R | FOR THE YEAR ENDED | |||||||||||||||||||
| 10/31/18 | 10/31/17 | 10/31/16 | 10/31/15 | 10/31/14 | ||||||||||||||||
Per share data (for a share outstanding throughout each year): | ||||||||||||||||||||
Net asset value - Beginning of year | $ | 12.70 | $ | 11.33 | $ | 12.34 | $ | 13.72 | $ | 13.25 | ||||||||||
|
|
|
|
|
|
|
|
|
| |||||||||||
Income (loss) from investment operations: | ||||||||||||||||||||
Net investment income1,2 | — | 3 | 0.03 | 0.06 | 0.08 | 0.07 | ||||||||||||||
Net realized and unrealized gain (loss) on investments | (0.02 | ) | 1.52 | 0.21 | (0.38 | ) | 0.93 | |||||||||||||
|
|
|
|
|
|
|
|
|
| |||||||||||
Total from investment operations | (0.02 | ) | 1.55 | 0.27 | (0.30 | ) | 1.00 | |||||||||||||
|
|
|
|
|
|
|
|
|
| |||||||||||
Less distributions to shareholders: | ||||||||||||||||||||
From net investment income | (0.03 | ) | (0.11 | ) | (0.07 | ) | (0.57 | ) | (0.43 | ) | ||||||||||
From net realized gain on investments | (0.16 | ) | (0.07 | ) | (1.21 | ) | (0.51 | ) | (0.10 | ) | ||||||||||
|
|
|
|
|
|
|
|
|
| |||||||||||
Total distributions to shareholders | (0.19 | ) | (0.18 | ) | (1.28 | ) | (1.08 | ) | (0.53 | ) | ||||||||||
|
|
|
|
|
|
|
|
|
| |||||||||||
Net asset value - End of year | $ | 12.49 | $ | 12.70 | $ | 11.33 | $ | 12.34 | $ | 13.72 | ||||||||||
|
|
|
|
|
|
|
|
|
| |||||||||||
Net assets - End of year (000’s omitted) | $ | 15,631 | $ | 7,112 | $ | 2,057 | $ | 2,337 | $ | 2,911 | ||||||||||
|
|
|
|
|
|
|
|
|
| |||||||||||
Total return4 | (0.18 | %) | 13.96 | % | 2.92 | % | (2.44 | %) | 7.82 | % | ||||||||||
Ratios (to average net assets)/Supplemental Data: | ||||||||||||||||||||
Expenses* | 0.70 | %5 | 0.55 | %6 | 0.55 | %7 | 0.55 | %7 | 0.55 | %8 | ||||||||||
Net investment income2 | 0.01 | % | 0.23 | % | 0.50 | % | 0.66 | % | 0.49 | % | ||||||||||
Series portfolio turnover9 | 32 | % | 173 | % | 22 | % | 26 | % | 24 | % | ||||||||||
| *The investment advisor paid a portion of the Series’ expenses. If these expenses had been incurred by the Series, the expense ratios (to average net assets) would have been increased by the following amounts: |
| |||||||||||||||||||
| 0.43 | %5 | 0.54 | %6 | 0.43 | %7 | 0.52 | %7 | 0.88 | %8 | |||||||||||
1Calculated based on average shares outstanding during the years.
2Net investment income is affected by the timing of distributions from the Underlying Series in which the Series invest. The ratios do not include net investment income of the Underlying Series in which the Series invests.
3Less than $0.01.
4Represents aggregate total return for the years indicated, and assumes reinvestment of all distributions. Total return would have been lower had certain expenses not been waived or reimbursed.
5Expense ratios do not include expenses of the Underlying Series in which the Series invests. The expense ratio of the Underlying Series were 0.55% for Manning & Napier Blended Asset Extended Series - Class R6 and 0.55% for Manning & Napier Blended Asset Maximum Series - Class R6.
6Expense ratios do not include expenses of the Underlying Series in which the Series invests. The expense ratios of the Underlying Series were 0.83% for Manning & Napier Pro-Blend® Extended Term Series - Class I, 0.85% for Manning & Napier Pro-Blend® Maximum Term Series - Class I, 0.55% for Manning & Napier Blended Asset Extended Series -Class R6 and 0.55% for Manning & Napier Blended Asset Maximum Series - Class R6.
7Expense ratios do not include expenses of the Underlying Series in which the Series invests. The expense ratios of the Underlying Series were 0.82% for Manning & Napier Pro-Blend® Extended Term Series - Class I and 0.83% for Manning & Napier Pro-Blend® Maximum Term Series - Class I.
8Expense ratios do not include expenses of the Underlying Series in which the Series invests. The expense ratios of the Underlying Series were 0.81% for Manning & Napier Pro-Blend® Extended Term Series - Class I and 0.82% for Manning & Napier Pro-Blend® Maximum Term Series - Class I.
9Reflects activity of the Series and does not include the activity of the Underlying Series.
The accompanying notes are an integral part of the financial statements.
55
Financial Highlights
| TARGET 2035 SERIES CLASS I | FOR THE YEAR ENDED | |||||||||||||||||||
| 10/31/18 | 10/31/17 | 10/31/16 | 10/31/15 | 10/31/14 | ||||||||||||||||
Per share data (for a share outstanding throughout each year | ||||||||||||||||||||
Net asset value - Beginning of year | $ | 12.71 | $ | 11.35 | $ | 12.36 | $ | 13.75 | $ | 13.25 | ||||||||||
|
|
|
|
|
|
|
|
|
| |||||||||||
Income (loss) from investment operations: | ||||||||||||||||||||
Net investment income1,2 | 0.07 | 0.16 | 0.11 | 0.14 | 0.12 | |||||||||||||||
Net realized and unrealized gain (loss) on investments | (0.04 | ) | 1.45 | 0.21 | (0.38 | ) | 0.96 | |||||||||||||
|
|
|
|
|
|
|
|
|
| |||||||||||
Total from investment operations | 0.03 | 1.61 | 0.32 | (0.24 | ) | 1.08 | ||||||||||||||
|
|
|
|
|
|
|
|
|
| |||||||||||
Less distributions to shareholders: | ||||||||||||||||||||
From net investment income | (0.06 | ) | (0.18 | ) | (0.12 | ) | (0.64 | ) | (0.48 | ) | ||||||||||
From net realized gain on investments | (0.16 | ) | (0.07 | ) | (1.21 | ) | (0.51 | ) | (0.10 | ) | ||||||||||
|
|
|
|
|
|
|
|
|
| |||||||||||
Total distributions to shareholders | (0.22 | ) | (0.25 | ) | (1.33 | ) | (1.15 | ) | (0.58 | ) | ||||||||||
|
|
|
|
|
|
|
|
|
| |||||||||||
Net asset value - End of year | $ | 12.52 | $ | 12.71 | $ | 11.35 | $ | 12.36 | $ | 13.75 | ||||||||||
|
|
|
|
|
|
|
|
|
| |||||||||||
Net assets - End of year (000’s omitted) | $ | 760 | $ | 964 | $ | 11,455 | $ | 10,993 | $ | 9,487 | ||||||||||
|
|
|
|
|
|
|
|
|
| |||||||||||
Total return3 | 0.27 | % | 14.53 | % | 3.45 | % | (1.98 | %) | 8.43 | % | ||||||||||
Ratios (to average net assets)/Supplemental Data: | ||||||||||||||||||||
Expenses* | 0.20 | %4 | 0.05 | %5 | 0.05 | %6 | 0.05 | %6 | 0.05 | %7 | ||||||||||
Net investment income2 | 0.54 | % | 1.37 | % | 1.01 | % | 1.07 | % | 0.88 | % | ||||||||||
Series portfolio turnover8 | 32 | % | 173 | % | 22 | % | 26 | % | 24 | % | ||||||||||
| *The investment advisor paid a portion of the Series’ expenses. If these expenses had been incurred by the Series, the expense ratios (to average net assets) would have been increased by the following amounts: |
| |||||||||||||||||||
| 0.56 | %4 | 0.54 | %5 | 0.43 | %6 | 0.52 | %6 | 0.91 | %7 | |||||||||||
| TARGET 2035 SERIES CLASS R6 |
FOR THE YEAR ENDED 10/31/18 | FOR THE PERIOD 10/16/179 TO 10/31/17 | ||||||||
Per share data (for a share outstanding throughout each period): | ||||||||||
Net asset value - Beginning of period | $ | 12.71 | $ | 12.71 | ||||||
|
|
|
| |||||||
Income (loss) from investment operations: | ||||||||||
Net investment Income2,10 | 0.09 | — | ||||||||
Net realized and unrealized gain (loss) on investments | (0.04 | ) | — | |||||||
|
|
|
| |||||||
Total from investment operations | 0.05 | — | ||||||||
|
|
|
| |||||||
Less distributions to shareholders: | ||||||||||
From net investment income | (0.07 | ) | — | |||||||
From net realized gain on investments | (0.16 | ) | — | |||||||
|
|
|
| |||||||
Total distributions to shareholders | (0.23 | ) | — | |||||||
|
|
|
| |||||||
Net asset value - End of period | $ | 12.53 | $ | 12.71 | ||||||
|
|
|
| |||||||
Net assets - End of period (000’s omitted) | $ | 5 | $ | 5 | ||||||
|
|
|
| |||||||
Total return11 | 0.44 | % | 0.00 | % | ||||||
Ratios (to average net assets)/Supplemental Data: | ||||||||||
Expenses* | 0.05 | %4 | 0.05 | %5,12 | ||||||
Net investment income (loss)2 | 0.66 | % | (0.05 | %)12 | ||||||
Series portfolio turnover8 | 32 | % | 173 | % | ||||||
| *The investment advisor paid a portion of the Series’ expenses. If these expenses had been incurred by the Series, the expense ratios (to average net assets) would have been increased by the following amounts: |
| |||||||||
| 0.56 | %4 | 0.54 | %5,12 | |||||||
1Calculated based on average shares outstanding during the years.
2Net investment income is affected by the timing of distributions from the Underlying Series in which the Series invest. The ratios do not include net investment income of the Underlying Series in which the Series invests.
3Represents aggregate total return for the years indicated, and assumes reinvestment of all distributions. Total return would have been lower had certain expenses not been waived or reimbursed.
4Expense ratios do not include expenses of the Underlying Series in which the Series invests. The expense ratio of the Underlying Series were 0.55% for Manning & Napier Blended Asset Extended Series - Class R6 and 0.55% for Manning & Napier Blended Asset Maximum Series - Class R6.
5Expense ratios do not include expenses of the Underlying Series in which the Series invests. The expense ratios of the Underlying Series were 0.83% for Manning & Napier Pro-Blend® Extended Term Series - Class I, 0.85% for Manning & Napier Pro-Blend® Maximum Term Series - Class I, 0.55% for Manning & Napier Blended Asset Extended Series -Class R6 and 0.55% for Manning & Napier Blended Asset Maximum Series - Class R6.
6Expense ratios do not include expenses of the Underlying Series in which the Series invests. The expense ratios of the Underlying Series were 0.82% for Manning & Napier Pro-Blend® Extended Term Series - Class I and 0.83% for Manning & Napier Pro-Blend® Maximum Term Series - Class I.
7Expense ratios do not include expenses of the Underlying Series in which the Series invests. The expense ratios of the Underlying Series were 0.81% for Manning & Napier Pro-Blend® Extended Term Series - Class I and 0.82% for Manning & Napier Pro-Blend® Maximum Term Series - Class I.
8Reflects activity of the Series and does not include the activity of the Underlying Series.
9Commencement of operations.
10Calculated based on average shares outstanding during the periods.
11Represents aggregate total return for the periods indicated, and assumes reinvestment of all distributions. Total return would have been lower had certain expenses not been reimbursed during the periods. Periods less than one year are not annualized.
12Annualized.
The accompanying notes are an integral part of the financial statements.
56
Financial Highlights
TARGET 2040 SERIES CLASS K | FOR THE YEAR ENDED | |||||||||||||||||||
| 10/31/18 | 10/31/17 | 10/31/16 | 10/31/15 | 10/31/14 | ||||||||||||||||
Per share data (for a share outstanding throughout each year): | ||||||||||||||||||||
Net asset value - Beginning of year | $ | 10.01 | $ | 8.73 | $ | 10.13 | $ | 12.50 | $ | 12.47 | ||||||||||
|
|
|
|
|
|
|
|
|
| |||||||||||
Income (loss) from investment operations: | ||||||||||||||||||||
Net investment income1,2 | 0.02 | 0.05 | 0.05 | 0.09 | 0.07 | |||||||||||||||
Net realized and unrealized gain on investments | 0.08 | 1.34 | 0.16 | (0.32 | ) | 0.94 | ||||||||||||||
|
|
|
|
|
|
|
|
|
| |||||||||||
Total from investment operations | 0.10 | 1.39 | 0.21 | (0.23 | ) | 1.01 | ||||||||||||||
|
|
|
|
|
|
|
|
|
| |||||||||||
Less distributions to shareholders: | ||||||||||||||||||||
From net investment income | (0.02 | ) | (0.11 | ) | (0.06 | ) | (0.61 | ) | (0.48 | ) | ||||||||||
From net realized gain on investments | (0.19 | ) | — | (1.55 | ) | (1.53 | ) | (0.50 | ) | |||||||||||
|
|
|
|
|
|
|
|
|
| |||||||||||
Total distributions to shareholders | (0.21 | ) | (0.11 | ) | (1.61 | ) | (2.14 | ) | (0.98 | ) | ||||||||||
|
|
|
|
|
|
|
|
|
| |||||||||||
Net asset value - End of year | $ | 9.90 | $ | 10.01 | $ | 8.73 | $ | 10.13 | $ | 12.50 | ||||||||||
|
|
|
|
|
|
|
|
|
| |||||||||||
Net assets - End of year (000’s omitted) | $ | 55,271 | $ | 52,397 | $ | 55,920 | $ | 51,931 | $ | 83,655 | ||||||||||
|
|
|
|
|
|
|
|
|
| |||||||||||
Total return3 | 1.01 | % | 16.08 | % | 3.24 | % | (2.30 | %) | 8.61 | % | ||||||||||
Ratios (to average net assets)/Supplemental Data: | ||||||||||||||||||||
Expenses* | 0.45 | %4 | 0.31 | %5 | 0.30 | %6 | 0.30 | %6 | 0.30 | %7 | ||||||||||
Net investment income2 | 0.19 | % | 0.54 | % | 0.57 | % | 0.80 | % | 0.54 | % | ||||||||||
Series portfolio turnover8 | 36 | % | 127 | % | 26 | % | 45 | % | 22 | % | ||||||||||
| *The investment advisor paid a portion of the Series’ expenses. If these expenses had been incurred by the Series, the expense ratios (to average net assets) would have been increased by the following amounts: |
| |||||||||||||||||||
|
| 0.22
| %4
|
| 0.14
| %5
|
| 0.10
| %6
|
| 0.08
| %6
|
| 0.06
| %7
| ||||||
TARGET 2040 SERIES CLASS R | FOR THE YEAR ENDED | |||||||||||||||||||
| 10/31/18 | 10/31/17 | 10/31/16 | 10/31/15 | 10/31/14 | ||||||||||||||||
Per share data (for a share outstanding throughout each year): | ||||||||||||||||||||
Net asset value - Beginning of year | $ | 9.93 | $ | 8.66 | $ | 10.06 | $ | 12.33 | $ | 12.39 | ||||||||||
|
|
|
|
|
|
|
|
|
| |||||||||||
Income (loss) from investment operations: | ||||||||||||||||||||
Net investment income (loss)1,2 | — | 9 | 0.02 | 0.03 | 0.07 | 0.03 | ||||||||||||||
Net realized and unrealized gain (loss) on investments | 0.09 | 1.34 | 0.15 | (0.24 | ) | 0.86 | ||||||||||||||
|
|
|
|
|
|
|
|
|
| |||||||||||
Total from investment operations | 0.09 | 1.36 | 0.18 | (0.17 | ) | 0.89 | ||||||||||||||
|
|
|
|
|
|
|
|
|
| |||||||||||
Less distributions to shareholders: | ||||||||||||||||||||
From net investment income | (0.02 | ) | (0.09 | ) | (0.03 | ) | (0.57 | ) | (0.45 | ) | ||||||||||
From net realized gain on investments | (0.19 | ) | — | (1.55 | ) | (1.53 | ) | (0.50 | ) | |||||||||||
|
|
|
|
|
|
|
|
|
| |||||||||||
Total distributions to shareholders | (0.21 | ) | (0.09 | ) | (1.58 | ) | (2.10 | ) | (0.95 | ) | ||||||||||
|
|
|
|
|
|
|
|
|
| |||||||||||
Net asset value - End of year | $ | 9.81 | $ | 9.93 | $ | 8.66 | $ | 10.06 | $ | 12.33 | ||||||||||
|
|
|
|
|
|
|
|
|
| |||||||||||
Net assets - End of year (000’s omitted) | $ | 14,956 | $ | 7,946 | $ | 4,653 | $ | 5,226 | $ | 10,469 | ||||||||||
|
|
|
|
|
|
|
|
|
| |||||||||||
Total return3 | 0.82 | % | 15.83 | % | 2.94 | % | (1.91 | %) | 7.60 | % | ||||||||||
Ratios (to average net assets)/Supplemental Data: | ||||||||||||||||||||
Expenses* | 0.70 | %4 | 0.56 | %5 | 0.55 | %6 | 0.55 | %6 | 0.55 | %7 | ||||||||||
Net investment income (loss)2 | (0.05 | %) | 0.25 | % | 0.36 | % | 0.62 | % | 0.23 | % | ||||||||||
Series portfolio turnover8 | 36 | % | 127 | % | 26 | % | 45 | % | 22 | % | ||||||||||
| *The investment advisor paid a portion of the Series’ expenses. If these expenses had been incurred by the Series, the expense ratios (to average net assets) would have been increased by the following amounts: |
| |||||||||||||||||||
| 0.11 | %4 | 0.14 | %5 | 0.10 | %6 | 0.08 | %6 | 0.06 | %7 | |||||||||||
1Calculated based on average shares outstanding during the years.
2Net investment income is affected by the timing of distributions from the Underlying Series in which the Series invest. The ratios do not include net investment income of the Underlying Series in which the Series invests.
3Represents aggregate total return for the years indicated, and assumes reinvestment of all distributions. Total return would have been lower had certain expenses not been waived or reimbursed during the years.
4Expense ratios do not include expenses of the Underlying Series in which the Series invests. The expense ratio of the Underlying Series were 0.55% for Manning & Napier Blended Asset Extended Series - Class R6 and 0.55% for Manning & Napier Blended Asset Maximum Series - Class R6.
5Expense ratios do not include expenses of the Underlying Series in which the Series invests. The expense ratios of the Underlying Series were 0.83% for Manning & Napier Pro-Blend® Extended Term Series - Class I, 0.85% for Manning & Napier Pro-Blend® Maximum Term Series - Class I, 0.55% for Manning & Napier Blended Asset Extended Series - Class R6 and 0.55% for Manning & Napier Blended Asset Maximum Series - Class R6.
6Expense ratios do not include expenses of the Underlying Series in which the Series invests. The expense ratios of the Underlying Series were 0.82% for Manning & Napier Pro-Blend® Extended Term Series - Class I and 0.83% for Manning & Napier Pro-Blend® Maximum Term Series - Class I.
7Expense ratios do not include expenses of the Underlying Series in which the Series invests. The expense ratios of the Underlying Series were 0.81% for Manning & Napier Pro-Blend® Extended Term Series - Class I and 0.82% for Manning & Napier Pro-Blend® Maximum Term Series - Class I.
8Reflects activity of the Series and does not include the activity of the Underlying Series.
9Less than $0.01.
The accompanying notes are an integral part of the financial statements.
57
Financial Highlights
TARGET 2040 SERIES CLASS I | FOR THE YEAR ENDED | |||||||||||||||||||
| 10/31/18 | 10/31/17 | 10/31/16 | 10/31/15 | 10/31/14 | ||||||||||||||||
Per share data (for a share outstanding throughout each year): | ||||||||||||||||||||
Net asset value - Beginning of year | $ | 10.10 | $ | 8.81 | $ | 10.20 | $ | 12.58 | $ | 12.55 | ||||||||||
|
|
|
|
|
|
|
|
|
| |||||||||||
Income (loss) from investment operations: | ||||||||||||||||||||
Net investment income1,2 | 0.06 | 0.09 | 0.09 | 0.10 | 0.10 | |||||||||||||||
Net realized and unrealized gain on investments | 0.07 | 1.33 | 0.15 | (0.30 | ) | 0.94 | ||||||||||||||
|
|
|
|
|
|
|
|
|
| |||||||||||
Total from investment operations | 0.13 | 1.42 | 0.24 | (0.20 | ) | 1.04 | ||||||||||||||
|
|
|
|
|
|
|
|
|
| |||||||||||
Less distributions to shareholders: | ||||||||||||||||||||
From net investment income | (0.04 | ) | (0.13 | ) | �� | (0.08 | ) | (0.65 | ) | (0.51 | ) | |||||||||
From net realized gain on investments | (0.19 | ) | — | (1.55 | ) | (1.53 | ) | (0.50 | ) | |||||||||||
|
|
|
|
|
|
|
|
|
| |||||||||||
Total distributions to shareholders | (0.23 | ) | (0.13 | ) | (1.63 | ) | (2.18 | ) | (1.01 | ) | ||||||||||
|
|
|
|
|
|
|
|
|
| |||||||||||
Net asset value - End of year | $ | 10.00 | $ | 10.10 | $ | 8.81 | $ | 10.20 | $ | 12.58 | ||||||||||
|
|
|
|
|
|
|
|
|
| |||||||||||
Net assets - End of year (000’s omitted) | $ | 2,701 | $ | 23,656 | $ | 27,895 | $ | 43,552 | $ | 32,952 | ||||||||||
|
|
|
|
|
|
|
|
|
| |||||||||||
Total return3 | 1.26 | % | 16.36 | % | 3.60 | % | (2.08 | %) | 8.81 | % | ||||||||||
Ratios (to average net assets)/Supplemental Data: | ||||||||||||||||||||
Expenses* | 0.20 | %4 | 0.06 | %5 | 0.05 | %6 | 0.05 | %6 | 0.05 | %7 | ||||||||||
Net investment income2 | 0.54 | % | 0.91 | % | 0.99 | % | 0.96 | % | 0.79 | % | ||||||||||
Series portfolio turnover8 | 36 | % | 127 | % | 26 | % | 45 | % | 22 | % | ||||||||||
| *The investment advisor paid a portion of the Series’ expenses. If these expenses had been incurred by the Series, the expense ratios (to average net assets) would have been increased by the following amounts: |
| |||||||||||||||||||
| 0.24 | %4 | 0.14 | %5 | 0.10 | %6 | 0.08 | %6 | 0.06 | %7 | |||||||||||
TARGET 2040 SERIES CLASS R6 | FOR THE YEAR ENDED | FOR THE PERIOD | ||||||
| 10/31/18 | 10/16/179 TO 10/31/17 | |||||||
Per share data (for a share outstanding throughout each period): | ||||||||
Net asset value - Beginning of period | $ | 10.10 | $ | 10.09 | ||||
|
|
|
| |||||
Income (loss) from investment operations: | ||||||||
Net investment income2,10 | 0.06 | — | ||||||
Net realized and unrealized gain (loss) on investments | 0.09 | 0.01 | ||||||
|
|
|
| |||||
Total from investment operations | 0.15 | 0.01 | ||||||
|
|
|
| |||||
Less distributions to shareholders: | ||||||||
From net investment income | (0.06 | ) | — | |||||
From net realized gain on investments | (0.19 | ) | — | |||||
|
|
|
| |||||
Total distributions to shareholders | (0.25 | ) | — | |||||
|
|
|
| |||||
Net asset value - End of period | $ | 10.00 | $ | 10.10 | ||||
|
|
|
| |||||
Net assets - End of period (000’s omitted) | $ | 5 | $ | 5 | ||||
|
|
|
| |||||
Total return11 | 1.45 | % | 0.10 | % | ||||
Ratios (to average net assets)/Supplemental Data: | ||||||||
Expenses* | 0.05 | %4 | 0.05 | %5,12 | ||||
Net investment income (loss)2 | 0.60 | % | (0.05 | %)12 | ||||
Series portfolio turnover8 | 36 | % | 127 | % | ||||
| *The investment advisor paid a portion of the Series’ expenses. If these expenses had been incurred by the Series, the expense ratios (to average net assets) would have been increased by the following amounts: |
| |||||||
| 0.23 | %4 | 0.14 | %5,12 | |||||
1Calculated based on average shares outstanding during the years.
2Net investment income is affected by the timing of distributions from the Underlying Series in which the Series invest. The ratios do not include net investment income of the Underlying Series in which the Series invests.
3Represents aggregate total return for the years indicated, and assumes reinvestment of all distributions. Total return would have been lower had certain expenses not been waived or reimbursed.
4Expense ratios do not include expenses of the Underlying Series in which the Series invests. The expense ratio of the Underlying Series were 0.55% for Manning & Napier Blended Asset Extended Series - Class R6 and 0.55% for Manning & Napier Blended Asset Maximum Series - Class R6.
5Expense ratios do not include expenses of the Underlying Series in which the Series invests. The expense ratios of the Underlying Series were 0.83% for Manning & Napier Pro-Blend® Extended Term Series - Class I, 0.85% for Manning & Napier Pro-Blend® Maximum Term Series - Class I, 0.55% for Manning & Napier Blended Asset Extended Series - Class R6 and 0.55% for Manning & Napier Blended Asset Maximum Series - Class R6.
6Expense ratios do not include expenses of the Underlying Series in which the Series invests. The expense ratios of the Underlying Series were 0.82% for Manning & Napier Pro-Blend® Extended Term Series - Class I and 0.83% for Manning & Napier Pro-Blend® Maximum Term Series - Class I.
7Expense ratios do not include expenses of the Underlying Series in which the Series invests. The expense ratios of the Underlying Series were 0.81% for Manning & Napier Pro-Blend® Extended Term Series - Class I and 0.82% for Manning & Napier Pro-Blend® Maximum Term Series - Class I.
8Reflects activity of the Series and does not include the activity of the Underlying Series.
9Commencement of operations.
10Calculated based on average shares outstanding during the periods.
11Represents aggregate total return for the periods indicated, and assumes reinvestment of all distributions. Total return would have been lower had certain expenses not been reimbursed during the periods. Periods less than one year are not annualized.
12Annualized.
The accompanying notes are an integral part of the financial statements.
58
Financial Highlights
TARGET 2045 SERIES CLASS K | FOR THE YEAR ENDED | |||||||||||||||||||
| 10/31/18 | 10/31/17 | 10/31/16 | 10/31/15 | 10/31/14 | ||||||||||||||||
Per share data (for a share outstanding throughout each year): | ||||||||||||||||||||
Net asset value - Beginning of year | $ | 13.44 | $ | 11.69 | $ | 12.71 | $ | 14.32 | $ | 13.73 | ||||||||||
|
|
|
|
|
|
|
|
|
| |||||||||||
Income (loss) from investment operations: | ||||||||||||||||||||
Net investment income1,2 | 0.01 | 0.05 | 0.04 | 0.08 | 0.03 | |||||||||||||||
Net realized and unrealized gain (loss) on investments | 0.25 | 1.99 | 0.28 | (0.34 | ) | 1.15 | ||||||||||||||
|
|
|
|
|
|
|
|
|
| |||||||||||
Total from investment operations | 0.26 | 2.04 | 0.32 | (0.26 | ) | 1.18 | ||||||||||||||
|
|
|
|
|
|
|
|
|
| |||||||||||
Less distributions to shareholders: | ||||||||||||||||||||
From net investment income | (0.03 | ) | (0.13 | ) | (0.06 | ) | (0.77 | ) | (0.52 | ) | ||||||||||
From net realized gain on investments | (0.71 | ) | (0.16 | ) | (1.28 | ) | (0.58 | ) | (0.07 | ) | ||||||||||
|
|
|
|
|
|
|
|
|
| |||||||||||
Total distributions to shareholders | (0.74 | ) | (0.29 | ) | (1.34 | ) | (1.35 | ) | (0.59 | ) | ||||||||||
|
|
|
|
|
|
|
|
|
| |||||||||||
Net asset value - End of year | $ | 12.96 | $ | 13.44 | $ | 11.69 | $ | 12.71 | $ | 14.32 | ||||||||||
|
|
|
|
|
|
|
|
|
| |||||||||||
Net assets - End of year (000’s omitted) | $ | 10,367 | $ | 9,795 | $ | 6,793 | $ | 3,812 | $ | 3,041 | ||||||||||
|
|
|
|
|
|
|
|
|
| |||||||||||
Total return3 | 1.93 | % | 17.87 | % | 3.26 | % | (2.10 | %) | 8.90 | % | ||||||||||
Ratios (to average net assets)/Supplemental Data: | ||||||||||||||||||||
Expenses* | 0.45 | %4 | 0.31 | %5 | 0.30 | %6 | 0.30 | %7 | 0.30 | %8 | ||||||||||
Net investment income2 | 0.11 | % | 0.43 | % | 0.33 | % | 0.58 | % | 0.23 | % | ||||||||||
Series portfolio turnover9 | 43 | % | 175 | % | 26 | % | 28 | % | 48 | % | ||||||||||
| *The investment advisor paid a portion of the Series’ expenses. If these expenses had been incurred by the Series, the expense ratios (to average net assets) would have been increased by the following amounts: |
| |||||||||||||||||||
|
| 0.89
| %4
|
| 0.97
| %5
|
| 0.89
| %6
|
| 1.21
| %7
|
| 1.95
| %8
| ||||||
TARGET 2045 SERIES CLASS R | FOR THE YEAR ENDED | |||||||||||||||||||
| 10/31/18 | 10/31/17 | 10/31/16 | 10/31/15 | 10/31/14 | ||||||||||||||||
Per share data (for a share outstanding throughout each year): | ||||||||||||||||||||
Net asset value - Beginning of year | $ | 13.36 | $ | 11.62 | $ | 12.64 | $ | 14.25 | $ | 13.66 | ||||||||||
|
|
|
|
|
|
|
|
|
| |||||||||||
Income (loss) from investment operations: | ||||||||||||||||||||
Net investment income (loss)1,2 | (0.01 | ) | 0.01 | 0.02 | 0.05 | 0.02 | ||||||||||||||
Net realized and unrealized gain (loss) on investments | 0.23 | 1.99 | 0.27 | (0.35 | ) | 1.13 | ||||||||||||||
|
|
|
|
|
|
|
|
|
| |||||||||||
Total from investment operations | 0.22 | 2.00 | 0.29 | (0.30 | ) | 1.15 | ||||||||||||||
|
|
|
|
|
|
|
|
|
| |||||||||||
Less distributions to shareholders: | ||||||||||||||||||||
From net investment income | (0.02 | ) | (0.10 | ) | (0.03 | ) | (0.73 | ) | (0.49 | ) | ||||||||||
From net realized gain on investments | (0.71 | ) | (0.16 | ) | (1.28 | ) | (0.58 | ) | (0.07 | ) | ||||||||||
|
|
|
|
|
|
|
|
|
| |||||||||||
Total distributions to shareholders | (0.73 | ) | (0.26 | ) | (1.31 | ) | (1.31 | ) | (0.56 | ) | ||||||||||
|
|
|
|
|
|
|
|
|
| |||||||||||
Net asset value - End of year | $ | 12.85 | $ | 13.36 | $ | 11.62 | $ | 12.64 | $ | 14.25 | ||||||||||
|
|
|
|
|
|
|
|
|
| |||||||||||
Net assets - End of year (000’s omitted) | $ | 9,384 | $ | 4,733 | $ | 1,731 | $ | 1,631 | $ | 1,825 | ||||||||||
|
|
|
|
|
|
|
|
|
| |||||||||||
Total return3 | 1.64 | % | 17.52 | % | 3.04 | % | (2.41 | %) | 8.71 | % | ||||||||||
Ratios (to average net assets)/Supplemental Data: | ||||||||||||||||||||
Expenses* | 0.70 | %4 | 0.55 | %5 | 0.55 | %6 | 0.55 | %7 | 0.55 | %8 | ||||||||||
Net investment income (loss)2 | (0.10 | %) | 0.10 | % | 0.14 | % | 0.36 | % | 0.12 | % | ||||||||||
Series portfolio turnover9 | 43 | % | 175 | % | 26 | % | 28 | % | 48 | % | ||||||||||
| *The investment advisor paid a portion of the Series’ expenses. If these expenses had been incurred by the Series, the expense ratios (to average net assets) would have been increased by the following amounts: |
| |||||||||||||||||||
| 0.81 | %4 | 0.97 | %5 | 0.89 | %6 | 1.21 | %7 | 2.06 | %8 | |||||||||||
1Calculated based on average shares outstanding during the years.
2Net investment income is affected by the timing of distributions from the Underlying Series in which the Series invest. The ratios do not include net investment income of the Underlying Series in which the Series invests.
3Represents aggregate total return for the years indicated, and assumes reinvestment of all distributions. Total return would have been lower had certain expenses not been waived or reimbursed.
4Expense ratios do not include expenses of the Underlying Series in which the Series invests. The expense ratios of the Underlying Series were 0.55% for Manning & Napier Blended Asset Extended Series - Class R6 and 0.55% for Manning & Napier Blended Asset Maximum Series - Class R6.
5Expense ratios do not include expenses of the Underlying Series in which the Series invests. The expense ratios of the Underlying Series were 0.83% for Manning & Napier Pro-Blend® Extended Term Series - Class I, 0.85% for Manning & Napier Pro-Blend® Maximum Term Series - Class I, 0.55% for Manning & Napier Blended Asset Extended Series - Class R6 and 0.55% for Manning & Napier Blended Asset Maximum Series - Class R6.
6Expense ratios do not include expenses of the Underlying Series in which the Series invests. The expense ratios of the Underlying Series were 0.82% for Manning & Napier Pro-Blend® Extended Term Series - Class I and 0.83% for Manning & Napier Pro-Blend® Maximum Term Series - Class I.
7Expense ratios do not include expenses of the Underlying Series in which the Series invests. The expense ratio of the Underlying Series was 0.83%.
8Expense ratios do not include expenses of the Underlying Series in which the Series invests. The expense ratio of the Underlying Series was 0.82%.
9Reflects activity of the Series and does not include the activity of the Underlying Series.
The accompanying notes are an integral part of the financial statements.
59
Financial Highlights
TARGET 2045 SERIES CLASS I | FOR THE YEAR ENDED | |||||||||||||||||||
| 10/31/18 | 10/31/17 | 10/31/16 | 10/31/15 | 10/31/14 | ||||||||||||||||
Per share data (for a share outstanding throughout each year): | ||||||||||||||||||||
Net asset value - Beginning of year | $ | 13.48 | $ | 11.71 | $ | 12.73 | $ | 14.35 | $ | 13.75 | ||||||||||
|
|
|
|
|
|
|
|
|
| |||||||||||
Income (loss) from investment operations: | ||||||||||||||||||||
Net investment income1,2 | 0.06 | 0.11 | 0.07 | 0.11 | 0.08 | |||||||||||||||
Net realized and unrealized gain (loss) on investments | 0.23 | 1.98 | 0.99 | (0.35 | ) | 1.14 | ||||||||||||||
|
|
|
|
|
|
|
|
|
| |||||||||||
Total from investment operations | 0.29 | 2.09 | 1.06 | (0.24 | ) | 1.22 | ||||||||||||||
|
|
|
|
|
|
|
|
|
| |||||||||||
Less distributions to shareholders: | ||||||||||||||||||||
From net investment income | (0.05 | ) | (0.16 | ) | (0.80 | ) | (0.80 | ) | (0.55 | ) | ||||||||||
From net realized gain on investments | (0.71 | ) | (0.16 | ) | (1.28 | ) | (0.58 | ) | (0.07 | ) | ||||||||||
|
|
|
|
|
|
|
|
|
| |||||||||||
Total distributions to shareholders | (0.76 | ) | (0.32 | ) | (2.08 | ) | (1.38 | ) | (0.62 | ) | ||||||||||
|
|
|
|
|
|
|
|
|
| |||||||||||
Net asset value - End of year | $ | 13.01 | $ | 13.48 | $ | 11.71 | $ | 12.73 | $ | 14.35 | ||||||||||
|
|
|
|
|
|
|
|
|
| |||||||||||
Net assets - End of year (000’s omitted) | $ | 754 | $ | 1,361 | $ | 5,548 | $ | 4,494 | $ | 2,894 | ||||||||||
|
|
|
|
|
|
|
|
|
| |||||||||||
Total return3 | 2.13 | % | 18.29 | % | 3.49 | % | (1.92 | %) | 9.15 | % | ||||||||||
Ratios (to average net assets)/Supplemental Data: | ||||||||||||||||||||
Expenses* | 0.20 | %4 | 0.05 | %5 | 0.05 | %6 | 0.05 | %7 | 0.05 | %8 | ||||||||||
Net investment income2 | 0.44 | % | 0.90 | % | 0.64 | % | 0.86 | % | 0.57 | % | ||||||||||
Series portfolio turnover9 | 43 | % | 175 | % | 26 | % | 28 | % | 48 | % | ||||||||||
| *The investment advisor paid a portion of the Series’ expenses. If these expenses had been incurred by the Series, the expense ratios (to average net assets) would have been increased by the following amounts: |
| |||||||||||||||||||
| 0.94 | %4 | 0.97 | %5 | 0.89 | %6 | 1.21 | %7 | 2.14 | %8 | |||||||||||
TARGET 2045 SERIES CLASS R6 | FOR THE YEAR ENDED | FOR THE PERIOD | ||||||
| 10/31/18 | 10/16/1710 TO 10/31/17 | |||||||
Per share data (for a share outstanding throughout each period): | ||||||||
Net asset value - Beginning of period | $ | 13.48 | $ | 13.46 | ||||
|
|
|
| |||||
Income (loss) from investment operations: | ||||||||
Net investment income2,11 | 0.07 | — | ||||||
Net realized and unrealized gain (loss) on investments | 0.24 | 0.02 | ||||||
|
|
|
| |||||
Total from investment operations | 0.31 | 0.02 | ||||||
|
|
|
| |||||
Less distributions to shareholders: | ||||||||
From net investment income | (0.05 | ) | — | |||||
From net realized gain on investments | (0.71 | ) | — | |||||
|
|
|
| |||||
Total distributions to shareholders | (0.76 | ) | — | |||||
|
|
|
| |||||
Net asset value - End of period | $ | 13.03 | $ | 13.48 | ||||
|
|
|
| |||||
Net assets - End of period (000’s omitted) | $ | 5 | $ | 5 | ||||
|
|
|
| |||||
Total return12 | 2.32 | % | 0.15 | % | ||||
Ratios (to average net assets)/Supplemental Data: | ||||||||
Expenses* | 0.05 | %4 | 0.05 | %5,13 | ||||
Net investment income (loss)2 | 0.54 | % | (0.05 | %)13 | ||||
Series portfolio turnover9 | 43 | % | 175 | % | ||||
| *The investment advisor paid a portion of the Series’ expenses. If these expenses had been incurred by the Series, the expense ratios (to average net assets) would have been increased by the following amounts: |
| |||||||
| 0.94 | %4 | 0.97 | %5,13 | |||||
1Calculated based on average shares outstanding during the years.
2Net investment income is affected by the timing of distributions from the Underlying Series in which the Series invest. The ratios do not include net investment income of the Underlying Series in which the Series invests.
3Represents aggregate total return for the years indicated, and assumes reinvestment of all distributions. Total return would have been lower had certain expenses not been waived or reimbursed.
4Expense ratios do not include expenses of the Underlying Series in which the Series invests. The expense ratio of the Underlying Series were 0.55% for Manning & Napier Blended Asset Extended Series - Class R6 and 0.55% for Manning & Napier Blended Asset Maximum Series - Class R6.
5Expense ratios do not include expenses of the Underlying Series in which the Series invests. The expense ratios of the Underlying Series were 0.83% for Manning & Napier Pro-Blend® Extended Term Series - Class I, 0.85% for Manning & Napier Pro-Blend® Maximum Term Series - Class I, 0.55% for Manning & Napier Blended Asset Extended Series - Class R6 and 0.55% for Manning & Napier Blended Asset Maximum Series - Class R6.
6Expense ratios do not include expenses of the Underlying Series in which the Series invests. The expense ratios of the Underlying Series were 0.82% for Manning & Napier Pro-Blend® Extended Term Series - Class I and 0.83% for Manning & Napier Pro-Blend® Maximum Term Series - Class I.
7Expense ratios do not include expenses of the Underlying Series in which the Series invests. The expense ratio of the Underlying Series was 0.83%.
8Expense ratios do not include expenses of the Underlying Series in which the Series invests. The expense ratio of the Underlying Series was 0.82%.
9Reflects activity of the Series and does not include the activity of the Underlying Series.
10Commencement of operations.
11Calculated based on average shares outstanding during the periods.
12Represents aggregate total return for the periods indicated, and assumes reinvestment of all distributions. Total return would have been lower had certain expenses not been reimbursed during the periods. Periods less than one year are not annualized.
13Annualized.
The accompanying notes are an integral part of the financial statements.
60
Financial Highlights
TARGET 2050 SERIES CLASS K | FOR THE YEAR ENDED | |||||||||||||||||||
| 10/31/18 | 10/31/17 | 10/31/16 | 10/31/15 | 10/31/14 | ||||||||||||||||
Per share data (for a share outstanding throughout each year): | ||||||||||||||||||||
Net asset value - Beginning of year | $ | 11.03 | $ | 9.41 | $ | 11.35 | $ | 13.73 | $ | 13.52 | ||||||||||
|
|
|
|
|
|
|
|
|
| |||||||||||
Income (loss) from investment operations: | ||||||||||||||||||||
Net investment income1,2 | 0.01 | 0.04 | 0.04 | 0.09 | 0.05 | |||||||||||||||
Net realized and unrealized gain (loss) on investments | 0.25 | 1.69 | 0.18 | (0.32 | ) | 1.07 | ||||||||||||||
|
|
|
|
|
|
|
|
|
| |||||||||||
Total from investment operations | 0.26 | 1.73 | 0.22 | (0.23 | ) | 1.12 | ||||||||||||||
|
|
|
|
|
|
|
|
|
| |||||||||||
Less distributions to shareholders: | ||||||||||||||||||||
From net investment income | (0.02 | ) | (0.11 | ) | (0.04 | ) | (0.72 | ) | (0.54 | ) | ||||||||||
From net realized gain on investments | (0.79 | ) | — | (2.12 | ) | (1.43 | ) | (0.37 | ) | |||||||||||
|
|
|
|
|
|
|
|
|
| |||||||||||
Total distributions to shareholders | (0.81 | ) | (0.11 | ) | (2.16 | ) | (2.15 | ) | (0.91 | ) | ||||||||||
|
|
|
|
|
|
|
|
|
| |||||||||||
Net asset value - End of year | $ | 10.48 | $ | 11.03 | $ | 9.41 | $ | 11.35 | $ | 13.73 | ||||||||||
|
|
|
|
|
|
|
|
|
| |||||||||||
Net assets - End of year (000’s omitted) | $ | 23,353 | $ | 18,667 | $ | 14,874 | $ | 15,144 | $ | 47,531 | ||||||||||
|
|
|
|
|
|
|
|
|
| |||||||||||
Total return3 | 2.32 | % | 18.55 | % | 3.43 | % | (2.15 | %) | 8.80 | % | ||||||||||
Ratios (to average net assets)/Supplemental Data: | ||||||||||||||||||||
Expenses* | 0.45 | %4 | 0.31 | %5 | 0.30 | %6 | 0.30 | %6 | 0.30 | %7 | ||||||||||
Net investment income2 | 0.09 | % | 0.39 | % | 0.40 | % | 0.72 | % | 0.40 | % | ||||||||||
Series portfolio turnover8 | 40 | % | 139 | % | 31 | % | 49 | % | 13 | % | ||||||||||
| *The investment advisor paid a portion of the Series’ expenses. If these expenses had been incurred by the Series, the expense ratios (to average net assets) would have been increased by the following amounts: |
| |||||||||||||||||||
|
| 0.52
| %4
|
| 0.41
| %5
|
| 0.37
| %6
|
| 0.26
| %6
|
| 0.18
| %7
| ||||||
TARGET 2050 SERIES CLASS R | FOR THE YEAR ENDED | |||||||||||||||||||
| 10/31/18 | 10/31/17 | 10/31/16 | 10/31/15 | 10/31/14 | ||||||||||||||||
Per share data (for a share outstanding throughout each year): | ||||||||||||||||||||
Net asset value - Beginning of year | $ | 10.91 | $ | 9.30 | $ | 11.25 | $ | 13.60 | $ | 13.43 | ||||||||||
|
|
|
|
|
|
|
|
|
| |||||||||||
Income (loss) from investment operations: | ||||||||||||||||||||
Net investment income (loss)1,2 | (0.01 | ) | 0.01 | 0.01 | 0.06 | 0.01 | ||||||||||||||
Net realized and unrealized gain (loss) on investments | 0.24 | 1.68 | 0.18 | (0.29 | ) | 1.04 | ||||||||||||||
|
|
|
|
|
|
|
|
|
| |||||||||||
Total from investment operations | 0.23 | 1.69 | 0.19 | (0.23 | ) | 1.05 | ||||||||||||||
|
|
|
|
|
|
|
|
|
| |||||||||||
Less distributions to shareholders: | ||||||||||||||||||||
From net investment income | (0.01 | ) | (0.08 | ) | (0.02 | ) | (0.69 | ) | (0.51 | ) | ||||||||||
From net realized gain on investments | (0.79 | ) | — | (2.12 | ) | (1.43 | ) | (0.37 | ) | |||||||||||
|
|
|
|
|
|
|
|
|
| |||||||||||
Total distributions to shareholders | (0.80 | ) | (0.08 | ) | (2.14 | ) | (2.12 | ) | (0.88 | ) | ||||||||||
|
|
|
|
|
|
|
|
|
| |||||||||||
Net asset value - End of year | $ | 10.34 | $ | 10.91 | $ | 9.30 | $ | 11.25 | $ | 13.60 | ||||||||||
|
|
|
|
|
|
|
|
|
| |||||||||||
Net assets - End of year (000’s omitted) | $ | 7,813 | $ | 3,345 | $ | 2,433 | $ | 2,215 | $ | 5,140 | ||||||||||
|
|
|
|
|
|
|
|
|
| |||||||||||
Total return3 | 2.07 | % | 18.35 | % | 3.09 | % | (2.17 | %) | 8.28 | % | ||||||||||
Ratios (to average net assets)/Supplemental Data: | ||||||||||||||||||||
Expenses* | 0.70 | %4 | 0.56 | %5 | 0.55 | %6 | 0.55 | %6 | 0.55 | %7 | ||||||||||
Net investment income (loss)2 | (0.14 | %) | 0.07 | % | 0.12 | % | 0.54 | % | 0.10 | % | ||||||||||
Series portfolio turnover8 | 40 | % | 139 | % | 31 | % | 49 | % | 13 | % | ||||||||||
| *The investment advisor paid a portion of the Series’ expenses. If these expenses had been incurred by the Series, the expense ratios (to average net assets) would have been increased by the following amounts: |
| |||||||||||||||||||
| 0.41 | %4 | 0.41 | %5 | 0.37 | %6 | 0.26 | %6 | 0.18 | %7 | |||||||||||
1Calculated based on average shares outstanding during the years.
2Net investment income is affected by the timing of distributions from the Underlying Series in which the Series invest. The ratios do not include net investment income of the Underlying Series in which the Series invests.
3Represents aggregate total return for the years indicated, and assumes reinvestment of all distributions. Total return would have been lower had certain expenses not been waived or reimbursed.
4Expense ratios do not include expenses of the Underlying Series in which the Series invests. The expense ratio of the Underlying Series was 0.55%.
5Expense ratios do not include expenses of the Underlying Series in which the Series invests. The expense ratio of the Underlying Series was 0.85% for Manning & Napier Pro-Blend® Maximum Term Series - Class I and 0.55% for Manning & Napier Blended Asset Maximum Series - Class R6.
6Expense ratios do not include expenses of the Underlying Series in which the Series invests. The expense ratio of the Underlying Series was 0.83%.
7Expense ratios do not include expenses of the Underlying Series in which the Series invests. The expense ratio of the Underlying Series was 0.82%.
8Reflects activity of the Series and does not include the activity of the Underlying Series.
The accompanying notes are an integral part of the financial statements.
61
Financial Highlights
TARGET 2050 SERIES CLASS I | FOR THE YEAR ENDED | |||||||||||||||||||
| 10/31/18 | 10/31/17 | 10/31/16 | 10/31/15 | 10/31/14 | ||||||||||||||||
Per share data (for a share outstanding throughout each year): | ||||||||||||||||||||
Net asset value - Beginning of year | $ | 11.12 | $ | 9.48 | $ | 11.43 | $ | 13.82 | $ | 13.60 | ||||||||||
|
|
|
|
|
|
|
|
|
| |||||||||||
Income (loss) from investment operations: | ||||||||||||||||||||
Net investment income1,2 | 0.05 | 0.07 | 0.07 | 0.10 | 0.08 | |||||||||||||||
Net realized and unrealized gain (loss) on investments | 0.24 | 1.70 | 0.17 | (0.29 | ) | 1.08 | ||||||||||||||
|
|
|
|
|
|
|
|
|
| |||||||||||
Total from investment operations | 0.29 | 1.77 | 0.24 | (0.19 | ) | 1.16 | ||||||||||||||
|
|
|
|
|
|
|
|
|
| |||||||||||
Less distributions to shareholders: | ||||||||||||||||||||
From net investment income | (0.04 | ) | (0.13 | ) | (0.07 | ) | (0.77 | ) | (0.57 | ) | ||||||||||
From net realized gain on investments | (0.79 | ) | — | (2.12 | ) | (1.43 | ) | (0.37 | ) | |||||||||||
|
|
|
|
|
|
|
|
|
| |||||||||||
Total distributions to shareholders | (0.83 | ) | (0.13 | ) | (2.19 | ) | (2.20 | ) | (0.94 | ) | ||||||||||
|
|
|
|
|
|
|
|
|
| |||||||||||
Net asset value - End of year | $ | 10.58 | $ | 11.12 | $ | 9.48 | $ | 11.43 | $ | 13.82 | ||||||||||
|
|
|
|
|
|
|
|
|
| |||||||||||
Net assets - End of year (000’s omitted) | $ | 1,859 | $ | 13,364 | $ | 12,928 | $ | 15,688 | $ | 12,077 | ||||||||||
|
|
|
|
|
|
|
|
|
| |||||||||||
Total return3 | 2.53 | % | 18.91 | % | 3.61 | % | (1.82 | %) | 9.07 | % | ||||||||||
Ratios (to average net assets)/Supplemental Data: | ||||||||||||||||||||
Expenses* | 0.20 | %4 | 0.06 | %5 | 0.05 | %6 | 0.05 | %6 | 0.05 | %7 | ||||||||||
Net investment income2 | 0.44 | % | 0.71 | % | 0.73 | % | 0.84 | % | 0.62 | % | ||||||||||
Series portfolio turnover8 | 40 | % | 139 | % | 31 | % | 49 | % | 13 | % | ||||||||||
| *The investment advisor paid a portion of the Series’ expenses. If these expenses had been incurred by the Series, the expense ratios (to average net assets) would have been increased by the following amounts: |
| |||||||||||||||||||
| 0.54 | %4 | 0.41 | %5 | 0.37 | %6 | 0.26 | %6 | 0.18 | %7 | |||||||||||
TARGET 2050 SERIES CLASS R6 | FOR THE YEAR ENDED | FOR THE PERIOD | ||||||
| 10/31/18 | 10/16/179 TO 10/31/17 | |||||||
Per share data (for a share outstanding throughout each period): | ||||||||
Net asset value - Beginning of period | $ | 11.12 | $ | 11.10 | ||||
|
|
|
| |||||
Income (loss) from investment operations: | ||||||||
Net investment income2,10 | 0.06 | — | ||||||
Net realized and unrealized gain (loss) on investments | 0.25 | 0.02 | ||||||
|
|
|
| |||||
Total from investment operations | 0.31 | 0.02 | ||||||
|
|
|
| |||||
Less distributions to shareholders: | ||||||||
From net investment income | (0.04 | ) | — | |||||
From net realized gain on investments | (0.79 | ) | — | |||||
|
|
|
| |||||
Total distributions to shareholders | (0.83 | ) | — | |||||
|
|
|
| |||||
Net asset value - End of period | $ | 10.60 | $ | 11.12 | ||||
|
|
|
| |||||
Net assets - End of period (000’s omitted) | $ | 5 | $ | 5 | ||||
|
|
|
| |||||
Total return11 | 2.75 | % | 0.18 | % | ||||
Ratios (to average net assets)/Supplemental Data: | ||||||||
Expenses* | 0.05 | %4 | 0.05 | %5,12 | ||||
Net investment income (loss) | 0.51 | % | (0.05 | %)12 | ||||
Series portfolio turnover8 | 40 | % | 139 | % | ||||
| *The investment advisor paid a portion of the Series’ expenses. If these expenses had been incurred by the Series, the expense ratios (to average net assets) would have been increased by the following amounts: |
| |||||||
| 0.52 | %4 | 0.41 | %5,12 | |||||
1Calculated based on average shares outstanding during the years.
2Net investment income is affected by the timing of distributions from the Underlying Series in which the Series invest. The ratios do not include net investment income of the Underlying Series in which the Series invests.
3Represents aggregate total return for the years indicated, and assumes reinvestment of all distributions. Total return would have been lower had certain expenses not been waived or reimbursed.
4Expense ratios do not include expenses of the Underlying Series in which the Series invests. The expense ratio of the Underlying Series was 0.55%.
5Expense ratios do not include expenses of the Underlying Series in which the Series invests. The expense ratio of the Underlying Series was 0.85% for Manning & Napier Pro-Blend® Maximum Term Series - Class I and 0.55% for Manning & Napier Blended Asset Maximum Series - Class R6.
6Expense ratios do not include expenses of the Underlying Series in which the Series invests. The expense ratio of the Underlying Series was 0.83%.
7Expense ratios do not include expenses of the Underlying Series in which the Series invests. The expense ratio of the Underlying Series was 0.82%.
8Reflects activity of the Series and does not include the activity of the Underlying Series.
9Commencement of operations.
10Calculated based on average shares outstanding during the periods.
11Represents aggregate total return for the periods indicated, and assumes reinvestment of all distributions. Total return would have been lower had certain expenses not been reimbursed during the periods. Periods less than one year are not annualized.
12Annualized.
The accompanying notes are an integral part of the financial statements.
62
Financial Highlights
TARGET 2055 SERIES CLASS K | FOR THE YEAR ENDED | |||||||||||||||||||
| 10/31/18 | 10/31/17 | 10/31/16 | 10/31/15 | 10/31/14 | ||||||||||||||||
Per share data (for a share outstanding throughout each year): | ||||||||||||||||||||
Net asset value - Beginning of year | $ | 13.57 | $ | 11.70 | $ | 12.56 | $ | 13.94 | $ | 13.85 | ||||||||||
|
|
|
|
|
|
|
|
|
| |||||||||||
Income (loss) from investment operations: | ||||||||||||||||||||
Net investment income (loss)1,2 | 0.01 | 0.05 | 0.03 | 0.09 | 0.06 | |||||||||||||||
Net realized and unrealized gain (loss) on investments | 0.30 | 2.08 | 0.30 | (0.35 | ) | 1.05 | ||||||||||||||
|
|
|
|
|
|
|
|
|
| |||||||||||
Total from investment operations | 0.31 | 2.13 | 0.33 | (0.26 | ) | 1.11 | ||||||||||||||
|
|
|
|
|
|
|
|
|
| |||||||||||
Less distributions to shareholders: | ||||||||||||||||||||
From net investment income | (0.03 | ) | (0.13 | ) | (0.05 | ) | (0.74 | ) | (0.55 | ) | ||||||||||
From net realized gain on investments | (1.12 | ) | (0.13 | ) | (1.14 | ) | (0.38 | ) | (0.47 | ) | ||||||||||
|
|
|
|
|
|
|
|
|
| |||||||||||
Total distributions to shareholders | (1.15 | ) | (0.26 | ) | (1.19 | ) | (1.12 | ) | (1.02 | ) | ||||||||||
|
|
|
|
|
|
|
|
|
| |||||||||||
Net asset value - End of year | $ | 12.73 | $ | 13.57 | $ | 11.70 | $ | 12.56 | $ | 13.94 | ||||||||||
|
|
|
|
|
|
|
|
|
| |||||||||||
Net assets - End of year (000’s omitted) | $ | 4,771 | $ | 4,141 | $ | 2,380 | $ | 1,142 | $ | 1,777 | ||||||||||
|
|
|
|
|
|
|
|
|
| |||||||||||
Total return3 | 2.26 | % | 18.61 | % | 3.38 | % | (2.06 | %) | 8.50 | % | ||||||||||
Ratios (to average net assets)/Supplemental Data: | ||||||||||||||||||||
Expenses* | 0.45 | %4 | 0.31 | %5 | 0.30 | %6 | 0.30 | %6 | 0.30 | %7 | ||||||||||
Net investment income2 | 0.10 | % | 0.37 | % | 0.30 | % | 0.68 | % | 0.43 | % | ||||||||||
Series portfolio turnover8 | 23 | % | 186 | % | 30 | % | 55 | % | 63 | % | ||||||||||
| *The investment advisor paid a portion of the Series’ expenses. If these expenses had been incurred by the Series, the expense ratios (to average net assets) would have been increased by the following amounts: |
| |||||||||||||||||||
|
| 1.87
| %4
|
| 2.15
| %5
|
| 2.44
| %6
|
| 3.68
| %6
|
| 4.79
| %7
| ||||||
TARGET 2055 SERIES CLASS R | FOR THE YEAR ENDED | |||||||||||||||||||
| 10/31/18 | 10/31/17 | 10/31/16 | 10/31/15 | 10/31/14 | ||||||||||||||||
Per share data (for a share outstanding throughout each year): | ||||||||||||||||||||
Net asset value - Beginning of year | $ | 13.43 | $ | 11.59 | $ | 12.45 | $ | 13.83 | $ | 13.77 | ||||||||||
|
|
|
|
|
|
|
|
|
| |||||||||||
Income (loss) from investment operations: | ||||||||||||||||||||
Net investment income (loss)1,2 | (0.02 | ) | 0.01 | 0.01 | 0.05 | 0.03 | ||||||||||||||
Net realized and unrealized gain (loss) on investments | 0.29 | 2.07 | 0.30 | (0.34 | ) | 1.04 | ||||||||||||||
|
|
|
|
|
|
|
|
|
| |||||||||||
Total from investment operations | 0.27 | 2.08 | 0.31 | (0.29 | ) | 1.07 | ||||||||||||||
|
|
|
|
|
|
|
|
|
| |||||||||||
Less distributions to shareholders: | ||||||||||||||||||||
From net investment income | (0.02 | ) | (0.11 | ) | (0.03 | ) | (0.71 | ) | (0.54 | ) | ||||||||||
From net realized gain on investments | (1.12 | ) | (0.13 | ) | (1.14 | ) | (0.38 | ) | (0.47 | ) | ||||||||||
|
|
|
|
|
|
|
|
|
| |||||||||||
Total distributions to shareholders | (1.14 | ) | (0.24 | ) | (1.17 | ) | (1.09 | ) | (1.01 | ) | ||||||||||
|
|
|
|
|
|
|
|
|
| |||||||||||
Net asset value - End of year | $ | 12.56 | $ | 13.43 | $ | 11.59 | $ | 12.45 | $ | 13.83 | ||||||||||
|
|
|
|
|
|
|
|
|
| |||||||||||
Net assets - End of year (000’s omitted) | $ | 5,136 | $ | 2,388 | $ | 519 | $ | 409 | $ | 515 | ||||||||||
|
|
|
|
|
|
|
|
|
| |||||||||||
Total return3 | 2.00 | % | 18.28 | % | 3.18 | % | (2.32 | %) | 8.21 | % | ||||||||||
Ratios (to average net assets)/Supplemental Data: | ||||||||||||||||||||
Expenses* | 0.70 | %4 | 0.55 | %5 | 0.55 | %6 | 0.55 | % | 0.55 | %7 | ||||||||||
Net investment income (loss)2 | (0.15 | %) | 0.04 | % | 0.11 | % | 0.39 | % | 0.24 | % | ||||||||||
Series portfolio turnover8 | 23 | % | 186 | % | 30 | % | 55 | % | 63 | % | ||||||||||
| *The investment advisor paid a portion of the Series’ expenses. If these expenses had been incurred by the Series, the expense ratios (to average net assets) would have been increased by the following amounts: |
| |||||||||||||||||||
| 1.77 | %4 | 2.15 | %5 | 2.44 | %6 | 3.68 | %6 | 5.39 | %7 | |||||||||||
1Calculated based on average shares outstanding during the years.
2Net investment income is affected by the timing of distributions from the Underlying Series in which the Series invest. The ratios do not include net investment income of the Underlying Series in which the Series invests.
3Represents aggregate total return for the years indicated, and assumes reinvestment of all distributions. Total return would have been lower had certain expenses not been waived or reimbursed.
4Expense ratios do not include expenses of the Underlying Series in which the Series invests. The expense ratio of the Underlying Series was 0.55%.
5Expense ratios do not include expenses of the Underlying Series in which the Series invests. The expense ratio of the Underlying Series was 0.85% for Manning & Napier Pro-Blend® Maximum Term Series - Class I and 0.55% for Manning & Napier Blended Asset Maximum Series - Class R6.
6Expense ratios do not include expenses of the Underlying Series in which the Series invests. The expense ratio of the Underlying Series was 0.83%.
7Expense ratios do not include expenses of the Underlying Series in which the Series invests. The expense ratio of the Underlying Series was 0.82%.
8Reflects activity of the Series and does not include the activity of the Underlying Series.
The accompanying notes are an integral part of the financial statements.
63
Financial Highlights
TARGET 2055 SERIES CLASS I | FOR THE YEAR ENDED | |||||||||||||||||||
| 10/31/18 | 10/31/17 | 10/31/16 | 10/31/15 | 10/31/14 | ||||||||||||||||
Per share data (for a share outstanding throughout each year): | ||||||||||||||||||||
Net asset value - Beginning of year | $ | 13.70 | $ | 11.81 | $ | 12.66 | $ | 14.05 | $ | 13.94 | ||||||||||
|
|
|
|
|
|
|
|
|
| |||||||||||
Income (loss) from investment operations: | ||||||||||||||||||||
Net investment income1,2 | 0.05 | 0.12 | 0.07 | 0.10 | 0.08 | |||||||||||||||
Net realized and unrealized gain (loss) on investments | 0.30 | 2.06 | 0.30 | (0.33 | ) | 1.07 | ||||||||||||||
|
|
|
|
|
|
|
|
|
| |||||||||||
Total from investment operations | 0.35 | 2.18 | 0.37 | (0.23 | ) | 1.15 | ||||||||||||||
|
|
|
|
|
|
|
|
|
| |||||||||||
Less distributions to shareholders: | ||||||||||||||||||||
From net investment income | (0.05 | ) | (0.16 | ) | (0.08 | ) | (0.78 | ) | (0.57 | ) | ||||||||||
From net realized gain on investments | (1.12 | ) | (0.13 | ) | (1.14 | ) | (0.38 | ) | (0.47 | ) | ||||||||||
|
|
|
|
|
|
|
|
|
| |||||||||||
Total distributions to shareholders | (1.17 | ) | (0.29 | ) | (1.22 | ) | (1.16 | ) | (1.04 | ) | ||||||||||
|
|
|
|
|
|
|
|
|
| |||||||||||
Net asset value - End of year | $ | 12.88 | $ | 13.70 | $ | 11.81 | $ | 12.66 | $ | 14.05 | ||||||||||
|
|
|
|
|
|
|
|
|
| |||||||||||
Net assets - End of year (000’s omitted) | $ | 315 | $ | 210 | $ | 2,783 | $ | 1,658 | $ | 872 | ||||||||||
|
|
|
|
|
|
|
|
|
| |||||||||||
Total return3 | 2.52 | % | 18.87 | % | 3.69 | % | (1.83 | %) | 8.75 | % | ||||||||||
Ratios (to average net assets)/Supplemental Data: | ||||||||||||||||||||
Expenses* | 0.20 | %4 | 0.05 | %5 | 0.05 | %6 | 0.05 | %6 | 0.05 | %7 | ||||||||||
Net investment income2 | 0.37 | % | 0.95 | % | 0.58 | % | 0.80 | % | 0.57 | % | ||||||||||
Series portfolio turnover8 | 23 | % | 186 | % | 30 | % | 55 | % | 63 | % | ||||||||||
| *The investment advisor paid a portion of the Series’ expenses. If these expenses had been incurred by the Series, the expense ratios (to average net assets) would have been increased by the following amounts: |
| |||||||||||||||||||
| 1.90 | %4 | 2.15 | %5 | 2.44 | %6 | 3.68 | %6 | 7.80 | %7 | |||||||||||
| TARGET 2055 SERIES CLASS R6 | FOR THE YEAR ENDED 10/31/18 | FOR THE PERIOD 10/16/179 TO 10/31/17 | ||||||
Per share data (for a share outstanding throughout each period): | ||||||||
Net asset value - Beginning of period | $ | 13.70 | $ | 13.68 | ||||
|
|
|
| |||||
Income (loss) from investment operations: | ||||||||
Net investment income2,10 | 0.07 | — | ||||||
Net realized and unrealized gain on (loss) on investments | 0.30 | 0.02 | ||||||
|
|
|
| |||||
Total from investment operations | 0.37 | 0.02 | ||||||
|
|
|
| |||||
Less distributions to shareholders: | ||||||||
From net investment income | (0.05 | ) | — | |||||
From net realized gain on investments | (1.12 | ) | — | |||||
|
|
|
| |||||
Total distributions to shareholders | (1.17 | ) | — | |||||
|
|
|
| |||||
Net asset value - End of period | $ | 12.90 | $ | 13.70 | ||||
|
|
|
| |||||
Net assets - End of period (000’s omitted) | $ | 5 | $ | 5 | ||||
|
|
|
| |||||
Total return11 | 2.71 | % | 0.15 | % | ||||
Ratios (to average net assets)/Supplemental Data: | ||||||||
Expenses* | 0.05 | %4 | 0.05 | %5,12 | ||||
Net investment income (loss)2 | 0.51 | % | (0.05 | %)12 | ||||
Series portfolio turnover8 | 23 | % | 186 | % | ||||
| *The investment advisor paid a portion of the Series’ expenses. If these expenses had been incurred by the Series, the expense ratios (to average net assets) would have been increased by the following amounts: |
| |||||||
| 1.90 | %4 | 2.15 | %5,12 | |||||
1Calculated based on average shares outstanding during the years.
2Net investment income is affected by the timing of distributions from the Underlying Series in which the Series invest. The ratios do not include net investment income of the Underlying Series in which the Series invests.
3Represents aggregate total return for the years indicated, and assumes reinvestment of all distributions. Total return would have been lower had certain expenses not been waived or reimbursed.
4Expense ratios do not include expenses of the Underlying Series in which the Series invests. The expense ratio of the Underlying Series was 0.55%.
5Expense ratios do not include expenses of the Underlying Series in which the Series invests. The expense ratio of the Underlying Series was 0.85% for Manning & Napier Pro-Blend® Maximum Term Series - Class I and 0.55% for Manning & Napier Blended Asset Maximum Series - Class R6.
6Expense ratios do not include expenses of the Underlying Series in which the Series invests. The expense ratio of the Underlying Series was 0.83%.
7Expense ratios do not include expenses of the Underlying Series in which the Series invests. The expense ratio of the Underlying Series was 0.82%.
8Reflects activity of the Series and does not include the activity of the Underlying Series.
9Commencement of operations.
10Calculated based on average shares outstanding during the periods.
11Represents aggregate total return for the periods indicated, and assumes reinvestment of all distributions. Total return would have been lower had certain expenses not been reimbursed during the periods. Periods less than one year are not annualized.
12Annualized.
The accompanying notes are an integral part of the financial statements.
64
Financial Highlights
TARGET 2060 SERIES CLASS K | FOR THE YEAR ENDED | FOR THE PERIOD | ||||||||||||||
| 10/31/18 | 10/31/17 | 10/31/16 | 9/21/151 TO 10/31/15 | |||||||||||||
Per share data (for a share outstanding throughout each period): | ||||||||||||||||
Net asset value - Beginning of period | $ | 12.45 | $ | 10.67 | $ | 10.36 | $ | 10.00 | ||||||||
|
|
|
|
|
|
|
| |||||||||
Income (loss) from investment operations: | ||||||||||||||||
Net investment income (loss)2,3 | 0.01 | 0.04 | 0.01 | — | 4 | |||||||||||
Net realized and unrealized gain (loss) on investments | 0.28 | 1.91 | 0.34 | 0.36 | ||||||||||||
|
|
|
|
|
|
|
| |||||||||
Total from investment operations | 0.29 | 1.95 | 0.35 | 0.36 | ||||||||||||
|
|
|
|
|
|
|
| |||||||||
Less distributions to shareholders: | ||||||||||||||||
From net investment income | (0.02 | ) | (0.12 | ) | (0.04 | ) | — | |||||||||
From net realized gain on investments | (1.28 | ) | (0.05 | ) | — | — | ||||||||||
|
|
|
|
|
|
|
| |||||||||
Total distributions to shareholders | (1.30 | ) | (0.17 | ) | (0.04 | ) | — | |||||||||
|
|
|
|
|
|
|
| |||||||||
Net asset value - End of period | $ | 11.44 | $ | 12.45 | $ | 10.67 | $ | 10.36 | ||||||||
|
|
|
|
|
|
|
| |||||||||
Net assets - End of period (000’s omitted) | $ | 6,895 | $ | 3,284 | $ | 1,407 | $ | 52 | ||||||||
|
|
|
|
|
|
|
| |||||||||
Total return5 | 2.32 | % | 18.56 | % | 3.45 | % | 3.60 | % | ||||||||
Ratios (to average net assets)/Supplemental Data: | ||||||||||||||||
Expenses* | 0.45 | %6 | 0.31 | %7 | 0.30 | %8 | 0.30 | %9,10 | ||||||||
Net investment income (loss)3 | 0.07 | % | 0.39 | % | 0.10 | % | (0.30 | %)9 | ||||||||
Series portfolio turnover11 | 5 | % | 173 | % | 14 | % | 4 | % | ||||||||
| *The investment advisor paid a portion of the Series’ expenses. If these expenses had been incurred by the Series, the expense ratios (to average net assets) would have been increased by the following amounts: |
| |||||||||||||||
|
| 2.29
| %6
|
| 5.26
| %7
|
| 9.37
| %8
|
| 151.35
| %9,10,12
| |||||
| TARGET 2060 SERIES CLASS R | FOR THE YEAR ENDED | FOR THE PERIOD | ||||||||||||||
| 10/31/18 | 10/31/17 | 10/31/16 | 9/21/151 TO 10/31/15 | |||||||||||||
Per share data (for a share outstanding throughout each period): | ||||||||||||||||
Net asset value - Beginning of period | $ | 12.43 | $ | 10.65 | $ | 10.36 | $ | 10.00 | ||||||||
|
|
|
|
|
|
|
| |||||||||
Income (loss) from investment operations: | ||||||||||||||||
Net investment income (loss)2,3 | (0.02 | ) | — | 4 | 0.01 | (0.01 | ) | |||||||||
Net realized and unrealized gain (loss) on investments | 0.28 | 1.92 | 0.31 | 0.37 | ||||||||||||
|
|
|
|
|
|
|
| |||||||||
Total from investment operations | 0.26 | 1.92 | 0.32 | 0.36 | ||||||||||||
|
|
|
|
|
|
|
| |||||||||
Less distributions to shareholders: | ||||||||||||||||
From net investment income | (0.01 | ) | (0.09 | ) | (0.03 | ) | — | |||||||||
From net realized gain on investments | (1.28 | ) | (0.05 | ) | — | — | ||||||||||
|
|
|
|
|
|
|
| |||||||||
Total distributions to shareholders | (1.29 | ) | (0.14 | ) | (0.03 | ) | — | |||||||||
|
|
|
|
|
|
|
| |||||||||
Net asset value - End of period | $ | 11.40 | $ | 12.43 | $ | 10.65 | $ | 10.36 | ||||||||
|
|
|
|
|
|
|
| |||||||||
Net assets - End of period (000’s omitted) | $ | 4,360 | $ | 1,242 | $ | 182 | $ | 56 | ||||||||
|
|
|
|
|
|
|
| |||||||||
Total return5 | 2.11 | % | 18.29 | % | 3.16 | % | 3.60 | % | ||||||||
Ratios (to average net assets)/Supplemental Data: | ||||||||||||||||
Expenses* | 0.70 | %6 | 0.55 | %7 | 0.55 | %8 | 0.55 | %9,10 | ||||||||
Net investment income (loss)3 | (0.16 | %) | (0.01 | %) | 0.09 | % | (0.55 | %)9 | ||||||||
Series portfolio turnover11 | 5 | % | 173 | % | 14 | % | 4 | % | ||||||||
| *The investment advisor paid a portion of the Series’ expenses. If these expenses had been incurred by the Series, the expense ratios (to average net assets) would have been increased by the following amounts: |
| |||||||||||||||
| 2.16 | %6 | 5.26 | %7 | 9.37 | %8 | 151.35 | %9,10,12 | |||||||||
1Commencement of operations.
2Calculated based on average shares outstanding during the periods.
3Net investment income is affected by the timing of distributions from the Underlying Series in which the Series invest. The ratios do not include net investment income of the Underlying Series in which the Series invests.
4Less than $(0.01).
5Represents aggregate total return for the periods indicated, and assumes reinvestment of all distributions. Total return would have been lower had certain expenses not been reimbursed during the periods. Periods less than one year are not annualized.
6Expense ratios do not include expenses of the Underlying Series in which the Series invests. The expense ratio of the Underlying Series was 0.55%.
7Expense ratios do not include expenses of the Underlying Series in which the Series invests. The expense ratio of the Underlying Series was 0.85% for Manning & Napier Pro-Blend® Maximum Term Series - Class I and 0.55% for Manning & Napier Blended Asset Maximum Series - Class R6.
8Expense ratios do not include expenses of the Underlying Series in which the Series invests. The expense ratio of the Underlying Series was 0.84%.
9Annualized.
10Expense ratios do not include expenses of the Underlying Series in which the Series invests. The expense ratio of the Underlying Series was 0.83%.
11Reflects activity of the Series and does not include the activity of the Underlying Series.
12The increase to the expense ratios (to average net assets) is largely due to the small net assets in each class.
The accompanying notes are an integral part of the financial statements.
65
Financial Highlights
TARGET 2060 SERIES CLASS I | FOR THE YEAR ENDED | FOR THE PERIOD | ||||||||||||||
| 10/31/18 | 10/31/17 | 10/31/16 | 9/21/151 TO 10/31/15 | |||||||||||||
Per share data (for a share outstanding throughout each period): | ||||||||||||||||
Net asset value - Beginning of period | $ | 12.46 | $ | 10.68 | $ | 10.36 | $ | 10.00 | ||||||||
|
|
|
|
|
|
|
| |||||||||
Income (loss) from investment operations: | ||||||||||||||||
Net investment income (loss)2,3 | 0.05 | 0.08 | (0.07 | ) | — | 4 | ||||||||||
Net realized and unrealized gain (loss) on investments | 0.27 | 1.89 | 0.31 | 0.36 | ||||||||||||
|
|
|
|
|
|
|
| |||||||||
Total from investment operations | 0.32 | 1.97 | 0.38 | 0.36 | ||||||||||||
|
|
|
|
|
|
|
| |||||||||
Less distributions to shareholders: | ||||||||||||||||
From net investment income | (0.04 | ) | (0.14 | ) | (0.06 | ) | — | |||||||||
From net realized gain on investments | (1.28 | ) | (0.05 | ) | — | — | ||||||||||
|
|
|
|
|
|
|
| |||||||||
Total distributions to shareholders | (1.32 | ) | (0.19 | ) | (0.06 | ) | — | |||||||||
|
|
|
|
|
|
|
| |||||||||
Net asset value - End of period | $ | 11.46 | $ | 12.46 | $ | 10.68 | $ | 10.36 | ||||||||
|
|
|
|
|
|
|
| |||||||||
Net assets - End of period (000’s omitted) | $ | 142 | $ | 104 | $ | 56 | $ | 52 | ||||||||
|
|
|
|
|
|
|
| |||||||||
Total return5 | 2.55 | % | 18.80 | % | 3.71 | % | 3.60 | % | ||||||||
Ratios (to average net assets)/Supplemental Data: | ||||||||||||||||
Expenses* | 0.20 | %6 | 0.05 | %7 | 0.05 | %8 | 0.05 | %9,10 | ||||||||
Net investment income (loss)3 | 0.40 | % | 0.72 | % | 0.65 | % | (0.05 | %)9 | ||||||||
Series portfolio turnover11 | 5 | % | 173 | % | 14 | % | 4 | % | ||||||||
| *The investment advisor paid a portion of the Series’ expenses. If these expenses had been incurred by the Series, the expense ratios (to average net assets) would have been increased by the following amounts: |
| |||||||||||||||
| 2.23 | %6 | 5.26 | %7 | 9.37 | %8 | 151.34 | %9,10,12 | |||||||||
TARGET 2060 SERIES CLASS R6 | FOR THE YEAR ENDED | FOR THE PERIOD | ||||||
| 10/31/18 | 10/16/171 TO 10/31/17 | |||||||
Per share data (for a share outstanding throughout each period): | ||||||||
Net asset value - Beginning of period | $ | 12.46 | $ | 12.44 | ||||
|
|
|
| |||||
Income (loss) from investment operations: | ||||||||
Net investment income2,3 | 0.06 | — | ||||||
Net realized and unrealized gain (loss) on investments | 0.28 | 0.02 | ||||||
|
|
|
| |||||
Total from investment operations | 0.34 | 0.02 | ||||||
|
|
|
| |||||
Less distributions to shareholders: | ||||||||
From net investment income | (0.04 | ) | — | |||||
From net realized gain on investments | (1.28 | ) | — | |||||
|
|
|
| |||||
Total distributions to shareholders | (1.32 | ) | — | |||||
|
|
|
| |||||
Net asset value - End of period | $ | 11.48 | $ | 12.46 | ||||
|
|
|
| |||||
Net assets - End of period (000’s omitted) | $ | 5 | $ | 5 | ||||
|
|
|
| |||||
Total return5 | 2.74 | % | 0.16 | % | ||||
Ratios (to average net assets)/Supplemental Data: | ||||||||
Expenses* | 0.05 | %6 | 0.05 | %7,9 | ||||
Net investment income (loss)3 | 0.51 | % | (0.05 | %)9 | ||||
Series portfolio turnover11 | 5 | % | 173 | % | ||||
| *The investment advisor paid a portion of the Series’ expenses. If these expenses had been incurred by the Series, the expense ratios (to average net assets) would have been increased by the following amounts: |
| |||||||
| 2.31 | %6 | 5.26 | %7,9 | |||||
1Commencement of operations.
2Calculated based on average shares outstanding during the periods.
3Net investment income is affected by the timing of distributions from the Underlying Series in which the Series invest. The ratios do not include net investment income of the Underlying Series in which the Series invests.
4Less than $(0.01).
5Represents aggregate total return for the periods indicated, and assumes reinvestment of all distributions. Total return would have been lower had certain expenses not been reimbursed during the periods. Periods less than one year are not annualized.
6Expense ratios do not include expenses of the Underlying Series in which the Series invests. The expense ratio of the Underlying Series was 0.55%.
7Expense ratios do not include expenses of the Underlying Series in which the Series invests. The expense ratio of the Underlying Series was 0.85% for Manning & Napier Pro-Blend® Maximum Term Series - Class I and 0.55% for Manning & Napier Blended Asset Maximum Series - Class R6.
8Expense ratios do not include expenses of the Underlying Series in which the Series invests. The expense ratio of the Underlying Series was 0.84%.
9Annualized.
10Expense ratios do not include expenses of the Underlying Series in which the Series invests. The expense ratio of the Underlying Series was 0.83%.
11Reflects activity of the Series and does not include the activity of the Underlying Series.
12The increase to the expense ratios (to average net assets) is largely due to the small net assets in each class.
The accompanying notes are an integral part of the financial statements.
66
Notes to Financial Statements
| 1. | Organization |
Target Income Series, Target 2015 Series, Target 2020 Series, Target 2025 Series, Target 2030 Series, Target 2035 Series, Target 2040 Series, Target 2045 Series, Target 2050 Series, Target 2055 Series and Target 2060 Series (each the “Series”) are no-load diversified series of Manning & Napier Fund, Inc. (the “Fund”). The Fund is organized in Maryland and is registered under the Investment Company Act of 1940 (the “1940 Act”), as amended, as an open-end management investment company.
Each Series seeks to achieve its investment objectives by investing in a combination of other Manning & Napier mutual funds (the “Underlying Series”) according to a target asset allocation strategy. The Series are designed to provide single investment portfolios that adjust over time to meet the changing risk and return objectives of investors over their expected investment horizon. As the target retirement date approaches, the Series’ portfolios become more conservative with a larger fixed-income investment component. The financial statements of the Underlying Series should be read in conjunction with the Series’ financial statements.
Each Series is authorized to issue four classes of shares (Class K, R, I and R6). Each class of shares is substantially the same, except that class-specific distribution and shareholder servicing expenses are borne by the specific class of shares to which they relate.
The Fund’s Advisor is Manning & Napier Advisors, LLC (the “Advisor”). Shares of each Series are offered to investors and employees of the Advisor and its affiliates. The total authorized capital stock of the Fund consists of 15 billion shares of common stock each having a par value of $0.01. As of October 31, 2018, 13.4 billion shares have been designated in total among 38 series, of which 40 million have been designated in each of the Series for Class K, R and R6 common stock and 100 million have been designated in each of the Series for Class I common stock.
| 2. | Significant Accounting Policies |
The following is a summary of significant accounting policies followed by the Series. Each Series is an investment company and, accordingly, follows the investment company accounting and reporting guidance of the Financial Accounting Standards Board Accounting Standards Codification Topic 946 - Investment Companies, which is part of accounting principles generally accepted in the United States of America (“GAAP”).
Security Valuation
Investments in the Underlying Series are valued at their net asset value per share on valuation date. In the absence of the availability of a net asset value per share on the Underlying Series, security valuations may be determined in good faith by the Advisor under procedures approved by and under the general supervision and responsibility of the Fund’s Board of Directors (the “Board”).
Volume and level of activity in established markets for an asset or liability are evaluated to determine whether recent transactions and quoted prices are determinative of fair value. Where there have been significant decreases in volume and level of activity, further analysis and adjustment may be necessary to estimate fair value. The Series measure fair value in these instances by the use of inputs and valuation techniques which may be based upon current market prices of securities that are comparable in coupon, rating, maturity and industry and/or expectation of future cash flows. As a result of trading in relatively thin markets and/or markets that experience significant volatility, the prices used by the Series to value these securities may differ from the value that would be realized if these securities were sold, and the differences could be material.
Securities for which representative valuations or prices are not available from the Series’ pricing service may be valued at fair value as determined in good faith by the Advisor under procedures approved by and under the general supervision and responsibility of the Board. Due to the inherent uncertainty of valuations of such securities, the fair value may differ significantly from the values that would have been used had a ready market for such securities existed. If trading or events occurring after the close of the principal market in which securities are traded are expected to materially affect the value of those securities, then they may be valued at their fair value, taking this trading or these events into account.
67
Notes to Financial Statements (continued)
| 2. | Significant Accounting Policies (continued) |
Security Valuation (continued)
Various inputs are used in determining the value of the Series’ assets or liabilities carried at fair value. These inputs are summarized in three broad levels. Level 1 includes quoted prices in active markets for identical assets and liabilities. Level 2 includes other significant observable inputs (including quoted prices for similar securities, interest rates, prepayment speeds, credit risk, etc.). Level 3 includes significant unobservable inputs (including the Series’ own assumptions in determining the fair value of investments). A financial instrument’s level within the fair value hierarchy is based on the lowest level on any input both individually and in aggregate that is significant to the fair value measurement. The inputs or methodology used for valuing securities are not necessarily an indication of the risk associated with investing in those securities.
The following is a summary of the valuation levels used for major security types as of October 31, 2018 in valuing the Series’ assets or liabilities carried at fair value:
| TARGET INCOME SERIES | ||||||||||||||||
| DESCRIPTION | TOTAL | LEVEL 1 | LEVEL 2 | LEVEL 3 | ||||||||||||
Assets: | ||||||||||||||||
Mutual fund | $ | 125,824,382 | $ | 125,824,382 | $ | — | $ | — | ||||||||
|
|
|
|
|
|
|
| |||||||||
Total assets | $ | 125,824,382 | $ | 125,824,382 | $ | — | $ | — | ||||||||
|
|
|
|
|
|
|
| |||||||||
| TARGET 2015 SERIES | ||||||||||||||||
| DESCRIPTION | TOTAL | LEVEL 1 | LEVEL 2 | LEVEL 3 | ||||||||||||
Assets: | ||||||||||||||||
Mutual funds | $ | 2,124,759 | $ | 2,124,759 | $ | — | $ | — | ||||||||
|
|
|
|
|
|
|
| |||||||||
Total assets | $ | 2,124,759 | $ | 2,124,759 | $ | — | $ | — | ||||||||
|
|
|
|
|
|
|
| |||||||||
| TARGET 2020 SERIES | ||||||||||||||||
| DESCRIPTION | TOTAL | LEVEL 1 | LEVEL 2 | LEVEL 3 | ||||||||||||
Assets: | ||||||||||||||||
Mutual funds | $ | 93,722,086 | $ | 93,722,086 | $ | — | $ | — | ||||||||
|
|
|
|
|
|
|
| |||||||||
Total assets | $ | 93,722,086 | $ | 93,722,086 | $ | — | $ | — | ||||||||
|
|
|
|
|
|
|
| |||||||||
| TARGET 2025 SERIES | ||||||||||||||||
| DESCRIPTION | TOTAL | LEVEL 1 | LEVEL 2 | LEVEL 3 | ||||||||||||
Assets: | ||||||||||||||||
Mutual funds | $ | 59,385,445 | $ | 59,385,445 | $ | — | $ | — | ||||||||
|
|
|
|
|
|
|
| |||||||||
Total assets | $ | 59,385,445 | $ | 59,385,445 | $ | — | $ | — | ||||||||
|
|
|
|
|
|
|
| |||||||||
| TARGET 2030 SERIES | ||||||||||||||||
| DESCRIPTION | TOTAL | LEVEL 1 | LEVEL 2 | LEVEL 3 | ||||||||||||
Assets: | ||||||||||||||||
Mutual funds | $ | 121,570,501 | $ | 121,570,501 | $ | — | $ | — | ||||||||
|
|
|
|
|
|
|
| |||||||||
Total assets | $ | 121,570,501 | $ | 121,570,501 | $ | — | $ | — | ||||||||
|
|
|
|
|
|
|
| |||||||||
| TARGET 2035 SERIES | ||||||||||||||||
| DESCRIPTION | TOTAL | LEVEL 1 | LEVEL 2 | LEVEL 3 | ||||||||||||
Assets: | ||||||||||||||||
Mutual funds | $ | 37,326,107 | $ | 37,326,107 | $ | — | $ | — | ||||||||
|
|
|
|
|
|
|
| |||||||||
Total assets | $ | 37,326,107 | $ | 37,326,107 | $ | — | $ | — | ||||||||
|
|
|
|
|
|
|
| |||||||||
68
Notes to Financial Statements (continued)
| 2. | Significant Accounting Policies (continued) |
Security Valuation (continued)
| TARGET 2040 SERIES | ||||||||||||||||
| DESCRIPTION | TOTAL | LEVEL 1 | LEVEL 2 | LEVEL 3 | ||||||||||||
Assets: | ||||||||||||||||
Mutual funds | $ | 72,983,615 | $ | `72,983,615 | $ | — | $ | — | ||||||||
|
|
|
|
|
|
|
| |||||||||
Total assets | $ | 72,983,615 | $ | 72,983,615 | $ | — | $ | — | ||||||||
|
|
|
|
|
|
|
| |||||||||
| TARGET 2045 SERIES | ||||||||||||||||
| DESCRIPTION | TOTAL | LEVEL 1 | LEVEL 2 | LEVEL 3 | ||||||||||||
Assets: | ||||||||||||||||
Mutual funds | $ | 20,512,443 | $ | 20,512,443 | $ | — | $ | — | ||||||||
|
|
|
|
|
|
|
| |||||||||
Total assets | $ | 20,512,443 | $ | 20,512,443 | $ | — | $ | — | ||||||||
|
|
|
|
|
|
|
| |||||||||
| TARGET 2050 SERIES | ||||||||||||||||
| DESCRIPTION | TOTAL | LEVEL 1 | LEVEL 2 | LEVEL 3 | ||||||||||||
Assets: | ||||||||||||||||
Mutual fund | $ | 33,049,623 | $ | 33,049,623 | $ | — | $ | — | ||||||||
|
|
|
|
|
|
|
| |||||||||
Total assets | $ | 33,049,623 | $ | 33,049,623 | $ | — | $ | — | ||||||||
|
|
|
|
|
|
|
| |||||||||
| TARGET 2055 SERIES | ||||||||||||||||
| DESCRIPTION | TOTAL | LEVEL 1 | LEVEL 2 | LEVEL 3 | ||||||||||||
Assets: | ||||||||||||||||
Mutual fund | $ | 10,223,687 | $ | 10,223,687 | $ | — | $ | — | ||||||||
|
|
|
|
|
|
|
| |||||||||
Total assets | $ | 10,223,687 | $ | 10,223,687 | $ | — | $ | — | ||||||||
|
|
|
|
|
|
|
| |||||||||
| TARGET 2060 SERIES | ||||||||||||||||
| DESCRIPTION | TOTAL | LEVEL 1 | LEVEL 2 | LEVEL 3 | ||||||||||||
Assets: | ||||||||||||||||
Mutual fund | $ | 11,393,453 | $ | 11,393,453 | $ | — | $ | — | ||||||||
|
|
|
|
|
|
|
| |||||||||
Total assets | $ | 11,393,453 | $ | 11,393,453 | $ | — | $ | — | ||||||||
|
|
|
|
|
|
|
| |||||||||
There were no Level 2 or Level 3 securities held by any of the Series as of October 31, 2017 or October 31, 2018.
New Accounting Pronouncements
The Securities and Exchange Commission (SEC) adopted changes to Regulation S-X to simplify the reporting of information by registered investment companies in financial statements. The amendments require presentation of the total, rather than the components, of distributable earnings on the Statements of Assets and Liabilities and also require presentation of the total, rather than the components, of distributions to shareholders, except for tax return of capital distributions, if any, on the Statements of Changes in Net Assets. The amendments also removed the requirement for parenthetical disclosure of undistributed net investment income on the Statements of Changes in Net Assets. These Regulation S-X amendments are reflected in the Series financial statements for the year ended October 31, 2018. As a result of adopting these amendments, the distributions to shareholders in the October 31, 2017 Statements of Changes in Net Assets presented herein have been reclassified to conform to the current year presentation.
On August 28, 2018, the FASB issued ASU 2018-13, “Disclosure Framework – Changes to the Disclosure Requirements for Fair Value Measurement,” which amends the fair value measurement disclosure requirements under U.S. GAAP. The amendments of ASU 2018-13 include new, eliminated, and modified disclosure requirements. In addition, the amendments clarify that materiality is an appropriate consideration of entities when evaluating disclosure requirements. The ASU is effective for all entities for fiscal years beginning after December 15, 2019, including interim periods therein. An entity is permitted to early adopt any eliminated
69
Notes to Financial Statements (continued)
| 2. | Significant Accounting Policies (continued) |
New Accounting Pronouncements (continued)
or modified disclosures upon issuance of this ASU and delay adoption of the new disclosures until their effective date. As such, each Series has early adopted the eliminated and modified disclosures, as permitted by this ASU.
Security Transactions, Investment Income and Expenses
Security transactions are accounted for on trade date. Dividend income is recorded on the ex-dividend date. Non-cash dividends, if any, are recorded at the fair value of the securities received. Income and capital gains distributions from the Underlying Series, if any, are recorded on the ex-dividend date.
Expenses are recorded on an accrual basis. Most expenses of the Fund can be attributed to a specific series. Expenses which cannot be directly attributed are apportioned among the series in the Fund in such a manner as deemed equitable by the Fund’s Board, taking into consideration, among other things, the nature and type of expense. Expenses included in the accompanying statements of operations do not include any expense of the Underlying Series.
Income, expenses (other than class specific expenses), and realized and unrealized gains and losses are prorated among the classes based on the relative net assets of each class. Class specific expenses are directly charged to that Class.
The Series use the identified cost method for determining realized gain or loss on investments for both financial statement and federal income tax reporting purposes.
Federal Taxes
Each Series’ policy is to comply with the provisions of the Internal Revenue Code applicable to regulated investment companies. The Series are not subject to federal income tax or excise tax to the extent that each Series distributes to shareholders each year its taxable income, including any net realized gains on investments, in accordance with requirements of the Internal Revenue Code. Accordingly, no provision for federal income tax or excise tax has been made in the financial statements.
Management evaluates its tax positions to determine if the tax positions taken meet the minimum recognition threshold in connection with accounting for uncertainties in income tax positions taken or expected to be taken for the purposes of measuring and recognizing tax liabilities in the financial statements. Recognition of tax benefits of an uncertain tax position is required only when the position is “more likely than not” to be sustained assuming examination by taxing authorities. At October 31, 2018, the Series have recorded no liability for net unrecognized tax benefits relating to uncertain income tax positions taken or expected to be taken in future tax returns.
The Series file income tax returns in the U.S. federal jurisdiction, various states and foreign jurisdictions, as required. No income tax returns are currently under investigation. The statute of limitations on Target Income Series, Target 2015 Series, Target 2020 Series, Target 2025 Series, Target 2030 Series, Target 2035 Series, Target 2040 Series, Target 2045 Series, Target 2050 Series and Target 2055 Series tax returns remains open for the years ended October 31, 2015 through October 31, 2018. The statute of limitations on Target 2060 Series remains open for the period ended October 31, 2015 and the years ended October 31, 2016 through 2018. The Series are not aware of any tax positions for which it is reasonably possible that the total amounts of unrecognized tax benefits will significantly change in the next twelve months.
Distributions of Income and Gains
Distributions to shareholders of net investment income are made semi-annually. Distributions of net realized gains are made annually. An additional distribution may be necessary to avoid taxation of a Series. Distributions are recorded on the ex-dividend date.
Indemnifications
The Fund’s organizational documents provide former and current directors and officers with a limited indemnification against liabilities arising in connection with the performance of their duties to the Fund. In the normal course of business, the Fund may also enter into contracts that provide general indemnifications. The Fund’s maximum exposure under these arrangements is
70
Notes to Financial Statements (continued)
| 2. | Significant Accounting Policies (continued) |
Indemnifications (continued)
unknown as this would be dependent on future claims that may be made against the Fund. The risk of material loss from such claims is considered remote.
Other
The preparation of financial statements in conformity with GAAP requires management to make estimates and assumptions that affect the reported amounts of assets and liabilities and the disclosure of contingent assets and liabilities at the date of the financial statements and the reported amounts of income and expenses during the reporting period. Actual results could differ from those estimates.
| 3. | Transactions with Affiliates and Other Agreements |
The Fund has an Investment Advisory Agreement (the “Agreement”) with the Advisor, for which the Advisor does not receive a fee for the services it performs for the Series. However, the Advisor is entitled to receive the management fee from each of the Underlying Series in which the Series invest.
Under the Agreement, personnel of the Advisor provide the Series with advice and assistance in the choice of investments and the execution of securities transactions, and otherwise maintain the Series’ organization. The Advisor also provides the Fund with necessary office space and fund administration and support services. The salaries of all officers of the Fund (except a percentage of the Fund’s Chief Compliance Officer’s salary, which is paid by the Fund), and of all Directors who are “affiliated persons” of the Fund, or of the Advisor, and all personnel of the Fund, or of the Advisor, performing services relating to research, statistical and investment activities, are paid by the Advisor. Each “non-affiliated” Director receives an annual stipend, which is allocated among all the active series of the Fund. In addition, these Directors also receive a fee per Board meeting attended plus a fee for each committee meeting attended and are reimbursed for travel and other out-of-pocket expenses incurred by them in connection with attending such meetings. The Fund also has an Audit Committee Chair, Governance & Nominating Committee Chair and Lead Independent Director who each receive an additional annual stipend for these roles.
The Fund may enter into agreements with financial intermediaries pursuant to which the Fund may pay financial intermediaries for non-distribution related sub-transfer agency, administrative, sub-accounting, and other shareholder services in an amount not to exceed 0.15% of the average daily net assets of the Class K, Class R and Class I shares. Payments made pursuant to such agreements are generally based on the current assets and/or number of accounts of the Series attributable to the financial intermediary. Any payments made pursuant to such agreements may be in addition to, rather than in lieu of, any Distribution and Shareholder Services Fee payable under the Rule 12b-1 plan of the Fund.
The Advisor has contractually agreed, until at least February 29, 2028 to limit its fees and reimburse expenses to the extent necessary so that the total direct annual fund operating expenses of each Class, exclusive of Distribution and Service (12b-1) Fees, do not exceed 0.20% of the average daily net assets of the Class I, Class K, and Class R shares, and 0.05% of the average daily net assets of the Class R6 shares. The Advisor’s agreement to limit each class’ operating expenses is limited to direct operating expenses and, therefore, does not apply to the indirect expenses incurred by the Series through their investments in the Underlying Series. For the year ended October 31, 2018, the Advisor reimbursed expenses of $101,514 for Target Income Series, $131,830 for Target 2015 Series, $127,737 for Target 2020 Series, $138,212 for Target 2025 Series, $148,802 for Target 2030 Series, $152,024 Target 2035 Series, $156,015 for Target 2040 Series, $161,618 for Target 2045 Series, $163,040 for Target 2050 Series, $165,409 for Target 2055 series and $174,617 for Target 2060 Series, which is included as a reduction of expenses on the Statements of Operations. The Advisor is not eligible to recoup any expenses that have been reimbursed in prior years.
Manning & Napier Investor Services, Inc., a registered broker-dealer affiliate of the Advisor, acts as distributor for the Fund’s shares. Each Series compensates the distributor for distributing and servicing the Series’ Class K and Class R shares pursuant to a distribution plan adopted under Rule 12b-1 of the 1940 Act, regardless of expenses actually incurred. Under the agreement, each Series pays distribution and service fees to the distributor at an annual rate of 0.25% of average daily net assets
71
Notes to Financial Statements (continued)
| 3. | Transactions with Affiliates and Other Agreements (continued) |
attributable to Class K shares and 0.50% of average daily net assets attributable to Class R shares. There are no distribution and service fees on Class I and Class R6 shares of each Series. The fees are accrued daily and paid monthly.
Pursuant to a master services agreement dated March 1, 2017, the Fund pays the Advisor an annual fee related to fund accounting and administration of 0.00225% of average daily net assets of the Target Series with an annual base fee of $40,000 per Target series. Additionally, certain transaction and out-of-pocket expenses, including charges for reporting relating to the Fund’s compliance program, are charged. The Advisor has agreements with BNY Mellon Investment Servicing (U.S.) Inc. (“BNY”) under which BNY serves as sub-accountant services agent.
| 4. | Purchases and Sales of Securities |
For the year ended October 31, 2018, purchases and sales of Underlying Series were as follows:
| SERIES | PURCHASES | SALES | ||||||
Target Income Series | $ | 39,563,160 | $ | 10,771,144 | ||||
Target 2015 Series | $ | 1,579,386 | $ | 3,961,631 | ||||
Target 2020 Series | $ | 27,196,546 | $ | 46,644,371 | ||||
Target 2025 Series | $ | 33,375,597 | $ | 12,897,189 | ||||
Target 2030 Series | $ | 37,689,845 | $ | 57,351,416 | ||||
Target 2035 Series | $ | 21,678,877 | $ | 10,277,111 | ||||
Target 2040 Series | $ | 27,962,367 | $ | 40,700,148 | ||||
Target 2045 Series | $ | 12,362,473 | $ | 7,932,081 | ||||
Target 2050 Series | $ | 13,136,893 | $ | 16,771,018 | ||||
Target 2055 Series | $ | 5,442,422 | $ | 2,026,052 | ||||
Target 2060 Series | $ | 7,320,168 | $ | 391,089 | ||||
| 5. | Investments in Affiliated Issuers |
A summary of the Series’ transactions in the shares of affiliated issuers of Manning & Napier during the year ended October 31, 2018 is set forth below:
TARGET INCOME SERIES | VALUE AT 10/31/17 | PURCHASE COST | SALES PROCEEDS | VALUE AT 10/31/18 | SHARES HELD AT 10/31/18 | DIVIDEND INCOME | DISTRIBUTIONS AND NET REALIZED GAIN OR LOSS | CHANGE IN UNREALIZED APPRECIATION (DEPRECIATION) | ||||||||||||||||||||||||
Blended Asset Conservative Series - Class R6 | $ | 98,989,721 | $ | 39,563,160 | $ | 10,771,144 | $ | 125,824,382 | 11,781,309 | $ | 1,222,572 | $ | 53,511 | $ | (2,010,867 | ) | ||||||||||||||||
TARGET 2015 SERIES | VALUE AT 10/31/17 | PURCHASE COST | SALES PROCEEDS | VALUE AT 10/31/18 | SHARES HELD AT 10/31/18 | DIVIDEND INCOME | DISTRIBUTIONS AND NET REALIZED GAIN OR LOSS | CHANGE IN UNREALIZED APPRECIATION (DEPRECIATION) | ||||||||||||||||||||||||
Blended Asset Conservative Series - Class R6 | $ | 1,766,362 | $ | 1,246,639 | $ | 1,692,484 | $ | 1,279,950 | 119,845 | $ | 18,073 | $ | (12,390 | ) | $ | (28,177 | ) | |||||||||||||||
Blended Asset Moderate Series - Class R6 | 2,792,015 | 332,747 | 2,269,147 | 844,809 | 80,458 | 14,765 | 5,119 | (15,925 | ) | |||||||||||||||||||||||
|
|
|
|
|
|
|
|
|
|
|
|
|
|
|
| |||||||||||||||||
| $ | 4,558,377 | $ | 1,579,386 | $ | 3,961,631 | $ | 2,124,759 | $ | 32,838 | $ | (7,271 | ) | $ | (44,102 | ) | |||||||||||||||||
|
|
|
|
|
|
|
|
|
|
|
|
|
| |||||||||||||||||||
72
Notes to Financial Statements (continued)
| 5. | Investments in Affiliated Issuers (continued) |
TARGET 2020 SERIES | VALUE AT 10/31/17 | PURCHASE COST | SALES PROCEEDS | VALUE AT 10/31/18 | SHARES HELD AT 10/31/18 | DIVIDEND INCOME | DISTRIBUTIONS AND NET REALIZED GAIN OR LOSS | CHANGE IN UNREALIZED APPRECIATION (DEPRECIATION) | ||||||||||||||||||||||||
Blended Asset Extended Series - Class R6 | $ | 17,770,393 | $ | 2,246,045 | $ | 10,721,134 | $ | 9,358,378 | 924,741 | $ | 97,178 | $ | 242,087 | $ | (179,014 | ) | ||||||||||||||||
Blended Asset Moderate Series - Class R6 | 96,805,738 | 24,950,501 | 35,923,237 | 84,363,708 | 8,034,639 | 812,414 | 493,037 | (1,962,330 | ) | |||||||||||||||||||||||
|
|
|
|
|
|
|
|
|
|
|
|
|
|
|
| |||||||||||||||||
| $ | 114,576,131 | $ | 27,196,546 | $ | 46,644,371 | $ | 93,722,086 | $ | 909,592 | $ | 735,124 | $ | (2,141,344 | ) | ||||||||||||||||||
|
|
|
|
|
|
|
|
|
|
|
|
|
| |||||||||||||||||||
TARGET 2025 SERIES | VALUE AT 10/31/17 | PURCHASE COST | SALES PROCEEDS | VALUE AT 10/31/18 | SHARES HELD AT 10/31/18 | DIVIDEND INCOME | DISTRIBUTIONS AND NET REALIZED GAIN OR LOSS | CHANGE IN UNREALIZED APPRECIATION (DEPRECIATION) | ||||||||||||||||||||||||
Blended Asset Extended Series - Class R6 | $ | 24,428,863 | $ | 14,801,387 | $ | 9,037,742 | $ | 29,628,989 | 2,927,766 | $ | 213,831 | $ | 126,641 | $ | (690,160 | ) | ||||||||||||||||
Blended Asset Moderate Series - Class R6 | 15,812,118 | 18,574,210 | 3,859,447 | 29,756,456 | 2,833,948 | 216,133 | (593 | ) | (769,831 | ) | ||||||||||||||||||||||
|
|
|
|
|
|
|
|
|
|
|
|
|
|
|
| |||||||||||||||||
| $ | 40,240,981 | $ | 33,375,597 | $ | 12,897,189 | $ | 59,385,445 | $ | 429,964 | $ | 126,048 | $ | (1,459,991 | ) | ||||||||||||||||||
|
|
|
|
|
|
|
|
|
|
|
|
|
| |||||||||||||||||||
TARGET 2030 SERIES | VALUE AT 10/31/17 | PURCHASE COST | SALES PROCEEDS | VALUE AT 10/31/18 | SHARES HELD AT 10/31/18 | DIVIDEND INCOME | DISTRIBUTIONS AND NET REALIZED GAIN OR LOSS | CHANGE IN UNREALIZED APPRECIATION (DEPRECIATION) | ||||||||||||||||||||||||
Blended Asset Extended Series - Class R6 | $ | 119,139,003 | $ | 34,569,385 | $ | 42,904,028 | $ | 109,347,539 | 10,805,093 | $ | 890,957 | $ | 1,018,167 | $ | (2,474,987 | ) | ||||||||||||||||
Blended Asset Maximum Series - Class R6 | 22,546,555 | 3,120,460 | 14,447,388 | 12,222,962 | 1,031,474 | 87,600 | 908,507 | 105,171 | ||||||||||||||||||||||||
|
|
|
|
|
|
|
|
|
|
|
|
|
|
|
| |||||||||||||||||
| $ | 141,685,558 | $ | 37,689,845 | $ | 57,351,416 | $ | 121,570,501 | $ | 978,557 | $ | 1,926,674 | $ | (2,369,816 | ) | ||||||||||||||||||
|
|
|
|
|
|
|
|
|
|
|
|
|
| |||||||||||||||||||
TARGET 2035 SERIES | VALUE AT 10/31/17 | PURCHASE COST | SALES PROCEEDS | VALUE AT 10/31/18 | SHARES HELD AT 10/31/18 | DIVIDEND INCOME | DISTRIBUTIONS AND NET REALIZED GAIN OR LOSS | CHANGE IN UNREALIZED APPRECIATION (DEPRECIATION) | ||||||||||||||||||||||||
Blended Asset Extended Series - Class R6 | $ | 15,365,587 | $ | 14,694,475 | $ | 5,211,366 | $ | 24,251,400 | 2,396,383 | $ | 159,174 | $ | 43,727 | $ | (641,022 | ) | ||||||||||||||||
Blended Asset Maximum Series - Class R6 | 10,951,620 | 6,984,402 | 5,065,745 | 13,074,707 | 1,103,351 | 65,969 | 278,396 | (68,704 | ) | |||||||||||||||||||||||
|
|
|
|
|
|
|
|
|
|
|
|
|
|
|
| |||||||||||||||||
| $ | 26,317,207 | $ | 21,678,877 | $ | 10,277,111 | $ | 37,326,107 | $ | 225,143 | $ | 322,123 | $ | (709,726 | ) | ||||||||||||||||||
|
|
|
|
|
|
|
|
|
|
|
|
|
| |||||||||||||||||||
73
Notes to Financial Statements (continued)
| 5. | Investments in Affiliated Issuers (continued) |
TARGET 2040 SERIES | VALUE AT 10/31/17 | PURCHASE COST | SALES PROCEEDS | VALUE AT 10/31/18 | SHARES HELD AT 10/31/18 | DIVIDEND INCOME | DISTRIBUTIONS AND NET REALIZED GAIN OR LOSS | CHANGE IN UNREALIZED APPRECIATION (DEPRECIATION) | ||||||||||||||||||||||||
Blended Asset Extended Series - Class R6 | $ | 28,065,508 | $ | 15,000,141 | $ | 13,545,156 | $ | 29,068,763 | 2,872,407 | $ | 226,366 | $ | 318,959 | $ | (770,689 | ) | ||||||||||||||||
Blended Asset Maximum Series - Class R6 | 55,962,686 | 12,962,226 | 27,154,992 | 43,914,852 | 3,705,895 | 267,580 | 1,875,657 | 295,076 | ||||||||||||||||||||||||
|
|
|
|
|
|
|
|
|
|
|
|
|
|
|
| |||||||||||||||||
| $ | 84,028,194 | $ | 27,962,367 | $ | 40,700,148 | $ | 72,983,615 | $ | 493,946 | $ | 2,194,616 | $ | (475,613 | ) | ||||||||||||||||||
|
|
|
|
|
|
|
|
|
|
|
|
|
| |||||||||||||||||||
TARGET 2045 SERIES | VALUE AT 10/31/17 | PURCHASE COST | SALES PROCEEDS | VALUE AT 10/31/18 | SHARES HELD AT 10/31/18 | DIVIDEND INCOME | DISTRIBUTIONS AND NET REALIZED GAIN OR LOSS | CHANGE IN UNREALIZED APPRECIATION (DEPRECIATION) | ||||||||||||||||||||||||
Blended Asset Extended Series - Class R6 | $ | 1,493,246 | $ | 2,641,083 | $ | 980,396 | $ | 3,067,693 | 303,132 | $ | 19,633 | $ | 10,312 | $ | (96,552 | ) | ||||||||||||||||
Blended Asset Maximum Series - Class R6 | 14,397,470 | 9,721,390 | 6,951,685 | 17,444,750 | 1,472,131 | 89,990 | 372,685 | (88,446 | ) | |||||||||||||||||||||||
|
|
|
|
|
|
|
|
|
|
|
|
|
|
|
| |||||||||||||||||
| $ | 15,890,716 | $ | 12,362,473 | $ | 7,932,081 | $ | 20,512,443 | $ | 109,623 | $ | 382,997 | $ | (184,998 | ) | ||||||||||||||||||
|
|
|
|
|
|
|
|
|
|
|
|
|
| |||||||||||||||||||
TARGET 2050 SERIES | VALUE AT 10/31/17 | PURCHASE COST | SALES PROCEEDS | VALUE AT 10/31/18 | SHARES HELD AT 10/31/18 | DIVIDEND INCOME | DISTRIBUTIONS AND NET REALIZED GAIN | CHANGE IN UNREALIZED APPRECIATION (DEPRECIATION) | ||||||||||||||||||||||||
Blended Asset Maximum Series - Class R6 | $ | 35,389,255 | $ | 13,136,893 | $ | 16,771,018 | $ | 33,049,623 | 2,788,998 | $ | 182,596 | $ | 1,263,212 | $ | 47,864 | |||||||||||||||||
TARGET 2055 SERIES | VALUE AT 10/31/17 | PURCHASE COST | SALES PROCEEDS | VALUE AT 10/31/18 | SHARES HELD AT 10/31/18 | DIVIDEND INCOME | DISTRIBUTIONS AND NET REALIZED GAIN OR LOSS | CHANGE IN UNREALIZED APPRECIATION (DEPRECIATION) | ||||||||||||||||||||||||
Blended Asset Maximum Series - Class R6 | $ | 6,736,319 | $ | 5,442,422 | $ | 2,026,052 | $ | 10,223,687 | 862,758 | $ | 49,766 | $ | 110,326 | $ | (35,998 | ) | ||||||||||||||||
TARGET 2060 SERIES | VALUE AT 10/31/17 | PURCHASE COST | SALES PROCEEDS | VALUE AT 10/31/18 | SHARES HELD AT 10/31/18 | DIVIDEND INCOME | DISTRIBUTIONS AND NET REALIZED GAIN OR LOSS | CHANGE IN UNREALIZED APPRECIATION (DEPRECIATION) | ||||||||||||||||||||||||
Blended Asset Maximum Series - Class R6 | $ | 4,618,675 | $ | 7,320,168 | $ | 391,089 | $ | 11,393,453 | 961,473 | $ | 41,273 | $ | 20,821 | $ | (172,805 | ) | ||||||||||||||||
| 6. | Capital Stock Transactions |
Transactions in Class K, Class R, Class I and Class R6 shares:
TARGET INCOME SERIES: | FOR THE YEAR ENDED 10/31/18 | FOR THE YEAR ENDED 10/31/17 | FOR THE YEAR ENDED 10/31/18 | FOR THE YEAR ENDED 10/31/17 | ||||||||||||||||||||||||||||
| CLASS K | CLASS K | CLASS R | CLASS R | |||||||||||||||||||||||||||||
| SHARES | AMOUNTS | SHARES | AMOUNTS | SHARES | AMOUNTS | SHARES | AMOUNTS | |||||||||||||||||||||||||
Sold | 3,459,198 | $ | 34,200,840 | 2,337,440 | $ | 22,659,341 | 1,282,576 | $ | 12,499,324 | 1,017,890 | $ | 9,772,506 | ||||||||||||||||||||
Reinvested | 55,745 | 550,512 | 106,700 | 992,014 | 8,088 | 78,863 | 2,785 | 26,048 | ||||||||||||||||||||||||
Repurchased | (794,763 | ) | (7,842,218 | ) | (1,119,121 | ) | (10,770,060 | ) | (348,958 | ) | (3,406,394 | ) | (129,081 | ) | (1,229,453 | ) | ||||||||||||||||
|
|
|
|
|
|
|
|
|
|
|
|
|
|
|
| |||||||||||||||||
Total | 2,720,180 | $ | 26,909,134 | 1,325,019 | $ | 12,881,295 | 941,706 | $ | 9,171,793 | 891,594 | $ | 8,569,101 | ||||||||||||||||||||
|
|
|
|
|
|
|
|
|
|
|
|
|
|
|
| |||||||||||||||||
74
Notes to Financial Statements (continued)
| 6. | Capital Stock Transactions (continued) |
TARGET INCOME SERIES: | FOR THE YEAR ENDED 10/31/18 | FOR THE YEAR ENDED 10/31/17 | FOR THE YEAR ENDED 10/31/18 | FOR THE PERIOD 10/16/171 TO 10/31/17 | ||||||||||||||||||||||||||||
| CLASS I | CLASS I | CLASS R6 | CLASS R6 | |||||||||||||||||||||||||||||
| SHARES | AMOUNTS | SHARES | AMOUNTS | SHARES | AMOUNTS | SHARES | AMOUNTS | |||||||||||||||||||||||||
Sold | 25,220 | $ | 253,822 | 131,766 | $ | 1,259,979 | — | $ | — | 504 | $ | 5,000 | ||||||||||||||||||||
Reinvested | 3,950 | 39,151 | 21,427 | 199,890 | 5 | 45 | — | — | ||||||||||||||||||||||||
Repurchased | (760,862 | ) | (7,626,184 | ) | (634,616 | ) | (6,088,342 | ) | — | — | — | — | ||||||||||||||||||||
|
|
|
|
|
|
|
|
|
|
|
|
|
|
|
| |||||||||||||||||
Total | (731,692 | ) | $ | (7,333,211 | ) | (481,423 | ) | $ | (4,628,473 | ) | 5 | $ | 45 | 504 | $ | 5,000 | ||||||||||||||||
|
|
|
|
|
|
|
|
|
|
|
|
|
|
|
| |||||||||||||||||
TARGET 2015 SERIES: | FOR THE YEAR ENDED 10/31/18 | FOR THE YEAR ENDED 10/31/17 | FOR THE YEAR ENDED 10/31/18 | FOR THE YEAR ENDED 10/31/17 | ||||||||||||||||||||||||||||
| CLASS K | CLASS K | CLASS R | CLASS R | |||||||||||||||||||||||||||||
| SHARES | AMOUNTS | SHARES | AMOUNTS | SHARES | AMOUNTS | SHARES | AMOUNTS | |||||||||||||||||||||||||
Sold | 37,320 | $ | 416,295 | 127,914 | $ | 1,381,081 | 251 | $ | 2,828 | 1,512 | $ | 15,971 | ||||||||||||||||||||
Reinvested | 1,657 | 18,450 | 4,600 | 47,515 | 13 | 150 | 7 | 72 | ||||||||||||||||||||||||
Repurchased | (250,959 | ) | (2,781,162 | ) | (68,059 | ) | (726,662 | ) | (405 | ) | (4,535 | ) | (74,290 | ) | (780,760 | ) | ||||||||||||||||
|
|
|
|
|
|
|
|
|
|
|
|
|
|
|
| |||||||||||||||||
Total | (211,982 | ) | $ | (2,346,417 | ) | 64,455 | $ | 701,934 | (141 | ) | $ | (1,557 | ) | (72,771 | ) | $ | (764,717 | ) | ||||||||||||||
|
|
|
|
|
|
|
|
|
|
|
|
|
|
|
| |||||||||||||||||
TARGET 2015 SERIES: | FOR THE YEAR ENDED 10/31/18 | FOR THE YEAR ENDED 10/31/17 | FOR THE YEAR ENDED 10/31/18 | FOR THE PERIOD 10/16/171 TO 10/31/17 | ||||||||||||||||||||||||||||
| CLASS I | CLASS I | CLASS R6 | CLASS R6 | |||||||||||||||||||||||||||||
| SHARES | AMOUNTS | SHARES | AMOUNTS | SHARES | AMOUNTS | SHARES | AMOUNTS | |||||||||||||||||||||||||
Sold | 10,319 | $ | 116,848 | 71,237 | $ | 759,360 | — | $ | — | 446 | $ | 5,000 | ||||||||||||||||||||
Reinvested | 263 | 2,948 | 3,867 | 40,103 | 5 | 49 | — | — | ||||||||||||||||||||||||
Repurchased | (13,809 | ) | (155,395 | ) | (298,585 | ) | (3,249,874 | ) | — | — | — | — | ||||||||||||||||||||
|
|
|
|
|
|
|
|
|
|
|
|
|
|
|
| |||||||||||||||||
Total | (3,227 | ) | $ | (35,599 | ) | (223,481 | ) | $ | (2,450,411 | ) | 5 | $ | 49 | 446 | $ | 5,000 | ||||||||||||||||
|
|
|
|
|
|
|
|
|
|
|
|
|
|
|
| |||||||||||||||||
TARGET 2020 SERIES: | FOR THE YEAR ENDED 10/31/18 | FOR THE YEAR ENDED 10/31/17 | FOR THE YEAR ENDED 10/31/18 | FOR THE YEAR ENDED 10/31/17 | ||||||||||||||||||||||||||||
| CLASS K | CLASS K | CLASS R | CLASS R | |||||||||||||||||||||||||||||
| SHARES | AMOUNTS | SHARES | AMOUNTS | SHARES | AMOUNTS | SHARES | AMOUNTS | |||||||||||||||||||||||||
Sold | 1,799,328 | $ | 17,011,756 | 2,172,901 | $ | 19,607,802 | 840,753 | $ | 7,833,720 | 886,323 | $ | 8,009,764 | ||||||||||||||||||||
Reinvested | 35,055 | 331,206 | 121,288 | 1,040,715 | 4,150 | 38,502 | 6,480 | 55,423 | ||||||||||||||||||||||||
Repurchased | (1,109,780 | ) | (10,488,707 | ) | (3,836,660 | ) | (34,880,548 | ) | (492,010 | ) | (4,595,463 | ) | (250,464 | ) | (2,227,372 | ) | ||||||||||||||||
|
|
|
|
|
|
|
|
|
|
|
|
|
|
|
| |||||||||||||||||
Total | 724,603 | $ | 6,854,255 | (1,542,471 | ) | $ | (14,232,031 | ) | 352,893 | $ | 3,276,759 | 642,339 | $ | 5,837,815 | ||||||||||||||||||
|
|
|
|
|
|
|
|
|
|
|
|
|
|
|
| |||||||||||||||||
TARGET 2020 SERIES: | FOR THE YEAR ENDED 10/31/18 | FOR THE YEAR ENDED 10/31/17 | FOR THE YEAR ENDED 10/31/18 | FOR THE PERIOD 10/16/171 TO 10/31/17 | ||||||||||||||||||||||||||||
| CLASS I | CLASS I | CLASS R6 | CLASS R6 | |||||||||||||||||||||||||||||
| SHARES | AMOUNTS | SHARES | AMOUNTS | SHARES | AMOUNTS | SHARES | AMOUNTS | |||||||||||||||||||||||||
Sold | 161,668 | $ | 1,542,712 | 682,033 | $ | 6,089,825 | — | $ | — | 529 | $ | 5,000 | ||||||||||||||||||||
Reinvested | 13,342 | 125,744 | 80,657 | 698,280 | 4 | 39 | — | — | ||||||||||||||||||||||||
Repurchased | (3,242,665 | ) | (31,221,702 | ) | (2,516,290 | ) | (23,043,275 | ) | — | — | — | — | ||||||||||||||||||||
|
|
|
|
|
|
|
|
|
|
|
|
|
|
|
| |||||||||||||||||
Total | (3,067,655 | ) | $ | (29,553,246 | ) | (1,753,600 | ) | $ | (16,255,170 | ) | 4 | $ | 39 | 529 | $ | 5,000 | ||||||||||||||||
|
|
|
|
|
|
|
|
|
|
|
|
|
|
|
| |||||||||||||||||
75
Notes to Financial Statements (continued)
| 6. | Capital Stock Transactions (continued) |
TARGET 2025 SERIES: | FOR THE YEAR ENDED 10/31/18 | FOR THE YEAR ENDED 10/31/17 | FOR THE YEAR ENDED 10/31/18 | FOR THE YEAR ENDED 10/31/17 | ||||||||||||||||||||||||||||
| CLASS K | CLASS K | CLASS R | CLASS R | |||||||||||||||||||||||||||||
| SHARES | AMOUNTS | SHARES | AMOUNTS | SHARES | AMOUNTS | SHARES | AMOUNTS | |||||||||||||||||||||||||
Sold | 1,534,730 | $ | 18,509,075 | 1,510,708 | $ | 17,519,643 | 1,225,545 | $ | 14,820,290 | 1,041,870 | $ | 12,170,838 | ||||||||||||||||||||
Reinvested | 9,973 | 120,080 | 18,798 | 204,099 | 4,298 | 51,881 | 2,406 | 26,982 | ||||||||||||||||||||||||
Repurchased | (729,450 | ) | (8,760,023 | ) | (605,174 | ) | (6,888,059 | ) | (303,550 | ) | (3,700,436 | ) | (137,641 | ) | (1,565,471 | ) | ||||||||||||||||
|
|
|
|
|
|
|
|
|
|
|
|
|
|
|
| |||||||||||||||||
Total | 815,253 | $ | 9,869,132 | 924,332 | $ | 10,835,683 | 926,293 | $ | 11,171,735 | 906,635 | $ | 10,632,349 | ||||||||||||||||||||
|
|
|
|
|
|
|
|
|
|
|
|
|
|
|
| |||||||||||||||||
TARGET 2025 SERIES: | FOR THE YEAR ENDED 10/31/18 | FOR THE YEAR ENDED 10/31/17 | FOR THE YEAR ENDED 10/31/18 | FOR THE PERIOD 10/16/171 TO 10/31/17 | ||||||||||||||||||||||||||||
| CLASS I | CLASS I | CLASS R6 | CLASS R6 | |||||||||||||||||||||||||||||
| SHARES | AMOUNTS | SHARES | AMOUNTS | SHARES | AMOUNTS | SHARES | AMOUNTS | |||||||||||||||||||||||||
Sold | 34,292 | $ | 410,576 | 370,555 | $ | 4,134,606 | — | $ | — | 418 | $ | 5,000 | ||||||||||||||||||||
Reinvested | 999 | 11,987 | 19,004 | 205,945 | 3 | 36 | — | — | ||||||||||||||||||||||||
Repurchased | (94,808 | ) | (1,146,696 | ) | (1,611,229 | ) | (18,497,112 | ) | — | — | — | — | ||||||||||||||||||||
|
|
|
|
|
|
|
|
|
|
|
|
|
|
|
| |||||||||||||||||
Total | (59,517 | ) | $ | (724,133 | ) | (1,221,670 | ) | $ | (14,156,561 | ) | 3 | $ | 36 | 418 | $ | 5,000 | ||||||||||||||||
|
|
|
|
|
|
|
|
|
|
|
|
|
|
|
| |||||||||||||||||
TARGET 2030 SERIES: | FOR THE YEAR ENDED 10/31/18 | FOR THE YEAR ENDED 10/31/17 | FOR THE YEAR ENDED 10/31/18 | FOR THE YEAR ENDED 10/31/17 | ||||||||||||||||||||||||||||
| CLASS K | CLASS K | CLASS R | CLASS R | |||||||||||||||||||||||||||||
| SHARES | AMOUNTS | SHARES | AMOUNTS | SHARES | AMOUNTS | SHARES | AMOUNTS | |||||||||||||||||||||||||
Sold | 2,083,281 | $ | 20,161,761 | 2,778,652 | $ | 25,188,374 | 1,231,615 | $ | 11,808,521 | 1,104,982 | $ | 10,086,182 | ||||||||||||||||||||
Reinvested | 31,911 | 307,548 | 134,225 | 1,140,501 | 4,237 | 40,572 | 10,235 | 86,458 | ||||||||||||||||||||||||
Repurchased | (1,535,516 | ) | (14,803,048 | ) | (2,812,564 | ) | (25,309,781 | ) | (363,201 | ) | (3,500,775 | ) | (497,936 | ) | (4,376,457 | ) | ||||||||||||||||
|
|
|
|
|
|
|
|
|
|
|
|
|
|
|
| |||||||||||||||||
Total | 579,676 | $ | 5,666,261 | 100,313 | $ | 1,019,094 | 872,651 | $ | 8,348,318 | 617,281 | $ | 5,796,183 | ||||||||||||||||||||
|
|
|
|
|
|
|
|
|
|
|
|
|
|
|
| |||||||||||||||||
TARGET 2030 SERIES: | FOR THE YEAR ENDED 10/31/18 | FOR THE YEAR ENDED 10/31/17 | FOR THE YEAR ENDED 10/31/18 | FOR THE PERIOD 10/16/171 TO 10/31/17 | ||||||||||||||||||||||||||||
| CLASS I | CLASS I | CLASS R6 | CLASS R6 | |||||||||||||||||||||||||||||
| SHARES | AMOUNTS | SHARES | AMOUNTS | SHARES | AMOUNTS | SHARES | AMOUNTS | |||||||||||||||||||||||||
Sold | 328,500 | $ | 3,198,818 | 758,409 | $ | 6,802,909 | — | $ | — | 520 | $ | 5,000 | ||||||||||||||||||||
Reinvested | 13,968 | 134,947 | 97,154 | 836,401 | 3 | 34 | — | — | ||||||||||||||||||||||||
Repurchased | (3,703,089 | ) | (36,954,583 | ) | (3,060,611 | ) | (28,059,927 | ) | — | — | — | — | ||||||||||||||||||||
|
|
|
|
|
|
|
|
|
|
|
|
|
|
|
| |||||||||||||||||
Total | (3,360,621 | ) | $ | (33,620,818 | ) | (2,205,048 | ) | $ | (20,420,617 | ) | 3 | $ | 34 | 520 | $ | 5,000 | ||||||||||||||||
|
|
|
|
|
|
|
|
|
|
|
|
|
|
|
| |||||||||||||||||
TARGET 2035 SERIES: | FOR THE YEAR ENDED 10/31/18 | FOR THE YEAR ENDED 10/31/17 | FOR THE YEAR ENDED 10/31/18 | FOR THE YEAR ENDED 10/31/17 | ||||||||||||||||||||||||||||
| CLASS K | CLASS K | CLASS R | CLASS R | |||||||||||||||||||||||||||||
| SHARES | AMOUNTS | SHARES | AMOUNTS | SHARES | AMOUNTS | SHARES | AMOUNTS | |||||||||||||||||||||||||
Sold | 894,857 | $ | 11,507,154 | 814,585 | $ | 9,738,361 | 814,355 | $ | 10,520,876 | 544,941 | $ | 6,670,222 | ||||||||||||||||||||
Reinvested | 24,501 | 309,903 | 21,885 | 243,472 | 9,442 | 119,395 | 2,155 | 24,341 | ||||||||||||||||||||||||
Repurchased | (681,703 | ) | (8,746,295 | ) | (434,491 | ) | (5,179,247 | ) | (132,161 | ) | (1,727,643 | ) | (168,720 | ) | (1,949,856 | ) | ||||||||||||||||
|
|
|
|
|
|
|
|
|
|
|
|
|
|
|
| |||||||||||||||||
Total | 237,655 | $ | 3,070,762 | 401,979 | $ | 4,802,586 | 691,636 | $ | 8,912,628 | 378,376 | $ | 4,744,707 | ||||||||||||||||||||
|
|
|
|
|
|
|
|
|
|
|
|
|
|
|
| |||||||||||||||||
76
Notes to Financial Statements (continued)
| 6. | Capital Stock Transactions (continued) |
TARGET 2035 SERIES: | FOR THE YEAR ENDED 10/31/18 | FOR THE YEAR ENDED 10/31/17 | FOR THE YEAR ENDED 10/31/18 | FOR THE PERIOD 10/16/171 TO 10/31/17 | ||||||||||||||||||||||||||||
| CLASS I | CLASS I | CLASS R6 | CLASS R6 | |||||||||||||||||||||||||||||
| SHARES | AMOUNTS | SHARES | AMOUNTS | SHARES | AMOUNTS | SHARES | AMOUNTS | |||||||||||||||||||||||||
Sold | 24,169 | $ | 313,517 | 234,658 | $ | 2,741,000 | — | $ | — | 393 | $ | 5,000 | ||||||||||||||||||||
Reinvested | 1,448 | 18,394 | 21,053 | 235,530 | 8 | 94 | — | — | ||||||||||||||||||||||||
Repurchased | (40,800 | ) | (534,892 | ) | (1,189,172 | ) | (14,478,654 | ) | — | — | — | — | ||||||||||||||||||||
|
|
|
|
|
|
|
|
|
|
|
|
|
|
|
| |||||||||||||||||
Total | (15,183 | ) | $ | (202,981 | ) | (933,461 | ) | $ | (11,502,124 | ) | 8 | $ | 94 | 393 | $ | 5,000 | ||||||||||||||||
|
|
|
|
|
|
|
|
|
|
|
|
|
|
|
| |||||||||||||||||
TARGET 2040 SERIES: | FOR THE YEAR ENDED 10/31/18 | FOR THE YEAR ENDED 10/31/17 | FOR THE YEAR ENDED 10/31/18 | FOR THE YEAR ENDED 10/31/17 | ||||||||||||||||||||||||||||
| CLASS K | CLASS K | CLASS R | CLASS R | |||||||||||||||||||||||||||||
| SHARES | AMOUNTS | SHARES | AMOUNTS | SHARES | AMOUNTS | SHARES | AMOUNTS | |||||||||||||||||||||||||
Sold | 1,332,229 | $ | 13,630,503 | 1,845,055 | $ | 17,096,157 | 902,770 | $ | 9,157,688 | 619,963 | $ | 5,888,746 | ||||||||||||||||||||
Reinvested | 112,904 | 1,128,727 | 74,153 | 646,006 | 17,371 | 172,255 | 5,183 | 44,814 | ||||||||||||||||||||||||
Repurchased | (1,096,514 | ) | (11,196,621 | ) | (3,091,920 | ) | (29,044,040 | ) | (195,400 | ) | (1,996,090 | ) | (362,011 | ) | (3,348,998 | ) | ||||||||||||||||
|
|
|
|
|
|
|
|
|
|
|
|
|
|
|
| |||||||||||||||||
Total | 348,619 | $ | 3,562,609 | (1,172,712 | ) | $ | (11,301,877 | ) | 724,741 | $ | 7,333,853 | 263,135 | $ | 2,584,562 | ||||||||||||||||||
|
|
|
|
|
|
|
|
|
|
|
|
|
|
|
| |||||||||||||||||
TARGET 2040 SERIES: | FOR THE YEAR ENDED 10/31/18 | FOR THE YEAR ENDED 10/31/17 | FOR THE YEAR ENDED 10/31/18 | FOR THE PERIOD 10/16/171 TO 10/31/17 | ||||||||||||||||||||||||||||
| CLASS I | CLASS I | CLASS R6 | CLASS R6 | |||||||||||||||||||||||||||||
| SHARES | AMOUNTS | SHARES | AMOUNTS | SHARES | AMOUNTS | SHARES | AMOUNTS | |||||||||||||||||||||||||
Sold | 245,103 | $ | 2,504,570 | 457,484 | $ | 4,244,538 | — | $ | — | 496 | $ | 5,000 | ||||||||||||||||||||
Reinvested | 53,363 | 537,445 | 45,229 | 401,029 | 12 | 123 | — | — | ||||||||||||||||||||||||
Repurchased | (2,371,127 | ) | (25,021,391 | ) | (1,327,779 | ) | (12,659,051 | ) | — | — | — | — | ||||||||||||||||||||
|
|
|
|
|
|
|
|
|
|
|
|
|
|
|
| |||||||||||||||||
Total | (2,072,661 | ) | $ | (21,979,376 | ) | (825,066 | ) | $ | (8,013,484 | ) | 12 | $ | 123 | 496 | $ | 5,000 | ||||||||||||||||
|
|
|
|
|
|
|
|
|
|
|
|
|
|
|
| |||||||||||||||||
TARGET 2045 SERIES: | FOR THE YEAR ENDED 10/31/18 | FOR THE YEAR ENDED 10/31/17 | FOR THE YEAR ENDED 10/31/18 | FOR THE YEAR ENDED 10/31/17 | ||||||||||||||||||||||||||||
| CLASS K | CLASS K | CLASS R | CLASS R | |||||||||||||||||||||||||||||
| SHARES | AMOUNTS | SHARES | AMOUNTS | SHARES | AMOUNTS | SHARES | AMOUNTS | |||||||||||||||||||||||||
Sold | 475,170 | $ | 6,394,714 | 289,509 | $ | 3,610,585 | 493,767 | $ | 6,575,433 | 309,595 | $ | 3,960,365 | ||||||||||||||||||||
Reinvested | 42,406 | 552,543 | 14,998 | 172,547 | 21,160 | 274,179 | 2,194 | 24,869 | ||||||||||||||||||||||||
Repurchased | (446,574 | ) | (5,981,696 | ) | (157,105 | ) | (1,895,184 | ) | (139,055 | ) | (1,881,446 | ) | (106,658 | ) | (1,260,324 | ) | ||||||||||||||||
|
|
|
|
|
|
|
|
|
|
|
|
|
|
|
| |||||||||||||||||
Total | 71,002 | $ | 965,561 | 147,402 | $ | 1,887,948 | 375,872 | $ | 4,968,166 | 205,131 | $ | 2,724,910 | ||||||||||||||||||||
|
|
|
|
|
|
|
|
|
|
|
|
|
|
|
| |||||||||||||||||
TARGET 2045 SERIES: | FOR THE YEAR ENDED 10/31/18 | FOR THE YEAR ENDED 10/31/17 | FOR THE YEAR ENDED 10/31/18 | FOR THE PERIOD 10/16/171 TO 10/31/17 | ||||||||||||||||||||||||||||
| CLASS I | CLASS I | CLASS R6 | CLASS R6 | |||||||||||||||||||||||||||||
| SHARES | AMOUNTS | SHARES | AMOUNTS | SHARES | AMOUNTS | SHARES | AMOUNTS | |||||||||||||||||||||||||
Sold | 37,004 | $ | 501,039 | 187,597 | $ | 2,278,160 | — | $ | — | 371 | $ | 5,000 | ||||||||||||||||||||
Reinvested | 6,649 | 86,772 | 11,904 | 137,492 | 22 | 284 | — | — | ||||||||||||||||||||||||
Repurchased | (86,728 | ) | (1,199,721 | ) | (572,125 | ) | (7,274,559 | ) | — | — | — | — | ||||||||||||||||||||
|
|
|
|
|
|
|
|
|
|
|
|
|
|
|
| |||||||||||||||||
Total | (43,075 | ) | $ | (611,910 | ) | (372,624 | ) | $ | (4,858,907 | ) | 22 | $ | 284 | 371 | $ | 5,000 | ||||||||||||||||
|
|
|
|
|
|
|
|
|
|
|
|
|
|
|
| |||||||||||||||||
77
Notes to Financial Statements (continued)
| 6. | Capital Stock Transactions (continued) |
TARGET 2050 SERIES: | FOR THE YEAR ENDED 10/31/18 | FOR THE YEAR ENDED 10/31/17 | FOR THE YEAR ENDED 10/31/18 | FOR THE YEAR ENDED 10/31/17 | ||||||||||||||||||||||||||||
| CLASS K | CLASS K | CLASS R | CLASS R | |||||||||||||||||||||||||||||
| SHARES | AMOUNTS | SHARES | AMOUNTS | SHARES | AMOUNTS | SHARES | AMOUNTS | |||||||||||||||||||||||||
Sold | 823,981 | $ | 9,011,773 | 719,001 | $ | 7,297,415 | 478,931 | $ | 5,143,876 | 254,979 | $ | 2,619,581 | ||||||||||||||||||||
Reinvested | 134,865 | 1,418,779 | 18,205 | 173,482 | 25,431 | 264,514 | 2,280 | 21,200 | ||||||||||||||||||||||||
Repurchased | (422,631 | ) | (4,606,915 | ) | (626,193 | ) | (6,386,413 | ) | (55,261 | ) | (604,748 | ) | (212,192 | ) | (2,122,025 | ) | ||||||||||||||||
|
|
|
|
|
|
|
|
|
|
|
|
|
|
|
| |||||||||||||||||
Total | 536,215 | $ | 5,823,637 | 111,013 | $ | 1,084,484 | 449,101 | $ | 4,803,642 | 45,067 | $ | 518,756 | ||||||||||||||||||||
|
|
|
|
|
|
|
|
|
|
|
|
|
|
|
| |||||||||||||||||
TARGET 2050 SERIES: | FOR THE YEAR ENDED 10/31/18 | FOR THE YEAR ENDED 10/31/17 | FOR THE YEAR ENDED 10/31/18 | FOR THE PERIOD 10/16/171 TO 10/31/17 | ||||||||||||||||||||||||||||
| CLASS I | CLASS I | CLASS R6 | CLASS R6 | |||||||||||||||||||||||||||||
| SHARES | AMOUNTS | SHARES | AMOUNTS | SHARES | AMOUNTS | SHARES | AMOUNTS | |||||||||||||||||||||||||
Sold | 134,308 | $ | 1,486,047 | 449,709 | $ | 4,542,067 | — | $ | — | 451 | $ | 5,000 | ||||||||||||||||||||
Reinvested | 93,742 | 993,663 | 18,875 | 182,278 | 35 | 372 | — | — | ||||||||||||||||||||||||
Repurchased | (1,254,171 | ) | (14,080,552 | ) | (630,302 | ) | (6,584,168 | ) | — | — | — | — | ||||||||||||||||||||
|
|
|
|
|
|
|
|
|
|
|
|
|
|
|
| |||||||||||||||||
Total | (1,026,121 | ) | $ | (11,600,842 | ) | (161,718 | ) | $ | (1,859,823 | ) | 35 | $ | 372 | 451 | $ | 5,000 | ||||||||||||||||
|
|
|
|
|
|
|
|
|
|
|
|
|
|
|
| |||||||||||||||||
TARGET 2055 SERIES: | FOR THE YEAR ENDED 10/31/18 | FOR THE YEAR ENDED 10/31/17 | FOR THE YEAR ENDED 10/31/18 | FOR THE YEAR ENDED 10/31/17 | ||||||||||||||||||||||||||||
| CLASS K | CLASS K | CLASS R | CLASS R | |||||||||||||||||||||||||||||
| SHARES | AMOUNTS | SHARES | AMOUNTS | SHARES | AMOUNTS | SHARES | AMOUNTS | |||||||||||||||||||||||||
Sold | 197,764 | $ | 2,623,883 | 183,894 | $ | 2,305,123 | 225,755 | $ | 2,962,773 | 166,456 | $ | 2,131,519 | ||||||||||||||||||||
Reinvested | 29,291 | 374,094 | 4,973 | 57,576 | 19,193 | 242,384 | 955 | 11,041 | ||||||||||||||||||||||||
Repurchased | (157,569 | ) | (2,087,370 | ) | (86,995 | ) | (1,064,756 | ) | (14,049 | ) | (186,293 | ) | (34,345 | ) | (418,012 | ) | ||||||||||||||||
|
|
|
|
|
|
|
|
|
|
|
|
|
|
|
| |||||||||||||||||
Total | 69,486 | $ | 910,607 | 101,872 | $ | 1,297,943 | 230,899 | $ | 3,018,864 | 133,066 | $ | 1,724,548 | ||||||||||||||||||||
|
|
|
|
|
|
|
|
|
|
|
|
|
|
|
| |||||||||||||||||
TARGET 2055 SERIES: | FOR THE YEAR ENDED 10/31/18 | FOR THE YEAR ENDED 10/31/17 | FOR THE YEAR ENDED 10/31/18 | FOR THE PERIOD 10/16/171 TO 10/31/17 | ||||||||||||||||||||||||||||
| CLASS I | CLASS I | CLASS R6 | CLASS R6 | |||||||||||||||||||||||||||||
| SHARES | AMOUNTS | SHARES | AMOUNTS | SHARES | AMOUNTS | SHARES | AMOUNTS | |||||||||||||||||||||||||
Sold | 23,787 | $ | 320,747 | 141,581 | $ | 1,738,110 | — | $ | — | 365 | $ | 5,000 | ||||||||||||||||||||
Reinvested | 1,693 | 21,844 | 5,949 | 69,828 | 34 | 428 | — | — | ||||||||||||||||||||||||
Repurchased | (16,336 | ) | (224,590 | ) | (367,843 | ) | (4,785,227 | ) | — | — | — | — | ||||||||||||||||||||
|
|
|
|
|
|
|
|
|
|
|
|
|
|
|
| |||||||||||||||||
Total | 9,144 | $ | 118,001 | (220,313 | ) | $ | (2,977,289 | ) | 34 | $ | 428 | 365 | $ | 5,000 | ||||||||||||||||||
|
|
|
|
|
|
|
|
|
|
|
|
|
|
|
| |||||||||||||||||
TARGET 2060 SERIES: | FOR THE YEAR ENDED 10/31/18 | FOR THE YEAR ENDED 10/31/17 | FOR THE YEAR ENDED 10/31/18 | FOR THE YEAR ENDED 10/31/17 | ||||||||||||||||||||||||||||
| CLASS K | CLASS K | CLASS R | CLASS R | |||||||||||||||||||||||||||||
| SHARES | AMOUNTS | SHARES | AMOUNTS | SHARES | AMOUNTS | SHARES | AMOUNTS | |||||||||||||||||||||||||
Sold | 327,857 | $ | 3,938,736 | 134,187 | $ | 1,564,437 | 286,497 | $ | 3,408,578 | 97,802 | $ | 1,164,532 | ||||||||||||||||||||
Reinvested | 33,071 | 379,653 | 2,389 | 25,579 | 13,328 | 152,746 | 196 | 2,130 | ||||||||||||||||||||||||
Repurchased | (21,914 | ) | (256,210 | ) | (4,631 | ) | (53,278 | ) | (17,190 | ) | (207,081 | ) | (15,100 | ) | (164,344 | ) | ||||||||||||||||
|
|
|
|
|
|
|
|
|
|
|
|
|
|
|
| |||||||||||||||||
Total | 339,014 | $ | 4,062,179 | 131,945 | $ | 1,536,738 | 282,635 | $ | 3,354,243 | 82,898 | $ | 1,002,318 | ||||||||||||||||||||
|
|
|
|
|
|
|
|
|
|
|
|
|
|
|
| |||||||||||||||||
78
Notes to Financial Statements (continued)
| 6. | Capital Stock Transactions (continued) |
TARGET 2060 SERIES: | FOR THE YEAR ENDED 10/31/18 | FOR THE YEAR ENDED 10/31/17 | FOR THE YEAR ENDED 10/31/18 | FOR THE PERIOD 10/16/171 TO 10/31/17 | ||||||||||||||||||||||||||||
| CLASS I | CLASS I | CLASS R6 | CLASS R 6 | |||||||||||||||||||||||||||||
| SHARES | AMOUNTS | SHARES | AMOUNTS | SHARES | AMOUNTS | SHARES | AMOUNTS | |||||||||||||||||||||||||
Sold | 5,597 | $ | 66,648 | 4,721 | $ | 53,596 | — | $ | — | 402 | $ | 5,000 | ||||||||||||||||||||
Reinvested | 789 | 9,062 | 108 | 1,164 | 46 | 531 | — | — | ||||||||||||||||||||||||
Repurchased | (2,302 | ) | (28,219 | ) | (1,774 | ) | (20,121 | ) | — | — | — | — | ||||||||||||||||||||
|
|
|
|
|
|
|
|
|
|
|
|
|
|
|
| |||||||||||||||||
Total | 4,084 | $ | 47,491 | 3,055 | $ | 34,639 | 46 | $ | 531 | 402 | $ | 5,000 | ||||||||||||||||||||
|
|
|
|
|
|
|
|
|
|
|
|
|
|
|
| |||||||||||||||||
1Commencement of operations.
The following table represents instances at October 31, 2018, where a shareholder account owned greater than 10% of a Series:
| SERIES | NUMBER OF ACCOUNTS OVER 10% | PERCENTAGE OF THE SERIES | ||||||
Target Income Series | 1 | 42.0 | % | |||||
Target 2015 Series | 2 | 46.4 | % | |||||
Target 2020 Series | 1 | 45.4 | % | |||||
Target 2030 Series | 1 | 44.2 | % | |||||
Target 2040 Series | 1 | 41.0 | % | |||||
Target 2050 Series | 2 | 41.3 | % | |||||
Target 2060 Series | 1 | 33.4 | % | |||||
At October 31, 2018, the Advisor and its affiliates owned 0.3% of the Target 2015 Series, 1.8% of the Target 2060 Series, and 0.1% or less of each remaining Series. Investment activities of these shareholders may have a material effect on the Series.
| 7. | Line of Credit |
The Fund has entered into a 364-day, $25 million credit agreement (the “line of credit”) with Bank of New York Mellon. Each series of the Fund may borrow under the line of credit for temporary or emergency purposes, including funding shareholder redemptions and other short-term liquidity purposes. The Fund pays an annual fee on the unused commitment amount, payable quarterly, and is allocated among all the series of the Fund and included in miscellaneous expenses in the Statement of Operations for each series. The line of credit expires in August 2019 unless extended or renewed. During the year ended October 31, 2018, none of the Series borrowed under the line of credit.
| 8. | Financial Instruments |
The Underlying Series may trade in instruments including written and purchased options, forward foreign currency exchange contracts and futures contracts and other derivatives in the normal course of investing activities to assist in managing exposure to various market risks. The Underlying Series may be subject to various elements of risk which may involve, to a varying degree, elements of risk in excess of the amounts recognized for financial statement purposes. These risks include: the risk that changes in the value of a derivative may not correlate perfectly with the underlying asset, rate or index; counterparty credit risk related to over the counter derivative counterparties’ failure to perform under contract terms; liquidity risk related to the lack of a liquid market for these contracts allowing the fund to close out its position(s); and documentation risk relating to disagreement over contract terms. No such investments were directly held by the Series as of October 31, 2018.
79
Notes to Financial Statements (continued)
| 9. | Federal Income Tax Information |
The amount and characterization of certain income and capital gains to be distributed are determined in accordance with federal income tax regulations, which may differ from GAAP. The differences are primarily due to differing book and tax treatment in the timing and recognition on net investment income or gains and losses, including losses deferred due to wash sales. Each Series may periodically make reclassifications among its capital accounts to reflect income and gains available for distribution (or available capital loss carryovers) under income tax regulations, without impacting the Series’ net asset value. For the fiscal year ended October 31, 2018, there were no reclassifications between paid-in-capital and total distributable earnings.
The tax character of distributions paid were as follows:
| TARGET INCOME SERIES | TARGET 2015 SERIES | TARGET 2020 SERIES | TARGET 2025 SERIES | TARGET SERIES | ||||||||||||||||||||
Ordinary income (2018) | $ | 672,375 | $21,596 | $ | 511,932 | $ | 184,177 | $ | 496,157 | |||||||||||||||
Ordinary income (2017) | $ | 1,234,782 | $90,007 | $ | 1,858,404 | $ | 475,544 | $ | 2,163,446 | |||||||||||||||
Long-term capital gain (2018) | $ | — | $ | — | $ | — | $ | 10 | $ | — | ||||||||||||||
TARGET 2035 | TARGET 2040 SERIES | TARGET 2045 SERIES | TARGET 2050 SERIES | TARGET 2055 SERIES | TARGET 2060 SERIES | |||||||||||||||||||
Ordinary income (2018) | $ | 353,015 | $ | 1,269,940 | $ | 332,652 | $ | 1,110,027 | $ | 310,269 | $ | 193,740 | ||||||||||||
Ordinary income (2017) | $ | 361,500 | $ | 1,141,133 | $ | 174,047 | $ | 391,345 | $ | 75,73 | $ | 24,681 | ||||||||||||
Long-term capital gain (2018) | $ | 95,020 | $ | 580,680 | $ | 581,311 | $ | 1,613,758 | $ | 328,481 | $ | 350,714 | ||||||||||||
Long-term capital gain (2017) | $ | 164,470 | $ | — | $ | 177,024 | $ | — | $ | 68,636 | $ | 4,290 | ||||||||||||
At October 31, 2018, the tax basis of components of distributable earnings and the net unrealized appreciation (depreciation) based on the identified cost of investments for federal income tax purposes were as follows:
| TARGET INCOME SERIES | TARGET 2015 SERIES | TARGET SERIES | TARGET SERIES | TARGET 2030 SERIES | ||||||||||||||||
Cost for federal income tax purposes | $ | 128,033,089 | $ | 2,181,400 | $ | 96,098,524 | $ | 60,936,430 | $ | 124,164,509 | ||||||||||
Unrealized appreciation | — | — | — | — | 125,412 | |||||||||||||||
Unrealized depreciation | $ | (2,208,707 | ) | $ | (56,641 | ) | $ | (2,376,438 | ) | $ | (1,550,985 | ) | $ | (2,719,420 | ) | |||||
|
|
|
|
|
|
|
|
|
| |||||||||||
Net unrealized depreciation | $ | (2,208,707 | ) | $ | (56,641 | ) | $ | (2,376,438 | ) | $ | (1,550,985 | ) | $ | (2,594,008 | ) | |||||
|
|
|
|
|
|
|
|
|
| |||||||||||
Undistributed ordinary income | $ | 64,403 | $ | 1,742 | $ | 36,997 | $ | 155,459 | $ | 336,606 | ||||||||||
Capital loss carryforward | $ | (331,241 | ) | $ | (435,145 | ) | $ | (1,570,302 | ) | $ | — | $ | — | |||||||
| TARGET | TARGET | TARGET | TARGET | TARGET | TARGET | |||||||||||||||||||
| 2035 | 2040 | 2045 | 2050 | 2055 | 2060 | |||||||||||||||||||
| SERIES | SERIES | SERIES | SERIES | SERIES | SERIES | |||||||||||||||||||
Cost for federal income tax purposes | $ | 38,057,145 | $ | 73,463,466 | $ | 20,689,035 | $ | 32,969,564 | $ | 10,253,783 | $ | 11,562,103 | ||||||||||||
Unrealized appreciation | — | 345,082 | — | 80,327 | — | — | ||||||||||||||||||
Unrealized depreciation | (731,038 | ) | (824,933 | ) | (176,592 | ) | (268 | ) | (30,096 | ) | (168,650 | ) | ||||||||||||
|
|
|
|
|
|
|
|
|
|
|
| |||||||||||||
Net unrealized appreciation (depreciation) | $ | (731,038 | ) | $ | (479,851 | ) | $ | (176,592 | ) | $ | 80,059 | $ | (30,096 | ) | $ | (168,650 | ) | |||||||
|
|
|
|
|
|
|
|
|
|
|
| |||||||||||||
Undistributed ordinary income | $ | 318,145 | $ | 2,168,394 | $ | 371,216 | $ | 1,238,775 | $ | 99,762 | $ | 13,393 | ||||||||||||
Undistributed long-term capital gains | $ | — | $ | 1,807 | $ | — | $ | — | $ | — | $ | — | ||||||||||||
At October 31, 2018, Target Income Series, Target 2015 Series, and Target 2020 Series had net long-term capital loss carryforwards of $331,241, $435,145, and $1,570,302, respectively, which may be carried forward indefinitely.
80
Notes to Financial Statements (continued)
| 9. | Federal Income Tax Information (continued) |
As of October 31, 2018, the capital loss carryover utilized in the current year for Target Income Series, Target 2020 Series, and Target 2030 Series was $74,768, $758,673, and $1,622,824, respectively.
81
Report of Independent Registered Public Accounting Firm
To the Board of Directors of Manning & Napier Fund, Inc. and Shareholders of Target Income Series, Target 2015 Series, Target 2020 Series, Target 2025 Series, Target 2030 Series, Target 2035 Series, Target 2040 Series, Target 2045 Series, Target 2050 Series, Target 2055 Series and Target 2060 Series
Opinions on the Financial Statements
We have audited the accompanying statements of assets and liabilities, including the investment portfolios, of Target Income Series, Target 2015 Series, Target 2020 Series, Target 2025 Series, Target 2030 Series, Target 2035 Series, Target 2040 Series, Target 2045 Series, Target 2050 Series, Target 2055 Series and Target 2060 Series (eleven of the series constituting Manning & Napier Fund, Inc., hereafter collectively referred to as the “Funds”) as of October 31, 2018, the related statements of operations for the year ended October 31, 2018, the statements of changes in net assets for each of the two years in the period ended October 31, 2018, including the related notes, and the financial highlights for each of the periods indicated therein (collectively referred to as the “financial statements”). In our opinion, the financial statements present fairly, in all material respects, the financial position of each of the Funds as of October 31, 2018, the results of each of their operations for the year then ended, the changes in each of their net assets for each of the two years in the period ended October 31, 2018 and each of the financial highlights for each of the periods indicated therein in conformity with accounting principles generally accepted in the United States of America.
Basis for Opinions
These financial statements are the responsibility of the Funds’ management. Our responsibility is to express an opinion on the Funds’ financial statements based on our audits. We are a public accounting firm registered with the Public Company Accounting Oversight Board (United States) (“PCAOB”) and are required to be independent with respect to the Funds in accordance with the U.S. federal securities laws and the applicable rules and regulations of the Securities and Exchange Commission and the PCAOB.
We conducted our audits of these financial statements in accordance with the standards of the PCAOB. Those standards require that we plan and perform the audit to obtain reasonable assurance about whether the financial statements are free of material misstatement, whether due to error or fraud.
Our audits included performing procedures to assess the risks of material misstatement of the financial statements, whether due to error or fraud, and performing procedures that respond to those risks. Such procedures included examining, on a test basis, evidence regarding the amounts and disclosures in the financial statements. Our audits also included evaluating the accounting principles used and significant estimates made by management, as well as evaluating the overall presentation of the financial statements. Our procedures included confirmation of securities owned as of October 31, 2018 by correspondence with the custodian and transfer agent. We believe that our audits provide a reasonable basis for our opinions.

New York, New York
December 14, 2018
We have served as the auditor of one or more investment companies in Manning & Napier Mutual Funds since 1992.
82
Supplemental Tax Information
(unaudited)
All reportings are based on financial information available as of the date of this annual report and, accordingly, are subject to change.
For federal income tax purposes, each of the Series reports for the current fiscal year the amount disclosed below or, if different, the maximum amount allowable under the tax law, as qualified dividend income (“QDI”).
| Series | QDI | |||
Target Income Series | $ | 262,118 | ||
Target 2015 Series | 8,566 | |||
Target 2020 Series | 239,083 | |||
Target 2025 Series | 71,179 | |||
Target 2030 Series | 203,871 | |||
Target 2035 Series | 98,056 | |||
Target 2040 Series | 349,982 | |||
Target 2045 Series | 78,309 | |||
Target 2050 Series | 200,054 | |||
Target 2055 Series | 44,457 | |||
Target 2060 Series | 18,384 | |||
For corporate shareholders, the percentage of investment income (dividend income plus short-term gain, if any) that qualifies for the dividends received deduction (DRD) for the current fiscal year is as follows:
| Series | DRD% | |||
Target Income Series | 25.81 | % | ||
Target 2015 Series | 21.57 | % | ||
Target 2020 Series | 18.80 | % | ||
Target 2025 Series | 16.03 | % | ||
Target 2030 Series | 17.29 | % | ||
Target 2035 Series | 16.14 | % | ||
Target 2040 Series | 16.97 | % | ||
Target 2045 Series | 14.91 | % | ||
Target 2050 Series | 11.54 | % | ||
Target 2055 Series | 9.11 | % | ||
Target 2060 Series | 5.58 | % | ||
The Series designate Long-Term Capital Gain dividends pursuant to Section 852(b)(3) of the Code for the fiscal year ended October 31, 2018 as follows:
| Series | ||||
Target 2025 Series | $ | 11 | ||
Target 2035 Series | �� | 696 | ||
Target 2040 Series | 2,629 | |||
Target 2045 Series | 27 | |||
Target 2050 Series | 840 | |||
Target 2055 Series | 23 | |||
Target 2060 Series | 26 | |||
83
Directors’ and Officers’ Information
(unaudited)
The Statement of Additional Information provides additional information about the Fund’s directors and officers and can be obtained without charge by calling 1-800-466-3863, at www.manning-napier.com, or on the EDGAR Database on the SEC Internet web site (http://www.sec.gov). The following chart shows certain information about the Fund’s directors and officers, including their principal occupations during the last five years. Unless specific dates are provided, the individuals have held the listed positions for longer than five years.
Interested Director and Officer
| Name: | Paul Battaglia* | |
| Address: | 290 Woodcliff Drive | |
| Fairport, NY 14450 | ||
| Age: | 40 | |
| Current Position(s) Held with Fund: | Principal Executive Officer, President, Chairman & Director | |
| Term of Office & Length of Time Served: | Indefinite – Chairman and Director since November 20181 | |
| Principal Occupation(s) During Past 5 Years: | Chief Financial Officer (2018 – Present); Vice President of Finance (2016 – 2018); Director of Finance (2011 – 2016); Financial Analyst/Internal | |
| Auditor (2004-2006) – Manning & Napier Advisors, LLC and affiliates | ||
| Holds one or more of the following titles for various affiliates: Chief | ||
| Financial Officer | ||
| Number of Portfolios Overseen within Fund Complex: | 36 | |
| Other Directorships Held Outside Fund Complex During | N/A | |
| Past 5 Years: | ||
| Independent Directors | ||
| Name: | Stephen B. Ashley | |
| Address: | 290 Woodcliff Drive | |
| Fairport, NY 14450 | ||
| Age: | 78 | |
| Current Position(s) Held with Fund: | Director, Audit Committee Member, Governance & Nominating Committee | |
| Member | ||
| Term of Office & Length of Time Served: | Indefinite - Since 1996 | |
| Principal Occupation(s) During Past 5 Years: | Chairman, Director & Chief Executive Officer (1997 to present) - The Ashley Group (property management and investment). Director | |
| (1995-2008) and Chairman (non-executive) (2004-2008) - Fannie Mae (mortgage) | ||
| Number of Portfolios Overseen within Fund Complex: | 36 | |
| Other Directorships Held Outside Fund Complex During | Fannie Mae (1995-2008) | |
| Past 5 Years: | The Ashley Group (1995-2008) | |
| Genesee Corporation (1987-2007) | ||
| Genesee Corporation (holding company)(1987-2007) | ||
| Name: | Paul A. Brooke | |
| Address: | 290 Woodcliff Drive | |
| Fairport, NY 14450 | ||
| Age: | 72 | |
| Current Position(s) Held with Fund: | Lead Independent Director, Audit Committee Member, Governance & | |
| Nominating Committee Chairman | ||
| Term of Office & Length of Time Served: | Indefinite – Director, Audit Committee Member, Governance & Nominating | |
| Committee Member since 2007; Governance & Nominating Committee | ||
| Chairman since 2016; Lead Independent Director since 2017 | ||
| Principal Occupation(s) During Past 5 Years: | Chairman & CEO (2005-2009) - Ithaka Acquisition Corporation (investments); Chairman (2007-2009) - Alsius Corporation (investments); Managing Member (1991-present) - PMSV Holdings LLC (investments); Managing Member (2010-2016) - Venbio (investments). | |
| Number of Portfolios Overseen within Fund Complex: | 36 | |
| Other Directorships Held Outside Fund Complex During Past 5 Years: | Incyte Corp. (biotech)(2000-present); ViroPharma, Inc. (speciality pharmaceuticals)(2000-2014); HLTH (WebMD)(information)(2000-2010); Cheyne Capital International (investment)(2000-2017); GMP Companies (investment)(2000-2011); Cytos Biotechnology Ltd (biotechnology)(2012-2014); Cerus (biomedical)(2016-present); PureEarth(non-profit)(2012-present) | |
84
Directors’ and Officers’ Information
(unaudited)
| Independent | Directors (continued) |
| Name: | Peter L. Faber | |
| Address: | 290 Woodcliff Drive | |
| Fairport, NY 14450 | ||
| Age: | 80 | |
| Current Position(s) Held with Fund: | Director, Governance & Nominating Committee Member | |
| Term of Office & Length of Time Served: | Indefinite – Since 1987 | |
| Principal Occupation(s) During Past 5 Years: | Senior Counsel (2006-2012), Partner (1995-2006 & 2013 -present) - McDermott, Will & Emery LLP (law firm) | |
| Number of Portfolios Overseen within Fund Complex: | 36 | |
| Other Directorships Held Outside Fund Complex During Past 5 Years: | Boston Early Music Festival (non-profit)(2007-present); Amherst Early Music, Inc. (non-profit)(2009-present); Gotham Early Music Scene, Inc. (non-profit)(2009-present); Partnership for New York City, Inc. (non-profit)(1989-2010); New York Collegium (non-profit)(2004-2011) | |
| Name: | Harris H. Rusitzky | |
| Address: | 290 Woodcliff Drive | |
| Fairport, NY 14450 | ||
| Age: | 83 | |
| Current Position(s) Held with Fund: | Director, Audit Committee Member, Governance & Nominating Committee Member | |
| Term of Office & Length of Time Served: | Indefinite – Since 1985 | |
| Principal Occupation(s) During Past 5 Years: | President (1994 - present) - The Greening Group (business consultants); | |
| Partner (2006-present) - The Restaurant Group (restaurants) | ||
| Number of Portfolios Overseen within Fund Complex: | 36 | |
| Other Directorships Held Outside Fund Complex During Past 5 Years: | Rochester Institute of Technology (university)(1972-present); Culinary Institute of America (non-profit college)(1985-present); George Eastman House (museum)(1988-present); National Restaurant Association (restaurant trade organization)(1978-present) | |
| Name: | Chester N. Watson | |
| Address: | 290 Woodcliff Drive | |
| Fairport, NY 14450 | ||
| Age: | 68 | |
| Current Position(s) Held with Fund: | Director, Audit Committee Chairman, Governance & Nominating Committee Member | |
| Term of Office & Length of Time Served: | Indefinite – Director, Audit Committee Member, Governance & Nominating Committee Member Since 2012; Audit Committee Chairman since 2013 | |
| Principal Occupation(s) During Past 5 Years: | General Auditor (2003-2011) - General Motors Company (auto manufacturer) | |
| Number of Portfolios Overseen within Fund Complex: | 36 | |
| Other Directorships Held Outside Fund Complex During | Rochester Institute of Technology (university)(2005-present); Town of | |
| Past 5 Years: | Greenburgh, NY Planning Board (municipal government) (2015-present) | |
| Officers: | ||
| Name: | Jeffrey S. Coons, Ph.D., CFA® | |
| Address: | 290 Woodcliff Drive | |
| Fairport, NY 14450 | ||
| Age: | 55 | |
| Current Position(s) Held with Fund: | Vice President | |
| Term of Office1 & Length of Time Served: | Since 2004 | |
| Principal Occupation(s) During Past 5 Years: | President since 2010, Co-CEO since 2018, Co-Director of Research (2002 – 2015) - Manning & Napier Advisors, LLC Holds one or more of the following titles for various subsidiaries and affiliates: President, Director, Treasurer, or Senior Trust Officer | |
| Name: | Elizabeth Craig | |
| Address: | 290 Woodcliff Drive | |
| Fairport, NY 14450 | ||
| Age: | 31 | |
| Current Position(s) Held with Fund: | Corporate Secretary | |
| Term of Office1 & Length of Time Served: | Since 2016 | |
| Principal Occupation(s) During Past 5 Years: | Fund Administration Manager since 2015; Mutual Fund Compliance Specialist (2009-2015) - Manning & Napier Advisors, LLC; Assistant Corporate Secretary (2011-2016) - Manning & Napier Fund, Inc. | |
85
Directors’ and Officers’ Information
(unaudited)
| Officers: | (continued) |
| Name: | Christine Glavin | |
| Address: | 290 Woodcliff Drive | |
| Fairport, NY 14450 | ||
| Age: | 52 | |
| Current Position(s) Held with Fund: | Principal Financial Officer, Chief Financial Officer | |
| Term of Office1 & Length of Time Served: Principal Occupation(s) During Past 5 Years: | Principal Financial Officer since 2002; Chief Financial Officer since 2001 Director of Fund Reporting since 2011; Fund Reporting Manager (1997-2011) - Manning & Napier Advisors, LLC; Assistant Treasurer since 2008 - Exeter Trust Company; Chief Financial Officer (2017-2018) - Rainier Investment Management Mutual Funds, Inc. | |
| Name: | Jodi L. Hedberg | |
| Address: | 290 Woodcliff Drive | |
| Fairport, NY 14450 | ||
| Age: | 50 | |
Current Position(s) Held with Fund: Term of Office1 & Length of Time Served: | Chief Compliance Officer, Anti-Money Laundering Compliance Officer Chief Compliance Officer since 2004; Anti-Money Laundering Officer since 2002; Corporate Secretary (1997-2016) - Manning & Napier Fund, Inc.; Chief Compliance Officer and Anti-Money Laundering Officer (2017-2018) – Rainier Investment Management Mutual Funds, Inc. | |
| Principal Occupation(s) During Past 5 Years: | Managing Director, Compliance & Regulatory Affairs since 2018; Director of Compliance (2005-2018); Compliance Manager (1995-2005) – Manning & Napier Advisors, LLC and affiliates; Corporate Secretary – Manning & Napier Investor Services, Inc. since 2006 | |
| Name: | Scott Morabito | |
| Address: | 290 Woodcliff Drive | |
| Fairport, NY 14450 | ||
| Age: | 30 | |
| Current Position(s) Held with Fund: | Assistant Vice President | |
| Term of Office1 & Length of Time Served: | Since 2017 | |
| Principal Occupation(s) During Past 5 Years: | Director of Funds Group since 2017; Fund Product and Strategy Manager (2014-2017); Senior Product and Strategy Analyst (2013-2014); Product and Strategy Analyst (2011-2013) - Manning & Napier Advisors, LLC. | |
| Name: | Sarah Turner | |
| Address: | 290 Woodcliff Drive | |
| Fairport, NY 14450 | ||
| Age: | 36 | |
| Current Position(s) Held with Fund: | Chief Legal Officer; Assistant Corporate Secretary | |
| Term of Office1 & Length of Time Served: | Since 2018 | |
| Principal Occupation(s) During Past 5 Years: | General Counsel since 2018 - Manning & Napier Advisors, LLC and affiliates; Counsel (2017-2018) - Harter Secrest and Emery LLP; Legal Counsel (2010-2017) - Manning & Napier Advisors, LLC and affiliates Holds one or more of the following titles for various affiliates: Corporate Secretary, General Counsel | |
| Name: | Amy Williams | |
| Address: | 290 Woodcliff Drive | |
| Fairport, NY 14450 | ||
| Age: | 56 | |
| Current Position(s) Held with Fund: | Assistant Corporate Secretary | |
| Term of Office1 & Length of Time Served: | Since 2016 | |
| Principal Occupation(s) During Past 5 Years: | Director of Fund Documentation - Manning & Napier Advisors, LLC since | |
| 2009 | ||
| Holds one or more of the following titles for various affiliates: Director | ||
*At a meeting of the Board of Directors held on November 15, 2018, the Board accepted the resignation of Michele T. Mosca from her positions as Principal Executive Officer, President, Chair and Interested Director of the Fund and appointed Paul J. Battaglia to each of the resigned positions effective immediately. Interested Director, within the meaning of the 1940 Act by reason of his positions with the Fund’s investment advisor, Manning & Napier Advisors, LLC.
1The term of office of all officers shall be one year and until their respective successors are chosen and qualified, or his or her earlier resignation or removal as provided in the Fund’s By-Laws.
86
Literature Requests
(unaudited)
Proxy Voting Policies and Procedures
A description of the policies and procedures that the Fund uses to determine how to vote proxies relating to portfolio securities is available, without charge, upon request:
| By phone | 1-800-466-3863 | |||
| On the Securities and Exchange | ||||
| Commission’s (SEC) web site | http://www.sec.gov |
Proxy Voting Record
Information regarding how the Fund voted proxies relating to portfolio securities during the most recent 12-month period ended June 30th is available, without charge, upon request:
| By phone | 1-800-466-3863 | |||
| On the SEC’s web site | http://www.sec.gov |
Quarterly Portfolio Holdings
The Series’ complete schedule of portfolio holdings for the 1st and 3rd quarters of each fiscal year are provided on Form N-Q, and are available, without charge, upon request:
| By phone | 1-800-466-3863 | |||
| On the SEC’s web site | http://www.sec.gov |
The Series’ Form N-Q may be reviewed and copied at the SEC’s Public Reference Room in Washington, D.C. Information on the operation of the Public Reference Room may be obtained by calling 1-800-SEC-0330.
Prospectus and Statement of Additional Information (SAI)
For more information about any of the Manning & Napier Fund, Inc. Series, you may obtain a prospectus and SAI at www.manning-napier.com or by calling (800) 466-3863. Before investing, carefully consider the objectives, risks, charges and expenses of the investment and read the prospectus carefully as it contains this and other information about the investment company. In addition, this information can be found on the SEC’s web site, http://www.sec.gov.
Additional information available at www.manning-napier.com
1. Fund Holdings - Month-End
2. Fund Holdings - Quarter-End
3. Shareholder Report - Annual
4. Shareholder Report - Semi-Annual
The Fund also offers electronic notification or “e-delivery” when certain documents are available on-line to be downloaded or reviewed. Direct shareholders can elect to receive electronic notification when shareholder reports, prospectus updates, and/or statements are available. If you do not currently have on-line access to your account, you can establish access by going to www.manning-napier.com, click on “Login” in the top corner of the page, and follow the prompts to self-enroll. Once enrolled, you can set your electronic notification preferences by clicking on the Account Options tab located within the green toolbar and then select E-Delivery Option. Should you have any questions on either how to establish on-line access or how to update your account settings, please contact Investor Services at 1-800-466-3863.
The Manning & Napier Fund, Inc. is managed by Manning & Napier Advisors, LLC. Manning & Napier Investor Services, Inc., an affiliate of Manning & Napier Advisors, LLC, is the distributor of the Fund shares.
MNTGT-10/18-AR

Disciplined Value Series
Management Discussion and Analysis
(unaudited)
Dear Shareholders:
The investment environment witnessed over the past twelve months was more volatile and bifurcated than what was experienced in prior years. For the fiscal year ending on October 31, 2018, US equities posted strong gains, with the S&P 500 Total Return Index up 7.35%.
Going forward, we believe the volatility experienced in October, as well as during the first few months of 2018, is likely to be reflective of what investors should come to expect going forward. While we do not anticipate an imminent recession, we see recent developments within the US and abroad as an indication that we are entering a higher risk regime for risk assets over the next twelve months.
The US is likely approaching a period of peak growth and continues to show signs of progressing further into late cycle territory. At the same time, key global risks are rising, including trade tensions, global growth concerns, and geopolitical uncertainty, all of which have continued escalating throughout 2018.
We are approaching the ten-year anniversary of the bull market, and while bull markets do not necessarily die of old age, they cannot extend indefinitely either. As the economy continues to move into later cycle territory, we believe investors should temper their expectations as the extraordinary returns experienced over the past several years are unlikely to persist.
With this in mind, we discuss recent fund performance in the enclosed, highlight how we are positioned amid the current economic environment, and provide our outlook of what to expect in financial markets.
We hope that you find this information helpful, and look forward to working with you in the years ahead to help you meet your investment goals.
Sincerely,
Manning & Napier Advisors, LLC
The S&P 500 Total Return Index is an unmanaged, capitalization-weighted measure comprised of 500 leading U.S. companies to gauge U.S. large cap equities. The Index returns do not reflect any fees or expenses. The index accounts for the reinvestment of regular cash dividends, but not for the withholding of taxes. Index returns provided by Morningstar. S&P Dow Jones Indices LLC, a subsidiary of the McGraw Hill Financial, Inc., is the publisher of various index based data products and services and has licensed certain of its products and services for use by Manning & Napier. All such content Copyright © 2018 by S&P Dow Jones Indices LLC and/or its affiliates. All rights reserved. Neither S&P Dow Jones Indices LLC, Dow Jones Trademark Holdings LLC, their affiliates nor their third party licensors make any representation or warranty, express or implied, as to the ability of any index to accurately represent the asset class or market sector that it purports to represent and none of these parties shall have any liability for any errors, omissions, or interruptions of any index or the data included therein.
©2018 Morningstar, Inc. All rights reserved. The information contained herein: (1) is proprietary to Morningstar and/or its content providers; (2) may not be copied, adapted or distributed; and (3) is not warranted to be accurate, complete or timely. Neither Morningstar nor its content providers are responsible for any damages or losses arising from any use of this information, except where such damages or losses cannot be limited or excluded by law in your jurisdiction. Past financial performance is no guarantee of future results.
1
Disciplined Value Series
Fund Commentary
(unaudited)
| Investment | Objective |
To provide competitive returns consistent with the broad equity market while also providing a level of capital protection during market downturns. The Series is designed to offer a diversified portfolio of dividend-paying US equity securities. Using a systematic process with a focus on mid- to large-capitalization US companies, securities are selected based on factors such as free cash flow generation and earnings power, minimum dividend yield, dividend sustainability, and financial health.
| Performance | Commentary |
U.S. equity markets generally delivered positive absolute returns for the twelve-month period ended October 31, 2018, as the S&P 500 Total Return Index returned 7.35%. Value stocks underperformed growth stocks during the period as the Russell 1000 Value Index returned 3.03% while the Russell 1000 Growth Index returned 10.71%. The Disciplined Value Series Class S provided positive absolute returns of 8.14%, outperforming the Russell 1000 Value Index on a relative basis.
The Series’ sector allocations and stock selections are a product of the Strategy’s systematic screens. Among those two drivers, stock selection was the primary contributor to relative performance over the course of the last year. In particular, the Series’ screening process was most additive to relative performance through stock selection within Industrials, Consumer Discretionary, and Consumer Staples. Offsetting a portion of the relative performance tailwind was the Series’ sector positioning, led by an overweight to the Industrials and an underweight to the Communication Services.
Within the Series, through our disciplined screening process, we pursue opportunities for shareholders to generate stable income with the potential for capital appreciation. Importantly, our approach will continue to emphasize risk management as a critical component in managing the Series.
As we begin the new fiscal year, we believe that we are entering a higher risk regime for equities, and that the United States is likely approaching a period of peak growth. This could result in lower returns as the economy is moving into late cycle territory as supply begins to become a binding constraint for growth. Despite this challenging environmental backdrop, we believe that our investment approach can continue to help our shareholders achieve their long-term investment objectives.
Please see the next page for additional performance information as of October 31, 2018.
Performance data quoted represents past performance and does not guarantee future results. The investment return and principal value of an investment will fluctuate, so that an investor’s shares, when redeemed, may be worth more or less than their original cost. Current performance may be higher or lower than that quoted; investors can obtain the most recent month-end performance at www.manning-napier.com or by calling (800) 466-3863.
All investments involve risks, including possible loss of principal. As with any stock fund, the value of your investment will fluctuate in response to stock market movements. Investing in the Series will also involve a number of other risks, including issuer-specific risk and mid-cap risk. The Series invests primarily in dividend-paying equity securities, with a focus on mid- to large- cap companies. There is no assurance or guarantee that such companies will declare, continue to pay, or increase dividends. Stocks of mid-cap companies tend to be more volatile than those of large-cap companies, as midcap companies tend to be more susceptible to adverse business or economic events than larger, more established companies. In addition, because the Advisor manages the Series using a disciplined screening process, the Series is subject to the additional risk that the investment approach may not be successful. Further, the Advisor does not intend to make frequent changes to the Series’ portfolio in response to market movements.
Commentary prepared using data provided by FactSet. Analysis Manning & Napier. Commentary presented is relative to the Russell 1000® Value Index. Additional information and associated disclosures can be found on the Performance Update page of this report.
The Russell 1000® Growth Index is an unmanaged, market capitalization-weighted index consisting of those Russell 1000® Index companies with higher price-to-book ratios and higher forecasted growth values. The Index returns are based on a market capitalization-weighted average of relative price changes of the component stocks plus dividends whose reinvestments are compounded daily. The Index returns do not reflect any fees or expenses. Index returns provided by Bloomberg.
2
Disciplined Value Series
Performance Update as of October 31, 2018
(unaudited)
AVERAGE ANNUAL TOTAL RETURNS AS OF OCTOBER 31, 2018 | ||||||
| ONE YEAR1 | FIVE YEAR | SINCE INCEPTION2 | ||||
Manning & Napier Fund, Inc. - Disciplined Value Series - Class I3 | 8.35% | 10.35% | 12.35% | |||
Manning & Napier Fund, Inc. - Disciplined Value Series - Class S3,4 | 8.14% | 10.07% | 12.06% | |||
Russell 1000® Value Index5 | 3.03% | 8.61% | 11.76% | |||
The following graph compares the value of a $1,000,000 investment in the Manning & Napier Fund, Inc. - Disciplined Value Series - Class I from its inception2 (November 7, 2008) to present (October 31, 2018) to the Russell 1000® Value Index.
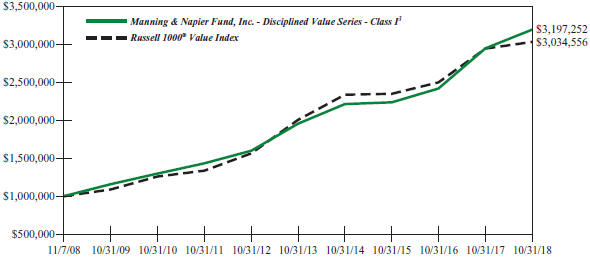
1The returns shown are based on net asset values calculated for shareholder transactions and may differ from the returns shown in the financial highlights, which reflect adjustments made to the net asset values in accordance with accounting principles generally accepted in the United States of America.
2Performance numbers for the Series and Index are calculated from November 7, 2008, the Series’ Class I inception date.
3The Series’ performance does not reflect the deduction of taxes that a shareholder would pay on fund distributions or the redemption of shares. The Series’ performance is historical and may not be indicative of future results. The performance returns shown are inclusive of the net expense ratio of the Series. For the year ended October 31, 2018, the net expense ratio was 0.85% for Class S and 0.60% for Class I. The annualized gross expense ratio, which does not account for any voluntary or contractual waivers currently in effect, was 0.89% for Class S and 0.64% for Class I for the year ended October 31, 2018.
4For periods through March 1, 2012 (the inception date of the Class S shares), performance for the Class S shares is hypothetical and is based on the historical performance of the Class I shares adjusted for the Class S shares’ charges and expenses.
5The Russell 1000® Value Index is an unmanaged, market capitalization-weighted index consisting of those Russell 1000® companies with lower price-to-book ratios and lower forecasted growth values. The Index returns are based on a market capitalization-weighted average of relative price changes of the component stocks plus dividends whose reinvestments are compounded daily. The Index returns do not reflect any fees or expenses. Index returns provided by Bloomberg.
3
Disciplined Value Series
Shareholder Expense Example
(unaudited)
As a shareholder of the Series, you incur ongoing costs, including management fees, shareholder service fees and other Series expenses. This example is intended to help you understand your ongoing costs (in dollars) of investing in the Series and to compare these costs with the ongoing costs of investing in other mutual funds.
The example is based on an investment of $1,000 invested in each class at the beginning of the period and held for the entire period (May 1, 2018 to October 31, 2018).
Actual Expenses
The Actual lines of the table below provide information about actual account values and actual expenses. You may use the information in this line, together with the amount you invested, to estimate the expenses that you paid over the period. Simply divide your account value by $1,000 (for example, an $8,600 account value divided by $1,000 = 8.6), then multiply the result by the number in the Actual line for the Class in which you have invested under the heading entitled “Expenses Paid During Period” to estimate the expenses you paid on your account during this period.
Hypothetical Example for Comparison Purposes
The Hypothetical lines of each Class in the table below provide information about hypothetical account values and hypothetical expenses based on the Class’ actual expense ratio and an assumed rate of return of 5% per year before expenses, which is not the Class’ actual return. The hypothetical account values and expenses may not be used to estimate the actual ending account balance or expenses you paid during the period. You may use this information to compare the ongoing costs of investing in a class of the Series and other funds. To do so, compare this 5% hypothetical example for the Class in which you have invested with the 5% hypothetical examples that appear in the shareholder reports of the other funds.
Please note that the expenses shown in the table are meant to highlight your ongoing costs only and do not reflect any transaction costs, such as sales charges (loads), redemption fees, or exchange fees that you may incur in other mutual funds. Therefore, the second line of the table is useful in comparing ongoing costs only, and will not help you determine the relative total costs of owning different funds.
| BEGINNING ACCOUNT VALUE 5/1/18 | ENDING ACCOUNT VALUE 10/31/18 | EXPENSES PAID DURING PERIOD* 5/1/18-10/31/18 | ANNUALIZED EXPENSE RATIO | |||||
Class S | ||||||||
Actual | $1,000.00 | $1,026.84 | $4.34 | 0.85% | ||||
Hypothetical (5% return before expenses) | $1,000.00 | $1,020.92 | $4.33 | 0.85% | ||||
Class I | ||||||||
Actual | $1,000.00 | $1,028.19 | $3.07 | 0.60% | ||||
Hypothetical (5% return before expenses) | $1,000.00 | $1,022.18 | $3.06 | 0.60% |
*Expenses are equal to each Class’ annualized expense ratio (for the six-month period), multiplied by the average account value over the period, multiplied by 184/365 (to reflect the one-half year period). Expenses are based on the most recent fiscal half year: therefore, the expense ratios stated above may differ from the expense ratios stated in the financial highlights, which are based on one-year data. The Class’ total return would have been lower had certain expenses not been waived during the period.
4
Disciplined Value Series
Portfolio Composition as of October 31, 2018
(unaudited)
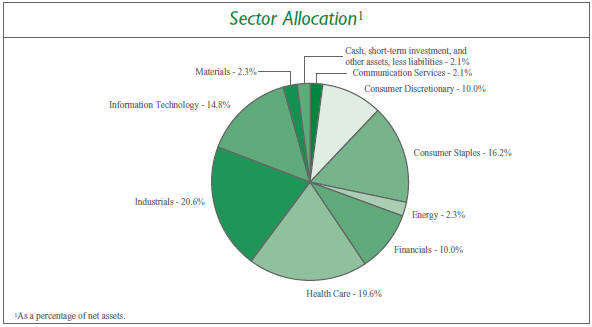
5
Disciplined Value Series
Investment Portfolio - October 31, 2018
| SHARES | VALUE (NOTE 2) | |||||||
COMMON STOCKS - 97.9% | ||||||||
Communication Services - 2.1% | ||||||||
Entertainment - 0.3% | ||||||||
Viacom, Inc. - Class B | 15,805 | $ | 505,444 | |||||
|
| |||||||
Media - 1.8% | ||||||||
Comcast Corp. - Class A | 73,909 | 2,818,889 | ||||||
|
| |||||||
Total Communication Services | 3,324,333 | |||||||
|
| |||||||
Consumer Discretionary - 10.0% | ||||||||
Distributors - 0.4% | ||||||||
Genuine Parts Co. | 7,337 | 718,439 | ||||||
|
| |||||||
Hotels, Restaurants & Leisure - 2.0% | ||||||||
McDonald’s Corp. | 18,340 | 3,244,346 | ||||||
|
| |||||||
Household Durables - 0.5% | ||||||||
Newell Brands, Inc. | 23,159 | 367,765 | ||||||
Whirlpool Corp. | 4,362 | 478,773 | ||||||
|
| |||||||
| 846,538 | ||||||||
|
| |||||||
Leisure Products - 0.4% | ||||||||
Hasbro, Inc. | 6,796 | 623,261 | ||||||
|
| |||||||
Multiline Retail - 1.9% | ||||||||
Kohl’s Corp. | 9,567 | 724,509 | ||||||
Macy’s, Inc. | 17,867 | 612,659 | ||||||
Target Corp. | 19,557 | 1,635,552 | ||||||
|
| |||||||
| 2,972,720 | ||||||||
|
| |||||||
Specialty Retail - 3.6% | ||||||||
Best Buy Co., Inc. | 12,413 | 870,896 | ||||||
The Gap, Inc. | 23,405 | 638,957 | ||||||
The Home Depot, Inc. | 24,564 | 4,320,316 | ||||||
|
| |||||||
| 5,830,169 | ||||||||
|
| |||||||
Textiles, Apparel & Luxury Goods - 1.2% | ||||||||
Tapestry, Inc. | 11,490 | 486,142 | ||||||
VF Corp. | 16,905 | 1,401,087 | ||||||
|
| |||||||
| 1,887,229 | ||||||||
|
| |||||||
Total Consumer Discretionary | 16,122,702 | |||||||
|
| |||||||
Consumer Staples - 16.2% | ||||||||
Beverages - 2.7% | ||||||||
Molson Coors Brewing Co. - Class B | 8,575 | 548,800 | ||||||
PepsiCo, Inc. | 33,236 | 3,735,062 | ||||||
|
| |||||||
| 4,283,862 | ||||||||
|
| |||||||
Food & Staples Retailing - 5.6% | ||||||||
Sysco Corp. | 19,736 | 1,407,769 | ||||||
The accompanying notes are an integral part of the financial statements.
6
Disciplined Value Series
Investment Portfolio - October 31, 2018
| SHARES | VALUE (NOTE 2) | |||||||
COMMON STOCKS (continued) | ||||||||
Consumer Staples (continued) | ||||||||
Food & Staples Retailing (continued) | ||||||||
Walgreens Boots Alliance, Inc. | 22,350 | $ | 1,782,859 | |||||
Walmart, Inc. | 58,102 | 5,826,469 | ||||||
|
| |||||||
| 9,017,097 | ||||||||
|
| |||||||
Food Products - 5.3% | ||||||||
Campbell Soup Co. | 17,467 | 653,440 | ||||||
Conagra Brands, Inc. | 15,904 | 566,182 | ||||||
General Mills, Inc. | 26,101 | 1,143,224 | ||||||
The Hershey Co. | 9,254 | 991,566 | ||||||
Hormel Foods Corp. | 16,890 | 737,080 | ||||||
The J.M. Smucker Co. | 6,639 | 719,136 | ||||||
Kellogg Co. | 11,887 | 778,361 | ||||||
The Kraft Heinz Co. | 28,807 | 1,583,521 | ||||||
Mondelez International, Inc. - Class A | 33,755 | 1,417,035 | ||||||
|
| |||||||
| 8,589,545 | ||||||||
|
| |||||||
Household Products - 2.6% | ||||||||
The Clorox Co. | 6,641 | 985,856 | ||||||
Colgate-Palmolive Co. | 29,883 | 1,779,533 | ||||||
Kimberly-Clark Corp. | 13,557 | 1,413,995 | ||||||
|
| |||||||
| 4,179,384 | ||||||||
|
| |||||||
Total Consumer Staples | 26,069,888 | |||||||
|
| |||||||
Energy - 2.3% | ||||||||
Oil, Gas & Consumable Fuels - 2.3% | ||||||||
Marathon Petroleum Corp. | 31,502 | 2,219,316 | ||||||
Valero Energy Corp. | 16,808 | 1,531,041 | ||||||
|
| |||||||
Total Energy | 3,750,357 | |||||||
|
| |||||||
Financials - 10.0% | ||||||||
Banks - 10.0% | ||||||||
Fifth Third Bancorp. | 29,931 | 807,838 | ||||||
JPMorgan Chase & Co. | 55,761 | 6,079,064 | ||||||
KeyCorp. | 34,699 | 630,134 | ||||||
SunTrust Banks, Inc. | 14,096 | 883,255 | ||||||
U.S. Bancorp. | 44,277 | 2,314,359 | ||||||
Wells Fargo & Co. | 100,898 | 5,370,800 | ||||||
|
| |||||||
Total Financials | 16,085,450 | |||||||
|
| |||||||
Health Care - 19.6% | ||||||||
Biotechnology - 5.3% | ||||||||
AbbVie, Inc. | 38,809 | 3,021,281 | ||||||
The accompanying notes are an integral part of the financial statements.
7
Disciplined Value Series
Investment Portfolio - October 31, 2018
| SHARES | VALUE (NOTE 2) | |||||||
COMMON STOCKS (continued) | ||||||||
Health Care (continued) | ||||||||
Biotechnology (continued) | ||||||||
Amgen, Inc. | 16,267 | $ | 3,136,115 | |||||
Gilead Sciences, Inc. | 34,347 | 2,341,778 | ||||||
|
| |||||||
| 8,499,174 | ||||||||
|
| |||||||
Health Care Providers & Services - 1.8% | ||||||||
CVS Health Corp. | 32,286 | 2,337,184 | ||||||
Quest Diagnostics, Inc. | 5,750 | 541,132 | ||||||
|
| |||||||
| 2,878,316 | ||||||||
|
| |||||||
Pharmaceuticals - 12.5% | ||||||||
Bristol-Myers Squibb Co. | 39,231 | 1,982,735 | ||||||
Eli Lilly & Co. | 20,899 | 2,266,288 | ||||||
Johnson & Johnson | 47,578 | 6,660,444 | ||||||
Merck & Co., Inc. | 57,497 | 4,232,354 | ||||||
Pfizer, Inc. | 114,974 | 4,950,780 | ||||||
|
| |||||||
| 20,092,601 | ||||||||
|
| |||||||
Total Health Care | 31,470,091 | |||||||
|
| |||||||
Industrials - 20.6% | ||||||||
Aerospace & Defense - 5.8% | ||||||||
The Boeing Co. | 12,096 | 4,292,387 | ||||||
Lockheed Martin Corp. | 8,266 | 2,428,964 | ||||||
United Technologies Corp. | 21,490 | 2,669,273 | ||||||
|
| |||||||
| 9,390,624 | ||||||||
|
| |||||||
Air Freight & Logistics - 1.9% | ||||||||
C.H. Robinson Worldwide, Inc. | 7,381 | 657,130 | ||||||
United Parcel Service, Inc. - Class B | 23,058 | 2,456,599 | ||||||
|
| |||||||
| 3,113,729 | ||||||||
|
| |||||||
Building Products - 0.6% | ||||||||
Johnson Controls International plc | 28,027 | 896,023 | ||||||
Resideo Technologies, Inc.* | 3,202 | 67,392 | ||||||
|
| |||||||
| 963,415 | ||||||||
|
| |||||||
Commercial Services & Supplies - 0.9% | ||||||||
Waste Management, Inc. | 15,586 | 1,394,479 | ||||||
|
| |||||||
Electrical Equipment - 1.8% | ||||||||
Eaton Corp. plc | 19,395 | 1,390,040 | ||||||
Emerson Electric Co. | 21,902 | 1,486,708 | ||||||
|
| |||||||
| 2,876,748 | ||||||||
|
| |||||||
Industrial Conglomerates - 3.5% | ||||||||
3M Co. | 15,229 | 2,897,470 | ||||||
The accompanying notes are an integral part of the financial statements.
8
Disciplined Value Series
Investment Portfolio - October 31, 2018
| SHARES | VALUE (NOTE 2) | |||||||
COMMON STOCKS (continued) | ||||||||
Industrials (continued) | ||||||||
Industrial Conglomerates (continued) | ||||||||
Honeywell International, Inc. | 19,209 | $ | 2,781,847 | |||||
|
| |||||||
| 5,679,317 | ||||||||
|
| |||||||
Machinery - 2.9% | ||||||||
Caterpillar, Inc. | 14,252 | 1,729,053 | ||||||
Cummins, Inc. | 7,141 | 976,103 | ||||||
Illinois Tool Works, Inc. | 8,412 | 1,073,119 | ||||||
Ingersoll-Rand plc | 8,337 | 799,852 | ||||||
|
| |||||||
| 4,578,127 | ||||||||
|
| |||||||
Road & Rail - 2.7% | ||||||||
Norfolk Southern Corp. | 8,040 | 1,349,353 | ||||||
Union Pacific Corp. | 20,967 | 3,065,795 | ||||||
|
| |||||||
| 4,415,148 | ||||||||
|
| |||||||
Trading Companies & Distributors - 0.5% | ||||||||
Fastenal Co. | 15,586 | 801,276 | ||||||
|
| |||||||
Total Industrials | 33,212,863 | |||||||
|
| |||||||
Information Technology - 14.8% | ||||||||
Communications Equipment - 3.4% | ||||||||
Cisco Systems, Inc. | 100,007 | 4,575,320 | ||||||
Motorola Solutions, Inc. | 7,538 | 923,857 | ||||||
|
| |||||||
| 5,499,177 | ||||||||
|
| |||||||
Electronic Equipment, Instruments & Components - 0.7% | ||||||||
Corning, Inc. | 37,019 | 1,182,757 | ||||||
|
| |||||||
IT Services - 3.8% | ||||||||
Automatic Data Processing, Inc. | 14,458 | 2,083,109 | ||||||
International Business Machines Corp. | 25,030 | 2,889,213 | ||||||
Paychex, Inc. | 16,028 | 1,049,674 | ||||||
|
| |||||||
| 6,021,996 | ||||||||
|
| |||||||
Semiconductors & Semiconductor Equipment - 6.5% | ||||||||
Broadcom, Inc. | 9,090 | 2,031,524 | ||||||
Intel Corp. | 98,322 | 4,609,335 | ||||||
KLA-Tencor Corp. | 7,568 | 692,775 | ||||||
Maxim Integrated Products, Inc. | 11,248 | 562,625 | ||||||
Texas Instruments, Inc. | 28,193 | 2,617,156 | ||||||
|
| |||||||
| 10,513,415 | ||||||||
|
| |||||||
Technology Hardware, Storage & Peripherals - 0.4% | ||||||||
Western Digital Corp. | 15,075 | 649,280 | ||||||
|
| |||||||
Total Information Technology | 23,866,625 | |||||||
|
| |||||||
The accompanying notes are an integral part of the financial statements.
9
Disciplined Value Series
Investment Portfolio - October 31, 2018
| SHARES | VALUE (NOTE 2) | |||||||
COMMON STOCKS (continued) | ||||||||
Materials - 2.3% | ||||||||
Chemicals - 1.1% | ||||||||
Eastman Chemical Co. | 7,678 | $ | 601,572 | |||||
LyondellBasell Industries N.V. - Class A | 14,363 | 1,282,185 | ||||||
|
| |||||||
| 1,883,757 | ||||||||
|
| |||||||
Containers & Packaging - 0.6% | ||||||||
Packaging Corp. of America | 5,564 | 510,831 | ||||||
Westrock Co. | 10,989 | 472,197 | ||||||
|
| |||||||
| 983,028 | ||||||||
|
| |||||||
Metals & Mining - 0.6% | ||||||||
Nucor Corp. | 15,334 | 906,546 | ||||||
|
| |||||||
Total Materials | 3,773,331 | |||||||
|
| |||||||
TOTAL COMMON STOCKS | ||||||||
(Identified Cost $155,751,527) | 157,675,640 | |||||||
|
| |||||||
SHORT-TERM INVESTMENT - 2.0% | ||||||||
Dreyfus Government Cash Management, Institutional Shares1, 2.05% | ||||||||
(Identified Cost $3,184,374) | 3,184,374 | 3,184,374 | ||||||
|
| |||||||
TOTAL INVESTMENTS - 99.9% | ||||||||
(Identified Cost $158,935,901) | 160,860,014 | |||||||
OTHER ASSETS, LESS LIABILITIES - 0.1% | 91,340 | |||||||
|
| |||||||
NET ASSETS - 100% | $ | 160,951,354 | ||||||
|
| |||||||
*Non-income producing security.
1Rate shown is the current yield as of October 31, 2018.
The Global Industry Classification Standard (GICS) was developed by and is the exclusive property and a service mark of MSCI Inc. (MSCI) and Standard & Poor’s, a division of The McGraw-Hill Companies, Inc. (S&P), and is licensed for use by Manning & Napier when referencing GICS sectors. Neither MSCI, S&P, nor any third party involved in making or compiling the GICS or any GICS classifications makes any express or implied warranties or representations with respect to such standard or classification, nor shall any such party have any liability therefrom.
The accompanying notes are an integral part of the financial statements.
10
Disciplined Value Series
Statement of Assets and Liabilities
October 31, 2018
| ASSETS: | ||||
Investments, at value (identified cost $158,935,901) (Note 2) | $ | 160,860,014 | ||
Receivable for fund shares sold | 990,431 | |||
Dividends receivable | 158,289 | |||
Foreign tax reclaims receivable | 11,408 | |||
Interest receivable | 5,759 | |||
Prepaid and other expenses | 16,301 | |||
|
| |||
TOTAL ASSETS | 162,042,202 | |||
|
| |||
LIABILITIES: | ||||
Accrued management fees (Note 3) | 43,203 | |||
Accrued fund accounting and administration fees (Note 3) | 16,815 | |||
Accrued shareholder services fees (Class S) (Note 3) | 15,067 | |||
Accrued Chief Compliance Officer service fees (Note 3) | 401 | |||
Payable for securities purchased | 809,792 | |||
Payable for fund shares repurchased | 151,620 | |||
Audit fees payable | 17,215 | |||
Other payables and accrued expenses | 36,735 | |||
|
| |||
TOTAL LIABILITIES | 1,090,848 | |||
|
| |||
TOTAL NET ASSETS | $ | 160,951,354 | ||
|
| |||
NET ASSETS CONSIST OF: | ||||
Capital stock | $ | 143,281 | ||
Additional paid-in-capital | 132,816,309 | |||
Total distributable earnings | 27,991,764 | |||
|
| |||
TOTAL NET ASSETS | $ | 160,951,354 | ||
|
| |||
NET ASSET VALUE, OFFERING PRICE AND REDEMPTION PRICE PER SHARE - Class S | ||||
($72,087,647/8,221,045 shares) | $ | 8.77 | ||
|
| |||
NET ASSET VALUE, OFFERING PRICE AND REDEMPTION PRICE PER SHARE - Class I | ||||
($88,863,707/6,107,029 shares) | $ | 14.55 | ||
|
| |||
The accompanying notes are an integral part of the financial statements.
11
Disciplined Value Series
Statement of Operations
For the Year Ended October 31, 2018
INVESTMENT INCOME: | ||||
Dividends (net of foreign taxes withheld, $302) | $ | 3,130,365 | ||
Interest | 16,515 | |||
|
| |||
Total Investment Income | 3,146,880 | |||
|
| |||
EXPENSES: | ||||
Management fees (Note 3) | 543,253 | |||
Shareholder services fees (Class S) (Note 3) | 132,429 | |||
Fund accounting and administration fees (Note 3) | 53,673 | |||
Directors’ fees (Note 3) | 9,337 | |||
Chief Compliance Officer service fees (Note 3) | 4,385 | |||
Custodian fees | 21,060 | |||
Miscellaneous | 140,524 | |||
|
| |||
Total Expenses | 904,661 | |||
Less reduction of expenses (Note 3) | (47,894 | ) | ||
|
| |||
Net Expenses | 856,767 | |||
|
| |||
NET INVESTMENT INCOME | 2,290,113 | |||
|
| |||
REALIZED AND UNREALIZED GAIN (LOSS) ON INVESTMENTS: | ||||
Net realized gain (loss) on investments | 25,894,128 | |||
Net change in unrealized appreciation (depreciation) on investments | (21,487,274 | ) | ||
|
| |||
NET REALIZED AND UNREALIZED GAIN (LOSS) ON INVESTMENTS | 4,406,854 | |||
|
| |||
NET INCREASE IN NET ASSETS RESULTING FROM OPERATIONS | $ | 6,696,967 | ||
|
| |||
The accompanying notes are an integral part of the financial statements.
12
Disciplined Value Series
Statements of Changes in Net Assets
| FOR THE YEAR ENDED 10/31/18 | FOR THE YEAR ENDED 10/31/17 | |||||||
INCREASE (DECREASE) IN NET ASSETS: | ||||||||
OPERATIONS: | ||||||||
Net investment income | $ | 2,290,113 | $ | 3,705,146 | ||||
Net realized gain (loss) on investments | 25,894,128 | 25,969,874 | ||||||
Net change in unrealized appreciation (depreciation) on investments | (21,487,274 | ) | 3,802,331 | |||||
|
|
|
| |||||
Net increase from operations | 6,696,967 | 33,477,351 | ||||||
|
|
|
| |||||
DISTRIBUTIONS TO SHAREHOLDERS (Note 8): | ||||||||
Class S | (10,674,798 | ) | (1,640,392 | ) | ||||
Class I | (12,965,874 | ) | (7,897,908 | ) | ||||
|
|
|
| |||||
Total distributions to shareholders | (23,640,672 | ) | (9,538,300 | )* | ||||
|
|
|
| |||||
CAPITAL STOCK ISSUED AND REPURCHASED: | ||||||||
Net increase (decrease) from capital share transactions (Note 5) | 29,598,590 | (43,416,296 | ) | |||||
|
|
|
| |||||
Net increase (decrease) in net assets | 12,654,885 | (19,477,245 | ) | |||||
NET ASSETS: | ||||||||
Beginning of year | 148,296,469 | 167,773,714 | ||||||
|
|
|
| |||||
End of year | $ | 160,951,354 | $ | 148,296,469 | ||||
|
|
|
| |||||
*For the year ended October 31, 2017, the distributions to shareholders from net investment income and net realized gain were $747,820 and $892,572 (Class S) and $3,303,961 and $4,593,947 (Class I), respectively.
The accompanying notes are an integral part of the financial statements.
13
Disciplined Value Series
Financial Highlights - Class S
| FOR THE YEAR ENDED | ||||||||||||||||||||
| 10/31/18 | 10/31/17 | 10/31/16 | 10/31/15 | 10/31/14 | ||||||||||||||||
Per share data (for a share outstanding throughout each year): | ||||||||||||||||||||
Net asset value - Beginning of year | $ | 11.42 | $ | 10.16 | $ | 11.64 | $ | 12.75 | $ | 11.88 | ||||||||||
|
|
|
|
|
|
|
|
|
| |||||||||||
Income from investment operations: | ||||||||||||||||||||
Net investment income1 | 0.16 | 0.20 | 0.22 | 0.26 | 0.26 | |||||||||||||||
Net realized and unrealized gain (loss) on investments | 0.72 | 1.89 | 0.53 | (0.21 | ) | 1.25 | ||||||||||||||
|
|
|
|
|
|
|
|
|
| |||||||||||
Total from investment operations | 0.88 | 2.09 | 0.75 | 0.05 | 1.51 | |||||||||||||||
|
|
|
|
|
|
|
|
|
| |||||||||||
Less distributions to shareholders: | ||||||||||||||||||||
From net investment income | (0.27 | ) | (0.33 | ) | (0.32 | ) | (0.36 | ) | (0.34 | ) | ||||||||||
From net realized gain on investments | (3.26 | ) | (0.50 | ) | (1.91 | ) | (0.80 | ) | (0.30 | ) | ||||||||||
|
|
|
|
|
|
|
|
|
| |||||||||||
Total distributions to shareholders | (3.53 | ) | (0.83 | ) | (2.23 | ) | (1.16 | ) | (0.64 | ) | ||||||||||
|
|
|
|
|
|
|
|
|
| |||||||||||
Net asset value - End of year | $ | 8.77 | $ | 11.42 | $ | 10.16 | $ | 11.64 | $ | 12.75 | ||||||||||
|
|
|
|
|
|
|
|
|
| |||||||||||
Net assets - End of year (000’s omitted) | $ | 72,088 | $ | 30,940 | $ | 15,022 | $ | 15,471 | $ | 13,716 | ||||||||||
|
|
|
|
|
|
|
|
|
| |||||||||||
Total return2 | 8.14 | % | 21.52 | % | 7.99 | % | 0.63 | % | 13.12 | % | ||||||||||
Ratios (to average net assets)/Supplemental Data: | ||||||||||||||||||||
Expenses* | 0.85 | % | 0.82 | % | 0.82 | % | 0.79 | % | 0.79 | % | ||||||||||
Net investment income | 1.71 | % | 1.91 | % | 2.19 | % | 2.14 | % | 2.11 | % | ||||||||||
Portfolio turnover | 96 | % | 34 | % | 39 | % | 49 | % | 23 | % | ||||||||||
| *For certain periods presented, the investment advisor did not impose all or a portion of its management and/or other fees, and in some periods may have paid a portion of the Series’ expenses. If these expenses had been incurred by the Class, the expense ratio (to average net assets) would have increased by the following amounts: |
| |||||||||||||||||||
| 0.04 | % | N/A | N/A | N/A | N/A | |||||||||||||||
1Calculated based on average shares outstanding during the year.
2Represents aggregate total return for the year indicated, and assumes reinvestment of all distributions. Total return would have been lower had certain expenses not been waived or reimbursed during certain years.
The accompanying notes are an integral part of the financial statements.
14
Disciplined Value Series
Financial Highlights - Class I
| FOR THE YEAR ENDED | ||||||||||||||||||||
| 10/31/18 | 10/31/17 | 10/31/16 | 10/31/15 | 10/31/14 | ||||||||||||||||
Per share data (for a share outstanding throughout each year): | ||||||||||||||||||||
Net asset value - Beginning of year | $ | 16.76 | $ | 14.54 | $ | 15.69 | $ | 16.76 | $ | 15.41 | ||||||||||
|
|
|
|
|
|
|
|
|
| |||||||||||
Income from investment operations: | ||||||||||||||||||||
Net investment income1 | 0.31 | 0.35 | 0.35 | 0.39 | 0.38 | |||||||||||||||
Net realized and unrealized gain (loss) on investments | 1.03 | 2.73 | 0.75 | (0.27 | ) | 1.64 | ||||||||||||||
|
|
|
|
|
|
|
|
|
| |||||||||||
Total from investment operations | 1.34 | 3.08 | 1.10 | 0.12 | 2.02 | |||||||||||||||
|
|
|
|
|
|
|
|
|
| |||||||||||
Less distributions to shareholders: | ||||||||||||||||||||
From net investment income | (0.29 | ) | (0.36 | ) | (0.34 | ) | (0.39 | ) | (0.37 | ) | ||||||||||
From net realized gain on investments | (3.26 | ) | (0.50 | ) | (1.91 | ) | (0.80 | ) | (0.30 | ) | ||||||||||
|
|
|
|
|
|
|
|
|
| |||||||||||
Total distributions to shareholders | (3.55 | ) | (0.86 | ) | (2.25 | ) | (1.19 | ) | (0.67 | ) | ||||||||||
|
|
|
|
|
|
|
|
|
| |||||||||||
Net asset value - End of year | $ | 14.55 | $ | 16.76 | $ | 14.54 | $ | 15.69 | $ | 16.76 | ||||||||||
|
|
|
|
|
|
|
|
|
| |||||||||||
Net assets - End of year (000’s omitted) | $ | 88,864 | $ | 117,357 | $ | 152,751 | $ | 160,999 | $ | 191,337 | ||||||||||
|
|
|
|
|
|
|
|
|
| |||||||||||
Total return2 | 8.35 | % | 21.86 | % | 8.24 | % | 0.91 | % | 13.44 | % | ||||||||||
Ratios (to average net assets)/Supplemental Data: | ||||||||||||||||||||
Expenses* | 0.60 | % | 0.57 | % | 0.57 | % | 0.54 | % | 0.54 | % | ||||||||||
Net investment income | 2.05 | % | 2.24 | % | 2.46 | % | 2.44 | % | 2.38 | % | ||||||||||
Portfolio turnover | 96 | % | 34 | % | 39 | % | 49 | % | 23 | % | ||||||||||
| *For certain periods presented, the investment advisor did not impose all or a portion of its management and/or other fees, and in some periods may have paid a portion of the Series’ expenses. If these expenses had been incurred by the Class, the expense ratio (to average net assets) would have increased by the following amounts: |
| |||||||||||||||||||
| 0.04 | % | N/A | N/A | N/A | N/A | |||||||||||||||
1Calculated based on average shares outstanding during the year.
2Represents aggregate total return for the years indicated, and assumes reinvestment of all distributions. Total return would have been lower had certain expenses not been waived or reimbursed during certain years.
The accompanying notes are an integral part of the financial statements.
15
Disciplined Value Series
Notes to Financial Statements
| 1. | Organization |
Disciplined Value Series (the “Series”) is a no-load diversified series of Manning & Napier Fund, Inc. (the “Fund”). The Fund is organized in Maryland and is registered under the Investment Company Act of 1940, as amended, as an open-end management investment company.
The Series’ investment objective is to provide competitive returns consistent with the broad equity market while providing a level of capital protection during market downturns.
The Fund’s Advisor is Manning & Napier Advisors, LLC (the “Advisor”). Shares of the Series are offered to investors, clients and employees of the Advisor and its affiliates. The total authorized capital stock of the Fund consists of 15 billion shares of common stock each having a par value of $0.01. As of October 31, 2018, 13.4 billion shares have been designated in total among 38 series, of which 100 million have been designated as Disciplined Value Series Class I common stock, 100 million have been designated as Disciplined Value Series Class S common stock, 100 million have been designated as Disciplined Value Series Class W common stock, and 100 million have been designated as Disciplined Value Series Class Z common stock. Class W common stock and Class Z common stock are not currently offered for sale.
| 2. | Significant Accounting Policies |
The following is a summary of significant accounting policies followed by the Series. The Series is an investment company and, accordingly, follows the investment company accounting and reporting guidance of the Financial Accounting Standards Board Accounting Standards Codification Topic 946—Investment Companies, which is part of accounting principles generally accepted in the United States of America (“GAAP”).
Security Valuation
Portfolio securities, including domestic equities, foreign equities, warrants and options, listed on an exchange other than the NASDAQ Stock Market are valued at the latest quoted sales price of the exchange on which the security is primarily traded. Securities not traded on valuation date or securities not listed on an exchange are valued at the latest quoted bid price provided by the Fund’s pricing service. Securities listed on the NASDAQ Stock Market are valued in accordance with the NASDAQ Official Closing Price.
Short-term investments that mature in sixty days or less may be valued at amortized cost, which approximates fair value. Investments in open-end investment companies are valued at their net asset value per share on valuation date.
Volume and level of activity in established markets for an asset or liability are evaluated to determine whether recent transactions and quoted prices are determinative of fair value. Where there have been significant decreases in volume and level of activity, further analysis and adjustment may be necessary to estimate fair value. The Series measures fair value in these instances by the use of inputs and valuation techniques which may be based upon current market prices of securities that are comparable in coupon, rating, maturity and industry and/or expectation of future cash flows. As a result of trading in relatively thin markets and/or markets that experience significant volatility, the prices used by the Series to value these securities may differ from the value that would be realized if these securities were sold, and the differences could be material.
Securities for which representative valuations or prices are not available from the Series’ pricing service may be valued at fair value as determined in good faith by the Advisor under procedures approved by and under the general supervision and responsibility of the Fund’s Board of Directors (the “Board”). Due to the inherent uncertainty of valuations of such securities, the fair value may differ significantly from the values that would have been used had a ready market for such securities existed. If trading or events occurring after the close of the principal market in which securities are traded are expected to materially affect the value of those securities, then they may be valued at their fair value, taking this trading or these events into account.
Various inputs are used in determining the value of the Series’ assets or liabilities carried at fair value. These inputs are summarized in three broad levels. Level 1 includes quoted prices in active markets for identical assets and liabilities. Level 2 includes other significant observable inputs (including quoted prices for similar securities, interest rates, prepayment speeds, credit risk, etc.). Level 3 includes significant unobservable inputs (including the Series’ own assumptions in determining the fair
16
Disciplined Value Series
Notes to Financial Statements (continued)
| 2. | Significant Accounting Policies (continued) |
Security Valuation (continued)
value of investments). A financial instrument’s level within the fair value hierarchy is based on the lowest level of any input both individually and in aggregate that is significant to the fair value measurement. The inputs or methodology used for valuing securities are not necessarily an indication of the risk associated with investing in those securities.
The following is a summary of the valuation levels used for major security types as of October 31, 2018 in valuing the Series’ assets or liabilities carried at fair value:
| DESCRIPTION | TOTAL | LEVEL 1 | LEVEL 2 | LEVEL 3 | ||||||||||||
Assets: | ||||||||||||||||
Equity Securities: | ||||||||||||||||
Communication Services | $ | 3,324,333 | $ | 3,324,333 | $ | — | $ | — | ||||||||
Consumer Discretionary | 16,122,702 | 16,122,702 | — | — | ||||||||||||
Consumer Staples | 26,069,888 | 26,069,888 | — | — | ||||||||||||
Energy | 3,750,357 | 3,750,357 | — | — | ||||||||||||
Financials | 16,085,450 | 16,085,450 | — | — | ||||||||||||
Health Care | 31,470,091 | 31,470,091 | — | — | ||||||||||||
Industrials | 33,212,863 | 33,212,863 | — | — | ||||||||||||
Information Technology | 23,866,625 | 23,866,625 | — | — | ||||||||||||
Materials | 3,773,331 | 3,773,331 | — | — | ||||||||||||
Mutual Fund | 3,184,374 | 3,184,374 | — | — | ||||||||||||
|
|
|
|
|
|
|
| |||||||||
Total assets | $ | 160,860,014 | $ | 160,860,014 | $ | — | $ | — | ||||||||
|
|
|
|
|
|
|
| |||||||||
There were no Level 2 or Level 3 securities held by the Series as of October 31, 2017 or October 31, 2018.
New Accounting Pronouncements
The Securities and Exchange Commission (SEC) adopted changes to Regulation S-X to simplify the reporting of information by registered investment companies in financial statements. The amendments require presentation of the total, rather than the components, of distributable earnings on the Statement of Assets and Liabilities and also require presentation of the total, rather than the components, of distributions to shareholders, except for tax return of capital distributions, if any, on the Statement of Changes in Net Assets. The amendments also removed the requirement for parenthetical disclosure of undistributed net investment income on the Statement of Changes in Net Assets. These Regulation S-X amendments are reflected in the Series financial statements for the year ended October 31, 2018. As a result of adopting these amendments, the distributions to shareholders in the October 31, 2017 Statement of Changes in Net Assets presented herein have been reclassified to conform to the current year presentation.
On August 28, 2018, the FASB issued ASU 2018-13, “Disclosure Framework – Changes to the Disclosure Requirements for Fair Value Measurement,” which amends the fair value measurement disclosure requirements under U.S. GAAP. The amendments of ASU 2018-13 include new, eliminated, and modified disclosure requirements. In addition, the amendments clarify that materiality is an appropriate consideration of entities when evaluating disclosure requirements. The ASU is effective for all entities for fiscal years beginning after December 15, 2019, including interim periods therein. An entity is permitted to early adopt any eliminated or modified disclosures upon issuance of this ASU and delay adoption of the new disclosures until their effective date. As such, the Series has early adopted the eliminated and modified disclosures, as permitted by this ASU.
Security Transactions, Investment Income and Expenses
Security transactions are accounted for on trade date. Dividend income is recorded on the ex-dividend date, except that if the ex-dividend date has passed, certain dividends from foreign securities are recorded as soon as the Series is informed of the ex-dividend date. Non-cash dividends, if any, are recorded at the fair value of the securities received. Interest income, including amortization of premium and accretion of discounts using the effective interest method, is earned from settlement date and accrued daily.
17
Disciplined Value Series
Notes to Financial Statements (continued)
| 2. | Significant Accounting Policies (continued) |
Security Transactions, Investment Income and Expenses (continued)
Expenses are recorded on an accrual basis. Most expenses of the Fund can be attributed to a specific series. Expenses which cannot be directly attributed are apportioned among the series in the Fund in such a manner as deemed equitable by the Fund’s Board, taking into consideration, among other things, the nature and type of expense. Income, expenses (other than class specific expenses), and realized and unrealized gains and losses are prorated among the classes based on the relative net assets of each class. Class specific expenses are directly charged to that class.
The Series uses the identified cost method for determining realized gain or loss on investments for both financial statement and federal income tax reporting purposes.
Federal Taxes
The Series’ policy is to comply with the provisions of the Internal Revenue Code applicable to regulated investment companies. The Series is not subject to federal income or excise tax to the extent that the Series distributes to shareholders each year its taxable income, including any net realized gains on investments, in accordance with requirements of the Internal Revenue Code. Accordingly, no provision for federal income tax or excise tax has been made in the financial statements.
Management evaluates its tax positions to determine if the tax positions taken meet the minimum recognition threshold in connection with accounting for uncertainties in income tax positions taken or expected to be taken for the purposes of measuring and recognizing tax liabilities in the financial statements. Recognition of tax benefits of an uncertain tax position is required only when the position is “more likely than not” to be sustained assuming examination by taxing authorities. At October 31, 2018, the Series has recorded no liability for net unrecognized tax benefits relating to uncertain income tax positions taken or expected to be taken in future tax returns.
The Series files income tax returns in the U.S. federal jurisdiction, various states and foreign jurisdictions, as required. No income tax returns are currently under investigation. The statute of limitations on the Series’ tax returns remains open for the years ended October 31, 2015 through October 31, 2018. The Series is not aware of any tax positions for which it is reasonably possible that the total amounts of unrecognized tax benefits will significantly change in the next twelve months.
Foreign Taxes
Based on the Series’ understanding of the tax rules and rates related to income, gains and currency purchase/repatriation transactions for foreign jurisdictions in which it invests, the Series will provide for foreign taxes, and where appropriate, deferred foreign tax.
Distributions of Income and Gains
Distributions to shareholders of net investment income are made quarterly. Distributions of net realized gains are made annually. An additional distribution may be necessary to avoid taxation of the Series. Distributions are recorded on the ex-dividend date.
Indemnifications
The Fund’s organizational documents provide former and current directors and officers with a limited indemnification against liabilities arising in connection with the performance of their duties to the Fund. In the normal course of business, the Fund may also enter into contracts that provide general indemnifications. The Fund’s maximum exposure under these arrangements is unknown as this would be dependent on future claims that may be made against the Fund. The risk of material loss from such claims is considered remote.
Other
The preparation of financial statements in conformity with GAAP requires management to make estimates and assumptions that affect the reported amounts of assets and liabilities and the disclosure of contingent assets and liabilities at the date of the financial statements and the reported amounts of income and expenses during the reporting period. Actual results could differ from those estimates.
18
Disciplined Value Series
Notes to Financial Statements (continued)
| 3. | Transactions with Affiliates |
The Fund has an Investment Advisory Agreement (the “Agreement”) with the Advisor, for which the Series pays a fee, computed daily and payable monthly, at an annual rate of 0.45% of the Series’ average daily net assets.
Under the Agreement, personnel of the Advisor provide the Series with advice and assistance in the choice of investments and the execution of securities transactions, and otherwise maintain the Series’ organization. The Advisor also provides the Fund with necessary office space and fund administration and support services. The salaries of all officers of the Fund (except a percentage of the Fund’s Chief Compliance Officer’s salary, which is paid by the Fund), and of all Directors who are “affiliated persons” of the Fund, or of the Advisor, and all personnel of the Fund, or of the Advisor, performing services relating to research, statistical and investment activities, are paid by the Advisor. Each “non-affiliated” Director receives an annual stipend, which is allocated among all the active series of the Fund. In addition, these Directors also receive a fee per Board meeting attended plus a fee for each committee meeting attended and are reimbursed for travel and other out-of-pocket expenses incurred by them in connection with attending such meetings. The Fund also has an Audit Committee Chair, Governance & Nominating Committee Chair and Lead Independent Director who each receive an additional annual stipend for these roles.
The Class S shares of the Series are subject to a shareholder services fee in accordance with a shareholder services plan adopted by the Fund’s Board. The shareholder services fee is intended to compensate financial intermediaries, including affiliates of the Fund, in connection with the provision of direct client service, personal services, maintenance of shareholder accounts and reporting services. For these services, the Class S shares of the Series pay a fee, computed daily and payable monthly, at an annual rate of 0.25% of the average daily net assets of Class S. The Fund has a Shareholder Services Agreement with the Advisor, for which the Advisor receives the shareholder services fee as stated above.
The Advisor has contractually agreed, until at least February 28, 2019, to waive its management fee and, if necessary, pay other operating expenses of the Series in order to maintain total direct annual fund operating expenses for the Series, exclusive of shareholder service fees, at no more than 0.60% of average daily net assets each year. Accordingly, the Advisor waived fees of $47,894 for the year ended October 31, 2018, which is included as a reduction of expenses on the Statement of Operations. The Advisor is not eligible to recoup any expenses that have been waived or reimbursed in prior years.
Manning & Napier Investor Services, Inc., a registered broker-dealer affiliate of the Advisor, acts as distributor for the Fund’s shares. The services of Manning & Napier Investor Services, Inc. are provided at no additional cost to the Series.
Pursuant to a master services agreement dated March 1, 2017, the Fund pays the Advisor an annual fee related to fund accounting and administration of 0.0085% on the first $25 billion of average daily net assets (excluding Target Series and Income Series); 0.0075% on the next $15 billion of average daily net assets (excluding Target Series and Income Series); and 0.0065% of average daily net assets in excess of $40 billion (excluding Target Series and Income Series); plus a base fee of $30,400 per series. Additionally, certain transaction and out-of-pocket expenses, including charges for reporting relating to the Fund’s compliance program, are charged. The Advisor has agreements with BNY Mellon Investment Servicing (U.S.) Inc. (“BNY”) under which BNY serves as sub-accountant services agent.
| 4. | Purchases and Sales of Securities |
For the year ended October 31, 2018, purchases and sales of securities, other than U.S. Government securities and short-term securities, were $125,559,455 and $118,301,305, respectively. There were no purchases or sales of U.S. Government securities.
19
Disciplined Value Series
Notes to Financial Statements (continued)
| 5. | Capital Stock Transactions |
Transactions in Class S and I shares of Disciplined Value Series were:
| CLASS S | FOR THE YEAR ENDED 10/31/18 | FOR THE YEAR ENDED 10/31/17 | ||||||||||||||
SHARES | AMOUNT | SHARES | AMOUNT | |||||||||||||
Sold | 9,688,588 | $ | 88,377,970 | 1,545,061 | $ | 16,323,508 | ||||||||||
Reinvested | 1,204,163 | 10,575,138 | 156,422 | 1,637,234 | ||||||||||||
Repurchased | (5,379,786 | ) | (47,861,945 | ) | (471,810 | ) | (5,038,973 | ) | ||||||||
|
|
|
|
|
|
|
| |||||||||
Total | 5,512,965 | $ | 51,091,163 | 1,229,673 | $ | 12,921,769 | ||||||||||
|
|
|
|
|
|
|
| |||||||||
| CLASS I | FOR THE YEAR ENDED 10/31/18 | FOR THE YEAR ENDED 10/31/17 | ||||||||||||||
SHARES | AMOUNT | SHARES | AMOUNT | |||||||||||||
Sold | 4,156,876 | $ | 63,107,551 | 1,890,531 | $ | 29,193,940 | ||||||||||
Reinvested | 525,788 | 7,609,244 | 285,798 | 4,347,380 | ||||||||||||
Repurchased | (5,577,192 | ) | (92,209,368 | ) | (5,679,847 | ) | (89,879,385 | ) | ||||||||
|
|
|
|
|
|
|
| |||||||||
Total | (894,528 | ) | $ | (21,492,573 | ) | (3,503,518 | ) | $ | (56,338,065 | ) | ||||||
|
|
|
|
|
|
|
| |||||||||
| 6. | Line of Credit |
The Fund has entered into a 364-day, $25 million credit agreement (the “line of credit”) with Bank of New York Mellon. Each series of the Fund may borrow under the line of credit for temporary or emergency purposes, including funding shareholder redemptions and other short-term liquidity purposes. The Fund pays an annual fee on the unused commitment amount, payable quarterly, and is allocated among all the series of the Fund and included in miscellaneous expenses in the Statement of Operations for each series. The line of credit expires in August 2019 unless extended or renewed. During the year ended October 31, 2018, the Series did not borrow under the line of credit.
| 7. | Financial Instruments |
The Series may trade in instruments including written and purchased options, forward foreign currency exchange contracts and futures contracts and other derivatives in the normal course of investing activities to assist in managing exposure to various market risks. The Series may be subject to various elements of risk which may involve, to a varying degree, elements of risk in excess of the amounts recognized for financial statement purposes. These risks include: the risk that changes in the value of a derivative may not correlate perfectly with the underlying asset, rate or index; counterparty credit risk related to over the counter derivative counterparties’ failure to perform under contract terms; liquidity risk related to the lack of a liquid market for these contracts allowing the fund to close out its position(s); and documentation risk relating to disagreement over contract terms. No such investments were held by the Series as of October 31, 2018.
| 8. | Federal Income Tax Information |
The amount and characterization of certain income and capital gains to be distributed are determined in accordance with federal income tax regulations, which may differ from GAAP. These differences are primarily due to differing book and tax treatment in the timing of recognition of net investment income, or gains and losses, including losses deferred due to wash sales and the use of equalization. The Series may periodically make reclassifications among its capital accounts to reflect income and gains available for distribution (or available capital loss carryovers) under income tax regulations, without impacting the Series’ net asset value. For the year ended October 31, 2018, amounts were reclassified within the capital accounts to increase Additional Paid in Capital by $13,753, and decrease Total Distributable Earnings by $13,753. Any such reclassifications are not reflected in the financial highlights.
20
Disciplined Value Series
Notes to Financial Statements (continued)
| 8. | Federal Income Tax Information (continued) |
The tax character of distributions paid for the year ended October 31, 2018 were as follows:
FOR THE YEAR ENDED 10/31/18 | FOR THE YEAR ENDED 10/31/17 | |||||||
Ordinary income | $ | 3,681,015 | $ | 4,505,240 | ||||
Long-term capital gains | 19,959,657 | 5,033,060 | ||||||
At October 31, 2018, the tax basis of components of distributable earnings and the net unrealized appreciation based on the identified cost of investments for federal income tax purposes were as follows:
Cost for federal income tax purposes | $ | 159,481,979 | ||
Unrealized appreciation | 8,561,488 | |||
Unrealized depreciation | (7,183,453 | ) | ||
|
| |||
Net unrealized appreciation | $ | 1,378,035 | ||
|
| |||
Undistributed ordinary income | $ | 2,400,285 | ||
Undistributed long-term capital gains | $ | 24,213,444 |
21
Disciplined Value Series
Report of Independent Registered Public Accounting Firm
To the Board of Directors of Manning & Napier Fund, Inc. and Shareholders of Disciplined Value Series
Opinion on the Financial Statements
We have audited the accompanying statement of assets and liabilities, including the investment portfolio, of Disciplined Value Series (one of the series constituting Manning & Napier Fund, Inc., referred to hereafter as the “Fund”) as of October 31, 2018, the related statement of operations for the year ended October 31, 2018, the statement of changes in net assets for each of the two years in the period ended October 31, 2018, including the related notes, and the financial highlights for each of the five years in the period ended October 31, 2018 (collectively referred to as the “financial statements”). In our opinion, the financial statements present fairly, in all material respects, the financial position of the Fund as of October 31, 2018, the results of its operations for the year then ended, the changes in its net assets for each of the two years in the period ended October 31, 2018 and the financial highlights for each of the five years in the period ended October 31, 2018 in conformity with accounting principles generally accepted in the United States of America.
Basis for Opinion
These financial statements are the responsibility of the Fund’s management. Our responsibility is to express an opinion on the Fund’s financial statements based on our audits. We are a public accounting firm registered with the Public Company Accounting Oversight Board (United States) (“PCAOB”) and are required to be independent with respect to the Fund in accordance with the U.S. federal securities laws and the applicable rules and regulations of the Securities and Exchange Commission and the PCAOB.
We conducted our audits of these financial statements in accordance with the standards of the PCAOB. Those standards require that we plan and perform the audit to obtain reasonable assurance about whether the financial statements are free of material misstatement, whether due to error or fraud.
Our audits included performing procedures to assess the risks of material misstatement of the financial statements, whether due to error or fraud, and performing procedures that respond to those risks. Such procedures included examining, on a test basis, evidence regarding the amounts and disclosures in the financial statements. Our audits also included evaluating the accounting principles used and significant estimates made by management, as well as evaluating the overall presentation of the financial statements. Our procedures included confirmation of securities owned as of October 31, 2018 by correspondence with the custodian and brokers; when replies were not received from brokers, we performed other auditing procedures. We believe that our audits provide a reasonable basis for our opinion.
New York, New York
December 14, 2018
We have served as the auditor of one or more investment companies in Manning & Napier Mutual Funds since 1992.
22
Disciplined Value Series
Supplemental Tax Information
(unaudited)
All reportings are based on financial information available as of the date of this annual report and, accordingly, are subject to change.
For federal income tax purposes, the Series reports for the current fiscal year $2,968,683 or, if different, the maximum amount allowable under the tax law, as qualified dividend income.
For corporate shareholders, the percentage of investment income (dividend income plus short-term gains, if any) that qualifies for the dividends received deduction for the current fiscal year is 78.00%.
The Series designates $25,424,116 as Long-Term Capital Gain dividends pursuant to Section 852(b) of the Code for the fiscal year ended October 31, 2018.
23
Disciplined Value Series
Directors’ and Officers’ Information
(unaudited)
The Statement of Additional Information provides additional information about the Fund’s directors and officers and can be obtained without charge by calling 1-800-466-3863, at www.manning-napier.com, or on the EDGAR Database on the SEC Internet web site (http://www.sec.gov). The following chart shows certain information about the Fund’s directors and officers, including their principal occupations during the last five years. Unless specific dates are provided, the individuals have held the listed positions for longer than five years.
| Interested Director and Officer | ||
| Name: | Paul Battaglia* | |
| Address: | 290 Woodcliff Drive | |
| Fairport, NY 14450 | ||
| Age: | 40 | |
| Current Position(s) Held with Fund: | Principal Executive Officer, President, Chairman & Director | |
| Term of Office & Length of Time Served: | Indefinite - Chairman and Director since November 20181 | |
| Principal Occupation(s) During Past 5 Years: | Chief Financial Officer (2018 - Present); Vice President of Finance (2016 - 2018); Director of Finance (2011 - 2016); Financial Analyst/Internal Auditor (2004-2006) - Manning & Napier Advisors, LLC and affiliates | |
| Holds one or more of the following titles for various affiliates: Chief Financial Officer | ||
| Number of Portfolios Overseen within Fund Complex: | 36 | |
| Other Directorships Held Outside Fund Complex During Past 5 Years: | N/A | |
| ||
| Independent Directors | ||
| Name: | Stephen B. Ashley | |
| Address: | 290 Woodcliff Drive | |
| Fairport, NY 14450 | ||
| Age: | 78 | |
| Current Position(s) Held with Fund: | Director, Audit Committee Member, Governance & Nominating Committee Member | |
| Term of Office & Length of Time Served: | Indefinite - Since 1996 | |
| Principal Occupation(s) During Past 5 Years: | Chairman, Director & Chief Executive Officer (1997 to present) - The Ashley Group (property management and investment). Director (1995-2008) and Chairman (non-executive) (2004-2008) - Fannie Mae (mortgage) | |
| Number of Portfolios Overseen within Fund Complex: | 36 | |
| Other Directorships Held Outside Fund Complex During | Fannie Mae (1995-2008) | |
Past 5 Years: | The Ashley Group (1995-2008) | |
| Genesee Corporation (1987-2007) | ||
| ||
| Name: | Paul A. Brooke | |
| Address: | 290 Woodcliff Drive | |
| Fairport, NY 14450 | ||
| Age: | 72 | |
| Current Position(s) Held with Fund: | Lead Independent Director, Audit Committee Member, Governance & Nominating Committee Chairman | |
| Term of Office & Length of Time Served: | Indefinite - Director, Audit Committee Member, Governance & Nominating Committee Member since 2007; Governance & Nominating Committee Chairman since 2016; Lead Independent Director since 2017 | |
| Principal Occupation(s) During Past 5 Years: | Chairman & CEO (2005-2009) - Ithaka Acquisition | |
| Corporation (investments); Chairman (2007-2009) - Alsius Corporation (investments); Managing Member (1991-present) - PMSV Holdings LLC (investments); Managing Member (2010-2016) - Venbio (investments). | ||
| Number of Portfolios Overseen within Fund Complex: | 36 | |
| Other Directorships Held Outside Fund Complex During Past 5 Years: | Incyte Corp. (biotech)(2000-present); ViroPharma, Inc. (speciality pharmaceuticals)(2000-2014); HLTH (WebMD)(information)(2000-2010); Cheyne Capital International (investment)(2000-2017); GMP Companies (investment)(2000-2011); Cytos Biotechnology Ltd (biotechnology)(2012-2014); Cerus (biomedical)(2016-present); PureEarth(non-profit)(2012-present) | |
| ||
24
Disciplined Value Series
Directors’ and Officers’ Information
(unaudited)
| Independent Directors (continued) | ||
| Name: | Peter L. Faber | |
| Address: | 290 Woodcliff Drive | |
| Fairport, NY 14450 | ||
| Age: | 80 | |
| Current Position(s) Held with Fund: | Director, Governance & Nominating Committee Member | |
| Term of Office & Length of Time Served: | Indefinite – Since 1987 | |
| Principal Occupation(s) During Past 5 Years: | Senior Counsel (2006-2012), Partner (1995-2006 & 2013-present) - McDermott, Will & Emery LLP (law firm) | |
| Number of Portfolios Overseen within Fund Complex: | 36 | |
| Other Directorships Held Outside Fund Complex During Past 5 Years: | Boston Early Music Festival (non-profit)(2007-present); Amherst Early Music, Inc. (non-profit)(2009-present); Gotham Early Music Scene, Inc. (non-profit)(2009-present); Partnership for New York City, Inc. (non-profit)(1989-2010); New York Collegium (non-profit)(2004-2011) | |
| Name: | Harris H. Rusitzky | |
| Address: | 290 Woodcliff Drive Fairport, NY 14450 | |
| Age: | 83 | |
| Current Position(s) Held with Fund: | Director, Audit Committee Member, Governance & Nominating Committee Member | |
| Term of Office & Length of Time Served: | Indefinite – Since 1985 | |
| Principal Occupation(s) During Past 5 Years: | President (1994- present) - The Greening Group (business consultants); Partner (2006-present) - The Restaurant Group (restaurants) | |
| Number of Portfolios Overseen within Fund Complex: | 36 | |
| Other Directorships Held Outside Fund Complex During Past 5 Years: | Rochester Institute of Technology (university)(1972-present); Culinary Institute of America (non-profit college)(1985-present); George Eastman House (museum)(1988-present); National Restaurant Association (restaurant trade organization)(1978-present) | |
| Name: | Chester N. Watson | |
| Address: | 290 Woodcliff Drive | |
| Fairport, NY 14450 | ||
| Age: | 68 | |
| Current Position(s) Held with Fund: | Director, Audit Committee Chairman, Governance & Nominating Committee Member | |
| Term of Office & Length of Time Served: | Indefinite – Director, Audit Committee Member, Governance & Nominating Committee Member Since 2012; Audit Committee Chairman since 2013 | |
| Principal Occupation(s) During Past 5 Years: | General Auditor (2003-2011) - General Motors Company (auto manufacturer) | |
| Number of Portfolios Overseen within Fund Complex: | 36 | |
| Other Directorships Held Outside Fund Complex During Past 5 Years: | Rochester Institute of Technology (university)(2005-present); Town of Greenburgh, NY Planning Board (municipal government) (2015-present) | |
| Officers: | ||
| Name: | Jeffrey S. Coons, Ph.D., CFA® | |
| Address: | 290 Woodcliff Drive | |
| Fairport, NY 14450 | ||
| Age: | 55 | |
| Current Position(s) Held with Fund: | Vice President | |
| Term of Office1 & Length of Time Served: | Since 2004 | |
| Principal Occupation(s) During Past 5 Years: | President since 2010, Co-CEO since 2018, Co-Director of | |
| Research (2002 - 2015) - Manning & Napier Advisors, LLC Holds one or more of the following titles for various subsidiaries and affiliates: President, Director, Treasurer, or Senior Trust Officer | ||
| Name: | Elizabeth Craig | |
| Address: | 290 Woodcliff Drive | |
| Fairport, NY 14450 | ||
| Age: | 31 | |
| Current Position(s) Held with Fund: | Corporate Secretary | |
| Term of Office1 & Length of Time Served: | Since 2016 | |
| Principal Occupation(s) During Past 5 Years: | Fund Administration Manager since 2015; Mutual Fund Compliance | |
| Specialist (2009-2015) - Manning & Napier Advisors, LLC; Assistant Corporate Secretary (2011-2016) - Manning & Napier Fund, Inc. | ||
25
Disciplined Value Series
Directors’ and Officers’ Information
(unaudited)
| Officers: (continued) | ||
| Name: | Christine Glavin | |
| Address: | 290 Woodcliff Drive | |
| Fairport, NY 14450 | ||
| Age: | 52 | |
| Current Position(s) Held with Fund: | Principal Financial Officer, Chief Financial Officer | |
| Term of Office1 & Length of Time Served: | Principal Financial Officer since 2002; Chief Financial Officer since 2001 | |
| Principal Occupation(s) During Past 5 Years: | Director of Fund Reporting since 2011; Fund Reporting | |
| Manager (1997-2011) - Manning & Napier Advisors, LLC; Assistant Treasurer since 2008 - Exeter Trust Company; Chief Financial Officer (2017-2018) - Rainier Investment Management Mutual Funds, Inc. | ||
| ||
| Name: | Jodi L. Hedberg | |
| Address: | 290 Woodcliff Drive | |
| Fairport, NY 14450 | ||
| Age: | 50 | |
| Current Position(s) Held with Fund: | Chief Compliance Officer, Anti-Money Laundering Compliance Officer | |
| Term of Office1 & Length of Time Served: | Chief Compliance Officer since 2004; Anti-Money | |
| Laundering Officer since 2002; Corporate Secretary (1997-2016) - Manning & Napier Fund, Inc.; Chief Compliance Officer and Anti-Money Laundering Officer (2017-2018) - Rainier Investment Management Mutual Funds, Inc. | ||
| Principal Occupation(s) During Past 5 Years: | Managing Director, Compliance & Regulatory Affairs since 2018; Director of Compliance (2005-2018); Compliance Manager (1995-2005) - Manning & Napier Advisors, LLC and affiliates; Corporate Secretary - Manning & Napier Investor Services, Inc. since 2006 | |
| ||
| Name: | Scott Morabito | |
| Address: | 290 Woodcliff Drive | |
| Fairport, NY 14450 | ||
| Age: | 30 | |
| Current Position(s) Held with Fund: | Assistant Vice President | |
| Term of Office1 & Length of Time Served: | Since 2017 | |
| Principal Occupation(s) During Past 5 Years: | Director of Funds Group since 2017; Fund Product and | |
| Strategy Manager (2014-2017); Senior Product and Strategy Analyst (2013-2014); Product and Strategy Analyst (2011-2013) - Manning & Napier Advisors, LLC. | ||
| ||
| Name: | Sarah Turner | |
| Address: | 290 Woodcliff Drive | |
| Fairport, NY 14450 | ||
| Age: | 36 | |
| Current Position(s) Held with Fund: | Chief Legal Officer; Assistant Corporate Secretary | |
| Term of Office1 & Length of Time Served: | Since 2018 | |
| Principal Occupation(s) During Past 5 Years: | General Counsel since 2018 - Manning & Napier Advisors, LLC and affiliates; Counsel (2017-2018) - Harter Secrest and Emery LLP; Legal Counsel (2010-2017) – Manning & Napier Advisors, LLC and affiliates Holds one or more of the following titles for various affiliates: Corporate Secretary, General Counsel | |
| ||
| Name: | Amy Williams | |
| Address: | 290 Woodcliff Drive | |
| Fairport, NY 14450 | ||
| Age: | 56 | |
| Current Position(s) Held with Fund: | Assistant Corporate Secretary | |
| Term of Office1 & Length of Time Served: | Since 2016 | |
| Principal Occupation(s) During Past 5 Years: | Director of Fund Documentation - Manning & Napier Advisors, LLC since 2009 | |
| Holds one or more of the following titles for various affiliates: Director | ||
| ||
*At a meeting of the Board of Directors held on November 15, 2018, the Board accepted the resignation of Michele T. Mosca from her positions as Principal Executive Officer, President, Chair and Interested Director of the Fund and appointed Paul J. Battaglia to each of the resigned positions effective immediately. Interested Director, within the meaning of the 1940 Act by reason of his positions with the Fund’s investment advisor, Manning & Napier Advisors, LLC.
1The term of office of all officers shall be one year and until their respective successors are chosen and qualified, or his or her earlier resignation or removal as provided in the Fund’s By-Laws.
26
Disciplined Value Series
Literature Requests
(unaudited)
Proxy Voting Policies and Procedures
A description of the policies and procedures that the Fund uses to determine how to vote proxies relating to portfolio securities is available, without charge, upon request:
| By phone | 1-800-466-3863 | |||
| On the Securities and Exchange | ||||
| Commission’s (SEC) web site | http://www.sec.gov |
Proxy Voting Record
Information regarding how the Fund voted proxies relating to portfolio securities during the most recent 12-month period ended June 30th is available, without charge, upon request:
| By phone | 1-800-466-3863 | |||
| On the SEC’s web site | http://www.sec.gov |
Quarterly Portfolio Holdings
The Series’ complete schedule of portfolio holdings for the 1st and 3rd quarters of each fiscal year are provided on Form N-Q, and are available, without charge, upon request:
| By phone | 1-800-466-3863 | |||
| On the SEC’s web site | http://www.sec.gov |
The Series’ Form N-Q may be reviewed and copied at the SEC’s Public Reference Room in Washington, D.C. Information on the operation of the Public Reference Room may be obtained by calling 1-800-SEC-0330.
Prospectus and Statement of Additional Information (SAI)
For more information about any of the Manning & Napier Fund, Inc. Series, you may obtain a prospectus and SAI at www.manning-napier.com or by calling (800) 466-3863. Before investing, carefully consider the objectives, risks, charges and expenses of the investment and read the prospectus carefully as it contains this and other information about the investment company. In addition, this information can be found on the SEC’s web site, http://www.sec.gov.
Additional information available at www.manning-napier.com
1. Fund Holdings - Month-End
2. Fund Holdings - Quarter-End
3. Shareholder Report - Annual
4. Shareholder Report - Semi-Annual
The Fund also offers electronic notification or “e-delivery” when certain documents are available on-line to be downloaded or reviewed. Direct shareholders can elect to receive electronic notification when shareholder reports, prospectus updates, and/or statements are available. If you do not currently have on-line access to your account, you can establish access by going to www.manning-napier.com, click on “Login” in the top corner of the page, and follow the prompts to self-enroll. Once enrolled, you can set your electronic notification preferences by clicking on the Account Options tab located within the green toolbar and then select E-Delivery Option. Should you have any questions on either how to establish on-line access or how to update your account settings, please contact Investor Services at 1-800-466-3863.
The Manning & Napier Fund, Inc. is managed by Manning & Napier Advisors, LLC. Manning & Napier Investor Services, Inc., an affiliate of Manning & Napier Advisors, LLC, is the distributor of the Fund shares.
MNDIV-10/18-AR

Overseas Series
Management Discussion and Analysis
(unaudited)
Dear Shareholders:
The investment environment witnessed over the past twelve months was more volatile and bifurcated than what was experienced in prior years. For the fiscal year ending on October 31, 2018, international equity performance was decidedly poor as the MSCI ACWI ex USA Index fell 8.24%.
Going forward, we believe the volatility experienced in October, as well as during the first few months of 2018, is likely to be reflective of what investors should come to expect going forward. While we do not anticipate an imminent recession, we see recent developments within the US and abroad as an indication that we are entering a higher risk regime for risk assets over the next twelve months.
The US is likely approaching a period of peak growth and continues to show signs of progressing further into late cycle territory, with potential spillover effects into the global economy. At the same time, key global risks are rising, including trade tensions, global growth concerns, and geopolitical uncertainty, all of which have continued escalating throughout 2018.
Given our updated outlook, we are reviewing late cycle risks in current and prospective investments and have adjusted our positioning across many of our portfolios. Going forward, we will continue to follow our disciplines, choosing to be selective in our investment decisions and seeking to avoid overvalued areas of the market.
With this in mind, we discuss recent fund performance in the enclosed, highlight how we are positioned amid the current economic environment, and provide our outlook of what to expect in financial markets.
We hope that you find this information helpful, and look forward to working with you in the years ahead to help you meet your investment goals.
Sincerely,
Manning & Napier Advisors, LLC
The MSCI ACWI ex USA Index (ACWIxUS) is designed to measure large and mid-cap representation across 22 of 23 Developed Markets countries (excluding the U.S.) and 24 Emerging Markets countries. The Index returns do not reflect any fees or expenses. The Index is denominated in U.S. dollars. The Index returns are net of withholding taxes. They assume daily reinvestment of net dividends thus accounting for any applicable dividend taxation. Index returns provided by Morningstar.
© 2018 Morningstar, Inc. All rights reserved. The information contained herein: (1) is proprietary to Morningstar and/or its content providers; (2) may not be copied, adapted or distributed; and (3) is not warranted to be accurate, complete or timely. Neither Morningstar nor its content providers are responsible for any damages or losses arising from any use of this information, except where such damages or losses cannot be limited or excluded by law in your jurisdiction. Past financial performance is no guarantee of future results.
1
Overseas Series
Fund Commentary
(unaudited)
Investment Objective
To maximize long-term growth by investing principally in the common stocks of companies located around the world. The Series invests primarily in foreign companies, including those in developed and emerging markets.
Performance Commentary
International equity markets generally delivered negative absolute returns for the twelve-month period ended October 31, 2018. The broad MSCI ACWI ex USA Index (ACWIxUS) returned -8.24%. Emerging market equities generally underperformed developed markets during the period, and the US dollar generally appreciated during the year which challenged international equity returns for US-based investors.
The Overseas Series Class S returned -8.96% during the year, underperforming the ACWIxUS benchmark on a relative basis. Importantly, the Series has provided robust positive absolute returns over the current international stock market cycle, which began in April 2003.
The Series’ underperformance relative to the ACWIxUS during the year was driven by country positioning and stock selection. Conversely, sector positioning aided relative returns. The most notable detractors from relative performance was stock selection in Consumer Staples, Financials, Communication Services, and Energy, as well as an underweight to Energy. This was offset with strong stock selection in Consumer Discretionary, Information Technology, Industrials, and Health Care. Overweights to Health Care and Consumer Staples and an underweight to Financials also contributed to relative returns.
From a country basis, stock selection in France, Japan, and Belgium provided the biggest headwinds to relative performance, along with an overweight to Belgium and an underweight to Japan, while stock selection in Canada, Ireland, Germany, and the Netherlands was a positive contributor.
Our increased concern for global growth and view that we are moving into late cycle territory has led to meaningful allocations to Health Care and Consumer Staples. The Series has underweight allocations to some of the more economically sensitive sectors like Financials, Energy, Consumer Discretionary, and Information Technology. We have generally found the more yield-oriented segments to be overvalued given the lower growth prospects, which has resulted in underweight allocations to Utilities and Real Estate. Regionally, the Series is meaningfully overweight to Europe and the Middle East and underweight to Asia, with the largest single country underweight to Japan. The Series is also currently underweight Emerging Markets.
Please see the next page for additional performance information as of October 31, 2018.
Performance data quoted represents past performance and does not guarantee future results. The investment return and principal value of an investment will fluctuate, so that an investor’s shares, when redeemed, may be worth more or less than their original cost. Current performance may be higher or lower than that quoted; investors can obtain the most recent month-end performance at www.manning-napier.com or by calling (800) 466-3863.
All investments involve risks, including possible loss of principal. Funds whose investments are concentrated in foreign countries may be subject to fluctuating currency values, different accounting standards, and economic and political instability. The value of the Series may be affected by changes in exchange rates between foreign currencies and the U.S. dollar. Investments in emerging markets may be more volatile than investments in more developed markets. Commentary prepared using data provided by FactSet. Analysis Manning & Napier. Commentary presented is relative to the MSCI ACWI ex USA Index. Additional information and associated disclosures can be found on the Performance Update page of this report.
2
Overseas Series
Performance Update as of October 31, 2018
(unaudited)
AVERAGE ANNUAL TOTAL RETURNS AS OF OCTOBER 31, 2018 | ||||||||||||
ONE YEAR1 | FIVE YEAR | TEN YEAR | ||||||||||
Manning & Napier Fund, Inc. - Overseas Series - Class I2 | -8.73 | % | -0.05 | % | 5.82 | % | ||||||
Manning & Napier Fund, Inc. - Overseas Series - Class S2,3 | -8.96 | % | -0.34 | % | 5.52 | % | ||||||
Manning & Napier Fund, Inc. - Overseas Series - Class Z2,4 | -8.64 | % | -0.04 | % | 5.83 | % | ||||||
MSCI ACWI ex USA Index5 | -8.24 | % | 1.63 | % | 6.92 | % | ||||||
The following graph compares the value of a $1,000,000 investment in the Manning & Napier Fund, Inc. - Overseas Series - Class I for the ten years ended October 31, 2018 to the MSCI ACWI ex USA Index.
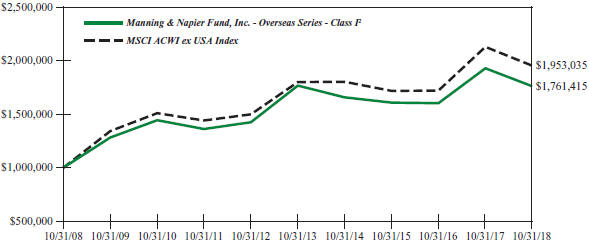
1The returns shown are based on net asset values calculated for shareholder transactions and may differ from the returns shown in the financial highlights, which reflect adjustments made to the net asset values in accordance with accounting principles generally accepted in the United States of America.
2The Series’ performance does not reflect the deduction of taxes that a shareholder would pay on fund distributions or the redemption of shares. The Series’ performance is historical and may not be indicative of future results. The performance returns shown are inclusive of the net expense ratio of the Series. For the year ended October 31, 2018, this net expense ratio was 0.75% for Class I, 1.05% for Class S and 0.65% for Class Z. The gross expense ratio, which does not account for any voluntary or contractual waivers currently in effect, was 0.77% for Class I, 1.11% for Class S and 0.74% for Class Z for the year ended October 31, 2018.
3For periods through the inception of Class S on September 21, 2018 the performance is hypothetical and is based on the historical performance of Class I shares adjusted for Class S shares’ charges and expenses.
4For periods through the inception of Class Z on May 1, 2018, performance is based on the historical performance of Class I shares. Because the Class Z shares invest in the same portfolio of securities as the Class I shares, performance will be different only to the extent that Class I shares have a higher expense ratio.
5The MSCI ACWI ex USA Index (ACWIxUS) is designed to measure large and mid-cap representation across 22 of 23 Developed Markets countries (excluding the U.S.) and 24 Emerging Markets countries. The Index returns do not reflect any fees or expenses. The Index is denominated in U.S. dollars. The Index returns are net of withholding taxes. They assume daily reinvestment of net dividends thus accounting for any applicable dividend taxation. Index returns provided by Bloomberg.
3
Overseas Series
Shareholder Expense Example
(unaudited)
As a shareholder of the Series, you incur ongoing costs, including management fees, shareholder service fees and other Series expenses. This example is intended to help you understand your ongoing costs (in dollars) of investing in the Series and to compare these costs with the ongoing costs of investing in other mutual funds.
The example is based on an investment of $1,000 invested at the beginning of the period and held for the entire period (May 1, 2018 to October 31, 2018).
Actual Expenses
The first line of the table below provides information about actual account values and actual expenses. You may use the information in this line, together with the amount you invested, to estimate the expenses that you paid over the period. Simply divide your account value by $1,000 (for example, an $8,600 account value divided by $1,000 = 8.6), then multiply the result by the number in the first line under the heading entitled “Expenses Paid During Period” to estimate the expenses you paid on your account during this period.
Hypothetical Example for Comparison Purposes
The second line of the table below provides information about hypothetical account values and hypothetical expenses based on the Series’ actual expense ratio and an assumed rate of return of 5% per year before expenses, which is not the Series’ actual return. The hypothetical account values and expenses may not be used to estimate the actual ending account balance or expenses you paid during the period. You may use this information to compare the ongoing costs of investing in the Series and other funds. To do so, compare this 5% hypothetical example with the 5% hypothetical examples that appear in the shareholder reports of the other funds.
Please note that the expenses shown in the table are meant to highlight your ongoing costs only and do not reflect any transaction costs, such as sales charges (loads), redemption fees, or exchange fees that you may incur in other mutual funds. Therefore, the second line of the table is useful in comparing ongoing costs only, and will not help you determine the relative total costs of owning different funds.
| BEGINNING ACCOUNT VALUE 5/1/18 | ENDING ACCOUNT VALUE 10/31/18 | EXPENSES PAID DURING PERIOD 5/1/18-10/31/18* | ANNUALIZED EXPENSE RATIO | |||||
Class I | ||||||||
Actual | $1,000.00 | $891.43 | $3.58 | 0.75% | ||||
| Hypothetical (5% return before expenses) | $1,000.00 | $1,021.42 | $3.82 | 0.75% | ||||
Class S | ||||||||
Actual | $1,000.00 | $896.80 | $1.09 | 1.05% | ||||
| Hypothetical (5% return before expenses) | $1,000.00 | $1,004.33 | $1.15 | 1.05% | ||||
Class Z | ||||||||
Actual | $1,000.00 | $892.90 | $3.08 | 0.65% | ||||
| Hypothetical (5% return before expenses) | $1,000.00 | $1,021.81 | $3.29 | 0.65% |
*Expenses are equal to the Series’ annualized expense ratio (for the six-month period), multiplied by the average account value over the period, multiplied by 184/365 (to reflect the one-half year period). Expenses are based on the most recent fiscal half year; therefore, the expense ratios stated above may differ from the expense ratios stated in the financial highlights, which are based on one-year data.
4
Overseas Series
Portfolio Composition as of October 31, 2018
(unaudited)
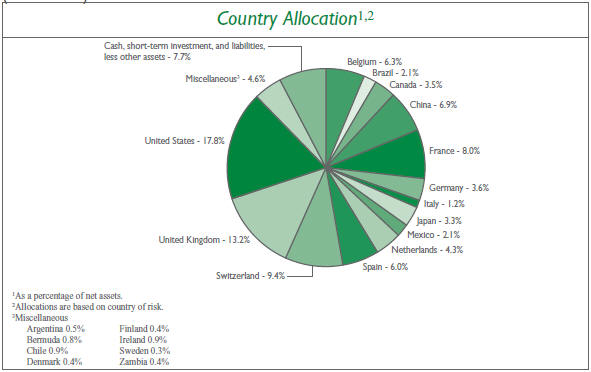
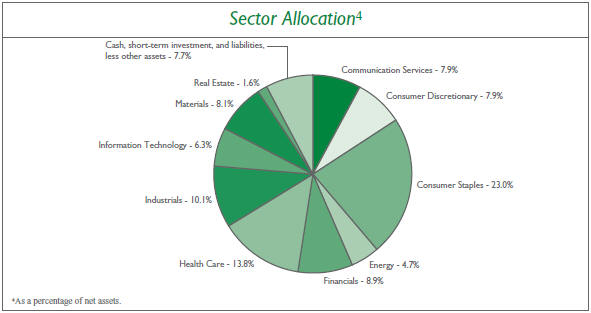
5
Overseas Series
Investment Portfolio - October 31, 2018
SHARES | VALUE | |||||||
| (NOTE 2) | ||||||||
COMMON STOCKS - 92.3% | ||||||||
Communication Services - 7.9% | ||||||||
Entertainment - 3.0% | ||||||||
NetEase, Inc. - ADR (China) | 56,580 | $ | 11,760,153 | |||||
Nexon Co. Ltd. (Japan)* | 954,500 | 10,888,219 | ||||||
|
| |||||||
| 22,648,372 | ||||||||
|
| |||||||
Interactive Media & Services - 2.4% | ||||||||
Tencent Holdings Ltd. - Class H (China) | 517,700 | 17,736,021 | ||||||
|
| |||||||
Media - 2.5% | ||||||||
Quebecor, Inc. - Class B (Canada) | 488,383 | 9,578,829 | ||||||
Shaw Communications, Inc. - Class B (Canada) | 484,230 | 9,015,517 | ||||||
|
| |||||||
| 18,594,346 | ||||||||
|
| |||||||
Total Communication Services | 58,978,739 | |||||||
|
| |||||||
Consumer Discretionary - 7.9% | ||||||||
Hotels, Restaurants & Leisure - 1.8% | ||||||||
Accor S.A. (France) | 291,718 | 13,329,230 | ||||||
|
| |||||||
Internet & Direct Marketing Retail - 2.9% | ||||||||
Alibaba Group Holding Ltd. - ADR (China)* | 124,715 | 17,744,450 | ||||||
Despegar.com Corp. (Argentina)* | 237,835 | 3,822,009 | ||||||
|
| |||||||
| 21,566,459 | ||||||||
|
| |||||||
Specialty Retail - 1.1% | ||||||||
Industria de Diseno Textil S.A. (Spain) | 290,360 | 8,183,666 | ||||||
|
| |||||||
Textiles, Apparel & Luxury Goods - 2.1% | ||||||||
lululemon athletica, Inc. (United States)* | 112,890 | 15,887,010 | ||||||
|
| |||||||
Total Consumer Discretionary | 58,966,365 | |||||||
|
| |||||||
Consumer Staples - 23.0% | ||||||||
Beverages - 9.1% | ||||||||
Ambev S.A. - ADR (Brazil) | 3,625,746 | 15,699,480 | ||||||
Anheuser-Busch InBev S.A./N.V. (Belgium) | 366,700 | 27,121,484 | ||||||
Diageo plc (United Kingdom) | 726,540 | 25,117,593 | ||||||
|
| |||||||
| 67,938,557 | ||||||||
|
| |||||||
Food Products - 6.0% | ||||||||
Danone S.A. (France) | 261,625 | 18,526,454 | ||||||
Nestle S.A. (Switzerland) | 312,760 | 26,404,172 | ||||||
|
| |||||||
| 44,930,626 | ||||||||
|
| |||||||
Personal Products - 6.0% | ||||||||
Beiersdorf AG (Germany) | 126,936 | 13,124,777 | ||||||
Unilever plc - ADR (United Kingdom) | 589,040 | 31,207,339 | ||||||
|
| |||||||
| 44,332,116 | ||||||||
|
| |||||||
The accompanying notes are an integral part of the financial statements.
6
Overseas Series
Investment Portfolio - October 31, 2018
| VALUE | ||||||||
| SHARES | (NOTE 2) | |||||||
COMMON STOCKS (continued) | ||||||||
Consumer Staples (continued) | ||||||||
Tobacco - 1.9% | ||||||||
British American Tobacco plc - ADR (United Kingdom) | 328,770 | $ | 14,268,618 | |||||
|
| |||||||
Total Consumer Staples | 171,469,917 | |||||||
|
| |||||||
Energy - 4.7% | ||||||||
Energy Equipment & Services - 3.7% | ||||||||
Schlumberger Ltd. (United States) | 546,940 | 28,063,492 | ||||||
|
| |||||||
Oil, Gas & Consumable Fuels - 1.0% | ||||||||
Cameco Corp. (Canada) | 674,095 | 7,226,298 | ||||||
|
| |||||||
Total Energy | 35,289,790 | |||||||
|
| |||||||
Financials - 8.9% | ||||||||
Banks - 6.9% | ||||||||
The Bank Of N.T. Butterfield & Son Ltd. (Bermuda) | 151,805 | 6,116,224 | ||||||
Bankia S.A. (Spain) | 3,625,191 | 11,386,871 | ||||||
Bankinter S.A. (Spain) | 1,506,305 | 12,341,094 | ||||||
CaixaBank S.A. (Spain) | 3,113,675 | 12,600,077 | ||||||
FinecoBank Banca Fineco S.p.A. (Italy) | 851,045 | 8,894,758 | ||||||
|
| |||||||
| 51,339,024 | ||||||||
|
| |||||||
Capital Markets - 2.0% | ||||||||
Julius Baer Group Ltd. (Switzerland) | 327,220 | 14,922,797 | ||||||
|
| |||||||
Total Financials | 66,261,821 | |||||||
|
| |||||||
Health Care - 13.8% | ||||||||
Health Care Equipment & Supplies - 3.7% | ||||||||
Medtronic plc (United States) | 263,090 | 23,630,744 | ||||||
Shandong Weigao Group Medical Polymer Co. Ltd. - Class H (China) | 4,733,867 | 4,240,354 | ||||||
|
| |||||||
| 27,871,098 | ||||||||
|
| |||||||
Life Sciences Tools & Services - 2.4% | ||||||||
QIAGEN N.V. (United States)* | 202,104 | 7,336,375 | ||||||
QIAGEN N.V. (United States)* | 288,307 | 10,465,120 | ||||||
|
| |||||||
| 17,801,495 | ||||||||
|
| |||||||
Pharmaceuticals - 7.7% | ||||||||
Merck KGaA (Germany) | 58,535 | 6,263,401 | ||||||
Novartis AG - ADR (Switzerland) | 332,195 | 29,053,775 | ||||||
Perrigo Co. plc (United States) | 310,145 | 21,803,194 | ||||||
|
| |||||||
| 57,120,370 | ||||||||
|
| |||||||
Total Health Care | 102,792,963 | |||||||
|
| |||||||
Industrials - 10.1% | ||||||||
Aerospace & Defense - 1.9% | ||||||||
BAE Systems plc (United Kingdom) | 2,145,535 | 14,386,430 | ||||||
|
| |||||||
The accompanying notes are an integral part of the financial statements.
7
Overseas Series
Investment Portfolio - October 31, 2018
| VALUE | ||||||||
| SHARES | (NOTE 2) | |||||||
COMMON STOCKS (continued) | ||||||||
Industrials (continued) | ||||||||
Airlines - 0.9% | ||||||||
Ryanair Holdings plc - ADR (Ireland)* | 83,810 | $ | 6,939,468 | |||||
|
| |||||||
Construction & Engineering - 2.5% | ||||||||
FLSmidth & Co. A/S (Denmark) | 60,863 | 3,193,514 | ||||||
Vinci S.A. (France) | 176,120 | 15,674,485 | ||||||
|
| |||||||
| 18,867,999 | ||||||||
|
| |||||||
Machinery - 2.5% | ||||||||
Epiroc AB - Class A (Sweden)* | 212,260 | 1,863,942 | ||||||
Metso OYJ (Finland) | 86,946 | 2,745,037 | ||||||
The Weir Group plc (United Kingdom) | 682,921 | 13,819,959 | ||||||
|
| |||||||
| 18,428,938 | ||||||||
|
| |||||||
Trading Companies & Distributors - 1.0% | ||||||||
Brenntag AG (Germany) | 143,882 | 7,514,140 | ||||||
|
| |||||||
Transportation Infrastructure - 1.3% | ||||||||
Grupo Aeroportuario del Centro Norte S.A.B. de C.V. (Mexico) | 883,100 | 4,625,208 | ||||||
Grupo Aeroportuario del Pacifico S.A.B. de C.V. - ADR (Mexico) | 57,715 | 4,783,419 | ||||||
|
| |||||||
| 9,408,627 | ||||||||
|
| |||||||
Total Industrials | 75,545,602 | |||||||
|
| |||||||
Information Technology - 6.3% | ||||||||
Electronic Equipment, Instruments & Components - 1.9% | ||||||||
Keyence Corp. (Japan) | 28,100 | 13,727,407 | ||||||
|
| |||||||
IT Services - 4.4% | ||||||||
Amdocs Ltd. (United States) | 401,971 | 25,432,705 | ||||||
InterXion Holding N.V. (Netherlands)* | 130,005 | 7,653,394 | ||||||
|
| |||||||
| 33,086,099 | ||||||||
|
| |||||||
Total Information Technology | 46,813,506 | |||||||
|
| |||||||
Materials - 8.1% | ||||||||
Chemicals - 6.8% | ||||||||
Akzo Nobel N.V. (Netherlands) | 291,310 | 24,459,718 | ||||||
Mexichem S.A.B. de C.V. (Mexico) | 2,344,600 | 6,132,382 | ||||||
Solvay S.A. (Belgium) | 176,180 | 20,068,086 | ||||||
|
| |||||||
| 50,660,186 | ||||||||
|
| |||||||
Metals & Mining - 1.3% | ||||||||
Antofagasta plc (Chile) | 356,745 | 3,571,027 | ||||||
First Quantum Minerals Ltd. (Zambia) | 314,985 | 3,143,988 | ||||||
Lundin Mining Corp. (Chile) | 812,518 | 3,339,073 | ||||||
|
| |||||||
| 10,054,088 | ||||||||
|
| |||||||
Total Materials | 60,714,274 | |||||||
|
| |||||||
The accompanying notes are an integral part of the financial statements.
8
Overseas Series
Investment Portfolio - October 31, 2018
| VALUE | ||||||||
| SHARES | (NOTE 2) | |||||||
COMMON STOCKS (continued) | ||||||||
Real Estate - 1.6% | ||||||||
Equity Real Estate Investment Trusts (REITS) - 1.6% | ||||||||
Unibail-Rodamco-Westfield (France) | 64,795 | $ | 11,725,182 | |||||
|
| |||||||
TOTAL COMMON STOCKS | ||||||||
(Identified Cost $744,170,298) | 688,558,159 | |||||||
|
| |||||||
SHORT-TERM INVESTMENT - 4.5% | ||||||||
Dreyfus Government Cash Management, Institutional Shares1, 2.05% | ||||||||
(Identified Cost $33,900,860) | 33,900,860 | 33,900,860 | ||||||
|
| |||||||
TOTAL INVESTMENTS - 96.8% | ||||||||
(Identified Cost $778,071,158) | 722,459,019 | |||||||
OTHER ASSETS, LESS LIABILITIES - 3.2% | 23,682,448 | |||||||
|
| |||||||
NET ASSETS - 100% | $ | 746,141,467 | ||||||
|
| |||||||
ADR - American Depositary Receipt
*Non-income producing security.
1Rate shown is the current yield as of October 31, 2018.
The Series’ portfolio holds, as a percentage of net assets, greater than 10% in the following countries:
United States - 17.8%; United Kingdom - 13.2%.
The Global Industry Classification Standard (GICS) was developed by and is the exclusive property and a service mark of MSCI Inc. (MSCI) and Standard & Poor’s, a division of The McGraw-Hill Companies, Inc. (S&P), and is licensed for use by Manning & Napier when referencing GICS sectors. Neither MSCI, S&P, nor any third party involved in making or compiling the GICS or any GICS classifications makes any express or implied warranties or representations with respect to such standard or classification, nor shall any such party have any liability therefrom.
The accompanying notes are an integral part of the financial statements.
9
Overseas Series
Statement of Assets & Liabilities
October 31, 2018
ASSETS: | ||||
Investments, at value (identified cost $778,071,158) (Note 2) | $ | 722,459,019 | ||
Foreign currency, at value (identified cost $114,780) | 113,671 | |||
Receivable for securities sold | 18,335,376 | |||
Foreign tax reclaims receivable | 10,102,856 | |||
Dividends receivable | 727,830 | |||
Receivable for fund shares sold | 193,221 | |||
Interest receivable | 36,233 | |||
Prepaid expenses | 11,834 | |||
|
| |||
TOTAL ASSETS | 751,980,040 | |||
|
| |||
LIABILITIES: | ||||
Accrued management fees (Note 3) | 361,053 | |||
Accrued sub-transfer agent fees (Note 3) | 127,469 | |||
Accrued distribution and service (Rule 12b-1) fees (Class S)(Note 3) | 114,180 | |||
Accrued fund accounting and administration fees (Note 3) | 44,285 | |||
Accrued Chief Compliance Officer service fees (Note 3) | 401 | |||
Payable for fund shares repurchased | 512,221 | |||
Payable for securities purchased | 4,390,683 | |||
Other payables and accrued expenses | 288,281 | |||
|
| |||
TOTAL LIABILITIES | 5,838,573 | |||
|
| |||
TOTAL NET ASSETS | $ | 746,141,467 | ||
|
| |||
NET ASSETS CONSIST OF: | ||||
Capital stock | $ | 336,485 | ||
Additional paid-in-capital | 1,299,490,373 | |||
Total distributable earnings (loss) | (553,685,391 | ) | ||
|
| |||
TOTAL NET ASSETS | $ | 746,141,467 | ||
|
| |||
NET ASSET VALUE, OFFERING PRICE AND REDEMPTION PRICE PER SHARE - Class I | ||||
($140,653,287/6,342,720 shares) | $ | 22.18 | ||
|
| |||
NET ASSET VALUE, OFFERING PRICE AND REDEMPTION PRICE PER SHARE - Class S | ||||
($500,950,427/22,594,311 shares) | $ | 22.17 | ||
|
| |||
NET ASSET VALUE, OFFERING PRICE AND REDEMPTION PRICE PER SHARE - Class Z | ||||
($104,537,753/4,711,514 shares) | $ | 22.19 | ||
|
| |||
The accompanying notes are an integral part of the financial statements.
10
Overseas Series
Statement of Operations
For the Year Ended October 31, 2018
INVESTMENT INCOME: | ||||
Dividends (net of foreign taxes withheld, $1,265,533) | $ | 10,696,425 | ||
|
| |||
EXPENSES: | ||||
Management fees (Note 3) | 3,152,469 | |||
Sub-transfer agent fees (Note 3) | 201,938 | |||
Distribution and service (Rule 12b-1) fees (Class S) (Note 3) | 150,333 | |||
Fund accounting and administration fees (Note 3) | 90,951 | |||
Directors’ fees (Note 3) | 38,104 | |||
Chief Compliance Officer service fees (Note 3) | 4,385 | |||
Custodian fees | 121,835 | |||
Miscellaneous | 423,857 | |||
|
| |||
Total Expenses | 4,183,872 | |||
Less reduction of expenses (Note 3) | (161,051 | ) | ||
|
| |||
Net Expenses | 4,022,821 | |||
|
| |||
NET INVESTMENT INCOME | 6,673,604 | |||
|
| |||
REALIZED AND UNREALIZED GAIN (LOSS) ON INVESTMENTS AND FOREIGN CURRENCY: | ||||
Net realized gain (loss) on- | ||||
Investments | 72,047,277 | |||
Foreign currency and translation of other assets and liabilities | 196,807 | |||
|
| |||
| 72,244,084 | ||||
|
| |||
Net change in unrealized appreciation (depreciation) on- | ||||
Investments | (154,250,689 | ) | ||
Foreign currency and translation of other assets and liabilities | (262,369 | ) | ||
|
| |||
| (154,513,058 | ) | |||
|
| |||
NET REALIZED AND UNREALIZED GAIN (LOSS) ON INVESTMENTS AND FOREIGN CURRENCY | (82,268,974 | ) | ||
|
| |||
NET DECREASE IN NET ASSETS RESULTING FROM OPERATIONS | $ | (75,595,370 | ) | |
|
| |||
The accompanying notes are an integral part of the financial statements.
11
Overseas Series
Statements of Changes in Net Assets
FOR THE YEAR 10/31/18 | FOR THE YEAR ENDED 10/31/17 | |||||||
INCREASE (DECREASE) IN NET ASSETS: | ||||||||
OPERATIONS: | ||||||||
Net investment income | $ | 6,673,604 | $ | 10,274,321 | ||||
Net realized gain (loss) on investments and foreign currency | 72,244,084 | 58,104,182 | ||||||
Net change in unrealized appreciation (depreciation) on investments and foreign currency | (154,513,058 | ) | 101,467,459 | |||||
|
|
|
| |||||
Net increase (decrease) from operations | (75,595,370 | ) | 169,845,962 | |||||
|
|
|
| |||||
DISTRIBUTIONS TO SHAREHOLDERS (Note 9): | ||||||||
Class I | (10,748,629 | ) | (15,662,741 | )* | ||||
|
|
|
| |||||
CAPITAL STOCK ISSUED AND REPURCHASED: | ||||||||
Net increase (decrease) from capital share transactions (Note 5) | 77,003,717 | (332,306,533 | ) | |||||
|
|
|
| |||||
Net decrease in net assets | (9,340,282 | ) | (178,123,312 | ) | ||||
NET ASSETS: | ||||||||
Beginning of year | 755,481,749 | 933,605,061 | ||||||
|
|
|
| |||||
End of year | $ | 746,141,467 | $ | 755,481,749 | ||||
|
|
|
| |||||
*For the year ended October 31, 2017, the distributions to shareholders from net investment income for Class I was $15,662,741.
The accompanying notes are an integral part of the financial statements.
12
Overseas Series
Financial Highlights - Class I*
| FOR THE YEAR ENDED | ||||||||||||||||||||
10/31/18 |
10/31/17 |
10/31/16 |
10/31/15 |
10/31/14 | ||||||||||||||||
Per share data (for a share outstanding throughout each year): | ||||||||||||||||||||
Net asset value- Beginning of year | $ | 24.73 | $ | 20.88 | $ | 21.34 | $ | 24.31 | $ | 27.39 | ||||||||||
|
|
|
|
|
|
|
|
|
| |||||||||||
Income (loss) from investment operations: | ||||||||||||||||||||
Net investment income1 | 0.41 | 0.26 | 0.32 | 0.32 | 0.36 | |||||||||||||||
Net realized and unrealized gain (loss) on investments | (2.51 | ) | 3.94 | (0.41 | ) | (1.14 | ) | (1.98 | ) | |||||||||||
|
|
|
|
|
|
|
|
|
| |||||||||||
Total from investment operations | (2.10 | ) | 4.20 | (0.09 | ) | (0.82 | ) | (1.62 | ) | |||||||||||
|
|
|
|
|
|
|
|
|
| |||||||||||
Less distributions to shareholders: | ||||||||||||||||||||
From net investment income | (0.45 | ) | (0.35 | ) | (0.37 | ) | (0.36 | ) | (0.37 | ) | ||||||||||
From net realized gain on investments | — | — | — | (1.79 | ) | (1.09 | ) | |||||||||||||
|
|
|
|
|
|
|
|
|
| |||||||||||
Total distributions to shareholders | (0.45 | ) | (0.35 | ) | (0.37 | ) | (2.15 | ) | (1.46 | ) | ||||||||||
|
|
|
|
|
|
|
|
|
| |||||||||||
Net asset value - End of year | $ | 22.18 | $ | 24.73 | $ | 20.88 | $ | 21.34 | $ | 24.31 | ||||||||||
|
|
|
|
|
|
|
|
|
| |||||||||||
Net assets - End of year (000’s omitted) | $ | 140,653 | $ | 755,482 | $ | 933,605 | $ | 1,725,278 | $ | 2,652,308 | ||||||||||
|
|
|
|
|
|
|
|
|
| |||||||||||
Total return2 | (8.69 | %) | 20.49 | %3 | (0.35 | %) | (3.02 | %) | (6.13 | %) | ||||||||||
Ratios (to average net assets)/Supplemental Data: | ||||||||||||||||||||
Expenses** | 0.75 | % | 0.75 | % | 0.75 | % | 0.74 | % | 0.74 | % | ||||||||||
Net investment income | 1.62 | % | 1.16 | % | 1.54 | % | 1.41 | % | 1.37 | % | ||||||||||
Portfolio turnover | 34 | % | 44 | % | 37 | % | 59 | % | 39 | % | ||||||||||
| *Effective March 1, 2017, Class A shares of the Series have been redesignated as Class I shares. |
| |||||||||||||||||||
| **For certain periods presented, the investment advisor did not impose all or a portion of its management and/or other fees, and in some years may have paid a portion of the Series’ expenses. If these expenses had been incurred by the Series, the expense ratio (to average net assets) would have increased by the following amounts: |
| |||||||||||||||||||
| 0.02 | % | 0.02 | % | N/A | N/A | N/A | ||||||||||||||
1Calculated based on average shares outstanding during the years.
2Represents aggregate total return for the year indicated, and assumes reinvestment of all distributions. Total return would have been lower had certain expenses not been waived during certain years.
3Includes litigation proceeds. Excluding this amount, the Series’ total return is 20.10%.
The accompanying notes are an integral part of the financial statements.
13
Overseas Series
Financial Highlights - Class S
| FOR THE PERIOD 9/21/181 TO 10/31/18 | ||||
Per share data (for a share outstanding throughout each period): | ||||
Net asset value - Beginning of period | $ | 24.72 | ||
|
| |||
Income (loss) from investment operations: | ||||
Net investment income2 | 0.01 | |||
Net realized and unrealized gain (loss) on investments | (2.56 | ) | ||
|
| |||
Total from investment operations | (2.55 | ) | ||
|
| |||
Less distributions to shareholders: | ||||
From net investment income | — | |||
From net realized gain on investments | — | |||
|
| |||
Total distributions to shareholders | — | |||
|
| |||
Net asset value - End of period | $ | 22.17 | ||
|
| |||
Net assets - End of period (000’s omitted) | $ | 500,950 | ||
|
| |||
Total return3 | (10.32 | %) | ||
Ratios (to average net assets)/Supplemental Data: | ||||
Expenses* | 1.05 | %4 | ||
Net investment income | 0.38 | %4 | ||
Portfolio turnover | 34 | % | ||
| *The investment advisor did not impose all or a portion of its management and/or other fees, and in some years may have paid a portion of the Series’ expenses. If these expenses had been incurred by the Series, the expense ratio (to average net assets) would have increased by the following amounts: |
| |||
| 0.06 | %4 | |||
1Commencement of operations.
2Calculated based on average shares outstanding during the period.
3Represents aggregate total return for the period indicated, and assumes reinvestment of all distributions. Total return would have been lower had certain expenses not been reimbursed during the period. Periods less than one year are not annualized.
4Annualized.
The accompanying notes are an integral part of the financial statements.
14
Overseas Series
Financial Highlights - Class Z
| FOR THE PERIOD 5/1/181 TO 10/31/18 | ||||
Per share data (for a share outstanding throughout each period): | ||||
Net asset value - Beginning of period | $ | 24.85 | ||
|
| |||
Income (loss) from investment operations: | ||||
Net investment income2 | 0.13 | |||
Net realized and unrealized loss on investments | (2.79 | ) | ||
|
| |||
Total from investment operations | (2.66 | ) | ||
|
| |||
Less distributions to shareholders: | ||||
From net investment income | �� | |||
From net realized gain on investments | — | |||
|
| |||
Total distributions to shareholders | — | |||
|
| |||
Net asset value - End of period | $ | 22.19 | ||
|
| |||
Net assets - End of period (000’s omitted) | $ | 104,538 | ||
|
| |||
Total return3 | (10.71 | %) | ||
Ratios (to average net assets)/Supplemental Data: | ||||
Expenses* | 0.65 | %4 | ||
Net investment income | 1.04 | %4 | ||
Portfolio turnover | 34 | % | ||
| *For certain periods presented, the investment advisor did not impose all or a portion of its management and/or other fees, and in some periods may have paid a portion of the Series’ expenses. If these expenses had been incurred by the Class, the expense ratio (to average net assets) would have increased by the following amounts: |
| |||
| 0.09 | %4 | |||
1Commencement of operations.
2Calculated based on average shares outstanding during the period.
3Represents aggregate total return for the period indicated, and assumes reinvestment of all distributions. Total return would have been lower had certain expenses not been reimbursed during the period. Periods less than one year are not annualized.
4Annualized.
The accompanying notes are an integral part of the financial statements.
15
Overseas Series
Notes to Financial Statements
| 1. | Organization |
Overseas Series (the “Series”) is a no-load diversified series of Manning & Napier Fund, Inc. (the “Fund”). The Fund is organized in Maryland and is registered under the Investment Company Act of 1940, as amended, as an open-end management investment company.
The Series’ investment objective is to provide long-term growth.
The Series is authorized to issue three classes of shares (Class I, S and Z). Each class of shares is substantially the same, except that class-specific distribution and shareholder servicing expenses are borne by the specific class of shares to which they relate.
The Fund’s Advisor is Manning & Napier Advisors, LLC (the “Advisor”). Shares of the Series are offered to investors, clients and employees of the Advisor and its affiliates. The total authorized capital stock of the Fund consists of 15 billion shares of common stock each having a par value of $0.01. As of October 31, 2018, 13.4 billion shares have been designated in total among 38 series, of which 200 million have been designated as Overseas Series Class I common stock, 400 million have been designated as Overseas Series Class S common stock, 75 million have been designated as Overseas Series Class W common stock and 100 million have been designated as Overseas Series Class Z common stock. Class W common stock is not currently offered for sale. Class Z shares of the Series commenced operations on May 1, 2018 and Class S shares of the Series commenced operations on September 24, 2018.
Reorganization
On September 18, 2018, the shareholders of World Opportunities Series approved the reorganization of World Opportunities Series into Overseas Series, each a series of the Fund, pursuant to which Overseas Series acquired substantially all of the assets and assumed certain stated liabilities of World Opportunities Series in exchange for an equal aggregate value of Overseas Series shares. For U.S. GAAP purposes, the transaction was treated as a merger. The merger took place after the close of business on September 21, 2018.
Each shareholder of World Opportunities Series received shares of Overseas Series with the same class designation and an aggregate Net Asset Value of such shareholder’s World Opportunities Series shares, as determined at the close of business on September 21, 2018.
The reorganization was accomplished by a tax-free exchange of shares of Overseas Series in the following amount and at the following conversion ratio:
WORLD OPPORTUNITIES PRIOR TO | CONVERSION RATIO | SHARES OF OVERSEAS SERIES | ||||||||||
Class S | 72,203,693 | 0.330372 | 23,854,078 | |||||||||
World Opportunities Series’ net assets and composition of net assets on September 21, 2018, the date of the reorganization, were as follows:
NET ASSETS | PAID-IN CAPITAL | ACCUMULATED INVESTMENT | ACCUMULATED NET REALIZED LOSS | NET UNREALIZED APPRECIATION | ||||||
$589,676,263 | $1,011,588,366 | $(109,562) | $(446,854,928) | $25,052,387 | ||||||
For financial reporting purposes, assets received and shares issued by Overseas Series were recorded at fair value; however, the cost basis of the investments received from World Opportunities Series was carried forward to align ongoing reporting of Overseas Series’ realized and unrealized gains and losses with amounts distributable to shareholders for tax purposes.
16
Overseas Series
Notes to Financial Statements (continued)
| 1. | Organization (continued) |
Reorganization (continued)
The aggregate net assets of Overseas Series immediately prior to, and after the acquisition, amounted to $310,629,139 and $900,305,402, respectively. World Opportunities Series’ fair value and cost of investments on September 21, 2018 were $583,171,966 and $558,177,803, respectively.
The purpose of the transaction was to combine two funds managed by the Advisor, the investment advisor to both Overseas Series and World Opportunities Series, with the same or substantially similar (but not identical) investment objectives, investment policies, strategies, risks and restrictions.
Assuming the acquisition had been completed on November 1, 2017, the beginning of the annual reporting period for Overseas Series, the pro forma results of operations for the year ended October 31, 2018, are as follows:
| • | Net investment income: $14,199,284 |
| • | Net realized and change in unrealized gain/loss on investments: $(50,062,232) |
| • | Net decrease in the net assets resulting from operations: $(35,862,948) |
Because the combined investment portfolios have been managed as a single integrated portfolio since the acquisition was completed, it is not practicable to separate the amounts of revenue and earnings of World Opportunities Series that have been included in the Overseas Series’ Statement of Operations since September 21, 2018.
Reorganization costs incurred by Overseas Series in connection with the reorganization were paid by the Advisor.
| 2. | Significant Accounting Policies |
The following is a summary of significant accounting policies followed by the Series. The Series is an investment company and, accordingly, follows the investment company accounting and reporting guidance of the Financial Accounting Standards Board Accounting Standards Codification Topic 946—Investment Companies, which is part of accounting principles generally accepted in the United States of America (“GAAP”).
Security Valuation
Portfolio securities, including domestic equities, foreign equities, warrants and options, listed on an exchange other than the NASDAQ Stock Market are valued at the latest quoted sales price of the exchange on which the security is primarily traded. Securities not traded on valuation date or securities not listed on an exchange are valued at the latest quoted bid price provided by the Fund’s pricing service. Securities listed on the NASDAQ Stock Market are valued in accordance with the NASDAQ Official Closing Price.
Short-term investments that mature in sixty days or less may be valued at amortized cost, which approximates fair value. Investments in open-end investment companies are valued at their net asset value per share on valuation date.
Volume and level of activity in established markets for an asset or liability are evaluated to determine whether recent transactions and quoted prices are determinative of fair value. Where there have been significant decreases in volume and level of activity, further analysis and adjustment may be necessary to estimate fair value. The Series measures fair value in these instances by the use of inputs and valuation techniques which may be based upon current market prices of securities that are comparable in coupon, rating, maturity and industry and/or expectation of future cash flows. As a result of trading in relatively thin markets and/or markets that experience significant volatility, the prices used by the Series to value these securities may differ from the value that would be realized if these securities were sold, and the differences could be material.
Securities for which representative valuations or prices are not available from the Series’ pricing service may be valued at fair value as determined in good faith by the Advisor under procedures approved by and under the general supervision and
17
Overseas Series
Notes to Financial Statements (continued)
| 2. | Significant Accounting Policies (continued) |
Security Valuation (continued)
responsibility of the Fund’s Board of Directors (the “Board”). Due to the inherent uncertainty of valuations of such securities, the fair value may differ significantly from the values that would have been used had a ready market for such securities existed. If trading or events occurring after the close of the principal market in which securities are traded are expected to materially affect the value of those securities, then they may be valued at their fair value, taking this trading or these events into account. In accordance with the procedures approved by the Board, the values of certain securities trading outside the U.S. were adjusted following the close of local trading using a factor from a third party vendor. The third party vendor uses statistical analyses and quantitative models, which consider among other things subsequent movement and changes in the prices of indices, securities and exchange rates in other markets, to determine the factors which are used to adjust local market prices. The value of securities used for net asset value calculation under these procedures may differ from published prices for the same securities. It is the Fund’s policy to classify each foreign equity security where a factor from a third party vendor is provided as a Level 2 security.
Various inputs are used in determining the value of the Series’ assets or liabilities carried at fair value. These inputs are summarized in three broad levels. Level 1 includes quoted prices in active markets for identical assets and liabilities. Level 2 includes other significant observable inputs (including quoted prices for similar securities, interest rates, prepayment speeds, credit risk, etc.). Level 3 includes significant unobservable inputs (including the Series’ own assumptions in determining the fair value of investments). A financial instrument’s level within the fair value hierarchy is based on the lowest level of any input both individually and in aggregate that is significant to the fair value measurement. The inputs or methodology used for valuing securities are not necessarily an indication of the risk associated with investing in those securities.
The following is a summary of the valuation levels used for major security types as of October 31, 2018 in valuing the Series’ assets or liabilities carried at fair value:
| DESCRIPTION | TOTAL | LEVEL 1 | LEVEL 2 | LEVEL 3 | ||||||||||||
Assets: | ||||||||||||||||
Equity Securities: | ||||||||||||||||
Communication Services | $ | 58,978,739 | $ | 30,354,499 | $ | 28,624,240 | # | $ | — | |||||||
Consumer Discretionary | 58,966,365 | 37,453,469 | 21,512,896 | # | — | |||||||||||
Consumer Staples | 171,469,917 | 61,175,437 | 110,294,480 | # | — | |||||||||||
Energy | 35,289,790 | 35,289,790 | — | — | ||||||||||||
Financials | 66,261,821 | 6,116,224 | 60,145,597 | # | — | |||||||||||
Health Care | 102,792,963 | 81,824,088 | 20,968,875 | # | — | |||||||||||
Industrials | 75,545,602 | 16,348,095 | 59,197,507 | # | — | |||||||||||
Information Technology | 46,813,506 | 33,086,099 | 13,727,407 | # | — | |||||||||||
Materials | 60,714,274 | 12,615,443 | 48,098,831 | # | — | |||||||||||
Real Estate | 11,725,182 | — | 11,725,182 | # | — | |||||||||||
Mutual Fund | 33,900,860 | 33,900,860 | — | — | ||||||||||||
|
|
|
|
|
|
|
| |||||||||
Total assets | $ | 722,459,019 | $ | 348,164,004 | $ | 374,295,015 | $ | — | ||||||||
|
|
|
|
|
|
|
| |||||||||
# Consists of certain foreign securities for which a factor from a third party vendor was applied to determine the securities’ fair value following the close of local trading.
There were no Level 3 securities held by the Series as of October 31, 2017 or October 31, 2018.
New Accounting Pronouncements
The Securities and Exchange Commission (SEC) adopted changes to Regulation S-X to simplify the reporting of information by registered investment companies in financial statements. The amendments require presentation of the total, rather than the components, of distributable earnings on the Statement of Assets and Liabilities and also require presentation of the total, rather than the components, of distributions to shareholders, except for tax return of capital distributions, if any, on the Statement of Changes in Net Assets. The amendments also removed the requirement for parenthetical disclosure of undistributed net investment income on the Statement of Changes in Net Assets. These Regulation S-X amendments are reflected in the Series
18
Overseas Series
Notes to Financial Statements (continued)
| 2. | Significant Accounting Policies (continued) |
New Accounting Pronouncements (continued)
financial statements for the year ended October 31, 2018. As a result of adopting these amendments, the distributions to shareholders in the October 31, 2017 Statement of Changes in Net Assets presented herein have been reclassified to conform to the current year presentation.
On August 28, 2018, the FASB issued ASU 2018-13, “Disclosure Framework – Changes to the Disclosure Requirements for Fair Value Measurement,” which amends the fair value measurement disclosure requirements under U.S. GAAP. The amendments of ASU 2018-13 include new, eliminated, and modified disclosure requirements. In addition, the amendments clarify that materiality is an appropriate consideration of entities when evaluating disclosure requirements. The ASU is effective for all entities for fiscal years beginning after December 15, 2019, including interim periods therein. An entity is permitted to early adopt any eliminated or modified disclosures upon issuance of this ASU and delay adoption of the new disclosures until their effective date. As such, the Series has early adopted the eliminated and modified disclosures, as permitted by this ASU.
Security Transactions, Investment Income and Expenses
Security transactions are accounted for on trade date. Dividend income is recorded on the ex-dividend date, except that if the ex-dividend date has passed, certain dividends from foreign securities are recorded as soon as the Series is informed of the ex-dividend date. Non-cash dividends, if any, are recorded at the fair value of the securities received. Interest income, including amortization of premium and accretion of discounts using the effective interest method, is earned from settlement date and accrued daily.
Expenses are recorded on an accrual basis. Most expenses of the Fund can be attributed to a specific series. Expenses which cannot be directly attributed are apportioned among the series in the Fund in such a manner as deemed equitable by the Fund’s Board, taking into consideration, among other things, the nature and type of expense.
The Series uses the identified cost method for determining realized gain or loss on investments for both financial statement and federal income tax reporting purposes.
Foreign Currency Translation
The books and records of the Series are maintained in U.S. dollars. Foreign currencies, investments and other assets and liabilities are translated into U.S. dollars at the current exchange rates. Purchases and sales of investment securities and income and expenses are translated on the respective dates of such transactions. The Series does not isolate realized and unrealized gains and losses attributable to changes in the exchange rates from gains and losses that arise from changes in the fair value of investments. Such fluctuations are included with net realized and unrealized gain or loss on investments. Net realized foreign currency gains and losses represent foreign currency gains and losses between trade date and settlement date on securities transactions, gains and losses on disposition of foreign currencies and the difference between the amount of income and foreign withholding taxes recorded on the books of the Series and the amounts actually received or paid.
Federal Taxes
The Series’ policy is to comply with the provisions of the Internal Revenue Code applicable to regulated investment companies. The Series is not subject to federal income tax or excise tax to the extent that the Series distributes to shareholders each year its taxable income, including any net realized gains on investments, in accordance with requirements of the Internal Revenue Code. Accordingly, no provision for federal income tax or excise tax has been made in the financial statements.
Management evaluates its tax positions to determine if the tax positions taken meet the minimum recognition threshold in connection with accounting for uncertainties in income tax positions taken or expected to be taken for the purposes of measuring and recognizing tax liabilities in the financial statements. Recognition of tax benefits of an uncertain tax position is required only when the position is “more likely than not” to be sustained assuming examination by taxing authorities. At October 31, 2018, the Series has recorded no liability for net unrecognized tax benefits relating to uncertain income tax positions taken or expected to be taken in future tax returns.
19
Overseas Series
Notes to Financial Statements (continued)
| 2. | Significant Accounting Policies (continued) |
Federal Taxes (continued)
The Series files income tax returns in the U.S. federal jurisdiction, various states and foreign jurisdictions, as required. No income tax returns are currently under investigation. The statute of limitations on the Series’ tax returns remains open for the years ended October 31, 2015 through October 31, 2018. The Series is not aware of any tax positions for which it is reasonably possible that the total amounts of unrecognized tax benefits will significantly change in the next twelve months.
Foreign Taxes
Based on the Series’ understanding of the tax rules and rates related to income, gains and currency purchase/repatriation transactions for foreign jurisdictions in which it invests, the Series will provide for foreign taxes, and where appropriate, deferred foreign tax.
Distributions of Income and Gains
Distributions to shareholders of net investment income and net realized gains are made annually. An additional distribution may be necessary to avoid taxation of the Series. Distributions are recorded on the ex-dividend date.
Indemnifications
The Fund’s organizational documents provide former and current directors and officers with a limited indemnification against liabilities arising in connection with the performance of their duties to the Fund. In the normal course of business, the Fund may also enter into contracts that provide general indemnifications. The Fund’s maximum exposure under these arrangements is unknown as this would be dependent on future claims that may be made against the Fund. The risk of material loss from such claims is considered remote.
Other
The preparation of financial statements in conformity with GAAP requires management to make estimates and assumptions that affect the reported amounts of assets and liabilities and the disclosure of contingent assets and liabilities at the date of the financial statements and the reported amounts of income and expenses during the reporting period. Actual results could differ from those estimates.
| 3. | Transactions with Affiliates and Other Agreements |
The Fund has an Investment Advisory Agreement (the “Agreement”) with the Advisor, for which the Series pays a fee, computed daily and payable monthly, at an annual rate of 0.60% of the Series’ average daily net assets. Prior to March 1, 2018, the amount paid to the Advisor for advisory services was 0.70%.
Under the Agreement, personnel of the Advisor provide the Series with advice and assistance in the choice of investments and the execution of securities transactions, and otherwise maintain the Series’ organization. The Advisor also provides the Fund with necessary office space and fund administration and support services. The salaries of all officers of the Fund (except a percentage of the Fund’s Chief Compliance Officer’s salary, which is paid by the Fund), and of all Directors who are “affiliated persons” of the Fund, or of the Advisor, and all personnel of the Fund, or of the Advisor, performing services relating to research, statistical and investment activities, are paid by the Advisor. Each “non-affiliated” Director receives an annual stipend, which is allocated among all the active series of the Fund. In addition, these Directors also receive a fee per Board meeting attended plus a fee for each committee meeting attended and are reimbursed for travel and other out-of-pocket expenses incurred by them in connection with attending such meetings. The Fund also has an Audit Committee Chair, Governance & Nominating Committee Chair and Lead Independent Director who each receive an additional annual stipend for these roles.
The Fund may enter into agreements with financial intermediaries pursuant to which the Fund may pay financial intermediaries for non-distribution related sub-transfer agency, administrative, sub-accounting, and other shareholder services in an annual amount not to exceed 0.15% of the average daily net assets of the Class I and Class S shares of the Series. Payments made pursuant to such agreements are generally based on the current assets and/or number of accounts of the Series attributable to the financial intermediary. Any payments made pursuant to such agreements may be in addition to, rather than in lieu of, any Distribution and Shareholder Services Fee payable under the Rule 12b-1 plan of the Fund.
20
Overseas Series
Notes to Financial Statements (continued)
| 3. | Transactions with Affiliates and Other Agreements (continued) |
The Advisor has contractually agreed, until at least February 29, 2020, to waive its management fee and, if necessary, pay other operating expenses of the Series in order to maintain total direct annual fund operating expenses of each Class, exclusive of shareholder services fees and distribution and service (12b-1) fees, at no more than 0.75% of the average daily net assets of the Class I shares, 0.80% of the average daily net assets of the Class S shares, and 0.65% of the average daily net assets of the Class Z shares each year. Accordingly, the Advisor waived fees of $161,051 for the year ended October 31, 2018, which is included as a reduction of expenses on the Statement of Operations. The Advisor is not eligible to recoup any expenses that have been waived or reimbursed in prior years.
Manning & Napier Investor Services, Inc., a registered broker-dealer affiliate of the Advisor, acts as distributor for the Fund’s shares. The Series compensates the distributor for distributing and servicing the Series’ Class S shares pursuant to a distribution plan adopted under Rule 12b-1 of the 1940 Act, regardless of expenses actually incurred. Under the agreement, the Series pays distribution and service fees to the distributor at an annual rate of 0.25% of average daily net assets attributable to Class S shares. There are no distribution and service fees on the Class I or Class Z shares. The fees are accrued daily and paid monthly.
Pursuant to a master services agreement dated March 1, 2017, the Fund pays the Advisor an annual fee related to fund accounting and administration of 0.0085% on the first $25 billion of average daily net assets (excluding Target Series and Income Series); 0.0075% on the next $15 billion of average daily net assets (excluding Target Series and Income Series); and 0.0065% of average daily net assets in excess of $40 billion (excluding Target Series and Income Series); plus a base fee of $30,400 per series. Additionally, certain transaction and out-of-pocket expenses, including charges for reporting relating to the Fund’s compliance program, are charged. The Advisor has agreements with BNY Mellon Investment Servicing (U.S.) Inc. (“BNY”) under which BNY serves as sub-accountant services agent.
| 4. | Purchases and Sales of Securities |
For the year ended October 31, 2018, purchases and sales of securities, other than U.S. Government securities and short-term securities, were $167,090,350 and $678,481,403, respectively. There were no purchases or sales of U.S. Government securities.
| 5. | Capital Stock Transactions |
Transactions in Class I, Class S and Class Z shares of Overseas Series were:
| CLASS I | FOR THE YEAR ENDED 10/31/2018 | FOR THE YEAR ENDED 10/31/2017 | ||||||||||||||
| SHARES | AMOUNT | SHARES | AMOUNT | |||||||||||||
Sold | 1,392,938 | $ | 34,946,149 | 4,379,024 | $ | 98,607,521 | ||||||||||
Reinvested | 418,319 | 10,324,113 | 686,873 | 13,936,654 | ||||||||||||
Repurchased | (26,019,153 | ) | (645,877,161 | ) | (19,225,166 | ) | (444,850,708 | ) | ||||||||
|
|
|
|
|
|
|
| |||||||||
Total | (24,207,896 | ) | $ | (600,606,899 | ) | (14,159,269 | ) | $ | (332,306,533 | ) | ||||||
|
|
|
|
|
|
|
| |||||||||
| CLASS S | FOR THE PERIOD 9/21/2018 (COMMENCEMENT OF OPERATIONS) TO 10/31/2018 | |||||||||||||||
| SHARES | AMOUNT | |||||||||||||||
Sold | 190,967 | $ | 4,553,940 | |||||||||||||
Shares issued in reorganization1 | 23,854,078 | 589,676,263 | ||||||||||||||
Reinvested | — | — | ||||||||||||||
Repurchased | (1,450,734 | ) | (33,687,813 | ) | ||||||||||||
|
|
|
| |||||||||||||
Total | 22,594,311 | $ | 560,542,390 | |||||||||||||
|
|
|
| |||||||||||||
21
Overseas Series
Notes to Financial Statements (continued)
| 5. | Capital Stock Transactions (continued) |
| CLASS Z | FOR THE PERIOD 5/1/2018 (COMMENCEMENT OF OPERATIONS) TO 10/31/2018 | |||||||||||||||
| SHARES | AMOUNT | |||||||||||||||
Sold | 5,468,547 | $ | 135,889,148 | |||||||||||||
Reinvested | — | — | ||||||||||||||
Repurchased | (757,033 | ) | (18,820,922 | ) | ||||||||||||
|
|
|
| |||||||||||||
Total | 4,711,514 | $ | 117,068,226 | |||||||||||||
|
|
|
| |||||||||||||
1See Note 1 regarding the reorganization.
At October 31, 2018, the Advisor and its affiliates owned 0.6% of the Series.
| 6. | Line of Credit |
The Fund has entered into a 364-day, $25 million credit agreement (the “line of credit”) with Bank of New York Mellon. Each series of the Fund may borrow under the line of credit for temporary or emergency purposes, including funding shareholder redemptions and other short-term liquidity purposes. The Fund pays an annual fee on the unused commitment amount, payable quarterly, and is allocated among all the series of the Fund and included in miscellaneous expenses in the Statement of Operations for each series. The line of credit expires in August 2019 unless extended or renewed. During the year ended October 31, 2018, the Series did not borrow under the line of credit.
| 7. | Financial Instruments |
The Series may trade in instruments including written and purchased options, forward foreign currency exchange contracts and futures contracts and other derivatives in the normal course of investing activities to assist in managing exposure to various market risks. The Series may be subject to various elements of risk, which may involve, to a varying degree, elements of risk in excess of the amounts recognized for financial statement purposes. These risks include: the risk that changes in the value of a derivative may not correlate perfectly with the underlying asset, rate or index; counterparty credit risk related to over the counter derivative counterparties’ failure to perform under contract terms; liquidity risk related to the lack of a liquid market for these contracts allowing the fund to close out its position(s); and documentation risk relating to disagreement over contract terms. No such investments were held by the Series as of October 31, 2018.
| 8. | Foreign Securities |
Investing in securities of foreign companies and foreign governments involves special risks and considerations not typically associated with investing in securities of domestic companies and the U.S. Government. These risks include revaluation of currencies and future adverse political and economic developments. Moreover, securities of foreign companies and foreign governments and their markets may be less liquid and their prices more volatile than those of comparable domestic companies and the U.S. Government.
| 9. | Federal Income Tax Information |
The amount and characterization of certain income and capital gains to be distributed are determined in accordance with federal income tax regulations, which may differ from GAAP. These differences are primarily due to differing book and tax treatments in the timing of the recognition of net investment income or gains and losses, including losses deferred due to wash sales and foreign currency gains and losses. The Series may periodically make reclassifications among its capital accounts to reflect income and gains available for distribution (or available capital loss carryovers) under income tax regulations, without impacting the Series’ net asset value. For the year ended October 31, 2018, amounts were reclassified within the capital accounts to increase Additional Paid in Capital by $446,668,219 and decrease Total Distributable Earnings (Loss) by $446,668,219. Any such reclassifications are not reflected in the financial highlights.
22
Overseas Series
Notes to Financial Statements (continued)
| 9. | Federal Income Tax Information (continued) |
The tax character of distributions paid were as follows:
FOR THE YEAR 10/31/18 | FOR THE YEAR 10/31/17 | |||||||
Ordinary income | $ | 10,748,629 | $ | 15,662,741 | ||||
At October 31, 2018, the tax basis of components of distributable earnings and the net unrealized depreciation based on the identified cost for federal income tax purposes were as follows:
Cost for federal income tax purposes | $ | 792,597,579 | ||
Unrealized appreciation | 40,176,444 | |||
Unrealized depreciation | (110,315,004 | ) | ||
|
| |||
Net unrealized depreciation | $ | (70,138,560 | ) | |
|
| |||
Undistributed ordinary income | $ | 5,090,529 | ||
Capital loss carryforward | $ | (488,223,183 | ) |
At October 31, 2018, the Series had net short-term capital loss carryforwards of $65,704,244 and net long-term capital loss carryforwards of $422,518,939, which may be carried forward indefinitely.
As of October 31, 2018, the capital loss carryover utilized in the current year was $62,642,124.
23
Overseas Series
Report of Independent Registered Public Accounting Firm
To the Board of Directors of Manning & Napier Fund, Inc. and Shareholders of Overseas Series
Opinion on the Financial Statements
We have audited the accompanying statement of assets and liabilities, including the investment portfolio, of Overseas Series (one of the series constituting Manning & Napier Fund, Inc., referred to hereafter as the “Fund”) as of October 31, 2018, the related statement of operations for the year ended October 31, 2018, the statement of changes in net assets for each of the two years in the period ended October 31, 2018, including the related notes, and the financial highlights for each of the periods indicated therein (collectively referred to as the “financial statements”). In our opinion, the financial statements present fairly, in all material respects, the financial position of the Fund as of October 31, 2018, the results of its operations for the year then ended, the changes in its net assets for each of the two years in the period ended October 31, 2018 and the financial highlights for each of the periods indicated therein in conformity with accounting principles generally accepted in the United States of America.
Basis for Opinion
These financial statements are the responsibility of the Fund’s management. Our responsibility is to express an opinion on the Fund’s financial statements based on our audits. We are a public accounting firm registered with the Public Company Accounting Oversight Board (United States) (“PCAOB”) and are required to be independent with respect to the Fund in accordance with the U.S. federal securities laws and the applicable rules and regulations of the Securities and Exchange Commission and the PCAOB.
We conducted our audits of these financial statements in accordance with the standards of the PCAOB. Those standards require that we plan and perform the audit to obtain reasonable assurance about whether the financial statements are free of material misstatement, whether due to error or fraud.
Our audits included performing procedures to assess the risks of material misstatement of the financial statements, whether due to error or fraud, and performing procedures that respond to those risks. Such procedures included examining, on a test basis, evidence regarding the amounts and disclosures in the financial statements. Our audits also included evaluating the accounting principles used and significant estimates made by management, as well as evaluating the overall presentation of the financial statements. Our procedures included confirmation of securities owned as of October 31, 2018 by correspondence with the custodian and brokers; when replies were not received from brokers, we performed other auditing procedures. We believe that our audits provide a reasonable basis for our opinion.

New York, New York
December 14, 2018
We have served as the auditor of one or more investment companies in Manning & Napier Mutual Funds since 1992.
24
Overseas Series
Supplemental Tax Information
(unaudited)
All reportings are based on financial information available as of the date of this annual report and, accordingly, are subject to change.
For federal income tax purposes, the Series reports for the current fiscal year $11,791,728 or, if different, the maximum amount allowable under the tax law, as qualified dividend income.
The Series has elected to pass through to its shareholders, foreign source income of $11,714,573 and foreign taxes paid of $1,043,099 for the year ended October 31, 2018.
The World Opportunities Series elected to pass through to its shareholders foreign source income of $12,382,539 and foreign taxes paid of $1,247,868 for the period prior to the merger into the Overseas Series.
25
Results of Special Meeting of Shareholders
(unaudited)
A Special Meeting of the Shareholders of the World Opportunities Series was held on September 18, 2018. The number of votes necessary to conduct the meeting and approve the proposal was obtained, and the results of the vote is listed below:
Proposal:
| FOR | AGAINST | ABSTAIN | ||||||||||
To approve the Agreement and Plan of Reorganization of the World Opportunities Series into the Overseas Series | 38,242,259 | 277,969 | 2,377,235 | |||||||||
26
Overseas Series
Directors’ and Officers’ Information
(unaudited)
The Statement of Additional Information provides additional information about the Fund’s directors and officers and can be obtained without charge by calling 1-800-466-3863, at www.manning-napier.com, or on the EDGAR Database on the SEC Internet web site (http://www.sec.gov). The following chart shows certain information about the Fund’s directors and officers, including their principal occupations during the last five years. Unless specific dates are provided, the individuals have held the listed positions for longer than five years.
| Interested Director and Officer | ||
| Name: | Paul Battaglia* | |
| Address: | 290 Woodcliff Drive | |
| Fairport, NY 14450 | ||
| Age: | 40 | |
| Current Position(s) Held with Fund: | Principal Executive Officer, President, Chairman & Director | |
| Term of Office & Length of Time Served: | Indefinite – Chairman and Director since November 20181 | |
| Principal Occupation(s) During Past 5 Years: | Chief Financial Officer (2018 - Present); Vice President of Finance (2016 - 2018); Director of Finance (2011 – 2016); Financial Analyst/Internal Auditor (2004-2006) – Manning & Napier Advisors, LLC and affiliates Holds one or more of the following titles for various affiliates: Chief Financial Officer | |
| Number of Portfolios Overseen within Fund Complex: | 36 | |
| Other Directorships Held Outside Fund Complex During Past 5 Years: | N/A | |
| Independent Directors | ||
| Name: | Stephen B. Ashley | |
| Address: | 290 Woodcliff Drive | |
| Fairport, NY 14450 | ||
| Age: | 78 | |
| Current Position(s) Held with Fund: | Director, Audit Committee Member, Governance & Nominating Committee Member | |
| Term of Office & Length of Time Served: | Indefinite - Since 1996 | |
| Principal Occupation(s) During Past 5 Years: | Chairman, Director & Chief Executive Officer (1997 to present) - The Ashley Group (property management and investment). Director (1995-2008) and Chairman (non-executive) (2004-2008) - Fannie Mae (mortgage) | |
| Number of Portfolios Overseen within Fund Complex: | 36 | |
| Other Directorships Held Outside Fund Complex During Past 5 Years: | Fannie Mae (1995-2008) The Ashley Group (1995-2008) Genesee Corporation (1987-2007) | |
| Name: | Paul A. Brooke | |
| Address: | 290 Woodcliff Drive | |
| Fairport, NY 14450 | ||
| Age: | 72 | |
| Current Position(s) Held with Fund: | Lead Independent Director, Audit Committee Member, Governance & Nominating Committee Chairman | |
| Term of Office & Length of Time Served: | Indefinite - Director, Audit Committee Member, Governance & Nominating Committee Member since 2007; Governance & Nominating Committee Chairman since 2016; Lead Independent Director since 2017 | |
| Principal Occupation(s) During Past 5 Years: | Chairman & CEO (2005-2009) - Ithaka Acquisition Corporation (investments); Chairman (2007-2009) - Alsius Corporation (investments); Managing Member (1991-present) - PMSV Holdings LLC (investments); Managing Member (2010-2016) - Venbio (investments). | |
| Number of Portfolios Overseen within Fund Complex: | 36 | |
| Other Directorships Held Outside Fund Complex During Past 5 Years: | Incyte Corp. (biotech)(2000-present); ViroPharma, Inc. (speciality pharmaceuticals)(2000-2014); HLTH (WebMD) (information) (2000-2010); Cheyne Capital International (investment) (2000-2017); GMP Companies (investment)(2000-2011); Cytos Biotechnology Ltd (biotechnology)(2012-2014); Cerus (biomedical) (2016-present); PureEarth(non-profit)(2012-present) | |
27
Overseas Series
Directors’ and Officers’ Information
(unaudited)
| Independent Directors (continued) | ||
| Name: | Peter L. Faber | |
| Address: | 290 Woodcliff Drive | |
| Fairport, NY 14450 | ||
| Age: | 80 | |
| Current Position(s) Held with Fund: | Director, Governance & Nominating Committee Member | |
| Term of Office & Length of Time Served: | Indefinite – Since 1987 | |
| Principal Occupation(s) During Past 5 Years: | Senior Counsel (2006-2012), Partner (1995-2006 & 2013-present) - McDermott, Will & Emery LLP (law firm) | |
| Number of Portfolios Overseen within Fund Complex: | 36 | |
| Other Directorships Held Outside Fund Complex During Past 5 Years: | Boston Early Music Festival (non-profit) (2007-present); Amherst Early Music, Inc. (non-profit) (2009-present); Gotham Early Music Scene, Inc. (non-profit) (2009-present); Partnership for New York City, Inc. (non-profit) (1989-2010); New York Collegium (non-profit) (2004-2011) | |
| Name: | Harris H. Rusitzky | |
| Address: | 290 Woodcliff Drive | |
| Fairport, NY 14450 | ||
| Age: | 83 | |
| Current Position(s) Held with Fund: | Director, Audit Committee Member, Governance & Nominating Committee Member | |
| Term of Office & Length of Time Served: | Indefinite - Since 1985 | |
| Principal Occupation(s) During Past 5 Years: | President (1994- present) - The Greening Group (business consultants); Partner (2006-present) - The Restaurant Group (restaurants) | |
| Number of Portfolios Overseen within Fund Complex: | 36 | |
| Other Directorships Held Outside Fund Complex During Past 5 Years: | Rochester Institute of Technology (university) (1972-present); Culinary Institute of America (non-profit college) (1985-present); George Eastman House (museum) (1988-present); National Restaurant Association (restaurant trade organization) (1978-present) | |
| Name: | Chester N. Watson | |
| Address: | 290 Woodcliff Drive | |
| Fairport, NY 14450 | ||
| Age: | 68 | |
| Current Position(s) Held with Fund: | Director, Audit Committee Chairman, Governance & Nominating Committee Member | |
| Term of Office & Length of Time Served: | Indefinite - Director, Audit Committee Member, Governance & Nominating Committee Member Since 2012; Audit Committee Chairman since 2013 | |
| Principal Occupation(s) During Past 5 Years: | General Auditor (2003-2011) - General Motors Company (auto manufacturer) | |
| Number of Portfolios Overseen within Fund Complex: | 36 | |
| Other Directorships Held Outside Fund Complex During Past 5 Years: | Rochester Institute of Technology (university)(2005-present); Town of Greenburgh, NY Planning Board (municipal government) (2015-present) | |
| Officers: | ||
| Name: | Jeffrey S. Coons, Ph.D., CFA® | |
| Address: | 290 Woodcliff Drive | |
| Fairport, NY 14450 | ||
| Age: | 55 | |
| Current Position(s) Held with Fund: | Vice President | |
| Term of Office1 & Length of Time Served: | Since 2004 | |
| Principal Occupation(s) During Past 5 Years: | President since 2010, Co-CEO since 2018, Co-Director of Research (2002 - 2015) - Manning & Napier Advisors, LLC Holds one or more of the following titles for various subsidiaries and affiliates: President, Director, Treasurer, or Senior Trust Officer | |
| Name: | Elizabeth Craig | |
| Address: | 290 Woodcliff Drive | |
| Fairport, NY 14450 | ||
| Age: | 31 | |
| Current Position(s) Held with Fund: | Corporate Secretary | |
| Term of Office1 & Length of Time Served: | Since 2016 | |
| Principal Occupation(s) During Past 5 Years: | Fund Administration Manager since 2015; Mutual Fund Compliance Specialist (2009-2015) - Manning & Napier Advisors, LLC; Assistant Corporate Secretary (2011-2016) - Manning & Napier Fund, Inc. | |
28
Overseas Series
Directors’ and Officers’ Information
(unaudited)
| Officers: (continued) | ||
| Name: | Christine Glavin | |
| Address: | 290 Woodcliff Drive | |
| Fairport, NY 14450 | ||
| Age: | 52 | |
| Current Position(s) Held with Fund: | Principal Financial Officer, Chief Financial Officer | |
| Term of Office1 & Length of Time Served: | Principal Financial Officer since 2002; Chief Financial Officer since 2001 | |
| Principal Occupation(s) During Past 5 Years: | Director of Fund Reporting since 2011; Fund Reporting Manager (1997-2011) - Manning & Napier Advisors, LLC; Assistant Treasurer since 2008 - Exeter Trust Company; Chief Financial Officer (2017-2018) - Rainier Investment Management Mutual Funds, Inc. | |
| Name: | Jodi L. Hedberg | |
| Address: | 290 Woodcliff Drive | |
| Fairport, NY 14450 | ||
| Age: | 50 | |
| Current Position(s) Held with Fund: | Chief Compliance Officer, Anti-Money Laundering Compliance Officer | |
| Term of Office1 & Length of Time Served: | Chief Compliance Officer since 2004; Anti-Money Laundering Officer since 2002; Corporate Secretary (1997-2016) - Manning & Napier Fund, Inc.; Chief Compliance Officer and Anti-Money Laundering Officer (2017-2018) - Rainier Investment Management Mutual Funds, Inc. | |
| Principal Occupation(s) During Past 5 Years: | Managing Director, Compliance & Regulatory Affairs since 2018; Director of Compliance (2005-2018); Compliance Manager (1995-2005) - Manning & Napier Advisors, LLC and affiliates; Corporate Secretary - Manning & Napier Investor Services, Inc. since 2006 | |
| Name: | Scott Morabito | |
| Address: | 290 Woodcliff Drive | |
| Fairport, NY 14450 | ||
| Age: | 30 | |
| Current Position(s) Held with Fund: | Assistant Vice President | |
| Term of Office1 & Length of Time Served: | Since 2017 | |
| Principal Occupation(s) During Past 5 Years: | Director of Funds Group since 2017; Fund Product and Strategy Manager (2014-2017); Senior Product and Strategy Analyst (2013-2014); Product and Strategy Analyst (2011-2013) - Manning & Napier Advisors, LLC. | |
| Name: | Sarah Turner | |
| Address: | 290 Woodcliff Drive | |
| Fairport, NY 14450 | ||
| Age: | 36 | |
| Current Position(s) Held with Fund: | Chief Legal Officer; Assistant Corporate Secretary | |
| Term of Office1 & Length of Time Served: | Since 2018 | |
| Principal Occupation(s) During Past 5 Years: | General Counsel since 2018 - Manning & Napier Advisors, LLC and affiliates; Counsel (2017-2018) – Harter Secrest and Emery LLP; Legal Counsel (2010-2017) – Manning & Napier Advisors, LLC and affiliates Holds one or more of the following titles for various affiliates: Corporate Secretary, General Counsel | |
| Name: | Amy Williams | |
| Address: | 290 Woodcliff Drive | |
| Fairport, NY 14450 | ||
| Age: | 56 | |
| Current Position(s) Held with Fund: | Assistant Corporate Secretary | |
| Term of Office1 & Length of Time Served: | Since 2016 | |
| Principal Occupation(s) During Past 5 Years: | Director of Fund Documentation - Manning & Napier Advisors, LLC since 2009 | |
| Holds one or more of the following titles for various affiliates: Director | ||
*At a meeting of the Board of Directors held on November 15, 2018, the Board accepted the resignation of Michele T. Mosca from her positions as Principal Executive Officer, President, Chair and Interested Director of the Fund and appointed Paul J. Battaglia to each of the resigned positions effective immediately. Interested Director, within the meaning of the 1940 Act by reason of his positions with the Fund’s investment advisor, Manning & Napier Advisors, LLC.
1The term of office of all officers shall be one year and until their respective successors are chosen and qualified, or his or her earlier resignation or removal as provided in the Fund’s By-Laws.
29
Overseas Series
Literature Requests
Proxy Voting Policies and Procedures
A description of the policies and procedures that the Fund uses to determine how to vote proxies relating to portfolio securities is available, without charge, upon request:
| By phone | 1-800-466-3863 | |||
| On the Securities and Exchange | ||||
| Commission’s (SEC) web site | http://www.sec.gov |
Proxy Voting Record
Information regarding how the Fund voted proxies relating to portfolio securities during the most recent 12-month period ended June 30th is available, without charge, upon request:
| By phone | 1-800-466-3863 | |||
| On the SEC’s web site | http://www.sec.gov |
Quarterly Portfolio Holdings
The Series’ complete schedule of portfolio holdings for the 1st and 3rd quarters of each fiscal year are provided on Form N-Q, and are available, without charge, upon request:
| By phone | 1-800-466-3863 | |||
| On the SEC’s web site | http://www.sec.gov |
The Series’ Form N-Q may be reviewed and copied at the SEC’s Public Reference Room in Washington, D.C. Information on the operation of the Public Reference Room may be obtained by calling 1-800-SEC-0330.
Prospectus and Statement of Additional Information (SAI)
For more information about any of the Manning & Napier Fund, Inc. Series, you may obtain a prospectus and SAI at www.manning-napier.com or by calling (800) 466-3863. Before investing, carefully consider the objectives, risks, charges and expenses of the investment and read the prospectus carefully as it contains this and other information about the investment company. In addition, this information can be found on the SEC’s web site, http://www.sec.gov.
Additional information available at www.manning-napier.com
1. Fund Holdings - Month-End
2. Fund Holdings - Quarter-End
3. Shareholder Report - Annual
4. Shareholder Report - Semi-Annual
The Fund also offers electronic notification or “e-delivery” when certain documents are available on-line to be downloaded or reviewed. Direct shareholders can elect to receive electronic notification when shareholder reports, prospectus updates, and/or statements are available. If you do not currently have on-line access to your account, you can establish access by going to www.manning-napier.com, click on “Login” in the top corner of the page, and follow the prompts to self-enroll. Once enrolled, you can set your electronic notification preferences by clicking on the Account Options tab located within the green toolbar and then select E-Delivery Option. Should you have any questions on either how to establish on-line access or how to update your account settings, please contact Investor Services at 1-800-466-3863.
The Manning & Napier Fund, Inc. is managed by Manning & Napier Advisors, LLC. Manning & Napier Investor Services, Inc., an affiliate of Manning & Napier Advisors, LLC, is the distributor of the Fund shares.
MNOVS-10/18-AR

Management Discussion and Analysis
(unaudited)
Dear Shareholders:
The investment environment witnessed over the past twelve months was more volatile and bifurcated than what was experienced in prior years across both equities and fixed income, as well as between domestic and international investing.
For the fiscal year ending on October 31, 2018, US equities posted strong gains, with the S&P 500 Total Return Index up 7.35%. On the other hand, international equity performance was decidedly poor as the MSCI ACWI ex USA Index fell 8.24%. Regarding fixed income, domestic investment-grade bonds, as measured by the Bloomberg Barclays U.S. Aggregate Bond Index, fell 2.05% as rising interest rates weighed on returns.
Going forward, we believe the volatility experienced in October, as well as during the first few months of 2018, is likely to be reflective of what investors should come to expect going forward. While we do not anticipate an imminent recession, we see recent developments within the US and abroad as an indication that we are entering a higher risk regime for risk assets over the next twelve months.
The US is likely approaching a period of peak growth and continues to show signs of progressing further into late cycle territory. At the same time, key global risks are rising, including trade tensions, global growth concerns, and geopolitical uncertainty, all of which have continued escalating throughout 2018.
We are approaching the ten-year anniversary of the bull market, and while bull markets do not necessarily die of old age, they cannot extend indefinitely either. As the economy continues to move into later cycle territory, we believe investors should temper their expectations as the strong returns experienced over the past several years are unlikely to persist.
Given our updated outlook, we are reviewing late cycle risks in current and prospective investments and have adjusted our positioning across many of our portfolios. Going forward, we will continue to follow our disciplines, choosing to be selective in our investment decisions and seeking to avoid overvalued areas of the market.
With this in mind, we discuss recent fund performance in the enclosed, highlight how we are positioned amid the current economic environment, and provide our outlook of what to expect in financial markets.
We hope that you find this information helpful, and look forward to working with you in the years ahead to help you meet your investment goals.
Sincerely,
Manning & Napier Advisors, LLC
The S&P 500 Total Return Index is an unmanaged, capitalization-weighted measure comprised of 500 leading U.S. companies to gauge U.S. large cap equities. The Index returns do not reflect any fees or expenses. The index accounts for the reinvestment of regular cash dividends, but not for the withholding of taxes. Index returns provided by Morningstar. S&P Dow Jones Indices LLC, a subsidiary of the McGraw Hill Financial, Inc., is the publisher of various index based data products and services and has licensed certain of its products and services for use by Manning & Napier. All such content Copyright © 2018 by S&P Dow Jones Indices LLC and/or its affiliates. All rights reserved. Neither S&P Dow Jones Indices LLC, Dow Jones Trademark Holdings LLC, their affiliates nor their third party licensors make any representation or warranty, express or implied, as to the ability of any index to accurately represent the asset class or market sector that it purports to represent and none of these parties shall have any liability for any errors, omissions, or interruptions of any index or the data included therein.
The MSCI ACWI ex USA Index is designed to measure large and mid-cap representation across 22 of 23 Developed Markets countries (excluding the U.S.) and 24 Emerging Markets countries. The Index returns do not reflect any fees or expenses. The Index is denominated in U.S. dollars. The Index returns are net of withholding taxes. They assume daily reinvestment of net dividends thus accounting for any applicable dividend taxation. Index returns provided by Morningstar.
The Bloomberg Barclays U.S. Aggregate Bond Index is an unmanaged, market value-weighted index of U.S. domestic investment-grade debt issues, including government, corporate, asset-backed, and mortgage-backed securities with maturities of one year or more. Index returns provided by Morningstar.
©2018 Morningstar, Inc. All rights reserved. The information contained herein: (1) is proprietary to Morningstar and/or its content providers; (2) may not be copied, adapted or distributed; and (3) is not warranted to be accurate, complete or timely. Neither Morningstar nor its content providers are responsible for any damages or losses arising from any use of this information, except where such damages or losses cannot be limited or excluded by law in your jurisdiction. Past financial performance is no guarantee of future results.
1
Fund Commentary
(unaudited)
Investment Objective
The Pro-Blend® Series are strategically allocated across stocks, bonds, and cash to balance growth, capital preservation, and income to fit a range of investor risk management priorities.
Performance Commentary
In absolute terms, the performance results for the Class S shares were mixed as the Pro-Blend Maximum Term Series delivered positive returns while the Conservative, Moderate, and Extended portfolios experienced negative returns during the one-year period. Each Series underperformed its respective blended benchmarks on a relative basis. Importantly, each Series has provided strong positive absolute and relative returns over the current stock market cycle, which began in April 2000.
The Pro-Blend Maximum Term Series was modestly overweight in equities as compared to its benchmark, contributing to relative performance, as equities outperformed fixed income during the one-year period. Conversely, an equity underweight, to varying degrees, in the Pro-Blend Conservative, Moderate, and Extended portfolios detracted from relative performance.
Stock selection challenged relative returns and was the primary contributor to the Series’ underperformance. Specifically, selection in the Consumer Staples, Communication Services, and Health Care sectors detracted from relative returns across all portfolios.
Offsetting a portion of the relative performance headwind was the aggregate effect of sector allocations, which aided relative returns. Each Series’ overweight to Health Care, and underweight to Financials and Industrials, aided relative returns. Within fixed income, with the exception of the Conservative Term Series, the portfolios benefitted from a slightly shorter duration as rates generally rose over the course of the year.
In general, we believe that we are entering a higher risk regime for equities and credit, and that the US is likely approaching a period of peak growth. This could result in lower returns as the economy is moving into late cycle territory as supply begins to become a binding constraint for growth. Given this outlook, we believe that the equity section of each Series should focus on higher quality businesses and reasonably priced growth companies tend to perform well later cycle and have historically provided some degree of downside protection in higher risk market environments.
Regarding fixed income, we continue to view corporate bonds as moderately attractive as they continue to adequately compensate investors on a fundamental basis. That said, we are aware that we are in the later stages of an economic expansion and we may look to reduce exposure if spreads tighten or if economic conditions deteriorate. Each Series also has a notable allocation to U.S. Treasury securities. With the exception of the Maximum Term Series, each Series holds Agencies as well as pass-through securities, which include asset-backed and commercial mortgage-backed securities.
Additionally, we believe that domestic conditions argue for higher interest rates across the curve and expect the yield curve to flatten. While at the early stages of policy normalization, we expect European and Japanese interest rates to remain very low for an extended period of time, keeping US yields at lower levels than domestic conditions alone would argue for.
We think the Fed will remain opportunistic, looking to hike the federal funds target rate as economic conditions allow, while also remaining sensitive to domestic and global market conditions as they continue to reduce the size of their balance sheet by decreasing reinvestment of principal in Treasuries and agency mortgage-backed securities.
Performance data quoted represents past performance and does not guarantee future results. The investment return and principal value of an investment will fluctuate, so that an investor’s shares, when redeemed, may be worth more or less than their original cost. Current performance may be higher or lower than that quoted; investors can obtain the most recent month-end performance at www.manning-napier.com or by calling (800) 593-4353.
All investments involve risks, including possible loss of principal. Because the fund invests in both stocks and bonds, the value of your investment will fluctuate in response to stock market movements and changes in interest rates. Investing in the fund will also involve a number of other risks, including issuer-specific risk, foreign investment risk, and small-cap/mid-cap risk. Investments in options and futures, like all derivatives, can be highly volatile and involve risks in addition to the risks of the underlying instrument on which the derivative is based, such as counterparty, correlation and liquidity risk. Also, the use of leverage increases exposure to the market and may magnify potential losses.
Commentary prepared using data provided by FactSet. Analysis Manning & Napier. Commentary presented is relative to each Series’ respective blended benchmark. Additional information and associated disclosures can be found on the Performance Update pages contained in this report.
2
Performance Update as of October 31, 2018 - Pro-Blend® Conservative Term Series
(unaudited)
| AVERAGE ANNUAL TOTAL RETURNS AS OF OCTOBER 31, 2018 | ||||||
| ONE YEAR1 | FIVE YEAR | TEN YEAR | ||||
Manning & Napier Fund, Inc. - Pro-Blend® Conservative Term Series - Class S2 | -0.75% | 2.64% | 5.36% | |||
Manning & Napier Fund, Inc. - Pro-Blend® Conservative Term Series - Class I2 | -0.62% | 2.83% | 5.55% | |||
Manning & Napier Fund, Inc. - Pro-Blend® Conservative Term Series - Class R2,3 | -1.08% | 2.33% | 5.07% | |||
Manning & Napier Fund, Inc. - Pro-Blend® Conservative Term Series - Class R22,3 | -1.58% | 1.80% | 4.52% | |||
Bloomberg Barclays U.S. Intermediate Aggregate Bond Index4 | -1.23% | 1.51% | 3.47% | |||
Conservative Term Composite Benchmark5 | 0.01% | 3.64% | 5.94% | |||
The following graph compares the value of a $10,000 investment in the Manning & Napier Fund, Inc. - Pro-Blend® Conservative Term Series - Class S for the ten years ended October 31, 2018 to the Bloomberg Barclays U.S. Intermediate Aggregate Bond Index and Conservative Term Composite Benchmark.
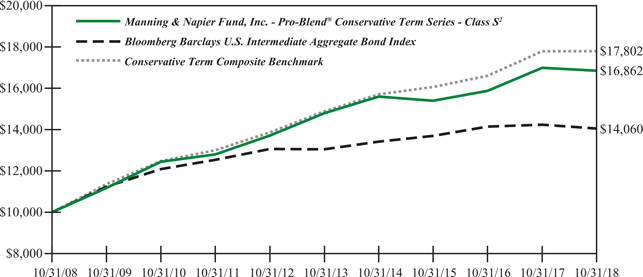
1The returns shown are based on net asset values calculated for shareholder transactions and may differ from the returns shown in the financial highlights, which reflect adjustments made to the net asset values in accordance with accounting principles generally accepted in the United States of America.
2The Series’ performance does not reflect the deduction of taxes that a shareholder would pay on fund distributions or the redemption of shares. The Series’ performance is historical and may not be indicative of future results. The performance returns shown are inclusive of the net expense ratio of the Series. For the year ended October 31, 2018, this net expense ratio was 0.88% for Class S, 0.68% for Class I, 1.18% for Class R and 1.68% for Class R2. The gross expense ratio, which does not account for any voluntary or contractual waivers currently in effect, was 0.88% for Class S, 0.68% for Class I, 1.18% for Class R and 1.68% for Class R2 for the year ended October 31, 2018.
3For periods through the inception of Class R2 on January 4, 2010 and Class R on June 30, 2010, the performance is hypothetical and is based on the historical performance of Class S shares adjusted for the respective class’ charges and expenses.
4The Bloomberg Barclays U.S Intermediate Aggregate Bond Index is an unmanaged, market-value weighted index of U.S. domestic investment-grade debt issues, including government, corporate, asset-backed and mortgage-backed securities, with maturities greater than one year but less than ten years. Index returns do not reflect any fees or expenses. Index returns provided by Interactive Data.
5The Conservative Term Composite Benchmark is a blend of the Russell 3000® Index (Russell 3000), MSCI ACWI ex USA Index (ACWIxUS), and Bloomberg Barclays U.S. Intermediate Aggregate Bond Index (BIAB) in the following weightings: 15% Russell 3000, 5% ACWIxUS, and 80% BIAB through 05/31/2012; and 22% Russell 3000, 8% ACWIxUS, and 70% BIAB beginning 06/01/2012. Russell 3000 is an unmanaged index that consists of 3,000 of the largest U.S. companies based on total market capitalization. Index returns are based on a market capitalization-weighted average of relative price
3
Performance Update as of October 31, 2018 - Pro-Blend® Conservative Term Series
(unaudited)
changes of the component stocks plus dividends whose reinvestments are compounded daily. Index returns provided by Bloomberg. ACWIxUS is designed to measure large and mid-cap representation across 22 of 23 Developed Markets countries (excluding the U.S.) and 24 Emerging Markets countries. The Index is denominated in U.S. dollars. The Index returns are net of withholding taxes. They assume daily reinvestment of net dividends thus accounting for any applicable dividend taxation. Index returns provided by Bloomberg. BIAB is an unmanaged, market value-weighted index of U.S. domestic investment-grade debt issues, including government, corporate, asset-backed, and mortgage-backed securities with maturities of greater than one year but less than ten years. Index returns provided by Interactive Data. The returns of the indices do not reflect any fees or expenses. Returns provided are calculated monthly using a blended allocation. Because the fund’s asset allocation will vary over time, the composition of the fund’s portfolio may not match the composition of the Conservative Term Composite Benchmark.
4
Shareholder Expense Example - Pro-Blend® Conservative Term Series
(unaudited)
As a shareholder of the Series, you incur ongoing costs, including management fees, shareholder service fees and other Series expenses. This example is intended to help you understand your ongoing costs (in dollars) of investing in the Series and to compare these costs with the ongoing costs of investing in other mutual funds.
The example is based on an investment of $1,000 invested in each class at the beginning of the period and held for the entire period (May 1, 2018 to October 31, 2018).
Actual Expenses
The Actual lines of the table below provide information about actual account values and actual expenses. You may use the information in these lines, together with the amount you invested, to estimate the expenses that you paid over the period. Simply divide your account value by $1,000 (for example, an $8,600 account value divided by $1,000 = 8.6), then multiply the result by the number in the Actual line for the Class in which you have invested under the heading entitled “Expenses Paid During Period” to estimate the expenses you paid on your account during this period.
Hypothetical Example for Comparison Purposes
The Hypothetical lines of each class in the table below provide information about hypothetical account values and hypothetical expenses based on the Class’ actual expense ratio and an assumed rate of return of 5% per year before expenses, which is not the Class’ actual return. The hypothetical account values and expenses may not be used to estimate the actual ending account balance or expenses you paid during the period. You may use this information to compare the ongoing costs of investing in a class of the Series and other funds. To do so, compare this 5% hypothetical example for the Class in which you have invested with the 5% hypothetical examples that appear in the shareholder reports of the other funds.
Please note that the expenses shown in the table are meant to highlight your ongoing costs only and do not reflect any transaction costs such as sales charges (loads), redemption fees, or exchange fees that you may incur in other mutual funds. Therefore, the second line of the table is useful in comparing ongoing costs only, and will not help you determine the relative total costs of owning different funds.
BEGINNING ACCOUNT VALUE 5/1/18 | ENDING ACCOUNT VALUE 10/31/18 | EXPENSES PAID DURING PERIOD 5/1/18-10/31/18* | ANNUALIZED EXPENSE RATIO | |||||
Class S | ||||||||
Actual | $1,000.00 | $1,002.04 | $4.44 | 0.88% | ||||
Hypothetical (5% return before expenses) | $1,000.00 | $1,020.77 | $4.48 | 0.88% | ||||
Class I | ||||||||
Actual | $1,000.00 | $1,001.94 | $3.43 | 0.68% | ||||
Hypothetical (5% return before expenses) | $1,000.00 | $1,021.78 | $3.47 | 0.68% | ||||
Class R | ||||||||
Actual | $1,000.00 | $1,000.53 | $5.95 | 1.18% | ||||
Hypothetical (5% return before expenses) | $1,000.00 | $1,019.26 | $6.01 | 1.18% | ||||
Class R2 | ||||||||
Actual | $1,000.00 | $997.55 | $8.46 | 1.68% | ||||
Hypothetical (5% return before expenses) | $1,000.00 | $1,016.74 | $8.54 | 1.68% |
*Expenses are equal to the Class’ annualized expense ratio (for the six-month period), multiplied by the average account value over the period, multiplied by 184/365 (to reflect the one-half year period). Expenses are based on the most recent fiscal half year; therefore, the expense ratios stated above may differ from the expense ratios stated in the financial highlights, which are based on one-year data.
5
Portfolio Composition - Pro-Blend® Conservative Term Series
As of October 31, 2018 (unaudited)
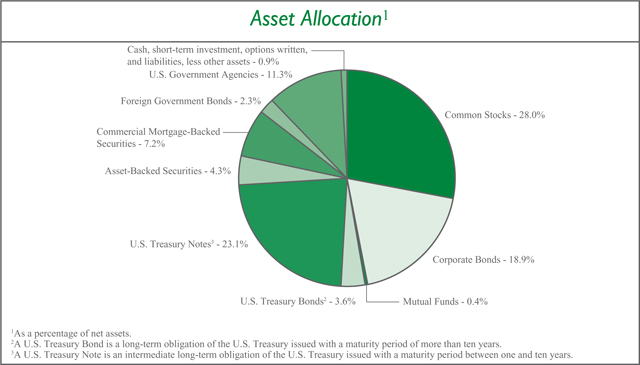
Sector Allocation4 | ||||||||
Financials | 8.5 | % | ||||||
Health Care | 5.9 | % | ||||||
Energy | 5.1 | % | ||||||
Consumer Discretionary | 4.6 | % | ||||||
Information Technology | 4.3 | % | ||||||
Industrials | 4.2 | % | ||||||
Communication Services | 4.1 | % | ||||||
Real Estate | 3.6 | % | ||||||
Consumer Staples | 3.2 | % | ||||||
Materials | 2.5 | % | ||||||
Utilities | 0.3 | % | ||||||
4Including common stocks and corporate bonds, as a percentage of total investments. | ||||||||
Top Five Stock Holdings5 | ||||
Johnson & Johnson | 0.8 | % | ||
Medtronic plc | 0.6 | % | ||
Microsoft Corp. | 0.6 | % | ||
Mastercard, Inc. - Class A | 0.6 | % | ||
Novartis AG - ADR (Switzerland) | 0.6 | % | ||
5As a percentage of total investments. | ||||
Top Five Bond Holdings6 | ||||
U.S. Treasury Note, 1.625%, 4/30/2019 | 6.1 | % | ||
U.S. Treasury Note, 2.00%, 7/31/2022 | 5.2 | % | ||
U.S. Treasury Inflation Indexed Note, 0.125%, 4/15/2020 | 5.0 | % | ||
U.S. Treasury Note, 1.625%, 4/30/2023 | 2.0 | % | ||
U.S. Treasury Note, 1.625%, 5/15/2026 | 2.0 | % | ||
6As a percentage of total investments. | ||||
6
Investment Portfolio - October 31, 2018
| PRO-BLEND® CONSERVATIVE TERM SERIES | SHARES | VALUE (NOTE 2) | ||||||
COMMON STOCKS - 28.0% | ||||||||
Communication Services - 1.8% | ||||||||
Diversified Telecommunication Services - 0.4% |
| |||||||
Verizon Communications, Inc. | 14,855 | $ | 848,072 | |||||
Zayo Group Holdings, Inc.* | 82,200 | 2,456,136 | ||||||
|
| |||||||
| 3,304,208 | ||||||||
|
| |||||||
Entertainment - 0.2% |
| |||||||
Electronic Arts, Inc.* | 25,200 | 2,292,696 | ||||||
|
| |||||||
Interactive Media & Services - 0.9% |
| |||||||
Alphabet, Inc. - Class A* | 1,430 | 1,559,529 | ||||||
Alphabet, Inc. - Class C* | 2,650 | 2,853,441 | ||||||
Tencent Holdings Ltd. - Class H (China) | 96,160 | 3,294,371 | ||||||
|
| |||||||
| 7,707,341 | ||||||||
|
| |||||||
Media - 0.3% |
| |||||||
Comcast Corp. - Class A | 26,437 | 1,008,307 | ||||||
Quebecor, Inc. - Class B (Canada) | 43,590 | 854,946 | ||||||
Shaw Communications, Inc. - Class B (Canada) | 40,835 | 760,276 | ||||||
|
| |||||||
| 2,623,529 | ||||||||
|
| |||||||
Total Communication Services | 15,927,774 | |||||||
|
| |||||||
Consumer Discretionary - 2.2% |
| |||||||
Automobiles - 0.1% |
| |||||||
Honda Motor Co., Ltd. - ADR (Japan) | 19,437 | 553,954 | ||||||
|
| |||||||
Hotels, Restaurants & Leisure - 0.1% |
| |||||||
McDonald’s Corp. | 6,400 | 1,132,160 | ||||||
|
| |||||||
Household Durables - 0.1% |
| |||||||
Newell Brands, Inc. | 31,415 | 498,870 | ||||||
|
| |||||||
Internet & Direct Marketing Retail - 1.0% |
| |||||||
Alibaba Group Holding Ltd. - ADR (China)* | 17,510 | 2,491,324 | ||||||
Amazon.com, Inc.* | 910 | 1,454,189 | ||||||
Booking Holdings, Inc.* | 2,700 | 5,061,366 | ||||||
|
| |||||||
| 9,006,879 | ||||||||
|
| |||||||
Multiline Retail - 0.1% |
| |||||||
Dollar General Corp. | 6,915 | 770,193 | ||||||
Target Corp. | 6,530 | 546,104 | ||||||
|
| |||||||
| 1,316,297 | ||||||||
|
| |||||||
Specialty Retail - 0.5% |
| |||||||
Dick’s Sporting Goods, Inc. | 11,755 | 415,774 | ||||||
The Home Depot, Inc. | 7,364 | 1,295,180 | ||||||
Industria de Diseno Textil S.A. (Spain) | 73,590 | 2,074,101 | ||||||
O’Reilly Automotive, Inc.* | 1,455 | 466,691 | ||||||
|
| |||||||
| 4,251,746 | ||||||||
|
| |||||||
Textiles, Apparel & Luxury Goods - 0.3% | ||||||||
lululemon athletica, Inc.* | 21,890 | 3,080,580 | ||||||
|
| |||||||
Total Consumer Discretionary | 19,840,486 | |||||||
|
| |||||||
Consumer Staples - 3.2% | ||||||||
Beverages - 1.7% | ||||||||
Ambev S.A. - ADR (Brazil) | 411,680 | 1,782,574 | ||||||
Anheuser-Busch InBev S.A./N.V. (Belgium) | 55,530 | 4,107,052 | ||||||
The Coca-Cola Co. | 36,870 | 1,765,336 | ||||||
Diageo plc (United Kingdom) | 102,771 | 3,552,950 | ||||||
Molson Coors Brewing Co. - Class B | 4,120 | 263,680 | ||||||
PepsiCo, Inc. | 30,906 | 3,473,216 | ||||||
|
| |||||||
| 14,944,808 | ||||||||
|
| |||||||
Food & Staples Retailing - 0.3% | ||||||||
Walgreens Boots Alliance, Inc. | 7,397 | 590,059 | ||||||
Walmart, Inc. | 18,605 | 1,865,709 | ||||||
|
| |||||||
| 2,455,768 | ||||||||
|
| |||||||
Food Products - 0.7% | ||||||||
J&J Snack Foods Corp. | 4,022 | 628,076 | ||||||
The Kraft Heinz Co. | 8,413 | 462,463 | ||||||
Mondelez International, Inc. - Class A | 83,681 | 3,512,928 | ||||||
Nestle S.A. (Switzerland) | 20,930 | 1,766,976 | ||||||
|
| |||||||
| 6,370,443 | ||||||||
|
| |||||||
Household Products - 0.1% | ||||||||
Colgate-Palmolive Co. | 15,502 | 923,144 | ||||||
|
| |||||||
Personal Products - 0.4% | ||||||||
Unilever plc - ADR (United Kingdom) | 75,702 | 4,010,692 | ||||||
|
| |||||||
Total Consumer Staples | 28,704,855 | |||||||
|
| |||||||
Energy - 1.5% | ||||||||
Energy Equipment & Services - 0.8% | ||||||||
Diamond Offshore Drilling, Inc.* | 67,990 | 964,098 | ||||||
Ensco plc - Class A | 170,840 | 1,219,798 | ||||||
Schlumberger Ltd. | 57,390 | 2,944,681 | ||||||
Transocean Ltd.* | 151,260 | 1,665,373 | ||||||
|
| |||||||
| 6,793,950 | ||||||||
|
| |||||||
Oil, Gas & Consumable Fuels - 0.7% | ||||||||
BP plc - ADR (United Kingdom) | 21,624 | 937,834 | ||||||
Chevron Corp. | 7,091 | 791,710 | ||||||
China Petroleum & Chemical Corp. - ADR (China) | 10,549 | 850,882 | ||||||
Exxon Mobil Corp. | 27,033 | 2,153,989 | ||||||
Hess Corp. | 8,811 | 505,751 | ||||||
The accompanying notes are an integral part of the financial statements.
7
Investment Portfolio - October 31, 2018
| PRO-BLEND® CONSERVATIVE TERM SERIES | SHARES | VALUE (NOTE 2) | ||||||
COMMON STOCKS (continued) | ||||||||
Energy (continued) | ||||||||
Oil, Gas & Consumable Fuels (continued) | ||||||||
Marathon Petroleum Corp. | 5,923 | $ | 417,275 | |||||
Royal Dutch Shell plc - Class B - ADR (Netherlands) | 7,085 | 465,555 | ||||||
Valero Energy Corp. | 4,988 | 454,357 | ||||||
|
| |||||||
| 6,577,353 | ||||||||
|
| |||||||
Total Energy | 13,371,303 | |||||||
|
| |||||||
Financials - 2.7% | ||||||||
Banks - 1.3% | ||||||||
Bank of America Corp. | 55,315 | 1,521,163 | ||||||
BankUnited, Inc. | 4,805 | 159,046 | ||||||
Citigroup, Inc. | 20,113 | 1,316,597 | ||||||
Fifth Third Bancorp | 6,155 | 166,123 | ||||||
Huntington Bancshares, Inc. | 11,370 | 162,932 | ||||||
JPMorgan Chase & Co. | 32,624 | 3,556,668 | ||||||
KeyCorp. | 27,873 | 506,174 | ||||||
The PNC Financial Services Group, Inc. | 2,114 | 271,628 | ||||||
Regions Financial Corp. | 17,790 | 301,896 | ||||||
SunTrust Banks, Inc. | 4,500 | 281,970 | ||||||
U.S. Bancorp | 14,761 | 771,557 | ||||||
Wells Fargo & Co. | 48,610 | 2,587,510 | ||||||
|
| |||||||
| 11,603,264 | ||||||||
|
| |||||||
Capital Markets - 1.0% | ||||||||
Apollo Global Management LLC - Class A | 12,235 | 359,954 | ||||||
Ares Management LP | 12,155 | 238,360 | ||||||
BlackRock, Inc. | 6,925 | 2,849,084 | ||||||
The Blackstone Group LP | 12,015 | 388,805 | ||||||
Cboe Global Markets, Inc. | 8,250 | 931,012 | ||||||
The Charles Schwab Corp. | 35,635 | 1,647,762 | ||||||
CME Group, Inc. | 4,690 | 859,396 | ||||||
E*TRADE Financial Corp. | 16,680 | 824,326 | ||||||
Intercontinental Exchange, Inc. | 11,460 | 882,878 | ||||||
|
| |||||||
| 8,981,577 | ||||||||
|
| |||||||
Diversified Financial Services - 0.2% | ||||||||
Berkshire Hathaway, Inc. - Class B* . | 8,030 | 1,648,398 | ||||||
|
| |||||||
Insurance - 0.2% | ||||||||
The Allstate Corp. | 2,770 | 265,145 | ||||||
Arthur J. Gallagher & Co. | 4,365 | 323,054 | ||||||
Chubb Ltd. | 2,840 | 354,744 | ||||||
Lincoln National Corp. | 3,690 | 222,101 | ||||||
Old Republic International Corp. | 13,340 | 294,147 | ||||||
Principal Financial Group, Inc. | 4,071 | 191,622 | ||||||
Willis Towers Watson plc | 1,830 | 261,983 | ||||||
|
| |||||||
| 1,912,796 | ||||||||
|
| |||||||
Total Financials | 24,146,035 | |||||||
|
| |||||||
Health Care - 5.8% | ||||||||
Biotechnology - 1.8% | ||||||||
AbbVie, Inc. | 12,811 | 997,336 | ||||||
Amgen, Inc. | 5,300 | 1,021,787 | ||||||
BioMarin Pharmaceutical, Inc.* | 29,440 | 2,713,485 | ||||||
Gilead Sciences, Inc. | 11,085 | 755,775 | ||||||
Incyte Corp.* | 78,000 | 5,055,960 | ||||||
Regeneron Pharmaceuticals, Inc.* | 6,410 | 2,174,528 | ||||||
Seattle Genetics, Inc.* | 40,910 | 2,296,278 | ||||||
Vertex Pharmaceuticals, Inc.* | 7,575 | 1,283,660 | ||||||
|
| |||||||
| 16,298,809 | ||||||||
|
| |||||||
Health Care Equipment & Supplies - 0.7% | ||||||||
Koninklijke Philips N.V. (Netherlands) | 11,565 | 430,565 | ||||||
Medtronic plc | 62,390 | 5,603,870 | ||||||
|
| |||||||
| 6,034,435 | ||||||||
|
| |||||||
Health Care Providers & Services - 0.3% | ||||||||
CVS Health Corp. | 8,770 | 634,860 | ||||||
DaVita, Inc.* | 37,430 | 2,520,536 | ||||||
|
| |||||||
| 3,155,396 | ||||||||
|
| |||||||
Pharmaceuticals - 3.0% | ||||||||
AstraZeneca plc (United Kingdom) | 7,920 | 605,798 | ||||||
Bristol-Myers Squibb Co. | 57,001 | 2,880,831 | ||||||
Eli Lilly & Co. | 13,818 | 1,498,424 | ||||||
Johnson & Johnson | 50,868 | 7,121,011 | ||||||
Merck & Co., Inc. | 61,125 | 4,499,411 | ||||||
Merck KGaA (Germany) | 16,325 | 1,746,819 | ||||||
Novartis AG - ADR (Switzerland) | 57,965 | 5,069,619 | ||||||
Pfizer, Inc. | 38,826 | 1,671,848 | ||||||
Sanofi (France) | 8,293 | 741,063 | ||||||
Sanofi - ADR (France) | 21,715 | 971,095 | ||||||
|
| |||||||
| 26,805,919 | ||||||||
|
| |||||||
Total Health Care | 52,294,559 | |||||||
|
| |||||||
Industrials - 2.1% | ||||||||
Aerospace & Defense - 0.3% | ||||||||
The Boeing Co. | 4,203 | 1,491,477 | ||||||
Lockheed Martin Corp. | 2,586 | 759,896 | ||||||
United Technologies Corp. | 7,080 | 879,407 | ||||||
|
| |||||||
| 3,130,780 | ||||||||
|
| |||||||
The accompanying notes are an integral part of the financial statements.
8
Investment Portfolio - October 31, 2018
| PRO-BLEND® CONSERVATIVE TERM SERIES | SHARES | VALUE (NOTE 2) | ||||||
COMMON STOCKS (continued) | ||||||||
Industrials (continued) | ||||||||
Air Freight & Logistics - 0.4% | ||||||||
FedEx Corp. | 11,750 | $ | 2,588,995 | |||||
United Parcel Service, Inc. - Class B | 7,778 | 828,668 | ||||||
|
| |||||||
| 3,417,663 | ||||||||
|
| |||||||
Airlines - 0.1% | ||||||||
Delta Air Lines, Inc. | 6,715 | 367,512 | ||||||
Southwest Airlines Co. | 6,190 | 303,929 | ||||||
|
| |||||||
| 671,441 | ||||||||
|
| |||||||
Building Products - 0.0%## | ||||||||
Johnson Controls International plc | 13,425 | 429,197 | ||||||
Resideo Technologies, Inc.* | 1,054 | 22,187 | ||||||
|
| |||||||
| 451,384 | ||||||||
|
| |||||||
Commercial Services & Supplies - 0.2% | ||||||||
Covanta Holding Corp. | 40,510 | 595,092 | ||||||
Waste Management, Inc. | 10,870 | 972,539 | ||||||
|
| |||||||
| 1,567,631 | ||||||||
|
| |||||||
Construction & Engineering - 0.0%## | ||||||||
Comfort Systems USA, Inc. | 6,890 | 368,477 | ||||||
|
| |||||||
Electrical Equipment - 0.1% | ||||||||
ABB Ltd. (Asea Brown Boveri) - ADR (Switzerland) | 23,998 | 481,399 | ||||||
Emerson Electric Co. | 7,574 | 514,123 | ||||||
|
| |||||||
| 995,522 | ||||||||
|
| |||||||
Industrial Conglomerates - 0.3% | ||||||||
3M Co. | 7,059 | 1,343,045 | ||||||
Honeywell International, Inc. | 6,328 | 916,421 | ||||||
|
| |||||||
| 2,259,466 | ||||||||
|
| |||||||
Machinery - 0.1% | ||||||||
Caterpillar, Inc. | 4,303 | 522,040 | ||||||
Mueller Water Products, Inc. - Class A | 33,760 | 346,378 | ||||||
|
| |||||||
| 868,418 | ||||||||
|
| |||||||
Professional Services - 0.2% | ||||||||
Equifax, Inc. | 15,860 | 1,608,838 | ||||||
|
| |||||||
Road & Rail - 0.4% | ||||||||
Genesee & Wyoming, Inc. - Class A* | 21,120 | 1,673,338 | ||||||
Kansas City Southern | 7,634 | 778,363 | ||||||
Union Pacific Corp. | 6,724 | 983,183 | ||||||
|
| |||||||
| 3,434,884 | ||||||||
|
| |||||||
Total Industrials | 18,774,504 | |||||||
|
| |||||||
Information Technology - 4.3% | ||||||||
Communications Equipment - 0.2% | ||||||||
Cisco Systems, Inc. | 32,603 | 1,491,587 | ||||||
|
| |||||||
IT Services - 1.7% | ||||||||
Automatic Data Processing, Inc. | 4,475 | 644,759 | ||||||
International Business Machines Corp. | 7,462 | 861,339 | ||||||
InterXion Holding N.V. (Netherlands)* | 33,355 | 1,963,609 | ||||||
LiveRamp Holdings, Inc.* | 53,455 | 2,441,824 | ||||||
Mastercard, Inc. - Class A1 | 25,690 | 5,078,142 | ||||||
Visa, Inc. - Class A1 | 34,570 | 4,765,474 | ||||||
|
| |||||||
| 15,755,147 | ||||||||
|
| |||||||
Semiconductors & Semiconductor Equipment - 1.5% | ||||||||
Broadcom, Inc. | 2,548 | 569,453 | ||||||
Intel Corp. | 66,326 | 3,109,363 | ||||||
Qorvo, Inc.* | 67,150 | 4,936,196 | ||||||
Skyworks Solutions, Inc. | 26,445 | 2,294,368 | ||||||
Taiwan Semiconductor Manufacturing Co. Ltd. - ADR (Taiwan) | 37,932 | 1,445,209 | ||||||
Texas Instruments, Inc. | 8,633 | 801,401 | ||||||
|
| |||||||
| 13,155,990 | ||||||||
|
| |||||||
Software - 0.8% | ||||||||
Microsoft Corp. | 51,412 | 5,491,316 | ||||||
ServiceNow, Inc.* | 9,910 | 1,794,106 | ||||||
|
| |||||||
| 7,285,422 | ||||||||
|
| |||||||
Technology Hardware, Storage & Peripherals - 0.1% | ||||||||
Apple, Inc. | 4,154 | 909,145 | ||||||
|
| |||||||
Total Information Technology | 38,597,291 | |||||||
|
| |||||||
Materials - 1.3% | ||||||||
Chemicals - 0.2% | ||||||||
DowDuPont, Inc. | 11,505 | 620,350 | ||||||
FMC Corp. | 9,730 | 759,718 | ||||||
LyondellBasell Industries N.V. - Class A | 4,798 | 428,317 | ||||||
|
| |||||||
| 1,808,385 | ||||||||
|
| |||||||
Containers & Packaging - 0.9% | ||||||||
Ball Corp. | 80,000 | 3,584,000 | ||||||
Graphic Packaging Holding Co. | 74,431 | 819,485 | ||||||
Sealed Air Corp. | 81,785 | 2,646,563 | ||||||
Sonoco Products Co. | 19,167 | 1,046,135 | ||||||
|
| |||||||
| 8,096,183 | ||||||||
|
| |||||||
Metals & Mining - 0.2% | ||||||||
BHP Billiton Ltd. - ADR (Australia) | 16,607 | 766,911 | ||||||
The accompanying notes are an integral part of the financial statements.
9
Investment Portfolio - October 31, 2018
| PRO-BLEND® CONSERVATIVE TERM SERIES | SHARES | VALUE (NOTE 2) | ||||||
COMMON STOCKS (continued) | ||||||||
Materials (continued) | ||||||||
Metals & Mining (continued) | ||||||||
Rio Tinto plc - ADR (Australia) | 12,347 | $ | 608,584 | |||||
|
| |||||||
| 1,375,495 | ||||||||
|
| |||||||
Total Materials | 11,280,063 | |||||||
|
| |||||||
Real Estate - 2.9% | ||||||||
Equity Real Estate Investment Trusts (REITS) - 2.9% | ||||||||
Acadia Realty Trust | 3,200 | 89,087 | ||||||
Agree Realty Corp. | 2,150 | 123,131 | ||||||
Alexandria Real Estate Equities, Inc. | 705 | 86,172 | ||||||
American Campus Communities, Inc. | 2,380 | 94,034 | ||||||
American Homes 4 Rent - Class A | 18,310 | 385,792 | ||||||
American Tower Corp. | 11,560 | 1,801,164 | ||||||
Americold Realty Trust | 3,305 | 81,799 | ||||||
Apartment Investment & Management Co. - Class A | 6,600 | 284,064 | ||||||
Apple Hospitality REIT, Inc. | 8,980 | 145,207 | ||||||
AvalonBay Communities, Inc. | 3,950 | 692,751 | ||||||
Boston Properties, Inc. | 4,290 | 518,060 | ||||||
Brandywine Realty Trust | 21,770 | 306,086 | ||||||
CatchMark Timber Trust, Inc. - Class A | 18,255 | 161,557 | ||||||
Chesapeake Lodging Trust | 4,635 | 136,223 | ||||||
Colony Capital, Inc. | 70,403 | 413,266 | ||||||
Community Healthcare Trust, Inc. | 21,637 | 643,052 | ||||||
CoreCivic, Inc. | 20,870 | 468,740 | ||||||
Cousins Properties, Inc. | 37,900 | 314,949 | ||||||
Crown Castle International Corp. | 9,023 | 981,161 | ||||||
CubeSmart | 2,530 | 73,319 | ||||||
Digital Realty Trust, Inc. | 7,660 | 790,972 | ||||||
EastGroup Properties, Inc. | 875 | 83,816 | ||||||
Equinix, Inc. | 8,870 | 3,359,424 | ||||||
Equity LifeStyle Properties, Inc. | 2,055 | 194,588 | ||||||
Equity Residential | 8,575 | 557,032 | ||||||
Essex Property Trust, Inc. | 1,435 | 359,869 | ||||||
Extra Space Storage, Inc. | 1,920 | 172,915 | ||||||
Federal Realty Investment Trust | 725 | 89,936 | ||||||
First Industrial Realty Trust, Inc. | 4,590 | 140,913 | ||||||
Getty Realty Corp. | 5,565 | 149,309 | ||||||
HCP, Inc. | 10,560 | 290,928 | ||||||
Healthcare Realty Trust, Inc. | 6,425 | 179,000 | ||||||
Healthcare Trust of America, Inc. - Class A | 7,450 | 195,637 | ||||||
Hibernia REIT plc (Ireland) | 96,180 | 151,423 | ||||||
Host Hotels & Resorts, Inc. | 18,450 | 352,580 | ||||||
Independence Realty Trust, Inc. | 16,210 | 160,641 | ||||||
Invitation Homes, Inc. | 15,950 | 348,986 | ||||||
Jernigan Capital, Inc. | 23,550 | 460,874 | ||||||
Kimco Realty Corp. | 8,495 | 136,685 | ||||||
Lamar Advertising Co. - Class A | 4,855 | 355,969 | ||||||
Lexington Realty Trust | 16,870 | 131,080 | ||||||
Liberty Property Trust | 7,150 | 299,370 | ||||||
The Macerich Co. | 1,270 | 65,557 | ||||||
Mid-America Apartment Communities, Inc. | 2,940 | 287,267 | ||||||
National Retail Properties, Inc. | 3,350 | 156,612 | ||||||
National Storage Affiliates Trust | 2,755 | 73,366 | ||||||
Outfront Media, Inc. | 14,260 | 252,687 | ||||||
Physicians Realty Trust | 23,275 | 385,900 | ||||||
Plymouth Industrial REIT, Inc. | 12,745 | 178,430 | ||||||
Prologis, Inc. | 11,175 | 720,452 | ||||||
Public Storage | 2,255 | 463,335 | ||||||
Realty Income Corp. | 1,520 | 91,610 | ||||||
SBA Communications Corp.* | 10,025 | 1,625,754 | ||||||
Simon Property Group, Inc. | 5,415 | 993,761 | ||||||
STAG Industrial, Inc. | 16,630 | 440,030 | ||||||
STORE Capital Corp. | 3,090 | 89,703 | ||||||
Sun Communities, Inc. | 3,565 | 358,176 | ||||||
Sunstone Hotel Investors, Inc. | 14,295 | 206,849 | ||||||
Tier REIT, Inc. | 12,820 | 277,809 | ||||||
UDR, Inc. | 9,130 | 357,805 | ||||||
UMH Properties, Inc. | 6,480 | 92,858 | ||||||
Unibail-Rodamco-Westfield (France) | 1,105 | 199,959 | ||||||
Urban Edge Properties | 14,315 | 293,314 | ||||||
Ventas, Inc. | 2,920 | 169,477 | ||||||
VEREIT, Inc. | 33,010 | 241,963 | ||||||
Vornado Realty Trust | 5,430 | 369,674 | ||||||
Weingarten Realty Investors | 7,965 | 223,976 | ||||||
Welltower, Inc. | 3,775 | 249,414 | ||||||
|
| |||||||
| 25,627,299 | ||||||||
|
| |||||||
Real Estate Management & Development - 0.0%## | ||||||||
StorageVault Canada, Inc. (Canada) | 23,295 | 45,654 | ||||||
|
| |||||||
Total Real Estate | 25,672,953 | |||||||
|
| |||||||
Utilities - 0.2% | ||||||||
Electric Utilities - 0.0%## | ||||||||
Exelon Corp. | 7,580 | 332,080 | ||||||
|
| |||||||
Independent Power and Renewable Electricity Producers - 0.1% | ||||||||
Boralex, Inc. - Class A (Canada) | 14,585 | 188,344 | ||||||
Innergex Renewable Energy, Inc. (Canada) | 23,950 | 222,135 | ||||||
The accompanying notes are an integral part of the financial statements.
10
Investment Portfolio - October 31, 2018
| PRO-BLEND® CONSERVATIVE TERM SERIES | SHARES/ PRINCIPAL AMOUNT2 | VALUE (NOTE 2) | ||||||
COMMON STOCKS (continued) | ||||||||
Utilities (continued) | ||||||||
Independent Power and Renewable Electricity Producers (continued) | ||||||||
Northland Power, Inc. (Canada) | 13,535 | $ | 208,199 | |||||
Pattern Energy Group, Inc. - Class A | 13,605 | 243,802 | ||||||
|
| |||||||
| 862,480 | ||||||||
|
| |||||||
Multi-Utilities - 0.1% | ||||||||
CMS Energy Corp. | 10,796 | 534,617 | ||||||
|
| |||||||
Total Utilities | 1,729,177 | |||||||
|
| |||||||
TOTAL COMMON STOCKS | ||||||||
(Identified Cost $227,761,985) | 250,339,000 | |||||||
|
| |||||||
CORPORATE BONDS - 18.9% | ||||||||
Non-Convertible Corporate Bonds - 18.9% | ||||||||
Communication Services - 2.4% | ||||||||
Diversified Telecommunication Services - 1.5% | ||||||||
AT&T, Inc., 4.25%, 3/1/2027 | 5,690,000 | 5,517,952 | ||||||
Verizon Communications, Inc., 5.50%, 3/16/2047 | 7,950,000 | 8,283,687 | ||||||
|
| |||||||
| 13,801,639 | ||||||||
|
| |||||||
Media - 0.8% | ||||||||
Altice US Finance I Corp.3, 5.50%, 5/15/2026 | 235,000 | 228,904 | ||||||
CCO Holdings LLC - CCO Holdings Capital Corp.3, 5.50%, 5/1/2026 | 255,000 | 248,625 | ||||||
Cequel Communications Holdings I LLC - Cequel Capital Corp.3, 7.50%, 4/1/2028 | 200,000 | 207,294 | ||||||
Discovery Communications LLC, 5.20%, 9/20/2047 | 5,860,000 | 5,419,838 | ||||||
Telenet Finance Luxembourg Notes S.A.R.L (Belgium)3, 5.50%, 3/1/2028 | 400,000 | 371,000 | ||||||
UPCB Finance IV Ltd. (Netherlands)3, 5.375%, 1/15/2025 | 225,000 | 218,925 | ||||||
|
| |||||||
| 6,694,586 | ||||||||
|
| |||||||
Wireless Telecommunication Services - 0.1% | ||||||||
Hughes Satellite Systems Corp., 5.25%, 8/1/2026 | 463,000 | 439,850 | ||||||
Inmarsat Finance plc (United Kingdom)3, 4.875%, 5/15/2022 | 170,000 | 166,518 | ||||||
Sprint Communications, Inc.3, 9.00%, 11/15/2018 | 104,000 | 104,208 | ||||||
Sprint Communications, Inc.3, 7.00%, 3/1/2020 | 104,000 | 107,770 | ||||||
|
| |||||||
| 818,346 | ||||||||
|
| |||||||
Total Communication Services | 21,314,571 | |||||||
|
| |||||||
PRINCIPAL AMOUNT2 | VALUE (NOTE 2) | |||||||
Consumer Discretionary - 2.5% | ||||||||
Auto Components - 0.0%## | ||||||||
Techniplas LLC3, 10.00%, 5/1/2020 | 300,000 | 282,000 | ||||||
|
| |||||||
Automobiles - 0.6% | ||||||||
General Motors Co.4, (3 mo. LIBOR US + 0.900%), 3.227%, 9/10/2021 | 5,610,000 | 5,601,888 | ||||||
|
| |||||||
Household Durables - 0.3% | ||||||||
Century Communities, Inc., 5.875%, 7/15/2025 | 498,000 | 450,690 | ||||||
LGI Homes, Inc.3, 6.875%, 7/15/2026 | 350,000 | 332,500 | ||||||
Meritage Homes Corp., 5.125%, 6/6/2027 | 185,000 | 162,800 | ||||||
TRI Pointe Group, Inc. - TRI Pointe Homes, Inc., 4.375%, 6/15/2019 | 340,000 | 340,000 | ||||||
TRI Pointe Group, Inc. - TRI Pointe Homes, Inc., 5.875%, 6/15/2024 | 260,000 | 242,775 | ||||||
Weekley Homes LLC - Weekley Finance Corp., 6.00%, 2/1/2023 | 235,000 | 225,600 | ||||||
Weekley Homes LLC - Weekley Finance Corp., 6.625%, 8/15/2025 | 350,000 | 330,750 | ||||||
|
| |||||||
| 2,085,115 | ||||||||
|
| |||||||
Internet & Direct Marketing Retail - 1.0% | ||||||||
Booking Holdings, Inc., 3.60%, 6/1/2026 | 8,750,000 | 8,356,597 | ||||||
|
| |||||||
Multiline Retail - 0.6% | ||||||||
Macy’s Retail Holdings, Inc., 7.00%, 2/15/2028 | 2,600,000 | 2,745,635 | ||||||
Macy’s Retail Holdings, Inc., 6.90%, 4/1/2029 | 2,610,000 | 2,737,856 | ||||||
|
| |||||||
| 5,483,491 | ||||||||
|
| |||||||
Total Consumer Discretionary | 21,809,091 | |||||||
|
| |||||||
Consumer Staples - 0.1% | ||||||||
Food & Staples Retailing - 0.0%## | ||||||||
C&S Group Enterprises LLC3, 5.375%, 7/15/2022 | 175,000 | 168,875 | ||||||
|
| |||||||
The accompanying notes are an integral part of the financial statements.
11
Investment Portfolio - October 31, 2018
| PRO-BLEND® CONSERVATIVE TERM SERIES | PRINCIPAL AMOUNT2 | VALUE (NOTE 2) | ||||||||||
CORPORATE BONDS (continued) | ||||||||||||
Non-Convertible Corporate Bonds (continued) | ||||||||||||
Consumer Staples (continued) | ||||||||||||
Household Products - 0.1% | ||||||||||||
First Quality Finance Co., Inc.3, 5.00%, 7/1/2025 | 250,000 | $ | 230,000 | |||||||||
|
| |||||||||||
Total Consumer Staples | 398,875 | |||||||||||
|
| |||||||||||
Energy - 3.6% | ||||||||||||
Energy Equipment & Services - 0.0%## | ||||||||||||
Shelf Drilling Holdings Ltd. (United Arab Emirates)3, 8.25%, 2/15/2025 | 250,000 | 250,625 | ||||||||||
TerraForm Power Operating, LLC3, 5.00%, 1/31/2028 | 190,000 | 169,812 | ||||||||||
|
| |||||||||||
| 420,437 | ||||||||||||
|
| |||||||||||
Oil, Gas & Consumable Fuels - 3.6% | ||||||||||||
American Midstream Partners LP - American Midstream Finance Corp.3, 9.50%, 12/15/2021 | 270,000 | 264,600 | ||||||||||
Boardwalk Pipelines LP, 5.95%, 6/1/2026 | 7,910,000 | 8,265,255 | ||||||||||
DCP Midstream Operating LP3, 5.35%, 3/15/2020 | 165,000 | 166,856 | ||||||||||
Dynagas LNG Partners LP - Dynagas Finance, Inc. (Monaco), 6.25%, 10/30/2019 | 359,000 | 358,102 | ||||||||||
GasLog Ltd. (Monaco), 8.875%, 3/22/2022 | 430,000 | 445,050 | ||||||||||
Genesis Energy LP - Genesis Energy Finance Corp., 5.625%, 6/15/2024 | 200,000 | 181,000 | ||||||||||
Jonah Energy LLC - Jonah Energy Finance Corp.3, 7.25%, 10/15/2025 | 495,000 | 393,525 | ||||||||||
Kinder Morgan Energy Partners LP, 6.95%, 1/15/2038 | 7,150,000 | 8,189,606 | ||||||||||
Rockies Express Pipeline, LLC3, 5.625%, 4/15/2020 | 195,000 | 199,232 | ||||||||||
Sabine Pass Liquefaction LLC, 5.875%, 6/30/2026 | 7,880,000 | 8,365,592 | ||||||||||
SemGroup Corp., 6.375%, 3/15/2025 | 185,000 | 178,988 | ||||||||||
Seven Generations Energy Ltd. (Canada)3, 5.375%, 9/30/2025 | 241,000 | 224,732 | ||||||||||
Southwestern Energy Co.5, 6.20%, 1/23/2025 | 263,000 | 255,768 | ||||||||||
Tallgrass Energy Partners LP - Tallgrass Energy Finance Corp.3, 5.50%, 9/15/2024 | 170,000 | 171,062 | ||||||||||
W&T Offshore, Inc.3, 9.75%, 11/1/2023 | 260,000 | 251,602 | ||||||||||
The Williams Companies, Inc., 3.75%, 6/15/2027 | 4,410,000 | 4,106,321 | ||||||||||
|
| |||||||||||
| 32,017,291 | ||||||||||||
|
| |||||||||||
Total Energy | 32,437,728 | |||||||||||
|
| |||||||||||
Financials - 5.9% | ||||||||||||
Banks - 3.5% | ||||||||||||
Bank of America Corp., 4.00%, 1/22/2025 | 8,600,000 | 8,375,008 | ||||||||||
Citigroup, Inc., 8.125%, 7/15/2039 | 5,895,000 | 8,230,868 | ||||||||||
JPMorgan Chase & Co., 6.30%, 4/23/2019 | 8,230,000 | 8,363,283 | ||||||||||
Popular, Inc., 6.125%, 9/14/2023 | 280,000 | 283,304 | ||||||||||
Santander Holdings USA, Inc., 4.50%, 7/17/2025 | 5,630,000 | 5,505,270 | ||||||||||
|
| |||||||||||
| 30,757,733 | ||||||||||||
|
| |||||||||||
Capital Markets - 1.0% | ||||||||||||
LPL Holdings, Inc.3, 5.75%, 9/15/2025 | 335,000 | 325,369 | ||||||||||
Morgan Stanley4, (3 mo. LIBOR US + 1.220%), 3.563%, 5/8/2024 | 8,380,000 | 8,468,409 | ||||||||||
|
| |||||||||||
| 8,793,778 | ||||||||||||
|
| |||||||||||
Consumer Finance - 0.1% | ||||||||||||
Ally Financial, Inc., 3.50%, 1/27/2019 | 235,000 | 234,706 | ||||||||||
Navient Corp., 7.25%, 9/25/2023 | 205,000 | 212,175 | ||||||||||
SLM Corp., 5.125%, 4/5/2022 | 330,000 | 328,350 | ||||||||||
|
| |||||||||||
| 775,231 | ||||||||||||
|
| |||||||||||
Diversified Financial Services - 0.7% | ||||||||||||
AerCap Ireland Capital DAC - AerCap Global Aviation Trust (Ireland), 4.45%, 10/1/2025 | 5,640,000 | 5,507,410 | ||||||||||
FS Energy & Power Fund3, 7.50%, 8/15/2023 | 355,000 | 359,970 | ||||||||||
Oxford Finance, LLC - Oxford Finance Co.- Issuer II, Inc.3, 6.375%, 12/15/2022 | 350,000 | 354,812 | ||||||||||
|
| |||||||||||
| 6,222,192 | ||||||||||||
|
| |||||||||||
Insurance - 0.6% | ||||||||||||
Prudential Financial, Inc.6, (3 mo. LIBOR US + 4.175%), 5.875%, 9/15/2042 | 5,340,000 | 5,556,270 | ||||||||||
|
| |||||||||||
The accompanying notes are an integral part of the financial statements.
12
Investment Portfolio - October 31, 2018
| PRO-BLEND® CONSERVATIVE TERM SERIES | PRINCIPAL AMOUNT2 | VALUE (NOTE 2) | ||||||||||
CORPORATE BONDS (continued) | ||||||||||||
Non-Convertible Corporate Bonds (continued) | ||||||||||||
Financials (continued) | ||||||||||||
Thrifts & Mortgage Finance - 0.0%## | ||||||||||||
Ladder Capital Finance Holdings LLLP - Ladder Capital Finance Corp.3, 5.875%, 8/1/2021 | 225,000 | $ | 226,688 | |||||||||
|
| |||||||||||
Total Financials | 52,331,892 | |||||||||||
|
| |||||||||||
Health Care - 0.1% | ||||||||||||
Health Care Providers & Services - 0.1% | ||||||||||||
DaVita, Inc., 5.00%, 5/1/2025 | 285,000 | 269,325 | ||||||||||
HCA, Inc., 5.375%, 9/1/2026 | 240,000 | 238,200 | ||||||||||
Ortho-Clinical Diagnostics, Inc. - Ortho-Clinical Diagnostics S.A.3, 6.625%, 5/15/2022 | 245,000 | 235,445 | ||||||||||
|
| |||||||||||
| 742,970 | ||||||||||||
|
| |||||||||||
Pharmaceuticals - 0.0%## | ||||||||||||
Horizon Pharma, Inc. - Horizon Pharma USA, Inc.3, 8.75%, 11/1/2024 | 400,000 | 419,000 | ||||||||||
|
| |||||||||||
Total Health Care | 1,161,970 | |||||||||||
|
| |||||||||||
Industrials - 2.2% | ||||||||||||
Airlines - 0.1% | ||||||||||||
Allegiant Travel Co., 5.50%, 7/15/2019 | 254,000 | 255,270 | ||||||||||
American Airlines Group, Inc.3, 5.50%, 10/1/2019 | 225,000 | 227,464 | ||||||||||
|
| |||||||||||
| 482,734 | ||||||||||||
|
| |||||||||||
Commercial Services & Supplies - 0.1% | ||||||||||||
The ADT Security Corp., 5.25%, 3/15/2020 | 165,000 | 166,650 | ||||||||||
Covanta Holding Corp., 6.00%, 1/1/2027 | 235,000 | 226,775 | ||||||||||
W/S Packaging Holdings, Inc.3, 9.00%, 4/15/2023 | 355,000 | 362,100 | ||||||||||
|
| |||||||||||
| 755,525 | ||||||||||||
|
| |||||||||||
Construction & Engineering - 0.0%## | ||||||||||||
Tutor Perini Corp.3, 6.875%, 5/1/2025 | 359,000 | 359,449 | ||||||||||
|
| |||||||||||
Industrial Conglomerates - 0.5% | ||||||||||||
General Electric Co.6,7, (3 mo. LIBOR US + 3.330%), 5.00% | 4,490,000 | 4,158,862 | ||||||||||
|
| |||||||||||
Machinery - 0.6% | ||||||||||||
CNH Industrial Capital LLC, 3.375%, 7/15/2019 | 5,700,000 | 5,694,870 | ||||||||||
|
| |||||||||||
Marine - 0.1% | ||||||||||||
Borealis Finance, LLC3, 7.50%, 11/16/2022 | 440,000 | 431,200 | ||||||||||
Global Ship Lease, Inc. (United Kingdom)3, 9.875%, 11/15/2022 | 495,000 | 471,488 | ||||||||||
|
| |||||||||||
| 902,688 | ||||||||||||
|
| |||||||||||
Trading Companies & Distributors - 0.7% | ||||||||||||
Aircastle Ltd., 6.25%, 12/1/2019 | 140,000 | 143,878 | ||||||||||
Fortress Transportation & Infrastructure Investors, LLC3, 6.50%, 10/1/2025 | 260,000 | 255,450 | ||||||||||
International Lease Finance Corp., 6.25%, 5/15/2019 | 5,764,000 | 5,855,930 | ||||||||||
Park Aerospace Holdings Ltd. (Ireland)3, 4.50%, 3/15/2023 | 371,000 | 352,962 | ||||||||||
|
| |||||||||||
| 6,608,220 | ||||||||||||
|
| |||||||||||
Transportation Infrastructure - 0.1% | ||||||||||||
Eagle Bulk Shipco, LLC, 8.25%, 11/28/2022 | 200,000 | 205,500 | ||||||||||
MPC Container Ships Invest B.V. (Norway)4,8, (3 mo. LIBORUS+ 4.750%), 7.116%, 9/22/2022 | 200,000 | 203,316 | ||||||||||
|
| |||||||||||
| 408,816 | ||||||||||||
|
| |||||||||||
Total Industrials | 19,371,164 | |||||||||||
|
| |||||||||||
Information Technology - 0.0%## | ||||||||||||
Semiconductors & Semiconductor Equipment - 0.0%## | ||||||||||||
MagnaChip Semiconductor Corp. (South Korea), 6.625%, 7/15/2021 | 386,000 | 362,840 | ||||||||||
|
| |||||||||||
Materials - 1.2% | ||||||||||||
Chemicals - 0.0%## | ||||||||||||
LSB Industries, Inc.3, 9.625%, 5/1/2023 | 300,000 | 311,250 | ||||||||||
|
| |||||||||||
Containers & Packaging - 0.0%## | ||||||||||||
Ardagh Packaging Finance plc - Ardagh Holdings USA, Inc. (Ireland)3, 6.00%, 2/15/2025 | 220,000 | 206,250 | ||||||||||
|
| |||||||||||
Metals & Mining - 1.2% | ||||||||||||
Corp Nacional del Cobre de Chile (Chile)3, 5.625%, 9/21/2035 | 3,775,000 | 4,001,010 | ||||||||||
Mountain Province Diamonds, Inc. (Canada)3, 8.00%, 12/15/2022 | 420,000 | 426,300 | ||||||||||
Northwest Acquisitions ULC - Dominion Finco, Inc.3, 7.125%, 11/1/2022 | 420,000 | 422,877 | ||||||||||
The accompanying notes are an integral part of the financial statements.
13
Investment Portfolio - October 31, 2018
| PRO-BLEND® CONSERVATIVE TERM SERIES | PRINCIPAL AMOUNT2 / SHARES | VALUE (NOTE 2) | ||||||||||
CORPORATE BONDS (continued) | ||||||||||||
Non-Convertible Corporate Bonds (continued) | ||||||||||||
Materials (continued) | ||||||||||||
Metals & Mining (continued) | ||||||||||||
Southern Copper Corp. (Peru), 5.375%, 4/16/2020 | 5,460,000 | $ | 5,608,282 | |||||||||
|
| |||||||||||
| 10,458,469 | ||||||||||||
|
| |||||||||||
Total Materials | 10,975,969 | |||||||||||
|
| |||||||||||
Real Estate - 0.8% | ||||||||||||
Equity Real Estate Investment Trusts (REITS) - 0.8% | ||||||||||||
American Homes 4 Rent LP, 4.25%, 2/15/2028 | 5,840,000 | 5,520,173 | ||||||||||
Greystar Real Estate Partners, LLC3, 5.75%, 12/1/2025 | 370,000 | 358,900 | ||||||||||
GTP Acquisition Partners I LLC3, 2.35%, 6/15/2020 | 945,000 | 923,944 | ||||||||||
iStar, Inc., 5.25%, 9/15/2022 | 336,000 | 325,080 | ||||||||||
|
| |||||||||||
Total Real Estate | 7,128,097 | |||||||||||
|
| |||||||||||
Utilities - 0.1% | ||||||||||||
Gas Utilities - 0.0%## | ||||||||||||
NGL Energy Partners LP - NGL Energy Finance Corp., 6.125%, 3/1/2025 | 290,000 | 263,900 | ||||||||||
|
| |||||||||||
Independent Power and Renewable Electricity Producers - 0.1% | ||||||||||||
Atlantica Yield plc (Spain)3, 7.00%, 11/15/2019 | 440,000 | 453,200 | ||||||||||
Clearway Energy Operating, LLC, 5.00%, 9/15/2026 | 190,000 | 176,700 | ||||||||||
Drax Finco plc (United Kingdom)3, 6.625%, 11/1/2025 | 350,000 | 349,125 | ||||||||||
|
| |||||||||||
Total Utilities | 1,242,925 | |||||||||||
|
| |||||||||||
TOTAL CORPORATE BONDS | ||||||||||||
(Identified Cost $173,737,860) | 168,535,122 | |||||||||||
|
| |||||||||||
MUTUAL FUNDS - 0.4% | ||||||||||||
iShares iBoxx High Yield Corporate Bond ETF | 22,945 | 1,935,411 | ||||||||||
iShares Russell 1000 Value ETF | 10,540 | 1,265,749 | ||||||||||
iShares U.S. Real Estate ETF | 3,530 | 275,728 | ||||||||||
|
| |||||||||||
TOTAL MUTUAL FUNDS | ||||||||||||
(Identified Cost $3,501,610) | 3,476,888 | |||||||||||
|
| |||||||||||
U.S. TREASURY SECURITIES - 26.7% | ||||||||||||
U.S. Treasury Bonds - 3.6% | ||||||||||||
U.S. Treasury Bond, 6.25%, 5/15/2030 | 6,958,000 | 9,008,162 | ||||||||||
U.S. Treasury Bond, 4.75%, 2/15/2037 | 10,907,000 | 13,131,858 | ||||||||||
U.S. Treasury Bond, 2.50%, 2/15/2045 | 7,548,000 | 6,361,845 | ||||||||||
U.S. Treasury Inflation Indexed Bond, 0.75%, 2/15/2042 | 4,769,941 | 4,236,863 | ||||||||||
|
| |||||||||||
Total U.S. Treasury Bonds | ||||||||||||
(Identified Cost $36,177,181) | 32,738,728 | |||||||||||
|
| |||||||||||
PRINCIPAL AMOUNT2 | VALUE (NOTE 2) | |||||||||||
U.S. Treasury Notes - 23.1% | ||||||||||||
U.S. Treasury Inflation Indexed Note, 0.125%, 4/15/2020 | 46,257,399 | 45,468,975 | ||||||||||
U.S. Treasury Inflation Indexed Note, 0.125%, 1/15/2023 | 4,684,453 | 4,509,986 | ||||||||||
U.S. Treasury Note, 1.625%, 4/30/2019 | 55,159,000 | 54,924,143 | ||||||||||
U.S. Treasury Note, 2.00%, 7/31/2022 | 48,550,000 | 46,894,369 | ||||||||||
U.S. Treasury Note, 1.625%, 4/30/2023 | 19,465,000 | 18,357,168 | ||||||||||
U.S. Treasury Note, 2.125%, 5/15/2025 | 18,885,000 | 17,828,620 | ||||||||||
U.S. Treasury Note, 1.625%, 5/15/2026 | 20,150,000 | 18,163,337 | ||||||||||
|
| |||||||||||
Total U.S. Treasury Notes | ||||||||||||
(Identified Cost $207,663,227) | 206,146,598 | |||||||||||
|
| |||||||||||
TOTAL U.S. TREASURY SECURITIES | ||||||||||||
(Identified Cost $243,840,408) | 238,885,326 | |||||||||||
|
| |||||||||||
ASSET-BACKED SECURITIES - 4.3% | ||||||||||||
CarMax Auto Owner Trust, Series 2017-3, Class A3, 1.97%, 4/15/2022 | 2,173,000 | 2,138,075 | ||||||||||
Cazenovia Creek Funding I LLC, Series 2015-1A, Class A3, 2.00%, 12/10/2023 | 119,170 | 118,909 | ||||||||||
Cazenovia Creek Funding II LLC, Series 2018-1A, Class A3, 3.561%, 7/15/2030 | 2,309,847 | 2,299,582 | ||||||||||
Chesapeake Funding II LLC, Series 2017-2A, Class A13, 1.99%, 5/15/2029 | 4,667,305 | 4,619,765 | ||||||||||
Chesapeake Funding II LLC, Series 2017-4A, Class A13, 2.12%, 11/15/2029 | 1,984,090 | 1,957,665 | ||||||||||
Colony American Homes, Series 2015-1A, Class A3,4, (1 mo. LIBOR US + 1.200%), 3.487%, 7/17/2032 | 1,821,570 | 1,821,573 | ||||||||||
The accompanying notes are an integral part of the financial statements.
14
Investment Portfolio - October 31, 2018
| PRO-BLEND® CONSERVATIVE TERM SERIES | PRINCIPAL AMOUNT2 | VALUE (NOTE 2) | ||||||||||
ASSET-BACKED SECURITIES (continued) | ||||||||||||
Credit Acceptance Auto Loan Trust, Series 2017-1A, Class A3, 2.56%, 10/15/2025 | 1,445,000 | $ | 1,437,401 | |||||||||
Enterprise Fleet Financing LLC, Series 2016-2, Class A23, 1.74%, 2/22/2022 | 85,228 | 84,898 | ||||||||||
Enterprise Fleet Financing LLC, Series 2016-2, Class A33, 2.04%, 2/22/2022 | 980,000 | 966,464 | ||||||||||
Hyundai Auto Lease Securitization Trust, Series 2017-B, Class A33, 1.97%, 7/15/2020 | 3,900,000 | 3,875,127 | ||||||||||
Invitation Homes Trust, Series 2017-SFR2, Class A3,4, (1 mo. LIBOR US + 0.850%), 3.14%, 12/17/2036 | 764,322 | 765,038 | ||||||||||
Invitation Homes Trust, Series 2017-SFR2, Class B3,4, (1 mo. LIBOR US + 1.150%), 3.44%, 12/17/2036 | 570,000 | 573,753 | ||||||||||
Progress Residential Trust, Series 2017-SFR2, Class A3, 2.897%, 12/1/2034 | 1,500,000 | 1,445,761 | ||||||||||
SBA Small Business Investment Companies, Series 2015-10B, Class 1, 2.829%, 9/1/2025 | 4,065,128 | 3,952,470 | ||||||||||
SoFi Consumer Loan Program LLC, Series 2017-4, Class A3, 2.50%, 5/26/2026 | 581,387 | 572,935 | ||||||||||
SoFi Consumer Loan Program LLC, Series 2017-5, Class A13, 2.14%, 9/25/2026 | 1,100,836 | 1,095,676 | ||||||||||
SoFi Professional Loan Program LLC, Series 2017-A, Class A2A3, 1.55%, 3/26/2040 | 380,136 | 377,118 | ||||||||||
SoFi Professional Loan Program LLC, Series 2017-C, Class A2A3, 1.75%, 7/25/2040 | 124,237 | 123,104 | ||||||||||
SoFi Professional Loan Program LLC, Series 2017-D, Class A2FX3, 2.65%, 9/25/2040 | 1,400,000 | 1,354,359 | ||||||||||
SoFi Professional Loan Program LLC, Series 2017-F, Class A1FX3, 2.05%, 1/25/2041 | 450,177 | 445,505 | ||||||||||
SoFi Professional Loan Program LLC, Series 2017-F, Class A2FX3, 2.84%, 1/25/2041 | 500,000 | 484,781 | ||||||||||
SoFi Professional Loan Program LLC, Series 2018-A, Class A2A3, 2.39%, 2/25/2042 | 1,131,400 | 1,119,620 | ||||||||||
SoFi Professional Loan Program LLC, Series 2018-C, Class A1FX3, 3.08%, 1/25/2048 | 2,888,147 | 2,879,668 | ||||||||||
Tax Ease Funding LLC, Series 2016-1A, Class A3, 3.131%, 6/15/2028 | 440,258 | 438,737 | ||||||||||
Tricon American Homes Trust, Series 2016-SFR1, Class A3, 2.589%, 11/1/2033 | 1,801,256 | 1,734,493 | ||||||||||
Tricon American Homes Trust, Series 2017-SFR2, Class A3, 2.928%, 1/1/2036 | 1,843,034 | 1,758,877 | ||||||||||
|
| |||||||||||
TOTAL ASSET-BACKED SECURITIES |
| 38,441,354 | ||||||||||
|
| |||||||||||
COMMERCIAL MORTGAGE-BACKED SECURITIES - 7.2% |
| |||||||||||
Americold LLC Trust, Series 2010-ARTA, Class A13, 3.847%, 1/11/2029 | 134,968 | 135,579 | ||||||||||
BWAY Mortgage Trust, Series 2015-1740, Class A3, 2.917%, 1/1/2035 | 4,633,000 | 4,420,486 | ||||||||||
Caesars Palace Las Vegas Trust, Series 2017-VICI, Class A3, 3.531%, 10/1/2034 | 2,520,000 | 2,514,418 | ||||||||||
Commercial Mortgage Pass-Through Certificates, Series 2015-3BP, Class A3, 3.178%, 2/1/2035 | 500,000 | 481,591 | ||||||||||
Commercial Mortgage Pass-Through Certificates, Series 2015-DC1, Class A5, 3.35%, 2/1/2048 | 4,455,000 | 4,321,562 | ||||||||||
Credit Suisse Mortgage Capital Trust, Series 2013-IVR3, Class A13,9, 2.50%, 5/1/2043 | 1,288,287 | 1,187,804 | ||||||||||
Credit Suisse Mortgage Capital Trust, Series 2013-TH1, Class A13,9, 2.13%, 2/1/2043 | 842,929 | 763,992 | ||||||||||
Fannie Mae REMICS, Series 2018-31, Class KP, 3.50%, 7/1/2047 | 2,458,471 | 2,425,894 | ||||||||||
FDIC Trust, Series 2011-R1, Class A3, 2.672%, 7/1/2026 | 152,323 | 151,509 | ||||||||||
Freddie Mac Multifamily Structured Pass-Through Certificates, Series K009, Class X1 | 20,359,431 | 366,885 | ||||||||||
Freddie Mac Multifamily Structured Pass-Through Certificates, Series K014, Class X1 | 2,620,666 | 64,020 | ||||||||||
Freddie Mac Multifamily Structured Pass-Through Certificates, Series K016, Class X1 | 6,492,134 | 238,919 | ||||||||||
The accompanying notes are an integral part of the financial statements.
15
Investment Portfolio - October 31, 2018
| PRO-BLEND® CONSERVATIVE TERM SERIES | PRINCIPAL AMOUNT2 | VALUE (NOTE 2) | ||||||||||||||
COMMERCIAL MORTGAGE-BACKED SECURITIES (continued) |
| |||||||||||||||
Freddie Mac Multifamily Structured Pass-Through Certificates, Series K017, Class X1 (IO)9, 1.452%, 12/1/2021 | 8,041,195 | $ | 268,173 | |||||||||||||
Freddie Mac Multifamily Structured Pass-Through Certificates, Series K021, Class X1 (IO)9, 1.578%, 6/1/2022 | 14,984,910 | 647,616 | ||||||||||||||
Freddie Mac Multifamily Structured Pass-Through Certificates, Series K030, Class X1 (IO)9, 0.199%, 4/1/2023 | 75,438,533 | 582,808 | ||||||||||||||
Freddie Mac Multifamily Structured Pass-Through Certificates, Series K032, Class X1 (IO)9, 0.105%, 5/1/2023 | 46,808,007 | 220,807 | ||||||||||||||
Freddie Mac REMICS, Series 4791, Class BA, 4.00%, 3/1/2044 | 3,167,771 | 3,211,895 | ||||||||||||||
Freddie Mac REMICS, Series 4801, Class BA, 4.50%, 5/1/2044 | 3,182,029 | 3,274,132 | ||||||||||||||
FREMF Mortgage Trust, Series 2011-K13, Class B3,9, 4.768%, 1/1/2048 | 2,255,000 | 2,304,460 | ||||||||||||||
FREMF Mortgage Trust, Series 2012-K711, Class B3,9, 3.57%, 8/1/2045 | 2,200,000 | 2,199,961 | ||||||||||||||
FREMF Mortgage Trust, Series 2013-K28, Class X2A (IO)3, 0.10%, 6/1/2046 | 199,523,358 | 679,577 | ||||||||||||||
FREMF Mortgage Trust, Series 2013-K712, Class B3,9, 3.358%, 5/1/2045 | 1,025,000 | 1,023,318 | ||||||||||||||
FREMF Mortgage Trust, Series 2014-K41, Class B3,9, 3.832%, 11/1/2047 | 2,227,000 | 2,180,930 | ||||||||||||||
FREMF Mortgage Trust, Series 2014-K716, Class B3,9, 3.949%, 8/1/2047 | 2,624,000 | 2,640,448 | ||||||||||||||
FREMF Mortgage Trust, Series 2015-K42, Class B3,9, 3.983%, 12/1/2024 | 490,000 | 479,051 | ||||||||||||||
FREMF Mortgage Trust, Series 2015-K43, Class B3,9, 3.734%, 2/1/2048 | 500,000 | 484,241 | ||||||||||||||
FREMF Mortgage Trust, Series 2015-K720, Class B3,9, 3.39%, 7/1/2022 | 270,000 | 262,422 | ||||||||||||||
GAHR Commercial Mortgage Trust, Series 2015-NRF, Class BFX3,9, 3.495%, 12/1/2034 | 2,495,000 | 2,487,275 | ||||||||||||||
Government National Mortgage Association, Series 2017-54, Class AH, 2.60%, 12/1/2056 | 2,428,442 | 2,224,734 | ||||||||||||||
GS Mortgage Securities Trust, Series 2010-C2, Class A13, 3.849%, 12/1/2043 | 71,394 | 71,837 | ||||||||||||||
JP Morgan Mortgage Trust, Series 2013-1, Class 1A23,9, 3.00%, 3/1/2043 | 666,162 | 631,207 | ||||||||||||||
JP Morgan Mortgage Trust, Series 2013-2, Class A23,9, 3.50%, 5/1/2043 | 721,697 | 696,458 | ||||||||||||||
JP Morgan Mortgage Trust, Series 2014-2, Class 1A13,9, 3.00%, 6/1/2029 | 957,205 | 937,650 | ||||||||||||||
JP Morgan Mortgage Trust, Series 2017-3, Class 1A53,9, 3.50%, 8/1/2047 | 2,817,418 | 2,760,078 | ||||||||||||||
JP Morgan Mortgage Trust, Series 2017-6, Class A33,9, 3.50%, 12/1/2048 | 1,377,681 | 1,322,681 | ||||||||||||||
JP Morgan Mortgage Trust, Series 2017-6, Class A53,9, 3.50%, 12/1/2048 | 2,155,361 | 2,110,148 | ||||||||||||||
LSTAR Commercial Mortgage Trust, Series 2014-2, Class A23, 2.767%, 1/1/2041 | 4,077 | 4,068 | ||||||||||||||
New Residential Mortgage Loan Trust, Series 2014-3A, Class AFX33,9, 3.75%, 11/1/2054 | 834,862 | 830,524 | ||||||||||||||
New Residential Mortgage Loan Trust, Series 2015-2A, Class A13,9, 3.75%, 8/1/2055 | 912,205 | 906,563 | ||||||||||||||
New Residential Mortgage Loan Trust, Series 2016-4A, Class A13,9, 3.75%, 11/1/2056 | 1,192,412 | 1,183,444 | ||||||||||||||
SBA Small Business Investment Companies, Series 2015-10A, Class 1, 2.517%, 3/1/2025 | 871,223 | 839,824 | ||||||||||||||
Sequoia Mortgage Trust, Series 2013-2, Class A9, 1.874%, 2/1/2043 | 832,420 | 725,278 | ||||||||||||||
Sequoia Mortgage Trust, Series 2013-7, Class A29, 3.00%, 6/1/2043 | 826,633 | 773,968 | ||||||||||||||
Sequoia Mortgage Trust, Series 2013-8, Class A19, 3.00%, 6/1/2043 | 1,014,875 | 950,927 | ||||||||||||||
Starwood Retail Property Trust, Series 2014-STAR, Class A3,4, (1 mo. LIBOR US + 1.220%), 3.50%, 11/15/2027 | 2,123,755 | 2,124,043 | ||||||||||||||
Towd Point Mortgage Trust, Series 2016-5, Class A13,9, 2.50%, 10/1/2056 | 1,943,005 | 1,886,357 | ||||||||||||||
The accompanying notes are an integral part of the financial statements.
16
Investment Portfolio - October 31, 2018
| PRO-BLEND® CONSERVATIVE TERM SERIES | PRINCIPAL AMOUNT2 | VALUE (NOTE 2) | ||||||||||||||
COMMERCIAL MORTGAGE-BACKED SECURITIES (continued) |
| |||||||||||||||
Vornado DP LLC Trust, Series 2010-VNO, Class A2FX3, 4.004%, 9/10/2028 | 155,000 | $ | 157,204 | |||||||||||||
Wells Fargo Commercial Mortgage Trust, Series 2010-C1, Class A23, 4.393%, 11/1/2043 | 265,000 | 269,060 | ||||||||||||||
WF-RBS Commercial Mortgage Trust, Series 2011-C2, Class A43,9, 4.869%, 2/1/2044 | 837,004 | 858,119 | ||||||||||||||
WinWater Mortgage Loan Trust, Series 2015-1, Class A13,9, 3.50%, 1/1/2045 | 1,010,151 | 983,521 | ||||||||||||||
WinWater Mortgage Loan Trust, Series 2015-3, Class A53,9, 3.50%, 3/1/2045 | 860,729 | 858,481 | ||||||||||||||
|
| |||||||||||||||
TOTAL COMMERCIAL MORTGAGE-BACKED SECURITIES | 64,125,947 | |||||||||||||||
|
| |||||||||||||||
FOREIGN GOVERNMENT BONDS - 2.3% | ||||||||||||||||
Canada Housing Trust No. 1 (Canada)3, 4.10%, 12/15/2018 | CAD | 268,000 | 204,089 | |||||||||||||
Canadian Government Bond (Canada), 2.75%, 6/1/2022 | CAD | 327,000 | 251,269 | |||||||||||||
Export-Import Bank of Korea (South Korea), 2.625%, 12/30/2020 | 8,725,000 | 8,581,386 | ||||||||||||||
The Korea Development Bank (South Korea), 1.375%, 9/12/2019 | 200,000 | 197,103 | ||||||||||||||
The Korea Development Bank (South Korea)4, (3 mo. LIBOR US + 0.675%), 3.014%, 9/19/2020 | 3,000,000 | 3,007,290 | ||||||||||||||
Mexican Government Bond (Mexico), 8.00%, 6/11/2020 | MXN | 7,267,000 | 354,388 | |||||||||||||
Mexican Government Bond (Mexico), 6.50%, 6/10/2021 | MXN | 2,725,000 | 127,506 | |||||||||||||
Mexican Government Bond (Mexico), 6.50%, 6/9/2022 | MXN | 4,996,000 | 229,617 | |||||||||||||
Mexican Government Bond (Mexico), 7.75%, 5/29/2031 | MXN | 908,000 | 40,745 | |||||||||||||
Province of Ontario (Canada), 1.25%, 6/17/2019 | 2,044,000 | 2,024,582 | ||||||||||||||
Singapore Government Bond (Singapore), 2.50%, 6/1/2019 | SGD | 590,000 | 427,216 | |||||||||||||
Svensk Exportkredit AB (Sweden), 1.125%, 8/28/2019 | 4,996,000 | 4,927,116 | ||||||||||||||
|
| |||||||||||||||
TOTAL FOREIGN GOVERNMENT BONDS | 20,372,307 | |||||||||||||||
|
| |||||||||||||||
U.S. GOVERNMENT AGENCIES - 11.3% | ||||||||||||||||
Mortgage-Backed Securities - 11.3% | ||||||||||||||||
Fannie Mae, Pool #888468, 5.50%, 9/1/2021 | 144,491 | 146,959 | ||||||||||||||
Fannie Mae, Pool #995233, 5.50%, 10/1/2021 | 10,067 | 10,198 | ||||||||||||||
Fannie Mae, Pool #888017, 6.00%, 11/1/2021 | 24,628 | 25,246 | ||||||||||||||
Fannie Mae, Pool #995329, 5.50%, 12/1/2021 | 111,798 | 113,799 | ||||||||||||||
Fannie Mae, Pool #888136, 6.00%, 12/1/2021 | 29,763 | 30,504 | ||||||||||||||
Fannie Mae, Pool #888815, 4.50%, 11/1/2022 | 19,673 | 20,063 | ||||||||||||||
Fannie Mae, Pool #888810, 5.50%, 11/1/2022 | 174,415 | 177,405 | ||||||||||||||
Fannie Mae, Pool #AA1563, 4.50%, 2/1/2024 | 18,889 | 19,183 | ||||||||||||||
Fannie Mae, Pool #AC1557, 4.50%, 9/1/2024 | 55,779 | 57,012 | ||||||||||||||
Fannie Mae, Pool #AD0462, 5.50%, 10/1/2024 | 23,374 | 24,217 | ||||||||||||||
Fannie Mae, Pool #MA3463, 4.00%, 9/1/2033 | 4,152,754 | 4,232,072 | ||||||||||||||
Fannie Mae, Pool #MA1834, 4.50%, 2/1/2034 | 745,032 | 766,670 | ||||||||||||||
Fannie Mae, Pool #MA1903, 4.50%, 5/1/2034 | 735,756 | 757,145 | ||||||||||||||
Fannie Mae, Pool #745418, 5.50%, 4/1/2036 | 459,396 | 492,543 | ||||||||||||||
Fannie Mae, Pool #886904, 6.50%, 9/1/2036 | 52,742 | 57,432 | ||||||||||||||
Fannie Mae, Pool #909786, 5.50%, 3/1/2037 | 140,683 | 150,253 | ||||||||||||||
Fannie Mae, Pool #918516, 5.50%, 6/1/2037 | 55,923 | 59,492 | ||||||||||||||
Fannie Mae, Pool #933521, 5.00%, 1/1/2038 | 12,504 | 13,140 | ||||||||||||||
Fannie Mae, Pool #889260, 5.00%, 4/1/2038 | 18,934 | 19,867 | ||||||||||||||
Fannie Mae, Pool #889576, 6.00%, 4/1/2038 | 409,142 | 445,716 | ||||||||||||||
Fannie Mae, Pool #912948, 5.00%, 5/1/2038 | 8,635 | 9,009 | ||||||||||||||
Fannie Mae, Pool #975840, 5.00%, 5/1/2038 | 53,778 | 56,109 | ||||||||||||||
Fannie Mae, Pool #889624, 5.50%, 5/1/2038 | 358,025 | 382,421 | ||||||||||||||
Fannie Mae, Pool #995196, 6.00%, 7/1/2038 | 566,008 | 617,881 | ||||||||||||||
Fannie Mae, Pool #986458, 6.00%, 8/1/2038 | 9,237 | 9,983 | ||||||||||||||
The accompanying notes are an integral part of the financial statements.
17
Investment Portfolio - October 31, 2018
| PRO-BLEND® CONSERVATIVE TERM SERIES | PRINCIPAL AMOUNT2 | VALUE (NOTE 2) | ||||||||||
U.S. GOVERNMENT AGENCIES (continued) | ||||||||||||
Mortgage-Backed Securities (continued) | ||||||||||||
Fannie Mae, Pool #987831, 6.00%, 9/1/2038 | 9,990 | $ | 10,728 | |||||||||
Fannie Mae, Pool #990897, 6.00%, 9/1/2038 | 30,247 | 32,482 | ||||||||||
Fannie Mae, Pool #AD0220, 6.00%, 10/1/2038 | 71,495 | 78,164 | ||||||||||
Fannie Mae, Pool #993920, 6.00%, 11/1/2038 | 80,181 | 86,107 | ||||||||||
Fannie Mae, Pool #257497, 6.00%, 12/1/2038 | 18,731 | 20,308 | ||||||||||
Fannie Mae, Pool #AA0675, 6.00%, 12/1/2038 | 13,252 | 14,232 | ||||||||||
Fannie Mae, Pool #971022, 5.00%, 1/1/2039 | 34,102 | 35,805 | ||||||||||
Fannie Mae, Pool #AA1810, 5.00%, 1/1/2039 | 83,263 | 87,471 | ||||||||||
Fannie Mae, Pool #890294, 5.50%, 1/1/2039 | 720,198 | 771,135 | ||||||||||
Fannie Mae, Pool #AD0307, 5.50%, 1/1/2039 | 375,332 | 401,604 | ||||||||||
Fannie Mae, Pool #983686, 5.00%, 2/1/2039 | 63,969 | 66,803 | ||||||||||
Fannie Mae, Pool #AE0604, 6.00%, 7/1/2039 | 412,397 | 449,120 | ||||||||||
Fannie Mae, Pool #AA6788, 6.00%, 8/1/2039 | 159,744 | 171,710 | ||||||||||
Fannie Mae, Pool #AC0463, 5.00%, 11/1/2039 | 58,807 | 62,088 | ||||||||||
Fannie Mae, Pool #AC5111, 5.00%, 11/1/2039 | 113,376 | 119,838 | ||||||||||
Fannie Mae, Pool #MA0258, 4.50%, 12/1/2039 | 908,929 | 941,254 | ||||||||||
Fannie Mae, Pool #MA0259, 5.00%, 12/1/2039 | 52,140 | 55,117 | ||||||||||
Fannie Mae, Pool #AC8573, 5.00%, 1/1/2040 | 86,225 | 91,184 | ||||||||||
Fannie Mae, Pool #890326, 5.50%, 1/1/2040 | 755,785 | 808,895 | ||||||||||
Fannie Mae, Pool #AL1595, 6.00%, 1/1/2040 | 532,787 | 579,698 | ||||||||||
Fannie Mae, Pool #AE0061, 6.00%, 2/1/2040 | 217,085 | 236,851 | ||||||||||
Fannie Mae, Pool #AL0152, 6.00%, 6/1/2040 | 735,154 | 801,996 | ||||||||||
Fannie Mae, Pool #AI5172, 4.00%, 8/1/2041 | 505,735 | 509,578 | ||||||||||
Fannie Mae, Pool #AL1410, 4.50%, 12/1/2041 | 1,166,265 | 1,206,168 | ||||||||||
Fannie Mae, Pool #AB4300, 3.50%, 1/1/2042 | 269,485 | 264,706 | ||||||||||
Fannie Mae, Pool #AL7729, 4.00%, 6/1/2043 | 640,627 | 645,475 | ||||||||||
Fannie Mae, Pool #AS3622, 3.50%, 10/1/2044 | 13,632,348 | 13,327,299 | ||||||||||
Fannie Mae, Pool #AX5234, 4.50%, 11/1/2044 | 918,746 | 941,644 | ||||||||||
Fannie Mae, Pool #AS4103, 4.50%, 12/1/2044 | 989,611 | 1,023,056 | ||||||||||
Fannie Mae, Pool #AZ2001, 3.50%, 5/1/2045 | 2,500,250 | 2,444,766 | ||||||||||
Fannie Mae, Pool #AZ9215, 4.00%, 10/1/2045 | 917,017 | 919,834 | ||||||||||
Fannie Mae, Pool #BC3490, 3.50%, 2/1/2046 | 2,094,315 | 2,047,440 | ||||||||||
Fannie Mae, Pool #BC6764, 3.50%, 4/1/2046 | 1,642,666 | 1,605,391 | ||||||||||
Fannie Mae, Pool #BC8677, 4.00%, 5/1/2046 | 533,438 | 533,996 | ||||||||||
Fannie Mae, Pool #BC2098, 4.00%, 6/1/2046 | 1,012,383 | 1,013,494 | ||||||||||
Fannie Mae, Pool #MA2670, 3.00%, 7/1/2046 | 2,359,283 | 2,234,602 | ||||||||||
Fannie Mae, Pool #BD2179, 4.00%, 7/1/2046 | 220,619 | 220,838 | ||||||||||
Fannie Mae, Pool #MA2705, 3.00%, 8/1/2046 | 2,711,758 | 2,568,307 | ||||||||||
Fannie Mae, Pool #BD6987, 4.00%, 10/1/2046 | 1,167,222 | 1,168,081 | ||||||||||
Fannie Mae, Pool #BD6997, 4.00%, 10/1/2046 | 799,744 | 800,353 | ||||||||||
Fannie Mae, Pool #BE3812, 4.00%, 12/1/2046 | 860,966 | 861,578 | ||||||||||
Fannie Mae, Pool #BE7845, 4.50%, 2/1/2047 | 1,094,557 | 1,128,966 | ||||||||||
Fannie Mae, Pool #MA3184, 4.50%, 11/1/2047 | 3,148,266 | 3,226,364 | ||||||||||
Fannie Mae, Pool #CA1922, 5.00%, 6/1/2048 | 3,854,015 | 4,026,681 | ||||||||||
Fannie Mae, Pool #CA2056, 4.50%, 7/1/2048 | 2,163,488 | 2,217,914 | ||||||||||
Fannie Mae, Pool #BK9366, 4.50%, 8/1/2048 | 2,876,733 | 2,948,189 | ||||||||||
Fannie Mae, Pool #BK9598, 4.50%, 8/1/2048 | 2,876,068 | 2,947,506 | ||||||||||
Fannie Mae, Pool #CA2219, 5.00%, 8/1/2048 | 1,917,254 | 2,003,054 | ||||||||||
Fannie Mae, Pool #CA2373, 5.00%, 9/1/2048 | 7,273,954 | 7,599,097 | ||||||||||
Fannie Mae, Pool #AL8674, 5.654%, 1/1/2049 | 1,303,723 | 1,388,206 | ||||||||||
The accompanying notes are an integral part of the financial statements.
18
Investment Portfolio - October 31, 2018
| PRO-BLEND® CONSERVATIVE TERM SERIES | PRINCIPAL AMOUNT2 | VALUE (NOTE 2) | ||||||||||||||
U.S. GOVERNMENT AGENCIES (continued) | ||||||||||||||||
Mortgage-Backed Securities (continued) | ||||||||||||||||
Freddie Mac, Pool #G11850, 5.50%, 7/1/2020 | 23,493 | $ | 23,681 | |||||||||||||
Freddie Mac, Pool #G12610, 6.00%, 3/1/2022 | 32,746 | 33,508 | ||||||||||||||
Freddie Mac, Pool #G12655, 6.00%, 5/1/2022 | 22,949 | 23,588 | ||||||||||||||
Freddie Mac, Pool #G13078, 6.00%, 3/1/2023 | 31,515 | 32,472 | ||||||||||||||
Freddie Mac, Pool #C91746, 4.50%, 12/1/2033 | 131,429 | 135,378 | ||||||||||||||
Freddie Mac, Pool #C91762, 4.50%, 5/1/2034 | 1,009,583 | 1,039,677 | ||||||||||||||
Freddie Mac, Pool #G07655, 5.50%, 12/1/2035 | 120,451 | 129,549 | ||||||||||||||
Freddie Mac, Pool #G08216, 5.50%, 8/1/2037 | 296,435 | 318,484 | ||||||||||||||
Freddie Mac, Pool #G03926, 6.00%, 2/1/2038 | 353,537 | 388,675 | ||||||||||||||
Freddie Mac, Pool #G04731, 5.50%, 4/1/2038 | 259,094 | 278,065 | ||||||||||||||
Freddie Mac, Pool #G04176, 5.50%, 5/1/2038 | 119,559 | 127,994 | ||||||||||||||
Freddie Mac, Pool #A78227, 5.50%, 6/1/2038 | 129,204 | 137,999 | ||||||||||||||
Freddie Mac, Pool #G08273, 5.50%, 6/1/2038 | 326,964 | 349,955 | ||||||||||||||
Freddie Mac, Pool #G04471, 5.50%, 7/1/2038 | 40,685 | 43,470 | ||||||||||||||
Freddie Mac, Pool #G04776, 5.50%, 7/1/2038 | 266,583 | 284,891 | ||||||||||||||
Freddie Mac, Pool #G05196, 5.50%, 10/1/2038 | 340,362 | 365,277 | ||||||||||||||
Freddie Mac, Pool #G05409, 5.50%, 3/1/2039 | 301,739 | 323,612 | ||||||||||||||
Freddie Mac, Pool #G05906, 6.00%, 4/1/2040 | 73,145 | 80,454 | ||||||||||||||
Freddie Mac, Pool #G07104, 5.50%, 5/1/2040 | 237,412 | 252,783 | ||||||||||||||
Freddie Mac, Pool #G06789, 6.00%, 5/1/2040 | 282,231 | 310,538 | ||||||||||||||
Freddie Mac, Pool #A92889, 4.50%, 7/1/2040 | 1,323,423 | 1,371,309 | ||||||||||||||
Freddie Mac, Pool #A93451, 4.50%, 8/1/2040 | 1,334,466 | 1,382,691 | ||||||||||||||
Freddie Mac, Pool #G60334, 4.50%, 10/1/2041 | 1,112,288 | 1,152,462 | ||||||||||||||
Freddie Mac, Pool #Q17513, 3.50%, 4/1/2043 | 1,888,697 | 1,855,302 | ||||||||||||||
Freddie Mac, Pool #Q24752, 3.50%, 2/1/2044 | 1,546,319 | 1,518,818 | ||||||||||||||
Freddie Mac, Pool #G60183, 4.00%, 12/1/2044 | 1,061,509 | 1,063,600 | ||||||||||||||
Freddie Mac, Pool #Q37592, 4.00%, 12/1/2045 | 2,010,586 | 2,013,446 | ||||||||||||||
Freddie Mac, Pool #G60636, 4.00%, 1/1/2046 | 1,511,115 | 1,513,966 | ||||||||||||||
Freddie Mac, Pool #Q38388, 4.00%, 1/1/2046 | 335,707 | 336,531 | ||||||||||||||
Freddie Mac, Pool #Q42596, 3.50%, 8/1/2046 | 2,272,727 | 2,219,553 | ||||||||||||||
Freddie Mac, Pool #Q51334, 4.00%, 10/1/2047 | 3,373,289 | 3,376,452 | ||||||||||||||
Freddie Mac, Pool #G08786, 4.50%, 10/1/2047 | 1,953,252 | 2,009,170 | ||||||||||||||
Ginnie Mae, Pool #671161, 5.50%, 11/1/2037 | 29,890 | 31,778 | ||||||||||||||
|
| |||||||||||||||
TOTAL U.S. GOVERNMENT AGENCIES | 100,964,620 | |||||||||||||||
|
| |||||||||||||||
PRINCIPAL SHARES | VALUE (NOTE 2) | |||||||||||||||
SHORT-TERM INVESTMENT - 2.0% | ||||||||||||||||
Dreyfus Government Cash Management, Institutional Shares10, 2.05%, (Identified Cost $18,238,171) | 18,238,171 | 18,238,171 | ||||||||||||||
|
| |||||||||||||||
TOTAL INVESTMENTS IN SECURITIES -101.1% | 903,378,735 | |||||||||||||||
|
| |||||||||||||||
TOTAL OPTIONS WRITTEN - 0.0%## | (216,123 | ) | ||||||||||||||
|
| |||||||||||||||
TOTAL INVESTMENTS - 101.1% | 903,162,612 | |||||||||||||||
LIABILITIES, LESS OTHER ASSETS - (1.1%) | (9,895,617 | ) | ||||||||||||||
|
| |||||||||||||||
NET ASSETS - 100% | $ | 893,266,995 | ||||||||||||||
|
| |||||||||||||||
The accompanying notes are an integral part of the financial statements.
19
Investment Portfolio - October 31, 2018
ADR - American Depositary Receipt
CAD - Canadian Dollar
ETF - Exchange-traded fund
IO - Interest only
MXN - Mexican Peso
No. - Number
SGD - Singapore Dollar
| EXCHANGE-TRADED OPTIONS WRITTEN | |||||||||||||||||||||||||
| DESCRIPTION | NUMBER OF | EXPIRATION DATE | EXERCISE PRICE | NOTIONAL AMOUNT2 (000) | VALUE | ||||||||||||||||||||
Call | |||||||||||||||||||||||||
Booking Holdings, Inc., | 5 | 11/09/18 | $ | 1,960.00 | 937 | $ | (20,000 | ) | |||||||||||||||||
Qorvo, Inc. | 129 | 11/16/18 | 77.50 | 948 | (27,735 | ) | |||||||||||||||||||
Alphabet, Inc. - Class C | 12 | 11/23/18 | 1,110.00 | 1,292 | (26,400 | ) | |||||||||||||||||||
|
| ||||||||||||||||||||||||
| (74,135 | ) | ||||||||||||||||||||||||
|
| ||||||||||||||||||||||||
Put | |||||||||||||||||||||||||
lululemon athletica, Inc. | 68 | 11/9/18 | 149.00 | 957 | (55,420 | ) | |||||||||||||||||||
Mastercard, Inc. - Class A | 67 | 11/9/18 | 197.50 | 1,324 | (26,130 | ) | |||||||||||||||||||
Medtronic plc | 147 | 11/16/18 | 90.00 | 1,320 | (21,315 | ) | |||||||||||||||||||
Microsoft Corp. | 133 | 11/16/18 | 100.00 | 1,421 | (12,103 | ) | |||||||||||||||||||
Qorvo, Inc. | 193 | 11/16/18 | 67.50 | 1,419 | (27,020 | ) | |||||||||||||||||||
|
| ||||||||||||||||||||||||
| (141,988 | ) | ||||||||||||||||||||||||
|
| ||||||||||||||||||||||||
TOTAL EXCHANGE-TRADED OPTIONS WRITTEN |
| $ | (216,123 | ) | |||||||||||||||||||||
|
| ||||||||||||||||||||||||
*Non-income producing security.
## Less than 0.1%.
1A portion of this security is designated with the broker as collateral for options contracts written. As of October 31, 2018, the total value of such securities was $7,375,539.
2Amount is stated in USD unless otherwise noted.
3Restricted securities - Investment in securities that are restricted as to public resale under the Securities Act of 1933, as amended. These securities have been sold under Rule 144A and have been determined to be liquid under guidelines established by the Board of Directors. These securities amount to $92,136,321, or 10.31% of the Series’ net assets as of October 31, 2018 (see Note 2 to the financial statements).
4Floating rate security. Rate shown is the rate in effect as of October 31, 2018.
5Step coupon rate security - Rate steps up/down by 25 basis points upon rating downgrade/upgrade by Moody’s and S&P rating agencies (Subject to a maximum of 100 basis points per agency, 200 basis points maximum).
6Variable rate security. Security may be issued at a fixed coupon rate, which converts to a variable rate at a specified date. Rate shown is the rate in effect as of October 31, 2018.
7Security is perpetual in nature and has no stated maturity date.
8Illiquid security - This security was acquired on November 3, 2017 at a cost of $198,500 ($99.25 per share). This security has been determined to be illiquid under guidelines established by the Board of Directors. This security amounts to $203,316, or less than 0.1% of the Series’ net assets as of October 31, 2018 (see Note 2 to the financial statements).
9Variable or floating rate security, the interest rate of which adjusts periodically based on changes in current interest rates and prepayments on the underlying pool of assets. Rate shown is the rate in effect as of October 31, 2018.
10Rate shown is the current yield as of October 31, 2018.
The Global Industry Classification Standard (GICS) was developed by and is the exclusive property and a service mark of MSCI Inc. (MSCI) and Standard & Poor’s, a division of The McGraw-Hill Companies, Inc. (S&P), and is licensed for use by Manning & Napier when referencing GICS sectors. Neither MSCI, S&P, nor any third party involved in making or compiling the GICS or any GICS classifications makes any express or implied warranties or representations with respect to such standard or classification, nor shall any such party have any liability therefrom.
The accompanying notes are an integral part of the financial statements.
20
Statement of Assets and Liabilities - Pro-Blend® Conservative Term Series
October 31, 2018
ASSETS: | ||||
Investments in securities, at value (identified cost $896,215,106) (Note 2) | $ | 903,378,735 | ||
Receivable for securities sold | 4,545,406 | |||
Interest receivable | 3,938,215 | |||
Receivable for fund shares sold | 952,316 | |||
Foreign tax reclaims receivable | 175,969 | |||
Dividends receivable | 125,350 | |||
Prepaid and other expenses | 20,537 | |||
|
| |||
TOTAL ASSETS | 913,136,528 | |||
|
| |||
LIABILITIES: | ||||
Accrued management fees (Note 3) | 458,898 | |||
Accrued shareholder services fees (Class S) (Note 3) | 102,004 | |||
Accrued distribution and service (Rule 12b-1) fees (Class R) (Class R2) (Note 3) | 86,062 | |||
Accrued fund accounting and administration fees (Note 3) | 51,387 | |||
Accrued Chief Compliance Officer service fees (Note 3) | 401 | |||
Options written, at value (premiums received $147,962) (Note 2) | 216,123 | |||
Payable for securities purchased | 18,268,716 | |||
Payable for fund shares repurchased | 548,451 | |||
Other payables and accrued expenses | 137,491 | |||
|
| |||
TOTAL LIABILITIES | 19,869,533 | |||
|
| |||
TOTAL NET ASSETS | $ | 893,266,995 | ||
|
| |||
NET ASSETS CONSIST OF: | ||||
Capital stock | $ | 742,397 | ||
Additional paid-in-capital | 859,896,071 | |||
Total distributable earnings | 32,628,527 | |||
|
| |||
TOTAL NET ASSETS | $ | 893,266,995 | ||
|
| |||
The accompanying notes are an integral part of the financial statements.
21
Statement of Assets and Liabilities - Pro-Blend® Conservative Term Series
October 31, 2018
NET ASSET VALUE, OFFERING PRICE AND REDEMPTION PRICE PER SHARE - Class S | $ | 13.39 | ||
|
| |||
NET ASSET VALUE, OFFERING PRICE AND REDEMPTION PRICE PER SHARE - Class I | $ | 10.15 | ||
|
| |||
NET ASSET VALUE, OFFERING PRICE AND REDEMPTION PRICE PER SHARE - Class R | $ | 9.73 | ||
|
| |||
NET ASSET VALUE, OFFERING PRICE AND REDEMPTION PRICE PER SHARE - Class R2 | $ | 9.71 | ||
|
|
The accompanying notes are an integral part of the financial statements.
22
Statement of Operations - Pro-Blend® Conservative Term Series
For the Year Ended October 31, 2018
INVESTMENT INCOME: | ||||
Interest | $ | 18,871,275 | ||
Dividends (net of foreign taxes withheld, $155,556) | 4,600,837 | |||
|
| |||
Total Investment Income | 23,472,112 | |||
|
| |||
EXPENSES: | ||||
Management fees (Note 3) | 5,426,136 | |||
Shareholder services fees (Class S) (Note 3) | 1,213,464 | |||
Distribution and service (Rule 12b-1) fees (Class R2) (Note 3) | 1,041,069 | |||
Distribution and service (Rule 12b-1) fees (Class R) (Note 3) | 63,494 | |||
Fund accounting and administration fees (Note 3) | 188,550 | |||
Directors’ fees (Note 3) | 70,096 | |||
Chief Compliance Officer service fees (Note 3) | 4,384 | |||
Custodian fees | 57,214 | |||
Miscellaneous | 426,903 | |||
|
| |||
Total Expenses | 8,491,310 | |||
|
| |||
NET INVESTMENT INCOME | 14,980,802 | |||
|
| |||
REALIZED AND UNREALIZED GAIN (LOSS) ON INVESTMENTS AND FOREIGN CURRENCY: | ||||
Net realized gain (loss) on- | ||||
Investments in securities | 18,660,032 | |||
Options written | 763,722 | |||
Foreign currency and translation of other assets and liabilities | 9,796 | |||
|
| |||
| 19,433,550 | ||||
|
| |||
Net change in unrealized appreciation (depreciation) on- | ||||
Investments in securities | (42,431,332 | ) | ||
Options written | (99,692 | ) | ||
Foreign currency and translation of other assets and liabilities | (3,286 | ) | ||
|
| |||
| (42,534,310 | ) | |||
|
| |||
NET REALIZED AND UNREALIZED GAIN (LOSS) ON INVESTMENTS AND FOREIGN CURRENCY | (23,100,760 | ) | ||
|
| |||
NET DECREASE IN NET ASSETS RESULTING FROM OPERATIONS | $ | (8,119,958 | ) | |
|
| |||
The accompanying notes are an integral part of the financial statements.
23
Statements of Changes in Net Assets - Pro-Blend® Conservative Term Series
FOR THE YEAR ENDED | FOR THE YEAR ENDED | |||||||
INCREASE (DECREASE) IN NET ASSETS: | ||||||||
OPERATIONS: | ||||||||
Net investment income | $ | 14,980,802 | $ | 14,964,134 | ||||
Net realized gain (loss) on investments and foreign currency | 19,433,550 | 37,307,982 | ||||||
Net realized gain (loss) from in-kind redemptions | — | 3,897,625 | ||||||
Net change in unrealized appreciation (depreciation) on investments and foreign currency | (42,534,310 | ) | 17,014,001 | |||||
|
|
|
| |||||
Net increase (decrease) from operations | (8,119,958 | ) | 73,183,742 | |||||
|
|
|
| |||||
DISTRIBUTIONS TO SHAREHOLDERS (Note 9): | ||||||||
Class S | (27,066,336 | ) | (9,472,113 | ) | ||||
Class I | (10,654,505 | ) | (6,016,806 | ) | ||||
Class R | (786,315 | ) | (259,818 | ) | ||||
Class R2 | (5,698,305 | ) | (1,356,723 | ) | ||||
|
|
|
| |||||
Total distributions to shareholders | (44,205,461 | ) | (17,105,460 | )* | ||||
|
|
|
| |||||
CAPITAL STOCK ISSUED AND REPURCHASED: | ||||||||
Net decrease from capital share transactions (Note 5) | (22,092,436 | ) | (250,449,181 | ) | ||||
|
|
|
| |||||
Net decrease in net assets | (74,417,855 | ) | (194,370,899 | ) | ||||
NET ASSETS: | ||||||||
Beginning of year | 967,684,850 | 1,162,055,749 | ||||||
|
|
|
| |||||
End of year | $ | 893,266,995 | $ | 967,684,850 | ||||
|
|
|
| |||||
* For the year ended October 31, 2017, the distributions to shareholders from net investment income and net realized gain were $8,240,473 and $1,231,640 (Class S), $5,354,879 and $661,927 (Class I), $219,383 and $40,435 (Class R) and $1,063,946 and $292,777 (Class R2), respectively.
The accompanying notes are an integral part of the financial statements.
24
Financial Highlights - Pro-Blend® Conservative Term Series - Class S
| FOR THE YEAR ENDED | ||||||||||||||||||||
| 10/31/18 | 10/31/17 | 10/31/16 | 10/31/15 | 10/31/14 | ||||||||||||||||
Per share data (for a share outstanding throughout each year): | ||||||||||||||||||||
Net asset value - Beginning of year | $ | 14.10 | $ | 13.36 | $ | 13.15 | $ | 14.13 | $ | 14.18 | ||||||||||
|
|
|
|
|
|
|
|
|
| |||||||||||
Income (loss) from investment operations: | ||||||||||||||||||||
Net investment income1 | 0.23 | 0.19 | 0.19 | 0.22 | 0.22 | |||||||||||||||
Net realized and unrealized gain (loss) on investments | (0.33 | ) | 0.73 | 0.21 | (0.41 | ) | 0.52 | |||||||||||||
|
|
|
|
|
|
|
|
|
| |||||||||||
Total from investment operations | (0.10 | ) | 0.92 | 0.40 | (0.19 | ) | 0.74 | |||||||||||||
|
|
|
|
|
|
|
|
|
| |||||||||||
Less distributions to shareholders: | ||||||||||||||||||||
From net investment income | (0.18 | ) | (0.16 | ) | (0.19 | ) | (0.18 | ) | (0.20 | ) | ||||||||||
From net realized gain on investments | (0.43 | ) | (0.02 | ) | — | (0.61 | ) | (0.59 | ) | |||||||||||
|
|
|
|
|
|
|
|
|
| |||||||||||
Total distributions to shareholders | (0.61 | ) | (0.18 | ) | (0.19 | ) | (0.79 | ) | (0.79 | ) | ||||||||||
|
|
|
|
|
|
|
|
|
| |||||||||||
Net asset value - End of year | $ | 13.39 | $ | 14.10 | $ | 13.36 | $ | 13.15 | $ | 14.13 | ||||||||||
|
|
|
|
|
|
|
|
|
| |||||||||||
Net assets - End of year (000’s omitted) | $ | 596,934 | $ | 627,523 | $ | 724,270 | $ | 911,956 | $ | 1,124,851 | ||||||||||
|
|
|
|
|
|
|
|
|
| |||||||||||
Total return2 | (0.75 | %) | 7.02 | % | 3.07 | % | (1.33 | %) | 5.46 | % | ||||||||||
Ratios (to average net assets)/Supplemental Data: | ||||||||||||||||||||
Expenses | 0.88 | % | 0.87 | % | 0.87 | % | 0.88 | % | 0.87 | % | ||||||||||
Net investment income | 1.71 | % | 1.42 | % | 1.47 | % | 1.60 | % | 1.57 | % | ||||||||||
Series portfolio turnover | 80 | % | 58 | % | 65 | % | 51 | % | 45 | % | ||||||||||
1Calculated based on average shares outstanding during the years.
2Represents aggregate total return for the years indicated, and assumes reinvestment of all distributions.
The accompanying notes are an integral part of the financial statements.
25
Financial Highlights - Pro-Blend® Conservative Term Series - Class I
| FOR THE YEAR ENDED | ||||||||||||||||||||
| 10/31/18 | 10/31/17 | 10/31/16 | 10/31/15 | 10/31/14 | ||||||||||||||||
Per share data (for a share outstanding throughout each year): | ||||||||||||||||||||
Net asset value - Beginning of year | $ | 10.85 | $ | 10.33 | $ | 10.22 | $ | 11.17 | $ | 11.38 | ||||||||||
|
|
|
|
|
|
|
|
|
| |||||||||||
Income (loss) from investment operations: | ||||||||||||||||||||
Net investment income1 | 0.20 | 0.17 | 0.17 | 0.19 | 0.20 | |||||||||||||||
Net realized and unrealized gain (loss) on investments | (0.26 | ) | 0.56 | 0.15 | (0.32 | ) | 0.40 | |||||||||||||
|
|
|
|
|
|
|
|
|
| |||||||||||
Total from investment operations | (0.06 | ) | 0.73 | 0.32 | (0.13 | ) | 0.60 | |||||||||||||
|
|
|
|
|
|
|
|
|
| |||||||||||
Less distributions to shareholders: | ||||||||||||||||||||
From net investment income | (0.21 | ) | (0.19 | ) | (0.21 | ) | (0.21 | ) | (0.22 | ) | ||||||||||
From net realized gain on investments | (0.43 | ) | (0.02 | ) | — | (0.61 | ) | (0.59 | ) | |||||||||||
|
|
|
|
|
|
|
|
|
| |||||||||||
Total distributions to shareholders | (0.64 | ) | (0.21 | ) | (0.21 | ) | (0.82 | ) | (0.81 | ) | ||||||||||
|
|
|
|
|
|
|
|
|
| |||||||||||
Net asset value - End of year | $ | 10.15 | $ | 10.85 | $ | 10.33 | $ | 10.22 | $ | 11.17 | ||||||||||
|
|
|
|
|
|
|
|
|
| |||||||||||
Net assets - End of year (000’s omitted) | $ | 192,157 | $ | 213,824 | $ | 291,632 | $ | 325,700 | $ | 353,538 | ||||||||||
|
|
|
|
|
|
|
|
|
| |||||||||||
Total return2 | (0.62 | %) | 7.25 | % | 3.26 | % | (1.15 | %) | 5.66 | % | ||||||||||
Ratios (to average net assets)/Supplemental Data: | ||||||||||||||||||||
Expenses | 0.68 | % | 0.67 | % | 0.67 | % | 0.68 | % | 0.67 | % | ||||||||||
Net investment income | 1.92 | % | 1.62 | % | 1.66 | % | 1.81 | % | 1.77 | % | ||||||||||
Series portfolio turnover | 80 | % | 58 | % | 65 | % | 51 | % | 45 | % | ||||||||||
1Calculated based on average shares outstanding during the years.
2Represents aggregate total return for the years indicated, and assumes reinvestment of all distributions.
The accompanying notes are an integral part of the financial statements.
26
Financial Highlights - Pro-Blend® Conservative Term Series - Class R
| FOR THE YEAR ENDED | ||||||||||||||||||||
| 10/31/18 | 10/31/17 | 10/31/16 | 10/31/15 | 10/31/14 | ||||||||||||||||
Per share data (for a share outstanding throughout each year): | ||||||||||||||||||||
Net asset value - Beginning of year | $ | 10.42 | $ | 9.92 | $ | 9.81 | $ | 10.75 | $ | 10.99 | ||||||||||
|
|
|
|
|
|
|
|
|
| |||||||||||
Income (loss) from investment operations: | ||||||||||||||||||||
Net investment income1 | 0.14 | 0.11 | 0.12 | 0.13 | 0.14 | |||||||||||||||
Net realized and unrealized gain (loss) on investments | (0.24 | ) | 0.54 | 0.15 | (0.30 | ) | 0.38 | |||||||||||||
|
|
|
|
|
|
|
|
|
| |||||||||||
Total from investment operations | (0.10 | ) | 0.65 | 0.27 | (0.17 | ) | 0.52 | |||||||||||||
|
|
|
|
|
|
|
|
|
| |||||||||||
Less distributions to shareholders: | ||||||||||||||||||||
From net investment income | (0.16 | ) | (0.13 | ) | (0.16 | ) | (0.16 | ) | (0.17 | ) | ||||||||||
From net realized gain on investments | (0.43 | ) | (0.02 | ) | — | (0.61 | ) | (0.59 | ) | |||||||||||
|
|
|
|
|
|
|
|
|
| |||||||||||
Total distributions to shareholders | (0.59 | ) | (0.15 | ) | (0.16 | ) | (0.77 | ) | (0.76 | ) | ||||||||||
|
|
|
|
|
|
|
|
|
| |||||||||||
Net asset value - End of year | $ | 9.73 | $ | 10.42 | $ | 9.92 | $ | 9.81 | $ | 10.75 | ||||||||||
|
|
|
|
|
|
|
|
|
| |||||||||||
Net assets - End of year (000’s omitted) | $ | 10,886 | $ | 13,672 | $ | 19,054 | $ | 55,315 | $ | 59,101 | ||||||||||
|
|
|
|
|
|
|
|
|
| |||||||||||
Total return2 | (1.08 | %) | 6.72 | % | 2.79 | % | (1.60 | %) | 5.08 | % | ||||||||||
Ratios (to average net assets)/Supplemental Data: | ||||||||||||||||||||
Expenses | 1.18 | % | 1.17 | % | 1.17 | % | 1.18 | % | 1.17 | % | ||||||||||
Net investment income | 1.40 | % | 1.12 | % | 1.19 | % | 1.30 | % | 1.27 | % | ||||||||||
Series portfolio turnover | 80 | % | 58 | % | 65 | % | 51 | % | 45 | % | ||||||||||
1Calculated based on average shares outstanding during the years.
2Represents aggregate total return for the years indicated, and assumes reinvestment of all distributions.
The accompanying notes are an integral part of the financial statements.
27
Financial Highlights - Pro-Blend® Conservative Term Series - Class R2*
| FOR THE YEAR ENDED | ||||||||||||||||||||
| 10/31/18 | 10/31/17 | 10/31/16 | 10/31/15 | 10/31/14 | ||||||||||||||||
Per share data (for a share outstanding throughout each year): | ||||||||||||||||||||
Net asset value - Beginning of year | $ | 10.40 | $ | 9.91 | $ | 9.81 | $ | 10.75 | $ | 10.99 | ||||||||||
|
|
|
|
|
|
|
|
|
| |||||||||||
Income (loss) from investment operations: | ||||||||||||||||||||
Net investment income1 | 0.09 | 0.06 | 0.06 | 0.08 | 0.08 | |||||||||||||||
Net realized and unrealized gain (loss) on investments | (0.24 | ) | 0.54 | 0.15 | (0.31 | ) | 0.39 | |||||||||||||
|
|
|
|
|
|
|
|
|
| |||||||||||
Total from investment operations | (0.15 | ) | 0.60 | 0.21 | (0.23 | ) | 0.47 | |||||||||||||
|
|
|
|
|
|
|
|
|
| |||||||||||
Less distributions to shareholders: | ||||||||||||||||||||
From net investment income | (0.11 | ) | (0.09 | ) | (0.11 | ) | (0.10 | ) | (0.12 | ) | ||||||||||
From net realized gain on investments | (0.43 | ) | (0.02 | ) | — | (0.61 | ) | (0.59 | ) | |||||||||||
|
|
|
|
|
|
|
|
|
| |||||||||||
Total distributions to shareholders | (0.54 | ) | (0.11 | ) | (0.11 | ) | (0.71 | ) | (0.71 | ) | ||||||||||
|
|
|
|
|
|
|
|
|
| |||||||||||
Net asset value - End of year | $ | 9.71 | $ | 10.40 | $ | 9.91 | $ | 9.81 | $ | 10.75 | ||||||||||
|
|
|
|
|
|
|
|
|
| |||||||||||
Net assets - End of year (000’s omitted) | $ | 93,290 | $ | 112,666 | $ | 127,100 | $ | 137,697 | $ | 139,291 | ||||||||||
|
|
|
|
|
|
|
|
|
| |||||||||||
Total return2 | (1.58 | %) | 6.13 | % | 2.24 | % | (2.10 | %) | 4.58 | % | ||||||||||
Ratios (to average net assets)/Supplemental Data: | ||||||||||||||||||||
Expenses | 1.68 | % | 1.67 | % | 1.67 | % | 1.68 | % | 1.67 | % | ||||||||||
Net investment income | 0.91 | % | 0.62 | % | 0.66 | % | 0.81 | % | 0.77 | % | ||||||||||
Series portfolio turnover | 80 | % | 58 | % | 65 | % | 51 | % | 45 | % | ||||||||||
*Effective March 1, 2017, Class C shares of the Series have been redesignated as Class R2 Shares.
1Calculated based on average shares outstanding during the years.
2Represents aggregate total return for the years indicated, and assumes reinvestment of all distributions.
The accompanying notes are an integral part of the financial statements.
28
Performance Update as of October 31, 2018 - Pro-Blend® Moderate Term Series
(unaudited)
| AVERAGE ANNUAL TOTAL RETURNS AS OF OCTOBER 31, 2018 | ||||||||||||
ONE YEAR1 | FIVE YEAR | TEN YEAR | ||||||||||
Manning & Napier Fund, Inc. - Pro-Blend® Moderate Term | -1.67 | % | 2.53 | % | 6.16 | % | ||||||
Manning & Napier Fund, Inc. - Pro-Blend® Moderate Term | -1.49 | % | 2.78 | % | 6.44 | % | ||||||
Manning & Napier Fund, Inc. - Pro-Blend® Moderate Term | -1.96 | % | 2.27 | % | 5.87 | % | ||||||
Manning & Napier Fund, Inc. - Pro-Blend® Moderate Term | -2.42 | % | 1.76 | % | 5.37 | % | ||||||
Bloomberg Barclays U.S. Aggregate Bond Index4 | -2.05 | % | 1.83 | % | 3.94 | % | ||||||
30/10/60 Blended Index5 | -0.01 | % | 4.59 | % | 7.28 | % | ||||||
The following graph compares the value of a $10,000 investment in the Manning & Napier Fund, Inc. - Pro-Blend® Moderate Term Series - Class S for the ten years ended October 31, 2018 to the Bloomberg Barclays U.S. Aggregate Bond Index and the 30/10/60 Blended Index.
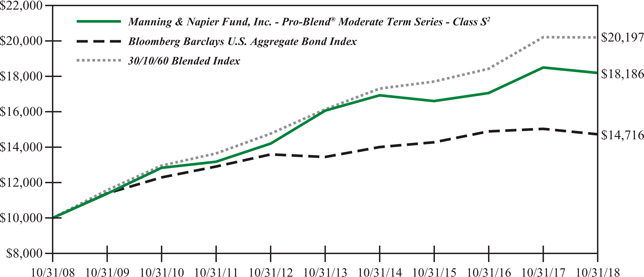
1The returns shown are based on net asset values calculated for shareholder transactions and may differ from the returns shown in the financial highlights, which reflect adjustments made to the net asset values in accordance with accounting principles generally accepted in the United States of America.
2The Series’ performance does not reflect the deduction of taxes that a shareholder would pay on fund distributions or the redemption of shares. The Series’ performance is historical and may not be indicative of future results. The performance returns shown are inclusive of the net expense ratio of the Series. For the year ended October 31, 2018, this net expense ratio was 1.10% for Class S, 0.85% for Class I, 1.35% for Class R and 1.85% for Class R2. The gross expense ratio, which does not account for any voluntary or contractual waivers currently in effect, was 1.10% for Class S, 0.85% for Class I, 1.35% for Class R and 1.85% for Class R2 for the year ended October 31, 2018.
3For periods through the inception of Class R2 on January 4, 2010 and Class R on June 30, 2010, the performance is hypothetical and is based on the historical performance of Class S shares adjusted for the respective class’ charges and expenses.
4The Bloomberg Barclays U.S. Aggregate Bond Index is an unmanaged, market-value weighted index of U.S. domestic investment-grade debt issues, including government, corporate, asset-backed, and mortgage-backed securities, with maturities of one year or more. Index returns do not reflect any fees or expenses. Index returns provided by Interactive Data.
5The 30/10/60 Blended Index is 30% Russell 3000® Index (Russell 3000), 10% MSCI ACWI ex USA Index (ACWIxUS), and 60% Bloomberg Barclays U.S. Aggregate Bond Index (BAB). Russell 3000 is an unmanaged index that consists of 3,000 of the largest U.S. companies based on total market capitalization. Index returns are based on a market capitalization-weighted average of relative price changes of the component stocks plus dividends whose reinvestments are compounded daily. Index returns provided by Bloomberg. ACWIxUS is designed to measure large and mid-cap representation across 22 of 23 Developed Markets countries (excluding the U.S.) and 24 Emerging Markets countries. The Index is denominated in U.S. dollars. The Index returns are net of withholding taxes. They assume daily reinvestment of net dividends thus accounting for any applicable dividend taxation. Index returns provided by Bloomberg. BAB is an unmanaged, market value-weighted index of U.S. domestic investment-grade debt issues, including government, corporate, asset-backed and mortgage-backed securities with maturities of one year or more. Index returns provided by Interactive Data. The returns of the indices do not reflect any fees or expenses. Returns provided are calculated monthly using a blended allocation. Because the fund’s asset
29
Performance Update as of October 31, 2018 - Pro-Blend® Moderate Term Series
(unaudited)
allocation will vary over time, the composition of the fund’s portfolio may not match the composition of the comparative Indices. Mid-month performance may not be available for all indices within the blended index. Where applicable, performance for those indices is included from the first of the month following the corresponding Fund’s inception date.
30
Shareholder Expense Example - Pro-Blend® Moderate Term Series
(unaudited)
As a shareholder of the Series, you incur ongoing costs, including management fees, shareholder service fees and other Series expenses. This example is intended to help you understand your ongoing costs (in dollars) of investing in the Series and to compare these costs with the ongoing costs of investing in other mutual funds.
The example is based on an investment of $1,000 invested in each class at the beginning of the period and held for the entire period (May 1, 2018 to October 31, 2018).
Actual Expenses
The Actual lines of the table below provide information about actual account values and actual expenses. You may use the information in these lines, together with the amount you invested, to estimate the expenses that you paid over the period. Simply divide your account value by $1,000 (for example, an $8,600 account value divided by $1,000 = 8.6), then multiply the result by the number in the Actual line for the Class in which you have invested under the heading entitled “Expenses Paid During Period” to estimate the expenses you paid on your account during this period.
Hypothetical Example for Comparison Purposes
The Hypothetical lines of each class in the table below provide information about hypothetical account values and hypothetical expenses based on the Class’ actual expense ratio and an assumed rate of return of 5% per year before expenses, which is not the Class’ actual return. The hypothetical account values and expenses may not be used to estimate the actual ending account balance or expenses you paid during the period. You may use this information to compare the ongoing costs of investing in a class of the Series and other funds. To do so, compare this 5% hypothetical example for the Class in which you have invested with the 5% hypothetical examples that appear in the shareholder reports of the other funds.
Please note that the expenses shown in the table are meant to highlight your ongoing costs only and do not reflect any transaction costs such as sales charges (loads), redemption fees, or exchange fees that you may incur in other mutual funds. Therefore, the second line of the table is useful in comparing ongoing costs only, and will not help you determine the relative total costs of owning different funds.
BEGINNING ACCOUNT VALUE 5/1/18 | ENDING ACCOUNT VALUE 10/31/18 | EXPENSES PAID DURING PERIOD 5/1/18-10/31/18* | ANNUALIZED EXPENSE RATIO | |||||
Class S | ||||||||
Actual | $1,000.00 | $989.62 | $5.47 | 1.09% | ||||
Hypothetical (5% return before expenses) | $1,000.00 | $1,019.71 | $5.55 | 1.09% | ||||
Class I | ||||||||
Actual | $1,000.00 | $990.57 | $4.21 | 0.84% | ||||
Hypothetical (5% return before expenses) | $1,000.00 | $1,020.97 | $4.28 | 0.84% | ||||
Class R | ||||||||
Actual | $1,000.00 | $987.83 | $6.71 | 1.34% | ||||
Hypothetical (5% return before expenses) | $1,000.00 | $1,018.45 | $6.82 | 1.34% | ||||
Class R2 | ||||||||
Actual | $1,000.00 | $986.24 | $9.21 | 1.84% | ||||
Hypothetical (5% return before expenses) | $1,000.00 | $1,015.93 | $9.35 | 1.84% |
*Expenses are equal to the Class’ annualized expense ratio (for the six-month period), multiplied by the average account value over the period, multiplied by 184/365 (to reflect the one-half year period). Expenses are based on the most recent fiscal half year; therefore, the expense ratios stated above may differ from the expense ratios stated in the financial highlights, which are based on one-year data.
31
Portfolio Composition - Pro-Blend® Moderate Term Series
As of October 31, 2018 (unaudited)
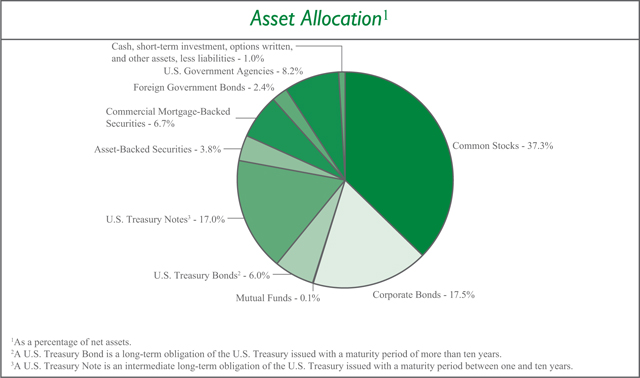
Sector Allocation4 | ||||||
Health Care | 9.0 | % | ||||
Financials | 7.7 | % | ||||
Information Technology | 6.3 | % | ||||
Consumer Discretionary | 5.9 | % | ||||
Communication Services | 5.4 | % | ||||
Energy | 5.2 | % | ||||
Consumer Staples | 5.1 | % | ||||
Industrials | 3.8 | % | ||||
Real Estate | 3.8 | % | ||||
Materials | 2.6 | % | ||||
Utilities | 0.2 | % | ||||
| 4 Including common stocks and corporate bonds, as a percentage of total investments. | ||||||
Top Ten Stock Holdings5 | ||||
Novartis AG - ADR (Switzerland) | 1.2 | % | ||
Booking Holdings, Inc. | 1.2 | % | ||
Incyte Corp. | 1.2 | % | ||
Qorvo, Inc. | 1.1 | % | ||
Mastercard, Inc. - Class A | 1.1 | % | ||
Medtronic plc | 1.1 | % | ||
Visa, Inc. - Class A | 1.1 | % | ||
Microsoft Corp. | 1.0 | % | ||
Ball Corp. | 0.9 | % | ||
Anheuser-Busch InBev S.A./N.V. (Belgium) | 0.9 | % | ||
| 5 As a percentage of total investments. | ||||
32
Investment Portfolio - October 31, 2018
| PRO-BLEND® MODERATE TERM SERIES | SHARES | VALUE (NOTE 2) | ||||||
COMMON STOCKS - 37.3% | ||||||||
Communication Services - 3.2% | ||||||||
Diversified Telecommunication Services - 0.6% |
| |||||||
Orange S.A. (France) | 2,315 | $ | 36,133 | |||||
Telefonica Brasil S.A. (Brazil) | 2,600 | 30,105 | ||||||
Zayo Group Holdings, Inc.* | 102,650 | 3,067,182 | ||||||
|
| |||||||
| 3,133,420 | ||||||||
|
| |||||||
Entertainment - 0.6% | ||||||||
Electronic Arts, Inc.* | 31,090 | 2,828,568 | ||||||
NetEase, Inc. - ADR (China) | 480 | 99,768 | ||||||
Nexon Co. Ltd. (Japan)* | 7,600 | 86,695 | ||||||
Toho Co. Ltd. -Tokyo (Japan) | 1,600 | 52,201 | ||||||
Vivendi S.A. (France) | 1,195 | 28,821 | ||||||
|
| |||||||
| 3,096,053 | ||||||||
|
| |||||||
Interactive Media & Services - 1.6% | ||||||||
Alphabet, Inc. - Class A*1 | 1,810 | 1,973,950 | ||||||
Alphabet, Inc. - Class C* | 3,130 | 3,370,290 | ||||||
Tencent Holdings Ltd. - Class H (China) | 110,246 | 3,776,947 | ||||||
|
| |||||||
| 9,121,187 | ||||||||
|
| |||||||
Media - 0.4% | ||||||||
Hakuhodo DY Holdings, Inc. (Japan) | 3,100 | 51,704 | ||||||
Quebecor, Inc. - Class B (Canada) | 59,090 | 1,158,953 | ||||||
Shaw Communications, Inc. - Class B (Canada) | 59,280 | 1,103,690 | ||||||
|
| |||||||
| 2,314,347 | ||||||||
|
| |||||||
Wireless Telecommunication Services - 0.0%## | ||||||||
KDDI Corp. (Japan) | 4,200 | 101,639 | ||||||
NTT DOCOMO, Inc. (Japan) | 4,100 | 101,675 | ||||||
|
| |||||||
Total Communication Services | 17,868,321 | |||||||
|
| |||||||
Consumer Discretionary - 3.7% | ||||||||
Auto Components - 0.0%## | ||||||||
Nemak S.A.B. de C.V. (Mexico)2 | 99,900 | 72,147 | ||||||
NGK Spark Plug Co. Ltd. (Japan) | 2,700 | 54,635 | ||||||
|
| |||||||
| 126,782 | ||||||||
|
| |||||||
Automobiles - 0.1% | ||||||||
Geely Automobile Holdings Ltd. (China) | 41,000 | 79,007 | ||||||
Isuzu Motors Ltd. (Japan) | 4,000 | 52,442 | ||||||
Peugeot S.A. (France) | 620 | 14,738 | ||||||
Renault S.A. (France) | 290 | 21,655 | ||||||
Suzuki Motor Corp. (Japan) | 2,300 | 114,693 | ||||||
|
| |||||||
| 282,535 | ||||||||
|
| |||||||
Diversified Consumer Services - 0.1% | ||||||||
China Maple Leaf Educational Systems Ltd. (China) | 126,000 | 54,685 | ||||||
China Yuhua Education Corp. Ltd. (China)2 | 192,000 | 77,420 | ||||||
Fu Shou Yuan International Group Ltd. (China) | 164,640 | 126,528 | ||||||
New Oriental Education & Technology Group, Inc. - ADR (China)* | 1,935 | 113,217 | ||||||
TAL Education Group - ADR (China)* | 1,550 | 44,919 | ||||||
Wisdom Education International Holdings Co. Ltd. (China) | 122,000 | 54,903 | ||||||
|
| |||||||
| 471,672 | ||||||||
|
| |||||||
Hotels, Restaurants & Leisure - 0.0%## | ||||||||
Accor S.A. (France) | 2,315 | 105,777 | ||||||
Basic-Fit N.V. (Netherlands)*2 | 2,535 | 72,987 | ||||||
|
| |||||||
| 178,764 | ||||||||
|
| |||||||
Household Durables - 0.0%## | ||||||||
Sekisui Chemical Co. Ltd. (Japan) | 3,400 | 53,468 | ||||||
Techtronic Industries Co. Ltd. (Hong Kong) | 11,000 | 51,796 | ||||||
|
| |||||||
| 105,264 | ||||||||
|
| |||||||
Internet & Direct Marketing Retail - 2.1% | ||||||||
Alibaba Group Holding Ltd. - ADR (China)* | 23,365 | 3,324,372 | ||||||
Amazon.com, Inc.* | 1,110 | 1,773,791 | ||||||
Booking Holdings, Inc.* | 3,440 | 6,448,555 | ||||||
Despegar.com Corp. (Argentina)* | 1,885 | 30,292 | ||||||
|
| |||||||
| 11,577,010 | ||||||||
|
| |||||||
Leisure Products - 0.1% | ||||||||
Bandai Namco Holdings, Inc. (Japan) | 2,900 | 103,167 | ||||||
Yamaha Corp. (Japan) | 2,500 | 109,861 | ||||||
|
| |||||||
| 213,028 | ||||||||
|
| |||||||
Multiline Retail - 0.0%## | ||||||||
El Puerto de Liverpool SAB de C.V. (Mexico) | 6,720 | 42,676 | ||||||
Lojas Americanas S.A. (Brazil) | 4,700 | 23,503 | ||||||
Lojas Renner S.A. (Brazil) | 3,060 | 30,982 | ||||||
Magazine Luiza S.A. (Brazil) | 500 | 22,627 | ||||||
Next plc (United Kingdom) | 760 | 50,489 | ||||||
|
| |||||||
| 170,277 | ||||||||
|
| |||||||
Specialty Retail - 0.5% | ||||||||
Fast Retailing Co. Ltd. (Japan) | 100 | 50,351 | ||||||
The accompanying notes are an integral part of the financial statements.
33
Investment Portfolio - October 31, 2018
| PRO-BLEND® MODERATE TERM SERIES | SHARES | VALUE (NOTE 2) | ||||||
COMMON STOCKS (continued) | ||||||||
Consumer Discretionary (continued) | ||||||||
Specialty Retail (continued) | ||||||||
Industria de Diseno Textil S.A. (Spain) | 92,080 | $ | 2,595,233 | |||||
Nitori Holdings Co. Ltd. (Japan) | 400 | 52,229 | ||||||
USS Co. Ltd. (Japan) | 2,900 | 52,292 | ||||||
|
| |||||||
| 2,750,105 | ||||||||
|
| |||||||
Textiles, Apparel & Luxury Goods - 0.8% | ||||||||
ANTA Sports Products Ltd. (China) | 18,180 | 75,057 | ||||||
Burberry Group plc (United Kingdom) | 2,275 | 52,642 | ||||||
Hermes International (France) | 90 | 51,381 | ||||||
Kering S.A. (France) | 100 | 44,449 | ||||||
lululemon athletica, Inc.* | 30,320 | 4,266,934 | ||||||
LVMH Moet Hennessy Louis Vuitton SE (France) | 340 | 103,157 | ||||||
Moncler S.p.A (Italy) | 1,475 | 51,223 | ||||||
|
| |||||||
| 4,644,843 | ||||||||
|
| |||||||
Total Consumer Discretionary | 20,520,280 | |||||||
|
| |||||||
Consumer Staples - 5.0% | ||||||||
Beverages - 3.0% | ||||||||
Ambev S.A. - ADR (Brazil) | 490,236 | 2,122,722 | ||||||
Ambev S.A. (Brazil) | 17,500 | 76,367 | ||||||
Anheuser-Busch InBev S.A./N.V. (Belgium) | 66,280 | 4,902,132 | ||||||
The Coca-Cola Co. | 47,060 | 2,253,233 | ||||||
Diageo plc (United Kingdom) | 137,823 | 4,764,751 | ||||||
Fomento Economico Mexicano SAB de C.V. (Mexico) | 5,600 | 47,701 | ||||||
PepsiCo, Inc. | 19,900 | 2,236,362 | ||||||
Pernod Ricard S.A. (France) | 290 | 44,221 | ||||||
Treasury Wine Estates Ltd. (Australia) | 15,750 | 169,526 | ||||||
|
| |||||||
| 16,617,015 | ||||||||
|
| |||||||
Food & Staples Retailing - 0.1% | ||||||||
Atacadao Distribuicao Comercio e Industria Ltda. (Brazil) | 5,600 | 22,827 | ||||||
Matsumotokiyoshi Holdings Co. Ltd. (Japan) | 2,300 | 83,154 | ||||||
Tsuruha Holdings, Inc. (Japan) | 500 | 52,185 | ||||||
Wal-Mart de Mexico S.A.B. de C.V. (Mexico) | 35,520 | 90,823 | ||||||
Wesfarmers Ltd. (Australia) | 1,575 | 52,160 | ||||||
|
| |||||||
| 301,149 | ||||||||
|
| |||||||
Food Products - 1.2% | ||||||||
Barry Callebaut AG (Switzerland) | 25 | 48,864 | ||||||
Chocoladefabriken Lindt & Spruengli AG (Switzerland) | 15 | 103,414 | ||||||
Danone S.A. (France) | 3,111 | 220,299 | ||||||
Grupo Bimbo S.A.B. de C.V. - Series A (Mexico) | 19,675 | 36,787 | ||||||
Kerry Group plc - Class A (Ireland) | 1,510 | 154,525 | ||||||
Kikkoman Corp. (Japan) | 1,900 | 104,096 | ||||||
Mondelez International, Inc. - Class A | 80,030 | 3,359,659 | ||||||
Nestle S.A. (Switzerland) | 32,369 | 2,732,692 | ||||||
|
| |||||||
| 6,760,336 | ||||||||
|
| |||||||
Household Products - 0.0%## | ||||||||
Henkel AG & Co. KGaA (Germany) | 515 | 50,448 | ||||||
Kimberly-Clark de Mexico S.A.B. de C.V. - Class A (Mexico) | 47,800 | 68,877 | ||||||
Lion Corp. (Japan) | 4,000 | 75,203 | ||||||
|
| |||||||
| 194,528 | ||||||||
|
| |||||||
Personal Products - 0.7% | ||||||||
Beiersdorf AG (Germany) | 2,035 | 210,413 | ||||||
Kao Corp. (Japan) | 800 | 53,218 | ||||||
Kobayashi Pharmaceutical Co. Ltd. (Japan) | 800 | 52,178 | ||||||
L’Oreal S.A. (France) | 480 | 108,146 | ||||||
Unilever plc - ADR (United Kingdom) | 67,285 | 3,564,759 | ||||||
|
| |||||||
| 3,988,714 | ||||||||
|
| |||||||
Tobacco - 0.0%## | ||||||||
British American Tobacco plc - ADR (United Kingdom) | 2,535 | 110,019 | ||||||
KT&G Corp. (South Korea) | 585 | 52,165 | ||||||
Swedish Match AB (Sweden) | 1,035 | 52,722 | ||||||
|
| |||||||
| 214,906 | ||||||||
|
| |||||||
Total Consumer Staples | 28,076,648 | |||||||
|
| |||||||
Energy - 1.9% | ||||||||
Energy Equipment & Services - 1.6% | ||||||||
Core Laboratories N.V | 840 | 71,602 | ||||||
Diamond Offshore Drilling, Inc.* | 83,030 | 1,177,365 | ||||||
Ensco plc - Class A | 218,150 | 1,557,591 | ||||||
Schlumberger Ltd. | 82,978 | 4,257,601 | ||||||
Transocean Ltd.* | 167,270 | 1,841,643 | ||||||
|
| |||||||
| 8,905,802 | ||||||||
|
| |||||||
Oil, Gas & Consumable Fuels - 0.3% | ||||||||
Cameco Corp. (Canada) | 6,054 | 64,899 | ||||||
Canadian Natural Resources Ltd. (Canada) | 3,905 | 107,143 | ||||||
The accompanying notes are an integral part of the financial statements.
34
Investment Portfolio - October 31, 2018
| PRO-BLEND® MODERATE TERM SERIES | SHARES | VALUE (NOTE 2) | ||||||||||
COMMON STOCKS (continued) | ||||||||||||
Energy (continued) | ||||||||||||
Oil, Gas & Consumable Fuels (continued) | ||||||||||||
China Petroleum & Chemical Corp. - Class H (China) | 134,000 | $ | 109,153 | |||||||||
Eni S.p.A. (Italy) | 6,165 | 109,488 | ||||||||||
Galp Energia SGPS S.A. (Portugal) | 12,605 | 219,178 | ||||||||||
Repsol S.A. (Spain) | 10,515 | 187,890 | ||||||||||
Royal Dutch Shell plc - Class B - ADR (Netherlands) | 3,440 | 226,042 | ||||||||||
SK Innovation Co. Ltd. (South Korea) | 490 | 91,958 | ||||||||||
Suncor Energy, Inc. (Canada) | 3,030 | 101,641 | ||||||||||
TOTAL S.A. (France) | 3,145 | 184,533 | ||||||||||
Vermilion Energy, Inc. (Canada) | 4,050 | 107,399 | ||||||||||
Woodside Petroleum Ltd. (Australia) | 4,570 | 112,515 | ||||||||||
|
| |||||||||||
| 1,621,839 | ||||||||||||
|
| |||||||||||
Total Energy | 10,527,641 | |||||||||||
|
| |||||||||||
Financials - 2.5% | ||||||||||||
Banks - 0.3% | ||||||||||||
Banco Bradesco S.A. (Brazil) | 8,100 | 74,220 | ||||||||||
Banco Comercial Portugues S.A. (Portugal)* | 290,665 | 78,184 | ||||||||||
Banco do Brasil S.A. (Brazil) | 3,200 | 36,673 | ||||||||||
Banco Santander Brasil S.A. (Brazil) | 3,200 | 36,286 | ||||||||||
The Bank Of N.T. Butterfield & Son Ltd. (Bermuda) | 1,565 | 63,054 | ||||||||||
Bankia S.A. (Spain) | 34,147 | 107,257 | ||||||||||
Bankinter S.A. (Spain) | 13,370 | 109,540 | ||||||||||
BNP Paribas S.A. (France) | 1,490 | 77,649 | ||||||||||
CaixaBank S.A. (Spain) | 45,020 | 182,182 | ||||||||||
Credit Agricole S.A. (France) | 1,710 | 21,901 | ||||||||||
Erste Group Bank AG (Austria) | 1,780 | 72,459 | ||||||||||
FinecoBank Banca Fineco S.p.A. (Italy) | 15,200 | 158,864 | ||||||||||
Itau Unibanco Holding S.A. (Brazil) | 5,600 | 73,944 | ||||||||||
Itausa - Investimentos Itau S.A. (Brazil) | 12,400 | 37,318 | ||||||||||
Jyske Bank A/S (Denmark) | 2,060 | 84,112 | ||||||||||
KBC Group N.V. (Belgium) | 1,230 | 84,766 | ||||||||||
Societe Generale S.A. (France) | 985 | 36,108 | ||||||||||
Sydbank A/S (Denmark) | 2,385 | 55,087 | ||||||||||
|
| |||||||||||
| 1,389,604 | ||||||||||||
|
| |||||||||||
Capital Markets - 1.8% | ||||||||||||
B3 S.A. - Brasil Bolsa Balcao (Brazil) | 5,400 | 38,728 | ||||||||||
BlackRock, Inc. | 7,790 | 3,204,962 | ||||||||||
Cboe Global Markets, Inc. | 10,560 | 1,191,696 | ||||||||||
The Charles Schwab Corp. | 46,070 | 2,130,277 | ||||||||||
CME Group, Inc. | 5,990 | 1,097,608 | ||||||||||
E*TRADE Financial Corp. | 21,260 | 1,050,669 | ||||||||||
Intercontinental Exchange, Inc. | 14,650 | 1,128,636 | ||||||||||
Japan Exchange Group, Inc. (Japan) | 5,000 | 89,554 | ||||||||||
Julius Baer Group Ltd. (Switzerland) | 6,080 | 277,277 | ||||||||||
|
| |||||||||||
| 10,209,407 | ||||||||||||
|
| |||||||||||
Diversified Financial Services - 0.4% | ||||||||||||
Berkshire Hathaway, Inc. - Class B* . | 10,230 | 2,100,014 | ||||||||||
|
| |||||||||||
Insurance - 0.0%## | ||||||||||||
Admiral Group plc (United Kingdom) | 2,025 | 52,055 | ||||||||||
AXA S.A. (France) | 2,615 | 65,444 | ||||||||||
BB Seguridade Participacoes S.A. (Brazil) | 3,700 | 26,476 | ||||||||||
|
| |||||||||||
| 143,975 | ||||||||||||
|
| |||||||||||
Thrifts & Mortgage Finance - 0.0%## | ||||||||||||
Aareal Bank AG (Germany) | 1,920 | 71,426 | ||||||||||
|
| |||||||||||
Total Financials | 13,914,426 | |||||||||||
|
| |||||||||||
Health Care - 8.3% | ||||||||||||
Biotechnology - 3.0% | ||||||||||||
BioMarin Pharmaceutical, Inc.* | 37,410 | 3,448,080 | ||||||||||
Incyte Corp.* | 99,360 | 6,440,515 | ||||||||||
Regeneron Pharmaceuticals, Inc.* | 8,165 | 2,769,895 | ||||||||||
Seattle Genetics, Inc.* | 43,755 | 2,455,968 | ||||||||||
Vertex Pharmaceuticals, Inc.* | 10,620 | 1,799,665 | ||||||||||
|
| |||||||||||
| 16,914,123 | ||||||||||||
|
| |||||||||||
Health Care Equipment & Supplies - 1.2% | ||||||||||||
Coloplast A/S - Class B (Denmark) | 1,060 | 98,912 | ||||||||||
EssilorLuxottica (France) | 745 | 101,750 | ||||||||||
Hoya Corp. (Japan) | 1,000 | 56,576 | ||||||||||
Medtronic plc | 65,390 | 5,873,330 | ||||||||||
Shandong Weigao Group Medical Polymer Co. Ltd. - Class H (China) | 59,510 | 53,306 | ||||||||||
Smith & Nephew plc (United Kingdom) | 3,115 | 50,634 | ||||||||||
Sonova Holding AG (Switzerland) | 320 | 52,187 | ||||||||||
Terumo Corp. (Japan) | 2,000 | 107,964 | ||||||||||
William Demant Holding A/S (Denmark)* | 1,605 | 52,759 | ||||||||||
|
| |||||||||||
| 6,447,418 | ||||||||||||
|
| |||||||||||
Health Care Providers & Services - 0.6% | ||||||||||||
DaVita, Inc.* | 52,250 | 3,518,515 | ||||||||||
|
| |||||||||||
The accompanying notes are an integral part of the financial statements.
35
Investment Portfolio - October 31, 2018
| PRO-BLEND® MODERATE TERM SERIES | SHARES | VALUE (NOTE 2) |
| |||||||||
COMMON STOCKS (continued) | ||||||||||||
Health Care (continued) | ||||||||||||
Life Sciences Tools & Services - 0.0%## | ||||||||||||
QIAGEN N.V.* | 1,761 | $ | 63,924 | |||||||||
QIAGEN N.V.* | 2,512 | 91,182 | ||||||||||
Tecan Group AG (Switzerland) | 175 | 39,478 | ||||||||||
|
| |||||||||||
| 194,584 | ||||||||||||
|
| |||||||||||
Pharmaceuticals - 3.5% | ||||||||||||
Astellas Pharma, Inc. (Japan) | 3,400 | 52,531 | ||||||||||
Bristol-Myers Squibb Co | 40,260 | 2,034,740 | ||||||||||
Chugai Pharmaceutical Co. Ltd. (Japan) | 1,700 | 99,530 | ||||||||||
Johnson & Johnson | 33,770 | 4,727,462 | ||||||||||
Merck & Co., Inc. | 36,000 | 2,649,960 | ||||||||||
Merck KGaA (Germany) | 22,320 | 2,388,300 | ||||||||||
Novartis AG - ADR (Switzerland) | 78,095 | 6,830,189 | ||||||||||
Novartis AG (Switzerland) | 2,300 | 201,416 | ||||||||||
Novo Nordisk A/S - Class B (Denmark) | 1,200 | 51,824 | ||||||||||
Perrigo Co. plc | 2,530 | 177,859 | ||||||||||
Sanofi (France) | 1,340 | 119,743 | ||||||||||
|
| |||||||||||
| 19,333,554 | ||||||||||||
|
| |||||||||||
Total Health Care | 46,408,194 | |||||||||||
|
| |||||||||||
Industrials - 1.8% | ||||||||||||
Aerospace & Defense - 0.1% | ||||||||||||
Airbus S.E. (France) | 715 | 79,017 | ||||||||||
BAE Systems plc (United Kingdom) | 18,220 | 122,170 | ||||||||||
MTU Aero Engines AG (Germany) | 245 | 52,021 | ||||||||||
Safran S.A. (France) | 410 | 52,983 | ||||||||||
Thales S.A. (France) | 115 | 14,687 | ||||||||||
|
| |||||||||||
| 320,878 | ||||||||||||
|
| |||||||||||
Air Freight & Logistics - 0.6% | ||||||||||||
FedEx Corp. | 13,630 | 3,003,234 | ||||||||||
|
| |||||||||||
Airlines - 0.0%## | ||||||||||||
Ryanair Holdings plc - ADR (Ireland)* | 739 | 61,189 | ||||||||||
|
| |||||||||||
Building Products - 0.0%## | ||||||||||||
Cie de Saint-Gobain (France) | 590 | 22,226 | ||||||||||
TOTO Ltd. (Japan) | 1,500 | 53,664 | ||||||||||
|
| |||||||||||
| 75,890 | ||||||||||||
|
| |||||||||||
Commercial Services & Supplies - 0.0%## | ||||||||||||
Secom Co. Ltd. (Japan) | 600 | 49,123 | ||||||||||
|
| |||||||||||
Construction & Engineering - 0.0%## | ||||||||||||
FLSmidth & Co. A/S (Denmark) | 371 | 19,467 | ||||||||||
Vinci S.A. (France) | 2,025 | 180,223 | ||||||||||
|
| |||||||||||
| 199,690 | ||||||||||||
|
| |||||||||||
Electrical Equipment - 0.0%## | ||||||||||||
Schneider Electric SE (France) | 715 | 51,702 | ||||||||||
|
| |||||||||||
Industrial Conglomerates - 0.0%## | ||||||||||||
Siemens AG (Germany) | 1,285 | 147,706 | ||||||||||
|
| |||||||||||
Machinery - 0.2% | ||||||||||||
Epiroc AB - Class A (Sweden)* | 10,235 | 89,878 | ||||||||||
FANUC Corp. (Japan) | 499 | 86,810 | ||||||||||
Hoshizaki Corp. (Japan) | 1,100 | 88,793 | ||||||||||
Hyundai Heavy Industries Co. Ltd. (South Korea)* | 720 | 79,202 | ||||||||||
Hyundai Mipo Dockyard Co. Ltd. (South Korea)* | 930 | 77,135 | ||||||||||
Jungheinrich AG (Germany) | 2,230 | 73,884 | ||||||||||
KION Group AG (Germany) | 1,930 | 112,781 | ||||||||||
Kone OYJ - Class B (Finland) | 1,040 | 50,621 | ||||||||||
Makita Corp. (Japan) | 1,300 | 44,944 | ||||||||||
Metso OYJ (Finland) | 2,969 | 93,737 | ||||||||||
MISUMI Group, Inc. (Japan) | 2,700 | 54,110 | ||||||||||
Samsung Heavy Industries Co. Ltd. (South Korea)* | 6,215 | 38,131 | ||||||||||
Schindler Holding AG (Switzerland) | 500 | 105,432 | ||||||||||
WEG S.A. (Brazil) | 4,600 | 22,261 | ||||||||||
The Weir Group plc (United Kingdom) | 10,295 | 208,335 | ||||||||||
|
| |||||||||||
| 1,226,054 | ||||||||||||
|
| |||||||||||
Professional Services - 0.4% | ||||||||||||
Equifax, Inc. | 19,590 | 1,987,210 | ||||||||||
Experian plc (United Kingdom) | 2,180 | 50,138 | ||||||||||
Recruit Holdings Co. Ltd. (Japan) | 4,300 | 115,410 | ||||||||||
Teleperformance (France) | 295 | 48,584 | ||||||||||
Wolters Kluwer N.V. (Netherlands) | 880 | 49,926 | ||||||||||
|
| |||||||||||
| 2,251,268 | ||||||||||||
|
| |||||||||||
Road & Rail - 0.4% | ||||||||||||
Canadian National Railway Co. (Canada) | 625 | 53,430 | ||||||||||
Genesee & Wyoming, Inc. - Class A* | 27,350 | 2,166,941 | ||||||||||
|
| |||||||||||
| 2,220,371 | ||||||||||||
|
| |||||||||||
Trading Companies & Distributors - 0.1% | ||||||||||||
Ashtead Group plc (United Kingdom) | 3,025 | 74,678 | ||||||||||
Brenntag AG (Germany) | 1,108 | 57,865 | ||||||||||
Kanamoto Co. Ltd. (Japan) | 2,300 | 76,856 | ||||||||||
|
| |||||||||||
| 209,399 | ||||||||||||
|
| |||||||||||
The accompanying notes are an integral part of the financial statements.
36
Investment Portfolio - October 31, 2018
| PRO-BLEND® MODERATE TERM SERIES | SHARES | VALUE (NOTE 2) |
| |||||||||
COMMON STOCKS (continued) | ||||||||||||
Industrials (continued) | ||||||||||||
Transportation Infrastructure - 0.0%## | ||||||||||||
Grupo Aeroportuario del Centro Norte S.A.B. de C.V. (Mexico) | 8,200 | $ | 42,947 | |||||||||
Grupo Aeroportuario del Pacifico S.A.B. de C.V. - ADR (Mexico) | 495 | 41,026 | ||||||||||
|
| |||||||||||
| 83,973 | ||||||||||||
|
| |||||||||||
Total Industrials | 9,900,477 | |||||||||||
|
| |||||||||||
Information Technology - 6.2% | ||||||||||||
Electronic Equipment, Instruments & Components - 0.1% | ||||||||||||
Halma plc (United Kingdom) | 4,850 | 82,306 | ||||||||||
Hexagon A.B. - Class B (Sweden) | 2,285 | 111,836 | ||||||||||
Keyence Corp. (Japan) | 506 | 247,191 | ||||||||||
Yokogawa Electric Corp. (Japan) | 2,700 | 53,012 | ||||||||||
|
| |||||||||||
| 494,345 | ||||||||||||
|
| |||||||||||
IT Services - 3.2% | ||||||||||||
Amadeus IT Group S.A. (Spain) | 635 | 51,133 | ||||||||||
Amdocs Ltd. | 3,605 | 228,088 | ||||||||||
Capgemini SE (France) | 180 | 21,979 | ||||||||||
InterXion Holding N.V. (Netherlands)* | 39,935 | 2,350,973 | ||||||||||
LiveRamp Holdings, Inc.* | 68,130 | 3,112,178 | ||||||||||
Mastercard, Inc. - Class A | 29,830 | 5,896,496 | ||||||||||
Nomura Research Institute Ltd. (Japan) | 2,500 | 110,834 | ||||||||||
Obic Co. Ltd. (Japan) | 1,300 | 118,352 | ||||||||||
Otsuka Corp. (Japan) | 1,600 | 53,070 | ||||||||||
Visa, Inc. - Class A1 | 42,580 | 5,869,653 | ||||||||||
|
| |||||||||||
| 17,812,756 | ||||||||||||
|
| |||||||||||
Semiconductors & Semiconductor Equipment - 1.5% | ||||||||||||
Qorvo, Inc.* | 83,770 | 6,157,933 | ||||||||||
Skyworks Solutions, Inc. | 23,440 | 2,033,654 | ||||||||||
|
| |||||||||||
| 8,191,587 | ||||||||||||
|
| |||||||||||
Software - 1.4% | ||||||||||||
Check Point Software Technologies Ltd. (Israel)* | 945 | 104,895 | ||||||||||
Dassault Systemes S.E. (France) | 180 | 22,533 | ||||||||||
Microsoft Corp. | 52,630 | 5,621,410 | ||||||||||
Oracle Corp. (Japan) | 800 | 54,151 | ||||||||||
SAP SE (Germany) | 480 | 51,395 | ||||||||||
ServiceNow, Inc.* | 12,265 | 2,220,456 | ||||||||||
Trend Micro, Inc. (Japan) | 1,900 | 109,375 | ||||||||||
|
| |||||||||||
| 8,184,215 | ||||||||||||
|
| |||||||||||
Total Information Technology | 34,682,903 | |||||||||||
|
| |||||||||||
Materials - 1.6% | ||||||||||||
Chemicals - 0.1% | ||||||||||||
Air Liquide S.A. (France) | 530 | 64,069 | ||||||||||
Akzo Nobel N.V. (Netherlands) | 2,210 | 185,562 | ||||||||||
Asahi Kasei Corp. (Japan) | 4,400 | 52,793 | ||||||||||
Croda International plc (United Kingdom) | 1,795 | 110,564 | ||||||||||
FUCHS PETROLUB S.E. (Germany) | 604 | 27,959 | ||||||||||
Givaudan S.A. (Switzerland) | 20 | 48,478 | ||||||||||
Mexichem S.A.B. de C.V. (Mexico) | 34,110 | 89,216 | ||||||||||
Nissan Chemical Corp. (Japan) | 1,100 | 51,866 | ||||||||||
Novozymes A/S - Class B (Denmark) | 1,065 | 52,595 | ||||||||||
Solvay S.A. (Belgium) | 1,490 | 169,721 | ||||||||||
|
| |||||||||||
| 852,823 | ||||||||||||
|
| |||||||||||
Containers & Packaging - 1.4% | ||||||||||||
Ball Corp. | 113,660 | 5,091,968 | ||||||||||
DS Smith plc (United Kingdom) | 22,544 | 113,117 | ||||||||||
Sealed Air Corp. | 82,760 | 2,678,114 | ||||||||||
|
| |||||||||||
| 7,883,199 | ||||||||||||
|
| |||||||||||
Metals & Mining - 0.1% | ||||||||||||
Antofagasta plc (Chile) | 18,705 | 187,238 | ||||||||||
First Quantum Minerals Ltd. (Zambia) | 11,590 | 115,684 | ||||||||||
Lundin Mining Corp. (Chile) | 25,815 | 106,088 | ||||||||||
Southern Copper Corp. (Peru) | 2,985 | 114,445 | ||||||||||
|
| |||||||||||
| 523,455 | ||||||||||||
|
| |||||||||||
Total Materials | 9,259,477 | |||||||||||
|
| |||||||||||
Real Estate - 3.1% | ||||||||||||
Equity Real Estate Investment Trusts (REITS) - 3.1% | ||||||||||||
Acadia Realty Trust | 1,815 | 50,530 | ||||||||||
Agree Realty Corp. | 1,080 | 61,852 | ||||||||||
Alexandria Real Estate Equities, Inc. | 435 | 53,170 | ||||||||||
American Campus Communities, Inc. | 1,350 | 53,339 | ||||||||||
American Homes 4 Rent - Class A | 9,760 | 205,643 | ||||||||||
American Tower Corp. | 15,015 | 2,339,487 | ||||||||||
Americold Realty Trust | 1,995 | 49,376 | ||||||||||
Apartment Investment & Management Co. - Class A | 3,925 | 168,932 | ||||||||||
Apple Hospitality REIT, Inc. | 5,410 | 87,480 | ||||||||||
AvalonBay Communities, Inc. | 2,430 | 426,173 | ||||||||||
Boston Properties, Inc. | 2,490 | 300,692 | ||||||||||
Brandywine Realty Trust | 13,435 | 188,896 | ||||||||||
CatchMark Timber Trust, Inc. - Class A | 3,812 | 33,736 | ||||||||||
The accompanying notes are an integral part of the financial statements.
37
Investment Portfolio - October 31, 2018
| PRO-BLEND® MODERATE TERM SERIES | PRINCIPAL AMOUNT3 | VALUE (NOTE 2) | ||||||||||
COMMON STOCKS (continued) | ||||||||||||
Real Estate (continued) | ||||||||||||
Equity Real Estate Investment Trusts (REITS) (continued) | ||||||||||||
Chesapeake Lodging Trust | 2,480 | $ | 72,887 | |||||||||
Colony Capital, Inc. | 11,258 | 66,084 | ||||||||||
Community Healthcare Trust, Inc. | 3,225 | 95,847 | ||||||||||
CoreCivic, Inc. | 6,080 | 136,557 | ||||||||||
Cousins Properties, Inc. | 23,395 | 194,412 | ||||||||||
Crown Castle International Corp. | 1,365 | 148,430 | ||||||||||
CubeSmart | 1,435 | 41,586 | ||||||||||
Digital Realty Trust, Inc. | 2,770 | 286,030 | ||||||||||
EastGroup Properties, Inc. | 470 | 45,021 | ||||||||||
Equinix, Inc. | 8,490 | 3,215,503 | ||||||||||
Equity LifeStyle Properties, Inc. | 1,115 | 105,579 | ||||||||||
Equity Residential | 4,935 | 320,578 | ||||||||||
Essex Property Trust, Inc. | 825 | 206,894 | ||||||||||
Extra Space Storage, Inc. | 1,175 | 105,821 | ||||||||||
Federal Realty Investment Trust | 410 | 50,861 | ||||||||||
First Industrial Realty Trust, Inc. | 2,665 | 81,816 | ||||||||||
Getty Realty Corp. | 3,355 | 90,015 | ||||||||||
HCP, Inc. | 5,725 | 157,724 | ||||||||||
Healthcare Realty Trust, Inc. | 3,945 | 109,908 | ||||||||||
Healthcare Trust of America, Inc. - Class A | 4,130 | 108,454 | ||||||||||
Hibernia REIT plc (Ireland) | 53,665 | 84,489 | ||||||||||
Host Hotels & Resorts, Inc. | 9,960 | 190,336 | ||||||||||
Independence Realty Trust, Inc. | 9,330 | 92,460 | ||||||||||
Invitation Homes, Inc. | 8,459 | 185,083 | ||||||||||
Jernigan Capital, Inc. | 5,215 | 102,058 | ||||||||||
Kimco Realty Corp. | 4,665 | 75,060 | ||||||||||
Lamar Advertising Co. - Class A | 925 | 67,821 | ||||||||||
Lexington Realty Trust | 9,435 | 73,310 | ||||||||||
Liberty Property Trust | 4,410 | 184,647 | ||||||||||
The Macerich Co. | 720 | 37,166 | ||||||||||
Mid-America Apartment Communities, Inc. | 1,690 | 165,130 | ||||||||||
National Retail Properties, Inc. | 2,025 | 94,669 | ||||||||||
National Storage Affiliates Trust | 1,560 | 41,543 | ||||||||||
Outfront Media, Inc. | 2,852 | 50,537 | ||||||||||
Physicians Realty Trust | 14,020 | 232,452 | ||||||||||
Plymouth Industrial REIT, Inc. | 3,690 | 51,660 | ||||||||||
Prologis, Inc. | 6,490 | 418,410 | ||||||||||
Public Storage | 1,365 | 280,467 | ||||||||||
Realty Income Corp. | 865 | 52,134 | ||||||||||
SBA Communications Corp.* | 14,390 | 2,333,626 | ||||||||||
Simon Property Group, Inc. | 3,070 | 563,406 | ||||||||||
STAG Industrial, Inc. | 4,355 | 115,233 | ||||||||||
STORE Capital Corp. | 1,755 | 50,948 | ||||||||||
Sun Communities, Inc. | 2,170 | 218,020 | ||||||||||
Sunstone Hotel Investors, Inc. | 7,650 | 110,696 | ||||||||||
Tier REIT, Inc. | 7,790 | 168,809 | ||||||||||
UDR, Inc. | 5,255 | 205,943 | ||||||||||
UMH Properties, Inc. | 3,995 | 57,248 | ||||||||||
Unibail-Rodamco-Westfield (France) . | 1,100 | 199,054 | ||||||||||
Urban Edge Properties | 8,410 | 172,321 | ||||||||||
Ventas, Inc. | 1,715 | 99,539 | ||||||||||
VEREIT, Inc. | 19,070 | 139,783 | ||||||||||
Vornado Realty Trust | 2,740 | 186,539 | ||||||||||
Weingarten Realty Investors | 4,515 | 126,962 | ||||||||||
Welltower, Inc. | 2,040 | 134,783 | ||||||||||
|
| |||||||||||
| 17,021,655 | ||||||||||||
|
| |||||||||||
Real Estate Management & Development - 0.0%## | ||||||||||||
Daito Trust Construction Co. Ltd. (Japan) | 400 | 52,735 | ||||||||||
StorageVault Canada, Inc. (Canada) | 14,240 | 27,908 | ||||||||||
|
| |||||||||||
| 80,643 | ||||||||||||
|
| |||||||||||
Total Real Estate | 17,102,298 | |||||||||||
|
| |||||||||||
Utilities - 0.0%## | ||||||||||||
Independent Power and Renewable Electricity Producers - 0.0%## | ||||||||||||
China Longyuan Power Group Corp. Ltd. - Class H (China) | 24,000 | 18,264 | ||||||||||
Engie Brasil Energia S.A. (Brazil) | 2,100 | 22,459 | ||||||||||
Huaneng Renewables Corp. Ltd. - Class H (China) | 275,364 | 70,872 | ||||||||||
|
| |||||||||||
| 111,595 | ||||||||||||
|
| |||||||||||
Multi-Utilities - 0.0%## | ||||||||||||
Engie S.A. (France) | 2,235 | 29,697 | ||||||||||
|
| |||||||||||
Water Utilities - 0.0%## | ||||||||||||
Guangdong Investment Ltd. (China) | 58,000 | 103,836 | ||||||||||
|
| |||||||||||
Total Utilities | 245,128 | |||||||||||
|
| |||||||||||
TOTAL COMMON STOCKS | 208,505,793 | |||||||||||
|
| |||||||||||
CORPORATE BONDS - 17.5% | ||||||||||||
Non-Convertible Corporate Bonds - 17.5% | ||||||||||||
Communication Services - 2.2% | ||||||||||||
Diversified Telecommunication Services - 1.4% | ||||||||||||
AT&T, Inc., 4.25%, 3/1/2027 | 3,030,000 | $ | 2,938,382 | |||||||||
Verizon Communications, Inc., 5.50%, 3/16/2047 | 4,440,000 | 4,626,361 | ||||||||||
|
| |||||||||||
| 7,564,743 | ||||||||||||
|
| |||||||||||
The accompanying notes are an integral part of the financial statements.
38
Investment Portfolio - October 31, 2018
| PRO-BLEND® MODERATE TERM SERIES | PRINCIPAL AMOUNT3 | VALUE (NOTE 2) | ||||||||||
CORPORATE BONDS (continued) | ||||||||||||
Non-Convertible Corporate Bonds (continued) | ||||||||||||
Communication Services (continued) | ||||||||||||
Media - 0.7% | ||||||||||||
Altice US Finance I Corp.2, 5.50%, 5/15/2026 | 200,000 | $ | 194,812 | |||||||||
CCO Holdings LLC - CCO Holdings Capital Corp.2, 5.50%, 5/1/2026 | 175,000 | 170,625 | ||||||||||
Discovery Communications LLC, 5.20%, 9/20/2047 | 3,280,000 | 3,033,630 | ||||||||||
Telenet Finance Luxembourg Notes S.A.R.L (Belgium)2, 5.50%, 3/1/2028 | 400,000 | 371,003 | ||||||||||
UPCB Finance IV Ltd. (Netherlands)2, 5.375%, 1/15/2025 | 285,000 | 277,305 | ||||||||||
|
| |||||||||||
| 4,047,375 | ||||||||||||
|
| |||||||||||
Wireless Telecommunication Services - 0.1% | ||||||||||||
Hughes Satellite Systems Corp., 5.25%, 8/1/2026 | 310,000 | 294,500 | ||||||||||
Inmarsat Finance plc (United Kingdom)2, 4.875%, 5/15/2022 | 120,000 | 117,542 | ||||||||||
Sprint Communications, Inc.2, 9.00%, 11/15/2018 | 73,000 | 73,146 | ||||||||||
Sprint Communications, Inc.2, 7.00%, 3/1/2020 | 73,000 | 75,646 | ||||||||||
|
| |||||||||||
| 560,834 | ||||||||||||
|
| |||||||||||
Total Communication Services | 12,172,952 | |||||||||||
|
| |||||||||||
Consumer Discretionary - 2.2% | ||||||||||||
Techniplas LLC2, 10.00%, 5/1/2020 | 205,000 | 192,700 | ||||||||||
|
| |||||||||||
Automobiles - 0.5% | ||||||||||||
General Motors Co.4, (3 mo. LIBOR US + 0.900%), 3.227%, 9/10/2021 | 2,910,000 | 2,905,792 | ||||||||||
|
| |||||||||||
Household Durables - 0.3% | ||||||||||||
Century Communities, Inc., 5.875%, 7/15/2025 | 347,000 | 314,035 | ||||||||||
LGI Homes, Inc.2, 6.875%, 7/15/2026 | 240,000 | 228,000 | ||||||||||
Meritage Homes Corp., 5.125%, 6/6/2027 | 130,000 | 114,400 | ||||||||||
TRI Pointe Group, Inc. - TRI Pointe Homes, Inc., 4.375%, 6/15/2019 | 215,000 | 215,000 | ||||||||||
TRI Pointe Group, Inc. - TRI Pointe Homes, Inc., 5.875%, 6/15/2024 | 180,000 | 168,075 | ||||||||||
Weekley Homes LLC - Weekley Finance Corp., 6.00%, 2/1/2023 | 155,000 | 148,800 | ||||||||||
Weekley Homes LLC - Weekley Finance Corp., 6.625%, 8/15/2025 | 256,000 | 241,920 | ||||||||||
|
| |||||||||||
| 1,430,230 | ||||||||||||
|
| |||||||||||
Internet & Direct Marketing Retail - 0.9% | ||||||||||||
Booking Holdings, Inc., 3.60%, 6/1/2026 | 4,890,000 | 4,670,144 | ||||||||||
|
| |||||||||||
Multiline Retail - 0.5% | ||||||||||||
Macy’s Retail Holdings, Inc., 7.00%, 2/15/2028 | 1,400,000 | 1,478,419 | ||||||||||
Macy’s Retail Holdings, Inc., 6.90%, 4/1/2029 | 1,415,000 | 1,484,316 | ||||||||||
|
| |||||||||||
| 2,962,735 | ||||||||||||
|
| |||||||||||
Total Consumer Discretionary | 12,161,601 | |||||||||||
|
| |||||||||||
Consumer Staples - 0.1% | ||||||||||||
Food & Staples Retailing - 0.0%## | ||||||||||||
C&S Group Enterprises LLC2, 5.375%, 7/15/2022 | 125,000 | 120,625 | ||||||||||
|
| |||||||||||
Household Products - 0.1% | ||||||||||||
First Quality Finance Co., Inc.2, 5.00%, 7/1/2025 | 165,000 | 151,800 | ||||||||||
|
| |||||||||||
Total Consumer Staples | 272,425 | |||||||||||
|
| |||||||||||
Energy - 3.3% | ||||||||||||
Energy Equipment & Services - 0.1% | ||||||||||||
Shelf Drilling Holdings Ltd. (United Arab Emirates)2, 8.25%, 2/15/2025 | 165,000 | 165,412 | ||||||||||
TerraForm Power Operating, LLC2, 5.00%, 1/31/2028 | 120,000 | 107,250 | ||||||||||
|
| |||||||||||
| 272,662 | ||||||||||||
|
| |||||||||||
Oil, Gas & Consumable Fuels - 3.2% | ||||||||||||
American Midstream Partners LP - American Midstream Finance Corp.2, 9.50%, 12/15/2021 | 175,000 | 171,500 | ||||||||||
Boardwalk Pipelines LP, 5.95%, 6/1/2026 | 4,420,000 | 4,618,512 | ||||||||||
DCP Midstream Operating LP2, 5.35%, 3/15/2020 | 105,000 | 106,181 | ||||||||||
Dynagas LNG Partners LP - Dynagas Finance, Inc. (Monaco), 6.25%, 10/30/2019 | 286,000 | 285,285 | ||||||||||
GasLog Ltd. (Monaco), 8.875%, 3/22/2022 | 272,000 | 281,520 | ||||||||||
Genesis Energy LP - Genesis Energy Finance Corp., 5.625%, 6/15/2024 | 130,000 | 117,650 | ||||||||||
Jonah Energy LLC - Jonah Energy Finance Corp.2, 7.25%, 10/15/2025 | 346,000 | 275,070 | ||||||||||
Kinder Morgan Energy Partners LP, 6.95%, 1/15/2038 | 3,980,000 | 4,558,690 | ||||||||||
Rockies Express Pipeline, LLC2, 5.625%, 4/15/2020 | 135,000 | 137,930 | ||||||||||
Sabine Pass Liquefaction LLC, 5.875%, 6/30/2026 | 4,400,000 | 4,671,143 | ||||||||||
SemGroup Corp., 6.375%, 3/15/2025 | 120,000 | 116,100 | ||||||||||
Seven Generations Energy Ltd. (Canada)2, 5.375%, 9/30/2025 | 173,000 | 161,322 | ||||||||||
Southwestern Energy Co.5, 6.20%, 1/23/2025 | 204,000 | 198,390 | ||||||||||
Tallgrass Energy Partners LP - Tallgrass Energy Finance Corp.2, 5.50%, 9/15/2024 | 120,000 | 120,750 | ||||||||||
The accompanying notes are an integral part of the financial statements.
39
Investment Portfolio - October 31, 2018
| PRO-BLEND® MODERATE TERM SERIES | PRINCIPAL AMOUNT3 | VALUE (NOTE 2) | ||||||||||||||
CORPORATE BONDS (continued) | ||||||||||||||||
Non-Convertible Corporate Bonds (continued) | ||||||||||||||||
Energy (continued) | ||||||||||||||||
Oil, Gas & Consumable Fuels (continued) | ||||||||||||||||
W&T Offshore, Inc.2, 9.75%, 11/1/2023 | 170,000 | $ | 164,509 | |||||||||||||
The Williams Companies, Inc., 3.75%, 6/15/2027 | 2,290,000 | 2,132,307 | ||||||||||||||
|
|
|
| |||||||||||||
| 18,116,859 | ||||||||||||||||
|
| |||||||||||||||
Total Energy | 18,389,521 | |||||||||||||||
|
| |||||||||||||||
Financials - 5.2% | ||||||||||||||||
Banks - 3.0% | ||||||||||||||||
Bank of America Corp., 4.00%, 1/22/2025 | 4,810,000 | 4,684,162 | ||||||||||||||
Citigroup, Inc., 8.125%, 7/15/2039 | 3,280,000 | 4,579,686 | ||||||||||||||
JPMorgan Chase & Co., 6.30%, 4/23/2019 | 4,600,000 | 4,674,496 | ||||||||||||||
Popular, Inc., 6.125%, 9/14/2023 | 180,000 | 182,124 | ||||||||||||||
Santander Holdings USA, Inc., 4.50%, 7/17/2025 | 2,920,000 | 2,855,309 | ||||||||||||||
|
| |||||||||||||||
| 16,975,777 | ||||||||||||||||
|
| |||||||||||||||
Capital Markets - 0.9% | ||||||||||||||||
LPL Holdings, Inc.2, 5.75%, 9/15/2025 | 230,000 | 223,388 | ||||||||||||||
Morgan Stanley4, (3 mo. LIBOR US + 1.220%), 3.563%, 5/8/2024 | 4,680,000 | 4,729,374 | ||||||||||||||
|
| |||||||||||||||
| 4,952,762 | ||||||||||||||||
|
| |||||||||||||||
Consumer Finance - 0.1% | ||||||||||||||||
Ally Financial, Inc., 3.50%, 1/27/2019 | 160,000 | 159,800 | ||||||||||||||
Navient Corp., 7.25%, 9/25/2023 | 135,000 | 139,725 | ||||||||||||||
SLM Corp., 5.125%, 4/5/2022 | 220,000 | 218,900 | ||||||||||||||
|
| |||||||||||||||
| 518,425 | ||||||||||||||||
|
| |||||||||||||||
Diversified Financial Services - 0.6% | ||||||||||||||||
AerCap Ireland Capital DAC - AerCap Global Aviation Trust (Ireland), 4.45%, 10/1/2025 | 2,980,000 | 2,909,943 | ||||||||||||||
FS Energy & Power Fund2, 7.50%, 8/15/2023 | 230,000 | 233,220 | ||||||||||||||
Oxford Finance, LLC - Oxford Finance Co.- Issuer II, Inc.2, 6.375%, 12/15/2022 | 235,000 | 238,231 | ||||||||||||||
|
| |||||||||||||||
| 3,381,394 | ||||||||||||||||
|
| |||||||||||||||
Insurance - 0.6% | ||||||||||||||||
Prudential Financial, Inc.6 , (3 mo. LIBOR US + 4.175%), 5.875%, 9/15/2042 | 2,990,000 | 3,111,095 | ||||||||||||||
|
| |||||||||||||||
Thrifts & Mortgage Finance - 0.0%## | ||||||||||||||||
Ladder Capital Finance Holdings LLLP - Ladder Capital Finance Corp.2, 5.875%, 8/1/2021 | 150,000 | 151,125 | ||||||||||||||
|
| |||||||||||||||
Total Financials | 29,090,578 | |||||||||||||||
|
| |||||||||||||||
Health Care - 0.7% | ||||||||||||||||
Health Care Providers & Services - 0.6% | ||||||||||||||||
DaVita, Inc., 5.00%, 5/1/2025 | 201,000 | 189,945 | ||||||||||||||
Fresenius Medical Care US Finance II, Inc. (Germany)2, 5.625%, 7/31/2019 | 2,882,000 | 2,926,964 | ||||||||||||||
HCA, Inc., 5.375%, 9/1/2026 | 165,000 | 163,762 | ||||||||||||||
Ortho-Clinical Diagnostics, Inc. - Ortho-Clinical Diagnostics S.A.2, 6.625%, 5/15/2022 | 170,000 | 163,370 | ||||||||||||||
|
| |||||||||||||||
| 3,444,041 | ||||||||||||||||
|
| |||||||||||||||
Pharmaceuticals - 0.1% | ||||||||||||||||
Horizon Pharma, Inc. - Horizon Pharma USA, Inc.2, 8.75%, 11/1/2024 | 330,000 | 345,675 | ||||||||||||||
|
| |||||||||||||||
Total Health Care | 3,789,716 | |||||||||||||||
|
| |||||||||||||||
Industrials - 2.0% | ||||||||||||||||
Airlines - 0.0%## | ||||||||||||||||
Allegiant Travel Co., 5.50%, 7/15/2019 | 182,000 | 182,910 | ||||||||||||||
American Airlines Group, Inc.2, 5.50%, 10/1/2019 | 140,000 | 141,533 | ||||||||||||||
|
| |||||||||||||||
| 324,443 | ||||||||||||||||
|
| |||||||||||||||
Commercial Services & Supplies - 0.1% | ||||||||||||||||
The ADT Security Corp., 5.25%, 3/15/2020 | 105,000 | 106,050 | ||||||||||||||
Covanta Holding Corp., 6.00%, 1/1/2027 | 155,000 | 149,575 | ||||||||||||||
W/S Packaging Holdings, Inc.2, 9.00%, 4/15/2023 | 235,000 | 239,700 | ||||||||||||||
|
| |||||||||||||||
| 495,325 | ||||||||||||||||
|
| |||||||||||||||
Construction & Engineering - 0.0%## | ||||||||||||||||
Tutor Perini Corp.2, 6.875%, 5/1/2025 | 286,000 | 286,358 | ||||||||||||||
|
| |||||||||||||||
Industrial Conglomerates - 0.4% | ||||||||||||||||
General Electric Co.6,7, (3 mo. LIBOR US + 3.330%), 5.00% | 2,260,000 | 2,093,325 | ||||||||||||||
|
| |||||||||||||||
Machinery - 0.6% | ||||||||||||||||
CNH Industrial Capital LLC, 3.375%, 7/15/2019 | 3,180,000 | 3,177,138 | ||||||||||||||
|
| |||||||||||||||
Marine - 0.1% | ||||||||||||||||
Borealis Finance, LLC2, 7.50%, 11/16/2022 | 400,000 | 392,000 | ||||||||||||||
Global Ship Lease, Inc. (United Kingdom)2, 9.875%, 11/15/2022 | 350,000 | 333,375 | ||||||||||||||
|
| |||||||||||||||
| 725,375 | ||||||||||||||||
|
| |||||||||||||||
Trading Companies & Distributors - 0.7% | ||||||||||||||||
Aircastle Ltd., 6.25%, 12/1/2019 | 100,000 | 102,770 | ||||||||||||||
Fortress Transportation & Infrastructure Investors, LLC2, 6.50%, 10/1/2025 | 160,000 | 157,200 | ||||||||||||||
International Lease Finance Corp., 6.25%, 5/15/2019 | 3,279,000 | 3,331,297 | ||||||||||||||
The accompanying notes are an integral part of the financial statements.
40
Investment Portfolio - October 31, 2018
| PRO-BLEND® MODERATE TERM SERIES | PRINCIPAL AMOUNT3 | VALUE (NOTE 2) | ||||||||
CORPORATE BONDS (continued) | ||||||||||
Non-Convertible Corporate Bonds (continued) | ||||||||||
Industrials (continued) | ||||||||||
Trading Companies & Distributors (continued) | ||||||||||
Park Aerospace Holdings Ltd. (Ireland)2, 4.50%, 3/15/2023 | 248,000 | $ | 235,942 | |||||||
|
| |||||||||
| 3,827,209 | ||||||||||
|
| |||||||||
Transportation Infrastructure - 0.1% | ||||||||||
Eagle Bulk Shipco, LLC, 8.25%, 11/28/2022 | 200,000 | 205,500 | ||||||||
MPC Container Ships Invest B.V. (Norway)4,8, (3 mo. LIBOR US + 4.750%), 7.116%, 9/22/2022 | 200,000 | 203,316 | ||||||||
|
| |||||||||
| 408,816 | ||||||||||
|
| |||||||||
Total Industrials |
| 11,337,989 | ||||||||
|
| |||||||||
Information Technology - 0.0%## | ||||||||||
Semiconductors & Semiconductor Equipment - 0.0%## | ||||||||||
MagnaChip Semiconductor Corp. (South Korea), 6.625%, 7/15/2021 | 277,000 | 260,380 | ||||||||
|
| |||||||||
Materials - 0.9% | ||||||||||
LSB Industries, Inc.2, 9.625%, 5/1/2023 | 210,000 | 217,875 | ||||||||
|
| |||||||||
Containers & Packaging - 0.0%## | ||||||||||
Ardagh Packaging Finance plc - Ardagh Holdings USA, Inc. (Ireland)2, 6.00%, 2/15/2025 | 200,000 | 187,500 | ||||||||
|
| |||||||||
Metals & Mining - 0.9% | ||||||||||
Corp Nacional del Cobre de Chile (Chile)2, 5.625%, 9/21/2035 | 2,110,000 | 2,236,326 | ||||||||
Mountain Province Diamonds, Inc. (Canada)2, 8.00%, 12/15/2022 | 295,000 | 299,425 | ||||||||
Northwest Acquisitions ULC - Dominion Finco, Inc.2, 7.125%, 11/1/2022 | 295,000 | 297,021 | ||||||||
Southern Copper Corp. (Peru), 5.375%, 4/16/2020 | 2,000,000 | 2,054,316 | ||||||||
|
| |||||||||
| 4,887,088 | ||||||||||
|
| |||||||||
Total Materials. |
| 5,292,463 | ||||||||
|
| |||||||||
Real Estate - 0.7% | ||||||||||
Equity Real Estate Investment Trusts (REITS) - 0.7% | ||||||||||
American Homes 4 Rent LP, 4.25%, 2/15/2028 | 3,270,000 | 3,090,919 | ||||||||
Greystar Real Estate Partners, LLC2, 5.75%, 12/1/2025 | 190,000 | 184,300 | ||||||||
GTP Acquisition Partners I LLC2, 2.35%, 6/15/2020 | 589,000 | 575,876 | ||||||||
iStar, Inc., 5.25%, 9/15/2022 | 229,000 | 221,558 | ||||||||
|
| |||||||||
Total Real Estate |
| 4,072,653 | ||||||||
|
| |||||||||
Utilities - 0.2% | ||||||||||
NGL Energy Partners LP - NGL Energy Finance Corp., 6.125%, 3/1/2025 | 190,000 | 172,900 | ||||||||
|
| |||||||||
Independent Power and Renewable Electricity Producers - 0.2% | ||||||||||
Atlantica Yield plc (Spain)2, 7.00%, 11/15/2019. | 445,000 | 458,350 | ||||||||
Clearway Energy Operating, LLC, 5.00%, 9/15/2026 | 125,000 | 116,250 | ||||||||
Drax Finco plc (United Kingdom)2, 6.625%, 11/1/2025 | 250,000 | 249,375 | ||||||||
|
| |||||||||
Total Utilities | 996,875 | |||||||||
|
| |||||||||
TOTAL CORPORATE BONDS | ||||||||||
(Identified Cost $100,934,936) | 97,837,153 | |||||||||
|
| |||||||||
| PRINCIPAL AMOUNT3 / SHARES | VALUE (NOTE 2) | |||||||||
MUTUAL FUNDS - 0.1% | ||||||||||
iShares MSCI Thailand ETF | 3,375 | 292,612 | ||||||||
iShares U.S. Real Estate ETF | 1,945 | 151,924 | ||||||||
|
| |||||||||
TOTAL MUTUAL FUNDS | ||||||||||
(Identified Cost $452,826) | 444,536 | |||||||||
|
| |||||||||
U.S. TREASURY SECURITIES - 23.0% | ||||||||||
U.S. Treasury Bonds - 6.0% | ||||||||||
U.S. Treasury Bond, 6.25%, 5/15/2030 | 4,011,000 | 5,192,834 | ||||||||
U.S. Treasury Bond, 4.75%, 2/15/2037 | 7,244,000 | 8,721,663 | ||||||||
U.S. Treasury Bond, 2.50%, 2/15/2045 | 9,498,000 | 8,005,404 | ||||||||
U.S. Treasury Bond, 3.00%, 5/15/2047 | 9,245,000 | 8,562,820 | ||||||||
U.S. Treasury Inflation Indexed Bond, 0.75%, 2/15/2042 | 3,355,786 | 2,980,751 | ||||||||
|
| |||||||||
Total U.S. Treasury Bonds | ||||||||||
(Identified Cost $36,358,168) | 33,463,472 | |||||||||
|
| |||||||||
U.S. Treasury Notes - 17.0% | ||||||||||
U.S. Treasury Inflation Indexed Note, 0.125%, 4/15/2020 | 25,429,758 | 24,996,326 | ||||||||
U.S. Treasury Inflation Indexed Note, 0.125%, 1/15/2023 | 3,222,521 | 3,102,502 | ||||||||
U.S. Treasury Note, 1.625%, 4/30/2019 | 12,180,000 | 12,128,140 | ||||||||
U.S. Treasury Note, 1.25%, 7/31/2023 | 11,373,000 | 10,503,143 | ||||||||
U.S. Treasury Note, 2.125%, 5/15/2025 | 12,390,000 | 11,696,934 | ||||||||
U.S. Treasury Note, 1.625%, 5/15/2026 | 11,387,000 | 10,264,313 | ||||||||
U.S. Treasury Note, 2.375%, 5/15/2027 | 11,628,000 | 10,975,288 | ||||||||
U.S. Treasury Note, 2.75%, 2/15/2028 | 11,885,000 | 11,501,523 | ||||||||
|
| |||||||||
Total U.S. Treasury Notes | ||||||||||
(Identified Cost $96,667,833) | 95,168,169 | |||||||||
|
| |||||||||
TOTAL U.S. TREASURY SECURITIES | ||||||||||
(Identified Cost $133,026,001) | 128,631,641 | |||||||||
|
| |||||||||
The accompanying notes are an integral part of the financial statements.
41
Investment Portfolio - October 31, 2018
| PRO-BLEND® MODERATE TERM SERIES | PRINCIPAL AMOUNT3 | VALUE (NOTE 2) | ||||||||||
ASSET-BACKED SECURITIES - 3.8% | ||||||||||||
BMW Vehicle Owner Trust, Series 2016-A, Class A3, 1.16%, 11/25/2020 | 1,246,170 | $ | 1,236,078 | |||||||||
Cazenovia Creek Funding I LLC, Series 2015-1A, Class A2, 2.00%, 12/10/2023 | 107,512 | 107,277 | ||||||||||
Cazenovia Creek Funding II LLC, Series 2018-1A, Class A2, 3.561%, 7/15/2030 | 1,519,168 | 1,512,418 | ||||||||||
Chesapeake Funding II LLC, Series 2017-2A, Class A12, 1.99%, 5/15/2029 | 3,166,734 | 3,134,478 | ||||||||||
Chesapeake Funding II LLC, Series 2017-4A, Class A12, 2.12%, 11/15/2029 | 1,319,813 | 1,302,235 | ||||||||||
Colony American Homes, Series 2015-1A, Class A2,4, (1 mo. LIBOR US + 1.200%), 3.487%, 7/17/2032 | 996,743 | 996,744 | ||||||||||
Credit Acceptance Auto Loan Trust, Series 2017-1A, Class A2, 2.56%, 10/15/2025 | 1,320,000 | 1,313,058 | ||||||||||
Enterprise Fleet Financing LLC, Series 2017-1, Class A22, 2.13%, 7/20/2022 | 480,698 | 477,962 | ||||||||||
Hyundai Auto Lease Securitization Trust, Series 2017-B, Class A32, 1.97%, 7/15/2020 | 3,400,000 | 3,378,316 | ||||||||||
Invitation Homes Trust, Series 2017-SFR2, Class A2,4, (1 mo. LIBOR US + 0.850%), 3.14%, 12/17/2036 | 536,018 | 536,520 | ||||||||||
Invitation Homes Trust, Series 2017-SFR2, Class B2,4, (1 mo. LIBOR US + 1.150%), 3.44%, 12/17/2036 | 400,000 | 402,634 | ||||||||||
SoFi Consumer Loan Program LLC, Series 2017-5, Class A12, 2.14%, 9/25/2026 | 679,529 | 676,343 | ||||||||||
SoFi Professional Loan Program LLC, Series 2017-A, Class A2A2, 1.55%, 3/26/2040 | 345,124 | 342,383 | ||||||||||
SoFi Professional Loan Program LLC, Series 2017-F, Class A1FX2, 2.05%, 1/25/2041 | 333,464 | 330,004 | ||||||||||
SoFi Professional Loan Program LLC, Series 2017-F, Class A2FX2, 2.84%, 1/25/2041 | 300,000 | 290,868 | ||||||||||
SoFi Professional Loan Program LLC, Series 2018-A, Class A2A2, 2.39%, 2/25/2042 | 754,266 | 746,413 | ||||||||||
SoFi Professional Loan Program LLC, Series 2018-C, Class A1FX2, 3.08%, 1/25/2048 | 1,925,431 | 1,919,779 | ||||||||||
Tax Ease Funding LLC, Series 2016-1A, Class A2, 3.131%, 6/15/2028 | 352,655 | 351,437 | ||||||||||
Tricon American Homes Trust, Series 2016-SFR1, Class A2, 2.589%, 11/1/2033 | 1,184,906 | 1,140,987 | ||||||||||
Tricon American Homes Trust, Series 2017-SFR2, Class A2, 2.928%, 1/1/2036 | 1,248,668 | 1,191,651 | ||||||||||
|
| |||||||||||
TOTAL ASSET-BACKED SECURITIES | 21,387,585 | |||||||||||
|
| |||||||||||
COMMERCIAL MORTGAGE-BACKED SECURITIES - 6.7% | ||||||||||||
Americold LLC Trust, Series 2010-ARTA, Class A12, 3.847%, 1/11/2029 | 112,024 | 112,530 | ||||||||||
BWAY Mortgage Trust, Series 2015-1740, Class A2, 2.917%, 1/1/2035 | 2,809,000 | 2,680,152 | ||||||||||
Caesars Palace Las Vegas Trust, Series 2017-VICI, Class A2, 3.531%, 10/1/2034 | 1,850,000 | 1,845,902 | ||||||||||
Credit Suisse Mortgage Capital Trust, Series 2013-IVR3, Class A12,9, 2.50%, 5/1/2043 | 1,045,698 | 964,136 | ||||||||||
Credit Suisse Mortgage Capital Trust, Series 2013-TH1, Class A12,9, 2.13%, 2/1/2043 | 713,233 | 646,441 | ||||||||||
Fannie Mae REMICS, Series 2018-31, Class KP, 3.50%, 7/1/2047 | 1,278,405 | 1,261,465 | ||||||||||
FDIC Trust, Series 2011-R1, Class A2, 2.672%, 7/1/2026 | 161,141 | 160,281 | ||||||||||
Freddie Mac Multifamily Structured Pass-Through Certificates, Series K009, | 12,963,421 | 233,606 | ||||||||||
Freddie Mac Multifamily Structured Pass-Through Certificates, Series K014, | 7,883,589 | 192,588 | ||||||||||
Freddie Mac Multifamily Structured Pass-Through Certificates, Series K016, | 5,355,629 | 197,094 | ||||||||||
Freddie Mac Multifamily Structured Pass-Through Certificates, Series K017, | 8,011,670 | 267,188 | ||||||||||
The accompanying notes are an integral part of the financial statements.
42
Investment Portfolio - October 31, 2018
| PRO-BLEND® MODERATE TERM SERIES | PRINCIPAL AMOUNT3 | VALUE (NOTE 2) | ||||||||||
COMMERCIAL MORTGAGE-BACKED SECURITIES (continued) |
| |||||||||||
Freddie Mac Multifamily Structured Pass-Through Certificates, Series K021, Class X1 (IO)9, 1.578%, 6/1/2022 | 9,874,549 | $ | 426,757 | |||||||||
Freddie Mac Multifamily Structured Pass-Through Certificates, Series K030, Class X1 (IO)9, 0.199%, 4/1/2023 | 51,279,581 | 396,166 | ||||||||||
Freddie Mac Multifamily Structured Pass-Through Certificates, Series K032, Class X1 (IO)9, 0.105%, 5/1/2023 | 38,613,856 | 182,153 | ||||||||||
Freddie Mac REMICS, Series 4791, Class BA, 4.00%, 3/1/2044 | 1,660,510 | 1,683,640 | ||||||||||
Freddie Mac REMICS, Series 4801, Class BA, 4.50%, 5/1/2044 | 1,662,254 | 1,710,367 | ||||||||||
FREMF Mortgage Trust, Series 2013-K28, Class X2A (IO)2, 0.10%, 6/1/2046 | 127,037,954 | 432,691 | ||||||||||
FREMF Mortgage Trust, Series 2013-K712, Class B2,9, 3.358%, 5/1/2045 | 742,000 | 740,782 | ||||||||||
FREMF Mortgage Trust, Series 2013-K713, Class B2,9, 3.263%, 4/1/2046 | 1,350,000 | 1,344,376 | ||||||||||
FREMF Mortgage Trust, Series 2014-K37, Class B2,9, 4.714%, 1/1/2047 | 1,657,000 | 1,704,381 | ||||||||||
FREMF Mortgage Trust, Series 2014-K503, Class B2,9, 3.139%, 10/1/2047 | 1,325,000 | 1,320,548 | ||||||||||
GAHR Commercial Mortgage Trust, Series 2015-NRF, Class BFX2,9, 3.495%, 12/1/2034 | 1,928,000 | 1,922,031 | ||||||||||
GAHR Commercial Mortgage Trust, Series 2015-NRF, Class DFX2,9, 3.495%, 12/1/2034 | 1,000,000 | 992,582 | ||||||||||
Government National Mortgage Association, Series 2017-54, Class AH, 2.60%, 12/1/2056 | 1,523,547 | 1,395,746 | ||||||||||
GS Mortgage Securities Trust, Series 2010-C2, Class A12, 3.849%, 12/1/2043 | 67,029 | 67,446 | ||||||||||
JP Morgan Mortgage Trust, Series 2013-1, Class 1A22,9, 3.00%, 3/1/2043 | 593,081 | 561,961 | ||||||||||
JP Morgan Mortgage Trust, Series 2013-2, Class A22,9, 3.50%, 5/1/2043 | 584,967 | 564,510 | ||||||||||
JP Morgan Mortgage Trust, Series 2014-2, Class 1A12,9, 3.00%, 6/1/2029 | 770,618 | 754,875 | ||||||||||
JP Morgan Mortgage Trust, Series 2017-3, Class 1A52,9, 3.50%, 8/1/2047 | 1,522,929 | 1,491,934 | ||||||||||
JP Morgan Mortgage Trust, Series 2017-6, Class A52,9, 3.50%, 12/1/2048 | 1,526,714 | 1,494,688 | ||||||||||
New Residential Mortgage Loan Trust, Series 2014-3A, Class AFX32,9, 3.75%, 11/1/2054 | 622,796 | 619,559 | ||||||||||
New Residential Mortgage Loan Trust, Series 2015-2A, Class A12,9, 3.75%, 8/1/2055 | 793,885 | 788,975 | ||||||||||
New Residential Mortgage Loan Trust, Series 2016-4A, Class A12,9, 3.75%, 11/1/2056 | 829,158 | 822,922 | ||||||||||
OBP Depositor LLC Trust, Series 2010-OBP, Class A2, 4.646%, 7/1/2045 | 115,000 | 116,876 | ||||||||||
Sequoia Mortgage Trust, Series 2013-2, Class A9, 1.874%, 2/1/2043 | 653,416 | 569,314 | ||||||||||
Sequoia Mortgage Trust, Series 2013-7, Class A29, 3.00%, 6/1/2043 | 706,301 | 661,302 | ||||||||||
Sequoia Mortgage Trust, Series 2013-8, Class A19, 3.00%, 6/1/2043 | 820,148 | 768,470 | ||||||||||
Starwood Retail Property Trust, Series 2014-STAR, Class A2,4, (1 mo. LIBOR US + 1.220%), 3.50%, 11/15/2027 | 1,616,970 | 1,617,190 | ||||||||||
Towd Point Mortgage Trust, Series 2016-5, Class A12,9, 2.50%, 10/1/2056 | 1,459,966 | 1,417,401 | ||||||||||
Vornado DP LLC Trust, Series 2010-VNO, Class A2FX2, 4.004%, 9/10/2028 | 350,000 | 354,977 | ||||||||||
Wells Fargo Commercial Mortgage Trust, Series 2010-C1, Class A22, 4.393%, 11/1/2043 | 545,000 | 553,351 | ||||||||||
WinWater Mortgage Loan Trust, Series 2015-1, Class A12,9, 3.50%, 1/1/2045 | 832,073 | 810,138 | ||||||||||
WinWater Mortgage Loan Trust, Series 2015-3, Class A52,9, 3.50%, 3/1/2045 | 701,714 | 699,881 | ||||||||||
|
|
|
| |||||||||
TOTAL COMMERCIAL MORTGAGE-BACKED SECURITIES | ||||||||||||
(Identified Cost $38,032,112) | 37,549,373 | |||||||||||
|
|
|
| |||||||||
The accompanying notes are an integral part of the financial statements.
43
Investment Portfolio - October 31, 2018
| PRO-BLEND® MODERATE TERM SERIES | PRINCIPAL AMOUNT3 | VALUE (NOTE 2) | ||||||||||||||
FOREIGN GOVERNMENT BONDS - 2.4% | ||||||||||||||||
Canada Housing Trust No. 1 (Canada)2, 4.10%, 12/15/2018 | CAD | 338,000 | $ | 257,396 | ||||||||||||
Canadian Government Bond (Canada), 2.75%, 6/1/2022 | CAD | 433,000 | 332,720 | |||||||||||||
Export-Import Bank of Korea (South Korea), 2.625%, 12/30/2020 | 6,700,000 | 6,589,718 | ||||||||||||||
The Korea Development Bank (South Korea), 1.375%, 9/12/2019 | 400,000 | 394,206 | ||||||||||||||
Mexican Government Bond (Mexico), 8.00%, 6/11/2020 | MXN | 8,562,000 | 417,540 | |||||||||||||
Mexican Government Bond (Mexico), 6.50%, 6/10/2021 | MXN | 3,460,000 | 161,897 | |||||||||||||
Mexican Government Bond (Mexico), 6.50%, 6/9/2022 | MXN | 5,621,000 | 258,342 | |||||||||||||
Mexican Government Bond (Mexico), 7.75%, 5/29/2031 | MXN | 1,081,000 | 48,508 | |||||||||||||
Province of Ontario (Canada), 1.25%, 6/17/2019 | 1,297,000 | 1,284,678 | ||||||||||||||
Singapore Government Bond (Singapore), 2.50%, 6/1/2019 | SGD | 739,000 | 535,107 | |||||||||||||
Svensk Exportkredit AB (Sweden), 1.125%, 8/28/2019 | 3,200,000 | 3,155,878 | ||||||||||||||
|
| |||||||||||||||
TOTAL FOREIGN GOVERNMENT BONDS | ||||||||||||||||
(Identified Cost $14,383,093) | 13,435,990 | |||||||||||||||
|
| |||||||||||||||
U.S. GOVERNMENT AGENCIES - 8.2% | ||||||||||||||||
Mortgage-Backed Securities - 8.2% | ||||||||||||||||
Fannie Mae, Pool #888468, 5.50%, 9/1/2021 | 161,500 | 164,258 | ||||||||||||||
Fannie Mae, Pool #995233, 5.50%, 10/1/2021 | 9,466 | 9,590 | ||||||||||||||
Fannie Mae, Pool #888017, 6.00%, 11/1/2021 | 22,966 | 23,543 | ||||||||||||||
Fannie Mae, Pool #995329, 5.50%, 12/1/2021 | 132,329 | 134,698 | ||||||||||||||
Fannie Mae, Pool #888136, 6.00%, 12/1/2021 | 27,706 | 28,396 | ||||||||||||||
Fannie Mae, Pool #888810, 5.50%, 11/1/2022 | 196,101 | 199,462 | ||||||||||||||
Fannie Mae, Pool #AD0462, 5.50%, 10/1/2024 | 21,823 | 22,609 | ||||||||||||||
Fannie Mae, Pool #MA3463, 4.00%, 9/1/2033 | 2,761,996 | 2,814,751 | ||||||||||||||
Fannie Mae, Pool #MA1834, 4.50%, 2/1/2034 | 660,580 | 679,766 | ||||||||||||||
Fannie Mae, Pool #MA1903, 4.50%, 5/1/2034 | 525,052 | 540,315 | ||||||||||||||
Fannie Mae, Pool #745418, 5.50%, 4/1/2036 | 497,362 | 533,248 | ||||||||||||||
Fannie Mae, Pool #889576, 6.00%, 4/1/2038 | 409,513 | 446,120 | ||||||||||||||
Fannie Mae, Pool #995196, 6.00%, 7/1/2038 | 944,908 | 1,031,506 | ||||||||||||||
Fannie Mae, Pool #AD0207, 6.00%, 10/1/2038 | 140,711 | 153,514 | ||||||||||||||
Fannie Mae, Pool #AD0220, 6.00%, 10/1/2038 | 47,233 | 51,639 | ||||||||||||||
Fannie Mae, Pool #MA0258, 4.50%, 12/1/2039 | 819,425 | 848,567 | ||||||||||||||
Fannie Mae, Pool #AL1595, 6.00%, 1/1/2040 | 598,263 | 650,940 | ||||||||||||||
Fannie Mae, Pool #AL0152, 6.00%, 6/1/2040 | 698,650 | 762,173 | ||||||||||||||
Fannie Mae, Pool #AL0241, 4.00%, 4/1/2041 | 963,259 | 970,565 | ||||||||||||||
Fannie Mae, Pool #AI5172, 4.00%, 8/1/2041 | 685,709 | 690,920 | ||||||||||||||
Fannie Mae, Pool #AL1410, 4.50%, 12/1/2041 | 1,501,549 | 1,552,923 | ||||||||||||||
Fannie Mae, Pool #AL7068, 4.50%, 9/1/2042 | 1,679,713 | 1,739,439 | ||||||||||||||
Fannie Mae, Pool #AL7729, 4.00%, 6/1/2043 | 823,224 | 829,453 | ||||||||||||||
Fannie Mae, Pool #AS3622, 3.50%, 10/1/2044 | 2,250,173 | 2,199,821 | ||||||||||||||
Fannie Mae, Pool #AX5234, 4.50%, 11/1/2044 | 915,917 | 938,744 | ||||||||||||||
Fannie Mae, Pool #AZ9215, 4.00%, 10/1/2045 | 726,692 | 728,924 | ||||||||||||||
Fannie Mae, Pool #BC3490, 3.50%, 2/1/2046 | 2,187,357 | 2,138,400 | ||||||||||||||
Fannie Mae, Pool #BC6764, 3.50%, 4/1/2046 | 1,273,258 | 1,244,365 | ||||||||||||||
Fannie Mae, Pool #BD1381, 3.50%, 6/1/2046 | 811,031 | 792,039 | ||||||||||||||
Fannie Mae, Pool #MA2670, 3.00%, 7/1/2046 | 2,170,573 | 2,055,865 | ||||||||||||||
Fannie Mae, Pool #MA2705, 3.00%, 8/1/2046 | 1,683,160 | 1,594,121 | ||||||||||||||
Fannie Mae, Pool #BE7845, 4.50%, 2/1/2047 | 548,115 | 565,346 | ||||||||||||||
Fannie Mae, Pool #CA1922, 5.00%, 6/1/2048 | 2,377,057 | 2,483,553 | ||||||||||||||
Fannie Mae, Pool #CA2056, 4.50%, 7/1/2048 | 2,178,272 | 2,233,071 | ||||||||||||||
Fannie Mae, Pool #BK9598, 4.50%, 8/1/2048 | 648,212 | 664,313 | ||||||||||||||
Fannie Mae, Pool #CA2219, 5.00%, 8/1/2048 | 1,276,514 | 1,333,639 | ||||||||||||||
The accompanying notes are an integral part of the financial statements.
44
Investment Portfolio - October 31, 2018
| PRO-BLEND® MODERATE TERM SERIES | PRINCIPAL AMOUNT3 / SHARES | VALUE (NOTE 2) | ||||||||||
U.S. GOVERNMENT AGENCIES (continued) | ||||||||||||
Mortgage-Backed Securities (continued) | ||||||||||||
Fannie Mae, Pool #CA2373, 5.00%, 9/1/2048 | 2,075,991 | $ | 2,168,787 | |||||||||
Fannie Mae, Pool #AL8674, 5.654%, 1/1/2049 | 1,802,781 | 1,919,604 | ||||||||||
Freddie Mac, Pool #G11850, 5.50%, 7/1/2020 | 27,735 | 27,958 | ||||||||||
Freddie Mac, Pool #G12610, 6.00%, 3/1/2022 | 30,523 | 31,234 | ||||||||||
Freddie Mac, Pool #G12655, 6.00%, 5/1/2022 | 21,421 | 22,017 | ||||||||||
Freddie Mac, Pool #G12988, 6.00%, 1/1/2023 | 16,615 | 17,120 | ||||||||||
Freddie Mac, Pool #G13078, 6.00%, 3/1/2023 | 29,396 | 30,289 | ||||||||||
Freddie Mac, Pool #G13331, 5.50%, 10/1/2023 | 13,788 | 14,165 | ||||||||||
Freddie Mac, Pool #C91762, 4.50%, 5/1/2034 | 718,573 | 739,992 | ||||||||||
Freddie Mac, Pool #G03696, 5.50%, 1/1/2038 | 1,405 | 1,510 | ||||||||||
Freddie Mac, Pool #G03781, 6.00%, 1/1/2038 | 214,500 | 235,635 | ||||||||||
Freddie Mac, Pool #G03926, 6.00%, 2/1/2038 | 215,592 | 237,020 | ||||||||||
Freddie Mac, Pool #G04731, 5.50%, 4/1/2038 | 214,860 | 230,593 | ||||||||||
Freddie Mac, Pool #G08273, 5.50%, 6/1/2038 | 271,189 | 290,258 | ||||||||||
Freddie Mac, Pool #G05900, 6.00%, 3/1/2040 | 127,288 | 137,408 | ||||||||||
Freddie Mac, Pool #G05906, 6.00%, 4/1/2040 | 170,030 | 187,020 | ||||||||||
Freddie Mac, Pool #A92889, 4.50%, 7/1/2040 | 1,699,257 | 1,760,742 | ||||||||||
Freddie Mac, Pool #G60183, 4.00%, 12/1/2044 | 837,621 | 839,271 | ||||||||||
Freddie Mac, Pool #Q37592, 4.00%, 12/1/2045 | 1,739,370 | 1,741,843 | ||||||||||
Freddie Mac, Pool #Q42596, 3.50%, 8/1/2046 | 1,371,120 | 1,339,040 | ||||||||||
Ginnie Mae, Pool #263096, 9.50%, 3/1/2020 | 271 | 271 | ||||||||||
|
| |||||||||||
TOTAL U.S. GOVERNMENT AGENCIES | ||||||||||||
(Identified Cost $47,063,255) | 45,822,373 | |||||||||||
|
| |||||||||||
| SHARES | VALUE (NOTE 2) | |||||||||||
SHORT-TERM INVESTMENT - 0.3% | ||||||||||||
Dreyfus Government Cash Management, Institutional Shares10, 2.05%, | ||||||||||||
(Identified Cost $1,884,118) | 1,884,118 | 1,884,118 | ||||||||||
|
| |||||||||||
TOTAL INVESTMENTS IN SECURITIES - 99.3% | ||||||||||||
(Identified Cost $552,214,003) | 555,498,562 | |||||||||||
|
| |||||||||||
TOTAL OPTIONS WRITTEN - 0.0%## | ||||||||||||
(Premiums Received $157,054) | (229,503 | ) | ||||||||||
|
| |||||||||||
TOTAL INVESTMENTS - 99.3% | 555,269,059 | |||||||||||
OTHER ASSETS, LESS LIABILITIES - 0.7% | 4,176,483 | |||||||||||
|
| |||||||||||
NET ASSETS - 100% | $ | 559,445,542 | ||||||||||
|
| |||||||||||
ADR - American Depositary Receipt
CAD - Canadian Dollar
ETF - Exchange-traded fund
IO - Interest only
MXN - Mexican Peso
No. - Number
SGD - Singapore Dollar
The accompanying notes are an integral part of the financial statements.
45
Investment Portfolio - October 31, 2018
| EXCHANGE-TRADED OPTIONS WRITTEN | ||||||||||||||||||||
| DESCRIPTION | NUMBER OF CONTRACTS | EXPIRATION DATE | EXERCISE PRICE | NOTIONAL AMOUNT3 (000) | VALUE | |||||||||||||||
Call | ||||||||||||||||||||
Booking Holdings, Inc. | 5 | 11/09/18 | $ | 1,960.00 | 937 | $ | (20,000 | ) | ||||||||||||
Qorvo, Inc. | 135 | 11/16/18 | 77.50 | 992 | (29,025 | ) | ||||||||||||||
Alphabet, Inc. - Class C | 13 | 11/23/18 | 1,110.00 | 1,400 | (28,600 | ) | ||||||||||||||
|
| |||||||||||||||||||
| (77,625 | ) | |||||||||||||||||||
|
| |||||||||||||||||||
Put | ||||||||||||||||||||
lululemon athletica, Inc. | 73 | 11/09/18 | 149.00 | 1,027 | (59,495 | ) | ||||||||||||||
Mastercard, Inc. - Class A | 72 | 11/09/18 | 197.50 | 1,423 | (28,080 | ) | ||||||||||||||
Medtronic plc | 157 | 11/16/18 | 90.00 | 1,410 | (22,765 | ) | ||||||||||||||
Microsoft Corp. | 138 | 11/16/18 | 100.00 | 1,474 | (12,558 | ) | ||||||||||||||
Qorvo, Inc. | 207 | 11/16/18 | 67.50 | 1,522 | (28,980 | ) | ||||||||||||||
|
| |||||||||||||||||||
| (151,878 | ) | |||||||||||||||||||
|
| |||||||||||||||||||
TOTAL EXCHANGE-TRADED OPTIONS WRITTEN |
| $ | (229,503 | ) | ||||||||||||||||
|
| |||||||||||||||||||
*Non-income producing security.
## Less than 0.1%.
1A portion of this security is designated with the broker as collateral for options contracts written. As of October 31, 2018, the total value of such securities was $6,808,349.
2Restricted securities - Investment in securities that are restricted as to public resale under the Securities Act of 1933, as amended. These securities have been sold under Rule 144A and have been determined to be liquid under guidelines established by the Board of Directors. These securities amount to $62,392,231, or 11.2% of the Series’ net assets as of October 31, 2018 (see Note 2 to the financial statements).
3Amount is stated in USD unless otherwise noted.
4Floating rate security. Rate shown is the rate in effect as of October 31, 2018.
5Step coupon rate security - Rate steps up/down by 25 basis points upon rating downgrade/upgrade by Moody’s and S&P rating agencies (Subject to a maximum of 100 basis points per agency, 200 basis points maximum).
6Variable rate security. Security may be issued at a fixed coupon rate, which converts to a variable rate at a specified date. Rate shown is the rate in effect as of October 31, 2018.
7Security is perpetual in nature and has no stated maturity date.
8Illiquid security - This security was acquired on November 3, 2017 at a cost of $198,500 ($99.25 per share). This security has been determined to be illiquid under guidelines established by the Board of Directors. This security amounts to $203,316, or less than 0.1% of the Series’ net assets as of October 31, 2018. (see Note 2 to the financial statements).
9Variable or floating rate security, the interest rate of which adjusts periodically based on changes in current interest rates and prepayments on the underlying pool of assets. Rate shown is the rate in effect as of October 31, 2018.
10Rate shown is the current yield as of October 31, 2018.
The Global Industry Classification Standard (GICS) was developed by and is the exclusive property and a service mark of MSCI Inc. (MSCI) and Standard & Poor, a division of The McGraw-Hill Companies, Inc. (S&P), and is licensed for use by Manning & Napier when referencing GICS sectors. Neither MSCI, S&P, nor any third party involved in making or compiling the GICS or any GICS classifications makes any express or implied warranties or representations with respect to such standard or classification, nor shall any such party have any liability therefrom.
The accompanying notes are an integral part of the financial statements.
46
Statement of Assets and Liabilities - Pro-Blend® Moderate Term Series
October 31, 2018
ASSETS: | ||||
Investments in securities, at value (identified cost $552,214,003) (Note 2) | $ | 555,498,562 | ||
Foreign currency, at value (identified cost $18,078) | 18,048 | |||
Receivable for securities sold | 7,797,579 | |||
Interest receivable | 2,589,768 | |||
Foreign tax reclaims receivable | 344,760 | |||
Receivable for fund shares sold | 213,340 | |||
Dividends receivable | 99,876 | |||
Prepaid expenses | 21,071 | |||
|
| |||
TOTAL ASSETS | 566,583,004 | |||
|
| |||
LIABILITIES: | ||||
Accrued management fees (Note 3) | 364,532 | |||
Accrued distribution and service (Rule 12b-1) fees (Class R) (Class R2) (Note 3) | 92,759 | |||
Accrued shareholder services fees (Class S) (Note 3) | 69,079 | |||
Accrued fund accounting and administration fees (Note 3) | 42,568 | |||
Accrued Chief Compliance Officer service fees (Note 3) | 401 | |||
Options written, at value (premiums received $157,054) (Note 2) | 229,503 | |||
Payable for securities purchased | 5,830,568 | |||
Payable for fund shares repurchased | 390,884 | |||
Other payables and accrued expenses | 117,168 | |||
|
| |||
TOTAL LIABILITIES | 7,137,462 | |||
|
| |||
TOTAL NET ASSETS | $ | 559,445,542 | ||
|
| |||
NET ASSETS CONSIST OF: | ||||
Capital stock | $ | 488,354 | ||
Additional paid-in-capital | 531,065,524 | |||
Total distributable earnings | 27,891,664 | |||
|
| |||
TOTAL NET ASSETS | $ | 559,445,542 | ||
|
| |||
The accompanying notes are an integral part of the financial statements.
47
Statement of Assets and Liabilities - Pro-Blend® Moderate Term Series
October 31, 2018
NET ASSET VALUE, OFFERING PRICE AND REDEMPTION PRICE PER SHARE - Class S | $ | 13.13 | ||
|
| |||
NET ASSET VALUE, OFFERING PRICE AND REDEMPTION PRICE PER SHARE - Class I | $ | 9.72 | ||
|
| |||
NET ASSET VALUE, OFFERING PRICE AND REDEMPTION PRICE PER SHARE - Class R | $ | 10.25 | ||
|
| |||
NET ASSET VALUE, OFFERING PRICE AND REDEMPTION PRICE PER SHARE - Class R2 | $ | 9.84 | ||
|
|
The accompanying notes are an integral part of the financial statements.
48
Statement of Operations - Pro-Blend® Moderate Term Series
For the Year Ended October 31, 2018
INVESTMENT INCOME: | ||||
Interest | $ | 11,799,225 | ||
Dividends (net of foreign taxes withheld, $206,425) | 2,891,053 | |||
|
| |||
Total Investment Income | 14,690,278 | |||
|
| |||
EXPENSES: | ||||
Management fees (Note 3) | 4,705,957 | |||
Distribution and service (Rule 12b-1) fees (Class R2) (Note 3) | 1,084,034 | |||
Distribution and service (Rule 12b-1) fees (Class R) (Note 3) | 98,669 | |||
Shareholder services fees (Class S) (Note 3) | 919,490 | |||
Fund accounting and administration fees (Note 3) | 154,566 | |||
Directors’ fees (Note 3) | 49,169 | |||
Chief Compliance Officer service fees (Note 3) | 4,385 | |||
Custodian fees | 56,245 | |||
Miscellaneous | 333,321 | |||
|
| |||
Total Expenses | 7,405,836 | |||
|
| |||
NET INVESTMENT INCOME | 7,284,442 | |||
|
| |||
REALIZED AND UNREALIZED GAIN (LOSS) ON INVESTMENTS AND FOREIGN CURRENCY: | ||||
Net realized gain (loss) on- | ||||
Investments in securities | 20,575,418 | |||
Options written | 890,117 | |||
Foreign currency and translation of other assets and liabilities | 2,891 | |||
|
| |||
| 21,468,426 | ||||
|
| |||
Net change in unrealized appreciation (depreciation) on- | ||||
Investments in securities | (37,503,611 | ) | ||
Options written | (112,453 | ) | ||
Foreign currency and translation of other assets and liabilities | 2,517 | |||
|
| |||
| (37,613,547 | ) | |||
|
| |||
NET REALIZED AND UNREALIZED GAIN (LOSS) ON INVESTMENTS AND FOREIGN CURRENCY | (16,145,121 | ) | ||
|
| |||
NET DECREASE IN NET ASSETS RESULTING FROM OPERATIONS | $ | (8,860,679 | ) | |
|
| |||
The accompanying notes are an integral part of the financial statements.
49
Statements of Changes in Net Assets - Pro-Blend® Moderate Term Series
FOR THE YEAR ENDED 10/31/18 | FOR THE YEAR ENDED 10/31/17 | |||||||
INCREASE (DECREASE) IN NET ASSETS: | ||||||||
OPERATIONS: | ||||||||
Net investment income | $ | 7,284,442 | $ | 8,370,337 | ||||
Net realized gain (loss) on investments and foreign currency | 21,468,426 | 51,009,452 | ||||||
Net realized gain (loss) from in-kind redemption transactions and foreign currency | — | 7,226,146 | ||||||
Net change in unrealized appreciation (depreciation) on investments and foreign currency | (37,613,547 | ) | 4,788,535 | |||||
|
|
|
| |||||
Net increase (decrease) from operations | (8,860,679 | ) | 71,394,470 | |||||
|
|
|
| |||||
DISTRIBUTIONS TO SHAREHOLDERS (Note 9): | ||||||||
Class S | (24,129,787 | ) | (11,168,254 | ) | ||||
Class I | (10,762,805 | ) | (9,568,863 | ) | ||||
Class R | (1,531,067 | ) | (731,216 | ) | ||||
Class R2 | (7,862,881 | ) | (2,833,511 | ) | ||||
|
|
|
| |||||
Total distributions to shareholders | (44,286,540 | ) | (24,301,844 | )* | ||||
|
|
|
| |||||
CAPITAL STOCK ISSUED AND REPURCHASED: | ||||||||
Net decrease from capital share transactions (Note 5) | (93,924,864 | ) | (309,336,437 | ) | ||||
|
|
|
| |||||
Net decrease in net assets | (147,072,083 | ) | (262,243,811 | ) | ||||
NET ASSETS: | ||||||||
Beginning of year | 706,517,625 | 968,761,436 | ||||||
|
|
|
| |||||
End of year | $ | 559,445,542 | $ | 706,517,625 | ||||
|
|
|
| |||||
* For the year ended October 31, 2017, the distributions to shareholders from net investment income and net realized gain were $3,749,931 and $7,418,323 (Class S), $3,924,939 and $5,643,924 (Class I), $214,584 and $516,632 (Class R) and $398,551 and $2,434,960 (Class R2), respectively.
The accompanying notes are an integral part of the financial statements.
50
Financial Highlights - Pro-Blend® Moderate Term Series - Class S
| FOR THE YEAR ENDED | ||||||||||||||||||||
| 10/31/18 | 10/31/17 | 10/31/16 | 10/31/15 | 10/31/14 | ||||||||||||||||
Per share data (for a share outstanding throughout each year): | ||||||||||||||||||||
Net asset value - Beginning of year | $ | 14.17 | $ | 13.37 | $ | 13.15 | $ | 14.53 | $ | 14.52 | ||||||||||
|
|
|
|
|
|
|
|
|
| |||||||||||
Income (loss) from investment operations: | ||||||||||||||||||||
Net investment income1 | 0.17 | 0.13 | 0.13 | 0.15 | 0.16 | |||||||||||||||
Net realized and unrealized gain (loss) on investments | (0.38 | ) | 0.97 | 0.23 | (0.44 | ) | 0.59 | |||||||||||||
|
|
|
|
|
|
|
|
|
| |||||||||||
Total from investment operations | (0.21 | ) | 1.10 | 0.36 | (0.29 | ) | 0.75 | |||||||||||||
|
|
|
|
|
|
|
|
|
| |||||||||||
Less distributions to shareholders: | ||||||||||||||||||||
From net investment income | (0.12 | ) | (0.10 | ) | (0.10 | ) | (0.12 | ) | (0.12 | ) | ||||||||||
From net realized gain on investments | (0.71 | ) | (0.20 | ) | (0.04 | ) | (0.97 | ) | (0.62 | ) | ||||||||||
|
|
|
|
|
|
|
|
|
| |||||||||||
Total distributions to shareholders | (0.83 | ) | (0.30 | ) | (0.14 | ) | (1.09 | ) | (0.74 | ) | ||||||||||
|
|
|
|
|
|
|
|
|
| |||||||||||
Net asset value - End of year | $ | 13.13 | $ | 14.17 | $ | 13.37 | $ | 13.15 | $ | 14.53 | ||||||||||
|
|
|
|
|
|
|
| �� |
|
| ||||||||||
Net assets - End of year (000’s omitted) | $ | 318,691 | $ | 426,426 | $ | 511,577 | $ | 683,089 | $ | 788,276 | ||||||||||
|
|
|
|
|
|
|
|
|
| |||||||||||
Total return2 | (1.67 | %) | 8.46 | % | 2.77 | % | (1.99 | %) | 5.47 | % | ||||||||||
Ratios (to average net assets)/Supplemental Data: | ||||||||||||||||||||
Expenses | 1.10 | % | 1.08 | % | 1.07 | % | 1.06 | % | 1.06 | % | ||||||||||
Net investment income | 1.24 | % | 0.98 | % | 0.97 | % | 1.08 | % | 1.12 | % | ||||||||||
Series portfolio turnover | 74 | % | 68 | % | 67 | % | 56 | % | 53 | % | ||||||||||
1Calculated based on average shares outstanding during the years.
2Represents aggregate total return for the years indicated, and assumes reinvestment of all distributions.
The accompanying notes are an integral part of the financial statements.
51
Financial Highlights - Pro-Blend® Moderate Term Series - Class I
| FOR THE YEAR ENDED | ||||||||||||||||||||
| 10/31/18 | 10/31/17 | 10/31/16 | 10/31/15 | 10/31/14 | ||||||||||||||||
Per share data (for a share outstanding throughout each year): | ||||||||||||||||||||
Net asset value - Beginning of year | $ | 10.72 | $ | 10.20 | $ | 10.07 | $ | 11.40 | $ | 11.56 | ||||||||||
|
|
|
|
|
|
|
|
|
| |||||||||||
Income (loss) from investment operations: | ||||||||||||||||||||
Net investment income1 | 0.15 | 0.13 | 0.12 | 0.14 | 0.16 | |||||||||||||||
Net realized and unrealized gain (loss) on investments | (0.29 | ) | 0.73 | 0.18 | (0.35 | ) | 0.46 | |||||||||||||
|
|
|
|
|
|
|
|
|
| |||||||||||
Total from investment operations | (0.14 | ) | 0.86 | 0.30 | (0.21 | ) | 0.62 | |||||||||||||
|
|
|
|
|
|
|
|
|
| |||||||||||
Less distributions to shareholders: | ||||||||||||||||||||
From net investment income | (0.15 | ) | (0.14 | ) | (0.13 | ) | (0.15 | ) | (0.16 | ) | ||||||||||
From net realized gain on investments | (0.71 | ) | (0.20 | ) | (0.04 | ) | (0.97 | ) | (0.62 | ) | ||||||||||
|
|
|
|
|
|
|
|
|
| |||||||||||
Total distributions to shareholders | (0.86 | ) | (0.34 | ) | (0.17 | ) | (1.12 | ) | (0.78 | ) | ||||||||||
|
|
|
|
|
|
|
|
|
| |||||||||||
Net asset value - End of year | $ | 9.72 | $ | 10.72 | $ | 10.20 | $ | 10.07 | $ | 11.40 | ||||||||||
|
|
|
|
|
|
|
|
|
| |||||||||||
Net assets - End of year (000’s omitted) | $ | 125,647 | $ | 140,706 | $ | 299,009 | $ | 740,524 | $ | 719,847 | ||||||||||
|
|
|
|
|
|
|
|
|
| |||||||||||
Total return2 | (1.49 | %) | 8.72 | % | 3.08 | % | (1.76 | %) | 5.73 | % | ||||||||||
Ratios (to average net assets)/Supplemental Data: | ||||||||||||||||||||
Expenses | 0.85 | % | 0.83 | % | 0.82 | % | 0.81 | % | 0.81 | % | ||||||||||
Net investment income | 1.50 | % | 1.24 | % | 1.24 | % | 1.33 | % | 1.37 | % | ||||||||||
Series portfolio turnover | 74 | % | 68 | % | 67 | % | 56 | % | 53 | % | ||||||||||
1Calculated based on average shares outstanding during the years.
2Represents aggregate total return for the years indicated, and assumes reinvestment of all distributions.
The accompanying notes are an integral part of the financial statements.
52
Financial Highlights - Pro-Blend® Moderate Term Series - Class R
| FOR THE YEAR ENDED | ||||||||||||||||||||
| 10/31/18 | 10/31/17 | 10/31/16 | 10/31/15 | 10/31/14 | ||||||||||||||||
Per share data (for a share outstanding throughout each year): | ||||||||||||||||||||
Net asset value - Beginning of year | $ | 11.25 | $ | 10.68 | $ | 10.53 | $ | 11.87 | $ | 12.00 | ||||||||||
|
|
|
|
|
|
|
|
|
| |||||||||||
Income (loss) from investment operations: | ||||||||||||||||||||
Net investment income1 | 0.11 | 0.08 | 0.07 | 0.09 | 0.10 | |||||||||||||||
Net realized and unrealized gain (loss) on investments | (0.31 | ) | 0.77 | 0.20 | (0.36 | ) | 0.49 | |||||||||||||
|
|
|
|
|
|
|
|
|
| |||||||||||
Total from investment operations | (0.20 | ) | 0.85 | 0.27 | (0.27 | ) | 0.59 | |||||||||||||
|
|
|
|
|
|
|
|
|
| |||||||||||
Less distributions to shareholders: | ||||||||||||||||||||
From net investment income | (0.09 | ) | (0.08 | ) | (0.08 | ) | (0.10 | ) | (0.10 | ) | ||||||||||
From net realized gain on investments | (0.71 | ) | (0.20 | ) | (0.04 | ) | (0.97 | ) | (0.62 | ) | ||||||||||
|
|
|
|
|
|
|
|
|
| |||||||||||
Total distributions to shareholders | (0.80 | ) | (0.28 | ) | (0.12 | ) | (1.07 | ) | (0.72 | ) | ||||||||||
|
|
|
|
|
|
|
|
|
| |||||||||||
Net asset value - End of year | $ | 10.25 | $ | 11.25 | $ | 10.68 | $ | 10.53 | $ | 11.87 | ||||||||||
|
|
|
|
|
|
|
|
|
| |||||||||||
Net assets - End of year (000’s omitted) | $ | 16,537 | $ | 22,662 | $ | 29,499 | $ | 39,917 | $ | 47,180 | ||||||||||
|
|
|
|
|
|
|
|
|
| |||||||||||
Total return2 | (1.96 | %) | 8.21 | % | 2.55 | % | (2.30 | %) | 5.24 | % | ||||||||||
Ratios (to average net assets)/Supplemental Data: | ||||||||||||||||||||
Expenses | 1.35 | % | 1.33 | % | 1.32 | % | 1.31 | % | 1.31 | % | ||||||||||
Net investment income | 1.00 | % | 0.73 | % | 0.72 | % | 0.83 | % | 0.87 | % | ||||||||||
Series portfolio turnover | 74 | % | 68 | % | 67 | % | 56 | % | 53 | % | ||||||||||
1Calculated based on average shares outstanding during the years.
2Represents aggregate total return for the years indicated, and assumes reinvestment of all distributions.
The accompanying notes are an integral part of the financial statements.
53
Financial Highlights - Pro-Blend® Moderate Term Series - Class R2*
| FOR THE YEAR ENDED | ||||||||||||||||||||
| 10/31/18 | 10/31/17 | 10/31/16 | 10/31/15 | 10/31/14 | ||||||||||||||||
Per share data (for a share outstanding throughout each year): | ||||||||||||||||||||
Net asset value - Beginning of year | $ | 10.83 | $ | 10.29 | $ | 10.16 | $ | 11.49 | $ | 11.65 | ||||||||||
|
|
|
|
|
|
|
|
|
| |||||||||||
Income (loss) from investment operations: | ||||||||||||||||||||
Net investment income1 | 0.05 | 0.02 | 0.02 | 0.03 | 0.04 | |||||||||||||||
Net realized and unrealized gain (loss) on investments | (0.29 | ) | 0.75 | 0.18 | (0.35 | ) | 0.47 | |||||||||||||
|
|
|
|
|
|
|
|
|
| |||||||||||
Total from investment operations | (0.24 | ) | 0.77 | 0.20 | (0.32 | ) | 0.51 | |||||||||||||
|
|
|
|
|
|
|
|
|
| |||||||||||
Less distributions to shareholders: | ||||||||||||||||||||
From net investment income | (0.04 | ) | (0.03 | ) | (0.03 | ) | (0.04 | ) | (0.05 | ) | ||||||||||
From net realized gain on investments | (0.71 | ) | (0.20 | ) | (0.04 | ) | (0.97 | ) | (0.62 | ) | ||||||||||
|
|
|
|
|
|
|
|
|
| |||||||||||
Total distributions to shareholders | (0.75 | ) | (0.23 | ) | (0.07 | ) | (1.01 | ) | (0.67 | ) | ||||||||||
|
|
|
|
|
|
|
|
|
| |||||||||||
Net asset value - End of year | $ | 9.84 | $ | 10.83 | $ | 10.29 | $ | 10.16 | $ | 11.49 | ||||||||||
|
|
|
|
|
|
|
|
|
| |||||||||||
Net assets - End of year (000’s omitted) | $ | 98,571 | $ | 116,724 | $ | 128,677 | $ | 148,143 | $ | 150,654 | ||||||||||
|
|
|
|
|
|
|
|
|
| |||||||||||
Total return2 | (2.42 | %) | 7.71 | % | 1.98 | % | (2.77 | %) | 4.69 | % | ||||||||||
Ratios (to average net assets)/Supplemental Data: | ||||||||||||||||||||
Expenses | 1.85 | % | 1.83 | % | 1.82 | % | 1.81 | % | 1.81 | % | ||||||||||
Net investment income | 0.50 | % | 0.23 | % | 0.22 | % | 0.33 | % | 0.37 | % | ||||||||||
Series portfolio turnover | 74 | % | 68 | % | 67 | % | 56 | % | 53 | % | ||||||||||
*Effective March 1, 2017, Class C shares of the Series have been redesignated as Class R2 Shares.
1Calculated based on average shares outstanding during the years.
2Represents aggregate total return for the years indicated, and assumes reinvestment of all distributions.
The accompanying notes are an integral part of the financial statements.
54
Performance Update as of October 31, 2018 - Pro-Blend® Extended Term Series
(unaudited)
| AVERAGE ANNUAL TOTAL RETURNS AS OF OCTOBER 31, 2018 | ||||||||||||
ONE YEAR1 | FIVE YEAR | TEN YEAR | ||||||||||
Manning & Napier Fund, Inc. - Pro-Blend® Extended Term Series - Class S2 | -1.47 | % | 3.47 | % | 7.56 | % | ||||||
Manning & Napier Fund, Inc. - Pro-Blend® Extended Term Series - Class I2 | -1.15 | % | 3.74 | % | 7.84 | % | ||||||
Manning & Napier Fund, Inc. - Pro-Blend® Extended Term Series - Class R2,3 | -1.65 | % | 3.21 | % | 7.28 | % | ||||||
Manning & Napier Fund, Inc. - Pro-Blend® Extended Term Series - Class R22,3 | -2.13 | % | 2.69 | % | 6.77 | % | ||||||
Bloomberg Barclays U.S. Aggregate Bond Index4 | -2.05 | % | 1.83 | % | 3.94 | % | ||||||
40/15/45 Blended Index5 | 0.53 | % | 5.48 | % | 8.39 | % | ||||||
The following graph compares the value of a $10,000 investment in the Manning & Napier Fund, Inc. - Pro-Blend® Extended Term Series - Class S for the ten years ended October 31, 2018 to the Bloomberg Barclays U.S. Aggregate Bond Index and the 40/15/45 Blended Index.
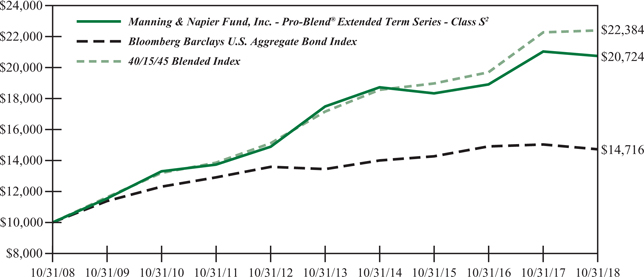
1The returns shown are based on net asset values calculated for shareholder transactions and may differ from the returns shown in the financial highlights, which reflect adjustments made to the net asset values in accordance with accounting principles generally accepted in the United States of America.
2The Series’ performance does not reflect the deduction of taxes that a shareholder would pay on fund distributions or the redemption of shares. The Series’ performance is historical and may not be indicative of future results. The performance returns shown are inclusive of the net expense ratio of the Series. For the year ended October 31, 2018, this net expense ratio was 1.10% for Class S, 0.85% for Class I, 1.35% for Class R and 1.85% for Class R2. The gross expense ratio, which does not account for any voluntary or contractual waivers currently in effect, was 1.11% for Class S, 0.86% for Class I, 1.36% for Class R and 1.86% for Class R2 for the year ended October 31, 2018.
3For periods through the inception of Class R2 on January 4, 2010, and Class R on June 30, 2010, the performance is hypothetical and is based on the historical performance of Class S shares adjusted for the respective class’ charges and expenses.
4The Bloomberg Barclays U.S. Aggregate Bond Index is an unmanaged, market-value weighted index of U.S. domestic investment-grade debt issues, including government, corporate, asset-backed, and mortgage-backed securities, with maturities of one year or more. Index returns do not reflect any fees or expenses. Index returns provided by Interactive Data.
5The 40/15/45 Blended Index is 40% Russell 3000® Index (Russell 3000), 15% MSCI ACWI ex USA Index (ACWIxUS), and 45% Bloomberg Barclays U.S. Aggregate Bond Index (BAB). Russell 3000 is an unmanaged index that consists of 3,000 of the largest U.S. companies based on total market capitalization. Index returns are based on a market capitalization weighted average of relative price changes of the component stocks plus dividends whose reinvestments are compounded daily. Index returns provided by Bloomberg. ACWIxUS is designed to measure large and mid-cap representation across 22 of 23 Developed Markets countries (excluding the U.S.) and 24 Emerging Markets countries. The Index is denominated in U.S. dollars. The Index returns are net of withholding taxes. They assume daily reinvestment of net dividends thus accounting for any applicable dividend taxation. Index returns provided by Bloomberg. Index returns provided by Bloomberg. BAB is an unmanaged, market value-weighted index of U.S. domestic investment-grade debt issues, including government, corporate, asset-backed and mortgage-backed securities with maturities of one year or more. Index returns provided by Interactive Data. The returns of the indices do not reflect any fees or expenses. Returns provided
55
Performance Update as of October 31, 2018 - Pro-Blend® Extended Term Series
(unaudited)
are calculated monthly using a blended allocation. Because the fund’s asset allocation will vary over time, the composition of the fund’s portfolio may not match the composition of the comparative Indices. Mid-month performance may not be available for all indices within the blended index. Where applicable, performance for those indices is included from the first of the month following the corresponding Fund’s inception date.
56
Shareholder Expense Example - Pro-Blend® Extended Term Series
(unaudited)
As a shareholder of the Series, you incur ongoing costs, including management fees, shareholder service fees and other Series expenses. This example is intended to help you understand your ongoing costs (in dollars) of investing in the Series and to compare these costs with the ongoing costs of investing in other mutual funds.
The example is based on an investment of $1,000 invested in each class at the beginning of the period and held for the entire period (May 1, 2018 to October 31, 2018).
Actual Expenses
The Actual lines of the table below provide information about actual account values and actual expenses. You may use the information in these lines, together with the amount you invested, to estimate the expenses that you paid over the period. Simply divide your account value by $1,000 (for example, an $8,600 account value divided by $1,000 = 8.6), then multiply the result by the number in the Actual line for the Class in which you have invested under the heading entitled “Expenses Paid During Period” to estimate the expenses you paid on your account during this period.
Hypothetical Example for Comparison Purposes
The Hypothetical lines of each class in the table below provide information about hypothetical account values and hypothetical expenses based on the Class’ actual expense ratio and an assumed rate of return of 5% per year before expenses, which is not the Class’ actual return. The hypothetical account values and expenses may not be used to estimate the actual ending account balance or expenses you paid during the period. You may use this information to compare the ongoing costs of investing in a class of the Series and other funds. To do so, compare this 5% hypothetical example for the Class in which you have invested with the 5% hypothetical examples that appear in the shareholder reports of the other funds.
Please note that the expenses shown in the table are meant to highlight your ongoing costs only and do not reflect any transaction costs such as sales charges (loads), redemption fees, or exchange fees that you may incur in other mutual funds. Therefore, the second line of the table is useful in comparing ongoing costs only, and will not help you determine the relative total costs of owning different funds.
BEGINNING ACCOUNT VALUE 5/1/18 | ENDING ACCOUNT VALUE 10/31/18 | EXPENSES PAID DURING PERIOD 5/1/18-10/31/18* | ANNUALIZED EXPENSE RATIO | |||||
Class S | ||||||||
Actual | $1,000.00 | $986.92 | $5.51 | 1.10% | ||||
Hypothetical (5% return before expenses) | $1,000.00 | $1,019.66 | $5.60 | 1.10% | ||||
Class I | ||||||||
Actual | $1,000.00 | $988.62 | $4.26 | 0.85% | ||||
Hypothetical (5% return before expenses) | $1,000.00 | $1,020.92 | $4.33 | 0.85% | ||||
Class R | ||||||||
Actual | $1,000.00 | $986.22 | $6.76 | 1.35% | ||||
Hypothetical (5% return before expenses) | $1,000.00 | $1,018.40 | $6.87 | 1.35% | ||||
Class R2 | ||||||||
Actual | $1,000.00 | $984.03 | $9.25 | 1.85% | ||||
Hypothetical (5% return before expenses) | $1,000.00 | $1,015.88 | $9.40 | 1.85% |
*Expenses are equal to the Class’ annualized expense ratio (for the six-month period), multiplied by the average account value over the period, multiplied by 184/365 to reflect the one-half year period. Expenses are based on the most recent fiscal half year; therefore, the expense ratios stated above may differ from the expense ratios stated in the financial highlights, which are based on one-year data. The Class’ total return would have been lower had certain expenses not been waived during the period.
57
Portfolio Composition - Pro-Blend® Extended Term Series
As of October 31, 2018 (unaudited)
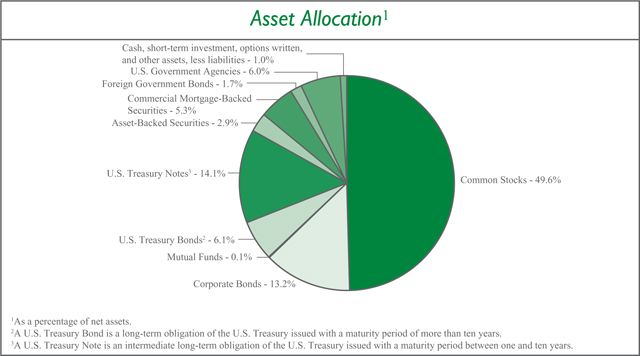
Sector Allocation4 | ||||||||
Health Care | 11.4% | |||||||
Information Technology | 8.4% | |||||||
Financials | 7.4% | |||||||
Consumer Staples | 7.0% | |||||||
Consumer Discretionary | 6.6% | |||||||
Communication Services | 6.0% | |||||||
Energy | 5.1% | |||||||
Real Estate | 4.4% | |||||||
Industrials | 4.0% | |||||||
Materials | 2.6% | |||||||
Utilities | 0.2% | |||||||
| 4Including common stocks and corporate bonds, as a percentage of total investments. |
| |||||||
Top Ten Stock Holdings5 | ||||
Novartis AG - ADR (Switzerland) | 1.6% | |||
Booking Holdings, Inc. | 1.6% | |||
Incyte Corp. | 1.6% | |||
Qorvo, Inc. | 1.5% | |||
Microsoft Corp. | 1.5% | |||
Mastercard, Inc. - Class A | 1.4% | |||
Medtronic plc | 1.3% | |||
Ball Corp. | 1.3% | |||
Johnson & Johnson | 1.2% | |||
Anheuser-Busch InBev S.A./N.V. (Belgium) | 1.2% | |||
| 5As a percentage of total investments. |
| |||
58
Investment Portfolio - October 31, 2018
| PRO-BLEND® EXTENDED TERM SERIES | SHARES | VALUE (NOTE 2) | ||||||||||
COMMON STOCKS - 49.6% | ||||||||||||
Communication Services - 4.3% | ||||||||||||
Diversified Telecommunication Services - 0.7% |
| |||||||||||
Orange S.A. (France) | 3,095 | $ | 48,307 | |||||||||
Telefonica Brasil S.A. (Brazil) | 3,400 | 39,367 | ||||||||||
Zayo Group Holdings, Inc.* | 127,170 | 3,799,840 | ||||||||||
|
| |||||||||||
| 3,887,514 | ||||||||||||
|
| |||||||||||
Entertainment - 0.7% | ||||||||||||
Electronic Arts, Inc.* | 40,300 | 3,666,494 | ||||||||||
NetEase, Inc. - ADR (China) | 560 | 116,396 | ||||||||||
Nexon Co. Ltd. (Japan)* | 10,100 | 115,213 | ||||||||||
Toho Co. Ltd. -Tokyo (Japan) | 2,100 | 68,513 | ||||||||||
Vivendi S.A. (France) | 1,595 | 38,469 | ||||||||||
|
| |||||||||||
| 4,005,085 | ||||||||||||
|
| |||||||||||
Interactive Media & Services - 2.2% | ||||||||||||
Alphabet, Inc. - Class A*1 | 2,410 | 2,628,298 | ||||||||||
Alphabet, Inc. - Class C* | 4,140 | 4,457,828 | ||||||||||
Tencent Holdings Ltd. - Class H (China) | 146,439 | 5,016,892 | ||||||||||
|
| |||||||||||
| 12,103,018 | ||||||||||||
|
| |||||||||||
Media - 0.6% | ||||||||||||
Hakuhodo DY Holdings, Inc. (Japan) | 4,100 | 68,382 | ||||||||||
Quebecor, Inc. - Class B (Canada) | 86,550 | 1,697,536 | ||||||||||
Shaw Communications, Inc. - Class B (Canada) | 79,195 | 1,474,473 | ||||||||||
|
| |||||||||||
| 3,240,391 | ||||||||||||
|
| |||||||||||
Wireless Telecommunication Services - 0.1% | ||||||||||||
KDDI Corp. (Japan) | 5,500 | 133,099 | ||||||||||
NTT DOCOMO, Inc. (Japan) | 5,400 | 133,914 | ||||||||||
|
| |||||||||||
| 267,013 | ||||||||||||
|
| |||||||||||
Total Communication Services | 23,503,021 | |||||||||||
|
| |||||||||||
Consumer Discretionary - 4.8% | ||||||||||||
Auto Components - 0.0%## | ||||||||||||
Nemak S.A.B. de C.V. (Mexico)2 | 133,500 | 96,412 | ||||||||||
NGK Spark Plug Co. Ltd. (Japan) | 3,500 | 70,823 | ||||||||||
|
| |||||||||||
| 167,235 | ||||||||||||
|
| |||||||||||
Automobiles - 0.1% | ||||||||||||
Geely Automobile Holdings Ltd. (China) | 55,000 | 105,985 | ||||||||||
Isuzu Motors Ltd. (Japan) | 5,300 | 69,486 | ||||||||||
Peugeot S.A. (France) | 830 | 19,730 | ||||||||||
Renault S.A. (France) | 380 | 28,376 | ||||||||||
Suzuki Motor Corp. (Japan) | 3,000 | 149,600 | ||||||||||
|
| |||||||||||
| 373,177 | ||||||||||||
|
| |||||||||||
Diversified Consumer Services - 0.1% | ||||||||||||
China Maple Leaf Educational Systems Ltd. (China) | 166,000 | 72,045 | ||||||||||
China Yuhua Education Corp. Ltd. (China)2 | 252,000 | 101,613 | ||||||||||
Fu Shou Yuan International Group Ltd. (China) | 219,000 | 168,304 | ||||||||||
New Oriental Education & Technology Group, Inc. - ADR (China)* | 2,550 | 149,200 | ||||||||||
TAL Education Group - ADR (China)* | 2,065 | 59,844 | ||||||||||
Wisdom Education International Holdings Co. Ltd. (China) | 160,000 | 72,004 | ||||||||||
|
| |||||||||||
| 623,010 | ||||||||||||
|
| |||||||||||
Hotels, Restaurants & Leisure - 0.1% | ||||||||||||
Accor S.A. (France) | 3,115 | 142,331 | ||||||||||
Basic-Fit N.V. (Netherlands)*2 | 3,345 | 96,308 | ||||||||||
|
| |||||||||||
| 238,639 | ||||||||||||
|
| |||||||||||
Household Durables - 0.0%## | ||||||||||||
Sekisui Chemical Co. Ltd. (Japan) | 4,500 | 70,767 | ||||||||||
Techtronic Industries Co. Ltd. (Hong Kong) | 14,500 | 68,277 | ||||||||||
|
| |||||||||||
| 139,044 | ||||||||||||
|
| |||||||||||
Internet & Direct Marketing Retail - 2.7% | ||||||||||||
Alibaba Group Holding Ltd. - ADR (China)* | 30,245 | 4,303,258 | ||||||||||
Amazon.com, Inc.* | 1,310 | 2,093,393 | ||||||||||
Booking Holdings, Inc.* | 4,600 | 8,623,068 | ||||||||||
Despegar.com Corp. (Argentina)* | 2,460 | 39,532 | ||||||||||
|
| |||||||||||
| 15,059,251 | ||||||||||||
|
| |||||||||||
Leisure Products - 0.1% | ||||||||||||
Bandai Namco Holdings, Inc. (Japan) | 3,900 | 138,742 | ||||||||||
Yamaha Corp. (Japan) | 3,300 | 145,016 | ||||||||||
|
| |||||||||||
| 283,758 | ||||||||||||
|
| |||||||||||
Multiline Retail - 0.0%## | ||||||||||||
El Puerto de Liverpool SAB de C.V. (Mexico) | 8,975 | 56,996 | ||||||||||
Lojas Americanas S.A. (Brazil) | 6,100 | 30,504 | ||||||||||
Lojas Renner S.A. (Brazil) | 4,040 | 40,905 | ||||||||||
Magazine Luiza S.A. (Brazil) | 600 | 27,152 | ||||||||||
Next plc (United Kingdom) | 1,000 | 66,433 | ||||||||||
|
| |||||||||||
| 221,990 | ||||||||||||
|
| |||||||||||
Specialty Retail - 0.6% | ||||||||||||
Fast Retailing Co. Ltd. (Japan) | 100 | 50,351 | ||||||||||
The accompanying notes are an integral part of the financial statements.
59
Investment Portfolio - October 31, 2018
| PRO-BLEND® EXTENDED TERM SERIES | SHARES | VALUE (NOTE 2) | ||||||||||
COMMON STOCKS (continued) | ||||||||||||
Consumer Discretionary (continued) | ||||||||||||
Specialty Retail (continued) | ||||||||||||
Industria de Diseno Textil S.A. (Spain) | 118,060 | $ | 3,327,468 | |||||||||
Nitori Holdings Co. Ltd. (Japan) | 500 | 65,287 | ||||||||||
USS Co. Ltd. (Japan) | 3,900 | 70,324 | ||||||||||
|
| |||||||||||
| 3,513,430 | ||||||||||||
|
| |||||||||||
Textiles, Apparel & Luxury Goods - 1.1% | ||||||||||||
ANTA Sports Products Ltd. (China) | 24,000 | 99,085 | ||||||||||
Burberry Group plc (United Kingdom) | 3,005 | 69,534 | ||||||||||
Hermes International (France) | 115 | 65,653 | ||||||||||
Kering S.A. (France) | 135 | 60,006 | ||||||||||
lululemon athletica, Inc.* | 40,279 | 5,668,464 | ||||||||||
LVMH Moet Hennessy Louis Vuitton SE (France) | 450 | 136,532 | ||||||||||
Moncler S.p.A (Italy) | 1,945 | 67,545 | ||||||||||
|
| |||||||||||
| 6,166,819 | ||||||||||||
|
| |||||||||||
Total Consumer Discretionary | 26,786,353 | |||||||||||
|
| |||||||||||
Consumer Staples - 6.9% | ||||||||||||
Beverages - 4.0% | ||||||||||||
Ambev S.A. - ADR (Brazil) | 651,923 | 2,822,826 | ||||||||||
Ambev S.A. (Brazil) | 23,000 | 100,368 | ||||||||||
Anheuser-Busch InBev S.A./N.V. (Belgium) | 87,894 | 6,500,725 | ||||||||||
The Coca-Cola Co. | 62,640 | 2,999,203 | ||||||||||
Diageo plc (United Kingdom) | 182,635 | 6,313,970 | ||||||||||
Fomento Economico Mexicano SAB de C.V. (Mexico) | 7,300 | 62,182 | ||||||||||
PepsiCo, Inc. | 26,420 | 2,969,080 | ||||||||||
Pernod Ricard S.A. (France) | 390 | 59,469 | ||||||||||
Treasury Wine Estates Ltd. (Australia) | 20,780 | 223,667 | ||||||||||
|
| |||||||||||
| 22,051,490 | ||||||||||||
|
| |||||||||||
Food & Staples Retailing - 0.1% | ||||||||||||
Atacadao Distribuicao Comercio e Industria Ltda. (Brazil) | 7,400 | 30,165 | ||||||||||
Matsumotokiyoshi Holdings Co. Ltd. (Japan) | 3,000 | 108,462 | ||||||||||
Tsuruha Holdings, Inc. (Japan) | 700 | 73,059 | ||||||||||
Wal-Mart de Mexico S.A.B. de C.V. (Mexico) | 47,420 | 121,251 | ||||||||||
Wesfarmers Ltd. (Australia) | 2,080 | 68,885 | ||||||||||
|
| |||||||||||
| 401,822 | ||||||||||||
|
| |||||||||||
Food Products - 1.6% | ||||||||||||
Barry Callebaut AG (Switzerland) | 35 | 68,410 | ||||||||||
Chocoladefabriken Lindt & Spruengli AG (Switzerland) | 20 | 137,886 | ||||||||||
Danone S.A. (France) | 4,078 | 288,775 | ||||||||||
Grupo Bimbo S.A.B. de C.V. - Series A (Mexico) | 26,320 | 49,211 | ||||||||||
Kerry Group plc - Class A (Ireland) | 2,015 | 206,204 | ||||||||||
Kikkoman Corp. (Japan) | 2,500 | 136,968 | ||||||||||
Mondelez International, Inc. - Class A | 106,625 | 4,476,117 | ||||||||||
Nestle S.A. (Switzerland) | 42,821 | 3,615,082 | ||||||||||
|
| |||||||||||
| 8,978,653 | ||||||||||||
|
| |||||||||||
Household Products - 0.0%## | ||||||||||||
Henkel AG & Co. KGaA (Germany) | 690 | 67,591 | ||||||||||
Kimberly-Clark de Mexico S.A.B. de C.V. - Class A (Mexico) | 64,100 | 92,364 | ||||||||||
Lion Corp. (Japan) | 5,300 | 99,645 | ||||||||||
|
| |||||||||||
| 259,600 | ||||||||||||
|
| |||||||||||
Personal Products - 1.1% | ||||||||||||
Beiersdorf AG (Germany) | 2,840 | 293,647 | ||||||||||
Kao Corp. (Japan) | 1,000 | 66,522 | ||||||||||
Kobayashi Pharmaceutical Co. Ltd. (Japan) | 1,100 | 71,744 | ||||||||||
L’Oreal S.A. (France) | 630 | 141,942 | ||||||||||
Unilever plc - ADR (United Kingdom) | 108,624 | 5,754,900 | ||||||||||
|
| |||||||||||
| 6,328,755 | ||||||||||||
|
| |||||||||||
Tobacco - 0.1% | ||||||||||||
British American Tobacco plc - ADR (United Kingdom) | 3,610 | 156,674 | ||||||||||
KT&G Corp. (South Korea) | 755 | 67,324 | ||||||||||
Swedish Match AB (Sweden) | 1,380 | 70,295 | ||||||||||
|
| |||||||||||
| 294,293 | ||||||||||||
|
| |||||||||||
Total Consumer Staples | 38,314,613 | |||||||||||
|
| |||||||||||
Energy - 2.4% | ||||||||||||
Energy Equipment & Services - 2.0% | ||||||||||||
Core Laboratories N.V | 1,110 | 94,616 | ||||||||||
Diamond Offshore Drilling, Inc.* | 108,330 | 1,536,120 | ||||||||||
Ensco plc - Class A | 274,650 | 1,961,001 | ||||||||||
Schlumberger Ltd | 97,408 | 4,998,004 | ||||||||||
Transocean Ltd.* | 230,430 | 2,537,034 | ||||||||||
|
| |||||||||||
| 11,126,775 | ||||||||||||
|
| |||||||||||
Oil, Gas & Consumable Fuels - 0.4% | ||||||||||||
Cameco Corp. (Canada) | 8,196 | 87,861 | ||||||||||
Canadian Natural Resources Ltd. (Canada) | 5,150 | 141,303 | ||||||||||
The accompanying notes are an integral part of the financial statements.
60
Investment Portfolio - October 31, 2018
| PRO-BLEND® EXTENDED TERM SERIES | SHARES | VALUE (NOTE 2) | ||||||||||
COMMON STOCKS (continued) | ||||||||||||
Energy (continued) | ||||||||||||
Oil, Gas & Consumable Fuels (continued) | ||||||||||||
China Petroleum & Chemical Corp. - Class H (China) | 178,000 | $ | 144,995 | |||||||||
Eni S.p.A. (Italy) | 8,225 | 146,073 | ||||||||||
Galp Energia SGPS S.A. (Portugal) | 16,630 | 289,165 | ||||||||||
Repsol S.A. (Spain) | 13,875 | 247,929 | ||||||||||
Royal Dutch Shell plc - Class B - ADR (Netherlands) | 4,445 | 292,081 | ||||||||||
SK Innovation Co. Ltd. (South Korea) | 655 | 122,924 | ||||||||||
Suncor Energy, Inc. (Canada) | 4,000 | 134,179 | ||||||||||
TOTAL S.A. (France) | 4,150 | 243,502 | ||||||||||
Vermilion Energy, Inc. (Canada) | 5,415 | 143,597 | ||||||||||
Woodside Petroleum Ltd. (Australia) | 6,030 | 148,460 | ||||||||||
|
| |||||||||||
| 2,142,069 | ||||||||||||
|
| |||||||||||
Total Energy | 13,268,844 | |||||||||||
|
| |||||||||||
Financials - 3.3% | ||||||||||||
Banks - 0.3% | ||||||||||||
Banco Bradesco S.A. (Brazil) | 10,600 | 97,128 | ||||||||||
Banco Comercial Portugues S.A. (Portugal)* | 374,975 | 100,863 | ||||||||||
Banco do Brasil S.A. (Brazil) | 4,200 | 48,134 | ||||||||||
Banco Santander Brasil S.A. (Brazil) | 4,200 | 47,626 | ||||||||||
The Bank Of N.T. Butterfield & Son Ltd. (Bermuda) | 2,110 | 85,012 | ||||||||||
Bankia S.A. (Spain) | 44,848 | 140,869 | ||||||||||
Bankinter S.A. (Spain) | 16,450 | 134,774 | ||||||||||
BNP Paribas S.A. (France) | 1,965 | 102,404 | ||||||||||
CaixaBank S.A. (Spain) | 59,670 | 241,466 | ||||||||||
Credit Agricole S.A. (France) | 2,255 | 28,881 | ||||||||||
Erste Group Bank AG (Austria) | 2,375 | 96,680 | ||||||||||
FinecoBank Banca Fineco S.p.A. (Italy) | 19,495 | 203,753 | ||||||||||
Itau Unibanco Holding S.A. (Brazil) | 7,400 | 97,712 | ||||||||||
Itausa - Investimentos Itau S.A. (Brazil) | 16,300 | 49,055 | ||||||||||
Jyske Bank A/S (Denmark) | 2,685 | 109,631 | ||||||||||
KBC Group N.V. (Belgium) | 1,690 | 116,467 | ||||||||||
Societe Generale S.A. (France) | 1,295 | 47,472 | ||||||||||
Sydbank A/S (Denmark) | 3,180 | 73,449 | ||||||||||
|
| |||||||||||
| 1,821,376 | ||||||||||||
|
| |||||||||||
Capital Markets - 2.5% | ||||||||||||
B3 S.A. - Brasil Bolsa Balcao (Brazil) | 7,100 | 50,920 | ||||||||||
BlackRock, Inc. | 10,470 | 4,307,567 | ||||||||||
Cboe Global Markets, Inc. | 14,030 | 1,583,284 | ||||||||||
The Charles Schwab Corp. | 60,455 | 2,795,439 | ||||||||||
CME Group, Inc. | 8,000 | 1,465,920 | ||||||||||
E*TRADE Financial Corp. | 28,430 | 1,405,011 | ||||||||||
Intercontinental Exchange, Inc. | 19,520 | 1,503,821 | ||||||||||
Japan Exchange Group, Inc. (Japan) | 6,800 | 121,793 | ||||||||||
Julius Baer Group Ltd. (Switzerland) | 7,960 | 363,014 | ||||||||||
|
| |||||||||||
| 13,596,769 | ||||||||||||
|
| |||||||||||
Diversified Financial Services - 0.5% | ||||||||||||
Berkshire Hathaway, Inc. - Class B* | 13,600 | 2,791,808 | ||||||||||
|
| |||||||||||
Insurance - 0.0%## | ||||||||||||
Admiral Group plc (United Kingdom) | 2,600 | 66,836 | ||||||||||
AXA S.A. (France) | 3,450 | 86,342 | ||||||||||
BB Seguridade Participacoes S.A. (Brazil) | 4,900 | 35,063 | ||||||||||
|
| |||||||||||
| 188,241 | ||||||||||||
|
| |||||||||||
Thrifts & Mortgage Finance - 0.0%## | ||||||||||||
Aareal Bank AG (Germany) | 2,580 | 95,979 | ||||||||||
|
| |||||||||||
Total Financials | 18,494,173 | |||||||||||
|
| |||||||||||
Health Care - 11.1% | ||||||||||||
Biotechnology - 4.1% | ||||||||||||
BioMarin Pharmaceutical, Inc.* | 50,630 | 4,666,567 | ||||||||||
Incyte Corp.* | 131,960 | 8,553,647 | ||||||||||
Regeneron Pharmaceuticals, Inc.* | 10,985 | 3,726,551 | ||||||||||
Seattle Genetics, Inc.* | 58,925 | 3,307,460 | ||||||||||
Vertex Pharmaceuticals, Inc.* | 14,320 | 2,426,667 | ||||||||||
|
| |||||||||||
| 22,680,892 | ||||||||||||
|
| |||||||||||
Health Care Equipment & Supplies - 1.5% | ||||||||||||
Coloplast A/S - Class B (Denmark) | 1,420 | 132,505 | ||||||||||
EssilorLuxottica (France) | 995 | 135,895 | ||||||||||
Hoya Corp. (Japan) | 1,300 | 73,549 | ||||||||||
Medtronic plc | 81,760 | 7,343,683 | ||||||||||
Shandong Weigao Group Medical Polymer Co. Ltd. - Class H (China) | 75,510 | 67,638 | ||||||||||
Smith & Nephew plc (United Kingdom) | 4,110 | 66,807 | ||||||||||
Sonova Holding AG (Switzerland) | 425 | 69,311 | ||||||||||
Terumo Corp. (Japan) | 2,600 | 140,353 | ||||||||||
William Demant Holding A/S (Denmark)* | 2,140 | 70,345 | ||||||||||
|
| |||||||||||
| 8,100,086 | ||||||||||||
|
| |||||||||||
Health Care Providers & Services - 0.8% | ||||||||||||
DaVita, Inc.* | 67,710 | 4,559,592 | ||||||||||
|
| |||||||||||
The accompanying notes are an integral part of the financial statements.
61
Investment Portfolio - October 31, 2018
| PRO-BLEND® EXTENDED TERM SERIES | SHARES | VALUE (NOTE 2) | ||||||||||
COMMON STOCKS (continued) | ||||||||||||
Health Care (continued) | ||||||||||||
Life Sciences Tools & Services - 0.0%## | ||||||||||||
QIAGEN N.V.* | 2,432 | $ | 88,282 | |||||||||
QIAGEN N.V.* | 3,469 | 125,920 | ||||||||||
Tecan Group AG (Switzerland) | 235 | 53,013 | ||||||||||
|
| |||||||||||
| 267,215 | ||||||||||||
|
| |||||||||||
Pharmaceuticals - 4.7% | ||||||||||||
Astellas Pharma, Inc. (Japan) | 4,400 | 67,981 | ||||||||||
Bristol-Myers Squibb Co. | 56,122 | 2,836,406 | ||||||||||
Chugai Pharmaceutical Co. Ltd. (Japan) | 2,300 | 134,658 | ||||||||||
Johnson & Johnson1 | 46,620 | 6,526,334 | ||||||||||
Merck & Co., Inc. | 48,020 | 3,534,752 | ||||||||||
Merck KGaA (Germany) | 29,730 | 3,181,190 | ||||||||||
Novartis AG - ADR (Switzerland) | 102,290 | 8,946,283 | ||||||||||
Novartis AG (Switzerland) | 3,070 | 268,847 | ||||||||||
Novo Nordisk A/S - Class B (Denmark) | 1,605 | 69,314 | ||||||||||
Perrigo Co. plc | 3,320 | 233,396 | ||||||||||
Sanofi (France) | 1,790 | 159,955 | ||||||||||
|
| |||||||||||
| 25,959,116 | ||||||||||||
|
| |||||||||||
Total Health Care | 61,566,901 | |||||||||||
|
| |||||||||||
Industrials - 2.3% | ||||||||||||
Aerospace & Defense - 0.1% | ||||||||||||
Airbus S.E. (France) | 955 | 105,541 | ||||||||||
BAE Systems plc (United Kingdom) | 22,055 | 147,885 | ||||||||||
MTU Aero Engines AG (Germany) | 330 | 70,069 | ||||||||||
Safran S.A. (France) | 550 | 71,075 | ||||||||||
Thales S.A. (France) | 155 | 19,796 | ||||||||||
|
| |||||||||||
| 414,366 | ||||||||||||
|
| |||||||||||
Air Freight & Logistics - 0.7% | ||||||||||||
FedEx Corp. | 17,410 | 3,836,119 | ||||||||||
|
| |||||||||||
Airlines - 0.0%## | ||||||||||||
Ryanair Holdings plc - ADR (Ireland)* | 961 | 79,571 | ||||||||||
|
| |||||||||||
Building Products - 0.0%## | ||||||||||||
Cie de Saint-Gobain (France) | 775 | 29,195 | ||||||||||
TOTO Ltd. (Japan) | 1,900 | 67,975 | ||||||||||
|
| |||||||||||
| 97,170 | ||||||||||||
|
| |||||||||||
Commercial Services & Supplies - 0.0%## | ||||||||||||
Secom Co. Ltd. (Japan) | 800 | 65,497 | ||||||||||
|
| |||||||||||
Construction & Engineering - 0.1% | ||||||||||||
FLSmidth & Co. A/S (Denmark) | 561 | 29,436 | ||||||||||
Vinci S.A. (France) | 2,830 | 251,867 | ||||||||||
|
| |||||||||||
| 281,303 | ||||||||||||
|
| |||||||||||
Electrical Equipment - 0.0%## | ||||||||||||
Schneider Electric SE (France) | 955 | 69,057 | ||||||||||
|
| |||||||||||
Industrial Conglomerates - 0.0%## | ||||||||||||
Siemens AG (Germany) | 1,730 | 198,857 | ||||||||||
|
| |||||||||||
Machinery - 0.3% | ||||||||||||
Epiroc AB - Class A (Sweden)* | 13,515 | 118,681 | ||||||||||
FANUC Corp. (Japan) | 570 | 99,161 | ||||||||||
Hoshizaki Corp. (Japan) | 1,500 | 121,081 | ||||||||||
Hyundai Heavy Industries Co. Ltd. (South Korea)* | 950 | 104,503 | ||||||||||
Hyundai Mipo Dockyard Co. Ltd. (South Korea)* | 1,230 | 102,017 | ||||||||||
Jungheinrich AG (Germany) | 2,940 | 97,407 | ||||||||||
KION Group AG (Germany) | 2,545 | 148,719 | ||||||||||
Kone OYJ - Class B (Finland) | 1,390 | 67,657 | ||||||||||
Makita Corp. (Japan) | 1,700 | 58,773 | ||||||||||
Metso OYJ (Finland) | 4,039 | 127,518 | ||||||||||
MISUMI Group, Inc. (Japan) | 3,500 | 70,143 | ||||||||||
Samsung Heavy Industries Co. Ltd. (South Korea)* | 8,205 | 50,340 | ||||||||||
Schindler Holding AG (Switzerland) | 660 | 139,170 | ||||||||||
WEG S.A. (Brazil) | 6,100 | 29,521 | ||||||||||
The Weir Group plc (United Kingdom) | 13,170 | 266,515 | ||||||||||
|
| |||||||||||
| 1,601,206 | ||||||||||||
|
| |||||||||||
Professional Services - 0.5% | ||||||||||||
Equifax, Inc. | 21,395 | 2,170,309 | ||||||||||
Experian plc (United Kingdom) | 2,910 | 66,928 | ||||||||||
Recruit Holdings Co. Ltd. (Japan) | 5,600 | 150,302 | ||||||||||
Teleperformance (France) | 395 | 65,053 | ||||||||||
Wolters Kluwer N.V. (Netherlands) | 1,170 | 66,379 | ||||||||||
|
| |||||||||||
| 2,518,971 | ||||||||||||
|
| |||||||||||
Road & Rail - 0.5% | ||||||||||||
Canadian National Railway Co. (Canada) | 825 | 70,527 | ||||||||||
Genesee & Wyoming, Inc. - Class A* | 36,460 | 2,888,726 | ||||||||||
|
| |||||||||||
| 2,959,253 | ||||||||||||
|
| |||||||||||
Trading Companies & Distributors - 0.1% | ||||||||||||
Ashtead Group plc (United Kingdom) | 3,990 | 98,500 | ||||||||||
Brenntag AG (Germany) | 1,502 | 78,441 | ||||||||||
Kanamoto Co. Ltd. (Japan) | 3,000 | 100,247 | ||||||||||
|
| |||||||||||
| 277,188 | ||||||||||||
|
| |||||||||||
The accompanying notes are an integral part of the financial statements.
62
Investment Portfolio - October 31, 2018
| PRO-BLEND® EXTENDED TERM SERIES | SHARES | VALUE (NOTE 2) | ||||||||||
COMMON STOCKS (continued) | ||||||||||||
Industrials (continued) | ||||||||||||
Transportation Infrastructure - 0.0%## | ||||||||||||
Grupo Aeroportuario del Centro Norte S.A.B. de C.V. (Mexico) | 11,100 | $ | 58,136 | |||||||||
Grupo Aeroportuario del Pacifico S.A.B. de C.V. - ADR (Mexico) | 715 | 59,259 | ||||||||||
|
| |||||||||||
| 117,395 | ||||||||||||
|
| |||||||||||
Total Industrials | 12,515,953 | |||||||||||
|
| |||||||||||
Information Technology - 8.3% | ||||||||||||
Electronic Equipment, Instruments & Components - 0.1% |
| |||||||||||
Halma plc (United Kingdom) | 6,520 | 110,647 | ||||||||||
Hexagon A.B. - Class B (Sweden) | 3,045 | 149,033 | ||||||||||
Keyence Corp. (Japan) | 718 | 350,757 | ||||||||||
Yokogawa Electric Corp. (Japan) | 3,500 | 68,719 | ||||||||||
|
| |||||||||||
| 679,156 | ||||||||||||
|
| |||||||||||
IT Services - 4.0% | ||||||||||||
Amadeus IT Group S.A. (Spain) | 835 | 67,238 | ||||||||||
Amdocs Ltd. | 4,835 | 305,911 | ||||||||||
Capgemini SE (France) | 240 | 29,305 | ||||||||||
InterXion Holding N.V. (Netherlands)* | 53,055 | 3,123,348 | ||||||||||
LiveRamp Holdings, Inc.* | 89,990 | 4,110,743 | ||||||||||
Mastercard, Inc. - Class A | 40,260 | 7,958,194 | ||||||||||
Nomura Research Institute Ltd. (Japan) | 3,200 | 141,867 | ||||||||||
Obic Co. Ltd. (Japan) | 1,700 | 154,768 | ||||||||||
Otsuka Corp. (Japan) | 2,100 | 69,655 | ||||||||||
Visa, Inc. - Class A1 | 45,930 | 6,331,450 | ||||||||||
|
| |||||||||||
| 22,292,479 | ||||||||||||
|
| |||||||||||
Semiconductors & Semiconductor Equipment - 2.1% |
| |||||||||||
Qorvo, Inc.* | 115,800 | 8,512,458 | ||||||||||
Skyworks Solutions, Inc. | 31,535 | 2,735,977 | ||||||||||
|
| |||||||||||
| 11,248,435 | ||||||||||||
|
| |||||||||||
Software - 2.1% | ||||||||||||
Check Point Software Technologies Ltd. (Israel)* | 1,250 | 138,750 | ||||||||||
Dassault Systemes S.E. (France) | 235 | 29,418 | ||||||||||
Microsoft Corp. | 76,170 | 8,135,718 | ||||||||||
Oracle Corp. (Japan) | 1,000 | 67,689 | ||||||||||
SAP SE (Germany) | 635 | 67,991 | ||||||||||
ServiceNow, Inc.* | 16,530 | 2,992,591 | ||||||||||
Trend Micro, Inc. (Japan) | 2,500 | 143,915 | ||||||||||
|
| |||||||||||
| 11,576,072 | ||||||||||||
|
| |||||||||||
Total Information Technology | 45,796,142 | |||||||||||
|
| |||||||||||
Materials - 2.3% | ||||||||||||
Chemicals - 0.2% | ||||||||||||
Air Liquide S.A. (France) | 710 | 85,829 | ||||||||||
Akzo Nobel N.V. (Netherlands) | 2,965 | 248,955 | ||||||||||
Asahi Kasei Corp. (Japan) | 5,800 | 69,591 | ||||||||||
Croda International plc (United Kingdom) | 2,395 | 147,521 | ||||||||||
FUCHS PETROLUB S.E. (Germany) | 795 | 36,800 | ||||||||||
Givaudan S.A. (Switzerland) | 30 | 72,718 | ||||||||||
Mexichem S.A.B. de C.V. (Mexico) | 43,215 | 113,030 | ||||||||||
Nissan Chemical Corp. (Japan) | 1,400 | 66,012 | ||||||||||
Novozymes A/S - Class B (Denmark) | 1,405 | 69,386 | ||||||||||
Solvay S.A. (Belgium) | 1,925 | 219,270 | ||||||||||
|
| |||||||||||
| 1,129,112 | ||||||||||||
|
| |||||||||||
Containers & Packaging - 1.9% | ||||||||||||
Ball Corp. | 156,260 | 7,000,448 | ||||||||||
DS Smith plc (United Kingdom) | 29,748 | 149,264 | ||||||||||
Sealed Air Corp. | 106,560 | 3,448,282 | ||||||||||
|
| |||||||||||
| 10,597,994 | ||||||||||||
|
| |||||||||||
Metals & Mining - 0.2% | ||||||||||||
Antofagasta plc (Chile) | 24,905 | 249,300 | ||||||||||
First Quantum Minerals Ltd. (Zambia) | 15,080 | 150,519 | ||||||||||
Lundin Mining Corp. (Chile) | 33,600 | 138,080 | ||||||||||
Southern Copper Corp. (Peru) | 4,050 | 155,277 | ||||||||||
|
| |||||||||||
| 693,176 | ||||||||||||
|
| |||||||||||
Total Materials | 12,420,282 | |||||||||||
|
| |||||||||||
Real Estate - 3.8% | ||||||||||||
Equity Real Estate Investment Trusts (REITS) - 3.8% |
| |||||||||||
Acadia Realty Trust | 2,080 | 57,907 | ||||||||||
Agree Realty Corp. | 1,240 | 71,015 | ||||||||||
Alexandria Real Estate Equities, Inc. | 455 | 55,615 | ||||||||||
American Campus Communities, Inc. | 1,545 | 61,043 | ||||||||||
American Homes 4 Rent - Class A | 11,180 | 235,563 | ||||||||||
American Tower Corp. | 20,005 | 3,116,979 | ||||||||||
Americold Realty Trust | 2,270 | 56,182 | ||||||||||
Apartment Investment & Management Co. - Class A | 4,570 | 196,693 | ||||||||||
Apple Hospitality REIT, Inc. | 6,185 | 100,011 | ||||||||||
AvalonBay Communities, Inc. | 2,860 | 501,587 | ||||||||||
Boston Properties, Inc. | 2,870 | 346,581 | ||||||||||
Brandywine Realty Trust | 15,030 | 211,322 | ||||||||||
CatchMark Timber Trust, Inc. - Class A | 4,363 | 38,613 | ||||||||||
The accompanying notes are an integral part of the financial statements.
63
Investment Portfolio - October 31, 2018
| PRO-BLEND® EXTENDED TERM SERIES | PRINCIPAL AMOUNT3 | VALUE (NOTE 2) | ||||||||||
COMMON STOCKS (continued) | ||||||||||||
Real Estate (continued) | ||||||||||||
Equity Real Estate Investment Trusts (REITS) (continued) |
| |||||||||||
Chesapeake Lodging Trust | 2,840 | $ | 83,468 | |||||||||
Colony Capital, Inc. | 12,890 | 75,664 | ||||||||||
Community Healthcare Trust, Inc. | 3,720 | 110,558 | ||||||||||
CoreCivic, Inc. | 6,965 | 156,434 | ||||||||||
Cousins Properties, Inc. | 26,165 | 217,431 | ||||||||||
Crown Castle International Corp. | 1,565 | 170,178 | ||||||||||
CubeSmart | 1,645 | 47,672 | ||||||||||
Digital Realty Trust, Inc. | 3,175 | 327,850 | ||||||||||
EastGroup Properties, Inc. | 540 | 51,727 | ||||||||||
Equinix, Inc. | 11,125 | 4,213,482 | ||||||||||
Equity LifeStyle Properties, Inc. | 1,415 | 133,986 | ||||||||||
Equity Residential | 5,660 | 367,674 | ||||||||||
Essex Property Trust, Inc. | 950 | 238,241 | ||||||||||
Extra Space Storage, Inc. | 1,360 | 122,482 | ||||||||||
Federal Realty Investment Trust | 470 | 58,304 | ||||||||||
First Industrial Realty Trust, Inc. | 3,070 | 94,249 | ||||||||||
Getty Realty Corp. | 3,835 | 102,893 | ||||||||||
HCP, Inc. | 7,245 | 199,600 | ||||||||||
Healthcare Realty Trust, Inc. | 4,165 | 116,037 | ||||||||||
Healthcare Trust of America, Inc. - Class A | 4,730 | 124,210 | ||||||||||
Hibernia REIT plc (Ireland) | 61,450 | 96,745 | ||||||||||
Host Hotels & Resorts, Inc. | 11,405 | 217,950 | ||||||||||
Independence Realty Trust, Inc. | 10,700 | 106,037 | ||||||||||
Invitation Homes, Inc. | 9,683 | 211,864 | ||||||||||
Jernigan Capital, Inc. | 5,975 | 116,931 | ||||||||||
Kimco Realty Corp. | 5,275 | 84,875 | ||||||||||
Lamar Advertising Co. - Class A | 1,055 | 77,353 | ||||||||||
Lexington Realty Trust | 10,805 | 83,955 | ||||||||||
Liberty Property Trust | 4,935 | 206,628 | ||||||||||
The Macerich Co. | 825 | 42,586 | ||||||||||
Mid-America Apartment Communities, Inc. | 1,940 | 189,557 | ||||||||||
National Retail Properties, Inc. | 2,095 | 97,941 | ||||||||||
National Storage Affiliates Trust | 1,790 | 47,668 | ||||||||||
Outfront Media, Inc. | 3,270 | 57,944 | ||||||||||
Physicians Realty Trust | 15,960 | 264,617 | ||||||||||
Plymouth Industrial REIT, Inc. | 4,255 | 59,570 | ||||||||||
Prologis, Inc. | 7,480 | 482,236 | ||||||||||
Public Storage | 1,570 | 322,588 | ||||||||||
Realty Income Corp. | 985 | 59,366 | ||||||||||
SBA Communications Corp.* | 19,170 | 3,108,799 | ||||||||||
Simon Property Group, Inc. | 3,515 | 645,073 | ||||||||||
STAG Industrial, Inc. | 4,875 | 128,992 | ||||||||||
STORE Capital Corp. | 2,005 | 58,205 | ||||||||||
Sun Communities, Inc. | 2,500 | 251,175 | ||||||||||
Sunstone Hotel Investors, Inc. | 8,760 | 126,757 | ||||||||||
Tier REIT, Inc. | 8,920 | 193,296 | ||||||||||
UDR, Inc. | 6,030 | 236,316 | ||||||||||
UMH Properties, Inc. | 4,475 | 64,127 | ||||||||||
Unibail-Rodamco-Westfield (France) | 1,370 | 247,913 | ||||||||||
Urban Edge Properties | 10,675 | 218,731 | ||||||||||
Ventas, Inc. | 2,180 | 126,527 | ||||||||||
VEREIT, Inc. | 19,775 | 144,951 | ||||||||||
Vornado Realty Trust | 3,140 | 213,771 | ||||||||||
Weingarten Realty Investors | 5,170 | 145,380 | ||||||||||
Welltower, Inc. | 2,335 | 154,273 | ||||||||||
|
| |||||||||||
| 20,951,948 | ||||||||||||
|
| |||||||||||
Real Estate Management & Development - 0.0%## |
| |||||||||||
Daito Trust Construction Co. Ltd. (Japan) | 500 | 65,919 | ||||||||||
StorageVault Canada, Inc. (Canada) | 16,475 | 32,288 | ||||||||||
|
| |||||||||||
| 98,207 | ||||||||||||
|
| |||||||||||
Total Real Estate | 21,050,155 | |||||||||||
|
| |||||||||||
Utilities - 0.1% | ||||||||||||
Independent Power and Renewable Electricity Producers - 0.1% |
| |||||||||||
China Longyuan Power Group Corp. Ltd. - Class H (China) | 28,000 | 21,308 | ||||||||||
Engie Brasil Energia S.A. (Brazil) | 2,800 | 29,945 | ||||||||||
Huaneng Renewables Corp. Ltd. - Class H (China) | 357,937 | 92,124 | ||||||||||
|
| |||||||||||
| 143,377 | ||||||||||||
|
| |||||||||||
Multi-Utilities - 0.0%## | ||||||||||||
Engie S.A. (France) | 2,945 | 39,131 | ||||||||||
|
| |||||||||||
Water Utilities - 0.0%## | ||||||||||||
Guangdong Investment Ltd. (China) | 76,000 | 136,060 | ||||||||||
|
| |||||||||||
Total Utilities | 318,568 | |||||||||||
|
| |||||||||||
TOTAL COMMON STOCKS | 274,035,005 | |||||||||||
|
| |||||||||||
CORPORATE BONDS - 13.2% | ||||||||||||
Non-Convertible Corporate Bonds - 13.2% | ||||||||||||
Communication Services - 1.7% | ||||||||||||
Diversified Telecommunication Services - 1.0% |
| |||||||||||
AT&T, Inc., 4.25%, 3/1/2027 | 2,280,000 | $ | 2,211,059 | |||||||||
Verizon Communications, Inc., 5.50%, 3/16/2047 | 3,360,000 | 3,501,030 | ||||||||||
|
| |||||||||||
| 5,712,089 | ||||||||||||
|
| |||||||||||
The accompanying notes are an integral part of the financial statements.
64
Investment Portfolio - October 31, 2018
| PRO-BLEND® EXTENDED TERM SERIES | PRINCIPAL AMOUNT3 | VALUE (NOTE 2) | ||||||||||
CORPORATE BONDS (continued) | ||||||||||||
Non-Convertible Corporate Bonds (continued) | ||||||||||||
Communication Services (continued) | ||||||||||||
Media - 0.6% | ||||||||||||
Altice US Finance I Corp.2, 5.50%, 5/15/2026 | 200,000 | $ | 194,812 | |||||||||
CCO Holdings LLC - CCO Holdings Capital Corp.2, 5.50%, 5/1/2026 | 175,000 | 170,625 | ||||||||||
Cequel Communications Holdings I LLC - Cequel Capital Corp.2, 7.50%, 4/1/2028 | 200,000 | 207,294 | ||||||||||
Discovery Communications LLC, 5.20%, 9/20/2047 | 2,480,000 | 2,293,720 | ||||||||||
Telenet Finance Luxembourg Notes S.A.R.L (Belgium)2, 5.50%, 3/1/2028 | 400,000 | 371,000 | ||||||||||
UPCB Finance IV Ltd. (Netherlands)2, 5.375%, 1/15/2025 | 120,000 | 116,760 | ||||||||||
|
| |||||||||||
| 3,354,211 | ||||||||||||
|
| |||||||||||
Wireless Telecommunication Services - 0.1% |
| |||||||||||
Hughes Satellite Systems Corp., 5.25%, 8/1/2026 | 310,000 | 294,500 | ||||||||||
Inmarsat Finance plc (United Kingdom)2, 4.875%, 5/15/2022 | 120,000 | 117,542 | ||||||||||
Sprint Communications, Inc.2, 9.00%, 11/15/2018 | 73,000 | 73,146 | ||||||||||
Sprint Communications, Inc. 2, 7.00%, 3/1/2020 | 73,000 | 75,646 | ||||||||||
|
| |||||||||||
| 560,834 | ||||||||||||
|
| |||||||||||
Total Communication Services | 9,627,134 | |||||||||||
|
| |||||||||||
Consumer Discretionary - 1.7% | ||||||||||||
Auto Components - 0.0%## | ||||||||||||
Techniplas LLC2, 10.00%, 5/1/2020 | 205,000 | 192,700 | ||||||||||
|
| |||||||||||
Automobiles - 0.4% | ||||||||||||
General Motors Co.4, (3 mo. LIBOR US + 0.900%), 3.227%, 9/10/2021 | 2,180,000 | 2,176,848 | ||||||||||
|
| |||||||||||
Household Durables - 0.3% | ||||||||||||
Century Communities, Inc., 5.875%, 7/15/2025 | 340,000 | 307,700 | ||||||||||
LGI Homes, Inc.2, 6.875%, 7/15/2026 | 240,000 | 228,000 | ||||||||||
Meritage Homes Corp., 5.125%, 6/6/2027 | 130,000 | 114,400 | ||||||||||
TRI Pointe Group, Inc. - TRI Pointe Homes, Inc., 4.375%, 6/15/2019 | 215,000 | 215,000 | ||||||||||
TRI Pointe Group, Inc. - TRI Pointe Homes, Inc., 5.875%, 6/15/2024 | 185,000 | 172,744 | ||||||||||
Weekley Homes LLC - Weekley Finance Corp., 6.00%, 2/1/2023 | 155,000 | 148,800 | ||||||||||
Weekley Homes LLC - Weekley Finance Corp., 6.625%, 8/15/2025 | 250,000 | 236,250 | ||||||||||
|
| |||||||||||
| 1,422,894 | ||||||||||||
|
| |||||||||||
Internet & Direct Marketing Retail - 0.6% | ||||||||||||
Booking Holdings, Inc., 3.60%, 6/1/2026 | 3,700,000 | 3,533,647 | ||||||||||
|
| |||||||||||
Multiline Retail - 0.4% | ||||||||||||
Macy’s Retail Holdings, Inc., 7.00%, 2/15/2028 | 1,085,000 | 1,145,775 | ||||||||||
Macy’s Retail Holdings, Inc., 6.90%, 4/1/2029 | 1,090,000 | 1,143,396 | ||||||||||
|
| |||||||||||
| 2,289,171 | ||||||||||||
|
| |||||||||||
Total Consumer Discretionary | 9,615,260 | |||||||||||
|
| |||||||||||
Consumer Staples - 0.0%## | ||||||||||||
Food & Staples Retailing - 0.0%## | ||||||||||||
C&S Group Enterprises LLC2, 5.375%, 7/15/2022 | 125,000 | 120,625 | ||||||||||
|
| |||||||||||
Household Products - 0.0%## | ||||||||||||
First Quality Finance Co., Inc.2, 5.00%, 7/1/2025 | 170,000 | 156,400 | ||||||||||
|
| |||||||||||
Total Consumer Staples | 277,025 | |||||||||||
|
| |||||||||||
Energy - 2.6% | ||||||||||||
Energy Equipment & Services - 0.0%## | ||||||||||||
Shelf Drilling Holdings Ltd. (United Arab Emirates)2, 8.25%, 2/15/2025 | 170,000 | 170,425 | ||||||||||
TerraForm Power Operating, LLC2, 5.00%, 1/31/2028 | 120,000 | 107,250 | ||||||||||
|
| |||||||||||
| 277,675 | ||||||||||||
|
| |||||||||||
Oil, Gas & Consumable Fuels - 2.6% | ||||||||||||
American Midstream Partners LP - American Midstream Finance Corp.2, 9.50%, 12/15/2021 | 175,000 | 171,500 | ||||||||||
Boardwalk Pipelines LP, 5.95%, 6/1/2026 | 3,350,000 | 3,500,456 | ||||||||||
DCP Midstream Operating LP2, 5.35%, 3/15/2020 | 110,000 | 111,237 | ||||||||||
Dynagas LNG Partners LP - Dynagas Finance, Inc. (Monaco), 6.25%, 10/30/2019 | 272,000 | 271,320 | ||||||||||
GasLog Ltd. (Monaco), 8.875%, 3/22/2022 | 295,000 | 305,325 | ||||||||||
The accompanying notes are an integral part of the financial statements.
65
Investment Portfolio - October 31, 2018
| PRO-BLEND® EXTENDED TERM SERIES | PRINCIPAL AMOUNT3 | VALUE (NOTE 2) | ||||||||||
CORPORATE BONDS (continued) | ||||||||||||
Non-Convertible Corporate Bonds (continued) | ||||||||||||
Energy (continued) | ||||||||||||
Oil, Gas & Consumable Fuels (continued) | ||||||||||||
Genesis Energy LP - Genesis Energy Finance Corp., 5.625%, 6/15/2024 | 130,000 | $ | 117,650 | |||||||||
Jonah Energy LLC - Jonah Energy Finance Corp.2, 7.25%, 10/15/2025 | 340,000 | 270,300 | ||||||||||
Kinder Morgan Energy Partners LP, 6.95%, 1/15/2038 | 3,010,000 | 3,447,652 | ||||||||||
Rockies Express Pipeline, LLC2, 5.625%, 4/15/2020 | 135,000 | 137,930 | ||||||||||
Sabine Pass Liquefaction LLC, 5.875%, 6/30/2026 | 3,330,000 | 3,535,206 | ||||||||||
SemGroup Corp., 6.375%, 3/15/2025 | 120,000 | 116,100 | ||||||||||
Seven Generations Energy Ltd. (Canada)2, 5.375%, 9/30/2025 | 166,000 | 154,795 | ||||||||||
Southwestern Energy Co.5, 6.20%, 1/23/2025 | 194,000 | 188,665 | ||||||||||
Tallgrass Energy Partners LP - Tallgrass Energy Finance Corp.2, 5.50%, 9/15/2024 | 120,000 | 120,750 | ||||||||||
W&T Offshore, Inc.2, 9.75%, 11/1/2023 | 165,000 | 159,670 | ||||||||||
The Williams Companies, Inc., 3.75%, 6/15/2027 | 1,720,000 | 1,601,558 | ||||||||||
|
| |||||||||||
| 14,210,114 | ||||||||||||
|
| |||||||||||
Total Energy | 14,487,789 | |||||||||||
|
| |||||||||||
Financials - 4.1% | ||||||||||||
Banks - 2.4% | ||||||||||||
Bank of America Corp., 4.00%, 1/22/2025 | 3,630,000 | 3,535,033 | ||||||||||
Citigroup, Inc., 8.125%, 7/15/2039 | 2,490,000 | 3,476,652 | ||||||||||
JPMorgan Chase & Co., 6.30%, 4/23/2019 | 3,480,000 | 3,536,358 | ||||||||||
Popular, Inc., 6.125%, 9/14/2023 | 180,000 | 182,124 | ||||||||||
Santander Holdings USA, Inc., 4.50%, 7/17/2025 | 2,190,000 | 2,141,482 | ||||||||||
|
| |||||||||||
| 12,871,649 | ||||||||||||
|
| |||||||||||
Capital Markets - 0.7% | ||||||||||||
LPL Holdings, Inc.2, 5.75%, 9/15/2025 | 240,000 | 233,100 | ||||||||||
Morgan Stanley4, (3 mo. LIBOR US + 1.220%), 3.563%, 5/8/2024 | 3,540,000 | 3,577,347 | ||||||||||
|
| |||||||||||
| 3,810,447 | ||||||||||||
|
| |||||||||||
Consumer Finance - 0.1% | ||||||||||||
Ally Financial, Inc., 3.50%, 1/27/2019 | 160,000 | 159,800 | ||||||||||
Navient Corp., 7.25%, 9/25/2023 | 140,000 | 144,900 | ||||||||||
SLM Corp., 5.125%, 4/5/2022 | 220,000 | 218,900 | ||||||||||
|
| |||||||||||
| 523,600 | ||||||||||||
|
| |||||||||||
Diversified Financial Services - 0.5% | ||||||||||||
AerCap Ireland Capital DAC - AerCap Global Aviation Trust (Ireland), 4.45%, 10/1/2025 | 2,260,000 | 2,206,869 | ||||||||||
FS Energy & Power Fund2, 7.50%, 8/15/2023 | 230,000 | 233,220 | ||||||||||
Oxford Finance, LLC - Oxford Finance Co.- Issuer II, Inc.2, 6.375%, 12/15/2022 | 235,000 | 238,231 | ||||||||||
|
| |||||||||||
| 2,678,320 | ||||||||||||
|
| |||||||||||
Insurance - 0.4% | ||||||||||||
Prudential Financial, Inc.6, (3 mo. LIBOR US + 4.175%), 5.875%, 9/15/2042 | 2,260,000 | 2,351,530 | ||||||||||
|
| |||||||||||
Thrifts & Mortgage Finance - 0.0%## | ||||||||||||
Ladder Capital Finance Holdings LLLP - Ladder Capital Finance Corp.2, 5.875%, 8/1/2021 | 150,000 | 151,125 | ||||||||||
|
| |||||||||||
Total Financials | 22,386,671 | |||||||||||
|
| |||||||||||
Health Care - 0.2% | ||||||||||||
Health Care Providers & Services - 0.1% | ||||||||||||
DaVita, Inc., 5.00%, 5/1/2025 | 195,000 | 184,275 | ||||||||||
HCA, Inc., 5.375%, 9/1/2026 | 165,000 | 163,762 | ||||||||||
Ortho-Clinical Diagnostics, Inc. - Ortho-Clinical Diagnostics S.A.2, 6.625%, 5/15/2022 | 170,000 | 163,371 | ||||||||||
|
| |||||||||||
| 511,408 | ||||||||||||
|
| |||||||||||
Pharmaceuticals - 0.1% | ||||||||||||
Horizon Pharma, Inc. - Horizon Pharma USA, Inc.2, 8.75%, 11/1/2024 | 350,000 | 366,625 | ||||||||||
|
| |||||||||||
Total Health Care | 878,033 | |||||||||||
|
| |||||||||||
Industrials - 1.7% | ||||||||||||
Airlines - 0.1% | ||||||||||||
Allegiant Travel Co., 5.50%, 7/15/2019 | 175,000 | 175,875 | ||||||||||
American Airlines Group, Inc.2, 5.50%, 10/1/2019 | 140,000 | 141,533 | ||||||||||
|
| |||||||||||
| 317,408 | ||||||||||||
|
| |||||||||||
The accompanying notes are an integral part of the financial statements.
66
Investment Portfolio - October 31, 2018
| PRO-BLEND® EXTENDED TERM SERIES | PRINCIPAL AMOUNT3 | VALUE (NOTE 2) | ||||||||||||||
CORPORATE BONDS (continued) | ||||||||||||||||
Non-Convertible Corporate Bonds (continued) | ||||||||||||||||
Industrials (continued) | ||||||||||||||||
Commercial Services & Supplies - 0.1% | ||||||||||||||||
The ADT Security Corp., 5.25%, 3/15/2020 | 110,000 | $ | 111,100 | |||||||||||||
Covanta Holding Corp., 6.00%, 1/1/2027 | 155,000 | 149,575 | ||||||||||||||
W/S Packaging Holdings, Inc.2, 9.00%, 4/15/2023 | 235,000 | 239,700 | ||||||||||||||
|
| |||||||||||||||
| 500,375 | ||||||||||||||||
|
| |||||||||||||||
Construction & Engineering - 0.0%## | ||||||||||||||||
Tutor Perini Corp.2, 6.875%, 5/1/2025 | 276,000 | 276,345 | ||||||||||||||
|
| |||||||||||||||
Industrial Conglomerates - 0.3% | ||||||||||||||||
General Electric Co.6,7,(3mo. LIBOR US + 3.330%), 5.00% | 1,670,000 | 1,546,838 | ||||||||||||||
|
| |||||||||||||||
Machinery - 0.4% | ||||||||||||||||
CNH Industrial Capital LLC, 3.375%, 7/15/2019 | 2,410,000 | 2,407,831 | ||||||||||||||
|
| |||||||||||||||
Marine - 0.1% | ||||||||||||||||
Borealis Finance, LLC2, 7.50%, 11/16/2022 | 400,000 | 392,000 | ||||||||||||||
Global Ship Lease, Inc. (United Kingdom)2, 9.875%, 11/15/2022 | 345,000 | 328,612 | ||||||||||||||
|
| |||||||||||||||
| 720,612 | ||||||||||||||||
|
| |||||||||||||||
Trading Companies & Distributors - 0.6% | ||||||||||||||||
Aircastle Ltd., 6.25%, 12/1/2019 | 95,000 | 97,631 | ||||||||||||||
Fortress Transportation & Infrastructure Investors, LLC2, 6.50%, 10/1/2025 | 160,000 | 157,200 | ||||||||||||||
International Lease Finance Corp., 6.25%, 5/15/2019 | 2,528,000 | 2,568,319 | ||||||||||||||
Park Aerospace Holdings Ltd. (Ireland)2, 4.50%, 3/15/2023 | 251,000 | 238,797 | ||||||||||||||
|
| |||||||||||||||
| 3,061,947 | ||||||||||||||||
|
| |||||||||||||||
Transportation Infrastructure - 0.1% | ||||||||||||||||
Eagle Bulk Shipco, LLC, 8.25%, 11/28/2022 | 200,000 | 205,500 | ||||||||||||||
MPC Container Ships Invest B.V. (Norway)4,8, (3 mo. LIBOR US + 4.750%), 7.116%, 9/22/2022 | 200,000 | 203,316 | ||||||||||||||
|
| |||||||||||||||
| 408,816 | ||||||||||||||||
|
| |||||||||||||||
Total Industrials | 9,240,172 | |||||||||||||||
|
| |||||||||||||||
Information Technology - 0.0%## | ||||||||||||||||
Semiconductors & Semiconductor Equipment - 0.0%## |
| |||||||||||||||
MagnaChip Semiconductor Corp. (South Korea), 6.625%, 7/15/2021 | 267,000 | 250,980 | ||||||||||||||
|
| |||||||||||||||
Materials - 0.4% | ||||||||||||||||
Chemicals - 0.1% | ||||||||||||||||
LSB Industries, Inc.2, 9.625%, 5/1/2023 | 210,000 | 217,875 | ||||||||||||||
|
| |||||||||||||||
Containers & Packaging - 0.0%## | ||||||||||||||||
Ardagh Packaging Finance plc - Ardagh Holdings USA, Inc. (Ireland)2, 6.00%, 2/15/2025 | 200,000 | 187,500 | ||||||||||||||
|
| |||||||||||||||
Metals & Mining - 0.3% | ||||||||||||||||
Corp Nacional del Cobre de Chile (Chile)2, 5.625%, 9/21/2035 | 350,000 | 370,955 | ||||||||||||||
Mountain Province Diamonds, Inc. (Canada)2, 8.00%, 12/15/2022 | 295,000 | 299,425 | ||||||||||||||
Northwest Acquisitions ULC - Dominion Finco, Inc.2, 7.125%, 11/1/2022 | 295,000 | 297,021 | ||||||||||||||
Southern Copper Corp. (Peru), 5.375%, 4/16/2020 | 610,000 | 626,566 | ||||||||||||||
|
| |||||||||||||||
| 1,593,967 | ||||||||||||||||
|
| |||||||||||||||
Total Materials | 1,999,342 | |||||||||||||||
|
| |||||||||||||||
Real Estate - 0.6% | ||||||||||||||||
Equity Real Estate Investment Trusts (REITS) - 0.6% |
| |||||||||||||||
American Homes 4 Rent LP, 4.25%, 2/15/2028 | 2,470,000 | 2,334,730 | ||||||||||||||
Greystar Real Estate Partners, LLC2, 5.75%, 12/1/2025 | 185,000 | 179,450 | ||||||||||||||
GTP Acquisition Partners I LLC2, 2.35%, 6/15/2020 | 427,000 | 417,486 | ||||||||||||||
iStar, Inc., 5.25%, 9/15/2022 | 198,000 | 191,565 | ||||||||||||||
|
| |||||||||||||||
Total Real Estate | 3,123,231 | |||||||||||||||
|
| |||||||||||||||
Utilities - 0.2% | ||||||||||||||||
Gas Utilities - 0.0%## | ||||||||||||||||
NGL Energy Partners LP - NGL Energy Finance Corp., 6.125%, 3/1/2025 | 190,000 | 172,900 | ||||||||||||||
|
| |||||||||||||||
Independent Power and Renewable Electricity Producers - 0.2% |
| |||||||||||||||
Atlantica Yield plc (Spain)2, 7.00%, 11/15/2019 | 506,000 | 521,180 | ||||||||||||||
Clearway Energy Operating, LLC, 5.00%, 9/15/2026 | 125,000 | 116,250 | ||||||||||||||
The accompanying notes are an integral part of the financial statements.
67
Investment Portfolio - October 31, 2018
| PRO-BLEND® EXTENDED TERM SERIES | PRINCIPAL AMOUNT3/ SHARES | VALUE (NOTE 2) | ||||||||||
CORPORATE BONDS (continued) | ||||||||||||
Non-Convertible Corporate Bonds (continued) | ||||||||||||
Utilities (continued) | ||||||||||||
Independent Power and Renewable Electricity Producers (continued) | ||||||||||||
Drax Finco plc (United Kingdom)2, 6.625%, 11/1/2025 | 245,000 | $ | 244,387 | |||||||||
|
| |||||||||||
Total Utilities | 1,054,717 | |||||||||||
|
| |||||||||||
TOTAL CORPORATE BONDS | 72,940,354 | |||||||||||
|
| |||||||||||
MUTUAL FUNDS - 0.1% | ||||||||||||
iShares MSCI Thailand ETF | 4,480 | 388,416 | ||||||||||
iShares U.S. Real Estate ETF | 2,190 | 171,061 | ||||||||||
|
| |||||||||||
TOTAL MUTUAL FUNDS | 559,477 | |||||||||||
|
| |||||||||||
U.S. TREASURY SECURITIES - 20.2% | ||||||||||||
U.S. Treasury Bonds - 6.1% | ||||||||||||
U.S. Treasury Bond, 6.25%, 5/15/2030 | 4,599,000 | 5,954,088 | ||||||||||
U.S. Treasury Bond, 4.75%, 2/15/2037 | 7,419,000 | 8,932,360 | ||||||||||
U.S. Treasury Bond, 2.50%, 2/15/2045 | 8,578,000 | 7,229,981 | ||||||||||
U.S. Treasury Bond, 3.00%, 5/15/2047 | 9,305,000 | 8,618,393 | ||||||||||
U.S. Treasury Inflation Indexed Bond, 0.75%, 2/15/2042 | 3,155,932 | 2,803,232 | ||||||||||
|
| |||||||||||
Total U.S. Treasury Bonds | 33,538,054 | |||||||||||
|
| |||||||||||
U.S. Treasury Notes - 14.1% | ||||||||||||
U.S. Treasury Inflation Indexed Note, 0.125%, 4/15/2020 | 16,673,978 | 16,389,782 | ||||||||||
U.S. Treasury Inflation Indexed Note, 0.125%, 1/15/2023 | 3,028,405 | 2,915,615 | ||||||||||
U.S. Treasury Note, 1.625%, 4/30/2019 | 5,890,000 | 5,864,922 | ||||||||||
U.S. Treasury Note, 1.625%, 4/30/2023 | 6,050,000 | 5,705,670 | ||||||||||
U.S. Treasury Note, 2.125%, 7/31/2024 | 13,399,000 | 12,758,360 | ||||||||||
U.S. Treasury Note, 2.125%, 5/15/2025 | 11,215,000 | 10,587,661 | ||||||||||
U.S. Treasury Note, 1.625%, 5/15/2026 | 6,599,000 | 5,948,380 | ||||||||||
U.S. Treasury Note, 2.375%, 5/15/2027 | 6,465,000 | 6,102,101 | ||||||||||
U.S. Treasury Note, 2.75%, 2/15/2028 | 12,135,000 | 11,743,457 | ||||||||||
|
| |||||||||||
Total U.S. Treasury Notes | 78,015,948 | |||||||||||
|
| |||||||||||
TOTAL U.S. TREASURY SECURITIES | 111,554,002 | |||||||||||
|
| |||||||||||
| PRO-BLEND® EXTENDED TERM SERIES | PRINCIPAL AMOUNT3 | VALUE (NOTE 2) | ||||||||||
ASSET-BACKED SECURITIES - 2.9% | ||||||||||||
Cazenovia Creek Funding I LLC, Series 2015-1A, Class A2, 2.00%, 12/10/2023 | 80,310 | 80,135 | ||||||||||
Cazenovia Creek Funding II LLC, Series 2018-1A, Class A2, 3.561%, 7/15/2030 | 1,279,300 | 1,273,615 | ||||||||||
Chesapeake Funding II LLC, Series 2017-2A, Class A12, 1.99%, 5/15/2029 | 5,084,945 | 5,033,151 | ||||||||||
Chesapeake Funding II LLC, Series 2017-4A, Class A12, 2.12%, 11/15/2029 | 1,332,924 | 1,315,171 | ||||||||||
Credit Acceptance Auto Loan Trust, Series 2017-1A, Class A2, 2.56%, 10/15/2025 | 1,224,000 | 1,217,563 | ||||||||||
Invitation Homes Trust, Series 2017-SFR2, Class A2,4, (1 mo. LIBOR US + 0.850%), 3.14%, 12/17/2036 | 521,129 | 521,617 | ||||||||||
Invitation Homes Trust, Series 2017-SFR2, Class B2,4, (1 mo. LIBOR US + 1.150%), 3.44%, 12/17/2036 | 390,000 | 392,568 | ||||||||||
SoFi Consumer Loan Program LLC, Series 2017-5, Class A12, 2.14%, 9/25/2026 | 747,482 | 743,978 | ||||||||||
SoFi Professional Loan Program LLC, Series 2017-A, Class A2A2, 1.55%, 3/26/2040 | 329,841 | 327,221 | ||||||||||
SoFi Professional Loan Program LLC, Series 2017-F, Class A1FX2, 2.05%, 1/25/2041 | 333,464 | 330,004 | ||||||||||
SoFi Professional Loan Program LLC, Series 2017-F, Class A2FX2, 2.84%, 1/25/2041 | 300,000 | 290,868 | ||||||||||
SoFi Professional Loan Program LLC, Series 2018-A, Class A2A2, 2.39%, 2/25/2042 | 754,266 | 746,413 | ||||||||||
SoFi Professional Loan Program LLC, Series 2018-C, Class A1FX2, 3.08%, 1/25/2048 | 1,939,872 | 1,934,177 | ||||||||||
The accompanying notes are an integral part of the financial statements.
68
Investment Portfolio - October 31, 2018
| PRO-BLEND® EXTENDED TERM SERIES | PRINCIPAL AMOUNT3 | VALUE (NOTE 2) | ||||||||||
ASSET-BACKED SECURITIES (continued) | ||||||||||||
South Carolina Student Loan Corp., Series 2005, Class A34, (3 mo. LIBOR US + 0.140%), 2.461%, 12/1/2023 | 144,144 | $ | 144,141 | |||||||||
Tax Ease Funding LLC, Series 2016-1A, Class A2, 3.131%, 6/15/2028 | 226,418 | 225,636 | ||||||||||
Tricon American Homes Trust, Series 2016-SFR1, Class A2, 2.589%, 11/1/2033 | 873,246 | 840,879 | ||||||||||
Tricon American Homes Trust, Series 2017-SFR2, Class A2, 2.928%, 1/1/2036 | 998,934 | 953,321 | ||||||||||
|
| |||||||||||
TOTAL ASSET-BACKED SECURITIES | 16,370,458 | |||||||||||
|
| |||||||||||
COMMERCIAL MORTGAGE-BACKED SECURITIES - 5.3% | ||||||||||||
Americold LLC Trust, Series 2010-ARTA, Class A12, 3.847%, 1/11/2029 | 85,030 | 85,414 | ||||||||||
BWAY Mortgage Trust, Series 2015-1740, Class A2, 2.917%, 1/1/2035 | 2,411,000 | 2,300,408 | ||||||||||
Credit Suisse Mortgage Capital Trust, Series 2013-IVR3, Class A12,9, 2.50%, 5/1/2043 | 607,450 | 560,071 | ||||||||||
Credit Suisse Mortgage Capital Trust, Series 2013-TH1, Class A12,9, 2.13%, 2/1/2043 | 561,475 | 508,895 | ||||||||||
Fannie Mae REMICS, Series 2018-31, Class KP, 3.50%, 7/1/2047 | 983,388 | 970,358 | ||||||||||
FDIC Trust, Series 2011-R1, Class A2, 2.672%, 7/1/2026 | 169,319 | 168,414 | ||||||||||
Freddie Mac Multifamily Structured Pass-Through Certificates, Series K009, Class X1 (IO)9, 1.444%, 8/1/2020 | 7,926,935 | 142,847 | ||||||||||
Freddie Mac Multifamily Structured Pass-Through Certificates, Series K014, Class X1 (IO)9, 1.149%, 4/1/2021 | 9,034,864 | 220,713 | ||||||||||
Freddie Mac Multifamily Structured Pass-Through Certificates, Series K016, Class X1 (IO)9, 1.501%, 10/1/2021 | 3,916,821 | 144,144 | ||||||||||
Freddie Mac Multifamily Structured Pass-Through Certificates, Series K017, Class X1 (IO)9, 1.452%, 12/1/2021 | 16,147,799 | 538,528 | ||||||||||
Freddie Mac Multifamily Structured Pass-Through Certificates, Series K021, Class X1 (IO)9, 1.578%, 6/1/2022 | 10,927,353 | 472,257 | ||||||||||
Freddie Mac Multifamily Structured Pass-Through Certificates, Series K030, Class X1 (IO)9, 0.199%, 4/1/2023 | 43,982,265 | 339,789 | ||||||||||
Freddie Mac Multifamily Structured Pass-Through Certificates, Series K032, Class X1 (IO)9, 0.105%, 5/1/2023 | 28,240,114 | 133,217 | ||||||||||
Freddie Mac Multifamily Structured Pass-Through Certificates, Series KP01, Class A2, 1.72%, 1/1/2019 | 24,103 | 24,060 | ||||||||||
Freddie Mac REMICS, Series 4791, Class BA, 4.00%, 3/1/2044 | 1,236,272 | 1,253,492 | ||||||||||
Freddie Mac REMICS, Series 4801, Class BA, 4.50%, 5/1/2044 | 1,282,310 | 1,319,426 | ||||||||||
FREMF Mortgage Trust, Series 2013-K28, Class X2A (IO)2, 0.10%, 6/1/2046 | 77,684,328 | 264,593 | ||||||||||
FREMF Mortgage Trust, Series 2013-K712, Class B2,9, 3.358%, 5/1/2045 | 767,000 | 765,742 | ||||||||||
FREMF Mortgage Trust, Series 2013-K713, Class B2,9, 3.263%, 4/1/2046 | 1,350,000 | 1,344,376 | ||||||||||
FREMF Mortgage Trust, Series 2014-K41, Class B2,9, 3.832%, 11/1/2047 | 1,315,000 | 1,287,796 | ||||||||||
FREMF Mortgage Trust, Series 2014-K503, Class B2,9, 3.139%, 10/1/2047 | 1,325,000 | 1,320,548 | ||||||||||
FREMF Mortgage Trust, Series 2014-K715, Class B2,9, 3.978%, 2/1/2046 | 1,279,000 | 1,288,647 | ||||||||||
GAHR Commercial Mortgage Trust, Series 2015-NRF, Class BFX2,9, 3.495%, 12/1/2034 | 1,535,000 | 1,530,248 | ||||||||||
Government National Mortgage Association, Series 2017-54, Class AH, 2.60%, 12/1/2056 | 1,477,379 | 1,353,450 | ||||||||||
GS Mortgage Securities Trust, Series 2010-C2, Class A12, 3.849%, 12/1/2043 | 46,765 | 47,055 | ||||||||||
JP Morgan Mortgage Trust, Series 2013-1, Class 1A22,9, 3.00%, 3/1/2043 | 396,324 | 375,528 | ||||||||||
JP Morgan Mortgage Trust, Series 2013-2, Class A22,9, 3.50%, 5/1/2043 | 340,797 | 328,878 | ||||||||||
The accompanying notes are an integral part of the financial statements.
69
Investment Portfolio - October 31, 2018
| PRO-BLEND® EXTENDED TERM SERIES | PRINCIPAL AMOUNT3 | VALUE (NOTE 2) | ||||||||||||||
COMMERCIAL MORTGAGE-BACKED SECURITIES (continued) | ||||||||||||||||
JP Morgan Mortgage Trust, Series 2014-2, Class 1A12,9, 3.00%, 6/1/2029 | 563,522 | $ | 552,010 | |||||||||||||
JP Morgan Mortgage Trust, Series 2017-3, Class 1A52,9, 3.50%, 8/1/2047 | 1,218,343 | 1,193,547 | ||||||||||||||
JP Morgan Mortgage Trust, Series 2017-6, Class A52,9, 3.50%, 12/1/2048 | 1,459,359 | 1,428,746 | ||||||||||||||
LSTAR Commercial Mortgage Trust, Series 2014-2, Class A22, 2.767%, 1/1/2041 | 15,290 | 15,255 | ||||||||||||||
New Residential Mortgage Loan Trust, Series 2014-3A, Class AFX32,9, 3.75%, 11/1/2054 | 410,729 | 408,595 | ||||||||||||||
New Residential Mortgage Loan Trust, Series 2015-2A, Class A12,9, 3.75%, 8/1/2055 | 615,667 | 611,859 | ||||||||||||||
New Residential Mortgage Loan Trust, Series 2016-4A, Class A12,9, 3.75%, 11/1/2056 | 622,618 | 617,935 | ||||||||||||||
OBP Depositor LLC Trust, Series 2010-OBP, Class A2, 4.646%, 7/1/2045 | 115,000 | 116,876 | ||||||||||||||
Sequoia Mortgage Trust, Series 2013-2, Class A9, 1.874%, 2/1/2043 | 425,622 | 370,840 | ||||||||||||||
Sequoia Mortgage Trust, Series 2013-7, Class A29, 3.00%, 6/1/2043 | 473,483 | 443,317 | ||||||||||||||
Sequoia Mortgage Trust, Series 2013-8, Class A19, 3.00%, 6/1/2043 | 484,258 | 453,745 | ||||||||||||||
Starwood Retail Property Trust, Series 2014-STAR, Class A2,4, (1 mo. LIBOR US + 1.220%), 3.50%, 11/15/2027 | 998,985 | 999,121 | ||||||||||||||
Towd Point Mortgage Trust, Series 2016-5, Class A12,9, 2.50%, 10/1/2056 | 1,082,334 | 1,050,779 | ||||||||||||||
Vornado DP LLC Trust, Series 2010-VNO, Class A2FX2, 4.004%, 9/10/2028 | 350,000 | 354,977 | ||||||||||||||
Wells Fargo Commercial Mortgage Trust, Series 2010-C1, Class A22, 4.393%, 11/1/2043 | 600,000 | 609,193 | ||||||||||||||
WinWater Mortgage Loan Trust, Series 2015-1, Class A12,9, 3.50%, 1/1/2045 | 471,545 | 459,113 | ||||||||||||||
WinWater Mortgage Loan Trust, Series 2015-3, Class A52,9, 3.50%, 3/1/2045 | 406,364 | 405,302 | ||||||||||||||
|
| |||||||||||||||
TOTAL COMMERCIAL MORTGAGE-BACKED SECURITIES | 29,180,104 | |||||||||||||||
|
| |||||||||||||||
FOREIGN GOVERNMENT BONDS - 1.7% | ||||||||||||||||
Canada Housing Trust No. 1 (Canada)2, 4.10%, 12/15/2018 | CAD | 299,000 | 227,696 | |||||||||||||
Canadian Government Bond (Canada), 2.75%, 6/1/2022 | CAD | 358,000 | 275,090 | |||||||||||||
Export-Import Bank of Korea (South Korea), 2.625%, 12/30/2020 | 4,625,000 | 4,548,872 | ||||||||||||||
Mexican Government Bond (Mexico), 8.00%, 6/11/2020 | MXN | 7,313,000 | 356,631 | |||||||||||||
Mexican Government Bond (Mexico), 6.50%, 6/10/2021 | MXN | 3,112,000 | 145,614 | |||||||||||||
Mexican Government Bond (Mexico), 6.50%, 6/9/2022 | MXN | 5,057,000 | 232,421 | |||||||||||||
Mexican Government Bond (Mexico), 7.75%, 5/29/2031 | MXN | 972,000 | 43,617 | |||||||||||||
Province of Ontario (Canada), 1.25%, 6/17/2019 | 777,000 | 769,618 | ||||||||||||||
Singapore Government Bond (Singapore), 2.50%, 6/1/2019 | SGD | 657,000 | 475,731 | |||||||||||||
Svensk Exportkredit AB (Sweden), 1.125%, 8/28/2019 | 2,179,000 | 2,148,956 | ||||||||||||||
|
| |||||||||||||||
TOTAL FOREIGN GOVERNMENT BONDS | 9,224,246 | |||||||||||||||
|
| |||||||||||||||
U.S. GOVERNMENT AGENCIES - 6.0% | ||||||||||||||||
Mortgage-Backed Securities - 6.0% | ||||||||||||||||
Fannie Mae, Pool #888468, 5.50%, 9/1/2021 | 101,770 | 103,508 | ||||||||||||||
Fannie Mae, Pool #995233, 5.50%, 10/1/2021 | 6,863 | 6,953 | ||||||||||||||
Fannie Mae, Pool #888017, 6.00%, 11/1/2021 | 16,746 | 17,166 | ||||||||||||||
Fannie Mae, Pool #995329, 5.50%, 12/1/2021 | 96,514 | 98,242 | ||||||||||||||
Fannie Mae, Pool #888136, 6.00%, 12/1/2021 | 20,245 | 20,749 | ||||||||||||||
Fannie Mae, Pool #888810, 5.50%, 11/1/2022 | 123,615 | 125,734 | ||||||||||||||
Fannie Mae, Pool #990895, 5.50%, 10/1/2023 | 21,742 | 22,475 | ||||||||||||||
Fannie Mae, Pool #AD0462, 5.50%, 10/1/2024 | 15,906 | 16,480 | ||||||||||||||
The accompanying notes are an integral part of the financial statements.
70
Investment Portfolio - October 31, 2018
| PRO-BLEND® EXTENDED TERM SERIES | PRINCIPAL AMOUNT3 | VALUE (NOTE 2) | ||||||||||
U.S. GOVERNMENT AGENCIES (continued) | ||||||||||||
Mortgage-Backed Securities (continued) | ||||||||||||
Fannie Mae, Pool #MA3463, 4.00%, 9/1/2033 | 1,927,542 | $ | 1,964,358 | |||||||||
Fannie Mae, Pool #MA1834, 4.50%, 2/1/2034 | 730,062 | 751,265 | ||||||||||
Fannie Mae, Pool #MA1903, 4.50%, 5/1/2034 | 441,361 | 454,191 | ||||||||||
Fannie Mae, Pool #909786, 5.50%, 3/1/2037 | 103,013 | 110,021 | ||||||||||
Fannie Mae, Pool #889576, 6.00%, 4/1/2038 | 272,931 | 297,329 | ||||||||||
Fannie Mae, Pool #889579, 6.00%, 5/1/2038 | 237,280 | 257,046 | ||||||||||
Fannie Mae, Pool #995196, 6.00%, 7/1/2038 | 14,284 | 15,593 | ||||||||||
Fannie Mae, Pool #AD0207, 6.00%, 10/1/2038 | 587,146 | 640,566 | ||||||||||
Fannie Mae, Pool #AD0220, 6.00%, 10/1/2038 | 22,890 | 25,025 | ||||||||||
Fannie Mae, Pool #AD0307, 5.50%, 1/1/2039 | 367,809 | 393,554 | ||||||||||
Fannie Mae, Pool #MA0258, 4.50%, 12/1/2039 | 477,892 | 494,888 | ||||||||||
Fannie Mae, Pool #AL1595, 6.00%, 1/1/2040 | 291,567 | 317,239 | ||||||||||
Fannie Mae, Pool #AL0152, 6.00%, 6/1/2040 | 550,178 | 600,202 | ||||||||||
Fannie Mae, Pool #AL0241, 4.00%, 4/1/2041 | 797,594 | 803,644 | ||||||||||
Fannie Mae, Pool #AI5172, 4.00%, 8/1/2041 | 651,325 | 656,275 | ||||||||||
Fannie Mae, Pool #AL1410, 4.50%, 12/1/2041 | 1,232,289 | 1,274,451 | ||||||||||
Fannie Mae, Pool #AL7729, 4.00%, 6/1/2043 | 671,753 | 676,837 | ||||||||||
Fannie Mae, Pool #AS3622, 3.50%, 10/1/2044 | 2,250,173 | 2,199,821 | ||||||||||
Fannie Mae, Pool #AX5234, 4.50%, 11/1/2044 | 536,792 | 550,170 | ||||||||||
Fannie Mae, Pool #AS4103, 4.50%, 12/1/2044 | 729,272 | 753,918 | ||||||||||
Fannie Mae, Pool #AZ9215, 4.00%, 10/1/2045 | 553,698 | 555,399 | ||||||||||
Fannie Mae, Pool #BC3490, 3.50%, 2/1/2046 | 1,718,073 | 1,679,619 | ||||||||||
Fannie Mae, Pool #BC6764, 3.50%, 4/1/2046 | 752,205 | 735,136 | ||||||||||
Fannie Mae, Pool #MA2670, 3.00%, 7/1/2046 | 519,158 | 491,722 | ||||||||||
Fannie Mae, Pool #MA2705, 3.00%, 8/1/2046 | 1,028,598 | 974,185 | ||||||||||
Fannie Mae, Pool #BD6997, 4.00%, 10/1/2046 | 759,297 | 759,875 | ||||||||||
Fannie Mae, Pool #BE7845, 4.50%, 2/1/2047 | 920,947 | 949,898 | ||||||||||
Fannie Mae, Pool #CA1922, 5.00%, 6/1/2048 | 2,234,865 | 2,334,991 | ||||||||||
Fannie Mae, Pool #BK9598, 4.50%, 8/1/2048 | 670,180 | 686,826 | ||||||||||
Fannie Mae, Pool #CA2219, 5.00%, 8/1/2048 | 1,271,547 | 1,328,450 | ||||||||||
Fannie Mae, Pool #CA2373, 5.00%, 9/1/2048 | 1,347,398 | 1,407,626 | ||||||||||
Fannie Mae, Pool #AL8674, 5.654%, 1/1/2049 | 1,416,452 | 1,508,241 | ||||||||||
Freddie Mac, Pool #G11850, 5.50%, 7/1/2020 | 20,226 | 20,388 | ||||||||||
Freddie Mac, Pool #G12610, 6.00%, 3/1/2022 | 22,258 | 22,776 | ||||||||||
Freddie Mac, Pool #G12655, 6.00%, 5/1/2022 | 15,624 | 16,059 | ||||||||||
Freddie Mac, Pool #G12988, 6.00%, 1/1/2023 | 12,116 | 12,485 | ||||||||||
Freddie Mac, Pool #G13078, 6.00%, 3/1/2023 | 21,431 | 22,082 | ||||||||||
Freddie Mac, Pool #G13331, 5.50%, 10/1/2023 | 9,344 | 9,599 | ||||||||||
Freddie Mac, Pool #C91762, 4.50%, 5/1/2034 | 441,701 | 454,867 | ||||||||||
Freddie Mac, Pool #C91771, 4.50%, 6/1/2034 | 408,513 | 423,519 | ||||||||||
Freddie Mac, Pool #C91780, 4.50%, 7/1/2034 | 476,453 | 490,545 | ||||||||||
Freddie Mac, Pool #G03926, 6.00%, 2/1/2038 | 127,369 | 140,028 | ||||||||||
Freddie Mac, Pool #G04731, 5.50%, 4/1/2038 | 191,722 | 205,761 | ||||||||||
Freddie Mac, Pool #G08273, 5.50%, 6/1/2038 | 241,984 | 259,000 | ||||||||||
Freddie Mac, Pool #G04601, 5.50%, 7/1/2038 | 555,149 | 592,845 | ||||||||||
Freddie Mac, Pool #G04587, 5.50%, 8/1/2038 | 509,445 | 544,791 | ||||||||||
Freddie Mac, Pool #G05906, 6.00%, 4/1/2040 | 156,950 | 172,634 | ||||||||||
Freddie Mac, Pool #A92889, 4.50%, 7/1/2040 | 1,394,213 | 1,444,660 | ||||||||||
Freddie Mac, Pool #G60183, 4.00%, 12/1/2044 | 638,454 | 639,711 | ||||||||||
The accompanying notes are an integral part of the financial statements.
71
Investment Portfolio - October 31, 2018
| PRO-BLEND® EXTENDED TERM SERIES | PRINCIPAL SHARES | VALUE (NOTE 2) | ||||||||||
U.S. GOVERNMENT AGENCIES (continued) | ||||||||||||
Mortgage-Backed Securities (continued) | ||||||||||||
Freddie Mac, Pool #Q33778, 4.00%, 6/1/2045 | 676,341 | $ | 678,144 | |||||||||
|
| |||||||||||
TOTAL U.S. GOVERNMENT AGENCIES | ||||||||||||
(Identified Cost $34,040,103) | 33,209,562 | |||||||||||
|
| |||||||||||
SHORT-TERM INVESTMENT - 0.4% | ||||||||||||
Dreyfus Government Cash Management, Institutional Shares10, 2.05%, | 2,479,350 | 2,479,350 | ||||||||||
|
| |||||||||||
TOTAL INVESTMENTS IN SECURITIES - 99.4% | 549,552,558 | |||||||||||
|
| |||||||||||
TOTAL OPTIONS WRITTEN - 0.0%## | (308,007 | ) | ||||||||||
|
| |||||||||||
TOTAL INVESTMENTS - 99.4% | 549,244,551 | |||||||||||
OTHER ASSETS, LESS LIABILITIES - 0.6% | 3,409,656 | |||||||||||
|
| |||||||||||
NET ASSETS - 100% | $ | 552,654,207 | ||||||||||
|
| |||||||||||
ADR - American Depositary Receipt
CAD - Canadian Dollar
ETF - Exchange-traded fund
IO - Interest only
MXN - Mexican Peso
No. - Number
SGD - Singapore Dollar
| EXCHANGE-TRADED OPTIONS WRITTEN | ||||||||||||||||||||
| DESCRIPTION | NUMBER OF | EXPIRATION DATE | EXERCISE PRICE | NOTIONAL AMOUNT3 (000) | VALUE | |||||||||||||||
Call | ||||||||||||||||||||
Booking Holdings, Inc. | 7 | 11/09/18 | $ | 1,960.00 | 1,312 | $ | (28,000 | ) | ||||||||||||
Qorvo, Inc. | 177 | 11/16/18 | 77.50 | 1,301 | (38,055 | ) | ||||||||||||||
Alphabet, Inc. - Class C | 17 | 11/23/18 | 1,110.00 | 1,831 | (37,400 | ) | ||||||||||||||
|
| |||||||||||||||||||
| (103,455 | ) | |||||||||||||||||||
|
| |||||||||||||||||||
Put | ||||||||||||||||||||
lululemon athletica, Inc. | 97 | 11/09/18 | 149.00 | 1,365 | (79,055 | ) | ||||||||||||||
Mastercard, Inc. - Class A | 97 | 11/09/18 | 197.50 | 1,917 | (37,830 | ) | ||||||||||||||
Medtronic plc | 214 | 11/16/18 | 90.00 | 1,922 | (31,030 | ) | ||||||||||||||
Microsoft Corp. | 187 | 11/16/18 | 100.00 | 1,997 | (17,017 | ) | ||||||||||||||
Qorvo, Inc. | 283 | 11/16/18 | 67.50 | 2,080 | (39,620 | ) | ||||||||||||||
|
| |||||||||||||||||||
| (204,552 | ) | |||||||||||||||||||
|
| |||||||||||||||||||
TOTAL EXCHANGE-TRADED OPTIONS WRITTEN |
| $ | (308,007 | ) | ||||||||||||||||
|
| |||||||||||||||||||
*Non-income producing security.
## Less than 0.1%.
1A portion of this security is designated with the broker as collateral for options contracts written. As of October 31, 2018, the total value of such securities was $11,059,598.
2Restricted securities - Investment in securities that are restricted as to public resale under the Securities Act of 1933, as amended. These securities have been sold under Rule 144A and have been determined to be liquid under guidelines established by the Board of Directors. These securities amount to $47,071,812, or 8.5% of the Series’ net assets as of October 31, 2018 (see Note 2 to the financial statements).
3Amount is stated in USD unless otherwise noted.
The accompanying notes are an integral part of the financial statements.
72
Investment Portfolio - October 31, 2018
4Floating rate security. Rate shown is the rate in effect as of October 31, 2018.
5Step coupon rate security - Rate steps up/down by 25 basis points upon rating downgrade/upgrade by Moody’s and S&P rating agencies (Subject to a maximum of 100 basis points per agency, 200 basis points maximum).
6Variable rate security. Security may be issued at a fixed coupon rate, which converts to a variable rate at a specified date. Rate shown is the rate in effect as of October 31, 2018.
7Security is perpetual in nature and has no stated maturity date.
8Illiquid security - This security was acquired November 3, 2017 at a cost of $198,500 ($99.25 per share). This security has been determined to be illiquid under guidelines established by the Board of Directors. This security amounts to $203,316, or less than 0.1% of the Series’ net assets as of October 31, 2018 (see Note 2 to the financial statements).
9Variable or floating rate security, the interest rate of which adjusts periodically based on changes in current interest rates and prepayments on the underlying pool of assets. Rate shown is the rate in effect as of October 31, 2018.
10Rate shown is the current yield as of October 31, 2018.
The Global Industry Classification Standard (GICS) was developed by and is the exclusive property and a service mark of MSCI Inc. (MSCI) and Standard & Poor’s, a division of The McGraw-Hill Companies, Inc. (S&P), and is licensed for use by Manning & Napier when referencing GICS sectors. Neither MSCI, S&P, nor any third party involved in making or compiling the GICS or any GICS classifications makes any express or implied warranties or representations with respect to such standard or classification, nor shall any such party have any liability therefrom.
The accompanying notes are an integral part of the financial statements.
73
Statement of Assets and Liabilities - Pro-Blend® Extended Term Series
October 31, 2018
ASSETS: | ||||
Investments in securities, at value (identified cost $538,853,623) (Note 2) | $ | 549,552,558 | ||
Foreign currency, at value (identified cost $66,212) | 66,085 | |||
Receivable for securities sold | 7,431,218 | |||
Interest receivable | 2,147,296 | |||
Foreign tax reclaims receivable | 411,713 | |||
Dividends receivable | 132,914 | |||
Receivable for fund shares sold | 103,444 | |||
Prepaid and other expenses | 21,508 | |||
|
| |||
TOTAL ASSETS | 559,866,736 | |||
|
| |||
LIABILITIES: | ||||
Accrued management fees (Note 3) | 350,180 | |||
Accrued distribution and service (Rule 12b-1) fees (Class R) (Class R2) (Note 3) | 98,106 | |||
Accrued shareholder services fees (Class S) (Note 3) | 67,102 | |||
Accrued fund accounting and administration fees (Note 3) | 42,365 | |||
Accrued Chief Compliance Officer service fees (Note 3) | 402 | |||
Options written, at value (premiums received $211,174) (Note 2) | 308,007 | |||
Payable for securities purchased | 5,460,686 | |||
Payable for fund shares repurchased | 753,791 | |||
Other payables and accrued expenses | 131,890 | |||
|
| |||
TOTAL LIABILITIES | 7,212,529 | |||
|
| |||
TOTAL NET ASSETS | $ | 552,654,207 | ||
|
| |||
NET ASSETS CONSIST OF: | ||||
Capital stock | $ | 442,653 | ||
Additional paid-in-capital | 507,887,105 | |||
Total distributable earnings | 44,324,449 | |||
|
| |||
TOTAL NET ASSETS | $ | 552,654,207 | ||
|
| |||
The accompanying notes are an integral part of the financial statements.
74
Statement of Assets and Liabilities - Pro-Blend® Extended Term Series
October 31, 2018
NET ASSET VALUE, OFFERING PRICE AND REDEMPTION PRICE PER SHARE - Class S | $ | 16.85 | ||
|
| |||
NET ASSET VALUE, OFFERING PRICE AND REDEMPTION PRICE PER SHARE - Class I | $ | 9.04 | ||
|
| |||
NET ASSET VALUE, OFFERING PRICE AND REDEMPTION PRICE PER SHARE - Class R | $ | 10.54 | ||
|
| |||
NET ASSET VALUE, OFFERING PRICE AND REDEMPTION PRICE PER SHARE - Class R2 | $ | 9.78 | ||
|
| |||
The accompanying notes are an integral part of the financial statements.
75
Statement of Operations - Pro-Blend® Extended Term Series
For the Year Ended October 31, 2018
INVESTMENT INCOME: | ||||
Interest | $ | 9,666,393 | ||
Dividends (net of foreign taxes withheld, $270,468) | 3,726,676 | |||
|
| |||
Total Investment Income | 13,393,069 | |||
|
| |||
EXPENSES: | ||||
Management fees (Note 3) | 4,708,799 | |||
Distribution and service (Rule 12b-1) fees (Class R2) (Note 3) | 1,199,419 | |||
Distribution and service (Rule 12b-1) fees (Class R) (Note 3) | 64,617 | |||
Shareholder services fees (Class S) (Note 3) | 898,988 | |||
Fund accounting and administration fees (Note 3) | 153,798 | |||
Directors’ fees (Note 3) | 49,281 | |||
Chief Compliance Officer service fees (Note 3) | 4,385 | |||
Custodian fees | 57,904 | |||
Miscellaneous | 408,901 | |||
|
| |||
Total Expenses | 7,546,092 | |||
Less reduction of expenses (Note 3) | (50,028 | ) | ||
|
| |||
Net Expenses | 7,496,064 | |||
|
| |||
NET INVESTMENT INCOME | 5,897,005 | |||
|
| |||
REALIZED AND UNREALIZED GAIN (LOSS) ON INVESTMENTS AND FOREIGN CURRENCY: | ||||
Net realized gain (loss) on- | ||||
Investments in securities | 30,252,225 | |||
Options written | 1,186,411 | |||
Foreign currency and translation of other assets and liabilities | (11,092 | ) | ||
|
| |||
| 31,427,544 | ||||
|
| |||
Net change in unrealized appreciation (depreciation) on- | ||||
Investments in securities | (43,500,338 | ) | ||
Options written | (153,245 | ) | ||
Foreign currency and translation of other assets and liabilities | 7,391 | |||
|
| |||
| (43,646,192 | ) | |||
|
| |||
NET REALIZED AND UNREALIZED GAIN (LOSS) ON INVESTMENTS AND FOREIGN CURRENCY | (12,218,648 | ) | ||
|
| |||
NET DECREASE IN NET ASSETS RESULTING FROM OPERATIONS | $ | (6,321,643 | ) | |
|
| |||
The accompanying notes are an integral part of the financial statements.
76
Statements of Changes in Net Assets - Pro-Blend® Extended Term Series
FOR THE YEAR ENDED 10/31/18 | FOR THE YEAR ENDED 10/31/17 | |||||||
INCREASE (DECREASE) IN NET ASSETS: | ||||||||
OPERATIONS: | ||||||||
Net investment income | $ | 5,897,005 | $ | 8,264,146 | ||||
Net realized gain (loss) on investments and foreign currency | 31,427,544 | 71,758,599 | ||||||
Net realized gain (loss) from in-kind redemptions | — | 17,004,207 | ||||||
Net change in unrealized appreciation (depreciation) on investments and foreign currency | (43,646,192 | ) | 3,708,567 | |||||
|
|
|
| |||||
Net increase (decrease) from operations | (6,321,643 | ) | 100,735,519 | |||||
|
|
|
| |||||
DISTRIBUTIONS TO SHAREHOLDERS (Note 9): | ||||||||
Class S | (24,072,437 | ) | (6,821,681 | ) | ||||
Class I | (15,480,841 | ) | (11,326,322 | ) | ||||
Class R | (1,300,676 | ) | (483,395 | ) | ||||
Class R2 | (12,321,868 | ) | (2,541,143 | ) | ||||
|
|
|
| |||||
Total distributions to shareholders | (53,175,822 | ) | (21,172,541 | )* | ||||
|
|
|
| |||||
CAPITAL STOCK ISSUED AND REPURCHASED: | ||||||||
Net decrease from capital share transactions (Note 5) | (80,709,339 | ) | (443,218,271 | ) | ||||
|
|
|
| |||||
Net decrease in net assets | (140,206,804 | ) | (363,655,293 | ) | ||||
NET ASSETS: | ||||||||
Beginning of year | 692,861,011 | 1,056,516,304 | ||||||
|
|
|
| |||||
End of year | $ | 552,654,207 | $ | 692,861,011 | ||||
|
|
|
| |||||
* For the year ended October 31, 2017, the distributions to shareholders from net investment income and net realized gain were $2,292,566 and $4,529,115 (Class S), $5,110,490 and $6,215,832 (Class I), $145,224 and $338,171 (Class R), $329,287 and $2,211,856 (Class R2), respectively.
The accompanying notes are an integral part of the financial statements.
77
Financial Highlights - Pro-Blend® Extended Term Series - Class S
| FOR THE YEAR ENDED | ||||||||||||||||||||
| 10/31/18 | 10/31/17 | 10/31/16 | 10/31/15 | 10/31/14 | ||||||||||||||||
Per share data (for a share outstanding throughout each year): | ||||||||||||||||||||
Net asset value - Beginning of year | $ | 18.22 | $ | 16.62 | $ | 16.42 | $ | 18.28 | $ | 18.10 | ||||||||||
|
|
|
|
|
|
|
|
|
| |||||||||||
Income (loss) from investment operations: | ||||||||||||||||||||
Net investment income1 | 0.18 | 0.15 | 0.14 | 0.16 | 0.19 | |||||||||||||||
Net realized and unrealized gain (loss) on investments | (0.43 | ) | 1.70 | 0.37 | (0.56 | ) | 1.02 | |||||||||||||
|
|
|
|
|
|
|
|
|
| |||||||||||
Total from investment operations | (0.25 | ) | 1.85 | 0.51 | (0.40 | ) | 1.21 | |||||||||||||
|
|
|
|
|
|
|
|
|
| |||||||||||
Less distributions to shareholders: | ||||||||||||||||||||
From net investment income | (0.10 | ) | (0.09 | ) | (0.09 | ) | (0.11 | ) | (0.13 | ) | ||||||||||
From net realized gain on investments | (1.02 | ) | (0.16 | ) | (0.22 | ) | (1.35 | ) | (0.90 | ) | ||||||||||
|
|
|
|
|
|
|
|
|
| |||||||||||
Total distributions to shareholders | (1.12 | ) | (0.25 | ) | (0.31 | ) | (1.46 | ) | (1.03 | ) | ||||||||||
|
|
|
|
|
|
|
|
|
| |||||||||||
Net asset value - End of year | $ | 16.85 | $ | 18.22 | $ | 16.62 | $ | 16.42 | $ | 18.28 | ||||||||||
|
|
|
|
|
|
|
|
|
| |||||||||||
Net assets - End of year (000’s omitted) | $ | 308,334 | $ | 400,117 | $ | 498,344 | $ | 718,811 | $ | 872,014 | ||||||||||
|
|
|
|
|
|
|
|
|
| |||||||||||
Total return2 | (1.47 | %) | 11.26 | % | 3.23 | % | (2.16 | %) | 7.08 | % | ||||||||||
Ratios (to average net assets)/Supplemental Data: | ||||||||||||||||||||
Expenses* | 1.10 | % | 1.08 | % | 1.07 | % | 1.07 | % | 1.06 | % | ||||||||||
Net investment income | 1.03 | % | 0.89 | % | 0.86 | % | 0.96 | % | 1.04 | % | ||||||||||
Series portfolio turnover | 75 | % | 79 | % | 63 | % | 66 | % | 65 | % | ||||||||||
| *For certain periods presented, the investment advisor did not impose all or a portion of its management and/or other fees, and in some periods may have paid a portion of the Series’ expenses. If these expenses had been incurred by the Class, the expense ratio (to average net assets) would have increased by the following amounts: | ||||||||||||||||||||
| 0.01 | % | N/A | N/A | N/A | N/A | |||||||||||||||
1Calculated based on average shares outstanding during the years.
2Represents aggregate total return for the years indicated, and assumes reinvestment of all distributions.
The accompanying notes are an integral part of the financial statements.
78
Financial Highlights - Pro-Blend® Extended Term Series - Class I
| FOR THE YEAR ENDED | ||||||||||||||||||||
| 10/31/18 | 10/31/17 | 10/31/16 | 10/31/15 | 10/31/14 | ||||||||||||||||
Per share data (for a share outstanding throughout each year): | ||||||||||||||||||||
Net asset value - Beginning of year | $ | 10.31 | $ | 9.53 | $ | 9.57 | $ | 11.30 | $ | 11.60 | ||||||||||
Income (loss) from investment operations: | ||||||||||||||||||||
Net investment income1 | 0.12 | 0.11 | 0.10 | 0.12 | 0.15 | |||||||||||||||
Net realized and unrealized gain (loss) on investments | (0.22 | ) | 0.96 | 0.21 | (0.34 | ) | 0.62 | |||||||||||||
|
|
|
|
|
|
|
|
|
| |||||||||||
Total from investment operations | (0.10 | ) | 1.07 | 0.31 | (0.22 | ) | 0.77 | |||||||||||||
|
|
|
|
|
|
|
|
|
| |||||||||||
Less distributions to shareholders: | ||||||||||||||||||||
From net investment income | (0.15 | ) | (0.13 | ) | (0.13 | ) | (0.16 | ) | (0.17 | ) | ||||||||||
From net realized gain on investments | (1.02 | ) | (0.16 | ) | (0.22 | ) | (1.35 | ) | (0.90 | ) | ||||||||||
|
|
|
|
|
|
|
|
|
| |||||||||||
Total distributions to shareholders | (1.17 | ) | (0.29 | ) | (0.35 | ) | (1.51 | ) | (1.07 | ) | ||||||||||
|
|
|
|
|
|
|
|
|
| |||||||||||
Net asset value - End of year | $ | 9.04 | $ | 10.31 | $ | 9.53 | $ | 9.57 | $ | 11.30 | ||||||||||
|
|
|
|
|
|
|
|
|
| |||||||||||
Net assets - End of year (000’s omitted) | $ | 126,834 | $ | 147,257 | $ | 386,926 | $ | 545,570 | $ | 659,331 | ||||||||||
|
|
|
|
|
|
|
|
|
| |||||||||||
Total return2 | (1.15 | %) | 11.56 | % | 3.52 | % | (1.91 | %) | 7.32 | % | ||||||||||
Ratios (to average net assets)/Supplemental Data: | ||||||||||||||||||||
Expenses* | 0.85 | % | 0.83 | % | 0.82 | % | 0.82 | % | 0.81 | % | ||||||||||
Net investment income | 1.29 | % | 1.15 | % | 1.12 | % | 1.22 | % | 1.29 | % | ||||||||||
Series portfolio turnover | 75 | % | 79 | % | 63 | % | 66 | % | 65 | % | ||||||||||
| *For certain periods presented, the investment advisor did not impose all or a portion of its management and/or other fees, and in some periods may have paid a portion of the Series’ expenses. If these expenses had been incurred by the Class, the expense ratio (to average net assets) would have increased by the following amounts: |
| |||||||||||||||||||
| 0.01 | % | N/A | N/A | N/A | N/A | |||||||||||||||
1Calculated based on average shares outstanding during the years.
2Represents aggregate total return for the years indicated, and assumes reinvestment of all distributions.
The accompanying notes are an integral part of the financial statements.
79
Financial Highlights - Pro-Blend® Extended Term Series - Class R
| FOR THE YEAR ENDED | ||||||||||||||||||||
| 10/31/18 | 10/31/17 | 10/31/16 | 10/31/15 | 10/31/14 | ||||||||||||||||
Per share data (for a share outstanding throughout each year): | ||||||||||||||||||||
Net asset value - Beginning of year | $ | 11.82 | $ | 10.88 | $ | 10.87 | $ | 12.62 | $ | 12.83 | ||||||||||
Income (loss) from investment operations: | ||||||||||||||||||||
Net investment income1 | 0.09 | 0.07 | 0.06 | 0.08 | 0.10 | |||||||||||||||
Net realized and unrealized gain (loss) on investments | (0.26 | ) | 1.10 | 0.24 | (0.38 | ) | 0.70 | |||||||||||||
|
|
|
|
|
|
|
|
|
| |||||||||||
Total from investment operations | (0.17 | ) | 1.17 | 0.30 | (0.30 | ) | 0.80 | |||||||||||||
|
|
|
|
|
|
|
|
|
| |||||||||||
Less distributions to shareholders: | ||||||||||||||||||||
From net investment income | (0.09 | ) | (0.07 | ) | (0.07 | ) | (0.10 | ) | (0.11 | ) | ||||||||||
From net realized gain on investments | (1.02 | ) | (0.16 | ) | (0.22 | ) | (1.35 | ) | (0.90 | ) | ||||||||||
|
|
|
|
|
|
|
|
|
| |||||||||||
Total distributions to shareholders | (1.11 | ) | (0.23 | ) | (0.29 | ) | (1.45 | ) | (1.01 | ) | ||||||||||
|
|
|
|
|
|
|
|
|
| |||||||||||
Net asset value - End of year | $ | 10.54 | $ | 11.82 | $ | 10.88 | $ | 10.87 | $ | 12.62 | ||||||||||
|
|
|
|
|
|
|
|
|
| |||||||||||
Net assets - End of year (000’s omitted) | $ | 11,138 | $ | 15,358 | $ | 24,692 | $ | 40,379 | $ | 65,563 | ||||||||||
|
|
|
|
|
|
|
|
|
| |||||||||||
Total return2 | (1.65 | %) | 10.97 | % | 2.93 | % | (2.39 | %) | 6.81 | % | ||||||||||
Ratios (to average net assets)/Supplemental Data: | ||||||||||||||||||||
Expenses* | 1.35 | % | 1.33 | % | 1.32 | % | 1.32 | % | 1.31 | % | ||||||||||
Net investment income | 0.79 | % | 0.65 | % | 0.61 | % | 0.71 | % | 0.79 | % | ||||||||||
Series portfolio turnover | 75 | % | 79 | % | 63 | % | 66 | % | 65 | % | ||||||||||
| *For certain periods presented, the investment advisor did not impose all or a portion of its management and/or other fees, and in some periods may have paid a portion of the Series’ expenses. If these expenses had been incurred by the Class, the expense ratio (to average net assets) would have increased by the following amounts: |
| |||||||||||||||||||
| 0.01 | % | N/A | N/A | N/A | N/A | |||||||||||||||
1Calculated based on average shares outstanding during the years.
2Represents aggregate total return for the years indicated, and assumes reinvestment of all distributions.
The accompanying notes are an integral part of the financial statements.
80
Financial Highlights - Pro-Blend® Extended Term Series - Class R2*
| FOR THE YEAR ENDED | ||||||||||||||||||||
| 10/31/18 | 10/31/17 | 10/31/16 | 10/31/15 | 10/31/14 | ||||||||||||||||
Per share data (for a share outstanding throughout each year): | ||||||||||||||||||||
Net asset value - Beginning of year | $ | 11.05 | $ | 10.19 | $ | 10.21 | $ | 11.95 | $ | 12.21 | ||||||||||
|
|
|
|
|
|
|
|
|
| |||||||||||
Income (loss) from investment operations: | ||||||||||||||||||||
Net investment income1 | 0.03 | 0.01 | 0.01 | 0.02 | 0.03 | |||||||||||||||
Net realized and unrealized gain (loss) on investments | (0.24 | ) | 1.03 | 0.22 | (0.36 | ) | 0.67 | |||||||||||||
|
|
|
|
|
|
|
|
|
| |||||||||||
Total from investment operations | (0.21 | ) | 1.04 | 0.23 | (0.34 | ) | 0.70 | |||||||||||||
|
|
|
|
|
|
|
|
|
| |||||||||||
Less distributions to shareholders: | ||||||||||||||||||||
From net investment income | (0.04 | ) | (0.02 | ) | (0.03 | ) | (0.05 | ) | (0.06 | ) | ||||||||||
From net realized gain on investments | (1.02 | ) | (0.16 | ) | (0.22 | ) | (1.35 | ) | (0.90 | ) | ||||||||||
|
|
|
|
|
|
|
|
|
| |||||||||||
Total distributions to shareholders | (1.06 | ) | (0.18 | ) | (0.25 | ) | (1.40 | ) | (0.96 | ) | ||||||||||
|
|
|
|
|
|
|
|
|
| |||||||||||
Net asset value - End of year | $ | 9.78 | $ | 11.05 | $ | 10.19 | $ | 10.21 | $ | 11.95 | ||||||||||
|
|
|
|
|
|
|
|
|
| |||||||||||
Net assets - End of year (000’s omitted) | $ | 106,348 | $ | 130,130 | $ | 146,554 | $ | 165,898 | $ | 164,191 | ||||||||||
|
|
|
|
|
|
|
|
|
| |||||||||||
Total return2 | (2.13 | %) | 10.42 | % | 2.43 | % | (2.91 | %) | 6.28 | % | ||||||||||
Ratios (to average net assets)/Supplemental Data: | ||||||||||||||||||||
Expenses** | 1.85 | % | 1.83 | % | 1.82 | % | 1.82 | % | 1.81 | % | ||||||||||
Net investment income | 0.28 | % | 0.14 | % | 0.11 | % | 0.21 | % | 0.29 | % | ||||||||||
Series portfolio turnover | 75 | % | 79 | % | 63 | % | 66 | % | 65 | % | ||||||||||
*Effective March 1, 2017, Class C shares of the Series have been redesignated as Class R2 shares.
**For certain periods presented, the investment advisor did not impose all or a portion of its management and/or other fees, and in some periods may | ||||||||||||||||||||
| 0.01 | % | N/A | N/A | N/A | N/A | |||||||||||||||
1Calculated based on average shares outstanding during the years.
2Represents aggregate total return for the years indicated, and assumes reinvestment of all distributions.
The accompanying notes are an integral part of the financial statements.
81
Performance Update as of October 31, 2018 - Pro-Blend® Maximum Term Series
(unaudited)
| AVERAGE ANNUAL TOTAL RETURNS AS OF OCTOBER 31, 2018 | ||||||||||||
ONE YEAR1 | FIVE YEAR | TEN YEAR | ||||||||||
Manning & Napier Fund, Inc. - Pro-Blend® Maximum Term Series - Class S2 | 2.24 | % | 5.98 | % | 9.82 | % | ||||||
Manning & Napier Fund, Inc. - Pro-Blend® Maximum Term Series - Class I2 | 2.44 | % | 6.24 | % | 10.09 | % | ||||||
Manning & Napier Fund, Inc. - Pro-Blend® Maximum Term Series - Class R2,3 | 1.99 | % | 5.72 | % | 9.56 | % | ||||||
Manning & Napier Fund, Inc. - Pro-Blend® Maximum Term Series - Class R22,3 | 1.40 | % | 5.19 | % | 9.00 | % | ||||||
Russell 3000® Index4 | 6.60 | % | 10.81 | % | 13.35 | % | ||||||
65/20/15 Blended Index5 | 2.28 | % | 7.67 | % | 10.79 | % | ||||||
The following graph compares the value of a $10,000 investment in the Manning & Napier Fund, Inc. - Pro-Blend® Maximum Term Series - Class S for the ten years ended October 31, 2018 to the Russell 3000® Index and the 65/20/15 Blended Index.
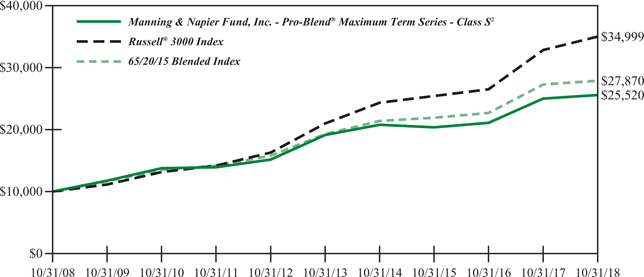
1The returns shown are based on net asset values calculated for shareholder transactions and may differ from the returns shown in the financial highlights, which reflect adjustments made to the net asset values in accordance with accounting principles generally accepted in the United States of America.
2The Series’ performance does not reflect the deduction of taxes that a shareholder would pay on fund distributions or the redemption of shares. The Series’ performance is historical and may not be indicative of future results. The performance returns shown are inclusive of the net expense ratio of the Series. For the year ended October 31, 2018, this net expense ratio was 1.10% for Class S, 0.85% for Class I, 1.35% for Class R and 1.85% for Class R2. The gross expense ratio, which does not account for any voluntary or contractual waivers currently in effect, was 1.13% for Class S, 0.88% for Class I, 1.38% for Class R and 1.88% for Class R2 for the year ended October 31, 2018.
3For periods through the inception of Class R2 on January 4, 2010 and Class R on June 30, 2010, the performance is hypothetical and is based on the historical performance of Class S shares adjusted for the respective class’ charges and expenses.
4The Russell 3000® Index is an unmanaged index that consists of 3,000 of the largest U.S. companies based on total market capitalization. The Index returns are based on a market capitalization-weighted average of relative price changes of the component stocks plus dividends whose reinvestments are compounded daily. The Index returns do not reflect any fees or expenses. Index returns provided by Bloomberg.
5The 65/20/15 Blended Index is 65% Russell 3000® Index (Russell 3000), 20% MSCI ACWI ex USA Index (ACWIxUS), and 15% Bloomberg Barclays U.S. Aggregate Bond Index (BAB). Russell 3000 is an unmanaged index that consists of 3,000 of the largest U.S. companies based on total market capitalization. The Index returns are based on a market capitalization-weighted average of relative price changes of the component stocks plus dividends whose reinvestments are compounded daily. Index returns provided by Bloomberg. ACWIxUS is designed to measure large and mid-cap representation across 22 of 23 Developed Markets countries (excluding the U.S.) and 24 Emerging Markets countries. The Index is denominated in U.S. dollars. The Index returns are net of withholding taxes. They assume daily reinvestment of net dividends thus accounting for any applicable dividend taxation. Index returns provided by Bloomberg. BAB is an unmanaged, market value-weighted index of U.S. domestic investment-grade debt issues, including government, corporate, asset-backed, and mortgage-backed securities with
82
Performance Update as of October 31, 2018 - Pro-Blend® Maximum Term Series (unaudited)
maturities of one year or more. Index returns provided by Interactive Data. The returns of the indices do not reflect any fees or expenses. Returns provided are calculated monthly using a blended allocation. Because the fund’s asset allocation will vary over time, the composition of the fund’s portfolio may not match the composition of the comparative Indices.
83
Shareholder Expense Example - Pro-Blend® Maximum Term Series
(unaudited)
As a shareholder of the Series, you incur ongoing costs, including management fees, shareholder service fees and other Series expenses. This example is intended to help you understand your ongoing costs (in dollars) of investing in the Series and to compare these costs with the ongoing costs of investing in other mutual funds.
The example is based on an investment of $1,000 invested in each class at the beginning of the period and held for the entire period (May 1, 2018 to October 31, 2018).
Actual Expenses
The Actual lines of the table below provide information about actual account values and actual expenses. You may use the information in these lines, together with the amount you invested, to estimate the expenses that you paid over the period. Simply divide your account value by $1,000 (for example, an $8,600 account value divided by $1,000 = 8.6), then multiply the result by the number in the Actual line for the Class in which you have invested under the heading entitled “Expenses Paid During Period” to estimate the expenses you paid on your account during this period.
Hypothetical Example for Comparison Purposes
The Hypothetical lines of each class in the table below provide information about hypothetical account values and hypothetical expenses based on the Class’ actual expense ratio and an assumed rate of return of 5% per year before expenses, which is not the Class’ actual return. The hypothetical account values and expenses may not be used to estimate the actual ending account balance or expenses you paid during the period. You may use this information to compare the ongoing costs of investing in a class of the Series and other funds. To do so, compare this 5% hypothetical example for the Class in which you have invested with the 5% hypothetical examples that appear in the shareholder reports of the other funds.
Please note that the expenses shown in the table are meant to highlight your ongoing costs only and do not reflect any transaction costs such as sales charges (loads), redemption fees, or exchange fees that you may incur in other mutual funds. Therefore, the second line of the table is useful in comparing ongoing costs only, and will not help you determine the relative total costs of owning different funds.
BEGINNING ACCOUNT VALUE 5/1/18 | ENDING ACCOUNT VALUE 10/31/18 | EXPENSES PAID DURING PERIOD 5/1/18-10/31/18* | ANNUALIZED EXPENSE RATIO | |||||
Class S | ||||||||
Actual | $1,000.00 | $986.69 | $5.51 | 1.10% | ||||
Hypothetical (5% return before expenses) | $1,000.00 | $1,019.66 | $5.60 | 1.10% | ||||
Class I | ||||||||
Actual | $1,000.00 | $987.96 | $4.26 | 0.85% | ||||
Hypothetical (5% return before expenses) | $1,000.00 | $1,020.92 | $4.33 | 0.85% | ||||
Class R | ||||||||
Actual | $1,000.00 | $985.39 | $6.76 | 1.35% | ||||
Hypothetical (5% return before expenses) | $1,000.00 | $1,018.40 | $6.87 | 1.35% | ||||
Class R2 | ||||||||
Actual | $1,000.00 | $982.65 | $9.25 | 1.85% | ||||
Hypothetical (5% return before expenses) | $1,000.00 | $1,015.88 | $9.40 | 1.85% |
*Expenses are equal to the Class’ annualized expense ratio (for the six-month period), multiplied by the average account value over the period, multiplied by 184/365 (to reflect the one-half year period). Expenses are based on the most recent fiscal half year; therefore, the expense ratios stated above may differ from the expense ratios stated in the financial highlights, which are based on one-year data. The Class’ total return would have been lower had certain expenses not been waived during the period.
84
Portfolio Composition - Pro-Blend® Maximum Term Series
As of October 31, 2018 (unaudited)
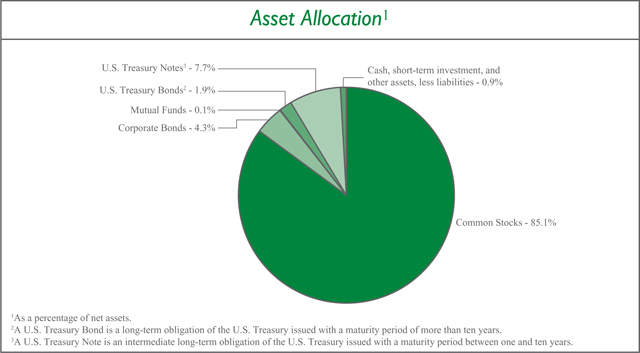
Sector Allocation4 | ||||||||
Health Care | 16.0% | |||||||
Consumer Staples | 13.5% | |||||||
Information Technology | 12.5% | |||||||
Consumer Discretionary | 11.8% | |||||||
Financials | 8.3% | |||||||
Communication Services | 7.1% | |||||||
Materials | 6.5% | |||||||
Industrials | 5.4% | |||||||
Real Estate | 4.7% | |||||||
Energy | 3.6% | |||||||
Utilities | 0.2% | |||||||
| 4Including common stocks and corporate bonds, as a percentage of total investments. |
| |||||||
Top Ten Stock Holdings5 | ||||
Qorvo, Inc. | 1.9% | |||
Medtronic plc | 1.9% | |||
Incyte Corp. | 1.9% | |||
Booking Holdings, Inc. | 1.8% | |||
Novartis AG - ADR (Switzerland) | 1.7% | |||
Mastercard, Inc. - Class A | 1.7% | |||
lululemon athletica, Inc. | 1.7% | |||
Visa, Inc. - Class A | 1.6% | |||
The Coca-Cola Co. | 1.6% | |||
Microsoft Corp. | 1.5% | |||
| 5As a percentage of total investments. |
| |||
85
Investment Portfolio - October 31, 2018
| PRO-BLEND® MAXIMUM TERM SERIES | SHARES | VALUE (NOTE 2) | ||||||||||
COMMON STOCKS - 85.1% |
| |||||||||||
Communication Services - 6.6% |
| |||||||||||
Diversified Telecommunication Services - 1.2% |
| |||||||||||
Orange S.A. (France) | 2,440 | $ | 38,084 | |||||||||
Telefonica Brasil S.A. (Brazil) | 2,600 | 30,105 | ||||||||||
Zayo Group Holdings, Inc.* | 162,240 | 4,847,731 | ||||||||||
|
| |||||||||||
| 4,915,920 | ||||||||||||
|
| |||||||||||
Entertainment - 0.9% |
| |||||||||||
Electronic Arts, Inc.* | 38,415 | 3,494,997 | ||||||||||
NetEase, Inc. - ADR (China) | 490 | 101,846 | ||||||||||
Nexon Co. Ltd. (Japan)* | 8,300 | 94,680 | ||||||||||
Toho Co. Ltd. - Tokyo (Japan) | 1,600 | 52,201 | ||||||||||
Vivendi S.A. (France) | 1,260 | 30,389 | ||||||||||
|
| |||||||||||
| 3,774,113 | ||||||||||||
|
| |||||||||||
Interactive Media & Services - 3.0% |
| |||||||||||
Alphabet, Inc. - Class A* | 3,225 | 3,517,121 | ||||||||||
Alphabet, Inc. - Class C* | 3,265 | 3,515,654 | ||||||||||
Tencent Holdings Ltd. - Class H (China) | 148,474 | 5,086,610 | ||||||||||
|
| |||||||||||
| 12,119,385 | ||||||||||||
|
| |||||||||||
Media - 1.4% |
| |||||||||||
Hakuhodo DY Holdings, Inc. (Japan) | 3,200 | 53,372 | ||||||||||
Quebecor, Inc. - Class B (Canada) | 155,370 | 3,047,327 | ||||||||||
Shaw Communications, Inc. - Class B (Canada) | 147,415 | 2,744,610 | ||||||||||
|
| |||||||||||
| 5,845,309 | ||||||||||||
|
| |||||||||||
Wireless Telecommunication Services - 0.1% |
| |||||||||||
KDDI Corp. (Japan) | 4,200 | 101,639 | ||||||||||
NTT DOCOMO, Inc. (Japan) | 4,000 | 99,195 | ||||||||||
|
| |||||||||||
| 200,834 | ||||||||||||
|
| |||||||||||
Total Communication Services | 26,855,561 | |||||||||||
|
| |||||||||||
Consumer Discretionary - 11.2% | ||||||||||||
Auto Components - 0.0%## | ||||||||||||
Nemak S.A.B. de C.V. (Mexico)1 | 104,800 | 75,685 | ||||||||||
NGK Spark Plug Co. Ltd. (Japan) | 2,700 | 54,635 | ||||||||||
|
| |||||||||||
| 130,320 | ||||||||||||
|
| |||||||||||
Automobiles - 0.1% |
| |||||||||||
Geely Automobile Holdings Ltd. (China) | 43,000 | 82,861 | ||||||||||
Isuzu Motors Ltd. (Japan) | 4,000 | 52,442 | ||||||||||
Peugeot S.A. (France) | 655 | 15,570 | ||||||||||
Renault S.A. (France) | 285 | 21,282 | ||||||||||
Suzuki Motor Corp. (Japan) | 2,300 | 114,693 | ||||||||||
|
| |||||||||||
| 286,848 | ||||||||||||
|
| |||||||||||
Diversified Consumer Services - 0.1% |
| |||||||||||
China Maple Leaf Educational Systems Ltd. (China) | 126,000 | 54,685 | ||||||||||
China Yuhua Education Corp. Ltd. (China)1 | 194,000 | 78,226 | ||||||||||
Fu Shou Yuan International Group Ltd. (China) | 172,000 | 132,184 | ||||||||||
New Oriental Education & Technology Group, Inc. - ADR (China)* | 1,950 | 114,094 | ||||||||||
TAL Education Group - ADR (China)* | 1,630 | 47,237 | ||||||||||
Wisdom Education International Holdings Co. Ltd. (China) | 122,000 | 54,903 | ||||||||||
|
| |||||||||||
| 481,329 | ||||||||||||
|
| |||||||||||
Hotels, Restaurants & Leisure - 0.1% |
| |||||||||||
Accor S.A. (France) | 2,450 | 111,946 | ||||||||||
Basic-Fit N.V. (Netherlands)*1 | 2,555 | 73,562 | ||||||||||
|
| |||||||||||
| 185,508 | ||||||||||||
|
| |||||||||||
Household Durables - 0.0%## |
| |||||||||||
Sekisui Chemical Co. Ltd. (Japan) | 3,400 | 53,468 | ||||||||||
Techtronic Industries Co. Ltd. (Hong Kong) | 11,000 | 51,796 | ||||||||||
|
| |||||||||||
| 105,264 | ||||||||||||
|
| |||||||||||
Internet & Direct Marketing Retail - 3.9% |
| |||||||||||
Alibaba Group Holding Ltd. - ADR (China)* | 32,385 | 4,607,738 | ||||||||||
Amazon.com, Inc.* | 2,615 | 4,178,796 | ||||||||||
Booking Holdings, Inc.* | 3,875 | 7,263,998 | ||||||||||
Despegar.com Corp. (Argentina)* | 1,990 | 31,979 | ||||||||||
|
| |||||||||||
| 16,082,511 | ||||||||||||
|
| |||||||||||
Leisure Products - 0.1% |
| |||||||||||
Bandai Namco Holdings, Inc. (Japan) | 2,900 | 103,167 | ||||||||||
Yamaha Corp. (Japan) | 2,500 | 109,861 | ||||||||||
|
| |||||||||||
| 213,028 | ||||||||||||
|
| |||||||||||
Multiline Retail - 0.0%## |
| |||||||||||
El Puerto de Liverpool SAB de C.V. (Mexico) | 7,095 | 45,057 | ||||||||||
Lojas Americanas S.A. (Brazil) | 4,700 | 23,503 | ||||||||||
Lojas Renner S.A. (Brazil) | 3,085 | 31,235 | ||||||||||
Magazine Luiza S.A. (Brazil) | 500 | 22,627 | ||||||||||
Next plc (United Kingdom) | 755 | 50,157 | ||||||||||
|
| |||||||||||
| 172,579 | ||||||||||||
|
| |||||||||||
Specialty Retail - 4.6% |
| |||||||||||
AutoZone, Inc.* | 7,380 | 5,413,009 | ||||||||||
Dick’s Sporting Goods, Inc. | 128,055 | 4,529,305 | ||||||||||
Fast Retailing Co. Ltd. (Japan) | 100 | 50,351 | ||||||||||
Industria de Diseno Textil S.A. (Spain) | 108,280 | 3,051,823 | ||||||||||
Nitori Holdings Co. Ltd. (Japan) | 400 | 52,229 | ||||||||||
O’Reilly Automotive, Inc.* | 8,670 | 2,780,902 | ||||||||||
The accompanying notes are an integral part of the financial statements.
86
Investment Portfolio - October 31, 2018
| PRO-BLEND® MAXIMUM TERM SERIES | SHARES | VALUE (NOTE 2) | ||||||||||
COMMON STOCKS (continued) |
| |||||||||||
Consumer Discretionary (continued) |
| |||||||||||
Specialty Retail (continued) |
| |||||||||||
Ulta Beauty, Inc.* | 10,140 | $ | 2,783,633 | |||||||||
USS Co. Ltd. (Japan) | 2,900 | 52,292 | ||||||||||
|
| |||||||||||
| 18,713,544 | ||||||||||||
|
| |||||||||||
Textiles, Apparel & Luxury Goods - 2.3% |
| |||||||||||
ANTA Sports Products Ltd. (China) | 19,000 | 78,442 | ||||||||||
Burberry Group plc (United Kingdom) | 2,285 | 52,873 | ||||||||||
Hermes International (France) | 90 | 51,381 | ||||||||||
Kering S.A. (France) | 105 | 46,671 | ||||||||||
lululemon athletica, Inc.* | 48,211 | 6,784,734 | ||||||||||
LVMH Moet Hennessy Louis Vuitton SE (France) | 345 | 104,674 | ||||||||||
Moncler S.p.A (Italy) | 1,455 | 50,529 | ||||||||||
NIKE, Inc. - Class B | 31,015 | 2,327,366 | ||||||||||
|
| |||||||||||
| 9,496,670 | ||||||||||||
|
| |||||||||||
Total Consumer Discretionary | 45,867,601 | |||||||||||
|
| |||||||||||
Consumer Staples - 13.4% | ||||||||||||
Beverages - 5.2% | ||||||||||||
Ambev S.A. - ADR (Brazil) | 911,262 | 3,945,764 | ||||||||||
Ambev S.A. (Brazil) | 17,600 | 76,803 | ||||||||||
Anheuser-Busch InBev S.A./N.V. (Belgium) | 42,367 | 3,133,504 | ||||||||||
The Coca-Cola Co. | 135,667 | 6,495,736 | ||||||||||
Diageo plc (United Kingdom) | 95,615 | 3,305,556 | ||||||||||
Fomento Economico Mexicano SAB de C.V. (Mexico) | 5,500 | 46,849 | ||||||||||
PepsiCo, Inc. | 35,920 | 4,036,690 | ||||||||||
Pernod Ricard S.A. (France) | 305 | 46,508 | ||||||||||
Treasury Wine Estates Ltd. (Australia) | 15,875 | 170,872 | ||||||||||
|
| |||||||||||
| 21,258,282 | ||||||||||||
|
| |||||||||||
Food & Staples Retailing - 0.1% |
| |||||||||||
Atacadao Distribuicao Comercio e Industria Ltda. (Brazil) | 5,600 | 22,827 | ||||||||||
Matsumotokiyoshi Holdings Co. Ltd. (Japan) | 2,200 | 79,538 | ||||||||||
Tsuruha Holdings, Inc. (Japan) | 500 | 52,185 | ||||||||||
Wal-Mart de Mexico S.A.B. de C.V. (Mexico) | 37,500 | 95,886 | ||||||||||
Wesfarmers Ltd. (Australia) | 1,565 | 51,829 | ||||||||||
|
| |||||||||||
| 302,265 | ||||||||||||
|
| |||||||||||
Food Products - 3.4% |
| |||||||||||
Barry Callebaut AG (Switzerland) | 25 | 48,864 | ||||||||||
Campbell Soup Co. | 94,221 | 3,524,808 | ||||||||||
Chocoladefabriken Lindt & Spruengli AG (Switzerland) | 16 | 110,309 | ||||||||||
Danone S.A. (France) | 3,091 | 218,883 | ||||||||||
Grupo Bimbo S.A.B. de C.V. - Series A (Mexico) | 20,625 | 38,563 | ||||||||||
Kerry Group plc - Class A (Ireland) | 1,580 | 161,688 | ||||||||||
Kikkoman Corp. (Japan) | 1,900 | 104,096 | ||||||||||
Mondelez International, Inc. - Class A | 123,115 | 5,168,368 | ||||||||||
Nestle S.A. (Switzerland) | 56,415 | 4,762,730 | ||||||||||
|
| |||||||||||
| 14,138,309 | ||||||||||||
|
| |||||||||||
Household Products - 0.7% |
| |||||||||||
Colgate-Palmolive Co. | 45,805 | 2,727,688 | ||||||||||
Henkel AG & Co. KGaA (Germany) | 545 | 53,387 | ||||||||||
Kimberly-Clark de Mexico S.A.B. de C.V. - Class A (Mexico) | 48,800 | 70,317 | ||||||||||
Lion Corp. (Japan) | 4,000 | 75,203 | ||||||||||
|
| |||||||||||
| 2,926,595 | ||||||||||||
|
| |||||||||||
Personal Products - 2.2% |
| |||||||||||
Beiersdorf AG (Germany) | 40,030 | 4,138,974 | ||||||||||
Kao Corp. (Japan) | 800 | 53,218 | ||||||||||
Kobayashi Pharmaceutical Co. Ltd. (Japan) | 800 | 52,178 | ||||||||||
L’Oreal S.A. (France) | 485 | 109,273 | ||||||||||
Unilever plc - ADR (United Kingdom) | 90,404 | 4,789,604 | ||||||||||
|
| |||||||||||
| 9,143,247 | ||||||||||||
|
| |||||||||||
Tobacco - 1.8% |
| |||||||||||
Altria Group, Inc. | 47,315 | 3,077,368 | ||||||||||
British American Tobacco plc - ADR (United Kingdom) | 2,895 | 125,643 | ||||||||||
KT&G Corp. (South Korea) | 595 | 53,057 | ||||||||||
Philip Morris International, Inc. | 44,825 | 3,947,738 | ||||||||||
Swedish Match AB (Sweden) | 1,090 | 55,523 | ||||||||||
|
| |||||||||||
| 7,259,329 | ||||||||||||
|
| |||||||||||
Total Consumer Staples | 55,028,027 | |||||||||||
|
| |||||||||||
Energy - 2.8% | ||||||||||||
Energy Equipment & Services - 2.4% | ||||||||||||
Core Laboratories N.V. | 850 | 72,454 | ||||||||||
Diamond Offshore Drilling, Inc.* | 84,040 | 1,191,687 | ||||||||||
Ensco plc - Class A | 344,000 | 2,456,160 | ||||||||||
Schlumberger Ltd. | 82,423 | 4,229,124 | ||||||||||
Transocean Ltd.* | 175,225 | 1,929,227 | ||||||||||
|
| |||||||||||
| 9,878,652 | ||||||||||||
|
| |||||||||||
Oil, Gas & Consumable Fuels - 0.4% |
| |||||||||||
Cameco Corp. (Canada) | 7,425 | 79,596 | ||||||||||
Canadian Natural Resources Ltd. (Canada) | 3,935 | 107,966 | ||||||||||
China Petroleum & Chemical Corp. - Class H (China) | 136,000 | 110,782 | ||||||||||
Eni S.p.A. (Italy) | 6,485 | 115,171 | ||||||||||
The accompanying notes are an integral part of the financial statements.
87
Investment Portfolio - October 31, 2018
| PRO-BLEND® MAXIMUM TERM SERIES | SHARES | VALUE (NOTE 2) | ||||||||||
COMMON STOCKS (continued) |
| |||||||||||
Energy (continued) |
| |||||||||||
Oil, Gas & Consumable Fuels (continued) |
| |||||||||||
Galp Energia SGPS S.A. (Portugal) | 12,485 | $ | 217,091 | |||||||||
Repsol S.A. (Spain) | 10,405 | 185,924 | ||||||||||
Royal Dutch Shell plc - Class B - ADR (Netherlands) | 3,505 | 230,314 | ||||||||||
SK Innovation Co. Ltd. (South Korea) | 475 | 89,143 | ||||||||||
Suncor Energy, Inc. (Canada) | 3,055 | 102,479 | ||||||||||
TOTAL S.A. (France) | 3,145 | 184,533 | ||||||||||
Vermilion Energy, Inc. (Canada) | 4,250 | 112,703 | ||||||||||
Woodside Petroleum Ltd. (Australia) | 4,480 | 110,299 | ||||||||||
|
| |||||||||||
| 1,646,001 | ||||||||||||
|
| |||||||||||
Total Energy | 11,524,653 | |||||||||||
|
| |||||||||||
Financials - 7.2% |
| |||||||||||
Banks - 2.0% |
| |||||||||||
Banco Bradesco S.A. (Brazil) | 8,100 | 74,220 | ||||||||||
Banco Comercial Portugues S.A. (Portugal)* | 293,060 | 78,829 | ||||||||||
Banco do Brasil S.A. (Brazil) | 3,200 | 36,673 | ||||||||||
Banco Santander Brasil S.A. (Brazil) | 3,200 | 36,286 | ||||||||||
The Bank Of N.T. Butterfield & Son Ltd. (Bermuda) | 1,495 | 60,234 | ||||||||||
Bankia S.A. (Spain) | 495,448 | 1,556,222 | ||||||||||
Bankinter S.A. (Spain) | 13,275 | 108,762 | ||||||||||
BNP Paribas S.A. (France) | 1,505 | 78,431 | ||||||||||
CaixaBank S.A. (Spain) | 689,875 | 2,791,710 | ||||||||||
Credit Agricole S.A. (France) | 1,720 | 22,029 | ||||||||||
Erste Group Bank AG (Austria) | 1,875 | 76,326 | ||||||||||
FinecoBank Banca Fineco S.p.A. (Italy) | 281,835 | 2,945,619 | ||||||||||
Itau Unibanco Holding S.A. (Brazil) | 5,600 | 73,944 | ||||||||||
Itausa - Investimentos Itau S.A. (Brazil) | 12,500 | 37,619 | ||||||||||
Jyske Bank A/S (Denmark) | 1,730 | 70,638 | ||||||||||
KBC Group N.V. (Belgium) | 1,090 | 75,118 | ||||||||||
Societe Generale S.A. (France) | 990 | 36,291 | ||||||||||
Sydbank A/S (Denmark) | 2,505 | 57,859 | ||||||||||
|
| |||||||||||
| 8,216,810 | ||||||||||||
|
| |||||||||||
Capital Markets - 4.1% |
| |||||||||||
B3 S.A. - Brasil Bolsa Balcao (Brazil) | 5,400 | 38,728 | ||||||||||
BlackRock, Inc. | 11,825 | 4,865,042 | ||||||||||
Cboe Global Markets, Inc. | 9,710 | 1,095,774 | ||||||||||
The Charles Schwab Corp. | 79,660 | 3,683,478 | ||||||||||
CME Group, Inc. | 5,985 | 1,096,691 | ||||||||||
E*TRADE Financial Corp. | 43,195 | 2,134,697 | ||||||||||
Intercontinental Exchange, Inc. | 13,395 | 1,031,951 | ||||||||||
Japan Exchange Group, Inc. (Japan) | 4,400 | 78,807 | ||||||||||
Julius Baer Group Ltd. (Switzerland) | 56,300 | 2,567,549 | ||||||||||
|
| |||||||||||
| 16,592,717 | ||||||||||||
|
| |||||||||||
Diversified Financial Services - 1.1% |
| |||||||||||
Berkshire Hathaway, Inc. - Class B* | 20,745 | 4,258,534 | ||||||||||
|
| |||||||||||
Insurance - 0.0%## |
| |||||||||||
Admiral Group plc (United Kingdom) | 2,055 | 52,826 | ||||||||||
AXA S.A. (France) | 2,595 | 64,944 | ||||||||||
BB Seguridade Participacoes S.A. (Brazil) | 3,800 | 27,192 | ||||||||||
|
| |||||||||||
| 144,962 | ||||||||||||
|
| |||||||||||
Thrifts & Mortgage Finance - 0.0%## |
| |||||||||||
Aareal Bank AG (Germany) | 1,990 | 74,030 | ||||||||||
|
| |||||||||||
Total Financials | 29,287,053 | |||||||||||
|
| |||||||||||
Health Care - 15.8% |
| |||||||||||
Biotechnology - 4.7% |
| |||||||||||
BioMarin Pharmaceutical, Inc.* | 51,698 | 4,765,005 | ||||||||||
Incyte Corp.* | 116,765 | 7,568,707 | ||||||||||
Regeneron Pharmaceuticals, Inc.* | 7,280 | 2,469,667 | ||||||||||
Seattle Genetics, Inc.* | 47,115 | 2,644,565 | ||||||||||
Vertex Pharmaceuticals, Inc.* | 11,472 | 1,944,045 | ||||||||||
|
| |||||||||||
| 19,391,989 | ||||||||||||
|
| |||||||||||
Health Care Equipment & Supplies - 2.9% |
| |||||||||||
Coloplast A/S - Class B (Denmark) | 1,120 | 104,511 | ||||||||||
EssilorLuxottica (France) | 790 | 107,896 | ||||||||||
Hoya Corp. (Japan) | 1,000 | 56,576 | ||||||||||
Intuitive Surgical, Inc.* | 6,610 | 3,445,000 | ||||||||||
Medtronic plc | 84,810 | 7,617,634 | ||||||||||
Shandong Weigao Group Medical Polymer Co. Ltd. - Class H (China) | 63,510 | 56,889 | ||||||||||
Smith & Nephew plc (United Kingdom) | 3,075 | 49,984 | ||||||||||
Sonova Holding AG (Switzerland) | 315 | 51,372 | ||||||||||
Terumo Corp. (Japan) | 2,000 | 107,964 | ||||||||||
William Demant Holding A/S (Denmark)* | 1,690 | 55,553 | ||||||||||
|
| |||||||||||
| 11,653,379 | ||||||||||||
|
| |||||||||||
Health Care Providers & Services - 0.8% |
| |||||||||||
DaVita, Inc.* | 50,220 | 3,381,815 | ||||||||||
|
| |||||||||||
Life Sciences Tools & Services - 1.4% |
| |||||||||||
QIAGEN N.V.* | 84,583 | 3,070,363 | ||||||||||
QIAGEN N.V.* | 2,668 | 96,844 | ||||||||||
Tecan Group AG (Switzerland) | 170 | 38,350 | ||||||||||
Thermo Fisher Scientific, Inc. | 10,565 | 2,468,512 | ||||||||||
|
| |||||||||||
| 5,674,069 | ||||||||||||
|
| |||||||||||
The accompanying notes are an integral part of the financial statements.
88
Investment Portfolio - October 31, 2018
| PRO-BLEND® MAXIMUM TERM SERIES | SHARES | VALUE (NOTE 2) | ||||||||||
COMMON STOCKS (continued) |
| |||||||||||
Health Care (continued) |
| |||||||||||
Pharmaceuticals - 6.0% |
| |||||||||||
Astellas Pharma, Inc. (Japan) | 3,400 | $ | 52,531 | |||||||||
Bristol-Myers Squibb Co. | 29,675 | 1,499,774 | ||||||||||
Chugai Pharmaceutical Co. Ltd. (Japan) | 1,800 | 105,384 | ||||||||||
Johnson & Johnson | 43,405 | 6,076,266 | ||||||||||
Merck & Co., Inc. | 28,480 | 2,096,413 | ||||||||||
Merck KGaA (Germany) | 20,860 | 2,232,076 | ||||||||||
Mylan N.V.* | 42,015 | 1,312,969 | ||||||||||
Novartis AG - ADR (Switzerland) | 79,500 | 6,953,070 | ||||||||||
Novartis AG (Switzerland) | 2,420 | 211,925 | ||||||||||
Novo Nordisk A/S - Class B (Denmark) | 1,270 | 54,847 | ||||||||||
Perrigo Co. plc | 53,240 | 3,742,772 | ||||||||||
Sanofi (France) | 1,410 | 125,998 | ||||||||||
|
| |||||||||||
| 24,464,025 | ||||||||||||
|
| |||||||||||
Total Health Care | 64,565,277 | |||||||||||
|
| |||||||||||
Industrials - 4.8% |
| |||||||||||
Aerospace & Defense - 0.1% |
| |||||||||||
Airbus S.E. (France) | 755 | 83,438 | ||||||||||
BAE Systems plc (United Kingdom) | 17,985 | 120,595 | ||||||||||
MTU Aero Engines AG (Germany) | 260 | 55,206 | ||||||||||
Safran S.A. (France) | 435 | 56,214 | ||||||||||
Thales S.A. (France) | 120 | 15,326 | ||||||||||
|
| |||||||||||
| 330,779 | ||||||||||||
|
| |||||||||||
Air Freight & Logistics - 1.0% |
| |||||||||||
FedEx Corp. | 18,645 | 4,108,239 | ||||||||||
|
| |||||||||||
Airlines - 0.0%## |
| |||||||||||
Ryanair Holdings plc - ADR (Ireland)* | 690 | 57,132 | ||||||||||
|
| |||||||||||
Building Products - 0.0%## |
| |||||||||||
Cie de Saint-Gobain (France) | 590 | 22,226 | ||||||||||
TOTO Ltd. (Japan) | 1,500 | 53,664 | ||||||||||
|
| |||||||||||
| 75,890 | ||||||||||||
|
| |||||||||||
Commercial Services & Supplies - 1.0% |
| |||||||||||
Advanced Disposal Services, Inc.* | 155,660 | 4,216,829 | ||||||||||
Secom Co. Ltd. (Japan) | 600 | 49,123 | ||||||||||
|
| |||||||||||
| 4,265,952 | ||||||||||||
|
| |||||||||||
Construction & Engineering - 1.0% |
| |||||||||||
FLSmidth & Co. A/S (Denmark) | 421 | 22,090 | ||||||||||
Vinci S.A. (France) | 44,530 | 3,963,121 | ||||||||||
|
| |||||||||||
| 3,985,211 | ||||||||||||
|
| |||||||||||
Electrical Equipment - 0.0%## |
| |||||||||||
Schneider Electric SE (France) | 755 | 54,595 | ||||||||||
|
| |||||||||||
Industrial Conglomerates - 0.0%## |
| |||||||||||
Siemens AG (Germany) | 1,265 | 145,407 | ||||||||||
|
| |||||||||||
Machinery - 0.3% |
| |||||||||||
Epiroc AB - Class A (Sweden)* | 10,385 | 91,195 | ||||||||||
FANUC Corp. (Japan) | 491 | 85,418 | ||||||||||
Hoshizaki Corp. (Japan) | 1,100 | 88,793 | ||||||||||
Hyundai Heavy Industries Co. Ltd. (South Korea)* | 725 | 79,752 | ||||||||||
Hyundai Mipo Dockyard Co. Ltd. (South Korea)* | 940 | 77,964 | ||||||||||
Jungheinrich AG (Germany) | 2,215 | 73,387 | ||||||||||
KION Group AG (Germany) | 1,945 | 113,657 | ||||||||||
Kone OYJ - Class B (Finland) | 1,100 | 53,542 | ||||||||||
Makita Corp. (Japan) | 1,300 | 44,944 | ||||||||||
Metso OYJ (Finland) | 3,064 | 96,736 | ||||||||||
MISUMI Group, Inc. (Japan) | 2,700 | 54,110 | ||||||||||
Samsung Heavy Industries Co. Ltd. (South Korea)* | 6,270 | 38,468 | ||||||||||
Schindler Holding AG (Switzerland) | 505 | 106,487 | ||||||||||
WEG S.A. (Brazil) | 4,700 | 22,745 | ||||||||||
The Weir Group plc (United Kingdom) | 9,670 | 195,687 | ||||||||||
|
| |||||||||||
| 1,222,885 | ||||||||||||
|
| |||||||||||
Professional Services - 0.5% |
| |||||||||||
Equifax, Inc. | 17,150 | 1,739,696 | ||||||||||
Experian plc (United Kingdom) | 2,300 | 52,898 | ||||||||||
Recruit Holdings Co. Ltd. (Japan) | 4,300 | 115,410 | ||||||||||
Teleperformance (France) | 310 | 51,054 | ||||||||||
Wolters Kluwer N.V. (Netherlands) | 925 | 52,479 | ||||||||||
|
| |||||||||||
| 2,011,537 | ||||||||||||
|
| |||||||||||
Road & Rail - 0.8% |
| |||||||||||
Canadian National Railway Co. (Canada) | 620 | 53,002 | ||||||||||
Genesee & Wyoming, Inc. - Class A* | 39,290 | 3,112,947 | ||||||||||
|
| |||||||||||
| 3,165,949 | ||||||||||||
|
| |||||||||||
Trading Companies & Distributors - 0.1% |
| |||||||||||
Ashtead Group plc (United Kingdom) | 3,050 | 75,295 | ||||||||||
Brenntag AG (Germany) | 1,207 | 63,035 | ||||||||||
Kanamoto Co. Ltd. (Japan) | 2,300 | 76,856 | ||||||||||
|
| |||||||||||
| 215,186 | ||||||||||||
|
| |||||||||||
Transportation Infrastructure - 0.0%## |
| |||||||||||
Grupo Aeroportuario del Centro Norte S.A.B. de C.V. (Mexico) | 10,200 | 53,422 | ||||||||||
Grupo Aeroportuario del Pacifico S.A.B. de C.V. - ADR (Mexico) | 570 | 47,242 | ||||||||||
|
| |||||||||||
| 100,664 | ||||||||||||
|
| |||||||||||
Total Industrials | 19,739,426 | |||||||||||
|
| |||||||||||
The accompanying notes are an integral part of the financial statements.
89
Investment Portfolio - October 31, 2018
| PRO-BLEND® MAXIMUM TERM SERIES | SHARES | VALUE (NOTE 2) | ||||||||||
COMMON STOCKS (continued) |
| |||||||||||
Information Technology - 12.5% |
| |||||||||||
Electronic Equipment, Instruments & Components - 1.0% |
| |||||||||||
Cognex Corp. | 42,095 | $ | 1,803,350 | |||||||||
Halma plc (United Kingdom) | 4,770 | 80,949 | ||||||||||
Hexagon A.B. - Class B (Sweden) | 2,220 | 108,655 | ||||||||||
Keyence Corp. (Japan) | 4,392 | 2,145,579 | ||||||||||
Yokogawa Electric Corp. (Japan) | 2,700 | 53,012 | ||||||||||
|
| |||||||||||
| 4,191,545 | ||||||||||||
|
| |||||||||||
IT Services - 4.9% |
| |||||||||||
Amadeus IT Group S.A. (Spain) | 635 | 51,133 | ||||||||||
Amdocs Ltd. | 67,105 | 4,245,733 | ||||||||||
Capgemini SE (France) | 190 | 23,200 | ||||||||||
InterXion Holding N.V. (Netherlands)* | 34,955 | 2,057,801 | ||||||||||
Mastercard, Inc. - Class A | 34,400 | 6,799,848 | ||||||||||
Nomura Research Institute Ltd. (Japan) | 2,500 | 110,834 | ||||||||||
Obic Co. Ltd. (Japan) | 1,300 | 118,352 | ||||||||||
Otsuka Corp. (Japan) | 1,600 | 53,070 | ||||||||||
Visa, Inc. - Class A | 47,455 | 6,541,672 | ||||||||||
|
| |||||||||||
| 20,001,643 | ||||||||||||
|
| |||||||||||
Semiconductors & Semiconductor Equipment - 2.4% |
| |||||||||||
Qorvo, Inc.* | 106,325 | 7,815,951 | ||||||||||
Skyworks Solutions, Inc. | 25,020 | 2,170,735 | ||||||||||
|
| |||||||||||
| 9,986,686 | ||||||||||||
|
| |||||||||||
Software - 4.2% |
| |||||||||||
Adobe, Inc.* | 18,530 | 4,553,933 | ||||||||||
Check Point Software Technologies Ltd. (Israel)* | 950 | 105,450 | ||||||||||
Dassault Systemes S.E. (France) | 180 | 22,533 | ||||||||||
Microsoft Corp. | 58,700 | 6,269,747 | ||||||||||
Oracle Corp. (Japan) | 800 | 54,151 | ||||||||||
SAP SE (Germany) | 485 | 51,930 | ||||||||||
ServiceNow, Inc.* | 31,915 | 5,777,892 | ||||||||||
Trend Micro, Inc. (Japan) | 1,900 | 109,375 | ||||||||||
|
| |||||||||||
| 16,945,011 | ||||||||||||
|
| |||||||||||
Total Information Technology | 51,124,885 | |||||||||||
|
| |||||||||||
Materials - 6.2% |
| |||||||||||
Chemicals - 2.8% |
| |||||||||||
Air Liquide S.A. (France) | 560 | 67,696 | ||||||||||
Akzo Nobel N.V. (Netherlands) | 44,955 | 3,774,627 | ||||||||||
Asahi Kasei Corp. (Japan) | 4,400 | 52,793 | ||||||||||
Axalta Coating Systems Ltd.* | 85,350 | 2,106,438 | ||||||||||
CF Industries Holdings, Inc. | 60,000 | 2,881,800 | ||||||||||
Croda International plc (United Kingdom) | 1,873 | 115,369 | ||||||||||
FUCHS PETROLUB S.E. (Germany) | 606 | 28,051 | ||||||||||
Givaudan S.A. (Switzerland) | 20 | 48,478 | ||||||||||
Mexichem S.A.B. de C.V. (Mexico) | 35,965 | 94,068 | ||||||||||
Nissan Chemical Corp. (Japan) | 1,100 | 51,866 | ||||||||||
Novozymes A/S - Class B (Denmark) | 1,075 | 53,089 | ||||||||||
Olin Corp. | 89,205 | 1,801,941 | ||||||||||
Solvay S.A. (Belgium) | 1,470 | 167,443 | ||||||||||
|
| |||||||||||
| 11,243,659 | ||||||||||||
|
| |||||||||||
Containers & Packaging - 2.0% |
| |||||||||||
Ball Corp. | 77,785 | 3,484,768 | ||||||||||
Crown Holdings, Inc.* | 34,110 | 1,442,512 | ||||||||||
DS Smith plc (United Kingdom) | 22,730 | 114,050 | ||||||||||
Sealed Air Corp. | 101,355 | 3,279,848 | ||||||||||
|
| |||||||||||
| 8,321,178 | ||||||||||||
|
| |||||||||||
Metals & Mining - 1.4% |
| |||||||||||
Antofagasta plc (Chile) | 99,455 | 995,547 | ||||||||||
First Quantum Minerals Ltd. (Zambia) | 11,065 | 110,444 | ||||||||||
Freeport-McMoRan, Inc. | 152,045 | 1,771,324 | ||||||||||
Lundin Mining Corp. (Chile) | 209,695 | 861,749 | ||||||||||
Southern Copper Corp. (Peru) | 56,825 | 2,178,670 | ||||||||||
|
| |||||||||||
| 5,917,734 | ||||||||||||
|
| |||||||||||
Total Materials | 25,482,571 | |||||||||||
|
| |||||||||||
Real Estate - 4.5% |
| |||||||||||
Equity Real Estate Investment Trusts (REITS) - 4.5% |
| |||||||||||
Acadia Realty Trust | 855 | 23,803 | ||||||||||
Agree Realty Corp. | 695 | 39,803 | ||||||||||
Alexandria Real Estate Equities, Inc. | 200 | 24,446 | ||||||||||
American Campus Communities, Inc. | 635 | 25,089 | ||||||||||
American Homes 4 Rent - Class A | 4,885 | 102,927 | ||||||||||
American Tower Corp. | 36,675 | 5,714,332 | ||||||||||
Americold Realty Trust | 890 | 22,028 | ||||||||||
Apartment Investment & Management Co. - Class A | 1,800 | 77,472 | ||||||||||
Apple Hospitality REIT, Inc. | 2,410 | 38,970 | ||||||||||
AvalonBay Communities, Inc. | 1,110 | 194,672 | ||||||||||
Boston Properties, Inc. | 1,195 | 144,308 | ||||||||||
Brandywine Realty Trust | 6,085 | 85,555 | ||||||||||
CatchMark Timber Trust, Inc. - Class A | 1,788 | 15,824 | ||||||||||
Chesapeake Lodging Trust | 1,245 | 36,591 | ||||||||||
Colony Capital, Inc. | 5,787 | 33,970 | ||||||||||
Community Healthcare Trust, Inc. | 1,550 | 46,066 | ||||||||||
CoreCivic, Inc. | 2,845 | 63,899 | ||||||||||
Cousins Properties, Inc. | 10,595 | 88,044 | ||||||||||
Crown Castle International Corp. | 675 | 73,400 | ||||||||||
CubeSmart | 675 | 19,562 | ||||||||||
Digital Realty Trust, Inc. | 1,430 | 147,662 | ||||||||||
The accompanying notes are an integral part of the financial statements.
90
Investment Portfolio - October 31, 2018
| PRO-BLEND® MAXIMUM TERM SERIES | SHARES/ PRINCIPAL AMOUNT2 | VALUE (NOTE 2) | ||||||||||
COMMON STOCKS (continued) |
| |||||||||||
Real Estate (continued) |
| |||||||||||
Equity Real Estate Investment Trusts (REITS) (continued) |
| |||||||||||
EastGroup Properties, Inc. | 240 | $ | 22,990 | |||||||||
Equinix, Inc. | 8,405 | 3,183,310 | ||||||||||
Equity LifeStyle Properties, Inc. | 555 | 52,553 | ||||||||||
Equity Residential | 2,320 | 150,707 | ||||||||||
Essex Property Trust, Inc. | 390 | 97,804 | ||||||||||
Extra Space Storage, Inc. | 550 | 49,533 | ||||||||||
Federal Realty Investment Trust | 195 | 24,190 | ||||||||||
First Industrial Realty Trust, Inc. | 1,280 | 39,296 | ||||||||||
Getty Realty Corp. | 1,495 | 40,111 | ||||||||||
HCP, Inc. | 2,830 | 77,966 | ||||||||||
Healthcare Realty Trust, Inc. | 1,800 | 50,148 | ||||||||||
Healthcare Trust of America, Inc. - Class A | 2,055 | 53,964 | ||||||||||
Hibernia REIT plc (Ireland) | 26,485 | 41,697 | ||||||||||
Host Hotels & Resorts, Inc. | 4,945 | 94,499 | ||||||||||
Independence Realty Trust, Inc. | 4,390 | 43,505 | ||||||||||
Invitation Homes, Inc. | 4,251 | 93,012 | ||||||||||
Jernigan Capital, Inc. | 2,450 | 47,946 | ||||||||||
Kimco Realty Corp. | 2,090 | 33,628 | ||||||||||
Lamar Advertising Co. - Class A | 440 | 32,261 | ||||||||||
Lexington Realty Trust | 4,480 | 34,810 | ||||||||||
Liberty Property Trust | 1,995 | 83,531 | ||||||||||
The Macerich Co. | 340 | 17,551 | ||||||||||
Mid-America Apartment Communities, Inc. | 795 | 77,679 | ||||||||||
National Retail Properties, Inc. | 925 | 43,244 | ||||||||||
National Storage Affiliates Trust | 735 | 19,573 | ||||||||||
Outfront Media, Inc. | 1,365 | 24,188 | ||||||||||
Physicians Realty Trust | 6,235 | 103,376 | ||||||||||
Plymouth Industrial REIT, Inc. | 1,770 | 24,780 | ||||||||||
Prologis, Inc. | 3,115 | 200,824 | ||||||||||
Public Storage | 620 | �� | 127,391 | |||||||||
Realty Income Corp. | 405 | 24,409 | ||||||||||
SBA Communications Corp.* | 31,860 | 5,166,736 | ||||||||||
Simon Property Group, Inc. | 1,440 | 264,269 | ||||||||||
STAG Industrial, Inc. | 1,975 | 52,258 | ||||||||||
STORE Capital Corp. | 825 | 23,950 | ||||||||||
Sun Communities, Inc. | 1,020 | 102,479 | ||||||||||
Sunstone Hotel Investors, Inc. | 3,830 | 55,420 | ||||||||||
Tier REIT, Inc. | 3,650 | 79,096 | ||||||||||
UDR, Inc. | 2,470 | 96,799 | ||||||||||
UMH Properties, Inc. | 1,820 | 26,081 | ||||||||||
Unibail-Rodamco-Westfield (France) | 800 | 144,767 | ||||||||||
Urban Edge Properties | 4,055 | 83,087 | ||||||||||
Ventas, Inc. | 830 | 48,173 | ||||||||||
VEREIT, Inc. | 5,665 | 41,524 | ||||||||||
Vornado Realty Trust | 1,755 | 119,480 | ||||||||||
Weingarten Realty Investors | 2,120 | 59,614 | ||||||||||
Welltower, Inc. | 1,045 | 69,043 | ||||||||||
|
| |||||||||||
| 18,461,675 | ||||||||||||
|
| |||||||||||
Real Estate Management & Development - 0.0%## |
| |||||||||||
Daito Trust Construction Co. Ltd. (Japan) | 400 | 52,735 | ||||||||||
StorageVault Canada, Inc. (Canada) | 6,655 | 13,043 | ||||||||||
|
| |||||||||||
| 65,778 | ||||||||||||
|
| |||||||||||
Total Real Estate | 18,527,453 | |||||||||||
|
| |||||||||||
Utilities - 0.1% |
| |||||||||||
Independent Power and Renewable Electricity Producers - 0.0%## |
| |||||||||||
China Longyuan Power Group Corp. Ltd. - Class H (China) | 17,000 | 12,937 | ||||||||||
Engie Brasil Energia S.A. (Brazil) | 2,100 | 22,459 | ||||||||||
Huaneng Renewables Corp. Ltd. - Class H (China) | 264,438 | 68,060 | ||||||||||
|
| |||||||||||
| 103,456 | ||||||||||||
|
| |||||||||||
Multi-Utilities - 0.0%## |
| |||||||||||
Engie S.A. (France) | 2,220 | 29,497 | ||||||||||
|
| |||||||||||
Water Utilities - 0.1% |
| |||||||||||
Guangdong Investment Ltd. (China) | 58,000 | 103,836 | ||||||||||
|
| |||||||||||
Total Utilities | 236,789 | |||||||||||
|
| |||||||||||
TOTAL COMMON STOCKS | 348,239,296 | |||||||||||
|
| |||||||||||
CORPORATE BONDS - 4.3% |
| |||||||||||
Non-Convertible Corporate Bonds - 4.3% | ||||||||||||
Communication Services - 0.5% | ||||||||||||
Diversified Telecommunication Services - 0.3% |
| |||||||||||
AT&T, Inc., 4.25%, 3/1/2027 | 450,000 | 436,393 | ||||||||||
Verizon Communications, Inc., 5.50%, 3/16/2047 | 660,000 | 687,702 | ||||||||||
|
| |||||||||||
| 1,124,095 | ||||||||||||
|
| |||||||||||
Media - 0.1% |
| |||||||||||
CCO Holdings LLC - CCO Holdings Capital Corp.1, 5.50%, 5/1/2026 | 80,000 | 78,000 | ||||||||||
Discovery Communications LLC, 5.20%, 9/20/2047 | 480,000 | 443,946 | ||||||||||
Telenet Finance Luxembourg Notes S.A.R.L (Belgium)1, 5.50%, 3/1/2028 | 200,000 | 185,500 | ||||||||||
|
| |||||||||||
| 707,446 | ||||||||||||
|
| |||||||||||
Wireless Telecommunication Services - 0.1% |
| |||||||||||
Hughes Satellite Systems Corp., 5.25%, 8/1/2026 | 136,000 | 129,200 | ||||||||||
Inmarsat Finance plc (United Kingdom)1, 4.875%, 5/15/2022 | 153,000 | 149,867 | ||||||||||
The accompanying notes are an integral part of the financial statements.
91
Investment Portfolio - October 31, 2018
| PRO-BLEND® MAXIMUM TERM SERIES | PRINCIPAL AMOUNT2 | VALUE (NOTE 2) | ||||||||||
CORPORATE BONDS (continued) |
| |||||||||||
Non-Convertible Corporate Bonds (continued) |
| |||||||||||
Communication Services (continued) | ||||||||||||
Wireless Telecommunication Services (continued) |
| |||||||||||
Sprint Communications, Inc.1, 9.00%, 11/15/2018 | 27,000 | $ | 27,054 | |||||||||
Sprint Communications, Inc.1, 7.00%, 3/1/2020 | 27,000 | 27,979 | ||||||||||
|
| |||||||||||
| 334,100 | ||||||||||||
|
| |||||||||||
Total Communication Services | 2,165,641 | |||||||||||
|
| |||||||||||
Consumer Discretionary - 0.5% |
| |||||||||||
Auto Components - 0.0%## |
| |||||||||||
Techniplas LLC1, 10.00%, 5/1/2020 | 75,000 | 70,500 | ||||||||||
|
| |||||||||||
Automobiles - 0.1% |
| |||||||||||
General Motors Co.3, (3 mo. LIBOR US + 0.900%), 3.227%, 9/10/2021 | 440,000 | 439,364 | ||||||||||
|
| |||||||||||
Household Durables - 0.1% |
| |||||||||||
Century Communities, Inc., 5.875%, 7/15/2025 | 124,000 | 112,220 | ||||||||||
LGI Homes, Inc.1, 6.875%, 7/15/2026 | 90,000 | 85,500 | ||||||||||
Meritage Homes Corp., 5.125%, 6/6/2027 | 60,000 | 52,800 | ||||||||||
TRI Pointe Group, Inc. - TRI Pointe Homes, Inc., 4.375%, 6/15/2019 | 80,000 | 80,000 | ||||||||||
TRI Pointe Group, Inc. - TRI Pointe Homes, Inc., 5.875%, 6/15/2024 | 85,000 | 79,369 | ||||||||||
Weekley Homes LLC - Weekley Finance Corp., 6.00%, 2/1/2023 | 55,000 | 52,800 | ||||||||||
Weekley Homes LLC - Weekley Finance Corp., 6.625%, 8/15/2025 | 89,000 | 84,105 | ||||||||||
|
| |||||||||||
| 546,794 | ||||||||||||
|
| |||||||||||
Internet & Direct Marketing Retail - 0.2% |
| |||||||||||
Booking Holdings, Inc., 3.60%, 6/1/2026 | 720,000 | 687,629 | ||||||||||
|
| |||||||||||
Multiline Retail - 0.1% |
| |||||||||||
Macy’s Retail Holdings, Inc., 7.00%, 2/15/2028 | 210,000 | 221,763 | ||||||||||
Macy’s Retail Holdings, Inc., 6.90%, 4/1/2029 | 210,000 | 220,287 | ||||||||||
|
| |||||||||||
| 442,050 | ||||||||||||
|
| |||||||||||
Total Consumer Discretionary | 2,186,337 | |||||||||||
|
| |||||||||||
Consumer Staples - 0.0%## |
| |||||||||||
Food & Staples Retailing - 0.0%## |
| |||||||||||
C&S Group Enterprises LLC1, 5.375%, 7/15/2022 | 60,000 | 57,900 | ||||||||||
|
| |||||||||||
Household Products - 0.0%## |
| |||||||||||
First Quality Finance Co., Inc.1, 5.00%, 7/1/2025 | 65,000 | 59,800 | ||||||||||
|
| |||||||||||
Total Consumer Staples | 117,700 | |||||||||||
|
| |||||||||||
Energy - 0.8% |
| |||||||||||
Energy Equipment & Services - 0.0%## |
| |||||||||||
Shelf Drilling Holdings Ltd. (United Arab Emirates)1, 8.25%, 2/15/2025 | 60,000 | 60,150 | ||||||||||
TerraForm Power Operating, LLC1, 5.00%, 1/31/2028 | 55,000 | 49,156 | ||||||||||
|
| |||||||||||
| 109,306 | ||||||||||||
|
| |||||||||||
Oil, Gas & Consumable Fuels - 0.8% |
| |||||||||||
American Midstream Partners LP - American Midstream Finance Corp.1, 9.50%, 12/15/2021 | 85,000 | 83,300 | ||||||||||
Boardwalk Pipelines LP, 5.95%, 6/1/2026 | 650,000 | 679,193 | ||||||||||
DCP Midstream Operating LP1, 5.35%, 3/15/2020 | 50,000 | 50,562 | ||||||||||
Dynagas LNG Partners LP - Dynagas Finance, Inc. (Monaco), 6.25%, 10/30/2019 | 102,000 | 101,745 | ||||||||||
GasLog Ltd. (Monaco), 8.875%, 3/22/2022 | 110,000 | 113,850 | ||||||||||
Genesis Energy LP - Genesis Energy Finance Corp., 5.625%, 6/15/2024 | 65,000 | 58,825 | ||||||||||
Jonah Energy LLC - Jonah Energy Finance Corp.1, 7.25%, 10/15/2025 | 120,000 | 95,400 | ||||||||||
Kinder Morgan Energy Partners LP, 6.95%, 1/15/2038 | 590,000 | 675,786 | ||||||||||
Rockies Express Pipeline, LLC1, 5.625%, 4/15/2020 | 50,000 | 51,085 | ||||||||||
Sabine Pass Liquefaction LLC, 5.875%, 6/30/2026 | 650,000 | 690,055 | ||||||||||
SemGroup Corp., 6.375%, 3/15/2025 | 60,000 | 58,050 | ||||||||||
Seven Generations Energy Ltd. (Canada)1, 5.375%, 9/30/2025 | 62,000 | 57,815 | ||||||||||
Southwestern Energy Co.4, 6.20%, 1/23/2025 | 74,000 | 71,965 | ||||||||||
Tallgrass Energy Partners LP - Tallgrass Energy Finance Corp.1, 5.50%, 9/15/2024 | 55,000 | 55,344 | ||||||||||
W&T Offshore, Inc.1, 9.75%, 11/1/2023 | 75,000 | 72,578 | ||||||||||
The Williams Companies, Inc., 3.75%, 6/15/2027 | 350,000 | 325,898 | ||||||||||
|
| |||||||||||
| 3,241,451 | ||||||||||||
|
| |||||||||||
Total Energy | 3,350,757 | |||||||||||
|
| |||||||||||
Financials - 1.2% |
| |||||||||||
Banks - 0.6% |
| |||||||||||
Bank of America Corp., 4.00%, 1/22/2025 | 710,000 | 691,425 | ||||||||||
Citigroup, Inc., 8.125%, 7/15/2039 | 480,000 | 670,198 | ||||||||||
JPMorgan Chase & Co., 6.30%, 4/23/2019 | 680,000 | 691,012 | ||||||||||
Popular, Inc., 6.125%, 9/14/2023 | 85,000 | 86,003 | ||||||||||
The accompanying notes are an integral part of the financial statements.
92
Investment Portfolio - October 31, 2018
| PRO-BLEND® MAXIMUM TERM SERIES | PRINCIPAL AMOUNT2 | VALUE (NOTE 2) | ||||||||||
CORPORATE BONDS (continued) |
| |||||||||||
Non-Convertible Corporate Bonds (continued) |
| |||||||||||
Financials (continued) |
| |||||||||||
Banks (continued) |
| |||||||||||
Santander Holdings USA, Inc., 4.50%, 7/17/2025 | 440,000 | $ | 430,252 | |||||||||
|
| |||||||||||
| 2,568,890 | ||||||||||||
|
| |||||||||||
Capital Markets - 0.2% |
| |||||||||||
LPL Holdings, Inc.1, 5.75%, 9/15/2025 | 85,000 | 82,556 | ||||||||||
Morgan Stanley3, (3 mo. LIBOR US + 1.220%), 3.563%, 5/8/2024 | 690,000 | 697,280 | ||||||||||
|
| |||||||||||
| 779,836 | ||||||||||||
|
| |||||||||||
Consumer Finance - 0.1% |
| |||||||||||
Ally Financial, Inc., 3.50%, 1/27/2019 | 60,000 | 59,925 | ||||||||||
Navient Corp., 7.25%, 9/25/2023 | 50,000 | 51,750 | ||||||||||
SLM Corp., 5.125%, 4/5/2022 | 85,000 | 84,575 | ||||||||||
|
| |||||||||||
| 196,250 | ||||||||||||
|
| |||||||||||
Diversified Financial Services - 0.2% |
| |||||||||||
AerCap Ireland Capital DAC - AerCap Global Aviation Trust (Ireland), 4.45%, 10/1/2025 | 450,000 | 439,421 | ||||||||||
FS Energy & Power Fund1, 7.50%, 8/15/2023 | 95,000 | 96,330 | ||||||||||
Oxford Finance, LLC - Oxford Finance Co. - Issuer II, Inc.1, 6.375%, 12/15/2022 | 90,000 | 91,238 | ||||||||||
|
| |||||||||||
| 626,989 | ||||||||||||
|
| |||||||||||
Insurance - 0.1% |
| |||||||||||
Prudential Financial, Inc.5, (3 mo. LIBOR US + 4.175%), 5.875%, 9/15/2042 | 440,000 | 457,820 | ||||||||||
|
| |||||||||||
Thrifts & Mortgage Finance - 0.0%## |
| |||||||||||
Ladder Capital Finance Holdings LLLP - Ladder Capital Finance Corp.1, 5.875%, 8/1/2021 | 55,000 | 55,412 | ||||||||||
|
| |||||||||||
Total Financials | 4,685,197 | |||||||||||
|
| |||||||||||
Health Care - 0.2% |
| |||||||||||
Health Care Providers & Services - 0.2% |
| |||||||||||
DaVita, Inc., 5.00%, 5/1/2025 | 94,000 | 88,830 | ||||||||||
Fresenius Medical Care US Finance II, Inc. (Germany)1, 5.625%, 7/31/2019 | 450,000 | 457,021 | ||||||||||
HCA, Inc., 5.375%, 9/1/2026 | 80,000 | 79,400 | ||||||||||
Ortho-Clinical Diagnostics, Inc. - Ortho-Clinical Diagnostics S.A.1, 6.625%, 5/15/2022 | 60,000 | 57,660 | ||||||||||
|
| |||||||||||
Total Health Care | 682,911 | |||||||||||
|
| |||||||||||
Industrials - 0.6% |
| |||||||||||
Airlines - 0.0%## |
| |||||||||||
Allegiant Travel Co., 5.50%, 7/15/2019 | 62,000 | 62,310 | ||||||||||
American Airlines Group, Inc.1, 5.50%, 10/1/2019 | 50,000 | 50,548 | ||||||||||
|
| |||||||||||
| 112,858 | ||||||||||||
|
| |||||||||||
Commercial Services & Supplies - 0.1% |
| |||||||||||
The ADT Security Corp., 5.25%, 3/15/2020 | 50,000 | 50,500 | ||||||||||
Covanta Holding Corp., 6.00%, 1/1/2027 | 75,000 | 72,375 | ||||||||||
W/S Packaging Holdings, Inc.1, 9.00%, 4/15/2023 | 85,000 | 86,700 | ||||||||||
|
| |||||||||||
| 209,575 | ||||||||||||
|
| |||||||||||
Construction & Engineering - 0.0%## |
| |||||||||||
Tutor Perini Corp.1, 6.875%, 5/1/2025 | 97,000 | 97,121 | ||||||||||
|
| |||||||||||
Industrial Conglomerates - 0.1% |
| |||||||||||
General Electric Co.5,6, (3 mo. LIBOR US + 3.330%), 5.00% | 330,000 | 305,662 | ||||||||||
|
| |||||||||||
Machinery - 0.1% |
| |||||||||||
CNH Industrial Capital LLC, 3.375%, 7/15/2019 | 470,000 | 469,577 | ||||||||||
|
| |||||||||||
Marine - 0.1% |
| |||||||||||
Borealis Finance, LLC1, 7.50%, 11/16/2022 | 200,000 | 196,000 | ||||||||||
Global Ship Lease, Inc. (United Kingdom)1, 9.875%, 11/15/2022 | 120,000 | 114,300 | ||||||||||
|
| |||||||||||
| 310,300 | ||||||||||||
|
| |||||||||||
Trading Companies & Distributors - 0.2% |
| |||||||||||
Aircastle Ltd., 6.25%, 12/1/2019 | 35,000 | 35,971 | ||||||||||
Fortress Transportation & Infrastructure Investors, LLC1, 6.50%, 10/1/2025 | 80,000 | 78,600 | ||||||||||
International Lease Finance Corp., 6.25%, 5/15/2019 | 530,000 | 538,453 | ||||||||||
Park Aerospace Holdings Ltd. (Ireland)1, 4.50%, 3/15/2023 | 91,000 | 86,576 | ||||||||||
|
| |||||||||||
| 739,600 | ||||||||||||
|
| |||||||||||
Transportation Infrastructure - 0.0%## |
| |||||||||||
Eagle Bulk Shipco, LLC, 8.25%, 11/28/2022 | 200,000 | 205,500 | ||||||||||
|
| |||||||||||
Total Industrials | 2,450,193 | |||||||||||
|
| |||||||||||
Information Technology - 0.0%## |
| |||||||||||
Semiconductors & Semiconductor Equipment - 0.0%## |
| |||||||||||
MagnaChip Semiconductor Corp. (South Korea), 6.625%, 7/15/2021 | 97,000 | 91,180 | ||||||||||
|
| |||||||||||
Materials - 0.2% |
| |||||||||||
Chemicals - 0.0%## |
| |||||||||||
LSB Industries, Inc.1, 9.625%, 5/1/2023 | 100,000 | 103,750 | ||||||||||
|
| |||||||||||
The accompanying notes are an integral part of the financial statements.
93
Investment Portfolio - October 31, 2018
| PRO-BLEND® MAXIMUM TERM SERIES | PRINCIPAL AMOUNT2/ SHARES | VALUE (NOTE 2) | ||||||||||
CORPORATE BONDS (continued) |
| |||||||||||
Non-Convertible Corporate Bonds (continued) | ||||||||||||
Materials (continued) | ||||||||||||
Containers & Packaging - 0.0%## |
| |||||||||||
Ardagh Packaging Finance plc - Ardagh Holdings USA, Inc. (Ireland)1, 6.00%, 2/15/2025 | 200,000 | $ | 187,500 | |||||||||
|
| |||||||||||
Metals & Mining - 0.2% |
| |||||||||||
Corp Nacional del Cobre de Chile (Chile)1, 5.625%, 9/21/2035 | 315,000 | 333,859 | ||||||||||
Mountain Province Diamonds, Inc. (Canada)1, 8.00%, 12/15/2022 | 145,000 | 147,175 | ||||||||||
Northwest Acquisitions ULC - Dominion Finco, Inc.1, 7.125%, 11/1/2022 | 135,000 | 135,925 | ||||||||||
|
| |||||||||||
| 616,959 | ||||||||||||
|
| |||||||||||
Total Materials | 908,209 | |||||||||||
|
| |||||||||||
Real Estate - 0.2% |
| |||||||||||
Equity Real Estate Investment Trusts (REITS) - 0.2% |
| |||||||||||
American Homes 4 Rent LP, 4.25%, 2/15/2028 | 480,000 | 453,713 | ||||||||||
Greystar Real Estate Partners, LLC1, 5.75%, 12/1/2025 | 90,000 | 87,300 | ||||||||||
iStar, Inc., 5.25%, 9/15/2022 | 70,000 | 67,725 | ||||||||||
|
| |||||||||||
Total Real Estate | 608,738 | |||||||||||
|
| |||||||||||
Utilities - 0.1% |
| |||||||||||
Gas Utilities - 0.0%## |
| |||||||||||
NGL Energy Partners LP - NGL Energy Finance Corp., 6.125%, 3/1/2025 | 90,000 | 81,900 | ||||||||||
|
| |||||||||||
Independent Power and Renewable Electricity Producers - 0.1% |
| |||||||||||
Atlantica Yield plc (Spain)1, 7.00%, 11/15/2019 | 215,000 | 221,450 | ||||||||||
Clearway Energy Operating, LLC, 5.00%, 9/15/2026 | 60,000 | 55,800 | ||||||||||
Drax Finco plc (United Kingdom)1, 6.625%, 11/1/2025 | 200,000 | 199,500 | ||||||||||
|
| |||||||||||
Total Utilities | 558,650 | |||||||||||
|
| |||||||||||
TOTAL CORPORATE BONDS | 17,805,513 | |||||||||||
|
| |||||||||||
MUTUAL FUNDS - 0.1% |
| |||||||||||
iShares MSCI Thailand ETF | 3,571 | 309,606 | ||||||||||
iShares U.S. Real Estate ETF | 765 | 59,754 | ||||||||||
|
| |||||||||||
TOTAL MUTUAL FUNDS | 369,360 | |||||||||||
|
| |||||||||||
U.S. TREASURY SECURITIES - 9.6% |
| |||||||||||
U.S. Treasury Bonds - 1.9% | ||||||||||||
U.S. Treasury Bond, 6.25%, 5/15/2030 | 1,748,000 | 2,263,045 | ||||||||||
U.S. Treasury Bond, 4.75%, 2/15/2037 | 2,748,000 | 3,308,549 | ||||||||||
U.S. Treasury Bond, 3.00%, 5/15/2047 | 1,150,000 | 1,065,143 | ||||||||||
U.S. Treasury Inflation Indexed Bond, 0.75%, 2/15/2042 | 1,179,262 | 1,047,470 | ||||||||||
|
| |||||||||||
Total U.S. Treasury Bonds | 7,684,207 | |||||||||||
|
| |||||||||||
U.S. Treasury Notes - 7.7% |
| |||||||||||
U.S. Treasury Inflation Indexed Note, 0.125%, 4/15/2020 | 4,804,325 | 4,722,438 | ||||||||||
U.S. Treasury Inflation Indexed Note, 0.125%, 1/15/2023 | 1,147,217 | 1,104,491 | ||||||||||
U.S. Treasury Note, 1.625%, 4/30/2019 | 4,090,000 | 4,072,586 | ||||||||||
U.S. Treasury Note, 2.125%, 7/31/2024 | 8,480,000 | 8,074,550 | ||||||||||
U.S. Treasury Note, 1.625%, 5/15/2026 | 5,000,000 | 4,507,031 | ||||||||||
U.S. Treasury Note, 2.375%, 5/15/2027 | 4,877,000 | 4,603,240 | ||||||||||
U.S. Treasury Note, 2.75%, 2/15/2028 | 4,600,000 | 4,451,578 | ||||||||||
|
| |||||||||||
Total U.S. Treasury Notes | 31,535,914 | |||||||||||
|
| |||||||||||
TOTAL U.S. TREASURY SECURITIES | 39,220,121 | |||||||||||
|
| |||||||||||
SHORT-TERM INVESTMENT - 0.8% | ||||||||||||
Dreyfus Government Cash Management, Institutional Shares7, 2.05%, (Identified Cost $3,153,398) | 3,153,398 | 3,153,398 | ||||||||||
|
| |||||||||||
TOTAL INVESTMENTS - 99.9% (Identified Cost $382,475,572) | 408,787,688 | |||||||||||
OTHER ASSETS, LESS LIABILITIES - 0.1% | 397,154 | |||||||||||
|
| |||||||||||
NET ASSETS - 100% | $ | 409,184,842 | ||||||||||
|
| |||||||||||
The accompanying notes are an integral part of the financial statements.
94
Investment Portfolio - October 31, 2018
ADR - American Depositary Receipt
ETF - Exchange-traded fund
*Non-income producing security.
## Less than 0.1%.
1Restricted securities - Investment in securities that are restricted as to public resale under the Securities Act of 1933, as amended. These securities have been sold under Rule 144A and have been determined to be liquid under guidelines established by the Board of Directors. These securities amount to $4,511,484 or 1.1% of the Series’ net assets as of October 31, 2018 (see Note 2 to the financial statements).
2Amount is stated in USD unless otherwise noted.
3Floating rate security. Rate shown is the rate in effect as of October 31, 2018.
4Step coupon rate security - Rate steps up/down by 25 basis points upon rating downgrade/upgrade by Moody’s and S&P rating agencies (Subject to a maximum of 100 basis points per agency, 200 basis points maximum).
5Variable rate security. Security may be issued at a fixed coupon rate, which converts to a variable rate at a specified date. Rate shown is the rate in effect as of October 31, 2018.
6Security is perpetual in nature and has no stated maturity date.
7Rate shown is the current yield as of October 31, 2018.
The Global Industry Classification Standard (GICS) was developed by and is the exclusive property and a service mark of MSCI Inc. (MSCI) and Standard & Poor’s, a division of The McGraw-Hill Companies, Inc. (S&P), and is licensed for use by Manning & Napier when referencing GICS sectors. Neither MSCI, S&P, nor any third party involved in making or compiling the GICS or any GICS classifications makes any express or implied warranties or representations with respect to such standard or classification, nor shall any such party have any liability therefrom.
The accompanying notes are an integral part of the financial statements.
95
Statement of Assets and Liabilities - Pro-Blend® Maximum Term Series
October 31, 2018
ASSETS: | ||||
Investments, at value (identified cost $382,475,572) (Note 2) | $ | 408,787,688 | ||
Foreign currency, at value (identified cost $52,995) | 52,777 | |||
Receivable for securities sold | 5,210,217 | |||
Foreign tax reclaims receivable | 646,399 | |||
Interest receivable | 534,372 | |||
Receivable for fund shares sold | 357,182 | |||
Dividends receivable | 123,534 | |||
Prepaid expenses | 21,570 | |||
|
| |||
TOTAL ASSETS | 415,733,739 | |||
|
| |||
LIABILITIES: | ||||
Accrued management fees (Note 3) | 250,617 | |||
Accrued shareholder services fees (Class S) (Note 3) | 54,598 | |||
Accrued distribution and service (Rule 12b-1) fees (Class R) (Class R2) (Note 3) | 52,571 | |||
Accrued fund accounting and administration fees (Note 3) | 30,710 | |||
Accrued Chief Compliance Officer service fees (Note 3) | 402 | |||
Payable for securities purchased | 5,741,828 | |||
Payable for fund shares repurchased | 284,478 | |||
Other payables and accrued expenses | 133,693 | |||
|
| |||
TOTAL LIABILITIES | 6,548,897 | |||
|
| |||
TOTAL NET ASSETS | $ | 409,184,842 | ||
|
| |||
NET ASSETS CONSIST OF: | ||||
Capital stock | $ | 272,304 | ||
Additional paid-in-capital | 337,175,688 | |||
Total distributable earnings | 71,736,850 | |||
|
| |||
TOTAL NET ASSETS | $ | 409,184,842 | ||
|
| |||
The accompanying notes are an integral part of the financial statements.
96
Statement of Assets and Liabilities - Pro-Blend® Maximum Term Series
October 31, 2018
NET ASSET VALUE, OFFERING PRICE AND REDEMPTION PRICE PER SHARE - Class S | $ | 20.59 | ||
|
| |||
NET ASSET VALUE, OFFERING PRICE AND REDEMPTION PRICE PER SHARE - Class I | $ | 10.22 | ||
|
| |||
NET ASSET VALUE, OFFERING PRICE AND REDEMPTION PRICE PER SHARE - Class R | $ | 12.98 | ||
|
| |||
NET ASSET VALUE, OFFERING PRICE AND REDEMPTION PRICE PER SHARE - Class R2 | $ | 10.76 | ||
|
| |||
The accompanying notes are an integral part of the financial statements.
97
Statement of Operations - Pro-Blend® Maximum Term Series
For the Year Ended October 31, 2018
INVESTMENT INCOME: | ||||
Dividends (net of foreign taxes withheld, $369,543) | $ | 4,985,970 | ||
Interest | 1,690,205 | |||
|
| |||
Total Investment Income | 6,676,175 | |||
|
| |||
EXPENSES: | ||||
Management fees (Note 3) | 3,445,861 | |||
Shareholder services fees (Class S) (Note 3) | 701,417 | |||
Distribution and service (Rule 12b-1) fees (Class R2) (Note 3) | 563,042 | |||
Distribution and service (Rule 12b-1) fees (Class R) (Note 3) | 81,585 | |||
Fund accounting and administration fees (Note 3) | 110,031 | |||
Directors’ fees (Note 3) | 35,988 | |||
Chief Compliance Officer service fees (Note 3) | 4,385 | |||
Custodian fees | 55,981 | |||
Miscellaneous | 385,882 | |||
|
| |||
Total Expenses | 5,384,172 | |||
Less reduction of expenses (Note 3) | (136,336 | ) | ||
|
| |||
Net Expenses | 5,247,836 | |||
|
| |||
NET INVESTMENT INCOME | 1,428,339 | |||
|
| |||
REALIZED AND UNREALIZED GAIN (LOSS) ON INVESTMENTS AND FOREIGN CURRENCY: | ||||
Net realized gain (loss) on- | ||||
Investments | 46,111,454 | |||
Foreign currency and translation of other assets and liabilities | (25,959 | ) | ||
|
| |||
| 46,085,495 | ||||
|
| |||
Net change in unrealized appreciation (depreciation) on- | ||||
Investments | (34,280,161 | ) | ||
Foreign currency and translation of other assets and liabilities | (3,420 | ) | ||
|
| |||
| (34,283,581 | ) | |||
| �� |
|
| ||
NET REALIZED AND UNREALIZED GAIN (LOSS) ON INVESTMENTS AND FOREIGN CURRENCY | 11,801,914 | |||
|
| |||
NET INCREASE IN NET ASSETS RESULTING FROM OPERATIONS | $ | 13,230,253 | ||
|
| |||
The accompanying notes are an integral part of the financial statements.
98
Statements of Changes in Net Assets - Pro-Blend® Maximum Term Series
| FOR THE YEAR ENDED 10/31/18 | FOR THE YEAR ENDED 10/31/17 | |||||||
INCREASE (DECREASE) IN NET ASSETS: | ||||||||
OPERATIONS: | ||||||||
Net investment income | $ | 1,428,339 | $ | 3,344,535 | ||||
Net realized gain (loss) on investments and foreign currency | 46,085,495 | 69,826,631 | ||||||
Net realized gain (loss) from In-kind redemption transactions | — | 19,818,286 | ||||||
Net change in unrealized appreciation (depreciation) on investments and foreign currency | (34,283,581 | ) | 23,288,158 | |||||
|
|
|
| |||||
Net increase from operations | 13,230,253 | 116,277,610 | ||||||
|
|
|
| |||||
DISTRIBUTIONS TO SHAREHOLDERS (Note 9): | ||||||||
Class S | (21,869,531 | ) | (7,556,288 | ) | ||||
Class I | (15,572,505 | ) | (12,795,090 | ) | ||||
Class R | (1,807,537 | ) | (705,096 | ) | ||||
Class R2 | (7,051,008 | ) | (1,906,119 | ) | ||||
|
|
|
| |||||
Total distributions to shareholders | (46,300,581 | ) | (22,962,593 | )* | ||||
|
|
|
| |||||
CAPITAL STOCK ISSUED AND REPURCHASED: | ||||||||
Net decrease from capital share transactions (Note 5) | (51,635,718 | ) | (345,403,390 | ) | ||||
|
|
|
| |||||
Net decrease in net assets | (84,706,046 | ) | (252,088,373 | ) | ||||
NET ASSETS: | ||||||||
Beginning of year | 493,890,888 | 745,979,261 | ||||||
|
|
|
| |||||
End of year | $ | 409,184,842 | $ | 493,890,888 | ||||
|
|
|
| |||||
* For the year ended October 31, 2017, the distributions to shareholders from net investment income and net realized gain were $600,809 and $6,955,479 (Class S), $2,056,295 and $10,738,795 (Class I), $53,919 and $651,177 (Class R) and $55,249 and $1,850,870 (Class R2), respectively.
The accompanying notes are an integral part of the financial statements.
99
Financial Highlights - Pro-Blend® Maximum Term Series - Class S
| FOR THE YEARS ENDED | ||||||||||||||||||||
| 10/31/18 | 10/31/17 | 10/31/16 | 10/31/15 | 10/31/14 | ||||||||||||||||
Per share data (for a share outstanding throughout each year): | ||||||||||||||||||||
Net asset value - Beginning of year | $ | 21.71 | $ | 18.71 | $ | 18.30 | $ | 20.86 | $ | 21.01 | ||||||||||
|
|
|
|
|
|
|
|
|
| |||||||||||
Income (loss) from investment operations: | ||||||||||||||||||||
Net investment income1 | 0.08 | 0.09 | 0.03 | 0.09 | 0.09 | |||||||||||||||
Net realized and unrealized gain (loss) on investments | 0.42 | 3.32 | 0.59 | (0.54 | ) | 1.60 | ||||||||||||||
|
|
|
|
|
|
|
|
|
| |||||||||||
Total from investment operations | 0.50 | 3.41 | 0.62 | (0.45 | ) | 1.69 | ||||||||||||||
|
|
|
|
|
|
|
|
|
| |||||||||||
Less distributions to shareholders: | ||||||||||||||||||||
From net investment income | (0.06 | ) | (0.04 | ) | (0.02 | ) | (0.05 | ) | (0.04 | ) | ||||||||||
From net realized gain on investments | (1.56 | ) | (0.37 | ) | (0.19 | ) | (2.06 | ) | (1.80 | ) | ||||||||||
|
|
|
|
|
|
|
|
|
| |||||||||||
Total distributions to shareholders | (1.62 | ) | (0.41 | ) | (0.21 | ) | (2.11 | ) | (1.84 | ) | ||||||||||
|
|
|
|
|
|
|
|
|
| |||||||||||
Net asset value - End of year | $ | 20.59 | $ | 21.71 | $ | 18.71 | $ | 18.30 | $ | 20.86 | ||||||||||
|
|
|
|
|
|
|
|
|
| |||||||||||
Net assets - End of year (000’s omitted) | $ | 248,691 | $ | 306,055 | $ | 367,227 | $ | 503,378 | $ | 597,578 | ||||||||||
|
|
|
|
|
|
|
|
|
| |||||||||||
Total return2 | 2.24 | % | 18.60 | % | 3.45 | % | (2.03 | %) | 8.80 | % | ||||||||||
Ratios (to average net assets)/Supplemental Data: | ||||||||||||||||||||
Expenses* | 1.10 | % | 1.10 | % | 1.08 | % | 1.08 | % | 1.07 | % | ||||||||||
Net investment income | 0.35 | % | 0.45 | % | 0.15 | % | 0.45 | % | 0.45 | % | ||||||||||
Series portfolio turnover | 63 | % | 85 | % | 49 | % | 59 | % | 74 | % | ||||||||||
| *For certain periods presented, the investment advisor did not impose all or a portion of its management and/or other fees, and in some periods may have paid a portion of the Series’ expenses. If these expenses had been incurred by the Class, the expense ratio (to average net assets) would have increased by the following amounts: |
| |||||||||||||||||||
| 0.03 | % | N/A | N/A | N/A | N/A | |||||||||||||||
1Calculated based on average shares outstanding during the years.
2Represents aggregate total return for the years indicated, and assumes reinvestment of all distributions.
The accompanying notes are an integral part of the financial statements.
100
Financial Highlights - Pro-Blend® Maximum Term Series - Class I
| FOR THE YEAR ENDED | ||||||||||||||||||||
| 10/31/18 | 10/31/17 | 10/31/16 | 10/31/15 | 10/31/14 | ||||||||||||||||
Per share data (for a share outstanding throughout each year): | ||||||||||||||||||||
Net asset value - Beginning of year | $ | 11.60 | $ | 10.19 | $ | 10.09 | $ | 12.51 | $ | 13.35 | ||||||||||
|
|
|
|
|
|
|
|
|
| |||||||||||
Income (loss) from investment operations: | ||||||||||||||||||||
Net investment income1 | 0.07 | 0.08 | 0.04 | 0.08 | 0.09 | |||||||||||||||
Net realized and unrealized gain (loss) on investments | 0.22 | 1.78 | 0.32 | (0.33 | ) | 0.96 | ||||||||||||||
|
|
|
|
|
|
|
|
|
| |||||||||||
Total from investment operations | 0.29 | 1.86 | 0.36 | (0.25 | ) | 1.05 | ||||||||||||||
|
|
|
|
|
|
|
|
|
| |||||||||||
Less distributions to shareholders: | ||||||||||||||||||||
From net investment income | (0.11 | ) | (0.08 | ) | (0.07 | ) | (0.11 | ) | (0.09 | ) | ||||||||||
From net realized gain on investments | (1.56 | ) | (0.37 | ) | (0.19 | ) | (2.06 | ) | (1.80 | ) | ||||||||||
|
|
|
|
|
|
|
|
|
| |||||||||||
Total distributions to shareholders | (1.67 | ) | (0.45 | ) | (0.26 | ) | (2.17 | ) | (1.89 | ) | ||||||||||
|
|
|
|
|
|
|
|
|
| |||||||||||
Net asset value - End of year | $ | 10.22 | $ | 11.60 | $ | 10.19 | $ | 10.09 | $ | 12.51 | ||||||||||
|
|
|
|
|
|
|
|
|
| |||||||||||
Net assets - End of year (000’s omitted) | $ | 94,093 | $ | 114,391 | $ | 301,846 | $ | 390,931 | $ | 504,866 | ||||||||||
|
|
|
|
|
|
|
|
|
| |||||||||||
Total return2 | 2.44 | % | 18.97 | % | 3.69 | % | (1.82 | %) | 9.10 | % | ||||||||||
Ratios (to average net assets)/Supplemental Data: | ||||||||||||||||||||
Expenses* | 0.85 | % | 0.85 | % | 0.83 | % | 0.83 | % | 0.82 | % | ||||||||||
Net investment income | 0.60 | % | 0.72 | % | 0.40 | % | 0.71 | % | 0.70 | % | ||||||||||
Series portfolio turnover | 63 | % | 85 | % | 49 | % | 59 | % | 74 | % | ||||||||||
| *For certain periods presented, the investment advisor did not impose all or a portion of its management and/or other fees, and in some periods may have paid a portion of the Series’ expenses. If these expenses had been incurred by the Class, the expense ratio (to average net assets) would have increased by the following amounts: |
| |||||||||||||||||||
| 0.03 | % | N/A | N/A | N/A | N/A | |||||||||||||||
1Calculated based on average shares outstanding during the years.
2Represents aggregate total return for the years indicated, and assumes reinvestment of all distributions.
The accompanying notes are an integral part of the financial statements.
101
Financial Highlights - Pro-Blend® Maximum Term Series - Class R
| FOR THE YEAR ENDED | ||||||||||||||||||||
| 10/31/18 | 10/31/17 | 10/31/16 | 10/31/15 | 10/31/14 | ||||||||||||||||
Per share data (for a share outstanding throughout each year): | ||||||||||||||||||||
Net asset value - Beginning of year | $ | 14.28 | $ | 12.48 | $ | 12.28 | $ | 14.73 | $ | 15.39 | ||||||||||
|
|
|
|
|
|
|
|
|
| |||||||||||
Income (loss) from investment operations: | ||||||||||||||||||||
Net investment income (loss)1 | 0.01 | 0.03 | (0.01 | ) | 0.03 | 0.03 | ||||||||||||||
Net realized and unrealized gain (loss) on investments | 0.29 | 2.17 | 0.40 | (0.38 | ) | 1.13 | ||||||||||||||
|
|
|
|
|
|
|
|
|
| |||||||||||
Total from investment operations | 0.30 | 2.20 | 0.39 | (0.35 | ) | 1.16 | ||||||||||||||
|
|
|
|
|
|
|
|
|
| |||||||||||
Less distributions to shareholders: | ||||||||||||||||||||
From net investment income | (0.04 | ) | (0.03 | ) | (0.00 | )2 | (0.04 | ) | (0.02 | ) | ||||||||||
From net realized gain on investments | (1.56 | ) | (0.37 | ) | (0.19 | ) | (2.06 | ) | (1.80 | ) | ||||||||||
|
|
|
|
|
|
|
|
|
| |||||||||||
Total distributions to shareholders | (1.60 | ) | (0.40 | ) | (0.19 | ) | (2.10 | ) | (1.82 | ) | ||||||||||
|
|
|
|
|
|
|
|
|
| |||||||||||
Net asset value - End of year | $ | 12.98 | $ | 14.28 | $ | 12.48 | $ | 12.28 | $ | 14.73 | ||||||||||
|
|
|
|
|
|
|
|
|
| |||||||||||
Net assets - End of year (000’s omitted) | $ | 13,841 | $ | 17,404 | $ | 22,153 | $ | 31,517 | $ | 38,166 | ||||||||||
|
|
|
|
|
|
|
|
|
| |||||||||||
Total return3 | 1.99 | % | 18.21 | % | 3.26 | % | (2.28 | %) | 8.53 | % | ||||||||||
Ratios (to average net assets)/Supplemental Data: | ||||||||||||||||||||
Expenses* | 1.35 | % | 1.35 | % | 1.33 | % | 1.33 | % | 1.32 | % | ||||||||||
Net investment income (loss) | 0.11 | % | 0.22 | % | (0.10 | %) | 0.20 | % | 0.20 | % | ||||||||||
Series portfolio turnover | 63 | % | 85 | % | 49 | % | 59 | % | 74 | % | ||||||||||
| *For certain periods presented, the investment advisor did not impose all or a portion of its management and/or other fees, and in some periods may have paid a portion of the Series’ expenses. If these expenses had been incurred by the Class, the expense ratio (to average net assets) would have increased by the following amounts: |
| |||||||||||||||||||
| 0.03 | % | N/A | N/A | N/A | N/A | |||||||||||||||
1Calculated based on average shares outstanding during the years.
2Less than $0.01.
3Represents aggregate total return for the years indicated, and assumes reinvestment of all distributions.
The accompanying notes are an integral part of the financial statements.
102
Financial Highlights - Pro-Blend® Maximum Term Series - Class R2*
| FOR THE YEAR ENDED | ||||||||||||||||||||
| 10/31/18 | 10/31/17 | 10/31/16 | 10/31/15 | 10/31/14 | ||||||||||||||||
Per share data (for a share outstanding throughout each year): | ||||||||||||||||||||
Net asset value - Beginning of year | $ | 12.13 | $ | 10.68 | $ | 10.60 | $ | 13.03 | $ | 13.86 | ||||||||||
|
|
|
|
|
|
|
|
|
| |||||||||||
Income (loss) from investment operations: | ||||||||||||||||||||
Net investment loss1 | (0.05 | ) | (0.03 | ) | (0.06 | ) | (0.03 | ) | (0.04 | ) | ||||||||||
Net realized and unrealized gain (loss) on investments | 0.24 | 1.86 | 0.33 | (0.34 | ) | 1.01 | ||||||||||||||
|
|
|
|
|
|
|
|
|
| |||||||||||
Total from investment operations | 0.19 | 1.83 | 0.27 | (0.37 | ) | 0.97 | ||||||||||||||
|
|
|
|
|
|
|
|
|
| |||||||||||
Less distributions to shareholders: | ||||||||||||||||||||
From net investment income | — | (0.01 | ) | — | (0.00 | )2 | (0.00 | )2 | ||||||||||||
From net realized gain on investments | (1.56 | ) | (0.37 | ) | (0.19 | ) | (2.06 | ) | (1.80 | ) | ||||||||||
|
|
|
|
|
|
|
|
|
| |||||||||||
Total distributions to shareholders | (1.56 | ) | (0.38 | ) | (0.19 | ) | (2.06 | ) | (1.80 | ) | ||||||||||
|
|
|
|
|
|
|
|
|
| |||||||||||
Net asset value - End of year | $ | 10.76 | $ | 12.13 | $ | 10.68 | $ | 10.60 | $ | 13.03 | ||||||||||
|
|
|
|
|
|
|
|
|
| |||||||||||
Net assets - End of year (000’s omitted) | $ | 52,560 | $ | 56,040 | $ | 54,753 | $ | 57,507 | $ | 55,781 | ||||||||||
|
|
|
|
|
|
|
|
|
| |||||||||||
Total return3 | 1.40 | % | 17.78 | % | 2.62 | % | (2.76 | %) | 8.06 | % | ||||||||||
Ratios (to average net assets)/Supplemental Data: | ||||||||||||||||||||
Expenses** | 1.85 | % | 1.85 | % | 1.83 | % | 1.83 | % | 1.82 | % | ||||||||||
Net investment loss | (0.40 | %) | (0.31 | %) | (0.61 | %) | (0.30 | %) | (0.30 | %) | ||||||||||
Series portfolio turnover | 63 | % | 85 | % | 49 | % | 59 | % | 74 | % | ||||||||||
| *Effective March 1, 2017, Class C shares of the Series have been redesignated as Class R2 shares. |
| |||||||||||||||||||
| **For certain periods presented, the investment advisor did not impose all or a portion of its management and/or other fees, and in some periods may have paid a portion of the Series’ expenses. If these expenses had been incurred by the Class, the expense ratio (to average net assets) would have increased by the following amounts: |
| |||||||||||||||||||
| 0.03 | % | N/A | N/A | N/A | N/A | |||||||||||||||
1Calculated based on average shares outstanding during the years.
2Less than $0.01.
3Represents aggregate total return for the years indicated, and assumes reinvestment of all distributions.
The accompanying notes are an integral part of the financial statements.
103
Notes to Financial Statements
| 1. | Organization |
Pro-Blend® Conservative Term Series, Pro-Blend® Moderate Term Series, Pro-Blend® Extended Term Series and Pro-Blend® Maximum Term Series (each the “Series”) are no-load diversified series of Manning & Napier Fund, Inc. (the “Fund”). The Fund is organized in Maryland and is registered under the Investment Company Act of 1940 (the “1940 Act”), as amended, as an open-end management investment company.
The Series are asset allocation funds. Each invests in a combination of stocks, bonds and cash and is managed according to specific objectives. The objectives are as follows: Pro-Blend® Conservative Term Series - primary objective is preservation of capital; secondary objective is to provide income and long-term growth of capital. Pro-Blend® Moderate Term Series - equal emphasis on long-term growth of capital and preservation of capital. Pro-Blend® Extended Term Series - primary objective is long-term growth of capital; secondary objective is preservation of capital. Pro-Blend® Maximum Term Series - primary objective is long-term growth of capital.
Each Series is authorized to issue four classes of shares (Class S, I, R and R2). Each class of shares is substantially the same, except that class-specific distribution and shareholder servicing expenses are borne by the specific class of shares to which they relate.
The Fund’s Advisor is Manning & Napier Advisors, LLC (the “Advisor”). Shares of each Series are offered to investors and employees of the Advisor and its affiliates. The total authorized capital stock of the Fund consists of 15 billion shares of common stock each having a par value of $0.01. As of October 31, 2018, 13.4 billion shares have been designated in total among 38 series, of which 162.5 million have been designated as Pro-Blend® Conservative Term Series Class S common stock, 75 million have been designated as Pro-Blend® Conservative Term Series Class I common stock, 125 million each have been designated as Class S common stock and Class I common stock for Pro-Blend® Moderate Term Series, 125 million each have been designated as Class S common stock for Pro-Blend® Extended Term Series and Pro-Blend® Maximum Term Series, 200 million each have been designated as Class I common stock for Pro-Blend® Extended Term Series and Pro-Blend® Maximum Term Series, 52.5 million have been designated in each of the Series as Class R common stock, 25 million have been designated in each of the Series as Class R2 common stock, 100 million have been designated in each of the Series as Class W common stock, and 100 million have been designated in each of the Series as Class Z common stock. Class W common stock and Class Z common stock are not currently offered for sale.
| 2. | Significant Accounting Policies |
The following is a summary of significant accounting policies followed by the Series. Each Series is an investment company and, accordingly, follows the investment company accounting and reporting guidance of the Financial Accounting Standards Board Accounting Standards Codification Topic 946 - Investment Companies, which is part of accounting principles generally accepted in the United States of America (“GAAP”).
Security Valuation
Portfolio securities, including domestic equities, foreign equities, warrants and options, listed on an exchange other than the NASDAQ Stock Market are valued at the latest quoted sales price of the exchange on which the security is primarily traded. Securities not traded on valuation date or securities not listed on an exchange are valued at the latest quoted bid price provided by the Fund’s pricing service. Securities listed on the NASDAQ Stock Market are valued in accordance with the NASDAQ Official Closing Price.
Debt securities, including government bonds, foreign bonds, asset-backed securities, structured notes, supranational obligations, sovereign bonds, corporate bonds and mortgage-backed securities will normally be valued on the basis of evaluated bid prices provided directly by an independent pricing service. The pricing services use multiple valuation techniques to determine fair value. In instances where sufficient market activity exists, the pricing services may utilize a market-based approach through which quotes from market makers are used to determine fair value. In instances where sufficient market activity may not exist or is limited, the pricing services also utilize proprietary valuation models which may consider market characteristics such as benchmark yield curves, option-adjusted spreads, credit spreads, estimated defaulted rates, coupon rates, anticipated timing of principal repayments, underlying collateral and other unique security features in order to estimate the relevant cash flows,
104
Notes to Financial Statements (continued)
| 2. | Significant Accounting Policies (continued) |
Security Valuation (continued)
which are then discounted to calculate the fair value. Certain investments in securities held by the Series may be valued on a basis of a price provided directly by a principal market maker. These prices may differ from the value that would have been used had a broader market for securities existed.
Short-term investments that mature in sixty days or less may be valued at amortized cost, which approximates fair value. Investments in open-end investment companies are valued at their net asset value per share on valuation date.
Volume and level of activity in established markets for an asset or liability are evaluated to determine whether recent transactions and quoted prices are determinative of fair value. Where there have been significant decreases in volume and level of activity, further analysis and adjustment may be necessary to estimate fair value. The Series measure fair value in these instances by the use of inputs and valuation techniques which may be based upon current market prices of securities that are comparable in coupon, rating, maturity and industry and/or expectation of future cash flows. As a result of trading in relatively thin markets and/or markets that experience significant volatility, the prices used by the Series to value these securities may differ from the value that would be realized if these securities were sold, and the differences could be material.
Securities for which representative valuations or prices are not available from the Series’ pricing service may be valued at fair value as determined in good faith by the Advisor under procedures approved by and under the general supervision and responsibility of the Fund’s Board of Directors (the “Board”). Due to the inherent uncertainty of valuations of such securities, the fair value may differ significantly from the values that would have been used had a ready market for such securities existed. If trading or events occurring after the close of the principal market in which securities are traded are expected to materially affect the value of those securities, then they may be valued at their fair value, taking this trading or these events into account. In accordance with the procedures approved by the Board, the values of certain securities trading outside the U.S. were adjusted following the close of local trading using a factor from a third party vendor. The third party vendor uses statistical analyses and quantitative models, which consider among other things subsequent movement and changes in the prices of indices, securities and exchange rates in other markets, to determine the factors which are used to adjust local market prices. The value of securities used for net asset value calculation under these procedures may differ from published prices for the same securities. It is the Fund’s policy to classify each foreign equity security where a factor from a third party vendor is provided as a Level 2 security.
Various inputs are used in determining the value of the Series’ assets or liabilities carried at fair value. These inputs are summarized in three broad levels. Level 1 includes quoted prices in active markets for identical assets and liabilities. Level 2 includes other significant observable inputs (including quoted prices for similar securities, interest rates, prepayment speeds, credit risk, etc.). Level 3 includes significant unobservable inputs (including the Series’ own assumptions in determining the fair value of investments). A financial instrument’s level within the fair value hierarchy is based on the lowest level of any input both individually and in aggregate that is significant to their fair value measure. The inputs or methodology used for valuing securities are not necessarily an indication of the risk associated with investing in those securities.
The following is a summary of the valuation levels used for major security types as of October 31, 2018 in valuing the Series’ assets or liabilities carried at fair value:
| PRO-BLEND® CONSERVATIVE TERM SERIES | ||||||||||||||||
| DESCRIPTION | TOTAL | LEVEL 1 | LEVEL 2 | LEVEL 3 | ||||||||||||
Assets: | ||||||||||||||||
Equity Securities: | ||||||||||||||||
Communication Services | $ | 15,927,774 | $ | 12,633,403 | $ | 3,294,371 | # | $ | — | |||||||
Consumer Discretionary | 19,840,486 | 17,766,385 | 2,074,101 | # | — | |||||||||||
Consumer Staples | 28,704,855 | 19,277,877 | 9,426,978 | # | — | |||||||||||
Energy | 13,371,303 | 13,371,303 | — | — | ||||||||||||
Financials | 24,146,035 | 24,146,035 | — | — | ||||||||||||
Health Care | 52,294,559 | 49,200,879 | 3,093,680 | # | — | |||||||||||
105
Notes to Financial Statements (continued)
| 2. | Significant Accounting Policies (continued) |
Security Valuation (continued)
| PRO-BLEND® CONSERVATIVE TERM SERIES | ||||||||||||||||
| DESCRIPTION | TOTAL | LEVEL 1 | LEVEL 2 | LEVEL 3 | ||||||||||||
Industrials | $ | 18,774,504 | $ | 18,774,504 | $ | — | $ | — | ||||||||
Information Technology | 38,597,291 | 38,597,291 | — | — | ||||||||||||
Materials | 11,280,063 | 11,280,063 | — | — | ||||||||||||
Real Estate | 25,672,953 | 25,321,571 | 351,382 | # | — | |||||||||||
Utilities | 1,729,177 | 1,729,177 | — | — | ||||||||||||
Debt securities: | ||||||||||||||||
U.S. Treasury and other U.S. | ||||||||||||||||
Government agencies | 339,849,946 | — | 339,849,946 | — | ||||||||||||
Corporate debt: | ||||||||||||||||
Communication Services | 21,314,571 | — | 21,314,571 | — | ||||||||||||
Consumer Discretionary | 21,809,091 | — | 21,809,091 | — | ||||||||||||
Consumer Staples | 398,875 | — | 398,875 | — | ||||||||||||
Energy | 32,437,728 | — | 32,437,728 | — | ||||||||||||
Financials | 52,331,892 | — | 52,331,892 | — | ||||||||||||
Health Care | 1,161,970 | — | 1,161,970 | — | ||||||||||||
Industrials | 19,371,164 | — | 19,371,164 | — | ||||||||||||
Information Technology | 362,840 | — | 362,840 | — | ||||||||||||
Materials | 10,975,969 | — | 10,975,969 | — | ||||||||||||
Real Estate | 7,128,097 | — | 7,128,097 | — | ||||||||||||
Utilities | 1,242,925 | — | 1,242,925 | — | ||||||||||||
Asset-backed securities | 38,441,354 | — | 38,441,354 | — | ||||||||||||
Commercial mortgage-backed securities | 64,125,947 | — | 64,125,947 | — | ||||||||||||
Foreign government bonds | 20,372,307 | — | 20,372,307 | — | ||||||||||||
Mutual funds | 21,715,059 | 21,715,059 | — | — | ||||||||||||
|
|
|
|
|
|
|
| |||||||||
Total assets | 903,378,735 | 253,813,547 | 649,565,188 | — | ||||||||||||
|
|
|
|
|
|
|
| |||||||||
Liabilities: | ||||||||||||||||
Other financial instruments*: | ||||||||||||||||
Equity contracts | (216,123 | ) | (160,703 | ) | (55,420 | ) | — | |||||||||
|
|
|
|
|
|
|
| |||||||||
Total liabilities | (216,123 | ) | (160,703 | ) | (55,420 | ) | — | |||||||||
|
|
|
|
|
|
|
| |||||||||
Total | $ | 903,162,612 | $ | 253,652,844 | $ | 649,509,768 | $ | — | ||||||||
|
|
|
|
|
|
|
| |||||||||
| PRO-BLEND® MODERATE TERM SERIES | ||||||||||||||||
| DESCRIPTION | TOTAL | LEVEL 1 | LEVEL 2 | LEVEL 3 | ||||||||||||
Assets: | ||||||||||||||||
Equity Securities: | ||||||||||||||||
Communication Services | $ | 17,868,321 | $ | 13,632,506 | $ | 4,235,815 | # | $ | — | |||||||
Consumer Discretionary | 20,520,280 | 16,194,015 | 4,326,265 | # | — | |||||||||||
Consumer Staples | 28,076,648 | 13,990,136 | 14,086,512 | # | — | |||||||||||
Energy | 10,527,641 | 9,512,926 | 1,014,715 | # | — | |||||||||||
Financials | 13,914,426 | 12,290,561 | 1,623,865 | # | — | |||||||||||
Health Care | 46,408,194 | 42,790,102 | 3,618,092 | # | — | |||||||||||
Industrials | 9,900,477 | 7,378,238 | 2,522,239 | # | — | |||||||||||
Information Technology | 34,682,903 | 33,595,736 | 1,087,167 | # | — | |||||||||||
Materials | 9,259,477 | 8,195,515 | 1,063,962 | # | — | |||||||||||
Real Estate | 17,102,298 | 16,766,020 | 336,278 | # | — | |||||||||||
Utilities | 245,128 | 22,459 | 222,669 | # | — | |||||||||||
106
Notes to Financial Statements (continued)
| 2. | Significant Accounting Policies (continued) |
Security Valuation (continued)
| PRO-BLEND® MODERATE TERM SERIES | ||||||||||||||||
| DESCRIPTION | TOTAL | LEVEL 1 | LEVEL 2 | LEVEL 3 | ||||||||||||
Debt securities: | ||||||||||||||||
U.S. Treasury and other U.S. | ||||||||||||||||
Government agencies | $ | 174,454,014 | $ | — | $ | 174,454,014 | $ | — | ||||||||
Corporate debt: | ||||||||||||||||
Communication Services | 12,172,952 | — | 12,172,952 | — | ||||||||||||
Consumer Discretionary | 12,161,601 | — | 12,161,601 | — | ||||||||||||
Consumer Staples | 272,425 | — | 272,425 | — | ||||||||||||
Energy | 18,389,521 | — | 18,389,521 | — | ||||||||||||
Financials | 29,090,578 | — | 29,090,578 | — | ||||||||||||
Health Care | 3,789,716 | — | 3,789,716 | — | ||||||||||||
Industrials | 11,337,989 | — | 11,337,989 | — | ||||||||||||
Information Technology | 260,380 | — | 260,380 | — | ||||||||||||
Materials | 5,292,463 | — | 5,292,463 | — | ||||||||||||
Real Estate | 4,072,653 | — | 4,072,653 | — | ||||||||||||
Utilities | 996,875 | — | 996,875 | — | ||||||||||||
Asset-backed securities | 21,387,585 | — | 21,387,585 | — | ||||||||||||
Commercial mortgage-backed securities | 37,549,373 | — | 37,549,373 | — | ||||||||||||
Foreign government bonds | 13,435,990 | — | 13,435,990 | — | ||||||||||||
Mutual funds | 2,328,654 | 2,328,654 | — | — | ||||||||||||
|
|
|
|
|
|
|
| |||||||||
Total assets | 555,498,562 | 176,696,868 | 378,801,694 | — | ||||||||||||
|
|
|
|
|
|
|
| |||||||||
Liabilities: | ||||||||||||||||
Other financial instruments*: | ||||||||||||||||
Equity contracts | (229,503 | ) | (170,008 | ) | (59,495 | ) | — | |||||||||
|
|
|
|
|
|
|
| |||||||||
Total liabilities | (229,503 | ) | (170,008 | ) | (59,495 | ) | — | |||||||||
|
|
|
|
|
|
|
| |||||||||
Total | $ | 555,269,059 | $ | 176,526,860 | $ | 378,742,199 | $ | — | ||||||||
|
|
|
|
|
|
|
| |||||||||
| PRO-BLEND® EXTENDED TERM SERIES | ||||||||||||||||
| DESCRIPTION | TOTAL | LEVEL 1 | LEVEL 2 | LEVEL 3 | ||||||||||||
Assets: | ||||||||||||||||
Equity Securities: | ||||||||||||||||
Communication Services | $ | 23,503,021 | $ | 17,880,232 | $ | 5,622,789 | # | $ | — | |||||||
Consumer Discretionary | 26,786,353 | 21,188,728 | 5,597,625 | # | — | |||||||||||
Consumer Staples | 38,314,613 | 19,634,341 | 18,680,272 | # | — | |||||||||||
Energy | 13,268,844 | 11,925,796 | 1,343,048 | # | — | |||||||||||
Financials | 18,494,173 | 16,363,500 | 2,130,673 | # | — | |||||||||||
Health Care | 61,566,901 | 56,749,620 | 4,817,281 | # | — | |||||||||||
Industrials | 12,515,953 | 9,192,168 | 3,323,785 | # | — | |||||||||||
Information Technology | 45,796,142 | 44,345,140 | 1,451,002 | # | — | |||||||||||
Materials | 12,420,282 | 11,005,636 | 1,414,646 | # | — | |||||||||||
Real Estate | 21,050,155 | 20,639,578 | 410,577 | # | — | |||||||||||
Utilities | 318,568 | 29,945 | 288,623 | # | �� | |||||||||||
Debt securities: | ||||||||||||||||
U.S. Treasury and other U.S. | ||||||||||||||||
Government agencies | 144,763,564 | — | 144,763,564 | — | ||||||||||||
Corporate debt: | ||||||||||||||||
Communication Services | 9,627,134 | — | 9,627,134 | — | ||||||||||||
Consumer Discretionary | 9,615,260 | — | 9,615,260 | — | ||||||||||||
Consumer Staples | 277,025 | — | 277,025 | — | ||||||||||||
Energy | 14,487,789 | — | 14,487,789 | — | ||||||||||||
Financials | 22,386,671 | — | 22,386,671 | — | ||||||||||||
107
Notes to Financial Statements (continued)
| 2. | Significant Accounting Policies (continued) |
Security Valuation (continued)
| PRO-BLEND® EXTENDED TERM SERIES | ||||||||||||||||
| DESCRIPTION | TOTAL | LEVEL 1 | LEVEL 2 | LEVEL 3 | ||||||||||||
Health Care | $ | 878,033 | $ | — | $ | 878,033 | $ | — | ||||||||
Industrials | 9,240,172 | — | 9,240,172 | — | ||||||||||||
Information Technology | 250,980 | — | 250,980 | — | ||||||||||||
Materials | 1,999,342 | — | 1,999,342 | — | ||||||||||||
Real Estate | 3,123,231 | — | 3,123,231 | — | ||||||||||||
Utilities | 1,054,717 | — | 1,054,717 | — | ||||||||||||
Asset-backed securities | 16,370,458 | — | 16,370,458 | — | ||||||||||||
Commercial mortgage-backed securities | 29,180,104 | — | 29,180,104 | — | ||||||||||||
Foreign government bonds | 9,224,246 | — | 9,224,246 | — | ||||||||||||
Mutual funds | 3,038,827 | 3,038,827 | — | — | ||||||||||||
|
|
|
|
|
|
|
| |||||||||
Total assets | 549,552,558 | 231,993,511 | 317,559,047 | — | ||||||||||||
|
|
|
|
|
|
|
| |||||||||
Liabilities: | ||||||||||||||||
Other financial instruments*: | ||||||||||||||||
Equity contracts | (308,007 | ) | (228,952 | ) | (79,055 | ) | — | |||||||||
|
|
|
|
|
|
|
| |||||||||
Total liabilities | (308,007 | ) | (228,952 | ) | (79,055 | ) | — | |||||||||
|
|
|
|
|
|
|
| |||||||||
Total | $ | 549,244,551 | $ | 231,764,559 | $ | 317,479,992 | $ | — | ||||||||
|
|
|
|
|
|
|
| |||||||||
| PRO-BLEND® MAXIMUM TERM SERIES | ||||||||||||||||
| DESCRIPTION | TOTAL | LEVEL 1 | LEVEL 2 | LEVEL 3 | ||||||||||||
Assets: | ||||||||||||||||
Equity Securities: | ||||||||||||||||
Communication Services | $ | 26,855,561 | $ | 21,299,391 | $ | 5,556,170 | # | $ | — | |||||||
Consumer Discretionary | 45,867,601 | 41,060,898 | 4,806,703 | # | — | |||||||||||
Consumer Staples | 55,028,027 | 38,190,652 | 16,837,375 | # | — | |||||||||||
Energy | 11,524,653 | 10,511,710 | 1,012,943 | # | — | |||||||||||
Financials | 29,287,053 | 18,551,063 | 10,735,990 | # | — | |||||||||||
Health Care | 64,565,277 | 61,056,577 | 3,508,700 | # | — | |||||||||||
Industrials | 19,739,426 | 13,411,254 | 6,328,172 | # | — | |||||||||||
Information Technology | 51,124,885 | 48,142,112 | 2,982,773 | # | — | |||||||||||
Materials | 25,482,571 | 20,013,562 | 5,469,009 | # | — | |||||||||||
Real Estate | 18,527,453 | 18,288,254 | 239,199 | # | — | |||||||||||
Utilities | 236,789 | 22,459 | 214,330 | # | — | |||||||||||
Debt securities: | ||||||||||||||||
U.S. Treasury and other U.S. | ||||||||||||||||
Government agencies | 39,220,121 | — | 39,220,121 | — | ||||||||||||
Corporate debt: | ||||||||||||||||
Communication Services | 2,165,641 | — | 2,165,641 | — | ||||||||||||
Consumer Discretionary | 2,186,337 | — | 2,186,337 | — | ||||||||||||
Consumer Staples | 117,700 | — | 117,700 | — | ||||||||||||
Energy | 3,350,757 | — | 3,350,757 | — | ||||||||||||
Financials | 4,685,197 | — | 4,685,197 | — | ||||||||||||
Health Care | 682,911 | — | 682,911 | — | ||||||||||||
Industrials | 2,450,193 | — | 2,450,193 | — | ||||||||||||
Information Technology | 91,180 | — | 91,180 | — | ||||||||||||
Materials | 908,209 | — | 908,209 | — | ||||||||||||
Real Estate | 608,738 | — | 608,738 | — | ||||||||||||
Utilities | 558,650 | — | 558,650 | — | ||||||||||||
Mutual funds | 3,522,758 | 3,522,758 | — | — | ||||||||||||
|
|
|
|
|
|
|
| |||||||||
Total assets | $ | 408,787,688 | $ | 294,070,690 | $ | 114,716,998 | $ | — | ||||||||
|
|
|
|
|
|
|
| |||||||||
108
Notes to Financial Statements (continued)
| 2. | Significant Accounting Policies (continued) |
Security Valuation (continued)
#Consists of certain foreign securities for which a factor from a third party vendor was applied to determine the securities’ fair value following the close of local trading.
*Other financial instruments are exchange traded options (Level 1 and Level 2).
There were no Level 3 securities held by any of the Pro-Blend® Series as of October 31, 2018.
China literature ltd. - right was a Level 3 security held as of October 31, 2017. However, this security is no longer held by the Series.
New Accounting Pronouncements
The Securities and Exchange Commission (SEC) adopted changes to Regulation S-X to simplify the reporting of information by registered investment companies in financial statements. The amendments require presentation of the total, rather than the components, of distributable earnings on the Statement of Assets and Liabilities and also require presentation of the total, rather than the components, of distributions to shareholders, except for tax return of capital distributions, if any, on the Statement of Changes in Net Assets. The amendments also removed the requirement for parenthetical disclosure of undistributed net investment income on the Statement of Changes in Net Assets. These Regulation S-X amendments are reflected in the Series financial statements for the year ended October 31, 2018. As a result of adopting these amendments, the distributions to shareholders in the October 31, 2017 Statement of Changes in Net Assets presented herein have been reclassified to conform to the current year presentation.
In March 2017, the Financial Accounting Standards Board issued Accounting Standards Update No 2017-08, Receivables - Nonrefundable Fees and Other Costs (Subtopic 310-20): “Premium Amortization of Purchased Callable Debt Securities” which amends the amortization period for certain purchased callable debt securities. Under the new guidance, the premium amortization of purchased callable debt securities that have explicit, non-contingent call features and are callable at fixed prices will be amortized to the earliest call date. The guidance does not require an accounting change for securities held at a discount; which continue to be amortized to maturity. The guidance will be applied on a modified retrospective basis and is effective for fiscal years, and their interim periods, beginning after December 15, 2018. Management is currently evaluating the impact of this guidance to the Series.
On August 28, 2018, the FASB issued ASU 2018-13, “Disclosure Framework – Changes to the Disclosure Requirements for Fair Value Measurement,” which amends the fair value measurement disclosure requirements under U.S. GAAP. The amendments of ASU 2018-13 include new, eliminated, and modified disclosure requirements. In addition, the amendments clarify that materiality is an appropriate consideration of entities when evaluating disclosure requirements. The ASU is effective for all entities for fiscal years beginning after December 15, 2019, including interim periods therein. An entity is permitted to early adopt any eliminated or modified disclosures upon issuance of this ASU and delay adoption of the new disclosures until their effective date. As such, each Series has early adopted the eliminated and modified disclosures, as permitted by this ASU.
Security Transactions, Investment Income and Expenses
Security transactions are accounted for on trade date. Dividend income is recorded on the ex-dividend date, except that if the ex-dividend date has passed, certain dividends from foreign securities are recorded as soon as the Series is informed of the ex-dividend date. Non-cash dividends, if any, are recorded at the fair value of the securities received. Interest income, including amortization of premium and accretion of discounts using the effective interest method, is earned from settlement date and accrued daily.
Expenses are recorded on an accrual basis. Most expenses of the Fund can be attributed to a specific series. Expenses which cannot be directly attributed are apportioned among the series in the Fund in such a manner as deemed equitable by the Fund’s Board, taking into consideration, among other things, the nature and type of expense.
109
Notes to Financial Statements (continued)
| 2. | Significant Accounting Policies (continued) |
Security Transactions, Investment Income and Expenses (continued)
Income, expenses (other than class specific expenses), and realized and unrealized gains and losses are prorated among the classes based on the relative net assets of each class. Class specific expenses are directly charged to that Class.
The Series use the identified cost method for determining realized gain or loss on investments for both financial statement and federal income tax reporting purposes.
Foreign Currency Translation
The books and records of the Series are maintained in U.S. dollars. Foreign currencies, investments and other assets and liabilities are translated into U.S. dollars at the current exchange rates. Purchases and sales of investment securities and income and expenses are translated on the respective dates of such transactions. The Series do not isolate realized and unrealized gains and losses attributable to changes in the exchange rates from gains and losses that arise from changes in the fair value of investments. Such fluctuations are included with net realized and unrealized gain or loss on investments. Net realized foreign currency gains and losses represent foreign currency gains and losses between trade date and settlement date on securities transactions, gains and losses on disposition of foreign currencies and the difference between the amount of income and foreign withholding taxes recorded on the books of the Series and the amounts actually received or paid.
Option Contracts
The Series may write (sell) or buy call or put options on securities and other financial instruments. When a Series writes a call, the Series gives the purchaser the right to buy the underlying security from the Series at the price specified in the option contract (the “exercise price”) at any time during the option period. When a Series writes a put option, the Series gives the purchaser the right to sell to the Series the underlying security at the exercise price at any time during the option period. The Series will only write options on a “covered basis.” This means that the Series will own the underlying security when the Series writes a call or the Series will put aside cash, U.S. Government securities, or other liquid assets in an amount not less than the exercise price at all times the put option is outstanding.
When a Series writes an option, an amount equal to the premium received is reflected as a liability and is subsequently marked-to-market to reflect the current market value of the option. The Series, as a writer of an option, has no control over whether the underlying security or financial instrument may be sold (call) or purchased (put) and, as a result, bears the market risk of an unfavorable change in the price of the security or financial instrument underlying the written option. There is a risk that the Series may not be able to enter into a closing transaction because of an illiquid market.
Each Series may also purchase options in an attempt to hedge against fluctuations in the value of its portfolio and to protect against declines in the value of the securities. The premium paid by a Series for the purchase of an option is reflected as an investment and subsequently marked-to-market to reflect the current market value of the option. The risk associated with purchasing options is limited to the premium paid.
When a security is purchased or sold through an exercise of an option, the related premium paid (or received) is added to (or deducted from) the basis of the security acquired or deducted from (or added to) the proceeds of the security sold. When an option expires (or a Series enters into a closing transaction), the Series realizes a gain or loss on the option to the extent of the premium received or paid (or gain or loss to the extent the cost of the closing transaction exceeds the premium paid or received).
The measurement of the risks associated with option contracts is meaningful only when all related and offsetting transactions are considered. The counterparty for the Series’ written options contracts outstanding during the year ended October 31, 2018 is Pershing LLC, a BNY Mellon Company.
110
Notes to Financial Statements (continued)
| 2. | Significant Accounting Policies (continued) |
Option Contracts (continued)
The following table presents the present value of derivatives held at October 31, 2018 as reflected on the Statement of Assets and Liabilities, and the effect of the derivative instruments on the Statement of Operations:
| PRO-BLEND® CONSERVATIVE TERM SERIES | ||||||
| STATEMENT OF ASSETS AND LIABILITIES | ||||||
Derivative | Liabilities Location | |||||
Equity contracts | Options written, at value | $ | (216,123 | ) | ||
| STATEMENT OF OPERATIONS | ||||||
Derivative | Location of Gain or (Loss) on Derivatives | | Realized Gain (Loss) on Derivatives | | ||
Equity contracts | Net realized gain (loss) on options written | $ | 763,722 | |||
Derivative | Location of Appreciation (Depreciation) on Derivatives | | Unrealized Appreciation (Depreciation) on Derivatives | | ||
Equity contracts | Net change in unrealized appreciation (depreciation) on options written | $ | (99,692 | ) | ||
| PRO-BLEND® MODERATE TERM SERIES | ||||||
| STATEMENT OF ASSETS AND LIABILITIES | ||||||
Derivative | Liabilities Location | |||||
Equity contracts | Options written, at value | $ | (229,503 | ) | ||
| STATEMENT OF OPERATIONS | ||||||
Derivative | Location of Gain or (Loss) on Derivatives | | Realized Gain (Loss) on Derivatives | | ||
Equity contracts | Net realized gain (loss) on options written | $ | 890,117 | |||
Derivative | Location of Appreciation (Depreciation) on Derivatives | | Unrealized Appreciation (Depreciation) on Derivatives | | ||
Equity contracts | Net change in unrealized appreciation (depreciation) on options written | $ | (112,453 | ) | ||
111
Notes to Financial Statements (continued)
| 2. | Significant Accounting Policies (continued) |
| PRO-BLEND® EXTENDED TERM SERIES | ||||||
| STATEMENT OF ASSETS AND LIABILITIES | ||||||
Derivative | Liabilities Location | |||||
Equity contracts | Options written, at value | $ | (308,007 | ) | ||
| STATEMENT OF OPERATIONS | ||||||
Derivative | Location of Gain or (Loss) on Derivatives | | Realized Gain (Loss) on Derivatives | | ||
Equity contracts | Net realized gain (loss) on options written | $ | 1,186,411 | |||
Derivative | Location of Appreciation (Depreciation) on Derivatives | | Unrealized Appreciation (Depreciation) on Derivatives | | ||
Equity contracts | Net change in unrealized appreciation (depreciation) on options written | $ | (153,245 | ) | ||
The average month-end balances for the year ended October 31, 2018, the period in which such derivatives were outstanding, were as follows:
| PRO-BLEND® CONSERVATIVE TERM SERIES | PRO-BLEND® MODERATE TERM SERIES | PRO-BLEND® EXTENDED TERM SERIES | ||||||||||
Options: | ||||||||||||
Average number of option contracts written | 677 | 783 | 1,045 | |||||||||
Average notional value of option contracts written | $ | 6,831,368 | $ | 7,894,560 | $ | 10,561,961 | ||||||
Asset-Backed Securities
Each Series may invest in asset-backed securities. Asset-backed securities are generally issued as pass-through certificates or as debt instruments. Asset-backed securities issued as pass-through certificates represent undivided fractional ownership interests in an underlying pool of assets. Asset-backed securities issued as debt instruments, which are also known as collateralized obligations, are typically issued as the debt of a special purpose entity organized solely for the purpose of owning such assets and issuing such debt. Asset-backed securities are often backed by a pool of assets representing the obligations of a number of different parties. The yield characteristics of certain asset-backed securities may differ from traditional debt securities. One such major difference is that all or a principal part of the obligations may be prepaid at any time because the underlying assets (i.e. loans) may be prepaid at any time. As a result, a decrease in interest rates in the market may result in increases in the level of prepayments as borrowers, particularly mortgagors, refinance and repay their loans. An increased prepayment rate with respect to an asset-backed security will have the effect of shortening the maturity of the security. In addition, a Series may subsequently have to reinvest the proceeds at lower interest rates. If a Series has purchased such an asset-backed security at a premium, a faster than anticipated prepayment rate could result in a loss of principal to the extent of the premium paid.
Mortgage-Backed Securities
Each Series may invest in mortgage-backed securities (“MBS” or pass-through certificates) that represent an interest in a pool of specific underlying mortgage loans and entitle a Series to the periodic payments of principal and interest from those mortgages. MBS may be issued by government agencies or corporations, or private issuers. Most MBS issued by government agencies are guaranteed; however, the degree of protection differs based on the issuer. For MBS there are a number of important differences among the agencies and instrumentalities of the U.S. Government that issue mortgage-related securities and among the securities that they issue. For example, mortgage-related securities guaranteed by Ginnie Mae are guaranteed as to the timely payment of principal and interest by Ginnie Mae and such guarantee is backed by the full faith and credit of the United States. However, mortgage-related securities issued by Freddie Mac and Fannie Mae, including Freddie Mac and Fannie
112
Notes to Financial Statements (continued)
| 2. | Significant Accounting Policies (continued) |
Mortgage-Backed Securities (continued)
Mae guaranteed mortgage pass-through certificates, which are solely the obligations of Freddie Mac and Fannie Mae, are not backed by or entitled to the full faith and credit of the United States, but are supported by the right of the issuer to borrow from the U.S. Treasury. Non-agency mortgage-backed securities are securities issued by non-governmental issuers and have no direct or indirect government guarantees of payment and are subject to various risks. Non-agency mortgage loans are obligations of the borrowers thereunder only and are not typically insured or guaranteed by any other person or entity. The ability of a borrower to repay a loan is dependent upon the income or assets of the borrower. A number of factors, including a general economic downturn, acts of God, terrorism, social unrest and civil disturbances, may impair a borrower’s ability to repay its loans.
Inflation-Indexed Bonds
Each Series may invest in inflation-indexed bonds. Inflation-indexed bonds are fixed income securities whose principal value is periodically adjusted according to the rate of inflation. If the index measuring inflation rises or falls, the principal value of inflation-indexed bonds will be adjusted upward or downward, and consequently the interest payable on these securities (calculated with respect to a larger or smaller principal amount) will be increased or reduced, respectively. Any upward or downward adjustment in the principal amount of an inflation-indexed bond will be included as interest income in the Statements of Operations, even though investors do not receive their principal until maturity. Repayment of the original bond principal upon maturity (as adjusted for inflation) is guaranteed in the case of U.S. Treasury inflation-indexed bonds. For bonds that do not provide a similar guarantee, the adjusted principal value of the bond repaid at maturity may be less than the original principal.
Securities Purchased on a When-Issued Basis or Forward Commitment
Each Series may purchase securities on a when-issued basis or forward commitment. These transactions involve a commitment by the Series to purchase securities for a predetermined price with payment and delivery taking place beyond the customary settlement period. When such purchases are outstanding, the Series will designate liquid assets in an amount sufficient to meet the purchase price. When purchasing a security on a delayed delivery basis, the Series assumes the rights and risks of ownership of the security, including the risk of price and yield fluctuations, and take such fluctuations into account when determining their net asset value. The Series may sell the when-issued securities before they are delivered, which may result in a capital gain or loss.
In connection with their ability to purchase or sell securities on a forward commitment basis, the Series may enter into forward roll transactions principally using To Be Announced (TBA) securities. Forward roll transactions require the sale of securities for delivery in the current month, and a simultaneous agreement to repurchase substantially similar (same type, coupon and maturity) securities on a specified future date. Risks of entering into forward roll transactions include the potential inability of the counterparty to meet the terms of the agreement; the potential of the Series to receive inferior securities at redelivery as compared to the securities sold to the counterparty; counterparty credit risk; and the potential pay down speed variance between the mortgage-backed pools. During the roll period, the Series forgoes principal and interest paid on the securities. The Series accounts for such dollar rolls as purchases and sales. No such investments were held by the Series on October 31, 2018.
Interest Only Securities
The Series may invest in stripped mortgage-backed securities issued by the U.S. government, its agencies and instrumentalities. Stripped mortgage-backed securities are usually structured with two classes that receive different proportions of the interest and principal distributions on a pool of mortgage assets. In certain cases, one class will receive all of the interest (the interest-only or “IO” class), while the other class will receive all of the principal (the principal-only or “PO” class). The yield to maturity on IOs is sensitive to the rate of principal repayments (including prepayments) on the related underlying mortgage assets, and principal payments may have a material effect on yield to maturity. If the underlying mortgage assets experience greater than anticipated prepayments of principal, a Series may not fully recoup its initial investment in IOs.
113
Notes to Financial Statements (continued)
| 2. | Significant Accounting Policies (continued) |
Restricted Securities
Restricted securities are purchased in private placement transactions, are not registered under the Securities Act of 1933, as amended, and may have contractual restrictions on resale. Information regarding restricted securities is included at the end of each applicable Series’ Investment Portfolio.
Illiquid Securities
A security may be considered illiquid if so deemed in good faith by the Advisor under procedures approved by and under the general supervision and responsibility of the Fund’s Board. Securities that are illiquid are marked with the applicable footnote at the end of each applicable Series’ Investment Portfolio.
Federal Taxes
Each Series’ policy is to comply with the provisions of the Internal Revenue Code applicable to regulated investment companies. The Series are not subject to federal income tax or excise tax to the extent that each Series distributes to shareholders each year its taxable income, including any net realized gains on investments, in accordance with requirements of the Internal Revenue Code. Accordingly, no provision for federal income tax or excise tax has been made in the financial statements.
Management evaluates its tax positions to determine if the tax positions taken meet the minimum recognition threshold in connection with accounting for uncertainties in income tax positions taken or expected to be taken for the purposes of measuring and recognizing tax liabilities in the financial statements. Recognition of tax benefits of an uncertain tax position is required only when the position is “more likely than not” to be sustained assuming examination by taxing authorities. At October 31, 2018, the Series have recorded no liability for net unrecognized tax benefits relating to uncertain income tax positions taken or expected to be taken in future tax returns.
The Series file income tax returns in the U.S. federal jurisdiction, various states and foreign jurisdictions, as required. No income tax returns are currently under investigation. The statute of limitations on the Series’ tax returns remains open for the years ended October 31, 2015 through October 31, 2018. The Fund is not aware of any tax positions for which it is reasonably possible that the total amounts of unrecognized tax benefits will significantly change in the next twelve months.
Foreign Taxes
Based on the Series’ understanding of the tax rules and rates related to income, gains and currency purchase/repatriation transactions for foreign jurisdictions in which they invest, the Series will provide for foreign taxes, and where appropriate, deferred foreign tax.
Distributions of Income and Gains
Distributions to shareholders of net investment income are made semi-annually. Distributions of net realized gains are made annually. An additional distribution may be necessary to avoid taxation of a Series. Distributions are recorded on the ex-dividend date.
Indemnifications
The Fund’s organizational documents provide former and current directors and officers with a limited indemnification against liabilities arising in connection with the performance of their duties to the Fund. In the normal course of business, the Fund may also enter into contracts that provide general indemnifications. The Fund’s maximum exposure under these arrangements is unknown as this would be dependent on future claims that may be made against the Fund. The risk of material loss from such claims is considered remote.
Other
The preparation of financial statements in conformity with GAAP requires management to make estimates and assumptions that affect the reported amounts of assets and liabilities and the disclosure of contingent assets and liabilities at the date of the financial statements and the reported amounts of income and expenses during the reporting period. Actual results could differ from those estimates.
114
Notes to Financial Statements (continued)
| 3. | Transactions with Affiliates |
The Fund has an Investment Advisory Agreement (the “Agreement”) with the Advisor, for which each Series pays a fee, computed daily and payable monthly, at an annual rate of 0.60% for Pro-Blend® Conservative Term Series and 0.75% for Pro-Blend® Moderate Term Series, Pro-Blend® Extended Term Series and Pro-Blend® Maximum Term Series, of the Series’ average daily net assets.
Under the Agreement, personnel of the Advisor provide the Series with advice and assistance in the choice of investments and the execution of securities transactions, and otherwise maintain the Series’ organization. The Advisor also provides the Fund with necessary office space and fund administration and support services. The salaries of all officers of the Fund (except a percentage of the Fund’s Chief Compliance Officer’s salary, which is paid by the Fund), and of all Directors who are “affiliated persons” of the Fund, or of the Advisor, and all personnel of the Fund, or of the Advisor, performing services relating to research, statistical and investment activities, are paid by the Advisor. Each “non-affiliated” Director receives an annual stipend, which is allocated among all the active series of the Fund. In addition, these Directors also receive a fee per Board meeting attended plus a fee for each committee meeting attended and are reimbursed for travel and other out-of-pocket expenses incurred by them in connection with attending such meetings. The Fund also has an Audit Committee Chair, Governance & Nominating Committee Chair and Lead Independent Director who each receive an additional annual stipend for these roles.
Class S shares of each Series are subject to a shareholder services fee in accordance with a shareholder services plan adopted by the Fund’s Board. The shareholder services fee is intended to compensate financial intermediaries, including affiliates of the Fund, in connection with the provision of direct client service, personal services, maintenance of shareholder accounts and reporting services. For these services, Class S of each Series pays a fee, computed daily and payable monthly, at an annual rate of 0.20% for Pro-Blend® Conservative Term Series Class S and 0.25% for Pro-Blend® Moderate Term Series Class S, Pro-Blend® Extended Term Series Class S and Pro-Blend® Maximum Term Series Class S, of the Class’ average daily net assets. The Fund has a Shareholder Services Agreement with the Advisor, for which the Advisor receives the shareholder services fee as stated above.
The Advisor has contractually agreed, until at least February 28, 2019, to waive its management fee and, if necessary, pay other operating expenses of the Series in order to maintain total direct annual fund operating expenses for the Series, exclusive of shareholder services fees and distribution and service (12b-1) fees, at no more than the amounts presented in the following table, of average daily net assets each year.
| SERIES/CLASS | EXPENSE LIMIT | |||
Pro-Blend® Conservative Term Series | 0.70 | % | ||
Pro-Blend® Moderate Term Series | 0.85 | % | ||
Pro-Blend® Extended Term Series | 0.85 | % | ||
Pro-Blend® Maximum Term Series | 0.85 | % | ||
For the year ended October 31, 2018, the Advisor waived the following amounts which are included as a reduction of expenses on the Statements of Operations:
| SERIES/CLASS | WAIVER AMOUNT | |||
Pro-Blend Extended Term Series | $ | 50,028 | ||
Pro-Blend Maximum Term Series | 136,336 | |||
The Advisor is not eligible to recoup any expenses that have been waived or reimbursed in prior years.
Manning & Napier Investor Services, Inc., a registered broker-dealer affiliate of the Advisor, acts as distributor for the Fund’s shares. Each Series compensates the distributor for distributing and servicing the Series’ Class R2 and Class R shares pursuant to a distribution plan adopted under Rule 12b-1 of the 1940 Act, regardless of expenses actually incurred. Under the agreement, each Series pays distribution and service fees to the distributor at an annual rate of 1.00% of average daily net assets attributable to Class R2 shares and an annual rate of 0.50% of daily net assets attributable to Class R shares. There are no distribution and service fees on the Class S or Class I shares of each Series. The fees are accrued daily and paid monthly.
115
Notes to Financial Statements (continued)
| 3. | Transactions with Affiliates (continued) |
Pursuant to a master services agreement dated March 1, 2017, the Fund pays the Advisor an annual fee related to fund accounting and administration of 0.0085% on the first $25 billion of average daily net assets (excluding Target Series and Income Series); 0.0075% on the next $15 billion of average daily net assets (excluding Target Series and Income Series); and 0.0065% of average daily net assets in excess of $40 billion (excluding Target Series and Income Series); plus a base fee of $30,400 per series. Additionally, certain transaction and out-of-pocket expenses, including charges for reporting relating to the Fund’s compliance program, are charged. The Advisor has agreements with BNY Mellon Investment Servicing (U.S.) Inc. (“BNY”) under which BNY serves as sub-accountant services agent.
| 4. | Purchases and Sales of Securities |
For the year ended October 31, 2018, purchases and sales of securities, including paydowns and other than short-term securities, were as follows:
| SERIES | PURCHASES OTHER ISSUERS | GOVERNMENT | SALES OTHER ISSUERS | GOVERNMENT | ||||||||||||
Pro-Blend® Conservative Term Series | $ | 381,966,258 | $ | 324,255,731 | $ | 450,878,951 | $ | 296,960,187 | ||||||||
Pro-Blend® Moderate Term Series | 266,470,192 | 187,071,325 | 343,589,162 | 224,666,388 | ||||||||||||
Pro-Blend® Extended Term Series | 279,576,560 | 180,667,591 | 364,760,955 | 211,461,414 | ||||||||||||
Pro-Blend® Maximum Term Series | 180,235,819 | 105,402,271 | 279,523,230 | 93,855,343 | ||||||||||||
| 5. | Capital Stock Transactions |
Transactions in Class S, Class I, Class R and Class R2 shares were:
| PRO-BLEND® CONSERVATIVE | FOR THE YEAR ENDED 10/31/18 | FOR THE YEAR ENDED 10/31/17 | ||||||||||||||
| TERM SERIES CLASS S: | SHARES | AMOUNT | SHARES | AMOUNT | ||||||||||||
Sold | 13,485,072 | $ | 184,831,181 | 9,432,882 | $ | 126,733,906 | ||||||||||
Reinvested | 1,932,249 | 26,362,664 | 690,857 | 9,178,179 | ||||||||||||
Repurchased | (15,328,727 | ) | (209,336,128 | ) | (19,846,186 | ) | (267,809,092 | ) | ||||||||
|
|
|
|
|
|
|
| |||||||||
Total | 88,594 | $ | 1,857,717 | (9,722,447 | ) | $ | (131,897,007 | ) | ||||||||
|
|
|
|
|
|
|
| |||||||||
| PRO-BLEND® CONSERVATIVE | FOR THE YEAR ENDED 10/31/18 | FOR THE YEAR ENDED 10/31/17 | ||||||||||||||
| TERM SERIES CLASS I: | SHARES | AMOUNT | SHARES | AMOUNT | ||||||||||||
Sold | 6,032,983 | $ | 62,576,922 | 8,379,550 | $ | 88,182,073 | ||||||||||
Reinvested | 983,663 | 10,191,906 | 409,762 | 4,197,197 | ||||||||||||
Repurchased | (7,799,355 | ) | (82,660,492 | ) | (17,312,832 | ) | (184,806,157 | ) | ||||||||
|
|
|
|
|
|
|
| |||||||||
Total | (782,709 | ) | $ | (9,891,664 | ) | (8,523,520 | ) | $ | (92,426,887 | ) | ||||||
|
|
|
|
|
|
|
| |||||||||
| PRO-BLEND® CONSERVATIVE | FOR THE YEAR ENDED 10/31/18 | FOR THE YEAR ENDED 10/31/17 | ||||||||||||||
| TERM SERIES CLASS R: | SHARES | AMOUNT | SHARES | AMOUNT | ||||||||||||
Sold | 343,229 | $ | 3,463,136 | 327,790 | $ | 3,312,044 | ||||||||||
Reinvested | 78,356 | 779,958 | 25,987 | 255,488 | ||||||||||||
Repurchased | (614,836 | ) | (6,092,178 | ) | (962,879 | ) | (9,662,205 | ) | ||||||||
|
|
|
|
|
|
|
| |||||||||
Total | (193,251 | ) | $ | (1,849,084 | ) | (609,102 | ) | $ | (6,094,673 | ) | ||||||
|
|
|
|
|
|
|
| |||||||||
116
Notes to Financial Statements (continued)
| 5. | Capital Stock Transactions (continued) |
| PRO-BLEND® CONSERVATIVE | FOR THE YEAR ENDED 10/31/18 | FOR THE YEAR ENDED 10/31/17 | ||||||||||||||
| TERM SERIES CLASS R2: | SHARES | AMOUNT | SHARES | AMOUNT | ||||||||||||
Sold | 1,033,277 | $ | 10,310,962 | 1,461,640 | $ | 14,777,472 | ||||||||||
Reinvested | 560,024 | 5,575,191 | 135,249 | 1,328,023 | ||||||||||||
Repurchased | (2,819,696 | ) | (28,095,558 | ) | (3,596,927 | ) | (36,136,109 | ) | ||||||||
|
|
|
|
|
|
|
| |||||||||
Total | (1,226,395 | ) | $ | (12,209,405 | ) | (2,000,038 | ) | $ | (20,030,614 | ) | ||||||
|
|
|
|
|
|
|
| |||||||||
| PRO-BLEND® MODERATE | FOR THE YEAR ENDED 10/31/18 | FOR THE YEAR ENDED 10/31/17 | ||||||||||||||
| TERM SERIES CLASS S: | SHARES | AMOUNT | SHARES | AMOUNT | ||||||||||||
Sold | 2,645,523 | $ | 36,095,900 | 3,606,565 | $ | 48,643,819 | ||||||||||
Reinvested | 1,766,612 | 23,789,342 | 850,374 | 11,009,876 | ||||||||||||
Repurchased | (10,220,583 | ) | (139,249,031 | ) | (12,633,045 | ) | (170,384,253 | ) | ||||||||
|
|
|
|
|
|
|
| |||||||||
Total | (5,808,448 | ) | $ | (79,363,789 | ) | (8,176,106 | ) | $ | (110,730,558 | ) | ||||||
|
|
|
|
|
|
|
| |||||||||
| PRO-BLEND® MODERATE | FOR THE YEAR ENDED 10/31/18 | FOR THE YEAR ENDED 10/31/17 | ||||||||||||||
| TERM SERIES CLASS I: | SHARES | AMOUNT | SHARES | AMOUNT | ||||||||||||
Sold | 2,979,315 | $ | 30,087,491 | 8,503,985 | $ | 87,481,428 | ||||||||||
Reinvested | 1,074,662 | 10,720,324 | 572,660 | 5,623,868 | ||||||||||||
Repurchased | (4,255,387 | ) | (43,174,771 | ) | (25,268,653 | ) | (265,560,412 | ) | ||||||||
|
|
|
|
|
|
|
| |||||||||
Total | (201,410 | ) | $ | (2,366,956 | ) | (16,192,008 | ) | $ | (172,455,116 | ) | ||||||
|
|
|
|
|
|
|
| |||||||||
| PRO-BLEND® MODERATE | FOR THE YEAR ENDED 10/31/18 | FOR THE YEAR ENDED 10/31/17 | ||||||||||||||
| TERM SERIES CLASS R: | SHARES | AMOUNT | SHARES | AMOUNT | ||||||||||||
Sold | 133,188 | $ | 1,416,277 | 344,032 | $ | 3,699,735 | ||||||||||
Reinvested | 144,335 | 1,520,382 | 70,612 | 727,384 | ||||||||||||
Repurchased | (678,665 | ) | (7,237,249 | ) | (1,162,387 | ) | (12,606,863 | ) | ||||||||
|
|
|
|
|
|
|
| |||||||||
Total | (401,142 | ) | $ | (4,300,590 | ) | (747,743 | ) | $ | (8,179,744 | ) | ||||||
|
|
|
|
|
|
|
| |||||||||
| PRO-BLEND® MODERATE | FOR THE YEAR ENDED 10/31/18 | FOR THE YEAR ENDED 10/31/17 | ||||||||||||||
| TERM SERIES CLASS R2: | SHARES | AMOUNT | SHARES | AMOUNT | ||||||||||||
Sold | 681,877 | $ | 6,961,412 | 1,039,576 | $ | 10,760,838 | ||||||||||
Reinvested | 769,080 | 7,791,848 | 283,529 | 2,803,766 | ||||||||||||
Repurchased | (2,208,253 | ) | (22,646,789 | ) | (3,046,835 | ) | (31,535,623 | ) | ||||||||
|
|
|
|
|
|
|
| |||||||||
Total | (757,296 | ) | $ | (7,893,529 | ) | (1,723,730 | ) | $ | (17,971,019 | ) | ||||||
|
|
|
|
|
|
|
| |||||||||
| PRO-BLEND® EXTENDED | FOR THE YEAR ENDED 10/31/18 | FOR THE YEAR ENDED 10/31/17 | ||||||||||||||
| TERM SERIES CLASS S: | SHARES | AMOUNT | SHARES | AMOUNT | ||||||||||||
Sold | 1,917,422 | $ | 33,638,594 | 2,255,438 | $ | 38,747,349 | ||||||||||
Reinvested | 1,371,524 | 23,661,283 | 412,975 | 6,726,540 | ||||||||||||
Repurchased | (6,955,971 | ) | (122,072,805 | ) | (10,683,421 | ) | (181,791,515 | ) | ||||||||
|
|
|
|
|
|
|
| |||||||||
Total | (3,667,025 | ) | $ | (64,772,928 | ) | (8,015,008 | ) | $ | (136,317,626 | ) | ||||||
|
|
|
|
|
|
|
| |||||||||
117
Notes to Financial Statements (continued)
| 5. | Capital Stock Transactions (continued) |
| PRO-BLEND® EXTENDED | FOR THE YEAR ENDED 10/31/18 | FOR THE YEAR ENDED 10/31/17 | ||||||||||||||
| TERM SERIES CLASS I: | SHARES | AMOUNT | SHARES | AMOUNT | ||||||||||||
Sold | 5,494,219 | $ | 51,649,838 | 12,201,332 | $ | 118,655,981 | ||||||||||
Reinvested | 1,665,148 | 15,434,205 | 558,278 | 5,174,249 | ||||||||||||
Repurchased | (7,406,430 | ) | (70,917,263 | ) | (39,058,958 | ) | (392,590,574 | ) | ||||||||
|
|
|
|
|
|
|
| |||||||||
Total | (247,063 | ) | $ | (3,833,220 | ) | (26,299,348 | ) | $ | (268,760,344 | ) | ||||||
|
|
|
|
|
|
|
| |||||||||
| PRO-BLEND® EXTENDED | FOR THE YEAR ENDED 10/31/18 | FOR THE YEAR ENDED 10/31/17 | ||||||||||||||
| TERM SERIES CLASS R: | SHARES | AMOUNT | SHARES | AMOUNT | ||||||||||||
Sold | 231,918 | $ | 2,529,480 | 294,649 | $ | 3,282,693 | ||||||||||
Reinvested | 116,252 | 1,257,462 | 45,566 | 483,306 | ||||||||||||
Repurchased | (590,475 | ) | (6,536,081 | ) | (1,310,115 | ) | (14,697,871 | ) | ||||||||
|
|
|
|
|
|
|
| |||||||||
Total | (242,305 | ) | $ | (2,749,139 | ) | (969,900 | ) | $ | (10,931,872 | ) | ||||||
|
|
|
|
|
|
|
| |||||||||
| PRO-BLEND® EXTENDED | FOR THE YEAR ENDED 10/31/18 | FOR THE YEAR ENDED 10/31/17 | ||||||||||||||
| TERM SERIES CLASS R2: | SHARES | AMOUNT | SHARES | AMOUNT | ||||||||||||
Sold | 695,952 | $ | 7,153,586 | 1,175,907 | $ | 12,218,413 | ||||||||||
Reinvested | 1,217,239 | 12,247,875 | 255,457 | 2,523,716 | ||||||||||||
Repurchased | (2,810,668 | ) | (28,755,513 | ) | (4,032,929 | ) | (41,950,558 | ) | ||||||||
|
|
|
|
|
|
|
| |||||||||
Total | (897,477 | ) | $ | (9,354,052 | ) | (2,601,565 | ) | $ | (27,208,429 | ) | ||||||
|
|
|
|
|
|
|
| |||||||||
| PRO-BLEND® MAXIMUM | FOR THE YEAR ENDED 10/31/18 | FOR THE YEAR ENDED 10/31/17 | ||||||||||||||
| TERM SERIES CLASS S: | SHARES | AMOUNT | SHARES | AMOUNT | ||||||||||||
Sold | 1,103,752 | $ | 23,650,449 | 1,435,686 | $ | 28,284,671 | ||||||||||
Reinvested | 1,036,452 | 21,459,898 | 404,158 | 7,421,754 | ||||||||||||
Repurchased | (4,160,253 | ) | (89,146,108 | ) | (7,367,075 | ) | (144,168,928 | ) | ||||||||
|
|
|
|
|
|
|
| |||||||||
Total | (2,020,049 | ) | $ | (44,035,761 | ) | (5,527,231 | ) | $ | (108,462,503 | ) | ||||||
|
|
|
|
|
|
|
| |||||||||
| PRO-BLEND® MAXIMUM | FOR THE YEAR ENDED 10/31/18 | FOR THE YEAR ENDED 10/31/17 | ||||||||||||||
| TERM SERIES CLASS I: | SHARES | AMOUNT | SHARES | AMOUNT | ||||||||||||
Sold | 2,014,113 | $ | 21,746,102 | 7,931,943 | $ | 83,927,061 | ||||||||||
Reinvested | 1,508,732 | 15,549,489 | 626,789 | 6,190,476 | ||||||||||||
Repurchased | (4,183,021 | ) | (45,362,603 | ) | (28,303,596 | ) | (314,016,017 | ) | ||||||||
|
|
|
|
|
|
|
| |||||||||
Total | (660,176 | ) | $ | (8,067,012 | ) | (19,744,864 | ) | $ | (223,898,480 | ) | ||||||
|
|
|
|
|
|
|
| |||||||||
| PRO-BLEND® MAXIMUM | FOR THE YEAR ENDED 10/31/18 | FOR THE YEAR ENDED 10/31/17 | ||||||||||||||
| TERM SERIES CLASS R: | SHARES | AMOUNT | SHARES | AMOUNT | ||||||||||||
Sold | 337,592 | $ | 4,593,055 | 334,618 | $ | 4,472,264 | ||||||||||
Reinvested | 134,694 | 1,762,998 | 58,144 | 704,274 | ||||||||||||
Repurchased | (624,728 | ) | (8,490,869 | ) | (950,033 | ) | (12,610,442 | ) | ||||||||
|
|
|
|
|
|
|
| |||||||||
Total | (152,442 | ) | $ | (2,134,816 | ) | (557,271 | ) | $ | (7,433,904 | ) | ||||||
|
|
|
|
|
|
|
| |||||||||
118
Notes to Financial Statements (continued)
| 5. | Capital Stock Transactions (continued) |
| PRO-BLEND® MAXIMUM | FOR THE YEAR ENDED 10/31/18 | FOR THE YEAR ENDED 10/31/17 | ||||||||||||||
| TERM SERIES CLASS R2: | SHARES | AMOUNT | SHARES | AMOUNT | ||||||||||||
Sold | 568,570 | $ | 6,446,638 | 664,356 | $ | 7,380,136 | ||||||||||
Reinvested | 645,934 | 7,027,766 | 185,278 | 1,900,023 | ||||||||||||
Repurchased | (953,464 | ) | (10,872,533 | ) | (1,352,932 | ) | (14,888,662 | ) | ||||||||
|
|
|
|
|
|
|
| |||||||||
Total | 261,040 | $ | 2,601,871 | (503,298 | ) | $ | (5,608,503 | ) | ||||||||
|
|
|
|
|
|
|
| |||||||||
At October 31, 2018, one shareholder owned 10.4% of Pro-Blend® Conservative Term Series and one shareholder owned 20.5% of Pro-Blend® Moderate Term Series. Investment activities of these shareholders may have a material effect on the respective Series.
| 6. | Line of Credit |
The Fund has entered into a 364-day, $25 million credit agreement (the “line of credit”) with Bank of New York Mellon. Each series of the Fund may borrow under the line of credit for temporary or emergency purposes, including funding shareholder redemptions and other short-term liquidity purposes. The Fund pays an annual fee on the unused commitment amount, payable quarterly, and is allocated among all the series of the Fund and included in miscellaneous expenses in the Statement of Operations for each series. During the year ended October 31, 2018, the Series did not borrow under the line of credit. The line of credit expires in August 2019 unless extended or renewed. During the year ended October 31, 2018, none of the Series borrowed under the line of credit.
| 7. | Financial Instruments and Loan Assignments |
The Series may trade in instruments including written and purchased options, forward foreign currency exchange contracts and futures contracts and other derivatives in the normal course of investing activities to assist in managing exposure to various market risks. The Series may be subject to various elements of risk which may involve, to a varying degree, elements of risk in excess of the amounts recognized for financial statement purposes. These risks include: the risk that changes in the value of a derivative may not correlate perfectly with the underlying asset, rate or index; counterparty credit risk related to over the counter derivative counterparties’ failure to perform under contract terms; liquidity risk related to the lack of a liquid market for these contracts allowing the fund to close out its position(s); and documentation risk relating to disagreement over contract terms. At October 31, 2018, Pro-Blend® Conservative Term Series, Pro-Blend® Moderate Term Series and Pro-Blend® Extended Term Series invested in options contracts (equity risk).
The Series may invest in a loan assignment of all or a portion of the loans. A Series has direct rights against the borrower on a loan when it purchases an assignment; however, the Series’ rights may be more limited than the lender from which it acquired the assignment and the Series may be able to enforce its rights only through an administrative agent. Loan assignments are vulnerable to market conditions and may become illiquid due to economic conditions or other events may reduce the demand for loan assignments and certain loan assignments which were liquid when purchased may become illiquid. At October 31, 2018, none of the Series held any loan assignments.
| 8. | Foreign Securities |
Investing in securities of foreign companies and foreign governments involves special risks and considerations not typically associated with investing in securities of domestic companies and the U.S. Government. These risks include revaluation of currencies and future adverse political and economic developments. Moreover, securities of foreign companies and foreign governments and their markets may be less liquid and their prices more volatile than those of comparable domestic companies and the U.S. Government.
119
Notes to Financial Statements (continued)
| 9. | Federal Income Tax Information |
The amount and characterization of certain income and capital gains to be distributed are determined in accordance with federal income tax regulations, which may differ from GAAP. These differences are primarily due to differing book and tax treatments in the timing of the recognition on net investment income or gains and losses, including foreign currency gains and losses, losses deferred due to wash sales, investments in passive foreign investment companies (PFICs) and real estate investment trusts. Each Series may periodically make reclassifications among its capital accounts to reflect income and gains available for distribution (or available capital loss carryovers) under income tax regulations, without impacting the Series’ net asset value. For the fiscal year ended October 31, 2018, $119,148, $77,908, $88,604 and $43,135 was reclassified within the capital accounts from Total Distributable Earnings to Additional Paid in Capital for Pro-Blend® Conservative Term Series, Pro-Blend® Moderate Term Series, Pro-Blend® Extended Term Series and Pro-Blend® Maximum Term Series, respectively. Any such reclassifications are not reflected in the financial highlights.
The tax character of distributions paid were as follows:
| PRO-BLEND® CONSERVATIVE TERM SERIES | PRO-BLEND® MODERATE TERM SERIES | |||||||||||||||
| FOR THE YEAR ENDED 10/31/18 | FOR THE YEAR ENDED 10/31/17 | FOR THE YEAR ENDED 10/31/18 | FOR THE YEAR ENDED 10/31/17 | |||||||||||||
Ordinary income | $ | 21,330,487 | $ | 14,878,681 | $ | 18,396,321 | $ | 10,444,582 | ||||||||
Long-term capital gains | 22,874,974 | 2,226,779 | 25,890,219 | 13,857,262 | ||||||||||||
| PRO-BLEND® EXTENDED TERM SERIES | PRO-BLEND® MAXIMUM TERM SERIES | |||||||||||||||
| FOR THE YEAR ENDED 10/31/18 | FOR THE YEAR ENDED 10/31/17 | FOR THE YEAR ENDED 10/31/18 | FOR THE YEAR ENDED 10/31/17 | |||||||||||||
Ordinary income | $ | 21,183,099 | $ | 11,918,950 | $ | 14,885,916 | $ | 6,939,426 | ||||||||
Long-term capital gains | 31,992,723 | 9,253,591 | 31,414,665 | 16,023,167 | ||||||||||||
At October 31, 2018, the tax basis of components of distributable earnings and the net unrealized appreciation based on the identified cost of investments for federal income tax purposes were as follows:
| PRO-BLEND® CONSERVATIVE TERM SERIES | PRO-BLEND® MODERATE TERM SERIES | PRO-BLEND® EXTENDED TERM SERIES | PRO-BLEND® MAXIMUM TERM SERIES | |||||||||||||
Cost for federal income tax purposes | $ | 897,627,133 | $ | 553,821,172 | $ | 540,858,163 | $ | 383,816,693 | ||||||||
Unrealized appreciation | 34,037,516 | 25,834,086 | 34,431,989 | 49,534,870 | ||||||||||||
Unrealized depreciation | (28,502,037 | ) | (24,386,892 | ) | (26,046,662 | ) | (24,564,752 | ) | ||||||||
|
|
|
|
|
|
|
| |||||||||
Net unrealized appreciation | $ | 5,535,479 | $ | 1,447,194 | $ | 8,385,327 | $ | 24,970,118 | ||||||||
|
|
|
|
|
|
|
| |||||||||
Undistributed ordinary income | $ | 7,515,724 | $ | 3,529,077 | $ | 3,661,532 | $ | 10,952,209 | ||||||||
Undistributed long-term gains | $ | 19,588,043 | $ | 22,931,398 | $ | 32,292,040 | $ | 35,837,011 | ||||||||
120
Report of Independent Registered Public Accounting Firm
To the Board of Directors of Manning & Napier Fund, Inc. and Shareholders of Pro-Blend® Conservative Term Series, Pro-Blend® Moderate Term Series, Pro-Blend® Extended Term Series and Pro-Blend® Maximum Term Series
Opinions on the Financial Statements
We have audited the accompanying statements of assets and liabilities, including the investment portfolios, of Pro-Blend® Conservative Term Series, Pro-Blend® Moderate Term Series, Pro-Blend® Extended Term Series and Pro-Blend® Maximum Term Series (four of the series constituting Manning & Napier Fund, Inc., hereafter collectively referred to as the “Funds”) as of October 31, 2018, the related statements of operations for the year ended October 31, 2018, the statements of changes in net assets for each of the two years in the period ended October 31, 2018, including the related notes, and the financial highlights for each of the five years in the period ended October 31, 2018 (collectively referred to as the “financial statements”). In our opinion, the financial statements present fairly, in all material respects, the financial position of each of the Funds as of October 31, 2018, the results of each of their operations for the year then ended, the changes in each of their net assets for each of the two years in the period ended October 31, 2018 and each of the financial highlights for each of the five years in the period ended October 31, 2018 in conformity with accounting principles generally accepted in the United States of America.
Basis for Opinions
These financial statements are the responsibility of the Funds’ management. Our responsibility is to express an opinion on the Funds’ financial statements based on our audits. We are a public accounting firm registered with the Public Company Accounting Oversight Board (United States) (“PCAOB”) and are required to be independent with respect to the Funds in accordance with the U.S. federal securities laws and the applicable rules and regulations of the Securities and Exchange Commission and the PCAOB.
We conducted our audits of these financial statements in accordance with the standards of the PCAOB. Those standards require that we plan and perform the audit to obtain reasonable assurance about whether the financial statements are free of material misstatement, whether due to error or fraud.
Our audits included performing procedures to assess the risks of material misstatement of the financial statements, whether due to error or fraud, and performing procedures that respond to those risks. Such procedures included examining, on a test basis, evidence regarding the amounts and disclosures in the financial statements. Our audits also included evaluating the accounting principles used and significant estimates made by management, as well as evaluating the overall presentation of the financial statements. Our procedures included confirmation of securities owned as of October 31, 2018 by correspondence with the custodian and brokers; when replies were not received from brokers, we performed other auditing procedures. We believe that our audits provide a reasonable basis for our opinions.

New York, New York
December 14, 2018
We have served as the auditor of one or more investment companies in Manning & Napier Mutual Funds since 1992.
121
Supplemental Tax Information
(unaudited)
All reportings are based on financial information available as of the date of this annual report and, accordingly, are subject to change.
For federal income tax purposes, each of the Series reports for the current fiscal year the amount disclosed below or, if different, the maximum amount allowable under the tax law as qualified dividend income (“QDI”).
| Series | QDI | |||
Pro-Blend® Conservative Term Series | $5,652,339 | |||
Pro-Blend® Moderate Term Series | 4,593,642 | |||
Pro-Blend® Extended Term Series | 5,902,627 | |||
Pro-Blend® Maximum Term Series | 5,818,377 | |||
For corporate shareholders, the percentage of investment income (dividend income plus short-term gain, if any) that qualifies for the dividends received deduction (DRD) for the current fiscal year is as follows:
| Series | DRD% | |||
Pro-Blend® Conservative Term Series | 18.86% | |||
Pro-Blend® Moderate Term Series | 12.00% | |||
Pro-Blend® Extended Term Series | 13.52% | |||
Pro-Blend® Maximum Term Series | 19.61% | |||
The Series designate Long-Term Capital Gain dividends pursuant to Section 852(b)(3) of the Code for the fiscal year ended October 31, 2018 as follows:
| Series | ||||
Pro-Blend® Conservative Term Series | $20,567,445 | |||
Pro-Blend® Moderate Term Series | 24,077,968 | |||
Pro-Blend® Extended Term Series | 33,906,642 | |||
Pro-Blend® Maximum Term Series | 37,628,862 | |||
122
Directors’ and Officers’ Information
(unaudited)
The Statement of Additional Information provides additional information about the Fund’s directors and officers and can be obtained without charge by calling 1-800-466-3863, at www.manning-napier.com, or on the EDGAR Database on the SEC Internet web site (http://www.sec.gov). The following chart shows certain information about the Fund’s directors and officers, including their principal occupations during the last five years. Unless specific dates are provided, the individuals have held the listed positions for longer than five years.
Interested Director and Officer
Name: | Paul Battaglia* | |
| Address: | 290 Woodcliff Drive Fairport, NY 14450 | |
| Age: | 40 | |
| Current Position(s) Held with Fund: | Principal Executive Officer, President, Chairman & Director | |
| Term of Office & Length of Time Served: | Indefinite – Chairman and Director since November 20181 | |
| Principal Occupation(s) During Past 5 Years: | Chief Financial Officer (2018 – Present); Vice President of Finance (2016 – 2018); Director of Finance (2011 – 2016); Financial Analyst/Internal Auditor (2004-2006) – Manning & Napier Advisors, LLC and affiliates Holds one or more of the following titles for various affiliates: Chief Financial Officer | |
| Number of Portfolios Overseen within Fund Complex: | 36 | |
| Other Directorships Held Outside Fund Complex During Past 5 Years: | N/A | |
| Independent Directors | ||
| Name: | Stephen B. Ashley | |
| Address: | 290 Woodcliff Drive | |
| Fairport, NY 14450 | ||
| Age: | 78 | |
| Current Position(s) Held with Fund: | Director, Audit Committee Member, Governance & Nominating Committee Member | |
| Term of Office & Length of Time Served: | Indefinite – Since 1996 | |
| Principal Occupation(s) During Past 5 Years: | Chairman, Director & Chief Executive Officer (1997 to present) - The Ashley Group (property management and investment). Director (1995-2008) and Chairman (non-executive) (2004-2008) - Fannie Mae (mortgage) | |
| Number of Portfolios Overseen within Fund Complex: | 36 | |
| Other Directorships Held Outside Fund Complex During | Fannie Mae (1995-2008) | |
| Past 5 Years: | The Ashley Group (1995-2008) Genesee Corporation (1987-2007) | |
| Name: | Paul A. Brooke | |
| Address: | 290 Woodcliff Drive Fairport, NY 14450 | |
| Age: | 72 | |
| Current Position(s) Held with Fund: | Lead Independent Director, Audit Committee Member, Governance & Nominating Committee Chairman | |
| Term of Office & Length of Time Served: | Indefinite – Director, Audit Committee Member, Governance & Nominating Committee Member since 2007; Governance & Nominating Committee Chairman since 2016; Lead Independent Director since 2017 | |
| Principal Occupation(s) During Past 5 Years: | Chairman & CEO (2005-2009) - Ithaka Acquisition Corporation (investments); Chairman (2007-2009) - Alsius Corporation (investments); Managing Member (1991-present) - PMSV Holdings LLC (investments); Managing Member (2010-2016) - Venbio (investments). | |
| Number of Portfolios Overseen within Fund Complex: | 36 | |
| Other Directorships Held Outside Fund Complex During Past 5 Years: | Incyte Corp. (biotech)(2000-present); ViroPharma, Inc. (speciality pharmaceuticals)(2000-2014); HLTH (WebMD)(information)(2000-2010); Cheyne Capital International (investment)(2000-2017); GMP Companies (investment)(2000-2011); Cytos Biotechnology Ltd (biotechnology)(2012-2014); Cerus (biomedical)(2016-present); PureEarth(non-profit)(2012-present) | |
123
Directors’ and Officers’ Information
(unaudited)
Independent Directors (continued)
| Name: | Peter L. Faber | |
| Address: | 290 Woodcliff Drive | |
| Fairport, NY 14450 | ||
| Age: | 80 | |
| Current Position(s) Held with Fund: | Director, Governance & Nominating Committee Member | |
| Term of Office & Length of Time Served: | Indefinite – Since 1987 | |
| Principal Occupation(s) During Past 5 Years: | Senior Counsel (2006-2012), Partner (1995-2006 & 2013-present) - McDermott, Will & Emery LLP (law firm) | |
| Number of Portfolios Overseen within Fund Complex: | 36 | |
| Other Directorships Held Outside Fund Complex During Past 5 Years: | Boston Early Music Festival (non-profit)(2007-present); Amherst Early Music, Inc. (non-profit)(2009-present); Gotham Early Music Scene, Inc. (non-profit)(2009-present); Partnership for New York City, Inc. (non-profit)(1989-2010); New York Collegium (non-profit)(2004-2011) | |
| Name: | Harris H. Rusitzky | |
| Address: | 290 Woodcliff Drive | |
| Fairport, NY 14450 | ||
| Age: | 83 | |
| Current Position(s) Held with Fund: | Director, Audit Committee Member, Governance & Nominating Committee Member | |
| Term of Office & Length of Time Served: | Indefinite – Since 1985 | |
| Principal Occupation(s) During Past 5 Years: | President (1994- present) - The Greening Group (business consultants); | |
| Partner (2006-present) - The Restaurant Group (restaurants) | ||
| Number of Portfolios Overseen within Fund Complex: | 36 | |
| Other Directorships Held Outside Fund Complex During Past 5 Years: | Rochester Institute of Technology (university)(1972-present); Culinary Institute of America (non-profit college)(1985-present); George Eastman House (museum)(1988-present); National Restaurant Association (restaurant trade organization)(1978-present) | |
| Name: | Chester N. Watson | |
| Address: | 290 Woodcliff Drive | |
| Fairport, NY 14450 | ||
| Age: | 68 | |
| Current Position(s) Held with Fund: | Director, Audit Committee Chairman, Governance & Nominating Committee Member | |
| Term of Office & Length of Time Served: | Indefinite – Director, Audit Committee Member, Governance & Nominating Committee Member Since 2012; Audit Committee Chairman since 2013 | |
| Principal Occupation(s) During Past 5 Years: | General Auditor (2003-2011) - General Motors Company (auto manufacturer) | |
| Number of Portfolios Overseen within Fund Complex: | 36 | |
| Other Directorships Held Outside Fund Complex During Past 5 Years: | Rochester Institute of Technology (university)(2005-present); Town of Greenburgh, NY Planning Board (municipal government) (2015-present) | |
| Officers: | ||
| Name: | Jeffrey S. Coons, Ph.D., CFA® | |
| Address: | 290 Woodcliff Drive | |
| Fairport, NY 14450 | ||
| Age: | 55 | |
| Current Position(s) Held with Fund: | Vice President | |
| Term of Office1 & Length of Time Served: | Since 2004 | |
| Principal Occupation(s) During Past 5 Years: | President since 2010, Co-CEO since 2018, Co-Director of Research (2002 – 2015) - Manning & Napier Advisors, LLC Holds one or more of the following titles for various subsidiaries and affiliates: President, Director, Treasurer, or Senior Trust Officer | |
| Name: | Elizabeth Craig | |
| Address: | 290 Woodcliff Drive | |
| Fairport, NY 14450 | ||
| Age: | 31 | |
| Current Position(s) Held with Fund: | Corporate Secretary | |
| Term of Office1 & Length of Time Served: | Since 2016 | |
| Principal Occupation(s) During Past 5 Years: | Fund Administration Manager since 2015; Mutual Fund Compliance Specialist (2009-2015) - Manning & Napier Advisors, LLC; Assistant Corporate Secretary (2011-2016) - Manning & Napier Fund, Inc. | |
124
Directors’ and Officers’ Information
(unaudited)
Officers: (continued)
| Name: | Christine Glavin | |
| Address: | 290 Woodcliff Drive | |
| Fairport, NY 14450 | ||
| Age: | 52 | |
| Current Position(s) Held with Fund: | Principal Financial Officer, Chief Financial Officer | |
| Term of Office1 & Length of Time Served: | Principal Financial Officer since 2002; Chief Financial Officer since 2001 | |
| Principal Occupation(s) During Past 5 Years: | Director of Fund Reporting since 2011; Fund Reporting Manager (1997-2011) - Manning & Napier Advisors, LLC; Assistant Treasurer since 2008 - Exeter Trust Company; Chief Financial Officer (2017-2018) - Rainier Investment Management Mutual Funds, Inc. | |
| Name: | Jodi L. Hedberg | |
| Address: | 290 Woodcliff Drive | |
| Fairport, NY 14450 | ||
| Age: | 50 | |
| Current Position(s) Held with Fund: | Chief Compliance Officer, Anti-Money Laundering Compliance Officer | |
| Term of Office1 & Length of Time Served: | Chief Compliance Officer since 2004; Anti-Money Laundering Officer since 2002; Corporate Secretary (1997-2016) - Manning & Napier Fund, Inc.; Chief Compliance Officer and Anti-Money Laundering Officer (2017-2018) – Rainier Investment Management Mutual Funds, Inc. | |
| Principal Occupation(s) During Past 5 Years: | Managing Director, Compliance & Regulatory Affairs since 2018; Director of Compliance (2005-2018); Compliance Manager (1995-2005) – Manning & Napier Advisors, LLC and affiliates; Corporate Secretary – Manning & Napier Investor Services, Inc. since 2006 | |
| Name: | Scott Morabito | |
| Address: | 290 Woodcliff Drive | |
| Fairport, NY 14450 | ||
| Age: | 30 | |
| Current Position(s) Held with Fund: | Assistant Vice President | |
| Term of Office1 & Length of Time Served: | Since 2017 | |
| Principal Occupation(s) During Past 5 Years: | Director of Funds Group since 2017; Fund Product and Strategy Manager (2014-2017); Senior Product and Strategy Analyst (2013-2014); Product and Strategy Analyst (2011-2013) - Manning & Napier Advisors, LLC. | |
| Name: | Sarah Turner | |
| Address: | 290 Woodcliff Drive | |
| Fairport, NY 14450 | ||
| Age: | 36 | |
| Current Position(s) Held with Fund: | Chief Legal Officer; Assistant Corporate Secretary | |
| Term of Office1 & Length of Time Served: | Since 2018 | |
| Principal Occupation(s) During Past 5 Years: | General Counsel since 2018 - Manning & Napier Advisors, LLC and affiliates; Counsel (2017-2018) – Harter Secrest and Emery LLP; Legal Counsel (2010-2017) – Manning & Napier Advisors, LLC and affiliates Holds one or more of the following titles for various affiliates: Corporate Secretary, General Counsel | |
| Name: | Amy Williams | |
| Address: | 290 Woodcliff Drive | |
| Fairport, NY 14450 | ||
| Age: | 56 | |
| Current Position(s) Held with Fund: | Assistant Corporate Secretary | |
| Term of Office1 & Length of Time Served: | Since 2016 | |
| Principal Occupation(s) During Past 5 Years: | Director of Fund Documentation - Manning & Napier Advisors, LLC since 2009 Holds one or more of the following titles for various affiliates: Director |
*At a meeting of the Board of Directors held on November 15, 2018, the Board accepted the resignation of Michele T. Mosca from her positions as Principal Executive Officer, President, Chair and Interested Director of the Fund and appointed Paul J. Battaglia to each of the resigned positions effective immediately. Interested Director, within the meaning of the 1940 Act by reason of his positions with the Fund’s investment advisor, Manning & Napier Advisors, LLC.
1The term of office of all officers shall be one year and until their respective successors are chosen and qualified, or his or her earlier resignation or removal as provided in the Fund’s By-Laws.
125
{This page intentionally left blank}
126
Literature Requests
(unaudited)
Proxy Voting Policies and Procedures
A description of the policies and procedures that the Fund uses to determine how to vote proxies relating to portfolio securities is available, without charge, upon request:
| By phone | 1-800-466-3863 | |||
| On the Securities and Exchange | ||||
| Commission’s (SEC) web site | http://www.sec.gov |
Proxy Voting Record
Information regarding how the Fund voted proxies relating to portfolio securities during the most recent 12-month period ended June 30th is available, without charge, upon request:
| By phone | 1-800-466-3863 | |||
| On the SEC’s web site | http://www.sec.gov |
Quarterly Portfolio Holdings
The Series’ complete schedule of portfolio holdings for the 1st and 3rd quarters of each fiscal year are provided on Form N-Q, and are available, without charge, upon request:
| By phone | 1-800-466-3863 | |||
| On the SEC’s web site | http://www.sec.gov |
The Series’ Form N-Q may be reviewed and copied at the SEC’s Public Reference Room in Washington, D.C. Information on the operation of the Public Reference Room may be obtained by calling 1-800-SEC-0330.
Prospectus and Statement of Additional Information (SAI)
For more information about any of the Manning & Napier Fund, Inc. Series, you may obtain a prospectus and SAI at www.manning-napier.com or by calling (800) 466-3863. Before investing, carefully consider the objectives, risks, charges and expenses of the investment and read the prospectus carefully as it contains this and other information about the investment company. In addition, this information can be found on the SEC’s web site, http://www.sec.gov.
Additional information available at www.manning-napier.com
1. Fund Holdings - Month-End
2. Fund Holdings - Quarter-End
3. Shareholder Report - Annual
4. Shareholder Report - Semi-Annual
The Fund also offers electronic notification or “e-delivery” when certain documents are available on-line to be downloaded or reviewed. Direct shareholders can elect to receive electronic notification when shareholder reports, prospectus updates, and/or quarterly statements are available. If you do not currently have on-line access to your account, you can establish access by going to www.manning-napier.com, click on “Login” in the top corner of the page, and follow the prompts to self-enroll. Once enrolled, you can set your electronic notification preferences by clicking on the Account Options tab located within the green toolbar and then select E-Delivery Option. Should you have any questions on either how to establish on-line access or how to update your account settings, please contact Investor Services at 1-800-466-3863.
The Manning & Napier Fund, Inc. is managed by Manning & Napier Advisors, LLC. Manning & Napier Investor Services, Inc., an affiliate of Manning & Napier Advisors, LLC, is the distributor of the Fund shares.
MNPRO-10/18-AR

Rainier International Discovery Series
Management Discussion and Analysis
(unaudited)
Dear Shareholders:
The investment environment witnessed over the past twelve months was more volatile and bifurcated than what was experienced in prior years. For the fiscal year ending on October 31, 2018, international equity performance was decidedly poor as the MSCI ACWI ex USA Index fell 8.24%.
Going forward, we believe the volatility experienced in October, as well as during the first few months of 2018, is likely to be reflective of what investors should come to expect going forward. While we do not anticipate an imminent recession, we see recent developments within the US and abroad as an indication that we are entering a higher risk regime for risk assets over the next twelve months.
The US is likely approaching a period of peak growth and continues to show signs of progressing further into late cycle territory, with potential spillover effects into the global economy. At the same time, key global risks are rising, including trade tensions, global growth concerns, and geopolitical uncertainty, all of which have continued escalating throughout 2018.
Given our updated outlook, we are reviewing late cycle risks in current and prospective investments and have adjusted our positioning across many of our portfolios. Going forward, we will continue to follow our disciplines, choosing to be selective in our investment decisions and seeking to avoid overvalued areas of the market.
With this in mind, we discuss recent fund performance in the enclosed, highlight how we are positioned amid the current economic environment, and provide our outlook of what to expect in financial markets.
We hope that you find this information helpful, and look forward to working with you in the years ahead to help you meet your investment goals.
Sincerely,
Manning & Napier Advisors, LLC
The MSCI ACWI ex USA Index (ACWIxUS) is designed to measure large and mid-cap representation across 22 of 23 Developed Markets countries (excluding the U.S.) and 24 Emerging Markets countries. The Index returns do not reflect any fees or expenses. The Index is denominated in U.S. dollars. The Index returns are net of withholding taxes. They assume daily reinvestment of net dividends thus accounting for any applicable dividend taxation. Index returns provided by Morningstar.
©2018 Morningstar, Inc. All rights reserved. The information contained herein: (1) is proprietary to Morningstar and/or its content providers; (2) may not be copied, adapted or distributed; and (3) is not warranted to be accurate, complete or timely. Neither Morningstar nor its content providers are responsible for any damages or losses arising from any use of this information, except where such damages or losses cannot be limited or excluded by law in your jurisdiction. Past financial performance is no guarantee of future results.
1
Rainier International Discovery Series
Fund Commentary
(unaudited)
Investment Objective
To seek long-term capital appreciation. The Series invests primarily in equity securities of foreign developed and emerging market companies that are small- to mid-sized at the time of purchase.
Performance Commentary
International equity markets generally delivered negative absolute returns for the twelve-month period ended October 31, 2018. The broad MSCI ACWI ex USA Index (ACWIxUS) returned -8.24%. International small cap stocks underperformed the broad market with the ACWIxUS Small Cap Index (ACWIxUS Small Cap) returning -9.73%. Emerging market equities generally underperformed developed markets during the period, and the US dollar generally appreciated during the year which challenged international equity returns for US-based investors.
The International Discovery Series Class K returned -8.69% during the year, but held up better than the ACWIxUS Small Cap benchmark on a relative basis. Importantly, the Series has provided robust positive absolute returns since its inception in March 2013. The Series’ performance relative to the ACWIxUS Small Cap during the year was driven by both stock selection and sector allocations. Conversely, country positioning challenged relative returns.
The most notable contributors to relative performance were stock selection in Health Care, Information Technology, and Consumer Staples, along with an overweight to Health Care. This was partially offset by stock selection in the Consumer Discretionary and Financials sectors along with an underweight allocation to Real Estate. From a country basis, stock selection in Denmark, France, Germany, and Italy provided the biggest contributions to relative performance, while stock selection in Japan was the largest relative detractor.
The Series’ focus continues to be on owning well-established companies with dominant market positions and meaningful growth potential. The Series’ portfolio will generally be well-diversified amongst sectors, countries, and regions, with the primary focus of portfolio construction being on bottom-up security selection.
Currently, the portfolio’s largest overweight allocations are to Health Care, Consumer Staples, and Industrials (approximately 53% of the portfolio in total). The largest underweight allocations are to Real Estate, Materials, and Consumer Discretionary (approximately 11% of the portfolio compared to approximately 34% of the benchmark). From a country perspective, the portfolio is overweight to Denmark, France, and Germany, and underweight to Japan, United Kingdom, and Sweden relative to the benchmark. The Series is currently underweight Emerging Markets relative to the benchmark.
The past fiscal year has seen negative absolute returns, both for the Series’ and broadly in the international small cap market. However, despite these challenges, the management team continues to find investment opportunities with growth potential at attractive valuations and remains confident in the Series’ ability to continue its success. We believe, the international small cap asset class, given its vast expanse and relatively limited information availability, lends itself to providing an ideal environment for dedicated, experienced, active management to add value. The Series will continue to invest in dominant companies that have a clear catalyst for continued growth and are trading at attractive valuations. The team believes that this investment approach in the international small cap market has the ability to continue to add value over the long-term.
Performance data quoted represents past performance and does not guarantee future results. The investment return and principal value of an investment will fluctuate, so that an investor’s shares, when redeemed, may be worth more or less than their original cost. Current performance may be higher or lower than that quoted; investors can obtain the most recent month-end performance at www.manning-napier.com or by calling (800) 466-3863.
Please see the next page for additional performance information as of October 31, 2018.
All investments involve risks, including possible loss of principal. As with any stock fund, the value of your investment will fluctuate in response to stock market movements. Small- and medium-capitalization companies tend to have limited liquidity and greater price volatility than large-capitalization companies. Funds whose investments are concentrated in foreign and emerging market countries may be subject to fluctuating currency values, different accounting standards, and economic and political instability. The value of the Series may be affected by changes in exchange rates between foreign currencies and the U.S. dollar. Investments in emerging markets may be more volatile than investments in more developed markets. Additionally, the Series is subject to portfolio turnover risk as it may buy and sell investments frequently, which may result in higher expenses and an increase in realized capital gains and potential tax implications for shareholders.
Commentary prepared using data provided by FactSet. Analysis Manning & Napier. Commentary presented is relative to the ACWIxUS Small Cap Index. Additional information and associated disclosures can be found on the Performance Update page of this report.
2
Rainier International Discovery Series
Performance Update as of October 31, 2018
(unaudited)
AVERAGE ANNUAL TOTAL RETURNS AS OF OCTOBER 31, 2018 | ||||||||||||
ONE YEAR1 | FIVE YEAR | SINCE INCEPTION2 | ||||||||||
Manning & Napier Fund, Inc. - Rainier International Discovery Series - Class K3,4 | -8.69 | % | 6.55 | % | 11.25 | % | ||||||
Manning & Napier Fund, Inc. - Rainier International Discovery Series - Class I3,4 | -8.42 | % | 6.82 | % | 11.53 | % | ||||||
Manning & Napier Fund, Inc. - Rainier International Discovery Series - Class Z3,4 | -8.29 | % | 6.85 | % | 11.55 | % | ||||||
MSCI ACWI ex USA Small Cap Index5 | -9.73 | % | 3.36 | % | 5.73 | % | ||||||
The following graph compares the value of a $1,000,000 investment in the Manning & Napier Fund, Inc. - Rainier International Discovery Series - Class I from its inception2 (March 28, 2012) to present (October 31, 2018) to the MSCI ACWI ex USA Small Cap Index.
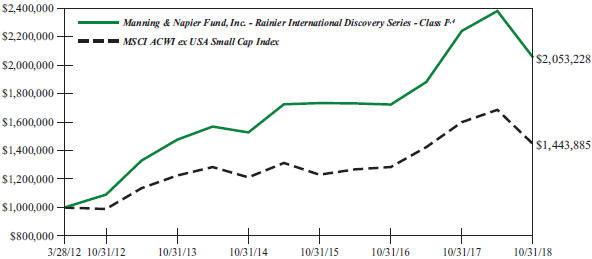
1The returns shown are based on net asset values calculated for shareholder transactions and may differ from the returns shown in the financial highlights, which reflect adjustments made to the net asset values in accordance with accounting principles generally accepted in the United States of America.
2Performance numbers for the Series and the MSCI ACWI ex USA Small Cap Index are calculated from March 28, 2012, the Class I inception date.
3The Series’ performance does not reflect the deduction of taxes that a shareholder would pay on fund distributions or the redemption of shares. The Series’ performance is historical and may not be indicative of future results. The performance returns shown are inclusive of the net expense ratio of the Series. For the year ended October 31, 2018, this net expense ratio was 1.40% for Class K, 1.12% for Class I and 1.00% for Class Z. The gross expense ratio, which does not account for any voluntary or contractual waivers currently in effect, was 1.43% for Class K, 1.12% for Class I and 1.04% for Class Z for the year ended October 31, 2018.
4The Rainier International Discovery Fund (Predecessor Fund), which was managed by Rainier Investment Management, LLC, was reorganized into the Manning & Napier Fund, Inc. Rainier International Discovery Series on 08/21/2017. For periods prior to 08/21/2017, performance for the Class I and Z Shares is based on the historical performance of the Predecessor Fund’s Institutional Shares, and will differ to the extent that the Predecessor Fund’s Institutional Shares had a higher expense ratio. For periods between 11/30/2012 and 08/21/2017, performance for Class K is based on the historical performance of the Predecessor Fund’s Class A Shares; performance prior to 11/30/2012 is based on the historical performance of the Predecessor Fund’s Institutional Shares and adjusted for the Predecessor Fund’s Class A Shares expenses. If the sales charges were reflected or if performance had been adjusted to reflect the Class K Shares’ expenses, the performance would have been different depending on total expenses incurred by the Predecessor Fund.
5The MSCI ACWI ex USA Small Cap Index is designed to measure a small cap representation across 22 of 23 Developed Markets countries (excluding the U.S.) and 24 Emerging Markets countries. The Index returns do not reflect any fees or expenses. The Index is denominated in U.S. dollars. The Index returns are net of withholding taxes. They assume daily reinvestment of net dividends thus accounting for any applicable dividend taxation. Index returns provided by Bloomberg.
3
Rainier International Discovery Series
Shareholder Expense Example
(unaudited)
As a shareholder of the Series, you incur ongoing costs, including management fees, shareholder service fees and other Series expenses. This example is intended to help you understand your ongoing costs (in dollars) of investing in the Series and to compare these costs with the ongoing costs of investing in other mutual funds.
The example is based on an investment of $1,000 invested in each class at the beginning of the period and held for the entire period (May 1, 2018 to October 31, 2018).
Actual Expenses
The Actual lines of the table below provide information about actual account values and actual expenses. You may use the information in this line, together with the amount you invested, to estimate the expenses that you paid over the period. Simply divide your account value by $1,000 (for example, an $8,600 account value divided by $1,000 = 8.6), then multiply the result by the number in the Actual line for the Class in which you have invested under the heading entitled “Expenses Paid During Period” to estimate the expenses you paid on your account during this period.
Hypothetical Example for Comparison Purposes
The Hypothetical lines of each Class in the table below provide information about hypothetical account values and hypothetical expenses based on the Class’ actual expense ratio and an assumed rate of return of 5% per year before expenses, which is not the Class’ actual return. The hypothetical account values and expenses may not be used to estimate the actual ending account balance or expenses you paid during the period. You may use this information to compare the ongoing costs of investing in a class of the Series and other funds. To do so, compare this 5% hypothetical example for the class in which you have invested with the 5% hypothetical examples that appear in the shareholder reports of the other funds.
Please note that the expenses shown in the table are meant to highlight your ongoing costs only and do not reflect any transaction costs, such as sales charges (loads), redemption fees, or exchange fees that you may incur in other mutual funds. Therefore, the second line of the table is useful in comparing ongoing costs only, and will not help you determine the relative total costs of owning different funds.
| BEGINNING ACCOUNT VALUE 5/1/18 | ENDING ACCOUNT VALUE 10/31/18 | EXPENSES PAID 5/1/18-10/31/18 | ANNUALIZED EXPENSE RATIO | |||||
Class K | ||||||||
Actual | $1,000.00 | $860.94 | $6.57 | 1.40% | ||||
| Hypothetical (5% return before expenses) | $1,000.00 | $1,018.15 | $7.12 | 1.40% | ||||
Class I | ||||||||
Actual | $1,000.00 | $862.70 | $5.21 | 1.11% | ||||
| Hypothetical (5% return before expenses) | $1,000.00 | $1,019.61 | $5.65 | 1.11% | ||||
Class Z | ||||||||
Actual | $1,000.00 | $863.23 | $4.70 | 1.00% | ||||
| Hypothetical (5% return before expenses) | $1,000.00 | $1,020.16 | $5.09 | 1.00% |
*Expenses are equal to each Class’ annualized expense ratio (for the six-month period), multiplied by the average account value over the period, multiplied by 184/365 to reflect the one-half year period. Expenses are based on the most recent fiscal half year; therefore, the expense ratios stated above may differ from the expense ratios stated in the financial highlights, which are based on one-year data. The Series’ total return would have been lower had certain expenses not been waived during the period.
4
Rainier International Discovery Series
Portfolio Composition as of October 31, 2018
(unaudited)
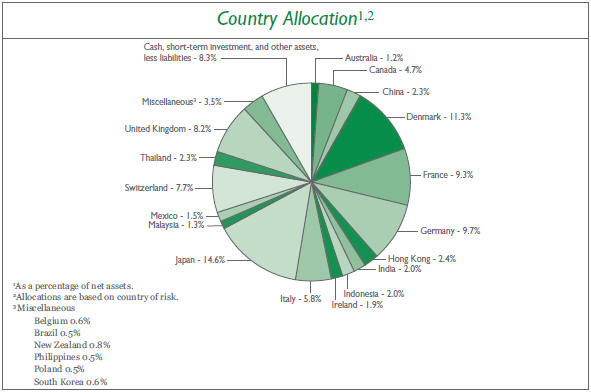
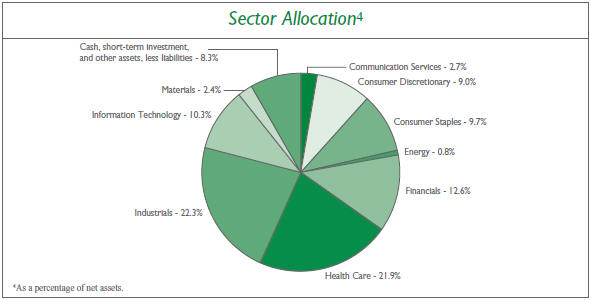
5
Rainier International Discovery Series
Investment Portfolio - October 31, 2018
| SHARES | VALUE (NOTE 2) | |||||||
COMMON STOCKS - 91.7% | ||||||||
Communication Services - 2.7% | ||||||||
Interactive Media & Services - 2.7% | ||||||||
Scout24 AG (Germany)1 | 97,285 | $ | 4,039,538 | |||||
Wise Talent Information Technology Co. Ltd. (China)* | 539,299 | 1,763,977 | ||||||
XING SE (Germany) | 27,902 | 8,390,605 | ||||||
|
| |||||||
Total Communication Services | 14,194,120 | |||||||
|
| |||||||
Consumer Discretionary - 9.0% | ||||||||
Hotels, Restaurants & Leisure - 1.2% | ||||||||
Corporate Travel Management Ltd. (Australia) | 436,630 | 6,199,452 | ||||||
|
| |||||||
Household Durables - 2.4% | ||||||||
Techtronic Industries Co. Ltd. (Hong Kong) | 2,611,500 | 12,296,953 | ||||||
|
| |||||||
Internet & Direct Marketing Retail - 0.7% | ||||||||
Baozun, Inc. - ADR (China)* | 94,140 | 3,747,713 | ||||||
|
| |||||||
Multiline Retail - 0.6% | ||||||||
Seria Co. Ltd. (Japan) | 98,100 | 3,308,109 | ||||||
|
| |||||||
Specialty Retail - 1.8% | ||||||||
Ace Hardware Indonesia Tbk PT (Indonesia) | 75,452,000 | 6,799,490 | ||||||
Wilcon Depot, Inc. (Philippines) | 13,364,232 | 2,822,462 | ||||||
|
| |||||||
| 9,621,952 | ||||||||
|
| |||||||
Textiles, Apparel & Luxury Goods - 2.3% | ||||||||
Canada Goose Holdings, Inc. (Canada)* | 94,585 | 5,164,472 | ||||||
Moncler S.p.A (Italy) | 192,210 | 6,674,991 | ||||||
|
| |||||||
| 11,839,463 | ||||||||
|
| |||||||
Total Consumer Discretionary | 47,013,642 | |||||||
|
| |||||||
Consumer Staples - 9.7% | ||||||||
Beverages - 3.5% | ||||||||
Royal Unibrew A/S (Denmark) | 255,250 | 18,127,791 | ||||||
|
| |||||||
Food & Staples Retailing - 1.0% | ||||||||
Dino Polska S.A. (Poland)*1 | 108,194 | 2,382,600 | ||||||
Raia Drogasil S.A. (Brazil) | 171,900 | 2,906,803 | ||||||
|
| |||||||
| 5,289,403 | ||||||||
|
| |||||||
Food Products - 2.6% | ||||||||
Ariake Japan Co. Ltd. (Japan) | 115,600 | 10,245,048 | ||||||
Gruma SAB de CV - Class B (Mexico) | 320,475 | 3,352,538 | ||||||
|
| |||||||
| 13,597,586 | ||||||||
|
| |||||||
Household Products - 2.6% | ||||||||
Pigeon Corp. (Japan) | 328,400 | 13,941,029 | ||||||
|
| |||||||
Total Consumer Staples | 50,955,809 | |||||||
|
| |||||||
The accompanying notes are an integral part of the financial statements.
6
Rainier International Discovery Series
Investment Portfolio - October 31, 2018
| SHARES | VALUE (NOTE 2) | |||||||
COMMON STOCKS (continued) | ||||||||
Energy - 0.8% | ||||||||
Oil, Gas & Consumable Fuels - 0.8% | ||||||||
Vermilion Energy, Inc. (Canada) | 166,571 | $ | 4,417,178 | |||||
|
| |||||||
Financials - 12.6% | ||||||||
Banks - 7.8% | ||||||||
Bank Tabungan Negara Persero Tbk PT (Indonesia) | 28,172,500 | 3,928,676 | ||||||
Canadian Western Bank (Canada) | 341,755 | 7,949,059 | ||||||
Federal Bank Ltd. (India) | 4,811,365 | 5,384,278 | ||||||
FinecoBank Banca Fineco S.p.A. (Italy) | 1,142,505 | 11,940,973 | ||||||
Regional SAB de CV (Mexico) | 878,100 | 4,325,820 | ||||||
Tisco Financial Group PCL (Thailand) | 1,282,900 | 3,047,613 | ||||||
Tisco Financial Group PCL - NVDR (Thailand) | 1,788,400 | 4,248,462 | ||||||
|
| |||||||
| 40,824,881 | ||||||||
|
| |||||||
Capital Markets - 1.7% | ||||||||
Vontobel Holding AG (Switzerland) | 143,635 | 8,913,456 | ||||||
|
| |||||||
Consumer Finance - 0.9% | ||||||||
Krungthai Card PCL - NVDR (Thailand) | 4,365,200 | 4,575,888 | ||||||
|
| |||||||
Diversified Financial Services - 1.4% | ||||||||
GRENKE AG (Germany) | 74,715 | 7,176,242 | ||||||
|
| |||||||
Insurance - 0.8% | ||||||||
Anicom Holdings, Inc. (Japan) | 136,500 | 4,361,080 | ||||||
|
| |||||||
Total Financials | 65,851,547 | |||||||
|
| |||||||
Health Care - 21.9% | ||||||||
Biotechnology - 1.9% | ||||||||
Abcam plc (United Kingdom) | 658,775 | 10,104,557 | ||||||
|
| |||||||
Health Care Equipment & Supplies - 8.7% | ||||||||
Ambu A/S - Class B (Denmark) | 313,670 | 6,538,264 | ||||||
Asahi Intecc Co. Ltd. (Japan) | 120,700 | 4,936,682 | ||||||
BioMerieux (France) | 94,625 | 7,223,692 | ||||||
Carl Zeiss Meditec AG (Germany) | 155,225 | 12,737,772 | ||||||
DiaSorin S.p.A (Italy) | 78,130 | 7,415,753 | ||||||
Sartorius AG (Germany) | 44,875 | 6,505,907 | ||||||
|
| |||||||
| 45,358,070 | ||||||||
|
| |||||||
Health Care Providers & Services - 6.7% | ||||||||
Amplifon S.p.A (Italy) | 230,284 | 4,084,594 | ||||||
Korian S.A. (France) | 288,445 | 11,382,419 | ||||||
Orpea (France) | 102,120 | 12,590,200 | ||||||
Ryman Healthcare Ltd. (New Zealand) | 555,223 | 4,383,959 | ||||||
Solasto Corp. (Japan) | 258,660 | 2,721,048 | ||||||
|
| |||||||
| 35,162,220 | ||||||||
|
| |||||||
The accompanying notes are an integral part of the financial statements.
7
Rainier International Discovery Series
Investment Portfolio - October 31, 2018
| SHARES | VALUE (NOTE 2) | |||||||
COMMON STOCKS (continued) | ||||||||
Health Care (continued) | ||||||||
Life Sciences Tools & Services - 2.2% | ||||||||
Bachem Holding AG (Switzerland) | 34,050 | $ | 3,982,614 | |||||
Siegfried Holding AG (Switzerland) | 19,000 | 7,621,506 | ||||||
|
| |||||||
| 11,604,120 | ||||||||
|
| |||||||
Pharmaceuticals - 2.4% | ||||||||
Dechra Pharmaceuticals plc (United Kingdom) | 420,540 | 12,288,035 | ||||||
|
| |||||||
Total Health Care | 114,517,002 | |||||||
|
| |||||||
Industrials - 22.3% | ||||||||
Aerospace & Defense - 1.4% | ||||||||
CAE, Inc. (Canada) | 411,565 | 7,259,326 | ||||||
|
| |||||||
Building Products - 2.8% | ||||||||
Kingspan Group plc (Ireland) | 88,535 | 3,850,699 | ||||||
Rockwool International A/S - Class B (Denmark) | 31,345 | 10,716,565 | ||||||
|
| |||||||
| 14,567,264 | ||||||||
|
| |||||||
Machinery - 6.4% | ||||||||
Daifuku Co. Ltd. (Japan) | 178,500 | 7,688,306 | ||||||
Nissei ASB Machine Co. Ltd. (Japan) | 1,048 | 35,201 | ||||||
OC Oerlikon Corp. AG (Switzerland) | 618,375 | 7,361,680 | ||||||
Rotork plc (United Kingdom) | 1,664,320 | 6,377,748 | ||||||
Stabilus S.A. (Germany) | 34,590 | 2,321,306 | ||||||
Takeuchi Manufacturing Co. Ltd. (Japan) | 309,400 | 6,408,187 | ||||||
VAT Group AG (Switzerland)1 | 33,270 | 3,343,022 | ||||||
|
| |||||||
| 33,535,450 | ||||||||
|
| |||||||
Professional Services - 9.5% | ||||||||
51job, Inc. - ADR (China)* | 106,975 | 6,569,335 | ||||||
en-japan, Inc. (Japan) | 186,000 | 7,434,395 | ||||||
L&T Technology Services Ltd. (India)1 | 214,725 | 4,938,864 | ||||||
Nihon M&A Center, Inc. (Japan) | 213,400 | 5,119,633 | ||||||
Persol Holdings Co. Ltd. (Japan) | 428,800 | 8,162,914 | ||||||
Teleperformance (France) | 106,545 | 17,547,024 | ||||||
|
| |||||||
| 49,772,165 | ||||||||
|
| |||||||
Trading Companies & Distributors - 0.9% | ||||||||
Howden Joinery Group plc (United Kingdom) | 795,965 | 4,772,636 | ||||||
|
| |||||||
Transportation Infrastructure - 1.3% | ||||||||
Malaysia Airports Holdings Berhad (Malaysia) | 3,411,500 | 6,766,746 | ||||||
|
| |||||||
Total Industrials | 116,673,587 | |||||||
|
| |||||||
Information Technology - 10.3% | ||||||||
Electronic Equipment, Instruments & Components - 1.8% | ||||||||
Electrocomponents plc (United Kingdom) | 552,685 | 4,378,529 | ||||||
The accompanying notes are an integral part of the financial statements.
8
Rainier International Discovery Series
Investment Portfolio—October 31, 2018
| SHARES | VALUE (NOTE 2) | |||||||
COMMON STOCKS (continued) | ||||||||
Information Technology (continued) | ||||||||
Electronic Equipment, Instruments & Components (continued) | ||||||||
Halma plc (United Kingdom) | 299,320 | $ | 5,079,577 | |||||
|
| |||||||
| 9,458,106 | ||||||||
|
| |||||||
IT Services - 1.5% | ||||||||
Keywords Studios plc (Ireland) | 342,480 | 5,997,285 | ||||||
NET One Systems Co. Ltd. (Japan) | 100,448 | 2,102,700 | ||||||
|
| |||||||
| 8,099,985 | ||||||||
|
| |||||||
Semiconductors & Semiconductor Equipment - 1.3% | ||||||||
Koh Young Technology, Inc. (South Korea) | 41,425 | 3,278,957 | ||||||
Melexis N.V. (Belgium) | 50,715 | 3,337,382 | ||||||
|
| |||||||
| 6,616,339 | ||||||||
|
| |||||||
Software - 4.0% | ||||||||
Nemetschek SE (Germany) | 73,955 | 9,725,080 | ||||||
Netcompany Group A/S (Denmark)*1 | 121,720 | 4,025,672 | ||||||
SimCorp A/S (Denmark) | 90,950 | 7,007,412 | ||||||
|
| |||||||
| 20,758,164 | ||||||||
|
| |||||||
Technology Hardware, Storage & Peripherals - 1.7% | ||||||||
Logitech International S.A. (Switzerland) | 240,790 | 8,910,533 | ||||||
|
| |||||||
Total Information Technology | 53,843,127 | |||||||
|
| |||||||
Materials - 2.4% | ||||||||
Chemicals - 2.4% | ||||||||
Chr. Hansen Holding A/S (Denmark) | 123,365 | 12,469,662 | ||||||
|
| |||||||
TOTAL COMMON STOCKS | 479,935,674 | |||||||
|
| |||||||
SHORT-TERM INVESTMENT - 8.6% | ||||||||
Dreyfus Government Cash Management, Institutional Shares2, 2.05%, | ||||||||
(Identified Cost $44,738,072) | 44,738,072 | 44,738,072 | ||||||
|
| |||||||
TOTAL INVESTMENTS - 100.3% | ||||||||
(Identified Cost $516,675,910) | 524,673,746 | |||||||
LIABILITIES, LESS OTHER ASSETS - (0.3%) | (1,424,367 | ) | ||||||
|
| |||||||
NET ASSETS - 100% | $ | 523,249,379 | ||||||
|
| |||||||
ADR - American Depositary Receipt
NVDR - Non-Voting Depository Receipt
*Non-income producing security.
1Restricted securities - Investment in securities that are restricted as to public resale under the Securities Act of 1933, as amended. These securities have been sold under Rule 144A and have been determined to be liquid under guidelines established by the Board of Directors. These securities amount to $18,729,696, or 3.6% of the Series’ net assets as of October 31, 2018.
2Rate shown is the current yield as of October 31, 2018.
The accompanying notes are an integral part of the financial statements.
9
Rainier International Discovery Series
Investment Portfolio - October 31, 2018
The Series’ portfolio holds, as a percentage of net assets, greater than 10% in the following countries:
Japan - 14.6%; Denmark - 11.3%.
The Global Industry Classification Standard (GICS) was developed by and is the exclusive property and a service mark of MSCI Inc. (MSCI) and Standard & Poor’s, a division of The McGraw-Hill Companies, Inc. (S&P), and is licensed for use by Manning & Napier when referencing GICS sectors. Neither MSCI, S&P, nor any third party involved in making or compiling the GICS or any GICS classifications makes any express or implied warranties or representations with respect to such standard or classification, nor shall any such party have any liability therefrom.
The accompanying notes are an integral part of the financial statements.
10
Rainier International Discovery Series
Statement of Assets & Liabilities
October 31, 2018
| ASSETS: | ||||
Investments, at value (identified cost $516,675,910) (Note 2) | $ | 524,673,746 | ||
Foreign currency, at value (cost $177,983) | 177,983 | |||
Interest receivable | 94,756 | |||
Receivable for securities sold | 4,410,412 | |||
Receivable for fund shares sold | 1,714,041 | |||
Dividends receivable | 346,661 | |||
Foreign tax reclaims receivable | 385,359 | |||
Prepaid and other expenses | 43,267 | |||
|
| |||
TOTAL ASSETS | 531,846,225 | |||
|
| |||
LIABILITIES: | ||||
Accrued management fees (Note 3) | 408,681 | |||
Accrued sub-transfer agent fees (Note 3) | 162,825 | |||
Accrued distribution and service (Rule 12b-1) fees (Class K) (Note 3) | 43,478 | |||
Accrued fund accounting and administration fees (Note 3) | 28,513 | |||
Accrued Chief Compliance Officer service fees (Note 3) | 401 | |||
Accrued foreign capital gains tax (Note 2) | 84,575 | |||
Payable for securities purchased | 6,733,466 | |||
Payable for fund shares repurchased | 940,055 | |||
Other payables and accrued expenses | 194,852 | |||
|
| |||
TOTAL LIABILITIES | 8,596,846 | |||
|
| |||
TOTAL NET ASSETS | $ | 523,249,379 | ||
|
| |||
NET ASSETS CONSIST OF: | ||||
Capital stock | $ | 275,854 | ||
Additional paid-in-capital | 519,383,139 | |||
Total distributable earnings | 3,590,386 | |||
|
| |||
TOTAL NET ASSETS | $ | 523,249,379 | ||
|
| |||
NET ASSET VALUE, OFFERING PRICE AND REDEMPTION PRICE PER SHARE - Class K ($193,070,600/10,255,381 shares) | $ | 18.83 | ||
|
| |||
NET ASSET VALUE, OFFERING PRICE AND REDEMPTION PRICE PER SHARE - Class I ($161,389,958/8,476,658 shares) | $ | 19.04 | ||
|
| |||
NET ASSET VALUE, OFFERING PRICE AND REDEMPTION PRICE PER SHARE - Class Z | $ | 19.06 | ||
|
| |||
The accompanying notes are an integral part of the financial statements.
11
Rainier International Discovery Series
Statement of Operations
For the Year Ended October 31, 2018
INVESTMENT INCOME: | ||||
Dividends (net of foreign taxes withheld, $613,403) | $ | 5,589,130 | ||
Interest | 268,299 | |||
|
| |||
Total Investment Income | 5,857,429 | |||
|
| |||
EXPENSES: | ||||
Management fees (Note 3) | 3,836,109 | |||
Sub-transfer agent fees (Note 3) | 415,704 | |||
Distribution and service (Rule 12b-1) fees (Class K) (Note 3) | 386,666 | |||
Fund accounting and administration fees (Note 3) | 94,631 | |||
Directors’ fees (Note 3) | 30,260 | |||
Chief Compliance Officer service fees (Note 3) | 4,360 | |||
Custodian fees | 160,963 | |||
Miscellaneous | 292,713 | |||
|
| |||
Total Expenses | 5,221,406 | |||
Less reduction of expenses (Note 3) | (59,617 | ) | ||
|
| |||
Net Expenses | 5,161,789 | |||
|
| |||
NET INVESTMENT INCOME | 695,640 | |||
|
| |||
REALIZED AND UNREALIZED GAIN (LOSS) ON INVESTMENTS AND FOREIGN CURRENCY: | ||||
Net realized gain (loss) on- | ||||
Net realized gain (loss) on investments | (958,370 | ) | ||
Foreign currency and translation of other assets and liabilities | (175,737 | ) | ||
|
| |||
| (1,134,107 | ) | |||
|
| |||
Net change in unrealized appreciation (depreciation) on- | ||||
Investments (net of decrease in accrued foreign capital gains tax of $327,627) | (65,109,826 | ) | ||
Foreign currency and translation of other assets and liabilities | (20,071 | ) | ||
|
| |||
| (65,129,897 | ) | |||
|
| |||
NET REALIZED AND UNREALIZED GAIN (LOSS) ON INVESTMENTS AND FOREIGN CURRENCY | (66,264,004 | ) | ||
|
| |||
NET DECREASE IN NET ASSETS RESULTING FROM OPERATIONS | $ | (65,568,364 | ) | |
|
| |||
The accompanying notes are an integral part of the financial statements.
12
Rainier International Discovery Series
Statements of Changes in Net Assets
| FOR THE YEAR ENDED 10/31/18 | FOR THE PERIOD 4/1/17 TO 10/31/17 | FOR THE YEAR ENDED 3/31/17 | |||||||||||||
INCREASE (DECREASE) IN NET ASSETS: | |||||||||||||||
OPERATIONS: | |||||||||||||||
Net investment income (loss) | $ | 695,640 | $ | 490,149 | $ | (116,105 | ) | ||||||||
Net realized gain (loss) on investments and foreign currency | (1,134,107 | ) | 11,905,891 | (11,682,251 | ) | ||||||||||
Net change in unrealized appreciation (depreciation) on investments and foreign currency | (65,129,897 | ) | 44,086,385 | 14,933,038 | |||||||||||
|
|
|
|
|
| ||||||||||
Net increase (decrease) from operations | (65,568,364 | ) | 56,482,425 | 3,134,682 | |||||||||||
|
|
|
|
|
| ||||||||||
DISTRIBUTIONS TO SHAREHOLDERS (Note 9): | |||||||||||||||
Class I | (268,365 | ) | — | — | |||||||||||
Class Z | (39 | ) | — | — | |||||||||||
|
|
|
|
|
| ||||||||||
Total distributions to shareholders | (268,404 | ) | — | — | |||||||||||
|
|
|
|
|
| ||||||||||
CAPITAL STOCK ISSUED AND REPURCHASED: | |||||||||||||||
Net increase from capital share transactions (Note 5) | 278,711,170 | 61,145,797 | 13,043,608 | ||||||||||||
|
|
|
|
|
| ||||||||||
Net increase in net assets | 212,874,402 | 117,628,222 | 16,178,290 | ||||||||||||
NET ASSETS: | |||||||||||||||
Beginning of period | 310,374,977 | 192,746,755 | 176,568,465 | ||||||||||||
|
|
|
|
|
| ||||||||||
End of period | $ | 523,249,379 | $ | 310,374,977 | $ | 192,746,755 | |||||||||
|
|
|
|
|
| ||||||||||
The accompanying notes are an integral part of the financial statements.
13
Rainier International Discovery Series
Financial Highlights - Class K1
| FOR THE YEAR ENDED 10/31/18 | FOR THE PERIOD 4/1/17 TO 10/31/17 | FOR THE YEAR ENDED | ||||||||||||||||||||||
| 3/31/17 | 3/31/16 | 3/31/15 | 3/31/14 | |||||||||||||||||||||
Per share data (for a share outstanding throughout each period): | ||||||||||||||||||||||||
Net asset value - Beginning of period | $ | 20.61 | $ | 16.44 | $ | 15.93 | $ | 15.45 | $ | 15.56 | $ | 12.89 | ||||||||||||
|
|
|
|
|
|
|
|
|
|
|
| |||||||||||||
Income (loss) from investment operations: | ||||||||||||||||||||||||
Net investment income (loss)2 | (0.01 | ) | 0.02 | (0.02 | ) | (0.09 | ) | 0.01 | (0.10 | ) | ||||||||||||||
Net realized and unrealized gain on investments | (1.77 | ) | 4.15 | 0.53 | 0.58 | 0.61 | 3.03 | |||||||||||||||||
|
|
|
|
|
|
|
|
|
|
|
| |||||||||||||
Total from investment operations | (1.78 | ) | 4.17 | 0.51 | 0.49 | 0.62 | 2.93 | |||||||||||||||||
|
|
|
|
|
|
|
|
|
|
|
| |||||||||||||
Less distributions to shareholders: | ||||||||||||||||||||||||
From net investment income | — | — | — | — | — | (0.00 | )3 | |||||||||||||||||
From net realized gain on investments | — | — | — | (0.01 | ) | (0.73 | ) | (0.26 | ) | |||||||||||||||
|
|
|
|
|
|
|
|
|
|
|
| |||||||||||||
Total distributions to shareholders | — | — | — | (0.01 | ) | (0.73 | ) | (0.26 | ) | |||||||||||||||
|
|
|
|
|
|
|
|
|
|
|
| |||||||||||||
Net asset value - End of period | $ | 18.83 | $ | 20.61 | $ | 16.44 | $ | 15.93 | $ | 15.45 | $ | 15.56 | ||||||||||||
|
|
|
|
|
|
|
|
|
|
|
| |||||||||||||
Net assets - End of period (000’s omitted) | $ | 193,071 | $ | 120,399 | $ | 78,260 | $ | 99,944 | $ | 4,058 | $ | 2,939 | ||||||||||||
|
|
|
|
|
|
|
|
|
|
|
| |||||||||||||
Total return4 | (8.64 | %) | 25.36 | % | 3.14 | % | 3.22 | % | 4.55 | % | 22.91 | % | ||||||||||||
Ratios (to average net assets)/Supplemental Data: | ||||||||||||||||||||||||
Expenses* | 1.40 | % | 1.49 | %5,6 | 1.51 | %6 | 1.50 | % | 1.50 | % | 1.50 | % | ||||||||||||
Net investment income (loss) | (0.05 | %) | 0.20 | %5 | (0.12 | %) | (0.56 | %) | 0.06 | % | (0.66 | %) | ||||||||||||
Portfolio turnover | 73 | % | 46 | % | 123 | % | 93 | % | 111 | % | 80 | % | ||||||||||||
| *The investment advisor did not impose all or a portion of its management and/or other fees during the period, and may have paid a portion of the Series’ expenses. If these expenses had been incurred by the Class, the expense ratio (to average net assets) would have increased by the following amounts: |
| |||||||||||||||||||||||
| 0.03 | % | 0.21 | %5 | 0.14 | % | 0.14 | % | 0.32 | % | 0.33 | % | |||||||||||||
1Rainier International Discovery Fund (“the Predecessor Fund”) transferred its assets and liabilities to the Series at the close of business on August 21, 2017. Because the Series had no investment operations prior to the Reorganization, and based on the similarity of the Series to the Predecessor Fund, the Predecessor Fund is treated as the survivor for accounting and performance reporting purposes. Class K shares of the Series were formerly Class A shares of the Predecessor Fund.
2Calculated based on average shares outstanding during the periods.
3Less than $0.01.
4Represents aggregate total return for the periods indicated, and assumes reinvestment of all distributions. Total return would have been lower had certain expenses not been reimbursed during the periods. Periods less than one year are not annualized.
5Annualized.
6Expense ratio exceeds expense limitation due to recognition of expenses related to the Reorganization of the Fund. See Note 1 to the financial statements.
The accompanying notes are an integral part of the financial statements.
14
Rainier International Discovery Series
Financial Highlights - Class I1
| FOR THE YEAR ENDED 10/31/18 | FOR THE PERIOD 04/1/17 TO 10/31/17 | FOR THE YEAR ENDED | ||||||||||||||||||||||
| 3/31/17 | 3/31/16 | 3/31/15 | 3/31/14 | |||||||||||||||||||||
Per share data (for a share outstanding throughout each period): | ||||||||||||||||||||||||
Net asset value - Beginning of period | $ | 20.81 | $ | 16.58 | $ | 16.02 | $ | 15.50 | $ | 15.58 | $ | 12.89 | ||||||||||||
|
|
|
|
|
|
|
|
|
|
|
| |||||||||||||
Income (loss) from investment operations: | ||||||||||||||||||||||||
Net investment income (loss) | 0.07 | 2 | 0.05 | 2 | 0.00 | 2,3 | (0.03 | )2 | 0.04 | 2 | 0.01 | 2 | ||||||||||||
Net realized and unrealized gain on investments | (1.81 | ) | 4.18 | 0.56 | 0.56 | 0.62 | 2.95 | |||||||||||||||||
|
|
|
|
|
|
|
|
|
|
|
| |||||||||||||
Total from investment operations | (1.74 | ) | 4.23 | 0.56 | 0.53 | 0.66 | 2.96 | |||||||||||||||||
|
|
|
|
|
|
|
|
|
|
|
| |||||||||||||
Less distributions to shareholders: | ||||||||||||||||||||||||
From net investment income | (0.03 | ) | — | — | — | (0.01 | ) | (0.01 | ) | |||||||||||||||
From net realized gain on investments | — | — | — | (0.01 | ) | (0.73 | ) | (0.26 | ) | |||||||||||||||
|
|
|
|
|
|
|
|
|
|
|
| |||||||||||||
Total distributions to shareholders | (0.03 | ) | — | — | (0.01 | ) | (0.74 | ) | (0.27 | ) | ||||||||||||||
|
|
|
|
|
|
|
|
|
|
|
| |||||||||||||
Net asset value - End of period | $ | 19.04 | $ | 20.81 | $ | 16.58 | $ | 16.02 | $ | 15.50 | $ | 15.58 | ||||||||||||
|
|
|
|
|
|
|
|
|
|
|
| |||||||||||||
Net assets - End of period (000’s omitted) | $ | 161,390 | $ | 189,955 | $ | 114,487 | $ | 76,624 | $ | 40,356 | $ | 30,323 | ||||||||||||
|
|
|
|
|
|
|
|
|
|
|
| |||||||||||||
Total return4 | (8.38 | %) | 25.51 | % | 3.43 | % | 3.47 | % | 4.81 | % | 23.15 | % | ||||||||||||
Ratios (to average net assets)/Supplemental Data: | ||||||||||||||||||||||||
Expenses* | 1.12 | % | 1.24 | %5,6 | 1.26 | %6 | 1.25 | % | 1.25 | % | 1.25 | % | ||||||||||||
Net investment income (loss) | 0.30 | % | 0.41 | %5 | 0.01 | % | (0.19 | %) | 0.40 | % | 0.08 | % | ||||||||||||
Portfolio turnover | 73 | % | 46 | % | 123 | % | 93 | % | 111 | % | 80 | % | ||||||||||||
| *For certain periods presented, the investment advisor did not impose all or a portion of its management and/or other fees during the period, and may have paid a portion of the Series’ expenses. If these expenses had been incurred by the Class, the expense ratio (to average net assets) would have increased by the following amounts: |
| |||||||||||||||||||||||
| N/A | 0.11 | %5 | 0.07 | % | 0.06 | % | 0.27 | %3 | 0.36 | % | ||||||||||||||
1Rainier International Discovery Fund (“the Predecessor Fund”) transferred its assets and liabilities to the Series at the close of business on August 21, 2017. Because the Series had no investment operations prior to the Reorganization, and based on the similarity of the Series to the Predecessor Fund, the Predecessor Fund is treated as the survivor for accounting and performance reporting purposes. Class I shares of the Series were formerly Institutional shares of the Predecessor Fund.
2Calculated based on average shares outstanding during the periods.
3Less than $0.01.
4Represents aggregate total return for the periods indicated, and assumes reinvestment of all distributions. Total return would have been lower had certain expenses not been reimbursed during the periods. Periods less than one year are not annualized.
5Annualized.
6Expense ratio exceeds expense limitation due to recognition of expenses related to the Reorganization of the Fund. See Note 1 to the financial statements.
The accompanying notes are an integral part of the financial statements.
15
Rainier International Discovery Series
Financial Highlights - Class Z*
| FOR THE YEAR ENDED 10/31/18 | FOR THE PERIOD 8/21/171 TO 10/31/17 | |||||||||
Per share data (for a share outstanding throughout each period): | ||||||||||
Net asset value - Beginning of period | $ | 20.82 | $ | 19.40 | ||||||
|
|
|
| |||||||
Income (loss) from investment operations: | ||||||||||
Net investment income (loss)2 | 0.03 | 0.01 | ||||||||
Net realized and unrealized gain (loss) on investments | (1.75 | ) | 1.41 | |||||||
|
|
|
| |||||||
Total from investment operations | (1.72 | ) | 1.42 | |||||||
|
|
|
| |||||||
Less distributions to shareholders: | ||||||||||
From net investment income | (0.04 | ) | — | |||||||
|
|
|
| |||||||
Total distributions to shareholders | (0.04 | ) | — | |||||||
|
|
|
| |||||||
Net asset value - End of period | $ | 19.06 | $ | 20.82 | ||||||
Net assets - End of period (000’s omitted) | $ | 168,789 | $ | 21 | ||||||
Total return3 | (8.29 | %) | 7.32 | % | ||||||
Ratios (to average net assets)/Supplemental Data: | ||||||||||
Expenses** | 1.00 | % | 1.00 | %4 | ||||||
Net investment income | 0.16 | % | 0.14 | %4 | ||||||
Portfolio turnover | 73 | % | 46 | % | ||||||
| *Effective August 21, 2018, Class R6 shares of the Series have been redesignated as Class Z shares. |
| |||||||||
**The investment advisor did not impose all or a portion of its management and/or other fees during the period, and may have paid a portion of the Series’ expenses. If these expenses had been incurred by the Class, the expense ratio (to average net assets) would have increased by the following amounts4:
|
| |||||||||
| 0.04 | % | 0.17 | %4 | |||||||
1Commencement of operations.
2Calculated based on average shares outstanding during the periods.
3Represents aggregate total return for the periods indicated, and assumes reinvestment of all distributions. Total return would have been lower had certain expenses not been reimbursed during the periods. Periods less than one year are not annualized.
4Annualized.
The accompanying notes are an integral part of the financial statements.
16
Rainier International Discovery Series
Notes to Financial Statements
| 1. | Organization |
Rainier International Discovery Series (the “Series”) is a no-load diversified series of Manning & Napier Fund, Inc. (the “Fund”). The Fund is organized in Maryland and is registered under the Investment Company Act of 1940, as amended, as an open-end management investment company.
The Series’ investment objective is to seek long-term capital appreciation.
The Fund’s advisor is Manning & Napier Advisors, LLC (the “Advisor”). Shares of the Series are offered to investors, clients and employees of the Advisor and its affiliates. The Series is authorized to issue four classes of shares (Class K, Class I, Class W and Class Z). Class Z shares, formerly Class R6 of the Series, were issued on August 21, 2017. Each class of shares is substantially the same, except that Class K shares bear Distribution and Service (12b-1) Fees. The total authorized capital stock of the Fund consists of 15 billion shares of common stock each having a par value of $0.01. As of October 31, 2018, 13.4 billion shares have been designated in total among 38 series, of which 100 million have been designated as Rainier International Discovery Series Class K common stock, 100 million have been designated as Rainier International Discovery Series Class I common stock, 100 million have been designated as Rainier International Discovery Series Class W common stock and 100 million have been designated as Rainier International Discovery Series Class Z common stock. Class W common stock is not currently offered for sale.
Reorganization
The Series is the successor in interest to the Rainier International Discovery Fund (the “Predecessor Fund”), which had the same investment objective and was included as a series of another investment company, Rainier Investment Management Mutual Funds (“Predecessor Trust”), that was advised by Rainier Investment Management, LLC (an affiliated advisor of the Fund). The shareholders of the Predecessor Fund approved the reorganization of the Institutional shares and Class A shares of the Predecessor Fund with and into the Class I and Class K shares of the Series, respectively. Effective as of the close of business on August 21, 2017 (the “merger date”), the assets and liabilities of the Predecessor Fund were transferred to the Series.
The investment portfolio of the Predecessor Fund, with fair value of $271,784,669 and identified cost of $213,126,044 on August 21, 2017 was the principal asset acquired. Net assets and shares outstanding on August 21, 2017 were $163,001,355 and 8,409,569 for Institutional shares and $111,408,266 and 5,801,583 for Class A shares, respectively, all of which were transferred by a tax-free exchange into the Fund at Net Asset Value at the close of business on August 21, 2017. For financial reporting purposes, assets received and shares issued by the Series were recorded at fair value; however, the cost basis of the investments received from the Predecessor Fund was carried forward to align ongoing reporting of the Series’ realized and unrealized gains and losses with amounts distributable to shareholders for tax purposes.
As the Series was a shell fund prior to the merger date, the results of operations for the year ended October 31, 2017 represents the pro-forma results. Because the combined investment portfolios have been managed as a single integrated portfolio since the acquisition date, it is not practicable to separate the amounts of revenue and earnings of the Predecessor Fund that have been included in the Series’ Statement of Operations since the merger date, August 21, 2017.
The majority of the expenses incurred by the Series in connection with the reorganization were paid by the Advisor. The Series paid certain expenses, including half of the cost of the proxy, such as printing and solicitation, and all of the legal fees incurred in connection to the reorganization. The fiscal year end of the Predecessor Fund was March 31, 2017. Operations prior to August 21, 2017 were for the Predecessor Fund. The Series changed its fiscal year end to October 31, 2017 to reflect the fiscal year end of the Fund.
| 2. | Significant Accounting Policies |
The following is a summary of significant accounting policies followed by the Series. The Series is an investment company and, accordingly, follows the investment company accounting and reporting guidance of the Financial Accounting Standards Board Accounting Standards Codification Topic 946 - Investment Companies, which is part of accounting principles generally accepted in the United States of America (“GAAP”).
17
Rainier International Discovery Series
Notes to Financial Statements (continued)
| 2. | Significant Accounting Policies (continued) |
Security Valuation
Portfolio securities, including domestic equities, foreign equities, warrants and options, listed on an exchange other than the NASDAQ Stock Market are valued at the latest quoted sales price of the exchange on which the security is primarily traded. Securities not traded on valuation date or securities not listed on an exchange are valued at the latest quoted bid price provided by the Fund’s pricing service. Securities listed on the NASDAQ Stock Market are valued in accordance with the NASDAQ Official Closing Price.
Short-term investments that mature in sixty days or less may be valued at amortized cost, which approximates fair value. Investments in open-end investment companies are valued at their net asset value per share on valuation date.
Volume and level of activity in established markets for an asset or liability are evaluated to determine whether recent transactions and quoted prices are determinative of fair value. Where there have been significant decreases in volume and level of activity, further analysis and adjustment may be necessary to estimate fair value. The Series measures fair value in these instances by the use of inputs and valuation techniques which may be based upon current market prices of securities that are comparable in coupon, rating, maturity and industry and/or expectation of future cash flows. As a result of trading in relatively thin markets and/or markets that experience significant volatility, the prices used by the Series to value these securities may differ from the value that would be realized if these securities were sold, and the differences could be material.
Securities for which representative valuations or prices are not available from the Series’ pricing service may be valued at fair value as determined in good faith by the Advisor under procedures approved by and under the general supervision and responsibility of the Fund’s Board of Directors (the “Board”). Due to the inherent uncertainty of valuations of such securities, the fair value may differ significantly from the values that would have been used had a ready market for such securities existed. If trading or events occurring after the close of the principal market in which securities are traded are expected to materially affect the value of those securities, then they may be valued at their fair value, taking this trading or these events into account. In accordance with the procedures approved by the Board, the values of certain securities trading outside the U.S. were adjusted following the close of local trading using a factor from a third party vendor. The third party vendor uses statistical analyses and quantitative models, which consider among other things subsequent movement and changes in the prices of indices, securities and exchange rates in other markets, to determine the factors which are used to adjust local market prices. The value of securities used for net asset value calculation under these procedures may differ from published prices for the same securities. It is the Fund’s policy to classify each foreign equity security where a factor from a third party vendor is applied as a Level 2 security.
Various inputs are used in determining the value of the Series’ assets or liabilities carried at fair value. These inputs are summarized in three broad levels. Level 1 includes quoted prices in active markets for identical assets and liabilities. Level 2 includes other significant observable inputs (including quoted prices for similar securities, interest rates, prepayment speeds, credit risk, etc.). Level 3 includes significant unobservable inputs (including the Series’ own assumptions in determining the fair value of investments). A financial instrument’s level within the fair value hierarchy is based on the lowest level of any input both individually and in aggregate that is significant to the fair value measurement. The inputs or methodology used for valuing securities are not necessarily an indication of the risk associated with investing in those securities.
The following is a summary of the valuation levels used for major security types as of October 31, 2018 in valuing the Series’ assets or liabilities carried at fair value:
| DESCRIPTION | TOTAL | LEVEL 1 | LEVEL 2 | LEVEL 3 | ||||||||||||
Assets: | ||||||||||||||||
Equity securities: | ||||||||||||||||
Communication Services | $ | 14,194,120 | $ | 14,194,120 | $ | — | $ | — | ||||||||
Consumer Discretionary | 47,013,642 | 47,013,642 | — | — | ||||||||||||
Consumer Staples | 50,955,809 | 50,955,809 | — | — | ||||||||||||
Energy | 4,417,178 | 4,417,178 | — | — | ||||||||||||
Financials | 65,851,547 | 65,851,547 | — | — | ||||||||||||
18
Rainier International Discovery Series
Notes to Financial Statements (continued)
| 2. | Significant Accounting Policies (continued) |
Security Valuation (continued)
| DESCRIPTION | TOTAL | LEVEL 1 | LEVEL 2 | LEVEL 3 | ||||||||||||
Health Care | $ | 114,517,002 | $ | 114,517,002 | $ | — | $ | — | ||||||||
Industrials | 116,673,587 | 116,673,587 | — | — | ||||||||||||
Information Technology | 53,843,127 | 53,843,127 | — | — | ||||||||||||
Materials | 12,469,662 | 12,469,662 | — | — | ||||||||||||
Mutual fund | 44,738,072 | 44,738,072 | — | — | ||||||||||||
|
|
|
|
|
|
|
| |||||||||
Total assets | $ | 524,673,746 | $ | 524,673,746 | $ | — | $ | — | ||||||||
|
|
|
|
|
|
|
| |||||||||
There were no Level 2 or Level 3 securities held by the Series as of October 31, 2017 or October 31, 2018.
New Accounting Pronouncements
The Securities and Exchange Commission (SEC) adopted changes to Regulation S-X to simplify the reporting of information by registered investment companies in financial statements. The amendments require presentation of the total, rather than the components, of distributable earnings on the Statement of Assets and Liabilities and also require presentation of the total, rather than the components, of distributions to shareholders, except for tax return of capital distributions, if any, on the Statement of Changes in Net Assets. The amendments also removed the requirement for parenthetical disclosure of undistributed net investment income on the Statement of Changes in Net Assets. These Regulation S-X amendments are reflected in the Series financial statements for the year ended October 31, 2018. As a result of adopting these amendments, the distributions to shareholders in the October 31, 2017 Statement of Changes in Net Assets presented herein have been reclassified to conform to the current year presentation.
On August 28, 2018, the FASB issued ASU 2018-13, “Disclosure Framework – Changes to the Disclosure Requirements for Fair Value Measurement,” which amends the fair value measurement disclosure requirements under U.S. GAAP. The amendments of ASU 2018-13 include new, eliminated, and modified disclosure requirements. In addition, the amendments clarify that materiality is an appropriate consideration of entities when evaluating disclosure requirements. The ASU is effective for all entities for fiscal years beginning after December 15, 2019, including interim periods therein. An entity is permitted to early adopt any eliminated or modified disclosures upon issuance of this ASU and delay adoption of the new disclosures until their effective date. As such, the Series has early adopted the eliminated and modified disclosures, as permitted by this ASU.
Security Transactions, Investment Income and Expenses
Security transactions are accounted for on trade date. Dividend income is recorded on the ex-dividend date, except that if the ex-dividend date has passed, certain dividends from foreign securities are recorded as soon as the Series is informed of the ex-dividend date. Non-cash dividends, if any, are recorded at the fair value of the securities received. Interest income, including amortization of premium and accretion of discounts using the effective interest method, is earned from settlement date and accrued daily.
Expenses are recorded on an accrual basis. Most expenses of the Fund can be attributed to a specific series. Expenses which cannot be directly attributed are apportioned among the series in the Fund in such a manner as deemed equitable by the Fund’s Board, taking into consideration, among other things, the nature and type of expense. Income, expenses (other than shareholder services fees), and realized and unrealized gains and losses are prorated among the classes based on the relative net assets of each class. Class specific expenses are directly charged to that class.
The Series uses the identified cost method for determining realized gain or loss on investments for both financial statement and federal income tax reporting purposes.
Foreign Currency Translation
The books and records of the Series are maintained in U.S. dollars. Foreign currencies, investments and other assets and liabilities are translated into U.S. dollars at the current exchange rates. Purchases and sales of investment securities and income and expenses are translated on the respective dates of such transactions. The Series does not isolate realized and unrealized gains and losses attributable to changes in the exchange rates from gains and losses that arise from changes in the
19
Rainier International Discovery Series
Notes to Financial Statements (continued)
| 2. | Significant Accounting Policies (continued) |
Foreign Currency Translation (continued)
fair value of investments. Such fluctuations are included with net realized and unrealized gain or loss on investments. Net realized foreign currency gains and losses represent foreign currency gains and losses between trade date and settlement date on securities transactions, gains and losses on disposition of foreign currencies and the difference between the amount of income and foreign withholding taxes recorded on the books of the Series and the amounts actually received or paid.
Restricted Securities
Restricted securities are purchased in private placement transactions, are not registered under the Securities Act of 1933, as amended, and may have contractual restrictions on resale. Information regarding restricted securities is included at the end of the Investment Portfolio.
Federal Taxes
The Series’ policy is to comply with the provisions of the Internal Revenue Code applicable to regulated investment companies. The Series is not subject to federal income tax or excise tax to the extent that the Series distributes to shareholders each year its taxable income, including any net realized gains on investments, in accordance with requirements of the Internal Revenue Code. Accordingly, no provision for federal income tax or excise tax has been made in the financial statements.
Management evaluates its tax positions to determine if the tax positions taken meet the minimum recognition threshold in connection with accounting for uncertainties in income tax positions taken or expected to be taken for the purposes of measuring and recognizing tax liabilities in the financial statements. Recognition of tax benefits of an uncertain tax position is required only when the position is “more likely than not” to be sustained assuming examination by taxing authorities. At October 31, 2018, the Series has recorded no liability for net unrecognized tax benefits relating to uncertain income tax positions taken or expected to be taken in future tax returns.
The Series files income tax returns in the U.S. federal jurisdiction, various states and foreign jurisdictions, as required. No income tax returns are currently under investigation. The statute of limitations on the Series’ tax returns remains open for the three years ended March 31, 2014 through March 31, 2017, the period ended October 31, 2017 and the year ended October 31, 2018. The Series is not aware of any tax positions for which it is reasonably possible that the total amounts of unrecognized tax benefits will significantly change in the next twelve months.
Foreign Taxes
Based on the Series’ understanding of the tax rules and rates related to income, gains and currency purchase/repatriation transactions for foreign jurisdictions in which it invests, the Series will provide for foreign taxes, and where appropriate, deferred foreign tax. The Series is subject to a tax imposed on short term capital gains on securities of issuers domiciled in India. The Series records an estimated deferred tax liability for securities that have been held for less than a year at the end of the reporting period, assuming those positions were disposed of at the end of the period. This amount is reported in Accrued foreign capital gains tax in the accompanying Statement of Assets and Liabilities. Realized losses on the sale of securities of issuers domiciled in India can be carried forward for eight years to offset potential future short term realized capital gains.
Distributions of Income and Gains
Distributions to shareholders of net investment income and net realized gains are made annually. An additional distribution may be necessary to avoid taxation of the Series. Distributions are recorded on the ex-dividend date.
Indemnifications
The Fund’s organizational documents provide former and current directors and officers with a limited indemnification against liabilities arising in connection with the performance of their duties to the Fund. In the normal course of business, the Fund may also enter into contracts that provide general indemnifications. The Fund’s maximum exposure under these arrangements is unknown as this would be dependent on future claims that may be made against the Fund. The risk of material loss from such claims is considered remote.
20
Rainier International Discovery Series
Notes to Financial Statements (continued)
| 2. | Significant Accounting Policies (continued) |
Other
The preparation of financial statements in conformity with GAAP requires management to make estimates and assumptions that affect the reported amounts of assets and liabilities and the disclosure of contingent assets and liabilities at the date of the financial statements and the reported amounts of income and expenses during the reporting period. Actual results could differ from those estimates.
| 3. | Transactions with Affiliates and Other Agreements |
The Fund has an Investment Advisory Agreement (the “Agreement”) with the Advisor, for which the Series pays a fee, computed daily and payable monthly, at an annual rate of 0.90% of the Series’ average daily net assets. The investment sub-advisor of the Series is Rainier Investment Management, LLC (“Rainier” or the “Sub-Advisor”). The Advisor pays the Sub-Advisor out of the fee received from the Series at an annual rate of 0.70% of the Series’ average daily net assets.
Under the Agreement, personnel of the Advisor provide the Series with advice and assistance in the choice of investments and the execution of securities transactions, and otherwise maintain the Series’ organization. The Advisor also provides the Fund with necessary office space and fund administration and support services. The salaries of all officers of the Fund (except a percentage of the Fund’s Chief Compliance Officer’s salary, which is paid by the Fund), and of all Directors who are “affiliated persons” of the Fund, or of the Advisor, and all personnel of the Fund, or of the Advisor, performing services relating to research, statistical and investment activities, are paid by the Advisor and/or Sub-Advisor. Each “non-affiliated” Director receives an annual stipend, which is allocated among all the active series of the Fund. In addition, these Directors also receive a fee per Board meeting attended plus a fee for each committee meeting attended and are reimbursed for travel and other out-of-pocket expenses incurred by them in connection with attending such meetings. The Fund also has an Audit Committee Chair, Governance & Nominating Committee Chair and Lead Independent Director who each receive an additional annual stipend for these roles.
The Fund may enter into agreements with financial intermediaries pursuant to which the Fund may pay financial intermediaries for non-distribution related sub-transfer agency, administrative, sub-accounting, and other shareholder services in an amount not to exceed 0.15% of the average daily net assets of the Class K shares and Class I shares. Payments made pursuant to such agreements are generally based on the current assets and/or number of accounts of the Series attributable to the financial intermediary. Any payments made pursuant to such agreements may be in addition to, rather than in lieu of, any Distribution and Shareholder Services Fee payable under the Rule 12b-1 plan of the Fund.
The Advisor has contractually agreed, until at least February 28, 2019, to waive its management fee and, if necessary, pay other operating expenses of the Series in order to maintain total direct annual fund operating expenses for the Series, exclusive of Distribution and Service (12b-1) Fees, at no more than 1.15% of the average daily net assets of the Class K and Class I shares, and 1.00% of the average daily net assets of the Class Z shares. Accordingly, the Advisor waived fees of $59,617 for the year ended October 31, 2018, which is included as a reduction of expenses on the Statement of Operations. The Advisor is not eligible to recoup any expenses that have been waived or reimbursed in prior years.
During the year ended October 31, 2018, a trade processing error was discovered for which it was determined that the Advisor would reimburse the Series $10,472. The impact of the Advisor’s contribution on the Series’ total return was immaterial. As of October 31, 2018, the respective amount is included in net realized gain (loss) on investments on the Statement of Operations.
Manning & Napier Investor Services, Inc., a registered broker-dealer affiliate of the Advisor, acts as distributor for the Fund’s shares. The Series compensates the distributor for distributing and servicing the Series’ Class K shares pursuant to a distribution plan adopted under Rule 12b-1 of the 1940 Act, regardless of expenses actually incurred. Under the agreement, the Series pays distribution and service fees to the distributor at an annual rate of 0.25% of average daily net assets attributable to Class K shares. There are no distribution and service fees on the Class I or Class Z shares. The fees are accrued daily and paid monthly.
21
Rainier International Discovery Series
Notes to Financial Statements (continued)
| 3. | Transactions with Affiliates and Other Agreements (continued) |
Pursuant to a master services agreement dated March 1, 2017, the Fund pays the Advisor an annual fee related to fund accounting and administration of 0.0085% on the first $25 billion of average daily net assets (excluding Target Series and Income Series); 0.0075% on the next $15 billion of average daily net assets (excluding Target Series and Income Series); and 0.0065% of average daily net assets in excess of $40 billion (excluding Target Series and Income Series); plus a base fee of $30,400 per series. Additionally, certain transaction and out-of-pocket expenses, including charges for reporting relating to the Fund’s compliance program, are charged. The Advisor has agreements with BNY Mellon Investment Servicing (U.S.) Inc. (“BNY”) under which BNY serves as sub-accountant services agent.
| 4. | Purchases and Sales of Securities |
For the year ended October 31, 2018, purchases and sales of securities, other than U.S. Government securities and short-term securities, were $533,049,298 and $287,647,900, respectively. There were no purchases or sales of U.S. Government securities.
| 5. | Capital Stock Transactions |
Transactions in shares of Class K, Class I and Class Z shares of Rainier International Discovery Series were:
| CLASS K | FOR THE YEAR ENDED 10/31/18 | FOR THE PERIOD 4/1/17 TO 10/31/171 | FOR THE YEAR ENDED 3/31/17 | |||||||||||||||||||||
| SHARES | AMOUNT | SHARES | AMOUNT | SHARES | AMOUNT | |||||||||||||||||||
Sold | 6,476,157 | $ | 141,061,584 | 2,331,969 | $ | 42,030,540 | 3,301,733 | $ | 52,333,976 | |||||||||||||||
Repurchased | (2,062,177 | ) | (44,460,158 | ) | (1,251,334 | ) | (23,258,210 | ) | (4,816,056 | ) | (74,302,136 | ) | ||||||||||||
|
|
|
|
|
|
|
|
|
|
|
| |||||||||||||
Total | 4,413,980 | $ | 96,601,426 | 1,080,635 | $ | 18,772,330 | (1,514,323 | ) | $ | (21,968,160 | ) | |||||||||||||
|
|
|
|
|
|
|
|
|
|
|
| |||||||||||||
| CLASS I | FOR THE YEAR ENDED 10/31/18 | FOR THE PERIOD 4/1/17 TO 10/31/171 | FOR THE YEAR ENDED 3/31/17 | |||||||||||||||||||||
| SHARES | AMOUNT | SHARES | AMOUNT | SHARES | AMOUNT | |||||||||||||||||||
Sold | 9,319,947 | $ | 206,173,813 | 3,005,098 | $ | 56,814,033 | 4,535,287 | $ | 73,098,443 | |||||||||||||||
Reinvested | 6,335 | 132,393 | — | — | — | — | ||||||||||||||||||
Repurchased | (9,975,641 | ) | (218,818,955 | ) | (786,025 | ) | (14,460,565 | ) | (2,411,693 | ) | (38,086,675 | ) | ||||||||||||
|
|
|
|
|
|
|
|
|
|
|
| |||||||||||||
Total | (649,359 | ) | $ | (12,512,749 | ) | 2,219,073 | $ | 42,353,468 | 2,123,594 | $ | 35,011,768 | |||||||||||||
|
|
|
|
|
|
|
|
|
|
|
| |||||||||||||
| CLASS Z | FOR THE YEAR ENDED 10/31/18 | FOR THE PERIOD 8/21/17 (COMMENCEMENT OF OPERATIONS) TO 10/31/17 | ||||||||||||||
| SHARES | AMOUNT | SHARES | AMOUNT | |||||||||||||
Sold | 8,982,690 | $ | 197,271,626 | 1,045 | $ | 20,286 | ||||||||||
Reinvested | 2 | 39 | — | — | ||||||||||||
Repurchased | (130,380 | ) | (2,649,172 | ) | (14 | ) | (287 | ) | ||||||||
|
|
|
|
|
|
|
| |||||||||
Total | 8,852,312 | $ | 194,622,493 | 1,031 | $ | 19,999 | ||||||||||
|
|
|
|
|
|
|
| |||||||||
1Includes capital stock transactions for the predecessor fund, Rainier International Discovery Fund.
At October 31, 2018, one shareholder account owned 15.2% of the Series. In addition, the Advisor and its affiliates owned less than 0.1% of the Series. Investment activities of these shareholders may have a material effect on the Series.
22
Rainier International Discovery Series
Notes to Financial Statements (continued)
| 6. | Line of Credit |
The Fund has entered into a 364-day, $25 million credit agreement (the “line of credit”) with Bank of New York Mellon. Each series of the Fund may borrow under the line of credit for temporary or emergency purposes, including funding shareholder redemptions and other short-term liquidity purposes. The Fund pays an annual fee on the unused commitment amount, payable quarterly, and is allocated among all the series of the Fund and included in miscellaneous expenses in the Statement of Operations for each series. The line of credit expires in August 2019 unless extended or renewed. During the year ended October 31, 2018, the Series did not borrow under the line of credit.
| 7. | Financial Instruments |
The Series may trade in instruments including futures contracts and other derivatives in the normal course of investing activities to assist in managing exposure to various market risks. The Series may be subject to various elements of risk, which may involve, to a varying degree, elements of risk in excess of the amounts recognized for financial statement purposes. These risks include: the risk that changes in the value of a derivative may not correlate perfectly with the underlying asset, rate or index; counterparty credit risk related to over the counter derivative counterparties’ failure to perform under contract terms; liquidity risk related to the lack of a liquid market for these contracts allowing the fund to close out its position(s); and documentation risk relating to disagreement over contract terms. No such investments were held by the Series as of October 31, 2018.
| 8. | Foreign Securities |
Investing in securities of foreign companies and foreign governments involves special risks and considerations not typically associated with investing in securities of domestic companies and the U.S. Government. These risks include revaluation of currencies and future adverse political and economic developments. Moreover, securities of foreign companies and foreign governments and their markets may be less liquid and their prices more volatile than those of comparable domestic companies and the U.S. Government.
| 9. | Federal Income Tax Information |
The amount and characterization of certain income and capital gains to be distributed are determined in accordance with federal income tax regulations, which may differ from GAAP. These differences are primarily due to differing book and tax treatments in the timing and/or treatment of the recognition of net investment income or gains and losses, including foreign currency gains and losses, wash sales and foreign taxes. The Series may periodically make reclassifications among its capital accounts to reflect income and gains available for distribution (or available capital loss carryovers) under income tax regulations without impacting the Series’ net asset value. For the year ended October 31, 2018, amounts were reclassified within the capital accounts to decrease Additional Paid in Capital by $37,986, and increase Total Distributable Earnings by $37,986. Any such reclassifications are not reflected in the financial highlights.
The tax character of distributions paid were as follows:
| FOR THE YEAR ENDED 10/31/18 | FOR THE PERIOD 4/1/17 TO 10/31/17 | FOR THE YEAR ENDED 3/31/17 | ||||||||||
Ordinary income | $ | 268,404 | $ | — | — | |||||||
At October 31, 2018, he tax basis of components of distributable earnings and the net unrealized appreciation based on the identified cost of investments for federal income tax purposes were as follows:
Cost for federal income tax purposes | $ | 520,960,100 | ||
Unrealized appreciation | 35,644,836 | |||
Unrealized depreciation | (31,928,794 | ) | ||
|
| |||
Net unrealized appreciation | $ | 3,716,042 | ||
|
| |||
Undistributed ordinary income | $ | 1,565,401 | ||
Capital loss carryforward | $ | (1,590,002 | ) |
23
Rainier International Discovery Series
Notes to Financial Statements (continued)
| 9. | Federal Income Tax Information (continued) |
At October 31, 2018, the capital loss carryover utilized in the current year was $1,266,343.
At October 31, 2018, the Series had net short-term capital loss carryforwards of $1,590,002 carryforwards, which may be carried forward indefinitely.
24
Rainier International Discovery Series
Report of Independent Registered Public Accounting Firm
To the Board of Directors of Manning & Napier Fund, Inc. and Shareholders of Rainier International Discovery Series
Opinion on the Financial Statements
We have audited the accompanying statement of assets and liabilities, including the investment portfolio, of Rainier International Discovery Series (one of the series constituting Manning & Napier Fund, Inc., referred to hereafter as the “Fund”) as of October 31, 2018, the related statement of operations for the year ended October 31, 2018, and the statement of changes in net assets and the financial highlights for the year ended October 31, 2018 and for the period April 1, 2017 through October 31, 2017, including the related notes (collectively referred to as the “financial statements”). In our opinion, the financial statements present fairly, in all material respects, the financial position of the Fund as of October 31, 2018, the results of its operations for the year ended October 31, 2018, and the changes in its net assets and the financial highlights for the year ended October 31, 2018 and for the period April 1, 2017 through October 31, 2017 in conformity with accounting principles generally accepted in the United States of America.
The financial statements as of and for the period ended March 31, 2017 and the financial highlights for each of the periods ended on or prior to March 31, 2017 (not presented herein, other than statement of changes in net assets and the financial highlights) were audited by other auditors whose report dated May 22, 2017 expressed an unqualified opinion on those financial statements and financial highlights.
Basis for Opinion
These financial statements are the responsibility of the Fund’s management. Our responsibility is to express an opinion on the Fund’s financial statements based on our audits. We are a public accounting firm registered with the Public Company Accounting Oversight Board (United States) (“PCAOB”) and are required to be independent with respect to the Fund in accordance with the U.S. federal securities laws and the applicable rules and regulations of the Securities and Exchange Commission and the PCAOB.
We conducted our audits of these financial statements in accordance with the standards of the PCAOB. Those standards require that we plan and perform the audit to obtain reasonable assurance about whether the financial statements are free of material misstatement, whether due to error or fraud.
Our audits included performing procedures to assess the risks of material misstatement of the financial statements, whether due to error or fraud, and performing procedures that respond to those risks. Such procedures included examining, on a test basis, evidence regarding the amounts and disclosures in the financial statements. Our audits also included evaluating the accounting principles used and significant estimates made by management, as well as evaluating the overall presentation of the financial statements. Our procedures included confirmation of securities owned as of October 31, 2018 by correspondence with the custodian and brokers; when replies were not received from brokers, we performed other auditing procedures. We believe that our audits provide a reasonable basis for our opinion.

New York, New York
December 14, 2018
We have served as the auditor of one or more investment companies in Manning & Napier Mutual Funds since 1992.
25
Rainier International Discovery Series
Supplemental Tax Information
(unaudited)
All reportings are based on financial information available as of the date of this annual report and, accordingly are subject to change.
For federal income tax purposes, the Series reports for the current fiscal year $855,179 or, if different, the maximum amount allowable under the tax law as qualified dividend income.
The Series has elected to pass through to its shareholders the foreign taxes paid for the year ended October 31, 2018. The Series had $8,667,380 in foreign source income and paid foreign taxes of $797,834.
26
Rainier International Discovery Series
Directors’ and Officers’ Information
(unaudited)
The Statement of Additional Information provides additional information about the Fund’s directors and officers and can be obtained without charge by calling 1-800-466-3863, at www.manning-napier.com, or on the EDGAR Database on the SEC Internet web site (http://www.sec.gov). The following chart shows certain information about the Fund’s directors and officers, including their principal occupations during the last five years. Unless specific dates are provided, the individuals have held the listed positions for longer than five years.
| Interested Director and Officer | ||
| Name: | Paul Battaglia* | |
| Address: | 290 Woodcliff Drive | |
| Fairport, NY 14450 | ||
| Age: | 40 | |
| Current Position(s) Held with Fund: | Principal Executive Officer, President, Chairman & Director | |
| Term of Office & Length of Time Served: | Indefinite – Chairman and Director since November 20181 | |
| Principal Occupation(s) During Past 5 Years: | Chief Financial Officer (2018 – Present); Vice President of Finance (2016 – 2018); Director of Finance (2011 – 2016); Financial Analyst/Internal Auditor (2004-2006) – Manning & Napier Advisors, LLC and affiliates Holds one or more of the following titles for various affiliates: Chief Financial Officer | |
| Number of Portfolios Overseen within Fund Complex: | 36 | |
| Other Directorships Held Outside Fund Complex During Past 5 Years: | N/A | |
| Independent Directors | ||
| Name: | Stephen B. Ashley | |
| Address: | 290 Woodcliff Drive | |
| Fairport, NY 14450 | ||
| Age: | 78 | |
| Current Position(s) Held with Fund: | Director, Audit Committee Member, Governance & Nominating Committee Member | |
| Term of Office & Length of Time Served: | Indefinite – Since 1996 | |
| Principal Occupation(s) During Past 5 Years: | Chairman, Director & Chief Executive Officer (1997 to present) - The Ashley Group (property management and investment). Director (1995-2008) and Chairman (non-executive) (2004-2008) - Fannie Mae (mortgage) | |
| Number of Portfolios Overseen within Fund Complex: | 36 | |
| Other Directorships Held Outside Fund Complex During | Fannie Mae (1995-2008) | |
| Past 5 Years: | The Ashley Group (1995-2008) | |
| Genesee Corporation (1987-2007) | ||
| Name: | Paul A. Brooke | |
| Address: | 290 Woodcliff Drive | |
| Fairport, NY 14450 | ||
| Age: | 72 | |
| Current Position(s) Held with Fund: | Lead Independent Director, Audit Committee Member, Governance & Nominating Committee Chairman | |
| Term of Office & Length of Time Served: | Indefinite – Director, Audit Committee Member, Governance & Nominating Committee Member since 2007; Governance & Nominating Committee | |
| Principal Occupation(s) During Past 5 Years: | Chairman since 2016; Lead Independent Director since 2017 Chairman & CEO (2005-2009) - Ithaka Acquisition Corporation (investments); Chairman (2007-2009) - Alsius Corporation (investments); Managing Member (1991-present) - PMSV Holdings LLC (investments); | |
| Managing Member (2010-2016) - Venbio (investments). | ||
| Number of Portfolios Overseen within Fund Complex: | 36 | |
| Other Directorships Held Outside Fund Complex During Past 5 Years: | Incyte Corp. (biotech)(2000-present); ViroPharma, Inc. (speciality pharmaceuticals)(2000-2014); HLTH (WebMD)(information)(2000-2010); Cheyne Capital International (investment)(2000-2017); GMP Companies (investment)(2000-2011); Cytos Biotechnology Ltd (biotechnology)(2012-2014); Cerus (biomedical)(2016-present); PureEarth(non-profit)(2012-present) | |
27
Rainier International Discovery Series
Directors’ and Officers’ Information
(unaudited)
| Independent Directors (continued) | ||
| Name: | Peter L. Faber | |
| Address: | 290 Woodcliff Drive | |
| Fairport, NY 14450 | ||
| Age: | 80 | |
| Current Position(s) Held with Fund: | Director, Governance & Nominating Committee Member | |
| Term of Office & Length of Time Served: | Indefinite – Since 1987 | |
| Principal Occupation(s) During Past 5 Years: | Senior Counsel (2006-2012), Partner (1995-2006 & 2013-present) - McDermott, Will & Emery LLP (law firm) | |
| Number of Portfolios Overseen within Fund Complex: | 36 | |
| Other Directorships Held Outside Fund Complex During Past 5 Years: | Boston Early Music Festival (non-profit)(2007-present); Amherst Early Music, Inc. (non-profit)(2009-present); Gotham Early Music Scene, Inc. (non-profit)(2009-present); Partnership for New York City, Inc. (non-profit)(1989-2010); New York Collegium (non-profit)(2004-2011) | |
| Name: | Harris H. Rusitzky | |
| Address: | 290 Woodcliff Drive | |
| Fairport, NY 14450 | ||
| Age: | 83 | |
| Current Position(s) Held with Fund: | Director, Audit Committee Member, Governance & Nominating Committee Member | |
| Term of Office & Length of Time Served: | Indefinite – Since 1985 | |
| Principal Occupation(s) During Past 5 Years: | President (1994- present) - The Greening Group (business consultants); Partner (2006-present) - The Restaurant Group (restaurants) | |
| Number of Portfolios Overseen within Fund Complex: | 36 | |
| Other Directorships Held Outside Fund Complex During Past 5 Years: | Rochester Institute of Technology (university)(1972-present); Culinary Institute of America (non-profit college)(1985-present); George Eastman House (museum)(1988-present); National Restaurant Association (restaurant trade organization)(1978-present) | |
| Name: | Chester N. Watson | |
| Address: | 290 Woodcliff Drive | |
| Fairport, NY 14450 | ||
| Age: | 68 | |
| Current Position(s) Held with Fund: | Director, Audit Committee Chairman, Governance & | |
| Nominating Committee Member | ||
| Term of Office & Length of Time Served: | Indefinite – Director, Audit Committee Member, Governance & Nominating Committee Member Since 2012; Audit Committee Chairman since 2013 | |
| Principal Occupation(s) During Past 5 Years: | General Auditor (2003-2011) - General Motors Company (auto manufacturer) | |
| Number of Portfolios Overseen within Fund Complex: | 36 | |
| Other Directorships Held Outside Fund Complex During Past 5 Years: | Rochester Institute of Technology (university)(2005-present); Town of Greenburgh, NY Planning Board (municipal government) (2015-present) | |
| Officers: | ||
| Name: | Jeffrey S. Coons, Ph.D., CFA® | |
| Address: | 290 Woodcliff Drive | |
| Fairport, NY 14450 | ||
| Age: | 55 | |
| Current Position(s) Held with Fund: | Vice President | |
| Term of Office1 & Length of Time Served: | Since 2004 | |
| Principal Occupation(s) During Past 5 Years: | President since 2010, Co-CEO since 2018, Co-Director of Research (2002 – 2015) - Manning & Napier Advisors, LLC Holds one or more of the following titles for various subsidiaries and affiliates: President, Director, Treasurer, or Senior Trust Officer | |
| Name: | Elizabeth Craig | |
| Address: | 290 Woodcliff Drive | |
| Fairport, NY 14450 | ||
| Age: | 31 | |
| Current Position(s) Held with Fund: | Corporate Secretary | |
| Term of Office1 & Length of Time Served: | Since 2016 | |
| Principal Occupation(s) During Past 5 Years: | Fund Administration Manager since 2015; Mutual Fund Compliance Specialist (2009-2015) - Manning & Napier Advisors, LLC; Assistant Corporate Secretary (2011-2016) - Manning & Napier Fund, Inc. | |
28
Rainier International Discovery Series
Directors’ and Officers’ Information
(unaudited)
| Officers: (continued) | ||
| Name: | Christine Glavin | |
| Address: | 290 Woodcliff Drive | |
| Fairport, NY 14450 | ||
| Age: | 52 | |
| Current Position(s) Held with Fund: | Principal Financial Officer, Chief Financial Officer | |
| Term of Office1 & Length of Time Served: | Principal Financial Officer since 2002; Chief Financial Officer since 2001 | |
| Principal Occupation(s) During Past 5 Years: | Director of Fund Reporting since 2011; Fund Reporting Manager (1997-2011) – Manning & Napier Advisors, LLC; Assistant Treasurer since 2008 – Exeter Trust Company; Chief Financial Officer (2017-2018) - Rainier Investment Management Mutual Funds, Inc. | |
| Name: | Jodi L. Hedberg | |
| Address: | 290 Woodcliff Drive | |
| Fairport, NY 14450 | ||
| Age: | 50 | |
| Current Position(s) Held with Fund: | Chief Compliance Officer, Anti-Money Laundering Compliance Officer | |
| Term of Office1 & Length of Time Served: | Chief Compliance Officer since 2004; Anti-Money Laundering Officer since 2002; Corporate Secretary (1997-2016) – Manning & Napier Fund, Inc.; Chief Compliance Officer and Anti-Money Laundering Officer (2017-2018) – Rainier Investment Management Mutual Funds, Inc. | |
| Principal Occupation(s) During Past 5 Years: | Managing Director, Compliance & Regulatory Affairs since 2018; Director of Compliance (2005-2018); Compliance Manager (1995-2005) – Manning & Napier Advisors, LLC and affiliates; Corporate Secretary – Manning & Napier Investor Services, Inc. since 2006 | |
| Name: | Scott Morabito | |
| Address: | 290 Woodcliff Drive | |
| Fairport, NY 14450 | ||
| Age: | 30 | |
| Current Position(s) Held with Fund: | Assistant Vice President | |
| Term of Office1 & Length of Time Served: | Since 2017 | |
| Principal Occupation(s) During Past 5 Years: | Director of Funds Group since 2017; Fund Product and Strategy Manager (2014-2017); Senior Product and Strategy Analyst (2013-2014); Product and Strategy Analyst (2011-2013) – Manning & Napier Advisors, LLC. | |
| Name: | Sarah Turner | |
| Address: | 290 Woodcliff Drive | |
| Fairport, NY 14450 | ||
| Age: | 36 | |
| Current Position(s) Held with Fund: | Chief Legal Officer; Assistant Corporate Secretary | |
| Term of Office1 & Length of Time Served: | Since 2018 | |
| Principal Occupation(s) During Past 5 Years: | General Counsel since 2018 – Manning & Napier Advisors, LLC and affiliates; Counsel (2017-2018) – Harter Secrest and Emery LLP; Legal Counsel (2010-2017) – Manning & Napier Advisors, LLC and affiliates Holds one or more of the following titles for various affiliates: Corporate Secretary, General Counsel | |
| Name: | Amy Williams | |
| Address: | 290 Woodcliff Drive | |
| Fairport, NY 14450 | ||
| Age: | 56 | |
| Current Position(s) Held with Fund: | Assistant Corporate Secretary | |
| Term of Office1 & Length of Time Served: | Since 2016 | |
| Principal Occupation(s) During Past 5 Years: | Director of Fund Documentation – Manning & Napier Advisors, LLC since 2009 | |
| Holds one or more of the following titles for various affiliates: Director | ||
*At a meeting of the Board of Directors held on November 15, 2018, the Board accepted the resignation of Michele T. Mosca from her positions as Principal Executive Officer, President, Chair and Interested Director of the Fund and appointed Paul J. Battaglia to each of the resigned positions effective immediately. Interested Director, within the meaning of the 1940 Act by reason of his positions with the Fund’s investment advisor, Manning & Napier Advisors, LLC.
1The term of office of all officers shall be one year and until their respective successors are chosen and qualified, or his or her earlier resignation or removal as provided in the Fund’s By-Laws.
29
Rainier International Discovery Series
Literature Requests
(unaudited)
Proxy Voting Policies and Procedures
A description of the policies and procedures that the Fund uses to determine how to vote proxies relating to portfolio securities is available, without charge, upon request:
| By phone | 1-800-466-3863 | |||
| On the Securities and Exchange | ||||
| Commission’s (SEC) web site | http://www.sec.gov |
Proxy Voting Record
Information regarding how the Fund voted proxies relating to portfolio securities during the most recent 12-month period ended June 30th is available, without charge, upon request:
| By phone | 1-800-466-3863 | |||
| On the SEC’s web site | http://www.sec.gov |
Quarterly Portfolio Holdings
The Series’ complete schedule of portfolio holdings for the 1st and 3rd quarters of each fiscal year are provided on Form N-Q, and are available, without charge, upon request:
| By phone | 1-800-466-3863 | |||
| On the SEC’s web site | http://www.sec.gov |
The Series’ Form N-Q may be reviewed and copied at the SEC’s Public Reference Room in Washington, D.C. Information on the operation of the Public Reference Room may be obtained by calling 1-800-SEC-0330.
Prospectus and Statement of Additional Information (SAI)
For more information about any of the Manning & Napier Fund, Inc. Series, you may obtain a prospectus and SAI at www.manning-napier.com or by calling (800) 466-3863. Before investing, carefully consider the objectives, risks, charges and expenses of the investment and read the prospectus carefully as it contains this and other information about the investment company. In addition, this information can be found on the SEC’s web site, http://www.sec.gov.
Additional information available at www.manning-napier.com
1. Fund Holdings - Month-End
2. Fund Holdings - Quarter-End
3. Shareholder Report - Annual
4. Shareholder Report - Semi-Annual
The Fund also offers electronic notification or “e-delivery” when certain documents are available on-line to be downloaded or reviewed. Direct shareholders can elect to receive electronic notification when shareholder reports, prospectus updates, and/or statements are available. If you do not currently have on-line access to your account, you can establish access by going to www.manning-napier.com, click on “Login” in the top corner of the page, and follow the prompts to self-enroll. Once enrolled, you can set your electronic notification preferences by clicking on the Account Options tab located within the green toolbar and then select E-Delivery Option. Should you have any questions on either how to establish on-line access or how to update your account settings, please contact Investor Services at 1-800-466-3863.
The Manning & Napier Fund, Inc. is managed by Manning & Napier Advisors, LLC. Manning & Napier Investor Services, Inc., an affiliate of Manning & Napier Advisors, LLC, is the distributor of the Fund shares.
MNIDS-10/18-AR
ITEM 2: CODE OF ETHICS
| (a) | The registrant has adopted a code of ethics that applies to its principal executive officer, principal financial officer and principal accounting officer. A copy of the registrant’s code of ethics is filed herewith as Exhibit 13(a)(1). |
| (b) | During the period covered by this report, no amendments were made to the provisions of the code of ethics adopted in 2 (a) above. |
| (c) | During the period covered by this report, no implicit or explicit waivers to the provisions of the code of ethics adopted in 2 (a) above were granted. |
| (d) | Not applicable to the registrant due to the response given in 2 (c) above. |
ITEM 3: AUDIT COMMITTEE FINANCIAL EXPERT
All of the members of the Audit committee have been determined by the Registrant’s Board of Directors to be Audit Committee Financial Experts as defined in this item. The current members of the Audit Committee are: Stephen B. Ashley, Paul A. Brooke, Harris H. Rusitzky, and Chester N. Watson. All Audit Committee members are independent under applicable rules. This designation will not increase the designee’s duties, obligations or liability as compared to their duties, obligations and liability as a member of the Audit Committee and of the Board.
ITEM 4: PRINCIPAL ACCOUNTANT FEES AND SERVICES
Principal Accountant Fees and Services
Aggregate fees for professional services rendered for the Manning & Napier Fund, Inc. (Pro-Blend® Conservative Term Series, Pro-Blend® Moderate Term Series, Pro-Blend® Extended Term Series, Pro-Blend® Maximum Term Series, Blended Asset Conservative Series, Blended Asset Moderate Series, Blended Asset Extended Series, Blended Asset Maximum Series, Equity Series, Overseas Series, Disciplined Value Series, Quality Equity Series, Rainier International Discovery Series, Target Income Series, Target 2015 Series, Target 2020 Series, Target 2025 Series, Target 2030 Series, Target 2035 Series, Target 2040 Series, Target 2045 Series, Target 2050 Series, Target 2055 Series, and Target 2060 Series collectively the “Fund”) by PricewaterhouseCoopers LLP (“PwC”) as of and for the years ended October 31, 2018 and 2017 were:
| 2018 | 2017 | |||||||
Audit Fees (a) | $ | 550,850 | $ | 648,474 | ||||
Audit Related Fees (b) | $0 | $0 | ||||||
Tax Fees (c) | $ | 168,800 | $ | 208,210 | ||||
All Other Fees (d) | $0 | $0 | ||||||
| $ | 719,650 | $ | 856,684 | |||||
| (a) | Audit Fees |
These fees relate to professional services rendered by PwC for the audit of the Fund’s annual financial statements or services normally provided by the accountant in connection with statutory and regulatory filing or engagements. These services include the audits of the financial statements of the Fund, issuance of consents, income tax provision procedures and assistance with review of documents filed with the SEC.
| (b) | Audit-Related Fees |
These fees relate to assurance and related services by PwC that are reasonably related to the performance of the audit of the Fund’s financial statements and are not reported under “Audit Fees” above.
| (c) | Tax Fees |
These fees relate to professional services rendered by PwC for tax compliance, tax advice and tax planning. The tax services provided by PwC related to the review of the Fund’s federal and state income tax returns, excise tax calculations and returns, a review of the Fund’s calculations of capital gain and income distributions, and additional tax research for compliance purposes.
| (d) | All Other Fees |
These fees relate to products and services provided by PwC other than those reported above under “Audit Fees,” “Audit-Related Fees,” and “Tax Fees” above.
There were no amounts that were approved by the Audit Committee pursuant to the de minimus exception (Rule 2-01(c)(7) of Regulation S-X) for the fiscal years ended October 31, 2018 and 2017.
Non-Audit Services to the Fund’s Service Affiliates that were Pre-Approved by the Fund’s Audit Committee
The Fund’s Audit Committee is required to pre-approve non-audit services which meet both the following criteria:
| i) | Directly relate to the Fund’s operations and financial reporting; and |
| ii) | Rendered by PwC to the Fund’s advisor, Manning & Napier Advisors, LLC, and entities in a control relationship with the advisor (“service affiliate”) that provide ongoing services to the Fund. For purposes of disclosure, Manning & Napier Investor Services, Inc. is considered to be a service affiliate. |
| 2018 | 2017 | |||||||
Audit Related Fees | $1,800 | $1,800 | ||||||
Tax Fees | $0 | $0 | ||||||
| $1,800 | $1,800 | |||||||
The Audit Related fees for the years ended October 31, 2018 and 2017 were for a license for proprietary authoritative financial reporting and assurance literature library software.
There were no amounts that were approved by the Audit Committee pursuant to the de minimus exception (Rule 2-01(c)(7) of Regulation S-X) for the fiscal years ended October 31, 2018 and 2017.
Aggregate Fees
Aggregate fees billed to the Fund for non-audit services for 2018 and 2017 were $168,800 and $208,210, respectively. Aggregate fees billed to the Fund’s advisor and service affiliates for non-audit services were $1,800 and $1,800, respectively. These amounts include fees for non-audit services required to be pre-approved and fees for non-audit services that did not require pre-approval since they did not relate to the Fund’s operations and financial reporting.
The Fund’s Audit Committee has considered whether the provisions for non-audit services to the Fund’s advisor and service affiliates, which did not require pre-approval, are compatible with maintaining PwC’s independence.
ITEM 5: AUDIT COMMITTEE OF LISTED REGISTRANTS
Not applicable.
ITEM 6: INVESTMENTS
| (a) | See Investment Portfolios under Item 1 on this Form N-CSR. |
| (b) | Not applicable. |
| ITEM 7: | DISCLOSURE OF PROXY VOTING POLICIES AND PROCEDURES FOR CLOSED- END MANAGEMENT INVESTMENT COMPANIES |
Not applicable.
| ITEM 8: | PORTFOLIO MANAGERS OF CLOSED-END MANAGEMENT INVESTMENT COMPANIES |
Not applicable.
| ITEM 9: | PURCHASES OF EQUITY SECURITIES BY CLOSED-END MANAGEMENT INVESTMENT COMPANY AND AFFILIATED PURCHASERS |
Not applicable.
| ITEM 10: | SUBMISSION OF MATTERS TO A VOTE OF SECURITY HOLDERS |
There have been no material changes to the procedure by which shareholders may recommend nominees to the registrant’s board of directors.
| ITEM 11: | CONTROLS AND PROCEDURES |
(a) Based on their evaluation of the Funds’ disclosure controls and procedures, as of a date within 90 days of the filing date, the Funds’ Principal Executive Officer and Principal Financial Officer have concluded that the Funds’ disclosure controls and procedures are: (i) reasonably designed to ensure that information required to be disclosed in this report is appropriately communicated to the Funds’ officers to allow timely decisions regarding disclosures required in this report; (ii) reasonably designed to ensure that information required to be disclosed in this report is recorded, processed, summarized and reported in a timely manner; and (iii) are effective in achieving the goals described in (i) and (ii) above.
(b) During the second fiscal quarter of the period covered by this report, there have been no changes in the Funds’ internal control over financial reporting that the above officers believe to have materially affected, or to be reasonably likely to materially affect, the Funds’ internal control over financial reporting.
[Note that until the date that the registrant has filed its first report on Form N-PORT (17 CFR 270.150), the registrant’s disclosures required by this Item are limited to any change in the registrant’s internal control over financial reporting that occurred during the registrant’s last fiscal quarter that has materially affected or is reasonably likely to materially affect the registrant’s internal control over financial reporting.]
| ITEM 12: | DISCLOSURE OF SECURITIES LENDING ACTIVITIES FOR CLOSED-END MANAGEMENT INVESTMENT COMPANIES. |
Not applicable.
| ITEM 13: | EXHIBITS |
| (a)(1) | Code of ethics that is subject to the disclosure of Item 2 above. |
| (a)(2) | Separate certifications for the Registrant’s principal executive officer and principal financial officer, as required by Section 302 of the Sarbanes-Oxley Act of 2002 and Rule 30a-2(a) under the Investment Company Act of 1940, are attached as EX-99.CERT. |
[Note that until the date that the registrant has filed its first report on Form N-PORT (17 CFR 270.150), in the certification required by Item 13(a)(2), the registrant’s certifying officers must certify that they have disclosed in the report any change in the registrant’s internal control over financial reporting that occurred during the registrant’s most recent fiscal quarter that has materially affected, or is reasonably likely to materially affect the registrant’s internal control over financial reporting.]
| (a)(3) | Not applicable. |
| (a)(4) | Not applicable. |
| (b) | A certification of the Registrant’s principal executive officer and principal financial officer, as required by 18 U.S.C Section 1350, as adopted pursuant to Section 906 of the Sarbanes-Oxley Act of 2002, and Rule 30a-2(b) under the Investment Company Act of 1940, is attached as EX-99.906CERT. The certification furnished pursuant to this paragraph is not deemed to be “filed” for purposes of Section 18 of the Securities Exchange Act of 1934, or otherwise subject to the liability of that section. Such certification is not deemed to be incorporated by reference into any filing under the Securities Act of 1933 or the Securities Exchange Act of 1934, except to the extent that the Registrant specifically incorporates them by reference. |
SIGNATURES
Pursuant to the requirements of the Securities Exchange Act of 1934 and the Investment Company Act of 1940, the registrant has duly caused this report to be signed on its behalf by the undersigned, thereunto duly authorized.
Manning & Napier Fund, Inc.
| /s/ Paul J. Battaglia | ||
| Paul J. Battaglia | ||
| President & Principal Executive Officer of Manning & Napier Fund, Inc. | ||
Date 12/27/2018 | ||
Pursuant to the requirements of the Securities Exchange Act of 1934 and the Investment Company Act of 1940, this report has been signed below by the following persons on behalf of the registrant and in the capacities and on the dates indicated.
| /s/ Paul J. Battaglia | ||
| Paul J. Battaglia | ||
| President & Principal Executive Officer of Manning & Napier Fund, Inc. | ||
| Date 12/27/2018 | ||
| /s/ Christine Glavin | ||
| Christine Glavin | ||
| Chief Financial Officer & Principal Financial Officer of Manning & Napier Fund, Inc. | ||
| Date 12/27/2018 | ||