UNITED STATES
SECURITIES AND EXCHANGE COMMISSION
Washington, D.C. 20549
FORMN-CSR
CERTIFIED SHAREHOLDER REPORT OF REGISTERED MANAGEMENT INVESTMENT COMPANIES
Investment Company Act filenumber 811-04087
Manning & Napier Fund, Inc.
(Exact name of registrant as specified in charter)
290 Woodcliff Drive, Fairport, NY 14450
(Address of principal executive offices)(Zip Code)
Paul J. Battaglia 290 Woodcliff Drive, Fairport, NY 14450
(Name and address of agent for service)
Registrant’s telephone number, including area code:585-325-6880
Date of fiscal year end: October 31
Date of reporting period: November 1, 2018 through October 31, 2019
FormN-CSR is to be used by management investment companies to file reports with the Commission not later than 10 days after the transmission to stockholders of any report that is required to be transmitted to stockholders under Rule30e-1 under the Investment Company Act of 1940 (17 CFR270.30e-1). The Commission may use the information provided on FormN-CSR in its regulatory, disclosure review, inspection, and policymaking roles.
A registrant is required to disclose the information specified by FormN-CSR, and the Commission will make this information public. A registrant is not required to respond to the collection of information contained in FormN-CSR unless the Form displays a currently valid Office of Management and Budget (“OMB”) control number. Please direct comments concerning the accuracy of the information collection burden estimate and any suggestions for reducing the burden to Secretary, Securities and Exchange Commission, 450 Fifth Street, NW, Washington, DC 20549-0609. The OMB has reviewed this collection of information under the clearance requirements of 44 U.S.C. § 3507.
ITEM 1: REPORTS TO STOCKHOLDERS.

www.manning-napier.com
Manning & Napier Fund, Inc.
|
Equity Series |
Beginning on June 25, 2021, as permitted by Securities and Exchange Commission regulations, paper copies of the Series’ annual and semi-annual shareholder reports will no longer be sent by mail, unless you specifically request paper copies of the reports from the Fund or from your financial intermediary, such as a broker-dealer or bank. Instead, the reports will be made available on a website, and you will be notified by mail each time a report is posted and provided with a website link to access the report.
If you already elected to receive shareholder reports electronically, you will not be affected by this change and you need not take any action. You may elect to receive shareholder reports and other communications from the Fund electronically by contacting your financial intermediary or, if you are a direct investor, by visiting www.manning-napier.com or calling 1-800-466-3863.
You may elect to receive all future annual and semi-annual reports in paper free of charge. If you invest through a financial intermediary, you can contact your financial intermediary to request that you continue to receive paper copies of your shareholder reports. If you invest directly with the Fund, you can inform the Fund that you wish to continue receiving paper copies of your shareholder reports by visiting www.manning-napier.com or calling 1-800-466-3863. Your election to receive reports in paper will apply to all funds held with your financial intermediary if you invest through a financial intermediary or all series of the Fund if you invest directly with the Fund.
 | Independent Perspective| Real-World Solutions |
A Note from Our CEO
Dear Shareholder,
The investing world is constantly changing, yet investors’ needs and objectives remain substantially the same.
Whether you are an individual saver looking to ensure security in retirement, or an institutional investor with a fiduciary obligation to others, at the end of the day you look for a trusted partner to help you build, grow, and preserve wealth.
In order to do so successfully we recognize that, in the short-term, the world’s capital markets can be capricious and hard to predict.
Bubbles form, rise, and then pop. The hot stocks of today often become passing fads of tomorrow. Investor sentiment can swing wildly, whipsawing between exuberance one day and despondence the next.
As successful long-term investors, we are defined both by what we do as well as what we don’t do.
We don’t attempt to perfectly time every recession. We don’t jump on the latest trend. We don’t worry about capturing every market peak all across the globe.
On the other hand, we do maintain the rigorous disciplines we have developed over close to half a century. We are highly attentive to managing risk and protecting investors in down markets while participating fully in the opportunities our Research uncovers.
Our focus is on you, the shareholder, and helping you achieve your goals.
In the face of an uncertain world, we believe our investment philosophies, processes, and experience have stood the test of time and will do so in the future.
We appreciate your continued confidence in our approach.
 |
Sincerely,
Marc Mayer Chief Executive Officer
|

Corporate Headquarters | 290 Woodcliff Drive| Fairport, NY 14450| (585) 325-6880 phone| (800) 551-0224 toll free| www.manning-napier.com
1
Equity Series
Fund Commentary
(unaudited)
Investment Objective
To provide long-term growth of capital by investing primarily in common stocks. The Series may invest in large-, mid- and small-size companies within the US.
Performance Commentary
US equity markets posted positive returns for the twelve-month period ending October 31, 2019 and have experienced the second strongest year-to-date start in two decades. Over the one year period, large-cap stocks outperformed small- and mid-cap stocks, while growth stocks outperformed their value counterparts.
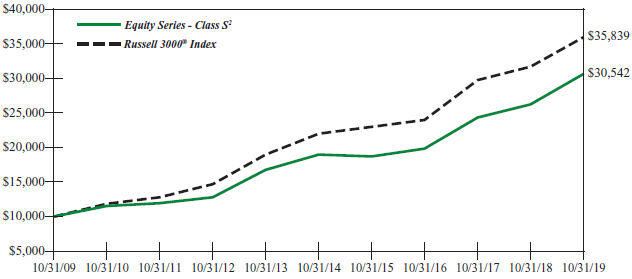
The Equity Series Class S delivered positive returns during the year and outperformed the Russell 3000® Index, returning 16.9% and 13.5%, respectively.
Outperformance was primarily driven by stock selection, led by decisions in Information Technology, Consumer Discretionary, Real Estate, and Materials. Sector positioning was also positive, though to a lesser degree. Specifically, an underweight to Energy benefitted relative returns (i.e., returns compared to the benchmark); however, selection within the sector was a detractor.
We believe the global economy is showing signs of moving into the later stages of the economic cycle. When this occurs, it is common to see strong stock market gains. While these rallies may give investors the feeling of missing out, it is exactly in these moments that risk management can be most valuable.
Given our outlook, the portfolio is focused on higher quality businesses and reasonably priced growth companies. We prefer businesses with strong management and solid balance sheets who have historically provided some degree of downside protection in adverse markets.
This view has led to meaningful positions in areas such as Consumer Staples and Health Care. In contrast, the portfolio is less exposed to sectors highly dependent on strong and above average economic growth such as Industrials and Energy.
Please see the next page for additional performance information as of October 31, 2019.
Performance data quoted represents past performance and does not guarantee future results. The investment return and principal value of an investment will fluctuate, so that an investor’s shares, when redeemed, may be worth more or less than their original cost. Current performance may be higher or lower than that quoted; investors can obtain the most recent month-end performance at www.manning-napier.com or by calling (800) 466-3863.
Commentary prepared using data provided by FactSet. Analysis Manning & Napier. Commentary presented is relative to the Russell 3000® Index. Additional information and associated disclosures can be found on the Performance Update page of this report.
All investments involve risks, including possible loss of principal. As with any stock fund, the value of your investment will fluctuate in response to stock market movements. Investing in the Series will also involve a number of other risks, including issuer-specific risk, small-cap/mid-cap risk, and interest rate risk.
2
Equity Series
Performance Update as of October 31, 2019
(unaudited)
AVERAGE ANNUAL TOTAL RETURNS AS OF OCTOBER 31, 2019 | ||||||
ONE YEAR1 | FIVE YEAR | TEN YEAR | ||||
Equity Series - Class S2 | 16.88% | 10.06% | 11.81% | |||
Equity Series - Class W2,3 | 17.64% | 10.20% | 11.88% | |||
Russell 3000® Index4 | 13.49% | 10.31% | 13.62% | |||
The following graph compares the value of a $10,000 investment in the Equity Series - Class S for the ten years ended October 31, 2019 to the Russell 3000® Index.
1The returns shown are based on net asset values calculated for shareholder transactions and may differ from the returns shown in the financial highlights, which reflect adjustments made to the net asset values in accordance with accounting principles generally accepted in the United States of America.
2The Series’ performance does not reflect the deduction of taxes that a shareholder would pay on fund distributions or the redemption of shares. The Series’ performance is historical and may not be indicative of future results. The performance returns shown are inclusive of the net expense ratio of the Series. For the year ended October 31, 2019, the net expense ratio was 1.05% for Class S and 0.05% for Class W. The gross expense ratio, which does not account for any voluntary or contractual waivers currently in effect, was 1.29% for Class S and 1.05% for Class W for the year ended October 31, 2019.
3For periods through March 1, 2019 (the inception date of the Class W shares), performance for the Class W shares is based on the historical performance of the Class S shares. Because the Class W shares invest in the same portfolio of securities as the Class S shares, performance will be different only to the extent that the Class S shares have a higher expense ratio.
4The Russell 3000® Index is an unmanaged index that consists of 3,000 of the largest U.S. companies based on total market capitalization. The Index returns are based on a market capitalization-weighted average of relative price changes of the component stocks plus dividends whose reinvestments are compounded daily. The Index returns do not reflect any fees or expenses. Index returns provided by Bloomberg.
3
Equity Series
Shareholder Expense Example
(unaudited)
As a shareholder of the Series, you incur ongoing costs, including management fees, shareholder service fees and other Series expenses. This example is intended to help you understand your ongoing costs (in dollars) of investing in the Series and to compare these costs with the ongoing costs of investing in other mutual funds.
The example is based on an investment of $1,000 invested in each class at the beginning of the period and held for the entire period (May 1, 2019 to October 31, 2019).
Actual Expenses
The Actual lines of the table below provide information about actual account values and actual expenses. You may use the information in these lines, together with the amount you invested, to estimate the expenses that you paid over the period. Simply divide your account value by $1,000 (for example, an $8,600 account value divided by $1,000 = 8.6), then multiply the result by the number in the Actual line for the Class in which you have invested under the heading entitled “Expenses Paid During Period” to estimate the expenses you paid on your account during this period.
Hypothetical Example for Comparison Purposes
The Hypothetical lines of each class in the table below provide information about hypothetical account values and hypothetical expenses based on the Class’ actual expense ratio and an assumed rate of return of 5% per year before expenses, which is not the Class’ actual return. The hypothetical account values and expenses may not be used to estimate the actual ending account balance or expenses you paid during the period. You may use this information to compare the ongoing costs of investing in a class of the Series and other funds. To do so, compare this 5% hypothetical example for the Class in which you have invested with the 5% hypothetical examples that appear in the shareholder reports of the other funds.
Please note that the expenses shown in the table are meant to highlight your ongoing costs only and do not reflect any transaction costs, such as sales charges (loads), redemption fees, or exchange fees that you may incur in other mutual funds. Therefore, the second line of the table is useful in comparing ongoing costs only, and will not help you determine the relative total costs of owning different funds.
| BEGINNING ACCOUNT VALUE 5/1/19 | ENDING ACCOUNT VALUE 10/31/19 | EXPENSES PAID DURING PERIOD 5/1/19-10/31/191 | ANNUALIZED RATIO | |||||
Class S | ||||||||
Actual | $1,000.00 | $1,049.10 | $5.42 | 1.05% | ||||
Hypothetical (5% return before expenses) | $1,000.00 | $1,019.91 | $5.35 | 1.05% | ||||
Class W | ||||||||
Actual | $1,000.00 | $1,054.30 | $0.26 | 0.05% | ||||
Hypothetical (5% return before expenses) | $1,000.00 | $1,024.95 | $0.26 | 0.05% | ||||
1Expenses are equal to the Series’ annualized expense ratio (for the six-month period), multiplied by the average account value over the period, multiplied by 184/365 (to reflect the one-half year period). Expenses are based on the most recent fiscal half year; therefore, the expense ratios stated above may differ from the expense ratios stated in the financial highlights, which are based on one-year data. The Class’ total return would have been lower had certain expenses not been waived during the period.
4
Equity Series
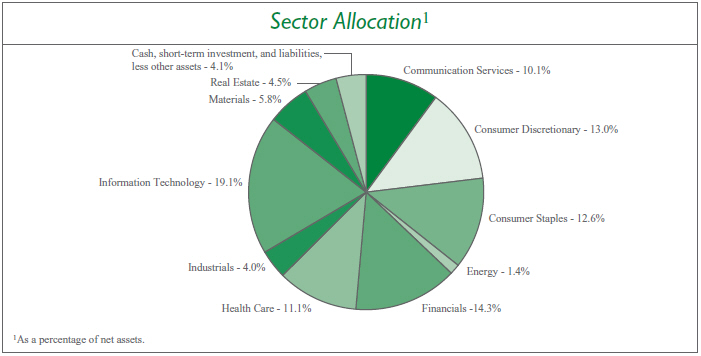
Portfolio Composition as of October 31, 2019
(unaudited)
5
Equity Series
Investment Portfolio - October 31, 2019
SHARES
|
VALUE
| |||||||
COMMON STOCKS - 95.9% |
| |||||||
Communication Services - 10.1% |
| |||||||
Entertainment - 3.5% | ||||||||
Activision Blizzard, Inc. | 14,400 | $ | 806,832 | |||||
Electronic Arts, Inc.* | 14,525 | 1,400,210 | ||||||
|
| |||||||
| 2,207,042 | ||||||||
|
| |||||||
Interactive Media & Services - 6.6% | ||||||||
Alphabet, Inc. - Class A* | 810 | 1,019,628 | ||||||
Alphabet, Inc. - Class C* | 810 | 1,020,689 | ||||||
Facebook, Inc. - Class A* | 8,135 | 1,559,073 | ||||||
IAC - InterActiveCorp.* | 2,790 | 634,028 | ||||||
|
| |||||||
| 4,233,418 | ||||||||
|
| |||||||
Total Communication Services |
| 6,440,460 | ||||||
|
| |||||||
Consumer Discretionary - 13.0% | ||||||||
Internet & Direct Marketing Retail - 3.4% | ||||||||
Amazon.com, Inc.* | 860 | 1,527,928 | ||||||
Booking Holdings, Inc.* | 330 | 676,094 | ||||||
|
| |||||||
| 2,204,022 | ||||||||
|
| |||||||
Multiline Retail - 4.3% | ||||||||
Dollar General Corp. | 8,380 | 1,343,649 | ||||||
Dollar Tree, Inc.* | 12,755 | 1,408,152 | ||||||
|
| |||||||
| 2,751,801 | ||||||||
|
| |||||||
Specialty Retail - 3.3% | ||||||||
Advance Auto Parts, Inc. | 4,995 | 811,588 | ||||||
AutoZone, Inc.* | 705 | 806,788 | ||||||
The TJX Cos., Inc. | 8,915 | 513,950 | ||||||
|
| |||||||
| 2,132,326 | ||||||||
|
| |||||||
Textiles, Apparel & Luxury Goods - 2.0% | ||||||||
NIKE, Inc. - Class B | 13,975 | 1,251,461 | ||||||
|
| |||||||
Total Consumer Discretionary |
| 8,339,610 | ||||||
|
| |||||||
Consumer Staples - 12.6% | ||||||||
Beverages - 6.2% | ||||||||
The Coca-Cola Co. | 41,995 | 2,285,788 | ||||||
PepsiCo, Inc. | 12,255 | 1,681,018 | ||||||
|
| |||||||
| 3,966,806 | ||||||||
|
| |||||||
Food Products - 3.2% | ||||||||
Mondelez International, Inc. - | ||||||||
Class A | 38,595 | 2,024,308 | ||||||
|
| |||||||
Household Products - 1.0% | ||||||||
Colgate-Palmolive Co. | 9,685 | 664,391 | ||||||
|
| |||||||
The accompanying notes are an integral part of the financial statements.
6
Equity Series
Investment Portfolio - October 31, 2019
SHARES
|
VALUE
| |||||||
COMMON STOCKS(continued) | ||||||||
Consumer Staples(continued) | ||||||||
Tobacco - 2.2% | ||||||||
Altria Group, Inc. | 11,860 | $ | 531,209 | |||||
Philip Morris International, Inc. | 11,230 | 914,571 | ||||||
|
| |||||||
| 1,445,780 | ||||||||
|
| |||||||
Total Consumer Staples | 8,101,285 | |||||||
|
| |||||||
Energy - 1.4% | ||||||||
Energy Equipment & Services - 1.4% | ||||||||
Diamond Offshore Drilling, Inc.* | 31,200 | 165,048 | ||||||
Halliburton Co. | 20,845 | 401,266 | ||||||
Transocean Ltd.* | 67,475 | 320,506 | ||||||
|
| |||||||
Total Energy | 886,820 | |||||||
|
| |||||||
Financials - 14.3% | ||||||||
Capital Markets - 11.0% | ||||||||
BlackRock, Inc. | 3,305 | 1,525,919 | ||||||
Cboe Global Markets, Inc. | 9,310 | 1,072,047 | ||||||
CME Group, Inc. | 5,270 | 1,084,303 | ||||||
Intercontinental Exchange, Inc. | 11,925 | 1,124,766 | ||||||
Moody’s Corp. | 5,055 | 1,115,588 | ||||||
S&P Global, Inc. | 4,310 | 1,111,937 | ||||||
|
| |||||||
| 7,034,560 | ||||||||
|
| |||||||
Diversified Financial Services - 3.3% | ||||||||
Berkshire Hathaway, Inc. - Class B* | 9,995 | 2,124,737 | ||||||
|
| |||||||
Total Financials | 9,159,297 | |||||||
|
| |||||||
Health Care - 11.1% | ||||||||
Biotechnology - 2.6% | ||||||||
BioMarin Pharmaceutical, Inc.* | 8,890 | 650,837 | ||||||
Incyte Corp.* | 3,845 | 322,672 | ||||||
Seattle Genetics, Inc.* | 3,205 | 344,217 | ||||||
Vertex Pharmaceuticals, Inc.* | 1,750 | 342,090 | ||||||
|
| |||||||
| 1,659,816 | ||||||||
|
| |||||||
Health Care Equipment & Supplies - 1.7% | ||||||||
Boston Scientific Corp.* | 17,800 | 742,260 | ||||||
Intuitive Surgical, Inc.* | 645 | 356,653 | ||||||
|
| |||||||
| 1,098,913 | ||||||||
|
| |||||||
Health Care Providers & Services - 1.2% | ||||||||
UnitedHealth Group, Inc. | 2,995 | 756,836 | ||||||
|
| |||||||
Life Sciences Tools & Services - 1.4% | ||||||||
Thermo Fisher Scientific, Inc. | 2,930 | 884,801 | ||||||
|
| |||||||
The accompanying notes are an integral part of the financial statements.
7
Equity Series
Investment Portfolio - October 31, 2019
SHARES
|
VALUE (NOTE 2)
| |||||||
COMMON STOCKS(continued) | ||||||||
Health Care(continued) | ||||||||
Pharmaceuticals - 4.2% | ||||||||
Johnson & Johnson | 18,125 | $ | 2,393,225 | |||||
Merck & Co., Inc. | 3,710 | 321,509 | ||||||
|
| |||||||
| 2,714,734 | ||||||||
|
| |||||||
Total Health Care | 7,115,100 | |||||||
|
| |||||||
Industrials - 4.0% | ||||||||
Commercial Services & Supplies - 2.6% | ||||||||
Stericycle, Inc.* | 12,305 | 708,768 | ||||||
Waste Management, Inc. | 8,245 | 925,171 | ||||||
|
| |||||||
| 1,633,939 | ||||||||
|
| |||||||
Road & Rail - 1.4% | ||||||||
JB Hunt Transport Services, Inc. | 7,880 | 926,373 | ||||||
|
| |||||||
Total Industrials | 2,560,312 | |||||||
|
| |||||||
Information Technology - 19.1% | ||||||||
Electronic Equipment, Instruments & Components - 1.5% | ||||||||
Cognex Corp. | 18,335 | 944,069 | ||||||
|
| |||||||
IT Services - 7.9% | ||||||||
EPAM Systems, Inc.* | 1,665 | 292,973 | ||||||
Mastercard, Inc. - Class A | 7,110 | 1,968,119 | ||||||
Verra Mobility Corp.* | 95,765 | 1,374,228 | ||||||
Visa, Inc. - Class A | 8,160 | 1,459,498 | ||||||
|
| |||||||
| 5,094,818 | ||||||||
|
| |||||||
Semiconductors & Semiconductor Equipment - 3.9% | ||||||||
Micron Technology, Inc.* | 34,790 | 1,654,264 | ||||||
NVIDIA Corp. | 4,055 | 815,136 | ||||||
|
| |||||||
| 2,469,400 | ||||||||
|
| |||||||
Software - 5.8% | ||||||||
Microsoft Corp. | 13,990 | 2,005,746 | ||||||
ServiceNow, Inc.* | 6,905 | 1,707,330 | ||||||
|
| |||||||
| 3,713,076 | ||||||||
|
| |||||||
Total Information Technology | 12,221,363 | |||||||
|
| |||||||
Materials - 5.8% | ||||||||
Chemicals - 3.8% | ||||||||
Axalta Coating Systems Ltd.* | 31,815 | 938,224 | ||||||
CF Industries Holdings, Inc. | 19,260 | 873,441 | ||||||
Corteva, Inc. | 24,940 | 657,917 | ||||||
|
| |||||||
| 2,469,582 | ||||||||
|
| |||||||
Containers & Packaging - 1.1% | ||||||||
Crown Holdings, Inc.* | 9,285 | 676,319 | ||||||
|
| |||||||
The accompanying notes are an integral part of the financial statements.
8
Equity Series
Investment Portfolio - October 31, 2019
SHARES
|
VALUE (NOTE 2)
| |||||||
COMMON STOCKS(continued) | ||||||||
Materials(continued) | ||||||||
Metals & Mining - 0.9% | ||||||||
Freeport-McMoRan, Inc. | 25,430 | $ | 249,723 | |||||
Southern Copper Corp. (Peru) | 8,370 | 297,805 | ||||||
|
| |||||||
| 547,528 | ||||||||
|
| |||||||
Total Materials | 3,693,429 | |||||||
|
| |||||||
Real Estate - 4.5% | ||||||||
Equity Real Estate Investment Trusts (REITS) - 4.5% | ||||||||
American Tower Corp. | 4,660 | 1,016,253 | ||||||
Equinix, Inc. | 1,445 | 818,997 | ||||||
SBA Communications Corp. | 4,365 | 1,050,437 | ||||||
|
| |||||||
Total Real Estate | 2,885,687 | |||||||
|
| |||||||
TOTAL COMMON STOCKS | 61,403,363 | |||||||
|
| |||||||
SHORT-TERM INVESTMENT - 4.3% | ||||||||
Dreyfus Government Cash Management, Institutional Shares, 1.73%1 | ||||||||
(Identified Cost $2,770,713) | 2,770,713 | 2,770,713 | ||||||
|
| |||||||
TOTAL INVESTMENTS - 100.2% | 64,174,076 | |||||||
LIABILITIES, LESS OTHER ASSETS - (0.2%) | (104,410 | ) | ||||||
|
| |||||||
NET ASSETS - 100% | $ | 64,069,666 | ||||||
|
| |||||||
*Non-income producing security.
1Rate shown is the current yield as of October 31, 2019.
The Global Industry Classification Standard (GICS) was developed by and is the exclusive property and a service mark of MSCI Inc. (MSCI) and Standard & Poor’s, a division of S&P Global Inc. (S&P), and is licensed for use by Manning & Napier when referencing GICS sectors. Neither MSCI, S&P, nor any third party involved in making or compiling the GICS or any GICS classifications makes any express or implied warranties or representations with respect to such standard or classification, nor shall any such party have any liability therefrom.
The accompanying notes are an integral part of the financial statements.
9
Equity Series
Statement of Assets and Liabilities
October 31, 2019
ASSETS: | ||||
Investments, at value (identified cost $51,603,659) (Note 2) | $ | 64,174,076 | ||
Dividends receivable | 10,462 | |||
Receivable for fund shares sold | 2,509 | |||
Prepaid expenses | 15,662 | |||
|
| |||
TOTAL ASSETS | 64,202,709 | |||
|
| |||
LIABILITIES: | ||||
Accrued management fees (Note 3) | 25,373 | |||
Accrued fund accounting and administration fees (Note 3) | 13,618 | |||
Accrued shareholder services fees (Class S) (Note 3) | 13,438 | |||
Accrued transfer agent fees (Note 3) | 5,498 | |||
Accrued Chief Compliance Officer service fees (Note 3) | 687 | |||
Accrued sub-transfer agent fees (Note 3) | 42 | |||
Payable for fund shares repurchased | 40,471 | |||
Audit fees payable | 20,634 | |||
Printing fees payable | 10,844 | |||
Other payables and accrued expenses | 2,438 | |||
|
| |||
TOTAL LIABILITIES | 133,043 | |||
|
| |||
TOTAL NET ASSETS | $ | 64,069,666 | ||
|
| |||
NET ASSETS CONSIST OF: | ||||
Capital stock | $ | 46,117 | ||
Additional paid-in-capital | 45,433,569 | |||
Total distributable earnings (loss) | 18,589,980 | |||
|
| |||
TOTAL NET ASSETS | $ | 64,069,666 | ||
|
| |||
NET ASSET VALUE, OFFERING PRICE AND REDEMPTION PRICE PER SHARE - Class S | $ | 13.89 | ||
|
| |||
NET ASSET VALUE, OFFERING PRICE AND REDEMPTION PRICE PER SHARE - Class W | $ | 13.98 | ||
|
| |||
The accompanying notes are an integral part of the financial statements.
10
Equity Series
Statement of Operations
For the Year Ended October 31, 2019
INVESTMENT INCOME: | ||||
Dividends | $ | 767,458 | ||
|
| |||
EXPENSES: | ||||
Management fees (Note 3) | 491,938 | |||
Shareholder services fees (Class S) (Note 3) | 163,367 | |||
Fund accounting and administration fees (Note 3) | 52,732 | |||
Directors’ fees (Note 3) | 6,103 | |||
Chief Compliance Officer service fees (Note 3) | 3,455 | |||
Sub-transfer agent fees (Note 3) | 42 | |||
Custodian fees | 4,309 | |||
Miscellaneous | 121,114 | |||
|
| |||
Total Expenses | 843,060 | |||
Less reduction of expenses (Note 3) | (156,798 | ) | ||
|
| |||
Net Expenses | 686,262 | |||
|
| |||
NET INVESTMENT INCOME | 81,196 | |||
|
| |||
REALIZED AND UNREALIZED GAIN (LOSS) ON INVESTMENTS: | ||||
Net realized gain (loss) on investments | 6,764,451 | |||
Net change in unrealized appreciation (depreciation) on investments | 3,236,054 | |||
|
| |||
NET REALIZED AND UNREALIZED GAIN (LOSS) ON INVESTMENTS | 10,000,505 | |||
|
| |||
NET INCREASE IN NET ASSETS RESULTING FROM OPERATIONS | $ | 10,081,701 | ||
|
| |||
The accompanying notes are an integral part of the financial statements.
11
Equity Series
Statements of Changes in Net Assets
FOR THE
| FOR THE
| |||||||
INCREASE (DECREASE) IN NET ASSETS: | ||||||||
OPERATIONS: | ||||||||
Net investment income (loss) | $ | 81,196 | $ | (132,735 | ) | |||
Net realized gain (loss) on investments | 6,764,451 | 11,047,143 | ||||||
Net change in unrealized appreciation (depreciation) on investments | 3,236,054 | (4,124,586 | ) | |||||
|
|
|
| |||||
Net increase from operations | 10,081,701 | 6,789,822 | ||||||
|
|
|
| |||||
DISTRIBUTIONS TO SHAREHOLDERS (Note 9): | ||||||||
Class S | (10,873,259 | ) | (5,983,527 | ) | ||||
|
|
|
| |||||
CAPITAL STOCK ISSUED AND REPURCHASED: | ||||||||
Net increase (decrease) from capital share transactions (Note 5) | (4,700,431 | ) | (14,599,547 | ) | ||||
|
|
|
| |||||
Net increase (decrease) in net assets | (5,491,989 | ) | (13,793,252 | ) | ||||
NET ASSETS: | ||||||||
Beginning of year | 69,561,655 | 83,354,907 | ||||||
|
|
|
| |||||
End of year | $ | 64,069,666 | $ | 69,561,655 | ||||
|
|
|
| |||||
The accompanying notes are an integral part of the financial statements.
12
Equity Series
Financial Highlights - Class S*
FOR THE YEAR ENDED | ||||||||||||||||||||
| 10/31/19 | 10/31/18 | 10/31/17 | 10/31/16 | 10/31/15 | ||||||||||||||||
Per share data (for a share outstanding throughout each year): | ||||||||||||||||||||
Net asset value - Beginning of year | $14.28 | $14.27 | $12.20 | $16.62 | $21.15 | |||||||||||||||
|
|
|
|
|
|
|
|
|
| |||||||||||
Income (loss) from investment operations: | ||||||||||||||||||||
Net investment income (loss)1 | 0.02 | (0.02 | ) | 0.01 | (0.07 | ) | 0.01 | |||||||||||||
Net realized and unrealized gain (loss) on investments | 1.86 | 1.07 | 2.63 | 0.64 | (0.42 | ) | ||||||||||||||
|
|
|
|
|
|
|
|
|
| |||||||||||
Total from investment operations | 1.88 | 1.05 | 2.64 | 0.57 | (0.41 | ) | ||||||||||||||
|
|
|
|
|
|
|
|
|
| |||||||||||
Less distributions to shareholders: | ||||||||||||||||||||
From net investment income | (0.01 | ) | — | — | (0.00 | )2 | (0.00 | )2 | ||||||||||||
From net realized gain on investments | (2.26 | ) | (1.04 | ) | (0.57 | ) | (4.99 | ) | (4.12 | ) | ||||||||||
|
|
|
|
|
|
|
|
|
| |||||||||||
Total distributions to shareholders | (2.27 | ) | (1.04 | ) | (0.57 | ) | (4.99 | ) | (4.12 | ) | ||||||||||
|
|
|
|
|
|
|
|
|
| |||||||||||
Net asset value - End of year | $13.89 | $14.28 | $14.27 | $12.20 | $16.62 | |||||||||||||||
|
|
|
|
|
|
|
|
|
| |||||||||||
Net assets - End of year(000’s omitted) | $63,701 | $69,562 | $83,355 | $98,470 | $500,946 | |||||||||||||||
|
|
|
|
|
|
|
|
|
| |||||||||||
Total return3 | 16.88% | 7.67% | 22.68% | 4 | 6.16% | (1.46% | ) | |||||||||||||
Ratios (to average net assets)/Supplemental Data: | ||||||||||||||||||||
Expenses** | 1.05% | 1.05% | 1.05% | 1.05% | 1.05% | |||||||||||||||
Net investment income (loss) | 0.12% | (0.17% | ) | 0.10% | (0.55% | ) | 0.04% | |||||||||||||
Series portfolio turnover | 48% | 45% | 71% | 40% | 62% | |||||||||||||||
| *Effective March 1, 2017, Class A shares of the Series have been designated as Class S shares. |
| |||||||||||||||||||
| **The investment advisor did not impose all or a portion of its management and/or other fees, and in some years may have paid a portion of the Series’ expenses. If these expenses had been incurred by the Class, the expense ratio (to average net assets) would have increased by the following amounts: |
| |||||||||||||||||||
| 0.24% | 0.17% | 0.15% | 0.09% | 0.03% | ||||||||||||||||
1Calculated based on average shares outstanding during the years.
2Less than $(0.01).
3Represents aggregate total return for the years indicated, and assumes reinvestment of all distributions. Total return would have been lower had certain expenses not been waived or reimbursed.
4Includes litigation proceeds. Excluding this amount, the Series’ total return is 21.48%.
The accompanying notes are an integral part of the financial statements.
13
Equity Series
Financial Highlights - Class W
| FOR THE PERIOD 3/1/191 TO 10/31/19 | |||||
Per share data (for a share outstanding throughout each period): | |||||
Net asset value - Beginning of period | $12.53 | ||||
|
| ||||
Income from investment operations: | |||||
Net investment income2 | 0.09 | ||||
Net realized and unrealized gain (loss) on investments | 1.36 | ||||
|
| ||||
Total from investment operations | 1.45 | ||||
|
| ||||
Net asset value - End of period | $13.98 | ||||
|
| ||||
Net assets - End of period(000’s omitted) | $369 | ||||
|
| ||||
Total return3 | 11.57% | ||||
Ratios (to average net assets)/Supplemental Data: | |||||
Expenses*4 | 0.05% | ||||
Net investment income4 | 1.04% | ||||
Series portfolio turnover | 48% | ||||
| *The investment advisor did not impose all or a portion of its management and/or other fees during the period, and may have paid a portion of the Series’ expenses. If these expenses had been incurred by the Class, the expense ratio (to average net assets) would have increased by the following amount4: |
| ||||
| 1.00% | |||||
1Commencement of operations.
2Calculated based on average shares outstanding during the period.
3Represents aggregate total return for the period indicated, and assumes reinvestment of all distributions. Total return would have been lower had certain expenses not been waived or reimbursed during the period. Periods less than one year are not annualized.
4Annualized.
The accompanying notes are an integral part of the financial statements.
14
Equity Series
Notes to Financial Statements
| 1. | Organization |
Equity Series (the “Series”) is a no-load diversified series of Manning & Napier Fund, Inc. (the “Fund”). The Fund is organized in Maryland and is registered under the Investment Company Act of 1940, as amended, as an open-end management investment company.
The Series’ investment objective is to provide long-term growth of capital.
The Series is authorized to issue two classes of shares (Class S and Class W). Class W shares of the Series were issued on March 1, 2019. Each class of shares is substantially the same, except that Class S shares bear shareholder servicing fees.
The Fund’s Advisor is Manning & Napier Advisors, LLC (the “Advisor”). Shares of the Series are offered to investors, clients and employees of the Advisor and its affiliates. The total authorized capital stock of the Fund consists of 15 billion shares of common stock each having a par value of $0.01. As of October 31, 2019, 10 billion shares have been designated in total among 34 series, of which 200 million have been designated as Equity Series Class S common stock and 100 million have been designated as Equity Series Class W common stock.
| 2. | Significant Accounting Policies |
The following is a summary of significant accounting policies followed by the Series. The Series is an investment company and, accordingly, follows the investment company accounting and reporting guidance of the Financial Accounting Standards Board Accounting Standards Codification Topic 946 - Investment Companies, which is part of accounting principles generally accepted in the United States of America (“GAAP”).
Security Valuation
Portfolio securities, including domestic equities, listed on an exchange other than the NASDAQ Stock Market are valued at the latest quoted sales price of the exchange on which the security is primarily traded. Securities not traded on valuation date or securities not listed on an exchange are valued at the latest quoted bid price provided by the Fund’s pricing service. Securities listed on the NASDAQ Stock Market are valued in accordance with the NASDAQ Official Closing Price.
Short-term investments that mature in sixty days or less may be valued at amortized cost, which approximates fair value. Investments in open-end investment companies are valued at their net asset value per share on valuation date.
Volume and level of activity in established markets for an asset or liability are evaluated to determine whether recent transactions and quoted prices are determinative of fair value. Where there have been significant decreases in volume and level of activity, further analysis and adjustment may be necessary to estimate fair value. The Series measures fair value in these instances by the use of inputs and valuation techniques which may be based upon current market prices of securities that are comparable in coupon, rating, maturity and industry and/or expectation of future cash flows. As a result of trading in relatively thin markets and/or markets that experience significant volatility, the prices used by the Series to value these securities may differ from the value that would be realized if these securities were sold, and the differences could be material.
Securities for which representative valuations or prices are not available from the Series’ pricing service may be valued at fair value as determined in good faith by the Advisor under procedures approved by and under the general supervision and responsibility of the Fund’s Board of Directors (the “Board”). Due to the inherent uncertainty of valuations of such securities, the fair value may differ significantly from the values that would have been used had a ready market for such securities existed. If trading or events occurring after the close of the principal market in which securities are traded are expected to materially affect the value of those securities, then they may be valued at their fair value, taking this trading or these events into account.
Various inputs are used in determining the value of the Series’ assets or liabilities carried at fair value. These inputs are summarized in three broad levels. Level 1 includes quoted prices in active markets for identical assets and liabilities. Level 2 includes other significant observable inputs (including quoted prices for similar securities, interest rates, prepayment speeds, credit risk, etc.). Level 3 includes significant unobservable inputs (including the Series’ own assumptions in determining the fair value of investments). A financial instrument’s level within the fair value hierarchy is based on the lowest level of any input both
15
Equity Series
Notes to Financial Statements (continued)
| 2. | Significant Accounting Policies (continued) |
Security Valuation(continued)
individually and in aggregate that is significant to the fair value measurement. The inputs or methodology used for valuing securities are not necessarily an indication of the risk associated with investing in those securities.
The following is a summary of the valuation levels used for major security types as of October 31, 2019 in valuing the Series’ assets or liabilities carried at fair value:
| DESCRIPTION | TOTAL | LEVEL 1 | LEVEL 2 | LEVEL 3 | ||||||||||||
Assets: | ||||||||||||||||
Equity Securities: | ||||||||||||||||
Communication Services | $ | 6,440,460 | $ | 6,440,460 | $ | — | $ | — | ||||||||
Consumer Discretionary | 8,339,610 | 8,339,610 | — | — | ||||||||||||
Consumer Staples | 8,101,285 | 8,101,285 | — | — | ||||||||||||
Energy | 886,820 | 886,820 | — | — | ||||||||||||
Financials | 9,159,297 | 9,159,297 | — | — | ||||||||||||
Health Care | 7,115,100 | 7,115,100 | — | — | ||||||||||||
Industrials | 2,560,312 | 2,560,312 | — | — | ||||||||||||
Information Technology | 12,221,363 | 12,221,363 | — | — | ||||||||||||
Materials | 3,693,429 | 3,693,429 | — | — | ||||||||||||
Real Estate | 2,885,687 | 2,885,687 | — | — | ||||||||||||
Short-Term Investment | 2,770,713 | 2,770,713 | — | — | ||||||||||||
|
|
|
|
|
|
|
| |||||||||
Total assets | $ | 64,174,076 | $ | 64,174,076 | $ | — | $ | — | ||||||||
|
|
|
|
|
|
|
| |||||||||
There were no Level 2 or Level 3 securities held by the Series as of October 31, 2018 or October 31, 2019.
Security Transactions, Investment Income and Expenses
Security transactions are accounted for on trade date. Dividend income is recorded on the ex-dividend date, except that if the ex-dividend date has passed, certain dividends from foreign securities are recorded as soon as the Series is informed of the ex-dividend date. Non-cash dividends, if any, are recorded at the fair value of the securities received. Interest income, including amortization of premium and accretion of discounts using the effective interest method, is earned from settlement date and accrued daily.
Expenses are recorded on an accrual basis. Most expenses of the Fund can be attributed to a specific series. Expenses which cannot be directly attributed are apportioned among the series in the Fund in such a manner as deemed equitable by the Fund’s Board, taking into consideration, among other things, the nature and type of expense.
The Series uses the identified cost method for determining realized gain or loss on investments for both financial statement and federal income tax reporting purposes.
Federal Taxes
The Series’ policy is to comply with the provisions of the Internal Revenue Code applicable to regulated investment companies. The Series is not subject to federal income tax or excise tax to the extent that the Series distributes to shareholders each year its taxable income, including any net realized gains on investments, in accordance with requirements of the Internal Revenue Code. Accordingly, no provision for federal income tax or excise tax has been made in the financial statements.
Management evaluates its tax positions to determine if the tax positions taken meet the minimum recognition threshold in connection with accounting for uncertainties in income tax positions taken or expected to be taken for the purposes of measuring and recognizing tax liabilities in the financial statements. Recognition of tax benefits of an uncertain tax position is required only when the position is “more likely than not” to be sustained assuming examination by taxing authorities. At October 31, 2019, the Series has recorded no liability for net unrecognized tax benefits relating to uncertain income tax positions taken or expected to be taken in future tax returns.
16
Equity Series
Notes to Financial Statements (continued)
| 2. | Significant Accounting Policies (continued) |
Federal Taxes(continued)
The Series files income tax returns in the U.S. federal jurisdiction, various states and foreign jurisdictions, as required. No income tax returns are currently under investigation. The statute of limitations on the Series’ tax returns remains open for the years ended October 31, 2016 through October 31, 2019. The Series is not aware of any tax positions for which it is reasonably possible that the total amounts of unrecognized tax benefits will significantly change in the next twelve months.
Foreign Taxes
Based on the Series’ understanding of the tax rules and rates related to income, gains and currency purchase/repatriation transactions for foreign jurisdictions in which it invests, the Series will provide for foreign taxes, and where appropriate, deferred foreign tax.
Distributions of Income and Gains
Distributions to shareholders of net investment income and net realized gains are made annually. An additional distribution may be necessary to avoid taxation of the Series. Distributions are recorded on the ex-dividend date.
Indemnifications
The Fund’s organizational documents provide former and current directors and officers with a limited indemnification against liabilities arising in connection with the performance of their duties to the Fund. In the normal course of business, the Fund may also enter into contracts that provide general indemnifications. The Fund’s maximum exposure under these arrangements is unknown as this would be dependent on future claims that may be made against the Fund. The risk of material loss from such claims is considered remote.
Other
The preparation of financial statements in conformity with GAAP requires management to make estimates and assumptions that affect the reported amounts of assets and liabilities and the disclosure of contingent assets and liabilities at the date of the financial statements and the reported amounts of income and expenses during the reporting period. Actual results could differ from those estimates.
| 3. | Transactions with Affiliates |
The Fund has an Investment Advisory Agreement (the “Agreement”) with the Advisor, for which the Series pays a fee, computed daily and payable monthly, at an annual rate of 0.75% of the Series’ average daily net assets.
Under the Agreement, personnel of the Advisor provide the Series with advice and assistance in the choice of investments and the execution of securities transactions, and otherwise maintain the Series’ organization. The Advisor also provides the Fund with necessary office space and fund administration and support services. The salaries of all officers of the Fund (except a percentage of the Fund’s Chief Compliance Officer’s salary, which is paid by the Fund), and of all Directors who are “affiliated persons” of the Fund, or of the Advisor, and all personnel of the Fund, or of the Advisor, performing services relating to research, statistical and investment activities, are paid by the Advisor. Each “non-affiliated” Director receives an annual stipend, which is allocated among all the active series of the Fund. In addition, these Directors also receive a fee per Board meeting attended plus a fee for each committee meeting attended and are reimbursed for travel and other out-of-pocket expenses incurred by them in connection with attending such meetings. The Fund also has an Audit Committee Chair, Governance & Nominating Committee Chair and Lead Independent Director who each receive an additional annual stipend for these roles.
The Class S shares of the Series are subject to a shareholder services fee in accordance with a shareholder services plan adopted by the Board. The shareholder services fee is intended to compensate financial intermediaries, including affiliates of the Fund, in connection with the provision of direct client service, personal services, maintenance of shareholder accounts and reporting services. For these services, Class S of the Series pay a fee, computed daily and payable monthly, at an annual rate of 0.25% of the average daily net assets of Class S shares. The Fund has a Shareholder Services Agreement with the Advisor, for which the Advisor receives the shareholder services fee as stated above.
17
Equity Series
Notes to Financial Statements (continued)
| 3. | Transactions with Affiliates (continued) |
Effective, March 1, 2019, the Advisor has contractually agreed to waive the management fee for the Class W shares. In addition, pursuant to a separate expense limitation agreement, the Advisor has contractually agreed to limit its fees and reimburse expenses to the extent necessary so that the total direct annual fund operating expenses, exclusive of the shareholder services fee and waived Class W management fees (collectively, “excluded expenses”), to 0.80% of the average daily net assets of the Class S shares and 0.05% of the average daily net assets of the Class W shares. These contractual waivers are expected to continue indefinitely, and may not be amended or terminated by the Advisor without the approval of the Series’ Board of Directors. The Advisor may receive from a Class the difference between the Class’s total direct annual fund operating expenses, not including excluded expenses, and the Class’s contractual expense limit to recoup all or a portion of its prior fee waivers (other than Class W management fee waivers) or expense reimbursements made during the rolling three-year period preceding the recoupment if at any point the total direct annual fund operating expenses, not including excluded expenses, are below the contractual expense limit (a) at the time of the fee waiver and/or expense reimbursement and (b) at the time of the recoupment.
Pursuant to the advisory fee waiver, the Advisor waived $1,839 in management fees for Class W shares for the year ended October 31, 2019. In addition, pursuant to the separate expense limitation agreement, the Advisor waived or reimbursed expenses of $154,347 and $612 for Class S and Class W shares, respectively, for the year ended October 31, 2019. These amounts are included as a reduction of expenses on the Statement of Operations. At October 31, 2019, the Advisor is eligible to recoup $109,525. For the year ended October 31, 2019, the Advisor did not recoup any expenses that have been previously waived or reimbursed.
Manning & Napier Investor Services, Inc., a registered broker-dealer affiliate of the Advisor, acts as distributor for the Fund’s shares. The services of Manning & Napier Investor Services, Inc. are provided at no additional cost to the Series.
Pursuant to a master services agreement dated March 1, 2017, the Fund pays the Advisor an annual fee related to fund accounting and administration of 0.0085% on the first $25 billion of average daily net assets (excluding Target Series and Income Series); 0.0075% on the next $15 billion of average daily net assets (excluding Target Series and Income Series); and 0.0065% of average daily net assets in excess of $40 billion (excluding Target Series and Income Series); plus a base fee of $30,400 per series. Additionally, certain transaction and out-of-pocket expenses, including charges for reporting relating to the Fund’s compliance program, are charged. The Advisor has agreements with BNY Mellon Investment Servicing (U.S.) Inc. (“BNY”) under which BNY serves as sub-accountant services agent.
| 4. | Purchases and Sales of Securities |
For the year ended October 31, 2019, purchases and sales of securities, other than U.S. Government securities and short-term securities, were $30,596,597 and $45,954,201, respectively. There were no purchases or sales of U.S. Government securities.
18
Equity Series
Notes to Financial Statements (continued)
| 5. | Capital Stock Transactions |
Transactions in Class S and Class W shares of Equity Series were:
| CLASS S | FOR THE YEAR ENDED 10/31/19 | FOR THE YEAR ENDED 10/31/18 | ||||||||||||||
| SHARES | AMOUNT | SHARES | AMOUNT | |||||||||||||
Sold | 269,984 | $ | 3,457,862 | 282,300 | $ | 4,076,767 | ||||||||||
Reinvested | 943,883 | 10,628,123 | 426,205 | 5,860,318 | ||||||||||||
Repurchased | (1,499,648 | ) | (19,117,104 | ) | (1,680,674 | ) | (24,536,632 | ) | ||||||||
|
|
|
|
|
|
|
| |||||||||
Total | (285,781 | ) | $ | (5,031,119 | ) | (972,169 | ) | $ | (14,599,547 | ) | ||||||
|
|
|
|
|
|
|
| |||||||||
| CLASS W | FOR THE PERIOD 3/1/19 (COMMENCEMENT OF OPERATIONS) TO 10/31/19 | |||||||||||||||
| SHARES | AMOUNT | |||||||||||||||
Sold | 28,317 | $ | 356,802 | |||||||||||||
Reinvested | — | — | ||||||||||||||
Repurchased | (1,924 | ) | (26,114 | ) | ||||||||||||
|
|
|
| |||||||||||||
Total | 26,393 | $ | 330,688 | |||||||||||||
|
|
|
| |||||||||||||
At October 31, 2019, the Advisor and its affiliates owned 11.1% of the Series.
| 6. | Line of Credit |
The Fund has entered into a 364-day, $25 million credit agreement (the “line of credit”) with Bank of New York Mellon. Each series of the Fund may borrow under the line of credit for temporary or emergency purposes, including funding shareholder redemptions and other short-term liquidity purposes. The Fund pays an annual fee on the unused commitment amount, payable quarterly, and is allocated among all the series of the Fund and included in miscellaneous expenses in the Statement of Operations for each series. The line of credit expires in August 2020 unless extended or renewed. During the year ended October 31, 2019, the Series did not borrow under the line of credit.
| 7. | Financial Instruments |
The Series may trade in instruments including written and purchased options, forward foreign currency exchange contracts and futures contracts and other derivatives in the normal course of investing activities to assist in managing exposure to various market risks. The Series may be subject to various elements of risk, which may involve, to a varying degree, elements of risk in excess of the amounts recognized for financial statement purposes. These risks include: the risk that changes in the value of a derivative may not correlate perfectly with the underlying asset, rate or index; counterparty credit risk related to over the counter derivative counterparties’ failure to perform under contract terms; liquidity risk related to the lack of a liquid market for these contracts allowing the fund to close out its position(s); and documentation risk relating to disagreement over contract terms. No such investments were held by the Series as of October 31, 2019.
| 8. | Foreign Securities |
Investing in securities of foreign companies and foreign governments involves special risks and considerations not typically associated with investing in securities of domestic companies and the U.S. Government. These risks include revaluation of currencies and future adverse political and economic developments. Moreover, securities of foreign companies and foreign governments and their markets may be less liquid and their prices more volatile than those of comparable domestic companies and the U.S. Government.
19
Equity Series
Notes to Financial Statements (continued)
| 9. | Federal Income Tax Information |
The amount and characterization of certain income and capital gains to be distributed are determined in accordance with federal income tax regulations, which may differ from GAAP. These differences are primarily due to differing book and tax treatments in the timing of the recognition of net investment income or gains and losses, including losses deferred due to wash sales, the use of equalization and investments in real estate investment trusts. The Series may periodically make reclassifications among its capital accounts to reflect income and gains available for distribution (or available capital loss carryovers) under income tax regulations, without impacting the Series’ net asset value. For the year ended October 31, 2019, amounts were reclassified within the capital accounts to increase Additional Paid in Capital by $469,409 and decrease Total Distributable Earnings (Loss) by $469,409. Any such reclassifications are not reflected in the financial highlights.
The tax character of distributions paid were as follows:
| FOR THE YEAR ENDED 10/31/19 | FOR THE YEAR ENDED 10/31/18 | ||||||||||||||
Ordinary income | $ | 3,116,908 | $ | 3,065,404 | |||||||||||
Long-term capital gains | 7,756,351 | 2,918,123 | |||||||||||||
At October 31, 2019, the tax basis of components of distributable earnings and the net unrealized appreciation based on the identified cost of investments for federal income tax purposes were as follows:
Cost for federal income tax purposes | $ | 51,775,918 | ||||||
Unrealized appreciation | 14,008,852 | |||||||
Unrealized depreciation | (1,610,694 | ) | ||||||
|
| |||||||
Net unrealized appreciation | $ | 12,398,158 | ||||||
|
| |||||||
Undistributed ordinary income | $ | 875,642 | ||||||
Undistributed long-term capital gains | $ | 5,316,181 | ||||||
20
Equity Series
Report of Independent Registered Public Accounting Firm
To the Board of Directors of Manning & Napier Fund, Inc. and Shareholders of Equity Series
Opinion on the Financial Statements
We have audited the accompanying statement of assets and liabilities, including the investment portfolio, of Equity Series (one of the series constituting Manning & Napier Fund, Inc., referred to hereafter as the “Fund”) as of October 31, 2019, the related statement of operations for the year ended October 31, 2019, the statement of changes in net assets for each of the two years in the period ended October 31, 2019, including the related notes, and the financial highlights for each of the periods indicated therein (collectively referred to as the “financial statements”). In our opinion, the financial statements present fairly, in all material respects, the financial position of the Fund as of October 31, 2019, the results of its operations for the year then ended, the changes in its net assets for each of the two years in the period ended October 31, 2019 and the financial highlights for each of the periods indicated therein in conformity with accounting principles generally accepted in the United States of America.
Basis for Opinion
These financial statements are the responsibility of the Fund’s management. Our responsibility is to express an opinion on the Fund’s financial statements based on our audits. We are a public accounting firm registered with the Public Company Accounting Oversight Board (United States) (“PCAOB”) and are required to be independent with respect to the Fund in accordance with the U.S. federal securities laws and the applicable rules and regulations of the Securities and Exchange Commission and the PCAOB.
We conducted our audits of these financial statements in accordance with the standards of the PCAOB. Those standards require that we plan and perform the audit to obtain reasonable assurance about whether the financial statements are free of material misstatement, whether due to error or fraud.
Our audits included performing procedures to assess the risks of material misstatement of the financial statements, whether due to error or fraud, and performing procedures that respond to those risks. Such procedures included examining, on a test basis, evidence regarding the amounts and disclosures in the financial statements. Our audits also included evaluating the accounting principles used and significant estimates made by management, as well as evaluating the overall presentation of the financial statements. Our procedures included confirmation of securities owned as of October 31, 2019 by correspondence with the custodian. We believe that our audits provide a reasonable basis for our opinion.

New York, New York
December 16, 2019
We have served as the auditor of one or more investment companies in Manning & Napier Mutual Funds since 1992.
21
Equity Series
Supplemental Tax Information
(unaudited)
All reportings are based on financial information available as of the date of this annual report and, accordingly, are subject to change.
For federal income tax purposes, the Series reports for the current fiscal year $676,482 or, if different, the maximum amount allowable under the tax law, as qualified dividend income.
For corporate shareholders, the percentage of investment income (dividend income plus short-term gains, if any) that qualifies for the dividends received deduction for the current fiscal year is 21.05%.
The Series designates $6,005,383 as Long-Term Capital Gain dividends pursuant to Section 852(b) of the Code for the fiscal year ended October 31, 2019.
22
Equity Series
Directors’ and Officers’ Information
(unaudited)
The Statement of Additional Information provides additional information about the Fund’s directors and officers and can be obtained without charge by calling 1-800-466-3863, at www.manning-napier.com, or on the EDGAR Database on the SEC Internet web site (http://www.sec.gov). The following chart shows certain information about the Fund’s directors and officers, including their principal occupations during the last five years. Unless specific dates are provided, the individuals have held the listed positions for longer than five years.
Interested Director and Officer
| Name: | Paul Battaglia* | |
| Address: | 290 Woodcliff Drive | |
| Fairport, NY 14450 | ||
| Age: | 41 | |
| Current Position(s) Held with Fund: | Principal Executive Officer, President, Chairman & Director | |
| Term of Office & Length of Time Served: | Indefinite – Chairman and Director since November 20181 | |
| Principal Occupation(s) During Past 5 Years: | Chief Financial Officer (2018 – Present); Vice President of Finance (2016 – 2018); Director of Finance (2011 – 2016); Financial Analyst/Internal Auditor (2004-2006) – Manning & Napier Advisors, LLC and affiliates Holds one or more of the following titles for various affiliates: Chief Financial Officer | |
| Number of Portfolios Overseen within Fund Complex: | 32 | |
| Other Directorships Held Outside Fund Complex During | N/A | |
Past 5 Years:
| ||
| Independent Directors | ||
| Name: | Stephen B. Ashley | |
| Address: | 290 Woodcliff Drive | |
| Fairport, NY 14450 | ||
| Age: | 79 | |
| Current Position(s) Held with Fund: | Director, Audit Committee Member, Governance & Nominating Committee Member | |
| Term of Office & Length of Time Served: | Indefinite – Since 1996 | |
| Principal Occupation(s) During Past 5 Years: | Chairman, Director & Chief Executive Officer (1997 to present) - The Ashley Group (property management and investment). Director (1995-2008) and Chairman (non-executive) (2004-2008) - Fannie Mae (mortgage) | |
| Number of Portfolios Overseen within Fund Complex: | 32 | |
| Other Directorships Held Outside Fund Complex During | Fannie Mae (1995-2008) | |
| Past 5 Years: | The Ashley Group (1995-2008) | |
Genesee Corporation (1987-2007)
| ||
| Name: | Paul A. Brooke | |
| Address: | 290 Woodcliff Drive | |
| Fairport, NY 14450 | ||
| Age: | 73 | |
| Current Position(s) Held with Fund: | Lead Independent Director, Audit Committee Member, Governance & Nominating Committee Chairman | |
| Term of Office & Length of Time Served: | Indefinite – Director, Audit Committee Member, Governance & Nominating Committee Member since 2007; Governance & Nominating Committee Chairman since 2016; Lead Independent Director since 2017 | |
| Principal Occupation(s) During Past 5 Years: | Chairman & CEO (2005-2009) - Ithaka Acquisition Corporation (investments); Chairman (2007-2009) - Alsius Corporation (investments); Managing Member (1991-present) - PMSV Holdings LLC (investments); Managing Member (2010-2016) - Venbio (investments). | |
| Number of Portfolios Overseen within Fund Complex: | 32 | |
| Other Directorships Held Outside Fund Complex During | Incyte Corp. (biotech)(2000-present); ViroPharma, Inc. (speciality | |
| Past 5 Years: | pharmaceuticals)(2000-2014); HLTH (WebMD)(information)(2000-2010); Cheyne Capital International (investment)(2000-2017); GMP Companies (investment)(2000-2011); Cytos Biotechnology Ltd (biotechnology)(2012-2014); Cerus (biomedical)(2016-present); PureEarth(non-profit)(2012-present); Caelum BioSciences (biomedical)(2018-present)
| |
23
Equity Series
Directors’ and Officers’ Information
(unaudited)
Independent Directors (continued)
| Name: | Peter L. Faber | |
| Address: | 290 Woodcliff Drive | |
| Fairport, NY 14450 | ||
| Age: | 81 | |
| Current Position(s) Held with Fund: | Director, Governance & Nominating Committee Member | |
| Term of Office & Length of Time Served: | Indefinite – Since 1987 | |
| Principal Occupation(s) During Past 5 Years: | Senior Counsel (2006-2012), Partner (1995-2006 & 2013-present) - | |
| McDermott, Will & Emery LLP (law firm) | ||
| Number of Portfolios Overseen within Fund Complex: | 32 | |
| Other Directorships Held Outside Fund Complex During Past 5 Years: | Boston Early Music Festival (non-profit)(2007-present); Amherst Early Music, Inc. (non-profit)(2009-present); Gotham Early Music Scene, Inc. (non-profit)(2009-present); Partnership for New York City, Inc. (non-profit)(1989-2010); New York Collegium (non-profit)(2004-2011); S’Cool Sounds, Inc. (non-profit)(2017-present)
| |
| Name: | Harris H. Rusitzky | |
| Address: | 290 Woodcliff Drive | |
| Fairport, NY 14450 | ||
| Age: | 84 | |
| Current Position(s) Held with Fund: | Director, Audit Committee Member, Governance & Nominating Committee Member | |
| Term of Office & Length of Time Served: | Indefinite – Since 1985 | |
| Principal Occupation(s) During Past 5 Years: | President (1994- present) - The Greening Group (business consultants); | |
| Partner (2006-present) - The Restaurant Group (restaurants) | ||
| Number of Portfolios Overseen within Fund Complex: | 32 | |
| Other Directorships Held Outside Fund Complex During Past 5 Years: | Rochester Institute of Technology (university)(1972-present); Culinary Institute of America (non-profit college)(1985-present); George Eastman House (museum)(1988-present); National Restaurant Association (restaurant trade organization)(1978-present)
| |
| Name: | Chester N. Watson | |
| Address: | 290 Woodcliff Drive | |
| Fairport, NY 14450 | ||
| Age: | 69 | |
| Current Position(s) Held with Fund: | Director, Audit Committee Chairman, Governance & Nominating Committee Member | |
| Term of Office & Length of Time Served: | Indefinite – Director, Audit Committee Member, Governance & Nominating Committee Member Since 2012; Audit Committee Chairman since 2013 | |
| Principal Occupation(s) During Past 5 Years: | General Auditor (2003-2011) - General Motors Company (auto manufacturer) | |
| Number of Portfolios Overseen within Fund Complex: | 32 | |
| Other Directorships Held Outside Fund Complex During Past 5 Years: | Rochester Institute of Technology (university)(2005-present); Town of Greenburgh, NY Planning Board (municipal government) (2015-2018)
| |
| Officers: | ||
| Name: | Elizabeth Craig | |
| Address: | 290 Woodcliff Drive | |
| Fairport, NY 14450 | ||
| Age: | 32 | |
| Current Position(s) Held with Fund: | Corporate Secretary | |
| Term of Office1 & Length of Time Served: | Since 2016 | |
| Principal Occupation(s) During Past 5 Years: | Fund Regulatory Administration Manager since 2018; Fund Administration Manager (2015-2018); Mutual Fund Compliance Specialist (2009-2015) - Manning & Napier Advisors, LLC; Assistant Corporate Secretary (2011-2016) - Manning & Napier Fund, Inc.
| |
24
Equity Series
Directors’ and Officers’ Information
(unaudited)
Officers: (continued)
| Name: | Christine Glavin | |
| Address: | 290 Woodcliff Drive | |
| Fairport, NY 14450 | ||
| Age: | 53 | |
| Current Position(s) Held with Fund: | Principal Financial Officer, Chief Financial Officer | |
| Term of Office1 & Length of Time Served: | Principal Financial Officer since 2002; Chief Financial Officer since 2001 | |
| Principal Occupation(s) During Past 5 Years: | Director of Fund Reporting since 2011; Fund Reporting Manager (1997-2011) - Manning & Napier Advisors, LLC; Assistant Treasurer since 2008 - Exeter Trust Company; Chief Financial Officer (2017-2018) - Rainier Investment Management Mutual Funds, Inc.
| |
| Name: | Samantha Larew | |
| Address: | 290 Woodcliff Drive | |
| Fairport, NY 14450 | ||
| Age: | 39 | |
| Current Position(s) Held with Fund: | Chief Compliance Officer and Anti-Money Laundering Compliance Officer | |
| Term of Office1 & Length of Time Served: | Chief Compliance Officer since 2019; Anti-Money Laundering Compliance Officer since 2018 | |
| Principal Occupation(s) During Past 5 Years: | Co-Director of Compliance (since 2018); Compliance Communications Supervisor (2014-2018); Compliance Supervisor (2011-2014); Broker-Dealer Compliance Analyst (2010-2014) - Manning & Napier Advisors, LLC and affiliates; Broker-Dealer Chief Compliance Officer (since 2013) – Manning & Napier Investor Services, Inc.; Compliance Analyst (2007-2009) – Wall Street Financial Group; Compliance Specialist (2003-2007) – Manning & Napier Advisors, LLC and affiliates Holds one or more of the following titles for various affiliates: Assistant Corporate Secretary, Chief Compliance Officer
| |
| Name: | Scott Morabito | |
| Address: | 290 Woodcliff Drive | |
| Fairport, NY 14450 | ||
| Age: | 31 | |
| Current Position(s) Held with Fund: | Vice President | |
| Term of Office1 & Length of Time Served: | Vice President since 2019; Assistant Vice President (2017-2019) | |
| Principal Occupation(s) During Past 5 Years: | Managing Director of Operations since 2019 and Director of Funds Group from 2017 - 2019; Fund Product and Strategy Manager (2014-2017); Senior Product and Strategy Analyst (2013-2014); Product and Strategy Analyst (2011-2013) - Manning & Napier Advisors, LLC; President, Director – Manning & Napier Investor Services, Inc. since 2018
| |
| Name: | Sarah Turner | |
| Address: | 290 Woodcliff Drive | |
| Fairport, NY 14450 | ||
| Age: | 37 | |
| Current Position(s) Held with Fund: | Chief Legal Officer; Assistant Corporate Secretary | |
| Term of Office1 & Length of Time Served: | Since 2018 | |
| Principal Occupation(s) During Past 5 Years: | General Counsel since 2018 - Manning & Napier Advisors, LLC and affiliates; Counsel (2017-2018) – Harter Secrest and Emery LLP; Legal Counsel (2010-2017) – Manning & Napier Advisors, LLC and affiliates Holds one or more of the following titles for various affiliates: Corporate Secretary, General Counsel | |
*Interested Director, within the meaning of the 1940 Act by reason of his positions with the Fund’s Advisor, Manning & Napier Advisors, LLC, and Distributor, Manning & Napier Investor Services, Inc.
1The term of office of all officers shall be one year and until their respective successors are chosen and qualified, or his or her earlier resignation or removal as provided in the Fund’s By-Laws.
25
Equity Series
Literature Requests
(unaudited)
Proxy Voting Policies and Procedures
A description of the policies and procedures that the Fund uses to determine how to vote proxies relating to portfolio securities is available, without charge, upon request:
By phone | 1-800-466-3863 | |
On the Securities and Exchange | ||
Commission’s (SEC) web site | http://www.sec.gov |
Proxy Voting Record
Information regarding how the Fund voted proxies relating to portfolio securities during the most recent 12-month period ended June 30th is available, without charge, upon request:
By phone | 1-800-466-3863 | |
On the SEC’s web site | http://www.sec.gov |
Quarterly Portfolio Holdings
The Series’ complete schedule of portfolio holdings for the 1st and 3rd quarters of each fiscal year are provided on Form N-PORT, and are available, without charge, upon request:
By phone | 1-800-466-3863 | |
On the SEC’s web site | http://www.sec.gov |
Prospectus and Statement of Additional Information (SAI)
For more information about any of the Manning & Napier Fund, Inc. Series, you may obtain a prospectus and SAI at www.manning-napier.com or by calling (800) 466-3863. Before investing, carefully consider the objectives, risks, charges and expenses of the investment and read the prospectus carefully as it contains this and other information about the investment company.In addition, this information can be found on the SEC’s web site, http://www.sec.gov.
Additional information available at www.manning-napier.com
1. Fund Holdings - Month-End
2. Fund Holdings - Quarter-End
3. Shareholder Report - Annual
4. Shareholder Report - Semi-Annual
The Fund also offers electronic notification or “e-delivery” when certain documents are available on-line to be downloaded or reviewed. Direct shareholders can elect to receive electronic notification when shareholder reports, prospectus updates, and/or statements are available. If you do not currently have on-line access to your account, you can establish access by going to www.manning-napier.com, click on “Login” in the top corner of the page, and follow the prompts to self-enroll. Once enrolled, you can set your electronic notification preferences by clicking on the Account Options tab located within the green toolbar and then select E-Delivery Option. Should you have any questions on either how to establish on-line access or how to update your account settings, please contact Investor Services at 1-800-466-3863.
The Manning & Napier Fund, Inc. is managed by Manning & Napier Advisors, LLC. Manning & Napier Investor Services, Inc., an affiliate of Manning & Napier Advisors, LLC, is the distributor of the Fund shares.
MNEQY-10/19-AR

www.manning-napier.com
Manning & Napier Fund, Inc.
|
Blended Asset Conservative Series |
Blended Asset Moderate Series |
Blended Asset Extended Series |
Blended Asset Maximum Series |
Beginning on June 25, 2021, as permitted by Securities and Exchange Commission regulations, paper copies of the Series’ annual and semi-annual shareholder reports will no longer be sent by mail, unless you specifically request paper copies of the reports from the Fund or from your financial intermediary, such as a broker-dealer or bank. Instead, the reports will be made available on a website, and you will be notified by mail each time a report is posted and provided with a website link to access the report.
If you already elected to receive shareholder reports electronically, you will not be affected by this change and you need not take any action. You may elect to receive shareholder reports and other communications from the Fund electronically by contacting your financial intermediary or, if you are a direct investor, by visiting www.manning-napier.com or calling 1-800-466-3863.
You may elect to receive all future annual and semi-annual reports in paper free of charge. If you invest through a financial intermediary, you can contact your financial intermediary to request that you continue to receive paper copies of your shareholder reports. If you invest directly with the Fund, you can inform the Fund that you wish to continue receiving paper copies of your shareholder reports by visiting www.manning-napier.com or calling
1-800-466-3863. Your election to receive reports in paper will apply to all funds held with your financial intermediary if you invest through a financial intermediary or all series of the Fund if you invest directly with the Fund.
 | Independent Perspective| Real-World Solutions |
A Note from Our CEO
Dear Shareholder,
The investing world is constantly changing, yet investors’ needs and objectives remain substantially the same.
Whether you are an individual saver looking to ensure security in retirement, or an institutional investor with a fiduciary obligation to others, at the end of the day you look for a trusted partner to help you build, grow, and preserve wealth.
In order to do so successfully we recognize that, in the short-term, the world’s capital markets can be capricious and hard to predict.
Bubbles form, rise, and then pop. The hot stocks of today often become passing fads of tomorrow. Investor sentiment can swing wildly, whipsawing between exuberance one day and despondence the next.
As successful long-term investors, we are defined both by what we do as well as what we don’t do.
We don’t attempt to perfectly time every recession. We don’t jump on the latest trend. We don’t worry about capturing every market peak all across the globe.
On the other hand, we do maintain the rigorous disciplines we have developed over close to half a century. We are highly attentive to managing risk and protecting investors in down markets while participating fully in the opportunities our Research uncovers.
Our focus is on you, the shareholder, and helping you achieve your goals.
In the face of an uncertain world, we believe our investment philosophies, processes, and experience have stood the test of time and will do so in the future.
We appreciate your continued confidence in our approach.
 |
Sincerely,
Marc Mayer Chief Executive Officer |

Corporate Headquarters | 290 Woodcliff Drive| Fairport, NY 14450| (585) 325-6880 phone| (800) 551-0224 toll free| www.manning-napier.com
1
Fund Commentary
(unaudited)
Investment Objective
The Blended Asset Series are strategically allocated across stocks, bonds, and cash to balance growth, capital preservation, and income to fit a range of investor risk management priorities.
Performance Commentary
Global equity and fixed income markets posted strong positive returns for the twelve-month period ending October 31, 2019. Over the one year period, equities outperformed fixed income markets, and within stocks, US equities outperformed international markets. With respect to equities, large-cap stocks outperformed small-and mid-cap stocks, while growth stocks outperformed their value counterparts. On the fixed income side, corporate bonds experienced the highest returns from a sector perspective, while longer dated bonds were the highest returning segment of the market from a maturity perspective as a result of falling interest rates.
Each of the Blended Asset Series delivered positive returns over the period, and, with the exception of Moderate Series, outperformed their respective blended benchmarks.
Among the largest contributors to relative returns (i.e., returns compared to the benchmark) was stock selection in Materials, Health Care, Consumer Staples, Information Technology, and Real Estate, as well as from an overweight to Real Estate and underweight to Energy. Additionally, selection within Consumer Discretionary was a large contributor to outperformance for the Maximum Series. Underperformance for the Moderate Series was largely attributable to positioning within the fixed income portion of the portfolio when compared to the benchmark. Specifically, a shorter duration in a period where interest rates generally fell.
We believe the global economy is showing signs of moving into the later stages of the economic cycle. When this occurs, it is common to see strong stock market gains. While these rallies may give investors the feeling of missing out, it is exactly in these moments that risk management can be most valuable.
Given our outlook, the portfolios are focused on higher quality businesses and reasonably priced growth companies. We prefer businesses with strong management and solid balance sheets who have historically provided some degree of downside protection in adverse markets.
This view has led to meaningful positions in areas such as Consumer Staples and Health Care. In contrast, the portfolios are less exposed to sectors that are highly dependent on strong and above average economic growth such as Industrials and Energy. On the fixed income side, we are seeing opportunities in select corporate bonds and shorter duration, higher-quality securitized credit.
Please see the next page for additional performance information as of October 31, 2019.
Performance data quoted represents past performance and does not guarantee future results. The investment return and principal value of an investment will fluctuate, so that an investor’s shares, when redeemed, may be worth more or less than their original cost. Current performance may be higher or lower than that quoted; investors can obtain the most recent month-end performance at www.manning-napier.com or by calling (800) 466-3863.
Commentary prepared using data provided by FactSet. Analysis Manning & Napier. Commentary presented is relative to each Series’ respective blended benchmark. Additional information and associated disclosures can be found on the Performance Update pages contained in this report.
All investments involve risks, including possible loss of principal. Because the fund invests in both stocks and bonds, the value of your investment will fluctuate in response to stock market movements and changes in interest rates. Investing in the fund will also involve a number of other risks, including issuer-specific risk, foreign investment risk, and small-cap/mid-cap risk. Investments in options and futures, like all derivatives, can be highly volatile and involve risks in addition to the risks of the underlying instrument on which the derivative is based, such as counterparty, correlation and liquidity risk. Also, the use of leverage increases exposure to the market and may magnify potential losses.
2
Performance Update as of October 31, 2019 - Blended Asset Conservative Series
(unaudited)
AVERAGE ANNUAL TOTAL RETURN AS OF OCTOBER 31,
| ||||
| ONE YEAR1 |
SINCE INCEPTION2
| |||
Blended Asset Conservative Series - Class R63 | 10.71% | 4.68% | ||
Bloomberg Barclays U.S. Intermediate Aggregate Bond Index4 | 8.83% | 3.48% | ||
Conservative Term Composite Benchmark5 | 10.38% | 4.94% | ||
The following graph compares the value of a $10,000 investment in the Blended Asset Conservative Series - Class R6 from its inception2 (October 13, 2017) to present (October 31, 2019) to the Bloomberg Barclays U.S. Intermediate Aggregate Bond Index and Conservative Term Composite Benchmark.
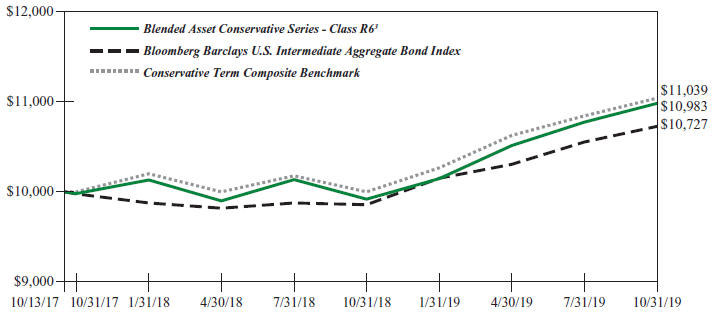
1The returns shown are based on net asset values calculated for shareholder transactions and may differ from the returns shown in the financial highlights, which reflect adjustments made to the net asset values in accordance with accounting principles generally accepted in the United States of America.
2Performance numbers for the Series and Indices are calculated from October 13, 2017, the Series’ inception date.
3The Series’ performance does not reflect the deduction of taxes that a shareholder would pay on fund distributions or the redemption of shares. The Series’ performance is historical and may not be indicative of future results. The performance returns shown are inclusive of the net expense ratio of the Series. For the year ended October 31, 2019, this net expense ratio was 0.45% for Class R6. The gross expense ratio, which does not account for any voluntary or contractual waivers currently in effect, was 0.64% for Class R6 for the year ended October 31, 2019.
4The Bloomberg Barclays U.S Intermediate Aggregate Bond Index is an unmanaged, market-value weighted index of U.S. domestic investment-grade debt issues, including government, corporate, asset-backed and mortgage-backed securities, with maturities greater than one year but less than ten years. Index returns do not reflect any fees or expenses. Index returns provided by Interactive Data.
5The Conservative Term Composite Benchmark is a blend of the Russell 3000® Index (Russell 3000), MSCI ACWI ex USA Index (ACWIxUS), and Bloomberg Barclays U.S. Intermediate Aggregate Bond Index (BIAB) in the following weightings: 15% Russell 3000, 5% ACWIxUS, and 80% BIAB through 05/31/2012; and 22% Russell 3000, 8% ACWIxUS, and 70% BIAB beginning 06/01/2012. Russell 3000 is an unmanaged index that consists of 3,000 of the largest U.S. companies based on total market capitalization. Index returns are based on a market capitalization-weighted average of relative price changes of the component stocks plus dividends whose reinvestments are compounded daily. Index returns provided by Bloomberg. ACWIxUS is designed to measure large and mid-cap representation across 22 of 23 Developed Markets countries (excluding the U.S.) and 26 Emerging Markets countries. The Index is denominated in U.S. dollars. The Index returns are net of withholding taxes. They assume daily reinvestment of net dividends thus accounting for any applicable dividend taxation. Index returns provided by Bloomberg. BIAB is an unmanaged, market value-weighted index of U.S. domestic investment-grade debt issues, including government, corporate, asset-backed, and mortgage-backed securities with maturities of greater than one year but less than ten years. Index returns provided by Interactive Data. The returns of the indices do not reflect any fees or expenses. Returns provided are calculated monthly using a blended allocation. Because the fund’s asset allocation will vary over time, the composition of the fund’s portfolio may not match the composition of the Conservative Term Composite Benchmark.
3
Shareholder Expense Example - Blended Asset Conservative Series
(unaudited)
As a shareholder of the Series, you incur ongoing costs, including management fees, shareholder service fees and other Series expenses. This example is intended to help you understand your ongoing costs (in dollars) of investing in the Series and to compare these costs with the ongoing costs of investing in other mutual funds.
The example is based on an investment of $1,000 invested at the beginning of the period and held for the entire period (May 1, 2019 to October 31, 2019).
Actual Expenses
The first line of the table below provides information about actual account values and actual expenses. You may use the information in this line, together with the amount you invested, to estimate the expenses that you paid over the period. Simply divide your account value by $1,000 (for example, an $8,600 account value divided by $1,000 = 8.6), then multiply the result by the number in the first line under the heading entitled “Expenses Paid During Period” to estimate the expenses you paid on your account during this period.
Hypothetical Example for Comparison Purposes
The second line of the table below provides information about hypothetical account values and hypothetical expenses based on the Series’ actual expense ratio and an assumed rate of return of 5% per year before expenses, which is not the Series’ actual return. The hypothetical account values and expenses may not be used to estimate the actual ending account balance or expenses you paid during the period. You may use this information to compare the ongoing costs of investing in the Series and other funds. To do so, compare this 5% hypothetical example with the 5% hypothetical examples that appear in the shareholder reports of the other funds.
Please note that the expenses shown in the table are meant to highlight your ongoing costs only and do not reflect any transaction costs such as sales charges (loads), redemption fees, or exchange fees that you may incur in other mutual funds. Therefore, the second line of the table is useful in comparing ongoing costs only, and will not help you determine the relative total costs of owning different funds.
BEGINNING
| ENDING
| EXPENSES PAID
| ||||
Actual | $1,000.00 | $1,044.50 | $2.32 | |||
Hypothetical | $1,000.00 | $1,022.94 | $2.29 | |||
*Expenses are equal to the Series’ annualized expense ratio (for the six-month period) of 0.45%, multiplied by the average account value over the period, multiplied by 184/365 (to reflect the one-half year period). Expenses are based on the most recent fiscal half year; therefore, the expense ratios stated above may differ from the expense ratios stated in the financial highlights, which are based on one-year data. The Series’ total return would have been lower had certain expenses not been waived during the period.
4
Portfolio Composition - Blended Asset Conservative Series
As of October 31, 2019 (unaudited)

| Sector Allocation5 | ||||
Financials | 7.1% | |||
Communication Services | 6.8% | |||
Health Care | 4.9% | |||
Energy | 4.8% | |||
Real Estate | 4.7% | |||
Consumer Discretionary | 4.6% | |||
Information Technology | 4.1% | |||
Industrials | 3.5% | |||
Consumer Staples | 3.2% | |||
Materials | 1.3% | |||
Utilities | 0.2% | |||
5Including common stocks and corporate bonds, as a percentage of total investments.
|
| |||
| Top Five Stock Holdings6 | ||||
Johnson & Johnson | 0.8% | |||
Medtronic plc | 0.8% | |||
Microsoft Corp. | 0.6% | |||
Mastercard, Inc. - Class A | 0.6% | |||
Novartis AG - ADR (Switzerland) | 0.6% | |||
6As a percentage of total investments.
| ||||
| Top Five Bond Holdings7 | ||||
U.S. Treasury Note, 2.50%, 8/15/2023 | 6.1% | |||
U.S. Treasury Inflation Indexed Note, 0.125%, 4/15/2020 | 3.9% | |||
U.S. Treasury Note, 1.625%, 5/15/2026 | 3.0% | |||
U.S. Treasury Note, 2.50%, 5/15/2024 | 3.0% | |||
U.S. Treasury Note, 2.125%, 5/15/2025 | 2.9% | |||
7As a percentage of total investments.
| ||||
5
Investment Portfolio - October 31, 2019
| BLENDED ASSET CONSERVATIVE SERIES | ||||||||
SHARES
| VALUE
| |||||||
COMMON STOCKS - 26.3% | ||||||||
Communication Services - 3.0% | ||||||||
Diversified Telecommunication Services - 0.1% |
| |||||||
AT&T, Inc. | 1,255 | $ | 48,305 | |||||
Verizon Communications, Inc. | 1,205 | 72,866 | ||||||
|
| |||||||
| 121,171 | ||||||||
|
| |||||||
Entertainment - 1.4% | ||||||||
Activision Blizzard, Inc.1 | 4,530 | 253,816 | ||||||
Electronic Arts, Inc.*1 | 2,310 | 222,684 | ||||||
Nexon Co. Ltd. (Japan)* | 25,800 | 298,977 | ||||||
Sea Ltd. - ADR (Taiwan)*1 | 8,840 | 263,078 | ||||||
The Walt Disney Co. | 320 | 41,574 | ||||||
|
| |||||||
| 1,080,129 | ||||||||
|
| |||||||
Interactive Media & Services - 1.3% | ||||||||
Alphabet, Inc. - Class A*1 | 175 | 220,290 | ||||||
Alphabet, Inc. - Class C*1 | 180 | 226,820 | ||||||
Facebook, Inc. - Class A* | 1,580 | 302,807 | ||||||
Tencent Holdings Ltd. - Class H (China) | 7,040 | 285,563 | ||||||
|
| |||||||
| 1,035,480 | ||||||||
|
| |||||||
Media - 0.2% | ||||||||
Quebecor, Inc. - Class B (Canada) | 3,140 | 72,999 | ||||||
Shaw Communications, Inc. - | 3,830 | 78,165 | ||||||
|
| |||||||
| 151,164 | ||||||||
|
| |||||||
Total Communication Services | 2,387,944 | |||||||
|
| |||||||
Consumer Discretionary - 2.2% | ||||||||
Automobiles - 0.0%## | ||||||||
Honda Motor Co. Ltd. - ADR (Japan) | 1,451 | 39,133 | ||||||
|
| |||||||
Distributors - 0.1% | ||||||||
Genuine Parts Co. | 545 | 55,906 | ||||||
|
| |||||||
Hotels, Restaurants & Leisure - 0.0%## |
| |||||||
Hilton Worldwide Holdings, Inc. | 130 | 12,605 | ||||||
McDonald’s Corp. | 95 | 18,686 | ||||||
|
| |||||||
| 31,291 | ||||||||
|
| |||||||
Household Durables - 0.4% | ||||||||
Sony Corp. - ADR (Japan) | 4,900 | 298,067 | ||||||
|
| |||||||
Internet & Direct Marketing Retail - 0.6% |
| |||||||
Amazon.com, Inc.*1 | 160 | 284,266 | ||||||
Booking Holdings, Inc.*1 | 75 | 153,658 | ||||||
|
| |||||||
| 437,924 | ||||||||
|
| |||||||
Multiline Retail - 0.2% | ||||||||
B&M European Value Retail S.A. (United Kingdom) | 5,390 | 25,858 | ||||||
Dollar General Corp. | 382 | 61,250 | ||||||
SHARES
| VALUE
| |||||||
COMMON STOCKS(continued) | ||||||||
Consumer Discretionary(continued) | ||||||||
Multiline Retail(continued) | ||||||||
Target Corp. | 365 | $ | 39,022 | |||||
|
| |||||||
| 126,130 | ||||||||
|
| |||||||
Specialty Retail - 0.5% | ||||||||
The Home Depot, Inc. | 505 | 118,463 | ||||||
Industria de Diseno Textil S.A. (Spain) | 8,040 | 250,533 | ||||||
O’Reilly Automotive, Inc.* | 76 | 33,099 | ||||||
|
| |||||||
| 402,095 | ||||||||
|
| |||||||
Textiles, Apparel & Luxury Goods - 0.4% |
| |||||||
lululemon athletica, Inc.* | 1,520 | 310,490 | ||||||
VF Corp. | 358 | 29,460 | ||||||
|
| |||||||
| 339,950 | ||||||||
|
| |||||||
Total Consumer Discretionary | 1,730,496 | |||||||
|
| |||||||
Consumer Staples - 3.2% | ||||||||
Beverages - 1.4% | ||||||||
Ambev S.A. - ADR (Brazil)1 | 15,360 | 66,202 | ||||||
Anheuser-Busch InBev S.A./N.V. (Belgium) | 3,210 | 259,103 | ||||||
The Coca-Cola Co. | 5,340 | 290,656 | ||||||
Diageo plc (United Kingdom) | 3,995 | 163,520 | ||||||
PepsiCo, Inc. | 2,565 | 351,841 | ||||||
|
| |||||||
| 1,131,322 | ||||||||
|
| |||||||
Food & Staples Retailing - 0.2% | ||||||||
Walgreens Boots Alliance, Inc. | 700 | 38,346 | ||||||
Walmart, Inc. | 1,188 | 139,305 | ||||||
|
| |||||||
| 177,651 | ||||||||
|
| |||||||
Food Products - 1.0% | ||||||||
J&J Snack Foods Corp. | 255 | 48,644 | ||||||
Mondelez International, Inc. - Class A | 7,512 | 394,004 | ||||||
Nestle S.A. (Switzerland) | 2,770 | 296,338 | ||||||
|
| |||||||
| 738,986 | ||||||||
|
| |||||||
Household Products - 0.2% | ||||||||
Colgate-Palmolive Co. | 1,246 | 85,476 | ||||||
Kimberly-Clark Corp. | 256 | 34,017 | ||||||
The Procter & Gamble Co. | 475 | 59,142 | ||||||
|
| |||||||
| 178,635 | ||||||||
|
| |||||||
Personal Products - 0.4% | ||||||||
Unilever plc - ADR (United Kingdom) | 5,582 | 335,534 | ||||||
|
| |||||||
Total Consumer Staples | 2,562,128 | |||||||
|
| |||||||
The accompanying notes are an integral part of the financial statements.
6
Investment Portfolio - October 31, 2019
| BLENDED ASSET CONSERVATIVE SERIES | ||||||||
SHARES
| VALUE
| |||||||
COMMON STOCKS(continued) |
| |||||||
Energy - 1.2% |
| |||||||
Energy Equipment & Services - 0.4% |
| |||||||
Halliburton Co. | 9,340 | $ | 179,795 | |||||
Schlumberger Ltd.1 | 3,400 | 111,146 | ||||||
Transocean Ltd.*1 | 12,610 | 59,898 | ||||||
|
| |||||||
| 350,839 | ||||||||
|
| |||||||
Oil, Gas & Consumable Fuels - 0.8% |
| |||||||
BP plc - ADR (United Kingdom)1 | 970 | 36,773 | ||||||
Chevron Corp.1 | 1,335 | 155,047 | ||||||
China Petroleum & Chemical Corp. - ADR (China)1 | 899 | 50,784 | ||||||
ConocoPhillips | 350 | 19,320 | ||||||
Equinor ASA - ADR (Norway) | 1,729 | 32,004 | ||||||
Exxon Mobil Corp. | 1,635 | 110,477 | ||||||
Marathon Petroleum Corp. | 665 | 42,527 | ||||||
Occidental Petroleum Corp. | 1,010 | 40,905 | ||||||
Petroleo Brasileiro S.A. - ADR (Brazil) | 3,061 | 46,190 | ||||||
Royal Dutch Shell plc - Class B - ADR (Netherlands) | 210 | 12,241 | ||||||
TOTAL S.A. - ADR (France) | 1,016 | 53,472 | ||||||
Valero Energy Corp. | 379 | 36,755 | ||||||
|
| |||||||
| 636,495 | ||||||||
|
| |||||||
Total Energy |
| 987,334 | ||||||
|
| |||||||
Financials - 3.2% |
| |||||||
Banks - 1.2% |
| |||||||
Bank of America Corp.1 | 7,172 | 224,268 | ||||||
Citigroup, Inc.1 | 2,248 | 161,541 | ||||||
JPMorgan Chase & Co. | 2,253 | 281,445 | ||||||
KeyCorp. | 1,135 | 20,396 | ||||||
The PNC Financial Services Group, Inc. | 175 | 25,673 | ||||||
Regions Financial Corp. | 1,160 | 18,676 | ||||||
U.S. Bancorp. | 1,005 | 57,305 | ||||||
Wells Fargo & Co. | 3,296 | 170,172 | ||||||
|
| |||||||
| 959,476 | ||||||||
|
| |||||||
Capital Markets - 1.2% |
| |||||||
Ares Management Corp. - Class A1 | 1,195 | 35,336 | ||||||
BlackRock, Inc.1 | 245 | 113,117 | ||||||
The Blackstone Group, Inc. - Class A1 | 835 | 44,389 | ||||||
Cboe Global Markets, Inc.1 | 1,310 | 150,847 | ||||||
CME Group, Inc.1 | 720 | 148,140 | ||||||
The Goldman Sachs Group, Inc. | 90 | 19,204 | ||||||
Intercontinental Exchange, Inc. | 1,660 | 156,571 | ||||||
Moody’s Corp. | 680 | 150,069 | ||||||
Morgan Stanley | 225 | 10,361 | ||||||
SHARES
| VALUE
| |||||||
COMMON STOCKS(continued) |
| |||||||
Financials(continued) |
| |||||||
Capital Markets(continued) |
| |||||||
S&P Global, Inc. | 600 | $ | 154,794 | |||||
|
| |||||||
| 982,828 | ||||||||
|
| |||||||
Diversified Financial Services - 0.5% |
| |||||||
Berkshire Hathaway, Inc. - Class B*1 | 1,765 | 375,204 | ||||||
|
| |||||||
Insurance - 0.3% |
| |||||||
The Allstate Corp.1 | 280 | 29,798 | ||||||
American International Group, Inc. | 520 | 27,539 | ||||||
Arthur J. Gallagher & Co. | 470 | 42,873 | ||||||
Assurant, Inc. | 180 | 22,693 | ||||||
Chubb Ltd.1 | 217 | 33,075 | ||||||
Fidelity National Financial, Inc. | 465 | 21,316 | ||||||
Lincoln National Corp. | 300 | 16,944 | ||||||
Principal Financial Group, Inc. | 335 | 17,882 | ||||||
|
| |||||||
| 212,120 | ||||||||
|
| |||||||
Total Financials |
| 2,529,628 | ||||||
|
| |||||||
Health Care - 4.4% |
| |||||||
Biotechnology - 0.9% |
| |||||||
AbbVie, Inc.1 | 881 | 70,084 | ||||||
Amgen, Inc.1 | 385 | 82,101 | ||||||
BioMarin Pharmaceutical, Inc.*1 | 2,450 | 179,365 | ||||||
Gilead Sciences, Inc. | 862 | 54,918 | ||||||
Incyte Corp.* | 1,220 | 102,382 | ||||||
Seattle Genetics, Inc.* | 1,220 | 131,028 | ||||||
Vertex Pharmaceuticals, Inc.* | 520 | 101,650 | ||||||
|
| |||||||
| 721,528 | ||||||||
|
| |||||||
Health Care Equipment & Supplies - 1.0% |
| |||||||
Alcon, Inc. (Switzerland)* | 2,400 | 142,248 | ||||||
Medtronic plc1 | 5,841 | 636,085 | ||||||
|
| |||||||
| 778,333 | ||||||||
|
| |||||||
Health Care Providers & Services - 0.1% |
| |||||||
CVS Health Corp.1 | 817 | 54,241 | ||||||
|
| |||||||
Pharmaceuticals - 2.4% |
| |||||||
Bristol-Myers Squibb Co.1 | 1,565 | 89,784 | ||||||
GlaxoSmithKline plc (United Kingdom) | 940 | 21,531 | ||||||
Johnson & Johnson | 5,080 | 670,763 | ||||||
Merck & Co., Inc. | 2,381 | 206,337 | ||||||
Merck KGaA (Germany) | 2,560 | 305,322 | ||||||
Novartis AG - ADR (Switzerland) | 5,230 | 457,311 | ||||||
Pfizer, Inc. | 3,727 | 143,005 | ||||||
The accompanying notes are an integral part of the financial statements.
7
Investment Portfolio - October 31, 2019
| BLENDED ASSET CONSERVATIVE SERIES | ||||||||
SHARES
| VALUE
| |||||||
COMMON STOCKS(continued) | ||||||||
Health Care(continued) | ||||||||
Pharmaceuticals(continued) | ||||||||
Sanofi (France) | 365 | $ | 33,648 | |||||
|
| |||||||
| 1,927,701 | ||||||||
|
| |||||||
Total Health Care | 3,481,803 | |||||||
|
| |||||||
Industrials - 1.3% | ||||||||
Aerospace & Defense - 0.3% | ||||||||
The Boeing Co.1 | 279 | 94,835 | ||||||
Lockheed Martin Corp. | 159 | 59,892 | ||||||
United Technologies Corp. | 544 | 78,107 | ||||||
|
| |||||||
| 232,834 | ||||||||
|
| |||||||
Air Freight & Logistics - 0.1% | ||||||||
United Parcel Service, Inc. - Class B | 1,037 | 119,431 | ||||||
|
| |||||||
Airlines - 0.0%## | ||||||||
Delta Air Lines, Inc. | 335 | 18,452 | ||||||
|
| |||||||
Building Products - 0.1% | ||||||||
Johnson Controls International plc1 | 1,445 | 62,612 | ||||||
|
| |||||||
Commercial Services & Supplies - 0.2% |
| |||||||
Covanta Holding Corp. | 2,525 | 36,461 | ||||||
Republic Services, Inc. | 525 | 45,943 | ||||||
Waste Management, Inc. | 812 | 91,115 | ||||||
|
| |||||||
| 173,519 | ||||||||
|
| |||||||
Electrical Equipment - 0.1% | ||||||||
Eaton Corp. plc | 374 | 32,579 | ||||||
Emerson Electric Co. | 548 | 38,442 | ||||||
|
| |||||||
| 71,021 | ||||||||
|
| |||||||
Industrial Conglomerates - 0.2% | ||||||||
3M Co. | 398 | 65,666 | ||||||
Honeywell International, Inc. | 398 | 68,746 | ||||||
|
| |||||||
| 134,412 | ||||||||
|
| |||||||
Machinery - 0.1% | ||||||||
Caterpillar, Inc.1 | 359 | 49,470 | ||||||
Illinois Tool Works, Inc. | 224 | 37,762 | ||||||
|
| |||||||
| 87,232 | ||||||||
|
| |||||||
Road & Rail - 0.2% | ||||||||
Kansas City Southern | 420 | 59,128 | ||||||
Union Pacific Corp. | 410 | 67,839 | ||||||
|
| |||||||
| 126,967 | ||||||||
|
| |||||||
Total Industrials | 1,026,480 | |||||||
|
| |||||||
Information Technology - 4.1% | ||||||||
Communications Equipment - 0.1% | ||||||||
Cisco Systems, Inc.1 | 1,860 | 88,369 | ||||||
|
| |||||||
SHARES
| VALUE
| |||||||
COMMON STOCKS(continued) | ||||||||
Information Technology(continued) | ||||||||
Electronic Equipment, Instruments & Components - 0.1% |
| |||||||
Cognex Corp. | 1,510 | $ | 77,750 | |||||
|
| |||||||
IT Services - 1.6% | ||||||||
International Business Machines Corp. | 526 | 70,342 | ||||||
InterXion Holding N.V. (Netherlands)*1 | 3,390 | 299,066 | ||||||
Mastercard, Inc. - Class A | 1,755 | 485,801 | ||||||
Visa, Inc. - Class A | 2,450 | 438,207 | ||||||
|
| |||||||
| 1,293,416 | ||||||||
|
| |||||||
Semiconductors & Semiconductor Equipment - 1.2% |
| |||||||
Broadcom, Inc.1 | 223 | 65,306 | ||||||
Intel Corp. | 4,008 | 226,572 | ||||||
Micron Technology, Inc.* | 9,560 | 454,578 | ||||||
NVIDIA Corp. | 840 | 168,857 | ||||||
Texas Instruments, Inc. | 561 | 66,192 | ||||||
|
| |||||||
| 981,505 | ||||||||
|
| |||||||
Software - 1.1% | ||||||||
Microsoft Corp. | 3,616 | 518,426 | ||||||
ServiceNow, Inc.*1 | 1,260 | 311,547 | ||||||
|
| |||||||
| 829,973 | ||||||||
|
| |||||||
Total Information Technology | 3,271,013 | |||||||
|
| |||||||
Materials - 0.4% | ||||||||
Chemicals - 0.2% | ||||||||
Dow, Inc. | 775 | 39,130 | ||||||
FMC Corp. | 450 | 41,175 | ||||||
RPM International, Inc. | 735 | 53,236 | ||||||
|
| |||||||
| 133,541 | ||||||||
|
| |||||||
Containers & Packaging - 0.1% | ||||||||
Graphic Packaging Holding Co. | 3,750 | 58,725 | ||||||
Sealed Air Corp. | 1,050 | 43,858 | ||||||
|
| |||||||
| 102,583 | ||||||||
|
| |||||||
Metals & Mining - 0.1% | ||||||||
BHP Group Ltd. - ADR (Australia)1 | 1,181 | 57,763 | ||||||
Rio Tinto plc - ADR (Australia) | 902 | 46,913 | ||||||
|
| |||||||
| 104,676 | ||||||||
|
| |||||||
Total Materials | 340,800 | |||||||
|
| |||||||
Real Estate - 3.1% | ||||||||
Equity Real Estate Investment Trusts (REITS) - 3.1% |
| |||||||
Acadia Realty Trust1 | 295 | 8,254 | ||||||
Agree Realty Corp.1 | 175 | 13,785 | ||||||
Alexandria Real Estate Equities, Inc.1 | 70 | 11,113 | ||||||
The accompanying notes are an integral part of the financial statements.
8
Investment Portfolio - October 31, 2019
| BLENDED ASSET CONSERVATIVE SERIES | ||||||||
SHARES
| VALUE
| |||||||
COMMON STOCKS(continued) | ||||||||
Real Estate(continued) | ||||||||
Equity Real Estate Investment Trusts (REITS)(continued) | ||||||||
American Campus Communities, Inc.1 | 490 | $ | 24,490 | |||||
American Homes 4 Rent - Class A1 | 1,675 | 44,337 | ||||||
American Tower Corp.1 | 650 | 141,752 | ||||||
Americold Realty Trust1 | 915 | 36,682 | ||||||
Apartment Investment & Management Co. - Class A1 | 799 | 43,849 | ||||||
AvalonBay Communities, Inc.1 | 395 | 85,976 | ||||||
Boston Properties, Inc.1 | 251 | 34,437 | ||||||
Brandywine Realty Trust1 | 2,235 | 34,151 | ||||||
Camden Property Trust1 | 290 | 33,167 | ||||||
Community Healthcare Trust, Inc. | 1,160 | 56,167 | ||||||
Cousins Properties, Inc. | 1,551 | 62,241 | ||||||
Crown Castle International Corp. | 465 | 64,537 | ||||||
CubeSmart | 260 | 8,242 | ||||||
Digital Realty Trust, Inc. | 240 | 30,490 | ||||||
Douglas Emmett, Inc. | 650 | 28,158 | ||||||
Equinix, Inc. | 615 | 348,570 | ||||||
Equity LifeStyle Properties, Inc. | 360 | 25,178 | ||||||
Equity Residential | 495 | 43,887 | ||||||
Essential Properties Realty Trust, Inc. | 1,094 | 28,072 | ||||||
Essex Property Trust, Inc. | 109 | 35,657 | ||||||
Extra Space Storage, Inc. | 95 | 10,666 | ||||||
Federal Realty Investment Trust | 65 | 8,841 | ||||||
First Industrial Realty Trust, Inc. | 430 | 18,107 | ||||||
Getty Realty Corp. | 505 | 16,938 | ||||||
Healthcare Realty Trust, Inc. | 1,395 | 48,504 | ||||||
Healthcare Trust of America, Inc. - Class A | 1,030 | 31,930 | ||||||
Healthpeak Properties, Inc. | 1,175 | 44,204 | ||||||
Hibernia REIT plc (Ireland) | 8,800 | 13,701 | ||||||
Host Hotels & Resorts, Inc. | 955 | 15,652 | ||||||
Independence Realty Trust, Inc. | 3,330 | 51,282 | ||||||
Invitation Homes, Inc. | 1,857 | 57,177 | ||||||
Jernigan Capital, Inc. | 1,805 | 34,277 | ||||||
Kilroy Realty Corp. | 115 | 9,652 | ||||||
Lexington Realty Trust | 1,115 | 12,131 | ||||||
Liberty Property Trust | 455 | 26,877 | ||||||
Life Storage, Inc. | 125 | 13,615 | ||||||
Mid-America Apartment Communities, Inc. | 140 | 19,459 | ||||||
National Retail Properties, Inc. | 490 | 28,866 | ||||||
National Storage Affiliates Trust | 475 | 16,231 | ||||||
Omega Healthcare Investors, Inc. | 450 | 19,818 | ||||||
Physicians Realty Trust | 2,765 | 51,623 | ||||||
SHARES
| VALUE
| |||||||
COMMON STOCKS(continued) | ||||||||
Real Estate(continued) | ||||||||
Equity Real Estate Investment Trusts (REITS) (continued) | ||||||||
Plymouth Industrial REIT, Inc. | 1,450 | $ | 27,347 | |||||
Prologis, Inc. | 1,055 | 92,587 | ||||||
Public Storage | 175 | 39,000 | ||||||
Realty Income Corp. | 140 | 11,451 | ||||||
SBA Communications Corp. | 590 | 141,984 | ||||||
Simon Property Group, Inc. | 425 | 64,039 | ||||||
STAG Industrial, Inc. | 1,350 | 41,904 | ||||||
STORE Capital Corp. | 410 | 16,605 | ||||||
Sun Communities, Inc. | 255 | 41,476 | ||||||
Sunstone Hotel Investors, Inc. | 795 | 10,740 | ||||||
UDR, Inc. | 681 | 34,220 | ||||||
UMH Properties, Inc. | 615 | 9,182 | ||||||
Urban Edge Properties | 1,115 | 23,538 | ||||||
Ventas, Inc. | 500 | 32,550 | ||||||
VEREIT, Inc. | 3,025 | 29,766 | ||||||
Vornado Realty Trust | 175 | 11,485 | ||||||
Weingarten Realty Investors | 725 | 23,004 | ||||||
Welltower, Inc. | 458 | 41,536 | ||||||
|
| |||||||
Total Real Estate | 2,485,157 | |||||||
|
| |||||||
Utilities - 0.2% | ||||||||
Electric Utilities - 0.0%## | ||||||||
Exelon Corp. | 625 | 28,431 | ||||||
|
| |||||||
Independent Power and Renewable Electricity Producers - 0.1% | ||||||||
Boralex, Inc. - Class A (Canada) | 1,185 | 19,613 | ||||||
Innergex Renewable Energy, Inc. (Canada) | 1,975 | 24,652 | ||||||
Northland Power, Inc. (Canada) | 1,195 | 23,862 | ||||||
Pattern Energy Group, Inc. - Class A | 789 | 22,116 | ||||||
|
| |||||||
| 90,243 | ||||||||
|
| |||||||
Multi-Utilities - 0.1% | ||||||||
CMS Energy Corp.1 | 890 | 56,889 | ||||||
|
| |||||||
Total Utilities | 175,563 | |||||||
|
| |||||||
TOTAL COMMON STOCKS | 20,978,346 | |||||||
|
| |||||||
The accompanying notes are an integral part of the financial statements.
9
Investment Portfolio - October 31, 2019
| BLENDED ASSET CONSERVATIVE SERIES | ||||||||
PRINCIPAL AMOUNT2
| VALUE
| |||||||
CORPORATE BONDS - 19.2% |
| |||||||
Non-Convertible Corporate Bonds - 19.2% |
| |||||||
Communication Services - 3.8% |
| |||||||
Diversified Telecommunication Services - 1.9% |
| |||||||
AT&T, Inc.1, 4.25%, 3/1/2027 | 520,000 | $ | 571,119 | |||||
CenturyLink, Inc., 5.625%, 4/1/2020 | 5,000 | 5,062 | ||||||
Verizon Communications, Inc., 5.25%, 3/16/2037 | 720,000 | 906,896 | ||||||
|
| |||||||
| 1,483,077 | ||||||||
|
| |||||||
Interactive Media & Services - 0.5% |
| |||||||
Tencent Holdings Ltd. (China)3, 3.975%, 4/11/2029 | 410,000 | 441,250 | ||||||
|
| |||||||
Media - 1.4% |
| |||||||
Cablevision Systems Corp., 8.00%, 4/15/2020 | 5,000 | 5,125 | ||||||
Comcast Corp., 3.25%, 11/1/2039 | 450,000 | 456,217 | ||||||
Diamond Sports Group LLC - Diamond Sports Finance Co.3, 6.625%, 8/15/2027 | 10,000 | 10,300 | ||||||
Discovery Communications LLC, 5.20%, 9/20/2047 | 550,000 | 601,456 | ||||||
Entercom Media Corp.3, 7.25%, 11/1/2024 | 5,000 | 5,213 | ||||||
Townsquare Media, Inc.3, 6.50%, 4/1/2023 | 5,000 | 4,950 | ||||||
|
| |||||||
| 1,083,261 | ||||||||
|
| |||||||
Wireless Telecommunication Services - 0.0%## |
| |||||||
Sprint Communications, Inc., 7.00%, 8/15/2020 | 15,000 | 15,453 | ||||||
Sprint Corp., 7.25%, 9/15/2021 | 5,000 | 5,335 | ||||||
Sprint Corp., 7.125%, 6/15/2024 | 5,000 | 5,425 | ||||||
|
| |||||||
| 26,213 | ||||||||
|
| |||||||
Total Communication Services |
| 3,033,801 | ||||||
|
| |||||||
Consumer Discretionary - 2.5% |
| |||||||
Auto Components - 0.0%## |
| |||||||
American Axle & Manufacturing, Inc., 6.25%, 4/1/2025 | 5,000 | 4,819 | ||||||
Techniplas LLC3, 10.00%, 5/1/2020 | 10,000 | 8,450 | ||||||
|
| |||||||
| 13,269 | ||||||||
|
| |||||||
Automobiles - 0.7% |
| |||||||
General Motors Financial Co., Inc., 3.15%, 1/15/2020 | 560,000 | 560,757 | ||||||
|
| |||||||
Diversified Consumer Services - 0.0%## |
| |||||||
GEMS MENASA Cayman Ltd. - GEMS Education Delaware LLC (United Arab Emirates)3, 7.125%, 7/31/2026 | 30,000 | 31,088 | ||||||
|
| |||||||
PRINCIPAL AMOUNT2
| VALUE
| |||||||
CORPORATE BONDS(continued) |
| |||||||
Non-Convertible Corporate Bonds(continued) |
| |||||||
Consumer Discretionary(continued) |
| |||||||
Household Durables - 0.1% |
| |||||||
Ashton Woods USA LLC - Ashton Woods Finance Co.3, 6.75%, 8/1/2025 | 10,000 | $ | 10,050 | |||||
LGI Homes, Inc.3, 6.875%, 7/15/2026 | 15,000 | 15,525 | ||||||
Weekley Homes LLC - Weekley Finance Corp., 6.625%, 8/15/2025 | 15,000 | 15,225 | ||||||
|
| |||||||
| 40,800 | ||||||||
|
| |||||||
Internet & Direct Marketing Retail - 1.7% |
| |||||||
Alibaba Group Holding Ltd. (China), 3.40%, 12/6/2027 | 440,000 | 457,011 | ||||||
Booking Holdings, Inc., 3.60%, 6/1/2026 | 790,000 | 855,299 | ||||||
Photo Holdings Merger Sub, Inc.3, 8.50%, 10/1/2026 | 10,000 | 8,801 | ||||||
|
| |||||||
| 1,321,111 | ||||||||
|
| |||||||
Specialty Retail - 0.0%## |
| |||||||
Foxtrot Escrow Issuer LLC - Foxtrot Escrow Corp.3, 12.25%, 11/15/2026 | 10,000 | 10,051 | ||||||
Staples, Inc.3, 7.50%, 4/15/2026 | 10,000 | 10,402 | ||||||
|
| |||||||
| 20,453 | ||||||||
|
| |||||||
Total Consumer Discretionary |
| 1,987,478 | ||||||
|
| |||||||
Consumer Staples - 0.0%## |
| |||||||
Food & Staples Retailing - 0.0%## |
| |||||||
KeHE Distributors LLC - KeHE Finance Corp.3, 8.625%, 10/15/2026 | 10,000 | 10,256 | ||||||
|
| |||||||
Energy - 3.6% |
| |||||||
Energy Equipment & Services - 0.0%## |
| |||||||
Nabors Industries, Inc., 5.50%, 1/15/2023 | 10,000 | 8,450 | ||||||
Shelf Drilling Holdings Ltd. (United Arab Emirates)3, 8.25%, 2/15/2025 | 10,000 | 8,400 | ||||||
|
| |||||||
| 16,850 | ||||||||
|
| |||||||
Oil, Gas & Consumable Fuels - 3.6% |
| |||||||
Antero Midstream Partners LP - Antero Midstream Finance Corp.3, 5.75%, 3/1/2027 | 10,000 | 7,437 | ||||||
Antero Midstream Partners LP - Antero Midstream Finance Corp.3, 5.75%, 1/15/2028 | 10,000 | 7,550 | ||||||
Bruin E&P Partners LLC1,3, 8.875%, 8/1/2023 | 10,000 | 6,600 | ||||||
The accompanying notes are an integral part of the financial statements.
10
Investment Portfolio - October 31, 2019
| BLENDED ASSET CONSERVATIVE SERIES | ||||||||
PRINCIPAL AMOUNT2
| VALUE
| |||||||
CORPORATE BONDS(continued) |
| |||||||
Non-Convertible Corporate Bonds(continued) |
| |||||||
Energy(continued) | ||||||||
Oil, Gas & Consumable Fuels(continued) |
| |||||||
Calumet Specialty Products Partners LP - Calumet Finance Corp.3, 11.00%, 4/15/2025 | 10,000 | $ | 10,025 | |||||
Energy Transfer Operating LP, 6.50%, 2/1/2042 | 390,000 | 467,104 | ||||||
Jonah Energy LLC - Jonah Energy Finance Corp.3, 7.25%, 10/15/2025 | 15,000 | 4,200 | ||||||
Kinder Morgan Energy Partners LP, 6.95%, 1/15/2038 | 460,000 | 594,652 | ||||||
Kinder Morgan, Inc., 3.05%, 12/1/2019 | 560,000 | 560,382 | ||||||
Lonestar Resources America, Inc.3, 11.25%, 1/1/2023 | 10,000 | 7,000 | ||||||
Moss Creek Resources Holdings, Inc.3, 10.50%, 5/15/2027 | 5,000 | 3,862 | ||||||
NuStar Logistics LP, 6.75%, 2/1/2021 | 10,000 | 10,362 | ||||||
Rockies Express Pipeline LLC3, 5.625%, 4/15/2020 | 10,000 | 10,168 | ||||||
Sabine Pass Liquefaction LLC, 5.875%, 6/30/2026 | 650,000 | 746,364 | ||||||
Southwestern Energy Co.4, 6.20%, 1/23/2025 | 10,000 | 8,800 | ||||||
W&T Offshore, Inc.3, 9.75%, 11/1/2023 | 5,000 | 4,688 | ||||||
The Williams Companies, Inc., 3.75%, 6/15/2027 | 400,000 | 417,058 | ||||||
|
| |||||||
| 2,866,252 | ||||||||
|
| |||||||
Total Energy | 2,883,102 | |||||||
|
| |||||||
Financials - 4.0% | ||||||||
Banks - 3.5% | ||||||||
Bank of America Corp.1, 4.00%, 1/22/2025 | 780,000 | 831,963 | ||||||
Citigroup, Inc.1, 8.125%, 7/15/2039 | 270,000 | 444,168 | ||||||
Credit Suisse AG (Switzerland), 5.40%, 1/14/2020 | 550,000 | 553,564 | ||||||
JPMorgan Chase & Co.5, (3 mo. LIBOR US + 1.000%), 4.023%, 12/5/2024 | 380,000 | 405,763 | ||||||
Santander Holdings USA, Inc., 4.50%, 7/17/2025 | 520,000 | 560,351 | ||||||
|
| |||||||
| 2,795,809 | ||||||||
|
| |||||||
Capital Markets - 0.4% | ||||||||
AG Merger Sub II, Inc.3, 10.75%, 8/1/2027 | 10,000 | 9,900 | ||||||
PRINCIPAL AMOUNT2
| VALUE
| |||||||
CORPORATE BONDS(continued) | ||||||||
Non-Convertible Corporate Bonds(continued) |
| |||||||
Financials(continued) | ||||||||
Capital Markets(continued) | ||||||||
Donnelley Financial Solutions, Inc., 8.25%, 10/15/2024 | 15,000 | $ | 15,600 | |||||
The Goldman Sachs Group, Inc., 4.25%, 10/21/2025 | 260,000 | 280,059 | ||||||
|
| |||||||
| 305,559 | ||||||||
|
| |||||||
Consumer Finance - 0.0%## | ||||||||
Navient Corp., 5.00%, 10/26/2020 | 10,000 | 10,184 | ||||||
SLM Corp., 5.125%, 4/5/2022 | 15,000 | 15,488 | ||||||
|
| |||||||
| 25,672 | ||||||||
|
| |||||||
Diversified Financial Services - 0.0%## |
| |||||||
Fidelity & Guaranty Life Holdings, Inc.3, 5.50%, 5/1/2025 | 5,000 | 5,338 | ||||||
Global Aircraft Leasing Co. Ltd. (Cayman Islands)3,6, 6.50%, 9/15/2024 | 10,000 | 10,235 | ||||||
VistaJet Malta Finance plc - XO Management Holding, Inc. (Switzerland)3, 10.50%, 6/1/2024 | 10,000 | 9,725 | ||||||
|
| |||||||
| 25,298 | ||||||||
|
| |||||||
Thrifts & Mortgage Finance - 0.1% | ||||||||
Acrisure LLC - Acrisure Finance, Inc.3, 7.00%, 11/15/2025 | 15,000 | 13,725 | ||||||
Radian Group, Inc., 4.875%, 3/15/2027 | 15,000 | 15,563 | ||||||
|
| |||||||
| 29,288 | ||||||||
|
| |||||||
Total Financials | 3,181,626 | |||||||
|
| |||||||
Health Care - 0.6% | ||||||||
Health Care Providers & Services - 0.6% |
| |||||||
HCA, Inc., 4.125%, 6/15/2029 | 440,000 | 466,138 | ||||||
|
| |||||||
Industrials - 2.2% | ||||||||
Commercial Services & Supplies - 0.0%## |
| |||||||
The ADT Security Corp., 6.25%, 10/15/2021 | 5,000 | 5,331 | ||||||
Prime Security Services Borrower LLC - Prime Finance, Inc.3, 5.75%, 4/15/2026 | 5,000 | 5,124 | ||||||
Stericycle, Inc.3, 5.375%, 7/15/2024 | 15,000 | 15,600 | ||||||
|
| |||||||
| 26,055 | ||||||||
|
| |||||||
Construction & Engineering - 0.0%## |
| |||||||
HC2 Holdings, Inc.3, 11.50%, 12/1/2021 | 5,000 | 4,556 | ||||||
Tutor Perini Corp.3, 6.875%, 5/1/2025 | 15,000 | 14,960 | ||||||
|
| |||||||
| 19,516 | ||||||||
|
| |||||||
The accompanying notes are an integral part of the financial statements.
11
Investment Portfolio - October 31, 2019
| BLENDED ASSET CONSERVATIVE SERIES | ||||||||
PRINCIPAL AMOUNT2
| VALUE
| |||||||
CORPORATE BONDS(continued) |
| |||||||
Non-Convertible Corporate Bonds(continued) |
| |||||||
Industrials(continued) |
| |||||||
Industrial Conglomerates - 0.6% |
| |||||||
General Electric Co.5,7, (3 mo. | 500,000 | $ | 481,875 | |||||
|
| |||||||
Marine - 0.1% |
| |||||||
American Tanker, Inc. (Norway)3, 9.25%, 2/22/2022 | 20,000 | 20,112 | ||||||
Borealis Finance LLC3, 7.50%, 11/16/2022 | 15,000 | 14,100 | ||||||
|
| |||||||
| 34,212 | ||||||||
|
| |||||||
Trading Companies & Distributors - 1.5% |
| |||||||
AerCap Ireland Capital DAC - AerCap Global Aviation Trust (Ireland)1, 4.45%, 10/1/2025 | 530,000 | 575,092 | ||||||
Air Lease Corp., 3.625%, 4/1/2027 | 570,000 | 594,606 | ||||||
Fortress Transportation & Infrastructure Investors LLC3, 6.50%, 10/1/2025 | 10,000 | 10,100 | ||||||
|
| |||||||
| 1,179,798 | ||||||||
|
| |||||||
Total Industrials |
| 1,741,456 | ||||||
|
| |||||||
Information Technology - 0.0%## |
| |||||||
Communications Equipment - 0.0%## |
| |||||||
Hughes Satellite Systems Corp., 5.25%, 8/1/2026 | 15,000 | 16,069 | ||||||
|
| |||||||
Materials - 0.9% |
| |||||||
Chemicals - 0.0%## |
| |||||||
CF Industries, Inc., 7.125%, 5/1/2020 | 5,000 | 5,120 | ||||||
Olin Corp., 5.625%, 8/1/2029 | 10,000 | 10,383 | ||||||
|
| |||||||
| 15,503 | ||||||||
|
| |||||||
Containers & Packaging - 0.1% |
| |||||||
ARD Securities Finance S.A.R.L (Luxembourg)3,6, 8.75%, 1/31/2023 | 5,218 | 5,427 | ||||||
Berry Global, Inc.3, 4.50%, 2/15/2026 | 5,000 | 5,031 | ||||||
Mauser Packaging Solutions Holding Co.3, 7.25%, 4/15/2025 | 10,000 | 9,563 | ||||||
|
| |||||||
| 20,021 | ||||||||
|
| |||||||
Metals & Mining - 0.8% |
| |||||||
Infrabuild Australia Pty Ltd. (Australia)3, 12.00%, 10/1/2024 | 10,000 | 10,191 | ||||||
Mountain Province Diamonds, Inc. (Canada)3, 8.00%, 12/15/2022 | 15,000 | 14,550 | ||||||
Northwest Acquisitions ULC - Dominion Finco, Inc.3, 7.125%, 11/1/2022 | 15,000 | 7,500 | ||||||
| PRINCIPAL | ||||||||
AMOUNT2/
| VALUE
| |||||||
CORPORATE BONDS(continued) |
| |||||||
Non-Convertible Corporate Bonds(continued) |
| |||||||
Materials(continued) |
| |||||||
Metals & Mining(continued) |
| |||||||
Southern Copper Corp. (Peru), 5.375%, 4/16/2020 | 580,000 | $ | 587,155 | |||||
SunCoke Energy Partners LP - SunCoke Energy Partners Finance Corp.3, 7.50%, 6/15/2025 | 5,000 | 4,250 | ||||||
|
| |||||||
| 623,646 | ||||||||
|
| |||||||
Total Materials |
| 659,170 | ||||||
|
| |||||||
Real Estate - 1.6% |
| |||||||
Equity Real Estate Investment Trusts (REITS) - 1.6% |
| |||||||
American Tower Corp., 3.80%, 8/15/2029 | 550,000 | 587,968 | ||||||
Crown Castle International Corp., 3.10%, 11/15/2029 | 580,000 | 589,365 | ||||||
GTP Acquisition Partners I LLC3, 2.35%, 6/15/2020 | 95,000 | 95,033 | ||||||
|
| |||||||
| 1,272,366 | ||||||||
|
| |||||||
Real Estate Management & Development - 0.0%## |
| |||||||
Five Point Operating Co. LP - Five Point Capital Corp.3, 7.875%, 11/15/2025 | 10,000 | 9,452 | ||||||
Forestar Group, Inc.3, 8.00%, 4/15/2024 | 5,000 | 5,375 | ||||||
|
| |||||||
| 14,827 | ||||||||
|
| |||||||
Total Real Estate |
| 1,287,193 | ||||||
|
| |||||||
TOTAL CORPORATE BONDS |
| 15,266,289 | ||||||
|
| |||||||
MUTUAL FUNDS - 0.4% | ||||||||
iShares Russell 1000 Value ETF | 1,360 | 176,895 | ||||||
Schwab U.S. Dividend Equity ETF | 2,296 | 127,474 | ||||||
|
| |||||||
TOTAL MUTUAL FUNDS |
| 304,369 | ||||||
|
| |||||||
U.S. TREASURY SECURITIES - 24.3% |
| |||||||
U.S. Treasury Bonds - 1.5% |
| |||||||
U.S. Treasury Bond, 3.00%, 5/15/2047 | 655,000 | 766,964 | ||||||
U.S. Treasury Inflation Indexed Bond, 0.75%, 2/15/2042 | 377,410 | 396,578 | ||||||
|
| |||||||
Total U.S. Treasury Bonds (Identified Cost $1,145,879) |
| 1,163,542 | ||||||
|
| |||||||
U.S. Treasury Notes - 22.8% |
| |||||||
U.S. Treasury Inflation Indexed | 3,154,446 | 3,137,565 | ||||||
The accompanying notes are an integral part of the financial statements.
12
Investment Portfolio - October 31, 2019
| BLENDED ASSET CONSERVATIVE SERIES | ||||||||
PRINCIPAL AMOUNT2
| VALUE
| |||||||
U.S. TREASURY SECURITIES(continued) |
| |||||||
U.S. Treasury Notes(continued) | ||||||||
U.S. Treasury Inflation Indexed Note, 0.50%, 4/15/2024 | 1,525,875 | $ | 1,545,935 | |||||
U.S. Treasury Note, 2.625%, 5/15/2021 | 1,535,000 | 1,558,984 | ||||||
U.S. Treasury Note, 2.50%, 8/15/2023 | 4,705,000 | 4,872,615 | ||||||
U.S. Treasury Note, 2.50%, 5/15/2024 | 2,265,000 | 2,360,555 | ||||||
U.S. Treasury Note, 2.125%, 5/15/2025 | 2,280,000 | 2,346,708 | ||||||
U.S. Treasury Note, 1.625%, 5/15/2026 | 2,360,000 | 2,363,780 | ||||||
|
| |||||||
Total U.S. Treasury Notes (Identified Cost $17,925,501) | 18,186,142 | |||||||
|
| |||||||
TOTAL U.S. TREASURY SECURITIES | ||||||||
(Identified Cost $19,071,380) | 19,349,684 | |||||||
|
| |||||||
ASSET-BACKED SECURITIES - 4.5% | ||||||||
Cazenovia Creek Funding II LLC, Series 2018-1A, Class A1,3, 3.561%, 7/15/2030 | 196,831 | 198,260 | ||||||
Invitation Homes Trust, Series 2017-SFR2, Class A3,8, (1 mo. LIBOR US + 0.850%), 2.739%, 12/17/2036 | 75,114 | 75,008 | ||||||
Invitation Homes Trust, Series 2017-SFR2, Class B3,8, (1 mo. LIBOR US + 1.150%), 3.039%, 12/17/2036 | 60,000 | 60,056 | ||||||
Navient Private Education Refi Loan Trust, Series 2019-CA, Class A13, 2.82%, 2/15/2068 | 229,384 | 231,631 | ||||||
Navient Student Loan Trust, Series 2019-2A, Class A23,8, (1 mo. LIBOR US + 1.000%), 2.823%, 2/27/2068 | 550,000 | 554,778 | ||||||
Progress Residential Trust, Series 2017-SFR2, Class A3, 2.897%, 12/17/2034 | 150,000 | 150,747 | ||||||
Progress Residential Trust, Series 2019-SFR2, Class A3, 3.147%, 5/17/2036 | 280,000 | 284,860 | ||||||
SBA Small Business Investment Companies, Series 2015-10A, Class 1, 2.517%, 3/10/2025 | 78,558 | 79,881 | ||||||
SoFi Consumer Loan Program LLC, Series 2016-5, Class A3, 3.06%, 9/25/2028 | 79,136 | 79,542 | ||||||
PRINCIPAL AMOUNT2
| VALUE
| |||||||
ASSET-BACKED SECURITIES (continued) |
| |||||||
SoFi Consumer Loan Program Trust, Series 2019-2, Class A3, 3.01%, 4/25/2028 | 180,040 | $ | 181,450 | |||||
SoFi Consumer Loan Program Trust, Series 2019-3, Class A3, 2.90%, 5/25/2028 | 225,082 | 226,684 | ||||||
SoFi Professional Loan Program LLC, Series 2015-D, Class A23, 2.72%, 10/27/2036 | 71,664 | 72,317 | ||||||
SoFi Professional Loan Program LLC, Series 2016-B, Class A2B3, 2.74%, 10/25/2032 | 56,954 | 57,329 | ||||||
SoFi Professional Loan Program LLC, Series 2016-E, Class A2B3, 2.49%, 1/25/2036 | 208,359 | 209,168 | ||||||
SoFi Professional Loan Program LLC, Series 2017-F, Class A1FX3, 2.05%, 1/25/2041 | 24,678 | 24,676 | ||||||
SoFi Professional Loan Program LLC, Series 2017-F, Class A2FX3, 2.84%, 1/25/2041 | 75,000 | 76,114 | ||||||
SoFi Professional Loan Program LLC, Series 2018-A, Class A2A3, 2.39%, 2/25/2042 | 64,349 | 64,473 | ||||||
Towd Point Mortgage Trust, Series 2016-5, Class A13,9, 2.50%, 10/25/2056 | 181,145 | 181,837 | ||||||
Towd Point Mortgage Trust, Series 2017-1, Class A13,9, 2.75%, 10/25/2056 | 168,109 | 170,099 | ||||||
Towd Point Mortgage Trust, Series 2019-HY1, Class A13,8, (1 mo. LIBOR US + 1.000%), 2.823%, 10/25/2048 | 159,112 | 159,961 | ||||||
Tricon American Homes Trust, Series 2016-SFR1, Class A3, 2.589%, 11/17/2033 | 215,065 | 215,019 | ||||||
Tricon American Homes Trust, Series 2017-SFR2, Class A3, 2.928%, 1/17/2036 | 199,434 | 202,425 | ||||||
|
| |||||||
TOTAL ASSET-BACKED SECURITIES |
| 3,556,315 | ||||||
|
| |||||||
COMMERCIAL MORTGAGE-BACKED SECURITIES - 7.5% |
| |||||||
Caesars Palace Las Vegas Trust, Series 2017-VICI, Class A1,3, 3.531%, 10/15/2034 | 260,000 | 270,384 | ||||||
CIM Trust, Series 2019-INV1, Class A13,9, 4.00%, 2/25/2049 | 96,616 | 98,725 | ||||||
The accompanying notes are an integral part of the financial statements.
13
Investment Portfolio - October 31, 2019
| BLENDED ASSET CONSERVATIVE SERIES | ||||||||
PRINCIPAL AMOUNT2
| VALUE
| |||||||
COMMERCIAL MORTGAGE-BACKED SECURITIES(continued) |
| |||||||
Credit Suisse Mortgage Capital Trust, Series 2013-IVR3, Class A11,3,9, 2.50%, 5/25/2043 | 131,921 | $ | 130,533 | |||||
Credit Suisse Mortgage Capital Trust, Series 2013-TH1, Class A13,9, 2.13%, 2/25/2043 | 86,872 | 84,957 | ||||||
Fannie Mae REMICS, Series 2018-31, Class KP, 3.50%, 7/25/2047 | 306,075 | 319,526 | ||||||
Fannie Mae-Aces, Series 2017-M15, Class A19, 2.959%, 9/25/2027 | 270,390 | 283,325 | ||||||
Freddie Mac REMICS, Series 4791, Class BA, 4.00%, 3/15/2044 | 311,481 | 315,690 | ||||||
Freddie Mac REMICS, Series 4801, Class BA, 4.50%, 5/15/2044 | 282,102 | 287,994 | ||||||
FREMF Mortgage Trust, Series 2011-K13, Class B3,9, 4.612%, 1/25/2048 | 321,504 | 329,791 | ||||||
FREMF Mortgage Trust, Series 2014-K41, Class B3,9, 3.832%, 11/25/2047 | 273,000 | 286,566 | ||||||
FREMF Mortgage Trust, Series 2014-K716, Class B3,9, 3.948%, 8/25/2047 | 451,000 | 463,061 | ||||||
Government National Mortgage Association, Series 2012-113, Class PY, 2.50%, 9/20/2042 | 250,000 | 249,724 | ||||||
Government National Mortgage Association, Series 2017-54, Class AH, 2.60%, 12/16/2056 | 318,011 | 320,674 | ||||||
JP Morgan Mortgage Trust, Series 2013-2, Class A23,9, 3.50%, 5/25/2043 | 74,717 | 76,175 | ||||||
JP Morgan Mortgage Trust, Series 2014-2, Class 1A13,9, 3.00%, 6/25/2029 | 94,122 | 95,598 | ||||||
JP Morgan Mortgage Trust, Series 2017-2, Class A53,9, 3.50%, 5/25/2047 | 273,289 | 276,890 | ||||||
JP Morgan Mortgage Trust, Series 2017-2, Class A63,9, 3.00%, 5/25/2047 | 293,533 | 295,111 | ||||||
JP Morgan Mortgage Trust, Series 2017-3, Class 1A33,9, 3.50%, 8/25/2047 | 271,999 | 276,628 | ||||||
New Residential Mortgage Loan Trust, Series 2014-3A, Class AFX33,9, 3.75%, 11/25/2054 | 79,286 | 82,476 | ||||||
New Residential Mortgage Loan Trust, Series 2015-2A, Class A13,9, 3.75%, 8/25/2055 | 89,819 | 93,640 | ||||||
PRINCIPAL AMOUNT2
| VALUE
| |||||||
COMMERCIAL MORTGAGE-BACKED SECURITIES(continued) |
| |||||||
New Residential Mortgage Loan Trust, Series 2016-4A, Class A13,9, 3.75%, 11/25/2056 | 120,081 | $ | 125,246 | |||||
Sequoia Mortgage Trust, Series 2013-8, Class A19, 3.00%, 6/25/2043 | 108,522 | 109,747 | ||||||
Starwood Retail Property Trust, Series 2014-STAR, Class A3,8, (1 mo. LIBOR US + 1.220%), 3.134%, 11/15/2027 | 252,607 | 252,153 | ||||||
Sutherland Commercial Mortgage Trust, Series 2019-SBC8, Class A3,9, 2.86%, 12/25/2035 | 258,030 | 259,500 | ||||||
Waikiki Beach Hotel Trust, Series 2019-WBM, Class A3,8, (1 mo. LIBOR US + 1.050%), 2.971%, 12/15/2033 | 175,000 | 175,109 | ||||||
WF-RBS Commercial Mortgage Trust, Series 2011-C2, Class A43,9, 4.869%, 2/15/2044 | 336,149 | 344,053 | ||||||
WinWater Mortgage Loan Trust, Series 2015-3, Class A53,9, 3.50%, 3/20/2045 | 68,254 | 68,409 | ||||||
|
| |||||||
TOTAL COMMERCIAL MORTGAGE-BACKED SECURITIES | 5,971,685 | |||||||
|
| |||||||
FOREIGN GOVERNMENT BONDS - 1.4% |
| |||||||
Canadian Government Bond (Canada), 2.75%, 6/1/2022 | CAD | 33,000 | 25,841 | |||||
Export-Import Bank of Korea (South Korea), 2.625%, 12/30/2020 | 1,000,000 | 1,005,745 | ||||||
Mexican Government Bond (Mexico), 8.00%, 6/11/2020 | MXN | 733,000 | 38,376 | |||||
Mexican Government Bond (Mexico), 6.50%, 6/10/2021 | MXN | 275,000 | 14,264 | |||||
Mexican Government Bond (Mexico), 6.50%, 6/9/2022 | MXN | 504,000 | 26,169 | |||||
Mexican Government Bond (Mexico), 7.75%, 5/29/2031 | MXN | 92,000 | 5,115 | |||||
|
| |||||||
TOTAL FOREIGN GOVERNMENT BONDS |
| 1,115,510 | ||||||
|
| |||||||
The accompanying notes are an integral part of the financial statements.
14
Investment Portfolio - October 31, 2019
| BLENDED ASSET CONSERVATIVE SERIES | ||||||||
PRINCIPAL AMOUNT2
| VALUE
| |||||||
U.S. GOVERNMENT AGENCIES - 13.8% |
| |||||||
Mortgage-Backed Securities - 13.8% | ||||||||
Fannie Mae, Pool #888468, 5.50%, 9/1/2021 | 7,547 | $ | 7,656 | |||||
Fannie Mae, Pool #888810, 5.50%, 11/1/2022 | 9,093 | 9,213 | ||||||
Fannie Mae, Pool #AL9409, 3.50%, 11/1/2031 | 251,519 | 261,396 | ||||||
Fannie Mae, Pool #MA3463, 4.00%, 9/1/2033 | 276,267 | 288,459 | ||||||
Fannie Mae, Pool #MA1834, 4.50%, 2/1/2034 | 70,879 | 76,178 | ||||||
Fannie Mae, Pool #MA1903, 4.50%, 5/1/2034 | 82,337 | 88,493 | ||||||
Fannie Mae, Pool #FM1158, 3.50%, 6/1/2034 | 303,324 | 314,249 | ||||||
Fannie Mae, Pool #MA3412, 3.50%, 7/1/2038 | 419,062 | 434,279 | ||||||
Fannie Mae, Pool #890294, 5.50%, 1/1/2039 | 73,079 | 82,091 | ||||||
Fannie Mae, Pool #AD0307, 5.50%, 1/1/2039 | 38,363 | 43,088 | ||||||
Fannie Mae, Pool #AE0604, 6.00%, 7/1/2039 | 44,395 | 51,086 | ||||||
Fannie Mae, Pool #MA0258, 4.50%, 12/1/2039 | 96,898 | 104,971 | ||||||
Fannie Mae, Pool #890326, 5.50%, 1/1/2040 | 77,985 | 87,621 | ||||||
Fannie Mae, Pool #AL0152, 6.00%, 6/1/2040 | 75,080 | 86,304 | ||||||
Fannie Mae, Pool #AL7729, 4.00%, 6/1/2043 | 68,356 | 73,132 | ||||||
Fannie Mae, Pool #AS3622, 3.50%, 10/1/2044 | 617,335 | 650,098 | ||||||
Fannie Mae, Pool #AZ2001, 3.50%, 5/1/2045 | 297,762 | 311,117 | ||||||
Fannie Mae, Pool #AZ9215, 4.00%, 10/1/2045 | 90,482 | 95,284 | ||||||
Fannie Mae, Pool #MA2705, 3.00%, 8/1/2046 | 290,006 | 297,652 | ||||||
Fannie Mae, Pool #BD6997, 4.00%, 10/1/2046 | 95,533 | 100,401 | ||||||
Fannie Mae, Pool #BE7845, 4.50%, 2/1/2047 | 91,035 | 96,124 | ||||||
Fannie Mae, Pool #CA1720, 5.00%, 5/1/2048 | 548,616 | 605,882 | ||||||
Fannie Mae, Pool #CA2056, 4.50%, 7/1/2048 | 582,693 | 615,028 | ||||||
Fannie Mae, Pool #MA3443, 4.00%, 8/1/2048 | 254,120 | 263,580 | ||||||
Fannie Mae, Pool #BK9366, 4.50%, 8/1/2048 | 110,483 | 116,292 | ||||||
PRINCIPAL AMOUNT2
| VALUE
| |||||||
U.S. GOVERNMENT AGENCIES(continued) |
| |||||||
Mortgage-Backed Securities(continued) |
| |||||||
Fannie Mae, Pool #CA2219, 5.00%, 8/1/2048 | 516,096 | $ | 553,277 | |||||
Fannie Mae, Pool #MA3521, 4.00%, 11/1/2048 | 837,924 | 869,879 | ||||||
Fannie Mae, Pool #MA3527, 5.00%, 11/1/2048 | 453,056 | 483,907 | ||||||
Fannie Mae, Pool #BN0622, 4.50%, 1/1/2049 | 259,812 | 273,417 | ||||||
Fannie Mae, Pool #AL8674, 5.645%, 1/1/2049 | 135,638 | 152,686 | ||||||
Fannie Mae, Pool #MA3692, 3.50%, 7/1/2049 | 586,520 | 601,712 | ||||||
Freddie Mac, Pool #C91762, 4.50%, 5/1/2034 | 106,417 | 114,435 | ||||||
Freddie Mac, Pool #QN0349, 3.00%, 8/1/2034 | 317,062 | 324,848 | ||||||
Freddie Mac, Pool #G03926, 6.00%, 2/1/2038 | 34,297 | 39,452 | ||||||
Freddie Mac, Pool #G05196, 5.50%, 10/1/2038 | 33,093 | 37,165 | ||||||
Freddie Mac, Pool #G05409, 5.50%, 3/1/2039 | 29,735 | 33,409 | ||||||
Freddie Mac, Pool #A92889, 4.50%, 7/1/2040 | 123,626 | 132,882 | ||||||
Freddie Mac, Pool #A93451, 4.50%, 8/1/2040 | 140,390 | 152,266 | ||||||
Freddie Mac, Pool #G60334, 4.50%, 10/1/2041 | 112,317 | 121,799 | ||||||
Freddie Mac, Pool #Q24752, 3.50%, 2/1/2044 | 162,561 | 170,689 | ||||||
Freddie Mac, Pool #G60183, 4.00%, 12/1/2044 | 95,299 | 100,050 | ||||||
Freddie Mac, Pool #Q37592, 4.00%, 12/1/2045 | 205,140 | 217,547 | ||||||
Freddie Mac, Pool #Q45878, 3.00%, 12/1/2046 | 290,931 | 298,323 | ||||||
Freddie Mac, Pool #ZM2525, 3.00%, 12/1/2046 | 296,318 | 303,667 | ||||||
Freddie Mac, Pool #Q59805, 4.50%, 11/1/2048 | 180,504 | 190,107 | ||||||
Freddie Mac, Pool #G61887, 5.00%, 2/1/2049 | 244,639 | 261,745 | ||||||
Freddie Mac, Pool #ZN4802, 4.00%, 4/1/2049 | 355,664 | 369,830 | ||||||
|
| |||||||
TOTAL U.S. GOVERNMENT AGENCIES |
| 10,962,766 | ||||||
|
| |||||||
The accompanying notes are an integral part of the financial statements.
15
Investment Portfolio - October 31, 2019
| BLENDED ASSET CONSERVATIVE SERIES PRINCIPAL | ||||||||
AMOUNT2/ SHARES
| VALUE
| |||||||
U.S. GOVERNMENT SECURITIES - 2.0% |
| |||||||
U.S. Treasury Bill - 2.0% | ||||||||
U.S. Treasury Bill10, 1.59%, 5/21/2020 (Identified Cost $1,585,859) | 1,600,000 | $ | 1,586,219 | |||||
|
| |||||||
SHORT-TERM INVESTMENT - 1.0% | ||||||||
Dreyfus Government Cash Management, Institutional Shares, 1.73%11 (Identified Cost $843,815) | 843,815 | 843,815 | ||||||
|
| |||||||
VALUE
| ||||
TOTAL INVESTMENTS IN SECURITIES - 100.4% | $ | 79,934,998 | ||
|
| |||
TOTAL OPTIONS WRITTEN — 0.0%## | (12,928 | ) | ||
|
| |||
TOTAL INVESTMENTS - 100.4% | 79,922,070 | |||
LIABILITIES, LESS OTHER ASSETS - (0.4%) | (304,067 | ) | ||
|
| |||
NET ASSETS - 100% | $ | 79,618,003 | ||
|
| |||
ADR - American Depositary Receipt
CAD - Canadian Dollar
ETF - Exchange-traded fund
LIBOR - London Interbank Offered Rate
MXN - Mexican Peso
| EXCHANGE-TRADED OPTIONS WRITTEN | ||||||||||||||||||||||||
| DESCRIPTION | NUMBER OF CONTRACTS | EXPIRATION DATE | EXERCISE PRICE | NOTIONAL AMOUNT (000)2 | VALUE | |||||||||||||||||||
Call | ||||||||||||||||||||||||
Sea Ltd. - ADR | 41 | 11/15/2019 | $ 27.00 | 122 | $(12,710) | |||||||||||||||||||
Put | ||||||||||||||||||||||||
Electronic Arts, Inc. | 9 | 11/01/2019 | 87.50 | 87 | (18) | |||||||||||||||||||
ServiceNow, Inc. | 5 | 11/08/2019 | 200.00 | 124 | (200) | |||||||||||||||||||
| (218) | ||||||||||||||||||||||||
TOTAL EXCHANGE-TRADED OPTIONS WRITTEN (PREMIUMS RECEIVED $7,662) |
| $(12,928) | ||||||||||||||||||||||
*Non-income producing security.
## Less than 0.1%.
1A portion of this security is designated as collateral for options contracts written. As of October 31, 2019, the total value of such securities was $7,527,611.
2Amount is stated in USD unless otherwise noted.
3Restricted securities - Investment in securities that are restricted as to public resale under the Securities Act of 1933, as amended. These securities have been sold under Rule 144A and have been determined to be liquid under the Fund’s Liquidity Risk Management Program. These securities amount to $8,497,552, or 10.7% of the Series’ net assets as of October 31, 2019 (see Note 2 to the financial statements).
4Step coupon rate security - Rate steps up/down by 25 basis points upon rating downgrade/upgrade by Moody’s and S&P rating agencies (Subject to a maximum of 100 basis points per agency, 200 basis points maximum).
5Variable rate security. Security may be issued at a fixed coupon rate, which converts to a variable rate at a specified date. Rate shown is the rate in effect as of October 31, 2019.
6Represents a Payment-In-Kind bond.
7Security is perpetual in nature and has no stated maturity date.
8Floating rate security. Rate shown is the rate in effect as of October 31, 2019.
9Variable or floating rate security, the interest rate of which adjusts periodically based on changes in current interest rates and prepayments on the underlying pool of assets. Rate shown is the rate in effect as of October 31, 2019.
10Represents the annualized yield at time of purchase.
11Rate shown is the current yield as of October 31, 2019.
The Global Industry Classification Standard (GICS) was developed by and is the exclusive property and a service mark of MSCI Inc. (MSCI) and Standard & Poor’s, a division of S&P Global Inc. (S&P), and is licensed for use by Manning & Napier when referencing GICS sectors. Neither MSCI, S&P, nor any third party involved in making or compiling the GICS or any GICS classifications makes any express or implied warranties or representations with respect to such standard or classification, nor shall any such party have any liability therefrom.
The accompanying notes are an integral part of the financial statements.
16
Statement of Assets and Liabilities - Blended Asset Conservative Series
October 31, 2019
ASSETS: | ||||
Investments in securities, at value (identified cost $76,543,267) (Note 2) | $ | 79,934,998 | ||
Interest receivable | 352,993 | |||
Receivable for securities sold | 33,097 | |||
Dividends receivable | 13,537 | |||
Foreign tax reclaims receivable | 8,915 | |||
Receivable for fund shares sold | 45 | |||
|
| |||
TOTAL ASSETS | 80,343,585 | |||
|
| |||
LIABILITIES: | ||||
Accrued fund accounting and administration fees (Note 3) | 25,693 | |||
Accrued management fees (Note 3) | 8,430 | |||
Accrued Chief Compliance Officer service fees (Note 3) | 687 | |||
Options written, at value (premiums received $7,662) (Note 2) | 12,928 | |||
Payable for securities purchased | 518,850 | |||
Payable for fund shares repurchased | 117,928 | |||
Other payables and accrued expenses | 41,066 | |||
|
| |||
TOTAL LIABILITIES | 725,582 | |||
|
| |||
TOTAL NET ASSETS | $ | 79,618,003 | ||
|
| |||
NET ASSETS CONSIST OF: | ||||
Capital stock | $ | 69,019 | ||
Additional paid-in-capital | 76,979,482 | |||
Total distributable earnings (loss) | 2,569,502 | |||
|
| |||
TOTAL NET ASSETS | $ | 79,618,003 | ||
|
| |||
NET ASSET VALUE, OFFERING PRICE AND REDEMPTION PRICE PER SHARE - | $ | 11.54 | ||
|
| |||
The accompanying notes are an integral part of the financial statements.
17
Statement of Operations - Blended Asset Conservative Series
For the Year Ended October 31, 2019
INVESTMENT INCOME: | ||||
Interest | $ | 1,960,156 | ||
Dividends (net of foreign taxes withheld, $16,487) | 490,328 | |||
|
| |||
Total Investment Income | 2,450,484 | |||
|
| |||
EXPENSES: | ||||
Management fees (Note 3) | 344,667 | |||
Fund accounting and administration fees (Note 3) | 89,038 | |||
Directors’ fees (Note 3) | 8,282 | |||
Chief Compliance Officer service fees (Note 3) | 3,455 | |||
Audit fees | 57,332 | |||
Custodian fees | 14,101 | |||
Miscellaneous | 32,999 | |||
|
| |||
Total Expenses | 549,874 | |||
Less reduction of expenses (Note 3) | (162,123 | ) | ||
|
| |||
Net Expenses | 387,751 | |||
|
| |||
NET INVESTMENT INCOME | 2,062,733 | |||
|
| |||
REALIZED AND UNREALIZED GAIN (LOSS) ON INVESTMENTS AND FOREIGN CURRENCY: | ||||
Net realized gain (loss) on- | ||||
Investments in securities | (456,397 | ) | ||
Options written | 84,912 | |||
Foreign currency and translation of other assets and liabilities | (256 | ) | ||
|
| |||
| (371,741 | ) | |||
|
| |||
Net change in unrealized appreciation (depreciation) on- | ||||
Investments in securities | 5,639,922 | |||
Options written | 4,533 | |||
Foreign currency and translation of other assets and liabilities | 87 | |||
|
| |||
| 5,644,542 | ||||
|
| |||
NET REALIZED AND UNREALIZED GAIN (LOSS) ON INVESTMENTS AND FOREIGN CURRENCY | 5,272,801 | |||
|
| |||
NET INCREASE IN NET ASSETS RESULTING FROM OPERATIONS | $ | 7,335,534 | ||
|
| |||
The accompanying notes are an integral part of the financial statements.
18
Statements of Changes in Net Assets - Blended Asset Conservative Series
FOR THE YEAR ENDED
| FOR THE YEAR ENDED
| |||||||
INCREASE (DECREASE) IN NET ASSETS: | ||||||||
OPERATIONS: | ||||||||
Net investment income | $ | 2,062,733 | $ | 2,519,701 | ||||
Net realized gain (loss) on investments and foreign currency | (371,741 | ) | (1,292,031 | ) | ||||
Net change in unrealized appreciation (depreciation) on investments and foreign currency | 5,644,542 | (2,062,771 | ) | |||||
|
|
|
| |||||
Net increase (decrease) from operations | 7,335,534 | (835,101 | ) | |||||
|
|
|
| |||||
DISTRIBUTIONS TO SHAREHOLDERS (Note 9): | ||||||||
Class R6 | (2,530,275 | ) | (1,240,645 | ) | ||||
|
|
|
| |||||
CAPITAL STOCK ISSUED AND REPURCHASED: | ||||||||
Net increase (decrease) from capital share transactions (Note 5) | (52,233,583 | ) | 28,346,171 | |||||
|
|
|
| |||||
Net increase (decrease) in net assets | (47,428,324 | ) | 26,270,425 | |||||
NET ASSETS: | ||||||||
Beginning of year | 127,046,327 | 100,775,902 | ||||||
|
|
|
| |||||
End of year | $ | 79,618,003 | $ | 127,046,327 | ||||
|
|
|
| |||||
The accompanying notes are an integral part of the financial statements.
19
Financial Highlights - Blended Asset Conservative Series - Class R6
FOR THE YEAR ENDED | FOR THE PERIOD 10/13/171 TO 10/31/17
| ||||||||||||||
10/31/19
| 10/31/18
| ||||||||||||||
Per share data (for a share outstanding throughout each period): | |||||||||||||||
Net asset value - Beginning of period |
| $10.68 |
| $10.85 |
| $10.87 | |||||||||
Income (loss) from investment operations: | |||||||||||||||
Net investment income2 |
| 0.26 |
| 0.23 |
| 0.01 | |||||||||
Net realized and unrealized gain (loss) on investments |
| 0.85 |
| (0.29 | ) |
| (0.03 | ) | |||||||
|
|
|
|
|
| ||||||||||
Total from investment operations |
| 1.11 |
| (0.06 | ) |
| (0.02 | ) | |||||||
|
|
|
|
|
| ||||||||||
Less distributions to shareholders: | |||||||||||||||
From net investment income |
| (0.25 | ) |
| (0.11 | ) |
| — | |||||||
|
|
|
|
|
| ||||||||||
Net asset value - End of period |
| $11.54 |
| $10.68 |
| $10.85 | |||||||||
|
|
|
|
|
| ||||||||||
Net assets - End of period(000’s omitted) |
| $79,618 |
| $127,046 |
| $100,776 | |||||||||
|
|
|
|
|
| ||||||||||
Total return3 |
| 10.61% |
| (0.52% | ) |
| (0.18% | ) | |||||||
Ratios (to average net assets)/Supplemental Data: | |||||||||||||||
Expenses* |
| 0.45% |
| 0.45% | 0.45% | 4 | |||||||||
Net investment income |
| 2.39% |
| 2.13% | 0.99% | 4 | |||||||||
Series portfolio turnover |
| 88% |
| 71% |
| 5% | |||||||||
| *The investment advisor did not impose all or a portion of its management and/or other fees during the period, and may have paid a portion of the Series’ expenses. If these expenses had been incurred by the Class, the expense ratio (to average net assets) would have increased by the following amounts: |
| ||||||||||||||
| 0.19% |
| 0.11% | 1.21% | 4 | ||||||||||
1Commencement of operations.
2Calculated based on average shares outstanding during the periods.
3Represents aggregate total return for the periods indicated, and assumes reinvestment of all distributions. Total return would have been lower had certain expenses not been waived or reimbursed during certain periods. Periods less than one year are not annualized.
4Annualized.
The accompanying notes are an integral part of the financial statements.
20
Performance Update as of October 31, 2019 - Blended Asset Moderate Series
(unaudited)
AVERAGE ANNUAL TOTAL RETURN AS OF OCTOBER 31, 2019
| ||||
ONE YEAR1
|
SINCE INCEPTION2
| |||
Blended Asset Moderate Series - Class R63 | 12.44% | 5.15% | ||
Bloomberg Barclays U.S. Aggregate Bond Index4 | 11.51% | 4.26% | ||
30/10/60 Blended Index5 | 12.51% | 5.94% | ||
The following graph compares the value of a $10,000 investment in the Blended Asset Moderate Series - Class R6 from its inception2 (October 13, 2017) to present (October 31, 2019) to the Bloomberg Barclays U.S. Aggregate Bond Index and the 30/10/60 Blended Index.
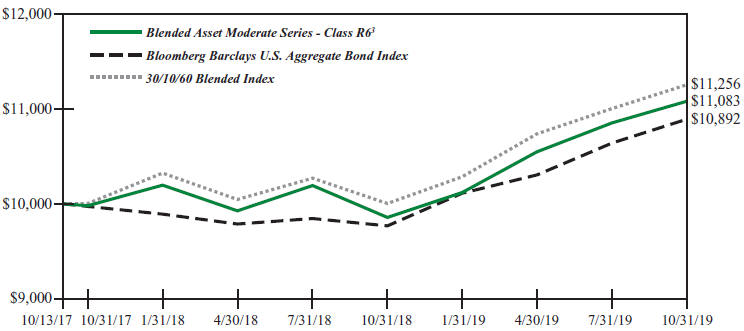
1The returns shown are based on net asset values calculated for shareholder transactions and may differ from the returns shown in the financial highlights, which reflect adjustments made to the net asset values in accordance with accounting principles generally accepted in the United States of America.
2Performance numbers for the Series and Indices are calculated from October 13, 2017, the Series’ inception date.
3The Series’ performance does not reflect the deduction of taxes that a shareholder would pay on fund distributions or the redemption of shares. The Series’ performance is historical and may not be indicative of future results. The performance returns shown are inclusive of the net expense ratio of the Series. For the year ended October 31, 2019, this net expense ratio was 0.50% for Class R6. The gross expense ratio, which does not account for any voluntary or contractual waivers currently in effect, was 0.70% for Class R for the year ended October 31, 2019.
4The Bloomberg Barclays U.S. Aggregate Bond Index is an unmanaged, market-value weighted index of U.S. domestic investment-grade debt issues, including government, corporate, asset-backed, and mortgage-backed securities, with maturities of one year or more. Index returns do not reflect any fees or expenses. Index returns provided by Interactive Data.
5The 30/10/60 Blended Index is 30% Russell 3000® Index (Russell 3000), 10% MSCI ACWI ex USA Index (ACWIxUS), and 60% Bloomberg Barclays U.S. Aggregate Bond Index (BAB). Russell 3000 is an unmanaged index that consists of 3,000 of the largest U.S. companies based on total market capitalization. Index returns are based on a market capitalization-weighted average of relative price changes of the component stocks plus dividends whose reinvestments are compounded daily. Index returns provided by Bloomberg. ACWIxUS is designed to measure large and mid-cap representation across 22 of 23 Developed Markets countries (excluding the U.S.) and 26 Emerging Markets countries. The Index is denominated in U.S. dollars. The Index returns are net of withholding taxes. They assume daily reinvestment of net dividends thus accounting for any applicable dividend taxation. Index returns provided by Bloomberg. BAB is an unmanaged, market value-weighted index of U.S. domestic investment-grade debt issues, including government, corporate, asset-backed and mortgage-backed securities with maturities of one year or more. Index returns provided by Interactive Data. The returns of the indices do not reflect any fees or expenses. Returns provided are calculated monthly using a blended allocation. Because the fund’s asset allocation will vary over time, the composition of the fund’s portfolio may not match the composition of the comparative Indices. Mid-month performance may not be available for all indices within the blended index. Where applicable, performance for those indices is included from the first of the month following the corresponding Fund’s inception date.
21
Shareholder Expense Example - Blended Asset Moderate Series
(unaudited)
As a shareholder of the Series, you incur ongoing costs, including management fees, shareholder service fees and other Series expenses. This example is intended to help you understand your ongoing costs (in dollars) of investing in the Series and to compare these costs with the ongoing costs of investing in other mutual funds.
The example is based on an investment of $1,000 invested at the beginning of the period and held for the entire period (May 1, 2019 to October 31, 2019).
Actual Expenses
The first line of the table below provides information about actual account values and actual expenses. You may use the information in this line, together with the amount you invested, to estimate the expenses that you paid over the period. Simply divide your account value by $1,000 (for example, an $8,600 account value divided by $1,000 = 8.6), then multiply the result by the number in the first line under the heading entitled “Expenses Paid During Period” to estimate the expenses you paid on your account during this period.
Hypothetical Example for Comparison Purposes
The second line of the table below provides information about hypothetical account values and hypothetical expenses based on the Series’ actual expense ratio and an assumed rate of return of 5% per year before expenses, which is not the Series’ actual return. The hypothetical account values and expenses may not be used to estimate the actual ending account balance or expenses you paid during the period. You may use this information to compare the ongoing costs of investing in the Series and other funds. To do so, compare this 5% hypothetical example with the 5% hypothetical examples that appear in the shareholder reports of the other funds.
Please note that the expenses shown in the table are meant to highlight your ongoing costs only and do not reflect any transaction costs such as sales charges (loads), redemption fees, or exchange fees that you may incur in other mutual funds. Therefore, the second line of the table is useful in comparing ongoing costs only, and will not help you determine the relative total costs of owning different funds.
BEGINNING
| ENDING
| EXPENSES PAID
| ||||
Actual | $1,000.00 | $1,050.80 | $2.58 | |||
Hypothetical | $1,000.00 | $1,022.68 | $2.55 | |||
*Expenses are equal to the Series’ annualized expense ratio (for the six-month period) of 0.50%, multiplied by the average account value over the period, multiplied by 184/365 (to reflect the one-half year period). Expenses are based on the most recent fiscal half year; therefore, the expense ratios stated above may differ from the expense ratios stated in the financial highlights, which are based on one-year data. The Series’ total return would have been lower had certain expenses not been waived during the period.
22
Portfolio Composition - Blended Asset Moderate Series
As of October 31, 2019 (unaudited)
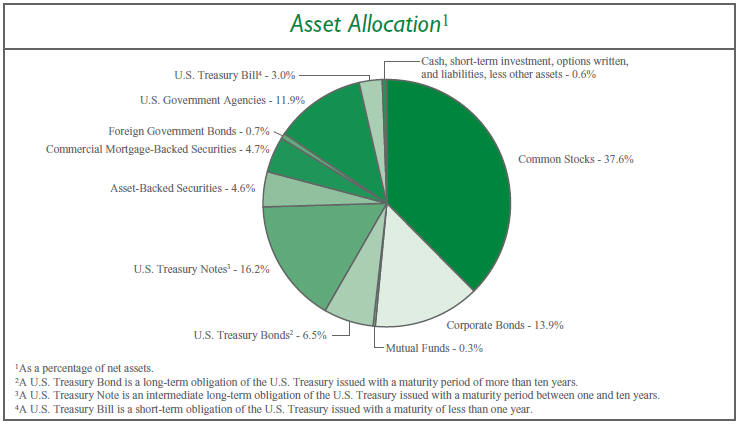
| Sector Allocation5 | ||||
Communication Services | 8.9 | % | ||
Health Care | 7.2 | % | ||
Financials | 7.0 | % | ||
Information Technology | 6.8 | % | ||
Consumer Discretionary | 5.9 | % | ||
Consumer Staples | 5.7 | % | ||
Real Estate | 3.8 | % | ||
Energy | 3.6 | % | ||
Industrials | 1.7 | % | ||
Materials | 0.8 | % | ||
Utilities6 | 0.0 | % | ||
5Including common stocks and corporate bonds, as a percentage of total investments.
6Less than 0.1%.
| ||||
| Top Ten Stock Holdings7 | ||||
Medtronic plc | 1.2 | % | ||
Novartis AG - ADR (Switzerland) | 1.2 | % | ||
Mastercard, Inc. - Class A | 1.2 | % | ||
Microsoft Corp. | 1.1 | % | ||
Visa, Inc. - Class A | 1.1 | % | ||
Johnson & Johnson | 1.1 | % | ||
Micron Technology, Inc. | 1.1 | % | ||
Berkshire Hathaway, Inc. - Class B | 0.9 | % | ||
lululemon athletica, Inc. | 0.9 | % | ||
Nestle S.A. (Switzerland) | 0.8 | % | ||
7As a percentage of total investments.
| ||||
23
Investment Portfolio - October 31, 2019
| BLENDED ASSET MODERATE SERIES | ||||||||
SHARES
| VALUE
| |||||||
COMMON STOCKS - 37.6% | ||||||||
Communication Services - 5.8% | ||||||||
Diversified Telecommunication Services - 0.1% |
| |||||||
Elisa OYJ (Finland) | 508 | $ | 27,745 | |||||
Orange S.A. (France) | 560 | 9,013 | ||||||
Telefonica Brasil S.A. (Brazil) | 400 | 5,293 | ||||||
|
| |||||||
| 42,051 | ||||||||
|
| |||||||
Entertainment - 2.6% | ||||||||
Activision Blizzard, Inc.1 | 12,730 | 713,262 | ||||||
Electronic Arts, Inc.*1 | 4,900 | 472,360 | ||||||
Nexon Co. Ltd. (Japan)* | 57,330 | 664,354 | ||||||
Sea Ltd. - ADR (Taiwan)*1 | 20,715 | 616,478 | ||||||
Toho Co. Ltd. - Tokyo (Japan) | 500 | 20,193 | ||||||
Viacom, Inc. - Class B | 84 | 1,811 | ||||||
Vivendi S.A. (France) | 285 | 7,937 | ||||||
|
| |||||||
| 2,496,395 | ||||||||
|
| |||||||
Interactive Media & Services - 2.7% | ||||||||
Alphabet, Inc. - Class A*1 | 425 | 534,990 | ||||||
Alphabet, Inc. - Class C*1 | 425 | 535,547 | ||||||
Autohome, Inc. - ADR (China)* | 215 | 18,180 | ||||||
Facebook, Inc. - Class A* | 3,520 | 674,608 | ||||||
Kakao Corp. (South Korea) | 225 | 27,304 | ||||||
Tencent Holdings Ltd. - Class H (China) | 17,903 | 726,198 | ||||||
|
| |||||||
| 2,516,827 | ||||||||
|
| |||||||
Media - 0.4% | ||||||||
Informa plc (United Kingdom) | 2,410 | 24,224 | ||||||
Quebecor, Inc. - Class B (Canada) | 7,555 | 175,639 | ||||||
Shaw Communications, Inc. - Class B (Canada) | 9,995 | 203,983 | ||||||
|
| |||||||
| 403,846 | ||||||||
|
| |||||||
Wireless Telecommunication Services - 0.0%## |
| |||||||
Globe Telecom, Inc. (Philippines) | 175 | 6,290 | ||||||
|
| |||||||
Total Communication Services | 5,465,409 | |||||||
|
| |||||||
Consumer Discretionary - 3.9% | ||||||||
Auto Components - 0.0%## | ||||||||
Cie Generale des Etablissements Michelin SCA (France) | 50 | 6,088 | ||||||
|
| |||||||
Automobiles - 0.0%## | ||||||||
Peugeot S.A. (France) | 160 | 4,052 | ||||||
|
| |||||||
Distributors - 0.0%## | ||||||||
Genuine Parts Co. | 33 | 3,385 | ||||||
|
| |||||||
Diversified Consumer Services - 0.1% | ||||||||
Fu Shou Yuan International Group Ltd. (China) | 13,000 | 11,474 | ||||||
SHARES
| VALUE
| |||||||
COMMON STOCKS(continued) | ||||||||
Consumer Discretionary(continued) | ||||||||
Diversified Consumer Services(continued) | ||||||||
New Oriental Education & Technology Group, Inc. - ADR (China)* | 230 | $ | 28,074 | |||||
TAL Education Group - ADR (China)* | 565 | 24,188 | ||||||
|
| |||||||
| 63,736 | ||||||||
|
| |||||||
Hotels, Restaurants & Leisure - 0.1% | ||||||||
Basic-Fit N.V. (Netherlands)*2 | 610 | 18,657 | ||||||
Galaxy Entertainment Group Ltd. (Macau) | 2,000 | 13,771 | ||||||
Hilton Worldwide Holdings, Inc. | 120 | 11,635 | ||||||
Melco Resorts & Entertainment Ltd. - ADR (Hong Kong) | 535 | 11,524 | ||||||
MGM China Holdings Ltd. (Macau) | 7,200 | 11,401 | ||||||
Restaurant Brands International, Inc. (Canada) | 240 | 15,706 | ||||||
Sands China Ltd. (Macau) | 3,600 | 17,732 | ||||||
Wynn Macau Ltd. (Macau) | 8,000 | 17,361 | ||||||
|
| |||||||
| 117,787 | ||||||||
|
| |||||||
Household Durables - 0.9% | ||||||||
Barratt Developments plc (United Kingdom) | 1,595 | 13,044 | ||||||
The Berkeley Group Holdings plc (United Kingdom) | 240 | 13,680 | ||||||
Persimmon plc (United Kingdom) | 485 | 14,306 | ||||||
Sony Corp. - ADR (Japan) | 12,145 | 738,780 | ||||||
Sony Corp. (Japan) | 500 | 30,434 | ||||||
Taylor Wimpey plc (United Kingdom) | 6,275 | 13,458 | ||||||
|
| |||||||
| 823,702 | ||||||||
|
| |||||||
Internet & Direct Marketing Retail - 1.1% | ||||||||
Alibaba Group Holding Ltd. - ADR (China)*1 | 245 | 43,284 | ||||||
Amazon.com, Inc.*1 | 365 | 648,481 | ||||||
Booking Holdings, Inc.*1 | 180 | 368,779 | ||||||
Farfetch Ltd. - Class A (United Kingdom)* | 685 | 6,117 | ||||||
|
| |||||||
| 1,066,661 | ||||||||
|
| |||||||
Leisure Products - 0.0%## | ||||||||
Technogym S.p.A. (Italy)2 | 1,945 | 21,459 | ||||||
|
| |||||||
Multiline Retail - 0.0%## | ||||||||
B&M European Value Retail S.A. (United Kingdom) | 2,810 | 13,481 | ||||||
Kohl’s Corp. | 45 | 2,307 | ||||||
Lojas Renner S.A. (Brazil) | 600 | 7,613 | ||||||
The accompanying notes are an integral part of the financial statements.
24
Investment Portfolio - October 31, 2019
| BLENDED ASSET MODERATE SERIES | ||||||||
SHARES
| VALUE
| |||||||
COMMON STOCKS(continued) | ||||||||
Consumer Discretionary(continued) | ||||||||
Multiline Retail(continued) | ||||||||
Magazine Luiza S.A. (Brazil) | 500 | $ | 5,535 | |||||
|
| |||||||
| 28,936 | ||||||||
|
| |||||||
Specialty Retail - 0.7% | ||||||||
Best Buy Co., Inc. | 53 | 3,807 | ||||||
The Gap, Inc. | 97 | 1,577 | ||||||
The Home Depot, Inc. | 100 | 23,458 | ||||||
Industria de Diseno Textil S.A. (Spain) | 21,205 | 660,765 | ||||||
|
| |||||||
| 689,607 | ||||||||
|
| |||||||
Textiles, Apparel & Luxury Goods - 1.0% | ||||||||
EssilorLuxottica S.A. (France) | 65 | 9,925 | ||||||
Hermes International (France) | 5 | 3,602 | ||||||
Kering S.A. (France) | 20 | 11,380 | ||||||
Kontoor Brands, Inc. | 8 | 304 | ||||||
lululemon athletica, Inc.* | 4,050 | 827,292 | ||||||
LVMH Moet Hennessy Louis Vuitton SE (France) | 65 | 27,759 | ||||||
Shenzhou International Group Holdings Ltd. (China) | 1,500 | 20,728 | ||||||
VF Corp. | 62 | 5,102 | ||||||
|
| |||||||
| 906,092 | ||||||||
|
| |||||||
Total Consumer Discretionary | 3,731,505 | |||||||
|
| |||||||
Consumer Staples - 5.7% | ||||||||
Beverages - 3.0% | ||||||||
Ambev S.A. - ADR (Brazil)1 | 38,535 | 166,086 | ||||||
Ambev S.A. (Brazil) | 3,800 | 16,449 | ||||||
Anheuser-Busch InBev S.A./N.V. (Belgium) | 8,130 | 656,233 | ||||||
The Coca-Cola Co. | 13,740 | 747,868 | ||||||
Coca-Cola European Partners plc (United Kingdom)1 | 440 | 23,544 | ||||||
Diageo plc (United Kingdom) | 9,290 | 380,250 | ||||||
Heineken N.V. (Netherlands) | 225 | 22,977 | ||||||
Molson Coors Brewing Co. - Class B | 41 | 2,162 | ||||||
PepsiCo, Inc. | 5,770 | 791,471 | ||||||
Pernod Ricard S.A. (France) | 135 | 24,939 | ||||||
|
| |||||||
| 2,831,979 | ||||||||
|
| |||||||
Food & Staples Retailing - 0.1% | ||||||||
Alimentation Couche-Tard, Inc. - Class B (Canada) | 800 | 23,992 | ||||||
ICA Gruppen AB (Sweden) | 530 | 23,453 | ||||||
The Kroger Co. | 108 | 2,661 | ||||||
Loblaw Companies Ltd. (Canada) | 465 | 24,798 | ||||||
SHARES
| VALUE
| |||||||
COMMON STOCKS(continued) | ||||||||
Consumer Staples(continued) | ||||||||
Food & Staples Retailing(continued) | ||||||||
Puregold Price Club, Inc. (Philippines) | 4,700 | $ | 3,780 | |||||
Raia Drogasil S.A. (Brazil) | 200 | 5,484 | ||||||
Robinsons Retail Holdings, Inc. (Philippines) | 2,800 | 4,185 | ||||||
Sysco Corp. | 80 | 6,390 | ||||||
Walgreens Boots Alliance, Inc. | 119 | 6,519 | ||||||
Walmart, Inc. | 225 | 26,384 | ||||||
|
| |||||||
| 127,646 | ||||||||
|
| |||||||
Food Products - 1.7% | ||||||||
Archer-Daniels-Midland Co. | 77 | 3,237 | ||||||
Barry Callebaut AG (Switzerland) | 5 | 10,567 | ||||||
Conagra Brands, Inc. | 87 | 2,353 | ||||||
Danone S.A. (France) | 665 | 55,089 | ||||||
General Mills, Inc. | 103 | 5,239 | ||||||
The Hershey Co. | 35 | 5,140 | ||||||
The J.M. Smucker Co. | 25 | 2,642 | ||||||
Kellogg Co. | 58 | 3,685 | ||||||
Kerry Group plc - Class A (Ireland) | 210 | 25,428 | ||||||
Mondelez International, Inc. - Class A | 12,914 | 677,339 | ||||||
Mowi ASA (Norway) | 1,045 | 25,511 | ||||||
Nestle S.A. (Switzerland) | 7,535 | 806,104 | ||||||
Tyson Foods, Inc. - Class A | 46 | 3,808 | ||||||
Universal Robina Corp. (Philippines) | 2,650 | 7,873 | ||||||
|
| |||||||
| 1,634,015 | ||||||||
|
| |||||||
Household Products - 0.1% | ||||||||
Colgate-Palmolive Co. | 114 | 7,820 | ||||||
Essity AB - Class B (Sweden) | 820 | 25,617 | ||||||
Henkel AG & Co. KGaA (Germany) | 245 | 25,449 | ||||||
Kimberly-Clark Corp. | 51 | 6,777 | ||||||
Reckitt Benckiser Group plc (United Kingdom) | 300 | 23,215 | ||||||
|
| |||||||
| 88,878 | ||||||||
|
| |||||||
Personal Products - 0.8% | ||||||||
Beiersdorf AG (Germany) | 140 | 16,574 | ||||||
LG Household & Health Care Ltd. | ||||||||
(South Korea) | 20 | 21,642 | ||||||
L’Oreal S.A. (France) | 70 | 20,444 | ||||||
Unilever plc - ADR (United Kingdom) | 11,165 | 671,128 | ||||||
|
| |||||||
| 729,788 | ||||||||
|
| |||||||
Tobacco - 0.0%## | ||||||||
British American Tobacco plc - ADR (United Kingdom)1 | 320 | 11,187 | ||||||
The accompanying notes are an integral part of the financial statements.
25
Investment Portfolio - October 31, 2019
| BLENDED ASSET MODERATE SERIES | ||||||||
SHARES
| VALUE
| |||||||
COMMON STOCKS(continued) | ||||||||
Consumer Staples(continued) | ||||||||
Tobacco(continued) | ||||||||
British American Tobacco plc (United Kingdom) | 735 | $ | 25,707 | |||||
|
| |||||||
| 36,894 | ||||||||
|
| |||||||
Total Consumer Staples | 5,449,200 | |||||||
|
| |||||||
Energy - 1.2% | ||||||||
Energy Equipment & Services - 0.9% | ||||||||
Baker Hughes Co. | 134 | 2,868 | ||||||
Core Laboratories N.V. | 260 | 11,450 | ||||||
Halliburton Co. | 22,544 | 433,972 | ||||||
Schlumberger Ltd.1 | 8,555 | 279,663 | ||||||
Transocean Ltd.*1 | 30,290 | 143,877 | ||||||
|
| |||||||
| 871,830 | ||||||||
|
| |||||||
Oil, Gas & Consumable Fuels - 0.3% | ||||||||
Cameco Corp. (Canada) | 1,795 | 16,029 | ||||||
Chevron Corp. | 127 | 14,750 | ||||||
Eni S.p.A. (Italy) | 1,570 | 23,818 | ||||||
Equinor ASA (Norway) | 1,370 | 25,435 | ||||||
Galp Energia SGPS S.A. (Portugal) | 1,585 | 25,352 | ||||||
Marathon Petroleum Corp. | 107 | 6,843 | ||||||
Occidental Petroleum Corp. | 89 | 3,604 | ||||||
Phillips 66 | 51 | 5,958 | ||||||
Repsol S.A. (Spain) | 1,744 | 28,741 | ||||||
Royal Dutch Shell plc - Class B - ADR (Netherlands) | 695 | 40,512 | ||||||
Suncor Energy, Inc. (Canada) | 635 | 18,880 | ||||||
TOTAL S.A. (France) | 520 | 27,491 | ||||||
Valero Energy Corp. | 67 | 6,498 | ||||||
|
| |||||||
| 243,911 | ||||||||
|
| |||||||
Total Energy | 1,115,741 | |||||||
|
| |||||||
Financials - 3.7% | ||||||||
Banks - 0.3% | ||||||||
Banco Bradesco S.A. (Brazil) | 3,300 | 29,022 | ||||||
Banco do Brasil S.A. (Brazil) | 1,000 | 11,971 | ||||||
Banco Santander Brasil S.A. (Brazil) | 400 | 4,730 | ||||||
Bank of America Corp. | 537 | 16,792 | ||||||
The Bank Of N.T. Butterfield & Son Ltd. (Bermuda) | 525 | 17,299 | ||||||
Bank of the Philippine Islands (Philippines) | 4,820 | 9,209 | ||||||
Barclays plc (United Kingdom) | 6,755 | 14,652 | ||||||
BB&T Corp. | 82 | 4,350 | ||||||
BDO Unibank, Inc. (Philippines) | 3,950 | 12,050 | ||||||
BNP Paribas S.A. (France) | 325 | 16,984 | ||||||
Citigroup, Inc. | 157 | 11,282 | ||||||
SHARES
| VALUE
| |||||||
COMMON STOCKS(continued) | ||||||||
Financials(continued) | ||||||||
Banks(continued) | ||||||||
Credit Agricole S.A. (France) | 355 | $ | 4,632 | |||||
Fifth Third Bancorp | 126 | 3,664 | ||||||
FinecoBank Banca Fineco S.p.A. (Italy) | 1,930 | 21,758 | ||||||
Itau Unibanco Holding S.A. (Brazil) | 3,700 | 33,453 | ||||||
Itausa - Investimentos Itau S.A. (Brazil) | 4,100 | 14,006 | ||||||
JPMorgan Chase & Co. KeyCorp | | 210 172 |
| | 26,233 3,091 |
| ||
Lloyds Banking Group plc (United Kingdom) | 18,800 | 13,830 | ||||||
Metropolitan Bank & Trust Co. (Philippines) | 7,068 | 9,409 | ||||||
Regions Financial Corp. | 153 | 2,463 | ||||||
Royal Bank of Scotland Group plc (United Kingdom) | 4,915 | 13,586 | ||||||
SunTrust Banks, Inc. | 64 | 4,374 | ||||||
U.S. Bancorp | 186 | 10,606 | ||||||
Wells Fargo & Co. | 402 | 20,755 | ||||||
|
| |||||||
| 330,201 | ||||||||
|
| |||||||
Capital Markets - 2.4% | ||||||||
B3 S.A. - Brasil Bolsa Balcao (Brazil) | 1,400 | 16,899 | ||||||
BlackRock, Inc.1 | 390 | 180,063 | ||||||
Cboe Global Markets, Inc.1 | 3,550 | 408,782 | ||||||
CME Group, Inc.1 | 1,800 | 370,350 | ||||||
Deutsche Boerse AG (Germany) | 165 | 25,552 | ||||||
Hargreaves Lansdown plc (United Kingdom) | 490 | 11,252 | ||||||
Intercontinental Exchange, Inc. | 4,440 | 418,781 | ||||||
Julius Baer Group Ltd. (Switzerland). | 310 | 13,728 | ||||||
London Stock Exchange Group plc (United Kingdom) | 135 | 12,166 | ||||||
Moody’s Corp. | 1,800 | 397,242 | ||||||
S&P Global, Inc. | 1,580 | 407,624 | ||||||
|
| |||||||
| 2,262,439 | ||||||||
|
| |||||||
Diversified Financial Services - 0.9% | ||||||||
Berkshire Hathaway, Inc. - Class B*1 | 4,150 | 882,207 | ||||||
|
| |||||||
Insurance - 0.1% | ||||||||
Admiral Group plc (United Kingdom). | 830 | 21,723 | ||||||
The Allstate Corp. | 39 | 4,150 | ||||||
AXA S.A. (France) | 555 | 14,692 | ||||||
BB Seguridade Participacoes S.A. (Brazil) | 700 | 5,926 | ||||||
Chubb Ltd. | 42 | 6,402 | ||||||
The accompanying notes are an integral part of the financial statements.
26
Investment Portfolio - October 31, 2019
| BLENDED ASSET MODERATE SERIES | ||||||||
SHARES
| VALUE
| |||||||
COMMON STOCKS(continued) | ||||||||
Financials(continued) | ||||||||
Insurance(continued) | ||||||||
The Hartford Financial Services Group, Inc. | 51 | $ | 2,911 | |||||
Ping An Insurance Group Co. of China Ltd. - Class H (China) | 1,500 | 17,313 | ||||||
The Travelers Companies, Inc. | 30 | 3,932 | ||||||
|
| |||||||
| 77,049 | ||||||||
|
| |||||||
Total Financials | 3,551,896 | |||||||
|
| |||||||
Health Care - 6.8% | ||||||||
Biotechnology - 1.3% | ||||||||
AbbVie, Inc. | 164 | 13,046 | ||||||
Amgen, Inc. | 73 | 15,567 | ||||||
BioMarin Pharmaceutical, Inc.*1 | 6,060 | 443,653 | ||||||
Gilead Sciences, Inc. | 161 | 10,257 | ||||||
Incyte Corp.* | 2,730 | 229,102 | ||||||
Seattle Genetics, Inc.* | 2,960 | 317,904 | ||||||
Vertex Pharmaceuticals, Inc.* | 1,250 | 244,350 | ||||||
|
| |||||||
| 1,273,879 | ||||||||
|
| |||||||
Health Care Equipment & Supplies - 1.8% | ||||||||
Alcon, Inc. (Switzerland)* | 6,169 | 365,637 | ||||||
Alcon, Inc. (Switzerland)* | 207 | 12,242 | ||||||
Getinge AB - Class B (Sweden) | 1,080 | 18,464 | ||||||
Hoya Corp. (Japan) | 300 | 26,513 | ||||||
Koninklijke Philips N.V. (Netherlands) Medtronic plc1 | | 550 10,832 |
| | 24,131 1,179,605 |
| ||
Shandong Weigao Group Medical Polymer Co. Ltd. - Class H (China) | 12,000 | 13,776 | ||||||
Smith & Nephew plc (United Kingdom) | 1,085 | 23,291 | ||||||
|
| |||||||
| 1,663,659 | ||||||||
|
| |||||||
Health Care Providers & Services - 0.0%## | ||||||||
CVS Health Corp. | 149 | 9,892 | ||||||
Quest Diagnostics, Inc. | 26 | 2,632 | ||||||
Sonic Healthcare Ltd. (Australia) | 1,310 | 25,800 | ||||||
|
| |||||||
| 38,324 | ||||||||
|
| |||||||
Life Sciences Tools & Services - 0.1% | ||||||||
Gerresheimer AG (Germany) | 230 | 18,548 | ||||||
QIAGEN N.V.*1 | 370 | 11,030 | ||||||
QIAGEN N.V.* | 635 | 19,100 | ||||||
Tecan Group AG (Switzerland) | 20 | 4,732 | ||||||
|
| |||||||
| 53,410 | ||||||||
|
| |||||||
Pharmaceuticals - 3.6% | ||||||||
Bristol-Myers Squibb Co. | 181 | 10,384 | ||||||
SHARES
| VALUE
| |||||||
COMMON STOCKS(continued) | ||||||||
Health Care(continued) | ||||||||
Pharmaceuticals(continued) | ||||||||
Johnson & Johnson | 7,735 | $ | 1,021,329 | |||||
Merck & Co., Inc. | 2,850 | 246,981 | ||||||
Merck KGaA (Germany) | 6,610 | 788,352 | ||||||
Novartis AG - ADR (Switzerland) | 13,285 | 1,161,640 | ||||||
Novartis AG (Switzerland) | 310 | 27,086 | ||||||
Perrigo Co. plc1 | 380 | 20,148 | ||||||
Pfizer, Inc. | 518 | 19,876 | ||||||
Recordati S.p.A. (Italy) | 575 | 24,164 | ||||||
Roche Holding AG (Switzerland) | 140 | 42,134 | ||||||
Sanofi (France) | 305 | 28,117 | ||||||
|
| |||||||
| 3,390,211 | ||||||||
|
| |||||||
Total Health Care | 6,419,483 | |||||||
|
| |||||||
Industrials - 0.5% | ||||||||
Aerospace & Defense - 0.1% | ||||||||
Airbus SE (France) | 155 | 22,236 | ||||||
BAE Systems plc (United Kingdom) | 3,640 | 27,190 | ||||||
The Boeing Co. | 50 | 16,995 | ||||||
General Dynamics Corp. | 29 | 5,127 | ||||||
Lockheed Martin Corp. | 31 | 11,677 | ||||||
Safran S.A. (France) | 90 | 14,255 | ||||||
Thales S.A. (France) | 20 | 1,955 | ||||||
United Technologies Corp. | 88 | 12,635 | ||||||
|
| |||||||
| 112,070 | ||||||||
|
| |||||||
Air Freight & Logistics - 0.0%## | ||||||||
C.H. Robinson Worldwide, Inc. | 36 | 2,723 | ||||||
United Parcel Service, Inc. - Class B | 110 | 12,669 | ||||||
|
| |||||||
| 15,392 | ||||||||
|
| |||||||
Airlines - 0.0%## | ||||||||
Ryanair Holdings plc - ADR (Ireland)* | 220 | 16,421 | ||||||
|
| |||||||
Building Products - 0.0%## | ||||||||
Cie de Saint-Gobain (France) | 135 | 5,498 | ||||||
Johnson Controls International plc | 129 | 5,590 | ||||||
|
| |||||||
| 11,088 | ||||||||
|
| |||||||
Commercial Services & Supplies - 0.0%## | ||||||||
Waste Management, Inc. | 61 | 6,845 | ||||||
|
| |||||||
Construction & Engineering - 0.0%## | ||||||||
Vinci S.A. (France) | 230 | 25,805 | ||||||
|
| |||||||
Electrical Equipment - 0.1% | ||||||||
Eaton Corp. plc | 68 | 5,923 | ||||||
Emerson Electric Co. | 94 | 6,594 | ||||||
Legrand S.A. (France) | 70 | 5,469 | ||||||
Rockwell Automation, Inc. | 17 | 2,924 | ||||||
The accompanying notes are an integral part of the financial statements.
27
Investment Portfolio - October 31, 2019
| BLENDED ASSET MODERATE SERIES | ||||||||
SHARES
| VALUE
| |||||||
COMMON STOCKS(continued) |
| |||||||
Industrials(continued) |
| |||||||
Electrical Equipment(continued) | ||||||||
Schneider Electric SE (France) | 150 | $ | 13,941 | |||||
WEG S.A. (Brazil) | 800 | 5,131 | ||||||
|
| |||||||
| 39,982 | ||||||||
|
| |||||||
Industrial Conglomerates - 0.1% |
| |||||||
3M Co. | 69 | 11,384 | ||||||
Honeywell International, Inc. | 74 | 12,782 | ||||||
LT Group, Inc. (Philippines) | 13,500 | 3,549 | ||||||
SM Investments Corp. (Philippines) | 610 | 12,366 | ||||||
|
| |||||||
| 40,081 | ||||||||
|
| |||||||
Machinery - 0.1% |
| |||||||
Caterpillar, Inc. | 62 | 8,544 | ||||||
Cummins, Inc. | 28 | 4,829 | ||||||
Daifuku Co. Ltd. (Japan) | 200 | 10,612 | ||||||
FANUC Corp. (Japan) | 100 | 19,725 | ||||||
Harmonic Drive Systems, Inc. (Japan) | 300 | 13,913 | ||||||
Illinois Tool Works, Inc. | 41 | 6,912 | ||||||
KION Group AG (Germany) | 260 | 17,300 | ||||||
Nabtesco Corp. (Japan) | 400 | 12,734 | ||||||
The Weir Group plc (United Kingdom) | 1,240 | 21,659 | ||||||
|
| |||||||
| 116,228 | ||||||||
|
| |||||||
Road & Rail - 0.0%## |
| |||||||
Localiza Rent a Car S.A. (Brazil) | 400 | 4,289 | ||||||
Rumo S.A. (Brazil)* | 1,100 | 6,276 | ||||||
Union Pacific Corp. | 75 | 12,409 | ||||||
|
| |||||||
| 22,974 | ||||||||
|
| |||||||
Trading Companies & Distributors - 0.0%## |
| |||||||
Fastenal Co. | 108 | 3,882 | ||||||
|
| |||||||
Transportation Infrastructure - 0.1% |
| |||||||
Grupo Aeroportuario del Centro Norte S.A.B. de C.V. (Mexico) | 1,700 | 11,797 | ||||||
Grupo Aeroportuario del Pacifico S.A.B. de C.V. - ADR (Mexico) | 80 | 8,361 | ||||||
Grupo Aeroportuario del Sureste S.A.B. de C.V. - ADR (Mexico) | 70 | 11,462 | ||||||
|
| |||||||
| 31,620 | ||||||||
|
| |||||||
Total Industrials | 442,388 | |||||||
|
| |||||||
Information Technology - 6.8% |
| |||||||
Communications Equipment - 0.0%## |
| |||||||
Cisco Systems, Inc. | 374 | 17,769 | ||||||
|
| |||||||
Electronic Equipment, Instruments & Components - 0.2% |
| |||||||
Cognex Corp. | 3,745 | 192,830 | ||||||
SHARES
| VALUE
| |||||||
COMMON STOCKS(continued) |
| |||||||
Information Technology(continued) |
| |||||||
Electronic Equipment, Instruments & Components(continued) |
| |||||||
Halma plc (United Kingdom) | 590 | $ | 14,317 | |||||
Hexagon AB - Class B (Sweden) | 290 | 14,847 | ||||||
|
| |||||||
| 221,994 | ||||||||
|
| |||||||
IT Services - 3.1% | ||||||||
Capgemini SE (France) | 40 | 4,509 | ||||||
International Business Machines Corp. | 96 | 12,838 | ||||||
InterXion Holding N.V. (Netherlands)*1 | 7,640 | 674,001 | ||||||
Keywords Studios plc (Ireland) | 365 | 5,260 | ||||||
Mastercard, Inc. - Class A | 4,180 | 1,157,066 | ||||||
Visa, Inc. - Class A | 5,810 | 1,039,177 | ||||||
|
| |||||||
| 2,892,851 | ||||||||
|
| |||||||
Semiconductors & Semiconductor Equipment - 1.6% |
| |||||||
Applied Materials, Inc. | 109 | 5,914 | ||||||
Broadcom, Inc. | 40 | 11,714 | ||||||
Intel Corp. | 423 | 23,912 | ||||||
KLA Corp. | 32 | �� | 5,409 | |||||
Lam Research Corp. | 19 | 5,150 | ||||||
Maxim Integrated Products, Inc. | 50 | 2,933 | ||||||
Micron Technology, Inc.* | 21,205 | 1,008,298 | ||||||
NVIDIA Corp. | 2,010 | 404,050 | ||||||
Texas Instruments, Inc. | 104 | 12,271 | ||||||
|
| |||||||
| 1,479,651 | ||||||||
|
| |||||||
Software - 1.9% | ||||||||
Dassault Systemes SE (France) | 40 | 6,075 | ||||||
Microsoft Corp. | 7,535 | 1,080,293 | ||||||
ServiceNow, Inc.*1 | 2,990 | 739,307 | ||||||
|
| |||||||
| 1,825,675 | ||||||||
|
| |||||||
Technology Hardware, Storage & Peripherals - 0.0%## |
| |||||||
NetApp, Inc. | 37 | 2,067 | ||||||
Western Digital Corp. | 61 | 3,151 | ||||||
|
| |||||||
| 5,218 | ||||||||
|
| |||||||
Total Information Technology | 6,443,158 | |||||||
|
| |||||||
Materials - 0.1% | ||||||||
Chemicals - 0.1% | ||||||||
Air Liquide S.A. (France) | 121 | 16,088 | ||||||
Akzo Nobel N.V. (Netherlands) | 180 | 16,595 | ||||||
Dow, Inc. | 86 | 4,342 | ||||||
Eastman Chemical Co. | 34 | 2,585 | ||||||
LyondellBasell Industries N.V. - Class A | 63 | 5,651 | ||||||
The accompanying notes are an integral part of the financial statements.
28
Investment Portfolio - October 31, 2019
| BLENDED ASSET MODERATE SERIES | ||||||||
SHARES
| VALUE
| |||||||
COMMON STOCKS(continued) |
| |||||||
Materials(continued) |
| |||||||
Chemicals(continued) | ||||||||
OCI N.V. (Netherlands)* | 230 | $ | 5,171 | |||||
Orbia Advance Corp. S.A.B. de C.V. (Mexico) | 6,800 | 14,720 | ||||||
Solvay S.A. (Belgium) | 280 | 30,443 | ||||||
|
| |||||||
| 95,595 | ||||||||
|
| |||||||
Containers & Packaging - 0.0%## |
| |||||||
International Paper Co. | 61 | 2,664 | ||||||
|
| |||||||
Metals & Mining - 0.0%## |
| |||||||
First Quantum Minerals Ltd. (Zambia) | 650 | 5,493 | ||||||
Lundin Mining Corp. (Chile) | 1,085 | 5,478 | ||||||
Nucor Corp. | 66 | 3,554 | ||||||
|
| |||||||
| 14,525 | ||||||||
|
| |||||||
Total Materials | 112,784 | |||||||
|
| |||||||
Real Estate - 3.1% |
| |||||||
Equity Real Estate Investment Trusts (REITS) - 3.1% |
| |||||||
Acadia Realty Trust1 | 280 | 7,834 | ||||||
Agree Realty Corp.1 | 180 | 14,178 | ||||||
Alexandria Real Estate Equities, Inc.1 | 60 | 9,525 | ||||||
American Campus Communities, Inc.1 | 455 | 22,741 | ||||||
American Homes 4 Rent - Class A1 | 1,550 | 41,028 | ||||||
American Tower Corp.1 | 1,660 | 362,013 | ||||||
Americold Realty Trust1 | 855 | 34,277 | ||||||
Apartment Investment & Management Co. - Class A1 | 744 | 40,831 | ||||||
AvalonBay Communities, Inc.1 | 265 | 57,680 | ||||||
Boston Properties, Inc.1 | 234 | 32,105 | ||||||
Brandywine Realty Trust1 | 2,375 | 36,290 | ||||||
The British Land Co. plc (United Kingdom) | 1,755 | 14,110 | ||||||
Camden Property Trust1 | 270 | 30,880 | ||||||
Community Healthcare Trust, Inc. | 505 | 24,452 | ||||||
Cousins Properties, Inc. | 1,400 | 56,182 | ||||||
Crown Castle International Corp. | 195 | 27,064 | ||||||
CubeSmart | 240 | 7,608 | ||||||
Digital Realty Trust, Inc. | 225 | 28,584 | ||||||
Douglas Emmett, Inc. | 600 | 25,992 | ||||||
Equinix, Inc. | 1,080 | 612,122 | ||||||
Equity LifeStyle Properties, Inc. | 370 | 25,878 | ||||||
Equity Residential | 460 | 40,784 | ||||||
Essential Properties Realty Trust, Inc. | 1,019 | 26,147 | ||||||
Essex Property Trust, Inc. | 101 | 33,040 | ||||||
Extra Space Storage, Inc. | 90 | 10,104 | ||||||
SHARES
| VALUE
| |||||||
COMMON STOCKS(continued) |
| |||||||
Real Estate(continued) |
| |||||||
Equity Real Estate Investment Trusts (REITS)(continued) |
| |||||||
Federal Realty Investment Trust | 60 | $ | 8,161 | |||||
First Industrial Realty Trust, Inc. | 420 | 17,686 | ||||||
Getty Realty Corp. | 495 | 16,602 | ||||||
Healthcare Realty Trust, Inc. | 745 | 25,904 | ||||||
Healthcare Trust of America, Inc. - Class A | 455 | 14,105 | ||||||
Healthpeak Properties, Inc. | 1,095 | 41,194 | ||||||
Hibernia REIT plc (Ireland) | 8,735 | 13,600 | ||||||
Host Hotels & Resorts, Inc. | 890 | 14,587 | ||||||
Independence Realty Trust, Inc. | 1,220 | 18,788 | ||||||
Invitation Homes, Inc. | 1,720 | 52,959 | ||||||
Jernigan Capital, Inc. | 815 | 15,477 | ||||||
Kilroy Realty Corp. | 107 | 8,980 | ||||||
Land Securities Group plc (United Kingdom) | 1,175 | 14,312 | ||||||
Liberty Property Trust | 420 | 24,809 | ||||||
Life Storage, Inc. | 115 | 12,526 | ||||||
Mid-America Apartment Communities, Inc. | 130 | 18,069 | ||||||
National Retail Properties, Inc. | 445 | 26,215 | ||||||
National Storage Affiliates Trust | 435 | 14,864 | ||||||
Omega Healthcare Investors, Inc. | 420 | 18,497 | ||||||
Physicians Realty Trust | 1,515 | 28,285 | ||||||
Plymouth Industrial REIT, Inc. | 550 | 10,373 | ||||||
Prologis, Inc. | 985 | 86,444 | ||||||
Public Storage | 165 | 36,772 | ||||||
Realty Income Corp. | 130 | 10,633 | ||||||
SBA Communications Corp. | 1,530 | 368,194 | ||||||
Simon Property Group, Inc. | 390 | 58,765 | ||||||
STAG Industrial, Inc. | 515 | 15,986 | ||||||
STORE Capital Corp. | 380 | 15,390 | ||||||
Sun Communities, Inc. | 235 | 38,223 | ||||||
Sunstone Hotel Investors, Inc. | 735 | 9,930 | ||||||
UDR, Inc. | 635 | 31,909 | ||||||
UMH Properties, Inc. | 575 | 8,585 | ||||||
Urban Edge Properties | 1,255 | 26,493 | ||||||
Ventas, Inc. | 467 | 30,402 | ||||||
VEREIT, Inc. | 2,960 | 29,126 | ||||||
Vornado Realty Trust | 160 | 10,501 | ||||||
Weingarten Realty Investors | 710 | 22,528 | ||||||
Welltower, Inc. | 426 | 38,634 | ||||||
|
| |||||||
| 2,875,957 | ||||||||
|
| |||||||
Real Estate Management & Development - 0.0%## |
| |||||||
Ayala Land, Inc. (Philippines) | 12,500 | 11,945 | ||||||
The accompanying notes are an integral part of the financial statements.
29
Investment Portfolio - October 31, 2019
| BLENDED ASSET MODERATE SERIES | SHARES/
| |||||||
VALUE
| ||||||||
COMMON STOCKS(continued) |
| |||||||
Real Estate(continued) |
| |||||||
Real Estate Management & Development(continued) |
| |||||||
SM Prime Holdings, Inc. (Philippines) | 20,360 | $ | 15,633 | |||||
|
| |||||||
| 27,578 | ||||||||
|
| |||||||
Total Real Estate | 2,903,535 | |||||||
|
| |||||||
Utilities - 0.0%## | ||||||||
Electric Utilities - 0.0%## |
| |||||||
Manila Electric Co. (Philippines) | 1,020 | 6,802 | ||||||
|
| |||||||
Independent Power and Renewable Electricity Producers - 0.0%## |
| |||||||
Aboitiz Power Corp. (Philippines) | 10,700 | 8,424 | ||||||
|
| |||||||
Multi-Utilities - 0.0%## | ||||||||
Engie S.A. (France) | 530 | 8,874 | ||||||
Veolia Environnement S.A. (France) . | 160 | 4,212 | ||||||
|
| |||||||
| 13,086 | ||||||||
|
| |||||||
Total Utilities | 28,312 | |||||||
|
| |||||||
TOTAL COMMON STOCKS | ||||||||
(Identified Cost $31,762,156) | 35,663,411 | |||||||
|
| |||||||
CORPORATE BONDS - 13.9% |
| |||||||
Non-Convertible Corporate Bonds - 13.9% |
| |||||||
Communication Services - 3.1% |
| |||||||
Diversified Telecommunication Services - 1.5% |
| |||||||
AT&T, Inc.1, 4.25%, 3/1/2027 | 530,000 | 582,102 | ||||||
CenturyLink, Inc., 5.625%, 4/1/2020 . | 10,000 | 10,125 | ||||||
Verizon Communications, Inc., 5.25%, 3/16/2037 | 680,000 | 856,513 | ||||||
|
| |||||||
| 1,448,740 | ||||||||
|
| |||||||
Interactive Media & Services - 0.4% |
| |||||||
Tencent Holdings Ltd. (China)2, 3.975%, 4/11/2029 | 390,000 | 419,726 | ||||||
|
| |||||||
Media - 1.1% | ||||||||
Cablevision Systems Corp., 8.00%, 4/15/2020 | 10,000 | 10,250 | ||||||
Comcast Corp., 3.25%, 11/1/2039 | 420,000 | 425,803 | ||||||
Diamond Sports Group LLC - Diamond Sports Finance Co.2, 6.625%, 8/15/2027 | 15,000 | 15,450 | ||||||
Discovery Communications LLC, 5.20%, 9/20/2047 | 550,000 | 601,456 | ||||||
Entercom Media Corp.2, 7.25%, 11/1/2024 | 5,000 | 5,212 | ||||||
Townsquare Media, Inc.2, 6.50%, 4/1/2023 | 5,000 | 4,950 | ||||||
|
| |||||||
| 1,063,121 | ||||||||
|
| |||||||
PRINCIPAL
| ||||||||
VALUE
| ||||||||
CORPORATE BONDS(continued) |
| |||||||
Non-Convertible Corporate Bonds(continued) |
| |||||||
Communication Services(continued) |
| |||||||
Wireless Telecommunication Services - 0.1% |
| |||||||
Sprint Communications, Inc., 7.00%, 8/15/2020 | 20,000 | $ | 20,603 | |||||
Sprint Corp., 7.25%, 9/15/2021 | 10,000 | 10,671 | ||||||
Sprint Corp., 7.125%, 6/15/2024 | 10,000 | 10,850 | ||||||
|
| |||||||
| 42,124 | ||||||||
|
| |||||||
Total Communication Services | 2,973,711 | |||||||
|
| |||||||
Consumer Discretionary - 2.0% | ||||||||
Auto Components - 0.0%## |
| |||||||
American Axle & Manufacturing, Inc., 6.25%, 4/1/2025 | 5,000 | 4,819 | ||||||
Techniplas LLC2, 10.00%, 5/1/2020 | 10,000 | 8,450 | ||||||
|
| |||||||
| 13,269 | ||||||||
|
| |||||||
Automobiles - 0.5% |
| |||||||
General Motors Financial Co., Inc., 3.15%, 1/15/2020 | 440,000 | 440,595 | ||||||
|
| |||||||
Diversified Consumer Services - 0.0%## |
| |||||||
GEMS MENASA Cayman Ltd. - GEMS Education Delaware LLC (United Arab Emirates)2, 7.125%, 7/31/2026 | 35,000 | 36,268 | ||||||
|
| |||||||
Household Durables - 0.1% |
| |||||||
Ashton Woods USA LLC - Ashton Woods Finance Co.2, 6.75%, 8/1/2025 | 10,000 | 10,050 | ||||||
LGI Homes, Inc.2, 6.875%, 7/15/2026 | 20,000 | 20,700 | ||||||
Weekley Homes LLC - Weekley Finance Corp., 6.625%, 8/15/2025 | 20,000 | 20,300 | ||||||
|
| |||||||
| 51,050 | ||||||||
|
| |||||||
Internet & Direct Marketing Retail - 1.4% |
| |||||||
Alibaba Group Holding Ltd. (China), 3.40%, 12/6/2027 | 420,000 | 436,238 | ||||||
Booking Holdings, Inc., 3.60%, 6/1/2026 | 800,000 | 866,126 | ||||||
Photo Holdings Merger Sub, Inc.2, 8.50%, 10/1/2026 | 15,000 | 13,202 | ||||||
|
| |||||||
| 1,315,566 | ||||||||
|
| |||||||
Specialty Retail - 0.0%## |
| |||||||
Foxtrot Escrow Issuer LLC - Foxtrot Escrow Corp.2, 12.25%, 11/15/2026 | 15,000 | 15,077 | ||||||
The accompanying notes are an integral part of the financial statements.
30
Investment Portfolio - October 31, 2019
| BLENDED ASSET MODERATE SERIES | ||||||||
PRINCIPAL AMOUNT3
| VALUE
| |||||||
CORPORATE BONDS(continued) | ||||||||
Non-Convertible Corporate Bonds(continued) |
| |||||||
Consumer Discretionary(continued) | ||||||||
Specialty Retail(continued) | ||||||||
Staples, Inc.2, 7.50%, 4/15/2026 | 15,000 | $ | 15,603 | |||||
|
| |||||||
| 30,680 | ||||||||
|
| |||||||
Total Consumer Discretionary | 1,887,428 | |||||||
|
| |||||||
Consumer Staples - 0.0%## |
| |||||||
Food & Staples Retailing - 0.0%## |
| |||||||
KeHE Distributors LLC - KeHE Finance Corp.2, 8.625%, 10/15/2026 | 10,000 | 10,256 | ||||||
|
| |||||||
Energy - 2.4% | ||||||||
Energy Equipment & Services - 0.0%## |
| |||||||
Nabors Industries, Inc., 5.50%, 1/15/2023 | 10,000 | 8,450 | ||||||
Shelf Drilling Holdings Ltd. (United Arab Emirates)2, 8.25%, 2/15/2025 | 10,000 | 8,400 | ||||||
|
| |||||||
| 16,850 | ||||||||
|
| |||||||
Oil, Gas & Consumable Fuels - 2.4% |
| |||||||
Antero Midstream Partners LP - Antero Midstream Finance Corp.2, 5.75%, 3/1/2027 | 10,000 | 7,438 | ||||||
Antero Midstream Partners LP - Antero Midstream Finance Corp.2, 5.75%, 1/15/2028 | 10,000 | 7,550 | ||||||
Bruin E&P Partners LLC1,2, 8.875%, 8/1/2023 | 10,000 | 6,600 | ||||||
Calumet Specialty Products Partners LP - Calumet Finance Corp.2, 11.00%, 4/15/2025 | 15,000 | 15,037 | ||||||
Energy Transfer Operating LP, 6.50%, 2/1/2042 | 360,000 | 431,173 | ||||||
Jonah Energy LLC - Jonah Energy Finance Corp.2, 7.25%, 10/15/2025 | 20,000 | 5,600 | ||||||
Kinder Morgan Energy Partners LP, 6.95%, 1/15/2038 | 430,000 | 555,871 | ||||||
Lonestar Resources America, Inc.2, 11.25%, 1/1/2023 | 10,000 | 7,000 | ||||||
Moss Creek Resources Holdings, Inc.2, 10.50%, 5/15/2027 | 5,000 | 3,862 | ||||||
NuStar Logistics LP, 6.75%, 2/1/2021 | 10,000 | 10,362 | ||||||
Rockies Express Pipeline LLC2, 5.625%, 4/15/2020 | 15,000 | 15,252 | ||||||
Sabine Pass Liquefaction LLC, 5.875%, 6/30/2026 | 670,000 | 769,329 | ||||||
Southwestern Energy Co.4, 6.20%, 1/23/2025 | 10,000 | 8,800 | ||||||
PRINCIPAL AMOUNT3
| VALUE
| |||||||
CORPORATE BONDS(continued) | ||||||||
Non-Convertible Corporate Bonds(continued) |
| |||||||
Energy(continued) | ||||||||
Oil, Gas & Consumable Fuels(continued) |
| |||||||
W&T Offshore, Inc.2, 9.75%, 11/1/2023 | 5,000 | $ | 4,687 | |||||
The Williams Companies, Inc., 3.75%, 6/15/2027 | 410,000 | 427,484 | ||||||
|
| |||||||
| 2,276,045 | ||||||||
|
| |||||||
Total Energy | 2,292,895 | |||||||
|
| |||||||
Financials - 3.3% | ||||||||
Banks - 2.8% | ||||||||
Bank of America Corp.1, 4.00%, 1/22/2025 | 800,000 | 853,295 | ||||||
Citigroup, Inc.1, 8.125%, 7/15/2039 | 260,000 | 427,718 | ||||||
Credit Suisse AG (Switzerland), 5.40%, 1/14/2020 | 420,000 | 422,722 | ||||||
JPMorgan Chase & Co.5, (3 mo. LIBOR US + 1.000%), 4.023%, 12/5/2024 | 390,000 | 416,441 | ||||||
Santander Holdings USA, Inc., 4.50%, 7/17/2025 | 520,000 | 560,351 | ||||||
|
| |||||||
| 2,680,527 | ||||||||
|
| |||||||
Capital Markets - 0.3% | ||||||||
AG Merger Sub II, Inc.2, 10.75%, 8/1/2027 | 10,000 | 9,900 | ||||||
Donnelley Financial Solutions, Inc., 8.25%, 10/15/2024 | 20,000 | 20,800 | ||||||
The Goldman Sachs Group, Inc., 4.25%, 10/21/2025 | 240,000 | 258,516 | ||||||
|
| |||||||
| 289,216 | ||||||||
|
| |||||||
Consumer Finance - 0.1% |
| |||||||
Navient Corp., 5.00%, 10/26/2020 | 15,000 | 15,277 | ||||||
SLM Corp., 5.125%, 4/5/2022 | 20,000 | 20,650 | ||||||
|
| |||||||
| 35,927 | ||||||||
|
| |||||||
Diversified Financial Services - 0.1% |
| |||||||
Fidelity & Guaranty Life Holdings, Inc.2, 5.50%, 5/1/2025 | 10,000 | 10,675 | ||||||
Global Aircraft Leasing Co. Ltd. (Cayman Islands)2,6, 6.50%, 9/15/2024 | 20,000 | 20,469 | ||||||
VistaJet Malta Finance plc - XO Management Holding, Inc. (Switzerland)2, 10.50%, 6/1/2024 | 15,000 | 14,587 | ||||||
|
| |||||||
| 45,731 | ||||||||
|
| |||||||
Thrifts & Mortgage Finance - 0.0%## |
| |||||||
Acrisure LLC - Acrisure Finance, Inc.2, 7.00%, 11/15/2025 | 15,000 | 13,725 | ||||||
The accompanying notes are an integral part of the financial statements.
31
Investment Portfolio - October 31, 2019
| BLENDED ASSET MODERATE SERIES | ||||||||
PRINCIPAL AMOUNT3
| VALUE
| |||||||
CORPORATE BONDS(continued) | ||||||||
Non-Convertible Corporate Bonds(continued) |
| |||||||
Financials(continued) | ||||||||
Thrifts & Mortgage Finance(continued) |
| |||||||
Radian Group, Inc., 4.875%, 3/15/2027 | 20,000 | $ | 20,750 | |||||
|
| |||||||
| 34,475 | ||||||||
|
| |||||||
Total Financials | 3,085,876 | |||||||
|
| |||||||
Health Care - 0.5% | ||||||||
Health Care Providers & Services - 0.5% |
| |||||||
HCA, Inc., 4.125%, 6/15/2029 | 410,000 | 434,356 | ||||||
|
| |||||||
Industrials - 1.2% |
| |||||||
Commercial Services & Supplies - 0.0%## |
| |||||||
The ADT Security Corp., 6.25%, 10/15/2021 | 10,000 | 10,663 | ||||||
Prime Security Services Borrower LLC - Prime Finance, Inc.2, 5.75%, 4/15/2026 | 10,000 | 10,247 | ||||||
Stericycle, Inc.2, 5.375%, 7/15/2024 . | 20,000 | 20,800 | ||||||
|
| |||||||
| 41,710 | ||||||||
|
| |||||||
Construction & Engineering - 0.0%## |
| |||||||
HC2 Holdings, Inc.2, 11.50%, 12/1/2021 | 5,000 | 4,556 | ||||||
Tutor Perini Corp.2, 6.875%, 5/1/2025 | 20,000 | 19,947 | ||||||
|
| |||||||
| 24,503 | ||||||||
|
| |||||||
Industrial Conglomerates - 0.5% |
| |||||||
General Electric Co.5,7, (3 mo. LIBOR US + 3.330%), 5.00% | 460,000 | 443,325 | ||||||
|
| |||||||
Marine - 0.1% |
| |||||||
American Tanker, Inc. (Norway)2, 9.25%, 2/22/2022 | 25,000 | 25,140 | ||||||
Borealis Finance LLC2, 7.50%, 11/16/2022 | 20,000 | 18,800 | ||||||
|
| |||||||
| 43,940 | ||||||||
|
| |||||||
Trading Companies & Distributors - 0.6% |
| |||||||
AerCap Ireland Capital DAC - AerCap Global Aviation Trust (Ireland)1, 4.45%, 10/1/2025 | 530,000 | 575,091 | ||||||
PRINCIPAL AMOUNT3
| VALUE
| |||||||
CORPORATE BONDS(continued) | ||||||||
Non-Convertible Corporate Bonds(continued) |
| |||||||
Industrials(continued) | ||||||||
Trading Companies & Distributors(continued) |
| |||||||
Fortress Transportation & Infrastructure Investors LLC2, 6.50%, 10/1/2025 | 15,000 | $ | 15,150 | |||||
|
| |||||||
| 590,241 | ||||||||
|
| |||||||
Total Industrials | 1,143,719 | |||||||
|
| |||||||
Information Technology - 0.0%## | ||||||||
Communications Equipment - 0.0%## |
| |||||||
Hughes Satellite Systems Corp., 5.25%, 8/1/2026 | 20,000 | 21,425 | ||||||
|
| |||||||
| Materials - 0.7% |
| |||||||
Chemicals - 0.0%## |
| |||||||
CF Industries, Inc., 7.125%, 5/1/2020 | 10,000 | 10,240 | ||||||
Olin Corp., 5.625%, 8/1/2029 | 10,000 | 10,383 | ||||||
|
| |||||||
| 20,623 | ||||||||
|
| |||||||
Containers & Packaging - 0.0%## |
| |||||||
ARD Securities Finance S.A.R.L (Luxembourg)2,6, 8.75%, 1/31/2023 | 5,218 | 5,427 | ||||||
Berry Global, Inc.2, 4.50%, 2/15/2026 | 5,000 | 5,031 | ||||||
Mauser Packaging Solutions Holding Co.2, 7.25%, 4/15/2025 | 10,000 | 9,562 | ||||||
|
| |||||||
| 20,020 | ||||||||
|
| |||||||
Metals & Mining - 0.7% |
| |||||||
Infrabuild Australia Pty Ltd. (Australia)2, 12.00%, 10/1/2024 | 15,000 | 15,287 | ||||||
Mountain Province Diamonds, Inc. (Canada)2, 8.00%, 12/15/2022 | 20,000 | 19,400 | ||||||
Northwest Acquisitions ULC - Dominion Finco, Inc.2, 7.125%, 11/1/2022 | 20,000 | 10,000 | ||||||
Southern Copper Corp. (Peru), 5.375%, 4/16/2020 | 560,000 | 566,909 | ||||||
SunCoke Energy Partners LP - SunCoke Energy Partners Finance Corp.2, 7.50%, 6/15/2025 | 5,000 | 4,250 | ||||||
|
| |||||||
| 615,846 | ||||||||
|
| |||||||
Total Materials | 656,489 | |||||||
|
| |||||||
Real Estate - 0.7% | ||||||||
Equity Real Estate Investment Trusts (REITS) - 0.7% |
| |||||||
American Tower Corp., 3.80%, 8/15/2029 | 520,000 | 555,897 | ||||||
The accompanying notes are an integral part of the financial statements.
32
Investment Portfolio - October 31, 2019
| BLENDED ASSET MODERATE SERIES | PRINCIPAL | |||||||
AMOUNT3/ SHARES
| VALUE
| |||||||
CORPORATE BONDS(continued) |
| |||||||
Non-Convertible Corporate Bonds(continued) |
| |||||||
Real Estate(continued) |
| |||||||
Equity Real Estate Investment Trusts (REITS)(continued) |
| |||||||
GTP Acquisition Partners I LLC2, 2.35%, 6/15/2020 | 92,000 | $ | 92,032 | |||||
|
| |||||||
| 647,929 | ||||||||
|
| |||||||
Real Estate Management & Development - 0.0%## |
| |||||||
Five Point Operating Co. LP - Five Point Capital Corp.2, 7.875%, 11/15/2025 | 15,000 | 14,178 | ||||||
Forestar Group, Inc.2, 8.00%, 4/15/2024 | 10,000 | 10,750 | ||||||
|
| |||||||
| 24,928 | ||||||||
|
| |||||||
Total Real Estate | 672,857 | |||||||
|
| |||||||
TOTAL CORPORATE BONDS |
| 13,179,012 | ||||||
|
| |||||||
MUTUAL FUNDS - 0.3% | ||||||||
iShares MSCI India ETF | 2,270 | 78,655 | ||||||
SPDR Gold Shares* | 786 | 111,950 | ||||||
VanEck Vectors Gold Miners ETF | 2,088 | 58,777 | ||||||
|
| |||||||
TOTAL MUTUAL FUNDS |
| 249,382 | ||||||
|
| |||||||
U.S. TREASURY SECURITIES - 22.7% |
| |||||||
U.S. Treasury Bonds - 6.5% |
| |||||||
U.S. Treasury Bond, 4.75%, 2/15/2037 | 1,281,000 | 1,822,523 | ||||||
U.S. Treasury Bond, 2.50%, 2/15/2045 | 1,862,000 | 1,980,848 | ||||||
U.S. Treasury Bond, 3.00%, 5/15/2047 | 1,547,000 | 1,811,440 | ||||||
U.S. Treasury Inflation Indexed Bond, 0.75%, 2/15/2042 | 502,646 | 528,174 | ||||||
|
| |||||||
Total U.S. Treasury Bonds |
| 6,142,985 | ||||||
|
| |||||||
U.S. Treasury Notes - 16.2% |
| |||||||
U.S. Treasury Inflation Indexed Note, 0.125%, 4/15/2020 | 2,757,963 | 2,743,204 | ||||||
U.S. Treasury Inflation Indexed Note, 0.50%, 4/15/2024 | 1,363,115 | 1,381,035 | ||||||
U.S. Treasury Note, 2.625%, 5/15/2021 | 915,000 | 929,297 | ||||||
U.S. Treasury Note, 1.75%, 5/15/2023 | 1,860,000 | 1,874,095 | ||||||
U.S. Treasury Note, 2.50%, 8/15/2023 | 2,725,000 | 2,822,078 | ||||||
U.S. Treasury Note, 2.375%, 8/15/2024 | 1,800,000 | 1,868,906 | ||||||
PRINCIPAL AMOUNT3
| VALUE
| |||||||
U.S. TREASURY SECURITIES(continued) |
| |||||||
U.S. Treasury Notes(continued) |
| |||||||
U.S. Treasury Note, 2.125%, 5/15/2025 | 1,827,000 | $ | 1,880,454 | |||||
U.S. Treasury Note, 1.625%, 5/15/2026 | 1,828,000 | 1,830,928 | ||||||
|
| |||||||
Total U.S. Treasury Notes |
| 15,329,997 | ||||||
|
| |||||||
TOTAL U.S. TREASURY SECURITIES |
| 21,472,982 | ||||||
|
| |||||||
ASSET-BACKED SECURITIES - 4.6% |
| |||||||
Cazenovia Creek Funding II LLC, Series 2018-1A, Class A1,2, 3.561%, 7/15/2030 | 181,292 | 182,608 | ||||||
CCG Receivables Trust, Series 2019-1, Class A22, 2.80%, 9/14/2026 | 570,000 | 575,306 | ||||||
Chesapeake Funding II LLC, Series 2017-4A, Class A1 (Canada)1,2, 2.12%, 11/15/2029 | 340,393 | 340,398 | ||||||
Enterprise Fleet Financing LLC, Series 2018-2, Class A22, 3.14%, 2/20/2024 | 407,114 | 410,768 | ||||||
Invitation Homes Trust, Series 2017-SFR2, Class A2,8, (1 mo. LIBOR US + 0.850%), 2.739%, 12/17/2036 | 84,504 | 84,385 | ||||||
Invitation Homes Trust, Series 2017-SFR2, Class B2,8, (1 mo. LIBOR US + 1.150%), 3.039%, 12/17/2036 | 65,000 | 65,061 | ||||||
Navient Private Education Refi Loan Trust, Series 2019-CA, Class A12, 2.82%, 2/15/2068 | 237,576 | 239,904 | ||||||
Progress Residential Trust, Series 2019-SFR2, Class A2, 3.147%, 5/17/2036 | 285,000 | 289,946 | ||||||
SoFi Consumer Loan Program LLC, Series 2016-1, Class A2, 3.26%, 8/25/2025 | 118,651 | 119,960 | ||||||
SoFi Consumer Loan Program LLC, Series 2016-5, Class A2, 3.06%, 9/25/2028 | 85,730 | 86,170 | ||||||
SoFi Consumer Loan Program Trust, Series 2019-2, Class A2, 3.01%, 4/25/2028 | 187,542 | 189,010 | ||||||
SoFi Consumer Loan Program Trust, Series 2019-3, Class A2, 2.90%, 5/25/2028 | 233,121 | 234,780 | ||||||
The accompanying notes are an integral part of the financial statements.
33
Investment Portfolio - October 31, 2019
| BLENDED ASSET MODERATE SERIES | ||||||||
PRINCIPAL AMOUNT3
| VALUE
| |||||||
ASSET-BACKED SECURITIES(continued) |
| |||||||
SoFi Professional Loan Program LLC, Series 2016-E, Class A2B2, 2.49%, 1/25/2036 | 319,979 | $ | 321,222 | |||||
SoFi Professional Loan Program LLC, Series 2017-F, Class A1FX2, 2.05%, 1/25/2041 | 24,678 | 24,676 | ||||||
SoFi Professional Loan Program LLC, Series 2017-F, Class A2FX2, 2.84%, 1/25/2041 | 75,000 | 76,114 | ||||||
SoFi Professional Loan Program LLC, Series 2018-A, Class A2A2, 2.39%, 2/25/2042 | 73,541 | 73,683 | ||||||
Towd Point Mortgage Trust, Series 2016-5, Class A12,9, 2.50%, 10/25/2056 | 202,606 | 203,380 | ||||||
Towd Point Mortgage Trust, Series 2017-1, Class A12,9, 2.75%, 10/25/2056 | 197,935 | 200,277 | ||||||
Towd Point Mortgage Trust, Series 2019-HY1, Class A12,8, (1 mo. LIBOR US + 1.000%), 2.823%, 10/25/2048 | 179,000 | 179,957 | ||||||
Tricon American Homes Trust, Series 2016-SFR1, Class A2, 2.589%, 11/17/2033 | 223,823 | 223,776 | ||||||
Tricon American Homes Trust, Series 2017-SFR2, Class A2, 2.928%, 1/17/2036 | 239,321 | 242,910 | ||||||
|
| |||||||
TOTAL ASSET-BACKED SECURITIES |
| 4,364,291 | ||||||
|
| |||||||
COMMERCIAL MORTGAGE-BACKED SECURITIES - 4.7% |
| |||||||
Caesars Palace Las Vegas Trust, Series 2017-VICI, Class A1,2, 3.531%, 10/15/2034 | 300,000 | 311,982 | ||||||
CIM Trust, Series 2019-INV1, Class A12,9, 4.00%, 2/25/2049 | 112,075 | 114,521 | ||||||
Credit Suisse Mortgage Capital Trust, Series 2013-IVR3, Class A11,2,9, 2.50%, 5/25/2043 | 159,438 | 157,761 | ||||||
Credit Suisse Mortgage Capital Trust, Series 2013-TH1, Class A12,9, 2.13%, 2/25/2043 | 109,413 | 107,001 | ||||||
Credit Suisse Mortgage Capital Trust, Series 2014-IVR3, Class A11,2,9, 3.50%, 7/25/2044 | 254,580 | 258,560 | ||||||
Fannie Mae REMICS, Series 2018-31, Class KP, 3.50%, 7/25/2047 | 231,875 | 242,065 | ||||||
Fannie Mae-Aces, Series 2017-M15, Class A19, 2.959%, 9/25/2027 | 283,910 | 297,492 | ||||||
PRINCIPAL AMOUNT3
| VALUE
| |||||||
COMMERCIAL MORTGAGE-BACKED SECURITIES(continued) |
| |||||||
Freddie Mac Multifamily Structured Pass-Through Certificates, Series K009, Class X1 (IO)9, 1.26%, 8/25/2020 | 2,381,917 | $ | 17,102 | |||||
Freddie Mac Multifamily Structured Pass-Through Certificates, Series K021, Class X1 (IO)9, 1.428%, 6/25/2022 | 1,852,243 | 59,606 | ||||||
Freddie Mac Multifamily Structured Pass-Through Certificates, Series K030, Class X1 (IO)9, 0.188%, 4/25/2023 | 9,614,031 | 58,029 | ||||||
Freddie Mac REMICS, Series 4791, Class BA, 4.00%, 3/15/2044 | 234,332 | 237,498 | ||||||
Freddie Mac REMICS, Series 4801, Class BA, 4.50%, 5/15/2044 | 212,369 | 216,804 | ||||||
FREMF Mortgage Trust, Series 2013-K28, Class X2A (IO)2, 0.10%, 6/25/2046 | 23,856,684 | 63,926 | ||||||
FREMF Mortgage Trust, Series 2014-K37, Class B2,9, 4.559%, 1/25/2047 | 320,000 | 348,121 | ||||||
Government National Mortgage Association, Series 2017-54, Class AH, 2.60%, 12/16/2056 | 299,839 | 302,350 | ||||||
JP Morgan Mortgage Trust, Series 2013-2, Class A22,9, 3.50%, 5/25/2043 | 90,156 | 91,916 | ||||||
JP Morgan Mortgage Trust, Series 2014-2, Class 1A12,9, 3.00%, 6/25/2029 | 112,766 | 114,535 | ||||||
New Residential Mortgage Loan Trust, Series 2014-3A, Class AFX32,9, 3.75%, 11/25/2054 | 87,976 | 91,515 | ||||||
New Residential Mortgage Loan Trust, Series 2015-2A, Class A12,9, 3.75%, 8/25/2055 | 116,327 | 121,276 | ||||||
New Residential Mortgage Loan Trust, Series 2016-4A, Class A12,9, 3.75%, 11/25/2056 | 124,297 | 129,644 | ||||||
Sequoia Mortgage Trust, Series 2013-2, Class A9, 1.874%, 2/25/2043 | 102,226 | 98,561 | ||||||
Sequoia Mortgage Trust, Series 2013-8, Class A19, 3.00%, 6/25/2043 | 130,507 | 131,980 | ||||||
Starwood Retail Property Trust, Series 2014-STAR, Class A2,8, (1 mo. LIBOR US + 1.220%), 3.134%, 11/15/2027 | 303,129 | 302,583 | ||||||
Sutherland Commercial Mortgage Trust, Series 2019-SBC8, Class A2,9, 2.86%, 12/25/2035 | 267,245 | 268,768 | ||||||
The accompanying notes are an integral part of the financial statements.
34
Investment Portfolio - October 31, 2019
| BLENDED ASSET MODERATE SERIES | ||||||||
PRINCIPAL AMOUNT3
| VALUE
| |||||||
COMMERCIAL MORTGAGE-BACKED SECURITIES(continued) |
| |||||||
Waikiki Beach Hotel Trust, Series 2019-WBM, Class A2,8, (1 mo. LIBOR US + 1.050%), 2.971%, 12/15/2033 | 205,000 | $ | 205,127 | |||||
WinWater Mortgage Loan Trust, Series 2015-3, Class A52,9, 3.50%, 3/20/2045 | 82,748 | 82,936 | ||||||
|
| |||||||
TOTAL COMMERCIAL MORTGAGE-BACKED SECURITIES |
| 4,431,659 | ||||||
|
| |||||||
FOREIGN GOVERNMENT BONDS - 0.7% |
| |||||||
Canadian Government Bond (Canada), 2.75%, 6/1/2022 | CAD | 67,000 | 52,466 | |||||
Export-Import Bank of Korea (South Korea), 2.625%, 12/30/2020 | 500,000 | 502,873 | ||||||
Mexican Government Bond (Mexico), 8.00%, 6/11/2020 | MXN | 1,338,000 | 70,050 | |||||
Mexican Government Bond (Mexico), 6.50%, 6/10/2021 | MXN | 540,000 | 28,009 | |||||
Mexican Government Bond (Mexico), 6.50%, 6/9/2022 | MXN | 879,000 | 45,641 | |||||
Mexican Government Bond (Mexico), 7.75%, 5/29/2031 | MXN | 169,000 | 9,395 | |||||
|
| |||||||
TOTAL FOREIGN GOVERNMENT BONDS |
| 708,434 | ||||||
|
| |||||||
U.S. GOVERNMENT AGENCIES - 11.9% |
| |||||||
Mortgage-Backed Securities - 11.9% |
| |||||||
Fannie Mae, Pool #888468, 5.50%, 9/1/2021 | 12,565 | 12,747 | ||||||
Fannie Mae, Pool #888810, 5.50%, 11/1/2022 | 15,231 | 15,432 | ||||||
Fannie Mae, Pool #AL9409, 3.50%, 11/1/2031 | 248,595 | 258,356 | ||||||
Fannie Mae, Pool #MA3463, 4.00%, 9/1/2033 | 254,165 | 265,383 | ||||||
Fannie Mae, Pool #MA1834, 4.50%, 2/1/2034 | 93,639 | 100,639 | ||||||
Fannie Mae, Pool #MA1903, 4.50%, 5/1/2034 | 87,523 | 94,067 | ||||||
Fannie Mae, Pool #FM1158, 3.50%, 6/1/2034 | 413,813 | 428,718 | ||||||
Fannie Mae, Pool #745418, 5.50%, 4/1/2036 | 74,722 | 84,126 | ||||||
Fannie Mae, Pool #MA3412, 3.50%, 7/1/2038 | 414,913 | 429,979 | ||||||
Fannie Mae, Pool #MA0258, 4.50%, 12/1/2039 | 130,140 | 140,982 | ||||||
PRINCIPAL AMOUNT3
| VALUE
| |||||||
U.S. GOVERNMENT AGENCIES(continued) |
| |||||||
Mortgage-Backed Securities(continued) |
| |||||||
Fannie Mae, Pool #AL0152, 6.00%, 6/1/2040 | 106,295 | $ | 122,184 | |||||
Fannie Mae, Pool #AL0241, 4.00%, 4/1/2041 | 158,684 | 169,812 | ||||||
Fannie Mae, Pool #AL1410, 4.50%, 12/1/2041 | 228,472 | 247,696 | ||||||
Fannie Mae, Pool #AL7068, 4.50%, 9/1/2042 | 257,590 | 278,867 | ||||||
Fannie Mae, Pool #AL7729, 4.00%, 6/1/2043 | 130,846 | 139,988 | ||||||
Fannie Mae, Pool #AS3622, 3.50%, 10/1/2044 | 569,848 | 600,090 | ||||||
Fannie Mae, Pool #BD1381, 3.50%, 6/1/2046 | 131,592 | 136,891 | ||||||
Fannie Mae, Pool #MA2705, 3.00%, 8/1/2046 | 207,147 | 212,609 | ||||||
Fannie Mae, Pool #BJ1323, 3.50%, 11/1/2047 | 546,424 | 570,549 | ||||||
Fannie Mae, Pool #CA1720, 5.00%, 5/1/2048 | 330,623 | 365,134 | ||||||
Fannie Mae, Pool #CA2056, 4.50%, 7/1/2048 | 353,500 | 373,117 | ||||||
Fannie Mae, Pool #MA3443, 4.00%, 8/1/2048 | 246,419 | 255,593 | ||||||
Fannie Mae, Pool #BK9366, 4.50%, 8/1/2048 | 105,480 | 111,025 | ||||||
Fannie Mae, Pool #CA2219, 5.00%, 8/1/2048 | 195,890 | 210,003 | ||||||
Fannie Mae, Pool #MA3521, 4.00%, 11/1/2048 | 517,774 | 537,520 | ||||||
Fannie Mae, Pool #MA3527, 5.00%, 11/1/2048 | 418,093 | 446,564 | ||||||
Fannie Mae, Pool #BN0622, 4.50%, 1/1/2049 | 310,223 | 326,468 | ||||||
Fannie Mae, Pool #AL8674, 5.645%, 1/1/2049 | 279,407 | 314,527 | ||||||
Fannie Mae, Pool #MA3692, 3.50%, 7/1/2049 | 605,909 | 621,604 | ||||||
Freddie Mac, Pool #C91762, 4.50%, 5/1/2034 | 115,607 | 124,318 | ||||||
Freddie Mac, Pool #QN0349, 3.00%, 8/1/2034 | 312,108 | 319,772 | ||||||
Freddie Mac, Pool #G03926, 6.00%, 2/1/2038 | 31,869 | 36,659 | ||||||
Freddie Mac, Pool #G04731, 5.50%, 4/1/2038 | 32,842 | 36,908 | ||||||
Freddie Mac, Pool #G08273, 5.50%, 6/1/2038 | 41,040 | 46,058 | ||||||
Freddie Mac, Pool #G60480, 4.50%, 11/1/2045 | 589,894 | 635,388 | ||||||
The accompanying notes are an integral part of the financial statements.
35
Investment Portfolio - October 31, 2019
| BLENDED ASSET MODERATE SERIES | ||||||||
PRINCIPAL AMOUNT3
| VALUE
| |||||||
U.S. GOVERNMENT AGENCIES(continued) |
| |||||||
Mortgage-Backed Securities(continued) |
| |||||||
Freddie Mac, Pool #Q37592, 4.00%, 12/1/2045 | 273,058 | $ | 289,571 | |||||
Freddie Mac, Pool #Q45878, 3.00%, 12/1/2046 | 408,688 | 419,072 | ||||||
Freddie Mac, Pool #ZM2525, 3.00%, 12/1/2046 | 288,622 | 295,780 | ||||||
Freddie Mac, Pool #G08772, 4.50%, 7/1/2047 | 263,133 | 278,155 | ||||||
Freddie Mac, Pool #Q59805, 4.50%, 11/1/2048 | 196,200 | 206,638 | ||||||
Freddie Mac, Pool #G61887, 5.00%, 2/1/2049 | 284,097 | 303,962 | ||||||
Freddie Mac, Pool #ZN4802, 4.00%, 4/1/2049 | 424,950 | 441,875 | ||||||
|
| |||||||
TOTAL U.S. GOVERNMENT AGENCIES |
| 11,304,826 | ||||||
|
| |||||||
U.S. GOVERNMENT SECURITIES - 3.0% |
| |||||||
U.S. Treasury Bill - 3.0% |
| |||||||
U.S. Treasury Bill10, 1.57%, 5/21/2020 (Identified Cost $2,831,062) | 2,856,000 | 2,831,401 | ||||||
|
| |||||||
SHARES
| VALUE
| |||||||
SHORT-TERM INVESTMENT - 1.2% |
| |||||||
Dreyfus Government Cash Management, Institutional Shares, 1.73%11 | 1,119,310 | $ | 1,119,310 | |||||
|
| |||||||
TOTAL INVESTMENTS IN SECURITIES - 100.6% |
| 95,324,708 | ||||||
|
| |||||||
TOTAL OPTIONS WRITTEN — 0.0%## |
| |||||||
(Premiums Received $16,023) |
| (26,520 | ) | |||||
|
| |||||||
TOTAL INVESTMENTS - 100.6% |
| 95,298,188 | ||||||
LIABILITIES, LESS OTHER ASSETS - (0.6%) |
| (531,300 | ) | |||||
|
| |||||||
NET ASSETS - 100% |
| $ | 94,766,888 | |||||
|
| |||||||
ADR - American Depositary Receipt
CAD - Canadian Dollar
ETF - Exchange-traded fund
IO - Interest only
LIBOR - London Interbank Offered Rate
MXN - Mexican Peso
| EXCHANGE-TRADED OPTIONS WRITTEN | ||||||||||||||||||||||||
| DESCRIPTION | NUMBER OF CONTRACTS | EXPIRATION DATE | EXERCISE PRICE | NOTIONAL AMOUNT (000)3 | VALUE | |||||||||||||||||||
Call | ||||||||||||||||||||||||
Sea Ltd. - ADR | 84 | 11/15/2019 | $ 27.00 | 250 | $(26,040) | |||||||||||||||||||
Put | ||||||||||||||||||||||||
Electronic Arts, Inc. | 20 | 11/01/2019 | 87.50 | 193 | (40) | |||||||||||||||||||
ServiceNow, Inc. | 11 | 11/08/2019 | 200.00 | 272 | (440) | |||||||||||||||||||
| (480) | ||||||||||||||||||||||||
TOTAL EXCHANGE-TRADED OPTIONS WRITTEN (PREMIUMS RECEIVED $16,023) |
| $(26,520) | ||||||||||||||||||||||
*Non-income producing security.
##Less than 0.1%.
1A portion of this security is designated as collateral for options contracts written. As of October 31, 2019, the total value of such securities was $10,650,425.
2Restricted securities - Investment in securities that are restricted as to public resale under the Securities Act of 1933, as amended. These securities have been sold under Rule 144A and have been determined to be liquid under the Fund’s Liquidity Risk Management Program. These securities amount to $8,200,862, or 8.7% of the Series’ net assets as of October 31, 2019 (see Note 2 to the financial statements).
3Amount is stated in USD unless otherwise noted.
4Step coupon rate security - Rate steps up/down by 25 basis points upon rating downgrade/upgrade by Moody’s and S&P rating agencies (Subject to a maximum of 100 basis points per agency, 200 basis points maximum).
5Variable rate security. Security may be issued at a fixed coupon rate, which converts to a variable rate at a specified date. Rate shown is the rate in effect as of October 31, 2019.
6Represents a Payment-In-Kind bond.
7Security is perpetual in nature and has no stated maturity date.
8Floating rate security. Rate shown is the rate in effect as of October 31, 2019.
The accompanying notes are an integral part of the financial statements.
36
Investment Portfolio - October 31, 2019
9Variable or floating rate security, the interest rate of which adjusts periodically based on changes in current interest rates and prepayments on the underlying pool of assets. Rate shown is the rate in effect as of October 31, 2019.
10Represents the annualized yield at time of purchase.
11Rate shown is the current yield as of October 31, 2019.
The Global Industry Classification Standard (GICS) was developed by and is the exclusive property and a service mark of MSCI Inc. (MSCI) and Standard &Poor, a division of S&P Global Inc. (S&P), and is licensed for use by Manning & Napier when referencing GICS sectors. Neither MSCI, S&P, nor any third party involved in making or compiling the GICS or any GICS classifications makes any express or implied warranties or representations with respect to such standard or classification, nor shall any such party have any liability therefrom.
The accompanying notes are an integral part of the financial statements.
37
Statement of Assets and Liabilities - Blended Asset Moderate Series
October 31, 2019
ASSETS: | ||||
Investments in securities, at value (identified cost $89,443,758) (Note 2) | $ | 95,324,708 | ||
Foreign currency, at value (identified cost $6,257) | 6,278 | |||
Interest receivable | 341,678 | |||
Receivable for fund shares sold | 33,212 | |||
Receivable for securities sold | 21,959 | |||
Dividends receivable | 19,604 | |||
Foreign tax reclaims receivable | 18,925 | |||
|
| |||
TOTAL ASSETS | 95,766,364 | |||
|
| |||
LIABILITIES: | ||||
Accrued fund accounting and administration fees (Note 3) | 27,216 | |||
Accrued management fees (Note 3) | 15,885 | |||
Accrued Chief Compliance Officer service fees (Note 3) | 687 | |||
Options written, at value (premiums received $16,023) (Note 2) | 26,520 | |||
Payable for securities purchased | 562,878 | |||
Payable for fund shares repurchased | 322,513 | |||
Other payables and accrued expenses | 43,777 | |||
|
| |||
TOTAL LIABILITIES | 999,476 | |||
|
| |||
TOTAL NET ASSETS | $ | 94,766,888 | ||
|
| |||
NET ASSETS CONSIST OF: | ||||
Capital stock | $ | 81,927 | ||
Additional paid-in-capital | 89,199,296 | |||
Total distributable earnings (loss) | 5,485,665 | |||
|
| |||
TOTAL NET ASSETS | $ | 94,766,888 | ||
|
| |||
NET ASSET VALUE, OFFERING PRICE AND REDEMPTION PRICE PER SHARE - | ||||
Class R6($94,766,888/8,192,653 shares) | $ | 11.57 | ||
|
| |||
The accompanying notes are an integral part of the financial statements.
38
Statement of Operations - Blended Asset Moderate Series
For the Year Ended October 31, 2019
INVESTMENT INCOME: | ||||
Interest | $ | 1,873,553 | ||
Dividends (net of foreign taxes withheld, $39,014) | 558,718 | |||
|
| |||
Total Investment Income | 2,432,271 | |||
|
| |||
EXPENSES: | ||||
Management fees (Note 3) | 428,748 | |||
Fund accounting and administration fees (Note 3) | 92,693 | |||
Directors’ fees (Note 3) | 8,932 | |||
Chief Compliance Officer service fees (Note 3) | 3,455 | |||
Audit fees | 55,152 | |||
Custodian fees | 43,693 | |||
Miscellaneous | 34,812 | |||
|
| |||
Total Expenses | 667,485 | |||
Less reduction of expenses (Note 3) | (191,098 | ) | ||
|
| |||
Net Expenses | 476,387 | |||
|
| |||
NET INVESTMENT INCOME | 1,955,884 | |||
|
| |||
REALIZED AND UNREALIZED GAIN (LOSS) ON INVESTMENTS AND FOREIGN CURRENCY: | ||||
Net realized gain (loss) on- | ||||
Investments in securities | (244,079 | ) | ||
Options written | 145,547 | |||
Foreign currency and translation of other assets and liabilities | (4,122 | ) | ||
|
| |||
| (102,654 | ) | |||
|
| |||
Net change in unrealized appreciation (depreciation) on- | ||||
Investments in securities | 8,220,238 | |||
Options written | 3,613 | |||
Foreign currency and translation of other assets and liabilities | 453 | |||
|
| |||
| 8,224,304 | ||||
|
| |||
NET REALIZED AND UNREALIZED GAIN (LOSS) ON INVESTMENTS AND FOREIGN CURRENCY | 8,121,650 | |||
|
| |||
NET INCREASE IN NET ASSETS RESULTING FROM OPERATIONS | $ | 10,077,534 | ||
|
| |||
The accompanying notes are an integral part of the financial statements.
39
Statements of Changes in Net Assets - Blended Asset Moderate Series
FOR THE YEAR ENDED
| FOR THE YEAR ENDED
| |||||||
INCREASE (DECREASE) IN NET ASSETS: | ||||||||
OPERATIONS: | ||||||||
Net investment income | $ | 1,955,884 | $ | 2,038,680 | ||||
Net realized gain (loss) on investments and foreign currency | (102,654 | ) | (1,126,575 | ) | ||||
Net change in unrealized appreciation (depreciation) on investments and foreign currency | 8,224,304 | (2,073,639 | ) | |||||
|
|
|
| |||||
Net increase (decrease) from operations | 10,077,534 | (1,161,534 | ) | |||||
|
|
|
| |||||
DISTRIBUTIONS TO SHAREHOLDERS (Note 9): | ||||||||
Class R6 | (2,137,657 | ) | (1,043,313 | ) | ||||
|
|
|
| |||||
CAPITAL STOCK ISSUED AND REPURCHASED: | ||||||||
Net increase (decrease) from capital share transactions (Note 5) | (28,145,069 | ) | 1,805,626 | |||||
|
|
|
| |||||
Net increase (decrease) in net assets | (20,205,192 | ) | (399,221 | ) | ||||
NET ASSETS: | ||||||||
Beginning of year | 114,972,080 | 115,371,301 | ||||||
|
|
|
| |||||
End of year | $ | 94,766,888 | $ | 114,972,080 | ||||
|
|
|
| |||||
The accompanying notes are an integral part of the financial statements.
40
Financial Highlights - Blended Asset Moderate Series - Class R6
FOR THE YEAR ENDED | FOR THE PERIOD 10/13/171 TO 10/31/17 | ||||||||||||||
10/31/19 | 10/31/18 | ||||||||||||||
Per share data (for a share outstanding throughout each period): | |||||||||||||||
Net asset value - Beginning of period | $10.50 | $10.73 | $10.75 | ||||||||||||
|
|
|
|
|
| ||||||||||
Income (loss) from investment operations: | |||||||||||||||
Net investment income2 | 0.23 | 0.19 | 0.00 | 3 | |||||||||||
Net realized and unrealized gain (loss) on investments | 1.06 | (0.32 | ) | (0.02 | ) | ||||||||||
|
|
|
|
|
| ||||||||||
Total from investment operations | 1.29 | (0.13 | ) | (0.02 | ) | ||||||||||
|
|
|
|
|
| ||||||||||
Less distributions to shareholders: | |||||||||||||||
From net investment income | (0.22 | ) | (0.10 | ) | — | ||||||||||
|
|
|
|
|
| ||||||||||
Net asset value - End of period | $11.57 | $10.50 | $10.73 | ||||||||||||
|
|
|
|
|
| ||||||||||
Net assets - End of period(000’s omitted) | $94,767 | $114,972 | $115,371 | ||||||||||||
|
|
|
|
|
| ||||||||||
Total return4 | 12.44% | (1.25% | ) | (0.19% | ) | ||||||||||
Ratios (to average net assets)/Supplemental Data: | |||||||||||||||
Expenses* | 0.50% | 0.50% | 0.50% | 5 | |||||||||||
Net investment income | 2.05% | 1.77% | 0.85% | 5 | |||||||||||
Series portfolio turnover | 88% | 91% | 4% | ||||||||||||
| *The investment advisor did not impose all or a portion of its management and/or other fees during the period, and may have paid a portion of the Series’ expenses. If these expenses had been incurred by the Class, the expense ratio (to average net assets) would have increased by the following amounts: |
| ||||||||||||||
| 0.20% | 0.12% | 0.99%5 | |||||||||||||
1Commencement of operations.
2Calculated based on average shares outstanding during the periods.
3Less than $0.01.
4Represents aggregate total return for the periods indicated, and assumes reinvestment of all distributions. Total return would have been lower had certain expenses not been waived or reimbursed during certain periods. Periods less than one year are not annualized.
5Annualized.
The accompanying notes are an integral part of the financial statements.
41
Performance Update as of October 31, 2019 - Blended Asset Extended Series
(unaudited)
AVERAGE ANNUAL TOTAL 2019
| ||||
ONE YEAR1
|
SINCE
| |||
Blended Asset Extended Series - Class R63 | 13.29% | 5.63% | ||
Bloomberg Barclays U.S. Aggregate Bond Index4 | 11.51% | 4.26% | ||
40/15/45 Blended Index5 | 12.71% | 6.37% | ||
The following graph compares the value of a $10,000 investment in the Blended Asset Extended Series - Class R6 from its inception2 (October 13, 2017) to present (October 31, 2019) to the Bloomberg Barclays U.S. Aggregate Bond Index and the 40/15/45 Blended Index.
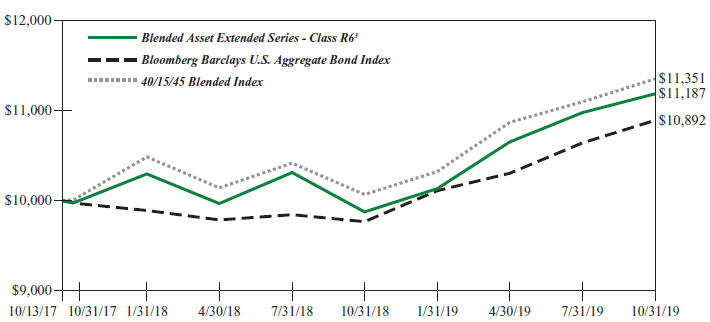
1The returns shown are based on net asset values calculated for shareholder transactions and may differ from the returns shown in the financial highlights, which reflect adjustments made to the net asset values in accordance with accounting principles generally accepted in the United States of America.
2Performance numbers for the Series and Indices are calculated from October 13, 2017, the Series’ inception date.
3The Series’ performance does not reflect the deduction of taxes that a shareholder would pay on fund distributions or the redemption of shares. The Series’ performance is historical and may not be indicative of future results. The performance returns shown are inclusive of the net expense ratio of the Series. For the year ended October 31, 2019, this net expense ratio was 0.55% for Class R6. The gross expense ratio, which does not account for any voluntary or contractual waivers currently in effect, was 0.66% for Class R6 for the year ended October 31, 2019.
4The Bloomberg Barclays U.S. Aggregate Bond Index is an unmanaged, market-value weighted index of U.S. domestic investment-grade debt issues, including government, corporate, asset-backed, and mortgage-backed securities, with maturities of one year or more. Index returns do not reflect any fees or expenses. Index returns provided by Interactive Data.
5The 40/15/45 Blended Index is 40% Russell 3000® Index (Russell 3000), 15% MSCI ACWI ex USA Index (ACWIxUS), and 45% Bloomberg Barclays U.S. Aggregate Bond Index (BAB). Russell 3000 is an unmanaged index that consists of 3,000 of the largest U.S. companies based on total market capitalization. Index returns are based on a market capitalization weighted average of relative price changes of the component stocks plus dividends whose reinvestments are compounded daily. Index returns provided by Bloomberg. ACWIxUS is designed to measure large and mid-cap representation across 22 of 23 Developed Markets countries (excluding the U.S.) and 26 Emerging Markets countries. The Index is denominated in U.S. dollars. The Index returns are net of withholding taxes. They assume daily reinvestment of net dividends thus accounting for any applicable dividend taxation. Index returns provided by Bloomberg. Index returns provided by Bloomberg. BAB is an unmanaged, market value-weighted index of U.S. domestic investment-grade debt issues, including government, corporate, asset-backed and mortgage-backed securities with maturities of one year or more. Index returns provided by Interactive Data. The returns of the indices do not reflect any fees or expenses. Returns provided are calculated monthly using a blended allocation. Because the fund’s asset allocation will vary over time, the composition of the fund’s portfolio may not match the composition of the comparative Indices. Mid-month performance may not be available for all indices within the blended index. Where applicable, performance for those indices is included from the first of the month following the corresponding Fund’s inception date.
42
Shareholder Expense Example - Blended Asset Extended Series
(unaudited)
As a shareholder of the Series, you incur ongoing costs, including management fees, shareholder service fees and other Series expenses. This example is intended to help you understand your ongoing costs (in dollars) of investing in the Series and to compare these costs with the ongoing costs of investing in other mutual funds.
The example is based on an investment of $1,000 invested at the beginning of the period and held for the entire period (May 1, 2019 to October 31, 2019).
Actual Expenses
The first line of the table below provides information about actual account values and actual expenses. You may use the information in this line, together with the amount you invested, to estimate the expenses that you paid over the period. Simply divide your account value by $1,000 (for example, an $8,600 account value divided by $1,000 = 8.6), then multiply the result by the number in the first line under the heading entitled “Expenses Paid During Period” to estimate the expenses you paid on your account during this period.
Hypothetical Example for Comparison Purposes
The second line of the table below provides information about hypothetical account values and hypothetical expenses based on the Series’ actual expense ratio and an assumed rate of return of 5% per year before expenses, which is not the Series’ actual return. The hypothetical account values and expenses may not be used to estimate the actual ending account balance or expenses you paid during the period. You may use this information to compare the ongoing costs of investing in the Series and other funds. To do so, compare this 5% hypothetical example with the 5% hypothetical examples that appear in the shareholder reports of the other funds.
Please note that the expenses shown in the table are meant to highlight your ongoing costs only and do not reflect any transaction costs such as sales charges (loads), redemption fees, or exchange fees that you may incur in other mutual funds. Therefore, the second line of the table is useful in comparing ongoing costs only, and will not help you determine the relative total costs of owning different funds.
BEGINNING
| ENDING
| EXPENSES PAID
| ||||
Actual | $1,000.00 | $1,050.30 | $2.84 | |||
Hypothetical | $1,000.00 | $1,022.43 | $2.80 | |||
*Expenses are equal to the Series’ annualized expense ratio (for the six-month period) of 0.55%, multiplied by the average account value over the period, multiplied by 184/365 (to reflect the one-half year period). Expenses are based on the most recent fiscal half year; therefore, the expense ratios stated above may differ from the expense ratios stated in the financial highlights, which are based on one-year data. The Series’ total return would have been lower had certain expenses not been waived during the period.
43
Portfolio Composition - Blended Asset Extended Series
As of October 31, 2019 (unaudited)
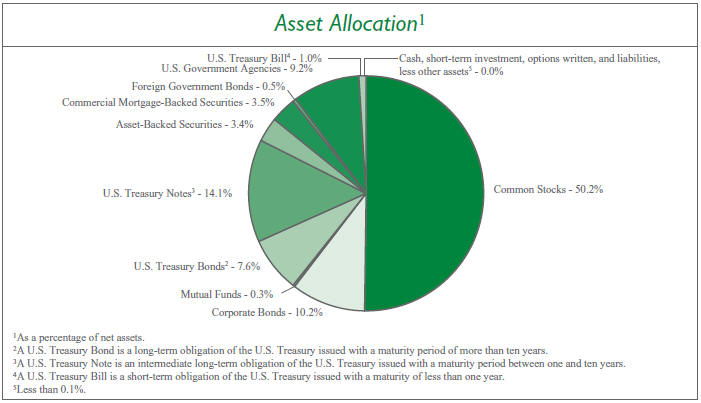
| Sector Allocation5 | ||||||
Communication Services | 10.0% | |||||
Health Care | 9.3% | |||||
Information Technology | 9.1% | |||||
Consumer Staples | 7.6% | |||||
Financials | 7.0% | |||||
Consumer Discretionary | 6.7% | |||||
Real Estate | 4.2% | |||||
Energy | 3.3% | |||||
Industrials | 1.5% | |||||
Materials | 0.7% | |||||
Utilities6 | 0.0% | |||||
5Including common stocks and corporate bonds, as a percentage of total investments.
6Less than 0.1%. | ||||||
| Top Ten Stock Holdings7 | ||||
Medtronic plc | 1.6% | |||
Mastercard, Inc. - Class A | 1.6% | |||
Novartis AG - ADR (Switzerland) | 1.6% | |||
Johnson & Johnson | 1.5% | |||
Microsoft Corp. | 1.5% | |||
Visa, Inc. - Class A | 1.4% | |||
Micron Technology, Inc. | 1.4% | |||
Berkshire Hathaway, Inc. - Class B | 1.2% | |||
Nestle S.A. (Switzerland) | 1.2% | |||
lululemon athletica, Inc. | 1.1% | |||
7As a percentage of total investments.
| ||||
44
Investment Portfolio - October 31, 2019
| BLENDED ASSET EXTENDED SERIES | ||||||||
| SHARES | VALUE (NOTE 2) | |||||||
COMMON STOCKS - 50.2% | ||||||||
Communication Services - 7.9% | ||||||||
Diversified Telecommunication Services - 0.1% |
| |||||||
Elisa OYJ (Finland) | 1,199 | $ | 65,485 | |||||
Orange S.A. (France) | 1,280 | 20,601 | ||||||
Telefonica Brasil S.A. (Brazil) | 1,000 | 13,233 | ||||||
|
| |||||||
| 99,319 | ||||||||
|
| |||||||
Entertainment - 3.7% |
| |||||||
Activision Blizzard, Inc.1 | 29,635 | 1,660,449 | ||||||
Electronic Arts, Inc.*1 | 12,880 | 1,241,632 | ||||||
Nexon Co. Ltd. (Japan)* | 150,032 | 1,738,608 | ||||||
Sea Ltd. - ADR (Taiwan)*1 | 49,615 | 1,476,542 | ||||||
Toho Co. Ltd. - Tokyo (Japan) | 1,300 | 52,501 | ||||||
Viacom, Inc. - Class B | 193 | 4,161 | ||||||
Vivendi S.A. (France) | 650 | 18,101 | ||||||
|
| |||||||
| 6,191,994 | ||||||||
|
| |||||||
Interactive Media & Services - 3.6% |
| |||||||
Alphabet, Inc. - Class A* | 1,000 | 1,258,800 | ||||||
Alphabet, Inc. - Class C* | 1,005 | 1,266,411 | ||||||
Autohome, Inc. - ADR (China)* | 495 | 41,857 | ||||||
Facebook, Inc. - Class A* | 8,270 | 1,584,945 | ||||||
Kakao Corp. (South Korea) | 510 | 61,890 | ||||||
Tencent Holdings Ltd. - Class H (China) | 41,958 | 1,701,939 | ||||||
|
| |||||||
| 5,915,842 | ||||||||
|
| |||||||
Media - 0.5% |
| |||||||
Informa plc (United Kingdom) | 5,480 | 55,081 | ||||||
Quebecor, Inc. - Class B (Canada) | 17,375 | 403,935 | ||||||
Shaw Communications, Inc. - Class B (Canada) | 20,390 | 416,129 | ||||||
|
| |||||||
| 875,145 | ||||||||
|
| |||||||
Wireless Telecommunication Services - 0.0%## |
| |||||||
Globe Telecom, Inc. (Philippines) | 405 | 14,557 | ||||||
|
| |||||||
Total Communication Services | 13,096,857 | |||||||
|
| |||||||
Consumer Discretionary - 5.3% |
| |||||||
Auto Components - 0.0%## | ||||||||
Cie Generale des Etablissements Michelin SCA (France) | 120 | 14,611 | ||||||
|
| |||||||
Automobiles - 0.0%## |
| |||||||
Peugeot S.A. (France) | 370 | 9,371 | ||||||
|
| |||||||
Distributors - 0.0%## |
| |||||||
Genuine Parts Co. | 76 | 7,796 | ||||||
|
| |||||||
Diversified Consumer Services - 0.1% |
| |||||||
Fu Shou Yuan International Group Ltd. (China) | 31,000 | 27,361 | ||||||
| SHARES | VALUE (NOTE 2) | |||||||
COMMON STOCKS(continued) | ||||||||
Consumer Discretionary(continued) | ||||||||
Diversified Consumer Services(continued) |
| |||||||
New Oriental Education & Technology Group, Inc. - ADR (China)* | 495 | $ | 60,420 | |||||
TAL Education Group - ADR (China)* | 1,325 | 56,723 | ||||||
|
| |||||||
| 144,504 | ||||||||
|
| |||||||
Hotels, Restaurants & Leisure - 0.2% |
| |||||||
Basic-Fit N.V. (Netherlands)*2 | 1,435 | 43,889 | ||||||
Galaxy Entertainment Group Ltd. (Macau) | 6,000 | 41,314 | ||||||
Hilton Worldwide Holdings, Inc. | 235 | 22,786 | ||||||
Melco Resorts & Entertainment Ltd. - ADR (Hong Kong) | 1,230 | 26,494 | ||||||
MGM China Holdings Ltd. (Macau) | 16,800 | 26,603 | ||||||
Restaurant Brands International, Inc. (Canada) | 565 | 36,974 | ||||||
Sands China Ltd. (Macau) | 8,400 | 41,375 | ||||||
Wynn Macau Ltd. (Macau) | 18,400 | 39,929 | ||||||
|
| |||||||
| 279,364 | ||||||||
|
| |||||||
Household Durables - 1.2% |
| |||||||
Barratt Developments plc (United Kingdom) | 3,770 | 30,830 | ||||||
The Berkeley Group Holdings plc (United Kingdom) | 570 | 32,490 | ||||||
Persimmon plc (United Kingdom) | 1,150 | 33,921 | ||||||
Sony Corp. - ADR (Japan) | 28,555 | 1,737,001 | ||||||
Sony Corp. (Japan) | 1,100 | 66,956 | ||||||
Taylor Wimpey plc (United Kingdom) | 14,825 | 31,795 | ||||||
|
| |||||||
| 1,932,993 | ||||||||
|
| |||||||
Internet & Direct Marketing Retail - 1.5% |
| |||||||
Alibaba Group Holding Ltd. - ADR (China)* | 575 | 101,585 | ||||||
Amazon.com, Inc.* | 855 | 1,519,044 | ||||||
Booking Holdings, Inc.* | 430 | 880,971 | ||||||
Farfetch Ltd. - Class A (United Kingdom)* | 1,630 | 14,556 | ||||||
|
| |||||||
| 2,516,156 | ||||||||
|
| |||||||
Leisure Products - 0.0%## |
| |||||||
Technogym S.p.A. (Italy)2 | 4,570 | 50,420 | ||||||
|
| |||||||
Multiline Retail - 0.0%## |
| |||||||
B&M European Value Retail S.A. (United Kingdom) | 6,665 | 31,975 | ||||||
Kohl’s Corp. | 104 | 5,331 | ||||||
Lojas Renner S.A. (Brazil) | 1,400 | 17,765 | ||||||
The accompanying notes are an integral part of the financial statements.
45
Investment Portfolio - October 31, 2019
| BLENDED ASSET EXTENDED SERIES | ||||||||
| SHARES | VALUE (NOTE 2) | |||||||
COMMON STOCKS(continued) | ||||||||
Consumer Discretionary(continued) | ||||||||
Multiline Retail(continued) |
| |||||||
Magazine Luiza S.A. (Brazil) | 1,200 | $ | 13,285 | |||||
|
| |||||||
| 68,356 | ||||||||
|
| |||||||
Specialty Retail - 1.0% |
| |||||||
Best Buy Co., Inc. | 122 | 8,763 | ||||||
The Gap, Inc. | 222 | 3,610 | ||||||
The Home Depot, Inc. | 229 | 53,719 | ||||||
Industria de Diseno Textil S.A. (Spain) | 49,340 | 1,537,474 | ||||||
|
| |||||||
| 1,603,566 | ||||||||
|
| |||||||
Textiles, Apparel & Luxury Goods - 1.3% |
| |||||||
EssilorLuxottica S.A. (France) | 160 | 24,431 | ||||||
Hermes International (France) | 20 | 14,407 | ||||||
Kering S.A. (France) | 50 | 28,450 | ||||||
Kontoor Brands, Inc. | 20 | 760 | ||||||
lululemon athletica, Inc.* | 9,435 | 1,927,287 | ||||||
LVMH Moet Hennessy Louis Vuitton SE (France) | 155 | 66,194 | ||||||
Shenzhou International Group Holdings Ltd. (China) | 3,500 | 48,365 | ||||||
VF Corp. | 143 | 11,767 | ||||||
|
| |||||||
| 2,121,661 | ||||||||
|
| |||||||
Total Consumer Discretionary |
| 8,748,798 | ||||||
|
| |||||||
Consumer Staples - 7.7% |
| |||||||
Beverages - 3.9% |
| |||||||
Ambev S.A. - ADR (Brazil) | 89,010 | 383,633 | ||||||
Ambev S.A. (Brazil) | 8,900 | 38,525 | ||||||
Anheuser-Busch InBev S.A./N.V. (Belgium) | 18,905 | 1,525,963 | ||||||
The Coca-Cola Co. | 30,470 | 1,658,482 | ||||||
Coca-Cola European Partners plc (United Kingdom)1 | 1,015 | 54,313 | ||||||
Diageo plc (United Kingdom) | 21,835 | 893,730 | ||||||
Heineken N.V. (Netherlands) | 520 | 53,102 | ||||||
Molson Coors Brewing Co. - Class B | 93 | 4,903 | ||||||
PepsiCo, Inc. | 13,250 | 1,817,503 | ||||||
Pernod Ricard S.A. (France) | 325 | 60,038 | ||||||
|
| |||||||
| 6,490,192 | ||||||||
|
| |||||||
Food & Staples Retailing - 0.2% |
| |||||||
Alimentation Couche-Tard, Inc. - Class B (Canada) | 1,840 | 55,182 | ||||||
ICA Gruppen AB (Sweden) | 1,252 | 55,403 | ||||||
The Kroger Co. | 248 | 6,111 | ||||||
Loblaw Companies Ltd. (Canada) | 1,100 | 58,662 | ||||||
| SHARES | VALUE (NOTE 2) | |||||||
COMMON STOCKS(continued) |
| |||||||
Consumer Staples(continued) |
| |||||||
Food & Staples Retailing(continued) |
| |||||||
Puregold Price Club, Inc. (Philippines) | 9,100 | $ | 7,320 | |||||
Raia Drogasil S.A. (Brazil) | 500 | 13,709 | ||||||
Robinsons Retail Holdings, Inc. (Philippines) | 5,670 | 8,475 | ||||||
Sysco Corp. | 184 | 14,696 | ||||||
Walgreens Boots Alliance, Inc. | 272 | 14,900 | ||||||
Walmart, Inc. | 515 | 60,389 | ||||||
|
| |||||||
| 294,847 | ||||||||
|
| |||||||
Food Products - 2.4% | ||||||||
Archer-Daniels-Midland Co. | 175 | 7,357 | ||||||
Barry Callebaut AG (Switzerland) | 10 | 21,133 | ||||||
Chocoladefabriken Lindt & Spruengli AG (Switzerland) | 2 | 14,861 | ||||||
Conagra Brands, Inc. | 200 | 5,410 | ||||||
Danone S.A. (France) | 1,565 | 129,647 | ||||||
General Mills, Inc. | 236 | 12,003 | ||||||
The Hershey Co. | 81 | 11,896 | ||||||
The J.M. Smucker Co. | 57 | 6,024 | ||||||
Kellogg Co. | 133 | 8,450 | ||||||
Kerry Group plc - Class A (Ireland) | 485 | 58,726 | ||||||
Mondelez International, Inc. - Class A | 31,996 | 1,678,190 | ||||||
Mowi ASA (Norway) | 2,460 | 60,053 | ||||||
Nestle S.A. (Switzerland) | 18,740 | 2,004,830 | ||||||
Tyson Foods, Inc. - Class A | 106 | 8,776 | ||||||
Universal Robina Corp. (Philippines). | 6,110 | 18,152 | ||||||
|
| |||||||
| 4,045,508 | ||||||||
|
| |||||||
Household Products - 0.1% | ||||||||
Colgate-Palmolive Co. | 260 | 17,836 | ||||||
Essity AB - Class B (Sweden) | 1,895 | 59,201 | ||||||
Henkel AG & Co. KGaA (Germany) | 575 | 59,727 | ||||||
Kimberly-Clark Corp. | 116 | 15,414 | ||||||
Reckitt Benckiser Group plc (United Kingdom) | 715 | 55,328 | ||||||
|
| |||||||
| 207,506 | ||||||||
|
| |||||||
Personal Products - 1.0% | ||||||||
Beiersdorf AG (Germany) | 335 | 39,660 | ||||||
LG Household & Health Care Ltd. (South Korea) | 50 | 54,105 | ||||||
L’Oreal S.A. (France) | 165 | 48,190 | ||||||
Unilever plc - ADR (United Kingdom) | 24,675 | 1,483,214 | ||||||
|
| |||||||
| 1,625,169 | ||||||||
|
| |||||||
The accompanying notes are an integral part of the financial statements.
46
Investment Portfolio - October 31, 2019
| BLENDED ASSET EXTENDED SERIES | ||||||||
SHARES
| VALUE
| |||||||
COMMON STOCKS(continued) | ||||||||
Consumer Staples(continued) | ||||||||
Tobacco - 0.1% | ||||||||
British American Tobacco plc - ADR (United Kingdom) | 755 | $ | 26,395 | |||||
British American Tobacco plc (United Kingdom) | 1,735 | 60,683 | ||||||
|
| |||||||
| 87,078 | ||||||||
|
| |||||||
Total Consumer Staples | 12,750,300 | |||||||
|
| |||||||
Energy - 1.6% | ||||||||
Energy Equipment & Services - 1.3% | ||||||||
Baker Hughes Co. | 307 | 6,570 | ||||||
Core Laboratories N.V | 620 | 27,305 | ||||||
Halliburton Co. | 52,435 | 1,009,374 | ||||||
Schlumberger Ltd.1 | 23,130 | 756,120 | ||||||
Transocean Ltd.*1 | 70,240 | 333,640 | ||||||
|
| |||||||
| 2,133,009 | ||||||||
|
| |||||||
Oil, Gas & Consumable Fuels - 0.3% | ||||||||
Cameco Corp. (Canada)1 | 4,255 | 37,997 | ||||||
Chevron Corp. | 291 | 33,797 | ||||||
Eni S.p.A. (Italy) | 3,680 | 55,829 | ||||||
Equinor ASA (Norway) | 3,205 | 59,503 | ||||||
Galp Energia SGPS S.A. (Portugal) . | 3,520 | 56,301 | ||||||
Marathon Petroleum Corp. | 245 | 15,668 | ||||||
Occidental Petroleum Corp. | 203 | 8,221 | ||||||
Phillips 66 | 116 | 13,551 | ||||||
Repsol S.A. (Spain) | 4,097 | 67,517 | ||||||
Royal Dutch Shell plc - Class B - ADR (Netherlands)1 | 1,630 | 95,013 | ||||||
Suncor Energy, Inc. (Canada) | 1,485 | 44,152 | ||||||
TOTAL S.A. (France) | 1,220 | 64,499 | ||||||
Valero Energy Corp. | 154 | 14,935 | ||||||
|
| |||||||
| 566,983 | ||||||||
|
| |||||||
Total Energy | 2,699,992 | |||||||
|
| |||||||
Financials - 4.8% | ||||||||
Banks - 0.5% | ||||||||
Banco Bradesco S.A. (Brazil) | 7,800 | 68,596 | ||||||
Banco do Brasil S.A. (Brazil) | 2,500 | 29,928 | ||||||
Banco Santander Brasil S.A. (Brazil) | 1,100 | 13,006 | ||||||
Bank of America Corp. | 1,231 | 38,493 | ||||||
The Bank Of N.T. Butterfield & Son Ltd. (Bermuda) | 1,225 | 40,364 | ||||||
Bank of the Philippine Islands (Philippines) | 11,090 | 21,187 | ||||||
Barclays plc (United Kingdom) | 15,960 | 34,619 | ||||||
BB&T Corp. | 188 | 9,973 | ||||||
BDO Unibank, Inc. (Philippines) | 9,100 | 27,760 | ||||||
SHARES
| VALUE
| |||||||
COMMON STOCKS(continued) | ||||||||
Financials(continued) | ||||||||
Banks(continued) | ||||||||
BNP Paribas S.A. (France) | 755 | $ | 39,456 | |||||
Citigroup, Inc. | 360 | 25,870 | ||||||
Credit Agricole S.A. (France) | 680 | 8,873 | ||||||
Fifth Third Bancorp | 289 | 8,404 | ||||||
FinecoBank Banca Fineco S.p.A. (Italy) | 4,440 | 50,054 | ||||||
Itau Unibanco Holding S.A. (Brazil) | 8,800 | 79,563 | ||||||
Itausa - Investimentos Itau S.A. (Brazil) | 9,600 | 32,794 | ||||||
JPMorgan Chase & Co. | 482 | 60,211 | ||||||
KeyCorp | 394 | 7,080 | ||||||
Lloyds Banking Group plc (United Kingdom) | 44,420 | 32,676 | ||||||
Metropolitan Bank & Trust Co. (Philippines) | 16,272 | 21,661 | ||||||
Regions Financial Corp. | 352 | 5,667 | ||||||
Royal Bank of Scotland Group plc (United Kingdom) | 11,615 | 32,107 | ||||||
SunTrust Banks, Inc. | 146 | 9,978 | ||||||
U.S. Bancorp | 426 | 24,291 | ||||||
Wells Fargo & Co. | 922 | 47,603 | ||||||
|
| |||||||
| 770,214 | ||||||||
|
| |||||||
Capital Markets - 3.0% | ||||||||
B3 S.A. - Brasil Bolsa Balcao (Brazil) | 3,400 | 41,041 | ||||||
BlackRock, Inc. | 910 | 420,147 | ||||||
Cboe Global Markets, Inc. | 7,410 | 853,262 | ||||||
CME Group, Inc. | 3,990 | 820,942 | ||||||
Deutsche Boerse AG (Germany) | 395 | 61,170 | ||||||
Hargreaves Lansdown plc (United Kingdom) | 1,165 | 26,752 | ||||||
Intercontinental Exchange, Inc. | 10,020 | 945,086 | ||||||
Julius Baer Group Ltd. (Switzerland). | 735 | 32,548 | ||||||
London Stock Exchange Group plc (United Kingdom) | 320 | 28,838 | ||||||
Moody’s Corp. | 4,035 | 890,484 | ||||||
S&P Global, Inc. | 3,545 | 914,575 | ||||||
|
| |||||||
| 5,034,845 | ||||||||
|
| |||||||
Diversified Financial Services - 1.2% | ||||||||
Berkshire Hathaway, Inc. - Class B* | 9,445 | 2,007,818 | ||||||
|
| |||||||
Insurance - 0.1% | ||||||||
Admiral Group plc (United Kingdom). | 1,970 | 51,559 | ||||||
The Allstate Corp. | 89 | 9,471 | ||||||
AXA S.A. (France) | 1,275 | 33,751 | ||||||
BB Seguridade Participacoes S.A. (Brazil) | 1,800 | 15,238 | ||||||
The accompanying notes are an integral part of the financial statements.
47
Investment Portfolio - October 31, 2019
| BLENDED ASSET EXTENDED SERIES | ||||||||
SHARES
| VALUE
| |||||||
COMMON STOCKS(continued) | ||||||||
Financials(continued) | ||||||||
Insurance(continued) | ||||||||
Chubb Ltd. | 96 | $ | 14,632 | |||||
The Hartford Financial Services Group, Inc. | 117 | 6,678 | ||||||
Ping An Insurance Group Co. of China Ltd. - Class H (China) | 4,000 | 46,167 | ||||||
The Travelers Companies, Inc. | 68 | 8,912 | ||||||
|
| |||||||
| 186,408 | ||||||||
|
| |||||||
Total Financials | 7,999,285 | |||||||
|
| |||||||
Health Care - 9.2% | ||||||||
Biotechnology - 1.8% | ||||||||
AbbVie, Inc. | 376 | 29,911 | ||||||
Amgen, Inc. | 166 | 35,400 | ||||||
BioMarin Pharmaceutical, Inc.* | 14,270 | 1,044,707 | ||||||
Gilead Sciences, Inc. | 369 | 23,509 | ||||||
Incyte Corp.* | 6,380 | 535,410 | ||||||
Seattle Genetics, Inc.* | 6,960 | 747,504 | ||||||
Vertex Pharmaceuticals, Inc.*1 | 2,930 | 572,756 | ||||||
|
| |||||||
| 2,989,197 | ||||||||
|
| |||||||
Health Care Equipment & Supplies - 2.4% |
| |||||||
Alcon, Inc. (Switzerland)* | 14,703 | 871,447 | ||||||
Alcon, Inc. (Switzerland)* | 475 | 28,091 | ||||||
Getinge AB - Class B (Sweden) | 2,125 | 36,330 | ||||||
Hoya Corp. (Japan) | 700 | 61,864 | ||||||
Koninklijke Philips N.V. (Netherlands) | 1,290 | 56,598 | ||||||
Medtronic plc1 | 25,577 | 2,785,335 | ||||||
Shandong Weigao Group Medical Polymer Co. Ltd. - Class H (China) | 28,000 | 32,145 | ||||||
Smith & Nephew plc (United Kingdom) | 2,550 | 54,740 | ||||||
|
| |||||||
| 3,926,550 | ||||||||
|
| |||||||
Health Care Providers & Services - 0.0%## |
| |||||||
CVS Health Corp. | 342 | 22,705 | ||||||
Quest Diagnostics, Inc. | 59 | 5,974 | ||||||
Sonic Healthcare Ltd. (Australia) | 3,035 | 59,774 | ||||||
|
| |||||||
| 88,453 | ||||||||
|
| |||||||
Life Sciences Tools & Services - 0.1% | ||||||||
Gerresheimer AG (Germany) | 550 | 44,355 | ||||||
QIAGEN N.V.*1 | 880 | 26,233 | ||||||
QIAGEN N.V.* | 1,505 | 45,269 | ||||||
Tecan Group AG (Switzerland) | 55 | 13,012 | ||||||
|
| |||||||
| 128,869 | ||||||||
|
| |||||||
SHARES
| VALUE
| |||||||
COMMON STOCKS(continued) | ||||||||
Health Care(continued) | ||||||||
Pharmaceuticals - 4.9% | ||||||||
Bristol-Myers Squibb Co. | 414 | $ | 23,751 | |||||
Johnson & Johnson | 19,412 | 2,563,160 | ||||||
Merck & Co., Inc. | 6,650 | 576,289 | ||||||
Merck KGaA (Germany) | 16,115 | 1,921,980 | ||||||
Novartis AG - ADR (Switzerland) | 30,335 | 2,652,492 | ||||||
Novartis AG (Switzerland) | 720 | 62,910 | ||||||
Perrigo Co. plc1 | 885 | 46,923 | ||||||
Pfizer, Inc. | 1,186 | 45,507 | ||||||
Recordati S.p.A. (Italy) | 1,325 | 55,682 | ||||||
Roche Holding AG (Switzerland) | 315 | 94,801 | ||||||
Sanofi (France) | 715 | 65,914 | ||||||
|
| |||||||
| 8,109,409 | ||||||||
|
| |||||||
Total Health Care | 15,242,478 | |||||||
|
| |||||||
Industrials - 0.6% | ||||||||
Aerospace & Defense - 0.2% | ||||||||
Airbus SE (France) | 360 | 51,645 | ||||||
BAE Systems plc (United Kingdom) . | 8,365 | 62,484 | ||||||
The Boeing Co. | 115 | 39,090 | ||||||
General Dynamics Corp. | 66 | 11,669 | ||||||
Lockheed Martin Corp. | 71 | 26,744 | ||||||
Safran S.A. (France) | 210 | 33,262 | ||||||
Thales S.A. (France) | 45 | 4,399 | ||||||
United Technologies Corp. | 201 | 28,860 | ||||||
|
| |||||||
| 258,153 | ||||||||
|
| |||||||
Air Freight & Logistics - 0.0%## | ||||||||
C.H. Robinson Worldwide, Inc. | 82 | 6,202 | ||||||
United Parcel Service, Inc. - Class B | 251 | 28,908 | ||||||
|
| |||||||
| 35,110 | ||||||||
|
| |||||||
Airlines - 0.0%## | ||||||||
Ryanair Holdings plc - ADR (Ireland)* | 520 | 38,813 | ||||||
|
| |||||||
Building Products - 0.0%## | ||||||||
Cie de Saint-Gobain (France) | 310 | 12,626 | ||||||
Johnson Controls International plc | 297 | 12,869 | ||||||
|
| |||||||
| 25,495 | ||||||||
|
| |||||||
Commercial Services & Supplies - 0.0%## |
| |||||||
Waste Management, Inc. | 140 | 15,709 | ||||||
|
| |||||||
Construction & Engineering - 0.0%## | ||||||||
Vinci S.A. (France) | 540 | 60,586 | ||||||
|
| |||||||
Electrical Equipment - 0.1% | ||||||||
Eaton Corp. plc | 156 | 13,589 | ||||||
Emerson Electric Co. | 215 | 15,082 | ||||||
Legrand S.A. (France) | 165 | 12,890 | ||||||
The accompanying notes are an integral part of the financial statements.
48
Investment Portfolio - October 31, 2019
| BLENDED ASSET EXTENDED SERIES | ||||||||
SHARES
| VALUE
| |||||||
COMMON STOCKS(continued) | ||||||||
Industrials(continued) | ||||||||
Electrical Equipment(continued) | ||||||||
Rockwell Automation, Inc. | 39 | $ | 6,708 | |||||
Schneider Electric SE (France) | 345 | 32,064 | ||||||
WEG S.A. (Brazil) | 2,100 | 13,468 | ||||||
|
| |||||||
| 93,801 | ||||||||
|
| |||||||
Industrial Conglomerates - 0.1% | ||||||||
3M Co. | 158 | 26,068 | ||||||
Honeywell International, Inc. | 171 | 29,537 | ||||||
LT Group, Inc. (Philippines) | 28,000 | 7,361 | ||||||
SM Investments Corp. (Philippines) | 1,400 | 28,381 | ||||||
|
| |||||||
| 91,347 | ||||||||
|
| |||||||
Machinery - 0.2% | ||||||||
Caterpillar, Inc. | 142 | 19,568 | ||||||
Cummins, Inc. | 63 | 10,866 | ||||||
Daifuku Co. Ltd. (Japan) | 600 | 31,837 | ||||||
FANUC Corp. (Japan) | 300 | 59,175 | ||||||
Harmonic Drive Systems, Inc. (Japan) | 800 | 37,101 | ||||||
Illinois Tool Works, Inc. | 95 | 16,015 | ||||||
KION Group AG (Germany) | 615 | 40,921 | ||||||
Nabtesco Corp. (Japan) | 1,100 | 35,018 | ||||||
The Weir Group plc (United Kingdom) | 2,840 | 49,607 | ||||||
|
| |||||||
| 300,108 | ||||||||
|
| |||||||
Professional Services - 0.0%## | ||||||||
SGS S.A. (Switzerland) | 10 | 26,081 | ||||||
|
| |||||||
Road & Rail - 0.0%## | ||||||||
Localiza Rent a Car S.A. (Brazil) | 1,000 | 10,722 | ||||||
Rumo S.A. (Brazil)* | 2,600 | 14,833 | ||||||
Union Pacific Corp. | 171 | 28,294 | ||||||
|
| |||||||
| 53,849 | ||||||||
|
| |||||||
Trading Companies & Distributors - 0.0%## |
| |||||||
Fastenal Co. | 246 | 8,841 | ||||||
|
| |||||||
Transportation Infrastructure - 0.0%## | ||||||||
Grupo Aeroportuario del Centro Norte S.A.B. de C.V. (Mexico) | 3,800 | 26,370 | ||||||
Grupo Aeroportuario del Pacifico S.A.B. de C.V. - ADR (Mexico) | 195 | 20,379 | ||||||
Grupo Aeroportuario del Sureste S.A.B. de C.V. - ADR (Mexico) | 165 | 27,019 | ||||||
|
| |||||||
| 73,768 | ||||||||
|
| |||||||
Total Industrials | 1,081,661 | |||||||
|
| |||||||
Information Technology - 9.2% | ||||||||
Communications Equipment - 0.0%## | ||||||||
Cisco Systems, Inc. | 858 | 40,763 | ||||||
|
| |||||||
| BLENDED ASSET EXTENDED SERIES | ||||||||
SHARES
| VALUE
| |||||||
COMMON STOCKS(continued) | ||||||||
Information Technology(continued) | ||||||||
Electronic Equipment, Instruments & Components - 0.4% |
| |||||||
Cognex Corp. | 8,610 | $ | 443,329 | |||||
Halma plc (United Kingdom) | 1,370 | 33,244 | ||||||
Hexagon AB - Class B (Sweden) | 685 | 35,070 | ||||||
Keyence Corp. (Japan) | 100 | 63,230 | ||||||
|
| |||||||
| 574,873 | ||||||||
|
| |||||||
IT Services - 4.1% | ||||||||
Capgemini SE (France) | 100 | 11,273 | ||||||
International Business Machines Corp. | 220 | 29,421 | ||||||
InterXion Holding N.V. (Netherlands)*1 | 19,010 | 1,677,062 | ||||||
Keywords Studios plc (Ireland) | 870 | 12,537 | ||||||
Mastercard, Inc. - Class A | 9,750 | 2,698,897 | ||||||
Visa, Inc. - Class A | 13,635 | 2,438,756 | ||||||
|
| |||||||
| 6,867,946 | ||||||||
|
| |||||||
Semiconductors & Semiconductor Equipment - 2.1% |
| |||||||
Applied Materials, Inc. | 251 | 13,619 | ||||||
Broadcom, Inc. | 92 | 26,942 | ||||||
Intel Corp. | 969 | 54,777 | ||||||
KLA Corp. | 74 | 12,509 | ||||||
Lam Research Corp. | 43 | 11,655 | ||||||
Maxim Integrated Products, Inc. | 115 | 6,746 | ||||||
Micron Technology, Inc.* | 50,185 | 2,386,297 | ||||||
NVIDIA Corp. | 4,815 | 967,911 | ||||||
Texas Instruments, Inc. | 237 | 27,964 | ||||||
|
| |||||||
| 3,508,420 | ||||||||
|
| |||||||
Software - 2.6% | ||||||||
Dassault Systemes SE (France) | 95 | 14,428 | ||||||
Microsoft Corp. | 17,810 | 2,553,420 | ||||||
ServiceNow, Inc.*1 | 6,930 | 1,713,512 | ||||||
|
| |||||||
| 4,281,360 | ||||||||
|
| |||||||
Technology Hardware, Storage & Peripherals - 0.0%## |
| |||||||
NetApp, Inc. | 86 | 4,806 | ||||||
Western Digital Corp. | 140 | 7,231 | ||||||
|
| |||||||
| 12,037 | ||||||||
|
| |||||||
Total Information Technology | 15,285,399 | |||||||
|
| |||||||
Materials - 0.2% | ||||||||
Chemicals - 0.2% | ||||||||
Air Liquide S.A. (France) | 286 | 38,027 | ||||||
Akzo Nobel N.V. (Netherlands) | 426 | 39,274 | ||||||
Dow, Inc. | 198 | 9,997 | ||||||
Eastman Chemical Co. | 77 | 5,855 | ||||||
The accompanying notes are an integral part of the financial statements.
49
Investment Portfolio - October 31, 2019
| BLENDED ASSET EXTENDED SERIES | ||||||||
SHARES
| VALUE
| |||||||
COMMON STOCKS(continued) | ||||||||
Materials(continued) | ||||||||
Chemicals(continued) | ||||||||
Givaudan S.A. (Switzerland) | 10 | $ | 29,379 | |||||
LyondellBasell Industries N.V. - Class A | 144 | 12,917 | ||||||
OCI N.V. (Netherlands)* | 550 | 12,367 | ||||||
Orbia Advance Corp. S.A.B. de C.V. (Mexico) | 16,800 | 36,366 | ||||||
Solvay S.A. (Belgium) | 670 | 72,846 | ||||||
|
| |||||||
| 257,028 | ||||||||
|
| |||||||
Containers & Packaging - 0.0%## | ||||||||
International Paper Co. | 139 | 6,072 | ||||||
|
| |||||||
Metals & Mining - 0.0%## | ||||||||
First Quantum Minerals Ltd. (Zambia) | 1,550 | 13,098 | ||||||
Lundin Mining Corp. (Chile) | 2,605 | 13,153 | ||||||
Nucor Corp. | 152 | 8,185 | ||||||
|
| |||||||
| 34,436 | ||||||||
|
| |||||||
Total Materials | 297,536 | |||||||
|
| |||||||
Real Estate - 3.7% | ||||||||
Equity Real Estate Investment Trusts (REITS) - 3.7% |
| |||||||
Acadia Realty Trust1 | 570 | 15,949 | ||||||
Agree Realty Corp.1 | 335 | 26,388 | ||||||
Alexandria Real Estate Equities, Inc. | 130 | 20,638 | ||||||
American Campus Communities, Inc. | 920 | 45,982 | ||||||
American Homes 4 Rent - Class A | 3,150 | 83,381 | ||||||
American Tower Corp. | 4,040 | 881,043 | ||||||
Americold Realty Trust | 1,725 | 69,155 | ||||||
Apartment Investment & Management Co. - Class A | 1,509 | 82,814 | ||||||
AvalonBay Communities, Inc. | 540 | 117,536 | ||||||
Boston Properties, Inc. | 472 | 64,758 | ||||||
Brandywine Realty Trust | 4,325 | 66,086 | ||||||
The British Land Co. plc (United Kingdom) | 4,150 | 33,367 | ||||||
Camden Property Trust | 545 | 62,332 | ||||||
Community Healthcare Trust, Inc. | 1,025 | 49,631 | ||||||
Cousins Properties, Inc. | 2,761 | 110,799 | ||||||
Crown Castle International Corp. | 385 | 53,434 | ||||||
CubeSmart | 485 | 15,374 | ||||||
Digital Realty Trust, Inc. | 430 | 54,627 | ||||||
Douglas Emmett, Inc. | 1,210 | 52,417 | ||||||
Equinix, Inc. | 2,430 | 1,377,275 | ||||||
Equity LifeStyle Properties, Inc. | 720 | 50,357 | ||||||
Equity Residential | 925 | 82,010 | ||||||
SHARES
| VALUE
| |||||||
COMMON STOCKS(continued) | ||||||||
Real Estate(continued) | ||||||||
Equity Real Estate Investment Trusts (REITS)(continued) | ||||||||
Essential Properties Realty Trust, Inc. | 2,065 | $ | 52,988 | |||||
Essex Property Trust, Inc. | 205 | 67,062 | ||||||
Extra Space Storage, Inc. | 180 | 20,209 | ||||||
Federal Realty Investment Trust | 125 | 17,001 | ||||||
First Industrial Realty Trust, Inc. | 845 | 35,583 | ||||||
Getty Realty Corp. | 965 | 32,366 | ||||||
Healthcare Realty Trust, Inc. | 1,475 | 51,286 | ||||||
Healthcare Trust of America, Inc. - Class A | 920 | 28,520 | ||||||
Healthpeak Properties, Inc. | 2,210 | 83,140 | ||||||
Hibernia REIT plc (Ireland) | 16,880 | 26,281 | ||||||
Host Hotels & Resorts, Inc. | 1,795 | 29,420 | ||||||
Independence Realty Trust, Inc. | 2,465 | 37,961 | ||||||
Invitation Homes, Inc. | 3,487 | 107,365 | ||||||
Jernigan Capital, Inc. | 1,615 | 30,669 | ||||||
Kilroy Realty Corp. | 217 | 18,213 | ||||||
Land Securities Group plc (United Kingdom) | 2,780 | 33,862 | ||||||
Liberty Property Trust | 830 | 49,028 | ||||||
Life Storage, Inc. | 240 | 26,141 | ||||||
Mid-America Apartment Communities, Inc. | 260 | 36,137 | ||||||
National Retail Properties, Inc. | 900 | 53,019 | ||||||
National Storage Affiliates Trust | 885 | 30,240 | ||||||
Omega Healthcare Investors, Inc. | 850 | 37,434 | ||||||
Physicians Realty Trust | 3,060 | 57,130 | ||||||
Plymouth Industrial REIT, Inc. | 1,108 | 20,897 | ||||||
Prologis, Inc. | 1,950 | 171,132 | ||||||
Public Storage | 320 | 71,315 | ||||||
Realty Income Corp. | 270 | 22,083 | ||||||
SBA Communications Corp. | 3,500 | 842,275 | ||||||
Simon Property Group, Inc. | 765 | 115,270 | ||||||
STAG Industrial, Inc. | 1,015 | 31,506 | ||||||
STORE Capital Corp. | 770 | 31,185 | ||||||
Sun Communities, Inc. | 475 | 77,259 | ||||||
Sunstone Hotel Investors, Inc. | 1,480 | 19,995 | ||||||
UDR, Inc. | 1,282 | 64,420 | ||||||
UMH Properties, Inc. | 1,180 | 17,617 | ||||||
Urban Edge Properties | 2,165 | 45,703 | ||||||
Ventas, Inc. | 931 | 60,608 | ||||||
VEREIT, Inc. | 5,870 | 57,761 | ||||||
Vornado Realty Trust1 | 325 | 21,330 | ||||||
Weingarten Realty Investors1 | 1,390 | 44,105 | ||||||
Welltower, Inc.1 | 861 | 78,084 | ||||||
|
| |||||||
| 6,168,953 | ||||||||
|
| |||||||
The accompanying notes are an integral part of the financial statements.
50
Investment Portfolio - October 31, 2019
| BLENDED ASSET EXTENDED SERIES | SHARES/ | |||||||
PRINCIPAL
| VALUE
| |||||||
COMMON STOCKS(continued) | ||||||||
Real Estate(continued) | ||||||||
Real Estate Management & Development - 0.0%## |
| |||||||
Ayala Land, Inc. (Philippines) | 28,200 | $ | 26,949 | |||||
SM Prime Holdings, Inc. (Philippines) | 46,975 | 36,068 | ||||||
|
| |||||||
| 63,017 | ||||||||
|
| |||||||
Total Real Estate | 6,231,970 | |||||||
|
| |||||||
Utilities - 0.0%## | ||||||||
Electric Utilities - 0.0%## | ||||||||
Manila Electric Co. (Philippines) | 2,350 | 15,671 | ||||||
|
| |||||||
Independent Power and Renewable Electricity Producers - 0.0%## | ||||||||
Aboitiz Power Corp. (Philippines) | 24,600 | 19,367 | ||||||
|
| |||||||
Multi-Utilities - 0.0%## | ||||||||
Engie S.A. (France) | 1,215 | 20,345 | ||||||
Veolia Environnement S.A. (France) | 370 | 9,740 | ||||||
|
| |||||||
| 30,085 | ||||||||
|
| |||||||
Total Utilities | 65,123 | |||||||
|
| |||||||
TOTAL COMMON STOCKS | 83,499,399 | |||||||
|
| |||||||
CORPORATE BONDS - 10.2% | ||||||||
Non-Convertible Corporate Bonds - 10.2% |
| |||||||
Communication Services - 2.3% | ||||||||
Diversified Telecommunication Services - 1.1% |
| |||||||
AT&T, Inc.1, 4.25%, 3/1/2027 | 610,000 | 669,966 | ||||||
CenturyLink, Inc., 5.625%, 4/1/2020 . | 15,000 | 15,188 | ||||||
Verizon Communications, Inc., 5.25%, 3/16/2037 | 900,000 | 1,133,620 | ||||||
|
| |||||||
| 1,818,774 | ||||||||
|
| |||||||
Interactive Media & Services - 0.3% | ||||||||
Tencent Holdings Ltd. (China)2, 3.975%, 4/11/2029 | 520,000 | 559,634 | ||||||
|
| |||||||
Media - 0.8% | ||||||||
Cablevision Systems Corp., 8.00%, 4/15/2020 | 15,000 | 15,375 | ||||||
Comcast Corp., 3.25%, 11/1/2039 | 560,000 | 567,737 | ||||||
Diamond Sports Group LLC - Diamond Sports Finance Co.2, 6.625%, 8/15/2027 | 25,000 | 25,750 | ||||||
Discovery Communications LLC, 5.20%, 9/20/2047 | 650,000 | 710,812 | ||||||
Entercom Media Corp.2, 7.25%, 11/1/2024 | 10,000 | 10,425 | ||||||
| ||||||||
PRINCIPAL
| VALUE
| |||||||
CORPORATE BONDS(continued) | ||||||||
Non-Convertible Corporate Bonds(continued) |
| |||||||
Communication Services(continued) |
| |||||||
Media(continued) | ||||||||
Townsquare Media, Inc.2, 6.50%, 4/1/2023 | 10,000 | $ | 9,900 | |||||
|
| |||||||
| 1,339,999 | ||||||||
|
| |||||||
Wireless Telecommunication Services - 0.1% |
| |||||||
Sprint Communications, Inc., 7.00%, 8/15/2020 | 35,000 | 36,056 | ||||||
Sprint Corp., 7.25%, 9/15/2021 | 15,000 | 16,006 | ||||||
Sprint Corp., 7.125%, 6/15/2024 | 15,000 | 16,275 | ||||||
|
| |||||||
| 68,337 | ||||||||
|
| |||||||
Total Communication Services | 3,786,744 | |||||||
|
| |||||||
Consumer Discretionary - 1.5% | ||||||||
Auto Components - 0.0%## | ||||||||
American Axle & Manufacturing, Inc., 6.25%, 4/1/2025 | 10,000 | 9,637 | ||||||
Techniplas LLC2, 10.00%, 5/1/2020 | 20,000 | 16,900 | ||||||
|
| |||||||
| 26,537 | ||||||||
|
| |||||||
Automobiles - 0.5% | ||||||||
General Motors Financial Co., Inc., 3.15%, 1/15/2020 | 750,000 | 751,014 | ||||||
|
| |||||||
Diversified Consumer Services - 0.0%## |
| |||||||
GEMS MENASA Cayman Ltd. - GEMS Education Delaware LLC (United Arab Emirates)2, 7.125%, 7/31/2026 | 60,000 | 62,175 | ||||||
|
| |||||||
Household Durables - 0.0%## | ||||||||
Ashton Woods USA LLC - Ashton Woods Finance Co.2, 6.75%, 8/1/2025 | 15,000 | 15,075 | ||||||
LGI Homes, Inc.2, 6.875%, 7/15/2026 | 30,000 | 31,050 | ||||||
Weekley Homes LLC - Weekley Finance Corp.1, 6.625%, 8/15/2025 | 35,000 | 35,525 | ||||||
|
| |||||||
| 81,650 | ||||||||
|
| |||||||
Internet & Direct Marketing Retail - 1.0% |
| |||||||
Alibaba Group Holding Ltd. (China), 3.40%, 12/6/2027 | 550,000 | 571,264 | ||||||
Booking Holdings, Inc., 3.60%, 6/1/2026 | 930,000 | 1,006,871 | ||||||
Photo Holdings Merger Sub, Inc.2, 8.50%, 10/1/2026 | 25,000 | 22,003 | ||||||
|
| |||||||
| 1,600,138 | ||||||||
|
| |||||||
The accompanying notes are an integral part of the financial statements.
51
Investment Portfolio - October 31, 2019
| BLENDED ASSET EXTENDED SERIES | ||||||||
PRINCIPAL
| VALUE
| |||||||
CORPORATE BONDS(continued) | ||||||||
Non-Convertible Corporate Bonds(continued) |
| |||||||
Consumer Discretionary(continued) |
| |||||||
Specialty Retail - 0.0%## | ||||||||
Foxtrot Escrow Issuer LLC - Foxtrot Escrow Corp.2, 12.25%, 11/15/2026 | 25,000 | $ | 25,128 | |||||
Staples, Inc.2, 7.50%, 4/15/2026 | 25,000 | 26,005 | ||||||
|
| |||||||
| 51,133 | ||||||||
|
| |||||||
Total Consumer Discretionary | 2,572,647 | |||||||
|
| |||||||
Consumer Staples - 0.0%## | ||||||||
Food & Staples Retailing - 0.0%## | ||||||||
KeHE Distributors LLC - KeHE Finance Corp.2, 8.625%, 10/15/2026 | 25,000 | 25,641 | ||||||
|
| |||||||
Energy - 1.7% | ||||||||
Energy Equipment & Services - 0.0%## |
| |||||||
Nabors Industries, Inc., 5.50%, 1/15/2023 | 15,000 | 12,675 | ||||||
Shelf Drilling Holdings Ltd. (United Arab Emirates)2, 8.25%, 2/15/2025 | 15,000 | 12,600 | ||||||
|
| |||||||
| 25,275 | ||||||||
|
| |||||||
Oil, Gas & Consumable Fuels - 1.7% | ||||||||
Antero Midstream Partners LP - Antero Midstream Finance Corp.2, 5.75%, 3/1/2027 | 15,000 | 11,156 | ||||||
Antero Midstream Partners LP - Antero Midstream Finance Corp.2, 5.75%, 1/15/2028 | 15,000 | 11,325 | ||||||
Bruin E&P Partners LLC2, 8.875%, 8/1/2023 | 15,000 | 9,900 | ||||||
Calumet Specialty Products Partners LP - Calumet Finance Corp.2, 11.00%, 4/15/2025 | 25,000 | 25,063 | ||||||
Energy Transfer Operating LP, 6.50%, 2/1/2042 | 470,000 | 562,920 | ||||||
Jonah Energy LLC - Jonah Energy Finance Corp.2, 7.25%, 10/15/2025 | 30,000 | 8,400 | ||||||
Kinder Morgan Energy Partners LP, 6.95%, 1/15/2038 | 570,000 | 736,852 | ||||||
Lonestar Resources America, Inc.2, 11.25%, 1/1/2023 | 15,000 | 10,500 | ||||||
Moss Creek Resources Holdings, Inc.2, 10.50%, 5/15/2027 | 5,000 | 3,862 | ||||||
NuStar Logistics LP, 6.75%, 2/1/2021 | 15,000 | 15,543 | ||||||
Rockies Express Pipeline LLC2, 5.625%, 4/15/2020 | 25,000 | 25,420 | ||||||
PRINCIPAL
| VALUE
| |||||||
CORPORATE BONDS(continued) | ||||||||
Non-Convertible Corporate Bonds(continued) |
| |||||||
Energy(continued) | ||||||||
Oil, Gas & Consumable Fuels(continued) |
| |||||||
Sabine Pass Liquefaction LLC, 5.875%, 6/30/2026 | 790,000 | $ | 907,119 | |||||
Southwestern Energy Co.4, 6.20%, 1/23/2025 | 15,000 | 13,200 | ||||||
W&T Offshore, Inc.1,2, 9.75%, 11/1/2023 | 10,000 | 9,375 | ||||||
The Williams Companies, Inc.1, 3.75%, 6/15/2027 | 480,000 | 500,469 | ||||||
|
| |||||||
| 2,851,104 | ||||||||
|
| |||||||
Total Energy | 2,876,379 | |||||||
|
| |||||||
Financials - 2.4% | ||||||||
Banks - 2.0% | ||||||||
Bank of America Corp., 4.00%, 1/22/2025 | 920,000 | 981,290 | ||||||
Citigroup, Inc., 8.125%, 7/15/2039 | 320,000 | 526,422 | ||||||
Credit Suisse AG (Switzerland), 5.40%, 1/14/2020 | 710,000 | 714,601 | ||||||
JPMorgan Chase & Co.5,(3 mo. LIBOR US + 1.000%), 4.023%, 12/5/2024 | 450,000 | 480,509 | ||||||
Santander Holdings USA, Inc., 4.50%, 7/17/2025 | 610,000 | 657,335 | ||||||
|
| |||||||
| 3,360,157 | ||||||||
|
| |||||||
Capital Markets - 0.2% | ||||||||
AG Merger Sub II, Inc.2, 10.75%, 8/1/2027 | 15,000 | 14,850 | ||||||
Donnelley Financial Solutions, Inc., 8.25%, 10/15/2024 | 30,000 | 31,200 | ||||||
The Goldman Sachs Group, Inc., 4.25%, 10/21/2025 | 310,000 | 333,917 | ||||||
|
| |||||||
| 379,967 | ||||||||
|
| |||||||
Consumer Finance - 0.1% | ||||||||
Navient Corp., 5.00%, 10/26/2020 | 25,000 | 25,461 | ||||||
SLM Corp., 5.125%, 4/5/2022 | 30,000 | 30,975 | ||||||
|
| |||||||
| 56,436 | ||||||||
|
| |||||||
Diversified Financial Services - 0.1% | ||||||||
Fidelity & Guaranty Life Holdings, Inc.2, 5.50%, 5/1/2025 | 15,000 | 16,012 | ||||||
Global Aircraft Leasing Co. Ltd. (Cayman Islands)2,6, 6.50%, 9/15/2024 | 25,000 | 25,586 | ||||||
VistaJet Malta Finance plc - XO Management Holding, Inc. (Switzerland)2, 10.50%, 6/1/2024 | 25,000 | 24,312 | ||||||
|
| |||||||
| 65,910 | ||||||||
|
| |||||||
The accompanying notes are an integral part of the financial statements.
52
Investment Portfolio - October 31, 2019
| BLENDED ASSET EXTENDED SERIES | ||||||||
PRINCIPAL
| VALUE
| |||||||
CORPORATE BONDS(continued) | ||||||||
Non-Convertible Corporate Bonds(continued) |
| |||||||
Financials(continued) | ||||||||
Thrifts & Mortgage Finance - 0.0%## | ||||||||
Acrisure LLC - Acrisure Finance, Inc.2, 7.00%, 11/15/2025 | 25,000 | $ | 22,875 | |||||
Radian Group, Inc., 4.875%, 3/15/2027 | 30,000 | 31,125 | ||||||
|
| |||||||
| 54,000 | ||||||||
|
| |||||||
Total Financials | 3,916,470 | |||||||
|
| |||||||
Health Care - 0.3% | ||||||||
Health Care Providers & Services - 0.3% |
| |||||||
HCA, Inc., 4.125%, 6/15/2029 | 520,000 | 550,891 | ||||||
|
| |||||||
Industrials - 0.9% | ||||||||
Commercial Services & Supplies - 0.0%## |
| |||||||
The ADT Security Corp., 6.25%, 10/15/2021 | 15,000 | 15,994 | ||||||
Prime Security Services Borrower LLC - Prime Finance, Inc.2, 5.75%, 4/15/2026 | 15,000 | 15,370 | ||||||
Stericycle, Inc.2, 5.375%, 7/15/2024 | 35,000 | 36,400 | ||||||
|
| |||||||
| 67,764 | ||||||||
|
| |||||||
Construction & Engineering - 0.0%## | ||||||||
HC2 Holdings, Inc.2, 11.50%, 12/1/2021 | 10,000 | 9,113 | ||||||
Tutor Perini Corp.2, 6.875%, 5/1/2025 | 30,000 | 29,920 | ||||||
|
| |||||||
| 39,033 | ||||||||
|
| |||||||
Industrial Conglomerates - 0.4% | ||||||||
General Electric Co.5,7, (3 mo. LIBOR US + 3.330%), 5.00% | 620,000 | 597,525 | ||||||
|
| |||||||
Marine - 0.1% | ||||||||
American Tanker, Inc. (Norway)2, 9.25%, 2/22/2022 | 40,000 | 40,224 | ||||||
Borealis Finance LLC2, 7.50%, 11/16/2022 | 35,000 | 32,900 | ||||||
|
| |||||||
| 73,124 | ||||||||
|
| |||||||
Trading Companies & Distributors - 0.4% |
| |||||||
AerCap Ireland Capital DAC - AerCap Global Aviation Trust (Ireland)1, 4.45%, 10/1/2025 | 620,000 | 672,748 | ||||||
Fortress Transportation & Infrastructure Investors LLC2, 6.50%, 10/1/2025 | 25,000 | 25,250 | ||||||
|
| |||||||
| 697,998 | ||||||||
|
| |||||||
Total Industrials | 1,475,444 | |||||||
|
| |||||||
PRINCIPAL
| VALUE
| |||||||
CORPORATE BONDS(continued) | ||||||||
Non-Convertible Corporate Bonds(continued) |
| |||||||
Information Technology - 0.0%## | ||||||||
Communications Equipment - 0.0%## |
| |||||||
Hughes Satellite Systems Corp., 5.25%, 8/1/2026 | 30,000 | $ | 32,138 | |||||
|
| |||||||
Materials - 0.6% | ||||||||
Chemicals - 0.0%## | ||||||||
CF Industries, Inc., 7.125%, 5/1/2020 | 15,000 | 15,360 | ||||||
Olin Corp., 5.625%, 8/1/2029 | 15,000 | 15,574 | ||||||
|
| |||||||
| 30,934 | ||||||||
|
| |||||||
Containers & Packaging - 0.1% | ||||||||
ARD Securities Finance S.A.R.L (Luxembourg)2,6, 8.75%, 1/31/2023 | 10,437 | 10,854 | ||||||
Berry Global, Inc.2, 4.50%, 2/15/2026 | 15,000 | 15,094 | ||||||
Mauser Packaging Solutions Holding Co.2, 7.25%, 4/15/2025 | 15,000 | 14,344 | ||||||
|
| |||||||
| 40,292 | ||||||||
|
| |||||||
Metals & Mining - 0.5% | ||||||||
Infrabuild Australia Pty Ltd. (Australia)2, 12.00%, 10/1/2024 | 25,000 | 25,478 | ||||||
Mountain Province Diamonds, Inc. | 35,000 | 33,950 | ||||||
Northwest Acquisitions ULC - Dominion Finco, Inc.2, 7.125%, 11/1/2022 | 30,000 | 15,000 | ||||||
Southern Copper Corp. (Peru), 5.375%, 4/16/2020 | 750,000 | 759,253 | ||||||
SunCoke Energy Partners LP - SunCoke Energy Partners Finance Corp.2, 7.50%, 6/15/2025. | 10,000 | 8,500 | ||||||
|
| |||||||
| 842,181 | ||||||||
|
| |||||||
Total Materials | 913,407 | |||||||
|
| |||||||
Real Estate - 0.5% | ||||||||
Equity Real Estate Investment Trusts (REITS) - 0.5% |
| |||||||
American Tower Corp., 3.80%, 8/15/2029 | 690,000 | 737,633 | ||||||
GTP Acquisition Partners I LLC2, 2.35%, 6/15/2020 | 123,000 | 123,043 | ||||||
|
| |||||||
| 860,676 | ||||||||
|
| |||||||
Real Estate Management & Development - 0.0%## |
| |||||||
Five Point Operating Co. LP - Five Point Capital Corp.2, 7.875%, 11/15/2025 | 25,000 | 23,629 | ||||||
The accompanying notes are an integral part of the financial statements.
53
Investment Portfolio - October 31, 2019
| BLENDED ASSET EXTENDED SERIES | PRINCIPAL SHARES
| VALUE
| ||||||
CORPORATE BONDS(continued) |
| |||||||
Non-Convertible Corporate Bonds(continued) |
| |||||||
Real Estate(continued) | ||||||||
Real Estate Management & Development(continued) |
| |||||||
Forestar Group, Inc.2, 8.00%, 4/15/2024 | 15,000 | $ | 16,125 | |||||
|
| |||||||
| 39,754 | ||||||||
|
| |||||||
Total Real Estate | 900,430 | |||||||
|
| |||||||
TOTAL CORPORATE BONDS |
| |||||||
(Identified Cost $16,371,131) | 17,050,191 | |||||||
|
| |||||||
MUTUAL FUNDS - 0.3% | ||||||||
iShares MSCI India ETF | 5,355 | 185,551 | ||||||
SPDR Gold Shares* | 1,845 | 262,783 | ||||||
VanEck Vectors Gold Miners ETF | 4,908 | 138,160 | ||||||
|
| |||||||
TOTAL MUTUAL FUNDS | ||||||||
(Identified Cost $540,439) | 586,494 | |||||||
|
| |||||||
U.S. TREASURY SECURITIES - 21.7% |
| |||||||
U.S. Treasury Bonds - 7.6% | ||||||||
U.S. Treasury Bond, 4.75%, 2/15/2037 | 2,361,000 | 3,359,076 | ||||||
U.S. Treasury Bond, 2.50%, 2/15/2045 | 3,162,000 | 3,363,824 | ||||||
U.S. Treasury Bond, 3.00%, 5/15/2047 | 4,260,000 | 4,988,194 | ||||||
U.S. Treasury Inflation Indexed Bond, 0.75%, 2/15/2042 | 935,351 | 982,854 | ||||||
|
| |||||||
Total U.S. Treasury Bonds | ||||||||
(Identified Cost $11,262,683) | 12,693,948 | |||||||
|
| |||||||
U.S. Treasury Notes - 14.1% | ||||||||
U.S. Treasury Inflation Indexed Note, 0.125%, 4/15/2020 | 3,317,246 | 3,299,494 | ||||||
U.S. Treasury Inflation Indexed Note, 0.50%, 4/15/2024 | 1,597,083 | 1,618,079 | ||||||
U.S. Treasury Note, 2.625%, 5/15/2021 | 1,615,000 | 1,640,234 | ||||||
U.S. Treasury Note, 2.50%, 5/15/2024 | 3,136,000 | 3,268,300 | ||||||
U.S. Treasury Note, 2.00%, 8/15/2025 | 10,125,000 | 10,360,327 | ||||||
U.S. Treasury Note, 1.625%, 5/15/2026 | 3,221,000 | 3,226,159 | ||||||
|
| |||||||
Total U.S. Treasury Notes | ||||||||
(Identified Cost $23,070,065) | 23,412,593 | |||||||
|
| |||||||
TOTAL U.S. TREASURY SECURITIES | ||||||||
(Identified Cost $34,332,748) | 36,106,541 | |||||||
|
| |||||||
PRINCIPAL
| VALUE
| |||||||
ASSET-BACKED SECURITIES - 3.4% |
| |||||||
Cazenovia Creek Funding II LLC, Series 2018-1A, Class A2, 3.561%, 7/15/2030 | 266,758 | $ | 268,695 | |||||
CCG Receivables Trust, Series 2019-1, Class A22, 2.80%, 9/14/2026 | 760,000 | 767,075 | ||||||
Chesapeake Funding II LLC, Series 2017-4A, Class A1 (Canada)2, 2.12%, 11/15/2029 | 284,107 | 284,111 | ||||||
Invitation Homes Trust, Series 2017-SFR2, Class A2,8, (1 mo. LIBOR US + 0.850%), 2.739%, 12/17/2036 | 154,923 | 154,705 | ||||||
Invitation Homes Trust, Series 2017-SFR2, Class B2,8, (1 mo. LIBOR US + 1.150%), 3.039%, 12/17/2036 | 120,000 | 120,113 | ||||||
Navient Private Education Refi Loan Trust, Series 2019-CA, Class A12, 2.82%, 2/15/2068 | 327,691 | 330,902 | ||||||
Oxford Finance Funding LLC, Series 2019-1A, Class A22, 4.459%, 2/15/2027 | 600,000 | 615,396 | ||||||
Progress Residential Trust, Series 2019-SFR2, Class A2, 3.147%, 5/17/2036 | 380,000 | 386,595 | ||||||
SoFi Consumer Loan Program LLC, Series 2016-2, Class A2, 3.09%, 10/27/2025 | 100,629 | 100,947 | ||||||
SoFi Consumer Loan Program Trust, Series 2019-2, Class A2, 3.01%, 4/25/2028 | 247,555 | 249,493 | ||||||
SoFi Consumer Loan Program Trust, Series 2019-3, Class A2, 2.90%, 5/25/2028 | 329,584 | 331,930 | ||||||
SoFi Professional Loan Program LLC, Series 2017-C, Class A2A2, 1.75%, 7/25/2040 | 90,055 | 90,007 | ||||||
SoFi Professional Loan Program Trust, Series 2018-C, Class A1FX2, 3.08%, 1/25/2048 | 398,677 | 401,174 | ||||||
Tax Ease Funding LLC, Series 2016-1A, Class A2, 3.131%, 6/15/2028 | 56,526 | 56,513 | ||||||
Towd Point Mortgage Trust, Series 2016-5, Class A12,9, 2.50%, 10/25/2056 | 303,363 | 304,523 | ||||||
Towd Point Mortgage Trust, Series 2017-1, Class A12,9, 2.75%, 10/25/2056 | 333,508 | 337,454 | ||||||
Towd Point Mortgage Trust, Series 2019-HY1, Class A12,8, (1 mo. LIBOR US + 1.000%), 2.823%, 10/25/2048 | 302,312 | 303,927 | ||||||
The accompanying notes are an integral part of the financial statements.
54
Investment Portfolio - October 31, 2019
| BLENDED ASSET EXTENDED SERIES | ||||||||
PRINCIPAL
| VALUE
| |||||||
ASSET-BACKED SECURITIES(continued) |
| |||||||
Tricon American Homes Trust, Series 2016-SFR1, Class A2, 2.589%, 11/17/2033 | 314,326 | $ | 314,259 | |||||
Tricon American Homes Trust, Series 2017-SFR2, Class A2, 2.928%, 1/17/2036 | 299,151 | 303,637 | ||||||
|
| |||||||
TOTAL ASSET-BACKED SECURITIES | 5,721,456 | |||||||
|
| |||||||
COMMERCIAL MORTGAGE-BACKED SECURITIES - 3.5% |
| |||||||
CIM Trust, Series 2019-INV1, Class A12,9, 4.00%, 2/25/2049 | 142,992 | 146,113 | ||||||
Credit Suisse Mortgage Capital Trust, Series 2013-IVR3, Class A12,9, 2.50%, 5/25/2043 | 187,256 | 185,286 | ||||||
Credit Suisse Mortgage Capital Trust, Series 2014-IVR3, Class A12,9, 3.50%, 7/25/2044 | 332,912 | 338,117 | ||||||
Fannie Mae REMICS, Series 2018-31, Class KP, 3.50%, 7/25/2047 | 287,525 | 300,160 | ||||||
Fannie Mae-Aces, Series 2017-M15, | 387,560 | 406,100 | ||||||
Freddie Mac Multifamily Structured Pass-Through Certificates, Series K017, Class X1 (IO)9, 1.298%, 12/25/2021 | 5,697,707 | 126,508 | ||||||
Freddie Mac REMICS, Series 4791, Class BA, 4.00%, 3/15/2044 | 297,060 | 301,074 | ||||||
Freddie Mac REMICS, Series 4801, Class BA, 4.50%, 5/15/2044 | 266,254 | 271,814 | ||||||
FREMF Mortgage Trust, Series 2014-K41, Class B2,9, 3.832%, 11/25/2047 | 485,000 | 509,100 | ||||||
FREMF Mortgage Trust, Series 2014-K715, Class B2,9, 3.971%, 2/25/2046 | 471,000 | 480,099 | ||||||
Government National Mortgage Association, Series 2017-54, Class AH, 2.60%, 12/16/2056 | 481,560 | 485,592 | ||||||
JP Morgan Mortgage Trust, Series 2013-2, Class A22,9, 3.50%, 5/25/2043 | 106,136 | 108,208 | ||||||
JP Morgan Mortgage Trust, Series 2014-2, Class 1A12,9, 3.00%, 6/25/2029 | 166,355 | 168,964 | ||||||
New Residential Mortgage Loan Trust, Series 2014-3A, Class AFX32,9, 3.75%, 11/25/2054 | 116,917 | 121,620 | ||||||
New Residential Mortgage Loan Trust, Series 2015-2A, Class A12,9, 3.75%, 8/25/2055 | 182,029 | 189,774 | ||||||
PRINCIPAL
| VALUE
| |||||||
COMMERCIAL MORTGAGE-BACKED SECURITIES(continued) |
| |||||||
New Residential Mortgage Loan Trust, Series 2016-4A, Class A12,9, 3.75%, 11/25/2056 | 188,417 | $ | 196,522 | |||||
Sequoia Mortgage Trust, Series 2013-2, Class A9, 1.874%, 2/25/2043 | 134,502 | 129,680 | ||||||
Sequoia Mortgage Trust, Series 2013-8, Class A19, 3.00%, 6/25/2043 | 155,485 | 157,241 | ||||||
Starwood Retail Property Trust, Series 2014-STAR, Class A2,8, (1 mo. LIBOR US + 1.220%), 3.134%, 11/15/2027 | 358,082 | 357,438 | ||||||
Sutherland Commercial Mortgage Trust, Series 2019-SBC8, Class A2,9, 2.86%, 12/25/2035 | 377,829 | 379,982 | ||||||
Waikiki Beach Hotel Trust, Series 2019-WBM, Class A2,8, (1 mo. LIBOR US + 1.050%), 2.971%, 12/15/2033 | 345,000 | 345,214 | ||||||
WinWater Mortgage Loan Trust, Series 2015-3, Class A52,9, 3.50%, 3/20/2045 | 96,484 | 96,703 | ||||||
|
| |||||||
TOTAL COMMERCIAL MORTGAGE-BACKED SECURITIES |
| |||||||
(Identified Cost $5,667,001) | 5,801,309 | |||||||
|
| |||||||
FOREIGN GOVERNMENT BONDS - 0.5% |
| |||||||
Canadian Government Bond (Canada), 2.75%, 6/1/2022 | CAD | 102,000 | 79,874 | |||||
Export-Import Bank of Korea (South Korea), 2.625%, 12/30/2020 | 500,000 | 502,873 | ||||||
Mexican Government Bond (Mexico), 8.00%, 6/11/2020 | MXN | 2,087,000 | | 109,263 | ||||
Mexican Government Bond (Mexico), 6.50%, 6/10/2021 | MXN | 888,000 | 46,059 | |||||
Mexican Government Bond (Mexico), 6.50%, 6/9/2022 | MXN | 1,443,000 | | 74,926 | ||||
Mexican Government Bond (Mexico), 7.75%, 5/29/2031 | MXN | 278,000 | 15,455 | |||||
|
| |||||||
TOTAL FOREIGN GOVERNMENT BONDS |
| |||||||
(Identified Cost $831,572) | 828,450 | |||||||
|
| |||||||
U.S. GOVERNMENT AGENCIES - 9.2% |
| |||||||
Mortgage-Backed Securities - 9.2% |
| |||||||
Fannie Mae, Pool #888468, 5.50%, 9/1/2021 | 16,028 | 16,260 | ||||||
Fannie Mae, Pool #888810, 5.50%, 11/1/2022 | 19,434 | 19,691 | ||||||
Fannie Mae, Pool #AL9409, 3.50%, 11/1/2031 | 339,259 | 352,580 | ||||||
The accompanying notes are an integral part of the financial statements.
55
Investment Portfolio - October 31, 2019
| BLENDED ASSET EXTENDED SERIES | ||||||||
PRINCIPAL
| VALUE
| |||||||
U.S. GOVERNMENT AGENCIES(continued) |
| |||||||
Mortgage-Backed Securities(continued) |
| |||||||
Fannie Mae, Pool #MA1834, 4.50%, 2/1/2034 | 209,510 | $ | 225,173 | |||||
Fannie Mae, Pool #FM1158, 3.50%, 6/1/2034 | 660,130 | 683,907 | ||||||
Fannie Mae, Pool #MA3412, 3.50%, 7/1/2038 | 622,370 | 644,969 | ||||||
Fannie Mae, Pool #AD0207, 6.00%, 10/1/2038 | 180,222 | 207,148 | ||||||
Fannie Mae, Pool #AD0307, 5.50%, 1/1/2039 | 113,371 | 127,332 | ||||||
Fannie Mae, Pool #MA0258, 4.50%, 12/1/2039 | 153,642 | 166,442 | ||||||
Fannie Mae, Pool #AL0241, 4.00%, 4/1/2041 | 265,965 | 284,617 | ||||||
Fannie Mae, Pool #AL1410, 4.50%, 12/1/2041 | 379,541 | 411,476 | ||||||
Fannie Mae, Pool #AL7729, 4.00%, 6/1/2043 | 216,138 | 231,238 | ||||||
Fannie Mae, Pool #AS3622, 3.50%, 10/1/2044 | 997,234 | 1,050,158 | ||||||
Fannie Mae, Pool #AS4103, 4.50%, 12/1/2044 | 221,315 | 238,162 | ||||||
Fannie Mae, Pool #MA2705, 3.00%, 8/1/2046 | 290,006 | 297,652 | ||||||
Fannie Mae, Pool #BJ1323, 3.50%, 11/1/2047 | 952,646 | 994,707 | ||||||
Fannie Mae, Pool #CA1720, 5.00%, 5/1/2048 | 439,619 | 485,508 | ||||||
Fannie Mae, Pool #CA1922, 5.00%, 6/1/2048 | 436,019 | 467,440 | ||||||
Fannie Mae, Pool #CA2056, 4.50%, 7/1/2048 | 466,154 | 492,023 | ||||||
Fannie Mae, Pool #MA3443, 4.00%, 8/1/2048 | 335,746 | 348,245 | ||||||
Fannie Mae, Pool #BK9366, 4.50%, 8/1/2048 | 188,356 | 198,259 | ||||||
Fannie Mae, Pool #CA2219, 5.00%, 8/1/2048 | 342,808 | 367,505 | ||||||
Fannie Mae, Pool #MA3521, 4.00%, 11/1/2048 | 743,065 | 771,402 | ||||||
Fannie Mae, Pool #MA3527, 5.00%, 11/1/2048 | 731,299 | 781,097 | ||||||
Fannie Mae, Pool #BN0622, 4.50%, 1/1/2049 | 523,501 | 550,915 | ||||||
Fannie Mae, Pool #AL8674, 5.645%, 1/1/2049 | 444,373 | 500,228 | ||||||
Fannie Mae, Pool #MA3692, 3.50%, 7/1/2049 | 901,592 | 924,946 | ||||||
Freddie Mac, Pool #C91762, 4.50%, 5/1/2034 | 143,856 | 154,695 | ||||||
PRINCIPAL SHARES
| VALUE
| |||||||
U.S. GOVERNMENT AGENCIES(continued) |
| |||||||
Mortgage-Backed Securities(continued) |
| |||||||
Freddie Mac, Pool #C91771, 4.50%, 6/1/2034 | 117,313 | $ | 126,017 | |||||
Freddie Mac, Pool #C91780, 4.50%, 7/1/2034 | 162,415 | 174,654 | ||||||
Freddie Mac, Pool #QN0349, 3.00%, 8/1/2034 | 426,052 | 436,514 | ||||||
Freddie Mac, Pool #G04601, 5.50%, 7/1/2038 | 160,787 | 180,104 | ||||||
Freddie Mac, Pool #G04587, 5.50%, 8/1/2038 | 155,952 | 175,068 | ||||||
Freddie Mac, Pool #Q33778, 4.00%, 6/1/2045 | 229,343 | 242,616 | ||||||
Freddie Mac, Pool #ZM2525, 3.00%, 12/1/2046 | 396,374 | 406,204 | ||||||
Freddie Mac, Pool #Q59805, 4.50%, 11/1/2048 | 313,919 | 330,621 | ||||||
Freddie Mac, Pool #G61887, 5.00%, 2/1/2049 | 363,013 | 388,396 | ||||||
Freddie Mac, Pool #ZN4802, 4.00%, 4/1/2049 | 752,900 | 782,887 | ||||||
|
| |||||||
TOTAL U.S. GOVERNMENT AGENCIES |
| |||||||
(Identified Cost $14,968,588) | 15,236,856 | |||||||
|
| |||||||
U.S. GOVERNMENT SECURITIES - 1.0% |
| |||||||
U.S. Treasury Bill - 1.0% |
| |||||||
U.S. Treasury Bill10, 1.62%, 5/21/2020 | ||||||||
(Identified Cost $1,679,783) | 1,695,000 | 1,680,401 | ||||||
|
| |||||||
SHORT-TERM INVESTMENT - 1.6% |
| |||||||
Dreyfus Government Cash Management, Institutional Shares, 1.73%11 | ||||||||
(Identified Cost $2,656,669) | 2,656,669 | 2,656,669 | ||||||
|
| |||||||
TOTAL INVESTMENTS IN SECURITIES - 101.6% |
| |||||||
(Identified Cost $157,474,173) | 169,167,766 | |||||||
|
| |||||||
TOTAL OPTIONS WRITTEN — 0.0%## |
| |||||||
(Premiums Received $38,697) | (64,104 | ) | ||||||
|
| |||||||
TOTAL INVESTMENTS - 101.6% |
|
169,103,662 |
| |||||
LIABILITIES, LESS OTHER ASSETS - (1.6%) | (2,631,395 | ) | ||||||
|
| |||||||
NET ASSETS - 100% |
$ |
166,472,267 |
| |||||
|
| |||||||
The accompanying notes are an integral part of the financial statements.
56
Investment Portfolio - October 31, 2019
ADR - American Depositary Receipt
CAD - Canadian Dollar
ETF - Exchange-traded fund
IO - Interest only
LIBOR - London Interbank Offered Rate
MXN - Mexican Peso
| EXCHANGE-TRADED OPTIONS WRITTEN | ||||||||||||||||||||||||
| DESCRIPTION | NUMBER OF CONTRACTS
| EXPIRATION DATE | EXERCISE PRICE | NOTIONAL AMOUNT (000)3 | VALUE | |||||||||||||||||||
Call | ||||||||||||||||||||||||
Sea Ltd. - ADR | 203 | 11/15/2019 | $ 27.00 | 604 | $(62,930 | ) | ||||||||||||||||||
Put | ||||||||||||||||||||||||
Electronic Arts, Inc. | 47 | 11/01/2019 | 87.50 | 453 | (94 | ) | ||||||||||||||||||
ServiceNow, Inc. | 27 | 11/08/2019 | 200.00 | 668 | (1,080 | ) | ||||||||||||||||||
| (1,174 | ) | |||||||||||||||||||||||
TOTAL EXCHANGE-TRADED OPTIONS WRITTEN (PREMIUMS RECEIVED $38,697) |
| $(64,104 | ) | |||||||||||||||||||||
*Non-income producing security.
## Less than 0.1%.
1A portion of this security is designated as collateral for options contracts written. As of October 31, 2019, the total value of such securities was $10,080,156.
2Restricted securities - Investment in securities that are restricted as to public resale under the Securities Act of 1933, as amended. These securities have been sold under Rule 144A and have been determined to be liquid under the Fund’s Liquidity Risk Management Program. These securities amount to $10,975,021, or 6.6% of the Series’ net assets as of October 31, 2019 (see Note 2 to the financial statements).
3Amount is stated in USD unless otherwise noted.
4Step coupon rate security - Rate steps up/down by 25 basis points upon rating downgrade/upgrade by Moody’s and S&P rating agencies (Subject to a maximum of 100 basis points per agency, 200 basis points maximum).
5Variable rate security. Security may be issued at a fixed coupon rate, which converts to a variable rate at a specified date. Rate shown is the rate in effect as of October 31, 2019.
6Represents a Payment-In-Kind bond.
7Security is perpetual in nature and has no stated maturity date.
8Floating rate security. Rate shown is the rate in effect as of October 31, 2019.
9Variable or floating rate security, the interest rate of which adjusts periodically based on changes in current interest rates and prepayments on the underlying pool of assets. Rate shown is the rate in effect as of October 31, 2019.
10Represents the annualized yield at time of purchase.
11Rate shown is the current yield as of October 31, 2019.
The Global Industry Classification Standard (GICS) was developed by and is the exclusive property and a service mark of MSCI Inc. (MSCI) and Standard & Poor’s, a division of S&P Global Inc. (S&P), and is licensed for use by Manning & Napier when referencing GICS sectors. Neither MSCI, S&P, nor any third party involved in making or compiling the GICS or any GICS classifications makes any express or implied warranties or representations with respect to such standard or classification, nor shall any such party have any liability therefrom.
The accompanying notes are an integral part of the financial statements.
57
Statement of Assets and Liabilities - Blended Asset Extended Series
October 31, 2019
ASSETS: | ||||
Investments in securities, at value (identified cost $157,474,173) (Note 2) | $ | 169,167,766 | ||
Foreign currency, at value (identified cost $15,993) | 16,046 | |||
Interest receivable | 505,333 | |||
Receivable for securities sold | 46,992 | |||
Foreign tax reclaims receivable | 46,320 | |||
Dividends receivable | 44,969 | |||
Receivable for fund shares sold | 22,232 | |||
|
| |||
TOTAL ASSETS | 169,849,658 | |||
|
| |||
LIABILITIES: | ||||
Accrued management fees (Note 3) | 52,898 | |||
Accrued fund accounting and administration fees (Note 3) | 28,250 | |||
Accrued Chief Compliance Officer service fees (Note 3) | 688 | |||
Options written, at value (premiums received $38,697) (Note 2) | 64,104 | |||
Payable for fund shares repurchased | 2,300,511 | |||
Payable for securities purchased | 880,611 | |||
Other payables and accrued expenses | 50,329 | |||
|
| |||
TOTAL LIABILITIES | 3,377,391 | |||
|
| |||
TOTAL NET ASSETS | $ | 166,472,267 | ||
|
| |||
NET ASSETS CONSIST OF: | ||||
Capital stock | $ | 148,193 | ||
Additional paid-in-capital | 155,656,322 | |||
Total distributable earnings (loss) | 10,667,752 | |||
|
| |||
TOTAL NET ASSETS | $ | 166,472,267 | ||
|
| |||
NET ASSET VALUE, OFFERING PRICE AND REDEMPTION PRICE PER SHARE - | $ | 11.23 | ||
|
| |||
The accompanying notes are an integral part of the financial statements.
58
Statement of Operations - Blended Asset Extended Series
For the Year Ended October 31, 2019
INVESTMENT INCOME: | ||||
Interest | $ | 2,617,105 | ||
Dividends (net of foreign taxes withheld, $89,120) | 1,243,581 | |||
|
| |||
Total Investment Income | 3,860,686 | |||
|
| |||
EXPENSES: | ||||
Management fees (Note 3) | 831,332 | |||
Fund accounting and administration fees (Note 3) | 97,826 | |||
Directors’ fees (Note 3) | 15,486 | |||
Chief Compliance Officer service fees (Note 3) | 3,455 | |||
Custodian fees | 47,437 | |||
Miscellaneous | 102,427 | |||
|
| |||
Total Expenses | 1,097,963 | |||
Less reduction of expenses (Note 3) | (183,498 | ) | ||
|
| |||
Net Expenses | 914,465 | |||
|
| |||
NET INVESTMENT INCOME | 2,946,221 | |||
|
| |||
REALIZED AND UNREALIZED GAIN (LOSS) ON INVESTMENTS AND FOREIGN CURRENCY: | ||||
Net realized gain (loss) on- | ||||
Investments in securities | (1,502,587 | ) | ||
Options written | 358,796 | |||
Foreign currency and translation of other assets and liabilities | (9,561 | ) | ||
|
| |||
|
(1,153,352 |
) | ||
|
| |||
Net change in unrealized appreciation (depreciation) on- | ||||
Investments | 16,181,429 | |||
Options written | 8,856 | |||
Foreign currency and translation of other assets and liabilities | 808 | |||
|
| |||
| 16,191,093 | ||||
|
| |||
NET REALIZED AND UNREALIZED GAIN (LOSS) ON INVESTMENTS AND FOREIGN CURRENCY | 15,037,741 | |||
|
| |||
NET INCREASE IN NET ASSETS RESULTING FROM OPERATIONS | $ | 17,983,962 | ||
|
| |||
The accompanying notes are an integral part of the financial statements.
59
Statements of Changes in Net Assets - Blended Asset Extended Series
FOR THE YEAR ENDED
| FOR THE YEAR ENDED
| |||||||
INCREASE (DECREASE) IN NET ASSETS: | ||||||||
OPERATIONS: | ||||||||
Net investment income | $ | 2,946,221 | $ | 3,100,848 | ||||
Net realized gain (loss) on investments and foreign currency | (1,153,352 | ) | (404,854 | ) | ||||
Net change in unrealized appreciation (depreciation) on investments and foreign currency | 16,191,093 | (4,014,649 | ) | |||||
|
|
|
| |||||
Net increase from operations | 17,983,962 | (1,318,655 | ) | |||||
|
|
|
| |||||
DISTRIBUTIONS TO SHAREHOLDERS (Note 9): | ||||||||
Class R6 | (3,918,264 | ) | (1,607,139 | ) | ||||
|
|
|
| |||||
CAPITAL STOCK ISSUED AND REPURCHASED: | ||||||||
Net increase (decrease) from capital share transactions (Note 5) | (52,399,797 | ) | 1,552,694 | |||||
|
|
|
| |||||
Net increase (decrease) in net assets | (38,334,099 | ) | (1,373,100 | ) | ||||
NET ASSETS: | ||||||||
Beginning of year | 204,806,366 | 206,179,466 | ||||||
|
|
|
| |||||
End of year | $ | 166,472,267 | $ | 204,806,366 | ||||
|
|
|
| |||||
The accompanying notes are an integral part of the financial statements.
60
Financial Highlights - Blended Asset Extended Series - Class R6
FOR THE YEAR ENDED | FOR THE PERIOD 10/13/171 TO 10/31/17
| ||||||||||||||
10/31/19
| 10/31/18
| ||||||||||||||
Per share data (for a share outstanding throughout each period): | |||||||||||||||
Net asset value - Beginning of period |
| $10.12 |
| $10.31 |
| $10.33 | |||||||||
|
|
|
|
|
| ||||||||||
Income (loss) from investment operations: | |||||||||||||||
Net investment income2 |
| 0.19 |
| 0.16 |
| 0.00 | 3 | ||||||||
Net realized and unrealized gain (loss) on investments |
| 1.13 |
| (0.27 | ) |
| (0.02 | ) | |||||||
|
|
|
|
|
| ||||||||||
Total from investment operations |
| 1.32 |
| (0.11 | ) |
| (0.02 | ) | |||||||
|
|
|
|
|
| ||||||||||
Less distributions to shareholders: | |||||||||||||||
From net investment income |
| (0.18 | ) |
| (0.08 | ) |
| — | |||||||
From net realized gain on investments |
| (0.03 | ) |
| — |
| — | ||||||||
|
|
|
|
|
| ||||||||||
Total distributions to shareholders |
| (0.21 | ) |
| (0.08 | ) |
| — | |||||||
|
|
|
|
|
| ||||||||||
Net asset value - End of period |
| $11.23 |
| $10.12 |
| $10.31 | |||||||||
|
|
|
|
|
| ||||||||||
Net assets - End of period(000’s omitted) |
| $166,472 |
| $204,806 |
| $206,179 | |||||||||
|
|
|
|
|
| ||||||||||
Total return4 |
| 13.29% |
| (1.06% | ) |
| (0.19% | ) | |||||||
Ratios (to average net assets)/Supplemental Data: | |||||||||||||||
Expenses* |
| 0.55% |
| 0.55% |
| 0.55% | 5 | ||||||||
Net investment income |
| 1.77% |
| 1.53% |
| 0.61% | 5 | ||||||||
Series portfolio turnover |
| 84% |
| 99% |
| 4% | |||||||||
| *The investment advisor did not impose all or a portion of its management and/or other fees during the period, and may have paid a portion of the Series’ expenses. If these expenses had been incurred by the Class, the expense ratio (to average net assets) would have increased by the following amounts: |
| ||||||||||||||
| 0.11% |
| 0.07% |
| 0.54%5 |
| |||||||||
1Commencement of operations.
2Calculated based on average shares outstanding during the periods.
3Less than $0.01.
4Represents aggregate total return for the periods indicated, and assumes reinvestment of all distributions. Total return would have been lower had certain expenses not been waived or reimbursed during certain periods. Periods less than one year are not annualized.
5Annualized.
The accompanying notes are an integral part of the financial statements.
61
Performance Update as of October 31, 2019 - Blended Asset Maximum Series
(unaudited)
AVERAGE ANNUAL TOTAL
| ||||
| ONE YEAR1 |
SINCE INCEPTION2
| |||
Blended Asset Maximum Series - Class R63 | 13.94% | 8.05% | ||
Russell 3000® Index4 | 13.49% | 10.17% | ||
65/20/15 Blended Index5 | 13.01% | 7.55% | ||
The following graph compares the value of a $10,000 investment in the Blended Asset Maximum Series - Class R6 from its inception2 (October 13, 2017) to present (October 31, 2019) to the Russell 3000® Index and the 65/20/15 Blended Index.
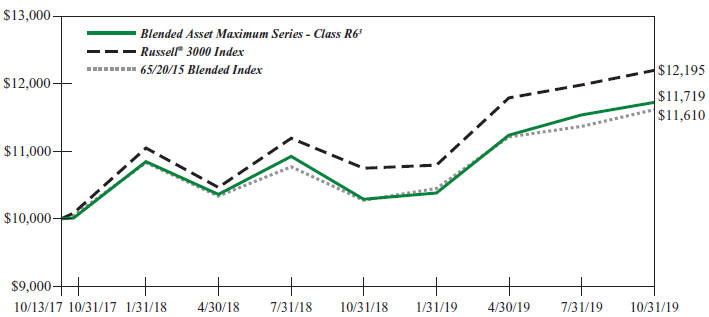
1The returns shown are based on net asset values calculated for shareholder transactions and may differ from the returns shown in the financial highlights, which reflect adjustments made to the net asset values in accordance with accounting principles generally accepted in the United States of America.
2Performance numbers for the Series and Indices are calculated from October 13, 2017, the Series’ inception date.
3The Series’ performance does not reflect the deduction of taxes that a shareholder would pay on fund distributions or the redemption of shares. The Series’ performance is historical and may not be indicative of future results. The performance returns shown are inclusive of the net expense ratio of the Series. For the year ended October 31, 2019, this net expense ratio was 0.55% for Class R6. The gross expense ratio, which does not account for any voluntary or contractual waivers currently in effect, was 0.68% for Class R6 for the year ended October 31, 2019.
4The Russell 3000® Index is an unmanaged index that consists of 3,000 of the largest U.S. companies based on total market capitalization. The Index returns are based on a market capitalization-weighted average of relative price changes of the component stocks plus dividends whose reinvestments are compounded daily. The Index returns do not reflect any fees or expenses. Index returns provided by Bloomberg.
5The 65/20/15 Blended Index is 65% Russell 3000® Index (Russell 3000), 20% MSCI ACWI ex USA Index (ACWIxUS), and 15% Bloomberg Barclays U.S. Aggregate Bond Index (BAB). Russell 3000 is an unmanaged index that consists of 3,000 of the largest U.S. companies based on total market capitalization. The Index returns are based on a market capitalization-weighted average of relative price changes of the component stocks plus dividends whose reinvestments are compounded daily. Index returns provided by Bloomberg. ACWIxUS is designed to measure large and mid-cap representation across 22 of 23 Developed Markets countries (excluding the U.S.) and 26 Emerging Markets countries. The Index is denominated in U.S. dollars. The Index returns are net of withholding taxes. They assume daily reinvestment of net dividends thus accounting for any applicable dividend taxation. Index returns provided by Bloomberg. BAB is an unmanaged, market value-weighted index of U.S. domestic investment-grade debt issues, including government, corporate, asset-backed, and mortgage-backed securities with maturities of one year or more. Index returns provided by Interactive Data. The returns of the indices do not reflect any fees or expenses. Returns provided are calculated monthly using a blended allocation. Because the fund’s asset allocation will vary over time, the composition of the fund’s portfolio may not match the composition of the comparative Indices.
62
Shareholder Expense Example - Blended Asset Maximum Series
(unaudited)
As a shareholder of the Series, you incur ongoing costs, including management fees, shareholder service fees and other Series expenses. This example is intended to help you understand your ongoing costs (in dollars) of investing in the Series and to compare these costs with the ongoing costs of investing in other mutual funds.
The example is based on an investment of $1,000 invested at the beginning of the period and held for the entire period (May 1, 2019 to October 31, 2019).
Actual Expenses
The first line of the table below provides information about actual account values and actual expenses. You may use the information in this line, together with the amount you invested, to estimate the expenses that you paid over the period. Simply divide your account value by $1,000 (for example, an $8,600 account value divided by $1,000 = 8.6), then multiply the result by the number in the first line under the heading entitled “Expenses Paid During Period” to estimate the expenses you paid on your account during this period.
Hypothetical Example for Comparison Purposes
The second line of the table below provides information about hypothetical account values and hypothetical expenses based on the Series’ actual expense ratio and an assumed rate of return of 5% per year before expenses, which is not the Series’ actual return. The hypothetical account values and expenses may not be used to estimate the actual ending account balance or expenses you paid during the period. You may use this information to compare the ongoing costs of investing in the Series and other funds. To do so, compare this 5% hypothetical example with the 5% hypothetical examples that appear in the shareholder reports of the other funds.
Please note that the expenses shown in the table are meant to highlight your ongoing costs only and do not reflect any transaction costs such as sales charges (loads), redemption fees, or exchange fees that you may incur in other mutual funds. Therefore, the second line of the table is useful in comparing ongoing costs only, and will not help you determine the relative total costs of owning different funds.
BEGINNING
| ENDING
| EXPENSES PAID
| ||||
Actual | $1,000.00 | $1,043.00 | $2.83 | |||
Hypothetical | $1,000.00 | $1,022.43 | $2.80 | |||
*Expenses are equal to the Series’ annualized expense ratio (for the six-month period) of 0.55%, multiplied by the average account value over the period, multiplied by 184/365 (to reflect the one-half year period). Expenses are based on the most recent fiscal half year; therefore, the expense ratios stated above may differ from the expense ratios stated in the financial highlights, which are based on one-year data. The Series’ total return would have been lower had certain expenses not been waived during the period.
63
Portfolio Composition - Blended Asset Maximum Series
As of October 31, 2019 (unaudited)
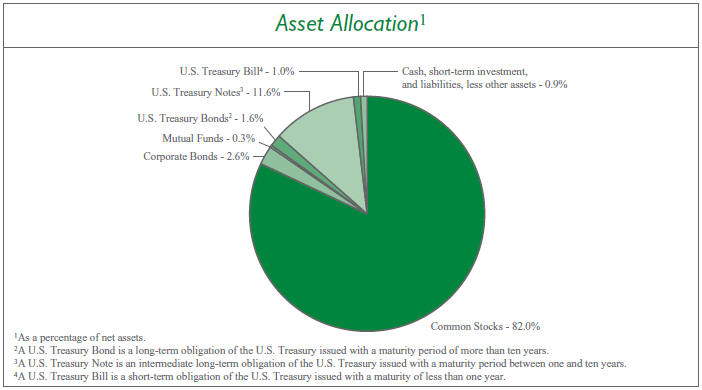
| Sector Allocation5 | ||||
Consumer Staples | 13.3 | % | ||
Consumer Discretionary | 12.3 | % | ||
Information Technology | 11.8 | % | ||
Health Care | 11.3 | % | ||
Communication Services | 10.9 | % | ||
Financials | 10.9 | % | ||
Real Estate | 4.3 | % | ||
Materials | 4.3 | % | ||
Energy | 3.6 | % | ||
Industrials | 1.6 | % | ||
Utilities6 | 0.0 | % | ||
5Including common stocks and corporate bonds, as a percentage of total investments.
6Less than 0.1%.
| ||||
| Top Ten Stock Holdings7 | ||||
ServiceNow, Inc. | 2.2 | % | ||
The Coca-Cola Co. | 2.1 | % | ||
Mondelez International, Inc. - Class A | 1.9 | % | ||
Johnson & Johnson | 1.9 | % | ||
Berkshire Hathaway, Inc. - Class B | 1.9 | % | ||
Medtronic plc | 1.7 | % | ||
Mastercard, Inc. - Class A | 1.7 | % | ||
Micron Technology, Inc. | 1.7 | % | ||
lululemon athletica, Inc. | 1.6 | % | ||
Dollar Tree, Inc. | 1.5 | % | ||
7As a percentage of total investments. | ||||
64
Investment Portfolio - October 31, 2019
| BLENDED ASSET MAXIMUM SERIES | ||||||||
SHARES
| VALUE
| |||||||
COMMON STOCKS - 82.0% |
| |||||||
Communication Services - 10.4% |
| |||||||
Diversified Telecommunication Services - 0.1% |
| |||||||
Elisa OYJ (Finland) | 915 | $ | 49,974 | |||||
Orange S.A. (France) | 975 | 15,692 | ||||||
Telefonica Brasil S.A. (Brazil) | 800 | 10,586 | ||||||
|
| |||||||
| 76,252 | ||||||||
|
| |||||||
Entertainment - 4.7% |
| |||||||
Activision Blizzard, Inc. | 22,630 | 1,267,959 | ||||||
Electronic Arts, Inc.* | 18,705 | 1,803,162 | ||||||
Nexon Co. Ltd. (Japan)* | 99,174 | 1,149,253 | ||||||
Sea Ltd. - ADR (Taiwan)* | 59,685 | 1,776,226 | ||||||
Toho Co. Ltd. - Tokyo (Japan) | 1,000 | 40,385 | ||||||
Viacom, Inc. - Class B | 159 | 3,428 | ||||||
Vivendi S.A. (France) | 495 | 13,785 | ||||||
|
| |||||||
| 6,054,198 | ||||||||
|
| |||||||
Interactive Media & Services - 4.3% |
| |||||||
Alphabet, Inc. - Class A* | 860 | 1,082,568 | ||||||
Alphabet, Inc. - Class C* | 860 | 1,083,695 | ||||||
Autohome, Inc. - ADR (China)* | 380 | 32,133 | ||||||
Facebook, Inc. - Class A* | 8,575 | 1,643,399 | ||||||
Kakao Corp. (South Korea) | 390 | 47,327 | ||||||
Tencent Holdings Ltd. - Class H (China) | 39,159 | 1,588,403 | ||||||
|
| |||||||
| 5,477,525 | ||||||||
|
| |||||||
Media - 1.3% |
| |||||||
Informa plc (United Kingdom) | 4,165 | 41,863 | ||||||
Quebecor, Inc. - Class B (Canada) | 33,980 | 789,968 | ||||||
Shaw Communications, Inc. - Class B (Canada) | 39,770 | 811,645 | ||||||
|
| |||||||
| 1,643,476 | ||||||||
|
| |||||||
Wireless Telecommunication Services - 0.0%## |
| |||||||
Globe Telecom, Inc. (Philippines) | 310 | 11,143 | ||||||
|
| |||||||
Total Communication Services |
| 13,262,594 | ||||||
|
| |||||||
Consumer Discretionary - 12.0% |
| |||||||
Auto Components - 0.0%## |
| |||||||
Cie Generale des Etablissements Michelin SCA (France) | 90 | 10,958 | ||||||
|
| |||||||
Automobiles - 0.0%## |
| |||||||
Peugeot S.A. (France) | 280 | 7,091 | ||||||
|
| |||||||
Distributors - 0.0%## |
| |||||||
Genuine Parts Co. | 63 | 6,463 | ||||||
�� |
| |||||||
Diversified Consumer Services - 0.1% |
| |||||||
Fu Shou Yuan International Group Ltd. (China) | 23,000 | 20,300 | ||||||
SHARES
| VALUE
| |||||||
COMMON STOCKS(continued) |
| |||||||
Consumer Discretionary(continued) |
| |||||||
Diversified Consumer Services(continued) |
| |||||||
New Oriental Education & Technology Group, Inc. - ADR (China)* | 355 | $ | 43,331 | |||||
TAL Education Group - ADR (China)* | 1,040 | 44,522 | ||||||
|
| |||||||
| 108,153 | ||||||||
|
| |||||||
Hotels, Restaurants & Leisure - 0.2% |
| |||||||
Basic-Fit N.V. (Netherlands)*1 | 1,095 | 33,491 | ||||||
Galaxy Entertainment Group Ltd. (Macau) | 4,000 | 27,543 | ||||||
Hilton Worldwide Holdings, Inc. | 95 | 9,211 | ||||||
Melco Resorts & Entertainment Ltd. - ADR (Hong Kong) | 945 | 20,355 | ||||||
MGM China Holdings Ltd. (Macau) | 12,800 | 20,269 | ||||||
Restaurant Brands International, Inc. (Canada) | 460 | 30,102 | ||||||
Sands China Ltd. (Macau) | 6,400 | 31,524 | ||||||
Wynn Macau Ltd. (Macau) | 14,000 | 30,381 | ||||||
|
| |||||||
| 202,876 | ||||||||
|
| |||||||
Household Durables - 1.4% |
| |||||||
Barratt Developments plc (United Kingdom) | 2,955 | 24,165 | ||||||
The Berkeley Group Holdings plc (United Kingdom) | 445 | 25,365 | ||||||
Persimmon plc (United Kingdom) | 900 | 26,547 | ||||||
Sony Corp. - ADR (Japan) | 27,685 | 1,684,079 | ||||||
Sony Corp. (Japan) | 900 | 54,782 | ||||||
Taylor Wimpey plc (United Kingdom) | 11,625 | 24,932 | ||||||
|
| |||||||
| 1,839,870 | ||||||||
|
| |||||||
Internet & Direct Marketing Retail - 1.8% |
| |||||||
Alibaba Group Holding Ltd. - ADR (China)* | 460 | 81,268 | ||||||
Amazon.com, Inc.* | 770 | 1,368,028 | ||||||
Booking Holdings, Inc.* | 405 | 829,752 | ||||||
Farfetch Ltd. - Class A (United Kingdom)* | 1,330 | 11,877 | ||||||
|
| |||||||
| 2,290,925 | ||||||||
|
| |||||||
Leisure Products - 0.0%## |
| |||||||
Technogym S.p.A. (Italy)1 | 3,495 | 38,559 | ||||||
|
| |||||||
Multiline Retail - 3.0% |
| |||||||
B&M European Value Retail S.A. (United Kingdom) | 5,480 | 26,290 | ||||||
Dollar General Corp. | 11,015 | 1,766,145 | ||||||
Dollar Tree, Inc.* | 17,730 | 1,957,392 | ||||||
Kohl’s Corp. | 78 | 3,998 | ||||||
The accompanying notes are an integral part of the financial statements.
65
Investment Portfolio - October 31, 2019
| BLENDED ASSET MAXIMUM SERIES | ||||||||
SHARES
| VALUE
| |||||||
COMMON STOCKS(continued) |
| |||||||
Consumer Discretionary(continued) |
| |||||||
Multiline Retail(continued) |
| |||||||
Lojas Renner S.A. (Brazil) | 1,000 | $ | 12,689 | |||||
Magazine Luiza S.A. (Brazil) | 900 | 9,964 | ||||||
|
| |||||||
| 3,776,478 | ||||||||
|
| |||||||
Specialty Retail - 2.3% |
| |||||||
Advance Auto Parts, Inc. | 6,860 | 1,114,613 | ||||||
AutoZone, Inc.* | 810 | 926,948 | ||||||
Best Buy Co., Inc. | 98 | 7,039 | ||||||
The Gap, Inc. | 167 | 2,715 | ||||||
The Home Depot, Inc. | 186 | 43,632 | ||||||
Industria de Diseno Textil S.A. (Spain) | 26,645 | 830,280 | ||||||
|
| |||||||
| 2,925,227 | ||||||||
|
| |||||||
Textiles, Apparel & Luxury Goods - 3.2% |
| |||||||
EssilorLuxottica S.A. (France) | 125 | 19,087 | ||||||
Hermes International (France) | 15 | 10,805 | ||||||
Kering S.A. (France) | 40 | 22,760 | ||||||
Kontoor Brands, Inc. | 15 | 570 | ||||||
lululemon athletica, Inc.* | 9,855 | 2,013,081 | ||||||
LVMH Moet Hennessy Louis Vuitton SE (France) | 120 | 51,247 | ||||||
NIKE, Inc. - Class B | 21,010 | 1,881,446 | ||||||
Shenzhou International Group Holdings Ltd. (China) | 2,700 | 37,310 | ||||||
VF Corp. | 126 | 10,369 | ||||||
|
| |||||||
| 4,046,675 | ||||||||
|
| |||||||
Total Consumer Discretionary | 15,253,275 | |||||||
|
| |||||||
Consumer Staples - 13.4% |
| |||||||
Beverages - 5.7% |
| |||||||
Ambev S.A. - ADR (Brazil) | 225,110 | 970,224 | ||||||
Ambev S.A. (Brazil) | 6,800 | 29,435 | ||||||
Anheuser-Busch InBev S.A./N.V. (Belgium) | 11,475 | 926,233 | ||||||
The Coca-Cola Co. | 49,400 | 2,688,842 | ||||||
Coca-Cola European Partners plc (United Kingdom) | 780 | 41,738 | ||||||
Diageo plc (United Kingdom) | 20,310 | 831,310 | ||||||
Heineken N.V. (Netherlands) | 395 | 40,337 | ||||||
Molson Coors Brewing Co. - Class B | 75 | 3,954 | ||||||
PepsiCo, Inc. | 12,055 | 1,653,584 | ||||||
Pernod Ricard S.A. (France) | 255 | 47,107 | ||||||
|
| |||||||
| 7,232,764 | ||||||||
|
| |||||||
Food & Staples Retailing - 0.2% |
| |||||||
Alimentation Couche-Tard, Inc. - Class B (Canada) | 1,420 | 42,586 | ||||||
SHARES
| VALUE
| |||||||
COMMON STOCKS(continued) |
| |||||||
Consumer Staples(continued) |
| |||||||
Food & Staples Retailing(continued) |
| |||||||
ICA Gruppen AB (Sweden) | 982 | $ | 43,455 | |||||
The Kroger Co. | 187 | 4,608 | ||||||
Loblaw Companies Ltd. (Canada) | 840 | 44,797 | ||||||
Puregold Price Club, Inc. (Philippines) | 6,500 | 5,228 | ||||||
Raia Drogasil S.A. (Brazil) | 400 | 10,967 | ||||||
Robinsons Retail Holdings, Inc. (Philippines) | 4,110 | 6,143 | ||||||
Sysco Corp. | 151 | 12,060 | ||||||
Walgreens Boots Alliance, Inc. | 224 | 12,271 | ||||||
Walmart, Inc. | 427 | 50,070 | ||||||
|
| |||||||
| 232,185 | ||||||||
|
| |||||||
Food Products - 3.1% | ||||||||
Archer-Daniels-Midland Co. | 132 | 5,549 | ||||||
Barry Callebaut AG (Switzerland) | 10 | 21,133 | ||||||
Conagra Brands, Inc. | 159 | 4,301 | ||||||
Danone S.A. (France) | 1,240 | 102,723 | ||||||
General Mills, Inc. | 200 | 10,172 | ||||||
The Hershey Co. | 71 | 10,428 | ||||||
The J.M. Smucker Co. | 46 | 4,861 | ||||||
Kellogg Co. | 109 | 6,925 | ||||||
Kerry Group plc - Class A (Ireland) | 370 | 44,801 | ||||||
Mondelez International, Inc. - Class A | 45,903 | 2,407,612 | ||||||
Mowi ASA (Norway) | 1,880 | 45,895 | ||||||
Nestle S.A. (Switzerland) | 11,705 | 1,252,217 | ||||||
Tyson Foods, Inc. - Class A | 90 | 7,451 | ||||||
Universal Robina Corp. (Philippines). | 4,700 | 13,963 | ||||||
|
| |||||||
| 3,938,031 | ||||||||
|
| |||||||
Household Products - 0.7% |
| |||||||
Colgate-Palmolive Co. | 11,305 | 775,523 | ||||||
Essity AB - Class B (Sweden) | 1,450 | 45,299 | ||||||
Henkel AG & Co. KGaA (Germany) | 440 | 45,704 | ||||||
Kimberly-Clark Corp. | 98 | 13,022 | ||||||
Reckitt Benckiser Group plc (United Kingdom) | 560 | 43,334 | ||||||
|
| |||||||
| 922,882 | ||||||||
|
| |||||||
Personal Products - 2.0% |
| |||||||
Beiersdorf AG (Germany) | 9,645 | 1,141,863 | ||||||
LG Household & Health Care Ltd. (South Korea) | 40 | 43,284 | ||||||
L’Oreal S.A. (France) | 125 | 36,508 | ||||||
Unilever plc - ADR (United Kingdom) | 21,995 | 1,322,119 | ||||||
|
| |||||||
| 2,543,774 | ||||||||
|
| |||||||
The accompanying notes are an integral part of the financial statements.
66
Investment Portfolio - October 31, 2019
| BLENDED ASSET MAXIMUM SERIES | ||||||||
SHARES
| VALUE
| |||||||
COMMON STOCKS(continued) | ||||||||
Consumer Staples(continued) | ||||||||
Tobacco - 1.7% | ||||||||
Altria Group, Inc. | 16,125 | $ | 722,239 | |||||
British American Tobacco plc - ADR (United Kingdom) | 615 | 21,500 | ||||||
British American Tobacco plc (United Kingdom) | 1,325 | 46,343 | ||||||
Philip Morris International, Inc. | 16,905 | 1,376,743 | ||||||
|
| |||||||
| 2,166,825 | ||||||||
|
| |||||||
Total Consumer Staples | 17,036,461 | |||||||
|
| |||||||
Energy - 3.2% | ||||||||
Energy Equipment & Services - 2.9% | ||||||||
Baker Hughes Co. | 244 | 5,222 | ||||||
Core Laboratories N.V | 21,395 | 942,236 | ||||||
Diamond Offshore Drilling, Inc.* | 53,145 | 281,137 | ||||||
Halliburton Co. | 59,644 | 1,148,147 | ||||||
Schlumberger Ltd. | 21,975 | 718,363 | ||||||
Transocean Ltd.* | 112,670 | 535,182 | ||||||
|
| |||||||
| 3,630,287 | ||||||||
|
| |||||||
Oil, Gas & Consumable Fuels - 0.3% | ||||||||
Cameco Corp. (Canada) | 3,340 | 29,826 | ||||||
Chevron Corp. | 229 | 26,596 | ||||||
Eni S.p.A. (Italy) | 2,880 | 43,692 | ||||||
Equinor ASA (Norway) | 2,510 | 46,600 | ||||||
Galp Energia SGPS S.A. (Portugal) | 2,555 | 40,867 | ||||||
Marathon Petroleum Corp. | 196 | 12,534 | ||||||
Occidental Petroleum Corp. | 153 | 6,196 | ||||||
Phillips 66 | 89 | 10,397 | ||||||
Repsol S.A. (Spain) | 3,133 | 51,631 | ||||||
Royal Dutch Shell plc - Class B - ADR (Netherlands) | 1,245 | 72,571 | ||||||
Suncor Energy, Inc. (Canada) | 1,160 | 34,489 | ||||||
TOTAL S.A. (France) | 935 | 49,432 | ||||||
Valero Energy Corp. | 116 | 11,250 | ||||||
|
| |||||||
| 436,081 | ||||||||
|
| |||||||
Total Energy | 4,066,368 | |||||||
|
| |||||||
Financials - 10.3% | ||||||||
Banks - 0.9% | ||||||||
Banco Bradesco S.A. (Brazil) | 6,000 | 52,766 | ||||||
Banco do Brasil S.A. (Brazil) | 1,900 | 22,745 | ||||||
Banco Santander Brasil S.A. (Brazil) | 800 | 9,459 | ||||||
Bank of America Corp. | 963 | 30,113 | ||||||
The Bank Of N.T. Butterfield & Son Ltd. (Bermuda) | 1,010 | 33,280 | ||||||
Bank of the Philippine Islands (Philippines) | 8,530 | 16,296 | ||||||
SHARES
| VALUE
| |||||||
COMMON STOCKS(continued) | ||||||||
Financials(continued) | ||||||||
Banks(continued) | ||||||||
Barclays plc (United Kingdom) | 12,510 | $ | 27,135 | |||||
BB&T Corp. | 154 | 8,170 | ||||||
BDO Unibank, Inc. (Philippines) | 7,000 | 21,354 | ||||||
BNP Paribas S.A. (France) | 570 | 29,788 | ||||||
Citigroup, Inc. | 279 | 20,049 | ||||||
Credit Agricole S.A. (France) | 495 | 6,459 | ||||||
Fifth Third Bancorp | 217 | 6,310 | ||||||
FinecoBank Banca Fineco S.p.A. (Italy) | 55,165 | 621,894 | ||||||
Itau Unibanco Holding S.A. (Brazil) | 6,700 | 60,576 | ||||||
Itausa - Investimentos Itau S.A. (Brazil) | 7,300 | 24,937 | ||||||
JPMorgan Chase & Co. | 375 | 46,845 | ||||||
KeyCorp | 314 | 5,643 | ||||||
Lloyds Banking Group plc (United Kingdom) | 34,825 | 25,618 | ||||||
Metropolitan Bank & Trust Co. (Philippines) | 12,503 | 16,644 | ||||||
Regions Financial Corp. | 277 | 4,460 | ||||||
Royal Bank of Scotland Group plc (United Kingdom) | 9,105 | 25,168 | ||||||
SunTrust Banks, Inc. | 120 | 8,201 | ||||||
U.S. Bancorp | 339 | 19,330 | ||||||
Wells Fargo & Co. | 736 | 38,000 | ||||||
|
| |||||||
| 1,181,240 | ||||||||
|
| |||||||
Capital Markets - 7.4% | ||||||||
B3 S.A. - Brasil Bolsa Balcao (Brazil) | 2,600 | 31,384 | ||||||
BlackRock, Inc. | 3,850 | 1,777,545 | ||||||
Cboe Global Markets, Inc. | 9,645 | 1,110,622 | ||||||
CME Group, Inc. | 5,490 | 1,129,568 | ||||||
Deutsche Boerse AG (Germany) | 7,895 | 1,222,617 | ||||||
Hargreaves Lansdown plc (United Kingdom) | 915 | 21,011 | ||||||
Intercontinental Exchange, Inc. | 11,925 | 1,124,766 | ||||||
Julius Baer Group Ltd. (Switzerland) | 14,115 | 625,063 | ||||||
London Stock Exchange Group plc (United Kingdom) | 250 | 22,530 | ||||||
Moody’s Corp. | 5,235 | 1,155,312 | ||||||
S&P Global, Inc. | 4,470 | 1,153,215 | ||||||
|
| |||||||
| 9,373,633 | ||||||||
|
| |||||||
Diversified Financial Services - 1.9% | ||||||||
Berkshire Hathaway, Inc. - Class B* | 11,240 | 2,389,399 | ||||||
|
| |||||||
Insurance - 0.1% | ||||||||
Admiral Group plc (United Kingdom) | 1,620 | 42,398 | ||||||
The accompanying notes are an integral part of the financial statements.
67
Investment Portfolio - October 31, 2019
| BLENDED ASSET MAXIMUM SERIES | ||||||||
SHARES
| VALUE
| |||||||
COMMON STOCKS(continued) |
| |||||||
Financials(continued) |
| |||||||
Insurance(continued) |
| |||||||
The Allstate Corp. | 75 | $ | 7,982 | |||||
AXA S.A. (France) | 965 | 25,545 | ||||||
BB Seguridade Participacoes S.A. (Brazil) | 1,400 | 11,851 | ||||||
Chubb Ltd. | 81 | 12,346 | ||||||
The Hartford Financial Services Group, Inc. | 98 | 5,594 | ||||||
Ping An Insurance Group Co. of China Ltd. - Class H (China) | 2,500 | 28,854 | ||||||
The Travelers Companies, Inc. | 60 | 7,864 | ||||||
|
| |||||||
| 142,434 | ||||||||
|
| |||||||
Total Financials | 13,086,706 | |||||||
|
| |||||||
Health Care - 11.2% |
| |||||||
Biotechnology - 1.8% |
| |||||||
AbbVie, Inc. | 311 | 24,740 | ||||||
Amgen, Inc. | 136 | 29,002 | ||||||
BioMarin Pharmaceutical, Inc.* | 11,585 | 848,138 | ||||||
Gilead Sciences, Inc. | 309 | 19,686 | ||||||
Incyte Corp.* | 4,825 | 404,914 | ||||||
Seattle Genetics, Inc.* | 5,180 | 556,332 | ||||||
Vertex Pharmaceuticals, Inc.* | 2,195 | 429,079 | ||||||
|
| |||||||
| 2,311,891 | ||||||||
|
| |||||||
Health Care Equipment & Supplies - 3.3% |
| |||||||
Alcon, Inc. (Switzerland)* | 9,579 | 567,747 | ||||||
Alcon, Inc. (Switzerland)* | 363 | 21,467 | ||||||
Boston Scientific Corp.* | 20,065 | 836,711 | ||||||
Getinge AB - Class B (Sweden) | 1,815 | 31,030 | ||||||
Hoya Corp. (Japan) | 500 | 44,189 | ||||||
Intuitive Surgical, Inc.* | 765 | 423,007 | ||||||
Koninklijke Philips N.V. (Netherlands) | 985 | 43,216 | ||||||
Medtronic plc | 20,400 | 2,221,560 | ||||||
Shandong Weigao Group Medical Polymer Co. Ltd. - Class H (China) | 24,000 | 27,553 | ||||||
Smith & Nephew plc (United Kingdom) | 1,950 | 41,860 | ||||||
|
| |||||||
| 4,258,340 | ||||||||
|
| |||||||
Health Care Providers & Services - 0.7% |
| |||||||
CVS Health Corp. | 284 | 18,855 | ||||||
Quest Diagnostics, Inc. | 49 | 4,961 | ||||||
Sonic Healthcare Ltd. (Australia) | 2,330 | 45,889 | ||||||
UnitedHealth Group, Inc. | 3,260 | 823,802 | ||||||
|
| |||||||
| 893,507 | ||||||||
|
| |||||||
SHARES
| VALUE
| |||||||
COMMON STOCKS(continued) |
| |||||||
Health Care(continued) |
| |||||||
Life Sciences Tools & Services - 1.4% |
| |||||||
Gerresheimer AG (Germany) | 450 | $ | 36,290 | |||||
QIAGEN N.V.* | 29,120 | 868,067 | ||||||
QIAGEN N.V.* | 1,225 | 36,847 | ||||||
Tecan Group AG (Switzerland) | 40 | 9,463 | ||||||
Thermo Fisher Scientific, Inc. | 2,640 | 797,227 | ||||||
|
| |||||||
| 1,747,894 | ||||||||
|
| |||||||
Pharmaceuticals - 4.0% |
| |||||||
Bristol-Myers Squibb Co. | 332 | 19,047 | ||||||
Johnson & Johnson | 18,163 | 2,398,243 | ||||||
Merck & Co., Inc. | 5,121 | 443,786 | ||||||
Merck KGaA (Germany) | 8,055 | 960,692 | ||||||
Novartis AG - ADR (Switzerland) | 11,620 | 1,016,053 | ||||||
Novartis AG (Switzerland) | 555 | 48,493 | ||||||
Perrigo Co. plc | 705 | 37,379 | ||||||
Pfizer, Inc. | 964 | 36,989 | ||||||
Recordati S.p.A. (Italy) | 1,015 | 42,654 | ||||||
Roche Holding AG (Switzerland) | 240 | 72,229 | ||||||
Sanofi (France) | 550 | 50,703 | ||||||
|
| |||||||
| 5,126,268 | ||||||||
|
| |||||||
Total Health Care | 14,337,900 | |||||||
|
| |||||||
Industrials - 1.4% |
| |||||||
Aerospace & Defense - 0.2% |
| |||||||
Airbus SE (France) | 275 | 39,451 | ||||||
BAE Systems plc (United Kingdom) . | 6,900 | 51,541 | ||||||
The Boeing Co. | 94 | 31,951 | ||||||
General Dynamics Corp. | 53 | 9,370 | ||||||
Lockheed Martin Corp. | 58 | 21,847 | ||||||
Safran S.A. (France) | 160 | 25,342 | ||||||
Thales S.A. (France) | 30 | 2,933 | ||||||
United Technologies Corp. | 159 | 22,829 | ||||||
|
| |||||||
| 205,264 | ||||||||
|
| |||||||
Air Freight & Logistics - 0.0%## |
| |||||||
C.H. Robinson Worldwide, Inc. | 62 | 4,690 | ||||||
United Parcel Service, Inc. - Class B | 206 | 23,725 | ||||||
|
| |||||||
| 28,415 | ||||||||
|
| |||||||
Airlines - 0.0%## |
| |||||||
Ryanair Holdings plc - ADR (Ireland)* | 430 | 32,095 | ||||||
|
| |||||||
Building Products - 0.0%## |
| |||||||
Cie de Saint-Gobain (France) | 235 | 9,571 | ||||||
Johnson Controls International plc | 240 | 10,399 | ||||||
|
| |||||||
| 19,970 | ||||||||
|
| |||||||
The accompanying notes are an integral part of the financial statements.
68
Investment Portfolio - October 31, 2019
| BLENDED ASSET MAXIMUM SERIES | ||||||||
SHARES
| VALUE
| |||||||
COMMON STOCKS(continued) |
| |||||||
Industrials(continued) |
| |||||||
Commercial Services & Supplies - 0.0%## |
| |||||||
Waste Management, Inc. | 119 | $ | 13,353 | |||||
|
| |||||||
Construction & Engineering - 0.0%## | ||||||||
Vinci S.A. (France) | 425 | 47,683 | ||||||
|
| |||||||
Electrical Equipment - 0.1% |
| |||||||
Eaton Corp. plc | 125 | 10,889 | ||||||
Emerson Electric Co. | 171 | 11,996 | ||||||
Legrand S.A. (France) | 125 | 9,766 | ||||||
Rockwell Automation, Inc. | 31 | 5,332 | ||||||
Schneider Electric SE (France) | 265 | 24,629 | ||||||
WEG S.A. (Brazil) | 1,600 | 10,261 | ||||||
|
| |||||||
| 72,873 | ||||||||
|
| |||||||
Industrial Conglomerates - 0.1% |
| |||||||
3M Co. | 130 | 21,449 | ||||||
Honeywell International, Inc. | 134 | 23,146 | ||||||
LT Group, Inc. (Philippines) | 20,000 | 5,258 | ||||||
SM Investments Corp. (Philippines) | 1,080 | 21,894 | ||||||
|
| |||||||
| 71,747 | ||||||||
|
| |||||||
Machinery - 0.2% |
| |||||||
Caterpillar, Inc. | 111 | 15,296 | ||||||
Cummins, Inc. | 51 | 8,796 | ||||||
Daifuku Co. Ltd. (Japan) | 500 | 26,531 | ||||||
FANUC Corp. (Japan) | 300 | 59,175 | ||||||
Harmonic Drive Systems, Inc. (Japan) | 600 | 27,826 | ||||||
Illinois Tool Works, Inc. | 74 | 12,475 | ||||||
KION Group AG (Germany) | 470 | 31,273 | ||||||
Nabtesco Corp. (Japan) | 800 | 25,468 | ||||||
The Weir Group plc (United Kingdom) | 2,410 | 42,096 | ||||||
|
| |||||||
| 248,936 | ||||||||
|
| |||||||
Professional Services - 0.0%## |
| |||||||
SGS S.A. (Switzerland) | 5 | 13,040 | ||||||
|
| |||||||
Road & Rail - 0.8% |
| |||||||
JB Hunt Transport Services, Inc. | 7,810 | 918,144 | ||||||
Localiza Rent a Car S.A. (Brazil) | 700 | 7,505 | ||||||
Rumo S.A. (Brazil)* | 1,900 | 10,840 | ||||||
Union Pacific Corp. | 133 | 22,006 | ||||||
|
| |||||||
| 958,495 | ||||||||
|
| |||||||
Trading Companies & Distributors - 0.0%## |
| |||||||
Fastenal Co. | 186 | 6,685 | ||||||
|
| |||||||
Transportation Infrastructure - 0.0%## |
| |||||||
Grupo Aeroportuario del Centro Norte S.A.B. de C.V. (Mexico) | 3,300 | 22,900 | ||||||
SHARES
| VALUE
| |||||||
COMMON STOCKS (continued) |
| |||||||
Industrials(continued) |
| |||||||
Transportation Infrastructure(continued) |
| |||||||
Grupo Aeroportuario del Pacifico S.A.B. de C.V. - ADR (Mexico) | 155 | $ | 16,199 | |||||
Grupo Aeroportuario del Sureste S.A.B. de C.V. - ADR (Mexico) | 135 | 22,106 | ||||||
|
| |||||||
| 61,205 | ||||||||
|
| |||||||
Total Industrials | 1,779,761 | |||||||
|
| |||||||
Information Technology - 11.8% |
| |||||||
Communications Equipment - 0.0%## |
| |||||||
Cisco Systems, Inc. | 695 | 33,019 | ||||||
|
| |||||||
Electronic Equipment, Instruments & Components - 1.0% |
| |||||||
Cognex Corp. | 11,465 | 590,333 | ||||||
Halma plc (United Kingdom) | 1,050 | 25,479 | ||||||
Hexagon AB - Class B (Sweden) | 525 | 26,879 | ||||||
Keyence Corp. (Japan) | 995 | 629,135 | ||||||
|
| |||||||
| 1,271,826 | ||||||||
|
| |||||||
IT Services - 4.6% |
| |||||||
Capgemini SE (France) | 75 | 8,455 | ||||||
International Business Machines Corp. | 181 | 24,205 | ||||||
InterXion Holding N.V. (Netherlands)* | 495 | 43,669 | ||||||
Keywords Studios plc (Ireland) | 710 | 10,231 | ||||||
Mastercard, Inc. - Class A | 7,905 | 2,188,183 | ||||||
Verra Mobility Corp.* | 123,890 | 1,777,822 | ||||||
Visa, Inc. - Class A | 9,925 | 1,775,186 | ||||||
|
| |||||||
| 5,827,751 | ||||||||
|
| |||||||
Semiconductors & Semiconductor Equipment - 2.5% |
| |||||||
Applied Materials, Inc. | 189 | 10,255 | ||||||
Broadcom, Inc. | 70 | 20,500 | ||||||
Intel Corp. | 730 | 41,267 | ||||||
KLA Corp. | 56 | 9,466 | ||||||
Lam Research Corp. | 32 | 8,673 | ||||||
Maxim Integrated Products, Inc. | 95 | 5,573 | ||||||
Micron Technology, Inc.* | 45,575 | 2,167,091 | ||||||
NVIDIA Corp. | 4,665 | 937,758 | ||||||
Texas Instruments, Inc. | 211 | 24,896 | ||||||
|
| |||||||
| 3,225,479 | ||||||||
|
| |||||||
Software - 3.7% |
| |||||||
Dassault Systemes SE (France) | 70 | 10,631 | ||||||
Microsoft Corp. | 13,175 | 1,888,900 | ||||||
ServiceNow, Inc.* | 11,280 | 2,789,093 | ||||||
|
| |||||||
| 4,688,624 | ||||||||
|
| |||||||
Technology Hardware, Storage & Peripherals - 0.0%## |
| |||||||
NetApp, Inc. | 65 | 3,632 | ||||||
The accompanying notes are an integral part of the financial statements.
69
Investment Portfolio - October 31, 2019
| BLENDED ASSET MAXIMUM SERIES | ||||||||
SHARES
| VALUE
| |||||||
COMMON STOCKS(continued) |
| |||||||
Information Technology(continued) |
| |||||||
Technology Hardware, Storage & Peripherals(continued) |
| |||||||
Western Digital Corp. | 105 | $ | 5,423 | |||||
|
| |||||||
| 9,055 | ||||||||
|
| |||||||
Total Information Technology | 15,055,754 | |||||||
|
| |||||||
Materials - 4.2% |
| |||||||
Chemicals - 2.2% |
| |||||||
Air Liquide S.A. (France) | 220 | 29,251 | ||||||
Akzo Nobel N.V. (Netherlands) | 10,883 | 1,003,341 | ||||||
Axalta Coating Systems Ltd.* | 22,725 | 670,160 | ||||||
CF Industries Holdings, Inc. | 20,695 | 938,518 | ||||||
Dow, Inc. | 149 | 7,523 | ||||||
Eastman Chemical Co. | 62 | 4,714 | ||||||
Givaudan S.A. (Switzerland) | 5 | 14,690 | ||||||
LyondellBasell Industries N.V. - Class A | 114 | 10,226 | ||||||
OCI N.V. (Netherlands)* | 450 | 10,118 | ||||||
Orbia Advance Corp. S.A.B. de C.V. (Mexico) | 14,400 | 31,171 | ||||||
Solvay S.A. (Belgium) | 545 | 59,256 | ||||||
|
| |||||||
| 2,778,968 | ||||||||
|
| |||||||
Containers & Packaging - 0.8% |
| |||||||
Crown Holdings, Inc.* | 13,045 | 950,198 | ||||||
International Paper Co. | 108 | 4,717 | ||||||
|
| |||||||
| 954,915 | ||||||||
|
| |||||||
Metals & Mining - 1.2% |
| |||||||
First Quantum Minerals Ltd. (Zambia) | 1,280 | 10,817 | ||||||
Freeport-McMoRan, Inc. | 54,420 | 534,404 | ||||||
Lundin Mining Corp. (Chile) | 57,415 | 289,887 | ||||||
Nucor Corp. | 114 | 6,139 | ||||||
Southern Copper Corp. (Peru) | 21,025 | 748,070 | ||||||
|
| |||||||
| 1,589,317 | ||||||||
|
| |||||||
Total Materials | 5,323,200 | |||||||
|
| |||||||
Real Estate - 4.1% |
| |||||||
Equity Real Estate Investment Trusts (REITS) - 4.1% |
| |||||||
Acadia Realty Trust | 215 | 6,016 | ||||||
Agree Realty Corp. | 130 | 10,240 | ||||||
Alexandria Real Estate Equities, Inc. | 50 | 7,936 | ||||||
American Campus Communities, Inc. | 370 | 18,493 | ||||||
American Homes 4 Rent - Class A | 1,280 | 33,882 | ||||||
American Tower Corp. | 6,055 | 1,320,474 | ||||||
Americold Realty Trust | 690 | 27,662 | ||||||
Apartment Investment & Management Co. - Class A | 619 | 33,971 | ||||||
SHARES
| VALUE
| |||||||
COMMON STOCKS(continued) |
| |||||||
Real Estate(continued) |
| |||||||
Equity Real Estate Investment Trusts (REITS)(continued) |
| |||||||
AvalonBay Communities, Inc. | 220 | $ | 47,885 | |||||
Boston Properties, Inc. | 194 | 26,617 | ||||||
Brandywine Realty Trust | 1,605 | 24,524 | ||||||
The British Land Co. plc (United Kingdom) | 3,250 | 26,130 | ||||||
Camden Property Trust | 220 | 25,161 | ||||||
Community Healthcare Trust, Inc. | 415 | 20,094 | ||||||
Cousins Properties, Inc. | 1,102 | 44,223 | ||||||
Crown Castle International Corp. | 145 | 20,125 | ||||||
CubeSmart | 195 | 6,182 | ||||||
Digital Realty Trust, Inc. | 170 | 21,597 | ||||||
Douglas Emmett, Inc. | 490 | 21,227 | ||||||
Equinix, Inc. | 2,295 | 1,300,760 | ||||||
Equity LifeStyle Properties, Inc. | 270 | 18,884 | ||||||
Equity Residential | 380 | 33,691 | ||||||
Essential Properties Realty Trust, Inc. | 847 | 21,734 | ||||||
Essex Property Trust, Inc. | 84 | 27,479 | ||||||
Extra Space Storage, Inc. | 75 | 8,420 | ||||||
Federal Realty Investment Trust | 50 | 6,800 | ||||||
First Industrial Realty Trust, Inc. | 310 | 13,054 | ||||||
Getty Realty Corp. | 365 | 12,242 | ||||||
Healthcare Realty Trust, Inc. | 545 | 18,950 | ||||||
Healthcare Trust of America, Inc. - Class A | 370 | 11,470 | ||||||
Healthpeak Properties, Inc. | 910 | 34,234 | ||||||
Hibernia REIT plc (Ireland) | 6,400 | 9,965 | ||||||
Host Hotels & Resorts, Inc. | 725 | 11,883 | ||||||
Independence Realty Trust, Inc. | 1,000 | 15,400 | ||||||
Invitation Homes, Inc. | 1,434 | 44,153 | ||||||
Jernigan Capital, Inc. | 740 | 14,053 | ||||||
Kilroy Realty Corp. | 89 | 7,470 | ||||||
Land Securities Group plc (United Kingdom) | 2,180 | 26,554 | ||||||
Liberty Property Trust | 330 | 19,493 | ||||||
Life Storage, Inc. | 95 | 10,347 | ||||||
Mid-America Apartment Communities, Inc. | 105 | 14,594 | ||||||
National Retail Properties, Inc. | 365 | 21,502 | ||||||
National Storage Affiliates Trust | 355 | 12,130 | ||||||
Omega Healthcare Investors, Inc. | 345 | 15,194 | ||||||
Physicians Realty Trust | 1,230 | 22,964 | ||||||
Plymouth Industrial REIT, Inc. | 450 | 8,487 | ||||||
Prologis, Inc. | 755 | 66,259 | ||||||
Public Storage | 120 | 26,743 | ||||||
Realty Income Corp. | 105 | 8,588 | ||||||
SBA Communications Corp. | 5,665 | 1,363,282 | ||||||
The accompanying notes are an integral part of the financial statements.
70
Investment Portfolio - October 31, 2019
| BLENDED ASSET MAXIMUM SERIES | SHARES/ | |||||||
PRINCIPAL AMOUNT2
| VALUE (NOTE 2)
| |||||||
COMMON STOCKS(continued) | ||||||||
Real Estate(continued) | ||||||||
Equity Real Estate Investment Trusts (REITS)(continued) |
| |||||||
Simon Property Group, Inc. | 305 | $ | 45,957 | |||||
STAG Industrial, Inc. | 405 | 12,571 | ||||||
STORE Capital Corp. | 315 | 12,758 | ||||||
Sun Communities, Inc. | 190 | 30,904 | ||||||
Sunstone Hotel Investors, Inc. | 600 | 8,106 | ||||||
UDR, Inc. | 527 | 26,482 | ||||||
UMH Properties, Inc. | 440 | 6,569 | ||||||
Urban Edge Properties | 800 | 16,888 | ||||||
Ventas, Inc. | 388 | 25,259 | ||||||
VEREIT, Inc. | 2,170 | 21,353 | ||||||
Vornado Realty Trust | 130 | 8,532 | ||||||
Weingarten Realty Investors | 525 | 16,658 | ||||||
Welltower, Inc. | 354 | 32,104 | ||||||
|
| |||||||
| 5,233,359 | ||||||||
|
| |||||||
Real Estate Management & Development - 0.0%## |
| |||||||
Ayala Land, Inc. (Philippines) | 21,700 | 20,737 | ||||||
SM Prime Holdings, Inc. (Philippines) | 36,055 | 27,683 | ||||||
|
| |||||||
| 48,420 | ||||||||
|
| |||||||
Total Real Estate | 5,281,779 | |||||||
|
| |||||||
Utilities - 0.0%## | ||||||||
Electric Utilities - 0.0%## | ||||||||
Manila Electric Co. (Philippines) | 1,810 | 12,070 | ||||||
|
| |||||||
Independent Power and Renewable Electricity Producers - 0.0%## |
| |||||||
Aboitiz Power Corp. (Philippines) | 18,900 | 14,879 | ||||||
|
| |||||||
Multi-Utilities - 0.0%## | ||||||||
Engie S.A. (France) | 920 | 15,405 | ||||||
Veolia Environnement S.A. (France) | 280 | 7,371 | ||||||
|
| |||||||
| 22,776 | ||||||||
|
| |||||||
Total Utilities | 49,725 | |||||||
|
| |||||||
TOTAL COMMON STOCKS | 104,533,523 | |||||||
|
| |||||||
CORPORATE BONDS - 2.6% | ||||||||
Non-Convertible Corporate Bonds - 2.6% | ||||||||
Communication Services - 0.6% | ||||||||
Diversified Telecommunication Services - 0.3% |
| |||||||
AT&T, Inc., 4.25%, 3/1/2027 | 110,000 | 120,814 | ||||||
CenturyLink, Inc., 5.625%, 4/1/2020 | 5,000 | 5,062 | ||||||
Verizon Communications, Inc., 5.25%, 3/16/2037 | 150,000 | 188,937 | ||||||
|
| |||||||
| 314,813 | ||||||||
|
| |||||||
PRINCIPAL AMOUNT2
| VALUE (NOTE 2)
| |||||||
CORPORATE BONDS(continued) |
| |||||||
Non-Convertible Corporate Bonds(continued) |
| |||||||
Communication Services(continued) | ||||||||
Interactive Media & Services - 0.1% | ||||||||
Tencent Holdings Ltd. (China)1, 3.975%, 4/11/2029 | 90,000 | $ | 96,860 | |||||
|
| |||||||
Media - 0.2% | ||||||||
Cablevision Systems Corp., 8.00%, 4/15/2020 | 5,000 | 5,125 | ||||||
Comcast Corp., 3.25%, 11/1/2039 | 100,000 | 101,382 | ||||||
Diamond Sports Group LLC - Diamond Sports Finance Co.1, 6.625%, 8/15/2027 | 10,000 | 10,300 | ||||||
Discovery Communications LLC, 5.20%, 9/20/2047 | 120,000 | 131,227 | ||||||
Entercom Media Corp.1, 7.25%, 11/1/2024 | 5,000 | 5,212 | ||||||
Townsquare Media, Inc.1, 6.50%, 4/1/2023 | 5,000 | 4,950 | ||||||
|
| |||||||
| 258,196 | ||||||||
|
| |||||||
Wireless Telecommunication Services - 0.0%## |
| |||||||
Sprint Communications, Inc., 7.00%, 8/15/2020 | 15,000 | 15,452 | ||||||
Sprint Corp., 7.25%, 9/15/2021 | 5,000 | 5,335 | ||||||
Sprint Corp., 7.125%, 6/15/2024 | 5,000 | 5,425 | ||||||
|
| |||||||
| 26,212 | ||||||||
|
| |||||||
Total Communication Services | 696,081 | |||||||
|
| |||||||
Consumer Discretionary - 0.4% | ||||||||
Auto Components - 0.0%## | ||||||||
American Axle & Manufacturing, Inc., 6.25%, 4/1/2025 | 5,000 | 4,819 | ||||||
Techniplas LLC1, 10.00%, 5/1/2020 | 5,000 | 4,225 | ||||||
|
| |||||||
| 9,044 | ||||||||
|
| |||||||
Diversified Consumer Services - 0.1% | ||||||||
GEMS MENASA Cayman Ltd. - GEMS Education Delaware LLC (United Arab Emirates)1, 7.125%, 7/31/2026 | 25,000 | 25,906 | ||||||
|
| |||||||
Household Durables - 0.0%## | ||||||||
Ashton Woods USA LLC - Ashton Woods Finance Co.1, 6.75%, 8/1/2025 | 5,000 | 5,025 | ||||||
LGI Homes, Inc.1, 6.875%, 7/15/2026 | 10,000 | 10,350 | ||||||
Weekley Homes LLC - Weekley Finance Corp., 6.625%, 8/15/2025 | 10,000 | 10,150 | ||||||
|
| |||||||
| 25,525 | ||||||||
|
| |||||||
The accompanying notes are an integral part of the financial statements.
71
Investment Portfolio - October 31, 2019
| BLENDED ASSET MAXIMUM SERIES | ||||||||
PRINCIPAL
| VALUE
| |||||||
CORPORATE BONDS(continued) | ||||||||
Non-Convertible Corporate Bonds(continued) |
| |||||||
Consumer Discretionary(continued) | ||||||||
Internet & Direct Marketing Retail - 0.3% |
| |||||||
Alibaba Group Holding Ltd. (China), 3.40%, 12/6/2027 | 200,000 | $ | 207,732 | |||||
Booking Holdings, Inc., 3.60%, 6/1/2026 | 170,000 | 184,052 | ||||||
Photo Holdings Merger Sub, Inc.1, 8.50%, 10/1/2026 | 10,000 | 8,801 | ||||||
|
| |||||||
| 400,585 | ||||||||
|
| |||||||
Specialty Retail - 0.0%## | ||||||||
Foxtrot Escrow Issuer LLC - Foxtrot Escrow Corp.1, 12.25%, 11/15/2026 | 10,000 | 10,051 | ||||||
Staples, Inc.1, 7.50%, 4/15/2026 | 10,000 | 10,402 | ||||||
|
| |||||||
| 20,453 | ||||||||
|
| |||||||
Total Consumer Discretionary | 481,513 | |||||||
|
| |||||||
Consumer Staples - 0.0%## | ||||||||
Food & Staples Retailing - 0.0%## KeHE Distributors LLC - KeHE Finance Corp.1, 8.625%, 10/15/2026 | 10,000 | 10,256 | ||||||
|
| |||||||
Energy - 0.4% | ||||||||
Energy Equipment & Services - 0.0%## |
| |||||||
Nabors Industries, Inc., 5.50%, 1/15/2023 | 5,000 | 4,225 | ||||||
Shelf Drilling Holdings Ltd. (United Arab Emirates)1, 8.25%, 2/15/2025 | 5,000 | 4,200 | ||||||
|
| |||||||
| 8,425 | ||||||||
|
| |||||||
Oil, Gas & Consumable Fuels - 0.4% | ||||||||
Antero Midstream Partners LP - Antero Midstream Finance Corp.1, 5.75%, 3/1/2027 | 5,000 | 3,719 | ||||||
Antero Midstream Partners LP - Antero Midstream Finance Corp.1, 5.75%, 1/15/2028 | 5,000 | 3,775 | ||||||
Bruin E&P Partners LLC1, 8.875%, 8/1/2023 | 5,000 | 3,300 | ||||||
Calumet Specialty Products Partners LP - Calumet Finance Corp.1, 11.00%, 4/15/2025 | 10,000 | 10,025 | ||||||
Energy Transfer Operating LP, 6.50%, 2/1/2042 | 80,000 | 95,816 | ||||||
Jonah Energy LLC - Jonah Energy Finance Corp.1, 7.25%, 10/15/2025 | 10,000 | 2,800 | ||||||
Kinder Morgan Energy Partners LP, 6.95%, 1/15/2038 | 90,000 | 116,345 | ||||||
PRINCIPAL AMOUNT2
| VALUE (NOTE 2)
| |||||||
CORPORATE BONDS(continued) | ||||||||
Non-Convertible Corporate Bonds(continued) |
| |||||||
Energy(continued) | ||||||||
Oil, Gas & Consumable Fuels(continued) |
| |||||||
Lonestar Resources America, Inc.1, 11.25%, 1/1/2023 | 5,000 | $ | 3,500 | |||||
NuStar Logistics LP, 6.75%, 2/1/2021 | 5,000 | 5,181 | ||||||
Rockies Express Pipeline LLC1, 5.625%, 4/15/2020 | 10,000 | 10,168 | ||||||
Sabine Pass Liquefaction LLC, 5.875%, 6/30/2026 | 130,000 | 149,272 | ||||||
Southwestern Energy Co.3, 6.20%, 1/23/2025 | 5,000 | 4,400 | ||||||
W&T Offshore, Inc.1, 9.75%, 11/1/2023 | 5,000 | 4,688 | ||||||
The Williams Companies, Inc., 3.75%, 6/15/2027 | 80,000 | 83,412 | ||||||
|
| |||||||
| 496,401 | ||||||||
|
| |||||||
Total Energy | 504,826 | |||||||
|
| |||||||
Financials - 0.6% | ||||||||
Banks - 0.5% | ||||||||
Bank of America Corp., 4.00%, 1/22/2025 | 160,000 | 170,659 | ||||||
Citigroup, Inc., 8.125%, 7/15/2039 | 60,000 | 98,704 | ||||||
Credit Suisse AG (Switzerland), 5.40%, 1/14/2020 | 160,000 | 161,037 | ||||||
JPMorgan Chase & Co.4, (3 mo. LIBOR US + 1.000%), 4.023%, 12/5/2024 | 80,000 | 85,424 | ||||||
Santander Holdings USA, Inc., 4.50%, 7/17/2025 | 110,000 | 118,536 | ||||||
|
| |||||||
| 634,360 | ||||||||
|
| |||||||
Capital Markets - 0.1% | ||||||||
AG Merger Sub II, Inc.1, 10.75%, 8/1/2027 | 5,000 | 4,950 | ||||||
Donnelley Financial Solutions, Inc., 8.25%, 10/15/2024 | 10,000 | 10,400 | ||||||
The Goldman Sachs Group, Inc., 4.25%, 10/21/2025 | 50,000 | 53,858 | ||||||
|
| |||||||
| 69,208 | ||||||||
|
| |||||||
Consumer Finance - 0.0%## | ||||||||
Navient Corp., 5.00%, 10/26/2020 | 10,000 | 10,185 | ||||||
SLM Corp., 5.125%, 4/5/2022 | 10,000 | 10,325 | ||||||
|
| |||||||
| 20,510 | ||||||||
|
| |||||||
Diversified Financial Services - 0.0%## | ||||||||
Fidelity & Guaranty Life Holdings, Inc.1, 5.50%, 5/1/2025 | 5,000 | 5,338 | ||||||
The accompanying notes are an integral part of the financial statements.
72
Investment Portfolio - October 31, 2019
| BLENDED ASSET MAXIMUM SERIES | ||||||||
PRINCIPAL
| VALUE (NOTE 2)
| |||||||
CORPORATE BONDS(continued) | ||||||||
Non-Convertible Corporate Bonds(continued) |
| |||||||
Financials(continued) | ||||||||
Diversified Financial Services(continued) | ||||||||
Global Aircraft Leasing Co. Ltd. (Cayman Islands)1,5, 6.50%, 9/15/2024 | 15,000 | $ | 15,352 | |||||
VistaJet Malta Finance plc - XO Management Holding, Inc. (Switzerland)1, 10.50%, 6/1/2024 | 10,000 | 9,725 | ||||||
|
| |||||||
| 30,415 | ||||||||
|
| |||||||
Thrifts & Mortgage Finance - 0.0%## | ||||||||
Acrisure LLC - Acrisure Finance, Inc.1, 7.00%, 11/15/2025 | 10,000 | 9,150 | ||||||
Radian Group, Inc., 4.875%, 3/15/2027 | 10,000 | 10,375 | ||||||
|
| |||||||
| 19,525 | ||||||||
|
| |||||||
Total Financials | 774,018 | |||||||
|
| |||||||
Health Care - 0.1% | ||||||||
Health Care Providers & Services - 0.1% | ||||||||
HCA, Inc., 4.125%, 6/15/2029 | 80,000 | 84,752 | ||||||
|
| |||||||
Industrials - 0.2% | ||||||||
Commercial Services & Supplies - 0.0%## | ||||||||
The ADT Security Corp., 6.25%, 10/15/2021 | 5,000 | 5,331 | ||||||
Prime Security Services Borrower LLC - Prime Finance, Inc.1, 5.75%, 4/15/2026 | 5,000 | 5,124 | ||||||
Stericycle, Inc.1, 5.375%, 7/15/2024 | 10,000 | 10,400 | ||||||
|
| |||||||
| 20,855 | ||||||||
|
| |||||||
Construction & Engineering - 0.0%## | ||||||||
HC2 Holdings, Inc.1, 11.50%, 12/1/2021 | 5,000 | 4,556 | ||||||
Tutor Perini Corp.1, 6.875%, 5/1/2025 | 10,000 | 9,974 | ||||||
|
| |||||||
| 14,530 | ||||||||
|
| |||||||
Industrial Conglomerates - 0.1% | ||||||||
General Electric Co.4,6, (3 mo. LIBOR US + 3.330%), 5.00% | 110,000 | 106,012 | ||||||
|
| |||||||
Marine - 0.0%## | ||||||||
American Tanker, Inc. (Norway)1, 9.25%, 2/22/2022 | 15,000 | 15,084 | ||||||
Borealis Finance LLC1, 7.50%, 11/16/2022 | 15,000 | 14,100 | ||||||
|
| |||||||
| 29,184 | ||||||||
|
| |||||||
PRINCIPAL
| VALUE (NOTE 2)
| |||||||
CORPORATE BONDS(continued) | ||||||||
Non-Convertible Corporate Bonds(continued) |
| |||||||
Industrials(continued) | ||||||||
Trading Companies & Distributors - 0.1% | ||||||||
AerCap Ireland Capital DAC - AerCap Global Aviation Trust (Ireland), 4.45%, 10/1/2025 | 110,000 | $ | 119,359 | |||||
Fortress Transportation & Infrastructure Investors LLC1, 6.50%, 10/1/2025 | 10,000 | 10,100 | ||||||
|
| |||||||
| 129,459 | ||||||||
|
| |||||||
Total Industrials | 300,040 | |||||||
|
| |||||||
Information Technology - 0.0%## | ||||||||
Communications Equipment - 0.0%## | ||||||||
Hughes Satellite Systems Corp., 5.25%, 8/1/2026 | 10,000 | 10,712 | ||||||
|
| |||||||
Materials - 0.1% | ||||||||
Chemicals - 0.0%## | ||||||||
CF Industries, Inc., 7.125%, 5/1/2020 | 5,000 | 5,120 | ||||||
Olin Corp., 5.625%, 8/1/2029 | 5,000 | 5,191 | ||||||
|
| |||||||
| 10,311 | ||||||||
|
| |||||||
Containers & Packaging - 0.0%## | ||||||||
ARD Securities Finance S.A.R.L (Luxembourg)1,5, 8.75%, 1/31/2023 | 5,218 | 5,427 | ||||||
Berry Global, Inc.1, 4.50%, 2/15/2026 | 5,000 | 5,031 | ||||||
Mauser Packaging Solutions Holding Co.1, 7.25%, 4/15/2025 | 5,000 | 4,781 | ||||||
|
| |||||||
| 15,239 | ||||||||
|
| |||||||
Metals & Mining - 0.1% | ||||||||
Infrabuild Australia Pty Ltd. (Australia)1, 12.00%, 10/1/2024 | 10,000 | 10,191 | ||||||
Mountain Province Diamonds, Inc. | 10,000 | 9,700 | ||||||
Northwest Acquisitions ULC - Dominion Finco, Inc.1, 7.125%, 11/1/2022 | 10,000 | 5,000 | ||||||
Southern Copper Corp. (Peru), 5.375%, 4/16/2020 | 120,000 | 121,481 | ||||||
SunCoke Energy Partners LP - SunCoke Energy Partners Finance Corp.1, 7.50%, 6/15/2025 . | 5,000 | 4,250 | ||||||
|
| |||||||
| 150,622 | ||||||||
|
| |||||||
Total Materials | 176,172 | |||||||
|
| |||||||
The accompanying notes are an integral part of the financial statements.
73
Investment Portfolio - October 31, 2019
| BLENDED ASSET MAXIMUM SERIES | PRINCIPAL AMOUNT2/ | VALUE | ||||||
SHARES
| (NOTE 2)
| |||||||
CORPORATE BONDS(continued) | ||||||||
Non-Convertible Corporate Bonds(continued) |
| |||||||
Real Estate - 0.2% | ||||||||
Equity Real Estate Investment Trusts (REITS) - 0.2% |
| |||||||
American Tower Corp., 3.80%, 8/15/2029 | 120,000 | $ | 128,284 | |||||
Crown Castle International Corp., 3.10%, 11/15/2029 | 120,000 | 121,938 | ||||||
|
| |||||||
| 250,222 | ||||||||
|
| |||||||
Real Estate Management & Development - 0.0%## |
| |||||||
Five Point Operating Co. LP - Five Point Capital Corp.1, 7.875%, 11/15/2025 | 10,000 | 9,452 | ||||||
Forestar Group, Inc.1, 8.00%, 4/15/2024 | 5,000 | �� | 5,375 | |||||
|
| |||||||
| 14,827 | ||||||||
|
| |||||||
Total Real Estate | 265,049 | |||||||
|
| |||||||
TOTAL CORPORATE BONDS | 3,303,419 | |||||||
|
| |||||||
MUTUAL FUNDS - 0.3% | ||||||||
iShares MSCI India ETF | 4,115 | 142,585 | ||||||
SPDR Gold Shares* | 1,430 | 203,675 | ||||||
VanEck Vectors Gold Miners ETF | 3,766 | 106,013 | ||||||
|
| |||||||
TOTAL MUTUAL FUNDS | 452,273 | |||||||
|
| |||||||
U.S. TREASURY SECURITIES - 13.2% | ||||||||
U.S. Treasury Bonds - 1.6% | ||||||||
U.S. Treasury Bond, 2.50%, 2/15/2045 | 825,000 | 877,658 | ||||||
U.S. Treasury Bond, 3.00%, 5/15/2047 | 785,000 | 919,186 | ||||||
U.S. Treasury Inflation Indexed Bond, 0.75%, 2/15/2042 | 252,288 | 265,101 | ||||||
|
| |||||||
Total U.S. Treasury Bonds | 2,061,945 | |||||||
|
| |||||||
ADR - American Depositary Receipt
ETF - Exchange-traded fund
LIBOR - London Interbank Offered Rate
| PRINCIPAL AMOUNT2/ | VALUE | |||||||
SHARES
| (NOTE 2)
| |||||||
U.S. TREASURY SECURITIES(continued) |
| |||||||
U.S. Treasury Notes - 11.6% | ||||||||
U.S. Treasury Inflation Indexed Note, 0.125%, 4/15/2020 | 1,138,287 | $ | 1,132,195 | |||||
U.S. Treasury Note, 2.625%, 5/15/2021 | 1,210,000 | 1,228,906 | ||||||
U.S. Treasury Note, 2.50%, 5/15/2024 | 2,245,000 | 2,339,711 | ||||||
U.S. Treasury Note, 2.00%, 8/15/2025 | 6,198,000 | 6,342,055 | ||||||
U.S. Treasury Note, 1.625%, 5/15/2026 | 2,480,000 | 2,483,972 | ||||||
U.S. Treasury Note, 2.375%, 5/15/2027 | 1,143,000 | 1,205,061 | ||||||
|
| |||||||
Total U.S. Treasury Notes | 14,731,900 | |||||||
|
| |||||||
TOTAL U.S. TREASURY SECURITIES(Identified Cost $16,435,229) | 16,793,845 | |||||||
|
| |||||||
U.S. GOVERNMENT SECURITIES - 1.0% | ||||||||
U.S. Treasury Bill - 1.0% | ||||||||
U.S. Treasury Bill7, 1.62%, 5/21/2020 (Identified Cost $1,248,688) | 1,260,000 | 1,249,148 | ||||||
|
| |||||||
SHORT-TERM INVESTMENT - 1.1% | ||||||||
Dreyfus Government Cash Management, Institutional Shares, 1.73%8 (Identified Cost $1,374,909) | 1,374,909 | 1,374,909 | ||||||
|
| |||||||
TOTAL INVESTMENTS - 100.2% | 127,707,117 | |||||||
LIABILITIES, LESS OTHER ASSETS - (0.2%) | (198,417 | ) | ||||||
|
| |||||||
NET ASSETS - 100% | $ | 127,508,700 | ||||||
|
| |||||||
The accompanying notes are an integral part of the financial statements.
74
Investment Portfolio - October 31, 2019
* Non-income producing security.
## Less than 0.1%.
| 1 | Restricted securities - Investment in securities that are restricted as to public resale under the Securities Act of 1933, as amended. These securities have been sold under Rule 144A and have been determined to be liquid under the Fund’s Liquidity Risk Management Program. These securities amount to $493,623, or 0.4% of the Series’ net assets as of October 31, 2019 (see Note 2 to the financial statements). |
| 2 | Amount is stated in USD unless otherwise noted. |
| 3 | Step coupon rate security - Rate steps up/down by 25 basis points upon rating downgrade/upgrade by Moody’s and S&P rating agencies (Subject to a maximum of 100 basis points per agency, 200 basis points maximum). |
| 4 | Variable rate security. Security may be issued at a fixed coupon rate, which converts to a variable rate at a specified date. Rate shown is the rate in effect as of October 31, 2019. |
| 5 | Represents a Payment-In-Kind bond. |
| 6 | Security is perpetual in nature and has no stated maturity date. |
| 7 | Represents the annualized yield at time of purchase. |
| 8 | Rate shown is the current yield as of October 31, 2019. |
The Global Industry Classification Standard (GICS) was developed by and is the exclusive property and a service mark of MSCI Inc. (MSCI) and Standard & Poor’s, a division of S&P Global Inc. (S&P), and is licensed for use by Manning & Napier when referencing GICS sectors. Neither MSCI, S&P, nor any third party involved in making or compiling the GICS or any GICS classifications makes any express or implied warranties or representations with respect to such standard or classification, nor shall any such party have any liability therefrom.
The accompanying notes are an integral part of the financial statements.
75
Statement of Assets and Liabilities - Blended Asset Maximum Series
October 31, 2019
ASSETS: | ||||
Investments, at value (identified cost $116,594,976) (Note 2) | $ | 127,707,117 | ||
Foreign currency, at value (identified cost $10,928) | 10,964 | |||
Receivable for securities sold | 717,047 | |||
Interest receivable | 156,642 | |||
Dividends receivable | 53,441 | |||
Foreign tax reclaims receivable | 41,333 | |||
Receivable for fund shares sold | 5,304 | |||
|
| |||
TOTAL ASSETS | 128,691,848 | |||
|
| |||
LIABILITIES: | ||||
Accrued management fees (Note 3) | 39,949 | |||
Accrued fund accounting and administration fees (Note 3) | 21,684 | |||
Accrued Chief Compliance Officer service fees (Note 3) | 687 | |||
Payable for fund shares repurchased | 657,372 | |||
Payable for securities purchased | 420,869 | |||
Other payables and accrued expenses | 42,587 | |||
|
| |||
TOTAL LIABILITIES | 1,183,148 | |||
|
| |||
TOTAL NET ASSETS | $ | 127,508,700 | ||
|
| |||
NET ASSETS CONSIST OF: | ||||
Capital stock | $ | 100,719 | ||
Additional paid-in-capital | 118,816,966 | |||
Total distributable earnings (loss) | 8,591,015 | |||
|
| |||
TOTAL NET ASSETS | $ | 127,508,700 | ||
|
| |||
NET ASSET VALUE, OFFERING PRICE AND REDEMPTION PRICE PER SHARE - | $ | 12.66 | ||
|
| |||
The accompanying notes are an integral part of the financial statements.
76
Statement of Operations - Blended Asset Maximum Series
For the Year Ended October 31, 2019
INVESTMENT INCOME: | ||||
Dividends (net of foreign taxes withheld, $81,144) | $ | 1,602,794 | ||
Interest | 547,973 | |||
|
| |||
Total Investment Income | 2,150,767 | |||
|
| |||
EXPENSES: | ||||
Management fees (Note 3) | 597,878 | |||
Fund accounting and administration fees (Note 3) | 80,123 | |||
Directors’ fees (Note 3) | 10,945 | |||
Chief Compliance Officer service fees (Note 3) | 3,455 | |||
Audit fees | 42,498 | |||
Custodian fees | 33,109 | |||
Miscellaneous | 45,373 | |||
|
| |||
Total Expenses | 813,381 | |||
Less reduction of expenses (Note 3) | (155,715 | ) | ||
|
| |||
Net Expenses | 657,666 | |||
|
| |||
NET INVESTMENT INCOME | 1,493,101 | |||
|
| |||
REALIZED AND UNREALIZED GAIN (LOSS) ON INVESTMENTS AND FOREIGN CURRENCY: | ||||
Net realized gain (loss) on- | ||||
Investments | (2,006,477 | ) | ||
Foreign currency and translation of other assets and liabilities | (7,528 | ) | ||
|
| |||
| (2,014,005 | ) | |||
|
| |||
Net change in unrealized appreciation (depreciation) on- | ||||
Investments | 12,759,116 | |||
Foreign currency and translation of other assets and liabilities | 231 | |||
|
| |||
| 12,759,347 | ||||
|
| |||
NET REALIZED AND UNREALIZED GAIN (LOSS) ON INVESTMENTS AND FOREIGN CURRENCY | 10,745,342 | |||
|
| |||
NET INCREASE IN NET ASSETS RESULTING FROM OPERATIONS | $ | 12,238,443 | ||
|
| |||
The accompanying notes are an integral part of the financial statements.
77
Statements of Changes in Net Assets - Blended Asset Maximum Series
| FOR THE YEAR ENDED 10/31/19 | FOR THE YEAR ENDED 10/31/18 | |||||||
INCREASE (DECREASE) IN NET ASSETS: | ||||||||
OPERATIONS: | ||||||||
Net investment income | $ | 1,493,101 | $ | 1,335,682 | ||||
Net realized gain (loss) on investments and foreign currency | (2,014,005 | ) | 6,055,941 | |||||
Net change in unrealized appreciation (depreciation) on investments and foreign currency | 12,759,347 | (1,699,434 | ) | |||||
|
|
|
| |||||
Net increase from operations | 12,238,443 | 5,692,189 | ||||||
|
|
|
| |||||
DISTRIBUTIONS TO SHAREHOLDERS (Note 9): | ||||||||
Class R6 | (8,597,011 | ) | (855,074 | ) | ||||
|
|
|
| |||||
CAPITAL STOCK ISSUED AND REPURCHASED: | ||||||||
Net increase (decrease) from capital share transactions (Note 5) | (17,429,148 | ) | (14,120,006 | ) | ||||
|
|
|
| |||||
Net increase (decrease) in net assets | (13,787,716 | ) | (9,282,891 | ) | ||||
NET ASSETS: | ||||||||
Beginning of year | 141,296,416 | 150,579,307 | ||||||
|
|
|
| |||||
End of year | $ | 127,508,700 | $ | 141,296,416 | ||||
|
|
|
| |||||
The accompanying notes are an integral part of the financial statements.
78
Financial Highlights - Blended Asset Maximum Series - Class R6
FOR THE YEAR ENDED | FOR THE PERIOD 10/13/171 TO 10/31/17
| ||||||||||||||
10/31/19
| 10/31/18
| ||||||||||||||
Per share data (for a share outstanding throughout each period): | |||||||||||||||
Net asset value - Beginning of period | $11.85 | $11.60 | $11.59 | ||||||||||||
|
|
|
|
|
| ||||||||||
Income (loss) from investment operations: | |||||||||||||||
Net investment income (loss)2 | 0.15 | 0.12 | (0.00 | )3 | |||||||||||
Net realized and unrealized gain (loss) on investments | 1.37 | 0.21 | 0.01 | ||||||||||||
|
|
|
|
|
| ||||||||||
Total from investment operations | 1.52 | 0.33 | 0.01 | ||||||||||||
|
|
|
|
|
| ||||||||||
Less distributions to shareholders: | |||||||||||||||
From net investment income | (0.13 | ) | (0.07 | ) | — | ||||||||||
From net realized gain on investments | (0.58 | ) | (0.01 | ) | — | ||||||||||
|
|
|
|
|
| ||||||||||
Total distributions to shareholders | (0.71 | ) | (0.08 | ) | — | ||||||||||
|
|
|
|
|
| ||||||||||
Net asset value - End of period | $12.66 | $11.85 | $11.60 | ||||||||||||
|
|
|
|
|
| ||||||||||
Net assets - End of period(000’s omitted) | $127,509 | $141,296 | $150,579 | ||||||||||||
|
|
|
|
|
| ||||||||||
Total return4 | 13.94% | 2.77% | 0.09% | ||||||||||||
Ratios (to average net assets)/Supplemental Data: | |||||||||||||||
Expenses* | 0.55% | 0.55% | 0.55% | 5 | |||||||||||
Net investment income (loss) | 1.25% | 0.96% | 0.11% | 5 | |||||||||||
Series portfolio turnover | 89% | 85% | 4% | ||||||||||||
| *The investment advisor did not impose all or a portion of its management and/or other fees during the period, and may have paid a portion of the Series’ expenses. If these expenses had been incurred by the Class, the expense ratio (to average net assets) would have increased by the following amounts: |
| ||||||||||||||
| 0.13% | 0.10% | 0.66% | 5 | ||||||||||||
1Commencement of operations.
2Calculated based on average shares outstanding during the periods.
3Less than $(0.01).
4Represents aggregate total return for the periods indicated, and assumes reinvestment of all distributions. Total return would have been lower had certain expenses not been waived or reimbursed during certain periods. Periods less than one year are not annualized.
5Annualized.
The accompanying notes are an integral part of the financial statements.
79
Notes to Financial Statements
| 1. | Organization |
Blended Asset Conservative Series, Blended Asset Moderate Series, Blended Asset Extended Series and Blended Asset Maximum Series (each the “Series”) are no-load diversified series of Manning & Napier Fund, Inc. (the “Fund”). The Fund is organized in Maryland and is registered under the Investment Company Act of 1940 (the “1940 Act”), as amended, as an open-end management investment company.
The Series are asset allocation funds. Each invests in a combination of stocks, bonds and cash and is managed according to specific objectives. The objectives are as follows: Blended Asset Conservative Series - primary objective is to provide current income and its secondary objectives are to provide preservation of capital and long-term growth of capital; secondary objective is to provide income and long-term growth of capital. Blended Asset Moderate Series - equal emphasis on long-term growth of capital and preservation of capital. Blended Asset Extended Series - primary objective is long-term growth of capital; secondary objective is preservation of capital. Blended Asset Maximum Series - primary objective is long-term growth of capital.
The Fund’s Advisor is Manning & Napier Advisors, LLC (the “Advisor”). The Series are offered exclusively to other funds managed by the Advisor. The total authorized capital stock of the Fund consists of 15 billion shares of common stock each having a par value of $0.01. As of October 31, 2019, 10 billion shares have been designated in total among 34 series, of which 100 million have been designated in each of the Series for Class R6 common stock.
| 2. | Significant Accounting Policies |
The following is a summary of significant accounting policies followed by the Series. Each Series is an investment company and, accordingly, follows the investment company accounting and reporting guidance of the Financial Accounting Standards Board Accounting Standards Codification Topic 946 - Investment Companies, which is part of accounting principles generally accepted in the United States of America (“GAAP”).
Security Valuation
Portfolio securities, including domestic equities, foreign equities, warrants and options, listed on an exchange other than the NASDAQ Stock Market are valued at the latest quoted sales price of the exchange on which the security is primarily traded. Securities not traded on valuation date or securities not listed on an exchange are valued at the latest quoted bid price provided by the Fund’s pricing service. Securities listed on the NASDAQ Stock Market are valued in accordance with the NASDAQ Official Closing Price.
Debt securities, including government bonds, foreign bonds, asset-backed securities, structured notes, supranational obligations, sovereign bonds, corporate bonds and mortgage-backed securities will normally be valued on the basis of evaluated bid prices provided directly by an independent pricing service. The pricing services use multiple valuation techniques to determine fair value. In instances where sufficient market activity exists, the pricing services may utilize a market-based approach through which quotes from market makers are used to determine fair value. In instances where sufficient market activity may not exist or is limited, the pricing services also utilize proprietary valuation models which may consider market characteristics such as benchmark yield curves, option-adjusted spreads, credit spreads, estimated defaulted rates, coupon rates, anticipated timing of principal repayments, underlying collateral and other unique security features in order to estimate the relevant cash flows, which are then discounted to calculate the fair value. Certain investments in securities held by the Series may be valued on a basis of a price provided directly by a principal market maker. These prices may differ from the value that would have been used had a broader market for securities existed.
Short-term investments that mature in sixty days or less may be valued at amortized cost, which approximates fair value. Investments in open-end investment companies are valued at their net asset value per share on valuation date.
Volume and level of activity in established markets for an asset or liability are evaluated to determine whether recent transactions and quoted prices are determinative of fair value. Where there have been significant decreases in volume and level of activity, further analysis and adjustment may be necessary to estimate fair value. The Series measure fair value in these instances by the use of inputs and valuation techniques which may be based upon current market prices of securities that are comparable in coupon, rating, maturity and industry and/or expectation of future cash flows. As a result of trading in relatively
80
Notes to Financial Statements (continued)
| 2. | Significant Accounting Policies (continued) |
Security Valuation(continued)
thin markets and/or markets that experience significant volatility, the prices used by the Series to value these securities may differ from the value that would be realized if these securities were sold, and the differences could be material.
Securities for which representative valuations or prices are not available from the Series’ pricing service may be valued at fair value as determined in good faith by the Advisor under procedures approved by and under the general supervision and responsibility of the Fund’s Board of Directors (the “Board”). Due to the inherent uncertainty of valuations of such securities, the fair value may differ significantly from the values that would have been used had a ready market for such securities existed. If trading or events occurring after the close of the principal market in which securities are traded are expected to materially affect the value of those securities, then they may be valued at their fair value, taking this trading or these events into account. In accordance with the procedures approved by the Board, the values of certain securities trading outside the U.S. were adjusted following the close of local trading using a factor from a third party vendor. The third party vendor uses statistical analyses and quantitative models, which consider among other things subsequent movement and changes in the prices of indices, securities and exchange rates in other markets, to determine the factors which are used to adjust local market prices. The value of securities used for net asset value calculation under these procedures may differ from published prices for the same securities. It is the Fund’s policy to classify each foreign equity security where a factor from a third party vendor is provided as a Level 2 security.
Various inputs are used in determining the value of the Series’ assets or liabilities carried at fair value. These inputs are summarized in three broad levels. Level 1 includes quoted prices in active markets for identical assets and liabilities. Level 2 includes other significant observable inputs (including quoted prices for similar securities, interest rates, prepayment speeds, credit risk, etc.). Level 3 includes significant unobservable inputs (including the Series’ own assumptions in determining the fair value of investments). A financial instrument’s level within the fair value hierarchy is based on the lowest level of any input both individually and in aggregate that is significant to their fair value measure. The inputs or methodology used for valuing securities are not necessarily an indication of the risk associated with investing in those securities.
The following is a summary of the valuation levels used for major security types as of October 31, 2019 in valuing the Series’ assets or liabilities carried at fair value:
| BLENDED ASSET CONSERVATIVE SERIES | ||||||||||||||||
| DESCRIPTION | TOTAL | LEVEL 1 | LEVEL 2# | LEVEL 3 | ||||||||||||
Assets: | ||||||||||||||||
Equity securities: | ||||||||||||||||
Communication Services | $ | 2,387,944 | $ | 1,803,404 | $ | 584,540 | $ | — | ||||||||
Consumer Discretionary | 1,730,496 | 1,454,105 | 276,391 | — | ||||||||||||
Consumer Staples | 2,562,128 | 1,843,167 | 718,961 | — | ||||||||||||
Energy | 987,334 | 987,334 | — | — | ||||||||||||
Financials | 2,529,628 | 2,529,628 | — | — | ||||||||||||
Health Care | 3,481,803 | 3,121,302 | 360,501 | — | ||||||||||||
Industrials | 1,026,480 | 1,026,480 | — | — | ||||||||||||
Information Technology | 3,271,013 | 3,271,013 | — | — | ||||||||||||
Materials | 340,800 | 340,800 | — | — | ||||||||||||
Real Estate | 2,485,157 | 2,471,456 | 13,701 | — | ||||||||||||
Utilities | 175,563 | 175,563 | — | — | ||||||||||||
Debt securities: | ||||||||||||||||
U.S. Treasury and other U.S. Government agencies | 31,898,669 | — | 31,898,669 | — | ||||||||||||
Corporate debt: | ||||||||||||||||
Communication Services | 3,033,801 | — | 3,033,801 | — | ||||||||||||
Consumer Discretionary | 1,987,478 | — | 1,987,478 | — | ||||||||||||
Consumer Staples | 10,256 | — | 10,256 | — | ||||||||||||
Energy | 2,883,102 | — | 2,883,102 | — | ||||||||||||
81
Notes to Financial Statements (continued)
| 2. | Significant Accounting Policies (continued) |
Security Valuation(continued)
| BLENDED ASSET CONSERVATIVE SERIES | ||||||||||||||||
| DESCRIPTION | TOTAL | LEVEL 1 | LEVEL 2# | LEVEL 3 | ||||||||||||
Financials | $ | 3,181,626 | $ | — | $ | 3,181,626 | $ | — | ||||||||
Health Care | 466,138 | — | 466,138 | — | ||||||||||||
Industrials | 1,741,456 | — | 1,741,456 | — | ||||||||||||
Information Technology | 16,069 | — | 16,069 | — | ||||||||||||
Materials | 659,170 | — | 659,170 | — | ||||||||||||
Real Estate | 1,287,193 | — | 1,287,193 | — | ||||||||||||
Asset-backed securities | 3,556,315 | — | 3,556,315 | — | ||||||||||||
Commercial mortgage-backed securities | 5,971,685 | — | 5,971,685 | — | ||||||||||||
Foreign government bonds | 1,115,510 | — | 1,115,510 | — | ||||||||||||
Mutual funds | 304,369 | 304,369 | — | — | ||||||||||||
Short-Term Investment | 843,815 | 843,815 | — | — | ||||||||||||
|
|
|
|
|
|
|
| |||||||||
Total assets | 79,934,998 | 20,172,436 | 59,762,562 | — | ||||||||||||
|
|
|
|
|
|
|
| |||||||||
Liabilities: | ||||||||||||||||
Other financial instruments*: | ||||||||||||||||
Equity contracts | (12,928 | ) | (12,728 | ) | (200 | ) | — | |||||||||
|
|
|
|
|
|
|
| |||||||||
Total liabilities | (12,928 | ) | (12,728 | ) | (200 | ) | — | |||||||||
|
|
|
|
|
|
|
| |||||||||
Total | $ | 79,922,070 | $ | 20,159,708 | $ | 59,762,362 | $ | — | ||||||||
|
|
|
|
|
|
|
| |||||||||
| ||||||||||||||||
| BLENDED ASSET MODERATE SERIES | ||||||||||||||||
| DESCRIPTION | TOTAL | LEVEL 1 | LEVEL 2# | LEVEL 3 | ||||||||||||
Assets: | ||||||||||||||||
Equity securities: | ||||||||||||||||
Communication Services | $ | 5,465,409 | $ | 3,952,151 | $ | 1,513,258 | $ | — | ||||||||
Consumer Discretionary | 3,731,505 | 2,776,948 | 954,557 | — | ||||||||||||
Consumer Staples | 5,449,200 | 3,244,163 | 2,205,037 | — | ||||||||||||
Energy | 1,115,741 | 984,904 | 130,837 | — | ||||||||||||
Financials | 3,551,896 | 3,319,360 | 232,536 | — | ||||||||||||
Health Care | 6,419,483 | 5,323,033 | 1,096,450 | — | ||||||||||||
Industrials | 442,388 | 214,181 | 228,207 | — | ||||||||||||
Information Technology | 6,443,158 | 6,398,150 | 45,008 | — | ||||||||||||
Materials | 112,784 | 44,487 | 68,297 | — | ||||||||||||
Real Estate | 2,903,535 | 2,833,935 | 69,600 | — | ||||||||||||
Utilities | 28,312 | — | 28,312 | — | ||||||||||||
Debt securities: | ||||||||||||||||
U.S. Treasury and other U.S. Government agencies | 35,609,209 | — | 35,609,209 | — | ||||||||||||
Corporate debt: | ||||||||||||||||
Communication Services | 2,973,711 | — | 2,973,711 | — | ||||||||||||
Consumer Discretionary | 1,887,428 | — | 1,887,428 | — | ||||||||||||
Consumer Staples | 10,256 | — | 10,256 | — | ||||||||||||
Energy | 2,292,895 | — | 2,292,895 | — | ||||||||||||
Financials | 3,085,876 | — | 3,085,876 | — | ||||||||||||
Health Care | 434,356 | — | 434,356 | — | ||||||||||||
Industrials | 1,143,719 | — | 1,143,719 | — | ||||||||||||
Information Technology | 21,425 | — | 21,425 | — | ||||||||||||
Materials | 656,489 | — | 656,489 | — | ||||||||||||
Real Estate | 672,857 | — | 672,857 | — | ||||||||||||
Asset-backed securities | 4,364,291 | — | 4,364,291 | — | ||||||||||||
Commercial mortgage-backed securities | 4,431,659 | — | 4,431,659 | — | ||||||||||||
82
Notes to Financial Statements (continued)
| 2. | Significant Accounting Policies (continued) |
Security Valuation(continued)
| BLENDED ASSET MODERATE SERIES | ||||||||||||||||
| DESCRIPTION | TOTAL | LEVEL 1 | LEVEL 2# | LEVEL 3 | ||||||||||||
Foreign government bonds | $ | 708,434 | $ | — | $ | 708,434 | $ | — | ||||||||
Mutual funds | 249,382 | 249,382 | — | — | ||||||||||||
Short-Term Investment | 1,119,310 | 1,119,310 | — | — | ||||||||||||
|
|
|
|
|
|
|
| |||||||||
Total assets | 95,324,708 | 30,460,004 | 64,864,704 | — | ||||||||||||
|
|
|
|
|
|
|
| |||||||||
Liabilities: | ||||||||||||||||
Other financial instruments*: | ||||||||||||||||
Equity contracts | (26,520 | ) | (26,080 | ) | (440 | ) | — | |||||||||
|
|
|
|
|
|
|
| |||||||||
Total liabilities | (26,520 | ) | (26,080 | ) | (440 | ) | — | |||||||||
|
|
|
|
|
|
|
| |||||||||
Total | $ | 95,298,188 | $ | 30,433,924 | $ | 64,864,264 | $ | — | ||||||||
|
|
|
|
|
|
|
| |||||||||
| BLENDED ASSET EXTENDED SERIES | ||||||||||||||||
| DESCRIPTION | TOTAL | LEVEL 1 | LEVEL 2# | LEVEL 3 | ||||||||||||
Assets: | ||||||||||||||||
Equity securities: | ||||||||||||||||
Communication Services | $ | 13,096,857 | $ | 9,368,094 | $ | 3,728,763 | $ | — | ||||||||
Consumer Discretionary | 8,748,798 | 6,506,637 | 2,242,161 | — | ||||||||||||
Consumer Staples | 12,750,300 | 7,461,973 | 5,288,327 | — | ||||||||||||
Energy | 2,699,992 | 2,396,343 | 303,649 | — | ||||||||||||
Financials | 7,999,285 | 7,450,107 | 549,178 | — | ||||||||||||
Health Care | 15,242,478 | 12,609,013 | 2,633,465 | — | ||||||||||||
Industrials | 1,081,661 | 496,223 | 585,438 | — | ||||||||||||
Information Technology | 15,285,399 | 15,115,617 | 169,782 | — | ||||||||||||
Materials | 297,536 | 105,643 | 191,893 | — | ||||||||||||
Real Estate | 6,231,970 | 6,075,443 | 156,527 | — | ||||||||||||
Utilities | 65,123 | — | 65,123 | — | ||||||||||||
Debt securities: | ||||||||||||||||
U.S. Treasury and other U.S. Government agencies | 53,023,798 | — | 53,023,798 | — | ||||||||||||
Corporate debt: | ||||||||||||||||
Communication Services | 3,786,744 | — | 3,786,744 | — | ||||||||||||
Consumer Discretionary | 2,572,647 | — | 2,572,647 | — | ||||||||||||
Consumer Staples | 25,641 | — | 25,641 | — | ||||||||||||
Energy | 2,876,379 | — | 2,876,379 | — | ||||||||||||
Financials | 3,916,470 | — | 3,916,470 | — | ||||||||||||
Health Care | 550,891 | — | 550,891 | — | ||||||||||||
Industrials | 1,475,444 | — | 1,475,444 | — | ||||||||||||
Information Technology | 32,138 | — | 32,138 | — | ||||||||||||
Materials | 913,407 | — | 913,407 | — | ||||||||||||
Real Estate | 900,430 | — | 900,430 | — | ||||||||||||
Asset-backed securities | 5,721,456 | — | 5,721,456 | — | ||||||||||||
Commercial mortgage-backed securities | 5,801,309 | — | 5,801,309 | — | ||||||||||||
Foreign government bonds | 828,450 | — | 828,450 | — | ||||||||||||
Mutual funds | 586,494 | 586,494 | — | — | ||||||||||||
Short-Term Investment | 2,656,669 | 2,656,669 | — | — | ||||||||||||
|
|
|
|
|
|
|
| |||||||||
Total assets | $ | 169,167,766 | $ | 70,828,256 | $ | 98,339,510 | $ | — | ||||||||
|
|
|
|
|
|
|
| |||||||||
83
Notes to Financial Statements (continued)
| 2. | Significant Accounting Policies (continued) |
Security Valuation(continued)
| BLENDED ASSET EXTENDED SERIES | ||||||||||||||||
| DESCRIPTION | TOTAL | LEVEL 1 | LEVEL 2# | LEVEL 3 | ||||||||||||
Liabilities: | ||||||||||||||||
Other financial instruments*: | ||||||||||||||||
Equity contracts | $ | (64,104 | ) | $ | (63,024 | ) | $ | (1,080 | ) | $ | — | |||||
|
|
|
|
|
|
|
| |||||||||
Total liabilities | (64,104 | ) | (63,024 | ) | (1,080 | ) | — | |||||||||
|
|
|
|
|
|
|
| |||||||||
Total | $ | 169,103,662 | $ | 70,765,232 | $ | 98,338,430 | $ | — | ||||||||
|
|
|
|
|
|
|
| |||||||||
| BLENDED ASSET MAXIMUM SERIES | ||||||||||||||||
| DESCRIPTION | TOTAL | LEVEL 1 | LEVEL 2# | LEVEL 3 | ||||||||||||
Assets: | ||||||||||||||||
Equity securities: | ||||||||||||||||
Communication Services | $ | 13,262,594 | $ | 10,304,769 | $ | 2,957,825 | $ | — | ||||||||
Consumer Discretionary | 15,253,275 | 13,879,589 | 1,373,686 | — | ||||||||||||
Consumer Staples | 17,036,461 | 12,253,581 | 4,782,880 | — | ||||||||||||
Energy | 4,066,368 | 3,834,146 | 232,222 | — | ||||||||||||
Financials | 13,086,706 | 10,308,332 | 2,778,374 | — | ||||||||||||
Health Care | 14,337,900 | 12,825,325 | 1,512,575 | — | ||||||||||||
Industrials | 1,779,761 | 1,316,284 | 463,477 | — | ||||||||||||
Information Technology | 15,055,754 | 14,344,944 | 710,810 | — | ||||||||||||
Materials | 5,323,200 | 4,206,544 | 1,116,656 | — | ||||||||||||
Real Estate | 5,281,779 | 5,170,710 | 111,069 | — | ||||||||||||
Utilities | 49,725 | — | 49,725 | — | ||||||||||||
Debt securities: | ||||||||||||||||
U.S. Treasury and other U.S. Government agencies | 18,042,993 | — | 18,042,993 | — | ||||||||||||
Corporate debt: | ||||||||||||||||
Communication Services | 696,081 | — | 696,081 | — | ||||||||||||
Consumer Discretionary | 481,513 | — | 481,513 | — | ||||||||||||
Consumer Staples | 10,256 | — | 10,256 | — | ||||||||||||
Energy | 504,826 | — | 504,826 | — | ||||||||||||
Financials | 774,018 | — | 774,018 | — | ||||||||||||
Health Care | 84,752 | — | 84,752 | — | ||||||||||||
Industrials | 300,040 | — | 300,040 | — | ||||||||||||
Information Technology | 10,712 | — | 10,712 | — | ||||||||||||
Materials | 176,172 | — | 176,172 | — | ||||||||||||
Real Estate | 265,049 | — | 265,049 | — | ||||||||||||
Mutual funds | 452,273 | 452,273 | — | — | ||||||||||||
Short-Term Investment | 1,374,909 | 1,374,909 | — | — | ||||||||||||
|
|
|
|
|
|
|
| |||||||||
Total assets | $ | 127,707,117 | $ | 90,271,406 | $ | 37,435,711 | $ | — | ||||||||
|
|
|
|
|
|
|
| |||||||||
#Includes certain foreign equity securities for which a factor from a third party vendor was applied to determine the securities’ fair value following the close of local trading.
*Other financial instruments are exchange traded options (Level 1 and Level 2).
There were no Level 3 securities held by any of the Blended Asset Series as of October 31, 2018 and October 31, 2019.
New Accounting Pronouncements
In March 2017, the Financial Accounting Standards Board issued Accounting Standards Update No. 2017-08, Receivables –Nonrefundable Fees and Other Costs (Subtopic 310-320): “Premium Amortization of Purchased Callable Debt Securities” which shortens the amortized period for certain callable debt securities, held at a premium, to be amortized to the earliest call date
84
Notes to Financial Statements (continued)
| 2. | Significant Accounting Policies (continued) |
New Accounting Pronouncements(continued)
rather than the contractual maturity date. The Series will adopt and apply ASU 2017-08 on a modified retrospective basis through a cumulative-effect adjustment on November 1, 2019. As a result of the adoption of ASU 2017-08, the amortized cost basis of investments will be reduced and unrealized appreciation of investments will be increased by immaterial amounts, and there will be no impact on net assets or overall results of operations.
Security Transactions, Investment Income and Expenses
Security transactions are accounted for on trade date. Dividend income is recorded on the ex-dividend date, except that if the ex-dividend date has passed, certain dividends from foreign securities are recorded as soon as the Series is informed of the ex-dividend date. Non-cash dividends, if any, are recorded at the fair value of the securities received. Interest income, including amortization of premium and accretion of discounts using the effective interest method, is earned from settlement date and accrued daily.
Expenses are recorded on an accrual basis. Most expenses of the Fund can be attributed to a specific series. Expenses which cannot be directly attributed are apportioned among the series in the Fund in such a manner as deemed equitable by the Fund’s Board, taking into consideration, among other things, the nature and type of expense.
Income, expenses (other than class specific expenses), and realized and unrealized gains and losses are prorated among the classes based on the relative net assets of each class. Class specific expenses are directly charged to that Class.
The Series use the identified cost method for determining realized gain or loss on investments for both financial statement and federal income tax reporting purposes.
Foreign Currency Translation
The books and records of the Series are maintained in U.S. dollars. Foreign currencies, investments and other assets and liabilities are translated into U.S. dollars at the current exchange rates. Purchases and sales of investment securities and income and expenses are translated on the respective dates of such transactions. The Series do not isolate realized and unrealized gains and losses attributable to changes in the exchange rates from gains and losses that arise from changes in the fair value of investments. Such fluctuations are included with net realized and unrealized gain or loss on investments. Net realized foreign currency gains and losses represent foreign currency gains and losses between trade date and settlement date on securities transactions, gains and losses on disposition of foreign currencies and the difference between the amount of income and foreign withholding taxes recorded on the books of the Series and the amounts actually received or paid.
Option Contracts
The Series may write (sell) or buy call or put options on securities and other financial instruments. When a Series writes a call, the Series gives the purchaser the right to buy the underlying security from the Series at the price specified in the option contract (the “exercise price”) at any time during the option period. When a Series writes a put option, the Series gives the purchaser the right to sell to the Series the underlying security at the exercise price at any time during the option period. The Series will only write options on a “covered basis.” This means that the Series will own the underlying security when the Series writes a call or the Series will put aside cash, U.S. Government securities, or other liquid assets in an amount not less than the exercise price at all times the put option is outstanding.
When a Series writes an option, an amount equal to the premium received is reflected as a liability and is subsequently marked-to-market to reflect the current market value of the option. The Series, as a writer of an option, has no control over whether the underlying security or financial instrument may be sold (call) or purchased (put) and, as a result, bears the market risk of an unfavorable change in the price of the security or financial instrument underlying the written option. There is a risk that the Series may not be able to enter into a closing transaction because of an illiquid market.
Each Series may also purchase options in an attempt to hedge against fluctuations in the value of its portfolio and to protect against declines in the value of the securities. The premium paid by a Series for the purchase of an option is reflected as an
85
Notes to Financial Statements (continued)
| 2. | Significant Accounting Policies (continued) |
Option Contracts(continued)
investment and subsequently marked-to-market to reflect the current market value of the option. The risk associated with purchasing options is limited to the premium paid.
When a security is purchased or sold through an exercise of an option, the related premium paid (or received) is added to (or deducted from) the basis of the security acquired or deducted from (or added to) the proceeds of the security sold. When an option expires (or a Series enters into a closing transaction), the Series realizes a gain or loss on the option to the extent of the premium received or paid (or gain or loss to the extent the cost of the closing transaction exceeds the premium paid or received).
The measurement of the risks associated with option contracts is meaningful only when all related and offsetting transactions are considered. The counterparty for the Series’ written options contracts outstanding during the year ended October 31, 2019 is Pershing LLC, a BNY Mellon Company.
The following table presents the present value of derivatives held at October 31, 2019 as reflected on the Statement of Assets and Liabilities, and the effect of the derivative instruments on the Statement of Operations:
| BLENDED ASSET CONSERVATIVE SERIES | ||||||
| STATEMENT OF ASSETS AND LIABILITIES | ||||||
Derivative | Liabilities Location | |||||
Equity contracts | Options written, at value | $ (12,928) | ||||
| STATEMENT OF OPERATIONS | ||||||
Derivative | Location of Gain or (Loss) on Derivatives | | Realized Gain (Loss) on Derivatives |
| ||
Equity contracts | Net realized gain (loss) on options written | $ 84,912 | ||||
Derivative | Location of Appreciation (Depreciation) on Derivatives | | Unrealized Appreciation (Depreciation) on Derivatives |
| ||
Equity contracts | Net change in unrealized appreciation (depreciation) on options written | $ 4,533 | ||||
86
Notes to Financial Statements (continued)
| 2. | Significant Accounting Policies (continued) |
Option Contracts(continued)
| BLENDED ASSET MODERATE SERIES | ||||||
| STATEMENT OF ASSETS AND LIABILITIES | ||||||
Derivative | Liabilities Location | |||||
Equity contracts | Options written, at value | $ (26,520 | ) | |||
| STATEMENT OF OPERATIONS | ||||||
Derivative | Location of Gain or (Loss) on Derivatives | | Realized Gain (Loss) on Derivatives | | ||
Equity contracts | Net realized gain (loss) on options written | $ 145,547 | ||||
Derivative | Location of Appreciation (Depreciation) on Derivatives | | Unrealized Appreciation (Depreciation) on Derivatives | | ||
Equity contracts | Net change in unrealized appreciation (depreciation) on options written | $ 3,613 | ||||
| BLENDED ASSET EXTENDED SERIES | ||||||
| STATEMENT OF ASSETS AND LIABILITIES | ||||||
Derivative | Liabilities Location | |||||
Equity contracts | Options written, at value | $ (64,104 | ) | |||
| ||||||
| STATEMENT OF OPERATIONS | ||||||
Derivative | Location of Gain or (Loss) on Derivatives | | Realized Gain (Loss) on Derivatives | | ||
Equity contracts | Net realized gain (loss) on options written | $ 358,796 | ||||
Derivative | Location of Appreciation (Depreciation) on Derivatives | | Unrealized Appreciation (Depreciation) on Derivatives | | ||
Equity contracts | Net change in unrealized appreciation (depreciation) on options written | $ 8,856 | ||||
The average month-end balances for the year ended October 31, 2019, the period in which such derivatives were outstanding, were as follows:
| BLENDED ASSET CONSERVATIVE SERIES | BLENDED ASSET MODERATE SERIES | BLENDED ASSET EXTENDED SERIES | ||||
Options: | ||||||
Average number of option contracts written | 44 | 84 | 202 | |||
Average notional value of option contracts written | $481,179 | $880,635 | $2,133,924 |
Asset-Backed Securities
Each Series may invest in asset-backed securities. Asset-backed securities are generally issued as pass-through certificates or as debt instruments. Asset-backed securities issued as pass-through certificates represent undivided fractional ownership interests in an underlying pool of assets. Asset-backed securities issued as debt instruments, which are also known as collateralized obligations, are typically issued as the debt of a special purpose entity organized solely for the purpose of owning such assets and issuing such debt. Asset-backed securities are often backed by a pool of assets representing the obligations of
87
Notes to Financial Statements (continued)
| 2. | Significant Accounting Policies (continued) |
Asset-Backed Securities(continued)
a number of different parties. The yield characteristics of certain asset-backed securities may differ from traditional debt securities. One such major difference is that all or a principal part of the obligations may be prepaid at any time because the underlying assets (i.e. loans) may be prepaid at any time. As a result, a decrease in interest rates in the market may result in increases in the level of prepayments as borrowers, particularly mortgagors, refinance and repay their loans. An increased prepayment rate with respect to an asset-backed security will have the effect of shortening the maturity of the security. In addition, a Series may subsequently have to reinvest the proceeds at lower interest rates. If a Series has purchased such an asset-backed security at a premium, a faster than anticipated prepayment rate could result in a loss of principal to the extent of the premium paid.
Mortgage-Backed Securities
Each Series may invest in mortgage-backed securities (“MBS” or pass-through certificates) that represent an interest in a pool of specific underlying mortgage loans and entitle a Series to the periodic payments of principal and interest from those mortgages. MBS may be issued by government agencies or corporations, or private issuers. Most MBS issued by government agencies are guaranteed; however, the degree of protection differs based on the issuer. For MBS there are a number of important differences among the agencies and instrumentalities of the U.S. Government that issue mortgage-related securities and among the securities that they issue. For example, mortgage-related securities guaranteed by Ginnie Mae are guaranteed as to the timely payment of principal and interest by Ginnie Mae and such guarantee is backed by the full faith and credit of the United States. However, mortgage-related securities issued by Freddie Mac and Fannie Mae, including Freddie Mac and Fannie Mae guaranteed mortgage pass-through certificates, which are solely the obligations of Freddie Mac and Fannie Mae, are not backed by or entitled to the full faith and credit of the United States, but are supported by the right of the issuer to borrow from the U.S. Treasury. Non-agency mortgage-backed securities are securities issued by non-governmental issuers and have no direct or indirect government guarantees of payment and are subject to various risks. Non-agency mortgage loans are obligations of the borrowers thereunder only and are not typically insured or guaranteed by any other person or entity. The ability of a borrower to repay a loan is dependent upon the income or assets of the borrower. A number of factors, including a general economic downturn, acts of God, terrorism, social unrest and civil disturbances, may impair a borrower’s ability to repay its loans.
Inflation-Indexed Bonds
Each Series may invest in inflation-indexed bonds. Inflation-indexed bonds are fixed income securities whose principal value is periodically adjusted according to the rate of inflation. If the index measuring inflation rises or falls, the principal value of inflation-indexed bonds will be adjusted upward or downward, and consequently the interest payable on these securities (calculated with respect to a larger or smaller principal amount) will be increased or reduced, respectively. Any upward or downward adjustment in the principal amount of an inflation-indexed bond will be included as interest income in the Statements of Operations, even though investors do not receive their principal until maturity. Repayment of the original bond principal upon maturity (as adjusted for inflation) is guaranteed in the case of U.S. Treasury inflation-indexed bonds. For bonds that do not provide a similar guarantee, the adjusted principal value of the bond repaid at maturity may be less than the original principal.
Securities Purchased on a When-Issued Basis or Forward Commitment
Each Series may purchase securities on a when-issued basis or forward commitment. These transactions involve a commitment by the Series to purchase securities for a predetermined price with payment and delivery taking place beyond the customary settlement period. When such purchases are outstanding, the Series will designate liquid assets in an amount sufficient to meet the purchase price. When purchasing a security on a delayed delivery basis, the Fund assumes the rights and risks of ownership of the security, including the risk of price and yield fluctuations, and takes such fluctuations into account when determining their net asset value. The Series may sell the when-issued securities before they are delivered, which may result in a capital gain or loss. No such investments were held by the Series on October 31, 2019.
In connection with their ability to purchase or sell securities on a forward commitment basis, the Series may enter into forward roll transactions principally using To Be Announced (TBA) securities. Forward roll transactions require the sale of securities for delivery in the current month, and a simultaneous agreement to repurchase substantially similar (same type, coupon and maturity) securities on a specified future date. Risks of entering into forward roll transactions include the potential inability of the
88
Notes to Financial Statements (continued)
| 2. | Significant Accounting Policies (continued) |
Securities Purchased on a When-Issued Basis or Forward Commitment(continued)
counterparty to meet the terms of the agreement; the potential of the Series to receive inferior securities at redelivery as compared to the securities sold to the counterparty; counterparty credit risk; and the potential pay down speed variance between the mortgage-backed pools. During the roll period, the Series forgoes principal and interest paid on the securities. The Series accounts for such dollar rolls as purchases and sales. No such investments were held by the Series on October 31, 2019.
Interest Only Securities
The Series may invest in stripped mortgage-backed securities issued by the U.S. government, its agencies and instrumentalities. Stripped mortgage-backed securities are usually structured with two classes that receive different proportions of the interest and principal distributions on a pool of mortgage assets. In certain cases, one class will receive all of the interest (the interest-only or “IO” class), while the other class will receive all of the principal (the principal-only or “PO” class). The yield to maturity on IOs is sensitive to the rate of principal repayments (including prepayments) on the related underlying mortgage assets, and principal payments may have a material effect on yield to maturity. If the underlying mortgage assets experience greater than anticipated prepayments of principal, a Series may not fully recoup its initial investment in IOs.
Restricted Securities
Restricted securities are purchased in private placement transactions, are not registered under the Securities Act of 1933, as amended, and may have contractual restrictions on resale. Information regarding restricted securities is included at the end of each applicable Series’ Investment Portfolio.
Illiquid Securities
A security may be considered illiquid if so deemed in good faith by the Advisor under procedures approved by and under the general supervision and responsibility of the Fund’s Board. Securities that are illiquid are marked with the applicable footnote at the end of each applicable Series’ Investment Portfolio. No such investments were held by the Series on October 31, 2019.
Federal Taxes
Each Series’ policy is to comply with the provisions of the Internal Revenue Code applicable to regulated investment companies. The Series are not subject to federal income tax or excise tax to the extent that each Series distributes to shareholders each year its taxable income, including any net realized gains on investments, in accordance with requirements of the Internal Revenue Code. Accordingly, no provision for federal income tax or excise tax has been made in the financial statements.
Management evaluates its tax positions to determine if the tax positions taken meet the minimum recognition threshold in connection with accounting for uncertainties in income tax positions taken or expected to be taken for the purposes of measuring and recognizing tax liabilities in the financial statements. Recognition of tax benefits of an uncertain tax position is required only when the position is “more likely than not” to be sustained assuming examination by taxing authorities. At October 31, 2019, the Series have recorded no liability for net unrecognized tax benefits relating to uncertain income tax positions taken or expected to be taken in future tax returns.
The Series file income tax returns in the U.S. federal jurisdiction, various states and foreign jurisdictions, as required. No income tax returns are currently under investigation. The statute of limitations on the Series’ tax returns remains open for the period ended October 31, 2017 and the years ended October 31, 2018 and October 31, 2019. The Fund is not aware of any tax positions for which it is reasonably possible that the total amounts of unrecognized tax benefits will significantly change in the next twelve months.
Foreign Taxes
Based on the Series’ understanding of the tax rules and rates related to income, gains and currency purchase/repatriation transactions for foreign jurisdictions in which they invest, the Series will provide for foreign taxes, and where appropriate, deferred foreign tax.
89
Notes to Financial Statements (continued)
| 2. | Significant Accounting Policies (continued) |
Distributions of Income and Gains
Distributions to shareholders of net investment income are made semi-annually. Distributions of net realized gains are made annually. An additional distribution may be necessary to avoid taxation of a Series. Distributions are recorded on the ex-dividend date.
Indemnifications
The Fund’s organizational documents provide former and current directors and officers with a limited indemnification against liabilities arising in connection with the performance of their duties to the Fund. In the normal course of business, the Fund may also enter into contracts that provide general indemnifications. The Fund’s maximum exposure under these arrangements is unknown as this would be dependent on future claims that may be made against the Fund. The risk of material loss from such claims is considered remote.
Other
The preparation of financial statements in conformity with GAAP requires management to make estimates and assumptions that affect the reported amounts of assets and liabilities and the disclosure of contingent assets and liabilities at the date of the financial statements and the reported amounts of income and expenses during the reporting period. Actual results could differ from those estimates.
| 3. | Transactions with Affiliates |
The Fund has an Investment Advisory Agreement (the “Agreement”) with the Advisor, for which each Series pays a fee, computed daily and payable monthly, at an annual rate of 0.40% for Blended Asset Conservative Term Series, 0.45% for Blended Asset Moderate Series, and 0.50% for Blended Asset Extended Series and Blended Asset Maximum Series, of the Series’ average daily net assets.
Under the Agreement, personnel of the Advisor provide the Series with advice and assistance in the choice of investments and the execution of securities transactions, and otherwise maintain the Series’ organization. The Advisor also provides the Fund with necessary office space and fund administration and support services. The salaries of all officers of the Fund (except a percentage of the Fund’s Chief Compliance Officer’s salary, which is paid by the Fund), and of all Directors who are “affiliated persons” of the Fund, or of the Advisor, and all personnel of the Fund, or of the Advisor, performing services relating to research, statistical and investment activities, are paid by the Advisor. Each “non-affiliated” Director receives an annual stipend, which is allocated among all the active series of the Fund. In addition, these Directors also receive a fee per Board meeting attended plus a fee for each committee meeting attended and are reimbursed for travel and other out-of-pocket expenses incurred by them in connection with attending such meetings. The Fund also has an Audit Committee Chair, Governance & Nominating Committee Chair and Lead Independent Director who each receive an additional annual stipend for these roles.
The Advisor has contractually agreed to waive its management fee and, if necessary, pay other operating expenses of the Series in order to maintain total direct annual fund operating expenses for the Series, at no more than the amounts presented in the following table, of average daily net assets each year.
| SERIES/CLASS | EXPENSE LIMIT | |||||||||||||||
Blended Asset Conservative Series | 0.45% | |||||||||||||||
Blended Asset Moderate Series | 0.50% | |||||||||||||||
Blended Asset Extended Series | 0.55% | |||||||||||||||
Blended Asset Maximum Series | 0.55% | |||||||||||||||
90
Notes to Financial Statements (continued)
| 3. | Transactions with Affiliates (continued) |
For the year ended October 31, 2019, the Advisor waived the following amounts which are included as a reduction of expenses on the Statements of Operations:
| SERIES/CLASS | WAIVER AMOUNT | |||||||||||||||
Blended Asset Conservative Series Class R6 | $162,123 | |||||||||||||||
Blended Asset Moderate Series Class R6 | 191,098 | |||||||||||||||
Blended Asset Extended Series Class R6 | 183,498 | |||||||||||||||
Blended Asset Maximum Series Class R6 | 155,715 | |||||||||||||||
Effective March 1, 2019, these contractual waivers are expected to continue indefinitely and may not be amended or terminated by the Advisor without the approval of the Series’ Board of Directors. The Advisor’s agreement to limit the Series’ operating expenses is limited to direct operating expenses and, therefore, does not apply to acquired fund fees and expenses, which are indirect expenses incurred by the Series through their investments in other investment companies. The Advisor may receive from a Series the difference between the Series’ total direct annual fund operating expenses and the Series’ contractual expense limit to recoup all or a portion of its prior fee waivers or expense reimbursements made during the rolling three-year period preceding the recoupment if at any point the total direct annual fund operating expenses are below the contractual expense limit (a) at the time of the fee waiver and/or expense reimbursement and (b) at the time of the recoupment. At October 31, 2019, the Advisor is eligible to recoup $112,080, $135,813, $129,515, and $108,804 from Blended Asset Conservative Series, Blended Asset Moderate Series, Blended Asset Extended Series and Blended Asset Maximum Series, respectively. For the year ended October 31, 2019, the Advisor did not recoup any expenses that have been previously waived or reimbursed.
Manning & Napier Investor Services, Inc., a registered broker-dealer affiliate of the Advisor, acts as distributor for the Fund’s shares. The services of Manning & Napier Investor Services, Inc. are provided at no additional cost to the Series.
Pursuant to a master services agreement dated March 1, 2017, the Fund pays the Advisor an annual fee related to fund accounting and administration of 0.0085% on the first $25 billion of average daily net assets (excluding Target Series and Income Series); 0.0075% on the next $15 billion of average daily net assets (excluding Target Series and Income Series); and 0.0065% of average daily net assets in excess of $40 billion (excluding Target Series and Income Series); plus a base fee of $30,400 per series. Additionally, certain transaction and out-of-pocket expenses, including charges for reporting relating to the Fund’s compliance program, are charged. The Advisor has agreements with BNY Mellon Investment Servicing (U.S.) Inc. (“BNY”) under which BNY serves as sub-accountant services agent.
| 4. | Purchases and Sales of Securities |
For the year ended ended October 31, 2019, purchases and sales of securities, including paydowns and other than short-term securities, were as follows:
| PURCHASES | SALES | |||||||||||||||
| SERIES | OTHER | GOVERNMENT | OTHER | GOVERNMENT | ||||||||||||
| ISSUERS | ISSUERS | |||||||||||||||
Blended Asset Conservative Series | $22,369,106 | $51,908,128 | $55,812,489 | $72,000,028 | ||||||||||||
Blended Asset Moderate Series | 34,396,563 | 48,218,120 | 54,059,939 | 57,612,050 | ||||||||||||
Blended Asset Extended Series | 67,518,159 | 69,522,943 | 105,648,515 | 83,515,820 | ||||||||||||
Blended Asset Maximum Series | 67,015,413 | 36,880,922 | 91,906,243 | 35,762,728 | ||||||||||||
91
Notes to Financial Statements (continued)
| 5. | Capital Stock Transactions |
Transactions in Class R6 shares of each Series were:
BLENDED CONSERVATIVE SERIES CLASS R6: | FOR THE YEAR ENDED 10/31/19 | FOR THE YEAR ENDED 10/31/18 | ||||||||||||||
| SHARES | AMOUNT | SHARES | AMOUNT | |||||||||||||
Sold | 988,490 | $ | 10,772,756 | 3,757,705 | $ | 40,809,799 | ||||||||||
Repurchased | (5,987,749 | ) | (63,006,339 | ) | (1,142,825 | ) | (12,463,628 | ) | ||||||||
|
|
|
|
|
|
|
| |||||||||
Total | (4,999,259 | ) | $ | (52,233,583 | ) | 2,614,880 | $ | 28,346,171 | ||||||||
|
|
|
|
|
|
|
| |||||||||
BLENDED ASSET MODERATE SERIES CLASS R6: | FOR THE YEAR ENDED 10/31/19 | FOR THE YEAR ENDED 10/31/18 | ||||||||||||||
| SHARES | AMOUNT | SHARES | AMOUNT | |||||||||||||
Sold | 2,049,197 | $ | 21,783,539 | 4,058,746 | $ | 43,857,457 | ||||||||||
Repurchased | (4,805,589 | ) | (49,928,608 | ) | (3,865,514 | ) | (42,051,831 | ) | ||||||||
|
|
|
|
|
|
|
| |||||||||
Total | (2,756,392 | ) | $ | (28,145,069 | ) | 193,232 | $ | 1,805,626 | ||||||||
|
|
|
|
|
|
|
| |||||||||
BLENDED ASSET EXTENDED SERIES CLASS R6: | FOR THE YEAR ENDED 10/31/19 | FOR THE YEAR ENDED 10/31/18 | ||||||||||||||
| SHARES | AMOUNT | SHARES | AMOUNT | |||||||||||||
Sold | 3,645,933 | $ | 37,740,778 | 8,029,832 | $ | 83,952,516 | ||||||||||
Repurchased | (9,056,132 | ) | (90,140,575 | ) | (7,806,382) | (82,399,822 | ) | |||||||||
|
|
|
|
|
|
|
| |||||||||
Total | (5,410,199 | ) | $ | (52,399,797 | ) | 223,450 | $ | 1,552,694 | ||||||||
|
|
|
|
|
|
|
| |||||||||
BLENDED ASSET MAXIMUM SERIES CLASS R6: | FOR THE YEAR ENDED 10/31/19 | FOR THE YEAR ENDED 10/31/18 | ||||||||||||||
| SHARES | AMOUNT | SHARES | AMOUNT | |||||||||||||
Sold | 3,226,874 | $ | 37,659,088 | 4,814,424 | $ | 58,687,962 | ||||||||||
Repurchased | (5,081,020 | ) | (55,088,236 | ) | (5,871,326 | ) | (72,807,968 | ) | ||||||||
|
|
|
|
|
|
|
| |||||||||
Total | (1,854,146 | ) | $ | (17,429,148 | ) | (1,056,902 | ) | $ | (14,120,006 | ) | ||||||
|
|
|
|
|
|
|
| |||||||||
At October 31, 2019, the Target Income Series, another series of the Fund, owned 98.7% of Blended Asset Conservative Series. The Target 2020 Series and Target 2025 Series, other series of the Fund, owned 56.5%, and 43.3%, respectively, of Blended Asset Moderate Series. The Target 2025 Series, The Target 2030 Series, Target 2035 Series, and Target 2040 Series, other series of the Fund, owned 16.7%, 44.9%, 19.9% and 13.7%, respectively, of Blended Asset Extended Series. The Target 2035 Series, Target 2040 Series, Target 2045 Series, Target 2050 Series, and Target 2060 Series, other series of the Fund, owned 11.6%, 22.8%, 16.6%, 25.3%, and, 10.4%, respectively, of Blended Asset Maximum Series. Investment activities of these shareholders may have a material effect on the respective Series.
| 6. | Line of Credit |
The Fund has entered into a 364-day, $25 million credit agreement (the “line of credit”) with Bank of New York Mellon. Each series of the Fund may borrow under the line of credit for temporary or emergency purposes, including funding shareholder redemptions and other short-term liquidity purposes. The Fund pays an annual fee on the unused commitment amount, payable quarterly, and is allocated among all the series of the Fund and included in miscellaneous expenses in the Statement of Operations for each series. The line of credit expires in August 2020 unless extended or renewed. During the year ended October 31, 2019, none of the Series borrowed under the line of credit.
92
Notes to Financial Statements (continued)
| 7. | Financial Instruments and Loan Assignments |
The Series may trade in instruments including written and purchased options, forward foreign currency exchange contracts and futures contracts and other derivatives in the normal course of investing activities to assist in managing exposure to various market risks. The Series may be subject to various elements of risk which may involve, to a varying degree, elements of risk in excess of the amounts recognized for financial statement purposes. These risks include: the risk that changes in the value of a derivative may not correlate perfectly with the underlying asset, rate or index; counterparty credit risk related to over the counter derivative counterparties’ failure to perform under contract terms; liquidity risk related to the lack of a liquid market for these contracts allowing the fund to close out its position(s); and documentation risk relating to disagreement over contract terms. At October 31, 2019, Blended Asset Conservative Series, Blended Asset Moderate Series and Blended Asset Extended Series invested in options contracts (equity risk).
The Series may invest in a loan assignment of all or a portion of the loans. A Series has direct rights against the borrower on a loan when it purchases an assignment; however, the Series’ rights may be more limited than the lender from which it acquired the assignment and the Series may be able to enforce its rights only through an administrative agent. Loan assignments are vulnerable to market conditions and may become illiquid due to economic conditions or other events may reduce the demand for loan assignments and certain loan assignments which were liquid when purchased may become illiquid. At October 31, 2019, none of the Series held any loan assignments.
| 8. | Foreign Securities |
Investing in securities of foreign companies and foreign governments involves special risks and considerations not typically associated with investing in securities of domestic companies and the U.S. Government. These risks include revaluation of currencies and future adverse political and economic developments. Moreover, securities of foreign companies and foreign governments and their markets may be less liquid and their prices more volatile than those of comparable domestic companies and the U.S. Government.
| 9. | Federal Income Tax Information |
The amount and characterization of certain income and capital gains to be distributed are determined in accordance with federal income tax regulations, which may differ from GAAP. These differences are primarily due to differing book and tax treatments in the timing of the recognition on net investment income or gains and losses, including foreign currency gains and losses, losses deferred due to wash sales, investments in passive foreign investment companies (PFICs) and real estate investment trusts. Each Series may periodically make reclassifications among its capital accounts to reflect income and gains available for distribution (or available capital loss carryovers) under income tax regulations, without impacting the Series’ net asset value. Any such reclassifications are not reflected in the financial highlights.
The tax character of distributions paid were as follows:
| BLENDED ASSET | BLENDED ASSET | |||||||||||||||
| CONSERVATIVE SERIES | MODERATE SERIES | |||||||||||||||
| FOR THE YEAR | FOR THE YEAR | FOR THE YEAR | FOR THE YEAR | |||||||||||||
| ENDED 10/31/19 | ENDED 10/31/18 | ENDED 10/31/19 | ENDED 10/31/18 | |||||||||||||
Ordinary income | $ | 2,530,275 | $ | 1,240,645 | $ | 2,137,657 | $ | 1,043,313 | ||||||||
| BLENDED ASSET | BLENDED ASSET | |||||||||||||||
| EXTENDED SERIES | MAXIMUM SERIES | |||||||||||||||
| FOR THE YEAR | FOR THE YEAR | FOR THE YEAR | FOR THE YEAR | |||||||||||||
| ENDED 10/31/19 | ENDED 10/31/18 | ENDED 10/31/19 | ENDED 10/31/18 | |||||||||||||
Ordinary income | $ | 3,918,264 | $ | 1,607,139 | $ | 8,518,827 | $ | 854,993 | ||||||||
Long-term capital gains | — | — | 78,184 | 81 | ||||||||||||
93
Notes to Financial Statements (continued)
| 9. | Federal Income Tax Information (continued) |
At October 31, 2019, the tax basis of components of distributable earnings and the net unrealized appreciation based on the identified cost of investments for federal income tax purposes were as follows:
| BLENDED ASSET CONSERVATIVE SERIES | BLENDED ASSET MODERATE SERIES | BLENDED ASSET EXTENDED SERIES | BLENDED ASSET MAXIMUM SERIES | |||||||||||||
Cost for federal income tax purposes | $ | 76,656,641 | $ | 89,765,958 | $ | 158,076,331 | $ | 117,142,414 | ||||||||
Unrealized appreciation | 4,076,032 | 7,153,720 | 14,533,534 | 14,712,361 | ||||||||||||
Unrealized depreciation | (810,603 | ) | (1,621,490 | ) | (3,506,203 | ) | (4,147,658 | ) | ||||||||
|
|
|
|
|
|
|
| |||||||||
Net unrealized appreciation | $ | 3,265,429 | $ | 5,532,230 | $ | 11,027,331 | $ | 10,564,703 | ||||||||
|
|
|
|
|
|
|
| |||||||||
Undistributed ordinary income | $ | 845,782 | $ | 840,535 | $ | 1,229,900 | $ | 552,920 | ||||||||
Capital loss carryforwards | $ | (1,541,649 | ) | $ | (887,050 | ) | $ | (1,589,034 | ) | $ | (2,525,463 | ) | ||||
At October 31, 2019, Blended Asset Conservative Series, Blended Asset Moderate Series, Blended Asset Extended Series and Blended Asset Maximum Series had net short-term capital loss carryforwards of $806,654, $0, $7,906 and $1,656,726 and long-term capital loss carryforwards of $734,995, $887,050, $1,581,128 and $868,737, respectively, which may be carried forward indefinitely.
94
Report of Independent Registered Public Accounting Firm
To the Board of Directors of Manning & Napier Fund, Inc. and Shareholders of Blended Asset Conservative Series, Blended Asset Moderate Series, Blended Asset Extended Series and Blended Asset Maximum Series
Opinions on the Financial Statements
We have audited the accompanying statements of assets and liabilities, including the investment portfolios, of Blended Asset Conservative Series, Blended Asset Moderate Series, Blended Asset Extended Series and Blended Asset Maximum Series (four of the series constituting Manning & Napier Fund, Inc., hereafter collectively referred to as the “Funds”) as of October 31, 2019, the related statements of operations for the year ended October 31, 2019, the statements of changes in net assets for each of the two years in the period ended October 31, 2019, including the related notes, and the financial highlights for each of the periods indicated therein (collectively referred to as the “financial statements”). In our opinion, the financial statements present fairly, in all material respects, the financial position of each of the Funds as of October 31, 2019, the results of each of their operations for the year then ended, the changes in each of their net assets for each of the two years in the period ended October 31, 2019 and each of the financial highlights for each of the periods indicated therein in conformity with accounting principles generally accepted in the United States of America.
Basis for Opinions
These financial statements are the responsibility of the Funds’ management. Our responsibility is to express an opinion on the Funds’ financial statements based on our audits. We are a public accounting firm registered with the Public Company Accounting Oversight Board (United States) (“PCAOB”) and are required to be independent with respect to the Funds in accordance with the U.S. federal securities laws and the applicable rules and regulations of the Securities and Exchange Commission and the PCAOB.
We conducted our audits of these financial statements in accordance with the standards of the PCAOB. Those standards require that we plan and perform the audit to obtain reasonable assurance about whether the financial statements are free of material misstatement, whether due to error or fraud.
Our audits included performing procedures to assess the risks of material misstatement of the financial statements, whether due to error or fraud, and performing procedures that respond to those risks. Such procedures included examining, on a test basis, evidence regarding the amounts and disclosures in the financial statements. Our audits also included evaluating the accounting principles used and significant estimates made by management, as well as evaluating the overall presentation of the financial statements. Our procedures included confirmation of securities owned as of October 31, 2019 by correspondence with the custodian and brokers; when replies were not received from brokers, we performed other auditing procedures. We believe that our audits provide a reasonable basis for our opinions.

New York, New York
December 16, 2019
We have served as the auditor of one or more investment companies in Manning & Napier Mutual Funds since 1992.
95
Supplemental Tax Information
(unaudited)
All reportings are based on financial information available as of the date of this annual report and, accordingly, are subject to change.
For federal income tax purposes, each of the Series reports for the current fiscal year the amount disclosed below or, if different, the maximum amount allowable under the tax law as qualified dividend income (“QDI”).
Series | QDI | |||||
Blended Asset Conservative Series | $535,880 | |||||
Blended Asset Moderate Series | 521,588 | |||||
Blended Asset Extended Series | 1,301,419 | |||||
Blended Asset Maximum Series | 2,295,938 | |||||
For corporate shareholders, the percentage of investment income (dividend income plus short-term gain, if any) that qualifies for the dividends received deduction (DRD) for the current fiscal year is as follows:
Series | DRD% | |||||
Blended Asset Conservative Series | 14.05% | |||||
Blended Asset Moderate Series | 9.89% | |||||
Blended Asset Extended Series | 13.18% | |||||
Blended Asset Maximum Series | 12.05% | |||||
96
Directors’ and Officers’ Information
(unaudited)
The Statement of Additional Information provides additional information about the Fund’s directors and officers and can be obtained without charge by calling 1-800-466-3863, at www.manning-napier.com, or on the EDGAR Database on the SEC Internet web site (http://www.sec.gov). The following chart shows certain information about the Fund’s directors and officers, including their principal occupations during the last five years. Unless specific dates are provided, the individuals have held the listed positions for longer than five years.
| Interested Director and Officer | ||
| Name: | Paul Battaglia* | |
| Address: | 290 Woodcliff Drive Fairport, NY 14450 | |
| Age: | 41 | |
| Current Position(s) Held with Fund: | Principal Executive Officer, President, Chairman & Director | |
| Term of Office & Length of Time Served: | Indefinite – Chairman and Director since November 20181 | |
| Principal Occupation(s) During Past 5 Years: | Chief Financial Officer (2018 – Present); Vice President of Finance (2016 – 2018); Director of Finance (2011 – 2016); Financial Analyst/Internal Auditor (2004-2006) – Manning & Napier Advisors, LLC and affiliates Holds one or more of the following titles for various affiliates: Chief Financial Officer | |
| Number of Portfolios Overseen within Fund Complex: | 32 | |
Other Directorships Held Outside Fund Complex During Past 5 Years:
| N/A | |
| Independent Directors | ||
| Name: | Stephen B. Ashley | |
| Address: | 290 Woodcliff Drive | |
| Fairport, NY 14450 | ||
| Age: | 79 | |
| Current Position(s) Held with Fund: | Director, Audit Committee Member, Governance & Nominating Committee Member | |
| Term of Office & Length of Time Served: | Indefinite – Since 1996 | |
| Principal Occupation(s) During Past 5 Years: | Chairman, Director & Chief Executive Officer (1997 to present) - The Ashley Group (property management and investment). Director (1995-2008) and Chairman (non-executive) (2004-2008) - Fannie Mae (mortgage) | |
| Number of Portfolios Overseen within Fund Complex: | 32 | |
| Other Directorships Held Outside Fund Complex During | Fannie Mae (1995-2008) | |
| Past 5 Years: | The Ashley Group (1995-2008) | |
Genesee Corporation (1987-2007)
| ||
| Name: | Paul A. Brooke | |
| Address: | 290 Woodcliff Drive | |
| Fairport, NY 14450 | ||
| Age: | 73 | |
| Current Position(s) Held with Fund: | Lead Independent Director, Audit Committee Member, Governance & Nominating Committee Chairman | |
| Term of Office & Length of Time Served: | Indefinite – Director, Audit Committee Member, Governance & Nominating Committee Member since 2007; Governance & Nominating Committee Chairman since 2016; Lead Independent Director since 2017 | |
| Principal Occupation(s) During Past 5 Years: | Chairman & CEO (2005-2009) - Ithaka Acquisition Corporation (investments); Chairman (2007-2009) - Alsius Corporation (investments); Managing Member (1991-present) - PMSV Holdings LLC (investments); Managing Member (2010-2016) - Venbio (investments). | |
| Number of Portfolios Overseen within Fund Complex: | 32 | |
Other Directorships Held Outside Fund Complex During Past 5 Years: | Incyte Corp. (biotech)(2000-present); ViroPharma, Inc. (speciality pharmaceuticals)(2000-2014); HLTH (WebMD)(information)(2000-2010); Cheyne Capital International (investment)(2000-2017); GMP Companies (investment)(2000-2011); Cytos Biotechnology Ltd. (biotechnology)(2012-2014); Cerus (biomedical)(2016-present); PureEarth(non-profit)(2012-present); Caelum BioSciences (biomedical)(2018-present)
| |
97
Directors’ and Officers’ Information
(unaudited)
Independent Directors (continued)
Name: | Peter L. Faber | |
Address: | 290 Woodcliff Drive | |
| Fairport, NY 14450 | ||
Age: | 81 | |
Current Position(s) Held with Fund: | Director, Governance & Nominating Committee Member | |
Term of Office & Length of Time Served: | Indefinite – Since 1987 | |
Principal Occupation(s) During Past 5 Years: | Senior Counsel (2006-2012), Partner (1995-2006 & 2013-present) - McDermott, Will & Emery LLP (law firm) | |
Number of Portfolios Overseen within Fund Complex: | 32 | |
Other Directorships Held Outside Fund Complex During Past 5 Years: | Boston Early Music Festival (non-profit)(2007-present); Amherst Early Music, Inc. (non-profit)(2009-present); Gotham Early Music Scene, Inc. (non-profit)(2009-present); Partnership for New York City, Inc. (non-profit)(1989-2010); New York Collegium (non-profit)(2004-2011); S’Cool Sounds, Inc. (non-profit)(2017-present)
| |
Name: | Harris H. Rusitzky | |
Address: | 290 Woodcliff Drive | |
| Fairport, NY 14450 | ||
Age: | 84 | |
Current Position(s) Held with Fund: | Director, Audit Committee Member, Governance & Nominating Committee Member | |
Term of Office & Length of Time Served: | Indefinite – Since 1985 | |
Principal Occupation(s) During Past 5 Years: | President (1994- present) - The Greening Group (business consultants); Partner (2006-present) - The Restaurant Group (restaurants) | |
Number of Portfolios Overseen within Fund Complex: | 32 | |
Other Directorships Held Outside Fund Complex During | Rochester Institute of Technology (university)(1972-present); Culinary | |
Past 5 Years: | Institute of America (non-profit college)(1985-present); George Eastman | |
House (museum)(1988-present); National Restaurant Association (restaurant trade organization)(1978-present)
| ||
Name: | Chester N. Watson | |
Address: | 290 Woodcliff Drive | |
| Fairport, NY 14450 | ||
Age: | 69 | |
Current Position(s) Held with Fund: | Director, Audit Committee Chairman, Governance & Nominating Committee Member | |
Term of Office & Length of Time Served: | Indefinite – Director, Audit Committee Member, Governance & Nominating Committee Member Since 2012; Audit Committee Chairman since 2013 | |
Principal Occupation(s) During Past 5 Years: | General Auditor (2003-2011) - General Motors Company (auto manufacturer) | |
Number of Portfolios Overseen within Fund Complex: | 32 | |
Other Directorships Held Outside Fund Complex During Past 5 Years: | Rochester Institute of Technology (university)(2005-present); Town of Greenburgh, NY Planning Board (municipal government) (2015-2018)
| |
| Officers: | ||
| Name: | Elizabeth Craig | |
| Address: | 290 Woodcliff Drive | |
| Fairport, NY 14450 | ||
| Age: | 32 | |
| Current Position(s) Held with Fund: | Corporate Secretary | |
| Term of Office1 & Length of Time Served: | Since 2016 | |
| Principal Occupation(s) During Past 5 Years: | Fund Regulatory Administration Manager since 2018; Fund Administration Manager (2015-2018); Mutual Fund Compliance Specialist (2009-2015) - Manning & Napier Advisors, LLC; Assistant Corporate Secretary (2011-2016) - Manning & Napier Fund, Inc.
| |
98
Directors’ and Officers’ Information
(unaudited)
Officers: (continued)
| Name: | Christine Glavin | |
| Address: | 290 Woodcliff Drive | |
| Fairport, NY 14450 | ||
| Age: | 53 | |
| Current Position(s) Held with Fund: | Principal Financial Officer, Chief Financial Officer | |
| Term of Office1 & Length of Time Served: | Principal Financial Officer since 2002; Chief Financial Officer since 2001 | |
| Principal Occupation(s) During Past 5 Years: | Director of Fund Reporting since 2011; Fund Reporting Manager (1997-2011) - Manning & Napier Advisors, LLC; Assistant Treasurer since 2008 - Exeter Trust Company; Chief Financial Officer (2017-2018) - Rainier Investment Management Mutual Funds, Inc.
| |
| Name: | Samantha Larew | |
| Address: | 290 Woodcliff Drive | |
| Fairport, NY 14450 | ||
| Age: | 39 | |
| Current Position(s) Held with Fund: | Chief Compliance Officer and Anti-Money Laundering Compliance Officer | |
| Term of Office1 & Length of Time Served: | Chief Compliance Officer since 2019; Anti-Money Laundering Compliance | |
| Officer since 2018 | ||
| Principal Occupation(s) During Past 5 Years: | Co-Director of Compliance (since 2018); Compliance Communications Supervisor (2014-2018); Compliance Supervisor (2011-2014); Broker-Dealer Compliance Analyst (2010-2014) - Manning & Napier Advisors, LLC and affiliates; Broker-Dealer Chief Compliance Officer (since 2013) – Manning & Napier Investor Services, Inc.; Compliance Analyst (2007-2009) – Wall Street Financial Group; Compliance Specialist (2003-2007) – Manning & Napier Advisors, LLC and affiliates Holds one or more of the following titles for various affiliates: Assistant Corporate Secretary, Chief Compliance Officer
| |
| Name: | Scott Morabito | |
| Address: | 290 Woodcliff Drive | |
| Fairport, NY 14450 | ||
| Age: | 31 | |
| Current Position(s) Held with Fund: | Vice President | |
| Term of Office1 & Length of Time Served: | Vice President since 2019; Assistant Vice President (2017-2019) | |
| Principal Occupation(s) During Past 5 Years: | Managing Director of Operations since 2019 and Director of Funds Group from 2017 - 2019; Fund Product and Strategy Manager (2014-2017); Senior Product and Strategy Analyst (2013-2014); Product and Strategy Analyst (2011-2013) - Manning & Napier Advisors, LLC; President, Director – Manning & Napier Investor Services, Inc. since 2018
| |
| Name: | Sarah Turner | |
| Address: | 290 Woodcliff Drive | |
| Fairport, NY 14450 | ||
| Age: | 37 | |
| Current Position(s) Held with Fund: | Chief Legal Officer; Assistant Corporate Secretary | |
| Term of Office1 & Length of Time Served: | Since 2018 | |
| Principal Occupation(s) During Past 5 Years: | General Counsel since 2018 - Manning & Napier Advisors, LLC and affiliates; Counsel (2017-2018) – Harter Secrest and Emery LLP; Legal Counsel (2010-2017) – Manning & Napier Advisors, LLC and affiliates Holds one or more of the following titles for various affiliates: Corporate Secretary, General Counsel
| |
*Interested Director, within the meaning of the 1940 Act by reason of his positions with the Fund’s Advisor, Manning & Napier Advisors, LLC, and Distributor, Manning & Napier Investor Services, Inc.
1The term of office of all officers shall be one year and until their respective successors are chosen and qualified, or his or her earlier resignation or removal as provided in the Fund’s By-Laws.
99
{This page intentionally left blank}
100
{This page intentionally left blank}
101
Literature Requests
(unaudited)
Proxy Voting Policies and Procedures
A description of the policies and procedures that the Fund uses to determine how to vote proxies relating to portfolio securities is available, without charge, upon request:
| By phone | 1-800-466-3863 | |
| On the Securities and Exchange | ||
| Commission’s (SEC) web site | http://www.sec.gov |
Proxy Voting Record
Information regarding how the Fund voted proxies relating to portfolio securities during the most recent 12-month period ended June 30th is available, without charge, upon request:
| By phone | 1-800-466-3863 | |
| On the SEC’s web site | http://www.sec.gov |
Quarterly Portfolio Holdings
The Series’ complete schedule of portfolio holdings for the 1st and 3rd quarters of each fiscal year are provided on Form N-PORT, and are available, without charge, upon request:
| By phone | 1-800-466-3863 | |
| On the SEC’s web site | http://www.sec.gov |
Prospectus and Statement of Additional Information (SAI)
For more information about any of the Manning & Napier Fund, Inc. Series, you may obtain a prospectus and SAI at www.manning-napier.com or by calling (800) 466-3863. Before investing, carefully consider the objectives, risks, charges and expenses of the investment and read the prospectus carefully as it contains this and other information about the investment company.In addition, this information can be found on the SEC’s web site, http://www.sec.gov.
Additional information available at www.manning-napier.com
1. Fund Holdings - Month-End
2. Fund Holdings - Quarter-End
3. Shareholder Report - Annual
4. Shareholder Report - Semi-Annual
The Fund also offers electronic notification or “e-delivery” when certain documents are available on-line to be downloaded or reviewed. Direct shareholders can elect to receive electronic notification when shareholder reports, prospectus updates, and/or quarterly statements are available. If you do not currently have on-line access to your account, you can establish access by going to www.manning-napier.com, click on “Login” in the top corner of the page, and follow the prompts to self-enroll. Once enrolled, you can set your electronic notification preferences by clicking on the Account Options tab located within the green toolbar and then select E-Delivery Option. Should you have any questions on either how to establish on-line access or how to update your account settings, please contact Investor Services at 1-800-466-3863.
The Manning & Napier Fund, Inc. is managed by Manning & Napier Advisors, LLC. Manning & Napier Investor Services, Inc., an affiliate of Manning & Napier Advisors, LLC, is the distributor of the Fund shares.
MNBLA-10/19-AR

Manning & Napier Fund, Inc.
| ||||
Target Income Series | ||||
Target 2015 Series | ||||
Target 2020 Series | ||||
Target 2025 Series | ||||
Target 2030 Series | ||||
Target 2035 Series | ||||
Target 2040 Series | ||||
Target 2045 Series | ||||
Target 2050 Series | ||||
Target 2055 Series | ||||
| Target 2060 Series | ||||
Beginning on June 25, 2021, as permitted by Securities and Exchange Commission regulations, paper copies of the Series’ annual and semi-annual shareholder reports will no longer be sent by mail, unless you specifically request paper copies of the reports from the Fund or from your financial intermediary, such as a broker-dealer or bank. Instead, the reports will be made available on a website, and you will be notified by mail each time a report is posted and provided with a website link to access the report.
If you already elected to receive shareholder reports electronically, you will not be affected by this change and you need not take any action. You may elect to receive shareholder reports and other communications from the Fund electronically by contacting your financial intermediary or, if you are a direct investor, by visiting www.manning-napier.com or calling1-800-466-3863.
You may elect to receive all future annual and semi-annual reports in paper free of charge. If you invest through a financial intermediary, you can contact your financial intermediary to request that you continue to receive paper copies of your shareholder reports. If you invest directly with the Fund, you can inform the Fund that you wish to continue receiving paper copies of your shareholder reports by visiting www.manning-napier.com or calling1-800-466-3863. Your election to receive reports in paper will apply to all funds held with your financial intermediary if you invest through a financial intermediary or all series of the Fund if you invest directly with the Fund.
 |
Independent Perspective| Real-World Solutions |
A Note from Our CEO
Dear Shareholder,
The investing world is constantly changing, yet investors’ needs and objectives remain substantially the same.
Whether you are an individual saver looking to ensure security in retirement, or an institutional investor with a fiduciary obligation to others, at the end of the day you look for a trusted partner to help you build, grow, and preserve wealth.
In order to do so successfully we recognize that, in the short-term, the world’s capital markets can be capricious and hard to predict.
Bubbles form, rise, and then pop. The hot stocks of today often become passing fads of tomorrow. Investor sentiment can swing wildly, whipsawing between exuberance one day and despondence the next.
As successful long-term investors, we are defined both by what we do as well as what we don’t do.
We don’t attempt to perfectly time every recession. We don’t jump on the latest trend. We don’t worry about capturing every market peak all across the globe.
On the other hand, we do maintain the rigorous disciplines we have developed over close to half a century. We are highly attentive to managing risk and protecting investors in down markets while participating fully in the opportunities our Research uncovers.
Our focus is on you, the shareholder, and helping you achieve your goals.
In the face of an uncertain world, we believe our investment philosophies, processes, and experience have stood the test of time and will do so in the future.
We appreciate your continued confidence in our approach.
 |
Sincerely, | |||
 | ||||
| Marc Mayer | ||||
Chief Executive Officer
| ||||
Corporate Headquarters| 290 Woodcliff Drive| Fairport, NY 14450| (585)325-6880 phone| (800)551-0224 toll free| www.manning-napier.com
1
Fund Commentary
(unaudited)
Investment Objective
To provide capital growth and manage risk for investors planning to retire (or meet another investment goal) in or around the year indicated in the fund’s name.
The Target Series include eleven distinct mutual funds, each of which is managed to a designated target date. The portfolios of each Series are strategically allocated to become increasingly conservative as the specified target date approaches.
Performance Commentary
Global equity and fixed income markets posted strong positive returns for the twelve-month period ending October 31, 2019. Over the one year period, equities outperformed fixed income markets, and within stocks, US equities outperformed international markets. With respect to equities,large-cap stocks outperformed small- andmid-cap stocks, while growth stocks outperformed their value counterparts. On the fixed income side, corporate bonds experienced the highest returns from a sector perspective, while longer dated bonds were the highest returning segment of the market from a maturity perspective as a result of falling interest rates.
Each of the Target Date Series Class K shares delivered positive returns over the period, and, with the exception of the Income through 2025 vintages, outperformed their respective blended benchmarks.
Among the largest contributors to relative returns (i.e., returns compared to the benchmark) was stock selection in Materials, Health Care, Consumer Staples, Information Technology, and Real Estate, as well as from an overweight to Real Estate and underweight to Energy. Additionally, selection within Consumer Discretionary was a large contributor to outperformance for the more equity-oriented vintages. Underperformance for the more fixed-income oriented vintages was largely attributable to positioning within the fixed income portion of the portfolio when compared to the benchmark. Specifically, a shorter duration in a period where interest rates generally fell.
We believe the global economy is showing signs of moving into the later stages of the economic cycle. When this occurs, it is common to see strong stock market gains. While these rallies may give investors the feeling of missing out, it is exactly in these moments that risk management can be most valuable.
Given our outlook, the portfolios are focused on higher quality businesses and reasonably priced growth companies. We prefer businesses with strong management and solid balance sheets who have historically provided some degree of downside protection in adverse markets.
This view has led to meaningful positions in areas such as Consumer Staples and Health Care. In contrast, the portfolios are less exposed to sectors that are highly dependent on strong and above average economic growth such as Industrials and Energy. On the fixed income side, we are seeing opportunities in select corporate bonds and shorter duration, higher-quality securitized credit.
Performance data quoted represents past performance and does not guarantee future results. The investment return and principal value of an investment will fluctuate, so that an investor’s shares, when redeemed, may be worth more or less than their original cost. Current performance may be higher or lower than that quoted; investors can obtain the most recentmonth-end performance at www.manning-napier.com or by calling (800)466-3863.
Commentary prepared using data provided by FactSet. Analysis Manning & Napier. Commentary presented is relative to each Series’ respective blended benchmark. Additional information and associated disclosures can be found on the Performance Update pages contained in this report.
Each Manning & Napier Fund, Inc. Target Series is invested in one or two of four proprietary risk-based funds based on the Target Series becoming increasingly conservative over time. Because the underlying funds invest in both stocks and bonds, the value of your investment will fluctuate in response to stock market movements and changes in interest rates. Investing in target date funds will also involve a number of other risks, including issuer-specific risk, foreign investment risk, andsmall-cap/mid-cap risk, as the underlying investments change over time. Investments in options and futures, like all derivatives, can be highly volatile and involve risks in addition to the risks of the underlying instrument on which the derivative is based, such as counterparty, correlation and liquidity risk. Also, the use of leverage increases exposure to the market and may magnify potential losses. Principal value is not guaranteed at any time, including at the target date (the approximate year when an investor plans to stop contributions and start periodic withdrawals).
2
Performance Update as of October 31, 2019 - Target Income Series
(unaudited)
AVERAGE ANNUAL TOTAL RETURNS | ||||||
| AS OF OCTOBER 31, 2019 | ||||||
| ONE | FIVE | TEN | ||||
| YEAR1 | YEAR | YEAR | ||||
Target Income Series - Class K2
|
10.25%
|
3.43%
|
5.10%
| |||
Target Income Series - Class R2
|
9.99%
|
3.17%
|
4.83%
| |||
Target Income Series - Class I2
| 10.47%
| 3.68%
| 5.35%
| |||
Standard & Poor’s (S&P) Target Date Retirement Income Index3
| 9.90%
| 4.33%
| 5.57%
| |||
Income Composite Benchmark4
| 10.38%
| 4.57%
|
5.58%
| |||
The following graph compares the value of a $10,000 investment in the Target Income Series - Class K for the ten years ended October 31, 2019 to the S&P Target Date Retirement Income Index and the Income Composite Benchmark.
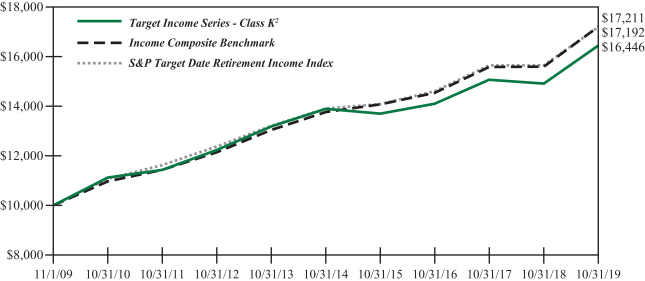
1The returns shown are based on net asset values calculated for shareholder transactions and may differ from the returns shown in the financial highlights, which reflect adjustments made to the net asset values in accordance with accounting principles generally accepted in the United States of America.
2The Series’ performance does not reflect the deduction of taxes that a shareholder would pay on fund distributions or the redemption of shares. The Series’ performance is historical and may not be indicative of future results. The performance returns shown are inclusive of the net expense ratio of the Series. For the year ended October 31, 2019, this net expense ratio was 0.45% for Class K, 0.70% for Class R and 0.20% for Class I. The gross expense ratio, which does not account for any voluntary or contractual waivers currently in effect, was 0.57% for Class K, 0.79% for Class R and 0.44% for Class I for the year ended October 31, 2019.
3The S&P Target Date Index Series is a series of unmanaged indices that reflect the market consensus for asset allocations for different target date horizons. Asset class weights are established annually and rebalanced monthly. Prior to 02/26/2010, the indices were rebalanced annually. Index returns assume daily reinvestment of dividends. Beginning 06/ 01/2017, the asset class exposure for each index is represented by indices and returns do not reflect any fees or expenses. Prior to 06/01/2017, the asset class exposure for each index is represented by exchange traded funds (ETFs) and returns are net of ETF expenses. Index returns provided by Bloomberg. S&P Dow Jones Indices LLC, a subsidiary of the McGraw Hill Financial, Inc., is the publisher of various index based data products and services and has licensed certain of its products and services for use by Manning & Napier. All such content Copyright © 2017 by S&P Dow Jones Indices LLC and/or its affiliates. All rights reserved. Neither S&P Dow Jones Indices LLC, Dow Jones Trademark Holdings LLC, their affiliates nor their third party licensors make any representation or warranty, express or implied, as to the ability of any index to accurately represent the asset class or market sector that it purports to represent and none of these parties shall have any liability for any errors, omissions, or interruptions of any index or the data included therein.
4The Target Composite Benchmark represents the performance of the target date fund’s asset classes according to their respective weightings, as adjusted over time to reflect the target date fund’s increasingly conservative asset allocations. The following indices are used to calculate the Target Composite Benchmarks: Russell 3000® Index (Russell 3000), MSCI ACWI ex USA Index (ACWIxUS), and Bloomberg Barclays U.S. Aggregate Bond Index (BAB) and/or Bloomberg Barclays U.S. Intermediate Aggregate Bond Index (BIAB). Russell 3000 is an unmanaged index that consists of 3,000 of the largest U.S. companies based on total market capitalization. Index returns are based on a market capitalization-weighted average of relative price changes of the component stocks plus dividends whose reinvestments are compounded daily. Index returns provided by Bloomberg. ACWIxUS
3
Performance Update as of October 31, 2019 - Target Income Series
(unaudited)
is designed to measure large andmid-cap representation across 22 of 23 Developed Markets countries (excluding the U.S.) and 26 Emerging Markets countries. The Index is denominated in U.S. dollars. The Index returns are net of withholding taxes. They assume daily reinvestment of net dividends thus accounting for any applicable dividend taxation. Index returns provided by Bloomberg. BAB and BIAB are both unmanaged, market value-weighted indices of U.S. domestic investment-grade debt issues, including government, corporate, asset-backed and mortgage-backed securities. BAB includes maturities of one year or more; BIAB includes maturities of greater than one year but less than ten years. BAB and BIAB returns provided by Interactive Data. Indices returns do not reflect any fees or expenses. Returns provided are calculated monthly using a blended allocation. Because the target date fund’s asset allocation will vary over time, the composition of the target date portfolio may not match the composition of the comparative Target Composite Benchmark.Mid-month performance is not available for the Composite Benchmark. Performance shown is from the first of the month following the corresponding Fund’s inception date.
4
Performance Update as of October 31, 2019 - Target 2015 Series
(unaudited)
AVERAGE ANNUAL TOTAL RETURNS AS OF OCTOBER 31, 2019
| ||||||
ONE YEAR1
|
FIVE YEAR
|
SINCE INCEPTION2
| ||||
Target 2015 Series - Class K3
| 10.45%
| 3.37%
| 5.62%
| |||
Target 2015 Series - Class R3
| 10.31%
| 3.13%
| 5.42%
| |||
Target 2015 Series - Class I3
| 10.68%
| 3.63%
| 5.90%
| |||
S&P Target Date 2015 Index4
| 10.28%
| 5.22%
| 6.95%
| |||
2015 Composite Benchmark5
| 10.74%
| 5.07%
| 6.27%
| |||
The following graph compares the value of a $10,000 investment in the Target 2015 Series - Class K from its inception2 (6/25/12) to present (10/31/19) to the S&P Target Date 2015 Index and the 2015 Composite Benchmark.
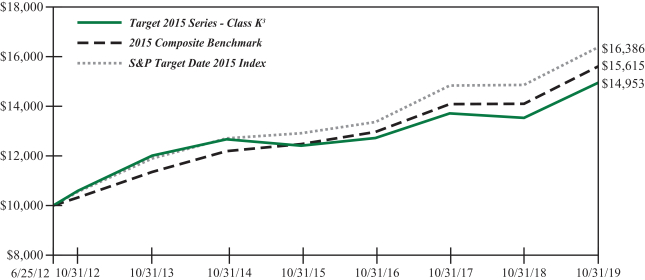
1The returns shown are based on net asset values calculated for shareholder transactions and may differ from the returns shown in the financial highlights, which reflect adjustments made to the net asset values in accordance with accounting principles generally accepted in the United States of America.
2Performance numbers for the Series and the S&P Target Date Index are calculated from June 25, 2012, the Series’ inception date. Performance numbers for the Target Composite Benchmark are calculated from June 30, 2012.
3The Series’ performance does not reflect the deduction of taxes that a shareholder would pay on fund distributions or the redemption of shares. The Series’ performance is historical and may not be indicative of future results. The performance returns shown are inclusive of the net expense ratio of the Series. For the year ended October 31, 2019, this net expense ratio was 0.45% for Class K, 0.70% for Class R and 0.20% for Class I. The gross expense ratio, which does not account for any voluntary or contractual waivers currently in effect, was 11.05% for Class K, 11.32% for Class R and 10.82% for Class I for the year ended October 31, 2019.
4The S&P Target Date Index Series is a series of unmanaged indices that reflect the market consensus for asset allocations for different target date horizons. Asset class weights are established annually and rebalanced monthly. Prior to 02/26/2010, the indices were rebalanced annually. Index returns assume daily reinvestment of dividends. Beginning 06/01/2017, the asset class exposure for each index is represented by indices and returns do not reflect any fees or expenses. Prior to 06/01/2017, the asset class exposure for each index is represented by exchange traded funds (ETFs) and returns are net of ETF expenses. Index returns provided by Bloomberg. S&P Dow Jones Indices LLC, a subsidiary of the McGraw Hill Financial, Inc., is the publisher of various index based data products and services and has licensed certain of its products and services for use by Manning & Napier. All such content Copyright © 2017 by S&P Dow Jones Indices LLC and/or its affiliates. All rights reserved. Neither S&P Dow Jones Indices LLC, Dow Jones Trademark Holdings LLC, their affiliates nor their third party licensors make any representation or warranty, express or implied, as to the ability of any index to accurately represent the asset class or market sector that it purports to represent and none of these parties shall have any liability for any errors, omissions, or interruptions of any index or the data included therein.
5The Target Composite Benchmark represents the performance of the target date fund’s asset classes according to their respective weightings, as adjusted over time to reflect the target date fund’s increasingly conservative asset allocations. The following indices are used to calculate the Target Composite Benchmarks: Russell 3000® Index (Russell 3000),
5
Performance Update as of October 31, 2019 - Target 2015 Series
(unaudited)
MSCI ACWI ex USA Index (ACWIxUS), and Bloomberg Barclays U.S. Aggregate Bond Index (BAB) and/or Bloomberg Barclays U.S. Intermediate Aggregate Bond Index (BIAB). Russell 3000 is an unmanaged index that consists of 3,000 of the largest U.S. companies based on total market capitalization. Index returns are based on a market capitalization-weighted average of relative price changes of the component stocks plus dividends whose reinvestments are compounded daily. Index returns provided by Bloomberg. ACWIxUS is designed to measure large andmid-cap representation across 22 of 23 Developed Markets countries (excluding the U.S.) and 26 Emerging Markets countries. The Index is denominated in U.S. dollars. The Index returns are net of withholding taxes. They assume daily reinvestment of net dividends thus accounting for any applicable dividend taxation. Index returns provided by Bloomberg. BAB and BIAB are both unmanaged, market value-weighted indices of U.S. domestic investment-grade debt issues, including government, corporate, asset-backed and mortgage-backed securities. BAB includes maturities of one year or more; BIAB includes maturities of greater than one year but less than ten years. BAB and BIAB returns provided by Interactive Data. Indices returns do not reflect any fees or expenses. Returns provided are calculated monthly using a blended allocation. Because the target date fund’s asset allocation will vary over time, the composition of the target date portfolio may not match the composition of the comparative Target Composite Benchmark.Mid-month performance is not available for the Composite Benchmark. Performance shown is from the first of the month following the corresponding Fund’s inception date.
6
Performance Update as of October 31, 2019 - Target 2020 Series
(unaudited)
AVERAGE ANNUAL TOTAL RETURNS AS OF OCTOBER 31, 2019 | ||||||
ONE YEAR1
|
FIVE YEAR
|
TEN YEAR
| ||||
Target 2020 Series - Class K2
| 11.93%
| 3.84%
| 6.60%
| |||
Target 2020 Series - Class R2
| 11.59%
| 3.59%
| 6.33%
| |||
Target 2020 Series - Class I2
| 12.29%
| 4.10%
| 6.87%
| |||
S&P Target Date 2020 Index3
| 10.57%
| 5.64%
| 7.82%
| |||
2020 Composite Benchmark4
| 12.46%
| 5.74%
| 7.48%
| |||
The following graph compares the value of a $10,000 investment in the Target 2020 Series - Class K for the ten years ended October 31, 2019 to the S&P Target Date 2020 Index and the 2020 Composite Benchmark.
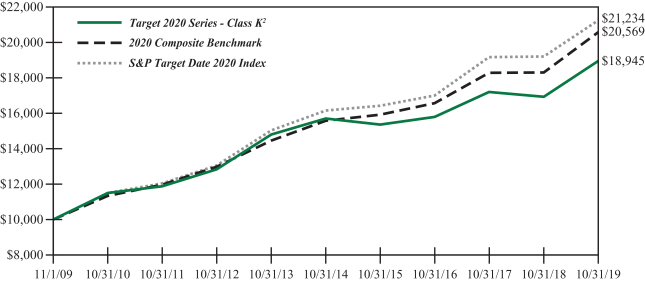
1The returns shown are based on net asset values calculated for shareholder transactions and may differ from the returns shown in the financial highlights, which reflect adjustments made to the net asset values in accordance with accounting principles generally accepted in the United States of America.
2The Series’ performance does not reflect the deduction of taxes that a shareholder would pay on fund distributions or the redemption of shares. The Series’ performance is historical and may not be indicative of future results. The performance returns shown are inclusive of the net expense ratio of the Series. For the year ended October 31, 2019, this net expense ratio was 0.45% for Class K, 0.70% for Class R and 0.20% for Class I. The gross expense ratio, which does not account for any voluntary or contractual waivers currently in effect, was 0.67% for Class K, 0.87% for Class R and 0.52% for Class I for the year ended October 31, 2019.
3The S&P Target Date Index Series is a series of unmanaged indices that reflect the market consensus for asset allocations for different target date horizons. Asset class weights are established annually and rebalanced monthly. Prior to 02/26/2010, the indices were rebalanced annually. Index returns assume daily reinvestment of dividends. Beginning 06/01/2017, the asset class exposure for each index is represented by indices and returns do not reflect any fees or expenses. Prior to 06/01/2017, the asset class exposure for each index is represented by exchange traded funds (ETFs) and returns are net of ETF expenses. Index returns provided by Bloomberg. S&P Dow Jones Indices LLC, a subsidiary of the McGraw Hill Financial, Inc., is the publisher of various index based data products and services and has licensed certain of its products and services for use by Manning & Napier. All such content Copyright © 2017 by S&P Dow Jones Indices LLC and/or its affiliates. All rights reserved. Neither S&P Dow Jones Indices LLC, Dow Jones Trademark Holdings LLC, their affiliates nor their third party licensors make any representation or warranty, express or implied, as to the ability of any index to accurately represent the asset class or market sector that it purports to represent and none of these parties shall have any liability for any errors, omissions, or interruptions of any index or the data included therein.
4The Target Composite Benchmark represents the performance of the target date fund’s asset classes according to their respective weightings, as adjusted over time to reflect the target date fund’s increasingly conservative asset allocations. The following indices are used to calculate the Target Composite Benchmarks: Russell 3000® Index (Russell 3000), MSCI ACWI ex USA Index (ACWIxUS), and Bloomberg Barclays U.S. Aggregate Bond Index (BAB) and/or Bloomberg Barclays U.S. Intermediate Aggregate Bond Index (BIAB). Russell 3000 is an unmanaged index that consists of 3,000 of the largest U.S. companies based on total market capitalization. Index returns are based on a market capitalization-weighted average of relative price changes of the component stocks plus dividends whose reinvestments are compounded daily. Index returns provided by Bloomberg. ACWIxUS
7
Performance Update as of October 31, 2019 - Target 2020 Series
(unaudited)
is designed to measure large andmid-cap representation across 22 of 23 Developed Markets countries (excluding the U.S.) and 26 Emerging Markets countries. The Index is denominated in U.S. dollars. The Index returns are net of withholding taxes. They assume daily reinvestment of net dividends thus accounting for any applicable dividend taxation. Index returns provided by Bloomberg. BAB and BIAB are both unmanaged, market value-weighted indices of U.S. domestic investment-grade debt issues, including government, corporate, asset-backed and mortgage-backed securities. BAB includes maturities of one year or more; BIAB includes maturities of greater than one year but less than ten years. BAB and BIAB returns provided by Interactive Data. Indices returns do not reflect any fees or expenses. Returns provided are calculated monthly using a blended allocation. Because the target date fund’s asset allocation will vary over time, the composition of the target date portfolio may not match the composition of the comparative Target Composite Benchmark.Mid-month performance is not available for the Composite Benchmark. Performance shown is from the first of the month following the corresponding Fund’s inception date.
8
Performance Update as of October 31, 2019 - Target 2025 Series
(unaudited)
AVERAGE ANNUAL TOTAL RETURNS AS OF OCTOBER 31, 2019
| ||||||
ONE
| FIVE YEAR
| SINCE INCEPTION2
| ||||
Target 2025 Series - Class K3 | 12.26% | 4.12% | 7.25% | |||
Target 2025 Series - Class R3 | 11.99% | 3.88% | 7.04% | |||
Target 2025 Series - Class I3 | 12.59% | 4.39% | 7.47% | |||
S&P Target Date 2025 Index4 | 10.95% | 6.08% | 8.48% | |||
2025 Composite Benchmark5 | 12.49% | 6.01% | 7.54% | |||
The following graph compares the value of a $10,000 investment in the Target 2025 Series - Class K from its inception2 (6/25/12) to present (10/31/19) to the 2025 Composite Benchmark, and S&P Target Date 2025 Index.
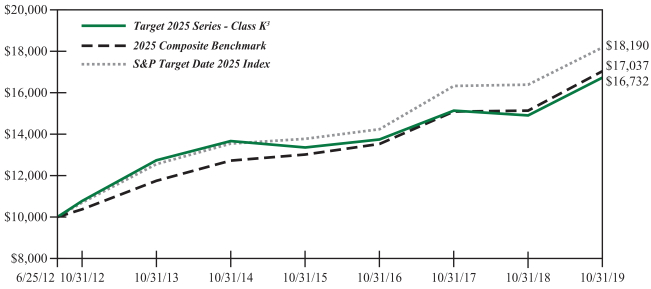
1The returns shown are based on net asset values calculated for shareholder transactions and may differ from the returns shown in the financial highlights, which reflect adjustments made to the net asset values in accordance with accounting principles generally accepted in the United States of America.
2Performance numbers for the Series and the S&P Target Date Index are calculated from June 25, 2012, the Series’ inception date. Performance numbers for the Target Composite Benchmark are calculated from June 30, 2012.
3The Series’ performance does not reflect the deduction of taxes that a shareholder would pay on fund distributions or the redemption of shares. The Series’ performance is historical and may not be indicative of future results. The performance returns shown are inclusive of the net expense ratio of the Series. For the year ended October 31, 2019, this net expense ratio was 0.45% for Class K, 0.70% for Class R and 0.20% for Class I. The gross expense ratio, which does not account for any voluntary or contractual waivers currently in effect, was 0.66% for Class K, 0.90% for Class R and 0.54% for Class I for the year ended October 31, 2019.
4The S&P Target Date Index Series is a series of unmanaged indices that reflect the market consensus for asset allocations for different target date horizons. Asset class weights are established annually and rebalanced monthly. Prior to 02/26/2010, the indices were rebalanced annually. Index returns assume daily reinvestment of dividends. Beginning 06/ 01/2017, the asset class exposure for each index is represented by indices and returns do not reflect any fees or expenses. Prior to 06/01/2017, the asset class exposure for each index is represented by exchange traded funds (ETFs) and returns are net of ETF expenses. Index returns provided by Bloomberg. S&P Dow Jones Indices LLC, a subsidiary of the McGraw Hill Financial, Inc., is the publisher of various index based data products and services and has licensed certain of its products and services for use by Manning & Napier. All such content Copyright© 2017 by S&P Dow Jones Indices LLC and/or its affiliates. All rights reserved. Neither S&P Dow Jones Indices LLC, Dow Jones Trademark Holdings LLC, their affiliates nor their third party licensors make any representation or warranty, express or implied, as to the ability of any index to accurately represent the asset class or market sector that it purports to represent and none of these parties shall have any liability for any errors, omissions, or interruptions of any index or the data included therein.
5The Target Composite Benchmark represents the performance of the target date fund’s asset classes according to their respective weightings, as adjusted over time to reflect the target date fund’s increasingly conservative asset allocations. The following indices are used to calculate the Target Composite Benchmarks: Russell 3000® Index (Russell 3000),
9
Performance Update as of October 31, 2019 - Target 2025 Series
(unaudited)
MSCI ACWI ex USA Index (ACWIxUS), and Bloomberg Barclays U.S. Aggregate Bond Index (BAB) and/or Bloomberg Barclays U.S. Intermediate Aggregate Bond Index (BIAB). Russell 3000 is an unmanaged index that consists of 3,000 of the largest U.S. companies based on total market capitalization. Index returns are based on a market capitalization-weighted average of relative price changes of the component stocks plus dividends whose reinvestments are compounded daily. Index returns provided by Bloomberg. ACWIxUS is designed to measure large andmid-cap representation across 22 of 23 Developed Markets countries (excluding the U.S.) and 26 Emerging Markets countries. The Index is denominated in U.S. dollars. The Index returns are net of withholding taxes. They assume daily reinvestment of net dividends thus accounting for any applicable dividend taxation. Index returns provided by Bloomberg. BAB and BIAB are both unmanaged, market value-weighted indices of U.S. domestic investment-grade debt issues, including government, corporate, asset-backed and mortgage-backed securities. BAB includes maturities of one year or more; BIAB includes maturities of greater than one year but less than ten years. BAB and BIAB returns provided by Interactive Data. Indices returns do not reflect any fees or expenses. Returns provided are calculated monthly using a blended allocation. Because the target date fund’s asset allocation will vary over time, the composition of the target date portfolio may not match the composition of the comparative Target Composite Benchmark.Mid-month performance is not available for the Composite Benchmark. Performance shown is from the first of the month following the corresponding Fund’s inception date.
10
Performance Update as of October 31, 2019 - Target 2030 Series
(unaudited)
| AVERAGE ANNUAL TOTAL RETURNS AS OF OCTOBER 31, 2019 | ||||||
| ONE YEAR1 | FIVE YEAR | TEN YEAR | ||||
Target 2030 Series - Class K2 | 12.65% | 4.82% | 7.96% | |||
Target 2030 Series - Class R2 | 12.38% | 4.55% | 7.69% | |||
Target 2030 Series - Class I2 | 12.94% | 5.10% | 8.24% | |||
S&P Target Date 2030 Index3 | 11.27% | 6.49% | 8.93% | |||
2030 Composite Benchmark4 | 12.52% | 6.42% | 8.65% | |||
The following graph compares the value of a $10,000 investment in the Target 2030 Series - Class K for the ten years ended October 31, 2019 to the 2030 Composite Benchmark and S&P Target Date 2030 Index.
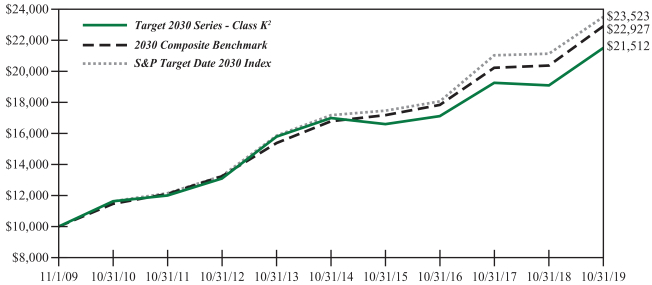
1The returns shown are based on net asset values calculated for shareholder transactions and may differ from the returns shown in the financial highlights, which reflect adjustments made to the net asset values in accordance with accounting principles generally accepted in the United States of America.
2The Series’ performance does not reflect the deduction of taxes that a shareholder would pay on fund distributions or the redemption of shares. The Series’ performance is historical and may not be indicative of future results. The performance returns shown are inclusive of the net expense ratio of the Series. For the year ended October 31, 2019, this net expense ratio was 0.45% for Class K, 0.70% for Class R and 0.20% for Class I. The gross expense ratio, which does not account for any voluntary or contractual waivers currently in effect, was 0.65% for Class K, 0.83% for Class R and 0.47% for Class I for the year ended October 31, 2019.
3The S&P Target Date Index Series is a series of unmanaged indices that reflect the market consensus for asset allocations for different target date horizons. Asset class weights are established annually and rebalanced monthly. Prior to 02/26/2010, the indices were rebalanced annually. Index returns assume daily reinvestment of dividends. Beginning 06/ 01/2017, the asset class exposure for each index is represented by indices and returns do not reflect any fees or expenses. Prior to 06/01/2017, the asset class exposure for each index is represented by exchange traded funds (ETFs) and returns are net of ETF expenses. Index returns provided by Bloomberg. S&P Dow Jones Indices LLC, a subsidiary of the McGraw Hill Financial, Inc., is the publisher of various index based data products and services and has licensed certain of its products and services for use by Manning & Napier. All such content Copyright © 2017 by S&P Dow Jones Indices LLC and/or its affiliates. All rights reserved. Neither S&P Dow Jones Indices LLC, Dow Jones Trademark Holdings LLC, their affiliates nor their third party licensors make any representation or warranty, express or implied, as to the ability of any index to accurately represent the asset class or market sector that it purports to represent and none of these parties shall have any liability for any errors, omissions, or interruptions of any index or the data included therein.
4The Target Composite Benchmark represents the performance of the target date fund’s asset classes according to their respective weightings, as adjusted over time to reflect the target date fund’s increasingly conservative asset allocations. The following indices are used to calculate the Target Composite Benchmarks: Russell 3000® Index (Russell 3000), MSCI ACWI ex USA Index (ACWIxUS), and Bloomberg Barclays U.S. Aggregate Bond Index (BAB) and/or Bloomberg Barclays U.S. Intermediate Aggregate Bond Index (BIAB). Russell 3000 is an unmanaged index that consists of 3,000 of the largest U.S. companies based on total market capitalization. Index returns are based on a market capitalization-weighted average of relative price changes of the component stocks plus dividends whose reinvestments are compounded daily. Index returns provided by Bloomberg. ACWIxUS
11
Performance Update as of October 31, 2019 - Target 2030 Series
(unaudited)
is designed to measure large andmid-cap representation across 22 of 23 Developed Markets countries (excluding the U.S.) and 26 Emerging Markets countries. The Index is denominated in U.S. dollars. The Index returns are net of withholding taxes. They assume daily reinvestment of net dividends thus accounting for any applicable dividend taxation. Index returns provided by Bloomberg. BAB and BIAB are both unmanaged, market value-weighted indices of U.S. domestic investment-grade debt issues, including government, corporate, asset-backed and mortgage-backed securities. BAB includes maturities of one year or more; BIAB includes maturities of greater than one year but less than ten years. BAB and BIAB returns provided by Interactive Data. Indices returns do not reflect any fees or expenses. Returns provided are calculated monthly using a blended allocation. Because the target date fund’s asset allocation will vary over time, the composition of the target date portfolio may not match the composition of the comparative Target Composite Benchmark.Mid-month performance is not available for the Composite Benchmark. Performance shown is from the first of the month following the corresponding Fund’s inception date.
12
Performance Update as of October 31, 2019 - Target 2035 Series
(unaudited)
AVERAGE ANNUAL TOTAL RETURNS | ||||||
AS OF OCTOBER 31, 2019
| ||||||
ONE YEAR1
|
FIVE YEAR
|
SINCE
| ||||
Target 2035 Series - Class K3
| 12.89%
| 5.41%
| 8.98%
| |||
Target 2035 Series - Class R3
| 12.56%
| 5.15%
| 8.75%
| |||
Target 2035 Series - Class I3
| 13.20%
| 5.68%
| 9.25%
| |||
S&P Target Date 2035 Index4
| 11.52%
| 6.86%
| 9.74%
| |||
2035 Composite Benchmark5
| 12.72%
| 6.99%
| 9.21%
| |||
The following graph compares the value of a $10,000 investment in the Target 2035 Series - Class K from its inception2 (6/25/12) to present (10/31/19) to the 2035 Composite Benchmark and S&P Target Date 2035 Index.
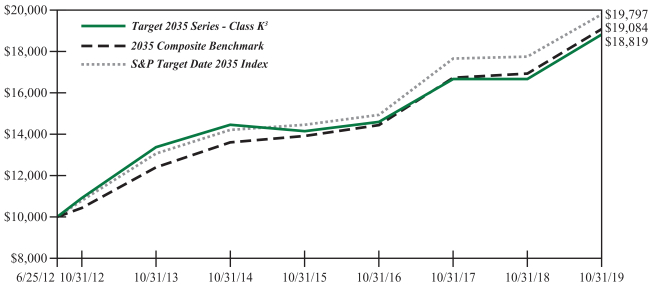
1The returns shown are based on net asset values calculated for shareholder transactions and may differ from the returns shown in the financial highlights, which reflect adjustments made to the net asset values in accordance with accounting principles generally accepted in the United States of America.
2Performance numbers for the Series and the S&P Target Date Index are calculated from June 25, 2012, the Series’ inception date. Performance numbers for the Target Composite Benchmark are calculated from June 30, 2012.
3The Series’ performance does not reflect the deduction of taxes that a shareholder would pay on fund distributions or the redemption of shares. The Series’ performance is historical and may not be indicative of future results. The performance returns shown are inclusive of the net expense ratio of the Series. For the year ended October 31, 2019, this net expense ratio was 0.45% for Class K, 0.70% for Class R and 0.20% for Class I. The gross expense ratio, which does not account for any voluntary or contractual waivers currently in effect, was 0.86% for Class K, 1.08% for Class R and 0.72% for Class I for the year ended October 31, 2019.
4The S&P Target Date Index Series is a series of unmanaged indices that reflect the market consensus for asset allocations for different target date horizons. Asset class weights are established annually and rebalanced monthly. Prior to 02/26/2010, the indices were rebalanced annually. Index returns assume daily reinvestment of dividends. Beginning 06/ 01/2017, the asset class exposure for each index is represented by indices and returns do not reflect any fees or expenses. Prior to 06/01/2017, the asset class exposure for each index is represented by exchange traded funds (ETFs) and returns are net of ETF expenses. Index returns provided by Bloomberg. S&P Dow Jones Indices LLC, a subsidiary of the McGraw Hill Financial, Inc., is the publisher of various index based data products and services and has licensed certain of its products and services for use by Manning & Napier. All such content Copyright © 2017 by S&P Dow Jones Indices LLC and/or its affiliates. All rights reserved. Neither S&P Dow Jones Indices LLC, Dow Jones Trademark Holdings LLC, their affiliates nor their third party licensors make any representation or warranty, express or implied, as to the ability of any index to accurately represent the asset class or market sector that it purports to represent and none of these parties shall have any liability for any errors, omissions, or interruptions of any index or the data included therein.
5The Target Composite Benchmark represents the performance of the target date fund’s asset classes according to their respective weightings, as adjusted over time to reflect the target date fund’s increasingly conservative asset allocations. The following indices are used to calculate the Target Composite Benchmarks: Russell 3000® Index (Russell 3000),
13
Performance Update as of October 31, 2019 - Target 2035 Series
(unaudited)
MSCI ACWI ex USA Index (ACWIxUS), and Bloomberg Barclays U.S. Aggregate Bond Index (BAB) and/or Bloomberg Barclays U.S. Intermediate Aggregate Bond Index (BIAB). Russell 3000 is an unmanaged index that consists of 3,000 of the largest U.S. companies based on total market capitalization. Index returns are based on a market capitalization-weighted average of relative price changes of the component stocks plus dividends whose reinvestments are compounded daily. Index returns provided by Bloomberg. ACWIxUS is designed to measure large andmid-cap representation across 22 of 23 Developed Markets countries (excluding the U.S.) and 24 Emerging Markets countries. The Index is denominated in U.S. dollars. The Index returns are net of withholding taxes. They assume daily reinvestment of net dividends thus accounting for any applicable dividend taxation. Index returns provided by Bloomberg. BAB and BIAB are both unmanaged, market value-weighted indices of U.S. domestic investment-grade debt issues, including government, corporate, asset-backed and mortgage-backed securities. BAB includes maturities of one year or more; BIAB includes maturities of greater than one year but less than ten years. BAB and BIAB returns provided by Interactive Data. Indices returns do not reflect any fees or expenses. Returns provided are calculated monthly using a blended allocation. Because the target date fund’s asset allocation will vary over time, the composition of the target date portfolio may not match the composition of the comparative Target Composite Benchmark.Mid-month performance is not available for the Composite Benchmark. Performance shown is from the first of the month following the corresponding Fund’s inception date.
14
Performance Update as of October 31, 2019 - Target 2040 Series
(unaudited)
AVERAGE ANNUAL TOTAL RETURNS | ||||||
AS OF OCTOBER 31, 2019
| ||||||
ONE YEAR1
|
FIVE YEAR
|
TEN YEAR
| ||||
Target 2040 Series - Class K2
| 12.90%
| 5.97%
| 8.81%
| |||
Target 2040 Series - Class R2
| 12.64%
| 5.71%
| 8.55%
| |||
Target 2040 Series - Class I2
| 13.24%
| 6.26%
| 9.10%
| |||
S&P Target Date 2040 Index3
| 11.69%
| 7.12%
| 9.68%
| |||
2040 Composite Benchmark4
| 12.67%
| 7.39%
| 9.89%
| |||
The following graph compares the value of a $10,000 investment in the Target 2040 Series - Class K for the ten years ended October 31, 2019 to the S&P Target Date 2040 Index and the 2040 Composite Benchmark.
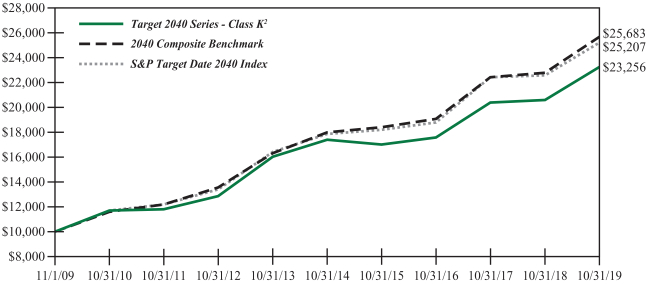
1The returns shown are based on net asset values calculated for shareholder transactions and may differ from the returns shown in the financial highlights, which reflect adjustments made to the net asset values in accordance with accounting principles generally accepted in the United States of America.
2The Series’ performance does not reflect the deduction of taxes that a shareholder would pay on fund distributions or the redemption of shares. The Series’ performance is historical and may not be indicative of future results. The performance returns shown are inclusive of the net expense ratio of the Series. For the year ended October 31, 2019, this net expense ratio was 0.45% for Class K, 0.70% for Class R and 0.20% for Class I. The gross expense ratio, which does not account for any voluntary or contractual waivers currently in effect, was 0.81% for Class K, 0.99% for Class R and 0.61% for Class I for the year ended October 31, 2019.
3The S&P Target Date Index Series is a series of unmanaged indices that reflect the market consensus for asset allocations for different target date horizons. Asset class weights are established annually and rebalanced monthly. Prior to 02/26/2010, the indices were rebalanced annually. Index returns assume daily reinvestment of dividends. Beginning 06/ 01/2017, the asset class exposure for each index is represented by indices and returns do not reflect any fees or expenses. Prior to 06/01/2017, the asset class exposure for each index is represented by exchange traded funds (ETFs) and returns are net of ETF expenses. Index returns provided by Bloomberg. S&P Dow Jones Indices LLC, a subsidiary of the McGraw Hill Financial, Inc., is the publisher of various index based data products and services and has licensed certain of its products and services for use by Manning & Napier. All such content Copyright © 2017 by S&P Dow Jones Indices LLC and/or its affiliates. All rights reserved. Neither S&P Dow Jones Indices LLC, Dow Jones Trademark Holdings LLC, their affiliates nor their third party licensors make any representation or warranty, express or implied, as to the ability of any index to accurately represent the asset class or market sector that it purports to represent and none of these parties shall have any liability for any errors, omissions, or interruptions of any index or the data included therein.
4The Target Composite Benchmark represents the performance of the target date fund’s asset classes according to their respective weightings, as adjusted over time to reflect the target date fund’s increasingly conservative asset allocations. The following indices are used to calculate the Target Composite Benchmarks: Russell 3000® Index (Russell 3000), MSCI ACWI ex USA Index (ACWIxUS), and Bloomberg Barclays U.S. Aggregate Bond Index (BAB) and/or Bloomberg Barclays U.S. Intermediate Aggregate Bond Index (BIAB). Russell 3000 is an unmanaged index that consists of 3,000 of the largest U.S. companies based on total market capitalization. Index returns are based on a market capitalization-weighted average of relative price changes of the component stocks plus dividends whose reinvestments are compounded daily. Index returns provided by Bloomberg. ACWIxUS
15
Performance Update as of October 31, 2019 - Target 2040 Series
(unaudited)
is designed to measure large andmid-cap representation across 22 of 23 Developed Markets countries (excluding the U.S.) and 26 Emerging Markets countries. The Index is denominated in U.S. dollars. The Index returns are net of withholding taxes. They assume daily reinvestment of net dividends thus accounting for any applicable dividend taxation. Index returns provided by Bloomberg. BAB and BIAB are both unmanaged, market value-weighted indices of U.S. domestic investment-grade debt issues, including government, corporate, asset-backed and mortgage-backed securities. BAB includes maturities of one year or more; BIAB includes maturities of greater than one year but less than ten years. BAB and BIAB returns provided by Interactive Data. Indices returns do not reflect any fees or expenses. Returns provided are calculated monthly using a blended allocation. Because the target date fund’s asset allocation will vary over time, the composition of the target date portfolio may not match the composition of the comparative Target Composite Benchmark.Mid-month performance is not available for the Composite Benchmark. Performance shown is from the first of the month following the corresponding Fund’s inception date.
16
Performance Update as of October 31, 2019 - Target 2045 Series
(unaudited)
AVERAGE ANNUAL TOTAL RETURNS
| ||||||
ONE YEAR1
| FIVE YEAR
| SINCE
| ||||
Target 2045 Series - Class K3 | 13.19% | 6.57% | 10.36% | |||
| ||||||
Target 2045 Series - Class R3 | 12.94% | 6.29% | 10.07% | |||
| ||||||
Target 2045 Series - Class I3 | 13.43% | 6.82% | 10.61% | |||
| ||||||
S&P Target Date 2045 Index4 | 11.79% | 7.28% | 10.45% | |||
| ||||||
2045 Composite Benchmark5 | 12.82% | 7.70% | 10.21% | |||
| ||||||
The following graph compares the value of a $10,000 investment in the Target 2045 Series - Class K from its inception2 (6/25/12) to present (10/31/19) to the S&P Target Date 2045 Index and the 2045 Composite Benchmark.
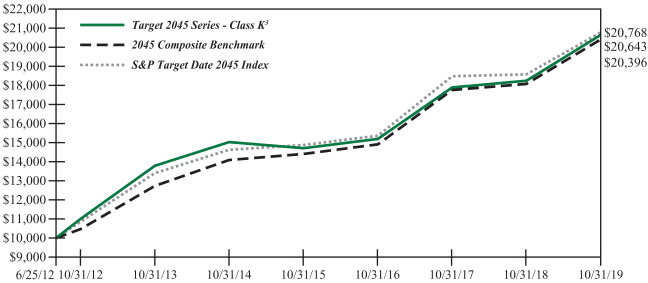
1The returns shown are based on net asset values calculated for shareholder transactions and may differ from the returns shown in the financial highlights, which reflect adjustments made to the net asset values in accordance with accounting principles generally accepted in the United States of America.
2Performance numbers for the Series and the S&P Target Date Index are calculated from June 25, 2012, the Series’ inception date. Performance numbers for the Target Composite Benchmark are calculated from June 30, 2012.
3The Series’ performance does not reflect the deduction of taxes that a shareholder would pay on fund distributions or the redemption of shares. The Series’ performance is historical and may not be indicative of future results. The performance returns shown are inclusive of the net expense ratio of the Series. For the year ended October 31, 2019, this net expense ratio was 0.45% for Class K, 0.70% for Class R and 0.20% for Class I. The gross expense ratio, which does not account for any voluntary or contractual waivers currently in effect, was 1.27% for Class K, 1.48% for Class R and 1.12% for Class I for the year ended October 31, 2019.
4The S&P Target Date Index Series is a series of unmanaged indices that reflect the market consensus for asset allocations for different target date horizons. Asset class weights are established annually and rebalanced monthly. Prior to 02/26/2010, the indices were rebalanced annually. Index returns assume daily reinvestment of dividends. Beginning 06/01/2017, the asset class exposure for each index is represented by indices and returns do not reflect any fees or expenses. Prior to 06/01/2017, the asset class exposure for each index is represented by exchange traded funds (ETFs) and returns are net of ETF expenses. Index returns provided by Bloomberg. S&P Dow Jones Indices LLC, a division of S&P Global Inc., is the publisher of various index based data products and services, certain of which have been licensed for use to Manning & Napier. All such content Copyright© 2019 by S&P Dow Jones Indices LLC and/or its affiliates. All rights reserved. Data provided is not a representation or warranty, express or implied, as to the ability of any index to accurately represent the asset class or market sector that it purports to represent and none of these parties shall have any liability for any errors, omissions, or interruptions of any index or the data included therein.
5The Target Composite Benchmark represents the performance of the target date fund’s asset classes according to their respective weightings, as adjusted over time to reflect the target date fund’s increasingly conservative asset allocations. The following indices are used to calculate the Target Composite Benchmarks: Russell 3000® Index (Russell 3000), MSCI ACWI ex USA Index (ACWIxUS), and Bloomberg Barclays U.S. Aggregate Bond Index (BAB) and/or Bloomberg Barclays U.S. Intermediate Aggregate Bond Index (BIAB).
17
Performance Update as of October 31, 2019 - Target 2045 Series
(unaudited)
Russell 3000 is an unmanaged index that consists of 3,000 of the largest U.S. companies based on total market capitalization. Index returns are based on a market capitalization-weighted average of relative price changes of the component stocks plus dividends whose reinvestments are compounded daily. Index returns provided by Bloomberg. ACWIxUS is designed to measure large andmid-cap representation across 22 of 23 Developed Markets countries (excluding the U.S.) and 26 Emerging Markets countries. The Index is denominated in U.S. dollars. The Index returns are net of withholding taxes. They assume daily reinvestment of net dividends thus accounting for any applicable dividend taxation. Index returns provided by Bloomberg. BAB and BIAB are both unmanaged, market value-weighted indices of U.S. domestic investment-grade debt issues, including government, corporate, asset-backed and mortgage-backed securities. BAB includes maturities of one year or more; BIAB includes maturities of greater than one year but less than ten years. BAB and BIAB returns provided by Interactive Data. Indices returns do not reflect any fees or expenses. Returns provided are calculated monthly using a blended allocation. Because the target date fund’s asset allocation will vary over time, the composition of the target date portfolio may not match the composition of the comparative Target Composite Benchmark.Mid-month performance is not available for the Composite Benchmark. Performance shown is from the first of the month following the corresponding Fund’s inception date.
18
Performance Update as of October 31, 2019 - Target 2050 Series
(unaudited)
AVERAGE ANNUAL TOTAL RETURNS AS OF OCTOBER 31, 2019
| ||||||
ONE
| FIVE
| TEN
| ||||
Target 2050 Series - Class K2 | 13.43% | 6.86% | 9.41% | |||
| ||||||
Target 2050 Series - Class R2 | 13.18% | 6.59% | 9.14% | |||
| ||||||
Target 2050 Series - Class I2 | 13.74% | 7.12% | 9.68% | |||
| ||||||
S&P Target Date 2050 Index3 | 11.77% | 7.42% | 10.05% | |||
| ||||||
2050 Composite Benchmark4 | 12.97% | 7.87% | 10.29% | |||
| ||||||
The following graph compares the value of a $10,000 investment in the Target 2050 Series - Class K for the ten years ended October 31, 2019 to the S&P Target Date 2050 Index and the 2050 Composite Benchmark.
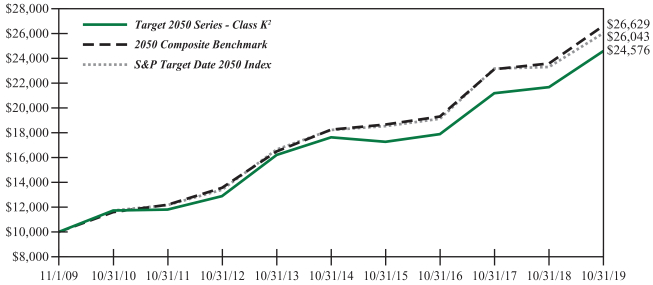
1The returns shown are based on net asset values calculated for shareholder transactions and may differ from the returns shown in the financial highlights, which reflect adjustments made to the net asset values in accordance with accounting principles generally accepted in the United States of America.
2The Series’ performance does not reflect the deduction of taxes that a shareholder would pay on fund distributions or the redemption of shares. The Series’ performance is historical and may not be indicative of future results. The performance returns shown are inclusive of the net expense ratio of the Series. For the year ended October 31, 2019, this net expense ratio was 0.45% for Class K, 0.70% for Class R and 0.20% for Class I. The gross expense ratio, which does not account for any voluntary or contractual waivers currently in effect, was 1.15% for Class K, 1.32% for Class R and 0.95% for Class I for the year ended October 31, 2019.
3The S&P Target Date Index Series is a series of unmanaged indices that reflect the market consensus for asset allocations for different target date horizons. Asset class weights are established annually and rebalanced monthly. Prior to 02/26/2010, the indices were rebalanced annually. Historical returns for the S&P Target Date 2050 Index prior to 05/31/2011 (the index launch date) are identical to the returns of the S&P Target Date 2045 Index, the closest dated target date index as of the launch date. Index returns assume daily reinvestment of dividends. Beginning 06/01/2017, the asset class exposure for each index is represented by indices and returns do not reflect any fees or expenses. Prior to 06/01/2017, the asset class exposure for each index is represented by exchange traded funds (ETFs) and returns are net of ETF expenses. Index returns provided by Bloomberg. S&P Dow Jones Indices LLC, a division of S&P Global Inc., is the publisher of various index based data products and services, certain of which have been licensed for use to Manning & Napier. All such content Copyright© 2019 by S&P Dow Jones Indices LLC and/or its affiliates. All rights reserved. Data provided is not a representation or warranty, express or implied, as to the ability of any index to accurately represent the asset class or market sector that it purports to represent and none of these parties shall have any liability for any errors, omissions, or interruptions of any index or the data included therein.
4The Target Composite Benchmark represents the performance of the target date fund’s asset classes according to their respective weightings, as adjusted over time to reflect the target date fund’s increasingly conservative asset allocations. The following indices are used to calculate the Target Composite Benchmarks: Russell 3000® Index (Russell 3000), MSCI ACWI ex USA Index (ACWIxUS), and Bloomberg Barclays U.S. Aggregate Bond Index (BAB) and/or Bloomberg Barclays U.S. Intermediate Aggregate Bond Index (BIAB). Russell 3000 is an unmanaged index that consists of 3,000 of the largest U.S. companies based on total market capitalization. Index returns are based on a market capitalization-weighted average of relative price changes of the component stocks plus dividends whose reinvestments are compounded daily. Index returns provided by Bloomberg. ACWIxUS
19
Performance Update as of October 31, 2019 - Target 2050 Series
(unaudited)
is designed to measure large andmid-cap representation across 22 of 23 Developed Markets countries (excluding the U.S.) and 26 Emerging Markets countries. The Index is denominated in U.S. dollars. The Index returns are net of withholding taxes. They assume daily reinvestment of net dividends thus accounting for any applicable dividend taxation. Index returns provided by Bloomberg. BAB and BIAB are both unmanaged, market value-weighted indices of U.S. domestic investment-grade debt issues, including government, corporate, asset-backed and mortgage-backed securities. BAB includes maturities of one year or more; BIAB includes maturities of greater than one year but less than ten years. BAB and BIAB returns provided by Interactive Data. Indices returns do not reflect any fees or expenses. Returns provided are calculated monthly using a blended allocation. Because the target date fund’s asset allocation will vary over time, the composition of the target date portfolio may not match the composition of the comparative Target Composite Benchmark.Mid-month performance is not available for the Composite Benchmark. Performance shown is from the first of the month following the corresponding Fund’s inception date.
20
Performance Update as of October 31, 2019 - Target 2055 Series
(unaudited)
| AVERAGE ANNUAL TOTAL RETURNS AS OF OCTOBER 31, 2019
| ||||||
| ONE YEAR1
| FIVE YEAR
| SINCE INCEPTION2
| ||||
Target 2055 Series - Class K3 | 13.55%
| 6.88%
| 10.63%
| |||
| ||||||
Target 2055 Series - Class R3 | 13.23%
| 6.60%
| 10.29%
| |||
| ||||||
Target 2055 Series - Class I3 | 13.81%
| 7.14%
| 10.97%
| |||
| ||||||
S&P Target Date 2055 Index4 | 11.82%
| 7.49%
| 10.92%
| |||
| ||||||
2055 Composite Benchmark5 | 12.97%
| 7.87%
| 10.33%
| |||
| ||||||
The following graph compares the value of a $10,000 investment in the Target 2055 Series - Class K from its inception2 (6/25/12) to present (10/31/19) to the S&P Target Date 2055 Index and the 2055 Composite Benchmark.
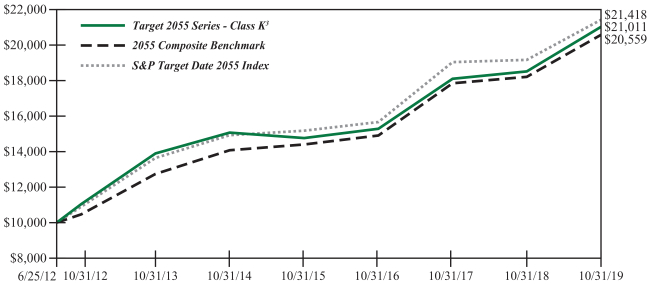
1The returns shown are based on net asset values calculated for shareholder transactions and may differ from the returns shown in the financial highlights, which reflect adjustments made to the net asset values in accordance with accounting principles generally accepted in the United States of America.
2Performance numbers for the Series and the S&P Target Date Index are calculated from June 25, 2012, the Series’ inception date. Performance numbers for the Target Composite Benchmark are calculated from June 30, 2012.
3The Series’ performance does not reflect the deduction of taxes that a shareholder would pay on fund distributions or the redemption of shares. The Series’ performance is historical and may not be indicative of future results. The performance returns shown are inclusive of the net expense ratio of the Series. For the year ended October 31, 2019, this net expense ratio was 0.45% for Class K, 0.70% for Class R and 0.20% for Class I. The gross expense ratio, which does not account for any voluntary or contractual waivers currently in effect, was 2.17% for Class K, 2.35% for Class R and 1.98% for Class I for the year ended October 31, 2019.
4The S&P Target Date Index Series is a series of unmanaged indices that reflect the market consensus for asset allocations for different target date horizons. Asset class weights are established annually and rebalanced monthly. Prior to 02/26/2010, the indices were rebalanced annually. Index returns assume daily reinvestment of dividends. Beginning 06/01/2017, the asset class exposure for each index is represented by indices and returns do not reflect any fees or expenses. Prior to 06/01/2017, the asset class exposure for each index is represented by exchange traded funds (ETFs) and returns are net of ETF expenses. Index returns provided by Bloomberg. S&P Dow Jones Indices LLC, a division of S&P Global Inc., is the publisher of various index based data products and services, certain of which have been licensed for use to Manning & Napier. All such content Copyright© 2019 by S&P Dow Jones Indices LLC and/or its affiliates. All rights reserved. Data provided is not a representation or warranty, express or implied, as to the ability of any index to accurately represent the asset class or market sector that it purports to represent and none of these parties shall have any liability for any errors, omissions, or interruptions of any index or the data included therein.
5The Target Composite Benchmark represents the performance of the target date fund’s asset classes according to their respective weightings, as adjusted over time to reflect the target date fund’s increasingly conservative asset allocations. The following indices are used to calculate the Target Composite Benchmarks: Russell 3000® Index (Russell 3000), MSCI ACWI ex USA Index (ACWIxUS), and Bloomberg Barclays U.S. Aggregate Bond Index (BAB) and/or Bloomberg Barclays U.S. Intermediate Aggregate Bond Index (BIAB).
21
Performance Update as of October 31, 2019 - Target 2055 Series
(unaudited)
Russell 3000 is an unmanaged index that consists of 3,000 of the largest U.S. companies based on total market capitalization. Index returns are based on a market capitalization-weighted average of relative price changes of the component stocks plus dividends whose reinvestments are compounded daily. Index returns provided by Bloomberg. ACWIxUS is designed to measure large andmid-cap representation across 22 of 23 Developed Markets countries (excluding the U.S.) and 26 Emerging Markets countries. The Index is denominated in U.S. dollars. The Index returns are net of withholding taxes. They assume daily reinvestment of net dividends thus accounting for any applicable dividend taxation. Index returns provided by Bloomberg. BAB and BIAB are both unmanaged, market value-weighted indices of U.S. domestic investment-grade debt issues, including government, corporate, asset-backed and mortgage-backed securities. BAB includes maturities of one year or more; BIAB includes maturities of greater than one year but less than ten years. BAB and BIAB returns provided by Interactive Data. Indices returns do not reflect any fees or expenses. Returns provided are calculated monthly using a blended allocation. Because the target date fund’s asset allocation will vary over time, the composition of the target date portfolio may not match the composition of the comparative Target Composite Benchmark.Mid-month performance is not available for the Composite Benchmark. Performance shown is from the first of the month following the corresponding Fund’s inception date.
22
Performance Update as of October 31, 2019 - Target 2060 Series
(unaudited)
| AVERAGE ANNUAL TOTAL RETURNS AS OF OCTOBER 31, 2019 | ||||||
| ONE YEAR1 | | SINCE INCEPTION2 | | |||
Target 2060 Series - Class K3
| 13.52%
|
| 9.93%
|
| ||
| ||||||
Target 2060 Series - Class R3
| 13.05%
|
| 9.63%
|
| ||
| ||||||
Target 2060 Series - Class I3
| 13.75%
|
| 10.17%
|
| ||
| ||||||
S&P Target Date 2060+ Index4
| 11.85%
|
| 9.93%
|
| ||
| ||||||
2060 Composite Benchmark5
| 12.97%
|
| 10.81%
|
| ||
| ||||||
The following graph compares the value of a $10,000 investment in the Target 2060 Series - Class K from its inception2 (9/21/15) to present (10/31/19) to the S&P Target Date 2060+ Index and the 2060 Composite Benchmark.
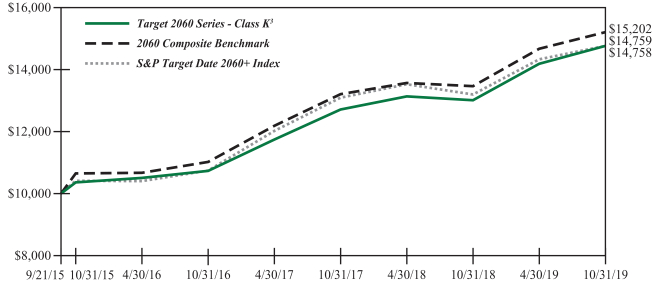
1The returns shown are based on net asset values calculated for shareholder transactions and may differ from the returns shown in the financial highlights, which reflect adjustments made to the net asset values in accordance with accounting principles generally accepted in the United States of America.
2Performance numbers for the Series and the S&P Target Date Index are calculated from September 21, 2015, the Series’ inception date. Performance numbers for the Target Composite Benchmark are calculated from September 30, 2015.
3The Series’ performance does not reflect the deduction of taxes that a shareholder would pay on fund distributions or the redemption of shares. The Series’ performance is historical and may not be indicative of future results. The performance returns shown are inclusive of the net expense ratio of the Series. For the year ended October 31, 2019, this net expense ratio was 0.45% for Class K, 0.70% for Class R and 0.20% for Class I. The gross expense ratio, which does not account for any voluntary or contractual waivers currently in effect, was 2.50% for Class K, 2.72% for Class R and 2.32% for Class I for the year ended October 31, 2019.
4The S&P Target Date Index Series is a series of unmanaged indices that reflect the market consensus for asset allocations for different target date horizons. Asset class weights are established annually and rebalanced monthly. Prior to 02/26/2010, the indices were rebalanced annually. Index returns assume daily reinvestment of dividends. Beginning 06/01/2017, the asset class exposure for each index is represented by indices and returns do not reflect any fees or expenses. Prior to 06/01/2017, the asset class exposure for each index is represented by exchange traded funds (ETFs) and returns are net of ETF expenses. Index returns provided by Bloomberg. S&P Dow Jones Indices LLC, a division of S&P Global Inc., is the publisher of various index based data products and services, certain of which have been licensed for use to Manning & Napier. All such content Copyright© 2019 by S&P Dow Jones Indices LLC and/or its affiliates. All rights reserved. Data provided is not a representation or warranty, express or implied, as to the ability of any index to accurately represent the asset class or market sector that it purports to represent and none of these parties shall have any liability for any errors, omissions, or interruptions of any index or the data included therein.
5The Target Composite Benchmark represents the performance of the target date fund’s asset classes according to their respective weightings, as adjusted over time to reflect the target date fund’s increasingly conservative asset allocations. The following indices are used to calculate the Target Composite Benchmarks: Russell 3000® Index (Russell 3000), MSCI ACWI ex USA Index (ACWIxUS), and Bloomberg Barclays U.S. Aggregate Bond Index (BAB) and/or Bloomberg Barclays U.S. Intermediate Aggregate Bond Index (BIAB).
23
Performance Update as of October 31, 2019 - Target 2060 Series
(unaudited)
Russell 3000 is an unmanaged index that consists of 3,000 of the largest U.S. companies based on total market capitalization. Index returns are based on a market capitalization-weighted average of relative price changes of the component stocks plus dividends whose reinvestments are compounded daily. Index returns provided by Bloomberg. ACWIxUS is designed to measure large andmid-cap representation across 22 of 23 Developed Markets countries (excluding the U.S.) and 26 Emerging Markets countries. The Index is denominated in U.S. dollars. The Index returns are net of withholding taxes. They assume daily reinvestment of net dividends thus accounting for any applicable dividend taxation. Index returns provided by Bloomberg. BAB and BIAB are both unmanaged, market value-weighted indices of U.S. domestic investment-grade debt issues, including government, corporate, asset-backed and mortgage-backed securities. BAB includes maturities of one year or more; BIAB includes maturities of greater than one year but less than ten years. BAB and BIAB returns provided by Interactive Data. Indices returns do not reflect any fees or expenses. Returns provided are calculated monthly using a blended allocation. Because the target date fund’s asset allocation will vary over time, the composition of the target date portfolio may not match the composition of the comparative Target Composite Benchmark.Mid-month performance is not available for the Composite Benchmark. Performance shown is from the first of the month following the corresponding Fund’s inception date.
24
Shareholder Expense Example
(unaudited)
As a shareholder of the Series, you incur ongoing costs, including management fees, shareholder service fees and other Series expenses. This example is intended to help you understand your ongoing costs (in dollars) of investing in the Series and to compare these costs with the ongoing costs of investing in other mutual funds.
The example is based on an investment of $1,000 invested at the beginning of the period and held for the entire period (May 1, 2019 to October 31, 2019).
Actual Expenses
The Actual lines of the tables below provide information about actual account values and actual expenses. You may use the information in these lines, together with the amount you invested, to estimate the expenses that you paid over the period. Simply divide your account value by $1,000 (for example, an $8,600 account value divided by $1,000 = 8.6), then multiply the result by the number in the Actual line for the Series and Class in which you have invested under the heading entitled “Expenses Paid During Period” to estimate the expenses you paid on your account during this period.
Hypothetical Example for Comparison Purposes
The Hypothetical lines of the tables below provide information about hypothetical account values and hypothetical expenses based on the Class’ actual expense ratio and an assumed rate of return of 5% per year before expenses, which is not the Class’ actual return. The hypothetical account values and expenses may not be used to estimate the actual ending account balance or expenses you paid during the period. You may use this information to compare the ongoing costs of investing in a Class of the Series and other funds. To do so, compare this 5% hypothetical example for the Series and Class in which you have invested with the 5% hypothetical examples that appear in the shareholder reports of the other funds.
Please note that the expenses shown in the tables are meant to highlight your ongoing costs only and do not reflect any transaction costs, such as sales charges (loads), redemption fees, or exchange fees that you may incur in other mutual funds. Therefore, the Hypothetical lines of the tables are useful in comparing ongoing costs only, and will not help you determine the relative total costs of owning different funds.
BEGINNING 5/1/19
|
ENDING 10/31/19
| EXPENSES PAID DURING PERIOD 5/1/19-10/31/191 | ANNUALIZED EXPENSE RATIO2 | |||||||||||||
Target Income
| ||||||||||||||||
Actual (Class K)
|
| $1,000.00
|
|
| $1,042.10
|
|
| $2.32
|
|
| 0.45%
|
| ||||
Hypothetical3
|
| $1,000.00
|
|
| $1,022.94
|
|
| $2.29
|
|
| 0.45%
|
| ||||
Actual (Class R)
|
| $1,000.00
|
|
| $1,040.70
|
|
| $3.60
|
|
| 0.70%
|
| ||||
Hypothetical3
|
| $1,000.00
|
|
| $1,021.68
|
|
| $3.57
|
|
| 0.70%
|
| ||||
Actual (Class I)
|
| $1,000.00
|
|
| $1,043.40
|
|
| $1.03
|
|
| 0.20%
|
| ||||
Hypothetical3
|
| $1,000.00
|
|
| $1,024.20
|
|
| $1.02
|
|
| 0.20%
|
| ||||
25
Shareholder Expense Example
(unaudited)
BEGINNING 5/1/19
|
ENDING 10/31/19
| EXPENSES PAID DURING PERIOD 5/1/19-10/31/191 | ANNUALIZED EXPENSE RATIO2 | |||||||||||||
Target 2015
| ||||||||||||||||
Actual (Class K)
|
| $1,000.00
|
|
| $1,042.80
|
|
| $2.32
|
|
| 0.45%
|
| ||||
Hypothetical3
|
| $1,000.00
|
|
| $1,022.94
|
|
| $2.29
|
|
| 0.45%
|
| ||||
Actual (Class R)
|
| $1,000.00
|
|
| $1,043.30
|
|
| $3.61
|
|
| 0.70%
|
| ||||
Hypothetical3
|
| $1,000.00
|
|
| $1,021.68
|
|
| $3.57
|
|
| 0.70%
|
| ||||
Actual (Class I)
|
| $1,000.00
|
|
| $1,044.60
|
|
| $1.03
|
|
| 0.20%
|
| ||||
Hypothetical3
|
| $1,000.00
|
|
| $1,024.20
|
|
| $1.02
|
|
| 0.20%
|
| ||||
BEGINNING 5/1/19
|
ENDING 10/31/19
| EXPENSES PAID DURING PERIOD 5/1/19-10/31/191 | ANNUALIZED EXPENSE RATIO2 | |||||||||||||
Target 2020
| ||||||||||||||||
Actual (Class K)
|
| $1,000.00
|
|
| $1,048.00
|
|
| $2.32
|
|
| 0.45%
|
| ||||
Hypothetical3
|
| $1,000.00
|
|
| $1,022.94
|
|
| $2.29
|
|
| 0.45%
|
| ||||
Actual (Class R)
|
| $1,000.00
|
|
| $1,046.80
|
|
| $3.61
|
|
| 0.70%
|
| ||||
Hypothetical3
|
| $1,000.00
|
|
| $1,021.68
|
|
| $3.57
|
|
| 0.70%
|
| ||||
Actual (Class I)
|
| $1,000.00
|
|
| $1,050.40
|
|
| $1.03
|
|
| 0.20%
|
| ||||
Hypothetical3
|
| $1,000.00
|
|
| $1,024.20
|
|
| $1.02
|
|
| 0.20%
|
| ||||
BEGINNING 5/1/19
|
ENDING 10/31/19
| EXPENSES PAID DURING PERIOD 5/1/19-10/31/191 | ANNUALIZED EXPENSE RATIO2 | |||||||||||||
Target 2025
| ||||||||||||||||
Actual (Class K)
|
| $1,000.00
|
|
| $1,047.70
|
|
| $2.32
|
|
| 0.45%
|
| ||||
Hypothetical3
|
| $1,000.00
|
|
| $1,022.94
|
|
| $2.29
|
|
| 0.45%
|
| ||||
Actual (Class R)
|
| $1,000.00
|
|
| $1,047.30
|
|
| $3.61
|
|
| 0.70%
|
| ||||
Hypothetical3
|
| $1,000.00
|
|
| $1,021.68
|
|
| $3.57
|
|
| 0.70%
|
| ||||
Actual (Class I)
|
| $1,000.00
|
|
| $1,050.00
|
|
| $1.03
|
|
| 0.20%
|
| ||||
Hypothetical3
|
| $1,000.00
|
|
| $1,024.20
|
|
| $1.02
|
|
| 0.20%
|
| ||||
26
Shareholder Expense Example
(unaudited)
BEGINNING 5/1/19
|
ENDING 10/31/19
| EXPENSES PAID DURING PERIOD 5/1/19-10/31/191 | ANNUALIZED EXPENSE RATIO2 | |||||||||||||
Target 2030
| ||||||||||||||||
Actual (Class K)
|
| $1,000.00
|
|
| $1,048.50
|
|
| $2.32
|
|
| 0.45%
|
| ||||
Hypothetical3
|
| $1,000.00
|
|
| $1,022.94
|
|
| $2.29
|
|
| 0.45%
|
| ||||
Actual (Class R)
|
| $1,000.00
|
|
| $1,046.00
|
|
| $3.61
|
|
| 0.70%
|
| ||||
Hypothetical3
|
| $1,000.00
|
|
| $1,021.68
|
|
| $3.57
|
|
| 0.70%
|
| ||||
Actual (Class I)
|
| $1,000.00
|
|
| $1,049.70
|
|
| $1.03
|
|
| 0.20%
|
| ||||
Hypothetical3
|
| $1,000.00
|
|
| $1,024.20
|
|
| $1.02
|
|
| 0.20%
|
| ||||
BEGINNING 5/1/19
|
ENDING 10/31/19
| EXPENSES PAID DURING PERIOD 5/1/19-10/31/191 | ANNUALIZED EXPENSE RATIO2 | |||||||||||||
Target 2035
| ||||||||||||||||
Actual (Class K)
|
| $1,000.00
|
|
| $1,045.60
|
|
| $2.32
|
|
| 0.45%
|
| ||||
Hypothetical3
|
| $1,000.00
|
|
| $1,022.94
|
|
| $2.29
|
|
| 0.45%
|
| ||||
Actual (Class R)
|
| $1,000.00
|
|
| $1,044.60
|
|
| $3.61
|
|
| 0.70%
|
| ||||
Hypothetical3
|
| $1,000.00
|
|
| $1,021.68
|
|
| $3.57
|
|
| 0.70%
|
| ||||
Actual (Class I)
|
| $1,000.00
|
|
| $1,047.50
|
|
| $1.03
|
|
| 0.20%
|
| ||||
Hypothetical3
|
| $1,000.00
|
|
| $1,024.20
|
|
| $1.02
|
|
| 0.20%
|
| ||||
BEGINNING 5/1/19
|
ENDING 10/31/19
| EXPENSES PAID DURING PERIOD 5/1/19-10/31/191 | ANNUALIZED EXPENSE RATIO2 | |||||||||||||
Target 2040
| ||||||||||||||||
Actual (Class K)
|
| $1,000.00
|
|
| $1,043.60
|
|
| $2.32
|
|
| 0.45%
|
| ||||
Hypothetical3
|
| $1,000.00
|
|
| $1,022.94
|
|
| $2.29
|
|
| 0.45%
|
| ||||
Actual (Class R)
|
| $1,000.00
|
|
| $1,042.10
|
|
| $3.60
|
|
| 0.70%
|
| ||||
Hypothetical3
|
| $1,000.00
|
|
| $1,021.68
|
|
| $3.57
|
|
| 0.70%
|
| ||||
Actual (Class I)
|
| $1,000.00
|
|
| $1,044.90
|
|
| $1.03
|
|
| 0.20%
|
| ||||
Hypothetical3
|
| $1,000.00
|
|
| $1,024.20
|
|
| $1.02
|
|
| 0.20%
|
| ||||
27
Shareholder Expense Example
(unaudited)
BEGINNING ACCOUNT VALUE 5/1/19 |
ENDING ACCOUNT VALUE 10/31/19 |
EXPENSES PAID DURING PERIOD 5/1/19-10/31/191 |
ANNUALIZED EXPENSE RATIO2 | |||||||||||||
Target 2045
| ||||||||||||||||
Actual (Class K)
| $1,000.00 | $1,042.30 | $2.32 | 0.45% | ||||||||||||
Hypothetical3
| $1,000.00 | $1,022.94 | $2.29 | 0.45% | ||||||||||||
Actual (Class R)
| $1,000.00 | $1,041.00 | $3.60 | 0.70% | ||||||||||||
Hypothetical3
| $1,000.00 | $1,021.68 | $3.57 | 0.70% | ||||||||||||
Actual (Class I)
| $1,000.00 | $1,043.50 | $1.03 | 0.20% | ||||||||||||
Hypothetical3
| $1,000.00 | $1,024.20 | $1.02 | 0.20% | ||||||||||||
BEGINNING ACCOUNT VALUE 5/1/19 |
ENDING ACCOUNT VALUE 10/31/19 |
EXPENSES PAID DURING PERIOD 5/1/19-10/31/191 |
ANNUALIZED EXPENSE RATIO2 | |||||||||||||
Target 2050
| ||||||||||||||||
Actual (Class K)
| $1,000.00 | $1,040.80 | $2.31 | 0.45% | ||||||||||||
Hypothetical3
| $1,000.00 | $1,022.94 | $2.29 | 0.45% | ||||||||||||
Actual (Class R)
| $1,000.00 | $1,039.60 | $3.60 | 0.70% | ||||||||||||
Hypothetical3
| $1,000.00 | $1,021.68 | $3.57 | 0.70% | ||||||||||||
Actual (Class I)
| $1,000.00 | $1,042.10 | $1.03 | 0.20% | ||||||||||||
Hypothetical3
| $1,000.00 | $1,024.20 | $1.02 | 0.20% | ||||||||||||
BEGINNING ACCOUNT VALUE 5/1/19 |
ENDING ACCOUNT VALUE 10/31/19 |
EXPENSES PAID DURING PERIOD 5/1/19-10/31/191 |
ANNUALIZED EXPENSE RATIO2 | |||||||||||||
Target 2055
| ||||||||||||||||
Actual (Class K)
| $1,000.00 | $1,041.70 | $2.32 | 0.45% | ||||||||||||
Hypothetical3
| $1,000.00 | $1,022.94 | $2.29 | 0.45% | ||||||||||||
Actual (Class R)
| $1,000.00 | $1,040.00 | $3.60 | 0.70% | ||||||||||||
Hypothetical3
| $1,000.00 | $1,021.68 | $3.57 | 0.70% | ||||||||||||
Actual (Class I)
| $1,000.00 | $1,042.70 | $1.03 | 0.20% | ||||||||||||
Hypothetical3
| $1,000.00 | $1,024.20 | $1.02 | 0.20% | ||||||||||||
28
Shareholder Expense Example
(unaudited)
BEGINNING ACCOUNT VALUE 5/1/19 |
ENDING ACCOUNT VALUE 10/31/19 |
EXPENSES PAID DURING PERIOD 5/1/19-10/31/191 |
ANNUALIZED EXPENSE | |||||||||||||
Target 2060
| ||||||||||||||||
Actual (Class K)
| $1,000.00 | $1,041.00 | $2.31 | 0.45% | ||||||||||||
Hypothetical3
| $1,000.00 | $1,022.94 | $2.29 | 0.45% | ||||||||||||
Actual (Class R)
| $1,000.00 | $1,039.40 | $3.60 | 0.70% | ||||||||||||
Hypothetical3
| $1,000.00 | $1,021.68 | $3.57 | 0.70% | ||||||||||||
Actual (Class I)
| $1,000.00 | $1,041.70 | $1.03 | 0.20% | ||||||||||||
Hypothetical3
| $1,000.00 | $1,024.20 | $1.02 | 0.20% | ||||||||||||
1Expenses are equal to each Class’ annualized expense ratio (for thesix-month period), multiplied by the average account value over the period, multiplied by 184/365 (to reflect theone-half year period). Expenses are based on the most recent fiscal half year; therefore, the expense ratios stated above may differ from the expense ratios stated in the financial highlights, which are based onone-year data. The Class’ total return would have been lower had certain expenses not been waived or reimbursed during the period.
2Expense ratios of the Class do not include fees and expenses indirectly incurred by the underlying funds. If these expenses were included, the expense ratios would have been higher.
3Assumes 5% annual return before expenses.
29
Portfolio Composition as of October 31, 2019 - Asset Allocation1
(unaudited)
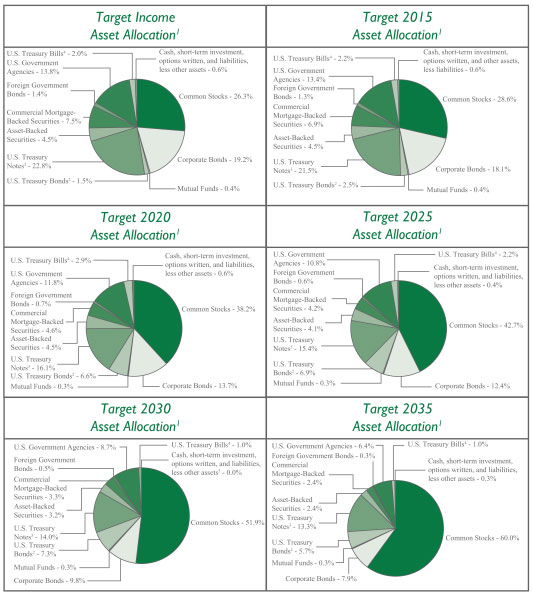
1 Represents portfolio composition of the underlying investment(s) for each Series as a percentage of net assets.
2 A U.S. Treasury Bond is a long-term obligation of the U.S. Treasury issued with a maturity period of more than ten years.
3 A U.S. Treasury Note is an intermediate-term obligation of the U.S. Treasury issued with a maturity period between one and ten years.
4 A U.S. Treasury Bill is a short-term obligation of the U.S. Treasury issued with a maturity of less than one year.
5 Less than 0.1%.
30
Portfolio Composition as of October 31, 2019 - Asset Allocation1
(unaudited)
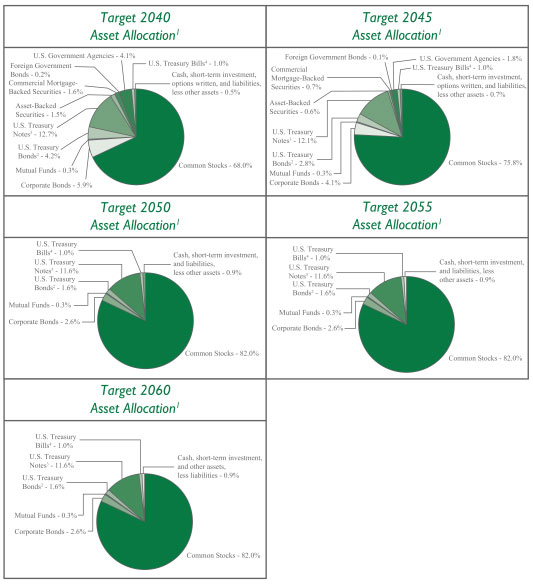
1 Represents portfolio composition of the underlying investment(s) for each Series as a percentage of net assets.
2 A U.S. Treasury Bond is a long-term obligation of the U.S. Treasury issued with a maturity period of more than ten years.
3 A U.S. Treasury Note is an intermediate-term obligation of the U.S. Treasury issued with a maturity period between one and ten years.
4 A U.S. Treasury Bill is a short-term obligation of the U.S. Treasury issued with a maturity of less than one year.
31
Investment Portfolios - October 31, 2019
TARGET INCOME SERIES
| SHARES
|
VALUE (NOTE 2) | ||||||
AFFILIATED INVESTMENT COMPANIES - 100.1% | ||||||||
Manning & Napier Blended Asset Conservative Series - Class R6 | 6,815,127 | $ | 78,646,562 | |||||
|
| |||||||
TOTAL AFFILIATED INVESTMENT COMPANIES | 78,646,562 | |||||||
LIABILITIES, LESS OTHER ASSETS - (0.1%) | (44,750 | ) | ||||||
|
| |||||||
NET ASSETS - 100% | $ | 78,601,812 | ||||||
|
| |||||||
TARGET 2015 SERIES
| SHARES
|
VALUE (NOTE 2) | ||||||
AFFILIATED INVESTMENT COMPANIES - 99.5% | ||||||||
Manning & Napier Blended Asset Conservative Series - Class R6 | 86,770 | $ | 1,001,322 | |||||
Manning & Napier Blended Asset Moderate Series - Class R6 | 22,373 | 258,861 | ||||||
|
| |||||||
TOTAL AFFILIATED INVESTMENT COMPANIES | 1,260,183 | |||||||
OTHER ASSETS, LESS LIABILITIES - 0.5% | 6,863 | |||||||
|
| |||||||
NET ASSETS - 100% | $ | 1,267,046 | ||||||
|
| |||||||
TARGET 2020 SERIES
| SHARES
|
VALUE (NOTE 2) | ||||||
AFFILIATED INVESTMENT COMPANIES - 100.1% | ||||||||
Manning & Napier Blended Asset Extended Series - Class R6 | 257,551 | $ | 2,892,293 | |||||
Manning & Napier Blended Asset Moderate Series - Class R6 | 4,625,584 | 53,518,007 | ||||||
|
| |||||||
TOTAL AFFILIATED INVESTMENT COMPANIES | 56,410,300 | |||||||
LIABILITIES, LESS OTHER ASSETS - (0.1%) | (36,372 | ) | ||||||
|
| |||||||
NET ASSETS - 100% | $ | 56,373,928 | ||||||
|
| |||||||
The accompanying notes are an integral part of the financial statements.
32
Investment Portfolios - October 31, 2019
TARGET 2025 SERIES
| SHARES
|
VALUE (NOTE 2) | ||||||
AFFILIATED INVESTMENT COMPANIES - 100.0% | ||||||||
Manning & Napier Blended Asset Extended Series - Class R6 | 2,480,443 | $ | 27,855,379 | |||||
Manning & Napier Blended Asset Moderate Series - Class R6 | 3,544,696 | 41,012,132 | ||||||
|
| |||||||
TOTAL AFFILIATED INVESTMENT COMPANIES | 68,867,511 | |||||||
LIABILITIES, LESS OTHER ASSETS - (0.0%)## | (33,851 | ) | ||||||
|
| |||||||
NET ASSETS - 100% | $ | 68,833,660 | ||||||
|
| |||||||
## Less than (0.1%). | ||||||||
TARGET 2030 SERIES
| SHARES
|
VALUE | ||||||
AFFILIATED INVESTMENT COMPANIES - 100.1% | ||||||||
Manning & Napier Blended Asset Extended Series - Class R6 | 6,652,407 | $ | 74,706,530 | |||||
Manning & Napier Blended Asset Maximum Series - Class R6 | 330,389 | 4,182,728 | ||||||
|
| |||||||
TOTAL AFFILIATED INVESTMENT COMPANIES | 78,889,258 | |||||||
LIABILITIES, LESS OTHER ASSETS - (0.1%) | (56,412 | ) | ||||||
|
| |||||||
NET ASSETS - 100% | $ | 78,832,846 | ||||||
|
| |||||||
TARGET 2035 SERIES
| SHARES
|
VALUE | ||||||
AFFILIATED INVESTMENT COMPANIES - 100.0% | ||||||||
Manning & Napier Blended Asset Extended Series - Class R6 | 2,949,316 | $ | 33,120,822 | |||||
Manning & Napier Blended Asset Maximum Series - Class R6 | 1,171,124 | 14,826,435 | ||||||
|
| |||||||
TOTAL AFFILIATED INVESTMENT COMPANIES | 47,947,257 | |||||||
LIABILITIES, LESS OTHER ASSETS - (0.0%)## | (23,291 | ) | ||||||
|
| |||||||
NET ASSETS - 100% | $ | 47,923,966 | ||||||
|
| |||||||
## Less than (0.1%). | ||||||||
The accompanying notes are an integral part of the financial statements.
33
Investment Portfolios - October 31, 2019
TARGET 2040 SERIES
| SHARES
|
VALUE (NOTE 2) | ||||||
AFFILIATED INVESTMENT COMPANIES - 100.1% | ||||||||
Manning & Napier Blended Asset Extended Series - Class R6 | 2,027,649 | $ | 22,770,498 | |||||
Manning & Napier Blended Asset Maximum Series - Class R6 | 2,299,409 | 29,110,514 | ||||||
|
| |||||||
TOTAL AFFILIATED INVESTMENT COMPANIES | 51,881,012 | |||||||
LIABILITIES, LESS OTHER ASSETS - (0.1%) | (37,705 | ) | ||||||
|
| |||||||
NET ASSETS - 100% | $ | 51,843,307 | ||||||
|
| |||||||
TARGET 2045 SERIES
| SHARES
|
VALUE | ||||||
AFFILIATED INVESTMENT COMPANIES - 100.0% | ||||||||
Manning & Napier Blended Asset Extended Series - Class R6 | 451,957 | $ | 5,075,474 | |||||
Manning & Napier Blended Asset Maximum Series - Class R6 | 1,676,122 | 21,219,701 | ||||||
|
| |||||||
TOTAL AFFILIATED INVESTMENT COMPANIES | 26,295,175 | |||||||
LIABILITIES, LESS OTHER ASSETS - (0.0%)## | (11,949 | ) | ||||||
|
| |||||||
NET ASSETS - 100% | $ | 26,283,226 | ||||||
|
| |||||||
## Less than (0.1%). | ||||||||
TARGET 2050 SERIES
| SHARES
|
VALUE | ||||||
AFFILIATED INVESTMENT COMPANIES - 100.1% | ||||||||
Manning & Napier Blended Asset Maximum Series - Class R6 | 2,543,766 | $ | 32,204,079 | |||||
|
| |||||||
TOTAL AFFILIATED INVESTMENT COMPANIES | 32,204,079 | |||||||
LIABILITIES, LESS OTHER ASSETS - (0.1%) | (23,203 | ) | ||||||
|
| |||||||
NET ASSETS - 100% | $ | 32,180,876 | ||||||
|
| |||||||
The accompanying notes are an integral part of the financial statements.
34
Investment Portfolios - October 31, 2019
TARGET 2055 SERIES
| SHARES
|
VALUE (NOTE 2) | ||||||
AFFILIATED INVESTMENT COMPANIES - 100.0% | ||||||||
Manning & Napier Blended Asset Maximum Series - Class R6 | 1,005,731 | $ | 12,732,553 | |||||
|
| |||||||
TOTAL AFFILIATED INVESTMENT COMPANIES | ||||||||
(Identified Cost $11,900,775) | 12,732,553 | |||||||
LIABILITIES, LESS OTHER ASSETS - (0.0%)## | (1,947 | ) | ||||||
|
| |||||||
NET ASSETS - 100% | $ | 12,730,606 | ||||||
|
| |||||||
## Less than (0.1%).
| ||||||||
TARGET 2060 SERIES
| SHARES
|
VALUE (NOTE 2) | ||||||
AFFILIATED INVESTMENT COMPANIES - 100.0% | ||||||||
Manning & Napier Blended Asset Maximum Series - Class R6 | 1,045,392 | $ | 13,234,661 | |||||
|
| |||||||
TOTAL AFFILIATED INVESTMENT COMPANIES | ||||||||
(Identified Cost $12,644,038) | 13,234,661 | |||||||
OTHER ASSETS, LESS LIABILITIES - 0.0%## | 796 | |||||||
|
| |||||||
NET ASSETS - 100% | $ | 13,235,457 | ||||||
|
| |||||||
## Less than 0.1%. | ||||||||
The accompanying notes are an integral part of the financial statements.
35
Statements of Assets and Liabilities
October 31, 2019
| TARGET INCOME | TARGET 2015 | TARGET 2020 | TARGET 2025 | TARGET 2030 | ||||||||||||||||
ASSETS: | ||||||||||||||||||||
Total investments in Underlying Series: | $ | 78,646,562 | $ | 1,260,183 | $ | 56,410,300 | $ | 68,867,511 | $ | 78,889,258 | ||||||||||
Receivable from Advisor (Note 3) | 11,082 | 17,727 | 14,036 | 18,337 | 17,051 | |||||||||||||||
Receivable for shares of Underlying Series sold | 117,928 | — | 339,436 | 82 | 1,922,812 | |||||||||||||||
Receivable for fund shares sold | 9,826 | 64 | 4,463 | 55,756 | 5,286 | |||||||||||||||
Prepaid expenses | 16,963 | 21,374 | 16,604 | 23,077 | 16,919 | |||||||||||||||
|
|
|
|
|
|
|
|
|
| |||||||||||
TOTAL ASSETS | 78,802,361 | 1,299,348 | 56,784,839 | 68,964,763 | 80,851,326 | |||||||||||||||
|
|
|
|
|
|
|
|
|
| |||||||||||
LIABILITIES: | ||||||||||||||||||||
Accrued distribution and service (Rule12b-1) fees (Note 3) | 20,448 | 249 | 14,170 | 19,212 | 20,695 | |||||||||||||||
Accrued fund accounting and administration fees (Note 3) | 12,858 | 12,386 | 12,724 | 12,798 | 12,870 | |||||||||||||||
Accruedsub-transfer agent fees (Note 3) | 2,333 | 551 | 8,283 | 4,145 | 15,578 | |||||||||||||||
Accrued Chief Compliance Officer service fees (Note 3) | 687 | 687 | 688 | 687 | 688 | |||||||||||||||
Payable for fund shares repurchased | 127,687 | 7 | 343,853 | 421 | 1,928,014 | |||||||||||||||
Audit fees payable | 14,357 | 14,357 | 14,357 | 14,357 | 14,357 | |||||||||||||||
Accrued transfer agent fees | 11,529 | 149 | 7,979 | 13,609 | 14,622 | |||||||||||||||
Accrued printing and postage fees | 8,116 | 1,348 | 6,047 | 7,546 | 8,538 | |||||||||||||||
Legal fees payable | 1,676 | 1,676 | 1,676 | 1,676 | 1,676 | |||||||||||||||
Payable for shares of Underlying Series purchased | — | 57 | — | 55,335 | — | |||||||||||||||
Other payables and accrued expenses | 858 | 835 | 1,134 | 1,317 | 1,442 | |||||||||||||||
|
|
|
|
|
|
|
|
|
| |||||||||||
TOTAL LIABILITIES | 200,549 | 32,302 | 410,911 | 131,103 | 2,018,480 | |||||||||||||||
|
|
|
|
|
|
|
|
|
| |||||||||||
TOTAL NET ASSETS | $ | 78,601,812 | $ | 1,267,046 | $ | 56,373,928 | $ | 68,833,660 | $ | 78,832,846 | ||||||||||
|
|
|
|
|
|
|
|
|
| |||||||||||
NET ASSETS CONSIST OF: | ||||||||||||||||||||
Capital stock | 75,006 | 1,067 | 55,744 | 53,203 | 76,384 | |||||||||||||||
Additionalpaid-in-capital | 76,325,569 | 1,638,655 | 56,036,337 | 63,780,435 | 76,136,924 | |||||||||||||||
Total distributable earnings (loss) | 2,201,237 | (372,676 | ) | 281,847 | 5,000,022 | 2,619,538 | ||||||||||||||
|
|
|
|
|
|
|
|
|
| |||||||||||
TOTAL NET ASSETS | $ | 78,601,812 | $ | 1,267,046 | $ | 56,373,928 | $ | 68,833,660 | $ | 78,832,846 | ||||||||||
|
|
|
|
|
|
|
|
|
| |||||||||||
Class K | ||||||||||||||||||||
Net Assets | $ | 57,731,550 | $ | 1,184,623 | $ | 37,417,721 | $ | 43,163,389 | $ | 47,194,615 | ||||||||||
Shares Outstanding | 5,488,010 | 99,817 | 3,686,243 | 3,337,486 | 4,562,111 | |||||||||||||||
Net Asset Value, Offering Price, and Redemption Price per share | $ | 10.52 | $ | 11.87 | $ | 10.15 | $ | 12.93 | $ | 10.34 | ||||||||||
Class R | ||||||||||||||||||||
Net Assets | $ | 19,779,206 | $ | 147 | $ | 14,937,282 | $ | 24,305,272 | $ | 24,708,017 | ||||||||||
Shares Outstanding | 1,909,511 | 12 | 1,494,762 | 1,877,197 | 2,414,843 | |||||||||||||||
Net Asset Value, Offering Price, and Redemption Price per share | $ | 10.36 | $ | 12.05 | 1 | $ | 9.99 | $ | 12.95 | $ | 10.23 | |||||||||
Class I | ||||||||||||||||||||
Net Assets | $ | 1,091,056 | $ | 82,276 | $ | 4,018,925 | $ | 1,364,999 | $ | 6,930,214 | ||||||||||
Shares Outstanding | 103,105 | 6,908 | 393,346 | 105,593 | 661,494 | |||||||||||||||
Net Asset Value, Offering Price, and Redemption Price per share | $ | 10.58 | $ | 11.91 | $ | 10.22 | $ | 12.93 | $ | 10.48 | ||||||||||
*At identified cost | $ | 74,060,125 | $ | 1,183,395 | $ | 52,445,924 | $ | 63,792,822 | $ | 73,129,649 | ||||||||||
|
|
|
|
|
|
|
|
|
| |||||||||||
1The net asset value of the Class R Shares of the Manning & Napier Target 2015 Series net asset value was calculated using unrounded net assets of $147.35 divided by the unrounded shares outstanding of 12.232.
The accompanying notes are an integral part of the financial statements.
36
Statements of Assets and Liabilities
October 31, 2019
TARGET 2035 | TARGET 2040 | TARGET 2045 | TARGET 2050 | TARGET 2055 | TARGET 2060 | |||||||||||||||||||
ASSETS: | ||||||||||||||||||||||||
Total investments in Underlying Series: | $ | 47,947,257 | $ | 51,881,012 | $ | 26,295,175 | $ | 32,204,079 | $ | 12,732,553 | $ | 13,234,661 | ||||||||||||
Receivable from Advisor (Note 3) | 22,547 | 21,696 | 23,767 | 24,639 | 24,623 | 31,292 | ||||||||||||||||||
Receivable for fund shares sold | 4,930 | 20,535 | 574 | 5,038 | 5,850 | 1,632 | ||||||||||||||||||
Receivable for shares of Underlying Series sold | 6,376 | 1,005,240 | 72 | 74 | 4,562 | 1,744 | ||||||||||||||||||
Prepaid expenses | 22,047 | 16,273 | 21,559 | 15,814 | 21,626 | 25,662 | ||||||||||||||||||
|
|
|
|
|
|
|
|
|
|
|
| |||||||||||||
TOTAL ASSETS | 48,003,157 | 52,944,756 | 26,341,147 | 32,249,644 | 12,789,214 | 13,294,991 | ||||||||||||||||||
|
|
|
|
|
|
|
|
|
|
|
| |||||||||||||
LIABILITIES: | ||||||||||||||||||||||||
Accrued distribution and service (Rule12b-1) fees | 13,811 | 14,016 | 7,797 | 8,244 | 3,842 | 4,123 | ||||||||||||||||||
Accrued fund accounting and administration fees (Note 3) | 12,667 | 12,698 | 12,536 | 12,570 | 12,455 | 12,455 | ||||||||||||||||||
Accruedsub-transfer agent fees (Note 3) | 3,721 | 10,384 | 2,716 | 7,694 | 1,802 | 326 | ||||||||||||||||||
Accrued Chief Compliance Officer service fees | 688 | 687 | 687 | 687 | 687 | 688 | ||||||||||||||||||
Audit fees payable | 14,357 | 14,357 | 14,357 | 14,357 | 14,357 | 14,357 | ||||||||||||||||||
Accrued transfer agent fees | 13,698 | 14,045 | 11,911 | 12,730 | 11,121 | 17,514 | ||||||||||||||||||
Payable for fund shares repurchased | 11,223 | 1,025,692 | 83 | 128 | 8,345 | 3,268 | ||||||||||||||||||
Accrued printing and postage fees | 5,973 | 6,480 | 4,355 | 4,747 | 3,404 | 4,066 | ||||||||||||||||||
Legal fees payable | 1,676 | 1,676 | 1,676 | 1,676 | 1,676 | 1,676 | ||||||||||||||||||
Payable for shares of Underlying Series purchased | — | — | 491 | 4,911 | — | — | ||||||||||||||||||
Other payables and accrued expenses | 1,377 | 1,414 | 1,312 | 1,024 | 919 | 1,061 | ||||||||||||||||||
|
|
|
|
|
|
|
|
|
|
|
| |||||||||||||
TOTAL LIABILITIES | 79,191 | 1,101,449 | 57,921 | 68,768 | 58,608 | 59,534 | ||||||||||||||||||
|
|
|
|
|
|
|
|
|
|
|
| |||||||||||||
TOTAL NET ASSETS | $ | 47,923,966 | $ | 51,843,307 | $ | 26,283,226 | $ | 32,180,876 | $ | 12,730,606 | $ | 13,235,457 | ||||||||||||
|
|
|
|
|
|
|
|
|
|
|
| |||||||||||||
NET ASSETS CONSIST OF: | ||||||||||||||||||||||||
Capital stock | 35,427 | 50,073 | 19,352 | 30,115 | 9,512 | 10,870 | ||||||||||||||||||
Additionalpaid-in-capital | 44,594,007 | 50,609,279 | 24,590,272 | 31,096,590 | 11,812,623 | 13,011,243 | ||||||||||||||||||
Total distributable earnings (loss) | 3,294,532 | 1,183,955 | 1,673,602 | 1,054,171 | 908,471 | 213,344 | ||||||||||||||||||
|
|
|
|
|
|
|
|
|
|
|
| |||||||||||||
TOTAL NET ASSETS | $ | 47,923,966 | $ | 51,843,307 | $ | 26,283,226 | $ | 32,180,876 | $ | 12,730,606 | $ | 13,235,457 | ||||||||||||
|
|
|
|
|
|
|
|
|
|
|
| |||||||||||||
Class K | ||||||||||||||||||||||||
Net Assets | $ | 27,944,861 | $ | 31,636,544 | $ | 13,115,593 | $ | 19,766,637 | $ | 6,145,506 | $ | 5,975,139 | ||||||||||||
Shares Outstanding | 2,067,268 | 3,046,764 | 961,353 | 1,841,882 | 455,957 | 489,151 | ||||||||||||||||||
Net Asset Value, Offering Price, and Redemption Price per share | $ | 13.52 | $ | 10.38 | $ | 13.64 | $ | 10.73 | $ | 13.48 | $ | 12.22 | ||||||||||||
Class R | ||||||||||||||||||||||||
Net Assets | $ | 19,216,771 | $ | 17,293,649 | $ | 12,243,586 | $ | 9,917,109 | $ | 6,135,535 | $ | 6,973,583 | ||||||||||||
Shares Outstanding | 1,419,456 | 1,683,147 | 906,418 | 939,536 | 462,286 | 574,439 | ||||||||||||||||||
Net Asset Value, Offering Price, and Redemption Price per share | $ | 13.54 | $ | 10.27 | $ | 13.51 | $ | 10.56 | $ | 13.27 | $ | 12.14 | ||||||||||||
Class I | ||||||||||||||||||||||||
Net Assets | $ | 762,334 | $ | 2,913,114 | $ | 924,047 | $ | 2,497,130 | $ | 449,565 | $ | 286,735 | ||||||||||||
Shares Outstanding | 56,022 | 277,405 | 67,393 | 230,126 | 32,963 | 23,444 | ||||||||||||||||||
Net Asset Value, Offering Price, and Redemption Price per share | $ | 13.61 | $ | 10.50 | $ | 13.71 | $ | 10.85 | $ | 13.64 | $ | 12.23 | ||||||||||||
*At identified cost | $ | 44,666,833 | $ | 48,363,293 | $ | 24,657,673 | $ | 30,236,057 | $ | 11,900,775 | $ | 12,644,038 | ||||||||||||
|
|
|
|
|
|
|
|
|
|
|
| |||||||||||||
The accompanying notes are an integral part of the financial statements.
37
Statements of Operations
For the Year Ended October 31, 2019
| TARGET INCOME | �� | TARGET 2015 | TARGET 2020 | TARGET 2025 | TARGET 2030 | |||||||||||||||
INVESTMENT INCOME: | ||||||||||||||||||||
Income distributions from Underlying Series | $ | 2,509,324 | $ | 29,911 | $ | 1,584,328 | $ | 1,152,148 | $ | 1,750,669 | ||||||||||
|
|
|
|
|
|
|
|
|
| |||||||||||
EXPENSES: | ||||||||||||||||||||
Distribution and services (Rule12b-1) fees | 159,489 | 3,239 | 106,669 | 94,113 | 133,037 | |||||||||||||||
Distribution and services (Rule12b-1) fees | 101,393 | 78 | 75,687 | 126,689 | 123,183 | |||||||||||||||
Fund accounting and administration fees | 52,385 | 50,292 | 51,796 | 51,556 | 52,369 | |||||||||||||||
Sub-transfer agent fees (Note 3) | 21,480 | 1,878 | 36,235 | 10,874 | 57,641 | |||||||||||||||
Directors’ fees (Note 3) | 8,169 | 153 | 5,932 | 5,850 | 7,980 | |||||||||||||||
Chief Compliance Officer service fees (Note 3) | 3,455 | 3,455 | 3,455 | 3,455 | 3,455 | |||||||||||||||
Transfer agent fees | 61,216 | 617 | 43,072 | 73,618 | 77,073 | |||||||||||||||
Registration and filing fees | 59,135 | 51,537 | 57,725 | 56,845 | 59,407 | |||||||||||||||
Audit fees | 22,666 | 22,196 | 22,530 | 22,588 | 22,655 | |||||||||||||||
Legal fees | 10,367 | 10,279 | 10,342 | 10,354 | 10,368 | |||||||||||||||
Custodian fees | 3,274 | 5,912 | 5,944 | 6,027 | 6,018 | |||||||||||||||
Miscellaneous | 23,290 | 6,025 | 17,981 | 22,916 | 25,502 | |||||||||||||||
|
|
|
|
|
|
|
|
|
| |||||||||||
Total Expenses | 526,319 | 155,661 | 437,368 | 484,885 | 578,688 | |||||||||||||||
Less reduction of expenses (Note 3) | (95,277 | ) | (149,526 | ) | (131,598 | ) | (135,554 | ) | (154,337 | ) | ||||||||||
|
|
|
|
|
|
|
|
|
| |||||||||||
Net Expenses | 431,042 | 6,135 | 305,770 | 349,331 | 424,351 | |||||||||||||||
|
|
|
|
|
|
|
|
|
| |||||||||||
NET INVESTMENT INCOME | 2,078,282 | 23,776 | 1,278,558 | 802,817 | 1,326,318 | |||||||||||||||
|
|
|
|
|
|
|
|
|
| |||||||||||
| REALIZED AND UNREALIZED GAIN (LOSS) ON UNDERLYING SERIES: | ||||||||||||||||||||
Net realized gain (loss) on Underlying Series | (2,085,634 | ) | (11,330 | ) | (2,113,952 | ) | (84,324 | ) | (3,146,653 | ) | ||||||||||
Distributions of realized gains from Underlying Series | — | — | 30,592 | 96,454 | 969,561 | |||||||||||||||
Net change in unrealized appreciation (depreciation) on Underlying Series | 6,772,108 | 129,314 | 6,316,607 | 6,607,607 | 8,333,767 | |||||||||||||||
|
|
|
|
|
|
|
|
|
| |||||||||||
NET REALIZED AND UNREALIZED GAIN (LOSS) ON UNDERLYING SERIES | 4,686,474 | 117,984 | 4,233,247 | 6,619,737 | 6,156,675 | |||||||||||||||
|
|
|
|
|
|
|
|
|
| |||||||||||
NET INCREASE IN NET ASSETS RESULTING FROM OPERATIONS | $ | 6,764,756 | $ | 141,760 | $ | 5,511,805 | $ | 7,422,554 | $ | 7,482,993 | ||||||||||
|
|
|
|
|
|
|
|
|
| |||||||||||
The accompanying notes are an integral part of the financial statements.
38
Statements of Operations
For the Year Ended October 31, 2019
| TARGET 2035 | TARGET 2040 | TARGET 2045 | TARGET 2050 | TARGET 2055 | TARGET 2060 | |||||||||||||||||||
INVESTMENT INCOME: | ||||||||||||||||||||||||
Income distributions from Underlying Series | $ | 608,237 | $ | 870,991 | $ | 274,295 | $ | 350,144 | $ | 124,971 | $ | 133,955 | ||||||||||||
|
|
|
|
|
|
|
|
|
|
|
| |||||||||||||
EXPENSES: | ||||||||||||||||||||||||
Distribution and services (Rule12b-1) fees (Class R) (Note 3) | 93,625 | 84,518 | 56,835 | 46,381 | 29,615 | 30,957 | ||||||||||||||||||
Distribution and services (Rule12b-1) fees (Class K) (Note 3) | 57,524 | 83,969 | 27,863 | 43,324 | 13,142 | 11,704 | ||||||||||||||||||
Fund accounting and administration fees (Note 3) | 51,017 | 51,617 | 50,547 | 51,010 | 50,257 | 50,587 | ||||||||||||||||||
Sub-transfer agent fees (Note 3) | 9,868 | 36,409 | 7,467 | 22,404 | 5,231 | 1,770 | ||||||||||||||||||
Directors’ fees (Note 3) | 3,823 | 5,015 | 2,086 | 2,614 | 1,036 | 976 | ||||||||||||||||||
Chief Compliance Officer service fees (Note 3) | 3,455 | 3,455 | 3,455 | 3,455 | 3,455 | 3,455 | ||||||||||||||||||
Transfer agent fees | 72,180 | 72,734 | 62,240 | 64,153 | 56,621 | 83,688 | ||||||||||||||||||
Registration and filing fees | 54,444 | 57,156 | 53,225 | 55,649 | 51,850 | 54,043 | ||||||||||||||||||
Audit fees | 22,446 | 22,486 | 22,328 | 22,345 | 22,259 | 22,247 | ||||||||||||||||||
Legal fees | 10,330 | 10,337 | 10,307 | 10,312 | 10,292 | 10,290 | ||||||||||||||||||
Custodian fees | 6,026 | 5,951 | 6,048 | 3,318 | 3,289 | 3,365 | ||||||||||||||||||
Miscellaneous | 20,243 | 21,438 | 16,672 | 17,685 | 14,487 | 17,717 | ||||||||||||||||||
|
|
|
|
|
|
|
|
|
|
|
| |||||||||||||
Total Expenses | 404,981 | 455,085 | 319,073 | 342,650 | 261,534 | 290,799 | ||||||||||||||||||
Less reduction of expenses (Note 3) | (168,910 | ) | (179,821 | ) | (187,700 | ) | (195,491 | ) | (195,620 | ) | (225,968 | ) | ||||||||||||
|
|
|
|
|
|
|
|
|
|
|
| |||||||||||||
Net Expenses | 236,071 | 275,264 | 131,373 | 147,159 | 65,914 | 64,831 | ||||||||||||||||||
|
|
|
|
|
|
|
|
|
|
|
| |||||||||||||
NET INVESTMENT INCOME | 372,166 | 595,727 | 142,922 | 202,985 | 59,057 | 69,124 | ||||||||||||||||||
|
|
|
|
|
|
|
|
|
|
|
| |||||||||||||
| REALIZED AND UNREALIZED GAIN (LOSS) ON UNDERLYING SERIES: | ||||||||||||||||||||||||
Net realized gain (loss) on Underlying Series | 2,423 | (2,362,947 | ) | 25,659 | (933,863 | ) | 70,602 | (384,091 | ) | |||||||||||||||
Distributions of realized gains from Underlying Series | 734,436 | 2,287,894 | 900,730 | 1,643,491 | 514,700 | 616,381 | ||||||||||||||||||
Net change in unrealized appreciation (depreciation) on Underlying Series | 4,007,487 | 3,995,878 | 1,812,688 | 1,887,695 | 861,760 | 759,245 | ||||||||||||||||||
|
|
|
|
|
|
|
|
|
|
|
| |||||||||||||
NET REALIZED AND UNREALIZED GAIN (LOSS) ON UNDERLYING SERIES | 4,744,346 | 3,920,825 | 2,739,077 | 2,597,323 | 1,447,062 | 991,535 | ||||||||||||||||||
|
|
|
|
|
|
|
|
|
|
|
| |||||||||||||
NET INCREASE IN NET ASSETS RESULTING FROM OPERATIONS | $ | 5,116,512 | $ | 4,516,552 | $ | 2,881,999 | $ | 2,800,308 | $ | 1,506,119 | $ | 1,060,659 | ||||||||||||
|
|
|
|
|
|
|
|
|
|
|
| |||||||||||||
The accompanying notes are an integral part of the financial statements.
39
Statements of Changes in Net Assets
| TARGET INCOME | TARGET 2015 | |||||||||||||||
| FOR THE YEAR ENDED 10/31/19 | FOR THE YEAR ENDED 10/31/18 | FOR THE YEAR ENDED 10/31/19 | FOR THE YEAR ENDED 10/31/18 | |||||||||||||
INCREASE (DECREASE) IN NET ASSETS: | ||||||||||||||||
OPERATIONS: | ||||||||||||||||
Net investment income | $ | 2,078,282 | $ | 667,063 | $ 23,776 | $ | 18,037 | |||||||||
Net realized gain (loss) on Underlying Series | (2,085,634 | ) | 53,511 | (11,330 | ) | (7,271 | ) | |||||||||
Net change in unrealized appreciation (depreciation) on Underlying | ||||||||||||||||
Series | 6,772,108 | (2,010,867 | ) | 129,314 | (44,102 | ) | ||||||||||
|
|
|
|
|
|
|
| |||||||||
Net increase (decrease) from operations | 6,764,756 | (1,290,293 | ) | 141,760 | (33,336 | ) | ||||||||||
|
|
|
|
|
|
|
| |||||||||
DISTRIBUTIONS TO SHAREHOLDERS (Note 9): | ||||||||||||||||
Class K | (1,741,589 | ) | (551,937 | ) | (22,028 | ) | (18,450 | ) | ||||||||
Class R | (327,071 | ) | (79,029 | ) | (510 | ) | (150 | ) | ||||||||
Class I | (19,232 | ) | (41,364 | ) | (1,765 | ) | (2,948 | ) | ||||||||
Class R6 | (82 | ) | (45 | ) | (89 | ) | (48 | ) | ||||||||
|
|
|
|
|
|
|
| |||||||||
Total distributions to shareholders | (2,087,974 | ) | (672,375 | ) | (24,392 | ) | (21,596 | ) | ||||||||
|
|
|
|
|
|
|
| |||||||||
CAPITAL STOCK ISSUED AND REPURCHASED: | ||||||||||||||||
Net increase (decrease) from capital share transactions (Note 6) | (51,820,962 | ) | 28,747,761 | (977,578 | ) | (2,383,524 | ) | |||||||||
|
|
|
|
|
|
|
| |||||||||
Net increase (decrease) in net assets | (47,144,180 | ) | 26,785,093 | (860,210 | ) | (2,438,456 | ) | |||||||||
NET ASSETS: | ||||||||||||||||
Beginning of year | 125,745,992 | 98,960,899 | 2,127,256 | 4,565,712 | ||||||||||||
|
|
|
|
|
|
|
| |||||||||
End of year | $ | 78,601,812 | $ | 125,745,992 | $1,267,046 | $ | 2,127,256 | |||||||||
|
|
|
|
|
|
|
| |||||||||
The accompanying notes are an integral part of the financial statements.
40
Statements of Changes in Net Assets
| TARGET 2020 | TARGET 2025 | TARGET 2030 | ||||||||||||||||||||||
| FOR THE | FOR THE | FOR THE | FOR THE | FOR THE | FOR THE | |||||||||||||||||||
| YEAR ENDED | YEAR ENDED | YEAR ENDED | YEAR ENDED | YEAR ENDED | YEAR ENDED | |||||||||||||||||||
| 10/31/19 | 10/31/18 | 10/31/19 | 10/31/18 | 10/31/19 | 10/31/18 | |||||||||||||||||||
INCREASE (DECREASE) IN NET ASSETS: | ||||||||||||||||||||||||
OPERATIONS: | ||||||||||||||||||||||||
Net investment income | $ | 1,278,558 | $ | 453,324 | $ | 802,817 | $ | 155,354 | $ | 1,326,318 | $ | 398,171 | ||||||||||||
Net realized gain (loss) on Underlying Series | (2,113,952 | ) | 735,124 | (84,324 | ) | 126,048 | (3,146,653 | ) | 1,916,331 | |||||||||||||||
Distributions of realized gains from Underlying Series | 30,592 | — | 96,454 | — | 969,561 | 10,343 | ||||||||||||||||||
Net change in unrealized appreciation (depreciation) on Underlying Series | 6,316,607 | (2,141,344 | ) | 6,607,607 | (1,459,991 | ) | 8,333,767 | (2,369,816 | ) | |||||||||||||||
|
|
|
|
|
|
|
|
|
|
|
| |||||||||||||
Net increase (decrease) from operations | 5,511,805 | (952,896 | ) | 7,422,554 | (1,178,589 | ) | 7,482,993 | (44,971 | ) | |||||||||||||||
|
|
|
|
|
|
|
|
|
|
|
| |||||||||||||
DISTRIBUTIONS TO SHAREHOLDERS (Note 9): | ||||||||||||||||||||||||
Class K | (1,055,432 | ) | (333,197 | ) | (618,436 | ) | (120,108 | ) | (1,979,160 | ) | (308,506 | ) | ||||||||||||
Class R | (200,008 | ) | (38,502 | ) | (383,438 | ) | (51,904 | ) | (489,793 | ) | (40,634 | ) | ||||||||||||
Class I | (64,703 | ) | (140,194 | ) | (25,048 | ) | (12,139 | ) | (136,991 | ) | (146,983 | ) | ||||||||||||
Class R6 | (72 | ) | (39 | ) | (84 | ) | (36 | ) | (109 | ) | (34 | ) | ||||||||||||
|
|
|
|
|
|
|
|
|
|
|
| |||||||||||||
Total distributions to shareholders | (1,320,215 | ) | (511,932 | ) | (1,027,006 | ) | (184,187 | ) | (2,606,053 | ) | (496,157 | ) | ||||||||||||
|
|
|
|
|
|
|
|
|
|
|
| |||||||||||||
CAPITAL STOCK ISSUED AND REPURCHASED: |
| |||||||||||||||||||||||
Net increase (decrease) from capital share transactions (Note 6) | (41,474,278 | ) | (19,422,193 | ) | 3,071,326 | 20,316,770 | (47,529,020 | ) | (19,606,205 | ) | ||||||||||||||
|
|
|
|
|
|
|
|
|
|
|
| |||||||||||||
Net increase (decrease) in net assets | (37,282,688 | ) | (20,887,021 | ) | 9,466,874 | 18,953,994 | (42,652,080 | ) | (20,147,333 | ) | ||||||||||||||
NET ASSETS: | ||||||||||||||||||||||||
Beginning of year | 93,656,616 | 114,543,637 | 59,366,786 | 40,412,792 | 121,484,926 | 141,632,259 | ||||||||||||||||||
|
|
|
|
|
|
|
|
|
|
|
| |||||||||||||
End of year | $ | 56,373,928 | $ | 93,656,616 | $68,833,660 | $59,366,786 | $ | 78,832,846 | $ | 121,484,926 | ||||||||||||||
|
|
|
|
|
|
|
|
|
|
|
| |||||||||||||
The accompanying notes are an integral part of the financial statements.
41
Statements of Changes in Net Assets
| TARGET 2035 | TARGET 2040 | TARGET 2045 | ||||||||||||||||||||||
| FOR THE | FOR THE | FOR THE | FOR THE | FOR THE | FOR THE | |||||||||||||||||||
| YEAR ENDED | YEAR ENDED | YEAR ENDED | YEAR ENDED | YEAR ENDED | YEAR ENDED | |||||||||||||||||||
| 10/31/19 | 10/31/18 | 10/31/19 | 10/31/18 | 10/31/19 | 10/31/18 | |||||||||||||||||||
INCREASE (DECREASE) IN NET ASSETS: | ||||||||||||||||||||||||
OPERATIONS: | ||||||||||||||||||||||||
Net investment income | $ | 372,166 | $ | 52,384 | $ | 595,727 | $ | 144,038 | $ | 142,922 | $ | 10,542 | ||||||||||||
Net realized gain (loss) on Underlying Series | 2,423 | 316,861 | (2,362,947 | ) | 2,168,815 | 25,659 | 376,331 | |||||||||||||||||
Distributions of realized gains from Underlying Series | 734,436 | 5,262 | 2,287,894 | 25,801 | 900,730 | 6,666 | ||||||||||||||||||
Net change in unrealized appreciation (depreciation) on Underlying Series | 4,007,487 | (709,726 | ) | 3,995,878 | (475,613 | ) | 1,812,688 | (184,998 | ) | |||||||||||||||
|
|
|
|
|
|
|
|
|
|
|
| |||||||||||||
Net increase (decrease) from operations | 5,116,512 | (335,219 | ) | 4,516,552 | 1,863,041 | 2,881,999 | 208,541 | |||||||||||||||||
|
|
|
|
|
|
|
|
|
|
|
| |||||||||||||
DISTRIBUTIONS TO SHAREHOLDERS (Note 9): | ||||||||||||||||||||||||
Class K | (786,478 | ) | (309,933 | ) | (3,764,757 | ) | (1,134,887 | ) | (691,460 | ) | (552,542 | ) | ||||||||||||
Class R | (596,100 | ) | (119,611 | ) | (1,068,704 | ) | (173,383 | ) | (660,963 | ) | (274,363 | ) | ||||||||||||
Class I | (26,322 | ) | (18,396 | ) | (189,141 | ) | (542,227 | ) | (50,249 | ) | (86,775 | ) | ||||||||||||
Class R6 | (187 | ) | (95 | ) | (345 | ) | (123 | ) | (349 | ) | (283 | ) | ||||||||||||
|
|
|
|
|
|
|
|
|
|
|
| |||||||||||||
Total distributions to shareholders | (1,409,087 | ) | (448,035 | ) | (5,022,947 | ) | (1,850,620 | ) | (1,403,021 | ) | (913,963 | ) | ||||||||||||
|
|
|
|
|
|
|
|
|
|
|
| |||||||||||||
CAPITAL STOCK ISSUED AND REPURCHASED: |
| |||||||||||||||||||||||
Net increase (decrease) from capital share transactions (Note 6) | 6,902,408 | 11,780,503 | (20,583,552 | ) | (11,082,791 | ) | 4,293,821 | 5,322,101 | ||||||||||||||||
|
|
|
|
|
|
|
|
|
|
|
| |||||||||||||
Net increase (decrease) in net assets | 10,609,833 | 10,997,249 | (21,089,947 | ) | (11,070,370 | ) | 5,772,799 | 4,616,679 | ||||||||||||||||
NET ASSETS: | ||||||||||||||||||||||||
Beginning of year | 37,314,133 | 26,316,884 | 72,933,254 | 84,003,624 | 20,510,427 | 15,893,748 | ||||||||||||||||||
|
|
|
|
|
|
|
|
|
|
|
| |||||||||||||
End of year | $47,923,966 | $37,314,133 | $ | 51,843,307 | $ | 72,933,254 | $26,283,226 | $20,510,427 | ||||||||||||||||
|
|
|
|
|
|
|
|
|
|
|
| |||||||||||||
The accompanying notes are an integral part of the financial statements.
42
Statements of Changes in Net Assets
| TARGET 2050 | TARGET 2055 | TARGET 2060 | ||||||||||||||||||||||
| FOR THE | FOR THE | FOR THE | FOR THE | FOR THE | FOR THE | |||||||||||||||||||
| YEAR ENDED | YEAR ENDED | YEAR ENDED | YEAR ENDED | YEAR ENDED | YEAR ENDED | |||||||||||||||||||
| 10/31/19 | 10/31/18 | 10/31/19 | 10/31/18 | 10/31/19 | 10/31/18 | |||||||||||||||||||
INCREASE (DECREASE) IN NET ASSETS: | ||||||||||||||||||||||||
OPERATIONS: | ||||||||||||||||||||||||
Net investment income (loss) | $ 202,985 | $ 35,266 | $ 59,057 | $ (249 | ) | $ 69,124 | $ (191 | ) | ||||||||||||||||
Net realized gain (loss) on Underlying Series | (933,863 | ) | 1,246,629 | 70,602 | 106,996 | (384,091 | ) | 18,505 | ||||||||||||||||
Distributions of realized gains from Underlying Series | 1,643,491 | 16,583 | 514,700 | 3,330 | 616,381 | 2,316 | ||||||||||||||||||
Net change in unrealized appreciation (depreciation) on Underlying Series | 1,887,695 | 47,864 | 861,760 | (35,998 | ) | 759,245 | (172,805 | ) | ||||||||||||||||
|
|
|
|
|
|
|
|
|
|
|
| |||||||||||||
Net increase (decrease) from operations | 2,800,308 | 1,346,342 | 1,506,119 | 74,079 | 1,060,659 | (152,175 | ) | |||||||||||||||||
|
|
|
|
|
|
|
|
|
|
|
| |||||||||||||
DISTRIBUTIONS TO SHAREHOLDERS (Note 9): | ||||||||||||||||||||||||
Class K | (2,139,439 | ) | (1,432,399 | ) | (304,231 | ) | (374,095 | ) | (402,474 | ) | (379,653 | ) | ||||||||||||
Class R | (752,168 | ) | (264,695 | ) | (339,226 | ) | (242,383 | ) | (280,280 | ) | (152,746 | ) | ||||||||||||
Class I | (172,886 | ) | (1,026,318 | ) | (23,522 | ) | (21,844 | ) | (9,914 | ) | (11,524 | ) | ||||||||||||
Class R6 | (478 | ) | (373 | ) | (335 | ) | (428 | ) | (293 | ) | (531 | ) | ||||||||||||
|
|
|
|
|
|
|
|
|
|
|
| |||||||||||||
Total distributions to shareholders | (3,064,971 | ) | (2,723,785 | ) | (667,314 | ) | (638,750 | ) | (692,961 | ) | (544,454 | ) | ||||||||||||
|
|
|
|
|
|
|
|
|
|
|
| |||||||||||||
CAPITAL STOCK ISSUED AND REPURCHASED: |
| |||||||||||||||||||||||
Net increase (decrease) from capital share transactions (Note 6) | (584,682 | ) | (973,191 | ) | 1,664,750 | 4,047,900 | 1,465,472 | 7,464,444 | ||||||||||||||||
|
|
|
|
|
|
|
|
|
|
|
| |||||||||||||
Net increase (decrease) in net assets | (849,345 | ) | (2,350,634 | ) | 2,503,555 | 3,483,229 | 1,833,170 | 6,767,815 | ||||||||||||||||
NET ASSETS: | ||||||||||||||||||||||||
Beginning of year | 33,030,221 | 35,380,855 | 10,227,051 | 6,743,822 | 11,402,287 | 4,634,472 | ||||||||||||||||||
|
|
|
|
|
|
|
|
|
|
|
| |||||||||||||
End of year | $32,180,876 | $33,030,221 | $12,730,606 | $10,227,051 | $13,235,457 | $11,402,287 | ||||||||||||||||||
|
|
|
|
|
|
|
|
|
|
|
| |||||||||||||
The accompanying notes are an integral part of the financial statements.
43
Financial Highlights
| TARGET INCOME SERIES CLASS K | FOR THE YEAR ENDED | ||||||||||||||||||||||||
| 10/31/19 | 10/31/18 | 10/31/17 | 10/31/16 | 10/31/15 | |||||||||||||||||||||
Per share data (for a share outstanding throughout each year): |
| ||||||||||||||||||||||||
Net asset value - Beginning of year | $9.73 | $9.88 | $9.39 | $9.72 | $10.84 | ||||||||||||||||||||
|
|
|
|
|
|
|
|
|
| ||||||||||||||||
Income (loss) from investment operations: | |||||||||||||||||||||||||
Net investment income1,2 | 0.27 | 0.06 | 0.14 | 0.17 | 0.15 | ||||||||||||||||||||
Net realized and unrealized gain (loss) on investments | 0.70 | (0.15 | ) | 0.49 | 0.09 | (0.29 | ) | ||||||||||||||||||
|
|
|
|
|
|
|
|
|
| ||||||||||||||||
Total from investment operations | 0.97 | (0.09 | ) | 0.63 | 0.26 | (0.14 | ) | ||||||||||||||||||
|
|
|
|
|
|
|
|
|
| ||||||||||||||||
Less distributions to shareholders: | |||||||||||||||||||||||||
From net investment income | (0.18 | ) | (0.06 | ) | (0.14 | ) | (0.17 | ) | (0.28 | ) | |||||||||||||||
From net realized gain on investments | — | — | — | (0.42 | ) | (0.70 | ) | ||||||||||||||||||
|
|
|
|
|
|
|
|
|
| ||||||||||||||||
Total distributions to shareholders | (0.18 | ) | (0.06 | ) | (0.14 | ) | (0.59 | ) | (0.98 | ) | |||||||||||||||
|
|
|
|
|
|
|
|
|
| ||||||||||||||||
Net asset value - End of year | $10.52 | $9.73 | $9.88 | $9.39 | $9.72 | ||||||||||||||||||||
|
|
|
|
|
|
|
|
|
| ||||||||||||||||
Net assets - End of year (000’s omitted) | $57,732 | $105,986 | $80,786 | $64,297 | $67,322 | ||||||||||||||||||||
|
|
|
|
|
|
|
|
|
| ||||||||||||||||
Total return3 | 10.14% | (0.93% | ) | 6.85% | 2.97% | (1.38% | ) | ||||||||||||||||||
Ratios (to average net assets)/Supplemental Data: | |||||||||||||||||||||||||
Expenses* | 0.45% | 4 | 0.45% | 4 | 0.31% | 5 | 0.30% | 6 | 0.30% | 7 | |||||||||||||||
Net investment income2 | 2.72% | 0.59% | 1.45% | 1.84% | 1.54% | ||||||||||||||||||||
Series portfolio turnover8 | 12% | 9% | 133% | 6% | 16% | ||||||||||||||||||||
*The investment advisor paid a portion of the Series’ expenses. If these expenses had been incurred by the Class, the expense ratios (to average net assets) would have been increased by the following amounts: |
| ||||||||||||||||||||||||
| 0.12% | 4 | 0.10% | 4 | 0.15% | 5 | 0.12% | 6 | 0.16% | 7 | |||||||||||||||
| TARGET INCOME SERIES CLASS R | FOR THE YEAR ENDED | ||||||||||||||||||||||||
| 10/31/19 | 10/31/18 | 10/31/17 | 10/31/16 | 10/31/15 | |||||||||||||||||||||
Per share data (for a share outstanding throughout each year): |
| ||||||||||||||||||||||||
Net asset value - Beginning of year | $9.59 | $9.76 | $9.28 | $9.61 | $10.71 | ||||||||||||||||||||
|
|
|
|
|
|
|
|
|
| ||||||||||||||||
Income (loss) from investment operations: | |||||||||||||||||||||||||
Net investment income1,2 | 0.16 | 0.04 | 0.05 | 0.19 | 0.21 | ||||||||||||||||||||
Net realized and unrealized gain (loss) on investments | 0.77 | (0.16 | ) | 0.56 | 0.04 | (0.38 | ) | ||||||||||||||||||
|
|
|
|
|
|
|
|
|
| ||||||||||||||||
Total from investment operations | 0.93 | (0.12 | ) | 0.61 | 0.23 | (0.17 | ) | ||||||||||||||||||
|
|
|
|
|
|
|
|
|
| ||||||||||||||||
Less distributions to shareholders: | |||||||||||||||||||||||||
From net investment income | (0.16 | ) | (0.05 | ) | (0.13 | ) | (0.14 | ) | (0.23 | ) | |||||||||||||||
From net realized gain on investments | — | — | — | (0.42 | ) | (0.70 | ) | ||||||||||||||||||
|
|
|
|
|
|
|
|
|
| ||||||||||||||||
Total distributions to shareholders | (0.16 | ) | (0.05 | ) | (0.13 | ) | (0.56 | ) | (0.93 | ) | |||||||||||||||
|
|
|
|
|
|
|
|
|
| ||||||||||||||||
Net asset value - End of year | $10.36 | $9.59 | $9.76 | $9.28 | $9.61 | ||||||||||||||||||||
|
|
|
|
|
|
|
|
|
| ||||||||||||||||
Net assets - End of year (000’s omitted) | $19,779 | $18,769 | $9,910 | $1,148 | $2,468 | ||||||||||||||||||||
|
|
|
|
|
|
|
|
|
| ||||||||||||||||
Total return3 | 9.87% | (1.21% | ) | 6.68% | 2.69% | (1.70% | ) | ||||||||||||||||||
Ratios (to average net assets)/Supplemental Data: | |||||||||||||||||||||||||
Expenses* | 0.70% | 4 | 0.70% | 4 | 0.55% | 5 | 0.55% | 6 | 0.55% | 7 | |||||||||||||||
Net investment income2 | 1.58% | 0.37% | 0.57% | 2.07% | 2.05% | ||||||||||||||||||||
Series portfolio turnover8 | 12% | 9% | 133% | 6% | 16% | ||||||||||||||||||||
*The investment advisor paid a portion of the Series’ expenses. If these expenses had been incurred by the Class, the expense ratios (to average net assets) would have been increased by the following amounts: |
| ||||||||||||||||||||||||
| 0.09% | 4 | 0.00% | 4 | 0.15% | 5 | 0.12% | 6 | 0.16% | 7 | ||||||||||||||||
1Calculated based on average shares outstanding during the years.
2Net investment income is affected by the timing of distributions from the Underlying Series in which the Series invest. The ratios do not include net investment income of the Underlying Series in which the Series invests.
3Represents aggregate total return for the years indicated, and assumes reinvestment of all distributions. Total return would have been lower had certain expenses not been waived or reimbursed.
4Expense ratios do not include expenses of the Underlying Series in which the Series invests. The expense ratio of the Underlying Series was 0.45% for Manning & Napier Blended Asset Conservative Series - Class R6.
5Expense ratios do not include expenses of the Underlying Series in which the Series invests. The expense ratio of the Underlying Series was 0.67% for Manning & NapierPro-Blend® Conservative Term Series - Class I and 0.45% for Manning & Napier Blended Asset Conservative Series - Class R6.
6Expense ratios do not include expenses of the Underlying Series in which the Series invests. The average expense ratio of the Underlying Series was 0.67%.
7Expense ratios do not include expenses of the Underlying Series in which the Series invests. The expense ratio of the Underlying Series was 0.68%.
8Reflects activity of the Series and does not include the activity of the Underlying Series.
The accompanying notes are an integral part of the financial statements.
44
Financial Highlights
TARGET INCOME SERIES CLASS I | FOR THE YEAR ENDED | ||||||||||||||||||||||||
| 10/31/19 | 10/31/18 | 10/31/17 | 10/31/16 | 10/31/15 | |||||||||||||||||||||
Per share data (for a share outstanding throughout each year): |
| ||||||||||||||||||||||||
Net asset value - Beginning of year | $9.78 | $9.92 | $9.42 | $9.75 | $10.88 | ||||||||||||||||||||
|
|
|
|
|
|
|
|
|
| ||||||||||||||||
Income (loss) from investment operations: | |||||||||||||||||||||||||
Net investment income1,2 | 0.21 | 0.11 | 0.19 | 0.24 | 0.16 | ||||||||||||||||||||
Net realized and unrealized gain (loss) on investments | 0.78 | (0.18 | ) | 0.48 | 0.04 | (0.28 | ) | ||||||||||||||||||
|
|
|
|
|
|
|
|
|
| ||||||||||||||||
Total from investment operations | 0.99 | (0.07 | ) | 0.67 | 0.28 | (0.12 | ) | ||||||||||||||||||
|
|
|
|
|
|
|
|
|
| ||||||||||||||||
Less distributions to shareholders: | |||||||||||||||||||||||||
From net investment income | (0.19 | ) | (0.07 | ) | (0.17 | ) | (0.19 | ) | (0.31 | ) | |||||||||||||||
From net realized gain on investments | — | — | — | (0.42 | ) | (0.70 | ) | ||||||||||||||||||
|
|
|
|
|
|
|
|
|
| ||||||||||||||||
Total distributions to shareholders | (0.19 | ) | (0.07 | ) | (0.17 | ) | (0.61 | ) | (1.01 | ) | |||||||||||||||
|
|
|
|
|
|
|
|
|
| ||||||||||||||||
Net asset value - End of year | $10.58 | $9.78 | $9.92 | $9.42 | $9.75 | ||||||||||||||||||||
|
|
|
|
|
|
|
|
|
| ||||||||||||||||
Net assets - End of year (000’s omitted) | $1,091 | $986 | $8,260 | $12,380 | $26,000 | ||||||||||||||||||||
|
|
|
|
|
|
|
|
|
| ||||||||||||||||
Total return3 | 10.36% | (0.70% | ) | 7.20% | 3.20% | (1.21% | ) | ||||||||||||||||||
Ratios (to average net assets)/Supplemental Data: | |||||||||||||||||||||||||
Expenses* | 0.20% | 4 | 0.20% | 4 | 0.06% | 5 | 0.05% | 6 | 0.05% | 7 | |||||||||||||||
Net investment income2 | 2.07% | 1.10% | 2.02% | 2.61% | 1.65% | ||||||||||||||||||||
Series portfolio turnover8 | 12% | 9% | 133% | 6% | 16% | ||||||||||||||||||||
| *The investment advisor paid a portion of the Series’ expenses. If these expenses had been incurred by the Class, the expense ratios (to average net assets) would have been increased by the following amounts: |
| ||||||||||||||||||||||||
| 0.24% | 4 | 0.16% | 4 | 0.15% | 5 | 0.12% | 6 | 0.16% | 7 | ||||||||||||||||
1Calculated based on average shares outstanding during the years.
2Net investment income is affected by the timing of distributions from the Underlying Series in which the Series invest. The ratios do not include net investment income of the Underlying Series in which the Series invests.
3Represents aggregate total return for the years indicated, and assumes reinvestment of all distributions. Total return would have been lower had certain expenses not been waived or reimbursed.
4Expense ratios do not include expenses of the Underlying Series in which the Series invests. The expense ratio of the Underlying Series was 0.45% for Manning & Napier Blended Asset Conservative Series - Class R6.
5Expense ratios do not include expenses of the Underlying Series in which the Series invests. The expense ratio of the Underlying Series was 0.67% for Manning & NapierPro-Blend® Conservative Term Series - Class I and 0.45% for Manning & Napier Blended Asset Conservative Series - Class R6.
6Expense ratios do not include expenses of the Underlying Series in which the Series invests. The average expense ratio of the Underlying Series was 0.67%.
7Expense ratios do not include expenses of the Underlying Series in which the Series invests. The expense ratio of the Underlying Series was 0.68%.
8Reflects activity of the Series and does not include the activity of the Underlying Series.
The accompanying notes are an integral part of the financial statements.
45
Financial Highlights
TARGET 2015 SERIES CLASS K | FOR THE YEAR ENDED | ||||||||||||||||||||||||
| 10/31/19 | 10/31/18 | 10/31/17 | 10/31/16 | 10/31/15 | |||||||||||||||||||||
Per share data (for a share outstanding throughout each year): |
| ||||||||||||||||||||||||
Net asset value - Beginning of year | $10.95 | $11.14 | $10.49 | $11.17 | $12.07 | ||||||||||||||||||||
|
|
|
|
|
|
|
|
|
| ||||||||||||||||
Income (loss) from investment operations: | |||||||||||||||||||||||||
Net investment income1,2 | 0.19 | 0.05 | 0.12 | 0.11 | 0.12 | ||||||||||||||||||||
Net realized and unrealized gain (loss) on investments | 0.92 | (0.18 | ) | 0.68 | 0.13 | (0.35 | ) | ||||||||||||||||||
|
|
|
|
|
|
|
|
|
| ||||||||||||||||
Total from investment operations | 1.11 | (0.13 | ) | 0.80 | 0.24 | (0.23 | ) | ||||||||||||||||||
|
|
|
|
|
|
|
|
|
| ||||||||||||||||
Less distributions to shareholders: | |||||||||||||||||||||||||
From net investment income | (0.19 | ) | (0.06 | ) | (0.15 | ) | (0.12 | ) | (0.28 | ) | |||||||||||||||
From net realized gain on investments | — | — | — | (0.80 | ) | (0.39 | ) | ||||||||||||||||||
|
|
|
|
|
|
|
|
|
| ||||||||||||||||
Total distributions to shareholders | (0.19 | ) | (0.06 | ) | (0.15 | ) | (0.92 | ) | (0.67 | ) | |||||||||||||||
|
|
|
|
|
|
|
|
|
| ||||||||||||||||
Net asset value - End of year | $11.87 | $10.95 | $11.14 | $10.49 | $11.17 | ||||||||||||||||||||
|
|
|
|
|
|
|
|
|
| ||||||||||||||||
Net assets - End of year (000’s omitted) | $1,185 | $1,802 | $4,196 | $3,274 | $3,500 | ||||||||||||||||||||
|
|
|
|
|
|
|
|
|
| ||||||||||||||||
Total return3 | 10.35% | (1.16% | ) | 7.70% | 2.58% | (2.04% | ) | ||||||||||||||||||
Ratios (to average net assets)/Supplemental Data: | |||||||||||||||||||||||||
Expenses* | 0.45% | 4 | 0.45% | 4 | 0.31% | 5 | 0.30% | 6 | 0.30% | 7 | |||||||||||||||
Net investment income2 | 1.66% | 0.49% | 1.11% | 1.09% | 1.01% | ||||||||||||||||||||
Series portfolio turnover8 | 40% | 46% | 139% | 49% | 46% | ||||||||||||||||||||
| *The investment advisor paid a portion of the Series’ expenses. If these expenses had been incurred by the Class, the expense ratios (to average net assets) would have been increased by the following amounts: |
| ||||||||||||||||||||||||
| 10.60% | 4 | 3.81% | 4 | 2.39% | 5 | 1.51% | 6 | 1.14% | 7 | ||||||||||||||||
TARGET 2015 SERIES CLASS R | FOR THE YEAR ENDED | ||||||||||||||||||||||||
| 10/31/19 | 10/31/18 | 10/31/17 | 10/31/16 | 10/31/15 | |||||||||||||||||||||
Per share data (for a share outstanding throughout each year): |
| ||||||||||||||||||||||||
Net asset value - Beginning of year | $11.08 | $11.29 | $10.51 | $11.19 | $12.09 | ||||||||||||||||||||
|
|
|
|
|
|
|
|
|
| ||||||||||||||||
Income (loss) from investment operations: | |||||||||||||||||||||||||
Net investment income1,2 | 0.30 | 0.03 | 0.13 | 0.09 | 0.12 | ||||||||||||||||||||
Net realized and unrealized gain (loss) on investments | 0.82 | (0.20 | ) | 0.66 | 0.13 | (0.39 | ) | ||||||||||||||||||
|
|
|
|
|
|
|
|
|
| ||||||||||||||||
Total from investment operations | 1.12 | (0.17 | ) | 0.79 | 0.22 | (0.27 | ) | ||||||||||||||||||
|
|
|
|
|
|
|
|
|
| ||||||||||||||||
Less distributions to shareholders: | |||||||||||||||||||||||||
From net investment income | (0.15 | ) | (0.04 | ) | (0.01 | ) | (0.10 | ) | (0.24 | ) | |||||||||||||||
From net realized gain on investments | — | — | — | (0.80 | ) | (0.39 | ) | ||||||||||||||||||
|
|
|
|
|
|
|
|
|
| ||||||||||||||||
Total distributions to shareholders | (0.15 | ) | (0.04 | ) | (0.01 | ) | (0.90 | ) | (0.63 | ) | |||||||||||||||
|
|
|
|
|
|
|
|
|
| ||||||||||||||||
Net asset value - End of year | $12.05 | $11.08 | $11.29 | $10.51 | $11.19 | ||||||||||||||||||||
|
|
|
|
|
|
|
|
|
| ||||||||||||||||
Net assets - End of year (000’s omitted) | $— | 9 | $38 | $40 | $802 | $839 | |||||||||||||||||||
|
|
|
|
|
|
|
|
|
| ||||||||||||||||
Total return3 | 10.31% | (1.50% | ) | 7.47% | 2.34% | (2.37% | ) | ||||||||||||||||||
Ratios (to average net assets)/Supplemental Data: | |||||||||||||||||||||||||
Expenses* | 0.70% | 4 | 0.70% | 4 | 0.55% | 5 | 0.55% | 6 | 0.55% | 7 | |||||||||||||||
Net investment income2 | 2.62% | 0.28% | 1.21% | 0.86% | 1.07% | ||||||||||||||||||||
Series portfolio turnover8 | 40% | 46% | 139% | 49% | 46% | ||||||||||||||||||||
| *The investment advisor paid a portion of the Series’ expenses. If these expenses had been incurred by the Class, the expense ratios (to average net assets) would have been increased by the following amounts: |
| ||||||||||||||||||||||||
| 10.62% | 4 | 3.80% | 4 | 2.39% | 5 | 1.51% | 6 | 1.14% | 7 | ||||||||||||||||
1Calculated based on average shares outstanding during the years.
2Net investment income is affected by the timing of distributions from the Underlying Series in which the Series invest. The ratios do not include net investment income of the Underlying Series in which the Series invests.
3Represents aggregate total return for the years indicated, and assumes reinvestment of all distributions. Total return would have been lower had certain expenses not been waived or reimbursed.
4Expense ratios do not include expenses of the Underlying Series in which the Series invests. The expense ratios of the Underlying Series were 0.45% for Manning & Napier Blended Asset Conservative Series - Class R6 and 0.50% for Manning & Napier Blended Asset Moderate Series - Class R6.
5Expense ratios do not include expenses of the Underlying Series in which the Series invests. The expense ratios of the Underlying Series were 0.67% for Manning & NapierPro-Blend® Conservative Term Series - Class I, 0.83% for Manning & NapierPro-Blend® Moderate Term Series - Class I, 0.45% for Manning & Napier Blended Asset Conservative Series - Class R6 and 0.50% for Manning & Napier Blended Asset Moderate Series - Class R6.
6Expense ratios do not include expenses of the Underlying Series in which the Series invests. The expense ratios of the Underlying Series were 0.67% for Manning & NapierPro-Blend® Conservative Term Series - Class I and 0.82% for Manning & NapierPro-Blend® Moderate Term Series - Class I.
7Expense ratios do not include expenses of the Underlying Series in which the Series invests. The expense ratios of the Underlying Series were 0.81% for Manning & NapierPro-Blend® Moderate Term Series - Class I and 0.82% for Manning & NapierPro-Blend® Extended Term Series - Class I.
8Reflects activity of the Series and does not include the activity of the Underlying Series.
9Amount rounds to less than $1,000.
The accompanying notes are an integral part of the financial statements.
46
Financial Highlights
| TARGET 2015 SERIES CLASS I | FOR THE YEAR ENDED | ||||||||||||||||||||||||
| 10/31/19 | 10/31/18 | 10/31/17 | 10/31/16 | 10/31/15 | |||||||||||||||||||||
Per share data (for a share outstanding throughout each year): |
| ||||||||||||||||||||||||
Net asset value - Beginning of year | $10.99 | $11.19 | $10.53 | $11.21 | $12.11 | ||||||||||||||||||||
|
|
|
|
|
|
|
|
|
| ||||||||||||||||
Income (loss) from investment operations: | |||||||||||||||||||||||||
Net investment income1,2 | 0.21 | 0.09 | 0.20 | 0.16 | 0.15 | ||||||||||||||||||||
Net realized and unrealized gain (loss) on investments | 0.93 | (0.19 | ) | 0.63 | 0.11 | (0.35 | ) | ||||||||||||||||||
|
|
|
|
|
|
|
|
|
| ||||||||||||||||
Total from investment operations | 1.14 | (0.10 | ) | 0.83 | 0.27 | (0.20 | ) | ||||||||||||||||||
|
|
|
|
|
|
|
|
|
| ||||||||||||||||
Less distributions to shareholders: | |||||||||||||||||||||||||
From net investment income | (0.22 | ) | (0.10 | ) | (0.17 | ) | (0.15 | ) | (0.31 | ) | |||||||||||||||
From net realized gain on investments | — | — | — | (0.80 | ) | (0.39 | ) | ||||||||||||||||||
|
|
|
|
|
|
|
|
|
| ||||||||||||||||
Total distributions to shareholders | (0.22 | ) | (0.10 | ) | (0.17 | ) | (0.95 | ) | (0.70 | ) | |||||||||||||||
|
|
|
|
|
|
|
|
|
| ||||||||||||||||
Net asset value - End of year | $11.91 | $10.99 | $11.19 | $10.53 | $11.21 | ||||||||||||||||||||
|
|
|
|
|
|
|
|
|
| ||||||||||||||||
Net assets - End of year (000’s omitted) | $82 | $283 | $324 | $2,657 | $5,129 | ||||||||||||||||||||
|
|
|
|
|
|
|
|
|
| ||||||||||||||||
Total return3 | 10.58% | (0.94% | ) | 8.03% | 2.85% | (1.78% | ) | ||||||||||||||||||
Ratios (to average net assets)/Supplemental Data: | |||||||||||||||||||||||||
Expenses* | 0.20% | 4 | 0.20% | 4 | 0.05% | 5 | 0.05% | 6 | 0.05% | 7 | |||||||||||||||
Net investment income2 | 1.80% | 0.83% | 1.88% | 1.53% | 1.28% | ||||||||||||||||||||
Series portfolio turnover8 | 40% | 46% | 139% | 49% | 46% | ||||||||||||||||||||
| *The investment advisor paid a portion of the Series’ expenses. If these expenses had been incurred by the Class, the expense ratios (to average net assets) would have been increased by the following amounts: |
| ||||||||||||||||||||||||
| 10.62% | 4 | 3.81% | 4 | 2.39% | 5 | 1.51% | 6 | 1.14% | 7 | ||||||||||||||||
1Calculated based on average shares outstanding during the years.
2Net investment income is affected by the timing of distributions from the Underlying Series in which the Series invest. The ratios do not include net investment income of the Underlying Series in which the Series invests.
3Represents aggregate total return for the years indicated, and assumes reinvestment of all distributions. Total return would have been lower had certain expenses not been waived or reimbursed.
4Expense ratios do not include expenses of the Underlying Series in which the Series invests. The expense ratios of the Underlying Series were 0.45% for Manning & Napier Blended Asset Conservative Series - Class R6 and 0.50% for Manning & Napier Blended Asset Moderate Series - Class R6.
5Expense ratios do not include expenses of the Underlying Series in which the Series invests. The expense ratios of the Underlying Series were 0.67% for Manning & NapierPro-Blend® Conservative Term Series - Class I, 0.83% for Manning & NapierPro-Blend® Moderate Term Series - Class I, 0.45% for Manning & Napier Blended Asset Conservative Series - Class R6 and 0.50% for Manning & Napier Blended Asset Moderate Series - Class R6.
6Expense ratios do not include expenses of the Underlying Series in which the Series invests. The expense ratios of the Underlying Series were 0.67% for Manning & NapierPro-Blend® Conservative Term Series - Class I and 0.82% for Manning & NapierPro-Blend® Moderate Term Series - Class I.
7Expense ratios do not include expenses of the Underlying Series in which the Series invests. The expense ratios of the Underlying Series were 0.81% for Manning & NapierPro-Blend® Moderate Term Series - Class I and 0.82% for Manning & NapierPro-Blend® Extended Term Series - Class I.
8Reflects activity of the Series and does not include the activity of the Underlying Series.
The accompanying notes are an integral part of the financial statements.
47
Financial Highlights
| TARGET 2020 SERIES CLASS K | FOR THE YEAR ENDED | ||||||||||||||||||||||||
| 10/31/19 | 10/31/18 | 10/31/17 | 10/31/16 | 10/31/15 | |||||||||||||||||||||
Per share data (for a share outstanding throughout each year): |
| ||||||||||||||||||||||||
Net asset value - Beginning of year | $9.21 | $9.40 | $8.75 | $9.45 | $10.77 | ||||||||||||||||||||
|
|
|
|
|
|
|
|
|
| ||||||||||||||||
Income (loss) from investment operations: | |||||||||||||||||||||||||
Net investment income1,2 | 0.23 | 0.04 | 0.09 | 0.09 | 0.11 | ||||||||||||||||||||
Net realized and unrealized gain (loss) on investments | 0.85 | (0.19 | ) | 0.68 | 0.12 | (0.33 | ) | ||||||||||||||||||
|
|
|
|
|
|
|
|
|
| ||||||||||||||||
Total from investment operations | 1.08 | (0.15 | ) | 0.77 | 0.21 | (0.22 | ) | ||||||||||||||||||
|
|
|
|
|
|
|
|
|
| ||||||||||||||||
Less distributions to shareholders: | |||||||||||||||||||||||||
From net investment income | (0.14 | ) | (0.04 | ) | (0.12 | ) | (0.10 | ) | (0.28 | ) | |||||||||||||||
From net realized gain on investments | — | — | — | (0.81 | ) | (0.82 | ) | ||||||||||||||||||
|
|
|
|
|
|
|
|
|
| ||||||||||||||||
Total distributions to shareholders | (0.14 | ) | (0.04 | ) | (0.12 | ) | (0.91 | ) | (1.10 | ) | |||||||||||||||
|
|
|
|
|
|
|
|
|
| ||||||||||||||||
Net asset value - End of year | $10.15 | $9.21 | $9.40 | $8.75 | $9.45 | ||||||||||||||||||||
|
|
|
|
|
|
|
|
|
| ||||||||||||||||
Net assets - End of year (000’s omitted) | $37,418 | $75,844 | $70,632 | $79,236 | $80,006 | ||||||||||||||||||||
|
|
|
|
|
|
|
|
|
| ||||||||||||||||
Total return3 | 11.93% | (1.58% | ) | 8.91% | 2.83% | (2.24% | ) | ||||||||||||||||||
Ratios (to average net assets)/Supplemental Data: | |||||||||||||||||||||||||
Expenses* | 0.45% | 4 | 0.45% | 4 | 0.31% | 5 | 0.30% | 6 | 0.30% | 7 | |||||||||||||||
Net investment income2 | 2.40% | 0.44% | 1.04% | 1.08% | 1.17% | ||||||||||||||||||||
Series portfolio turnover8 | 17% | 27% | 118% | 16% | 42% | ||||||||||||||||||||
| *The investment advisor paid a portion of the Series’ expenses. If these expenses had been incurred by the Class, the expense ratios (to average net assets) would have been increased by the following amounts: |
| ||||||||||||||||||||||||
| 0.22% | 4 | 0.14% | 4 | 0.09% | 5 | 0.06% | 6 | 0.04% | 7 | ||||||||||||||||
| TARGET 2020 SERIES CLASS R | FOR THE YEAR ENDED | ||||||||||||||||||||||||
| 10/31/19 | 10/31/18 | 10/31/17 | 10/31/16 | 10/31/15 | |||||||||||||||||||||
Per share data (for a share outstanding throughout each year): |
| ||||||||||||||||||||||||
Net asset value - Beginning of year | $9.08 | $9.28 | $8.64 | $9.34 | $10.60 | ||||||||||||||||||||
|
|
|
|
|
|
|
|
|
| ||||||||||||||||
Income (loss) from investment operations: | |||||||||||||||||||||||||
Net investment income1,2 | 0.12 | 0.02 | 0.06 | 0.09 | 0.12 | ||||||||||||||||||||
Net realized and unrealized gain (loss) on investments | 0.92 | (0.19 | ) | 0.68 | 0.09 | (0.32 | ) | ||||||||||||||||||
|
|
|
|
|
|
|
|
|
| ||||||||||||||||
Total from investment operations | 1.04 | (0.17 | ) | 0.74 | 0.18 | (0.20 | ) | ||||||||||||||||||
|
|
|
|
|
|
|
|
|
| ||||||||||||||||
Less distributions to shareholders: | |||||||||||||||||||||||||
From net investment income | (0.13 | ) | (0.03 | ) | (0.10 | ) | (0.07 | ) | (0.24 | ) | |||||||||||||||
From net realized gain on investments | — | — | — | (0.81 | ) | (0.82 | ) | ||||||||||||||||||
|
|
|
|
|
|
|
|
|
| ||||||||||||||||
Total distributions to shareholders | (0.13 | ) | (0.03 | ) | (0.10 | ) | (0.88 | ) | (1.06 | ) | |||||||||||||||
|
|
|
|
|
|
|
|
|
| ||||||||||||||||
Net asset value - End of year | $9.99 | $9.08 | $9.28 | $8.64 | $9.34 | ||||||||||||||||||||
|
|
|
|
|
|
|
|
|
| ||||||||||||||||
Net assets - End of year (000’s omitted) | $14,937 | $13,814 | $10,851 | $4,553 | $8,193 | ||||||||||||||||||||
|
|
|
|
|
|
|
|
|
| ||||||||||||||||
Total return3 | 11.59% | (1.85% | ) | 8.69% | 2.56% | (2.13% | ) | ||||||||||||||||||
Ratios (to average net assets)/Supplemental Data: | |||||||||||||||||||||||||
Expenses* | 0.70% | 4 | 0.70% | 4 | 0.56% | 5 | 0.55% | 6 | 0.55% | 7 | |||||||||||||||
Net investment income2 | 1.22% | 0.17% | 0.63% | 1.04% | 1.24% | ||||||||||||||||||||
Series portfolio turnover8 | 17% | 27% | 118% | 16% | 42% | ||||||||||||||||||||
| *The investment advisor paid a portion of the Series’ expenses. If these expenses had been incurred by the Class, the expense ratios (to average net assets) would have been increased by the following amounts: |
| ||||||||||||||||||||||||
| 0.17% | 4 | 0.04% | 4 | 0.09% | 5 | 0.06% | 6 | 0.04% | 7 | ||||||||||||||||
1Calculated based on average shares outstanding during the years.
2Net investment income is affected by the timing of distributions from the Underlying Series in which the Series invest. The ratios do not include net investment income of the Underlying Series in which the Series invests.
3Represents aggregate total return for the years indicated, and assumes reinvestment of all distributions. Total return would have been lower had certain expenses not been waived or reimbursed.
4Expense ratios do not include expenses of the Underlying Series in which the Series invests. The expense ratios of the Underlying Series were 0.55% for Manning & Napier Blended Asset Extended Series - Class R6 and 0.50% for Manning & Napier Blended Asset Moderate Series - Class R6.
5Expense ratios do not include expenses of the Underlying Series in which the Series invests. The expense ratios of the Underlying Series were 0.83% for Manning & NapierPro-Blend® Extended Term Series - Class I, 0.83% for Manning & NapierPro-Blend® Moderate Term Series - Class I, 0.55% for Manning & Napier Blended Asset Extended Series -Class R6 and 0.50% for Manning & Napier Blended Asset Moderate Series - Class R6.
6Expense ratios do not include expenses of the Underlying Series in which the Series invests. The expense ratios of the Underlying Series were 0.82% for Manning & NapierPro-Blend® Moderate Term Series - Class I and 0.82% for Manning & NapierPro-Blend® Extended Term Series - Class I.
7Expense ratios do not include expenses of the Underlying Series in which the Series invests. The expense ratios of the Underlying Series were 0.81% for Manning & NapierPro-Blend® Moderate Term Series - Class I and 0.82% for Manning & NapierPro-Blend® Extended Term Series - Class I.
8Reflects activity of the Series and does not include the activity of the Underlying Series.
The accompanying notes are an integral part of the financial statements.
48
Financial Highlights
TARGET 2020 SERIES CLASS I | FOR THE YEAR ENDED | ||||||||||||||||||||||||
| 10/31/19 | 10/31/18 | 10/31/17 | 10/31/16 | 10/31/15 | |||||||||||||||||||||
Per share data (for a share outstanding throughout each year): |
| ||||||||||||||||||||||||
Net asset value - Beginning of year | $9.26 | $9.45 | $8.79 | $9.50 | $10.81 | ||||||||||||||||||||
|
|
|
|
|
|
|
|
|
| ||||||||||||||||
Income (loss) from investment operations: | |||||||||||||||||||||||||
Net investment income1,2 | 0.17 | 0.08 | 0.13 | 0.13 | 0.13 | ||||||||||||||||||||
Net realized and unrealized gain (loss) on investments | 0.95 | (0.21 | ) | 0.67 | 0.09 | (0.31 | ) | ||||||||||||||||||
|
|
|
|
|
|
|
|
|
| ||||||||||||||||
Total from investment operations | 1.12 | (0.13 | ) | 0.80 | 0.22 | (0.18 | ) | ||||||||||||||||||
|
|
|
|
|
|
|
|
|
| ||||||||||||||||
Less distributions to shareholders: | |||||||||||||||||||||||||
From net investment income | (0.16 | ) | (0.06 | ) | (0.14 | ) | (0.12 | ) | (0.31 | ) | |||||||||||||||
From net realized gain on investments | — | — | — | (0.81 | ) | (0.82 | ) | ||||||||||||||||||
|
|
|
|
|
|
|
|
|
| ||||||||||||||||
Total distributions to shareholders | (0.16 | ) | (0.06 | ) | (0.14 | ) | (0.93 | ) | (1.13 | ) | |||||||||||||||
|
|
|
|
|
|
|
|
|
| ||||||||||||||||
Net asset value - End of year | $10.22 | $9.26 | $9.45 | $8.79 | $9.50 | ||||||||||||||||||||
|
|
|
|
|
|
|
|
|
| ||||||||||||||||
Net assets - End of year (000’s omitted) | $4,019 | $3,994 | $33,056 | $46,194 | $74,947 | ||||||||||||||||||||
|
|
|
|
|
|
|
|
|
| ||||||||||||||||
Total return3 | 12.29% | (1.43% | ) | 9.28% | 2.97% | (1.87% | ) | ||||||||||||||||||
Ratios (to average net assets)/Supplemental Data: | |||||||||||||||||||||||||
Expenses* | 0.20% | 4 | 0.20% | 4 | 0.06% | 5 | 0.05% | 6 | 0.05% | 7 | |||||||||||||||
Net investment income2 | 1.74% | 0.84% | 1.44% | 1.55% | 1.33% | ||||||||||||||||||||
Series portfolio turnover8 | 17% | 27% | 118% | 16% | 42% | ||||||||||||||||||||
| *The investment advisor paid a portion of the Series’ expenses. If these expenses had been incurred by the Class, the expense ratios (to average net assets) would have been increased by the following amounts: |
| ||||||||||||||||||||||||
| 0.32% | 4 | 0.17% | 4 | 0.09% | 5 | 0.06% | 6 | 0.04% | 7 | ||||||||||||||||
1Calculated based on average shares outstanding during the years.
2Net investment income is affected by the timing of distributions from the Underlying Series in which the Series invest. The ratios do not include net investment income of the Underlying Series in which the Series invests.
3Represents aggregate total return for the years indicated, and assumes reinvestment of all distributions. Total return would have been lower had certain expenses not been waived or reimbursed.
4Expense ratios do not include expenses of the Underlying Series in which the Series invests. The expense ratios of the Underlying Series were 0.55% for Manning & Napier Blended Asset Extended Series - Class R6 and 0.50% for Manning & Napier Blended Asset Moderate Series - Class R6.
5Expense ratios do not include expenses of the Underlying Series in which the Series invests. The expense ratios of the Underlying Series were 0.83% for Manning & NapierPro-Blend® Extended Term Series - Class I, 0.83% for Manning & NapierPro-Blend® Moderate Term Series - Class I, 0.55% for Manning & Napier Blended Asset Extended Series - Class R6 and 0.50% for Manning & Napier Blended Asset Moderate Series - Class R6.
6Expense ratios do not include expenses of the Underlying Series in which the Series invests. The expense ratios of the Underlying Series were 0.82% for Manning & NapierPro-Blend® Moderate Term Series - Class I and 0.82% for Manning & NapierPro-Blend® Extended Term Series - Class I.
7Expense ratios do not include expenses of the Underlying Series in which the Series invests. The expense ratios of the Underlying Series were 0.81% for Manning & NapierPro-Blend® Moderate Term Series - Class I and 0.82% for Manning & NapierPro-Blend® Extended Term Series - Class I.
8Reflects activity of the Series and does not include the activity of the Underlying Series.
The accompanying notes are an integral part of the financial statements.
49
Financial Highlights
| TARGET 2025 SERIES CLASS K | FOR THE YEAR ENDED | ||||||||||||||||||||||||||
| 10/31/19 | 10/31/18 | 10/31/17 | 10/31/16 | 10/31/15 | |||||||||||||||||||||||
Per share data (for a share outstanding throughout each year): |
| ||||||||||||||||||||||||||
Net asset value - Beginning of year | $11.73 | $11.97 | $11.02 | $11.82 | $13.01 | ||||||||||||||||||||||
|
|
|
|
|
|
|
|
|
| ||||||||||||||||||
Income (loss) from investment operations: | |||||||||||||||||||||||||||
Net investment income1,2 | 0.16 | 0.04 | 0.10 | 0.12 | 0.12 | ||||||||||||||||||||||
Net realized and unrealized gain (loss) on investments | 1.25 | (0.22 | ) | 1.01 | 0.15 | (0.40 | ) | ||||||||||||||||||||
|
|
|
|
|
|
|
|
|
| ||||||||||||||||||
Total from investment operations | 1.41 | (0.18 | ) | 1.11 | 0.27 | (0.28 | ) | ||||||||||||||||||||
|
|
|
|
|
|
|
|
|
| ||||||||||||||||||
Less distributions to shareholders: | |||||||||||||||||||||||||||
From net investment income | (0.18 | ) | (0.05 | ) | (0.16 | ) | (0.13 | ) | (0.43 | ) | |||||||||||||||||
From net realized gain on investments | (0.03 | ) | (0.01 | ) | — | (0.94 | ) | (0.48 | ) | ||||||||||||||||||
|
|
|
|
|
|
|
|
|
| ||||||||||||||||||
Total distributions to shareholders | (0.21 | ) | (0.06 | ) | (0.16 | ) | (1.07 | ) | (0.91 | ) | |||||||||||||||||
|
|
|
|
|
|
|
|
|
| ||||||||||||||||||
Net asset value - End of year | $12.93 | $11.73 | $11.97 | $11.02 | $11.82 | ||||||||||||||||||||||
|
|
|
|
|
|
|
|
|
| ||||||||||||||||||
Net assets - End of year(000’s omitted) | $43,163 | $34,659 | $25,591 | $13,381 | $11,896 | ||||||||||||||||||||||
|
|
|
|
|
|
|
|
|
| ||||||||||||||||||
Total return3 | 12.26% | (1.58% | ) | 10.23% | 2.86% | (2.31% | ) | ||||||||||||||||||||
Ratios (to average net assets)/Supplemental Data: | |||||||||||||||||||||||||||
Expenses* | 0.45% | 4 | 0.45% | 4 | 0.31% | 5 | 0.30% | 6 | 0.30% | 7 | |||||||||||||||||
Net investment income2 | 1.31% | 0.37% | 0.86% | 1.08% | 1.01% | ||||||||||||||||||||||
Series portfolio turnover8 | 20% | 25% | 208% | 51% | 27% | ||||||||||||||||||||||
| *The investment advisor paid a portion of the Series’ expenses. If these expenses had been incurred by the Class, the expense ratios (to average net assets) would have been increased by the following amounts: |
| ||||||||||||||||||||||||||
| 0.21% | 4 | 0.28% | 4 | 0.43% | 5 | 0.33% | 6 | 0.39% | 7 | ||||||||||||||||||
| TARGET 2025 SERIES CLASS R | FOR THE YEAR ENDED | ||||||||||||||||||||||||||
| 10/31/19 | 10/31/18 | 10/31/17 | 10/31/16 | 10/31/15 | |||||||||||||||||||||||
Per share data (for a share outstanding throughout each year): |
| ||||||||||||||||||||||||||
Net asset value - Beginning of year | $11.75 | $12.00 | $11.05 | $11.86 | $13.02 | ||||||||||||||||||||||
|
|
|
|
|
|
|
|
|
| ||||||||||||||||||
Income (loss) from investment operations: | |||||||||||||||||||||||||||
Net investment income1,2 | 0.14 | 0.02 | 0.04 | 0.09 | 0.13 | ||||||||||||||||||||||
Net realized and unrealized gain (loss) on investments | 1.25 | (0.23 | ) | 1.04 | 0.14 | (0.43 | ) | ||||||||||||||||||||
|
|
|
|
|
|
|
|
|
| ||||||||||||||||||
Total from investment operations | 1.39 | (0.21 | ) | 1.08 | 0.23 | (0.30 | ) | ||||||||||||||||||||
|
|
|
|
|
|
|
|
|
| ||||||||||||||||||
Less distributions to shareholders: | |||||||||||||||||||||||||||
From net investment income | (0.16 | ) | (0.03 | ) | (0.13 | ) | (0.10 | ) | (0.38 | ) | |||||||||||||||||
From net realized gain on investments | (0.03 | ) | (0.01 | ) | — | (0.94 | ) | (0.48 | ) | ||||||||||||||||||
|
|
|
|
|
|
|
|
|
| ||||||||||||||||||
Total distributions to shareholders | (0.19 | ) | (0.04 | ) | (0.13 | ) | (1.04 | ) | (0.86 | ) | |||||||||||||||||
|
|
|
|
|
|
|
|
|
| ||||||||||||||||||
Net asset value - End of year | $12.95 | $11.75 | $12.00 | $11.05 | $11.86 | ||||||||||||||||||||||
|
|
|
|
|
|
|
|
|
| ||||||||||||||||||
Net assets - End of year (000’s omitted) | $24,305 | $23,317 | $12,693 | $1,671 | $2,101 | ||||||||||||||||||||||
|
|
|
|
|
|
|
|
|
| ||||||||||||||||||
Total return3 | 11.99% | (1.78% | ) | 9.94% | 2.50% | (2.44% | ) | ||||||||||||||||||||
Ratios (to average net assets)/Supplemental Data: | |||||||||||||||||||||||||||
Expenses* | 0.70% | 4 | 0.70% | 4 | 0.55% | 5 | 0.55% | 6 | 0.55% | 7 | |||||||||||||||||
Net investment income2 | 1.13% | 0.16% | 0.30% | 0.87% | 1.07% | ||||||||||||||||||||||
Series portfolio turnover8 | 20% | 25% | 208% | 51% | 27% | ||||||||||||||||||||||
| *The investment advisor paid a portion of the Series’ expenses. If these expenses had been incurred by the Class, the expense ratios (to average net assets) would have been increased by the following amounts: |
| ||||||||||||||||||||||||||
| 0.20% | 4 | 0.24% | 4 | 0.43% | 5 | 0.33% | 6 | 0.39% | 7 | ||||||||||||||||||
1Calculated based on average shares outstanding during the years.
2Net investment income is affected by the timing of distributions from the Underlying Series in which the Series invest. The ratios do not include net investment income of the Underlying Series in which the Series invests.
3Represents aggregate total return for the years indicated, and assumes reinvestment of all distributions. Total return would have been lower had certain expenses not been waived or reimbursed.
4Expense ratios do not include expenses of the Underlying Series in which the Series invests. The expense ratios of the Underlying Series were 0.55% for Manning & Napier Blended Asset Extended Series - Class R6 and 0.50% for Manning & Napier Blended Asset Moderate Series - Class R6.
5Expense ratios do not include expenses of the Underlying Series in which the Series invests. The expense ratios of the Underlying Series were 0.83% for Manning & NapierPro-Blend® Extended Term Series - Class I, 0.83% for Manning & NapierPro-Blend® Moderate Term Series - Class I, 0.55% for Manning & Napier Blended Asset Extended Series - Class R6 and 0.50% for Manning & Napier Blended Asset Moderate Series - Class R6.
6Expense ratios do not include expenses of the Underlying Series in which the Series invests. The expense ratios of the Underlying Series were 0.82% for Manning & NapierPro-Blend® Moderate Term Series - Class I and 0.82% for Manning & NapierPro-Blend® Extended Term Series - Class I.
7Expense ratios do not include expenses of the Underlying Series in which the Series invests. The expense ratios of the Underlying Series were 0.82% for Manning & NapierPro-Blend® Extended Term Series - Class I and 0.83% for Manning & NapierPro-Blend® Maximum Term Series - Class I.
8Reflects activity of the Series and does not include the activity of the Underlying Series.
The accompanying notes are an integral part of the financial statements.
50
Financial Highlights
| TARGET 2025 SERIES CLASS I | FOR THE YEAR ENDED | ||||||||||||||||||||||||
| 10/31/19 | 10/31/18 | 10/31/17 | 10/31/16 | 10/31/15 | |||||||||||||||||||||
Per share data (for a share outstanding throughout each year): |
| ||||||||||||||||||||||||
Net asset value - Beginning of year | $11.71 | $11.94 | $10.99 | $11.80 | $12.98 | ||||||||||||||||||||
|
|
|
|
|
|
|
|
|
| ||||||||||||||||
Income (loss) from investment operations: | |||||||||||||||||||||||||
Net investment income1,2 | 0.21 | 0.08 | 0.19 | 0.15 | 0.16 | ||||||||||||||||||||
Net realized and unrealized gain (loss) on investments | 1.24 | (0.23 | ) | 0.95 | 0.14 | (0.40 | ) | ||||||||||||||||||
|
|
|
|
|
|
|
|
|
| ||||||||||||||||
Total from investment operations | 1.45 | (0.15 | ) | 1.14 | 0.29 | (0.24 | ) | ||||||||||||||||||
|
|
|
|
|
|
|
|
|
| ||||||||||||||||
Less distributions to shareholders: | |||||||||||||||||||||||||
From net investment income | (0.20 | ) | (0.07 | ) | (0.19 | ) | (0.16 | ) | (0.46 | ) | |||||||||||||||
From net realized gain on investments | (0.03 | ) | (0.01 | ) | — | (0.94 | ) | (0.48 | ) | ||||||||||||||||
|
|
|
|
|
|
|
|
|
| ||||||||||||||||
Total distributions to shareholders | (0.23 | ) | (0.08 | ) | (0.19 | ) | (1.10 | ) | (0.94 | ) | |||||||||||||||
|
|
|
|
|
|
|
|
|
| ||||||||||||||||
Net asset value - End of year | $12.93 | $11.71 | $11.94 | $10.99 | $11.80 | ||||||||||||||||||||
|
|
|
|
|
|
|
|
|
| ||||||||||||||||
Net assets - End of year (000’s omitted) | $1,365 | $1,386 | $2,123 | $15,384 | $15,539 | ||||||||||||||||||||
|
|
|
|
|
|
|
|
|
| ||||||||||||||||
Total return3 | 12.59% | (1.33% | ) | 10.52% | 3.04% | (2.00% | ) | ||||||||||||||||||
Ratios (to average net assets)/Supplemental Data: | |||||||||||||||||||||||||
Expenses* | 0.20% | 4 | 0.20% | 4 | 0.05% | 5 | 0.05% | 6 | 0.05% | 7 | |||||||||||||||
Net investment income2 | 1.74% | 0.69% | 1.71% | 1.38% | 1.29% | ||||||||||||||||||||
Series portfolio turnover8 | 20% | 25% | 208% | 51% | 27% | ||||||||||||||||||||
| *The investment advisor paid a portion of the Series’ expenses. If these expenses had been incurred by the Class, the expense ratios (to average net assets) would have been increased by the following amounts: |
| ||||||||||||||||||||||||
| 0.34% | 4 | 0.37% | 4 | 0.43% | 5 | 0.33% | 6 | 0.39% | 7 | ||||||||||||||||
1Calculated based on average shares outstanding during the years.
2Net investment income is affected by the timing of distributions from the Underlying Series in which the Series invest. The ratios do not include net investment income of the Underlying Series in which the Series invests.
3Represents aggregate total return for the years indicated, and assumes reinvestment of all distributions. Total return would have been lower had certain expenses not been waived or reimbursed.
4Expense ratios do not include expenses of the Underlying Series in which the Series invests. The expense ratios of the Underlying Series were 0.55% for Manning & Napier Blended Asset Extended Series - Class R6 and 0.50% for Manning & Napier Blended Asset Moderate Series - Class R6.
5Expense ratios do not include expenses of the Underlying Series in which the Series invests. The expense ratios of the Underlying Series were 0.83% for Manning & NapierPro-Blend® Extended Term Series - Class I, 0.83% for Manning & NapierPro-Blend® Moderate Term Series - Class I, 0.55% for Manning & Napier Blended Asset Extended Series -Class R6 and 0.50% for Manning & Napier Blended Asset Moderate Series - Class R6.
6Expense ratios do not include expenses of the Underlying Series in which the Series invests. The expense ratios of the Underlying Series were 0.82% for Manning & NapierPro-Blend® Moderate Term Series - Class I and 0.82% for Manning & NapierPro-Blend® Extended Term Series - Class I.
7Expense ratios do not include expenses of the Underlying Series in which the Series invests. The expense ratios of the Underlying Series were 0.82% for Manning & NapierPro-Blend® Extended Term Series - Class I and 0.83% for Manning & NapierPro-Blend® Maximum Term Series - Class I.
8Reflects activity of the Series and does not include the activity of the Underlying Series.
The accompanying notes are an integral part of the financial statements.
51
Financial Highlights
| TARGET 2030 SERIES CLASS K | FOR THE YEAR ENDED | ||||||||||||||||||||||||
| 10/31/19 | 10/31/18 | 10/31/17 | 10/31/16 | 10/31/15 | |||||||||||||||||||||
Per share data (for a share outstanding throughout each year): |
| ||||||||||||||||||||||||
Net asset value - Beginning of year | $9.40 | $9.52 | $8.59 | $9.78 | $11.52 | ||||||||||||||||||||
|
|
|
|
|
|
|
|
|
| ||||||||||||||||
Income (loss) from investment operations: | |||||||||||||||||||||||||
Net investment income1,2 | 0.19 | 0.03 | 0.08 | 0.08 | 0.11 | ||||||||||||||||||||
Net realized and unrealized gain (loss) on investments | 0.95 | (0.12 | ) | 0.98 | 0.13 | (0.34 | ) | ||||||||||||||||||
|
|
|
|
|
|
|
|
|
| ||||||||||||||||
Total from investment operations | 1.14 | (0.09 | ) | 1.06 | 0.21 | (0.23 | ) | ||||||||||||||||||
|
|
|
|
|
|
|
|
|
| ||||||||||||||||
Less distributions to shareholders: | |||||||||||||||||||||||||
From net investment income | (0.18 | ) | (0.03 | ) | (0.13 | ) | (0.09 | ) | (0.44 | ) | |||||||||||||||
From net realized gain on investments | (0.02 | ) | — | — | (1.31 | ) | (1.07 | ) | |||||||||||||||||
|
|
|
|
|
|
|
|
|
| ||||||||||||||||
Total distributions to shareholders | (0.20 | ) | (0.03 | ) | (0.13 | ) | (1.40 | ) | (1.51 | ) | |||||||||||||||
|
|
|
|
|
|
|
|
|
| ||||||||||||||||
Net asset value - End of year | $10.34 | $9.40 | $9.52 | $8.59 | $9.78 | ||||||||||||||||||||
|
|
|
|
|
|
|
|
|
| ||||||||||||||||
Net assets - End of year (000’s omitted) | $47,195 | $93,346 | $89,018 | $79,527 | $79,169 | ||||||||||||||||||||
|
|
|
|
|
|
|
|
|
| ||||||||||||||||
Total return3 | 12.54% | (0.93% | ) | 12.49% | 3.12% | (2.33% | ) | ||||||||||||||||||
Ratios (to average net assets)/Supplemental Data: | |||||||||||||||||||||||||
Expenses* | 0.45% | 4 | 0.45% | 4 | 0.31% | 5 | 0.30% | 6 | 0.30% | 6 | |||||||||||||||
Net investment income2 | 1.91% | 0.31% | 0.89% | 0.94% | 1.11% | ||||||||||||||||||||
Series portfolio turnover7 | 19% | 29% | 130% | 22% | 38% | ||||||||||||||||||||
| *The investment advisor paid a portion of the Series’ expenses. If these expenses had been incurred by the Class, the expense ratios (to average net assets) would have been increased by the following amounts: |
| ||||||||||||||||||||||||
| 0.20% | 4 | 0.13% | 4 | 0.08% | 5 | 0.06% | 6 | 0.04% | 6 | ||||||||||||||||
| TARGET 2030 SERIES CLASS R | FOR THE YEAR ENDED | ||||||||||||||||||||||||
| 10/31/19 | 10/31/18 | 10/31/17 | 10/31/16 | 10/31/15 | |||||||||||||||||||||
Per share data (for a share outstanding throughout each year): |
| ||||||||||||||||||||||||
Net asset value - Beginning of year | $9.30 | $9.43 | $8.51 | $9.70 | $11.37 | ||||||||||||||||||||
|
|
|
|
|
|
|
|
|
| ||||||||||||||||
Income (loss) from investment operations: | |||||||||||||||||||||||||
Net investment income1,2 | 0.09 | 0.01 | 0.05 | 0.07 | 0.10 | ||||||||||||||||||||
Net realized and unrealized gain (loss) on investments | 1.03 | (0.12 | ) | 0.98 | 0.12 | (0.30 | ) | ||||||||||||||||||
|
|
|
|
|
|
|
|
|
| ||||||||||||||||
Total from investment operations | 1.12 | (0.11 | ) | 1.03 | 0.19 | (0.20 | ) | ||||||||||||||||||
|
|
|
|
|
|
|
|
|
| ||||||||||||||||
Less distributions to shareholders: | |||||||||||||||||||||||||
From net investment income | (0.17 | ) | (0.02 | ) | (0.11 | ) | (0.07 | ) | (0.40 | ) | |||||||||||||||
From net realized gain on investments | (0.02 | ) | — | — | (1.31 | ) | (1.07 | ) | |||||||||||||||||
|
|
|
|
|
|
|
|
|
| ||||||||||||||||
Total distributions to shareholders | (0.19 | ) | (0.02 | ) | (0.11 | ) | (1.38 | ) | (1.47 | ) | |||||||||||||||
|
|
|
|
|
|
|
|
|
| ||||||||||||||||
Net asset value - End of year | $10.23 | $9.30 | $9.43 | $8.51 | $9.70 | ||||||||||||||||||||
|
|
|
|
|
|
|
|
|
| ||||||||||||||||
Net assets - End of year (000’s omitted) | $24,708 | $22,413 | $14,500 | $7,832 | $11,115 | ||||||||||||||||||||
|
|
|
|
|
|
|
|
|
| ||||||||||||||||
Total return3 | 12.38% | (1.15% | ) | 12.20% | 2.85% | (2.11% | ) | ||||||||||||||||||
Ratios (to average net assets)/Supplemental Data: | |||||||||||||||||||||||||
Expenses* | 0.70% | 4 | 0.70% | 4 | 0.56% | 5 | 0.55% | 6 | 0.55% | 6 | |||||||||||||||
Net investment income2 | 0.92% | 0.08% | 0.59% | 0.84% | 0.95% | ||||||||||||||||||||
Series portfolio turnover7 | 19% | 29% | 130% | 22% | 38% | ||||||||||||||||||||
| *The investment advisor paid a portion of the Series’ expenses. If these expenses had been incurred by the Class, the expense ratios (to average net assets) would have been increased by the following amounts: |
| ||||||||||||||||||||||||
| 0.13% | 4 | 0.03% | 4 | 0.08% | 5 | 0.06% | 6 | 0.04% | 6 | ||||||||||||||||
1Calculated based on average shares outstanding during the years.
2Net investment income is affected by the timing of distributions from the Underlying Series in which the Series invest. The ratios do not include net investment income of the Underlying Series in which the Series invests.
3Represents aggregate total return for the years indicated, and assumes reinvestment of all distributions. Total return would have been lower had certain expenses not been waived or reimbursed.
4Expense ratios do not include expenses of the Underlying Series in which the Series invests. The expense ratio of the Underlying Series were 0.55% for Manning & Napier Blended Asset Extended Series - Class R6 and 0.55% for Manning & Napier Blended Asset Maximum Series - Class R6.
5Expense ratios do not include expenses of the Underlying Series in which the Series invests. The expense ratios of the Underlying Series were 0.83% for Manning & NapierPro-Blend® Extended Term Series - Class I, 0.85% for Manning & NapierPro-Blend® Maximum Term Series - Class I, 0.55% for Manning & Napier Blended Asset Extended Series - Class R6 and 0.55% for Manning & Napier Blended Asset Maximum Series - Class R6.
6Expense ratios do not include expenses of the Underlying Series in which the Series invests. The expense ratios of the Underlying Series were 0.82% for Manning & NapierPro-Blend® Extended Term Series - Class I and 0.83% for Manning & NapierPro-Blend® Maximum Term Series - Class I.
7Reflects activity of the Series and does not include the activity of the Underlying Series.
The accompanying notes are an integral part of the financial statements.
52
Financial Highlights
| TARGET 2030 SERIES CLASS I | FOR THE YEAR ENDED | ||||||||||||||||||||||||
| 10/31/19 | 10/31/18 | 10/31/17 | 10/31/16 | 10/31/15 | |||||||||||||||||||||
Per share data (for a share outstanding throughout each year): |
| ||||||||||||||||||||||||
Net asset value - Beginning of year | $9.51 | $9.62 | $8.68 | $9.87 | $11.61 | ||||||||||||||||||||
|
|
|
|
|
|
|
|
|
| ||||||||||||||||
Income (loss) from investment operations: | |||||||||||||||||||||||||
Net investment income1,2 | 0.14 | 0.06 | 0.12 | 0.12 | 0.12 | ||||||||||||||||||||
Net realized and unrealized gain (loss) on investments | 1.05 | (0.12 | ) | 0.97 | 0.11 | (0.32 | ) | ||||||||||||||||||
|
|
|
|
|
|
|
|
|
| ||||||||||||||||
Total from investment operations | 1.19 | (0.06 | ) | 1.09 | 0.23 | (0.20 | ) | ||||||||||||||||||
|
|
|
|
|
|
|
|
|
| ||||||||||||||||
Less distributions to shareholders: | |||||||||||||||||||||||||
From net investment income | (0.20 | ) | (0.05 | ) | (0.15 | ) | (0.11 | ) | (0.47 | ) | |||||||||||||||
From net realized gain on investments | (0.02 | ) | — | — | (1.31 | ) | (1.07 | ) | |||||||||||||||||
|
|
|
|
|
|
|
|
|
| ||||||||||||||||
Total distributions to shareholders | (0.22 | ) | (0.05 | ) | (0.15 | ) | (1.42 | ) | (1.54 | ) | |||||||||||||||
|
|
|
|
|
|
|
|
|
| ||||||||||||||||
Net asset value - End of year | $10.48 | $9.51 | $9.62 | $8.68 | $9.87 | ||||||||||||||||||||
|
|
|
|
|
|
|
|
|
| ||||||||||||||||
Net assets - End of year (000’s omitted) | $6,930 | $5,721 | $38,110 | $53,551 | $75,870 | ||||||||||||||||||||
|
|
|
|
|
|
|
|
|
| ||||||||||||||||
Total return3 | 12.94% | (0.65% | ) | 12.76% | 3.38% | (2.02% | ) | ||||||||||||||||||
Ratios (to average net assets)/Supplemental Data: | |||||||||||||||||||||||||
Expenses* | 0.20% | 4 | 0.20% | 4 | 0.06% | 5 | 0.05% | 6 | 0.05% | 6 | |||||||||||||||
Net investment income2 | 1.39% | 0.66% | 1.30% | 1.36% | 1.22% | ||||||||||||||||||||
Series portfolio turnover7 | 19% | 29% | 130% | 22% | 38% | ||||||||||||||||||||
| *The investment advisor paid a portion of the Series’ expenses. If these expenses had been incurred by the Class, the expense ratios (to average net assets) would have been increased by the following amounts: |
| ||||||||||||||||||||||||
| 0.27% | 4 | 0.15% | 4 | 0.08% | 5 | 0.06% | 6 | 0.04% | 6 | ||||||||||||||||
1Calculated based on average shares outstanding during the years.
2Net investment income is affected by the timing of distributions from the Underlying Series in which the Series invest. The ratios do not include net investment income of the Underlying Series in which the Series invests.
3Represents aggregate total return for the years indicated, and assumes reinvestment of all distributions. Total return would have been lower had certain expenses not been waived or reimbursed.
4Expense ratios do not include expenses of the Underlying Series in which the Series invests. The expense ratio of the Underlying Series were 0.55% for Manning & Napier Blended Asset Extended Series - Class R6 and 0.55% for Manning & Napier Blended Asset Maximum Series - Class R6.
5Expense ratios do not include expenses of the Underlying Series in which the Series invests. The expense ratios of the Underlying Series were 0.83% for Manning & NapierPro-Blend® Extended Term Series - Class I, 0.85% for Manning & NapierPro-Blend® Maximum Term Series - Class I, 0.55% for Manning & Napier Blended Asset Extended Series - Class R6 and 0.55% for Manning & Napier Blended Asset Maximum Series - Class R6.
6Expense ratios do not include expenses of the Underlying Series in which the Series invests. The expense ratios of the Underlying Series were 0.82% for Manning & NapierPro-Blend® Extended Term Series - Class I and 0.83% for Manning & NapierPro-Blend® Maximum Term Series - Class I.
7Reflects activity of the Series and does not include the activity of the Underlying Series.
The accompanying notes are an integral part of the financial statements.
53
Financial Highlights
| TARGET 2035 SERIES CLASS K | FOR THE YEAR ENDED | ||||||||||||||||||||||||
| 10/31/19 | 10/31/18 | 10/31/17 | 10/31/16 | 10/31/15 | |||||||||||||||||||||
Per share data (for a share outstanding throughout each year): |
| ||||||||||||||||||||||||
Net asset value - Beginning of year | $12.46 | $12.66 | $11.30 | $12.32 | $13.71 | ||||||||||||||||||||
|
|
|
|
|
|
|
|
|
| ||||||||||||||||
Income (loss) from investment operations: | |||||||||||||||||||||||||
Net investment income1,2 | 0.12 | 0.03 | 0.08 | 0.08 | 0.11 | ||||||||||||||||||||
Net realized and unrealized gain (loss) on investments | 1.40 | (0.03 | ) | 1.50 | 0.21 | (0.38 | ) | ||||||||||||||||||
|
|
|
|
|
|
|
|
|
| ||||||||||||||||
Total from investment operations | 1.52 | — | 3 | 1.58 | 0.29 | (0.27 | ) | ||||||||||||||||||
|
|
|
|
|
|
|
|
|
| ||||||||||||||||
Less distributions to shareholders: | |||||||||||||||||||||||||
From net investment income | (0.36 | ) | (0.04 | ) | (0.15 | ) | (0.10 | ) | (0.61 | ) | |||||||||||||||
From net realized gain on investments | (0.10 | ) | (0.16 | ) | (0.07 | ) | (1.21 | ) | (0.51 | ) | |||||||||||||||
|
|
|
|
|
|
|
|
|
| ||||||||||||||||
Total distributions to shareholders | (0.46 | ) | (0.20 | ) | (0.22 | ) | (1.31 | ) | (1.12 | ) | |||||||||||||||
|
|
|
|
|
|
|
|
|
| ||||||||||||||||
Net asset value - End of year | $13.52 | $12.46 | $12.66 | $11.30 | $12.32 | ||||||||||||||||||||
|
|
|
|
|
|
|
|
|
| ||||||||||||||||
Net assets - End of year (000’s omitted) | $27,945 | $20,918 | $18,235 | $11,745 | $8,979 | ||||||||||||||||||||
|
|
|
|
|
|
|
|
|
| ||||||||||||||||
Total return4 | 12.89% | (0.01% | ) | 14.32% | 3.13% | (2.20% | ) | ||||||||||||||||||
Ratios (to average net assets)/Supplemental Data: | |||||||||||||||||||||||||
Expenses* | 0.45% | 5 | 0.45% | 5 | 0.31% | 6 | 0.30% | 7 | 0.30% | 7 | |||||||||||||||
Net investment income2 | 0.97% | 0.23% | 0.67% | 0.71% | 0.86% | ||||||||||||||||||||
Series portfolio turnover8 | 14% | 32% | 173% | 22% | 26% | ||||||||||||||||||||
| *The investment advisor paid a portion of the Series’ expenses. If these expenses had been incurred by the Class, the expense ratios (to average net assets) would have been increased by the following amounts: |
| ||||||||||||||||||||||||
| 0.41% | 5 | 0.49% | 5 | 0.54% | 6 | 0.43% | 7 | 0.52% | 7 | ||||||||||||||||
| TARGET 2035 SERIES CLASS R | FOR THE YEAR ENDED | ||||||||||||||||||||||||
| 10/31/19 | 10/31/18 | 10/31/17 | 10/31/16 | 10/31/15 | |||||||||||||||||||||
Per share data (for a share outstanding throughout each year): |
| ||||||||||||||||||||||||
Net asset value - Beginning of year | $12.49 | $12.70 | $ | 11.33 | $ | 12.34 | $ | 13.72 | |||||||||||||||||
|
|
|
|
|
|
|
|
|
| ||||||||||||||||
Income (loss) from investment operations: | |||||||||||||||||||||||||
Net investment income1,2 | 0.10 | — | 3 | 0.03 | 0.06 | 0.08 | |||||||||||||||||||
Net realized and unrealized gain (loss) on investments | 1.39 | (0.02 | ) | 1.52 | 0.21 | (0.38 | ) | ||||||||||||||||||
|
|
|
|
|
|
|
|
|
| ||||||||||||||||
Total from investment operations | 1.49 | (0.02 | ) | 1.55 | 0.27 | (0.30 | ) | ||||||||||||||||||
|
|
|
|
|
|
|
|
|
| ||||||||||||||||
Less distributions to shareholders: | |||||||||||||||||||||||||
From net investment income | (0.34 | ) | (0.03 | ) | (0.11 | ) | (0.07 | ) | (0.57 | ) | |||||||||||||||
From net realized gain on investments | (0.10 | ) | (0.16 | ) | (0.07 | ) | (1.21 | ) | (0.51 | ) | |||||||||||||||
|
|
|
|
|
|
|
|
|
| ||||||||||||||||
Total distributions to shareholders | (0.44 | ) | (0.19 | ) | (0.18 | ) | (1.28 | ) | (1.08 | ) | |||||||||||||||
|
|
|
|
|
|
|
|
|
| ||||||||||||||||
Net asset value - End of year | $13.54 | $12.49 | $ | 12.70 | $ | 11.33 | $ | 12.34 | |||||||||||||||||
|
|
|
|
|
|
|
|
|
| ||||||||||||||||
Net assets - End of year (000’s omitted) | $ | 19,217 | $ | 15,631 | $ | 7,112 | $ | 2,057 | $ | 2,337 | |||||||||||||||
|
|
|
|
|
|
|
|
|
| ||||||||||||||||
Total return4 | 12.56% | (0.18% | ) | 13.96% | 2.92% | (2.44% | ) | ||||||||||||||||||
Ratios (to average net assets)/Supplemental Data: | |||||||||||||||||||||||||
Expenses* | 0.70% | 5 | 0.70% | 5 | 0.55% | 6 | 0.55% | 7 | 0.55% | 7 | |||||||||||||||
Net investment income2 | 0.74% | 0.01% | 0.23% | 0.50% | 0.66% | ||||||||||||||||||||
Series portfolio turnover8 | 14% | 32% | 173% | 22% | 26% | ||||||||||||||||||||
| *The investment advisor paid a portion of the Series’ expenses. If these expenses had been incurred by the Class, the expense ratios (to average net assets) would have been increased by the following amounts: |
| ||||||||||||||||||||||||
| 0.38% | 5 | 0.43% | 5 | 0.54% | 6 | 0.43% | 7 | 0.52% | 7 | ||||||||||||||||
1Calculated based on average shares outstanding during the years.
2Net investment income is affected by the timing of distributions from the Underlying Series in which the Series invest. The ratios do not include net investment income of the Underlying Series in which the Series invests.
3Less than $0.01.
4Represents aggregate total return for the year indicated, and assumes reinvestment of all distributions. Total return would have been lower had certain expenses not been waived or reimbursed.
5Expense ratios do not include expenses of the Underlying Series in which the Series invests. The expense ratio of the Underlying Series were 0.55% for Manning & Napier Blended Asset Extended Series - Class R6 and 0.55% for Manning & Napier Blended Asset Maximum Series - Class R6.
6Expense ratios do not include expenses of the Underlying Series in which the Series invests. The expense ratios of the Underlying Series were 0.83% for Manning & NapierPro-Blend® Extended Term Series - Class I, 0.85% for Manning & NapierPro-Blend® Maximum Term Series - Class I, 0.55% for Manning & Napier Blended Asset Extended Series - Class R6 and 0.55% for Manning & Napier Blended Asset Maximum Series - Class R6.
7Expense ratios do not include expenses of the Underlying Series in which the Series invests. The expense ratios of the Underlying Series were 0.82% for Manning & NapierPro-Blend® Extended Term Series - Class I and 0.83% for Manning & NapierPro-Blend® Maximum Term Series - Class I.
8Reflects activity of the Series and does not include the activity of the Underlying Series.
9Expense ratios do not include expenses of the Underlying Series in which the Series invests. The expense ratios of the Underlying Series were 0.81% for Manning & NapierPro-Blend® Extended Term Series - Class I and 0.82% for Manning & NapierPro-Blend® Maximum Term Series - Class I.
The accompanying notes are an integral part of the financial statements.
54
Financial Highlights
| TARGET 2035 SERIES CLASS I | FOR THE YEAR ENDED | ||||||||||||||||||||||||
| 10/31/19 | 10/31/18 | 10/31/17 | 10/31/16 | 10/31/15 | |||||||||||||||||||||
Per share data (for a share outstanding throughout each year): |
| ||||||||||||||||||||||||
Net asset value - Beginning of year | $12.52 | $12.71 | $11.35 | $12.36 | $13.75 | ||||||||||||||||||||
|
|
|
|
|
|
|
|
|
| ||||||||||||||||
Income (loss) from investment operations: | |||||||||||||||||||||||||
Net investment income1,2 | 0.16 | 0.07 | 0.16 | 0.11 | 0.14 | ||||||||||||||||||||
Net realized and unrealized gain (loss) on investments | 1.41 | (0.04 | ) | 1.45 | 0.21 | (0.38 | ) | ||||||||||||||||||
|
|
|
|
|
|
|
|
|
| ||||||||||||||||
Total from investment operations | 1.57 | 0.03 | 1.61 | 0.32 | (0.24 | ) | |||||||||||||||||||
|
|
|
|
|
|
|
|
|
| ||||||||||||||||
Less distributions to shareholders: | |||||||||||||||||||||||||
From net investment income | (0.38 | ) | (0.06 | ) | (0.18 | ) | (0.12 | ) | (0.64 | ) | |||||||||||||||
From net realized gain on investments | (0.10 | ) | (0.16 | ) | (0.07 | ) | (1.21 | ) | (0.51 | ) | |||||||||||||||
|
|
|
|
|
|
|
|
|
| ||||||||||||||||
Total distributions to shareholders | (0.48 | ) | (0.22 | ) | (0.25 | ) | (1.33 | ) | (1.15 | ) | |||||||||||||||
|
|
|
|
|
|
|
|
|
| ||||||||||||||||
Net asset value - End of year | $13.61 | $12.52 | $12.71 | $11.35 | $12.36 | ||||||||||||||||||||
|
|
|
|
|
|
|
|
|
| ||||||||||||||||
Net assets - End of year (000’s omitted) | $762 | $760 | $964 | $11,455 | $10,993 | ||||||||||||||||||||
|
|
|
|
|
|
|
|
|
| ||||||||||||||||
Total return3 | 13.20% | 0.27% | 14.53% | 3.45% | (1.98% | ) | |||||||||||||||||||
Ratios (to average net assets)/Supplemental Data: | |||||||||||||||||||||||||
Expenses* | 0.20% | 4 | 0.20% | 4 | 0.05% | 5 | 0.05% | 6 | 0.05% | 6 | |||||||||||||||
Net investment income2 | 1.24% | 0.54% | 1.37% | 1.01% | 1.07% | ||||||||||||||||||||
Series portfolio turnover7 | 14% | 32% | 173% | 22% | 26% | ||||||||||||||||||||
| *The investment advisor paid a portion of the Series’ expenses. If these expenses had been incurred by the Class, the expense ratios (to average net assets) would have been increased by the following amounts: |
| ||||||||||||||||||||||||
| 0.52% | 4 | 0.56% | 4 | 0.54% | 5 | 0.43% | 6 | 0.52% | 6 | ||||||||||||||||
1Calculated based on average shares outstanding during the years.
2Net investment income is affected by the timing of distributions from the Underlying Series in which the Series invest. The ratios do not include net investment income of the Underlying Series in which the Series invests.
3Represents aggregate total return for the years indicated, and assumes reinvestment of all distributions. Total return would have been lower had certain expenses not been waived or reimbursed.
4Expense ratios do not include expenses of the Underlying Series in which the Series invests. The expense ratio of the Underlying Series were 0.55% for Manning & Napier Blended Asset Extended Series - Class R6 and 0.55% for Manning & Napier Blended Asset Maximum Series - Class R6.
5Expense ratios do not include expenses of the Underlying Series in which the Series invests. The expense ratios of the Underlying Series were 0.83% for Manning & NapierPro-Blend® Extended Term Series - Class I, 0.85% for Manning & NapierPro-Blend® Maximum Term Series - Class I, 0.55% for Manning & Napier Blended Asset Extended Series - Class R6 and 0.55% for Manning & Napier Blended Asset Maximum Series - Class R6.
6Expense ratios do not include expenses of the Underlying Series in which the Series invests. The expense ratios of the Underlying Series were 0.82% for Manning & NapierPro-Blend® Extended Term Series - Class I and 0.83% for Manning & NapierPro-Blend® Maximum Term Series - Class I.
7Reflects activity of the Series and does not include the activity of the Underlying Series.
The accompanying notes are an integral part of the financial statements.
55
Financial Highlights
| TARGET 2040 SERIES CLASS K | FOR THE YEAR ENDED | ||||||||||||||||||||||||
| 10/31/19 | 10/31/18 | 10/31/17 | 10/31/16 | 10/31/15 | |||||||||||||||||||||
Per share data (for a share outstanding throughout each year): |
| ||||||||||||||||||||||||
Net asset value - Beginning of year | $9.90 | $10.01 | $8.73 | $10.13 | $12.50 | ||||||||||||||||||||
|
|
|
|
|
|
|
|
|
| ||||||||||||||||
Income (loss) from investment operations: | |||||||||||||||||||||||||
Net investment income1,2 | 0.13 | 0.02 | 0.05 | 0.05 | 0.09 | ||||||||||||||||||||
Net realized and unrealized gain (loss) on investments | 1.03 | 0.08 | 1.34 | 0.16 | (0.32 | ) | |||||||||||||||||||
|
|
|
|
|
|
|
|
|
| ||||||||||||||||
Total from investment operations | 1.16 | 0.10 | 1.39 | 0.21 | (0.23 | ) | |||||||||||||||||||
|
|
|
|
|
|
|
|
|
| ||||||||||||||||
Less distributions to shareholders: | |||||||||||||||||||||||||
From net investment income | (0.39 | ) | (0.02 | ) | (0.11 | ) | (0.06 | ) | (0.61 | ) | |||||||||||||||
From net realized gain on investments | (0.29 | ) | (0.19 | ) | — | (1.55 | ) | (1.53 | ) | ||||||||||||||||
|
|
|
|
|
|
|
|
|
| ||||||||||||||||
Total distributions to shareholders | (0.68 | ) | (0.21 | ) | (0.11 | ) | (1.61 | ) | (2.14 | ) | |||||||||||||||
|
|
|
|
|
|
|
|
|
| ||||||||||||||||
Net asset value - End of year | $10.38 | $9.90 | $10.01 | $8.73 | $10.13 | ||||||||||||||||||||
|
|
|
|
|
|
|
|
|
| ||||||||||||||||
Net assets - End of year (000’s omitted) | $31,637 | $55,271 | $52,397 | $55,920 | $51,931 | ||||||||||||||||||||
|
|
|
|
|
|
|
|
|
| ||||||||||||||||
Total return3 | 12.90% | 1.01% | 16.08% | 3.24% | (2.30% | ) | |||||||||||||||||||
Ratios (to average net assets)/Supplemental Data: | |||||||||||||||||||||||||
Expenses* | 0.45% | 4 | 0.45% | 4 | 0.31% | 5 | 0.30% | 6 | 0.30% | 6 | |||||||||||||||
Net investment income2 | 1.36% | 0.19% | 0.54% | 0.57% | 0.80% | ||||||||||||||||||||
Series portfolio turnover7 | 24% | 36% | 127% | 26% | 45% | ||||||||||||||||||||
| *The investment advisor paid a portion of the Series’ expenses. If these expenses had been incurred by the Class, the expense ratios (to average net assets) would have been increased by the following amounts: |
| ||||||||||||||||||||||||
| 0.36% | 4 | 0.22% | 4 | 0.14% | 5 | 0.10% | 6 | 0.08% | 6 | ||||||||||||||||
| TARGET 2040 SERIES CLASS R | FOR THE YEAR ENDED | ||||||||||||||||||||||||
| 10/31/19 | 10/31/18 | 10/31/17 | 10/31/16 | 10/31/15 | |||||||||||||||||||||
Per share data (for a share outstanding throughout each year): |
| ||||||||||||||||||||||||
Net asset value - Beginning of year | $9.81 | $9.93 | $8.66 | $10.06 | $12.33 | ||||||||||||||||||||
|
|
|
|
|
|
|
|
|
| ||||||||||||||||
Income (loss) from investment operations: | |||||||||||||||||||||||||
Net investment income (loss)1,2 | 0.06 | — | 8 | 0.02 | 0.03 | 0.07 | |||||||||||||||||||
Net realized and unrealized gain (loss) on investments | 1.06 | 0.09 | 1.34 | 0.15 | (0.24 | ) | |||||||||||||||||||
|
|
|
|
|
|
|
|
|
| ||||||||||||||||
Total from investment operations | 1.12 | 0.09 | 1.36 | 0.18 | (0.17 | ) | |||||||||||||||||||
|
|
|
|
|
|
|
|
|
| ||||||||||||||||
Less distributions to shareholders: | |||||||||||||||||||||||||
From net investment income | (0.37 | ) | (0.02 | ) | (0.09 | ) | (0.03 | ) | (0.57 | ) | |||||||||||||||
From net realized gain on investments | (0.29 | ) | (0.19 | ) | — | (1.55 | ) | (1.53 | ) | ||||||||||||||||
|
|
|
|
|
|
|
|
|
| ||||||||||||||||
Total distributions to shareholders | (0.66 | ) | (0.21 | ) | (0.09 | ) | (1.58 | ) | (2.10 | ) | |||||||||||||||
|
|
|
|
|
|
|
|
|
| ||||||||||||||||
Net asset value - End of year | $10.27 | $9.81 | $9.93 | $8.66 | $10.06 | ||||||||||||||||||||
|
|
|
|
|
|
|
|
|
| ||||||||||||||||
Net assets - End of year (000’s omitted) | $17,294 | $14,956 | $7,946 | $4,653 | $5,226 | ||||||||||||||||||||
|
|
|
|
|
|
|
|
|
| ||||||||||||||||
Total return3 | 12.64% | 0.82% | 15.83% | 2.94% | (1.91% | ) | |||||||||||||||||||
Ratios (to average net assets)/Supplemental Data: | |||||||||||||||||||||||||
Expenses* | 0.70% | 4 | 0.70% | 4 | 0.56% | 5 | 0.55% | 6 | 0.55% | 6 | |||||||||||||||
Net investment income (loss)2 | 0.62% | (0.05% | ) | 0.25% | 0.36% | 0.62% | |||||||||||||||||||
Series portfolio turnover7 | 24% | 36% | 127% | 26% | 45% | ||||||||||||||||||||
| *The investment advisor paid a portion of the Series’ expenses. If these expenses had been incurred by the Class, the expense ratios (to average net assets) would have been increased by the following amounts: |
| ||||||||||||||||||||||||
| 0.29% | 4 | 0.11% | 4 | 0.14% | 5 | 0.10% | 6 | 0.08% | 6 | ||||||||||||||||
1Calculated based on average shares outstanding during the years.
2Net investment income is affected by the timing of distributions from the Underlying Series in which the Series invest. The ratios do not include net investment income of the Underlying Series in which the Series invests.
3Represents aggregate total return for the years indicated, and assumes reinvestment of all distributions. Total return would have been lower had certain expenses not been waived or reimbursed during the years.
4Expense ratios do not include expenses of the Underlying Series in which the Series invests. The expense ratio of the Underlying Series were 0.55% for Manning & Napier Blended Asset Extended Series - Class R6 and 0.55% for Manning & Napier Blended Asset Maximum Series - Class R6.
5Expense ratios do not include expenses of the Underlying Series in which the Series invests. The expense ratios of the Underlying Series were 0.83% for Manning & NapierPro-Blend® Extended Term Series - Class I, 0.85% for Manning & NapierPro-Blend® Maximum Term Series - Class I, 0.55% for Manning & Napier Blended Asset Extended Series - Class R6 and 0.55% for Manning & Napier Blended Asset Maximum Series - Class R6.
6Expense ratios do not include expenses of the Underlying Series in which the Series invests. The expense ratios of the Underlying Series were 0.82% for Manning & NapierPro-Blend® Extended Term Series - Class I and 0.83% for Manning & NapierPro-Blend® Maximum Term Series - Class I.
7Reflects activity of the Series and does not include the activity of the Underlying Series.
8Less than $0.01.
The accompanying notes are an integral part of the financial statements.
56
Financial Highlights
| TARGET 2040 SERIES CLASS I | FOR THE YEAR ENDED | ||||||||||||||||||||||||
| 10/31/19 | 10/31/18 | 10/31/17 | 10/31/16 | 10/31/15 | |||||||||||||||||||||
Per share data (for a share outstanding throughout each year): |
| ||||||||||||||||||||||||
Net asset value - Beginning of year | $10.00 | $10.10 | $8.81 | $10.20 | $12.58 | ||||||||||||||||||||
|
|
|
|
|
|
|
|
|
| ||||||||||||||||
Income (loss) from investment operations: | |||||||||||||||||||||||||
Net investment income1,2 | 0.11 | 0.06 | 0.09 | 0.09 | 0.10 | ||||||||||||||||||||
Net realized and unrealized gain (loss) on investments | 1.09 | 0.07 | 1.33 | 0.15 | (0.30 | ) | |||||||||||||||||||
|
|
|
|
|
|
|
|
|
| ||||||||||||||||
Total from investment operations | 1.20 | 0.13 | 1.42 | 0.24 | (0.20 | ) | |||||||||||||||||||
|
|
|
|
|
|
|
|
|
| ||||||||||||||||
Less distributions to shareholders: | |||||||||||||||||||||||||
From net investment income | (0.41 | ) | (0.04 | ) | (0.13 | ) | (0.08 | ) | (0.65 | ) | |||||||||||||||
From net realized gain on investments | (0.29 | ) | (0.19 | ) | — | (1.55 | ) | (1.53 | ) | ||||||||||||||||
|
|
|
|
|
|
|
|
|
| ||||||||||||||||
Total distributions to shareholders | (0.70 | ) | (0.23 | ) | (0.13 | ) | (1.63 | ) | (2.18 | ) | |||||||||||||||
|
|
|
|
|
|
|
|
|
| ||||||||||||||||
Net asset value - End of year | $10.50 | $10.00 | $10.10 | $8.81 | $10.20 | ||||||||||||||||||||
|
|
|
|
|
|
|
|
|
| ||||||||||||||||
Net assets - End of year (000’s omitted) | $2,913 | $2,701 | $23,656 | $27,895 | $43,552 | ||||||||||||||||||||
|
|
|
|
|
|
|
|
|
| ||||||||||||||||
Total return3 | 13.24% | 1.26% | 16.36% | 3.60% | (2.08% | ) | |||||||||||||||||||
Ratios (to average net assets)/Supplemental Data: | |||||||||||||||||||||||||
Expenses* | 0.20% | 4 | 0.20% | 4 | 0.06% | 5 | 0.05% | 6 | 0.05% | 6 | |||||||||||||||
Net investment income2 | 1.13% | 0.54% | 0.91% | 0.99% | 0.96% | ||||||||||||||||||||
Series portfolio turnover7 | 24% | 36% | 127% | 26% | 45% | ||||||||||||||||||||
| *The investment advisor paid a portion of the Series’ expenses. If these expenses had been incurred by the Class, the expense ratios (to average net assets) would have been increased by the following amounts: |
| ||||||||||||||||||||||||
| 0.41% | 4 | 0.24% | 4 | 0.14% | 5 | 0.10% | 6 | 0.08% | 6 | ||||||||||||||||
1Calculated based on average shares outstanding during the years.
2Net investment income is affected by the timing of distributions from the Underlying Series in which the Series invest. The ratios do not include net investment income of the Underlying Series in which the Series invests.
3Represents aggregate total return for the year indicated, and assumes reinvestment of all distributions. Total return would have been lower had certain expenses not been waived or reimbursed.
4Expense ratios do not include expenses of the Underlying Series in which the Series invests. The expense ratio of the Underlying Series were 0.55% for Manning & Napier Blended Asset Extended Series - Class R6 and 0.55% for Manning & Napier Blended Asset Maximum Series - Class R6.
5Expense ratios do not include expenses of the Underlying Series in which the Series invests. The expense ratios of the Underlying Series were 0.83% for Manning & NapierPro-Blend® Extended Term Series - Class I, 0.85% for Manning & NapierPro-Blend® Maximum Term Series - Class I, 0.55% for Manning & Napier Blended Asset Extended Series - Class R6 and 0.55% for Manning & Napier Blended Asset Maximum Series - Class R6.
6Expense ratios do not include expenses of the Underlying Series in which the Series invests. The expense ratios of the Underlying Series were 0.82% for Manning & NapierPro-Blend® Extended Term Series - Class I and 0.83% for Manning & NapierPro-Blend® Maximum Term Series - Class I.
7Reflects activity of the Series and does not include the activity of the Underlying Series.
The accompanying notes are an integral part of the financial statements.
57
Financial Highlights
| TARGET 2045 SERIES CLASS K | FOR THE YEAR ENDED | ||||||||||||||||||||||||
| 10/31/19 | 10/31/18 | 10/31/17 | 10/31/16 | 10/31/15 | |||||||||||||||||||||
Per share data (for a share outstanding throughout each year): |
| ||||||||||||||||||||||||
Net asset value - Beginning of year | $12.96 | $13.44 | $11.69 | $12.71 | $14.32 | ||||||||||||||||||||
|
|
|
|
|
|
|
|
|
| ||||||||||||||||
Income (loss) from investment operations: | |||||||||||||||||||||||||
Net investment income1,2 | 0.09 | 0.01 | 0.05 | 0.04 | 0.08 | ||||||||||||||||||||
Net realized and unrealized gain (loss) on investments | 1.44 | 0.25 | 1.99 | 0.28 | (0.34 | ) | |||||||||||||||||||
|
|
|
|
|
|
|
|
|
| ||||||||||||||||
Total from investment operations | 1.53 | 0.26 | 2.04 | 0.32 | (0.26 | ) | |||||||||||||||||||
|
|
|
|
|
|
|
|
|
| ||||||||||||||||
Less distributions to shareholders: | |||||||||||||||||||||||||
From net investment income | (0.63 | ) | (0.03 | ) | (0.13 | ) | (0.06 | ) | (0.77 | ) | |||||||||||||||
From net realized gain on investments | (0.22 | ) | (0.71 | ) | (0.16 | ) | (1.28 | ) | (0.58 | ) | |||||||||||||||
|
|
|
|
|
|
|
|
|
| ||||||||||||||||
Total distributions to shareholders | (0.85 | ) | (0.74 | ) | (0.29 | ) | (1.34 | ) | (1.35 | ) | |||||||||||||||
|
|
|
|
|
|
|
|
|
| ||||||||||||||||
Net asset value - End of year | $13.64 | $12.96 | $13.44 | $11.69 | $12.71 | ||||||||||||||||||||
|
|
|
|
|
|
|
|
|
| ||||||||||||||||
Net assets - End of year (000’s omitted) | $13,116 | $10,367 | $9,795 | $6,793 | $3,812 | ||||||||||||||||||||
|
|
|
|
|
|
|
|
|
| ||||||||||||||||
Total return3 | 13.19% | 1.93% | 17.87% | 3.26% | (2.10% | ) | |||||||||||||||||||
Ratios (to average net assets)/Supplemental Data: | |||||||||||||||||||||||||
Expenses* | 0.45% | 4 | 0.45% | 4 | 0.31% | 5 | 0.30% | 6 | 0.30% | 7 | |||||||||||||||
Net investment income2 | 0.73% | 0.11% | 0.43% | 0.33% | 0.58% | ||||||||||||||||||||
Series portfolio turnover8 | 16% | 43% | 175% | 26% | 28% | ||||||||||||||||||||
*The investment advisor paid a portion of the Series’ expenses. If these expenses had been incurred by the Class, the expense ratios (to average net assets) would have been increased by the following amounts: |
| ||||||||||||||||||||||||
| 0.82%4
| 0.89%4
| 0.97%5
| 0.89%6
| 1.21%7
| |||||||||||||||||||||
| TARGET 2045 SERIES CLASS R | FOR THE YEAR ENDED | ||||||||||||||||||||||||
| 10/31/19 | 10/31/18 | 10/31/17 | 10/31/16 | 10/31/15 | |||||||||||||||||||||
Per share data (for a share outstanding throughout each year): |
| ||||||||||||||||||||||||
Net asset value - Beginning of year | $12.85 | $13.36 | $11.62 | $12.64 | $14.25 | ||||||||||||||||||||
|
|
|
|
|
|
|
|
|
| ||||||||||||||||
Income (loss) from investment operations: | |||||||||||||||||||||||||
Net investment income (loss)1,2 | 0.06 | (0.01 | ) | 0.01 | 0.02 | 0.05 | |||||||||||||||||||
Net realized and unrealized gain (loss) on investments | 1.43 | 0.23 | 1.99 | 0.27 | (0.35 | ) | |||||||||||||||||||
|
|
|
|
|
|
|
|
|
| ||||||||||||||||
Total from investment operations | 1.49 | 0.22 | 2.00 | 0.29 | (0.30 | ) | |||||||||||||||||||
|
|
|
|
|
|
|
|
|
| ||||||||||||||||
Less distributions to shareholders: | |||||||||||||||||||||||||
From net investment income | (0.61 | ) | (0.02 | ) | (0.10 | ) | (0.03 | ) | (0.73 | ) | |||||||||||||||
From net realized gain on investments | (0.22 | ) | (0.71 | ) | (0.16 | ) | (1.28 | ) | (0.58 | ) | |||||||||||||||
|
|
|
|
|
|
|
|
|
| ||||||||||||||||
Total distributions to shareholders | (0.83 | ) | (0.73 | ) | (0.26 | ) | (1.31 | ) | (1.31 | ) | |||||||||||||||
|
|
|
|
|
|
|
|
|
| ||||||||||||||||
Net asset value - End of year | $13.51 | $12.85 | $13.36 | $11.62 | $12.64 | ||||||||||||||||||||
|
|
|
|
|
|
|
|
|
| ||||||||||||||||
Net assets - End of year (000’s omitted) | $12,244 | $9,384 | $4,733 | $1,731 | $1,631 | ||||||||||||||||||||
|
|
|
|
|
|
|
|
|
| ||||||||||||||||
Total return3 | 12.94% | 1.64% | 17.52% | 3.04% | (2.41% | ) | |||||||||||||||||||
Ratios (to average net assets)/Supplemental Data: | |||||||||||||||||||||||||
Expenses* | 0.70% | 4 | 0.70% | 4 | 0.55% | 5 | 0.55% | 6 | 0.55% | 7 | |||||||||||||||
Net investment income (loss)2 | 0.47% | (0.10% | ) | 0.10% | 0.14% | 0.36% | |||||||||||||||||||
Series portfolio turnover8 | 16% | 43% | 175% | 26% | 28% | ||||||||||||||||||||
*The investment advisor paid a portion of the Series’ expenses. If these expenses had been incurred by the Class, the expense ratios (to average net assets) would have been increased by the following amounts: |
| ||||||||||||||||||||||||
| 0.78%4 | 0.81%4 | 0.97%5 | 0.89%6 | 1.21%7 | |||||||||||||||||||||
1Calculated based on average shares outstanding during the years.
2Net investment income is affected by the timing of distributions from the Underlying Series in which the Series invest. The ratios do not include net investment income of the Underlying Series in which the Series invests.
3Represents aggregate total return for the year indicated, and assumes reinvestment of all distributions. Total return would have been lower had certain expenses not been waived or reimbursed.
4Expense ratios do not include expenses of the Underlying Series in which the Series invests. The expense ratio of the Underlying Series were 0.55% for Manning & Napier Blended Asset Extended Series - Class R6 and 0.55% for Manning & Napier Blended Asset Maximum Series - Class R6.
5Expense ratios do not include expenses of the Underlying Series in which the Series invests. The expense ratios of the Underlying Series were 0.83% for Manning & NapierPro-Blend® Extended Term Series - Class I, 0.85% for Manning & NapierPro-Blend® Maximum Term Series - Class I, 0.55% for Manning & Napier Blended Asset Extended Series - Class R6 and 0.55% for Manning & Napier Blended Asset Maximum Series - Class R6.
6Expense ratios do not include expenses of the Underlying Series in which the Series invests. The expense ratios of the Underlying Series were 0.82% for Manning & NapierPro-Blend® Extended Term Series - Class I and 0.83% for Manning & NapierPro-Blend® Maximum Term Series - Class I.
7Expense ratios do not include expenses of the Underlying Series in which the Series invests. The expense ratio of the Underlying Series was 0.83%.8Reflects activity of the Series and does not include the activity of the Underlying Series.
The accompanying notes are an integral part of the financial statements.
58
Financial Highlights
| TARGET 2045 SERIES CLASS I | FOR THE YEAR ENDED | ||||||||||||||||||||||||
| 10/31/19 | 10/31/18 | 10/31/17 | 10/31/16 | 10/31/15 | |||||||||||||||||||||
Per share data (for a share outstanding throughout each year): |
| ||||||||||||||||||||||||
Net asset value - Beginning of year | $13.01 | $13.48 | $11.71 | $12.73 | $14.35 | ||||||||||||||||||||
|
|
|
|
|
|
|
|
|
| ||||||||||||||||
Income (loss) from investment operations: | |||||||||||||||||||||||||
Net investment income1,2 | 0.12 | 0.06 | 0.11 | 0.07 | 0.11 | ||||||||||||||||||||
Net realized and unrealized gain (loss) on investments | 1.45 | 0.23 | 1.98 | 0.99 | (0.35 | ) | |||||||||||||||||||
|
|
|
|
|
|
|
|
|
| ||||||||||||||||
Total from investment operations | 1.57 | 0.29 | 2.09 | 1.06 | (0.24 | ) | |||||||||||||||||||
|
|
|
|
|
|
|
|
|
| ||||||||||||||||
Less distributions to shareholders: | |||||||||||||||||||||||||
From net investment income | (0.65 | ) | (0.05 | ) | (0.16 | ) | (0.80 | ) | (0.80 | ) | |||||||||||||||
From net realized gain on investments | (0.22 | ) | (0.71 | ) | (0.16 | ) | (1.28 | ) | (0.58 | ) | |||||||||||||||
|
|
|
|
|
|
|
|
|
| ||||||||||||||||
Total distributions to shareholders | (0.87 | ) | (0.76 | ) | (0.32 | ) | (2.08 | ) | (1.38 | ) | |||||||||||||||
|
|
|
|
|
|
|
|
|
| ||||||||||||||||
Net asset value - End of year | $13.71 | $13.01 | $13.48 | $11.71 | $12.73 | ||||||||||||||||||||
|
|
|
|
|
|
|
|
|
| ||||||||||||||||
Net assets - End of year (000’s omitted) | $924 | $754 | $1,361 | $5,548 | $4,494 | ||||||||||||||||||||
|
|
|
|
|
|
|
|
|
| ||||||||||||||||
Total return3 | 13.43% | 2.13% | 18.29% | 3.49% | (1.92% | ) | |||||||||||||||||||
Ratios (to average net assets)/Supplemental Data: | |||||||||||||||||||||||||
Expenses* | 0.20% | 4 | 0.20% | 4 | 0.05% | 5 | 0.05% | 6 | 0.05% | 7 | |||||||||||||||
Net investment income2 | 0.96% | 0.44% | 0.90% | 0.64% | 0.86% | ||||||||||||||||||||
Series portfolio turnover8 | 16% | 43% | 175% | 26% | 28% | ||||||||||||||||||||
*The investment advisor paid a portion of the Series’ expenses. If these expenses had been incurred by the Class, the expense ratios (to average net assets) would have been increased by the following amounts: |
| ||||||||||||||||||||||||
| 0.92% | 4 | 0.94% | 4 | 0.97% | 5 | 0.89% | 6 | 1.21% | 7 | ||||||||||||||||
1Calculated based on average shares outstanding during the years.
2Net investment income is affected by the timing of distributions from the Underlying Series in which the Series invest. The ratios do not include net investment income of the Underlying Series in which the Series invests.
3Represents aggregate total return for the year indicated, and assumes reinvestment of all distributions. Total return would have been lower had certain expenses not been waived or reimbursed.
4Expense ratios do not include expenses of the Underlying Series in which the Series invests. The expense ratio of the Underlying Series were 0.55% for Manning & Napier Blended Asset Extended Series - Class R6 and 0.55% for Manning & Napier Blended Asset Maximum Series - Class R6.
5Expense ratios do not include expenses of the Underlying Series in which the Series invests. The expense ratios of the Underlying Series were 0.83% for Manning & NapierPro-Blend® Extended Term Series - Class I, 0.85% for Manning & NapierPro-Blend® Maximum Term Series - Class I, 0.55% for Manning & Napier Blended Asset Extended Series - Class R6 and 0.55% for Manning & Napier Blended Asset Maximum Series - Class R6.
6Expense ratios do not include expenses of the Underlying Series in which the Series invests. The expense ratios of the Underlying Series were 0.82% for Manning & NapierPro-Blend® Extended Term Series - Class I and 0.83% for Manning & NapierPro-Blend® Maximum Term Series - Class I.
7Expense ratios do not include expenses of the Underlying Series in which the Series invests. The expense ratio of the Underlying Series was 0.83%.8Reflects activity of the Series and does not include the activity of the Underlying Series.
The accompanying notes are an integral part of the financial statements.
59
Financial Highlights
| TARGET 2050 SERIES CLASS K | FOR THE YEAR ENDED | ||||||||||||||||||||||||||
| 10/31/19 | 10/31/18 | 10/31/17 | 10/31/16 | 10/31/15 | |||||||||||||||||||||||
Per share data (for a share outstanding throughout each year): |
| ||||||||||||||||||||||||||
Net asset value - Beginning of year | $10.48 | $11.03 | $9.41 | $11.35 | $13.73 | ||||||||||||||||||||||
|
|
|
|
|
|
|
|
|
| ||||||||||||||||||
Income (loss) from investment operations: | |||||||||||||||||||||||||||
Net investment income1,2 | 0.09 | 0.01 | 0.04 | 0.04 | 0.09 | ||||||||||||||||||||||
Net realized and unrealized gain (loss) on investments | 1.12 | 0.25 | 1.69 | 0.18 | (0.32 | ) | |||||||||||||||||||||
|
|
|
|
|
|
|
|
|
| ||||||||||||||||||
Total from investment operations | 1.21 | 0.26 | 1.73 | 0.22 | (0.23 | ) | |||||||||||||||||||||
|
|
|
|
|
|
|
|
|
| ||||||||||||||||||
Less distributions to shareholders: | |||||||||||||||||||||||||||
From net investment income | (0.57 | ) | (0.02 | ) | (0.11 | ) | (0.04 | ) | (0.72 | ) | |||||||||||||||||
From net realized gain on investments | (0.39 | ) | (0.79 | ) | — | (2.12 | ) | (1.43 | ) | ||||||||||||||||||
|
|
|
|
|
|
|
|
|
| ||||||||||||||||||
Total distributions to shareholders | (0.96 | ) | (0.81 | ) | (0.11 | ) | (2.16 | ) | (2.15 | ) | |||||||||||||||||
|
|
|
|
|
|
|
|
|
| ||||||||||||||||||
Net asset value - End of year | $10.73 | $10.48 | $11.03 | $9.41 | $11.35 | ||||||||||||||||||||||
|
|
|
|
|
|
|
|
|
| ||||||||||||||||||
Net assets - End of year (000’s omitted) | $19,767 | $23,353 | $18,667 | $14,874 | $15,144 | ||||||||||||||||||||||
|
|
|
|
|
|
|
|
|
| ||||||||||||||||||
Total return3 | 13.43% | 2.32% | 18.55% | 3.43% | (2.15% | ) | |||||||||||||||||||||
Ratios (to average net assets)/Supplemental Data: | |||||||||||||||||||||||||||
Expenses* | 0.45% | 4 | 0.45% | 4 | 0.31% | 5 | 0.30% | 6 | 0.30% | 6 | |||||||||||||||||
Net investment income2 | 0.87% | 0.09% | 0.39% | 0.40% | 0.72% | ||||||||||||||||||||||
Series portfolio turnover7 | 36% | 40% | 139% | 31% | 49% | ||||||||||||||||||||||
*The investment advisor paid a portion of the Series’ expenses. If these expenses had been incurred by the Class, the expense ratios (to average net assets) would have been increased by the following amounts: |
| ||||||||||||||||||||||||||
| 0.70% | 4 | 0.52% | 4 | 0.41% | 5 | 0.37% | 6 | 0.26% | 6 | ||||||||||||||||||
| TARGET 2050 SERIES CLASS R | FOR THE YEAR ENDED | ||||||||||||||||||||||||||
| 10/31/19 | 10/31/18 | 10/31/17 | 10/31/16 | 10/31/15 | |||||||||||||||||||||||
Per share data (for a share outstanding throughout each year): |
| ||||||||||||||||||||||||||
Net asset value - Beginning of year | $10.34 | $10.91 | $9.30 | $11.25 | $13.60 | ||||||||||||||||||||||
|
|
|
|
|
|
|
|
|
| ||||||||||||||||||
Income (loss) from investment operations: | |||||||||||||||||||||||||||
Net investment income (loss)1,2 | 0.04 | (0.01 | ) | 0.01 | 0.01 | 0.06 | |||||||||||||||||||||
Net realized and unrealized gain (loss) on investments | 1.13 | 0.24 | 1.68 | 0.18 | (0.29 | ) | |||||||||||||||||||||
|
|
|
|
|
|
|
|
|
| ||||||||||||||||||
Total from investment operations | 1.17 | 0.23 | 1.69 | 0.19 | (0.23 | ) | |||||||||||||||||||||
|
|
|
|
|
|
|
|
|
| ||||||||||||||||||
Less distributions to shareholders: | |||||||||||||||||||||||||||
From net investment income | (0.56 | ) | (0.01 | ) | (0.08 | ) | (0.02 | ) | (0.69 | ) | |||||||||||||||||
From net realized gain on investments | (0.39 | ) | (0.79 | ) | — | (2.12 | ) | (1.43 | ) | ||||||||||||||||||
|
|
|
|
|
|
|
|
|
| ||||||||||||||||||
Total distributions to shareholders | (0.95 | ) | (0.80 | ) | (0.08 | ) | (2.14 | ) | (2.12 | ) | |||||||||||||||||
|
|
|
|
|
|
|
|
|
| ||||||||||||||||||
Net asset value - End of year | $10.56 | $10.34 | $10.91 | $9.30 | $11.25 | ||||||||||||||||||||||
|
|
|
|
|
|
|
|
|
| ||||||||||||||||||
Net assets - End of year (000’s omitted) | $9,917 | $7,813 | $3,345 | $2,433 | $2,215 | ||||||||||||||||||||||
|
|
|
|
|
|
|
|
|
| ||||||||||||||||||
Total return3 | 13.18% | 2.07% | 18.35% | 3.09% | (2.17% | ) | |||||||||||||||||||||
Ratios (to average net assets)/Supplemental Data: | |||||||||||||||||||||||||||
Expenses* | 0.70% | 4 | 0.70% | 4 | 0.56% | 5 | 0.55% | 6 | 0.55% | 6 | |||||||||||||||||
Net investment income (loss)2 | 0.37% | (0.14% | ) | 0.07% | 0.12% | 0.54% | |||||||||||||||||||||
Series portfolio turnover7 | 36% | 40% | 139% | 31% | 49% | ||||||||||||||||||||||
*The investment advisor paid a portion of the Series’ expenses. If these expenses had been incurred by the Class, the expense ratios (to average net assets) would have been increased by the following amounts: |
| ||||||||||||||||||||||||||
| 0.62% | 4 | 0.41% | 4 | 0.41% | 5 | 0.37% | 6 | 0.26% | 6 | ||||||||||||||||||
1Calculated based on average shares outstanding during the years.
2Net investment income is affected by the timing of distributions from the Underlying Series in which the Series invest. The ratios do not include net investment income of the Underlying Series in which the Series invests.
3Represents aggregate total return for the year indicated, and assumes reinvestment of all distributions. Total return would have been lower had certain expenses not been waived or reimbursed.
4Expense ratios do not include expenses of the Underlying Series in which the Series invests. The expense ratio of the Underlying Series was 0.55%.
5Expense ratios do not include expenses of the Underlying Series in which the Series invests. The expense ratio of the Underlying Series was 0.85% for Manning & NapierPro-Blend® Maximum Term Series - Class I and 0.55% for Manning & Napier Blended Asset Maximum Series - Class R6.
6Expense ratios do not include expenses of the Underlying Series in which the Series invests. The expense ratio of the Underlying Series was 0.83%.7Reflects activity of the Series and does not include the activity of the Underlying Series.
The accompanying notes are an integral part of the financial statements.
60
Financial Highlights
| TARGET 2050 SERIES CLASS I | FOR THE YEAR ENDED | ||||||||||||||||||||||||
| 10/31/19 | 10/31/18 | 10/31/17 | 10/31/16 | 10/31/15 | |||||||||||||||||||||
Per share data (for a share outstanding throughout each year): |
| ||||||||||||||||||||||||
Net asset value - Beginning of year | $10.58 | $11.12 | $9.48 | $11.43 | $13.82 | ||||||||||||||||||||
|
|
|
|
|
|
|
|
|
| ||||||||||||||||
Income (loss) from investment operations: | |||||||||||||||||||||||||
Net investment income1,2 | 0.09 | 0.05 | 0.07 | 0.07 | 0.10 | ||||||||||||||||||||
Net realized and unrealized gain (loss) on investments | 1.16 | 0.24 | 1.70 | 0.17 | (0.29 | ) | |||||||||||||||||||
|
|
|
|
|
|
|
|
|
| ||||||||||||||||
Total from investment operations | 1.25 | 0.29 | 1.77 | 0.24 | (0.19 | ) | |||||||||||||||||||
|
|
|
|
|
|
|
|
|
| ||||||||||||||||
Less distributions to shareholders: | |||||||||||||||||||||||||
From net investment income | (0.59 | ) | (0.04 | ) | (0.13 | ) | (0.07 | ) | (0.77 | ) | |||||||||||||||
From net realized gain on investments | (0.39 | ) | (0.79 | ) | — | (2.12 | ) | (1.43 | ) | ||||||||||||||||
|
|
|
|
|
|
|
|
|
| ||||||||||||||||
Total distributions to shareholders | (0.98 | ) | (0.83 | ) | (0.13 | ) | (2.19 | ) | (2.20 | ) | |||||||||||||||
|
|
|
|
|
|
|
|
|
| ||||||||||||||||
Net asset value - End of year | $10.85 | $10.58 | $11.12 | $9.48 | $11.43 | ||||||||||||||||||||
|
|
|
|
|
|
|
|
|
| ||||||||||||||||
Net assets - End of year (000’s omitted) | $2,497 | $1,859 | $13,364 | $12,928 | $15,688 | ||||||||||||||||||||
|
|
|
|
|
|
|
|
|
| ||||||||||||||||
Total return3 | 13.74% | 2.53% | 18.91% | 3.61% | (1.82% | ) | |||||||||||||||||||
Ratios (to average net assets)/Supplemental Data: |
| ||||||||||||||||||||||||
Expenses* | 0.20% | 4 | 0.20% | 4 | 0.06% | 5 | 0.05% | 6 | 0.05% | 6 | |||||||||||||||
Net investment income2 | 0.87% | 0.44% | 0.71% | 0.73% | 0.84% | ||||||||||||||||||||
Series portfolio turnover7 | 36% | 40% | 139% | 31% | 49% | ||||||||||||||||||||
*The investment advisor paid a portion of the Series’ expenses. If these expenses had been incurred by the Class, the expense ratios (to average net assets) would have been increased by the following amounts: |
| ||||||||||||||||||||||||
| 0.75% | 4 | 0.54% | 4 | 0.41% | 5 | 0.37% | 6 | 0.26% | 6 | ||||||||||||||||
1Calculated based on average shares outstanding during the years.
2Net investment income is affected by the timing of distributions from the Underlying Series in which the Series invest. The ratios do not include net investment income of the Underlying Series in which the Series invests.
3Represents aggregate total return for the years indicated, and assumes reinvestment of all distributions. Total return would have been lower had certain expenses not been waived or reimbursed.
4Expense ratios do not include expenses of the Underlying Series in which the Series invests. The expense ratio of the Underlying Series was 0.55%.
5Expense ratios do not include expenses of the Underlying Series in which the Series invests. The expense ratio of the Underlying Series was 0.85% for Manning & NapierPro-Blend® Maximum Term Series - Class I and 0.55% for Manning & Napier Blended Asset Maximum Series - Class R6.
6Expense ratios do not include expenses of the Underlying Series in which the Series invests. The expense ratio of the Underlying Series was 0.83%.7Reflects activity of the Series and does not include the activity of the Underlying Series.
The accompanying notes are an integral part of the financial statements.
61
Financial Highlights
| TARGET 2055 SERIES CLASS K | FOR THE YEAR ENDED | ||||||||||||||||||||||||
| 10/31/19 | 10/31/18 | 10/31/17 | 10/31/16 | 10/31/15 | |||||||||||||||||||||
Per share data (for a share outstanding throughout each year): |
| ||||||||||||||||||||||||
Net asset value - Beginning of year | $12.73 | $13.57 | $11.70 | $12.56 | $13.94 | ||||||||||||||||||||
|
|
|
|
|
|
|
|
|
| ||||||||||||||||
Income (loss) from investment operations: | |||||||||||||||||||||||||
Net investment income1,2 | 0.08 | 0.01 | 0.05 | 0.03 | 0.09 | ||||||||||||||||||||
Net realized and unrealized gain (loss) on investments | 1.48 | 0.30 | 2.08 | 0.30 | (0.35 | ) | |||||||||||||||||||
|
|
|
|
|
|
|
|
|
| ||||||||||||||||
Total from investment operations | 1.56 | 0.31 | 2.13 | 0.33 | (0.26 | ) | |||||||||||||||||||
|
|
|
|
|
|
|
|
|
| ||||||||||||||||
Less distributions to shareholders: | |||||||||||||||||||||||||
From net investment income | (0.69 | ) | (0.03 | ) | (0.13 | ) | (0.05 | ) | (0.74 | ) | |||||||||||||||
From net realized gain on investments | (0.12 | ) | (1.12 | ) | (0.13 | ) | (1.14 | ) | (0.38 | ) | |||||||||||||||
|
|
|
|
|
|
|
|
|
| ||||||||||||||||
Total distributions to shareholders | (0.81 | ) | (1.15 | ) | (0.26 | ) | (1.19 | ) | (1.12 | ) | |||||||||||||||
|
|
|
|
|
|
|
|
|
| ||||||||||||||||
Net asset value - End of year | $13.48 | $12.73 | $13.57 | $11.70 | $12.56 | ||||||||||||||||||||
|
|
|
|
|
|
|
|
|
| ||||||||||||||||
Net assets - End of year (000’s omitted) | $6,146 | $4,771 | $4,141 | $2,380 | $1,142 | ||||||||||||||||||||
|
|
|
|
|
|
|
|
|
| ||||||||||||||||
Total return3 | 13.55% | 2.26% | 18.61% | 3.38% | (2.06% | ) | |||||||||||||||||||
Ratios (to average net assets)/Supplemental Data: | |||||||||||||||||||||||||
Expenses* | 0.45% | 4 | 0.45% | 4 | 0.31% | 5 | 0.30% | 6 | 0.30% | 6 | |||||||||||||||
Net investment income2 | 0.63% | 0.10% | 0.37% | 0.30% | 0.68% | ||||||||||||||||||||
Series portfolio turnover7 | 20% | 23% | 186% | 30% | 55% | ||||||||||||||||||||
| *The investment advisor paid a portion of the Series’ expenses. If these expenses had been incurred by the Class, the expense ratios (to average net assets) would have been increased by the following amounts: |
| ||||||||||||||||||||||||
| 1.72% | 4 | 1.87% | 4 | 2.15% | 5 | 2.44% | 6 | 3.68% | 6 | ||||||||||||||||
| TARGET 2055 SERIES CLASS R | FOR THE YEAR ENDED | ||||||||||||||||||||||||
| 10/31/19 | 10/31/18 | 10/31/17 | 10/31/16 | 10/31/15 | |||||||||||||||||||||
Per share data (for a share outstanding throughout each year): |
| ||||||||||||||||||||||||
Net asset value - Beginning of year | $12.56 | $13.43 | $11.59 | $12.45 | $13.83 | ||||||||||||||||||||
|
|
|
|
|
|
|
|
|
| ||||||||||||||||
Income (loss) from investment operations: | |||||||||||||||||||||||||
Net investment income (loss)1,2 | 0.05 | (0.02 | ) | 0.01 | 0.01 | 0.05 | |||||||||||||||||||
Net realized and unrealized gain (loss) on investments | 1.45 | 0.29 | 2.07 | 0.30 | (0.34 | ) | |||||||||||||||||||
|
|
|
|
|
|
|
|
|
| ||||||||||||||||
Total from investment operations | 1.50 | 0.27 | 2.08 | 0.31 | (0.29 | ) | |||||||||||||||||||
|
|
|
|
|
|
|
|
|
| ||||||||||||||||
Less distributions to shareholders: | |||||||||||||||||||||||||
From net investment income | (0.67 | ) | (0.02 | ) | (0.11 | ) | (0.03 | ) | (0.71 | ) | |||||||||||||||
From net realized gain on investments | (0.12 | ) | (1.12 | ) | (0.13 | ) | (1.14 | ) | (0.38 | ) | |||||||||||||||
|
|
|
|
|
|
|
|
|
| ||||||||||||||||
Total distributions to shareholders | (0.79 | ) | (1.14 | ) | (0.24 | ) | (1.17 | ) | (1.09 | ) | |||||||||||||||
|
|
|
|
|
|
|
|
|
| ||||||||||||||||
Net asset value - End of year | $13.27 | $12.56 | $13.43 | $11.59 | $12.45 | ||||||||||||||||||||
|
|
|
|
|
|
|
|
|
| ||||||||||||||||
Net assets - End of year (000’s omitted) | $6,136 | $5,136 | $2,388 | $519 | $409 | ||||||||||||||||||||
|
|
|
|
|
|
|
|
|
| ||||||||||||||||
Total return3 | 13.23% | 2.00% | 18.28% | 3.18% | (2.32% | ) | |||||||||||||||||||
Ratios (to average net assets)/Supplemental Data: | |||||||||||||||||||||||||
Expenses* | 0.70% | 4 | 0.70% | 4 | 0.55% | 5 | 0.55% | 6 | 0.55% | 6 | |||||||||||||||
Net investment income (loss)2 | 0.38% | (0.15% | ) | 0.04% | 0.11% | 0.39% | |||||||||||||||||||
Series portfolio turnover7 | 20% | 23% | 186% | 30% | 55% | ||||||||||||||||||||
| *The investment advisor paid a portion of the Series’ expenses. If these expenses had been incurred by the Class, the expense ratios (to average net assets) would have been increased by the following amounts: |
| ||||||||||||||||||||||||
| 1.65% | 4 | 1.77% | 4 | 2.15% | 5 | 2.44% | 6 | 3.68% | 6 | ||||||||||||||||
1Calculated based on average shares outstanding during the years.
2Net investment income is affected by the timing of distributions from the Underlying Series in which the Series invest. The ratios do not include net investment income of the Underlying Series in which the Series invests.
3Represents aggregate total return for the year indicated, and assumes reinvestment of all distributions. Total return would have been lower had certain expenses not been waived or reimbursed.
4Expense ratios do not include expenses of the Underlying Series in which the Series invests. The expense ratio of the Underlying Series was 0.55%.
5Expense ratios do not include expenses of the Underlying Series in which the Series invests. The expense ratio of the Underlying Series was 0.85% for Manning & NapierPro-Blend® Maximum Term Series - Class I and 0.55% for Manning & Napier Blended Asset Maximum Series - Class R6.
6Expense ratios do not include expenses of the Underlying Series in which the Series invests. The expense ratio of the Underlying Series was 0.83%.7Reflects activity of the Series and does not include the activity of the Underlying Series.
The accompanying notes are an integral part of the financial statements.
62
Financial Highlights
TARGET 2055 SERIES CLASS I | FOR THE YEAR ENDED | ||||||||||||||||||||||||
| 10/31/19 | 10/31/18 | 10/31/17 | 10/31/16 | 10/31/15 | |||||||||||||||||||||
Per share data (for a share outstanding throughout each year): |
| ||||||||||||||||||||||||
Net asset value - Beginning of year | $12.88 | $13.70 | $11.81 | $12.66 | $14.05 | ||||||||||||||||||||
|
|
|
|
|
|
|
|
|
| ||||||||||||||||
Income (loss) from investment operations: | |||||||||||||||||||||||||
Net investment income1,2 | 0.12 | 0.05 | 0.12 | 0.07 | 0.10 | ||||||||||||||||||||
Net realized and unrealized gain (loss) on investments | 1.48 | 0.30 | 2.06 | 0.30 | (0.33 | ) | |||||||||||||||||||
|
|
|
|
|
|
|
|
|
| ||||||||||||||||
Total from investment operations | 1.60 | 0.35 | 2.18 | 0.37 | (0.23 | ) | |||||||||||||||||||
|
|
|
|
|
|
|
|
|
| ||||||||||||||||
Less distributions to shareholders: | |||||||||||||||||||||||||
From net investment income | (0.72 | ) | (0.05 | ) | (0.16 | ) | (0.08 | ) | (0.78 | ) | |||||||||||||||
From net realized gain on investments | (0.12 | ) | (1.12 | ) | (0.13 | ) | (1.14 | ) | (0.38 | ) | |||||||||||||||
|
|
|
|
|
|
|
|
|
| ||||||||||||||||
Total distributions to shareholders | (0.84 | ) | (1.17 | ) | (0.29 | ) | (1.22 | ) | (1.16 | ) | |||||||||||||||
|
|
|
|
|
|
|
|
|
| ||||||||||||||||
Net asset value - End of year | $13.64 | $12.88 | $13.70 | $11.81 | $12.66 | ||||||||||||||||||||
|
|
|
|
|
|
|
|
|
| ||||||||||||||||
Net assets - End of year (000’s omitted) | $450 | $315 | $210 | $2,783 | $1,658 | ||||||||||||||||||||
|
|
|
|
|
|
|
|
|
| ||||||||||||||||
Total return3 | 13.81% | 2.52% | 18.87% | 3.69% | (1.83% | ) | |||||||||||||||||||
Ratios (to average net assets)/Supplemental Data: | |||||||||||||||||||||||||
Expenses* | 0.20% | 4 | 0.20% | 4 | 0.05% | 5 | 0.05% | 6 | 0.05% | 6 | |||||||||||||||
Net investment income2 | 0.94% | 0.37% | 0.95% | 0.58% | 0.80% | ||||||||||||||||||||
Series portfolio turnover7 | 20% | 23% | 186% | 30% | 55% | ||||||||||||||||||||
*The investment advisor paid a portion of the Series’ expenses. If these expenses had been incurred by the Class, the expense ratios (to average net assets) would have been increased by the following amounts: |
| ||||||||||||||||||||||||
| 1.78% | 4 | 1.90% | 4 | 2.15% | 5 | 2.44% | 6 | 3.68% | 6 | ||||||||||||||||
1Calculated based on average shares outstanding during the years.
2Net investment income is affected by the timing of distributions from the Underlying Series in which the Series invest. The ratios do not include net investment income of the Underlying Series in which the Series invests.
3Represents aggregate total return for the years indicated, and assumes reinvestment of all distributions. Total return would have been lower had certain expenses not been waived or reimbursed.
4Expense ratios do not include expenses of the Underlying Series in which the Series invests. The expense ratio of the Underlying Series was 0.55%.
5Expense ratios do not include expenses of the Underlying Series in which the Series invests. The expense ratio of the Underlying Series was 0.85% for Manning & NapierPro-Blend® Maximum Term Series - Class I and 0.55% for Manning & Napier Blended Asset Maximum Series - Class R6.
6Expense ratios do not include expenses of the Underlying Series in which the Series invests. The expense ratio of the Underlying Series was 0.83%.7Reflects activity of the Series and does not include the activity of the Underlying Series.
The accompanying notes are an integral part of the financial statements.
63
Financial Highlights
| TARGET 2060 SERIES CLASS K | FOR THE YEAR ENDED | FOR THE PERIOD | |||||||||||||||||||||||
| 10/31/19 | 10/31/18 | 10/31/17 | 10/31/16 | 9/21/151 TO 10/31/15 | |||||||||||||||||||||
Per share data (for a share outstanding throughout each period): |
| ||||||||||||||||||||||||
Net asset value - Beginning of period | $11.44 | $12.45 | $10.67 | $10.36 | $10.00 | ||||||||||||||||||||
|
|
|
|
|
|
|
|
|
| ||||||||||||||||
Income (loss) from investment operations: | |||||||||||||||||||||||||
Net investment income (loss)2,3 | 0.11 | 0.01 | 0.04 | 0.01 | — | 4 | |||||||||||||||||||
Net realized and unrealized gain (loss) on investments | 1.30 | 0.28 | 1.91 | 0.34 | 0.36 | ||||||||||||||||||||
|
|
|
|
|
|
|
|
|
| ||||||||||||||||
Total from investment operations | 1.41 | 0.29 | 1.95 | 0.35 | 0.36 | ||||||||||||||||||||
|
|
|
|
|
|
|
|
|
| ||||||||||||||||
Less distributions to shareholders: | |||||||||||||||||||||||||
From net investment income | (0.62 | ) | (0.02 | ) | (0.12 | ) | (0.04 | ) | — | ||||||||||||||||
From net realized gain on investments | (0.01 | ) | (1.28 | ) | (0.05 | ) | — | — | |||||||||||||||||
|
|
|
|
|
|
|
|
|
| ||||||||||||||||
Total distributions to shareholders | (0.63 | ) | (1.30 | ) | (0.17 | ) | (0.04 | ) | — | ||||||||||||||||
|
|
|
|
|
|
|
|
|
| ||||||||||||||||
Net asset value - End of period | $12.22 | $11.44 | $12.45 | $10.67 | $10.36 | ||||||||||||||||||||
|
|
|
|
|
|
|
|
|
| ||||||||||||||||
Net assets - End of period (000’s omitted) | $5,975 | $6,895 | $3,284 | $1,407 | $52 | ||||||||||||||||||||
|
|
|
|
|
|
|
|
|
| ||||||||||||||||
Total return5 | 13.52% | 2.32% | 18.56% | 3.45% | 3.60% | ||||||||||||||||||||
Ratios (to average net assets)/Supplemental Data: | |||||||||||||||||||||||||
Expenses* | 0.45% | 6 | 0.45% | 6 | 0.31% | 7 | 0.30% | 8 | 0.30% | 9,10 | |||||||||||||||
Net investment income (loss)3 | 0.96% | 0.07% | 0.39% | 0.10% | (0.30% | )9 | |||||||||||||||||||
Series portfolio turnover11 | 38% | 5% | 173% | 14% | 4% | ||||||||||||||||||||
| *The investment advisor paid a portion of the Series’ expenses. If these expenses had been incurred by the Class, the expense ratios (to average net assets) would have been increased by the following amounts: |
| ||||||||||||||||||||||||
| 2.05% | 6 | 2.29% | 6 | 5.26% | 7 | 9.37% | 8 | 151.35% | 9,10,12 | ||||||||||||||||
| TARGET 2060 SERIES CLASS R | FOR THE YEAR ENDED | FOR THE PERIOD | |||||||||||||||||||||||
| 10/31/19 | 10/31/18 | 10/31/17 | 10/31/16 | 9/21/151TO 10/31/15 | |||||||||||||||||||||
Per share data (for a share outstanding throughout each period): |
| ||||||||||||||||||||||||
Net asset value - Beginning of period | $11.40 | $12.43 | $10.65 | $10.36 | $10.00 | ||||||||||||||||||||
|
|
|
|
|
|
|
|
|
| ||||||||||||||||
Income (loss) from investment operations: | |||||||||||||||||||||||||
Net investment income (loss)2,3 | 0.04 | (0.02 | ) | — | 4 | 0.01 | (0.01 | ) | |||||||||||||||||
Net realized and unrealized gain (loss) on investments | 1.32 | 0.28 | 1.92 | 0.31 | 0.37 | ||||||||||||||||||||
|
|
|
|
|
|
|
|
|
| ||||||||||||||||
Total from investment operations | 1.36 | 0.26 | 1.92 | 0.32 | 0.36 | ||||||||||||||||||||
|
|
|
|
|
|
|
|
|
| ||||||||||||||||
Less distributions to shareholders: | |||||||||||||||||||||||||
From net investment income | (0.61 | ) | (0.01 | ) | (0.09 | ) | (0.03 | ) | — | ||||||||||||||||
From net realized gain on investments | (0.01 | ) | (1.28 | ) | (0.05 | ) | — | — | |||||||||||||||||
|
|
|
|
|
|
|
|
|
| ||||||||||||||||
Total distributions to shareholders | (0.62 | ) | (1.29 | ) | (0.14 | ) | (0.03 | ) | — | ||||||||||||||||
|
|
|
|
|
|
|
|
|
| ||||||||||||||||
Net asset value - End of period | $12.14 | $11.40 | $12.43 | $10.65 | $10.36 | ||||||||||||||||||||
|
|
|
|
|
|
|
|
|
| ||||||||||||||||
Net assets - End of period (000’s omitted) | $6,974 | $4,360 | $1,242 | $182 | $56 | ||||||||||||||||||||
|
|
|
|
|
|
|
|
|
| ||||||||||||||||
Total return5 | 13.05% | 2.11% | 18.29% | 3.16% | 3.60% | ||||||||||||||||||||
Ratios (to average net assets)/Supplemental Data: | |||||||||||||||||||||||||
Expenses* | 0.70% | 6 | 0.70% | 6 | 0.55% | 7 | 0.55% | 8 | 0.55% | 9,10 | |||||||||||||||
Net investment income (loss)3 | 0.36% | (0.16% | ) | (0.01% | ) | 0.09% | (0.55% | )9 | |||||||||||||||||
Series portfolio turnover11 | 38% | 5% | 173% | 14% | 4% | ||||||||||||||||||||
| *The investment advisor paid a portion of the Series’ expenses. If these expenses had been incurred by the Class, the expense ratios (to average net assets) would have been increased by the following amounts: |
| ||||||||||||||||||||||||
| 2.02% | 6 | 2.16% | 6 | 5.26% | 7 | 9.37% | 8 | 151.35% | 9,10,12 | ||||||||||||||||
1Commencement of operations.
2Calculated based on average shares outstanding during the periods.
3Net investment income is affected by the timing of distributions from the Underlying Series in which the Series invest. The ratios do not include net
investment income of the Underlying Series in which the Series invests.
4Less than $(0.01).
5Represents aggregate total return for the periods indicated, and assumes reinvestment of all distributions. Total return would have been lower had certain expenses not been reimbursed during the periods. Periods less than one year are not annualized.
6Expense ratios do not include expenses of the Underlying Series in which the Series invests. The expense ratio of the Underlying Series was 0.55%.
7Expense ratios do not include expenses of the Underlying Series in which the Series invests. The expense ratio of the Underlying Series was 0.85% for Manning & NapierPro-Blend® Maximum Term Series - Class I and 0.55% for Manning & Napier Blended Asset Maximum Series - Class R6.
8Expense ratios do not include expenses of the Underlying Series in which the Series invests. The expense ratio of the Underlying Series was 0.84%.9Annualized.
10Expense ratios do not include expenses of the Underlying Series in which the Series invests. The expense ratio of the Underlying Series was 0.83%.
11Reflects activity of the Series and does not include the activity of the Underlying Series.
12The increase to the expense ratios (to average net assets) is largely due to the small net assets in each class.
The accompanying notes are an integral part of the financial statements.
64
Financial Highlights
| TARGET 2060 SERIES CLASS I | FOR THE YEAR ENDED | FOR THE PERIOD 9/21/151 TO 10/31/15 | |||||||||||||||||||||||
| 10/31/19 | 10/31/18 | 10/31/17 | 10/31/16 | ||||||||||||||||||||||
Per share data (for a share outstanding throughout each period): |
| ||||||||||||||||||||||||
Net asset value - Beginning of period | $ | 11.46 | $ | 12.46 | $ | 10.68 | $ | 10.36 | $10.00 | ||||||||||||||||
|
|
|
|
|
|
|
|
|
| ||||||||||||||||
Income (loss) from investment operations: | |||||||||||||||||||||||||
Net investment income (loss)2,3 | 0.10 | 0.05 | 0.08 | (0.07 | ) | — | 4 | ||||||||||||||||||
Net realized and unrealized gain (loss) on investments | 1.33 | 0.27 | 1.89 | 0.31 | 0.36 | ||||||||||||||||||||
|
|
|
|
|
|
|
|
|
| ||||||||||||||||
Total from investment operations | 1.43 | 0.32 | 1.97 | 0.38 | 0.36 | ||||||||||||||||||||
|
|
|
|
|
|
|
|
|
| ||||||||||||||||
Less distributions to shareholders: | |||||||||||||||||||||||||
From net investment income | (0.65 | ) | (0.04 | ) | (0.14 | ) | (0.06 | ) | — | ||||||||||||||||
From net realized gain on investments | (0.01 | ) | (1.28 | ) | (0.05 | ) | — | — | |||||||||||||||||
|
|
|
|
|
|
|
|
|
| ||||||||||||||||
Total distributions to shareholders | (0.66 | ) | (1.32 | ) | (0.19 | ) | (0.06 | ) | — | ||||||||||||||||
|
|
|
|
|
|
|
|
|
| ||||||||||||||||
Net asset value - End of period | $ | 12.23 | $ | 11.46 | $ | 12.46 | $ | 10.68 | $ | 10.36 | |||||||||||||||
|
|
|
|
|
|
|
|
|
| ||||||||||||||||
Net assets - End of period (000’s omitted) | $287 | $142 | $104 | $56 | $52 | ||||||||||||||||||||
|
|
|
|
|
|
|
|
|
| ||||||||||||||||
Total return5 | 13.75% | 2.55% | 18.80% | 3.71% | 3.60% | ||||||||||||||||||||
Ratios (to average net assets)/Supplemental Data: | |||||||||||||||||||||||||
Expenses* | 0.20% | 6 | 0.20% | 6 | 0.05% | 7 | 0.05% | 8 | 0.05% | 9,10 | |||||||||||||||
Net investment income (loss)3 | 0.84% | 0.40% | 0.72% | 0.65% | (0.05% | )9 | |||||||||||||||||||
Series portfolio turnover11 | 38% | 5% | 173% | 14% | 4% | ||||||||||||||||||||
*The investment advisor paid a portion of the Series’ expenses. If these expenses had been incurred by the Class, the expense ratios (to average net assets) would have been increased by the following amounts: |
| ||||||||||||||||||||||||
| 2.12% | 6 | 2.23% | 6 | 5.26% | 7 | 9.37% | 8 | 151.34% | 9,10,12 | ||||||||||||||||
1Commencement of operations.
2Calculated based on average shares outstanding during the periods.
3Net investment income is affected by the timing of distributions from the Underlying Series in which the Series invest. The ratios do not include net investment income of the Underlying Series in which the Series invests.
4Less than $(0.01).
5Represents aggregate total return for the periods indicated, and assumes reinvestment of all distributions. Total return would have been lower had certain expenses not been reimbursed during the periods. Periods less than one year are not annualized.
6Expense ratios do not include expenses of the Underlying Series in which the Series invests. The expense ratio of the Underlying Series was 0.55%.
7Expense ratios do not include expenses of the Underlying Series in which the Series invests. The expense ratio of the Underlying Series was 0.85% for Manning & NapierPro-Blend® Maximum Term Series - Class I and 0.55% for Manning & Napier Blended Asset Maximum Series - Class R6.
8Expense ratios do not include expenses of the Underlying Series in which the Series invests. The expense ratio of the Underlying Series was 0.84%.9Annualized.
10Expense ratios do not include expenses of the Underlying Series in which the Series invests. The expense ratio of the Underlying Series was 0.83%.
11Reflects activity of the Series and does not include the activity of the Underlying Series.
12The increase to the expense ratios (to average net assets) is largely due to the small net assets in each class.
The accompanying notes are an integral part of the financial statements.
65
Notes to Financial Statements
| 1. | Organization |
Target Income Series, Target 2015 Series, Target 2020 Series, Target 2025 Series, Target 2030 Series, Target 2035 Series, Target 2040 Series, Target 2045 Series, Target 2050 Series, Target 2055 Series and Target 2060 Series (each the “Series”) areno-load diversified series of Manning & Napier Fund, Inc. (the “Fund”). The Fund is organized in Maryland and is registered under the Investment Company Act of 1940 (the “1940 Act”), as amended, as anopen-end management investment company.
Each Series seeks to achieve its investment objectives by investing in a combination of other Manning & Napier mutual funds (the “Underlying Series”) according to a target asset allocation strategy. The Series are designed to provide single investment portfolios that adjust over time to meet the changing risk and return objectives of investors over their expected investment horizon. As the target retirement date approaches, the Series’ portfolios become more conservative with a larger fixed-income investment component. The financial statements of the Underlying Series should be read in conjunction with the Series’ financial statements.
Each Series is authorized to issue three classes of shares (Class K, R, and I). Each class of shares is substantially the same, except that class-specific distribution and shareholder servicing expenses are borne by the specific class of shares to which they relate. Class R6 shares of the Target Series were liquidated by March 1, 2019.
The Fund’s Advisor is Manning & Napier Advisors, LLC (the “Advisor”). Shares of each Series are offered to investors and employees of the Advisor and its affiliates. The total authorized capital stock of the Fund consists of 15 billion shares of common stock each having a par value of $0.01. As of October 31, 2019, 10 billion shares have been designated in total among 34 series, of which 40 million have been designated in each of the Series for Class K and R common stock and 100 million have been designated in each of the Series for Class I common stock.
| 2. | Significant Accounting Policies |
The following is a summary of significant accounting policies followed by the Series. Each Series is an investment company and, accordingly, follows the investment company accounting and reporting guidance of the Financial Accounting Standards Board Accounting Standards Codification Topic 946 - Investment Companies, which is part of accounting principles generally accepted in the United States of America (“GAAP”).
Security Valuation
Investments in the Underlying Series are valued at their net asset value per share on valuation date. In the absence of the availability of a net asset value per share on the Underlying Series, security valuations may be determined in good faith by the Advisor under procedures approved by and under the general supervision and responsibility of the Fund’s Board of Directors (the “Board”).
Volume and level of activity in established markets for an asset or liability are evaluated to determine whether recent transactions and quoted prices are determinative of fair value. Where there have been significant decreases in volume and level of activity, further analysis and adjustment may be necessary to estimate fair value. The Series measure fair value in these instances by the use of inputs and valuation techniques which may be based upon current market prices of securities that are comparable in coupon, rating, maturity and industry and/or expectation of future cash flows. As a result of trading in relatively thin markets and/or markets that experience significant volatility, the prices used by the Series to value these securities may differ from the value that would be realized if these securities were sold, and the differences could be material.
Securities for which representative valuations or prices are not available from the Series’ pricing service may be valued at fair value as determined in good faith by the Advisor under procedures approved by and under the general supervision and responsibility of the Board. Due to the inherent uncertainty of valuations of such securities, the fair value may differ significantly from the values that would have been used had a ready market for such securities existed. If trading or events occurring after the close of the principal market in which securities are traded are expected to materially affect the value of those securities, then they may be valued at their fair value, taking this trading or these events into account.
66
Notes to Financial Statements (continued)
| 2. | Significant Accounting Policies (continued) |
Security Valuation(continued)
Various inputs are used in determining the value of the Series’ assets or liabilities carried at fair value. These inputs are summarized in three broad levels. Level 1 includes quoted prices in active markets for identical assets and liabilities. Level 2 includes other significant observable inputs (including quoted prices for similar securities, interest rates, prepayment speeds, credit risk, etc.). Level 3 includes significant unobservable inputs (including the Series’ own assumptions in determining the fair value of investments). A financial instrument’s level within the fair value hierarchy is based on the lowest level on any input both individually and in aggregate that is significant to the fair value measurement. The inputs or methodology used for valuing securities are not necessarily an indication of the risk associated with investing in those securities.
The following is a summary of the valuation levels used for major security types as of October 31, 2019 in valuing the Series’ assets or liabilities carried at fair value:
| TARGET INCOME SERIES | ||||||||||||||||
DESCRIPTION | TOTAL | LEVEL 1 | LEVEL 2 | LEVEL 3 | ||||||||||||
Assets: | ||||||||||||||||
Mutual fund | $ | 78,646,562 | $ | 78,646,562 | $ | — | $ | — | ||||||||
|
|
|
|
|
|
|
| |||||||||
Total assets | $ | 78,646,562 | $ | 78,646,562 | $ | — | $ | — | ||||||||
|
|
|
|
|
|
|
| |||||||||
| TARGET 2015 SERIES | ||||||||||||||||
DESCRIPTION | TOTAL | LEVEL 1 | LEVEL 2 | LEVEL 3 | ||||||||||||
Assets: | ||||||||||||||||
Mutual funds | $ | 1,260,183 | $ | 1,260,183 | $ | — | $ | — | ||||||||
|
|
|
|
|
|
|
| |||||||||
Total assets | $ | 1,260,183 | $ | 1,260,183 | $ | — | $ | — | ||||||||
|
|
|
|
|
|
|
| |||||||||
| TARGET 2020 SERIES | ||||||||||||||||
DESCRIPTION | TOTAL | LEVEL 1 | LEVEL 2 | LEVEL 3 | ||||||||||||
Assets: | ||||||||||||||||
Mutual funds | $ | 56,410,300 | $ | 56,410,300 | $ | — | $ | — | ||||||||
|
|
|
|
|
|
|
| |||||||||
Total assets | $ | 56,410,300 | $ | 56,410,300 | $ | — | $ | — | ||||||||
|
|
|
|
|
|
|
| |||||||||
| TARGET 2025 SERIES | ||||||||||||||||
DESCRIPTION | TOTAL | LEVEL 1 | LEVEL 2 | LEVEL 3 | ||||||||||||
Assets: | ||||||||||||||||
Mutual funds | $ | 68,867,511 | $ | 68,867,511 | $ | — | $ | — | ||||||||
|
|
|
|
|
|
|
| |||||||||
Total assets | $ | 68,867,511 | $ | 68,867,511 | $ | — | $ | — | ||||||||
|
|
|
|
|
|
|
| |||||||||
| TARGET 2030 SERIES | ||||||||||||||||
DESCRIPTION | TOTAL | LEVEL 1 | LEVEL 2 | LEVEL 3 | ||||||||||||
Assets: | ||||||||||||||||
Mutual funds | $ | 78,889,258 | $ | 78,889,258 | $ | — | $ | — | ||||||||
|
|
|
|
|
|
|
| |||||||||
Total assets | $ | 78,889,258 | $ | 78,889,258 | $ | — | $ | — | ||||||||
|
|
|
|
|
|
|
| |||||||||
| TARGET 2035 SERIES | ||||||||||||||||
DESCRIPTION | TOTAL | LEVEL 1 | LEVEL 2 | LEVEL 3 | ||||||||||||
Assets: | ||||||||||||||||
Mutual funds | $ | 47,947,257 | $ | 47,947,257 | $ | — | $ | — | ||||||||
|
|
|
|
|
|
|
| |||||||||
Total assets | $ | 47,947,257 | $ | 47,947,257 | $ | — | $ | — | ||||||||
|
|
|
|
|
|
|
| |||||||||
67
Notes to Financial Statements (continued)
| 2. | Significant Accounting Policies (continued) |
Security Valuation(continued)
| TARGET 2040 SERIES | ||||||||||||||||
DESCRIPTION | TOTAL | LEVEL 1 | LEVEL 2 | LEVEL 3 | ||||||||||||
Assets: | ||||||||||||||||
Mutual funds | $ 51,881,012 | $ 51,881,012 | $ — | $ — | ||||||||||||
|
|
|
|
|
|
|
| |||||||||
Total assets | $ 51,881,012 | $ 51,881,012 | $ — | $ — | ||||||||||||
|
|
|
|
|
|
|
| |||||||||
| TARGET 2045 SERIES | ||||||||||||||||
DESCRIPTION | TOTAL | LEVEL 1 | LEVEL 2 | LEVEL 3 | ||||||||||||
Assets: | ||||||||||||||||
Mutual funds | $ 26,295,175 | $ 26,295,175 | $ — | $ — | ||||||||||||
|
|
|
|
|
|
|
| |||||||||
Total assets | $ 26,295,175 | $ 26,295,175 | $ — | $ — | ||||||||||||
|
|
|
|
|
|
|
| |||||||||
| TARGET 2050 SERIES | ||||||||||||||||
DESCRIPTION | TOTAL | LEVEL 1 | LEVEL 2 | LEVEL 3 | ||||||||||||
Assets: | ||||||||||||||||
Mutual fund | $ 32,204,079 | $ 32,204,079 | $ — | $ — | ||||||||||||
|
|
|
|
|
|
|
| |||||||||
Total assets | $ 32,204,079 | $ 32,204,079 | $ — | $ — | ||||||||||||
|
|
|
|
|
|
|
| |||||||||
| TARGET 2055 SERIES | ||||||||||||||||
DESCRIPTION | TOTAL | LEVEL 1 | LEVEL 2 | LEVEL 3 | ||||||||||||
Assets: | ||||||||||||||||
Mutual fund | $ 12,732,553 | $ 12,732,553 | $ — | $ — | ||||||||||||
|
|
|
|
|
|
|
| |||||||||
Total assets | $ 12,732,553 | $ 12,732,553 | $ — | $ — | ||||||||||||
|
|
|
|
|
|
|
| |||||||||
| TARGET 2060 SERIES | ||||||||||||||||
DESCRIPTION | TOTAL | LEVEL 1 | LEVEL 2 | LEVEL 3 | ||||||||||||
Assets: | ||||||||||||||||
Mutual fund | $ 13,234,661 | $ 13,234,661 | $ — | $ — | ||||||||||||
|
|
|
|
|
|
|
| |||||||||
Total assets | $ 13,234,661 | $ 13,234,661 | $ — | $ — | ||||||||||||
|
|
|
|
|
|
|
| |||||||||
There were no Level 2 or Level 3 securities held by any of the Series as of October 31, 2018 or October 31, 2019.
Security Transactions, Investment Income and Expenses
Security transactions are accounted for on trade date. Dividend income is recorded on theex-dividend date.Non-cash dividends, if any, are recorded at the fair value of the securities received. Income and capital gains distributions from the Underlying Series, if any, are recorded on theex-dividend date.
Expenses are recorded on an accrual basis. Most expenses of the Fund can be attributed to a specific series. Expenses which cannot be directly attributed are apportioned among the series in the Fund in such a manner as deemed equitable by the Fund’s Board, taking into consideration, among other things, the nature and type of expense. Expenses included in the accompanying statements of operations do not include any expense of the Underlying Series.
Income, expenses (other than class specific expenses), and realized and unrealized gains and losses are prorated among the classes based on the relative net assets of each class. Class specific expenses are directly charged to that Class.
The Series use the identified cost method for determining realized gain or loss on investments for both financial statement and federal income tax reporting purposes.
68
Notes to Financial Statements (continued)
| 2. | Significant Accounting Policies (continued) |
Federal Taxes
Each Series’ policy is to comply with the provisions of the Internal Revenue Code applicable to regulated investment companies. The Series are not subject to federal income tax or excise tax to the extent that each Series distributes to shareholders each year its taxable income, including any net realized gains on investments, in accordance with requirements of the Internal Revenue Code. Accordingly, no provision for federal income tax or excise tax has been made in the financial statements.
Management evaluates its tax positions to determine if the tax positions taken meet the minimum recognition threshold in connection with accounting for uncertainties in income tax positions taken or expected to be taken for the purposes of measuring and recognizing tax liabilities in the financial statements. Recognition of tax benefits of an uncertain tax position is required only when the position is “more likely than not” to be sustained assuming examination by taxing authorities. At October 31, 2019, the Series have recorded no liability for net unrecognized tax benefits relating to uncertain income tax positions taken or expected to be taken in future tax returns.
The Series file income tax returns in the U.S. federal jurisdiction, various states and foreign jurisdictions, as required. No income tax returns are currently under investigation. The statute of limitations on the Series’ tax returns remains open for the years ended October 31, 2016 through October 31, 2019. The Fund is not aware of any tax positions for which it is reasonably possible that the total amounts of unrecognized tax benefits will significantly change in the next twelve months.
Distributions of Income and Gains
Distributions to shareholders of net investment income are made semi-annually. Distributions of net realized gains are made annually. An additional distribution may be necessary to avoid taxation of a Series. Distributions are recorded on theex-dividend date.
Indemnifications
The Fund’s organizational documents provide former and current directors and officers with a limited indemnification against liabilities arising in connection with the performance of their duties to the Fund. In the normal course of business, the Fund may also enter into contracts that provide general indemnifications. The Fund’s maximum exposure under these arrangements is unknown as this would be dependent on future claims that may be made against the Fund. The risk of material loss from such claims is considered remote.
Other
The preparation of financial statements in conformity with GAAP requires management to make estimates and assumptions that affect the reported amounts of assets and liabilities and the disclosure of contingent assets and liabilities at the date of the financial statements and the reported amounts of income and expenses during the reporting period. Actual results could differ from those estimates.
| 3. | Transactions with Affiliates and Other Agreements |
The Fund has an Investment Advisory Agreement (the “Agreement”) with the Advisor, for which the Advisor does not receive a fee for the services it performs for the Series. However, the Advisor is entitled to receive the management fee from each of the Underlying Series in which the Series invest.
Under the Agreement, personnel of the Advisor provide the Series with advice and assistance in the choice of investments and the execution of securities transactions, and otherwise maintain the Series’ organization. The Advisor also provides the Fund with necessary office space and fund administration and support services. The salaries of all officers of the Fund (except a percentage of the Fund’s Chief Compliance Officer’s salary, which is paid by the Fund), and of all Directors who are “affiliated persons” of the Fund, or of the Advisor, and all personnel of the Fund, or of the Advisor, performing services relating to research, statistical and investment activities, are paid by the Advisor. Each“non-affiliated” Director receives an annual stipend, which is allocated among all the active series of the Fund. In addition, these Directors also receive a fee per Board meeting attended plus a fee for each committee meeting attended and are reimbursed for travel and otherout-of-pocket expenses
69
Notes to Financial Statements (continued)
| 3. | Transactions with Affiliates and Other Agreements (continued) |
incurred by them in connection with attending such meetings. The Fund also has an Audit Committee Chair, Governance & Nominating Committee Chair and Lead Independent Director who each receive an additional annual stipend for these roles.
The Fund may enter into agreements with financial intermediaries pursuant to which the Fund may pay financial intermediaries fornon-distribution relatedsub-transfer agency, administrative,sub-accounting, and other shareholder services in an amount not to exceed 0.15% of the average daily net assets of the Class K, Class R and Class I shares. Payments made pursuant to such agreements are generally based on the current assets and/or number of accounts of the Series attributable to the financial intermediary. Any payments made pursuant to such agreements may be in addition to, rather than in lieu of, any Distribution and Shareholder Services Fee payable under the Rule12b-1 plan of the Fund.
The Advisor has contractually agreed to limit its fees and reimburse expenses to the extent necessary so that the total direct annual fund operating expenses of each Class, exclusive of Distribution and Service(12b-1) Fees, do not exceed 0.20% of the average daily net assets of the Class I, Class K, and Class R shares. Effective March 1, 2019, this contractual limitation is expected to continue indefinitely and may not be amended or terminated by the Advisor without the approval of the Series’ Board of Directors. The Advisor’s agreement to limit each class’s operating expenses is limited to direct operating expenses and, therefore, does not apply to acquired fund fees and expenses (AFFE), which are indirect expenses incurred by the Series through their investments in the underlying funds. The Advisor may receive from a class the difference between the class’s total direct annual fund operating expenses, exclusive of Rule12b-1 Fees, and the class’s contractual expense limit to recoup all or a portion of its prior fee waivers or expense reimbursements made during the rolling three-year period preceding the recoupment if at any point the total direct annual fund operating expenses, exclusive of Rule12b-1 Fees, are below the contractual expense limit (a) at the time of the fee waiver and/or expense reimbursement and (b) at the time of the recoupment. The Advisor’s agreement to limit each class’ operating expenses is limited to direct operating expenses and, therefore, does not apply to the indirect expenses incurred by the Series through their investments in the Underlying Series. For the year ended October 31, 2019, the Advisor reimbursed expenses of $95,277 for Target Income Series, $149,526 for Target 2015 Series, $131,598 for Target 2020 Series, $135,554 for Target 2025 Series, $154,337 for Target 2030 Series, $168,910 Target 2035 Series, $179,821 for Target 2040 Series, $187,700 for Target 2045 Series, $195,491 for Target 2050 Series, $195,620 for Target 2055 series and $225,968 for Target 2060 Series, which is included as a reduction of expenses on the Statements of Operations. At October 31, 2019, the Advisor is eligible to recoup $62,617 for Target Income Series, $104,573 for Target 2015 Series, $88,785 for Target 2020 Series, $97,230 for Target 2025 Series, $106,172 for Target 2030 Series, $122,438 Target 2035 Series, $127,646 for Target 2040 Series, $135,478 for Target 2045 Series, $141,519 for Target 2050 Series, $140,899 for Target 2055 series and $167,640 for Target 2060 Series. For the year ended October 31, 2019, the Advisor did not recoup any expenses that have been previously waived or reimbursed.
Manning & Napier Investor Services, Inc., a registered broker-dealer affiliate of the Advisor, acts as distributor for the Fund’s shares. Each Series compensates the distributor for distributing and servicing the Series’ Class K and Class R shares pursuant to a distribution plan adopted under Rule12b-1 of the 1940 Act, regardless of expenses actually incurred. Under the agreement, each Series pays distribution and service fees to the distributor at an annual rate of 0.25% of average daily net assets attributable to Class K shares and 0.50% of average daily net assets attributable to Class R shares. There are no distribution and service fees on Class I shares of each Series. The fees are accrued daily and paid monthly.
Pursuant to a master services agreement dated March 1, 2017, the Fund pays the Advisor an annual fee related to fund accounting and administration of 0.00225% of average daily net assets of the Target Series with an annual base fee of $40,000 per Target series. Additionally, certain transaction andout-of-pocket expenses, including charges for reporting relating to the Fund’s compliance program, are charged. The Advisor has agreements with BNY Mellon Investment Servicing (U.S.) Inc. (“BNY”) under which BNY serves assub-accountant services agent.
70
Notes to Financial Statements (continued)
| 4. | Purchases and Sales of Securities |
For the year ended October 31, 2019, purchases and sales of Underlying Series were as follows:
| SERIES | PURCHASES | SALES | ||||||||||
Target Income Series | $ | 10,273,168 | $ | 62,137,461 | ||||||||
Target 2015 Series | $ | 575,275 | $ | 1,557,835 | ||||||||
Target 2020 Series | $ | 10,846,877 | $ | 52,361,319 | ||||||||
Target 2025 Series | $ | 15,841,584 | $ | 12,882,800 | ||||||||
Target 2030 Series | $ | 16,666,029 | $ | 64,534,385 | ||||||||
Target 2035 Series | $ | 12,362,904 | $ | 5,751,665 | ||||||||
Target 2040 Series | $ | 13,222,563 | $ | 35,958,097 | ||||||||
Target 2045 Series | $ | 7,764,689 | $ | 3,820,303 | ||||||||
Target 2050 Series | $ | 10,667,145 | $ | 12,466,520 | ||||||||
Target 2055 Series | $ | 3,915,728 | $ | 2,339,224 | ||||||||
Target 2060 Series | $ | 5,820,203 | $ | 4,354,149 | ||||||||
| 5. | Investments in Affiliated Issuers |
A summary of the Series’ transactions in the shares of affiliated issuers of Manning & Napier during the year ended October 31, 2019 is set forth below:
| TARGET INCOME SERIES | VALUE AT 10/31/18 | PURCHASE COST | SALES PROCEEDS | VALUE AT 10/31/19 | SHARES HELD AT 10/31/19 | DIVIDEND INCOME | DISTRIBUTIONS NET REALIZED | CHANGE IN UNREALIZED APPRECIATION (DEPRECIATION) | ||||||||||||||||||||||||||
Blended Asset Conservative Series - Class R6 | $125,824,382 | $10,273,168 | $62,137,461 | $78,646,562 | 6,815,127 | $2,509,324 | $(2,085,634 | ) | $6,772,108 | |||||||||||||||||||||||||
| TARGET 2015 SERIES | VALUE AT 10/31/18 | PURCHASE COST | SALES PROCEEDS | VALUE AT 10/31/19 | SHARES HELD AT 10/31/19 | DIVIDEND INCOME | DISTRIBUTIONS NET REALIZED | CHANGE IN UNREALIZED APPRECIATION (DEPRECIATION) | ||||||||||||||||||||||||||
Blended Asset Conservative Series - Class R6 | $1,279,950 | $499,588 | $ 868,878 | $1,001,322 | 86,770 | $20,951 | $ (1,127 | ) | $ 91,789 | |||||||||||||||||||||||||
Blended Asset | 844,809 | 75,687 | 688,957 | 258,861 | 22,373 | 8,960 | (10,203 | ) | 37,525 | |||||||||||||||||||||||||
|
|
|
|
|
|
|
|
|
|
|
|
|
|
|
| |||||||||||||||||||
| $2,124,759 | $575,275 | $1,557,835 | $1,260,183 | $29,911 | $(11,330 | ) | $129,314 | |||||||||||||||||||||||||||
|
|
|
|
|
|
|
|
|
|
|
|
|
| |||||||||||||||||||||
71
Notes to Financial Statements (continued)
| 5. | Investments in Affiliated Issuers (continued) |
| TARGET 2020 SERIES | VALUE AT 10/31/18 | PURCHASE COST | SALES PROCEEDS | VALUE AT 10/31/19 | SHARES HELD AT 10/31/19 | DIVIDEND INCOME | DISTRIBUTIONS NET REALIZED | CHANGE IN UNREALIZED APPRECIATION (DEPRECIATION) | |||||||||||||||||||||||||
Blended Asset | $ 9,358,378 | $ 606,849 | $ 7,176,634 | $ 2,892,293 | 257,551 | $ 119,387 | $ (296,696 | ) | $ 430,988 | |||||||||||||||||||||||||
Blended Asset | 84,363,708 | 10,240,028 | 45,184,685 | 53,518,007 | 4,625,584 | 1,464,941 | (1,786,664 | ) | 5,885,619 | |||||||||||||||||||||||||
|
|
|
|
|
|
|
|
|
|
|
|
|
|
|
| |||||||||||||||||||
| $93,722,086 | $10,846,877 | $52,361,319 | $56,410,300 | $1,584,328 | $(2,083,360 | ) | $6,316,607 | |||||||||||||||||||||||||||
|
|
|
|
|
|
|
|
|
|
|
|
|
| |||||||||||||||||||||
| TARGET 2025 SERIES | VALUE AT 10/31/18 | PURCHASE COST | SALES PROCEEDS | VALUE AT 10/31/19 | SHARES HELD AT 10/31/19 | DIVIDEND INCOME | DISTRIBUTIONS NET REALIZED | CHANGE IN UNREALIZED APPRECIATION (DEPRECIATION) | ||||||||||||||||||||||||||
Blended Asset | $29,628,989 | $ 4,373,759 | $ 8,827,835 | $27,855,379 | 2,480,443 | $ 488,391 | $(53,635 | ) | $2,830,556 | |||||||||||||||||||||||||
Blended Asset Moderate Series - Class R6 | 29,756,456 | 11,467,825 | 4,054,965 | 41,012,132 | 3,544,696 | 663,757 | 65,765 | 3,777,051 | ||||||||||||||||||||||||||
|
|
|
|
|
|
|
|
|
|
|
|
|
|
|
| |||||||||||||||||||
| $59,385,445 | $15,841,584 | $12,882,800 | $68,867,511 | $1,152,148 | $ 12,130 | $6,607,607 | ||||||||||||||||||||||||||||
|
|
|
|
|
|
|
|
|
|
|
|
|
| |||||||||||||||||||||
| TARGET 2030 SERIES | VALUE AT 10/31/18 | PURCHASE COST | SALES PROCEEDS | VALUE AT 10/31/19 | SHARES HELD AT 10/31/19 | DIVIDEND INCOME | DISTRIBUTIONS NET REALIZED | CHANGE IN UNREALIZED APPRECIATION (DEPRECIATION) | ||||||||||||||||||||||||||
Blended Asset | $109,347,539 | $15,690,628 | $56,145,368 | $74,706,530 | 6,652,407 | $1,654,819 | $(2,067,805 | ) | $8,242,496 | |||||||||||||||||||||||||
Blended Asset Maximum Series - Class R6 | 12,222,962 | 975,401 | 8,389,017 | 4,182,728 | 330,389 | 95,850 | (109,287 | ) | 91,271 | |||||||||||||||||||||||||
|
|
|
|
|
|
|
|
|
|
|
|
|
|
|
| |||||||||||||||||||
| $121,570,501 | $16,666,029 | $64,534,385 | $78,889,258 | $1,750,669 | $(2,177,092 | ) | $8,333,767 | |||||||||||||||||||||||||||
|
|
|
|
|
|
|
|
|
|
|
|
|
| |||||||||||||||||||||
| TARGET 2035 SERIES | VALUE AT 10/31/18 | PURCHASE COST | SALES PROCEEDS | VALUE AT 10/31/19 | SHARES HELD AT 10/31/19 | DIVIDEND INCOME | DISTRIBUTIONS NET REALIZED | CHANGE IN UNREALIZED APPRECIATION (DEPRECIATION) | ||||||||||||||||||||||||||
Blended Asset | $24,251,400 | $ 8,834,927 | $3,101,631 | $33,120,822 | 2,949,316 | $458,538 | $135,073 | $3,081,434 | ||||||||||||||||||||||||||
Blended Asset | 13,074,707 | 3,527,977 | 2,650,034 | 14,826,435 | 1,171,124 | 149,699 | 601,786 | 926,053 | ||||||||||||||||||||||||||
|
|
|
|
|
|
|
|
|
|
|
|
|
|
|
| |||||||||||||||||||
| $37,326,107 | $12,362,904 | $5,751,665 | $47,947,257 | $608,237 | $736,859 | $4,007,487 | ||||||||||||||||||||||||||||
|
|
|
|
|
|
|
|
|
|
|
|
|
| |||||||||||||||||||||
72
Notes to Financial Statements (continued)
| 5. | Investments in Affiliated Issuers (continued) |
| TARGET 2040 SERIES | VALUE AT 10/31/18 | PURCHASE COST | SALES PROCEEDS | VALUE AT 10/31/19 | SHARES HELD AT 10/31/19 | DIVIDEND INCOME | DISTRIBUTIONS NET REALIZED | CHANGE IN UNREALIZED APPRECIATION (DEPRECIATION) | ||||||||||||||||||||||||||
| Blended Asset | $29,068,763 | $ 6,142,839 | $14,312,624 | $22,770,498 | 2,027,649 | $457,940 | $(475,203 | ) | $2,442,894 | ||||||||||||||||||||||||
Blended Asset | 43,914,852 | 7,079,724 | 21,645,473 | 29,110,514 | 2,299,409 | 413,051 | 400,150 | 1,552,984 | ||||||||||||||||||||||||||
|
|
|
|
|
|
|
|
|
|
|
|
|
|
|
| |||||||||||||||||||
| $72,983,615 | $13,222,563 | $35,958,097 | $51,881,012 | $870,991 | $ (75,053 | ) | $3,995,878 | |||||||||||||||||||||||||||
|
|
|
|
|
|
|
|
|
|
|
|
|
| |||||||||||||||||||||
| TARGET 2045 SERIES | VALUE AT 10/31/18 | PURCHASE COST | SALES PROCEEDS | VALUE AT 10/31/19 | SHARES HELD AT 10/31/19 | DIVIDEND INCOME | DISTRIBUTIONS AND NET REALIZED GAIN OR LOSS | CHANGE IN UNREALIZED APPRECIATION (DEPRECIATION) | ||||||||||||||||||||||||||
Blended Asset | $ 3,067,693 | $2,091,778 | $ 576,484 | $ 5,075,474 | 451,957 | $ 64,258 | $ 27,300 | $ 475,560 | ||||||||||||||||||||||||||
Blended Asset | 17,444,750 | 5,672,911 | 3,243,819 | 21,219,701 | 1,676,122 | 210,037 | 899,089 | 1,337,128 | ||||||||||||||||||||||||||
|
|
|
|
|
|
|
|
|
|
|
|
|
|
|
| |||||||||||||||||||
| $20,512,443 | $7,764,689 | $3,820,303 | $26,295,175 | $274,295 | $926,389 | $1,812,688 | ||||||||||||||||||||||||||||
|
|
|
|
|
|
|
|
|
|
|
|
|
| |||||||||||||||||||||
| TARGET 2050 SERIES | VALUE AT 10/31/18 | PURCHASE COST | SALES PROCEEDS | VALUE AT 10/31/19 | SHARES HELD AT 10/31/19 | DIVIDEND INCOME | DISTRIBUTIONS AND NET REALIZED GAIN | CHANGE IN UNREALIZED APPRECIATION (DEPRECIATION) | ||||||||||||||||||||||||||
Blended Asset | $33,049,623 | $10,667,145 | $12,466,520 | $32,204,079 | 2,543,766 | $350,144 | $709,628 | $1,887,695 | ||||||||||||||||||||||||||
| TARGET 2055 SERIES | VALUE AT 10/31/18 | PURCHASE COST | SALES PROCEEDS | VALUE AT 10/31/19 | SHARES HELD AT 10/31/19 | DIVIDEND INCOME | DISTRIBUTIONS AND NET REALIZED GAIN OR LOSS | CHANGE IN UNREALIZED APPRECIATION (DEPRECIATION) | ||||||||||||||||||||||||||
Blended Asset | $10,223,687 | $3,915,728 | $2,339,224 | $12,732,553 | 1,005,731 | $124,971 | $585,302 | $861,760 | ||||||||||||||||||||||||||
| TARGET 2060 SERIES | VALUE AT 10/31/18 | PURCHASE COST | SALES PROCEEDS | VALUE AT 10/31/19 | SHARES HELD AT 10/31/19 | DIVIDEND INCOME | DISTRIBUTIONS AND NET REALIZED GAIN OR LOSS | CHANGE IN UNREALIZED APPRECIATION (DEPRECIATION) | ||||||||||||||||||||||||||
Blended Asset | $11,393,453 | $5,820,203 | $4,354,149 | $13,234,661 | 1,045,392 | $133,955 | $232,290 | $759,245 | ||||||||||||||||||||||||||
| 6. | Capital Stock Transactions |
Transactions in Class K, Class R, Class I, and Class R6 shares:
| TARGET INCOME SERIES: | FOR THE YEAR
| FOR THE YEAR
| FOR THE YEAR
| FOR THE YEAR
| ||||||||||||||||||||||||||||||
| CLASS K | CLASS K | CLASS R | CLASS R | |||||||||||||||||||||||||||||||
| SHARES | AMOUNTS | SHARES | AMOUNTS | SHARES | AMOUNTS | SHARES | AMOUNTS | |||||||||||||||||||||||||||
Sold | 962,007 | $ | 9,707,566 | 3,459,198 | $ | 34,200,840 | 319,488 | $ | 3,148,036 | 1,282,576 | $ | 12,499,324 | ||||||||||||||||||||||
Reinvested | 181,436 | 1,733,380 | 55,745 | 550,512 | 34,501 | 326,409 | 8,088 | 78,863 | ||||||||||||||||||||||||||
Repurchased | (6,551,328 | ) | (62,697,503 | ) | (794,763 | ) | (7,842,218 | ) | (401,484 | ) | (4,058,779 | ) | (348,958 | ) | (3,406,394 | ) | ||||||||||||||||||
|
|
|
|
|
|
|
|
|
|
|
|
|
|
|
| |||||||||||||||||||
Total | (5,407,885 | ) | $ | (51,256,557 | ) | 2,720,180 | $ | 26,909,134 | (47,495 | ) | $ | (584,334 | ) | 941,706 | $ | 9,171,793 | ||||||||||||||||||
|
|
|
|
|
|
|
|
|
|
|
|
|
|
|
| |||||||||||||||||||
73
Notes to Financial Statements (continued)
| 6. | Capital Stock Transactions (continued) |
TARGET INCOME |
FOR THE YEAR
CLASS I |
FOR THE YEAR
CLASS I |
FOR THE YEAR
CLASS R6 |
FOR THE YEAR
CLASS R6 | ||||||||||||||||||||||||||||||||
| SHARES | AMOUNTS | SHARES | AMOUNTS | SHARES | AMOUNTS | SHARES | AMOUNTS | |||||||||||||||||||||||||||||
| Sold | 11,488 | $ | 117,333 | 25,220 | $ | 253,822 | — | $ | — | — | $ | — | ||||||||||||||||||||||||
| Reinvested | 1,405 | 13,585 | 3,950 | 39,151 | 9 | 82 | 5 | 45 | ||||||||||||||||||||||||||||
| Repurchased | (10,631 | ) | (105,949 | ) | (760,862 | ) | (7,626,184 | ) | (517 | ) | (5,122 | ) | — | — | ||||||||||||||||||||||
|
|
|
|
|
|
|
|
|
|
|
|
|
|
|
| |||||||||||||||||||||
| Total | 2,262 | $ | 24,969 | (731,692 | ) | $ | (7,333,211 | ) | (508 | ) | $ | (5,040 | ) | 5 | $ | 45 | ||||||||||||||||||||
|
|
|
|
|
|
|
|
|
|
|
|
|
|
|
| |||||||||||||||||||||
TARGET 2015 SERIES: |
FOR THE YEAR
CLASS K |
FOR THE YEAR
CLASS K |
FOR THE YEAR
CLASS R |
FOR THE YEAR ENDED 10/31/18
CLASS R | ||||||||||||||||||||||||||||||||
| SHARES | AMOUNTS | SHARES | AMOUNTS | SHARES | AMOUNTS | SHARES | AMOUNTS | |||||||||||||||||||||||||||||
| Sold | 11,457 | $ | 130,015 | 37,320 | $ | 416,295 | 57 | $ | 631 | 251 | $ | 2,828 | ||||||||||||||||||||||||
| Reinvested | 2,039 | 22,028 | 1,657 | 18,450 | 47 | 510 | 13 | 150 | ||||||||||||||||||||||||||||
| Repurchased | (78,276 | ) | (877,434 | ) | (250,959 | ) | (2,781,162 | ) | (3,510 | ) | (40,130 | ) | (405 | ) | (4,535 | ) | ||||||||||||||||||||
|
|
|
|
|
|
|
|
|
|
|
|
|
|
|
| |||||||||||||||||||||
| Total | (64,780 | ) | $ | (725,391 | ) | (211,982 | ) | $ | (2,346,417 | ) | (3,406 | ) | $ | (38,989 | ) | (141 | ) | $ | (1,557 | ) | ||||||||||||||||
|
|
|
|
|
|
|
|
|
|
|
|
|
|
|
| |||||||||||||||||||||
TARGET 2015 SERIES: |
FOR THE YEAR
CLASS I |
FOR THE YEAR
CLASS I |
FOR THE YEAR
CLASS R6 |
FOR THE YEAR ENDED 10/31/18
CLASS R6 | ||||||||||||||||||||||||||||||||
| SHARES | AMOUNTS | SHARES | AMOUNTS | SHARES | AMOUNTS | SHARES | AMOUNTS | |||||||||||||||||||||||||||||
| Sold | 1,354 | $ | 15,002 | 10,319 | $ | 116,848 | — | $ | — | — | $ | — | ||||||||||||||||||||||||
| Reinvested | 163 | 1,765 | 263 | 2,948 | 8 | 89 | 5 | 49 | ||||||||||||||||||||||||||||
| Repurchased | (20,357 | ) | (224,940 | ) | (13,809 | ) | (155,395 | ) | (459 | ) | (5,114 | ) | — | — | ||||||||||||||||||||||
|
|
|
|
|
|
|
|
|
|
|
|
|
|
|
| |||||||||||||||||||||
| Total | (18,840 | ) | $ | (208,173 | ) | (3,227 | ) | $ | (35,599 | ) | (451 | ) | $ | (5,025 | ) | 5 | $ | 49 | ||||||||||||||||||
|
|
|
|
|
|
|
|
|
|
|
|
|
|
|
| |||||||||||||||||||||
TARGET 2020 SERIES: |
FOR THE YEAR
CLASS K |
FOR THE YEAR
CLASS K |
FOR THE YEAR
CLASS R |
FOR THE YEAR
CLASS R | ||||||||||||||||||||||||||||||||
| SHARES | AMOUNTS | SHARES | AMOUNTS | SHARES | AMOUNTS | SHARES | AMOUNTS | |||||||||||||||||||||||||||||
| Sold | 754,254 | $ | 7,250,970 | 1,799,328 | $ | 17,011,756 | 281,861 | $ | 2,629,905 | 840,753 | $ | 7,833,720 | ||||||||||||||||||||||||
| Reinvested | 116,291 | 1,047,489 | 35,055 | 331,206 | 22,422 | 200,008 | 4,150 | 38,502 | ||||||||||||||||||||||||||||
| Repurchased | (5,419,700 | ) | (49,035,047 | ) | (1,109,780 | ) | (10,488,707 | ) | (331,658 | ) | (3,202,503 | ) | (492,010 | ) | (4,595,463 | ) | ||||||||||||||||||||
|
|
|
|
|
|
|
|
|
|
|
|
|
|
|
| |||||||||||||||||||||
| Total | (4,549,155 | ) | $(40,736,588 | ) | 724,603 | $ | 6,854,255 | (27,375 | ) | $ | (372,590 | ) | 352,893 | $ | 3,276,759 | |||||||||||||||||||||
|
|
|
|
|
|
|
|
|
|
|
|
|
|
|
| |||||||||||||||||||||
TARGET 2020 SERIES: | FOR THE YEAR
CLASS I | FOR THE YEAR
CLASS I |
FOR THE PERIOD 11/1/18 TO 3/1/19
CLASS R6 | FOR THE YEAR ENDED 10/31/18
CLASS R6 | ||||||||||||||||||||||||||||||||
| SHARES | AMOUNTS | SHARES | AMOUNTS | SHARES | AMOUNTS | SHARES | AMOUNTS | |||||||||||||||||||||||||||||
| Sold | 26,083 | $ | 250,270 | 161,668 | $ | 1,542,712 | — | $ | — | — | $ | — | ||||||||||||||||||||||||
| Reinvested | 2,877 | 26,279 | 13,342 | 125,744 | 8 | 72 | 4 | 39 | ||||||||||||||||||||||||||||
| Repurchased | (66,892 | ) | (636,604 | ) | (3,242,665 | ) | (31,221,702 | ) | (541 | ) | (5,117 | ) | — | — | ||||||||||||||||||||||
|
|
|
|
|
|
|
|
|
|
|
|
|
|
|
| |||||||||||||||||||||
| Total | (37,932 | ) | $ | (360,055 | ) | (3,067,655 | ) | $ | (29,553,246 | ) | (533 | ) | $ | (5,045 | ) | 4 | $ | 39 | ||||||||||||||||||
|
|
|
|
|
|
|
|
|
|
|
|
|
|
|
| |||||||||||||||||||||
74
Notes to Financial Statements (continued)
| 6. | Capital Stock Transactions (continued) |
| TARGET 2025 SERIES: | FOR THE YEAR
CLASS K | FOR THE YEAR
CLASS K | FOR THE YEAR
CLASS R | FOR THE YEAR
CLASS R | ||||||||||||||||||||||||||||||
| SHARES | AMOUNTS | SHARES | AMOUNTS | SHARES | AMOUNTS | SHARES | AMOUNTS | |||||||||||||||||||||||||||
Sold | 738,968 | $ | 9,121,599 | 1,534,730 | $ | 18,509,075 | 419,486 | $ | 5,078,875 | 1,225,545 | $ | 14,820,290 | ||||||||||||||||||||||
Reinvested | 53,819 | 617,781 | 9,973 | 120,080 | 33,477 | 382,607 | 4,298 | 51,881 | ||||||||||||||||||||||||||
Repurchased | (408,916 | ) | (4,994,545 | ) | (729,450 | ) | (8,760,023 | ) | (559,888 | ) | (6,994,177 | ) | (303,550 | ) | (3,700,436 | ) | ||||||||||||||||||
|
|
|
|
|
|
|
|
|
|
|
|
|
|
|
| |||||||||||||||||||
Total | 383,871 | $ | 4,744,835 | 815,253 | $ | 9,869,132 | (106,925 | ) | $ | (1,532,695 | ) | 926,293 | $ | 11,171,735 | ||||||||||||||||||||
|
|
|
|
|
|
|
|
|
|
|
|
|
|
|
| |||||||||||||||||||
| TARGET 2025 SERIES: |
FOR THE YEAR
CLASS I |
FOR THE YEAR
CLASS I |
FOR THE PERIOD 11/1/18 TO
CLASS R6 |
FOR THE YEAR
CLASS R6 | ||||||||||||||||||||||||||||||
| SHARES | AMOUNTS | SHARES | AMOUNTS | SHARES | AMOUNTS | SHARES | AMOUNTS | |||||||||||||||||||||||||||
Sold | 48,377 | $ | 592,711 | 34,292 | $ | 410,576 | — | $ | — | — | $ | — | ||||||||||||||||||||||
Reinvested | 2,141 | 24,580 | 999 | 11,987 | 8 | 84 | 3 | 36 | ||||||||||||||||||||||||||
Repurchased | (63,269 | ) | (753,060 | ) | (94,808 | ) | (1,146,696 | ) | (429 | ) | (5,129 | ) | — | — | ||||||||||||||||||||
|
|
|
|
|
|
|
|
|
|
|
|
|
|
|
| |||||||||||||||||||
Total | (12,751 | ) | $ | (135,769 | ) | (59,517 | ) | $ | (724,133 | ) | (421 | ) | $ | (5,045 | ) | 3 | $ | 36 | ||||||||||||||||
|
|
|
|
|
|
|
|
|
|
|
|
|
|
|
| |||||||||||||||||||
| TARGET 2030 SERIES: |
FOR THE YEAR
CLASS K |
FOR THE YEAR
CLASS K |
FOR THE YEAR
CLASS R |
FOR THE YEAR
CLASS R | ||||||||||||||||||||||||||||||
| SHARES | AMOUNTS | SHARES | AMOUNTS | SHARES | AMOUNTS | SHARES | AMOUNTS | |||||||||||||||||||||||||||
Sold | 1,026,683 | $ | 10,060,839 | 2,083,281 | $ | 20,161,761 | 676,480 | $ | 6,478,226 | 1,231,615 | $ | 11,808,521 | ||||||||||||||||||||||
Reinvested | 219,932 | 1,974,424 | 31,911 | 307,548 | 55,022 | 489,275 | 4,237 | 40,572 | ||||||||||||||||||||||||||
Repurchased | (6,619,061 | ) | (59,998,542 | ) | (1,535,516 | ) | (14,803,048 | ) | (726,480 | ) | (7,121,470 | ) | (363,201 | ) | (3,500,775 | ) | ||||||||||||||||||
|
|
|
|
|
|
|
|
|
|
|
|
|
|
|
| |||||||||||||||||||
Total | (5,372,446 | ) | $ | (47,963,279 | ) | 579,676 | $ | 5,666,261 | 5,022 | $ | (153,969 | ) | 872,651 | $ | 8,348,318 | |||||||||||||||||||
|
|
|
|
|
|
|
|
|
|
|
|
|
|
|
| |||||||||||||||||||
| TARGET 2030 SERIES: |
FOR THE YEAR
CLASS I |
FOR THE YEAR
CLASS I |
FOR THE YEAR
CLASS R6 |
FOR THE YEAR
CLASS R6 | ||||||||||||||||||||||||||||||
| SHARES | AMOUNTS | SHARES | AMOUNTS | SHARES | AMOUNTS | SHARES | AMOUNTS | |||||||||||||||||||||||||||
Sold | 105,528 | $ | 1,050,547 | 328,500 | $ | 3,198,818 | — | $ | — | — | $ | — | ||||||||||||||||||||||
Reinvested | 8,368 | 76,651 | 13,968 | 134,947 | 12 | 109 | 3 | 34 | ||||||||||||||||||||||||||
Repurchased | (54,254 | ) | (533,911 | ) | (3,703,089 | ) | (36,954,583 | ) | (535 | ) | (5,168 | ) | — | — | ||||||||||||||||||||
|
|
|
|
|
|
|
|
|
|
|
|
|
|
|
| |||||||||||||||||||
Total | 59,642 | $ | 593,287 | (3,360,621 | ) | $ | (33,620,818 | ) | (523 | ) | $ | (5,059 | ) | 3 | $ | 34 | ||||||||||||||||||
|
|
|
|
|
|
|
|
|
|
|
|
|
|
|
| |||||||||||||||||||
| TARGET 2035 SERIES: |
FOR THE YEAR
CLASS K |
FOR THE YEAR
CLASS K |
FOR THE YEAR
CLASS R |
FOR THE YEAR
CLASS R | ||||||||||||||||||||||||||||||
| SHARES | AMOUNTS | SHARES | AMOUNTS | SHARES | AMOUNTS | SHARES | AMOUNTS | |||||||||||||||||||||||||||
Sold | 657,919 | $ | 8,540,585 | 894,857 | $ | 11,507,154 | 476,096 | $ | 6,066,432 | 814,355 | $ | 10,520,876 | ||||||||||||||||||||||
Reinvested | 67,799 | 786,410 | 24,501 | 309,903 | 51,428 | 596,100 | 9,442 | 119,395 | ||||||||||||||||||||||||||
Repurchased | (337,040 | ) | (4,261,217 | ) | (681,703 | ) | (8,746,295 | ) | (359,638 | ) | (4,759,279 | ) | (132,161 | ) | (1,727,643 | ) | ||||||||||||||||||
|
|
|
| �� |
|
|
|
|
|
|
|
|
|
|
| |||||||||||||||||||
Total | 388,678 | $ | 5,065,778 | 237,655 | $ | 3,070,762 | 167,886 | $ | 1,903,253 | 691,636 | $ | 8,912,628 | ||||||||||||||||||||||
|
|
|
|
|
|
|
|
|
|
|
|
|
|
|
| |||||||||||||||||||
75
Notes to Financial Statements (continued)
| 6. | Capital Stock Transactions (continued) |
| TARGET 2035 SERIES: | FOR THE YEAR
CLASS I | FOR THE YEAR
CLASS I | FOR THE YEAR
CLASS R6 | FOR THE YEAR
CLASS R6 | |||||||||||||||||||||||||||||
| SHARES | AMOUNTS | SHARES | AMOUNTS | SHARES | AMOUNTS | SHARES | AMOUNTS | |||||||||||||||||||||||||||
Sold | 6,161 | $ | 78,871 | 24,169 | $ | 313,517 | — | $ | — | — | $ | — | ||||||||||||||||||||||
Reinvested | 2,254 | 26,322 | 1,448 | 18,394 | 16 | 187 | 8 | 94 | ||||||||||||||||||||||||||
Repurchased | (13,076 | ) | (166,791 | ) | (40,800 | ) | (534,892 | ) | (417 | ) | (5,212 | ) | — | — | ||||||||||||||||||||
|
|
|
|
|
|
|
|
|
|
|
|
|
|
|
| |||||||||||||||||||
Total | (4,661 | ) | $ | (61,598 | ) | (15,183 | ) | $ | (202,981 | ) | (401 | ) | $ | (5,025 | ) | 8 | $ | 94 | ||||||||||||||||
|
|
|
|
|
|
|
|
|
|
|
|
|
|
|
| |||||||||||||||||||
TARGET 2040 SERIES:
| FOR THE YEAR
CLASS K | FOR THE YEAR
CLASS K | FOR THE YEAR
CLASS R | FOR THE YEAR
CLASS R | ||||||||||||||||||||||||||||||
| SHARES | AMOUNTS | SHARES | AMOUNTS | SHARES | AMOUNTS | SHARES | AMOUNTS | |||||||||||||||||||||||||||
Sold | 782,837 | $ | 7,718,919 | 1,332,229 | $ | 13,630,503 | 466,330 | $ | 4,527,663 | 902,770 | $ | 9,157,688 | ||||||||||||||||||||||
Reinvested | 426,779 | 3,744,224 | 112,904 | 1,128,727 | 122,823 | 1,066,161 | 17,371 | 172,255 | ||||||||||||||||||||||||||
Repurchased | (3,745,561 | ) | (33,400,130 | ) | (1,096,514 | ) | (11,196,621 | ) | (430,909 | ) | (4,268,833 | ) | (195,400 | ) | (1,996,090 | ) | ||||||||||||||||||
|
|
|
|
|
|
|
|
|
|
|
|
|
|
|
| |||||||||||||||||||
Total | (2,535,945 | ) | $ | (21,936,987 | ) | 348,619 | $ | 3,562,609 | 158,244 | $ | 1,324,991 | 724,741 | $ | 7,333,853 | ||||||||||||||||||||
|
|
|
|
|
|
|
|
|
|
|
|
|
|
|
| |||||||||||||||||||
TARGET 2040 SERIES: |
FOR THE YEAR
CLASS I |
FOR THE YEAR
CLASS I |
FOR THE YEAR
CLASS R6 |
FOR THE YEAR
CLASS R6 | ||||||||||||||||||||||||||||||
| SHARES | AMOUNTS | SHARES | AMOUNTS | SHARES | AMOUNTS | SHARES | AMOUNTS | |||||||||||||||||||||||||||
Sold | 57,843 | $ | 570,919 | 245,103 | $ | 2,504,570 | — | $ | — | — | $ | — | ||||||||||||||||||||||
Reinvested | 19,146 | 170,060 | 53,363 | 537,445 | 39 | 345 | 12 | 123 | ||||||||||||||||||||||||||
Repurchased | (69,782 | ) | (707,625 | ) | (2,371,127 | ) | (25,021,391 | ) | (547 | ) | (5,255 | ) | — | — | ||||||||||||||||||||
|
|
|
|
|
|
|
|
|
|
|
|
|
|
|
| |||||||||||||||||||
Total | 7,207 | $ | 33,354 | (2,072,661 | ) | $ | (21,979,376 | ) | (508 | ) | $ | (4,910 | ) | 12 | $ | 123 | ||||||||||||||||||
|
|
|
|
|
|
|
|
|
|
|
|
|
|
|
| |||||||||||||||||||
TARGET 2045 |
FOR THE YEAR
CLASS K |
FOR THE YEAR
CLASS K |
FOR THE YEAR
CLASS R |
FOR THE YEAR
CLASS R | ||||||||||||||||||||||||||||||
| SHARES | AMOUNTS | SHARES | AMOUNTS | SHARES | AMOUNTS | SHARES | AMOUNTS | |||||||||||||||||||||||||||
Sold | 306,810 | $ | 4,044,623 | 475,170 | $ | 6,394,714 | 299,090 | $ | 3,841,569 | 493,767 | $ | 6,575,433 | ||||||||||||||||||||||
Reinvested | 60,712 | 691,460 | 42,406 | 552,543 | 58,633 | 660,544 | 21,160 | 274,179 | ||||||||||||||||||||||||||
Repurchased | (205,839 | ) | (2,672,787 | ) | (446,574 | ) | (5,981,696 | ) | (181,330 | ) | (2,382,394 | ) | (139,055 | ) | (1,881,446 | ) | ||||||||||||||||||
|
|
|
|
|
|
|
|
|
|
|
|
|
|
|
| |||||||||||||||||||
Total | 161,683 | $ | 2,063,296 | 71,002 | $ | 965,561 | 176,393 | $ | 2,119,719 | 375,872 | $ | 4,968,166 | ||||||||||||||||||||||
|
|
|
|
|
|
|
|
|
|
|
|
|
|
|
| |||||||||||||||||||
TARGET |
FOR THE YEAR
CLASS I |
FOR THE YEAR
CLASS I |
FOR THE YEAR
CLASS R6 |
FOR THE YEAR
CLASS R6 | ||||||||||||||||||||||||||||||
| SHARES | AMOUNTS | SHARES | AMOUNTS | SHARES | AMOUNTS | SHARES | AMOUNTS | |||||||||||||||||||||||||||
Sold | 8,322 | $ | 108,182 | 37,004 | $ | 501,039 | — | $ | — | — | $ | — | ||||||||||||||||||||||
Reinvested | 4,389 | 50,249 | 6,649 | 86,772 | 31 | 349 | 22 | 284 | ||||||||||||||||||||||||||
Repurchased | (3,253 | ) | (42,676 | ) | (86,728 | ) | (1,199,721 | ) | (424 | ) | (5,298 | ) | — | — | ||||||||||||||||||||
|
|
|
|
|
|
|
|
|
|
|
|
|
|
|
| |||||||||||||||||||
Total | 9,458 | $ | 115,755 | (43,075 | ) | $ | (611,910 | ) | (393 | ) | $ | (4,949 | ) | 22 | $ | 284 | ||||||||||||||||||
|
|
|
|
|
|
|
|
|
|
|
|
|
|
|
| |||||||||||||||||||
76
Notes to Financial Statements (continued)
| 6. | Capital Stock Transactions (continued) |
TARGET | ||||||||||||||||||||||||||||||||||
| 2050 | FOR THE YEAR | FOR THE YEAR | FOR THE YEAR | FOR THE YEAR | |||||||||||||||||||||||||||||
SERIES: | ENDED 10/31/19 | ENDED 10/31/18 | ENDED 10/31/19 | ENDED 10/31/18 | ||||||||||||||||||||||||||||||
| CLASS K | CLASS K | CLASS R | CLASS R | |||||||||||||||||||||||||||||||
| SHARES | AMOUNTS | SHARES | AMOUNTS | SHARES | AMOUNTS | SHARES | AMOUNTS | |||||||||||||||||||||||||||
Sold | 705,800 | $ | 7,241,003 | 823,981 | $ | 9,011,773 | 379,318 | $ | 3,793,938 | 478,931 | $ | 5,143,876 | ||||||||||||||||||||||
Reinvested | 240,335 | 2,132,184 | 134,865 | 1,418,779 | 86,076 | 751,001 | 25,431 | 264,514 | ||||||||||||||||||||||||||
Repurchased | (1,332,263 | ) | (12,158,663 | ) | (422,631 | ) | (4,606,915 | ) | (281,510 | ) | (2,873,841 | ) | (55,261 | ) | (604,748 | ) | ||||||||||||||||||
|
|
|
|
|
|
|
|
|
|
|
|
|
|
|
| |||||||||||||||||||
Total | (386,128 | ) | $ | (2,785,476 | ) | 536,215 | $ | 5,823,637 | 183,884 | $ | 1,671,098 | 449,101 | $ | 4,803,642 | ||||||||||||||||||||
|
|
|
|
|
|
|
|
|
|
|
|
|
|
|
| |||||||||||||||||||
TARGET | ||||||||||||||||||||||||||||||||||
2050 | FOR THE YEAR | FOR THE YEAR | FOR THE YEAR | FOR THE YEAR | ||||||||||||||||||||||||||||||
SERIES: | ENDED 10/31/19 | ENDED 10/31/18 | ENDED 10/31/19 | ENDED 10/31/18 | ||||||||||||||||||||||||||||||
| CLASS I | CLASS I | CLASS R6 | CLASS R6 | |||||||||||||||||||||||||||||||
| SHARES | AMOUNTS | SHARES | AMOUNTS | SHARES | AMOUNTS | SHARES | AMOUNTS | |||||||||||||||||||||||||||
Sold | 77,873 | $ | 786,721 | 134,308 | $ | 1,486,047 | — | $ | — | — | $ | — | ||||||||||||||||||||||
Reinvested | 14,130 | 126,784 | 93,742 | 993,663 | 53 | 478 | 35 | 372 | ||||||||||||||||||||||||||
Repurchased | (37,541 | ) | (378,966 | ) | (1,254,171 | ) | (14,080,552 | ) | (539 | ) | (5,321 | ) | — | — | ||||||||||||||||||||
|
|
|
|
|
|
|
|
|
|
|
|
|
|
|
| |||||||||||||||||||
Total | 54,462 | $ | 534,539 | (1,026,121 | ) | $ | (11,600,842 | ) | (486 | ) | $ | (4,843 | ) | 35 | $ | 372 | ||||||||||||||||||
|
|
|
|
|
|
|
|
|
|
|
|
|
|
|
| |||||||||||||||||||
TARGET | ||||||||||||||||||||||||||||||||||
2055 | FOR THE YEAR | FOR THE YEAR | FOR THE YEAR | FOR THE YEAR | ||||||||||||||||||||||||||||||
SERIES: | ENDED 10/31/19 | ENDED 10/31/18 | ENDED 10/31/19 | ENDED 10/31/18 | ||||||||||||||||||||||||||||||
| CLASS K | CLASS K | CLASS R | CLASS R | |||||||||||||||||||||||||||||||
| SHARES | AMOUNTS | SHARES | AMOUNTS | SHARES | AMOUNTS | SHARES | AMOUNTS | |||||||||||||||||||||||||||
Sold | 182,856 | $ | 2,324,241 | 197,764 | $ | 2,623,883 | 149,787 | $ | 1,858,282 | 225,755 | $ | 2,962,773 | ||||||||||||||||||||||
Reinvested | 27,325 | 304,231 | 29,291 | 374,094 | 30,948 | 339,226 | 19,193 | 242,384 | ||||||||||||||||||||||||||
Repurchased | (128,894 | ) | (1,639,804 | ) | (157,569 | ) | (2,087,370 | ) | (127,205 | ) | (1,622,153 | ) | (14,049 | ) | (186,293 | ) | ||||||||||||||||||
|
|
|
|
|
|
|
|
|
|
|
|
|
|
|
| |||||||||||||||||||
Total | 81,287 | $ | 988,668 | 69,486 | $ | 910,607 | 53,530 | $ | 575,355 | 230,899 | $ | 3,018,864 | ||||||||||||||||||||||
|
|
|
|
|
|
|
|
|
|
|
|
|
|
|
| |||||||||||||||||||
TARGET | ||||||||||||||||||||||||||||||||||
2055 | FOR THE YEAR | FOR THE YEAR | FOR THE YEAR | FOR THE YEAR | ||||||||||||||||||||||||||||||
SERIES: | ENDED 10/31/19 | ENDED 10/31/18 | ENDED 10/31/19 | ENDED 10/31/18 | ||||||||||||||||||||||||||||||
| CLASS I | CLASS I | CLASS R6 | CLASS R6 | |||||||||||||||||||||||||||||||
| SHARES | AMOUNTS | SHARES | AMOUNTS | SHARES | AMOUNTS | SHARES | AMOUNTS | |||||||||||||||||||||||||||
Sold | 15,137 | $ | 195,386 | 23,787 | $ | 320,747 | — | $ | — | — | $ | — | ||||||||||||||||||||||
Reinvested | 2,087 | 23,522 | 1,693 | 21,844 | 30 | 335 | 34 | 428 | ||||||||||||||||||||||||||
Repurchased | (8,718 | ) | (113,197 | ) | (16,336 | ) | (224,590 | ) | (429 | ) | (5,319 | ) | — | — | ||||||||||||||||||||
|
|
|
|
|
|
|
|
|
|
|
|
|
|
|
| |||||||||||||||||||
Total | 8,506 | $ | 105,711 | 9,144 | $ | 118,001 | (399 | ) | $ | (4,984 | ) | 34 | $ | 428 | ||||||||||||||||||||
|
|
|
|
|
|
|
|
|
|
|
|
|
|
|
| |||||||||||||||||||
TARGET | ||||||||||||||||||||||||||||||||||
2060 | FOR THE YEAR | FOR THE YEAR | FOR THE YEAR | FOR THE YEAR | ||||||||||||||||||||||||||||||
SERIES: | ENDED 10/31/19 | ENDED 10/31/18 | ENDED 10/31/19 | ENDED 10/31/18 | ||||||||||||||||||||||||||||||
| CLASS K | CLASS K | CLASS R | CLASS R | |||||||||||||||||||||||||||||||
| SHARES | AMOUNTS | SHARES | AMOUNTS | SHARES | AMOUNTS | SHARES | AMOUNTS | |||||||||||||||||||||||||||
Sold | 254,520 | $ | 3,003,439 | 327,857 | $ | 3,938,736 | 267,080 | $ | 3,054,877 | 286,497 | $ | 3,408,578 | ||||||||||||||||||||||
Reinvested | 39,861 | 402,474 | 33,071 | 379,653 | 28,097 | 280,280 | 13,328 | 152,746 | ||||||||||||||||||||||||||
Repurchased | (408,001 | ) | (4,158,775 | ) | (21,914 | ) | (256,210 | ) | (103,327 | ) | (1,238,833 | ) | (17,190 | ) | (207,081 | ) | ||||||||||||||||||
|
|
|
|
|
|
|
|
|
|
|
|
|
|
|
| |||||||||||||||||||
Total | (113,620 | ) | $ | (752,862 | ) | 339,014 | $ | 4,062,179 | 191,850 | $ | 2,096,324 | 282,635 | $ | 3,354,243 | ||||||||||||||||||||
|
|
|
|
|
|
|
|
|
|
|
|
|
|
|
| |||||||||||||||||||
77
Notes to Financial Statements (continued)
| 6. | Capital Stock Transactions (continued) |
TARGET | ||||||||||||||||||||||||||||||||||
| 2060 | FOR THE YEAR | FOR THE YEAR | FOR THE YEAR | FOR THE YEAR | |||||||||||||||||||||||||||||
SERIES: | ENDED 10/31/19 | ENDED 10/31/18 | ENDED 10/31/19 | ENDED 10/31/18 | ||||||||||||||||||||||||||||||
| CLASS I | CLASS I | CLASS R6 | CLASS R6 | |||||||||||||||||||||||||||||||
| SHARES | AMOUNTS | SHARES | AMOUNTS | SHARES | AMOUNTS | SHARES | AMOUNTS | |||||||||||||||||||||||||||
Sold | 14,345 | $ | 164,198 | 5,597 | $ | 66,648 | — | $ | 2 | — | $ | — | ||||||||||||||||||||||
Reinvested | 576 | 5,840 | 789 | 9,062 | 29 | 293 | 46 | 531 | ||||||||||||||||||||||||||
Repurchased | (3,873 | ) | (43,002 | ) | (2,302 | ) | (28,219 | ) | (477 | ) | (5,321 | ) | — | — | ||||||||||||||||||||
|
|
|
|
|
|
|
|
|
|
|
|
|
|
|
| |||||||||||||||||||
Total | 11,048 | $ | 127,036 | 4,084 | $ | 47,491 | (448 | ) | $ | (5,026 | ) | 46 | $ | 531 | ||||||||||||||||||||
|
|
|
|
|
|
|
|
|
|
|
|
|
|
|
| |||||||||||||||||||
The following table represents instances at October 31, 2019, where a shareholder account owned greater than 10% of a Series:
| NUMBER OF | PERCENTAGE | |||||
SERIES | ACCOUNTS | OF THE | ||||
| OVER 10% | SERIES | |||||
| Target 2015 Series | 3 | 68.3% | |||
Target 2050 Series | 1 | 16.6% |
At October 31, 2019, the Advisor and its affiliates owned 1.8% of the Target 2060 Series and less than 0.1% of Target 2015 Series, Target 2025 Series, Target 2035 Series, Target 2045 Series and Target 2055 Series. Investment activities of these shareholders may have a material effect on the Series.
| 7. | Line of Credit |
The Fund has entered into a364-day, $25 million credit agreement (the “line of credit”) with Bank of New York Mellon. Each series of the Fund may borrow under the line of credit for temporary or emergency purposes, including funding shareholder redemptions and other short-term liquidity purposes. The Fund pays an annual fee on the unused commitment amount, payable quarterly, and is allocated among all the series of the Fund and included in miscellaneous expenses in the Statement of Operations for each series. The line of credit expires in August 2020 unless extended or renewed. During the year ended October 31, 2019, none of the Series borrowed under the line of credit.
| 8. | Financial Instruments |
The Underlying Series may trade in instruments including written and purchased options, forward foreign currency exchange contracts and futures contracts and other derivatives in the normal course of investing activities to assist in managing exposure to various market risks. The Underlying Series may be subject to various elements of risk which may involve, to a varying degree, elements of risk in excess of the amounts recognized for financial statement purposes. These risks include: the risk that changes in the value of a derivative may not correlate perfectly with the underlying asset, rate or index; counterparty credit risk related to over the counter derivative counterparties’ failure to perform under contract terms; liquidity risk related to the lack of a liquid market for these contracts allowing the fund to close out its position(s); and documentation risk relating to disagreement over contract terms. No such investments were directly held by the Series as of October 31, 2019.
| 9. | Federal Income Tax Information |
The amount and characterization of certain income and capital gains to be distributed are determined in accordance with federal income tax regulations, which may differ from GAAP. The differences are primarily due to differing book and tax treatment in the timing and recognition on net investment income or gains and losses, including losses deferred due to wash sales. Each Series may periodically make reclassifications among its capital accounts to reflect income and gains available for distribution (or available capital loss carryovers) under income tax regulations, without impacting the Series’ net asset value. For the fiscal year ended October 31, 2019, $903 was reclassified within the capital accounts from Additional Paid in Capital to the Total Distributable Earnings (Loss) for the Target 2060 Series. Any such reclassifications are not reflected in the financial highlights.
78
Notes to Financial Statements (continued)
| 9. | Federal Income Tax Information (continued) |
The tax character of distributions paid were as follows:
| TARGET | TARGET | TARGET | TARGET | TARGET | |||||||||||||||||||||
| INCOME | 2015 | 2020 | 2025 | 2030 | ||||||||||||||||||||||
| SERIES | SERIES | SERIES | SERIES | SERIES | ||||||||||||||||||||||
Ordinary income (2019) |
| $ | 2,087,974 | $24,392 | $ | 1,320,215 | $ | 1,027,006 | $ | 2,606,053 | ||||||||||||||||
Ordinary income (2018) |
| $ | 672,375 | $21,596 | $ | 511,932 | $ | 184,177 | $ | 496,157 | ||||||||||||||||
Long-term capital gain (2018) |
| $
| —
|
|
| $ —
|
| $
| —
|
| $
| 10
|
| $
| —
|
| ||||||||||
| TARGET | TARGET | TARGET | TARGET | TARGET | TARGET | |||||||||||||||||||||
| 2035 | 2040 | 2045 | 2050 | 2055 | 2060 | |||||||||||||||||||||
| SERIES | SERIES | SERIES | SERIES | SERIES | SERIES | |||||||||||||||||||||
Ordinary income (2019) | $ | 1,409,087 | $ | 5,021,140 | $ | 1,403,021 | $ | 3,064,971 | $667,314 | $692,961 | ||||||||||||||||
Ordinary income (2018) | $ | 353,015 | $ | 1,269,940 | $ | 332,652 | $ | 1,110,027 | $310,269 | $193,740 | ||||||||||||||||
Long-term capital gain (2019) | $ | — | $ | 1,807 | $ | — | $ | — | $ — | $ — | ||||||||||||||||
Long-term capital gain (2018) | $ | 95,020 | $ | 580,680 | $ | 581,311 | $ | 1,613,758 | $328,481 | $350,714 | ||||||||||||||||
At October 31, 2019, the tax basis of components of distributable earnings and the net unrealized appreciation based on the identified cost of investments for federal income tax purposes were as follows:
| TARGET | TARGET | TARGET | TARGET | TARGET | ||||||||||||||||||||||
| INCOME | 2015 | 2020 | 2025 | 2030 | ||||||||||||||||||||||
| SERIES | SERIES | SERIES | SERIES | SERIES | ||||||||||||||||||||||
Cost for federal income tax purposes |
| $ | 74,262,091 | $ | 1,188,354 | $ | 52,782,372 | $ | 63,899,918 | $ | 73,590,885 | |||||||||||||||
Unrealized appreciation |
| 4,384,471 | 71,829 | 3,627,928 | 4,967,593 | 5,298,373 | ||||||||||||||||||||
Unrealized depreciation |
| — | — | — | — | — | ||||||||||||||||||||
|
|
|
|
|
|
|
|
|
| |||||||||||||||||
Net unrealized appreciation |
| $ | 4,384,471 | $ | 71,829 | $ | 3,627,928 | $ | 4,967,593 | $ | 5,298,373 | |||||||||||||||
|
|
|
|
|
|
|
|
|
| |||||||||||||||||
Undistributed ordinary income |
| $ | 54,711 | $ | 1,126 | $ | 25,933 | $ | 27,724 | $ | 19,913 | |||||||||||||||
Undistributed long-term capital gains |
| $ | — | $ | — | $ | — | $ | 4,704 | $ | — | |||||||||||||||
Capital loss carryforward
|
| $
| (2,237,945
| )
| $
| (445,631
| )
| $
| (3,372,013)
|
| $
| —
|
| $
| (2,698,747
| )
| ||||||||||
| TARGET | TARGET | TARGET | TARGET | TARGET | TARGET | |||||||||||||||||||||
| 2035 | 2040 | 2045 | 2050 | 2055 | 2060 | |||||||||||||||||||||
| SERIES | SERIES | SERIES | SERIES | SERIES | SERIES | |||||||||||||||||||||
Cost for federal income tax purposes | $ | 44,772,170 | $ | 48,847,144 | $ | 24,742,143 | $ | 30,565,560 | $ | 11,910,699 | $ | 12,797,214 | ||||||||||||||
Unrealized appreciation | 3,175,087 | 3,033,868 | 1,553,032 | 1,638,519 | 821,854 | 437,447 | ||||||||||||||||||||
Unrealized depreciation | — | — | — | — | — | — | ||||||||||||||||||||
|
|
|
|
|
|
|
|
|
|
|
| |||||||||||||||
Net unrealized appreciation | $ | 3,175,087 | $ | 3,033,868 | $ | 1,553,032 | $ | 1,638,519 | $ | 821,854 | $ | 437,447 | ||||||||||||||
|
|
|
|
|
|
|
|
|
|
|
| |||||||||||||||
Undistributed ordinary income | $ | 8,353 | $ | 6,960 | $ | 1,861 | $ | 2,088 | $ | 409 | $ | — | ||||||||||||||
Undistributed long-term capital gains | $ | 111,091 | $ | — | $ | 118,709 | $ | — | $ | 86,207 | $ | — | ||||||||||||||
Capital loss carryforwards | $ | — | $ | (1,856,872 | ) | $ | — | $ | (586,436 | ) | $ | — | $ | (224,104 | ) | |||||||||||
At October 31, 2019, Target 2015 Series had net short-term capital loss carryforwards of $4,988 and Target Income Series, Target 2015 Series, Target 2020 Series, Target 2030 Series, Target 2040 Series, Target 2050 Series, and Target 2060 Series had net long-term capital loss carryforwards of $2,237,945, $440,643, $3,372,013, $2,698,747, $1,856,872, $586,436, and $224,104, respectively, which may be carried forward indefinitely.
79
Report of Independent Registered Public Accounting Firm
To the Board of Directors of Manning & Napier Fund, Inc. and Shareholders of Target Income Series, Target 2015 Series, Target 2020 Series, Target 2025 Series, Target 2030 Series, Target 2035 Series, Target 2040 Series, Target 2045 Series, Target 2050 Series, Target 2055 Series and Target 2060 Series
Opinions on the Financial Statements
We have audited the accompanying statements of assets and liabilities, including the investment portfolios, of Target Income Series, Target 2015 Series, Target 2020 Series, Target 2025 Series, Target 2030 Series, Target 2035 Series, Target 2040 Series, Target 2045 Series, Target 2050 Series, Target 2055 Series and Target 2060 Series (eleven of the series constituting Manning & Napier Fund, Inc., hereafter collectively referred to as the “Funds”) as of October 31, 2019, the related statements of operations for the year ended October 31, 2019, the statements of changes in net assets for each of the two years in the period ended October 31, 2019, including the related notes, and the financial highlights for each of the periods indicated therein (collectively referred to as the “financial statements”). In our opinion, the financial statements present fairly, in all material respects, the financial position of each of the Funds as of October 31, 2019, the results of each of their operations for the year then ended, the changes in each of their net assets for each of the two years in the period ended October 31, 2019 and each of the financial highlights for each of the periods indicated therein in conformity with accounting principles generally accepted in the United States of America.
Basis for Opinions
These financial statements are the responsibility of the Funds’ management. Our responsibility is to express an opinion on the Funds’ financial statements based on our audits. We are a public accounting firm registered with the Public Company Accounting Oversight Board (United States) (“PCAOB”) and are required to be independent with respect to the Funds in accordance with the U.S. federal securities laws and the applicable rules and regulations of the Securities and Exchange Commission and the PCAOB.
We conducted our audits of these financial statements in accordance with the standards of the PCAOB. Those standards require that we plan and perform the audit to obtain reasonable assurance about whether the financial statements are free of material misstatement, whether due to error or fraud.
Our audits included performing procedures to assess the risks of material misstatement of the financial statements, whether due to error or fraud, and performing procedures that respond to those risks. Such procedures included examining, on a test basis, evidence regarding the amounts and disclosures in the financial statements. Our audits also included evaluating the accounting principles used and significant estimates made by management, as well as evaluating the overall presentation of the financial statements. Our procedures included confirmation of securities owned as of October 31, 2019 by correspondence with the custodian and transfer agent. We believe that our audits provide a reasonable basis for our opinions.
New York, New York
December 16, 2019
We have served as the auditor of one or more investment companies in Manning & Napier Mutual Funds since 1992.
80
Supplemental Tax Information
(unaudited)
All reportings are based on financial information available as of the date of this annual report and, accordingly, are subject to change.
For federal income tax purposes, each of the Series reports for the current fiscal year the amount disclosed below or, if different, the maximum amount allowable under the tax law, as qualified dividend income (“QDI”).
Series | QDI | |
Target Income Series | $542,664 | |
Target 2015 Series | 7,018 | |
Target 2020 Series | 417,139 | |
Target 2025 Series | 404,544 | |
Target 2030 Series | 984,791 | |
Target 2035 Series | 444,531 | |
Target 2040 Series | 1,001,046 | |
Target 2045 Series | 344,579 | |
Target 2050 Series | 575,022 | |
Target 2055 Series | 181,973 | |
Target 2060 Series | 208,234 |
For corporate shareholders, the percentage of investment income (dividend income plus short-term gain, if any) that qualifies for the dividends received deduction (DRD) for the current fiscal year is as follows:
Series | DRD% | |
Target Income Series | 17.23% | |
Target 2015 Series | 16.47% | |
Target 2020 Series | 12.73% | |
Target 2025 Series | 15.60% | |
Target 2030 Series | 15.16% | |
Target 2035 Series | 13.08% | |
Target 2040 Series | 8.45% | |
Target 2045 Series | 10.63% | |
Target 2050 Series | 8.18% | |
Target 2055 Series | 11.92% | |
Target 2060 Series | 13.22% |
The Series designate Long-Term Capital Gain dividends pursuant to Section 852(b)(3) of the Code for the fiscal year ended October 31, 2019 as follows:
Series | ||
Target 2025 Series | $ — | |
Target 2035 Series | — | |
Target 2040 Series | — | |
Target 2045 Series | 124,644 | |
Target 2050 Series | — | |
Target 2055 Series | 90,517 | |
Target 2060 Series | — |
81
Directors’ and Officers’ Information
(unaudited)
The Statement of Additional Information provides additional information about the Fund’s directors and officers and can be obtained without charge by calling1-800-466-3863, at www.manning-napier.com, or on the EDGAR Database on the SEC Internet web site (http://www.sec.gov). The following chart shows certain information about the Fund’s directors and officers, including their principal occupations during the last five years. Unless specific dates are provided, the individuals have held the listed positions for longer than five years.
| Interested Director and Officer | ||
| Name: | Paul Battaglia* | |
| Address: | 290 Woodcliff Drive | |
| Fairport, NY 14450 | ||
| Age: | 41 | |
| Current Position(s) Held with Fund: | Principal Executive Officer, President, Chairman & Director | |
| Term of Office & Length of Time Served: | Indefinite – Chairman and Director since November 20181 | |
| Principal Occupation(s) During Past 5 Years: | Chief Financial Officer (2018 – Present); Vice President of Finance (2016 – 2018); Director of Finance (2011 – 2016); Financial Analyst/Internal Auditor (2004-2006) – Manning & Napier Advisors, LLC and affiliates Holds one or more of the following titles for various affiliates: Chief Financial Officer | |
| Number of Portfolios Overseen within Fund Complex: | 32 | |
Other Directorships Held Outside Fund Complex During
| N/A | |
| Independent Directors | ||
| Name: | Stephen B. Ashley | |
| Address: | 290 Woodcliff Drive | |
| Fairport, NY 14450 | ||
| Age: | 79 | |
| Current Position(s) Held with Fund: | Director, Audit Committee Member, Governance & Nominating Committee Member | |
| Term of Office & Length of Time Served: | Indefinite – Since 1996 | |
| Principal Occupation(s) During Past 5 Years: | Chairman, Director & Chief Executive Officer (1997 to present) - The Ashley Group (property management and investment). Director (1995-2008) and Chairman(non-executive) (2004-2008) - Fannie Mae (mortgage) | |
| Number of Portfolios Overseen within Fund Complex: | 32 | |
| Other Directorships Held Outside Fund Complex During | Fannie Mae (1995-2008) | |
| Past 5 Years: | The Ashley Group (1995-2008) | |
Genesee Corporation (1987-2007)
| ||
| Name: | Paul A. Brooke | |
| Address: | 290 Woodcliff Drive | |
| Fairport, NY 14450 | ||
| Age: | 73 | |
| Current Position(s) Held with Fund: | Lead Independent Director, Audit Committee Member, Governance & Nominating Committee Chairman | |
| Term of Office & Length of Time Served: | Indefinite – Director, Audit Committee Member, Governance & Nominating Committee Member since 2007; Governance & Nominating Committee Chairman since 2016; Lead Independent Director since 2017 | |
| Principal Occupation(s) During Past 5 Years: | Chairman & CEO (2005-2009) - Ithaka Acquisition Corporation (investments); Chairman (2007-2009) - Alsius Corporation (investments); Managing Member (1991-present) - PMSV Holdings LLC (investments); Managing Member (2010-2016) - Venbio (investments). | |
| Number of Portfolios Overseen within Fund Complex: | 32 | |
| Other Directorships Held Outside Fund Complex During Past 5 Years: | Incyte Corp. (biotech)(2000-present); ViroPharma, Inc. (speciality pharmaceuticals)(2000-2014); HLTH (WebMD)(information)(2000-2010); Cheyne Capital International (investment)(2000-2017); GMP Companies (investment)(2000-2011); Cytos Biotechnology Ltd (biotechnology)(2012-2014); Cerus (biomedical)(2016-present);PureEarth(non-profit)(2012-present); Caelum BioSciences (biomedical)(2018-present)
| |
82
Directors’ and Officers’ Information
(unaudited)
| Independent Directors (continued) | ||
| Name: | Peter L. Faber | |
| Address: | 290 Woodcliff Drive | |
| Fairport, NY 14450 | ||
| Age: | 81 | |
| Current Position(s) Held with Fund: | Director, Governance & Nominating Committee Member | |
| Term of Office & Length of Time Served: | Indefinite – Since 1987 | |
| Principal Occupation(s) During Past 5 Years: | Senior Counsel (2006-2012), Partner (1995-2006 & 2013-present) - McDermott, Will & Emery LLP (law firm) | |
| Number of Portfolios Overseen within Fund Complex: | 32 | |
Other Directorships Held Outside Fund Complex During Past 5 Years: | Boston Early Music Festival(non-profit)(2007-present); Amherst Early Music, Inc.(non-profit)(2009-present); Gotham Early Music Scene, Inc.(non-profit)(2009-present); Partnership for New York City, Inc.(non-profit)(1989-2010); New York Collegium(non-profit)(2004-2011); S’Cool Sounds, Inc.(non-profit)(2017-present)
| |
| Name: | Harris H. Rusitzky | |
| Address: | 290 Woodcliff Drive | |
| Fairport, NY 14450 | ||
| Age: | 84 | |
| Current Position(s) Held with Fund: | Director, Audit Committee Member, Governance & Nominating Committee Member | |
| Term of Office & Length of Time Served: | Indefinite – Since 1985 | |
| Principal Occupation(s) During Past 5 Years: | President (1994- present) - The Greening Group (business consultants); Partner (2006-present) - The Restaurant Group (restaurants) | |
| Number of Portfolios Overseen within Fund Complex: | 32 | |
Other Directorships Held Outside Fund Complex During Past 5 Years: | Rochester Institute of Technology (university)(1972-present); Culinary Institute of America(non-profit college)(1985-present); George Eastman House (museum)(1988-present); National Restaurant Association (restaurant trade organization)(1978-present)
| |
| Name: | Chester N. Watson | |
| Address: | 290 Woodcliff Drive | |
| Fairport, NY 14450 | ||
| Age: | 69 | |
| Current Position(s) Held with Fund: | Director, Audit Committee Chairman, Governance & Nominating Committee Member | |
| Term of Office & Length of Time Served: | Indefinite – Director, Audit Committee Member, Governance & Nominating Committee Member Since 2012; Audit Committee Chairman since 2013 | |
| Principal Occupation(s) During Past 5 Years: | General Auditor (2003-2011) - General Motors Company (auto manufacturer) | |
| Number of Portfolios Overseen within Fund Complex: | 32 | |
| Other Directorships Held Outside Fund Complex During | Rochester Institute of Technology (university)(2005-present); Town of | |
| Past 5 Years: | Greenburgh, NY Planning Board (municipal government)
| |
| Officers: | ||
| Name: | Elizabeth Craig | |
| Address: | 290 Woodcliff Drive | |
| Fairport, NY 14450 | ||
| Age: | 32 | |
| Current Position(s) Held with Fund: | Corporate Secretary | |
| Term of Office1& Length of Time Served: | Since 2016 | |
| Principal Occupation(s) During Past 5 Years: | Fund Regulatory Administration Manager since 2018; Fund Administration Manager (2015-2018); Mutual Fund Compliance Specialist (2009-2015) - Manning & Napier Advisors, LLC; Assistant Corporate Secretary (2011-2016) - Manning & Napier Fund, Inc.
| |
83
Directors’ and Officers’ Information
(unaudited)
| Officers: (continued) | ||
| Name: | Christine Glavin | |
| Address: | 290 Woodcliff Drive | |
| Fairport, NY 14450 | ||
| Age: | 53 | |
| Current Position(s) Held with Fund: | Principal Financial Officer, Chief Financial Officer | |
| Term of Office1& Length of Time Served: | Principal Financial Officer since 2002; Chief Financial Officer since 2001 | |
| Principal Occupation(s) During Past 5 Years: | Director of Fund Reporting since 2011; Fund Reporting Manager (1997-2011) - Manning & Napier Advisors, LLC; Assistant Treasurer since 2008 - Exeter Trust Company; Chief Financial Officer (2017-2018) - Rainier Investment Management Mutual Funds, Inc.
| |
| Name: | Samantha Larew | |
| Address: | 290 Woodcliff Drive | |
| Fairport, NY 14450 | ||
| Age: | 39 | |
| Current Position(s) Held with Fund: | Chief Compliance Officer and Anti-Money Laundering Compliance Officer | |
| Term of Office1& Length of Time Served: | Chief Compliance Officer since 2019; Anti-Money Laundering Compliance Officer since 2018 | |
| Principal Occupation(s) During Past 5 Years: | Co-Director of Compliance (since 2018); Compliance Communications Supervisor (2014-2018); Compliance Supervisor (2011-2014); Broker-Dealer Compliance Analyst (2010-2014) - Manning & Napier Advisors, LLC and affiliates; Broker-Dealer Chief Compliance Officer (since 2013) – Manning & Napier Investor Services, Inc.; Compliance Analyst (2007-2009) – Wall Street Financial Group; Compliance Specialist (2003-2007) – Manning & Napier Advisors, LLC and affiliates Holds one or more of the following titles for various affiliates: Assistant Corporate Secretary, Chief Compliance Officer
| |
| Name: | Scott Morabito | |
| Address: | 290 Woodcliff Drive | |
| Fairport, NY 14450 | ||
| Age: | 31 | |
| Current Position(s) Held with Fund: | Vice President | |
| Term of Office1& Length of Time Served: | Vice President since 2019; Assistant Vice President (2017-2019) | |
| Principal Occupation(s) During Past 5 Years: | Managing Director of Operations since 2019 and Director of Funds Group from 2017 - 2019; Fund Product and Strategy Manager (2014-2017); Senior Product and Strategy Analyst (2013-2014); Product and Strategy Analyst (2011-2013) - Manning & Napier Advisors, LLC; President, Director – Manning & Napier Investor Services, Inc. since 2018
| |
| Name: | Sarah Turner | |
| Address: | 290 Woodcliff Drive | |
| Fairport, NY 14450 | ||
| Age: | 37 | |
| Current Position(s) Held with Fund: | Chief Legal Officer; Assistant Corporate Secretary | |
| Term of Office1& Length of Time Served: | Since 2018 | |
| Principal Occupation(s) During Past 5 Years: | General Counsel since 2018 - Manning & Napier Advisors, LLC and affiliates; Counsel (2017-2018) – Harter Secrest and Emery LLP; Legal Counsel (2010-2017) – Manning & Napier Advisors, LLC and affiliates Holds one or more of the following titles for various affiliates: Corporate Secretary, General Counsel
| |
*Interested Director, within the meaning of the 1940 Act by reason of his positions with the Fund’s Advisor, Manning & Napier Advisors, LLC, and Distributor, Manning & Napier Investor Services, Inc.
1The term of office of all officers shall be one year and until their respective successors are chosen and qualified, or his or her earlier resignation or removal as provided in the Fund’sBy-Laws.
84
{This page intentionally left blank}
85
Literature Requests
(unaudited)
Proxy Voting Policies and Procedures
A description of the policies and procedures that the Fund uses to determine how to vote proxies relating to portfolio securities is available, without charge, upon request:
By phone | 1-800-466-3863 | |
On the Securities and Exchange Commission’s (SEC) web site | http://www.sec.gov |
Proxy Voting Record
Information regarding how the Fund voted proxies relating to portfolio securities during the most recent12-month period ended June 30th is available, without charge, upon request:
By phone | 1-800-466-3863 | |
On the SEC’s web site | http://www.sec.gov |
Quarterly Portfolio Holdings
The Series’ complete schedule of portfolio holdings for the 1st and 3rd quarters of each fiscal year are provided on FormN-PORT, and are available, without charge, upon request:
By phone | 1-800-466-3863 | |
On the SEC’s web site | http://www.sec.gov |
Prospectus and Statement of Additional Information (SAI)
For more information about any of the Manning & Napier Fund, Inc. Series, you may obtain a prospectus and SAI at www.manning-napier.com or by calling (800)466-3863. Before investing, carefully consider the objectives, risks, charges and expenses of the investment and read the prospectus carefully as it contains this and other information about the investment company. In addition, this information can be found on the SEC’s web site, http://www.sec.gov.
Additional information available at www.manning-napier.com
1. Fund Holdings -Month-End
2. Fund Holdings -Quarter-End
3. Shareholder Report - Annual
4. Shareholder Report - Semi-Annual
The Fund also offers electronic notification or“e-delivery” when certain documents are availableon-line to be downloaded or reviewed. Direct shareholders can elect to receive electronic notification when shareholder reports, prospectus updates, and/or statements are available. If you do not currently haveon-line access to your account, you can establish access by going to www.manning-napier.com, click on “Login” in the top corner of the page, and follow the prompts to self-enroll. Once enrolled, you can set your electronic notification preferences by clicking on the Account Options tab located within the green toolbar and then selectE-Delivery Option. Should you have any questions on either how to establishon-line access or how to update your account settings, please contact Investor Services at1-800-466-3863.
The Manning & Napier Fund, Inc. is managed by Manning & Napier Advisors, LLC. Manning & Napier Investor Services, Inc., an affiliate of Manning & Napier Advisors, LLC, is the distributor of the Fund shares.
MNTGT-10/19-AR
www.manning-napier.com
Manning & Napier Fund, Inc.
|
Disciplined Value Series |
Beginning on June 25, 2021, as permitted by Securities and Exchange Commission regulations, paper copies of the Series’ annual and semi-annual shareholder reports will no longer be sent by mail, unless you specifically request paper copies of the reports from the Fund or from your financial intermediary, such as a broker-dealer or bank. Instead, the reports will be made available on a website, and you will be notified by mail each time a report is posted and provided with a website link to access the report.
If you already elected to receive shareholder reports electronically, you will not be affected by this change and you need not take any action. You may elect to receive shareholder reports and other communications from the Fund electronically by contacting your financial intermediary or, if you are a direct investor, by visiting www.manning-napier.com or calling 1-800-466-3863.
You may elect to receive all future annual and semi-annual reports in paper free of charge. If you invest through a financial intermediary, you can contact your financial intermediary to request that you continue to receive paper copies of your shareholder reports. If you invest directly with the Fund, you can inform the Fund that you wish to continue receiving paper copies of your shareholder reports by visiting www.manning-napier.com or calling 1-800-466-3863. Your election to receive reports in paper will apply to all funds held with your financial intermediary if you invest through a financial intermediary or all series of the Fund if you invest directly with the Fund.
| Independent Perspective| Real-World Solutions |
A Note from Our CEO
Dear Shareholder,
The investing world is constantly changing, yet investors’ needs and objectives remain substantially the same.
Whether you are an individual saver looking to ensure security in retirement, or an institutional investor with a fiduciary obligation to others, at the end of the day you look for a trusted partner to help you build, grow, and preserve wealth.
In order to do so successfully we recognize that, in the short-term, the world’s capital markets can be capricious and hard to predict.
Bubbles form, rise, and then pop. The hot stocks of today often become passing fads of tomorrow. Investor sentiment can swing wildly, whipsawing between exuberance one day and despondence the next.
As successful long-term investors, we are defined both by what we do as well as what we don’t do.
We don’t attempt to perfectly time every recession. We don’t jump on the latest trend. We don’t worry about capturing every market peak all across the globe.
On the other hand, we do maintain the rigorous disciplines we have developed over close to half a century. We are highly attentive to managing risk and protecting investors in down markets while participating fully in the opportunities our Research uncovers.
Our focus is on you, the shareholder, and helping you achieve your goals.
In the face of an uncertain world, we believe our investment philosophies, processes, and experience have stood the test of time and will do so in the future.
We appreciate your continued confidence in our approach.
|
Sincerely,
Marc Mayer Chief Executive Officer
|
Corporate Headquarters | 290 Woodcliff Drive| Fairport, NY 14450| (585) 325-6880 phone| (800) 551-0224 toll free| www.manning-napier.com
1
Disciplined Value Series
Fund Commentary
(unaudited)
Investment Objective
To provide competitive returns consistent with the broad equity market while also providing a level of capital protection during market downturns. The Series is designed to offer a diversified portfolio of dividend-paying US equity securities. Using a systematic process with a focus on mid- to large-capitalization US companies, securities are selected based on factors such as free cash flow generation and earnings power, minimum dividend yield, dividend sustainability, and financial health.
Performance Commentary
US equity markets posted positive returns for the twelve-month period ending October 31, 2019 and have experienced the second strongest year-to-date start in the past two decades. Over the one year period, large-cap stocks outperformed small- and mid-cap stocks, while growth stocks outperformed their value counterparts.
The Disciplined Value Series Class S slightly underperformed the Russell 1000® Value Index, returning 11.1% and 11.2%, respectively, with underperformance occurring in the first and second quarter of 2019.
The specific equities owned in the portfolio detracted from relative returns versus the benchmark and was the primary driver of slight underperformance, while positioning across sectors contributed to relative returns. More specifically, selection decisions within and an underweight to Energy along with an overweight to Industrials and Information Technology were the largest contributors to relative returns. In contrast, an underweight to Utilities and Real Estate as well as selection within Industrials, Consumer Staples, Health Care, and Materials detracted from relative returns.
From a factor perspective, growth stocks outperformed during the first half of the year as macro-economic concerns, such as the US-China trade war, subsided. Small cap outperformed mega-cap companies, serving as a headwind for the Series. Given the Series’ valuation emphasis, the portfolio has generally steered away from the more expensive areas of the market.
Within the Series, we pursue opportunities for shareholders through our disciplined screening process. Our goal is to generate stable income with the potential for capital growth. Importantly, this approach will continue to emphasize risk management as a critical component in managing the Series.
Please see the next page for additional performance information as of October 31, 2019.
Performance data quoted represents past performance and does not guarantee future results. The investment return and principal value of an investment will fluctuate, so that an investor’s shares, when redeemed, may be worth more or less than their original cost. Current performance may be higher or lower than that quoted; investors can obtain the most recent month-end performance at www.manning-napier.com or by calling (800) 466-3863.
Commentary prepared using data provided by FactSet. Analysis Manning & Napier. Commentary presented is relative to the Russell 1000® Value Index. Additional information and associated disclosures can be found on the Performance Update page of this report.
All investments involve risks, including possible loss of principal. As with any stock fund, the value of your investment will fluctuate in response to stock market movements. Investing in the Series will also involve a number of other risks, including issuer-specific risk and mid-cap risk. The Series invests primarily in dividend-paying equity securities, with a focus on mid- to large- cap companies. There is no assurance or guarantee that such companies will declare, continue to pay, or increase dividends. Stocks of mid-cap companies tend to be more volatile than those of large-cap companies, as mid-cap companies tend to be more susceptible to adverse business or economic events than larger, more established companies. In addition, because the Advisor manages the Series using a disciplined screening process, the Series is subject to the additional risk that the investment approach may not be successful. Further, the Advisor does not intend to make frequent changes to the Series’ portfolio in response to market movements.
2
Disciplined Value Series
Performance Update as of October 31, 2019
(unaudited)
AVERAGE ANNUAL TOTAL RETURNS AS OF OCTOBER 31, 2019
| ||||||
ONE YEAR1 | FIVE YEAR | TEN YEAR | ||||
Disciplined Value Series - Class I2 | 11.44% | 9.95% | 11.89% | |||
Disciplined Value Series - Class S2,3 | 11.11% | 9.67% | 11.60% | |||
Disciplined Value Series - Class W2,3 | 11.79% | 10.02% | 11.93% | |||
Disciplined Value Series - Class Z2,3 | 11.51% | 9.97% | 11.90% | |||
Russell 1000® Value Index4 | 11.21% | 7.61% | 11.96% | |||
The following graph compares the value of a $1,000,000 investment in the Disciplined Value Series - Class I for the ten years ended October 31, 2019 to the Russell 1000® Value Index.
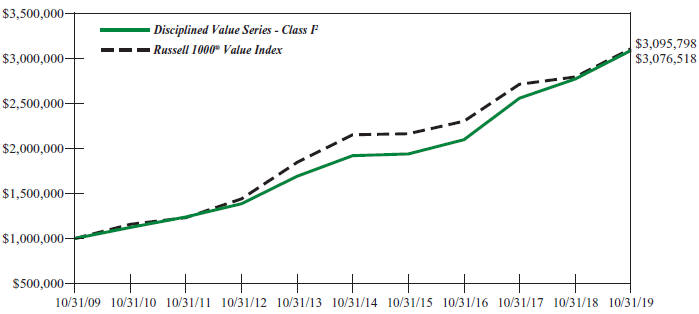
1The returns shown are based on net asset values calculated for shareholder transactions and may differ from the returns shown in the financial highlights, which reflect adjustments made to the net asset values in accordance with accounting principles generally accepted in the United States of America.
2The Series’ performance does not reflect the deduction of taxes that a shareholder would pay on fund distributions or the redemption of shares. The Series’ performance is historical and may not be indicative of future results. The performance returns shown are inclusive of the net expense ratio of the Series. For the year ended October 31, 2019, this net expense ratio was 0.82% for Class S, 0.58% for Class I, 0.15% for Class W and 0.45% for Class Z. The gross expense ratio, which does not account for any voluntary or contractual waivers currently in effect, was 0.82% for Class S, 0.58% for Class I, 0.47% for Class W and 0.47% for Class Z for the year ended October 31, 2019.
3For periods through the inception of Class S on September 21, 2018 the performance is hypothetical and is based on the historical performance of Class I shares adjusted for Class S shares’ charges and expenses. For periods through March, 1, 2019 (the inception date of the Class W and Class Z shares), performance for the Class W and Class Z shares is based on the historical performance of the Class I shares. Because the Class W and Class Z shares invest in the same portfolio of securities as the Class I shares, performance for the respective shares will be different only to the extent that the Class I shares have a higher expense ratio.
4The Russell 1000® Value Index is an unmanaged, market capitalization-weighted index consisting of those Russell 1000® companies with lower price-to-book ratios and lower forecasted growth values. The Index returns are based on a market capitalization-weighted average of relative price changes of the component stocks plus dividends whose reinvestments are compounded daily. The Index returns do not reflect any fees or expenses. Index returns provided by Bloomberg.
3
Disciplined Value Series
Shareholder Expense Example
(unaudited)
As a shareholder of the Series, you incur ongoing costs, including management fees, shareholder service fees and other Series expenses. This example is intended to help you understand your ongoing costs (in dollars) of investing in the Series and to compare these costs with the ongoing costs of investing in other mutual funds.
The example is based on an investment of $1,000 invested in each class at the beginning of the period and held for the entire period (May 1, 2019 to October 31, 2019).
Actual Expenses
The Actual lines of the table below provide information about actual account values and actual expenses. You may use the information in these lines, together with the amount you invested, to estimate the expenses that you paid over the period. Simply divide your account value by $1,000 (for example, an $8,600 account value divided by $1,000 = 8.6), then multiply the result by the number in the Actual line for the Class in which you have invested under the heading entitled “Expenses Paid During Period” to estimate the expenses you paid on your account during this period.
Hypothetical Example for Comparison Purposes
The Hypothetical lines of each class in the table below provide information about hypothetical account values and hypothetical expenses based on the Class’ actual expense ratio and an assumed rate of return of 5% per year before expenses, which is not the Class’ actual return. The hypothetical account values and expenses may not be used to estimate the actual ending account balance or expenses you paid during the period. You may use this information to compare the ongoing costs of investing in a class of the Series and other funds. To do so, compare this 5% hypothetical example for the Class in which you have invested with the 5% hypothetical examples that appear in the shareholder reports of the other funds.
Please note that the expenses shown in the table are meant to highlight your ongoing costs only and do not reflect any transaction costs, such as sales charges (loads), redemption fees, or exchange fees that you may incur in other mutual funds. Therefore, the second line of the table is useful in comparing ongoing costs only, and will not help you determine the relative total costs of owning different funds.
BEGINNING |
ENDING |
EXPENSES PAID | ANNUALIZED EXPENSE RATIO | |||||
Class S | ||||||||
Actual | $1,000.00 | $1,032.50 | $4.15 | 0.81% | ||||
Hypothetical | $1,000.00 | $1,021.12 | $4.13 | 0.81% | ||||
Class I | ||||||||
Actual | $1,000.00 | $1,034.20 | $3.03 | 0.59% | ||||
Hypothetical | $1,000.00 | $1,022.23 | $3.01 | 0.59% | ||||
Class W | ||||||||
Actual | $1,000.00 | $1,037.90 | $0.77 | 0.15% | ||||
Hypothetical | $1,000.00 | $1,024.45 | $0.77 | 0.15% | ||||
Class Z | ||||||||
Actual | $1,000.00 | $1,034.80 | $2.31 | 0.45% | ||||
Hypothetical | $1,000.00 | $1,022.94 | $2.29 | 0.45% | ||||
1Expenses are equal to the Series’ annualized expense ratio (for the six-month period), multiplied by the average account value over the period, multiplied by 184/365 (to reflect the one-half year period). Expenses are based on the most recent fiscal half year; therefore, the expense ratios stated above may differ from the expense ratios stated in the financial highlights, which are based on one-year data. The Class’ total return would have been lower had certain expenses not been waived during the period.
4
Disciplined Value Series
Portfolio Composition as of October 31, 2019
(unaudited)
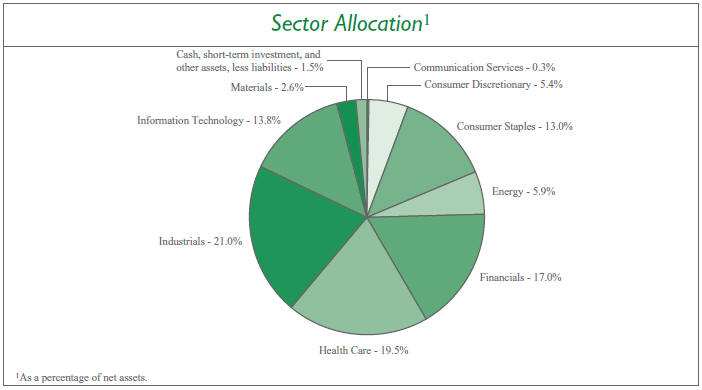
5
Disciplined Value Series
Investment Portfolio - October 31, 2019
| SHARES | VALUE (NOTE 2) | |||||||
COMMON STOCKS - 98.5% | ||||||||
Communication Services - 0.3% | ||||||||
Entertainment - 0.3% | ||||||||
Viacom, Inc. - Class B | 37,112 | $ | 800,135 | |||||
|
| |||||||
Consumer Discretionary - 5.4% | ||||||||
Distributors - 0.5% | ||||||||
Genuine Parts Co. | 15,400 | 1,579,732 | ||||||
|
| |||||||
Multiline Retail - 0.3% | ||||||||
Kohl’s Corp. | 16,188 | 829,797 | ||||||
|
| |||||||
Specialty Retail - 3.9% | ||||||||
Best Buy Co., Inc. | 24,064 | 1,728,517 | ||||||
The Gap, Inc. | 43,174 | 702,009 | ||||||
The Home Depot, Inc. | 42,876 | 10,057,852 | ||||||
|
| |||||||
| 12,488,378 | ||||||||
|
| |||||||
Textiles, Apparel & Luxury Goods - 0.7% | ||||||||
VF Corp. | 26,609 | 2,189,655 | ||||||
|
| |||||||
Total Consumer Discretionary | 17,087,562 | |||||||
|
| |||||||
Consumer Staples - 13.0% | ||||||||
Beverages - 0.3% | ||||||||
Molson Coors Brewing Co. - Class B | 18,105 | 954,496 | ||||||
|
| |||||||
Food & Staples Retailing - 5.8% | ||||||||
The Kroger Co. | 46,122 | 1,136,446 | ||||||
Sysco Corp. | 35,189 | 2,810,545 | ||||||
Walgreens Boots Alliance, Inc. | 52,849 | 2,895,068 | ||||||
Walmart, Inc. | 98,536 | 11,554,331 | ||||||
|
| |||||||
| 18,396,390 | ||||||||
|
| |||||||
Food Products - 4.9% | ||||||||
Archer-Daniels-Midland Co. | 33,048 | 1,389,338 | ||||||
Conagra Brands, Inc. | 39,123 | 1,058,277 | ||||||
General Mills, Inc. | 45,570 | 2,317,690 | ||||||
The Hershey Co. | 15,679 | 2,302,775 | ||||||
The J.M. Smucker Co. | 11,003 | 1,162,797 | ||||||
Kellogg Co. | 25,567 | 1,624,272 | ||||||
Mondelez International, Inc. - Class A | 72,847 | 3,820,825 | ||||||
Tyson Foods, Inc. - Class A | 19,954 | 1,651,992 | ||||||
|
| |||||||
| 15,327,966 | ||||||||
|
| |||||||
Household Products - 2.0% | ||||||||
Colgate-Palmolive Co. | 50,461 | 3,461,624 | ||||||
Kimberly-Clark Corp. | 22,685 | 3,014,383 | ||||||
|
| |||||||
| 6,476,007 | ||||||||
|
| |||||||
Total Consumer Staples | 41,154,859 | |||||||
|
| |||||||
The accompanying notes are an integral part of the financial statements.
6
Disciplined Value Series
Investment Portfolio - October 31, 2019
| SHARES | VALUE (NOTE 2) | |||||||
COMMON STOCKS(continued) | ||||||||
Energy - 5.9% | ||||||||
Energy Equipment & Services - 0.7% | ||||||||
Baker Hughes Co. | 58,259 | $ | 1,246,743 | |||||
Halliburton Co. | 48,706 | 937,590 | ||||||
|
| |||||||
| 2,184,333 | ||||||||
|
| |||||||
Oil, Gas & Consumable Fuels - 5.2% | ||||||||
Chevron Corp. | 57,000 | 6,619,980 | ||||||
Marathon Petroleum Corp. | 49,187 | 3,145,509 | ||||||
Occidental Petroleum Corp. | 37,372 | 1,513,566 | ||||||
Phillips 66 | 20,882 | 2,439,435 | ||||||
Valero Energy Corp. | 26,660 | 2,585,487 | ||||||
|
| |||||||
| 16,303,977 | ||||||||
|
| |||||||
Total Energy | 18,488,310 | |||||||
|
| |||||||
Financials - 17.0% | ||||||||
Banks - 14.6% | ||||||||
Bank of America Corp. | 238,840 | 7,468,527 | ||||||
BB&T Corp. | 37,843 | 2,007,571 | ||||||
Citigroup, Inc. | 66,459 | 4,775,744 | ||||||
Fifth Third Bancorp | 52,673 | 1,531,731 | ||||||
JPMorgan Chase & Co. | 92,840 | 11,597,573 | ||||||
KeyCorp | 76,568 | 1,375,927 | ||||||
Regions Financial Corp. | 65,887 | 1,060,781 | ||||||
SunTrust Banks, Inc. | 29,345 | 2,005,437 | ||||||
U.S. Bancorp | 84,270 | 4,805,075 | ||||||
Wells Fargo & Co. | 182,750 | 9,435,382 | ||||||
|
| |||||||
| 46,063,748 | ||||||||
|
| |||||||
Insurance - 2.4% | ||||||||
The Allstate Corp. | 17,400 | 1,851,708 | ||||||
Chubb Ltd. | 18,567 | 2,829,982 | ||||||
The Hartford Financial Services Group, Inc. | 22,672 | 1,294,118 | ||||||
The Travelers Cos., Inc. | 12,951 | 1,697,358 | ||||||
|
| |||||||
| 7,673,166 | ||||||||
|
| |||||||
Total Financials | 53,736,914 | |||||||
|
| |||||||
Health Care - 19.5% | ||||||||
Biotechnology - 5.5% | ||||||||
AbbVie, Inc. | 74,757 | 5,946,919 | ||||||
Amgen, Inc. | 31,727 | 6,765,783 | ||||||
Gilead Sciences, Inc. | 72,860 | 4,641,911 | ||||||
|
| |||||||
| 17,354,613 | ||||||||
|
| |||||||
Health Care Equipment & Supplies - 1.6% | ||||||||
Medtronic plc | 47,495 | 5,172,205 | ||||||
|
| |||||||
The accompanying notes are an integral part of the financial statements.
7
Disciplined Value Series
Investment Portfolio - October 31, 2019
| SHARES | VALUE (NOTE 2) | |||||||
COMMON STOCKS(continued) | ||||||||
Health Care(continued) | ||||||||
Health Care Providers & Services - 1.8% | ||||||||
CVS Health Corp. | 67,476 | $ | 4,479,732 | |||||
Quest Diagnostics, Inc. | 11,410 | 1,155,262 | ||||||
|
| |||||||
| 5,634,994 | ||||||||
|
| |||||||
Pharmaceuticals - 10.6% | ||||||||
Bristol-Myers Squibb Co. | 80,761 | 4,633,258 | ||||||
Johnson & Johnson | 77,589 | 10,244,852 | ||||||
Merck & Co., Inc. | 109,601 | 9,498,023 | ||||||
Pfizer, Inc. | 231,163 | 8,869,724 | ||||||
|
| |||||||
| 33,245,857 | ||||||||
|
| |||||||
Total Health Care | 61,407,669 | |||||||
|
| |||||||
Industrials - 21.0% | ||||||||
Aerospace & Defense - 6.5% | ||||||||
The Boeing Co. | 22,580 | 7,675,168 | ||||||
General Dynamics Corp. | 12,807 | 2,264,278 | ||||||
Lockheed Martin Corp. | 13,610 | 5,126,615 | ||||||
United Technologies Corp. | 37,782 | 5,424,739 | ||||||
|
| |||||||
| 20,490,800 | ||||||||
|
| |||||||
Air Freight & Logistics - 2.1% | ||||||||
C.H. Robinson Worldwide, Inc. | 14,916 | 1,128,246 | ||||||
United Parcel Service, Inc. - Class B | 48,084 | 5,537,834 | ||||||
|
| |||||||
| 6,666,080 | ||||||||
|
| |||||||
Building Products - 0.8% | ||||||||
Johnson Controls International plc | 57,673 | 2,498,971 | ||||||
|
| |||||||
Commercial Services & Supplies - 1.0% | ||||||||
Waste Management, Inc. | 27,009 | 3,030,680 | ||||||
|
| |||||||
Electrical Equipment - 2.2% | ||||||||
Eaton Corp. plc | 31,670 | 2,758,774 | ||||||
Emerson Electric Co. | 41,695 | 2,924,904 | ||||||
Rockwell Automation, Inc. | 7,518 | 1,293,021 | ||||||
|
| |||||||
| 6,976,699 | ||||||||
|
| |||||||
Industrial Conglomerates - 3.4% | ||||||||
3M Co. | 31,181 | 5,144,553 | ||||||
Honeywell International, Inc. | 32,918 | 5,685,926 | ||||||
|
| |||||||
| 10,830,479 | ||||||||
|
| |||||||
Machinery - 2.8% | ||||||||
Caterpillar, Inc. | 26,571 | 3,661,484 | ||||||
The accompanying notes are an integral part of the financial statements.
8
Disciplined Value Series
Investment Portfolio - October 31, 2019
| SHARES | VALUE (NOTE 2) | |||||||
COMMON STOCKS(continued) | ||||||||
Industrials(continued) | ||||||||
Machinery(continued) | ||||||||
Cummins, Inc. | 12,441 | $ | 2,145,824 | |||||
Illinois Tool Works, Inc. | 18,358 | 3,094,792 | ||||||
|
| |||||||
| 8,902,100 | ||||||||
|
| |||||||
Road & Rail - 1.7% | ||||||||
Union Pacific Corp. | 31,452 | 5,204,048 | ||||||
|
| |||||||
Trading Companies & Distributors - 0.5% | ||||||||
Fastenal Co. | 47,379 | 1,702,801 | ||||||
|
| |||||||
Total Industrials | 66,302,658 | |||||||
|
| |||||||
Information Technology - 13.8% | ||||||||
Communications Equipment - 2.6% | ||||||||
Cisco Systems, Inc. | 169,345 | 8,045,581 | ||||||
|
| |||||||
IT Services - 1.8% | ||||||||
International Business Machines Corp. | 42,624 | 5,700,108 | ||||||
|
| |||||||
Semiconductors & Semiconductor Equipment - 8.7% | ||||||||
Applied Materials, Inc. | 42,891 | 2,327,266 | ||||||
Broadcom, Inc. | 16,298 | 4,772,869 | ||||||
Intel Corp. | 167,300 | 9,457,469 | ||||||
KLA Corp. | 13,808 | 2,334,104 | ||||||
Lam Research Corp. | 6,913 | 1,873,699 | ||||||
Maxim Integrated Products, Inc. | 22,159 | 1,299,847 | ||||||
Texas Instruments, Inc. | 45,788 | 5,402,526 | ||||||
|
| |||||||
| 27,467,780 | ||||||||
|
| |||||||
Technology Hardware, Storage & Peripherals - 0.7% | ||||||||
NetApp, Inc. | 16,483 | 921,070 | ||||||
Western Digital Corp. | 26,408 | 1,363,973 | ||||||
|
| |||||||
| 2,285,043 | ||||||||
|
| |||||||
Total Information Technology | 43,498,512 | |||||||
|
| |||||||
Materials - 2.6% | ||||||||
Chemicals - 1.7% | ||||||||
Dow, Inc. | 36,079 | 1,821,629 | ||||||
Eastman Chemical Co. | 15,019 | 1,142,045 | ||||||
LyondellBasell Industries N.V. - Class A | 28,438 | 2,550,889 | ||||||
|
| |||||||
| 5,514,563 | ||||||||
|
| |||||||
Containers & Packaging - 0.4% | ||||||||
International Paper Co. | 25,515 | 1,114,495 | ||||||
|
| |||||||
The accompanying notes are an integral part of the financial statements.
9
Disciplined Value Series
Investment Portfolio - October 31, 2019
| SHARES | VALUE (NOTE 2) | |||||||
COMMON STOCKS(continued) | ||||||||
Materials(continued) | ||||||||
Metals & Mining - 0.5% | ||||||||
Nucor Corp. | 27,784 | $ | 1,496,168 | |||||
|
| |||||||
Total Materials | 8,125,226 | |||||||
|
| |||||||
TOTAL COMMON STOCKS | 310,601,845 | |||||||
|
| |||||||
SHORT-TERM INVESTMENT - 1.3% | ||||||||
Dreyfus Government Cash Management, Institutional Shares, 1.73%1 | ||||||||
(Identified Cost $4,074,225) | 4,074,225 | 4,074,225 | ||||||
|
| |||||||
TOTAL INVESTMENTS - 99.8% | 314,676,070 | |||||||
OTHER ASSETS, LESS LIABILITIES - 0.2% | 727,616 | |||||||
|
| |||||||
NET ASSETS - 100% | $ | 315,403,686 | ||||||
|
| |||||||
1Rate shown is the current yield as of October 31, 2019.
The Global Industry Classification Standard (GICS) was developed by and is the exclusive property and a service mark of MSCI Inc. (MSCI) and Standard & Poor’s, a division of The McGraw-Hill Companies, Inc. (S&P), and is licensed for use by Manning & Napier when referencing GICS sectors. Neither MSCI, S&P, nor any third party involved in making or compiling the GICS or any GICS classifications makes any express or implied warranties or representations with respect to such standard or classification, nor shall any such party have any liability therefrom.
The accompanying notes are an integral part of the financial statements.
10
Disciplined Value Series
Statement of Assets and Liabilities
October 31, 2019
ASSETS: | ||||
Investments, at value (identified cost $297,612,057) (Note 2) | $ | 314,676,070 | ||
Receivable for fund shares sold | 900,477 | |||
Dividends receivable | 332,426 | |||
Foreign tax reclaims receivable | 12,628 | |||
Prepaid and other expenses | 30,209 | |||
|
| |||
TOTAL ASSETS | 315,951,810 | |||
|
| |||
LIABILITIES: | ||||
Accrued sub-transfer agent fees (Note 3) | 83,819 | |||
Accrued management fees (Note 3) | 58,941 | |||
Accrued fund accounting and administration fees (Note 3) | 22,041 | |||
Accrued distribution and service (Rule 12b-1) fees (Class S) (Note 3) | 17,381 | |||
Accrued Chief Compliance Officer service fees (Note 3) | 688 | |||
Payable for fund shares repurchased | 295,420 | |||
Accrued transfer agent fees | 28,077 | |||
Other payables and accrued expenses | 41,757 | |||
|
| |||
TOTAL LIABILITIES | 548,124 | |||
|
| |||
TOTAL NET ASSETS | $ | 315,403,686 | ||
|
| |||
NET ASSETS CONSIST OF: | ||||
Capital stock | $ | 318,235 | ||
Additional paid-in-capital | 288,365,757 | |||
Total distributable earnings (loss) | 26,719,694 | |||
|
| |||
TOTAL NET ASSETS | $ | 315,403,686 | ||
|
| |||
NET ASSET VALUE, OFFERING PRICE AND REDEMPTION PRICE PER SHARE - Class S($83,332,130/10,862,258 shares) | $ | 7.67 | ||
|
| |||
NET ASSET VALUE, OFFERING PRICE AND REDEMPTION PRICE PER SHARE - Class I | $ | 14.12 | ||
|
| |||
NET ASSET VALUE, OFFERING PRICE AND REDEMPTION PRICE PER SHARE - Class W | $ | 7.69 | ||
|
| |||
NET ASSET VALUE, OFFERING PRICE AND REDEMPTION PRICE PER SHARE - Class Z | $ | 14.12 | ||
|
| |||
The accompanying notes are an integral part of the financial statements.
11
Disciplined Value Series
Statement of Operations
For the Year Ended October 31, 2019
INVESTMENT INCOME: | ||||
Dividends | $ | 7,389,949 | ||
|
| |||
EXPENSES: | ||||
Management fees (Note 3) | 847,911 | |||
Sub-transfer agent fees (Note 3) | 163,837 | |||
Distribution and service (Rule 12b-1) fees (Class S) (Note 3) | 137,931 | |||
Fund accounting and administration fees (Note 3) | 79,066 | |||
Shareholder services fees (Class S) (Note 3) | 63,792 | |||
Directors’ fees (Note 3) | 21,015 | |||
Chief Compliance Officer service fees (Note 3) | 3,455 | |||
Transfer agent fees | 123,140 | |||
Custodian fees | 6,540 | |||
Miscellaneous | 163,416 | |||
|
| |||
Total Expenses | 1,610,103 | |||
Less reduction of expenses (Note 3) | (101,784 | ) | ||
|
| |||
Net Expenses | 1,508,319 | |||
|
| |||
NET INVESTMENT INCOME | 5,881,630 | |||
|
| |||
REALIZED AND UNREALIZED GAIN (LOSS) ON INVESTMENTS: | ||||
Net realized gain (loss) on investments | 9,065,670 | |||
Net change in unrealized appreciation (depreciation) on investments | 15,139,900 | |||
|
| |||
NET REALIZED AND UNREALIZED GAIN (LOSS) ON INVESTMENTS | 24,205,570 | |||
|
| |||
NET INCREASE IN NET ASSETS RESULTING FROM OPERATIONS | $ | 30,087,200 | ||
|
| |||
The accompanying notes are an integral part of the financial statements.
12
Disciplined Value Series
Statements of Changes in Net Assets
FOR THE YEAR ENDED | FOR THE YEAR ENDED | |||||||
INCREASE (DECREASE) IN NET ASSETS: | ||||||||
OPERATIONS: | ||||||||
Net investment income | $ | 5,881,630 | $ | 2,290,113 | ||||
Net realized gain (loss) on investments | 9,065,670 | 25,894,128 | ||||||
Net change in unrealized appreciation (depreciation) on investments | 15,139,900 | (21,487,274 | ) | |||||
|
|
|
| |||||
Net increase from operations | 30,087,200 | 6,696,967 | ||||||
|
|
|
| |||||
DISTRIBUTIONS TO SHAREHOLDERS (Note 8): | ||||||||
Class S | (17,499,976 | ) | (10,674,798 | ) | ||||
Class I | (12,602,886 | ) | (12,965,874 | ) | ||||
Class W | (1,057,248 | ) | — | |||||
Class Z | (199,160 | ) | — | |||||
|
|
|
| |||||
Total distributions to shareholders | (31,359,270 | ) | (23,640,672 | ) | ||||
|
|
|
| |||||
CAPITAL STOCK ISSUED AND REPURCHASED: | ||||||||
Net increase (decrease) from capital share transactions (Note 5) | 155,724,402 | 29,598,590 | ||||||
|
|
|
| |||||
Net increase (decrease) in net assets | 154,452,332 | 12,654,885 | ||||||
NET ASSETS: | ||||||||
Beginning of year | 160,951,354 | 148,296,469 | ||||||
|
|
|
| |||||
End of year | $ | 315,403,686 | $ | 160,951,354 | ||||
|
|
|
| |||||
The accompanying notes are an integral part of the financial statements.
13
Disciplined Value Series
Financial Highlights - Class S
| FOR THE YEAR ENDED | |||||||||||||||||||||||||
| 10/31/19 | 10/31/18 | 10/31/17 | 10/31/16 | 10/31/15 | |||||||||||||||||||||
Per share data (for a share outstanding throughout each year): | |||||||||||||||||||||||||
Net asset value - Beginning of year | $8.77 | $11.42 | $10.16 | $11.64 | $12.75 | ||||||||||||||||||||
|
|
|
|
|
|
|
|
|
| ||||||||||||||||
Income from investment operations: | |||||||||||||||||||||||||
Net investment income1 | 0.16 | 0.16 | 0.20 | 0.22 | 0.26 | ||||||||||||||||||||
Net realized and unrealized gain (loss) on investments | 0.54 | 0.72 | 1.89 | 0.53 | (0.21 | ) | |||||||||||||||||||
|
|
|
|
|
|
|
|
|
| ||||||||||||||||
Total from investment operations | 0.70 | 0.88 | 2.09 | 0.75 | 0.05 | ||||||||||||||||||||
|
|
|
|
|
|
|
|
|
| ||||||||||||||||
Less distributions to shareholders: | |||||||||||||||||||||||||
From net investment income | (0.19 | ) | (0.27 | ) | (0.33 | ) | (0.32 | ) | (0.36 | ) | |||||||||||||||
From net realized gain on investments | (1.61 | ) | (3.26 | ) | (0.50 | ) | (1.91 | ) | (0.80 | ) | |||||||||||||||
|
|
|
|
|
|
|
|
|
| ||||||||||||||||
Total distributions to shareholders | (1.80 | ) | (3.53 | ) | (0.83 | ) | (2.23 | ) | (1.16 | ) | |||||||||||||||
|
|
|
|
|
|
|
|
|
| ||||||||||||||||
Net asset value - End of year | $7.67 | $8.77 | $11.42 | $10.16 | $11.64 | ||||||||||||||||||||
|
|
|
|
|
|
|
|
|
| ||||||||||||||||
Net assets - End of year(000’s omitted) | $83,332 | $72,088 | $30,940 | $15,022 | $15,471 | ||||||||||||||||||||
|
|
|
|
|
|
|
|
|
| ||||||||||||||||
Total return2 | 11.11% | 8.14% | 21.52% | 7.99% | 0.63% | ||||||||||||||||||||
Ratios (to average net assets)/Supplemental Data: | |||||||||||||||||||||||||
Expenses* | 0.82% | 0.85% | 0.82% | 0.82% | 0.79% | ||||||||||||||||||||
Net investment income | 2.14% | 1.71% | 1.91% | 2.19% | 2.14% | ||||||||||||||||||||
Series portfolio turnover | 35% | 96% | 34% | 39% | 49% | ||||||||||||||||||||
| *For certain periods presented, the investment advisor did not impose all or a portion of its management and/or other fees, and in some periods may have paid a portion of the Series’ expenses. If these expenses had been incurred by the Class, the expense ratio (to average net assets) would have increased by the following amounts: |
| ||||||||||||||||||||||||
| N/A | 0.04% | N/A | N/A | N/A | |||||||||||||||||||||
1Calculated based on average shares outstanding during the years.
2Represents aggregate total return for the year indicated, and assumes reinvestment of all distributions. Total return would have been lower had certain expenses not been waived or reimbursed during certain years.
The accompanying notes are an integral part of the financial statements.
14
Disciplined Value Series
Financial Highlights - Class I
| FOR THE YEAR ENDED | |||||||||||||||||||||||||
| 10/31/19 | 10/31/18 | 10/31/17 | 10/31/16 | 10/31/15 | |||||||||||||||||||||
Per share data (for a share outstanding throughout each year): | |||||||||||||||||||||||||
Net asset value - Beginning of year | $14.55 | $16.76 | $14.54 | $15.69 | $16.76 | ||||||||||||||||||||
|
|
|
|
|
|
|
|
|
| ||||||||||||||||
Income from investment operations: | |||||||||||||||||||||||||
Net investment income1 | 0.32 | 0.31 | 0.35 | 0.35 | 0.39 | ||||||||||||||||||||
Net realized and unrealized gain (loss) on investments | 1.07 | 1.03 | 2.73 | 0.75 | (0.27 | ) | |||||||||||||||||||
|
|
|
|
|
|
|
|
|
| ||||||||||||||||
Total from investment operations | 1.39 | 1.34 | 3.08 | 1.10 | 0.12 | ||||||||||||||||||||
|
|
|
|
|
|
|
|
|
| ||||||||||||||||
Less distributions to shareholders: | |||||||||||||||||||||||||
From net investment income | (0.21 | ) | (0.29 | ) | (0.36 | ) | (0.34 | ) | (0.39 | ) | |||||||||||||||
From net realized gain on investments | (1.61 | ) | (3.26 | ) | (0.50 | ) | (1.91 | ) | (0.80 | ) | |||||||||||||||
|
|
|
|
|
|
|
|
|
| ||||||||||||||||
Total distributions to shareholders | (1.82 | ) | (3.55 | ) | (0.86 | ) | (2.25 | ) | (1.19 | ) | |||||||||||||||
|
|
|
|
|
|
|
|
|
| ||||||||||||||||
Net asset value - End of year | $14.12 | $14.55 | $16.76 | $14.54 | $15.69 | ||||||||||||||||||||
|
|
|
|
|
|
|
|
|
| ||||||||||||||||
Net assets - End of year(000’s omitted) | $137,296 | $88,864 | $117,357 | $152,751 | $160,999 | ||||||||||||||||||||
|
|
|
|
|
|
|
|
|
| ||||||||||||||||
Total return2 | 11.44% | 8.35% | 21.86% | 8.24% | 0.91% | ||||||||||||||||||||
Ratios (to average net assets)/Supplemental Data: | |||||||||||||||||||||||||
Expenses* | 0.58% | 0.60% | 0.57% | 0.57% | 0.54% | ||||||||||||||||||||
Net investment income | 2.38% | 2.05% | 2.24% | 2.46% | 2.44% | ||||||||||||||||||||
Series portfolio turnover | 35% | 96% | 34% | 39% | 49% | ||||||||||||||||||||
| *For certain periods presented, the investment advisor did not impose all or a portion of its management and/or other fees, and in some periods may have paid a portion of the Series’ expenses. If these expenses had been incurred by the Class, the expense ratio (to average net assets) would have increased by the following amounts: |
| ||||||||||||||||||||||||
| N/A | 0.04% | N/A | N/A | N/A | |||||||||||||||||||||
1Calculated based on average shares outstanding during the years.
2Represents aggregate total return for the year indicated, and assumes reinvestment of all distributions. Total return would have been lower had certain expenses not been waived or reimbursed during certain years.
The accompanying notes are an integral part of the financial statements.
15
Disciplined Value Series
Financial Highlights - Class W
| FOR THE PERIOD 3/1/191 TO 10/31/19 | |||||
Per share data (for a share outstanding throughout the period): | |||||
Net asset value - Beginning of period | $7.36 | ||||
|
| ||||
Income from investment operations: | |||||
Net investment income2 | 0.13 | ||||
Net realized and unrealized gain (loss) on investments | 0.35 | ||||
|
| ||||
Total from investment operations | 0.48 | ||||
|
| ||||
Less distributions to shareholders: | |||||
From net investment income | (0.15 | ) | |||
|
| ||||
Net asset value - End of period | $7.69 | ||||
|
| ||||
Net assets - End of period(000’s omitted) | $76,322 | ||||
|
| ||||
Total return3 | 6.58% | ||||
Ratios (to average net assets)/Supplemental Data: | |||||
Expenses4 | 0.15% | ||||
Net investment income4 | 2.63% | ||||
Series portfolio turnover | 35% | ||||
| *The investment advisor did not impose all or a portion of its management and/or other fees during the period, and may have paid a portion of the Series’ expenses. If these expenses had been incurred by the Class, the expense ratio (to average net assets) would have increased by the following amount4: |
| ||||
| 0.32% | |||||
1Commencement of operations.
2Calculated based on average shares outstanding during the period.
3Represents aggregate total return for the period indicated, and assumes reinvestment of all distributions. Total return would have been lower had certain expenses not been waived or reimbursed during the period. Periods less than one year are not annualized.
4Annualized.
The accompanying notes are an integral part of the financial statements.
16
Disciplined Value Series
Financial Highlights - Class Z
| FOR THE PERIOD 3/1/191 TO 10/31/19 | |||||
Per share data (for a share outstanding throughout the period): | |||||
Net asset value - Beginning of period | $13.42 | ||||
|
| ||||
Income from investment operations: | |||||
Net investment income2 | 0.21 | ||||
Net realized and unrealized gain (loss) on investments | 0.63 | ||||
|
| ||||
Total from investment operations | 0.84 | ||||
|
| ||||
Less distributions to shareholders: | |||||
From net investment income | (0.14 | ) | |||
|
| ||||
Net asset value - End of period | $14.12 | ||||
|
| ||||
Net assets - End of period(000’s omitted) | $18,454 | ||||
|
| ||||
Total return3 | 6.31% | ||||
Ratios (to average net assets)/Supplemental Data: | |||||
Expenses4 | 0.45% | ||||
Net investment income4 | 2.35% | ||||
Series portfolio turnover | 35% | ||||
| *The investment advisor did not impose all or a portion of its management and/or other fees during the period, and may have paid a portion of the Series’ expenses. If these expenses had been incurred by the Class, the expense ratio (to average net assets) would have increased by the following amount4: |
| ||||
| 0.02% | |||||
1Commencement of operations.
2Calculated based on average shares outstanding during the period.
3Represents aggregate total return for the period indicated, and assumes reinvestment of all distributions. Total return would have been lower had certain expenses not been waived or reimbursed during the period. Periods less than one year are not annualized.
4Annualized.
The accompanying notes are an integral part of the financial statements.
17
Disciplined Value Series
Notes to Financial Statements
| 1. | Organization |
Disciplined Value Series (the “Series”) is a no-load diversified series of Manning & Napier Fund, Inc. (the “Fund”). The Fund is organized in Maryland and is registered under the Investment Company Act of 1940, as amended, as an open-end management investment company.
The Series’ investment objective is to provide competitive returns consistent with the broad equity market while providing a level of capital protection during market downturns.
The Series is authorized to issue four classes of shares (Class S, I, W, and Z). Class W and Z shares of the Series were issued on March 1, 2019. Each class of shares is substantially the same, except that class-specific distribution and shareholder servicing expenses are borne by the specific class of shares to which they relate.
The Fund’s Advisor is Manning & Napier Advisors, LLC (the “Advisor”). Shares of the Series are offered to investors, clients and employees of the Advisor and its affiliates. The total authorized capital stock of the Fund consists of 15 billion shares of common stock each having a par value of $0.01. As of October 31, 2019, 10 billion shares have been designated in total among 34 series, of which 100 million have been designated as Disciplined Value Series Class I common stock, Disciplined Value Series Class S common stock, Disciplined Value Series Class W common stock, and Disciplined Value Series Class Z common stock.
| 2. | Significant Accounting Policies |
The following is a summary of significant accounting policies followed by the Series. The Series is an investment company and, accordingly, follows the investment company accounting and reporting guidance of the Financial Accounting Standards Board Accounting Standards Codification Topic 946 - Investment Companies, which is part of accounting principles generally accepted in the United States of America (“GAAP”).
Security Valuation
Portfolio securities, including domestic equities, foreign equities, warrants and options, listed on an exchange other than the NASDAQ Stock Market are valued at the latest quoted sales price of the exchange on which the security is primarily traded. Securities not traded on valuation date or securities not listed on an exchange are valued at the latest quoted bid price provided by the Fund’s pricing service. Securities listed on the NASDAQ Stock Market are valued in accordance with the NASDAQ Official Closing Price.
Short-term investments that mature in sixty days or less may be valued at amortized cost, which approximates fair value. Investments in open-end investment companies are valued at their net asset value per share on valuation date.
Volume and level of activity in established markets for an asset or liability are evaluated to determine whether recent transactions and quoted prices are determinative of fair value. Where there have been significant decreases in volume and level of activity, further analysis and adjustment may be necessary to estimate fair value. The Series measures fair value in these instances by the use of inputs and valuation techniques which may be based upon current market prices of securities that are comparable in coupon, rating, maturity and industry and/or expectation of future cash flows. As a result of trading in relatively thin markets and/or markets that experience significant volatility, the prices used by the Series to value these securities may differ from the value that would be realized if these securities were sold, and the differences could be material.
Securities for which representative valuations or prices are not available from the Series’ pricing service may be valued at fair value as determined in good faith by the Advisor under procedures approved by and under the general supervision and responsibility of the Fund’s Board of Directors (the “Board”). Due to the inherent uncertainty of valuations of such securities, the fair value may differ significantly from the values that would have been used had a ready market for such securities existed. If trading or events occurring after the close of the principal market in which securities are traded are expected to materially affect the value of those securities, then they may be valued at their fair value, taking this trading or these events into account.
18
Disciplined Value Series
Notes to Financial Statements (continued)
| 2. | Significant Accounting Policies (continued) |
Security Valuation(continued)
Various inputs are used in determining the value of the Series’ assets or liabilities carried at fair value. These inputs are summarized in three broad levels. Level 1 includes quoted prices in active markets for identical assets and liabilities. Level 2 includes other significant observable inputs (including quoted prices for similar securities, interest rates, prepayment speeds, credit risk, etc.). Level 3 includes significant unobservable inputs (including the Series’ own assumptions in determining the fair value of investments). A financial instrument’s level within the fair value hierarchy is based on the lowest level of any input both individually and in aggregate that is significant to the fair value measurement. The inputs or methodology used for valuing securities are not necessarily an indication of the risk associated with investing in those securities.
The following is a summary of the valuation levels used for major security types as of October 31, 2019 in valuing the Series’ assets or liabilities carried at fair value:
| DESCRIPTION | TOTAL | LEVEL 1 | LEVEL 2 | LEVEL 3 | ||||||||||||
Assets: | ||||||||||||||||
Equity Securities: | ||||||||||||||||
Communication Services | $ | 800,135 | $ | 800,135 | $ | — | $ | — | ||||||||
Consumer Discretionary | 17,087,562 | 17,087,562 | — | — | ||||||||||||
Consumer Staples | 41,154,859 | 41,154,859 | — | — | ||||||||||||
Energy | 18,488,310 | 18,488,310 | — | — | ||||||||||||
Financials | 53,736,914 | 53,736,914 | — | — | ||||||||||||
Health Care | 61,407,669 | 61,407,669 | — | — | ||||||||||||
Industrials | 66,302,658 | 66,302,658 | — | — | ||||||||||||
Information Technology | 43,498,512 | 43,498,512 | — | — | ||||||||||||
Materials | 8,125,226 | 8,125,226 | — | — | ||||||||||||
Short-Term Investment | 4,074,225 | 4,074,225 | — | — | ||||||||||||
|
|
|
|
|
|
|
| |||||||||
Total assets | $ | 314,676,070 | $ | 314,676,070 | $ | — | $ | — | ||||||||
|
|
|
|
|
|
|
| |||||||||
There were no Level 2 or Level 3 securities held by the Series as of October 31, 2018 or October 31, 2019.
Security Transactions, Investment Income and Expenses
Security transactions are accounted for on trade date. Dividend income is recorded on the ex-dividend date, except that if the ex-dividend date has passed, certain dividends from foreign securities are recorded as soon as the Series is informed of the ex-dividend date. Non-cash dividends, if any, are recorded at the fair value of the securities received. Interest income, including amortization of premium and accretion of discounts using the effective interest method, is earned from settlement date and accrued daily.
Expenses are recorded on an accrual basis. Most expenses of the Fund can be attributed to a specific series. Expenses which cannot be directly attributed are apportioned among the series in the Fund in such a manner as deemed equitable by the Fund’s Board, taking into consideration, among other things, the nature and type of expense. Income, expenses (other than class specific expenses), and realized and unrealized gains and losses are prorated among the classes based on the relative net assets of each class. Class specific expenses are directly charged to that class.
The Series uses the identified cost method for determining realized gain or loss on investments for both financial statement and federal income tax reporting purposes.
Federal Taxes
The Series’ policy is to comply with the provisions of the Internal Revenue Code applicable to regulated investment companies. The Series is not subject to federal income or excise tax to the extent that the Series distributes to shareholders each year its taxable income, including any net realized gains on investments, in accordance with requirements of the Internal Revenue Code. Accordingly, no provision for federal income tax or excise tax has been made in the financial statements.
19
Disciplined Value Series
Notes to Financial Statements (continued)
| 2. | Significant Accounting Policies (continued) |
Federal Taxes(continued)
Management evaluates its tax positions to determine if the tax positions taken meet the minimum recognition threshold in connection with accounting for uncertainties in income tax positions taken or expected to be taken for the purposes of measuring and recognizing tax liabilities in the financial statements. Recognition of tax benefits of an uncertain tax position is required only when the position is “more likely than not” to be sustained assuming examination by taxing authorities. At October 31, 2019, the Series has recorded no liability for net unrecognized tax benefits relating to uncertain income tax positions taken or expected to be taken in future tax returns.
The Series files income tax returns in the U.S. federal jurisdiction, various states and foreign jurisdictions, as required. No income tax returns are currently under investigation. The statute of limitations on the Series’ tax returns remains open for the years ended October 31, 2016 through October 31, 2019. The Series is not aware of any tax positions for which it is reasonably possible that the total amounts of unrecognized tax benefits will significantly change in the next twelve months.
Foreign Taxes
Based on the Series’ understanding of the tax rules and rates related to income, gains and currency purchase/repatriation transactions for foreign jurisdictions in which it invests, the Series will provide for foreign taxes, and where appropriate, deferred foreign tax.
Distributions of Income and Gains
Distributions to shareholders of net investment income are made quarterly. Distributions of net realized gains are made annually. An additional distribution may be necessary to avoid taxation of the Series. Distributions are recorded on the ex-dividend date.
Indemnifications
The Fund’s organizational documents provide former and current directors and officers with a limited indemnification against liabilities arising in connection with the performance of their duties to the Fund. In the normal course of business, the Fund may also enter into contracts that provide general indemnifications. The Fund’s maximum exposure under these arrangements is unknown as this would be dependent on future claims that may be made against the Fund. The risk of material loss from such claims is considered remote.
Other
The preparation of financial statements in conformity with GAAP requires management to make estimates and assumptions that affect the reported amounts of assets and liabilities and the disclosure of contingent assets and liabilities at the date of the financial statements and the reported amounts of income and expenses during the reporting period. Actual results could differ from those estimates.
| 3. | Transactions with Affiliates |
The Fund has an Investment Advisory Agreement (the “Agreement”) with the Advisor, for which the Series pays a fee, computed daily and payable monthly, at an annual rate of 0.30% of the Series’ average daily net assets. Prior to March 1, 2019, the management fee for the Series was 0.45%.
Under the Agreement, personnel of the Advisor provide the Series with advice and assistance in the choice of investments and the execution of securities transactions, and otherwise maintain the Series’ organization. The Advisor also provides the Fund with necessary office space and fund administration and support services. The salaries of all officers of the Fund (except a percentage of the Fund’s Chief Compliance Officer’s salary, which is paid by the Fund), and of all Directors who are “affiliated persons” of the Fund, or of the Advisor, and all personnel of the Fund, or of the Advisor, performing services relating to research, statistical and investment activities, are paid by the Advisor. Each “non-affiliated” Director receives an annual stipend, which is allocated among all the active series of the Fund. In addition, these Directors also receive a fee per Board meeting attended plus a fee for each committee meeting attended and are reimbursed for travel and other out-of-pocket expenses incurred by them in connection with attending such meetings. The Fund also has an Audit Committee Chair, Governance & Nominating Committee Chair and Lead Independent Director who each receive an additional annual stipend for these roles.
20
Disciplined Value Series
Notes to Financial Statements (continued)
| 3. | Transactions with Affiliates (continued) |
Effective March 1, 2019, the Fund may enter into agreements with financial intermediaries pursuant to which the Fund may pay financial intermediaries for non-distribution related sub-transfer agency, administrative, sub-accounting, and other shareholder services in an amount not to exceed 0.15% of the average daily net assets of the Class S and Class I shares. Payments made pursuant to such agreements are generally based on the current assets and/or number of accounts of the Series attributable to the financial intermediary. Any payments made pursuant to such agreements may be in addition to, rather than in lieu of, any Distribution and Shareholder Services Fee payable under the Rule 12b-1 plan of the Fund.
Prior to March 1, 2019, the Class S shares of the Series were subject to a shareholder services fee in accordance with a shareholder services plan adopted by the Fund’s Board. The shareholder services fee was intended to compensate financial intermediaries, including affiliates of the Fund, in connection with the provision of direct client service, personal services, maintenance of shareholder accounts and reporting services. For these services, the Class S shares of the Series paid a fee, computed daily and payable monthly, at an annual rate of 0.25% of the average daily net assets of Class S. The Fund had a Shareholder Services Agreement with the Advisor, for which the Advisor received the shareholder services fee as stated above.
Effective March 1, 2019, the Advisor has contractually agreed to waive the management fee for the Class W shares. In addition, pursuant to a separate expense limitation agreement, the Advisor has contractually agreed to limit its fees and reimburse expenses to the extent necessary so that the total direct annual fund operating expenses, exclusive of the shareholder services fee and/or distribution and service (12b-1) fees and waived Class W management fees (collectively, “excluded expenses”), to 0.60% of the average daily net assets of the Class I and Class S shares, 0.45% of the average daily net assets of the Class Z shares, and 0.15% of the average daily net assets of the Class W shares. These contractual waivers are expected to continue indefinitely, and may not be amended or terminated by the Advisor without the approval of the Series’ Board of Directors. The Advisor may receive from a Class the difference between the Class’s total direct annual fund operating expenses, not including excluded expenses, and the Class’s contractual expense limit to recoup all or a portion of its prior fee waivers (other than Class W management fee waivers) or expense reimbursements made during the rolling three-year period preceding the recoupment if at any point the total direct annual fund operating expenses, not including excluded expenses, are below the contractual expense limit (a) at the time of the fee waiver and/or expense reimbursement and (b) at the time of the recoupment.
Pursuant to the advisory fee waiver, the Advisor waived $94,435 in management fees for Class W shares for the year ended October 31, 2019. In addition, pursuant to the separate expense limitation agreement, the Advisor waived or reimbursed expenses of $5,197 and $2,152 for Class W and Class Z shares, respectively, for the year ended October 31, 2019. These amounts are included as a reduction of expenses on the Statement of Operations. At October 31, 2019, the Advisor is eligible to recoup $7,349. For the year ended October 31, 2019, the Advisor did not recoup any expenses that have been previously waived or reimbursed.
Manning & Napier Investor Services, Inc., a registered broker-dealer affiliate of the Advisor, acts as distributor for the Fund’s shares. Effective March 1, 2019, the Series compensates the distributor for distributing and servicing the Series’ Class S shares pursuant to a distribution plan adopted under Rule 12b-1 of the 1940 Act, regardless of expenses actually incurred. Under the agreement, the Series pays distribution and service fees to the distributor at an annual rate of 0.25% of average daily net assets attributable to Class S shares. There are no distribution and service fees on the Class I, Class W or Class Z shares. The fees are accrued daily and paid monthly.
Pursuant to a master services agreement dated March 1, 2017, the Fund pays the Advisor an annual fee related to fund accounting and administration of 0.0085% on the first $25 billion of average daily net assets (excluding Target Series and Income Series); 0.0075% on the next $15 billion of average daily net assets (excluding Target Series and Income Series); and 0.0065% of average daily net assets in excess of $40 billion (excluding Target Series and Income Series); plus a base fee of $30,400 per series. Additionally, certain transaction and out-of-pocket expenses, including charges for reporting relating to the Fund’s compliance program, are charged. The Advisor has agreements with BNY Mellon Investment Servicing (U.S.) Inc. (“BNY”) under which BNY serves as sub-accountant services agent.
21
Disciplined Value Series
Notes to Financial Statements (continued)
| 4. | Purchases and Sales of Securities |
For the year ended October 31, 2019, purchases and sales of securities, other than U.S. Government securities and short-term securities, were $214,882,029 and $86,123,596, respectively. There were no purchases or sales of U.S. Government securities.
| 5. | Capital Stock Transactions |
Transactions in Class S, Class I, Class W, and Class Z shares of Disciplined Value Series were:
| CLASS S | FOR THE YEAR ENDED 10/31/19 | FOR THE YEAR ENDED 10/31/18 | ||||||||||||||
| SHARES | AMOUNT | SHARES | AMOUNT | |||||||||||||
Sold | 7,454,001 | $ | 55,765,138 | 9,688,588 | $ | 88,377,970 | ||||||||||
Reinvested | 2,522,364 | 17,068,654 | 1,204,163 | 10,575,138 | ||||||||||||
Repurchased | (7,335,152 | ) | (51,979,899 | ) | (5,379,786 | ) | (47,861,945 | ) | ||||||||
|
|
|
|
|
|
|
| |||||||||
Total | 2,641,213 | $ | 20,853,893 | 5,512,965 | $ | 51,091,163 | ||||||||||
|
|
|
|
|
|
|
| |||||||||
| CLASS I | FOR THE YEAR ENDED 10/31/19 | FOR THE YEAR ENDED 10/31/18 | ||||||||||||||
| SHARES | AMOUNT | SHARES | AMOUNT | |||||||||||||
Sold | 7,644,103 | $ | 100,547,027 | 4,156,876 | $ | 63,107,551 | ||||||||||
Reinvested | 908,285 | 11,256,166 | 525,788 | 7,609,244 | ||||||||||||
Repurchased | (4,933,483 | ) | (66,396,088 | ) | (5,577,192 | ) | (92,209,368 | ) | ||||||||
|
|
|
|
|
|
|
| |||||||||
Total | 3,618,905 | $ | 45,407,105 | (894,528 | ) | $ | (21,492,573 | ) | ||||||||
|
|
|
|
|
|
|
| |||||||||
| CLASS W | FOR THE PERIOD 3/1/19 (COMMENCEMENT OF OPERATIONS) TO 10/31/19 | |||||||||||||||
| SHARES | AMOUNT | |||||||||||||||
Sold | 10,277,841 | $ | 74,540,349 | |||||||||||||
Reinvested | 137,393 | 1,023,018 | ||||||||||||||
Repurchased | (486,655 | ) | (3,569,394 | ) | ||||||||||||
|
|
|
| |||||||||||||
Total | 9,928,579 | $ | 71,993,973 | |||||||||||||
|
|
|
| |||||||||||||
| CLASS Z | FOR THE PERIOD 3/1/19 (COMMENCEMENT OF OPERATIONS) TO 10/31/19 | |||||||||||||||
| SHARES | AMOUNT | |||||||||||||||
Sold | 1,813,117 | $ | 24,404,587 | |||||||||||||
Reinvested | 8,784 | 119,095 | ||||||||||||||
Repurchased | (515,135 | ) | (7,054,251 | ) | ||||||||||||
|
|
|
| |||||||||||||
Total | 1,306,766 | $ | 17,469,431 | |||||||||||||
|
|
|
| |||||||||||||
At October 31, 2019 the Advisor and its affiliates owned 0.3% of the Series.
| 6. | Line of Credit |
The Fund has entered into a 364-day, $25 million credit agreement (the “line of credit”) with Bank of New York Mellon. Each series of the Fund may borrow under the line of credit for temporary or emergency purposes, including funding shareholder
22
Disciplined Value Series
Notes to Financial Statements (continued)
| 6. | Line of Credit (continued) |
redemptions and other short-term liquidity purposes. The Fund pays an annual fee on the unused commitment amount, payable quarterly, and is allocated among all the series of the Fund and included in miscellaneous expenses in the Statement of Operations for each series. The line of credit expires in August 2020 unless extended or renewed. Borrowings under this arrangement bear interest at a floating rate equal to the higher of the (i) Federal Funds rate in effect on such day plus 125 basis points or (ii) the 30 day LIBOR plus 125 basis points in effect on that day. This amount, if any, would be included in “Interest expense” in the Statement of Operations. During the year ended October 31, 2019, the Disciplined Value Series average daily amount of borrowings outstanding under the line of credit was $19,178 with a weighted average interest rate of 3.35%. As of October 31, 2019, there was no borrowing outstanding.
| 7. | Financial Instruments |
The Series may trade in instruments including written and purchased options, forward foreign currency exchange contracts and futures contracts and other derivatives in the normal course of investing activities to assist in managing exposure to various market risks. The Series may be subject to various elements of risk which may involve, to a varying degree, elements of risk in excess of the amounts recognized for financial statement purposes. These risks include: the risk that changes in the value of a derivative may not correlate perfectly with the underlying asset, rate or index; counterparty credit risk related to over the counter derivative counterparties’ failure to perform under contract terms; liquidity risk related to the lack of a liquid market for these contracts allowing the fund to close out its position(s); and documentation risk relating to disagreement over contract terms. No such investments were held by the Series as of October 31, 2019.
| 8. | Federal Income Tax Information |
The amount and characterization of certain income and capital gains to be distributed are determined in accordance with federal income tax regulations, which may differ from GAAP. These differences are primarily due to differing book and tax treatment in the timing of recognition of net investment income, or gains and losses, including losses deferred due to wash sales and the use of equalization. The Series may periodically make reclassifications among its capital accounts to reflect income and gains available for distribution (or available capital loss carryovers) under income tax regulations, without impacting the Series’ net asset value. Any such reclassifications are not reflected in the financial highlights.
The tax character of distributions paid were as follows:
| FOR THE YEAR ENDED 10/31/19 | FOR THE YEAR ENDED 10/31/18 | |||||||||
Ordinary income | $ 7,145,068 | $ 3,681,015 | ||||||||
Long-term capital gains | 24,214,202 | 19,959,657 | ||||||||
At October 31, 2019, the tax basis of components of distributable earnings and the net unrealized appreciation based on the identified cost of investments for federal income tax purposes were as follows:
Cost for federal income tax purposes | $ | 299,219,969 | ||||
Unrealized appreciation | 24,175,305 | |||||
Unrealized depreciation | (8,719,204 | ) | ||||
|
| |||||
Net unrealized appreciation |
$ |
15,456,101 |
| |||
|
| |||||
Undistributed ordinary income | $ | 2,800,037 | ||||
Undistributed long-term capital gains | $ | 8,463,556 | ||||
23
Disciplined Value Series
Notes to Financial Statements (continued)
| 9. | Subsequent Events |
In preparing these financial statements, management of the Series has evaluated events and transactions for recognition or disclosure through December 16, 2019, the date the financial statements were issued, and the following item was noted:
Effective after the close of trading on December 5, 2019, the total outstanding shares of Class I and Z of the Disciplined Value Series split on a 1.75-for-1 basis as of record date December 4, 2019. The impact of the stock split increased the number of shares outstanding by a factor of 1.75, while decreasing the NAV per share and market price per share by a factor of 1.75, resulting in no effect on fund net assets or on the total value of a shareholder’s investment.
24
Disciplined Value Series
Report of Independent Registered Public Accounting Firm
To the Board of Directors of Manning & Napier Fund, Inc. and Shareholders of Disciplined Value Series
Opinion on the Financial Statements
We have audited the accompanying statement of assets and liabilities, including the investment portfolio, of Disciplined Value Series (one of the series constituting Manning & Napier Fund, Inc., referred to hereafter as the “Fund”) as of October 31, 2019, the related statement of operations for the year ended October 31, 2019, the statement of changes in net assets for each of the two years in the period ended October 31, 2019, including the related notes, and the financial highlights for each of the periods indicated therein (collectively referred to as the “financial statements”). In our opinion, the financial statements present fairly, in all material respects, the financial position of the Fund as of October 31, 2019, the results of its operations for the year then ended, the changes in its net assets for each of the two years in the period ended October 31, 2019 and the financial highlights for each of the periods indicated therein in conformity with accounting principles generally accepted in the United States of America.
Basis for Opinion
These financial statements are the responsibility of the Fund’s management. Our responsibility is to express an opinion on the Fund’s financial statements based on our audits. We are a public accounting firm registered with the Public Company Accounting Oversight Board (United States) (“PCAOB”) and are required to be independent with respect to the Fund in accordance with the U.S. federal securities laws and the applicable rules and regulations of the Securities and Exchange Commission and the PCAOB.
We conducted our audits of these financial statements in accordance with the standards of the PCAOB. Those standards require that we plan and perform the audit to obtain reasonable assurance about whether the financial statements are free of material misstatement, whether due to error or fraud.
Our audits included performing procedures to assess the risks of material misstatement of the financial statements, whether due to error or fraud, and performing procedures that respond to those risks. Such procedures included examining, on a test basis, evidence regarding the amounts and disclosures in the financial statements. Our audits also included evaluating the accounting principles used and significant estimates made by management, as well as evaluating the overall presentation of the financial statements. Our procedures included confirmation of securities owned as of October 31, 2019 by correspondence with the custodian. We believe that our audits provide a reasonable basis for our opinion.
New York, New York
December 16, 2019
We have served as the auditor of one or more investment companies in Manning & Napier Mutual Funds since 1992.
25
Disciplined Value Series
Supplemental Tax Information
(unaudited)
All reportings are based on financial information available as of the date of this annual report and, accordingly, are subject to change.
For federal income tax purposes, the Series reports for the current fiscal year $6,382,949 or, if different, the maximum amount allowable under the tax law, as qualified dividend income.
For corporate shareholders, the percentage of investment income (dividend income plus short-term gains, if any) that qualifies for the dividends received deduction for the current fiscal year is 85.75%.
The Series designates $8,887,530 as Long-Term Capital Gain dividends pursuant to Section 852(b) of the Code for the fiscal year ended October 31, 2019.
26
Disciplined Value Series
Directors’ and Officers’ Information
(unaudited)
The Statement of Additional Information provides additional information about the Fund’s directors and officers and can be obtained without charge by calling 1-800-466-3863, at www.manning-napier.com, or on the EDGAR Database on the SEC Internet web site (http://www.sec.gov). The following chart shows certain information about the Fund’s directors and officers, including their principal occupations during the last five years. Unless specific dates are provided, the individuals have held the listed positions for longer than five years.
| Interested Director and Officer | ||
| Name: | Paul Battaglia* | |
| Address: | 290 Woodcliff Drive | |
| Fairport, NY 14450 | ||
| Age: | 41 | |
| Current Position(s) Held with Fund: | Principal Executive Officer, President, Chairman & Director | |
| Term of Office & Length of Time Served: | Indefinite – Chairman and Director since November 20181 | |
| Principal Occupation(s) During Past 5 Years: | Chief Financial Officer (2018 – Present); Vice President of Finance (2016 – 2018); Director of Finance (2011 – 2016); Financial Analyst/Internal Auditor (2004-2006) – Manning & Napier Advisors, LLC and affiliates Holds one or more of the following titles for various affiliates: Chief Financial Officer | |
| Number of Portfolios Overseen within Fund Complex: | 32 | |
Other Directorships Held Outside Fund Complex During Past 5 Years: | N/A | |
| Independent Directors | ||
| Name: | Stephen B. Ashley | |
| Address: | 290 Woodcliff Drive | |
| Fairport, NY 14450 | ||
| Age: | 79 | |
| Current Position(s) Held with Fund: | Director, Audit Committee Member, Governance & Nominating Committee Member | |
| Term of Office & Length of Time Served: | Indefinite – Since 1996 | |
| Principal Occupation(s) During Past 5 Years: | Chairman, Director & Chief Executive Officer (1997 to present) - The Ashley Group (property management and investment). Director (1995-2008) and Chairman (non-executive) (2004-2008) - Fannie Mae (mortgage) | |
| Number of Portfolios Overseen within Fund Complex: | 32 | |
| Other Directorships Held Outside Fund Complex During | Fannie Mae (1995-2008) | |
| Past 5 Years: | The Ashley Group (1995-2008) | |
| Genesee Corporation (1987-2007) | ||
| Name: | Paul A. Brooke | |
| Address: | 290 Woodcliff Drive | |
| Fairport, NY 14450 | ||
| Age: | 73 | |
| Current Position(s) Held with Fund: | Lead Independent Director, Audit Committee Member, Governance & Nominating Committee Chairman | |
| Term of Office & Length of Time Served: | Indefinite – Director, Audit Committee Member, Governance & Nominating Committee Member since 2007; Governance & Nominating Committee Chairman since 2016; Lead Independent Director since 2017 | |
| Principal Occupation(s) During Past 5 Years: | Chairman & CEO (2005-2009) - Ithaka Acquisition Corporation (investments); Chairman (2007-2009) - Alsius Corporation (investments); Managing Member (1991-present) - PMSV Holdings LLC (investments); Managing Member (2010-2016) - Venbio (investments). | |
| Number of Portfolios Overseen within Fund Complex: | 32 | |
| Other Directorships Held Outside Fund Complex During | Incyte Corp. (biotech)(2000-present); ViroPharma, Inc. (speciality | |
| Past 5 Years: | pharmaceuticals)(2000-2014); HLTH (WebMD)(information)(2000-2010); Cheyne Capital International (investment)(2000-2017); GMP Companies (investment)(2000-2011); Cytos Biotechnology Ltd (biotechnology)(2012-2014); Cerus (biomedical)(2016-present); PureEarth(non-profit)(2012-present); Caelum BioSciences (biomedical)(2018-present) | |
27
Disciplined Value Series
Directors’ and Officers’ Information
(unaudited)
Independent Directors (continued)
| Name: | Peter L. Faber | |
| Address: | 290 Woodcliff Drive | |
| Fairport, NY 14450 | ||
| Age: | 81 | |
| Current Position(s) Held with Fund: | Director, Governance & Nominating Committee Member | |
| Term of Office & Length of Time Served: | Indefinite – Since 1987 | |
| Principal Occupation(s) During Past 5 Years: | Senior Counsel (2006-2012), Partner (1995-2006 & 2013-present) - McDermott, Will & Emery LLP (law firm) | |
| Number of Portfolios Overseen within Fund Complex: | 32 | |
Other Directorships Held Outside Fund Complex During Past 5 Years: | Boston Early Music Festival (non-profit)(2007-present); Amherst Early Music, Inc. (non-profit)(2009-present); Gotham Early Music Scene, Inc. (non-profit)(2009-present); Partnership for New York City, Inc. (non-profit)(1989-2010); New York Collegium (non-profit)(2004-2011); S’Cool Sounds, Inc. (non-profit)(2017-present) | |
| Name: | Harris H. Rusitzky | |
| Address: | 290 Woodcliff Drive | |
| Fairport, NY 14450 | ||
| Age: | 84 | |
| Current Position(s) Held with Fund: | Director, Audit Committee Member, Governance & Nominating Committee Member | |
| Term of Office & Length of Time Served: | Indefinite – Since 1985 | |
| Principal Occupation(s) During Past 5 Years: | President (1994- present) - The Greening Group (business consultants); Partner (2006-present) - The Restaurant Group (restaurants) | |
| Number of Portfolios Overseen within Fund Complex: | 32 | |
Other Directorships Held Outside Fund Complex During Past 5 Years: | Rochester Institute of Technology (university)(1972-present); Culinary Institute of America (non-profit college)(1985-present); George Eastman House (museum)(1988-present); National Restaurant Association (restaurant trade organization)(1978-present) | |
| Name: | Chester N. Watson | |
| Address: | 290 Woodcliff Drive | |
| Fairport, NY 14450 | ||
| Age: | 69 | |
| Current Position(s) Held with Fund: | Director, Audit Committee Chairman, Governance & Nominating Committee Member | |
| Term of Office & Length of Time Served: | Indefinite – Director, Audit Committee Member, Governance & Nominating Committee Member Since 2012; Audit Committee Chairman since 2013 | |
| Principal Occupation(s) During Past 5 Years: | General Auditor (2003-2011) - General Motors Company (auto | |
| manufacturer) | ||
| Number of Portfolios Overseen within Fund Complex: | 32 | |
Other Directorships Held Outside Fund Complex During Past 5 Years: | Rochester Institute of Technology (university)(2005-present); Town of Greenburgh, NY Planning Board (municipal government) (2015-2018) | |
| Officers: | ||
| Name: | Elizabeth Craig | |
| Address: | 290 Woodcliff Drive | |
| Fairport, NY 14450 | ||
| Age: | 32 | |
| Current Position(s) Held with Fund: | Corporate Secretary | |
| Term of Office1 & Length of Time Served: | Since 2016 | |
| Principal Occupation(s) During Past 5 Years: | Fund Regulatory Administration Manager since 2018; Fund Administration Manager (2015-2018); Mutual Fund Compliance Specialist (2009-2015) - Manning & Napier Advisors, LLC; Assistant Corporate Secretary (2011-2016) - Manning & Napier Fund, Inc. | |
28
Disciplined Value Series
Directors’ and Officers’ Information
(unaudited)
Officers: (continued)
| Name: | Christine Glavin | |
| Address: | 290 Woodcliff Drive | |
| Fairport, NY 14450 | ||
| Age: | 53 | |
| Current Position(s) Held with Fund: | Principal Financial Officer, Chief Financial Officer | |
| Term of Office1 & Length of Time Served: | Principal Financial Officer since 2002; Chief Financial Officer since 2001 | |
| Principal Occupation(s) During Past 5 Years: | Director of Fund Reporting since 2011; Fund Reporting Manager (1997-2011) - Manning & Napier Advisors, LLC; Assistant Treasurer since 2008 - Exeter Trust Company; Chief Financial Officer (2017-2018) - Rainier Investment Management Mutual Funds, Inc. | |
| Name: | Samantha Larew | |
| Address: | 290 Woodcliff Drive | |
| Fairport, NY 14450 | ||
| Age: | 39 | |
| Current Position(s) Held with Fund: | Chief Compliance Officer and Anti-Money Laundering Compliance Officer | |
| Term of Office1 & Length of Time Served: | Chief Compliance Officer since 2019; Anti-Money Laundering Compliance Officer since 2018 | |
| Principal Occupation(s) During Past 5 Years: | Co-Director of Compliance (since 2018); Compliance Communications Supervisor (2014-2018); Compliance Supervisor (2011-2014); Broker-Dealer Compliance Analyst (2010-2014) - Manning & Napier Advisors, LLC and affiliates; Broker-Dealer Chief Compliance Officer (since 2013) – Manning & Napier Investor Services, Inc.; Compliance Analyst (2007-2009) – Wall Street Financial Group; Compliance Specialist (2003-2007) – Manning & Napier Advisors, LLC and affiliates Holds one or more of the following titles for various affiliates: Assistant Corporate Secretary, Chief Compliance Officer | |
| Name: | Scott Morabito | |
| Address: | 290 Woodcliff Drive | |
| Fairport, NY 14450 | ||
| Age: | 31 | |
| Current Position(s) Held with Fund: | Vice President | |
| Term of Office1 & Length of Time Served: | Vice President since 2019; Assistant Vice President (2017-2019) | |
| Principal Occupation(s) During Past 5 Years: | Managing Director of Operations since 2019 and Director of Funds Group from 2017 - 2019; Fund Product and Strategy Manager (2014-2017); Senior Product and Strategy Analyst (2013-2014); Product and Strategy Analyst (2011-2013) - Manning & Napier Advisors, LLC; President, Director – Manning & Napier Investor Services, Inc. since 2018 | |
| Name: | Sarah Turner | |
| Address: | 290 Woodcliff Drive | |
| Fairport, NY 14450 | ||
| Age: | 37 | |
| Current Position(s) Held with Fund: | Chief Legal Officer; Assistant Corporate Secretary | |
| Term of Office1 & Length of Time Served: | Since 2018 | |
| Principal Occupation(s) During Past 5 Years: | General Counsel since 2018 - Manning & Napier Advisors, LLC and affiliates; Counsel (2017-2018) – Harter Secrest and Emery LLP; Legal Counsel (2010-2017) – Manning & Napier Advisors, LLC and affiliates Holds one or more of the following titles for various affiliates: Corporate Secretary, General Counsel | |
*Interested Director, within the meaning of the 1940 Act by reason of his positions with the Fund’s Advisor, Manning & Napier Advisors, LLC, and Distributor, Manning & Napier Investor Services, Inc.
1The term of office of all officers shall be one year and until their respective successors are chosen and qualified, or his or her earlier resignation or removal as provided in the Fund’s By-Laws.
29
Disciplined Value Series
Literature Requests
(unaudited)
Proxy Voting Policies and Procedures
A description of the policies and procedures that the Fund uses to determine how to vote proxies relating to portfolio securities is available, without charge, upon request:
| By phone | 1-800-466-3863 | |
| On the Securities and Exchange | ||
| Commission’s (SEC) web site | http://www.sec.gov |
Proxy Voting Record
Information regarding how the Fund voted proxies relating to portfolio securities during the most recent 12-month period ended June 30th is available, without charge, upon request:
| By phone | 1-800-466-3863 | |
| On the SEC’s web site | http://www.sec.gov |
Quarterly Portfolio Holdings
The Series’ complete schedule of portfolio holdings for the 1st and 3rd quarters of each fiscal year are provided on Form N-PORT, and are available, without charge, upon request:
| By phone | 1-800-466-3863 | |
| On the SEC’s web site | http://www.sec.gov |
Prospectus and Statement of Additional Information (SAI)
For more information about any of the Manning & Napier Fund, Inc. Series, you may obtain a prospectus and SAI at www.manning-napier.com or by calling (800) 466-3863. Before investing, carefully consider the objectives, risks, charges and expenses of the investment and read the prospectus carefully as it contains this and other information about the investment company.In addition, this information can be found on the SEC’s web site, http://www.sec.gov.
Additional information available at www.manning-napier.com
1. Fund Holdings - Month-End
2. Fund Holdings - Quarter-End
3. Shareholder Report - Annual
4. Shareholder Report - Semi-Annual
The Fund also offers electronic notification or “e-delivery” when certain documents are available on-line to be downloaded or reviewed. Direct shareholders can elect to receive electronic notification when shareholder reports, prospectus updates, and/or statements are available. If you do not currently have on-line access to your account, you can establish access by going to www.manning-napier.com, click on “Login” in the top corner of the page, and follow the prompts to self-enroll. Once enrolled, you can set your electronic notification preferences by clicking on the Account Options tab located within the green toolbar and then select E-Delivery Option. Should you have any questions on either how to establish on-line access or how to update your account settings, please contact Investor Services at 1-800-466-3863.
The Manning & Napier Fund, Inc. is managed by Manning & Napier Advisors, LLC. Manning & Napier Investor Services, Inc., an affiliate of Manning & Napier Advisors, LLC, is the distributor of the Fund shares.
MNDIV-10/19-AR
www.manning-napier.com
Manning & Napier Fund, Inc.
|
Overseas Series |
Beginning on June 25, 2021, as permitted by Securities and Exchange Commission regulations, paper copies of the Series’ annual and semi-annual shareholder reports will no longer be sent by mail, unless you specifically request paper copies of the reports from the Fund or from your financial intermediary, such as a broker-dealer or bank. Instead, the reports will be made available on a website, and you will be notified by mail each time a report is posted and provided with a website link to access the report.
If you already elected to receive shareholder reports electronically, you will not be affected by this change and you need not take any action. You may elect to receive shareholder reports and other communications from the Fund electronically by contacting your financial intermediary or, if you are a direct investor, by visiting www.manning-napier.com or calling 1-800-466-3863.
You may elect to receive all future annual and semi-annual reports in paper free of charge. If you invest through a financial intermediary, you can contact your financial intermediary to request that you continue to receive paper copies of your shareholder reports. If you invest directly with the Fund, you can inform the Fund that you wish to continue receiving paper copies of your shareholder reports by visiting www.manning-napier.com or calling 1-800-466-3863. Your election to receive reports in paper will apply to all funds held with your financial intermediary if you invest through a financial intermediary or all series of the Fund if you invest directly with the Fund.
| Independent Perspective| Real-World Solutions |
A Note from Our CEO
Dear Shareholder,
The investing world is constantly changing, yet investors’ needs and objectives remain substantially the same.
Whether you are an individual saver looking to ensure security in retirement, or an institutional investor with a fiduciary obligation to others, at the end of the day you look for a trusted partner to help you build, grow, and preserve wealth.
In order to do so successfully we recognize that, in the short-term, the world’s capital markets can be capricious and hard to predict.
Bubbles form, rise, and then pop. The hot stocks of today often become passing fads of tomorrow. Investor sentiment can swing wildly, whipsawing between exuberance one day and despondence the next.
As successful long-term investors, we are defined both by what we do as well as what we don’t do.
We don’t attempt to perfectly time every recession. We don’t jump on the latest trend. We don’t worry about capturing every market peak all across the globe.
On the other hand, we do maintain the rigorous disciplines we have developed over close to half a century. We are highly attentive to managing risk and protecting investors in down markets while participating fully in the opportunities our Research uncovers.
Our focus is on you, the shareholder, and helping you achieve your goals.
In the face of an uncertain world, we believe our investment philosophies, processes, and experience have stood the test of time and will do so in the future.
We appreciate your continued confidence in our approach.
 |
Sincerely,
Marc Mayer Chief Executive Officer |
Corporate Headquarters | 290 Woodcliff Drive| Fairport, NY 14450| (585) 325-6880 phone| (800) 551-0224 toll free| www.manning-napier.com
1
Overseas Series
Fund Commentary
(unaudited)
Investment Objective
To maximize long-term growth by investing principally in the common stocks of companies located around the world. The Series invests primarily in foreign companies, including those in developed and emerging markets.
Performance Commentary
International equity markets posted positive returns for the twelve-month period ending October 31, 2019. During the period, international large-cap stocks outperformed small- and mid-cap stocks, while international growth stocks outperformed their value counterparts. On a regional basis, emerging markets modestly outperformed developed markets.
The Overseas Series Class S delivered positive returns but underperformed the MSCI ACWI ex USA Index, returning 9.9% and 11.3%, respectively.
Underperformance was generally driven by stock selection, most notably within Energy and Health Care. Alternatively, the Series benefitted from stock selection within Communication Services and Consumer Staples, as well as from an underweight to Financials and overweight to Consumer Staples.
On a country basis, the Series benefitted from an overweight to the Netherlands; however, stock selection within the country was the largest detractor to relative returns (i.e., returns compared to the benchmark).
We believe the global economy is showing signs of moving into the later stages of the economic cycle. When this occurs, it is common to see strong stock market gains. While these rallies may give investors the feeling of missing out, it is exactly in these moments that risk management can be most valuable.
Given our outlook, the portfolio is focused on higher quality businesses and reasonably priced growth companies. We prefer businesses with strong management and solid balance sheets who have historically provided some degree of downside protection in adverse markets.
This view has led to meaningful positions in areas such as Consumer Staples and Health Care. In contrast, the portfolio is less exposed to sectors highly dependent on strong and above average economic growth such as Financials, Industrials, and Energy.
Please see the next page for additional performance information as of October 31, 2019.
Performance data quoted represents past performance and does not guarantee future results. The investment return and principal value of an investment will fluctuate, so that an investor’s shares, when redeemed, may be worth more or less than their original cost. Current performance may be higher or lower than that quoted; investors can obtain the most recent month-end performance at www.manning-napier.com or by calling (800) 466-3863.
Commentary prepared using data provided by FactSet. Analysis Manning & Napier. Commentary presented is relative to the MSCI ACWI ex USA Index. Additional information and associated disclosures can be found on the Performance Update page of this report.
All investments involve risks, including possible loss of principal. Funds whose investments are concentrated in foreign countries may be subject to fluctuating currency values, different accounting standards, and economic and political instability. The value of the Series may be affected by changes in exchange rates between foreign currencies and the U.S. dollar. Investments in emerging markets may be more volatile than investments in more developed markets.
2
Overseas Series
Performance Update as of October 31, 2019
(unaudited)
| AVERAGE ANNUAL TOTAL RETURNS AS OF OCTOBER 31, 2019 | ||||||
ONE YEAR1 | FIVE YEAR | TEN YEAR | ||||
Overseas Series - Class S2,3 | 9.88% | 2.91% | 3.94% | |||
Overseas Series - Class I2 | 10.23% | 3.21% | 4.25% | |||
Overseas Series - Class W2,4 | 10.78% | 3.31% | 4.30% | |||
Overseas Series - Class Z2,5 | 10.36% | 3.25% | 4.27% | |||
MSCI ACWI ex USA Index6 | 11.27% | 3.82% | 4.94% | |||
The following graph compares the value of a $1,000,000 investment in the Overseas Series - Class I for the ten years ended October 31, 2019 to the MSCI ACWI ex USA Index.
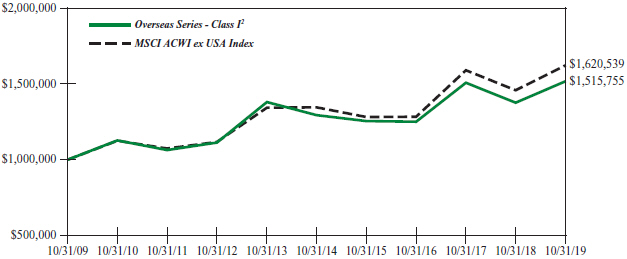
1The returns shown are based on net asset values calculated for shareholder transactions and may differ from the returns shown in the financial highlights, which reflect adjustments made to the net asset values in accordance with accounting principles generally accepted in the United States of America.
2The Series’ performance does not reflect the deduction of taxes that a shareholder would pay on fund distributions or the redemption of shares. The Series’ performance is historical and may not be indicative of future results. The performance returns shown are inclusive of the net expense ratio of the Series. For the year ended October 31, 2019, this net expense ratio was 1.05% for Class S, 0.75% for Class I, 0.05% for Class W and 0.65% for Class Z. The gross expense ratio, which does not account for any voluntary or contractual waivers currently in effect, was 1.09% for Class S, 0.80% for Class I, 0.72% for Class W and 0.72% for Class Z for the year ended October 31, 2019.
3For periods through September 21, 2018 (the inception date of the Class S shares), performance for the Class S shares is hypothetical and is based on the historical performance of the Class I shares adjusted for the Class S shares’ charges and expenses.
4For periods through March 1, 2019 (the inception date of the Class W shares), performance for the Class W shares is based on the historical performance of the Class I shares. Because the Class W shares invest in the same portfolio of securities as the Class I shares, performance will be different only to the extent that the Class I shares have a higher expense ratio.
5For periods through May 1, 2018 (the inception date of the Class Z shares), performance for the Class Z shares is based on the historical performance of the Class I shares. Because the Class Z shares invest in the same portfolio of securities as the Class I shares, performance will be different only to the extent that the Class I shares have a higher expense ratio.
6The MSCI ACWI ex USA Index (ACWIxUS) is designed to measure large and mid-cap representation across 22 of 23 Developed Markets countries (excluding the U.S.) and 26 Emerging Markets countries. The Index returns do not reflect any fees or expenses. The Index is denominated in U.S. dollars. The Index returns are net of withholding taxes. They assume daily reinvestment of net dividends thus accounting for any applicable dividend taxation. Index returns provided by Bloomberg.
3
Overseas Series
Shareholder Expense Example
(unaudited)
As a shareholder of the Series, you incur ongoing costs, including management fees, shareholder service fees and other Series expenses. This example is intended to help you understand your ongoing costs (in dollars) of investing in the Series and to compare these costs with the ongoing costs of investing in other mutual funds.
The example is based on an investment of $1,000 invested in each class at the beginning of the period and held for the entire period (May 1, 2019 to October 31, 2019).
Actual Expenses
The Actual lines of the table below provide information about actual account values and actual expenses. You may use the information in these lines, together with the amount you invested, to estimate the expenses that you paid over the period. Simply divide your account value by $1,000 (for example, an $8,600 account value divided by $1,000 = 8.6), then multiply the result by the number in the Actual line for the Class in which you have invested under the heading entitled “Expenses Paid During Period” to estimate the expenses you paid on your account during this period.
Hypothetical Example for Comparison Purposes
The Hypothetical lines of each class in the table below provide information about hypothetical account values and hypothetical expenses based on the Class’ actual expense ratio and an assumed rate of return of 5% per year before expenses, which is not the Class’ actual return. The hypothetical account values and expenses may not be used to estimate the actual ending account balance or expenses you paid during the period. You may use this information to compare the ongoing costs of investing in a class of the Series and other funds. To do so, compare this 5% hypothetical example for the Class in which you have invested with the 5% hypothetical examples that appear in the shareholder reports of the other funds.
Please note that the expenses shown in the table are meant to highlight your ongoing costs only and do not reflect any transaction costs, such as sales charges (loads), redemption fees, or exchange fees that you may incur in other mutual funds. Therefore, the second line of the table is useful in comparing ongoing costs only, and will not help you determine the relative total costs of owning different funds.
| BEGINNING ACCOUNT VALUE 5/1/19 | ENDING ACCOUNT VALUE 10/31/19 | EXPENSES PAID DURING PERIOD 5/1/19-10/31/191 | ANNUALIZED RATIO | |||||||||||||
Class S | ||||||||||||||||
Actual | $1,000.00 | $1,010.00 | $5.32 | 1.05% | ||||||||||||
Hypothetical | $1,000.00 | $1,019.91 | $5.35 | 1.05% | ||||||||||||
Class I | ||||||||||||||||
Actual | $1,000.00 | $1,011.30 | $3.80 | 0.75% | ||||||||||||
Hypothetical | $1,000.00 | $1,021.42 | $3.82 | 0.75% | ||||||||||||
Class W | ||||||||||||||||
Actual | $1,000.00 | $1,015.50 | $0.25 | 0.05% | ||||||||||||
Hypothetical | $1,000.00 | $1,024.95 | $0.26 | 0.05% | ||||||||||||
Class Z | ||||||||||||||||
Actual | $1,000.00 | $1,012.50 | $3.30 | 0.65% | ||||||||||||
Hypothetical | $1,000.00 | $1,021.93 | $3.31 | 0.65% | ||||||||||||
1 Expenses are equal to the Series’ annualized expense ratio (for the six-month period), multiplied by the average account value over the period, multiplied by 184/365 (to reflect the one-half year period). Expenses are based on the most recent fiscal half year; therefore, the expense ratios stated above may differ from the expense ratios stated in the financial highlights, which are based on one-year data. The Class’ total return would have been lower had certain expenses not been waived during the period.
4
Overseas Series
Portfolio Composition as of October 31, 2019
(unaudited)
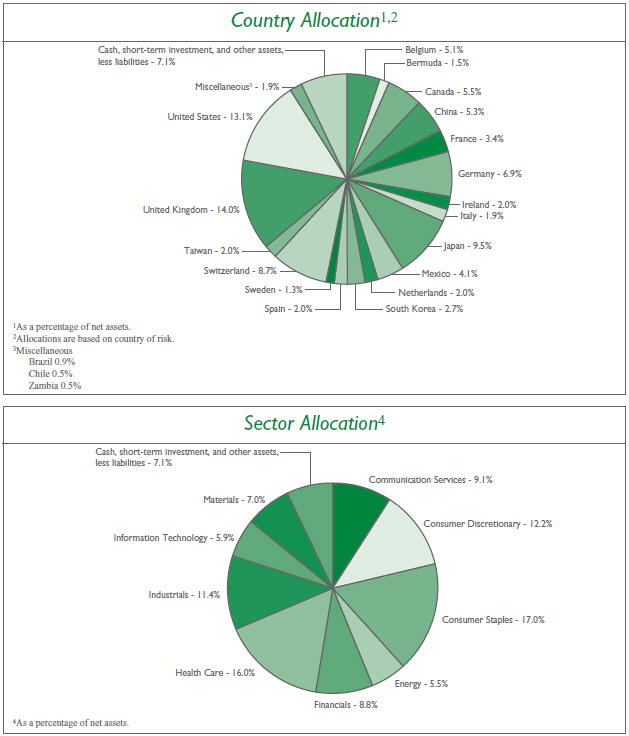
5
Overseas Series
Investment Portfolio - October 31, 2019
SHARES
|
VALUE (NOTE 2)
| |||||||||||
COMMON STOCKS - 92.9% |
| |||||||||||
Communication Services - 9.1% | ||||||||||||
Entertainment - 4.3% | ||||||||||||
Nexon Co. Ltd. (Japan)* | 1,018,200 | $ | 11,799,153 | |||||||||
Sea Ltd. - ADR (Taiwan)* | 336,095 | 10,002,187 | ||||||||||
|
| |||||||||||
| 21,801,340 | ||||||||||||
|
| |||||||||||
Interactive Media & Services - 2.0% | ||||||||||||
Tencent Holdings Ltd. - Class H (China) | 249,900 | 10,136,673 | ||||||||||
|
| |||||||||||
Media - 2.8% | ||||||||||||
Quebecor, Inc. - Class B (Canada) | 261,398 | 6,076,993 | ||||||||||
Shaw Communications, Inc. - | ||||||||||||
Class B (Canada) | 382,420 | 7,804,608 | ||||||||||
|
| |||||||||||
| 13,881,601 | ||||||||||||
|
| |||||||||||
Total Communication Services | 45,819,614 | |||||||||||
|
| |||||||||||
Consumer Discretionary - 12.2% | ||||||||||||
Hotels, Restaurants & Leisure - 1.3% | ||||||||||||
Restaurant Brands International, Inc. (Canada) | 104,750 | 6,854,840 | ||||||||||
|
| |||||||||||
Household Durables - 2.5% | ||||||||||||
Sony Corp. (Japan) | 208,200 | 12,672,957 | ||||||||||
|
| |||||||||||
Internet & Direct Marketing Retail - 2.5% | ||||||||||||
Alibaba Group Holding Ltd. - ADR (China)* | 56,645 | 10,007,472 | ||||||||||
Farfetch Ltd. - Class A (United Kingdom)* | 273,335 | 2,440,882 | ||||||||||
|
| |||||||||||
| 12,448,354 | ||||||||||||
|
| |||||||||||
Multiline Retail - 1.3% | ||||||||||||
B&M European Value Retail S.A. (United Kingdom) | 1,370,195 | 6,573,374 | ||||||||||
|
| |||||||||||
Specialty Retail - 2.0% | ||||||||||||
Industria de Diseno Textil S.A. (Spain) | 322,440 | 10,047,492 | ||||||||||
|
| |||||||||||
Textiles, Apparel & Luxury Goods - 2.6% lululemon athletica, Inc. (United States)* | 64,090 | 13,091,664 | ||||||||||
|
| |||||||||||
Total Consumer Discretionary | 61,688,681 | |||||||||||
|
| |||||||||||
Consumer Staples - 17.0% | ||||||||||||
Beverages - 5.2% | ||||||||||||
Ambev S.A. - ADR (Brazil) | 1,067,831 | 4,602,351 | ||||||||||
Anheuser-Busch InBev S.A./N.V. (Belgium) | 142,265 | 11,483,265 | ||||||||||
Diageo plc (United Kingdom) | 245,095 | 10,032,006 | ||||||||||
|
| |||||||||||
| 26,117,622 | ||||||||||||
|
| |||||||||||
Food Products - 6.0% | ||||||||||||
Danone S.A. (France) | 147,680 | 12,234,000 | ||||||||||
Nestle S.A. (Switzerland) | 167,195 | 17,886,746 | ||||||||||
|
| |||||||||||
| 30,120,746 | ||||||||||||
|
| |||||||||||
The accompanying notes are an integral part of the financial statements.
6
Overseas Series
Investment Portfolio - October 31, 2019
SHARES
|
VALUE (NOTE 2)
| |||||||||||
COMMON STOCKS(continued) | ||||||||||||
Consumer Staples(continued) | ||||||||||||
Personal Products - 4.8% | ||||||||||||
Beiersdorf AG (Germany) | 68,311 | $ | 8,087,275 | |||||||||
Unilever plc - ADR (United Kingdom) | 265,825 | 15,978,741 | ||||||||||
|
| |||||||||||
| 24,066,016 | ||||||||||||
|
| |||||||||||
Tobacco - 1.0% | ||||||||||||
British American Tobacco plc - ADR (United Kingdom) | 151,125 | 5,283,330 | ||||||||||
|
| |||||||||||
Total Consumer Staples | 85,587,714 | |||||||||||
|
| |||||||||||
Energy - 5.5% | ||||||||||||
Energy Equipment & Services - 4.1% | ||||||||||||
Core Laboratories N.V. (United States) | 115,855 | 5,102,254 | ||||||||||
Schlumberger Ltd. (United States) | 474,490 | 15,511,078 | ||||||||||
|
| |||||||||||
| 20,613,332 | ||||||||||||
|
| |||||||||||
Oil, Gas & Consumable Fuels - 1.4% | ||||||||||||
Cameco Corp. (Canada) | 801,740 | 7,159,539 | ||||||||||
|
| |||||||||||
Total Energy | 27,772,871 | |||||||||||
|
| |||||||||||
Financials - 8.8% | ||||||||||||
Banks - 3.5% | ||||||||||||
The Bank Of N.T. Butterfield & Son Ltd. (Bermuda) | 233,585 | 7,696,626 | ||||||||||
FinecoBank Banca Fineco S.p.A. (Italy) | 869,610 | 9,803,405 | ||||||||||
|
| |||||||||||
| 17,500,031 | ||||||||||||
|
| |||||||||||
Capital Markets - 3.4% | ||||||||||||
Deutsche Boerse AG (Germany) | 71,415 | 11,059,302 | ||||||||||
Julius Baer Group Ltd. (Switzerland) | 139,680 | 6,185,538 | ||||||||||
|
| |||||||||||
| 17,244,840 | ||||||||||||
|
| |||||||||||
Insurance - 1.9% | ||||||||||||
Admiral Group plc (United Kingdom) | 374,120 | 9,791,407 | ||||||||||
|
| |||||||||||
Total Financials | 44,536,278 | |||||||||||
|
| |||||||||||
Health Care - 16.0% | ||||||||||||
Health Care Equipment & Supplies - 7.1% | ||||||||||||
Alcon, Inc. (Switzerland)* | 168,728 | 10,000,509 | ||||||||||
Getinge AB - Class B (Sweden) | 368,850 | 6,306,064 | ||||||||||
Medtronic plc (United States) | 122,070 | 13,293,423 | ||||||||||
Shandong Weigao Group Medical Polymer Co. Ltd. - Class H (China) | 5,636,000 | 6,470,358 | ||||||||||
|
| |||||||||||
| 36,070,354 | ||||||||||||
|
| |||||||||||
Life Sciences Tools & Services - 3.9% | ||||||||||||
Gerresheimer AG (Germany) | 100,085 | 8,071,370 | ||||||||||
QIAGEN N.V. (United States)* | 144,419 | 4,305,130 | ||||||||||
QIAGEN N.V. (United States)* | 235,572 | 7,085,783 | ||||||||||
|
| |||||||||||
| 19,462,283 | ||||||||||||
|
|
|
| |||||||||
The accompanying notes are an integral part of the financial statements.
7
Overseas Series
Investment Portfolio - October 31, 2019
SHARES
|
VALUE (NOTE 2)
| |||||||||||
COMMON STOCKS(continued) | ||||||||||||
Health Care(continued) | ||||||||||||
Pharmaceuticals - 5.0% | ||||||||||||
Merck KGaA (Germany) | 65,495 | $ | 7,811,362 | |||||||||
Novartis AG - ADR (Switzerland) | 115,120 | 10,066,093 | ||||||||||
Perrigo Co. plc (United States) | 143,055 | 7,584,776 | ||||||||||
|
| |||||||||||
| 25,462,231 | ||||||||||||
|
| |||||||||||
Total Health Care | 80,994,868 | |||||||||||
|
| |||||||||||
Industrials - 11.4% | ||||||||||||
Aerospace & Defense - 2.4% | ||||||||||||
BAE Systems plc (United Kingdom) | 1,609,030 | 12,019,032 | ||||||||||
|
| |||||||||||
Airlines - 1.6% | ||||||||||||
Ryanair Holdings plc - ADR (Ireland)* | 107,910 | 8,054,402 | ||||||||||
|
| |||||||||||
Construction & Engineering - 1.0% | ||||||||||||
Vinci S.A. (France) | 45,945 | 5,154,859 | ||||||||||
|
| |||||||||||
Machinery - 3.5% | ||||||||||||
FANUC Corp. (Japan) | 45,000 | 8,876,219 | ||||||||||
The Weir Group plc (United Kingdom) | 502,586 | 8,778,712 | ||||||||||
|
| |||||||||||
| 17,654,931 | ||||||||||||
|
| |||||||||||
Transportation Infrastructure - 2.9% | ||||||||||||
Grupo Aeroportuario del Centro Norte S.A.B. de C.V. (Mexico) | 749,300 | 5,199,702 | ||||||||||
Grupo Aeroportuario del Pacifico S.A.B. de C.V. - ADR (Mexico) | 37,325 | 3,900,836 | ||||||||||
Grupo Aeroportuario del Sureste S.A.B. de C.V. - ADR (Mexico) | 32,455 | 5,314,506 | ||||||||||
|
| |||||||||||
| 14,415,044 | ||||||||||||
|
| |||||||||||
Total Industrials | 57,298,268 | |||||||||||
|
| |||||||||||
Information Technology - 5.9% | ||||||||||||
Electronic Equipment, Instruments & Components - 2.8% | ||||||||||||
Keyence Corp. (Japan) | 22,800 | 14,416,358 | ||||||||||
|
| |||||||||||
IT Services - 0.4% | ||||||||||||
Keywords Studios plc (Ireland) | 147,467 | 2,125,012 | ||||||||||
|
| |||||||||||
Technology Hardware, Storage & Peripherals - 2.7% | ||||||||||||
Samsung Electronics Co. Ltd. (South Korea) | 311,915 | 13,480,920 | ||||||||||
|
| |||||||||||
Total Information Technology | 30,022,290 | |||||||||||
|
| |||||||||||
Materials - 7.0% | ||||||||||||
Chemicals - 6.0% | ||||||||||||
Akzo Nobel N.V. (Netherlands) | 83,498 | 7,697,967 | ||||||||||
OCI N.V. (Netherlands)* | 105,985 | 2,383,006 | ||||||||||
Orbia Advance Corp. S.A.B. de C.V. (Mexico) | 2,802,700 | 6,066,822 | ||||||||||
Solvay S.A. (Belgium) | 130,965 | 14,239,296 | ||||||||||
|
| |||||||||||
| 30,387,091 | ||||||||||||
|
| |||||||||||
The accompanying notes are an integral part of the financial statements.
8
Overseas Series
Investment Portfolio - October 31, 2019
SHARES
|
VALUE (NOTE 2)
| |||||||||||
COMMON STOCKS(continued) | ||||||||||||
Materials(continued) | ||||||||||||
Metals & Mining - 1.0% | ||||||||||||
First Quantum Minerals Ltd. (Zambia) | 289,500 | $ | 2,446,386 | |||||||||
Lundin Mining Corp. (Chile) | 475,423 | 2,400,397 | ||||||||||
|
| |||||||||||
| 4,846,783 | ||||||||||||
|
| |||||||||||
Total Materials | 35,233,874 | |||||||||||
|
| |||||||||||
TOTAL COMMON STOCKS | 468,954,458 | |||||||||||
|
| |||||||||||
SHORT-TERM INVESTMENT - 3.8% | ||||||||||||
Dreyfus Government Cash Management, Institutional Shares, 1.73%1 | ||||||||||||
(Identified Cost $19,463,979) | 19,463,979 | 19,463,979 | ||||||||||
|
| |||||||||||
TOTAL INVESTMENTS - 96.7% | 488,418,437 | |||||||||||
OTHER ASSETS, LESS LIABILITIES - 3.3% | 16,424,625 | |||||||||||
|
| |||||||||||
NET ASSETS - 100% | $ | 504,843,062 | ||||||||||
|
| |||||||||||
ADR - American Depositary Receipt
*Non-income producing security.
1Rate shown is the current yield as of October 31, 2019.
The Series’ portfolio holds, as a percentage of net assets, greater than 10% in the following countries:
United Kingdom - 14.0%; United States - 13.1%.
The Global Industry Classification Standard (GICS) was developed by and is the exclusive property and a service mark of MSCI Inc. (MSCI) and Standard & Poor’s, a division of S&P Global Inc. (S&P), and is licensed for use by Manning & Napier when referencing GICS sectors. Neither MSCI, S&P, nor any third party involved in making or compiling the GICS or any GICS classifications makes any express or implied warranties or representations with respect to such standard or classification, nor shall any such party have any liability therefrom.
The accompanying notes are an integral part of the financial statements.
9
Overseas Series
Statement of Assets & Liabilities
October 31, 2019
ASSETS: | ||||
Investments, at value (identified cost $497,258,566) (Note 2) | $ | 488,418,437 | ||
Foreign tax reclaims receivable | 8,520,850 | |||
Receivable for securities sold | 7,766,655 | |||
Dividends receivable | 967,285 | |||
Receivable for fund shares sold | 254,228 | |||
Prepaid expenses | 28,564 | |||
|
| |||
TOTAL ASSETS | 505,956,019 | |||
|
| |||
LIABILITIES: | ||||
Accrued management fees (Note 3) | 184,831 | |||
Accrued sub-transfer agent fees (Note 3) | 159,830 | |||
Accrued distribution and service (Rule 12b-1) fees (Class S) (Note 3) | 61,837 | |||
Accrued fund accounting and administration fees (Note 3) | 28,915 | |||
Accrued Chief Compliance Officer service fees (Note 3) | 688 | |||
Payable for fund shares repurchased | 562,729 | |||
Other payables and accrued expenses | 114,127 | |||
|
| |||
TOTAL LIABILITIES | 1,112,957 | |||
|
| |||
TOTAL NET ASSETS | $ | 504,843,062 | ||
|
| |||
NET ASSETS CONSIST OF: | ||||
Capital stock | $ | 208,620 | ||
Additional paid-in-capital | 1,005,768,327 | |||
Total distributable earnings (loss) | (501,133,885 | ) | ||
|
| |||
TOTAL NET ASSETS | $ | 504,843,062 | ||
|
| |||
NET ASSET VALUE, OFFERING PRICE AND REDEMPTION PRICE PER SHARE - Class S($272,760,471/11,297,815 shares) | $ | 24.14 | ||
|
| |||
NET ASSET VALUE, OFFERING PRICE AND REDEMPTION PRICE PER SHARE - Class I($74,325,208/3,068,402 shares) | $ | 24.22 | ||
|
| |||
NET ASSET VALUE, OFFERING PRICE AND REDEMPTION PRICE PER SHARE - Class W($107,191,812/4,409,432 shares) | $ | 24.31 | ||
|
| |||
NET ASSET VALUE, OFFERING PRICE AND REDEMPTION PRICE PER SHARE - Class Z($50,565,571/2,086,308 shares) | $ | 24.24 | ||
|
| |||
The accompanying notes are an integral part of the financial statements.
10
Overseas Series
Statement of Operations
For the Year Ended October 31, 2019
INVESTMENT INCOME: | ||||
Dividends (net of foreign taxes withheld, $1,479,675) | $ | 15,700,188 | ||
|
| |||
EXPENSES: | ||||
Management fees (Note 3) | 3,669,477 | |||
Distribution and service (Rule 12b-1) fees (Class S) (Note 3) | 958,650 | |||
Sub-transfer agent fees (Note 3) | 547,048 | |||
Fund accounting and administration fees (Note 3) | 120,056 | |||
Directors’ fees (Note 3) | 58,769 | |||
Chief Compliance Officer service fees (Note 3) | 3,455 | |||
Custodian fees | 42,475 | |||
Interest expense | 4,809 | |||
Miscellaneous | 479,181 | |||
|
| |||
Total Expenses | 5,883,920 | |||
Less reduction of expenses (Note 3) | (685,517 | ) | ||
|
| |||
Net Expenses | 5,198,403 | |||
|
| |||
NET INVESTMENT INCOME | 10,501,785 | |||
|
| |||
REALIZED AND UNREALIZED GAIN (LOSS) ON INVESTMENTS AND FOREIGN CURRENCY: | ||||
Net realized gain (loss) on- | ||||
Investments | 1,298,637 | |||
Foreign currency and translation of other assets and liabilities | (103,822 | ) | ||
|
| |||
| 1,194,815 | ||||
|
| |||
Net change in unrealized appreciation (depreciation) on- | ||||
Investments | 46,772,010 | |||
Foreign currency and translation of other assets and liabilities | 210,748 | |||
|
| |||
| 46,982,758 | ||||
|
| |||
NET REALIZED AND UNREALIZED GAIN (LOSS) ON INVESTMENTS AND FOREIGN CURRENCY | 48,177,573 | |||
|
| |||
NET INCREASE IN NET ASSETS RESULTING FROM OPERATIONS | $ | 58,679,358 | ||
|
| |||
The accompanying notes are an integral part of the financial statements.
11
Overseas Series
Statements of Changes in Net Assets
FOR THE YEAR ENDED 10/31/19
| FOR THE YEAR ENDED
| |||||||
INCREASE (DECREASE) IN NET ASSETS: | ||||||||
OPERATIONS: | ||||||||
Net investment income | $ | 10,501,785 | $ | 6,673,604 | ||||
Net realized gain (loss) on investments and foreign currency | 1,194,815 | 72,244,084 | ||||||
Net change in unrealized appreciation (depreciation) on investments and foreign currency | 46,982,758 | (154,513,058 | ) | |||||
|
|
|
| |||||
Net increase (decrease) from operations | 58,679,358 | (75,595,370 | ) | |||||
|
|
|
| |||||
DISTRIBUTIONS TO SHAREHOLDERS (Note 9): | ||||||||
Class S | (4,153,199 | ) | — | |||||
Class I | (1,010,826 | ) | (10,748,629 | ) | ||||
Class Z | (963,827 | ) | — | |||||
|
|
|
| |||||
Total distributions to shareholders | (6,127,852 | ) | (10,748,629 | ) | ||||
|
|
|
| |||||
CAPITAL STOCK ISSUED AND REPURCHASED: | ||||||||
Net increase (decrease) from capital share transactions (Note 5) | (293,849,911 | ) | 77,003,717 | |||||
|
|
|
| |||||
Net increase (decrease) in net assets | (241,298,405 | ) | (9,340,282 | ) | ||||
NET ASSETS: | ||||||||
Beginning of year | 746,141,467 | 755,481,749 | ||||||
|
|
|
| |||||
End of year | $ | 504,843,062 | $ | 746,141,467 | ||||
|
|
|
| |||||
The accompanying notes are an integral part of the financial statements.
12
Overseas Series
Financial Highlights - Class S
FOR THE
| FOR THE PERIOD
| |||||||||
Per share data (for a share outstanding throughout each period): | ||||||||||
Net asset value - Beginning of period | $22.17 | $24.72 | ||||||||
|
|
|
| |||||||
Income (loss) from investment operations: | ||||||||||
Net investment income2 | 0.35 | 0.01 | ||||||||
Net realized and unrealized gain (loss) on investments | 1.81 | (2.56 | ) | |||||||
|
|
|
| |||||||
Total from investment operations | 2.16 | (2.55 | ) | |||||||
|
|
|
| |||||||
Less distributions to shareholders: | ||||||||||
From net investment income | (0.19 | ) | — | |||||||
|
|
|
| |||||||
Net asset value - End of period | $24.14 | $22.17 | ||||||||
|
|
|
| |||||||
Net assets - End of period(000’s omitted) | $272,760 | $500,950 | ||||||||
|
|
|
| |||||||
Total return3 | 9.88% | (10.32% | ) | |||||||
Ratios (to average net assets)/Supplemental Data: | ||||||||||
Expenses* | 1.05% | 1.05% | 4 | |||||||
Net investment income | 1.55% | 0.38% | 4 | |||||||
Series portfolio turnover | 43% | 34% | ||||||||
| *The investment advisor did not impose all or a portion of its management and/or other fees, and in some periods may have paid a portion of the Series’ expenses. If these expenses had been incurred by the Class, the expense ratio (to average net assets) would have increased by the following amounts: |
| |||||||||
| 0.04% | 0.06% | 4 | ||||||||
1Commencement of operations.
2Calculated based on average shares outstanding during the periods.
3Represents aggregate total return for the periods indicated, and assumes reinvestment of all distributions. Total return would have been lower had certain expenses not been waived or reimbursed during certain periods. Periods less than one year are not annualized.
4Annualized.
The accompanying notes are an integral part of the financial statements.
13
Overseas Series
Financial Highlights - Class I*
| FOR THE YEAR ENDED | ||||||||||||||||||||
| 10/31/19 | 10/31/18 | 10/31/17 | 10/31/16 | 10/31/15 | ||||||||||||||||
Per share data (for a share outstanding throughout each year): | ||||||||||||||||||||
Net asset value - Beginning of year | $22.18 | $24.73 | $20.88 | $21.34 | $24.31 | |||||||||||||||
|
|
|
|
|
|
|
|
|
| |||||||||||
Income (loss) from investment operations: | ||||||||||||||||||||
Net investment income1 | 0.42 | 0.41 | 0.26 | 0.32 | 0.32 | |||||||||||||||
Net realized and unrealized gain (loss) on investments | 1.81 | (2.51 | ) | 3.94 | (0.41 | ) | (1.14 | ) | ||||||||||||
|
|
|
|
|
|
|
|
|
| |||||||||||
Total from investment operations | 2.23 | (2.10 | ) | 4.20 | (0.09 | ) | (0.82 | ) | ||||||||||||
|
|
|
|
|
|
|
|
|
| |||||||||||
Less distributions to shareholders: | ||||||||||||||||||||
From net investment income | (0.19 | ) | (0.45 | ) | (0.35 | ) | (0.37 | ) | (0.36 | ) | ||||||||||
From net realized gain on investments | — | — | — | — | (1.79 | ) | ||||||||||||||
|
|
|
|
|
|
|
|
|
| |||||||||||
Total distributions to shareholders | (0.19 | ) | (0.45 | ) | (0.35 | ) | (0.37 | ) | (2.15 | ) | ||||||||||
|
|
|
|
|
|
|
|
|
| |||||||||||
Net asset value - End of year | $24.22 | $22.18 | $24.73 | $20.88 | $21.34 | |||||||||||||||
|
|
|
|
|
|
|
|
|
| |||||||||||
Net assets - End of year(000’s omitted) | $74,325 | $140,653 | $755,482 | $933,605 | $1,725,278 | |||||||||||||||
|
|
|
|
|
|
|
|
|
| |||||||||||
Total return2 | 10.18% | (8.69% | ) | 20.49% | 3 | (0.35% | ) | (3.02% | ) | |||||||||||
Ratios (to average net assets)/Supplemental Data: | ||||||||||||||||||||
Expenses** | 0.75% | 0.75% | 0.75% | 0.75% | 0.74% | |||||||||||||||
Net investment income | 1.86% | 1.62% | 1.16% | 1.54% | 1.41% | |||||||||||||||
Series portfolio turnover | 43% | 34% | 44% | 37% | 59% | |||||||||||||||
| *Effective March 1, 2017, Class A shares of the Series have been redesignated as Class I shares. |
| |||||||||||||||||||
| **For certain periods presented, the investment advisor did not impose all or a portion of its management and/or other fees, and in some years may have paid a portion of the Series’ expenses. If these expenses had been incurred by the Class, the expense ratio (to average net assets) would have increased by the following amounts: |
| |||||||||||||||||||
| 0.05% | 0.02% | 0.02% | N/A | N/A | ||||||||||||||||
1Calculated based on average shares outstanding during the years.
2Represents aggregate total return for the year indicated, and assumes reinvestment of all distributions. Total return would have been lower had certain expenses not been waived or reimbursed during certain years.
3Includes litigation proceeds. Excluding this amount, the Series’ total return is 20.10%.
The accompanying notes are an integral part of the financial statements.
14
Overseas Series
Financial Highlights - Class W
FOR THE PERIOD
| |||||
Per share data (for a share outstanding throughout each period): | |||||
Net asset value - Beginning of period | $22.95 | ||||
|
| ||||
Income from investment operations: | |||||
Net investment income2 | 0.35 | ||||
Net realized and unrealized gain (loss) on investments | 1.01 | ||||
|
| ||||
Total from investment operations | 1.36 | ||||
|
| ||||
Net asset value - End of period | $24.31 | ||||
|
| ||||
Net assets - End of period(000’s omitted) | $107,192 | ||||
|
| ||||
Total return3 | 5.93% | ||||
Ratios (to average net assets)/Supplemental Data: | |||||
Expenses*4 | 0.05% | ||||
Net investment income4 | 2.23% | ||||
Series portfolio turnover | 43% | ||||
| *The investment advisor did not impose all or a portion of its management and/or other fees during the period, and may have paid a portion of the Series’ expenses. If these expenses had been incurred by the Class, the expense ratio (to average net assets) would have increased by the following amount4: |
| ||||
| 0.67% | |||||
1Commencement of operations.
2Calculated based on average shares outstanding during the period.
3Represents aggregate total return for the period indicated, and assumes reinvestment of all distributions. Total return would have been lower had certain expenses not been waived or reimbursed during the period. Periods less than one year are not annualized.
4Annualized.
The accompanying notes are an integral part of the financial statements.
15
Overseas Series
Financial Highlights - Class Z
FOR THE
|
FOR THE PERIOD
| |||||||||
Per share data (for a share outstanding throughout each period): | ||||||||||
Net asset value - Beginning of period | $22.19 | $24.85 | ||||||||
|
|
|
| |||||||
Income (loss) from investment operations: | ||||||||||
Net investment income2 | 0.44 | 0.13 | ||||||||
Net realized and unrealized gain (loss) on investments | 1.82 | (2.79 | ) | |||||||
|
|
|
| |||||||
Total from investment operations | 2.26 | (2.66 | ) | |||||||
|
|
|
| |||||||
Less distributions to shareholders: | ||||||||||
From net investment income | (0.21 | ) | — | |||||||
|
|
|
| |||||||
Net asset value - End of period | $24.24 | $22.19 | ||||||||
|
|
|
| |||||||
Net assets - End of period (000’s omitted) | $50,566 | $104,538 | ||||||||
|
|
|
| |||||||
Total return3 | 10.36% | (10.71% | ) | |||||||
Ratios (to average net assets)/Supplemental Data: | ||||||||||
Expenses* | 0.65% | 0.65% | 4 | |||||||
Net investment income | 1.95% | 1.04% | 4 | |||||||
Series portfolio turnover | 43% | 34% | ||||||||
| *The investment advisor did not impose all or a portion of its management and/or other fees, and in some periods may have paid a portion of the Series’ expenses. If these expenses had been incurred by the Class, the expense ratio (to average net assets) would have increased by the following amounts: |
| |||||||||
| 0.07% | 0.09% | 4 | ||||||||
1Commencement of operations.
2Calculated based on average shares outstanding during the periods.
3Represents aggregate total return for the periods indicated, and assumes reinvestment of all distributions. Total return would have been lower had certain expenses not been waived or reimbursed during certain periods. Periods less than one year are not annualized.
4Annualized.
The accompanying notes are an integral part of the financial statements.
16
Overseas Series
Notes to Financial Statements
| 1. | Organization |
Overseas Series (the “Series”) is a no-load diversified series of Manning & Napier Fund, Inc. (the “Fund”). The Fund is organized in Maryland and is registered under the Investment Company Act of 1940, as amended, as an open-end management investment company.
The Series’ investment objective is to provide long-term growth.
The Series is authorized to issue four classes of shares (Class I, S, W, and Z). Class W shares of the Series were issued on March 1, 2019. Each class of shares is substantially the same, except that class-specific distribution and shareholder servicing expenses are borne by the specific class of shares to which they relate.
The Fund’s Advisor is Manning & Napier Advisors, LLC (the “Advisor”). Shares of the Series are offered to investors, clients and employees of the Advisor and its affiliates. The total authorized capital stock of the Fund consists of 15 billion shares of common stock each having a par value of $0.01. As of October 31, 2019, 10 billion shares have been designated in total among 34 series, of which 200 million have been designated as Overseas Series Class I common stock, 400 million have been designated as Overseas Series Class S common stock, 75 million have been designated as Overseas Series Class W common stock and 100 million have been designated as Overseas Series Class Z common stock.
Reorganization
On September 18, 2018, the shareholders of World Opportunities Series approved the reorganization of World Opportunities Series into Overseas Series, each a series of the Fund, pursuant to which Overseas Series acquired substantially all of the assets and assumed certain stated liabilities of World Opportunities Series in exchange for an equal aggregate value of Overseas Series shares. For U.S. GAAP purposes, the transaction was treated as a merger. The merger took place after the close of business on September 21, 2018.
Each shareholder of World Opportunities Series received shares of Overseas Series with the same class designation and an aggregate Net Asset Value of such shareholder’s World Opportunities Series shares, as determined at the close of business on September 21, 2018.
The reorganization was accomplished by a tax-free exchange of shares of Overseas Series in the following amount and at the following conversion ratio:
WORLD OPPORTUNITIES PRIOR TO REORGANIZATION
| CONVERSION RATIO | SHARES OF OVERSEAS SERIES | ||||||||
Class S | 72,203,693 | ’0.330372 | 23,854,078 | |||||||
World Opportunities Series’ net assets and composition of net assets on September 21, 2018, the date of the reorganization, were as follows:
NET ASSETS | PAID-IN CAPITAL |
ACCUMULATED INVESTMENT LOSS
| ACCUMULATED REALIZED LOSS | NET UNREALIZED | ||||||||||||
$589,676,263 | $ | 1,011,588,366 | $ | (109,562 | ) | $ | (446,854,928 | ) | $ | 25,052,387 | ||||||
For financial reporting purposes, assets received and shares issued by Overseas Series were recorded at fair value; however, the cost basis of the investments received from World Opportunities Series was carried forward to align ongoing reporting of Overseas Series’ realized and unrealized gains and losses with amounts distributable to shareholders for tax purposes.
17
Overseas Series
Notes to Financial Statements (continued)
| 1. | Organization (continued) |
Reorganization(continued)
The aggregate net assets of Overseas Series immediately prior to, and after the acquisition, amounted to $310,629,139 and $900,305,402, respectively. World Opportunities Series’ fair value and cost of investments on September 21, 2018 were $583,171,966 and $558,177,803, respectively.
The purpose of the transaction was to combine two funds managed by the Advisor, the investment advisor to both Overseas Series and World Opportunities Series, with the same or substantially similar (but not identical) investment objectives, investment policies, strategies, risks and restrictions.
Assuming the acquisition had been completed on November 1, 2017, the beginning of the annual reporting period for Overseas Series, the pro forma results of operations for the year ended October 31, 2018, are as follows:
| • | Net investment income: $14,199,284 |
| • | Net realized and change in unrealized gain/loss on investments: $(50,062,232) |
| • | Net decrease in the net assets resulting from operations: $(35,862,948) |
Because the combined investment portfolios have been managed as a single integrated portfolio since the acquisition was completed, it is not practicable to separate the amounts of revenue and earnings of World Opportunities Series that have been included in the Overseas Series’ Statement of Operations since September 21, 2018.
Reorganization costs incurred by Overseas Series in connection with the reorganization were paid by the Advisor.
| 2. | Significant Accounting Policies |
The following is a summary of significant accounting policies followed by the Series. The Series is an investment company and, accordingly, follows the investment company accounting and reporting guidance of the Financial Accounting Standards Board Accounting Standards Codification Topic 946 - Investment Companies, which is part of accounting principles generally accepted in the United States of America (“GAAP”).
Security Valuation
Portfolio securities, including domestic equities, foreign equities, warrants and options, listed on an exchange other than the NASDAQ Stock Market are valued at the latest quoted sales price of the exchange on which the security is primarily traded. Securities not traded on valuation date or securities not listed on an exchange are valued at the latest quoted bid price provided by the Fund’s pricing service. Securities listed on the NASDAQ Stock Market are valued in accordance with the NASDAQ Official Closing Price.
Short-term investments that mature in sixty days or less may be valued at amortized cost, which approximates fair value. Investments in open-end investment companies are valued at their net asset value per share on valuation date.
Volume and level of activity in established markets for an asset or liability are evaluated to determine whether recent transactions and quoted prices are determinative of fair value. Where there have been significant decreases in volume and level of activity, further analysis and adjustment may be necessary to estimate fair value. The Series measures fair value in these instances by the use of inputs and valuation techniques which may be based upon current market prices of securities that are comparable in coupon, rating, maturity and industry and/or expectation of future cash flows. As a result of trading in relatively thin markets and/or markets that experience significant volatility, the prices used by the Series to value these securities may differ from the value that would be realized if these securities were sold, and the differences could be material.
Securities for which representative valuations or prices are not available from the Series’ pricing service may be valued at fair value as determined in good faith by the Advisor under procedures approved by and under the general supervision and
18
Overseas Series
Notes to Financial Statements (continued)
| 2. | Significant Accounting Policies (continued) |
Security Valuation(continued)
responsibility of the Fund’s Board of Directors (the “Board”). Due to the inherent uncertainty of valuations of such securities, the fair value may differ significantly from the values that would have been used had a ready market for such securities existed. If trading or events occurring after the close of the principal market in which securities are traded are expected to materially affect the value of those securities, then they may be valued at their fair value, taking this trading or these events into account. In accordance with the procedures approved by the Board, the values of certain securities trading outside the U.S. were adjusted following the close of local trading using a factor from a third party vendor. The third party vendor uses statistical analyses and quantitative models, which consider among other things subsequent movement and changes in the prices of indices, securities and exchange rates in other markets, to determine the factors which are used to adjust local market prices. The value of securities used for net asset value calculation under these procedures may differ from published prices for the same securities. It is the Fund’s policy to classify each foreign equity security where a factor from a third party vendor is provided as a Level 2 security.
Various inputs are used in determining the value of the Series’ assets or liabilities carried at fair value. These inputs are summarized in three broad levels. Level 1 includes quoted prices in active markets for identical assets and liabilities. Level 2 includes other significant observable inputs (including quoted prices for similar securities, interest rates, prepayment speeds, credit risk, etc.). Level 3 includes significant unobservable inputs (including the Series’ own assumptions in determining the fair value of investments). A financial instrument’s level within the fair value hierarchy is based on the lowest level of any input both individually and in aggregate that is significant to the fair value measurement. The inputs or methodology used for valuing securities are not necessarily an indication of the risk associated with investing in those securities.
The following is a summary of the valuation levels used for major security types as of October 31, 2019 in valuing the Series’ assets or liabilities carried at fair value:
| DESCRIPTION | TOTAL | LEVEL 1 | LEVEL 2# | LEVEL 3 | ||||||||||||
Assets: | ||||||||||||||||
Equity Securities: | ||||||||||||||||
Communication Services | $ | 45,819,614 | $ | 23,883,788 | $ | 21,935,826 | $ | — | ||||||||
Consumer Discretionary | 61,688,681 | 32,394,858 | 29,293,823 | — | ||||||||||||
Consumer Staples | 85,587,714 | 25,864,422 | 59,723,292 | — | ||||||||||||
Energy | 27,772,871 | 27,772,871 | — | — | ||||||||||||
Financials | 44,536,278 | 7,696,626 | 36,839,652 | — | ||||||||||||
Health Care | 80,994,868 | 45,249,931 | 35,744,937 | — | ||||||||||||
Industrials | 57,298,268 | 22,469,446 | 34,828,822 | — | ||||||||||||
Information Technology | 30,022,290 | — | 30,022,290 | — | ||||||||||||
Materials | 35,233,874 | 10,913,605 | 24,320,269 | — | ||||||||||||
Short-Term Investment | 19,463,979 | 19,463,979 | — | — | ||||||||||||
|
|
|
|
|
|
|
| |||||||||
Total assets | $ | 488,418,437 | $ | 215,709,526 | $ | 272,708,911 | $ | — | ||||||||
|
|
|
|
|
|
|
| |||||||||
#Includes certain equity foreign securities for which a factor from a third party vendor was applied to determine the securities’ fair value following the close of local trading.
There were no Level 3 securities held by the Series as of October 31, 2018 or October 31, 2019.
Security Transactions, Investment Income and Expenses
Security transactions are accounted for on trade date. Dividend income is recorded on the ex-dividend date, except that if the ex-dividend date has passed, certain dividends from foreign securities are recorded as soon as the Series is informed of the ex-dividend date. Non-cash dividends, if any, are recorded at the fair value of the securities received. Interest income, including amortization of premium and accretion of discounts using the effective interest method, is earned from settlement date and accrued daily.
19
Overseas Series
Notes to Financial Statements (continued)
| 2. | Significant Accounting Policies (continued) |
Security Transactions, Investment Income and Expenses(continued)
Expenses are recorded on an accrual basis. Most expenses of the Fund can be attributed to a specific series. Expenses which cannot be directly attributed are apportioned among the series in the Fund in such a manner as deemed equitable by the Fund’s Board, taking into consideration, among other things, the nature and type of expense.
The Series uses the identified cost method for determining realized gain or loss on investments for both financial statement and federal income tax reporting purposes.
Foreign Currency Translation
The books and records of the Series are maintained in U.S. dollars. Foreign currencies, investments and other assets and liabilities are translated into U.S. dollars at the current exchange rates. Purchases and sales of investment securities and income and expenses are translated on the respective dates of such transactions. The Series does not isolate realized and unrealized gains and losses attributable to changes in the exchange rates from gains and losses that arise from changes in the fair value of investments. Such fluctuations are included with net realized and unrealized gain or loss on investments. Net realized foreign currency gains and losses represent foreign currency gains and losses between trade date and settlement date on securities transactions, gains and losses on disposition of foreign currencies and the difference between the amount of income and foreign withholding taxes recorded on the books of the Series and the amounts actually received or paid.
Federal Taxes
The Series’ policy is to comply with the provisions of the Internal Revenue Code applicable to regulated investment companies. The Series is not subject to federal income tax or excise tax to the extent that the Series distributes to shareholders each year its taxable income, including any net realized gains on investments, in accordance with requirements of the Internal Revenue Code. Accordingly, no provision for federal income tax or excise tax has been made in the financial statements.
Management evaluates its tax positions to determine if the tax positions taken meet the minimum recognition threshold in connection with accounting for uncertainties in income tax positions taken or expected to be taken for the purposes of measuring and recognizing tax liabilities in the financial statements. Recognition of tax benefits of an uncertain tax position is required only when the position is “more likely than not” to be sustained assuming examination by taxing authorities. At October 31, 2019, the Series has recorded no liability for net unrecognized tax benefits relating to uncertain income tax positions taken or expected to be taken in future tax returns.
The Series files income tax returns in the U.S. federal jurisdiction, various states and foreign jurisdictions, as required. No income tax returns are currently under investigation. The statute of limitations on the Series’ tax returns remains open for the years ended October 31, 2016 through October 31, 2019. The Series is not aware of any tax positions for which it is reasonably possible that the total amounts of unrecognized tax benefits will significantly change in the next twelve months.
Foreign Taxes
Based on the Series’ understanding of the tax rules and rates related to income, gains and currency purchase/repatriation transactions for foreign jurisdictions in which it invests, the Series will provide for foreign taxes, and where appropriate, deferred foreign tax.
Distributions of Income and Gains
Distributions to shareholders of net investment income and net realized gains are made annually. An additional distribution may be necessary to avoid taxation of the Series. Distributions are recorded on the ex-dividend date.
Indemnifications
The Fund’s organizational documents provide former and current directors and officers with a limited indemnification against liabilities arising in connection with the performance of their duties to the Fund. In the normal course of business, the Fund may also enter into contracts that provide general indemnifications. The Fund’s maximum exposure under these arrangements is unknown as this would be dependent on future claims that may be made against the Fund. The risk of material loss from such claims is considered remote.
20
Overseas Series
Notes to Financial Statements (continued)
| 2. | Significant Accounting Policies (continued) |
Other
The preparation of financial statements in conformity with GAAP requires management to make estimates and assumptions that affect the reported amounts of assets and liabilities and the disclosure of contingent assets and liabilities at the date of the financial statements and the reported amounts of income and expenses during the reporting period. Actual results could differ from those estimates.
| 3. | Transactions with Affiliates and Other Agreements |
The Fund has an Investment Advisory Agreement (the “Agreement”) with the Advisor, for which the Series pays a fee, computed daily and payable monthly, at an annual rate of 0.60% of the Series’ average daily net assets.
Under the Agreement, personnel of the Advisor provide the Series with advice and assistance in the choice of investments and the execution of securities transactions, and otherwise maintain the Series’ organization. The Advisor also provides the Fund with necessary office space and fund administration and support services. The salaries of all officers of the Fund (except a percentage of the Fund’s Chief Compliance Officer’s salary, which is paid by the Fund), and of all Directors who are “affiliated persons” of the Fund, or of the Advisor, and all personnel of the Fund, or of the Advisor, performing services relating to research, statistical and investment activities, are paid by the Advisor. Each “non-affiliated” Director receives an annual stipend, which is allocated among all the active series of the Fund. In addition, these Directors also receive a fee per Board meeting attended plus a fee for each committee meeting attended and are reimbursed for travel and other out-of-pocket expenses incurred by them in connection with attending such meetings. The Fund also has an Audit Committee Chair, Governance & Nominating Committee Chair and Lead Independent Director who each receive an additional annual stipend for these roles.
The Fund may enter into agreements with financial intermediaries pursuant to which the Fund may pay financial intermediaries for non-distribution related sub-transfer agency, administrative, sub-accounting, and other shareholder services in an annual amount not to exceed 0.15% of the average daily net assets of the Class I and Class S shares of the Series. Payments made pursuant to such agreements are generally based on the current assets and/or number of accounts of the Series attributable to the financial intermediary. Any payments made pursuant to such agreements may be in addition to, rather than in lieu of, any Distribution and Shareholder Services Fee payable under the Rule 12b-1 plan of the Fund.
Effective March 1, 2019, the Advisor has contractually agreed to waive the management fee for the Class W shares. In addition, pursuant to a separate expense limitation agreement, the Advisor has contractually agreed to limit its fees and reimburse expenses to the extent necessary so that the total direct annual fund operating expenses, exclusive of distribution and service (12b-1) fees and waived Class W management fees (collectively, “excluded expenses”), to 0.75% of the average daily net assets of the Class I shares, 0.80% of the average daily net assets of the Class S shares, 0.65% of the average daily net assets of the Class Z shares, and 0.05% of the average daily net assets of the Class W shares. These contractual waivers are expected to continue indefinitely, and may not be amended or terminated by the Advisor without the approval of the Series’ Board of Directors. The Advisor may receive from a Class the difference between the Class’s total direct annual fund operating expenses, not including excluded expenses, and the Class’s contractual expense limit to recoup all or a portion of its prior fee waivers (other than Class W management fee waivers) or expense reimbursements made during the rolling three-year period preceding the recoupment if at any point the total direct annual fund operating expenses, not including excluded expenses, are below the contractual expense limit (a) at the time of the fee waiver and/or expense reimbursement and (b) at the time of the recoupment.
Pursuant to the advisory fee waiver, the Advisor waived $402,141 in management fees for Class W shares for the year ended October 31, 2019. In addition, pursuant to the separate expense limitation agreement, the Advisor waived or reimbursed expenses of $148,567, $43,628, $45,443, and $45,738 and for Class S, Class I, Class W, and Class Z shares, respectively, for the year ended October 31, 2019. These amounts are included as a reduction of expenses on the Statement of Operations. At October 31, 2019, the Advisor is eligible to recoup $216,157. For the year ended October 31, 2019, the Advisor did not recoup any expenses that have been previously waived or reimbursed.
21
Overseas Series
Notes to Financial Statements (continued)
| 3. | Transactions with Affiliates and Other Agreements (continued) |
Manning & Napier Investor Services, Inc., a registered broker-dealer affiliate of the Advisor, acts as distributor for the Fund’s shares. The Series compensates the distributor for distributing and servicing the Series’ Class S shares pursuant to a distribution plan adopted under Rule 12b-1 of the 1940 Act, regardless of expenses actually incurred. Under the agreement, the Series pays distribution and service fees to the distributor at an annual rate of 0.25% of average daily net assets attributable to Class S shares. There are no distribution and service fees on the Class I, Class W or Class Z shares. The fees are accrued daily and paid monthly.
Pursuant to a master services agreement dated March 1, 2017, the Fund pays the Advisor an annual fee related to fund accounting and administration of 0.0085% on the first $25 billion of average daily net assets (excluding Target Series and Income Series); 0.0075% on the next $15 billion of average daily net assets (excluding Target Series and Income Series); and 0.0065% of average daily net assets in excess of $40 billion (excluding Target Series and Income Series); plus a base fee of $30,400 per series. Additionally, certain transaction and out-of-pocket expenses, including charges for reporting relating to the Fund’s compliance program, are charged. The Advisor has agreements with BNY Mellon Investment Servicing (U.S.) Inc. (“BNY”) under which BNY serves as sub-accountant services agent.
| 4. | Purchases and Sales of Securities |
For the year ended October 31, 2019, purchases and sales of securities, other than U.S. Government securities and short-term securities, were $250,123,119 and $517,797,466, respectively. There were no purchases or sales of U.S. Government securities.
| 5. | Capital Stock Transactions |
Transactions in Class S, Class I, Class W and Class Z shares of Overseas Series were:
CLASS S | FOR THE YEAR ENDED 10/31/19 | FOR THE PERIOD 9/21/18 (COMMENCEMENT OF OPERATIONS) TO 10/31/18 | ||||||||||||||
| SHARES | AMOUNT | SHARES | AMOUNT | |||||||||||||
Sold | 869,816 | $ | 19,478,947 | 190,967 | $ | 4,553,940 | ||||||||||
Shares issued in reorganization1 | — | — | 23,854,078 | 589,676,263 | ||||||||||||
Reinvested | 192,957 | 3,994,201 | — | — | ||||||||||||
Repurchased | (12,359,269 | ) | (283,363,765 | ) | (1,450,734 | ) | (33,687,813 | ) | ||||||||
|
|
|
|
|
|
|
| |||||||||
Total | (11,296,496 | ) | $ | (259,890,617 | ) | 22,594,311 | $ | 560,542,390 | ||||||||
|
|
|
|
|
|
|
| |||||||||
| CLASS I | FOR THE YEAR ENDED 10/31/19 | FOR THE YEAR ENDED 10/31/18 | ||||||||||||||
| SHARES | AMOUNT | SHARES | AMOUNT | |||||||||||||
Sold | 730,015 | $ | 16,835,516 | 1,392,938 | $ | 34,946,149 | ||||||||||
Reinvested | 43,918 | 909,540 | 418,319 | 10,324,113 | ||||||||||||
Repurchased | (4,048,251 | ) | (91,847,425 | ) | (26,019,153 | ) | (645,877,161 | ) | ||||||||
|
|
|
|
|
|
|
| |||||||||
Total | (3,274,318 | ) | $ | (74,102,369 | ) | (24,207,896 | ) | $ | (600,606,899 | ) | ||||||
|
|
|
|
|
|
|
| |||||||||
22
Overseas Series
Notes to Financial Statements (continued)
| 5. | Capital Stock Transactions (continued) |
CLASS W | FOR THE PERIOD 3/1/19 (COMMENCEMENT OF OPERATIONS) TO 10/31/19 | |||||||||||||||
| SHARES | AMOUNT | |||||||||||||||
Sold | 4,947,620 | $ | 114,167,181 | |||||||||||||
Reinvested | — | — | ||||||||||||||
Repurchased | (538,188 | ) | (12,608,460 | ) | ||||||||||||
|
|
|
| |||||||||||||
Total | 4,409,432 | $ | 101,558,721 | |||||||||||||
|
|
|
| |||||||||||||
| CLASS Z | FOR THE YEAR ENDED 10/31/19 | FOR THE PERIOD 5/1/18 (COMMENCEMENT OF OPERATIONS) TO 10/31/18 | ||||||||||||||
| SHARES | AMOUNT | SHARES | AMOUNT | |||||||||||||
Sold | 183,003 | $ | 4,382,553 | 5,468,547 | $ | 135,889,148 | ||||||||||
Reinvested | 46,562 | 963,827 | — | — | ||||||||||||
Repurchased | (2,854,771 | ) | (66,762,026 | ) | (757,033 | ) | (18,820,922 | ) | ||||||||
|
|
|
|
|
|
|
| |||||||||
Total | (2,625,206 | ) | $ | (61,415,646 | ) | 4,711,514 | $ | 117,068,226 | ||||||||
|
|
|
|
|
|
|
| |||||||||
1See Note 1 regarding the reorganization.
At October 31, 2019, the Advisor and its affiliates owned 0.9% of the Series.
| 6. | Line of Credit |
The Fund has entered into a 364-day, $25 million credit agreement (the “line of credit”) with Bank of New York Mellon. Each series of the Fund may borrow under the line of credit for temporary or emergency purposes, including funding shareholder redemptions and other short-term liquidity purposes. The Fund pays an annual fee on the unused commitment amount, payable quarterly, and is allocated among all the series of the Fund and included in miscellaneous expenses in the Statement of Operations for each series. The line of credit expires in August 2020 unless extended or renewed. Borrowings under this arrangement bear interest at a floating rate equal to the higher of the (i) Federal Funds rate in effect on such day plus 125 basis points or (ii) the 30 day LIBOR plus 125 basis points in effect on that day. This amount, if any, would be included in “Interest expense” in the Statement of Operations. During the year ended October 31, 2019, the Overseas Series average daily amount of borrowings outstanding under the line of credit was $127,397 with a weighted average interest rate of 3.77%. As of October 31, 2019, there was no borrowing outstanding.
| 7. | Financial Instruments |
The Series may trade in instruments including written and purchased options, forward foreign currency exchange contracts and futures contracts and other derivatives in the normal course of investing activities to assist in managing exposure to various market risks. The Series may be subject to various elements of risk, which may involve, to a varying degree, elements of risk in excess of the amounts recognized for financial statement purposes. These risks include: the risk that changes in the value of a derivative may not correlate perfectly with the underlying asset, rate or index; counterparty credit risk related to over the counter derivative counterparties’ failure to perform under contract terms; liquidity risk related to the lack of a liquid market for these contracts allowing the fund to close out its position(s); and documentation risk relating to disagreement over contract terms. No such investments were held by the Series as of October 31, 2019.
| 8. | Foreign Securities |
Investing in securities of foreign companies and foreign governments involves special risks and considerations not typically associated with investing in securities of domestic companies and the U.S. Government. These risks include revaluation of currencies and future adverse political and economic developments. Moreover, securities of foreign companies and foreign
23
Overseas Series
Notes to Financial Statements (continued)
| 8. | Foreign Securities (continued) |
governments and their markets may be less liquid and their prices more volatile than those of comparable domestic companies and the U.S. Government.
| 9. | Federal Income Tax Information |
The amount and characterization of certain income and capital gains to be distributed are determined in accordance with federal income tax regulations, which may differ from GAAP. These differences are primarily due to differing book and tax treatments in the timing of the recognition of net investment income or gains and losses, including losses deferred due to wash sales and foreign currency gains and losses. The Series may periodically make reclassifications among its capital accounts to reflect income and gains available for distribution (or available capital loss carryovers) under income tax regulations, without impacting the Series’ net asset value. Any such reclassifications are not reflected in the financial highlights.
The tax character of distributions paid were as follows:
FOR THE YEAR 10/31/19 | FOR THE YEAR 10/31/18 |
| ||||||
Ordinary income | $6,127,852 | $10,748,629 | ||||||
At October 31, 2019, the tax basis of components of distributable earnings and the net unrealized depreciation based on the identified cost of investments for federal income tax purposes were as follows:
Cost for federal income tax purposes | $ | 505,895,095 | ||||||
Unrealized appreciation | 58,139,543 | |||||||
Unrealized depreciation | (75,616,201 | ) | ||||||
|
| |||||||
Net unrealized depreciation | $ | (17,476,658 | ) | |||||
|
| |||||||
Undistributed ordinary income | $ | 9,360,640 | ||||||
Capital loss carryforward | $ | (492,814,439 | ) |
At October 31, 2019, the Series had net short-term capital loss carryforwards of $53,306,525 and net long-term capital loss carryforwards of $439,507,914, which may be carried forward indefinitely.
24
Overseas Series
Report of Independent Registered Public Accounting Firm
To the Board of Directors of Manning & Napier Fund, Inc. and Shareholders of Overseas Series
Opinion on the Financial Statements
We have audited the accompanying statement of assets and liabilities, including the investment portfolio, of Overseas Series (one of the series constituting Manning & Napier Fund, Inc., referred to hereafter as the “Fund”) as of October 31, 2019, the related statement of operations for the year ended October 31, 2019, the statement of changes in net assets for each of the two years in the period ended October 31, 2019, including the related notes, and the financial highlights for each of the periods indicated therein (collectively referred to as the “financial statements”). In our opinion, the financial statements present fairly, in all material respects, the financial position of the Fund as of October 31, 2019, the results of its operations for the year then ended, the changes in its net assets for each of the two years in the period ended October 31, 2019 and the financial highlights for each of the periods indicated therein in conformity with accounting principles generally accepted in the United States of America.
Basis for Opinion
These financial statements are the responsibility of the Fund’s management. Our responsibility is to express an opinion on the Fund’s financial statements based on our audits. We are a public accounting firm registered with the Public Company Accounting Oversight Board (United States) (“PCAOB”) and are required to be independent with respect to the Fund in accordance with the U.S. federal securities laws and the applicable rules and regulations of the Securities and Exchange Commission and the PCAOB.
We conducted our audits of these financial statements in accordance with the standards of the PCAOB. Those standards require that we plan and perform the audit to obtain reasonable assurance about whether the financial statements are free of material misstatement, whether due to error or fraud.
Our audits included performing procedures to assess the risks of material misstatement of the financial statements, whether due to error or fraud, and performing procedures that respond to those risks. Such procedures included examining, on a test basis, evidence regarding the amounts and disclosures in the financial statements. Our audits also included evaluating the accounting principles used and significant estimates made by management, as well as evaluating the overall presentation of the financial statements. Our procedures included confirmation of securities owned as of October 31, 2019 by correspondence with the custodian. We believe that our audits provide a reasonable basis for our opinion.
New York, New York
December 16, 2019
We have served as the auditor of one or more investment companies in Manning & Napier Mutual Funds since 1992.
25
Overseas Series
Supplemental Tax Information
(unaudited)
All reportings are based on financial information available as of the date of this annual report and, accordingly, are subject to change.
For federal income tax purposes, the Series reports for the current fiscal year $6,127,852 or, if different, the maximum amount allowable under the tax law, as qualified dividend income.
The Series has elected to pass through to its shareholders, foreign source income of $16,528,942 and foreign taxes paid of $1,470,718 for the year ended October 31, 2019.
26
Overseas Series
Directors’ and Officers’ Information
(unaudited)
The Statement of Additional Information provides additional information about the Fund’s directors and officers and can be obtained without charge by calling 1-800-466-3863, at www.manning-napier.com, or on the EDGAR Database on the SEC Internet web site (http://www.sec.gov). The following chart shows certain information about the Fund’s directors and officers, including their principal occupations during the last five years. Unless specific dates are provided, the individuals have held the listed positions for longer than five years.
Interested Director and Officer
| Name: | Paul Battaglia* | |
| Address: | 290 Woodcliff Drive | |
| Fairport, NY 14450 | ||
| Age: | 41 | |
| Current Position(s) Held with Fund: | Principal Executive Officer, President, Chairman & Director | |
| Term of Office & Length of Time Served: | Indefinite – Chairman and Director since November 20181 | |
| Principal Occupation(s) During Past 5 Years: | Chief Financial Officer (2018 – Present); Vice President of Finance (2016 – 2018); Director of Finance (2011 – 2016); Financial Analyst/Internal Auditor (2004-2006) – Manning & Napier Advisors, LLC and affiliates Holds one or more of the following titles for various affiliates: Chief Financial Officer | |
| Number of Portfolios Overseen within Fund Complex: | 32 | |
| Other Directorships Held Outside Fund Complex During Past 5 Years: | N/A | |
| Independent Directors | ||
| Name: | Stephen B. Ashley | |
| Address: | 290 Woodcliff Drive | |
| Fairport, NY 14450 | ||
| Age: | 79 | |
| Current Position(s) Held with Fund: | Director, Audit Committee Member, Governance & Nominating Committee Member | |
| Term of Office & Length of Time Served: | Indefinite – Since 1996 | |
| Principal Occupation(s) During Past 5 Years: | Chairman, Director & Chief Executive Officer (1997 to present) - The Ashley Group (property management and investment). Director (1995-2008) and Chairman (non-executive) (2004-2008) - Fannie Mae (mortgage) | |
| Number of Portfolios Overseen within Fund Complex: | 32 | |
| Other Directorships Held Outside Fund Complex During Past 5 Years: | Fannie Mae (1995-2008) The Ashley Group (1995-2008) | |
| Genesee Corporation (1987-2007) | ||
| Name: | Paul A. Brooke | |
| Address: | 290 Woodcliff Drive | |
| Fairport, NY 14450 | ||
| Age: | 73 | |
| Current Position(s) Held with Fund: | Lead Independent Director, Audit Committee Member, Governance & Nominating Committee Chairman | |
| Term of Office & Length of Time Served: | Indefinite – Director, Audit Committee Member, Governance & Nominating Committee Member since 2007; Governance & Nominating Committee Chairman since 2016; Lead Independent Director since 2017 | |
| Principal Occupation(s) During Past 5 Years: | Chairman & CEO (2005-2009) - Ithaka Acquisition Corporation (investments); Chairman (2007-2009) - Alsius Corporation (investments); Managing Member (1991-present) - PMSV Holdings LLC (investments); Managing Member (2010-2016) - Venbio (investments). | |
| Number of Portfolios Overseen within Fund Complex: | 32 | |
| Other Directorships Held Outside Fund Complex DuringPast 5 Years: | Incyte Corp. (biotech)(2000-present); ViroPharma, Inc. (speciality pharmaceuticals)(2000-2014); HLTH (WebMD)(information)(2000-2010); Cheyne Capital International (investment)(2000-2017); GMP Companies (investment)(2000-2011); Cytos Biotechnology Ltd (biotechnology)(2012-2014); Cerus (biomedical)(2016-present); PureEarth(non-profit)(2012-present); Caelum BioSciences (biomedical)(2018-present)
| |
27
Overseas Series
Directors’ and Officers’ Information
(unaudited)
Independent Directors (continued)
| Name: | Peter L. Faber | |
| Address: | 290 Woodcliff Drive | |
| Fairport, NY 14450 | ||
| Age: | 81 | |
| Current Position(s) Held with Fund: | Director, Governance & Nominating Committee Member | |
| Term of Office & Length of Time Served: | Indefinite – Since 1987 | |
| Principal Occupation(s) During Past 5 Years: | Senior Counsel (2006-2012), Partner (1995-2006 & 2013-present) - | |
| McDermott, Will & Emery LLP (law firm) | ||
| Number of Portfolios Overseen within Fund Complex: | 32 | |
| Other Directorships Held Outside Fund Complex During Past 5 Years: | Boston Early Music Festival (non-profit)(2007-present); Amherst Early Music, Inc. (non-profit)(2009-present); Gotham Early Music Scene, Inc. (non-profit)(2009-present); Partnership for New York City, Inc. (non-profit)(1989-2010); New York Collegium (non-profit)(2004-2011); S’Cool Sounds, Inc. (non-profit)(2017-present)
| |
| Name: | Harris H. Rusitzky | |
| Address: | 290 Woodcliff Drive | |
| Fairport, NY 14450 | ||
| Age: | 84 | |
| Current Position(s) Held with Fund: | Director, Audit Committee Member, Governance & Nominating Committee | |
| Member | ||
| Term of Office & Length of Time Served: | Indefinite – Since 1985 | |
| Principal Occupation(s) During Past 5 Years: | President (1994- present) - The Greening Group (business consultants); Partner (2006-present) - The Restaurant Group (restaurants) | |
| Number of Portfolios Overseen within Fund Complex: | 32 | |
| Other Directorships Held Outside Fund Complex During Past 5 Years: | Rochester Institute of Technology (university)(1972-present); Culinary Institute of America (non-profit college)(1985-present); George Eastman House (museum)(1988-present); National Restaurant Association (restaurant trade organization)(1978-present)
| |
| Name: | Chester N. Watson | |
| Address: | 290 Woodcliff Drive | |
| Fairport, NY 14450 | ||
| Age: | 69 | |
| Current Position(s) Held with Fund: | Director, Audit Committee Chairman, Governance & Nominating Committee Member | |
| Term of Office & Length of Time Served: | Indefinite – Director, Audit Committee Member, Governance & Nominating Committee Member Since 2012; Audit Committee Chairman since 2013 | |
| Principal Occupation(s) During Past 5 Years: | General Auditor (2003-2011) - General Motors Company (auto manufacturer) | |
| Number of Portfolios Overseen within Fund Complex: | 32 | |
Other Directorships Held Outside Fund Complex During Past 5 Years:
| Rochester Institute of Technology (university)(2005-present); Town of Greenburgh, NY Planning Board (municipal government) (2015-2018)
| |
| Officers: | ||
| Name: | Elizabeth Craig | |
| Address: | 290 Woodcliff Drive | |
| Fairport, NY 14450 | ||
| Age: | 32 | |
| Current Position(s) Held with Fund: | Corporate Secretary | |
| Term of Office1 & Length of Time Served: | Since 2016 | |
| Principal Occupation(s) During Past 5 Years: | Fund Regulatory Administration Manager since 2018; Fund Administration Manager (2015-2018); Mutual Fund Compliance Specialist (2009-2015) - Manning & Napier Advisors, LLC; Assistant Corporate Secretary (2011-2016) - Manning & Napier Fund, Inc.
| |
28
Overseas Series
Directors’ and Officers’ Information
(unaudited)
Officers: (continued)
| Name: | Christine Glavin | |
| Address: | 290 Woodcliff Drive | |
| Fairport, NY 14450 | ||
| Age: | 53 | |
| Current Position(s) Held with Fund: | Principal Financial Officer, Chief Financial Officer | |
| Term of Office1 & Length of Time Served: | Principal Financial Officer since 2002; Chief Financial Officer since 2001 | |
| Principal Occupation(s) During Past 5 Years: | Director of Fund Reporting since 2011; Fund Reporting Manager (1997-2011) - Manning & Napier Advisors, LLC; Assistant Treasurer since 2008 - Exeter Trust Company; Chief Financial Officer (2017-2018) - Rainier Investment Management Mutual Funds, Inc.
| |
| Name: | Samantha Larew | |
| Address: | 290 Woodcliff Drive | |
| Fairport, NY 14450 | ||
| Age: | 39 | |
| Current Position(s) Held with Fund: | Chief Compliance Officer and Anti-Money Laundering Compliance Officer | |
| Term of Office1 & Length of Time Served: | Chief Compliance Officer since 2019; Anti-Money Laundering Compliance Officer since 2018 | |
| Principal Occupation(s) During Past 5 Years: | Co-Director of Compliance (since 2018); Compliance Communications Supervisor (2014-2018); Compliance Supervisor (2011-2014); Broker-Dealer Compliance Analyst (2010-2014) - Manning & Napier Advisors, LLC and affiliates; Broker-Dealer Chief Compliance Officer (since 2013) – Manning & Napier Investor Services, Inc.; Compliance Analyst (2007-2009) – Wall Street Financial Group; Compliance Specialist (2003-2007) – Manning & Napier Advisors, LLC and affiliates Holds one or more of the following titles for various affiliates: Assistant Corporate Secretary, Chief Compliance Officer
| |
| Name: | Scott Morabito | |
| Address: | 290 Woodcliff Drive | |
| Fairport, NY 14450 | ||
| Age: | 31 | |
| Current Position(s) Held with Fund: | Vice President | |
| Term of Office1 & Length of Time Served: | Vice President since 2019; Assistant Vice President (2017-2019) | |
| Principal Occupation(s) During Past 5 Years: | Managing Director of Operations since 2019 and Director of Funds Group from 2017 - 2019; Fund Product and Strategy Manager (2014-2017); Senior Product and Strategy Analyst (2013-2014); Product and Strategy Analyst (2011-2013) - Manning & Napier Advisors, LLC; President, Director – Manning & Napier Investor Services, Inc. since 2018
| |
| Name: | Sarah Turner | |
| Address: | 290 Woodcliff Drive | |
| Fairport, NY 14450 | ||
| Age: | 37 | |
| Current Position(s) Held with Fund: | Chief Legal Officer; Assistant Corporate Secretary | |
| Term of Office1 & Length of Time Served: | Since 2018 | |
| Principal Occupation(s) During Past 5 Years: | General Counsel since 2018 - Manning & Napier Advisors, LLC and affiliates; Counsel (2017-2018) – Harter Secrest and Emery LLP; Legal Counsel (2010-2017) – Manning & Napier Advisors, LLC and affiliates Holds one or more of the following titles for various affiliates: Corporate Secretary, General Counsel
| |
*Interested Director, within the meaning of the 1940 Act by reason of his positions with the Fund’s Advisor, Manning & Napier Advisors, LLC, and Distributor, Manning & Napier Investor Services, Inc.
1The term of office of all officers shall be one year and until their respective successors are chosen and qualified, or his or her earlier resignation or removal as provided in the Fund’s By-Laws.
29
Overseas Series
Literature Requests
(unaudited)
Proxy Voting Policies and Procedures
A description of the policies and procedures that the Fund uses to determine how to vote proxies relating to portfolio securities is available, without charge, upon request:
By phone | 1-800-466-3863 | |
On the Securities and Exchange | ||
Commission’s (SEC) web site | http://www.sec.gov |
Proxy Voting Record
Information regarding how the Fund voted proxies relating to portfolio securities during the most recent 12-month period ended June 30th is available, without charge, upon request:
By phone | 1-800-466-3863 | |
On the SEC’s web site | http://www.sec.gov |
Quarterly Portfolio Holdings
The Series’ complete schedule of portfolio holdings for the 1st and 3rd quarters of each fiscal year are provided on Form N-PORT, and are available, without charge, upon request:
By phone | 1-800-466-3863 | |
On the SEC’s web site | http://www.sec.gov |
Prospectus and Statement of Additional Information (SAI)
For more information about any of the Manning & Napier Fund, Inc. Series, you may obtain a prospectus and SAI at www.manning-napier.com or by calling (800) 466-3863. Before investing, carefully consider the objectives, risks, charges and expenses of the investment and read the prospectus carefully as it contains this and other information about the investment company.In addition, this information can be found on the SEC’s web site, http://www.sec.gov.
Additional information available at www.manning-napier.com
1. Fund Holdings - Month-End
2. Fund Holdings - Quarter-End
3. Shareholder Report - Annual
4. Shareholder Report - Semi-Annual
The Fund also offers electronic notification or “e-delivery” when certain documents are available on-line to be downloaded or reviewed. Direct shareholders can elect to receive electronic notification when shareholder reports, prospectus updates, and/or statements are available. If you do not currently have on-line access to your account, you can establish access by going to www.manning-napier.com, click on “Login” in the top corner of the page, and follow the prompts to self-enroll. Once enrolled, you can set your electronic notification preferences by clicking on the Account Options tab located within the green toolbar and then select E-Delivery Option. Should you have any questions on either how to establish on-line access or how to update your account settings, please contact Investor Services at 1-800-466-3863.
The Manning & Napier Fund, Inc. is managed by Manning & Napier Advisors, LLC. Manning & Napier Investor Services, Inc., an affiliate of Manning & Napier Advisors, LLC, is the distributor of the Fund shares.
MNOVS-10/19-AR
www.manning-napier.com
Manning & Napier Fund, Inc.
|
Pro-Blend®Conservative Term Series |
Pro-Blend®Moderate Term Series |
Pro-Blend®Extended Term Series |
Pro-Blend®Maximum Term Series |
Beginning on June 25, 2021, as permitted by Securities and Exchange Commission regulations, paper copies of the Series’ annual and semi-annual shareholder reports will no longer be sent by mail, unless you specifically request paper copies of the reports from the Fund or from your financial intermediary, such as a broker-dealer or bank. Instead, the reports will be made available on a website, and you will be notified by mail each time a report is posted and provided with a website link to access the report.
If you already elected to receive shareholder reports electronically, you will not be affected by this change and you need not take any action. You may elect to receive shareholder reports and other communications from the Fund electronically by contacting your financial intermediary or, if you are a direct investor, by visiting www.manning-napier.com or calling1-800-466-3863.
You may elect to receive all future annual and semi-annual reports in paper free of charge. If you invest through a financial intermediary, you can contact your financial intermediary to request that you continue to receive paper copies of your shareholder reports. If you invest directly with the Fund, you can inform the Fund that you wish to continue receiving paper copies of your shareholder reports by visiting www.manning-napier.com or calling1-800-466-3863. Your election to receive reports in paper will apply to all funds held with your financial intermediary if you invest through a financial intermediary or all series of the Fund if you invest directly with the Fund.
| Independent Perspective| Real-World Solutions |
A Note from Our CEO
Dear Shareholder,
The investing world is constantly changing, yet investors’ needs and objectives remain substantially the same.
Whether you are an individual saver looking to ensure security in retirement, or an institutional investor with a fiduciary obligation to others, at the end of the day you look for a trusted partner to help you build, grow, and preserve wealth.
In order to do so successfully we recognize that, in the short-term, the world’s capital markets can be capricious and hard to predict.
Bubbles form, rise, and then pop. The hot stocks of today often become passing fads of tomorrow. Investor sentiment can swing wildly, whipsawing between exuberance one day and despondence the next.
As successful long-term investors, we are defined both by what we do as well as what we don’t do.
We don’t attempt to perfectly time every recession. We don’t jump on the latest trend. We don’t worry about capturing every market peak all across the globe.
On the other hand, we do maintain the rigorous disciplines we have developed over close to half a century. We are highly attentive to managing risk and protecting investors in down markets while participating fully in the opportunities our Research uncovers.
Our focus is on you, the shareholder, and helping you achieve your goals.
In the face of an uncertain world, we believe our investment philosophies, processes, and experience have stood the test of time and will do so in the future.
We appreciate your continued confidence in our approach.
|
Sincerely,
Marc Mayer Chief Executive Officer
|
Corporate Headquarters | 290 Woodcliff Drive| Fairport, NY 14450| (585) 325-6880 phone| (800) 551-0224 toll free| www.manning-napier.com
1
Fund Commentary
(unaudited)
Investment Objective
ThePro-Blend® Series are strategically allocated across stocks, bonds, and cash to balance growth, capital preservation, and income to fit a range of investor risk management priorities.
Performance Commentary
Global equity and fixed income markets posted strong positive returns for the twelve-month period ending October 31, 2019. Over the one year period, equities outperformed fixed income markets, and within stocks, US equities outperformed international markets. With respect to equities,large-cap stocks outperformedsmall-andmid-cap stocks, while growth stocks outperformed their value counterparts. On the fixed income side, corporate bonds experienced the highest returns from a sector perspective, while longer dated bonds were the highest returning segment of the market from a maturity perspective as a result of falling interest rates.
Each of thePro-Blend Series Class S shares delivered positive returns over the period, and, with the exception of Moderate Term, outperformed their respective blended benchmarks.
Among the largest contributors to relative returns (i.e., returns compared to the benchmark) was stock selection in Materials, Health Care, Consumer Staples, Information Technology, and Real Estate, as well as from an overweight to Real Estate and underweight to Energy. Additionally, selection within Consumer Discretionary was a large contributor to outperformance for the Maximum Term Series. Underperformance for the Moderate Term Series was largely attributable to positioning within the fixed income portion of the portfolio when compared to the benchmark. Specifically, a shorter duration in a period where interest rates generally fell.
We believe the global economy is showing signs of moving into the later stages of the economic cycle. When this occurs, it is common to see strong stock market gains. While these rallies may give investors the feeling of missing out, it is exactly in these moments that risk management can be most valuable.
Given our outlook, the portfolios are focused on higher quality businesses and reasonably priced growth companies. We prefer businesses with strong management and solid balance sheets who have historically provided some degree of downside protection in adverse markets.
This view has led to meaningful positions in areas such as Consumer Staples and Health Care. In contrast, the portfolios are less exposed to sectors that are highly dependent on strong and above average economic growth such as Industrials and Energy. On the fixed income side, we are seeing opportunities in select corporate bonds and shorter duration, higher-quality securitized credit.
Performance data quoted represents past performance and does not guarantee future results. The investment return and principal value of an investment will fluctuate, so that an investor’s shares, when redeemed, may be worth more or less than their original cost. Current performance may be higher or lower than that quoted; investors can obtain the most recentmonth-end performance at www.manning-napier.com or by calling (800)466-3863.
Commentary prepared using data provided by FactSet. Analysis Manning & Napier. Commentary presented is relative to each Series’ respective blended benchmark. Additional information and associated disclosures can be found on the Performance Update pages contained in this report.
All investments involve risks, including possible loss of principal. Because the fund invests in both stocks and bonds, the value of your investment will fluctuate in response to stock market movements and changes in interest rates. Investing in the fund will also involve a number of other risks, including issuer-specific risk, foreign investment risk, andsmall-cap/mid-cap risk. Investments in options and futures, like all derivatives, can be highly volatile and involve risks in addition to the risks of the underlying instrument on which the derivative is based, such as counterparty, correlation and liquidity risk. Also, the use of leverage increases exposure to the market and may magnify potential losses.
2
Performance Update as of October 31, 2019 -Pro-Blend® Conservative Term Series
(unaudited)
AVERAGE ANNUAL TOTAL RETURNS AS OF OCTOBER 31, 2019
| ||||||
ONE YEAR1
|
FIVE YEAR
|
TEN YEAR
| ||||
Pro-Blend®Conservative Term Series - Class S2 | 10.40% | 3.59% | 5.23% | |||
Pro-Blend®Conservative Term Series - Class I2 | 10.69% | 3.79% | 5.43% | |||
Pro-Blend®Conservative Term Series - Class R2,3 | 10.12% | 3.29% | 4.94% | |||
Pro-Blend®Conservative Term Series - Class L2,3 | 9.61% | 2.76% | 4.39% | |||
Pro-Blend®Conservative Term Series - Class W2,4 | 11.01% | 3.70% | 5.29% | |||
Bloomberg Barclays U.S. Intermediate Aggregate Bond Index5 | 8.83% | 2.65% | 3.13% | |||
Conservative Term Composite Benchmark6 | 10.38% | 4.57% | 5.63% | |||
The following graph compares the value of a $10,000 investment in thePro-Blend® Conservative Term Series - Class S for the ten years ended October 31, 2019 to the Bloomberg Barclays U.S. Intermediate Aggregate Bond Index and Conservative Term Composite Benchmark.
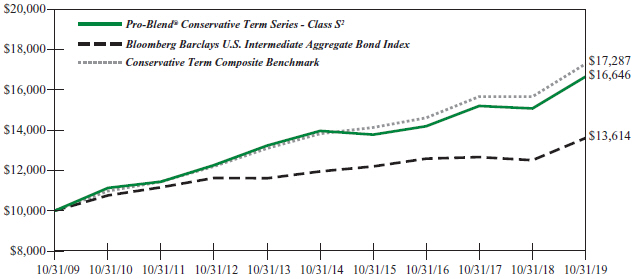
1The returns shown are based on net asset values calculated for shareholder transactions and may differ from the returns shown in the financial highlights, which reflect adjustments made to the net asset values in accordance with accounting principles generally accepted in the United States of America.
2The Series’ performance does not reflect the deduction of taxes that a shareholder would pay on fund distributions or the redemption of shares. The Series’ performance is historical and may not be indicative of future results. The performance returns shown are inclusive of the net expense ratio of the Series. For the year ended October 31, 2019, this net expense ratio was 0.87% for Class S, 0.64% for Class I, 1.10% for Class R, 1.59% for Class L and 0.08% for Class W. The gross expense ratio, which does not account for any voluntary or contractual waivers currently in effect, was 0.87% for Class S, 0.64% for Class I, 1.10% for Class R, 1.59% for Class L and 0.48% for Class W for the year ended October 31, 2019.
3For periods through the inception of Class L on January 4, 2010 and Class R on June 30, 2010, the performance is hypothetical and is based on the historical performance of the Class S shares adjusted for the respective class’ charges and expenses.
4For periods through April 1, 2019 (the inception date of the Class W shares), performance for the Class W shares is based on the historical performance of the Class S shares. Because the Class W shares invest in the same portfolio of securities as the Class S shares, performance will be different only to the extent that the Class S shares have a higher expense ratio.
5The Bloomberg Barclays U.S Intermediate Aggregate Bond Index is an unmanaged, market-value weighted index of U.S. domestic investment-grade debt issues, including government, corporate, asset-backed and mortgage-backed securities, with maturities greater than one year but less than ten years. Index returns do not reflect any fees or expenses. Index returns provided by Interactive Data.
6The Conservative Term Composite Benchmark is a blend of the Russell 3000® Index (Russell 3000), MSCI ACWI ex USA Index (ACWIxUS), and Bloomberg Barclays U.S. Intermediate Aggregate Bond Index (BIAB) in the following weightings: 15% Russell 3000, 5% ACWIxUS, and 80% BIAB through 05/31/2012; and 22% Russell 3000, 8% ACWIxUS, and 70% BIAB beginning 06/01/2012. Russell 3000 is an unmanaged index that consists of 3,000 of the largest U.S. companies based on total market capitalization. Index returns are based on a market capitalization-weighted average of relative price changes of the component stocks plus dividends whose reinvestments are compounded daily. Index returns provided by Bloomberg. ACWIxUS is designed to measure large andmid-cap representation across 22 of 23 Developed Markets countries (excluding the U.S.) and 26 Emerging Markets countries. The Index is denominated in U.S. dollars. The Index returns are net of withholding taxes. They
3
Performance Update as of October 31, 2019 -Pro-Blend® Conservative Term Series
(unaudited)
assume daily reinvestment of net dividends thus accounting for any applicable dividend taxation. Index returns provided by Bloomberg. BIAB is an unmanaged, market value-weighted index of U.S. domestic investment-grade debt issues, including government, corporate, asset-backed, and mortgage-backed securities with maturities of greater than one year but less than ten years. Index returns provided by Interactive Data. The returns of the indices do not reflect any fees or expenses. Returns provided are calculated monthly using a blended allocation. Because the fund’s asset allocation will vary over time, the composition of the fund’s portfolio may not match the composition of the Conservative Term Composite Benchmark.
4
Shareholder Expense Example -Pro-Blend® Conservative Term Series
(unaudited)
As a shareholder of the Series, you incur ongoing costs, including management fees, shareholder service fees and other Series expenses. This example is intended to help you understand your ongoing costs (in dollars) of investing in the Series and to compare these costs with the ongoing costs of investing in other mutual funds.
The example is based on an investment of $1,000 invested in each class at the beginning of the period and held for the entire period (May 1, 2019 to October 31, 2019).
Actual Expenses
The Actual lines of the table below provide information about actual account values and actual expenses. You may use the information in these lines, together with the amount you invested, to estimate the expenses that you paid over the period. Simply divide your account value by $1,000 (for example, an $8,600 account value divided by $1,000 = 8.6), then multiply the result by the number in the Actual line for the Class in which you have invested under the heading entitled “Expenses Paid During Period” to estimate the expenses you paid on your account during this period.
Hypothetical Example for Comparison Purposes
The Hypothetical lines of each class in the table below provide information about hypothetical account values and hypothetical expenses based on the Class’ actual expense ratio and an assumed rate of return of 5% per year before expenses, which is not the Class’ actual return. The hypothetical account values and expenses may not be used to estimate the actual ending account balance or expenses you paid during the period. You may use this information to compare the ongoing costs of investing in a class of the Series and other funds. To do so, compare this 5% hypothetical example for the Class in which you have invested with the 5% hypothetical examples that appear in the shareholder reports of the other funds.
Please note that the expenses shown in the table are meant to highlight your ongoing costs only and do not reflect any transaction costs such as sales charges (loads), redemption fees, or exchange fees that you may incur in other mutual funds. Therefore, the second line of the table is useful in comparing ongoing costs only, and will not help you determine the relative total costs of owning different funds.
BEGINNING
|
ENDING
|
EXPENSES PAID
| ANNUALIZED
| |||||
Class S | ||||||||
Actual | $1,000.00 | $1,043.70 | $4.43 | 0.86% | ||||
Hypothetical | $1,000.00 | $1,020.87 | $4.38 | 0.86% | ||||
Class I | ||||||||
Actual | $1,000.00 | $1,044.20 | $3.25 | 0.63% | ||||
Hypothetical | $1,000.00 | $1,022.03 | $3.21 | 0.63% | ||||
Class R | ||||||||
Actual | $1,000.00 | $1,041.70 | $5.40 | 1.05% | ||||
Hypothetical | $1,000.00 | $1,019.91 | $5.35 | 1.05% | ||||
Class L | ||||||||
Actual | $1,000.00 | $1,038.90 | $7.91 | 1.54% | ||||
Hypothetical | $1,000.00 | $1,017.44 | $7.83 | 1.54% | ||||
Class W | ||||||||
Actual | $1,000.00 | $1,047.90 | $0.41 | 0.08% | ||||
Hypothetical | $1,000.00 | $1,024.80 | $0.41 | 0.08% | ||||
5
Shareholder Expense Example -Pro-Blend® Conservative Term Series
(unaudited)
1Expenses are equal to the Class’ annualized expense ratio (for thesix-month period), multiplied by the average account value over the period, multiplied by 184/365 (to reflect theone-half year period). Expenses are based on the most recent fiscal half year; therefore, the expense ratios stated above may differ from the expense ratios stated in the financial highlights, which are based onone-year data. The Class’ total return would have been lower had certain expenses not been waived during the period.
6
Portfolio Composition -Pro-Blend® Conservative Term Series
As of October 31, 2019 (unaudited)
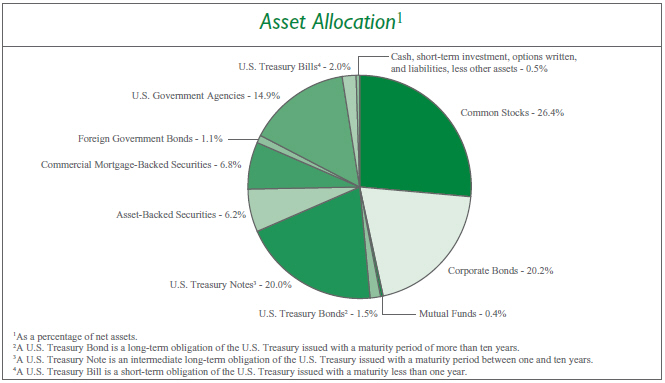
| Sector Allocation5 | ||||
Financials | 7.6 | % | ||
Communication Services | 6.8 | % | ||
Energy | 4.9 | % | ||
Health Care | 4.9 | % | ||
Consumer Discretionary | 4.8 | % | ||
Real Estate | 4.8 | % | ||
Information Technology | 4.1 | % | ||
Industrials | 3.6 | % | ||
Consumer Staples | 3.5 | % | ||
Materials | 1.3 | % | ||
Utilities | 0.2 | % | ||
| 5Including common stocks and corporate bonds, as a percentage of total investments. |
| |||
| Top Five Stock Holdings6 | ||||
Johnson & Johnson | 0.8 | % | ||
Medtronic plc | 0.8 | % | ||
Microsoft Corp. | 0.7 | % | ||
Mastercard, Inc. - Class A | 0.6 | % | ||
Visa, Inc. - Class A | 0.6 | % | ||
6As a percentage of total investments.
| ||||
| Top Five Bond Holdings7 | ||||
U.S. Treasury Inflation Indexed Note, 0.125%, 4/15/2020 | 4.0 | % | ||
U.S. Treasury Note, 1.625%, 5/15/2026 | 3.0 | % | ||
U.S. Treasury Note, 2.50%, 8/15/2023 | 3.0 | % | ||
U.S. Treasury Note, 2.50%, 5/15/2024 | 3.0 | % | ||
U.S. Treasury Note, 2.125%, 5/15/2025 | 3.0 | % | ||
7As a percentage of total investments. | ||||
7
Investment Portfolio - October 31, 2019
PRO-BLEND®CONSERVATIVE TERM SERIES | ||||||||
SHARES
| VALUE (NOTE 2) | |||||||
COMMON STOCKS - 26.4% | ||||||||
Communication Services - 2.9% | ||||||||
Diversified Telecommunication Services - 0.1% |
| |||||||
AT&T, Inc. | 14,790 | $ | 569,268 | |||||
Verizon Communications, Inc. | 14,370 | 868,954 | ||||||
|
| |||||||
| 1,438,222 | ||||||||
|
| |||||||
Entertainment - 1.3% | ||||||||
Activision Blizzard, Inc.1 | 62,530 | 3,503,556 | ||||||
Electronic Arts, Inc.*1 | 25,200 | 2,429,280 | ||||||
Nexon Co. Ltd. (Japan)* | 265,300 | 3,074,362 | ||||||
Sea Ltd. - ADR (Taiwan)*1 | 69,280 | 2,061,773 | ||||||
The Walt Disney Co. | 3,770 | 489,798 | ||||||
|
| |||||||
| 11,558,769 | ||||||||
|
| |||||||
Interactive Media & Services - 1.3% | ||||||||
Alphabet, Inc. - Class A* | 2,025 | 2,549,070 | ||||||
Alphabet, Inc. - Class C* | 2,030 | 2,558,023 | ||||||
Facebook, Inc. - Class A* | 17,060 | 3,269,549 | ||||||
Tencent Holdings Ltd. - Class H (China) | 81,400 | 3,301,821 | ||||||
|
| |||||||
| 11,678,463 | ||||||||
|
| |||||||
Media - 0.2% | ||||||||
Quebecor, Inc. - Class B (Canada) | 35,310 | 820,888 | ||||||
Shaw Communications, Inc. - Class B (Canada) | 40,835 | 833,380 | ||||||
|
| |||||||
| 1,654,268 | ||||||||
|
| |||||||
Total Communication Services | 26,329,722 | |||||||
|
| |||||||
Consumer Discretionary - 2.2% | ||||||||
Automobiles - 0.0%## | ||||||||
Honda Motor Co. Ltd. - ADR (Japan) | 16,763 | 452,098 | ||||||
|
| |||||||
Distributors - 0.1% | ||||||||
Genuine Parts Co. | 6,465 | 663,180 | ||||||
|
| |||||||
Hotels, Restaurants & Leisure - 0.0%## | ||||||||
Hilton Worldwide Holdings, Inc. | 1,515 | 146,894 | ||||||
McDonald’s Corp. | 1,115 | 219,320 | ||||||
|
| |||||||
| 366,214 | ||||||||
|
| |||||||
Household Durables - 0.4% | ||||||||
Sony Corp. - ADR (Japan) | 58,870 | 3,581,062 | ||||||
|
| |||||||
Internet & Direct Marketing Retail - 0.5% | ||||||||
Amazon.com, Inc.* | 1,770 | 3,144,688 | ||||||
Booking Holdings, Inc.* | 870 | 1,782,430 | ||||||
|
| |||||||
| 4,927,118 | ||||||||
|
| |||||||
Multiline Retail - 0.2% | ||||||||
B&M European Value Retail S.A. | 61,690 | 295,952 | ||||||
Dollar General Corp. | 4,409 | 706,939 | ||||||
| SHARES | VALUE (NOTE 2) | |||||||
COMMON STOCKS(continued) | ||||||||
Consumer Discretionary(continued) | ||||||||
Multiline Retail(continued) | ||||||||
Target Corp. | 4,245 | $ | 453,833 | |||||
|
| |||||||
| 1,456,724 | ||||||||
|
| |||||||
Specialty Retail - 0.5% | ||||||||
The Home Depot, Inc. | 5,840 | 1,369,947 | ||||||
Industria de Diseno Textil S.A. (Spain) | 100,695 | 3,137,738 | ||||||
O’Reilly Automotive, Inc.* | 881 | 383,684 | ||||||
|
| |||||||
| 4,891,369 | ||||||||
|
| |||||||
Textiles, Apparel & Luxury Goods - 0.5% | ||||||||
lululemon athletica, Inc.* | 18,570 | 3,793,294 | ||||||
VF Corp. | 4,133 | 340,105 | ||||||
|
| |||||||
| 4,133,399 | ||||||||
|
| |||||||
Total Consumer Discretionary | 20,471,164 | |||||||
|
| |||||||
Consumer Staples - 3.3% | ||||||||
Beverages - 1.5% | ||||||||
Ambev S.A. - ADR (Brazil) | 166,325 | 716,860 | ||||||
Anheuser-Busch InBev S.A./N.V. (Belgium) | 37,825 | 3,053,137 | ||||||
The Coca-Cola Co. | 65,615 | 3,571,424 | ||||||
Diageo plc (United Kingdom) | 46,306 | 1,895,355 | ||||||
PepsiCo, Inc. | 32,825 | 4,502,605 | ||||||
|
| |||||||
| 13,739,381 | ||||||||
|
| |||||||
Food & Staples Retailing - 0.2% | ||||||||
Walgreens Boots Alliance, Inc. | 8,091 | 443,225 | ||||||
Walmart, Inc. | 13,766 | 1,614,201 | ||||||
|
| |||||||
| 2,057,426 | ||||||||
|
| |||||||
Food Products - 0.9% | ||||||||
J&J Snack Foods Corp. | 2,932 | 559,308 | ||||||
Mondelez International, Inc. - Class A | 83,351 | 4,371,760 | ||||||
Nestle S.A. (Switzerland) | 32,550 | 3,482,243 | ||||||
|
| |||||||
| 8,413,311 | ||||||||
|
| |||||||
Household Products - 0.3% | ||||||||
Colgate-Palmolive Co. | 14,536 | 997,170 | ||||||
Kimberly-Clark Corp. | 2,957 | 392,926 | ||||||
The Procter & Gamble Co. | 5,560 | 692,276 | ||||||
|
| |||||||
| 2,082,372 | ||||||||
|
| |||||||
Personal Products - 0.4% | ||||||||
Unilever plc - ADR (United Kingdom) | 61,915 | 3,721,711 | ||||||
|
| |||||||
Total Consumer Staples | 30,014,201 | |||||||
|
| |||||||
The accompanying notes are an integral part of the financial statements.
8
Investment Portfolio - October 31, 2019
PRO-BLEND®CONSERVATIVE TERM SERIES | ||||||||
| SHARES | VALUE (NOTE 2) | |||||||
COMMON STOCKS(continued) | ||||||||
Energy - 1.2% | ||||||||
Energy Equipment & Services - 0.4% | ||||||||
Halliburton Co. | 88,090 | $ | 1,695,732 | |||||
Schlumberger Ltd. | 35,130 | 1,148,400 | ||||||
Transocean Ltd.* | 82,610 | 392,398 | ||||||
|
| |||||||
| 3,236,530 | ||||||||
|
| |||||||
Oil, Gas & Consumable Fuels - 0.8% | ||||||||
BP plc - ADR (United Kingdom) | 11,244 | 426,259 | ||||||
Chevron Corp. | 15,435 | 1,792,621 | ||||||
China Petroleum & Chemical Corp. - ADR (China) | 10,382 | 586,479 | ||||||
ConocoPhillips | 4,105 | 226,596 | ||||||
Equinor ASA - ADR (Norway) | 19,974 | 369,719 | ||||||
Exxon Mobil Corp. | 19,228 | 1,299,236 | ||||||
Marathon Petroleum Corp. | 7,828 | 500,601 | ||||||
Occidental Petroleum Corp. | 11,730 | 475,065 | ||||||
Petroleo Brasileiro S.A. - ADR (Brazil) | 35,369 | 533,718 | ||||||
Royal Dutch Shell plc - Class B - ADR (Netherlands) | 2,485 | 144,851 | ||||||
TOTAL S.A. - ADR (France) | 11,736 | 617,666 | ||||||
Valero Energy Corp. | 4,381 | 424,869 | ||||||
|
| |||||||
| 7,397,680 | ||||||||
|
| |||||||
Total Energy | 10,634,210 | |||||||
|
| |||||||
Financials - 3.3% | ||||||||
Banks - 1.2% | ||||||||
Bank of America Corp. | 82,813 | 2,589,562 | ||||||
Citigroup, Inc. | 25,944 | 1,864,336 | ||||||
JPMorgan Chase & Co. | 26,469 | 3,306,507 | ||||||
KeyCorp | 13,023 | 234,023 | ||||||
The PNC Financial Services Group, Inc. | 2,019 | 296,187 | ||||||
Regions Financial Corp. | 13,670 | 220,087 | ||||||
U.S. Bancorp | 11,608 | 661,888 | ||||||
Wells Fargo & Co. | 38,144 | 1,969,375 | ||||||
|
| |||||||
| 11,141,965 | ||||||||
|
| |||||||
Capital Markets - 1.3% | ||||||||
Ares Management Corp. - Class A | 14,065 | 415,903 | ||||||
BlackRock, Inc. | 2,895 | 1,336,621 | ||||||
The Blackstone Group, Inc. - Class A | 9,740 | 517,778 | ||||||
Cboe Global Markets, Inc.1 | 15,630 | 1,799,794 | ||||||
CME Group, Inc. | 8,730 | 1,796,197 | ||||||
The Goldman Sachs Group, Inc. | 1,090 | 232,584 | ||||||
Intercontinental Exchange, Inc. | 20,730 | 1,955,254 | ||||||
Moody’s Corp. | 8,745 | 1,929,934 | ||||||
Morgan Stanley | 2,665 | 122,723 | ||||||
| SHARES | VALUE (NOTE 2) | |||||||
COMMON STOCKS(continued) | ||||||||
Financials(continued) | ||||||||
Capital Markets(continued) | ||||||||
S&P Global, Inc. | 7,680 | $ | 1,981,363 | |||||
|
| |||||||
| 12,088,151 | ||||||||
|
| |||||||
Diversified Financial Services - 0.5% | ||||||||
Berkshire Hathaway, Inc. - Class B* | 20,835 | 4,429,104 | ||||||
|
| |||||||
Insurance - 0.3% | ||||||||
The Allstate Corp. | 3,280 | 349,059 | ||||||
American International Group, Inc. | 6,010 | 318,291 | ||||||
Arthur J. Gallagher & Co. | 5,460 | 498,061 | ||||||
Assurant, Inc. | 2,100 | 264,748 | ||||||
Chubb Ltd. | 2,503 | 381,507 | ||||||
Fidelity National Financial, Inc. | 5,395 | 247,307 | ||||||
Lincoln National Corp. | 3,505 | 197,962 | ||||||
Principal Financial Group, Inc. | 3,896 | 207,968 | ||||||
|
| |||||||
| 2,464,903 | ||||||||
|
| |||||||
Total Financials | 30,124,123 | |||||||
|
| |||||||
Health Care - 4.3% | ||||||||
Biotechnology - 0.9% | ||||||||
AbbVie, Inc. | 10,180 | 809,819 | ||||||
Amgen, Inc. | 4,450 | 948,962 | ||||||
BioMarin Pharmaceutical, Inc.* | 28,160 | 2,061,594 | ||||||
Gilead Sciences, Inc | 9,956 | 634,297 | ||||||
Incyte Corp.* | 13,170 | 1,105,226 | ||||||
Seattle Genetics, Inc.* | 14,230 | 1,528,302 | ||||||
Vertex Pharmaceuticals, Inc.* | 6,010 | 1,174,835 | ||||||
|
| |||||||
| 8,263,035 | ||||||||
|
| |||||||
Health Care Equipment & Supplies - 1.0% | ||||||||
Alcon, Inc. (Switzerland)* | 27,893 | 1,653,218 | ||||||
Medtronic plc | 65,995 | 7,186,856 | ||||||
|
| |||||||
| 8,840,074 | ||||||||
|
| |||||||
Health Care Providers & Services - 0.1% | ||||||||
CVS Health Corp. | 9,438 | 626,589 | ||||||
|
| |||||||
Pharmaceuticals - 2.3% | ||||||||
Bristol-Myers Squibb Co.1 | 18,492 | 1,060,886 | ||||||
GlaxoSmithKline plc (United Kingdom) | 11,075 | 253,673 | ||||||
Johnson & Johnson | 54,891 | 7,247,808 | ||||||
Merck & Co., Inc. | 26,893 | 2,330,547 | ||||||
Merck KGaA (Germany) | 31,150 | 3,715,153 | ||||||
Novartis AG - ADR (Switzerland) | 56,360 | 4,928,118 | ||||||
Pfizer, Inc. | 43,135 | 1,655,090 | ||||||
The accompanying notes are an integral part of the financial statements.
9
Investment Portfolio - October 31, 2019
| PRO-BLEND® CONSERVATIVE TERM SERIES | VALUE | |||||||
SHARES
| (NOTE 2)
| |||||||
COMMON STOCKS(continued) |
| |||||||
Health Care(continued) |
| |||||||
Pharmaceuticals(continued) | ||||||||
Sanofi (France) | 4,233 | $ | 390,228 | |||||
|
| |||||||
| 21,581,503 | ||||||||
|
| |||||||
Total Health Care | 39,311,201 | |||||||
|
| |||||||
Industrials - 1.3% | ||||||||
Aerospace & Defense - 0.3% | ||||||||
The Boeing Co. | 3,225 | 1,096,211 | ||||||
Lockheed Martin Corp. | 1,838 | 692,338 | ||||||
United Technologies Corp. | 6,291 | 903,262 | ||||||
|
| |||||||
| 2,691,811 | ||||||||
|
| |||||||
Air Freight & Logistics - 0.1% | ||||||||
United Parcel Service, Inc. - Class B | 12,020 | 1,384,343 | ||||||
|
| |||||||
Airlines - 0.0%## | ||||||||
Delta Air Lines, Inc. | 3,940 | 217,015 | ||||||
|
| |||||||
Building Products - 0.1% | ||||||||
Johnson Controls International plc | 16,810 | 728,377 | ||||||
|
| |||||||
Commercial Services & Supplies - 0.2% | ||||||||
Covanta Holding Corp. | 29,245 | 422,298 | ||||||
Republic Services, Inc. | 6,085 | 532,498 | ||||||
Waste Management, Inc. | 9,401 | 1,054,886 | ||||||
|
| |||||||
| 2,009,682 | ||||||||
|
| |||||||
Electrical Equipment - 0.1% | ||||||||
Eaton Corp. plc | 4,321 | 376,402 | ||||||
Emerson Electric Co. | 6,331 | 444,120 | ||||||
|
| |||||||
| 820,522 | ||||||||
|
| |||||||
Industrial Conglomerates - 0.2% | ||||||||
3M Co. | 4,601 | 759,119 | ||||||
Honeywell International, Inc. | 4,593 | 793,349 | ||||||
|
| |||||||
| 1,552,468 | ||||||||
|
| |||||||
Machinery - 0.1% | ||||||||
Caterpillar, Inc. | 4,149 | 571,732 | ||||||
Illinois Tool Works, Inc. | 2,586 | 435,948 | ||||||
|
| |||||||
| 1,007,680 | ||||||||
|
| |||||||
Road & Rail - 0.2% | ||||||||
Kansas City Southern | 4,844 | 681,938 | ||||||
Union Pacific Corp. | 4,742 | 784,611 | ||||||
|
| |||||||
| 1,466,549 | ||||||||
|
| |||||||
Total Industrials | 11,878,447 | |||||||
|
| |||||||
Information Technology - 4.1% | ||||||||
Communications Equipment - 0.1% | ||||||||
Cisco Systems, Inc. | 21,490 | 1,020,990 | ||||||
|
| |||||||
| | VALUE | |||||||
SHARES
| (NOTE 2)
| |||||||
COMMON STOCKS(continued) | ||||||||
Information Technology(continued) | ||||||||
Electronic Equipment, Instruments & Components - 0.1% |
| |||||||
Cognex Corp. | 17,385 | $ | 895,154 | |||||
|
| |||||||
IT Services - 1.7% | ||||||||
International Business Machines Corp. | 6,072 | 812,009 | ||||||
InterXion Holding N.V. (Netherlands)* | 44,910 | 3,961,960 | ||||||
Mastercard, Inc. - Class A | 20,210 | 5,594,330 | ||||||
Visa, Inc. - Class A1 | 28,235 | 5,050,112 | ||||||
|
| |||||||
| 15,418,411 | ||||||||
|
| |||||||
Semiconductors & Semiconductor Equipment - 1.2% |
| |||||||
Broadcom, Inc. | 2,571 | 752,918 | ||||||
Intel Corp. | 46,248 | 2,614,399 | ||||||
Micron Technology, Inc.* | 101,880 | 4,844,394 | ||||||
NVIDIA Corp. | 9,715 | 1,952,909 | ||||||
Texas Instruments, Inc. | 6,488 | 765,519 | ||||||
|
| |||||||
| 10,930,139 | ||||||||
|
| |||||||
Software - 1.0% | ||||||||
Microsoft Corp. | 41,955 | 6,015,088 | ||||||
ServiceNow, Inc.*1 | 12,240 | 3,026,462 | ||||||
|
| |||||||
| 9,041,550 | ||||||||
|
| |||||||
Total Information Technology | 37,306,244 | |||||||
|
| |||||||
Materials - 0.4% | ||||||||
Chemicals - 0.2% | ||||||||
Dow, Inc. | 8,820 | 445,322 | ||||||
FMC Corp. | 5,155 | 471,682 | ||||||
RPM International, Inc. | 8,500 | 615,655 | ||||||
|
| |||||||
| 1,532,659 | ||||||||
|
| |||||||
Containers & Packaging - 0.1% | ||||||||
Graphic Packaging Holding Co. | 43,591 | 682,635 | ||||||
Sealed Air Corp. | 12,205 | 509,803 | ||||||
|
| |||||||
| 1,192,438 | ||||||||
|
| |||||||
Metals & Mining - 0.1% | ||||||||
BHP Group Ltd. - ADR (Australia) | 13,649 | 667,573 | ||||||
Rio Tinto plc - ADR (Australia) | 10,425 | 542,204 | ||||||
|
| |||||||
| 1,209,777 | ||||||||
|
| |||||||
Total Materials | 3,934,874 | |||||||
|
| |||||||
Real Estate - 3.2% | ||||||||
Equity Real Estate Investment Trusts (REITS) - 3.2% |
| |||||||
Acadia Realty Trust | 3,435 | 96,110 | ||||||
Agree Realty Corp. | 2,150 | 169,354 | ||||||
Alexandria Real Estate Equities, Inc. | 770 | 122,237 | ||||||
The accompanying notes are an integral part of the financial statements.
10
Investment Portfolio - October 31, 2019
| PRO-BLEND® CONSERVATIVE TERM SERIES | VALUE | |||||||
SHARES
| (NOTE 2)
| |||||||
COMMON STOCKS(continued) | ||||||||
Real Estate(continued) | ||||||||
Equity Real Estate Investment Trusts (REITS)(continued) | ||||||||
American Campus Communities, Inc. | 5,700 | $ | 284,886 | |||||
American Homes 4 Rent - Class A | 19,370 | 512,724 | ||||||
American Tower Corp. | 7,920 | 1,727,194 | ||||||
Americold Realty Trust | 10,650 | 426,958 | ||||||
Apartment Investment & Management Co. - Class A | 9,252 | 507,750 | ||||||
AvalonBay Communities, Inc. | 4,935 | 1,074,152 | ||||||
Boston Properties, Inc. | 2,896 | 397,331 | ||||||
Brandywine Realty Trust | 27,195 | 415,540 | ||||||
Camden Property Trust | 3,355 | 383,711 | ||||||
Community Healthcare Trust, Inc. | 13,692 | 662,967 | ||||||
Cousins Properties, Inc. | 17,646 | 708,134 | ||||||
Crown Castle International Corp. | 5,428 | 753,352 | ||||||
CubeSmart | 3,030 | 96,051 | ||||||
Digital Realty Trust, Inc. | 2,840 | 360,794 | ||||||
Douglas Emmett, Inc. | 7,525 | 325,983 | ||||||
Equinix, Inc. | 7,645 | 4,333,033 | ||||||
Equity LifeStyle Properties, Inc. | 4,350 | 304,239 | ||||||
Equity Residential | 5,810 | 515,115 | ||||||
Essential Properties Realty Trust, Inc. | 12,607 | 323,496 | ||||||
Essex Property Trust, Inc. | 1,259 | 411,857 | ||||||
Extra Space Storage, Inc. | 1,110 | 124,620 | ||||||
Federal Realty Investment Trust | 775 | 105,408 | ||||||
First Industrial Realty Trust, Inc. | 5,085 | 214,129 | ||||||
Getty Realty Corp. | 6,000 | 201,240 | ||||||
Healthcare Realty Trust, Inc. | 16,550 | 575,444 | ||||||
Healthcare Trust of America, Inc. - Class A | 11,975 | 371,225 | ||||||
Healthpeak Properties, Inc. | 13,535 | 509,187 | ||||||
Hibernia REIT plc (Ireland) | 105,835 | 164,781 | ||||||
Host Hotels & Resorts, Inc. | 11,150 | 182,748 | ||||||
Independence Realty Trust, Inc. | 38,675 | 595,595 | ||||||
Invitation Homes, Inc. | 21,450 | 660,446 | ||||||
Jernigan Capital, Inc. | 21,250 | 403,538 | ||||||
Kilroy Realty Corp. | 1,331 | 111,711 | ||||||
Lexington Realty Trust | 13,005 | 141,494 | ||||||
Liberty Property Trust | 5,255 | 310,413 | ||||||
Life Storage, Inc. | 1,495 | 162,835 | ||||||
Mid-America Apartment Communities, Inc. | 1,605 | 223,079 | ||||||
National Retail Properties, Inc. | 5,600 | 329,896 | ||||||
National Storage Affiliates Trust | 5,490 | 187,593 | ||||||
Omega Healthcare Investors, Inc. | 5,305 | 233,632 | ||||||
Physicians Realty Trust | 32,350 | 603,974 | ||||||
| SHARES/ | ||||||||
PRINCIPAL AMOUNT2
| VALUE (NOTE 2)
| |||||||
COMMON STOCKS(continued) | ||||||||
Real Estate(continued) | ||||||||
Equity Real Estate Investment Trusts (REITS)(continued) | ||||||||
Plymouth Industrial REIT, Inc. | 16,859 | $ | 317,961 | |||||
Prologis, Inc. | 12,340 | 1,082,958 | ||||||
Public Storage | 2,125 | 473,578 | ||||||
Realty Income Corp. | 1,640 | 134,136 | ||||||
SBA Communications Corp. | 7,290 | 1,754,338 | ||||||
Simon Property Group, Inc. | 4,885 | 736,072 | ||||||
STAG Industrial, Inc. | 15,820 | 491,053 | ||||||
STORE Capital Corp. | 4,710 | 190,755 | ||||||
Sun Communities, Inc. | 2,965 | 482,257 | ||||||
Sunstone Hotel Investors, Inc. | 9,220 | 124,562 | ||||||
UDR, Inc. | 7,858 | 394,864 | ||||||
UMH Properties, Inc. | 7,070 | 105,555 | ||||||
Urban Edge Properties | 13,135 | 277,280 | ||||||
Ventas, Inc. | 5,717 | 372,177 | ||||||
VEREIT, Inc. | 35,665 | 350,944 | ||||||
Vornado Realty Trust | 2,025 | 132,901 | ||||||
Weingarten Realty Investors | 8,610 | 273,195 | ||||||
Welltower, Inc. | 5,279 | 478,753 | ||||||
|
| |||||||
Total Real Estate | 29,499,295 | |||||||
|
| |||||||
Utilities - 0.2% | ||||||||
Electric Utilities - 0.0%## | ||||||||
Exelon Corp. | 7,455 | 339,128 | ||||||
|
| |||||||
Independent Power and Renewable Electricity Producers - 0.1% |
| |||||||
Boralex, Inc. - Class A (Canada) | 14,085 | 233,128 | ||||||
Innergex Renewable Energy, Inc. (Canada) | 23,430 | 292,453 | ||||||
Northland Power, Inc. (Canada) | 14,100 | 281,550 | ||||||
Pattern Energy Group, Inc. - Class A | 9,091 | 254,821 | ||||||
|
| |||||||
| 1,061,952 | ||||||||
|
| |||||||
Multi-Utilities - 0.1% | ||||||||
CMS Energy Corp.1 | 10,611 | 678,255 | ||||||
|
| |||||||
Total Utilities | 2,079,335 | |||||||
|
| |||||||
TOTAL COMMON STOCKS | 241,582,816 | |||||||
|
| |||||||
CORPORATE BONDS - 20.2% | ||||||||
Non-Convertible Corporate Bonds - 20.2% | ||||||||
Communication Services - 4.0% | ||||||||
Diversified Telecommunication Services - 2.0% |
| |||||||
AT&T, Inc., 4.25%, 3/1/2027 | 6,620,000 | 7,270,783 | ||||||
CenturyLink, Inc., 5.625%, 4/1/2020 | 85,000 | 86,062 | ||||||
The accompanying notes are an integral part of the financial statements.
11
Investment Portfolio - October 31, 2019
| PRO-BLEND® CONSERVATIVE | ||||||||
TERM SERIES | PRINCIPAL AMOUNT2
| VALUE (NOTE 2)
| ||||||
CORPORATE BONDS(continued) |
| |||||||
Non-Convertible Corporate Bonds(continued) |
| |||||||
Communication Services(continued) |
| |||||||
Diversified Telecommunication Services(continued) |
| |||||||
Verizon Communications, Inc., 5.25%, 3/16/2037 | 8,320,000 | $ | 10,479,690 | |||||
|
| |||||||
| 17,836,535 | ||||||||
|
| |||||||
Interactive Media & Services - 0.6% | ||||||||
Tencent Holdings Ltd. (China)3, 3.975%, 4/11/2029 | 4,790,000 | 5,155,092 | ||||||
|
| |||||||
Media - 1.4% | ||||||||
Cablevision Systems Corp., 8.00%, 4/15/2020 | 85,000 | 87,125 | ||||||
Comcast Corp., 3.25%, 11/1/2039 | 5,180,000 | 5,251,567 | ||||||
Diamond Sports Group LLC - Diamond Sports Finance Co.3, 6.625%, 8/15/2027 | 130,000 | 133,900 | ||||||
Discovery Communications LLC, 5.20%, 9/20/2047 | 6,640,000 | 7,261,212 | ||||||
Entercom Media Corp.3, 7.25%, 11/1/2024 | 45,000 | 46,912 | ||||||
Townsquare Media, Inc.3, 6.50%, 4/1/2023 | 90,000 | 89,100 | ||||||
|
| |||||||
| 12,869,816 | ||||||||
|
| |||||||
Wireless Telecommunication Services - 0.0%## |
| |||||||
Sprint Communications, Inc., 7.00%, 8/15/2020 | 205,000 | 211,185 | ||||||
Sprint Corp., 7.25%, 9/15/2021 | 85,000 | 90,700 | ||||||
Sprint Corp., 7.125%, 6/15/2024 | 85,000 | 92,225 | ||||||
|
| |||||||
| 394,110 | ||||||||
|
| |||||||
Total Communication Services | 36,255,553 | |||||||
|
| |||||||
Consumer Discretionary - 2.6% | ||||||||
Auto Components - 0.0%## | ||||||||
American Axle & Manufacturing, Inc., 6.25%, 4/1/2025 | 45,000 | 43,369 | ||||||
Techniplas LLC3, 10.00%, 5/1/2020 | 110,000 | 92,950 | ||||||
|
| |||||||
| 136,319 | ||||||||
|
| |||||||
Automobiles - 0.7% | ||||||||
General Motors Financial Co., Inc., 3.15%, 1/15/2020 | 6,700,000 | 6,709,058 | ||||||
|
| |||||||
Diversified Consumer Services - 0.0%## |
| |||||||
GEMS MENASA Cayman Ltd. - GEMS Education Delaware LLC (United Arab Emirates)3, 7.125%, 7/31/2026 | 140,000 | 145,075 | ||||||
|
| |||||||
Household Durables - 0.1% | ||||||||
Ashton Woods USA LLC - Ashton Woods Finance Co.3, 6.75%, 8/1/2025 | 90,000 | 90,450 | ||||||
PRINCIPAL AMOUNT2
| VALUE (NOTE 2)
| |||||||
CORPORATE BONDS (continued) |
| |||||||
Non-Convertible Corporate Bonds(continued) |
| |||||||
Consumer Discretionary(continued) |
| |||||||
Household Durables(continued) |
| |||||||
LGI Homes, Inc.3, 6.875%, 7/15/2026 | 175,000 | $ | 181,125 | |||||
Weekley Homes LLC - Weekley Finance Corp., 6.625%, 8/15/2025 | 180,000 | 182,700 | ||||||
|
| |||||||
| 454,275 | ||||||||
|
| |||||||
Internet & Direct Marketing Retail - 1.8% |
| |||||||
Alibaba Group Holding Ltd. (China), 3.40%, 12/6/2027 5,140,000 |
| 5,338,720 | ||||||
Booking Holdings, Inc., 3.60%, 6/1/2026 | 10,080,000 | 10,913,187 | ||||||
Photo Holdings Merger Sub, Inc.3, 8.50%, 10/1/2026 | 135,000 | 118,818 | ||||||
|
| |||||||
| 16,370,725 | ||||||||
|
| |||||||
Specialty Retail - 0.0%## | ||||||||
Foxtrot Escrow Issuer LLC - Foxtrot Escrow Corp.3, 12.25%, 11/15/2026 130,000 |
| 130,663 | ||||||
Staples, Inc.3, 7.50%, 4/15/2026 | 135,000 | 140,427 | ||||||
|
| |||||||
| 271,090 | ||||||||
|
| |||||||
Total Consumer Discretionary | 24,086,542 | |||||||
|
| |||||||
Consumer Staples - 0.2% | ||||||||
Beverages - 0.2% | ||||||||
Constellation Brands, Inc., 2.00%, 11/7/2019 | 2,000,000 | 1,999,953 | ||||||
|
| |||||||
Food & Staples Retailing - 0.0%## |
| |||||||
KeHE Distributors LLC - KeHE | ||||||||
Finance Corp.3, 8.625%, 10/15/2026 | 125,000 | 128,203 | ||||||
|
| |||||||
Total Consumer Staples | 2,128,156 | |||||||
|
| |||||||
Energy - 3.8% | ||||||||
Energy Equipment & Services - 0.0%## |
| |||||||
Nabors Industries, Inc., 5.50%, 1/15/2023 | 90,000 | 76,050 | ||||||
Shelf Drilling Holdings Ltd. (United | ||||||||
Arab Emirates)3, 8.25%, 2/15/2025 | 90,000 | 75,600 | ||||||
|
| |||||||
| 151,650 | ||||||||
|
| |||||||
Oil, Gas & Consumable Fuels - 3.8% |
| |||||||
Antero Midstream Partners LP - Antero Midstream Finance Corp.3, 5.75%, 3/1/2027 | 90,000 | 66,937 | ||||||
Antero Midstream Partners LP - Antero Midstream Finance Corp.3, 5.75%, 1/15/2028 | 90,000 | 67,950 | ||||||
The accompanying notes are an integral part of the financial statements.
12
Investment Portfolio - October 31, 2019
| PRO-BLEND® CONSERVATIVE | ||||||||
| TERM SERIES | PRINCIPAL AMOUNT2
| VALUE (NOTE 2)
| ||||||
CORPORATE BONDS(continued) | ||||||||
Non-Convertible Corporate Bonds(continued) |
| |||||||
Energy(continued) | ||||||||
Oil, Gas & Consumable Fuels(continued) |
| |||||||
Bruin E&P Partners LLC3, 8.875%, 8/1/2023 | 90,000 | $ | 59,400 | |||||
Calumet Specialty Products Partners LP - Calumet Finance Corp.3, 11.00%, 4/15/2025 | 135,000 | 135,338 | ||||||
Energy Transfer Operating LP, 6.50%, 2/1/2042 | 4,570,000 | 5,473,502 | ||||||
Jonah Energy LLC - Jonah Energy Finance Corp.3, 7.25%, 10/15/2025 | 180,000 | 50,400 | ||||||
Kinder Morgan Energy Partners LP, 6.95%, 1/15/2038 | 5,550,000 | 7,174,610 | ||||||
Kinder Morgan, Inc., 3.05%, 12/1/2019 | 6,670,000 | 6,674,551 | ||||||
Lonestar Resources America, Inc.3, 11.25%, 1/1/2023 | 90,000 | 63,000 | ||||||
Moss Creek Resources Holdings, Inc.3, 10.50%, 5/15/2027 | 30,000 | 23,175 | ||||||
NuStar Logistics LP, 6.75%, 2/1/2021 | 85,000 | 88,075 | ||||||
Rockies Express Pipeline LLC3, 5.625%, 4/15/2020 | 130,000 | 132,184 | ||||||
Sabine Pass Liquefaction LLC, 5.875%, 6/30/2026 | 7,640,000 | 8,772,642 | ||||||
Southwestern Energy Co.4, 6.20%, 1/23/2025 | 90,000 | 79,200 | ||||||
W&T Offshore, Inc.3, 9.75%, 11/1/2023 | 45,000 | 42,188 | ||||||
The Williams Companies, Inc., 3.75%, 6/15/2027 | 5,150,000 | 5,369,619 | ||||||
|
| |||||||
| 34,272,771 | ||||||||
|
| |||||||
Total Energy | 34,424,421 | |||||||
|
| |||||||
Financials - 4.3% | ||||||||
Banks - 3.8% | ||||||||
Bank of America Corp., 4.00%, 1/22/2025 | 10,060,000 | 10,730,188 | ||||||
Citigroup, Inc., 8.125%, 7/15/2039 | 3,240,000 | 5,330,021 | ||||||
Credit Suisse AG (Switzerland), 5.40%, 1/14/2020 | 6,550,000 | 6,592,444 | ||||||
JPMorgan Chase & Co.5, (3 mo. LIBOR US + 1.000%), 4.023%, 12/5/2024 | 4,560,000 | 4,869,158 | ||||||
Santander Holdings USA, Inc., 4.50%, 7/17/2025 | 6,590,000 | 7,101,374 | ||||||
|
| |||||||
| 34,623,185 | ||||||||
|
| |||||||
PRINCIPAL AMOUNT2
| VALUE (NOTE 2)
| |||||||
CORPORATE BONDS (continued) |
| |||||||
Non-Convertible Corporate Bonds(continued) |
| |||||||
Financials(continued) | ||||||||
Capital Markets - 0.4% | ||||||||
AG Merger Sub II, Inc.3, 10.75%, 8/1/2027 | 90,000 | $ | 89,100 | |||||
Donnelley Financial Solutions, Inc., 8.25%, 10/15/2024 | 175,000 | 182,000 | ||||||
The Goldman Sachs Group, Inc., 4.25%, 10/21/2025 | 3,180,000 | 3,425,340 | ||||||
|
| |||||||
| 3,696,440 | ||||||||
|
| |||||||
Consumer Finance - 0.0%## | ||||||||
Navient Corp., 5.00%, 10/26/2020 | 135,000 | 137,491 | ||||||
SLM Corp., 5.125%, 4/5/2022 | 175,000 | 180,688 | ||||||
|
| |||||||
| 318,179 | ||||||||
|
| |||||||
Diversified Financial Services - 0.1% | ||||||||
Fidelity & Guaranty Life Holdings, Inc.3, 5.50%, 5/1/2025 | 85,000 | 90,738 | ||||||
Global Aircraft Leasing Co. Ltd. (Cayman Islands)3,6, 6.50%, 9/15/2024 | 135,000 | 138,166 | ||||||
VistaJet Malta Finance plc - XO Management Holding, Inc. (Switzerland)3, 10.50%, 6/1/2024 | 135,000 | 131,288 | ||||||
|
| |||||||
| 360,192 | ||||||||
|
| |||||||
Thrifts & Mortgage Finance - 0.0%## | ||||||||
Acrisure LLC - Acrisure Finance, Inc.3, 7.00%, 11/15/2025 | 150,000 | 137,249 | ||||||
Radian Group, Inc., 4.875%, 3/15/2027 | 180,000 | 186,750 | ||||||
|
| |||||||
| 323,999 | ||||||||
|
| |||||||
Total Financials | 39,321,995 | |||||||
|
| |||||||
Health Care - 0.6% | ||||||||
Health Care Providers & Services - 0.6% |
| |||||||
HCA, Inc., 4.125%, 6/15/2029 | 5,100,000 | 5,402,965 | ||||||
|
| |||||||
Industrials - 2.3% | ||||||||
Commercial Services & Supplies - 0.1% |
| |||||||
The ADT Security Corp., 6.25%, 10/15/2021 | 85,000 | 90,631 | ||||||
Prime Security Services Borrower LLC - Prime Finance, Inc.3, 5.75%, 4/15/2026 | 85,000 | 87,100 | ||||||
Stericycle, Inc.3, 5.375%, 7/15/2024 | 180,000 | 187,200 | ||||||
|
| |||||||
| 364,931 | ||||||||
|
| |||||||
Construction & Engineering - 0.0%## | ||||||||
HC2 Holdings, Inc.3, 11.50%, 12/1/2021 | 45,000 | 41,006 | ||||||
The accompanying notes are an integral part of the financial statements.
13
Investment Portfolio - October 31, 2019
| PRO-BLEND® CONSERVATIVE | ||||||||
| TERM SERIES | PRINCIPAL AMOUNT2
| VALUE
| ||||||
CORPORATE BONDS(continued) |
| |||||||
Non-Convertible Corporate Bonds(continued) |
| |||||||
Industrials(continued) |
| |||||||
Construction & Engineering(continued) |
| |||||||
Tutor Perini Corp.3, 6.875%, 5/1/2025 | 180,000 | $ | 179,523 | |||||
|
| |||||||
| 220,529 | ||||||||
|
| |||||||
Industrial Conglomerates - 0.6% |
| |||||||
General Electric Co.5,7, (3 mo. LIBOR US + 3.330%), 5.00% | 5,550,000 | 5,348,812 | ||||||
|
| |||||||
Marine - 0.1% |
| |||||||
American Tanker, Inc. (Norway)3, 9.25%, 2/22/2022 | 225,000 | 226,262 | ||||||
Borealis Finance LLC3, 7.50%, 11/16/2022 | 190,000 | 178,600 | ||||||
Global Ship Lease, Inc. | 200,000 | 207,500 | ||||||
|
| |||||||
| 612,362 | ||||||||
|
| |||||||
Trading Companies & Distributors - 1.5% |
| |||||||
AerCap Ireland Capital DAC - AerCap Global Aviation Trust (Ireland), 4.45%, 10/1/2025 | 6,440,000 | 6,987,903 | ||||||
Air Lease Corp., 3.625%, 4/1/2027 | 6,600,000 | 6,884,908 | ||||||
Fortress Transportation & Infrastructure Investors LLC3, 6.50%, 10/1/2025 | 135,000 | 136,350 | ||||||
|
| |||||||
| 14,009,161 | ||||||||
|
| |||||||
Total Industrials | 20,555,795 | |||||||
|
| |||||||
Information Technology - 0.0%## |
| |||||||
Communications Equipment - 0.0%## |
| |||||||
Hughes Satellite Systems Corp., 5.25%, 8/1/2026 | 170,000 | 182,113 | ||||||
|
| |||||||
Materials - 0.8% |
| |||||||
Chemicals - 0.0%## |
| |||||||
CF Industries, Inc., 7.125%, 5/1/2020 | 85,000 | 87,043 | ||||||
Olin Corp., 5.625%, 8/1/2029 | 90,000 | 93,444 | ||||||
|
| |||||||
| 180,487 | ||||||||
|
| |||||||
Containers & Packaging - 0.0%## |
| |||||||
ARD Securities Finance S.A.R.L (Luxembourg)3,6, 8.75%, 1/31/2023 | 52,187 | 54,275 | ||||||
Berry Global, Inc.3, 4.50%, 2/15/2026 | 65,000 | 65,406 | ||||||
Mauser Packaging Solutions Holding Co.3, 7.25%, 4/15/2025 | 95,000 | 90,844 | ||||||
|
| |||||||
| 210,525 | ||||||||
|
| |||||||
PRINCIPAL
| VALUE
| |||||||
CORPORATE BONDS(continued) |
| |||||||
Non-Convertible Corporate Bonds(continued) |
| |||||||
Materials(continued) |
| |||||||
Metals & Mining - 0.8% | ||||||||
Infrabuild Australia Pty Ltd. (Australia)3, 12.00%, 10/1/2024 | 135,000 | $ | 137,581 | |||||
Mountain Province Diamonds, Inc. | 180,000 | 174,600 | ||||||
Northwest Acquisitions ULC - Dominion Finco, Inc.3, 7.125%, 11/1/2022 | 180,000 | 90,000 | ||||||
Southern Copper Corp. (Peru), 5.375%, 4/16/2020 | 6,740,000 | 6,823,149 | ||||||
SunCoke Energy Partners LP - SunCoke Energy Partners Finance Corp.3, 7.50%, 6/15/2025 | 45,000 | 38,250 | ||||||
|
| |||||||
| 7,263,580 | ||||||||
|
| |||||||
Total Materials | 7,654,592 | |||||||
|
| |||||||
Real Estate - 1.6% | ||||||||
Equity Real Estate Investment Trusts (REITS) - 1.6% |
| |||||||
American Tower Corp., 3.80%, 8/15/2029 | 6,410,000 | 6,852,501 | ||||||
Crown Castle International Corp., 3.10%, 11/15/2029 | 6,780,000 | 6,889,476 | ||||||
GTP Acquisition Partners I LLC3, 2.35%, 6/15/2020 | 945,000 | 945,330 | ||||||
|
| |||||||
| 14,687,307 | ||||||||
|
| |||||||
Real Estate Management & Development - 0.0%## |
| |||||||
Five Point Operating Co. LP - Five Point Capital Corp.3, 7.875%, 11/15/2025 | 135,000 | 127,598 | ||||||
Forestar Group, Inc.3, 8.00%, 4/15/2024 | 85,000 | 91,375 | ||||||
|
| |||||||
| 218,973 | ||||||||
|
| |||||||
Total Real Estate | 14,906,280 | |||||||
|
| |||||||
TOTAL CORPORATE BONDS | ||||||||
(Identified Cost $177,718,518) | 184,918,412 | |||||||
|
| |||||||
MUTUAL FUNDS - 0.4% | ||||||||
iShares Russell 1000 Value ETF | 15,780 | 2,052,504 | ||||||
Schwab U.S. Dividend Equity ETF | 26,461 | 1,469,115 | ||||||
|
| |||||||
TOTAL MUTUAL FUNDS | ||||||||
(Identified Cost $3,395,953) | 3,521,619 | |||||||
|
| |||||||
The accompanying notes are an integral part of the financial statements.
14
Investment Portfolio - October 31, 2019
| PRO-BLEND® CONSERVATIVE | ||||||||
| TERM SERIES | PRINCIPAL AMOUNT2
| VALUE (NOTE 2)
| ||||||
U.S. TREASURY SECURITIES - 21.5% |
| |||||||
U.S. Treasury Bonds - 1.5% |
| |||||||
U.S. Treasury Bond, 3.00%, 5/15/2047 | 7,645,000 | $ | 8,951,817 | |||||
U.S. Treasury Inflation Indexed Bond, 0.75%, 2/15/2042 | 4,853,424 | 5,099,916 | ||||||
|
| |||||||
Total U.S. Treasury Bonds |
| |||||||
(Identified Cost $13,641,527) | 14,051,733 | |||||||
|
| |||||||
U.S. Treasury Notes - 20.0% |
| |||||||
U.S. Treasury Inflation Indexed Note, 0.125%, 4/15/2020 | 36,867,128 | 36,669,831 | ||||||
U.S. Treasury Inflation Indexed Note, 0.50%, 4/15/2024 | 17,725,581 | 17,958,612 | ||||||
U.S. Treasury Note, 2.625%, 5/15/2021 | 17,785,000 | 18,062,891 | ||||||
U.S. Treasury Note, 2.50%, 8/15/2023 | 26,540,000 | 27,485,488 | ||||||
U.S. Treasury Note, 2.50%, 5/15/2024 | 26,140,000 | 27,242,781 | ||||||
U.S. Treasury Note, 2.125%, 5/15/2025 | 26,365,000 | 27,136,382 | ||||||
U.S. Treasury Note, 1.625%, 5/15/2026 | 27,785,000 | 27,829,499 | ||||||
|
| |||||||
Total U.S. Treasury Notes | ||||||||
(Identified Cost $179,503,338) | 182,385,484 | |||||||
|
| |||||||
TOTAL U.S. TREASURY SECURITIES | ||||||||
(Identified Cost $193,144,865) | 196,437,217 | |||||||
|
| |||||||
ASSET-BACKED SECURITIES - 6.2% | ||||||||
CarMax Auto Owner Trust, Series2017-3, Class A3, 1.97%, 4/15/2022 | 1,613,153 | 1,612,780 | ||||||
Cazenovia Creek Funding I LLC, Series2015-1A, Class A3, 2.00%, 12/10/2023 | 13,919 | 13,912 | ||||||
Cazenovia Creek Funding II LLC, Series2018-1A, Class A3, 3.561%, 7/15/2030 | 1,346,738 | 1,356,517 | ||||||
Chesapeake Funding II LLC, Series2017-2A, Class A1 (Canada)3, 1.99%, 5/15/2029 | 3,735,757 | 3,734,598 | ||||||
Chesapeake Funding II LLC, Series2017-4A, Class A1 (Canada)3, 2.12%, 11/15/2029 | 1,216,837 | 1,216,854 | ||||||
Commonbond Student Loan Trust, Series2019-AGS, Class A13, 2.54%, 1/25/2047 | 2,500,000 | 2,499,146 | ||||||
Credit Acceptance Auto Loan Trust, Series2017-1A, Class A3, 2.56%, 10/15/2025 | 288,082 | 288,197 | ||||||
PRINCIPAL
| VALUE
| |||||||
ASSET-BACKED SECURITIES(continued) |
| |||||||
Enterprise Fleet Financing LLC, Series2016-2, Class A33, 2.04%, 2/22/2022 | 827,711 | $ | 827,336 | |||||
Home Partners of America Trust, Series2019-1, Class A3, 2.908%, 9/17/2039 | 3,040,520 | 3,101,331 | ||||||
Hyundai Auto Lease Securitization Trust, Series2017-B, Class A33, 1.97%, 7/15/2020 | 402,139 | 402,114 | ||||||
Invitation Homes Trust, Series 2017-SFR2, Class A3,8, (1 mo. LIBOR US + 0.850%), 2.739%, 12/17/2036 | 722,974 | 721,958 | ||||||
Invitation Homes Trust, Series 2017-SFR2, Class B3,8, (1 mo. LIBOR US + 1.150%), 3.039%, 12/17/2036 | 570,000 | 570,535 | ||||||
Navient Private Education Refi Loan Trust, Series2019-CA, Class A13, 2.82%, 2/15/2068 | 2,678,876 | 2,705,124 | ||||||
Navient Private Education Refi Loan Trust, Series2019-EA, Class A2A3, 2.64%, 5/15/2068 | 3,000,000 | 3,035,420 | ||||||
Navient Student Loan Trust, Series2019-2A, Class A23,8, (1 mo. LIBOR US + 1.000%), 2.823%, 2/27/2068 | 6,500,000 | 6,556,466 | ||||||
Progress Residential Trust, Series 2017-SFR2, Class A3, 2.897%, 12/17/2034 | 1,500,000 | 1,507,470 | ||||||
Progress Residential Trust, Series 2019-SFR2, Class A3, 3.147%, 5/17/2036 | 3,250,000 | 3,306,407 | ||||||
Progress Residential Trust, Series 2019-SFR4, Class A3, 2.687%, 10/17/2036 | 4,200,000 | 4,217,940 | ||||||
SBA Small Business Investment Companies, Series2015-10A, Class 1, 2.517%, 3/10/2025 | 655,038 | 666,065 | ||||||
SoFi Consumer Loan Program LLC, Series2017-4, Class A3, 2.50%, 5/26/2026 | 306,112 | 306,920 | ||||||
SoFi Consumer Loan Program Trust, Series2019-2, Class A3, 3.01%, 4/25/2028 | 2,100,469 | 2,116,913 | ||||||
SoFi Consumer Loan Program Trust, Series2019-3, Class A3, 2.90%, 5/25/2028 | 2,636,675 | 2,655,438 | ||||||
SoFi Professional Loan Program LLC, Series2017-C, Class A2A3, 1.75%, 7/25/2040 | 13,930 | 13,923 | ||||||
SoFi Professional Loan Program LLC, Series2017-D, Class A2FX3, 2.65%, 9/25/2040 | 1,388,318 | 1,399,998 | ||||||
The accompanying notes are an integral part of the financial statements.
15
Investment Portfolio - October 31, 2019
| PRO-BLEND® CONSERVATIVE | ||||||||
| TERM SERIES | PRINCIPAL
| VALUE
| ||||||
ASSET-BACKED SECURITIES (continued) | ||||||||
SoFi Professional Loan Program LLC, Series2017-F, Class A1FX3, 2.05%, 1/25/2041 | 166,574 | $ | 166,562 | |||||
SoFi Professional Loan Program LLC, Series2017-F, Class A2FX3, 2.84%, 1/25/2041 | 500,000 | 507,425 | ||||||
SoFi Professional Loan Program LLC, Series2018-A, Class A2A3, 2.39%, 2/25/2042 | 551,560 | 552,623 | ||||||
SoFi Professional Loan Program Trust, Series2018-C, Class A1FX3, 3.08%, 1/25/2048 | 1,708,614 | 1,719,318 | ||||||
Tax Ease Funding LLC, Series2016-1A, Class A3, 3.131%, 6/15/2028 | 297,823 | 297,756 | ||||||
Towd Point Mortgage Trust, Series2016-5, Class A13,9, 2.50%, 10/25/2056 | 1,507,669 | 1,513,435 | ||||||
Towd Point Mortgage Trust, Series2017-1, Class A13,9, 2.75%, 10/25/2056 | 2,014,602 | 2,038,440 | ||||||
Towd Point Mortgage Trust, Series2019-HY1, Class A13,8, (1 mo. LIBOR US + 1.000%), 2.823%, 10/25/2048 | 1,829,783 | 1,839,557 | ||||||
Tricon American Homes Trust, Series 2016-SFR1, Class A3, 2.589%, 11/17/2033 | 1,760,418 | 1,760,046 | ||||||
Tricon American Homes Trust, Series 2017-SFR2, Class A3, 2.928%, 1/17/2036 | 1,839,781 | 1,867,369 | ||||||
|
| |||||||
TOTAL ASSET-BACKED SECURITIES | ||||||||
(Identified Cost $56,606,723) | 57,095,893 | |||||||
|
| |||||||
COMMERCIAL MORTGAGE-BACKED SECURITIES - 6.8% |
| |||||||
Americold LLC Trust, Series 2010-ARTA, Class A13, 3.847%, 1/14/2029 | 76,832 | 77,599 | ||||||
BWAY Mortgage Trust, Series 2015-1740, Class A3, 2.917%, 1/10/2035 | 4,633,000 | 4,745,620 | ||||||
Caesars Palace Las Vegas Trust, Series 2017-VICI, Class A3, 3.531%, 10/15/2034 | 2,520,000 | 2,620,647 | ||||||
CIM Trust, Series 2019-INV1, Class A13,9, 4.00%, 2/25/2049 | 1,155,530 | 1,180,747 | ||||||
Commercial Mortgage Pass-Through Certificates, Series2015-3BP, Class A3, 3.178%, 2/10/2035 | 500,000 | 524,534 | ||||||
PRINCIPAL
| VALUE
| |||||||
COMMERCIAL MORTGAGE-BACKED SECURITIES(continued) |
| |||||||
Commercial Mortgage Pass-Through Certificates, Series2015-DC1, Class A5, 3.35%, 2/10/2048 | 4,455,000 | $ | 4,684,451 | |||||
Credit Suisse Mortgage Capital Trust, Series 2013-IVR3, Class A13,9, 2.50%, 5/25/2043 | 1,091,056 | 1,079,578 | ||||||
Credit Suisse Mortgage Capital Trust, Series2013-TH1, Class A13,9, 2.13%, 2/25/2043 | 726,263 | 710,253 | ||||||
Fannie Mae REMICS, Series2018-31, Class KP, 3.50%, 7/25/2047 | 2,318,747 | 2,420,648 | ||||||
FannieMae-Aces, Series2017-M15, Class A19, 2.959%, 9/25/2027 | 3,177,088 | 3,329,073 | ||||||
FDIC Trust, Series2011-R1, Class A3, 2.672%, 7/25/2026 | 10,004 | 9,986 | ||||||
Freddie Mac Multifamily Structured Pass-Through Certificates, Series K009, Class X1 (IO)9, 1.26%, 8/25/2020 | 19,443,659 | 139,605 | ||||||
Freddie Mac Multifamily Structured Pass-Through Certificates, Series K014, Class X1 (IO)9, 1.149%, 4/25/2021 | 2,565,927 | 35,809 | ||||||
Freddie Mac Multifamily Structured Pass-Through Certificates, Series K016, Class X1 (IO)9, 1.478%, 10/25/2021 | 6,013,692 | 148,831 | ||||||
Freddie Mac Multifamily Structured Pass-Through Certificates, Series K017, Class X1 (IO)9, 1.298%, 12/25/2021 | 7,716,962 | 171,343 | ||||||
Freddie Mac Multifamily Structured Pass-Through Certificates, Series K021, Class X1 (IO)9, 1.428%, 6/25/2022 | 14,611,508 | 470,207 | ||||||
Freddie Mac Multifamily Structured Pass-Through Certificates, Series K030, Class X1 (IO)9, 0.188%, 4/25/2023 | 73,512,046 | 443,711 | ||||||
Freddie Mac Multifamily Structured Pass-Through Certificates, Series K032, Class X1 (IO)9, 0.098%, 5/25/2023 | 45,556,865 | 177,813 | ||||||
Freddie Mac REMICS, Series 4791, Class BA, 4.00%, 3/15/2044 | 2,444,259 | 2,477,287 | ||||||
Freddie Mac REMICS, Series 4801, Class BA, 4.50%, 5/15/2044 | 2,123,692 | 2,168,042 | ||||||
FREMF Mortgage Trust, Series2011-K13, Class B3,9, 4.612%, 1/25/2048 | 2,255,000 | 2,313,123 | ||||||
FREMF Mortgage Trust, Series2013-K28, Class X2A (IO)3, 0.10%, 6/25/2046 | 194,709,611 | 521,744 | ||||||
The accompanying notes are an integral part of the financial statements.
16
Investment Portfolio - October 31, 2019
| PRO-BLEND® CONSERVATIVE | ||||||||
| TERM SERIES | PRINCIPAL AMOUNT2
| VALUE
| ||||||
COMMERCIAL MORTGAGE-BACKED SECURITIES(continued) |
| |||||||
FREMF Mortgage Trust, Series 2013-K712, Class B3,9, 3.263%, 5/25/2045 | 1,025,000 | $ | 1,023,983 | |||||
FREMF Mortgage Trust, Series2014-K41, Class B3,9, 3.832%, 11/25/2047 | 2,227,000 | 2,337,662 | ||||||
FREMF Mortgage Trust, Series 2014-K716, Class B3,9, 3.948%, 8/25/2047 | 2,624,000 | 2,694,173 | ||||||
FREMF Mortgage Trust, Series2015-K42, Class B3,9, 3.851%, 12/25/2024 | 490,000 | 513,346 | ||||||
FREMF Mortgage Trust, Series2015-K43, Class B3,9, 3.734%, 2/25/2048 | 500,000 | 520,356 | ||||||
FREMF Mortgage Trust, Series 2015-K720, Class B3,9, 3.391%, 7/25/2022 | 270,000 | 275,836 | ||||||
Government National Mortgage Association, Series2017-54, Class AH, 2.60%, 12/16/2056 | 2,389,628 | 2,409,638 | ||||||
GS Mortgage Securities Trust, Series2010-C2, Class A13, 3.849%, 12/10/2043 | 36,448 | 36,662 | ||||||
JP Morgan Mortgage Trust, Series2013-1, Class 1A23,9, 3.00%, 3/25/2043 | 578,583 | 584,246 | ||||||
JP Morgan Mortgage Trust, Series2013-2, Class A23,9, 3.50%, 5/25/2043 | 619,755 | 631,853 | ||||||
JP Morgan Mortgage Trust, Series2014-2, Class 1A13,9, 3.00%, 6/25/2029 | 789,400 | 801,782 | ||||||
JP Morgan Mortgage Trust, Series2017-3, Class 1A53,9, 3.50%, 8/25/2047 | 2,121,321 | 2,146,677 | ||||||
JP Morgan Mortgage Trust, Series2017-6, Class A33,9, 3.50%, 12/25/2048 | 1,182,482 | 1,202,608 | ||||||
JP Morgan Mortgage Trust, Series2017-6, Class A53,9, 3.50%, 12/25/2048 | 1,764,964 | 1,789,282 | ||||||
New Residential Mortgage Loan Trust, Series2014-3A, Class AFX33,9, 3.75%, 11/25/2054 | 668,970 | 695,885 | ||||||
New Residential Mortgage Loan Trust, Series2015-2A, Class A13,9, 3.75%, 8/25/2055 | 751,219 | 783,183 | ||||||
New Residential Mortgage Loan Trust, Series2016-4A, Class A13,9, 3.75%, 11/25/2056 | 1,002,427 | 1,045,546 | ||||||
Sequoia Mortgage Trust, Series2013-2, Class A9, 1.874%, 2/25/2043 | 728,243 | 702,135 | ||||||
PRINCIPAL
| VALUE
| |||||||
COMMERCIAL MORTGAGE-BACKED SECURITIES(continued) |
| |||||||
Sequoia Mortgage Trust, Series2013-7, Class A29, 3.00%, 6/25/2043 | 737,943 | $ | 743,317 | |||||
Sequoia Mortgage Trust, Series2013-8, Class A19, 3.00%, 6/25/2043 | 909,336 | 919,602 | ||||||
Starwood Retail Property Trust, Series 2014-STAR, Class A3,8, (1 mo. LIBOR US + 1.220%), 3.134%, 11/15/2027 | 2,065,176 | 2,061,460 | ||||||
Sutherland Commercial Mortgage Trust, Series 2019-SBC8, Class A3,9, 2.86%, 12/25/2035 | 3,013,416 | 3,030,591 | ||||||
Vornado DP LLC Trust, Series2010-VNO, Class A2FX3, 4.004%, 9/13/2028 | 155,000 | 156,087 | ||||||
Waikiki Beach Hotel Trust, Series2019-WBM, Class A3,8, (1 mo. LIBOR US + 1.050%), 2.971%, 12/15/2033 | 2,125,000 | 2,126,318 | ||||||
Wells Fargo Commercial Mortgage Trust, Series2010-C1, Class A23, 4.393%, 11/15/2043 | 265,000 | 268,503 | ||||||
WF-RBS Commercial Mortgage Trust, Series2011-C2, Class A43,9, 4.869%, 2/15/2044 | 810,878 | 829,944 | ||||||
WinWater Mortgage Loan Trust, Series2015-1, Class A13,9, 3.50%, 1/20/2045 | 835,583 | 850,891 | ||||||
WinWater Mortgage Loan Trust, Series2015-3, Class A53,9, 3.50%, 3/20/2045 | 578,792 | 580,106 | ||||||
|
| |||||||
TOTAL COMMERCIAL MORTGAGE-BACKED SECURITIES | ||||||||
(Identified Cost $61,166,964) | 62,212,323 | |||||||
|
| |||||||
FOREIGN GOVERNMENT BONDS - 1.1% |
| |||||||
Canadian Government Bond (Canada), 2.75%, 6/1/2022 | CAD | 327,000 | 256,066 | |||||
Export-Import Bank of Korea (South Korea), 2.625%, 12/30/2020 | 8,725,000 | 8,775,126 | ||||||
Mexican Government Bond (Mexico), 8.00%, 6/11/2020 | MXN | 7,267,000 | 380,457 | |||||
Mexican Government Bond (Mexico), 6.50%, 6/10/2021 | MXN | 2,725,000 | 141,342 | |||||
Mexican Government Bond (Mexico), 6.50%, 6/9/2022 | MXN | 4,996,000 | 259,411 | |||||
Mexican Government Bond (Mexico), 7.75%, 5/29/2031 | MXN | 908,000 | 50,479 | |||||
|
| |||||||
TOTAL FOREIGN GOVERNMENT | ||||||||
BONDS | ||||||||
(Identified Cost $10,242,524) | 9,862,881 | |||||||
|
| |||||||
The accompanying notes are an integral part of the financial statements.
17
Investment Portfolio - October 31, 2019
| PRO-BLEND® CONSERVATIVE | ||||||||
| TERM SERIES | PRINCIPAL
| VALUE
| ||||||
U.S. GOVERNMENT AGENCIES - 14.9% |
| |||||||
Mortgage-Backed Securities - 14.9% |
| |||||||
Fannie Mae, Pool #888468, 5.50%, 9/1/2021 | 61,917 | $ | 62,812 | |||||
Fannie Mae, Pool #995233, 5.50%, 10/1/2021 | 2,437 | 2,460 | ||||||
Fannie Mae, Pool #888017, 6.00%, 11/1/2021 | 12,554 | 12,824 | ||||||
Fannie Mae, Pool #995329, 5.50%, 12/1/2021 | 46,999 | 47,723 | ||||||
Fannie Mae, Pool #888136, 6.00%, 12/1/2021 | 14,109 | 14,436 | ||||||
Fannie Mae, Pool #888815, 4.50%, 11/1/2022 | 9,178 | 9,460 | ||||||
Fannie Mae, Pool #888810, 5.50%, 11/1/2022 | 74,608 | 75,595 | ||||||
Fannie Mae, Pool #AA1563, 4.50%, 2/1/2024 | 12,070 | 12,437 | ||||||
Fannie Mae, Pool #AC1557, 4.50%, 9/1/2024 | 38,154 | 39,735 | ||||||
Fannie Mae, Pool #AD0462, 5.50%, 10/1/2024 | 15,943 | 16,739 | ||||||
Fannie Mae, Pool #AL9409, 3.50%, 11/1/2031 | 2,942,191 | 3,057,720 | ||||||
Fannie Mae, Pool #MA3463, 4.00%, 9/1/2033 | 3,134,706 | 3,273,053 | ||||||
Fannie Mae, Pool #MA1834, 4.50%, 2/1/2034 | 581,652 | 625,137 | ||||||
Fannie Mae, Pool #MA1903, 4.50%, 5/1/2034 | 675,564 | 726,074 | ||||||
Fannie Mae, Pool #FM1158, 3.50%, 6/1/2034 | 4,350,570 | 4,507,275 | ||||||
Fannie Mae, Pool #745418, 5.50%, 4/1/2036 | 380,132 | 427,970 | ||||||
Fannie Mae, Pool #886904, 6.50%, 9/1/2036 | 51,122 | 57,907 | ||||||
Fannie Mae, Pool #909786, 5.50%, 3/1/2037 | 123,118 | 137,938 | ||||||
Fannie Mae, Pool #918516, 5.50%, 6/1/2037 | 46,536 | 52,154 | ||||||
Fannie Mae, Pool #933521, 5.00%, 1/1/2038 | 10,173 | 11,194 | ||||||
Fannie Mae, Pool #889260, 5.00%, 4/1/2038 | 15,659 | 17,244 | ||||||
Fannie Mae, Pool #889576, 6.00%, 4/1/2038 | 352,281 | 405,366 | ||||||
Fannie Mae, Pool #912948, 5.00%, 5/1/2038 | 8,386 | 8,961 | ||||||
Fannie Mae, Pool #975840, 5.00%, 5/1/2038 | 33,490 | 35,766 | ||||||
Fannie Mae, Pool #889624, 5.50%, 5/1/2038 | 307,154 | 345,109 | ||||||
PRINCIPAL
| VALUE
| |||||||
U.S. GOVERNMENT AGENCIES(continued) |
| |||||||
Mortgage-Backed Securities(continued) |
| |||||||
Fannie Mae, Pool #MA3412, 3.50%, 7/1/2038 | 5,352,382 | $ | 5,546,731 | |||||
Fannie Mae, Pool #995196, 6.00%, 7/1/2038 | 471,689 | 542,790 | ||||||
Fannie Mae, Pool #986458, 6.00%, 8/1/2038 | 8,972 | 10,264 | ||||||
Fannie Mae, Pool #987831, 6.00%, 9/1/2038 | 9,734 | 10,751 | ||||||
Fannie Mae, Pool #990897, 6.00%, 9/1/2038 | 26,470 | 29,244 | ||||||
Fannie Mae, Pool #AD0220, 6.00%, 10/1/2038 | 58,897 | 67,759 | ||||||
Fannie Mae, Pool #993920, 6.00%, 11/1/2038 | 76,384 | 84,362 | ||||||
Fannie Mae, Pool #257497, 6.00%, 12/1/2038 | 15,788 | 18,116 | ||||||
Fannie Mae, Pool #971022, 5.00%, 1/1/2039 | 29,091 | 32,050 | ||||||
Fannie Mae, Pool #AA1810, 5.00%, 1/1/2039 | 79,932 | 88,130 | ||||||
Fannie Mae, Pool #890294, 5.50%, 1/1/2039 | 599,611 | 673,560 | ||||||
Fannie Mae, Pool #AD0307, 5.50%, 1/1/2039 | 314,769 | 353,531 | ||||||
Fannie Mae, Pool #983686, 5.00%, 2/1/2039 | 29,492 | 31,514 | ||||||
Fannie Mae, Pool #AE0604, 6.00%, 7/1/2039 | 364,249 | 419,141 | ||||||
Fannie Mae, Pool #AA6788, 6.00%, 8/1/2039 | 123,714 | 137,079 | ||||||
Fannie Mae, Pool #AC0463, 5.00%, 11/1/2039 | 49,586 | 54,728 | ||||||
Fannie Mae, Pool #AC5111, 5.00%, 11/1/2039 | 82,655 | 90,470 | ||||||
Fannie Mae, Pool #MA0258, 4.50%, 12/1/2039 | 795,072 | 861,310 | ||||||
Fannie Mae, Pool #MA0259, 5.00%, 12/1/2039 | 44,870 | 49,593 | ||||||
Fannie Mae, Pool #AC8573, 5.00%, 1/1/2040 | 70,666 | 78,007 | ||||||
Fannie Mae, Pool #890326, 5.50%, 1/1/2040 | 639,835 | 718,900 | ||||||
Fannie Mae, Pool #AL1595, 6.00%, 1/1/2040 | 450,251 | 518,135 | ||||||
Fannie Mae, Pool #AE0061, 6.00%, 2/1/2040 | 183,773 | 211,330 | ||||||
Fannie Mae, Pool #AL0152, 6.00%, 6/1/2040 | 616,013 | 708,099 | ||||||
Fannie Mae, Pool #AI5172, 4.00%, 8/1/2041 | 421,679 | 451,276 | ||||||
The accompanying notes are an integral part of the financial statements.
18
Investment Portfolio - October 31, 2019
| PRO-BLEND® CONSERVATIVE | ||||||||
| TERM SERIES | PRINCIPAL
| VALUE
| ||||||
U.S. GOVERNMENT AGENCIES (continued) |
| |||||||
Mortgage-Backed Securities (continued) |
| |||||||
Fannie Mae, Pool #AL1410, 4.50%, 12/1/2041 | 977,318 | $ | 1,059,550 | |||||
Fannie Mae, Pool #AB4300, 3.50%, 1/1/2042 | 244,922 | 257,034 | ||||||
Fannie Mae, Pool #AL7729, 4.00%, 6/1/2043 | 560,804 | 599,985 | ||||||
Fannie Mae, Pool #AS3622, 3.50%, 10/1/2044 | 12,760,123 | 13,437,317 | ||||||
Fannie Mae, Pool #AX5234, 4.50%, 11/1/2044 | 737,553 | 782,973 | ||||||
Fannie Mae, Pool #AS4103, 4.50%, 12/1/2044 | 817,040 | 879,233 | ||||||
Fannie Mae, Pool #AZ2001, 3.50%, 5/1/2045 | 2,443,217 | 2,552,805 | ||||||
Fannie Mae, Pool #AZ9215, 4.00%, 10/1/2045 | 742,464 | 781,873 | ||||||
Fannie Mae, Pool #BC3490, 3.50%, 2/1/2046 | 1,868,408 | 1,947,748 | ||||||
Fannie Mae, Pool #AS6613, 4.00%, 2/1/2046 | 4,951,225 | 5,228,340 | ||||||
Fannie Mae, Pool #BC6764, 3.50%, 4/1/2046 | 1,373,737 | 1,431,509 | ||||||
Fannie Mae, Pool #BC8677, 4.00%, 5/1/2046 | 441,522 | 465,168 | ||||||
Fannie Mae, Pool #BC2098, 4.00%, 6/1/2046 | 929,306 | 978,697 | ||||||
Fannie Mae, Pool #MA2670, 3.00%, 7/1/2046 | 2,093,009 | 2,150,541 | ||||||
Fannie Mae, Pool #BD2179, 4.00%, 7/1/2046 | 191,848 | 202,142 | ||||||
Fannie Mae, Pool #MA2705, 3.00%, 8/1/2046 | 2,402,906 | 2,466,259 | ||||||
Fannie Mae, Pool #BD6987, 4.00%, 10/1/2046 | 1,144,869 | 1,202,922 | ||||||
Fannie Mae, Pool #BD6997, 4.00%, 10/1/2046 | 783,656 | 823,596 | ||||||
Fannie Mae, Pool #BE3812, 4.00%, 12/1/2046 | 675,144 | 709,250 | ||||||
Fannie Mae, Pool #BE7845, 4.50%, 2/1/2047 | 747,110 | 788,873 | ||||||
Fannie Mae, Pool #MA3184, 4.50%, 11/1/2047 | 2,519,262 | 2,658,009 | ||||||
Fannie Mae, Pool #CA1922, 5.00%, 6/1/2048 | 2,938,389 | 3,150,139 | ||||||
Fannie Mae, Pool #CA2056, 4.50%, 7/1/2048 | 1,705,347 | 1,799,983 | ||||||
Fannie Mae, Pool #MA3443, 4.00%, 8/1/2048 | 2,930,532 | 3,039,627 | ||||||
Fannie Mae, Pool #BK9366, 4.50%, 8/1/2048 | 2,172,880 | 2,287,120 | ||||||
PRINCIPAL
| VALUE
| |||||||
U.S. GOVERNMENT AGENCIES (continued) |
| |||||||
Mortgage-Backed Securities (continued) |
| |||||||
Fannie Mae, Pool #BK9598, 4.50%, 8/1/2048 | 2,334,294 | $ | 2,461,041 | |||||
Fannie Mae, Pool #CA2219, 5.00%, 8/1/2048 | 1,454,110 | 1,558,867 | ||||||
Fannie Mae, Pool #CA2373, 5.00%, 9/1/2048 | 5,413,446 | 5,803,321 | ||||||
Fannie Mae, Pool #MA3521, 4.00%, 11/1/2048 | 5,849,658 | 6,072,743 | ||||||
Fannie Mae, Pool #AL8674, 5.645%, 1/1/2049 | 1,112,858 | 1,252,737 | ||||||
Fannie Mae, Pool #MA3692, 3.50%, 7/1/2049 | 6,684,384 | 6,857,530 | ||||||
Freddie Mac, Pool #G11850, 5.50%, 7/1/2020 | 1,066 | 1,069 | ||||||
Freddie Mac, Pool #G12610, 6.00%, 3/1/2022 | 17,953 | 18,398 | ||||||
Freddie Mac, Pool #G12655, 6.00%, 5/1/2022 | 12,330 | 12,677 | ||||||
Freddie Mac, Pool #G13078, 6.00%, 3/1/2023 | 18,133 | 18,742 | ||||||
Freddie Mac, Pool #C91746, 4.50%, 12/1/2033 | 105,461 | 113,374 | ||||||
Freddie Mac, Pool #C91762, 4.50%, 5/1/2034 | 894,620 | 962,026 | ||||||
Freddie Mac, Pool #QN0349, 3.00%, 8/1/2034 | 3,701,041 | 3,791,929 | ||||||
Freddie Mac, Pool #G07655, 5.50%, 12/1/2035 | 99,369 | 111,761 | ||||||
Freddie Mac, Pool #G08216, 5.50%, 8/1/2037 | 258,836 | 290,464 | ||||||
Freddie Mac, Pool #G03926, 6.00%, 2/1/2038 | 287,826 | 331,083 | ||||||
Freddie Mac, Pool #G04731, 5.50%, 4/1/2038 | 218,125 | 245,128 | ||||||
Freddie Mac, Pool #G04176, 5.50%, 5/1/2038 | 97,973 | 110,188 | ||||||
Freddie Mac, Pool #A78227, 5.50%, 6/1/2038 | 99,763 | 110,233 | ||||||
Freddie Mac, Pool #G08273, 5.50%, 6/1/2038 | 272,527 | 305,850 | ||||||
Freddie Mac, Pool #G04471, 5.50%, 7/1/2038 | 34,835 | 39,158 | ||||||
Freddie Mac, Pool #G04776, 5.50%, 7/1/2038 | 230,132 | 258,625 | ||||||
Freddie Mac, Pool #G05196, 5.50%, 10/1/2038 | 281,190 | 315,789 | ||||||
Freddie Mac, Pool #G05409, 5.50%, 3/1/2039 | 249,889 | 280,770 | ||||||
Freddie Mac, Pool #G05906, 6.00%, 4/1/2040 | 53,244 | 59,679 | ||||||
The accompanying notes are an integral part of the financial statements.
19
Investment Portfolio - October 31, 2019
| PRO-BLEND® CONSERVATIVE | ||||||||
TERM SERIES | PRINCIPAL AMOUNT2
| VALUE
| ||||||
U.S. GOVERNMENT AGENCIES(continued) |
| |||||||
Mortgage-Backed Securities (continued) |
| |||||||
Freddie Mac, Pool #G07104, 5.50%, 5/1/2040 | 180,610 | $ | 196,714 | |||||
Freddie Mac, Pool #G06789, 6.00%, 5/1/2040 | 238,702 | 274,358 | ||||||
Freddie Mac, Pool #A92889, 4.50%, 7/1/2040 | 1,038,856 | 1,116,642 | ||||||
Freddie Mac, Pool #A93451, 4.50%, 8/1/2040 | 1,177,938 | 1,277,579 | ||||||
Freddie Mac, Pool #G60334, 4.50%, 10/1/2041 | 940,389 | 1,019,771 | ||||||
Freddie Mac, Pool #Q17513, 3.50%, 4/1/2043 | 1,826,286 | 1,917,842 | ||||||
Freddie Mac, Pool #Q24752, 3.50%, 2/1/2044 | 1,362,740 | 1,430,870 | ||||||
Freddie Mac, Pool #G60183, 4.00%, 12/1/2044 | 802,180 | 842,168 | ||||||
Freddie Mac, Pool #Q37592, 4.00%, 12/1/2045 | 1,738,528 | 1,843,668 | ||||||
Freddie Mac, Pool #G60636, 4.00%, 1/1/2046 | 1,372,849 | 1,451,499 | ||||||
Freddie Mac, Pool #Q38388, 4.00%, 1/1/2046 | 292,546 | 310,536 | ||||||
Freddie Mac, Pool #Q42596, 3.50%, 8/1/2046 | 1,969,046 | 2,049,974 | ||||||
Freddie Mac, Pool #ZM2525, 3.00%, 12/1/2046 | 3,436,627 | 3,521,860 | ||||||
Freddie Mac, Pool #Q51334, 4.00%, 10/1/2047 | 2,911,778 | 3,055,826 | ||||||
Freddie Mac, Pool #G08786, 4.50%, 10/1/2047 | 1,568,860 | 1,662,946 | ||||||
Freddie Mac, Pool #Q59805, 4.50%, 11/1/2048 | 2,064,019 | 2,173,831 | ||||||
Freddie Mac, Pool #Q60730, 4.00%, 1/1/2049 | 3,323,013 | 3,458,031 | ||||||
ADR - American Depositary Receipt
CAD - Canadian Dollar
ETF - Exchange-traded fund
IO - Interest only
LIBOR - London Interbank Offered Rate
MXN - Mexican Peso
PRINCIPAL AMOUNT2/ SHARES
| VALUE
| |||||||
U.S. GOVERNMENT AGENCIES(continued) |
| |||||||
Mortgage-Backed Securities(continued) |
| |||||||
Ginnie Mae, Pool #671161, 5.50%, 11/15/2037 | 29,015 | $ | 31,175 | |||||
|
| |||||||
TOTAL U.S. GOVERNMENT AGENCIES | 136,469,124 | |||||||
|
| |||||||
U.S. GOVERNMENT SECURITIES - 2.0% | ||||||||
U.S. Treasury Bill - 2.0% | ||||||||
U.S. Treasury Bill10, 1.59%, 5/21/2020 (Identified Cost $18,202,689) | 18,365,000 | 18,206,821 | ||||||
|
| |||||||
SHORT-TERM INVESTMENT - 0.7% | ||||||||
Dreyfus Government Cash Management, Institutional Shares, 1.73%11 (Identified Cost $6,082,021) | 6,082,021 | 6,082,021 | ||||||
|
| |||||||
TOTAL INVESTMENTS IN SECURITIES - 100.2% (Identified Cost $864,020,701) |
| 916,389,127 | ||||||
|
| |||||||
TOTAL OPTIONS | ||||||||
WRITTEN — 0.0%## (Premiums Received $44,720) | (46,180 | ) | ||||||
|
| |||||||
TOTAL INVESTMENTS - 100.2% | 916,342,947 | |||||||
LIABILITIES, LESS OTHER ASSETS - (0.2%) |
| (1,796,960 | ) | |||||
|
| |||||||
NET ASSETS - 100% | $ | 914,545,987 | ||||||
|
| |||||||
The accompanying notes are an integral part of the financial statements.
20
Investment Portfolio - October 31, 2019
| EXCHANGE-TRADED OPTIONS WRITTEN | ||||||||||||||||||||||||
| DESCRIPTION | NUMBER OF | EXPIRATION DATE | EXERCISE PRICE | NOTIONAL AMOUNT (000)2 | VALUE | |||||||||||||||||||
Call | ||||||||||||||||||||||||
Sea Ltd. - ADR | 140 | 11/15/2019 | $ 27.00 | 417 | $(43,400) | |||||||||||||||||||
Put | ||||||||||||||||||||||||
Electronic Arts, Inc. | 110 | 11/01/2019 | 87.50 | 1,060 | (220) | |||||||||||||||||||
ServiceNow, Inc. | 64 | 11/08/2019 | 200.00 | 1,582 | (2,560) | |||||||||||||||||||
| (2,780) | ||||||||||||||||||||||||
TOTAL EXCHANGE-TRADED OPTIONS WRITTEN (PREMIUMS RECEIVED $44,720) |
| $(46,180) | ||||||||||||||||||||||
*Non-income producing security.
## Less than 0.1%.
1A portion of this security is designated as collateral for options contracts written. As of October 31, 2019, the total value of such securities was $12,428,355.
2Amount is stated in USD unless otherwise noted.
3Restricted securities - Investment in securities that are restricted as to public resale under the Securities Act of 1933, as amended. These securities have been sold under Rule 144A and have been determined to be liquid under the Fund’s Liquidity Risk Management Program. These securities amount to $106,402,087, or 11.6% of the Series’ net assets as of October 31, 2019 (see Note 2 to the financial statements).
4Step coupon rate security - Rate steps up/down by 25 basis points upon rating downgrade/upgrade by Moody’s and S&P rating agencies (Subject to a maximum of 100 basis points per agency, 200 basis points maximum).
5Variable rate security. Security may be issued at a fixed coupon rate, which converts to a variable rate at a specified date. Rate shown is the rate in effect as of October 31, 2019.
6Represents aPayment-In-Kind bond.
7Security is perpetual in nature and has no stated maturity date.
8Floating rate security. Rate shown is the rate in effect as of October 31, 2019.
9Variable or floating rate security, the interest rate of which adjusts periodically based on changes in current interest rates and prepayments on the underlying pool of assets. Rate shown is the rate in effect as of October 31, 2019.
10Represents the annualized yield at time of purchase.
11Rate shown is the current yield as of October 31, 2019.
The Global Industry Classification Standard (GICS) was developed by and is the exclusive property and a service mark of MSCI Inc. (MSCI) and Standard & Poor’s, a division of S&P Global Inc. (S&P), and is licensed for use by Manning & Napier when referencing GICS sectors. Neither MSCI, S&P, nor any third party involved in making or compiling the GICS or any GICS classifications makes any express or implied warranties or representations with respect to such standard or classification, nor shall any such party have any liability therefrom.
The accompanying notes are an integral part of the financial statements.
21
Statement of Assets and Liabilities -Pro-Blend® Conservative Term Series
October 31, 2019
ASSETS: | ||||
Investments in securities, at value (identified cost $864,020,701) (Note 2) | $ | 916,389,127 | ||
Interest receivable | 4,057,426 | |||
Receivable for securities sold | 764,819 | |||
Receivable for fund shares sold | 552,021 | |||
Foreign tax reclaims receivable | 237,158 | |||
Dividends receivable | 170,930 | |||
Prepaid and other expenses | 34,168 | |||
|
| |||
TOTAL ASSETS | 922,205,649 | |||
|
| |||
LIABILITIES: | ||||
Accruedsub-transfer agent fees (Note 3) | 400,587 | |||
Accrued management fees (Note 3) | 308,501 | |||
Accrued distribution and service (Rule12b-1) fees (Class S) (Class R) (Class L) (Note 3) | 206,637 | |||
Accrued fund accounting and administration fees (Note 3) | 54,503 | |||
Accrued Chief Compliance Officer service fees (Note 3) | 687 | |||
Options written, at value (premiums received $44,720) (Note 2) | 46,180 | |||
Payable for securities purchased | 6,322,291 | |||
Payable for fund shares repurchased | 214,896 | |||
Other payables and accrued expenses | 105,380 | |||
|
| |||
TOTAL LIABILITIES | 7,659,662 | |||
|
| |||
TOTAL NET ASSETS | $ | 914,545,987 | ||
|
| |||
NET ASSETS CONSIST OF: | ||||
Capital stock | $ | 718,666 | ||
Additionalpaid-in-capital | 828,213,640 | |||
Total distributable earnings (loss) | 85,613,681 | |||
|
| |||
TOTAL NET ASSETS | $ | 914,545,987 | ||
|
| |||
The accompanying notes are an integral part of the financial statements.
22
Statement of Assets and Liabilities -Pro-Blend® Conservative Term Series
October 31, 2019
NET ASSET VALUE, OFFERING PRICE AND REDEMPTION PRICE PER SHARE - Class S($609,145,008/42,810,714 shares) | $14.23 | |||
|
| |||
NET ASSET VALUE, OFFERING PRICE AND REDEMPTION PRICE PER SHARE - Class I($207,346,164/19,463,984 shares) | $10.65 | |||
|
| |||
NET ASSET VALUE, OFFERING PRICE AND REDEMPTION PRICE PER SHARE - Class R($8,850,146/868,381 shares) | $10.19 | |||
|
| |||
NET ASSET VALUE, OFFERING PRICE AND REDEMPTION PRICE PER SHARE - Class L($87,627,956/8,613,080 shares) | $10.17 | |||
|
| |||
NET ASSET VALUE, OFFERING PRICE AND REDEMPTION PRICE PER SHARE - Class W($1,576,713/110,449 shares) | $14.28 | |||
|
| |||
The accompanying notes are an integral part of the financial statements.
23
Statement of Operations -Pro-Blend® Conservative Term Series
For the Year Ended October 31, 2019
INVESTMENT INCOME: | ||||
Interest | $ | 20,706,456 | ||
Dividends (net of foreign taxes withheld, $154,091) | 5,230,039 | |||
|
| |||
Total Investment Income | 25,936,495 | |||
|
| |||
EXPENSES: | ||||
Management fees (Note 3) | 4,194,851 | |||
Distribution and service (Rule12b-1) fees (Class S) (Note 3) | 1,024,283 | |||
Distribution and service (Rule12b-1) fees (Class L) (Note 3) | 893,222 | |||
Distribution and service (Rule12b-1) fees (Class R) (Note 3) | 46,192 | |||
Sub-transfer agent fees (Note 3) | 788,908 | |||
Shareholder services fees (Class S) (Note 3) | 396,253 | |||
Fund accounting and administration fees (Note 3) | 182,513 | |||
Directors’ fees (Note 3) | 83,715 | |||
Chief Compliance Officer service fees (Note 3) | 3,455 | |||
Custodian fees | 49,560 | |||
Miscellaneous | 394,034 | |||
|
| |||
Total Expenses | 8,056,986 | |||
Less reduction of expenses (Note 3) | (3,404 | ) | ||
|
| |||
Net Expenses | 8,053,582 | |||
|
| |||
NET INVESTMENT INCOME | 17,882,913 | |||
|
| |||
REALIZED AND UNREALIZED GAIN (LOSS) ON INVESTMENTS AND FOREIGN CURRENCY: | ||||
Net realized gain (loss) on- | ||||
Investments in securities | 25,701,177 | |||
Options written | 857,460 | |||
Foreign currency and translation of other assets and liabilities | (4,543 | ) | ||
|
| |||
| 26,554,094 | ||||
|
| |||
Net change in unrealized appreciation (depreciation) on- | ||||
Investments in securities | 45,204,797 | |||
Options written | 66,701 | |||
Foreign currency and translation of other assets and liabilities | 2,855 | |||
|
| |||
| 45,274,353 | ||||
|
| |||
NET REALIZED AND UNREALIZED GAIN (LOSS) ON INVESTMENTS AND FOREIGN CURRENCY | 71,828,447 | |||
|
| |||
NET INCREASE IN NET ASSETS RESULTING FROM OPERATIONS | $ | 89,711,360 | ||
|
| |||
The accompanying notes are an integral part of the financial statements.
24
Statements of Changes in Net Assets -Pro-Blend® Conservative Term Series
| FOR THE YEAR ENDED 10/31/19 | FOR THE YEAR ENDED 10/31/18 | |||||||
INCREASE (DECREASE) IN NET ASSETS: | ||||||||
OPERATIONS: | ||||||||
Net investment income | $ | 17,882,913 | $ | 14,980,802 | ||||
Net realized gain (loss) on investments and foreign currency | 26,554,094 | 19,433,550 | ||||||
Net change in unrealized appreciation (depreciation) on investments and foreign currency | 45,274,353 | (42,534,310 | ) | |||||
|
|
|
| |||||
Net increase (decrease) from operations | 89,711,360 | (8,119,958 | ) | |||||
|
|
|
| |||||
DISTRIBUTIONS TO SHAREHOLDERS (Note 9): | ||||||||
Class S | (22,245,086 | ) | (27,066,336 | ) | ||||
Class I | (9,999,209 | ) | (10,654,505 | ) | ||||
Class R | (468,279 | ) | (786,315 | ) | ||||
Class L | (4,001,133 | ) | (5,698,305 | ) | ||||
Class W | (12,499 | ) | — | |||||
|
|
|
| |||||
Total distributions to shareholders | (36,726,206 | ) | (44,205,461 | ) | ||||
|
|
|
| |||||
CAPITAL STOCK ISSUED AND REPURCHASED: | ||||||||
Net increase (decrease) from capital share transactions (Note 5) | (31,706,162 | ) | (22,092,436 | ) | ||||
|
|
|
| |||||
Net increase (decrease) in net assets | 21,278,992 | (74,417,855 | ) | |||||
NET ASSETS: | ||||||||
Beginning of year | 893,266,995 | 967,684,850 | ||||||
|
|
|
| |||||
End of year | $ | 914,545,987 | $ | 893,266,995 | ||||
|
|
|
| |||||
The accompanying notes are an integral part of the financial statements.
25
Financial Highlights -Pro-Blend® Conservative Term Series - Class S
FOR THE YEAR ENDED | |||||||||||||||||||||||||
10/31/19
| 10/31/18
| 10/31/17 | 10/31/16
| 10/31/15
| |||||||||||||||||||||
Per share data (for a share outstanding throughout each year): | |||||||||||||||||||||||||
Net asset value - Beginning of year | $13.39 | $14.10 | $13.36 | $13.15 | $14.13 | ||||||||||||||||||||
|
|
|
|
|
|
|
|
|
| ||||||||||||||||
Income (loss) from investment operations: | |||||||||||||||||||||||||
Net investment income1 | 0.27 | 0.23 | 0.19 | 0.19 | 0.22 | ||||||||||||||||||||
Net realized and unrealized gain (loss) on investments | 1.07 | (0.33 | ) | 0.73 | 0.21 | (0.41 | ) | ||||||||||||||||||
|
|
|
|
|
|
|
|
|
| ||||||||||||||||
Total from investment operations | 1.34 | (0.10 | ) | 0.92 | 0.40 | (0.19 | ) | ||||||||||||||||||
|
|
|
|
|
|
|
|
|
| ||||||||||||||||
Less distributions to shareholders: | |||||||||||||||||||||||||
From net investment income | (0.23 | ) | (0.18 | ) | (0.16 | ) | (0.19 | ) | (0.18 | ) | |||||||||||||||
From net realized gain on investments | (0.27 | ) | (0.43 | ) | (0.02 | ) | — | (0.61 | ) | ||||||||||||||||
|
|
|
|
|
|
|
|
|
| ||||||||||||||||
Total distributions to shareholders | (0.50 | ) | (0.61 | ) | (0.18 | ) | (0.19 | ) | (0.79 | ) | |||||||||||||||
|
|
|
|
|
|
|
|
|
| ||||||||||||||||
Net asset value - End of year | $14.23 | $13.39 | $14.10 | $13.36 | $13.15 | ||||||||||||||||||||
|
|
|
|
|
|
|
|
|
| ||||||||||||||||
Net assets - End of year(000’s omitted) | $609,145 | $596,934 | $627,523 | $724,270 | $911,956 | ||||||||||||||||||||
|
|
|
|
|
|
|
|
|
| ||||||||||||||||
Total return2 | 10.40% | (0.75% | ) | 7.02% | 3.07% | (1.33% | ) | ||||||||||||||||||
Ratios (to average net assets)/Supplemental Data: | |||||||||||||||||||||||||
Expenses | 0.87% | 0.88% | 0.87% | 0.87% | 0.88% | ||||||||||||||||||||
Net investment income | 2.01% | 1.71% | 1.42% | 1.47% | 1.60% | ||||||||||||||||||||
Series portfolio turnover | 68% | 80% | 58% | 65% | 51% | ||||||||||||||||||||
1Calculated based on average shares outstanding during the years.
2Represents aggregate total return for the years indicated, and assumes reinvestment of all distributions.
The accompanying notes are an integral part of the financial statements.
26
Financial Highlights -Pro-Blend® Conservative Term Series - Class I
FOR THE YEAR ENDED | |||||||||||||||||||||||||
10/31/19 | 10/31/18 | 10/31/17 | 10/31/16 | 10/31/15 | |||||||||||||||||||||
Per share data (for a share outstanding throughout each year): | |||||||||||||||||||||||||
Net asset value - Beginning of year | $10.15 | $10.85 | $10.33 | $10.22 | $11.17 | ||||||||||||||||||||
|
|
|
|
|
|
|
|
|
| ||||||||||||||||
Income (loss) from investment operations: | |||||||||||||||||||||||||
Net investment income1 | 0.23 | 0.20 | 0.17 | 0.17 | 0.19 | ||||||||||||||||||||
Net realized and unrealized gain (loss) on investments | 0.80 | (0.26 | ) | 0.56 | 0.15 | (0.32 | ) | ||||||||||||||||||
|
|
|
|
|
|
|
|
|
| ||||||||||||||||
Total from investment operations | 1.03 | (0.06 | ) | 0.73 | 0.32 | (0.13 | ) | ||||||||||||||||||
|
|
|
|
|
|
|
|
|
| ||||||||||||||||
Less distributions to shareholders: | |||||||||||||||||||||||||
From net investment income | (0.26 | ) | (0.21 | ) | (0.19 | ) | (0.21 | ) | (0.21 | ) | |||||||||||||||
From net realized gain on investments | (0.27 | ) | (0.43 | ) | (0.02 | ) | — | (0.61 | ) | ||||||||||||||||
|
|
|
|
|
|
|
|
|
| ||||||||||||||||
Total distributions to shareholders | (0.53 | ) | (0.64 | ) | (0.21 | ) | (0.21 | ) | (0.82 | ) | |||||||||||||||
|
|
|
|
|
|
|
|
|
| ||||||||||||||||
Net asset value - End of year | $10.65 | $10.15 | $10.85 | $10.33 | $10.22 | ||||||||||||||||||||
|
|
|
|
|
|
|
|
|
| ||||||||||||||||
Net assets - End of year(000’s omitted) | $207,346 | $192,157 | $213,824 | $291,632 | $325,700 | ||||||||||||||||||||
|
|
|
|
|
|
|
|
|
| ||||||||||||||||
Total return2 | 10.69% | (0.62% | ) | 7.25% | 3.26% | (1.15% | ) | ||||||||||||||||||
Ratios (to average net assets)/Supplemental Data: | |||||||||||||||||||||||||
Expenses | 0.64% | 0.68% | 0.67% | 0.67% | 0.68% | ||||||||||||||||||||
Net investment income | 2.23% | 1.92% | 1.62% | 1.66% | 1.81% | ||||||||||||||||||||
Series portfolio turnover | 68% | 80% | 58% | 65% | 51% | ||||||||||||||||||||
1Calculated based on average shares outstanding during the years.
2Represents aggregate total return for the years indicated, and assumes reinvestment of all distributions.
The accompanying notes are an integral part of the financial statements.
27
Financial Highlights -Pro-Blend® Conservative Term Series - Class R
FOR THE YEAR ENDED | |||||||||||||||||||||||||
10/31/19 | 10/31/18 | 10/31/17 | 10/31/16 | 10/31/15 | |||||||||||||||||||||
Per share data (for a share outstanding throughout each year): | |||||||||||||||||||||||||
Net asset value - Beginning of year | $9.73 | $10.42 | $9.92 | $9.81 | $10.75 | ||||||||||||||||||||
|
|
|
|
|
|
|
|
|
| ||||||||||||||||
Income (loss) from investment operations: | |||||||||||||||||||||||||
Net investment income1 | 0.17 | 0.14 | 0.11 | 0.12 | 0.13 | ||||||||||||||||||||
Net realized and unrealized gain (loss) on investments | 0.77 | (0.24 | ) | 0.54 | 0.15 | (0.30 | ) | ||||||||||||||||||
|
|
|
|
|
|
|
|
|
| ||||||||||||||||
Total from investment operations | 0.94 | (0.10 | ) | 0.65 | 0.27 | (0.17 | ) | ||||||||||||||||||
|
|
|
|
|
|
|
|
|
| ||||||||||||||||
Less distributions to shareholders: | |||||||||||||||||||||||||
From net investment income | (0.21 | ) | (0.16 | ) | (0.13 | ) | (0.16 | ) | (0.16 | ) | |||||||||||||||
From net realized gain on investments | (0.27 | ) | (0.43 | ) | (0.02 | ) | — | (0.61 | ) | ||||||||||||||||
|
|
|
|
|
|
|
|
|
| ||||||||||||||||
Total distributions to shareholders | (0.48 | ) | (0.59 | ) | (0.15 | ) | (0.16 | ) | (0.77 | ) | |||||||||||||||
|
|
|
|
|
|
|
|
|
| ||||||||||||||||
Net asset value - End of year | 10.19 | 9.73 | 10.42 | 9.92 | 9.81 | ||||||||||||||||||||
|
|
|
|
|
|
|
|
|
| ||||||||||||||||
Net assets - End of year(000’s omitted) | $8,850 | $10,886 | $13,672 | $19,054 | $55,315 | ||||||||||||||||||||
|
|
|
|
|
|
|
|
|
| ||||||||||||||||
Total return2 | 10.12% | (1.08% | ) | 6.72% | 2.79% | (1.60% | ) | ||||||||||||||||||
Ratios (to average net assets)/Supplemental Data: | |||||||||||||||||||||||||
Expenses | 1.10% | 1.18% | 1.17% | 1.17% | 1.18% | ||||||||||||||||||||
Net investment income | 1.77% | 1.40% | 1.12% | 1.19% | 1.30% | ||||||||||||||||||||
Series portfolio turnover | 68% | 80% | 58% | 65% | 51% | ||||||||||||||||||||
1Calculated based on average shares outstanding during the years.
2Represents aggregate total return for the years indicated, and assumes reinvestment of all distributions.
The accompanying notes are an integral part of the financial statements.
28
Financial Highlights -Pro-Blend® Conservative Term Series - Class L*
FOR THE YEAR ENDED | |||||||||||||||||||||||||
10/31/19 | 10/31/18 | 10/31/17 | 10/31/16 | 10/31/15 | |||||||||||||||||||||
Per share data (for a share outstanding throughout each year): | |||||||||||||||||||||||||
Net asset value - Beginning of year | $9.71 | $10.40 | $9.91 | $9.81 | $10.75 | ||||||||||||||||||||
|
|
|
|
|
|
|
|
|
| ||||||||||||||||
Income (loss) from investment operations: | |||||||||||||||||||||||||
Net investment income1 | 0.13 | 0.09 | 0.06 | 0.06 | 0.08 | ||||||||||||||||||||
Net realized and unrealized gain (loss) on investments | 0.76 | (0.24 | ) | 0.54 | 0.15 | (0.31 | ) | ||||||||||||||||||
|
|
|
|
|
|
|
|
|
| ||||||||||||||||
Total from investment operations | 0.89 | (0.15 | ) | 0.60 | 0.21 | (0.23 | ) | ||||||||||||||||||
|
|
|
|
|
|
|
|
|
| ||||||||||||||||
Less distributions to shareholders: | |||||||||||||||||||||||||
From net investment income | (0.16 | ) | (0.11 | ) | (0.09 | ) | (0.11 | ) | (0.10 | ) | |||||||||||||||
From net realized gain on investments | (0.27 | ) | (0.43 | ) | (0.02 | ) | — | (0.61 | ) | ||||||||||||||||
|
|
|
|
|
|
|
|
|
| ||||||||||||||||
Total distributions to shareholders | (0.43 | ) | (0.54 | ) | (0.11 | ) | (0.11 | ) | (0.71 | ) | |||||||||||||||
|
|
|
|
|
|
|
|
|
| ||||||||||||||||
Net asset value - End of year | $10.17 | $9.71 | $10.40 | $9.91 | $9.81 | ||||||||||||||||||||
|
|
|
|
|
|
|
|
|
| ||||||||||||||||
Net assets - End of year(000’s omitted) | $87,628 | $93,290 | $112,666 | $127,100 | $137,697 | ||||||||||||||||||||
|
|
|
|
|
|
|
|
|
| ||||||||||||||||
Total return2 | 9.61% | (1.58% | ) | 6.13% | 2.24% | (2.10% | ) | ||||||||||||||||||
Ratios (to average net assets)/Supplemental Data: | |||||||||||||||||||||||||
Expenses | 1.59% | 1.68% | 1.67% | 1.67% | 1.68% | ||||||||||||||||||||
Net investment income | 1.29% | 0.91% | 0.62% | 0.66% | 0.81% | ||||||||||||||||||||
Series portfolio turnover | 68% | 80% | 58% | 65% | 51% | ||||||||||||||||||||
*Effective March 1, 2019, Class R2 shares of the Series have been redesignated as Class L Shares.
1Calculated based on average shares outstanding during the years.
2Represents aggregate total return for the years indicated, and assumes reinvestment of all distributions.
The accompanying notes are an integral part of the financial statements.
29
Financial Highlights -Pro-Blend® Conservative Term Series - Class W
| FOR THE PERIOD 4/1/191 TO 10/31/19 | ||||||||||||
Per share data (for a share outstanding throughout the period): | ||||||||||||
Net asset value - Beginning of period | $13.62 | |||||||||||
|
| |||||||||||
Income from investment operations: | ||||||||||||
Net investment income2 | 0.23 | |||||||||||
Net realized and unrealized gain (loss) on investments | 0.54 | |||||||||||
|
| |||||||||||
Total from investment operations | 0.77 | |||||||||||
|
| |||||||||||
Less distributions to shareholders: | ||||||||||||
From net investment income | (0.11 | ) | ||||||||||
From net realized gain on investments | (0.00 | )3 | ||||||||||
|
| |||||||||||
Total distributions to shareholders | (0.11 | ) | ||||||||||
|
| |||||||||||
Net asset value - End of period | $14.28 | |||||||||||
|
| |||||||||||
Net assets - End of period(000’s omitted) | $1,577 | |||||||||||
|
| |||||||||||
Total return4 | 5.71% | |||||||||||
Ratios (to average net assets)/Supplemental Data: | ||||||||||||
Expenses*5 | 0.08% | |||||||||||
Net investment income5 | 2.81% | |||||||||||
Series portfolio turnover | 68% | |||||||||||
| *The investment advisor did not impose all or a portion of its management and/or other fees during the period, and may have paid a portion of the Series’ expenses. If these expenses had been incurred by the Class, the expense ratio (to average net assets) would have increased by the following amounts5: |
| |||||||||||
| 0.40% | ||||||||||||
1Commencement of operations.
2Calculated based on average shares outstanding during the period.
3Less than $(0.01).
4Represents aggregate total return for the period indicated. Total return would have been lower had certain expenses not been waived or reimbursed during the period. Periods less than one year are not annualized.
5Annualized.
The accompanying notes are an integral part of the financial statements.
30
Performance Update as of October 31, 2019 -Pro-Blend® Moderate Term Series
(unaudited)
| AVERAGE ANNUAL TOTAL RETURNS AS OF OCTOBER 31, 2019 | ||||||
ONE YEAR1 | FIVE YEAR | TEN YEAR | ||||
Pro-Blend®Moderate Term Series - Class S2 | 11.85% | 3.74% | 5.99% | |||
Pro-Blend®Moderate Term Series - Class I2 | 12.20% | 4.01% | 6.26% | |||
Pro-Blend®Moderate Term Series - Class R2,3 | 11.60% | 3.47% | 5.70% | |||
Pro-Blend®Moderate Term Series - Class L2,3 | 11.10% | 2.97% | 5.21% | |||
Pro-Blend®Moderate Term Series - Class W2,4 | 12.45% | 3.85% | 6.05% | |||
Bloomberg Barclays U.S. Aggregate Bond Index5 | 11.51% | 3.24% | 3.73% | |||
30/10/60 Blended Index6 | 12.51% | 5.59% | 7.00% | |||
The following graph compares the value of a $10,000 investment in thePro-Blend® Moderate Term Series - Class S for the ten years ended October 31, 2019 to the Bloomberg Barclays U.S. Aggregate Bond Index and the 30/10/60 Blended Index.
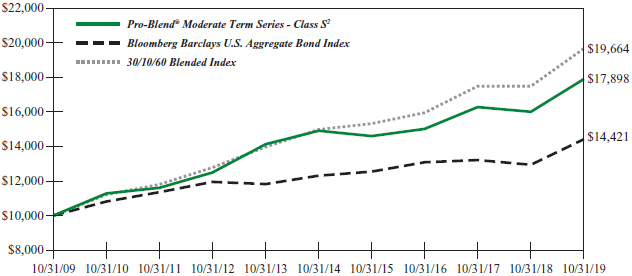
1The returns shown are based on net asset values calculated for shareholder transactions and may differ from the returns shown in the financial highlights, which reflect adjustments made to the net asset values in accordance with accounting principles generally accepted in the United States of America.
2The Series’ performance does not reflect the deduction of taxes that a shareholder would pay on fund distributions or the redemption of shares. The Series’ performance is historical and may not be indicative of future results. The performance returns shown are inclusive of the net expense ratio of the Series. For the year ended October 31, 2019, this net expense ratio was 1.09% for Class S, 0.85% for Class I, 1.35% for Class R, 1.80% for Class L and 0.10% for Class W. The gross expense ratio, which does not account for any voluntary or contractual waivers currently in effect, was 1.09% for Class S, 0.87% for Class I, 1.38% for Class R, 1.81% for Class L and 0.74% for Class W for the year ended October 31, 2019.
3For periods through the inception of Class L on January 4, 2010 and Class R on June 30, 2010, the performance is hypothetical and is based on the historical performance of the Class S shares adjusted for the respective class’ charges and expenses.
4For periods through April 1, 2019 (the inception date of the Class W shares), performance for the Class W shares is based on the historical performance of the Class S shares. Because the Class W shares invest in the same portfolio of securities as the Class S shares, performance will be different only to the extent that the Class S shares have a higher expense ratio.
5The Bloomberg Barclays U.S. Aggregate Bond Index is an unmanaged, market-value weighted index of U.S. domestic investment-grade debt issues, including government, corporate, asset-backed, and mortgage-backed securities, with maturities of one year or more. Index returns do not reflect any fees or expenses. Index returns provided by Interactive Data.
6The 30/10/60 Blended Index is 30% Russell 3000® Index (Russell 3000), 10% MSCI ACWI ex USA Index (ACWIxUS), and 60% Bloomberg Barclays U.S. Aggregate Bond Index (BAB). Russell 3000 is an unmanaged index that consists of 3,000 of the largest U.S. companies based on total market capitalization. Index returns are based on a market capitalization-weighted average of relative price changes of the component stocks plus dividends whose reinvestments are compounded daily. Index returns provided by Bloomberg. ACWIxUS is designed to measure large andmid-cap representation across 22 of 23 Developed Markets countries (excluding the U.S.) and 26 Emerging Markets countries. The Index is denominated in U.S. dollars. The Index returns are net of withholding taxes. They assume daily
31
Performance Update as of October 31, 2019 -Pro-Blend® Moderate Term Series
(unaudited)
reinvestment of net dividends thus accounting for any applicable dividend taxation. Index returns provided by Bloomberg. BAB is an unmanaged, market value-weighted index of U.S. domestic investment-grade debt issues, including government, corporate, asset-backed and mortgage-backed securities with maturities of one year or more. Index returns provided by Interactive Data. The returns of the indices do not reflect any fees or expenses. Returns provided are calculated monthly using a blended allocation. Because the fund’s asset allocation will vary over time, the composition of the fund’s portfolio may not match the composition of the comparative Indices.Mid-month performance may not be available for all indices within the blended index. Where applicable, performance for those indices is included from the first of the month following the corresponding Fund’s inception date.
32
Shareholder Expense Example -Pro-Blend® Moderate Term Series
(unaudited)
As a shareholder of the Series, you incur ongoing costs, including management fees, shareholder service fees and other Series expenses. This example is intended to help you understand your ongoing costs (in dollars) of investing in the Series and to compare these costs with the ongoing costs of investing in other mutual funds.
The example is based on an investment of $1,000 invested in each class at the beginning of the period and held for the entire period (May 1, 2019 to October 31, 2019).
Actual Expenses
The Actual lines of the table below provide information about actual account values and actual expenses. You may use the information in these lines, together with the amount you invested, to estimate the expenses that you paid over the period. Simply divide your account value by $1,000 (for example, an $8,600 account value divided by $1,000 = 8.6), then multiply the result by the number in the Actual line for the Class in which you have invested under the heading entitled “Expenses Paid During Period” to estimate the expenses you paid on your account during this period.
Hypothetical Example for Comparison Purposes
The Hypothetical lines of each class in the table below provide information about hypothetical account values and hypothetical expenses based on the Class’ actual expense ratio and an assumed rate of return of 5% per year before expenses, which is not the Class’ actual return. The hypothetical account values and expenses may not be used to estimate the actual ending account balance or expenses you paid during the period. You may use this information to compare the ongoing costs of investing in a class of the Series and other funds. To do so, compare this 5% hypothetical example for the Class in which you have invested with the 5% hypothetical examples that appear in the shareholder reports of the other funds.
Please note that the expenses shown in the table are meant to highlight your ongoing costs only and do not reflect any transaction costs such as sales charges (loads), redemption fees, or exchange fees that you may incur in other mutual funds. Therefore, the second line of the table is useful in comparing ongoing costs only, and will not help you determine the relative total costs of owning different funds.
BEGINNING
| ENDING
| EXPENSES PAID
| ANNUALIZED
| |||||
Class S | ||||||||
Actual | $1,000.00 | $1,046.60 | $5.57 | 1.08% | ||||
Hypothetical | $1,000.00 | $1,019.76 | $5.50 | 1.08% | ||||
Class I | ||||||||
Actual | $1,000.00 | $1,048.20 | $4.39 | 0.85% | ||||
Hypothetical | $1,000.00 | $1,020.92 | $4.33 | 0.85% | ||||
Class R | ||||||||
Actual | $1,000.00 | $1,044.70 | $6.96 | 1.35% | ||||
Hypothetical | $1,000.00 | $1,018.40 | $6.87 | 1.35% | ||||
Class L | ||||||||
Actual | $1,000.00 | $1,043.30 | $9.17 | 1.78% | ||||
Hypothetical | $1,000.00 | $1,016.23 | $9.05 | 1.78% | ||||
Class W | ||||||||
Actual | $1,000.00 | $1,051.40 | $0.52 | 0.10% | ||||
Hypothetical | $1,000.00 | $1,024.70 | $0.51 | 0.10% | ||||
33
Shareholder Expense Example -Pro-Blend® Moderate Term Series
(unaudited)
1Expenses are equal to the Class’ annualized expense ratio (for thesix-month period), multiplied by the average account value over the period, multiplied by 184/365 (to reflect theone-half year period). Expenses are based on the most recent fiscal half year; therefore, the expense ratios stated above may differ from the expense ratios stated in the financial highlights, which are based onone-year data. The Class’ total return would have been lower had certain expenses not been waived during the period.
34
Portfolio Composition -Pro-Blend® Moderate Term Series
As of October 31, 2019 (unaudited)
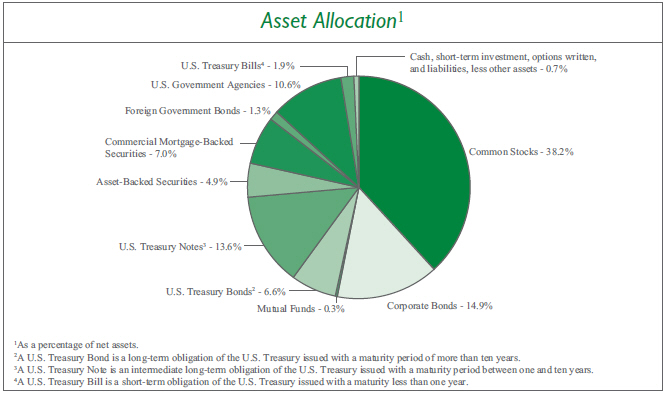
| Sector Allocation5 | ||||
Communication Services | 9.1 | % | ||
Financials | 7.4 | % | ||
Health Care | 7.3 | % | ||
Information Technology | 6.9 | % | ||
Consumer Discretionary | 6.1 | % | ||
Consumer Staples | 5.9 | % | ||
Real Estate | 3.9 | % | ||
Energy | 3.6 | % | ||
Industrials | 2.0 | % | ||
Materials | 0.8 | % | ||
Utilities6 | 0.0 | % | ||
5Including common stocks and corporate bonds, as a percentage of total investments.
6Less than 0.1%.
| ||||
| Top Ten Stock Holdings7 | ||||
Mastercard, Inc. - Class A | 1.3 | % | ||
Medtronic plc | 1.3 | % | ||
Microsoft Corp. | 1.2 | % | ||
Novartis AG - ADR (Switzerland) | 1.2 | % | ||
Visa, Inc. - Class A | 1.2 | % | ||
Johnson & Johnson | 1.1 | % | ||
Micron Technology, Inc. | 1.1 | % | ||
Berkshire Hathaway, Inc. - Class B | 1.0 | % | ||
Nestle S.A. (Switzerland) | 0.9 | % | ||
The Coca-Cola Co. | 0.8 | % | ||
7As a percentage of total investments.
| ||||
35
Investment Portfolio - October 31, 2019
| PRO-BLEND® MODERATE TERM SERIES | ||||||||
SHARES
| VALUE (NOTE 2)
| |||||||
COMMON STOCKS - 38.2% | ||||||||
Communication Services - 5.9% | ||||||||
Diversified Telecommunication Services - 0.0%## |
| |||||||
Elisa OYJ (Finland) | 2,211 | $ | 120,756 | |||||
Orange S.A. (France) | 2,515 | 40,478 | ||||||
Telefonica Brasil S.A. (Brazil) | 2,000 | 26,466 | ||||||
|
| |||||||
| 187,700 | ||||||||
|
| |||||||
Entertainment - 2.6% | ||||||||
Activision Blizzard, Inc.1 | 47,460 | 2,659,184 | ||||||
Electronic Arts, Inc.*1 | 23,425 | 2,258,170 | ||||||
Nexon Co. Ltd. (Japan)* | 250,300 | 2,900,538 | ||||||
Sea Ltd. - ADR (Taiwan)*1 | 75,735 | 2,253,874 | ||||||
Toho Co. Ltd. - Tokyo (Japan) | 2,500 | 100,964 | ||||||
Viacom, Inc. - Class B | 378 | 8,150 | ||||||
Vivendi S.A. (France) | 1,280 | 35,645 | ||||||
|
| |||||||
| 10,216,525 | ||||||||
|
| |||||||
Interactive Media & Services - 2.8% | ||||||||
Alphabet, Inc. - Class A*1 | 1,865 | 2,347,662 | ||||||
Alphabet, Inc. - Class C* | 1,870 | 2,356,406 | ||||||
Autohome, Inc. - ADR (China)* | 955 | 80,755 | ||||||
Facebook, Inc. - Class A* | 15,475 | 2,965,784 | ||||||
Kakao Corp. (South Korea) | 985 | 119,532 | ||||||
Tencent Holdings Ltd. - Class H (China) | 77,636 | 3,149,143 | ||||||
|
| |||||||
| 11,019,282 | ||||||||
|
| |||||||
Media - 0.5% | ||||||||
Informa plc (United Kingdom) | 10,330 | 103,830 | ||||||
Quebecor, Inc. - Class B (Canada) | 33,585 | 780,786 | ||||||
Shaw Communications, Inc. - Class B (Canada) | 43,130 | 880,217 | ||||||
|
| |||||||
| 1,764,833 | ||||||||
|
| |||||||
Wireless Telecommunication Services - 0.0%## |
| |||||||
Globe Telecom, Inc. (Philippines) | 780 | 28,037 | ||||||
|
| |||||||
Total Communication Services | 23,216,377 | |||||||
|
| |||||||
Consumer Discretionary - 4.0% | ||||||||
Auto Components - 0.0%## | ||||||||
Cie Generale des Etablissements Michelin SCA (France) | 235 | 28,613 | ||||||
|
| |||||||
Automobiles - 0.0%## | ||||||||
Peugeot S.A. (France) | 725 | 18,361 | ||||||
|
| |||||||
Distributors - 0.0%## | ||||||||
Genuine Parts Co. | 150 | 15,387 | ||||||
|
| |||||||
Diversified Consumer Services - 0.1% | ||||||||
Fu Shou Yuan International Group Ltd. (China) | 56,640 | 49,990 | ||||||
SHARES
| VALUE (NOTE 2)
| |||||||
COMMON STOCKS(continued) | ||||||||
Consumer Discretionary(continued) | ||||||||
Diversified Consumer Services(continued) | ||||||||
New Oriental Education & Technology Group, Inc. - ADR (China)* | 1,010 | $ | 123,281 | |||||
TAL Education Group - ADR (China)* | 2,510 | 107,453 | ||||||
|
| |||||||
| 280,724 | ||||||||
|
| |||||||
Hotels, Restaurants & Leisure - 0.2% | ||||||||
Basic-Fit N.V. (Netherlands)*2 | 2,645 | 80,897 | ||||||
Galaxy Entertainment Group Ltd. (Macau) | 11,000 | 75,742 | ||||||
Hilton Worldwide Holdings, Inc. | 530 | 51,389 | ||||||
Melco Resorts & Entertainment Ltd. - ADR (Hong Kong) | 2,360 | 50,834 | ||||||
MGM China Holdings Ltd. (Macau) | 32,400 | 51,305 | ||||||
Restaurant Brands International, Inc. (Canada) | 985 | 64,458 | ||||||
Sands China Ltd. (Macau) | 16,000 | 78,810 | ||||||
Wynn Macau Ltd. (Macau) | 35,200 | 76,387 | ||||||
|
| |||||||
| 529,822 | ||||||||
|
| |||||||
Household Durables - 0.9% | ||||||||
Barratt Developments plc (United Kingdom) | 6,875 | 56,223 | ||||||
The Berkeley Group Holdings plc (United Kingdom) | 1,040 | 59,280 | ||||||
Persimmon plc (United Kingdom) | 2,100 | 61,942 | ||||||
Sony Corp. - ADR (Japan) | 53,405 | 3,248,626 | ||||||
Sony Corp. (Japan) | 2,000 | 121,738 | ||||||
Taylor Wimpey plc (United Kingdom) | 27,045 | 58,004 | ||||||
|
| |||||||
| 3,605,813 | ||||||||
|
| |||||||
Internet & Direct Marketing Retail - 1.2% | ||||||||
Alibaba Group Holding Ltd. - ADR (China)*1 | 1,085 | 191,687 | ||||||
Amazon.com, Inc.*1 | 1,605 | 2,851,539 | ||||||
Booking Holdings, Inc.* | 785 | 1,608,284 | ||||||
Farfetch Ltd. - Class A (United Kingdom)* | 2,920 | 26,076 | ||||||
|
| |||||||
| 4,677,586 | ||||||||
|
| |||||||
Leisure Products - 0.0%## | ||||||||
Technogym S.p.A. (Italy)2 | 8,420 | 92,896 | ||||||
|
| |||||||
Multiline Retail - 0.0%## | ||||||||
B&M European Value Retail S.A. (United Kingdom) | 12,075 | 57,929 | ||||||
Kohl’s Corp. | 203 | 10,406 | ||||||
Lojas Renner S.A. (Brazil) | 2,600 | 32,992 | ||||||
The accompanying notes are an integral part of the financial statements.
36
Investment Portfolio - October 31, 2019
| PRO-BLEND® MODERATE TERM SERIES | ||||||||
SHARES
| VALUE (NOTE 2)
| |||||||
COMMON STOCKS(continued) | ||||||||
Consumer Discretionary(continued) | ||||||||
Multiline Retail(continued) | ||||||||
Magazine Luiza S.A. (Brazil) | 2,300 | $ | 25,463 | |||||
|
| |||||||
| 126,790 | ||||||||
|
| |||||||
Specialty Retail - 0.7% | ||||||||
Best Buy Co., Inc. | 239 | 17,167 | ||||||
The Gap, Inc. | 436 | 7,089 | ||||||
The Home Depot, Inc. | 448 | 105,092 | ||||||
Industria de Diseno Textil S.A. (Spain) | 83,360 | 2,597,565 | ||||||
|
| |||||||
| 2,726,913 | ||||||||
|
| |||||||
Textiles, Apparel & Luxury Goods - 0.9% | ||||||||
EssilorLuxottica S.A. (France) | 300 | 45,808 | ||||||
Hermes International (France) | 40 | 28,814 | ||||||
Kering S.A. (France) | 105 | 59,745 | ||||||
Kontoor Brands, Inc. | 40 | 1,520 | ||||||
lululemon athletica, Inc.* | 15,315 | 3,128,395 | ||||||
LVMH Moet Hennessy Louis Vuitton SE (France) | 300 | 128,117 | ||||||
Shenzhou International Group | ||||||||
Holdings Ltd. (China) | 6,900 | 95,349 | ||||||
VF Corp. | 280 | 23,041 | ||||||
|
| |||||||
| 3,510,789 | ||||||||
|
| |||||||
Total Consumer Discretionary | 15,613,694 | |||||||
|
| |||||||
Consumer Staples - 5.9% | ||||||||
Beverages - 3.0% | ||||||||
Ambev S.A. - ADR (Brazil) | 168,061 | 724,343 | ||||||
Ambev S.A. (Brazil) | 16,400 | 70,990 | ||||||
Anheuser-Busch InBev S.A./N.V. (Belgium) | 35,640 | 2,876,769 | ||||||
The Coca-Cola Co. | 60,530 | 3,294,648 | ||||||
Coca-Cola European Partners plc (United Kingdom)1 | 1,950 | 104,344 | ||||||
Diageo plc (United Kingdom) | 40,513 | 1,658,241 | ||||||
Heineken N.V. (Netherlands) | 1,000 | 102,120 | ||||||
Molson Coors Brewing Co. - Class B | 183 | 9,648 | ||||||
PepsiCo, Inc. | 21,420 | 2,938,181 | ||||||
Pernod Ricard S.A. (France) | 595 | 109,916 | ||||||
|
| |||||||
| 11,889,200 | ||||||||
|
| |||||||
Food & Staples Retailing - 0.2% | ||||||||
Alimentation Couche-Tard, Inc. - Class B (Canada) | 3,530 | 105,865 | ||||||
ICA Gruppen AB (Sweden) | 2,284 | 101,071 | ||||||
The Kroger Co. | 486 | 11,975 | ||||||
Loblaw Companies Ltd. (Canada) | 2,030 | 108,258 | ||||||
SHARES
| VALUE (NOTE 2)
| |||||||
COMMON STOCKS(continued) | ||||||||
Consumer Staples(continued) | ||||||||
Food & Staples Retailing(continued) | ||||||||
Puregold Price Club, Inc. (Philippines) | 19,700 | $ | 15,846 | |||||
Raia Drogasil S.A. (Brazil) | 900 | 24,676 | ||||||
Robinsons Retail Holdings, Inc. (Philippines) | 11,560 | 17,279 | ||||||
Sysco Corp. | 361 | 28,833 | ||||||
Walgreens Boots Alliance, Inc. | 534 | 29,253 | ||||||
Walmart, Inc. | 1,010 | 118,433 | ||||||
|
| |||||||
| 561,489 | ||||||||
|
| |||||||
Food Products - 1.8% | ||||||||
Archer-Daniels-Midland Co. | 344 | 14,462 | ||||||
Barry Callebaut AG (Switzerland) | 25 | 52,832 | ||||||
Chocoladefabriken Lindt & Spruengli AG (Switzerland) | 5 | 37,152 | ||||||
Conagra Brands, Inc. | 392 | 10,604 | ||||||
Danone S.A. (France) | 2,851 | 236,180 | ||||||
General Mills, Inc. | 462 | 23,497 | ||||||
The Hershey Co. | 159 | 23,352 | ||||||
The J.M. Smucker Co. | 111 | 11,730 | ||||||
Kellogg Co. | 261 | 16,581 | ||||||
Kerry Group plc - Class A (Ireland) | 930 | 112,609 | ||||||
Mondelez International, Inc. - Class A | 57,136 | 2,996,783 | ||||||
Mowi ASA (Norway) | 4,540 | 110,830 | ||||||
Nestle S.A. (Switzerland) | 32,534 | 3,480,531 | ||||||
Tyson Foods, Inc. - Class A | 207 | 17,138 | ||||||
Universal Robina Corp. (Philippines) | 11,720 | 34,818 | ||||||
|
| |||||||
| 7,179,099 | ||||||||
|
| |||||||
Household Products - 0.1% | ||||||||
Colgate-Palmolive Co. | 510 | 34,986 | ||||||
Essity AB - Class B (Sweden) | 3,590 | 112,154 | ||||||
Henkel AG & Co. KGaA (Germany) | 1,065 | 110,624 | ||||||
Kimberly-Clark Corp. | 228 | 30,297 | ||||||
Reckitt Benckiser Group plc (United Kingdom) | 1,305 | 100,983 | ||||||
|
| |||||||
| 389,044 | ||||||||
|
| |||||||
Personal Products - 0.8% | ||||||||
Beiersdorf AG (Germany) | 560 | 66,298 | ||||||
LG Household & Health Care Ltd. (South Korea) | 95 | 102,799 | ||||||
L’Oreal S.A. (France) | 320 | 93,460 | ||||||
Unilever plc - ADR (United Kingdom) | 44,679 | 2,685,655 | ||||||
|
| |||||||
| 2,948,212 | ||||||||
|
| |||||||
The accompanying notes are an integral part of the financial statements.
37
Investment Portfolio - October 31, 2019
| PRO-BLEND® MODERATE TERM SERIES | ||||||||
SHARES
| VALUE (NOTE 2)
| |||||||
COMMON STOCKS (continued) | ||||||||
Consumer Staples (continued) | ||||||||
Tobacco - 0.0%## | ||||||||
British American Tobacco plc - ADR (United Kingdom)1 | 1,350 | $ | 47,196 | |||||
British American Tobacco plc (United Kingdom) | 3,195 | 111,748 | ||||||
|
| |||||||
| 158,944 | ||||||||
|
| |||||||
Total Consumer Staples | 23,125,988 | |||||||
|
| |||||||
Energy - 1.1% | ||||||||
Energy Equipment & Services - 0.8% | ||||||||
Baker Hughes Co. | 601 | 12,861 | ||||||
Core Laboratories N.V | 1,110 | 48,884 | ||||||
Halliburton Co. | 85,517 | 1,646,202 | ||||||
Schlumberger Ltd. | 34,368 | 1,123,490 | ||||||
Transocean Ltd.* | 91,500 | 434,625 | ||||||
|
| |||||||
| 3,266,062 | ||||||||
|
| |||||||
Oil, Gas & Consumable Fuels - 0.3% | ||||||||
Cameco Corp. (Canada) | 7,619 | 68,038 | ||||||
Chevron Corp. | 569 | 66,084 | ||||||
Eni S.p.A. (Italy) | 6,955 | 105,514 | ||||||
Equinor ASA (Norway) | 6,060 | 112,508 | ||||||
Galp Energia SGPS S.A. (Portugal) | 7,045 | 112,683 | ||||||
Marathon Petroleum Corp. | 479 | 30,632 | ||||||
Occidental Petroleum Corp. | 398 | 16,119 | ||||||
Phillips 66 | 227 | 26,518 | ||||||
Repsol S.A. (Spain) | 7,547 | 124,372 | ||||||
Royal Dutch Shell plc - Class B - ADR (Netherlands) | 3,005 | 175,161 | ||||||
Suncor Energy, Inc. (Canada) | 2,805 | 83,398 | ||||||
TOTAL S.A. (France) | 2,250 | 118,954 | ||||||
Valero Energy Corp. | 300 | 29,094 | ||||||
|
| |||||||
| 1,069,075 | ||||||||
|
| |||||||
Total Energy | 4,335,137 | |||||||
|
| |||||||
Financials - 3.8% | ||||||||
Banks - 0.4% | ||||||||
Banco Bradesco S.A. (Brazil) | 14,500 | 127,519 | ||||||
Banco do Brasil S.A. (Brazil) | 4,700 | 56,264 | ||||||
Banco Santander Brasil S.A. (Brazil) | 2,000 | 23,648 | ||||||
Bank of America Corp. | 2,411 | 75,392 | ||||||
The Bank Of N.T. Butterfield & Son Ltd. (Bermuda) | 2,155 | 71,007 | ||||||
Bank of the Philippine Islands (Philippines) | 21,280 | 40,655 | ||||||
Barclays plc (United Kingdom) | 29,110 | 63,142 | ||||||
BB&T Corp. | 368 | 19,522 | ||||||
BDO Unibank, Inc. (Philippines) | 17,450 | 53,231 | ||||||
SHARES
| VALUE (NOTE 2)
| |||||||
COMMON STOCKS(continued) | ||||||||
Financials(continued) | ||||||||
Banks(continued) | ||||||||
BNP Paribas S.A. (France) | 1,480 | $ | 77,344 | |||||
Citigroup, Inc. | 705 | 50,661 | ||||||
Credit Agricole S.A. (France) | 1,450 | 18,920 | ||||||
Fifth Third Bancorp | 566 | 16,459 | ||||||
FinecoBank Banca Fineco S.p.A. (Italy) | 7,995 | 90,130 | ||||||
Itau Unibanco Holding S.A. (Brazil) | 16,200 | 146,469 | ||||||
Itausa - Investimentos Itau S.A. (Brazil) | 17,800 | 60,805 | ||||||
JPMorgan Chase & Co. | 943 | 117,800 | ||||||
KeyCorp | 771 | 13,855 | ||||||
Lloyds Banking Group plc (United Kingdom) | 81,025 | 59,603 | ||||||
Metropolitan Bank & Trust Co. (Philippines) | 31,199 | 41,532 | ||||||
Regions Financial Corp. | 690 | 11,109 | ||||||
Royal Bank of Scotland Group plc (United Kingdom) | 21,190 | 58,574 | ||||||
SunTrust Banks, Inc. | 286 | 19,545 | ||||||
U.S. Bancorp | 836 | 47,669 | ||||||
Wells Fargo & Co. | 1,805 | 93,192 | ||||||
|
| |||||||
| 1,454,047 | ||||||||
|
| |||||||
Capital Markets - 2.3% | ||||||||
B3 S.A. - Brasil Bolsa Balcao (Brazil) | 6,300 | 76,046 | ||||||
BlackRock, Inc.1 | 1,610 | 743,337 | ||||||
Cboe Global Markets, Inc. | 13,770 | 1,585,616 | ||||||
CME Group, Inc. | 7,080 | 1,456,710 | ||||||
Deutsche Boerse AG (Germany) | 720 | 111,499 | ||||||
Hargreaves Lansdown plc (United Kingdom) | 2,125 | 48,797 | ||||||
Intercontinental Exchange, Inc. | 16,280 | 1,535,530 | ||||||
Julius Baer Group Ltd. (Switzerland) | 1,315 | 58,233 | ||||||
London Stock Exchange Group plc (United Kingdom) | 590 | 53,170 | ||||||
Moody’s Corp. | 7,160 | 1,580,140 | ||||||
S&P Global, Inc. | 6,360 | 1,640,816 | ||||||
|
| |||||||
| 8,889,894 | ||||||||
|
| |||||||
Diversified Financial Services - 1.0% | ||||||||
Berkshire Hathaway, Inc. - Class B*1 | 19,375 | 4,118,738 | ||||||
|
| |||||||
Insurance - 0.1% | ||||||||
Admiral Group plc (United Kingdom) | 3,570 | 93,433 | ||||||
The Allstate Corp. | 175 | 18,624 | ||||||
AXA S.A. (France) | 2,495 | 66,046 | ||||||
BB Seguridade Participacoes S.A. | 3,300 | 27,935 | ||||||
The accompanying notes are an integral part of the financial statements.
38
Investment Portfolio - October 31, 2019
| PRO-BLEND® MODERATE TERM SERIES | ||||||||
SHARES
| VALUE (NOTE 2)
| |||||||
COMMON STOCKS(continued) | ||||||||
Financials(continued) | ||||||||
Insurance(continued) | ||||||||
Chubb Ltd. | 188 | $ | 28,655 | |||||
The Hartford Financial Services Group, Inc. | 228 | 13,014 | ||||||
Ping An Insurance Group Co. of China Ltd. - Class H (China) | 7,500 | 86,563 | ||||||
The Travelers Companies, Inc. | 132 | 17,300 | ||||||
|
| |||||||
| 351,570 | ||||||||
|
| |||||||
Total Financials | 14,814,249 | |||||||
|
| |||||||
Health Care - 6.8% | ||||||||
Biotechnology - 1.3% | ||||||||
AbbVie, Inc. | 735 | 58,469 | ||||||
Amgen, Inc. | 326 | 69,520 | ||||||
BioMarin Pharmaceutical, Inc.* | 25,150 | 1,841,232 | ||||||
Gilead Sciences, Inc. | 723 | 46,062 | ||||||
Incyte Corp.* | 11,890 | 997,809 | ||||||
Seattle Genetics, Inc.* | 9,360 | 1,005,264 | ||||||
Vertex Pharmaceuticals, Inc.* | 5,430 | 1,061,456 | ||||||
|
| |||||||
| 5,079,812 | ||||||||
|
| |||||||
Health Care Equipment & Supplies - 1.8% | ||||||||
Alcon, Inc. (Switzerland)* | 26,655 | 1,579,842 | ||||||
Alcon, Inc. (Switzerland)* | 920 | 54,407 | ||||||
Getinge AB - Class B (Sweden) | 4,200 | 71,806 | ||||||
Hoya Corp. (Japan) | 1,300 | 114,890 | ||||||
Koninklijke Philips N.V. (Netherlands) | 2,380 | 104,420 | ||||||
Medtronic plc | 46,306 | 5,042,723 | ||||||
Shandong Weigao Group Medical Polymer Co. Ltd. - Class H (China) | 48,000 | 55,106 | ||||||
Smith & Nephew plc (United Kingdom) | 4,695 | 100,785 | ||||||
|
| |||||||
| 7,123,979 | ||||||||
|
| |||||||
Health Care Providers & Services - 0.0%## | ||||||||
CVS Health Corp. | 670 | 44,481 | ||||||
Quest Diagnostics, Inc. | 115 | 11,644 | ||||||
Sonic Healthcare Ltd. (Australia) | 5,675 | 111,769 | ||||||
|
| |||||||
| 167,894 | ||||||||
|
| |||||||
Life Sciences Tools & Services - 0.1% | ||||||||
Gerresheimer AG (Germany) | 995 | 80,242 | ||||||
QIAGEN N.V.*1 | 1,581 | 47,130 | ||||||
QIAGEN N.V.* | 2,692 | 80,973 | ||||||
Tecan Group AG (Switzerland) | 105 | 24,841 | ||||||
|
| |||||||
| 233,186 | ||||||||
|
| |||||||
SHARES
| VALUE (NOTE 2)
| |||||||
COMMON STOCKS(continued) | ||||||||
Health Care(continued) | ||||||||
Pharmaceuticals - 3.6% | ||||||||
Bristol-Myers Squibb Co. | 811 | $ | 46,527 | |||||
Johnson & Johnson | 33,937 | 4,481,041 | ||||||
Merck & Co., Inc. | 12,407 | 1,075,191 | ||||||
Merck KGaA (Germany) | 27,310 | 3,257,169 | ||||||
Novartis AG - ADR (Switzerland) | 53,310 | 4,661,426 | ||||||
Novartis AG (Switzerland) | 1,385 | 121,015 | ||||||
Perrigo Co. plc | 1,695 | 89,869 | ||||||
Pfizer, Inc. | 2,324 | 89,172 | ||||||
Recordati S.p.A. (Italy) | 2,525 | 106,111 | ||||||
Roche Holding AG (Switzerland) | 610 | 183,583 | ||||||
Sanofi (France) | 1,325 | 122,148 | ||||||
|
| |||||||
| 14,233,252 | ||||||||
|
| |||||||
Total Health Care | 26,838,123 | |||||||
|
| |||||||
Industrials - 0.5% | ||||||||
Aerospace & Defense - 0.1% | ||||||||
Airbus SE (France) | 690 | 98,986 | ||||||
BAE Systems plc (United Kingdom) | 16,175 | 120,823 | ||||||
The Boeing Co. | 225 | 76,480 | ||||||
General Dynamics Corp. | 129 | 22,807 | ||||||
Lockheed Martin Corp. | 139 | 52,359 | ||||||
Safran S.A. (France) | 385 | 60,980 | ||||||
Thales S.A. (France) | 95 | 9,287 | ||||||
United Technologies Corp. | 394 | 56,571 | ||||||
|
| |||||||
| 498,293 | ||||||||
|
| |||||||
Air Freight & Logistics - 0.0%## | ||||||||
C.H. Robinson Worldwide, Inc. | 160 | 12,102 | ||||||
United Parcel Service, Inc. - Class B | 492 | 56,664 | ||||||
|
| |||||||
| 68,766 | ||||||||
|
| |||||||
Airlines - 0.0%## | ||||||||
Ryanair Holdings plc - ADR (Ireland)* | 949 | 70,833 | ||||||
|
| |||||||
Building Products - 0.0%## | ||||||||
Cie de Saint-Gobain (France) | 605 | 24,640 | ||||||
Johnson Controls International plc | 581 | 25,175 | ||||||
|
| |||||||
| 49,815 | ||||||||
|
| |||||||
Commercial Services & Supplies - 0.0%## | ||||||||
Waste Management, Inc. | 275 | 30,858 | ||||||
|
| |||||||
Construction & Engineering - 0.0%## | ||||||||
Vinci S.A. (France) | 1,030 | 115,562 | ||||||
|
| |||||||
Electrical Equipment - 0.1% | ||||||||
Eaton Corp. plc | 306 | 26,656 | ||||||
Emerson Electric Co. | 421 | 29,533 | ||||||
Legrand S.A. (France) | 325 | 25,390 | ||||||
The accompanying notes are an integral part of the financial statements.
39
Investment Portfolio - October 31, 2019
| PRO-BLEND® MODERATE TERM SERIES | ||||||||
SHARES
| VALUE (NOTE 2)
| |||||||
COMMON STOCKS(continued) | ||||||||
Industrials(continued) | ||||||||
Electrical Equipment(continued) | ||||||||
Rockwell Automation, Inc. | 76 | $ | 13,071 | |||||
Schneider Electric SE (France) | 680 | 63,199 | ||||||
WEG S.A. (Brazil) | 3,800 | 24,370 | ||||||
|
| |||||||
| 182,219 | ||||||||
|
| |||||||
Industrial Conglomerates - 0.1% | ||||||||
3M Co. | 310 | 51,147 | ||||||
Honeywell International, Inc. | 334 | 57,692 | ||||||
LT Group, Inc. (Philippines) | 54,800 | 14,406 | ||||||
SM Investments Corp. (Philippines) | 2,690 | 54,533 | ||||||
|
| |||||||
| 177,778 | ||||||||
|
| |||||||
Machinery - 0.2% | ||||||||
Caterpillar, Inc. | 278 | 38,308 | ||||||
Cummins, Inc. | 124 | 21,388 | ||||||
Daifuku Co. Ltd. (Japan) | 1,200 | 63,674 | ||||||
FANUC Corp. (Japan) | 700 | 138,075 | ||||||
Harmonic Drive Systems, Inc. (Japan) | 1,500 | 69,565 | ||||||
Illinois Tool Works, Inc. | 186 | 31,356 | ||||||
KION Group AG (Germany) | 1,140 | 75,853 | ||||||
Nabtesco Corp. (Japan) | 2,100 | 66,853 | ||||||
The Weir Group plc (United Kingdom) | 5,275 | 92,139 | ||||||
|
| |||||||
| 597,211 | ||||||||
|
| |||||||
Professional Services - 0.0%## | ||||||||
SGS S.A. (Switzerland) | 20 | 52,162 | ||||||
|
| |||||||
Road & Rail - 0.0%## | ||||||||
Localiza Rent a Car S.A. (Brazil) | 1,800 | 19,299 | ||||||
Rumo S.A. (Brazil)* | 4,800 | 27,384 | ||||||
Union Pacific Corp. | 335 | 55,429 | ||||||
|
| |||||||
| 102,112 | ||||||||
|
| |||||||
Trading Companies & Distributors - 0.0%## | ||||||||
Fastenal Co. | 482 | 17,323 | ||||||
|
| |||||||
Transportation Infrastructure - 0.0%## | ||||||||
Grupo Aeroportuario del Centro Norte S.A.B. de C.V. (Mexico) | 7,900 | 54,821 | ||||||
Grupo Aeroportuario del Pacifico S.A.B. de C.V. - ADR (Mexico) | 340 | 35,533 | ||||||
Grupo Aeroportuario del Sureste S.A.B. de C.V. - ADR (Mexico) | 295 | 48,306 | ||||||
|
| |||||||
| 138,660 | ||||||||
|
| |||||||
Total Industrials | 2,101,592 | |||||||
|
| |||||||
Information Technology - 6.9% | ||||||||
Cisco Systems, Inc. | 1,680 | 79,817 | ||||||
|
| |||||||
SHARES
| VALUE (NOTE 2)
| |||||||
COMMON STOCKS(continued) | ||||||||
Information Technology(continued) | ||||||||
Electronic Equipment, Instruments & Components - 0.3% | ||||||||
Cognex Corp. | 14,020 | $ | 721,890 | |||||
Halma plc (United Kingdom) | 2,535 | 61,513 | ||||||
Hexagon AB - Class B (Sweden) | 1,270 | 65,021 | ||||||
Keyence Corp. (Japan) | 306 | 193,483 | ||||||
|
| |||||||
| 1,041,907 | ||||||||
|
| |||||||
IT Services - 3.1% | ||||||||
Capgemini SE (France) | 195 | 21,982 | ||||||
International Business Machines Corp. | 430 | 57,504 | ||||||
InterXion Holding N.V. (Netherlands)* | 28,720 | 2,533,678 | ||||||
Keywords Studios plc (Ireland) | 1,557 | 22,436 | ||||||
Mastercard, Inc. - Class A | 18,260 | 5,054,551 | ||||||
Visa, Inc. - Class A | 25,390 | 4,541,255 | ||||||
|
| |||||||
| 12,231,406 | ||||||||
|
| |||||||
Semiconductors & Semiconductor Equipment - 1.6% |
| |||||||
Applied Materials, Inc. | 492 | 26,696 | ||||||
Broadcom, Inc. | 181 | 53,006 | ||||||
Intel Corp. | 1,898 | 107,294 | ||||||
KLA Corp. | 146 | 24,680 | ||||||
Lam Research Corp. | 84 | 22,767 | ||||||
Maxim Integrated Products, Inc. | 226 | 13,257 | ||||||
Micron Technology, Inc.* | 91,235 | 4,338,224 | ||||||
NVIDIA Corp. | 8,625 | 1,733,798 | ||||||
Texas Instruments, Inc. | 465 | 54,865 | ||||||
|
| |||||||
| 6,374,587 | ||||||||
|
| |||||||
Software - 1.9% | ||||||||
Dassault Systemes SE (France) | 185 | 28,097 | ||||||
Microsoft Corp. | 32,920 | 4,719,740 | ||||||
ServiceNow, Inc.*1 | 11,170 | 2,761,894 | ||||||
|
| |||||||
| 7,509,731 | ||||||||
|
| |||||||
Technology Hardware, Storage & Peripherals - 0.0%## | ||||||||
NetApp, Inc. | 168 | 9,388 | ||||||
Western Digital Corp. | 274 | 14,152 | ||||||
|
| |||||||
| 23,540 | ||||||||
|
| |||||||
Total Information Technology | 27,260,988 | |||||||
|
| |||||||
Materials - 0.2% | ||||||||
Chemicals - 0.2% | ||||||||
Air Liquide S.A. (France) | 533 | 70,868 | ||||||
Akzo Nobel N.V. (Netherlands) | 763 | 70,344 | ||||||
Dow, Inc. | 387 | 19,540 | ||||||
Eastman Chemical Co. | 151 | 11,482 | ||||||
The accompanying notes are an integral part of the financial statements.
40
Investment Portfolio - October 31, 2019
| PRO-BLEND® MODERATE TERM SERIES | ||||||||
SHARES
| VALUE (NOTE 2)
| |||||||
COMMON STOCKS(continued) | ||||||||
Materials(continued) | ||||||||
Chemicals(continued) | ||||||||
Givaudan S.A. (Switzerland) | 20 | $ | 58,759 | |||||
LyondellBasell Industries N.V. - Class A | 281 | 25,206 | ||||||
OCI N.V. (Netherlands)* | 985 | 22,147 | ||||||
Orbia Advance Corp. S.A.B. de C.V. (Mexico) | 26,400 | 57,146 | ||||||
Solvay S.A. (Belgium) | 1,180 | 128,297 | ||||||
|
| |||||||
| 463,789 | ||||||||
|
| |||||||
Containers & Packaging - 0.0%## | ||||||||
International Paper Co. | 273 | 11,925 | ||||||
|
| |||||||
Metals & Mining - 0.0%## | ||||||||
First Quantum Minerals Ltd. (Zambia) | 2,745 | 23,196 | ||||||
Lundin Mining Corp. (Chile) | 4,265 | 21,534 | ||||||
Nucor Corp. | 297 | 15,993 | ||||||
|
| |||||||
| 60,723 | ||||||||
|
| |||||||
Total Materials | 536,437 | |||||||
|
| |||||||
Real Estate - 3.1% | ||||||||
Equity Real Estate Investment Trusts (REITS) - 3.1% |
| |||||||
Acadia Realty Trust1 | 1,195 | 33,436 | ||||||
Agree Realty Corp.1 | 750 | 59,078 | ||||||
Alexandria Real Estate Equities, Inc.1 | 275 | 43,656 | ||||||
American Campus Communities, Inc.1 | 1,970 | 98,461 | ||||||
American Homes 4 Rent - Class A1 | 6,640 | 175,761 | ||||||
American Tower Corp. | 7,340 | 1,600,707 | ||||||
Americold Realty Trust1 | 3,690 | 147,932 | ||||||
Apartment Investment & Management Co. - Class A1 | 3,216 | 176,494 | ||||||
AvalonBay Communities, Inc.1 | 1,130 | 245,956 | ||||||
Boston Properties, Inc. | 979 | 134,319 | ||||||
Brandywine Realty Trust1 | 9,585 | 146,459 | ||||||
The British Land Co. plc (United Kingdom) | 7,570 | 60,864 | ||||||
Camden Property Trust1 | 1,160 | 132,669 | ||||||
Community Healthcare Trust, Inc. | 2,150 | 104,103 | ||||||
Cousins Properties, Inc.1 | 6,007 | 241,061 | ||||||
Crown Castle International Corp.1 | 825 | 114,502 | ||||||
CubeSmart | 1,055 | 33,444 | ||||||
Digital Realty Trust, Inc. | 960 | 121,958 | ||||||
Douglas Emmett, Inc. | 2,545 | 110,249 | ||||||
Equinix, Inc. | 4,220 | 2,391,812 | ||||||
Equity LifeStyle Properties, Inc. | 1,550 | 108,407 | ||||||
Equity Residential | 1,990 | 176,433 | ||||||
SHARES
| VALUE (NOTE 2)
| |||||||
COMMON STOCKS(continued) | ||||||||
Real Estate(continued) | ||||||||
Equity Real Estate Investment Trusts (REITS)(continued) |
| |||||||
Essential Properties Realty Trust, Inc. | 4,260 | $ | 109,312 | |||||
Essex Property Trust, Inc. | 425 | 139,030 | ||||||
Extra Space Storage, Inc. | 385 | 43,224 | ||||||
Federal Realty Investment Trust | 270 | 36,723 | ||||||
First Industrial Realty Trust, Inc. | 1,810 | 76,219 | ||||||
Getty Realty Corp. | 2,075 | 69,596 | ||||||
Healthcare Realty Trust, Inc. | 3,185 | 110,742 | ||||||
Healthcare Trust of America, Inc. - Class A | 1,965 | 60,915 | ||||||
Healthpeak Properties, Inc. | 4,575 | 172,112 | ||||||
Hibernia REIT plc (Ireland) | 37,110 | 57,779 | ||||||
Host Hotels & Resorts, Inc. | 3,720 | 60,971 | ||||||
Independence Realty Trust, Inc. | 5,145 | 79,233 | ||||||
Invitation Homes, Inc. | 7,349 | 226,276 | ||||||
Jernigan Capital, Inc. | 3,870 | 73,491 | ||||||
Kilroy Realty Corp. | 450 | 37,768 | ||||||
Land Securities Group plc (United Kingdom) | 5,075 | 61,816 | ||||||
Liberty Property Trust | 1,795 | 106,031 | ||||||
Life Storage, Inc. | 505 | 55,005 | ||||||
Mid-America Apartment Communities, Inc. | 555 | 77,139 | ||||||
National Retail Properties, Inc. | 1,890 | 111,340 | ||||||
National Storage Affiliates Trust | 1,870 | 63,898 | ||||||
Omega Healthcare Investors, Inc. | 1,785 | 78,611 | ||||||
Physicians Realty Trust | 6,530 | 121,915 | ||||||
Plymouth Industrial REIT, Inc. | 2,351 | 44,340 | ||||||
Prologis, Inc. | 4,325 | 379,562 | ||||||
Public Storage | 710 | 158,231 | ||||||
Realty Income Corp. | 575 | 47,029 | ||||||
SBA Communications Corp. | 6,180 | 1,487,217 | ||||||
Simon Property Group, Inc. | 1,655 | 249,375 | ||||||
STAG Industrial, Inc. | 2,260 | 70,150 | ||||||
STORE Capital Corp. | 1,590 | 64,395 | ||||||
Sun Communities, Inc. | 1,030 | 167,530 | ||||||
Sunstone Hotel Investors, Inc. | 3,115 | 42,084 | ||||||
UDR, Inc. | 2,656 | 133,464 | ||||||
UMH Properties, Inc. | 2,515 | 37,549 | ||||||
Urban Edge Properties | 4,670 | 98,584 | ||||||
Ventas, Inc. | 1,913 | 124,536 | ||||||
VEREIT, Inc. | 12,555 | 123,541 | ||||||
Vornado Realty Trust | 680 | 44,628 | ||||||
Weingarten Realty Investors | 3,000 | 95,190 | ||||||
Welltower, Inc. | 1,784 | 161,791 | ||||||
|
| |||||||
| 12,016,103 | ||||||||
|
| |||||||
The accompanying notes are an integral part of the financial statements.
41
Investment Portfolio - October 31, 2019
| PRO-BLEND® MODERATE TERM SERIES | SHARES/ | |||||||
PRINCIPAL AMOUNT3
| VALUE (NOTE 2)
| |||||||
COMMON STOCKS(continued) | ||||||||
Real Estate(continued) | ||||||||
Real Estate Management & Development - 0.0%## |
| |||||||
Ayala Land, Inc. (Philippines) | 54,200 | $ | 51,795 | |||||
SM Prime Holdings, Inc. (Philippines) | 90,075 | 69,160 | ||||||
|
| |||||||
| 120,955 | ||||||||
|
| |||||||
Total Real Estate | 12,137,058 | |||||||
|
| |||||||
Utilities - 0.0%## | ||||||||
Electric Utilities - 0.0%## | ||||||||
Manila Electric Co. (Philippines) | 4,520 | 30,142 | ||||||
|
| |||||||
Independent Power and Renewable Electricity Producers - 0.0%## |
| |||||||
Aboitiz Power Corp. (Philippines) | 47,200 | 37,159 | ||||||
|
| |||||||
Multi-Utilities - 0.0%## | ||||||||
Engie S.A. (France) | 2,380 | 39,853 | ||||||
Veolia Environnement S.A. (France) | 725 | 19,085 | ||||||
|
| |||||||
| 58,938 | ||||||||
|
| |||||||
Total Utilities | 126,239 | |||||||
|
| |||||||
TOTAL COMMON STOCKS | ||||||||
(Identified Cost $131,311,370) | 150,105,882 | |||||||
|
| |||||||
CORPORATE BONDS - 14.9% | ||||||||
Non-Convertible Corporate Bonds - 14.9% | ||||||||
Communication Services - 3.2% | ||||||||
Diversified Telecommunication Services - 1.6% |
| |||||||
AT&T, Inc., 4.25%, 3/1/2027 | 2,350,000 | 2,581,018 | ||||||
CenturyLink, Inc., 5.625%, 4/1/2020 | 40,000 | 40,500 | ||||||
Verizon Communications, Inc., 5.25%, 3/16/2037 | 2,830,000 | 3,564,606 | ||||||
|
| |||||||
| 6,186,124 | ||||||||
|
| |||||||
Interactive Media & Services - 0.5% | ||||||||
Tencent Holdings Ltd. (China)2, 3.975%, 4/11/2029 | 1,690,000 | 1,818,811 | ||||||
|
| |||||||
Media - 1.1% | ||||||||
Cablevision Systems Corp., 8.00%, 4/15/2020 | 40,000 | 41,000 | ||||||
Comcast Corp., 3.25%, 11/1/2039 | 1,760,000 | 1,784,316 | ||||||
Diamond Sports Group LLC - Diamond Sports Finance Co.2, 6.625%, 8/15/2027 | 60,000 | 61,800 | ||||||
Discovery Communications LLC, 5.20%, 9/20/2047 | 2,160,000 | 2,362,081 | ||||||
Entercom Media Corp.2, 7.25%, 11/1/2024 | 20,000 | 20,850 | ||||||
PRINCIPAL AMOUNT3
| VALUE (NOTE 2)
| |||||||
CORPORATE BONDS(continued) | ||||||||
Non-Convertible Corporate Bonds(continued) |
| |||||||
Communication Services(continued) | ||||||||
Media(continued) | ||||||||
Townsquare Media, Inc.2, 6.50%, 4/1/2023 | 40,000 | $ | 39,600 | |||||
|
| |||||||
| 4,309,647 | ||||||||
|
| |||||||
Wireless Telecommunication Services - 0.0%## |
| |||||||
Sprint Communications, Inc., 7.00%, 8/15/2020 | 90,000 | 92,715 | ||||||
Sprint Corp., 7.25%, 9/15/2021 | 40,000 | 42,682 | ||||||
Sprint Corp., 7.125%, 6/15/2024 | 35,000 | 37,975 | ||||||
|
| |||||||
| 173,372 | ||||||||
|
| |||||||
Total Communication Services | 12,487,954 | |||||||
|
| |||||||
Consumer Discretionary - 2.1% | ||||||||
Auto Components - 0.0%## | ||||||||
American Axle & Manufacturing, Inc., 6.25%, 4/1/2025 | 20,000 | 19,275 | ||||||
Techniplas LLC2, 10.00%, 5/1/2020 | 50,000 | 42,250 | ||||||
|
| |||||||
| 61,525 | ||||||||
|
| |||||||
Automobiles - 0.5% | ||||||||
General Motors Financial Co., Inc., 3.15%, 1/15/2020 | 2,120,000 | 2,122,866 | ||||||
|
| |||||||
Diversified Consumer Services - 0.0%## | ||||||||
GEMS MENASA Cayman Ltd. - GEMS Education Delaware LLC (United Arab Emirates)2, 7.125%, 7/31/2026 | 155,000 | 160,619 | ||||||
|
| |||||||
Household Durables - 0.1% | ||||||||
Ashton Woods USA LLC - Ashton Woods Finance Co.2, 6.75%, 8/1/2025 | 30,000 | 30,150 | ||||||
LGI Homes, Inc.2, 6.875%, 7/15/2026 | 80,000 | 82,800 | ||||||
Weekley Homes LLC - Weekley Finance Corp., 6.625%, 8/15/2025 | 80,000 | 81,200 | ||||||
|
| |||||||
| 194,150 | ||||||||
|
| |||||||
Internet & Direct Marketing Retail - 1.5% | ||||||||
Alibaba Group Holding Ltd. (China), 3.40%, 12/6/2027 | 1,800,000 | 1,869,591 | ||||||
Booking Holdings, Inc., 3.60%, 6/1/2026 | 3,600,000 | 3,897,567 | ||||||
Photo Holdings Merger Sub, Inc.2, 8.50%, 10/1/2026 | 60,000 | 52,808 | ||||||
|
| |||||||
| 5,819,966 | ||||||||
|
| |||||||
The accompanying notes are an integral part of the financial statements.
42
Investment Portfolio - October 31, 2019
| PRO-BLEND® MODERATE TERM SERIES | ||||||||
PRINCIPAL AMOUNT3
| VALUE (NOTE 2)
| |||||||
CORPORATE BONDS(continued) | ||||||||
Non-Convertible Corporate Bonds(continued) |
| |||||||
Consumer Discretionary(continued) | ||||||||
Specialty Retail - 0.0%## | ||||||||
Foxtrot Escrow Issuer LLC - Foxtrot Escrow Corp.2, 12.25%, 11/15/2026 | 60,000 | $ | 60,306 | |||||
Staples, Inc.2, 7.50%, 4/15/2026 | 60,000 | 62,412 | ||||||
|
| |||||||
| 122,718 | ||||||||
|
| |||||||
Total Consumer Discretionary | 8,481,844 | |||||||
|
| |||||||
Consumer Staples - 0.0%## | ||||||||
Food & Staples Retailing - 0.0%## | ||||||||
KeHE Distributors LLC - KeHE Finance Corp.2, 8.625%, 10/15/2026 | 60,000 | 61,538 | ||||||
|
| |||||||
Energy - 2.5% | ||||||||
Energy Equipment & Services - 0.0%## | ||||||||
Nabors Industries, Inc., 5.50%, 1/15/2023 | 40,000 | 33,800 | ||||||
Shelf Drilling Holdings Ltd. (United Arab Emirates)2, 8.25%, 2/15/2025 | 40,000 | 33,600 | ||||||
|
| |||||||
| 67,400 | ||||||||
|
| |||||||
Oil, Gas & Consumable Fuels - 2.5% | ||||||||
Antero Midstream Partners LP - Antero Midstream Finance Corp.2, 5.75%, 3/1/2027 | 40,000 | 29,750 | ||||||
Antero Midstream Partners LP - Antero Midstream Finance Corp.2, 5.75%, 1/15/2028 | 40,000 | 30,200 | ||||||
Bruin E&P Partners LLC2, 8.875%, 8/1/2023 | 40,000 | 26,400 | ||||||
Calumet Specialty Products Partners LP - Calumet Finance Corp.2, 11.00%, 4/15/2025 | 60,000 | 60,150 | ||||||
Energy Transfer Operating LP, 6.50%, 2/1/2042 | 1,620,000 | 1,940,279 | ||||||
Jonah Energy LLC - Jonah Energy Finance Corp.2, 7.25%, 10/15/2025 | 80,000 | 22,400 | ||||||
Kinder Morgan Energy Partners LP, 6.95%, 1/15/2038 | 1,910,000 | 2,469,100 | ||||||
Lonestar Resources America, Inc.2, 11.25%, 1/1/2023 | 40,000 | 28,000 | ||||||
Moss Creek Resources Holdings, Inc.2, 10.50%, 5/15/2027 | 15,000 | 11,588 | ||||||
NuStar Logistics LP, 6.75%, 2/1/2021 | 40,000 | 41,447 | ||||||
Rockies Express Pipeline LLC2, 5.625%, 4/15/2020 | 60,000 | 61,008 | ||||||
PRINCIPAL AMOUNT3
| VALUE (NOTE 2)
| |||||||
CORPORATE BONDS(continued) | ||||||||
Non-Convertible Corporate Bonds(continued) |
| |||||||
Energy(continued) | ||||||||
Oil, Gas & Consumable Fuels(continued) | ||||||||
Sabine Pass Liquefaction LLC, 5.875%, 6/30/2026 | 2,690,000 | $ | 3,088,797 | |||||
Southwestern Energy Co.4, 6.20%, 1/23/2025 | 40,000 | 35,200 | ||||||
W&T Offshore, Inc.2, 9.75%, 11/1/2023 | 20,000 | 18,750 | ||||||
The Williams Companies, Inc., 3.75%, 6/15/2027 | 1,840,000 | 1,918,466 | ||||||
|
| |||||||
| 9,781,535 | ||||||||
|
| |||||||
Total Energy | 9,848,935 | |||||||
|
| |||||||
Financials - 3.7% | ||||||||
Banks - 3.2% | ||||||||
Bank of America Corp., 4.00%, 1/22/2025 | 3,530,000 | 3,765,165 | ||||||
Citigroup, Inc., 8.125%, 7/15/2039 | 1,080,000 | 1,776,674 | ||||||
Credit Suisse AG (Switzerland), 5.40%, 1/14/2020 | 2,620,000 | 2,636,978 | ||||||
JPMorgan Chase & Co.5, (3 mo. LIBOR US + 1.000%), 4.023%, 12/5/2024 | 1,730,000 | 1,847,290 | ||||||
Santander Holdings USA, Inc., 4.50%, 7/17/2025 | 2,320,000 | 2,500,029 | ||||||
|
| |||||||
| 12,526,136 | ||||||||
|
| |||||||
Capital Markets - 0.4% | ||||||||
AG Merger Sub II, Inc.2, 10.75%, 8/1/2027 | 40,000 | 39,600 | ||||||
Donnelley Financial Solutions, Inc., 8.25%, 10/15/2024 | 75,000 | 78,000 | ||||||
The Goldman Sachs Group, Inc., 4.25%, 10/21/2025 | 1,200,000 | 1,292,581 | ||||||
|
| |||||||
| 1,410,181 | ||||||||
|
| |||||||
Consumer Finance - 0.0%## | ||||||||
Navient Corp., 5.00%, 10/26/2020 | 60,000 | 61,107 | ||||||
SLM Corp., 5.125%, 4/5/2022 | 80,000 | 82,600 | ||||||
|
| |||||||
| 143,707 | ||||||||
|
| |||||||
Diversified Financial Services - 0.1% | ||||||||
Fidelity & Guaranty Life Holdings, Inc.2, 5.50%, 5/1/2025 | 40,000 | 42,700 | ||||||
Global Aircraft Leasing Co. Ltd. (Cayman Islands)2,6, 6.50%, 9/15/2024 | 60,000 | 61,407 | ||||||
VistaJet Malta Finance plc - XO Management Holding, Inc. (Switzerland)2, 10.50%, 6/1/2024 | 60,000 | 58,350 | ||||||
|
| |||||||
| 162,457 | ||||||||
|
| |||||||
The accompanying notes are an integral part of the financial statements.
43
Investment Portfolio - October 31, 2019
| PRO-BLEND® MODERATE TERM SERIES | ||||||||
PRINCIPAL AMOUNT3
| VALUE (NOTE 2)
| |||||||
CORPORATE BONDS(continued) | ||||||||
Non-Convertible Corporate Bonds(continued) |
| |||||||
Financials(continued) | ||||||||
Thrifts & Mortgage Finance - 0.0%## | ||||||||
Acrisure LLC - Acrisure Finance, Inc.2, 7.00%, 11/15/2025 | 65,000 | $ | 59,475 | |||||
Radian Group, Inc., 4.875%, 3/15/2027 | 80,000 | 83,000 | ||||||
|
| |||||||
| 142,475 | ||||||||
|
| |||||||
Total Financials | 14,384,956 | |||||||
|
| |||||||
Health Care - 0.5% | ||||||||
Health Care Providers & Services - 0.5% | ||||||||
HCA, Inc., 4.125%, 6/15/2029 | 1,810,000 | 1,917,523 | ||||||
|
| |||||||
Industrials - 1.4% | ||||||||
Commercial Services & Supplies - 0.0%## |
| |||||||
The ADT Security Corp., 6.25%, 10/15/2021 | 40,000 | 42,650 | ||||||
Prime Security Services Borrower LLC - Prime Finance, Inc.2, 5.75%, 4/15/2026 | 40,000 | 40,988 | ||||||
Stericycle, Inc.2, 5.375%, 7/15/2024 | 80,000 | 83,200 | ||||||
|
| |||||||
| 166,838 | ||||||||
|
| |||||||
Construction & Engineering - 0.0%## | ||||||||
HC2 Holdings, Inc.2, 11.50%, 12/1/2021 | 20,000 | 18,225 | ||||||
Tutor Perini Corp.2, 6.875%, 5/1/2025 | 80,000 | 79,788 | ||||||
|
| |||||||
| 98,013 | ||||||||
|
| |||||||
Industrial Conglomerates - 0.5% | ||||||||
General Electric Co.5,7, (3 mo. LIBOR US + 3.330%), 5.00% | 1,910,000 | 1,840,763 | ||||||
|
| |||||||
Marine - 0.1% | ||||||||
American Tanker, Inc. (Norway)2, 9.25%, 2/22/2022 | 100,000 | 100,561 | ||||||
Borealis Finance LLC2, 7.50%, 11/16/2022 | 85,000 | 79,900 | ||||||
Global Ship Lease, Inc. (United Kingdom)2, 9.875%, 11/15/2022 | 130,000 | 134,875 | ||||||
|
| |||||||
| 315,336 | ||||||||
|
| |||||||
Trading Companies & Distributors - 0.8% |
| |||||||
AerCap Ireland Capital DAC - AerCap Global Aviation Trust (Ireland), 4.45%, 10/1/2025 | 2,430,000 | 2,636,740 | ||||||
Air Lease Corp., 3.625%, 4/1/2027 | 535,000 | 558,095 | ||||||
PRINCIPAL AMOUNT3
| VALUE (NOTE 2)
| |||||||
CORPORATE BONDS(continued) | ||||||||
Non-Convertible Corporate Bonds(continued) |
| |||||||
Industrials(continued) | ||||||||
Trading Companies & Distributors(continued) |
| |||||||
Fortress Transportation & Infrastructure Investors LLC2, 6.50%, 10/1/2025 | 60,000 | $ | 60,600 | |||||
|
| |||||||
| 3,255,435 | ||||||||
|
| |||||||
Total Industrials | 5,676,385 | |||||||
|
| |||||||
Information Technology - 0.0%## | ||||||||
Communications Equipment - 0.0%## | ||||||||
Hughes Satellite Systems Corp., 5.25%, 8/1/2026 | 75,000 | 80,344 | ||||||
|
| |||||||
Materials - 0.7% | ||||||||
Chemicals - 0.0%## | ||||||||
CF Industries, Inc., 7.125%, 5/1/2020 | 40,000 | 40,961 | ||||||
Olin Corp., 5.625%, 8/1/2029 | 40,000 | 41,531 | ||||||
|
| |||||||
| 82,492 | ||||||||
|
| |||||||
Containers & Packaging - 0.0%## | ||||||||
ARD Securities Finance S.A.R.L (Luxembourg)2,6, 8.75%, 1/31/2023 | 20,875 | 21,710 | ||||||
Berry Global, Inc.2, 4.50%, 2/15/2026 | 25,000 | 25,156 | ||||||
Mauser Packaging Solutions Holding Co.2, 7.25%, 4/15/2025 | 40,000 | 38,250 | ||||||
|
| |||||||
| 85,116 | ||||||||
|
| |||||||
Metals & Mining - 0.7% | ||||||||
Infrabuild Australia Pty Ltd. (Australia)2, 12.00%, 10/1/2024 | 60,000 | 61,147 | ||||||
Mountain Province Diamonds, Inc. | 80,000 | 77,600 | ||||||
Northwest Acquisitions ULC - Dominion Finco, Inc.2, 7.125%, 11/1/2022 | 80,000 | 40,000 | ||||||
Southern Copper Corp. (Peru), 5.375%, 4/16/2020 | 2,270,000 | 2,298,004 | ||||||
SunCoke Energy Partners LP - SunCoke Energy Partners Finance Corp.2, 7.50%, 6/15/2025 | 20,000 | 17,000 | ||||||
|
| |||||||
| 2,493,751 | ||||||||
|
| |||||||
Total Materials | 2,661,359 | |||||||
|
| |||||||
Real Estate - 0.8% | ||||||||
Equity Real Estate Investment Trusts (REITS) - 0.8% |
| |||||||
American Tower Corp., 3.80%, 8/15/2029 | 2,260,000 | 2,416,014 | ||||||
The accompanying notes are an integral part of the financial statements.
44
Investment Portfolio - October 31, 2019
| PRO-BLEND® MODERATE TERM SERIES | PRINCIPAL | |||||||
AMOUNT3/
| VALUE (NOTE 2)
| |||||||
CORPORATE BONDS(continued) | ||||||||
Non-Convertible Corporate Bonds(continued) |
| |||||||
Real Estate (continued) | ||||||||
Equity Real Estate Investment Trusts (REITS)(continued) |
| |||||||
GTP Acquisition Partners I LLC2, 2.35%, 6/15/2020 | 589,000 | $ | 589,206 | |||||
|
| |||||||
| 3,005,220 | ||||||||
|
| |||||||
Real Estate Management & Development - 0.0%## |
| |||||||
Five Point Operating Co. LP - Five Point Capital Corp.2, 7.875%, 11/15/2025 | 60,000 | 56,710 | ||||||
Forestar Group, Inc.2, 8.00%, 4/15/2024 | 35,000 | 37,625 | ||||||
|
| |||||||
| 94,335 | ||||||||
|
| |||||||
Total Real Estate | 3,099,555 | |||||||
|
| |||||||
TOTAL CORPORATE BONDS | ||||||||
(Identified Cost $56,252,211) | 58,700,393 | |||||||
|
| |||||||
MUTUAL FUNDS - 0.3% | ||||||||
iShares MSCI India ETF | 9,845 | 341,129 | ||||||
SPDR Gold Shares* | 3,419 | 486,968 | ||||||
VanEck Vectors Gold Miners ETF | 9,071 | 255,349 | ||||||
|
| |||||||
TOTAL MUTUAL FUNDS | ||||||||
(Identified Cost $992,760) | 1,083,446 | |||||||
|
| |||||||
U.S. TREASURY SECURITIES - 20.2% | ||||||||
U.S. Treasury Bonds - 6.6% | ||||||||
U.S. Treasury Bond, 4.75%, 2/15/2037 | 5,409,000 | 7,695,570 | ||||||
U.S. Treasury Bond, 2.50%, 2/15/2045 | 7,418,000 | 7,891,477 | ||||||
U.S. Treasury Bond, 3.00%, 5/15/2047 | 6,720,000 | 7,868,700 | ||||||
U.S. Treasury Inflation Indexed Bond, 0.75%, 2/15/2042 | 2,245,046 | 2,359,066 | ||||||
|
| |||||||
Total U.S. Treasury Bonds | ||||||||
(Identified Cost $22,054,065) | 25,814,813 | |||||||
|
| |||||||
U.S. Treasury Notes - 13.6% | ||||||||
U.S. Treasury Inflation Indexed Note, 0.125%, 4/15/2020 | 12,289,773 | 12,224,004 | ||||||
U.S. Treasury Inflation Indexed Note, 0.50%, 4/15/2024 | 5,966,171 | 6,044,606 | ||||||
U.S. Treasury Note, 1.75%, 5/15/2023 | 7,505,000 | 7,561,874 | ||||||
U.S. Treasury Note, 2.375%, 8/15/2024 | 10,720,000 | 11,130,375 | ||||||
U.S. Treasury Note, 2.125%, 5/15/2025 | 8,035,000 | 8,270,086 | ||||||
PRINCIPAL AMOUNT3
| VALUE (NOTE 2)
| |||||||
U.S. TREASURY SECURITIES(continued) | ||||||||
U.S. Treasury Notes(continued) | ||||||||
U.S. Treasury Note, 1.625%, 5/15/2026 | 8,177,000 | $ | 8,190,096 | |||||
|
| |||||||
Total U.S. Treasury Notes | ||||||||
(Identified Cost $52,778,930) | 53,421,041 | |||||||
|
| |||||||
TOTAL U.S. TREASURY SECURITIES | ||||||||
(Identified Cost $74,832,995) | 79,235,854 | |||||||
|
| |||||||
ASSET-BACKED SECURITIES - 4.9% | ||||||||
Cazenovia Creek Funding I LLC, Series2015-1A, Class A2, 2.00%, 12/10/2023 | 12,557 | 12,550 | ||||||
Cazenovia Creek Funding II LLC, Series2018-1A, Class A2, 3.561%, 7/15/2030 | 885,739 | 892,171 | ||||||
Chesapeake Funding II LLC, Series2017-2A, Class A1 (Canada)2, 1.99%, 5/15/2029 | 2,439,323 | 2,438,566 | ||||||
Commonbond Student Loan Trust, Series2019-AGS, Class A12, 2.54%, 1/25/2047 | 1,750,000 | 1,749,403 | ||||||
Invitation Homes Trust, Series 2017-SFR2, Class A2,8, (1 mo. LIBOR US + 0.850%), 2.739%, 12/17/2036 | 507,021 | 506,308 | ||||||
Invitation Homes Trust, Series 2017-SFR2, Class B2,8, (1 mo. LIBOR US + 1.150%), 3.039%, 12/17/2036 | 400,000 | 400,375 | ||||||
Navient Private Education Refi Loan Trust, Series2019-CA, Class A12, 2.82%, 2/15/2068 | 1,048,612 | 1,058,886 | ||||||
Navient Student Loan Trust, Series2019-2A, Class A22,8, (1 mo. LIBOR US + 1.000%), 2.823%, 2/27/2068 | 2,590,000 | 2,612,499 | ||||||
Progress Residential Trust, Series 2019-SFR2, Class A2, 3.147%, 5/17/2036 | 1,285,000 | 1,307,302 | ||||||
SoFi Consumer Loan Program Trust, Series2019-2, Class A2, 3.01%, 4/25/2028 | 832,686 | 839,205 | ||||||
SoFi Professional Loan Program LLC, Series2017-F, Class A1FX2, 2.05%, 1/25/2041 | 123,388 | 123,379 | ||||||
SoFi Professional Loan Program LLC, Series2017-F, Class A2FX2, 2.84%, 1/25/2041 | 300,000 | 304,455 | ||||||
SoFi Professional Loan Program LLC, Series2018-A, Class A2A2, 2.39%, 2/25/2042 | 367,707 | 368,416 | ||||||
The accompanying notes are an integral part of the financial statements.
45
Investment Portfolio - October 31, 2019
| PRO-BLEND®MODERATE TERM SERIES | ||||||||
PRINCIPAL AMOUNT3
| VALUE (NOTE 2)
| |||||||
ASSET-BACKED SECURITIES(continued) | ||||||||
SoFi Professional Loan Program Trust, Series2018-C, Class A1FX2, 3.08%, 1/25/2048 | 1,139,076 | $ | 1,146,212 | |||||
Tax Ease Funding LLC, Series2016-1A, Class A2, 3.131%, 6/15/2028 | 238,562 | 238,509 | ||||||
Towd Point Mortgage Trust, Series2016-5, Class A12,9, 2.50%, 10/25/2056 | 1,132,856 | 1,137,189 | ||||||
Towd Point Mortgage Trust, Series2017-1, Class A12,9, 2.75%, 10/25/2056 | 905,622 | 916,338 | ||||||
Towd Point Mortgage Trust, Series2019-HY1, Class A12,8, (1 mo. LIBOR US + 1.000%), 2.823%, 10/25/2048 | 835,335 | 839,798 | ||||||
Tricon American Homes Trust, Series 2016-SFR1, Class A2, 2.589%, 11/17/2033 | 1,158,042 | 1,157,797 | ||||||
Tricon American Homes Trust, Series 2017-SFR2, Class A2, 2.928%, 1/17/2036 | 1,246,464 | 1,265,155 | ||||||
|
| |||||||
TOTAL ASSET-BACKED SECURITIES | ||||||||
(Identified Cost $19,167,138) | 19,314,513 | |||||||
|
| |||||||
COMMERCIAL MORTGAGE-BACKED SECURITIES - 7.0% |
| |||||||
Americold LLC Trust, Series 2010-ARTA, Class A12, 3.847%, 1/14/2029 | 63,771 | 64,408 | ||||||
Caesars Palace Las Vegas Trust, Series 2017-VICI, Class A2, 3.531%, 10/15/2034 | 1,850,000 | 1,923,888 | ||||||
CIM Trust, Series 2019-INV1, Class A12,9, 4.00%, 2/25/2049 | 517,863 | 529,165 | ||||||
Credit Suisse Mortgage Capital Trust, Series 2013-IVR3, Class A12,9, 2.50%, 5/25/2043 | 885,606 | 876,289 | ||||||
Credit Suisse Mortgage Capital Trust, Series2013-TH1, Class A12,9, 2.13%, 2/25/2043 | 614,517 | 600,970 | ||||||
Fannie Mae REMICS, Series2018-31, Class KP, 3.50%, 7/25/2047 | 1,205,748 | 1,258,737 | ||||||
FannieMae-Aces, Series2017-M15, Class A19, 2.959%, 9/25/2027 | 1,257,315 | 1,317,463 | ||||||
FDIC Trust, Series2011-R1, Class A2, 2.672%, 7/25/2026 | 10,583 | 10,564 | ||||||
Freddie Mac Multifamily Structured Pass-Through Certificates, Series K009, Class X1 (IO)9, 1.26%, 8/25/2020 | 12,380,324 | 88,891 | ||||||
PRINCIPAL AMOUNT3
| VALUE (NOTE 2)
| |||||||
COMMERCIAL MORTGAGE-BACKED SECURITIES(continued) |
| |||||||
Freddie Mac Multifamily Structured Pass-Through Certificates, Series K014, Class X1 (IO)9, 1.149%, 4/25/2021 | 7,718,921 | $ | 107,721 | |||||
Freddie Mac Multifamily Structured Pass-Through Certificates, Series K016, Class X1 (IO)9, 1.478%, 10/25/2021 | 4,960,943 | 122,777 | ||||||
Freddie Mac Multifamily Structured Pass-Through Certificates, Series K017, Class X1 (IO)9, 1.298%, 12/25/2021 | 7,688,628 | 170,714 | ||||||
Freddie Mac Multifamily Structured Pass-Through Certificates, Series K021, Class X1 (IO)9, 1.428%, 6/25/2022 | 9,628,489 | 309,851 | ||||||
Freddie Mac Multifamily Structured Pass-Through Certificates, Series K030, Class X1 (IO)9, 0.188%, 4/25/2023 | 49,970,046 | 301,614 | ||||||
Freddie Mac Multifamily Structured Pass-Through Certificates, Series K032, Class X1 (IO)9, 0.098%, 5/25/2023 | 37,581,738 | 146,685 | ||||||
Freddie Mac REMICS, Series 4791, Class BA, 4.00%, 3/15/2044 | 1,281,253 | 1,298,566 | ||||||
Freddie Mac REMICS, Series 4801, Class BA, 4.50%, 5/15/2044 | 1,109,391 | 1,132,559 | ||||||
FREMF Mortgage Trust, Series2013-K28, Class X2A (IO)2, 0.10%, 6/25/2046 | 123,973,007 | 332,198 | ||||||
FREMF Mortgage Trust, Series 2013-K713, Class B2,9, 3.152%, 4/25/2046 | 1,350,000 | 1,352,180 | ||||||
FREMF Mortgage Trust, Series2014-K37, Class B2,9, 4.559%, 1/25/2047 | 1,657,000 | 1,802,614 | ||||||
Government National Mortgage Association, Series2017-54, Class AH, 2.60%, 12/16/2056 | 1,499,196 | 1,511,750 | ||||||
GS Mortgage Securities Trust, Series2010-C2, Class A12, 3.849%, 12/10/2043 | 34,220 | 34,421 | ||||||
JP Morgan Mortgage Trust, Series2013-1, Class 1A22,9, 3.00%, 3/25/2043 | 515,109 | 520,152 | ||||||
JP Morgan Mortgage Trust, Series2013-2, Class A22,9, 3.50%, 5/25/2043 | 502,339 | 512,144 | ||||||
JP Morgan Mortgage Trust, Series2014-2, Class 1A12,9, 3.00%, 6/25/2029 | 635,523 | 645,491 | ||||||
The accompanying notes are an integral part of the financial statements.
46
Investment Portfolio - October 31, 2019
| PRO-BLEND®MODERATE TERM SERIES | ||||||||
PRINCIPAL AMOUNT3
| VALUE (NOTE 2)
| |||||||
COMMERCIAL MORTGAGE-BACKED SECURITIES(continued) |
| |||||||
JP Morgan Mortgage Trust, Series2017-3, Class 1A52,9, 3.50%, 8/25/2047 | 1,146,660 | $ | 1,160,366 | |||||
JP Morgan Mortgage Trust, Series2017-6, Class A52,9, 3.50%, 12/25/2048 | 1,250,183 | 1,267,408 | ||||||
New Residential Mortgage Loan Trust, Series2014-3A, Class AFX32,9, 3.75%, 11/25/2054 | 499,042 | 519,120 | ||||||
New Residential Mortgage Loan Trust, Series2015-2A, Class A12,9, 3.75%, 8/25/2055 | 653,780 | 681,598 | ||||||
New Residential Mortgage Loan Trust, Series2016-4A, Class A12,9, 3.75%, 11/25/2056 | 697,050 | 727,033 | ||||||
OBP Depositor LLC Trust, Series2010-OBP, Class A2, 4.646%, 7/15/2045 | 115,000 | 115,451 | ||||||
Sequoia Mortgage Trust, Series2013-2, Class A9, 1.874%, 2/25/2043 | 571,642 | 551,148 | ||||||
Sequoia Mortgage Trust, Series2013-7, Class A29, 3.00%, 6/25/2043 | 630,521 | 635,113 | ||||||
Sequoia Mortgage Trust, Series2013-8, Class A19, 3.00%, 6/25/2043 | 734,860 | 743,156 | ||||||
Starwood Retail Property Trust, Series 2014-STAR, Class A2,8, (1 mo. LIBOR US + 1.220%), 3.134%, 11/15/2027 | 1,572,370 | 1,569,541 | ||||||
Vornado DP LLC Trust, Series2010-VNO, Class A2FX2, 4.004%, 9/13/2028 | 350,000 | 352,455 | ||||||
Waikiki Beach Hotel Trust, Series2019-WBM, Class A2,8, (1 mo. LIBOR US + 1.050%), 2.971%, 12/15/2033 | 965,000 | 965,598 | ||||||
WinWater Mortgage Loan Trust, Series2015-1, Class A12,9, 3.50%, 1/20/2045 | 688,279 | 700,889 | ||||||
WinWater Mortgage Loan Trust, Series2015-3, Class A52,9, 3.50%, 3/20/2045 | 471,863 | 472,934 | ||||||
|
| |||||||
TOTAL COMMERCIAL MORTGAGE-BACKED SECURITIES | ||||||||
(Identified Cost $26,851,649) | 27,433,622 | |||||||
|
| |||||||
FOREIGN GOVERNMENT BONDS - 1.3% | ||||||||
Canadian Government Bond (Canada), 2.75%, 6/1/2022 CAD | 433,000 | 339,072 | ||||||
PRINCIPAL AMOUNT3
| VALUE (NOTE 2)
| |||||||
FOREIGN GOVERNMENT BONDS(continued) |
| |||||||
Export-Import Bank of Korea (South Korea), 2.625%, 12/30/2020 | 3,700,000 | $ | 3,721,257 | |||||
Mexican Government Bond (Mexico), 8.00%, 6/11/2020 | MXN 8,562,000 | 448,256 | ||||||
Mexican Government Bond (Mexico), 6.50%, 6/10/2021 | MXN 3,460,000 | 179,465 | ||||||
Mexican Government Bond (Mexico), 6.50%, 6/9/2022 | MXN 5,621,000 | 291,863 | ||||||
Mexican Government Bond (Mexico), 7.75%, 5/29/2031 | MXN 1,081,000 | 60,097 | ||||||
|
| |||||||
TOTAL FOREIGN GOVERNMENT | ||||||||
BONDS | ||||||||
(Identified Cost $5,528,743) | 5,040,010 | |||||||
|
| |||||||
U.S. GOVERNMENT AGENCIES - 10.6% | ||||||||
Mortgage-Backed Securities - 10.6% | ||||||||
Fannie Mae, Pool #888468, 5.50%, 9/1/2021 | 69,206 | 70,206 | ||||||
Fannie Mae, Pool #995233, 5.50%, 10/1/2021 | 2,292 | 2,313 | ||||||
Fannie Mae, Pool #888017, 6.00%, 11/1/2021 | 11,707 | 11,959 | ||||||
Fannie Mae, Pool #995329, 5.50%, 12/1/2021 | 55,630 | 56,487 | ||||||
Fannie Mae, Pool #888136, 6.00%, 12/1/2021 | 13,134 | 13,439 | ||||||
Fannie Mae, Pool #888810, 5.50%, 11/1/2022 | 83,884 | 84,993 | ||||||
Fannie Mae, Pool #AD0462, 5.50%, 10/1/2024 | 14,885 | 15,628 | ||||||
Fannie Mae, Pool #AL9409, 3.50%, 11/1/2031 | 1,047,022 | 1,088,135 | ||||||
Fannie Mae, Pool #MA3463, 4.00%, 9/1/2033 | 2,084,893 | 2,176,907 | ||||||
Fannie Mae, Pool #MA1834, 4.50%, 2/1/2034 | 515,720 | 554,276 | ||||||
Fannie Mae, Pool #MA1903, 4.50%, 5/1/2034 | 482,098 | 518,143 | ||||||
Fannie Mae, Pool #FM1158, 3.50%, 6/1/2034 | 1,587,268 | 1,644,440 | ||||||
Fannie Mae, Pool #745418, 5.50%, 4/1/2036 | 411,548 | 463,338 | ||||||
Fannie Mae, Pool #889576, 6.00%, 4/1/2038 | 352,600 | 405,733 | ||||||
Fannie Mae, Pool #MA3412, 3.50%, 7/1/2038 | 1,560,074 | 1,616,721 | ||||||
Fannie Mae, Pool #995196, 6.00%, 7/1/2038 | 787,450 | 906,148 | ||||||
Fannie Mae, Pool #AD0207, 6.00%, 10/1/2038 | 117,514 | 135,071 | ||||||
The accompanying notes are an integral part of the financial statements.
47
Investment Portfolio - October 31, 2019
| PRO-BLEND®MODERATE TERM SERIES | ||||||||
PRINCIPAL AMOUNT3
| VALUE (NOTE 2)
| |||||||
U.S. GOVERNMENT AGENCIES(continued) |
| |||||||
Mortgage-Backed Securities(continued) | ||||||||
Fannie Mae, Pool #AD0220, 6.00%, 10/1/2038 | 38,910 | $ | 44,765 | |||||
Fannie Mae, Pool #MA0258, 4.50%, 12/1/2039 | 716,780 | 776,495 | ||||||
Fannie Mae, Pool #AL1595, 6.00%, 1/1/2040 | 505,584 | 581,810 | ||||||
Fannie Mae, Pool #AL0152, 6.00%, 6/1/2040 | 585,425 | 672,938 | ||||||
Fannie Mae, Pool #AS3622, 3.50%, 10/1/2044 | 2,106,202 | 2,217,981 | ||||||
Fannie Mae, Pool #AX5234, 4.50%, 11/1/2044 | 735,281 | 780,562 | ||||||
Fannie Mae, Pool #AZ9215, 4.00%, 10/1/2045 | 588,367 | 619,596 | ||||||
Fannie Mae, Pool #BC3490, 3.50%, 2/1/2046 | 1,951,414 | 2,034,279 | ||||||
Fannie Mae, Pool #MA2705, 3.00%, 8/1/2046 | 1,491,459 | 1,530,782 | ||||||
Fannie Mae, Pool #BE7845, 4.50%, 2/1/2047 | 374,126 | 395,039 | ||||||
Fannie Mae, Pool #CA1922, 5.00%, 6/1/2048 | 1,812,322 | 1,942,924 | ||||||
Fannie Mae, Pool #CA2056, 4.50%, 7/1/2048 | 1,717,001 | 1,812,283 | ||||||
Fannie Mae, Pool #MA3443, 4.00%, 8/1/2048 | 1,039,581 | 1,078,282 | ||||||
Fannie Mae, Pool #BK9598, 4.50%, 8/1/2048 | 526,106 | 554,673 | ||||||
Fannie Mae, Pool #CA2219, 5.00%, 8/1/2048 | 968,151 | 1,037,899 | ||||||
Fannie Mae, Pool #CA2373, 5.00%, 9/1/2048 | 1,545,001 | 1,656,272 | ||||||
Fannie Mae, Pool #MA3521, 4.00%, 11/1/2048 | 1,644,228 | 1,706,933 | ||||||
Fannie Mae, Pool #BN0622, 4.50%, 1/1/2049 | 1,410,234 | 1,484,083 | ||||||
Fannie Mae, Pool #AL8674, 5.645%, 1/1/2049 | 1,538,854 | 1,732,277 | ||||||
Fannie Mae, Pool #MA3692, 3.50%, 7/1/2049 | 2,064,937 | 2,118,425 | ||||||
Freddie Mac, Pool #G11850, 5.50%, 7/1/2020 | 1,258 | 1,262 | ||||||
Freddie Mac, Pool #G12610, 6.00%, 3/1/2022 | 16,735 | 17,149 | ||||||
Freddie Mac, Pool #G12655, 6.00%, 5/1/2022 | 11,509 | 11,832 | ||||||
Freddie Mac, Pool #G12988, 6.00%, 1/1/2023 | 10,119 | 10,494 | ||||||
Freddie Mac, Pool #G13078, 6.00%, 3/1/2023 | 16,914 | 17,482 | ||||||
| PRINCIPAL | ||||||||
AMOUNT3/ SHARES
| VALUE (NOTE 2)
| |||||||
U.S. GOVERNMENT AGENCIES(continued) | ||||||||
Mortgage-Backed Securities(continued) | ||||||||
Freddie Mac, Pool #G13331, 5.50%, 10/1/2023 | 8,323 | $ | 8,631 | |||||
Freddie Mac, Pool #C91762, 4.50%, 5/1/2034 | 636,747 | 684,724 | ||||||
Freddie Mac, Pool #QN0349, 3.00%, 8/1/2034 | 1,317,788 | 1,350,149 | ||||||
Freddie Mac, Pool #G03696, 5.50%, 1/1/2038 | 1,185 | 1,332 | ||||||
Freddie Mac, Pool #G03781, 6.00%, 1/1/2038 | 170,868 | 193,909 | ||||||
Freddie Mac, Pool #G03926, 6.00%, 2/1/2038 | 175,520 | 201,900 | ||||||
Freddie Mac, Pool #G04731, 5.50%, 4/1/2038 | 180,886 | 203,279 | ||||||
Freddie Mac, Pool #G08273, 5.50%, 6/1/2038 | 226,038 | 253,677 | ||||||
Freddie Mac, Pool #G05900, 6.00%, 3/1/2040 | 97,357 | 109,932 | ||||||
Freddie Mac, Pool #G05906, 6.00%, 4/1/2040 | 123,770 | 138,727 | ||||||
Freddie Mac, Pool #A92889, 4.50%, 7/1/2040 | 1,333,877 | 1,433,753 | ||||||
Freddie Mac, Pool #G60183, 4.00%, 12/1/2044 | 632,989 | 664,543 | ||||||
Freddie Mac, Pool #ZM2525, 3.00%, 12/1/2046 | 1,219,907 | 1,250,162 | ||||||
Freddie Mac, Pool #Q59805, 4.50%, 11/1/2048 | 753,406 | 793,490 | ||||||
|
| |||||||
TOTAL U.S. GOVERNMENT AGENCIES | ||||||||
(Identified Cost $41,043,664) | 41,888,662 | |||||||
|
| |||||||
U.S. GOVERNMENT SECURITIES - 1.9% | ||||||||
U.S. Treasury Bill - 1.9% | ||||||||
U.S. Treasury Bill10, 1.58%, 5/21/2020 | ||||||||
(Identified Cost $7,531,492) | 7,598,000 | 7,532,558 | ||||||
|
| |||||||
SHORT-TERM INVESTMENT - 0.9% | ||||||||
Dreyfus Government Cash Management, Institutional Shares, 1.73%11 | ||||||||
(Identified Cost $3,758,324) | 3,758,324 | 3,758,324 | ||||||
|
| |||||||
TOTAL INVESTMENTS IN | ||||||||
(Identified Cost $367,270,346) | 394,093,264 | |||||||
|
| |||||||
The accompanying notes are an integral part of the financial statements.
48
Investment Portfolio - October 31, 2019
| PRO-BLEND®MODERATE TERM SERIES | ||||
VALUE
| ||||
TOTAL OPTIONS | ||||
WRITTEN — 0.0%## | ||||
(Premiums Received $50,247) | $ | (72,726 | ) | |
|
| |||
VALUE
| ||||
TOTAL INVESTMENTS - 100.2% | $ | 394,020,538 | ||
LIABILITIES, LESS OTHER ASSETS - (0.2%) | (977,275 | ) | ||
|
| |||
NET ASSETS - 100% | $ | 393,043,263 | ||
|
| |||
ADR - American Depositary Receipt
CAD - Canadian Dollar
ETF - Exchange-traded fund
IO - Interest only
LIBOR - London Interbank Offered Rate
MXN - Mexican Peso
EXCHANGE-TRADED OPTIONS WRITTEN | ||||||||||||||||||||
| DESCRIPTION | NUMBER OF | EXPIRATION DATE | EXERCISE PRICE | NOTIONAL AMOUNT (000)3 | VALUE | |||||||||||||||
Call | ||||||||||||||||||||
Sea Ltd. - ADR | 228 | 11/15/2019 | $ 27.00 | 679 | $(70,680 | ) | ||||||||||||||
Put | ||||||||||||||||||||
Electronic Arts, Inc. | 83 | 11/01/2019 | 87.50 | 800 | (166 | ) | ||||||||||||||
ServiceNow, Inc. | 47 | 11/08/2019 | 200.00 | 1,162 | (1,880 | ) | ||||||||||||||
| (2,046 | ) | |||||||||||||||||||
TOTAL EXCHANGE-TRADED OPTIONS WRITTEN (PREMIUMS RECEIVED $50,247) |
|
$(72,726 |
) | |||||||||||
*Non-income producing security.
## Less than 0.1%.
1A portion of this security is designated as collateral for options contracts written. As of October 31, 2019, the total value of such securities was $11,789,998.
2Restricted securities - Investment in securities that are restricted as to public resale under the Securities Act of 1933, as amended. These securities have been sold under Rule 144A and have been determined to be liquid under the Fund’s Liquidity Risk Management Program. These securities amount to $41,865,046, or 10.7% of the Series’ net assets as of October 31, 2019 (see Note 2 to the financial statements).
3Amount is stated in USD unless otherwise noted.
4Step coupon rate security - Rate steps up/down by 25 basis points upon rating downgrade/upgrade by Moody’s and S&P rating agencies (Subject to a maximum of 100 basis points per agency, 200 basis points maximum).
5Variable rate security. Security may be issued at a fixed coupon rate, which converts to a variable rate at a specified date. Rate shown is the rate in effect as of October 31, 2019.
6Represents aPayment-In-Kind bond.
7Security is perpetual in nature and has no stated maturity date.
8Floating rate security. Rate shown is the rate in effect as of October 31, 2019.
9Variable or floating rate security, the interest rate of which adjusts periodically based on changes in current interest rates and prepayments on the underlying pool of assets. Rate shown is the rate in effect as of October 31, 2019.
10Represents the annualized yield at time of purchase.
11Rate shown is the current yield as of October 31, 2019.
The Global Industry Classification Standard (GICS) was developed by and is the exclusive property and a service mark of MSCI Inc. (MSCI) and Standard & Poor’s, a division of S&P Global Inc. (S&P), and is licensed for use by Manning & Napier when referencing GICS sectors. Neither MSCI, S&P, nor any third party involved in making or compiling the GICS or any GICS classifications makes any express or implied warranties or representations with respect to such standard or classification, nor shall any such party have any liability therefrom.
The accompanying notes are an integral part of the financial statements.
49
Statement of Assets and Liabilities -Pro-Blend® Moderate Term Series
October 31, 2019
ASSETS: | ||||
Investments in securities, at value (identified cost $367,270,346) (Note 2) | $ | 394,093,264 | ||
Foreign currency, at value (identified cost $114) | 114 | |||
Interest receivable | 1,462,551 | |||
Receivable for fund shares sold | 417,394 | |||
Receivable for securities sold | 356,307 | |||
Foreign tax reclaims receivable | 285,945 | |||
Dividends receivable | 86,026 | |||
Prepaid expenses | 32,452 | |||
|
| |||
TOTAL ASSETS | 396,734,053 | |||
|
| |||
LIABILITIES: | ||||
Accrued management fees (Note 3) | 201,265 | |||
Accruedsub-transfer agent fees (Note 3) | 130,202 | |||
Accrued distribution and service (Rule12b-1) fees (Class S) (Class R) (Class L) (Note 3) | 121,875 | |||
Accrued fund accounting and administration fees (Note 3) | 39,179 | |||
Accrued Chief Compliance Officer service fees (Note 3) | 687 | |||
Options written, at value (premiums received $50,247) (Note 2) | 72,726 | |||
Payable for securities purchased | 2,562,868 | |||
Payable for fund shares repurchased | 479,368 | |||
Other payables and accrued expenses | 82,620 | |||
|
| |||
TOTAL LIABILITIES | 3,690,790 | |||
|
| |||
TOTAL NET ASSETS | $ | 393,043,263 | ||
|
| |||
NET ASSETS CONSIST OF: | ||||
Capital stock | $ | 337,345 | ||
Additionalpaid-in-capital | 347,969,276 | |||
Total distributable earnings (loss) | 44,736,642 | |||
|
| |||
TOTAL NET ASSETS | $ | 393,043,263 | ||
|
| |||
The accompanying notes are an integral part of the financial statements.
50
Statement of Assets and Liabilities -Pro-Blend® Moderate Term Series
October 31, 2019
NET ASSET VALUE, OFFERING PRICE AND REDEMPTION PRICE PER SHARE - Class S($179,977,451/12,888,525 shares) | $ | 13.96 | ||
|
| |||
NET ASSET VALUE, OFFERING PRICE AND REDEMPTION PRICE PER SHARE - Class I($111,636,851/11,012,489 shares) | $ | 10.14 | ||
|
| |||
NET ASSET VALUE, OFFERING PRICE AND REDEMPTION PRICE PER SHARE - Class R($7,609,918/707,051 shares) | $ | 10.76 | ||
|
| |||
NET ASSET VALUE, OFFERING PRICE AND REDEMPTION PRICE PER SHARE - Class L($93,686,865/9,117,020 shares) | $ | 10.28 | ||
|
| |||
NET ASSET VALUE, OFFERING PRICE AND REDEMPTION PRICE PER SHARE - Class W($132,178/9,440 shares) | $ | 14.00 | ||
|
| |||
The accompanying notes are an integral part of the financial statements.
51
Statement of Operations -Pro-Blend® Moderate Term Series
For the Year Ended October 31, 2019
INVESTMENT INCOME: | ||||
Interest | $ | 9,003,116 | ||
Dividends (net of foreign taxes withheld, $162,441) | 2,530,825 | |||
|
| |||
Total Investment Income | 11,533,941 | |||
|
| |||
EXPENSES: | ||||
Management fees (Note 3) | 2,892,997 | |||
Distribution and service (Rule12b-1) fees (Class L) (Note 3) | 957,462 | |||
Distribution and service (Rule12b-1) fees (Class S) (Note 3) | 321,857 | |||
Distribution and service (Rule12b-1) fees (Class R) (Note 3) | 55,899 | |||
Sub-transfer agent fees (Note 3) | 259,732 | |||
Shareholder services fees (Class S) (Note 3) | 226,646 | |||
Fund accounting and administration fees (Note 3) | 133,745 | |||
Directors’ fees (Note 3) | 41,613 | |||
Chief Compliance Officer service fees (Note 3) | 3,455 | |||
Custodian fees | 67,566 | |||
Miscellaneous | 325,931 | |||
|
| |||
Total Expenses | 5,286,903 | |||
Less reduction of expenses (Note 3) | (50,180 | ) | ||
|
| |||
Net Expenses | 5,236,723 | |||
|
| |||
NET INVESTMENT INCOME | 6,297,218 | |||
|
| |||
REALIZED AND UNREALIZED GAIN (LOSS) ON INVESTMENTS AND FOREIGN CURRENCY: | ||||
Net realized gain (loss) on- | ||||
Investments in securities | 16,403,699 | |||
Options written | 749,704 | |||
Foreign currency and translation of other assets and liabilities | (43,861 | ) | ||
|
| |||
| 17,109,542 | ||||
|
| |||
Net change in unrealized appreciation (depreciation) on- | ||||
Investments in securities | 23,538,359 | |||
Options written | 49,970 | |||
Foreign currency and translation of other assets and liabilities | 14,539 | |||
|
| |||
| 23,602,868 | ||||
|
| |||
NET REALIZED AND UNREALIZED GAIN (LOSS) ON INVESTMENTS AND FOREIGN CURRENCY | 40,712,410 | |||
|
| |||
NET INCREASE IN NET ASSETS RESULTING FROM OPERATIONS | $ | 47,009,628 | ||
|
| |||
The accompanying notes are an integral part of the financial statements.
52
Statements of Changes in Net Assets -Pro-Blend® Moderate Term Series
FOR THE YEAR
| FOR THE YEAR
| |||||||
INCREASE (DECREASE) IN NET ASSETS: | ||||||||
OPERATIONS: | ||||||||
Net investment income | $ | 6,297,218 | $ | 7,284,442 | ||||
Net realized gain (loss) on investments and foreign currency | 17,109,542 | 21,468,426 | ||||||
Net change in unrealized appreciation (depreciation) on investments and foreign currency | 23,602,868 | (37,613,547 | ) | |||||
|
|
|
| |||||
Net increase (decrease) from operations | 47,009,628 | (8,860,679 | ) | |||||
|
|
|
| |||||
DISTRIBUTIONS TO SHAREHOLDERS (Note 9): | ||||||||
Class S | (15,080,047 | ) | (24,129,787 | ) | ||||
Class I | (8,499,100 | ) | (10,762,805 | ) | ||||
Class R | (916,708 | ) | (1,531,067 | ) | ||||
Class L | (5,668,759 | ) | (7,862,881 | ) | ||||
Class W | (36.00 | ) | — | |||||
|
|
|
| |||||
Total distributions to shareholders | (30,164,650 | ) | (44,286,540 | ) | ||||
|
|
|
| |||||
CAPITAL STOCK ISSUED AND REPURCHASED: | ||||||||
Net increase (decrease) from capital share transactions (Note 5) | (183,247,257 | ) | (93,924,864 | ) | ||||
|
|
|
| |||||
Net increase (decrease) in net assets | (166,402,279 | ) | (147,072,083 | ) | ||||
NET ASSETS: | ||||||||
Beginning of year | 559,445,542 | 706,517,625 | ||||||
|
|
|
| |||||
End of year | $ | 393,043,263 | $ | 559,445,542 | ||||
|
|
|
| |||||
The accompanying notes are an integral part of the financial statements.
53
Financial Highlights -Pro-Blend® Moderate Term Series - Class S
| FOR THE YEAR ENDED | |||||||||||||||||||||||||
| 10/31/19 | 10/31/18 | 10/31/17 | 10/31/16 | 10/31/15 | |||||||||||||||||||||
Per share data (for a share outstanding throughout each year): | |||||||||||||||||||||||||
Net asset value - Beginning of year | $13.13 | $14.17 | $13.37 | $13.15 | $14.53 | ||||||||||||||||||||
|
|
|
|
|
|
|
|
|
| ||||||||||||||||
Income (loss) from investment operations: | |||||||||||||||||||||||||
Net investment income1 | 0.20 | 0.17 | 0.13 | 0.13 | 0.15 | ||||||||||||||||||||
Net realized and unrealized gain (loss) on investments | 1.28 | (0.38 | ) | 0.97 | 0.23 | (0.44 | ) | ||||||||||||||||||
|
|
|
|
|
|
|
|
|
| ||||||||||||||||
Total from investment operations | 1.48 | (0.21 | ) | 1.10 | 0.36 | (0.29 | ) | ||||||||||||||||||
|
|
|
|
|
|
|
|
|
| ||||||||||||||||
Less distributions to shareholders: | |||||||||||||||||||||||||
From net investment income | (0.17 | ) | (0.12 | ) | (0.10 | ) | (0.10 | ) | (0.12 | ) | |||||||||||||||
From net realized gain on investments | (0.48 | ) | (0.71 | ) | (0.20 | ) | (0.04 | ) | (0.97 | ) | |||||||||||||||
|
|
|
|
|
|
|
|
|
| ||||||||||||||||
Total distributions to shareholders | (0.65 | ) | (0.83 | ) | (0.30 | ) | (0.14 | ) | (1.09 | ) | |||||||||||||||
|
|
|
|
|
|
|
|
|
| ||||||||||||||||
Net asset value - End of year | $13.96 | $13.13 | $14.17 | $13.37 | $13.15 | ||||||||||||||||||||
|
|
|
|
|
|
|
|
|
| ||||||||||||||||
Net assets - End of year(000’s omitted) | $179,977 | $318,691 | $426,426 | $511,577 | $683,089 | ||||||||||||||||||||
|
|
|
|
|
|
|
|
|
| ||||||||||||||||
Total return2 | 11.85% | (1.67% | ) | 8.46% | 2.77% | (1.99% | ) | ||||||||||||||||||
Ratios (to average net assets)/Supplemental Data: | |||||||||||||||||||||||||
Expenses* | 1.09% | 1.10% | 1.08% | 1.07% | 1.06% | ||||||||||||||||||||
Net investment income | 1.53% | 1.24% | 0.98% | 0.97% | 1.08% | ||||||||||||||||||||
Series portfolio turnover | 53% | 74% | 68% | 67% | 56% | ||||||||||||||||||||
| *For certain periods presented, the investment advisor did not impose all or a portion of its management and/or other fees, and in some periods may have paid a portion of the Series’ expenses. If these expenses had been incurred by the Class, the expense ratio (to average net assets) would have increased by the following amounts: |
| ||||||||||||||||||||||||
| 0.00% | 3 | N/A | N/A | N/A | N/A | ||||||||||||||||||||
1Calculated based on average shares outstanding during the years.
2Represents aggregate total return for the years indicated, and assumes reinvestment of all distributions. Total return would have been lower had certain expenses not been waived or reimbursed during certain years.
3Less than 0.01%.
The accompanying notes are an integral part of the financial statements.
54
Financial Highlights -Pro-Blend® Moderate Term Series - Class I
| FOR THE YEAR ENDED | |||||||||||||||||||||||||
| 10/31/19 | 10/31/18 | 10/31/17 | 10/31/16 | 10/31/15 | |||||||||||||||||||||
Per share data (for a share outstanding throughout each year): | |||||||||||||||||||||||||
Net asset value - Beginning of year | $9.72 | $10.72 | $10.20 | $10.07 | $11.40 | ||||||||||||||||||||
|
|
|
|
|
|
|
|
|
| ||||||||||||||||
Income (loss) from investment operations: | |||||||||||||||||||||||||
Net investment income1 | 0.17 | 0.15 | 0.13 | 0.12 | 0.14 | ||||||||||||||||||||
Net realized and unrealized gain (loss) on investments | 0.93 | (0.29 | ) | 0.73 | 0.18 | (0.35 | ) | ||||||||||||||||||
|
|
|
|
|
|
|
|
|
| ||||||||||||||||
Total from investment operations | 1.10 | (0.14 | ) | 0.86 | 0.30 | (0.21 | ) | ||||||||||||||||||
|
|
|
|
|
|
|
|
|
| ||||||||||||||||
Less distributions to shareholders: | |||||||||||||||||||||||||
From net investment income | (0.20 | ) | (0.15 | ) | (0.14 | ) | (0.13 | ) | (0.15 | ) | |||||||||||||||
From net realized gain on investments | (0.48 | ) | (0.71 | ) | (0.20 | ) | (0.04 | ) | (0.97 | ) | |||||||||||||||
|
|
|
|
|
|
|
|
|
| ||||||||||||||||
Total distributions to shareholders | (0.68 | ) | (0.86 | ) | (0.34 | ) | (0.17 | ) | (1.12 | ) | |||||||||||||||
|
|
|
|
|
|
|
|
|
| ||||||||||||||||
Net asset value - End of year | $10.14 | $9.72 | $10.72 | $10.20 | $10.07 | ||||||||||||||||||||
|
|
|
|
|
|
|
|
|
| ||||||||||||||||
Net assets - End of year(000’s omitted) | $111,637 | $125,647 | $140,706 | $299,009 | $740,524 | ||||||||||||||||||||
|
|
|
|
|
|
|
|
|
| ||||||||||||||||
Total return2 | 12.20% | (1.49% | ) | 8.72% | 3.08% | (1.76% | ) | ||||||||||||||||||
Ratios (to average net assets)/Supplemental Data: | |||||||||||||||||||||||||
Expenses* | 0.85% | 0.85% | 0.83% | 0.82% | 0.81% | ||||||||||||||||||||
Net investment income | 1.76% | 1.50% | 1.24% | 1.24% | 1.33% | ||||||||||||||||||||
Series portfolio turnover | 53% | 74% | 68% | 67% | 56% | ||||||||||||||||||||
| *For certain periods presented, the investment advisor did not impose all or a portion of its management and/or other fees, and in some periods may have paid a portion of the Series’ expenses. If these expenses had been incurred by the Class, the expense ratio (to average net assets) would have increased by the following amounts: |
| ||||||||||||||||||||||||
| 0.02% | N/A | N/A | N/A | N/A | |||||||||||||||||||||
1Calculated based on average shares outstanding during the years.
2Represents aggregate total return for the years indicated, and assumes reinvestment of all distributions. Total return would have been lower had certain expenses not been waived or reimbursed during certain years.
The accompanying notes are an integral part of the financial statements.
55
Financial Highlights -Pro-Blend® Moderate Term Series - Class R
FOR THE YEAR ENDED
| |||||||||||||||||||||||||
10/31/19
|
10/31/18
|
10/31/17
|
10/31/16
|
10/31/15
| |||||||||||||||||||||
Per share data (for a share outstanding throughout each year): | |||||||||||||||||||||||||
Net asset value - Beginning of year | $10.25 | $11.25 | $10.68 | $10.53 | $11.87 | ||||||||||||||||||||
|
|
|
|
|
|
|
|
|
| ||||||||||||||||
Income (loss) from investment operations: | |||||||||||||||||||||||||
Net investment income1 | 0.13 | 0.11 | 0.08 | 0.07 | 0.09 | ||||||||||||||||||||
Net realized and unrealized gain (loss) on investments | 0.99 | (0.31 | ) | 0.77 | 0.20 | (0.36 | ) | ||||||||||||||||||
|
|
|
|
|
|
|
|
|
| ||||||||||||||||
Total from investment operations | 1.12 | (0.20 | ) | 0.85 | 0.27 | (0.27 | ) | ||||||||||||||||||
|
|
|
|
|
|
|
|
|
| ||||||||||||||||
Less distributions to shareholders: | |||||||||||||||||||||||||
From net investment income | (0.13 | ) | (0.09 | ) | (0.08 | ) | (0.08 | ) | (0.10 | ) | |||||||||||||||
From net realized gain on investments | (0.48 | ) | (0.71 | ) | (0.20 | ) | (0.04 | ) | (0.97 | ) | |||||||||||||||
|
|
|
|
|
|
|
|
|
| ||||||||||||||||
Total distributions to shareholders | (0.61 | ) | (0.80 | ) | (0.28 | ) | (0.12 | ) | (1.07 | ) | |||||||||||||||
|
|
|
|
|
|
|
|
|
| ||||||||||||||||
Net asset value - End of year | $10.76 | $10.25 | $11.25 | $10.68 | $10.53 | ||||||||||||||||||||
|
|
|
|
|
|
|
|
|
| ||||||||||||||||
Net assets - End of year(000’s omitted) | $7,610 | $16,537 | $22,662 | $29,499 | $39,917 | ||||||||||||||||||||
|
|
|
|
|
|
|
|
|
| ||||||||||||||||
Total return2 | 11.60% | (1.96% | ) | 8.21% | 2.55% | (2.30% | ) | ||||||||||||||||||
Ratios (to average net assets)/Supplemental Data: | |||||||||||||||||||||||||
Expenses* | 1.35% | 1.35% | 1.33% | 1.32% | 1.31% | ||||||||||||||||||||
Net investment income | 1.26% | 1.00% | 0.73% | 0.72% | 0.83% | ||||||||||||||||||||
Series portfolio turnover | 53% | 74% | 68% | 67% | 56% | ||||||||||||||||||||
| *For certain periods presented, the investment advisor did not impose all or a portion of its management and/or other fees, and in some periods may have paid a portion of the Series’ expenses. If these expenses had been incurred by the Class, the expense ratio (to average net assets) would have increased by the following amounts: |
| ||||||||||||||||||||||||
| 0.03% | N/A | N/A | N/A | N/A | |||||||||||||||||||||
1Calculated based on average shares outstanding during the years.
2Represents aggregate total return for the years indicated, and assumes reinvestment of all distributions. Total return would have been lower had certain expenses not been waived or reimbursed during certain years.
The accompanying notes are an integral part of the financial statements.
56
Financial Highlights -Pro-Blend® Moderate Term Series - Class L*
FOR THE YEAR ENDED
| |||||||||||||||||||||||||
10/31/19
|
10/31/18
|
10/31/17
|
10/31/16
|
10/31/15
| |||||||||||||||||||||
Per share data (for a share outstanding throughout each year): | |||||||||||||||||||||||||
Net asset value - Beginning of year | $9.84 | $10.83 | $10.29 | $10.16 | $11.49 | ||||||||||||||||||||
|
|
|
|
|
|
|
|
|
| ||||||||||||||||
Income (loss) from investment operations: | |||||||||||||||||||||||||
Net investment income1 | 0.08 | 0.05 | 0.02 | 0.02 | 0.03 | ||||||||||||||||||||
Net realized and unrealized gain (loss) on investments | 0.95 | (0.29 | ) | 0.75 | 0.18 | (0.35 | ) | ||||||||||||||||||
|
|
|
|
|
|
|
|
|
| ||||||||||||||||
Total from investment operations | 1.03 | (0.24 | ) | 0.77 | 0.20 | (0.32 | ) | ||||||||||||||||||
|
|
|
|
|
|
|
|
|
| ||||||||||||||||
Less distributions to shareholders: | |||||||||||||||||||||||||
From net investment income | (0.11 | ) | (0.04 | ) | (0.03 | ) | (0.03 | ) | (0.04 | ) | |||||||||||||||
From net realized gain on investments | (0.48 | ) | (0.71 | ) | (0.20 | ) | (0.04 | ) | (0.97 | ) | |||||||||||||||
|
|
|
|
|
|
|
|
|
| ||||||||||||||||
Total distributions to shareholders | (0.59 | ) | (0.75 | ) | (0.23 | ) | (0.07 | ) | (1.01 | ) | |||||||||||||||
|
|
|
|
|
|
|
|
|
| ||||||||||||||||
Net asset value - End of year | $10.28 | $9.84 | $10.83 | $10.29 | $10.16 | ||||||||||||||||||||
|
|
|
|
|
|
|
|
|
| ||||||||||||||||
Net assets - End of year(000’s omitted) | $93,687 | $98,571 | $116,724 | $128,677 | $148,143 | ||||||||||||||||||||
|
|
|
|
|
|
|
|
|
| ||||||||||||||||
Total return2 | 11.10% | (2.42% | ) | 7.71% | 1.98% | (2.77% | ) | ||||||||||||||||||
Ratios (to average net assets)/Supplemental Data: | |||||||||||||||||||||||||
Expenses** | 1.80% | 1.85% | 1.83% | 1.82% | 1.81% | ||||||||||||||||||||
Net investment income | 0.81% | 0.50% | 0.23% | 0.22% | 0.33% | ||||||||||||||||||||
Series portfolio turnover | 53% | 74% | 68% | 67% | 56% | ||||||||||||||||||||
*Effective March 1, 2019, Class R2 shares of the Series have been redesignated as Class L Shares. |
| ||||||||||||||||||||||||
| **For certain periods presented, the investment advisor did not impose all or a portion of its management and/or other fees, and in some periods may have paid a portion of the Series’ expenses. If these expenses had been incurred by the Class, the expense ratio (to average net assets) would have increased by the following amounts: |
| ||||||||||||||||||||||||
| 0.01% | N/A | N/A | N/A | N/A | |||||||||||||||||||||
1Calculated based on average shares outstanding during the years.
2Represents aggregate total return for the years indicated, and assumes reinvestment of all distributions. Total return would have been lower had certain expenses not been waived or reimbursed during certain years.
The accompanying notes are an integral part of the financial statements.
57
Financial Highlights -Pro-Blend® Moderate Term Series - Class W
FOR THE PERIOD 4/1/191 TO 10/31/19
| |||||
Per share data (for a share outstanding throughout the period): | |||||
Net asset value - Beginning of period | $13.27 | ||||
|
| ||||
Income from investment operations: | |||||
Net investment income2 | 0.23 | ||||
Net realized and unrealized gain (loss) on investments | 0.59 | ||||
|
| ||||
Total from investment operations | 0.82 | ||||
|
| ||||
Less distributions to shareholders: | |||||
From net investment income | (0.09 | ) | |||
From net realized gains on investments | (0.00 | )3 | |||
|
| ||||
Total distributions to shareholders | (0.09 | ) | |||
|
| ||||
Net asset value - End of period | $14.00 | ||||
|
| ||||
Net assets - End of period(000’s omitted) | $132 | ||||
|
| ||||
Total return4 | 6.25% | ||||
Ratios (to average net assets)/Supplemental Data: | |||||
Expenses*5 | 0.10% | ||||
Net investment income5 | 3.15% | ||||
Series portfolio turnover | 53% | ||||
| *The investment advisor did not impose all or a portion of its management and/or other fees during the period, and may have paid a portion of the Series’ expenses. If these expenses had been incurred by the Class, the expense ratio (to average net assets) would have increased by the following amounts5: |
| ||||
| 0.64% | |||||
1Commencement of operations.
2Calculated based on average shares outstanding during the period.
3Less than $(0.01).
4Represents aggregate total return for the period indicated. Total return would have been lower had certain expenses not been waived or reimbursed during the period. Periods less than one year are not annualized.
5Annualized.
The accompanying notes are an integral part of the financial statements.
58
Performance Update as of October 31, 2019 -Pro-Blend® Extended Term Series
(unaudited)
AVERAGE ANNUAL TOTAL RETURNS AS OF OCTOBER 31, 2019
| ||||||
ONE YEAR1
|
FIVE YEAR
|
TEN
| ||||
Pro-Blend®Extended Term Series - Class S2 | 13.16% | 4.61% | 7.34% | |||
Pro-Blend®Extended Term Series - Class I2 | 13.36% | 4.88% | 7.61% | |||
Pro-Blend®Extended Term Series - Class R2,3 | 12.73% | 4.33% | 7.05% | |||
Pro-Blend®Extended Term Series - Class L2,3 | 12.26% | 3.83% | 6.55% | |||
Pro-Blend®Extended Term Series - Class W2,4 | 13.80% | 4.73% | 7.40% | |||
Bloomberg Barclays U.S. Aggregate Bond Index5 | 11.51% | 3.24% | 3.73% | |||
40/15/45 Blended Index6 | 12.71% | 6.34% | 8.06% | |||
The following graph compares the value of a $10,000 investment in thePro-Blend® Extended Term Series - Class S for the ten years ended October 31, 2019 to the Bloomberg Barclays U.S. Aggregate Bond Index and the 40/15/45 Blended Index.
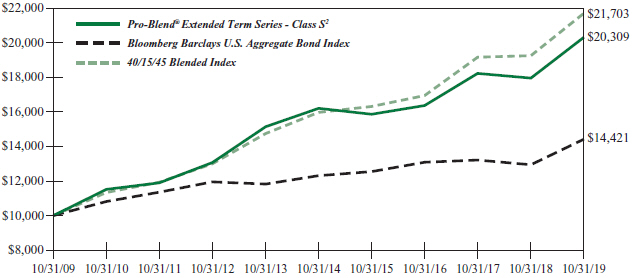
1The returns shown are based on net asset values calculated for shareholder transactions and may differ from the returns shown in the financial highlights, which reflect adjustments made to the net asset values in accordance with accounting principles generally accepted in the United States of America.
2The Series’ performance does not reflect the deduction of taxes that a shareholder would pay on fund distributions or the redemption of shares. The Series’ performance is historical and may not be indicative of future results. The performance returns shown are inclusive of the net expense ratio of the Series. For the year ended October 31, 2019, this net expense ratio was 1.05% for Class S, 0.85% for Class I, 1.35% for Class R, 1.80% for Class L and 0.10% for Class W. The gross expense ratio, which does not account for any voluntary or contractual waivers currently in effect, was 1.06% for Class S, 0.86% for Class I, 1.37% for Class R, 1.80% for Class L and 0.72% for Class W for the year ended October 31, 2019.
3For periods through the inception of Class L on January 4, 2010 and Class R on June 30, 2010, the performance is hypothetical and is based on the historical performance of the Class S shares adjusted for the respective class’ charges and expenses.
4For periods through April 1, 2019 (the inception date of the Class W shares), performance for the Class W shares is based on the historical performance of the Class S shares. Because the Class W shares invest in the same portfolio of securities as the Class S shares, performance will be different only to the extent that the Class S shares have a higher expense ratio.
5The Bloomberg Barclays U.S. Aggregate Bond Index is an unmanaged, market-value weighted index of U.S. domestic investment-grade debt issues, including government, corporate, asset-backed, and mortgage-backed securities, with maturities of one year or more. Index returns do not reflect any fees or expenses. Index returns provided by Interactive Data.
6The 40/15/45 Blended Index is 40% Russell 3000® Index (Russell 3000), 15% MSCI ACWI ex USA Index (ACWIxUS), and 45% Bloomberg Barclays U.S. Aggregate Bond Index (BAB). Russell 3000 is an unmanaged index that consists of 3,000 of the largest U.S. companies based on total market capitalization. Index returns are based on a market capitalization weighted average of relative price changes of the component stocks plus dividends whose reinvestments are compounded daily. Index returns provided by Bloomberg. ACWIxUS is designed to measure large andmid-cap representation across 22 of 23 Developed Markets countries (excluding the U.S.) and 26 Emerging Markets countries. The Index is denominated in U.S. dollars. The Index returns are net of withholding taxes. They assume daily
59
Performance Update as of October 31, 2019 -Pro-Blend® Extended Term Series
(unaudited)
reinvestment of net dividends thus accounting for any applicable dividend taxation. Index returns provided by Bloomberg. Index returns provided by Bloomberg. BAB is an unmanaged, market value-weighted index of U.S. domestic investment-grade debt issues, including government, corporate, asset-backed and mortgage-backed securities with maturities of one year or more. Index returns provided by Interactive Data. The returns of the indices do not reflect any fees or expenses. Returns provided are calculated monthly using a blended allocation. Because the fund’s asset allocation will vary over time, the composition of the fund’s portfolio may not match the composition of the comparative Indices.Mid-month performance may not be available for all indices within the blended index. Where applicable, performance for those indices is included from the first of the month following the corresponding Fund’s inception date.
60
Shareholder Expense Example -Pro-Blend® Extended Term Series
(unaudited)
As a shareholder of the Series, you incur ongoing costs, including management fees, shareholder service fees and other Series expenses. This example is intended to help you understand your ongoing costs (in dollars) of investing in the Series and to compare these costs with the ongoing costs of investing in other mutual funds.
The example is based on an investment of $1,000 invested in each class at the beginning of the period and held for the entire period (May 1, 2019 to October 31, 2019).
Actual Expenses
The Actual lines of the table below provide information about actual account values and actual expenses. You may use the information in these lines, together with the amount you invested, to estimate the expenses that you paid over the period. Simply divide your account value by $1,000 (for example, an $8,600 account value divided by $1,000 = 8.6), then multiply the result by the number in the Actual line for the Class in which you have invested under the heading entitled “Expenses Paid During Period” to estimate the expenses you paid on your account during this period.
Hypothetical Example for Comparison Purposes
The Hypothetical lines of each class in the table below provide information about hypothetical account values and hypothetical expenses based on the Class’ actual expense ratio and an assumed rate of return of 5% per year before expenses, which is not the Class’ actual return. The hypothetical account values and expenses may not be used to estimate the actual ending account balance or expenses you paid during the period. You may use this information to compare the ongoing costs of investing in a class of the Series and other funds. To do so, compare this 5% hypothetical example for the Class in which you have invested with the 5% hypothetical examples that appear in the shareholder reports of the other funds.
Please note that the expenses shown in the table are meant to highlight your ongoing costs only and do not reflect any transaction costs such as sales charges (loads), redemption fees, or exchange fees that you may incur in other mutual funds. Therefore, the second line of the table is useful in comparing ongoing costs only, and will not help you determine the relative total costs of owning different funds.
BEGINNING
| ENDING
| EXPENSES PAID
| ANNUALIZED
| |||||||||||||
Class S | ||||||||||||||||
Actual | $1,000.00 | $1,049.80 | $5.32 | 1.03% | ||||||||||||
Hypothetical | $1,000.00 | $1,020.01 | $5.24 | 1.03% | ||||||||||||
Class I | ||||||||||||||||
Actual | $1,000.00 | $1,050.90 | $4.39 | 0.85% | ||||||||||||
Hypothetical | $1,000.00 | $1,020.92 | $4.33 | 0.85% | ||||||||||||
Class R | ||||||||||||||||
Actual | $1,000.00 | $1,047.40 | $6.97 | 1.35% | ||||||||||||
Hypothetical | $1,000.00 | $1,018.40 | $6.87 | 1.35% | ||||||||||||
Class L | ||||||||||||||||
Actual | $1,000.00 | $1,045.30 | $9.12 | 1.77% | ||||||||||||
Hypothetical | $1,000.00 | $1,016.28 | $9.00 | 1.77% | ||||||||||||
Class W | ||||||||||||||||
Actual | $1,000.00 | $1,054.50 | $0.52 | 0.10% | ||||||||||||
Hypothetical | $1,000.00 | $1,024.70 | $0.51 | 0.10% | ||||||||||||
61
Shareholder Expense Example -Pro-Blend® Extended Term Series
(unaudited)
1Expenses are equal to the Class’ annualized expense ratio (for thesix-month period), multiplied by the average account value over the period, multiplied by 184/365 (to reflect theone-half year period). Expenses are based on the most recent fiscal half year; therefore, the expense ratios stated above may differ from the expense ratios stated in the financial highlights, which are based onone-year data. The Class’ total return would have been lower had certain expenses not been waived during the period.
62
Portfolio Composition -Pro-Blend® Extended Term Series
As of October 31, 2019 (unaudited)
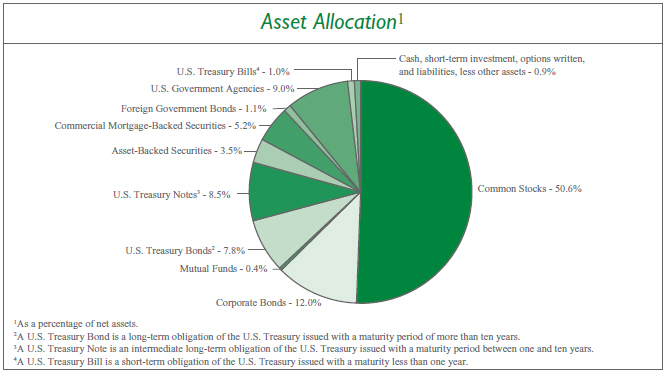
| Sector Allocation5 | ||||
Communication Services | 10.6% | |||
Information Technology | 9.5% | |||
Health Care | 9.5% | |||
Consumer Staples | 7.8% | |||
Financials | 7.6% | |||
Consumer Discretionary | 7.0% | |||
Real Estate | 4.3% | |||
Energy | 3.3% | |||
Industrials | 2.2% | |||
Materials | 0.8% | |||
Utilities | 0.1% | |||
5Including common stocks and corporate bonds, as a percentage of total investments.
|
| |||
| Top Ten Stock Holdings6 | ||||
Mastercard, Inc. - Class A | 1.8% | |||
Medtronic plc | 1.7% | |||
Microsoft Corp. | 1.7% | |||
Novartis AG - ADR (Switzerland) | 1.6% | |||
Visa, Inc. - Class A | 1.6% | |||
Johnson & Johnson | 1.5% | |||
Micron Technology, Inc. | 1.5% | |||
Berkshire Hathaway, Inc. - Class B | 1.3% | |||
Sony Corp. - ADR (Japan) | 1.1% | |||
Merck KGaA (Germany) | 1.1% | |||
6As a percentage of total investments.
| ||||
63
Investment Portfolio - October 31, 2019
| PRO-BLEND®EXTENDED TERM SERIES | ||||||||
SHARES
| VALUE (NOTE 2)
| |||||||
COMMON STOCKS - 50.6% | ||||||||
Communication Services - 8.1% | ||||||||
Diversified Telecommunication Services - 0.1% |
| |||||||
Elisa OYJ (Finland) | 3,746 | $ | 204,592 | |||||
Orange S.A. (France) | 4,370 | 70,333 | ||||||
Telefonica Brasil S.A. (Brazil) | 3,400 | 44,991 | ||||||
|
| |||||||
| 319,916 | ||||||||
|
| |||||||
Entertainment - 3.6% | ||||||||
Activision Blizzard, Inc.1 | 77,580 | 4,346,807 | ||||||
Electronic Arts, Inc.*1 | 39,435 | 3,801,534 | ||||||
Nexon Co. Ltd. (Japan)* | 434,200 | 5,031,617 | ||||||
Sea Ltd. - ADR (Taiwan)*1 | 152,950 | 4,551,792 | ||||||
Toho Co. Ltd. - Tokyo (Japan) | 4,400 | 177,696 | ||||||
Viacom, Inc. - Class B | 657 | 14,165 | ||||||
Vivendi S.A. (France) | 2,225 | 61,961 | ||||||
|
| |||||||
| 17,985,572 | ||||||||
|
| |||||||
Interactive Media & Services - 3.8% | ||||||||
Alphabet, Inc. - Class A*1 | 3,270 | 4,116,276 | ||||||
Alphabet, Inc. - Class C* | 3,280 | 4,133,161 | ||||||
Autohome, Inc. - ADR (China)* | 1,660 | 140,370 | ||||||
Facebook, Inc. - Class A* | 27,075 | 5,188,924 | ||||||
Kakao Corp. (South Korea) | 1,670 | 202,658 | ||||||
Tencent Holdings Ltd. - Class H (China) | 135,379 | 5,491,367 | ||||||
|
| |||||||
| 19,272,756 | ||||||||
|
| |||||||
Media - 0.6% | ||||||||
Informa plc (United Kingdom) | 18,015 | 181,074 | ||||||
Quebecor, Inc. - Class B (Canada) | 61,865 | 1,438,240 | ||||||
Shaw Communications, Inc. - Class B (Canada) | 72,150 | 1,472,471 | ||||||
|
| |||||||
| 3,091,785 | ||||||||
|
| |||||||
Wireless Telecommunication Services - 0.0%## |
| |||||||
Globe Telecom, Inc. (Philippines) | 1,355 | 48,705 | ||||||
|
| |||||||
Total Communication Services | 40,718,734 | |||||||
|
| |||||||
Consumer Discretionary - 5.3% | ||||||||
Auto Components - 0.0%## | ||||||||
Cie Generale des Etablissements Michelin SCA (France) | 405 | 49,312 | ||||||
|
| |||||||
Automobiles - 0.0%## | ||||||||
Peugeot S.A. (France) | 1,260 | 31,911 | ||||||
|
| |||||||
Distributors - 0.0%## | ||||||||
Genuine Parts Co. | 260 | 26,671 | ||||||
|
| |||||||
Diversified Consumer Services - 0.1% | ||||||||
Fu Shou Yuan International Group Ltd. (China) | 97,000 | 85,612 | ||||||
SHARES
| VALUE (NOTE 2)
| |||||||
COMMON STOCKS (continued) | ||||||||
Consumer Discretionary (continued) | ||||||||
Diversified Consumer Services(continued) |
| |||||||
New Oriental Education & Technology Group, Inc. - ADR (China)* | 1,710 | $ | 208,723 | |||||
TAL Education Group - ADR (China)* | 4,370 | 187,080 | ||||||
|
| |||||||
| 481,415 | ||||||||
|
| |||||||
Hotels, Restaurants & Leisure - 0.2% | ||||||||
Basic-Fit N.V. (Netherlands)*2 | 4,485 | 137,174 | ||||||
Galaxy Entertainment Group Ltd. (Macau) | 20,000 | 137,713 | ||||||
Hilton Worldwide Holdings, Inc. | 765 | 74,174 | ||||||
Melco Resorts & Entertainment Ltd. - ADR (Hong Kong) | 4,095 | 88,206 | ||||||
MGM China Holdings Ltd. (Macau) | 56,000 | 88,675 | ||||||
Restaurant Brands International, Inc. (Canada) | 1,720 | 112,557 | ||||||
Sands China Ltd. (Macau) | 28,000 | 137,917 | ||||||
Wynn Macau Ltd. (Macau) | 61,200 | 132,809 | ||||||
|
| |||||||
| 909,225 | ||||||||
|
| |||||||
Household Durables - 1.3% | ||||||||
Barratt Developments plc (United Kingdom) | 11,660 | 95,354 | ||||||
The Berkeley Group Holdings plc (United Kingdom) | 1,765 | 100,604 | ||||||
Persimmon plc (United Kingdom) | 3,560 | 105,007 | ||||||
Sony Corp. - ADR (Japan) | 93,435 | 5,683,651 | ||||||
Sony Corp. (Japan) | 3,400 | 206,955 | ||||||
Taylor Wimpey plc (United Kingdom) | 45,855 | 98,346 | ||||||
|
| |||||||
| 6,289,917 | ||||||||
|
| |||||||
Internet & Direct Marketing Retail - 1.6% | ||||||||
Alibaba Group Holding Ltd. - ADR (China)* | 1,870 | 330,373 | ||||||
Amazon.com, Inc.* | 2,810 | 4,992,415 | ||||||
Booking Holdings, Inc.* | 1,240 | 2,540,475 | ||||||
Farfetch Ltd. - Class A (United Kingdom)* | 1,825 | 16,297 | ||||||
|
| |||||||
| 7,879,560 | ||||||||
|
| |||||||
Leisure Products - 0.0%## | ||||||||
Technogym S.p.A. (Italy)2 | 14,270 | 157,437 | ||||||
|
| |||||||
Multiline Retail - 0.1% | ||||||||
B&M European Value Retail S.A. (United Kingdom) | 20,650 | 99,066 | ||||||
Kohl’s Corp. | 354 | 18,146 | ||||||
Lojas Renner S.A. (Brazil) | 4,400 | 55,832 | ||||||
The accompanying notes are an integral part of the financial statements.
64
Investment Portfolio - October 31, 2019
| PRO-BLEND®EXTENDED TERM SERIES | ||||||||
SHARES
| VALUE (NOTE 2)
| |||||||
COMMON STOCKS (continued) | ||||||||
Consumer Discretionary(continued) | ||||||||
Multiline Retail(continued) | ||||||||
Magazine Luiza S.A. (Brazil) | 4,000 | $ | 44,284 | |||||
|
| |||||||
| 217,328 | ||||||||
|
| |||||||
Specialty Retail - 0.9% | ||||||||
Best Buy Co., Inc. | 415 | 29,809 | ||||||
The Gap, Inc. | 758 | 12,325 | ||||||
The Home Depot, Inc. | 780 | 182,972 | ||||||
Industria de Diseno Textil S.A. (Spain) | 141,940 | 4,422,966 | ||||||
|
| |||||||
| 4,648,072 | ||||||||
|
| |||||||
Textiles, Apparel & Luxury Goods - 1.1% | ||||||||
EssilorLuxottica S.A. (France) | 510 | 77,874 | ||||||
Hermes International (France) | 70 | 50,425 | ||||||
Kering S.A. (France) | 180 | 102,419 | ||||||
Kontoor Brands, Inc. | 69 | 2,622 | ||||||
lululemon athletica, Inc.* | 24,439 | 4,992,155 | ||||||
LVMH Moet Hennessy Louis Vuitton SE (France) | 520 | 222,069 | ||||||
Shenzhou International Group Holdings Ltd. (China) | 12,000 | 165,824 | ||||||
VF Corp. | 486 | 39,993 | ||||||
|
| |||||||
| 5,653,381 | ||||||||
|
| |||||||
Total Consumer Discretionary | 26,344,229 | |||||||
|
| |||||||
Consumer Staples - 7.8% | ||||||||
Beverages - 4.0% | ||||||||
Ambev S.A. - ADR (Brazil) | 291,188 | 1,255,020 | ||||||
Ambev S.A. (Brazil) | 27,900 | 120,769 | ||||||
Anheuser-Busch InBev S.A./N.V. (Belgium) | 62,299 | 5,028,615 | ||||||
The Coca-Cola Co. | 94,220 | 5,128,395 | ||||||
Coca-Cola European Partners plc (United Kingdom) | 3,390 | 181,399 | ||||||
Diageo plc (United Kingdom) | 71,251 | 2,916,381 | ||||||
Heineken N.V. (Netherlands) | 1,745 | 178,199 | ||||||
Molson Coors Brewing Co. - Class B | 318 | 16,765 | ||||||
PepsiCo, Inc. | 38,050 | 5,219,318 | ||||||
Pernod Ricard S.A. (France) | 1,010 | 186,581 | ||||||
|
| |||||||
| 20,231,442 | ||||||||
|
| |||||||
Food & Staples Retailing - 0.2% | ||||||||
Alimentation Couche-Tard, Inc. - Class B (Canada) | 6,150 | 184,439 | ||||||
ICA Gruppen AB (Sweden) | 3,873 | 171,387 | ||||||
The Kroger Co. | 845 | 20,821 | ||||||
Loblaw Companies Ltd. (Canada) | 3,440 | 183,453 | ||||||
SHARES
| VALUE (NOTE 2)
| |||||||
COMMON STOCKS (continued) | ||||||||
Consumer Staples (continued) | ||||||||
Food & Staples Retailing (continued) | ||||||||
Puregold Price Club, Inc. (Philippines) | 32,900 | $ | 26,463 | |||||
Raia Drogasil S.A. (Brazil) | 1,600 | 43,869 | ||||||
Robinsons Retail Holdings, Inc. (Philippines) | 19,570 | 29,252 | ||||||
Sysco Corp. | 628 | 50,158 | ||||||
Walgreens Boots Alliance, Inc. | 929 | 50,891 | ||||||
Walmart, Inc. | 1,755 | 205,791 | ||||||
|
| |||||||
| 966,524 | ||||||||
|
| |||||||
Food Products - 2.4% | ||||||||
Archer-Daniels-Midland Co. | 599 | 25,182 | ||||||
Barry Callebaut AG (Switzerland) | 45 | 95,098 | ||||||
Chocoladefabriken Lindt & Spruengli AG (Switzerland) | 10 | 74,303 | ||||||
Conagra Brands, Inc. | 681 | 18,421 | ||||||
Danone S.A. (France) | 4,983 | 412,798 | ||||||
General Mills, Inc. | 804 | 40,891 | ||||||
The Hershey Co. | 276 | 40,536 | ||||||
The J.M. Smucker Co. | 193 | 20,396 | ||||||
Kellogg Co. | 454 | 28,843 | ||||||
Kerry Group plc - Class A (Ireland) | 1,620 | 196,158 | ||||||
Mondelez International, Inc. - Class A | 98,821 | 5,183,161 | ||||||
Mowi ASA (Norway) | 7,700 | 187,972 | ||||||
Nestle S.A. (Switzerland) | 51,676 | 5,528,368 | ||||||
Tyson Foods, Inc. - Class A | 361 | 29,887 | ||||||
Universal Robina Corp. (Philippines). | 20,320 | 60,367 | ||||||
|
| |||||||
| 11,942,381 | ||||||||
|
| |||||||
Household Products - 0.1% | ||||||||
Colgate-Palmolive Co. | 887 | 60,848 | ||||||
Essity AB - Class B (Sweden) | 6,080 | 189,944 | ||||||
Henkel AG & Co. KGaA (Germany) | 1,805 | 187,490 | ||||||
Kimberly-Clark Corp. | 397 | 52,753 | ||||||
Reckitt Benckiser Group plc (United Kingdom) | 2,210 | 171,014 | ||||||
|
| |||||||
| 662,049 | ||||||||
|
| |||||||
Personal Products - 1.0% | ||||||||
Beiersdorf AG (Germany) | 975 | 115,429 | ||||||
LG Household & Health Care Ltd. (South Korea) | 160 | 173,136 | ||||||
L’Oreal S.A. (France) | 540 | 157,713 | ||||||
Unilever plc - ADR (United Kingdom) | 79,043 | 4,751,275 | ||||||
|
| |||||||
| 5,197,553 | ||||||||
|
| |||||||
The accompanying notes are an integral part of the financial statements.
65
Investment Portfolio - October 31, 2019
| PRO-BLEND®EXTENDED TERM SERIES | ||||||||
SHARES
| VALUE (NOTE 2)
| |||||||
COMMON STOCKS (continued) | ||||||||
Consumer Staples (continued) | ||||||||
Tobacco - 0.1% | ||||||||
British American Tobacco plc - ADR (United Kingdom) | 1,995 | $ | 69,745 | |||||
British American Tobacco plc (United Kingdom) | 5,420 | 189,570 | ||||||
|
| |||||||
| 259,315 | ||||||||
|
| |||||||
Total Consumer Staples | 39,259,264 | |||||||
|
| |||||||
Energy - 1.3% | ||||||||
Energy Equipment & Services - 1.0% | ||||||||
Baker Hughes Co. | 1,046 | 22,384 | ||||||
Core Laboratories N.V | 1,410 | 62,096 | ||||||
Halliburton Co. | 107,810 | 2,075,342 | ||||||
Schlumberger Ltd | 64,793 | 2,118,083 | ||||||
Transocean Ltd.* | 127,930 | 607,668 | ||||||
|
| |||||||
| 4,885,573 | ||||||||
|
| |||||||
Oil, Gas & Consumable Fuels - 0.3% | ||||||||
Cameco Corp. (Canada) | 10,681 | 95,381 | ||||||
Chevron Corp. | 991 | 115,095 | ||||||
Eni S.p.A. (Italy) | 12,115 | 183,796 | ||||||
Equinor ASA (Norway) | 10,555 | 195,961 | ||||||
Galp Energia SGPS S.A. (Portugal) | 11,600 | 185,539 | ||||||
Marathon Petroleum Corp. | 835 | 53,398 | ||||||
Occidental Petroleum Corp. | 692 | 28,026 | ||||||
Phillips 66 | 395 | 46,144 | ||||||
Repsol S.A. (Spain) | 12,791 | 210,792 | ||||||
Royal Dutch Shell plc - Class B - ADR (Netherlands) | 5,095 | 296,988 | ||||||
Suncor Energy, Inc. (Canada) | 4,890 | 145,389 | ||||||
TOTAL S.A. (France) | 3,820 | 201,957 | ||||||
Valero Energy Corp. | 523 | 50,721 | ||||||
|
| |||||||
| 1,809,187 | ||||||||
|
| |||||||
Total Energy | 6,694,760 | |||||||
|
| |||||||
Financials - 4.8% | ||||||||
Banks - 0.5% | ||||||||
Banco Bradesco S.A. (Brazil) | 24,700 | 217,222 | ||||||
Banco do Brasil S.A. (Brazil) | 8,000 | 95,769 | ||||||
Banco Santander Brasil S.A. (Brazil) | 3,400 | 40,201 | ||||||
Bank of America Corp. | 4,194 | 131,146 | ||||||
The Bank Of N.T. Butterfield & Son Ltd. (Bermuda) | 3,680 | 121,256 | ||||||
Bank of the Philippine Islands (Philippines) | 36,890 | 70,478 | ||||||
Barclays plc (United Kingdom) | 49,365 | 107,077 | ||||||
BB&T Corp. | 640 | 33,952 | ||||||
BDO Unibank, Inc. (Philippines) | 30,270 | 92,339 | ||||||
SHARES
| VALUE (NOTE 2)
| |||||||
COMMON STOCKS (continued) | ||||||||
Financials (continued) | ||||||||
Banks(continued) | ||||||||
BNP Paribas S.A. (France) | 2,570 | $ | 134,307 | |||||
Citigroup, Inc. | 1,225 | 88,028 | ||||||
Credit Agricole S.A. (France) | 2,415 | 31,512 | ||||||
Fifth Third Bancorp | 984 | 28,615 | ||||||
FinecoBank Banca Fineco S.p.A. (Italy) | 14,000 | 157,827 | ||||||
Itau Unibanco Holding S.A. (Brazil) | 27,500 | 248,635 | ||||||
Itausa - Investimentos Itau S.A. (Brazil) | 30,200 | 103,164 | ||||||
JPMorgan Chase & Co. | 1,641 | 204,994 | ||||||
KeyCorp | 1,342 | 24,116 | ||||||
Lloyds Banking Group plc (United Kingdom) | 137,380 | 101,058 | ||||||
Metropolitan Bank & Trust Co. (Philippines) | 54,087 | 72,001 | ||||||
Regions Financial Corp. | 1,200 | 19,320 | ||||||
Royal Bank of Scotland Group plc (United Kingdom) | 35,930 | 99,319 | ||||||
SunTrust Banks, Inc. | 497 | 33,965 | ||||||
U.S. Bancorp | 1,454 | 82,907 | ||||||
Wells Fargo & Co. | 3,139 | 162,067 | ||||||
|
| |||||||
| 2,501,275 | ||||||||
|
| |||||||
Capital Markets - 2.9% | ||||||||
B3 S.A. - Brasil Bolsa Balcao (Brazil) | 10,700 | 129,158 | ||||||
BlackRock, Inc. | 2,820 | 1,301,994 | ||||||
Cboe Global Markets, Inc. | 21,820 | 2,512,573 | ||||||
CME Group, Inc. | 11,990 | 2,466,942 | ||||||
Deutsche Boerse AG (Germany) | 1,170 | 181,186 | ||||||
Hargreaves Lansdown plc (United Kingdom) | 3,610 | 82,898 | ||||||
Intercontinental Exchange, Inc. | 27,800 | 2,622,096 | ||||||
Julius Baer Group Ltd. (Switzerland) | 2,250 | 99,638 | ||||||
London Stock Exchange Group plc (United Kingdom) | 1,000 | 90,119 | ||||||
Moody’s Corp. | 11,710 | 2,584,280 | ||||||
S&P Global, Inc. | 9,990 | 2,577,320 | ||||||
|
| |||||||
| 14,648,204 | ||||||||
|
| |||||||
Diversified Financial Services - 1.3% | ||||||||
Berkshire Hathaway, Inc. - Class B* | 29,820 | 6,339,136 | ||||||
|
| |||||||
Insurance - 0.1% | ||||||||
Admiral Group plc (United Kingdom) | 6,105 | 159,779 | ||||||
The Allstate Corp. | 305 | 32,458 | ||||||
AXA S.A. (France) | 4,340 | 114,885 | ||||||
BB Seguridade Participacoes S.A. (Brazil) | 5,700 | 48,252 | ||||||
The accompanying notes are an integral part of the financial statements.
66
Investment Portfolio - October 31, 2019
| PRO-BLEND®EXTENDED TERM SERIES | ||||||||
SHARES
| VALUE (NOTE 2)
| |||||||
COMMON STOCKS(continued) | ||||||||
Financials (continued) | ||||||||
Insurance(continued) | ||||||||
Chubb Ltd. | 327 | $ | 49,841 | |||||
The Hartford Financial Services Group, Inc. | 397 | 22,661 | ||||||
Ping An Insurance Group Co. of China Ltd. - Class H (China) | 13,000 | 150,043 | ||||||
The Travelers Companies, Inc. | 230 | 30,144 | ||||||
|
| |||||||
| 608,063 | ||||||||
|
| |||||||
Total Financials | 24,096,678 | |||||||
|
| |||||||
Health Care - 9.1% | ||||||||
Biotechnology - 1.7% | ||||||||
AbbVie, Inc. | 1,280 | 101,824 | ||||||
Amgen, Inc. | 566 | 120,699 | ||||||
BioMarin Pharmaceutical, Inc.* | 42,515 | 3,112,523 | ||||||
Gilead Sciences, Inc. | 1,258 | 80,147 | ||||||
Incyte Corp.* | 20,520 | 1,722,038 | ||||||
Seattle Genetics, Inc.* | 15,970 | 1,715,178 | ||||||
Vertex Pharmaceuticals, Inc.* | 8,290 | 1,620,529 | ||||||
|
| |||||||
| 8,472,938 | ||||||||
|
| |||||||
Health Care Equipment & Supplies - 2.4% |
| |||||||
Alcon, Inc. (Switzerland)* | 45,976 | 2,724,998 | ||||||
Alcon, Inc. (Switzerland)* | 1,602 | 94,739 | ||||||
Getinge AB - Class B (Sweden) | 7,360 | 125,831 | ||||||
Hoya Corp. (Japan) | 2,300 | 203,268 | ||||||
Koninklijke Philips N.V. (Netherlands) | 4,035 | 177,032 | ||||||
Medtronic plc | 78,565 | 8,555,728 | ||||||
Shandong Weigao Group Medical Polymer Co. Ltd. - Class H (China) | 84,000 | 96,435 | ||||||
Smith & Nephew plc (United Kingdom) | 7,955 | 170,766 | ||||||
|
| |||||||
| 12,148,797 | ||||||||
|
| |||||||
Health Care Providers & Services - 0.0%## |
| |||||||
CVS Health Corp. | 1,164 | 77,278 | ||||||
Quest Diagnostics, Inc. | 200 | 20,250 | ||||||
Sonic Healthcare Ltd. (Australia) | 9,615 | 189,368 | ||||||
|
| |||||||
| 286,896 | ||||||||
|
| |||||||
Life Sciences Tools & Services - 0.1% | ||||||||
Gerresheimer AG (Germany) | 1,710 | 137,903 | ||||||
QIAGEN N.V.* | 2,087 | 62,213 | ||||||
QIAGEN N.V.* | 3,399 | 102,239 | ||||||
Tecan Group AG (Switzerland) | 190 | 44,950 | ||||||
|
| |||||||
| 347,305 | ||||||||
|
| |||||||
SHARES
| VALUE (NOTE 2)
| |||||||
COMMON STOCKS (continued) | ||||||||
Health Care (continued) | ||||||||
Pharmaceuticals - 4.9% | ||||||||
Bristol-Myers Squibb Co. | 1,412 | $ | 81,006 | |||||
Johnson & Johnson1 | 58,165 | 7,680,107 | ||||||
Merck & Co., Inc. | 21,604 | 1,872,203 | ||||||
Merck KGaA (Germany) | 46,435 | 5,538,142 | ||||||
Novartis AG - ADR (Switzerland) | 91,980 | 8,042,731 | ||||||
Novartis AG (Switzerland) | 2,355 | 205,769 | ||||||
Perrigo Co. plc | 2,970 | 157,469 | ||||||
Pfizer, Inc. | 4,042 | 155,092 | ||||||
Recordati S.p.A. (Italy) | 4,280 | 179,863 | ||||||
Roche Holding AG (Switzerland) | 1,040 | 312,994 | ||||||
Sanofi (France) | 2,245 | 206,960 | ||||||
|
| |||||||
| 24,432,336 | ||||||||
|
| |||||||
Total Health Care | 45,688,272 | |||||||
|
| |||||||
Industrials - 0.7% | ||||||||
Aerospace & Defense - 0.2% | ||||||||
Airbus SE (France) | 1,205 | 172,867 | ||||||
BAE Systems plc (United Kingdom) | 27,265 | 203,662 | ||||||
The Boeing Co. | 392 | 133,245 | ||||||
General Dynamics Corp. | 225 | 39,780 | ||||||
Lockheed Martin Corp. | 242 | 91,157 | ||||||
Safran S.A. (France) | 660 | 104,537 | ||||||
Thales S.A. (France) | 155 | 15,153 | ||||||
United Technologies Corp. | 686 | 98,496 | ||||||
|
| |||||||
| 858,897 | ||||||||
|
| |||||||
Air Freight & Logistics - 0.0%## | ||||||||
C.H. Robinson Worldwide, Inc. | 279 | 21,104 | ||||||
United Parcel Service, Inc. - Class B | 856 | 98,586 | ||||||
|
| |||||||
| 119,690 | ||||||||
|
| |||||||
Airlines - 0.0%## | ||||||||
Ryanair Holdings plc - ADR (Ireland)* | 1,626 | 121,365 | ||||||
|
| |||||||
Building Products - 0.0%## | ||||||||
Cie de Saint-Gobain (France) | 1,055 | 42,968 | ||||||
Johnson Controls International plc | 1,011 | 43,807 | ||||||
|
| |||||||
| 86,775 | ||||||||
|
| |||||||
Commercial Services & Supplies - 0.0%## |
| |||||||
Waste Management, Inc. | 478 | 53,636 | ||||||
|
| |||||||
Construction & Engineering - 0.0%## | ||||||||
Vinci S.A. (France) | 1,760 | 197,466 | ||||||
|
| |||||||
Electrical Equipment - 0.1% | ||||||||
Eaton Corp. plc | 533 | 46,430 | ||||||
Emerson Electric Co. | 732 | 51,350 | ||||||
Legrand S.A. (France) | 565 | 44,140 | ||||||
The accompanying notes are an integral part of the financial statements.
67
Investment Portfolio - October 31, 2019
| PRO-BLEND®EXTENDED TERM SERIES | ||||||||
SHARES
| VALUE (NOTE 2)
| |||||||
COMMON STOCKS (continued) | ||||||||
Industrials (continued) | ||||||||
Electrical Equipment (continued) |
| |||||||
Rockwell Automation, Inc. | 132 | $ | 22,703 | |||||
Schneider Electric SE (France) | 1,185 | 110,134 | ||||||
WEG S.A. (Brazil) | 6,500 | 41,686 | ||||||
|
| |||||||
| 316,443 | ||||||||
|
| |||||||
Industrial Conglomerates - 0.1% | ||||||||
3M Co. | 540 | 89,095 | ||||||
Honeywell International, Inc. | 581 | 100,356 | ||||||
LT Group, Inc. (Philippines) | 92,700 | 24,369 | ||||||
SM Investments Corp. (Philippines) | 4,665 | 94,571 | ||||||
|
| |||||||
| 308,391 | ||||||||
|
| |||||||
Machinery - 0.2% | ||||||||
Caterpillar, Inc. | 483 | 66,557 | ||||||
Cummins, Inc. | 216 | 37,256 | ||||||
Daifuku Co. Ltd. (Japan) | 2,000 | 106,123 | ||||||
FANUC Corp. (Japan) | 1,300 | 256,424 | ||||||
Harmonic Drive Systems, Inc. (Japan) | 2,700 | 125,217 | ||||||
Illinois Tool Works, Inc. | 323 | 54,451 | ||||||
KION Group AG (Germany) | 1,930 | 128,418 | ||||||
Nabtesco Corp. (Japan) | 3,700 | 117,789 | ||||||
The Weir Group plc (United Kingdom) | 7,260 | 126,811 | ||||||
|
| |||||||
| 1,019,046 | ||||||||
|
| |||||||
Professional Services - 0.0%## | ||||||||
SGS S.A. (Switzerland) | 35 | 91,284 | ||||||
|
| |||||||
Road & Rail - 0.0%## | ||||||||
Localiza Rent a Car S.A. (Brazil) | 3,100 | 33,238 | ||||||
Rumo S.A. (Brazil)* | 8,100 | 46,211 | ||||||
Union Pacific Corp. | 582 | 96,298 | ||||||
|
| |||||||
| 175,747 | ||||||||
|
| |||||||
Trading Companies & Distributors - 0.0%## |
| |||||||
Fastenal Co. | 840 | 30,190 | ||||||
|
| |||||||
Transportation Infrastructure - 0.1% | ||||||||
Grupo Aeroportuario del Centro | ||||||||
Norte S.A.B. de C.V. (Mexico) | 13,400 | 92,988 | ||||||
Grupo Aeroportuario del Pacifico S.A.B. de C.V. - ADR (Mexico) | 595 | 62,183 | ||||||
Grupo Aeroportuario del Sureste S.A.B. de C.V. - ADR (Mexico) | 505 | 82,694 | ||||||
|
| |||||||
| 237,865 | ||||||||
|
| |||||||
Total Industrials | 3,616,795 | |||||||
|
| |||||||
Information Technology - 9.5% | ||||||||
Communications Equipment - 0.0%## | ||||||||
Cisco Systems, Inc. | 2,923 | 138,872 | ||||||
|
| |||||||
SHARES
| VALUE (NOTE 2)
| |||||||
COMMON STOCKS (continued) | ||||||||
Information Technology (continued) | ||||||||
Electronic Equipment, Instruments & Components - 0.4% |
| |||||||
Cognex Corp. | 23,840 | $ | 1,227,522 | |||||
Halma plc (United Kingdom) | 4,290 | 104,099 | ||||||
Hexagon AB - Class B (Sweden) | 2,150 | 110,076 | ||||||
Keyence Corp. (Japan) | 618 | 390,759 | ||||||
|
| |||||||
| 1,832,456 | ||||||||
|
| |||||||
IT Services - 4.3% | ||||||||
Capgemini SE (France) | 340 | 38,328 | ||||||
International Business Machines Corp. | 748 | 100,030 | ||||||
InterXion Holding N.V. (Netherlands)* | 52,060 | 4,592,733 | ||||||
Keywords Studios plc (Ireland) | 2,166 | 31,212 | ||||||
Mastercard, Inc. - Class A | 31,855 | 8,817,783 | ||||||
Visa, Inc. - Class A | 44,385 | 7,938,701 | ||||||
|
| |||||||
| 21,518,787 | ||||||||
|
| |||||||
Semiconductors & Semiconductor Equipment - 2.2% |
| |||||||
Applied Materials, Inc. | 855 | 46,392 | ||||||
Broadcom, Inc. | 315 | 92,248 | ||||||
Intel Corp. | 3,300 | 186,549 | ||||||
KLA Corp. | 253 | 42,767 | ||||||
Lam Research Corp. | 146 | 39,572 | ||||||
Maxim Integrated Products, Inc. | 393 | 23,053 | ||||||
Micron Technology, Inc.* | 156,470 | 7,440,148 | ||||||
NVIDIA Corp. | 14,725 | 2,960,019 | ||||||
Texas Instruments, Inc. | 809 | 95,454 | ||||||
|
| |||||||
| 10,926,202 | ||||||||
|
| |||||||
Software - 2.6% | ||||||||
Dassault Systemes SE (France) | 325 | 49,360 | ||||||
Microsoft Corp. | 57,910 | 8,302,557 | ||||||
ServiceNow, Inc.*1 | 19,435 | 4,805,498 | ||||||
|
| |||||||
| 13,157,415 | ||||||||
|
| |||||||
Technology Hardware, Storage & Peripherals - 0.0%## |
| |||||||
NetApp, Inc. | 292 | 16,317 | ||||||
Western Digital Corp. | 476 | 24,585 | ||||||
|
| |||||||
| 40,902 | ||||||||
|
| |||||||
Total Information Technology | 47,614,634 | |||||||
|
| |||||||
Materials - 0.2% | ||||||||
Chemicals - 0.2% | ||||||||
Air Liquide S.A. (France) | 907 | 120,596 | ||||||
Akzo Nobel N.V. (Netherlands) | 1,285 | 118,469 | ||||||
Dow, Inc. | 674 | 34,030 | ||||||
Eastman Chemical Co. | 264 | 20,075 | ||||||
The accompanying notes are an integral part of the financial statements.
68
Investment Portfolio - October 31, 2019
| PRO-BLEND®EXTENDED TERM SERIES | ||||||||
SHARES
| VALUE (NOTE 2)
| |||||||
COMMON STOCKS (continued) | ||||||||
Materials (continued) | ||||||||
Chemicals(continued) | ||||||||
Givaudan S.A. (Switzerland) | 30 | $ | 88,138 | |||||
LyondellBasell Industries N.V. - Class A | 489 | 43,863 | ||||||
OCI N.V. (Netherlands)* | 1,460 | 32,827 | ||||||
Orbia Advance Corp. S.A.B. de C.V. (Mexico) | 39,200 | 84,854 | ||||||
Solvay S.A. (Belgium) | 2,060 | 223,975 | ||||||
|
| |||||||
| 766,827 | ||||||||
|
| |||||||
Containers & Packaging - 0.0%## | ||||||||
International Paper Co. | 474 | 20,704 | ||||||
|
| |||||||
Metals & Mining - 0.0%## | ||||||||
First Quantum Minerals Ltd. (Zambia) | 5,330 | 45,041 | ||||||
Lundin Mining Corp. (Chile) | 7,485 | 37,792 | ||||||
Nucor Corp. | 517 | 27,840 | ||||||
|
| |||||||
| 110,673 | ||||||||
|
| |||||||
Total Materials | 898,204 | |||||||
|
| |||||||
Real Estate - 3.7% | ||||||||
Equity Real Estate Investment Trusts (REITS) - 3.7% |
| |||||||
Acadia Realty Trust | 1,740 | 48,685 | ||||||
Agree Realty Corp. | 1,095 | 86,253 | ||||||
Alexandria Real Estate Equities, Inc. | 400 | 63,500 | ||||||
American Campus Communities, Inc. | 2,875 | 143,692 | ||||||
American Homes 4 Rent - Class A | 9,605 | 254,244 | ||||||
American Tower Corp. | 11,020 | 2,403,242 | ||||||
Americold Realty Trust | 5,355 | 214,682 | ||||||
Apartment Investment & Management Co.- Class A | 4,666 | 256,070 | ||||||
AvalonBay Communities, Inc. | 1,650 | 359,139 | ||||||
Boston Properties, Inc. | 1,431 | 196,333 | ||||||
Brandywine Realty Trust | 13,975 | 213,538 | ||||||
The British Land Co. plc (United Kingdom) | 12,835 | 103,195 | ||||||
Camden Property Trust | 1,690 | 193,285 | ||||||
Community Healthcare Trust, Inc. | 3,135 | 151,797 | ||||||
Cousins Properties, Inc. | 8,757 | 351,418 | ||||||
Crown Castle International Corp. | 1,205 | 167,242 | ||||||
CubeSmart | 1,505 | 47,708 | ||||||
Digital Realty Trust, Inc. | 1,400 | 177,856 | ||||||
Douglas Emmett, Inc. | 3,710 | 160,717 | ||||||
Equinix, Inc. | 7,145 | 4,049,643 | ||||||
Equity LifeStyle Properties, Inc. | 2,260 | 158,064 | ||||||
Equity Residential | 2,915 | 258,444 | ||||||
SHARES
| VALUE (NOTE 2)
| |||||||
COMMON STOCKS (continued) | ||||||||
Real Estate (continued) | ||||||||
Equity Real Estate Investment Trusts (REITS)(continued) |
| |||||||
Essential Properties Realty Trust, Inc. | 6,260 | $ | 160,632 | |||||
Essex Property Trust, Inc. | 622 | 203,475 | ||||||
Extra Space Storage, Inc. | 560 | 62,871 | ||||||
Federal Realty Investment Trust | 395 | 53,724 | ||||||
First Industrial Realty Trust, Inc. | 2,635 | 110,960 | ||||||
Getty Realty Corp. | 3,025 | 101,458 | ||||||
Healthcare Realty Trust, Inc. | 4,650 | 161,680 | ||||||
Healthcare Trust of America, Inc. - Class A | 2,860 | 88,660 | ||||||
Healthpeak Properties, Inc. | 6,690 | 251,678 | ||||||
Hibernia REIT plc (Ireland) | 54,110 | 84,247 | ||||||
Host Hotels & Resorts, Inc. | 5,425 | 88,916 | ||||||
Independence Realty Trust, Inc. | 7,505 | 115,577 | ||||||
Invitation Homes, Inc. | 10,633 | 327,390 | ||||||
Jernigan Capital, Inc. | 5,580 | 105,964 | ||||||
Kilroy Realty Corp. | 658 | 55,226 | ||||||
Land Securities Group plc (United Kingdom) | 8,610 | 104,875 | ||||||
Liberty Property Trust | 2,615 | 154,468 | ||||||
Life Storage, Inc. | 740 | 80,601 | ||||||
Mid-America Apartment Communities, Inc. | 810 | 112,582 | ||||||
National Retail Properties, Inc. | 2,755 | 162,297 | ||||||
National Storage Affiliates Trust | 2,725 | 93,113 | ||||||
Omega Healthcare Investors, Inc. | 2,605 | 114,724 | ||||||
Physicians Realty Trust | 9,510 | 177,552 | ||||||
Plymouth Industrial REIT, Inc. | 3,427 | 64,633 | ||||||
Prologis, Inc. | 6,190 | 543,234 | ||||||
Public Storage | 1,035 | 230,660 | ||||||
Realty Income Corp. | 835 | 68,295 | ||||||
SBA Communications Corp. | 9,830 | 2,365,590 | ||||||
Simon Property Group, Inc. | 2,415 | 363,892 | ||||||
STAG Industrial, Inc. | 3,360 | 104,294 | ||||||
STORE Capital Corp. | 2,340 | 94,770 | ||||||
Sun Communities, Inc. | 1,475 | 239,909 | ||||||
Sunstone Hotel Investors, Inc. | 4,545 | 61,403 | ||||||
UDR, Inc. | 3,883 | 195,121 | ||||||
UMH Properties, Inc. | 3,665 | 54,718 | ||||||
Urban Edge Properties | 6,805 | 143,654 | ||||||
Ventas, Inc. | 2,796 | 182,020 | ||||||
VEREIT, Inc. | 18,310 | 180,170 | ||||||
Vornado Realty Trust | 995 | 65,302 | ||||||
Weingarten Realty Investors | 4,375 | 138,819 | ||||||
Welltower, Inc. | 2,609 | 236,610 | ||||||
|
| |||||||
| 18,364,511 | ||||||||
|
| |||||||
The accompanying notes are an integral part of the financial statements.
69
Investment Portfolio - October 31, 2019
| PRO-BLEND® EXTENDED TERM SERIES | SHARES/ PRINCIPAL AMOUNT3
| |||||||
VALUE (NOTE 2)
| ||||||||
COMMON STOCKS (continued) | ||||||||
Real Estate (continued) | ||||||||
Real Estate Management & Development - 0.0%## |
| |||||||
Ayala Land, Inc. (Philippines) | 94,000 | $ | 89,829 | |||||
SM Prime Holdings, Inc. (Philippines) | 156,175 | 119,913 | ||||||
|
| |||||||
| 209,742 | ||||||||
|
| |||||||
Total Real Estate | 18,574,253 | |||||||
|
| |||||||
Utilities - 0.1% | ||||||||
Electric Utilities - 0.0%## | ||||||||
Manila Electric Co. (Philippines) | 7,840 | 52,282 | ||||||
|
| |||||||
Independent Power and Renewable Electricity Producers - 0.0%## |
| |||||||
Aboitiz Power Corp. (Philippines) | 81,900 | 64,477 | ||||||
|
| |||||||
Multi-Utilities - 0.1% | ||||||||
Engie S.A. (France) | 4,140 | 69,323 | ||||||
Veolia Environnement S.A. (France) | 1,265 | 33,300 | ||||||
|
| |||||||
| 102,623 | ||||||||
|
| |||||||
Total Utilities | 219,382 | |||||||
|
| |||||||
TOTAL COMMON STOCKS | ||||||||
(Identified Cost $219,211,780) | 253,725,205 | |||||||
|
| |||||||
CORPORATE BONDS - 12.0% | ||||||||
Non-Convertible Corporate Bonds - 12.0% | ||||||||
Communication Services - 2.5% | ||||||||
Diversified Telecommunication Services - 1.2% |
| |||||||
AT&T, Inc., 4.25%, 3/1/2027 | 2,280,000 | 2,504,136 | ||||||
CenturyLink, Inc., 5.625%, 4/1/2020 . | 50,000 | 50,625 | ||||||
Verizon Communications, Inc., 5.25%, 3/16/2037 | 2,720,000 | 3,426,053 | ||||||
|
| |||||||
| 5,980,814 | ||||||||
|
| |||||||
Interactive Media & Services - 0.4% | ||||||||
Tencent Holdings Ltd. (China)2, 3.975%, 4/11/2029 | 1,620,000 | 1,743,476 | ||||||
|
| |||||||
Media - 0.9% | ||||||||
Cablevision Systems Corp., 8.00%, 4/15/2020 | 50,000 | 51,250 | ||||||
Comcast Corp., 3.25%, 11/1/2039 | 1,690,000 | 1,713,349 | ||||||
Diamond Sports Group LLC - | ||||||||
Diamond Sports Finance Co.2, 6.625%, 8/15/2027 | 75,000 | 77,250 | ||||||
Discovery Communications LLC, 5.20%, 9/20/2047 | 2,230,000 | 2,438,630 | ||||||
Entercom Media Corp.2, 7.25%, 11/1/2024 | 25,000 | 26,062 | ||||||
PRINCIPAL AMOUNT3
| VALUE (NOTE 2)
| |||||||
CORPORATE BONDS (continued) | ||||||||
Non-Convertible Corporate Bonds (continued) |
| |||||||
Communication Services(continued) | ||||||||
Media(continued) | ||||||||
Townsquare Media, Inc.2, 6.50%, 4/1/2023 | 50,000 | $ | 49,500 | |||||
|
| |||||||
| 4,356,041 | ||||||||
|
| |||||||
Wireless Telecommunication Services - 0.0%## |
| |||||||
Sprint Communications, Inc., 7.00%, 8/15/2020 | 115,000 | 118,470 | ||||||
Sprint Corp., 7.25%, 9/15/2021 | 50,000 | 53,353 | ||||||
Sprint Corp., 7.125%, 6/15/2024 | 50,000 | 54,250 | ||||||
|
| |||||||
| 226,073 | ||||||||
|
| |||||||
Total Communication Services | 12,306,404 | |||||||
|
| |||||||
Consumer Discretionary - 1.7% | ||||||||
Auto Components - 0.0%## | ||||||||
American Axle & Manufacturing, Inc., 6.25%, 4/1/2025 | 25,000 | 24,094 | ||||||
Techniplas LLC2, 10.00%, 5/1/2020 | 65,000 | 54,925 | ||||||
|
| |||||||
| 79,019 | ||||||||
|
| |||||||
Automobiles - 0.5% | ||||||||
General Motors Financial Co., Inc., 3.15%, 1/15/2020 | 2,670,000 | 2,673,610 | ||||||
|
| |||||||
Diversified Consumer Services - 0.0%## |
| |||||||
GEMS MENASA Cayman Ltd. - GEMS Education Delaware LLC (United Arab Emirates)2, 7.125%, 7/31/2026 | 200,000 | 207,250 | ||||||
|
| |||||||
Household Durables - 0.1% | ||||||||
Ashton Woods USA LLC - Ashton | ||||||||
Woods Finance Co.2, 6.75%, 8/1/2025 | 55,000 | 55,275 | ||||||
LGI Homes, Inc.2, 6.875%, 7/15/2026 | 100,000 | 103,500 | ||||||
Weekley Homes LLC - Weekley Finance Corp., 6.625%, 8/15/2025 | 105,000 | 106,575 | ||||||
|
| |||||||
| 265,350 | ||||||||
|
| |||||||
Internet & Direct Marketing Retail - 1.1% |
| |||||||
Alibaba Group Holding Ltd. (China), 3.40%, 12/6/2027 | 1,740,000 | 1,807,271 | ||||||
Booking Holdings, Inc., 3.60%, 6/1/2026 | 3,250,000 | 3,518,637 | ||||||
Photo Holdings Merger Sub, Inc.2, 8.50%, 10/1/2026 | 75,000 | 66,010 | ||||||
|
| |||||||
| 5,391,918 | ||||||||
|
| |||||||
The accompanying notes are an integral part of the financial statements.
70
Investment Portfolio - October 31, 2019
| PRO-BLEND®EXTENDED TERM SERIES | ||||||||
PRINCIPAL AMOUNT3
| VALUE (NOTE 2)
| |||||||
CORPORATE BONDS (continued) | ||||||||
Non-Convertible Corporate Bonds (continued) |
| |||||||
Consumer Discretionary(continued) | ||||||||
Specialty Retail - 0.0%## | ||||||||
Foxtrot Escrow Issuer LLC - Foxtrot Escrow Corp.2, 12.25%, 11/15/2026 | 75,000 | $ | 75,382 | |||||
Staples, Inc.2, 7.50%, 4/15/2026 | 80,000 | 83,216 | ||||||
|
| |||||||
| 158,598 | ||||||||
|
| |||||||
Total Consumer Discretionary | 8,775,745 | |||||||
|
| |||||||
Consumer Staples - 0.0%## | ||||||||
Food & Staples Retailing - 0.0%## | ||||||||
KeHE Distributors LLC - KeHE Finance Corp.2, 8.625%, 10/15/2026 | 70,000 | 71,794 | ||||||
|
| |||||||
Energy - 1.9% | ||||||||
Energy Equipment & Services - 0.0%## |
| |||||||
Nabors Industries, Inc., 5.50%, 1/15/2023 | 55,000 | 46,475 | ||||||
Shelf Drilling Holdings Ltd. (United Arab Emirates)2, 8.25%, 2/15/2025 | 55,000 | 46,200 | ||||||
|
| |||||||
| 92,675 | ||||||||
|
| |||||||
Oil, Gas & Consumable Fuels - 1.9% | ||||||||
Antero Midstream Partners LP - Antero Midstream Finance Corp.2, 5.75%, 3/1/2027 | 50,000 | 37,187 | ||||||
Antero Midstream Partners LP - Antero Midstream Finance Corp.2, 5.75%, 1/15/2028 | 55,000 | 41,525 | ||||||
Bruin E&P Partners LLC2, 8.875%, 8/1/2023 | 55,000 | 36,300 | ||||||
Calumet Specialty Products Partners LP - Calumet Finance Corp.2, 11.00%, 4/15/2025 | 75,000 | 75,187 | ||||||
Energy Transfer Operating LP, 6.50%, 2/1/2042 | 1,590,000 | 1,904,347 | ||||||
Jonah Energy LLC - Jonah Energy Finance Corp.2, 7.25%, 10/15/2025 | 105,000 | 29,400 | ||||||
Kinder Morgan Energy Partners LP, 6.95%, 1/15/2038 | 1,940,000 | 2,507,882 | ||||||
Lonestar Resources America, Inc.2, 11.25%, 1/1/2023 | 50,000 | 35,000 | ||||||
Moss Creek Resources Holdings, Inc.2, 10.50%, 5/15/2027 | 15,000 | 11,587 | ||||||
NuStar Logistics LP, 6.75%, 2/1/2021 | 50,000 | 51,809 | ||||||
Rockies Express Pipeline LLC2, 5.625%, 4/15/2020 | 75,000 | 76,260 | ||||||
PRINCIPAL AMOUNT3
| VALUE (NOTE 2)
| |||||||
CORPORATE BONDS (continued) | ||||||||
Non-Convertible Corporate Bonds (continued) |
| |||||||
Energy(continued) | ||||||||
Oil, Gas & Consumable Fuels(continued) |
| |||||||
Sabine Pass Liquefaction LLC, 5.875%, 6/30/2026 | 2,630,000 | $ | 3,019,902 | |||||
Southwestern Energy Co.4, 6.20%, 1/23/2025 | 55,000 | 48,400 | ||||||
W&T Offshore, Inc.2, 9.75%, 11/1/2023 | 25,000 | 23,438 | ||||||
The Williams Companies, Inc., 3.75%, 6/15/2027 | 1,720,000 | 1,793,349 | ||||||
|
| |||||||
| 9,691,573 | ||||||||
|
| |||||||
Total Energy | 9,784,248 | |||||||
|
| |||||||
Financials - 2.8% | ||||||||
Banks - 2.4% | ||||||||
Bank of America Corp., 4.00%, 1/22/2025 | 3,190,000 | 3,402,515 | ||||||
Citigroup, Inc., 8.125%, 7/15/2039 | 1,060,000 | 1,743,772 | ||||||
Credit Suisse AG (Switzerland), 5.40%, 1/14/2020 | 2,590,000 | 2,606,783 | ||||||
JPMorgan Chase & Co.5, (3 mo. LIBOR US + 1.000%), 4.023%, 12/5/2024 | 1,700,000 | 1,815,256 | ||||||
Santander Holdings USA, Inc., 4.50%, 7/17/2025 | 2,190,000 | 2,359,941 | ||||||
|
| |||||||
| 11,928,267 | ||||||||
|
| |||||||
Capital Markets - 0.3% | ||||||||
AG Merger Sub II, Inc.2, 10.75%, 8/1/2027 | 50,000 | 49,500 | ||||||
Donnelley Financial Solutions, Inc., 8.25%, 10/15/2024 | 95,000 | 98,800 | ||||||
The Goldman Sachs Group, Inc., 4.25%, 10/21/2025 | 1,140,000 | 1,227,952 | ||||||
|
| |||||||
| 1,376,252 | ||||||||
|
| |||||||
Consumer Finance - 0.0%## | ||||||||
Navient Corp., 5.00%, 10/26/2020 | 75,000 | 76,384 | ||||||
SLM Corp., 5.125%, 4/5/2022 | 105,000 | 108,412 | ||||||
|
| |||||||
| 184,796 | ||||||||
|
| |||||||
Diversified Financial Services - 0.1% | ||||||||
Fidelity & Guaranty Life Holdings, Inc.2, 5.50%, 5/1/2025 | 50,000 | 53,375 | ||||||
Global Aircraft Leasing Co. Ltd. (Cayman Islands)2,6, 6.50%, 9/15/2024 | 75,000 | 76,759 | ||||||
VistaJet Malta Finance plc - XO Management Holding, Inc. (Switzerland)2, 10.50%, 6/1/2024 | 80,000 | 77,800 | ||||||
|
| |||||||
| 207,934 | ||||||||
|
| |||||||
The accompanying notes are an integral part of the financial statements.
71
Investment Portfolio - October 31, 2019
| PRO-BLEND®EXTENDED TERM SERIES | ||||||||
PRINCIPAL AMOUNT3
| VALUE (NOTE 2)
| |||||||
CORPORATE BONDS (continued) | ||||||||
Non-Convertible Corporate Bonds (continued) |
| |||||||
Financials (continued) | ||||||||
Thrifts & Mortgage Finance - 0.0%## | ||||||||
Acrisure LLC - Acrisure Finance, Inc.2, 7.00%, 11/15/2025 | 85,000 | $ | 77,775 | |||||
Radian Group, Inc., 4.875%, 3/15/2027 | 105,000 | 108,937 | ||||||
|
| |||||||
| 186,712 | ||||||||
|
| |||||||
Total Financials | 13,883,961 | |||||||
|
| |||||||
Health Care - 0.4% | ||||||||
Health Care Providers & Services - 0.4% |
| |||||||
HCA, Inc., 4.125%, 6/15/2029 | 1,770,000 | 1,875,147 | ||||||
|
| |||||||
Industrials - 1.5% | ||||||||
Commercial Services & Supplies - 0.0%## |
| |||||||
The ADT Security Corp., 6.25%, 10/15/2021 | 50,000 | 53,312 | ||||||
Prime Security Services Borrower LLC - Prime Finance, Inc.2, 5.75%, 4/15/2026 | 50,000 | 51,235 | ||||||
Stericycle, Inc.2, 5.375%, 7/15/2024 . | 105,000 | 109,200 | ||||||
|
| |||||||
| 213,747 | ||||||||
|
| |||||||
Construction & Engineering - 0.0%## | ||||||||
HC2 Holdings, Inc.2, 11.50%, 12/1/2021 | 25,000 | 22,781 | ||||||
Tutor Perini Corp.2, 6.875%, 5/1/2025 | 105,000 | 104,722 | ||||||
|
| |||||||
| 127,503 | ||||||||
|
| |||||||
Industrial Conglomerates - 0.4% | ||||||||
General Electric Co.5,7, (3 mo. LIBOR US + 3.330%), 5.00% | 1,980,000 | 1,908,225 | ||||||
|
| |||||||
Marine - 0.1% | ||||||||
American Tanker, Inc. (Norway)2, 9.25%, 2/22/2022 | 130,000 | 130,729 | ||||||
Borealis Finance LLC2, 7.50%, 11/16/2022 | 110,000 | 103,400 | ||||||
Global Ship Lease, Inc. (United Kingdom)2, 9.875%, 11/15/2022 | 125,000 | 129,687 | ||||||
|
| |||||||
| 363,816 | ||||||||
|
| |||||||
Trading Companies & Distributors - 1.0% |
| |||||||
AerCap Ireland Capital DAC - AerCap Global Aviation Trust (Ireland), 4.45%, 10/1/2025 | 2,260,000 | 2,452,277 | ||||||
Air Lease Corp., 3.625%, 4/1/2027 | 2,290,000 | 2,388,855 | ||||||
PRINCIPAL AMOUNT3
| VALUE (NOTE 2)
| |||||||
CORPORATE BONDS (continued) | ||||||||
Non-Convertible Corporate Bonds (continued) |
| |||||||
Industrials (continued) | ||||||||
Trading Companies & Distributors(continued) |
| |||||||
Fortress Transportation & Infrastructure Investors LLC2, 6.50%, 10/1/2025 | 80,000 | $ | 80,800 | |||||
|
| |||||||
| 4,921,932 | ||||||||
|
| |||||||
Total Industrials |
|
7,535,223 |
| |||||
|
| |||||||
Information Technology - 0.0%## | ||||||||
Communications Equipment - 0.0%## | ||||||||
Hughes Satellite Systems Corp., 5.25%, 8/1/2026 | 100,000 | 107,125 | ||||||
|
| |||||||
Materials - 0.6% | ||||||||
Chemicals - 0.0%## | ||||||||
CF Industries, Inc., 7.125%, 5/1/2020 | 50,000 | 51,202 | ||||||
Olin Corp., 5.625%, 8/1/2029 | 50,000 | 51,913 | ||||||
|
| |||||||
| 103,115 | ||||||||
|
| |||||||
Containers & Packaging - 0.0%## | ||||||||
ARD Securities Finance S.A.R.L (Luxembourg)2,6, 8.75%, 1/31/2023 | 31,312 | 32,564 | ||||||
Berry Global, Inc.2, 4.50%, 2/15/2026 | 35,000 | 35,219 | ||||||
Mauser Packaging Solutions Holding Co.2, 7.25%, 4/15/2025 | 55,000 | 52,594 | ||||||
|
| |||||||
| 120,377 | ||||||||
|
| |||||||
Metals & Mining - 0.6% | ||||||||
Infrabuild Australia Pty Ltd. (Australia)2, 12.00%, 10/1/2024 | 80,000 | 81,530 | ||||||
Mountain Province Diamonds, Inc. | 105,000 | 101,850 | ||||||
Northwest Acquisitions ULC - Dominion Finco, Inc.2, 7.125%, 11/1/2022 | 105,000 | 52,500 | ||||||
Southern Copper Corp. (Peru), 5.375%, 4/16/2020 | 2,360,000 | 2,389,115 | ||||||
SunCoke Energy Partners LP - SunCoke Energy Partners Finance Corp.2, 7.50%, 6/15/2025 | 25,000 | 21,250 | ||||||
|
| |||||||
| 2,646,245 | ||||||||
|
| |||||||
Total Materials | 2,869,737 | |||||||
|
| |||||||
Real Estate - 0.6% | ||||||||
Equity Real Estate Investment Trusts (REITS) - 0.6% |
| |||||||
American Tower Corp., 3.80%, 8/15/2029 | 2,170,000 | 2,319,801 | ||||||
The accompanying notes are an integral part of the financial statements.
72
Investment Portfolio - October 31, 2019
| PRO-BLEND® EXTENDED TERM SERIES | PRINCIPAL AMOUNT3/ SHARES
| |||||||
VALUE (NOTE 2)
| ||||||||
CORPORATE BONDS (continued) | ||||||||
Non-Convertible Corporate Bonds (continued) |
| |||||||
Real Estate (continued) | ||||||||
Equity Real Estate Investment Trusts (REITS)(continued) |
| |||||||
GTP Acquisition Partners I LLC2, 2.35%, 6/15/2020 | 427,000 | $ | 427,149 | |||||
|
| |||||||
| 2,746,950 | ||||||||
|
| |||||||
Real Estate Management & Development - 0.0%## |
| |||||||
Five Point Operating Co. LP - Five Point Capital Corp.2, 7.875%, 11/15/2025 | 80,000 | 75,614 | ||||||
Forestar Group, Inc.2, 8.00%, 4/15/2024 | 50,000 | 53,750 | ||||||
|
| |||||||
| 129,364 | ||||||||
|
| |||||||
Total Real Estate | 2,876,314 | |||||||
|
| |||||||
Utilities - 0.0%## | ||||||||
Independent Power and Renewable Electricity Producers - 0.0%## |
| |||||||
Drax Finco plc (United Kingdom)2, 6.625%, 11/1/2025 | 245,000 | 259,394 | ||||||
|
| |||||||
TOTAL CORPORATE BONDS | ||||||||
(Identified Cost $58,029,971) | 60,345,092 | |||||||
|
| |||||||
MUTUAL FUNDS - 0.4% | ||||||||
iShares MSCI India ETF | 16,645 | 576,749 | ||||||
SPDR Gold Shares* | 5,835 | 831,079 | ||||||
VanEck Vectors Gold Miners ETF | 15,370 | 432,666 | ||||||
|
| |||||||
TOTAL MUTUAL FUNDS | ||||||||
(Identified Cost $1,690,525) | 1,840,494 | |||||||
|
| |||||||
U.S. TREASURY SECURITIES - 16.3% | ||||||||
U.S. Treasury Bonds - 7.8% | ||||||||
U.S. Treasury Bond, 4.75%, 2/15/2037 | 7,094,000 | 10,092,878 | ||||||
U.S. Treasury Bond, 2.50%, 2/15/2045 | 9,653,000 | 10,269,133 | ||||||
U.S. Treasury Bond, 3.00%, 5/15/2047 | 13,040,000 | 15,269,025 | ||||||
U.S. Treasury Inflation Indexed Bond, 0.75%, 2/15/2042 | 3,211,167 | 3,374,253 | ||||||
|
| |||||||
Total U.S. Treasury Bonds | ||||||||
(Identified Cost $34,666,336) | 39,005,289 | |||||||
|
| |||||||
U.S. Treasury Notes - 8.5% | ||||||||
U.S. Treasury Inflation Indexed Note, 0.125%, 4/15/2020 | 4,473,062 | 4,449,124 | ||||||
U.S. Treasury Inflation Indexed Note, 0.50%, 4/15/2024 | 5,203,234 | 5,271,638 | ||||||
PRINCIPAL AMOUNT3
| VALUE (NOTE 2)
| |||||||
U.S. TREASURY SECURITIES (continued) |
| |||||||
U.S. Treasury Notes (continued) |
| |||||||
U.S. Treasury Note, 2.625%, 5/15/2021 | 5,205,000 | $ | 5,286,328 | |||||
U.S. Treasury Note, 2.50%, 5/15/2024 | 9,596,000 | 10,000,831 | ||||||
U.S. Treasury Note, 2.00%, 8/15/2025 | 7,390,000 | 7,561,760 | ||||||
U.S. Treasury Note, 1.625%, 5/15/2026 | 10,134,000 | 10,150,230 | ||||||
|
| |||||||
Total U.S. Treasury Notes | ||||||||
(Identified Cost $42,091,538) | 42,719,911 | |||||||
|
| |||||||
TOTAL U.S. TREASURY SECURITIES | ||||||||
(Identified Cost $76,757,874) | 81,725,200 | |||||||
|
| |||||||
ASSET-BACKED SECURITIES - 3.5% | ||||||||
Cazenovia Creek Funding I LLC,Series 2015-1A, Class A2, 2.00%, 12/10/2023 | 9,380 | 9,375 | ||||||
Cazenovia Creek Funding II LLC,Series 2018-1A, Class A2, 3.561%, 7/15/2030 | 745,885 | 751,302 | ||||||
Chesapeake Funding II LLC,Series 2017-2A, Class A1 (Canada)2, 1.99%, 5/15/2029 | 2,746,414 | 2,745,563 | ||||||
Chesapeake Funding II LLC,Series 2017-4A, Class A1 (Canada)2, 2.12%, 11/15/2029 | 817,479 | 817,490 | ||||||
Commonbond Student Loan Trust,Series 2019-AGS, Class A12, 2.54%, 1/25/2047 | 1,750,000 | 1,749,403 | ||||||
Credit Acceptance Auto Loan Trust,Series 2017-1A, Class A2, 2.56%, 10/15/2025 | 244,023 | 244,119 | ||||||
Invitation Homes Trust, Series 2017-SFR2, Class A2,8, (1 mo. LIBOR US + 0.850%), 2.739%, 12/17/2036 | 492,937 | 492,244 | ||||||
Invitation Homes Trust, Series 2017-SFR2, Class B2,8, (1 mo. LIBOR US + 1.150%), 3.039%, 12/17/2036 | 390,000 | 390,366 | ||||||
Progress Residential Trust,Series 2019-SFR4, Class A2, 2.687%, 10/17/2036 | 1,200,000 | 1,205,126 | ||||||
SoFi Consumer Loan Program Trust, Series2019-2, Class A2, 3.01%, 4/25/2028 | 877,696 | 884,567 | ||||||
SoFi Consumer Loan Program Trust, Series2019-3, Class A2, 2.90%, 5/25/2028 | 1,125,410 | 1,133,418 | ||||||
The accompanying notes are an integral part of the financial statements.
73
Investment Portfolio - October 31, 2019
| PRO-BLEND® EXTENDED TERM SERIES | ||||||||
PRINCIPAL AMOUNT3
| VALUE (NOTE 2)
| |||||||
ASSET-BACKED SECURITIES (continued) |
| |||||||
SoFi Professional Loan Program LLC, Series2017-F, Class A1FX2, 2.05%, 1/25/2041 | 123,388 | $ | 123,379 | |||||
SoFi Professional Loan Program LLC, Series2017-F, Class A2FX2, 2.84%, 1/25/2041 | 300,000 | 304,455 | ||||||
SoFi Professional Loan Program LLC, Series2018-A, Class A2A2, 2.39%, 2/25/2042 | 367,707 | 368,416 | ||||||
SoFi Professional Loan Program Trust, Series2018-C, Class A1FX2, 3.08%, 1/25/2048 | 1,147,619 | 1,154,809 | ||||||
Tax Ease Funding LLC, Series2016-1A, Class A2, 3.131%, 6/15/2028 | 153,166 | 153,132 | ||||||
Towd Point Mortgage Trust, Series2016-5, Class A12,9, 2.50%, 10/25/2056 | 839,834 | 843,046 | ||||||
Towd Point Mortgage Trust, Series2017-1, Class A12,9, 2.75%, 10/25/2056 | 1,138,806 | 1,152,281 | ||||||
Towd Point Mortgage Trust, Series2019-HY1, Class A12,8, (1 mo. LIBOR US + 1.000%), 2.823%, 10/25/2048 | 1,034,225 | 1,039,750 | ||||||
Tricon American Homes Trust, Series 2016-SFR1, Class A2, 2.589%, 11/17/2033 | 853,448 | 853,267 | ||||||
Tricon American Homes Trust, Series 2017-SFR2, Class A2, 2.928%, 1/17/2036 | 997,171 | 1,012,124 | ||||||
|
| |||||||
TOTAL ASSET-BACKED SECURITIES | ||||||||
(Identified Cost $17,319,014) | 17,427,632 | |||||||
|
| |||||||
COMMERCIAL MORTGAGE-BACKED SECURITIES - 5.2% |
| |||||||
Americold LLC Trust, Series 2010-ARTA, Class A12, 3.847%, 1/14/2029 | 48,404 | 48,888 | ||||||
BWAY Mortgage Trust, Series 2015-1740, Class A2, 2.917%, 1/10/2035 | 2,411,000 | 2,469,608 | ||||||
CIM Trust, Series 2019-INV1, Class A12,9, 4.00%, 2/25/2049 | 490,810 | 501,522 | ||||||
Credit Suisse Mortgage Capital Trust, Series 2013-IVR3, Class A12,9, 2.50%, 5/25/2043 | 514,452 | 509,040 | ||||||
Credit Suisse Mortgage Capital Trust, Series2013-TH1, Class A12,9, 2.13%, 2/25/2043 | 483,763 | 473,099 | ||||||
Fannie Mae REMICS, Series2018-31, Class KP, 3.50%, 7/25/2047 | 927,499 | 968,259 | ||||||
PRINCIPAL AMOUNT3
| VALUE (NOTE 2)
| |||||||
COMMERCIAL MORTGAGE-BACKED SECURITIES (continued) |
| |||||||
FannieMae-Aces, Series2017-M15, Class A19, 2.959%, 9/25/2027 | 1,333,926 | $ | 1,397,738 | |||||
FDIC Trust, Series2011-R1, Class A2, 2.672%, 7/25/2026 | 11,120 | 11,100 | ||||||
Freddie Mac Multifamily StructuredPass-Through Certificates, Series K009, Class X1 (IO)9, 1.26%, 8/25/2020 | 7,570,380 | 54,355 | ||||||
Freddie Mac Multifamily StructuredPass-Through Certificates, Series K014, Class X1 (IO)9, 1.149%, 4/25/2021 | 8,846,148 | 123,452 | ||||||
Freddie Mac Multifamily StructuredPass-Through Certificates, Series K016, Class X1 (IO)9, 1.478%, 10/25/2021 | 3,628,168 | 89,792 | ||||||
Freddie Mac Multifamily StructuredPass-Through Certificates, Series K017, Class X1 (IO)9, 1.298%, 12/25/2021 | 15,496,697 | 344,079 | ||||||
Freddie Mac Multifamily StructuredPass-Through Certificates, Series K021, Class X1 (IO)9, 1.428%, 6/25/2022 | 10,655,059 | 342,886 | ||||||
Freddie Mac Multifamily StructuredPass-Through Certificates, Series K030, Class X1 (IO)9, 0.188%, 4/25/2023 | 42,859,082 | 258,693 | ||||||
Freddie Mac Multifamily StructuredPass-Through Certificates, Series K032, Class X1 (IO)9, 0.098%, 5/25/2023 | 27,485,278 | 107,278 | ||||||
Freddie Mac REMICS, Series 4791, Class BA, 4.00%, 3/15/2044 | 953,910 | 966,800 | ||||||
Freddie Mac REMICS, Series 4801, Class BA, 4.50%, 5/15/2044 | 855,816 | 873,689 | ||||||
FREMF Mortgage Trust, Series2013-K28, Class X2A (IO)2, 0.10%, 6/25/2046 | 75,810,098 | 203,141 | ||||||
FREMF Mortgage Trust, Series 2013-K712, Class B2,9, 3.263%, 5/25/2045 | 767,000 | 766,239 | ||||||
FREMF Mortgage Trust, Series 2013-K713, Class B2,9, 3.152%, 4/25/2046 | 1,350,000 | 1,352,180 | ||||||
FREMF Mortgage Trust, Series2014-K41, Class B2,9, 3.832%, 11/25/2047 | 1,315,000 | 1,380,344 | ||||||
FREMF Mortgage Trust, Series 2014-K715, Class B2,9, 3.971%, 2/25/2046 | 1,279,000 | 1,303,708 | ||||||
Government National Mortgage Association, Series2017-54, Class AH, 2.60%, 12/16/2056 | 1,453,766 | 1,465,939 | ||||||
The accompanying notes are an integral part of the financial statements.
74
Investment Portfolio - October 31, 2019
| PRO-BLEND® EXTENDED TERM SERIES | ||||||||
PRINCIPAL AMOUNT3
| VALUE (NOTE 2)
| |||||||
COMMERCIAL MORTGAGE-BACKED SECURITIES (continued) |
| |||||||
GS Mortgage Securities Trust, Series2010-C2, Class A12, 3.849%, 12/10/2043 | 23,874 | $ | 24,014 | |||||
JP Morgan Mortgage Trust, Series2013-1, Class 1A22,9, 3.00%, 3/25/2043 | 344,220 | 347,590 | ||||||
JP Morgan Mortgage Trust, Series2013-2, Class A22,9, 3.50%, 5/25/2043 | 292,658 | 298,371 | ||||||
JP Morgan Mortgage Trust, Series2014-2, Class 1A12,9, 3.00%, 6/25/2029 | 464,733 | 472,022 | ||||||
JP Morgan Mortgage Trust, Series2017-3, Class 1A52,9, 3.50%, 8/25/2047 | 917,328 | 928,293 | ||||||
JP Morgan Mortgage Trust, Series2017-6, Class A52,9, 3.50%, 12/25/2048 | 1,195,028 | 1,211,493 | ||||||
New Residential Mortgage Loan Trust, Series2014-3A, Class AFX32,9, 3.75%, 11/25/2054 | 329,115 | 342,356 | ||||||
New Residential Mortgage Loan Trust, Series2015-2A, Class A12,9, 3.75%, 8/25/2055 | 507,014 | 528,587 | ||||||
New Residential Mortgage Loan Trust, Series2016-4A, Class A12,9, 3.75%, 11/25/2056 | 523,417 | 545,932 | ||||||
OBP Depositor LLC Trust, Series2010-OBP, Class A2, 4.646%, 7/15/2045 | 115,000 | 115,451 | ||||||
Sequoia Mortgage Trust, Series2013-2, Class A9, 1.874%, 2/25/2043 | 372,356 | 359,006 | ||||||
Sequoia Mortgage Trust, Series2013-7, Class A29, 3.00%, 6/25/2043 | 422,683 | 425,761 | ||||||
Sequoia Mortgage Trust, Series2013-8, Class A19, 3.00%, 6/25/2043 | 433,899 | 438,798 | ||||||
Starwood Retail Property Trust, Series 2014-STAR, Class A2,8, (1 mo. LIBOR US + 1.220%), 3.134%, 11/15/2027 | 971,430 | 969,683 | ||||||
Vornado DP LLC Trust, Series2010-VNO, Class A2FX2, 4.004%, 9/13/2028 | 350,000 | 352,455 | ||||||
Waikiki Beach Hotel Trust, Series2019-WBM, Class A2,8, (1 mo. LIBOR US + 1.050%), 2.971%, 12/15/2033 | 1,200,000 | 1,200,744 | ||||||
Wells Fargo Commercial Mortgage Trust, Series2010-C1, Class A22, 4.393%, 11/15/2043 | 600,000 | 607,931 | ||||||
PRINCIPAL AMOUNT3
| VALUE (NOTE 2)
| |||||||
COMMERCIAL MORTGAGE-BACKED SECURITIES(continued) |
| |||||||
WinWater Mortgage Loan Trust,Series 2015-1, Class A12,9, 3.50%, 1/20/2045 | 390,055 | $ | 397,201 | |||||
WinWater Mortgage Loan Trust, Series2015-3, Class A52,9, 3.50%, 3/20/2045 | 273,257 | 273,877 | ||||||
|
| |||||||
TOTAL COMMERCIAL MORTGAGE-BACKED SECURITIES |
| |||||||
(Identified Cost $25,065,569) | 25,851,394 | |||||||
|
| |||||||
FOREIGN GOVERNMENT BONDS - 1.1% |
| |||||||
Canadian Government Bond (Canada), 2.75%, 6/1/2022 | CAD 358,000 | 280,341 | ||||||
Export-Import Bank of Korea (South Korea), 2.625%, 12/30/2020 | 4,625,000 | 4,651,571 | ||||||
Mexican Government Bond (Mexico), 8.00%, 6/11/2020 | MXN 7,313,000 | 382,866 | ||||||
Mexican Government Bond (Mexico), 6.50%, 6/10/2021 | MXN 3,112,000 | 161,415 | ||||||
Mexican Government Bond (Mexico), 6.50%, 6/9/2022 | MXN 5,057,000 | 262,578 | ||||||
Mexican Government Bond (Mexico), 7.75%, 5/29/2031 | MXN 972,000 | 54,037 | ||||||
|
| |||||||
TOTAL FOREIGN GOVERNMENT BONDS | ||||||||
(Identified Cost $6,213,326) | 5,792,808 | |||||||
|
| |||||||
U.S. GOVERNMENT AGENCIES - 9.0% |
| |||||||
Mortgage-Backed Securities - 9.0% |
| |||||||
Fannie Mae, Pool #888468, 5.50%, 9/1/2021 | 43,611 | 44,241 | ||||||
Fannie Mae, Pool #995233, 5.50%, 10/1/2021 | 1,661 | 1,677 | ||||||
Fannie Mae, Pool #888017, 6.00%, 11/1/2021 | 8,536 | 8,719 | ||||||
Fannie Mae, Pool #995329, 5.50%, 12/1/2021 | 40,574 | 41,199 | ||||||
Fannie Mae, Pool #888136, 6.00%, 12/1/2021 | 9,597 | 9,820 | ||||||
Fannie Mae, Pool #888810, 5.50%, 11/1/2022 | 52,878 | 53,577 | ||||||
Fannie Mae, Pool #990895, 5.50%, 10/1/2023 | 14,792 | 15,461 | ||||||
Fannie Mae, Pool #AD0462, 5.50%, 10/1/2024 | 10,849 | 11,391 | ||||||
Fannie Mae, Pool #AL9409, 3.50%, 11/1/2031 | 1,058,721 | 1,100,293 | ||||||
Fannie Mae, Pool #MA3463, 4.00%, 9/1/2033 | 1,455,004 | 1,519,220 | ||||||
Fannie Mae, Pool #MA1834, 4.50%, 2/1/2034 | 569,965 | 612,576 | ||||||
The accompanying notes are an integral part of the financial statements.
75
Investment Portfolio - October 31, 2019
| PRO-BLEND® EXTENDED TERM SERIES | ||||||||
PRINCIPAL AMOUNT3
| VALUE (NOTE 2)
| |||||||
U.S. GOVERNMENT AGENCIES (continued) |
| |||||||
Mortgage-Backed Securities (continued) | ||||||||
Fannie Mae, Pool #MA1903, 4.50%, 5/1/2034 | 405,253 | $ | 435,553 | |||||
Fannie Mae, Pool #FM1158, 3.50%, 6/1/2034 | 2,073,991 | 2,148,694 | ||||||
Fannie Mae, Pool #909786, 5.50%, 3/1/2037 | 90,152 | 101,004 | ||||||
Fannie Mae, Pool #889576, 6.00%, 4/1/2038 | 235,000 | 270,412 | ||||||
Fannie Mae, Pool #889579, 6.00%, 5/1/2038 | 196,699 | 226,138 | ||||||
Fannie Mae, Pool #MA3412, 3.50%, 7/1/2038 | 1,560,074 | 1,616,721 | ||||||
Fannie Mae, Pool #995196, 6.00%, 7/1/2038 | 11,904 | 13,698 | ||||||
Fannie Mae, Pool #AD0207, 6.00%, 10/1/2038 | 490,349 | 563,609 | ||||||
Fannie Mae, Pool #AD0220, 6.00%, 10/1/2038 | 18,856 | 21,694 | ||||||
Fannie Mae, Pool #AD0307, 5.50%, 1/1/2039 | 308,460 | 346,445 | ||||||
Fannie Mae, Pool #MA0258, 4.50%, 12/1/2039 | 418,029 | 452,855 | ||||||
Fannie Mae, Pool #AL1595, 6.00%, 1/1/2040 | 246,399 | 283,548 | ||||||
Fannie Mae, Pool #AL0152, 6.00%, 6/1/2040 | 461,015 | 529,931 | ||||||
Fannie Mae, Pool #AL0241, 4.00%, 4/1/2041 | 723,659 | 774,408 | ||||||
Fannie Mae, Pool #AI5172, 4.00%, 8/1/2041 | 543,071 | 581,188 | ||||||
Fannie Mae, Pool #AL1410, 4.50%, 12/1/2041 | 1,032,646 | 1,119,533 | ||||||
Fannie Mae, Pool #AL7729, 4.00%, 6/1/2043 | 588,052 | 629,137 | ||||||
Fannie Mae, Pool #AS3622, 3.50%, 10/1/2044 | 2,106,202 | 2,217,981 | ||||||
Fannie Mae, Pool #AX5234, 4.50%, 11/1/2044 | 430,926 | 457,464 | ||||||
Fannie Mae, Pool #AS4103, 4.50%, 12/1/2044 | 602,099 | 647,931 | ||||||
Fannie Mae, Pool #AZ9215, 4.00%, 10/1/2045 | 448,302 | 472,097 | ||||||
Fannie Mae, Pool #BC3490, 3.50%, 2/1/2046 | 1,532,750 | 1,597,837 | ||||||
Fannie Mae, Pool #BC6764, 3.50%, 4/1/2046 | 629,058 | 655,513 | ||||||
Fannie Mae, Pool #MA2670, 3.00%, 7/1/2046 | 460,564 | 473,224 | ||||||
Fannie Mae, Pool #MA2705, 3.00%, 8/1/2046 | 911,447 | 935,478 | ||||||
PRINCIPAL AMOUNT3
| VALUE (NOTE 2)
| |||||||
U.S. GOVERNMENT AGENCIES(continued) |
| |||||||
Mortgage-Backed Securities(continued) | ||||||||
Fannie Mae, Pool #BD6997, 4.00%, 10/1/2046 | 744,023 | $ | 781,942 | |||||
Fannie Mae, Pool #BE7845, 4.50%, 2/1/2047 | 628,609 | 663,748 | ||||||
Fannie Mae, Pool #CA1922, 5.00%, 6/1/2048 | 1,703,912 | 1,826,702 | ||||||
Fannie Mae, Pool #MA3443, 4.00%, 8/1/2048 | 1,054,983 | 1,094,256 | ||||||
Fannie Mae, Pool #BK9598, 4.50%, 8/1/2048 | 543,936 | 573,470 | ||||||
Fannie Mae, Pool #CA2219, 5.00%, 8/1/2048 | 964,384 | 1,033,860 | ||||||
Fannie Mae, Pool #CA2373, 5.00%, 9/1/2048 | 1,002,765 | 1,074,984 | ||||||
Fannie Mae, Pool #MA3521, 4.00%, 11/1/2048 | 2,158,049 | 2,240,350 | ||||||
Fannie Mae, Pool #BN0622, 4.50%, 1/1/2049 | 1,768,270 | 1,860,867 | ||||||
Fannie Mae, Pool #AL8674, 5.645%, 1/1/2049 | 1,209,084 | 1,361,057 | ||||||
Fannie Mae, Pool #MA3692, 3.50%, 7/1/2049 | 2,699,929 | 2,769,865 | ||||||
Freddie Mac, Pool #G11850, 5.50%, 7/1/2020 | 917 | 920 | ||||||
Freddie Mac, Pool #G12610, 6.00%, 3/1/2022 | 12,203 | 12,505 | ||||||
Freddie Mac, Pool #G12655, 6.00%, 5/1/2022 | 8,394 | 8,630 | ||||||
Freddie Mac, Pool #G12988, 6.00%, 1/1/2023 | 7,379 | 7,653 | ||||||
Freddie Mac, Pool #G13078, 6.00%, 3/1/2023 | 12,331 | 12,745 | ||||||
Freddie Mac, Pool #G13331, 5.50%, 10/1/2023 | 5,640 | 5,849 | ||||||
Freddie Mac, Pool #C91762, 4.50%, 5/1/2034 | 391,403 | 420,894 | ||||||
Freddie Mac, Pool #C91771, 4.50%, 6/1/2034 | 319,237 | 342,923 | ||||||
Freddie Mac, Pool #C91780, 4.50%, 7/1/2034 | 441,920 | 475,220 | ||||||
Freddie Mac, Pool #QN0349, 3.00%, 8/1/2034 | 1,327,696 | 1,360,301 | ||||||
Freddie Mac, Pool #G03926, 6.00%, 2/1/2038 | 103,695 | 119,280 | ||||||
Freddie Mac, Pool #G04731, 5.50%, 4/1/2038 | 161,407 | 181,389 | ||||||
Freddie Mac, Pool #G08273, 5.50%, 6/1/2038 | 201,696 | 226,358 | ||||||
Freddie Mac, Pool #G04601, 5.50%, 7/1/2038 | 437,471 | 490,027 | ||||||
The accompanying notes are an integral part of the financial statements.
76
Investment Portfolio - October 31, 2019
| PRO-BLEND® EXTENDED TERM SERIES | ||||||||
PRINCIPAL AMOUNT3
| VALUE (NOTE 2)
| |||||||
U.S. GOVERNMENT AGENCIES (continued) |
| |||||||
Mortgage-Backed Securities (continued) |
| |||||||
Freddie Mac, Pool #G04587, 5.50%, 8/1/2038 | 424,312 | $ | 476,322 | |||||
Freddie Mac, Pool #G05906, 6.00%, 4/1/2040 | 114,249 | 128,056 | ||||||
Freddie Mac, Pool #A92889, 4.50%, 7/1/2040 | 1,094,425 | 1,176,371 | ||||||
Freddie Mac, Pool #G60183, 4.00%, 12/1/2044 | 482,478 | 506,529 | ||||||
Freddie Mac, Pool #Q33778, 4.00%, 6/1/2045 | 623,913 | 660,020 | ||||||
Freddie Mac, Pool #ZM2525, 3.00%, 12/1/2046 | 1,235,300 | 1,265,937 | ||||||
Freddie Mac, Pool #Q59805, 4.50%, 11/1/2048 | 984,922 | 1,037,322 | ||||||
|
| |||||||
TOTAL U.S. GOVERNMENT AGENCIES | ||||||||
(Identified Cost $44,434,607) | 45,186,619 | |||||||
|
| |||||||
U.S. GOVERNMENT SECURITIES - 1.0% |
| |||||||
U.S. Treasury Bill - 1.0% |
| |||||||
U.S. Treasury Bill10, 1.62%, 5/21/2020 | ||||||||
(Identified Cost $5,138,450) | 5,185,000 | 5,140,341 | ||||||
|
| |||||||
SHARES
| VALUE (NOTE 2)
| |||||||
SHORT-TERM INVESTMENT - 1.1% |
| |||||||
Dreyfus Government Cash Management, | ||||||||
(Identified Cost $5,431,336) | 5,431,336 | $ | 5,431,336 | |||||
|
| |||||||
TOTAL INVESTMENTS INSECURITIES - 100.2% | ||||||||
(Identified Cost $459,292,452) | 502,466,121 | |||||||
|
| |||||||
TOTAL OPTIONS WRITTEN — 0.0%## | ||||||||
(Premiums Received $118,390) | (197,002 | ) | ||||||
|
| |||||||
TOTAL INVESTMENTS - 100.2% | 502,269,119 | |||||||
LIABILITIES, LESS OTHER ASSETS - (0.2%) | (1,019,129 | ) | ||||||
|
| |||||||
NET ASSETS - 100% | $ | 501,249,990 | ||||||
|
| |||||||
|
| |||||||
ADR - American Depositary Receipt
CAD - Canadian Dollar
ETF - Exchange-traded fund
IO - Interest only
LIBOR - London Interbank Offered Rate
MXN - Mexican Peso
| EXCHANGE-TRADED OPTIONS WRITTEN | ||||||||||||||||||||||||
| DESCRIPTION | NUMBER OF | EXPIRATION DATE | EXERCISE PRICE | NOTIONAL AMOUNT (000)3 | VALUE | |||||||||||||||||||
Call | ||||||||||||||||||||||||
Sea Ltd. - ADR | 624 | 11/15/2019 | $ 27.00 | 1,857 | $(193,440) | |||||||||||||||||||
Put | ||||||||||||||||||||||||
Electronic Arts, Inc. | 141 | 11/01/2019 | 87.50 | 1,359 | (282) | |||||||||||||||||||
ServiceNow, Inc. | 82 | 11/08/2019 | 200.00 | 2,028 | (3,280) | |||||||||||||||||||
| (3,562) | ||||||||||||||||||||||||
TOTAL EXCHANGE-TRADED OPTIONS WRITTEN (PREMIUMS RECEIVED $118,390) |
| $(197,002) | ||||||||||||||||||||||
*Non-income producing security.
## Less than 0.1%.
1A portion of this security is designated as collateral for options contracts written. As of October 31, 2019, the total value of such securities was $12,168,727.
2Restricted securities - Investment in securities that are restricted as to public resale under the Securities Act of 1933, as amended. These securities have been sold under Rule 144A and have been determined to be liquid under the Fund’s Liquidity Risk Management Program. These securities amount to $40,644,013, or 8.1% of the Series’ net assets as of October 31, 2019 (see Note 2 to the financial statements).
3Amount is stated in USD unless otherwise noted.
The accompanying notes are an integral part of the financial statements.
77
Investment Portfolio - October 31, 2019
4Step coupon rate security - Rate steps up/down by 25 basis points upon rating downgrade/upgrade by Moody’s and S&P rating agencies (Subject to a
maximum of 100 basis points per agency, 200 basis points maximum).
5Variable rate security. Security may be issued at a fixed coupon rate, which converts to a variable rate at a specified date. Rate shown is the rate in effect
as of October 31, 2019.
6Represents aPayment-In-Kind bond.
7Security is perpetual in nature and has no stated maturity date.
8Floating rate security. Rate shown is the rate in effect as of October 31, 2019.
9Variable or floating rate security, the interest rate of which adjusts periodically based on changes in current interest rates and prepayments on the
underlying pool of assets. Rate shown is the rate in effect as of October 31, 2019.
10Represents the annualized yield at time of purchase.
11Rate shown is the current yield as of October 31, 2019.
The Global Industry Classification Standard (GICS) was developed by and is the exclusive property and a service mark of MSCI Inc. (MSCI) and Standard & Poor’s, a division of S&P Global Inc. (S&P), and is licensed for use by Manning & Napier when referencing GICS sectors. Neither MSCI, S&P, nor any third party involved in making or compiling the GICS or any GICS classifications makes any express or implied warranties or representations with respect to such standard or classification, nor shall any such party have any liability therefrom.
The accompanying notes are an integral part of the financial statements.
78
Statement of Assets and Liabilities -Pro-Blend® Extended Term Series
October 31, 2019
ASSETS: | ||||
Investments in securities, at value (identified cost $459,292,452) (Note 2) | $ | 502,466,121 | ||
Interest receivable | 1,619,464 | |||
Foreign tax reclaims receivable | 504,030 | |||
Receivable for fund shares sold | 329,587 | |||
Receivable for securities sold | 163,827 | |||
Dividends receivable | 144,467 | |||
Prepaid and other expenses | 33,588 | |||
|
| |||
TOTAL ASSETS | 505,261,084 | |||
|
| |||
LIABILITIES: | ||||
Accrued management fees (Note 3) | 258,980 | |||
Accrued distribution and service (Rule12b-1) fees (Class S) (Class R) (Class L) (Note 3) | 148,041 | |||
Accruedsub-transfer agent fees (Note 3) | 127,722 | |||
Accrued fund accounting and administration fees (Note 3) | 42,791 | |||
Accrued Chief Compliance Officer service fees (Note 3) | 687 | |||
Options written, at value (premiums received $118,390) (Note 2) | 197,002 | |||
Payable for securities purchased | 2,860,104 | |||
Payable for fund shares repurchased | 279,021 | |||
Other payables and accrued expenses | 96,746 | |||
|
| |||
TOTAL LIABILITIES | 4,011,094 | |||
|
| |||
TOTAL NET ASSETS | $ | 501,249,990 | ||
|
| |||
NET ASSETS CONSIST OF: | ||||
Capital stock | $ | 388,717 | ||
Additionalpaid-in-capital | 431,202,550 | |||
Total distributable earnings (loss) | 69,658,723 | |||
|
| |||
TOTAL NET ASSETS | $ | 501,249,990 | ||
|
| |||
The accompanying notes are an integral part of the financial statements.
79
Statement of Assets and Liabilities -Pro-Blend® Extended Term Series
October 31, 2019
NET ASSET VALUE, OFFERING PRICE AND REDEMPTION PRICE PER SHARE - Class S($276,300,146/ 15,329,639 shares) | $ | 18.02 | ||
|
| |||
NET ASSET VALUE, OFFERING PRICE AND REDEMPTION PRICE PER SHARE - Class I($117,991,262/ 12,897,628 shares) | $ | 9.15 | ||
|
| |||
NET ASSET VALUE, OFFERING PRICE AND REDEMPTION PRICE PER SHARE - Class R($6,149,317/565,993 shares) | $ | 10.86 | ||
|
| |||
NET ASSET VALUE, OFFERING PRICE AND REDEMPTION PRICE PER SHARE - Class L($100,803,930/ 10,078,192 shares) | $ | 10.00 | ||
|
| |||
NET ASSET VALUE, OFFERING PRICE AND REDEMPTION PRICE PER SHARE - Class W($5,335/295 shares) | $ | 18.08 | ||
|
| |||
The accompanying notes are an integral part of the financial statements.
80
Statement of Operations -Pro-Blend® Extended Term Series
For the Year Ended October 31, 2019
INVESTMENT INCOME: | ||||
Interest | $ | 8,548,806 | ||
Dividends (net of foreign taxes withheld, $269,657) | 3,993,796 | |||
|
| |||
Total Investment Income | 12,542,602 | |||
|
| |||
EXPENSES: | ||||
Management fees (Note 3) | 3,451,516 | |||
Distribution and service (Rule12b-1) fees (Class L) (Note 3) | 1,036,328 | |||
Distribution and service (Rule12b-1) fees (Class S) (Note 3) | 490,138 | |||
Distribution and service (Rule12b-1) fees (Class R) (Note 3) | 38,375 | |||
Sub-transfer agent fees (Note 3) | 256,100 | |||
Shareholder services fees (Class S) (Note 3) | 246,703 | |||
Fund accounting and administration fees (Note 3) | 143,566 | |||
Directors’ fees (Note 3) | 49,866 | |||
Chief Compliance Officer service fees (Note 3) | 3,455 | |||
Custodian fees | 71,850 | |||
Miscellaneous | 384,306 | |||
|
| |||
Total Expenses | 6,172,203 | |||
Less reduction of expenses (Note 3) | (43,119 | ) | ||
|
| |||
Net Expenses | 6,129,084 | |||
|
| |||
NET INVESTMENT INCOME | 6,413,518 | |||
|
| |||
REALIZED AND UNREALIZED GAIN (LOSS) ON INVESTMENTS AND FOREIGN CURRENCY: | ||||
Net realized gain (loss) on- | ||||
Investments in securities | 24,966,378 | |||
Options written | 1,195,135 | |||
Foreign currency and translation of other assets and liabilities | (33,145 | ) | ||
|
| |||
| 26,128,368 | ||||
|
| |||
Net change in unrealized appreciation (depreciation) on- | ||||
Investments in securities | 32,474,734 | |||
Options written | 18,221 | |||
Foreign currency and translation of other assets and liabilities | 758 | |||
|
| |||
| 32,493,713 | ||||
|
| |||
NET REALIZED AND UNREALIZED GAIN (LOSS) ON INVESTMENTS AND FOREIGN CURRENCY | 58,622,081 | |||
|
| |||
NET INCREASE IN NET ASSETS RESULTING FROM OPERATIONS | $ | 65,035,599 | ||
|
| |||
The accompanying notes are an integral part of the financial statements.
81
Statements of Changes in Net Assets -Pro-Blend® Extended Term Series
FOR THE YEAR
| FOR THE YEAR
| |||||||
INCREASE (DECREASE) IN NET ASSETS: | ||||||||
OPERATIONS: | ||||||||
Net investment income | $ | 6,413,518 | $ | 5,897,005 | ||||
Net realized gain (loss) on investments and foreign currency | 26,128,368 | 31,427,544 | ||||||
Net change in unrealized appreciation (depreciation) on investments and foreign currency | 32,493,713 | (43,646,192 | ) | |||||
|
|
|
| |||||
Net increase (decrease) from operations | 65,035,599 | (6,321,643 | ) | |||||
|
|
|
| |||||
DISTRIBUTIONS TO SHAREHOLDERS (Note 9): | ||||||||
Class S | (16,366,482 | ) | (24,072,437 | ) | ||||
Class I | (13,372,839 | ) | (15,480,841 | ) | ||||
Class R | (870,640 | ) | (1,300,676 | ) | ||||
Class L | (9,091,336 | ) | (12,321,868 | ) | ||||
Class W | (28 | ) | — | |||||
|
|
|
| |||||
Total distributions to shareholders | (39,701,325 | ) | (53,175,822 | ) | ||||
|
|
|
| |||||
CAPITAL STOCK ISSUED AND REPURCHASED: | ||||||||
Net increase (decrease) from capital share transactions (Note 5) | (76,738,491 | ) | (80,709,339 | ) | ||||
|
|
|
| |||||
Net increase (decrease) in net assets | (51,404,217 | ) | (140,206,804 | ) | ||||
NET ASSETS: | ||||||||
Beginning of year | 552,654,207 | 692,861,011 | ||||||
|
|
|
| |||||
End of year | $ | 501,249,990 | $ | 552,654,207 | ||||
|
|
|
| |||||
The accompanying notes are an integral part of the financial statements.
82
Financial Highlights -Pro-Blend® Extended Term Series - Class S
FOR THE YEAR ENDED | |||||||||||||||||||||||||
10/31/19 | 10/31/18 | 10/31/17 | 10/31/16 | 10/31/15 | |||||||||||||||||||||
Per share data (for a share outstanding throughout each year): | |||||||||||||||||||||||||
Net asset value - Beginning of year | $16.85 | $18.22 | $16.62 | $16.42 | $18.28 | ||||||||||||||||||||
|
|
|
|
|
|
|
|
|
| ||||||||||||||||
Income (loss) from investment operations: | |||||||||||||||||||||||||
Net investment income1 | 0.22 | 0.18 | 0.15 | 0.14 | 0.16 | ||||||||||||||||||||
Net realized and unrealized gain (loss) on investments | 1.87 | (0.43 | ) | 1.70 | 0.37 | (0.56 | ) | ||||||||||||||||||
|
|
|
|
|
|
|
|
|
| ||||||||||||||||
Total from investment operations | 2.09 | (0.25 | ) | 1.85 | 0.51 | (0.40 | ) | ||||||||||||||||||
|
|
|
|
|
|
|
|
|
| ||||||||||||||||
Less distributions to shareholders: | |||||||||||||||||||||||||
From net investment income | (0.15 | ) | (0.10 | ) | (0.09 | ) | (0.09 | ) | (0.11 | ) | |||||||||||||||
From net realized gain on investments | (0.77 | ) | (1.02 | ) | (0.16 | ) | (0.22 | ) | (1.35 | ) | |||||||||||||||
|
|
|
|
|
|
|
|
|
| ||||||||||||||||
Total distributions to shareholders | (0.92 | ) | (1.12 | ) | (0.25 | ) | (0.31 | ) | (1.46 | ) | |||||||||||||||
|
|
|
|
|
|
|
|
|
| ||||||||||||||||
Net asset value - End of year | $18.02 | $16.85 | $18.22 | $16.62 | $16.42 | ||||||||||||||||||||
|
|
|
|
|
|
|
|
|
| ||||||||||||||||
Net assets - End of year(000’s omitted) | $276,300 | $308,334 | $400,117 | $498,344 | $718,811 | ||||||||||||||||||||
|
|
|
|
|
|
|
|
|
| ||||||||||||||||
Total return2 | 13.16% | (1.47% | ) | 11.26% | 3.23% | (2.16% | ) | ||||||||||||||||||
Ratios (to average net assets)/Supplemental Data: | |||||||||||||||||||||||||
Expenses* | 1.05% | 1.10% | 1.08% | 1.07% | 1.07% | ||||||||||||||||||||
Net investment income | 1.31% | 1.03% | 0.89% | 0.86% | 0.96% | ||||||||||||||||||||
Series portfolio turnover | 61% | 75% | 79% | 63% | 66% | ||||||||||||||||||||
| *For certain periods presented, the investment advisor did not impose all or a portion of its management and/or other fees, and in some periods may have paid a portion of the Series’ expenses. If these expenses had been incurred by the Class, the expense ratio (to average net assets) would have increased by the following amounts: |
| ||||||||||||||||||||||||
| 0.01% | 0.01% | N/A | N/A | N/A | |||||||||||||||||||||
1Calculated based on average shares outstanding during the years.
2Represents aggregate total return for the years indicated, and assumes reinvestment of all distributions. Total return would have been lower had certain expenses not been waived or reimbursed during certain years.
The accompanying notes are an integral part of the financial statements.
83
Financial Highlights -Pro-Blend® Extended Term Series - Class I
FOR THE YEAR ENDED | |||||||||||||||||||||||||
10/31/19 | 10/31/18 | 10/31/17 | 10/31/16 | 10/31/15 | |||||||||||||||||||||
Per share data (for a share outstanding throughout each year): | |||||||||||||||||||||||||
Net asset value - Beginning of year | $9.04 | $10.31 | $9.53 | $9.57 | $11.30 | ||||||||||||||||||||
|
|
|
|
|
|
|
|
|
| ||||||||||||||||
Income (loss) from investment operations: | |||||||||||||||||||||||||
Net investment income1 | 0.13 | 0.12 | 0.11 | 0.10 | 0.12 | ||||||||||||||||||||
Net realized and unrealized gain (loss) on investments | 0.95 | (0.22 | ) | 0.96 | 0.21 | (0.34 | ) | ||||||||||||||||||
|
|
|
|
|
|
|
|
|
| ||||||||||||||||
Total from investment operations | 1.08 | (0.10 | ) | 1.07 | 0.31 | (0.22 | ) | ||||||||||||||||||
|
|
|
|
|
|
|
|
|
| ||||||||||||||||
Less distributions to shareholders: | |||||||||||||||||||||||||
From net investment income | (0.20 | ) | (0.15 | ) | (0.13 | ) | (0.13 | ) | (0.16 | ) | |||||||||||||||
From net realized gain on investments | (0.77 | ) | (1.02 | ) | (0.16 | ) | (0.22 | ) | (1.35 | ) | |||||||||||||||
|
|
|
|
|
|
|
|
|
| ||||||||||||||||
Total distributions to shareholders | (0.97 | ) | (1.17 | ) | (0.29 | ) | (0.35 | ) | (1.51 | ) | |||||||||||||||
|
|
|
|
|
|
|
|
|
| ||||||||||||||||
Net asset value - End of year | $9.15 | $9.04 | $10.31 | $9.53 | $9.57 | ||||||||||||||||||||
|
|
|
|
|
|
|
|
|
| ||||||||||||||||
Net assets - End of year(000’s omitted) | $117,991 | $126,834 | $147,257 | $386,926 | $545,570 | ||||||||||||||||||||
|
|
|
|
|
|
|
|
|
| ||||||||||||||||
Total return2 | 13.36% | (1.15% | ) | 11.56% | 3.52% | (1.91% | ) | ||||||||||||||||||
Ratios (to average net assets)/Supplemental Data: | |||||||||||||||||||||||||
Expenses* | 0.85% | 0.85% | 0.83% | 0.82% | 0.82% | ||||||||||||||||||||
Net investment income | 1.51% | 1.29% | 1.15% | 1.12% | 1.22% | ||||||||||||||||||||
Series portfolio turnover | 61% | 75% | 79% | 63% | 66% | ||||||||||||||||||||
| *For certain periods presented, the investment advisor did not impose all or a portion of its management and/or other fees, and in some periods may have paid a portion of the Series’ expenses. If these expenses had been incurred by the Class, the expense ratio (to average net assets) would have increased by the following amounts: |
| ||||||||||||||||||||||||
| 0.01% | 0.01% | N/A | N/A | N/A | |||||||||||||||||||||
1Calculated based on average shares outstanding during the years.
2Represents aggregate total return for the years indicated, and assumes reinvestment of all distributions. Total return would have been lower had certain expenses not been waived or reimbursed during certain years.
The accompanying notes are an integral part of the financial statements.
84
Financial Highlights -Pro-Blend® Extended Term Series - Class R
FOR THE YEAR ENDED | |||||||||||||||||||||||||
10/31/19 | 10/31/18 | 10/31/17 | 10/31/16 | 10/31/15 | |||||||||||||||||||||
Per share data (for a share outstanding throughout each year): | |||||||||||||||||||||||||
Net asset value - Beginning of year | $10.54 | $11.82 | $10.88 | $10.87 | $12.62 | ||||||||||||||||||||
|
|
|
|
|
|
|
|
|
| ||||||||||||||||
Income (loss) from investment operations: | |||||||||||||||||||||||||
Net investment income1 | 0.11 | 0.09 | 0.07 | 0.06 | 0.08 | ||||||||||||||||||||
Net realized and unrealized gain (loss) on investments | 1.11 | (0.26 | ) | 1.10 | 0.24 | (0.38 | ) | ||||||||||||||||||
|
|
|
|
|
|
|
|
|
| ||||||||||||||||
Total from investment operations | 1.22 | (0.17 | ) | 1.17 | 0.30 | (0.30 | ) | ||||||||||||||||||
|
|
|
|
|
|
|
|
|
| ||||||||||||||||
Less distributions to shareholders: | |||||||||||||||||||||||||
From net investment income | (0.13 | ) | (0.09 | ) | (0.07 | ) | (0.07 | ) | (0.10 | ) | |||||||||||||||
From net realized gain on investments | (0.77 | ) | (1.02 | ) | (0.16 | ) | (0.22 | ) | (1.35 | ) | |||||||||||||||
|
|
|
|
|
|
|
|
|
| ||||||||||||||||
Total distributions to shareholders | (0.90 | ) | (1.11 | ) | (0.23 | ) | (0.29 | ) | (1.45 | ) | |||||||||||||||
|
|
|
|
|
|
|
|
|
| ||||||||||||||||
Net asset value - End of year | $10.86 | $10.54 | $11.82 | $10.88 | $10.87 | ||||||||||||||||||||
|
|
|
|
|
|
|
|
|
| ||||||||||||||||
Net assets - End of year(000’s omitted) | $6,149 | $11,138 | $15,358 | $24,692 | $40,379 | ||||||||||||||||||||
|
|
|
|
|
|
|
|
|
| ||||||||||||||||
Total return2 | 12.73% | (1.65% | ) | 10.97% | 2.93% | (2.39% | ) | ||||||||||||||||||
Ratios (to average net assets)/Supplemental Data: | |||||||||||||||||||||||||
Expenses* | 1.35% | 1.35% | 1.33% | 1.32% | 1.32% | ||||||||||||||||||||
Net investment income | 1.02% | 0.79% | 0.65% | 0.61% | 0.71% | ||||||||||||||||||||
Series portfolio turnover | 61% | 75% | 79% | 63% | 66% | ||||||||||||||||||||
| *For certain periods presented, the investment advisor did not impose all or a portion of its management and/or other fees, and in some periods may have paid a portion of the Series’ expenses. If these expenses had been incurred by the Class, the expense ratio (to average net assets) would have increased by the following amounts: |
| ||||||||||||||||||||||||
| 0.02% | 0.01% | N/A | N/A | N/A | |||||||||||||||||||||
1Calculated based on average shares outstanding during the years.
2Represents aggregate total return for the years indicated, and assumes reinvestment of all distributions. Total return would have been lower had certain expenses not been waived or reimbursed during certain years.
The accompanying notes are an integral part of the financial statements.
85
Financial Highlights -Pro-Blend® Extended Term Series - Class L*
FOR THE YEAR ENDED | |||||||||||||||||||||||||
10/31/19 | 10/31/18 | 10/31/17 | 10/31/16 | 10/31/15 | |||||||||||||||||||||
Per share data (for a share outstanding throughout each year): | |||||||||||||||||||||||||
Net asset value - Beginning of year | $9.78 | $11.05 | $10.19 | $10.21 | $11.95 | ||||||||||||||||||||
|
|
|
|
|
|
|
|
|
| ||||||||||||||||
Income (loss) from investment operations: | |||||||||||||||||||||||||
Net investment income1 | 0.05 | 0.03 | 0.01 | 0.01 | 0.02 | ||||||||||||||||||||
Net realized and unrealized gain (loss) on investments | 1.04 | (0.24 | ) | 1.03 | 0.22 | (0.36 | ) | ||||||||||||||||||
|
|
|
|
|
|
|
|
|
| ||||||||||||||||
Total from investment operations | 1.09 | (0.21 | ) | 1.04 | 0.23 | (0.34 | ) | ||||||||||||||||||
|
|
|
|
|
|
|
|
|
| ||||||||||||||||
Less distributions to shareholders: | |||||||||||||||||||||||||
From net investment income | (0.10 | ) | (0.04 | ) | (0.02 | ) | (0.03 | ) | (0.05 | ) | |||||||||||||||
From net realized gain on investments | (0.77 | ) | (1.02 | ) | (0.16 | ) | (0.22 | ) | (1.35 | ) | |||||||||||||||
|
|
|
|
|
|
|
|
|
| ||||||||||||||||
Total distributions to shareholders | (0.87 | ) | (1.06 | ) | (0.18 | ) | (0.25 | ) | (1.40 | ) | |||||||||||||||
|
|
|
|
|
|
|
|
|
| ||||||||||||||||
Net asset value - End of year | $10.00 | $9.78 | $11.05 | $10.19 | $10.21 | ||||||||||||||||||||
|
|
|
|
|
|
|
|
|
| ||||||||||||||||
Net assets - End of year(000’s omitted) | $100,804 | $106,348 | $130,130 | $146,554 | $165,898 | ||||||||||||||||||||
|
|
|
|
|
|
|
|
|
| ||||||||||||||||
Total return2 | 12.26% | (2.13% | ) | 10.42% | 2.43% | (2.91% | ) | ||||||||||||||||||
Ratios (to average net assets)/Supplemental Data: | |||||||||||||||||||||||||
Expenses** | 1.80% | 1.85% | 1.83% | 1.82% | 1.82% | ||||||||||||||||||||
Net investment income | 0.57% | 0.28% | 0.14% | 0.11% | 0.21% | ||||||||||||||||||||
Series portfolio turnover | 61% | 75% | 79% | 63% | 66% | ||||||||||||||||||||
| *Effective March 1, 2019, Class R2 shares of the Series have been redesignated as Class L shares. |
| ||||||||||||||||||||||||
| **For certain periods presented, the investment advisor did not impose all or a portion of its management and/or other fees, and in some periods may have paid a portion of the Series’ expenses. If these expenses had been incurred by the Class, the expense ratio (to average net assets) would have increased by the following amounts: |
| ||||||||||||||||||||||||
| 0.00% | 3 | 0.01% | N/A | N/A | N/A | ||||||||||||||||||||
1Calculated based on average shares outstanding during the years.
2Represents aggregate total return for the years indicated, and assumes reinvestment of all distributions. Total return would have been lower had certain expenses not been waived or reimbursed during certain years.
3Less than 0.01%.
The accompanying notes are an integral part of the financial statements.
86
Financial Highlights -Pro-Blend® Extended Term Series - Class W
FOR THE PERIOD | |||||
4/1/191 TO 10/31/19 | |||||
Per share data (for a share outstanding throughout the period): | |||||
Net asset value - Beginning of period | $17.04 | ||||
|
| ||||
Income from investment operations: | |||||
Net investment income2 | 0.23 | ||||
Net realized and unrealized gain (loss) on investments | 0.90 | ||||
|
| ||||
Total from investment operations | 1.13 | ||||
|
| ||||
Less distributions to shareholders: | |||||
From net investment income | (0.09 | ) | |||
From net realized gain on investments | | (0.00 | )3 | ||
|
| ||||
Total distributions to shareholders | (0.09 | ) | |||
|
| ||||
Net asset value - End of period | $18.08 | ||||
|
| ||||
Net assets - End of period(000’s omitted) | $5 | ||||
|
| ||||
Total return4 | 6.69% | ||||
Ratios (to average net assets)/Supplemental Data: | |||||
Expenses*5 | 0.10% | ||||
Net investment income5 | 2.20% | ||||
Series portfolio turnover | 61% | ||||
| *The investment advisor did not impose all or a portion of its management and/or other fees during the period, and may have paid a portion of the Series’ expenses. If these expenses had been incurred by the Class, the expense ratio (to average net assets) would have increased by the following amounts5: |
| ||||
| 0.62% | |||||
1Commencement of operations.
2Calculated based on average shares outstanding during the period.
3Less than $(0.01).
4Represents aggregate total return for the period indicated. Total return would have been lower had certain expenses not been waived or reimbursed during the period. Periods less than one year are not annualized.
5Annualized.
The accompanying notes are an integral part of the financial statements.
87
Performance Update as of October 31, 2019 -Pro-Blend® Maximum Term Series
(unaudited)
AVERAGE ANNUAL TOTAL RETURNS AS OF | ||||||
ONE YEAR1 |
FIVE YEAR |
TEN YEAR | ||||
Pro-Blend®Maximum Term Series - Class S2 | 14.19% | 7.01% | 9.52% | |||
Pro-Blend®Maximum Term Series - Class I2 | 14.44% | 7.26% | 9.79% | |||
Pro-Blend®Maximum Term Series - Class R2,3 | 13.84% | 6.73% | 9.25% | |||
Pro-Blend®Maximum Term Series - Class L2,3 | 13.40% | 6.21% | 8.71% | |||
Pro-Blend®Maximum Term Series - Class W2,4 | 14.83% | 7.13% | 9.58% | |||
Russell 3000®Index5 | 13.49% | 10.31% | 13.62% | |||
65/20/15 Blended Index6 | 13.01% | 8.06% | 10.50% | |||
The following graph compares the value of a $10,000 investment in thePro-Blend® Maximum Term Series - Class S for the ten years ended October 31, 2019 to the Russell 3000® Index and the 65/20/15 Blended Index.
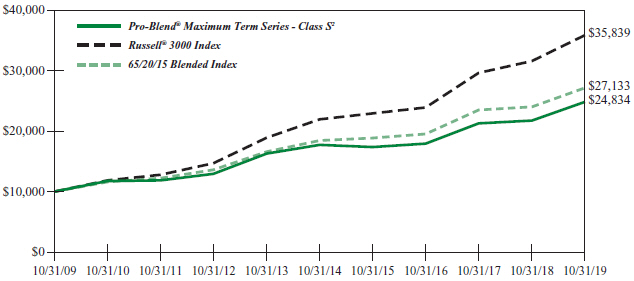
1The returns shown are based on net asset values calculated for shareholder transactions and may differ from the returns shown in the financial highlights, which reflect adjustments made to the net asset values in accordance with accounting principles generally accepted in the United States of America.
2The Series’ performance does not reflect the deduction of taxes that a shareholder would pay on fund distributions or the redemption of shares. The Series’ performance is historical and may not be indicative of future results. The performance returns shown are inclusive of the net expense ratio of the Series. For the year ended October 31, 2019, this net expense ratio was 1.10% for Class S, 0.85% for Class I, 1.34% for Class R, 1.82% for Class L and 0.10% for Class W. The gross expense ratio, which does not account for any voluntary or contractual waivers currently in effect, was 1.11% for Class S, 0.90% for Class I, 1.35% for Class R, 1.83% for Class L and 0.75% for Class W for the year ended October 31, 2019.
3For periods through the inception of Class L on January 4, 2010 and Class R on June 30, 2010, the performance is hypothetical and is based on the historical performance of the Class S shares adjusted for the respective class’ charges and expenses.
4For periods through April 1, 2019 (the inception date of the Class W shares), performance for the Class W shares is based on the historical performance of the Class S shares. Because the Class W shares invest in the same portfolio of securities as the Class S shares, performance will be different only to the extent that the Class S shares have a higher expense ratio.
5The Russell 3000® Index is an unmanaged index that consists of 3,000 of the largest U.S. companies based on total market capitalization. The Index returns are based on a market capitalization-weighted average of relative price changes of the component stocks plus dividends whose reinvestments are compounded daily. The Index returns do not reflect any fees or expenses. Index returns provided by Bloomberg.
6The 65/20/15 Blended Index is 65% Russell 3000® Index (Russell 3000), 20% MSCI ACWI ex USA Index (ACWIxUS), and 15% Bloomberg Barclays U.S. Aggregate Bond Index (BAB). Russell 3000 is an unmanaged index that consists of 3,000 of the largest U.S. companies based on total market capitalization. The Index returns are based on a market capitalization-weighted average of relative price changes of the component stocks plus dividends whose reinvestments are compounded daily. Index returns are provided by Bloomberg. ACWIxUS is designed to measure large andmid-cap representation across 22 of 23 Developed Markets countries (excluding the U.S.) and 26 Emerging Markets countries. The Index is denominated in U.S. dollars. The Index returns are net of withholding taxes. They
88
Performance Update as of October 31, 2019 -Pro-Blend® Maximum Term Series
(unaudited)
assume daily reinvestment of net dividends thus accounting for any applicable dividend taxation. Index returns provided by Bloomberg. BAB is an unmanaged, market value-weighted index of U.S. domestic investment-grade debt issues, including government, corporate, asset-backed, and mortgage-backed securities with maturities of one year or more. Index returns provided by Interactive Data. The returns of the indices do not reflect any fees or expenses. Returns provided are calculated monthly using a blended allocation. Because the fund’s asset allocation will vary over time, the composition of the fund’s portfolio may not match the composition of the comparative Indices.
89
Shareholder Expense Example -Pro-Blend® Maximum Term Series
(unaudited)
As a shareholder of the Series, you incur ongoing costs, including management fees, shareholder service fees and other Series expenses. This example is intended to help you understand your ongoing costs (in dollars) of investing in the Series and to compare these costs with the ongoing costs of investing in other mutual funds.
The example is based on an investment of $1,000 invested in each class at the beginning of the period and held for the entire period (May 1, 2019 to October 31, 2019).
Actual Expenses
The Actual lines of the table below provide information about actual account values and actual expenses. You may use the information in these lines, together with the amount you invested, to estimate the expenses that you paid over the period. Simply divide your account value by $1,000 (for example, an $8,600 account value divided by $1,000 = 8.6), then multiply the result by the number in the Actual line for the Class in which you have invested under the heading entitled “Expenses Paid During Period” to estimate the expenses you paid on your account during this period.
Hypothetical Example for Comparison Purposes
The Hypothetical lines of each class in the table below provide information about hypothetical account values and hypothetical expenses based on the Class’ actual expense ratio and an assumed rate of return of 5% per year before expenses, which is not the Class’ actual return. The hypothetical account values and expenses may not be used to estimate the actual ending account balance or expenses you paid during the period. You may use this information to compare the ongoing costs of investing in a class of the Series and other funds. To do so, compare this 5% hypothetical example for the Class in which you have invested with the 5% hypothetical examples that appear in the shareholder reports of the other funds.
Please note that the expenses shown in the table are meant to highlight your ongoing costs only and do not reflect any transaction costs such as sales charges (loads), redemption fees, or exchange fees that you may incur in other mutual funds. Therefore, the second line of the table is useful in comparing ongoing costs only, and will not help you determine the relative total costs of owning different funds.
BEGINNING ACCOUNT VALUE
| ENDING ACCOUNT VALUE 10/31/19 | EXPENSES PAID DURING PERIOD 5/1/19-10/31/191 | ANNUALIZED EXPENSE RATIO | |||||
Class S | ||||||||
Actual | $1,000.00 | $1,041.10 | $5.66 | 1.10% | ||||
Hypothetical | $1,000.00 | $1,019.66 | $5.60 | 1.10% | ||||
Class I | ||||||||
Actual | $1,000.00 | $1,041.50 | $4.37 | 0.85% | ||||
Hypothetical | $1,000.00 | $1,020.92 | $4.33 | 0.85% | ||||
Class R | ||||||||
Actual | $1,000.00 | $1,039.40 | $6.84 | 1.33% | ||||
Hypothetical | $1,000.00 | $1,018.50 | $6.77 | 1.33% | ||||
Class L | ||||||||
Actual | $1,000.00 | $1,037.80 | $9.30 | 1.81% | ||||
Hypothetical | $1,000.00 | $1,016.08 | $9.20 | 1.81% | ||||
Class W | ||||||||
Actual | $1,000.00 | $1,046.50 | $0.52 | 0.10% | ||||
Hypothetical | $1,000.00 | $1,024.70 | $0.51 | 0.10% | ||||
90
Shareholder Expense Example -Pro-Blend® Maximum Term Series
(unaudited)
1Expenses are equal to the Class’ annualized expense ratio (for thesix-month period), multiplied by the average account value over the period, multiplied by 184/365 (to reflect theone-half year period). Expenses are based on the most recent fiscal half year; therefore, the expense ratios stated above may differ from the expense ratios stated in the financial highlights, which are based onone-year data. The Class’ total return would have been lower had certain expenses not been waived during the period.
91
Portfolio Composition -Pro-Blend® Maximum Term Series
As of October 31, 2019 (unaudited)
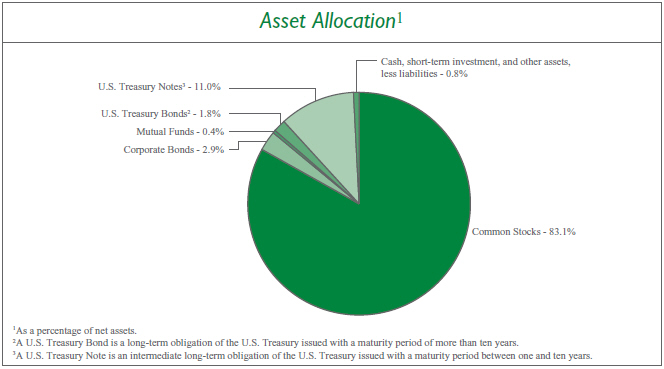
| Sector Allocation4 | ||||
Consumer Staples | 14.0% | |||
Consumer Discretionary | 12.5% | |||
Information Technology | 12.2% | |||
Health Care | 11.7% | |||
Communication Services | 11.2% | |||
Financials | 11.1% | |||
Materials | 4.6% | |||
Real Estate | 4.3% | |||
Energy | 3.0% | |||
Industrials | 1.9% | |||
Utilities5 | 0.0% | |||
4Including common stocks and corporate bonds, as a percentage of total investments.
5Less than 0.01%.
|
| |||
| Top Ten Stock Holdings6 | ||||
The Coca-Cola Co. | 2.3% | |||
Berkshire Hathaway, Inc. - Class B | 2.1% | |||
Johnson & Johnson | 2.1% | |||
ServiceNow, Inc. | 1.9% | |||
Mondelez International, Inc. - Class A | 1.9% | |||
Mastercard, Inc. - Class A | 1.9% | |||
Micron Technology, Inc. | 1.8% | |||
Medtronic plc | 1.7% | |||
Microsoft Corp. | 1.6% | |||
Electronic Arts, Inc. | 1.6% | |||
6As a percentage of total investments.
| ||||
92
Investment Portfolio - October 31, 2019
| PRO-BLEND®MAXIMUM TERM SERIES | ||||||||
SHARES
| VALUE
| |||||||
COMMON STOCKS - 83.1% | ||||||||
Communication Services - 10.6% | ||||||||
Diversified Telecommunication Services - 0.1% |
| |||||||
Elisa OYJ (Finland) | 2,849 | $ | 155,602 | |||||
Orange S.A. (France) | 3,345 | 53,836 | ||||||
Telefonica Brasil S.A. (Brazil) | 2,600 | 34,405 | ||||||
|
| |||||||
| 243,843 | ||||||||
|
| |||||||
Entertainment - 4.6% | ||||||||
Activision Blizzard, Inc. | 64,860 | 3,634,106 | ||||||
Electronic Arts, Inc.* | 62,180 | 5,994,152 | ||||||
Nexon Co. Ltd. (Japan)* | 275,200 | 3,189,085 | ||||||
Sea Ltd. - ADR (Taiwan)* | 148,865 | 4,430,222 | ||||||
Toho Co. Ltd. - Tokyo (Japan) | 3,400 | 137,311 | ||||||
Viacom, Inc. - Class B | 500 | 10,780 | ||||||
Vivendi S.A. (France) | 1,700 | 47,341 | ||||||
|
| |||||||
| 17,442,997 | ||||||||
|
| |||||||
Interactive Media & Services - 4.4% | ||||||||
Alphabet, Inc. - Class A* | 2,785 | 3,505,758 | ||||||
Alphabet, Inc. - Class C* | 2,790 | 3,515,707 | ||||||
Autohome, Inc. - ADR (China)* | 1,280 | 108,237 | ||||||
Facebook, Inc. - Class A* | 22,965 | 4,401,242 | ||||||
Kakao Corp. (South Korea) | 1,270 | 154,117 | ||||||
Tencent Holdings Ltd. - Class H (China) | 124,374 | 5,044,972 | ||||||
|
| |||||||
| 16,730,033 | ||||||||
|
| |||||||
Media - 1.5% | ||||||||
Informa plc (United Kingdom) | 14,230 | 143,030 | ||||||
Quebecor, Inc. - Class B (Canada) | 112,410 | 2,613,313 | ||||||
Shaw Communications, Inc. - Class B (Canada) | 130,760 | 2,668,612 | ||||||
|
| |||||||
| 5,424,955 | ||||||||
|
| |||||||
Wireless Telecommunication Services - 0.0%## |
| |||||||
Globe Telecom, Inc. (Philippines) | 1,045 | 37,562 | ||||||
|
| |||||||
Total Communication Services |
|
39,879,390 |
| |||||
|
| |||||||
Consumer Discretionary - 12.1% | ||||||||
Auto Components - 0.0%## | ||||||||
Cie Generale des Etablissements Michelin SCA (France) | 310 | 37,745 | ||||||
|
| |||||||
Automobiles - 0.0%## | ||||||||
Peugeot S.A. (France) | 965 | 24,440 | ||||||
|
| |||||||
Distributors - 0.0%## | ||||||||
Genuine Parts Co. | 198 | 20,311 | ||||||
|
| |||||||
Diversified Consumer Services - 0.1% | ||||||||
Fu Shou Yuan International Group Ltd. (China) | 74,000 | 65,312 | ||||||
SHARES
| VALUE
| |||||||
COMMON STOCKS(continued) | ||||||||
Consumer Discretionary(continued) | ||||||||
Diversified Consumer Services(continued) | ||||||||
New Oriental Education & Technology Group, Inc. - ADR (China)* | 1,310 | $ | 159,899 | |||||
TAL Education Group - ADR (China)* | 3,405 | 145,768 | ||||||
|
| |||||||
| 370,979 | ||||||||
|
| |||||||
Hotels, Restaurants & Leisure - 0.2% | ||||||||
Basic-Fit N.V. (Netherlands)*1 | 3,410 | 104,295 | ||||||
Galaxy Entertainment Group Ltd. (Macau) | 15,000 | 103,285 | ||||||
Hilton Worldwide Holdings, Inc. | 315 | 30,542 | ||||||
Melco Resorts & Entertainment Ltd. - ADR (Hong Kong) | 3,155 | 67,959 | ||||||
MGM China Holdings Ltd. (Macau) | 43,200 | 68,406 | ||||||
Restaurant Brands International, Inc. (Canada) | 1,370 | 89,653 | ||||||
Sands China Ltd. (Macau) | 21,600 | 106,393 | ||||||
Wynn Macau Ltd. (Macau) | 46,800 | 101,560 | ||||||
|
| |||||||
| 672,093 | ||||||||
|
| |||||||
Household Durables - 1.6% | ||||||||
Barratt Developments plc (United Kingdom) | 8,965 | 73,315 | ||||||
The Berkeley Group Holdings plc (United Kingdom) | 1,360 | 77,519 | ||||||
Persimmon plc (United Kingdom) | 2,735 | 80,673 | ||||||
Sony Corp. - ADR (Japan) | 89,765 | 5,460,405 | ||||||
Sony Corp. (Japan) | 2,700 | 164,347 | ||||||
Taylor Wimpey plc (United Kingdom) | 35,260 | 75,622 | ||||||
|
| |||||||
| 5,931,881 | ||||||||
|
| |||||||
Internet & Direct Marketing Retail - 1.9% | ||||||||
Alibaba Group Holding Ltd. - ADR (China)* | 1,460 | 257,938 | ||||||
Amazon.com, Inc.* | 2,340 | 4,157,384 | ||||||
Booking Holdings, Inc.* | 1,295 | 2,653,157 | ||||||
Farfetch Ltd. - Class A (United Kingdom)* | 1,460 | 13,038 | ||||||
|
| |||||||
| 7,081,517 | ||||||||
|
| |||||||
Leisure Products - 0.0%## | ||||||||
Technogym S.p.A. (Italy)1 | 10,850 | 119,705 | ||||||
|
| |||||||
Multiline Retail - 2.7% | ||||||||
B&M European Value Retail S.A. (United Kingdom) | 16,405 | 78,701 | ||||||
Dollar General Corp. | 30,585 | 4,903,999 | ||||||
Dollar Tree, Inc.* | 46,515 | 5,135,256 | ||||||
Kohl’s Corp. | 269 | 13,789 | ||||||
The accompanying notes are an integral part of the financial statements.
93
Investment Portfolio - October 31, 2019
| PRO-BLEND®MAXIMUM TERM SERIES | ||||||||
SHARES
| VALUE
| |||||||
COMMON STOCKS(continued) | ||||||||
Consumer Discretionary(continued) | ||||||||
Multiline Retail(continued) | ||||||||
Lojas Renner S.A. (Brazil) | 3,400 | $ | 43,143 | |||||
Magazine Luiza S.A. (Brazil) | 3,000 | 33,213 | ||||||
|
| |||||||
| 10,208,101 | ||||||||
|
| |||||||
Specialty Retail - 2.5% | ||||||||
Advance Auto Parts, Inc. | 19,195 | 3,118,805 | ||||||
AutoZone, Inc.* | 2,735 | 3,129,879 | ||||||
Best Buy Co., Inc. | 316 | 22,698 | ||||||
The Gap, Inc. | 577 | 9,382 | ||||||
The Home Depot, Inc. | 593 | 139,106 | ||||||
Industria de Diseno Textil S.A. (Spain) | 94,865 | 2,956,070 | ||||||
|
| |||||||
| 9,375,940 | ||||||||
|
| |||||||
Textiles, Apparel & Luxury Goods - 3.1% | ||||||||
EssilorLuxottica S.A. (France) | 385 | 58,787 | ||||||
Hermes International (France) | 55 | 39,619 | ||||||
Kering S.A. (France) | 140 | 79,660 | ||||||
Kontoor Brands, Inc. | 52 | 1,976 | ||||||
lululemon athletica, Inc.* | 27,446 | 5,606,394 | ||||||
LVMH Moet Hennessy Louis Vuitton SE (France) | 400 | 170,822 | ||||||
NIKE, Inc. - Class B | 64,110 | 5,741,050 | ||||||
Shenzhou International Group Holdings Ltd. (China) | 9,200 | 127,132 | ||||||
VF Corp. | 370 | 30,447 | ||||||
|
| |||||||
| 11,855,887 | ||||||||
|
| |||||||
Total Consumer Discretionary | 45,698,599 | |||||||
|
| |||||||
Consumer Staples - 13.9% | ||||||||
Beverages - 6.2% | ||||||||
Ambev S.A. - ADR (Brazil) | 714,957 | 3,081,465 | ||||||
Ambev S.A. (Brazil) | 21,200 | 91,767 | ||||||
Anheuser-Busch InBev S.A./N.V. (Belgium) | 41,137 | 3,320,473 | ||||||
The Coca-Cola Co | 161,897 | 8,812,054 | ||||||
Coca-Cola European Partners plc (United Kingdom) | 2,610 | 139,661 | ||||||
Diageo plc (United Kingdom) | 69,624 | 2,849,786 | ||||||
Heineken N.V. (Netherlands) | 1,345 | 137,351 | ||||||
Molson Coors Brewing Co. - Class B | 242 | 12,758 | ||||||
PepsiCo, Inc. | 36,300 | 4,979,271 | ||||||
Pernod Ricard S.A. (France) | 775 | 143,168 | ||||||
|
| |||||||
| 23,567,754 | ||||||||
|
| |||||||
Food & Staples Retailing - 0.2% | ||||||||
Alimentation Couche-Tard, Inc. - Class B (Canada) | 4,730 | 141,853 | ||||||
SHARES
| VALUE
| |||||||
COMMON STOCKS(continued) | ||||||||
Consumer Staples(continued) | ||||||||
Food & Staples Retailing(continued) | ||||||||
ICA Gruppen AB (Sweden) | 2,978 | $ | 131,782 | |||||
The Kroger Co. | 643 | 15,844 | ||||||
Loblaw Companies Ltd. (Canada) | 2,615 | 139,456 | ||||||
Puregold Price Club, Inc. (Philippines) | 24,500 | 19,707 | ||||||
Raia Drogasil S.A. (Brazil) | 1,200 | 32,902 | ||||||
Robinsons Retail Holdings, Inc. (Philippines) | 14,990 | 22,406 | ||||||
Sysco Corp. | 478 | 38,178 | ||||||
Walgreens Boots Alliance, Inc. | 707 | 38,729 | ||||||
Walmart, Inc. | 1,336 | 156,659 | ||||||
|
| |||||||
| 737,516 | ||||||||
|
| |||||||
Food Products - 3.1% | ||||||||
Archer-Daniels-Midland Co. | 456 | 19,170 | ||||||
Barry Callebaut AG (Switzerland) | 35 | 73,965 | ||||||
Chocoladefabriken Lindt & Spruengli AG (Switzerland) | 6 | 44,582 | ||||||
Conagra Brands, Inc. | 518 | 14,012 | ||||||
Danone S.A. (France) | 3,821 | 316,537 | ||||||
General Mills, Inc. | 612 | 31,126 | ||||||
The Hershey Co. | 210 | 30,843 | ||||||
The J.M. Smucker Co. | 147 | 15,535 | ||||||
Kellogg Co. | 346 | 21,981 | ||||||
Kerry Group plc - Class A (Ireland) | 1,245 | 150,751 | ||||||
Mondelez International, Inc. - Class A | 136,525 | 7,160,736 | ||||||
Mowi ASA (Norway) | 5,855 | 142,932 | ||||||
Nestle S.A. (Switzerland) | 33,860 | 3,622,388 | ||||||
Tyson Foods, Inc. - Class A | 274 | 22,684 | ||||||
Universal Robina Corp. (Philippines). | 15,660 | 46,523 | ||||||
|
| |||||||
| 11,713,765 | ||||||||
|
| |||||||
Household Products - 0.8% | ||||||||
Colgate-Palmolive Co. | 34,420 | 2,361,212 | ||||||
Essity AB - Class B (Sweden) | 4,625 | 144,489 | ||||||
Henkel AG & Co. KGaA (Germany) | 1,370 | 142,306 | ||||||
Kimberly-Clark Corp. | 302 | 40,130 | ||||||
Reckitt Benckiser Group plc (United Kingdom) | 1,700 | 131,549 | ||||||
|
| |||||||
| 2,819,686 | ||||||||
|
| |||||||
Personal Products - 2.0% | ||||||||
Beiersdorf AG (Germany) | 26,955 | 3,191,177 | ||||||
LG Household & Health Care Ltd. (South Korea) | 125 | 135,262 | ||||||
L’Oreal S.A. (France) | 410 | 119,745 | ||||||
The accompanying notes are an integral part of the financial statements.
94
Investment Portfolio - October 31, 2019
| PRO-BLEND®MAXIMUM TERM SERIES | ||||||||
SHARES
| VALUE
| |||||||
COMMON STOCKS(continued) | ||||||||
Consumer Staples(continued) | ||||||||
Personal Products(continued) | ||||||||
Unilever plc - ADR (United Kingdom) | 67,974 | $ | 4,085,917 | |||||
|
| |||||||
| 7,532,101 | ||||||||
|
| |||||||
Tobacco - 1.6% | ||||||||
Altria Group, Inc. | 47,315 | 2,119,239 | ||||||
British American Tobacco plc - ADR (United Kingdom) | 1,675 | 58,558 | ||||||
British American Tobacco plc (United Kingdom) | 4,120 | 144,101 | ||||||
Philip Morris International, Inc. | 44,825 | 3,650,548 | ||||||
|
| |||||||
| 5,972,446 | ||||||||
|
| |||||||
Total Consumer Staples | 52,343,268 | |||||||
|
| |||||||
Energy - 2.6% | ||||||||
Energy Equipment & Services - 2.2% | ||||||||
Baker Hughes Co. | 796 | 17,034 | ||||||
Core Laboratories N.V. | 47,305 | 2,083,312 | ||||||
Diamond Offshore Drilling, Inc.* | 84,040 | 444,572 | ||||||
Halliburton Co. | 155,428 | 2,991,989 | ||||||
Schlumberger Ltd. | 61,038 | 1,995,332 | ||||||
Transocean Ltd.* | 175,225 | 832,319 | ||||||
|
| |||||||
| 8,364,558 | ||||||||
|
| |||||||
Oil, Gas & Consumable Fuels - 0.4% | ||||||||
Cameco Corp. (Canada) | 8,415 | 75,145 | ||||||
Chevron Corp. | 754 | 87,570 | ||||||
Eni S.p.A. (Italy) | 9,435 | 143,138 | ||||||
Equinor ASA (Norway) | 8,220 | 152,610 | ||||||
Galp Energia SGPS S.A. (Portugal) | 9,320 | 149,071 | ||||||
Marathon Petroleum Corp. | 635 | 40,608 | ||||||
Occidental Petroleum Corp. | 527 | 21,344 | ||||||
Phillips 66 | 301 | 35,163 | ||||||
Repsol S.A. (Spain) | 9,726 | 160,282 | ||||||
Royal Dutch Shell plc - Class B - ADR (Netherlands) | 3,875 | 225,874 | ||||||
Suncor Energy, Inc. (Canada) | 3,810 | 113,279 | ||||||
TOTAL S.A. (France) | 2,900 | 153,318 | ||||||
Valero Energy Corp. | 398 | 38,598 | ||||||
|
| |||||||
| 1,396,000 | ||||||||
|
| |||||||
Total Energy | 9,760,558 | |||||||
|
| |||||||
Financials - 10.3% | ||||||||
Banks - 0.9% | ||||||||
Banco Bradesco S.A. (Brazil) | 18,700 | 164,456 | ||||||
Banco do Brasil S.A. (Brazil) | 6,000 | 71,826 | ||||||
Banco Santander Brasil S.A. (Brazil) | 2,600 | 30,742 | ||||||
SHARES
| VALUE
| |||||||
COMMON STOCKS(continued) | ||||||||
Financials(continued) | ||||||||
Banks(continued) | ||||||||
Bank of America Corp. | 3,193 | $ | 99,845 | |||||
The Bank Of N.T. Butterfield & Son Ltd. (Bermuda) | 2,975 | 98,026 | ||||||
Bank of the Philippine Islands (Philippines) | 28,440 | 54,334 | ||||||
Barclays plc (United Kingdom) | 37,960 | 82,338 | ||||||
BB&T Corp. | 487 | 25,835 | ||||||
BDO Unibank, Inc. (Philippines) | 23,330 | 71,168 | ||||||
BNP Paribas S.A. (France) | 1,970 | 102,951 | ||||||
Citigroup, Inc. | 933 | 67,045 | ||||||
Credit Agricole S.A. (France) | 1,850 | 24,139 | ||||||
Fifth Third Bancorp | 748 | 21,752 | ||||||
FinecoBank Banca Fineco S.p.A. (Italy) | 140,670 | 1,585,820 | ||||||
Itau Unibanco Holding S.A. (Brazil) | 20,900 | 188,962 | ||||||
Itausa - Investimentos Itau S.A. (Brazil) | 23,000 | 78,569 | ||||||
JPMorgan Chase & Co. | 1,249 | 156,025 | ||||||
KeyCorp | 1,021 | 18,347 | ||||||
Lloyds Banking Group plc (United Kingdom) | 105,640 | 77,710 | ||||||
Metropolitan Bank & Trust Co. (Philippines) | 41,685 | 55,492 | ||||||
Regions Financial Corp. | 913 | 14,699 | ||||||
Royal Bank of Scotland Group plc (United Kingdom) | 27,630 | 76,376 | ||||||
SunTrust Banks, Inc. | 378 | 25,833 | ||||||
U.S. Bancorp | 1,106 | 63,064 | ||||||
Wells Fargo & Co. | 2,389 | 123,344 | ||||||
|
| |||||||
| 3,378,698 | ||||||||
|
| |||||||
Capital Markets - 7.2% | ||||||||
B3 S.A. - Brasil Bolsa Balcao (Brazil) | 8,200 | 98,981 | ||||||
BlackRock, Inc. | 11,825 | 5,459,603 | ||||||
Cboe Global Markets, Inc. | 27,840 | 3,205,776 | ||||||
CME Group, Inc. | 15,275 | 3,142,831 | ||||||
Deutsche Boerse AG (Germany) | 21,840 | 3,382,135 | ||||||
Hargreaves Lansdown plc (United Kingdom) | 2,775 | 63,723 | ||||||
Intercontinental Exchange, Inc. | 35,455 | 3,344,116 | ||||||
Julius Baer Group Ltd. (Switzerland) | 36,925 | 1,635,173 | ||||||
London Stock Exchange Group plc (United Kingdom) | 770 | 69,392 | ||||||
Moody’s Corp. | 15,455 | 3,410,764 | ||||||
S&P Global, Inc. | 12,750 | 3,289,372 | ||||||
|
| |||||||
| 27,101,866 | ||||||||
|
| |||||||
The accompanying notes are an integral part of the financial statements.
95
Investment Portfolio - October 31, 2019
| PRO-BLEND®MAXIMUM TERM SERIES | ||||||||
SHARES
| VALUE
| |||||||
COMMON STOCKS(continued) | ||||||||
Financials(continued) | ||||||||
Diversified Financial Services - 2.1% | ||||||||
Berkshire Hathaway, Inc. - Class B* | 37,915 | $ | 8,059,971 | |||||
|
| |||||||
Insurance - 0.1% | ||||||||
Admiral Group plc (United Kingdom) | 4,850 | 126,933 | ||||||
The Allstate Corp. | 232 | 24,690 | ||||||
AXA S.A. (France) | 3,325 | 88,017 | ||||||
BB Seguridade Participacoes S.A. (Brazil) | 4,300 | 36,401 | ||||||
Chubb Ltd. | 249 | 37,953 | ||||||
The Hartford Financial Services Group, Inc. | 302 | 17,238 | ||||||
Ping An Insurance Group Co. of China Ltd. - Class H (China) | 10,000 | 115,418 | ||||||
The Travelers Companies, Inc. | 175 | 22,936 | ||||||
|
| |||||||
| 469,586 | ||||||||
|
| |||||||
Total Financials | 39,010,121 | |||||||
|
| |||||||
Health Care - 11.6% | ||||||||
Biotechnology - 1.8% | ||||||||
AbbVie, Inc. | 974 | 77,482 | ||||||
Amgen, Inc. | 431 | 91,911 | ||||||
BioMarin Pharmaceutical, Inc.* | 34,170 | 2,501,586 | ||||||
Gilead Sciences, Inc. | 957 | 60,970 | ||||||
Incyte Corp.* | 15,320 | 1,285,654 | ||||||
Seattle Genetics, Inc.* | 12,330 | 1,324,242 | ||||||
Vertex Pharmaceuticals, Inc.* | 6,965 | 1,361,518 | ||||||
|
| |||||||
| 6,703,363 | ||||||||
|
| |||||||
Health Care Equipment & Supplies - 3.4% | ||||||||
Alcon, Inc. (Switzerland)* | 30,244 | 1,792,562 | ||||||
Alcon, Inc. (Switzerland)* | 1,231 | 72,799 | ||||||
Boston Scientific Corp.* | 59,215 | 2,469,266 | ||||||
Getinge AB - Class B (Sweden) | 6,760 | 115,573 | ||||||
Hoya Corp. (Japan) | 1,700 | 150,241 | ||||||
Intuitive Surgical, Inc.* | 2,575 | 1,423,846 | ||||||
Koninklijke Philips N.V. (Netherlands) | 3,065 | 134,474 | ||||||
Medtronic plc | 59,910 | 6,524,199 | ||||||
Shandong Weigao Group Medical Polymer Co. Ltd. - Class H (China) | 64,000 | 73,475 | ||||||
Smith & Nephew plc (United Kingdom) | 6,050 | 129,872 | ||||||
|
| |||||||
| 12,886,307 | ||||||||
|
| |||||||
Health Care Providers & Services - 0.7% | ||||||||
CVS Health Corp. | 886 | 58,822 | ||||||
Quest Diagnostics, Inc. | 152 | 15,390 | ||||||
SHARES
| VALUE
| |||||||
COMMON STOCKS(continued) | ||||||||
Health Care(continued) | ||||||||
Health Care Providers & Services(continued) | ||||||||
Sonic Healthcare Ltd. (Australia) | 7,310 | $ | 143,971 | |||||
UnitedHealth Group, Inc. | 10,040 | 2,537,108 | ||||||
|
| |||||||
| 2,755,291 | ||||||||
|
| |||||||
Life Sciences Tools & Services - 1.2% | ||||||||
Gerresheimer AG (Germany) | 1,355 | 109,274 | ||||||
QIAGEN N.V.* | 70,088 | 2,089,323 | ||||||
QIAGEN N.V.* | 2,638 | 79,349 | ||||||
Tecan Group AG (Switzerland) | 145 | 34,304 | ||||||
Thermo Fisher Scientific, Inc. | 7,355 | 2,221,063 | ||||||
|
| |||||||
| 4,533,313 | ||||||||
|
| |||||||
Pharmaceuticals - 4.5% | ||||||||
Bristol-Myers Squibb Co. | 1,074 | 61,615 | ||||||
Johnson & Johnson | 58,428 | 7,714,833 | ||||||
Merck & Co., Inc. | 16,196 | 1,403,545 | ||||||
Merck KGaA (Germany) | 26,890 | 3,207,077 | ||||||
Novartis AG - ADR (Switzerland) | 39,535 | 3,456,940 | ||||||
Novartis AG (Switzerland) | 1,790 | 156,402 | ||||||
Perrigo Co. plc | 2,365 | 125,392 | ||||||
Pfizer, Inc. | 3,076 | 118,026 | ||||||
Recordati S.p.A. (Italy) | 3,255 | 136,789 | ||||||
Roche Holding AG (Switzerland) | 790 | 237,755 | ||||||
Sanofi (France) | 1,705 | 157,179 | ||||||
|
| |||||||
| 16,775,553 | ||||||||
|
| |||||||
Total Health Care | 43,653,827 | |||||||
|
| |||||||
Industrials - 1.5% | ||||||||
Aerospace & Defense - 0.2% | ||||||||
Airbus SE (France) | 925 | 132,699 | ||||||
BAE Systems plc (United Kingdom) . | 21,155 | 158,021 | ||||||
The Boeing Co. | 298 | 101,293 | ||||||
General Dynamics Corp. | 171 | 30,233 | ||||||
Lockheed Martin Corp. | 184 | 69,309 | ||||||
Safran S.A. (France) | 500 | 79,195 | ||||||
Thales S.A. (France) | 120 | 11,731 | ||||||
United Technologies Corp. | 522 | 74,949 | ||||||
|
| |||||||
| 657,430 | ||||||||
|
| |||||||
Air Freight & Logistics - 0.0%## | ||||||||
C.H. Robinson Worldwide, Inc. | 212 | 16,036 | ||||||
United Parcel Service, Inc. - Class B | 651 | 74,976 | ||||||
|
| |||||||
| 91,012 | ||||||||
|
| |||||||
Airlines - 0.0%## | ||||||||
Ryanair Holdings plc - ADR (Ireland)* | 1,290 | 96,286 | ||||||
|
| |||||||
The accompanying notes are an integral part of the financial statements.
96
Investment Portfolio - October 31, 2019
| PRO-BLEND®MAXIMUM TERM SERIES | ||||||||
SHARES
| VALUE
| |||||||
COMMON STOCKS(continued) | ||||||||
Industrials(continued) | ||||||||
Building Products - 0.0%## | ||||||||
Cie de Saint-Gobain (France) | 810 | $ | 32,990 | |||||
Johnson Controls International plc | 770 | 33,364 | ||||||
|
| |||||||
| 66,354 | ||||||||
|
| |||||||
Commercial Services & Supplies - 0.0%## | ||||||||
Waste Management, Inc. | 364 | 40,844 | ||||||
|
| |||||||
Construction & Engineering - 0.0%## | ||||||||
Vinci S.A. (France) | 1,360 | 152,587 | ||||||
|
| |||||||
Electrical Equipment - 0.1% | ||||||||
Eaton Corp. plc | 406 | 35,367 | ||||||
Emerson Electric Co. | 557 | 39,074 | ||||||
Legrand S.A. (France) | 430 | 33,593 | ||||||
Rockwell Automation, Inc. | 100 | 17,199 | ||||||
Schneider Electric SE (France) | 910 | 84,576 | ||||||
WEG S.A. (Brazil) | 5,000 | 32,066 | ||||||
|
| |||||||
| 241,875 | ||||||||
|
| |||||||
Industrial Conglomerates - 0.1% | ||||||||
3M Co. | 411 | 67,811 | ||||||
Honeywell International, Inc. | 442 | 76,347 | ||||||
LT Group, Inc. (Philippines) | 71,000 | 18,665 | ||||||
SM Investments Corp. (Philippines) | 3,595 | 72,879 | ||||||
|
| |||||||
| 235,702 | ||||||||
|
| |||||||
Machinery - 0.2% | ||||||||
Caterpillar, Inc. | 368 | 50,710 | ||||||
Cummins, Inc. | 164 | 28,287 | ||||||
Daifuku Co. Ltd. (Japan) | 1,500 | 79,593 | ||||||
FANUC Corp. (Japan) | 1,000 | 197,249 | ||||||
Harmonic Drive Systems, Inc. (Japan) | 2,100 | 97,391 | ||||||
Illinois Tool Works, Inc. | 246 | 41,471 | ||||||
KION Group AG (Germany) | 1,465 | 97,478 | ||||||
Nabtesco Corp. (Japan) | 2,800 | 89,137 | ||||||
The Weir Group plc (United Kingdom) | 6,490 | 113,361 | ||||||
|
| |||||||
| 794,677 | ||||||||
|
| |||||||
Professional Services - 0.0%## | ||||||||
SGS S.A. (Switzerland) | 25 | 65,203 | ||||||
|
| |||||||
Road & Rail - 0.8% | ||||||||
JB Hunt Transport Services, Inc. | 25,190 | 2,961,336 | ||||||
Localiza Rent a Car S.A. (Brazil) | 2,400 | 25,732 | ||||||
Rumo S.A. (Brazil)* | 6,200 | 35,371 | ||||||
Union Pacific Corp. | 443 | 73,299 | ||||||
|
| |||||||
| 3,095,738 | ||||||||
|
| |||||||
SHARES
| VALUE
| |||||||
COMMON STOCKS(continued) | ||||||||
Industrials(continued) | ||||||||
Trading Companies & Distributors - 0.0%## | ||||||||
Fastenal Co. | 640 | $ | 23,002 | |||||
|
| |||||||
Transportation Infrastructure - 0.1% | ||||||||
Grupo Aeroportuario del Centro Norte S.A.B. de C.V. (Mexico) | 10,600 | 73,558 | ||||||
Grupo Aeroportuario del Pacifico S.A.B. de C.V. - ADR (Mexico) | 475 | 49,642 | ||||||
Grupo Aeroportuario del Sureste S.A.B. de C.V. - ADR (Mexico) | 400 | 65,500 | ||||||
|
| |||||||
| 188,700 | ||||||||
|
| |||||||
Total Industrials | 5,749,410 | |||||||
|
| |||||||
Information Technology - 12.1% | ||||||||
Communications Equipment - 0.0%## | ||||||||
Cisco Systems, Inc. | 2,225 | 105,710 | ||||||
|
| |||||||
Electronic Equipment, Instruments & Components - 1.0% |
| |||||||
Cognex Corp. | 31,410 | 1,617,301 | ||||||
Halma plc (United Kingdom) | 3,295 | 79,955 | ||||||
Hexagon AB - Class B (Sweden) | 1,635 | 83,709 | ||||||
Keyence Corp. (Japan) | 3,207 | 2,027,775 | ||||||
|
| |||||||
| 3,808,740 | ||||||||
|
| |||||||
IT Services - 4.9% | ||||||||
Capgemini SE (France) | 260 | 29,310 | ||||||
International Business Machines Corp. | 570 | 76,226 | ||||||
InterXion Holding N.V. (Netherlands)* | 1,525 | 134,536 | ||||||
Keywords Studios plc (Ireland) | 1,726 | 24,872 | ||||||
Mastercard, Inc. - Class A | 25,410 | 7,033,742 | ||||||
Verra Mobility Corp.* | 375,010 | 5,381,394 | ||||||
Visa, Inc. - Class A | 31,905 | 5,706,528 | ||||||
|
| |||||||
| 18,386,608 | ||||||||
|
| |||||||
Semiconductors & Semiconductor Equipment - 2.6% |
| |||||||
Applied Materials, Inc. | 651 | 35,323 | ||||||
Broadcom, Inc. | 239 | 69,991 | ||||||
Intel Corp. | 2,512 | 142,003 | ||||||
KLA Corp. | 193 | 32,625 | ||||||
Lam Research Corp. | 111 | 30,085 | ||||||
Maxim Integrated Products, Inc. | 299 | 17,539 | ||||||
Micron Technology, Inc.* | 140,460 | 6,678,873 | ||||||
NVIDIA Corp. | 14,160 | 2,846,443 | ||||||
Texas Instruments, Inc. | 615 | 72,564 | ||||||
|
| |||||||
| 9,925,446 | ||||||||
|
| |||||||
Software - 3.6% | ||||||||
Dassault Systemes SE (France) | 250 | 37,969 | ||||||
Microsoft Corp. | 42,295 | 6,063,834 | ||||||
The accompanying notes are an integral part of the financial statements.
97
Investment Portfolio - October 31, 2019
| PRO-BLEND®MAXIMUM TERM SERIES | ||||||||
SHARES
| VALUE
| |||||||
COMMON STOCKS(continued) | ||||||||
Information Technology(continued) | ||||||||
Software(continued) | ||||||||
ServiceNow, Inc.* | 29,445 | $ | 7,280,571 | |||||
|
| |||||||
| 13,382,374 | ||||||||
|
| |||||||
Technology Hardware, Storage & Peripherals - 0.0%## |
| |||||||
NetApp, Inc. | 222 | 12,405 | ||||||
Western Digital Corp. | 362 | 18,697 | ||||||
|
| |||||||
| 31,102 | ||||||||
|
| |||||||
Total Information Technology | 45,639,980 | |||||||
|
| |||||||
Materials - 4.4% | ||||||||
Chemicals - 2.5% | ||||||||
Air Liquide S.A. (France) | 687 | 91,344 | ||||||
Akzo Nobel N.V. (Netherlands) | 38,960 | 3,591,856 | ||||||
Axalta Coating Systems Ltd.* | 74,590 | 2,199,659 | ||||||
CF Industries Holdings, Inc. | 66,670 | 3,023,485 | ||||||
Dow, Inc. | 513 | 25,901 | ||||||
Eastman Chemical Co. | 200 | 15,208 | ||||||
Givaudan S.A. (Switzerland) | 25 | 73,448 | ||||||
LyondellBasell Industries N.V. - Class A | 372 | 33,368 | ||||||
OCI N.V. (Netherlands)* | 1,170 | 26,307 | ||||||
Orbia Advance Corp. S.A.B. de C.V. (Mexico) | 40,000 | 86,585 | ||||||
Solvay S.A. (Belgium) | 1,565 | 170,156 | ||||||
|
| |||||||
| 9,337,317 | ||||||||
|
| |||||||
Containers & Packaging - 0.8% | ||||||||
Crown Holdings, Inc.* | 40,845 | 2,975,151 | ||||||
International Paper Co. | 361 | 15,768 | ||||||
|
| |||||||
| 2,990,919 | ||||||||
|
| |||||||
Metals & Mining - 1.1% | ||||||||
First Quantum Minerals Ltd. (Zambia) | 3,420 | 28,901 | ||||||
Freeport-McMoRan, Inc. | 129,410 | 1,270,806 | ||||||
Lundin Mining Corp. (Chile) | 191,250 | 965,616 | ||||||
Nucor Corp. | 393 | 21,163 | ||||||
Southern Copper Corp. (Peru) | 53,860 | 1,916,339 | ||||||
|
| |||||||
| 4,202,825 | ||||||||
|
| |||||||
Total Materials | 16,531,061 | |||||||
|
| |||||||
Real Estate - 4.0% | ||||||||
Equity Real Estate Investment Trusts (REITS) - 4.0% |
| |||||||
Acadia Realty Trust | 690 | 19,305 | ||||||
Agree Realty Corp. | 435 | 34,264 | ||||||
Alexandria Real Estate Equities, Inc. | 160 | 25,400 | ||||||
American Campus Communities, Inc. | 1,140 | 56,977 | ||||||
SHARES
| VALUE
| |||||||
COMMON STOCKS(continued) | ||||||||
Real Estate(continued) | ||||||||
Equity Real Estate Investment Trusts (REITS)(continued) |
| |||||||
American Homes 4 Rent - Class A | 3,885 | $ | 102,836 | |||||
American Tower Corp. | 17,695 | 3,858,926 | ||||||
Americold Realty Trust | 2,120 | 84,991 | ||||||
Apartment Investment & Management Co. - Class A | 1,863 | 102,241 | ||||||
AvalonBay Communities, Inc. | 655 | 142,567 | ||||||
Boston Properties, Inc. | 580 | 79,576 | ||||||
Brandywine Realty Trust | 5,540 | 84,651 | ||||||
The British Land Co. plc (United Kingdom) | 9,870 | 79,356 | ||||||
Camden Property Trust | 670 | 76,628 | ||||||
Community Healthcare Trust, Inc. | 1,245 | 60,283 | ||||||
Cousins Properties, Inc. | 3,470 | 139,251 | ||||||
Crown Castle International Corp. | 480 | 66,619 | ||||||
CubeSmart | 595 | 18,862 | ||||||
Digital Realty Trust, Inc. | 555 | 70,507 | ||||||
Douglas Emmett, Inc. | 1,470 | 63,680 | ||||||
Equinix, Inc. | 6,420 | 3,638,728 | ||||||
Equity LifeStyle Properties, Inc. | 890 | 62,247 | ||||||
Equity Residential | 1,165 | 103,289 | ||||||
Essential Properties Realty Trust, Inc. | 2,524 | 64,766 | ||||||
Essex Property Trust, Inc. | 252 | 82,437 | ||||||
Extra Space Storage, Inc. | 225 | 25,261 | ||||||
Federal Realty Investment Trust | 155 | 21,082 | ||||||
First Industrial Realty Trust, Inc. | 1,045 | 44,005 | ||||||
Getty Realty Corp. | 1,200 | 40,248 | ||||||
Healthcare Realty Trust, Inc. | 1,845 | 64,151 | ||||||
Healthcare Trust of America, Inc. - Class A | 1,130 | 35,030 | ||||||
Healthpeak Properties, Inc. | 2,710 | 101,950 | ||||||
Hibernia REIT plc (Ireland) | 21,455 | 33,405 | ||||||
Host Hotels & Resorts, Inc. | 2,150 | 35,238 | ||||||
Independence Realty Trust, Inc. | 2,975 | 45,815 | ||||||
Invitation Homes, Inc. | 4,301 | 132,428 | ||||||
Jernigan Capital, Inc. | 2,550 | 48,424 | ||||||
Kilroy Realty Corp. | 266 | 22,325 | ||||||
Land Securities Group plc (United Kingdom) | 6,620 | 80,635 | ||||||
Liberty Property Trust | 1,040 | 61,433 | ||||||
Life Storage, Inc. | 290 | 31,587 | ||||||
Mid-America Apartment Communities, Inc. | 320 | 44,477 | ||||||
National Retail Properties, Inc. | 1,095 | 64,506 | ||||||
National Storage Affiliates Trust | 1,080 | 36,904 | ||||||
Omega Healthcare Investors, Inc. | 1,030 | 45,361 | ||||||
Physicians Realty Trust | 3,765 | 70,293 | ||||||
The accompanying notes are an integral part of the financial statements.
98
Investment Portfolio - October 31, 2019
| PRO-BLEND®MAXIMUM TERM SERIES | ||||||||
SHARES
| VALUE
| |||||||
COMMON STOCKS (continued) | ||||||||
Real Estate(continued) | ||||||||
Equity Real Estate Investment Trusts (REITS)(continued) |
| |||||||
Plymouth Industrial REIT, Inc. | 1,360 | $ | 25,650 | |||||
Prologis, Inc. | 2,455 | 215,451 | ||||||
Public Storage | 410 | 91,373 | ||||||
Realty Income Corp. | 330 | 26,991 | ||||||
SBA Communications Corp. | 15,750 | 3,790,238 | ||||||
Simon Property Group, Inc. | 955 | 143,899 | ||||||
STAG Industrial, Inc. | 1,350 | 41,904 | ||||||
STORE Capital Corp. | 945 | 38,272 | ||||||
Sun Communities, Inc. | 585 | 95,150 | ||||||
Sunstone Hotel Investors, Inc. | 1,800 | 24,318 | ||||||
UDR, Inc. | 1,574 | 79,094 | ||||||
UMH Properties, Inc. | 1,455 | 21,723 | ||||||
Urban Edge Properties | 2,700 | 56,997 | ||||||
Ventas, Inc. | 1,137 | 74,019 | ||||||
VEREIT, Inc. | 5,665 | 55,744 | ||||||
Vornado Realty Trust | 395 | 25,924 | ||||||
Weingarten Realty Investors | 1,735 | 55,052 | ||||||
Welltower, Inc. | 1,057 | 95,859 | ||||||
|
| |||||||
| 15,160,603 | ||||||||
|
| |||||||
Real Estate Management & Development - 0.0%## |
| |||||||
Ayala Land, Inc. (Philippines) | 72,400 | 69,187 | ||||||
SM Prime Holdings, Inc. (Philippines) | 120,305 | 92,371 | ||||||
|
| |||||||
| 161,558 | ||||||||
|
| |||||||
Total Real Estate | 15,322,161 | |||||||
|
| |||||||
Utilities - 0.0%## | ||||||||
Electric Utilities - 0.0%## | ||||||||
Manila Electric Co. (Philippines) | 6,040 | 40,279 | ||||||
|
| |||||||
Independent Power and Renewable Electricity Producers - 0.0%## |
| |||||||
Aboitiz Power Corp. (Philippines) | 63,100 | 49,677 | ||||||
|
| |||||||
Multi-Utilities - 0.0%## | ||||||||
Engie S.A. (France) | 3,170 | 53,081 | ||||||
Veolia Environnement S.A. (France) | 965 | 25,402 | ||||||
|
| |||||||
| 78,483 | ||||||||
|
| |||||||
Total Utilities | 168,439 | |||||||
|
| |||||||
TOTAL COMMON STOCKS | 313,756,814 | |||||||
|
| |||||||
PRINCIPAL
| VALUE
| |||||||
CORPORATE BONDS - 2.9% | ||||||||
Non-Convertible Corporate Bonds - 2.9% | ||||||||
Communication Services - 0.6% | ||||||||
Diversified Telecommunication Services - 0.3% |
| |||||||
AT&T, Inc., 4.25%, 3/1/2027 | 350,000 | $ | 384,407 | |||||
CenturyLink, Inc., 5.625%, 4/1/2020 . | 20,000 | 20,250 | ||||||
Verizon Communications, Inc., 5.25%, 3/16/2037 | 460,000 | 579,406 | ||||||
|
| |||||||
| 984,063 | ||||||||
|
| |||||||
Interactive Media & Services - 0.1% | ||||||||
Tencent Holdings Ltd. (China)1, 3.975%, 4/11/2029 | 270,000 | 290,579 | ||||||
|
| |||||||
Media - 0.2% | ||||||||
Cablevision Systems Corp., 8.00%, 4/15/2020 | 20,000 | 20,500 | ||||||
Comcast Corp., 3.25%, 11/1/2039 | 280,000 | 283,869 | ||||||
Diamond Sports Group LLC - Diamond Sports Finance Co.1, 6.625%, 8/15/2027 | 30,000 | 30,900 | ||||||
Discovery Communications LLC, 5.20%, 9/20/2047 | 340,000 | 371,809 | ||||||
Entercom Media Corp.1, 7.25%, 11/1/2024 | 10,000 | 10,425 | ||||||
Townsquare Media, Inc.1, 6.50%, 4/1/2023 | 20,000 | 19,800 | ||||||
|
| |||||||
| 737,303 | ||||||||
|
| |||||||
Wireless Telecommunication Services - 0.0%## |
| |||||||
Sprint Communications, Inc., 7.00%, 8/15/2020 | 45,000 | 46,358 | ||||||
Sprint Corp., 7.25%, 9/15/2021 | 20,000 | 21,341 | ||||||
Sprint Corp., 7.125%, 6/15/2024 | 15,000 | 16,275 | ||||||
|
| |||||||
| 83,974 | ||||||||
|
| |||||||
Total Communication Services | 2,095,919 | |||||||
|
| |||||||
Consumer Discretionary - 0.3% | ||||||||
Auto Components - 0.0%## | ||||||||
American Axle & Manufacturing, Inc., 6.25%, 4/1/2025 | 10,000 | 9,638 | ||||||
Techniplas LLC1, 10.00%, 5/1/2020 | 25,000 | 21,125 | ||||||
|
| |||||||
| 30,763 | ||||||||
|
| |||||||
Diversified Consumer Services - 0.0%## | ||||||||
GEMS MENASA Cayman Ltd. - GEMS Education Delaware LLC (United Arab Emirates)1, 7.125%, 7/31/2026 | 75,000 | 77,718 | ||||||
|
| |||||||
Household Durables - 0.0%## | ||||||||
Ashton Woods USA LLC - Ashton Woods Finance Co.1, 6.75%, 8/1/2025 | 20,000 | 20,100 | ||||||
The accompanying notes are an integral part of the financial statements.
99
Investment Portfolio - October 31, 2019
| PRO-BLEND®MAXIMUM TERM SERIES | ||||||||
PRINCIPAL
| VALUE
| |||||||
CORPORATE BONDS(continued) | ||||||||
Non-Convertible Corporate Bonds(continued) |
| |||||||
| Consumer Discretionary(continued) | ||||||||
Household Durables(continued) | ||||||||
LGI Homes, Inc.1, 6.875%, 7/15/2026 | 35,000 | $ | 36,225 | |||||
Weekley Homes LLC - Weekley Finance Corp., 6.625%, 8/15/2025 | 40,000 | 40,600 | ||||||
|
| |||||||
| 96,925 | ||||||||
|
| |||||||
Internet & Direct Marketing Retail - 0.3% | ||||||||
Alibaba Group Holding Ltd. (China), 3.40%, 12/6/2027 | 290,000 | 301,212 | ||||||
Booking Holdings, Inc., 3.60%, 6/1/2026 | 570,000 | 617,115 | ||||||
Photo Holdings Merger Sub, Inc.1, 8.50%, 10/1/2026 | 30,000 | 26,404 | ||||||
|
| |||||||
| 944,731 | ||||||||
|
| |||||||
Specialty Retail - 0.0%## | ||||||||
Foxtrot Escrow Issuer LLC - Foxtrot Escrow Corp.1, 12.25%, 11/15/2026 | 30,000 | 30,153 | ||||||
Staples, Inc.1, 7.50%, 4/15/2026 | 30,000 | 31,206 | ||||||
|
| |||||||
| 61,359 | ||||||||
|
| |||||||
Total Consumer Discretionary | 1,211,496 | |||||||
|
| |||||||
Consumer Staples - 0.0%## | ||||||||
Food & Staples Retailing - 0.0%## | ||||||||
KeHE Distributors LLC - KeHE Finance Corp.1, 8.625%, 10/15/2026 | 30,000 | 30,769 | ||||||
|
| |||||||
Energy - 0.4% | ||||||||
Energy Equipment & Services - 0.0%## | ||||||||
Nabors Industries, Inc., 5.50%, 1/15/2023 | 20,000 | 16,900 | ||||||
Shelf Drilling Holdings Ltd. (United Arab Emirates)1, 8.25%, 2/15/2025 | 20,000 | 16,800 | ||||||
|
| |||||||
| 33,700 | ||||||||
|
| |||||||
Oil, Gas & Consumable Fuels - 0.4% | ||||||||
Antero Midstream Partners LP - Antero Midstream Finance Corp.1, 5.75%, 3/1/2027 | 20,000 | 14,874 | ||||||
Antero Midstream Partners LP - Antero Midstream Finance Corp.1, 5.75%, 1/15/2028 | 20,000 | 15,100 | ||||||
Bruin E&P Partners LLC1, 8.875%, 8/1/2023 | 20,000 | 13,200 | ||||||
Calumet Specialty Products Partners LP - Calumet Finance Corp.1, 11.00%, 4/15/2025 | 30,000 | 30,075 | ||||||
PRINCIPAL
| VALUE
| |||||||
CORPORATE BONDS(continued) | ||||||||
Non-Convertible Corporate Bonds(continued) |
| |||||||
| Energy(continued) | ||||||||
Oil, Gas & Consumable Fuels(continued) | ||||||||
Energy Transfer Operating LP, 6.50%, 2/1/2042 | 230,000 | $ | 275,472 | |||||
Jonah Energy LLC - Jonah Energy | ||||||||
Finance Corp.1, 7.25%, 10/15/2025 | 40,000 | 11,200 | ||||||
Kinder Morgan Energy Partners LP, 6.95%, 1/15/2038 | 290,000 | 374,890 | ||||||
Lonestar Resources America, Inc.1, 11.25%, 1/1/2023 | 20,000 | 14,000 | ||||||
Moss Creek Resources Holdings, Inc.1, 10.50%, 5/15/2027 | 5,000 | 3,862 | ||||||
NuStar Logistics LP, 6.75%, 2/1/2021 | 20,000 | 20,724 | ||||||
Rockies Express Pipeline LLC1, 5.625%, 4/15/2020 | 30,000 | 30,504 | ||||||
Sabine Pass Liquefaction LLC, 5.875%, 6/30/2026 | 440,000 | 505,231 | ||||||
Southwestern Energy Co.3, 6.20%, 1/23/2025 | 20,000 | 17,600 | ||||||
W&T Offshore, Inc.1, 9.75%, 11/1/2023 | 10,000 | 9,375 | ||||||
The Williams Companies, Inc., 3.75%, 6/15/2027 | 270,000 | 281,514 | ||||||
|
| |||||||
| 1,617,621 | ||||||||
|
| |||||||
Total Energy | 1,651,321 | |||||||
|
| |||||||
Financials - 0.7% | ||||||||
Banks - 0.6% | ||||||||
Bank of America Corp., 4.00%, 1/22/2025 | 570,000 | 607,973 | ||||||
Citigroup, Inc., 8.125%, 7/15/2039 | 170,000 | 279,661 | ||||||
Credit Suisse AG (Switzerland), 5.40%, 1/14/2020 | 570,000 | 573,693 | ||||||
JPMorgan Chase & Co.4, (3 mo. LIBOR US + 1.000%), 4.023%, 12/5/2024 | 270,000 | 288,305 | ||||||
Santander Holdings USA, Inc., 4.50%, 7/17/2025 | 380,000 | 409,487 | ||||||
|
| |||||||
| 2,159,119 | ||||||||
|
| |||||||
Capital Markets - 0.1% | ||||||||
AG Merger Sub II, Inc.1, 10.75%, 8/1/2027 | 20,000 | 19,800 | ||||||
Donnelley Financial Solutions, Inc., 8.25%, 10/15/2024 | 35,000 | 36,400 | ||||||
The Goldman Sachs Group, Inc., 4.25%, 10/21/2025 | 190,000 | 204,659 | ||||||
|
| |||||||
| 260,859 | ||||||||
|
| |||||||
The accompanying notes are an integral part of the financial statements.
100
Investment Portfolio - October 31, 2019
| PRO-BLEND®MAXIMUM TERM SERIES | ||||||||
PRINCIPAL
| VALUE
| |||||||
CORPORATE BONDS(continued) | ||||||||
Non-Convertible Corporate Bonds(continued) |
| |||||||
Financials(continued) | ||||||||
Consumer Finance - 0.0%## | ||||||||
Navient Corp., 5.00%, 10/26/2020 | 30,000 | $ | 30,554 | |||||
SLM Corp., 5.125%, 4/5/2022 | 35,000 | 36,138 | ||||||
|
| |||||||
| 66,692 | ||||||||
|
| |||||||
Diversified Financial Services - 0.0%## | ||||||||
Fidelity & Guaranty Life Holdings, Inc.1, 5.50%, 5/1/2025 | 20,000 | 21,350 | ||||||
Global Aircraft Leasing Co. Ltd. (Cayman Islands)1,5, 6.50%, 9/15/2024 | 30,000 | 30,704 | ||||||
VistaJet Malta Finance plc - XO Management Holding, Inc. (Switzerland)1, 10.50%, 6/1/2024 | 30,000 | 29,175 | ||||||
|
| |||||||
| 81,229 | ||||||||
|
| |||||||
Thrifts & Mortgage Finance - 0.0%## | ||||||||
Acrisure LLC - Acrisure Finance, Inc.1, 7.00%, 11/15/2025 | 30,000 | 27,450 | ||||||
Radian Group, Inc., 4.875%, 3/15/2027 | 40,000 | 41,500 | ||||||
|
| |||||||
| 68,950 | ||||||||
|
| |||||||
Total Financials | 2,636,849 | |||||||
|
| |||||||
Health Care - 0.1% | ||||||||
Health Care Providers & Services - 0.1% | ||||||||
HCA, Inc., 4.125%, 6/15/2029 | 290,000 | 307,227 | ||||||
|
| |||||||
| Industrials - 0.4% | ||||||||
Commercial Services & Supplies - 0.1% | ||||||||
The ADT Security Corp., 6.25%, 10/15/2021 | 20,000 | 21,325 | ||||||
Prime Security Services Borrower LLC - Prime Finance, Inc.1, 5.75%, 4/15/2026 | 20,000 | 20,494 | ||||||
Stericycle, Inc.1, 5.375%, 7/15/2024 . | 40,000 | 41,600 | ||||||
|
| |||||||
| 83,419 | ||||||||
|
| |||||||
Construction & Engineering - 0.0%## | ||||||||
HC2 Holdings, Inc.1, 11.50%, 12/1/2021 | 10,000 | 9,112 | ||||||
Tutor Perini Corp.1, 6.875%, 5/1/2025 | 40,000 | 39,894 | ||||||
|
| |||||||
| 49,006 | ||||||||
|
| |||||||
Industrial Conglomerates - 0.1% | ||||||||
General Electric Co.4,6, (3 mo. LIBOR US + 3.330%), 5.00% | 330,000 | 318,038 | ||||||
|
| |||||||
Marine - 0.0%## | ||||||||
American Tanker, Inc. (Norway)1, 9.25%, 2/22/2022 | 45,000 | 45,252 | ||||||
PRINCIPAL
| VALUE
| |||||||
CORPORATE BONDS(continued) | ||||||||
Non-Convertible Corporate Bonds(continued) |
| |||||||
Industrials(continued) | ||||||||
Marine(continued) | ||||||||
Borealis Finance LLC1, 7.50%, 11/16/2022 | 40,000 | $ | 37,600 | |||||
|
| |||||||
| 82,852 | ||||||||
|
| |||||||
Trading Companies & Distributors - 0.2% | ||||||||
AerCap Ireland Capital DAC - AerCap Global Aviation Trust (Ireland), 4.45%, 10/1/2025 | 380,000 | 412,330 | ||||||
Air Lease Corp., 3.625%, 4/1/2027 | 370,000 | 385,972 | ||||||
Fortress Transportation & Infrastructure Investors LLC1, 6.50%, 10/1/2025 | 30,000 | 30,300 | ||||||
|
| |||||||
| 828,602 | ||||||||
|
| |||||||
Total Industrials | 1,361,917 | |||||||
|
| |||||||
Information Technology - 0.0%## | ||||||||
Communications Equipment - 0.0%## | ||||||||
Hughes Satellite Systems Corp., 5.25%, 8/1/2026 | 35,000 | 37,494 | ||||||
|
| |||||||
Materials - 0.2% | ||||||||
Chemicals - 0.0%## | ||||||||
CF Industries, Inc., 7.125%, 5/1/2020 | 20,000 | 20,481 | ||||||
Olin Corp., 5.625%, 8/1/2029 | 20,000 | 20,765 | ||||||
|
| |||||||
| 41,246 | ||||||||
|
| |||||||
Containers & Packaging - 0.0%## | ||||||||
ARD Securities Finance S.A.R.L (Luxembourg)1,5, 8.75%, 1/31/2023 | 15,656 | 16,281 | ||||||
Berry Global, Inc.1, 4.50%, 2/15/2026 | 15,000 | 15,094 | ||||||
Mauser Packaging Solutions Holding Co.1, 7.25%, 4/15/2025 | 20,000 | 19,125 | ||||||
|
| |||||||
| 50,500 | ||||||||
|
| |||||||
Metals & Mining - 0.2% | ||||||||
Infrabuild Australia Pty Ltd. (Australia)1, 12.00%, 10/1/2024 | 30,000 | 30,574 | ||||||
Mountain Province Diamonds, Inc. | 40,000 | 38,800 | ||||||
Northwest Acquisitions ULC - Dominion Finco, Inc.1, 7.125%, 11/1/2022 | 40,000 | 20,000 | ||||||
Southern Copper Corp. (Peru), 5.375%, 4/16/2020 | 400,000 | 404,935 | ||||||
The accompanying notes are an integral part of the financial statements.
101
Investment Portfolio - October 31, 2019
| PRO-BLEND® MAXIMUM TERM SERIES | PRINCIPAL
| |||||||
VALUE
| ||||||||
CORPORATE BONDS(continued) | ||||||||
Non-Convertible Corporate Bonds(continued) |
| |||||||
Materials(continued) | ||||||||
Metals & Mining(continued) | ||||||||
SunCoke Energy Partners LP - SunCoke Energy Partners Finance Corp.1, 7.50%, 6/15/2025 | 10,000 | $ | 8,500 | |||||
|
| |||||||
| 502,809 | ||||||||
|
| |||||||
Total Materials | 594,555 | |||||||
|
| |||||||
Real Estate - 0.2% | ||||||||
Equity Real Estate Investment Trusts (REITS) - 0.2% |
| |||||||
American Tower Corp., 3.80%, 8/15/2029 | 360,000 | 384,852 | ||||||
Crown Castle International Corp., 3.10%, 11/15/2029 | 370,000 | 375,974 | ||||||
|
| |||||||
| 760,826 | ||||||||
|
| |||||||
Real Estate Management & Development - 0.0%## |
| |||||||
Five Point Operating Co. LP - Five Point Capital Corp.1, 7.875%, 11/15/2025 | 30,000 | 28,355 | ||||||
Forestar Group, Inc.1, 8.00%, 4/15/2024 | 20,000 | 21,500 | ||||||
|
| |||||||
| 49,855 | ||||||||
|
| |||||||
Total Real Estate | 810,681 | |||||||
|
| |||||||
TOTAL CORPORATE BONDS | 10,738,228 | |||||||
|
| |||||||
MUTUAL FUNDS - 0.4% | ||||||||
iShares MSCI India ETF | 12,640 | 437,977 | ||||||
SPDR Gold Shares* | 4,435 | 631,677 | ||||||
VanEck Vectors Gold Miners ETF | 11,683 | 328,876 | ||||||
|
| |||||||
TOTAL MUTUAL FUNDS | 1,398,530 | |||||||
|
| |||||||
U.S. TREASURY SECURITIES - 12.8% | ||||||||
U.S. Treasury Bonds - 1.8% | ||||||||
U.S. Treasury Bond, 2.50%, 2/15/2045 | 2,555,000 | 2,718,081 | ||||||
PRINCIPAL
| ||||||||
VALUE
| ||||||||
U.S. TREASURY SECURITIES(continued) | ||||||||
U.S. Treasury Bonds(continued) | ||||||||
U.S. Treasury Bond, 3.00%, 5/15/2047 | 2,430,000 | $ | 2,845,378 | |||||
U.S. Treasury Inflation Indexed Bond, 0.75%, 2/15/2042 | 1,199,901 | 1,260,841 | ||||||
|
| |||||||
Total U.S. Treasury Bonds | 6,824,300 | |||||||
|
| |||||||
U.S. Treasury Notes - 11.0% | ||||||||
U.S. Treasury Inflation Indexed Note, 0.125%, 4/15/2020 | 3,880,474 | 3,859,707 | ||||||
U.S. Treasury Note, 2.625%, 5/15/2021 | 3,960,000 | 4,021,875 | ||||||
U.S. Treasury Note, 1.75%, 5/15/2023 | 3,820,000 | 3,848,948 | ||||||
U.S. Treasury Note, 2.50%, 5/15/2024 | 3,640,000 | 3,793,562 | ||||||
U.S. Treasury Note, 2.00%, 8/15/2025 | 18,559,000 | 18,990,352 | ||||||
U.S. Treasury Note, 1.625%, 5/15/2026 | 7,020,000 | 7,031,244 | ||||||
|
| |||||||
Total U.S. Treasury Notes | 41,545,688 | |||||||
|
| |||||||
TOTAL U.S. TREASURY SECURITIES | 48,369,988 | |||||||
|
| |||||||
SHORT-TERM INVESTMENT - 0.2% | ||||||||
Dreyfus Government Cash Management, Institutional Shares, 1.73%7 | ||||||||
(Identified Cost $915,318) | 915,318 | 915,318 | ||||||
|
| |||||||
TOTAL INVESTMENTS - 99.4% | 375,178,878 | |||||||
OTHER ASSETS, LESS LIABILITIES - 0.6% | 2,445,685 | |||||||
|
| |||||||
NET ASSETS - 100% | $ | 377,624,563 | ||||||
|
| |||||||
ADR - American Depositary Receipt
ETF - Exchange-traded fund
LIBOR - London Interbank Offered Rate
*Non-income producing security.
## Less than 0.1%.
| 1Restricted | securities - Investment in securities that are restricted as to public resale under the Securities Act of 1933, as amended. These securities have |
| been | sold under Rule 144A and have been determined to be liquid under the Fund’s Liquidity Risk Management Program. These securities |
| amount | to $1,559,354, or 0.4% of the Series’ net assets as of October 31, 2019 (see Note 2 to the financial statements). |
The accompanying notes are an integral part of the financial statements.
102
Investment Portfolio - October 31, 2019
| 2Amount is | stated in USD unless otherwise noted. |
3Step coupon rate security - Rate steps up/down by 25 basis points upon rating downgrade/upgrade by Moody’s and S&P rating agencies (Subject to a maximum of 100 basis points per agency, 200 basis points maximum).
4Variable rate security. Security may be issued at a fixed coupon rate, which converts to a variable rate at a specified date. Rate shown is the rate in effect as of October 31, 2019.
| 5Represents | aPayment-In-Kind bond. |
| 6Security | is perpetual in nature and has no stated maturity date. |
| 7Rate | shown is the current yield as of October 31, 2019. |
The Global Industry Classification Standard (GICS) was developed by and is the exclusive property and a service mark of MSCI Inc. (MSCI) and Standard & Poor’s, a division of The McGraw-Hill Companies, Inc. (S&P), and is licensed for use by Manning & Napier when referencing GICS sectors. Neither MSCI, S&P, nor any third party involved in making or compiling the GICS or any GICS classifications makes any express or implied warranties or representations with respect to such standard or classification, nor shall any such party have any liability therefrom.
The accompanying notes are an integral part of the financial statements.
103
Statement of Assets and Liabilities -Pro-Blend® Maximum Term Series
October 31, 2019
ASSETS: | ||||
Investments, at value (identified cost $327,220,405) (Note 2) | $ | 375,178,878 | ||
Receivable for securities sold | 1,941,431 | |||
Foreign tax reclaims receivable | 659,173 | |||
Interest receivable | 424,165 | |||
Receivable for fund shares sold | 244,696 | |||
Dividends receivable | 167,538 | |||
Prepaid expenses | 33,814 | |||
|
| |||
TOTAL ASSETS | 378,649,695 | |||
|
| |||
LIABILITIES: | ||||
Accrued management fees (Note 3) | 188,428 | |||
Accruedsub-transfer agent fees (Note 3) | 129,610 | |||
Accrued distribution and service (Rule12b-1) fees (Class S) (Class R) (Class L) (Note 3) | 99,976 | |||
Accrued fund accounting and administration fees (Note 3) | 30,553 | |||
Accrued Chief Compliance Officer service fees (Note 3) | 687 | |||
Payable for securities purchased | 355,537 | |||
Payable for fund shares repurchased | 122,292 | |||
Other payables and accrued expenses | 98,049 | |||
|
| |||
TOTAL LIABILITIES | 1,025,132 | |||
|
| |||
TOTAL NET ASSETS | $ | 377,624,563 | ||
|
| |||
NET ASSETS CONSIST OF: | ||||
Capital stock | $ | 256,859 | ||
Additionalpaid-in-capital | 302,824,719 | |||
Total distributable earnings (loss) | 74,542,985 | |||
|
| |||
TOTAL NET ASSETS | $ | 377,624,563 | ||
|
| |||
The accompanying notes are an integral part of the financial statements.
104
Statement of Assets and Liabilities -Pro-Blend® Maximum Term Series
October 31, 2019
NET ASSET VALUE, OFFERING PRICE AND REDEMPTION PRICE PER SHARE - Class S($229,539,759/ 10,768,188 shares) | $ | 21.32 | ||
|
| |||
NET ASSET VALUE, OFFERING PRICE AND REDEMPTION PRICE PER SHARE - Class I($79,351,947/ 8,401,694 shares) | $ | 9.44 | ||
|
| |||
NET ASSET VALUE, OFFERING PRICE AND REDEMPTION PRICE PER SHARE - Class R($13,766,607/ 1,091,327 shares) | $ | 12.61 | ||
|
| |||
NET ASSET VALUE, OFFERING PRICE AND REDEMPTION PRICE PER SHARE - Class L($54,414,878/ 5,398,948 shares) | $ | 10.08 | ||
|
| |||
NET ASSET VALUE, OFFERING PRICE AND REDEMPTION PRICE PER SHARE - Class W($551,372/25,783 shares) | $ | 21.39 | ||
|
| |||
The accompanying notes are an integral part of the financial statements.
105
Statement of Operations -Pro-Blend® Maximum Term Series
For the Year Ended October 31, 2019
INVESTMENT INCOME: | ||||
Dividends (net of foreign taxes withheld, $275,701) | $ | 5,330,432 | ||
Interest | 1,692,430 | |||
|
| |||
Total Investment Income | 7,022,862 | |||
|
| |||
EXPENSES: | ||||
Management fees (Note 3) | 2,540,067 | |||
Distribution and service (Rule12b-1) fees (Class L) (Note 3) | 528,640 | |||
Distribution and service (Rule12b-1) fees (Class S) (Note 3) | 400,670 | |||
Distribution and service (Rule12b-1) fees (Class R) (Note 3) | 64,933 | |||
Sub-transfer agent fees (Note 3) | 261,295 | |||
Shareholder services fees (Class S) (Note 3) | 198,229 | |||
Fund accounting and administration fees (Note 3) | 110,016 | |||
Directors’ fees (Note 3) | 36,403 | |||
Chief Compliance Officer service fees (Note 3) | 3,455 | |||
Custodian fees | 50,621 | |||
Miscellaneous | 384,303 | |||
|
| |||
Total Expenses | 4,578,632 | |||
Less reduction of expenses (Note 3) | (90,444 | ) | ||
|
| |||
Net Expenses | 4,488,188 | |||
|
| |||
NET INVESTMENT INCOME | 2,534,674 | |||
|
| |||
REALIZED AND UNREALIZED GAIN (LOSS) ON INVESTMENTS AND FOREIGN CURRENCY: | ||||
Net realized gain (loss) on- | ||||
Investments | 27,329,098 | |||
Foreign currency and translation of other assets and liabilities | (25,925 | ) | ||
|
| |||
| 27,303,173 | ||||
|
| |||
Net change in unrealized appreciation (depreciation) on- | ||||
Investments | 21,646,357 | |||
Foreign currency and translation of other assets and liabilities | 8,210 | |||
|
| |||
| 21,654,567 | ||||
|
| |||
NET REALIZED AND UNREALIZED GAIN (LOSS) ON INVESTMENTS AND FOREIGN CURRENCY | 48,957,740 | |||
|
| |||
NET INCREASE IN NET ASSETS RESULTING FROM OPERATIONS | $ | 51,492,414 | ||
|
| |||
The accompanying notes are an integral part of the financial statements.
106
Statements of Changes in Net Assets -Pro-Blend® Maximum Term Series
FOR THE YEAR ENDED
| FOR THE YEAR
| |||||||
INCREASE (DECREASE) IN NET ASSETS: | ||||||||
OPERATIONS: | ||||||||
Net investment income | $ | 2,534,674 | $ | 1,428,339 | ||||
Net realized gain (loss) on investments and foreign currency | 27,303,173 | 46,085,495 | ||||||
Net change in unrealized appreciation (depreciation) on investments and foreign currency | 21,654,567 | (34,283,581 | ) | |||||
|
|
|
| |||||
Net increase from operations | 51,492,414 | 13,230,253 | ||||||
|
|
|
| |||||
DISTRIBUTIONS TO SHAREHOLDERS (Note 9): | ||||||||
Class S | (22,070,905 | ) | (21,869,531 | ) | ||||
Class I | (16,046,289 | ) | (15,572,505 | ) | ||||
Class R | (1,901,177 | ) | (1,807,537 | ) | ||||
Class L | (8,667,885 | ) | (7,051,008 | ) | ||||
Class W | (23 | ) | — | |||||
|
|
|
| |||||
Total distributions to shareholders | (48,686,279 | ) | (46,300,581 | ) | ||||
|
|
|
| |||||
CAPITAL STOCK ISSUED AND REPURCHASED: | ||||||||
Net increase (decrease) from capital share transactions (Note 5) | (34,366,414 | ) | (51,635,718 | ) | ||||
|
|
|
| |||||
Net increase (decrease) in net assets | (31,560,279 | ) | (84,706,046 | ) | ||||
NET ASSETS: | ||||||||
Beginning of year | 409,184,842 | 493,890,888 | ||||||
|
|
|
| |||||
End of year | $ | 377,624,563 | $ | 409,184,842 | ||||
|
|
|
| |||||
The accompanying notes are an integral part of the financial statements.
107
Financial Highlights -Pro-Blend® Maximum Term Series - Class S
FOR THE YEAR ENDED | |||||||||||||||||||||||||
10/31/19 | 10/31/18 | 10/31/17 | 10/31/16 | 10/31/15 | |||||||||||||||||||||
Per share data (for a share outstanding throughout each year): | |||||||||||||||||||||||||
Net asset value - Beginning of year |
| $20.59 |
| $21.71 |
| $18.71 |
| $18.30 |
| $20.86 | |||||||||||||||
|
|
|
|
|
|
|
|
|
| ||||||||||||||||
Income (loss) from investment operations: | |||||||||||||||||||||||||
Net investment income1 |
| 0.14 |
| 0.08 |
| 0.09 |
| 0.03 |
| 0.09 | |||||||||||||||
Net realized and unrealized gain (loss) on investments |
| 2.44 |
| 0.42 |
| 3.32 |
| 0.59 |
| (0.54 | ) | ||||||||||||||
|
|
|
|
|
|
|
|
|
| ||||||||||||||||
Total from investment operations |
| 2.58 |
| 0.50 |
| 3.41 |
| 0.62 |
| (0.45 | ) | ||||||||||||||
|
|
|
|
|
|
|
|
|
| ||||||||||||||||
Less distributions to shareholders: | |||||||||||||||||||||||||
From net investment income |
| (0.08 | ) |
| (0.06 | ) |
| (0.04 | ) |
| (0.02 | ) |
| (0.05 | ) | ||||||||||
From net realized gain on investments |
| (1.77 | ) |
| (1.56 | ) |
| (0.37 | ) |
| (0.19 | ) |
| (2.06 | ) | ||||||||||
|
|
|
|
|
|
|
|
|
| ||||||||||||||||
Total distributions to shareholders |
| (1.85 | ) |
| (1.62 | ) |
| (0.41 | ) |
| (0.21 | ) |
| (2.11 | ) | ||||||||||
|
|
|
|
|
|
|
|
|
| ||||||||||||||||
Net asset value - End of year |
| $21.32 |
| $20.59 |
| $21.71 |
| $18.71 |
| $18.30 | |||||||||||||||
|
|
|
|
|
|
|
|
|
| ||||||||||||||||
Net assets - End of year(000’s omitted) |
| $229,540 |
| $248,691 |
| $306,055 |
| $367,227 |
| $503,378 | |||||||||||||||
|
|
|
|
|
|
|
|
|
| ||||||||||||||||
Total return2 |
| 14.19% |
| 2.24% |
| 18.60% |
| 3.45% |
| (2.03% | ) | ||||||||||||||
Ratios (to average net assets)/Supplemental Data: | |||||||||||||||||||||||||
Expenses* |
| 1.10% |
| 1.10% |
| 1.10% |
| 1.08% |
| 1.08% | |||||||||||||||
Net investment income |
| 0.70% |
| 0.35% |
| 0.45% |
| 0.15% |
| 0.45% | |||||||||||||||
Series portfolio turnover |
| 73% |
| 63% |
| 85% |
| 49% |
| 59% | |||||||||||||||
| *For certain periods presented, the investment advisor did not impose all or a portion of its management and/or other fees, and in some periods may have paid a portion of the Series’ expenses. If these expenses had been incurred by the Class, the expense ratio (to average net assets) would have increased by the following amounts: |
| ||||||||||||||||||||||||
| 0.01% |
| 0.03% |
| N/A |
| N/A |
| N/A | ||||||||||||||||
1Calculated based on average shares outstanding during the years.
2Represents aggregate total return for the years indicated, and assumes reinvestment of all distributions. Total return would have been lower had certain expenses not been waived or reimbursed during certain years.
The accompanying notes are an integral part of the financial statements.
108
Financial Highlights -Pro-Blend® Maximum Term Series - Class I
FOR THE YEAR ENDED | |||||||||||||||||||||||||
10/31/19 | 10/31/18 | 10/31/17 | 10/31/16 | 10/31/15 | |||||||||||||||||||||
Per share data (for a share outstanding throughout each year): | |||||||||||||||||||||||||
Net asset value - Beginning of year |
| $10.22 |
| $11.60 |
| $10.19 |
| $10.09 |
| $12.51 | |||||||||||||||
|
|
|
|
|
|
|
|
|
| ||||||||||||||||
Income (loss) from investment operations: | |||||||||||||||||||||||||
Net investment income1 |
| 0.09 |
| 0.07 |
| 0.08 |
| 0.04 |
| 0.08 | |||||||||||||||
Net realized and unrealized gain (loss) on investments |
| 1.03 |
| 0.22 |
| 1.78 |
| 0.32 |
| (0.33 | ) | ||||||||||||||
|
|
|
|
|
|
|
|
|
| ||||||||||||||||
Total from investment operations |
| 1.12 |
| 0.29 |
| 1.86 |
| 0.36 |
| (0.25 | ) | ||||||||||||||
|
|
|
|
|
|
|
|
|
| ||||||||||||||||
Less distributions to shareholders: | |||||||||||||||||||||||||
From net investment income |
| (0.13 | ) |
| (0.11 | ) |
| (0.08 | ) |
| (0.07 | ) |
| (0.11 | ) | ||||||||||
From net realized gain on investments |
| (1.77 | ) |
| (1.56 | ) |
| (0.37 | ) |
| (0.19 | ) |
| (2.06 | ) | ||||||||||
|
|
|
|
|
|
|
|
|
| ||||||||||||||||
Total distributions to shareholders |
| (1.90 | ) |
| (1.67 | ) |
| (0.45 | ) |
| (0.26 | ) |
| (2.17 | ) | ||||||||||
|
|
|
|
|
|
|
|
|
| ||||||||||||||||
Net asset value - End of year |
| $9.44 |
| $10.22 |
| $11.60 |
| $10.19 |
| $10.09 | |||||||||||||||
|
|
|
|
|
|
|
|
|
| ||||||||||||||||
Net assets - End of year(000’s omitted) |
| $79,352 |
| $94,093 |
| $114,391 |
| $301,846 |
| $390,931 | |||||||||||||||
|
|
|
|
|
|
|
|
|
| ||||||||||||||||
Total return2 |
| 14.44% |
| 2.44% |
| 18.97% |
| 3.69% |
| (1.82% | ) | ||||||||||||||
Ratios (to average net assets)/Supplemental Data: | |||||||||||||||||||||||||
Expenses* |
| 0.85% |
| 0.85% |
| 0.85% |
| 0.83% |
| 0.83% | |||||||||||||||
Net investment income |
| 0.94% |
| 0.60% |
| 0.72% |
| 0.40% |
| 0.71% | |||||||||||||||
Series portfolio turnover |
| 73% |
| 63% |
| 85% |
| 49% |
| 59% | |||||||||||||||
| *For certain periods presented, the investment advisor did not impose all or a portion of its management and/or other fees, and in some periods may have paid a portion of the Series’ expenses. If these expenses had been incurred by the Class, the expense ratio (to average net assets) would have increased by the following amounts: |
| ||||||||||||||||||||||||
| 0.05% |
| 0.03% |
| N/A |
| N/A |
| N/A | ||||||||||||||||
1Calculated based on average shares outstanding during the years.
2Represents aggregate total return for the years indicated, and assumes reinvestment of all distributions. Total return would have been lower had certain expenses not been waived or reimbursed during certain years.
The accompanying notes are an integral part of the financial statements.
109
Financial Highlights -Pro-Blend® Maximum Term Series - Class R
FOR THE YEAR ENDED | |||||||||||||||||||||||||
10/31/19 | 10/31/18 | 10/31/17 | 10/31/16 | 10/31/15 | |||||||||||||||||||||
Per share data (for a share outstanding throughout each year): | |||||||||||||||||||||||||
Net asset value - Beginning of year |
| $12.98 |
| $14.28 |
| $12.48 |
| $12.28 |
| $14.73 | |||||||||||||||
|
|
|
|
|
|
|
|
|
| ||||||||||||||||
Income (loss) from investment operations: | |||||||||||||||||||||||||
Net investment income (loss)1 |
| 0.06 |
| 0.01 |
| 0.03 |
| (0.01 | ) |
| 0.03 | ||||||||||||||
Net realized and unrealized gain (loss) on investments |
| 1.40 |
| 0.29 |
| 2.17 |
| 0.40 |
| (0.38 | ) | ||||||||||||||
|
|
|
|
|
|
|
|
|
| ||||||||||||||||
Total from investment operations |
| 1.46 |
| 0.30 |
| 2.20 |
| 0.39 |
| (0.35 | ) | ||||||||||||||
|
|
|
|
|
|
|
|
|
| ||||||||||||||||
Less distributions to shareholders: | |||||||||||||||||||||||||
From net investment income |
| (0.06 | ) |
| (0.04 | ) |
| (0.03 | ) |
| (0.00 | )2 |
| (0.04 | ) | ||||||||||
From net realized gain on investments |
| (1.77 | ) |
| (1.56 | ) |
| (0.37 | ) |
| (0.19 | ) |
| (2.06 | ) | ||||||||||
|
|
|
|
|
|
|
|
|
| ||||||||||||||||
Total distributions to shareholders |
| (1.83 | ) |
| (1.60 | ) |
| (0.40 | ) |
| (0.19 | ) |
| (2.10 | ) | ||||||||||
|
|
|
|
|
|
|
|
|
| ||||||||||||||||
Net asset value - End of year |
| $12.61 |
| $12.98 |
| $14.28 |
| $12.48 |
| $12.28 | |||||||||||||||
|
|
|
|
|
|
|
|
|
| ||||||||||||||||
Net assets - End of year(000’s omitted) |
| $13,767 |
| $13,841 |
| $17,404 |
| $22,153 |
| $31,517 | |||||||||||||||
|
|
|
|
|
|
|
|
|
| ||||||||||||||||
Total return3 |
| 13.84% |
| 1.99% |
| 18.21% |
| 3.26% |
| (2.28% | ) | ||||||||||||||
Ratios (to average net assets)/Supplemental Data: | |||||||||||||||||||||||||
Expenses* |
| 1.34% |
| 1.35% |
| 1.35% |
| 1.33% |
| 1.33% | |||||||||||||||
Net investment income (loss) |
| 0.46% |
| 0.11% |
| 0.22% |
| (0.10% | ) |
| 0.20% | ||||||||||||||
Series portfolio turnover |
| 73% |
| 63% |
| 85% |
| 49% |
| 59% | |||||||||||||||
| *For certain periods presented, the investment advisor did not impose all or a portion of its management and/or other fees, and in some periods may have paid a portion of the Series’ expenses. If these expenses had been incurred by the Class, the expense ratio (to average net assets) would have increased by the following amounts: |
| ||||||||||||||||||||||||
| 0.01% |
| 0.03% |
| N/A |
| N/A |
| N/A | ||||||||||||||||
1Calculated based on average shares outstanding during the years.
2Less than $(0.01).
3Represents aggregate total return for the years indicated, and assumes reinvestment of all distributions. Total return would have been lower had certain expenses not been waived or reimbursed during certain years.
The accompanying notes are an integral part of the financial statements.
110
Financial Highlights -Pro-Blend® Maximum Term Series - Class L*
FOR THE YEAR ENDED | |||||||||||||||||||||||||
10/31/19 | 10/31/18 | 10/31/17 | 10/31/16 | 10/31/15 | |||||||||||||||||||||
Per share data (for a share outstanding throughout each year): | |||||||||||||||||||||||||
Net asset value - Beginning of year |
| $10.76 |
| $12.13 |
| $10.68 |
| $10.60 |
| $13.03 | |||||||||||||||
|
|
|
|
|
|
|
|
|
| ||||||||||||||||
Income (loss) from investment operations: | |||||||||||||||||||||||||
Net investment income (loss)1 |
| (0.00 | )2 |
| (0.05 | ) |
| (0.03 | ) |
| (0.06 | ) |
| (0.03 | ) | ||||||||||
Net realized and unrealized gain (loss) on investments |
| 1.12 |
| 0.24 |
| 1.86 |
| 0.33 |
| (0.34 | ) | ||||||||||||||
|
|
|
|
|
|
|
|
|
| ||||||||||||||||
Total from investment operations |
| 1.12 |
| 0.19 |
| 1.83 |
| 0.27 |
| (0.37 | ) | ||||||||||||||
|
|
|
|
|
|
|
|
|
| ||||||||||||||||
Less distributions to shareholders: | |||||||||||||||||||||||||
From net investment income |
| (0.03 | ) |
| — |
| (0.01 | ) |
| — |
| (0.00 | )2 | ||||||||||||
From net realized gain on investments |
| (1.77 | ) |
| (1.56 | ) |
| (0.37 | ) |
| (0.19 | ) |
| (2.06 | ) | ||||||||||
|
|
|
|
|
|
|
|
|
| ||||||||||||||||
Total distributions to shareholders |
| (1.80 | ) |
| (1.56 | ) |
| (0.38 | ) |
| (0.19 | ) |
| (2.06 | ) | ||||||||||
|
|
|
|
|
|
|
|
|
| ||||||||||||||||
Net asset value - End of year |
| $10.08 |
| $10.76 |
| $12.13 |
| $10.68 |
| $10.60 | |||||||||||||||
|
|
|
|
|
|
|
|
|
| ||||||||||||||||
Net assets - End of year(000’s omitted) |
| $54,415 |
| $52,560 |
| $56,040 |
| $54,753 |
| $57,507 | |||||||||||||||
|
|
|
|
|
|
|
|
|
| ||||||||||||||||
Total return3 |
| 13.40% |
| 1.40% |
| 17.78% |
| 2.62% |
| (2.76% | ) | ||||||||||||||
Ratios (to average net assets)/Supplemental Data: | |||||||||||||||||||||||||
Expenses** |
| 1.82% |
| 1.85% |
| 1.85% |
| 1.83% |
| 1.83% | |||||||||||||||
Net investment income (loss) |
| (0.03% | ) |
| (0.40% | ) |
| (0.31% | ) |
| (0.61% | ) |
| (0.30% | ) | ||||||||||
Series portfolio turnover |
| 73% |
| 63% |
| 85% |
| 49% |
| 59% | |||||||||||||||
*Effective March 1, 2019, Class R2 shares of the Series have been redesignated as Class L Shares. |
| ||||||||||||||||||||||||
| **For certain periods presented, the investment advisor did not impose all or a portion of its management and/or other fees, and in some periods may have paid a portion of the Series’ expenses. If these expenses had been incurred by the Class, the expense ratio (to average net assets) would have increased by the following amounts: |
| ||||||||||||||||||||||||
| 0.01% |
| 0.03% |
| N/A |
| N/A |
| N/A | ||||||||||||||||
1Calculated based on average shares outstanding during the years.
2Less than $(0.01).
3Represents aggregate total return for the years indicated, and assumes reinvestment of all distributions. Total return would have been lower had certain expenses not been waived or reimbursed during certain years.
The accompanying notes are an integral part of the financial statements.
111
Financial Highlights -Pro-Blend® Maximum Term Series - Class W
FOR THE PERIOD | |||||
4/1/191 TO 10/31/19 | |||||
Per share data (for a share outstanding throughout the period): | |||||
Net asset value - Beginning of period |
| $20.12 | |||
|
| ||||
Income (loss) from investment operations: | |||||
Net investment income2 |
| 0.12 | |||
Net realized and unrealized gain (loss) on investments |
| 1.24 | |||
|
| ||||
Total from investment operations |
| 1.36 | |||
|
| ||||
Less distributions to shareholders: | |||||
From net investment income |
| (0.09 | ) | ||
From net realized gain on investments |
| (0.00 | )3 | ||
|
| ||||
Total distributions to shareholders |
| (0.09 | ) | ||
|
| ||||
Net asset value - End of period |
| $21.39 | |||
|
| ||||
Net assets - End of period(000’s omitted) |
| $551 | |||
|
| ||||
Total return4 |
| 6.79% | |||
Ratios (to average net assets)/Supplemental Data: | |||||
Expenses*5 |
| 0.10% | |||
Net investment income5 |
| 1.04% | |||
Series portfolio turnover |
| 73% | |||
| *The investment advisor did not impose all or a portion of its management and/or other fees during the period, and may have paid a portion of the Series’ expenses. If these expenses had been incurred by the Class, the expense ratio (to average net assets) would have increased by the following amounts5: |
| ||||
| 0.65% | ||||
1Commencement of operations.
2Calculated based on average shares outstanding during the period.
3Less than $(0.01).
4Represents aggregate total return for the period indicated. Total return would have been lower had certain expenses not been waived or reimbursed during the period. Periods less than one year are not annualized.
5Annualized.
The accompanying notes are an integral part of the financial statements.
112
Notes to Financial Statements
| 1. | Organization |
Pro-Blend® Conservative Term Series,Pro-Blend® Moderate Term Series,Pro-Blend® Extended Term Series andPro-Blend® Maximum Term Series (each the “Series”) areno-load diversified series of Manning & Napier Fund, Inc. (the “Fund”). The Fund is organized in Maryland and is registered under the Investment Company Act of 1940 (the “1940 Act”), as amended, as anopen-end management investment company.
The Series are asset allocation funds. Each invests in a combination of stocks, bonds and cash and is managed according to specific objectives. The objectives are as follows:Pro-Blend® Conservative Term Series - primary objective is preservation of capital; secondary objective is to provide income and long-term growth of capital.Pro-Blend® Moderate Term Series - equal emphasis on long-term growth of capital and preservation of capital.Pro-Blend® Extended Term Series - primary objective is long-term growth of capital; secondary objective is preservation of capital.Pro-Blend® Maximum Term Series - primary objective is long-term growth of capital.
Each Series is authorized to issue six classes of shares (Class S, I, R, L (formerly Class R2), W, and Z). Class W shares of each Series were issued on April 1, 2019. Each class of shares is substantially the same, except that class-specific distribution and shareholder servicing expenses are borne by the specific class of shares to which they relate.
The Fund’s Advisor is Manning & Napier Advisors, LLC (the “Advisor”). Shares of each Series are offered to investors and employees of the Advisor and its affiliates. The total authorized capital stock of the Fund consists of 15 billion shares of common stock each having a par value of $0.01. As of October 31, 2019, 10 billion shares have been designated in total among 34 series, of which 162.5 million have been designated asPro-Blend® Conservative Term Series Class S common stock, 75 million have been designated asPro-Blend® Conservative Term Series Class I common stock, 125 million each have been designated as Class S common stock and Class I common stock forPro-Blend® Moderate Term Series, 125 million each have been designated as Class S common stock forPro-Blend® Extended Term Series andPro-Blend® Maximum Term Series, 200 million each have been designated as Class I common stock forPro-Blend® Extended Term Series andPro-Blend® Maximum Term Series, 52.5 million have been designated in each of the Series as Class R common stock, 25 million have been designated in each of the Series as Class L (formerly Class R2) common stock, 100 million have been designated in each of the Series as Class W common stock and Class Z common stock. Class Z common stock is not currently offered for sale.
| 2. | Significant Accounting Policies |
The following is a summary of significant accounting policies followed by the Series. Each Series is an investment company and, accordingly, follows the investment company accounting and reporting guidance of the Financial Accounting Standards Board Accounting Standards Codification Topic 946 - Investment Companies, which is part of accounting principles generally accepted in the United States of America (“GAAP”).
Security Valuation
Portfolio securities, including domestic equities, foreign equities, warrants and options, listed on an exchange other than the NASDAQ Stock Market are valued at the latest quoted sales price of the exchange on which the security is primarily traded. Securities not traded on valuation date or securities not listed on an exchange are valued at the latest quoted bid price provided by the Fund’s pricing service. Securities listed on the NASDAQ Stock Market are valued in accordance with the NASDAQ Official Closing Price.
Debt securities, including government bonds, foreign bonds, asset-backed securities, structured notes, supranational obligations, sovereign bonds, corporate bonds and mortgage-backed securities will normally be valued on the basis of evaluated bid prices provided directly by an independent pricing service. The pricing services use multiple valuation techniques to determine fair value. In instances where sufficient market activity exists, the pricing services may utilize a market-based approach through which quotes from market makers are used to determine fair value. In instances where sufficient market activity may not exist or is limited, the pricing services also utilize proprietary valuation models which may consider market characteristics such as benchmark yield curves, option-adjusted spreads, credit spreads, estimated defaulted rates, coupon rates, anticipated timing of principal repayments, underlying collateral and other unique security features in order to estimate the relevant cash flows, which are then discounted to calculate the fair value. Certain investments in securities held by the Series may be valued on a basis of
113
Notes to Financial Statements (continued)
| 2. | Significant Accounting Policies (continued) |
Security Valuation(continued)
a price provided directly by a principal market maker. These prices may differ from the value that would have been used had a broader market for securities existed.
Short-term investments that mature in sixty days or less may be valued at amortized cost, which approximates fair value. Investments inopen-end investment companies are valued at their net asset value per share on valuation date.
Volume and level of activity in established markets for an asset or liability are evaluated to determine whether recent transactions and quoted prices are determinative of fair value. Where there have been significant decreases in volume and level of activity, further analysis and adjustment may be necessary to estimate fair value. The Series measure fair value in these instances by the use of inputs and valuation techniques which may be based upon current market prices of securities that are comparable in coupon, rating, maturity and industry and/or expectation of future cash flows. As a result of trading in relatively thin markets and/or markets that experience significant volatility, the prices used by the Series to value these securities may differ from the value that would be realized if these securities were sold, and the differences could be material.
Securities for which representative valuations or prices are not available from the Series’ pricing service may be valued at fair value as determined in good faith by the Advisor under procedures approved by and under the general supervision and responsibility of the Fund’s Board of Directors (the “Board”). Due to the inherent uncertainty of valuations of such securities, the fair value may differ significantly from the values that would have been used had a ready market for such securities existed. If trading or events occurring after the close of the principal market in which securities are traded are expected to materially affect the value of those securities, then they may be valued at their fair value, taking this trading or these events into account. In accordance with the procedures approved by the Board, the values of certain securities trading outside the U.S. were adjusted following the close of local trading using a factor from a third party vendor. The third party vendor uses statistical analyses and quantitative models, which consider among other things subsequent movement and changes in the prices of indices, securities and exchange rates in other markets, to determine the factors which are used to adjust local market prices. The value of securities used for net asset value calculation under these procedures may differ from published prices for the same securities. It is the Fund’s policy to classify each foreign equity security where a factor from a third party vendor is provided as a Level 2 security.
Various inputs are used in determining the value of the Series’ assets or liabilities carried at fair value. These inputs are summarized in three broad levels. Level 1 includes quoted prices in active markets for identical assets and liabilities. Level 2 includes other significant observable inputs (including quoted prices for similar securities, interest rates, prepayment speeds, credit risk, etc.). Level 3 includes significant unobservable inputs (including the Series’ own assumptions in determining the fair value of investments). A financial instrument’s level within the fair value hierarchy is based on the lowest level of any input both individually and in aggregate that is significant to their fair value measure. The inputs or methodology used for valuing securities are not necessarily an indication of the risk associated with investing in those securities.
The following is a summary of the valuation levels used for major security types as of October 31, 2019 in valuing the Series’ assets or liabilities carried at fair value:
| PRO-BLEND® CONSERVATIVE TERM SERIES | ||||||||||||||||
| DESCRIPTION | TOTAL | LEVEL 1 | LEVEL 2# | LEVEL 3 | ||||||||||||
Assets: | ||||||||||||||||
Equity Securities: | ||||||||||||||||
Communication Services | $ | 26,329,722 | $ | 19,953,539 | $ | 6,376,183 | $ | — | ||||||||
Consumer Discretionary | 20,471,164 | 17,037,474 | 3,433,690 | — | ||||||||||||
Consumer Staples | 30,014,201 | 21,583,466 | 8,430,735 | — | ||||||||||||
Energy | 10,634,210 | 10,634,210 | — | — | ||||||||||||
Financials | 30,124,123 | 30,124,123 | — | — | ||||||||||||
Health Care | 39,311,201 | 34,952,147 | 4,359,054 | — | ||||||||||||
Industrials | 11,878,447 | 11,878,447 | — | — | ||||||||||||
114
Notes to Financial Statements (continued)
| 2. | Significant Accounting Policies (continued) |
Security Valuation(continued)
| PRO-BLEND® CONSERVATIVE TERM SERIES | ||||||||||||||||
| DESCRIPTION | TOTAL | LEVEL 1 | LEVEL 2# | LEVEL 3 | ||||||||||||
Information Technology | $ | 37,306,244 | $ | 37,306,244 | $ | — | $ | — | ||||||||
Materials | 3,934,874 | 3,934,874 | — | — | ||||||||||||
Real Estate | 29,499,295 | 29,334,514 | 164,781 | — | ||||||||||||
Utilities | 2,079,335 | 2,079,335 | — | — | ||||||||||||
Debt securities: | ||||||||||||||||
U.S. Treasury and other U.S. | ||||||||||||||||
Government agencies | 351,113,162 | — | 351,113,162 | — | ||||||||||||
Corporate debt: | ||||||||||||||||
Communication Services | 36,255,553 | — | 36,255,553 | — | ||||||||||||
Consumer Discretionary | 24,086,542 | — | 24,086,542 | — | ||||||||||||
Consumer Staples | 2,128,156 | — | 2,128,156 | — | ||||||||||||
Energy | 34,424,421 | — | 34,424,421 | — | ||||||||||||
Financials | 39,321,995 | — | 39,321,995 | — | ||||||||||||
Health Care | 5,402,965 | — | 5,402,965 | — | ||||||||||||
Industrials | 20,555,795 | — | 20,555,795 | — | ||||||||||||
Information Technology | 182,113 | — | 182,113 | — | ||||||||||||
Materials | 7,654,592 | — | 7,654,592 | — | ||||||||||||
Real Estate | 14,906,280 | — | 14,906,280 | — | ||||||||||||
Asset-backed securities | 57,095,893 | — | 57,095,893 | — | ||||||||||||
Commercial mortgage-backed securities | 62,212,323 | — | 62,212,323 | — | ||||||||||||
Foreign government bonds | 9,862,881 | — | 9,862,881 | — | ||||||||||||
Mutual funds | 3,521,619 | 3,521,619 | — | — | ||||||||||||
Short-Term Investment | 6,082,021 | 6,082,021 | — | — | ||||||||||||
|
|
|
|
|
|
|
| |||||||||
Total assets | 916,389,127 | 228,422,013 | 687,967,114 | — | ||||||||||||
|
|
|
|
|
|
|
| |||||||||
Liabilities: | ||||||||||||||||
Other financial instruments*: | ||||||||||||||||
Equity contracts | (46,180 | ) | (43,620 | ) | (2,560 | ) | — | |||||||||
|
|
|
|
|
|
|
| |||||||||
Total liabilities | (46,180 | ) | (43,620 | ) | (2,560 | ) | — | |||||||||
|
|
|
|
|
|
|
| |||||||||
Total | $ | 916,342,947 | $ | 228,378,393 | $ | 687,964,554 | $ | — | ||||||||
|
|
|
|
|
|
|
| |||||||||
| PRO-BLEND®MODERATE TERM SERIES | ||||||||||||||||
| DESCRIPTION | TOTAL | LEVEL 1 | LEVEL 2# | LEVEL 3 | ||||||||||||
Assets: | ||||||||||||||||
Equity Securities: | ||||||||||||||||
Communication Services | $ | 23,216,377 | $ | 16,617,454 | $ | 6,598,923 | $ | — | ||||||||
Consumer Discretionary | 15,613,694 | 11,690,179 | 3,923,515 | — | ||||||||||||
Consumer Staples | 23,125,988 | 13,481,728 | 9,644,260 | — | ||||||||||||
Energy | 4,335,137 | 3,761,106 | 574,031 | — | ||||||||||||
Financials | 14,814,249 | 13,793,377 | 1,020,872 | — | ||||||||||||
Health Care | 26,838,123 | 22,248,858 | 4,589,265 | — | ||||||||||||
Industrials | 2,101,592 | 955,465 | 1,146,127 | — | ||||||||||||
Information Technology | 27,260,988 | 26,868,456 | 392,532 | — | ||||||||||||
Materials | 536,437 | 186,022 | 350,415 | — | ||||||||||||
Real Estate | 12,137,058 | 11,835,644 | 301,414 | — | ||||||||||||
Utilities | 126,239 | — | 126,239 | — | ||||||||||||
115
Notes to Financial Statements (continued)
| 2. | Significant Accounting Policies (continued) |
Security Valuation(continued)
| PRO-BLEND®MODERATE TERM SERIES | ||||||||||||||||
| DESCRIPTION | TOTAL | LEVEL 1 | LEVEL 2# | LEVEL 3 | ||||||||||||
Debt securities: | ||||||||||||||||
U.S. Treasury and other U.S. | ||||||||||||||||
Government agencies | $ | 128,657,074 | $ | — | $ | 128,657,074 | $ | — | ||||||||
Corporate debt: | ||||||||||||||||
Communication Services | 12,487,954 | — | 12,487,954 | — | ||||||||||||
Consumer Discretionary | 8,481,844 | — | 8,481,844 | — | ||||||||||||
Consumer Staples | 61,538 | — | 61,538 | — | ||||||||||||
Energy | 9,848,935 | — | 9,848,935 | — | ||||||||||||
Financials | 14,384,956 | — | 14,384,956 | — | ||||||||||||
Health Care | 1,917,523 | — | 1,917,523 | — | ||||||||||||
Industrials | 5,676,385 | — | 5,676,385 | — | ||||||||||||
Information Technology | 80,344 | — | 80,344 | — | ||||||||||||
Materials | 2,661,359 | — | 2,661,359 | — | ||||||||||||
Real Estate | 3,099,555 | — | 3,099,555 | — | ||||||||||||
Asset-backed securities | 19,314,513 | — | 19,314,513 | — | ||||||||||||
Commercial mortgage-backed securities | 27,433,622 | — | 27,433,622 | — | ||||||||||||
Foreign government bonds | 5,040,010 | — | 5,040,010 | — | ||||||||||||
Mutual funds | 1,083,446 | 1,083,446 | — | — | ||||||||||||
Short-Term Investment | 3,758,324 | 3,758,324 | — | — | ||||||||||||
|
|
|
|
|
|
|
| |||||||||
Total assets | 394,093,264 | 126,280,059 | 267,813,205 | — | ||||||||||||
|
|
|
|
|
|
|
| |||||||||
Liabilities: | ||||||||||||||||
Other financial instruments*: | ||||||||||||||||
Equity contracts | (72,726 | ) | (70,846 | ) | (1,880 | ) | — | |||||||||
|
|
|
|
|
|
|
| |||||||||
Total liabilities | (72,726 | ) | (70,846 | ) | (1,880 | ) | — | |||||||||
|
|
|
|
|
|
|
| |||||||||
Total | $ | 394,020,538 | $ | 126,209,213 | $ | 267,811,325 | $ | — | ||||||||
|
|
|
|
|
|
|
| |||||||||
| PRO-BLEND®EXTENDED TERM SERIES | ||||||||||||||||
| DESCRIPTION | TOTAL | LEVEL 1 | LEVEL 2# | LEVEL 3 | ||||||||||||
Assets: | ||||||||||||||||
Equity Securities: | ||||||||||||||||
Communication Services | $ | 40,718,734 | $ | 29,248,731 | $ | 11,470,003 | $ | — | ||||||||
Consumer Discretionary | 26,344,229 | 19,638,760 | 6,705,469 | — | ||||||||||||
Consumer Staples | 39,259,264 | 22,983,026 | 16,276,238 | — | ||||||||||||
Energy | 6,694,760 | 5,716,715 | 978,045 | — | ||||||||||||
Financials | 24,096,678 | 22,352,212 | 1,744,466 | — | ||||||||||||
Health Care | 45,688,272 | 37,902,013 | 7,786,259 | — | ||||||||||||
Industrials | 3,616,795 | 1,654,862 | 1,961,933 | — | ||||||||||||
Information Technology | 47,614,634 | 46,890,800 | 723,834 | — | ||||||||||||
Materials | 898,204 | 314,199 | 584,005 | — | ||||||||||||
Real Estate | 18,574,253 | 18,072,194 | 502,059 | — | ||||||||||||
Utilities | 219,382 | — | 219,382 | — | ||||||||||||
Debt securities: | ||||||||||||||||
U.S. Treasury and other U.S. | ||||||||||||||||
Government agencies | 132,052,160 | — | 132,052,160 | — | ||||||||||||
Corporate debt: | ||||||||||||||||
Communication Services | 12,306,404 | — | 12,306,404 | — | ||||||||||||
Consumer Discretionary | 8,775,745 | — | 8,775,745 | — | ||||||||||||
Consumer Staples | 71,794 | — | 71,794 | — | ||||||||||||
Energy | 9,784,248 | — | 9,784,248 | — | ||||||||||||
Financials | 13,883,961 | — | 13,883,961 | — | ||||||||||||
116
Notes to Financial Statements (continued)
| 2. | Significant Accounting Policies (continued) |
Security Valuation(continued)
| PRO-BLEND®EXTENDED TERM SERIES | ||||||||||||||||
| DESCRIPTION | TOTAL | LEVEL 1 | LEVEL 2# | LEVEL 3 | ||||||||||||
Health Care | $ | 1,875,147 | $ | — | $ | 1,875,147 | $ | — | ||||||||
Industrials | 7,535,223 | — | 7,535,223 | — | ||||||||||||
Information Technology | 107,125 | — | 107,125 | — | ||||||||||||
Materials | 2,869,737 | — | 2,869,737 | — | ||||||||||||
Real Estate | 2,876,314 | — | 2,876,314 | — | ||||||||||||
Utilities | 259,394 | — | 259,394 | — | ||||||||||||
Asset-backed securities | 17,427,632 | — | 17,427,632 | — | ||||||||||||
Commercial mortgage-backed securities | 25,851,394 | — | 25,851,394 | — | ||||||||||||
Foreign government bonds | 5,792,808 | — | 5,792,808 | — | ||||||||||||
Mutual funds | 1,840,494 | 1,840,494 | — | — | ||||||||||||
Short-Term Investment | 5,431,336 | 5,431,336 | — | — | ||||||||||||
|
|
|
|
|
|
|
| |||||||||
Total assets | 502,466,121 | 212,045,342 | 290,420,779 | — | ||||||||||||
|
|
|
|
|
|
|
| |||||||||
Liabilities: | ||||||||||||||||
Other financial instruments*: | ||||||||||||||||
Equity contracts | (197,002 | ) | (193,722 | ) | (3,280 | ) | — | |||||||||
|
|
|
|
|
|
|
| |||||||||
Total liabilities | (197,002 | ) | (193,722 | ) | (3,280 | ) | — | |||||||||
|
|
|
|
|
|
|
| |||||||||
Total | $ | 502,269,119 | $ | 211,851,620 | $ | 290,417,499 | $ | — | ||||||||
|
|
|
|
|
|
|
| |||||||||
| PRO-BLEND®MAXIMUM TERM SERIES | ||||||||||||||||
| DESCRIPTION | TOTAL | LEVEL 1 | LEVEL 2# | LEVEL 3 | ||||||||||||
Assets: | ||||||||||||||||
Equity Securities: | ||||||||||||||||
Communication Services | $ | 39,879,390 | $ | 30,916,534 | $ | 8,962,856 | $ | — | ||||||||
Consumer Discretionary | 45,698,599 | 40,985,191 | 4,713,408 | — | ||||||||||||
Consumer Staples | 52,343,268 | 37,312,288 | 15,030,980 | — | ||||||||||||
Energy | 9,760,558 | 9,002,139 | 758,419 | — | ||||||||||||
Financials | 39,010,121 | 31,399,002 | 7,611,119 | — | ||||||||||||
Health Care | 43,653,827 | 38,715,293 | 4,938,534 | — | ||||||||||||
Industrials | 5,749,410 | 4,233,062 | 1,516,348 | — | ||||||||||||
Information Technology | 45,639,980 | 43,356,390 | 2,283,590 | — | ||||||||||||
Materials | 16,531,061 | 12,577,950 | 3,953,111 | — | ||||||||||||
Real Estate | 15,322,161 | 14,967,207 | 354,954 | — | ||||||||||||
Utilities | 168,439 | — | 168,439 | — | ||||||||||||
Debt securities: | ||||||||||||||||
U.S. Treasury and other U.S. | ||||||||||||||||
Government agencies | 48,369,988 | — | 48,369,988 | — | ||||||||||||
Corporate debt: | ||||||||||||||||
Communication Services | 2,095,919 | — | 2,095,919 | — | ||||||||||||
Consumer Discretionary | 1,211,496 | — | 1,211,496 | — | ||||||||||||
Consumer Staples | 30,769 | — | 30,769 | — | ||||||||||||
Energy | 1,651,321 | — | 1,651,321 | — | ||||||||||||
Financials | 2,636,849 | — | 2,636,849 | — | ||||||||||||
Health Care | 307,227 | — | 307,227 | — | ||||||||||||
Industrials | 1,361,917 | — | 1,361,917 | — | ||||||||||||
Information Technology | 37,494 | — | 37,494 | — | ||||||||||||
Materials | 594,555 | — | 594,555 | — | ||||||||||||
Real Estate | 810,681 | — | 810,681 | — | ||||||||||||
117
Notes to Financial Statements (continued)
| 2. | Significant Accounting Policies (continued) |
Security Valuation(continued)
| PRO-BLEND®MAXIMUM TERM SERIES | ||||||||||||||||
| DESCRIPTION | TOTAL | LEVEL 1 | LEVEL 2# | LEVEL 3 | ||||||||||||
Mutual funds | $ | 1,398,530 | $ | 1,398,530 | $ | — | $ | — | ||||||||
Short-Term Investment | 915,318 | 915,318 | — | — | ||||||||||||
|
|
|
|
|
|
|
| |||||||||
Total assets | $ | 375,178,878 | $ | 265,778,904 | $ | 109,399,974 | $ | — | ||||||||
|
|
|
|
|
|
|
| |||||||||
#Includes certain foreign equity securities for which a factor from a third party vendor was applied to determine the securities’ fair value following the close of local trading.
*Other financial instruments are exchange traded options (Level 1 and Level 2).
There were no Level 3 securities held by any of thePro-Blend® Series as of October 31, 2018 and October 31, 2019.
New Accounting Pronouncements
In March 2017, the Financial Accounting Standards Board issued Accounting Standards UpdateNo. 2017-08, Receivables – Nonrefundable Fees and Other Costs (Subtopic310-320): “Premium Amortization of Purchased Callable Debt Securities” which shortens the amortized period for certain callable debt securities, held at a premium, to be amortized to the earliest call date rather than the contractual maturity date. The Series will adopt and apply ASU2017-08 on a modified retrospective basis through a cumulative-effect adjustment on November 1, 2019. As a result of the adoption of ASU2017-08, the amortized cost basis of investments will be reduced and unrealized appreciation of investments will be increased by immaterial amounts, and there will be no impact on net assets or overall results of operations.
Security Transactions, Investment Income and Expenses
Security transactions are accounted for on trade date. Dividend income is recorded on theex-dividend date, except that if theex-dividend date has passed, certain dividends from foreign securities are recorded as soon as the Series is informed of theex-dividend date.Non-cash dividends, if any, are recorded at the fair value of the securities received. Interest income, including amortization of premium and accretion of discounts using the effective interest method, is earned from settlement date and accrued daily.
Expenses are recorded on an accrual basis. Most expenses of the Fund can be attributed to a specific series. Expenses which cannot be directly attributed are apportioned among the series in the Fund in such a manner as deemed equitable by the Fund’s Board, taking into consideration, among other things, the nature and type of expense.
Income, expenses (other than class specific expenses), and realized and unrealized gains and losses are prorated among the classes based on the relative net assets of each class. Class specific expenses are directly charged to that Class.
The Series use the identified cost method for determining realized gain or loss on investments for both financial statement and federal income tax reporting purposes.
Foreign Currency Translation
The books and records of the Series are maintained in U.S. dollars. Foreign currencies, investments and other assets and liabilities are translated into U.S. dollars at the current exchange rates. Purchases and sales of investment securities and income and expenses are translated on the respective dates of such transactions. The Series do not isolate realized and unrealized gains and losses attributable to changes in the exchange rates from gains and losses that arise from changes in the fair value of investments. Such fluctuations are included with net realized and unrealized gain or loss on investments. Net realized foreign currency gains and losses represent foreign currency gains and losses between trade date and settlement date on securities transactions, gains and losses on disposition of foreign currencies and the difference between the amount of income and foreign withholding taxes recorded on the books of the Series and the amounts actually received or paid.
118
Notes to Financial Statements (continued)
| 2. | Significant Accounting Policies (continued) |
Option Contracts
The Series may write (sell) or buy call or put options on securities and other financial instruments. When a Series writes a call, the Series gives the purchaser the right to buy the underlying security from the Series at the price specified in the option contract (the “exercise price”) at any time during the option period. When a Series writes a put option, the Series gives the purchaser the right to sell to the Series the underlying security at the exercise price at any time during the option period. The Series will only write options on a “covered basis.” This means that the Series will own the underlying security when the Series writes a call or the Series will put aside cash, U.S. Government securities, or other liquid assets in an amount not less than the exercise price at all times the put option is outstanding.
When a Series writes an option, an amount equal to the premium received is reflected as a liability and is subsequentlymarked-to-market to reflect the current market value of the option. The Series, as a writer of an option, has no control over whether the underlying security or financial instrument may be sold (call) or purchased (put) and, as a result, bears the market risk of an unfavorable change in the price of the security or financial instrument underlying the written option. There is a risk that the Series may not be able to enter into a closing transaction because of an illiquid market.
Each Series may also purchase options in an attempt to hedge against fluctuations in the value of its portfolio and to protect against declines in the value of the securities. The premium paid by a Series for the purchase of an option is reflected as an investment and subsequentlymarked-to-market to reflect the current market value of the option. The risk associated with purchasing options is limited to the premium paid.
When a security is purchased or sold through an exercise of an option, the related premium paid (or received) is added to (or deducted from) the basis of the security acquired or deducted from (or added to) the proceeds of the security sold. When an option expires (or a Series enters into a closing transaction), the Series realizes a gain or loss on the option to the extent of the premium received or paid (or gain or loss to the extent the cost of the closing transaction exceeds the premium paid or received).
The measurement of the risks associated with option contracts is meaningful only when all related and offsetting transactions are considered. The counterparty for the Series’ written options contracts outstanding during the year ended October 31, 2019 is Pershing LLC, a BNY Mellon Company.
The following table presents the present value of derivatives held at October 31, 2019 as reflected on the Statement of Assets and Liabilities, and the effect of the derivative instruments on the Statement of Operations:
| PRO-BLEND®CONSERVATIVE TERM SERIES | ||||
| STATEMENT OF ASSETS AND LIABILITIES | ||||
Derivative | Liabilities Location | |||
Equity contracts | Options written, at value | $ (46,180) | ||
| STATEMENT OF OPERATIONS | ||||
Derivative | Location of Gain or (Loss) on Derivatives | Realized Gain (Loss) on Derivatives | ||
Equity contracts | Net realized gain (loss) on options written | $ 857,460 | ||
Derivative | Location of Appreciation (Depreciation) on Derivatives | Unrealized Appreciation (Depreciation) on Derivatives | ||
Equity contracts | Net change in unrealized appreciation (depreciation) on options written | $ 66,701 | ||
119
Notes to Financial Statements (continued)
| 2. | Significant Accounting Policies (continued) |
Option Contracts(continued)
| PRO-BLEND®MODERATE TERM SERIES | ||||
| STATEMENT OF ASSETS AND LIABILITIES | ||||
Derivative | Liabilities Location | |||
Equity contracts | Options written, at value | $ 72,726 | ||
| STATEMENT OF OPERATIONS | ||||
Derivative | Location of Gain or (Loss) on Derivatives | Realized Gain (Loss) on Derivatives | ||
Equity contracts | Net realized gain (loss) on options written | $ 749,704 | ||
Derivative | Location of Appreciation (Depreciation) on Derivatives | Unrealized Appreciation (Depreciation) on Derivatives | ||
Equity contracts | Net change in unrealized appreciation (depreciation) on options written | $ 49,970 | ||
| PRO-BLEND®EXTENDED TERM SERIES | ||||
| STATEMENT OF ASSETS AND LIABILITIES | ||||
Derivative | Liabilities Location | |||
Equity contracts | Options written, at value | $ 197,002 | ||
| STATEMENT OF OPERATIONS | ||||
Derivative | Location of Gain or (Loss) on Derivatives | Realized Gain (Loss) on Derivatives | ||
Equity contracts | Net realized gain (loss) on options written | $ 1,195,135 | ||
Derivative | Location of Appreciation (Depreciation) on Derivatives | Unrealized Appreciation (Depreciation) on Derivatives | ||
Equity contracts | Net change in unrealized appreciation (depreciation) on options written | $ 18,221 | ||
The averagemonth-end balances for the year ended October 31, 2019, the period in which such derivatives were outstanding, were as follows:
| PRO-BLEND® CONSERVATIVE TERM SERIES | PRO-BLEND® MODERATE TERM SERIES | PRO-BLEND® EXTENDED TERM SERIES | |||||||||||||
Options: | |||||||||||||||
Average number of option contracts written | 460 | 382 | 656 | ||||||||||||
Average notional value of option contracts written | $5,088,606 | $4,288,243 | $7,035,467 | ||||||||||||
Asset-Backed Securities
Each Series may invest in asset-backed securities. Asset-backed securities are generally issued as pass-through certificates or as debt instruments. Asset-backed securities issued as pass-through certificates represent undivided fractional ownership interests in an underlying pool of assets. Asset-backed securities issued as debt instruments, which are also known as collateralized obligations, are typically issued as the debt of a special purpose entity organized solely for the purpose of owning such assets and issuing such debt. Asset-backed securities are often backed by a pool of assets representing the obligations of
120
Notes to Financial Statements (continued)
| 2. | Significant Accounting Policies (continued) |
Asset-Backed Securities(continued)
a number of different parties. The yield characteristics of certain asset-backed securities may differ from traditional debt securities. One such major difference is that all or a principal part of the obligations may be prepaid at any time because the underlying assets (i.e. loans) may be prepaid at any time. As a result, a decrease in interest rates in the market may result in increases in the level of prepayments as borrowers, particularly mortgagors, refinance and repay their loans. An increased prepayment rate with respect to an asset-backed security will have the effect of shortening the maturity of the security. In addition, a Series may subsequently have to reinvest the proceeds at lower interest rates. If a Series has purchased such an asset-backed security at a premium, a faster than anticipated prepayment rate could result in a loss of principal to the extent of the premium paid.
Mortgage-Backed Securities
Each Series may invest in mortgage-backed securities (“MBS” or pass-through certificates) that represent an interest in a pool of specific underlying mortgage loans and entitle a Series to the periodic payments of principal and interest from those mortgages. MBS may be issued by government agencies or corporations, or private issuers. Most MBS issued by government agencies are guaranteed; however, the degree of protection differs based on the issuer. For MBS there are a number of important differences among the agencies and instrumentalities of the U.S. Government that issue mortgage-related securities and among the securities that they issue. For example, mortgage-related securities guaranteed by Ginnie Mae are guaranteed as to the timely payment of principal and interest by Ginnie Mae and such guarantee is backed by the full faith and credit of the United States. However, mortgage-related securities issued by Freddie Mac and Fannie Mae, including Freddie Mac and Fannie Mae guaranteed mortgage pass-through certificates, which are solely the obligations of Freddie Mac and Fannie Mae, are not backed by or entitled to the full faith and credit of the United States, but are supported by the right of the issuer to borrow from the U.S. Treasury.Non-agency mortgage-backed securities are securities issued bynon-governmental issuers and have no direct or indirect government guarantees of payment and are subject to various risks.Non-agency mortgage loans are obligations of the borrowers thereunder only and are not typically insured or guaranteed by any other person or entity. The ability of a borrower to repay a loan is dependent upon the income or assets of the borrower. A number of factors, including a general economic downturn, acts of God, terrorism, social unrest and civil disturbances, may impair a borrower’s ability to repay its loans.
Inflation-Indexed Bonds
Each Series may invest in inflation-indexed bonds. Inflation-indexed bonds are fixed income securities whose principal value is periodically adjusted according to the rate of inflation. If the index measuring inflation rises or falls, the principal value of inflation-indexed bonds will be adjusted upward or downward, and consequently the interest payable on these securities (calculated with respect to a larger or smaller principal amount) will be increased or reduced, respectively. Any upward or downward adjustment in the principal amount of an inflation-indexed bond will be included as interest income in the Statements of Operations, even though investors do not receive their principal until maturity. Repayment of the original bond principal upon maturity (as adjusted for inflation) is guaranteed in the case of U.S. Treasury inflation-indexed bonds. For bonds that do not provide a similar guarantee, the adjusted principal value of the bond repaid at maturity may be less than the original principal.
Securities Purchased on a When-Issued Basis or Forward Commitment
Each Series may purchase securities on a when-issued basis or forward commitment. These transactions involve a commitment by the Series to purchase securities for a predetermined price with payment and delivery taking place beyond the customary settlement period. When such purchases are outstanding, the Series will designate liquid assets in an amount sufficient to meet the purchase price. When purchasing a security on a delayed delivery basis, the Series assumes the rights and risks of ownership of the security, including the risk of price and yield fluctuations, and take such fluctuations into account when determining their net asset value. The Series may sell the when-issued securities before they are delivered, which may result in a capital gain or loss.
In connection with their ability to purchase or sell securities on a forward commitment basis, the Series may enter into forward roll transactions principally using To Be Announced (TBA) securities. Forward roll transactions require the sale of securities for delivery in the current month, and a simultaneous agreement to repurchase substantially similar (same type, coupon and maturity) securities on a specified future date. Risks of entering into forward roll transactions include the potential inability of the
121
Notes to Financial Statements (continued)
| 2. | Significant Accounting Policies (continued) |
Securities Purchased on a When-Issued Basis or Forward Commitment(continued)
counterparty to meet the terms of the agreement; the potential of the Series to receive inferior securities at redelivery as compared to the securities sold to the counterparty; counterparty credit risk; and the potential pay down speed variance between the mortgage-backed pools. During the roll period, the Series forgoes principal and interest paid on the securities. The Series accounts for such dollar rolls as purchases and sales. No such investments were held by the Series on October 31, 2019.
Interest Only Securities
The Series may invest in stripped mortgage-backed securities issued by the U.S. government, its agencies and instrumentalities. Stripped mortgage-backed securities are usually structured with two classes that receive different proportions of the interest and principal distributions on a pool of mortgage assets. In certain cases, one class will receive all of the interest (the interest-only or “IO” class), while the other class will receive all of the principal (the principal-only or “PO” class). The yield to maturity on IOs is sensitive to the rate of principal repayments (including prepayments) on the related underlying mortgage assets, and principal payments may have a material effect on yield to maturity. If the underlying mortgage assets experience greater than anticipated prepayments of principal, a Series may not fully recoup its initial investment in IOs.
Restricted Securities
Restricted securities are purchased in private placement transactions, are not registered under the Securities Act of 1933, as amended, and may have contractual restrictions on resale. Information regarding restricted securities is included at the end of each applicable Series’ Investment Portfolio.
Illiquid Securities
A security may be considered illiquid if so deemed in good faith by the Advisor under procedures approved by and under the general supervision and responsibility of the Fund’s Board. Securities that are illiquid are marked with the applicable footnote at the end of each applicable Series’ Investment Portfolio.
Federal Taxes
Each Series’ policy is to comply with the provisions of the Internal Revenue Code applicable to regulated investment companies. The Series are not subject to federal income tax or excise tax to the extent that each Series distributes to shareholders each year its taxable income, including any net realized gains on investments, in accordance with requirements of the Internal Revenue Code. Accordingly, no provision for federal income tax or excise tax has been made in the financial statements.
Management evaluates its tax positions to determine if the tax positions taken meet the minimum recognition threshold in connection with accounting for uncertainties in income tax positions taken or expected to be taken for the purposes of measuring and recognizing tax liabilities in the financial statements. Recognition of tax benefits of an uncertain tax position is required only when the position is “more likely than not” to be sustained assuming examination by taxing authorities. At October 31, 2019, the Series have recorded no liability for net unrecognized tax benefits relating to uncertain income tax positions taken or expected to be taken in future tax returns.
The Series file income tax returns in the U.S. federal jurisdiction, various states and foreign jurisdictions, as required. No income tax returns are currently under investigation. The statute of limitations on the Series’ tax returns remains open for the years ended October 31, 2016 through October 31, 2019. The Fund is not aware of any tax positions for which it is reasonably possible that the total amounts of unrecognized tax benefits will significantly change in the next twelve months.
Foreign Taxes
Based on the Series’ understanding of the tax rules and rates related to income, gains and currency purchase/repatriation transactions for foreign jurisdictions in which they invest, the Series will provide for foreign taxes, and where appropriate, deferred foreign tax.
122
Notes to Financial Statements (continued)
| 2. | Significant Accounting Policies (continued) |
Distributions of Income and Gains
Distributions to shareholders of net investment income are made semi-annually. Distributions of net realized gains are made annually. An additional distribution may be necessary to avoid taxation of a Series. Distributions are recorded on theex-dividend date.
Indemnifications
The Fund’s organizational documents provide former and current directors and officers with a limited indemnification against liabilities arising in connection with the performance of their duties to the Fund. In the normal course of business, the Fund may also enter into contracts that provide general indemnifications. The Fund’s maximum exposure under these arrangements is unknown as this would be dependent on future claims that may be made against the Fund. The risk of material loss from such claims is considered remote.
Other
The preparation of financial statements in conformity with GAAP requires management to make estimates and assumptions that affect the reported amounts of assets and liabilities and the disclosure of contingent assets and liabilities at the date of the financial statements and the reported amounts of income and expenses during the reporting period. Actual results could differ from those estimates.
| 3. | Transactions with Affiliates |
The Fund has an Investment Advisory Agreement (the “Agreement”) with the Advisor, for which each Series pays a fee, computed daily and payable monthly, at an annual rate of 0.40% forPro-Blend® Conservative Term Series and 0.60% forPro-Blend® Moderate Term Series,Pro-Blend® Extended Term Series andPro-Blend® Maximum Term Series, of the Series’ average daily net assets. Prior to March 1, 2019, the contractual management fee was 0.60% for thePro-Blend® Conservative Term Series and 0.75% for thePro-Blend® Moderate Term Series,Pro-Blend® Extended Term Series, andPro-Blend® Maximum Term Series.
Under the Agreement, personnel of the Advisor provide the Series with advice and assistance in the choice of investments and the execution of securities transactions, and otherwise maintain the Series’ organization. The Advisor also provides the Fund with necessary office space and fund administration and support services. The salaries of all officers of the Fund (except a percentage of the Fund’s Chief Compliance Officer’s salary, which is paid by the Fund), and of all Directors who are “affiliated persons” of the Fund, or of the Advisor, and all personnel of the Fund, or of the Advisor, performing services relating to research, statistical and investment activities, are paid by the Advisor. Each“non-affiliated” Director receives an annual stipend, which is allocated among all the active series of the Fund. In addition, these Directors also receive a fee per Board meeting attended plus a fee for each committee meeting attended and are reimbursed for travel and otherout-of-pocket expenses incurred by them in connection with attending such meetings. The Fund also has an Audit Committee Chair, Governance & Nominating Committee Chair and Lead Independent Director who each receive an additional annual stipend for these roles.
Effective March 1, 2019, the Fund may enter into agreements with financial intermediaries pursuant to which the Fund may pay financial intermediaries fornon-distribution relatedsub-transfer agency, administrative,sub-accounting, and other shareholder services in an amount not to exceed 0.15% of the average daily net assets of the Class S, Class I, Class R and Class L shares. Payments made pursuant to such agreements are generally based on the current assets and/or number of accounts of the Series attributable to the financial intermediary. Any payments made pursuant to such agreements may be in addition to, rather than in lieu of, any Distribution and Shareholder Services Fee payable under the Rule12b-1 plan of the Fund.
Prior to March 1, 2019, Class S shares of each Series were subject to a shareholder services fee in accordance with a shareholder services plan adopted by the Fund’s Board. The shareholder services fee was intended to compensate financial intermediaries, including affiliates of the Fund, in connection with the provision of direct client service, personal services, maintenance of shareholder accounts and reporting services. For these services, Class S of each Series paid a fee, computed daily and payable monthly, at an annual rate of 0.20% forPro-Blend® Conservative Term Series Class S and 0.25% forPro-Blend® Moderate Term Series Class S,Pro-Blend® Extended Term Series Class S andPro-Blend® Maximum Term Series Class
123
Notes to Financial Statements (continued)
| 3. | Transactions with Affiliates (continued) |
S, of the Class’ average daily net assets. The Fund had a Shareholder Services Agreement with the Advisor, for which the Advisor received the shareholder services fee as stated above.
Effective March 1, 2019, the Advisor has contractually agreed to waive the management fee for the Class W shares. In addition, pursuant to a separate expense limitation agreement, the Advisor has contractually agreed to limit its fees and reimburse expenses to the extent necessary so that the total direct annual fund operating expenses, exclusive of the shareholder services fee and/or distribution and service(12b-1) fees and waived Class W management fees (collectively, “excluded expenses”), at no more than the amounts presented in the following table, of average daily net assets each year.
| SERIES/CLASS | EXPENSE LIMIT | |||
Pro-Blend®Conservative Term Series Class S, I, R and L | 0.65% | |||
Pro-Blend®Conservative Term Series Class Z | 0.50% | |||
Pro-Blend®Conservative Term Series Class W | 0.10% | |||
Pro-Blend®Moderate Term Series Class S, I, R and L | 0.85% | |||
Pro-Blend®Moderate Term Series Class Z | 0.70% | |||
Pro-Blend®Moderate Term Series Class W | 0.10% | |||
Pro-Blend®Extended Term Series Class S, I, R and L | 0.85% | |||
Pro-Blend®Extended Term Series Class Z | 0.70% | |||
Pro-Blend®Extended Term Series Class W | 0.10% | |||
Pro-Blend®Maximum Term Series Class S, I, R and L | 0.85% | |||
Pro-Blend®Maximum Term Series Class Z | 0.70% | |||
Pro-Blend®Maximum Term Series Class W | 0.10% |
Effective March 1, 2019, these contractual waivers are expected to continue indefinitely, and may not be amended or terminated by the Advisor without the approval of the Series’ Board of Directors. The Advisor’s agreement to limit each Class’s operating expenses is limited to direct operating expenses and, therefore, does not apply to acquired fund fees and expenses, which are indirect expenses incurred by the Series through its investments in other investment companies. The Advisor may receive from a Class the difference between the Class’s total direct annual fund operating expenses, not including excluded expenses, and the Class’s contractual expense limit to recoup all or a portion of its prior fee waivers (other than Class W management fee waivers) or expense reimbursements made during the rolling three-year period preceding the recoupment if at any point the total direct annual fund operating expenses, not including excluded expenses, are below the contractual expense limit (a) at the time of the fee waiver and/or expense reimbursement and (b) at the time of the recoupment.
Prior to March 1, 2019, the Advisor has contractually agreed, until at least February 28, 2019, to waive its management fee and, if necessary, pay other operating expenses of the Series in order to maintain total direct annual fund operating expenses for the Series, exclusive of shareholder services fees and distribution and service(12b-1) fees, at no more than the amounts presented in the following table, of average daily net assets each year.
| SERIES/CLASS | EXPENSE LIMIT | |||
Pro-Blend®Conservative Term Series | 0.70% | |||
Pro-Blend®Moderate Term Series | 0.85% | |||
Pro-Blend®Extended Term Series | 0.85% | |||
Pro-Blend®Maximum Term Series | 0.85% |
124
Notes to Financial Statements (continued)
| 3. | Transactions with Affiliates (continued) |
Pursuant to the advisory fee waiver, the Advisor waived the following management fees for Class W shares for the year ended October 31, 2019. In addition, pursuant to the separate expense limitation agreement, the Advisor waived or reimbursed the following expenses for Class S, Class I, Class R, Class L and Class W shares for the year ended October 31, 2019. These amounts are included as a reduction of expenses on the Statement of Operations:
| SERIES/CLASS | CLASS W MANAGEMENT FEE WAIVER | WAIVED OPERATING EXPENSES | ||||||||||
Pro-Blend®Conservative Term Series | $ | 3,404 | $ | — | ||||||||
Pro-Blend®Moderate Term Series | 20 | 50,160 | ||||||||||
Pro-Blend®Extended Term Series | 18 | 43,101 | ||||||||||
Pro-Blend®Maximum Term Series | 195 | 90,249 | ||||||||||
At October 31, 2019, the Advisor is eligible to recoup $23,546, $820, and $24,071 from thePro-Blend® Moderate Term Series,Pro-Blend® Extended Term Series andPro-Blend® Maximum Term Series, respectively. For the year ended October 31, 2019, the Advisor did not recoup any expenses that have been previously waived or reimbursed.
Manning & Napier Investor Services, Inc., a registered broker-dealer affiliate of the Advisor, acts as distributor for the Fund’s shares. Each Series compensates the distributor for distributing and servicing the Series’ Class L (formerly Class R2), Class R and effective March 1, 2019, Class S shares pursuant to a distribution plan adopted under Rule12b-1 of the 1940 Act, regardless of expenses actually incurred. Under the agreement, each Series pays distribution and service fees to the distributor at an annual rate of 0.25% of average daily net assets attributable to Class S shares, 1.00% of average daily net assets attributable to Class L shares (formerly Class R2) and an annual rate of 0.50% of daily net assets attributable to Class R shares. There are no distribution and service fees on the Class I, Class W, and Class Z shares of each Series and no such fees for Class S prior to March 1, 2019. The fees are accrued daily and paid monthly. Prior to March 1, 2019, each Series compensated the distributor for distributing and servicing the Series’ Class R2 and Class R shares pursuant to a distribution plan adopted under Rule12b-1 of the 1940 Act, regardless of expenses actually incurred. Under the agreement, each Series paid distribution and service fees to the distributor at an annual rate of 1.00% of average daily net assets attributable to Class R2 shares and an annual rate of 0.50% of daily net assets attributable to Class R shares. There were no distribution and service fees on the Class S or Class I shares of each Series. The fees were accrued daily and paid monthly.
Pursuant to a master services agreement dated March 1, 2017, the Fund pays the Advisor an annual fee related to fund accounting and administration of 0.0085% on the first $25 billion of average daily net assets (excluding Target Series and Income Series); 0.0075% on the next $15 billion of average daily net assets (excluding Target Series and Income Series); and 0.0065% of average daily net assets in excess of $40 billion (excluding Target Series and Income Series); plus a base fee of $30,400 per series. Additionally, certain transaction andout-of-pocket expenses, including charges for reporting relating to the Fund’s compliance program, are charged. The Advisor has agreements with BNY Mellon Investment Servicing (U.S.) Inc. (“BNY”) under which BNY serves assub-accountant services agent.
| 4. | Purchases and Sales of Securities |
For the year ended October 31, 2019, purchases and sales of securities, including paydowns and other than short-term securities, were as follows:
| PURCHASES | SALES | |||||||||||||||
| SERIES | OTHER ISSUERS | GOVERNMENT | OTHER ISSUERS | GOVERNMENT | ||||||||||||
Pro-Blend®Conservative Term Series | $262,827,064 | $327,451,527 | $305,282,082 | $357,811,886 | ||||||||||||
Pro-Blend®Moderate Term Series | 135,220,814 | 93,163,110 | 279,072,490 | 160,985,028 | ||||||||||||
Pro-Blend®Extended Term Series | 188,684,761 | 127,478,317 | 269,840,326 | 160,607,986 | ||||||||||||
Pro-Blend®Maximum Term Series | 167,164,359 | 112,794,422 | 253,307,890 | 103,468,594 | ||||||||||||
125
Notes to Financial Statements (continued)
| 5. | Capital Stock Transactions |
Transactions in Class S, Class I, Class R, Class L, and Class W shares were:
PRO-BLEND®CONSERVATIVE TERM SERIES CLASS S: | FOR THE YEAR ENDED 10/31/19 | FOR THE YEAR ENDED 10/31/18 | ||||||||||||||
| SHARES | AMOUNT | SHARES | AMOUNT | |||||||||||||
Sold | 7,716,892 | $ | 104,091,483 | 13,485,072 | $ | 184,831,181 | ||||||||||
Reinvested | 1,674,861 | 21,831,365 | 1,932,249 | 26,362,664 | ||||||||||||
Repurchased | (11,174,041 | ) | (152,330,368 | ) | (15,328,727 | ) | (209,336,128 | ) | ||||||||
|
|
|
|
|
|
|
| |||||||||
Total | (1,782,288 | ) | $ | (26,407,520 | ) | 88,594 | $ | 1,857,717 | ||||||||
|
|
|
|
|
|
|
| |||||||||
PRO-BLEND®CONSERVATIVE TERM SERIES CLASS I: | FOR THE YEAR ENDED 10/31/19 | FOR THE YEAR ENDED 10/31/18 | ||||||||||||||
| SHARES | AMOUNT | SHARES | AMOUNT | |||||||||||||
Sold | 4,572,820 | $ | 46,885,485 | 6,032,983 | $ | 62,576,922 | ||||||||||
Reinvested | 981,337 | 9,602,936 | 983,663 | 10,191,906 | ||||||||||||
Repurchased | (5,013,464 | ) | (50,958,234 | ) | (7,799,355 | ) | (82,660,492 | ) | ||||||||
|
|
|
|
|
|
|
| |||||||||
Total | 540,693 | $ | 5,530,187 | (782,709 | ) | $ | (9,891,664 | ) | ||||||||
|
|
|
|
|
|
|
| |||||||||
PRO-BLEND®CONSERVATIVE TERM SERIES CLASS R: | FOR THE YEAR ENDED 10/31/19 | FOR THE YEAR ENDED 10/31/18 | ||||||||||||||
| SHARES | AMOUNT | SHARES | AMOUNT | |||||||||||||
Sold | 303,354 | $ | 2,976,947 | 343,229 | $ | 3,463,136 | ||||||||||
Reinvested | 50,080 | 468,279 | 78,356 | 779,958 | ||||||||||||
Repurchased | (603,968 | ) | (5,915,153 | ) | (614,836 | ) | (6,092,178 | ) | ||||||||
|
|
|
|
|
|
|
| |||||||||
Total | (250,534 | ) | $ | (2,469,927 | ) | (193,251 | ) | $ | (1,849,084 | ) | ||||||
|
|
|
|
|
|
|
| |||||||||
PRO-BLEND®CONSERVATIVE TERM SERIES CLASS L (FORMERLY CLASS R2): | FOR THE YEAR ENDED 10/31/19 | FOR THE YEAR ENDED 10/31/18 | ||||||||||||||
| SHARES | AMOUNT | SHARES | AMOUNT | |||||||||||||
Sold | 1,133,273 | $ | 11,034,293 | 1,033,277 | $ | 10,310,962 | ||||||||||
Reinvested | 421,515 | 3,944,518 | 560,024 | 5,575,191 | ||||||||||||
Repurchased | (2,546,198 | ) | (24,846,552 | ) | (2,819,696 | ) | (28,095,558 | ) | ||||||||
|
|
|
|
|
|
|
| |||||||||
Total | (991,410 | ) | $ | (9,867,741 | ) | (1,226,395 | ) | $ | (12,209,405 | ) | ||||||
|
|
|
|
|
|
|
| |||||||||
PRO-BLEND®CONSERVATIVE TERM SERIES CLASS W: | FOR THE PERIOD 4/01/19 (COMMENCEMENT OF OPERATIONS) TO 10/31/19 | |||||||||||||||
| SHARES | AMOUNT | |||||||||||||||
Sold | 109,543 | $ | 1,496,340 | |||||||||||||
Reinvested | 906 | 12,499 | ||||||||||||||
Repurchased | — | — | ||||||||||||||
|
|
|
| |||||||||||||
Total | 110,449 | $ | 1,508,839 | |||||||||||||
|
|
|
| |||||||||||||
126
Notes to Financial Statements (continued)
| 5. | Capital Stock Transactions (continued) |
PRO-BLEND®MODERATE TERM SERIES CLASS S: | FOR THE YEAR ENDED 10/31/19 | FOR THE YEAR ENDED 10/31/18 | ||||||||||||||
| SHARES | AMOUNT | SHARES | AMOUNT | |||||||||||||
Sold | 1,890,869 | $ | 25,337,106 | 2,645,523 | $ | 36,095,900 | ||||||||||
Reinvested | 1,193,223 | 14,876,412 | 1,766,612 | 23,789,342 | ||||||||||||
Repurchased | (14,472,225 | ) | (186,635,824 | ) | (10,220,583 | ) | (139,249,031 | ) | ||||||||
|
|
|
|
|
|
|
| |||||||||
Total | (11,388,133 | ) | $ | (146,422,306 | ) | (5,808,448 | ) | $ | (79,363,789 | ) | ||||||
|
|
|
|
|
|
|
| |||||||||
PRO-BLEND®MODERATE TERM SERIES CLASS I: | FOR THE YEAR ENDED 10/31/19 | FOR THE YEAR ENDED 10/31/18 | ||||||||||||||
| SHARES | AMOUNT | SHARES | AMOUNT | |||||||||||||
Sold | 2,094,486 | $ | 20,385,798 | 2,979,315 | $ | 30,087,491 | ||||||||||
Reinvested | 929,739 | 8,454,143 | 1,074,662 | 10,720,324 | ||||||||||||
Repurchased | (4,937,621 | ) | (47,238,853 | ) | (4,255,387 | ) | (43,174,771 | ) | ||||||||
|
|
|
|
|
|
|
| |||||||||
Total | (1,913,396 | ) | $ | (18,398,912 | ) | (201,410 | ) | $ | (2,366,956 | ) | ||||||
|
|
|
|
|
|
|
| |||||||||
PRO-BLEND®MODERATE TERM SERIES CLASS R: | FOR THE YEAR ENDED 10/31/19 | FOR THE YEAR ENDED 10/31/18 | ||||||||||||||
| SHARES | AMOUNT | SHARES | AMOUNT | |||||||||||||
Sold | 232,681 | $ | 2,429,557 | 133,188 | $ | 1,416,277 | ||||||||||
Reinvested | 94,841 | 909,258 | 144,335 | 1,520,382 | ||||||||||||
Repurchased | (1,233,426 | ) | (12,617,188 | ) | (678,665 | ) | (7,237,249 | ) | ||||||||
|
|
|
|
|
|
|
| |||||||||
Total | (905,904 | ) | $ | (9,278,373 | ) | (401,142 | ) | $ | (4,300,590 | ) | ||||||
|
|
|
|
|
|
|
| |||||||||
PRO-BLEND®MODERATE TERM SERIES CLASS L (FORMERLY CLASS R2): | FOR THE YEAR ENDED 10/31/19 | FOR THE YEAR ENDED 10/31/18 | ||||||||||||||
| SHARES | AMOUNT | SHARES | AMOUNT | |||||||||||||
Sold | 683,747 | $ | 6,684,430 | 681,877 | $ | 6,961,412 | ||||||||||
Reinvested | 611,756 | 5,643,896 | 769,080 | 7,791,848 | ||||||||||||
Repurchased | (2,198,410 | ) | (21,607,147 | ) | (2,208,253 | ) | (22,646,789 | ) | ||||||||
|
|
|
|
|
|
|
| |||||||||
Total | (902,907 | ) | $ | (9,278,821 | ) | (757,296 | ) | $ | (7,893,529 | ) | ||||||
|
|
|
|
|
|
|
| |||||||||
PRO-BLEND®MODERATE TERM SERIES CLASS W: | FOR THE PERIOD 4/01/19 (COMMENCEMENT OF OPERATIONS) TO 10/31/19 | |||||||||||||||
| SHARES | AMOUNT | |||||||||||||||
Sold | 9,437 | $ | 131,119 | |||||||||||||
Reinvested | 3 | 36 | ||||||||||||||
Repurchased | — | — | ||||||||||||||
|
|
|
| |||||||||||||
Total | 9,440 | $ | 131,155 | |||||||||||||
|
|
|
| |||||||||||||
PRO-BLEND®EXTENDED TERM SERIES CLASS S: | FOR THE YEAR ENDED 10/31/19 | FOR THE YEAR ENDED 10/31/18 | ||||||||||||||
| SHARES | AMOUNT | SHARES | AMOUNT | |||||||||||||
Sold | 1,358,668 | $ | 23,246,755 | 1,917,422 | $ | 33,638,594 | ||||||||||
Reinvested | 1,014,951 | 16,040,883 | 1,371,524 | 23,661,283 | ||||||||||||
Repurchased | (5,339,420 | ) | (91,230,005 | ) | (6,955,971 | ) | (122,072,805 | ) | ||||||||
|
|
|
|
|
|
|
| |||||||||
Total | (2,965,801 | ) | $ | (51,942,367 | ) | (3,667,025 | ) | $ | (64,772,928 | ) | ||||||
|
|
|
|
|
|
|
| |||||||||
127
Notes to Financial Statements (continued)
| 5. | Capital Stock Transactions (continued) |
PRO-BLEND®EXTENDED TERM SERIES CLASS I: | FOR THE YEAR ENDED 10/31/19 | FOR THE YEAR ENDED 10/31/18 | ||||||||||||||
| SHARES | AMOUNT | SHARES | AMOUNT | |||||||||||||
Sold | 3,528,748 | $ | 30,806,783 | 5,494,219 | $ | 51,649,838 | ||||||||||
Reinvested | 1,652,114 | 13,328,478 | 1,665,148 | 15,434,205 | ||||||||||||
Repurchased | (6,319,812 | ) | (55,476,989 | ) | (7,406,430 | ) | (70,917,263 | ) | ||||||||
|
|
|
|
|
|
|
| |||||||||
Total | (1,138,950 | ) | $ | (11,341,728 | ) | (247,063 | ) | $ | (3,833,220 | ) | ||||||
|
|
|
|
|
|
|
| |||||||||
PRO-BLEND®EXTENDED TERM SERIES CLASS R: | FOR THE YEAR ENDED 10/31/19 | FOR THE YEAR ENDED 10/31/18 | ||||||||||||||
| SHARES | AMOUNT | SHARES | AMOUNT | |||||||||||||
Sold | 240,830 | $ | 2,521,015 | 231,918 | $ | 2,529,480 | ||||||||||
Reinvested | 91,258 | 870,069 | 116,252 | 1,257,462 | ||||||||||||
Repurchased | (823,189 | ) | (8,384,829 | ) | (590,475 | ) | (6,536,081 | ) | ||||||||
|
|
|
|
|
|
|
| |||||||||
Total | (491,101 | ) | $ | (4,993,745 | ) | (242,305 | ) | $ | (2,749,139 | ) | ||||||
|
|
|
|
|
|
|
| |||||||||
PRO-BLEND®EXTENDED TERM SERIES CLASS L (FORMERLY CLASS R2): | FOR THE YEAR ENDED 10/31/19 | FOR THE YEAR ENDED 10/31/18 | ||||||||||||||
| SHARES | AMOUNT | SHARES | AMOUNT | |||||||||||||
Sold | 769,684 | $ | 7,269,772 | 695,952 | $ | 7,153,586 | ||||||||||
Reinvested | 1,027,330 | 9,052,130 | 1,217,239 | 12,247,875 | ||||||||||||
Repurchased | (2,595,055 | ) | (24,787,581 | ) | (2,810,668 | ) | (28,755,513 | ) | ||||||||
|
|
|
|
|
|
|
| |||||||||
Total | (798,041 | ) | $ | (8,465,679 | ) | (897,477 | ) | $ | (9,354,052 | ) | ||||||
|
|
|
|
|
|
|
| |||||||||
PRO-BLEND®EXTENDED TERM SERIES CLASS W: | FOR THE PERIOD 4/01/19 (COMMENCEMENT OF OPERATIONS) TO 10/31/19 | |||||||||||||||
| SHARES | AMOUNT | |||||||||||||||
Sold | 293 | $ | 5,000 | |||||||||||||
Reinvested | 2 | 28 | ||||||||||||||
Repurchased | — | — | ||||||||||||||
|
|
|
| |||||||||||||
Total | 295 | $ | 5,028 | |||||||||||||
|
|
|
| |||||||||||||
PRO-BLEND®MAXIMUM TERM SERIES CLASS S: | FOR THE YEAR ENDED 10/31/19 | FOR THE YEAR ENDED 10/31/18 | ||||||||||||||
| SHARES | AMOUNT | SHARES | AMOUNT | |||||||||||||
Sold | 693,431 | $ | 13,975,744 | 1,103,752 | $ | 23,650,449 | ||||||||||
Reinvested | 1,205,790 | 21,679,532 | 1,036,452 | 21,459,898 | ||||||||||||
Repurchased | (3,209,037 | ) | (64,254,409 | ) | (4,160,253 | ) | (89,146,108 | ) | ||||||||
|
|
|
|
|
|
|
| |||||||||
Total | (1,309,816 | ) | $ | (28,599,133 | ) | (2,020,049 | ) | $ | (44,035,761 | ) | ||||||
|
|
|
|
|
|
|
| |||||||||
PRO-BLEND®MAXIMUM TERM SERIES CLASS I: | FOR THE YEAR ENDED 10/31/19 | FOR THE YEAR ENDED 10/31/18 | ||||||||||||||
| SHARES | AMOUNT | SHARES | AMOUNT | |||||||||||||
Sold | 2,588,964 | $ | 23,362,985 | 2,014,113 | $ | 21,746,102 | ||||||||||
Reinvested | 2,000,823 | 16,022,147 | 1,508,732 | 15,549,489 | ||||||||||||
Repurchased | (5,391,803 | ) | (49,717,137 | ) | (4,183,021 | ) | (45,362,603 | ) | ||||||||
|
|
|
|
|
|
|
| |||||||||
Total | (802,016 | ) | $ | (10,332,005 | ) | (660,176 | ) | $ | (8,067,012 | ) | ||||||
|
|
|
|
|
|
|
| |||||||||
128
Notes to Financial Statements (continued)
| 5. | Capital Stock Transactions (continued) |
PRO-BLEND®MAXIMUM TERM SERIES CLASS R: | FOR THE YEAR ENDED 10/31/19 | FOR THE YEAR ENDED 10/31/18 | ||||||||||||||
| SHARES | AMOUNT | SHARES | AMOUNT | |||||||||||||
Sold | 467,060 | $ | 5,591,070 | 337,592 | $ | 4,593,055 | ||||||||||
Reinvested | 177,718 | 1,897,030 | 134,694 | 1,762,998 | ||||||||||||
Repurchased | (619,464 | ) | (7,372,038 | ) | (624,728 | ) | (8,490,869 | ) | ||||||||
|
|
|
|
|
|
|
| |||||||||
Total | 25,314 | $ | 116,062 | (152,442 | ) | $ | (2,134,816 | ) | ||||||||
|
|
|
|
|
|
|
| |||||||||
PRO-BLEND®MAXIMUM TERM SERIES CLASS L (FORMERLY CLASS R2): | FOR THE YEAR ENDED 10/31/19 | FOR THE YEAR ENDED 10/31/18 | ||||||||||||||
| SHARES | AMOUNT | SHARES | AMOUNT | |||||||||||||
Sold | 704,235 | $ | 6,769,815 | 568,570 | $ | 6,446,638 | ||||||||||
Reinvested | 1,009,143 | 8,635,922 | 645,934 | 7,027,766 | ||||||||||||
Repurchased | (1,197,143 | ) | (11,496,558 | ) | (953,464 | ) | (10,872,533 | ) | ||||||||
|
|
|
|
|
|
|
| |||||||||
Total | 516,235 | $ | 3,909,179 | 261,040 | $ | 2,601,871 | ||||||||||
|
|
|
|
|
|
|
| |||||||||
PRO-BLEND®MAXIMUM TERM SERIES CLASS W: | FOR THE PERIOD 4/01/19 (COMMENCEMENT OF OPERATIONS) TO 10/31/19 | |||||||||||||||
| SHARES | AMOUNT | |||||||||||||||
Sold | 25,782 | $ | 539,460 | |||||||||||||
Reinvested | 1 | 23 | ||||||||||||||
Repurchased | — | — | ||||||||||||||
|
|
|
| |||||||||||||
Total | 25,783 | $ | 539,483 | |||||||||||||
|
|
|
| |||||||||||||
At October 31, 2019, one shareholder owned 11.9% ofPro-Blend® Conservative Term Series. In addition, the Advisor and its affiliates owned 0.1% or less of each Series. Investment activities of these shareholders may have a material effect on the respective Series.
| 6. | Line of Credit |
The Fund has entered into a364-day, $25 million credit agreement (the “line of credit”) with Bank of New York Mellon. Each series of the Fund may borrow under the line of credit for temporary or emergency purposes, including funding shareholder redemptions and other short-term liquidity purposes. The Fund pays an annual fee on the unused commitment amount, payable quarterly, and is allocated among all the series of the Fund and included in miscellaneous expenses in the Statement of Operations for each series. The line of credit expires in August 2020 unless extended or renewed. During the year ended October 31, 2019, none of the Series borrowed under the line of credit.
| 7. | Financial Instruments and Loan Assignments |
The Series may trade in instruments including written and purchased options, forward foreign currency exchange contracts and futures contracts and other derivatives in the normal course of investing activities to assist in managing exposure to various market risks. The Series may be subject to various elements of risk which may involve, to a varying degree, elements of risk in excess of the amounts recognized for financial statement purposes. These risks include: the risk that changes in the value of a derivative may not correlate perfectly with the underlying asset, rate or index; counterparty credit risk related to over the counter derivative counterparties’ failure to perform under contract terms; liquidity risk related to the lack of a liquid market for these contracts allowing the fund to close out its position(s); and documentation risk relating to disagreement over contract terms. At October 31, 2019,Pro-Blend® Conservative Term Series,Pro-Blend® Moderate Term Series andPro-Blend® Extended Term Series invested in options contracts (equity risk).
129
Notes to Financial Statements (continued)
| 7. | Financial Instruments and Loan Assignments (continued) |
The Series may invest in a loan assignment of all or a portion of the loans. A Series has direct rights against the borrower on a loan when it purchases an assignment; however, the Series’ rights may be more limited than the lender from which it acquired the assignment and the Series may be able to enforce its rights only through an administrative agent. Loan assignments are vulnerable to market conditions and may become illiquid due to economic conditions or other events may reduce the demand for loan assignments and certain loan assignments which were liquid when purchased may become illiquid. At October 31, 2019, none of the Series held any loan assignments.
| 8. | Foreign Securities |
Investing in securities of foreign companies and foreign governments involves special risks and considerations not typically associated with investing in securities of domestic companies and the U.S. Government. These risks include revaluation of currencies and future adverse political and economic developments. Moreover, securities of foreign companies and foreign governments and their markets may be less liquid and their prices more volatile than those of comparable domestic companies and the U.S. Government.
| 9. | Federal Income Tax Information |
The amount and characterization of certain income and capital gains to be distributed are determined in accordance with federal income tax regulations, which may differ from GAAP. These differences are primarily due to differing book and tax treatments in the timing of the recognition on net investment income or gains and losses, including foreign currency gains and losses, losses deferred due to wash sales, investments in passive foreign investment companies (PFICs) and real estate investment trusts. Each Series may periodically make reclassifications among its capital accounts to reflect income and gains available for distribution (or available capital loss carryovers) under income tax regulations, without impacting the Series’ net asset value. Any such reclassifications are not reflected in the financial highlights.
The tax character of distributions paid were as follows:
PRO-BLEND® CONSERVATIVE | PRO-BLEND® MODERATE | |||||||||||||||
| TERM SERIES | TERM SERIES | |||||||||||||||
| FOR THE YEAR | FOR THE YEAR | FOR THE YEAR | FOR THE YEAR | |||||||||||||
| ENDED 10/31/19 | ENDED 10/31/18 | ENDED 10/31/19 | ENDED 10/31/18 | |||||||||||||
Ordinary income | $ | 17,035,436 | $ | 21,330,487 | $ | 7,180,115 | $ | 18,396,321 | ||||||||
Long-term capital gains | 19,690,770 | 22,874,974 | 22,984,535 | 25,890,219 | ||||||||||||
| PRO-BLEND®EXTENDED | PRO-BLEND®MAXIMUM | |||||||||||||||
| TERM SERIES | TERM SERIES | |||||||||||||||
| FOR THE YEAR | FOR THE YEAR | FOR THE YEAR | FOR THE YEAR | |||||||||||||
| ENDED 10/31/19 | ENDED 10/31/18 | ENDED 10/31/19 | ENDED 10/31/18 | |||||||||||||
Ordinary income | $ | 7,355,814 | $ | 21,183,099 | $ | 12,829,278 | $ | 14,885,916 | ||||||||
Long-term capital gains | 32,345,511 | 31,992,723 | 35,857,001 | 31,414,665 | ||||||||||||
130
Notes to Financial Statements (continued)
| 9. | Federal Income Tax Information (continued) |
At October 31, 2019, the tax basis of components of distributable earnings and the net unrealized appreciation based on the identified cost of investments for federal income tax purposes were as follows:
| PRO-BLEND® CONSERVATIVE TERM SERIES | PRO-BLEND® MODERATE TERM SERIES | PRO-BLEND® EXTENDED TERM SERIES | PRO-BLEND® MAXIMUM TERM SERIES | |||||||||||||
Cost for federal income tax purposes | $ | 864,558,894 | $ | 368,411,865 | $ | 460,331,906 | $ | 328,189,713 | ||||||||
Unrealized appreciation | 60,980,600 | 34,372,367 | 55,786,677 | 62,821,353 | ||||||||||||
Unrealized depreciation | (9,196,547 | ) | (8,763,694 | ) | (13,849,464 | ) | (15,832,188 | ) | ||||||||
|
|
|
|
|
|
|
| |||||||||
Net unrealized appreciation | $ | 51,784,053 | $ | 25,608,673 | $ | 41,937,213 | $ | 46,989,165 | ||||||||
|
|
|
|
|
|
|
| |||||||||
Undistributed ordinary income | $ | 13,601,175 | $ | 3,264,199 | $ | 7,585,921 | $ | 2,816,210 | ||||||||
Undistributed long-term gains | $ | 20,236,316 | $ | 15,865,924 | $ | 20,150,342 | $ | 24,752,766 | ||||||||
131
Report of Independent Registered Public Accounting Firm
To the Board of Directors of Manning & Napier Fund, Inc. and Shareholders ofPro-Blend® Conservative Term Series,Pro-Blend® Moderate Term Series,Pro-Blend® Extended Term Series andPro-Blend® Maximum Term Series
Opinions on the Financial Statements
We have audited the accompanying statements of assets and liabilities, including the investment portfolios, ofPro-Blend® Conservative Term Series,Pro-Blend® Moderate Term Series,Pro-Blend® Extended Term Series andPro-Blend® Maximum Term Series (four of the series constituting Manning & Napier Fund, Inc., hereafter collectively referred to as the “Funds”) as of October 31, 2019, the related statements of operations for the year ended October 31, 2019, the statements of changes in net assets for each of the two years in the period ended October 31, 2019, including the related notes, and the financial highlights for each of the periods indicated therein (collectively referred to as the “financial statements”). In our opinion, the financial statements present fairly, in all material respects, the financial position of each of the Funds as of October 31, 2019, the results of each of their operations for the year then ended, the changes in each of their net assets for each of the two years in the period ended October 31, 2019 and each of the financial highlights for each of the periods indicated therein in conformity with accounting principles generally accepted in the United States of America.
Basis for Opinions
These financial statements are the responsibility of the Funds’ management. Our responsibility is to express an opinion on the Funds’ financial statements based on our audits. We are a public accounting firm registered with the Public Company Accounting Oversight Board (United States) (“PCAOB”) and are required to be independent with respect to the Funds in accordance with the U.S. federal securities laws and the applicable rules and regulations of the Securities and Exchange Commission and the PCAOB.
We conducted our audits of these financial statements in accordance with the standards of the PCAOB. Those standards require that we plan and perform the audit to obtain reasonable assurance about whether the financial statements are free of material misstatement, whether due to error or fraud.
Our audits included performing procedures to assess the risks of material misstatement of the financial statements, whether due to error or fraud, and performing procedures that respond to those risks. Such procedures included examining, on a test basis, evidence regarding the amounts and disclosures in the financial statements. Our audits also included evaluating the accounting principles used and significant estimates made by management, as well as evaluating the overall presentation of the financial statements. Our procedures included confirmation of securities owned as of October 31, 2019 by correspondence with the custodian and brokers; when replies were not received from brokers, we performed other auditing procedures. We believe that our audits provide a reasonable basis for our opinions.
New York, New York
December 16, 2019
We have served as the auditor of one or more investment companies in Manning & Napier Mutual Funds since 1992.
132
Supplemental Tax Information
(unaudited)
All reportings are based on financial information available as of the date of this annual report and, accordingly, are subject to change.
For federal income tax purposes, each of the Series reports for the current fiscal year the amount disclosed below or, if different, the maximum amount allowable under the tax law as qualified dividend income (“QDI”).
Series | QDI | |||||
Pro-Blend®Conservative Term Series | $4,008,067 | |||||
Pro-Blend®Moderate Term Series | 2,574,445 | |||||
Pro-Blend®Extended Term Series | 3,256,936 | |||||
Pro-Blend®Maximum Term Series | 6,598,602 | |||||
For corporate shareholders, the percentage of investment income (dividend income plus short-term gain, if any) that qualifies for the dividends received deduction (DRD) for the current fiscal year is as follows:
Series | DRD% | |||||
Pro-Blend®Conservative Term Series | 15.42% | |||||
Pro-Blend®Moderate Term Series | 14.19% | |||||
Pro-Blend®Extended Term Series | 16.96% | |||||
Pro-Blend®Maximum Term Series | 22.29% | |||||
The Series designate Long-Term Capital Gain dividends pursuant to Section 852(b)(3) of the Code for the fiscal year ended October 31, 2019 as follows:
Series | ||||||
Pro-Blend®Conservative Term Series | $21,249,619 | |||||
Pro-Blend®Moderate Term Series | 16,661,727 | |||||
Pro-Blend®Extended Term Series | 21,159,016 | |||||
Pro-Blend®Maximum Term Series | 25,990,404 | |||||
133
Directors’ and Officers’ Information
(unaudited)
The Statement of Additional Information provides additional information about the Fund’s directors and officers and can be obtained without charge by calling1-800-466-3863, at www.manning-napier.com, or on the EDGAR Database on the SEC Internet web site (http://www.sec.gov). The following chart shows certain information about the Fund’s directors and officers, including their principal occupations during the last five years. Unless specific dates are provided, the individuals have held the listed positions for longer than five years.
| Interested Director and Officer | ||
| Name: | Paul Battaglia* | |
| Address: | 290 Woodcliff Drive | |
| Fairport, NY 14450 | ||
| Age: | 41 | |
| Current Position(s) Held with Fund: | Principal Executive Officer, President, Chairman & Director | |
| Term of Office & Length of Time Served: | Indefinite – Chairman and Director since November 20181 | |
| Principal Occupation(s) During Past 5 Years: | Chief Financial Officer (2018 – Present); Vice President of Finance (2016 – 2018); Director of Finance (2011 – 2016); Financial Analyst/Internal Auditor (2004-2006) – Manning & Napier Advisors, LLC and affiliates Holds one or more of the following titles for various affiliates: Chief Financial Officer | |
Number of Portfolios Overseen within Fund Complex: | 32 | |
Other Directorships Held Outside Fund Complex During Past 5 Years: | N/A | |
| Independent Directors | ||
| Name: | Stephen B. Ashley | |
| Address: | 290 Woodcliff Drive | |
| Fairport, NY 14450 | ||
| Age: | 79 | |
| Current Position(s) Held with Fund: | Director, Audit Committee Member, Governance & Nominating Committee | |
| Member | ||
| Term of Office & Length of Time Served: | Indefinite – Since 1996 | |
Principal Occupation(s) During Past 5 Years: | Chairman, Director & Chief Executive Officer (1997 to present) - The Ashley Group (property management and investment). Director (1995-2008) and Chairman(non-executive) (2004-2008) - Fannie Mae (mortgage) | |
Number of Portfolios Overseen within Fund Complex: | 32 | |
| Other Directorships Held Outside Fund Complex During Past 5 Years: | Fannie Mae (1995-2008) The Ashley Group (1995-2008) Genesee Corporation (1987-2007) | |
Name: | Paul A. Brooke | |
Address: | 290 Woodcliff Drive | |
| Fairport, NY 14450 | ||
Age: | 73 | |
Current Position(s) Held with Fund: | Lead Independent Director, Audit Committee Member, Governance & Nominating Committee Chairman | |
Term of Office & Length of Time Served: | Indefinite – Director, Audit Committee Member, Governance & Nominating Committee Member since 2007; Governance & Nominating Committee Chairman since 2016; Lead Independent Director since 2017 | |
Principal Occupation(s) During Past 5 Years: | Chairman & CEO (2005-2009) - Ithaka Acquisition Corporation (investments); Chairman (2007-2009) - Alsius Corporation (investments); Managing Member (1991-present) - PMSV Holdings LLC (investments); Managing Member (2010-2016) - Venbio (investments). | |
Number of Portfolios Overseen within Fund Complex: | 32 | |
| Other Directorships Held Outside Fund Complex During Past 5 Years: | Incyte Corp. (biotech)(2000-present); ViroPharma, Inc. (speciality pharmaceuticals)(2000-2014); HLTH (WebMD)(information)(2000-2010); Cheyne Capital International (investment)(2000-2017); GMP Companies (investment)(2000-2011); Cytos Biotechnology Ltd (biotechnology)(2012-2014); Cerus (biomedical)(2016-present); PureEarth(non-profit)(2012-present); Caelum BioSciences (biomedical)(2018-present) | |
134
Directors’ and Officers’ Information
(unaudited)
Independent Directors (continued)
Name: | Peter L. Faber | |
Address: | 290 Woodcliff Drive | |
| Fairport, NY 14450 | ||
Age: | 81 | |
Current Position(s) Held with Fund: | Director, Governance & Nominating Committee Member | |
Term of Office & Length of Time Served: | Indefinite – Since 1987 | |
| Principal Occupation(s) During Past 5 Years: | Senior Counsel (2006-2012), Partner (1995-2006 & 2013-present) - McDermott, Will & Emery LLP (law firm) | |
Number of Portfolios Overseen within Fund Complex: | 32 | |
| Other Directorships Held Outside Fund Complex During Past 5 Years: | Boston Early Music Festival(non-profit)(2007-present); Amherst Early Music, Inc.(non-profit)(2009-present); Gotham Early Music Scene, Inc.(non-profit)(2009-present); Partnership for New York City, Inc.(non-profit)(1989-2010); New York Collegium(non-profit)(2004-2011); S’Cool Sounds, Inc.(non-profit)(2017-present) | |
Name: | Harris H. Rusitzky | |
Address: | 290 Woodcliff Drive | |
| Fairport, NY 14450 | ||
Age: | 84 | |
Current Position(s) Held with Fund: | Director, Audit Committee Member, Governance & Nominating Committee Member | |
Term of Office & Length of Time Served: | Indefinite – Since 1985 | |
Principal Occupation(s) During Past 5 Years: | President (1994- present) - The Greening Group (business consultants); | |
| Partner (2006-present) - The Restaurant Group (restaurants) | ||
Number of Portfolios Overseen within Fund Complex: | 32 | |
| Other Directorships Held Outside Fund Complex During Past 5 Years: | Rochester Institute of Technology (university)(1972-present); Culinary Institute of America(non-profit college)(1985-present); George Eastman House (museum)(1988-present); National Restaurant Association (restaurant trade organization)(1978-present) | |
Name: | Chester N. Watson | |
Address: | 290 Woodcliff Drive | |
| Fairport, NY 14450 | ||
Age: | 69 | |
Current Position(s) Held with Fund: | Director, Audit Committee Chairman, Governance & Nominating Committee Member | |
Term of Office & Length of Time Served: | Indefinite – Director, Audit Committee Member, Governance & Nominating Committee Member Since 2012; Audit Committee Chairman since 2013 | |
Principal Occupation(s) During Past 5 Years: | General Auditor (2003-2011) - General Motors Company (auto manufacturer) | |
Number of Portfolios Overseen within Fund Complex: | 32 | |
| Other Directorships Held Outside Fund Complex During Past 5 Years: | Rochester Institute of Technology (university)(2005-present); Town of Greenburgh, NY Planning Board (municipal government) (2015-2018) | |
| Officers: | ||
Name: | Elizabeth Craig | |
Address: | 290 Woodcliff Drive | |
| Fairport, NY 14450 | ||
Age: | 32 | |
Current Position(s) Held with Fund: | Corporate Secretary | |
Term of Office1& Length of Time Served: | Since 2016 | |
| Principal Occupation(s) During Past 5 Years: | Fund Regulatory Administration Manager since 2018; Fund Administration Manager (2015-2018); Mutual Fund Compliance Specialist (2009-2015) - Manning & Napier Advisors, LLC; Assistant Corporate Secretary (2011-2016) - Manning & Napier Fund, Inc. | |
135
Directors’ and Officers’ Information
(unaudited)
Officers: (continued)
| Name: | Christine Glavin | |
| Address: | 290 Woodcliff Drive | |
| Fairport, NY 14450 | ||
| Age: | 53 | |
| Current Position(s) Held with Fund: | Principal Financial Officer, Chief Financial Officer | |
| Term of Office1& Length of Time Served: | Principal Financial Officer since 2002; Chief Financial Officer since 2001 | |
| Principal Occupation(s) During Past 5 Years: | Director of Fund Reporting since 2011; Fund Reporting Manager (1997-2011) - Manning & Napier Advisors, LLC; Assistant Treasurer since 2008 - Exeter Trust Company; Chief Financial Officer (2017-2018) - Rainier Investment Management Mutual Funds, Inc. | |
| Name: | Samantha Larew | |
| Address: | 290 Woodcliff Drive | |
| Fairport, NY 14450 | ||
| Age: | 39 | |
| Current Position(s) Held with Fund: | Chief Compliance Officer and Anti-Money Laundering Compliance Officer | |
| Term of Office1& Length of Time Served: | Chief Compliance Officer since 2019; Anti-Money Laundering Compliance Officer since 2018 | |
| Principal Occupation(s) During Past 5 Years: | Co-Director of Compliance (since 2018); Compliance Communications Supervisor (2014-2018); Compliance Supervisor (2011-2014); Broker-Dealer Compliance Analyst (2010-2014) - Manning & Napier Advisors, LLC and affiliates; Broker-Dealer Chief Compliance Officer (since 2013) – Manning & Napier Investor Services, Inc.; Compliance Analyst (2007-2009) – Wall Street Financial Group; Compliance Specialist (2003-2007) – Manning & Napier Advisors, LLC and affiliates Holds one or more of the following titles for various affiliates: Assistant Corporate Secretary, Chief Compliance Officer | |
| Name: | Scott Morabito | |
| Address: | 290 Woodcliff Drive | |
| Fairport, NY 14450 | ||
| Age: | 31 | |
| Current Position(s) Held with Fund: | Vice President | |
| Term of Office1& Length of Time Served: | Vice President since 2019; Assistant Vice President (2017-2019) | |
| Principal Occupation(s) During Past 5 Years: | Managing Director of Operations since 2019 and Director of Funds Group from 2017 - 2019; Fund Product and Strategy Manager (2014-2017); Senior Product and Strategy Analyst (2013-2014); Product and Strategy Analyst (2011-2013) - Manning & Napier Advisors, LLC; President, Director – Manning & Napier Investor Services, Inc. since 2018 | |
| Name: | Sarah Turner | |
| Address: | 290 Woodcliff Drive | |
| Fairport, NY 14450 | ||
| Age: | 37 | |
| Current Position(s) Held with Fund: | Chief Legal Officer; Assistant Corporate Secretary | |
| Term of Office1& Length of Time Served: | Since 2018 | |
| Principal Occupation(s) During Past 5 Years: | General Counsel since 2018 - Manning & Napier Advisors, LLC and affiliates; Counsel (2017-2018) – Harter Secrest and Emery LLP; Legal Counsel (2010-2017) – Manning & Napier Advisors, LLC and affiliates Holds one or more of the following titles for various affiliates: Corporate Secretary, General Counsel | |
*Interested Director, within the meaning of the 1940 Act by reason of his positions with the Fund’s Advisor, Manning & Napier Advisors, LLC, and Distributor, Manning & Napier Investor Services, Inc.
1The term of office of all officers shall be one year and until their respective successors are chosen and qualified, or his or her earlier resignation or removal as provided in the Fund’sBy-Laws.
136
{This page intentionally left blank}
137
Literature Requests
(unaudited)
Proxy Voting Policies and Procedures
A description of the policies and procedures that the Fund uses to determine how to vote proxies relating to portfolio securities is available, without charge, upon request:
| By phone | 1-800-466-3863 | |
| On the Securities and Exchange | ||
| Commission’s (SEC) web site | http://www.sec.gov |
Proxy Voting Record
Information regarding how the Fund voted proxies relating to portfolio securities during the most recent12-month period ended June 30th is available, without charge, upon request:
| By phone | 1-800-466-3863 | |
| On the SEC’s web site | http://www.sec.gov |
Quarterly Portfolio Holdings
The Series’ complete schedule of portfolio holdings for the 1st and 3rd quarters of each fiscal year are provided on FormN-PORT, and are available, without charge, upon request:
| By phone | 1-800-466-3863 | |
| On the SEC’s web site | http://www.sec.gov |
Prospectus and Statement of Additional Information (SAI)
For more information about any of the Manning & Napier Fund, Inc. Series, you may obtain a prospectus and SAI at www.manning-napier.com or by calling (800)466-3863. Before investing, carefully consider the objectives, risks, charges and expenses of the investment and read the prospectus carefully as it contains this and other information about the investment company.In addition, this information can be found on the SEC’s web site, http://www.sec.gov.
Additional information available at www.manning-napier.com
1. Fund Holdings -Month-End
2. Fund Holdings -Quarter-End
3. Shareholder Report - Annual
4. Shareholder Report - Semi-Annual
The Fund also offers electronic notification or“e-delivery” when certain documents are availableon-line to be downloaded or reviewed. Direct shareholders can elect to receive electronic notification when shareholder reports, prospectus updates, and/or quarterly statements are available. If you do not currently haveon-line access to your account, you can establish access by going to www.manning-napier.com, click on “Login” in the top corner of the page, and follow the prompts to self-enroll. Once enrolled, you can set your electronic notification preferences by clicking on the Account Options tab located within the green toolbar and then selectE-Delivery Option. Should you have any questions on either how to establishon-line access or how to update your account settings, please contact Investor Services at1-800-466-3863.
The Manning & Napier Fund, Inc. is managed by Manning & Napier Advisors, LLC. Manning & Napier Investor Services, Inc., an affiliate of Manning & Napier Advisors, LLC, is the distributor of the Fund shares.
MNPRO-10/19-AR
www.manning-napier.com
Manning & Napier Fund, Inc.
|
Rainier International Discovery Series |
Beginning on June 25, 2021, as permitted by Securities and Exchange Commission regulations, paper copies of the Series’ annual and semi-annual shareholder reports will no longer be sent by mail, unless you specifically request paper copies of the reports from the Fund or from your financial intermediary, such as a broker-dealer or bank. Instead, the reports will be made available on a website, and you will be notified by mail each time a report is posted and provided with a website link to access the report.
If you already elected to receive shareholder reports electronically, you will not be affected by this change and you need not take any action. You may elect to receive shareholder reports and other communications from the Fund electronically by contacting your financial intermediary or, if you are a direct investor, by visiting www.manning-napier.com or calling1-800-466-3863.
You may elect to receive all future annual and semi-annual reports in paper free of charge. If you invest through a financial intermediary, you can contact your financial intermediary to request that you continue to receive paper copies of your shareholder reports. If you invest directly with the Fund, you can inform the Fund that you wish to continue receiving paper copies of your shareholder reports by visiting www.manning-napier.com or calling1-800-466-3863. Your election to receive reports in paper will apply to all funds held with your financial intermediary if you invest through a financial intermediary or all series of the Fund if you invest directly with the Fund.
| Independent Perspective| Real-World Solutions |
A Note from Our CEO
Dear Shareholder,
The investing world is constantly changing, yet investors’ needs and objectives remain substantially the same.
Whether you are an individual saver looking to ensure security in retirement, or an institutional investor with a fiduciary obligation to others, at the end of the day you look for a trusted partner to help you build, grow, and preserve wealth.
In order to do so successfully we recognize that, in the short-term, the world’s capital markets can be capricious and hard to predict.
Bubbles form, rise, and then pop. The hot stocks of today often become passing fads of tomorrow. Investor sentiment can swing wildly, whipsawing between exuberance one day and despondence the next.
As successful long-term investors, we are defined both by what we do as well as what we don’t do.
We don’t attempt to perfectly time every recession. We don’t jump on the latest trend. We don’t worry about capturing every market peak all across the globe.
On the other hand, we do maintain the rigorous disciplines we have developed over close to half a century. We are highly attentive to managing risk and protecting investors in down markets while participating fully in the opportunities our Research uncovers.
Our focus is on you, the shareholder, and helping you achieve your goals.
In the face of an uncertain world, we believe our investment philosophies, processes, and experience have stood the test of time and will do so in the future.
We appreciate your continued confidence in our approach.
|
Sincerely,
Marc Mayer Chief Executive Officer |
Corporate Headquarters | 290 Woodcliff Drive| Fairport, NY 14450| (585) 325-6880 phone| (800) 551-0224 toll free| www.manning-napier.com
1
Rainier International Discovery Series
Fund Commentary
(unaudited)
Investment Objective
To seek long-term capital appreciation. The Series invests primarily in equity securities of foreign developed and emerging market companies that are small- tomid-sized at the time of purchase.
Performance Commentary
International equity markets posted positive returns for the twelve-month period ending October 31, 2019. During that period, international large cap stocks outperformed small- andmid-cap stocks, while international growth stocks outperformed their value counterparts. On a regional basis, emerging markets modestly outperformed developed markets.
The Rainier International Discovery Series Class S shares delivered positive returns but modestly underperformed the MSCI ACWI ex USA Small Index, returning 8.6% and 8.8% respectively. Underperformance largely occurred during the fourth quarter of 2018, and most recently, this past September and October. Underperformance was primarily attributable to stock selection, most notably in Information Technology, Consumer Staples, and Japan, as well as to an underweight to Real Estate and overweight to Denmark.
The Series experienced notable outperformance during the second quarter this year, outperforming the benchmark by roughly 6%, and driving outperformanceyear-to-date. Strong results during the period were a result of stock selection, particularly in Health Care, Industrials, Information Technology, and the UK.
Consistent with our philosophy and approach over these last 7+ years, we continue to uncover opportunities through our diligent research process. Despite headline risks around the world, we remain constructive on the companies in which the portfolio is invested due to their strong market positions, innovative leadership, and ability to deliver financial results to their shareholders.
Please see the next page for additional performance information as of October 31, 2019.
Performance data quoted represents past performance and does not guarantee future results. The investment return and principal value of an investment will fluctuate, so that an investor’s shares, when redeemed, may be worth more or less than their original cost. Current performance may be higher or lower than that quoted; investors can obtain the most recentmonth-end performance at www.manning-napier.com or by calling (800)466-3863.
Commentary prepared using data provided by FactSet. Analysis Manning & Napier. Commentary presented is relative to the ACWIxUS Small Cap Index. Additional information and associated disclosures can be found on the Performance Update page of this report.
All investments involve risks, including possible loss of principal. As with any stock fund, the value of your investment will fluctuate in response to stock market movements. Small- and medium-capitalization companies tend to have limited liquidity and greater price volatility than large-capitalization companies. Funds whose investments are concentrated in foreign and emerging market countries may be subject to fluctuating currency values, different accounting standards, and economic and political instability. The value of the Series may be affected by changes in exchange rates between foreign currencies and the U.S. dollar. Investments in emerging markets may be more volatile than investments in more developed markets. Additionally, the Series is subject to portfolio turnover risk as it may buy and sell investments frequently, which may result in higher expenses and an increase in realized capital gains and potential tax implications for shareholders.
2
Rainier International Discovery Series
Performance Update as of October 31, 2019
(unaudited)
AVERAGE ANNUAL TOTAL RETURNS AS OF OCTOBER 31, 2019
| ||||||
ONE
|
FIVE
|
SINCE
| ||||
Rainier International Discovery Series - Class S3,4 | 8.59% | 7.62% | 10.90% | |||
Rainier International Discovery Series - Class I3,4 | 8.81% | 7.90% | 11.17% | |||
Rainier International Discovery Series - Class Z3,4 | 8.99% | 7.97% | 11.21% | |||
Rainier International Discovery Series - Class W3,5 | 9.56% | 8.05% | 11.27% | |||
MSCI ACWI ex USA Small Cap Index6 | 8.77% | 5.31% | 6.13% | |||
The following graph compares the value of a $1,000,000 investment in the Rainier International Discovery Series - Class I from its inception2 (March 28, 2012) to present (October 31, 2019) to the MSCI ACWI ex USA Small Cap Index.
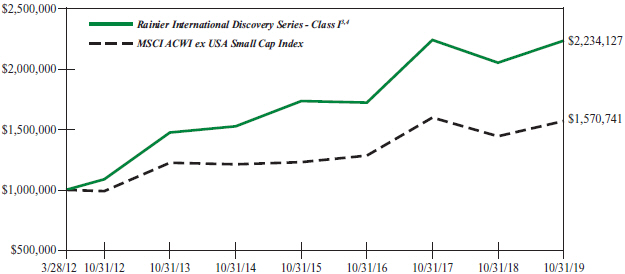
1The returns shown are based on net asset values calculated for shareholder transactions and may differ from the returns shown in the financial highlights, which reflect adjustments made to the net asset values in accordance with accounting principles generally accepted in the United States of America.
2Performance numbers for the Series and the MSCI ACWI ex USA Small Cap Index are calculated from March 28, 2012, the Class I inception date.
3The Series’ performance does not reflect the deduction of taxes that a shareholder would pay on fund distributions or the redemption of shares. The Series’ performance is historical and may not be indicative of future results. The performance returns shown are inclusive of the net expense ratio of the Series. For the year ended October 31, 2019, this net expense ratio was 1.40% for Class S, 1.14% for Class I, 0.10% for Class W and 1.00% for Class Z. The gross expense ratio, which does not account for any voluntary or contractual waivers currently in effect, was 1.44% for Class S, 1.17% for Class I, 1.10% for Class W and 1.08% for Class Z for the year ended October 31, 2019.
4The Rainier International Discovery Fund (Predecessor Fund), which was managed by Rainier Investment Management, LLC, was reorganized into the Manning & Napier Fund, Inc. Rainier International Discovery Series on 08/21/2017. For periods prior to 08/21/2017, performance for the Class I and Z Shares is based on the historical performance of the Predecessor Fund’s Institutional Shares, and will differ to the extent that the Predecessor Fund’s Institutional Shares had a higher expense ratio. For periods between 11/30/2012 and 08/21/2017, performance for Class S is based on the historical performance of the Predecessor Fund’s Class A Shares; performance prior to 11/30/2012 is based on the historical performance of the Predecessor Fund’s Institutional Shares and adjusted for the Predecessor Fund’s Class A Shares expenses. If the sales charges were reflected or if performance had been adjusted to reflect the Class S Shares’ expenses, the performance would have been different depending on total expenses incurred by the Predecessor Fund.
5For periods through March 1, 2019 (the inception date of the Class W shares), performance for the Class W shares is based on the historical performance of the Class I shares. Because the Class W shares invest in the same portfolio of securities as the Class I shares, performance will be different only to the extent that the Class I shares have a higher expense ratio.
6The MSCI ACWI ex USA Small Cap Index is designed to measure a small cap representation across 22 of 23 Developed Markets countries (excluding the U.S.) and 24 Emerging Markets countries. The Index returns do not reflect any fees or expenses. The Index is denominated in U.S. dollars. The Index returns are net of withholding taxes. They assume daily reinvestment of net dividends thus accounting for any applicable dividend taxation. Index returns provided by Bloomberg.
3
Rainier International Discovery Series
Shareholder Expense Example
(unaudited)
As a shareholder of the Series, you incur ongoing costs, including management fees, shareholder service fees and other Series expenses. This example is intended to help you understand your ongoing costs (in dollars) of investing in the Series and to compare these costs with the ongoing costs of investing in other mutual funds.
The example is based on an investment of $1,000 invested in each class at the beginning of the period and held for the entire period (May 1, 2019 to October 31, 2019).
Actual Expenses
The Actual lines of the table below provide information about actual account values and actual expenses. You may use the information in these lines, together with the amount you invested, to estimate the expenses that you paid over the period. Simply divide your account value by $1,000 (for example, an $8,600 account value divided by $1,000 = 8.6), then multiply the result by the number in the Actual line for the Class in which you have invested under the heading entitled “Expenses Paid During Period” to estimate the expenses you paid on your account during this period.
Hypothetical Example for Comparison Purposes
The Hypothetical lines of each class in the table below provide information about hypothetical account values and hypothetical expenses based on the Class’ actual expense ratio and an assumed rate of return of 5% per year before expenses, which is not the Class’ actual return. The hypothetical account values and expenses may not be used to estimate the actual ending account balance or expenses you paid during the period. You may use this information to compare the ongoing costs of investing in a class of the Series and other funds. To do so, compare this 5% hypothetical example for the Class in which you have invested with the 5% hypothetical examples that appear in the shareholder reports of the other funds.
Please note that the expenses shown in the table are meant to highlight your ongoing costs only and do not reflect any transaction costs, such as sales charges (loads), redemption fees, or exchange fees that you may incur in other mutual funds. Therefore, the second line of the table is useful in comparing ongoing costs only, and will not help you determine the relative total costs of owning different funds.
BEGINNING
|
ENDING
|
EXPENSES PAID
| ANNUALIZED
| |||||
Class S | ||||||||
Actual | $1,000.00 | $1,001.00 | $7.06 | 1.40% | ||||
Hypothetical | $1,000.00 | $1,018.15 | $7.12 | 1.40% | ||||
Class I | ||||||||
Actual | $1,000.00 | $1,002.40 | $5.80 | 1.15% | ||||
Hypothetical | $1,000.00 | $1,019.41 | $5.85 | 1.15% | ||||
Class W | ||||||||
Actual | $1,000.00 | $1,007.80 | $0.51 | 0.10% | ||||
Hypothetical | $1,000.00 | $1,024.70 | $0.51 | 0.10% | ||||
Class Z | ||||||||
Actual | $1,000.00 | $1,002.90 | $5.05 | 1.00% | ||||
Hypothetical | $1,000.00 | $1,020.16 | $5.09 | 1.00% | ||||
1 Expenses are equal to the Series’ annualized expense ratio (for thesix-month period), multiplied by the average account value over the period, multiplied by 184/365 (to reflect theone-half year period). Expenses are based on the most recent fiscal half year; therefore, the expense ratios stated above may differ from the expense ratios stated in the financial highlights, which are based onone-year data. The Class’ total return would have been lower had certain expenses not been waived during the period.
4
Rainier International Discovery Series
Portfolio Composition as of October 31, 2019
(unaudited)
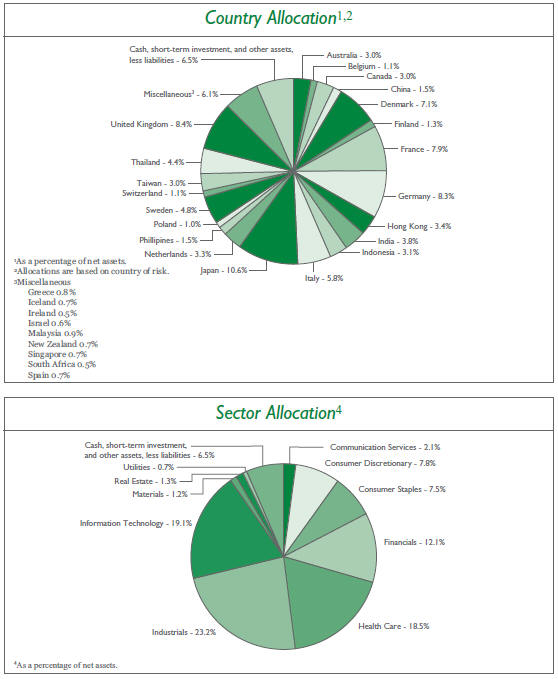
5
Rainier International Discovery Series
Investment Portfolio - October 31, 2019
VALUE | ||||||||||||
SHARES
| (NOTE 2)
| |||||||||||
COMMON STOCKS - 93.5% | ||||||||||||
Communication Services - 2.1% | ||||||||||||
Interactive Media & Services - 0.7% | ||||||||||||
New Work SE (Germany) | 9,547 | $ | 3,007,994 | |||||||||
|
| |||||||||||
Media - 1.4% | ||||||||||||
Future plc (United Kingdom) | 331,090 | 6,493,222 | ||||||||||
|
| |||||||||||
Total Communication Services | 9,501,216 | |||||||||||
|
| |||||||||||
Consumer Discretionary - 7.8% | ||||||||||||
Hotels, Restaurants & Leisure - 0.8% | ||||||||||||
Basic-Fit N.V. (Netherlands)*1 | 120,915 | 3,698,184 | ||||||||||
|
| |||||||||||
Internet & Direct Marketing Retail - 0.3% | ||||||||||||
Baozun, Inc. - ADR (China)* | 31,910 | 1,388,723 | ||||||||||
|
| |||||||||||
Leisure Products - 0.6% | ||||||||||||
MIPS AB (Sweden) | 179,550 | 2,751,223 | ||||||||||
|
| |||||||||||
Multiline Retail - 1.0% | ||||||||||||
Poya International Co. Ltd. (Taiwan) | 315,000 | 4,326,936 | ||||||||||
|
| |||||||||||
Specialty Retail - 3.3% | ||||||||||||
Ace Hardware Indonesia Tbk PT (Indonesia) | 23,828,300 | 2,867,808 | ||||||||||
Com7 PCL - NVDR (Thailand) | 4,677,400 | 4,457,268 | ||||||||||
JUMBO S.A. (Greece) | 182,282 | 3,551,291 | ||||||||||
Wilcon Depot, Inc. (Philippines) | 11,628,628 | 3,780,487 | ||||||||||
|
| |||||||||||
| 14,656,854 | ||||||||||||
|
| |||||||||||
Textiles, Apparel & Luxury Goods - 1.8% | ||||||||||||
Bata India Ltd. (India) | 115,940 | 2,950,927 | ||||||||||
Li Ning Co. Ltd. (China) | 1,533,500 | 5,199,826 | ||||||||||
|
| |||||||||||
| 8,150,753 | ||||||||||||
|
| |||||||||||
Total Consumer Discretionary | 34,972,673 | |||||||||||
|
| |||||||||||
Consumer Staples - 7.5% | ||||||||||||
Beverages - 4.6% | ||||||||||||
Carlsberg Brewery Malaysia Bhd (Malaysia) | 595,600 | 3,953,374 | ||||||||||
Royal Unibrew A/S (Denmark) | 156,631 | 12,849,891 | ||||||||||
Varun Beverages Ltd. (India) | 417,432 | 3,645,377 | ||||||||||
|
| |||||||||||
| 20,448,642 | ||||||||||||
|
| |||||||||||
Food & Staples Retailing - 1.0% | ||||||||||||
Dino Polska S.A. (Poland)*1 | 115,724 | 4,509,764 | ||||||||||
|
| |||||||||||
Food Products - 1.9% | ||||||||||||
AAK AB (Sweden) | 240,200 | 4,260,921 | ||||||||||
Indofood Sukses Makmur Tbk PT (Indonesia) | 7,984,200 | 4,375,369 | ||||||||||
|
| |||||||||||
| 8,636,290 | ||||||||||||
|
| |||||||||||
Total Consumer Staples | 33,594,696 | |||||||||||
|
| |||||||||||
The accompanying notes are an integral part of the financial statements.
6
Rainier International Discovery Series
Investment Portfolio - October 31, 2019
VALUE | ||||||||||||
SHARES
| (NOTE 2)
| |||||||||||
COMMON STOCKS(continued) | ||||||||||||
Financials - 12.1% | ||||||||||||
Banks - 4.8% | ||||||||||||
Bank Tabungan Pensiunan Nasional Syariah Tbk PT (Indonesia)* | 24,249,509 | $ | 6,631,869 | |||||||||
Federal Bank Ltd. (India) | 1,174,960 | 1,386,182 | ||||||||||
FinecoBank Banca Fineco S.p.A. (Italy) | 961,770 | 10,842,356 | ||||||||||
Tisco Financial Group PCL (Thailand) | 673,600 | 2,174,542 | ||||||||||
Tisco Financial Group PCL - NVDR (Thailand) | 192,800 | 622,405 | ||||||||||
|
| |||||||||||
| 21,657,354 | ||||||||||||
|
| |||||||||||
Capital Markets - 2.6% | ||||||||||||
AJ Bell plc (United Kingdom) | 684,510 | 3,285,159 | ||||||||||
Euronext N.V. (Netherlands)1 | 101,825 | 8,214,440 | ||||||||||
|
| |||||||||||
| 11,499,599 | ||||||||||||
|
| |||||||||||
Consumer Finance - 4.0% | ||||||||||||
CreditAccess Grameen Ltd. (India)* | 372,995 | 3,355,080 | ||||||||||
Krungthai Card PCL - NVDR (Thailand) | 7,029,600 | 9,664,850 | ||||||||||
Muangthai Capital PCL - NVDR (Thailand) | 1,356,600 | 2,787,006 | ||||||||||
Transaction Capital Ltd. (South Africa) | 1,588,175 | 2,317,545 | ||||||||||
|
| |||||||||||
| 18,124,481 | ||||||||||||
|
| |||||||||||
Insurance - 0.7% | ||||||||||||
Anicom Holdings, Inc. (Japan) | 80,800 | 2,970,380 | ||||||||||
|
| |||||||||||
Total Financials | 54,251,814 | |||||||||||
|
| |||||||||||
Health Care - 18.5% | ||||||||||||
Biotechnology - 0.9% | ||||||||||||
Abcam plc (United Kingdom) | 196,375 | 2,960,926 | ||||||||||
Vitrolife AB (Sweden) | 82,450 | 1,286,431 | ||||||||||
|
| |||||||||||
| 4,247,357 | ||||||||||||
|
| |||||||||||
Health Care Equipment & Supplies - 9.0% | ||||||||||||
Arjo AB - Class B (Sweden) | 1,312,175 | 5,411,840 | ||||||||||
Asahi Intecc Co. Ltd. (Japan) | 237,700 | 6,540,409 | ||||||||||
Carl Zeiss Meditec AG (Germany) | 64,295 | 7,008,422 | ||||||||||
Cellavision AB (Sweden) | 50,861 | 1,451,185 | ||||||||||
DiaSorin S.p.A. (Italy) | 45,210 | 5,097,472 | ||||||||||
Nanosonics Ltd. (Australia)* | 661,670 | 3,095,752 | ||||||||||
Ossur HF (Iceland) | 459,780 | 3,328,854 | ||||||||||
Revenio Group OYJ (Finland) | 95,530 | 2,818,104 | ||||||||||
Sartorius AG (Germany) | 21,735 | 4,223,588 | ||||||||||
Xvivo Perfusion AB (Sweden)* | 84,180 | 1,426,292 | ||||||||||
|
| |||||||||||
| 40,401,918 | ||||||||||||
|
| |||||||||||
Health Care Providers & Services - 4.8% | ||||||||||||
Amplifon S.p.A. (Italy) | 189,604 | 4,768,224 | ||||||||||
Fagron (Belgium) | 270,620 | 5,138,525 | ||||||||||
The accompanying notes are an integral part of the financial statements.
7
Rainier International Discovery Series
Investment Portfolio - October 31, 2019
VALUE | ||||||||||||
SHARES
| (NOTE 2)
| |||||||||||
COMMON STOCKS(continued) | ||||||||||||
Health Care(continued) | ||||||||||||
Health Care Providers & Services(continued) | ||||||||||||
Korian S.A. (France) | 280,615 | $ | 11,900,028 | |||||||||
|
| |||||||||||
| 21,806,777 | ||||||||||||
|
| |||||||||||
Health Care Technology - 0.8% | ||||||||||||
Pro Medicus Ltd. (Australia) | 91,270 | 1,674,892 | ||||||||||
RaySearch Laboratories AB (Sweden)* | 107,585 | 1,726,998 | ||||||||||
|
| |||||||||||
| 3,401,890 | ||||||||||||
|
| |||||||||||
Pharmaceuticals - 3.0% | ||||||||||||
ALK-Abello A/S (Denmark)* | 22,880 | 4,914,958 | ||||||||||
Dechra Pharmaceuticals plc (United Kingdom) | 250,980 | 8,561,351 | ||||||||||
|
| |||||||||||
| 13,476,309 | ||||||||||||
|
| |||||||||||
Total Health Care | 83,334,251 | |||||||||||
|
| |||||||||||
Industrials - 23.2% | ||||||||||||
Aerospace & Defense - 2.2% | ||||||||||||
CAE, Inc. (Canada) | 398,435 | 9,991,882 | ||||||||||
|
| |||||||||||
Commercial Services & Supplies - 1.7% | ||||||||||||
Loomis AB - Class B (Sweden) | 85,093 | 3,294,754 | ||||||||||
Prestige International, Inc. (Japan) | 507,900 | 4,203,761 | ||||||||||
|
| |||||||||||
| 7,498,515 | ||||||||||||
|
| |||||||||||
Electrical Equipment - 2.6% | ||||||||||||
Varta AG (Germany)* | 33,435 | 3,779,489 | ||||||||||
V-Guard Industries Ltd. (India) | 899,215 | 3,162,730 | ||||||||||
Voltronic Power Technology Corp. (Taiwan) | 207,900 | 4,602,056 | ||||||||||
|
| |||||||||||
| 11,544,275 | ||||||||||||
|
| |||||||||||
Machinery - 9.3% | ||||||||||||
Daifuku Co. Ltd. (Japan) | 75,900 | 4,027,387 | ||||||||||
Interpump Group S.p.A. (Italy) | 196,970 | 5,399,598 | ||||||||||
Konecranes Oyj (Finland) | 92,985 | 2,871,599 | ||||||||||
Rational AG (Germany) | 8,925 | 6,790,616 | ||||||||||
Rotork plc (United Kingdom) | 684,810 | 2,674,311 | ||||||||||
Techtronic Industries Co. Ltd. (Hong Kong) | 1,931,500 | 15,094,701 | ||||||||||
VAT Group AG (Switzerland)1 | 32,465 | 4,773,379 | ||||||||||
|
| |||||||||||
| 41,631,591 | ||||||||||||
|
| |||||||||||
Professional Services - 6.0% | ||||||||||||
ALS Ltd. (Australia) | 787,680 | 4,380,758 | ||||||||||
L&T Technology Services Ltd. (India)1 | 117,815 | 2,497,612 | ||||||||||
Nihon M&A Center, Inc. (Japan) | 194,400 | 5,910,752 | ||||||||||
Teleperformance (France) | 62,835 | 14,256,219 | ||||||||||
|
| |||||||||||
| 27,045,341 | ||||||||||||
|
| |||||||||||
The accompanying notes are an integral part of the financial statements.
8
Rainier International Discovery Series
Investment Portfolio - October 31, 2019
VALUE | ||||||||||||
SHARES
| (NOTE 2)
| |||||||||||
COMMON STOCKS(continued) | ||||||||||||
Industrials(continued) | ||||||||||||
Trading Companies & Distributors - 0.8% | ||||||||||||
Toromont Industries Ltd. (Canada) | 67,475 | $ | 3,484,151 | |||||||||
|
| |||||||||||
Transportation Infrastructure - 0.6% | ||||||||||||
International Container Terminal Services, Inc. (Philippines) | 1,233,380 | 2,883,365 | ||||||||||
|
| |||||||||||
Total Industrials | 104,079,120 | |||||||||||
|
| |||||||||||
Information Technology - 19.1% | ||||||||||||
Electronic Equipment, Instruments & Components - 3.9% | ||||||||||||
Anritsu Corp. (Japan) | 151,700 | 2,892,960 | ||||||||||
Electrocomponents plc (United Kingdom) | 871,635 | 7,690,559 | ||||||||||
Halma plc (United Kingdom) | 130,125 | 3,157,548 | ||||||||||
Ingenico Group S.A. (France) | 35,470 | 3,792,846 | ||||||||||
|
| |||||||||||
| 17,533,913 | ||||||||||||
|
| |||||||||||
IT Services - 5.3% | ||||||||||||
GMO Payment Gateway, Inc. (Japan) | 87,335 | 6,436,513 | ||||||||||
Keywords Studios plc (Ireland) | 171,465 | 2,470,825 | ||||||||||
NET One Systems Co. Ltd. (Japan) | 289,000 | 7,791,602 | ||||||||||
Softcat plc (United Kingdom) | 249,405 | 3,039,610 | ||||||||||
TIS, Inc. (Japan) | 68,078 | 4,127,810 | ||||||||||
|
| |||||||||||
| 23,866,360 | ||||||||||||
|
| |||||||||||
Semiconductors & Semiconductor Equipment - 2.3% | ||||||||||||
SOITEC (France)* | 51,245 | 5,652,378 | ||||||||||
Win Semiconductors Corp. (Taiwan) | 457,000 | 4,756,831 | ||||||||||
|
| |||||||||||
| 10,409,209 | ||||||||||||
|
| |||||||||||
Software - 7.6% | ||||||||||||
Altium Ltd. (Australia) | 90,230 | 1,997,443 | ||||||||||
CyberArk Software Ltd. (United States)* | 27,265 | 2,769,579 | ||||||||||
Cybozu, Inc. (Japan) | 246,665 | 2,528,048 | ||||||||||
Nemetschek SE (Germany) | 115,060 | 5,870,638 | ||||||||||
Netcompany Group A/S (Denmark)*1 | 174,905 | 7,455,592 | ||||||||||
SimCorp A/S (Denmark) | 51,125 | 4,574,551 | ||||||||||
TeamViewer AG (Germany)* | 137,105 | 3,617,925 | ||||||||||
Technology One Ltd. (Australia) | 470,365 | 2,389,467 | ||||||||||
Xero Ltd. (New Zealand)* | 61,700 | 2,926,694 | ||||||||||
|
| |||||||||||
| 34,129,937 | ||||||||||||
|
| |||||||||||
Total Information Technology | 85,939,419 | |||||||||||
|
| |||||||||||
Materials - 1.2% | ||||||||||||
Chemicals - 1.2% | ||||||||||||
Chr. Hansen Holding A/S (Denmark) | 28,965 | 2,223,809 | ||||||||||
Corbion N.V. (Netherlands) | 104,240 | 3,011,104 | ||||||||||
|
| |||||||||||
Total Materials | 5,234,913 | |||||||||||
|
| |||||||||||
The accompanying notes are an integral part of the financial statements.
9
Rainier International Discovery Series
Investment Portfolio - October 31, 2019
VALUE | ||||||||||||
SHARES
| (NOTE 2)
| |||||||||||
COMMON STOCKS(continued) | ||||||||||||
Real Estate - 1.3% | ||||||||||||
Equity Real Estate Investment Trusts (REITS) - 0.6% | ||||||||||||
Keppel DC REIT (Singapore) | 2,007,900 | $ | 2,949,173 | |||||||||
|
| |||||||||||
Real Estate Management & Development - 0.7% | ||||||||||||
Grand City Properties S.A. (Germany) | 135,105 | 3,162,992 | ||||||||||
|
| |||||||||||
Total Real Estate | 6,112,165 | |||||||||||
|
| |||||||||||
Utilities - 0.7% | ||||||||||||
Independent Power and Renewable Electricity Producers - 0.7% | ||||||||||||
Solaria Energia y Medio Ambiente S.A. (Spain)* | 398,771 | 3,087,927 | ||||||||||
|
| |||||||||||
TOTAL COMMON STOCKS | 420,108,194 | |||||||||||
|
| |||||||||||
WARRANTS - 0.0%## | ||||||||||||
Consumer Discretionary - 0.0%## | ||||||||||||
Hotels, Restaurants & Leisure - 0.0%## | ||||||||||||
Minor International PCL - NVDR - Warrants (Expires 09/30/2021) (Thailand)* (Identified Cost $—) | 193,920 | 19,527 | ||||||||||
|
| |||||||||||
SHORT-TERM INVESTMENT - 5.8% | ||||||||||||
Dreyfus Government Cash Management, Institutional Shares, 1.73%2 (Identified Cost $26,168,747) | 26,168,747 | 26,168,747 | ||||||||||
|
| |||||||||||
TOTAL INVESTMENTS - 99.3% | 446,296,468 | |||||||||||
OTHER ASSETS, LESS LIABILITIES - 0.7% | 2,934,601 | |||||||||||
|
| |||||||||||
NET ASSETS - 100% | $ | 449,231,069 | ||||||||||
|
| |||||||||||
ADR - American Depositary Receipt
NVDR -Non-Voting Depository Receipt
*Non-income producing security.
## Less than 0.1%.
1Restricted securities - Investment in securities that are restricted as to public resale under the Securities Act of 1933, as amended. These securities have been sold under Rule 144A and have been determined to be liquid under the Fund’s Liquidity Risk Management Program. These securities amount to $31,148,971, or 6.9% of the Series’ net assets as of October 31, 2019 (see Note 2 to the financial statements).
2Rate shown is the current yield as of October 31, 2019.
The Series’ portfolio holds, as a percentage of net assets, greater than 10% in the following country:
Japan - 10.6%.
The Global Industry Classification Standard (GICS) was developed by and is the exclusive property and a service mark of MSCI Inc. (MSCI) and Standard & Poor’s, a division of The McGraw-Hill Companies, Inc. (S&P), and is licensed for use by Manning & Napier when referencing GICS sectors. Neither MSCI, S&P, nor any third party involved in making or compiling the GICS or any GICS classifications makes any express or implied warranties or representations with respect to such standard or classification, nor shall any such party have any liability therefrom.
The accompanying notes are an integral part of the financial statements.
10
Rainier International Discovery Series
Statement of Assets & Liabilities
October 31, 2019
ASSETS: | ||||
Investments, at value (identified cost $369,057,759) (Note 2) | $ | 446,296,468 | ||
Foreign currency, at value (cost $95,577) | 95,585 | |||
Receivable for securities sold | 6,062,526 | |||
Foreign tax reclaims receivable | 542,832 | |||
Dividends receivable | 262,245 | |||
Receivable for fund shares sold | 259,358 | |||
Prepaid and other expenses | 29,143 | |||
|
| |||
TOTAL ASSETS | 453,548,157 | |||
|
| |||
LIABILITIES: | ||||
Accrued management fees (Note 3) | 291,063 | |||
Accruedsub-transfer agent fees (Note 3) | 70,007 | |||
Accrued fund accounting and administration fees (Note 3) | 35,988 | |||
Accrued distribution and service (Rule12b-1) fees (Class S) (Note 3) | 8,343 | |||
Accrued Chief Compliance Officer service fees (Note 3) | 687 | |||
Accrued foreign capital gains tax (Note 2) | 286,108 | |||
Payable for securities purchased | 2,857,310 | |||
Payable for fund shares repurchased | 616,259 | |||
Other payables and accrued expenses | 151,323 | |||
|
| |||
TOTAL LIABILITIES | 4,317,088 | |||
|
| |||
TOTAL NET ASSETS | $ | 449,231,069 | ||
|
| |||
NET ASSETS CONSIST OF: | ||||
Capital stock | $ | 217,723 | ||
Additionalpaid-in-capital | 410,128,349 | |||
Total distributable earnings | 38,884,997 | |||
|
| |||
TOTAL NET ASSETS | $ | 449,231,069 | ||
|
| |||
NET ASSET VALUE, OFFERING PRICE AND REDEMPTION PRICE PER SHARE - Class S | $ | 20.41 | ||
|
| |||
NET ASSET VALUE, OFFERING PRICE AND REDEMPTION PRICE PER SHARE - Class I | $ | 20.64 | ||
|
| |||
NET ASSET VALUE, OFFERING PRICE AND REDEMPTION PRICE PER SHARE - Class W | $ | 20.59 | ||
|
| |||
NET ASSET VALUE, OFFERING PRICE AND REDEMPTION PRICE PER SHARE - Class Z($237,739,575/11,501,579 shares) | $ | 20.67 | ||
|
| |||
The accompanying notes are an integral part of the financial statements.
11
Rainier International Discovery Series
Statement of Operations
For the Year Ended October 31, 2019
INVESTMENT INCOME: | ||||
Dividends (net of foreign taxes withheld, $808,318) | $ | 6,495,324 | ||
|
| |||
EXPENSES: | ||||
Management fees (Note 3) | 4,192,190 | |||
Sub-transfer agent fees (Note 3) | 275,839 | |||
Distribution and service (Rule12b-1) fees (Class S) (Note 3) | 214,052 | |||
Fund accounting and administration fees (Note 3) | 122,453 | |||
Directors’ fees (Note 3) | 44,821 | |||
Chief Compliance Officer service fees (Note 3) | 3,455 | |||
Custodian fees | 194,584 | |||
Miscellaneous | 443,667 | |||
|
| |||
Total Expenses | 5,491,061 | |||
Less reduction of expenses (Note 3) | (341,341 | ) | ||
|
| |||
Net Expenses | 5,149,720 | |||
|
| |||
NET INVESTMENT INCOME | 1,345,604 | |||
|
| |||
REALIZED AND UNREALIZED GAIN (LOSS) ON INVESTMENTS AND FOREIGN CURRENCY: | ||||
Net realized gain (loss) on- | ||||
Investments | (33,126,156 | ) | ||
Foreign currency and translation of other assets and liabilities | (402,438 | ) | ||
|
| |||
| (33,528,594 | ) | |||
|
| |||
Net change in unrealized appreciation (depreciation) on- | ||||
Investments (net of decrease in accrued foreign capital gains tax of $201,533) | 69,039,340 | |||
Foreign currency and translation of other assets and liabilities | 3,477 | |||
|
| |||
| 69,042,817 | ||||
|
| |||
NET REALIZED AND UNREALIZED GAIN (LOSS) ON INVESTMENTS AND FOREIGN CURRENCY | 35,514,223 | |||
|
| |||
NET INCREASE IN NET ASSETS RESULTING FROM OPERATIONS | $ | 36,859,827 | ||
|
| |||
The accompanying notes are an integral part of the financial statements.
12
Rainier International Discovery Series
Statements of Changes in Net Assets
FOR THE | FOR THE | |||||||
INCREASE (DECREASE) IN NET ASSETS: | ||||||||
OPERATIONS: | ||||||||
Net investment income | $ | 1,345,604 | $ | 695,640 | ||||
Net realized gain (loss) on investments and foreign currency | (33,528,594 | ) | (1,134,107 | ) | ||||
Net change in unrealized appreciation (depreciation) on investments and foreign currency | 69,042,817 | (65,129,897 | ) | |||||
|
|
|
| |||||
Net increase (decrease) from operations | 36,859,827 | (65,568,364 | ) | |||||
|
|
|
| |||||
DISTRIBUTIONS TO SHAREHOLDERS (Note 9): | ||||||||
Class S | (221,837 | ) | — | |||||
Class I | (583,940 | ) | (268,365 | ) | ||||
Class Z | (759,439 | ) | (39 | ) | ||||
|
|
|
| |||||
Total distributions to shareholders | (1,565,216 | ) | (268,404 | ) | ||||
|
|
|
| |||||
CAPITAL STOCK ISSUED AND REPURCHASED: | ||||||||
Net increase (decrease) from capital share transactions (Note 5) | (109,312,921 | ) | 278,711,170 | |||||
|
|
|
| |||||
Net increase (decrease) in net assets | (74,018,310 | ) | 212,874,402 | |||||
NET ASSETS: | ||||||||
Beginning of year | 523,249,379 | 310,374,977 | ||||||
|
|
|
| |||||
End of year | $ | 449,231,069 | $ | 523,249,379 | ||||
|
|
|
| |||||
The accompanying notes are an integral part of the financial statements.
13
Rainier International Discovery Series
Financial Highlights - Class S*1
| FOR THE YEAR ENDED | FOR THE PERIOD | FOR THE YEAR ENDED | ||||||||||||||||||||||
| 10/31/19 | 10/31/18 | 4/1/17 TO 10/31/17 | 3/31/17 | 3/31/16 | 3/31/15 | |||||||||||||||||||
Per share data (for a share outstanding throughout each period): |
| |||||||||||||||||||||||
Net asset value - Beginning of period |
| $18.83 |
|
| $20.61 |
|
| $16.44 |
|
| $15.93 |
|
| $15.45 |
|
| $15.56 |
| ||||||
|
|
|
|
|
|
|
|
|
|
|
| |||||||||||||
Income (loss) from investment operations: | ||||||||||||||||||||||||
Net investment income (loss)2 |
| (0.07 | ) |
| (0.01 | ) |
| 0.02 |
|
| (0.02 | ) |
| (0.09 | ) |
| 0.01 |
| ||||||
Net realized and unrealized gain (loss) on investments |
| 1.67 |
|
| (1.77 | ) |
| 4.15 |
|
| 0.53 |
|
| 0.58 |
|
| 0.61 |
| ||||||
|
|
|
|
|
|
|
|
|
|
|
| |||||||||||||
Total from investment operations |
| 1.60 |
|
| (1.78 | ) |
| 4.17 |
|
| 0.51 |
|
| 0.49 |
|
| 0.62 |
| ||||||
|
|
|
|
|
|
|
|
|
|
|
| |||||||||||||
Less distributions to shareholders: | ||||||||||||||||||||||||
From net investment income |
| (0.02 | ) |
| — |
|
| — |
|
| — |
|
| — |
|
| — |
| ||||||
From net realized gain on investments |
| — |
|
| — |
|
| — |
|
| — |
|
| (0.01 | ) |
| (0.73 | ) | ||||||
|
|
|
|
|
|
|
|
|
|
|
| |||||||||||||
Total distributions to shareholders |
| (0.02 | ) |
| — |
|
| — |
|
| — |
|
| (0.01 | ) |
| (0.73 | ) | ||||||
|
|
|
|
|
|
|
|
|
|
|
| |||||||||||||
Net asset value - End of period |
| $20.41 |
|
| $18.83 |
|
| $20.61 |
|
| $16.44 |
|
| $15.93 |
|
| $15.45 |
| ||||||
|
|
|
|
|
|
|
|
|
|
|
| |||||||||||||
Net assets - End of period(000’s omitted) |
| $39,387 |
|
| $193,071 |
|
| $120,399 |
|
| $78,260 |
|
| $99,944 |
|
| $4,058 |
| ||||||
|
|
|
|
|
|
|
|
|
|
|
| |||||||||||||
Total return3 |
| 8.53% |
|
| (8.64% | ) |
| 25.36% |
|
| 3.14% |
|
| 3.22% |
|
| 4.55% |
| ||||||
Ratios (to average net assets)/Supplemental Data: | ||||||||||||||||||||||||
Expenses** |
| 1.40% |
|
| 1.40% |
|
| 1.49% | 4,5 |
| 1.51% | 5 |
| 1.50% |
|
| 1.50% |
| ||||||
Net investment income (loss) |
| (0.36% | ) |
| (0.05% | ) |
| 0.20% | 4 |
| (0.12% | ) |
| (0.56% | ) |
| 0.06% |
| ||||||
Series portfolio turnover |
| 102% |
|
| 73% |
|
| 46% |
|
| 123% |
|
| 93% |
|
| 111% |
| ||||||
| *Effective March 1, 2019, Class K shares of the Series have been redesignated as Class S Shares. |
| |||||||||||||||||||||||
| **The investment advisor did not impose all or a portion of its management and/or other fees during the period, and may have paid a portion of the Series’ expenses. If these expenses had been incurred by the Class, the expense ratio (to average net assets) would have increased by the following amounts: |
| |||||||||||||||||||||||
| 0.04% |
|
| 0.03% |
|
| 0.21% | 4 |
| 0.14% |
|
| 0.14% |
|
| 0.32% |
| |||||||
1Rainier International Discovery Fund (“the Predecessor Fund”) transferred its assets and liabilities to the Series at the close of business on August 21, 2017. Because the Series had no investment operations prior to the Reorganization, and based on the similarity of the Series to the Predecessor Fund, the Predecessor Fund is treated as the survivor for accounting and performance reporting purposes. Class S shares of the Series (formerly Class K) were formerly Class A shares of the Predecessor Fund.
2Calculated based on average shares outstanding during the periods.
3Represents aggregate total return for the periods indicated, and assumes reinvestment of all distributions. Total return would have been lower had certain expenses not been waived or reimbursed during the periods. Periods less than one year are not annualized.
4Annualized.
5Expense ratio exceeds expense limitation due to recognition of expenses related to the Reorganization of the Fund. The majority of the expenses incurred by the Series in connection with the reorganization were paid by the Advisor. The Series paid certain expenses, including half of the cost of the proxy, such as printing and solicitation, and all of the legal fees incurred in connection to the reorganization.
The accompanying notes are an integral part of the financial statements.
14
Rainier International Discovery Series
Financial Highlights - Class I1
| FOR THE YEAR ENDED | FOR THE PERIOD | FOR THE YEAR ENDED | ||||||||||||||||||||||
| 10/31/19 | 10/31/18 | 04/1/17 TO 10/31/17 | 3/31/17 | 3/31/16 | 3/31/15 | |||||||||||||||||||
Per share data (for a share outstanding throughout each period): |
| |||||||||||||||||||||||
Net asset value - Beginning of period | $19.04 | $20.81 | $16.58 | $16.02 | $15.50 | $15.58 | ||||||||||||||||||
|
|
|
|
|
|
|
|
|
|
|
| |||||||||||||
Income (loss) from investment operations: | ||||||||||||||||||||||||
Net investment income (loss)2 | 0.06 | 0.07 | 0.05 | 0.00 | 3 | (0.03 | ) | 0.04 | ||||||||||||||||
Net realized and unrealized gain (loss) on investments | 1.61 | (1.81 | ) | 4.18 | 0.56 | 0.56 | 0.62 | |||||||||||||||||
|
|
|
|
|
|
|
|
|
|
|
| |||||||||||||
Total from investment operations | 1.67 | (1.74 | ) | 4.23 | 0.56 | 0.53 | 0.66 | |||||||||||||||||
|
|
|
|
|
|
|
|
|
|
|
| |||||||||||||
Less distributions to shareholders: | ||||||||||||||||||||||||
From net investment income | (0.07 | ) | (0.03 | ) | — | — | — | (0.01 | ) | |||||||||||||||
From net realized gain on investments | — | — | — | — | (0.01 | ) | (0.73 | ) | ||||||||||||||||
|
|
|
|
|
|
|
|
|
|
|
| |||||||||||||
Total distributions to shareholders | (0.07 | ) | (0.03 | ) | — | — | (0.01 | ) | (0.74 | ) | ||||||||||||||
|
|
|
|
|
|
|
|
|
|
|
| |||||||||||||
Net asset value - End of period | $20.64 | $19.04 | $20.81 | $16.58 | $16.02 | $15.50 | ||||||||||||||||||
|
|
|
|
|
|
|
|
|
|
|
| |||||||||||||
Net assets - End of period(000’s omitted) | $154,009 | $161,390 | $189,955 | $114,487 | $76,624 | $40,356 | ||||||||||||||||||
|
|
|
|
|
|
|
|
|
|
|
| |||||||||||||
Total return4 | 8.81% | (8.38% | ) | 25.51% | 3.43% | 3.47% | 4.81% | |||||||||||||||||
Ratios (to average net assets)/Supplemental Data: | ||||||||||||||||||||||||
Expenses* | 1.14% | 1.12% | 1.24% | 5,6 | 1.26% | 6 | 1.25% | 1.25% | ||||||||||||||||
Net investment income (loss) | 0.31% | 0.30% | 0.41% | 5 | 0.01% | (0.19% | ) | 0.40% | ||||||||||||||||
Series portfolio turnover | 102% | 73% | 46% | 123% | 93% | 111% | ||||||||||||||||||
| *For certain periods presented, the investment advisor did not impose all or a portion of its management and/or other fees during the period, and may have paid a portion of the Series’ expenses. If these expenses had been incurred by the Class, the expense ratio (to average net assets) would have increased by the following amounts: |
| |||||||||||||||||||||||
| 0.03% | N/A | 0.11% | 5 | 0.07% | 0.06% | 0.27% | ||||||||||||||||||
1Rainier International Discovery Fund (“the Predecessor Fund”) transferred its assets and liabilities to the Series at the close of business on August 21, 2017. Because the Series had no investment operations prior to the Reorganization, and based on the similarity of the Series to the Predecessor Fund, the Predecessor Fund is treated as the survivor for accounting and performance reporting purposes. Class I shares of the Series were formerly Institutional shares of the Predecessor Fund.
2Calculated based on average shares outstanding during the periods.
3Less than $0.01.
4Represents aggregate total return for the periods indicated, and assumes reinvestment of all distributions. Total return would have been lower had certain expenses not been waived or reimbursed during certain periods. Periods less than one year are not annualized.
5Annualized.
6Expense ratio exceeds expense limitation due to recognition of expenses related to the Reorganization of the Fund. The majority of the expenses incurred by the Series in connection with the reorganization were paid by the Advisor. The Series paid certain expenses, including half of the cost of the proxy, such as printing and solicitation, and all of the legal fees incurred in connection to the reorganization.
The accompanying notes are an integral part of the financial statements.
15
Rainier International Discovery Series
Financial Highlights - Class W
| FOR THE PERIOD 3/1/191 TO 10/31/19 | |||||
Per share data (for a share outstanding throughout the period): | |||||
Net asset value - Beginning of period | $19.34 | ||||
|
| ||||
Income from investment operations: | |||||
Net investment income2 | 0.22 | ||||
Net realized and unrealized gain (loss) on investments | 1.03 | ||||
|
| ||||
Total from investment operations | 1.25 | ||||
|
| ||||
Net asset value- End of period | $20.59 | ||||
|
| ||||
Net assets - End of period(000’s omitted) | $18,095 | ||||
|
| ||||
Total return3 | 6.46 | % | |||
Ratios (to average net assets)/Supplemental Data: | |||||
Expenses*4 | 0.10 | % | |||
Net investment income4 | 1.65 | % | |||
Series portfolio turnover | 102 | % | |||
| *The investment advisor did not impose all or a portion of its management and/or other fees during the period, and may have paid a portion of the Series’ expenses. If these expenses had been incurred by the Class, the expense ratio (to average net assets) would have increased by the following amount4: |
| ||||
| 1.00 | % | ||||
1Commencement of operations.
2Calculated based on average shares outstanding during the period.
3Represents aggregate total return for the period indicated. Total return would have been lower had certain expenses not been waived or reimbursed during the period. Periods less than one year are not annualized.
4Annualized.
The accompanying notes are an integral part of the financial statements.
16
Rainier International Discovery Series
Financial Highlights - Class Z*
| FOR THE YEAR ENDED | FOR THE PERIOD 8/21/171 TO 10/31/17 | ||||||||||||||
| 10/31/19 | 10/31/18 | ||||||||||||||
Per share data (for a share outstanding throughout each period): | |||||||||||||||
Net asset value - Beginning of period |
| $19.06 |
| $20.82 |
| $19.40 | |||||||||
|
|
|
|
|
| ||||||||||
Income (loss) from investment operations: | |||||||||||||||
Net investment income2 |
| 0.09 |
| 0.03 |
| 0.01 | |||||||||
Net realized and unrealized gain (loss) on investments |
| 1.61 |
| (1.75 | ) |
| 1.41 | ||||||||
|
|
|
|
|
| ||||||||||
Total from investment operations |
| 1.70 |
| (1.72 | ) |
| 1.42 | ||||||||
|
|
|
|
|
| ||||||||||
Less distributions to shareholders: | |||||||||||||||
From net investment income |
| (0.09 | ) |
| (0.04 | ) |
| — | |||||||
|
|
|
|
|
| ||||||||||
Net asset value - End of period |
| $20.67 |
| $19.06 |
| $20.82 | |||||||||
|
|
|
|
|
| ||||||||||
Net assets - End of period(000’s omitted) |
| $237,740 |
| $168,789 |
| $21 | |||||||||
|
|
|
|
|
| ||||||||||
Total return3 |
| 8.99% |
|
| (8.29% | ) |
| 7.32% |
| ||||||
Ratios (to average net assets)/Supplemental Data: | |||||||||||||||
Expenses** |
| 1.00% |
|
| 1.00% |
|
| 1.00% | 4 | ||||||
Net investment income |
| 0.48% |
|
| 0.16% |
|
| 0.14% | 4 | ||||||
Series portfolio turnover |
| 102% |
|
| 73% |
|
| 46% |
| ||||||
*Effective August 21, 2018, Class R6 shares of the Series have been redesignated as Class Z shares. |
| ||||||||||||||
| **The investment advisor did not impose all or a portion of its management and/or other fees during the period, and may have paid a portion of the Series’ expenses. If these expenses had been incurred by the Class, the expense ratio (to average net assets) would have increased by the following amounts: |
| ||||||||||||||
| 0.08% |
|
| 0.04% |
|
| 0.17% | 4 | |||||||
1Commencement of operations.
2Calculated based on average shares outstanding during the periods.
3Represents aggregate total return for the periods indicated, and assumes reinvestment of all distributions. Total return would have been lower had certain expenses not been waived or reimbursed during the periods. Periods less than one year are not annualized.
4Annualized.
The accompanying notes are an integral part of the financial statements.
17
Rainier International Discovery Series
Notes to Financial Statements
| 1. | Organization |
Rainier International Discovery Series (the “Series”) is ano-load diversified series of Manning & Napier Fund, Inc. (the “Fund”). The Fund is organized in Maryland and is registered under the Investment Company Act of 1940, as amended, as anopen-end management investment company.
The Series’ investment objective is to seek long-term capital appreciation.
The Series is authorized to issue four classes of shares (Class S, I, W and Z). Class W shares of the Series were issued on March 1, 2019. Each class is substantially the same, except that class specific distribution and shareholder servicing expenses are borne by the specific class of shares to which they relate.
The Fund’s advisor is Manning & Napier Advisors, LLC (the “Advisor”). Shares of the Series are offered to investors, clients and employees of the Advisor and its affiliates. The total authorized capital stock of the Fund consists of 15 billion shares of common stock each having a par value of $0.01. As of October 31, 2019, 10 billion shares have been designated in total among 34 series, of which 100 million have been designated as Rainier International Discovery Series Class I common stock, Rainier International Discovery Series Class S (formerly Class K) common stock, Rainier International Discovery Series Class W common stock and Rainier International Discovery Series Class Z (formerly Class R6) common stock.
| 2. | Significant Accounting Policies |
The following is a summary of significant accounting policies followed by the Series. The Series is an investment company and, accordingly, follows the investment company accounting and reporting guidance of the Financial Accounting Standards Board Accounting Standards Codification Topic 946 - Investment Companies, which is part of accounting principles generally accepted in the United States of America (“GAAP”).
Security Valuation
Portfolio securities, including domestic equities, foreign equities, warrants and options, listed on an exchange other than the NASDAQ Stock Market are valued at the latest quoted sales price of the exchange on which the security is primarily traded. Securities not traded on valuation date or securities not listed on an exchange are valued at the latest quoted bid price provided by the Fund’s pricing service. Securities listed on the NASDAQ Stock Market are valued in accordance with the NASDAQ Official Closing Price.
Short-term investments that mature in sixty days or less may be valued at amortized cost, which approximates fair value. Investments inopen-end investment companies are valued at their net asset value per share on valuation date.
Volume and level of activity in established markets for an asset or liability are evaluated to determine whether recent transactions and quoted prices are determinative of fair value. Where there have been significant decreases in volume and level of activity, further analysis and adjustment may be necessary to estimate fair value. The Series measures fair value in these instances by the use of inputs and valuation techniques which may be based upon current market prices of securities that are comparable in coupon, rating, maturity and industry and/or expectation of future cash flows. As a result of trading in relatively thin markets and/or markets that experience significant volatility, the prices used by the Series to value these securities may differ from the value that would be realized if these securities were sold, and the differences could be material.
Securities for which representative valuations or prices are not available from the Series’ pricing service may be valued at fair value as determined in good faith by the Advisor under procedures approved by and under the general supervision and responsibility of the Fund’s Board of Directors (the “Board”). Due to the inherent uncertainty of valuations of such securities, the fair value may differ significantly from the values that would have been used had a ready market for such securities existed. If trading or events occurring after the close of the principal market in which securities are traded are expected to materially affect the value of those securities, then they may be valued at their fair value, taking this trading or these events into account. In accordance with the procedures approved by the Board, the values of certain securities trading outside the U.S. were adjusted following the close of local trading using a factor from a third party vendor. The third party vendor uses statistical analyses and quantitative models, which consider among other things subsequent movement and changes in the prices of indices, securities
18
Rainier International Discovery Series
Notes to Financial Statements (continued)
| 2. | Significant Accounting Policies (continued) |
Security Valuation(continued)
and exchange rates in other markets, to determine the factors which are used to adjust local market prices. The value of securities used for net asset value calculation under these procedures may differ from published prices for the same securities. It is the Fund’s policy to classify each foreign equity security where a factor from a third party vendor is applied as a Level 2 security.
Various inputs are used in determining the value of the Series’ assets or liabilities carried at fair value. These inputs are summarized in three broad levels. Level 1 includes quoted prices in active markets for identical assets and liabilities. Level 2 includes other significant observable inputs (including quoted prices for similar securities, interest rates, prepayment speeds, credit risk, etc.). Level 3 includes significant unobservable inputs (including the Series’ own assumptions in determining the fair value of investments). A financial instrument’s level within the fair value hierarchy is based on the lowest level of any input both individually and in aggregate that is significant to the fair value measurement. The inputs or methodology used for valuing securities are not necessarily an indication of the risk associated with investing in those securities.
The following is a summary of the valuation levels used for major security types as of October 31, 2019 in valuing the Series’ assets or liabilities carried at fair value:
| DESCRIPTION | TOTAL | LEVEL 1 | LEVEL 2# | LEVEL 3 | ||||||||||||
Assets: | ||||||||||||||||
Equity securities: | ||||||||||||||||
Common stocks: | ||||||||||||||||
Communication Services | $ | 9,501,216 | $ | — | $ | 9,501,216 | $ | — | ||||||||
Consumer Discretionary | 34,972,673 | 1,388,723 | 33,583,950 | — | ||||||||||||
Consumer Staples | 33,594,696 | — | 33,594,696 | — | ||||||||||||
Financials | 54,251,814 | — | 54,251,814 | — | ||||||||||||
Health Care | 83,334,251 | — | 83,334,251 | — | ||||||||||||
Industrials | 104,079,120 | 13,476,033 | 90,603,087 | — | ||||||||||||
Information Technology | 85,939,419 | 2,769,579 | 83,169,840 | — | ||||||||||||
Materials | 5,234,913 | — | 5,234,913 | — | ||||||||||||
Real Estate | 6,112,165 | — | 6,112,165 | — | ||||||||||||
Utilities | 3,087,927 | — | 3,087,927 | — | ||||||||||||
Warrants: | ||||||||||||||||
Consumer Discretionary | 19,527 | — | 19,527 | — | ||||||||||||
Short-Term Investment | 26,168,747 | 26,168,747 | — | — | ||||||||||||
|
|
|
|
|
|
|
| |||||||||
Total assets | $ | 446,296,468 | $ | 43,803,082 | $ | 402,493,386 | $ | — | ||||||||
|
|
|
|
|
|
|
| |||||||||
#Includes certain foreign equity securities for which a factor from a third party vendor was applied to determine the securities’ fair value following the close of local trading.
There were no Level 2 securities held by the Series as of October 31, 2018. There were no Level 3 securities held by the Series as of October 31, 2018 or October 31, 2019.
Security Transactions, Investment Income and Expenses
Security transactions are accounted for on trade date. Dividend income is recorded on theex-dividend date, except that if theex-dividend date has passed, certain dividends from foreign securities are recorded as soon as the Series is informed of theex-dividend date.Non-cash dividends, if any, are recorded at the fair value of the securities received. Interest income, including amortization of premium and accretion of discounts using the effective interest method, is earned from settlement date and accrued daily.
Expenses are recorded on an accrual basis. Most expenses of the Fund can be attributed to a specific series. Expenses which cannot be directly attributed are apportioned among the series in the Fund in such a manner as deemed equitable by the Fund’s Board, taking into consideration, among other things, the nature and type of expense. Income, expenses (other than
19
Rainier International Discovery Series
Notes to Financial Statements (continued)
| 2. | Significant Accounting Policies (continued) |
Security Transactions, Investment Income and Expenses(continued)
shareholder services fees), and realized and unrealized gains and losses are prorated among the classes based on the relative net assets of each class. Class specific expenses are directly charged to that class.
The Series uses the identified cost method for determining realized gain or loss on investments for both financial statement and federal income tax reporting purposes.
Foreign Currency Translation
The books and records of the Series are maintained in U.S. dollars. Foreign currencies, investments and other assets and liabilities are translated into U.S. dollars at the current exchange rates. Purchases and sales of investment securities and income and expenses are translated on the respective dates of such transactions. The Series does not isolate realized and unrealized gains and losses attributable to changes in the exchange rates from gains and losses that arise from changes in the fair value of investments. Such fluctuations are included with net realized and unrealized gain or loss on investments. Net realized foreign currency gains and losses represent foreign currency gains and losses between trade date and settlement date on securities transactions, gains and losses on disposition of foreign currencies and the difference between the amount of income and foreign withholding taxes recorded on the books of the Series and the amounts actually received or paid.
Restricted Securities
Restricted securities are purchased in private placement transactions, are not registered under the Securities Act of 1933, as amended, and may have contractual restrictions on resale. Information regarding restricted securities is included at the end of the Investment Portfolio.
Federal Taxes
The Series’ policy is to comply with the provisions of the Internal Revenue Code applicable to regulated investment companies. The Series is not subject to federal income tax or excise tax to the extent that the Series distributes to shareholders each year its taxable income, including any net realized gains on investments, in accordance with requirements of the Internal Revenue Code. Accordingly, no provision for federal income tax or excise tax has been made in the financial statements.
Management evaluates its tax positions to determine if the tax positions taken meet the minimum recognition threshold in connection with accounting for uncertainties in income tax positions taken or expected to be taken for the purposes of measuring and recognizing tax liabilities in the financial statements. Recognition of tax benefits of an uncertain tax position is required only when the position is “more likely than not” to be sustained assuming examination by taxing authorities. At October 31, 2019, the Series has recorded no liability for net unrecognized tax benefits relating to uncertain income tax positions taken or expected to be taken in future tax returns.
The Series files income tax returns in the U.S. federal jurisdiction, various states and foreign jurisdictions, as required. No income tax returns are currently under investigation. The statute of limitations on the Series’ tax returns remains open for the two years ended March 31, 2016 and March 31, 2017, the period ended October 31, 2017 and the years ended October 31, 2018 and October 31, 2019. The Series is not aware of any tax positions for which it is reasonably possible that the total amounts of unrecognized tax benefits will significantly change in the next twelve months.
Foreign Taxes
Based on the Series’ understanding of the tax rules and rates related to income, gains and currency purchase/repatriation transactions for foreign jurisdictions in which it invests, the Series will provide for foreign taxes, and where appropriate, deferred foreign tax. The Series is subject to a tax imposed on short term capital gains on securities of issuers domiciled in India. The Series records an estimated deferred tax liability for securities that have been held for less than a year at the end of the reporting period, assuming those positions were disposed of at the end of the period. This amount is reported in Accrued foreign capital gains tax in the accompanying Statement of Assets and Liabilities. Realized losses on the sale of securities of issuers domiciled in India can be carried forward for eight years to offset potential future short term realized capital gains.
20
Rainier International Discovery Series
Notes to Financial Statements (continued)
| 2. | Significant Accounting Policies (continued) |
Distributions of Income and Gains
Distributions to shareholders of net investment income and net realized gains are made annually. An additional distribution may be necessary to avoid taxation of the Series. Distributions are recorded on theex-dividend date.
Indemnifications
The Fund’s organizational documents provide former and current directors and officers with a limited indemnification against liabilities arising in connection with the performance of their duties to the Fund. In the normal course of business, the Fund may also enter into contracts that provide general indemnifications. The Fund’s maximum exposure under these arrangements is unknown as this would be dependent on future claims that may be made against the Fund. The risk of material loss from such claims is considered remote.
Other
The preparation of financial statements in conformity with GAAP requires management to make estimates and assumptions that affect the reported amounts of assets and liabilities and the disclosure of contingent assets and liabilities at the date of the financial statements and the reported amounts of income and expenses during the reporting period. Actual results could differ from those estimates.
| 3. | Transactions with Affiliates and Other Agreements |
The Fund has an Investment Advisory Agreement (the “Agreement”) with the Advisor, for which the Series pays a fee, computed daily and payable monthly, at an annual rate of 0.90% of the Series’ average daily net assets. The investmentsub-advisor of the Series is Rainier Investment Management, LLC (“Rainier” or the“Sub-Advisor”). The Advisor pays theSub-Advisor out of the fee received from the Series at an annual rate of 0.70% of the Series’ average daily net assets.
Under the Agreement, personnel of the Advisor provide the Series with advice and assistance in the choice of investments and the execution of securities transactions, and otherwise maintain the Series’ organization. The Advisor also provides the Fund with necessary office space and fund administration and support services. The salaries of all officers of the Fund (except a percentage of the Fund’s Chief Compliance Officer’s salary, which is paid by the Fund), and of all Directors who are “affiliated persons” of the Fund, or of the Advisor, and all personnel of the Fund, or of the Advisor, performing services relating to research, statistical and investment activities, are paid by the Advisor and/orSub-Advisor. Each“non-affiliated” Director receives an annual stipend, which is allocated among all the active series of the Fund. In addition, these Directors also receive a fee per Board meeting attended plus a fee for each committee meeting attended and are reimbursed for travel and otherout-of-pocket expenses incurred by them in connection with attending such meetings. The Fund also has an Audit Committee Chair, Governance & Nominating Committee Chair and Lead Independent Director who each receive an additional annual stipend for these roles.
The Fund may enter into agreements with financial intermediaries pursuant to which the Fund may pay financial intermediaries fornon-distribution relatedsub-transfer agency, administrative,sub-accounting, and other shareholder services in an amount not to exceed 0.15% of the average daily net assets of the Class S shares and Class I shares. Payments made pursuant to such agreements are generally based on the current assets and/or number of accounts of the Series attributable to the financial intermediary. Any payments made pursuant to such agreements may be in addition to, rather than in lieu of, any Distribution and Shareholder Services Fee payable under the Rule12b-1 plan of the Fund.
Effective March 1, 2019, the Advisor has contractually agreed to waive the management fee for the Class W shares. In addition, pursuant to a separate expense limitation agreement, the Advisor has contractually agreed to limit its fees and reimburse expenses to the extent necessary so that the total direct annual fund operating expenses, exclusive of distribution and service(12b-1) fees and waived Class W management fees (collectively, “excluded expenses”), to 1.15% of the average daily net assets of the Class I and Class S shares, 1.00% of the average daily net assets of the Class Z shares, and 0.10% of the average daily net assets of the Class W shares. These contractual waivers are expected to continue indefinitely, and may not be amended or terminated by the Advisor without the approval of the Series’ Board of Directors. The Advisor may receive from a Class the difference between the Class’s total direct annual fund operating expenses, not including excluded expenses, and the
21
Rainier International Discovery Series
Notes to Financial Statements (continued)
| 3. | Transactions with Affiliates and Other Agreements (continued) |
Class’s contractual expense limit to recoup all or a portion of its prior fee waivers (other than Class W management fee waivers) or expense reimbursements made during the rolling three-year period preceding the recoupment if at any point the total direct annual fund operating expenses, not including excluded expenses, are below the contractual expense limit (a) at the time of the fee waiver and/or expense reimbursement and (b) at the time of the recoupment.
Pursuant to these agreements, the Advisor waived $87,149 in management fees for Class W shares for the year ended October 31, 2019. In addition, pursuant to the separate expense limitation agreement, the Advisor waived or reimbursed expenses of $36,573, $44,220, $9,606 and $163,793 for Class S, Class I, Class W, and Class Z shares, respectively, for the year ended October 31, 2019. These amounts are included as a reduction of expenses on the Statement of Operations. At October 31, 2019, the Advisor is eligible to recoup $224,640. For the year ended October 31, 2019, the Advisor did not recoup any expenses that have been previously waived or reimbursed.
Manning & Napier Investor Services, Inc., a registered broker-dealer affiliate of the Advisor, acts as distributor for the Fund’s shares. The Series compensates the distributor for distributing and servicing the Series’ Class S shares pursuant to a distribution plan adopted under Rule12b-1 of the 1940 Act, regardless of expenses actually incurred. Under the agreement, the Series pays distribution and service fees to the distributor at an annual rate of 0.25% of average daily net assets attributable to Class S shares. There are no distribution and service fees on the Class I, Class W or Class Z shares. The fees are accrued daily and paid monthly.
Pursuant to a master services agreement dated March 1, 2017, the Fund pays the Advisor an annual fee related to fund accounting and administration of 0.0085% on the first $25 billion of average daily net assets (excluding Target Series and Income Series); 0.0075% on the next $15 billion of average daily net assets (excluding Target Series and Income Series); and 0.0065% of average daily net assets in excess of $40 billion (excluding Target Series and Income Series); plus a base fee of $30,400 per series. Additionally, certain transaction andout-of-pocket expenses, including charges for reporting relating to the Fund’s compliance program, are charged. The Advisor has agreements with BNY Mellon Investment Servicing (U.S.) Inc. (“BNY”) under which BNY serves assub-accountant services agent.
| 4. | Purchases and Sales of Securities |
For the year ended October 31, 2019, purchases and sales of securities, other than U.S. Government securities and short-term securities, were $440,492,191 and $536,710,993, respectively. There were no purchases or sales of U.S. Government securities.
| 5. | Capital Stock Transactions |
Transactions in shares of Class S, Class I, Class W, and Class Z shares of Rainier International Discovery Series were:
CLASS S (FORMERLY CLASS K) | FOR THE YEAR ENDED 10/31/19 | FOR THE YEAR ENDED 10/31/18 | ||||||||||||||
| SHARES | AMOUNT | SHARES | AMOUNT | |||||||||||||
Sold | 1,280,251 | $ | 23,704,928 | 6,476,157 | $ | 141,061,584 | ||||||||||
Reinvested | 12,524 | 221,424 | — | — | ||||||||||||
Repurchased | (9,618,012 | ) | (181,537,350 | ) | (2,062,177 | ) | (44,460,158 | ) | ||||||||
|
|
|
|
|
|
|
| |||||||||
Total | (8,325,237 | ) | $ | (157,610,998 | ) | 4,413,980 | $ | 96,601,426 | ||||||||
|
|
|
|
|
|
|
| |||||||||
22
Rainier International Discovery Series
Notes to Financial Statements (continued)
| 5. | Capital Stock Transactions (continued) |
| CLASS I | FOR THE YEAR ENDED 10/31/19 | FOR THE YEAR ENDED 10/31/18 | ||||||||||||||
| SHARES | AMOUNT | SHARES | AMOUNT | |||||||||||||
Sold | 4,155,465 | $ | 79,344,260 | 9,319,947 | $ | 206,173,813 | ||||||||||
Reinvested | 27,468 | 490,020 | 6,335 | 132,393 | ||||||||||||
Repurchased | (5,197,891 | ) | (100,580,593 | ) | (9,975,641 | ) | (218,818,955 | ) | ||||||||
|
|
|
|
|
|
|
| |||||||||
Total | (1,014,958 | ) | $ | (20,746,313 | ) | (649,359 | ) | $ | (12,512,749 | ) | ||||||
|
|
|
|
|
|
|
| |||||||||
| CLASS W | FOR THE PERIOD 3/01/19 (COMMENCEMENT OF OPERATIONS) TO 10/31/19 | |||||||||||||||
| SHARES | AMOUNT | |||||||||||||||
Sold | 906,002 | $ | 17,700,743 | |||||||||||||
Reinvested | — | — | ||||||||||||||
Repurchased | (27,117 | ) | (549,662 | ) | ||||||||||||
|
|
|
| |||||||||||||
Total | 878,885 | $ | 17,151,081 | |||||||||||||
|
|
|
| |||||||||||||
| CLASS Z | FOR THE YEAR ENDED 10/31/19 | FOR THE YEAR ENDED 10/31/18 | ||||||||||||||
| SHARES | AMOUNT | SHARES | AMOUNT | |||||||||||||
Sold | 4,980,668 | $ | 96,859,767 | 8,982,690 | $ | 197,271,626 | ||||||||||
Reinvested | 11,075 | 197,579 | 2 | 39 | ||||||||||||
Repurchased | (2,343,507 | ) | (45,164,037 | ) | (130,380 | ) | (2,649,172 | ) | ||||||||
|
|
|
|
|
|
|
| |||||||||
Total | 2,648,236 | $ | 51,893,309 | 8,852,312 | $ | 194,622,493 | ||||||||||
|
|
|
| �� |
|
|
|
| ||||||||
At October 31, 2019, one shareholder account owned 20.0% of the Series. In addition, the Advisor and its affiliates owned less than 0.1% of the Series. Investment activities of these shareholders may have a material effect on the Series.
| 6. | Line of Credit |
The Fund has entered into a364-day, $25 million credit agreement (the “line of credit”) with Bank of New York Mellon. Each series of the Fund may borrow under the line of credit for temporary or emergency purposes, including funding shareholder redemptions and other short-term liquidity purposes. The Fund pays an annual fee on the unused commitment amount, payable quarterly, and is allocated among all the series of the Fund and included in miscellaneous expenses in the Statement of Operations for each series. The line of credit expires in August 2020 unless extended or renewed. During the year ended October 31, 2019, the Series did not borrow under the line of credit.
| 7. | Financial Instruments |
The Series may trade in instruments including futures contracts and other derivatives in the normal course of investing activities to assist in managing exposure to various market risks. The Series may be subject to various elements of risk, which may involve, to a varying degree, elements of risk in excess of the amounts recognized for financial statement purposes. These risks include: the risk that changes in the value of a derivative may not correlate perfectly with the underlying asset, rate or index; counterparty credit risk related to over the counter derivative counterparties’ failure to perform under contract terms; liquidity risk related to the lack of a liquid market for these contracts allowing the fund to close out its position(s); and documentation risk relating to disagreement over contract terms. No such investments were held by the Series as of October 31, 2019.
23
Rainier International Discovery Series
Notes to Financial Statements (continued)
| 8. | Foreign Securities |
Investing in securities of foreign companies and foreign governments involves special risks and considerations not typically associated with investing in securities of domestic companies and the U.S. Government. These risks include revaluation of currencies and future adverse political and economic developments. Moreover, securities of foreign companies and foreign governments and their markets may be less liquid and their prices more volatile than those of comparable domestic companies and the U.S. Government.
| 9. | Federal Income Tax Information |
The amount and characterization of certain income and capital gains to be distributed are determined in accordance with federal income tax regulations, which may differ from GAAP. These differences are primarily due to differing book and tax treatments in the timing and/or treatment of the recognition of net investment income or gains and losses, including foreign currency gains and losses, wash sales and foreign taxes. The Series may periodically make reclassifications among its capital accounts to reflect income and gains available for distribution (or available capital loss carryovers) under income tax regulations without impacting the Series’ net asset value. Any such reclassifications are not reflected in the financial highlights.
The tax character of distributions paid were as follows:
| FOR THE YEAR | FOR THE YEAR | |||||
| ENDED 10/31/19 | ENDED 10/31/18 | |||||
Ordinary income | $1,565,216 | $268,404 |
At October 31, 2019, the tax basis of components of distributable earnings and the net unrealized appreciation based on the identified cost of investments for federal income tax purposes were as follows:
Cost for federal income tax purposes | $ | 374,950,214 | ||||
Unrealized appreciation | 86,878,490 | |||||
Unrealized depreciation | (15,532,236 | ) | ||||
|
| |||||
Net unrealized appreciation | $ | 71,346,254 | ||||
|
| |||||
Undistributed ordinary income | $ | 1,544,196 | ||||
Capital loss carryforward | $ | (33,708,740 | ) | |||
At October 31, 2019, the Series had net short-term capital loss carryforwards of $33,708,740, which may be carried forward indefinitely.
24
Rainier International Discovery Series
Report of Independent Registered Public Accounting Firm
To the Board of Directors of Manning & Napier Fund, Inc. and Shareholders of Rainier International Discovery Series
Opinion on the Financial Statements
We have audited the accompanying statement of assets and liabilities, including the investment portfolio, of Rainier International Discovery Series (one of the series constituting Manning & Napier Fund, Inc., referred to hereafter as the “Fund”) as of October 31, 2019, the related statement of operations for the year ended October 31, 2019, the statement of changes in net assets for each of the two years in the period ended October 31, 2019, including the related notes, and the financial highlights for each of the periods presented ended on or after October 31, 2017 (collectively referred to as the “financial statements”). In our opinion, the financial statements present fairly, in all material respects, the financial position of the Fund as of October 31, 2019, the results of its operations for the year then ended, the changes in its net assets for each of the two years in the period ended October 31, 2019 and the financial highlights for each of the periods presented ended on or after October 31, 2017 in conformity with accounting principles generally accepted in the United States of America.
The financial statements as of and for the period ended March 31, 2017 and financial highlights for each of the periods ended on or prior to March 31, 2017 (not presented herein, other than the financial highlights) were audited by other auditors whose report dated May 22, 2017 expressed an unqualified opinion on those financial statements and financial highlights.
Basis for Opinion
These financial statements are the responsibility of the Fund’s management. Our responsibility is to express an opinion on the Fund’s financial statements based on our audits. We are a public accounting firm registered with the Public Company Accounting Oversight Board (United States) (“PCAOB”) and are required to be independent with respect to the Fund in accordance with the U.S. federal securities laws and the applicable rules and regulations of the Securities and Exchange Commission and the PCAOB.
We conducted our audits of these financial statements in accordance with the standards of the PCAOB. Those standards require that we plan and perform the audit to obtain reasonable assurance about whether the financial statements are free of material misstatement, whether due to error or fraud.
Our audits included performing procedures to assess the risks of material misstatement of the financial statements, whether due to error or fraud, and performing procedures that respond to those risks. Such procedures included examining, on a test basis, evidence regarding the amounts and disclosures in the financial statements. Our audits also included evaluating the accounting principles used and significant estimates made by management, as well as evaluating the overall presentation of the financial statements. Our procedures included confirmation of securities owned as of October 31, 2019 by correspondence with the custodian and brokers; when replies were not received from brokers, we performed other auditing procedures. We believe that our audits provide a reasonable basis for our opinion.
New York, New York
December 16, 2019
We have served as the auditor of one or more investment companies in Manning & Napier Mutual Funds since 1992.
25
Rainier International Discovery Series
Supplemental Tax Information
(unaudited)
All reportings are based on financial information available as of the date of this annual report and, accordingly are subject to change.
For federal income tax purposes, the Series reports for the current fiscal year $1,565,216 or, if different, the maximum amount allowable under the tax law as qualified dividend income.
The Series has elected to pass through to its shareholders the foreign taxes paid for the year ended October 31, 2019. The Series paid foreign taxes of $723,590.
26
Rainier International Discovery Series
Directors’ and Officers’ Information
(unaudited)
The Statement of Additional Information provides additional information about the Fund’s directors and officers and can be obtained without charge by calling1-800-466-3863, at www.manning-napier.com, or on the EDGAR Database on the SEC Internet web site (http://www.sec.gov). The following chart shows certain information about the Fund’s directors and officers, including their principal occupations during the last five years. Unless specific dates are provided, the individuals have held the listed positions for longer than five years.
| Interested Director and Officer | ||
| Name: | Paul Battaglia* | |
| Address: | 290 Woodcliff Drive | |
| Fairport, NY 14450 | ||
| Age: | 41 | |
| Current Position(s) Held with Fund: | Principal Executive Officer, President, Chairman & Director | |
| Term of Office & Length of Time Served: | Indefinite – Chairman and Director since November 20181 | |
| Principal Occupation(s) During Past 5 Years: | Chief Financial Officer (2018 – Present); Vice President of Finance (2016 – 2018); Director of Finance (2011 – 2016); Financial Analyst/Internal Auditor (2004-2006) – Manning & Napier Advisors, LLC and affiliates Holds one or more of the following titles for various affiliates: Chief Financial Officer | |
| Number of Portfolios Overseen within Fund Complex: | 32 | |
Other Directorships Held Outside Fund Complex During Past 5 Years: | N/A | |
| Independent Directors | ||
| Name: | Stephen B. Ashley | |
| Address: | 290 Woodcliff Drive | |
| Fairport, NY 14450 | ||
| Age: | 79 | |
| Current Position(s) Held with Fund: | Director, Audit Committee Member, Governance & Nominating Committee | |
| Member | ||
| Term of Office & Length of Time Served: | Indefinite – Since 1996 | |
| Principal Occupation(s) During Past 5 Years: | Chairman, Director & Chief Executive Officer (1997 to present) - The Ashley Group (property management and investment). Director (1995-2008) and Chairman(non-executive) (2004-2008) - Fannie Mae (mortgage) | |
| Number of Portfolios Overseen within Fund Complex: | 32 | |
| Other Directorships Held Outside Fund Complex During Past 5 Years: | Fannie Mae (1995-2008) The Ashley Group (1995-2008) | |
| Genesee Corporation (1987-2007) | ||
| Name: | Paul A. Brooke | |
| Address: | 290 Woodcliff Drive | |
| Fairport, NY 14450 | ||
| Age: | 73 | |
| Current Position(s) Held with Fund: | Lead Independent Director, Audit Committee Member, Governance & Nominating Committee Chairman | |
| Term of Office & Length of Time Served: | Indefinite – Director, Audit Committee Member, Governance & Nominating Committee Member since 2007; Governance & Nominating Committee Chairman since 2016; Lead Independent Director since 2017 | |
| Principal Occupation(s) During Past 5 Years: | Chairman & CEO (2005-2009) - Ithaka Acquisition Corporation (investments); Chairman (2007-2009) - Alsius Corporation (investments); Managing Member (1991-present) - PMSV Holdings LLC (investments); Managing Member (2010-2016) - Venbio (investments). | |
| Number of Portfolios Overseen within Fund Complex: | 32 | |
| Other Directorships Held Outside Fund Complex During Past 5 Years: | Incyte Corp. (biotech)(2000-present); ViroPharma, Inc. (speciality pharmaceuticals)(2000-2014); HLTH (WebMD)(information)(2000-2010); Cheyne Capital International (investment)(2000-2017); GMP Companies (investment)(2000-2011); Cytos Biotechnology Ltd (biotechnology)(2012-2014); Cerus (biomedical)(2016-present); PureEarth(non-profit)(2012-present); Caelum BioSciences (biomedical)(2018-present) | |
27
Rainier International Discovery Series
Directors’ and Officers’ Information
(unaudited)
Independent Directors (continued)
| Name: | Peter L. Faber | |
| Address: | 290 Woodcliff Drive | |
| Fairport, NY 14450 | ||
| Age: | 81 | |
| Current Position(s) Held with Fund: | Director, Governance & Nominating Committee Member | |
| Term of Office & Length of Time Served: | Indefinite – Since 1987 | |
| Principal Occupation(s) During Past 5 Years: | Senior Counsel (2006-2012), Partner (1995-2006 & 2013-present) - McDermott, Will & Emery LLP (law firm) | |
| Number of Portfolios Overseen within Fund Complex: | 32 | |
| Other Directorships Held Outside Fund Complex During Past 5 Years: | Boston Early Music Festival(non-profit)(2007-present); Amherst Early Music, Inc.(non-profit)(2009-present); Gotham Early Music Scene, Inc.(non-profit)(2009-present); Partnership for New York City, Inc.(non-profit)(1989-2010); New York Collegium(non-profit)(2004-2011); S’Cool Sounds, Inc.(non-profit)(2017-present) | |
| Name: | Harris H. Rusitzky | |
| Address: | 290 Woodcliff Drive | |
| Fairport, NY 14450 | ||
| Age: | 84 | |
| Current Position(s) Held with Fund: | Director, Audit Committee Member, Governance & Nominating Committee Member | |
| Term of Office & Length of Time Served: | Indefinite – Since 1985 | |
| Principal Occupation(s) During Past 5 Years: | President (1994- present) - The Greening Group (business consultants); Partner (2006-present) - The Restaurant Group (restaurants) | |
| Number of Portfolios Overseen within Fund Complex: | 32 | |
| Other Directorships Held Outside Fund Complex During Past 5 Years: | Rochester Institute of Technology (university)(1972-present); Culinary Institute of America(non-profit college)(1985-present); George Eastman House (museum)(1988-present); National Restaurant Association (restaurant trade organization)(1978-present) | |
| Name: | Chester N. Watson | |
| Address: | 290 Woodcliff Drive | |
| Fairport, NY 14450 | ||
| Age: | 69 | |
| Current Position(s) Held with Fund: | Director, Audit Committee Chairman, Governance & Nominating | |
| Committee Member | ||
| Term of Office & Length of Time Served: | Indefinite – Director, Audit Committee Member, Governance & Nominating Committee Member Since 2012; Audit Committee Chairman since 2013 | |
| Principal Occupation(s) During Past 5 Years: | General Auditor (2003-2011) - General Motors Company (auto manufacturer) | |
| Number of Portfolios Overseen within Fund Complex: | 32 | |
| Other Directorships Held Outside Fund Complex During Past 5 Years: | Rochester Institute of Technology (university)(2005-present); Town of Greenburgh, NY Planning Board (municipal government) (2015-2018) | |
| Officers: | ||
| Name: | Elizabeth Craig | |
| Address: | 290 Woodcliff Drive | |
| Fairport, NY 14450 | ||
| Age: | 32 | |
| Current Position(s) Held with Fund: | Corporate Secretary | |
| Term of Office1& Length of Time Served: | Since 2016 | |
| Principal Occupation(s) During Past 5 Years: | Fund Regulatory Administration Manager since 2018; Fund Administration Manager (2015-2018); Mutual Fund Compliance Specialist (2009-2015) - Manning & Napier Advisors, LLC; Assistant Corporate Secretary (2011-2016) - Manning & Napier Fund, Inc. | |
28
Rainier International Discovery Series
Directors’ and Officers’ Information
(unaudited)
Officers: (continued)
| Name: | Christine Glavin | |
| Address: | 290 Woodcliff Drive | |
| Fairport, NY 14450 | ||
| Age: | 53 | |
| Current Position(s) Held with Fund: | Principal Financial Officer, Chief Financial Officer | |
| Term of Office1& Length of Time Served: | Principal Financial Officer since 2002; Chief Financial Officer since 2001 | |
| Principal Occupation(s) During Past 5 Years: | Director of Fund Reporting since 2011; Fund Reporting Manager (1997-2011) - Manning & Napier Advisors, LLC; Assistant Treasurer since 2008 - Exeter Trust Company; Chief Financial Officer (2017-2018) - Rainier Investment Management Mutual Funds, Inc. | |
| Name: | Samantha Larew | |
| Address: | 290 Woodcliff Drive | |
| Fairport, NY 14450 | ||
| Age: | 39 | |
| Current Position(s) Held with Fund: | Chief Compliance Officer and Anti-Money Laundering Compliance Officer | |
| Term of Office1& Length of Time Served: | Chief Compliance Officer since 2019; Anti-Money Laundering Compliance Officer since 2018 | |
| Principal Occupation(s) During Past 5 Years: | Co-Director of Compliance (since 2018); Compliance Communications Supervisor (2014-2018); Compliance Supervisor (2011-2014); Broker-Dealer Compliance Analyst (2010-2014) - Manning & Napier Advisors, LLC and affiliates; Broker-Dealer Chief Compliance Officer (since 2013) – Manning & Napier Investor Services, Inc.; Compliance Analyst (2007-2009) – Wall Street Financial Group; Compliance Specialist (2003-2007) – Manning & Napier Advisors, LLC and affiliates Holds one or more of the following titles for various affiliates: Assistant Corporate Secretary, Chief Compliance Officer | |
| Name: | Scott Morabito | |
| Address: | 290 Woodcliff Drive | |
| Fairport, NY 14450 | ||
| Age: | 31 | |
| Current Position(s) Held with Fund: | Vice President | |
| Term of Office1& Length of Time Served: | Vice President since 2019; Assistant Vice President (2017-2019) | |
| Principal Occupation(s) During Past 5 Years: | Managing Director of Operations since 2019 and Director of Funds Group from 2017 - 2019; Fund Product and Strategy Manager (2014-2017); Senior Product and Strategy Analyst (2013-2014); Product and Strategy Analyst (2011-2013) - Manning & Napier Advisors, LLC; President, Director – Manning & Napier Investor Services, Inc. since 2018 | |
| Name: | Sarah Turner | |
| Address: | 290 Woodcliff Drive | |
| Fairport, NY 14450 | ||
| Age: | 37 | |
| Current Position(s) Held with Fund: | Chief Legal Officer; Assistant Corporate Secretary | |
| Term of Office1& Length of Time Served: | Since 2018 | |
| Principal Occupation(s) During Past 5 Years: | General Counsel since 2018 - Manning & Napier Advisors, LLC and affiliates; Counsel (2017-2018) – Harter Secrest and Emery LLP; Legal Counsel (2010-2017) – Manning & Napier Advisors, LLC and affiliates Holds one or more of the following titles for various affiliates: Corporate Secretary, General Counsel | |
*Interested Director, within the meaning of the 1940 Act by reason of his positions with the Fund’s Advisor, Manning & Napier Advisors, LLC, and Distributor, Manning & Napier Investor Services, Inc.
1The term of office of all officers shall be one year and until their respective successors are chosen and qualified, or his or her earlier resignation or removal as provided in the Fund’sBy-Laws.
29
Rainier International Discovery Series
Literature Requests
(unaudited)
Proxy Voting Policies and Procedures
A description of the policies and procedures that the Fund uses to determine how to vote proxies relating to portfolio securities is available, without charge, upon request:
| By phone | 1-800-466-3863 | |
| On the Securities and Exchange | ||
| Commission’s (SEC) web site | http://www.sec.gov |
Proxy Voting Record
Information regarding how the Fund voted proxies relating to portfolio securities during the most recent12-month period ended June 30th is available, without charge, upon request:
| By phone | 1-800-466-3863 | |
| On the SEC’s web site | http://www.sec.gov |
Quarterly Portfolio Holdings
The Series’ complete schedule of portfolio holdings for the 1st and 3rd quarters of each fiscal year are provided on FormN-PORT, and are available, without charge, upon request:
| By phone | 1-800-466-3863 | |
| On the SEC’s web site | http://www.sec.gov |
Prospectus and Statement of Additional Information (SAI)
For more information about any of the Manning & Napier Fund, Inc. Series, you may obtain a prospectus and SAI at www.manning-napier.com or by calling (800)466-3863. Before investing, carefully consider the objectives, risks, charges and expenses of the investment and read the prospectus carefully as it contains this and other information about the investment company.In addition, this information can be found on the SEC’s web site, http://www.sec.gov.
Additional information available at www.manning-napier.com
1. Fund Holdings -Month-End
2. Fund Holdings -Quarter-End
3. Shareholder Report - Annual
4. Shareholder Report - Semi-Annual
The Fund also offers electronic notification or“e-delivery” when certain documents are availableon-line to be downloaded or reviewed. Direct shareholders can elect to receive electronic notification when shareholder reports, prospectus updates, and/or statements are available. If you do not currently haveon-line access to your account, you can establish access by going to www.manning-napier.com, click on “Login” in the top corner of the page, and follow the prompts to self-enroll. Once enrolled, you can set your electronic notification preferences by clicking on the Account Options tab located within the green toolbar and then selectE-Delivery Option. Should you have any questions on either how to establishon-line access or how to update your account settings, please contact Investor Services at1-800-466-3863.
The Manning & Napier Fund, Inc. is managed by Manning & Napier Advisors, LLC. Manning & Napier Investor Services, Inc., an affiliate of Manning & Napier Advisors, LLC, is the distributor of the Fund shares.
MNIDS-10/19-AR
ITEM 2: CODE OF ETHICS
| (a) | The registrant has adopted a code of ethics that applies to its principal executive officer, principal financial officer and principal accounting officer. A copy of the registrant’s code of ethics is filed herewith as Exhibit 13(a)(1). |
| (b) | During the period covered by this report, no amendments were made to the provisions of the code of ethics adopted in 2 (a) above. |
| (c) | During the period covered by this report, no implicit or explicit waivers to the provisions of the code of ethics adopted in 2 (a) above were granted. |
| (d) | Not applicable to the registrant due to the response given in 2 (c) above. |
ITEM 3: AUDIT COMMITTEE FINANCIAL EXPERT
All of the members of the Audit committee have been determined by the Registrant’s Board of Directors to be Audit Committee Financial Experts as defined in this item. The current members of the Audit Committee are: Stephen B. Ashley, Paul A. Brooke, Harris H. Rusitzky, and Chester N. Watson. All Audit Committee members are independent under applicable rules. This designation will not increase the designee’s duties, obligations or liability as compared to their duties, obligations and liability as a member of the Audit Committee and of the Board.
ITEM 4: PRINCIPAL ACCOUNTANT FEES AND SERVICES
| • | Registrant may incorporate the following information by reference, if this information has been disclosed in the registrant’s definitive proxy statement or definitive information statement. The proxy statement or information statementmust be filed no later than 120 days after the end of the fiscal year covered by the Annual Report. |
Principal Accountant Fees and Services
Aggregate fees for professional services rendered for the Manning & Napier Fund, Inc.(Pro-Blend® Conservative Term Series,Pro-Blend® Moderate Term Series,Pro-Blend® Extended Term Series,Pro-Blend® Maximum Term Series, Blended Asset Conservative Series, Blended Asset Moderate Series, Blended Asset Extended Series, Blended Asset Maximum Series, Equity Series, Overseas Series, Disciplined Value Series, Rainier International Discovery Series, Target Income Series, Target 2015 Series, Target 2020 Series, Target 2025 Series, Target 2030 Series, Target 2035 Series, Target 2040 Series, Target 2045 Series, Target 2050 Series, Target 2055 Series, and Target 2060 Series collectively the “Fund”) by PricewaterhouseCoopers LLP (“PwC”) as of and for the years ended October 31, 2019 and 2018 were:
| 2019 | 2018 | |||||||
Audit Fees (a) | $ | 578,955 | $ | 553,697 | ||||
Audit Related Fees (b) | $ 0 | $ 0 | ||||||
Tax Fees (c) | $ | 309,890 | $ | 184,036 | ||||
All Other Fees (d) | $ 0 | $ 0 | ||||||
| $ | 888,845 | $ | 737,733 | |||||
| (a) | Audit Fees |
These fees relate to professional services rendered by PwC for the audit of the Fund’s annual financial statements or services normally provided by the accountant in connection with statutory and regulatory filing or engagements. These services include the audits of the financial statements of the Fund, issuance of consents, income tax provision procedures and assistance with review of documents filed with the SEC.
| (b) | Audit-Related Fees |
These fees relate to assurance and related services by PwC that are reasonably related to the performance of the audit of the Fund’s financial statements and are not reported under “Audit Fees” above.
| (c) | Tax Fees |
The fees for the year ended October 31, 2019 relate to professional services rendered by PwC for tax compliance, tax advice, tax planning and shareholder reporting. The fees for the year ended October 31, 2018 relate to professional services rendered by PwC for tax compliance, tax advice and tax planning. The tax services provided by PwC related to the review of the Fund’s federal and state income tax returns, excise tax calculations and returns, a review of the Fund’s calculations of capital gain and income distributions, and additional tax research for compliance purposes.
| (d) | All Other Fees |
These fees relate to products and services provided by PwC other than those reported above under “Audit Fees,” “Audit-Related Fees,” and “Tax Fees” above.
There were no amounts that were approved by the Audit Committee pursuant to the de minimus exception (Rule2-01(c)(7) of RegulationS-X) for the fiscal years ended October 31, 2019 and 2018.
Non-Audit Services to the Fund’s Service Affiliates that werePre-Approved by the Fund’s Audit Committee
The Fund’s Audit Committee is required topre-approvenon-audit services which meet both the following criteria:
| i) | Directly relate to the Fund’s operations and financial reporting; and |
| ii) | Rendered by PwC to the Fund’s advisor, Manning & Napier Advisors, LLC, and entities in a control relationship with the advisor (“service affiliate”) that provide ongoing services to the Fund. For purposes of disclosure, Manning & Napier Investor Services, Inc. is considered to be a service affiliate. |
| 2019 | 2018 | |||||||
Audit Related Fees | $0 | $91,300 | ||||||
Tax Fees | $0 | $ 0 | ||||||
| $ | 0 | $ | 91,300 | |||||
There were no Audit Related fees for the year ended October 31, 2019. The Audit related fees for the year ended October 31, 2018 were for work related to a fund merger, prospectus updates related to various fund changes, work related to the liquidating trusts for closed funds, a license for proprietary authoritative financial reporting and assurance literature library software.
There were no amounts that were approved by the Audit Committee pursuant to the de minimus exception (Rule2-01(c)(7) of RegulationS-X) for the fiscal years ended October 31, 2019 and 2018.
Aggregate Fees
Aggregate fees billed to the Fund fornon-audit services for 2019 and 2018 were $888,845 and $737,733, respectively. Aggregate fees billed to the Fund’s advisor and service affiliates fornon-audit services were $0 and $91,300, respectively. These amounts include fees fornon-audit services required to bepre-approved and fees fornon-audit services that did not requirepre-approval since they did not relate to the Fund’s operations and financial reporting.
The Fund’s Audit Committee has considered whether the provisions fornon-audit services to the Fund’s advisor and service affiliates, which did not requirepre-approval, are compatible with maintaining PwC’s independence.
ITEM 5: AUDIT COMMITTEE OF LISTED REGISTRANTS
Not applicable.
ITEM 6: INVESTMENTS
| (a) | See Investment Portfolios under Item 1 on this FormN-CSR. |
| (b) | Not applicable. |
| ITEM 7: | DISCLOSURE OF PROXY VOTING POLICIES AND PROCEDURES FOR CLOSED- END MANAGEMENT INVESTMENT COMPANIES |
Not applicable.
| ITEM 8: | PORTFOLIO MANAGERS OFCLOSED-END MANAGEMENT INVESTMENT COMPANIES |
Not applicable.
| ITEM 9: | PURCHASES OF EQUITY SECURITIES BYCLOSED-END MANAGEMENT INVESTMENT COMPANY AND AFFILIATED PURCHASERS |
Not applicable.
| ITEM 10: | SUBMISSION OF MATTERS TO A VOTE OF SECURITY HOLDERS |
There have been no material changes to the procedure by which shareholders may recommend nominees to the registrant’s board of directors.
| ITEM 11: | CONTROLS AND PROCEDURES |
(a) Based on their evaluation of the Funds’ disclosure controls and procedures, as of a date within 90 days of the filing date, the Funds’ Principal Executive Officer and Principal Financial Officer have concluded that the Funds’ disclosure controls and procedures are: (i) reasonably designed to ensure that information required to be disclosed in this report is appropriately communicated to the Funds’ officers to allow timely decisions regarding disclosures required in this report; (ii) reasonably designed to ensure that information required to be disclosed in this report is recorded, processed, summarized and reported in a timely manner; and (iii) are effective in achieving the goals described in (i) and (ii) above.
(b) During the period covered by this report, there have been no changes in the Funds’ internal control over financial reporting that the above officers believe to have materially affected, or to be reasonably likely to materially affect, the Funds’ internal control over financial reporting.
| ITEM 12: | DISCLOSURE OF SECURITIES LENDING ACTIVITIES FORCLOSED-END MANAGEMENT INVESTMENT COMPANIES. |
Not applicable.
| ITEM 13: | EXHIBITS |
| (a)(1) | Code of ethics that is subject to the disclosure of Item 2 above. |
| (a)(2) | Separate certifications for the Registrant’s principal executive officer and principal financial officer, as required by Section 302 of the Sarbanes-Oxley Act of 2002 and Rule30a-2(a) under the Investment Company Act of 1940, are attached asEX-99.CERT. |
| (a)(3) | Not applicable. |
| (a)(4) | Not applicable. |
| (b) | A certification of the Registrant’s principal executive officer and principal financial officer, as required by 18 U.S.C Section 1350, as adopted pursuant to Section 906 of the Sarbanes-Oxley Act of 2002, and Rule30a-2(b) under the Investment Company Act of 1940, is attached as EX-99.906CERT. The certification furnished pursuant to this paragraph is not deemed to be “filed” for purposes of Section 18 of the Securities Exchange Act of 1934, or otherwise subject to the liability of that section. Such certification is not deemed to be incorporated by reference into any filing under the Securities Act of 1933 or the Securities Exchange Act of 1934, except to the extent that the Registrant specifically incorporates them by reference. |
SIGNATURES
Pursuant to the requirements of the Securities Exchange Act of 1934 and the Investment Company Act of 1940, the registrant has duly caused this report to be signed on its behalf by the undersigned, thereunto duly authorized.
Manning & Napier Fund, Inc.
| /s/ Paul J. Battaglia | ||
| Paul J. Battaglia | ||
| President & Principal Executive Officer of Manning & Napier Fund, Inc. | ||
| Date: 12/20/2019 | ||
Pursuant to the requirements of the Securities Exchange Act of 1934 and the Investment Company Act of 1940, this report has been signed below by the following persons on behalf of the registrant and in the capacities and on the dates indicated.
| /s/ Paul J. Battaglia | ||
| Paul J. Battaglia | ||
| President & Principal Executive Officer of Manning & Napier Fund, Inc. | ||
| Date: 12/20/2019 | ||
| /s/ Christine Glavin | ||
| Christine Glavin | ||
| Chief Financial Officer & Principal Financial Officer of Manning & Napier Fund, Inc. | ||
| Date: 12/20/2019 | ||