UNITED STATES
SECURITIES AND EXCHANGE COMMISSION
Washington, D.C. 20549
FORMN-CSR
CERTIFIED SHAREHOLDER REPORT OF REGISTERED MANAGEMENT INVESTMENT
COMPANIES
Investment Company Act filenumber 811-04087
- - - - - - - - - - - - - - - - - - - - - - - - - - - - - - - -
Manning & Napier Fund, Inc.
- - - - - - - - - - - - - - - - - - - - - - - - - - - - - - - - - - - - - - - - - - - - - - - - - -
(Exact name of registrant as specified in charter)
290 Woodcliff Drive, Fairport, NY 14450
- - - - - - - - - - - - - - - - - - - - - - - - - - - - - - - - - - - - - - - - - - - - - - - - - -
(Address of principal executive offices)(Zip Code)
Paul J. Battaglia, 290 Woodcliff Drive, Fairport, NY 14450
- - - - - - - - - - - - - - - - - - - - - - - - - - - - - - - - - - - - - - - - - - - - - - - - - -
(Name and address of agent for service)
Registrant’s telephone number, including area code:585-325-6880
- - - - - - - - - - - - - - - - - - - - - -
Date of fiscal year end: December 31
- - - - - - - - - - - - - - - - - - - - - - - - - - - - - - - - - - - -
Date of reporting period: January 1, 2019 through December 31, 2019
FormN-CSR is to be used by management investment companies to file reports with the Commission not later than 10 days after the transmission to stockholders of any report that is required to be transmitted to stockholders underRule 30e-1 under the Investment Company Act of 1940 (17 CFR270.30e-1). The Commission may use the information provided on FormN-CSR in its regulatory, disclosure review, inspection, and policymaking roles.
A registrant is required to disclose the information specified by FormN-CSR, and the Commission will make this information public. A registrant is not required to respond to the collection of information contained in FormN-CSR unless the Form displays a currently valid Office of Management and Budget (“OMB”) control number. Please direct comments concerning the accuracy of the information collection burden estimate and any suggestions for reducing the burden to Secretary, Securities and Exchange Commission, 450 Fifth Street, NW, Washington, DC 20549-0609. The OMB has reviewed this collection of information under the clearance requirements of 44 U.S.C. § 3507.
ITEM 1: REPORTS TO STOCKHOLDERS

Manning & Napier Fund, Inc.
Real Estate Series
Beginning on February 25, 2021, as permitted by Securities and Exchange Commission regulations, paper copies of the Series’ annual and semi-annual shareholder reports will no longer be sent by mail, unless you specifically request paper copies of the reports from the Fund or from your financial intermediary, such as a broker-dealer or bank. Instead, the reports will be made available on a website, and you will be notified by mail each time a report is posted and provided with a website link to access the report.
If you already elected to receive shareholder reports electronically, you will not be affected by this change and you need not take any action. You may elect to receive shareholder reports and other communications from the Fund electronically by contacting your financial intermediary or, if you are a direct investor, by visiting www.manning-napier.com or calling1-800-466-3863.
You may elect to receive all future annual and semi-annual reports in paper free of charge. If you invest through a financial intermediary, you can contact your financial intermediary to request that you continue to receive paper copies of your shareholder reports. If you invest directly with the Fund, you can inform the Fund that you wish to continue receiving paper copies of your shareholder reports by visiting www.manning-napier.com or calling1-800-466-3863. Your election to receive reports in paper will apply to all funds held with your financial intermediary if you invest through a financial intermediary or all series of the Fund if you invest directly with the Fund. |
 | Independent Perspective | Real-World Solutions |
A Note from Our CEO
Dear Shareholder,
The investing world is constantly changing, yet investors’ needs and objectives remain substantially the same.
Whether you are an individual saver looking to ensure security in retirement, or an institutional investor with a fiduciary obligation to others, at the end of the day you look for a trusted partner to help you build, grow, and preserve wealth.
In order to do so successfully we recognize that, in the short-term, the world’s capital markets can be capricious and hard to predict.
Bubbles form, rise, and then pop. The hot stocks of today often become passing fads of tomorrow. Investor sentiment can swing wildly, whipsawing between exuberance one day and despondence the next.
As successful long-term investors, we are defined both by what we do as well as what we don’t do.
We don’t attempt to perfectly time every recession. We don’t jump on the latest trend. We don’t worry about capturing every market peak all across the globe.
On the other hand, we do maintain the rigorous disciplines we have developed over close to half a century. We are highly attentive to managing risk and protecting investors in down markets while participating fully in the opportunities our Research uncovers.
Our focus is on you, the shareholder, and helping you achieve your goals.
In the face of an uncertain world, we believe our investment philosophies, processes, and experience have stood the test of time and will do so in the future.
We appreciate your continued confidence in our approach.
 |
Sincerely,
Marc Mayer
Chief Executive Officer |

Corporate Headquarters | 290 Woodcliff Drive | Fairport, NY 14450 | (585)325-6880 phone | (800)551-0224 toll free | www.manning-napier.com
1
Real Estate Series
Fund Commentary
(unaudited)
Investment Objective
To provide high current income and long-term capital appreciation by investing principally in companies in the real estate industry. Under normal circumstances, at least 80% of the Series’ assets will be invested in securities of companies that are principally engaged in the US real estate industry.
Performance Commentary
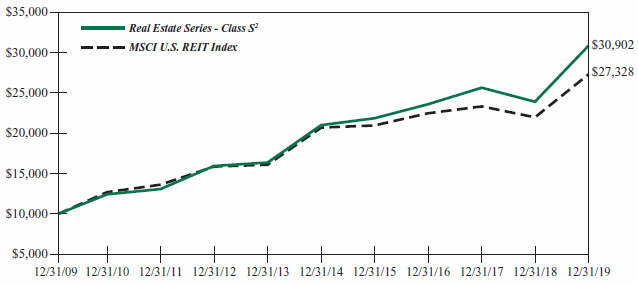
Real estate markets experienced significant gains during 2019 as the Series’ primary benchmark (MSCI US REIT index) returned 24.3%. Despite the strong absolute returns, the real estate market lagged behind the broad U.S. equity market.
Within the real estate market, performance varied widely bysub-industry during the period. For instance, Mall REITs returned negative 11.0%, while Data Storage, Industrial, Single-Family Housing, and Manufactured Housing all returned greater than positive 40% for the year.
The Real Estate Series provided strong absolute returns of over 29% for the year, outperforming the benchmark by greater than 4%. In aggregate, industry allocation and selection-related decisions aided relative returns. More specifically, the largest contributors to relative performance during the year were an overweight allocation to Data Storage REITs and Single-Family Housing REITs, an underweight allocation to Mall REITs, and stock selection within Data Center REITs, Healthcare REITs, and the Hospitalitysub-industry. Azero-weight allocation to Gaming REITs was a detractor during the year, as that segment of the market performed well. Throughout the year, the portfolio’s positions in Data Storage and Single-Family Housing REITs increased, while exposures to Mall REITs & Shopping Center REIT’s were decreased.
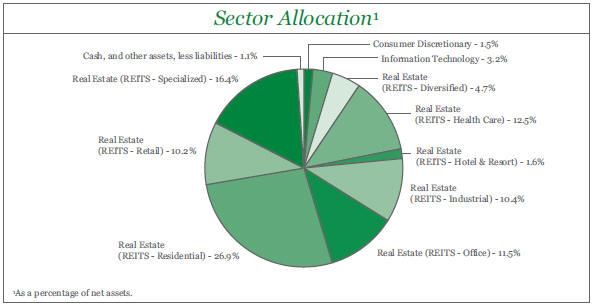
The portfolio currently favors Residential REITs including apartments, single-family housing, and manufactured housing REITs, as we expect the underbuilding of new houses relative to long-term household formation to result in excess demand and support pricing of residential rentals. The portfolio also has an overweight allocation to Data Storage REITs, which continue to be key beneficiaries of the secular shift of data moving to the cloud. Within traditional office REITs, we generally continue to prefer Sun Belt markets over coastal metropolitan markets due to the combination of strong job growth and manageable supply. We have become more negative on the New York and Washington DC office markets which have both seen new supply coming on at the same time as job growth has decelerated. The portfolio maintains an underweight allocation to Retail REITs, with exposure limited to highest-qualityA-Class malls. Online shopping and continued retailer bankruptcies are pressuring occupancy rates at malls and shopping centers. Within the Healthcare sector, we primarily favor companies with exposure to medical office buildings given their typically sticky tenants and high rent coverage.
Performance data quoted represents past performance and does not guarantee future results. The investment return and principal value of an investment will fluctuate, so that an investor’s shares, when redeemed, may be worth more or less than their original cost. Current performance may be higher or lower than that quoted; investors can obtain the most recentmonth-end performance at www.manning-napier.com or by calling (800)466-3863.
Additional information and associated disclosures can be found on the Performance Update page of this report.
All investments involve risks, including potential loss of principal. Funds whose investments are concentrated in a specific industry or sector may be subject to a higher degree of market risk than funds whose investments are diversified among a variety of sectors. The Real Estate Series is subject to risks associated with the direct ownership of real estate, including the potential for falling real estate prices and the possibility of being highly leveraged; an investment in the Series will be closely aligned with the performance of the real estate markets. Additionally, like all derivatives, investments in options can be highly volatile and involve risks in addition to the risks of the underlying instrument on which the derivative is based, such as counterparty, correlation and liquidity risk.
2
Real Estate Series
Performance Update as of December 31, 2019
(unaudited)
AVERAGE ANNUAL TOTAL RETURNS AS OF
| ||||||
ONE YEAR1
| FIVE YEAR
| TEN YEAR
| ||||
Real Estate Series - Class S2 | 29.14% | 8.02% | 11.94% | |||
Real Estate Series - Class I2,3 | 29.31% | 8.27% | 12.14% | |||
Real Estate Series - Class W2,4 | 30.15% | 8.19% | 12.03% | |||
Real Estate Series - Class Z2,4 | 29.64% | 8.10% | 11.99% | |||
MSCI U.S. Real Estate Investment Trust (REIT) Index5 | 24.33% | 5.68% | 10.58% | |||
The following graph compares the value of a $10,000 investment in the Real Estate Series - Class S for the ten years ended December 31, 2019 to the MSCI U.S. REIT Index.
1The returns shown are based on net asset values calculated for shareholder transactions and may differ from the returns shown in the financial highlights, which reflect adjustments made to the net asset values in accordance with accounting principles generally accepted in the United States of America.
2The Series’ performance does not reflect the deduction of taxes that a shareholder would pay on fund distributions or the redemption of shares. The Series’ performance is historical and may not be indicative of future results. The performance returns shown are inclusive of the net expense ratio of the Series. For the year ended December 31, 2019, this net expense ratio was 1.11% for Class S, 0.84% for Class I, 0.10% for Class W and 0.70% for Class Z. The gross expense ratio, which does not account for any voluntary or contractual waivers currently in effect, was 1.11% for Class S, 0.84% for Class I, 0.72% for Class W and 0.72% for Class Z for the year ended December 31, 2019.
3For periods through August 1, 2012 (the inception date of the Class I shares), performance for Class I shares is based on the historical performance of the Class S shares. Because the Class I shares invest in the same portfolio of securities as Class S, performance will only be different to the extent that the Class S shares have a higher expense ratio.
4For periods through March 1, 2019 (the inception date of the Class W and Class Z shares), performance for the Class W and Class Z shares is based on the historical performance of the Class S shares. Because the Class W and Class Z shares invest in the same portfolio of securities as the Class S shares, performance will be different only to the extent that the Class S shares have a higher expense ratio.
5The MSCI U.S. Real Estate Investment Trust (REIT) Index is a free float-adjusted market capitalization index that is comprised of equity REITs as classified as Equity REITs Industry under the GICS® Real Estate sector. The MSCI U.S. REIT Index is a subset of the MSCI USA Investable Market Index (IMI) which captures large, mid, andsmall-cap securities. The Index returns do not reflect any fees or expenses. The Index is denominated in U.S. dollars. The Index returns are net of withholding taxes. They assume daily reinvestment of net dividends thus accounting for any applicable dividend taxation. Index returns provided by Bloomberg.
3
Real Estate Series
Shareholder Expense Example
(unaudited)
As a shareholder of the Series, you incur ongoing costs, including management fees, shareholder service fees and other Series expenses. This example is intended to help you understand your ongoing costs (in dollars) of investing in the Series and to compare these costs with the ongoing costs of investing in other mutual funds.
The example is based on an investment of $1,000 invested in each class at the beginning of the period and held for the entire period (July 1, 2019 to December 31, 2019).
Actual Expenses
The Actual lines of the table below provide information about actual account values and actual expenses. You may use the information in this line, together with the amount you invested, to estimate the expenses that you paid over the period. Simply divide your account value by $1,000 (for example, an $8,600 account value divided by $1,000 = 8.6), then multiply the result by the number in the Actual line for the Class in which you have invested under the heading entitled “Expenses Paid During Period” to estimate the expenses you paid on your account during this period.
Hypothetical Example for Comparison Purposes
The Hypothetical lines of each class in the table below provide information about hypothetical account values and hypothetical expenses based on the Class’ actual expense ratio and an assumed rate of return of 5% per year before expenses, which is not the Class’ actual return. The hypothetical account values and expenses may not be used to estimate the actual ending account balance or expenses you paid during the period. You may use this information to compare the ongoing costs of investing in a class of the Series and other funds. To do so, compare this 5% hypothetical example for the class in which you have invested with the 5% hypothetical examples that appear in the shareholder reports of the other funds.
Please note that the expenses shown in the table are meant to highlight your ongoing costs only and do not reflect any transaction costs, such as sales charges (loads), redemption fees, or exchange fees that you may incur in other mutual funds. Therefore, the second line of the table is useful in comparing ongoing costs only, and will not help you determine the relative total costs of owning different funds.
BEGINNING
|
ENDING
|
EXPENSES PAID
|
ANNUALIZED
| |||||
Class S | ||||||||
Actual | $1,000.00 | $1,079.50 | $5.77 | 1.10% | ||||
Hypothetical | $1,000.00 | $1,019.66 | $5.60 | 1.10% | ||||
Class I | ||||||||
Actual | $1,000.00 | $1,079.30 | $4.40 | 0.84% | ||||
Hypothetical | $1,000.00 | $1,020.97 | $4.28 | 0.84% | ||||
Class W | ||||||||
Actual | $1,000.00 | $1,084.50 | $0.53 | 0.10% | ||||
Hypothetical | $1,000.00 | $1,024.70 | $0.51 | 0.10% | ||||
Class Z | ||||||||
Actual | $1,000.00 | $1,081.80 | $3.67 | 0.70% | ||||
Hypothetical | $1,000.00 | $1,021.68 | $3.57 | 0.70% | ||||
4
Real Estate Series
Shareholder Expense Example
(unaudited)
*Expenses are equal to each Class’ annualized expense ratio (for thesix-month period), multiplied by the average account value over the period, multiplied by 184/365 (to reflect theone-half year period). Expenses are based on the most recent fiscal half year; therefore, the expense ratios stated above may differ from the expense ratios stated in the financial highlights, which are based onone-year data. The Class’ total return would have been lower had certain expenses not been waived or reimbursed during the period.
5
Real Estate Series
Portfolio Composition as of December 31, 2019
(unaudited)
Top Ten Stock Holdings2
|
| |||||||||
Equinix, Inc. |
|
7.6 |
% |
Cousins Properties, Inc. | 3.3 | % | ||||
Prologis, Inc. | 5.5 | % | InterXion Holding N.V. (Netherlands) | 3.2 | % | |||||
Invitation Homes, Inc. | 3.7 | % | Healthpeak Properties, Inc. | 2.6 | % | |||||
Simon Property Group, Inc. | 3.6 | % | Apartment Investment & Management Co. - | |||||||
AvalonBay Communities, Inc. | 3.4 | % | Class A | 2.4 | % | |||||
| American Homes 4 Rent - Class A | 2.3 | % | ||||||||
2As a percentage of total investments. | ||||||||||
6
Real Estate Series
Investment Portfolio - December 31, 2019
SHARES
| VALUE (NOTE 2)
| |||||||
COMMON STOCKS - 98.9% | ||||||||
Consumer Discretionary - 1.5% | ||||||||
Hotels, Restaurants & Leisure - 1.5% | ||||||||
Hilton Worldwide Holdings, Inc. | 20,195 | $ | 2,239,828 | |||||
Wyndham Hotels & Resorts, Inc. | 35,915 | 2,255,821 | ||||||
|
| |||||||
Total Consumer Discretionary | 4,495,649 | |||||||
|
| |||||||
Information Technology - 3.2% | ||||||||
IT Services - 3.2% | ||||||||
InterXion Holding N.V. (Netherlands)* | 114,050 | 9,558,530 | ||||||
|
| |||||||
Real Estate - 94.2% | ||||||||
REITS - Diversified - 4.7% | ||||||||
Essential Properties Realty Trust, Inc. | 160,893 | 3,991,755 | ||||||
Liberty Property Trust | 40,590 | 2,437,430 | ||||||
STORE Capital Corp. | 71,010 | 2,644,412 | ||||||
VEREIT, Inc. | 545,110 | 5,036,817 | ||||||
|
| |||||||
|
14,110,414 |
| ||||||
|
| |||||||
REITS - Health Care - 12.5% | ||||||||
Community Healthcare Trust, Inc. | 92,955 | 3,984,051 | ||||||
Healthcare Realty Trust, Inc. | 137,840 | 4,599,721 | ||||||
Healthcare Trust of America, Inc. - Class A | 84,660 | 2,563,505 | ||||||
Healthpeak Properties, Inc. | 224,730 | 7,746,443 | ||||||
Omega Healthcare Investors, Inc. | 77,175 | 3,268,361 | ||||||
Physicians Realty Trust | 281,645 | 5,334,356 | ||||||
Ventas, Inc. | 62,385 | 3,602,110 | ||||||
Welltower, Inc. | 79,577 | 6,507,807 | ||||||
|
| |||||||
|
37,606,354 |
| ||||||
|
| |||||||
REITS - Hotel & Resort - 1.6% | ||||||||
Host Hotels & Resorts, Inc. | 162,395 | 3,012,427 | ||||||
Sunstone Hotel Investors, Inc. | 135,130 | 1,881,010 | ||||||
|
| |||||||
|
4,893,437 |
| ||||||
|
| |||||||
REITS - Industrial - 10.4% | ||||||||
Americold Realty Trust | 179,080 | 6,278,545 | ||||||
First Industrial Realty Trust, Inc. | 78,185 | 3,245,459 | ||||||
Plymouth Industrial REIT, Inc. | 102,004 | 1,875,854 | ||||||
Prologis, Inc. | 183,575 | 16,363,875 | ||||||
STAG Industrial, Inc. | 119,065 | 3,758,882 | ||||||
|
| |||||||
|
31,522,615 |
| ||||||
|
| |||||||
REITS - Office - 11.5% | ||||||||
Alexandria Real Estate Equities, Inc. | 11,970 | 1,934,113 | ||||||
Boston Properties, Inc. | 43,664 | 6,019,519 | ||||||
Brandywine Realty Trust | 415,105 | 6,537,904 | ||||||
Cousins Properties, Inc. | 242,292 | 9,982,430 | ||||||
The accompanying notes are an integral part of the financial statements.
7
Real Estate Series
Investment Portfolio - December 31, 2019
SHARES
| VALUE (NOTE 2)
| |||||||
| COMMON STOCKS(continued) | ||||||||
| Real Estate(continued) | ||||||||
REITS - Office(continued) | ||||||||
Douglas Emmett, Inc. | 110,325 | $ | 4,843,267 | |||||
Hibernia REIT plc (Ireland) | 1,606,740 | 2,541,226 | ||||||
Kilroy Realty Corp. | 20,074 | 1,684,209 | ||||||
Vornado Realty Trust | 18,215 | 1,211,298 | ||||||
|
| |||||||
|
34,753,966 |
| ||||||
|
| |||||||
REITS - Residential - 26.9% | ||||||||
American Campus Communities, Inc. | 85,320 | 4,012,600 | ||||||
American Homes 4 Rent - Class A | 262,365 | 6,876,587 | ||||||
Apartment Investment & Management Co. - Class A | 139,966 | 7,229,244 | ||||||
AvalonBay Communities, Inc. | 49,195 | 10,316,191 | ||||||
BSR Real Estate Investment Trust (Canada) | 63,870 | 740,253 | ||||||
Camden Property Trust | 63,950 | 6,785,095 | ||||||
Equity LifeStyle Properties, Inc. | 45,555 | 3,206,616 | ||||||
Equity Residential | 69,950 | 5,660,354 | ||||||
Essex Property Trust, Inc. | 16,572 | 4,985,852 | ||||||
Independence Realty Trust, Inc. | 223,675 | 3,149,344 | ||||||
Invitation Homes, Inc. | 371,640 | 11,138,051 | ||||||
Mid-America Apartment Communities, Inc. | 24,060 | 3,172,552 | ||||||
Sun Communities, Inc. | 43,495 | 6,528,599 | ||||||
UDR, Inc. | 118,456 | 5,531,895 | ||||||
UMH Properties, Inc. | 110,600 | 1,739,738 | ||||||
|
| |||||||
|
81,072,971 |
| ||||||
|
| |||||||
REITS - Retail - 10.2% | ||||||||
Acadia Realty Trust | 52,405 | 1,358,862 | ||||||
Agree Realty Corp. | 32,365 | 2,271,052 | ||||||
Federal Realty Investment Trust | 11,840 | 1,524,163 | ||||||
Getty Realty Corp. | 68,110 | 2,238,776 | ||||||
National Retail Properties, Inc. | 54,160 | 2,904,059 | ||||||
Realty Income Corp. | 24,880 | 1,831,914 | ||||||
Simon Property Group, Inc. | 72,265 | 10,764,595 | ||||||
Urban Edge Properties | 202,910 | 3,891,814 | ||||||
Weingarten Realty Investors | 130,355 | 4,072,290 | ||||||
|
| |||||||
|
30,857,525 |
| ||||||
|
| |||||||
REITS - Specialized - 16.4% | ||||||||
Crown Castle International Corp. | 35,615 | 5,062,672 | ||||||
Digital Realty Trust, Inc. | 41,430 | 4,960,828 | ||||||
Equinix, Inc. | 38,900 | 22,705,930 | ||||||
Extra Space Storage, Inc. | 16,775 | 1,771,776 | ||||||
Jernigan Capital, Inc. | 300,365 | 5,748,986 | ||||||
Life Storage, Inc. | 15,050 | 1,629,614 | ||||||
National Storage Affiliates Trust | 56,970 | 1,915,332 | ||||||
The accompanying notes are an integral part of the financial statements.
8
Real Estate Series
Investment Portfolio - December 31, 2019
SHARES
| VALUE (NOTE 2)
| |||||||
| COMMON STOCKS(continued) | ||||||||
| Real Estate(continued) | ||||||||
| REITS - Specialized(continued) | ||||||||
Public Storage | 27,320 | $ | 5,818,067 | |||||
|
| |||||||
| 49,613,205 | ||||||||
|
| |||||||
Total Real Estate | 284,430,487 | |||||||
|
| |||||||
TOTAL COMMON STOCKS | ||||||||
(Identified Cost $238,945,575) | 298,484,666 | |||||||
|
| |||||||
SHORT-TERM INVESTMENT - 0.5% | ||||||||
Dreyfus Government Cash Management, Institutional Shares, 1.51%1, (Identified Cost $1,573,683) | 1,573,683 | 1,573,683 | ||||||
|
| |||||||
TOTAL INVESTMENTS - 99.4% | ||||||||
(Identified Cost $240,519,258) | 300,058,349 | |||||||
OTHER ASSETS, LESS LIABILITIES - 0.6% | 1,801,483 | |||||||
|
| |||||||
NET ASSETS - 100% | $ | 301,859,832 | ||||||
|
| |||||||
REITS - Real Estate Investment Trusts
*Non-income producing security.
1Rate shown is the current yield as of December 31, 2019.
The Global Industry Classification Standard (GICS) was developed by and is the exclusive property and a service mark of MSCI Inc. (MSCI) and Standard & Poor’s, a division of S&P Global Inc. (S&P), and is licensed for use by Manning & Napier when referencing GICS sectors. Neither MSCI, S&P, nor any third party involved in making or compiling the GICS or any GICS classifications makes any express or implied warranties or representations with respect to such standard or classification, nor shall any such party have any liability therefrom.
The accompanying notes are an integral part of the financial statements.
9
Real Estate Series
Statement of Assets and Liabilities
December 31, 2019
ASSETS: | ||||
Investments, at value (identified cost $240,519,258) (Note 2) | $ | 300,058,349 | ||
Dividends receivable | 1,104,179 | |||
Receivable for fund shares sold | 872,930 | |||
Foreign tax reclaims receivable | 9,220 | |||
Prepaid expenses | 9,103 | |||
|
| |||
TOTAL ASSETS | 302,053,781 | |||
|
| |||
LIABILITIES: | ||||
Accrued management fees (Note 3) | 46,169 | |||
Accruedsub-transfer agent fees (Note 3) | 38,189 | |||
Accrued fund accounting and administration fees (Note 3) | 21,129 | |||
Accrued distribution and service (Rule12b-1) fees (Class S) (Note 3) | 12,681 | |||
Accrued Chief Compliance Officer service fees (Note 3) | 1,169 | |||
Payable for fund shares repurchased | 32,680 | |||
Accrued printing and postage fees payable | 17,343 | |||
Audit fees payable | 11,195 | |||
Other payables and accrued expenses | 13,394 | |||
|
| |||
TOTAL LIABILITIES | 193,949 | |||
|
| |||
TOTAL NET ASSETS | $ | 301,859,832 | ||
|
| |||
NET ASSETS CONSIST OF: | ||||
Capital stock | $ | 232,829 | ||
Additionalpaid-in-capital | 238,323,414 | |||
Total distributable earnings (loss) | 63,303,589 | |||
|
| |||
TOTAL NET ASSETS | $ | 301,859,832 | ||
|
| |||
NET ASSET VALUE, OFFERING PRICE AND REDEMPTION PRICE PER SHARE - Class S($59,922,795/3,675,048 shares) | $ | 16.31 | ||
|
| |||
NET ASSET VALUE, OFFERING PRICE AND REDEMPTION PRICE PER SHARE - Class I($50,024,601/7,762,060 shares) | $ | 6.44 | ||
|
| |||
NET ASSET VALUE, OFFERING PRICE AND REDEMPTION PRICE PER SHARE - Class W($191,372,972/11,762,231 shares) | $ | 16.27 | ||
|
| |||
NET ASSET VALUE, OFFERING PRICE AND REDEMPTION PRICE PER SHARE - Class Z($539,464/83,570 shares) | $ | 6.46 | ||
|
| |||
The accompanying notes are an integral part of the financial statements.
10
Real Estate Series
Statement of Operations
For the Year Ended December 31, 2019
INVESTMENT INCOME: | ||||
Dividends (net of foreign taxes withheld, $13,040) | $ | 7,413,166 | ||
|
| |||
EXPENSES: | ||||
Management fees (Note 3) | 1,866,241 | |||
Distribution and service (Rule12b-1) fees (Class S) (Note 3) | 130,637 | |||
Sub-transfer agent fees (Note 3) | 120,664 | |||
Shareholder services fees (Class S) (Note 3) | 91,763 | |||
Fund accounting and administration fees (Note 3) | 88,982 | |||
Directors’ fees (Note 3) | 30,294 | |||
Chief Compliance Officer service fees (Note 3) | 3,109 | |||
Custodian fees | 14,338 | |||
Miscellaneous | 219,668 | |||
|
| |||
Total Expenses | 2,565,696 | |||
Less reduction of expenses (Note 3) | (1,004,139 | ) | ||
|
| |||
Net Expenses | 1,561,557 | |||
|
| |||
NET INVESTMENT INCOME | 5,851,609 | |||
|
| |||
REALIZED AND UNREALIZED GAIN (LOSS) ON INVESTMENTS AND FOREIGN CURRENCY: | ||||
Net realized gain (loss) on- | ||||
Investments | 15,465,051 | |||
Litigation proceeds (Note 4) | 119,678 | |||
Foreign currency and translation of other assets and liabilities | (665 | ) | ||
|
| |||
| 15,584,064 | ||||
|
| |||
Net change in unrealized appreciation (depreciation) on- | ||||
Investments | 54,145,929 | |||
Foreign currency and translation of other assets and liabilities | (69 | ) | ||
|
| |||
| 54,145,860 | ||||
|
| |||
NET REALIZED AND UNREALIZED GAIN (LOSS) ON INVESTMENTS AND FOREIGN CURRENCY | 69,729,924 | |||
|
| |||
NET INCREASE IN NET ASSETS RESULTING FROM OPERATIONS | $ | 75,581,533 | ||
|
| |||
The accompanying notes are an integral part of the financial statements.
11
Real Estate Series
Statements of Changes in Net Assets
FOR THE YEAR ENDED
|
FOR THE YEAR ENDED
| |||||||
INCREASE (DECREASE) IN NET ASSETS: | ||||||||
OPERATIONS: | ||||||||
Net investment income | $ | 5,851,609 | $ | 5,574,428 | ||||
Net realized gain (loss) on investments and foreign currency | 15,584,064 | 10,998,672 | ||||||
Net change in unrealized appreciation (depreciation) on investments and foreign currency | 54,145,860 | (36,190,557 | ) | |||||
|
|
|
| |||||
Net increase (decrease) from operations | 75,581,533 | (19,617,457 | ) | |||||
|
|
|
| |||||
DISTRIBUTIONS TO SHAREHOLDERS (Note 10): | ||||||||
Class S | (2,082,294 | ) | (13,404,039 | ) | ||||
Class I | (4,713,102 | ) | (7,240,331 | ) | ||||
Class W | (8,513,530 | ) | — | |||||
Class Z | (50,026 | ) | — | |||||
From return of capital (Class S) | — | (376,898 | ) | |||||
From return of capital (Class I) | — | (227,910 | ) | |||||
|
|
|
| |||||
Total distributions to shareholders | (15,358,952 | ) | (21,249,178 | ) | ||||
|
|
|
| |||||
CAPITAL STOCK ISSUED AND REPURCHASED: | ||||||||
Net increase (decrease) from capital share transactions (Note 5) | (23,194,930 | ) | (12,870,550 | ) | ||||
|
|
|
| |||||
Net increase (decrease) in net assets | 37,027,651 | (53,737,185 | ) | |||||
NET ASSETS: | ||||||||
Beginning of year | 264,832,181 | 318,569,366 | ||||||
|
|
|
| |||||
End of year | $ | 301,859,832 | $ | 264,832,181 | ||||
|
|
|
| |||||
The accompanying notes are an integral part of the financial statements.
12
Real Estate Series
Financial Highlights - Class S
FOR THE YEAR ENDED | ||||||||||||||||||||
12/31/19
| 12/31/18
| 12/31/17
| 12/31/16
| 12/31/15
| ||||||||||||||||
Per share data (for a share outstanding throughout each year): | ||||||||||||||||||||
Net asset value - Beginning of year | $13.09 | $14.93 | $14.48 | $14.15 | $15.46 | |||||||||||||||
|
|
|
|
|
|
|
|
|
| |||||||||||
Income (loss) from investment operations: | ||||||||||||||||||||
Net investment income1 | 0.15 | 0.26 | 0.24 | 0.22 | 0.24 | |||||||||||||||
Net realized and unrealized gain (loss) on investments | 3.65 | (1.24 | ) | 1.02 | 0.88 | 0.34 | ||||||||||||||
|
|
|
|
|
|
|
|
|
| |||||||||||
Total from investment operations | 3.80 | (0.98 | ) | 1.26 | 1.10 | 0.58 | ||||||||||||||
|
|
|
|
|
|
|
|
|
| |||||||||||
Less distributions to shareholders: | ||||||||||||||||||||
From net investment income | (0.16 | ) | (0.21 | ) | (0.25 | ) | (0.27 | ) | (0.24 | ) | ||||||||||
From net realized gain on investments | (0.42 | ) | (0.63 | ) | (0.56 | ) | (0.50 | ) | (1.65 | ) | ||||||||||
From return of capital | — | (0.02 | ) | — | — | — | ||||||||||||||
|
|
|
|
|
|
|
|
|
| |||||||||||
Total distributions to shareholders | (0.58 | ) | (0.86 | ) | (0.81 | ) | (0.77 | ) | (1.89 | ) | ||||||||||
|
|
|
|
|
|
|
|
|
| |||||||||||
Net asset value - End of year | $16.31 | $13.09 | $14.93 | $14.48 | $14.15 | |||||||||||||||
|
|
|
|
|
|
|
|
|
| |||||||||||
Net assets - End of year(000’s omitted) | $ | 59,923 | $ | 214,722 | $ | 271,496 | $ | 278,322 | $ | 217,216 | ||||||||||
|
|
|
|
|
|
|
|
|
| |||||||||||
Total return2 | 29.14% | 3 | (6.73% | ) | 8.66% | 7.91% | 4.14% | |||||||||||||
Ratios (to average net assets)/Supplemental Data: | ||||||||||||||||||||
Expenses* | 1.11% | 1.11% | 1.10% | 1.09% | 1.09% | |||||||||||||||
Net investment income | 1.02% | 1.82% | 1.58% | 1.47% | 1.54% | |||||||||||||||
Series portfolio turnover | 24% | 44% | 42% | 46% | 57% | |||||||||||||||
| *The investment advisor did not impose all or a portion of its management and/or other fees, and in some periods may have paid a portion of the Series’ expenses. If these expenses had been incurred by the Class, the expense ratio (to average net assets) would have increased by the following amounts: |
| |||||||||||||||||||
| 0.00% | 4 | N/A | 0.00% | 4 | N/A | N/A | ||||||||||||||
1Calculated based on average shares outstanding during the years.
2Represents aggregate total return for the years indicated, and assumes reinvestment of all distributions. Total return would have been lower had certain expenses not been waived or reimbursed during certain years.
3Includes litigation proceeds (see Statement of Operations). Excluding this amount, the Class’ total return is 29.06%.
4Less than 0.01%.
The accompanying notes are an integral part of the financial statements.
13
Real Estate Series
Financial Highlights - Class I
| FOR THE YEAR ENDED | ||||||||||||||||||||
| 12/31/19 | 12/31/18 | 12/31/17 | 12/31/16 | 12/31/15 | ||||||||||||||||
Per share data (for a share outstanding throughout each year): | ||||||||||||||||||||
Net asset value - Beginning of year | $5.50 | $6.81 | $7.03 | $7.26 | $8.86 | |||||||||||||||
|
|
|
|
|
|
|
|
|
| |||||||||||
Income (loss) from investment operations: | ||||||||||||||||||||
Net investment income1 | 0.11 | 0.14 | 0.14 | 0.11 | 0.16 | |||||||||||||||
Net realized and unrealized gain (loss) on investments | 1.49 | (0.55 | ) | 0.49 | 0.47 | 0.17 | ||||||||||||||
|
|
|
|
|
|
|
|
|
| |||||||||||
Total from investment operations | 1.60 | (0.41 | ) | 0.63 | 0.58 | 0.33 | ||||||||||||||
|
|
|
|
|
|
|
|
|
| |||||||||||
Less distributions to shareholders: | ||||||||||||||||||||
From net investment income | (0.24 | ) | (0.24 | ) | (0.29 | ) | (0.31 | ) | (0.28 | ) | ||||||||||
From net realized gain on investments | (0.42 | ) | (0.63 | ) | (0.56 | ) | (0.50 | ) | (1.65 | ) | ||||||||||
From return of capital | — | (0.03 | ) | — | — | — | ||||||||||||||
|
|
|
|
|
|
|
|
|
| |||||||||||
Total distributions to shareholders | (0.66 | ) | (0.90 | ) | (0.85 | ) | (0.81 | ) | (1.93 | ) | ||||||||||
|
|
|
|
|
|
|
|
|
| |||||||||||
Net asset value - End of year | $6.44 | $5.50 | $6.81 | $7.03 | $7.26 | |||||||||||||||
|
|
|
|
|
|
|
|
|
| |||||||||||
Net assets - End of year(000’s omitted) | $ | 50,025 | $ | 50,111 | $ | 47,074 | $ | 26,300 | $ | 50,249 | ||||||||||
|
|
|
|
|
|
|
|
|
| |||||||||||
Total return2 | 29.31% | (6.41% | ) | 8.85% | 8.17% | 4.43% | ||||||||||||||
Ratios (to average net assets)/Supplemental Data: | ||||||||||||||||||||
Expenses* | 0.84% | 0.86% | 0.85% | 0.84% | 0.84% | |||||||||||||||
Net investment income | 1.62% | 2.12% | 1.95% | 1.50% | 1.81% | |||||||||||||||
Series portfolio turnover | 24% | 44% | 42% | 46% | 57% | |||||||||||||||
| *The investment advisor did not impose all or a portion of its management and/or other fees, and in some periods may have paid a portion of the Series’ expenses. If these expenses had been incurred by the Class, the expense ratio (to average net assets) would have increased by the following amounts: |
| |||||||||||||||||||
| N/A | N/A | 0.00% | 3 | N/A | N/A | |||||||||||||||
1Calculated based on average shares outstanding during the years.
2Represents aggregate total return for the years indicated, and assumes reinvestment of all distributions. Total return would have been lower had certain expenses not been waived or reimbursed during certain years.
3Less than 0.01%.
The accompanying notes are an integral part of the financial statements.
14
Real Estate Series
Financial Highlights - Class W
| FOR THE PERIOD 3/1/191 TO 12/31/19 | ||
Per share data (for a share outstanding throughout the period): | ||||||||||
Net asset value - Beginning of period | $14.76 | |||||||||
|
| |||||||||
Income from investment operations: | ||||||||||
Net investment income2 | 0.35 | |||||||||
Net realized and unrealized gain (loss) on investments | 1.91 | |||||||||
|
| |||||||||
Total from investment operations | 2.26 | |||||||||
|
| |||||||||
Less distributions to shareholders: | ||||||||||
From net investment income | (0.33 | ) | ||||||||
From net realized gain on investments | (0.42 | ) | ||||||||
|
| |||||||||
Total distributions to shareholders | (0.75 | ) | ||||||||
|
| |||||||||
Net asset value - End of period | $16.27 | |||||||||
|
| |||||||||
Net assets - End of period(000’s omitted) | $ | 191,373 | ||||||||
|
| |||||||||
Total return3,4 | 15.43% | |||||||||
Ratios (to average net assets)/Supplemental Data: | ||||||||||
Expenses*5 | 0.10% | |||||||||
Net investment income5 | 2.58% | |||||||||
Series portfolio turnover | 24% | |||||||||
| *The investment advisor did not impose all or a portion of its management and/or other fees during the period, and may have paid a portion of the Series’ expenses. If these expenses had been incurred by the Series, the expense ratio (to average net assets) would have increased by the following amount5: |
| |||||||||
| 0.62% | ||||||||||
1Commencement of operations.
2Calculated based on average shares outstanding during the period.
3Includes litigation proceeds (see Statement of Operations). Excluding this amount, the Class’ total return is 15.36%.
4Represents aggregate total return for the period indicated. Total return would have been lower had certain expenses not been waived or reimbursed during the period. Periods less than one year are not annualized.
5Annualized.
The accompanying notes are an integral part of the financial statements.
15
Real Estate Series
Financial Highlights - Class Z
| FOR THE PERIOD 3/1/191 TO 12/31/19 | ||
Per share data (for a share outstanding throughout the period): | ||||||||||
Net asset value - Beginning of period | $6.21 | |||||||||
|
| |||||||||
Income from investment operations: | ||||||||||
Net investment income2 | 0.08 | |||||||||
Net realized and unrealized gain (loss) on investments | 0.84 | |||||||||
|
| |||||||||
Total from investment operations | 0.92 | |||||||||
|
| |||||||||
Less distributions to shareholders: | ||||||||||
From net investment income | (0.25 | ) | ||||||||
From net realized gain on investments | (0.42 | ) | ||||||||
|
| |||||||||
Total distributions to shareholders | (0.67 | ) | ||||||||
|
| |||||||||
Net asset value - End of period | $6.46 | |||||||||
|
| |||||||||
Net assets - End of period(000’s omitted) | $539 | |||||||||
|
| |||||||||
Total return3,4 | 14.98% | |||||||||
Ratios (to average net assets)/Supplemental Data: | ||||||||||
Expenses*5 | 0.70% | |||||||||
Net investment income5 | 1.42% | |||||||||
Series portfolio turnover | 24% | |||||||||
| *The investment advisor did not impose all or a portion of its management and/or other fees during the period, and may have paid a portion of the Series’ expenses. If these expenses had been incurred by the Series, the expense ratio (to average net assets) would have increased by the following amount5: |
| |||||||||
| 0.02% | ||||||||||
1Commencement of operations.
2Calculated based on average shares outstanding during the period.
3Includes litigation proceeds (see Statement of Operations). Excluding this amount, the Class’ total return is 14.62%.
4Represents aggregate total return for the period indicated, and assumes reinvestment of all distributions. Total return would have been lower had certain expenses not been waived or reimbursed during the period. Period less than one year are not annualized.
5Annualized.
The accompanying notes are an integral part of the financial statements.
16
Real Estate Series
Notes to Financial Statements
| 1. | Organization |
Real Estate Series (the “Series”) is ano-load diversified series of Manning & Napier Fund, Inc. (the “Fund”). The Fund is organized in Maryland and is registered under the Investment Company Act of 1940, as amended, as anopen-end management investment company.
The Series’ investment objective is to provide high current income and long-term capital appreciation by investing principally in companies in the real estate industry.
The Fund’s advisor is Manning & Napier Advisors, LLC (the “Advisor”). Shares of the Series are offered to investors, clients and employees of the Advisor and its affiliates. The Series is authorized to issue four classes of shares (Class S, I, W, and Z). Class W and Z were issued on March 1, 2019. Each class of shares is substantially the same, except that class specific distribution and shareholder servicing expenses are borne by the specific class of shares to which they relate. The total authorized capital stock of the Fund consists of 15 billion shares of common stock each having a par value of $0.01. As of December 31, 2019, 8.9 billion shares have been designated in total among 31 series, of which 100 million have been designated as Real Estate Series Class I common stock, Real Estate Series Class S common stock and Real Estate Series Class Z common stock and 75 million have been designated as Real Estate Series Class W common stock.
| 2. | Significant Accounting Policies |
The following is a summary of significant accounting policies followed by the Series. The Series is an investment company and, accordingly, follows the investment company accounting and reporting guidance of the Financial Accounting Standards Board Accounting Standards Codification Topic 946 - Investment Companies, which is part of accounting principles generally accepted in the United States of America (“GAAP”).
Security Valuation
Portfolio securities, including domestic equities, foreign equities, warrants and options, listed on an exchange other than the NASDAQ Stock Market are valued at the latest quoted sales price of the exchange on which the security is primarily traded. Securities not traded on valuation date or securities not listed on an exchange are valued at the latest quoted bid price provided by the Fund’s pricing service. Securities listed on the NASDAQ Stock Market are valued in accordance with the NASDAQ Official Closing Price.
Short-term investments that mature in sixty days or less may be valued at amortized cost, which approximates fair value. Investments inopen-end investment companies are valued at their net asset value per share on valuation date.
Volume and level of activity in established markets for an asset or liability are evaluated to determine whether recent transactions and quoted prices are determinative of fair value. Where there have been significant decreases in volume and level of activity, further analysis and adjustment may be necessary to estimate fair value. The Series measures fair value in these instances by the use of inputs and valuation techniques which may be based upon current market prices of securities that are comparable in coupon, rating, maturity and industry and/or expectation of future cash flows. As a result of trading in relatively thin markets and/or markets that experience significant volatility, the prices used by the Series to value these securities may differ from the value that would be realized if these securities were sold, and the differences could be material.
Securities for which representative valuations or prices are not available from the Series’ pricing service may be valued at fair value as determined in good faith by the Advisor under procedures approved by and under the general supervision and responsibility of the Fund’s Board of Directors (the “Board”). Due to the inherent uncertainty of valuations of such securities, the fair value may differ significantly from the values that would have been used had a ready market for such securities existed. If trading or events occurring after the close of the principal market in which securities are traded are expected to materially affect the value of those securities, then they may be valued at their fair value, taking this trading or these events into account. In accordance with the procedures approved by the Board, the values of certain securities trading outside the U.S. were adjusted following the close of local trading using a factor from a third party vendor. The third party vendor uses statistical analyses and quantitative models, which consider among other things subsequent movement and changes in the prices of indices, securities and exchange rates in other markets, to determine the factors which are used to adjust local market prices. The value of
17
Real Estate Series
Notes to Financial Statements (continued)
| 2. | Significant Accounting Policies (continued) |
Security Valuation(continued)
securities used for net asset value calculation under these procedures may differ from published prices for the same securities. It is the Fund’s policy to classify each foreign equity security where a factor from a third party vendor is provided as a Level 2 security.
Various inputs are used in determining the value of the Series’ assets or liabilities carried at fair value. These inputs are summarized in three broad levels. Level 1 includes quoted prices in active markets for identical assets and liabilities. Level 2 includes other significant observable inputs (including quoted prices for similar securities, interest rates, prepayment speeds, credit risk, etc.). Level 3 includes significant unobservable inputs (including the Series’ own assumptions in determining the fair value of investments). A financial instrument’s level within the fair value hierarchy is based on the lowest level of any input both individually and in aggregate that is significant to the fair value measurement. The inputs or methodology used for valuing securities are not necessarily an indication of the risk associated with investing in those securities.
The following is a summary of the valuation levels used for major security types as of December 31, 2019 in valuing the Series’ assets or liabilities carried at fair value:
| DESCRIPTION | TOTAL | LEVEL 1 | LEVEL 2# | LEVEL 3 | ||||||||||||
Assets: | ||||||||||||||||
Equity securities: | ||||||||||||||||
Consumer Discretionary | $ | 4,495,649 | $ | 4,495,649 | $ | — | $ | — | ||||||||
Information Technology | 9,558,530 | 9,558,530 | — | — | ||||||||||||
Real Estate* | 284,430,487 | 281,149,008 | 3,281,479 | — | ||||||||||||
Short-Term Investment | 1,573,683 | 1,573,683 | — | — | ||||||||||||
|
|
|
|
|
|
|
| |||||||||
Total assets | $ | 300,058,349 | $ | 296,776,870 | $ | 3,281,479 | $ | — | ||||||||
|
|
|
|
|
|
|
| |||||||||
*Please refer to the Investment Portfolio for the industry classifications of these portfolio holdings.
#Includes certain foreign equity securities for which a factor from a third party vendor was applied to determine the securities’ fair value following the close of local trading.
There were no Level 3 securities held by the Series as of December 31, 2018 or December 31, 2019.
Security Transactions, Investment Income and Expenses
Security transactions are accounted for on trade date. Dividend income is recorded on theex-dividend date, except that if theex-dividend date has passed, certain dividends from foreign securities are recorded as soon as the Series is informed of theex-dividend date.Non-cash dividends, if any, are recorded at the fair value of the securities received. Interest income, including amortization of premium and accretion of discounts using the effective interest method, is earned from settlement date and accrued daily.
Expenses are recorded on an accrual basis. Most expenses of the Fund can be attributed to a specific series. Expenses which cannot be directly attributed are apportioned among the series in the Fund in such a manner as deemed equitable by the Fund’s Board, taking into consideration, among other things, the nature and type of expense. Income, expenses (other than shareholder services fees), and realized and unrealized gains and losses are prorated among the classes based on the relative net assets of each class. Class specific expenses are directly charged to that Class.
The Fund records distributions received in excess of income from underlying investments as a reduction of cost of investments and/or realized gain. Such amounts are based on estimates if actual amounts are not available and actual amounts of income, realized gain and return of capital may differ from the estimated amounts. The Fund adjusts the estimated amounts of components of distributions (and consequently its net investment income) as necessary once the issuers provide information about the actual composition of the distributions.
18
Real Estate Series
Notes to Financial Statements (continued)
| 2. | Significant Accounting Policies (continued) |
Security Transactions, Investment Income and Expenses(continued)
The Series uses the identified cost method for determining realized gain or loss on investments for both financial statement and federal income tax reporting purposes.
Foreign Currency Translation
The books and records of the Series are maintained in U.S. dollars. Foreign currencies, investments and other assets and liabilities are translated into U.S. dollars at the current exchange rates. Purchases and sales of investment securities and income and expenses are translated on the respective dates of such transactions. The Series does not isolate realized and unrealized gains and losses attributable to changes in the exchange rates from gains and losses that arise from changes in the market value of investments. Such fluctuations are included with net realized and unrealized gain or loss on investments. Net realized foreign currency gains and losses represent foreign currency gains and losses between trade date and settlement date on securities transactions, gains and losses on disposition of foreign currencies and the difference between the amount of income and foreign withholding taxes recorded on the books of the Series and the amounts actually received or paid.
Federal Taxes
The Series’ policy is to comply with the provisions of the Internal Revenue Code applicable to regulated investment companies. The Series is not subject to federal income tax or excise tax to the extent that the Series distributes to shareholders each year its taxable income, including any net realized gains on investments, in accordance with requirements of the Internal Revenue Code. Accordingly, no provision for federal income tax or excise tax has been made in the financial statements.
Management evaluates its tax positions to determine if the tax positions taken meet the minimum recognition threshold in connection with accounting for uncertainties in income tax positions taken or expected to be taken for the purposes of measuring and recognizing tax liabilities in the financial statements. Recognition of tax benefits of an uncertain tax position is required only when the position is “more likely than not” to be sustained assuming examination by taxing authorities. At December 31, 2019, the Series has recorded no liability for net unrecognized tax benefits relating to uncertain income tax positions taken or expected to be taken in future tax returns.
The Series files income tax returns in the U.S. federal jurisdiction, various states and foreign jurisdictions, as required. No income tax returns are currently under investigation. The statute of limitations on the Series’ tax returns remains open for the years ended December 31, 2016 through December 31, 2019. The Series is not aware of any tax positions for which it is reasonably possible that the total amounts of unrecognized tax benefits will significantly change in the next twelve months.
Foreign Taxes
Based on the Series’ understanding of the tax rules and rates related to income, gains and currency purchase/repatriation transactions for foreign jurisdictions in which it invests, the Series will provide for foreign taxes, and where appropriate, deferred foreign tax.
Distributions of Income and Gains
Distributions to shareholders of net investment income and net realized gains are made annually. An additional distribution may be necessary to avoid taxation of the Series. Distributions are recorded on theex-dividend date.
Indemnifications
The Fund’s organizational documents provide former and current directors and officers with a limited indemnification against liabilities arising in connection with the performance of their duties to the Fund. In the normal course of business, the Fund may also enter into contracts that provide general indemnifications. The Fund’s maximum exposure under these arrangements is unknown as this would be dependent on future claims that may be made against the Fund. The risk of material loss from such claims is considered remote.
Other
The preparation of financial statements in conformity with GAAP requires management to make estimates and assumptions that affect the reported amounts of assets and liabilities and the disclosure of contingent assets and liabilities at the date of the
19
Real Estate Series
Notes to Financial Statements (continued)
| 2. | Significant Accounting Policies (continued) |
Other(continued)
financial statements and the reported amounts of income and expenses during the reporting period. Actual results could differ from those estimates.
| 3. | Transactions with Affiliates |
The Fund has an Investment Advisory Agreement (the “Agreement”) with the Advisor, for which the Series pays a fee, computed daily and payable monthly, at an annual rate of 0.60% of the Series’ average daily net assets. Prior to March 1, 2019, the management fee for the Series was 0.75% of the Series’ average daily net assets.
Under the Agreement, personnel of the Advisor provide the Series with advice and assistance in the choice of investments and the execution of securities transactions, and otherwise maintain the Series’ organization. The Advisor also provides the Fund with necessary office space and fund administration and support services. The salaries of all officers of the Fund (except a percentage of the Fund’s Chief Compliance Officer’s salary, which is paid by the Fund), and of all Directors who are “affiliated persons” of the Fund, or of the Advisor, and all personnel of the Fund, or of the Advisor, performing services relating to research, statistical and investment activities, are paid by the Advisor. Each“non-affiliated” Director receives an annual stipend, which is allocated among all the active series of the Fund. In addition, these Directors also receive a fee per Board meeting attended plus a fee for each committee meeting attended and are reimbursed for travel and otherout-of-pocket expenses incurred by them in connection with attending such meetings. The Fund also has an Audit Committee Chair, Governance & Nominating Committee Chair and Lead Independent Director, who each receive an additional annual stipend for these roles.
The Fund may enter into agreements with financial intermediaries pursuant to which the Fund may pay financial intermediaries fornon-distribution relatedsub-transfer agency, administrative,sub-accounting, and other shareholder services in an annual amount not to exceed 0.15% of the average daily net assets of the Class I and Class S shares of the Series. Payments made pursuant to such agreements are generally based on the current assets and/or number of accounts of the Series attributable to the financial intermediary. Any payments made pursuant to such agreements may be in addition to, rather than in lieu of, any Distribution and Shareholder Services Fee payable under the Rule12b-1 plan of the Fund.
Prior to March 1, 2019, the Class S shares of the Series were subject to a shareholder services fee in accordance with a shareholder services plan adopted by the Fund’s Board. The shareholder services fee was intended to compensate financial intermediaries, including affiliates of the Fund, in connection with the provision of direct client service, personal services, maintenance of shareholder accounts and reporting services. For these services, the Class S shares of the Series paid a fee, computed daily and payable monthly, at an annual rate of 0.25% of the average daily net assets of Class S. The Fund had a Shareholder Services Agreement with the Advisor, for which the Advisor received the shareholder services fee as stated above.
Manning & Napier Investor Services, Inc., a registered broker-dealer affiliate of the Advisor, acts as distributor for the Fund’s shares. Effective March 1, 2019, the Series compensates the distributor for distributing and servicing the Series’ Class S shares pursuant to a distribution plan adopted under Rule12b-1 of the 1940 Act, regardless of expenses actually incurred. Under the agreement, the Series pays distribution and service fees to the distributor at an annual rate of 0.25% of average daily net assets attributable to Class S shares. There are no distribution and service fees on the Class I, Class W or Class Z shares. The fees are accrued daily and paid monthly.
Pursuant to a master services agreement dated March 1, 2017, as amended, the Fund pays the Advisor an annual fee related to fund accounting and administration of 0.0085% on the first $25 billion of average daily net assets (excluding Target Series and Income Series); 0.0075% on the next $15 billion of average daily net assets (excluding Target Series and Income Series); and 0.0065% of average daily net assets in excess of $40 billion (excluding Target Series and Income Series); plus a base fee of $30,400 per series. Additionally, certain transaction andout-of-pocket expenses, including charges for reporting relating to the Fund’s compliance program, are charged. The Advisor has agreements with BNY Mellon Investment Servicing (U.S.) Inc. (“BNY”) under which BNY serves assub-accountant services agent.
20
Real Estate Series
Notes to Financial Statements (continued)
| 3. | Transactions with Affiliates (continued) |
Effective March 1, 2019, the Advisor has contractually agreed to waive the management fee for the Class W shares. The full management fee will be waived under this agreement because Class W shares are only available to discretionary investment accounts and other accounts managed by the Advisor. These clients pay a management fee to the advisor that is separate from the fund’s expenses. In addition, pursuant to a separate expense limitation agreement, the Advisor has contractually agreed to limit its fees and reimburse expenses to the extent necessary so that the total direct annual fund operating expenses, exclusive of the shareholder services fee and/or distribution and service(12b-1) fees and waived Class W management fees (collectively, “excluded expenses”), to 0.85% of the average daily net assets of the Class S and Class I shares, 0.10% of the average daily net assets of the Class W shares, and 0.70% of the average daily net assets of the Class Z shares. These contractual waivers are expected to continue indefinitely, and may not be amended or terminated by the Advisor without the approval of the Series’ Board of Directors. The Advisor may receive from a Class the difference between the Class’s total direct annual fund operating expenses, not including excluded expenses, and the Class’s contractual expense limit to recoup all or a portion of its prior fee waivers (other than Class W management fee waivers) or expense reimbursements made during the rolling three-year period preceding the recoupment if at any point the total direct annual fund operating expenses, not including excluded expenses, are below the contractual expense limit (a) at the time of the fee waiver and/or expense reimbursement and (b) at the time of the recoupment.
Pursuant to the advisory fee waiver, the Advisor waived $964,937 in management fees for Class W for the year ended December 31, 2019. In addition, pursuant to the separate expense limitation agreement, the Advisor waived or reimbursed expenses of $6,660, $32,160 and $382 for Class S, Class W and Class Z, respectively, for the year ended December 31, 2019. These amounts are included as a reduction of expenses on the Statement of Operations. At December 31, 2019, the Advisor is eligible to recoup $39,202. For the year ended December 31, 2019, the Advisor did not recoup any expenses that have been previously waived or reimbursed.
| 4. | Purchases and Sales of Securities |
For the year ended December 31, 2019, purchases and sales of securities, other than U.S. Government securities and short-term securities, were $72,481,814 and $104,326,296, respectively. There were no purchases or sales of U.S. Government securities.
The Series received proceeds from settlement of litigation where they were able to recover a portion of investment losses previously realized. This amount is shown as ligation proceeds in the Statement of Operations.
| 5. | Capital Stock Transactions |
Transactions in shares of Class S, Class I, Class W and Class Z shares of Real Estate Series were:
| CLASS S | FOR THE YEAR ENDED 12/31/2019 | FOR THE YEAR ENDED 12/31/2018 | ||||||||||||||
| SHARES | AMOUNT | SHARES | AMOUNT | |||||||||||||
Sold | 730,886 | $ | 11,290,209 | 1,757,808 | $ | 25,004,617 | ||||||||||
Reinvested | 126,718 | 2,016,087 | 985,726 | 13,482,994 | ||||||||||||
Repurchased | (13,580,492 | ) | (201,560,930 | ) | (4,532,215 | ) | (64,555,664 | ) | ||||||||
|
|
|
|
|
|
|
| |||||||||
Total |
|
(12,722,888 |
) | $ | (188,254,634 | ) | (1,788,681 | ) | $ | (26,068,053 | ) | |||||
|
|
|
|
|
|
|
| |||||||||
21
Real Estate Series
Notes to Financial Statements (continued)
| 5. | Capital Stock Transactions (continued) |
| CLASS I |
FOR THE YEAR ENDED 12/31/2019 |
FOR THE YEAR ENDED 12/31/2018 | ||||||||||||||
SHARES
| AMOUNT
| SHARES
| AMOUNT
| |||||||||||||
Sold | 3,862,253 | $ | 25,033,978 | 4,087,337 | $ | 26,517,405 | ||||||||||
Reinvested | 708,353 | 4,455,539 | 1,131,254 | 6,539,568 | ||||||||||||
Repurchased | (5,917,378 | ) | (37,598,078 | ) | (3,017,310 | ) | (19,859,470 | ) | ||||||||
|
|
|
|
|
|
|
| |||||||||
Total |
|
(1,346,772 |
) | $ | (8,108,561 | ) | 2,201,281 | $ | 13,197,503 | |||||||
|
|
|
|
|
|
|
| |||||||||
| CLASS W |
FOR THE PERIOD 3/1/19 (COMMENCEMENT OF OPERATIONS) | |||||||||||||||
SHARES
| AMOUNT
| |||||||||||||||
Sold | 13,695,504 | $ | 203,620,504 | |||||||||||||
Reinvested | 520,176 | 8,255,204 | ||||||||||||||
Repurchased | (2,453,449 | ) | (38,939,976 | ) | ||||||||||||
|
|
|
| |||||||||||||
Total |
|
11,762,231 |
| $ | 172,935,732 | |||||||||||
|
|
|
| |||||||||||||
| CLASS Z |
FOR THE PERIOD 3/1/19 (COMMENCEMENT OF OPERATIONS) | |||||||||||||||
SHARES
| AMOUNT
| |||||||||||||||
Sold | 520,511 | $ | 3,286,106 | |||||||||||||
Reinvested | 7,871 | 49,584 | ||||||||||||||
Repurchased | (444,812 | ) | (3,103,157 | ) | ||||||||||||
|
|
|
| |||||||||||||
Total |
|
83,570 |
| $ | 232,533 | |||||||||||
|
|
|
| |||||||||||||
Approximately 63% of the shares outstanding are fiduciary accounts where the Advisor has sole investment discretion. At December 31, 2019, the Advisor and its affiliates owned less than 0.1% of the Series.
| 6. | Line of Credit |
The Fund has entered into a364-day, $25 million credit agreement (the “line of credit”) with Bank of New York Mellon. Each series of the Fund may borrow under the line of credit for temporary or emergency purposes, including funding shareholder redemptions and other short-term liquidity purposes. The Fund pays an annual fee on the unused commitment amount, payable quarterly, and is allocated among all the series of the Fund and included in miscellaneous expenses in the Statement of Operations for each series. The line of credit expires in August 2020 unless extended or renewed. During the year ended December 31, 2019, the Series did not borrow under the line of credit.
| 7. | Financial Instruments |
The Series may trade in instruments including written and purchased options, forward foreign currency exchange contracts and futures contracts and other derivatives in the normal course of investing activities to assist in managing exposure to various market risks. The Series may be subject to various elements of risk, which may involve, to a varying degree, elements of risk in excess of the amounts recognized for financial statement purposes. These risks include: the risk that changes in the value of a derivative may not correlate perfectly with the underlying asset, rate or index; counterparty credit risk related to over the counter derivative counterparties’ failure to perform under contract terms; liquidity risk related to the lack of a liquid market for these contracts allowing the fund to close out its position(s); and documentation risk relating to disagreement over contract terms. No such investments were held by the Series as of December 31, 2019.
22
Real Estate Series
Notes to Financial Statements (continued)
| 8. | Foreign Securities |
Investing in securities of foreign companies and foreign governments involves special risks and considerations not typically associated with investing in securities of domestic companies and the U.S. Government. These risks include revaluation of currencies and future adverse political and economic developments. Moreover, securities of foreign companies and foreign governments and their markets may be less liquid and their prices more volatile than those of comparable domestic companies and the U.S. Government.
| 9. | Real Estate Securities |
The Series may focus its investments in certain real estate related industries; hence, the Series may subject itself to a greater degree of risk than a series that is more diversified.
| 10. | Federal Income Tax Information |
The amount and characterization of certain income and capital gains to be distributed are determined in accordance with federal income tax regulations, which may differ from GAAP. The portion of distributions that exceeds a Series’ current and accumulated earnings and profits, as measured on a tax basis, constitutes anon-taxable return of capital. These differences are primarily due to differing book and tax treatments in the timing and/or treatment of the recognition of net investment income or gains and losses, including foreign currency gains and losses, redesignation of distributions paid, investments in passive foreign investment companies (PFICs), including losses deferred due to wash sales and qualified late-year losses. The Series may periodically make reclassifications among its capital accounts to reflect income and gains available for distribution (or available capital loss carryovers) under income tax regulations without impacting the Series’ net asset value. Any such reclassifications are not reflected in the financial highlights.
The tax character of distributions paid were as follows:
FOR THE YEAR
|
FOR THE YEAR
| |||||||||
| Ordinary income | $7,071,573 | $ 5,528,569 | |||||||
Long-term capital gains | $8,287,379 | $15,115,801 | ||||||||
Return of capital | $ — | $ 604,808 | ||||||||
At December 31, 2019, the tax basis of components of distributable earnings and the net unrealized appreciation based on identified cost for federal income tax purposes were as follows:
Cost for federal income tax purposes | $ | 240,863,628 | ||||
| Unrealized appreciation | 63,745,484 | ||||
Unrealized depreciation | (4,550,763 | ) | ||||
|
| |||||
Net unrealized appreciation | $ | 59,194,721 | ||||
|
| |||||
Undistributed ordinary income | $ | 384,350 | ||||
Undistributed long-term capital gains | $ | 3,724,715 | ||||
23
Real Estate Series
Report of Independent Registered Public Accounting Firm
To the Board of Directors of Manning & Napier Fund, Inc. and Shareholders of Real Estate Series
Opinion on the Financial Statements
We have audited the accompanying statement of assets and liabilities, including the investment portfolio, of Real Estate Series (one of the series constituting Manning & Napier Fund, Inc., referred to hereafter as the “Fund”) as of December 31, 2019, the related statement of operations for the year ended December 31, 2019, the statement of changes in net assets for each of the two years in the period ended December 31, 2019, including the related notes, and the financial highlights for each of the periods indicated therein (collectively referred to as the “financial statements”). In our opinion, the financial statements present fairly, in all material respects, the financial position of the Fund as of December 31, 2019, the results of its operations for the year then ended, the changes in its net assets for each of the two years in the period ended December 31, 2019 the financial highlights for each of the periods indicated therein in conformity with accounting principles generally accepted in the United States of America.
Basis for Opinion
These financial statements are the responsibility of the Fund’s management. Our responsibility is to express an opinion on the Fund’s financial statements based on our audits. We are a public accounting firm registered with the Public Company Accounting Oversight Board (United States) (PCAOB) and are required to be independent with respect to the Fund in accordance with the U.S. federal securities laws and the applicable rules and regulations of the Securities and Exchange Commission and the PCAOB.
We conducted our audits of these financial statements in accordance with the standards of the PCAOB. Those standards require that we plan and perform the audit to obtain reasonable assurance about whether the financial statements are free of material misstatement, whether due to error or fraud.
Our audits included performing procedures to assess the risks of material misstatement of the financial statements, whether due to error or fraud, and performing procedures that respond to those risks. Such procedures included examining, on a test basis, evidence regarding the amounts and disclosures in the financial statements. Our audits also included evaluating the accounting principles used and significant estimates made by management, as well as evaluating the overall presentation of the financial statements. Our procedures included confirmation of securities owned as of December 31, 2019 by correspondence with the custodian. We believe that our audits provide a reasonable basis for our opinion.

New York, New York
February 14, 2020
We have served as the auditor of one or more investment companies in Manning & Napier Mutual Funds since 1992.
24
Real Estate Series
Supplemental Tax Information
(unaudited)
All reportings are based on financial information available as of the date of this annual report and, accordingly, are subject to change.
For federal income tax purposes, the Series reports for the current fiscal year $196,334 or, if different, the maximum amount allowable under the tax law as qualified dividend income.
For corporate shareholders, the percentage of investment income (dividend income plus short-term gains, if any) that qualifies for the dividends received deduction for the current fiscal year is 0.51%, or if different, the maximum allowable under tax law.
The Series designates $12,612,699 as Long-Term Capital Gain dividends pursuant to Section 852(b)(3) of the Internal Revenue Code for the fiscal year ended December 31, 2019.
The Series designates $6,840,293, or 96.7% of the dividends distributed as Section 199A dividends.
The Series designates $393,549 as a Section 1250 gain distribution for the fiscal year ended December 31, 2019.
25
Real Estate Series
Renewal of Investment Advisory Agreement
(unaudited)
At the Manning & Napier Fund, Inc. (the “Fund”) Board of Directors’ (the “Board”) meeting, held on November 21, 2019, the Investment Advisory Agreement (the “Agreement”) between the Fund and Manning & Napier Advisors, LLC (the “Advisor”) was considered for renewal by the Board, including all of the Directors who are not “interested persons” (“Independent Directors”), within the meaning of the Investment Company Act of 1940, as amended (the “1940 Act”). In connection with the decision whether to renew the Agreement, a variety of material was provided to the Board in advance of the meeting for their review and consideration. The Board also held a working session on October 25, 2019 to review and discuss information provided to the Board, and for the Board to request additional information.
Representatives of the Advisor attended a portion of the working session and attended the Board meeting. The Advisor provided supplemental information requested by the Board and presented additional oral information to the Board to assist the Board in its considerations. In addition to the information furnished by the Advisor, the Board was provided with a legal memorandum discussing its fiduciary duties related to its approval of the continuation of the Agreement. Legal counsel for the Fund discussed with the Board the applicable legal considerations. In addition, the Board receivedin-person presentations about the Fund throughout the year.
The Independent Directors were advised by independent legal counsel with respect to these matters. The Independent Directors also met separately in an executive session with their legal counsel without any representatives of the Advisor present.
The Directors’ determinations at the meeting were made on the basis of each Director’s business judgment after consideration of all the information presented. In deciding to recommend the renewal of the Agreement with respect to each Series of the Fund, the Independent Directors did not identify any single or particular piece of information that, in isolation, was the controlling factor. Each Independent Director may also have weighed factors differently. This summary describes the most important, but not all, of the factors considered by the Board and the Independent Directors.
| • | The Board considered the nature and quality of services provided by the Advisor under the Agreement for over 30 years including, among others: deciding what securities to purchase and sell for each Series; arranging for the purchase and sale of such securities by placing orders with broker-dealers; administering the affairs of the Fund (including the books and records of the Fund not maintained by third party service providers such as the custodian or transfer agent); arranging for the insurance coverage for the Fund; and supervising the preparation of tax returns, SEC filings (including registration statements) and reports to shareholders for the Fund. The Board considered the numerous services performed by the Advisor and its affiliates beyond those stated in the Agreements. The Board also considered the Advisor’s personnel who perform services to the Fund, changes in senior or key personnel, industry trends impacting the mutual fund industry, the strength of the Advisor’s compliance infrastructure, policies and procedures relating to compliance with securities regulations, reputation, expertise and resources. The Board discussed the quality of these services with representatives from the Advisor and concluded that the Advisor was performing its services to the Fund required under the Agreement in a reasonable manner. |
| • | The Board considered the Advisor’s investments teams, including changes to the investment teams and investment team’s compensation during the past year, and the investment process. The Board considered the performance of each Series since its inception, as well as over multiple time periods including: one year, three year, five year, ten year, and current market cycle. A market cycle includes periods of both rising and falling markets. Returns for established benchmark indices for each Series were provided. In addition, the Board considered (and considers on a quarterly basis) a number of other factors relevant to performance at the meeting including: a peer group performance analysis consisting of Morningstar universes of mutual funds with similar investment objectives; the breadth of the Fund’s product offerings; and performance over reasonable time periods. Representatives of the Advisor discussed improved performance for many of the Series over theone- and three-year time periods ending September 30, 2019. The Board discussed with Representatives of the Advisor, performance challenges that continue to impact the three- and five-year performance of certain Fund’s strategies resulting from periods of underperformance in 2014 and 2016. After discussion, the Board acknowledged the improved short term performance of many of the Series and concluded that notwithstanding the performance challenges that continue to impact certain Series, the nature and quality of the investment management services provided by the Advisor to the Fund supported the renewal of the agreement. |
| • | The Board considered the fees and expenses of the various Series of the Fund. The Advisor presented the advisory fees and total expenses for each Series, including the advisory fee adjusted for any contractual expense waivers or reimbursements paid by the Advisor. Representatives of the Advisor discussed the multi-year fee restructuring initiative which was completed by the Advisor on March 1, 2019 to increase the competitiveness of the Fund’s fees. The fee |
26
Real Estate Series
Renewal of Investment Advisory Agreement
(unaudited)
restructuring project also resulted in a set of standardized share classes to help support the Fund’s distribution efforts across client types and varying intermediary distribution models. |
| • | The Board considered whether the Advisor had achieved economies of scale with respect to its services to the Fund. The Board acknowledged the expense caps incorporated in the Fund’s current fee structure, which requires the Advisor to subsidize the expenses of the Series operating above their expense cap, noting that 26 Series of the Fund are currently receiving expense reimbursements from the Advisor. The Board concluded that the Fund would need to grow in assets before the Advisor would be able to achieve meaningful economies of scale. |
| • | The Advisor provided the Board with information comparing each Series’ contractual management fees with the Advisor’s standard advisory fees for separate accounts and collective investment trusts. The Board considered that the range of services provided to the Series is more extensive than for the Advisor’s other clients due to additional infrastructure, administrative and regulatory requirements related to operating a mutual fund. |
| • | The current advisory fees,12b-1 Distribution and Service Fees, other expenses (e.g. a combination of Shareholder Services Fees, intermediarysub-TA fees, routine operating expenses and Acquired Fund Fees and Expenses forfund-of-fund Series) and total expense ratios of each Series and share class were compared and ranked (on both a mean and median basis) against respective peer universes. Respective peer universes included funds of a similar size and with similar investment objectives and expense characteristics as disclosed on the Morningstar database. Representatives of the Advisor discussed with the Board the comparisons and rankings of fees and net expense ratios for each Series of the Fund and the methodology behind the comparison. The Board considered the Advisor’s active portfolio management that results in portfolios that are more differentiated than the construction of their benchmarks. The Board acknowledged that the fee restructuring project completed on March 1, 2019 reduced the expense ratios for shareholders in many Series. Based on their review of the information provided, the Board concluded that the current fees and expenses of each Series of the Fund were reasonable on a comparative basis. |
| • | The Board also considered the other benefits the Advisor derives from its relationship with the Fund. Such other benefits include participation in a joint insurance program, sharing of compensation expenses for certain shared personnel, relationships with large service providers, the utilization of Series within the Advisor’s separately managed accounts and certain research services provided by soft dollars. The Board reviewed the broker-dealers who provided research to the Advisor and the products and services paid for, in whole or in part, using soft dollar commissions. The Board concluded that these additional benefits to the Advisor were reasonable. |
Based on the Board’s deliberations and their evaluation of the information described above, the Board, including a majority of the Independent Directors, concluded that the compensation under the Agreement was fair and reasonable with respect to each Series in light of the services and expenses and such other matters as the Directors considered to be relevant in the exercise of their reasonable judgment, and that the renewal of the Agreement would be in the best interests of each Series and its shareholders. The Board did not indicate that any single factor was determinative of its decision to approve the Agreement, but indicated that the Board based its determination on the total mix of information available to it.
27
Real Estate Series
Directors’ and Officers’ Information
(unaudited)
The Statement of Additional Information provides additional information about the Fund’s directors and officers and can be obtained without charge by calling1-800-466-3863, at www.manning-napier.com, or on the EDGAR Database on the SEC Internet web site (http://www.sec.gov). The following chart shows certain information about the Fund’s directors and officers, including their principal occupations during the last five years. Unless specific dates are provided, the individuals have held the listed positions for longer than five years.
| Interested Director and Officer | ||
| Name: | Paul Battaglia* | |
| Address: | 290 Woodcliff Drive | |
| Fairport, NY 14450 | ||
| Age: | 41 | |
| Current Position(s) Held with Fund: | Principal Executive Officer, President, Chairman & Director | |
| Term of Office & Length of Time Served: | Indefinite – Chairman and Director since November 20181 | |
| Principal Occupation(s) During Past 5 Years: | Chief Financial Officer (2018 – Present); Vice President of Finance (2016 – 2018); Director of Finance (2011 – 2016); Financial Analyst/Internal Auditor (2004-2006) – Manning & Napier Advisors, LLC and affiliates Holds one or more of the following titles for various subsidiaries and affiliates: Chief Financial Officer | |
| Number of Portfolios Overseen within Fund Complex: | 31 | |
Other Directorships Held Outside Fund Complex During Past 5 Years: | N/A | |
| Independent Directors | ||
| Name: | Stephen B. Ashley | |
| Address: | 290 Woodcliff Drive | |
| Fairport, NY 14450 | ||
| Age: | 79 | |
| Current Position(s) Held with Fund: | Director, Audit Committee Member, Governance & Nominating Committee Member | |
| Term of Office & Length of Time Served: | Indefinite – Since 1996 | |
| Principal Occupation(s) During Past 5 Years: | Chairman and Director (1997 to present); Chief Executive Officer | |
| (1997-2019) - Ashley Companies (property management and investment) . | ||
| Number of Portfolios Overseen within Fund Complex: | 31 | |
| Other Directorships Held Outside Fund Complex During | Ashley Companies (1997 - present) | |
| Past 5 Years: | ||
| Name: | Paul A. Brooke | |
| Address: | 290 Woodcliff Drive | |
| Fairport, NY 14450 | ||
| Age: | 74 | |
| Current Position(s) Held with Fund: | Lead Independent Director, Audit Committee Member, Governance & | |
| Nominating Committee Chairman | ||
| Term of Office & Length of Time Served: | Indefinite – Director, Audit Committee Member, Governance & Nominating Committee Member since 2007; Governance & Nominating Committee Chairman since 2016; Lead Independent Director since 2017 | |
| Principal Occupation(s) During Past 5 Years: | Chairman & CEO (2005-2009) - Ithaka Acquisition Corporation (investments); Chairman (2007-2009) - Alsius Corporation (investments); Managing Member (1991-present) - PMSV Holdings LLC (investments); Managing Member (2010-2016) - Venbio (investments). | |
| Number of Portfolios Overseen within Fund Complex: | 31 | |
| Other Directorships Held Outside Fund Complex During Past 5 Years: | Incyte Corp. (biotech)(2000-present); ViroPharma, Inc. (speciality pharmaceuticals)(2000-2014); HLTH (WebMD)(information)(2000-2010); Cheyne Capital International (investment)(2000-2017); GMP Companies (investment)(2000-2011); Cytos Biotechnology Ltd (biotechnology)(2012-2014); Cerus (biomedical)(2016-present);PureEarth(non-profit)
| |
28
Real Estate Series
Directors’ and Officers’ Information
(unaudited)
Independent Directors (continued)
| Name: | Peter L. Faber | |
| Address: | 290 Woodcliff Drive | |
| Fairport, NY 14450 | ||
| Age: | 81 | |
| Current Position(s) Held with Fund: | Director, Governance & Nominating Committee Member | |
| Term of Office & Length of Time Served: | Indefinite – Since 1987 | |
| Principal Occupation(s) During Past 5 Years: | Senior Counsel (2006-2012), Partner (1995-2006 & 2013-2018) - McDermott, Will & Emery LLP (law firm) | |
Number of Portfolios Overseen within Fund Complex: Other Directorships Held Outside Fund Complex During Past 5 Years: | 31 Boston Early Music Festival(non-profit)(2007-present); Amherst Early Music, Inc.(non-profit)(2009-present); Gotham Early Music Scene, Inc.(non-profit)(2009-present); Partnership for New York City, Inc.(non-profit)(1989-2010); New York Collegium(non-profit)(2004-2011); S’Cool Sounds, Inc.(non-profit)(2017-present) | |
| Name: | Harris H. Rusitzky | |
| Address: | 290 Woodcliff Drive | |
| Fairport, NY 14450 | ||
| Age: | 84 | |
| Current Position(s) Held with Fund: | Director, Audit Committee Member, Governance & Nominating Committee | |
| Member | ||
| Term of Office & Length of Time Served: | Indefinite – Since 1985 | |
| Principal Occupation(s) During Past 5 Years: | President (1994- present) - The Greening Group (business consultants); | |
| Partner (2006-present) - The Restaurant Group (restaurants) | ||
Number of Portfolios Overseen within Fund Complex: Other Directorships Held Outside Fund Complex During Past 5 Years: | 31 Rochester Institute of Technology (university)(1972-present); Culinary Institute of America(non-profit college)(1985-present); George Eastman Museum (museum)(1988-present); National Restaurant Association (restaurant trade organization)(1978-present) | |
| Name: | Chester N. Watson | |
| Address: | 290 Woodcliff Drive | |
| Fairport, NY 14450 | ||
| Age: | 69 | |
| Current Position(s) Held with Fund: | Director, Audit Committee Chairman, Governance & Nominating | |
| Committee Member | ||
| Term of Office & Length of Time Served: | Indefinite – Director, Audit Committee Member, Governance & Nominating | |
| Committee Member Since 2012; Audit Committee Chairman since 2013 | ||
| Principal Occupation(s) During Past 5 Years: | General Auditor (2003-2011) - General Motors Company (auto | |
| manufacturer) | ||
Number of Portfolios Overseen within Fund Complex: Other Directorships Held Outside Fund Complex During Past 5 Years: | 31 Rochester Institute of Technology (University)(2005-present); Town of Greenburgh, NY Planning Board (Municipal Government) (2015-2019); Hudson Valley Center for Innovation, Inc. (New Business and Economic Development) (2019 – present) | |
| Officers: | ||
| Name: | Elizabeth Craig | |
| Address: | 290 Woodcliff Drive | |
| Fairport, NY 14450 | ||
| Age: | 32 | |
| Current Position(s) Held with Fund: | Corporate Secretary | |
| Term of Office1& Length of Time Served: | Since 2016 | |
| Principal Occupation(s) During Past 5 Years: | Fund Regulatory Administration Manager since 2018; Fund Administration Manager (2015-2018); Mutual Fund Compliance Specialist (2009-2015) - Manning & Napier Advisors, LLC; Assistant Corporate Secretary (2011-2016) - Manning & Napier Fund, Inc.; Corporate Secretary, Director – Manning & Napier Investor Services, Inc. (since 2019)
| |
29
Real Estate Series
Directors’ and Officers’ Information
(unaudited)
Officers: (continued)
| Name: | Christine Glavin | |
| Address: | 290 Woodcliff Drive | |
| Fairport, NY 14450 | ||
| Age: | 53 | |
| Current Position(s) Held with Fund: | Principal Financial Officer, Chief Financial Officer | |
| Term of Office1& Length of Time Served: | Principal Financial Officer since 2002; Chief Financial Officer since 2001 | |
| Principal Occupation(s) During Past 5 Years: | Director of Fund Reporting since 2011; Fund Reporting Manager (1997-2011) - Manning & Napier Advisors, LLC; Assistant Treasurer since 2008 - Exeter Trust Company; Chief Financial Officer (2017-2018) - Rainier Investment Management Mutual Funds, Inc. | |
| Name: | Samantha Larew | |
| Address: | 290 Woodcliff Drive | |
| Fairport, NY 14450 | ||
| Age: | 39 | |
| Current Position(s) Held with Fund: | Chief Compliance Officer and Anti-Money Laundering Compliance Officer | |
| Term of Office1& Length of Time Served: | Chief Compliance Officer since 2019; Anti-Money Laundering Compliance | |
| Officer since 2018 | ||
| Principal Occupation(s) During Past 5 Years: | Co-Director of Compliance (since 2018); Compliance Communications Supervisor (2014-2018); Compliance Supervisor (2013-2014); Broker-Dealer Compliance Supervisor (2011-2013); Broker-Dealer Compliance Analyst (2010-2011) - Manning & Napier Advisors, LLC & Affiliates; Broker-Dealer Chief Compliance Officer (since 2013); Broker-Dealer Assistant Corporate Secretary (since 2011) – Manning & Napier Investor Services, Inc.; Compliance Analyst (2007-2009) – Wall Street Financial Group; Compliance Specialist (2003-2007) – Manning & Napier Advisors, LLC & Affiliates Holds one or more of the following titles for various affiliates: Assistant Corporate Secretary, Chief Compliance Officer | |
| Name: | Scott Morabito | |
| Address: | 290 Woodcliff Drive | |
| Fairport, NY 14450 | ||
| Age: | 32 | |
| Current Position(s) Held with Fund: | Vice President | |
| Term of Office1& Length of Time Served: | Vice President since 2019; Assistant Vice President (2017-2019) | |
| Principal Occupation(s) During Past 5 Years: | Managing Director of Operations since 2019; Director of Funds Group (2017-2019); Fund Product and Strategy Manager (2014-2017); Senior Product and Strategy Analyst (2013-2014); Product and Strategy Analyst (2011-2013) - Manning & Napier Advisors, LLC; President, Director – Manning & Napier Investor Services, Inc. (since 2018) | |
| Name: | Sarah Turner | |
| Address: | 290 Woodcliff Drive | |
| Fairport, NY 14450 | ||
| Age: | 37 | |
| Current Position(s) Held with Fund: | Chief Legal Officer; Assistant Corporate Secretary | |
| Term of Office1& Length of Time Served: | Since 2018 | |
| Principal Occupation(s) During Past 5 Years: | Attorney since 2018 - Manning & Napier Advisors, LLC and affiliates; Counsel (2017-2018) – Harter Secrest and Emery LLP; Legal Counsel (2010-2017) – Manning & Napier Advisors, LLC and affiliates Holds one or more of the following titles for various affiliates: Corporate Secretary, General Counsel | |
*Interested Director, within the meaning of the 1940 Act by reason of his positions with the Fund’s Advisor, Manning & Napier Advisors, LLC, and Distributor, Manning & Napier Investor Services, Inc.
1The term of office of all officers shall be one year and until their respective successors are chosen and qualified, or his or her earlier resignation or removal as provided in the Fund’sBy-Laws.
30
Real Estate Series
Literature Requests
(unaudited)
Proxy Voting Policies and Procedures
A description of the policies and procedures that the Fund uses to determine how to vote proxies relating to portfolio securities is available, without charge, upon request:
| By phone | 1-800-466-3863 | |||
| On the Securities and Exchange | ||||
| Commission’s (SEC) web site | http://www.sec.gov |
Proxy Voting Record
Information regarding how the Fund voted proxies relating to portfolio securities during the most recent12-month period ended June 30th is available, without charge, upon request:
| By phone | 1-800-466-3863 | |||
| On the SEC’s web site | http://www.sec.gov |
Quarterly Portfolio Holdings
The Series’ complete schedule of portfolio holdings for the 1st and 3rd quarters of each fiscal year are provided on FormN-PORT, and are available, without charge, upon request:
| By phone | 1-800-466-3863 | |||
| On the SEC’s web site | http://www.sec.gov |
Prospectus and Statement of Additional Information (SAI)
For more information about any of the Manning & Napier Fund, Inc. Series, you may obtain a prospectus and SAI at www.manning-napier.com or by calling (800)466-3863. Before investing, carefully consider the objectives, risks, charges and expenses of the investment and read the prospectus carefully as it contains this and other information about the investment company.In addition, this information can be found on the SEC’s web site, http://www.sec.gov.
Additional information available at www.manning-napier.com
1. Fund Holdings -Month-End
2. Fund Holdings -Quarter-End
3. Shareholder Report - Annual
4. Shareholder Report - Semi-Annual
The Fund also offers electronic notification or“e-delivery” when certain documents are availableon-line to be downloaded or reviewed. Direct shareholders can elect to receive electronic notification when shareholder reports, prospectus updates, and/or statements are available. If you do not currently haveon-line access to your account, you can establish access by going to www.manning-napier.com, click on “Login” in the top corner of the page, and follow the prompts to self-enroll. Once enrolled, you can set your electronic notification preferences by clicking on the Account Options tab located within the green toolbar and then selectE-Delivery Option. Should you have any questions on either how to establishon-line access or how to update your account settings, please contact Investor Services at1-800-466-3863.
The Manning & Napier Fund, Inc. is managed by Manning & Napier Advisors, LLC. Manning & Napier Investor Services, Inc., an affiliate of Manning & Napier Advisors, LLC, is the distributor of the Fund shares.
MNRES-12/19-AR
Manning & Napier Fund, Inc.
Diversified Tax Exempt Series
Beginning on February 25, 2021, as permitted by Securities and Exchange Commission regulations, paper copies of the Series’ annual and semi-annual shareholder reports will no longer be sent by mail, unless you specifically request paper copies of the reports from the Fund or from your financial intermediary, such as a broker-dealer or bank. Instead, the reports will be made available on a website, and you will be notified by mail each time a report is posted and provided with a website link to access the report.
If you already elected to receive shareholder reports electronically, you will not be affected by this change and you need not take any action. You may elect to receive shareholder reports and other communications from the Fund electronically by contacting your financial intermediary or, if you are a direct investor, by visiting www.manning-napier.com or calling1-800-466-3863.
You may elect to receive all future annual and semi-annual reports in paper free of charge. If you invest through a financial intermediary, you can contact your financial intermediary to request that you continue to receive paper copies of your shareholder reports. If you invest directly with the Fund, you can inform the Fund that you wish to continue receiving paper copies of your shareholder reports by visiting www.manning-napier.com or calling1-800-466-3863. Your election to receive reports in paper will apply to all funds held with your financial intermediary if you invest through a financial intermediary or all series of the Fund if you invest directly with the Fund. |
| Independent Perspective | Real-World Solutions |
A Note from Our CEO
Dear Shareholder,
The investing world is constantly changing, yet investors’ needs and objectives remain substantially the same.
Whether you are an individual saver looking to ensure security in retirement, or an institutional investor with a fiduciary obligation to others, at the end of the day you look for a trusted partner to help you build, grow, and preserve wealth.
In order to do so successfully we recognize that, in the short-term, the world’s capital markets can be capricious and hard to predict.
Bubbles form, rise, and then pop. The hot stocks of today often become passing fads of tomorrow. Investor sentiment can swing wildly, whipsawing between exuberance one day and despondence the next.
As successful long-term investors, we are defined both by what we do as well as what we don’t do.
We don’t attempt to perfectly time every recession. We don’t jump on the latest trend. We don’t worry about capturing every market peak all across the globe.
On the other hand, we do maintain the rigorous disciplines we have developed over close to half a century. We are highly attentive to managing risk and protecting investors in down markets while participating fully in the opportunities our Research uncovers.
Our focus is on you, the shareholder, and helping you achieve your goals.
In the face of an uncertain world, we believe our investment philosophies, processes, and experience have stood the test of time and will do so in the future.
We appreciate your continued confidence in our approach.
|
Sincerely,
Marc Mayer
Chief Executive Officer |
Corporate Headquarters | 290 Woodcliff Drive | Fairport, NY 14450 | (585)325-6880 phone | (800)551-0224 toll free | www.manning-napier.com
1
Diversified Tax Exempt Series
Fund Commentary
(unaudited)
Investment Objective
To provide as high a level of current income that is exempt from federal income taxes which the Advisor believes is consistent with the preservation of capital. The Series invests primarily in municipal bonds that provide income exempt from federal income tax.
Performance Commentary
The municipal bond market posted positive returns for the twelve-month period ending December 31, 2019. Despite some intra-year volatility, interest rates fell roughly 55 to 100 basis points across the yield curve as demand remained high for sources of tax-free income. Additionally, credit spreads ended the year tighter than the previous year as investors continued to search for sources of higher yield. Given these dynamics, longer-dated securities outperformed shorter-dated securities and lower-quality outperformed higher-quality.
The Diversified Tax Exempt Series Class A shares delivered positive absolute returns, returning 5.10% during the year, but modestly underperformed its benchmark, the Intercontinental (ICE) Bank of America Merrill Lynch (BofAML) 1-12 Year Municipal Bond Index, which returned 5.64%.
When viewed on a gross-of-fee basis the Series outperformed its benchmark, with allocations to longer-dated securities contributing positively to performance as yields broadly fell. As compared to the benchmark, the Series’ underweight allocation to middle tier credits detracted from relative returns as spreads tightened.
In terms of positioning, we continue to believe a modest duration remains in investors’ best interests. Going forward, we would view an increase in rates or a more negative view of the economy as an attractive opportunity to increase duration. Alternatively, should we see rates move lower without an accompanying meaningful change in the economic environment, we may look to decrease duration as investors are not likely being compensated for taking on the additional risk associated with longer-term bonds.
Our economic outlook remains constructive towards revenue bonds, which continue to offer attractive valuations while exhibiting stable credit fundamentals. Within revenue bonds, we maintain a focus on higher quality/essential service bonds (e.g., water and sewer authorities).
With respect to general obligations at the state level, we believe that most states are in a relatively stable credit position. We do, however, believe it’s unlikely that we see broad improvement in the sector considering where we are in the cycle, current valuations, and potential impacts of elevated pension obligations.
At the local level, our outlook also remains stable as property taxes are relatively healthy. That stated, we continue to monitor states where there is the potential for credit deterioration due to pension underfunding and the impact on local governments should costs be passed on.
While 2019 was a very strong year for municipal bonds, we believe investor return expectations for the coming year should be tempered as the fixed income landscape remains challenging due to low starting rates. That stated, we believe a flexible approach with the ability to adapt to changing environments (e.g., uncovering risks and opportunities) will remain essential to achieving investor objectives.
Performance for the Diversified Tax Exempt Series Class A shares is provided above. Performance for other shares classes will differ based on each class’ underlying expenses.
Performance data quoted represents past performance and does not guarantee future results. The investment return and principal value of an investment will fluctuate, so that an investor’s shares, when redeemed, may be worth more or less than their original cost. Current performance may be higher or lower than that quoted; investors can obtain the most recent month-end performance at www.manning-napier.com or by calling (800) 466-3863.
Additional information and associated disclosures can be found on the Performance Update page of this report.
All investments involve risks, including possible loss of principal. There is an inverse relationship between bond prices and interest rates; as interest rates rise, bond prices (and therefore the value of bond funds) fall. Likewise, as interest rates fall, bond prices and the value of bond funds rise. The income earned by the Series may be subject to the Alternative Minimum Tax (AMT), depending on your tax situation.
2
Diversified Tax Exempt Series
Performance Update as of December 31, 2019
(unaudited)
AVERAGE ANNUAL TOTAL RETURNS | ||||||
ONE
| FIVE
| TEN
| ||||
Diversified Tax Exempt Series - Class A2 | 5.10% | 1.74% | 2.03% | |||
Diversified Tax Exempt Series - Class W2,3 | 5.67% | 1.85% | 2.09% | |||
| Intercontinental Exchange (ICE) Bank of America Merrill Lynch (BofAML) 1-12 Year Municipal Bond Index4 | 5.64% | 2.55% | 3.08% | |||
The following graph compares the value of a $10,000 investment in the Diversified Tax Exempt Series - Class A for the ten years ended December 31, 2019 to the Intercontinental Exchange (ICE) BofA Merrill Lynch 1-12 Year Municipal Bond Index.
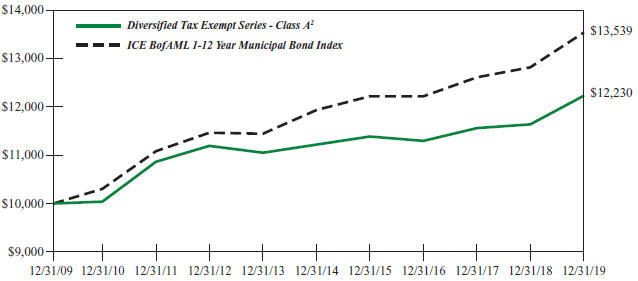
1The returns shown are based on net asset values calculated for shareholder transactions and may differ from the returns shown in the financial highlights, which reflect adjustments made to the net asset values in accordance with accounting principles generally accepted in the United States of America.
2The Series’ performance does not reflect the deduction of taxes that a shareholder would pay on fund distributions or the redemption of shares. The Series’ performance is historical and may not be indicative of future results. The performance returns shown are inclusive of the net expense ratio of the Series. For the year ended December 31, 2019, this net expense ratio was 0.58% for Class A and 0.11% for Class W. The gross expense ratio, which does not account for any voluntary or contractual waivers currently in effect, was 0.58% for Class A and 0.61% for Class W for the year ended December 31, 2019.
3For periods through March 1, 2019 (the inception date of the Class W shares), performance for the Class W shares is based on the historical performance of the Class A shares. Because the Class W shares invest in the same portfolio of securities as the Class A shares, performance will be different only to the extent that the Class A shares have a higher expense ratio.
4The Intercontinental Exchange (ICE) Bank of America Merrill Lynch (BofAML) 1-12 Year Municipal Bond Index is a subset of the ICE BofAML U.S. Municipal Securities Index. The Index includes all U.S. dollar denominated investment grade tax-exempt debt with a remaining term to final maturity greater than one year, but less than twelve years. Qualifying securities must have at least 18 months to final maturity at the time of issuance and a fixed coupon schedule. The Index returns do not reflect any fees or expenses. Index returns provided by Interactive Data.
3
Diversified Tax Exempt Series
Shareholder Expense Example
(unaudited)
As a shareholder of the Series, you incur ongoing costs, including management fees, shareholder service fees and other Series expenses. This example is intended to help you understand your ongoing costs (in dollars) of investing in the Series and to compare these costs with the ongoing costs of investing in other mutual funds.
The example is based on an investment of $1,000 invested in each class at the beginning of the period and held for the entire period (July 1, 2019 to December 31, 2019).
Actual Expenses
The Actual lines of the table below provide information about actual account values and actual expenses. You may use the information in this line, together with the amount you invested, to estimate the expenses that you paid over the period. Simply divide your account value by $1,000 (for example, an $8,600 account value divided by $1,000 = 8.6), then multiply the result by the number in the Actual line for the Class in which you have invested under the heading entitled “Expenses Paid During Period” to estimate the expenses you paid on your account during this period.
Hypothetical Example for Comparison Purposes
The Hypothetical lines of each class in the table below provide information about hypothetical account values and hypothetical expenses based on the Class’ actual expense ratio and an assumed rate of return of 5% per year before expenses, which is not the Class’ actual return. The hypothetical account values and expenses may not be used to estimate the actual ending account balance or expenses you paid during the period. You may use this information to compare the ongoing costs of investing in a class of the Series and other funds. To do so, compare this 5% hypothetical example for the class in which you have invested with the 5% hypothetical examples that appear in the shareholder reports of the other funds.
Please note that the expenses shown in the table are meant to highlight your ongoing costs only and do not reflect any transaction costs, such as sales charges (loads), redemption fees, or exchange fees that you may incur in other mutual funds. Therefore, the second line of the table is useful in comparing ongoing costs only, and will not help you determine the relative total costs of owning different funds.
BEGINNING ACCOUNT VALUE 7/1/19
|
ENDING ACCOUNT VALUE 12/31/19
|
EXPENSES PAID DURING PERIOD* 7/1/19-12/31/19
|
ANNUALIZED EXPENSE RATIO
| |||||
Class A | ||||||||
��Actual | $1,000.00 | $1,014.90 | $3.30 | 0.65% | ||||
Hypothetical | $1,000.00 | $1,021.93 | $3.31 | 0.65% | ||||
Class W | ||||||||
Actual | $1,000.00 | $1,018.10 | $0.66 | 0.13% | ||||
Hypothetical | $1,000.00 | $1,024.55 | $0.66 | 0.13% | ||||
*Expenses are equal to each Class’ annualized expense ratio (for the six-month period), multiplied by the average account value over the period, multiplied by 184/365 (to reflect the one-half year period). Expenses are based on the most recent fiscal half year; therefore; the expense ratio stated above may differ from the expense ratio stated in the financial highlights, which are based on one-year data. The Class’ total return would have been lower had certain expenses not been waived or reimbursed during the period.
4
Diversified Tax Exempt Series
Portfolio Composition as of December 31, 2019
(unaudited)

Top Ten States2 | ||||||||||||
New York | 19.8 | % | Maryland | 4.6% | ||||||||
Ohio | 8.4 | % | Arizona | 4.5% | ||||||||
Washington | 5.9 | % | Texas | 4.4% | ||||||||
Florida | 5.5 | % | Oregon | 3.8% | ||||||||
District of Columbia | 5.0 | % | Massachusetts | 3.4% | ||||||||
| 2As a percentage of total investments. | ||||||||||||
5
Diversified Tax Exempt Series
Investment Portfolio - December 31, 2019
| CREDIT | ||||||||||||||||||||||||
| COUPON | MATURITY | RATING1 | PRINCIPAL | VALUE | ||||||||||||||||||||
RATE
| DATE
| (UNAUDITED)
| AMOUNT
| (NOTE 2)
| ||||||||||||||||||||
MUNICIPAL BONDS - 96.2% | ||||||||||||||||||||||||
ALASKA - 0.3% | ||||||||||||||||||||||||
Alaska Municipal Bond Bank Authority, Series 2, Revenue Bond | 5.000% | 9/1/2022 | A1 | $ | 500,000 | $ | 539,495 | |||||||||||||||||
|
| |||||||||||||||||||||||
ARIZONA - 4.5% | ||||||||||||||||||||||||
Maricopa County Unified School District No. 89-Dysart, G.O. Bond | 5.000% | 7/1/2026 | A2 | 1,000,000 | 1,153,520 | |||||||||||||||||||
Mesa, Multiple Utility Impt., Revenue Bond | 5.000% | 7/1/2023 | Aa2 | 1,050,000 | 1,188,243 | |||||||||||||||||||
Mesa, Multiple Utility Impt., Revenue Bond | 5.000% | 7/1/2024 | Aa2 | 1,200,000 | 1,399,980 | |||||||||||||||||||
Mesa, Multiple Utility Impt., Revenue Bond | 3.000% | 7/1/2039 | Aa2 | 1,525,000 | 1,560,121 | |||||||||||||||||||
Pima County Sewer System, Series B, Revenue Bond | 5.000% | 7/1/2020 | AA2 | 1,400,000 | 1,427,062 | |||||||||||||||||||
Salt River Project Agricultural Impt. & Power District, Series B, Revenue Bond | 5.000% | 12/1/2020 | Aa1 | 400,000 | 414,248 | |||||||||||||||||||
Tucson Water System Revenue, Water Utility Impt., Revenue Bond | 5.000% | 7/1/2021 | Aa2 | 1,000,000 | 1,057,960 | |||||||||||||||||||
Yavapai County Industrial Development Authority, | ||||||||||||||||||||||||
Northern Arizona Healthcare System, Revenue Bond | 5.000% | 10/1/2020 | AA2 | 460,000 | 472,944 | |||||||||||||||||||
|
| |||||||||||||||||||||||
|
8,674,078 |
| ||||||||||||||||||||||
|
| |||||||||||||||||||||||
ARKANSAS - 0.5% | ||||||||||||||||||||||||
Beaver Water of Benton & Washington Counties, Revenue Bond | 4.000% | 11/15/2021 | AA2 | 1,000,000 | 1,025,020 | |||||||||||||||||||
|
| |||||||||||||||||||||||
COLORADO - 2.6% | ||||||||||||||||||||||||
Aurora Water, Green Bond, Revenue Bond | 4.000% | 8/1/2046 | AA2 | 2,000,000 | 2,173,200 | |||||||||||||||||||
Boulder County, Series A, Revenue Bond | 5.000% | 7/15/2026 | AA2 | 1,000,000 | 1,233,750 | |||||||||||||||||||
Denver Wastewater Management Division | ||||||||||||||||||||||||
Department of Public Works, Revenue Bond | 4.000% | 11/1/2020 | Aa1 | 1,500,000 | 1,536,225 | |||||||||||||||||||
|
| |||||||||||||||||||||||
|
4,943,175 |
| ||||||||||||||||||||||
|
| |||||||||||||||||||||||
DISTRICT OF COLUMBIA - 5.0% | ||||||||||||||||||||||||
District of Columbia Water & Sewer Authority, Series B, Revenue Bond | 5.000% | 10/1/2036 | Aa2 | 900,000 | 1,063,233 | |||||||||||||||||||
District of Columbia Water & Sewer Authority, Series C, Revenue Bond | 5.000% | 10/1/2022 | Aa2 | 1,000,000 | 1,106,230 | |||||||||||||||||||
District of Columbia Water & Sewer Authority, Sewer Impt., Series A, Revenue Bond | 4.000% | 10/1/2049 | Aa2 | 2,000,000 | 2,245,280 | |||||||||||||||||||
District of Columbia, Public Impt., Series A, G.O. Bond | 4.000% | 10/15/2044 | Aaa | 2,750,000 | 3,094,520 | |||||||||||||||||||
The accompanying notes are an integral part of the financial statements.
6
Diversified Tax Exempt Series
Investment Portfolio - December 31, 2019
| CREDIT | ||||||||||||||||||||||||
| COUPON | MATURITY | RATING1 | PRINCIPAL | VALUE | ||||||||||||||||||||
RATE
| DATE
| (UNAUDITED)
| AMOUNT
| (NOTE 2)
| ||||||||||||||||||||
MUNICIPAL BONDS(continued) | ||||||||||||||||||||||||
DISTRICT OF COLUMBIA(continued) | ||||||||||||||||||||||||
District of Columbia, Public Impt., Series D, G.O. Bond | 5.000% | 6/1/2026 | Aaa | $ | 750,000 | $ | 922,613 | |||||||||||||||||
District of Columbia, Public Impt., Series D, G.O. Bond | 5.000% | 6/1/2035 | Aaa | 1,000,000 | 1,216,200 | |||||||||||||||||||
|
| |||||||||||||||||||||||
|
9,648,076 |
| ||||||||||||||||||||||
|
| |||||||||||||||||||||||
FLORIDA - 5.4% | ||||||||||||||||||||||||
Florida State, Public Impt., Series B, G.O. Bond | 4.000% | 7/1/2048 | Aaa | 2,000,000 | 2,232,740 | |||||||||||||||||||
Hillsborough County, Series B, G.O. Bond | 3.000% | 7/1/2041 | Aaa | 1,070,000 | 1,110,189 | |||||||||||||||||||
Hillsborough County, Series B, G.O. Bond | 3.000% | 7/1/2046 | Aaa | 1,500,000 | 1,530,045 | |||||||||||||||||||
Miami Beach, Water & Sewer, Revenue Bond | 5.000% | 9/1/2047 | Aa3 | 1,400,000 | 1,655,010 | |||||||||||||||||||
Miami-Dade County, Water & Sewer, Revenue Bond | 5.000% | 10/1/2023 | Aa3 | 2,000,000 | 2,282,740 | |||||||||||||||||||
Miami-Dade County, Water & Sewer, Sewer Impt., Series B, Revenue Bond | 4.000% | 10/1/2049 | Aa3 | 1,000,000 | 1,108,980 | |||||||||||||||||||
Port St. Lucie Utility System, Water Utility Impt., Revenue Bond, NATL | 5.250% | 9/1/2023 | A1 | 500,000 | 570,760 | |||||||||||||||||||
|
| |||||||||||||||||||||||
|
10,490,464 |
| ||||||||||||||||||||||
|
| |||||||||||||||||||||||
GEORGIA - 1.1% | ||||||||||||||||||||||||
Atlanta, Water & Wastewater System, Revenue Bond | 3.000% | 11/1/2036 | Aa2 | 525,000 | 550,641 | |||||||||||||||||||
Atlanta, Water & Wastewater System, Revenue Bond | 3.000% | 11/1/2037 | Aa2 | 555,000 | 578,016 | |||||||||||||||||||
Municipal Electric Authority of Georgia, Series A, Revenue Bond | 5.000% | 11/1/2020 | A1 | 1,000,000 | 1,030,260 | |||||||||||||||||||
|
| |||||||||||||||||||||||
| 2,158,917 | ||||||||||||||||||||||||
|
| |||||||||||||||||||||||
HAWAII - 1.6% | ||||||||||||||||||||||||
Honolulu County Wastewater System, Sewer Impt., Series A, Revenue Bond | 5.000% | 7/1/2023 | Aa3 | 1,750,000 | 1,979,758 | |||||||||||||||||||
Honolulu County, Public Impt., Series C, G.O. Bond | 3.000% | 8/1/2040 | Aa1 | 500,000 | 516,865 | |||||||||||||||||||
Honolulu County, Public Impt., Series C, G.O. Bond | 3.000% | 8/1/2041 | Aa1 | 500,000 | 514,070 | |||||||||||||||||||
|
| |||||||||||||||||||||||
|
3,010,693 |
| ||||||||||||||||||||||
|
| |||||||||||||||||||||||
ILLINOIS - 1.8% | ||||||||||||||||||||||||
Aurora, Waterworks & Sewerage, Series B, Revenue Bond | 3.000% | 12/1/2022 | AA2 | 500,000 | 521,110 | |||||||||||||||||||
Aurora, Waterworks & Sewerage, Series B, Revenue Bond | 3.000% | 12/1/2023 | AA2 | 625,000 | 658,350 | |||||||||||||||||||
The accompanying notes are an integral part of the financial statements.
7
Diversified Tax Exempt Series
Investment Portfolio - December 31, 2019
| CREDIT | ||||||||||||||||||||||||
| COUPON | MATURITY | RATING1 | PRINCIPAL | VALUE | ||||||||||||||||||||
RATE
| DATE
| (UNAUDITED)
| AMOUNT
| (NOTE 2)
| ||||||||||||||||||||
MUNICIPAL BONDS (continued) | ||||||||||||||||||||||||
ILLINOIS(continued) | ||||||||||||||||||||||||
Illinois Municipal Electric Agency, Series A, Revenue Bond | 5.000% | 2/1/2025 | A1 | $ | 2,000,000 | $ | 2,349,660 | |||||||||||||||||
|
| |||||||||||||||||||||||
| 3,529,120 | ||||||||||||||||||||||||
|
| |||||||||||||||||||||||
INDIANA - 0.8% | ||||||||||||||||||||||||
Fort Wayne Waterworks, Water Utility Impt., Revenue Bond | 2.000% | 12/1/2020 | Aa3 | 745,000 | 750,245 | |||||||||||||||||||
Indiana Municipal Power Agency, Series A, Revenue Bond | 4.000% | 1/1/2020 | A1 | 750,000 | 750,000 | |||||||||||||||||||
|
| |||||||||||||||||||||||
|
1,500,245 |
| ||||||||||||||||||||||
|
| |||||||||||||||||||||||
IOWA - 1.2% | ||||||||||||||||||||||||
Cedar Falls, Electric Utility, Revenue Bond | 5.000% | 12/1/2023 | Aa2 | 2,000,000 | 2,292,200 | |||||||||||||||||||
|
| |||||||||||||||||||||||
KANSAS - 0.8% | ||||||||||||||||||||||||
Wyandotte County-Kansas City Unified Government Utility System, Water Utility Impt., Series A, Revenue Bond | 5.000% | 9/1/2020 | A2 | 1,495,000 | 1,532,166 | |||||||||||||||||||
|
| |||||||||||||||||||||||
LOUISIANA - 0.5% | ||||||||||||||||||||||||
New Orleans, Sewer Impt., Revenue Bond | 5.000% | 6/1/2021 | A2 | 600,000 | 631,542 | |||||||||||||||||||
Shreveport, Water & Sewer, Series B, Revenue Bond, AGM | 3.000% | 12/1/2022 | A2 | 300,000 | 314,418 | |||||||||||||||||||
|
| |||||||||||||||||||||||
|
945,960 |
| ||||||||||||||||||||||
|
| |||||||||||||||||||||||
MAINE - 1.0% | ||||||||||||||||||||||||
Maine Municipal Bond Bank, Various Purposes Impt., Series E, Revenue Bond | 4.000% | 11/1/2021 | Aa2 | 570,000 | 599,931 | |||||||||||||||||||
Maine, Public Impt., Series B, G.O. Bond | 5.000% | 6/1/2021 | Aa2 | 1,355,000 | 1,428,969 | |||||||||||||||||||
|
| |||||||||||||||||||||||
|
2,028,900 |
| ||||||||||||||||||||||
|
| |||||||||||||||||||||||
MARYLAND - 4.6% | ||||||||||||||||||||||||
Baltimore, Sewer Impt., Series A, Revenue Bond | 4.000% | 7/1/2044 | Aa2 | 2,000,000 | 2,242,340 | |||||||||||||||||||
Baltimore, Sewer Impt., Series C, Revenue Bond | 5.000% | 7/1/2026 | Aa2 | 815,000 | 1,001,733 | |||||||||||||||||||
Baltimore, Water Utility Impt., Series C, Revenue Bond | 4.000% | 7/1/2036 | A1 | 765,000 | 869,384 | |||||||||||||||||||
Baltimore, Water Utility Impt., Series C, Revenue Bond | 4.000% | 7/1/2037 | A1 | 555,000 | 628,377 | |||||||||||||||||||
Maryland, Series 2-C, G.O. Bond | 5.000% | 8/1/2021 | Aaa | 1,000,000 | 1,061,640 | |||||||||||||||||||
The accompanying notes are an integral part of the financial statements.
8
Diversified Tax Exempt Series
Investment Portfolio - December 31, 2019
| CREDIT | ||||||||||||||||||||||||
| COUPON | MATURITY | RATING1 | PRINCIPAL | VALUE | ||||||||||||||||||||
RATE
| DATE
| (UNAUDITED)
| AMOUNT
| (NOTE 2)
| ||||||||||||||||||||
MUNICIPAL BONDS(continued) | ||||||||||||||||||||||||
MARYLAND(continued) | ||||||||||||||||||||||||
Montgomery County, Public Impt., Series A, G.O. Bond | 5.000% | 11/1/2032 | Aaa | $ | 2,365,000 | $ | 3,008,043 | |||||||||||||||||
|
| |||||||||||||||||||||||
|
8,811,517 |
| ||||||||||||||||||||||
|
| |||||||||||||||||||||||
MASSACHUSETTS - 3.4% | ||||||||||||||||||||||||
Commonwealth of Massachusetts, Series C, G.O. Bond | 3.625% | 10/1/2040 | Aa1 | 3,000,000 | 3,029,430 | |||||||||||||||||||
Massachusetts Water Resources Authority, Series B, Revenue Bond, AGM | 5.250% | 8/1/2032 | Aa1 | 970,000 | 1,346,185 | |||||||||||||||||||
North Reading, School Impt., G.O. Bond | 5.000% | 5/15/2035 | Aa2 | 2,000,000 | 2,166,420 | |||||||||||||||||||
|
| |||||||||||||||||||||||
|
6,542,035 |
| ||||||||||||||||||||||
|
| |||||||||||||||||||||||
MICHIGAN - 1.0% | ||||||||||||||||||||||||
Ann Arbor Sewage Disposal System, Revenue Bond | 3.000% | 7/1/2020 | AA2 | 1,000,000 | 1,009,440 | |||||||||||||||||||
Ann Arbor Sewage Disposal System, Revenue Bond | 2.000% | 7/1/2027 | AA2 | 820,000 | 837,761 | |||||||||||||||||||
|
| |||||||||||||||||||||||
|
1,847,201 |
| ||||||||||||||||||||||
|
| |||||||||||||||||||||||
MINNESOTA - 1.2% | ||||||||||||||||||||||||
Minnesota State, Series D, G.O. Bond | 5.000% | 8/1/2024 | Aa1 | 2,000,000 | 2,345,920 | |||||||||||||||||||
|
| |||||||||||||||||||||||
MISSOURI - 1.9% | ||||||||||||||||||||||||
Kansas City, Sanitary Sewer System, Sewer Impt., Series A, Revenue Bond | 4.000% | 1/1/2025 | Aa2 | 750,000 | 854,078 | |||||||||||||||||||
Metropolitan St Louis Sewer District, Sewer Impt., Series C, Revenue Bond | 4.000% | 5/1/2041 | Aa1 | 2,000,000 | 2,194,640 | |||||||||||||||||||
Missouri State Health & Educational Facilities Authority, Revenue Bond | 5.000% | 1/1/2020 | Aa2 | 725,000 | 725,000 | |||||||||||||||||||
|
| |||||||||||||||||||||||
|
3,773,718 |
| ||||||||||||||||||||||
|
| |||||||||||||||||||||||
NEBRASKA - 0.5% | ||||||||||||||||||||||||
Nebraska Public Power District, Series B, Revenue Bond | 5.000% | 1/1/2020 | A1 | 1,000,000 | 1,000,000 | |||||||||||||||||||
|
| |||||||||||||||||||||||
NEVADA - 0.7% | ||||||||||||||||||||||||
Clark County, Stadium Impt., Series A, G.O. Bond | 5.000% | 6/1/2036 | Aa1 | 1,155,000 | 1,425,801 | |||||||||||||||||||
|
| |||||||||||||||||||||||
NEW HAMPSHIRE - 1.3% | ||||||||||||||||||||||||
New Hampshire State Turnpike System, Series B, Revenue Bond | 5.000% | 2/1/2020 | Aa3 | 2,575,000 | 2,582,725 | |||||||||||||||||||
|
| |||||||||||||||||||||||
The accompanying notes are an integral part of the financial statements.
9
Diversified Tax Exempt Series
Investment Portfolio - December 31, 2019
| CREDIT | ||||||||||||||||||||||||
| COUPON | MATURITY | RATING1 | PRINCIPAL | VALUE | ||||||||||||||||||||
RATE
| DATE
| (UNAUDITED)
| AMOUNT
| (NOTE 2)
| ||||||||||||||||||||
MUNICIPAL BONDS(continued) | ||||||||||||||||||||||||
NEW JERSEY - 0.3% | ||||||||||||||||||||||||
New Jersey State Turnpike Authority, Unrefunded Balance, Series H, Revenue Bond | 5.000% | 1/1/2020 | A2 | $ | 560,000 | $ | 560,000 | |||||||||||||||||
|
| |||||||||||||||||||||||
NEW MEXICO - 1.9% | ||||||||||||||||||||||||
Albuquerque Bernalillo County Water Utility Authority, Water Utility Impt., Revenue Bond | 5.000% | 7/1/2022 | Aa2 | 1,250,000 | 1,370,225 | |||||||||||||||||||
Albuquerque Bernalillo County Water Utility Authority, Water Utility Impt., Revenue Bond | 5.000% | 7/1/2023 | Aa2 | 2,000,000 | 2,265,520 | |||||||||||||||||||
|
| |||||||||||||||||||||||
|
3,635,745 |
| ||||||||||||||||||||||
|
| |||||||||||||||||||||||
NEW YORK - 19.6% | ||||||||||||||||||||||||
New York City Transitional Finance Authority, Future Tax Secured, Public Impt., Subseries C-2, Revenue Bond | 5.000% | 5/1/2037 | Aa1 | 2,740,000 | 3,350,472 | |||||||||||||||||||
New York City Transitional Finance Authority, Future Tax Secured, Public Impt., Subseries F-3, Revenue Bond | 3.000% | 2/1/2037 | Aa1 | 3,000,000 | 3,082,530 | |||||||||||||||||||
New York City Water & Sewer System, Series EE, Revenue Bond | 5.000% | 6/15/2040 | Aa1 | 3,500,000 | 4,263,770 | |||||||||||||||||||
New York City Water & Sewer System, Water Utility Impt., Series DD, Revenue Bond | 5.000% | 6/15/2047 | Aa1 | 3,000,000 | 3,550,650 | |||||||||||||||||||
New York City, Public Impt., Subseries D1, G.O. Bond | 4.000% | 12/1/2042 | Aa1 | 1,255,000 | 1,407,257 | |||||||||||||||||||
New York City, Series 1, G.O. Bond | 5.000% | 8/1/2020 | Aa1 | 1,000,000 | 1,022,570 | |||||||||||||||||||
New York City, Series 1, G.O. Bond | 5.000% | 8/1/2023 | Aa1 | 2,000,000 | 2,271,540 | |||||||||||||||||||
New York City, Series A, G.O. Bond | 5.000% | 8/1/2023 | Aa1 | 2,000,000 | 2,271,540 | |||||||||||||||||||
New York State Dormitory Authority, School Impt., Series A, Revenue Bond | 4.000% | 3/15/2048 | Aa1 | 3,000,000 | 3,325,380 | |||||||||||||||||||
New York State Dormitory Authority, School Impt., Series E, Revenue Bond | 5.000% | 3/15/2048 | Aa1 | 3,000,000 | 3,627,750 | |||||||||||||||||||
New York State Dormitory Authority, School Impt., Series E, Revenue Bond, AGM | 5.000% | 10/1/2025 | A2 | 860,000 | 982,266 | |||||||||||||||||||
New York State Dormitory Authority, Series 1, Revenue Bond | 4.000% | 7/1/2020 | Aa3 | 420,000 | 426,451 | |||||||||||||||||||
New York State Dormitory Authority, Series A, Revenue Bond | 5.000% | 2/15/2028 | Aa1 | 2,950,000 | 3,390,877 | |||||||||||||||||||
New York State Urban Development Corp., Highway Impt., Series C, Revenue Bond | 5.000% | 3/15/2024 | Aa1 | 765,000 | 857,328 | |||||||||||||||||||
Triborough Bridge & Tunnel Authority, Series A, Revenue Bond | 5.000% | 11/15/2023 | A1 | 2,805,000 | 3,167,911 | |||||||||||||||||||
The accompanying notes are an integral part of the financial statements.
10
Diversified Tax Exempt Series
Investment Portfolio - December 31, 2019
| CREDIT | ||||||||||||||||||||||||
| COUPON | MATURITY | RATING1 | PRINCIPAL | VALUE | ||||||||||||||||||||
RATE
| DATE
| (UNAUDITED)
| AMOUNT
| (NOTE 2)
| ||||||||||||||||||||
MUNICIPAL BONDS(continued) | ||||||||||||||||||||||||
NEW YORK(continued) | ||||||||||||||||||||||||
Triborough Bridge & Tunnel Authority, Series B, Revenue Bond | 5.000% | 11/15/2020 | Aa3 | $ | 920,000 | $ | 951,906 | |||||||||||||||||
|
| |||||||||||||||||||||||
|
37,950,198 |
| ||||||||||||||||||||||
|
| |||||||||||||||||||||||
NORTH CAROLINA - 3.1% | ||||||||||||||||||||||||
Charlotte, Water & Sewer System, Revenue Bond | 5.000% | 12/1/2020 | Aaa | 1,400,000 | 1,449,994 | |||||||||||||||||||
Charlotte, Water & Sewer System, Revenue Bond | 4.000% | 7/1/2047 | Aaa | 2,000,000 | 2,232,640 | |||||||||||||||||||
North Carolina Medical Care Commission, Moses Cone Health System, Revenue Bond | 5.000% | 10/1/2020 | AA2 | 580,000 | 596,756 | |||||||||||||||||||
North Carolina Municipal Power Agency No. 1, Series A, Revenue Bond | 5.000% | 1/1/2020 | A2 | 400,000 | 400,000 | |||||||||||||||||||
North Carolina, Series C, G.O. Bond | 5.000% | 5/1/2021 | Aaa | 1,200,000 | 1,262,484 | |||||||||||||||||||
|
| |||||||||||||||||||||||
|
5,941,874 |
| ||||||||||||||||||||||
|
| |||||||||||||||||||||||
OHIO - 8.3% | ||||||||||||||||||||||||
American Municipal Power, Inc., Fremont Energy Center Project, Prerefunded Balance, Series B, Revenue Bond | 5.000% | 2/15/2023 | A1 | 1,895,000 | 2,049,177 | |||||||||||||||||||
Brecksville-Broadview Heights City School District, School Impt., Prerefunded Balance, G.O. Bond | 5.000% | 12/1/2048 | Aa2 | 1,000,000 | 1,129,310 | |||||||||||||||||||
Cincinnati Water System, Series B, Revenue Bond | 5.000% | 12/1/2026 | Aaa | 500,000 | 621,230 | |||||||||||||||||||
Cincinnati Water System, Series C, Revenue Bond | 5.000% | 12/1/2025 | Aaa | 1,000,000 | 1,213,750 | |||||||||||||||||||
Columbus, Sewer Impt., Revenue Bond | 5.000% | 6/1/2026 | Aa1 | 520,000 | 611,712 | |||||||||||||||||||
Hamilton Wastewater System, Sewer Impt., Revenue Bond, BAM | 4.000% | 10/1/2041 | A1 | 1,235,000 | 1,375,457 | |||||||||||||||||||
Middletown City School District, School Impt., Prerefunded Balance, G.O. Bond | 5.250% | 12/1/2040 | AA2 | 1,000,000 | 1,118,570 | |||||||||||||||||||
Northeast Ohio Regional Sewer District, Sewer Impt., Revenue Bond | 3.000% | 11/15/2040 | Aa1 | 2,080,000 | 2,144,646 | |||||||||||||||||||
Northeast Ohio Regional Sewer District, Sewer Impt., Revenue Bond | 4.000% | 11/15/2043 | Aa1 | 1,565,000 | 1,747,307 | |||||||||||||||||||
Ohio State Turnpike Commission, Series A, Revenue Bond | 5.250% | 2/15/2027 | Aa2 | 600,000 | 758,160 | |||||||||||||||||||
Ohio State, Public Impt., Series B, G.O. Bond | 3.000% | 9/1/2021 | Aa1 | 2,000,000 | 2,063,360 | |||||||||||||||||||
Toledo Water System, Water Utility Impt., Series A, Revenue Bond | 5.000% | 11/15/2022 | Aa3 | 610,000 | 652,517 | |||||||||||||||||||
Toledo, Capital Impt., G.O. Bond | 5.000% | 12/1/2020 | A2 | 610,000 | 630,594 | |||||||||||||||||||
|
| |||||||||||||||||||||||
| 16,115,790 | ||||||||||||||||||||||||
|
| |||||||||||||||||||||||
The accompanying notes are an integral part of the financial statements.
11
Diversified Tax Exempt Series
Investment Portfolio - December 31, 2019
| CREDIT | ||||||||||||||||||||||||
| COUPON | MATURITY | RATING1 | PRINCIPAL | VALUE | ||||||||||||||||||||
RATE
| DATE
| (UNAUDITED)
| AMOUNT
| (NOTE 2)
| ||||||||||||||||||||
MUNICIPAL BONDS(continued) | ||||||||||||||||||||||||
OREGON - 3.8% | ||||||||||||||||||||||||
Oregon State Housing & Community Services | ||||||||||||||||||||||||
Department, Series A, Revenue Bond | 1.950% | 7/1/2020 | Aa2 | $ | 215,000 | $ | 215,772 | |||||||||||||||||
Portland Building Project, Series B, G.O. Bond | 5.000% | 6/15/2038 | Aaa | 4,000,000 | 4,961,640 | |||||||||||||||||||
Portland Sewer System, Series B, Revenue Bond | 2.125% | 6/15/2030 | Aa2 | 1,000,000 | 1,018,090 | |||||||||||||||||||
Washington County Clean Water Services, Sewer Impt., Series B, Revenue Bond | 5.000% | 10/1/2021 | Aa1 | 1,015,000 | 1,083,918 | |||||||||||||||||||
|
| |||||||||||||||||||||||
|
7,279,420 |
| ||||||||||||||||||||||
|
| |||||||||||||||||||||||
PENNSYLVANIA - 1.9% | ||||||||||||||||||||||||
Allegheny County Sanitary Authority, Sewer Impt., Revenue Bond, AGM | 4.000% | 12/1/2035 | A1 | 1,200,000 | 1,342,404 | |||||||||||||||||||
North Wales Water Authority, Series A, Revenue Bond | 5.000% | 11/1/2020 | AA2 | 1,000,000 | 1,032,200 | |||||||||||||||||||
Pennsylvania Turnpike Commission, Highway Impt., Series A-1, Revenue Bond | 5.000% | 12/1/2023 | A1 | 1,200,000 | 1,372,356 | |||||||||||||||||||
|
| |||||||||||||||||||||||
|
3,746,960 |
| ||||||||||||||||||||||
|
| |||||||||||||||||||||||
SOUTH CAROLINA - 0.6% | ||||||||||||||||||||||||
Charleston, Waterworks & Sewer System, Prerefunded Balance, Revenue Bond | 5.000% | 1/1/2022 | Aaa | 530,000 | 550,654 | |||||||||||||||||||
Greenwood Metropolitan District, Sewer Impt., Revenue Bond | 5.000% | 10/1/2026 | Aa3 | 500,000 | 614,145 | |||||||||||||||||||
|
| |||||||||||||||||||||||
|
1,164,799 |
| ||||||||||||||||||||||
|
| |||||||||||||||||||||||
TENNESSEE - 2.8% | ||||||||||||||||||||||||
Knoxville Electric System Revenue, Electric Light & Power Impt., Series II, Revenue Bond | 3.000% | 7/1/2028 | Aa2 | 1,090,000 | 1,161,351 | |||||||||||||||||||
Knoxville Electric System Revenue, Series FF, Revenue Bond | 5.000% | 7/1/2023 | Aa2 | 800,000 | 876,320 | |||||||||||||||||||
Knoxville Electric System Revenue, Series FF, Revenue Bond | 5.000% | 7/1/2025 | Aa2 | 705,000 | 771,157 | |||||||||||||||||||
Knoxville Wastewater System, Series A, Revenue Bond | 4.000% | 4/1/2020 | Aa2 | 685,000 | 689,857 | |||||||||||||||||||
Memphis, Public Impt., G.O. Bond | 4.000% | 6/1/2044 | Aa2 | 1,095,000 | 1,190,834 | |||||||||||||||||||
Newport Electric System, Revenue Bond, AGM | 3.000% | 5/1/2044 | A1 | 775,000 | 779,999 | |||||||||||||||||||
|
| |||||||||||||||||||||||
|
5,469,518 |
| ||||||||||||||||||||||
|
| |||||||||||||||||||||||
TEXAS - 4.3% | ||||||||||||||||||||||||
Austin Electric Utility, Series A, Revenue Bond | 5.000% | 11/15/2022 | Aa3 | 500,000 | 554,995 | |||||||||||||||||||
Fort Worth Water & Sewer System, Revenue Bond | 5.000% | 2/15/2020 | Aa1 | 550,000 | 552,514 | |||||||||||||||||||
The accompanying notes are an integral part of the financial statements.
12
Diversified Tax Exempt Series
Investment Portfolio - December 31, 2019
| CREDIT | ||||||||||||||||||||||||
| COUPON | MATURITY | RATING1 | PRINCIPAL | VALUE | ||||||||||||||||||||
RATE
| DATE
| (UNAUDITED)
| AMOUNT
| (NOTE 2)
| ||||||||||||||||||||
MUNICIPAL BONDS(continued) | ||||||||||||||||||||||||
TEXAS(continued) | ||||||||||||||||||||||||
Harris County, Senior Lien, Toll Road Impt., Series B, Revenue Bond | 5.000% | 8/15/2023 | Aa2 | $ | 600,000 | $ | 681,156 | |||||||||||||||||
Houston Combined Utility System, Water & Sewer, Series B, Revenue Bond | 4.000% | 11/15/2044 | Aa2 | 1,000,000 | 1,130,220 | |||||||||||||||||||
Houston Independent School District, School Impt., G.O. Bond | 5.000% | 7/15/2021 | Aaa | 1,000,000 | 1,059,760 | |||||||||||||||||||
McKinney Waterworks & Sewer System, Water Utility Impt., Revenue Bond | 3.000% | 3/15/2039 | Aa1 | 1,000,000 | 1,037,440 | |||||||||||||||||||
North Texas Municipal Water District, Sewer Impt., Revenue Bond | 3.500% | 6/1/2035 | Aa2 | 1,000,000 | 1,060,040 | |||||||||||||||||||
North Texas Tollway Authority, Series A, Revenue Bond | 5.000% | 1/1/2026 | A1 | 500,000 | 571,920 | |||||||||||||||||||
San Antonio Electric & Gas, Junior Lien, Revenue Bond | 4.000% | 2/1/2038 | Aa2 | 1,000,000 | 1,146,030 | |||||||||||||||||||
San Antonio Water System, Junior Lien, Series A, Revenue Bond | 5.000% | 5/15/2026 | Aa2 | 500,000 | 608,260 | |||||||||||||||||||
|
| |||||||||||||||||||||||
|
8,402,335 |
| ||||||||||||||||||||||
|
| |||||||||||||||||||||||
UTAH - 0.3% | ||||||||||||||||||||||||
Central Utah Water Conservancy District, Series B, Revenue Bond | 5.000% | 10/1/2025 | AA2 | 500,000 | 604,270 | |||||||||||||||||||
|
| |||||||||||||||||||||||
VIRGINIA - 1.3% | ||||||||||||||||||||||||
Norfolk Water & Sewer System, Revenue Bond | 5.000% | 11/1/2029 | AA2 | 2,000,000 | 2,521,800 | |||||||||||||||||||
|
| |||||||||||||||||||||||
WASHINGTON - 5.8% | ||||||||||||||||||||||||
Everett Water & Sewer, Revenue Bond | 5.000% | 12/1/2020 | AA2 | 1,330,000 | 1,377,627 | |||||||||||||||||||
King County, Series E, G.O. Bond | 5.000% | 6/1/2022 | Aaa | 2,000,000 | 2,185,480 | |||||||||||||||||||
King County, Water & Sewer, Revenue Bond | 4.000% | 7/1/2045 | Aa1 | 2,000,000 | 2,141,440 | |||||||||||||||||||
King County, Water & Sewer, Series B, Revenue Bond | 5.000% | 1/1/2020 | Aa1 | 750,000 | 750,000 | |||||||||||||||||||
Seattle, Drainage & Wastewater, Sewer Impt., Revenue Bond | 5.000% | 9/1/2021 | Aa1 | 2,000,000 | 2,128,700 | |||||||||||||||||||
Seattle, Drainage & Wastewater, Sewer Impt., Revenue Bond | 4.000% | 4/1/2034 | Aa1 | 2,435,000 | 2,730,122 | |||||||||||||||||||
|
| |||||||||||||||||||||||
|
11,313,369 |
| ||||||||||||||||||||||
|
| |||||||||||||||||||||||
The accompanying notes are an integral part of the financial statements.
13
Diversified Tax Exempt Series
Investment Portfolio - December 31, 2019
CREDIT RATING1 (UNAUDITED)
| ||||||||||||||||||||||||
COUPON RATE
| MATURITY DATE
| PRINCIPAL | VALUE (NOTE 2)
| |||||||||||||||||||||
AMOUNT/ SHARES
| ||||||||||||||||||||||||
MUNICIPAL BONDS(continued) | ||||||||||||||||||||||||
WISCONSIN - 0.5% | ||||||||||||||||||||||||
Milwaukee Sewerage System, Sewer Impt., Series S7, Revenue Bond | 3.000% | 6/1/2031 | A | 2 | $ | 1,000,000 | $ | 1,040,720 | ||||||||||||||||
|
| |||||||||||||||||||||||
TOTAL MUNICIPAL BONDS | 186,394,224 | |||||||||||||||||||||||
|
| |||||||||||||||||||||||
U.S. TREASURY SECURITIES - 1.0% | ||||||||||||||||||||||||
U.S. Treasury Notes - 1.0% | ||||||||||||||||||||||||
U.S. Treasury Floating Rate Note3, (3 mo. US Treasury Bill Yield + 0.300%), 1.826%, 10/31/2021 (Identified Cost $2,001,083) | 2,000,000 | 2,003,360 | ||||||||||||||||||||||
|
| |||||||||||||||||||||||
U.S. GOVERNMENT AGENCIES - 0.6% | ||||||||||||||||||||||||
Other Agencies - 0.6% | ||||||||||||||||||||||||
Freddie Mac Multifamily ML Certificates, Series 2019-ML05, Class ACA | 3.35% | 11/25/2033 | 497,433 | 538,512 | ||||||||||||||||||||
Freddie Mac Multifamily ML Certificates, Series 2019-ML05, Class AUS | 3.40% | 1/25/2036 | 491,177 | 543,964 | ||||||||||||||||||||
|
| |||||||||||||||||||||||
TOTAL U.S. GOVERNMENT AGENCIES | 1,082,476 | |||||||||||||||||||||||
|
| |||||||||||||||||||||||
SHORT-TERM INVESTMENT - 1.2% | ||||||||||||||||||||||||
Dreyfus Government Cash Management, Institutional Shares (Identified Cost $2,245,024) | 1.51%4 | 2,245,024 | 2,245,024 | |||||||||||||||||||||
|
| |||||||||||||||||||||||
TOTAL INVESTMENTS - 99.0% | 191,725,084 | |||||||||||||||||||||||
OTHER ASSETS, LESS LIABILITIES - 1.0% | 2,005,127 | |||||||||||||||||||||||
|
| |||||||||||||||||||||||
NET ASSETS - 100% |
$ |
193,730,211 |
| |||||||||||||||||||||
|
| |||||||||||||||||||||||
KEY:
G.O. Bond - General Obligation Bond
Impt. - Improvement
No. - Number
Scheduled principal and interest payments are guaranteed by:
AGM (Assurance Guaranty Municipal Corp.)
BAM (Build America Mutual Assurance Co.)
NATL (National Public Finance Guarantee Corp.)
The insurance does not guarantee the market value of the municipal bonds.
1Credit ratings from Moody’s (unaudited).
2Credit ratings from S&P (unaudited).
3Floating rate security. Rate shown is the rate in effect as of December 31, 2019.
4Rate shown is the current yield as of December 31, 2019.
The accompanying notes are an integral part of the financial statements.
14
Diversified Tax Exempt Series
Statement of Assets and Liabilities
December 31, 2019
ASSETS: | ||||
Investments, at value (identified cost $186,004,443) (Note 2) | $ | 191,725,084 | ||
Interest receivable | 2,057,357 | |||
Dividends receivable | 5,939 | |||
Receivable for securities sold | 5,000 | |||
Prepaid expenses | 5,311 | |||
|
| |||
TOTAL ASSETS | 193,798,691 | |||
|
| |||
LIABILITIES: | ||||
Accrued fund accounting and administration fees (Note 3) | 20,006 | |||
Accrued management fees (Note 3) | 1,865 | |||
Accrued Chief Compliance Officer service fees (Note 3) | 1,170 | |||
Payable for fund shares repurchased | 23,114 | |||
Audit fees payable | 9,469 | |||
Accrued printing and postage fees payable | 7,590 | |||
Other payables and accrued expenses | 5,266 | |||
|
| |||
TOTAL LIABILITIES | 68,480 | |||
|
| |||
TOTAL NET ASSETS | $ | 193,730,211 | ||
|
| |||
NET ASSETS CONSIST OF: | ||||
Capital stock | $ | 173,804 | ||
Additional paid-in-capital | 187,589,699 | |||
Total distributable earnings (loss) | 5,966,708 | |||
|
| |||
TOTAL NET ASSETS | $ | 193,730,211 | ||
|
| |||
NET ASSET VALUE, OFFERING PRICE AND REDEMPTION PRICE PER SHARE - Class A($4,393,801/394,325 shares) | $ | 11.14 | ||
|
| |||
NET ASSET VALUE, OFFERING PRICE AND REDEMPTION PRICE PER SHARE - Class W($189,336,410/16,986,063 shares) | $ | 11.15 | ||
|
| |||
The accompanying notes are an integral part of the financial statements.
15
Diversified Tax Exempt Series
Statement of Operations
For the Year Ended December 31, 2019
INVESTMENT INCOME: | ||||
Interest | $ | 5,387,756 | ||
Dividends | 112,526 | |||
|
| |||
Total Investment Income | 5,500,282 | |||
|
| |||
EXPENSES: | ||||
Management fees (Note 3) | 1,228,573 | |||
Fund accounting and administration fees (Note 3) | 92,704 | |||
Directors’ fees (Note 3) | 23,881 | |||
Chief Compliance Officer service fees (Note 3) | 3,109 | |||
Custodian fees | 9,568 | |||
Miscellaneous | 127,908 | |||
|
| |||
Total Expenses | 1,485,743 | |||
Less reduction of expenses (Note 3) | (952,019 | ) | ||
|
| |||
Net Expenses | 533,724 | |||
|
| |||
NET INVESTMENT INCOME | 4,966,558 | |||
|
| |||
REALIZED AND UNREALIZED GAIN (LOSS) ON INVESTMENTS: | ||||
Net realized gain (loss) on investments | 2,988,246 | |||
Net change in unrealized appreciation (depreciation) on investments | 6,471,799 | |||
|
| |||
NET REALIZED AND UNREALIZED GAIN (LOSS) ON INVESTMENTS | 9,460,045 | |||
|
| |||
NET INCREASE IN NET ASSETS RESULTING FROM OPERATIONS | $ | 14,426,603 | ||
|
| |||
The accompanying notes are an integral part of the financial statements.
16
Diversified Tax Exempt Series
Statements of Changes in Net Assets
FOR THE
|
FOR THE
| |||||||
INCREASE (DECREASE) IN NET ASSETS: | ||||||||
OPERATIONS: | ||||||||
Net investment income | $ | 4,966,558 | $ | 3,916,840 | ||||
Net realized gain (loss) on investments | 2,988,246 | (297,506 | ) | |||||
Net change in unrealized appreciation (depreciation) on investments | 6,471,799 | (1,870,441 | ) | |||||
|
|
|
| |||||
Net increase from operations | 14,426,603 | 1,748,893 | ||||||
|
|
|
| |||||
DISTRIBUTIONS TO SHAREHOLDERS (Note 8): | ||||||||
Class A | (258,792 | ) | (3,880,794 | ) | ||||
Class W | (6,689,944 | ) | — | |||||
|
|
|
| |||||
Total distributions to shareholders | (6,948,736 | ) | (3,880,794 | ) | ||||
|
|
|
| |||||
CAPITAL STOCK ISSUED AND REPURCHASED: | ||||||||
Net increase (decrease) from capital share transactions (Note 5) | (111,561,252 | ) | 21,616,363 | |||||
|
|
|
| |||||
Net increase (decrease) in net assets | (104,083,385 | ) | 19,484,462 | |||||
NET ASSETS: | ||||||||
Beginning of year | 297,813,596 | 278,329,134 | ||||||
|
|
|
| |||||
End of year | $ | 193,730,211 | $ | 297,813,596 | ||||
|
|
|
| |||||
The accompanying notes are an integral part of the financial statements.
17
Diversified Tax Exempt Series
Financial Highlights - Class A
FOR THE YEAR ENDED | ||||||||||||||||||||
12/31/19
| 12/31/18
| 12/31/17
| 12/31/16
| 12/31/15
| ||||||||||||||||
Per share data (for a share outstanding throughout each year): | ||||||||||||||||||||
Net asset value - Beginning of year | $10.90 | $10.98 | $10.86 | $11.07 | $11.00 | |||||||||||||||
|
|
|
|
|
|
|
|
|
| |||||||||||
Income (loss) from investment operations: | ||||||||||||||||||||
Net investment income1 | 0.17 | 0.15 | 0.13 | 0.11 | 0.09 | |||||||||||||||
Net realized and unrealized gain (loss) on investments | 0.39 | (0.08 | ) | 0.13 | (0.20 | ) | 0.08 | |||||||||||||
|
|
|
|
|
|
|
|
|
| |||||||||||
Total from investment operations | 0.56 | 0.07 | 0.26 | (0.09 | ) | 0.17 | ||||||||||||||
|
|
|
|
|
|
|
|
|
| |||||||||||
Less distributions to shareholders: | ||||||||||||||||||||
From net investment income | (0.20 | ) | (0.15 | ) | (0.14 | ) | (0.12 | ) | (0.10 | ) | ||||||||||
From net realized gain on investments | (0.12 | ) | — | — | — | — | ||||||||||||||
|
|
|
|
|
|
|
|
|
| |||||||||||
Total distributions to shareholders | (0.32 | ) | (0.15 | ) | (0.14 | ) | (0.12 | ) | (0.10 | ) | ||||||||||
|
|
|
|
|
|
|
|
|
| |||||||||||
Net asset value - End of year | $11.14 | $10.90 | $10.98 | $10.86 | $11.07 | |||||||||||||||
|
|
|
|
|
|
|
|
|
| |||||||||||
Net assets - End of year(000’s omitted) | $4,394 | $297,814 | $278,329 | $316,386 | $358,584 | |||||||||||||||
|
|
|
|
|
|
|
|
|
| |||||||||||
Total return2 | 5.10% | 0.65% | 2.37% | (0.83% | ) | 1.51% | ||||||||||||||
Ratios (to average net assets)/Supplemental Data: | ||||||||||||||||||||
Expenses | 0.58% | 0.59% | 0.58% | 0.57% | 0.57% | |||||||||||||||
Net investment income | 1.62% | 1.42% | 1.22% | 1.01% | 0.80% | |||||||||||||||
Series portfolio turnover | 29% | 12% | 4% | 16% | 33% | |||||||||||||||
1Calculated based on average shares outstanding during the years.
2Represents aggregate total return for the years indicated, and assumes reinvestment of all distributions.
The accompanying notes are an integral part of the financial statements.
18
Diversified Tax Exempt Series
Financial Highlights - Class W
FOR THE PERIOD
|
Per share data (for a share outstanding throughout the period): | ||||||||
Net asset value - Beginning of period | $11.01 | |||||||
|
| |||||||
Income from investment operations: | ||||||||
Net investment income2 | 0.20 | |||||||
Net realized and unrealized gain (loss) on investments | 0.31 | |||||||
|
| |||||||
Total from investment operations | 0.51 | |||||||
|
| |||||||
Less distributions to shareholders: | ||||||||
From net investment income | (0.25 | ) | ||||||
From net realized gain on investments | (0.12 | ) | ||||||
|
| |||||||
Total distributions to shareholders | (0.37 | ) | ||||||
|
| |||||||
Net asset value - End of period | $11.15 | |||||||
|
| |||||||
Net assets - End of period(000’s omitted) | $189,336 | |||||||
|
| |||||||
Total return3 | 4.61% | |||||||
Ratios (to average net assets)/Supplemental Data: | ||||||||
Expenses*4 | 0.11% | |||||||
Net investment income4 | 2.14% | |||||||
Series portfolio turnover | 29% | |||||||
*The investment advisor did not impose all or a portion of its management and/or other fees during the period, and may have paid a portion of the Series’ expenses. If these expenses had been incurred by the Class, the expense ratio (to average net assets) would have increased by the following amount4:
0.50%
1Commencement of operations.
2Calculated based on average shares outstanding during the period.
3Represents aggregate total return for the period indicated, and assumes reinvestment of all distributions. Total return would have been lower had certain expenses not been waived or reimbursed during the period. Periods less than one year are not annualized.
4Annualized.
The accompanying notes are an integral part of the financial statements.
19
Diversified Tax Exempt Series
Notes to Financial Statements
| 1. | Organization |
Diversified Tax Exempt Series (the “Series”) is a no-load diversified series of Manning & Napier Fund, Inc. (the “Fund”). The Fund is organized in Maryland and is registered under the Investment Company Act of 1940, as amended, as an open-end management investment company.
The Series’ investment objective is to provide as high a level of current income exempt from federal income tax as the Advisor believes is consistent with the preservation of capital.
The Series is authorized to issue two classes of shares (Class A and Class W). Class W shares were issued March 1, 2019. While each class of shares is substantially the same, each class has its own investment eligibility criteria and cost structure.
The Fund’s advisor is Manning & Napier Advisors, LLC (the “Advisor”). Shares of the Series are offered to investors, clients and employees of the Advisor and its affiliates. The total authorized capital stock of the Fund consists of 15 billion shares of common stock each having a par value of $0.01. As of December 31, 2019, 8.9 billion shares have been designated in total among 31 series, of which 100 million have been designated as Diversified Tax Exempt Series Class A common stock and 50 million have been designated as Diversified Tax Exempt Series Class W common stock.
| 2. | Significant Accounting Policies |
The following is a summary of significant accounting policies followed by the Series. The Series is an investment company and, accordingly, follows the investment company accounting and reporting guidance of the Financial Accounting Standards Board Accounting Standards Codification Topic 946 - Investment Companies, which is part of accounting principles generally accepted in the United States of America (“GAAP”).
Security Valuation
Municipal securities will normally be valued on the basis of market valuations provided by an independent pricing service (the “Service”). The Service utilizes the latest price quotations and a matrix system (which considers such factors as security prices of similar securities, yields, maturities and ratings). The Service has been approved by the Fund’s Board of Directors (the “Board”).
Short-term investments that mature in sixty days or less may be valued at amortized cost, which approximates fair value. Investments in open-end investment companies are valued at their net asset value per share on valuation date.
Volume and level of activity in established markets for an asset or liability are evaluated to determine whether recent transactions and quoted prices are determinative of fair value. Where there have been significant decreases in volume and level of activity, further analysis and adjustment may be necessary to estimate fair value. The Series measures fair value in these instances by the use of inputs and valuation techniques which may be based upon current market prices of securities that are comparable in coupon, rating, maturity and industry and/or expectation of future cash flows. As a result of trading in relatively thin markets and/or markets that experience significant volatility, the prices used by the Series to value these securities may differ from the value that would be realized if these securities were sold, and the differences could be material.
Securities for which representative valuations or prices are not available from the Series’ pricing service may be valued at fair value as determined in good faith by the Advisor under procedures approved by and under the general supervision and responsibility of the Board. Due to the inherent uncertainty of valuations of such securities, the fair value may differ significantly from the values that would have been used had a ready market for such securities existed. If trading or events occurring after the close of the principal market in which securities are traded are expected to materially affect the value of those securities, then they may be valued at their fair value, taking this trading or these events into account.
Various inputs are used in determining the value of the Series’ assets or liabilities carried at fair value. These inputs are summarized in three broad levels. Level 1 includes quoted prices in active markets for identical assets and liabilities. Level 2 includes other significant observable inputs (including quoted prices for similar securities, interest rates, prepayment speeds, credit risk, etc.). Level 3 includes significant unobservable inputs (including the Series’ own assumptions in determining the fair
20
Diversified Tax Exempt Series
Notes to Financial Statements (continued)
| 2. | Significant Accounting Policies (continued) |
Security Valuation(continued)
value of investments). A financial instrument’s level within the fair value hierarchy is based on the lowest level of any input both individually and in aggregate that is significant to the fair value measurement. The inputs or methodology used for valuing securities are not necessarily an indication of the risk associated with investing in those securities.
The following is a summary of the valuation levels used for major security types as of December 31, 2019 in valuing the Series’ assets or liabilities carried at fair value:
| DESCRIPTION | TOTAL | LEVEL 1 | LEVEL 2 | LEVEL 3 | ||||||||||||
Assets: | ||||||||||||||||
Debt securities: | ||||||||||||||||
States and political subdivisions | $ | 186,394,224 | $ | — | $ | 186,394,224 | $ | — | ||||||||
U.S. Treasury and other U.S. | 3,085,836 | — | 3,085,836 | — | ||||||||||||
Short-Term Investment | 2,245,024 | 2,245,024 | — | — | ||||||||||||
|
|
|
|
|
|
|
| |||||||||
Total assets | $ | 191,725,084 | $ | 2,245,024 | $ | 189,480,060 | $ | — | ||||||||
|
|
|
|
|
|
|
| |||||||||
There were no Level 3 securities held by the Series as of December 31, 2018 or December 31, 2019.
New Accounting Pronouncements
In March 2017, the Financial Accounting Standards Board issued Accounting Standards Update No. 2017-08, Receivables - Nonrefundable Fees and Other Costs (Subtopic 310-20): “Premium Amortization of Purchased Callable Debt Securities” which amends the amortization period for certain purchased callable debt securities. Under the new guidance, the premium amortization of purchased callable debt securities that have explicit, non-contingent call features and are callable at fixed prices will be amortized to the earliest call date. The guidance does not require an accounting change for securities held at a discount, which continue to be amortized to maturity. This guidance was adopted by the Series as of January 1, 2019 on a modified retrospective basis. The cost basis of the securities on January 1, 2019 has been decreased by $74. This change in accounting policy has been made to comply with the newly issued accounting standard and had no impact on total distributable earnings (loss) or the net asset value for any Class of the Series.
Security Transactions, Investment Income and Expenses
Security transactions are accounted for on trade date. Dividend income is recorded on the ex-dividend date, except that if the ex-dividend date has passed, certain dividends from foreign securities are recorded as soon as the Series is informed of the ex-dividend date. Non-cash dividends, if any, are recorded at the fair value of the securities received. Interest income, including amortization of premium and accretion of discounts using the effective interest method, is earned from settlement date and accrued daily.
Expenses are recorded on an accrual basis. Most expenses of the Fund can be attributed to a specific series. Expenses which cannot be directly attributed are apportioned among the series in the Fund in such a manner as deemed equitable by the Fund’s Board, taking into consideration, among other things, the nature and type of expense.
The Series uses the identified cost method for determining realized gain or loss on investments for both financial statement and federal income tax reporting purposes.
Federal Taxes
The Series’ policy is to comply with the provisions of the Internal Revenue Code applicable to regulated investment companies. The Series is not subject to federal income tax or excise tax to the extent that the Series distributes to shareholders each year its taxable income, including any net realized gains on investments, in accordance with requirements of the Internal Revenue Code. Accordingly, no provision for federal income tax or excise tax has been made in the financial statements.
21
Diversified Tax Exempt Series
Notes to Financial Statements (continued)
| 2. | Significant Accounting Policies (continued) |
Federal Taxes(continued)
Management evaluates its tax positions to determine if the tax positions taken meet the minimum recognition threshold in connection with accounting for uncertainties in income tax positions taken or expected to be taken for the purposes of measuring and recognizing tax liabilities in the financial statements. Recognition of tax benefits of an uncertain tax position is required only when the position is “more likely than not” to be sustained assuming examination by taxing authorities. At December 31, 2019, the Series has recorded no liability for net unrecognized tax benefits relating to uncertain income tax positions taken or expected to be taken in future tax returns.
The Series files income tax returns in the U.S. federal jurisdiction and various states, as required. No income tax returns are currently under investigation. The statute of limitations on the Series’ tax returns remains open for the years ended December 31, 2016 through December 31, 2019. The Series is not aware of any tax positions for which it is reasonably possible that the total amounts of unrecognized tax benefits will significantly change in the next twelve months.
Distributions of Income and Gains
Distributions to shareholders of net investment income are made quarterly. Distributions of net realized gains are made annually. An additional distribution may be necessary to avoid taxation of the Series. Distributions are recorded on the ex-dividend date.
Indemnifications
The Fund’s organizational documents provide former and current directors and officers with a limited indemnification against liabilities arising in connection with the performance of their duties to the Fund. In the normal course of business, the Fund may also enter into contracts that provide general indemnifications. The Fund’s maximum exposure under these arrangements is unknown as this would be dependent on future claims that may be made against the Fund. The risk of material loss from such claims is considered remote.
Other
The preparation of financial statements in conformity with GAAP requires management to make estimates and assumptions that affect the reported amounts of assets and liabilities and the disclosure of contingent assets and liabilities at the date of the financial statements and the reported amounts of income and expenses during the reporting period. Actual results could differ from those estimates.
| 3. | Transactions with Affiliates |
The Fund has an Investment Advisory Agreement (the “Agreement”) with the Advisor, for which the Series pays a fee, computed daily and payable monthly, at an annual rate of 0.50% of the Series’ average daily net assets.
Under the Agreement, personnel of the Advisor provide the Series with advice and assistance in the choice of investments and the execution of securities transactions, and otherwise maintain the Series’ organization. The Advisor also provides the Fund with necessary office space and fund administration and support services. The salaries of all officers of the Fund (except a percentage of the Fund’s Chief Compliance Officer’s salary, which is paid by the Fund), and of all Directors who are “affiliated persons” of the Fund, or of the Advisor, and all personnel of the Fund, or of the Advisor, performing services relating to research, statistical and investment activities, are paid by the Advisor. Each “non-affiliated” Director receives an annual stipend, which is allocated among all the active series of the Fund. In addition, these Directors also receive a fee per Board meeting attended plus a fee for each committee meeting attended and are reimbursed for travel and other out-of-pocket expenses incurred by them in connection with attending such meetings. The Fund also has an Audit Committee Chair, Governance & Nominating Committee Chair and Lead Independent Director, who each receive an additional annual stipend for these roles.
Manning & Napier Investor Services, Inc., a registered broker-dealer affiliate of the Advisor, acts as distributor for the Fund’s shares. The services of Manning & Napier Investor Services, Inc. are provided at no additional cost to the Series.
Pursuant to a master services agreement dated March 1, 2017, as amended, the Fund pays the Advisor an annual fee related to fund accounting and administration of 0.0085% on the first $25 billion of average daily net assets (excluding Target Series and Income Series); 0.0075% on the next $15 billion of average daily net assets (excluding Target Series and Income Series);
22
Diversified Tax Exempt Series
Notes to Financial Statements (continued)
| 3. | Transactions with Affiliates (continued) |
and 0.0065% of average daily net assets in excess of $40 billion (excluding Target Series and Income Series); plus a base fee of $30,400 per series. Additionally, certain transaction and out-of-pocket expenses, including charges for reporting relating to the Fund’s compliance program, are charged. The Advisor has agreements with BNY Mellon Investment Servicing (U.S.) Inc. (“BNY”) under which BNY serves as sub-accountant services agent.
Effective March 1, 2019, the Advisor has contractually agreed to waive the management fee for the Class W shares. The full management fee will be waived under this agreement because Class W shares are only available to discretionary investment accounts and other accounts managed by the Advisor. These clients pay a management fee to the advisor that is separate from the fund’s expenses. In addition, pursuant to a separate expense limitation agreement, the Advisor has contractually agreed to limit its fees and reimburse expenses to the extent necessary so that the total direct annual fund operating expenses, exclusive of the waived Class W management fees (collectively, “excluded expenses”), to 0.85% of the average daily net assets of the Class A shares and 0.35% of the average daily net assets of the Class W shares. These contractual waivers are expected to continue indefinitely, and may not be amended or terminated by the Advisor without the approval of the Series’ Board of Directors. The Advisor may receive from a Class the difference between the Class’s total direct annual fund operating expenses, not including excluded expenses, and the Class’s contractual expense limit to recoup all or a portion of its prior fee waivers (other than Class W management fee waivers) or expense reimbursements made during the rolling three-year period preceding the recoupment if at any point the total direct annual fund operating expenses, not including excluded expenses, are below the contractual expense limit (a) at the time of the fee waiver and/or expense reimbursement and (b) at the time of the recoupment.
Pursuant to the advisory fee waiver, the Advisor waived $952,019 in management fees for Class W for the year ended December 31, 2019. In addition, pursuant to the separate expense limitation agreement, the Advisor did not waive or reimburse expenses for Class A and Class W for the year ended December 31, 2019. These amounts are included as a reduction of expenses on the Statement of Operations. For the year ended December 31, 2019, the Advisor did not recoup any expenses that have been previously waived or reimbursed.
| 4. | Purchases and Sales of Securities |
For the year ended December 31, 2019, purchases and sales of securities, other than U.S. Government securities and short-term securities, were $67,674,449 and $173,743,861, respectively. Purchases of U.S. Government securities, other than short-term securities, were $2,001,106. There were no sales of U.S. Government securities.
| 5. | Capital Stock Transactions |
Transactions in shares of Class A and Class W of Diversified Tax Exempt Series were:
| CLASS A | FOR THE YEAR ENDED 12/31/19 | FOR THE YEAR ENDED 12/31/18 | ||||||||||||||
| SHARES | AMOUNT | SHARES | AMOUNT | |||||||||||||
Sold | 604,801 | $ | 6,700,600 | 4,863,994 | $ | 52,900,167 | ||||||||||
Reinvested | 22,708 | 251,634 | 310,100 | 3,362,079 | ||||||||||||
Repurchased | (27,558,330 | ) | (303,551,588 | ) | (3,192,267 | ) | (34,645,883 | ) | ||||||||
|
|
|
|
|
|
|
| |||||||||
Total | (26,930,821 | ) | $ | (296,599,354 | ) | 1,981,827 | $ | 21,616,363 | ||||||||
|
|
|
|
|
|
|
| |||||||||
23
Diversified Tax Exempt Series
Notes to Financial Statements (continued)
| 5. | Capital Stock Transactions (continued) |
| CLASS W | FOR THE PERIOD 3/1/19 (COMMENCEMENT OF OPERATIONS) TO 12/31/19 | |||||||||||||||
| SHARES | AMOUNT | |||||||||||||||
Sold | 27,664,974 | $ | 304,969,924 | |||||||||||||
Reinvested | 541,092 | 6,036,584 | ||||||||||||||
Repurchased | (11,220,003 | ) | (125,968,406 | ) | ||||||||||||
|
|
|
| |||||||||||||
Total |
|
16,986,063 |
| $ | 185,038,102 | |||||||||||
|
|
|
| |||||||||||||
Over 90% of the shares outstanding are fiduciary accounts where the Advisor has sole investment discretion.
| 6. | Line of Credit |
The Fund has entered into a 364-day, $25 million credit agreement (the “line of credit”) with Bank of New York Mellon. Each series of the Fund may borrow under the line of credit for temporary or emergency purposes, including funding shareholder redemptions and other short-term liquidity purposes. The Fund pays an annual fee on the unused commitment amount, payable quarterly, and is allocated among all the series of the Fund and included in miscellaneous expenses in the Statement of Operations for each series. The line of credit expires in August 2020 unless extended or renewed. During the year ended December 31, 2019, the Series did not borrow under the line of credit.
| 7. | Financial Instruments |
The Series may trade in instruments including written and purchased options, forward foreign currency exchange contracts and futures contracts and other derivatives in the normal course of investing activities to assist in managing exposure to various market risks. The Series may be subject to various elements of risk, which may involve, to a varying degree, elements of risk in excess of the amounts recognized for financial statement purposes. These risks include: the risk that changes in the value of a derivative may not correlate perfectly with the underlying asset, rate or index; counterparty credit risk related to over the counter derivative counterparties’ failure to perform under contract terms; liquidity risk related to the lack of a liquid market for these contracts allowing the fund to close out its position(s); and documentation risk relating to disagreement over contract terms. No such investments were held by the Series as of December 31, 2019.
| 8. | Federal Income Tax Information |
The amount and characterization of certain income and capital gains to be distributed are determined in accordance with federal income tax regulations, which may differ from GAAP. These differences are primarily due to differing book and tax treatments in the timing and/or treatment of the recognition of net investment income or gains and losses, including market discount on investments. The Series may periodically make reclassifications among its capital accounts to reflect income and gains available for distribution (or available capital loss carryovers) under income tax regulations without impacting the Series’ net asset value. Any such reclassifications are not reflected in the financial highlights.
The tax character of distributions paid were as follows:
FOR THE YEAR ENDED 12/31/19 | FOR THE YEAR ENDED 12/31/18 | |||||||||||
Ordinary income | $ 941,373 | $ 56,979 | ||||||||||
Tax exempt income | $4,853,907 | $3,823,815 | ||||||||||
Long-term capital gains | $1,153,456 | — | ||||||||||
24
Diversified Tax Exempt Series
Notes to Financial Statements (continued)
| 8. | Federal Income Tax Information (continued) |
At December 31, 2019, the tax basis of components of distributable earnings and the net unrealized appreciation based on identified cost for federal income tax purposes were as follows:
| ||||||
Cost for federal income tax purposes | $ | 185,989,998 | ||||
Unrealized appreciation | 5,840,206 | |||||
Unrealized depreciation | (115,292 | ) | ||||
|
| |||||
Net unrealized appreciation | $ | 5,724,914 | ||||
|
| |||||
Undistributed tax exempt income | $ | 241,793 | ||||
Qualified late-year losses1 | $ | 29 | ||||
1The Series has elected to defer certain qualified late-year short-term capital losses and recognize such losses in the year ending December 31, 2020.
At December 31, 2019, the capital loss carryover utilized in the current year was $1,024,715.
25
Diversified Tax Exempt Series
Report of Independent Registered Public Accounting Firm
To the Board of Directors of Manning & Napier Fund, Inc. and Shareholders of Diversified Tax Exempt Series
Opinion on the Financial Statements
We have audited the accompanying statement of assets and liabilities, including the investment portfolio, of Diversified Tax Exempt Series (one of the series constituting Manning & Napier Fund, Inc., referred to hereafter as the “Fund”) as of December 31, 2019, the related statement of operations for the year ended December 31, 2019, the statement of changes in net assets for each of the two years in the period ended December 31, 2019, including the related notes, and the financial highlights for each of the periods indicated therein (collectively referred to as the “financial statements”). In our opinion, the financial statements present fairly, in all material respects, the financial position of the Fund as of December 31, 2019, the results of its operations for the year then ended, the changes in its net assets for each of the two years in the period ended December 31, 2019 and the financial highlights for each of the periods indicated therein in conformity with accounting principles generally accepted in the United States of America.
Basis for Opinion
These financial statements are the responsibility of the Fund’s management. Our responsibility is to express an opinion on the Fund’s financial statements based on our audits. We are a public accounting firm registered with the Public Company Accounting Oversight Board (United States) (PCAOB) and are required to be independent with respect to the Fund in accordance with the U.S. federal securities laws and the applicable rules and regulations of the Securities and Exchange Commission and the PCAOB.
We conducted our audits of these financial statements in accordance with the standards of the PCAOB. Those standards require that we plan and perform the audit to obtain reasonable assurance about whether the financial statements are free of material misstatement, whether due to error or fraud.
Our audits included performing procedures to assess the risks of material misstatement of the financial statements, whether due to error or fraud, and performing procedures that respond to those risks. Such procedures included examining, on a test basis, evidence regarding the amounts and disclosures in the financial statements. Our audits also included evaluating the accounting principles used and significant estimates made by management, as well as evaluating the overall presentation of the financial statements. Our procedures included confirmation of securities owned as of December 31, 2019 by correspondence with the custodian. We believe that our audits provide a reasonable basis for our opinion.
New York, New York
February 14, 2020
We have served as the auditor of one or more investment companies in Manning & Napier Mutual Funds since 1992.
26
Diversified Tax Exempt Series
Supplemental Tax Information
(unaudited)
All reportings are based on financial information available as of the date of this annual report, and accordingly are subject to change.
The Series hereby reports $4,853,907 as tax exempt dividends for the year ended December 31, 2019. It is the intention of the Series to designate the maximum allowable under tax law.
The Series designates $1,211,129 as Long-Term Capital Gain dividends pursuant to Section 852(b)(3) of the Internal Revenue Code for the fiscal year ended December 31, 2019.
27
Diversified Tax Exempt Series
Renewal of Investment Advisory Agreement
(unaudited)
At the Manning & Napier Fund, Inc. (the “Fund”) Board of Directors’ (the “Board”) meeting, held on November 21, 2019, the Investment Advisory Agreement (the “Agreement”) between the Fund and Manning & Napier Advisors, LLC (the “Advisor”) was considered for renewal by the Board, including all of the Directors who are not “interested persons” (“Independent Directors”), within the meaning of the Investment Company Act of 1940, as amended (the “1940 Act”). In connection with the decision whether to renew the Agreement, a variety of material was provided to the Board in advance of the meeting for their review and consideration. The Board also held a working session on October 25, 2019 to review and discuss information provided to the Board, and for the Board to request additional information.
Representatives of the Advisor attended a portion of the working session and attended the Board meeting. The Advisor provided supplemental information requested by the Board and presented additional oral information to the Board to assist the Board in its considerations. In addition to the information furnished by the Advisor, the Board was provided with a legal memorandum discussing its fiduciary duties related to its approval of the continuation of the Agreement. Legal counsel for the Fund discussed with the Board the applicable legal considerations. In addition, the Board receivedin-person presentations about the Fund throughout the year.
The Independent Directors were advised by independent legal counsel with respect to these matters. The Independent Directors also met separately in an executive session with their legal counsel without any representatives of the Advisor present.
The Directors’ determinations at the meeting were made on the basis of each Director’s business judgment after consideration of all the information presented. In deciding to recommend the renewal of the Agreement with respect to each Series of the Fund, the Independent Directors did not identify any single or particular piece of information that, in isolation, was the controlling factor. Each Independent Director may also have weighed factors differently. This summary describes the most important, but not all, of the factors considered by the Board and the Independent Directors.
| • | The Board considered the nature and quality of services provided by the Advisor under the Agreement for over 30 years including, among others: deciding what securities to purchase and sell for each Series; arranging for the purchase and sale of such securities by placing orders with broker-dealers; administering the affairs of the Fund (including the books and records of the Fund not maintained by third party service providers such as the custodian or transfer agent); arranging for the insurance coverage for the Fund; and supervising the preparation of tax returns, SEC filings (including registration statements) and reports to shareholders for the Fund. The Board considered the numerous services performed by the Advisor and its affiliates beyond those stated in the Agreements. The Board also considered the Advisor’s personnel who perform services to the Fund, changes in senior or key personnel, industry trends impacting the mutual fund industry, the strength of the Advisor’s compliance infrastructure, policies and procedures relating to compliance with securities regulations, reputation, expertise and resources. The Board discussed the quality of these services with representatives from the Advisor and concluded that the Advisor was performing its services to the Fund required under the Agreement in a reasonable manner. |
| • | The Board considered the Advisor’s investments teams, including changes to the investment teams and investment team’s compensation during the past year, and the investment process. The Board considered the performance of each Series since its inception, as well as over multiple time periods including: one year, three year, five year, ten year, and current market cycle. A market cycle includes periods of both rising and falling markets. Returns for established benchmark indices for each Series were provided. In addition, the Board considered (and considers on a quarterly basis) a number of other factors relevant to performance at the meeting including: a peer group performance analysis consisting of Morningstar universes of mutual funds with similar investment objectives; the breadth of the Fund’s product offerings; and performance over reasonable time periods. Representatives of the Advisor discussed improved performance for many of the Series over theone- and three-year time periods ending September 30, 2019. The Board discussed with Representatives of the Advisor, performance challenges that continue to impact the three- and five-year performance of certain Fund’s strategies resulting from periods of underperformance in 2014 and 2016. After discussion, the Board acknowledged the improved short term performance of many of the Series and concluded that notwithstanding the performance challenges that continue to impact certain Series, the nature and quality of the investment management services provided by the Advisor to the Fund supported the renewal of the agreement. |
| • | The Board considered the fees and expenses of the various Series of the Fund. The Advisor presented the advisory fees and total expenses for each Series, including the advisory fee adjusted for any contractual expense waivers or reimbursements paid by the Advisor. Representatives of the Advisor discussed the multi-year fee restructuring initiative which was completed by the Advisor on March 1, 2019 to increase the competitiveness of the Fund’s fees. The fee |
28
Diversified Tax Exempt Series
Renewal of Investment Advisory Agreement
(unaudited)
restructuring project also resulted in a set of standardized share classes to help support the Fund’s distribution efforts across client types and varying intermediary distribution models. |
| • | The Board considered whether the Advisor had achieved economies of scale with respect to its services to the Fund. The Board acknowledged the expense caps incorporated in the Fund’s current fee structure, which requires the Advisor to subsidize the expenses of the Series operating above their expense cap, noting that 26 Series of the Fund are currently receiving expense reimbursements from the Advisor. The Board concluded that the Fund would need to grow in assets before the Advisor would be able to achieve meaningful economies of scale. |
| • | The Advisor provided the Board with information comparing each Series’ contractual management fees with the Advisor’s standard advisory fees for separate accounts and collective investment trusts. The Board considered that the range of services provided to the Series is more extensive than for the Advisor’s other clients due to additional infrastructure, administrative and regulatory requirements related to operating a mutual fund. |
| • | The current advisory fees,12b-1 Distribution and Service Fees, other expenses (e.g. a combination of Shareholder Services Fees, intermediarysub-TA fees, routine operating expenses and Acquired Fund Fees and Expenses forfund-of-fund Series) and total expense ratios of each Series and share class were compared and ranked (on both a mean and median basis) against respective peer universes. Respective peer universes included funds of a similar size and with similar investment objectives and expense characteristics as disclosed on the Morningstar database. Representatives of the Advisor discussed with the Board the comparisons and rankings of fees and net expense ratios for each Series of the Fund and the methodology behind the comparison. The Board considered the Advisor’s active portfolio management that results in portfolios that are more differentiated than the construction of their benchmarks. The Board acknowledged that the fee restructuring project completed on March 1, 2019 reduced the expense ratios for shareholders in many Series. Based on their review of the information provided, the Board concluded that the current fees and expenses of each Series of the Fund were reasonable on a comparative basis. |
| • | The Board also considered the other benefits the Advisor derives from its relationship with the Fund. Such other benefits include participation in a joint insurance program, sharing of compensation expenses for certain shared personnel, relationships with large service providers, the utilization of Series within the Advisor’s separately managed accounts and certain research services provided by soft dollars. The Board reviewed the broker-dealers who provided research to the Advisor and the products and services paid for, in whole or in part, using soft dollar commissions. The Board concluded that these additional benefits to the Advisor were reasonable. |
Based on the Board’s deliberations and their evaluation of the information described above, the Board, including a majority of the Independent Directors, concluded that the compensation under the Agreement was fair and reasonable with respect to each Series in light of the services and expenses and such other matters as the Directors considered to be relevant in the exercise of their reasonable judgment, and that the renewal of the Agreement would be in the best interests of each Series and its shareholders. The Board did not indicate that any single factor was determinative of its decision to approve the Agreement, but indicated that the Board based its determination on the total mix of information available to it.
29
Diversified Tax Exempt Series
Directors’ and Officers’ Information
(unaudited)
The Statement of Additional Information provides additional information about the Fund’s directors and officers and can be obtained without charge by calling1-800-466-3863, at www.manning-napier.com, or on the EDGAR Database on the SEC Internet web site (http://www.sec.gov). The following chart shows certain information about the Fund’s directors and officers, including their principal occupations during the last five years. Unless specific dates are provided, the individuals have held the listed positions for longer than five years.
| Interested Director and Officer | ||
| Name: | Paul Battaglia* | |
| Address: | 290 Woodcliff Drive | |
| Fairport, NY 14450 | ||
| Age: | 41 | |
| Current Position(s) Held with Fund: | Principal Executive Officer, President, Chairman & Director | |
| Term of Office & Length of Time Served: | Indefinite – Chairman and Director since November 20181 | |
| Principal Occupation(s) During Past 5 Years: | Chief Financial Officer (2018 – Present); Vice President of Finance (2016 – 2018); Director of Finance (2011 – 2016); Financial Analyst/Internal Auditor (2004-2006) – Manning & Napier Advisors, LLC and affiliates Holds one or more of the following titles for various subsidiaries and affiliates: Chief Financial Officer | |
| Number of Portfolios Overseen within Fund Complex: | 31 | |
Other Directorships Held Outside Fund Complex During Past 5 Years: | N/A | |
| Independent Directors | ||
| Name: | Stephen B. Ashley | |
| Address: | 290 Woodcliff Drive | |
| Fairport, NY 14450 | ||
| Age: | 79 | |
| Current Position(s) Held with Fund: | Director, Audit Committee Member, Governance & Nominating Committee Member | |
| Term of Office & Length of Time Served: | Indefinite – Since 1996 | |
| Principal Occupation(s) During Past 5 Years: | Chairman and Director (1997 to present); Chief Executive Officer | |
| (1997-2019) - Ashley Companies (property management and investment) . | ||
| Number of Portfolios Overseen within Fund Complex: | 31 | |
| Other Directorships Held Outside Fund Complex During | Ashley Companies (1997 - present) | |
| Past 5 Years: | ||
| Name: | Paul A. Brooke | |
| Address: | 290 Woodcliff Drive | |
| Fairport, NY 14450 | ||
| Age: | 74 | |
| Current Position(s) Held with Fund: | Lead Independent Director, Audit Committee Member, Governance & | |
| Nominating Committee Chairman | ||
| Term of Office & Length of Time Served: | Indefinite – Director, Audit Committee Member, Governance & Nominating Committee Member since 2007; Governance & Nominating Committee Chairman since 2016; Lead Independent Director since 2017 | |
| Principal Occupation(s) During Past 5 Years: | Chairman & CEO (2005-2009) - Ithaka Acquisition Corporation (investments); Chairman (2007-2009) - Alsius Corporation (investments); Managing Member (1991-present) - PMSV Holdings LLC (investments); Managing Member (2010-2016) - Venbio (investments). | |
| Number of Portfolios Overseen within Fund Complex: | 31 | |
| Other Directorships Held Outside Fund Complex During Past 5 Years: | Incyte Corp. (biotech)(2000-present); ViroPharma, Inc. (speciality pharmaceuticals)(2000-2014); HLTH (WebMD)(information)(2000-2010); Cheyne Capital International (investment)(2000-2017); GMP Companies (investment)(2000-2011); Cytos Biotechnology Ltd (biotechnology)(2012-2014); Cerus (biomedical)(2016-present);PureEarth(non-profit)
| |
30
Diversified Tax Exempt Series
Directors’ and Officers’ Information
(unaudited)
Independent Directors (continued)
| Name: | Peter L. Faber | |
| Address: | 290 Woodcliff Drive | |
| Fairport, NY 14450 | ||
| Age: | 81 | |
| Current Position(s) Held with Fund: | Director, Governance & Nominating Committee Member | |
| Term of Office & Length of Time Served: | Indefinite – Since 1987 | |
| Principal Occupation(s) During Past 5 Years: | Senior Counsel (2006-2012), Partner (1995-2006 & 2013-2018) - McDermott, Will & Emery LLP (law firm) | |
Number of Portfolios Overseen within Fund Complex: Other Directorships Held Outside Fund Complex During Past 5 Years: | 31 Boston Early Music Festival(non-profit)(2007-present); Amherst Early Music, Inc.(non-profit)(2009-present); Gotham Early Music Scene, Inc.(non-profit)(2009-present); Partnership for New York City, Inc.(non-profit)(1989-2010); New York Collegium(non-profit)(2004-2011); S’Cool Sounds, Inc.(non-profit)(2017-present) | |
| Name: | Harris H. Rusitzky | |
| Address: | 290 Woodcliff Drive | |
| Fairport, NY 14450 | ||
| Age: | 84 | |
| Current Position(s) Held with Fund: | Director, Audit Committee Member, Governance & Nominating Committee | |
| Member | ||
| Term of Office & Length of Time Served: | Indefinite – Since 1985 | |
| Principal Occupation(s) During Past 5 Years: | President (1994- present) - The Greening Group (business consultants); | |
| Partner (2006-present) - The Restaurant Group (restaurants) | ||
Number of Portfolios Overseen within Fund Complex: Other Directorships Held Outside Fund Complex During Past 5 Years: | 31 Rochester Institute of Technology (university)(1972-present); Culinary Institute of America(non-profit college)(1985-present); George Eastman Museum (museum)(1988-present); National Restaurant Association (restaurant trade organization)(1978-present) | |
| Name: | Chester N. Watson | |
| Address: | 290 Woodcliff Drive | |
| Fairport, NY 14450 | ||
| Age: | 69 | |
| Current Position(s) Held with Fund: | Director, Audit Committee Chairman, Governance & Nominating | |
| Committee Member | ||
| Term of Office & Length of Time Served: | Indefinite – Director, Audit Committee Member, Governance & Nominating | |
| Committee Member Since 2012; Audit Committee Chairman since 2013 | ||
| Principal Occupation(s) During Past 5 Years: | General Auditor (2003-2011) - General Motors Company (auto | |
| manufacturer) | ||
Number of Portfolios Overseen within Fund Complex: Other Directorships Held Outside Fund Complex During Past 5 Years: | 31 Rochester Institute of Technology (University)(2005-present); Town of Greenburgh, NY Planning Board (Municipal Government) (2015-2019); Hudson Valley Center for Innovation, Inc. (New Business and Economic Development) (2019 – present) | |
| Officers: | ||
| Name: | Elizabeth Craig | |
| Address: | 290 Woodcliff Drive | |
| Fairport, NY 14450 | ||
| Age: | 32 | |
| Current Position(s) Held with Fund: | Corporate Secretary | |
| Term of Office1& Length of Time Served: | Since 2016 | |
| Principal Occupation(s) During Past 5 Years: | Fund Regulatory Administration Manager since 2018; Fund Administration Manager (2015-2018); Mutual Fund Compliance Specialist (2009-2015) - Manning & Napier Advisors, LLC; Assistant Corporate Secretary (2011-2016) - Manning & Napier Fund, Inc.; Corporate Secretary, Director – Manning & Napier Investor Services, Inc. (since 2019)
| |
31
Diversified Tax Exempt Series
Directors’ and Officers’ Information
(unaudited)
Officers: (continued)
| Name: | Christine Glavin | |
| Address: | 290 Woodcliff Drive | |
| Fairport, NY 14450 | ||
| Age: | 53 | |
| Current Position(s) Held with Fund: | Principal Financial Officer, Chief Financial Officer | |
| Term of Office1& Length of Time Served: | Principal Financial Officer since 2002; Chief Financial Officer since 2001 | |
| Principal Occupation(s) During Past 5 Years: | Director of Fund Reporting since 2011; Fund Reporting Manager (1997-2011) - Manning & Napier Advisors, LLC; Assistant Treasurer since 2008 - Exeter Trust Company; Chief Financial Officer (2017-2018) - Rainier Investment Management Mutual Funds, Inc. | |
| Name: | Samantha Larew | |
| Address: | 290 Woodcliff Drive | |
| Fairport, NY 14450 | ||
| Age: | 39 | |
| Current Position(s) Held with Fund: | Chief Compliance Officer and Anti-Money Laundering Compliance Officer | |
| Term of Office1& Length of Time Served: | Chief Compliance Officer since 2019; Anti-Money Laundering Compliance | |
| Officer since 2018 | ||
| Principal Occupation(s) During Past 5 Years: | Co-Director of Compliance (since 2018); Compliance Communications Supervisor (2014-2018); Compliance Supervisor (2013-2014); Broker-Dealer Compliance Supervisor (2011-2013); Broker-Dealer Compliance Analyst (2010-2011) - Manning & Napier Advisors, LLC & Affiliates; Broker-Dealer Chief Compliance Officer (since 2013); Broker-Dealer Assistant Corporate Secretary (since 2011) – Manning & Napier Investor Services, Inc.; Compliance Analyst (2007-2009) – Wall Street Financial Group; Compliance Specialist (2003-2007) – Manning & Napier Advisors, LLC & Affiliates Holds one or more of the following titles for various affiliates: Assistant Corporate Secretary, Chief Compliance Officer | |
| Name: | Scott Morabito | |
| Address: | 290 Woodcliff Drive | |
| Fairport, NY 14450 | ||
| Age: | 32 | |
| Current Position(s) Held with Fund: | Vice President | |
| Term of Office1& Length of Time Served: | Vice President since 2019; Assistant Vice President (2017-2019) | |
| Principal Occupation(s) During Past 5 Years: | Managing Director of Operations since 2019; Director of Funds Group (2017-2019); Fund Product and Strategy Manager (2014-2017); Senior Product and Strategy Analyst (2013-2014); Product and Strategy Analyst (2011-2013) - Manning & Napier Advisors, LLC; President, Director – Manning & Napier Investor Services, Inc. (since 2018) | |
| Name: | Sarah Turner | |
| Address: | 290 Woodcliff Drive | |
| Fairport, NY 14450 | ||
| Age: | 37 | |
| Current Position(s) Held with Fund: | Chief Legal Officer; Assistant Corporate Secretary | |
| Term of Office1& Length of Time Served: | Since 2018 | |
| Principal Occupation(s) During Past 5 Years: | Attorney since 2018 - Manning & Napier Advisors, LLC and affiliates; Counsel (2017-2018) – Harter Secrest and Emery LLP; Legal Counsel (2010-2017) – Manning & Napier Advisors, LLC and affiliates Holds one or more of the following titles for various affiliates: Corporate Secretary, General Counsel | |
*Interested Director, within the meaning of the 1940 Act by reason of his positions with the Fund’s Advisor, Manning & Napier Advisors, LLC, and Distributor, Manning & Napier Investor Services, Inc.
1The term of office of all officers shall be one year and until their respective successors are chosen and qualified, or his or her earlier resignation or removal as provided in the Fund’sBy-Laws.
32
{This page intentionally left blank}
33
Diversified Tax Exempt Series
Literature Requests
(unaudited)
Proxy Voting Policies and Procedures
A description of the policies and procedures that the Fund uses to determine how to vote proxies relating to portfolio securities is available, without charge, upon request:
| By phone | 1-800-466-3863 | |||
| On the Securities and Exchange | ||||
| Commission’s (SEC) web site | http://www.sec.gov |
Proxy Voting Record
Information regarding how the Fund voted proxies relating to portfolio securities during the most recent12-month period ended June 30th is available, without charge, upon request:
| By phone | 1-800-466-3863 | |||
| On the SEC’s web site | http://www.sec.gov |
Quarterly Portfolio Holdings
The Series’ complete schedule of portfolio holdings for the 1st and 3rd quarters of each fiscal year are provided on FormN-PORT, and are available, without charge, upon request:
| By phone | 1-800-466-3863 | |||
| On the SEC’s web site | http://www.sec.gov |
Prospectus and Statement of Additional Information (SAI)
For more information about any of the Manning & Napier Fund, Inc. Series, you may obtain a prospectus and SAI at www.manning-napier.com or by calling (800)466-3863. Before investing, carefully consider the objectives, risks, charges and expenses of the investment and read the prospectus carefully as it contains this and other information about the investment company.In addition, this information can be found on the SEC’s web site, http://www.sec.gov.
Additional information available at www.manning-napier.com
1. Fund Holdings -Month-End
2. Fund Holdings -Quarter-End
3. Shareholder Report - Annual
4. Shareholder Report - Semi-Annual
The Fund also offers electronic notification or“e-delivery” when certain documents are availableon-line to be downloaded or reviewed. Direct shareholders can elect to receive electronic notification when shareholder reports, prospectus updates, and/or statements are available. If you do not currently haveon-line access to your account, you can establish access by going to www.manning-napier.com, click on “Login” in the top corner of the page, and follow the prompts to self-enroll. Once enrolled, you can set your electronic notification preferences by clicking on the Account Options tab located within the green toolbar and then selectE-Delivery Option. Should you have any questions on either how to establishon-line access or how to update your account settings, please contact Investor Services at1-800-466-3863.
The Manning & Napier Fund, Inc. is managed by Manning & Napier Advisors, LLC. Manning & Napier Investor Services, Inc., an affiliate of Manning & Napier Advisors, LLC, is the distributor of the Fund shares.
MNDTE-12/19-AR
Manning & Napier Fund, Inc.
New York Tax Exempt Series
Beginning on February 25, 2021, as permitted by Securities and Exchange Commission regulations, paper copies of the Series’ annual and semi-annual shareholder reports will no longer be sent by mail, unless you specifically request paper copies of the reports from the Fund or from your financial intermediary, such as a broker-dealer or bank. Instead, the reports will be made available on a website, and you will be notified by mail each time a report is posted and provided with a website link to access the report.
If you already elected to receive shareholder reports electronically, you will not be affected by this change and you need not take any action. You may elect to receive shareholder reports and other communications from the Fund electronically by contacting your financial intermediary or, if you are a direct investor, by visiting www.manning-napier.com or calling1-800-466-3863.
You may elect to receive all future annual and semi-annual reports in paper free of charge. If you invest through a financial intermediary, you can contact your financial intermediary to request that you continue to receive paper copies of your shareholder reports. If you invest directly with the Fund, you can inform the Fund that you wish to continue receiving paper copies of your shareholder reports by visiting www.manning-napier.com or calling1-800-466-3863. Your election to receive reports in paper will apply to all funds held with your financial intermediary if you invest through a financial intermediary or all series of the Fund if you invest directly with the Fund. |
| Independent Perspective| Real-World Solutions |
A Note from Our CEO
Dear Shareholder,
The investing world is constantly changing, yet investors’ needs and objectives remain substantially the same.
Whether you are an individual saver looking to ensure security in retirement, or an institutional investor with a fiduciary obligation to others, at the end of the day you look for a trusted partner to help you build, grow, and preserve wealth.
In order to do so successfully we recognize that, in the short-term, the world’s capital markets can be capricious and hard to predict.
Bubbles form, rise, and then pop. The hot stocks of today often become passing fads of tomorrow. Investor sentiment can swing wildly, whipsawing between exuberance one day and despondence the next.
As successful long-term investors, we are defined both by what we do as well as what we don’t do.
We don’t attempt to perfectly time every recession. We don’t jump on the latest trend. We don’t worry about capturing every market peak all across the globe.
On the other hand, we do maintain the rigorous disciplines we have developed over close to half a century. We are highly attentive to managing risk and protecting investors in down markets while participating fully in the opportunities our Research uncovers.
Our focus is on you, the shareholder, and helping you achieve your goals.
In the face of an uncertain world, we believe our investment philosophies, processes, and experience have stood the test of time and will do so in the future.
We appreciate your continued confidence in our approach.
|
Sincerely,
Marc Mayer
Chief Executive Officer |
Corporate Headquarters | 290 Woodcliff Drive| Fairport, NY 14450| (585)325-6880 phone| (800)551-0224 toll free| www.manning-napier.com
1
New York Tax Exempt Series
Fund Commentary
(unaudited)
Investment Objective
To provide as high a level of current income exempt from federal income tax and New York State personal income tax as the Advisor believes is consistent with the preservation of capital. The Series invests primarily in municipal bonds that provide income exempt from federal income tax and New York State personal income tax.
Performance Commentary
The municipal bond market posted positive returns for the twelve-month period ending December 31, 2019. Despite some intra-year volatility, interest rates fell roughly 55 to 100 basis points across the yield curve as demand remained high for sources oftax-free income. Additionally, credit spreads ended the year tighter than the previous year as investors continued to search for sources of higher yield. Given these dynamics, longer-dated securities outperformed shorter-dated securities and lower-quality outperformed higher-quality.
The NY Tax Exempt Series Class A shares delivered positive absolute returns, returning 4.86% during the year, but underperformed its benchmark, the Intercontinental (ICE) Bank of America Merrill Lynch (BofAML)1-12 Year Municipal Bond Index, which returned 5.64%.
The Series underperformance was more modest when viewed on agross-of-fee basis, with allocations to longer-dated securities contributing positively to performance as yields broadly fell. As compared to the benchmark, the Series’ underweight allocation to middle tier credits detracted from relative returns as spreads tightened.
In terms of positioning, we continue to believe a modest duration remains in investors’ best interests. Going forward, we would view an increase in rates or a more negative view of the economy as an attractive opportunity to increase duration. Alternatively, should we see rates move lower without an accompanying meaningful change in the economic environment, we may look to decrease duration as investors are not likely being compensated for taking on the additional risk associated with longer-term bonds.
Our economic outlook remains constructive towards revenue bonds, which continue to offer attractive valuations while exhibiting stable credit fundamentals. Within revenue bonds, we maintain a focus on higher quality/essential service bonds (e.g., water and sewer authorities).
With respect to general obligations, we believe that the state is in a relatively stable credit position. We do however believe it’s unlikely that we see broad improvement in the sector considering where we are in the cycle and valuations. At the local level, our outlook also remains stable as property taxes are relatively healthy.
While 2019 was a very strong year for municipal bonds, we believe investor return expectations for the coming year should be tempered as the fixed income landscape remains challenging due to low starting rates. That stated, we believe a flexible approach with the ability to adapt to changing environments (e.g., uncovering risks and opportunities) will remain essential to achieving investor objectives.
Performance for the New York Tax Exempt Series Class A shares is provided above. Performance for other shares classes will differ based on each class’ underlying expenses.
Performance data quoted represents past performance and does not guarantee future results. The investment return and principal value of an investment will fluctuate, so that an investor’s shares, when redeemed, may be worth more or less than their original cost. Current performance may be higher or lower than that quoted; investors can obtain the most recentmonth-end performance at www.manning-napier.com or by calling (800)466-3863.
Additional information and associated disclosures can be found on the Performance Update page of this report.
All investments involve risks, including possible loss of principal. There is an inverse relationship between bond prices and interest rates; as interest rates rise, bond prices (and therefore the value of bond funds) fall. Likewise, as interest rates fall, bond prices and the value of bond funds rise. The income earned by the Series may be subject to the Alternative Minimum Tax (AMT), depending on your tax situation.
2
New York Tax Exempt Series
Performance Update as of December 31, 2019
(unaudited)
AVERAGE ANNUAL TOTAL RETURNS AS OF | ||||||
ONE YEAR1 | FIVE YEAR | TEN YEAR | ||||
New York Tax Exempt Series - Class A2 | 4.86% | 1.67% | 1.96% | |||
New York Tax Exempt Series - Class W2,3 | 5.34% | 1.76% | 2.01% | |||
Intercontinental Exchange (ICE) Bank of America Merrill Lynch (BofAML)1-12 Year Municipal Bond Index4 | 5.64% | 2.55% | 3.08% | |||
The following graph compares the value of a $10,000 investment in the New York Tax Exempt Series - Class A for the ten years ended December 31, 2019 to the Intercontinental Exchange (ICE) Bank of America Merrill Lynch (BofAML)1-12 Year Municipal Bond Index.
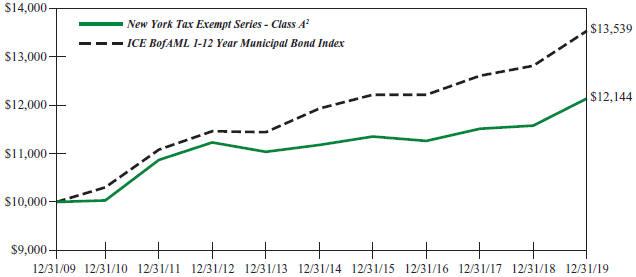
1The returns shown are based on net asset values calculated for shareholder transactions and may differ from the returns shown in the financial highlights, which reflect adjustments made to the net asset values in accordance with accounting principles generally accepted in the United States of America.
2The Series’ performance does not reflect the deduction of taxes that a shareholder would pay on fund distributions or the redemption of shares. The Series’ performance is historical and may not be indicative of future results. The performance returns shown are inclusive of the net expense ratio of the Series. For the year ended December 31, 2019, this net expense ratio was 0.63% for Class A and 0.16% for Class W. The gross expense ratio, which does not account for any voluntary or contractual waivers currently in effect, was 0.63% for Class A and 0.66% for Class W for the year ended December 31, 2019.
3For periods through March 1, 2019 (the inception date of the Class W shares), performance for the Class W shares is based on the historical performance of the Class A shares. Because the Class W shares invest in the same portfolio of securities as the Class A shares, performance will be different only to the extent that the Class A shares have a higher expense ratio.
4The Intercontinental Exchange (ICE) Bank of America Merrill Lynch (BofAML)1-12 Year Municipal Bond Index is a subset of the ICE BofAML U.S. Municipal Securities Index. The Index includes all U.S. dollar denominated investment gradetax-exempt debt with a remaining term to final maturity greater than one year, but less than twelve years. Qualifying securities must have at least 18 months to final maturity at the time of issuance and a fixed coupon schedule. The Index returns do not reflect any fees or expenses. Index returns provided by Interactive Data.
3
New York Tax Exempt Series
Shareholder Expense Example
(unaudited)
As a shareholder of the Series, you incur ongoing costs, including management fees, shareholder service fees and other Series expenses. This example is intended to help you understand your ongoing costs (in dollars) of investing in the Series and to compare these costs with the ongoing costs of investing in other mutual funds.
The example is based on an investment of $1,000 invested in each class at the beginning of the period and held for the entire period (July 1, 2019 to December 31, 2019).
Actual Expenses
The Actual lines of the table below provide information about actual account values and actual expenses. You may use the information in this line, together with the amount you invested, to estimate the expenses that you paid over the period. Simply divide your account value by $1,000 (for example, an $8,600 account value divided by $1,000 = 8.6), then multiply the result by the number in the Actual line for the Class in which you have invested under the heading entitled “Expenses Paid During Period” to estimate the expenses you paid on your account during this period.
Hypothetical Example for Comparison Purposes
The Hypothetical lines of each class in the table below provide information about hypothetical account values and hypothetical expenses based on the Class’ actual expense ratio and an assumed rate of return of 5% per year before expenses, which is not the Class’ actual return. The hypothetical account values and expenses may not be used to estimate the actual ending account balance or expenses you paid during the period. You may use this information to compare the ongoing costs of investing in a class of the Series and other funds. To do so, compare this 5% hypothetical example for the class in which you have invested with the 5% hypothetical examples that appear in the shareholder reports of the other funds.
Please note that the expenses shown in the table are meant to highlight your ongoing costs only and do not reflect any transaction costs, such as sales charges (loads), redemption fees, or exchange fees that you may incur in other mutual funds. Therefore, the second line of the table is useful in comparing ongoing costs only, and will not help you determine the relative total costs of owning different funds.
BEGINNING 7/1/19 | ENDING 12/31/19 | EXPENSES PAID 7/1/19-12/31/19 | ANNUALIZED EXPENSE RATIO | |||||
Class A | ||||||||
Actual | $1,000.00 | $1,012.00 | $3.65 | 0.72% | ||||
Hypothetical | $1,000.00 | $1,021.58 | $3.67 | 0.72% | ||||
Class W | ||||||||
Actual | $1,000.00 | $1,014.30 | $0.96 | 0.19% | ||||
Hypothetical | $1,000.00 | $1,024.25 | $0.97 | 0.19% | ||||
*Expenses are equal to each Class’ annualized expense ratio (for thesix-month period), multiplied by the average account value over the period, multiplied by 184/365 (to reflect theone-half year period). Expenses are based on the most recent fiscal half year; therefore, the expense ratios states above may differ from the expense ratios stated in the financial highlights, which is based onone-year data. The Class’ total return would have been lower had certain expenses not been waived or reimbursed during the period.
4
New York Tax Exempt Series
Portfolio Composition as of December 31, 2019
(unaudited)
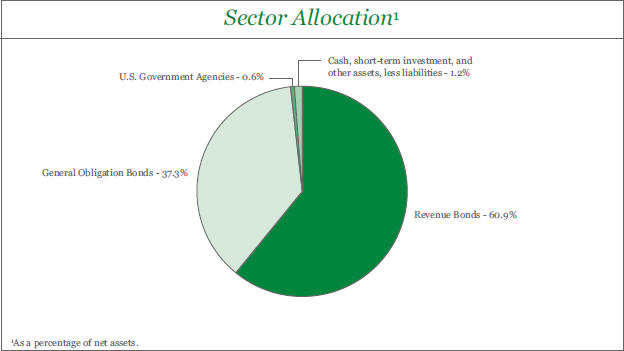
5
New York Tax Exempt Series
Investment Portfolio - December 31, 2019
| CREDIT | ||||||||||||||||||||||||
| COUPON | MATURITY | RATING1 | PRINCIPAL | VALUE | ||||||||||||||||||||
| RATE | DATE | (UNAUDITED) | AMOUNT | (NOTE 2) | ||||||||||||||||||||
NEW YORK MUNICIPAL BONDS - 98.2% | ||||||||||||||||||||||||
Ardsley, Parking Facility Impt., Series A, G.O. Bond | 3.000% | 7/15/2039 | Aa2 | $ | 1,000,000 | $ | 1,038,070 | |||||||||||||||||
Arlington Central School District, G.O. Bond | 4.000% | 12/15/2021 | Aa2 | 300,000 | 317,337 | |||||||||||||||||||
Babylon, Various Purposes, Public Impt., Series B, G.O. Bond | 2.250% | 12/1/2026 | Aaa | 705,000 | 740,201 | |||||||||||||||||||
Bedford Central School District, G.O. Bond | 2.000% | 10/15/2021 | Aa2 | 500,000 | 503,890 | |||||||||||||||||||
Briarcliff Manor, Public Impt., Series A, G.O. Bond | 3.000% | 2/1/2020 | Aa2 | 265,000 | 265,427 | |||||||||||||||||||
Buffalo Municipal Water Finance Authority, Series A, Revenue Bond | 4.000% | 7/1/2022 | A2 | 300,000 | 321,030 | |||||||||||||||||||
Buffalo Municipal Water Finance Authority, Series A, Revenue Bond | 5.000% | 7/1/2023 | A2 | 300,000 | 340,602 | |||||||||||||||||||
Buffalo Municipal Water Finance Authority, Water Utility Impt., Series A, Revenue Bond, AGM | 5.000% | 7/1/2039 | AA2 | 250,000 | 296,265 | |||||||||||||||||||
Buffalo Municipal Water Finance Authority, Water Utility Impt., Series A, Revenue Bond, AGM | 5.000% | 7/1/2043 | AA2 | 600,000 | 705,096 | |||||||||||||||||||
Buffalo Municipal Water Finance Authority, Water Utility Impt., Series A, Revenue Bond, AGM | 5.000% | 7/1/2048 | AA2 | 250,000 | 292,103 | |||||||||||||||||||
Canandaigua City School District, G.O. Bond | 2.125% | 6/15/2026 | Aa3 | 540,000 | 563,490 | |||||||||||||||||||
Canandaigua, Public Impt., G.O. Bond | 3.000% | 12/15/2028 | AA2 | 570,000 | 617,703 | |||||||||||||||||||
Chenango Valley Central School District, G.O. Bond, AGM | 2.125% | 6/15/2021 | A2 | 500,000 | 506,845 | |||||||||||||||||||
Clarence Central School District, G.O. Bond | 4.000% | 5/15/2021 | Aa2 | 250,000 | 260,152 | |||||||||||||||||||
Clarkstown Central School District, G.O. Bond | 4.000% | 10/15/2021 | Aa2 | 500,000 | 511,790 | |||||||||||||||||||
Dutchess County, G.O. Bond | 2.125% | 12/15/2023 | AA2 | 850,000 | 877,514 | |||||||||||||||||||
Erie County Fiscal Stability Authority, Series D Revenue Bond | 5.000% | 9/1/2038 | Aa1 | 1,000,000 | 1,228,570 | |||||||||||||||||||
Essex County, Public Impt., G.O. Bond | 5.000% | 5/1/2020 | AA2 | 500,000 | 506,605 | |||||||||||||||||||
Greece Central School District, G.O. Bond, BAM | 2.500% | 6/15/2023 | Aa3 | 620,000 | 648,774 | |||||||||||||||||||
Greene County, Correctional Facility Impt., G.O. Bond | 2.625% | 12/1/2048 | Aa2 | 1,000,000 | 911,890 | |||||||||||||||||||
Irondequoit, Public Impt., G.O. Bond | 3.000% | 4/15/2042 | Aa3 | 560,000 | 574,476 | |||||||||||||||||||
Iroquois Central School District, School Impt., G.O. Bond | 2.000% | 6/15/2021 | Aa2 | 500,000 | 502,620 | |||||||||||||||||||
Ithaca, Series B, G.O. Bond | 3.000% | 7/15/2042 | Aa2 | 440,000 | 442,583 | |||||||||||||||||||
Ithaca, Series B, G.O. Bond | 3.000% | 7/15/2043 | Aa2 | 400,000 | 401,788 | |||||||||||||||||||
Kings Park Central School District, G.O. Bond | 2.000% | 8/1/2020 | Aa2 | 500,000 | 502,870 | |||||||||||||||||||
Mamaroneck, Various Purposes, Public Impt., G.O. Bond | 2.000% | 7/15/2020 | Aaa | 335,000 | 336,956 | |||||||||||||||||||
Metropolitan Transportation Authority, Series F, Revenue Bond | 5.000% | 11/15/2022 | A1 | 250,000 | 276,600 | |||||||||||||||||||
Metropolitan Transportation Authority, Series F, Revenue Bond | 5.000% | 11/15/2025 | A1 | 505,000 | 557,611 | |||||||||||||||||||
Metropolitan Transportation Authority, SubseriesB-1, Revenue Bond | 5.000% | 11/15/2024 | AA2 | 1,885,000 | 2,169,013 | |||||||||||||||||||
Metropolitan Transportation Authority, Transit Impt., SubseriesB-2, Revenue Bond | 5.000% | 11/15/2021 | A1 | 1,000,000 | 1,070,310 | |||||||||||||||||||
The accompanying notes are an integral part of the financial statements.
6
New York Tax Exempt Series
Investment Portfolio - December 31, 2019
| CREDIT | ||||||||||||||||||||||||
| COUPON | MATURITY | RATING1 | PRINCIPAL | VALUE | ||||||||||||||||||||
| RATE | DATE | (UNAUDITED) | AMOUNT | (NOTE 2) | ||||||||||||||||||||
NEW YORK MUNICIPAL BONDS(continued) | ||||||||||||||||||||||||
Naples Central School District, G.O. Bond, BAM | 2.500% | 6/15/2020 | AA2 | $ | 710,000 | $ | 714,828 | |||||||||||||||||
Nassau County Sewer & Storm Water Finance Authority, Series A, Revenue Bond | 5.000% | 10/1/2022 | Aa3 | 500,000 | 555,275 | |||||||||||||||||||
New York City Transitional Finance Authority, Building Aid, Public Impt., SeriesS-2, Revenue Bond | 5.000% | 7/15/2023 | Aa2 | 2,000,000 | 2,269,900 | |||||||||||||||||||
New York City Transitional Finance Authority, Building Aid, School Impt., SeriesS-3, Revenue Bond | 5.000% | 7/15/2023 | Aa2 | 970,000 | 1,027,802 | |||||||||||||||||||
New York City Transitional Finance Authority, Building Aid, SeriesS-1, Revenue Bond | 5.000% | 7/15/2023 | Aa2 | 820,000 | 930,659 | |||||||||||||||||||
New York City Transitional Finance Authority, Building Aid, SeriesS-2A, Revenue Bond | 5.000% | 7/15/2033 | Aa2 | 1,000,000 | 1,244,240 | |||||||||||||||||||
New York City Transitional Finance Authority, Future Tax Secured, Public Impt., SeriesA-1, Revenue Bond | 3.250% | 8/1/2035 | Aa1 | 1,000,000 | 1,046,800 | |||||||||||||||||||
New York City Transitional Finance Authority, Future Tax Secured, Public Impt., SeriesC-1, Revenue Bond | 4.000% | 11/1/2042 | Aa1 | 1,680,000 | 1,886,657 | |||||||||||||||||||
New York City Transitional Finance Authority, Future Tax Secured, Public Impt., SeriesE-1, Revenue Bond | 5.000% | 2/1/2026 | Aa1 | 475,000 | 562,386 | |||||||||||||||||||
New York City Transitional Finance Authority, Future Tax Secured, Series B, Revenue Bond | 5.000% | 11/1/2024 | Aa1 | 3,000,000 | 3,329,130 | |||||||||||||||||||
New York City Water & Sewer System, Series A, Revenue Bond | 3.000% | 6/15/2036 | Aa1 | 1,250,000 | 1,292,762 | |||||||||||||||||||
New York City Water & Sewer System, Water Utility Impt., Series DD, Revenue Bond | 5.000% | 6/15/2047 | Aa1 | 3,000,000 | 3,550,650 | |||||||||||||||||||
New York City Water & Sewer System, Water Utility Impt., SubseriesBB-1, Revenue Bond | 5.000% | 6/15/2046 | Aa1 | 2,000,000 | 2,392,300 | |||||||||||||||||||
New York City, Public Impt., Subseries D1, G.O. Bond | 4.000% | 12/1/2041 | Aa1 | 1,650,000 | 1,854,039 | |||||||||||||||||||
New York City, Series 1, G.O. Bond | 5.000% | 8/1/2023 | Aa1 | 2,700,000 | 3,066,579 | |||||||||||||||||||
New York City, Series C, G.O. Bond | 5.000% | 8/1/2031 | Aa1 | 1,500,000 | 1,867,095 | |||||||||||||||||||
New York State Dormitory Authority, Income Tax Revenue, Series E, Revenue Bond | 3.500% | 3/15/2037 | Aa1 | 850,000 | 887,698 | |||||||||||||||||||
New York State Dormitory Authority, School Impt., Series A, Revenue Bond | 5.000% | 3/15/2030 | Aa1 | 1,500,000 | 1,850,355 | |||||||||||||||||||
New York State Dormitory Authority, School Impt., Series A, Revenue Bond | 4.000% | 10/1/2037 | Aa3 | 1,000,000 | 1,130,840 | |||||||||||||||||||
New York State Dormitory Authority, School Impt., Series A, Revenue Bond | 4.000% | 10/1/2038 | Aa3 | 1,000,000 | 1,127,040 | |||||||||||||||||||
New York State Dormitory Authority, School Impt., Series A, Revenue Bond | 5.000% | 3/15/2045 | Aa1 | 1,680,000 | 2,034,413 | |||||||||||||||||||
New York State Dormitory Authority, School Impt., Series A, Revenue Bond | 4.000% | 3/15/2047 | Aa1 | 1,050,000 | 1,153,740 | |||||||||||||||||||
New York State Dormitory Authority, School Impt., Series A, Revenue Bond | 4.000% | 3/15/2048 | Aa1 | 1,350,000 | 1,499,404 | |||||||||||||||||||
The accompanying notes are an integral part of the financial statements.
7
New York Tax Exempt Series
Investment Portfolio - December 31, 2019
| CREDIT | ||||||||||||||||||||||||
| COUPON | MATURITY | RATING1 | PRINCIPAL | VALUE | ||||||||||||||||||||
| RATE | DATE | (UNAUDITED) | AMOUNT | (NOTE 2) | ||||||||||||||||||||
NEW YORK MUNICIPAL BONDS(continued) | ||||||||||||||||||||||||
New York State Dormitory Authority, School Impt., Series A, Revenue Bond | 4.000% | 3/15/2048 | Aa1 | $ | 600,000 | $ | 665,076 | |||||||||||||||||
New York State Dormitory Authority, School Impt., Series E, Revenue Bond, AGM | 5.000% | 10/1/2025 | A2 | 1,000,000 | 1,142,170 | |||||||||||||||||||
New York State Environmental Facilities Corp., Water Utility Impt., Revenue Bond | 5.000% | 6/15/2025 | Aaa | 1,000,000 | 1,057,720 | |||||||||||||||||||
New York State Environmental Facilities Corp., Water Utility Impt., Series B, Revenue Bond | 4.000% | 8/15/2046 | Aaa | 2,000,000 | 2,193,140 | |||||||||||||||||||
New York State Environmental Facilities Corp., Water Utility Impt., Series B, Revenue Bond | 4.000% | 6/15/2049 | Aaa | 1,000,000 | 1,129,560 | |||||||||||||||||||
New York State Thruway Authority, Highway Impt., | 5.000% | 3/15/2020 | Aa1 | 550,000 | 554,362 | |||||||||||||||||||
New York State Urban Development Corp., Highway Impt., | 5.000% | 3/15/2037 | Aa1 | 500,000 | 587,310 | |||||||||||||||||||
New York State, Water Utility Impt., Series A, G.O. Bond | 5.000% | 3/1/2021 | Aa1 | 1,000,000 | 1,047,720 | |||||||||||||||||||
New York State, Water Utility Impt., Series E, G.O. Bond | 4.250% | 12/15/2041 | Aa1 | 480,000 | 504,336 | |||||||||||||||||||
Niagara County, Water Utility Impt., G.O. Bond | 2.000% | 2/1/2020 | Aa3 | 500,000 | 500,405 | |||||||||||||||||||
North Colonie Central School District, G.O. Bond | 4.000% | 7/15/2020 | AA2 | 400,000 | 406,280 | |||||||||||||||||||
Onondaga County, Public Impt., Correctional Facility Impt., G.O. Bond | 3.000% | 6/1/2035 | Aa3 | 1,000,000 | 1,023,890 | |||||||||||||||||||
Onondaga County, Public Impt., Recreational Facility Impt., G.O. Bond | 5.000% | 5/1/2020 | Aa3 | 250,000 | 253,310 | |||||||||||||||||||
Onondaga County, Public Impt., Telecommunications Impt., G.O. Bond | 5.000% | 5/15/2022 | Aa3 | 1,000,000 | 1,094,260 | |||||||||||||||||||
Onondaga County, Public Impt., Telecommunications Impt., G.O. Bond | 5.000% | 5/15/2023 | Aa3 | 1,000,000 | 1,132,720 | |||||||||||||||||||
Onondaga County, Public Impt., Water Utility Impt., G.O. Bond | 2.125% | 6/15/2030 | Aa3 | 715,000 | 721,328 | |||||||||||||||||||
Orange County, Various Purposes Impt., Series A, G.O. Bond, AGM | 5.000% | 3/1/2023 | Aa2 | 520,000 | 584,792 | |||||||||||||||||||
Pittsford Central School District, G.O. Bond | 4.000% | 10/1/2021 | Aa1 | 350,000 | 368,235 | |||||||||||||||||||
Pittsford, Public Impt., G.O. Bond | 2.000% | 11/1/2026 | Aaa | 595,000 | 622,673 | |||||||||||||||||||
Port Authority of New York & New Jersey, Airport & Marina Impt., Consolidated Series 189, Revenue Bond | 5.000% | 5/1/2024 | Aa3 | 800,000 | 931,584 | |||||||||||||||||||
Port Authority of New York & New Jersey, Airport & Marina Impt., Series 179, Revenue Bond | 5.000% | 12/1/2024 | Aa3 | 765,000 | 879,306 | |||||||||||||||||||
Port Authority of New York & New Jersey, Consolidated Series 184, Revenue Bond | 5.000% | 9/1/2025 | Aa3 | 2,500,000 | 2,937,325 | |||||||||||||||||||
Rensselaer County, Nursing Homes, Public Impt., G.O. Bond | 2.000% | 7/15/2020 | AA2 | 930,000 | 930,679 | |||||||||||||||||||
Rochester, School Impt., Series A, G.O. Bond, AMBAC | 5.000% | 8/15/2022 | A2 | 95,000 | 104,655 | |||||||||||||||||||
Roslyn Union Free School District, G.O. Bond | 5.000% | 10/15/2020 | Aa1 | 215,000 | 221,725 | |||||||||||||||||||
The accompanying notes are an integral part of the financial statements.
8
New York Tax Exempt Series
Investment Portfolio - December 31, 2019
| CREDIT | ||||||||||||||||||||||||
| COUPON | MATURITY | RATING1 | PRINCIPAL | VALUE | ||||||||||||||||||||
| RATE | DATE | (UNAUDITED) | AMOUNT | (NOTE 2) | ||||||||||||||||||||
NEW YORK MUNICIPAL BONDS(continued) | ||||||||||||||||||||||||
Shenendehowa Central School District, G.O. Bond | 4.000% | 7/15/2020 | AA2 | $ | 475,000 | $ | 482,814 | |||||||||||||||||
Southold Union Free School District, School Impt., G.O. Bond | 3.000% | 6/15/2028 | Aa2 | 435,000 | 467,077 | |||||||||||||||||||
Suffolk County Water Authority, Prerefunded Balance, Revenue Bond | 5.000% | 6/1/2021 | AAA2 | 1,225,000 | 1,295,254 | |||||||||||||||||||
Suffolk County Water Authority, Prerefunded Balance, Revenue Bond | 4.000% | 6/1/2022 | WR3 | 25,000 | 26,440 | |||||||||||||||||||
Suffolk County Water Authority, Unrefunded Balance, Revenue Bond | 4.000% | 6/1/2022 | AAA2 | 175,000 | 184,702 | |||||||||||||||||||
Sullivan County, Public Impt., G.O. Bond | 3.000% | 11/15/2023 | AA2 | 500,000 | 536,530 | |||||||||||||||||||
Triborough Bridge & Tunnel Authority, Highway Impt., | 5.000% | 11/15/2023 | Aa3 | 350,000 | 402,448 | |||||||||||||||||||
Triborough Bridge & Tunnel Authority, Highway Impt., | 4.000% | 11/15/2044 | Aa3 | 500,000 | 565,750 | |||||||||||||||||||
Triborough Bridge & Tunnel Authority, Series A, Revenue Bond | 5.000% | 11/15/2024 | Aa3 | 650,000 | 771,121 | |||||||||||||||||||
Triborough Bridge & Tunnel Authority, Series B, Revenue Bond | 5.000% | 11/15/2022 | Aa3 | 1,000,000 | 1,112,400 | |||||||||||||||||||
Triborough Bridge & Tunnel Authority, Series B, Revenue Bond | 5.000% | 11/15/2024 | Aa3 | 1,000,000 | 1,111,800 | |||||||||||||||||||
Ulster County, Public Impt., G.O. Bond | 3.000% | 11/15/2027 | AA2 | 425,000 | 468,724 | |||||||||||||||||||
Ulster County, Public Impt., Series B, G.O. Bond | 2.000% | 11/15/2020 | AA2 | 685,000 | 691,370 | |||||||||||||||||||
Vestal Central School District, G.O. Bond | 2.000% | 6/15/2025 | Aa2 | 685,000 | 712,674 | |||||||||||||||||||
Voorheesville Central School District, G.O. Bond | 5.000% | 6/15/2021 | AA2 | 500,000 | 528,865 | |||||||||||||||||||
Warren County, Public Impt., G.O. Bond, AGM | 4.000% | 7/15/2020 | AA2 | 500,000 | 507,850 | |||||||||||||||||||
Wayne County, Public Impt., G.O. Bond | 3.000% | 6/1/2021 | Aa2 | 295,000 | 303,582 | |||||||||||||||||||
Webster Central School District, School Impt., G.O. Bond | 2.000% | 10/15/2021 | AA2 | 315,000 | 319,375 | |||||||||||||||||||
Yonkers, Public Impt., Series C, G.O. Bond, AGM | 4.000% | 8/15/2020 | A2 | 350,000 | 356,216 | |||||||||||||||||||
|
| |||||||||||||||||||||||
TOTAL MUNICIPAL BONDS | ||||||||||||||||||||||||
(Identified Cost $85,186,593) | 88,002,326 | |||||||||||||||||||||||
|
| |||||||||||||||||||||||
U.S. GOVERNMENT AGENCIES - 0.6% | ||||||||||||||||||||||||
Other Agencies - 0.6% | ||||||||||||||||||||||||
Freddie Mac Multifamily ML Certificates, Series 2019-ML05, Class AUS | ||||||||||||||||||||||||
(Identified Cost $499,177) | 3.40% | 1/25/2036 | 491,177 | 543,964 | ||||||||||||||||||||
|
| |||||||||||||||||||||||
The accompanying notes are an integral part of the financial statements.
9
New York Tax Exempt Series
Investment Portfolio - December 31, 2019
| COUPON | VALUE | |||||||||||||||||||||||
| RATE | SHARES | (NOTE 2) | ||||||||||||||||||||||
SHORT-TERM INVESTMENT - 0.3% | ||||||||||||||||||||||||
Dreyfus Government Cash Management, Institutional Shares | ||||||||||||||||||||||||
(Identified Cost $274,974) | 1.51%4 | 274,974 | $ | 274,974 | ||||||||||||||||||||
|
| |||||||||||||||||||||||
TOTAL INVESTMENTS - 99.1% | ||||||||||||||||||||||||
(Identified Cost $85,960,744) | 88,821,264 | |||||||||||||||||||||||
OTHER ASSETS, LESS LIABILITIES - 0.9% | 851,749 | |||||||||||||||||||||||
|
| |||||||||||||||||||||||
NET ASSETS - 100% | $ | 89,673,013 | ||||||||||||||||||||||
|
| |||||||||||||||||||||||
KEY:
G.O. Bond - General Obligation Bond
Impt. - Improvement
Scheduled principal and interest payments are guaranteed by:
AGM (Assurance Guaranty Municipal Corp.)
AMBAC (AMBAC Assurance Corp.)
BAM (Build America Mutual Assurance Co.)
The insurance does not guarantee the market value of the municipal bonds.
1Credit ratings from Moody’s (unaudited).
2Credit ratings from S&P (unaudited).
3Credit rating has been withdrawn. As of December 31, 2019, there is no rating available (unaudited).
4Rate shown is the current yield as of December 31, 2019.
The accompanying notes are an integral part of the financial statements.
10
New York Tax Exempt Series
Statement of Assets and Liabilities
December 31, 2019
ASSETS: | ||||
Investments, at value (identified cost $85,960,744) (Note 2) | $ | 88,821,264 | ||
Interest receivable | 828,192 | |||
Receivable for fund shares sold | 65,688 | |||
Dividends receivable | 528 | |||
Prepaid expenses | 389 | |||
|
| |||
TOTAL ASSETS | 89,716,061 | |||
|
| |||
LIABILITIES: | ||||
Accrued fund accounting and administration fees (Note 3) | 16,079 | |||
Accrued Chief Compliance Officer service fees (Note 3) | 1,170 | |||
Accrued management fees (Note 3) | 827 | |||
Audit fees payable | 9,469 | |||
Payable for fund shares repurchased | 6,787 | |||
Accrued printing and postage fees payable | 5,379 | |||
Other payables and accrued expenses | 3,337 | |||
|
| |||
TOTAL LIABILITIES | 43,048 | |||
|
| |||
TOTAL NET ASSETS | $ | 89,673,013 | ||
|
| |||
NET ASSETS CONSIST OF: | ||||
Capital stock | $ | 85,446 | ||
Additionalpaid-in-capital | 86,573,752 | |||
Total distributable earnings (loss) | 3,013,815 | |||
|
| |||
TOTAL NET ASSETS | $ | 89,673,013 | ||
|
| |||
NET ASSET VALUE, OFFERING PRICE AND REDEMPTION PRICE PER SHARE - Class A | $ | 10.49 | ||
|
| |||
NET ASSET VALUE, OFFERING PRICE AND REDEMPTION PRICE PER SHARE - Class W | $ | 10.49 | ||
|
| |||
The accompanying notes are an integral part of the financial statements.
11
New York Tax Exempt Series
Statement of Operations
For the Year Ended December 31, 2019
INVESTMENT INCOME: | ||||
Interest | $ | 2,545,220 | ||
Dividends | 57,608 | |||
|
| |||
Total Investment Income | 2,602,828 | |||
|
| |||
EXPENSES: | ||||
Management fees (Note 3) | 581,717 | |||
Fund accounting and administration fees (Note 3) | 73,583 | |||
Directors’ fees (Note 3) | 11,340 | |||
Chief Compliance Officer service fees (Note 3) | 3,109 | |||
Audit fees | 44,837 | |||
Custodian fees | 4,663 | |||
Miscellaneous | 43,782 | |||
|
| |||
Total Expenses | 763,031 | |||
Less reduction of expenses (Note 3) | (457,418 | ) | ||
|
| |||
Net Expenses | 305,613 | |||
|
| |||
NET INVESTMENT INCOME | 2,297,215 | |||
|
| |||
REALIZED AND UNREALIZED GAIN (LOSS) ON INVESTMENTS: | ||||
Net realized gain (loss) on investments | 1,577,854 | |||
Net change in unrealized appreciation (depreciation) on investments | 2,835,962 | |||
|
| |||
NET REALIZED AND UNREALIZED GAIN (LOSS) ON INVESTMENTS | 4,413,816 | |||
|
| |||
NET INCREASE IN NET ASSETS RESULTING FROM OPERATIONS | $ | 6,711,031 | ||
|
| |||
The accompanying notes are an integral part of the financial statements.
12
New York Tax Exempt Series
Statements of Changes in Net Assets
| FOR THE YEAR ENDED 12/31/19 | FOR THE YEAR ENDED 12/31/18 | |||||||
INCREASE (DECREASE) IN NET ASSETS: | ||||||||
OPERATIONS: | ||||||||
Net investment income | $ | 2,297,215 | $ | 2,022,848 | ||||
Net realized gain (loss) on investments | 1,577,854 | (191,635 | ) | |||||
Net change in unrealized appreciation (depreciation) on investments | 2,835,962 | (1,261,106 | ) | |||||
|
|
|
| |||||
Net increase from operations | 6,711,031 | 570,107 | ||||||
|
|
|
| |||||
DISTRIBUTIONS TO SHAREHOLDERS (Note 9): | ||||||||
Class A | (113,686 | ) | (2,011,419 | ) | ||||
Class W | (3,626,022 | ) | — | |||||
|
|
|
| |||||
Total distributions to shareholders | (3,739,708 | ) | (2,011,419 | ) | ||||
|
|
|
| |||||
CAPITAL STOCK ISSUED AND REPURCHASED: | ||||||||
Net increase (decrease) from capital share transactions (Note 5) | (51,992,335 | ) | (13,882,426 | ) | ||||
|
|
|
| |||||
Net increase (decrease) in net assets | (49,021,012 | ) | (15,323,738 | ) | ||||
NET ASSETS: | ||||||||
Beginning of year | 138,694,025 | 154,017,763 | ||||||
|
|
|
| |||||
End of year | $ | 89,673,013 | $ | 138,694,025 | ||||
|
|
|
| |||||
The accompanying notes are an integral part of the financial statements.
13
New York Tax Exempt Series
Financial Highlights - Class A
| FOR THE YEAR ENDED | ||||||||||||||||||||
| 12/31/19 | 12/31/18 | 12/31/17 | 12/31/16 | 12/31/15 | ||||||||||||||||
Per share data (for a share outstanding throughout each year): | ||||||||||||||||||||
Net asset value - Beginning of year | $10.34 | $10.43 | $10.31 | $10.50 | $10.42 | |||||||||||||||
|
|
|
|
|
|
|
|
|
| |||||||||||
Income (loss) from investment operations: | ||||||||||||||||||||
Net investment income1 | 0.16 | 0.14 | 0.12 | 0.10 | 0.08 | |||||||||||||||
Net realized and unrealized gain (loss) on investments | 0.34 | (0.08 | ) | 0.11 | (0.18 | ) | 0.08 | |||||||||||||
|
|
|
|
|
|
|
|
|
| |||||||||||
Total from investment operations | 0.50 | 0.06 | 0.23 | (0.08 | ) | 0.16 | ||||||||||||||
|
|
|
|
|
|
|
|
|
| |||||||||||
Less distributions to shareholders: | ||||||||||||||||||||
From net investment income | (0.18 | ) | (0.15 | ) | (0.11 | ) | (0.11 | ) | (0.08 | ) | ||||||||||
From net realized gain on investments | (0.17 | ) | — | — | 2 | — | 2 | — | ||||||||||||
|
|
|
|
|
|
|
|
|
| |||||||||||
Total distributions to shareholders | (0.35 | ) | (0.15 | ) | (0.11 | ) | (0.11 | ) | (0.08 | ) | ||||||||||
|
|
|
|
|
|
|
|
|
| |||||||||||
Net asset value - End of year | $10.49 | $10.34 | $10.43 | $10.31 | $10.50 | |||||||||||||||
|
|
|
|
|
|
|
|
|
| |||||||||||
Net assets - End of year(000’s omitted) | $1,952 | $138,694 | $154,018 | $161,292 | $174,603 | |||||||||||||||
|
|
|
|
|
|
|
|
|
| |||||||||||
Total return3 | 4.86% | 0.54% | 2.27% | (0.79% | ) | 1.54% | ||||||||||||||
Ratios (to average net assets)/Supplemental Data: | ||||||||||||||||||||
Expenses | 0.63% | 0.62% | 0.60% | 0.60% | 0.60% | |||||||||||||||
Net investment income | 1.56% | 1.39% | 1.12% | 0.93% | 0.74% | |||||||||||||||
Series portfolio turnover | 24% | 21% | 9% | 19% | 35% | |||||||||||||||
1Calculated based on average shares outstanding during the years.
2Less than $0.01 per share.
3Represents aggregate total return for the years indicated, and assumes reinvestment of all distributions.
The accompanying notes are an integral part of the financial statements.
14
New York Tax Exempt Series
Financial Highlights - Class W
| FOR THE PERIOD 3/1/191 TO 12/31/19 | ||||||||||
Per share data (for a share outstanding throughout the period): | ||||||||||
Net asset value - Beginning of period |
| $10.45 | ||||||||
|
| |||||||||
Income from investment operations: | ||||||||||
Net investment income2 | 0.19 | |||||||||
Net realized and unrealized gain (loss) on investments | 0.25 | |||||||||
|
| |||||||||
Total from investment operations | 0.44 | |||||||||
|
| |||||||||
Less distributions to shareholders: | ||||||||||
From net investment income | (0.23 | ) | ||||||||
From net realized gain on investments | (0.17 | ) | ||||||||
|
| |||||||||
Total distributions to shareholders | (0.40 | ) | ||||||||
|
| |||||||||
Net asset value - End of period | $10.49 | |||||||||
|
| |||||||||
Net assets - End of period(000’s omitted) | $87,721 | |||||||||
|
| |||||||||
Total return3 | 4.23% | |||||||||
Ratios (to average net assets)/Supplemental Data: | ||||||||||
Expenses*4 | 0.16% | |||||||||
Net investment income4 | 2.09% | |||||||||
Series portfolio turnover | 24% | |||||||||
| *The investment advisor did not impose all or a portion of its management and/or other fees during the period, and may have paid a portion of the Series’ expenses. If these expenses had been incurred by the Class, the expense ratio (to average net assets) would have increased by the following amount4: |
| |||||||||
| 0.50% | ||||||||||
1Commencement of operations.
2Calculated based on average shares outstanding during the period.
3Represents aggregate total return for the period indicated, and assumes reinvestment of all distributions. Total return would have been lower had certain expenses not been waived or reimbursed during the period. Periods less than one year are not annualized.
4Annualized.
The accompanying notes are an integral part of the financial statements.
15
New York Tax Exempt Series
Notes to Financial Statements
| 1. | Organization |
New York Tax Exempt Series (the “Series”) is ano-load diversified series of Manning & Napier Fund, Inc. (the “Fund”). The Fund is organized in Maryland and is registered under the Investment Company Act of 1940, as amended, as anopen-end management investment company.
The Series’ investment objective is to provide as high a level of current income exempt from federal income tax and New York State personal income tax as the Advisor believes is consistent with the preservation of capital.
The Series is authorized to issue two classes of shares (Class A and Class W). Class W shares were issued March 1, 2019. While each class of shares is substantially the same, each class has its own investment eligibility criteria and cost structure.
The Fund’s advisor is Manning & Napier Advisors, LLC (the “Advisor”). Shares of the Series are offered to investors, clients and employees of the Advisor and its affiliates. The total authorized capital stock of the Fund consists of 15 billion shares of common stock each having a par value of $0.01. As of December 31, 2019, 8.9 billion shares have been designated in total among 31 series, of which 100 million have been designated as New York Tax Exempt Series Class A common stock and 50 million have been designated as New York Tax Exempt Series Class W common stock.
| 2. | Significant Accounting Policies |
The following is a summary of significant accounting policies followed by the Series. The Series is an investment company and, accordingly, follows the investment company accounting and reporting guidance of the Financial Accounting Standards Board Accounting Standards Codification Topic 946 - Investment Companies, which is part of accounting principles generally accepted in the United States of America (“GAAP”).
Security Valuation
Municipal securities will normally be valued on the basis of market valuations provided by an independent pricing service (the “Service”). The Service utilizes the latest price quotations and a matrix system (which considers such factors as security prices of similar securities, yields, maturities and ratings). The Service has been approved by the Fund’s Board of Directors (the “Board”).
Short-term investments that mature in sixty days or less may be valued at amortized cost, which approximates fair value. Investments inopen-end investment companies are valued at their net asset value per share on valuation date.
Volume and level of activity in established markets for an asset or liability are evaluated to determine whether recent transactions and quoted prices are determinative of fair value. Where there have been significant decreases in volume and level of activity, further analysis and adjustment may be necessary to estimate fair value. The Series measures fair value in these instances by the use of inputs and valuation techniques which may be based upon current market prices of securities that are comparable in coupon, rating, maturity and industry and/or expectation of future cash flows. As a result of trading in relatively thin markets and/or markets that experience significant volatility, the prices used by the Series to value these securities may differ from the value that would be realized if these securities were sold, and the differences could be material.
Securities for which representative valuations or prices are not available from the Series’ pricing service may be valued at fair value as determined in good faith by the Advisor under procedures approved by and under the general supervision and responsibility of the Board. Due to the inherent uncertainty of valuations of such securities, the fair value may differ significantly from the values that would have been used had a ready market for such securities existed. If trading or events occurring after the close of the principal market in which securities are traded are expected to materially affect the value of those securities, then they may be valued at their fair value, taking this trading or these events into account.
Various inputs are used in determining the value of the Series’ assets or liabilities carried at fair value. These inputs are summarized in three broad levels. Level 1 includes quoted prices in active markets for identical assets and liabilities. Level 2 includes other significant observable inputs (including quoted prices for similar securities, interest rates, prepayment speeds, credit risk, etc.). Level 3 includes significant unobservable inputs (including the Series’ own assumptions in determining the fair
16
New York Tax Exempt Series
Notes to Financial Statements (continued)
| 2. | Significant Accounting Policies (continued) |
Security Valuation(continued)
value of investments). A financial instrument’s level within the fair value hierarchy is based on the lowest level of any input both individually and in aggregate that is significant to the fair value measurement. The inputs or methodology used for valuing securities are not necessarily an indication of the risk associated with investing in those securities.
The following is a summary of the valuation levels used for major security types as of December 31, 2019 in valuing the Series’ assets or liabilities carried at fair value:
| DESCRIPTION | TOTAL | LEVEL 1 | LEVEL 2 | LEVEL 3 | ||||
Assets: | ||||||||
Debt securities: | ||||||||
States and political subdivisions (municipals) | $ 88,002,326 | $ — | $ 88,002,326 | $ — | ||||
U.S. Treasury and other U.S. Government agencies | 543,964 | — | 543,964 | — | ||||
Short-Term Investment | 274,974 | 274,974 | — | — | ||||
|
|
|
| |||||
Total assets | $ 88,821,264 | $ 274,974 | $ 88,546,290 | $ — | ||||
|
|
|
| |||||
There were no Level 3 securities held by the Series as of December 31, 2018 or December 31, 2019.
New Accounting Pronouncements
In March 2017, the Financial Accounting Standards Board issued Accounting Standards UpdateNo. 2017-08, Receivables - Nonrefundable Fees and Other Costs (Subtopic310-20): “Premium Amortization of Purchased Callable Debt Securities” which amends the amortization period for certain purchased callable debt securities. Under the new guidance, the premium amortization of purchased callable debt securities that have explicit,non-contingent call features and are callable at fixed prices will be amortized to the earliest call date. The guidance does not require an accounting change for securities held at a discount, which continue to be amortized to maturity. This guidance was adopted by the Series as of January 1, 2019 on a modified retrospective basis. The cost basis of the securities on January 1, 2019 has been decreased by $286. This change in accounting policy has been made to comply with the newly issued accounting standard and had no impact on total distributable earnings (loss) or the net asset value for any Class of the Series.
Security Transactions, Investment Income and Expenses
Security transactions are accounted for on trade date. Dividend income is recorded on theex-dividend date, except that if theex-dividend date has passed, certain dividends from foreign securities are recorded as soon as the Series is informed of theex-dividend date.Non-cash dividends, if any, are recorded at the fair value of the securities received. Interest income, including amortization of premium and accretion of discounts using the effective interest method, is earned from settlement date and accrued daily.
Expenses are recorded on an accrual basis. Most expenses of the Fund can be attributed to a specific series. Expenses which cannot be directly attributed are apportioned among the series in the Fund in such a manner as deemed equitable by the Fund’s Board, taking into consideration, among other things, the nature and type of expense.
The Series uses the identified cost method for determining realized gain or loss on investments for both financial statement and federal income tax reporting purpose.
Federal Taxes
The Series’ policy is to comply with the provisions of the Internal Revenue Code applicable to regulated investment companies. The Series is not subject to federal income tax or excise tax to the extent that the Series distributes to shareholders each year its taxable income, including any net realized gains on investments, in accordance with requirements of the Internal Revenue Code. Accordingly, no provision for federal income tax or excise tax has been made in the financial statements.
17
New York Tax Exempt Series
Notes to Financial Statements (continued)
| 2. | Significant Accounting Policies (continued) |
Federal Taxes(continued)
Management evaluates its tax positions to determine if the tax positions taken meet the minimum recognition threshold in connection with accounting for uncertainties in income tax positions taken or expected to be taken for the purposes of measuring and recognizing tax liabilities in the financial statements. Recognition of tax benefits of an uncertain tax position is required only when the position is “more likely than not” to be sustained assuming examination by taxing authorities. At December 31, 2019, the Series has recorded no liability for net unrecognized tax benefits relating to uncertain income tax positions taken or expected to be taken in future tax returns.
The Series files income tax returns in the U.S. federal jurisdiction and various states, as required. No income tax returns are currently under investigation. The statute of limitations on the Series’ tax returns remains open for the years ended December 31, 2016 through December 31, 2019. The Series is not aware of any tax positions for which it is reasonably possible that the total amounts of unrecognized tax benefits will significantly change in the next twelve months.
Distributions of Income and Gains
Distributions to shareholders of net investment income are made quarterly. Distributions of net realized gains are made annually. An additional distribution may be necessary to avoid taxation of the Series. Distributions are recorded on theex-dividend date.
Indemnifications
The Fund’s organizational documents provide former and current directors and officers with a limited indemnification against liabilities arising in connection with the performance of their duties to the Fund. In the normal course of business, the Fund may also enter into contracts that provide general indemnifications. The Fund’s maximum exposure under these arrangements is unknown as this would be dependent on future claims that may be made against the Fund. The risk of material loss from such claims is considered remote.
Other
The preparation of financial statements in conformity with GAAP requires management to make estimates and assumptions that affect the reported amounts of assets and liabilities and the disclosure of contingent assets and liabilities at the date of the financial statements and the reported amounts of income and expenses during the reporting period. Actual results could differ from those estimates.
| 3. | Transactions with Affiliates |
The Fund has an Investment Advisory Agreement (the “Agreement”) with the Advisor, for which the Series pays a fee, computed daily and payable monthly, at an annual rate of 0.50% of the Series’ average daily net assets.
Under the Agreement, personnel of the Advisor provide the Series with advice and assistance in the choice of investments and the execution of securities transactions, and otherwise maintain the Series’ organization. The Advisor also provides the Fund with necessary office space and fund administration and support services. The salaries of all officers of the Fund (except a percentage of the Fund’s Chief Compliance Officer’s salary, which is paid by the Fund), and of all Directors who are “affiliated persons” of the Fund, or of the Advisor, and all personnel of the Fund, or of the Advisor, performing services relating to research, statistical and investment activities, are paid by the Advisor. Each“non-affiliated” Director receives an annual stipend, which is allocated among all the active series of the Fund. In addition, these Directors also receive a fee per Board meeting attended plus a fee for each committee meeting attended and are reimbursed for travel and otherout-of-pocket expenses incurred by them in connection with attending such meetings. The Fund also has an Audit Committee Chair, Governance & Nominating Committee Chair and Lead Independent Director, who each receive an additional annual stipend for these roles.
Manning & Napier Investor Services, Inc., a registered broker-dealer affiliate of the Advisor, acts as distributor for the Fund’s shares. The services of Manning & Napier Investor Services, Inc. are provided at no additional cost to the Series.
Pursuant to a master services agreement dated March 1, 2017 as amended, the Fund pays the Advisor an annual fee related to fund accounting and administration of 0.0085% on the first $25 billion of average daily net assets (excluding Target Series and Income Series); 0.0075% on the next $15 billion of average daily net assets (excluding Target Series and Income Series); and
18
New York Tax Exempt Series
Notes to Financial Statements (continued)
| 3. | Transactions with Affiliates (continued) |
0.0065% of average daily net assets in excess of $40 billion (excluding Target Series and Income Series); plus a base fee of $30,400 per series. Additionally, certain transaction andout-of-pocket expenses, including charges for reporting relating to the Fund’s compliance program, are charged. The Advisor has agreements with BNY Mellon Investment Servicing (U.S.) Inc. (“BNY”) under which BNY serves assub-accountant services agent.
Effective March 1, 2019, the Advisor has contractually agreed to waive the management fee for the Class W shares. The full management fee will be waived under this agreement because Class W shares are only available to discretionary investment accounts and other accounts managed by the Advisor. These clients pay a management fee to the advisor that is separate from the fund’s expenses. In addition, pursuant to a separate expense limitation agreement, the Advisor has contractually agreed to limit its fees and reimburse expenses to the extent necessary so that the total direct annual fund operating expenses, exclusive of the waived Class W management fees (collectively, “excluded expenses”), to 0.85% of the average daily net assets of the Class A shares and 0.35% of the average daily net assets of the Class W shares. These contractual waivers are expected to continue indefinitely, and may not be amended or terminated by the Advisor without the approval of the Series’ Board of Directors. The Advisor may receive from a Class the difference between the Class’s total direct annual fund operating expenses, not including excluded expenses, and the Class’s contractual expense limit to recoup all or a portion of its prior fee waivers (other than Class W management fee waivers) or expense reimbursements made during the rolling three-year period preceding the recoupment if at any point the total direct annual fund operating expenses, not including excluded expenses, are below the contractual expense limit (a) at the time of the fee waiver and/or expense reimbursement and (b) at the time of the recoupment.
Pursuant to the advisory fee waiver, the Advisor waived $457,418 in management fees for Class W for the year ended December 31, 2019. In addition, pursuant to the separate expense limitation agreement, the Advisor did not waive or reimburse expenses for Class A and Class W for the year ended December 31, 2019. These amounts are included as a reduction of expenses on the Statement of Operations. For the year ended December 31, 2019, the Advisor did not recoup any expenses that have been previously waived or reimbursed.
| 4. | Purchases and Sales of Securities |
For the year ended December 31, 2019, purchases and sales of securities, other than U.S. Government securities and short-term securities, were $26,893,731 and $74,894,707, respectively. There were no purchases or sales of U.S. Government securities.
| 5. | Capital Stock Transactions |
Transactions in shares of Class A and Class W of New York Tax Exempt Series were:
| FOR THE YEAR | FOR THE YEAR | |||||||||||||||
| CLASS A | ENDED 12/31/19 | ENDED 12/31/18 | ||||||||||||||
| SHARES | AMOUNT | SHARES | AMOUNT | |||||||||||||
Sold | 62,199 | $ | 669,305 | 716,982 | $ | 7,402,714 | ||||||||||
Reinvested | 10,504 | 110,162 | 183,590 | 1,887,800 | ||||||||||||
Repurchased | (13,303,270 | ) | (139,046,760 | ) | (2,248,036 | ) | (23,172,940 | ) | ||||||||
|
|
|
|
|
|
|
| |||||||||
Total | (13,230,567 | ) | $ | (138,267,293 | ) | (1,347,464 | ) | $ | (13,882,426 | ) | ||||||
|
|
|
|
|
|
|
| |||||||||
19
New York Tax Exempt Series
Notes to Financial Statements (continued)
| 5. | Capital Stock Transactions (continued) |
| CLASS W | FOR THE PERIOD 3/1/19 (COMMENCEMENT OF OPERATIONS) TO 12/31/19 | |||||||||||||||
| SHARES | AMOUNT | |||||||||||||||
Sold | 13,074,577 | $ | 136,695,987 | |||||||||||||
Reinvested | 332,040 | 3,497,097 | ||||||||||||||
Repurchased | (5,048,082 | ) | (53,918,126 | ) | ||||||||||||
|
|
|
| |||||||||||||
Total | 8,358,535 | $ | 86,274,958 | |||||||||||||
|
|
|
| |||||||||||||
Over 90% of the shares outstanding are fiduciary accounts where the Advisor has sole investment discretion.
| 6. | Line of Credit |
The Fund has entered into a364-day, $25 million credit agreement (the “line of credit”) with Bank of New York Mellon. Each series of the Fund may borrow under the line of credit for temporary or emergency purposes, including funding shareholder redemptions and other short-term liquidity purposes. The Fund pays an annual fee on the unused commitment amount, payable quarterly, and is allocated among all the series of the Fund and included in miscellaneous expenses in the Statement of Operations for each series. The line of credit expires in August 2020 unless extended or renewed. During the year ended December 31, 2019, the Series did not borrow under the line of credit.
| 7. | Financial Instruments |
The Series may trade in instruments including written and purchased options, forward foreign currency exchange contracts and futures contracts and other derivatives in the normal course of investing activities to assist in managing exposure to various market risks. The Series may be subject to various elements of risk, which may involve, to a varying degree, elements of risk in excess of the amounts recognized for financial statement purposes. These risks include: the risk that changes in the value of a derivative may not correlate perfectly with the underlying asset, rate or index; counterparty credit risk related to over the counter derivative counterparties’ failure to perform under contract terms; liquidity risk related to the lack of a liquid market for these contracts allowing the fund to close out its position(s); and documentation risk relating to disagreement over contract terms. No such investments were held by the Series as of December 31, 2019.
| 8. | Concentration of Credit |
The Series primarily invests in debt obligations issued by the State of New York and its political subdivisions, agencies and public authorities to obtain funds for various public purposes. The Series is more susceptible to factors adversely affecting issues of New York municipal securities than is a municipal bond fund that is not concentrated in these issues to the same extent.
| 9. | Federal Income Tax Information |
The amount and characterization of certain income and capital gains to be distributed are determined in accordance with federal income tax regulations, which may differ from GAAP. These differences are primarily due to differing book and tax treatments in the timing and/or treatment of the recognition of net investment income or gains and losses, including market discount on investments. The Series may periodically make reclassifications among its capital accounts to reflect income and gains available for distribution (or available capital loss carryovers) under income tax regulations without impacting the Series’ net asset value. Any such reclassifications are not reflected in the financial highlights.
20
New York Tax Exempt Series
Notes to Financial Statements (continued)
| 9. | Federal Income Tax Information (continued) |
The tax character of distributions paid were as follows:
| FOR THE YEAR ENDED 12/31/19 | FOR THE YEAR ENDED 12/31/18 | |||
Ordinary income | $ 322,102 | $ 45,982 | ||
Tax exempt income | $2,265,415 | $1,965,437 | ||
Long-term capital gains | $1,152,191 | $ — |
At December 31, 2019, the tax basis of components of distributable earnings and the net unrealized appreciation based on identified cost for federal income tax purposes were as follows:
Cost for federal income tax purposes | $ | 85,939,099 | ||||||
Unrealized appreciation | 3,018,548 | |||||||
Unrealized depreciation | (134,269 | ) | ||||||
|
| |||||||
Net unrealized appreciation | $ | 2,884,279 | ||||||
|
| |||||||
Undistributed tax exempt income | $ | 129,538 | ||||||
Qualified late-year losses1 | $ | 16 | ||||||
1The Series has elected to defer certain qualified late-year short-term capital losses and recognize such losses in the year ending December 31, 2020.
At December 31, 2019, the capital loss carryover utilized in the current year was $195,194.
21
New York Tax Exempt Series
Report of Independent Registered Public Accounting Firm
To the Board of Directors of Manning & Napier Fund, Inc. and Shareholders of New York Tax Exempt Series
Opinion on the Financial Statements
We have audited the accompanying statement of assets and liabilities, including the investment portfolio, of New York Tax Exempt Series (one of the series constituting Manning & Napier Fund, Inc., referred to hereafter as the “Fund”) as of December 31, 2019, the related statement of operations for the year ended December 31, 2019, the statement of changes in net assets for each of the two years in the period ended December 31, 2019, including the related notes, and the financial highlights for each of the periods indicated therein (collectively referred to as the “financial statements”). In our opinion, the financial statements present fairly, in all material respects, the financial position of the Fund as of December 31, 2019, the results of its operations for the year then ended, the changes in its net assets for each of the two years in the period ended December 31, 2019 and the financial highlights for each of the periods indicated therein in conformity with accounting principles generally accepted in the United States of America.
Basis for Opinion
These financial statements are the responsibility of the Fund’s management. Our responsibility is to express an opinion on the Fund’s financial statements based on our audits. We are a public accounting firm registered with the Public Company Accounting Oversight Board (United States) (PCAOB) and are required to be independent with respect to the Fund in accordance with the U.S. federal securities laws and the applicable rules and regulations of the Securities and Exchange Commission and the PCAOB.
We conducted our audits of these financial statements in accordance with the standards of the PCAOB. Those standards require that we plan and perform the audit to obtain reasonable assurance about whether the financial statements are free of material misstatement, whether due to error or fraud.
Our audits included performing procedures to assess the risks of material misstatement of the financial statements, whether due to error or fraud, and performing procedures that respond to those risks. Such procedures included examining, on a test basis, evidence regarding the amounts and disclosures in the financial statements. Our audits also included evaluating the accounting principles used and significant estimates made by management, as well as evaluating the overall presentation of the financial statements. Our procedures included confirmation of securities owned as of December 31, 2019 by correspondence with the custodian. We believe that our audits provide a reasonable basis for our opinion.
New York, New York
February 14, 2020
We have served as the auditor of one or more investment companies in Manning & Napier Mutual Funds since 1992.
22
New York Tax Exempt Series
Supplemental Tax Information
(unaudited)
All reportings are based on financial information available as of the date of this annual report and, accordingly are subject to change.
The Series hereby reports $2,265,415 as tax exempt dividends for the year ended December 31, 2019. It is the intention of the Series to designate the maximum allowable under tax law.
The Series designates $1,209,801 as Long-Term Capital Gain dividends pursuant to Section 852(b)(3) of the Internal Revenue Code for the fiscal year ended December 31, 2019.
23
New York Tax Exempt Series
Renewal of Investment Advisory Agreement
(unaudited)
At the Manning & Napier Fund, Inc. (the “Fund”) Board of Directors’ (the “Board”) meeting, held on November 21, 2019, the Investment Advisory Agreement (the “Agreement”) between the Fund and Manning & Napier Advisors, LLC (the “Advisor”) was considered for renewal by the Board, including all of the Directors who are not “interested persons” (“Independent Directors”), within the meaning of the Investment Company Act of 1940, as amended (the “1940 Act”). In connection with the decision whether to renew the Agreement, a variety of material was provided to the Board in advance of the meeting for their review and consideration. The Board also held a working session on October 25, 2019 to review and discuss information provided to the Board, and for the Board to request additional information.
Representatives of the Advisor attended a portion of the working session and attended the Board meeting. The Advisor provided supplemental information requested by the Board and presented additional oral information to the Board to assist the Board in its considerations. In addition to the information furnished by the Advisor, the Board was provided with a legal memorandum discussing its fiduciary duties related to its approval of the continuation of the Agreement. Legal counsel for the Fund discussed with the Board the applicable legal considerations. In addition, the Board receivedin-person presentations about the Fund throughout the year.
The Independent Directors were advised by independent legal counsel with respect to these matters. The Independent Directors also met separately in an executive session with their legal counsel without any representatives of the Advisor present.
The Directors’ determinations at the meeting were made on the basis of each Director’s business judgment after consideration of all the information presented. In deciding to recommend the renewal of the Agreement with respect to each Series of the Fund, the Independent Directors did not identify any single or particular piece of information that, in isolation, was the controlling factor. Each Independent Director may also have weighed factors differently. This summary describes the most important, but not all, of the factors considered by the Board and the Independent Directors.
| • | The Board considered the nature and quality of services provided by the Advisor under the Agreement for over 30 years including, among others: deciding what securities to purchase and sell for each Series; arranging for the purchase and sale of such securities by placing orders with broker-dealers; administering the affairs of the Fund (including the books and records of the Fund not maintained by third party service providers such as the custodian or transfer agent); arranging for the insurance coverage for the Fund; and supervising the preparation of tax returns, SEC filings (including registration statements) and reports to shareholders for the Fund. The Board considered the numerous services performed by the Advisor and its affiliates beyond those stated in the Agreements. The Board also considered the Advisor’s personnel who perform services to the Fund, changes in senior or key personnel, industry trends impacting the mutual fund industry, the strength of the Advisor’s compliance infrastructure, policies and procedures relating to compliance with securities regulations, reputation, expertise and resources. The Board discussed the quality of these services with representatives from the Advisor and concluded that the Advisor was performing its services to the Fund required under the Agreement in a reasonable manner. |
| • | The Board considered the Advisor’s investments teams, including changes to the investment teams and investment team’s compensation during the past year, and the investment process. The Board considered the performance of each Series since its inception, as well as over multiple time periods including: one year, three year, five year, ten year, and current market cycle. A market cycle includes periods of both rising and falling markets. Returns for established benchmark indices for each Series were provided. In addition, the Board considered (and considers on a quarterly basis) a number of other factors relevant to performance at the meeting including: a peer group performance analysis consisting of Morningstar universes of mutual funds with similar investment objectives; the breadth of the Fund’s product offerings; and performance over reasonable time periods. Representatives of the Advisor discussed improved performance for many of the Series over theone- and three-year time periods ending September 30, 2019. The Board discussed with Representatives of the Advisor, performance challenges that continue to impact the three- and five-year performance of certain Fund’s strategies resulting from periods of underperformance in 2014 and 2016. After discussion, the Board acknowledged the improved short term performance of many of the Series and concluded that notwithstanding the performance challenges that continue to impact certain Series, the nature and quality of the investment management services provided by the Advisor to the Fund supported the renewal of the agreement. |
| • | The Board considered the fees and expenses of the various Series of the Fund. The Advisor presented the advisory fees and total expenses for each Series, including the advisory fee adjusted for any contractual expense waivers or reimbursements paid by the Advisor. Representatives of the Advisor discussed the multi-year fee restructuring initiative which was completed by the Advisor on March 1, 2019 to increase the competitiveness of the Fund’s fees. The fee |
24
New York Tax Exempt Series
Renewal of Investment Advisory Agreement
(unaudited)
restructuring project also resulted in a set of standardized share classes to help support the Fund’s distribution efforts across client types and varying intermediary distribution models. |
| • | The Board considered whether the Advisor had achieved economies of scale with respect to its services to the Fund. The Board acknowledged the expense caps incorporated in the Fund’s current fee structure, which requires the Advisor to subsidize the expenses of the Series operating above their expense cap, noting that 26 Series of the Fund are currently receiving expense reimbursements from the Advisor. The Board concluded that the Fund would need to grow in assets before the Advisor would be able to achieve meaningful economies of scale. |
| • | The Advisor provided the Board with information comparing each Series’ contractual management fees with the Advisor’s standard advisory fees for separate accounts and collective investment trusts. The Board considered that the range of services provided to the Series is more extensive than for the Advisor’s other clients due to additional infrastructure, administrative and regulatory requirements related to operating a mutual fund. |
| • | The current advisory fees,12b-1 Distribution and Service Fees, other expenses (e.g. a combination of Shareholder Services Fees, intermediarysub-TA fees, routine operating expenses and Acquired Fund Fees and Expenses forfund-of-fund Series) and total expense ratios of each Series and share class were compared and ranked (on both a mean and median basis) against respective peer universes. Respective peer universes included funds of a similar size and with similar investment objectives and expense characteristics as disclosed on the Morningstar database. Representatives of the Advisor discussed with the Board the comparisons and rankings of fees and net expense ratios for each Series of the Fund and the methodology behind the comparison. The Board considered the Advisor’s active portfolio management that results in portfolios that are more differentiated than the construction of their benchmarks. The Board acknowledged that the fee restructuring project completed on March 1, 2019 reduced the expense ratios for shareholders in many Series. Based on their review of the information provided, the Board concluded that the current fees and expenses of each Series of the Fund were reasonable on a comparative basis. |
| • | The Board also considered the other benefits the Advisor derives from its relationship with the Fund. Such other benefits include participation in a joint insurance program, sharing of compensation expenses for certain shared personnel, relationships with large service providers, the utilization of Series within the Advisor’s separately managed accounts and certain research services provided by soft dollars. The Board reviewed the broker-dealers who provided research to the Advisor and the products and services paid for, in whole or in part, using soft dollar commissions. The Board concluded that these additional benefits to the Advisor were reasonable. |
Based on the Board’s deliberations and their evaluation of the information described above, the Board, including a majority of the Independent Directors, concluded that the compensation under the Agreement was fair and reasonable with respect to each Series in light of the services and expenses and such other matters as the Directors considered to be relevant in the exercise of their reasonable judgment, and that the renewal of the Agreement would be in the best interests of each Series and its shareholders. The Board did not indicate that any single factor was determinative of its decision to approve the Agreement, but indicated that the Board based its determination on the total mix of information available to it.
25
New York Tax Exempt Series
Directors’ and Officers’ Information
(unaudited)
The Statement of Additional Information provides additional information about the Fund’s directors and officers and can be obtained without charge by calling1-800-466-3863, at www.manning-napier.com, or on the EDGAR Database on the SEC Internet web site (http://www.sec.gov). The following chart shows certain information about the Fund’s directors and officers, including their principal occupations during the last five years. Unless specific dates are provided, the individuals have held the listed positions for longer than five years.
| Interested Director and Officer | ||
| Name: | Paul Battaglia* | |
| Address: | 290 Woodcliff Drive | |
| Fairport, NY 14450 | ||
| Age: | 41 | |
| Current Position(s) Held with Fund: | Principal Executive Officer, President, Chairman & Director | |
| Term of Office & Length of Time Served: | Indefinite – Chairman and Director since November 20181 | |
| Principal Occupation(s) During Past 5 Years: | Chief Financial Officer (2018 – Present); Vice President of Finance (2016 – 2018); Director of Finance (2011 – 2016); Financial Analyst/Internal Auditor (2004-2006) – Manning & Napier Advisors, LLC and affiliates Holds one or more of the following titles for various subsidiaries and affiliates: Chief Financial Officer | |
| Number of Portfolios Overseen within Fund Complex: | 31 | |
Other Directorships Held Outside Fund Complex During Past 5 Years: | N/A | |
| Independent Directors | ||
| Name: | Stephen B. Ashley | |
| Address: | 290 Woodcliff Drive | |
| Fairport, NY 14450 | ||
| Age: | 79 | |
| Current Position(s) Held with Fund: | Director, Audit Committee Member, Governance & Nominating Committee Member | |
| Term of Office & Length of Time Served: | Indefinite – Since 1996 | |
| Principal Occupation(s) During Past 5 Years: | Chairman and Director (1997 to present); Chief Executive Officer | |
| (1997-2019) - Ashley Companies (property management and investment). | ||
| Number of Portfolios Overseen within Fund Complex: | 31 | |
| Other Directorships Held Outside Fund Complex During | Ashley Companies (1997 - present) | |
| Past 5 Years: | ||
| Name: | Paul A. Brooke | |
| Address: | 290 Woodcliff Drive | |
| Fairport, NY 14450 | ||
| Age: | 74 | |
| Current Position(s) Held with Fund: | Lead Independent Director, Audit Committee Member, Governance & | |
| Nominating Committee Chairman | ||
| Term of Office & Length of Time Served: | Indefinite – Director, Audit Committee Member, Governance & Nominating Committee Member since 2007; Governance & Nominating Committee Chairman since 2016; Lead Independent Director since 2017 | |
| Principal Occupation(s) During Past 5 Years: | Chairman & CEO (2005-2009) - Ithaka Acquisition Corporation (investments); Chairman (2007-2009) - Alsius Corporation (investments); Managing Member (1991-present) - PMSV Holdings LLC (investments); Managing Member (2010-2016) - Venbio (investments). | |
| Number of Portfolios Overseen within Fund Complex: | 31 | |
| Other Directorships Held Outside Fund Complex During Past 5 Years: | Incyte Corp. (biotech)(2000-present); ViroPharma, Inc. (speciality pharmaceuticals)(2000-2014); HLTH (WebMD)(information)(2000-2010); Cheyne Capital International (investment)(2000-2017); GMP Companies (investment)(2000-2011); Cytos Biotechnology Ltd (biotechnology)(2012-2014); Cerus (biomedical)(2016-present);PureEarth(non-profit)
| |
26
New York Tax Exempt Series
Directors’ and Officers’ Information
(unaudited)
Independent Directors (continued)
| Name: | Peter L. Faber | |
| Address: | 290 Woodcliff Drive | |
| Fairport, NY 14450 | ||
| Age: | 81 | |
| Current Position(s) Held with Fund: | Director, Governance & Nominating Committee Member | |
| Term of Office & Length of Time Served: | Indefinite – Since 1987 | |
| Principal Occupation(s) During Past 5 Years: | Senior Counsel (2006-2012), Partner (1995-2006 & 2013-2018) - McDermott, Will & Emery LLP (law firm) | |
Number of Portfolios Overseen within Fund Complex: Other Directorships Held Outside Fund Complex During Past 5 Years: | 31 Boston Early Music Festival(non-profit)(2007-present); Amherst Early Music, Inc.(non-profit)(2009-present); Gotham Early Music Scene, Inc.(non-profit)(2009-present); Partnership for New York City, Inc.(non-profit)(1989-2010); New York Collegium(non-profit)(2004-2011); S’Cool Sounds, Inc.(non-profit)(2017-present) | |
| Name: | Harris H. Rusitzky | |
| Address: | 290 Woodcliff Drive | |
| Fairport, NY 14450 | ||
| Age: | 84 | |
| Current Position(s) Held with Fund: | Director, Audit Committee Member, Governance & Nominating Committee | |
| Member | ||
| Term of Office & Length of Time Served: | Indefinite – Since 1985 | |
| Principal Occupation(s) During Past 5 Years: | President (1994- present) - The Greening Group (business consultants); | |
| Partner (2006-present) - The Restaurant Group (restaurants) | ||
Number of Portfolios Overseen within Fund Complex: Other Directorships Held Outside Fund Complex During Past 5 Years: | 31 Rochester Institute of Technology (university)(1972-present); Culinary Institute of America(non-profit college)(1985-present); George Eastman Museum (museum)(1988-present); National Restaurant Association (restaurant trade organization)(1978-present) | |
| Name: | Chester N. Watson | |
| Address: | 290 Woodcliff Drive | |
| Fairport, NY 14450 | ||
| Age: | 69 | |
| Current Position(s) Held with Fund: | Director, Audit Committee Chairman, Governance & Nominating | |
| Committee Member | ||
| Term of Office & Length of Time Served: | Indefinite – Director, Audit Committee Member, Governance & Nominating | |
| Committee Member Since 2012; Audit Committee Chairman since 2013 | ||
| Principal Occupation(s) During Past 5 Years: | General Auditor (2003-2011) - General Motors Company (auto | |
| manufacturer) | ||
Number of Portfolios Overseen within Fund Complex: Other Directorships Held Outside Fund Complex During Past 5 Years: | 31 Rochester Institute of Technology (University)(2005-present); Town of Greenburgh, NY Planning Board (Municipal Government) (2015-2019); Hudson Valley Center for Innovation, Inc. (New Business and Economic Development) (2019 – present) | |
| Officers: | ||
| Name: | Elizabeth Craig | |
| Address: | 290 Woodcliff Drive | |
| Fairport, NY 14450 | ||
| Age: | 32 | |
| Current Position(s) Held with Fund: | Corporate Secretary | |
| Term of Office1& Length of Time Served: | Since 2016 | |
| Principal Occupation(s) During Past 5 Years: | Fund Regulatory Administration Manager since 2018; Fund Administration Manager (2015-2018); Mutual Fund Compliance Specialist (2009-2015) - Manning & Napier Advisors, LLC; Assistant Corporate Secretary (2011-2016) - Manning & Napier Fund, Inc.; Corporate Secretary, Director – Manning & Napier Investor Services, Inc. (since 2019)
| |
27
New York Tax Exempt Series
Directors’ and Officers’ Information
(unaudited)
Officers: (continued)
| Name: | Christine Glavin | |
| Address: | 290 Woodcliff Drive | |
| Fairport, NY 14450 | ||
| Age: | 53 | |
| Current Position(s) Held with Fund: | Principal Financial Officer, Chief Financial Officer | |
| Term of Office1& Length of Time Served: | Principal Financial Officer since 2002; Chief Financial Officer since 2001 | |
| Principal Occupation(s) During Past 5 Years: | Director of Fund Reporting since 2011; Fund Reporting Manager (1997-2011) - Manning & Napier Advisors, LLC; Assistant Treasurer since 2008 - Exeter Trust Company; Chief Financial Officer (2017-2018) - Rainier Investment Management Mutual Funds, Inc. | |
| Name: | Samantha Larew | |
| Address: | 290 Woodcliff Drive | |
| Fairport, NY 14450 | ||
| Age: | 39 | |
| Current Position(s) Held with Fund: | Chief Compliance Officer and Anti-Money Laundering Compliance Officer | |
| Term of Office1& Length of Time Served: | Chief Compliance Officer since 2019; Anti-Money Laundering Compliance | |
| Officer since 2018 | ||
| Principal Occupation(s) During Past 5 Years: | Co-Director of Compliance (since 2018); Compliance Communications Supervisor (2014-2018); Compliance Supervisor (2013-2014); Broker-Dealer Compliance Supervisor (2011-2013); Broker-Dealer Compliance Analyst (2010-2011) - Manning & Napier Advisors, LLC & Affiliates; Broker-Dealer Chief Compliance Officer (since 2013); Broker-Dealer Assistant Corporate Secretary (since 2011) – Manning & Napier Investor Services, Inc.; Compliance Analyst (2007-2009) – Wall Street Financial Group; Compliance Specialist (2003-2007) – Manning & Napier Advisors, LLC & Affiliates Holds one or more of the following titles for various affiliates: Assistant Corporate Secretary, Chief Compliance Officer | |
| Name: | Scott Morabito | |
| Address: | 290 Woodcliff Drive | |
| Fairport, NY 14450 | ||
| Age: | 32 | |
| Current Position(s) Held with Fund: | Vice President | |
| Term of Office1& Length of Time Served: | Vice President since 2019; Assistant Vice President (2017-2019) | |
| Principal Occupation(s) During Past 5 Years: | Managing Director of Operations since 2019; Director of Funds Group (2017-2019); Fund Product and Strategy Manager (2014-2017); Senior Product and Strategy Analyst (2013-2014); Product and Strategy Analyst (2011-2013) - Manning & Napier Advisors, LLC; President, Director – Manning & Napier Investor Services, Inc. (since 2018) | |
| Name: | Sarah Turner | |
| Address: | 290 Woodcliff Drive | |
| Fairport, NY 14450 | ||
| Age: | 37 | |
| Current Position(s) Held with Fund: | Chief Legal Officer; Assistant Corporate Secretary | |
| Term of Office1& Length of Time Served: | Since 2018 | |
| Principal Occupation(s) During Past 5 Years: | Attorney since 2018 - Manning & Napier Advisors, LLC and affiliates; Counsel (2017-2018) – Harter Secrest and Emery LLP; Legal Counsel (2010-2017) – Manning & Napier Advisors, LLC and affiliates Holds one or more of the following titles for various affiliates: Corporate Secretary, General Counsel | |
*Interested Director, within the meaning of the 1940 Act by reason of his positions with the Fund’s Advisor, Manning & Napier Advisors, LLC, and Distributor, Manning & Napier Investor Services, Inc.
1The term of office of all officers shall be one year and until their respective successors are chosen and qualified, or his or her earlier resignation or removal as provided in the Fund’sBy-Laws.
28
{This page intentionally left blank}
29
New York Tax Exempt Series
Literature Requests
(unaudited)
Proxy Voting Policies and Procedures
A description of the policies and procedures that the Fund uses to determine how to vote proxies relating to portfolio securities is available, without charge, upon request:
| By phone | 1-800-466-3863 | |||
| On the Securities and Exchange | ||||
| Commission’s (SEC) web site | http://www.sec.gov |
Proxy Voting Record
Information regarding how the Fund voted proxies relating to portfolio securities during the most recent12-month period ended June 30th is available, without charge, upon request:
| By phone | 1-800-466-3863 | |||
| On the SEC’s web site | http://www.sec.gov |
Quarterly Portfolio Holdings
The Series’ complete schedule of portfolio holdings for the 1st and 3rd quarters of each fiscal year are provided on FormN-PORT, and are available, without charge, upon request:
| By phone | 1-800-466-3863 | |||
| On the SEC’s web site | http://www.sec.gov |
Prospectus and Statement of Additional Information (SAI)
For more information about any of the Manning & Napier Fund, Inc. Series, you may obtain a prospectus and SAI at www.manning-napier.com or by calling (800)466-3863. Before investing, carefully consider the objectives, risks, charges and expenses of the investment and read the prospectus carefully as it contains this and other information about the investment company.In addition, this information can be found on the SEC’s web site, http://www.sec.gov.
Additional information available at www.manning-napier.com
1. Fund Holdings -Month-End
2. Fund Holdings -Quarter-End
3. Shareholder Report - Annual
4. Shareholder Report - Semi-Annual
The Fund also offers electronic notification or“e-delivery” when certain documents are availableon-line to be downloaded or reviewed. Direct shareholders can elect to receive electronic notification when shareholder reports, prospectus updates, and/or statements are available. If you do not currently haveon-line access to your account, you can establish access by going to www.manning-napier.com, click on “Login” in the top corner of the page, and follow the prompts to self-enroll. Once enrolled, you can set your electronic notification preferences by clicking on the Account Options tab located within the green toolbar and then selectE-Delivery Option. Should you have any questions on either how to establishon-line access or how to update your account settings, please contact Investor Services at1-800-466-3863.
The Manning & Napier Fund, Inc. is managed by Manning & Napier Advisors, LLC. Manning & Napier Investor Services, Inc., an affiliate of Manning & Napier Advisors, LLC, is the distributor of the Fund shares.
MNNYT-12/19-AR
Manning & Napier Fund, Inc.
Core Bond Series
Beginning on February 25, 2021, as permitted by Securities and Exchange Commission regulations, paper copies of the Series’ annual and semi-annual shareholder reports will no longer be sent by mail, unless you specifically request paper copies of the reports from the Fund or from your financial intermediary, such as a broker-dealer or bank. Instead, the reports will be made available on a website, and you will be notified by mail each time a report is posted and provided with a website link to access the report.
If you already elected to receive shareholder reports electronically, you will not be affected by this change and you need not take any action. You may elect to receive shareholder reports and other communications from the Fund electronically by contacting your financial intermediary or, if you are a direct investor, by visiting www.manning-napier.com or calling1-800-466-3863.
You may elect to receive all future annual and semi-annual reports in paper free of charge. If you invest through a financial intermediary, you can contact your financial intermediary to request that you continue to receive paper copies of your shareholder reports. If you invest directly with the Fund, you can inform the Fund that you wish to continue receiving paper copies of your shareholder reports by visiting www.manning-napier.com or calling1-800-466-3863. Your election to receive reports in paper will apply to all funds held with your financial intermediary if you invest through a financial intermediary or all series of the Fund if you invest directly with the Fund. |
| Independent Perspective| Real-World Solutions |
A Note from Our CEO
Dear Shareholder,
The investing world is constantly changing, yet investors’ needs and objectives remain substantially the same.
Whether you are an individual saver looking to ensure security in retirement, or an institutional investor with a fiduciary obligation to others, at the end of the day you look for a trusted partner to help you build, grow, and preserve wealth.
In order to do so successfully we recognize that, in the short-term, the world’s capital markets can be capricious and hard to predict.
Bubbles form, rise, and then pop. The hot stocks of today often become passing fads of tomorrow. Investor sentiment can swing wildly, whipsawing between exuberance one day and despondence the next.
As successful long-term investors, we are defined both by what we do as well as what we don’t do.
We don’t attempt to perfectly time every recession. We don’t jump on the latest trend. We don’t worry about capturing every market peak all across the globe.
On the other hand, we do maintain the rigorous disciplines we have developed over close to half a century. We are highly attentive to managing risk and protecting investors in down markets while participating fully in the opportunities our Research uncovers.
Our focus is on you, the shareholder, and helping you achieve your goals.
In the face of an uncertain world, we believe our investment philosophies, processes, and experience have stood the test of time and will do so in the future.
We appreciate your continued confidence in our approach.
|
Sincerely,
Marc Mayer
Chief Executive Officer |
Corporate Headquarters | 290 Woodcliff Drive| Fairport, NY 14450| (585)325-6880 phone| (800)551-0224 toll free| www.manning-napier.com
1
Core Bond Series
Fund Commentary
(unaudited)
Investment Objective
To provide long-term total return by investing primarily in fixed income securities. Under normal circumstances, at least 80% of the Series’ assets will be invested in investment-grade bonds and other financial instruments with economic characteristics similar to bonds. Holdings will consist of US dollar denominated securities. The Series is not subject to maturity or duration restrictions.
Performance Commentary
Fixed income markets posted positive returns for the twelve-month period ending December 31, 2019. Despite some intra-year volatility, interest rates fell roughly 60 to 100 basis points across the yield curve during the year amid recessionary fears, geopolitical uncertainty, and a global central bank shift towards more accommodative monetary policy. Additionally, investment grade corporate credit spreads ended the year ~60 basis points tighter than the previous year as investors continued to search for sources of yield. Given these dynamics, longer-dated Treasuries outperformed shorter-dated Treasuries and corporate bonds were the best performing fixed income sector for the year.
The Core Bond Series Class S shares delivered a positive absolute return of 8.18% during 2019, but modestly underperformed its benchmark, the Bloomberg Barclays US Aggregate Bond Index, which returned 8.72%.
When viewed on agross-of-fee basis, the Series outperformed the benchmark, with positioning in corporate bonds contributing positively to performance. Yield curve positioning also contributed to relative performance, whereas a somewhat shorter duration at times marginally detracted from relative returns.
In terms of positioning, we continue to believe a modest duration remains in investors’ best interests. Going forward, we would view an increase in rates or a more negative view of the economy as an attractive opportunity to increase duration. Alternatively, should we see rates move lower without an accompanying meaningful change in the economic environment, we may look to decrease duration as investors are not likely being compensated for taking on the additional risk associated with longer-term bonds.
On a sector basis, we view corporate bonds as fairly valued as the environment remains accommodative in the near term. As spreads tighten, we may look to use the opportunity to reduce corporate exposure as we are in the later stages of the economic cycle. Additionally, we continue to find value in shorter-dated, higher-quality securitized credit and, more recently, in Treasury Inflation Protected Securities (TIPS) given relatively low inflation expectations being priced in the market. Finally, with respect to mortgages, falling valuations and increased volatility have made the sector more attractive.
While 2019 was a very strong year for fixed income, we believe investor return expectations for the coming year should be tempered as the fixed income landscape remains challenging due to low starting rates. That stated, we believe a flexible approach with the ability to adapt to changing environments while uncovering risks and opportunities will remain essential to achieving investor objectives.
Performance for the Core Bond Series Class S shares is provided above. Performance for other shares classes will differ based on each class’ underlying expenses.
Performance data quoted represents past performance and does not guarantee future results. The investment return and principal value of an investment will fluctuate, so that an investor’s shares, when redeemed, may be worth more or less than their original cost. Current performance may be higher or lower than that quoted; investors can obtain the most recentmonth-end performance at www.manning-napier.com or by calling (800)466-3863.
Additional information and associated disclosures can be found on the Performance Update page of this report.
All investments involve risks, including possible loss of principal. There is an inverse relationship between bond prices and interest rates; as interest rates rise, bond prices (and therefore the value of bond funds) fall. Likewise, as interest rates fall, bond prices and the value of bond funds rise. Investments in derivatives can be highly volatile and involve risks in addition to the risks of the underlying instrument on which the derivative is based, such as counterparty, correlation and liquidity risk. Also, the use of leverage increases exposure to the market and may magnify potential losses.
2
Core Bond Series
Performance Update as of December 31, 2019
(unaudited)
AVERAGE ANNUAL TOTAL RETURNS AS OF DECEMBER 31, 2019 | ||||||
| ONE YEAR1 | FIVE YEAR | TEN YEAR | ||||
Core Bond Series - Class S2 | 8.18% | 2.62% | 3.99% | |||
Core Bond Series - Class I2,3 | 8.38% | 2.83% | 4.09% | |||
Core Bond Series - Class W2,4 | 8.78% | 2.73% | 4.04% | |||
Core Bond Series - Class Z2,4 | 8.55% | 2.69% | 4.02% | |||
Bloomberg Barclays U.S. Aggregate Bond Index5 | 8.72% | 3.05% | 3.75% | |||
The following graph compares the value of a $10,000 investment in the Core Bond Series - Class S for the ten years ended December 31, 2019 to the Bloomberg Barclays U.S. Aggregate Bond Index.
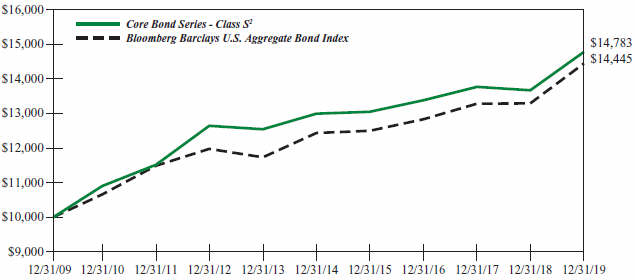
1The returns shown are based on net asset values calculated for shareholder transactions and may differ from the returns shown in the financial highlights, which reflect adjustments made to the net asset values in accordance with accounting principles generally accepted in the United States of America.
2The Series’ performance does not reflect the deduction of taxes that a shareholder would pay on fund distributions or the redemption of shares. The Series’ performance is historical and may not be indicative of future results. The performance returns shown are inclusive of the net expense ratio of the Series. For the year ended December 31, 2019, this net expense ratio was 0.69% for Class S, 0.45% for Class I, 0.05% for Class W and 0.30% for Class Z. The gross expense ratio, which does not account for any voluntary or contractual waivers currently in effect, was 0.76% for Class S, 0.51% for Class I, 0.39% for Class W and 0.39% for Class Z for the year ended December 31, 2019.
3For periods through August 3, 2015 (the inception date of the Class I shares), performance for the Class I shares is based on historical performance of the Class S shares. Because the Class I shares invest in the same portfolio of securities as Class S, performance will only be different to the extent that the Class S shares have a higher expense ratio.
4For periods through March 1, 2019 (the inception date of the Class W and Class Z shares), performance for the Class W and Class Z shares is based on the historical performance of the Class S shares. Because the Class W and Class Z shares invest in the same portfolio of securities as the Class S shares, performance will be different only to the extent that the Class S shares have a higher expense ratio.
5The Bloomberg Barclays U.S. Aggregate Bond Index is an unmanaged, market-value weighted index of U.S. domestic investment-grade debt issues, including government, corporate, asset backed, and mortgage-backed securities, with maturities of one year or more. Index returns do not reflect any fees or expenses. Index returns provided by Interactive Data.
3
Core Bond Series
Shareholder Expense Example
(unaudited)
As a shareholder of the Series, you incur ongoing costs, including management fees, shareholder service fees and other Series expenses. This example is intended to help you understand your ongoing costs (in dollars) of investing in the Series and to compare these costs with the ongoing costs of investing in other mutual funds.
The example is based on an investment of $1,000 invested in each class at the beginning of the period and held for the entire period (July 1, 2019 to December 31, 2019).
Actual Expenses
The Actual lines of the table below provide information about actual account values and actual expenses. You may use the information in this line, together with the amount you invested, to estimate the expenses that you paid over the period. Simply divide your account value by $1,000 (for example, an $8,600 account value divided by $1,000 = 8.6), then multiply the result by the number in the Actual line for the Class in which you have invested under the heading entitled “Expenses Paid During Period” to estimate the expenses you paid on your account during this period.
Hypothetical Example for Comparison Purposes
The Hypothetical lines of each class in the table below provide information about hypothetical account values and hypothetical expenses based on the Class’ actual expense ratio and an assumed rate of return of 5% per year before expenses, which is not the Class’ actual return. The hypothetical account values and expenses may not be used to estimate the actual ending account balance or expenses you paid during the period. You may use this information to compare the ongoing costs of investing in a class of the Series and other funds. To do so, compare this 5% hypothetical example for the class in which you have invested with the 5% hypothetical examples that appear in the shareholder reports of the other funds.
Please note that the expenses shown in the table are meant to highlight your ongoing costs only and do not reflect any transaction costs, such as sales charges (loads), redemption fees, or exchange fees that you may incur in other mutual funds. Therefore, the second line of the table is useful in comparing ongoing costs only, and will not help you determine the relative total costs of owning different funds.
BEGINNING ACCOUNT VALUE | ENDING ACCOUNT VALUE | EXPENSES PAID DURING PERIOD* |
ANNUALIZED
| |||||
Class S | ||||||||
Actual | $1,000.00 | $1,020.60 | $3.46 | 0.68% | ||||
Hypothetical | $1,000.00 | $1,021.78 | $3.47 | 0.68% | ||||
Class I | ||||||||
Actual | $1,000.00 | $1,021.60 | $2.34 | 0.46% | ||||
Hypothetical | $1,000.00 | $1,022.89 | $2.35 | 0.46% | ||||
Class W | ||||||||
Actual | $1,000.00 | $1,024.50 | $0.26 | 0.05% | ||||
Hypothetical | $1,000.00 | $1,024.95 | $0.26 | 0.05% | ||||
Class Z | ||||||||
Actual | $1,000.00 | $1,022.90 | $1.53 | 0.30% | ||||
Hypothetical | $1,000.00 | $1,023.69 | $1.53 | 0.30% | ||||
4
Core Bond Series
Shareholder Expense Example
(unaudited)
*Expenses are equal to each Class’ annualized expense ratio (for thesix-month period), multiplied by the average account value over the period, multiplied by 184/365 (to reflect theone-half year period). Expenses are based on the most recent fiscal half year; therefore, the expense ratios states above may differ from the expense ratios stated in the financial highlights, which is based onone-year data. The Class’ total return would have been lower had certain expenses not been waived or reimbursed during the period.
5
Core Bond Series
Portfolio Composition as of December 31, 2019
(unaudited)
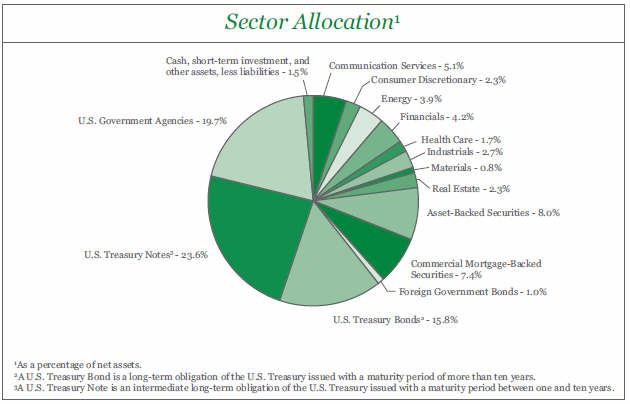
6
Core Bond Series
Investment Portfolio - December 31, 2019
| CREDIT | ||||||||||||||||
| RATING1 | PRINCIPAL | VALUE | ||||||||||||||
(UNAUDITED)
| AMOUNT
| (NOTE 2)
| ||||||||||||||
CORPORATE BONDS - 23.0% | ||||||||||||||||
Non-Convertible Corporate Bonds - 23.0% | ||||||||||||||||
Communication Services - 5.1% | ||||||||||||||||
Diversified Telecommunication Services - 2.5% | ||||||||||||||||
AT&T, Inc., 4.25%, 3/1/2027 | Baa2 | $ | 1,820,000 | $ | 1,999,055 | |||||||||||
Verizon Communications, Inc., 5.25%, 3/16/2037 | Baa1 | 2,590,000 | 3,252,857 | |||||||||||||
|
| |||||||||||||||
| 5,251,912 | ||||||||||||||||
|
| |||||||||||||||
Interactive Media & Services - 0.8% | ||||||||||||||||
Tencent Holdings Ltd. (China)2, 3.975%, 4/11/2029 | A1 | 1,550,000 | 1,673,934 | |||||||||||||
|
| |||||||||||||||
Media - 1.8% | ||||||||||||||||
Comcast Corp., 3.25%, 11/1/2039 | A3 | 1,610,000 | 1,635,549 | |||||||||||||
Discovery Communications LLC, 5.20%, 9/20/2047 | Baa3 | 1,870,000 | 2,179,855 | |||||||||||||
|
| |||||||||||||||
| 3,815,404 | ||||||||||||||||
|
| |||||||||||||||
Total Communication Services | 10,741,250 | |||||||||||||||
|
| |||||||||||||||
Consumer Discretionary - 2.3% | ||||||||||||||||
Internet & Direct Marketing Retail - 2.3% | ||||||||||||||||
Alibaba Group Holding Ltd. (China), 3.40%, 12/6/2027 | A1 | 1,660,000 | 1,729,574 | |||||||||||||
Booking Holdings, Inc., 3.60%, 6/1/2026 | A3 | 2,790,000 | 2,978,502 | |||||||||||||
|
| |||||||||||||||
Total Consumer Discretionary | 4,708,076 | |||||||||||||||
|
| |||||||||||||||
Energy - 3.9% | ||||||||||||||||
Oil, Gas & Consumable Fuels - 3.9% | ||||||||||||||||
Energy Transfer Operating LP, 6.50%, 2/1/2042 | Baa3 | 1,330,000 | 1,582,040 | |||||||||||||
Kinder Morgan Energy Partners LP, 6.95%, 1/15/2038 | Baa2 | 1,620,000 | 2,146,302 | |||||||||||||
Sabine Pass Liquefaction LLC, 5.875%, 6/30/2026 | Baa3 | 2,520,000 | 2,896,801 | |||||||||||||
The Williams Companies, Inc., 3.75%, 6/15/2027 | Baa3 | 1,495,000 | 1,559,374 | |||||||||||||
|
| |||||||||||||||
Total Energy | 8,184,517 | |||||||||||||||
|
| |||||||||||||||
Financials - 4.2% | ||||||||||||||||
Banks - 4.2% | ||||||||||||||||
Bank of America Corp., 4.00%, 1/22/2025 | Baa1 | 2,750,000 | 2,933,416 | |||||||||||||
Citigroup, Inc., 8.125%, 7/15/2039 | A3 | 960,000 | 1,602,679 | |||||||||||||
Credit Suisse AG (Switzerland), 5.40%, 1/14/2020 | Baa3 | 870,000 | 870,816 | |||||||||||||
JPMorgan Chase & Co.3, (3 mo. LIBOR US + 1.000%), 4.023%, 12/5/2024 | A2 | 1,320,000 | 1,407,743 | |||||||||||||
Santander Holdings USA, Inc., 4.50%, 7/17/2025 | Baa3 | 1,780,000 | 1,921,591 | |||||||||||||
|
| |||||||||||||||
Total Financials | 8,736,245 | |||||||||||||||
|
| |||||||||||||||
Health Care - 1.7% | ||||||||||||||||
Health Care Providers & Services - 1.7% | ||||||||||||||||
Fresenius Medical Care US Finance II, Inc. (Germany)2, 4.125%, 10/15/2020 | Baa3 | 2,000,000 | 2,019,916 | |||||||||||||
HCA, Inc., 4.125%, 6/15/2029 | Baa3 | 1,540,000 | 1,634,062 | |||||||||||||
|
| |||||||||||||||
Total Health Care | 3,653,978 | |||||||||||||||
|
| |||||||||||||||
The accompanying notes are an integral part of the financial statements.
7
Core Bond Series
Investment Portfolio - December 31, 2019
| CREDIT | ||||||||||||||||
| RATING1 | PRINCIPAL | VALUE | ||||||||||||||
(UNAUDITED)
| AMOUNT
| (NOTE 2)
| ||||||||||||||
CORPORATE BONDS(continued) | ||||||||||||||||
Non-Convertible Corporate Bonds(continued) | ||||||||||||||||
Industrials - 2.7% | ||||||||||||||||
Industrial Conglomerates - 0.7% | ||||||||||||||||
General Electric Co.3,4, (3 mo. LIBOR US + 3.330%), 5.00% | Baa3 | $ | 1,590,000 | $ | 1,557,341 | |||||||||||
|
| |||||||||||||||
Trading Companies & Distributors - 2.0% | ||||||||||||||||
AerCap Ireland Capital DAC - AerCap Global Aviation Trust (Ireland), 4.45%, 10/1/2025 | Baa3 | 1,810,000 | 1,946,322 | |||||||||||||
Air Lease Corp., 3.625%, 4/1/2027 | BBB5 | 2,150,000 | 2,229,867 | |||||||||||||
|
| |||||||||||||||
| 4,176,189 | ||||||||||||||||
|
| |||||||||||||||
Total Industrials | 5,733,530 | |||||||||||||||
|
| |||||||||||||||
Materials - 0.8% | ||||||||||||||||
Metals & Mining - 0.8% | ||||||||||||||||
Southern Copper Corp. (Peru), 5.375%, 4/16/2020 | Baa2 | 1,740,000 | 1,753,917 | |||||||||||||
|
| |||||||||||||||
Real Estate - 2.3% | ||||||||||||||||
Equity Real Estate Investment Trusts (REITS) - 2.3% | ||||||||||||||||
American Tower Corp., 3.80%, 8/15/2029 | Baa3 | 2,070,000 | 2,213,098 | |||||||||||||
Crown Castle International Corp., 3.10%, 11/15/2029 | Baa3 | 2,190,000 | 2,218,074 | |||||||||||||
GTP Acquisition Partners I LLC2, 2.35%, 6/15/2020 | Aaa | 450,000 | 450,072 | |||||||||||||
|
| |||||||||||||||
Total Real Estate | 4,881,244 | |||||||||||||||
|
| |||||||||||||||
TOTAL CORPORATE BONDS | 48,392,757 | |||||||||||||||
|
| |||||||||||||||
ASSET-BACKED SECURITIES - 8.0% | ||||||||||||||||
Cazenovia Creek Funding I LLC, Series2015-1A, Class A2, 2.00%, 12/10/2023 | WR6 | 378 | 377 | |||||||||||||
Cazenovia Creek Funding II LLC, Series2018-1A, Class A2, 3.561%, 7/15/2030 | WR6 | 230,344 | 231,656 | |||||||||||||
CCG Receivables Trust, Series2019-1, Class A22, 2.80%, 9/14/2026 | AAA5 | 1,940,000 | 1,955,730 | |||||||||||||
Chesapeake Funding II LLC, Series2017-4A, Class A1 (Canada)2, 2.12%, 11/15/2029 | Aaa | 228,255 | 228,311 | |||||||||||||
Commonbond Student Loan Trust, Series2019-AGS, Class A12, 2.54%, 1/25/2047 | Aaa | 741,860 | 734,950 | |||||||||||||
Credit Acceptance Auto Loan Trust, Series2017-1A, Class A2, 2.56%, 10/15/2025 | AAA5 | 10,300 | 10,301 | |||||||||||||
Credit Acceptance Auto Loan Trust, Series2018-1A, Class A2, 3.01%, 2/16/2027 | Aaa | 900,000 | 903,355 | |||||||||||||
Home Partners of America Trust, Series2019-1, Class A2, 2.908%, 9/17/2039 | Aaa | 989,032 | 983,923 | |||||||||||||
Invitation Homes Trust, Series 2017-SFR2, Class A2,7, (1 mo. LIBOR US + 0.850%), 2.587%, 12/17/2036 | Aaa | 144,587 | 144,037 | |||||||||||||
Invitation Homes Trust, Series 2017-SFR2, Class B2,7, (1 mo. LIBOR US + 1.150%), 2.887%, 12/17/2036 | Aa2 | 115,000 | 114,836 | |||||||||||||
The accompanying notes are an integral part of the financial statements.
8
Core Bond Series
Investment Portfolio - December 31, 2019
| CREDIT | ||||||||||||||||
| RATING1 | PRINCIPAL | VALUE | ||||||||||||||
(UNAUDITED)
| AMOUNT
| (NOTE 2)
| ||||||||||||||
ASSET-BACKED SECURITIES(continued) | ||||||||||||||||
Navient Private Education Refi Loan Trust, Series2019-EA, Class A2A2, 2.64%, 5/15/2068 | AAA5 | $ | 1,000,000 | $ | 991,834 | |||||||||||
Navient Student Loan Trust, Series2014-1, Class A37, (1 mo. LIBOR US + 0.510%), 2.302%, 6/25/2031 | A1 | 1,059,492 | 1,039,174 | |||||||||||||
Navient Student Loan Trust, Series2019-2A, Class A22,7, (1 mo. LIBOR US + 1.000%), 2.792%, 2/27/2068 | Aaa | 1,820,000 | 1,815,271 | |||||||||||||
Oxford Finance Funding LLC, Series2019-1A, Class A22, 4.459%, 2/15/2027 | WR6 | 900,000 | 913,316 | |||||||||||||
Progress Residential Trust, Series 2017-SFR2, Class A2, 2.897%, 12/17/2034 | Aaa | 399,257 | 399,747 | |||||||||||||
Progress Residential Trust, Series 2019-SFR2, Class A2, 3.147%, 5/17/2036 | Aaa | 910,000 | 921,854 | |||||||||||||
Progress Residential Trust, Series 2019-SFR4, Class A2, 2.687%, 10/17/2036 | Aaa | 800,000 | 797,473 | |||||||||||||
SoFi Consumer Loan Program Trust, Series2019-2, Class A2, 3.01%, 4/25/2028 | | AAA5 | | 517,622 | 520,969 | |||||||||||
SoFi Consumer Loan Program Trust, Series2019-3, Class A2, 2.90%, 5/25/2028 | | AAA5 | | 733,209 | 737,776 | |||||||||||
SoFi Professional Loan Program LLC, Series2016-E, Class A2B2, 2.49%, 1/25/2036 | Aaa | 656,547 | 656,585 | |||||||||||||
SoFi Professional Loan Program LLC, Series2017-F, Class A1FX2, 2.05%, 1/25/2041 | Aaa | 29,658 | 29,637 | |||||||||||||
SoFi Professional Loan Program LLC, Series2017-F, Class A2FX2, 2.84%, 1/25/2041 | Aaa | 150,000 | 151,181 | |||||||||||||
SoFi Professional Loan Program Trust, Series2018-C, Class A1FX2, 3.08%, 1/25/2048 | Aaa | 305,307 | 306,598 | |||||||||||||
Tax Ease Funding LLC, Series2016-1A, Class A2, 3.131%, 6/15/2028 | WR6 | 72,420 | 72,379 | |||||||||||||
Towd Point Mortgage Trust, Series2016-5, Class A12,8, 2.50%, 10/25/2056 | Aaa | 420,716 | 420,742 | |||||||||||||
Towd Point Mortgage Trust, Series2017-1, Class A12,8, 2.75%, 10/25/2056 | Aaa | 373,109 | 375,655 | |||||||||||||
Towd Point Mortgage Trust, Series2019-HY1, Class A12,7, (1 mo. LIBOR US + 1.000%), 2.792%, 10/25/2048 | Aaa | 336,168 | 336,897 | |||||||||||||
Tricon American Homes Trust, Series 2016-SFR1, Class A2, 2.589%, 11/17/2033 | Aaa | 484,482 | 483,583 | |||||||||||||
Tricon American Homes Trust, Series 2017-SFR2, Class A2, 2.928%, 1/17/2036 | Aaa | 498,586 | 502,160 | |||||||||||||
|
| |||||||||||||||
TOTAL ASSET-BACKED SECURITIES | 16,780,307 | |||||||||||||||
|
| |||||||||||||||
The accompanying notes are an integral part of the financial statements.
9
Core Bond Series
Investment Portfolio - December 31, 2019
| CREDIT | ||||||||||||||||
| RATING1 | PRINCIPAL | VALUE | ||||||||||||||
(UNAUDITED)
| AMOUNT
| (NOTE 2)
| ||||||||||||||
COMMERCIAL MORTGAGE-BACKED SECURITIES - 7.4% | ||||||||||||||||
Americold LLC Trust, Series 2010-ARTA, Class A12, 3.847%, 1/14/2029 | AA5 | $ | 13,372 | $ | 13,462 | |||||||||||
BWAY Mortgage Trust, Series 2015-1740, Class A2, 2.917%, 1/10/2035 | AAA5 | 400,000 | 404,183 | |||||||||||||
CIM Trust, Series 2019-INV1, Class A12,8, 4.00%, 2/25/2049 | Aaa | 255,314 | 259,122 | |||||||||||||
Credit Suisse Mortgage Capital Trust, Series2013-6, Class 2A12,8, 3.50%, 8/25/2043 | AAA5 | 704,287 | 715,839 | |||||||||||||
Credit Suisse Mortgage Capital Trust, Series 2013-IVR3, Class A12,8, 2.50%, 5/25/2043 | AAA5 | 208,816 | 204,959 | |||||||||||||
Credit Suisse Mortgage Capital Trust, Series2013-TH1, Class A12,8, 2.13%, 2/25/2043 | AAA5 | 147,608 | 142,972 | |||||||||||||
Fannie Mae REMICS, Series2018-31, Class KP, 3.50%, 7/25/2047 | Aaa | 608,788 | 632,344 | |||||||||||||
FannieMae-Aces, Series2017-M15, Class A18, 2.959%, 9/25/2027 | WR6 | 958,641 | 992,480 | |||||||||||||
Fontainebleau Miami Beach Trust, Series 2019-FBLU, Class A2, 3.144%, 12/10/2036 | Aaa | 1,050,000 | 1,074,810 | |||||||||||||
Freddie Mac Multifamily Structured Pass-Through Certificates, Series K014, Class X1 (IO)8, 1.149%, 4/25/2021 | Aaa | 6,831,148 | 80,171 | |||||||||||||
Freddie Mac Multifamily Structured Pass-Through Certificates, Series K016, Class X1 (IO)8, 1.478%, 10/25/2021 | Aaa | 1,017,986 | 22,806 | |||||||||||||
Freddie Mac Multifamily Structured Pass-Through Certificates, Series K021, Class X1 (IO)8, 1.425%, 6/25/2022 | Aaa | 8,807,216 | 263,877 | |||||||||||||
Freddie Mac Multifamily Structured Pass-Through Certificates, Series K030, Class X1 (IO)8, 0.183%, 4/25/2023 | Aaa | 13,104,064 | 71,333 | |||||||||||||
Freddie Mac Multifamily Structured Pass-Through Certificates, Series K032, Class X1 (IO)8, 0.097%, 5/25/2023 | Aaa | 7,704,684 | 28,418 | |||||||||||||
Freddie Mac REMICS, Series 4791, Class BA, 4.00%, 3/15/2044 | Aaa | 602,101 | 614,102 | |||||||||||||
Freddie Mac REMICS, Series 4801, Class BA, 4.50%, 5/15/2044 | Aaa | 500,763 | 511,634 | |||||||||||||
FREMF Mortgage Trust, Series2011-K15, Class B2,8, 4.961%, 8/25/2044 | WR6 | 170,000 | 176,182 | |||||||||||||
FREMF Mortgage Trust, Series 2014-K715, Class B2,8, 3.971%, 2/25/2046 | Aa2 | 465,000 | 471,407 | |||||||||||||
FREMF Mortgage Trust, Series2015-K42, Class B2,8, 3.851%, 12/25/2024 | A3 | 380,000 | 393,832 | |||||||||||||
FREMF Mortgage Trust, Series2015-K43, Class B2,8, 3.734%, 2/25/2048 | WR6 | 400,000 | 411,825 | |||||||||||||
FREMF Mortgage Trust, Series 2015-K720, Class B2,8, 3.392%, 7/25/2022 | Baa1 | 340,000 | 345,796 | |||||||||||||
Government National Mortgage Association, Series2017-54, Class AH, 2.60%, 12/16/2056 | Aaa | 461,280 | 461,388 | |||||||||||||
JP Morgan Chase Commercial Mortgage Securities Trust, Series2010-C2, Class A32, 4.07%, 11/15/2043 | AAA5 | 157,515 | 158,352 | |||||||||||||
JP Morgan Mortgage Trust, Series2013-1, Class 1A22,8, 3.00%, 3/25/2043 | WR6 | 105,356 | 106,153 | |||||||||||||
JP Morgan Mortgage Trust, Series2013-2, Class A22,8, 3.50%, 5/25/2043 | AAA5 | 117,646 | 120,122 | |||||||||||||
JP Morgan Mortgage Trust, Series2014-2, Class 1A12,8, 3.00%, 6/25/2029 | AAA5 | 137,495 | 138,834 | |||||||||||||
The accompanying notes are an integral part of the financial statements.
10
Core Bond Series
Investment Portfolio - December 31, 2019
| CREDIT | ||||||||||||||||
| RATING1 | PRINCIPAL | VALUE | ||||||||||||||
(UNAUDITED)
| AMOUNT
| (NOTE 2)
| ||||||||||||||
COMMERCIAL MORTGAGE-BACKED SECURITIES(continued) | ||||||||||||||||
JP Morgan Mortgage Trust, Series2017-3, Class 1A52,8, 3.50%, 8/25/2047 | Aaa | $ | 561,009 | $ | 567,013 | |||||||||||
JP Morgan Mortgage Trust, Series2017-6, Class A32,8, 3.50%, 12/25/2048 | Aaa | 257,960 | 262,744 | |||||||||||||
JP Morgan Mortgage Trust, Series2017-6, Class A52,8, 3.50%, 12/25/2048 | Aaa | 402,772 | 407,848 | |||||||||||||
New Residential Mortgage Loan Trust, Series2014-1A, Class A2,8, 3.75%, 1/25/2054 | AAA5 | 235,534 | 243,605 | |||||||||||||
New Residential Mortgage Loan Trust, Series2014-3A, Class AFX32,8, 3.75%, 11/25/2054 | AA5 | 104,781 | 108,086 | |||||||||||||
New Residential Mortgage Loan Trust, Series2015-2A, Class A12,8, 3.75%, 8/25/2055 | Aaa | 232,244 | 239,807 | |||||||||||||
New Residential Mortgage Loan Trust, Series2016-4A, Class A12,8, 3.75%, 11/25/2056 | AAA5 | 196,391 | 202,827 | |||||||||||||
OBP Depositor LLC Trust, Series2010-OBP, Class A2, 4.646%, 7/15/2045 | AA5 | 100,000 | 99,916 | |||||||||||||
Sequoia Mortgage Trust, Series2012-3, Class A18, 3.50%, 7/25/2042 | Aaa | 269,848 | 274,101 | |||||||||||||
Sequoia Mortgage Trust, Series2013-7, Class A28, 3.00%, 6/25/2043 | AAA5 | 127,648 | 127,885 | |||||||||||||
Sequoia Mortgage Trust, Series2013-8, Class A18, 3.00%, 6/25/2043 | Aaa | 173,852 | 175,098 | |||||||||||||
Sequoia Mortgage Trust, Series2016-3, Class A102,8, 3.50%, 11/25/2046 | Aaa | 864,954 | 882,342 | |||||||||||||
Starwood Retail Property Trust, Series 2014-STAR, Class A2,7, (1 mo. LIBOR US + 1.470%), 3.21%, 11/15/2027 | AAA5 | 362,541 | 361,429 | |||||||||||||
Sutherland Commercial Mortgage Trust, Series 2019-SBC8, Class A2,8, 2.86%, 4/25/2041 | WR6 | 928,500 | 928,642 | |||||||||||||
Vornado DP LLC Trust, Series2010-VNO, Class A2FX2, 4.004%, 9/13/2028 | AA5 | 245,000 | 245,887 | |||||||||||||
Waikiki Beach Hotel Trust, Series2019-WBM, Class A2,7, (1 mo. LIBOR US + 1.050%), 2.79%, 12/15/2033 | AAA5 | 415,000 | 414,496 | |||||||||||||
Wells Fargo Commercial Mortgage Trust, Series2010-C1, Class A22, 4.393%, 11/15/2043 | Aaa | 250,177 | 251,674 | |||||||||||||
WF-RBS Commercial Mortgage Trust, Series2011-C2, Class A42,8, 4.869%, 2/15/2044 | Aaa | 754,242 | 768,786 | |||||||||||||
WinWater Mortgage Loan Trust, Series2015-1, Class A12,8, 3.50%, 1/20/2045 | WR6 | 113,355 | 115,605 | |||||||||||||
WinWater Mortgage Loan Trust, Series2015-3, Class A52,8, 3.50%, 3/20/2045 | Aaa | 73,267 | 73,308 | |||||||||||||
|
| |||||||||||||||
TOTAL COMMERCIAL MORTGAGE-BACKED SECURITIES | 15,567,502 | |||||||||||||||
|
| |||||||||||||||
FOREIGN GOVERNMENT BONDS - 1.0% | ||||||||||||||||
Export-Import Bank of Korea (South Korea), 2.625%, 12/30/2020 (Identified Cost $1,999,475) | Aa2 | 2,000,000 | 2,011,576 | |||||||||||||
|
| |||||||||||||||
The accompanying notes are an integral part of the financial statements.
11
Core Bond Series
Investment Portfolio - December 31, 2019
PRINCIPAL
| VALUE (NOTE 2)
| ||||||||||||||
| U.S. TREASURY SECURITIES - 39.4% | |||||||||||||||
| U.S. Treasury Bonds - 15.8% | |||||||||||||||
U.S. Treasury Bond, 4.75%, 2/15/2037 | $ | 4,565,000 | $ | 6,289,536 | |||||||||||
U.S. Treasury Bond, 2.50%, 2/15/2045 | 8,217,000 | 8,403,808 | |||||||||||||
U.S. Treasury Bond, 3.00%, 5/15/2047 | 9,177,000 | 10,335,955 | |||||||||||||
U.S. Treasury Inflation Indexed Bond, 2.00%, 1/15/2026 | 5,672,625 | 6,305,386 | |||||||||||||
U.S. Treasury Inflation Indexed Bond, 0.75%, 2/15/2042 | 1,975,992 | 2,052,223 | |||||||||||||
|
|
|
| ||||||||||||
Total U.S. Treasury Bonds | 33,386,908 | ||||||||||||||
|
|
|
| ||||||||||||
| U.S. Treasury Notes - 23.6% | |||||||||||||||
U.S. Treasury Inflation Indexed Note, 0.125%, 4/15/2020 | 5,503,062 | 5,496,398 | |||||||||||||
U.S. Treasury Inflation Indexed Note, 0.50%, 4/15/2024 | 5,433,470 | 5,521,312 | |||||||||||||
U.S. Treasury Note, 2.625%, 5/15/2021 | 6,225,000 | 6,310,594 | |||||||||||||
U.S. Treasury Note, 1.75%, 5/15/2023 | 8,175,000 | 8,206,614 | |||||||||||||
U.S. Treasury Note, 2.50%, 5/15/2024 | 7,920,000 | 8,195,034 | |||||||||||||
U.S. Treasury Note, 2.125%, 5/15/2025 | 7,523,000 | 7,678,162 | |||||||||||||
U.S. Treasury Note, 1.625%, 5/15/2026 | 8,285,000 | 8,201,179 | |||||||||||||
|
|
|
| ||||||||||||
Total U.S. Treasury Notes | 49,609,293 | ||||||||||||||
|
|
|
| ||||||||||||
TOTAL U.S. TREASURY SECURITIES | 82,996,201 | ||||||||||||||
|
|
|
| ||||||||||||
| U.S. GOVERNMENT AGENCIES - 19.7% | |||||||||||||||
| Mortgage-Backed Securities - 19.7% | |||||||||||||||
Fannie Mae, Pool #888468, UMBS, 5.50%, 9/1/2021 | 28,836 | 29,185 | |||||||||||||
Fannie Mae, Pool #995233, UMBS, 5.50%, 10/1/2021 | 715 | 721 | |||||||||||||
Fannie Mae, Pool #888017, UMBS, 6.00%, 11/1/2021 | 4,261 | 4,341 | |||||||||||||
Fannie Mae, Pool #995329, UMBS, 5.50%, 12/1/2021 | 19,615 | 19,848 | |||||||||||||
Fannie Mae, Pool #888136, UMBS, 6.00%, 12/1/2021 | 4,900 | 5,004 | |||||||||||||
Fannie Mae, Pool #888810, UMBS, 5.50%, 11/1/2022 | 35,287 | 35,699 | |||||||||||||
Fannie Mae, Pool #AD0462, UMBS, 5.50%, 10/1/2024 | 5,976 | 6,245 | |||||||||||||
Fannie Mae, Pool #AL9409, UMBS, 3.50%, 11/1/2031 | 921,190 | 958,034 | |||||||||||||
Fannie Mae, Pool #MA3463, UMBS, 4.00%, 9/1/2033 | 578,629 | 604,055 | |||||||||||||
Fannie Mae, Pool #MA1834, UMBS, 4.50%, 2/1/2034 | 69,153 | 74,410 | |||||||||||||
Fannie Mae, Pool #FM1158, UMBS, 3.50%, 6/1/2034 | 1,100,667 | 1,141,046 | |||||||||||||
Fannie Mae, Pool #828377, UMBS, 5.50%, 6/1/2035 | 281,819 | 317,179 | |||||||||||||
Fannie Mae, Pool #MA2587, UMBS, 3.50%, 4/1/2036 | 552,480 | 576,079 | |||||||||||||
Fannie Mae, Pool #889494, UMBS, 5.50%, 1/1/2037 | 258,086 | 289,668 | |||||||||||||
Fannie Mae, Pool #889624, UMBS, 5.50%, 5/1/2038 | 38,472 | 43,206 | |||||||||||||
Fannie Mae, Pool #MA3412, UMBS, 3.50%, 7/1/2038 | 1,889,423 | 1,967,621 | |||||||||||||
Fannie Mae, Pool #995876, UMBS, 6.00%, 11/1/2038 | 109,430 | 125,490 | |||||||||||||
Fannie Mae, Pool #AD0307, UMBS, 5.50%, 1/1/2039 | 38,868 | 43,637 | |||||||||||||
Fannie Mae, Pool #AI5172, UMBS, 4.00%, 8/1/2041 | 90,236 | 95,505 | |||||||||||||
The accompanying notes are an integral part of the financial statements.
12
Core Bond Series
Investment Portfolio - December 31, 2019
PRINCIPAL
| VALUE (NOTE 2)
| ||||||||||||||
| U.S. GOVERNMENT AGENCIES(continued) | |||||||||||||||
| Mortgage-Backed Securities(continued) | |||||||||||||||
Fannie Mae, Pool #AH3858, UMBS, 4.50%, 8/1/2041 | $ | 421,355 | $ | 457,632 | |||||||||||
Fannie Mae, Pool #AL7729, UMBS, 4.00%, 6/1/2043 | 139,092 | 149,159 | |||||||||||||
Fannie Mae, Pool #AS3622, UMBS, 3.50%, 10/1/2044 | 2,100,486 | 2,216,242 | |||||||||||||
Fannie Mae, Pool #AX1685, UMBS, 3.50%, 11/1/2044 | 1,067,960 | 1,129,877 | |||||||||||||
Fannie Mae, Pool #AS4103, UMBS, 4.50%, 12/1/2044 | 273,442 | 294,607 | |||||||||||||
Fannie Mae, Pool #AY8604, UMBS, 3.50%, 4/1/2045 | 218,072 | 227,691 | |||||||||||||
Fannie Mae, Pool #AZ9215, UMBS, 4.00%, 10/1/2045 | 693,929 | 730,594 | |||||||||||||
Fannie Mae, Pool #BC6764, UMBS, 3.50%, 4/1/2046 | 121,112 | 126,347 | |||||||||||||
Fannie Mae, Pool #BC8677, UMBS, 4.00%, 5/1/2046 | 109,940 | 116,108 | |||||||||||||
Fannie Mae, Pool #MA2670, UMBS, 3.00%, 7/1/2046 | 325,527 | 333,382 | |||||||||||||
Fannie Mae, Pool #BD2179, UMBS, 4.00%, 7/1/2046 | 267,554 | 282,583 | |||||||||||||
Fannie Mae, Pool #MA2705, UMBS, 3.00%, 8/1/2046 | 925,317 | 946,795 | |||||||||||||
Fannie Mae, Pool #BD1191, UMBS, 3.50%, 1/1/2047 | 481,119 | 499,619 | |||||||||||||
Fannie Mae, Pool #BE7845, UMBS, 4.50%, 2/1/2047 | 173,298 | 183,206 | |||||||||||||
Fannie Mae, Pool #CA1922, UMBS, 5.00%, 6/1/2048 | 672,830 | 721,247 | |||||||||||||
Fannie Mae, Pool #CA2056, UMBS, 4.50%, 7/1/2048 | 424,246 | 448,199 | |||||||||||||
Fannie Mae, Pool #MA3443, UMBS, 4.00%, 8/1/2048 | 858,505 | 892,103 | |||||||||||||
Fannie Mae, Pool #BK9366, UMBS, 4.50%, 8/1/2048 | 279,414 | 294,597 | |||||||||||||
Fannie Mae, Pool #BK9598, UMBS, 4.50%, 8/1/2048 | 309,327 | 325,994 | |||||||||||||
Fannie Mae, Pool #CA2219, UMBS, 5.00%, 8/1/2048 | 1,009,313 | 1,081,922 | |||||||||||||
Fannie Mae, Pool #CA2373, UMBS, 5.00%, 9/1/2048 | 594,823 | 637,601 | |||||||||||||
Fannie Mae, Pool #BM5859, UMBS, 4.00%, 10/1/2048 | 792,193 | 824,511 | |||||||||||||
Fannie Mae, Pool #BM5024, UMBS, 3.00%, 11/1/2048 | 1,029,547 | 1,049,452 | |||||||||||||
Fannie Mae, Pool #MA3521, UMBS, 4.00%, 11/1/2048 | 2,950,298 | 3,068,877 | |||||||||||||
Fannie Mae, Pool #BN0622, UMBS, 4.50%, 1/1/2049 | 545,054 | 574,239 | |||||||||||||
Fannie Mae, Pool #AL8674, 5.645%, 1/1/2049 | 520,383 | 581,134 | |||||||||||||
Fannie Mae, Pool #MA3692, UMBS, 3.50%, 7/1/2049 | 1,738,255 | 1,786,756 | |||||||||||||
Freddie Mac, Pool #G11850, 5.50%, 7/1/2020 | 286 | 286 | |||||||||||||
Freddie Mac, Pool #G12610, 6.00%, 3/1/2022 | 6,276 | 6,410 | |||||||||||||
Freddie Mac, Pool #G12655, 6.00%, 5/1/2022 | 4,381 | 4,494 | |||||||||||||
Freddie Mac, Pool #G12988, 6.00%, 1/1/2023 | 3,937 | 4,074 | |||||||||||||
Freddie Mac, Pool #G13078, 6.00%, 3/1/2023 | 6,527 | 6,734 | |||||||||||||
Freddie Mac, Pool #D98711, 4.50%, 7/1/2031 | 105,342 | 113,280 | |||||||||||||
Freddie Mac, Pool #C91746, 4.50%, 12/1/2033 | 93,460 | 100,620 | |||||||||||||
Freddie Mac, Pool #C91771, 4.50%, 6/1/2034 | 99,723 | 107,082 | |||||||||||||
Freddie Mac, Pool #C91780, 4.50%, 7/1/2034 | 122,406 | 131,784 | |||||||||||||
Freddie Mac, Pool #QN0349, UMBS, 3.00%, 8/1/2034 | 1,185,119 | 1,215,441 | |||||||||||||
Freddie Mac, Pool #C91832, 3.50%, 6/1/2035 | 571,042 | 597,592 | |||||||||||||
Freddie Mac, Pool #G07655, 5.50%, 12/1/2035 | 77,993 | 87,678 | |||||||||||||
Freddie Mac, Pool #G08268, 5.00%, 5/1/2038 | 626,531 | 690,659 | |||||||||||||
Freddie Mac, Pool #G05275, 5.50%, 2/1/2039 | 171,532 | 187,300 | |||||||||||||
Freddie Mac, Pool #G05900, 6.00%, 3/1/2040 | 34,585 | 39,574 | |||||||||||||
Freddie Mac, Pool #A92889, 4.50%, 7/1/2040 | 253,764 | 274,893 | |||||||||||||
The accompanying notes are an integral part of the financial statements.
13
Core Bond Series
Investment Portfolio - December 31, 2019
PRINCIPAL SHARES
| VALUE (NOTE 2)
| ||||||||||||||
| U.S. GOVERNMENT AGENCIES(continued) | |||||||||||||||
| Mortgage-Backed Securities(continued) | |||||||||||||||
Freddie Mac, Pool #A93451, 4.50%, 8/1/2040 | $ | 739,709 | $ | 803,711 | |||||||||||
Freddie Mac, Pool #G60513, 5.00%, 7/1/2041 | 646,656 | 712,856 | |||||||||||||
Freddie Mac, Pool #G60071, 4.50%, 7/1/2042 | 278,072 | 302,064 | |||||||||||||
Freddie Mac, Pool #Q17513, 3.50%, 4/1/2043 | 192,124 | 202,640 | |||||||||||||
Freddie Mac, Pool #G60183, 4.00%, 12/1/2044 | 309,509 | 327,486 | |||||||||||||
Freddie Mac, Pool #Q37592, 4.00%, 12/1/2045 | 680,141 | 721,805 | |||||||||||||
Freddie Mac, Pool #Q37857, 4.00%, 12/1/2045 | 642,507 | 680,683 | |||||||||||||
Freddie Mac, Pool #G60855, 4.50%, 12/1/2045 | 268,039 | 288,418 | |||||||||||||
Freddie Mac, Pool #Q38388, 4.00%, 1/1/2046 | 736,063 | 783,719 | |||||||||||||
Freddie Mac, Pool #ZM2525, UMBS, 3.00%, 12/1/2046 | 1,089,247 | 1,114,344 | |||||||||||||
Freddie Mac, Pool #Q47544, 4.00%, 3/1/2047 | 831,195 | 890,393 | |||||||||||||
Freddie Mac, Pool #Q47130, 4.50%, 4/1/2047 | 291,489 | 307,763 | |||||||||||||
Freddie Mac, Pool #G08786, 4.50%, 10/1/2047 | 294,334 | 312,085 | |||||||||||||
Freddie Mac, Pool #Q57173, 4.50%, 7/1/2048 | 657,709 | 692,268 | |||||||||||||
Freddie Mac, Pool #Q59744, 4.50%, 11/1/2048 | 881,295 | 931,914 | |||||||||||||
Freddie Mac, Pool #Q59805, 4.50%, 11/1/2048 | 489,777 | 516,495 | |||||||||||||
Freddie Mac, Pool #G61887, 5.00%, 2/1/2049 | 1,074,662 | 1,149,728 | |||||||||||||
Freddie Mac, Pool #QA0192, UMBS, 3.50%, 6/1/2049 | 915,658 | 943,856 | |||||||||||||
|
| ||||||||||||||
TOTAL U.S. GOVERNMENT AGENCIES | 41,567,576 | ||||||||||||||
|
| ||||||||||||||
| SHORT-TERM INVESTMENT - 1.0% | |||||||||||||||
Dreyfus Government Cash Management, Institutional Shares, 1.51%9, | 2,165,035 | 2,165,035 | |||||||||||||
|
| ||||||||||||||
TOTAL INVESTMENTS - 99.5% | 209,480,954 | ||||||||||||||
OTHER ASSETS, LESS LIABILITIES - 0.5% | 1,080,423 | ||||||||||||||
|
| ||||||||||||||
NET ASSETS - 100% | $ | 210,561,377 | |||||||||||||
|
| ||||||||||||||
IO - Interest only
LIBOR - London Interbank Offered Rate
UMBS - Uniform Mortgage-Backed Securities
1Credit ratings from Moody’s (unaudited).
2Restricted securities - Investment in securities that are restricted as to public resale under the Securities Act of 1933, as amended. These securities have been sold under Rule 144A and have been determined to be liquid under the Fund’s Liquidity Risk Management Program. These securities amount to $31,196,920, or 14.8% of the Series’ net assets as of December 31, 2019 (see Note 2 to the financial statements).
3Variable rate security. Security may be issued at a fixed coupon rate, which converts to a variable rate at a specified date. Rate shown is the rate in effect as of December 31, 2019.
4Security is perpetual in nature and has no stated maturity date.
5Credit ratings from S&P (unaudited).
6Credit rating has been withdrawn. As of December 31, 2019, there is no rating available (unaudited).
7Floating rate security. Rate shown is the rate in effect as of December 31, 2019.
8Variable or floating rate security, the interest rate of which adjusts periodically based on changes in current interest rates and prepayments on the underlying pool of assets. Rate shown is the rate in effect as of December 31, 2019.
9Rate shown is the current yield as of December 31, 2019.
The accompanying notes are an integral part of the financial statements.
14
Core Bond Series
Investment Portfolio - December 31, 2019
The Global Industry Classification Standard (GICS) was developed by and is the exclusive property and a service mark of MSCI Inc. (MSCI) and Standard & Poor’s, a division of S&P Global Inc. (S&P), and is licensed for use by Manning & Napier when referencing GICS sectors. Neither MSCI, S&P, nor any third party involved in making or compiling the GICS or any GICS classifications makes any express or implied warranties or representations with respect to such standard or classification, nor shall any such party have any liability therefrom.
The accompanying notes are an integral part of the financial statements.
15
Core Bond Series
Statement of Assets and Liabilities
December 31, 2019
ASSETS: | ||||
Investments, at value (identified cost $204,178,615) (Note 2) | $ | 209,480,954 | ||
Receivable from Advisor (Note 3) | 20,075 | |||
Interest receivable | 1,083,432 | |||
Receivable for fund shares sold | 20,003 | |||
Dividends receivable | 2,417 | |||
Prepaid and other expenses | 6,480 | |||
|
| |||
TOTAL ASSETS | 210,613,361 | |||
|
| |||
LIABILITIES: | ||||
Accrued fund accounting and administration fees (Note 3) | 25,701 | |||
Accrued Chief Compliance Officer service fees (Note 3) | 1,170 | |||
Accruedsub-transfer agent fees (Note 3) | 822 | |||
Accrued distribution and service (Rule12b-1) fees (Class S) (Note 3) | 482 | |||
Audit fees payable | 10,115 | |||
Accrued printing and postage fees payable | 6,412 | |||
Accrued custodian fees | 3,798 | |||
Other payables and accrued expenses | 3,484 | |||
|
| |||
TOTAL LIABILITIES | 51,984 | |||
|
| |||
TOTAL NET ASSETS | $ | 210,561,377 | ||
|
| |||
NET ASSETS CONSIST OF: | ||||
Capital stock | $ | 194,460 | ||
Additionalpaid-in-capital | 204,847,199 | |||
Total distributable earnings (loss) | 5,519,718 | |||
|
| |||
TOTAL NET ASSETS | $ | 210,561,377 | ||
|
| |||
NET ASSET VALUE, OFFERING PRICE AND REDEMPTION PRICE PER SHARE - Class S($2,382,215/218,230 shares) | $ | 10.92 | ||
|
| |||
NET ASSET VALUE, OFFERING PRICE AND REDEMPTION PRICE PER SHARE - Class I($5,415,957/539,348 shares) | $ | 10.04 | ||
|
| |||
NET ASSET VALUE, OFFERING PRICE AND REDEMPTION PRICE PER SHARE - Class W($192,391,321/17,657,158 shares) | $ | 10.90 | ||
|
| |||
NET ASSET VALUE, OFFERING PRICE AND REDEMPTION PRICE PER SHARE - Class Z($10,371,884/1,031,246 shares) | $ | 10.06 | ||
|
| |||
The accompanying notes are an integral part of the financial statements.
16
Core Bond Series
Statement of Operations
For the Year Ended December 31, 2019
INVESTMENT INCOME: | ||||
Interest | $ | 5,898,174 | ||
Dividends | 49,753 | |||
|
| |||
Total Investment Income | 5,947,927 | |||
|
| |||
EXPENSES: | ||||
Management fees (Note 3) | 551,288 | |||
Fund accounting and administration fees (Note 3) | 104,461 | |||
Shareholder services fees (Class S) (Note 3) | 41,112 | |||
Directors’ fees (Note 3) | 20,751 | |||
Distribution and service (Rule12b-1) fees (Class S) (Note 3) | 8,213 | |||
Chief Compliance Officer service fees (Note 3) | 3,109 | |||
Sub-transfer agent fees (Note 3) | 2,397 | |||
Audit fees | 50,591 | |||
Custodian fees | 17,639 | |||
Miscellaneous | 90,442 | |||
|
| |||
Total Expenses | 890,003 | |||
Less reduction of expenses (Note 3) | (547,874 | ) | ||
|
| |||
Net Expenses | 342,129 | |||
|
| |||
NET INVESTMENT INCOME | 5,605,798 | |||
|
| |||
REALIZED AND UNREALIZED GAIN (LOSS) ON INVESTMENTS: | ||||
Net realized gain (loss) on investments | 3,729,448 | |||
Net change in unrealized appreciation (depreciation) on investments | 7,432,018 | |||
|
| |||
NET REALIZED AND UNREALIZED GAIN (LOSS) ON INVESTMENTS | 11,161,466 | |||
|
| |||
NET INCREASE IN NET ASSETS RESULTING FROM OPERATIONS | $ | 16,767,264 | ||
|
| |||
The accompanying notes are an integral part of the financial statements.
17
Core Bond Series
Statements of Changes in Net Assets
| FOR THE YEAR ENDED 12/31/19 | FOR THE YEAR ENDED 12/31/18 | |||||||
INCREASE (DECREASE) IN NET ASSETS: | ||||||||
OPERATIONS: | ||||||||
Net investment income | $ | 5,605,798 | $ | 4,454,362 | ||||
Net realized gain (loss) on investments | 3,729,448 | (3,218,080 | ) | |||||
Net change in unrealized appreciation (depreciation) on investments | 7,432,018 | (2,665,981 | ) | |||||
|
|
|
| |||||
Net increase (decrease) from operations | 16,767,264 | (1,429,699 | ) | |||||
|
|
|
| |||||
DISTRIBUTIONS TO SHAREHOLDERS (Note 9): | ||||||||
Class S | (100,742 | ) | (2,424,102 | ) | ||||
Class I | (173,998 | ) | (2,078,920 | ) | ||||
Class W | (4,883,965 | ) | — | |||||
Class Z | (561,811 | ) | — | |||||
|
|
|
| |||||
Total distributions to shareholders | (5,720,516 | ) | (4,503,022 | ) | ||||
|
|
|
| |||||
CAPITAL STOCK ISSUED AND REPURCHASED: | ||||||||
Net increase (decrease) from capital share transactions (Note 5) | 21,439,998 | (11,536,671 | ) | |||||
|
|
|
| |||||
Net increase (decrease) in net assets | 32,486,746 | (17,469,392 | ) | |||||
NET ASSETS: | ||||||||
Beginning of year | 178,074,631 | 195,544,023 | ||||||
|
|
|
| |||||
End of year | $ | 210,561,377 | $ | 178,074,631 | ||||
|
|
|
| |||||
The accompanying notes are an integral part of the financial statements.
18
Core Bond Series
Financial Highlights - Class S*
| FOR THE YEAR ENDED | ||||||||||||||||||||
| 12/31/19 | 12/31/18 | 12/31/17 | 12/31/16 | 12/31/15 | ||||||||||||||||
Per share data (for a share outstanding throughout each year): | ||||||||||||||||||||
Net asset value - Beginning of year | $10.30 | $10.62 | $10.52 | $10.48 | $10.69 | |||||||||||||||
|
|
|
|
|
|
|
|
|
| |||||||||||
Income (loss) from investment operations: | ||||||||||||||||||||
Net investment income1 | 0.23 | 0.24 | 0.20 | 0.17 | 0.22 | |||||||||||||||
Net realized and unrealized gain (loss) on investments | 0.61 | (0.32 | ) | 0.10 | 0.10 | (0.17 | ) | |||||||||||||
|
|
|
|
|
|
|
|
|
| |||||||||||
Total from investment operations | 0.84 | (0.08 | ) | 0.30 | 0.27 | 0.05 | ||||||||||||||
|
|
|
|
|
|
|
|
|
| |||||||||||
Less distributions to shareholders: | ||||||||||||||||||||
From net investment income | (0.22 | ) | (0.24 | ) | (0.19 | ) | (0.17 | ) | (0.20 | ) | ||||||||||
From net realized gain on investments | — | — | (0.01 | ) | (0.06 | ) | (0.06 | ) | ||||||||||||
|
|
|
|
|
|
|
|
|
| |||||||||||
Total distributions to shareholders | (0.22 | ) | (0.24 | ) | (0.20 | ) | (0.23 | ) | (0.26 | ) | ||||||||||
|
|
|
|
|
|
|
|
|
| |||||||||||
Net asset value - End of year | $10.92 | $10.30 | $10.62 | $10.52 | $10.48 | |||||||||||||||
|
|
|
|
|
|
|
|
|
| |||||||||||
Net assets - End of year(000’s omitted) | $2,382 | $101,314 | $119,137 | $117,559 | $147,074 | |||||||||||||||
|
|
|
|
|
|
|
|
|
| |||||||||||
Total return2 | 8.18% | (0.75% | ) | 2.91% | 2.53% | 0.44% | ||||||||||||||
Ratios (to average net assets)/Supplemental Data: | ||||||||||||||||||||
Expenses** | 0.69% | 0.70% | 0.70% | 0.70% | 0.69% | |||||||||||||||
Net investment income | 2.27% | 2.35% | 1.86% | 1.61% | 2.09% | |||||||||||||||
Series portfolio turnover | 66% | 78% | 48% | 75% | 88% | |||||||||||||||
| *Effective August 3, 2015, the shares of the Series have been designated as Class S. |
| |||||||||||||||||||
| **The investment advisor did not impose all or a portion of its management and/or other fees, and in some years may have paid a portion of the Series’ expenses. If these expenses had been incurred by the Class, the expense ratio (to average net assets) would have increased by the following amounts: |
| |||||||||||||||||||
| 0.07% | 0.08% | 0.07% | 0.06% | 0.03% | ||||||||||||||||
1Calculated based on average shares outstanding during the years.
2Represents aggregate total return for the years indicated, and assumes reinvestment of all distributions. Total return would have been lower had certain expenses not been waived or reimbursed during the years.
The accompanying notes are an integral part of the financial statements.
19
Core Bond Series
Financial Highlights - Class I
| FOR THE YEAR ENDED | FOR THE PERIOD | |||||||||||||||||||||||||||
| 12/31/19 | 12/31/18 | 12/31/17 | 12/31/16 | 8/3/151TO | ||||||||||||||||||||||||
| 12/31/15 | ||||||||||||||||||||||||||||
Per share data (for a share outstanding throughout each period): | ||||||||||||||||||||||||||||
Net asset value - Beginning of period | $9.52 | $9.84 | $9.77 | $9.75 | $10.00 | |||||||||||||||||||||||
|
|
|
|
|
|
|
|
|
| |||||||||||||||||||
Income (loss) from investment operations: | ||||||||||||||||||||||||||||
Net investment income2 | 0.24 | 0.25 | 0.21 | 0.18 | 0.08 | |||||||||||||||||||||||
Net realized and unrealized gain (loss) on investments | 0.55 | (0.31 | ) | 0.09 | 0.10 | (0.13 | ) | |||||||||||||||||||||
|
|
|
|
|
|
|
|
|
| |||||||||||||||||||
Total from investment operations | 0.79 | (0.06 | ) | 0.30 | 0.28 | (0.05 | ) | |||||||||||||||||||||
|
|
|
|
|
|
|
|
|
| |||||||||||||||||||
Less distributions to shareholders: | ||||||||||||||||||||||||||||
From net investment income | (0.27 | ) | (0.26 | ) | (0.22 | ) | (0.20 | ) | (0.14 | ) | ||||||||||||||||||
From net realized gain on investments | — | — | (0.01 | ) | (0.06 | ) | (0.06 | ) | ||||||||||||||||||||
|
|
|
|
|
|
|
|
|
| |||||||||||||||||||
Total distributions to shareholders | (0.27 | ) | (0.26 | ) | (0.23 | ) | (0.26 | ) | (0.20 | ) | ||||||||||||||||||
|
|
|
|
|
|
|
|
|
| |||||||||||||||||||
Net asset value - End of period | $10.04 | $9.52 | $9.84 | $9.77 | $9.75 | |||||||||||||||||||||||
|
|
|
|
|
|
|
|
|
| |||||||||||||||||||
Net assets - End of period(000’s omitted) | $5,416 | $76,761 | $76,407 | $64,763 | $79,303 | |||||||||||||||||||||||
|
|
|
|
|
|
|
|
|
| |||||||||||||||||||
Total return3 | 8.38% | (0.53% | ) | 3.10% | 2.80% | (0.51% | ) | |||||||||||||||||||||
Ratios (to average net assets)/Supplemental Data: | ||||||||||||||||||||||||||||
Expenses* | 0.45% | 0.45% | 0.45% | 0.45% | 0.46% | 4 | ||||||||||||||||||||||
Net investment income | 2.53% | 2.60% | 2.12% | 1.86% | 2.03% | 4 | ||||||||||||||||||||||
Series portfolio turnover | 66% | 78% | 48% | 75% | 88% | |||||||||||||||||||||||
| *The investment advisor did not impose all or a portion of its management and/or other fees, and in some years may have paid a portion of the Series’ expenses. If these expenses had been incurred by the Class, the expense ratio (to average net assets) would have increased by the following amount: |
| |||||||||||||||||||||||||||
| 0.06% | 0.08% | 0.07% | 0.06% | 0.06% | 4 | |||||||||||||||||||||||
1Commencement of operations.
2Calculated based on average shares outstanding during the periods.
3Represents aggregate total return for the periods indicated, and assumes reinvestment of all distributions. Total return would have been lower had certain expenses not been waived or reimbursed during the periods. Periods less than one year are not annualized.
4Annualized.
The accompanying notes are an integral part of the financial statements.
20
Core Bond Series
Financial Highlights - Class W
FOR THE PERIOD 3/1/191 TO 12/31/19 | ||||||||||||
Per share data (for a share outstanding throughout the period): | ||||||||||||
Net asset value - Beginning of period | $10.40 | |||||||||||
|
| |||||||||||
Income from investment operations: | ||||||||||||
Net investment income2 | 0.26 | |||||||||||
Net realized and unrealized gain on investments | 0.54 | �� | ||||||||||
|
| |||||||||||
Total from investment operations | 0.80 | |||||||||||
|
| |||||||||||
Less distributions to shareholders: | ||||||||||||
From net investment income | (0.30 | ) | ||||||||||
|
| |||||||||||
Net asset value - End of period | $10.90 | |||||||||||
|
| |||||||||||
Net assets - End of period(000’s omitted) | $192,391 | |||||||||||
|
| |||||||||||
Total return3 | 7.74% | |||||||||||
Ratios (to average net assets)/Supplemental Data: | ||||||||||||
Expenses*4 | 0.05% | |||||||||||
Net investment income4 | 2.87% | |||||||||||
Series portfolio turnover | 66% | |||||||||||
| *The investment advisor did not impose all or a portion of its management and/or other fees during the period, and may have paid a portion of the Series’ expenses. If these expenses had been incurred by the Class, the expense ratio (to average net assets) would have increased by the following amount4: |
| |||||||||||
| 0.34% | ||||||||||||
1Commencement of operations.
2Calculated based on average shares outstanding during the period.
3Represents aggregate total return for the period indicated, and assumes reinvestment of all distributions. Total return would have been lower had certain expenses not been waived or reimbursed during the period. Periods less than one year are not annualized.
4Annualized.
The accompanying notes are an integral part of the financial statements.
21
Core Bond Series
Financial Highlights - Class Z
| FOR THE PERIOD 3/1/191 TO 12/31/19 | ||||||||||||
Per share data (for a share outstanding throughout the period): | ||||||||||||
Net asset value - Beginning of period | $9.62 | |||||||||||
|
| |||||||||||
Income from investment operations: | ||||||||||||
Net investment income2 | 0.22 | |||||||||||
Net realized and unrealized gain on investments | 0.50 | |||||||||||
|
| |||||||||||
Total from investment operations | 0.72 | |||||||||||
|
| |||||||||||
Less distributions to shareholders: | ||||||||||||
From net investment income | (0.28 | ) | ||||||||||
|
| |||||||||||
Net asset value - End of period | $10.06 | |||||||||||
|
| |||||||||||
Net assets - End of period(000’s omitted) | $10,372 | |||||||||||
|
| |||||||||||
Total return3 | 7.50% | |||||||||||
Ratios (to average net assets)/Supplemental Data: | ||||||||||||
Expenses*4 | 0.30% | |||||||||||
Net investment income4 | 2.64% | |||||||||||
Series portfolio turnover | 66% | |||||||||||
| *The investment advisor did not impose all or a portion of its management and/or other fees during the period, and may have paid a portion of the Series’ expenses. If these expenses had been incurred by the Class, the expense ratio (to average net assets) would have increased by the following amount4: |
| |||||||||||
| 0.09% | ||||||||||||
1Commencement of operations.
2Calculated based on average shares outstanding during the period.
3Represents aggregate total return for the period indicated, and assumes reinvestment of all distributions. Total return would have been lower had certain expenses not been waived or reimbursed during the period. Periods less than one year are not annualized.
4Annualized.
The accompanying notes are an integral part of the financial statements.
22
Core Bond Series
Notes to Financial Statements
| 1. | Organization |
Core Bond Series (the “Series”) is ano-load diversified series of Manning & Napier Fund, Inc. (the “Fund”). The Fund is organized in Maryland and is registered under the Investment Company Act of 1940, as amended, as anopen-end management investment company.
The Series’ investment objective is to provide long-term total return by investing primarily in fixed income securities.
The Series is authorized to issue four classes of shares (Class S, I, W, and Z). Class W and Z shares were issued on March 1, 2019. Each class of shares is substantially the same, except that class specific distribution and shareholder servicing expenses are borne by the specific class of shares to which they relate.
The Fund’s advisor is Manning & Napier Advisors, LLC (the “Advisor”). Shares of the Series are offered to investors, clients and employees of the Advisor and its affiliates. The total authorized capital stock of the Fund consists of 15 billion shares of common stock each having a par value of $0.01. As of December 31, 2019, 8.9 billion shares have been designated in total among 31 series, of which 100 million have been designated as Core Bond Series Class I common stock, 125 million have been designated as Core Bond Series Class S common stock, 150 million have been designated as Core Bond Series Class W common stock and Core Bond Series Class Z common stock.
| 2. | Significant Accounting Policies |
The following is a summary of significant accounting policies followed by the Series. The Series is an investment company and, accordingly, follows the investment company accounting and reporting guidance of the Financial Accounting Standards Board Accounting Standards Codification Topic 946 - Investment Companies, which is part of accounting principles generally accepted in the United States of America (“GAAP”).
Security Valuation
Portfolio securities, including domestic equities, foreign equities, warrants and options, listed on an exchange other than the NASDAQ Stock Market are valued at the latest quoted sales price of the exchange on which the security is primarily traded. Securities not traded on valuation date or securities not listed on an exchange are valued at the latest quoted bid price provided by the Fund’s pricing service. Securities listed on the NASDAQ Stock Market are valued in accordance with the NASDAQ Official Closing Price.
Debt securities, including government bonds, foreign bonds, asset-backed securities, structured notes, supranational obligations, sovereign bonds, corporate bonds and mortgage-backed securities will normally be valued on the basis of evaluated bid prices provided directly by an independent pricing service (the “Service”). The pricing services use multiple valuation techniques to determine fair value. In instances where sufficient market activity exists, the pricing services may utilize a market-based approach through which quotes from market makers are used to determine fair value. In instances where sufficient market activity may not exist or is limited, the pricing services also utilize proprietary valuation models which may consider market characteristics such as benchmark yield curves, option-adjusted spreads, credit spreads, estimated default rates, coupon rates, anticipated timing of principal repayments, underlying collateral, and other unique security features in order to estimate the relevant cash flows, which are then discounted to calculate the fair value. Certain investments in securities held by the Series may be valued on a basis of a price provided directly by a principal market maker. These prices may differ from the value that would have been used had a broader market for securities existed.
Municipal securities will normally be valued on the basis of market valuations provided by the Service. The Service utilizes the latest price quotations and a matrix system (which considers such factors as security prices of similar securities, yields, maturities and ratings). The Service has been approved by the Fund’s Board of Directors (the “Board”).
Short-term investments that mature in sixty days or less may be valued at amortized cost, which approximates fair value. Investments inopen-end investment companies are valued at their net asset value per share on valuation date.
23
Core Bond Series
Notes to Financial Statements (continued)
| 2. | Significant Accounting Policies (continued) |
Security Valuation(continued)
Volume and level of activity in established markets for an asset or liability are evaluated to determine whether recent transactions and quoted prices are determinative of fair value. Where there have been significant decreases in volume and level of activity, further analysis and adjustment may be necessary to estimate fair value. The Series measures fair value in these instances by the use of inputs and valuation techniques which may be based upon current market prices of securities that are comparable in coupon, rating, maturity and industry and/or expectation of future cash flows. As a result of trading in relatively thin markets and/or markets that experience significant volatility, the prices used by the Series to value these securities may differ from the value that would be realized if these securities were sold, and the differences could be material.
Securities for which representative valuations or prices are not available from the Series’ pricing service may be valued at fair value as determined in good faith by the Advisor under procedures approved by and under the general supervision and responsibility of the Fund’s Board. Due to the inherent uncertainty of valuations of such securities, the fair value may differ significantly from the values that would have been used had a ready market for such securities existed. If trading or events occurring after the close of the principal market in which securities are traded are expected to materially affect the value of those securities, then they may be valued at their fair value, taking this trading or these events into account.
Various inputs are used in determining the value of the Series’ assets or liabilities carried at fair value. These inputs are summarized in three broad levels. Level 1 includes quoted prices in active markets for identical assets and liabilities. Level 2 includes other significant observable inputs (including quoted prices for similar securities, interest rates, prepayment speeds, credit risk, etc.). Level 3 includes significant unobservable inputs (including the Series’ own assumptions in determining the fair value of investments). A financial instrument’s level within the fair value hierarchy is based on the lowest level of any input both individually and in aggregate that is significant to the fair value measurement. The inputs or methodology used for valuing securities are not necessarily an indication of the risk associated with investing in those securities.
The following is a summary of the valuation levels used for major security types as of December 31, 2019 in valuing the Series’ assets or liabilities carried at fair value:
| DESCRIPTION | TOTAL | LEVEL 1 | LEVEL 2 | LEVEL 3 | ||||||||||||
Assets: | ||||||||||||||||
Debt securities: | ||||||||||||||||
U.S. Treasury and other U.S. | ||||||||||||||||
Government agencies | $ | 124,563,777 | $ | — | $ | 124,563,777 | $ | — | ||||||||
Corporate debt: | ||||||||||||||||
Communication Services | 10,741,250 | — | 10,741,250 | — | ||||||||||||
Consumer Discretionary | 4,708,076 | — | 4,708,076 | — | ||||||||||||
Energy | 8,184,517 | — | 8,184,517 | — | ||||||||||||
Financials | 8,736,245 | — | 8,736,245 | — | ||||||||||||
Health Care | 3,653,978 | — | 3,653,978 | — | ||||||||||||
Industrials | 5,733,530 | — | 5,733,530 | — | ||||||||||||
Materials | 1,753,917 | — | 1,753,917 | — | ||||||||||||
Real Estate | 4,881,244 | — | 4,881,244 | — | ||||||||||||
Asset-backed securities | 16,780,307 | — | 16,780,307 | — | ||||||||||||
Commercial mortgage-backed securities | 15,567,502 | — | 15,567,502 | — | ||||||||||||
Foreign government bonds | 2,011,576 | — | 2,011,576 | — | ||||||||||||
Short-Term Investment | 2,165,035 | 2,165,035 | — | — | ||||||||||||
|
|
|
|
|
|
|
| |||||||||
Total assets | $ | 209,480,954 | $ | 2,165,035 | $ | 207,315,919 | $ | — | ||||||||
|
|
|
|
|
|
|
| |||||||||
There were no Level 3 securities held by the Series as of December 31, 2018 or December 31, 2019.
24
Core Bond Series
Notes to Financial Statements (continued)
| 2. | Significant Accounting Policies (continued) |
Other Market and Credit Risk
Certain debt securities, derivatives and other financial instruments utilize the London Interbank Offered Rate (“LIBOR”) as the reference or benchmark rate for variable interest rate calculations. In July 2017, the UK Financial Conduct Authority announced a desire to phase out the use of LIBOR by the end of 2021, suggesting that LIBOR may cease to be published after that time. Regulators and financial industry groups have begun planning for a transition to the use of a different benchmark, but there are obstacles and a lack of global consensus, and the process for amending existing contracts or instruments to transition away from LIBOR remains unclear. The transition process might lead to increased volatility and illiquidity in markets that currently rely on the LIBOR to determine interest rates, a reduction in the values of some LIBOR-based investments, and reduced effectiveness of certain hedging strategies, which may adversely affect a Series’ performance or net asset value. Since the usefulness of LIBOR as a benchmark could deteriorate during the transition period, these effects could occur prior to the end of 2021. In addition, the alternative reference or benchmark rate may be an ineffective substitute resulting in prolonged adverse market conditions for a Portfolio.
New Accounting Pronouncements
In March 2017, the Financial Accounting Standards Board issued Accounting Standards UpdateNo. 2017-08, Receivables - Nonrefundable Fees and Other Costs (Subtopic310-20): “Premium Amortization of Purchased Callable Debt Securities” which amends the amortization period for certain purchased callable debt securities. Under the new guidance, the premium amortization of purchased callable debt securities that have explicit,non-contingent call features and are callable at fixed prices will be amortized to the earliest call date. The guidance does not require an accounting change for securities held at a discount, which continue to be amortized to maturity. This guidance was adopted by the Series as of January 1, 2019 on a modified retrospective basis. The cost basis of the securities on January 1, 2019 has been decreased by $32,371. This change in accounting policy has been made to comply with the newly issued accounting standard and had no impact on total distributable earnings (loss) or the net asset value for any Class of the Series.
Security Transactions, Investment Income and Expenses
Security transactions are accounted for on trade date. Dividend income is recorded on theex-dividend date, except that if theex-dividend date has passed, certain dividends from foreign securities are recorded as soon as the Series is informed of theex-dividend date.Non-cash dividends, if any, are recorded at the fair value of the securities received. Interest income, including amortization of premium and accretion of discounts using the effective interest method, is earned from settlement date and accrued daily.
Expenses are recorded on an accrual basis. Most expenses of the Fund can be attributed to a specific series. Expenses which cannot be directly attributed are apportioned among the series in the Fund in such a manner as deemed equitable by the Fund’s Board, taking into consideration, among other things, the nature and type of expense. Income, expenses (other than shareholder services fees), and realized and unrealized gains and losses are prorated among the classes based on the relative net assets of each class. Class specific expenses are directly charged to that Class.
The Series uses the identified cost method for determining realized gain or loss on investments for both financial statement and federal income tax reporting purposes.
Foreign Currency Translation
The books and records of the Series are maintained in U.S. dollars. Foreign currencies, investments and other assets and liabilities are translated into U.S. dollars at the current exchange rates. Purchases and sales of investment securities and income and expenses are translated on the respective dates of such transactions. The Series does not isolate realized and unrealized gains and losses attributable to changes in the exchange rates from gains and losses that arise from changes in the fair value of investments. Such fluctuations are included with net realized and unrealized gain or loss on investments. Net realized foreign currency gains and losses represent foreign currency gains and losses between trade date and settlement date on securities transactions, gains and losses on disposition of foreign currencies and the difference between the amount of income and foreign withholding taxes recorded on the books of the Series and the amounts actually received or paid.
25
Core Bond Series
Notes to Financial Statements (continued)
| 2. | Significant Accounting Policies (continued) |
Asset-Backed Securities
The Series may invest in asset-backed securities. Asset-backed securities are generally issued as pass-through certificates or as debt instruments. Asset-backed securities issued as pass-through certificates represent undivided fractional ownership interests in an underlying pool of assets. Asset-backed securities issued as debt instruments, which are also known as collateralized obligations, are typically issued as the debt of a special purpose entity organized solely for the purpose of owning such assets and issuing such debt. Asset-backed securities are often backed by a pool of assets representing the obligations of a number of different parties. The yield characteristics of certain asset-backed securities may differ from traditional debt securities. One such major difference is that all or a principal part of the obligations may be prepaid at any time because the underlying assets (i.e. loans) may be prepaid at any time. As a result, a decrease in interest rates in the market may result in increases in the level of prepayments as borrowers, particularly mortgagors, refinance and repay their loans. An increased prepayment rate with respect to an asset-backed security will have the effect of shortening the maturity of the security. In addition, the Series may subsequently have to reinvest the proceeds at lower interest rates. If the Series has purchased such an asset-backed security at a premium, a faster than anticipated prepayment rate could result in a loss of principal to the extent of the premium paid.
Mortgage-Backed Securities
The Series may invest in mortgage-backed securities (“MBS” or pass-through certificates) that represent an interest in a pool of specific underlying mortgage loans and entitle the Series to the periodic payments of principal and interest from those mortgages. MBS may be issued by government agencies or corporations, or private issuers. Most MBS issued by government agencies are guaranteed; however, the degree of protection differs based on the issuer. For MBS there are a number of important differences among the agencies and instrumentalities of the U.S. Government that issue mortgage-related securities and among the securities that they issue. For example, mortgage-related securities guaranteed by Ginnie Mae are guaranteed as to the timely payment of principal and interest by Ginnie Mae and such guarantee is backed by the full faith and credit of the United States. However, mortgage-related securities issued by Freddie Mac and Fannie Mae, including Freddie Mac and Fannie Mae guaranteed mortgage pass-through certificates, which are solely the obligations of Freddie Mac and Fannie Mae, are not backed by or entitled to the full faith and credit of the United States, but are supported by the right of the issuer to borrow from the U.S. Treasury.Non-agency mortgage-backed securities are securities issued bynon-governmental issuers and have no direct or indirect government guarantees of payment and are subject to various risks.Non-agency mortgage loans are obligations of the borrowers thereunder only and are not typically insured or guaranteed by any other person or entity. The ability of a borrower to repay a loan is dependent upon the income or assets of the borrower. A number of factors, including a general economic downturn, acts of God, terrorism, social unrest and civil disturbances, may impair a borrower’s ability to repay its loans.
Inflation-Indexed Bonds
The Series may invest in inflation-indexed bonds. Inflation-indexed bonds are fixed income securities whose principal value is periodically adjusted according to the rate of inflation. If the index measuring inflation rises or falls, the principal value of inflation-indexed bonds will be adjusted upward or downward, and consequently the interest payable on these securities (calculated with respect to a larger or smaller principal amount) will be increased or reduced, respectively. Any upward or downward adjustment in the principal amount of an inflation-indexed bond will be included as interest income in the Statement of Operations, even though investors do not receive their principal until maturity. Repayment of the original bond principal upon maturity (as adjusted for inflation) is guaranteed in the case of U.S. Treasury inflation-indexed bonds. For bonds that do not provide a similar guarantee, the adjusted principal value of the bond repaid at maturity may be less than the original principal.
Securities Purchased on a When-Issued Basis or Forward Commitment
The Series may purchase securities on a when-issued basis or forward commitment. These transactions involve a commitment by the Series to purchase securities for a predetermined price with payment and delivery taking place beyond the customary settlement period. When such purchases are outstanding, the Series will designate liquid assets in an amount sufficient to meet the purchase price. When purchasing a security on a delayed delivery basis, the Series assumes the rights and risks of ownership of the security, including the risk of price and yield fluctuations, and takes such fluctuations into account when determining its net asset value. The Series may sell the when-issued securities before they are delivered, which may result in a capital gain or loss. No such investments were held by the Series on December 31, 2019.
26
Core Bond Series
Notes to Financial Statements (continued)
| 2. | Significant Accounting Policies (continued) |
Securities Purchased on a When-Issued Basis or Forward Commitment(continued)
In connection with its ability to purchase or sell securities on a forward commitment basis, the Series may enter into forward roll transactions principally using To Be Announced (TBA) securities. Forward roll transactions require the sale of securities for delivery in the current month, and a simultaneous agreement to repurchase substantially similar (same type, coupon and maturity) securities on a specified future date. Risks of entering into forward roll transactions include the potential inability of the counterparty to meet the terms of the agreement; the potential of the Series to receive inferior securities at redelivery as compared to the securities sold to the counterparty; counterparty credit risk; and the potential pay down speed variance between the mortgage-backed pools. During the roll period, the Series forgoes principal and interest paid on the securities. The Series accounts for such dollar rolls as purchases and sales. Information regarding securities purchased on a when-issued basis is included in the Series’ Investment Portfolio. No such investments were held by the Series on December 31, 2019.
Restricted Securities
Restricted securities are purchased in private placement transactions, are not registered under the Securities Act of 1933, as amended, and may have contractual restrictions on resale. Information regarding restricted securities is included at the end of the Series’ Investment Portfolio.
Illiquid Securities
A security may be considered illiquid if so deemed in good faith by the Advisor under procedures approved by and under the general supervision and responsibility of the Fund’s Board. Securities that are illiquid are marked with the applicable footnote on the Investment Portfolio. No such investments were held by the Series on December 31, 2019.
Federal Taxes
The Series’ policy is to comply with the provisions of the Internal Revenue Code applicable to regulated investment companies. The Series is not subject to federal income tax or excise tax to the extent that the Series distributes to shareholders each year its taxable income, including any net realized gains on investments, in accordance with requirements of the Internal Revenue Code. Accordingly, no provision for federal income tax or excise tax has been made in the financial statements.
Management evaluates its tax positions to determine if the tax positions taken meet the minimum recognition threshold in connection with accounting for uncertainties in income tax positions taken or expected to be taken for the purposes of measuring and recognizing tax liabilities in the financial statements. Recognition of tax benefits of an uncertain tax position is required only when the position is “more likely than not” to be sustained assuming examination by taxing authorities. At December 31, 2019, the Series has recorded no liability for net unrecognized tax benefits relating to uncertain income tax positions taken or expected to be taken in future tax returns.
The Series files income tax returns in the U.S. federal jurisdiction, various states and foreign jurisdictions, as required. No income tax returns are currently under investigation. The statute of limitations on the Series’ tax returns remains open for the years ended December 31, 2016 through December 31, 2019. The Series is not aware of any tax positions for which it is reasonably possible that the total amounts of unrecognized tax benefits will significantly change in the next twelve months.
Foreign Taxes
Based on the Series’ understanding of the tax rules and rates related to income, gains and currency purchase/repatriation transactions for foreign jurisdictions in which it invests, the Series will provide for foreign taxes, and where appropriate, deferred foreign tax.
Distributions of Income and Gains
Distributions to shareholders of net investment income are made quarterly. Distributions of net realized gains are made annually. An additional distribution may be necessary to avoid taxation of the Series. Distributions are recorded on theex-dividend date.
Indemnifications
The Fund’s organizational documents provide former and current directors and officers with a limited indemnification against liabilities arising in connection with the performance of their duties to the Fund. In the normal course of business, the Fund may also enter into contracts that provide general indemnifications. The Fund’s maximum exposure under these arrangements is
27
Core Bond Series
Notes to Financial Statements (continued)
| 2. | Significant Accounting Policies (continued) |
Indemnifications(continued)
unknown as this would be dependent on future claims that may be made against the Fund. The risk of material loss from such claims is considered remote.
Other
The preparation of financial statements in conformity with GAAP requires management to make estimates and assumptions that affect the reported amounts of assets and liabilities and the disclosure of contingent assets and liabilities at the date of the financial statements and the reported amounts of income and expenses during the reporting period. Actual results could differ from those estimates.
| 3. | Transactions with Affiliates |
The Fund has an Investment Advisory Agreement (the “Agreement”) with the Advisor, for which the Series pays a fee, computed daily and payable monthly, at an annual rate of 0.25% of the Series’ average daily net assets. Prior to March 1, 2019, the management fee for the Series was 0.40% of the Series’ average daily net assets.
Under the Agreement, personnel of the Advisor provide the Series with advice and assistance in the choice of investments and the execution of securities transactions, and otherwise maintain the Series’ organization. The Advisor also provides the Fund with necessary office space and fund administration and support services. The salaries of all officers of the Fund (except a percentage of the Fund’s Chief Compliance Officer’s salary, which is paid by the Fund), and of all Directors who are “affiliated persons” of the Fund, or of the Advisor, and all personnel of the Fund, or of the Advisor, performing services relating to research, statistical and investment activities, are paid by the Advisor. Each“non-affiliated” Director receives an annual stipend, which is allocated among all the active series of the Fund. In addition, these Directors also receive a fee per Board meeting attended plus a fee for each committee meeting attended and are reimbursed for travel and otherout-of-pocket expenses incurred by them in connection with attending such meetings. The Fund also has an Audit Committee Chair, Governance & Nominating Committee Chair and Lead Independent Director, who each receive an additional annual stipend for these roles.
The Fund may enter into agreements with financial intermediaries pursuant to which the Fund may pay financial intermediaries fornon-distribution relatedsub-transfer agency, administrative,sub-accounting, and other shareholder services in an annual amount not to exceed 0.15% of the average daily net assets of the Class I and Class S shares of the Series. Payments made pursuant to such agreements are generally based on the current assets and/or number of accounts of the Series attributable to the financial intermediary. Any payments made pursuant to such agreements may be in addition to, rather than in lieu of, any Distribution and Shareholder Services Fee payable under the Rule12b-1 plan of the Fund.
Prior to March 1, 2019, the Class S shares of the Series were subject to a shareholder services fee in accordance with a shareholder services plan adopted by the Fund’s Board. The shareholder services fee was intended to compensate financial intermediaries, including affiliates of the Fund, in connection with the provision of direct client service, personal services, maintenance of shareholder accounts and reporting services. For these services, the Class S shares of the Series paid a fee, computed daily and payable monthly, at an annual rate of 0.25% of the average daily net assets of Class S. The Fund had a Shareholder Services Agreement with the Advisor, for which the Advisor received the shareholder services fee as stated above.
Manning & Napier Investor Services, Inc., a registered broker-dealer affiliate of the Advisor, acts as distributor for the Fund’s shares. Effective March 1, 2019, the Series compensates the distributor for distributing and servicing the Series’ Class S shares pursuant to a distribution plan adopted under Rule12b-1 of the 1940 Act, regardless of expenses actually incurred. Under the agreement, the Series pays distribution and service fees to the distributor at an annual rate of 0.25% of average daily net assets attributable to Class S shares. There are no distribution and service fees on the Class I, Class W or Class Z shares. The fees are accrued daily and paid monthly.
Pursuant to a master services agreement dated March 1, 2017, as amended, the Fund pays the Advisor an annual fee related to fund accounting and administration of 0.0085% on the first $25 billion of average daily net assets (excluding Target Series and Income Series); 0.0075% on the next $15 billion of average daily net assets (excluding Target Series and Income Series);
28
Core Bond Series
Notes to Financial Statements (continued)
| 3. | Transactions with Affiliates (continued) |
and 0.0065% of average daily net assets in excess of $40 billion (excluding Target Series and Income Series); plus a base fee of $30,400 per series. Additionally, certain transaction andout-of-pocket expenses, including charges for reporting relating to the Fund’s compliance program, are charged. The Advisor has agreements with BNY Mellon Investment Servicing (U.S.) Inc. (“BNY”) under which BNY serves assub-accountant services agent.
Effective March 1, 2019, the Advisor has contractually agreed to waive the management fee for the Class W shares. The full management fee will be waived under this agreement because Class W shares are only available to discretionary investment accounts and other accounts managed by the Advisor. These clients pay a management fee to the advisor that is separate from the fund’s expenses. In addition, pursuant to a separate expense limitation agreement, the Advisor has contractually agreed to limit its fees and reimburse expenses to the extent necessary so that the total direct annual fund operating expenses, exclusive of the shareholder services fee and/or distribution and service(12b-1) fees and waived Class W management fees (collectively, “excluded expenses”), to 0.45% of the average daily net assets of the Class S and Class I shares, 0.05% of the average daily net assets of the Class W shares, and 0.30% of the average daily net assets of the Class Z shares. These contractual waivers are expected to continue indefinitely, and may not be amended or terminated by the Advisor without the approval of the Series’ Board of Directors. The Advisor may receive from a Class the difference between the Class’s total direct annual fund operating expenses, not including excluded expenses, and the Class’s contractual expense limit to recoup all or a portion of its prior fee waivers (other than Class W management fee waivers) or expense reimbursements made during the rolling three-year period preceding the recoupment if at any point the total direct annual fund operating expenses, not including excluded expenses, are below the contractual expense limit (a) at the time of the fee waiver and/or expense reimbursement and (b) at the time of the recoupment.
Pursuant to the advisory fee waiver, the Advisor waived $369,313 in management fees for Class W for the year ended December 31, 2019. In addition, pursuant to the separate expense limitation agreement, the Advisor waived or reimbursed expenses of $13,962, $10,534, $136,322 and $17,743 for Class S, Class I, Class W, and Class Z, respectively, for the year ended December 31, 2019. These amounts are included as a reduction of expenses on the Statement of Operations. At December 31, 2019, the Advisor is eligible to recoup $154,065. For the year ended December 31, 2019, the Advisor did not recoup any expenses that have been previously waived or reimbursed.
| 4. | Purchases and Sales of Securities |
For the year ended December 31, 2019, purchases and sales of securities, other than U.S. Government securities and short-term securities, were $40,584,619 and $37,033,906, respectively. Purchases and sales of U.S. Government securities, other than short-term securities, were $108,886,978 and $91,759,884, respectively.
| 5. | Capital Stock Transactions |
Transactions in shares of Class S, Class I, Class W and Class Z of Core Bond Series were:
| CLASS S | FOR THE YEAR ENDED 12/31/19 | FOR THE YEAR ENDED 12/31/18 | ||||||||||||||
| SHARES | AMOUNT | SHARES | AMOUNT | |||||||||||||
Sold | 129,995 | $ | 1,424,512 | 755,405 | $ | 7,789,737 | ||||||||||
Reinvested | 9,371 | 99,394 | 233,967 | 2,406,471 | ||||||||||||
Repurchased | (9,760,167 | ) | (101,821,543 | ) | (2,366,041 | ) | (24,491,257 | ) | ||||||||
|
|
|
|
|
|
|
| |||||||||
Total | (9,620,801 | ) | $ | (100,297,637 | ) | (1,376,669 | ) | $ | (14,295,049 | ) | ||||||
|
|
|
|
|
|
|
| |||||||||
29
Core Bond Series
Notes to Financial Statements (continued)
| 5. | Capital Stock Transactions (continued) |
| CLASS I | FOR THE YEAR ENDED 12/31/19 | FOR THE YEAR ENDED 12/31/18 | ||||||||||||||
| SHARES | AMOUNT | SHARES | AMOUNT | |||||||||||||
Sold | 744,741 | $ | 7,267,770 | 2,833,088 | $ | 27,002,772 | ||||||||||
Reinvested | 15,644 | 154,418 | 149,244 | 1,419,524 | ||||||||||||
Repurchased | (8,284,544 | ) | (79,804,759 | ) | (2,682,885 | ) | (25,663,918 | ) | ||||||||
|
|
|
|
|
|
|
| |||||||||
Total | (7,524,159 | ) | $ | (72,382,571 | ) | 299,447 | $ | 2,758,378 | ||||||||
|
|
|
|
|
|
|
| |||||||||
| CLASS W | FOR THE PERIOD 3/1/19 (COMMENCEMENT OF OPERATIONS) TO 12/31/19 | |||||||||||||||
| SHARES | AMOUNT | |||||||||||||||
Sold | 18,446,163 | $ | 193,480,853 | |||||||||||||
Reinvested | 425,973 | 4,607,516 | ||||||||||||||
Repurchased | (1,214,978 | ) | (13,122,933 | ) | ||||||||||||
|
|
|
| |||||||||||||
Total | 17,657,158 | $ | 184,965,436 | |||||||||||||
|
|
|
| |||||||||||||
| CLASS Z | FOR THE PERIOD 3/1/19 (COMMENCEMENT OF OPERATIONS) TO 12/31/19 | |||||||||||||||
| SHARES | AMOUNT | |||||||||||||||
Sold | 3,403,661 | $ | 33,173,552 | |||||||||||||
Reinvested | 22,135 | 221,314 | ||||||||||||||
Repurchased | (2,394,550 | ) | (24,240,096 | ) | ||||||||||||
|
|
|
| |||||||||||||
Total | 1,031,246 | $ | 9,154,770 | |||||||||||||
|
|
|
| |||||||||||||
Over 90% of the shares outstanding are fiduciary accounts where the Advisor has sole investment discretion. At December 31, 2019, the Advisor and its affiliates owned less than 0.1% of the Series.
| 6. | Line of Credit |
The Fund has entered into a364-day, $25 million credit agreement (the “line of credit”) with Bank of New York Mellon. Each series of the Fund may borrow under the line of credit for temporary or emergency purposes, including funding shareholder redemptions and other short-term liquidity purposes. The Fund pays an annual fee on the unused commitment amount, payable quarterly, and is allocated among all the series of the Fund and included in miscellaneous expenses in the Statement of Operations for each series. The line of credit expires in August 2020 unless extended or renewed. During the year ended December 31, 2019, the Series did not borrow under the line of credit.
| 7. | Financial Instruments |
The Series may trade in instruments including written and purchased options, forward foreign currency exchange contracts and futures contracts and other derivatives in the normal course of investing activities to assist in managing exposure to various market risks. The Series may be subject to various elements of risk, which may involve, to a varying degree, elements of risk in excess of the amounts recognized for financial statement purposes. These risks include: the risk that changes in the value of a derivative may not correlate perfectly with the underlying asset, rate or index; counterparty credit risk related to over the counter derivative counterparties’ failure to perform under contract terms; liquidity risk related to the lack of a liquid market for these contracts allowing the fund to close out its position(s); and documentation risk relating to disagreement over contract terms. No such investments were held by the Series as of December 31, 2019.
30
Core Bond Series
Notes to Financial Statements (continued)
| 8. | Foreign Securities |
Investing in securities of foreign companies and foreign governments involves special risks and considerations not typically associated with investing in securities of domestic companies and the U.S. Government. These risks include revaluation of currencies and future adverse political and economic developments. Moreover, securities of foreign companies and foreign governments and their markets may be less liquid and their prices more volatile than those of comparable domestic companies and the U.S. Government.
| 9. | Federal Income Tax Information |
The amount and characterization of certain income and capital gains to be distributed are determined in accordance with federal income tax regulations, which may differ from GAAP. These differences are primarily due to differing book and tax treatments in the timing and/or treatment of the recognition of net investment income or gains and losses including redesignation of distributions paid and wash sales. The Series may periodically make reclassifications among its capital accounts to reflect income and gains available for distribution (or available capital loss carryovers) under income tax regulations without impacting the Series’ net asset value. Any such reclassifications are not reflected in the financial highlights.
The tax character of distributions paid were as follows:
| FOR THE YEAR ENDED 12/31/19 | FOR THE YEAR ENDED 12/31/18 | |||||||||||||||||||||||||
Ordinary income | $5,662,797 | $4,476,238 | ||||||||||||||||||||||||
Long-term capital gains | $ 57,719 | $ 26,784 | ||||||||||||||||||||||||
At December 31, 2019, the tax basis of components of distributable earnings and the net unrealized appreciation based on the identified cost of investments for federal income tax purposes were as follows:
| Cost for federal income tax purposes | $ | 204,183,810 | ||||
| Unrealized appreciation | 5,516,721 | ||||
| Unrealized depreciation | (244,088 | ) | ||||
|
| |||||
| Net unrealized appreciation | $ | 5,272,633 | ||||
|
| |||||
| Undistributed long-term capital gains | $ | 247,084 | ||||
At December 31, 2019, the capital loss carryover utilized in the current year was $3,312,785.
31
Core Bond Series
Report of Independent Registered Public Accounting Firm
To the Board of Directors of Manning & Napier Fund, Inc. and Shareholders of Core Bond Series
Opinion on the Financial Statements
We have audited the accompanying statement of assets and liabilities, including the investment portfolio, of Core Bond Series (one of the series constituting Manning & Napier Fund, Inc., referred to hereafter as the “Fund”) as of December 31, 2019, the related statement of operations for the year ended December 31, 2019, the statement of changes in net assets for each of the two years in the period ended December 31, 2019, including the related notes, and the financial highlights for each of the periods indicated therein (collectively referred to as the “financial statements”). In our opinion, the financial statements present fairly, in all material respects, the financial position of the Fund as of December 31, 2019, the results of its operations for the year then ended, the changes in its net assets for each of the two years in the period ended December 31, 2019 and the financial highlights for each of the periods indicated therein in conformity with accounting principles generally accepted in the United States of America.
Basis for Opinion
These financial statements are the responsibility of the Fund’s management. Our responsibility is to express an opinion on the Fund’s financial statements based on our audits. We are a public accounting firm registered with the Public Company Accounting Oversight Board (United States) (PCAOB) and are required to be independent with respect to the Fund in accordance with the U.S. federal securities laws and the applicable rules and regulations of the Securities and Exchange Commission and the PCAOB.
We conducted our audits of these financial statements in accordance with the standards of the PCAOB. Those standards require that we plan and perform the audit to obtain reasonable assurance about whether the financial statements are free of material misstatement, whether due to error or fraud.
Our audits included performing procedures to assess the risks of material misstatement of the financial statements, whether due to error or fraud, and performing procedures that respond to those risks. Such procedures included examining, on a test basis, evidence regarding the amounts and disclosures in the financial statements. Our audits also included evaluating the accounting principles used and significant estimates made by management, as well as evaluating the overall presentation of the financial statements. Our procedures included confirmation of securities owned as of December 31, 2019 by correspondence with the custodian. We believe that our audits provide a reasonable basis for our opinion.
New York, New York
February 14, 2020
We have served as the auditor of one or more investment companies in Manning & Napier Mutual Funds since 1992.
32
Core Bond Series
Supplemental Tax Information
(unaudited)
All reportings are based on financial information available as of the date of this annual report and, accordingly are subject to change.
The Series designates $320,043 as Long-Term Capital Gain dividends pursuant to Section 852(b)(3) of the Internal Revenue Code for the fiscal year ended December 31, 2019.
33
Core Bond Series
Renewal of Investment Advisory Agreement
(unaudited)
At the Manning & Napier Fund, Inc. (the “Fund”) Board of Directors’ (the “Board”) meeting, held on November 21, 2019, the Investment Advisory Agreement (the “Agreement”) between the Fund and Manning & Napier Advisors, LLC (the “Advisor”) was considered for renewal by the Board, including all of the Directors who are not “interested persons” (“Independent Directors”), within the meaning of the Investment Company Act of 1940, as amended (the “1940 Act”). In connection with the decision whether to renew the Agreement, a variety of material was provided to the Board in advance of the meeting for their review and consideration. The Board also held a working session on October 25, 2019 to review and discuss information provided to the Board, and for the Board to request additional information.
Representatives of the Advisor attended a portion of the working session and attended the Board meeting. The Advisor provided supplemental information requested by the Board and presented additional oral information to the Board to assist the Board in its considerations. In addition to the information furnished by the Advisor, the Board was provided with a legal memorandum discussing its fiduciary duties related to its approval of the continuation of the Agreement. Legal counsel for the Fund discussed with the Board the applicable legal considerations. In addition, the Board receivedin-person presentations about the Fund throughout the year.
The Independent Directors were advised by independent legal counsel with respect to these matters. The Independent Directors also met separately in an executive session with their legal counsel without any representatives of the Advisor present.
The Directors’ determinations at the meeting were made on the basis of each Director’s business judgment after consideration of all the information presented. In deciding to recommend the renewal of the Agreement with respect to each Series of the Fund, the Independent Directors did not identify any single or particular piece of information that, in isolation, was the controlling factor. Each Independent Director may also have weighed factors differently. This summary describes the most important, but not all, of the factors considered by the Board and the Independent Directors.
| • | The Board considered the nature and quality of services provided by the Advisor under the Agreement for over 30 years including, among others: deciding what securities to purchase and sell for each Series; arranging for the purchase and sale of such securities by placing orders with broker-dealers; administering the affairs of the Fund (including the books and records of the Fund not maintained by third party service providers such as the custodian or transfer agent); arranging for the insurance coverage for the Fund; and supervising the preparation of tax returns, SEC filings (including registration statements) and reports to shareholders for the Fund. The Board considered the numerous services performed by the Advisor and its affiliates beyond those stated in the Agreements. The Board also considered the Advisor’s personnel who perform services to the Fund, changes in senior or key personnel, industry trends impacting the mutual fund industry, the strength of the Advisor’s compliance infrastructure, policies and procedures relating to compliance with securities regulations, reputation, expertise and resources. The Board discussed the quality of these services with representatives from the Advisor and concluded that the Advisor was performing its services to the Fund required under the Agreement in a reasonable manner. |
| • | The Board considered the Advisor’s investments teams, including changes to the investment teams and investment team’s compensation during the past year, and the investment process. The Board considered the performance of each Series since its inception, as well as over multiple time periods including: one year, three year, five year, ten year, and current market cycle. A market cycle includes periods of both rising and falling markets. Returns for established benchmark indices for each Series were provided. In addition, the Board considered (and considers on a quarterly basis) a number of other factors relevant to performance at the meeting including: a peer group performance analysis consisting of Morningstar universes of mutual funds with similar investment objectives; the breadth of the Fund’s product offerings; and performance over reasonable time periods. Representatives of the Advisor discussed improved performance for many of the Series over theone- and three-year time periods ending September 30, 2019. The Board discussed with Representatives of the Advisor, performance challenges that continue to impact the three- and five-year performance of certain Fund’s strategies resulting from periods of underperformance in 2014 and 2016. After discussion, the Board acknowledged the improved short term performance of many of the Series and concluded that notwithstanding the performance challenges that continue to impact certain Series, the nature and quality of the investment management services provided by the Advisor to the Fund supported the renewal of the agreement. |
| • | The Board considered the fees and expenses of the various Series of the Fund. The Advisor presented the advisory fees and total expenses for each Series, including the advisory fee adjusted for any contractual expense waivers or reimbursements paid by the Advisor. Representatives of the Advisor discussed the multi-year fee restructuring initiative which was completed by the Advisor on March 1, 2019 to increase the competitiveness of the Fund’s fees. The fee |
34
Core Bond Series
Renewal of Investment Advisory Agreement
(unaudited)
restructuring project also resulted in a set of standardized share classes to help support the Fund’s distribution efforts across client types and varying intermediary distribution models. |
| • | The Board considered whether the Advisor had achieved economies of scale with respect to its services to the Fund. The Board acknowledged the expense caps incorporated in the Fund’s current fee structure, which requires the Advisor to subsidize the expenses of the Series operating above their expense cap, noting that 26 Series of the Fund are currently receiving expense reimbursements from the Advisor. The Board concluded that the Fund would need to grow in assets before the Advisor would be able to achieve meaningful economies of scale. |
| • | The Advisor provided the Board with information comparing each Series’ contractual management fees with the Advisor’s standard advisory fees for separate accounts and collective investment trusts. The Board considered that the range of services provided to the Series is more extensive than for the Advisor’s other clients due to additional infrastructure, administrative and regulatory requirements related to operating a mutual fund. |
| • | The current advisory fees,12b-1 Distribution and Service Fees, other expenses (e.g. a combination of Shareholder Services Fees, intermediarysub-TA fees, routine operating expenses and Acquired Fund Fees and Expenses forfund-of-fund Series) and total expense ratios of each Series and share class were compared and ranked (on both a mean and median basis) against respective peer universes. Respective peer universes included funds of a similar size and with similar investment objectives and expense characteristics as disclosed on the Morningstar database. Representatives of the Advisor discussed with the Board the comparisons and rankings of fees and net expense ratios for each Series of the Fund and the methodology behind the comparison. The Board considered the Advisor’s active portfolio management that results in portfolios that are more differentiated than the construction of their benchmarks. The Board acknowledged that the fee restructuring project completed on March 1, 2019 reduced the expense ratios for shareholders in many Series. Based on their review of the information provided, the Board concluded that the current fees and expenses of each Series of the Fund were reasonable on a comparative basis. |
| • | The Board also considered the other benefits the Advisor derives from its relationship with the Fund. Such other benefits include participation in a joint insurance program, sharing of compensation expenses for certain shared personnel, relationships with large service providers, the utilization of Series within the Advisor’s separately managed accounts and certain research services provided by soft dollars. The Board reviewed the broker-dealers who provided research to the Advisor and the products and services paid for, in whole or in part, using soft dollar commissions. The Board concluded that these additional benefits to the Advisor were reasonable. |
Based on the Board’s deliberations and their evaluation of the information described above, the Board, including a majority of the Independent Directors, concluded that the compensation under the Agreement was fair and reasonable with respect to each Series in light of the services and expenses and such other matters as the Directors considered to be relevant in the exercise of their reasonable judgment, and that the renewal of the Agreement would be in the best interests of each Series and its shareholders. The Board did not indicate that any single factor was determinative of its decision to approve the Agreement, but indicated that the Board based its determination on the total mix of information available to it.
35
Core Bond Series
Directors’ and Officers’ Information
(unaudited)
The Statement of Additional Information provides additional information about the Fund’s directors and officers and can be obtained without charge by calling1-800-466-3863, at www.manning-napier.com, or on the EDGAR Database on the SEC Internet web site (http://www.sec.gov). The following chart shows certain information about the Fund’s directors and officers, including their principal occupations during the last five years. Unless specific dates are provided, the individuals have held the listed positions for longer than five years.
| Interested Director and Officer | ||
| Name: | Paul Battaglia* | |
| Address: | 290 Woodcliff Drive | |
| Fairport, NY 14450 | ||
| Age: | 41 | |
| Current Position(s) Held with Fund: | Principal Executive Officer, President, Chairman & Director | |
| Term of Office & Length of Time Served: | Indefinite – Chairman and Director since November 20181 | |
| Principal Occupation(s) During Past 5 Years: | Chief Financial Officer (2018 – Present); Vice President of Finance (2016 – 2018); Director of Finance (2011 – 2016); Financial Analyst/Internal Auditor (2004-2006) – Manning & Napier Advisors, LLC and affiliates Holds one or more of the following titles for various subsidiaries and affiliates: Chief Financial Officer | |
| Number of Portfolios Overseen within Fund Complex: | 31 | |
Other Directorships Held Outside Fund Complex During Past 5 Years: | N/A | |
| Independent Directors | ||
| Name: | Stephen B. Ashley | |
| Address: | 290 Woodcliff Drive | |
| Fairport, NY 14450 | ||
| Age: | 79 | |
| Current Position(s) Held with Fund: | Director, Audit Committee Member, Governance & Nominating Committee Member | |
| Term of Office & Length of Time Served: | Indefinite – Since 1996 | |
| Principal Occupation(s) During Past 5 Years: | Chairman and Director (1997 to present); Chief Executive Officer | |
| (1997-2019) - Ashley Companies (property management and investment). | ||
| Number of Portfolios Overseen within Fund Complex: | 31 | |
| Other Directorships Held Outside Fund Complex During | Ashley Companies (1997 - present) | |
| Past 5 Years: | ||
| Name: | Paul A. Brooke | |
| Address: | 290 Woodcliff Drive | |
| Fairport, NY 14450 | ||
| Age: | 74 | |
| Current Position(s) Held with Fund: | Lead Independent Director, Audit Committee Member, Governance & | |
| Nominating Committee Chairman | ||
| Term of Office & Length of Time Served: | Indefinite – Director, Audit Committee Member, Governance & Nominating Committee Member since 2007; Governance & Nominating Committee Chairman since 2016; Lead Independent Director since 2017 | |
| Principal Occupation(s) During Past 5 Years: | Chairman & CEO (2005-2009) - Ithaka Acquisition Corporation (investments); Chairman (2007-2009) - Alsius Corporation (investments); Managing Member (1991-present) - PMSV Holdings LLC (investments); Managing Member (2010-2016) - Venbio (investments). | |
| Number of Portfolios Overseen within Fund Complex: | 31 | |
| Other Directorships Held Outside Fund Complex During Past 5 Years: | Incyte Corp. (biotech)(2000-present); ViroPharma, Inc. (speciality pharmaceuticals)(2000-2014); HLTH (WebMD)(information)(2000-2010); Cheyne Capital International (investment)(2000-2017); GMP Companies (investment)(2000-2011); Cytos Biotechnology Ltd (biotechnology)(2012-2014); Cerus (biomedical)(2016-present);PureEarth(non-profit)
| |
36
Core Bond Series
Directors’ and Officers’ Information
(unaudited)
Independent Directors (continued)
| Name: | Peter L. Faber | |
| Address: | 290 Woodcliff Drive | |
| Fairport, NY 14450 | ||
| Age: | 81 | |
| Current Position(s) Held with Fund: | Director, Governance & Nominating Committee Member | |
| Term of Office & Length of Time Served: | Indefinite – Since 1987 | |
| Principal Occupation(s) During Past 5 Years: | Senior Counsel (2006-2012), Partner (1995-2006 & 2013-2018) - McDermott, Will & Emery LLP (law firm) | |
Number of Portfolios Overseen within Fund Complex: Other Directorships Held Outside Fund Complex During Past 5 Years: | 31 Boston Early Music Festival(non-profit)(2007-present); Amherst Early Music, Inc.(non-profit)(2009-present); Gotham Early Music Scene, Inc.(non-profit)(2009-present); Partnership for New York City, Inc.(non-profit)(1989-2010); New York Collegium(non-profit)(2004-2011); S’Cool Sounds, Inc.(non-profit)(2017-present) | |
| Name: | Harris H. Rusitzky | |
| Address: | 290 Woodcliff Drive | |
| Fairport, NY 14450 | ||
| Age: | 84 | |
| Current Position(s) Held with Fund: | Director, Audit Committee Member, Governance & Nominating Committee | |
| Member | ||
| Term of Office & Length of Time Served: | Indefinite – Since 1985 | |
| Principal Occupation(s) During Past 5 Years: | President (1994- present) - The Greening Group (business consultants); | |
| Partner (2006-present) - The Restaurant Group (restaurants) | ||
Number of Portfolios Overseen within Fund Complex: Other Directorships Held Outside Fund Complex During Past 5 Years: | 31 Rochester Institute of Technology (university)(1972-present); Culinary Institute of America(non-profit college)(1985-present); George Eastman Museum (museum)(1988-present); National Restaurant Association (restaurant trade organization)(1978-present) | |
| Name: | Chester N. Watson | |
| Address: | 290 Woodcliff Drive | |
| Fairport, NY 14450 | ||
| Age: | 69 | |
| Current Position(s) Held with Fund: | Director, Audit Committee Chairman, Governance & Nominating | |
| Committee Member | ||
| Term of Office & Length of Time Served: | Indefinite – Director, Audit Committee Member, Governance & Nominating | |
| Committee Member Since 2012; Audit Committee Chairman since 2013 | ||
| Principal Occupation(s) During Past 5 Years: | General Auditor (2003-2011) - General Motors Company (auto | |
| manufacturer) | ||
Number of Portfolios Overseen within Fund Complex: Other Directorships Held Outside Fund Complex During Past 5 Years: | 31 Rochester Institute of Technology (University)(2005-present); Town of Greenburgh, NY Planning Board (Municipal Government) (2015-2019); Hudson Valley Center for Innovation, Inc. (New Business and Economic Development) (2019 – present) | |
| Officers: | ||
| Name: | Elizabeth Craig | |
| Address: | 290 Woodcliff Drive | |
| Fairport, NY 14450 | ||
| Age: | 32 | |
| Current Position(s) Held with Fund: | Corporate Secretary | |
| Term of Office1& Length of Time Served: | Since 2016 | |
| Principal Occupation(s) During Past 5 Years: | Fund Regulatory Administration Manager since 2018; Fund Administration Manager (2015-2018); Mutual Fund Compliance Specialist (2009-2015) - Manning & Napier Advisors, LLC; Assistant Corporate Secretary (2011-2016) - Manning & Napier Fund, Inc.; Corporate Secretary, Director – Manning & Napier Investor Services, Inc. (since 2019)
| |
37
Core Bond Series
Directors’ and Officers’ Information
(unaudited)
Officers: (continued)
| Name: | Christine Glavin | |
| Address: | 290 Woodcliff Drive | |
| Fairport, NY 14450 | ||
| Age: | 53 | |
| Current Position(s) Held with Fund: | Principal Financial Officer, Chief Financial Officer | |
| Term of Office1& Length of Time Served: | Principal Financial Officer since 2002; Chief Financial Officer since 2001 | |
| Principal Occupation(s) During Past 5 Years: | Director of Fund Reporting since 2011; Fund Reporting Manager (1997-2011) - Manning & Napier Advisors, LLC; Assistant Treasurer since 2008 - Exeter Trust Company; Chief Financial Officer (2017-2018) - Rainier Investment Management Mutual Funds, Inc. | |
| Name: | Samantha Larew | |
| Address: | 290 Woodcliff Drive | |
| Fairport, NY 14450 | ||
| Age: | 39 | |
| Current Position(s) Held with Fund: | Chief Compliance Officer and Anti-Money Laundering Compliance Officer | |
| Term of Office1& Length of Time Served: | Chief Compliance Officer since 2019; Anti-Money Laundering Compliance | |
| Officer since 2018 | ||
| Principal Occupation(s) During Past 5 Years: | Co-Director of Compliance (since 2018); Compliance Communications Supervisor (2014-2018); Compliance Supervisor (2013-2014); Broker-Dealer Compliance Supervisor (2011-2013); Broker-Dealer Compliance Analyst (2010-2011) - Manning & Napier Advisors, LLC & Affiliates; Broker-Dealer Chief Compliance Officer (since 2013); Broker-Dealer Assistant Corporate Secretary (since 2011) – Manning & Napier Investor Services, Inc.; Compliance Analyst (2007-2009) – Wall Street Financial Group; Compliance Specialist (2003-2007) – Manning & Napier Advisors, LLC & Affiliates Holds one or more of the following titles for various affiliates: Assistant Corporate Secretary, Chief Compliance Officer | |
| Name: | Scott Morabito | |
| Address: | 290 Woodcliff Drive | |
| Fairport, NY 14450 | ||
| Age: | 32 | |
| Current Position(s) Held with Fund: | Vice President | |
| Term of Office1& Length of Time Served: | Vice President since 2019; Assistant Vice President (2017-2019) | |
| Principal Occupation(s) During Past 5 Years: | Managing Director of Operations since 2019; Director of Funds Group (2017-2019); Fund Product and Strategy Manager (2014-2017); Senior Product and Strategy Analyst (2013-2014); Product and Strategy Analyst (2011-2013) - Manning & Napier Advisors, LLC; President, Director – Manning & Napier Investor Services, Inc. (since 2018) | |
| Name: | Sarah Turner | |
| Address: | 290 Woodcliff Drive | |
| Fairport, NY 14450 | ||
| Age: | 37 | |
| Current Position(s) Held with Fund: | Chief Legal Officer; Assistant Corporate Secretary | |
| Term of Office1& Length of Time Served: | Since 2018 | |
| Principal Occupation(s) During Past 5 Years: | Attorney since 2018 - Manning & Napier Advisors, LLC and affiliates; Counsel (2017-2018) – Harter Secrest and Emery LLP; Legal Counsel (2010-2017) – Manning & Napier Advisors, LLC and affiliates Holds one or more of the following titles for various affiliates: Corporate Secretary, General Counsel | |
*Interested Director, within the meaning of the 1940 Act by reason of his positions with the Fund’s Advisor, Manning & Napier Advisors, LLC, and Distributor, Manning & Napier Investor Services, Inc.
1The term of office of all officers shall be one year and until their respective successors are chosen and qualified, or his or her earlier resignation or removal as provided in the Fund’sBy-Laws.
38
Core Bond Series
Literature Requests
(unaudited)
Proxy Voting Policies and Procedures
A description of the policies and procedures that the Fund uses to determine how to vote proxies relating to portfolio securities is available, without charge, upon request:
| By phone | 1-800-466-3863 | |||
| On the Securities and Exchange | ||||
| Commission’s (SEC) web site | http://www.sec.gov |
Proxy Voting Record
Information regarding how the Fund voted proxies relating to portfolio securities during the most recent12-month period ended June 30th is available, without charge, upon request:
| By phone | 1-800-466-3863 | |||
| On the SEC’s web site | http://www.sec.gov |
Quarterly Portfolio Holdings
The Series’ complete schedule of portfolio holdings for the 1st and 3rd quarters of each fiscal year are provided on FormN-PORT, and are available, without charge, upon request:
| By phone | 1-800-466-3863 | |||
| On the SEC’s web site | http://www.sec.gov |
Prospectus and Statement of Additional Information (SAI)
For more information about any of the Manning & Napier Fund, Inc. Series, you may obtain a prospectus and SAI at www.manning-napier.com or by calling (800)466-3863. Before investing, carefully consider the objectives, risks, charges and expenses of the investment and read the prospectus carefully as it contains this and other information about the investment company.In addition, this information can be found on the SEC’s web site, http://www.sec.gov.
Additional information available at www.manning-napier.com
1. Fund Holdings -Month-End
2. Fund Holdings -Quarter-End
3. Shareholder Report - Annual
4. Shareholder Report - Semi-Annual
The Fund also offers electronic notification or“e-delivery” when certain documents are availableon-line to be downloaded or reviewed. Direct shareholders can elect to receive electronic notification when shareholder reports, prospectus updates, and/or statements are available. If you do not currently haveon-line access to your account, you can establish access by going to www.manning-napier.com, click on “Login” in the top corner of the page, and follow the prompts to self-enroll. Once enrolled, you can set your electronic notification preferences by clicking on the Account Options tab located within the green toolbar and then selectE-Delivery Option. Should you have any questions on either how to establishon-line access or how to update your account settings, please contact Investor Services at1-800-466-3863.
The Manning & Napier Fund, Inc. is managed by Manning & Napier Advisors, LLC. Manning & Napier Investor Services, Inc., an affiliate of Manning & Napier Advisors, LLC, is the distributor of the Fund shares.
MNCOB-12/19-AR
Manning & Napier Fund, Inc.
High Yield Bond Series
Beginning on February 25, 2021, as permitted by Securities and Exchange Commission regulations, paper copies of the Series’ annual and semi-annual shareholder reports will no longer be sent by mail, unless you specifically request paper copies of the reports from the Fund or from your financial intermediary, such as a broker-dealer or bank. Instead, the reports will be made available on a website, and you will be notified by mail each time a report is posted and provided with a website link to access the report.
If you already elected to receive shareholder reports electronically, you will not be affected by this change and you need not take any action. You may elect to receive shareholder reports and other communications from the Fund electronically by contacting your financial intermediary or, if you are a direct investor, by visiting www.manning-napier.com or calling1-800-466-3863.
You may elect to receive all future annual and semi-annual reports in paper free of charge. If you invest through a financial intermediary, you can contact your financial intermediary to request that you continue to receive paper copies of your shareholder reports. If you invest directly with the Fund, you can inform the Fund that you wish to continue receiving paper copies of your shareholder reports by visiting www.manning-napier.com or calling1-800-466-3863. Your election to receive reports in paper will apply to all funds held with your financial intermediary if you invest through a financial intermediary or all series of the Fund if you invest directly with the Fund. |
| Independent Perspective | Real-World Solutions |
A Note from Our CEO
Dear Shareholder,
The investing world is constantly changing, yet investors’ needs and objectives remain substantially the same.
Whether you are an individual saver looking to ensure security in retirement, or an institutional investor with a fiduciary obligation to others, at the end of the day you look for a trusted partner to help you build, grow, and preserve wealth.
In order to do so successfully we recognize that, in the short-term, the world’s capital markets can be capricious and hard to predict.
Bubbles form, rise, and then pop. The hot stocks of today often become passing fads of tomorrow. Investor sentiment can swing wildly, whipsawing between exuberance one day and despondence the next.
As successful long-term investors, we are defined both by what we do as well as what we don’t do.
We don’t attempt to perfectly time every recession. We don’t jump on the latest trend. We don’t worry about capturing every market peak all across the globe.
On the other hand, we do maintain the rigorous disciplines we have developed over close to half a century. We are highly attentive to managing risk and protecting investors in down markets while participating fully in the opportunities our Research uncovers.
Our focus is on you, the shareholder, and helping you achieve your goals.
In the face of an uncertain world, we believe our investment philosophies, processes, and experience have stood the test of time and will do so in the future.
We appreciate your continued confidence in our approach.
|
Sincerely,
Marc Mayer
Chief Executive Officer |
Corporate Headquarters | 290 Woodcliff Drive | Fairport, NY 14450 | (585)325-6880 phone | (800)551-0224 toll free | www.manning-napier.com
1
High Yield Bond Series
Fund Commentary
(unaudited)
Investment Objective
To provide a high level of long-term total return, which is a combination of income and capital appreciation. Under normal circumstances, the Series will invest at least 80% of its assets in bonds that are rated below investment-grade (junk bonds), and/or securities that are designed to track the performance of non-investment grade securities, principally exchange-traded funds.
Performance Commentary
Fixed income markets posted positive returns for the twelve-month period ending December 31, 2019. During that period, high yield markets experienced double digit returns as credit spreads tightened by ~170 basis points over the course of the year. From a credit quality perspective, higher-quality issuances within the below-investment grade market tended to outperform lower-quality issuances as investors increasingly sought to re-allocate towards “safer” areas of the market. In addition to the flight to safety, higher-quality issuances generally outperformed as a result of their higher duration amid falling interest rates during the year.
The High Yield Series Class S shares delivered positive absolute returns during the year, returning 13.97%, but underperformed its benchmark, the Intercontinental Exchange (ICE) Bank of America Merrill Lynch (BofAML) BB-B U.S. Cash Pay High Yield Index, which returned 15.08%.
Relative underperformance was largely due to the Series’ underweight allocation to BB rated issuances, which we currently view as relatively expensive. Additionally, specific names we held, particularly within industrials and energy, detracted from returns.
Going forward, we remain cognizant of uncertainties regarding geopolitics, as well as slowing global economic growth, and the fact that leverage remains generally elevated in the corporate bond space. On a quality basis, we continue to find attractively priced bonds relative to the risks assumed in the single B segment of the market, whereas we view BB rated bonds as relatively expensive. Finally, we continue to focus on companies with stronger balance sheets, stability of margins, and strong free cash flow generation throughout the cycle.
While 2019 was a very strong year for high yield, we believe investor return expectations for the coming year should be tempered as the high yield landscape remains challenging due to relatively tight credit spreads and uncertainties that exist in the market. As challenges and opportunities arrive, we believe that a select, disciplined approach focused on current valuations and conditions will be key to helping investors achieve their objectives.
Performance for the High Yield Bond Series Class S shares is provided above. Performance for other shares classes will differ based on each class’ underlying expenses.
Performance data quoted represents past performance and does not guarantee future results. The investment return and principal value of an investment will fluctuate, so that an investor’s shares, when redeemed, may be worth more or less than their original cost. Current performance may be higher or lower than that quoted; investors can obtain the most recent month-end performance at www.manning-napier.com or by calling (800) 466-3863.
Additional information and associated disclosures can be found on the Performance Update page of this report.
All investments involve risks, including possible loss of principal. There is an inverse relationship between bond prices and interest rates; as interest rates rise, bond prices (and therefore the value of bond funds) fall. Likewise, as interest rates fall, bond prices and the value of bond funds rise. Investments in higher-yielding, lower-rated securities involve additional risks, including a higher risk of default and loss of principal. Investments in derivatives can be highly volatile and involve risks in addition to the risks of the underlying instrument on which the derivative is based, such as counterparty, correlation and liquidity risk. Also, the use of leverage increases exposure to the market and may magnify potential losses.
2
High Yield Bond Series
Performance Update as of December 31, 2019
(unaudited)
AVERAGE ANNUAL TOTAL RETURNS AS OF DECEMBER 31, 2019 | ||||||
ONE YEAR1 | FIVE YEAR | TEN YEAR | ||||
High Yield Bond Series - Class S2 | 13.97% | 6.01% | 7.15% | |||
High Yield Bond Series - Class I2,3 | 14.24% | 6.27% | 7.35% | |||
High Yield Bond Series - Class W2,4 | 14.82% | 6.16% | 7.23% | |||
High Yield Bond Series - Class Z2,4 | 14.43% | 6.09% | 7.20% | |||
Intercontinental Exchange (ICE) Bank of America Merrill Lynch (BofAML) BB-B U.S. Cash Pay High Yield Index5 | 15.08% | 6.10% | 7.43% | |||
Intercontinental Exchange (ICE) Bank of America Merrill Lynch (BofAML) U.S. Cash Pay High Yield Index6 | 14.40% | 6.12% | 7.49% | |||
The following graph compares the value of a $10,000 investment in the High Yield Bond Series - Class S for the ten years ended (December 31, 2019) to the Intercontinental Exchange (ICE) Bank of America Merrill Lynch (BofAML) BB-B U.S. Cash Pay High Yield Index and Intercontinental Exchange (ICE) Bank of America Merrill Lynch (BofAML) U.S. Cash Pay High Yield Index.
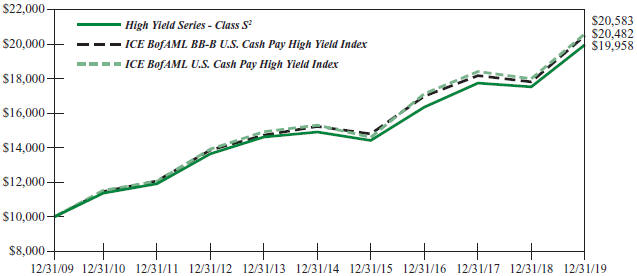
1The returns shown are based on net asset values calculated for shareholder transactions and may differ from the returns shown in the financial highlights, which reflect adjustments made to the net asset values in accordance with accounting principles generally accepted in the United States of America.
2The Series’ performance does not reflect the deduction of taxes that a shareholder would pay on fund distributions or the redemption of shares. The Series’ performance is historical and may not be indicative of future results. The performance returns shown are inclusive of the net expense ratio of the Series. For the year ended December 31, 2019, this net expense ratio was 0.90% for Class S, 0.65% for Class I, 0.10% for Class W and 0.50% for Class Z. The gross expense ratio, which does not account for any voluntary or contractual waivers currently in effect, was 1.02% for Class S, 0.78% for Class I, 0.69% for Class W and 0.69% for Class Z for the year ended December 31, 2019.
3For periods through August 1, 2012 (the inception date of the Class I shares), performance for the Class I shares is based on historical performance of the Class S shares. Because the Class I shares invest in the same portfolio of securities as Class S, performance will only be different to the extent that the Class S shares have a higher expense ratio.
3
High Yield Bond Series
Performance Update as of December 31, 2019
(unaudited)
4For periods through March 1, 2019 (the inception date of the Class W and Class Z shares), performance for the Class W and Class Z shares is based on the historical performance of the Class S shares. Because the Class W and Class Z shares invest in the same portfolio of securities as the Class S shares, performance will be different only to the extent that the Class S shares have a higher expense ratio.
5The Intercontinental Exchange (ICE) Bank of America Merrill Lynch (BofAML) BB-B U.S. Cash Pay High Yield Index is a subset of the ICE BofAML U.S. Cash Pay High Yield Index. The Index includes all U.S. dollar denominated below investment grade corporate debt securities currently in a coupon paying period rated BB1 through B3. Qualifying securities must have at least one year remaining term to final maturity, at least 18 months to final maturity at point of issuance, a fixed coupon schedule, and a minimum amount outstanding of $250 million. The Index returns do not reflect any fees or expenses. Index returns provided by Bloomberg.
6The Intercontinental Exchange (ICE) Bank of America Merrill Lynch (BofAML) U.S. Cash Pay High Yield Index tracks the performance of U.S. dollar denominated below investment grade corporate debt, currently in a coupon paying period, issued in the U.S. domestic market. Qualifying securities must have at least one year remaining term to final maturity as of the rebalancing date, at least 18 months to final maturity at the time of issuance, a fixed coupon schedule, and a minimum amount outstanding of $250 million. The Index returns do not reflect any fees or expenses. Index returns provided by Bloomberg.
4
High Yield Bond Series
Shareholder Expense Example
(unaudited)
As a shareholder of the Series, you incur ongoing costs, including management fees, shareholder service fees and other Series expenses. This example is intended to help you understand your ongoing costs (in dollars) of investing in the Series and to compare these costs with the ongoing costs of investing in other mutual funds.
The example is based on an investment of $1,000 invested in each class at the beginning of the period and held for the entire period (July 1, 2019 to December 31, 2019).
Actual Expenses
The Actual lines of the table below provide information about actual account values and actual expenses. You may use the information in this line, together with the amount you invested, to estimate the expenses that you paid over the period. Simply divide your account value by $1,000 (for example, an $8,600 account value divided by $1,000 = 8.6), then multiply the result by the number in the Actual line for the Class in which you have invested under the heading entitled “Expenses Paid During Period” to estimate the expenses you paid on your account during this period.
Hypothetical Example for Comparison Purposes
The Hypothetical lines of each class in the table below provide information about hypothetical account values and hypothetical expenses based on the Class’ actual expense ratio and an assumed rate of return of 5% per year before expenses, which is not the Class’ actual return. The hypothetical account values and expenses may not be used to estimate the actual ending account balance or expenses you paid during the period. You may use this information to compare the ongoing costs of investing in a class of the Series and other funds. To do so, compare this 5% hypothetical example for the class in which you have invested with the 5% hypothetical examples that appear in the shareholder reports of the other funds.
Please note that the expenses shown in the table are meant to highlight your ongoing costs only and do not reflect any transaction costs, such as sales charges (loads), redemption fees, or exchange fees that you may incur in other mutual funds. Therefore, the second line of the table is useful in comparing ongoing costs only, and will not help you determine the relative total costs of owning different funds.
| BEGINNING ACCOUNT VALUE 7/1/19 | ENDING ACCOUNT VALUE | EXPENSES PAID DURING PERIOD* 7/1/19-12/31/19 | ANNUALIZED EXPENSE RATIO | |||||
Class S | ||||||||
Actual | $1,000.00 | $1,048.70 | $4.65 | 0.90% | ||||
Hypothetical | $1,000.00 | $1,020.67 | $4.58 | 0.90% | ||||
Class I | ||||||||
Actual | $1,000.00 | $1,050.60 | $3.36 | 0.65% | ||||
Hypothetical | $1,000.00 | $1,021.93 | $3.31 | 0.65% | ||||
Class W | ||||||||
Actual | $1,000.00 | $1,053.60 | $0.52 | 0.10% | ||||
Hypothetical | $1,000.00 | $1,024.70 | $0.51 | 0.10% | ||||
Class Z | ||||||||
Actual | $1,000.00 | $1,051.20 | $2.59 | 0.50% | ||||
Hypothetical | $1,000.00 | $1,022.68 | $2.55 | 0.50% | ||||
5
High Yield Bond Series
Shareholder Expense Example
(unaudited)
*Expenses are equal to each Class’ annualized expense ratio (for the six-month period), multiplied by the average account value over the period, multiplied by 184/365 (to reflect the one-half year period). Expenses are based on the most recent fiscal half year; therefore, the expense ratios stated above may differ from the expense ratios stated in the financial highlights, which are based on one-year data. The Class’ total returns would have been lower had certain expenses not been waived or reimbursed during the period.
6
High Yield Bond Series
Portfolio Composition as of December 31, 2019
(unaudited)
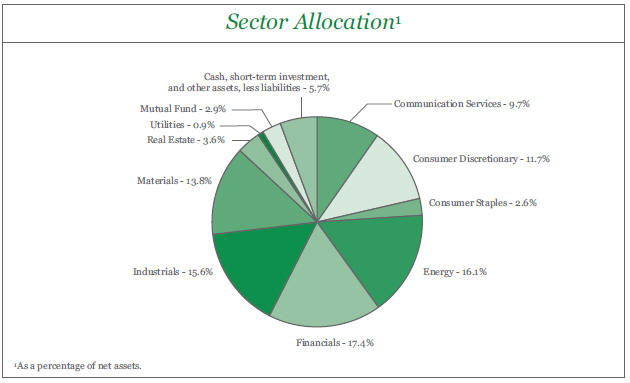
7
High Yield Bond Series
Investment Portfolio - December 31, 2019
CREDIT (UNAUDITED) | PRINCIPAL AMOUNT | VALUE (NOTE 2) |
| |||||||||||||
CORPORATE BONDS - 91.4% | ||||||||||||||||
Non-Convertible Corporate Bonds - 91.4% | ||||||||||||||||
Communication Services - 9.7% | ||||||||||||||||
Diversified Telecommunication Services - 1.0% | ||||||||||||||||
CenturyLink, Inc., 5.625%, 4/1/2020 | B2 | $ | 660,000 | $ | 664,125 | |||||||||||
|
| |||||||||||||||
Media - 5.5% | ||||||||||||||||
Cumulus Media New Holdings, Inc.2, 6.75%, 7/1/2026 | B2 | 690,000 | 739,162 | |||||||||||||
Diamond Sports Group LLC - Diamond Sports Finance Co.2, 6.625%, 8/15/2027 | B2 | 980,000 | 953,050 | |||||||||||||
LCPR Senior Secured Financing DAC2, 6.75%, 10/15/2027 | B1 | 1,000,000 | 1,060,000 | |||||||||||||
Townsquare Media, Inc.2, 6.50%, 4/1/2023 | B3 | 875,000 | 888,125 | |||||||||||||
|
| |||||||||||||||
| 3,640,337 | ||||||||||||||||
|
| |||||||||||||||
Wireless Telecommunication Services - 3.2% | ||||||||||||||||
Sprint Communications, Inc., 7.00%, 8/15/2020 | B3 | 695,000 | 709,769 | |||||||||||||
Sprint Corp., 7.25%, 9/15/2021 | B3 | 660,000 | 697,950 | |||||||||||||
Sprint Corp., 7.125%, 6/15/2024 | B3 | 645,000 | 695,794 | |||||||||||||
|
| |||||||||||||||
| 2,103,513 | ||||||||||||||||
|
| |||||||||||||||
Total Communication Services | 6,407,975 | |||||||||||||||
|
| |||||||||||||||
Consumer Discretionary - 11.7% | ||||||||||||||||
Auto Components - 1.1% | ||||||||||||||||
Techniplas LLC2, 10.00%, 5/1/2020 | WR3 | 870,000 | 739,500 | |||||||||||||
|
| |||||||||||||||
Diversified Consumer Services - 1.3% | ||||||||||||||||
GEMS MENASA Cayman Ltd. - GEMS Education Delaware LLC (United Arab Emirates)2, 7.125%, 7/31/2026 | B2 | 825,000 | 868,312 | |||||||||||||
|
| |||||||||||||||
Household Durables - 6.3% | ||||||||||||||||
Ashton Woods USA LLC - Ashton Woods Finance Co.2, 6.75%, 8/1/2025 | Caa1 | 715,000 | 731,087 | |||||||||||||
LGI Homes, Inc.2, 6.875%, 7/15/2026 | B1 | 1,345,000 | 1,408,888 | |||||||||||||
TRI Pointe Group, Inc. - TRI Pointe Homes, Inc., 5.875%, 6/15/2024 | Ba3 | 750,000 | 815,625 | |||||||||||||
Weekley Homes LLC - Weekley Finance Corp., 6.625%, 8/15/2025 | B1 | 1,170,000 | 1,213,875 | |||||||||||||
|
| |||||||||||||||
| 4,169,475 | ||||||||||||||||
|
| |||||||||||||||
Internet & Direct Marketing Retail - 1.4% | ||||||||||||||||
Photo Holdings Merger Sub, Inc.2, 8.50%, 10/1/2026 | B1 | 1,020,000 | 948,600 | |||||||||||||
|
| |||||||||||||||
Specialty Retail - 1.6% | ||||||||||||||||
Foxtrot Escrow Issuer LLC - Foxtrot Escrow Corp.2, 12.25%, 11/15/2026 | B3 | 980,000 | 1,020,425 | |||||||||||||
|
| |||||||||||||||
Total Consumer Discretionary | 7,746,312 | |||||||||||||||
|
| |||||||||||||||
Consumer Staples - 2.6% | ||||||||||||||||
Food & Staples Retailing - 2.6% | ||||||||||||||||
Albertsons Cos, Inc. - Safeway, Inc. - New Albertsons LP - Albertsons LLC, 5.75%, 3/15/2025 | B3 | 630,000 | 652,050 | |||||||||||||
The accompanying notes are an integral part of the financial statements.
8
High Yield Bond Series
Investment Portfolio - December 31, 2019
CREDIT RATING1 (UNAUDITED) | PRINCIPAL AMOUNT | VALUE (NOTE 2) |
| |||||||||||||
CORPORATE BONDS(continued) | ||||||||||||||||
Non-Convertible Corporate Bonds(continued) | ||||||||||||||||
Consumer Staples(continued) | ||||||||||||||||
Food & Staples Retailing(continued) | ||||||||||||||||
KeHE Distributors LLC - KeHE Finance Corp.2, 8.625%, 10/15/2026 | B3 | $ | 1,000,000 | $ | 1,047,500 | |||||||||||
|
| |||||||||||||||
Total Consumer Staples | 1,699,550 | |||||||||||||||
|
| |||||||||||||||
Energy - 16.1% | ||||||||||||||||
Energy Equipment & Services - 2.4% | ||||||||||||||||
Oceaneering International, Inc., 6.00%, 2/1/2028 | Ba2 | 970,000 | 950,600 | |||||||||||||
Shelf Drilling Holdings Ltd. (United Arab Emirates)2, 8.25%, 2/15/2025 | B3 | 695,000 | 661,988 | |||||||||||||
|
| |||||||||||||||
| 1,612,588 | ||||||||||||||||
|
| |||||||||||||||
Oil, Gas & Consumable Fuels - 13.7% | ||||||||||||||||
Antero Midstream Partners LP - Antero Midstream Finance Corp.2, 5.75%, 3/1/2027 | B1 | 695,000 | 611,166 | |||||||||||||
Antero Midstream Partners LP - Antero Midstream Finance Corp.2, 5.75%, 1/15/2028 | B1 | 695,000 | 604,650 | |||||||||||||
Bruin E&P Partners LLC2, 8.875%, 8/1/2023 | Caa1 | 695,000 | 451,750 | |||||||||||||
Calumet Specialty Products Partners LP - Calumet Finance Corp.2, 11.00%, 4/15/2025 | Caa1 | 1,025,000 | 1,114,687 | |||||||||||||
Enviva Partners LP - Enviva Partners Finance Corp.2, 6.50%, 1/15/2026. | B1 | 955,000 | 1,022,452 | |||||||||||||
Euronav Luxembourg S.A. (Belgium)2, 7.50%, 5/31/2022 | WR3 | 800,000 | 822,000 | |||||||||||||
Jonah Energy LLC - Jonah Energy Finance Corp.2, 7.25%, 10/15/2025 | Caa2 | 1,085,000 | 320,075 | |||||||||||||
Laredo Petroleum, Inc., 5.625%, 1/15/2022 | B3 | 630,000 | 611,100 | |||||||||||||
Lonestar Resources America, Inc.2, 11.25%, 1/1/2023 | Caa2 | 695,000 | 474,338 | |||||||||||||
Moss Creek Resources Holdings, Inc.2, 7.50%, 1/15/2026 | B3 | 640,000 | 486,400 | |||||||||||||
Moss Creek Resources Holdings, Inc.2, 10.50%, 5/15/2027 | B3 | 225,000 | 187,875 | |||||||||||||
NuStar Logistics LP, 6.75%, 2/1/2021 | Ba2 | 670,000 | 695,125 | |||||||||||||
Rockies Express Pipeline LLC2, 5.625%, 4/15/2020 | Ba1 | 1,025,000 | 1,035,863 | |||||||||||||
W&T Offshore, Inc.2, 9.75%, 11/1/2023 | B3 | 640,000 | 610,400 | |||||||||||||
|
| |||||||||||||||
| 9,047,881 | ||||||||||||||||
|
| |||||||||||||||
Total Energy | 10,660,469 | |||||||||||||||
|
| |||||||||||||||
Financials - 17.4% | ||||||||||||||||
Capital Markets - 3.2% | ||||||||||||||||
AG Merger Sub II, Inc.2, 10.75%, 8/1/2027 | Caa1 | 975,000 | 975,000 | |||||||||||||
Donnelley Financial Solutions, Inc., 8.25%, 10/15/2024 | B2 | 1,080,000 | 1,104,300 | |||||||||||||
|
| |||||||||||||||
| 2,079,300 | ||||||||||||||||
|
| |||||||||||||||
Consumer Finance - 4.6% | ||||||||||||||||
Credit Acceptance Corp.2, 5.125%, 12/31/2024 | BB4 | 630,000 | 654,230 | |||||||||||||
Navient Corp., 5.00%, 10/26/2020 | Ba3 | 975,000 | 989,332 | |||||||||||||
SLM Corp., 5.125%, 4/5/2022 | Ba1 | 1,365,000 | 1,412,775 | |||||||||||||
|
| |||||||||||||||
| 3,056,337 | ||||||||||||||||
|
| |||||||||||||||
Diversified Financial Services - 5.1% | ||||||||||||||||
Fidelity & Guaranty Life Holdings, Inc.2, 5.50%, 5/1/2025 | Ba2 | 670,000 | 713,550 | |||||||||||||
The accompanying notes are an integral part of the financial statements.
9
High Yield Bond Series
Investment Portfolio - December 31, 2019
CREDIT RATING1 (UNAUDITED) | PRINCIPAL AMOUNT | VALUE (NOTE 2) |
| |||||||||||||
CORPORATE BONDS(continued) | ||||||||||||||||
Non-Convertible Corporate Bonds(continued) | ||||||||||||||||
Financials(continued) | ||||||||||||||||
Diversified Financial Services(continued) | ||||||||||||||||
Global Aircraft Leasing Co. Ltd. (Cayman Islands)2,5, 6.50%, 9/15/2024 | Ba2 | $ | 1,250,000 | $ | 1,304,312 | |||||||||||
Jefferies Finance LLC - JFIN Co. - Issuer Corp.2, 6.25%, 6/3/2026 | Ba2 | 350,000 | 366,625 | |||||||||||||
VistaJet Malta Finance plc - XO Management Holding, Inc. (Switzerland)2, 10.50%, 6/1/2024 | B3 | 1,060,000 | 1,007,000 | |||||||||||||
|
| |||||||||||||||
| 3,391,487 | ||||||||||||||||
|
| |||||||||||||||
Mortgage Real Estate Investment Trusts (REITS) - 1.4% | ||||||||||||||||
Starwood Property Trust, Inc., 3.625%, 2/1/2021 | Ba3 | 935,000 | 940,844 | |||||||||||||
|
| |||||||||||||||
Thrifts & Mortgage Finance - 3.1% | ||||||||||||||||
Acrisure LLC - Acrisure Finance, Inc.2, 7.00%, 11/15/2025 | Caa2 | 1,065,000 | 1,027,725 | |||||||||||||
Radian Group, Inc., 4.875%, 3/15/2027 | Ba1 | 940,000 | 989,350 | |||||||||||||
|
| |||||||||||||||
| 2,017,075 | ||||||||||||||||
|
| |||||||||||||||
Total Financials | 11,485,043 | |||||||||||||||
|
| |||||||||||||||
Industrials - 15.6% | ||||||||||||||||
Commercial Services & Supplies - 3.1% | ||||||||||||||||
The ADT Security Corp., 6.25%, 10/15/2021 | Ba3 | 660,000 | 696,300 | |||||||||||||
Prime Security Services Borrower LLC - Prime Finance, Inc.2, 5.25%, 4/15/2024 | Ba3 | 600,000 | 634,800 | |||||||||||||
Prime Security Services Borrower LLC - Prime Finance, Inc.2, 5.75%, 4/15/2026 | Ba3 | 660,000 | 717,341 | |||||||||||||
|
| |||||||||||||||
| 2,048,441 | ||||||||||||||||
|
| |||||||||||||||
Construction & Engineering - 2.7% | ||||||||||||||||
HC2 Holdings, Inc.2, 11.50%, 12/1/2021 | Caa1 | 350,000 | 325,500 | |||||||||||||
Tutor Perini Corp.2, 6.875%, 5/1/2025 | B2 | 1,510,000 | 1,457,150 | |||||||||||||
|
| |||||||||||||||
| 1,782,650 | ||||||||||||||||
|
| |||||||||||||||
Marine - 7.8% | ||||||||||||||||
American Tanker, Inc. (Norway)2, 9.25%, 2/22/2022 | WR3 | 1,760,000 | 1,803,533 | |||||||||||||
Borealis Finance LLC2, 7.50%, 11/16/2022 | WR3 | 1,470,000 | 1,352,400 | |||||||||||||
Diana Shipping, Inc. (Greece), 9.50%, 9/27/2023 | WR3 | 700,000 | 694,750 | |||||||||||||
Global Ship Lease, Inc. (United Kingdom)2, 9.875%, 11/15/2022 | B3 | 1,248,000 | 1,301,040 | |||||||||||||
|
| |||||||||||||||
| 5,151,723 | ||||||||||||||||
|
| |||||||||||||||
Trading Companies & Distributors - 2.0% | ||||||||||||||||
Fortress Transportation & Infrastructure Investors LLC2, 6.50%, | ||||||||||||||||
10/1/2025 | B1 | 1,260,000 | 1,329,930 | |||||||||||||
|
| |||||||||||||||
Total Industrials | 10,312,744 | |||||||||||||||
|
| |||||||||||||||
Materials - 13.8% | ||||||||||||||||
Chemicals - 2.3% | ||||||||||||||||
OCI N.V. (Netherlands)2, 5.25%, 11/1/2024 | Ba3 | 800,000 | 830,000 | |||||||||||||
The accompanying notes are an integral part of the financial statements.
10
High Yield Bond Series
Investment Portfolio - December 31, 2019
CREDIT RATING1 (UNAUDITED) | PRINCIPAL AMOUNT | VALUE (NOTE 2) |
| |||||||||||||
CORPORATE BONDS(continued) | ||||||||||||||||
Non-Convertible Corporate Bonds(continued) | ||||||||||||||||
Materials(continued) | ||||||||||||||||
Chemicals(continued) | ||||||||||||||||
Olin Corp., 5.625%, 8/1/2029 | Ba1 | $ | 685,000 | $ | 723,497 | |||||||||||
|
| |||||||||||||||
| 1,553,497 | ||||||||||||||||
|
| |||||||||||||||
Metals & Mining - 11.5% | ||||||||||||||||
Compass Minerals International, Inc.2, 6.75%, 12/1/2027 | B1 | 1,270,000 | 1,349,375 | |||||||||||||
IAMGOLD Corp. (Canada)2, 7.00%, 4/15/2025 | B2 | 935,000 | 974,139 | |||||||||||||
Infrabuild Australia Pty Ltd. (Australia)2, 12.00%, 10/1/2024 | Ba3 | 1,035,000 | 1,066,857 | |||||||||||||
Kinross Gold Corp. (Canada), 4.50%, 7/15/2027 | Ba1 | 675,000 | 707,062 | |||||||||||||
Mountain Province Diamonds, Inc. (Canada)2, 8.00%, 12/15/2022 | B3 | 1,415,000 | 1,365,475 | |||||||||||||
Northwest Acquisitions ULC - Dominion Finco, Inc.2, 7.125%, 11/1/2022 | Caa1 | 1,395,000 | 1,046,250 | |||||||||||||
Petra Diamonds US Treasury plc (South Africa)2, 7.25%, 5/1/2022 | Caa1 | 695,000 | 438,719 | |||||||||||||
SunCoke Energy Partners LP - SunCoke Energy Partners Finance Corp.2, 7.50%, 6/15/2025 | B2 | 650,000 | 625,086 | |||||||||||||
|
| |||||||||||||||
| 7,572,963 | ||||||||||||||||
|
| |||||||||||||||
Total Materials | 9,126,460 | |||||||||||||||
|
| |||||||||||||||
Real Estate - 3.6% | ||||||||||||||||
Equity Real Estate Investment Trusts (REITS) - 1.0% | ||||||||||||||||
iStar, Inc., 4.25%, 8/1/2025 | Ba3 | 630,000 | 636,905 | |||||||||||||
|
| |||||||||||||||
Real Estate Management & Development - 2.6% | ||||||||||||||||
Five Point Operating Co. LP - Five Point Capital Corp.2, 7.875%, | ||||||||||||||||
11/15/2025 | B3 | 1,050,000 | 1,057,675 | |||||||||||||
Forestar Group, Inc.2, 8.00%, 4/15/2024 | B2 | 640,000 | 696,000 | |||||||||||||
|
| |||||||||||||||
| 1,753,675 | ||||||||||||||||
|
| |||||||||||||||
Total Real Estate | 2,390,580 | |||||||||||||||
|
| |||||||||||||||
Utilities - 0.9% | ||||||||||||||||
Independent Power and Renewable Electricity Producers - 0.9% | ||||||||||||||||
Drax Finco plc (United Kingdom)2, 6.625%, 11/1/2025 | BB4 | 555,000 | 589,687 | |||||||||||||
|
| |||||||||||||||
TOTAL CORPORATE BONDS | ||||||||||||||||
(Identified Cost $61,112,638) | 60,418,820 | |||||||||||||||
|
| |||||||||||||||
The accompanying notes are an integral part of the financial statements.
11
High Yield Bond Series
Investment Portfolio - December 31, 2019
| SHARES | VALUE (NOTE 2) |
| ||||||||||
MUTUAL FUND - 2.9% | ||||||||||||
SPDR Bloomberg Barclays High Yield Bond ETF (Identified Cost $1,928,569) | 17,615 | $ | 1,929,547 | |||||||||
|
| |||||||||||
SHORT-TERM INVESTMENT - 2.9% | ||||||||||||
Dreyfus Government Cash Management, Institutional Shares, 1.51%6, | ||||||||||||
(Identified Cost $1,891,147) | 1,891,147 | 1,891,147 | ||||||||||
|
| |||||||||||
TOTAL INVESTMENTS - 97.2% | ||||||||||||
(Identified Cost $64,932,354) | 64,239,514 | |||||||||||
OTHER ASSETS, LESS LIABILITIES - 2.8% | 1,837,061 | |||||||||||
|
| |||||||||||
NET ASSETS - 100% | $ | 66,076,575 | ||||||||||
|
| |||||||||||
ETF - Exchange-Traded Fund
1Credit ratings from Moody’s (unaudited).
2Restricted securities - Investment in securities that are restricted as to public resale under the Securities Act of 1933, as amended. These securities have been sold under Rule 144A and have been determined to be liquid under the Fund’s Liquidity Risk Management Program. These securities amount to $43,817,692, or 66.3% of the Series’ net assets as of December 31, 2019 (See Note 2 to the financial statements).
3Credit rating has been withdrawn. As of December 31, 2019, there is no rating available (unaudited).
4Credit ratings from S&P (unaudited).
5Represents a Payment-In-Kind bond.
6Rate shown is the current yield as of December 31, 2019.
The Global Industry Classification Standard (GICS) was developed by and is the exclusive property and a service mark of MSCI Inc. (MSCI) and Standard & Poor’s, a division of S&P Global Inc. (S&P), and is licensed for use by Manning & Napier when referencing GICS sectors. Neither MSCI, S&P, nor any third party involved in making or compiling the GICS or any GICS classifications makes any express or implied warranties or representations with respect to such standard or classification, nor shall any such party have any liability therefrom.
The accompanying notes are an integral part of the financial statements.
12
High Yield Bond Series
Statement of Assets and Liabilities
December 31, 2019
ASSETS: | ||||
Investments, at value (identified cost $64,932,354) (Note 2) | $ | 64,239,514 | ||
Receivable from investment advisor (Note 3) | 10,043 | |||
Interest receivable | 1,131,255 | |||
Receivable for fund shares sold | 745,549 | |||
Dividends receivable | 3,425 | |||
Prepaid expenses | 13,458 | |||
|
| |||
TOTAL ASSETS | 66,143,244 | |||
|
| |||
LIABILITIES: | ||||
Accrued fund accounting and administration fees (Note 3) | 16,857 | |||
Accrued sub-transfer agent fees (Note 3) | 9,197 | |||
Accrued distribution and service (Rule 12b-1) fees (Class S) (Note 3) | 2,497 | |||
Accrued Chief Compliance Officer service fees (Note 3) | 1,170 | |||
Audit fees payable | 14,097 | |||
Payable for fund shares repurchased | 8,092 | |||
Accrued printing and postage fees payable | 9,306 | |||
Other payables and accrued expenses | 5,453 | |||
|
| |||
TOTAL LIABILITIES | 66,669 | |||
|
| |||
TOTAL NET ASSETS | $ | 66,076,575 | ||
|
| |||
NET ASSETS CONSIST OF: | ||||
Capital stock | $ | 69,276 | ||
Additional paid-in-capital | 72,397,989 | |||
Total distributable earnings (loss) | (6,390,690 | ) | ||
|
| |||
TOTAL NET ASSETS | $ | 66,076,575 | ||
|
| |||
NET ASSET VALUE, OFFERING PRICE AND REDEMPTION PRICE PER SHARE - Class S($13,112,853/1,297,790 shares) | $ | 10.10 | ||
|
| |||
NET ASSET VALUE, OFFERING PRICE AND REDEMPTION PRICE PER SHARE - Class I($20,973,898/2,429,170 shares) | $ | 8.63 | ||
|
| |||
NET ASSET VALUE, OFFERING PRICE AND REDEMPTION PRICE PER SHARE - Class W($30,362,716/3,012,204 shares) | $ | 10.08 | ||
|
| |||
NET ASSET VALUE, OFFERING PRICE AND REDEMPTION PRICE PER SHARE - Class Z($1,627,108/188,430 shares) | $ | 8.64 | ||
|
| |||
The accompanying notes are an integral part of the financial statements.
13
High Yield Bond Series
Statement of Operations
For the Year Ended December 31, 2019
INVESTMENT INCOME: | ||||
Interest | $ | 6,368,285 | ||
Dividends | 165,932 | |||
|
| �� | ||
Total Investment Income | 6,534,217 | |||
|
| |||
EXPENSES: | ||||
Management fees (Note 3) | 414,198 | |||
Fund accounting and administration fees (Note 3) | 74,229 | |||
Shareholder services fees (Class S) (Note 3) | 35,082 | |||
Sub-transfer agent fees (Note 3) | 30,275 | |||
Distribution and service (Rule 12b-1) fees (Class S) (Note 3) | 26,581 | |||
Directors’ fees (Note 3) | 10,162 | |||
Chief Compliance Officer service fees (Note 3) | 3,109 | |||
Audit fees | 60,189 | |||
Custodian fees | 5,914 | |||
Miscellaneous | 103,998 | |||
|
| |||
Total Expenses | 763,737 | |||
Less reduction of expenses (Note 3) | (326,414 | ) | ||
|
| |||
Net Expenses | 437,323 | |||
|
| |||
NET INVESTMENT INCOME | 6,096,894 | |||
|
| |||
REALIZED AND UNREALIZED GAIN (LOSS) ON INVESTMENTS: | ||||
Net realized gain (loss) on investments | 673,081 | |||
Net change in unrealized appreciation (depreciation) on investments | 6,238,038 | |||
|
| |||
NET REALIZED AND UNREALIZED GAIN (LOSS) ON INVESTMENTS | 6,911,119 | |||
|
| |||
NET INCREASE IN NET ASSETS RESULTING FROM OPERATIONS | $ | 13,008,013 | ||
|
| |||
The accompanying notes are an integral part of the financial statements.
14
High Yield Bond Series
Statements of Changes in Net Assets
FOR THE YEAR ENDED | FOR THE YEAR ENDED | |||||||
INCREASE (DECREASE) IN NET ASSETS: | ||||||||
OPERATIONS: | ||||||||
Net investment income | $ | 6,096,894 | $ | 6,339,544 | ||||
Net realized gain (loss) on investments | 673,081 | 480,420 | ||||||
Net change in unrealized appreciation (depreciation) on investments | 6,238,038 | (8,475,559 | ) | |||||
|
|
|
| |||||
Net increase (decrease) from operations | 13,008,013 | (1,655,595 | ) | |||||
|
|
|
| |||||
DISTRIBUTIONS TO SHAREHOLDERS (Note 9): | ||||||||
Class S | (869,975 | ) | (4,387,135 | ) | ||||
Class I | (1,548,134 | ) | (1,907,413 | ) | ||||
Class W | (3,127,762 | ) | — | |||||
Class Z | (599,127 | ) | — | |||||
|
|
|
| |||||
Total distributions to shareholders | (6,144,998 | ) | (6,294,548 | ) | ||||
|
|
|
| |||||
CAPITAL STOCK ISSUED AND REPURCHASED: | ||||||||
Net increase (decrease) from capital share transactions (Note 5) | (56,147,752 | ) | 2,318,967 | |||||
|
|
|
| |||||
Net increase (decrease) in net assets | (49,284,737 | ) | (5,631,176 | ) | ||||
NET ASSETS: | ||||||||
Beginning of year | 115,361,312 | 120,992,488 | ||||||
|
|
|
| |||||
End of year | $ | 66,076,575 | $ | 115,361,312 | ||||
|
|
|
| |||||
The accompanying notes are an integral part of the financial statements.
15
High Yield Bond Series
Financial Highlights - Class S
| FOR THE YEAR ENDED | ||||||||||||||||||||
| 12/31/19 | 12/31/18 | 12/31/17 | 12/31/16 | 12/31/15 | ||||||||||||||||
Per share data (for a share outstanding throughout each year): | ||||||||||||||||||||
Net asset value - Beginning of year | $9.47 | $10.09 | $9.79 | $9.21 | $10.04 | |||||||||||||||
|
|
|
|
|
|
|
|
|
| |||||||||||
Income (loss) from investment operations: | ||||||||||||||||||||
Net investment income1 | 0.57 | 0.53 | 0.54 | 0.56 | 0.51 | |||||||||||||||
Net realized and unrealized gain (loss) on investments | 0.73 | (0.65 | ) | 0.28 | 0.66 | (0.82 | ) | |||||||||||||
|
|
|
|
|
|
|
|
|
| |||||||||||
Total from investment operations | 1.30 | (0.12 | ) | 0.82 | 1.22 | (0.31 | ) | |||||||||||||
|
|
|
|
|
|
|
|
|
| |||||||||||
Less distributions to shareholders: | ||||||||||||||||||||
From net investment income | (0.67 | ) | (0.50 | ) | (0.51 | ) | (0.64 | ) | (0.52 | ) | ||||||||||
From return of capital | — | — | (0.01 | ) | — | — | ||||||||||||||
|
|
|
|
|
|
|
|
|
| |||||||||||
Total distributions to shareholders | (0.67 | ) | (0.50 | ) | (0.52 | ) | (0.64 | ) | (0.52 | ) | ||||||||||
|
|
|
|
|
|
|
|
|
| |||||||||||
Net asset value - End of year | $10.10 | $9.47 | $10.09 | $9.79 | $9.21 | |||||||||||||||
|
|
|
|
|
|
|
|
|
| |||||||||||
Net assets - End of year(000’s omitted) | $13,113 | $82,399 | $94,533 | $89,921 | $108,202 | |||||||||||||||
|
|
|
|
|
|
|
|
|
| |||||||||||
Total return2 | 13.97% | (1.31% | ) | 8.49% | 13.41% | (3.28% | ) | |||||||||||||
Ratios (to average net assets)/Supplemental Data: | ||||||||||||||||||||
Expenses* | 0.90% | 0.90% | 0.90% | 0.94% | 1.11% | |||||||||||||||
Net investment income | 5.90% | 5.32% | 5.31% | 5.82% | 5.04% | |||||||||||||||
Series portfolio turnover | 143% | 100% | 106% | 77% | 109% | |||||||||||||||
| *For certain periods presented, the investment advisor did not impose all or a portion of its management and/or other fees, and in some periods may have paid a portion of the Series’ expenses. If these expenses had been incurred by the Class, the expense ratio (to average net assets) would have increased by the following amounts: |
| |||||||||||||||||||
| 0.12% | 0.08% | 0.07% | 0.02% | N/A | ||||||||||||||||
1Calculated based on average shares outstanding during the years.
2Represents aggregate total return for the year indicated, and assumes reinvestment of all distributions. Total return would have been lower had certain expenses not been waived during certain years.
The accompanying notes are an integral part of the financial statements.
16
High Yield Bond Series
Financial Highlights - Class I
| FOR THE YEAR ENDED | ||||||||||||||||||||
| 12/31/19 | 12/31/18 | 12/31/17 | 12/31/16 | 12/31/15 | ||||||||||||||||
Per share data (for a share outstanding throughout each year): | ||||||||||||||||||||
Net asset value - Beginning of year | $8.20 | $8.80 | $8.61 | $8.18 | $8.97 | |||||||||||||||
|
|
|
|
|
|
|
|
|
| |||||||||||
Income (loss) from investment operations: | ||||||||||||||||||||
Net investment income1 | 0.53 | 0.49 | 0.49 | 0.52 | 0.47 | |||||||||||||||
Net realized and unrealized gain (loss) on investments | 0.61 | (0.57 | ) | 0.25 | 0.57 | (0.72 | ) | |||||||||||||
|
|
|
|
|
|
|
|
|
| |||||||||||
Total from investment operations | 1.14 | (0.08 | ) | 0.74 | 1.09 | (0.25 | ) | |||||||||||||
|
|
|
|
|
|
|
|
|
| |||||||||||
Less distributions to shareholders: | ||||||||||||||||||||
From net investment income | (0.71 | ) | (0.52 | ) | (0.54 | ) | (0.66 | ) | (0.54 | ) | ||||||||||
From return of capital | — | — | (0.01 | ) | — | — | ||||||||||||||
|
|
|
|
|
|
|
|
|
| |||||||||||
Total distributions to shareholders | (0.71 | ) | (0.52 | ) | (0.55 | ) | (0.66 | ) | (0.54 | ) | ||||||||||
|
|
|
|
|
|
|
|
|
| |||||||||||
Net asset value - End of year | $8.63 | $8.20 | $8.80 | $8.61 | $8.18 | |||||||||||||||
|
|
|
|
|
|
|
|
|
| |||||||||||
Net assets - End of year(000’s omitted) | $20,974 | $32,962 | $26,459 | $22,658 | $52,383 | |||||||||||||||
|
|
|
|
|
|
|
|
|
| |||||||||||
Total return2 | 14.24% | (0.98% | ) | 8.68% | 13.60% | (2.93% | ) | |||||||||||||
Ratios (to average net assets)/Supplemental Data: | ||||||||||||||||||||
Expenses* | 0.65% | 0.65% | 0.65% | 0.68% | 0.87% | |||||||||||||||
Net investment income | 6.17% | 5.63% | 5.57% | 6.04% | 5.34% | |||||||||||||||
Series portfolio turnover | 143% | 100% | 106% | 77% | 109% | |||||||||||||||
| *For the certain periods presented, the investment advisor did not impose all or a portion of its management and/or other fees, and in some periods may have paid a portion of the Series’ expenses. If these expenses had been incurred by the Class, the expense ratio (to average net assets) would have increased by the following amounts: |
| |||||||||||||||||||
| 0.13% | 0.08% | 0.07% | 0.02% | N/A | ||||||||||||||||
1Calculated based on average shares outstanding during the years.
2Represents aggregate total return for the year indicated, and assumes reinvestment of all distributions. Total return would have been lower had certain expenses not been waived during certain years.
The accompanying notes are an integral part of the financial statements.
17
High Yield Bond Series
Financial Highlights - Class W
| FOR THE PERIOD 3/1/191 TO 12/31/19 | |||||
Per share data (for a share outstanding throughout the period): | |||||
Net asset value - Beginning of period | $10.01 | ||||
|
| ||||
Income from investment operations: | |||||
Net investment income2 | 0.56 | ||||
Net realized and unrealized gain (loss) on investments | 0.27 | ||||
|
| ||||
Total from investment operations | 0.83 | ||||
|
| ||||
Less distributions to shareholders: | |||||
From net investment income | (0.76 | ) | |||
|
| ||||
Net asset value - End of period | $10.08 | ||||
|
| ||||
Net assets - End of period(000’s omitted) | $30,363 | ||||
|
| ||||
Total return3 | 8.63% | ||||
Ratios (to average net assets)/Supplemental Data: | |||||
Expenses*4 | 0.10% | ||||
Net investment income4 | 6.66% | ||||
Series portfolio turnover | 143% | ||||
| *The investment advisor did not impose all or a portion of its management and/or other fees during the period, and may have paid a portion of the Series’ expenses. If these expenses had been incurred by the Class, the expense ratio (to average net assets) would have increased by the following amounts4: |
| ||||
| 0.59% | |||||
1Commencement of operations.
2Calculated based on average shares outstanding during the period.
3Represents aggregate total return for the period indicated, and assumes reinvestment of all distributions. Total return would have been lower had certain expenses not been waived or reimbursed during the period. Periods less than one year are not annualized.
4Annualized.
The accompanying notes are an integral part of the financial statements.
18
High Yield Bond Series
Financial Highlights - Class Z
| FOR THE PERIOD 3/1/191 TO 12/31/19 | |||||
Per share data (for a share outstanding throughout the period): | |||||
Net asset value - Beginning of period | $8.67 | ||||
|
| ||||
Income from investment operations: | |||||
Net investment income2 | 0.46 | ||||
Net realized and unrealized gain (loss) on investments | 0.23 | ||||
|
| ||||
Total from investment operations | 0.69 | ||||
|
| ||||
Less distributions to shareholders: | |||||
From net investment income | (0.72 | ) | |||
|
| ||||
Net asset value - End of period | $8.64 | ||||
|
| ||||
Net assets - End of period(000’s omitted) | $1,627 | ||||
|
| ||||
Total return3 | 8.26% | ||||
Ratios (to average net assets)/Supplemental Data: | |||||
Expenses*4 | 0.50% | ||||
Net investment income4 | 6.26% | ||||
Series portfolio turnover | 143% | ||||
| *The investment advisor did not impose all or a portion of its management and/or other fees during the period, and may have paid a portion of the Series’ expenses. If these expenses had been incurred by the Class, the expense ratio (to average net assets) would have increased by the following amount4: |
| ||||
| 0.19% | |||||
1Commencement of operations.
2Calculated based on average shares outstanding during the period.
3Represents aggregate total return for the period indicated, and assumes reinvestment of all distributions. Total return would have been lower had certain expenses not been waived or reimbursed during the period. Periods less than one year are not annualized.
4Annualized.
The accompanying notes are an integral part of the financial statements.
19
High Yield Bond Series
Notes to Financial Statements
| 1. | Organization |
High Yield Bond Series (the “Series”) is a no-load diversified series of Manning & Napier Fund, Inc. (the “Fund”). The Fund is organized in Maryland and is registered under the Investment Company Act of 1940, as amended, as an open-end management investment company.
The Series’ investment objective is to provide a high level of long-term total return by investing principally in non-investment grade fixed income securities that are issued by government and corporate entities.
The Series is authorized to issue four classes of shares (Class S, I, W, and Z). Class W and Z shares were issued on March 1, 2019. Each class of shares is substantially the same, except that class specific distribution and shareholder servicing expenses are borne by the specific class of shares to which they relate.
The Fund’s advisor is Manning & Napier Advisors, LLC (the “Advisor”). Shares of the Series are offered to investors, clients and employees of the Advisor and its affiliates. The total authorized capital stock of the Fund consists of 15 billion shares of common stock each having a par value of $0.01. As of December 31, 2019, 8.9 billion shares have been designated in total among 31 series, of which 100 million have been designated as High Yield Bond Series Class I common stock and High Yield Bond Series Class Z common stock, 125 million have been designated as High Yield Bond Series Class S common stock and 50 million have been designated as High Yield Bond Series Class W common stock.
| 2. | Significant Accounting Policies |
The following is a summary of significant accounting policies followed by the Series. The Series is an investment company and, accordingly, follows the investment company accounting and reporting guidance of the Financial Accounting Standards Board Accounting Standards Codification Topic 946 - Investment Companies, which is part of accounting principles generally accepted in the United States of America (“GAAP”).
Security Valuation
Portfolio securities, including domestic equities, foreign equities, warrants and options, listed on an exchange other than the NASDAQ Stock Market are valued at the latest quoted sales price of the exchange on which the security is primarily traded. Securities not traded on valuation date or securities not listed on an exchange are valued at the latest quoted bid price provided by the Fund’s pricing service. Securities listed on the NASDAQ Stock Market are valued in accordance with the NASDAQ Official Closing Price.
Debt securities, including government bonds, foreign bonds, asset-backed securities, structured notes, supranational obligations, sovereign bonds, corporate bonds, loan assignments, and mortgage-backed securities will normally be valued on the basis of evaluated bid prices provided directly by an independent pricing service. The pricing services use multiple valuation techniques to determine fair value. In instances where sufficient market activity exists, the pricing services may utilize a market-based approach through which quotes from market makers are used to determine fair value. In instances where sufficient market activity may not exist or is limited, the pricing services also utilize proprietary valuation models which may consider market characteristics such as benchmark yield curves, option-adjusted spreads, credit spreads, estimated default rates, coupon rates, anticipated timing of principal repayments, underlying collateral, and other unique security features in order to estimate the relevant cash flows, which are then discounted to calculate the fair value. Certain investments in securities held by the Series may be valued on a basis of a price provided directly by a principal market maker. These prices may differ from the value that would have been used had a broader market for securities existed.
The fair value of loan assignments is estimated using recently executed transactions, market price quotations, credit/market events, and cross-asset pricing. Inputs are generally observable market inputs obtained from independent sources. Loan assignments are generally categorized in Level 2 of the fair value hierarchy, unless key inputs are unobservable, in which case they would be categorized in Level 3.
Short-term investments that mature in sixty days or less may be valued at amortized cost, which approximates fair value. Investments in open-end investment companies are valued at their net asset value per share on valuation date.
20
High Yield Bond Series
Notes to Financial Statements (continued)
| 2. | Significant Accounting Policies (continued) |
Security Valuation(continued)
Volume and level of activity in established markets for an asset or liability are evaluated to determine whether recent transactions and quoted prices are determinative of fair value. Where there have been significant decreases in volume and level of activity, further analysis and adjustment may be necessary to estimate fair value. The Series measures fair value in these instances by the use of inputs and valuation techniques which may be based upon current market prices of securities that are comparable in coupon, rating, maturity and industry and/or expectation of future cash flows. As a result of trading in relatively thin markets and/or markets that experience significant volatility, the prices used by the Series to value these securities may differ from the value that would be realized if these securities were sold, and the differences could be material.
Securities for which representative valuations or prices are not available from the Series’ pricing service may be valued at fair value as determined in good faith by the Advisor under procedures approved by and under the general supervision and responsibility of the Fund’s Board of Directors (the “Board”). Due to the inherent uncertainty of valuations of such securities, the fair value may differ significantly from the values that would have been used had a ready market for such securities existed. If trading or events occurring after the close of the principal market in which securities are traded are expected to materially affect the value of those securities, then they may be valued at their fair value, taking this trading or these events into account.
Various inputs are used in determining the value of the Series’ assets or liabilities carried at fair value. These inputs are summarized in three broad levels. Level 1 includes quoted prices in active markets for identical assets and liabilities. Level 2 includes other significant observable inputs (including quoted prices for similar securities, interest rates, prepayment speeds, credit risk, etc.). Level 3 includes significant unobservable inputs (including the Series’ own assumptions in determining the fair value of investments). A financial instrument’s level within the fair value hierarchy is based on the lowest level of any input both individually and in aggregate that is significant to the fair value measurement. The inputs or methodology used for valuing securities are not necessarily an indication of the risk associated with investing in those securities.
The following is a summary of the valuation levels used for major security types as of December 31, 2019 in valuing the Series’ assets or liabilities carried at fair value:
| DESCRIPTION | TOTAL | LEVEL 1 | LEVEL 2 | LEVEL 3 | ||||||||||||
Assets: | ||||||||||||||||
Debt securities: | ||||||||||||||||
Corporate debt: | ||||||||||||||||
Communication Services | $ | 6,407,975 | $ | — | $ | 6,407,975 | $ | — | ||||||||
Consumer Discretionary | 7,746,312 | — | 7,746,312 | — | ||||||||||||
Consumer Staples | 1,699,550 | — | 1,699,550 | — | ||||||||||||
Energy | 10,660,469 | — | 10,660,469 | — | ||||||||||||
Financials | 11,485,043 | — | 11,485,043 | — | ||||||||||||
Industrials | 10,312,744 | — | 10,312,744 | — | ||||||||||||
Materials | 9,126,460 | — | 9,126,460 | — | ||||||||||||
Real Estate | 2,390,580 | — | 2,390,580 | — | ||||||||||||
Utilities | 589,687 | — | 589,687 | — | ||||||||||||
Mutual fund | 1,929,547 | 1,929,547 | — | — | ||||||||||||
Short-Term Investment | 1,891,147 | 1,891,147 | — | — | ||||||||||||
|
|
|
|
|
|
|
| |||||||||
Total assets | $ | 64,239,514 | $ | 3,820,694 | $ | 60,418,820 | $ | — | ||||||||
|
|
|
|
|
|
|
| |||||||||
There were no Level 3 securities held by the Series as of December 31, 2018 or December 31, 2019.
New Accounting Pronouncements
In March 2017, the Financial Accounting Standards Board issued Accounting Standards Update No. 2017-08, Receivables - Nonrefundable Fees and Other Costs (Subtopic 310-20): “Premium Amortization of Purchased Callable Debt Securities” which amends the amortization period for certain purchased callable debt securities. Under the new guidance, the premium
21
High Yield Bond Series
Notes to Financial Statements (continued)
| 2. | Significant Accounting Policies (continued) |
New Accounting Pronouncements(continued)
amortization of purchased callable debt securities that have explicit, non-contingent call features and are callable at fixed prices will be amortized to the earliest call date. The guidance does not require an accounting change for securities held at a discount, which continue to be amortized to maturity. This guidance was adopted by the Series as of January 1, 2019 on a modified retrospective basis. The cost basis of the securities on January 1, 2019 has been decreased by $97. This change in accounting policy has been made to comply with the newly issued accounting standard and had no impact on total distributable earnings (loss) or the net asset value for any Class of the Series.
Security Transactions, Investment Income and Expenses
Security transactions are accounted for on trade date. Dividend income is recorded on the ex-dividend date, except that if the ex-dividend date has passed, certain dividends from foreign securities are recorded as soon as the Series is informed of the ex-dividend date. Non-cash dividends, if any, are recorded at the fair value of the securities received. Interest income, including amortization of premium and accretion of discounts using the effective interest method, is earned from settlement date and accrued daily.
Expenses are recorded on an accrual basis. Most expenses of the Fund can be attributed to a specific series. Expenses which cannot be directly attributed are apportioned among the series in the Fund in such a manner as deemed equitable by the Fund’s Board, taking into consideration, among other things, the nature and type of expense. Income, expenses (other than shareholder services fees), and realized and unrealized gains and losses are prorated among the classes based on the relative net assets of each class. Class specific expenses are directly charged to that Class.
The Series uses the identified cost method for determining realized gain or loss on investments for both financial statement and federal income tax reporting purposes.
Foreign Currency Translation
The books and records of the Series are maintained in U.S. dollars. Foreign currencies, investments and other assets and liabilities are translated into U.S. dollars at the current exchange rates. Purchases and sales of investment securities and income and expenses are translated on the respective dates of such transactions. The Series does not isolate realized and unrealized gains and losses attributable to changes in the exchange rates from gains and losses that arise from changes in the fair value of investments. Such fluctuations are included with net realized and unrealized gain or loss on investments. Net realized foreign currency gains and losses represent foreign currency gains and losses between trade date and settlement date on securities transactions, gains and losses on disposition of foreign currencies and the difference between the amount of income and foreign withholding taxes recorded on the books of the Series and the amounts actually received or paid.
Securities Purchased on a When-Issued Basis or Forward Commitment
The Series may purchase securities on a when-issued basis or forward commitment. These transactions involve a commitment by the Series to purchase securities for a predetermined price with payment and delivery taking place beyond the customary settlement period. When such purchases are outstanding, the Series will designate liquid assets in an amount sufficient to meet the purchase price. When purchasing a security on a delayed delivery basis, the Series assumes the rights and risks of ownership of the security, including the risk of price and yield fluctuations, and takes such fluctuations into account when determining its net asset value. The Series may sell the when-issued securities before they are delivered, which may result in a capital gain or loss. No such investments were held by the Series on December 31, 2019.
In connection with its ability to purchase or sell securities on a forward commitment basis, the Series may enter into forward roll transactions principally using To Be Announced (TBA) securities. Forward roll transactions require the sale of securities for delivery in the current month, and a simultaneous agreement to repurchase substantially similar (same type, coupon and maturity) securities on a specified future date. Risks of entering into forward roll transactions include the potential inability of the counterparty to meet the terms of the agreement; the potential of the Series to receive inferior securities at redelivery as compared to the securities sold to the counterparty; counterparty credit risk; and the potential pay down speed variance between the mortgage-backed pools. During the roll period, the Series forgoes principal and interest paid on the securities. The
22
High Yield Bond Series
Notes to Financial Statements (continued)
| 2. | Significant Accounting Policies (continued) |
Securities Purchased on a When-Issued Basis or Forward Commitment(continued)
Series accounts for such dollar rolls as purchases and sales. Information regarding securities purchased on a when-issued basis is included in the Series’ Investment Portfolio. No such investments were held by the Series on December 31, 2019.
Asset-Backed Securities
The Series may invest in asset-backed securities. Asset-backed securities are generally issued as pass-through certificates or as debt instruments. Asset-backed securities issued as pass-through certificates represent undivided fractional ownership interests in an underlying pool of assets. Asset-backed securities issued as debt instruments, which are also known as collateralized obligations, are typically issued as the debt of a special purpose entity organized solely for the purpose of owning such assets and issuing such debt. Asset-backed securities are often backed by a pool of assets representing the obligations of a number of different parties. The yield characteristics of certain asset-backed securities may differ from traditional debt securities. One such major difference is that all or a principal part of the obligations may be prepaid at any time because the underlying assets (i.e. loans) may be prepaid at any time. As a result, a decrease in interest rates in the market may result in increases in the level of prepayments as borrowers, particularly mortgagors, refinance and repay their loans. An increased prepayment rate with respect to an asset-backed security will have the effect of shortening the maturity of the security. In addition, the Series may subsequently have to reinvest the proceeds at lower interest rates. If the Series has purchased such an asset-backed security at a premium, a faster than anticipated prepayment rate could result in a loss of principal to the extent of the premium paid.
Mortgage-Backed Securities
The Series may invest in mortgage-backed securities (“MBS” or pass-through certificates) that represent an interest in a pool of specific underlying mortgage loans and entitle the Series to the periodic payments of principal and interest from those mortgages. MBS may be issued by government agencies or corporations, or private issuers. Most MBS issued by government agencies are guaranteed; however, the degree of protection differs based on the issuer. For MBS, there are a number of important differences among the agencies and instrumentalities of the U.S. Government that issue mortgage-related securities and among the securities that they issue. For example, mortgage-related securities guaranteed by Ginnie Mae are guaranteed as to the timely payment of principal and interest by Ginnie Mae and such guarantee is backed by the full faith and credit of the United States. However, mortgage-related securities issued by Freddie Mac and Fannie Mae, including Freddie Mac and Fannie Mae guaranteed mortgage pass-through certificates, which are solely the obligations of Freddie Mac and Fannie Mae, are not backed by or entitled to the full faith and credit of the United States, but are supported by the right of the issuer to borrow from the U.S. Treasury. Non-agency mortgage-backed securities are securities issued by non-governmental issuers and have no direct or indirect government guarantees of payment and are subject to various risks. Non-agency mortgage loans are obligations of the borrowers thereunder only and are not typically insured or guaranteed by any other person or entity. The ability of a borrower to repay a loan is dependent upon the income or assets of the borrower. A number of factors, including a general economic downturn, acts of God, terrorism, social unrest and civil disturbances, may impair a borrower’s ability to repay its loans.
Restricted Securities
Restricted securities are purchased in private placement transactions, are not registered under the Securities Act of 1933, as amended, and may have contractual restrictions on resale. Information regarding restricted securities is included at the end of the Series’ Investment Portfolio.
Illiquid Securities
A security may be considered illiquid if so deemed in good faith by the Advisor under procedures approved by and under the general supervision and responsibility of the Fund’s Board. Securities that are illiquid are marked with the applicable footnote on the Investment Portfolio. No such investments were held by the Series as of December 31, 2019.
Federal Taxes
The Series’ policy is to comply with the provisions of the Internal Revenue Code applicable to regulated investment companies. The Series is not subject to federal income tax or excise tax to the extent that the Series distributes to shareholders each year its taxable income, including any net realized gains on investments, in accordance with requirements of the Internal Revenue Code. Accordingly, no provision for federal income tax or excise tax has been made in the financial statements.
23
High Yield Bond Series
Notes to Financial Statements (continued)
| 2. | Significant Accounting Policies (continued) |
Federal Taxes(continued)
Management evaluates its tax positions to determine if the tax positions taken meet the minimum recognition threshold in connection with accounting for uncertainties in income tax positions taken or expected to be taken for the purposes of measuring and recognizing tax liabilities in the financial statements. Recognition of tax benefits of an uncertain tax position is required only when the position is “more likely than not” to be sustained assuming examination by taxing authorities. At December 31, 2019, the Series has recorded no liability for net unrecognized tax benefits relating to uncertain income tax positions taken or expected to be taken in future tax returns.
The Series files income tax returns in the U.S. federal jurisdiction, various states and foreign jurisdictions, as required. No income tax returns are currently under investigation. The statute of limitations on the Series’ tax returns remains open for the years ended December 31, 2016 through December 31, 2019. The Series is not aware of any tax positions for which it is reasonably possible that the total amounts of unrecognized tax benefits will significantly change in the next twelve months.
Foreign Taxes
Based on the Series’ understanding of the tax rules and rates related to income, gains and currency purchase/repatriation transactions for foreign jurisdictions in which it invests, the Series will provide for foreign taxes, and where appropriate, deferred foreign tax.
Distributions of Income and Gains
Distributions to shareholders of net investment income are made quarterly. Distributions of net realized gains are made annually. An additional distribution may be necessary to avoid taxation of the Series. Distributions are recorded on the ex-dividend date.
Indemnifications
The Fund’s organizational documents provide former and current directors and officers with a limited indemnification against liabilities arising in connection with the performance of their duties to the Fund. In the normal course of business, the Fund may also enter into contracts that provide general indemnifications. The Fund’s maximum exposure under these arrangements is unknown as this would be dependent on future claims that may be made against the Fund. The risk of material loss from such claims is considered remote.
Other
The preparation of financial statements in conformity with GAAP requires management to make estimates and assumptions that affect the reported amounts of assets and liabilities and the disclosure of contingent assets and liabilities at the date of the financial statements and the reported amounts of income and expenses during the reporting period. Actual results could differ from those estimates.
| 3. | Transactions with Affiliates |
The Fund has an Investment Advisory Agreement (the “Agreement”) with the Advisor, for which the Series pays a fee, computed daily and payable monthly, at an annual rate of 0.40% of the Series’ average daily net assets. Prior to March 1, 2019, the management fee for the Series was 0.55% of the Series’ average daily net assets.
Under the Agreement, personnel of the Advisor provide the Series with advice and assistance in the choice of investments and the execution of securities transactions, and otherwise maintain the Series’ organization. The Advisor also provides the Fund with necessary office space and fund administration and support services. The salaries of all officers of the Fund (except a percentage of the Fund’s Chief Compliance Officer’s salary, which is paid by the Fund), and of all Directors who are “affiliated persons” of the Fund, or of the Advisor, and all personnel of the Fund, or of the Advisor, performing services relating to research, statistical and investment activities, are paid by the Advisor. Each “non-affiliated” Director receives an annual stipend, which is allocated among all the active series of the Fund. In addition, these Directors also receive a fee per Board meeting attended plus a fee for each committee meeting attended and are reimbursed for travel and other out-of-pocket expenses incurred by them in connection with attending such meetings. The Fund also has an Audit Committee Chair, Governance & Nominating Committee Chair and Lead Independent Director, who each receive an additional annual stipend for these roles.
24
High Yield Bond Series
Notes to Financial Statements (continued)
| 3. | Transactions with Affiliates (continued) |
The Fund may enter into agreements with financial intermediaries pursuant to which the Fund may pay financial intermediaries for non-distribution related sub-transfer agency, administrative, sub-accounting, and other shareholder services in an annual amount not to exceed 0.15% of the average daily net assets of the Class I and Class S shares of the Series. Payments made pursuant to such agreements are generally based on the current assets and/or number of accounts of the Series attributable to the financial intermediary. Any payments made pursuant to such agreements may be in addition to, rather than in lieu of, any Distribution and Shareholder Services Fee payable under the Rule 12b-1 plan of the Fund.
Prior to March 1, 2019, the Class S shares of the Series were subject to a shareholder services fee in accordance with a shareholder services plan adopted by the Fund’s Board. The shareholder services fee was intended to compensate financial intermediaries, including affiliates of the Fund, in connection with the provision of direct client service, personal services, maintenance of shareholder accounts and reporting services. For these services, the Class S shares of the Series paid a fee, computed daily and payable monthly, at an annual rate of 0.25% of the average daily net assets of Class S. The Fund had a Shareholder Services Agreement with the Advisor, for which the Advisor received the shareholder services fee as stated above.
Manning & Napier Investor Services, Inc., a registered broker-dealer affiliate of the Advisor, acts as distributor for the Fund’s shares. Effective March 1, 2019, the Series compensates the distributor for distributing and servicing the Series’ Class S shares pursuant to a distribution plan adopted under Rule 12b-1 of the 1940 Act, regardless of expenses actually incurred. Under the agreement, the Series pays distribution and service fees to the distributor at an annual rate of 0.25% of average daily net assets attributable to Class S shares. There are no distribution and service fees on the Class I, Class W or Class Z shares. The fees are accrued daily and paid monthly.
Pursuant to a master services agreement dated March 1, 2017, as amended, the Fund pays the Advisor an annual fee related to fund accounting and administration of 0.0085% on the first $25 billion of average daily net assets (excluding Target Series and Income Series); 0.0075% on the next $15 billion of average daily net assets (excluding Target Series and Income Series); and 0.0065% of average daily net assets in excess of $40 billion (excluding Target Series and Income Series); plus a base fee of $30,400 per series. Additionally, certain transaction and out-of-pocket expenses, including charges for reporting relating to the Fund’s compliance program, are charged. The Advisor has agreements with BNY Mellon Investment Servicing (U.S.) Inc. (“BNY”) under which BNY serves as sub-accountant services agent.
Effective March 1, 2019, the Advisor has contractually agreed to waive the management fee for the Class W shares. The full management fee will be waived under this agreement because Class W shares are only available to discretionary investment accounts and other accounts managed by the Advisor. These clients pay a management fee to the advisor that is separate from the fund’s expenses. In addition, pursuant to a separate expense limitation agreement, the Advisor has contractually agreed to limit its fees and reimburse expenses to the extent necessary so that the total direct annual fund operating expenses, exclusive of the shareholder services fee and/or distribution and service (12b-1) fees and waived Class W management fees (collectively, “excluded expenses”), to 0.65% of the average daily net assets of the Class S and Class I shares, 0.10% of the average daily net assets of the Class W shares, and 0.50% of the average daily net assets of the Class Z shares. These contractual waivers are expected to continue indefinitely, and may not be amended or terminated by the Advisor without the approval of the Series’ Board of Directors. The Advisor may receive from a Class the difference between the Class’s total direct annual fund operating expenses, not including excluded expenses, and the Class’s contractual expense limit to recoup all or a portion of its prior fee waivers (other than Class W management fee waivers) or expense reimbursements made during the rolling three-year period preceding the recoupment if at any point the total direct annual fund operating expenses, not including excluded expenses, are below the contractual expense limit (a) at the time of the fee waiver and/or expense reimbursement and (b) at the time of the recoupment.
Pursuant to the advisory fee waiver, the Advisor waived $174,095 in management fees for Class W for the year ended December 31, 2019. In addition, pursuant to the separate expense limitation agreement, the Advisor waived or reimbursed expenses of $29,587, $26,197, $82,483 and $14,052 for Class S, Class I, Class W, and Class Z, respectively, for the year ended December 31, 2019. These amounts are included as a reduction of expenses on the Statement of Operations. At
25
High Yield Bond Series
Notes to Financial Statements (continued)
| 3. | Transactions with Affiliates (continued) |
December 31, 2019, the Advisor is eligible to recoup $137,142. For the year ended December 31, 2019, the Advisor did not recoup any expenses that have been previously waived or reimbursed.
| 4. | Purchases and Sales of Securities |
For the year ended December 31, 2019, purchases and sales of securities, other than U.S. Government securities and short-term securities, were $125,852,074 and $180,407,324, respectively. There were no purchases or sales of U.S. Government securities.
| 5. | Capital Stock Transactions |
Transactions in shares of Class S, Class I, Class W and Class Z shares of High Yield Bond Series were:
| CLASS S | FOR THE YEAR ENDED 12/31/19 | FOR THE YEAR ENDED 12/31/18 | ||||||||||||||
| SHARES | AMOUNT | SHARES | AMOUNT | |||||||||||||
Sold | 1,642,995 | $ | 16,381,730 | 1,739,400 | $ | 17,402,185 | ||||||||||
Reinvested | 70,733 | 706,281 | 413,607 | 4,067,430 | ||||||||||||
Repurchased | (9,114,775 | ) | (91,206,439 | ) | (2,824,655 | ) | (28,102,329 | ) | ||||||||
|
|
|
|
|
|
|
| |||||||||
Total | (7,401,047 | ) | $ | (74,118,428 | ) | (671,648 | ) | $ | (6,632,714 | ) | ||||||
|
|
|
|
|
|
|
| |||||||||
| CLASS I | FOR THE YEAR ENDED 12/31/19 | FOR THE YEAR ENDED 12/31/18 | ||||||||||||||
| SHARES | AMOUNT | SHARES | AMOUNT | |||||||||||||
Sold | 1,671,447 | $ | 14,404,572 | 3,138,986 | $ | 27,366,623 | ||||||||||
Reinvested | 180,138 | 1,544,925 | 172,346 | 1,470,674 | ||||||||||||
Repurchased | (3,441,929 | ) | (29,641,919 | ) | (2,297,624 | ) | (19,885,616 | ) | ||||||||
|
|
|
|
|
|
|
| |||||||||
Total | (1,590,344 | ) | $ | (13,692,422 | ) | 1,013,708 | $ | 8,951,681 | ||||||||
|
|
|
|
|
|
|
| |||||||||
| CLASS W | FOR THE PERIOD 3/1/19 TO 12/31/19 | |||||||||||||||
| SHARES | AMOUNT | |||||||||||||||
Sold | 7,954,385 | $ | 79,582,220 | |||||||||||||
Reinvested | 296,675 | 2,958,361 | ||||||||||||||
Repurchased | (5,238,856 | ) | (52,565,362 | ) | ||||||||||||
|
|
|
| |||||||||||||
Total | 3,012,204 | $ | 29,975,219 | |||||||||||||
|
|
|
| |||||||||||||
| CLASS Z | FOR THE PERIOD 3/1/19 TO 12/31/19 | |||||||||||||||
| SHARES | AMOUNT | |||||||||||||||
Sold | 1,423,915 | $ | 12,339,574 | |||||||||||||
Reinvested | 13,020 | 111,657 | ||||||||||||||
Repurchased | (1,248,505 | ) | (10,763,352 | ) | ||||||||||||
|
|
|
| |||||||||||||
Total | 188,430 | $ | 1,687,879 | |||||||||||||
|
|
|
| |||||||||||||
Approximately 46% of the shares outstanding are fiduciary accounts where the Advisor has sole investment discretion. At December 31, 2019, the Advisor and its affiliates owned less than 0.1% of the Series.
26
High Yield Bond Series
Notes to Financial Statements (continued)
| 6. | Line of Credit |
The Fund has entered into a 364-day, $25 million credit agreement (the “line of credit”) with Bank of New York Mellon. Each series of the Fund may borrow under the line of credit for temporary or emergency purposes, including funding shareholder redemptions and other short-term liquidity purposes. The Fund pays an annual fee on the unused commitment amount, payable quarterly, and is allocated among all the series of the Fund and included in miscellaneous expenses in the Statement of Operations for each series. The line of credit expires in August 2020 unless extended or renewed. During the year ended December 31, 2019, the Series did not borrow under the line of credit.
| 7. | Financial Instruments and Loan Assignments |
The Series may trade in instruments including written and purchased options, forward foreign currency exchange contracts and futures contracts and other derivatives in the normal course of investing activities to assist in managing exposure to various market risks. The Series may be subject to various elements of risk, which may involve, to a varying degree, elements of risk in excess of the amounts recognized for financial statement purposes. These risks include: the risk that changes in the value of a derivative may not correlate perfectly with the underlying asset, rate or index; counterparty credit risk related to over the counter derivative counterparties’ failure to perform under contract terms; liquidity risk related to the lack of a liquid market for these contracts allowing the fund to close out its position(s); and documentation risk relating to disagreement over contract terms. No such investments were held by the Series as of December 31, 2019.
The Series may invest in a loan assignment of all or a portion of the loans. The Series has direct rights against the borrower on a loan when it purchases an assignment; however, the Series’ rights may be more limited than the lender from which it acquired the assignment and the Series may be able to enforce its rights only through an administrative agent. Loan assignments are vulnerable to market conditions and may become illiquid due to economic conditions or other events may reduce the demand for loan assignments and certain loan assignments which were liquid when purchased may become illiquid. No such investments were held by the Series as of December 31, 2019.
| 8. | Foreign Securities |
Investing in securities of foreign companies and foreign governments involves special risks and considerations not typically associated with investing in securities of domestic companies and the U.S. Government. These risks include revaluation of currencies and future adverse political and economic developments. Moreover, securities of foreign companies and foreign governments and their markets may be less liquid and their prices more volatile than those of comparable domestic companies and the U.S. Government.
| 9. | Federal Income Tax Information |
The amount and characterization of certain income and capital gains to be distributed are determined in accordance with federal income tax regulations, which may differ from GAAP. These differences are primarily due to differing book and tax treatments in the timing and/or treatment of the recognition of net investment income or gains and losses, including losses deferred due to wash sales. The Series may periodically make reclassifications among its capital accounts to reflect income and gains available for distribution (or available capital loss carryovers) under income tax regulations without impacting the Series’ net asset value. For the year ended December 31, 2019, $2,913 was reclassified within the capital accounts from Paid-in Capital to Total Distributable Earnings (Loss). Any such reclassifications are not reflected in the financial highlights.
The tax character of distributions paid were as follows:
| FOR THE YEAR ENDED 12/31/19 | FOR THE YEAR ENDED 12/31/18 | |||
Ordinary income | $6,144,998 | $6,294,548 |
27
High Yield Bond Series
Notes to Financial Statements (continued)
| 9. | Federal Income Tax Information (continued) |
At December 31, 2019, the tax basis of components of distributable earnings and the net unrealized depreciation based on the identified cost for federal income tax purposes were as follows:
Cost for federal income tax purposes | $ | 64,972,887 | ||
Unrealized appreciation | 1,729,165 | |||
Unrealized depreciation | (2,464,033 | ) | ||
|
| |||
Net unrealized depreciation | $ | (734,868 | ) | |
|
| |||
Capital loss carryforwards | $ | (5,655,822 | ) | |
At December 31, 2019, the capital loss carryover utilized in the current year was $680,975.
As of December 31, 2019, the Series had net long-term capital loss carryforwards of $5,655,822, which may be carried forward indefinitely.
28
High Yield Bond Series
Report of Independent Registered Public Accounting Firm
To the Board of Directors of Manning & Napier Fund, Inc. and Shareholders of High Yield Bond Series
Opinion on the Financial Statements
We have audited the accompanying statement of assets and liabilities, including the investment portfolio, of High Yield Bond Series (one of the series constituting Manning & Napier Fund, Inc., referred to hereafter as the “Fund”) as of December 31, 2019, the related statement of operations for the year ended December 31, 2019, the statement of changes in net assets for each of the two years in the period ended December 31, 2019, including the related notes, and the financial highlights for each of the periods indicated therein (collectively referred to as the “financial statements”). In our opinion, the financial statements present fairly, in all material respects, the financial position of the Fund as of December 31, 2019, the results of its operations for the year then ended, the changes in its net assets for each of the two years in the period ended December 31, 2019 and the financial highlights for each of the periods indicated therein in conformity with accounting principles generally accepted in the United States of America.
Basis for Opinion
These financial statements are the responsibility of the Fund’s management. Our responsibility is to express an opinion on the Fund’s financial statements based on our audits. We are a public accounting firm registered with the Public Company Accounting Oversight Board (United States) (PCAOB) and are required to be independent with respect to the Fund in accordance with the U.S. federal securities laws and the applicable rules and regulations of the Securities and Exchange Commission and the PCAOB.
We conducted our audits of these financial statements in accordance with the standards of the PCAOB. Those standards require that we plan and perform the audit to obtain reasonable assurance about whether the financial statements are free of material misstatement, whether due to error or fraud.
Our audits included performing procedures to assess the risks of material misstatement of the financial statements, whether due to error or fraud, and performing procedures that respond to those risks. Such procedures included examining, on a test basis, evidence regarding the amounts and disclosures in the financial statements. Our audits also included evaluating the accounting principles used and significant estimates made by management, as well as evaluating the overall presentation of the financial statements. Our procedures included confirmation of securities owned as of December 31, 2019 by correspondence with the custodian. We believe that our audits provide a reasonable basis for our opinion.
New York, New York
February 14, 2020
We have served as the auditor of one or more investment companies in Manning & Napier Mutual Funds since 1992.
29
High Yield Bond Series
Renewal of Investment Advisory Agreement
(unaudited)
At the Manning & Napier Fund, Inc. (the “Fund”) Board of Directors’ (the “Board”) meeting, held on November 21, 2019, the Investment Advisory Agreement (the “Agreement”) between the Fund and Manning & Napier Advisors, LLC (the “Advisor”) was considered for renewal by the Board, including all of the Directors who are not “interested persons” (“Independent Directors”), within the meaning of the Investment Company Act of 1940, as amended (the “1940 Act”). In connection with the decision whether to renew the Agreement, a variety of material was provided to the Board in advance of the meeting for their review and consideration. The Board also held a working session on October 25, 2019 to review and discuss information provided to the Board, and for the Board to request additional information.
Representatives of the Advisor attended a portion of the working session and attended the Board meeting. The Advisor provided supplemental information requested by the Board and presented additional oral information to the Board to assist the Board in its considerations. In addition to the information furnished by the Advisor, the Board was provided with a legal memorandum discussing its fiduciary duties related to its approval of the continuation of the Agreement. Legal counsel for the Fund discussed with the Board the applicable legal considerations. In addition, the Board receivedin-person presentations about the Fund throughout the year.
The Independent Directors were advised by independent legal counsel with respect to these matters. The Independent Directors also met separately in an executive session with their legal counsel without any representatives of the Advisor present.
The Directors’ determinations at the meeting were made on the basis of each Director’s business judgment after consideration of all the information presented. In deciding to recommend the renewal of the Agreement with respect to each Series of the Fund, the Independent Directors did not identify any single or particular piece of information that, in isolation, was the controlling factor. Each Independent Director may also have weighed factors differently. This summary describes the most important, but not all, of the factors considered by the Board and the Independent Directors.
| • | The Board considered the nature and quality of services provided by the Advisor under the Agreement for over 30 years including, among others: deciding what securities to purchase and sell for each Series; arranging for the purchase and sale of such securities by placing orders with broker-dealers; administering the affairs of the Fund (including the books and records of the Fund not maintained by third party service providers such as the custodian or transfer agent); arranging for the insurance coverage for the Fund; and supervising the preparation of tax returns, SEC filings (including registration statements) and reports to shareholders for the Fund. The Board considered the numerous services performed by the Advisor and its affiliates beyond those stated in the Agreements. The Board also considered the Advisor’s personnel who perform services to the Fund, changes in senior or key personnel, industry trends impacting the mutual fund industry, the strength of the Advisor’s compliance infrastructure, policies and procedures relating to compliance with securities regulations, reputation, expertise and resources. The Board discussed the quality of these services with representatives from the Advisor and concluded that the Advisor was performing its services to the Fund required under the Agreement in a reasonable manner. |
| • | The Board considered the Advisor’s investments teams, including changes to the investment teams and investment team’s compensation during the past year, and the investment process. The Board considered the performance of each Series since its inception, as well as over multiple time periods including: one year, three year, five year, ten year, and current market cycle. A market cycle includes periods of both rising and falling markets. Returns for established benchmark indices for each Series were provided. In addition, the Board considered (and considers on a quarterly basis) a number of other factors relevant to performance at the meeting including: a peer group performance analysis consisting of Morningstar universes of mutual funds with similar investment objectives; the breadth of the Fund’s product offerings; and performance over reasonable time periods. Representatives of the Advisor discussed improved performance for many of the Series over theone- and three-year time periods ending September 30, 2019. The Board discussed with Representatives of the Advisor, performance challenges that continue to impact the three- and five-year performance of certain Fund’s strategies resulting from periods of underperformance in 2014 and 2016. After discussion, the Board acknowledged the improved short term performance of many of the Series and concluded that notwithstanding the performance challenges that continue to impact certain Series, the nature and quality of the investment management services provided by the Advisor to the Fund supported the renewal of the agreement. |
| • | The Board considered the fees and expenses of the various Series of the Fund. The Advisor presented the advisory fees and total expenses for each Series, including the advisory fee adjusted for any contractual expense waivers or reimbursements paid by the Advisor. Representatives of the Advisor discussed the multi-year fee restructuring initiative which was completed by the Advisor on March 1, 2019 to increase the competitiveness of the Fund’s fees. The fee |
30
High Yield Bond Series
Renewal of Investment Advisory Agreement
(unaudited)
restructuring project also resulted in a set of standardized share classes to help support the Fund’s distribution efforts across client types and varying intermediary distribution models. |
| • | The Board considered whether the Advisor had achieved economies of scale with respect to its services to the Fund. The Board acknowledged the expense caps incorporated in the Fund’s current fee structure, which requires the Advisor to subsidize the expenses of the Series operating above their expense cap, noting that 26 Series of the Fund are currently receiving expense reimbursements from the Advisor. The Board concluded that the Fund would need to grow in assets before the Advisor would be able to achieve meaningful economies of scale. |
| • | The Advisor provided the Board with information comparing each Series’ contractual management fees with the Advisor’s standard advisory fees for separate accounts and collective investment trusts. The Board considered that the range of services provided to the Series is more extensive than for the Advisor’s other clients due to additional infrastructure, administrative and regulatory requirements related to operating a mutual fund. |
| • | The current advisory fees,12b-1 Distribution and Service Fees, other expenses (e.g. a combination of Shareholder Services Fees, intermediarysub-TA fees, routine operating expenses and Acquired Fund Fees and Expenses forfund-of-fund Series) and total expense ratios of each Series and share class were compared and ranked (on both a mean and median basis) against respective peer universes. Respective peer universes included funds of a similar size and with similar investment objectives and expense characteristics as disclosed on the Morningstar database. Representatives of the Advisor discussed with the Board the comparisons and rankings of fees and net expense ratios for each Series of the Fund and the methodology behind the comparison. The Board considered the Advisor’s active portfolio management that results in portfolios that are more differentiated than the construction of their benchmarks. The Board acknowledged that the fee restructuring project completed on March 1, 2019 reduced the expense ratios for shareholders in many Series. Based on their review of the information provided, the Board concluded that the current fees and expenses of each Series of the Fund were reasonable on a comparative basis. |
| • | The Board also considered the other benefits the Advisor derives from its relationship with the Fund. Such other benefits include participation in a joint insurance program, sharing of compensation expenses for certain shared personnel, relationships with large service providers, the utilization of Series within the Advisor’s separately managed accounts and certain research services provided by soft dollars. The Board reviewed the broker-dealers who provided research to the Advisor and the products and services paid for, in whole or in part, using soft dollar commissions. The Board concluded that these additional benefits to the Advisor were reasonable. |
Based on the Board’s deliberations and their evaluation of the information described above, the Board, including a majority of the Independent Directors, concluded that the compensation under the Agreement was fair and reasonable with respect to each Series in light of the services and expenses and such other matters as the Directors considered to be relevant in the exercise of their reasonable judgment, and that the renewal of the Agreement would be in the best interests of each Series and its shareholders. The Board did not indicate that any single factor was determinative of its decision to approve the Agreement, but indicated that the Board based its determination on the total mix of information available to it.
31
High Yield Bond Series
Directors’ and Officers’ Information
(unaudited)
The Statement of Additional Information provides additional information about the Fund’s directors and officers and can be obtained without charge by calling1-800-466-3863, at www.manning-napier.com, or on the EDGAR Database on the SEC Internet web site (http://www.sec.gov). The following chart shows certain information about the Fund’s directors and officers, including their principal occupations during the last five years. Unless specific dates are provided, the individuals have held the listed positions for longer than five years.
| Interested Director and Officer | ||
| Name: | Paul Battaglia* | |
| Address: | 290 Woodcliff Drive | |
| Fairport, NY 14450 | ||
| Age: | 41 | |
| Current Position(s) Held with Fund: | Principal Executive Officer, President, Chairman & Director | |
| Term of Office & Length of Time Served: | Indefinite – Chairman and Director since November 20181 | |
| Principal Occupation(s) During Past 5 Years: | Chief Financial Officer (2018 – Present); Vice President of Finance (2016 – 2018); Director of Finance (2011 – 2016); Financial Analyst/Internal Auditor (2004-2006) – Manning & Napier Advisors, LLC and affiliates Holds one or more of the following titles for various subsidiaries and affiliates: Chief Financial Officer | |
| Number of Portfolios Overseen within Fund Complex: | 31 | |
Other Directorships Held Outside Fund Complex During Past 5 Years: | N/A | |
| Independent Directors | ||
| Name: | Stephen B. Ashley | |
| Address: | 290 Woodcliff Drive | |
| Fairport, NY 14450 | ||
| Age: | 79 | |
| Current Position(s) Held with Fund: | Director, Audit Committee Member, Governance & Nominating Committee Member | |
| Term of Office & Length of Time Served: | Indefinite – Since 1996 | |
| Principal Occupation(s) During Past 5 Years: | Chairman and Director (1997 to present); Chief Executive Officer | |
| (1997-2019) - Ashley Companies (property management and investment). | ||
| Number of Portfolios Overseen within Fund Complex: | 31 | |
| Other Directorships Held Outside Fund Complex During | Ashley Companies (1997 - present) | |
| Past 5 Years: | ||
| Name: | Paul A. Brooke | |
| Address: | 290 Woodcliff Drive | |
| Fairport, NY 14450 | ||
| Age: | 74 | |
| Current Position(s) Held with Fund: | Lead Independent Director, Audit Committee Member, Governance & | |
| Nominating Committee Chairman | ||
| Term of Office & Length of Time Served: | Indefinite – Director, Audit Committee Member, Governance & Nominating Committee Member since 2007; Governance & Nominating Committee Chairman since 2016; Lead Independent Director since 2017 | |
| Principal Occupation(s) During Past 5 Years: | Chairman & CEO (2005-2009) - Ithaka Acquisition Corporation (investments); Chairman (2007-2009) - Alsius Corporation (investments); Managing Member (1991-present) - PMSV Holdings LLC (investments); Managing Member (2010-2016) - Venbio (investments). | |
| Number of Portfolios Overseen within Fund Complex: | 31 | |
| Other Directorships Held Outside Fund Complex During Past 5 Years: | Incyte Corp. (biotech)(2000-present); ViroPharma, Inc. (speciality pharmaceuticals)(2000-2014); HLTH (WebMD)(information)(2000-2010); Cheyne Capital International (investment)(2000-2017); GMP Companies (investment)(2000-2011); Cytos Biotechnology Ltd (biotechnology)(2012-2014); Cerus (biomedical)(2016-present);PureEarth(non-profit)
| |
32
High Yield Bond Series
Directors’ and Officers’ Information
(unaudited)
Independent Directors (continued)
| Name: | Peter L. Faber | |
| Address: | 290 Woodcliff Drive | |
| Fairport, NY 14450 | ||
| Age: | 81 | |
| Current Position(s) Held with Fund: | Director, Governance & Nominating Committee Member | |
| Term of Office & Length of Time Served: | Indefinite – Since 1987 | |
| Principal Occupation(s) During Past 5 Years: | Senior Counsel (2006-2012), Partner (1995-2006 & 2013-2018) - McDermott, Will & Emery LLP (law firm) | |
Number of Portfolios Overseen within Fund Complex: Other Directorships Held Outside Fund Complex During Past 5 Years: | 31 Boston Early Music Festival(non-profit)(2007-present); Amherst Early Music, Inc.(non-profit)(2009-present); Gotham Early Music Scene, Inc.(non-profit)(2009-present); Partnership for New York City, Inc.(non-profit)(1989-2010); New York Collegium(non-profit)(2004-2011); S’Cool Sounds, Inc.(non-profit)(2017-present) | |
| Name: | Harris H. Rusitzky | |
| Address: | 290 Woodcliff Drive | |
| Fairport, NY 14450 | ||
| Age: | 84 | |
| Current Position(s) Held with Fund: | Director, Audit Committee Member, Governance & Nominating Committee | |
| Member | ||
| Term of Office & Length of Time Served: | Indefinite – Since 1985 | |
| Principal Occupation(s) During Past 5 Years: | President (1994- present) - The Greening Group (business consultants); | |
| Partner (2006-present) - The Restaurant Group (restaurants) | ||
Number of Portfolios Overseen within Fund Complex: Other Directorships Held Outside Fund Complex During Past 5 Years: | 31 Rochester Institute of Technology (university)(1972-present); Culinary Institute of America(non-profit college)(1985-present); George Eastman Museum (museum)(1988-present); National Restaurant Association (restaurant trade organization)(1978-present) | |
| Name: | Chester N. Watson | |
| Address: | 290 Woodcliff Drive | |
| Fairport, NY 14450 | ||
| Age: | 69 | |
| Current Position(s) Held with Fund: | Director, Audit Committee Chairman, Governance & Nominating | |
| Committee Member | ||
| Term of Office & Length of Time Served: | Indefinite – Director, Audit Committee Member, Governance & Nominating | |
| Committee Member Since 2012; Audit Committee Chairman since 2013 | ||
| Principal Occupation(s) During Past 5 Years: | General Auditor (2003-2011) - General Motors Company (auto | |
| manufacturer) | ||
Number of Portfolios Overseen within Fund Complex: Other Directorships Held Outside Fund Complex During Past 5 Years: | 31 Rochester Institute of Technology (University)(2005-present); Town of Greenburgh, NY Planning Board (Municipal Government) (2015-2019); Hudson Valley Center for Innovation, Inc. (New Business and Economic Development) (2019 – present) | |
| Officers: | ||
| Name: | Elizabeth Craig | |
| Address: | 290 Woodcliff Drive | |
| Fairport, NY 14450 | ||
| Age: | 32 | |
| Current Position(s) Held with Fund: | Corporate Secretary | |
| Term of Office1& Length of Time Served: | Since 2016 | |
| Principal Occupation(s) During Past 5 Years: | Fund Regulatory Administration Manager since 2018; Fund Administration Manager (2015-2018); Mutual Fund Compliance Specialist (2009-2015) - Manning & Napier Advisors, LLC; Assistant Corporate Secretary (2011-2016) - Manning & Napier Fund, Inc.; Corporate Secretary, Director – Manning & Napier Investor Services, Inc. (since 2019)
| |
33
High Yield Bond Series
Directors’ and Officers’ Information
(unaudited)
Officers: (continued)
| Name: | Christine Glavin | |
| Address: | 290 Woodcliff Drive | |
| Fairport, NY 14450 | ||
| Age: | 53 | |
| Current Position(s) Held with Fund: | Principal Financial Officer, Chief Financial Officer | |
| Term of Office1& Length of Time Served: | Principal Financial Officer since 2002; Chief Financial Officer since 2001 | |
| Principal Occupation(s) During Past 5 Years: | Director of Fund Reporting since 2011; Fund Reporting Manager (1997-2011) - Manning & Napier Advisors, LLC; Assistant Treasurer since 2008 - Exeter Trust Company; Chief Financial Officer (2017-2018) - Rainier Investment Management Mutual Funds, Inc. | |
| Name: | Samantha Larew | |
| Address: | 290 Woodcliff Drive | |
| Fairport, NY 14450 | ||
| Age: | 39 | |
| Current Position(s) Held with Fund: | Chief Compliance Officer and Anti-Money Laundering Compliance Officer | |
| Term of Office1& Length of Time Served: | Chief Compliance Officer since 2019; Anti-Money Laundering Compliance | |
| Officer since 2018 | ||
| Principal Occupation(s) During Past 5 Years: | Co-Director of Compliance (since 2018); Compliance Communications Supervisor (2014-2018); Compliance Supervisor (2013-2014); Broker-Dealer Compliance Supervisor (2011-2013); Broker-Dealer Compliance Analyst (2010-2011) - Manning & Napier Advisors, LLC & Affiliates; Broker-Dealer Chief Compliance Officer (since 2013); Broker-Dealer Assistant Corporate Secretary (since 2011) – Manning & Napier Investor Services, Inc.; Compliance Analyst (2007-2009) – Wall Street Financial Group; Compliance Specialist (2003-2007) – Manning & Napier Advisors, LLC & Affiliates Holds one or more of the following titles for various affiliates: Assistant Corporate Secretary, Chief Compliance Officer | |
| Name: | Scott Morabito | |
| Address: | 290 Woodcliff Drive | |
| Fairport, NY 14450 | ||
| Age: | 32 | |
| Current Position(s) Held with Fund: | Vice President | |
| Term of Office1& Length of Time Served: | Vice President since 2019; Assistant Vice President (2017-2019) | |
| Principal Occupation(s) During Past 5 Years: | Managing Director of Operations since 2019; Director of Funds Group (2017-2019); Fund Product and Strategy Manager (2014-2017); Senior Product and Strategy Analyst (2013-2014); Product and Strategy Analyst (2011-2013) - Manning & Napier Advisors, LLC; President, Director – Manning & Napier Investor Services, Inc. (since 2018) | |
| Name: | Sarah Turner | |
| Address: | 290 Woodcliff Drive | |
| Fairport, NY 14450 | ||
| Age: | 37 | |
| Current Position(s) Held with Fund: | Chief Legal Officer; Assistant Corporate Secretary | |
| Term of Office1& Length of Time Served: | Since 2018 | |
| Principal Occupation(s) During Past 5 Years: | Attorney since 2018 - Manning & Napier Advisors, LLC and affiliates; Counsel (2017-2018) – Harter Secrest and Emery LLP; Legal Counsel (2010-2017) – Manning & Napier Advisors, LLC and affiliates Holds one or more of the following titles for various affiliates: Corporate Secretary, General Counsel | |
*Interested Director, within the meaning of the 1940 Act by reason of his positions with the Fund’s Advisor, Manning & Napier Advisors, LLC, and Distributor, Manning & Napier Investor Services, Inc.
1The term of office of all officers shall be one year and until their respective successors are chosen and qualified, or his or her earlier resignation or removal as provided in the Fund’sBy-Laws.
34
High Yield Bond Series
Literature Requests
(unaudited)
Proxy Voting Policies and Procedures
A description of the policies and procedures that the Fund uses to determine how to vote proxies relating to portfolio securities is available, without charge, upon request:
| By phone | 1-800-466-3863 | |||
| On the Securities and Exchange | ||||
| Commission’s (SEC) web site | http://www.sec.gov |
Proxy Voting Record
Information regarding how the Fund voted proxies relating to portfolio securities during the most recent12-month period ended June 30th is available, without charge, upon request:
| By phone | 1-800-466-3863 | |||
| On the SEC’s web site | http://www.sec.gov |
Quarterly Portfolio Holdings
The Series’ complete schedule of portfolio holdings for the 1st and 3rd quarters of each fiscal year are provided on FormN-PORT, and are available, without charge, upon request:
| By phone | 1-800-466-3863 | |||
| On the SEC’s web site | http://www.sec.gov |
Prospectus and Statement of Additional Information (SAI)
For more information about any of the Manning & Napier Fund, Inc. Series, you may obtain a prospectus and SAI at www.manning-napier.com or by calling (800)466-3863. Before investing, carefully consider the objectives, risks, charges and expenses of the investment and read the prospectus carefully as it contains this and other information about the investment company.In addition, this information can be found on the SEC’s web site, http://www.sec.gov.
Additional information available at www.manning-napier.com
1. Fund Holdings -Month-End
2. Fund Holdings -Quarter-End
3. Shareholder Report - Annual
4. Shareholder Report - Semi-Annual
The Fund also offers electronic notification or“e-delivery” when certain documents are availableon-line to be downloaded or reviewed. Direct shareholders can elect to receive electronic notification when shareholder reports, prospectus updates, and/or statements are available. If you do not currently haveon-line access to your account, you can establish access by going to www.manning-napier.com, click on “Login” in the top corner of the page, and follow the prompts to self-enroll. Once enrolled, you can set your electronic notification preferences by clicking on the Account Options tab located within the green toolbar and then selectE-Delivery Option. Should you have any questions on either how to establishon-line access or how to update your account settings, please contact Investor Services at1-800-466-3863.
The Manning & Napier Fund, Inc. is managed by Manning & Napier Advisors, LLC. Manning & Napier Investor Services, Inc., an affiliate of Manning & Napier Advisors, LLC, is the distributor of the Fund shares.
MNHYB-12/19-AR
Manning & Napier Fund, Inc.
Unconstrained Bond Series
Beginning on February 25, 2021, as permitted by Securities and Exchange Commission regulations, paper copies of the Series’ annual and semi-annual shareholder reports will no longer be sent by mail, unless you specifically request paper copies of the reports from the Fund or from your financial intermediary, such as a broker-dealer or bank. Instead, the reports will be made available on a website, and you will be notified by mail each time a report is posted and provided with a website link to access the report.
If you already elected to receive shareholder reports electronically, you will not be affected by this change and you need not take any action. You may elect to receive shareholder reports and other communications from the Fund electronically by contacting your financial intermediary or, if you are a direct investor, by visiting www.manning-napier.com or calling1-800-466-3863.
You may elect to receive all future annual and semi-annual reports in paper free of charge. If you invest through a financial intermediary, you can contact your financial intermediary to request that you continue to receive paper copies of your shareholder reports. If you invest directly with the Fund, you can inform the Fund that you wish to continue receiving paper copies of your shareholder reports by visiting www.manning-napier.com or calling1-800-466-3863. Your election to receive reports in paper will apply to all funds held with your financial intermediary if you invest through a financial intermediary or all series of the Fund if you invest directly with the Fund. |
| Independent Perspective | Real-World Solutions |
A Note from Our CEO
Dear Shareholder,
The investing world is constantly changing, yet investors’ needs and objectives remain substantially the same.
Whether you are an individual saver looking to ensure security in retirement, or an institutional investor with a fiduciary obligation to others, at the end of the day you look for a trusted partner to help you build, grow, and preserve wealth.
In order to do so successfully we recognize that, in the short-term, the world’s capital markets can be capricious and hard to predict.
Bubbles form, rise, and then pop. The hot stocks of today often become passing fads of tomorrow. Investor sentiment can swing wildly, whipsawing between exuberance one day and despondence the next.
As successful long-term investors, we are defined both by what we do as well as what we don’t do.
We don’t attempt to perfectly time every recession. We don’t jump on the latest trend. We don’t worry about capturing every market peak all across the globe.
On the other hand, we do maintain the rigorous disciplines we have developed over close to half a century. We are highly attentive to managing risk and protecting investors in down markets while participating fully in the opportunities our Research uncovers.
Our focus is on you, the shareholder, and helping you achieve your goals.
In the face of an uncertain world, we believe our investment philosophies, processes, and experience have stood the test of time and will do so in the future.
We appreciate your continued confidence in our approach.
|
Sincerely,
Marc Mayer
Chief Executive Officer |
Corporate Headquarters | 290 Woodcliff Drive | Fairport, NY 14450 | (585)325-6880 phone | (800)551-0224 toll free | www.manning-napier.com
1
Unconstrained Bond Series
Fund Commentary
(unaudited)
Investment Objective
Primarily to provide long-term total return, with a secondary objective of preservation of capital. Under normal circumstances, at least 80% of the Series’ assets will be invested in bonds and other financial instruments with economic characteristics similar to bonds. Up to 50% of the Series may be invested in below investment-grade securities and/or innon-US dollar denominated securities, including securities issued by companies located in emerging markets. Derivatives, such as futures, options, swaps, and forwards, may also be used to manage interest rate exposure, duration, or currency risk.
Performance Commentary
Fixed income markets posted positive returns for the twelve-month period ending December 31, 2019. Despite some intra-year volatility, interest rates fell roughly 60 to 100 basis points across the yield curve during the year amid recessionary fears, geopolitical uncertainty, and a global central bank shift towards more accommodative monetary policy. With respect to credit, investment grade corporate credit spreads ended the year ~60 basis points tighter than the previous year and high yield spreads ended ~170 basis points tighter as investors continued to search for sources of yield. Given these dynamics, longer dated Treasuries outperformed shorter dated Treasuries and corporate bonds were the best performing fixed income sector for the year.
The Unconstrained Bond Series Class S shares delivered positive absolute returns during 2019, returning 5.01%, and outperformed its benchmark, the FTSE3-Month Treasury Bill Index, which returned 2.25%.
Relative outperformance is attributable to the Series’ longer duration as interest rates broadly fell for the year, as well as its notable allocation to credit-related securities as spreads tightened.
In terms of positioning, we continue to believe a low absolute duration and large allocation to short-dated credit-related securities are most appropriate given the Series’ goal of delivering positive absolute returns over a variety of environments. With respect to high yield, we continue to have a modest allocation with a portion of that invested in shorter-dated high yield. Additionally, we continue to find select opportunities innon-dollar securities outside the United States.
While 2019 was a very strong year for fixed income, we believe investor return expectations for the coming year should be tempered as the fixed income landscape remains challenging due to low starting rates. That stated, we believe our “go anywhere” solution allows flexibility to find positive absolute returns during different phases of the market and economic cycle by allowing us to target specific risks as valuations and conditions warrant.
Performance for the Unconstrained Bond Series Class S shares is provided above. Performance for other shares classes will differ based on each class’ underlying expenses.
Performance data quoted represents past performance and does not guarantee future results. The investment return and principal value of an investment will fluctuate, so that an investor’s shares, when redeemed, may be worth more or less than their original cost. Current performance may be higher or lower than that quoted; investors can obtain the most recentmonth-end performance at www.manning-napier.com or by calling (800)466-3863.
Additional information and associated disclosures can be found on the Performance Update page of this report.
All investments involve risks, including possible loss of principal. There is an inverse relationship between bond prices and interest rates; as interest rates rise, bond prices (and therefore the value of bond funds) fall. Likewise, as interest rates fall, bond prices and the value of bond funds rise. Investments in higher-yielding, lower-rated securities involve additional risks, including a higher risk of default and loss of principal. Funds that invest in foreign countries may be subject to the risks of adverse changes in foreign economic, political, regulatory and other conditions as well as risks related to the use of different financial standards. Investments in emerging markets may be more volatile than investments in more developed markets. Investments in derivatives can be highly volatile and involve risks in addition to the risks of the underlying instrument on which the derivative is based, such as counterparty, correlation and liquidity risk. Also, the use of leverage increases exposure to the market and may magnify potential losses.
2
Unconstrained Bond Series
Performance Update as of December 31, 2019
(unaudited)
AVERAGE ANNUAL TOTAL RETURNS AS OF DECEMBER 31, 2019 | ||||||
| ONE YEAR1 | FIVE YEAR | TEN YEAR | ||||
Unconstrained Bond Series - Class S2 | 5.01% | 2.30% | 4.01% | |||
Unconstrained Bond Series - Class I2,3 | 5.37% | 2.57% | 4.17% | |||
Unconstrained Bond Series - Class W2,4 | 5.74% | 2.44% | 4.08% | |||
FTSE3-Month Treasury Bill Index5 | 2.25% | 1.05% | 0.56% | |||
Bloomberg Barclays U.S. Aggregate Bond Index6 | 8.72% | 3.05% | 3.75% | |||
The following graph compares the value of a $10,000 investment in the Unconstrained Bond Series - Class S for the ten years ended December 31, 2019 to the FTSE3-Month Treasury Bill Index and Bloomberg Barclays U.S. Aggregate Bond Index.
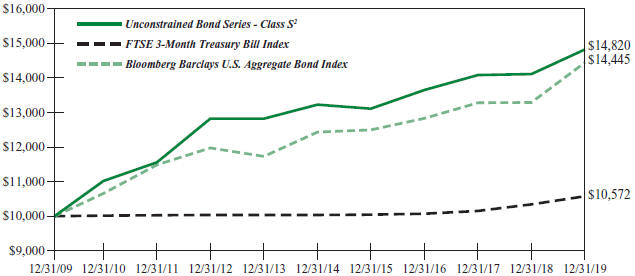
1The returns shown are based on net asset values calculated for shareholder transactions and may differ from the returns shown in the financial highlights, which reflect adjustments made to the net asset values in accordance with accounting principles generally accepted in the United States of America.
2The Series’ performance does not reflect the deduction of taxes that a shareholder would pay on fund distributions or the redemption of shares. The Series’ performance is historical and may not be indicative of future results. The performance returns shown are inclusive of the net expense ratio of the Series. For the year ended December 31, 2019, this net expense ratio was 0.75% for Class S, 0.48% for Class I and 0.05% for Class W. The gross expense ratio, which does not account for any voluntary or contractual waivers currently in effect, was 0.76% for Class S, 0.49% for Class I and 0.36% for Class W for the year ended December 31, 2019.
3For periods through August 1, 2013 (the inception date of the Class I shares), performance for the Class I shares is based on the historical performance of the Class S shares. Because the Class I shares invest in the same portfolio of securities as Class S, performance will only be different to the extent that the Class S shares have a higher expense ratio.
4For periods through March 1, 2019 (the inception date of the Class W shares), performance for the Class W shares is based on the historical performance of the Class S shares. Because the Class W shares invest in the same portfolio of securities as the Class S shares, performance will be different only to the extent that the Class S shares have a higher expense ratio.
5The FTSE3-Month Treasury Bill Index is an unmanaged index based on3-Month U.S. treasury bills. The Index measures the monthly return equivalents of yield averages that are not marked to market. The Index returns do not reflect any fees or expenses. Index returns provided by Interactive Data.
3
Unconstrained Bond Series
Performance Update as of December 31, 2019
(unaudited)
6The Bloomberg Barclays U.S. Aggregate Bond Index is an unmanaged, market-value weighted index of U.S. domestic investment-grade debt issues, including government, corporate, asset-backed, and mortgage-backed securities, with maturities of one year or more. Index returns do not reflect any fees or expenses. Index returns provided by Interactive Data.
4
Unconstrained Bond Series
Shareholder Expense Example
(unaudited)
As a shareholder of the Series, you incur ongoing costs, including management fees, shareholder service fees and other Series expenses. This example is intended to help you understand your ongoing costs (in dollars) of investing in the Series and to compare these costs with the ongoing costs of investing in other mutual funds.
The example is based on an investment of $1,000 invested in each class at the beginning of the period and held for the entire period (July 1, 2019 to December 31, 2019).
Actual Expenses
The Actual lines of the table below provide information about actual account values and actual expenses. You may use the information in this line, together with the amount you invested, to estimate the expenses that you paid over the period. Simply divide your account value by $1,000 (for example, an $8,600 account value divided by $1,000 = 8.6), then multiply the result by the number in the Actual line for the Class in which you have invested under the heading entitled “Expenses Paid During Period” to estimate the expenses you paid on your account during this period.
Hypothetical Example for Comparison Purposes
The Hypothetical lines of each class in the table below provide information about hypothetical account values and hypothetical expenses based on the Class’ actual expense ratio and an assumed rate of return of 5% per year before expenses, which is not the Class’ actual return. The hypothetical account values and expenses may not be used to estimate the actual ending account balance or expenses you paid during the period. You may use this information to compare the ongoing costs of investing in a class of the Series and other funds. To do so, compare this 5% hypothetical example for the class in which you have invested with the 5% hypothetical examples that appear in the shareholder reports of the other funds.
Please note that the expenses shown in the table are meant to highlight your ongoing costs only and do not reflect any transaction costs, such as sales charges (loads), redemption fees, or exchange fees that you may incur in other mutual funds. Therefore, the second line of the table is useful in comparing ongoing costs only, and will not help you determine the relative total costs of owning different funds.
BEGINNING
|
ENDING
|
EXPENSES PAID
|
ANNUALIZED
| |||||
Class S | ||||||||
Actual | $1,000.00 | $1,019.60 | $3.85 | 0.76% | ||||
Hypothetical | $1,000.00 | $1,021.40 | $3.85 | 0.76% | ||||
Class I | ||||||||
Actual | $1,000.00 | $1,021.70 | $2.50 | 0.49% | ||||
Hypothetical | $1,000.00 | $1,022.74 | $2.50 | 0.49% | ||||
Class W | ||||||||
Actual | $1,000.00 | $1,023.60 | $0.26 | 0.05% | ||||
Hypothetical | $1,000.00 | $1,024.95 | $0.26 | 0.05% | ||||
*Expenses are equal to each Class’ annualized expense ratio (for thesix-month period), multiplied by the average account value over the period, multiplied by 184/365 (to reflect theone-half year period). Expenses are based on the most recent fiscal half year; therefore, the expense ratios stated above may differ from the expense ratios stated in the financial highlights, which are based onone-year data. The Class’ total return would have been lower had certain expenses not been waived or reimbursed during the period.
5
Unconstrained Bond Series
Portfolio Composition as of December 31, 2019
(unaudited)
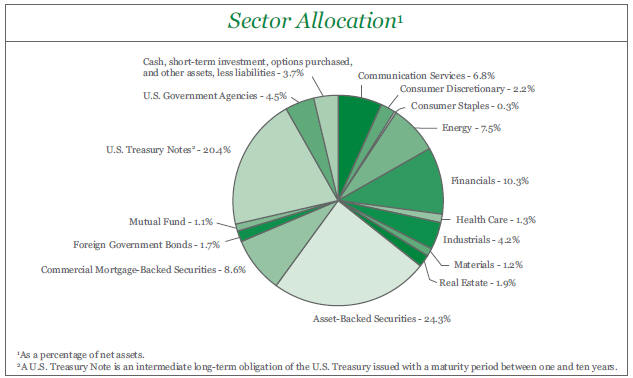 |
6
Unconstrained Bond Series
Investment Portfolio - December 31, 2019
CREDIT |
PRINCIPAL |
VALUE (NOTE 2) | ||||||||||||||
CORPORATE BONDS - 35.7% | ||||||||||||||||
Non-Convertible Corporate Bonds - 35.7% | ||||||||||||||||
Communication Services - 6.8% | ||||||||||||||||
Diversified Telecommunication Services - 3.5% | ||||||||||||||||
AT&T, Inc.3, (3 mo. LIBOR US + 0.930%), 2.891%, 6/30/2020 | Baa2 | 8,000,000 | $ | 8,028,387 | ||||||||||||
AT&T, Inc.4, 2.45%, 6/30/2020 | Baa2 | 2,000,000 | 2,006,805 | |||||||||||||
AT&T, Inc.4, 4.25%, 3/1/2027 | Baa2 | 9,000,000 | 9,885,439 | |||||||||||||
CenturyLink, Inc., 5.625%, 4/1/2020 | B2 | 1,400,000 | 1,408,750 | |||||||||||||
Verizon Communications, Inc., 4.125%, 3/16/2027 | Baa1 | 9,000,000 | 9,992,149 | |||||||||||||
|
| |||||||||||||||
| 31,321,530 | ||||||||||||||||
|
| |||||||||||||||
Interactive Media & Services - 0.7% | ||||||||||||||||
Baidu, Inc. (China), 3.00%, 6/30/2020 | A3 | 2,400,000 | 2,408,520 | |||||||||||||
Tencent Holdings Ltd. (China)5, 2.875%, 2/11/2020 | A1 | 3,873,000 | 3,875,672 | |||||||||||||
|
| |||||||||||||||
| 6,284,192 | ||||||||||||||||
|
| |||||||||||||||
Media - 1.7% | ||||||||||||||||
Charter Communications Operating LLC - Charter Communications | ||||||||||||||||
Operating Capital Corp., 3.579%, 7/23/2020 | Ba1 | 5,708,000 | 5,744,377 | |||||||||||||
Discovery Communications LLC, 3.95%, 3/20/2028 | Baa3 | 9,000,000 | 9,607,696 | |||||||||||||
|
| |||||||||||||||
| 15,352,073 | ||||||||||||||||
|
| |||||||||||||||
Wireless Telecommunication Services - 0.9% | ||||||||||||||||
Sprint Communications, Inc.5, 7.00%, 3/1/2020 | B1 | 8,238,000 | 8,281,826 | |||||||||||||
|
| |||||||||||||||
Total Communication Services | 61,239,621 | |||||||||||||||
|
| |||||||||||||||
Consumer Discretionary - 2.2% | ||||||||||||||||
Automobiles - 0.4% | ||||||||||||||||
Ford Motor Credit Co. LLC3, (3 mo. LIBOR US + 1.000%), 3.012%, 1/9/2020 | Ba1 | 700,000 | 700,098 | |||||||||||||
Ford Motor Credit Co. LLC3, (3 mo. LIBOR US + 0.790%), 2.677%, 6/12/2020 | Ba1 | 2,630,000 | 2,631,531 | |||||||||||||
|
| |||||||||||||||
| 3,331,629 | ||||||||||||||||
|
| |||||||||||||||
Diversified Consumer Services - 0.2% | ||||||||||||||||
GEMS MENASA Cayman Ltd. - GEMS Education Delaware LLC (United | ||||||||||||||||
Arab Emirates)5, 7.125%, 7/31/2026 | B2 | 1,880,000 | 1,978,700 | |||||||||||||
|
| |||||||||||||||
Household Durables - 0.2% | ||||||||||||||||
Weekley Homes LLC - Weekley Finance Corp., 6.625%, 8/15/2025 | B1 | 1,470,000 | 1,525,125 | |||||||||||||
|
| |||||||||||||||
Internet & Direct Marketing Retail - 1.4% | ||||||||||||||||
Booking Holdings, Inc., 3.60%, 6/1/2026 | A3 | 7,450,000 | 7,953,347 | |||||||||||||
Photo Holdings Merger Sub, Inc.5, 8.50%, 10/1/2026 | B1 | 5,450,000 | 5,068,500 | |||||||||||||
|
| |||||||||||||||
| 13,021,847 | ||||||||||||||||
|
| |||||||||||||||
Total Consumer Discretionary | 19,857,301 | |||||||||||||||
|
| |||||||||||||||
Consumer Staples - 0.3% | ||||||||||||||||
Food & Staples Retailing - 0.2% | ||||||||||||||||
KeHE Distributors LLC - KeHE Finance Corp.5, 8.625%, 10/15/2026 | B3 | 1,500,000 | 1,571,250 | |||||||||||||
|
| |||||||||||||||
The accompanying notes are an integral part of the financial statements.
7
Unconstrained Bond Series
Investment Portfolio - December 31, 2019
CREDIT |
PRINCIPAL |
VALUE (NOTE 2) | ||||||||||||||
CORPORATE BONDS(continued) | ||||||||||||||||
Non-Convertible Corporate Bonds(continued) | ||||||||||||||||
Consumer Staples(continued) | ||||||||||||||||
Food Products - 0.1% | ||||||||||||||||
Kraft Heinz Foods Co., 2.80%, 7/2/2020 | Baa3 | 938,000 | $ | 939,499 | ||||||||||||
|
| |||||||||||||||
Total Consumer Staples | 2,510,749 | |||||||||||||||
|
| |||||||||||||||
Energy - 7.5% | ||||||||||||||||
Oil, Gas & Consumable Fuels - 7.5% | ||||||||||||||||
Antero Midstream Partners LP - Antero Midstream Finance Corp.5, 5.75%, 3/1/2027 | B1 | 2,200,000 | 1,934,626 | |||||||||||||
Antero Midstream Partners LP - Antero Midstream Finance Corp.5, 5.75%, 1/15/2028 | B1 | 1,440,000 | 1,252,800 | |||||||||||||
Calumet Specialty Products Partners LP - Calumet Finance Corp.5, 11.00%, 4/15/2025 | Caa1 | 3,445,000 | 3,746,438 | |||||||||||||
DCP Midstream Operating LP5, 5.35%, 3/15/2020 | Ba2 | 3,638,000 | 3,656,190 | |||||||||||||
Euronav Luxembourg S.A. (Belgium)5, 7.50%, 5/31/2022 | WR6 | 1,800,000 | 1,849,500 | |||||||||||||
Jonah Energy LLC - Jonah Energy Finance Corp.5, 7.25%, 10/15/2025 | Caa2 | 1,620,000 | 477,900 | |||||||||||||
Kinder Morgan Energy Partners LP, 6.85%, 2/15/2020 | Baa2 | 3,677,000 | 3,695,553 | |||||||||||||
Kinder Morgan Energy Partners LP, 6.50%, 4/1/2020 | Baa2 | 5,223,000 | 5,278,027 | |||||||||||||
Lonestar Resources America, Inc.5, 11.25%, 1/1/2023 | Caa2 | 3,485,000 | 2,378,512 | |||||||||||||
NuStar Logistics LP, 4.80%, 9/1/2020 | Ba2 | 1,250,000 | 1,265,625 | |||||||||||||
Rockies Express Pipeline LLC5, 5.625%, 4/15/2020 | Ba1 | 9,861,000 | 9,965,504 | |||||||||||||
Sabine Pass Liquefaction LLC, 5.625%, 2/1/2021 | Baa3 | 9,000,000 | 9,251,036 | |||||||||||||
Sabine Pass Liquefaction LLC, 5.75%, 5/15/2024 | Baa3 | 7,000,000 | 7,809,886 | |||||||||||||
Tennessee Gas Pipeline Co. LLC, 7.00%, 3/15/2027 | Baa2 | 6,775,000 | 8,439,244 | |||||||||||||
Tennessee Gas Pipeline Co. LLC, 7.00%, 10/15/2028 | Baa2 | 2,225,000 | 2,852,573 | |||||||||||||
The Williams Companies, Inc., 3.75%, 6/15/2027 | Baa3 | 4,000,000 | 4,172,239 | |||||||||||||
|
| |||||||||||||||
Total Energy | 68,025,653 | |||||||||||||||
|
| |||||||||||||||
Financials - 10.3% | ||||||||||||||||
Banks - 4.2% | ||||||||||||||||
Bank of America Corp.4, 4.00%, 1/22/2025 | Baa1 | 7,000,000 | 7,466,877 | |||||||||||||
Bank of America Corp.3, (3 mo. LIBOR US + 0.760%), 2.654%, 9/15/2026 | Baa1 | 3,561,000 | 3,486,991 | |||||||||||||
Barclays plc (United Kingdom), 2.875%, 6/8/2020 | Baa3 | 3,292,000 | 3,298,321 | |||||||||||||
Credit Suisse AG (Switzerland), 5.40%, 1/14/2020 | Baa3 | 7,655,000 | 7,662,180 | |||||||||||||
JPMorgan Chase & Co., 4.95%, 3/25/2020 | A2 | 150,000 | 151,011 | |||||||||||||
JPMorgan Chase & Co., 8.00%, 4/29/2027 | A3 | 9,000,000 | 12,015,909 | |||||||||||||
Santander Holdings USA, Inc., 2.65%, 4/17/2020 | Baa3 | 3,950,000 | 3,954,476 | |||||||||||||
|
| |||||||||||||||
| 38,035,765 | ||||||||||||||||
|
| |||||||||||||||
Capital Markets - 3.1% | ||||||||||||||||
Drawbridge Special Opportunities Fund LP - Drawbridge Special | ||||||||||||||||
Opportunities Finance5, 5.00%, 8/1/2021 | BBB7 | 2,755,000 | 2,797,612 | |||||||||||||
The Goldman Sachs Group, Inc., 5.375%, 3/15/2020 | A3 | 7,800,000 | 7,852,850 | |||||||||||||
Morgan Stanley3, (3 mo. LIBOR US + 1.140%), 3.076%, 1/27/2020 | A3 | 8,750,000 | 8,756,640 | |||||||||||||
The accompanying notes are an integral part of the financial statements.
8
Unconstrained Bond Series
Investment Portfolio - December 31, 2019
CREDIT |
PRINCIPAL |
VALUE (NOTE 2) | ||||||||||||||
CORPORATE BONDS(continued) | ||||||||||||||||
Non-Convertible Corporate Bonds(continued) | ||||||||||||||||
Financials(continued) | ||||||||||||||||
Capital Markets(continued) | ||||||||||||||||
UBS AG (Switzerland)3, (3 mo. LIBOR US + 0.850%), 2.757%, 6/1/2020 | Aa3 | 8,000,000 | $ | 8,024,174 | ||||||||||||
|
| |||||||||||||||
| 27,431,276 | ||||||||||||||||
|
| |||||||||||||||
Consumer Finance - 2.1% | ||||||||||||||||
Ally Financial, Inc., 8.00%, 3/15/2020 | Ba1 | 1,835,000 | 1,851,056 | |||||||||||||
American Express Credit Corp.3, (3 mo. LIBOR US + 0.730%), 2.647%, 5/26/2020 | A2 | 7,500,000 | 7,515,029 | |||||||||||||
Navient Corp., 8.00%, 3/25/2020 | Ba3 | 2,496,000 | 2,521,759 | |||||||||||||
Navient Corp., 5.00%, 10/26/2020 | Ba3 | 500,000 | 507,350 | |||||||||||||
SLM Corp., 5.125%, 4/5/2022 | Ba1 | 6,109,000 | 6,322,815 | |||||||||||||
|
| |||||||||||||||
| 18,718,009 | ||||||||||||||||
|
| |||||||||||||||
Diversified Financial Services - 0.2% | ||||||||||||||||
VistaJet Malta Finance plc - XO Management Holding, Inc. (Switzerland)5, 10.50%, 6/1/2024 | B3 | 2,250,000 | 2,137,500 | |||||||||||||
|
| |||||||||||||||
Mortgage Real Estate Investment Trusts (REITS) - 0.5% | ||||||||||||||||
Starwood Property Trust, Inc., 3.625%, 2/1/2021 | Ba3 | 4,785,000 | 4,814,906 | |||||||||||||
|
| |||||||||||||||
Thrifts & Mortgage Finance - 0.2% | ||||||||||||||||
Acrisure LLC - Acrisure Finance, Inc.5, 7.00%, 11/15/2025 | Caa2 | 1,865,000 | 1,799,726 | |||||||||||||
|
| |||||||||||||||
Total Financials | 92,937,182 | |||||||||||||||
|
| |||||||||||||||
Health Care - 1.3% | ||||||||||||||||
Health Care Providers & Services - 1.3% | ||||||||||||||||
Fresenius Medical Care US Finance II, Inc. (Germany)5, 4.125%, 10/15/2020 | Baa3 | 11,869,000 | 11,987,192 | |||||||||||||
|
| |||||||||||||||
Industrials - 4.2% | ||||||||||||||||
Commercial Services & Supplies - 0.3% | ||||||||||||||||
The ADT Security Corp., 6.25%, 10/15/2021 | Ba3 | 1,000,000 | 1,055,000 | |||||||||||||
Prime Security Services Borrower LLC - Prime Finance, Inc.5, 5.75%, 4/15/2026 | Ba3 | 1,000,000 | 1,086,880 | |||||||||||||
|
| |||||||||||||||
| 2,141,880 | ||||||||||||||||
|
| |||||||||||||||
Construction & Engineering - 0.4% | ||||||||||||||||
Tutor Perini Corp.5, 6.875%, 5/1/2025 | B2 | 3,840,000 | 3,705,600 | |||||||||||||
|
| |||||||||||||||
Marine - 1.5% | ||||||||||||||||
American Tanker, Inc. (Norway)5, 9.25%, 2/22/2022 | WR6 | 4,450,000 | 4,560,069 | |||||||||||||
Borealis Finance LLC5, 7.50%, 11/16/2022 | WR6 | 2,860,000 | 2,631,200 | |||||||||||||
Diana Shipping, Inc. (Greece), 9.50%, 9/27/2023 | WR6 | 4,450,000 | 4,416,625 | |||||||||||||
Global Ship Lease, Inc. (United Kingdom)5, 9.875%, 11/15/2022 | B3 | 1,973,000 | 2,056,852 | |||||||||||||
|
| |||||||||||||||
| 13,664,746 | ||||||||||||||||
|
| |||||||||||||||
The accompanying notes are an integral part of the financial statements.
9
Unconstrained Bond Series
Investment Portfolio - December 31, 2019
CREDIT |
PRINCIPAL |
VALUE (NOTE 2) | ||||||||||||||
CORPORATE BONDS(continued) | ||||||||||||||||
Non-Convertible Corporate Bonds(continued) | ||||||||||||||||
Industrials(continued) | ||||||||||||||||
Trading Companies & Distributors - 2.0% | ||||||||||||||||
AerCap Ireland Capital DAC - AerCap Global Aviation Trust (Ireland), 4.625%, 10/30/2020 | Baa3 | 4,974,000 | $ | 5,073,507 | ||||||||||||
Aircastle Ltd., 7.625%, 4/15/2020 | Baa3 | 6,375,000 | 6,469,340 | |||||||||||||
Aviation Capital Group LLC5, 7.125%, 10/15/2020 | BBB7 | 2,572,000 | 2,669,095 | |||||||||||||
Aviation Capital Group LLC5, 6.75%, 4/6/2021 | BBB7 | 3,750,000 | 3,951,872 | |||||||||||||
|
| |||||||||||||||
| 18,163,814 | ||||||||||||||||
|
| |||||||||||||||
Total Industrials | 37,676,040 | |||||||||||||||
|
| |||||||||||||||
Materials - 1.2% | ||||||||||||||||
Metals & Mining - 1.2% | ||||||||||||||||
Infrabuild Australia Pty Ltd. (Australia)5, 12.00%, 10/1/2024 | Ba3 | 3,425,000 | 3,530,422 | |||||||||||||
Northwest Acquisitions ULC - Dominion Finco, Inc.5, 7.125%, 11/1/2022 | Caa1 | 5,870,000 | 4,402,500 | |||||||||||||
Southern Copper Corp. (Peru), 5.375%, 4/16/2020 | Baa2 | 3,000,000 | 3,023,994 | |||||||||||||
|
| |||||||||||||||
Total Materials | 10,956,916 | |||||||||||||||
|
| |||||||||||||||
Real Estate - 1.9% | ||||||||||||||||
Equity Real Estate Investment Trusts (REITS) - 1.1% | ||||||||||||||||
American Tower Corp., 2.80%, 6/1/2020 | Baa3 | 5,595,000 | 5,611,111 | |||||||||||||
Crown Castle International Corp., 3.40%, 2/15/2021 | Baa3 | 532,000 | 539,239 | |||||||||||||
SBA Tower Trust5, 2.836%, 1/15/2025 | A2 | 3,500,000 | 3,535,676 | |||||||||||||
|
| |||||||||||||||
| 9,686,026 | ||||||||||||||||
|
| |||||||||||||||
Real Estate Management & Development - 0.8% | ||||||||||||||||
Five Point Operating Co. LP - Five Point Capital Corp.5, 7.875%, 11/15/2025 | B3 | 5,235,000 | 5,273,268 | |||||||||||||
Forestar Group, Inc.5, 8.00%, 4/15/2024 | B2 | 1,562,000 | 1,698,675 | |||||||||||||
|
| |||||||||||||||
| 6,971,943 | ||||||||||||||||
|
| |||||||||||||||
Total Real Estate | 16,657,969 | |||||||||||||||
|
| |||||||||||||||
TOTAL CORPORATE BONDS | 321,848,623 | |||||||||||||||
|
| |||||||||||||||
ASSET-BACKED SECURITIES - 24.3% | ||||||||||||||||
Ally Auto Receivables Trust, Series2018-2, Class A2, 2.64%, 2/16/2021 | Aaa | 28,689 | 28,692 | |||||||||||||
CarMax Auto Owner Trust, Series2017-3, Class A3, 1.97%, 4/15/2022 | AAA7 | 2,430,174 | 2,430,313 | |||||||||||||
Cazenovia Creek Funding I LLC, Series2015-1A, Class A5, 2.00%, 12/10/2023 | WR6 | 1,103 | 1,101 | |||||||||||||
Cazenovia Creek Funding II LLC, Series2018-1A, Class A5, 3.561%, 7/15/2030 | WR6 | 3,737,652 | 3,758,952 | |||||||||||||
CCG Receivables Trust, Series2019-1, Class A25, 2.80%, 9/14/2026 | AAA7 | 6,000,000 | 6,048,648 | |||||||||||||
Chesapeake Funding II LLC, Series2017-2A, Class A1 (Canada)5, 1.99%, 5/15/2029 | Aaa | 1,167,044 | 1,166,084 | |||||||||||||
The accompanying notes are an integral part of the financial statements.
10
Unconstrained Bond Series
Investment Portfolio - December 31, 2019
CREDIT |
PRINCIPAL |
VALUE (NOTE 2) | ||||||||||||||
ASSET-BACKED SECURITIES(continued) | ||||||||||||||||
Commonbond Student Loan Trust, Series2019-AGS, Class A15, 2.54%, 1/25/2047 | Aaa | 6,429,453 | $ | 6,369,562 | ||||||||||||
Corevest American Finance Trust, Series2019-1, Class A5, 3.324%, 3/15/2052 | WR6 | 4,967,166 | 5,106,529 | |||||||||||||
Corevest American Finance Trust, Series2019-3, Class A5, 2.705%, 10/15/2052 | WR6 | 3,245,964 | 3,244,401 | |||||||||||||
Credit Acceptance Auto Loan Trust, Series2017-1A, Class A5, 2.56%, 10/15/2025 | AAA7 | 50,027 | 50,032 | |||||||||||||
Credit Acceptance Auto Loan Trust, Series2018-1A, Class A5, 3.01%, 2/16/2027 | Aaa | 7,846,000 | 7,875,251 | |||||||||||||
Credit Acceptance Auto Loan Trust, Series2018-2A, Class A5, 3.47%, 5/17/2027 | Aaa | 9,000,000 | 9,113,535 | |||||||||||||
Credit Acceptance Auto Loan Trust, Series2019-1A, Class A5, 3.33%, 2/15/2028 | Aaa | 4,050,000 | 4,121,943 | |||||||||||||
Dell Equipment Finance Trust, Series2019-1, Class A15, 2.648%, 4/22/2020 | Aaa | 187,046 | 187,103 | |||||||||||||
Dell Equipment Finance Trust, Series2019-1, Class A25, 2.78%, 8/23/2021 | Aaa | 6,500,000 | 6,525,862 | |||||||||||||
DLL LLC, Series2019-DA1, Class A25, 2.79%, 11/22/2021 | Aaa | 3,923,871 | 3,936,209 | |||||||||||||
Drive Auto Receivables Trust, Series2019-1, Class A2A, 3.08%, 9/15/2021 | Aaa | 47,192 | 47,211 | |||||||||||||
DT Auto Owner Trust, Series2018-3A, Class A5, 3.02%, 2/15/2022 | AAA7 | 1,788,674 | 1,792,315 | |||||||||||||
DT Auto Owner Trust, Series2019-1A, Class A5, 3.08%, 9/15/2022 | AAA7 | 2,283,173 | 2,291,377 | |||||||||||||
DT Auto Owner Trust, Series2019-2A, Class A5, 2.85%, 9/15/2022 | AAA7 | 1,509,737 | 1,514,732 | |||||||||||||
DT Auto Owner Trust, Series2019-3A, Class A5, 2.55%, 8/15/2022 | AAA7 | 1,684,546 | 1,688,463 | |||||||||||||
EDvestinU Private Education Loan Issue No. 1 LLC, Series2019-A, Class A5,8, 3.58%, 11/25/2038 | AAA7 | 4,050,984 | 4,126,851 | |||||||||||||
Enterprise Fleet Financing LLC, Series2016-2, Class A35, 2.04%, 2/22/2022 | AAA7 | 2,546,722 | 2,545,717 | |||||||||||||
Enterprise Fleet Financing LLC, Series2017-1, Class A25, 2.13%, 7/20/2022 | AAA7 | 222,231 | 222,232 | |||||||||||||
Enterprise Fleet Financing LLC, Series2018-2, Class A25, 3.14%, 2/20/2024 | AAA7 | 4,186,029 | 4,218,835 | |||||||||||||
Enterprise Fleet Financing LLC, Series2019-1, Class A25, 2.98%, 10/20/2024 | AAA7 | 2,500,000 | 2,524,052 | |||||||||||||
Ford Credit Auto Owner Trust, Series2017-B, Class A3, 1.69%, 11/15/2021 | Aaa | 148,866 | 148,719 | |||||||||||||
GLS Auto Receivables Trust, Series2018-3A, Class A5, 3.35%, 8/15/2022 | AA7 | 830,253 | 833,727 | |||||||||||||
GLS Auto Receivables Trust, Series2019-2A, Class A5, 3.06%, 4/17/2023 | AA7 | 2,049,069 | 2,059,798 | |||||||||||||
GM Financial Consumer Automobile Receivables Trust, Series2018-4, Class A2, 2.93%, 11/16/2021 | Aaa | 421,660 | 422,420 | |||||||||||||
Great American Auto Leasing, Inc., Series2019-1, Class A25, 2.97%, 6/15/2021 | AAA7 | 2,741,977 | 2,753,042 | |||||||||||||
The accompanying notes are an integral part of the financial statements.
11
Unconstrained Bond Series
Investment Portfolio - December 31, 2019
CREDIT |
PRINCIPAL |
VALUE (NOTE 2) | ||||||||||||||
ASSET-BACKED SECURITIES(continued) | ||||||||||||||||
Hertz Fleet Lease Funding LP, Series2018-1, Class A25, 3.23%, 5/10/2032 | Aaa | 5,745,305 | $ | 5,784,776 | ||||||||||||
Hyundai Auto Receivables Trust, Series2017-A, Class A3, 1.76%, 8/16/2021 | AAA7 | 55,227 | 55,188 | |||||||||||||
Hyundai Auto Receivables Trust, Series2019-A, Class A2, 2.67%, 12/15/2021 | AAA7 | 2,289,356 | 2,296,902 | |||||||||||||
Invitation Homes Trust, Series 2017-SFR2, Class A3,5, (1 mo. LIBOR US + 0.850%), 2.587%, 12/17/2036 | Aaa | 466,409 | 464,636 | |||||||||||||
Invitation Homes Trust, Series 2017-SFR2, Class B3,5, (1 mo. LIBOR US + 1.150%), 2.887%, 12/17/2036 | Aa2 | 400,000 | 399,429 | |||||||||||||
John Deere Owner Trust, Series2019-A, Class A2, 2.85%, 12/15/2021 | Aaa | 2,121,888 | 2,128,791 | |||||||||||||
Laurel Road Prime Student Loan Trust, Series2019-A, Class A2FX5, 2.73%, 10/25/2048 | AAA7 | 2,100,000 | 2,087,077 | |||||||||||||
Marlette Funding Trust, Series2019-2A, Class A5, 3.13%, 7/16/2029 | WR6 | 2,761,876 | 2,779,569 | |||||||||||||
Navient Private Education Refi Loan Trust, Series2019-CA, Class A15, 2.82%, 2/15/2068 | AAA7 | 2,400,732 | 2,411,422 | |||||||||||||
Navient Private Education Refi Loan Trust, Series2019-EA, Class A15, 2.39%, 5/15/2068 | AAA7 | 9,378,344 | 9,394,151 | |||||||||||||
Navient Student Loan Trust, Series2014-1, Class A33, (1 mo. LIBOR US + 0.510%), 2.302%, 6/25/2031 | A1 | 5,998,239 | 5,883,208 | |||||||||||||
Navient Student Loan Trust, Series2019-2A, Class A23,5, (1 mo. LIBOR US + 1.000%), 2.792%, 2/27/2068 | Aaa | 5,540,000 | 5,525,604 | |||||||||||||
Navient Student Loan Trust, Series2019-BA, Class A13,5, (1 mo. LIBOR US + 0.400%), 2.14%, 12/15/2059 | AAA7 | 3,246,504 | 3,239,743 | |||||||||||||
Nissan Auto Lease Trust, Series2019-A, Class A2, 2.71%, 7/15/2021 | Aaa | 4,572,411 | 4,588,735 | |||||||||||||
Nissan Auto Lease Trust, Series2019-B, Class A1, 2.282%, 7/15/2020 | Aaa | 1,785,221 | 1,785,157 | |||||||||||||
Nissan Auto Receivables Owner Trust, Series2016-C, Class A3, 1.18%, 1/15/2021 | Aaa | 252,736 | 252,588 | |||||||||||||
NYCTL Trust, Series2018-A, Class A5, 3.22%, 11/10/2031 | Aaa | 1,252,213 | 1,254,216 | |||||||||||||
Oxford Finance Funding LLC, Series2019-1A, Class A25, 4.459%, 2/15/2027 | WR6 | 7,000,000 | 7,103,570 | |||||||||||||
Progress Residential Trust, Series 2015-SFR3, Class A5, 3.067%, 11/12/2032 | Aaa | 4,836,028 | 4,829,934 | |||||||||||||
Progress Residential Trust, Series 2017-SFR2, Class A5, 2.897%, 12/17/2034 | Aaa | 1,646,935 | 1,648,958 | |||||||||||||
Progress Residential Trust, Series 2019-SFR2, Class A5, 3.147%, 5/17/2036 | Aaa | 8,610,000 | 8,722,162 | |||||||||||||
Progress Residential Trust, Series 2019-SFR4, Class A5, 2.687%, 10/17/2036 | Aaa | 3,800,000 | 3,787,996 | |||||||||||||
SCF Equipment Leasing LLC, Series2019-1A, Class A15, 3.04%, 3/20/2023 | Aaa | 1,637,486 | 1,641,912 | |||||||||||||
SLC Student Loan Trust, Series2004-1, Class A63, (3 mo. LIBOR US + 0.160%), 2.07%, 5/15/2023 | Aaa | 345,030 | 344,877 | |||||||||||||
SLM Student Loan Trust, Series2004-10, Class A6A3,5, (3 mo. LIBOR US + 0.550%), 2.49%, 4/27/2026 | Aaa | 775,848 | 776,206 | |||||||||||||
The accompanying notes are an integral part of the financial statements.
12
Unconstrained Bond Series
Investment Portfolio - December 31, 2019
CREDIT |
PRINCIPAL |
VALUE (NOTE 2) | ||||||||||||||
ASSET-BACKED SECURITIES(continued) | ||||||||||||||||
SMB Private Education Loan Trust, Series2018-A, Class A13,5, (1 mo. LIBOR US + 0.350%), 2.09%, 3/16/2026 | Aaa | 612,650 | $ | 612,126 | ||||||||||||
SMB Private Education Loan Trust, Series2019-A, Class A13,5, (1 mo. LIBOR US + 0.350%), 2.09%, 2/16/2026 | Aaa | 2,013,932 | 2,012,663 | |||||||||||||
SoFi Consumer Loan Program LLC, Series2016-5, Class A5, 3.06%, 9/25/2028 | WR6 | 449,527 | 451,394 | |||||||||||||
SoFi Consumer Loan Program LLC, Series2017-3, Class A5, 2.77%, 5/25/2026 | AA7 | 1,425,032 | 1,430,015 | |||||||||||||
SoFi Consumer Loan Program LLC, Series2017-4, Class A5, 2.50%, 5/26/2026 | AA7 | 535,055 | 535,926 | |||||||||||||
SoFi Consumer Loan Program Trust, Series2019-1, Class A5, 3.24%, 2/25/2028 | AAA7 | 2,800,283 | 2,819,857 | |||||||||||||
SoFi Consumer Loan Program Trust, Series2019-2, Class A5, 3.01%, 4/25/2028 | AAA7 | 2,621,721 | 2,638,674 | |||||||||||||
SoFi Consumer Loan Program Trust, Series2019-3, Class A5, 2.90%, 5/25/2028 | AAA7 | 1,691,462 | 1,701,998 | |||||||||||||
SoFi Professional Loan Program LLC, Series2015-A, Class A25, 2.42%, 3/25/2030 | Aaa | 278,382 | 278,339 | |||||||||||||
SoFi Professional Loan Program LLC, Series2016-C, Class A2B5, 2.36%, 12/27/2032 | Aaa | 368,235 | 366,762 | |||||||||||||
SoFi Professional Loan Program LLC, Series2017-F, Class A1FX5, 2.05%, 1/25/2041 | Aaa | 127,107 | 127,016 | |||||||||||||
SoFi Professional Loan Program LLC, Series2017-F, Class A2FX5, 2.84%, 1/25/2041 | Aaa | 750,000 | 755,904 | |||||||||||||
SoFi Professional Loan Program LLC, Series2019-B, Class A1FX5, 2.78%, 8/17/2048 | AAA7 | 3,980,558 | 3,995,496 | |||||||||||||
SoFi Professional Loan Program Trust, Series2018-B, Class A1FX5, 2.64%, 8/25/2047 | Aaa | 2,886,264 | 2,890,549 | |||||||||||||
Store Master FundingI-VII LLC, Series2019-1, Class A15, 2.82%, 11/20/2049 | AAA7 | 2,495,712 | 2,485,914 | |||||||||||||
Tax Ease Funding LLC, Series2016-1A, Class A5, 3.131%, 6/15/2028 | WR6 | 300,821 | 300,651 | |||||||||||||
Tesla Auto Lease Trust, Series2019-A, Class A15, 2.005%, 12/18/2020 | Aaa | 6,638,403 | 6,639,675 | |||||||||||||
Towd Point Mortgage Trust, Series2016-5, Class A15,8, 2.50%, 10/25/2056 | Aaa | 1,187,903 | 1,187,977 | |||||||||||||
Towd Point Mortgage Trust, Series2017-1, Class A15,8, 2.75%, 10/25/2056 | Aaa | 4,181,934 | 4,210,469 | |||||||||||||
Towd Point Mortgage Trust, Series2018-2, Class A15,8, 3.25%, 3/25/2058 | Aaa | 1,512,311 | 1,538,332 | |||||||||||||
Towd Point Mortgage Trust, Series2019-HY1, Class A13,5, (1 mo. LIBOR US + 1.000%), 2.792%, 10/25/2048 | Aaa | 4,004,132 | 4,012,815 | |||||||||||||
Tricon American Homes Trust, Series 2016-SFR1, Class A5, 2.589%, 11/17/2033 | Aaa | 2,325,513 | 2,321,200 | |||||||||||||
Volvo Financial Equipment LLC, Series2019-1A, Class A25, 2.90%, 11/15/2021 | Aaa | 915,196 | 918,525 | |||||||||||||
World Omni Auto Receivables Trust, Series2017-A, Class A3, 1.93%, 9/15/2022 | AAA7 | 2,042,482 | 2,041,574 | |||||||||||||
The accompanying notes are an integral part of the financial statements.
13
Unconstrained Bond Series
Investment Portfolio - December 31, 2019
CREDIT |
PRINCIPAL |
VALUE (NOTE 2) | ||||||||||||||
ASSET-BACKED SECURITIES(continued) | ||||||||||||||||
World Omni Auto Receivables Trust, Series2019-B, Class A2, 2.63%, 6/15/2022 | AAA7 | 3,742,857 | $ | 3,754,197 | ||||||||||||
World Omni Automobile Lease Securitization Trust, Series2017-A, Class A4, 2.32%, 8/15/2022 | Aaa | 302,650 | 302,667 | |||||||||||||
World Omni Automobile Lease Securitization Trust, Series2019-A, Class A2, 2.89%, 11/15/2021 | Aaa | 2,247,530 | 2,258,234 | |||||||||||||
|
| |||||||||||||||
TOTAL ASSET-BACKED SECURITIES | 218,929,464 | |||||||||||||||
|
| |||||||||||||||
COMMERCIAL MORTGAGE-BACKED SECURITIES - 8.6% | ||||||||||||||||
Americold LLC Trust, Series 2010-ARTA, Class A15, 3.847%, 1/14/2029 . | AA7 | 58,168 | 58,561 | |||||||||||||
CIM Trust, Series 2019-INV1, Class A15,8, 4.00%, 2/25/2049 | Aaa | 1,038,745 | 1,054,237 | |||||||||||||
Citigroup Commercial Mortgage Trust, Series 2019-SST2, Class A3,5, (1 mo. LIBOR US + 0.920%), 2.66%, 12/15/2036 | Aaa | 7,000,000 | 6,982,576 | |||||||||||||
Credit Suisse Mortgage Capital Trust, Series2013-TH1, Class A15,8, 2.13%, 2/25/2043 | AAA7 | 514,195 | 498,044 | |||||||||||||
Fannie Mae REMICS, Series2018-31, Class KP, 3.50%, 7/25/2047 | Aaa | 2,843,975 | 2,954,014 | |||||||||||||
FannieMae-Aces, Series2017-M15, Class A18, 2.959%, 9/25/2027 | WR6 | 5,591,327 | 5,788,698 | |||||||||||||
Fontainebleau Miami Beach Trust, Series 2019-FBLU, Class A5, 3.144%, 12/10/2036 | Aaa | 4,480,000 | 4,585,854 | |||||||||||||
Freddie Mac Multifamily Structured Pass-Through Certificates, Series K009, Class X1 (IO)8, 1.26%, 8/25/2020 | Aaa | 8,514,767 | 42,620 | |||||||||||||
Freddie Mac Multifamily Structured Pass-Through Certificates, Series K014, Class X1 (IO)8, 1.149%, 4/25/2021 | Aaa | 6,911,013 | 81,108 | |||||||||||||
Freddie Mac Multifamily Structured Pass-Through Certificates, Series K016, Class X1 (IO)8, 1.478%, 10/25/2021 | Aaa | 4,290,941 | 96,131 | |||||||||||||
Freddie Mac Multifamily Structured Pass-Through Certificates, Series K017, Class X1 (IO)8, 1.291%, 12/25/2021 | Aaa | 31,048,282 | 603,721 | |||||||||||||
Freddie Mac Multifamily Structured Pass-Through Certificates, Series K021, Class X1 (IO)8, 1.425%, 6/25/2022 | Aaa | 16,452,450 | 492,940 | |||||||||||||
Freddie Mac Multifamily Structured Pass-Through Certificates, Series K030, Class X1 (IO)8, 0.183%, 4/25/2023 | Aaa | 55,235,306 | 300,679 | |||||||||||||
Freddie Mac Multifamily Structured Pass-Through Certificates, Series K032, Class X1 (IO)8, 0.097%, 5/25/2023 | Aaa | 32,476,228 | 119,785 | |||||||||||||
Freddie Mac REMICS, Series 4791, Class BA, 4.00%, 3/15/2044 | Aaa | 2,715,999 | 2,770,136 | |||||||||||||
Freddie Mac REMICS, Series 4801, Class BA, 4.50%, 5/15/2044 | Aaa | 2,340,521 | 2,391,330 | |||||||||||||
FREMF Mortgage Trust, Series2013-K28, Class X2A (IO)5, 0.10%, 6/25/2046 | WR6 | 85,306,308 | 211,671 | |||||||||||||
FREMF Mortgage Trust, Series 2014-K715, Class B5,8, 3.971%, 2/25/2046 | Aa2 | 2,185,000 | 2,215,107 | |||||||||||||
FREMF Mortgage Trust, Series 2014-K716, Class B5,8, 3.952%, 8/25/2047 | A1 | 2,550,000 | 2,603,326 | |||||||||||||
FREMF Mortgage Trust, Series2015-K42, Class B5,8, 3.851%, 12/25/2024 | A3 | 1,900,000 | 1,969,161 | |||||||||||||
The accompanying notes are an integral part of the financial statements.
14
Unconstrained Bond Series
Investment Portfolio - December 31, 2019
CREDIT |
PRINCIPAL |
VALUE (NOTE 2) | ||||||||||||||
COMMERCIAL MORTGAGE-BACKED SECURITIES(continued) | ||||||||||||||||
FREMF Mortgage Trust, Series2015-K43, Class B5,8, 3.734%, 2/25/2048 | WR6 | 1,500,000 | $ | 1,544,344 | ||||||||||||
JP Morgan Chase Commercial Mortgage Securities Trust, Series2010-C2, Class A35, 4.07%, 11/15/2043 | AAA7 | 590,680 | 593,820 | |||||||||||||
JP Morgan Mortgage Trust, Series2013-1, Class 1A25,8, 3.00%, 3/25/2043 | WR6 | 367,010 | 369,786 | |||||||||||||
JP Morgan Mortgage Trust, Series2013-2, Class A25,8, 3.50%, 5/25/2043 | AAA7 | 433,003 | 442,116 | |||||||||||||
JP Morgan Mortgage Trust, Series2014-2, Class 1A15,8, 3.00%, 6/25/2029 | AAA7 | 618,728 | 624,753 | |||||||||||||
JP Morgan Mortgage Trust, Series2017-3, Class 1A55,8, 3.50%, 8/25/2047 | Aaa | 2,295,035 | 2,319,599 | |||||||||||||
Metlife Securitization Trust, Series2019-1A, Class A5,8, 3.75%, 4/25/2058 | WR6 | 1,807,407 | 1,870,524 | |||||||||||||
New Residential Mortgage Loan Trust, Series2014-3A, Class AFX35,8, 3.75%, 11/25/2054 | AA7 | 521,001 | 537,436 | |||||||||||||
New Residential Mortgage Loan Trust, Series2015-2A, Class A15,8, 3.75%, 8/25/2055 | Aaa | 851,562 | 879,293 | |||||||||||||
New Residential Mortgage Loan Trust, Series2019-2A, Class A15,8, 4.25%, 12/25/2057 | Aaa | 4,256,651 | 4,435,307 | |||||||||||||
OBP Depositor LLC Trust, Series2010-OBP, Class A5, 4.646%, 7/15/2045 | AA7 | 420,000 | 419,647 | |||||||||||||
PSMC Trust, Series2019-3, Class A35,8, 3.50%, 11/25/2049 | WR6 | 3,444,917 | 3,501,165 | |||||||||||||
Sequoia Mortgage Trust, Series2013-2, Class A8, 1.874%, 2/25/2043 | AAA7 | 537,309 | 512,707 | |||||||||||||
Sequoia Mortgage Trust, Series2013-7, Class A28, 3.00%, 6/25/2043 | AAA7 | 469,563 | 470,435 | |||||||||||||
Sequoia Mortgage Trust, Series2013-8, Class A18, 3.00%, 6/25/2043 | Aaa | 643,028 | 647,634 | |||||||||||||
Starwood Retail Property Trust, Series 2014-STAR, Class A3,5, (1 mo. LIBOR US + 1.470%), 3.21%, 11/15/2027 | AAA7 | 1,772,914 | 1,767,476 | |||||||||||||
Sutherland Commercial Mortgage Trust, Series 2019-SBC8, Class A5,8, 2.86%, 4/25/2041 | WR6 | 4,017,548 | 4,018,164 | |||||||||||||
Toorak Mortgage Corp., Series2019-1, Class A15,9, 4.458%, 3/25/2022 | WR6 | 5,000,000 | 5,044,636 | |||||||||||||
Vornado DP LLC Trust, Series2010-VNO, Class A2FX5, 4.004%, 9/13/2028 | AA7 | 1,195,000 | 1,199,326 | |||||||||||||
Waikiki Beach Hotel Trust, Series2019-WBM, Class A3,5, (1 mo. LIBOR US + 1.050%), 2.79%, 12/15/2033 | AAA7 | 7,000,000 | 6,991,492 | |||||||||||||
Wells Fargo Commercial Mortgage Trust, Series2010-C1, Class A25, 4.393%, 11/15/2043 | Aaa | 1,228,139 | 1,235,491 | |||||||||||||
WF-RBS Commercial Mortgage Trust, Series2011-C2, Class A45,8, 4.869%, 2/15/2044 | Aaa | 1,443,304 | 1,471,134 | |||||||||||||
WinWater Mortgage Loan Trust, Series2015-1, Class A15,8, 3.50%, 1/20/2045 | WR6 | 566,777 | 578,024 | |||||||||||||
WinWater Mortgage Loan Trust, Series2015-3, Class A55,8, 3.50%, 3/20/2045 | Aaa | 366,337 | 366,541 | |||||||||||||
|
| |||||||||||||||
TOTAL COMMERCIAL MORTGAGE-BACKED SECURITIES | 77,660,549 | |||||||||||||||
|
| |||||||||||||||
The accompanying notes are an integral part of the financial statements.
15
Unconstrained Bond Series
Investment Portfolio - December 31, 2019
CREDIT |
PRINCIPAL SHARES |
VALUE (NOTE 2) | ||||||||||||||
FOREIGN GOVERNMENT BONDS - 1.7% | ||||||||||||||||
Argentine Republic Government International Bond (Argentina), 5.625%, 1/26/2022 | Caa2 | 2,000,000 | $ | 1,035,000 | ||||||||||||
Argentine Republic Government International Bond (Argentina), 6.875%, 1/26/2027 | Caa2 | 2,000,000 | 995,000 | |||||||||||||
Argentine Republic Government International Bond (Argentina), 5.875%, 1/11/2028 | Caa2 | 2,000,000 | 940,000 | |||||||||||||
Brazilian Government International Bond (Brazil), 4.25%, 1/7/2025 | Ba2 | 1,300,000 | 1,383,525 | |||||||||||||
Chile Government Bond (Chile), 5.50%, 8/5/2020 | A1 | CLP | 1,800,000,000 | 2,440,594 | ||||||||||||
Mexican Government Bond (Mexico), 8.00%, 6/11/2020 | A3 | MXN | 35,000,000 | 1,860,891 | ||||||||||||
Mexican Government Bond (Mexico), 6.50%, 6/9/2022 | A3 | MXN | 126,000,000 | 6,625,238 | ||||||||||||
|
| |||||||||||||||
TOTAL FOREIGN GOVERNMENT BONDS | 15,280,248 | |||||||||||||||
|
| |||||||||||||||
MUTUAL FUND - 1.1% | ||||||||||||||||
VanEck Vectors J.P. Morgan EM Local Currency Bond ETF (Identified Cost $9,189,801) | 280,000 | 9,522,800 | ||||||||||||||
|
| |||||||||||||||
U.S. TREASURY SECURITIES - 20.4% | ||||||||||||||||
U.S. Treasury Notes - 20.4% | ||||||||||||||||
U.S. Treasury Floating Rate Note3, (3 mo. US Treasury Bill Yield + 0.300%), 1.826%, 10/31/2021 | 45,000,000 | 45,075,603 | ||||||||||||||
U.S. Treasury Inflation Indexed Note, 0.125%, 4/15/2020 | 46,154,640 | 46,098,750 | ||||||||||||||
U.S. Treasury Inflation Indexed Note, 0.125%, 4/15/2021 | 46,896,566 | 46,799,718 | ||||||||||||||
U.S. Treasury Inflation Indexed Note, 0.625%, 1/15/2024 | 45,142,516 | 46,098,122 | ||||||||||||||
|
| |||||||||||||||
TOTAL U.S. TREASURY SECURITIES | 184,072,193 | |||||||||||||||
|
| |||||||||||||||
U.S. GOVERNMENT AGENCIES - 4.5% | ||||||||||||||||
Mortgage-Backed Securities - 4.5% | ||||||||||||||||
Fannie Mae, Pool #888468, UMBS, 5.50%, 9/1/2021 | 69,939 | 70,785 | ||||||||||||||
Fannie Mae, Pool #995233, UMBS, 5.50%, 10/1/2021 | 1,872 | 1,887 | ||||||||||||||
Fannie Mae, Pool #888017, UMBS, 6.00%, 11/1/2021 | 10,355 | 10,551 | ||||||||||||||
Fannie Mae, Pool #995329, UMBS, 5.50%, 12/1/2021 | 47,688 | 48,256 | ||||||||||||||
Fannie Mae, Pool #888136, UMBS, 6.00%, 12/1/2021 | 11,867 | 12,118 | ||||||||||||||
Fannie Mae, Pool #888810, UMBS, 5.50%, 11/1/2022 | 85,610 | 86,608 | ||||||||||||||
Fannie Mae, Pool #AD0462, UMBS, 5.50%, 10/1/2024 | 14,514 | 15,168 | ||||||||||||||
Fannie Mae, Pool #MA0115, UMBS, 4.50%, 7/1/2029 | 67,758 | 72,196 | ||||||||||||||
Fannie Mae, Pool #MA1834, UMBS, 4.50%, 2/1/2034 | 267,825 | 288,182 | ||||||||||||||
Fannie Mae, Pool #918516, UMBS, 5.50%, 6/1/2037 | 93,900 | 105,164 | ||||||||||||||
Fannie Mae, Pool #889624, UMBS, 5.50%, 5/1/2038 | 148,997 | 167,333 | ||||||||||||||
Fannie Mae, Pool #MA3412, UMBS, 3.50%, 7/1/2038 | 4,113,008 | 4,283,235 | ||||||||||||||
Fannie Mae, Pool #995876, UMBS, 6.00%, 11/1/2038 | 385,399 | 441,960 | ||||||||||||||
Fannie Mae, Pool #AD0307, UMBS, 5.50%, 1/1/2039 | 150,534 | 169,002 | ||||||||||||||
The accompanying notes are an integral part of the financial statements.
16
Unconstrained Bond Series
Investment Portfolio - December 31, 2019
|
PRINCIPAL SHARES |
VALUE (NOTE 2) | ||||||||||||||
U.S. GOVERNMENT AGENCIES(continued) | ||||||||||||||||
Mortgage-Backed Securities(continued) | ||||||||||||||||
Fannie Mae, Pool #AA7236, UMBS, 4.00%, 6/1/2039 | 801,159 | $ | 858,881 | |||||||||||||
Fannie Mae, Pool #AJ1989, UMBS, 4.50%, 10/1/2041 | 1,562,262 | 1,696,771 | ||||||||||||||
Fannie Mae, Pool #AW5338, UMBS, 4.50%, 6/1/2044 | 942,559 | 1,014,821 | ||||||||||||||
Fannie Mae, Pool #AS3878, UMBS, 4.50%, 11/1/2044 | 822,599 | 884,389 | ||||||||||||||
Fannie Mae, Pool #BC5442, UMBS, 4.00%, 4/1/2046 | 2,066,471 | 2,163,595 | ||||||||||||||
Fannie Mae, Pool #BC9568, UMBS, 4.00%, 5/1/2046 | 2,840,609 | 2,970,383 | ||||||||||||||
Fannie Mae, Pool #BE7845, UMBS, 4.50%, 2/1/2047 | 481,384 | 508,905 | ||||||||||||||
Fannie Mae, Pool #CA1922, UMBS, 5.00%, 6/1/2048 | 2,893,170 | 3,101,363 | ||||||||||||||
Freddie Mac, Pool #G11850, 5.50%, 7/1/2020 | 695 | 695 | ||||||||||||||
Freddie Mac, Pool #G12610, 6.00%, 3/1/2022 | 15,230 | 15,556 | ||||||||||||||
Freddie Mac, Pool #G12655, 6.00%, 5/1/2022 | 10,642 | 10,915 | ||||||||||||||
Freddie Mac, Pool #G12988, 6.00%, 1/1/2023 | 9,572 | 9,905 | ||||||||||||||
Freddie Mac, Pool #G13078, 6.00%, 3/1/2023 | 15,820 | 16,324 | ||||||||||||||
Freddie Mac, Pool #G13331, 5.50%, 10/1/2023 | 7,718 | 7,986 | ||||||||||||||
Freddie Mac, Pool #C91359, 4.50%, 2/1/2031 | 168,497 | 180,546 | ||||||||||||||
Freddie Mac, Pool #D98711, 4.50%, 7/1/2031 | 479,891 | 516,052 | ||||||||||||||
Freddie Mac, Pool #C91746, 4.50%, 12/1/2033 | 413,673 | 445,363 | ||||||||||||||
Freddie Mac, Pool #C91760, 3.50%, 5/1/2034 | 2,239,699 | 2,346,277 | ||||||||||||||
Freddie Mac, Pool #G07655, 5.50%, 12/1/2035 | 394,811 | 443,837 | ||||||||||||||
Freddie Mac, Pool #G04176, 5.50%, 5/1/2038 | 165,283 | 185,451 | ||||||||||||||
Freddie Mac, Pool #A78227, 5.50%, 6/1/2038 | 167,869 | 183,378 | ||||||||||||||
Freddie Mac, Pool #G05900, 6.00%, 3/1/2040 | 66,501 | 76,094 | ||||||||||||||
Freddie Mac, Pool #A96363, 4.50%, 1/1/2041 | 2,673,749 | 2,911,897 | ||||||||||||||
Freddie Mac, Pool #G60342, 4.50%, 5/1/2042 | 2,516,694 | 2,733,805 | ||||||||||||||
Freddie Mac, Pool #G07998, 4.50%, 7/1/2044 | 2,880,461 | 3,125,375 | ||||||||||||||
Freddie Mac, Pool #Q38473, 4.00%, 1/1/2046 | 3,967,830 | 4,207,180 | ||||||||||||||
Freddie Mac, Pool #Q40375, 3.50%, 5/1/2046 | 4,310,560 | 4,497,369 | ||||||||||||||
|
| |||||||||||||||
TOTAL U.S. GOVERNMENT AGENCIES | 40,885,558 | |||||||||||||||
|
| |||||||||||||||
SHORT-TERM INVESTMENT - 2.2% | ||||||||||||||||
Dreyfus Government Cash Management, Institutional Shares, 1.51%10, (Identified Cost $20,100,158) | 20,100,158 | 20,100,158 | ||||||||||||||
|
| |||||||||||||||
TOTAL OPTIONS PURCHASED — 0.0%## | 210,000 | |||||||||||||||
|
| |||||||||||||||
TOTAL INVESTMENTS - 98.5% | 888,509,593 | |||||||||||||||
OTHER ASSETS, LESS LIABILITIES - 1.5% | 13,300,971 | |||||||||||||||
|
| |||||||||||||||
NET ASSETS - 100% | $ | 901,810,564 | ||||||||||||||
|
| |||||||||||||||
The accompanying notes are an integral part of the financial statements.
17
Unconstrained Bond Series
Investment Portfolio - December 31, 2019
| EXCHANGE-TRADED OPTIONS PURCHASED | ||||||||||||||||||||
| DESCRIPTION | NUMBER OF | EXPIRATION DATE | EXERCISE PRICE | NOTIONAL AMOUNT2 (000) | VALUE | |||||||||||||||
Call | ||||||||||||||||||||
EUR Currency Futures | 200 | 01/03/2020 | $1.12 | 28,205 | $207,500 | |||||||||||||||
Put | ||||||||||||||||||||
EUR Currency Futures | 200 | 01/03/2020 | 1.12 | 28,205 | 2,500 | |||||||||||||||
TOTAL EXCHANGE-TRADED OPTIONS PURCHASED (COST $460,173) |
| $210,000 | ||||||||||||||||||
| FUTURES CONTRACTS: LONG POSITIONS OPEN AT DECEMBER 31, 2019: | ||||||||||||||||||||
CONTRACTS PURCHASED | ISSUE | EXCHANGE | EXPIRATION | NOTIONAL VALUE2 | VALUE/UNREALIZED APPRECIATION/ | |||||||||||||||
243 | CAD Currency | CME | March 2020 | 18,731,655 | $ 450,780 | |||||||||||||||
165 | Euro-BTP | Eurex | March 2020 | 26,366,685 | (296,341) | |||||||||||||||
116 | Euro-OAT | Eurex | March 2020 | 21,179,271 | (333,256) | |||||||||||||||
114 | GBP Currency | CME | March 2020 | 9,470,550 | 119,373 | |||||||||||||||
158 | JPY Currency | CME | March 2020 | 18,259,863 | (50,816) | |||||||||||||||
1,670 | U.S. Treasury Notes (2 Year) | CBOT | March 2020 | 359,885,000 | (224,920) | |||||||||||||||
TOTAL LONG POSITIONS |
| $(335,180) | ||||||||||||||||||
| FUTURES CONTRACTS: SHORT POSITIONS OPEN AT DECEMBER 31, 2019: | ||||||||||||||||||||
| CONTRACTS SOLD | ISSUE | EXCHANGE | EXPIRATION | NOTIONAL VALUE2 | VALUE/UNREALIZED APPRECIATION | |||||||||||||||
265 | Euro-BONO | Eurex | March 2020 | (47,150,084) | $ 230,171 | |||||||||||||||
150 | Euro-BUND | Eurex | March 2020 | (28,685,923) | 499,519 | |||||||||||||||
25 | Euro-BUXL (30 Year) | Eurex | March 2020 | (5,563,096) | 240,012 | |||||||||||||||
141 | Long Gilt | ICE | March 2020 | (24,537,818) | 399,566 | |||||||||||||||
200 | | U.S. Treasury Notes (5 Year) | | CBOT | March 2020 | (23,721,875) | 87,116 | |||||||||||||
| U.S. Ultra Treasury | ||||||||||||||||||||
553 | Bonds (10 Year) | CBOT | March 2020 | (77,808,828) | 962,308 | |||||||||||||||
TOTAL SHORT POSITIONS |
| $2,418,692 | ||||||||||||||||||
CAD - Canadian Dollar
CBOT - Chicago Board of Trade
CLP - Chilean Peso
CME - Chicago Mercantile Exchange
ETF - Exchange-Traded Fund
EUR - Euro
EUREX - Eurex Exchange
GBP - British Pound
ICE - Intercontinental Exchange
IO - Interest only
JPY - Japanese Yen
LIBOR - London Interbank Offered Rate
MXN - Mexican Peso
No. - Number
UMBS - Uniform Mortgage-Backed Securities
The accompanying notes are an integral part of the financial statements.
18
Unconstrained Bond Series
Investment Portfolio - December 31, 2019
## Less than 0.1%.
1Credit ratings from Moody’s (unaudited).
2Amount is stated in USD unless otherwise noted.
3Floating rate security. Rate shown is the rate in effect as of December 31, 2019.
4A portion of this security is designated as collateral. As of December 31, 2019, the total value of such securities was $19,359,120.
5Restricted securities - Investment in securities that are restricted as to public resale under the Securities Act of 1933, as amended. These securities have been sold under Rule 144A and have been determined to be liquid under the Fund’s Liquidity Risk Management Program. These securities amount to $354,410,159, or 39.3% of the Series’ net assets as of December 31, 2019 (see Note 2 to the financial statements).
6Credit rating has been withdrawn. As of December 31, 2019, there is no rating available (unaudited).
7Credit ratings from S&P (unaudited).
8Variable or floating rate security, the interest rate of which adjusts periodically based on changes in current interest rates and prepayments on the underlying pool of assets. Rate shown is the rate in effect as of December 31, 2019.
9Represents astep-up bond that pays initial coupon rate for the first period and then a higher coupon rate for the following periods. Rate shown reflects the current coupon as of December 31, 2019.
10Rate shown is the current yield as of December 31, 2019.
The Global Industry Classification Standard (GICS) was developed by and is the exclusive property and a service mark of MSCI Inc. (MSCI) and Standard & Poor’s, a division of S&P Global Inc. (S&P), and is licensed for use by Manning & Napier when referencing GICS sectors. Neither MSCI, S&P, nor any third party involved in making or compiling the GICS or any GICS classifications makes any express or implied warranties or representations with respect to such standard or classification, nor shall any such party have any liability therefrom.
The accompanying notes are an integral part of the financial statements.
19
Unconstrained Bond Series
Statement of Assets and Liabilities
December 31, 2019
ASSETS: | ||||
Investments in securities, at value (identified cost $885,452,490) (Note 2) | $ | 888,509,593 | ||
Receivable from investment advisor (Note 3) | 14,768 | |||
Deposits at broker for futures contracts | 6,940,879 | |||
Interest receivable | 5,547,739 | |||
Receivable for fund shares sold | 577,655 | |||
Futures variation margin receivable | 434,010 | |||
Dividends receivable | 99,884 | |||
Prepaid and other expenses | 8,943 | |||
|
| |||
TOTAL ASSETS | 902,133,471 | |||
|
| |||
LIABILITIES: | ||||
Accrued fund accounting and administration fees (Note 3) | 42,293 | |||
Accruedsub-transfer agent fees (Note 3) | 14,849 | |||
Accrued distribution and service (Rule12b-1) fees (Class S) (Note 3) | 4,814 | |||
Accrued Chief Compliance Officer service fees (Note 3) | 1,170 | |||
Futures variation margin payable | 106,459 | |||
Payable for fund shares repurchased | 103,315 | |||
Accrued printing and postage fees payable | 17,084 | |||
Other payables and accrued expenses | 32,923 | |||
|
| |||
TOTAL LIABILITIES | 322,907 | |||
|
| |||
TOTAL NET ASSETS | $ | 901,810,564 | ||
|
| |||
NET ASSETS CONSIST OF: | ||||
Capital stock | $ | 868,873 | ||
Additionalpaid-in-capital | 901,877,511 | |||
Total distributable earnings (loss) | (935,820 | ) | ||
|
| |||
TOTAL NET ASSETS | $ | 901,810,564 | ||
|
| |||
NET ASSET VALUE, OFFERING PRICE AND REDEMPTION PRICE PER SHARE - Class S | ||||
($22,884,080/2,191,599 shares) | $ | 10.44 | ||
|
| |||
NET ASSET VALUE, OFFERING PRICE AND REDEMPTION PRICE PER SHARE - Class I | ||||
($19,038,797/2,056,759 shares) | $ | 9.26 | ||
|
| |||
NET ASSET VALUE, OFFERING PRICE AND REDEMPTION PRICE PER SHARE - Class W | ||||
($859,887,687/82,638,919 shares) | $ | 10.41 | ||
|
| |||
The accompanying notes are an integral part of the financial statements.
20
Unconstrained Bond Series
Statement of Operations
For the Year Ended December 31, 2019
INVESTMENT INCOME: | ||||
Interest | $ | 29,225,576 | ||
Dividends | 1,044,034 | |||
|
| |||
Total Investment Income | 30,269,610 | |||
|
| |||
EXPENSES: | ||||
Management fees (Note 3) | 2,770,290 | |||
Shareholder services fees (Class S) (Note 3) | 277,758 | |||
Fund accounting and administration fees (Note 3) | 168,481 | |||
Directors’ fees (Note 3) | 88,010 | |||
Distribution and service (Rule12b-1) fees (Class S) (Note 3) | 56,533 | |||
Accruedsub-transfer agent fees (Note 3) | 47,041 | |||
Chief Compliance Officer service fees (Note 3) | 3,109 | |||
Custodian fees | 40,110 | |||
Miscellaneous | 237,867 | |||
|
| |||
Total Expenses | 3,689,199 | |||
Less reduction of expenses (Note 3) | (2,233,793 | ) | ||
|
| |||
Net Expenses | 1,455,406 | |||
|
| |||
NET INVESTMENT INCOME | 28,814,204 | |||
|
| |||
REALIZED AND UNREALIZED GAIN (LOSS) ON INVESTMENTS AND FOREIGN CURRENCY: | ||||
Net realized gain (loss) on- | ||||
Investments | 347,491 | |||
Litigation proceeds (Note 4) | 90,653 | |||
Futures contracts | (2,248,424 | ) | ||
Options Written | 239,265 | |||
Foreign currency and translation of other assets and liabilities | 27,686 | |||
|
| |||
| (1,543,329 | ) | |||
|
| |||
Net change in unrealized appreciation (depreciation) on- | ||||
Investments | 18,293,636 | |||
Futures contracts | 1,174,493 | |||
Foreign currency and translation of other assets and liabilities | (405 | ) | ||
|
| |||
| 19,467,724 | ||||
|
| |||
NET REALIZED AND UNREALIZED GAIN (LOSS) ON INVESTMENTS AND FOREIGN CURRENCY | 17,924,395 | |||
|
| |||
NET INCREASE IN NET ASSETS RESULTING FROM OPERATIONS | $ | 46,738,599 | ||
|
| |||
The accompanying notes are an integral part of the financial statements.
21
Unconstrained Bond Series
Statements of Changes in Net Assets
FOR THE YEAR ENDED | FOR THE YEAR ENDED | |||||||
INCREASE (DECREASE) IN NET ASSETS: | ||||||||
OPERATIONS: | ||||||||
Net investment income | $ | 28,814,204 | $ | 19,978,931 | ||||
Net realized gain (loss) on investments and foreign currency | (1,543,329 | ) | (5,431,216 | ) | ||||
Net change in unrealized appreciation (depreciation) on investments and foreign currency | 19,467,724 | (13,596,889 | ) | |||||
|
|
|
| |||||
Net increase from operations | 46,738,599 | 950,826 | ||||||
|
|
|
| |||||
DISTRIBUTIONS TO SHAREHOLDERS (Note 9): | ||||||||
Class S | (569,520 | ) | (18,048,897 | ) | ||||
Class I | (656,971 | ) | (1,144,935 | ) | ||||
Class W | (27,871,927 | ) | — | |||||
|
|
|
| |||||
Total distributions to shareholders | (29,098,418 | ) | (19,193,832 | ) | ||||
|
|
|
| |||||
CAPITAL STOCK ISSUED AND REPURCHASED: | ||||||||
Net increase (decrease) from capital share transactions (Note 5) | 170,021,787 | (104,975,148 | ) | |||||
|
|
|
| |||||
Net increase (decrease) in net assets | 187,661,968 | (123,218,154 | ) | |||||
NET ASSETS: | ||||||||
Beginning of year | 714,148,596 | 837,366,750 | ||||||
|
|
|
| |||||
End of year | $ | 901,810,564 | $ | 714,148,596 | ||||
|
|
|
| |||||
The accompanying notes are an integral part of the financial statements.
22
Unconstrained Bond Series
Financial Highlights - Class S
| FOR THE YEAR ENDED | ||||||||||||||||||||
| 12/31/19 | 12/31/18 | 12/31/17 | 12/31/16 | 12/31/15 | ||||||||||||||||
Per share data (for a share outstanding throughout each year): | ||||||||||||||||||||
Net asset value - Beginning of year | $10.18 | $10.42 | $10.33 | $10.12 | $10.53 | |||||||||||||||
|
|
|
|
|
|
|
|
|
| |||||||||||
Income (loss) from investment operations: | ||||||||||||||||||||
Net investment income1 | 0.28 | 0.26 | 0.22 | 0.22 | 0.27 | |||||||||||||||
Net realized and unrealized gain (loss) on investments | 0.23 | (0.24 | ) | 0.11 | 0.19 | (0.36 | ) | |||||||||||||
|
|
|
|
|
|
|
|
|
| |||||||||||
Total from investment operations | 0.51 | 0.02 | 0.33 | 0.41 | (0.09 | ) | ||||||||||||||
|
|
|
|
|
|
|
|
|
| |||||||||||
Less distributions to shareholders: | ||||||||||||||||||||
From net investment income | (0.25 | ) | (0.25 | ) | (0.23 | ) | (0.20 | ) | (0.26 | ) | ||||||||||
From net realized gain on investments | — | (0.01 | ) | (0.01 | ) | — | (0.05 | ) | ||||||||||||
From return of capital | — | — | — | — | (0.01 | ) | ||||||||||||||
|
|
|
|
|
|
|
|
|
| |||||||||||
Total distributions to shareholders | (0.25 | ) | (0.26 | ) | (0.24 | ) | (0.20 | ) | (0.32 | ) | ||||||||||
|
|
|
|
|
|
|
|
|
| |||||||||||
Net asset value - End of year | $10.44 | $10.18 | $10.42 | $10.33 | $10.12 | |||||||||||||||
|
|
|
|
|
|
|
|
|
| |||||||||||
Net assets - End of year(000’s omitted) | $22,884 | $685,649 | $770,824 | $845,043 | $835,610 | |||||||||||||||
|
|
|
|
|
|
|
|
|
| |||||||||||
Total return2 | 5.01% | 0.20% | 3.19% | 4.08% | (0.88% | ) | ||||||||||||||
Ratios (to average net assets)/Supplemental Data: | ||||||||||||||||||||
Expenses* | 0.75% | 0.75% | 0.75% | 0.75% | 0.75% | |||||||||||||||
Net investment income | 2.80% | 2.56% | 2.08% | 2.18% | 2.58% | |||||||||||||||
Series portfolio turnover | 75% | 58% | 62% | 56% | 81% | |||||||||||||||
| *The investment advisor did not impose all or a portion of its management and/or other fees, and in some periods may have paid a portion of the Series’ expenses. If these expenses had been incurred by the Class, the expense ratio (to average net assets) would have increased by the following amounts: |
| |||||||||||||||||||
| 0.01% | 0.01% | 0.00%3 | N/A | N/A | ||||||||||||||||
1Calculated based on average shares outstanding during the years.
2Represents aggregate total return for the years indicated, and assumes reinvestment of all distributions. Total return would have been lower had certain expenses not been waived or reimbursed during certain years.
3Less than 0.01%.
The accompanying notes are an integral part of the financial statements.
23
Unconstrained Bond Series
Financial Highlights - Class I
| FOR THE YEAR ENDED | ||||||||||||||||||||
| 12/31/19 | 12/31/18 | 12/31/17 | 12/31/16 | 12/31/15 | ||||||||||||||||
Per share data (for a share outstanding throughout each year): | ||||||||||||||||||||
Net asset value - Beginning of year | $9.09 | $9.34 | $9.28 | $9.12 | $9.52 | |||||||||||||||
|
|
|
|
|
|
|
|
|
| |||||||||||
Income (loss) from investment operations: | ||||||||||||||||||||
Net investment income1 | 0.28 | 0.26 | 0.22 | 0.23 | 0.29 | |||||||||||||||
Net realized and unrealized gain (loss) on investments | 0.20 | (0.22 | ) | 0.11 | 0.16 | (0.34 | ) | |||||||||||||
|
|
|
|
|
|
|
|
|
| |||||||||||
Total from investment operations | 0.48 | 0.04 | 0.33 | 0.39 | (0.05 | ) | ||||||||||||||
|
|
|
|
|
|
|
|
|
| |||||||||||
Less distributions to shareholders: | ||||||||||||||||||||
From net investment income | (0.31 | ) | (0.28 | ) | (0.26 | ) | (0.23 | ) | (0.29 | ) | ||||||||||
From net realized gain on investments | — | (0.01 | ) | (0.01 | ) | — | (0.05 | ) | ||||||||||||
From return of capital | — | — | — | — | (0.01 | ) | ||||||||||||||
|
|
|
|
|
|
|
|
|
| |||||||||||
Total distributions to shareholders | (0.31 | ) | (0.29 | ) | (0.27 | ) | (0.23 | ) | (0.35 | ) | ||||||||||
|
|
|
|
|
|
|
|
|
| |||||||||||
Net asset value - End of year | $9.26 | $9.09 | $9.34 | $9.28 | $9.12 | |||||||||||||||
|
|
|
|
|
|
|
|
|
| |||||||||||
Net assets - End of year(000’s omitted) | $19,039 | $28,499 | $66,543 | $49,233 | $37,749 | |||||||||||||||
|
|
|
|
|
|
|
|
|
| |||||||||||
Total return2 | 5.37% | 0.40% | 3.52% | 4.27% | (0.59% | ) | ||||||||||||||
Ratios (to average net assets)/Supplemental Data: | ||||||||||||||||||||
Expenses* | 0.48% | 0.50% | 0.50% | 0.50% | 0.50% | |||||||||||||||
Net investment income | 3.01% | 2.75% | 2.33% | 2.50% | 3.00% | |||||||||||||||
Series portfolio turnover | 75% | 58% | 62% | 56% | 81% | |||||||||||||||
| *The investment advisor did not impose all or a portion of its management and/or other fees, and in some periods may have paid a portion of the Series’ expenses. If these expenses had been incurred by the Class, the expense ratio (to average net assets) would have increased by the following amounts: |
| |||||||||||||||||||
| 0.01% | 0.01% | 0.00 | %3 | N/A | N/A | |||||||||||||||
1Calculated based on average shares outstanding during the years.
2Represents aggregate total return for the years indicated, and assumes reinvestment of all distributions. Total return would have been lower had certain expenses not been waived or reimbursed during certain years.
3Less than 0.01%.
The accompanying notes are an integral part of the financial statements.
24
Unconstrained Bond Series
Financial Highlights - Class W
FOR THE PERIOD 3/1/191 TO 12/31/19 | |||||||||||||
Per share data (for a share outstanding throughout the period): |
| ||||||||||||
Net asset value - Beginning of period | $10.34 | ||||||||||||
|
| ||||||||||||
Income from investment operations: | |||||||||||||
Net investment income2 | 0.30 | ||||||||||||
Net realized and unrealized gain (loss) on investments | 0.12 | ||||||||||||
|
| ||||||||||||
Total from investment operations | 0.42 | ||||||||||||
|
| ||||||||||||
Less distributions to shareholders: | |||||||||||||
From net investment income | (0.35 | ) | |||||||||||
|
| ||||||||||||
Net asset value - End of period | $10.41 | ||||||||||||
|
| ||||||||||||
Net assets - End of period(000’s omitted) | $859,888 | ||||||||||||
|
| ||||||||||||
Total return3,4 | 4.10% | ||||||||||||
Ratios (to average net assets)/Supplemental Data: | |||||||||||||
Expenses*5 | 0.05% | ||||||||||||
Net investment income5 | 3.44% | ||||||||||||
Series portfolio turnover | 75% | ||||||||||||
| *The investment advisor did not impose all or a portion of its management and/or other fees during the period, and may have paid a portion of the Series’ expenses. If these expenses had been incurred by the Series, the expense ratio (to average net assets) would have increased by the following amount5: |
| ||||||||||||
| 0.31% | |||||||||||||
1Commencement of operations.
2Calculated based on average shares outstanding during the period.
3Represents aggregate total return for the period indicated, and assumes reinvestment of all distributions. Total return would have been lower had certain expenses not been reimbursed during the period. Periods less than one year are not annualized.
4Includes litigation proceeds (see Statement of Operations). Excluding this amount, the Class’ total return is 4.00%.
5Annualized.
The accompanying notes are an integral part of the financial statements.
25
Unconstrained Bond Series
Notes to Financial Statements
| 1. | Organization |
Unconstrained Bond Series (the “Series”) is ano-load diversified series of Manning & Napier Fund, Inc. (the “Fund”). The Fund is organized in Maryland and is registered under the Investment Company Act of 1940, as amended, as anopen-end management investment company.
The Series’ primary investment objective is to provide long-term total return, and its secondary objective is to provide preservation of capital.
The Fund’s advisor is Manning & Napier Advisors, LLC (the “Advisor”). Shares of the Series are offered to investors, clients and employees of the Advisor and its affiliates. The Series is authorized to issue four classes of shares (Class S, I, W, and Z). Class W shares were issued on March 1, 2019. Each class of shares is substantially the same, except that class specific distribution and shareholder servicing expenses are borne by the specific class of shares to which they relate. The total authorized capital stock of the Fund consists of 15 billion shares of common stock each having a par value of $0.01. As of December 31, 2019, 8.9 billion shares have been designated in total among 31 series, of which 100 million have been designated as Unconstrained Bond Series Class I common stock and Unconstrained Bond Series Class Z common stock, 125 million have been designated as Unconstrained Bond Series Class S common stock and 150 million have been designated as Unconstrained Bond Series Class W common stock. Class Z common stock is not currently offered for sale.
| 2. | Significant Accounting Policies |
The following is a summary of significant accounting policies followed by the Series. The Series is an investment company and, accordingly, follows the investment company accounting and reporting guidance of the Financial Accounting Standards Board Accounting Standards Codification Topic 946 - Investment Companies, which is part of accounting principles generally accepted in the United States of America (“GAAP”).
Security Valuation
Portfolio securities, including domestic equities, foreign equities, warrants and options, listed on an exchange other than the NASDAQ Stock Market are valued at the latest quoted sales price of the exchange on which the security is primarily traded. Securities not traded on valuation date or securities not listed on an exchange are valued at the latest quoted bid price provided by the Fund’s pricing service. Securities listed on the NASDAQ Stock Market are valued in accordance with the NASDAQ Official Closing Price.
Debt securities, including government bonds, foreign bonds, asset-backed securities, structured notes, supranational obligations, sovereign bonds, corporate bonds, loan assignments, and mortgage-backed securities will normally be valued on the basis of evaluated bid prices provided directly by an independent pricing service (the “Service”). The pricing services use multiple valuation techniques to determine fair value. In instances where sufficient market activity exists, the pricing services may utilize a market-based approach through which quotes from market makers are used to determine fair value. In instances where sufficient market activity may not exist or is limited, the pricing services also utilize proprietary valuation models which may consider market characteristics such as benchmark yield curves, option-adjusted spreads, credit spreads, estimated default rates, coupon rates, anticipated timing of principal repayments, underlying collateral, and other unique security features in order to estimate the relevant cash flows, which are then discounted to calculate the fair value. Certain investments in securities held by the Series may be valued on a basis of a price provided directly by a principal market maker. These prices may differ from the value that would have been used had a broader market for securities existed.
The fair value of loan assignments is estimated using recently executed transactions, market price quotations, credit/market events, and cross-asset pricing. Inputs are generally observable market inputs obtained from independent sources. Loan assignments are generally categorized in Level 2 of the fair value hierarchy, unless key inputs are unobservable, in which case they would be categorized in Level 3.
Municipal securities will normally be valued on the basis of market valuations provided by the Service. The Service utilizes the latest price quotations and a matrix system (which considers such factors as security prices of similar securities, yields, maturities and ratings). The Service has been approved by the Fund’s Board of Directors (the “Board”).
26
Unconstrained Bond Series
Notes to Financial Statements (continued)
| 2. | Significant Accounting Policies (continued) |
Security Valuation(continued)
Short-term investments that mature in sixty days or less may be valued at amortized cost, which approximates fair value. Investments inopen-end investment companies are valued at their net asset value per share on valuation date.
Volume and level of activity in established markets for an asset or liability are evaluated to determine whether recent transactions and quoted prices are determinative of fair value. Where there have been significant decreases in volume and level of activity, further analysis and adjustment may be necessary to estimate fair value. The Series measures fair value in these instances by the use of inputs and valuation techniques which may be based upon current market prices of securities that are comparable in coupon, rating, maturity and industry and/or expectation of future cash flows. As a result of trading in relatively thin markets and/or markets that experience significant volatility, the prices used by the Series to value these securities may differ from the value that would be realized if these securities were sold, and the differences could be material.
Securities for which representative valuations or prices are not available from the Series’ pricing service may be valued at fair value as determined in good faith by the Advisor under procedures approved by and under the general supervision and responsibility of the Fund’s Board. Due to the inherent uncertainty of valuations of such securities, the fair value may differ significantly from the values that would have been used had a ready market for such securities existed. If trading or events occurring after the close of the principal market in which securities are traded are expected to materially affect the value of those securities, then they may be valued at their fair value, taking this trading or these events into account.
Various inputs are used in determining the value of the Series’ assets or liabilities carried at fair value. These inputs are summarized in three broad levels. Level 1 includes quoted prices in active markets for identical assets and liabilities. Level 2 includes other significant observable inputs (including quoted prices for similar securities, interest rates, prepayment speeds, credit risk, etc.). Level 3 includes significant unobservable inputs (including the Series’ own assumptions in determining the fair value of investments). A financial instrument’s level within the fair value hierarchy is based on the lowest level of any input both individually and in aggregate that is significant to the fair value measurement. The inputs or methodology used for valuing securities are not necessarily an indication of the risk associated with investing in those securities.
The following is a summary of the valuation levels used for major security types as of December 31, 2019 in valuing the Series’ assets or liabilities carried at fair value:
| DESCRIPTION | TOTAL | LEVEL 1 | LEVEL 2 | LEVEL 3 | ||||||||||||
Assets: | ||||||||||||||||
Debt securities: | ||||||||||||||||
U.S. Treasury and other U.S. | $ | 224,957,751 | $ | — | $ | 224,957,751 | $ | — | ||||||||
Corporate debt: | ||||||||||||||||
Communication Services | 61,239,621 | — | 61,239,621 | — | ||||||||||||
Consumer Discretionary | 19,857,301 | — | 19,857,301 | — | ||||||||||||
Consumer Staples | 2,510,749 | — | 2,510,749 | — | ||||||||||||
Energy | 68,025,653 | — | 68,025,653 | — | ||||||||||||
Financials | 92,937,182 | — | 92,937,182 | — | ||||||||||||
Health Care | 11,987,192 | — | 11,987,192 | — | ||||||||||||
Industrials | 37,676,040 | — | 37,676,040 | — | ||||||||||||
Materials | 10,956,916 | — | 10,956,916 | — | ||||||||||||
Real Estate | 16,657,969 | — | 16,657,969 | — | ||||||||||||
Asset-backed securities | 218,929,464 | — | 218,929,464 | — | ||||||||||||
Commercial mortgage-backed securities | 77,660,549 | — | 77,660,549 | — | ||||||||||||
Foreign government bonds | 15,280,248 | — | 15,280,248 | — | ||||||||||||
Mutual fund | 9,522,800 | 9,522,800 | — | — | ||||||||||||
27
Unconstrained Bond Series
Notes to Financial Statements (continued)
| 2. | Significant Accounting Policies (continued) |
Security Valuation(continued)
| DESCRIPTION | TOTAL | LEVEL 1 | LEVEL 2 | LEVEL 3 | ||||||||||||
Short-Term Investment | $ | 20,100,158 | $ | 20,100,158 | $ | — | $ | — | ||||||||
Options purchased : | ||||||||||||||||
Foreign currency exchange contracts | 210,000 | 210,000 | — | — | ||||||||||||
Other financial instruments:* | ||||||||||||||||
Foreign currency exchange contracts | 570,153 | 570,153 | — | — | ||||||||||||
Interest rate contracts | 2,418,692 | 2,418,692 | — | — | ||||||||||||
|
|
|
|
|
|
|
| |||||||||
Total assets | 891,498,438 | 32,821,803 | 858,676,635 | — | ||||||||||||
|
|
|
|
|
|
|
| |||||||||
Liabilities: | ||||||||||||||||
Other financial instruments:* | ||||||||||||||||
Foreign currency exchange contracts | (50,816 | ) | (50,816 | ) | — | — | ||||||||||
Interest rate contracts | (854,517 | ) | (854,517 | ) | — | — | ||||||||||
|
|
|
|
|
|
|
| |||||||||
Total liabilities | (905,333 | ) | (905,333 | ) | — | — | ||||||||||
|
|
|
|
|
|
|
| |||||||||
Total | $ | 890,593,105 | $ | 31,916,470 | $ | 858,676,635 | $ | — | ||||||||
|
|
|
|
|
|
|
| |||||||||
There were no Level 3 securities held by the Series as of December 31, 2018 or December 31, 2019.
*Other financial instruments are futures (Level 1). Futures are valued at the unrealized appreciation (depreciation) on the instrument.
Other Market and Credit Risk
Certain debt securities, derivatives and other financial instruments utilize the London Interbank Offered Rate (“LIBOR”) as the reference or benchmark rate for variable interest rate calculations. In July 2017, the UK Financial Conduct Authority announced a desire to phase out the use of LIBOR by the end of 2021, suggesting that LIBOR may cease to be published after that time. Regulators and financial industry groups have begun planning for a transition to the use of a different benchmark, but there are obstacles and a lack of global consensus, and the process for amending existing contracts or instruments to transition away from LIBOR remains unclear. The transition process might lead to increased volatility and illiquidity in markets that currently rely on the LIBOR to determine interest rates, a reduction in the values of some LIBOR-based investments, and reduced effectiveness of certain hedging strategies, which may adversely affect a Series’ performance or net asset value. Since the usefulness of LIBOR as a benchmark could deteriorate during the transition period, these effects could occur prior to the end of 2021. In addition, the alternative reference or benchmark rate may be an ineffective substitute resulting in prolonged adverse market conditions for a Portfolio.
New Accounting Pronouncements
In March 2017, the Financial Accounting Standards Board issued Accounting Standards UpdateNo. 2017-08, Receivables -Nonrefundable Fees and Other Costs (Subtopic310-20): “Premium Amortization of Purchased Callable Debt Securities” which amends the amortization period for certain purchased callable debt securities. Under the new guidance, the premium amortization of purchased callable debt securities that have explicit,non-contingent call features and are callable at fixed prices will be amortized to the earliest call date. The guidance does not require an accounting change for securities held at a discount, which continue to be amortized to maturity. This guidance was adopted by the Series as of January 1, 2019 on a modified retrospective basis. The cost basis of the securities on January 1, 2019 has been decreased by $25,489. This change in accounting policy has been made to comply with the newly issued accounting standard and had no impact on total distributable earnings (loss) or the net asset value for any Class of the Series.
28
Unconstrained Bond Series
Notes to Financial Statements (continued)
| 2. | Significant Accounting Policies (continued) |
Security Transactions, Investment Income and Expenses
Security transactions are accounted for on trade date. Dividend income is recorded on theex-dividend date, except that if theex-dividend date has passed, certain dividends from foreign securities are recorded as soon as the Series is informed of theex-dividend date.Non-cash dividends, if any, are recorded at the fair value of the securities received. Interest income, including amortization of premium and accretion of discounts using the effective interest method, is earned from settlement date and accrued daily.
Expenses are recorded on an accrual basis. Most expenses of the Fund can be attributed to a specific series. Expenses which cannot be directly attributed are apportioned among the series in the Fund in such a manner as deemed equitable by the Fund’s Board, taking into consideration, among other things, the nature and type of expense. Income, expenses (other than shareholder services fees), and realized and unrealized gains and losses are prorated among the classes based on the relative net assets of each class. Class specific examples are directly charged to that Class.
The Series uses the identified cost method for determining realized gain or loss on investments for both financial statement and federal income tax reporting purposes.
Foreign Currency Translation
The books and records of the Series are maintained in U.S. dollars. Foreign currencies, investments and other assets and liabilities are translated into U.S. dollars at the current exchange rates. Purchases and sales of investment securities and income and expenses are translated on the respective dates of such transactions. The Series does not isolate realized and unrealized gains and losses attributable to changes in the exchange rates from gains and losses that arise from changes in the fair value of investments. Such fluctuations are included with net realized and unrealized gain or loss on investments. Net realized foreign currency gains and losses represent foreign currency gains and losses between trade date and settlement date on securities transactions, gains and losses on disposition of foreign currencies and the difference between the amount of income and foreign withholding taxes recorded on the books of the Series and the amounts actually received or paid.
Forward Foreign Currency Exchange Contracts
The Series may purchase or sell forward foreign currency exchange contracts in order to hedge a portfolio position or specific transaction. Risks may arise if the counterparties to a contract are unable to meet the terms of the contract or if the value of the foreign currency moves unfavorably.
All forward foreign currency exchange contracts are adjusted daily by the exchange rate of the underlying currency and, for financial statement purposes, any gain or loss is recorded as unrealized gain or loss until a contract has been closed.
The Series may regularly trade forward foreign currency exchange contracts withoff-balance sheet risk in the normal course of its investing activities to assist in managing exposure to changes in foreign currency exchange rates.
The notional or contractual amount of these instruments represents the investment the Series has in forward foreign currency exchange contracts and does not necessarily represent the amounts potentially at risk. The measurement of the risks associated with forward foreign currency exchange contracts is meaningful only when all related and offsetting transactions are considered. The Series’ forward foreign currency exchange contracts are not subject to master netting arrangements (the right to close out all transactions traded with a counterparty, and net amounts owed or due across transactions). No such investments were held by the Series on December 31, 2019.
Futures
The Series may purchase or sell exchange-traded futures contracts, which are contracts that obligate the Series to make or take delivery of a financial instrument or the cash value of a security index at a specified future date at a specified price. The Series may use futures contracts to manage exposure to the bond market or changes in interest rates and currency values, or for gaining exposure to markets. Risks of entering into futures contracts include the possibility that there may be an illiquid market at the time the Advisor to the Series may be attempting to sell some or all the Series’ holdings or that a change in the value of the contract may not correlate with changes in the value of the underlying securities. Upon entering into a futures contract, a
29
Unconstrained Bond Series
Notes to Financial Statements (continued)
| 2. | Significant Accounting Policies (continued) |
Futures(continued)
Series is required to deposit either cash or securities (initial margin). Subsequent payments (variation margin) are made or received by the Series, generally on a daily basis. The variation margin payments are equal to the daily changes in the contract value and are recorded as unrealized gains or losses. The Series recognize a realized gain or loss when the contract is closed or expires.
Futures transactions involve minimal counterparty risk since futures contracts are guaranteed against default by the exchange on which they trade. The Series’ futures contracts are not subject to master netting arrangements (the right to close out all transactions traded with a counterparty, and net amounts owed or due across transactions).
Option Contracts
The Series may write (sell) or buy call or put options on securities and other financial instruments. When the Series writes a call, the Series gives the purchaser the right to buy the underlying security from the Series at the price specified in the option contract (the “exercise price”) at any time during the option period. When the Series writes a put option, the Series gives the purchaser the right to sell to the Series the underlying security at the exercise price at any time during the option period. The Series will only write options on a “covered basis.” This means that the Series will own the underlying security when the Series writes a call or the Series will put aside cash, U.S. Government securities, or other liquid assets in an amount not less than the exercise price at all times the put option is outstanding.
When the Series writes an option, an amount equal to the premium received is reflected as a liability and is subsequentlymarked-to-market to reflect the current market value of the option. The Series, as a writer of an option, has no control over whether the underlying security or financial instrument may be sold (call) or purchased (put) and, as a result, bears the market risk of an unfavorable change in the price of the security or financial instrument underlying the written option. There is a risk that the Series may not be able to enter into a closing transaction because of an illiquid market.
The Series may also purchase options in an attempt to hedge against fluctuations in the value of its portfolio and to protect against declines in the value of the securities. The premium paid by the Series for the purchase of an option is reflected as an investment and subsequentlymarked-to-market to reflect the current market value of the option. The risk associated with purchasing options is limited to the premium paid.
When a security is purchased or sold through an exercise of an option, the related premium paid (or received) is added to (or deducted from) the basis of the security acquired or deducted from (or added to) the proceeds of the security sold. When an option expires (or the Series enters into a closing transaction), the Series realizes a gain or loss on the option to the extent of the premium received or paid (or gain or loss to the extent the cost of the closing transaction exceeds the premium paid or received).
The measurement of the risks associated with option contracts is meaningful only when all related and offsetting transactions are considered.
30
Unconstrained Bond Series
Notes to Financial Statements (continued)
| 2. | Significant Accounting Policies (continued) |
The following table presents the present value of derivatives held at December 31, 2019 as reflected on the Statement of Assets and Liabilities, and the effect of derivative instruments on the Statement of Operations:
| STATEMENT OF ASSETS AND LIABILITIES | ||||||
Derivative | Assets Location | |||||
Foreign currency exchange contracts | Investments in securities, at value1 | $ 210,000 | ||||
Foreign currency exchange contracts | Net unrealized appreciation2 | $ 570,153 | ||||
Interest rate contracts | Net unrealized appreciation2 | $ 2,418,692 | ||||
Derivative | Liabilities Location | |||||
Foreign currency exchange contracts | Net unrealized depreciation2 | $ (50,816 | ) | |||
Interest rate contracts | Net unrealized depreciation2 | $ (854,517 | ) | |||
| STATEMENT OF OPERATIONS | ||||||
Derivative | Location of Gain or (Loss) on Derivatives | | Realized Gain (Loss) on | | ||
Equity contracts | Net realized gain (loss) on investments3 | $ (708,899 | ) | |||
Foreign currency exchange contracts | Net realized gain (loss) on investments3 | $ (17,972 | ) | |||
Foreign currency exchange contracts | Net realized gain (loss) on futures contracts | $ 172,057 | ||||
Interest rate contracts | Net realized gain (loss) on futures contracts | $ (2,420,481 | ) | |||
Equity contracts | Net realized gain (loss) on options written | $ 239,265 | ||||
Derivative | Location of Appreciation (Depreciation) on Derivatives | | Unrealized Appreciation (Depreciation) on Derivatives | | ||
Foreign currency exchange contracts | Net change in unrealized appreciation (depreciation) on investments4 | $ 210,000 | ||||
Foreign currency exchange contracts | Net change in unrealized appreciation (depreciation) on futures contracts | $ 473,615 | ||||
Interest rate contracts | Net change in unrealized appreciation (depreciation) on futures contracts | $ 700,878 | ||||
1Includes options purchased at value as reported in the Investment Portfolio.
2Includes cumulative appreciation/depreciation on futures contracts as reported in the Investment Portfolio, and is included within Net Assets as the components of capital are not required to be presented separately on the Statement of Assets and Liabilities. Only the current day’s variation margin is reported within the Statement of Assets and Liabilities.
3Options purchased are included in net realized gain (loss) on investments.
4Options purchased are included in net change in unrealized appreciation (depreciation) on investments.
31
Unconstrained Bond Series
Notes to Financial Statements (continued)
| 2. | Significant Accounting Policies (continued) |
The averagemonth-end balances for the year ended December 31, 2019, the period in which such derivatives were outstanding, were as follows:
Futures Contracts: | ||||||||||||
Average number of contracts purchased1 | 1,548 | |||||||||||
Average number of contracts sold | 1,135 | |||||||||||
Average notional value of contracts purchased1 | $307,282,081 | |||||||||||
Average notional value of contracts sold | $249,245,616 | |||||||||||
Options: | ||||||||||||
Average number of option contracts purchased1 | 1,943 | |||||||||||
Average number of option contracts written2 | 3,200 | |||||||||||
Average notional value of option contracts purchased1 | $ 54,899,929 | |||||||||||
Average notional value of option contracts written2 | $ 43,890,667 |
1Average notional calculations were performed utilizing the period held rather than 12 months.
2Average notional calculations are for a period less than one month.
Asset-Backed Securities
The Series may invest in asset-backed securities. Asset-backed securities are generally issued as pass-through certificates or as debt instruments. Asset-backed securities issued as pass-through certificates represent undivided fractional ownership interests in an underlying pool of assets. Asset-backed securities issued as debt instruments, which are also known as collateralized obligations, are typically issued as the debt of a special purpose entity organized solely for the purpose of owning such assets and issuing such debt. Asset-backed securities are often backed by a pool of assets representing the obligations of a number of different parties. The yield characteristics of certain asset-backed securities may differ from traditional debt securities. One such major difference is that all or a principal part of the obligations may be prepaid at any time because the underlying assets (i.e. loans) may be prepaid at any time. As a result, a decrease in interest rates in the market may result in increases in the level of prepayments as borrowers, particularly mortgagors, refinance and repay their loans. An increased prepayment rate with respect to an asset-backed security will have the effect of shortening the maturity of the security. In addition, the Series may subsequently have to reinvest the proceeds at lower interest rates. If the Series has purchased such an asset-backed security at a premium, a faster than anticipated prepayment rate could result in a loss of principal to the extent of the premium paid.
Mortgage-Backed Securities
The Series may invest in mortgage-backed securities (“MBS” or pass-through certificates) that represent an interest in a pool of specific underlying mortgage loans and entitle the Series to the periodic payments of principal and interest from those mortgages. MBS may be issued by government agencies or corporations, or private issuers. Most MBS issued by government agencies are guaranteed; however, the degree of protection differs based on the issuer. For MBS there are a number of important differences among the agencies and instrumentalities of the U.S. Government that issue mortgage-related securities and among the securities that they issue. For example, mortgage-related securities guaranteed by Ginnie Mae are guaranteed as to the timely payment of principal and interest by Ginnie Mae and such guarantee is backed by the full faith and credit of the United States. However, mortgage-related securities issued by Freddie Mac and Fannie Mae, including Freddie Mac and Fannie Mae guaranteed mortgage pass-through certificates, which are solely the obligations of Freddie Mac and Fannie Mae, are not backed by or entitled to the full faith and credit of the United States, but are supported by the right of the issuer to borrow from the U.S. Treasury.Non-agency mortgage-backed securities are securities issued bynon-governmental issuers and have no direct or indirect government guarantees of payment and are subject to various risks.Non-agency mortgage loans are obligations of the borrowers thereunder only and are not typically insured or guaranteed by any other person or entity. The ability of a borrower to repay a loan is dependent upon the income or assets of the borrower. A number of factors, including a general economic downturn, acts of God, terrorism, social unrest and civil disturbances, may impair a borrower’s ability to repay its loans.
32
Unconstrained Bond Series
Notes to Financial Statements (continued)
| 2. | Significant Accounting Policies (continued) |
Inflation-Indexed Bonds
The Series may invest in inflation-indexed bonds. Inflation-indexed bonds are fixed income securities whose principal value is periodically adjusted according to the rate of inflation. If the index measuring inflation rises or falls, the principal value of inflation-indexed bonds will be adjusted upward or downward, and consequently the interest payable on these securities (calculated with respect to a larger or smaller principal amount) will be increased or reduced, respectively. Any upward or downward adjustment in the principal amount of an inflation-indexed bond will be included as interest income in the Statement of Operations, even though investors do not receive their principal until maturity. Repayment of the original bond principal upon maturity (as adjusted for inflation) is guaranteed in the case of U.S. Treasury inflation-indexed bonds. For bonds that do not provide a similar guarantee, the adjusted principal value of the bond repaid at maturity may be less than the original principal.
Securities Purchased on a When-Issued Basis or Forward Commitment
The Series may purchase securities on a when-issued basis or forward commitment. These transactions involve a commitment by the Series to purchase securities for a predetermined price with payment and delivery taking place beyond the customary settlement period. When such purchases are outstanding, the Series will designate liquid assets in an amount sufficient to meet the purchase price. When purchasing a security on a delayed delivery basis, the Series assumes the rights and risks of ownership of the security, including the risk of price and yield fluctuations, and takes such fluctuations into account when determining its net asset value. The Series may sell the when-issued securities before they are delivered, which may result in a capital gain or loss. No such investments were held by the Series on December 31, 2019.
In connection with its ability to purchase or sell securities on a forward commitment basis, the Series may enter into forward roll transactions principally using To Be Announced (TBA) securities. Forward roll transactions require the sale of securities for delivery in the current month, and a simultaneous agreement to repurchase substantially similar (same type, coupon and maturity) securities on a specified future date. Risks of entering into forward roll transactions include the potential inability of the counterparty to meet the terms of the agreement; the potential of the Series to receive inferior securities at redelivery as compared to the securities sold to the counterparty; counterparty credit risk; and the potential pay down speed variance between the mortgage-backed pools. During the roll period, the Series forgoes principal and interest paid on the securities. The Series accounts for such dollar rolls as purchases and sales. Information regarding securities purchased on a when-issued basis is included in the Series’ Investment Portfolio. No such investments were held by the Series on December 31, 2019.
Restricted Securities
Restricted securities are purchased in private placement transactions, are not registered under the Securities Act of 1933, as amended, and may have contractual restrictions on resale. Information regarding restricted securities is included at the end of the Series’ Investment Portfolio.
Illiquid Securities
A security may be considered illiquid if so deemed in good faith by the Advisor under procedures approved by and under the general supervision and responsibility of the Fund’s Board. Securities that are illiquid are marked with the applicable footnote on the Investment Portfolio. No such investments were hold by the Series on December 31, 2019.
Federal Taxes
The Series’ policy is to comply with the provisions of the Internal Revenue Code applicable to regulated investment companies. The Series is not subject to federal income tax or excise tax to the extent that the Series distributes to shareholders each year its taxable income, including any net realized gains on investments, in accordance with requirements of the Internal Revenue Code. Accordingly, no provision for federal income tax or excise tax has been made in the financial statements.
Management evaluates its tax positions to determine if the tax positions taken meet the minimum recognition threshold in connection with accounting for uncertainties in income tax positions taken or expected to be taken for the purposes of measuring and recognizing tax liabilities in the financial statements. Recognition of tax benefits of an uncertain tax position is required only when the position is “more likely than not” to be sustained assuming examination by taxing authorities. At December 31, 2019, the Series has recorded no liability for net unrecognized tax benefits relating to uncertain income tax positions taken or expected to be taken in future tax returns.
33
Unconstrained Bond Series
Notes to Financial Statements (continued)
| 2. | Significant Accounting Policies (continued) |
Federal Taxes(continued)
The Series files income tax returns in the U.S. federal jurisdiction, various states and foreign jurisdictions, as required. No income tax returns are currently under investigation. The statute of limitations on the Series’ tax returns remains open for the years ended December 31, 2016 through December 31, 2019. The Series is not aware of any tax positions for which it is reasonably possible that the total amounts of unrecognized tax benefits will significantly change in the next twelve months.
Foreign Taxes
Based on the Series’ understanding of the tax rules and rates related to income, gains and currency purchase/repatriation transactions for foreign jurisdictions in which it invests, the Series will provide for foreign taxes, and where appropriate, deferred foreign tax.
Distributions of Income and Gains
Distributions to shareholders of net investment income are made quarterly. Distributions of net realized gains are made annually. An additional distribution may be necessary to avoid taxation of the Series. Distributions are recorded on theex-dividend date.
Indemnifications
The Fund’s organizational documents provide former and current directors and officers with a limited indemnification against liabilities arising in connection with the performance of their duties to the Fund. In the normal course of business, the Fund may also enter into contracts that provide general indemnifications. The Fund’s maximum exposure under these arrangements is unknown as this would be dependent on future claims that may be made against the Fund. The risk of material loss from such claims is considered remote.
Other
The preparation of financial statements in conformity with GAAP requires management to make estimates and assumptions that affect the reported amounts of assets and liabilities and the disclosure of contingent assets and liabilities at the date of the financial statements and the reported amounts of income and expenses during the reporting period. Actual results could differ from those estimates.
| 3. | Transactions with Affiliates |
The Fund has an Investment Advisory Agreement (the “Agreement”) with the Advisor, for which the Series pays a fee, computed daily and payable monthly, at an annual rate of 0.30% of the Series’ average daily net assets. Prior to March 1, 2019, the management fee for the Series was 0.45% of the Series’ average daily net assets.
Under the Agreement, personnel of the Advisor provide the Series with advice and assistance in the choice of investments and the execution of securities transactions, and otherwise maintain the Series’ organization. The Advisor also provides the Fund with necessary office space and fund administration and support services. The salaries of all officers of the Fund (except a percentage of the Fund’s Chief Compliance Officer’s salary, which is paid by the Fund), and of all Directors who are “affiliated persons” of the Fund, or of the Advisor, and all personnel of the Fund, or of the Advisor, performing services relating to research, statistical and investment activities, are paid by the Advisor. Each“non-affiliated” Director receives an annual stipend, which is allocated among all the active series of the Fund. In addition, these Directors also receive a fee per Board meeting attended plus a fee for each committee meeting attended and are reimbursed for travel and otherout-of-pocket expenses incurred by them in connection with attending such meetings. The Fund also has an Audit Committee Chair, Governance & Nominating Committee Chair and Lead Independent Director, who each receive an additional annual stipend for these roles.
The Fund may enter into agreements with financial intermediaries pursuant to which the Fund may pay financial intermediaries fornon-distribution relatedsub-transfer agency, administrative,sub-accounting, and other shareholder services in an annual amount not to exceed 0.15% of the average daily net assets of the Class I and Class S shares of the Series. Payments made pursuant to such agreements are generally based on the current assets and/or number of accounts of the Series attributable to the financial intermediary. Any payments made pursuant to such agreements may be in addition to, rather than in lieu of, any Distribution and Shareholder Services Fee payable under the Rule12b-1 plan of the Fund.
34
Unconstrained Bond Series
Notes to Financial Statements (continued)
| 3. | Transactions with Affiliates (continued) |
Prior to March 1, 2019, the Class S shares of the Series were subject to a shareholder services fee in accordance with a shareholder services plan adopted by the Fund’s Board. The shareholder services fee was intended to compensate financial intermediaries, including affiliates of the Fund, in connection with the provision of direct client service, personal services, maintenance of shareholder accounts and reporting services. For these services, the Class S shares of the Series paid a fee, computed daily and payable monthly, at an annual rate of 0.25% of the average daily net assets of Class S. The Fund had a Shareholder Services Agreement with the Advisor, for which the Advisor received the shareholder services fee as stated above.
Manning & Napier Investor Services, Inc., a registered broker-dealer affiliate of the Advisor, acts as distributor for the Fund’s shares. Effective March 1, 2019, the Series compensates the distributor for distributing and servicing the Series’ Class S shares pursuant to a distribution plan adopted under Rule12b-1 of the 1940 Act, regardless of expenses actually incurred. Under the agreement, the Series pays distribution and service fees to the distributor at an annual rate of 0.25% of average daily net assets attributable to Class S shares. There are no distribution and service fees on the Class I, Class W or Class Z shares. The fees are accrued daily and paid monthly.
Pursuant to a master services agreement dated March 1, 2017, as amended, the Fund pays the Advisor an annual fee related to fund accounting and administration of 0.0085% on the first $25 billion of average daily net assets (excluding Target Series and Income Series); 0.0075% on the next $15 billion of average daily net assets (excluding Target Series and Income Series); and 0.0065% of average daily net assets in excess of $40 billion (excluding Target Series and Income Series); plus a base fee of $30,400 per series. Additionally, certain transaction andout-of-pocket expenses, including charges for reporting relating to the Fund’s compliance program, are charged. The Advisor has agreements with BNY Mellon Investment Servicing (U.S.) Inc. (“BNY”) under which BNY serves assub-accountant services agent.
Effective March 1, 2019, the Advisor has contractually agreed to waive the management fee for the Class W shares. The full management fee will be waived under this agreement because Class W shares are only available to discretionary investment accounts and other accounts managed by the Advisor. These clients pay a management fee to the advisor that is separate from the fund’s expenses. In addition, pursuant to a separate expense limitation agreement, the Advisor has contractually agreed to limit its fees and reimburse expenses to the extent necessary so that the total direct annual fund operating expenses, exclusive of the shareholder services fee and/or distribution and service(12b-1) fees and waived Class W management fees (collectively, “excluded expenses”), to 0.50% of the average daily net assets of the Class S and Class I shares, 0.05% of the average daily net assets of the Class W shares, and 0.35% of the average daily net assets of the Class Z shares. These contractual waivers are expected to continue indefinitely, and may not be amended or terminated by the Advisor without the approval of the Series’ Board of Directors. The Advisor may receive from a Class the difference between the Class’s total direct annual fund operating expenses, not including excluded expenses, and the Class’s contractual expense limit to recoup all or a portion of its prior fee waivers (other than Class W management fee waivers) or expense reimbursements made during the rolling three-year period preceding the recoupment if at any point the total direct annual fund operating expenses, not including excluded expenses, are below the contractual expense limit (a) at the time of the fee waiver and/or expense reimbursement and (b) at the time of the recoupment.
Pursuant to the advisory fee waiver, the Advisor waived $2,133,601 in management fees for Class W for the year ended December 31, 2019. In addition, pursuant to the separate expense limitation agreement, the Advisor waived or reimbursed expenses of $15,003, $622, and $84,567 for Class S, Class I, and Class W, respectively, for the year ended December 31, 2019. These amounts are included as a reduction of expenses on the Statement of Operations. At December 31, 2019, the Advisor is eligible to recoup $84,567. For the year ended December 31, 2019, the Advisor did not recoup any expenses that have been previously waived or reimbursed.
| 4. | Purchases and Sales of Securities |
For the year ended December 31, 2019, purchases and sales of securities, other than U.S. Government securities and short-term securities, were $556,473,755 and $538,649,971, respectively. Purchases and sales of U.S. Government securities, other than short-term securities, were $159,703,181 and $15,554,312, respectively.
35
Unconstrained Bond Series
Notes to Financial Statements (continued)
| 4. | Purchases and Sales of Securities (continued) |
The Series received proceeds from settlement of litigation where they were able to recover a portion of investment losses previously realized. This amount is shown as ligation proceeds in the Statement of Operations.
| 5. | Capital Stock Transactions |
Transactions in shares of Class S, Class I and Class W shares of Unconstrained Bond Series were:
| CLASS S | FOR THE YEAR ENDED 12/31/19 | FOR THE YEAR ENDED 12/31/18 | ||||||||||||||
| SHARES | AMOUNT | SHARES | AMOUNT | |||||||||||||
Sold | 1,192,081 | $ | 12,463,772 | 4,877,133 | $ | 50,378,294 | ||||||||||
Reinvested | 50,716 | 526,853 | 1,724,906 | 17,659,603 | ||||||||||||
Repurchased | (66,433,565 | ) | (686,982,994 | ) | (13,213,873 | ) | (136,106,597 | ) | ||||||||
|
|
|
|
|
|
|
| |||||||||
Total | (65,190,768 | ) | $ | (673,992,369 | ) | (6,611,834 | ) | $ | (68,068,700 | ) | ||||||
|
|
|
|
|
|
|
| |||||||||
| CLASS I | FOR THE YEAR ENDED 12/31/19 | FOR THE YEAR ENDED 12/31/18 | ||||||||||||||
| SHARES | AMOUNT | SHARES | AMOUNT | |||||||||||||
Sold | 977,242 | $ | 9,028,573 | 1,503,440 | $ | 13,926,808 | ||||||||||
Reinvested | 43,111 | 397,461 | 72,094 | 660,419 | ||||||||||||
Repurchased | (2,099,868 | ) | (19,392,391 | ) | (5,567,142 | ) | (51,493,675 | ) | ||||||||
|
|
|
|
|
|
|
| |||||||||
Total | (1,079,515 | ) | $ | (9,966,357 | ) | (3,991,608 | ) | $ | (36,906,448 | ) | ||||||
|
|
|
|
|
|
|
| |||||||||
| CLASS W | FOR THE PERIOD 3/1/19 (COMMENCEMENT OF OPERATIONS) TO 12/31/19 | |||||||||||||||
| SHARES | AMOUNT | |||||||||||||||
Sold | 90,241,283 | $ | 933,240,082 | |||||||||||||
Reinvested | 2,596,706 | 26,876,368 | ||||||||||||||
Repurchased | (10,199,070 | ) | (106,135,937 | ) | ||||||||||||
|
|
|
| |||||||||||||
Total | 82,638,919 | $ | 853,980,513 | |||||||||||||
|
|
|
| |||||||||||||
Over 90% of the shares outstanding are fiduciary accounts where the Advisor has sole investment discretion. At December 31, 2019, the Advisor and its affiliates owned less than 0.1% of the Series.
| 6. | Line of Credit |
The Fund has entered into a364-day, $25 million credit agreement (the “line of credit”) with Bank of New York Mellon. Each series of the Fund may borrow under the line of credit for temporary or emergency purposes, including funding shareholder redemptions and other short-term liquidity purposes. The Fund pays an annual fee on the unused commitment amount, payable quarterly, and is allocated among all the series of the Fund and included in miscellaneous expenses in the Statement of Operations for each series. The line of credit expires in August 2020 unless extended or renewed. For the year ended December 31, 2019, the series did not borrow under the line of credit.
| 7. | Financial Instruments and Loan Assignments |
The Series may trade in instruments including written and purchased options, forward foreign currency exchange contracts and futures contracts and other derivatives in the normal course of investing activities to assist in managing exposure to various market risks. The Series may be subject to various elements of risk, which may involve, to a varying degree, elements of risk in excess of the amounts recognized for financial statement purposes. These risks include: the risk that changes in the value of a derivative may not correlate perfectly with the underlying asset, rate or index; counterparty credit risk related to over the counter
36
Unconstrained Bond Series
Notes to Financial Statements (continued)
| 7. | Financial Instruments and Loan Assignments (continued) |
derivative counterparties’ failure to perform under contract terms; liquidity risk related to the lack of a liquid market for these contracts allowing the fund to close out its position(s); and documentation risk relating to disagreement over contract terms. For the year ended December 31, 2019, the Series invested in futures contracts (foreign currency exchange risk and interest rate risk), options purchased (equity risk and foreign currency exchange risk) and options written (equity risk).
The Series may invest in a loan assignment of all or a portion of the loans. The Series has direct rights against the borrower on a loan when it purchases an assignment; however, the Series’ rights may be more limited than the lender from which it acquired the assignment and the Series may be able to enforce its rights only through an administrative agent. Loan assignments are vulnerable to market conditions and may become illiquid due to economic conditions or other events may reduce the demand for loan assignments and certain loan assignments which were liquid when purchased may become illiquid.
| 8. | Foreign Securities |
Investing in securities of foreign companies and foreign governments involves special risks and considerations not typically associated with investing in securities of domestic companies and the U.S. Government. These risks include revaluation of currencies and future adverse political and economic developments. Moreover, securities of foreign companies and foreign governments and their markets may be less liquid and their prices more volatile than those of comparable domestic companies and the U.S. Government.
| 9. | Federal Income Tax Information |
The amount and characterization of certain income and capital gains to be distributed are determined in accordance with federal income tax regulations, which may differ from GAAP. These differences are primarily due to differing book and tax treatments in the timing and/or treatment of the recognition of net investment income or gains and losses, including wash sales and investments in Treasury Inflation Protected securities, foreign currency gains and losses, and the realization for tax purposes of unrealized gains/losses on certain futures. The Series may periodically make reclassifications among its capital accounts to reflect income and gains available for distribution (or available capital loss carryovers) under income tax regulations without impacting the Series’ net asset value. For the year ended December 31, 2019, $283,127 was reclassified within the capital accounts fromPaid-in Capital to Total Distributable Earnings (Loss). Any such reclassifications are not reflected in the financial highlights.
The tax character of distributions paid were as follows:
| FOR THE YEAR ENDED 12/31/19 | FOR THE YEAR ENDED 12/31/18 | |||
Ordinary income | $29,098,418 | $19,193,832 |
At December 31, 2019, the tax basis of components of distributable earnings and the net unrealized appreciation based on identified cost for federal income tax purposes were as follows:
Cost for federal income tax purposes | $ | 887,436,289 | ||
Unrealized appreciation | 11,206,756 | |||
Unrealized depreciation | (8,029,415 | ) | ||
|
| |||
Net unrealized appreciation | $ | 3,177,341 | ||
|
| |||
Capital loss carryforwards | $ | (4,112,193 | ) |
As of December 31, 2019, the Series had net short-term capital loss carryforwards of $1,145,092 and net long-term capital loss carryforwards of $2,967,101, which may be carried forward indefinitely.
At December 31, 2019, the capital loss carryover utilized in the current year was $1,300,148.
37
Unconstrained Bond Series
Report of Independent Registered Public Accounting Firm
To the Board of Directors of Manning & Napier Fund, Inc. and Shareholders of Unconstrained Bond Series
Opinion on the Financial Statements
We have audited the accompanying statement of assets and liabilities, including the investment portfolio, of Unconstrained Bond Series (one of the series constituting Manning & Napier Fund, Inc., referred to hereafter as the “Fund”) as of December 31, 2019, the related statement of operations for the year ended December 31, 2019, the statement of changes in net assets for each of the two years in the period ended December 31, 2019, including the related notes, and the financial highlights for each of the periods indicated therein (collectively referred to as the “financial statements”). In our opinion, the financial statements present fairly, in all material respects, the financial position of the Fund as of December 31, 2019, the results of its operations for the year then ended, the changes in its net assets for each of the two years in the period ended December 31, 2019 and the financial highlights for each of the periods indicated therein in conformity with accounting principles generally accepted in the United States of America.
Basis for Opinion
These financial statements are the responsibility of the Fund’s management. Our responsibility is to express an opinion on the Fund’s financial statements based on our audits. We are a public accounting firm registered with the Public Company Accounting Oversight Board (United States) (PCAOB) and are required to be independent with respect to the Fund in accordance with the U.S. federal securities laws and the applicable rules and regulations of the Securities and Exchange Commission and the PCAOB.
We conducted our audits of these financial statements in accordance with the standards of the PCAOB. Those standards require that we plan and perform the audit to obtain reasonable assurance about whether the financial statements are free of material misstatement, whether due to error or fraud.
Our audits included performing procedures to assess the risks of material misstatement of the financial statements, whether due to error or fraud, and performing procedures that respond to those risks. Such procedures included examining, on a test basis, evidence regarding the amounts and disclosures in the financial statements. Our audits also included evaluating the accounting principles used and significant estimates made by management, as well as evaluating the overall presentation of the financial statements. Our procedures included confirmation of securities owned as of December 31, 2019 by correspondence with the custodian and brokers. We believe that our audits provide a reasonable basis for our opinion.
New York, New York
February 14, 2020
We have served as the auditor of one or more investment companies in Manning & Napier Mutual Funds since 1992.
38
Unconstrained Bond Series
Renewal of Investment Advisory Agreement
(unaudited)
At the Manning & Napier Fund, Inc. (the “Fund”) Board of Directors’ (the “Board”) meeting, held on November 21, 2019, the Investment Advisory Agreement (the “Agreement”) between the Fund and Manning & Napier Advisors, LLC (the “Advisor”) was considered for renewal by the Board, including all of the Directors who are not “interested persons” (“Independent Directors”), within the meaning of the Investment Company Act of 1940, as amended (the “1940 Act”). In connection with the decision whether to renew the Agreement, a variety of material was provided to the Board in advance of the meeting for their review and consideration. The Board also held a working session on October 25, 2019 to review and discuss information provided to the Board, and for the Board to request additional information.
Representatives of the Advisor attended a portion of the working session and attended the Board meeting. The Advisor provided supplemental information requested by the Board and presented additional oral information to the Board to assist the Board in its considerations. In addition to the information furnished by the Advisor, the Board was provided with a legal memorandum discussing its fiduciary duties related to its approval of the continuation of the Agreement. Legal counsel for the Fund discussed with the Board the applicable legal considerations. In addition, the Board receivedin-person presentations about the Fund throughout the year.
The Independent Directors were advised by independent legal counsel with respect to these matters. The Independent Directors also met separately in an executive session with their legal counsel without any representatives of the Advisor present.
The Directors’ determinations at the meeting were made on the basis of each Director’s business judgment after consideration of all the information presented. In deciding to recommend the renewal of the Agreement with respect to each Series of the Fund, the Independent Directors did not identify any single or particular piece of information that, in isolation, was the controlling factor. Each Independent Director may also have weighed factors differently. This summary describes the most important, but not all, of the factors considered by the Board and the Independent Directors.
| • | The Board considered the nature and quality of services provided by the Advisor under the Agreement for over 30 years including, among others: deciding what securities to purchase and sell for each Series; arranging for the purchase and sale of such securities by placing orders with broker-dealers; administering the affairs of the Fund (including the books and records of the Fund not maintained by third party service providers such as the custodian or transfer agent); arranging for the insurance coverage for the Fund; and supervising the preparation of tax returns, SEC filings (including registration statements) and reports to shareholders for the Fund. The Board considered the numerous services performed by the Advisor and its affiliates beyond those stated in the Agreements. The Board also considered the Advisor’s personnel who perform services to the Fund, changes in senior or key personnel, industry trends impacting the mutual fund industry, the strength of the Advisor’s compliance infrastructure, policies and procedures relating to compliance with securities regulations, reputation, expertise and resources. The Board discussed the quality of these services with representatives from the Advisor and concluded that the Advisor was performing its services to the Fund required under the Agreement in a reasonable manner. |
| • | The Board considered the Advisor’s investments teams, including changes to the investment teams and investment team’s compensation during the past year, and the investment process. The Board considered the performance of each Series since its inception, as well as over multiple time periods including: one year, three year, five year, ten year, and current market cycle. A market cycle includes periods of both rising and falling markets. Returns for established benchmark indices for each Series were provided. In addition, the Board considered (and considers on a quarterly basis) a number of other factors relevant to performance at the meeting including: a peer group performance analysis consisting of Morningstar universes of mutual funds with similar investment objectives; the breadth of the Fund’s product offerings; and performance over reasonable time periods. Representatives of the Advisor discussed improved performance for many of the Series over theone- and three-year time periods ending September 30, 2019. The Board discussed with Representatives of the Advisor, performance challenges that continue to impact the three- and five-year performance of certain Fund’s strategies resulting from periods of underperformance in 2014 and 2016. After discussion, the Board acknowledged the improved short term performance of many of the Series and concluded that notwithstanding the performance challenges that continue to impact certain Series, the nature and quality of the investment management services provided by the Advisor to the Fund supported the renewal of the agreement. |
| • | The Board considered the fees and expenses of the various Series of the Fund. The Advisor presented the advisory fees and total expenses for each Series, including the advisory fee adjusted for any contractual expense waivers or reimbursements paid by the Advisor. Representatives of the Advisor discussed the multi-year fee restructuring initiative which was completed by the Advisor on March 1, 2019 to increase the competitiveness of the Fund’s fees. The fee |
39
Unconstrained Bond Series
Renewal of Investment Advisory Agreement
(unaudited)
restructuring project also resulted in a set of standardized share classes to help support the Fund’s distribution efforts across client types and varying intermediary distribution models. |
| • | The Board considered whether the Advisor had achieved economies of scale with respect to its services to the Fund. The Board acknowledged the expense caps incorporated in the Fund’s current fee structure, which requires the Advisor to subsidize the expenses of the Series operating above their expense cap, noting that 26 Series of the Fund are currently receiving expense reimbursements from the Advisor. The Board concluded that the Fund would need to grow in assets before the Advisor would be able to achieve meaningful economies of scale. |
| • | The Advisor provided the Board with information comparing each Series’ contractual management fees with the Advisor’s standard advisory fees for separate accounts and collective investment trusts. The Board considered that the range of services provided to the Series is more extensive than for the Advisor’s other clients due to additional infrastructure, administrative and regulatory requirements related to operating a mutual fund. |
| • | The current advisory fees,12b-1 Distribution and Service Fees, other expenses (e.g. a combination of Shareholder Services Fees, intermediarysub-TA fees, routine operating expenses and Acquired Fund Fees and Expenses forfund-of-fund Series) and total expense ratios of each Series and share class were compared and ranked (on both a mean and median basis) against respective peer universes. Respective peer universes included funds of a similar size and with similar investment objectives and expense characteristics as disclosed on the Morningstar database. Representatives of the Advisor discussed with the Board the comparisons and rankings of fees and net expense ratios for each Series of the Fund and the methodology behind the comparison. The Board considered the Advisor’s active portfolio management that results in portfolios that are more differentiated than the construction of their benchmarks. The Board acknowledged that the fee restructuring project completed on March 1, 2019 reduced the expense ratios for shareholders in many Series. Based on their review of the information provided, the Board concluded that the current fees and expenses of each Series of the Fund were reasonable on a comparative basis. |
| • | The Board also considered the other benefits the Advisor derives from its relationship with the Fund. Such other benefits include participation in a joint insurance program, sharing of compensation expenses for certain shared personnel, relationships with large service providers, the utilization of Series within the Advisor’s separately managed accounts and certain research services provided by soft dollars. The Board reviewed the broker-dealers who provided research to the Advisor and the products and services paid for, in whole or in part, using soft dollar commissions. The Board concluded that these additional benefits to the Advisor were reasonable. |
Based on the Board’s deliberations and their evaluation of the information described above, the Board, including a majority of the Independent Directors, concluded that the compensation under the Agreement was fair and reasonable with respect to each Series in light of the services and expenses and such other matters as the Directors considered to be relevant in the exercise of their reasonable judgment, and that the renewal of the Agreement would be in the best interests of each Series and its shareholders. The Board did not indicate that any single factor was determinative of its decision to approve the Agreement, but indicated that the Board based its determination on the total mix of information available to it.
40
Unconstrained Bond Series
Directors’ and Officers’ Information
(unaudited)
The Statement of Additional Information provides additional information about the Fund’s directors and officers and can be obtained without charge by calling1-800-466-3863, at www.manning-napier.com, or on the EDGAR Database on the SEC Internet web site (http://www.sec.gov). The following chart shows certain information about the Fund’s directors and officers, including their principal occupations during the last five years. Unless specific dates are provided, the individuals have held the listed positions for longer than five years.
| Interested Director and Officer | ||
| Name: | Paul Battaglia* | |
| Address: | 290 Woodcliff Drive | |
| Fairport, NY 14450 | ||
| Age: | 41 | |
| Current Position(s) Held with Fund: | Principal Executive Officer, President, Chairman & Director | |
| Term of Office & Length of Time Served: | Indefinite – Chairman and Director since November 20181 | |
| Principal Occupation(s) During Past 5 Years: | Chief Financial Officer (2018 – Present); Vice President of Finance (2016 – 2018); Director of Finance (2011 – 2016); Financial Analyst/Internal Auditor (2004-2006) – Manning & Napier Advisors, LLC and affiliates Holds one or more of the following titles for various subsidiaries and affiliates: Chief Financial Officer | |
| Number of Portfolios Overseen within Fund Complex: | 31 | |
Other Directorships Held Outside Fund Complex During Past 5 Years: | N/A | |
| Independent Directors | ||
| Name: | Stephen B. Ashley | |
| Address: | 290 Woodcliff Drive | |
| Fairport, NY 14450 | ||
| Age: | 79 | |
| Current Position(s) Held with Fund: | Director, Audit Committee Member, Governance & Nominating Committee Member | |
| Term of Office & Length of Time Served: | Indefinite – Since 1996 | |
| Principal Occupation(s) During Past 5 Years: | Chairman and Director (1997 to present); Chief Executive Officer | |
| (1997-2019) - Ashley Companies (property management and investment) . | ||
| Number of Portfolios Overseen within Fund Complex: | 31 | |
| Other Directorships Held Outside Fund Complex During | Ashley Companies (1997 - present) | |
| Past 5 Years: | ||
| Name: | Paul A. Brooke | |
| Address: | 290 Woodcliff Drive | |
| Fairport, NY 14450 | ||
| Age: | 74 | |
| Current Position(s) Held with Fund: | Lead Independent Director, Audit Committee Member, Governance & | |
| Nominating Committee Chairman | ||
| Term of Office & Length of Time Served: | Indefinite – Director, Audit Committee Member, Governance & Nominating Committee Member since 2007; Governance & Nominating Committee Chairman since 2016; Lead Independent Director since 2017 | |
| Principal Occupation(s) During Past 5 Years: | Chairman & CEO (2005-2009) - Ithaka Acquisition Corporation (investments); Chairman (2007-2009) - Alsius Corporation (investments); Managing Member (1991-present) - PMSV Holdings LLC (investments); Managing Member (2010-2016) - Venbio (investments). | |
| Number of Portfolios Overseen within Fund Complex: | 31 | |
| Other Directorships Held Outside Fund Complex During Past 5 Years: | Incyte Corp. (biotech)(2000-present); ViroPharma, Inc. (speciality pharmaceuticals)(2000-2014); HLTH (WebMD)(information)(2000-2010); Cheyne Capital International (investment)(2000-2017); GMP Companies (investment)(2000-2011); Cytos Biotechnology Ltd (biotechnology)(2012-2014); Cerus (biomedical)(2016-present);PureEarth(non-profit)
| |
41
Unconstrained Bond Series
Directors’ and Officers’ Information
(unaudited)
Independent Directors (continued)
| Name: | Peter L. Faber | |
| Address: | 290 Woodcliff Drive | |
| Fairport, NY 14450 | ||
| Age: | 81 | |
| Current Position(s) Held with Fund: | Director, Governance & Nominating Committee Member | |
| Term of Office & Length of Time Served: | Indefinite – Since 1987 | |
| Principal Occupation(s) During Past 5 Years: | Senior Counsel (2006-2012), Partner (1995-2006 & 2013-2018) - McDermott, Will & Emery LLP (law firm) | |
Number of Portfolios Overseen within Fund Complex: Other Directorships Held Outside Fund Complex During Past 5 Years: | 31 Boston Early Music Festival(non-profit)(2007-present); Amherst Early Music, Inc.(non-profit)(2009-present); Gotham Early Music Scene, Inc.(non-profit)(2009-present); Partnership for New York City, Inc.(non-profit)(1989-2010); New York Collegium(non-profit)(2004-2011); S’Cool Sounds, Inc.(non-profit)(2017-present) | |
| Name: | Harris H. Rusitzky | |
| Address: | 290 Woodcliff Drive | |
| Fairport, NY 14450 | ||
| Age: | 84 | |
| Current Position(s) Held with Fund: | Director, Audit Committee Member, Governance & Nominating Committee | |
| Member | ||
| Term of Office & Length of Time Served: | Indefinite – Since 1985 | |
| Principal Occupation(s) During Past 5 Years: | President (1994- present) - The Greening Group (business consultants); | |
| Partner (2006-present) - The Restaurant Group (restaurants) | ||
Number of Portfolios Overseen within Fund Complex: Other Directorships Held Outside Fund Complex During Past 5 Years: | 31 Rochester Institute of Technology (university)(1972-present); Culinary Institute of America(non-profit college)(1985-present); George Eastman Museum (museum)(1988-present); National Restaurant Association (restaurant trade organization)(1978-present) | |
| Name: | Chester N. Watson | |
| Address: | 290 Woodcliff Drive | |
| Fairport, NY 14450 | ||
| Age: | 69 | |
| Current Position(s) Held with Fund: | Director, Audit Committee Chairman, Governance & Nominating | |
| Committee Member | ||
| Term of Office & Length of Time Served: | Indefinite – Director, Audit Committee Member, Governance & Nominating | |
| Committee Member Since 2012; Audit Committee Chairman since 2013 | ||
| Principal Occupation(s) During Past 5 Years: | General Auditor (2003-2011) - General Motors Company (auto | |
| manufacturer) | ||
Number of Portfolios Overseen within Fund Complex: Other Directorships Held Outside Fund Complex During Past 5 Years: | 31 Rochester Institute of Technology (University)(2005-present); Town of Greenburgh, NY Planning Board (Municipal Government) (2015-2019); Hudson Valley Center for Innovation, Inc. (New Business and Economic Development) (2019 – present) | |
| Officers: | ||
| Name: | Elizabeth Craig | |
| Address: | 290 Woodcliff Drive | |
| Fairport, NY 14450 | ||
| Age: | 32 | |
| Current Position(s) Held with Fund: | Corporate Secretary | |
| Term of Office1& Length of Time Served: | Since 2016 | |
| Principal Occupation(s) During Past 5 Years: | Fund Regulatory Administration Manager since 2018; Fund Administration Manager (2015-2018); Mutual Fund Compliance Specialist (2009-2015) - Manning & Napier Advisors, LLC; Assistant Corporate Secretary (2011-2016) - Manning & Napier Fund, Inc.; Corporate Secretary, Director – Manning & Napier Investor Services, Inc. (since 2019)
| |
42
Unconstrained Bond Series
Directors’ and Officers’ Information
(unaudited)
Officers: (continued)
| Name: | Christine Glavin | |
| Address: | 290 Woodcliff Drive | |
| Fairport, NY 14450 | ||
| Age: | 53 | |
| Current Position(s) Held with Fund: | Principal Financial Officer, Chief Financial Officer | |
| Term of Office1& Length of Time Served: | Principal Financial Officer since 2002; Chief Financial Officer since 2001 | |
| Principal Occupation(s) During Past 5 Years: | Director of Fund Reporting since 2011; Fund Reporting Manager (1997-2011) - Manning & Napier Advisors, LLC; Assistant Treasurer since 2008 - Exeter Trust Company; Chief Financial Officer (2017-2018) - Rainier Investment Management Mutual Funds, Inc. | |
| Name: | Samantha Larew | |
| Address: | 290 Woodcliff Drive | |
| Fairport, NY 14450 | ||
| Age: | 39 | |
| Current Position(s) Held with Fund: | Chief Compliance Officer and Anti-Money Laundering Compliance Officer | |
| Term of Office1& Length of Time Served: | Chief Compliance Officer since 2019; Anti-Money Laundering Compliance | |
| Officer since 2018 | ||
| Principal Occupation(s) During Past 5 Years: | Co-Director of Compliance (since 2018); Compliance Communications Supervisor (2014-2018); Compliance Supervisor (2013-2014); Broker-Dealer Compliance Supervisor (2011-2013); Broker-Dealer Compliance Analyst (2010-2011) - Manning & Napier Advisors, LLC & Affiliates; Broker-Dealer Chief Compliance Officer (since 2013); Broker-Dealer Assistant Corporate Secretary (since 2011) – Manning & Napier Investor Services, Inc.; Compliance Analyst (2007-2009) – Wall Street Financial Group; Compliance Specialist (2003-2007) – Manning & Napier Advisors, LLC & Affiliates Holds one or more of the following titles for various affiliates: Assistant Corporate Secretary, Chief Compliance Officer | |
| Name: | Scott Morabito | |
| Address: | 290 Woodcliff Drive | |
| Fairport, NY 14450 | ||
| Age: | 32 | |
| Current Position(s) Held with Fund: | Vice President | |
| Term of Office1& Length of Time Served: | Vice President since 2019; Assistant Vice President (2017-2019) | |
| Principal Occupation(s) During Past 5 Years: | Managing Director of Operations since 2019; Director of Funds Group (2017-2019); Fund Product and Strategy Manager (2014-2017); Senior Product and Strategy Analyst (2013-2014); Product and Strategy Analyst (2011-2013) - Manning & Napier Advisors, LLC; President, Director – Manning & Napier Investor Services, Inc. (since 2018) | |
| Name: | Sarah Turner | |
| Address: | 290 Woodcliff Drive | |
| Fairport, NY 14450 | ||
| Age: | 37 | |
| Current Position(s) Held with Fund: | Chief Legal Officer; Assistant Corporate Secretary | |
| Term of Office1& Length of Time Served: | Since 2018 | |
| Principal Occupation(s) During Past 5 Years: | Attorney since 2018 - Manning & Napier Advisors, LLC and affiliates; Counsel (2017-2018) – Harter Secrest and Emery LLP; Legal Counsel (2010-2017) – Manning & Napier Advisors, LLC and affiliates Holds one or more of the following titles for various affiliates: Corporate Secretary, General Counsel | |
*Interested Director, within the meaning of the 1940 Act by reason of his positions with the Fund’s Advisor, Manning & Napier Advisors, LLC, and Distributor, Manning & Napier Investor Services, Inc.
1The term of office of all officers shall be one year and until their respective successors are chosen and qualified, or his or her earlier resignation or removal as provided in the Fund’sBy-Laws.
43
{This page intentionally left blank}
44
{This page intentionally left blank}
45
Unconstrained Bond Series
Literature Requests
(unaudited)
Proxy Voting Policies and Procedures
A description of the policies and procedures that the Fund uses to determine how to vote proxies relating to portfolio securities is available, without charge, upon request:
| By phone | 1-800-466-3863 | |||
| On the Securities and Exchange | ||||
| Commission’s (SEC) web site | http://www.sec.gov |
Proxy Voting Record
Information regarding how the Fund voted proxies relating to portfolio securities during the most recent12-month period ended June 30th is available, without charge, upon request:
| By phone | 1-800-466-3863 | |||
| On the SEC’s web site | http://www.sec.gov |
Quarterly Portfolio Holdings
The Series’ complete schedule of portfolio holdings for the 1st and 3rd quarters of each fiscal year are provided on FormN-PORT, and are available, without charge, upon request:
| By phone | 1-800-466-3863 | |||
| On the SEC’s web site | http://www.sec.gov |
Prospectus and Statement of Additional Information (SAI)
For more information about any of the Manning & Napier Fund, Inc. Series, you may obtain a prospectus and SAI at www.manning-napier.com or by calling (800)466-3863. Before investing, carefully consider the objectives, risks, charges and expenses of the investment and read the prospectus carefully as it contains this and other information about the investment company.In addition, this information can be found on the SEC’s web site, http://www.sec.gov.
Additional information available at www.manning-napier.com
1. Fund Holdings -Month-End
2. Fund Holdings -Quarter-End
3. Shareholder Report - Annual
4. Shareholder Report - Semi-Annual
The Fund also offers electronic notification or“e-delivery” when certain documents are availableon-line to be downloaded or reviewed. Direct shareholders can elect to receive electronic notification when shareholder reports, prospectus updates, and/or statements are available. If you do not currently haveon-line access to your account, you can establish access by going to www.manning-napier.com, click on “Login” in the top corner of the page, and follow the prompts to self-enroll. Once enrolled, you can set your electronic notification preferences by clicking on the Account Options tab located within the green toolbar and then selectE-Delivery Option. Should you have any questions on either how to establishon-line access or how to update your account settings, please contact Investor Services at1-800-466-3863.
The Manning & Napier Fund, Inc. is managed by Manning & Napier Advisors, LLC. Manning & Napier Investor Services, Inc., an affiliate of Manning & Napier Advisors, LLC, is the distributor of the Fund shares.
MNCPB-12/19-AR
ITEM 2: CODE OF ETHICS
| (a) | The registrant has adopted a code of ethics that applies to its principal executive officer, principal financial officer and principal accounting officer. A copy of the registrant’s code of ethics is filed herewith as Exhibit 13(a)(1). |
| (b) | During the period covered by this report, no amendments were made to the provisions of the code of ethics adopted in 2 (a) above. |
| (c) | During the period covered by this report, no implicit or explicit waivers to the provisions of the code of ethics adopted in 2 (a) above were granted. |
| (d) | Not applicable to the registrant due to the response given in 2 (c) above. |
| (e) | Not applicable. |
| (f) | A copy of the code of ethics is attached hereto as Exhibit 13(a)(1). |
ITEM 3: AUDIT COMMITTEE FINANCIAL EXPERT
All of the members of the Audit committee have been determined by the Registrant’s Board of Directors to be Audit Committee Financial Experts as defined in this item. The current members of the Audit Committee are: Stephen B. Ashley, Paul A. Brooke, Harris H. Rusitzky, and Chester N. Watson. All Audit Committee members are independent under applicable rules. This designation will not increase the designee’s duties, obligations or liability as compared to their duties, obligations and liability as a member of the Audit Committee and of the Board.
ITEM 4: PRINCIPAL ACCOUNTANT FEES AND SERVICES
Principal Accountant Fees and Services
Aggregate fees for professional services rendered for the Manning & Napier Fund, Inc. [Real Estate Series, Core Bond Series, Unconstrained Bond Series, High Yield Bond Series, Diversified Tax Exempt Series, and New York Tax Exempt Series (collectively the “Fund”) by PricewaterhouseCoopers LLP (“PwC”) as of and for the years ended December 31, 2019 and 2018 were:
2019 | 2018 | |||
| ||||
Audit Fees (a) | $237,845 | $269,921 | ||
Audit Related Fees (b) | $0 | $0 | ||
Tax Fees (c) | $120,638 | $81,900 | ||
All Other Fees (d) | $0 | $0 | ||
| ||||
$358,483 | $351,821 | |||
| ||||
| (a) | Audit Fees |
These fees relate to professional services rendered by PwC for the audit of the Fund’s annual financial statements or services normally provided by the accountant in connection with statutory and regulatory filing or engagements. These services include the audits of the financial statements of the Fund, issuance of consents, income tax provision procedures and assistance with review of documents filed with the SEC.
| (b) | Audit-Related Fees |
These fees relate to assurance and related services by PwC that are reasonably related to the performance of the audit of the Fund’s financial statements and are not reported under “Audit Fees” above.
| (c) | Tax Fees |
The fees for the year ended December 31, 2019 relate to professional services rendered by PwC for tax compliance, tax advice, tax planning and shareholder reporting. The fees for the year ended December 31, 2018 relate to professional services rendered by PwC for tax compliance, tax advice and tax planning.
| (d) | All Other Fees |
These fees relate to products and services provided by PwC other than those reported above under “Audit Fees,” “Audit-Related Fees,” and “Tax Fees” above.
There were no amounts that were approved by the Audit Committee pursuant to the de minimus exception (Rule2-01(c)(7) of RegulationS-X) for the fiscal years ended December 31, 2019 and 2018.
Non-Audit Services to the Fund’s Service Affiliates that werePre-Approved by the Fund’s Audit Committee
The Fund’s Audit Committee is required topre-approvenon-audit services which meet both the following criteria:
| i) | Directly relate to the Fund’s operations and financial reporting; and |
| ii) | Rendered by PwC to the Fund’s advisor, Manning & Napier Advisors, LLC, and entities in a control relationship with the advisor (“service affiliate”) that provides ongoing services to the Fund. For purposes of disclosure, Manning & Napier Investor Services, Inc. is considered to be a service affiliate. |
2019 | 2018 | |||
| ||||
Audit Related Fees | $0 | $80,300 | ||
Tax Fees | $0 | $0 | ||
| ||||
$0 | $80,300 | |||
| ||||
There were no Audit Related fees for the year ended December 31, 2019. The Audit related fees for the year ended December 31, 2018 were for work related to prospectus updates related to various fund changes, work related to the liquidating trusts for closed funds, a license for proprietary authoritative financial reporting and assurance literature library software.
There were no amounts that were approved by the Audit Committee pursuant to the de minimus exception (Rule2-01(c)(7) of RegulationS-X) for the fiscal years ended December 31, 2019 and 2018.
Aggregate Fees
Aggregate fees billed to the Fund fornon-audit services for 2019 and 2018 were $358,483 and $351,821, respectively. Aggregate fees billed to the Fund’s advisor and service affiliates fornon-audit services were $0and $80,300, respectively. These amounts include fees fornon-audit services required to bepre-approved and fees fornon-audit services that did not requirepre-approval since they did not relate to the Fund’s operations and financial reporting.
The Fund’s Audit Committee has considered whether the provisions fornon-audit services to the Fund’s advisor and service affiliates, which did not requirepre-approval, are compatible with maintaining PwC’s independence.
| ITEM 5: | AUDIT COMMITTEE OF LISTED REGISTRANTS |
Not applicable.
| ITEM 6: | INVESTMENTS |
| (a) | See Investment Portfolios under Item 1 on this FormN-CSR. |
| (b) | Not applicable. |
| ITEM 7: | DISCLOSURE OF PROXY VOTING POLICIES AND PROCEDURES FORCLOSED-END MANAGEMENT INVESTMENT COMPANIES |
Not applicable.
| ITEM 8: | PORTFOLIO MANAGERS OFCLOSED-END MANAGEMENT INVESTMENT COMPANIES |
Not applicable.
| ITEM 9: | PURCHASES OF EQUITY SECURITIES BYCLOSED-END MANAGEMENT INVESTMENT COMPANY AND AFFILIATED PURCHASERS |
Not applicable.
| ITEM 10: | SUBMISSION OF MATTERS TO A VOTE OF SECURITY HOLDERS |
There have been no material changes to the procedure by which shareholders may recommend nominees to the registrant’s board of directors.
| ITEM 11: | CONTROLS AND PROCEDURES |
| (a) | Based on their evaluation of the Funds’ disclosure controls and procedures, as of a date within 90 days of the filing date, the Funds’ Principal Executive Officer and Principal Financial Officer have concluded that the Funds’ disclosure controls and procedures are: (i) reasonably designed to ensure that information required to be disclosed in this report is appropriately communicated to the Funds’ officers to allow timely decisions regarding disclosures required in this report; (ii) reasonably designed to ensure that information required to be disclosed in this report is recorded, processed, summarized and reported in a timely manner; and (iii) are effective in achieving the goals described in (i) and (ii) above. |
| (b) | During the period covered by this report there have been no changes in the Funds’ internal control over financial reporting that the above officers believe to have materially affected, or to be reasonably likely to materially affect, the Funds’ internal control over financial reporting. |
| ITEM 12: | DISCLOSURE OF SECURITIES LENDING ACTIVITIES FORCLOSED-END MANAGEMENT INVESTMENT COMPANIES |
Not applicable.
| ITEM 13: | EXHIBITS |
| (a)(1) | Code of ethics that is subject to the disclosure of Item 2 above. |
| (a)(2) | Separate certifications for the Registrant’s principal executive officer and principal financial officer, as required by Section 302 of the Sarbanes-Oxley Act of 2002 and Rule30a-2(a) under the Investment Company Act of 1940, are attached asEX-99.CERT. |
| (a)(3) | Not applicable. |
| (a)(4) | Not applicable. |
| (b) | A certification of the Registrant’s principal executive officer and principal financial officer, as required by 18 U.S.C Section 1350, as adopted pursuant to Section 906 of the Sarbanes-Oxley Act of 2002, and Rule30a-2(b) under the Investment Company Act of 1940, is attached asEX-99.906CERT. The certification furnished pursuant to this paragraph is not deemed to be “filed” for purposes of Section 18 of the Securities Exchange Act of 1934, or otherwise subject to the liability of that section. Such certification is not deemed to be incorporated by reference into any filing under the Securities Act of 1933 or the Securities Exchange Act of 1934, except to the extent that the Registrant specifically incorporates them by reference. |
SIGNATURES
Pursuant to the requirements of the Securities Exchange Act of 1934 and the Investment Company Act of 1940, the registrant has duly caused this report to be signed on its behalf by the undersigned, thereunto duly authorized.
Manning & Napier Fund, Inc.
/s/ Paul J. Battaglia |
| Paul J. Battaglia |
| President & Principal Executive Officer |
| Manning & Napier Fund, Inc. |
| Date: February 25, 2020 |
Pursuant to the requirements of the Securities Exchange Act of 1934 and the Investment Company Act of 1940, this report has been signed below by the following persons on behalf of the registrant and in the capacities and on the dates indicated.
Manning & Napier Fund, Inc.
/s/ Paul J. Battaglia |
| Paul J. Battaglia |
| President & Principal Executive Officer |
| Manning & Napier Fund, Inc. |
| Date: February 25, 2020 |
/s/ Christine Glavin |
| Christine Glavin |
| Chief Financial Officer & Principal Financial Officer |
| Manning & Napier Fund, Inc. |
| Date: February 25, 2020 |