UNITED STATES
SECURITIES AND EXCHANGE COMMISSION
Washington, D.C. 20549
FORMN-CSR
CERTIFIED SHAREHOLDER REPORT OF REGISTERED MANAGEMENT INVESTMENT COMPANIES
Investment Company Act file number811-04087
Manning & Napier Fund, Inc.
(Exact name of registrant as specified in charter)
290 Woodcliff Drive, Fairport, NY 14450
(Address of principal executive offices)(Zip Code)
Paul J. Battaglia 290 Woodcliff Drive, Fairport, NY 14450
(Name and address of agent for service)
Registrant’s telephone number, including area code:585-325-6880
Date of fiscal year end: December 31
Date of reporting period: January 1, 2018 through December 31, 2018
FormN-CSR is to be used by management investment companies to file reports with the Commission not later than 10 days after the transmission to stockholders of any report that is required to be transmitted to stockholders under Rule30e-1 under the Investment Company Act of 1940 (17 CFR270.30e-1). The Commission may use the information provided on FormN-CSR in its regulatory, disclosure review, inspection, and policymaking roles.
A registrant is required to disclose the information specified by FormN-CSR, and the Commission will make this information public. A registrant is not required to respond to the collection of information contained in FormN-CSR unless the Form displays a currently valid Office of Management and Budget (“OMB”) control number. Please direct comments concerning the accuracy of the information collection burden estimate and any suggestions for reducing the burden to Secretary, Securities and Exchange Commission, 450 Fifth Street, NW, Washington, DC 20549-0609. The OMB has reviewed this collection of information under the clearance requirements of 44 U.S.C. § 3507.
ITEM 1: REPORTS TO STOCKHOLDERS.

Manning & Napier Fund, Inc.
Real Estate Series
Beginning on February 25, 2021, as permitted by Securities and Exchange Commission regulations, paper copies of the Series’ annual and semi-annual shareholder reports will no longer be sent by mail, unless you specifically request paper copies of the reports from the Fund or from your financial intermediary, such as a broker-dealer or bank. Instead, the reports will be made available on a website, and you will be notified by mail each time a report is posted and provided with a website link to access the report.
If you already elected to receive shareholder reports electronically, you will not be affected by this change and you need not take any action. You may elect to receive shareholder reports and other communications from the Fund electronically by contacting your financial intermediary or, if you are a direct investor, by visiting www.manning-napier.com or calling1-800-466-3863.
You may elect to receive all future annual and semi-annual reports in paper free of charge. If you invest through a financial intermediary, you can contact your financial intermediary to request that you continue to receive paper copies of your shareholder reports. If you invest directly with the Fund, you can inform the Fund that you wish to continue receiving paper copies of your shareholder reports by visiting www.manning-napier.com or calling1-800-466-3863. Your election to receive reports in paper will apply to all funds held with your financial intermediary if you invest through a financial intermediary or all series of the Fund if you invest directly with the Fund. |
Real Estate Series
Management Discussion and Analysis
(unaudited)
Dear Shareholders:
The investment environment we witnessed over the past twelve months was far more volatile than in prior years. It resulted in a sharp drawdown in global equity markets during the fourth quarter of 2018.
For the fiscal year ending on December 31, 2018, US equities experienced negative returns, with the S&P 500 Total Return Index falling 4.38%. International equity performance was somewhat worse, with the MSCI ACWI ex USA Index returning negative 14.20%.
In fixed income, domestic investment-grade bond performance was essentially flat for the year, as measured by the Bloomberg Barclays U.S. Aggregate Bond Index, rising 0.01% as income generated over the period was offset by rising interest rates (when interest rates rise, bond prices fall).
We believe recent volatility, both at the beginning and end of last year, is reflective of what investors should expect going forward. While we do not believe we are immediately heading for a recession, we see recent developments within the US and abroad as an indication that we are entering a higher risk period for financial markets.
The US economy is likely approaching a period of peak growth. It continues to show signs of progressing toward the later stages of its economic and market cycle (typical characteristics of anend-of-cycle phase are an economic recession and financial market selloff).
As economic growth decelerates to more sustainable levels, we believe that investors are facing a growing risk of disappointment. At the same time, key global risks remain, including trade tensions, geopolitical uncertainty, and tightening monetary policy.
Considering the current economic and market backdrop, we believe investors should temper their performance expectations. The returns experienced over the latter half of the post-Global Financial Crisis bull market are unlikely to continue.
Additionally, given our cautious outlook, we are reviewing current and prospective investments for excessive risk exposures, and we have adjusted our positioning across many of our portfolios. Going forward, we will continue to follow our disciplines, focusing on flexibility and selectivity in today’s incredibly dynamic investment environment.
With this in mind, in the enclosed we discuss recent fund performance, highlight our positioning, and briefly provide our outlook amid the current investment environment.
We hope that you find this information helpful, and we look forward to working with you in the years ahead. Thank you for your continued confidence in Manning & Napier.
Sincerely,
Manning & Napier Advisors, LLC
The S&P 500 Index is an unmanaged, capitalization-weighted measure comprised of 500 leading U.S. companies to gauge U.S. large cap equities. The Index returns do not reflect any fees or expenses. The Index includes dividends, but not the reinvestment of dividends. Index returns provided by Bloomberg. S&P Dow Jones Indices LLC, a subsidiary of the McGraw Hill Financial, Inc., is the publisher of various index based data products and services and has licensed certain of its products and services for use by Manning & Napier. All such content Copyright© 2019 by S&P Dow Jones Indices LLC and/or its affiliates. All rights reserved. Neither S&P Dow Jones Indices LLC, Dow Jones Trademark Holdings LLC, their affiliates nor their third party licensors make any representation or warranty, express or implied, as to the ability of any index to accurately represent the asset class or market sector that it purports to represent and none of these parties shall have any liability for any errors, omissions, or interruptions of any index or the data included therein.
The MSCI ACWI ex USA Index (ACWIxUS) is designed to measure large andmid-cap representation across 22 of 23 Developed Markets countries (excluding the U.S.) and 24 Emerging Markets countries. The Index returns do not reflect any fees or expenses. The Index is denominated in U.S. dollars. The Index returns are net of withholding taxes. They assume daily reinvestment of net dividends thus accounting for any applicable dividend taxation. Index returns provided by Bloomberg.
The Bloomberg Barclays U.S. Aggregate Bond Index is an unmanaged, market-value weighted index of U.S. domestic investment-grade debt issues, including government, corporate, asset-backed, and mortgage-backed securities, with maturities of one year or more. Index returns do not reflect any fees or expenses. Index returns provided by Interactive Data.
1
Real Estate Series
Fund Commentary
(unaudited)
Investment Objective
To provide high current income and long-term capital appreciation by investing principally in companies in the real estate industry. Under normal circumstances, at least 80% of the Series’ assets will be invested in securities of companies that are principally engaged in the US real estate industry.
Performance Commentary
Real estate markets experienced some of the volatility affecting equity markets during 2018 as the Series’ primary benchmark (MSCI US REIT index) returned negative 5.83%. The real estate index did provide greater downside protection than broader equity indices over the course of last year.
Within the benchmark, performance varied dramatically bysub-industry during the period, with areas more exposed to overall economic activity experiencing some of the largest declines. Timber, shopping centers, and lodging REITs returned negative 32.0%, 14.6%, and 12.8%, respectively, with most of the declines taking place in the fourth quarter. Manufactured homes, healthcare, and apartment REITs were some of the better performing sectors, returning 11.4%, 7.6%, and 3.7%, respectively.
The Real Estate Series Class S returned negative 6.73% for the year, underperforming the benchmark on a relative basis. The largest detractors from relative performance during the year were an overweight allocation to data storage REITs, underweights to certain healthcare REITs. Overweight allocations to timber REITs and homebuilders also detracted from relative returns, along with stock selection within diversified and mall REITs. During the year, our increased concern for the homebuilding cycle led to meaningful shifts in the portfolio. The Series closed its positions in timber REITs and the homebuilders, while increasing its allocation to healthcare and apartment REITs.
The portfolio currently favors residential sector REITs including apartments, single-family housing, and manufactured housing REITs, as growing long-term household formation demand is likely to support pricing for apartments and single-family housing. The portfolio is also overweight data storage REITs within the office segment, which are key beneficiaries from the shift of data to the cloud. The portfolio is currently underweight retail. Online shopping and continued retailer bankruptcies are pressuring occupancy rates at malls and shopping centers. In addition, the portfolio is underweight hospitality for a few reasons; first, the segment is more cyclical and second, we have seen continued increases in capacity in major metro areas. Lastly, the majority of expenses are wages, which have been increasing recently and reducing operating profits.
Performance data quoted represents past performance and does not guarantee future results. The investment return and principal value of an investment will fluctuate, so that an investor’s shares, when redeemed, may be worth more or less than their original cost. Current performance may be higher or lower than that quoted; investors can obtain the most recentmonth-end performance at www.manning-napier.com or by calling (800)466-3863. Performance for the Real Estate Series Class S shares is provided above. Performance for the Class I shares will be higher based on the Class’ lower expenses.
Please see the next page for additional performance information as of December 31, 2018.
All investments involve risks, including potential loss of principal. Funds whose investments are concentrated in a specific industry or sector may be subject to a higher degree of market risk than funds whose investments are diversified among a variety of sectors. The Real Estate Series is subject to risks associated with the direct ownership of real estate, including the potential for falling real estate prices and the possibility of being highly leveraged; an investment in the Series will be closely aligned with the performance of the real estate markets. Additionally, like all derivatives, investments in options can be highly volatile and involve risks in addition to the risks of the underlying instrument on which the derivative is based, such as counterparty, correlation and liquidity risk.
The MSCI U.S. Real Estate Investment Trust (REIT) Index is a free float-adjusted market capitalization index that is comprised of equity REITs as classified as Equity REITs Industry under the GICS® Real Estate sector. The MSCI U.S. REIT Index is a subset of the MSCI USA Investable Market Index (IMI) which captures large, mid, andsmall-cap securities. The Index returns do not reflect any fees or expenses. The Index is denominated in U.S. dollars. The Index returns are net of withholding taxes. They assume daily reinvestment of net dividends thus accounting for any applicable dividend taxation. Index returns provided by Bloomberg.
2
Real Estate Series
Performance Update as of December 31, 2018
(unaudited)
| AVERAGE ANNUAL TOTAL RETURNS AS OF DECEMBER 31, 2018 | ||||||
ONE YEAR1 | FIVE YEAR | SINCE INCEPTION2 | ||||
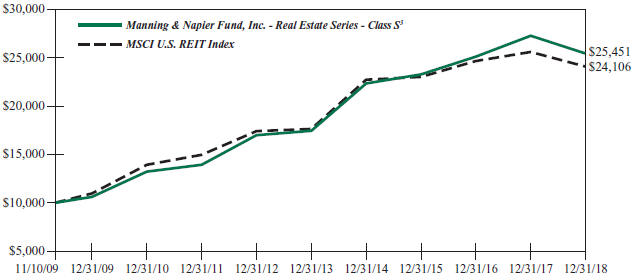
Manning & Napier Fund, Inc. - Real Estate Series - Class S3 | -6.73% | 7.85% | 10.76% | |||
Manning & Napier Fund, Inc. - Real Estate Series - Class I3,4 | -6.41% | 8.13% | 10.96% | |||
MSCI U.S. Real Estate Investment Trust (REIT) Index5 | -5.83% | 6.43% | 10.47% | |||
The following graph compares the value of a $10,000 investment in the Manning & Napier Fund, Inc. - Real Estate Series - Class S from its inception2 (November 10, 2009) to present (December 31, 2018) to the MSCI U.S. REIT Index.
1The returns shown are based on net asset values calculated for shareholder transactions and may differ from the returns shown in the financial highlights, which reflect adjustments made to the net asset values in accordance with accounting principles generally accepted in the United States of America.
2Performance numbers for the Series and Index are calculated from November 10, 2009, the Class S inception date.
3The Series’ performance does not reflect the deduction of taxes that a shareholder would pay on fund distributions or the redemption of shares. The Series’ performance is historical and may not be indicative of future results. The performance returns shown are inclusive of the net expense ratio of the Series. For the year ended December 31, 2018, this net expense ratio was 1.11% for Class S and 0.86% for Class I. The gross expense ratio, which does not account for any voluntary or contractual waivers currently in effect, was 1.11% for Class S and 0.86% for Class I for the year ended December 31, 2018.
4For periods through August 1, 2012 (the inception date of the Class I shares), performance for Class I shares is based on the historical performance of the Class S shares. Because Class I shares invest in the same portfolio of securities as Class S, performance will only be different to the extent that the Class S shares have a higher expense ratio.
5The MSCI U.S. Real Estate Investment Trust (REIT) Index is a free float-adjusted market capitalization index that is comprised of equity REITs as classified as Equity REITs Industry under the GICS® Real Estate sector. The MSCI U.S. REIT Index is a subset of the MSCI USA Investable Market Index (IMI) which captures large, mid, andsmall-cap securities. The Index returns do not reflect any fees or expenses. The Index is denominated in U.S. dollars. The Index returns are net of withholding taxes. They assume daily reinvestment of net dividends thus accounting for any applicable dividend taxation. Index returns provided by Bloomberg.
3
Real Estate Series
Shareholder Expense Example
(unaudited)
As a shareholder of the Series, you incur ongoing costs, including management fees, shareholder service fees and other Series expenses. This example is intended to help you understand your ongoing costs (in dollars) of investing in the Series and to compare these costs with the ongoing costs of investing in other mutual funds.
The example is based on an investment of $1,000 invested in each class at the beginning of the period and held for the entire period (July 1, 2018 to December 31, 2018).
Actual Expenses
The Actual lines of the table below provide information about actual account values and actual expenses. You may use the information in this line, together with the amount you invested, to estimate the expenses that you paid over the period. Simply divide your account value by $1,000 (for example, an $8,600 account value divided by $1,000 = 8.6), then multiply the result by the number in the Actual line for the Class in which you have invested under the heading entitled “Expenses Paid During Period” to estimate the expenses you paid on your account during this period.
Hypothetical Example for Comparison Purposes
The Hypothetical lines of each class in the table below provide information about hypothetical account values and hypothetical expenses based on the Class’ actual expense ratio and an assumed rate of return of 5% per year before expenses, which is not the Class’ actual return. The hypothetical account values and expenses may not be used to estimate the actual ending account balance or expenses you paid during the period. You may use this information to compare the ongoing costs of investing in a class of the Series and other funds. To do so, compare this 5% hypothetical example for the class in which you have invested with the 5% hypothetical examples that appear in the shareholder reports of the other funds.
Please note that the expenses shown in the table are meant to highlight your ongoing costs only and do not reflect any transaction costs such as sales charges (loads), redemption fees, or exchange fees that you may incur in other mutual funds. Therefore, the second line of the table is useful in comparing ongoing costs only, and will not help you determine the relative total costs of owning different funds.
BEGINNING ACCOUNT VALUE 7/1/18 | ENDING ACCOUNT VALUE 12/31/18 | EXPENSES PAID DURING PERIOD* 7/1/18-12/31/18 |
ANNUALIZED EXPENSE RATIO
| |||||||||||||
Class S | ||||||||||||||||
Actual | $1,000.00 | $931.45 | $5.40 | 1.11% | ||||||||||||
Hypothetical (5% return before expenses) | $1,000.00 | $1,019.61 | $5.65 | 1.11% | ||||||||||||
Class I | ||||||||||||||||
Actual | $1,000.00 | $ 933.12 | $4.19 | 0.86% | ||||||||||||
Hypothetical (5% return before expenses) | $1,000.00 | $1,020.87 | $4.38 | 0.86% | ||||||||||||
*Expenses are equal to each Class’ annualized expense ratio (for thesix-month period), multiplied by the average account value over the period, multiplied by 184/365 (to reflect theone-half year period). Expenses are based on the most recent fiscal half year; therefore, the expense ratios stated above may differ from the expense ratios stated in the financial highlights, which are based onone-year data.
4
Real Estate Series
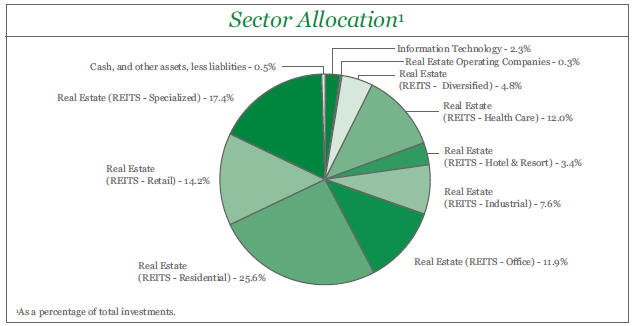
Portfolio Composition as of December 31, 2018
(unaudited)
Top Ten Stock Holdings2 | ||||||||||||||
Simon Property Group, Inc. | 5.6 | % | Digital Realty Trust, Inc. | 3.4% | ||||||||||
Equinix, Inc. | 5.2 | % | Boston Properties, Inc. | 3.1% | ||||||||||
AvalonBay Communities, Inc. | 4.3 | % | Public Storage | 2.8% | ||||||||||
Prologis, Inc. | 4.2 | % | Sun Communities, Inc. | 2.3% | ||||||||||
Equity Residential | 3.6 | % | InterXion Holding N.V. (Netherlands) | 2.3% | ||||||||||
| 2As a percentage of total investments. | ||||||||||||||
5
Real Estate Series
Investment Portfolio - December 31, 2018
| SHARES | VALUE (NOTE 2) | |||||||
COMMON STOCKS - 99.5% | ||||||||
Information Technology - 2.3% | ||||||||
IT Services - 2.3% | ||||||||
InterXion Holding N.V. (Netherlands)* | 112,380 | $ | 6,086,501 | |||||
|
| |||||||
Real Estate - 97.2% | ||||||||
Real Estate Operating Companies - 0.3% | ||||||||
StorageVault Canada, Inc. (Canada) | 409,065 | 710,141 | ||||||
|
| |||||||
REITS - Diversified - 4.8% | ||||||||
Lexington Realty Trust | 274,815 | 2,256,231 | ||||||
Liberty Property Trust | 121,685 | 5,096,168 | ||||||
STORE Capital Corp. | 50,605 | 1,432,628 | ||||||
VEREIT, Inc. | 545,110 | 3,897,536 | ||||||
|
| |||||||
| 12,682,563 | ||||||||
|
| |||||||
REITS - Health Care - 12.0% | ||||||||
Community Healthcare Trust, Inc. | 151,940 | 4,380,430 | ||||||
HCP, Inc. | 162,240 | 4,531,363 | ||||||
Healthcare Realty Trust, Inc. | 137,840 | 3,920,170 | ||||||
Healthcare Trust of America, Inc. - Class A | 219,500 | 5,555,545 | ||||||
Physicians Realty Trust | 377,240 | 6,047,157 | ||||||
Ventas, Inc. | 51,400 | 3,011,526 | ||||||
Welltower, Inc. | 60,800 | 4,220,128 | ||||||
|
| |||||||
| 31,666,319 | ||||||||
|
| |||||||
REITS - Hotel & Resort - 3.4% | ||||||||
Apple Hospitality REIT, Inc. | 90,530 | 1,290,958 | ||||||
Chesapeake Lodging Trust | 74,740 | 1,819,919 | ||||||
Host Hotels & Resorts, Inc. | 204,130 | 3,402,847 | ||||||
Sunstone Hotel Investors, Inc. | 191,135 | 2,486,666 | ||||||
|
| |||||||
| 9,000,390 | ||||||||
|
| |||||||
REITS - Industrial - 7.6% | ||||||||
Americold Realty Trust | 53,720 | 1,372,009 | ||||||
EastGroup Properties, Inc. | 11,350 | 1,041,135 | ||||||
First Industrial Realty Trust, Inc. | 78,185 | 2,256,419 | ||||||
Plymouth Industrial REIT, Inc. | 108,420 | 1,367,176 | ||||||
Prologis, Inc. | 190,180 | 11,167,370 | ||||||
STAG Industrial, Inc. | 120,055 | 2,986,968 | ||||||
|
| |||||||
| 20,191,077 | ||||||||
|
| |||||||
REITS - Office - 11.9% | ||||||||
Alexandria Real Estate Equities, Inc. | 11,970 | 1,379,423 | ||||||
Boston Properties, Inc. | 73,155 | 8,233,595 | ||||||
Brandywine Realty Trust | 370,515 | 4,768,528 | ||||||
Cousins Properties, Inc. | 735,155 | 5,807,724 | ||||||
Hibernia REIT plc (Ireland) | 1,606,740 | 2,304,837 | ||||||
Tier REIT, Inc. | 232,460 | 4,795,650 | ||||||
The accompanying notes are an integral part of the financial statements.
6
Real Estate Series
Investment Portfolio - December 31, 2018
| SHARES | VALUE (NOTE 2) | |||||||
COMMON STOCKS(continued) | ||||||||
Real Estate (continued) | ||||||||
REITS - Office(continued) | ||||||||
Vornado Realty Trust | 69,185 | $ | 4,291,546 | |||||
|
| |||||||
| 31,581,303 | ||||||||
|
| |||||||
REITS - Residential - 25.6% | ||||||||
American Campus Communities, Inc. | 38,935 | 1,611,520 | ||||||
American Homes 4 Rent - Class A | 291,170 | 5,779,724 | ||||||
Apartment Investment & Management Co. - Class A | 94,300 | 4,137,884 | ||||||
AvalonBay Communities, Inc. | 65,495 | 11,399,405 | ||||||
Camden Property Trust | 15,295 | 1,346,725 | ||||||
Equity LifeStyle Properties, Inc. | 33,390 | 3,243,171 | ||||||
Equity Residential | 142,375 | 9,398,174 | ||||||
Essex Property Trust, Inc. | 23,870 | 5,853,163 | ||||||
Independence Realty Trust, Inc. | 269,215 | 2,471,394 | ||||||
Invitation Homes, Inc. | 253,630 | 5,092,890 | ||||||
Mid-America Apartment Communities, Inc. | 42,015 | 4,020,835 | ||||||
Sun Communities, Inc. | 59,905 | 6,092,937 | ||||||
UDR, Inc. | 151,655 | 6,008,571 | ||||||
UMH Properties, Inc. | 110,600 | 1,309,504 | ||||||
|
| |||||||
| 67,765,897 | ||||||||
|
| |||||||
REITS - Retail - 14.2% | ||||||||
Acadia Realty Trust | 52,405 | 1,245,143 | ||||||
Agree Realty Corp. | 32,365 | 1,913,419 | ||||||
Federal Realty Investment Trust | 11,840 | 1,397,594 | ||||||
Getty Realty Corp. | 89,995 | 2,646,753 | ||||||
Kimco Realty Corp. | 138,745 | 2,032,614 | ||||||
National Retail Properties, Inc. | 54,865 | 2,661,501 | ||||||
Realty Income Corp. | 24,880 | 1,568,435 | ||||||
Simon Property Group, Inc. | 88,645 | 14,891,474 | ||||||
Unibail-Rodamco-Westfield (France) | 17,790 | 2,752,908 | ||||||
Urban Edge Properties | 202,910 | 3,372,364 | ||||||
Weingarten Realty Investors | 130,355 | 3,234,108 | ||||||
|
| |||||||
| 37,716,313 | ||||||||
|
| |||||||
REITS - Specialized - 17.4% | ||||||||
CoreCivic, Inc. | 209,885 | 3,742,250 | ||||||
Crown Castle International Corp. | 35,615 | 3,868,857 | ||||||
CubeSmart | 41,405 | 1,187,909 | ||||||
Digital Realty Trust, Inc. | 83,025 | 8,846,314 | ||||||
Equinix, Inc. | 39,175 | 13,811,538 | ||||||
Extra Space Storage, Inc. | 34,180 | 3,092,606 | ||||||
Jernigan Capital, Inc. | 150,535 | 2,983,604 | ||||||
National Storage Affiliates Trust | 45,090 | 1,193,081 | ||||||
The accompanying notes are an integral part of the financial statements.
7
Real Estate Series
Investment Portfolio - December 31, 2018
| SHARES | VALUE (NOTE 2) | |||||||
COMMON STOCKS(continued) | ||||||||
Real Estate(continued) | ||||||||
REITS - Specialized(continued) | ||||||||
Public Storage | 36,945 | $ | 7,478,038 | |||||
|
| |||||||
| 46,204,197 | ||||||||
|
| |||||||
Total Real Estate | 257,518,200 | |||||||
|
| |||||||
TOTAL INVESTMENTS - 99.5% | ||||||||
(Identified Cost $258,211,539) | 263,604,701 | |||||||
OTHER ASSETS, LESS LIABILITIES - 0.5% | 1,227,480 | |||||||
|
| |||||||
NET ASSETS - 100% | $ | 264,832,181 | ||||||
|
| |||||||
REITS - Real Estate Investment Trusts
*Non-income producing security.
The Global Industry Classification Standard (GICS) was developed by and is the exclusive property and a service mark of MSCI Inc. (MSCI) and Standard & Poor’s, a division of The McGraw-Hill Companies, Inc. (S&P), and is licensed for use by Manning & Napier when referencing GICS sectors. Neither MSCI, S&P, nor any third party involved in making or compiling the GICS or any GICS classifications makes any express or implied warranties or representations with respect to such standard or classification, nor shall any such party have any liability therefrom.
The accompanying notes are an integral part of the financial statements.
8
Real Estate Series
Statement of Assets and Liabilities
December 31, 2018
ASSETS: | ||||
Investments, at value (identified cost $258,211,539) (Note 2) | $ | 263,604,701 | ||
Receivable for securities sold | 1,599,408 | |||
Dividends receivable | 1,366,675 | |||
Receivable for fund shares sold | 260,530 | |||
Foreign tax reclaims receivable | 7,520 | |||
Prepaid expenses | 15,586 | |||
|
| |||
TOTAL ASSETS | 266,854,420 | |||
|
| |||
LIABILITIES: | ||||
Due to custodian | 711,944 | |||
Accrued management fees (Note 3) | 179,587 | |||
Accrued shareholder services fees (Class S) (Note 3) | 48,528 | |||
Accrued fund accounting and administration fees (Note 3) | 19,846 | |||
Accrued Chief Compliance Officer service fees (Note 3) | 427 | |||
Payable for securities purchased | 747,966 | |||
Payable for fund shares repurchased | 274,465 | |||
Other payables and accrued expenses | 39,476 | |||
|
| |||
TOTAL LIABILITIES | 2,022,239 | |||
|
| |||
TOTAL NET ASSETS | $ | 264,832,181 | ||
|
| |||
NET ASSETS CONSIST OF: | ||||
Capital stock | $ | 255,068 | ||
Additionalpaid-in-capital | 261,496,105 | |||
Total distributable earnings (loss) | 3,081,008 | |||
|
| |||
TOTAL NET ASSETS | $ | 264,832,181 | ||
|
| |||
NET ASSET VALUE, OFFERING PRICE AND REDEMPTION PRICE PER SHARE - Class S($214,721,637/ 16,397,936 shares) | $ | 13.09 | ||
|
| |||
NET ASSET VALUE, OFFERING PRICE AND REDEMPTION PRICE PER SHARE - Class I($50,110,544/ | $ | 5.50 | ||
|
| |||
The accompanying notes are an integral part of the financial statements.
9
Real Estate Series
Statement of Operations
For the Year Ended December 31, 2018
INVESTMENT INCOME: | ||||
Dividends (net of foreign taxes withheld, $46,435) | $ | 8,742,914 | ||
|
| |||
EXPENSES: | ||||
Management fees (Note 3) | 2,229,378 | |||
Shareholder services fees (Class S) (Note 3) | 609,929 | |||
Fund accounting and administration fees (Note 3) | 75,742 | |||
Directors’ fees (Note 3) | 24,097 | |||
Chief Compliance Officer service fees (Note 3) | 4,634 | |||
Custodian fees | 21,519 | |||
Miscellaneous | 203,187 | |||
|
| |||
Total Expenses | 3,168,486 | |||
|
| |||
NET INVESTMENT INCOME | 5,574,428 | |||
|
| |||
REALIZED AND UNREALIZED GAIN (LOSS) ON INVESTMENTS AND FOREIGN CURRENCY: | ||||
Net realized gain (loss) on- | ||||
Investments | 11,000,105 | |||
Foreign currency and translation of other assets and liabilities | (1,433 | ) | ||
|
| |||
| 10,998,672 | ||||
|
| |||
Net change in unrealized appreciation (depreciation) on- | ||||
Investments | (36,190,337 | ) | ||
Foreign currency and translation of other assets and liabilities | (220 | ) | ||
|
| |||
| (36,190,557 | ) | |||
|
| |||
NET REALIZED AND UNREALIZED GAIN (LOSS) ON INVESTMENTS AND FOREIGN CURRENCY | (25,191,885 | ) | ||
|
| |||
NET DECREASE IN NET ASSETS RESULTING FROM OPERATIONS | $ | (19,617,457 | ) | |
|
| |||
The accompanying notes are an integral part of the financial statements.
10
Real Estate Series
Statements of Changes in Net Assets
FOR THE YEAR ENDED | FOR THE YEAR ENDED | |||||||
INCREASE (DECREASE) IN NET ASSETS: | ||||||||
OPERATIONS: | ||||||||
Net investment income | $ | 5,574,428 | $ | 5,130,544 | ||||
Net realized gain (loss) on investments and foreign currency | 10,998,672 | 16,002,452 | ||||||
Net change in unrealized appreciation (depreciation) on investments and foreign currency | (36,190,557 | ) | 5,112,488 | |||||
|
|
|
| |||||
Net increase (decrease) from operations | (19,617,457 | ) | 26,245,484 | |||||
|
|
|
| |||||
DISTRIBUTIONS TO SHAREHOLDERS (Note 10): | ||||||||
Class S | (13,404,039 | ) | (14,177,128 | ) | ||||
Class I | (7,240,331 | ) | (5,250,618 | ) | ||||
From return of capital (Class S) | (376,898 | ) | — | |||||
From return of capital (Class I) | (227,910 | ) | — | |||||
|
|
|
| |||||
Total distributions to shareholders | (21,249,178 | ) | (19,427,746 | )1 | ||||
|
|
|
| |||||
CAPITAL STOCK ISSUED AND REPURCHASED: | ||||||||
Net increase (decrease) from capital share transactions (Note 5) | (12,870,550 | ) | 7,130,309 | |||||
|
|
|
| |||||
Net increase (decrease) in net assets | (53,737,185 | ) | 13,948,047 | |||||
NET ASSETS: | ||||||||
Beginning of year | 318,569,366 | 304,621,319 | ||||||
|
|
|
| |||||
End of year2 | $ | 264,832,181 | $ | 318,569,366 | ||||
|
|
|
| |||||
1 For the year ended December 31, 2017, the distributions to shareholders from net investment income and net realized gain were $4,348,614 and $9,828,514 (Class S) and $1,792,970 and $3,457,648 (Class I), respectively.
2 Includes accumulated undistributed (overdistributed) net investment income of ($595,405) as of December 31, 2017. The SEC eliminated the requirement to disclose undistributed net investment income in 2018.
The accompanying notes are an integral part of the financial statements.
11
Real Estate Series
Financial Highlights - Class S
| FOR THE YEAR ENDED | ||||||||||||||||||||
| 12/31/18 | 12/31/17 | 12/31/16 | 12/31/15 | 12/31/14 | ||||||||||||||||
Per share data (for a share outstanding throughout each year): | ||||||||||||||||||||
Net asset value - Beginning of year | $14.93 | $14.48 | $14.15 | $15.46 | $13.32 | |||||||||||||||
|
|
|
|
|
|
|
|
|
| |||||||||||
Income (loss) from investment operations: | ||||||||||||||||||||
Net investment income1 | 0.26 | 0.24 | 0.22 | 0.24 | 0.44 | 2 | ||||||||||||||
Net realized and unrealized gain (loss) on investments | (1.24 | ) | 1.02 | 0.88 | 0.34 | 3.24 | ||||||||||||||
|
|
|
|
|
|
|
|
|
| |||||||||||
Total from investment operations | (0.98 | ) | 1.26 | 1.10 | 0.58 | 3.68 | ||||||||||||||
|
|
|
|
|
|
|
|
|
| |||||||||||
Less distributions to shareholders: | ||||||||||||||||||||
From net investment income | (0.21 | ) | (0.25 | ) | (0.27 | ) | (0.24 | ) | (0.44 | ) | ||||||||||
From net realized gain on investments | (0.63 | ) | (0.56 | ) | (0.50 | ) | (1.65 | ) | (1.10 | ) | ||||||||||
From return of capital | (0.02 | ) | — | — | — | — | ||||||||||||||
|
|
|
|
|
|
|
|
|
| |||||||||||
Total distributions to shareholders | (0.86 | ) | (0.81 | ) | (0.77 | ) | (1.89 | ) | (1.54 | ) | ||||||||||
|
|
|
|
|
|
|
|
|
| |||||||||||
Net asset value - End of year | $13.09 | $14.93 | $14.48 | $14.15 | $15.46 | |||||||||||||||
|
|
|
|
|
|
|
|
|
| |||||||||||
Net assets - End of year(000’s omitted) | $ | 214,722 | $ | 271,496 | $ | 278,322 | $ | 217,216 | $ | 231,188 | ||||||||||
|
|
|
|
|
|
|
|
|
| |||||||||||
Total return3 | (6.73% | ) | 8.66% | 7.91% | 4.14% | 28.14% | ||||||||||||||
Ratios (to average net assets)/Supplemental Data: | ||||||||||||||||||||
Expenses* | 1.11% | 1.10% | �� | 1.09% | 1.09% | 1.11% | ||||||||||||||
Net investment income | 1.82% | 1.58% | 1.47% | 1.54% | 2.89% | 2 | ||||||||||||||
Portfolio turnover | 44% | 42% | 46% | 57% | 44% | |||||||||||||||
| *The investment advisor did not impose all or a portion of its management and/or other fees, and in some periods may have paid a portion of the Series’ expenses. If these expenses had been incurred by the Class, the expense ratio (to average net assets) would have increased by the following amounts: |
| |||||||||||||||||||
| N/A | 0.00% | 4 | N/A | N/A | N/A | |||||||||||||||
1Calculated based on average shares outstanding during the years.
2Reflects a special dividend paid out during the period by two of the Series’ holdings. Had the Series not received the special dividends, the net investment income per share would have been $0.22 and the net investment income ratio would have been 1.49%.
3Represents aggregate total return for the years indicated, and assumes reinvestment of all distributions. Total return would have been lower had certain expenses not been waived or reimbursed during certain years.
4Less than 0.01%.
The accompanying notes are an integral part of the financial statements.
12
Real Estate Series
Financial Highlights - Class I
| FOR THE YEAR ENDED | ||||||||||||||||||||
| 12/31/18 | 12/31/17 | 12/31/16 | 12/31/15 | 12/31/14 | ||||||||||||||||
Per share data (for a share outstanding throughout each year): | ||||||||||||||||||||
Net asset value - Beginning of year | $6.81 | $7.03 | $7.26 | $8.86 | $8.18 | |||||||||||||||
|
|
|
|
|
|
|
|
|
| |||||||||||
Income (loss) from investment operations: | ||||||||||||||||||||
Net investment income1 | 0.14 | 0.14 | 0.11 | 0.16 | 0.29 | 2 | ||||||||||||||
Net realized and unrealized gain (loss) on investments | (0.55 | ) | 0.49 | 0.47 | 0.17 | 1.97 | ||||||||||||||
|
|
|
|
|
|
|
|
|
| |||||||||||
Total from investment operations | (0.41 | ) | 0.63 | 0.58 | 0.33 | 2.26 | ||||||||||||||
|
|
|
|
|
|
|
|
|
| |||||||||||
Less distributions to shareholders: | ||||||||||||||||||||
From net investment income | (0.24 | ) | (0.29 | ) | (0.31 | ) | (0.28 | ) | (0.48 | ) | ||||||||||
From net realized gain on investments | (0.63 | ) | (0.56 | ) | (0.50 | ) | (1.65 | ) | (1.10 | ) | ||||||||||
From return of capital | (0.03 | ) | — | — | — | — | ||||||||||||||
|
|
|
|
|
|
|
|
|
| |||||||||||
Total distributions to shareholders | (0.90 | ) | (0.85 | ) | (0.81 | ) | (1.93 | ) | (1.58 | ) | ||||||||||
|
|
|
|
|
|
|
|
|
| |||||||||||
Net asset value - End of year | $5.50 | $6.81 | $7.03 | $7.26 | $8.86 | |||||||||||||||
|
|
|
|
|
|
|
|
|
| |||||||||||
Net assets - End of year(000’s omitted) | $ | 50,111 | $ | 47,074 | $ | 26,300 | $ | 50,249 | $ | 50,513 | ||||||||||
|
|
|
|
|
|
|
|
|
| |||||||||||
Total return3 | (6.41% | ) | 8.85% | 8.17% | 4.43% | 28.44% | ||||||||||||||
Ratios (to average net assets)/Supplemental Data: | ||||||||||||||||||||
Expenses* | 0.86% | 0.85% | 0.84% | 0.84% | 0.86% | |||||||||||||||
Net investment income | 2.12% | 1.95% | 1.50% | 1.81% | 3.14% | 2 | ||||||||||||||
Portfolio turnover | 44% | 42% | 46% | 57% | 44% | |||||||||||||||
| *The investment advisor did not impose all or a portion of its management and/or other fees, and in some periods may have paid a portion of the Series’ expenses. If these expenses had been incurred by the Class, the expense ratio (to average net assets) would have increased by the following amounts: |
| |||||||||||||||||||
| N/A | 0.00% | 4 | N/A | N/A | N/A | |||||||||||||||
1Calculated based on average shares outstanding during the years.
2Reflects a special dividend paid out during the period by two of the Series’ holdings. Had the Series not received the special dividends, the net investment income per share would have been $0.16 and the net investment income ratio would have been 1.74%.
3Represents aggregate total return for the years indicated, and assumes reinvestment of all distributions. Total return would have been lower had certain expenses not been waived or reimbursed during certain years.
4Less than 0.01%.
The accompanying notes are an integral part of the financial statements.
13
Real Estate Series
Notes to Financial Statements
| 1. | Organization |
Real Estate Series (the “Series”) is ano-load diversified series of Manning & Napier Fund, Inc. (the “Fund”). The Fund is organized in Maryland and is registered under the Investment Company Act of 1940, as amended, as anopen-end management investment company.
The Series’ investment objective is to provide high current income and long-term capital appreciation by investing principally in companies in the real estate industry.
The Fund’s advisor is Manning & Napier Advisors, LLC (the “Advisor”). Shares of the Series are offered to investors, clients and employees of the Advisor and its affiliates. The Series is authorized to issue two classes of shares (Class S and Class I). Each class of shares is substantially the same, except that Class S shares bear shareholder services fees. The total authorized capital stock of the Fund consists of 15 billion shares of common stock each having a par value of $0.01. As of December 31, 2018, 10.4 billion shares have been designated in total among 34 series, of which 100 million have been designated as Real Estate Series Class I common stock, 100 million have been designated as Real Estate Series Class S common stock, 75 million have been designated as Real Estate Series Class W common stock, and 100 million have been designated as Real Estate Series Class Z common stock. Class W common stock and Class Z common stock are not currently offered for sale.
| 2. | Significant Accounting Policies |
The following is a summary of significant accounting policies followed by the Series. The Series is an investment company and, accordingly, follows the investment company accounting and reporting guidance of the Financial Accounting Standards Board Accounting Standards Codification Topic 946 - Investment Companies, which is part of accounting principles generally accepted in the United States of America (“GAAP”).
Security Valuation
Portfolio securities, including domestic equities, foreign equities, warrants and options, listed on an exchange other than the NASDAQ Stock Market are valued at the latest quoted sales price of the exchange on which the security is primarily traded. Securities not traded on valuation date or securities not listed on an exchange are valued at the latest quoted bid price provided by the Fund’s pricing service. Securities listed on the NASDAQ Stock Market are valued in accordance with the NASDAQ Official Closing Price.
Short-term investments that mature in sixty days or less may be valued at amortized cost, which approximates fair value. Investments inopen-end investment companies are valued at their net asset value per share on valuation date.
Volume and level of activity in established markets for an asset or liability are evaluated to determine whether recent transactions and quoted prices are determinative of fair value. Where there have been significant decreases in volume and level of activity, further analysis and adjustment may be necessary to estimate fair value. The Series measures fair value in these instances by the use of inputs and valuation techniques which may be based upon current market prices of securities that are comparable in coupon, rating, maturity and industry and/or expectation of future cash flows. As a result of trading in relatively thin markets and/or markets that experience significant volatility, the prices used by the Series to value these securities may differ from the value that would be realized if these securities were sold, and the differences could be material.
Securities for which representative valuations or prices are not available from the Series’ pricing service may be valued at fair value as determined in good faith by the Advisor under procedures approved by and under the general supervision and responsibility of the Fund’s Board of Directors (the “Board”). Due to the inherent uncertainty of valuations of such securities, the fair value may differ significantly from the values that would have been used had a ready market for such securities existed. If trading or events occurring after the close of the principal market in which securities are traded are expected to materially affect the value of those securities, then they may be valued at their fair value, taking this trading or these events into account. In accordance with the procedures approved by the Board, the values of certain securities trading outside the U.S. were adjusted following the close of local trading using a factor from a third party vendor. The third party vendor uses statistical analyses and quantitative models, which consider among other things subsequent movement and changes in the prices of indices, securities and exchange rates in other markets, to determine the factors which are used to adjust local market prices. The value of
14
Real Estate Series
Notes to Financial Statements (continued)
| 2. | Significant Accounting Policies (continued) |
Security Valuation(continued)
securities used for net asset value calculation under these procedures may differ from published prices for the same securities. It is the Fund’s policy to classify each foreign equity security where a factor from a third party vendor is provided as a Level 2 security.
Various inputs are used in determining the value of the Series’ assets or liabilities carried at fair value. These inputs are summarized in three broad levels. Level 1 includes quoted prices in active markets for identical assets and liabilities. Level 2 includes other significant observable inputs (including quoted prices for similar securities, interest rates, prepayment speeds, credit risk, etc.). Level 3 includes significant unobservable inputs (including the Series’ own assumptions in determining the fair value of investments). A financial instrument’s level within the fair value hierarchy is based on the lowest level of any input both individually and in aggregate that is significant to the fair value measurement. The inputs or methodology used for valuing securities are not necessarily an indication of the risk associated with investing in those securities.
The following is a summary of the valuation levels used for major security types as of December 31, 2018 in valuing the Series’ assets or liabilities carried at fair value:
| DESCRIPTION | TOTAL | LEVEL 1 | LEVEL 2 | LEVEL 3 | ||||||||||||
Assets: | ||||||||||||||||
Equity Securities: | ||||||||||||||||
Information Technology | $ | 6,086,501 | $ | 6,086,501 | $ | — | $ | — | ||||||||
Real Estate* | 257,518,200 | 252,460,455 | 5,057,745 | # | — | |||||||||||
|
|
|
|
|
|
|
| |||||||||
Total assets | $ | 263,604,701 | $ | 258,546,956 | $ | 5,057,745 | $ | — | ||||||||
|
|
|
|
|
|
|
| |||||||||
*Please refer to the Investment Portfolio for the industry classifications of these portfolio holdings.
#Consists of certain foreign securities for which a factor from a third party vendor was applied to determine the securities’ fair value following the close of local trading.
There were no Level 3 securities held by the Series as of December 31, 2017 or December 31, 2018.
New Accounting Pronouncements
The Securities and Exchange Commission (SEC) adopted changes to RegulationS-X to simplify the reporting of information by registered investment companies in financial statements. The amendments require presentation of the total, rather than the components, of distributable earnings on the Statement of Assets and Liabilities and also require presentation of the total, rather than the components, of distributions to shareholders, except for tax return of capital distributions, if any, on the Statement of Changes in Net Assets. The amendments also removed the requirement for parenthetical disclosure of undistributed net investment income on the Statement of Changes in Net Assets. These RegulationS-X amendments are reflected in the Series financial statements for the year ended December 31, 2018. As a result of adopting these amendments, the distributions to shareholders in the December 31, 2017 Statement of Changes in Net Assets presented herein have been reclassified to conform to the current year presentation.
On August 28, 2018, the FASB issued ASU2018-13, “Disclosure Framework – Changes to the Disclosure Requirements for Fair Value Measurement,” which amends the fair value measurement disclosure requirements under U.S. GAAP. The amendments of ASU2018-13 include new, eliminated, and modified disclosure requirements. In addition, the amendments clarify that materiality is an appropriate consideration of entities when evaluating disclosure requirements. The ASU is effective for all entities for fiscal years beginning after December 15, 2019, including interim periods therein. An entity is permitted to early adopt any eliminated or modified disclosures upon issuance of this ASU and delay adoption of the new disclosures until their effective date. As such, each Series has early adopted the eliminated and modified disclosures, as permitted by this ASU.
15
Real Estate Series
Notes to Financial Statements (continued)
| 2. | Significant Accounting Policies (continued) |
Security Transactions, Investment Income and Expenses
Security transactions are accounted for on trade date. Dividend income is recorded on theex-dividend date, except that if theex-dividend date has passed, certain dividends from foreign securities are recorded as soon as the Series is informed of theex-dividend date.Non-cash dividends, if any, are recorded at the fair value of the securities received. Interest income, including amortization of premium and accretion of discounts using the effective interest method, is earned from settlement date and accrued daily.
Expenses are recorded on an accrual basis. Most expenses of the Fund can be attributed to a specific series. Expenses which cannot be directly attributed are apportioned among the series in the Fund in such a manner as deemed equitable by the Fund’s Board, taking into consideration, among other things, the nature and type of expense. Income, expenses (other than shareholder services fees), and realized and unrealized gains and losses are prorated among the classes based on the relative net assets of each class. Class specific expenses are directly charged to that Class.
The Fund records distributions received in excess of income from underlying investments as a reduction of cost of investments and/or realized gain. Such amounts are based on estimates if actual amounts are not available and actual amounts of income, realized gain and return of capital may differ from the estimated amounts. The Fund adjusts the estimated amounts of components of distributions (and consequently its net investment income) as necessary once the issuers provide information about the actual composition of the distributions.
The Series uses the identified cost method for determining realized gain or loss on investments for both financial statement and federal income tax reporting purposes.
Foreign Currency Translation
The books and records of the Series are maintained in U.S. dollars. Foreign currencies, investments and other assets and liabilities are translated into U.S. dollars at the current exchange rates. Purchases and sales of investment securities and income and expenses are translated on the respective dates of such transactions. The Series does not isolate realized and unrealized gains and losses attributable to changes in the exchange rates from gains and losses that arise from changes in the market value of investments. Such fluctuations are included with net realized and unrealized gain or loss on investments. Net realized foreign currency gains and losses represent foreign currency gains and losses between trade date and settlement date on securities transactions, gains and losses on disposition of foreign currencies and the difference between the amount of income and foreign withholding taxes recorded on the books of the Series and the amounts actually received or paid.
Federal Taxes
The Series’ policy is to comply with the provisions of the Internal Revenue Code applicable to regulated investment companies. The Series is not subject to federal income tax or excise tax to the extent that the Series distributes to shareholders each year its taxable income, including any net realized gains on investments, in accordance with requirements of the Internal Revenue Code. Accordingly, no provision for federal income tax or excise tax has been made in the financial statements.
Management evaluates its tax positions to determine if the tax positions taken meet the minimum recognition threshold in connection with accounting for uncertainties in income tax positions taken or expected to be taken for the purposes of measuring and recognizing tax liabilities in the financial statements. Recognition of tax benefits of an uncertain tax position is required only when the position is “more likely than not” to be sustained assuming examination by taxing authorities. At December 31, 2018, the Series has recorded no liability for net unrecognized tax benefits relating to uncertain income tax positions taken or expected to be taken in future tax returns.
The Series files income tax returns in the U.S. federal jurisdiction, various states and foreign jurisdictions, as required. No income tax returns are currently under investigation. The statute of limitations on the Series’ tax returns remains open for the years ended December 31, 2015 through December 31, 2018. The Series is not aware of any tax positions for which it is reasonably possible that the total amounts of unrecognized tax benefits will significantly change in the next twelve months.
16
Real Estate Series
Notes to Financial Statements (continued)
| 2. | Significant Accounting Policies (continued) |
Foreign Taxes
Based on the Series’ understanding of the tax rules and rates related to income, gains and currency purchase/repatriation transactions for foreign jurisdictions in which it invests, the Series will provide for foreign taxes, and where appropriate, deferred foreign tax.
Distributions of Income and Gains
Distributions to shareholders of net investment income and net realized gains are made annually. An additional distribution may be necessary to avoid taxation of the Series. Distributions are recorded on theex-dividend date.
Indemnifications
The Fund’s organizational documents provide former and current directors and officers with a limited indemnification against liabilities arising in connection with the performance of their duties to the Fund. In the normal course of business, the Fund may also enter into contracts that provide general indemnifications. The Fund’s maximum exposure under these arrangements is unknown as this would be dependent on future claims that may be made against the Fund. The risk of material loss from such claims is considered remote.
Other
The preparation of financial statements in conformity with GAAP requires management to make estimates and assumptions that affect the reported amounts of assets and liabilities and the disclosure of contingent assets and liabilities at the date of the financial statements and the reported amounts of income and expenses during the reporting period. Actual results could differ from those estimates.
| 3. | Transactions with Affiliates |
The Fund has an Investment Advisory Agreement (the “Agreement”) with the Advisor, for which the Series pays a fee, computed daily and payable monthly, at an annual rate of 0.75% of the Series’ average daily net assets.
Under the Agreement, personnel of the Advisor provide the Series with advice and assistance in the choice of investments and the execution of securities transactions, and otherwise maintain the Series’ organization. The Advisor also provides the Fund with necessary office space and fund administration and support services. The salaries of all officers of the Fund (except a percentage of the Fund’s Chief Compliance Officer’s salary, which is paid by the Fund), and of all Directors who are “affiliated persons” of the Fund, or of the Advisor, and all personnel of the Fund, or of the Advisor, performing services relating to research, statistical and investment activities, are paid by the Advisor. Each“non-affiliated” Director receives an annual stipend, which is allocated among all the active series of the Fund. In addition, these Directors also receive a fee per Board meeting attended plus a fee for each committee meeting attended and are reimbursed for travel and otherout-of-pocket expenses incurred by them in connection with attending such meetings. The Fund also has an Audit Committee Chair, Governance & Nominating Committee Chair and Lead Independent Director, who each receive an additional annual stipend for these roles.
The Class S shares of the Series are subject to a shareholder services fee in accordance with a shareholder services plan adopted by the Board. The shareholder services fee is intended to compensate financial intermediaries, including affiliates of the Fund, in connection with the provision of direct client service, personal services, maintenance of shareholder accounts and reporting services. For these services, Class S of the Series pays a fee, computed daily and payable monthly, at an annual rate of 0.25% of the average daily net assets of Class S. The Fund has a Shareholder Services Agreement with the Advisor, for which the Advisor receives the shareholder services fee as stated above.
The Advisor has contractually agreed, until at least April 30, 2019, to waive its management fee and, if necessary, pay other operating expenses of the Series in order to maintain total direct annual fund operating expenses for the Series, exclusive of shareholder services fee, at no more than 0.95% of average daily net assets. The Advisor did not waive any fees for the year ended December 31, 2018. The Advisor is not eligible to recoup any expenses that have been waived or reimbursed in prior years.
17
Real Estate Series
Notes to Financial Statements (continued)
| 3. | Transactions with Affiliates (continued) |
During the year ended December 31, 2018, a trade processing error was discovered for which it was determined that the Advisor would reimburse the Series $17,203. The impact of the Advisor’s contribution on the Series total return was immaterial. As of December 31, 2018, the respective amount is included in net realized gain (loss) on investments on the Statement of Operations.
Manning & Napier Investor Services, Inc., a registered broker-dealer affiliate of the Advisor, acts as distributor for the Fund’s shares. The services of Manning & Napier Investor Services, Inc. are provided at no additional cost to the Series.
Pursuant to a master services agreement dated March 1, 2017, as amended, the Fund pays the Advisor an annual fee related to fund accounting and administration of 0.0085% on the first $25 billion of average daily net assets (excluding Target Series and Income Series); 0.0075% on the next $15 billion of average daily net assets (excluding Target Series and Income Series); and 0.0065% of average daily net assets in excess of $40 billion (excluding Target Series and Income Series); plus a base fee of $30,400 per series. Additionally, certain transaction andout-of-pocket expenses, including charges for reporting relating to the Fund’s compliance program, are charged. The Advisor has agreements with BNY Mellon Investment Servicing (U.S.) Inc. (“BNY”) under which BNY serves assub-accountant services agent.
| 4. | Purchases and Sales of Securities |
For the year ended December 31, 2018, purchases and sales of securities, other than U.S. Government securities and short-term securities, were $129,968,501 and $154,400,199, respectively. There were no purchases or sales of U.S. Government securities.
| 5. | Capital Stock Transactions |
Transactions in shares of Class S and I shares of Real Estate Series were:
| CLASS S | FOR THE YEAR ENDED 12/31/2018 | FOR THE YEAR ENDED 12/31/2017 | ||||||||||||||
| SHARES | AMOUNT | SHARES | AMOUNT | |||||||||||||
Sold | 1,757,808 | $ | 25,004,617 | 2,903,019 | $ | 43,684,165 | ||||||||||
Reinvested | 985,726 | 13,482,994 | 917,117 | 13,838,828 | ||||||||||||
Repurchased | (4,532,215 | ) | (64,555,664 | ) | (4,857,374 | ) | (73,411,141 | ) | ||||||||
|
|
|
|
|
|
|
| |||||||||
Total | (1,788,681 | ) | $ | (26,068,053 | ) | (1,037,238 | ) | $ | (15,888,148 | ) | ||||||
|
|
|
|
|
|
|
| |||||||||
| CLASS I | FOR THE YEAR ENDED 12/31/2018 | FOR THE YEAR ENDED 12/31/2017 | ||||||||||||||
| SHARES | AMOUNT | SHARES | AMOUNT | |||||||||||||
Sold | 4,087,337 | $ | 26,517,405 | 4,014,260 | $ | 29,420,634 | ||||||||||
Reinvested | 1,131,254 | 6,539,568 | 622,410 | 4,295,968 | ||||||||||||
Repurchased | (3,017,310 | ) | (19,859,470 | ) | (1,469,901 | ) | (10,698,145 | ) | ||||||||
|
|
|
|
|
|
|
| |||||||||
Total | 2,201,281 | $ | 13,197,503 | 3,166,769 | $ | 23,018,457 | ||||||||||
|
|
|
|
|
|
|
| |||||||||
Approximately 66% of the shares outstanding are fiduciary accounts where the Advisor has sole investment discretion.
| 6. | Line of Credit |
The Fund has entered into a364-day, $25 million credit agreement (the “line of credit”) with Bank of New York Mellon. Each series of the Fund may borrow under the line of credit for temporary or emergency purposes, including funding shareholder redemptions and other short-term liquidity purposes. The Fund pays an annual fee on the unused commitment amount, payable quarterly, and is allocated among all the series of the Fund and included in miscellaneous expenses in the Statement of
18
Real Estate Series
Notes to Financial Statements (continued)
| 6. | Line of Credit (continued) |
Operations for each series. The line of credit expires in August 2019 unless extended or renewed. During the year ended December 31, 2018, the Series did not borrow under the line of credit.
| 7. | Financial Instruments |
The Series may trade in instruments including written and purchased options, forward foreign currency exchange contracts and futures contracts and other derivatives in the normal course of investing activities to assist in managing exposure to various market risks. The Series may be subject to various elements of risk, which may involve, to a varying degree, elements of risk in excess of the amounts recognized for financial statement purposes. These risks include: the risk that changes in the value of a derivative may not correlate perfectly with the underlying asset, rate or index; counterparty credit risk related to over the counter derivative counterparties’ failure to perform under contract terms; liquidity risk related to the lack of a liquid market for these contracts allowing the fund to close out its position(s); and documentation risk relating to disagreement over contract terms. No such investments were held by the Series as of December 31, 2018.
| 8. | Foreign Securities |
Investing in securities of foreign companies and foreign governments involves special risks and considerations not typically associated with investing in securities of domestic companies and the U.S. Government. These risks include revaluation of currencies and future adverse political and economic developments. Moreover, securities of foreign companies and foreign governments and their markets may be less liquid and their prices more volatile than those of comparable domestic companies and the U.S. Government.
| 9. | Real Estate Securities |
The Series may focus its investments in certain real estate related industries; hence, the Series may subject itself to a greater degree of risk than a series that is more diversified.
| 10. | Federal Income Tax Information |
The amount and characterization of certain income and capital gains to be distributed are determined in accordance with federal income tax regulations, which may differ from GAAP. The portion of distributions that exceeds a Series’ current and accumulated earnings and profits, as measured on a tax basis, constitutes anon-taxable return of capital. These differences are primarily due to differing book and tax treatments in the timing and/or treatment of the recognition of net investment income or gains and losses, including foreign currency gains and losses, redesignation of distributions paid, investments in passive foreign investment companies (PFICs), including losses deferred due to wash sales and qualified late-year losses. The Series may periodically make reclassifications among its capital accounts to reflect income and gains available for distribution (or available capital loss carryovers) under income tax regulations without impacting the Series’ net asset value. Any such reclassifications are not reflected in the financial highlights.
19
Real Estate Series
Notes to Financial Statements (continued)
| 10. | Federal Income Tax Information (continued) |
The tax character of distributions paid were as follows:
| FOR THE YEAR ENDED 12/31/18 | FOR THE YEAR ENDED 12/31/17 | |||||||||||
| Ordinary income | $ | 5,528,569 | $ | 6,084,677 | |||||||
Long-term capital gains | $ | 15,115,801 | $ | 13,343,069 | ||||||||
Return of capital | $ | 604,808 | $ | — | ||||||||
At December 31, 2018, the tax basis of components of distributable earnings and the net unrealized appreciation based on identified cost for federal income tax purposes were as follows:
| Cost for federal income tax purposes | $ | 258,256,842 | |||
Unrealized appreciation | 19,998,475 | |||||
Unrealized depreciation | (14,650,616 | ) | ||||
|
| |||||
Net unrealized appreciation | $ | 5,347,859 | ||||
|
| |||||
Qualified late-year losses1 | $ | 2,266,718 |
1 The Series has elected to defer certain qualified late-year losses and recognize such losses in the year ending December 31, 2019.
20
Real Estate Series
Report of Independent Registered Public Accounting Firm
To the Board of Directors of Manning & Napier Fund, Inc. and Shareholders of Real Estate Series
Opinion on the Financial Statements
We have audited the accompanying statement of assets and liabilities, including the investment portfolio, of Real Estate Series (one of the series constituting Manning & Napier Fund, Inc., referred to hereafter as the “Fund”) as of December 31, 2018, the related statement of operations for the year ended December 31, 2018, the statement of changes in net assets for each of the two years in the period ended December 31, 2018, including the related notes, and the financial highlights for each of the five years in the period ended December 31, 2018 (collectively referred to as the “financial statements”). In our opinion, the financial statements present fairly, in all material respects, the financial position of the Fund as of December 31, 2018, the results of its operations for the year then ended, the changes in its net assets for each of the two years in the period ended December 31, 2018 and the financial highlights for each of the five years in the period ended December 31, 2018 in conformity with accounting principles generally accepted in the United States of America.
Basis for Opinion
These financial statements are the responsibility of the Fund’s management. Our responsibility is to express an opinion on the Fund’s financial statements based on our audits. We are a public accounting firm registered with the Public Company Accounting Oversight Board (United States) (PCAOB) and are required to be independent with respect to the Fund in accordance with the U.S. federal securities laws and the applicable rules and regulations of the Securities and Exchange Commission and the PCAOB.
We conducted our audits of these financial statements in accordance with the standards of the PCAOB. Those standards require that we plan and perform the audit to obtain reasonable assurance about whether the financial statements are free of material misstatement, whether due to error or fraud.
Our audits included performing procedures to assess the risks of material misstatement of the financial statements, whether due to error or fraud, and performing procedures that respond to those risks. Such procedures included examining, on a test basis, evidence regarding the amounts and disclosures in the financial statements. Our audits also included evaluating the accounting principles used and significant estimates made by management, as well as evaluating the overall presentation of the financial statements. Our procedures included confirmation of securities owned as of December 31, 2018 by correspondence with the custodian and brokers; when replies were not received from brokers, we performed other auditing procedures. We believe that our audits provide a reasonable basis for our opinion.

New York, New York
February 15, 2019
We have served as the auditor of one or more investment companies in Manning & Napier Mutual Funds since 1992.
21
Real Estate Series
Supplemental Tax Information
(unaudited)
All reportings are based on financial information available as of the date of this annual report and, accordingly, are subject to change.
The Series designates $13,215,350 as Long-Term Capital Gain dividends pursuant to Section 852(b)(3) of the Internal Revenue Code for the fiscal year ended December 31, 2018.
22
Real Estate Series
Renewal of Investment Advisory Agreement
(unaudited)
At the Manning & Napier Fund, Inc. (the “Fund”) Board of Directors’ (the “Board”) meeting, held on November 15, 2018, the Investment Advisory Agreement (the “Agreement”) between the Fund and Manning & Napier Advisors, LLC (the “Advisor”) was considered for renewal by the Board, including all of the Directors who are not “interested persons” (“Independent Directors”), within the meaning of the Investment Company Act of 1940, as amended (the “1940 Act”). In connection with the decision whether to renew the Agreement, a variety of material was provided to the Board in advance of the meeting for their review and consideration. The Board also held a working session on October 31, 2018 to review and discuss information provided to the Board, and for the Board to request additional information.
Representatives of the Advisor attended a portion of the working session and attended the Board meeting. The Advisor provided supplemental information requested by the Board and presented additional oral information to the Board to assist the Board in its considerations. In addition to the information furnished by the Advisor, the Board was provided with a legal memorandum discussing its fiduciary duties related to its approval of the continuation of the Agreement. Legal counsel for the Fund discussed with the Board the applicable legal considerations. In addition, the Board receivedin-person presentations about the Fund throughout the year.
The Independent Directors were advised by independent legal counsel with respect to these matters. The Independent Directors also met separately in an executive session with their legal counsel without any representatives of the Advisor present.
The Directors’ determinations at the meeting were made on the basis of each Director’s business judgment after consideration of all the information presented. In deciding to recommend the renewal of the Agreement with respect to each Series of the Fund, the Independent Directors did not identify any single or particular piece of information that, in isolation, was the controlling factor. Each Independent Director may also have weighed factors differently. This summary describes the most important, but not all, of the factors considered by the Board and the Independent Directors.
| • | The Board considered the nature and quality of services provided by the Advisor under the Agreement for over 30 years including, among others: deciding what securities to purchase and sell for each Series; arranging for the purchase and sale of such securities by placing orders with broker-dealers; administering the affairs of the Fund (including the books and records of the Fund not maintained by third party service providers such as the custodian or transfer agent); arranging for the insurance coverage for the Fund; and supervising the preparation of tax returns, SEC filings (including registration statements) and reports to shareholders for the Fund. The Board considered the numerous services performed by the Advisor and its affiliates beyond those stated in the Agreements. The Board also considered the Advisor’s personnel who perform services to the Fund, changes in senior or key personnel, the strength of the Advisor’s compliance infrastructure, policies and procedures relating to compliance with securities regulations, reputation, expertise and resources. The Board discussed the quality of these services with representatives from the Advisor and concluded that the Advisor was performing its services to the Fund required under the Agreement in a reasonable manner. |
| • | The Board considered the Advisor’s investments teams, including changes to the investment teams and investment team’s compensation during the past year, and the investment process. The Board considered the performance of each Series since its inception, as well as over multiple time periods including: one year, three year, five year, ten year, and current market cycle. A market cycle includes periods of both rising and falling markets. Returns for established benchmark indices for each Series were provided. In addition, the Board considered (and considers on a quarterly basis) a number of other factors relevant to performance at the meeting including: a peer group performance analysis consisting of Morningstar universes of mutual funds with similar investment objectives; the breadth of the Fund’s product offerings; and performance over reasonable time periods. The Board discussed with Representatives of the Advisor, short-term performance challenges in the Fund’s core strategies that have resulted in a downward trend in assets under management. After discussion, the Board concluded that notwithstanding the performance challenges of certain Series, the nature and quality of the investment management services provided by the Advisor to the Fund supported the renewal of the agreement. |
| • | The Board considered the fees and expenses of the various Series of the Fund. The Advisor presented the advisory fees and total expenses for each Series, including the advisory fee adjusted for any contractual expense waivers or reimbursements paid by the Advisor. The Advisor also presentedpro-forma information related to several management fee and overall expense reductions that were set to take effect in early 2019. These changes were approved by the Board in a prior meeting and by shareholders at a Shareholder Meeting in May 2018. |
| • | The Board considered whether the Advisor had achieved economies of scale with respect to its services to the Fund. The Board acknowledged the expense caps incorporated in the Fund’s current fee structure, which requires the Advisor to |
23
Real Estate Series
Renewal of Investment Advisory Agreement
(unaudited)
subsidize the expenses of the Series operating above their expense cap, noting that 27 Series of the Fund are currently receiving expense reimbursements from the Advisor. The Board concluded that the Fund would need to grow in assets before the Advisor would be able to achieve meaningful economies of scale. |
| • | The Advisor provided the Board with information comparing each Series’ contractual management fees with the Advisor’s standard advisory fees for separate accounts and collective investment trusts. The Board considered that the range of services provided to the Series is more extensive than for the Advisor’s other clients due to additional infrastructure, administrative and regulatory requirements related to operating a mutual fund. |
| • | The current andpro-forma advisory fees,12b-1 Distribution and Service Fees, other expenses (e.g. a combination of Shareholder Services Fees, intermediarysub-transfer agent fees, routine operating expenses and Acquired Fund Fees and Expenses forfund-of-fund Series) and total expense ratios of each Series and share class were compared and ranked (on both a mean and median basis) against respective peer universes. Respective peer universes included funds of a similar size and with similar investment objectives and expense characteristics as disclosed on the Morningstar database. Representatives of the Advisor discussed with the Board the comparisons and rankings of fees and net expense ratios for each Series of the Fund and the methodology behind the comparison. The Board considered the Advisor’s active portfolio management that results in portfolios that are more differentiated than the construction of their benchmarks. Based on their review of the information provided, the Board concluded that the current andpro-forma fees and expenses of each Series of the Fund were reasonable on a comparative basis. |
| • | The Board considered the costs of the Advisor’s services and the profits of the Advisor as they relate to the Advisor’s services to the Fund under the Agreement. The Board was provided with information on the Advisor’s financial condition and profitability by mutual fund agreement and by Series. Information provided by the Advisor addressed the anticipated effects of the upcoming fee reductions. The Board discussed the Advisor’s revenues generated from the Fund and its expenses associated with providing the services under the Agreement. The Advisor presented the Board with information on firm wide investment management profitability to provide a comparison of the Advisor’s profitability from its Fund activities relative to its profitability from its other investment management business. In addition, the Board reviewed the Advisor’s expense allocation methodology used to calculate profitability since many of the Advisor’s resources and expenses are shared across the Advisor’s various investment management vehicles. The Board considered the Advisor’s expenses associated with Fund activities outside of the Agreement (such as expense reimbursements pursuant to expense caps and payments made by the Advisor to third party platforms on which shares of the Fund are available for purchase). After discussing the above costs and profits, the Board concluded that the Advisor’s profitability relating to its services provided under the Agreement was reasonable. |
| • | The Board also considered the other benefits the Advisor derives from its relationship with the Fund. Such other benefits include participation in a joint insurance program, sharing of compensation expenses for certain shared personnel, relationships with large service providers, the utilization of Series within the Advisor’s separately managed accounts and certain research services provided by soft dollars. The Board reviewed the broker-dealers who provided research to the Advisor and the products and services paid for, in whole or in part, using soft dollar commissions. The Board concluded that these additional benefits to the Advisor were reasonable. |
Based on the Board’s deliberations and their evaluation of the information described above, the Board, including a majority of the Independent Directors, concluded that the compensation under the Agreement was fair and reasonable with respect to each Series in light of the services and expenses and such other matters as the Directors considered to be relevant in the exercise of their reasonable judgment, and that the renewal of the Agreement would be in the best interests of each Series and its shareholders. The Board did not indicate that any single factor was determinative of its decision to approve the Agreement, but indicated that the Board based its determination on the total mix of information available to it.
24
Real Estate Series
Directors’ and Officers’ Information
(unaudited)
The Statement of Additional Information provides additional information about the Fund’s directors and officers and can be obtained without charge by calling1-800-466-3863, at www.manning-napier.com, or on the EDGAR Database on the SEC Internet web site (http://www.sec.gov). The following chart shows certain information about the Fund’s directors and officers, including their principal occupations during the last five years. Unless specific dates are provided, the individuals have held the listed positions for longer than five years.
Interested Director and Officer
| Name: | Paul Battaglia* | |
| Address: | 290 Woodcliff Drive | |
| Fairport, NY 14450 | ||
| Age: | 40 | |
| Current Position(s) Held with Fund: | Principal Executive Officer, President, Chairman and Director | |
| Term of Office & Length of Time Served: | Indefinite – Chairman and Director since November 20181 | |
| Principal Occupation(s) During Past 5 Years: | Chief Financial Officer (2018 – Present); Vice President of Finance (2016 | |
| – 2018); Director of Finance (2011 – 2016); Financial Analyst/Internal | ||
| Auditor (2004-2006) – Manning & Napier Advisors, LLC and affiliates | ||
| Holds one or more of the following titles for various subsidiaries and | ||
| affiliates: Chief Financial Officer | ||
| Number of Portfolios Overseen within Fund Complex: | 34 | |
| Other Directorships Held Outside Fund Complex During | N/A | |
| Past 5 Years: | ||
| Independent Directors | ||
| Name: | Stephen B. Ashley | |
| Address: | 290 Woodcliff Drive | |
| Fairport, NY 14450 | ||
| Age: | 78 | |
| Current Position(s) Held with Fund: | Director, Audit Committee Member, Governance & Nominating Committee Member | |
| Term of Office & Length of Time Served: | Indefinite – Since 1996 | |
| Principal Occupation(s) During Past 5 Years: | Chairman, Director & Chief Executive Officer (1997 to present) - The Ashley Group (property management and investment). Director (1995-2008) and Chairman(non-executive) (2004-2008) - Fannie Mae (mortgage) | |
| Number of Portfolios Overseen within Fund Complex: | 34 | |
| Other Directorships Held Outside Fund Complex During | Fannie Mae (1995-2008) | |
| Past 5 Years: | The Ashley Group (1995-2008) | |
Genesee Corporation (1987-2007)
| ||
| Name: | Paul A. Brooke | |
| Address: | 290 Woodcliff Drive | |
| Fairport, NY 14450 | ||
| Age: | 73 | |
| Current Position(s) Held with Fund: | Lead Independent Director, Audit Committee Member, Governance & Nominating Committee Chairman | |
| Term of Office & Length of Time Served: | Indefinite – Director, Audit Committee Member, Governance & Nominating Committee Member since 2007; Governance & Nominating Committee Chairman since 2016; Lead Independent Director since 2017 | |
| Principal Occupation(s) During Past 5 Years: | Chairman & CEO (2005-2009) - Ithaka Acquisition Corporation (investments); Chairman (2007-2009) - Alsius Corporation (investments); Managing Member (1991-present) - PMSV Holdings LLC (investments); Managing Member (2010-2016) - Venbio (investments). | |
| Number of Portfolios Overseen within Fund Complex: | 34 | |
| Other Directorships Held Outside Fund Complex During Past 5 Years: | Incyte Corp. (biotech)(2000-present); ViroPharma, Inc. (speciality pharmaceuticals)(2000-2014); HLTH (WebMD)(information)(2000-2010); Cheyne Capital International (investment)(2000-2017); GMP Companies (investment)(2000-2011); Cytos Biotechnology Ltd (biotechnology)(2012-2014); Cerus (biomedical)(2016-present);PureEarth(non-profit)(2012-present); Caelum BioSciences (biomedical)(2018-present)
| |
25
Real Estate Series
Directors’ and Officers’ Information
(unaudited)
Independent Directors (continued)
| Name: | Peter L. Faber | |
| Address: | 290 Woodcliff Drive | |
| Fairport, NY 14450 | ||
| Age: | 80 | |
| Current Position(s) Held with Fund: | Director, Governance & Nominating Committee Member | |
| Term of Office & Length of Time Served: | Indefinite – Since 1987 | |
| Principal Occupation(s) During Past 5 Years: | Senior Counsel (2006-2012), Partner (1995-2006 & 2013-2018) - McDermott, Will & Emery LLP (law firm) | |
| Number of Portfolios Overseen within Fund Complex: | 34 | |
| Other Directorships Held Outside Fund Complex During Past 5 Years: | Boston Early Music Festival(non-profit)(2007-present); Amherst Early Music, Inc.(non-profit)(2009-present); Gotham Early Music Scene, Inc.(non-profit)(2009-present); Partnership for New York City, Inc.(non-profit)(1989-2010); New York Collegium(non-profit)(2004-2011); S’Cool Sounds, Inc.(non-profit)(2017-present) | |
| Name: | Harris H. Rusitzky | |
| Address: | 290 Woodcliff Drive | |
| Fairport, NY 14450 | ||
| Age: | 83 | |
| Current Position(s) Held with Fund: | Director, Audit Committee Member, Governance & Nominating Committee Member | |
| Term of Office & Length of Time Served: | Indefinite – Since 1985 | |
| Principal Occupation(s) During Past 5 Years: | President (1994- present) - The Greening Group (business consultants); | |
| Partner (2006-present) - The Restaurant Group (restaurants) | ||
| Number of Portfolios Overseen within Fund Complex: | 34 | |
| Other Directorships Held Outside Fund Complex During Past 5 Years: | Rochester Institute of Technology (university)(1972-present); Culinary Institute of America(non-profit college)(1985-present); George Eastman Museum (museum)(1988-present); National Restaurant Association (restaurant trade organization)(1978-present) | |
| Name: | Chester N. Watson | |
| Address: | 290 Woodcliff Drive | |
| Fairport, NY 14450 | ||
| Age: | 68 | |
| Current Position(s) Held with Fund: | Director, Audit Committee Chairman, Governance & Nominating Committee Member | |
| Term of Office & Length of Time Served: | Indefinite – Director, Audit Committee Member, Governance & Nominating Committee Member Since 2012; Audit Committee Chairman since 2013 | |
| Principal Occupation(s) During Past 5 Years: | General Auditor (2003-2011) - General Motors Company (auto manufacturer) | |
| Number of Portfolios Overseen within Fund Complex: | 34 | |
| Other Directorships Held Outside Fund Complex During Past 5 Years: | Rochester Institute of Technology (university)(2005-present); Town of Greenburgh, NY Planning Board (municipal government) (2015-2018) | |
| Officers: | ||
| Name: | Jeffrey S. Coons, Ph.D., CFA® | |
| Address: | 290 Woodcliff Drive | |
| Fairport, NY 14450 | ||
| Age: | 55 | |
| Current Position(s) Held with Fund: | Vice President | |
| Term of Office1& Length of Time Served: | Since 2004 | |
| Principal Occupation(s) During Past 5 Years: | President since 2010,Co-CEO since 2018,Co-Director of Research (2002 – 2015) - Manning & Napier Advisors, LLC Holds one or more of the following titles for various subsidiaries and affiliates: President, Director, Treasurer, or Senior Trust Officer | |
26
Real Estate Series
Directors’ and Officers’ Information
(unaudited)
Officers: (continued)
| Name: | Elizabeth Craig | |
| Address: | 290 Woodcliff Drive | |
| Fairport, NY 14450 | ||
| Age: | 31 | |
| Current Position(s) Held with Fund: | Corporate Secretary | |
| Term of Office1& Length of Time Served: | Since 2016 | |
| Principal Occupation(s) During Past 5 Years: | Fund Administration Manager since 2015; Mutual Fund Compliance Specialist (2009-2015) - Manning & Napier Advisors, LLC; Assistant Corporate Secretary (2011-2016) - Manning & Napier Fund, Inc. | |
| Name: | Christine Glavin | |
| Address: | 290 Woodcliff Drive | |
| Fairport, NY 14450 | ||
| Age: | 52 | |
| Current Position(s) Held with Fund: | Principal Financial Officer, Chief Financial Officer | |
| Term of Office1& Length of Time Served: | Principal Financial Officer since 2002; Chief Financial Officer since 2001 | |
| Principal Occupation(s) During Past 5 Years: | Director of Fund Reporting since 2011; Fund Reporting Manager (1997-2011) - Manning & Napier Advisors, LLC; Assistant Treasurer since 2008 - Exeter Trust Company; Chief Financial Officer (2017-2018) - Rainier Investment Management Mutual Funds, Inc. | |
| Name: | Jodi L. Hedberg | |
| Address: | 290 Woodcliff Drive | |
| Fairport, NY 14450 | ||
| Age: | 51 | |
| Current Position(s) Held with Fund: | Chief Compliance Officer, Anti-Money Laundering Compliance Officer | |
| Term of Office1& Length of Time Served: | Chief Compliance Officer since 2004; Anti-Money Laundering Officer since 2002; Corporate Secretary (1997-2016) - Manning & Napier Fund, Inc.; Chief Compliance Officer and Anti-Money Laundering Officer (2017-2018) – Rainier Investment Management Mutual Funds, Inc. | |
| Principal Occupation(s) During Past 5 Years: | Managing Director, Compliance & Regulatory Affairs since 2018; Director of Compliance (2005-2018); Compliance Manager (1995-2005) – Manning & Napier Advisors, LLC and affiliates; Corporate Secretary – Manning & Napier Investor Services, Inc. since 2006 | |
| Name: | Scott Morabito | |
| Address: | 290 Woodcliff Drive | |
| Fairport, NY 14450 | ||
| Age: | 31 | |
| Current Position(s) Held with Fund: | Assistant Vice President | |
| Term of Office1& Length of Time Served: | Since 2017 | |
| Principal Occupation(s) During Past 5 Years: | Director of Funds Group since 2017; Fund Product and Strategy Manager (2014-2017); Senior Product and Strategy Analyst (2013-2014); Product and Strategy Analyst (2011-2013) - Manning & Napier Advisors, LLC; President, Director – Manning & Napier Investor Services, Inc. since 2018 | |
| Name: | Sarah Turner | |
| Address: | 290 Woodcliff Drive | |
| Fairport, NY 14450 | ||
| Age: | 36 | |
| Current Position(s) Held with Fund: | Chief Legal Officer; Assistant Corporate Secretary | |
| Term of Office1& Length of Time Served: | Since 2018 | |
| Principal Occupation(s) During Past 5 Years: | General Counsel since 2018 - Manning & Napier Advisors, LLC and affiliates; Counsel (2017-2018) – Harter Secrest and Emery LLP; Legal Counsel (2010-2017) – Manning & Napier Advisors, LLC and affiliates Holds one or more of the following titles for various affiliates: Corporate Secretary, General Counsel
| |
27
Real Estate Series
Directors’ and Officers’ Information
(unaudited)
Officers: (continued)
| Name: | Amy Williams | |
| Address: | 290 Woodcliff Drive | |
| Fairport, NY 14450 | ||
| Age: | 57 | |
| Current Position(s) Held with Fund: | Assistant Corporate Secretary | |
| Term of Office1& Length of Time Served: | Since 2016 | |
| Principal Occupation(s) During Past 5 Years: | Director of Fund Documentation - Manning & Napier Advisors, LLC since 2009 Holds one or more of the following titles for various affiliates: Director |
*Interested Director, within the meaning of the 1940 Act by reason of her positions with the Fund’s investment advisor, Manning & Napier Advisors, LLC and Distributor, Manning & Napier Investor Services, Inc.
1 The term of office of all officers shall be one year and until their respective successors are chosen and qualified, or his or her earlier resignation or removal as provided in the
Fund’sBy-Laws.
28
{This page intentionally left blank}
29
Real Estate Series
Literature Requests
(unaudited)
Proxy Voting Policies and Procedures
A description of the policies and procedures that the Fund uses to determine how to vote proxies relating to portfolio securities is available, without charge, upon request:
| By phone | 1-800-466-3863 | |||
| On the Securities and Exchange | ||||
| Commission’s (SEC) web site | http://www.sec.gov |
Proxy Voting Record
Information regarding how the Fund voted proxies relating to portfolio securities during the most recent12-month period ended June 30th is available, without charge, upon request:
| By phone | 1-800-466-3863 | |||
| On the SEC’s web site | http://www.sec.gov |
Quarterly Portfolio Holdings
The Series’ complete schedule of portfolio holdings for the 1st and 3rd quarters of each fiscal year are provided on FormN-Q, and are available, without charge, upon request:
| By phone | 1-800-466-3863 | |||
| On the SEC’s web site | http://www.sec.gov |
Prospectus and Statement of Additional Information (SAI)
For more information about any of the Manning & Napier Fund, Inc. Series, you may obtain a prospectus and SAI at www.manning-napier.com or by calling (800)466-3863. Before investing, carefully consider the objectives, risks, charges and expenses of the investment and read the prospectus carefully as it contains this and other information about the investment company.In addition, this information can be found on the SEC’s web site, http://www.sec.gov.
Additional information available at www.manning-napier.com
1. Fund Holdings -Month-End
2. Fund Holdings -Quarter-End
3. Shareholder Report - Annual
4. Shareholder Report - Semi-Annual
The Fund also offers electronic notification or“e-delivery” when certain documents are availableon-line to be downloaded or reviewed. Direct shareholders can elect to receive electronic notification when shareholder reports, prospectus updates, and/or statements are available. If you do not currently haveon-line access to your account, you can establish access by going to www.manning-napier.com, click on “Login” in the top corner of the page, and follow the prompts to self-enroll. Once enrolled, you can set your electronic notification preferences by clicking on the Account Options tab located within the green toolbar and then selectE-Delivery Option. Should you have any questions on either how to establishon-line access or how to update your account settings, please contact Investor Services at1-800-466-3863.
The Manning & Napier Fund, Inc. is managed by Manning & Napier Advisors, LLC. Manning & Napier Investor Services, Inc., an affiliate of Manning & Napier Advisors, LLC, is the distributor of the Fund shares.
MNRES-12/18-AR

Manning & Napier Fund, Inc.
International Series
Beginning on February 25, 2021, as permitted by Securities and Exchange Commission regulations, paper copies of the Series’ annual and semi-annual shareholder reports will no longer be sent by mail, unless you specifically request paper copies of the reports from the Fund or from your financial intermediary, such as a broker-dealer or bank. Instead, the reports will be made available on a website, and you will be notified by mail each time a report is posted and provided with a website link to access the report.
If you already elected to receive shareholder reports electronically, you will not be affected by this change and you need not take any action. You may elect to receive shareholder reports and other communications from the Fund electronically by contacting your financial intermediary or, if you are a direct investor, by visiting www.manning-napier.com or calling1-800-466-3863.
You may elect to receive all future annual and semi-annual reports in paper free of charge. If you invest through a financial intermediary, you can contact your financial intermediary to request that you continue to receive paper copies of your shareholder reports. If you invest directly with the Fund, you can inform the Fund that you wish to continue receiving paper copies of your shareholder reports by visiting www.manning-napier.com or calling1-800-466-3863. Your election to receive reports in paper will apply to all funds held with your financial intermediary if you invest through a financial intermediary or all series of the Fund if you invest directly with the Fund. |
International Series
Management Discussion and Analysis
(unaudited)
Dear Shareholders:
The investment environment we witnessed over the past twelve months was far more volatile than in prior years. It resulted in a sharp drawdown in global equity markets during the fourth quarter of 2018.
For the fiscal year ending on December 31, 2018, US equities experienced negative returns, with the S&P 500 Total Return Index falling 4.38%. International equity performance was somewhat worse, with the MSCI ACWI ex USA Index returning negative 14.20%.
In fixed income, domestic investment-grade bond performance was essentially flat for the year, as measured by the Bloomberg Barclays U.S. Aggregate Bond Index, rising 0.01% as income generated over the period was offset by rising interest rates (when interest rates rise, bond prices fall).
We believe recent volatility, both at the beginning and end of last year, is reflective of what investors should expect going forward. While we do not believe we are immediately heading for a recession, we see recent developments within the US and abroad as an indication that we are entering a higher risk period for financial markets.
The US economy is likely approaching a period of peak growth. It continues to show signs of progressing toward the later stages of its economic and market cycle (typical characteristics of anend-of-cycle phase are an economic recession and financial market selloff).
As economic growth decelerates to more sustainable levels, we believe that investors are facing a growing risk of disappointment. At the same time, key global risks remain, including trade tensions, geopolitical uncertainty, and tightening monetary policy.
Considering the current economic and market backdrop, we believe investors should temper their performance expectations. The returns experienced over the latter half of the post-Global Financial Crisis bull market are unlikely to continue.
Additionally, given our cautious outlook, we are reviewing current and prospective investments for excessive risk exposures, and we have adjusted our positioning across many of our portfolios. Going forward, we will continue to follow our disciplines, focusing on flexibility and selectivity in today’s incredibly dynamic investment environment.
With this in mind, in the enclosed we discuss recent fund performance, highlight our positioning, and briefly provide our outlook amid the current investment environment.
We hope that you find this information helpful, and we look forward to working with you in the years ahead. Thank you for your continued confidence in Manning & Napier.
Sincerely,
Manning & Napier Advisors, LLC
The S&P 500 Index is an unmanaged, capitalization-weighted measure comprised of 500 leading U.S. companies to gauge U.S. large cap equities. The Index returns do not reflect any fees or expenses. The Index includes dividends, but not the reinvestment of dividends. Index returns provided by Bloomberg. S&P Dow Jones Indices LLC, a subsidiary of the McGraw Hill Financial, Inc., is the publisher of various index based data products and services and has licensed certain of its products and services for use by Manning & Napier. All such content Copyright© 2019 by S&P Dow Jones Indices LLC and/or its affiliates. All rights reserved. Neither S&P Dow Jones Indices LLC, Dow Jones Trademark Holdings LLC, their affiliates nor their third party licensors make any representation or warranty, express or implied, as to the ability of any index to accurately represent the asset class or market sector that it purports to represent and none of these parties shall have any liability for any errors, omissions, or interruptions of any index or the data included therein.
The MSCI EAFE Index (EAFE) is a free float-adjusted market capitalization index designed to measure large andmid-cap representation across 21 Developed Markets countries (excluding the U.S. and Canada). The Index returns do not reflect any fees or expenses. The Index is denominated in U.S. dollars. The Index returns are net of withholding taxes. They assume daily reinvestment of net dividends thus accounting for any applicable dividend taxation. Index returns provided by Interactive Data. The Bloomberg Barclays U.S. Aggregate Bond Index is an unmanaged, market-value weighted index of U.S. domestic investment-grade debt issues, including government, corporate, asset-backed, and mortgage-backed securities, with maturities of one year or more. Index returns do not reflect any fees or expenses. Index returns provided by Interactive Data.
1
International Series
Fund Commentary
(unaudited)
Investment Objective
To provide long-term growth by investing principally in common stock of companies located outside the US. The Series may include investments of any market capitalization in developed and emerging markets. In managing the Series, we implement a“top-down” approach by examining global economic, market, and industry specific trends to identify investment opportunities. Such“top-down” trends include but are not limited to those being created by economic change, government reform, and demographic shifts taking place around the world.
Performance Commentary
International equity markets experienced negative absolute returns during 2018. The MSCI ACWI ex USA index (ACWIxUS) returned negative 14.20%, and the MSCI EAFE index (EAFE) returned negative 13.79%. Performance varied dramatically during the year, with growth stocks outperforming during the first half of the year, along with developed markets, while value stocks and emerging markets performed best in the second half as markets broadly declined.
The International Series Class S returned negative 19.30% during the year (Class I shares returned negative 19.17%), underperforming its ACWIxUS benchmark on a relative basis. Stock selection, country and sector positioning all contributed to the Series’ underperformance relative to the ACWIxUS during the year. More specifically, investment themes tied to French reforms, Chinese education, oil hurdle rate, and copper hurdle rate were the largest detractors from relative performance. Investments in our global healthy lifestyle, Korean shipbuilders, weak peso, and weak pound themes made the largest contributions to relative performance.
During the year, we became increasingly concerned with the trajectory of global growth, and our view led to meaningful shifts in the portfolio across both sectors and regions. The Series substantially reduced its allocation to the Industrials and Financials sectors, and increased allocations to Consumer Staples, Energy, and Health Care. The Series has decreased its exposures to India, Argentina, and France, while increasing exposure to Japan and the United Kingdom.
While our outlook is not a call for an imminent recession or market downturn, we believe that the US is moving into late-cycle territory, with potential spillover effects on the global economy. Our increased concern for growth comes at a time when global risks are rising – including mounting trade tensions, China slowing more than expected, and greater political uncertainty both at home and abroad. Considering our revised outlook, we recommend an active approach to manage these ongoing risks.
Performance data quoted represents past performance and does not guarantee future results. The investment return and principal value of an investment will fluctuate, so that an investor’s shares, when redeemed, may be worth more or less than their original cost. Current performance may be higher or lower than that quoted; investors can obtain the most recentmonth-end performance at www.manning-napier.com or by calling (800)466-3863.
Please see the next page for additional performance information as of December 31, 2018.
The MSCI ACWI ex USA Index (ACWIxUS) is designed to measure large andmid-cap representation across 22 of 23 Developed Markets countries (excluding the U.S.) and 24 Emerging Markets countries. The Index returns do not reflect any fees or expenses. The Index is denominated in U.S. dollars. The Index returns are net of withholding taxes. They assume daily reinvestment of net dividends thus accounting for any applicable dividend taxation. Index returns provided by Bloomberg.
The MSCI EAFE Index (EAFE) is a free float-adjusted market capitalization index designed to measure large andmid-cap representation across 21 Developed Markets countries (excluding the U.S. and Canada). The Index returns do not reflect any fees or expenses. The Index is denominated in U.S. dollars. The Index returns are net of withholding taxes. They assume daily reinvestment of net dividends thus accounting for any applicable dividend taxation. Index returns provided by Interactive Data. All investments involve risks, including possible loss of principal. Funds whose investments are concentrated in foreign countries may be subject to fluctuating currency values, different accounting standards, and economic and political instability. The value of the Series may be affected by changes in exchange rates between foreign currencies and the U.S. dollar. Investments in emerging markets may be more volatile than investments in more developed markets.
2
International Series
Performance Update as of December 31, 2018
(unaudited)
AVERAGE ANNUAL TOTAL RETURNS AS OF DECEMBER 31, 2018 | ||||||
ONE YEAR1 | FIVE YEAR | TEN YEAR | ||||
Manning & Napier Fund, Inc. - International Series - Class S2 | -19.30% | -1.12% | 5.55% | |||
Manning & Napier Fund, Inc. - International Series - Class I2,3 | -19.17% | -0.87% | 5.74% | |||
MSCI ACWI ex USA Index (ACWIxUS)4 | -14.20% | 0.67% | 6.57% | |||
The following graph compares the value of a $10,000 investment in the Manning & Napier Fund, Inc. - International Series - Class S for the ten years ended December 31, 2018 to the MSCI ACWI ex USA Index (ACWIxUS).
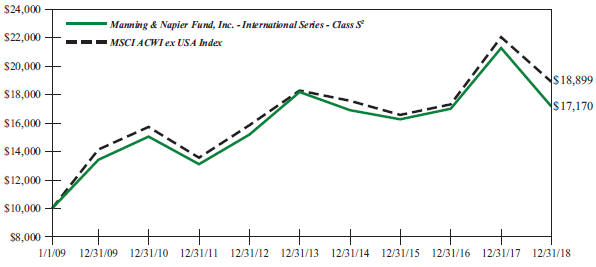
1The returns shown are based on net asset values calculated for shareholder transactions and may differ from the returns shown in the financial highlights, which reflect adjustments made to the net asset values in accordance with accounting principles generally accepted in the United States of America.
2The Series’ performance does not reflect the deduction of taxes that a shareholder would pay on fund distributions or the redemption of shares. The Series’ performance is historical and may not be indicative of future results. The performance returns shown are inclusive of the net expense ratio of the Series. For the year ended December 31, 2018, this net expense ratio was 1.10% for Class S and 0.85% for Class I. The gross expense ratio, which does not account for any voluntary or contractual waivers currently in effect, was 1.15% for Class S and 0.90% for Class I for the year ended December 31, 2018.
3For periods through March 15, 2012 (the inception date of the Class I shares), performance for the Class I shares is based on historical performance of the Class S shares. Because Class I shares invest in the same portfolio of securities as Class S, performance will only be different to the extent that the Class S shares have a higher expense ratio.
4The MSCI ACWI ex USA Index (ACWIxUS) is designed to measure large andmid-cap representation across 22 of 23 Developed Markets countries (excluding the U.S.) and 24 Emerging Markets countries. The Index returns do not reflect any fees or expenses. The Index is denominated in U.S. dollars. The Index returns are net of withholding taxes. They assume daily reinvestment of net dividends thus accounting for any applicable dividend taxation. Index returns provided by Bloomberg.
3
International Series
Shareholder Expense Example
(unaudited)
As a shareholder of the Series, you incur ongoing costs, including management fees, shareholder service fees and other Series expenses. This example is intended to help you understand your ongoing costs (in dollars) of investing in the Series and to compare these costs with the ongoing costs of investing in other mutual funds.
The example is based on an investment of $1,000 invested in each class at the beginning of the period and held for the entire period (July 1, 2018 to December 31, 2018).
Actual Expenses
The Actual lines of the table below provide information about actual account values and actual expenses. You may use the information in this line, together with the amount you invested, to estimate the expenses that you paid over the period. Simply divide your account value by $1,000 (for example, an $8,600 account value divided by $1,000 = 8.6), then multiply the result by the number in the Actual line for the Class in which you have invested under the heading entitled “Expenses Paid During Period” to estimate the expenses you paid on your account during this period.
Hypothetical Example for Comparison Purposes
The Hypothetical lines of each class in the table below provide information about hypothetical account values and hypothetical expenses based on the Class’ actual expense ratio and an assumed rate of return of 5% per year before expenses, which is not the Class’ actual return. The hypothetical account values and expenses may not be used to estimate the actual ending account balance or expenses you paid during the period. You may use this information to compare the ongoing costs of investing in a class of the Series and other funds. To do so, compare this 5% hypothetical example for the class in which you have invested with the 5% hypothetical examples that appear in the shareholder reports of the other funds.
Please note that the expenses shown in the table are meant to highlight your ongoing costs only and do not reflect any transaction costs, such as sales charges (loads), redemption fees, or exchange fees that you may incur in other mutual funds. Therefore, the second line of the table is useful in comparing ongoing costs only, and will not help you determine the relative total costs of owning different funds.
BEGINNING ACCOUNT VALUE 7/1/18 | ENDING ACCOUNT VALUE 12/31/18 | EXPENSES PAID DURING PERIOD* 7/1/18-12/31/18 |
ANNUALIZED EXPENSE RATIO
| |||||
Class S | ||||||||
Actual | $1,000.00 | $ 838.25 | $5.10 | 1.10% | ||||
Hypothetical (5% return before expenses) | $1,000.00 | $ 1,019.66 | $5.60 | 1.10% | ||||
Class I | ||||||||
Actual | $1,000.00 | $ 839.22 | $3.94 | 0.85% | ||||
Hypothetical (5% return before expenses) | $1,000.00 | $1,020.92 | $4.33 | 0.85% |
*Expenses are equal to each Class’ annualized expense ratio (for thesix-month period), multiplied by the average account value over the period, multiplied by 184/365 (to reflect theone-half year period). Expenses are based on the most recent fiscal half year; therefore, the expense ratios stated above may differ from the expense ratios stated in the financial highlights, which are based onone-year data. The Class’ total return would have been lower had certain expenses not been waived during the period.
4
International Series
Portfolio Composition as of December 31, 2018
(unaudited)
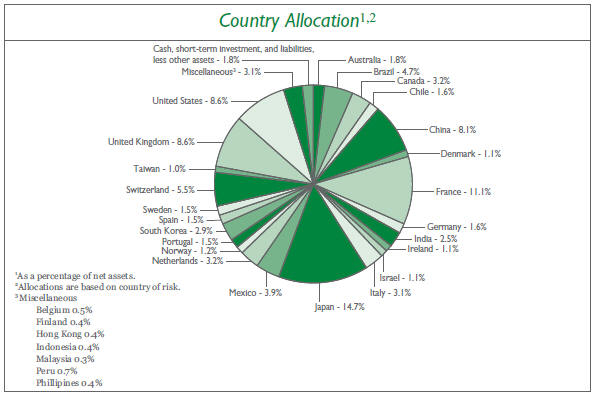
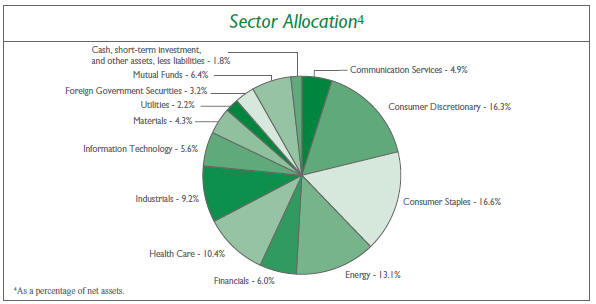
5
International Series
Investment Portfolio - December 31, 2018
| SHARES |
VALUE (NOTE 2) | |||||||
COMMON STOCKS - 88.6% | ||||||||
Communication Services - 4.9% | ||||||||
Diversified Telecommunication Services - 1.3% | ||||||||
Elisa OYJ (Finland) | 29,705 | $ | 1,230,361 | |||||
Orange S.A. (France) | 62,825 | 1,018,129 | ||||||
Telefonica Brasil S.A. (Brazil) | 101,500 | 1,210,693 | ||||||
Telekomunikasi Indonesia Persero Tbk PT (Indonesia) | 4,828,600 | 1,262,358 | ||||||
|
| |||||||
| 4,721,541 | ||||||||
|
| |||||||
Entertainment - 1.2% | ||||||||
NCSoft Corp. (South Korea) | 4,295 | 1,800,337 | ||||||
Toho Co. Ltd. - Tokyo (Japan) | 42,100 | 1,525,407 | ||||||
Vivendi S.A. (France) | 32,365 | 784,441 | ||||||
|
| |||||||
| 4,110,185 | ||||||||
|
| |||||||
Interactive Media & Services - 1.3% | ||||||||
Tencent Holdings Ltd. - Class H (China) | 110,200 | 4,416,855 | ||||||
|
| |||||||
Media - 1.1% | ||||||||
Hakuhodo DY Holdings, Inc. (Japan) | 78,200 | 1,115,948 | ||||||
Megacable Holdings S.A.B. de C.V. (Mexico) | 582,900 | 2,609,914 | ||||||
|
| |||||||
| 3,725,862 | ||||||||
|
| |||||||
Total Communication Services | 16,974,443 | |||||||
|
| |||||||
Consumer Discretionary - 16.3% | ||||||||
Auto Components - 0.9% | ||||||||
Bridgestone Corp. (Japan) | 30,600 | 1,173,994 | ||||||
Nemak S.A.B. de C.V. (Mexico)1 | 2,588,800 | 1,933,852 | ||||||
|
| |||||||
| 3,107,846 | ||||||||
|
| |||||||
Automobiles - 2.2% | ||||||||
Bajaj Auto Ltd. (India) | 31,090 | 1,210,172 | ||||||
Geely Automobile Holdings Ltd. (China) | 1,082,000 | 1,908,198 | ||||||
Isuzu Motors Ltd. (Japan) | 84,700 | 1,188,096 | ||||||
Peugeot S.A. (France) | 16,875 | 359,907 | ||||||
Renault S.A. (France) | 7,340 | 457,232 | ||||||
Suzuki Motor Corp. (Japan) | 47,400 | 2,389,502 | ||||||
|
| |||||||
| 7,513,107 | ||||||||
|
| |||||||
Diversified Consumer Services - 3.0% | ||||||||
China Maple Leaf Educational Systems Ltd. (China) | 3,122,000 | 1,390,221 | ||||||
China Yuhua Education Corp. Ltd. (China)1 | 4,508,000 | 1,827,178 | ||||||
Fu Shou Yuan International Group Ltd. (China) | 3,463,000 | 2,612,393 | ||||||
New Oriental Education & Technology Group, Inc. - ADR (China)* | 47,080 | 2,580,455 | ||||||
TAL Education Group - ADR (China)* | 42,355 | 1,130,031 | ||||||
Wisdom Education International Holdings Co. Ltd. (China) | 2,726,000 | 996,255 | ||||||
|
| |||||||
| 10,536,533 | ||||||||
|
| |||||||
The accompanying notes are an integral part of the financial statements.
6
International Series
Investment Portfolio - December 31, 2018
| SHARES |
VALUE (NOTE 2) | |||||||
COMMON STOCKS(continued) | ||||||||
Consumer Discretionary(continued) | ||||||||
Hotels, Restaurants & Leisure - 2.4% | ||||||||
Basic-Fit N.V. (Netherlands)*1 | 63,685 | $ | 1,894,100 | |||||
Compass Group plc (United Kingdom) | 58,695 | 1,235,227 | ||||||
Kangwon Land, Inc. (South Korea) | 47,580 | 1,362,131 | ||||||
Oriental Land Co. Ltd. (Japan) | 24,500 | 2,463,952 | ||||||
Sodexo S.A. (France) | 12,065 | 1,237,333 | ||||||
|
| |||||||
| 8,192,743 | ||||||||
|
| |||||||
Internet & Direct Marketing Retail - 0.5% | ||||||||
Alibaba Group Holding Ltd. - ADR (China)* | 11,885 | 1,629,077 | ||||||
|
| |||||||
Leisure Products - 2.4% | ||||||||
Bandai Namco Holdings, Inc. (Japan) | 74,500 | 3,344,994 | ||||||
Thule Group AB (Sweden)1 | 136,600 | 2,500,095 | ||||||
Yamaha Corp. (Japan) | 61,500 | 2,616,170 | ||||||
|
| |||||||
| 8,461,259 | ||||||||
|
| |||||||
Multiline Retail - 1.5% | ||||||||
El Puerto de Liverpool S.A.B. de C.V. (Mexico) | 388,470 | 2,494,289 | ||||||
Lojas Americanas S.A. (Brazil) | 117,200 | 595,714 | ||||||
Lojas Renner S.A. (Brazil) | 123,880 | 1,355,225 | ||||||
Magazine Luiza S.A. (Brazil) | 12,200 | 569,968 | ||||||
|
| |||||||
| 5,015,196 | ||||||||
|
| |||||||
Specialty Retail - 0.4% | ||||||||
Fast Retailing Co. Ltd. (Japan) | 2,600 | 1,327,927 | ||||||
|
| |||||||
Textiles, Apparel & Luxury Goods - 3.0% | ||||||||
ANTA Sports Products Ltd. (China) | 569,000 | 2,724,008 | ||||||
EssilorLuxottica S.A. (France) | 7,265 | 920,897 | ||||||
Hermes International (France) | 970 | 538,894 | ||||||
Kering S.A. (France) | 2,735 | 1,281,263 | ||||||
lululemon athletica, Inc. (United States)* | 20,500 | 2,493,005 | ||||||
LVMH Moet Hennessy Louis Vuitton SE (France) | 8,550 | 2,503,237 | ||||||
|
| |||||||
| 10,461,304 | ||||||||
|
| |||||||
Total Consumer Discretionary | 56,244,992 | |||||||
|
| |||||||
Consumer Staples - 16.6% | ||||||||
Beverages - 4.5% | ||||||||
Ambev S.A. (Brazil) | 439,300 | 1,743,258 | ||||||
Arca Continental S.A.B. de C.V. (Mexico) | 172,200 | 963,007 | ||||||
Coca-Cola European Partners plc (United Kingdom) | 37,510 | 1,719,834 | ||||||
Davide Campari-Milano S.p.A. (Italy) | 151,250 | 1,280,846 | ||||||
Diageo plc (United Kingdom) | 74,205 | 2,651,671 | ||||||
Fomento Economico Mexicano S.A.B. de C.V. (Mexico) | 199,900 | 1,718,885 | ||||||
Pernod Ricard S.A. (France) | 11,355 | 1,863,591 | ||||||
The accompanying notes are an integral part of the financial statements.
7
International Series
Investment Portfolio - December 31, 2018
| SHARES |
VALUE (NOTE 2) | |||||||
COMMON STOCKS(continued) | ||||||||
Consumer Staples(continued) | ||||||||
Beverages(continued) | ||||||||
Treasury Wine Estates Ltd. (Australia) | 339,400 | $ | 3,539,190 | |||||
|
| |||||||
| 15,480,282 | ||||||||
|
| |||||||
Food & Staples Retailing - 2.8% | ||||||||
Alimentation Couche-Tard, Inc. - Class B (Canada) | 36,870 | 1,834,048 | ||||||
Atacadao Distribuicao Comercio e Industria Ltda. (Brazil) | 140,700 | 656,715 | ||||||
Koninklijke Ahold Delhaize N.V. (Netherlands) | 70,765 | 1,787,681 | ||||||
Matsumotokiyoshi Holdings Co. Ltd. (Japan) | 50,200 | 1,543,488 | ||||||
Metro, Inc. (Canada) | 38,020 | 1,318,391 | ||||||
Wal-Mart de Mexico S.A.B. de C.V. (Mexico) | 1,026,935 | 2,611,788 | ||||||
|
| |||||||
| 9,752,111 | ||||||||
|
| |||||||
Food Products - 5.6% | ||||||||
Chocoladefabriken Lindt & Spruengli AG (Switzerland) | 412 | 2,560,114 | ||||||
Danone S.A. (France) | 21,305 | 1,501,634 | ||||||
Grupo Bimbo S.A.B. de C.V. - Series A (Mexico) | 508,580 | 1,014,482 | ||||||
Kerry Group plc - Class A (Ireland) | 39,035 | 3,835,116 | ||||||
Kikkoman Corp. (Japan) | 46,700 | 2,499,130 | ||||||
Nestle S.A. (Switzerland) | 67,240 | 5,457,386 | ||||||
Yakult Honsha Co. Ltd. (Japan) | 34,800 | 2,436,130 | ||||||
|
| |||||||
| 19,303,992 | ||||||||
|
| |||||||
Household Products - 1.1% | ||||||||
Lion Corp. (Japan) | 96,700 | 1,998,549 | ||||||
Unicharm Corp. (Japan) | 61,400 | 1,985,797 | ||||||
|
| |||||||
| 3,984,346 | ||||||||
|
| |||||||
Personal Products - 2.2% | ||||||||
L’Oreal S.A. (France) | 12,480 | 2,855,731 | ||||||
TCI Co. Ltd. (Taiwan) | 130,000 | 2,187,546 | ||||||
Unilever plc - ADR (United Kingdom) | 49,860 | 2,605,185 | ||||||
|
| |||||||
| 7,648,462 | ||||||||
|
| |||||||
Tobacco - 0.4% | ||||||||
KT&G Corp. (South Korea)* | 15,395 | 1,401,662 | ||||||
|
| |||||||
Total Consumer Staples | 57,570,855 | |||||||
|
| |||||||
Energy - 13.1% | ||||||||
Energy Equipment & Services - 0.5% | ||||||||
Core Laboratories N.V. (United States) | 28,365 | 1,692,256 | ||||||
|
| |||||||
Oil, Gas & Consumable Fuels - 12.6% | ||||||||
China Petroleum & Chemical Corp. - Class H (China) | 5,534,000 | 3,944,691 | ||||||
Eni S.p.A. (Italy) | 271,930 | 4,295,738 | ||||||
Galp Energia SGPS S.A. (Portugal) | 330,590 | 5,205,419 | ||||||
Repsol S.A. - Rights (Expires 1/9/2019) (Spain)* | 313,390 | 143,627 | ||||||
The accompanying notes are an integral part of the financial statements.
8
International Series
Investment Portfolio - December 31, 2018
| SHARES |
VALUE (NOTE 2) | |||||||
COMMON STOCKS(continued) | ||||||||
Energy(continued) | ||||||||
Oil, Gas & Consumable Fuels(continued) | ||||||||
Repsol S.A. (Spain) | 313,390 | $ | 5,038,394 | |||||
Royal Dutch Shell plc - Class B - ADR (Netherlands) | 101,960 | 6,111,482 | ||||||
Statoil ASA (Norway) | 201,150 | 4,266,822 | ||||||
Suncor Energy, Inc. (Canada) | 152,810 | 4,267,979 | ||||||
TOTAL S.A. (France) | 98,140 | 5,176,411 | ||||||
Vermilion Energy, Inc. (Canada) | 118,040 | 2,486,691 | ||||||
Woodside Petroleum Ltd. (Australia) | 121,800 | 2,682,936 | ||||||
|
| |||||||
| 43,620,190 | ||||||||
|
| |||||||
Total Energy | 45,312,446 | |||||||
|
| |||||||
Financials - 6.0% | ||||||||
Banks - 4.3% | ||||||||
Banco Bradesco S.A. (Brazil) | 202,600 | 2,020,381 | ||||||
Banco do Brasil S.A. (Brazil) | 80,900 | 970,404 | ||||||
Banco Santander Brasil S.A. (Brazil) | 79,200 | 872,564 | ||||||
BNP Paribas S.A. (France) | 37,180 | 1,679,078 | ||||||
Credit Agricole S.A. (France) | 41,725 | 449,063 | ||||||
FinecoBank Banca Fineco S.p.A. (Italy) | 127,735 | 1,285,198 | ||||||
Intesa Sanpaolo S.p.A. (Italy) | 587,015 | 1,307,062 | ||||||
Itau Unibanco Holding S.A. (Brazil) | 211,500 | 1,937,238 | ||||||
Itausa - Investimentos Itau S.A. (Brazil) | 311,200 | 969,953 | ||||||
Mediobanca Banca di Credito Finanziario S.p.A. (Italy) | 157,850 | 1,335,640 | ||||||
Societe Generale S.A. (France) | 23,735 | 752,508 | ||||||
UniCredit S.p.A. (Italy) | 105,718 | 1,197,459 | ||||||
|
| |||||||
| 14,776,548 | ||||||||
|
| |||||||
Capital Markets - 0.7% | ||||||||
B3 S.A. - Brasil Bolsa Balcao (Brazil) | 135,000 | 933,845 | ||||||
Japan Exchange Group, Inc. (Japan) | 103,000 | 1,661,379 | ||||||
|
| |||||||
| 2,595,224 | ||||||||
|
| |||||||
Insurance - 1.0% | ||||||||
Admiral Group plc (United Kingdom) | 52,915 | 1,380,747 | ||||||
AXA S.A. (France) | 66,780 | 1,441,241 | ||||||
BB Seguridade Participacoes S.A. (Brazil) | 93,800 | 667,727 | ||||||
|
| |||||||
| 3,489,715 | ||||||||
|
| |||||||
Total Financials | 20,861,487 | |||||||
|
| |||||||
Health Care - 10.4% | ||||||||
Health Care Equipment & Supplies - 3.8% | ||||||||
Coloplast A/S - Class B (Denmark) | 28,865 | 2,684,895 | ||||||
Hoya Corp. (Japan) | 30,100 | 1,815,031 | ||||||
Medtronic plc (United States) | 19,515 | 1,775,084 | ||||||
Smith & Nephew plc (United Kingdom) | 142,500 | 2,667,410 | ||||||
The accompanying notes are an integral part of the financial statements.
9
International Series
Investment Portfolio - December 31, 2018
| SHARES |
VALUE (NOTE 2) | |||||||
COMMON STOCKS(continued) | ||||||||
Health Care(continued) | ||||||||
Health Care Equipment & Supplies(continued) | ||||||||
STERIS plc (United States) | 16,035 | $ | 1,713,340 | |||||
Terumo Corp. (Japan) | 45,100 | 2,543,871 | ||||||
|
| |||||||
| 13,199,631 | ||||||||
|
| |||||||
Life Sciences Tools & Services - 0.3% | ||||||||
Tecan Group AG (Switzerland) | 4,470 | 870,023 | ||||||
|
| |||||||
Pharmaceuticals - 6.3% | ||||||||
Chugai Pharmaceutical Co. Ltd. (Japan) | 44,500 | 2,580,966 | ||||||
Eisai Co. Ltd. (Japan) | 20,700 | 1,602,591 | ||||||
Merck KGaA (Germany) | 16,415 | 1,689,640 | ||||||
Novartis AG (Switzerland) | 53,455 | 4,578,114 | ||||||
Novo Nordisk A/S - Class B (Denmark) | 26,600 | 1,221,660 | ||||||
Roche Holding AG (Switzerland) | 16,795 | 4,169,508 | ||||||
Sanofi (France) | 36,320 | 3,150,760 | ||||||
Santen Pharmaceutical Co. Ltd. (Japan) | 79,800 | 1,151,375 | ||||||
UCB S.A. (Belgium) | 21,055 | 1,719,703 | ||||||
|
| |||||||
| 21,864,317 | ||||||||
|
| |||||||
Total Health Care | 35,933,971 | |||||||
|
| |||||||
Industrials - 9.2% | ||||||||
Aerospace & Defense - 2.1% | ||||||||
Airbus S.E. (France) | 19,390 | 1,848,641 | ||||||
CAE, Inc. (Canada) | 66,170 | 1,216,090 | ||||||
Elbit Systems Ltd. (Israel) | 9,970 | 1,144,439 | ||||||
MTU Aero Engines AG (Germany) | 6,775 | 1,230,352 | ||||||
Safran S.A. (France) | 11,135 | 1,335,478 | ||||||
Thales S.A. (France) | 3,110 | 363,426 | ||||||
|
| |||||||
| 7,138,426 | ||||||||
|
| |||||||
Building Products - 0.1% | ||||||||
Cie de Saint-Gobain (France) | 15,210 | 504,919 | ||||||
|
| |||||||
Commercial Services & Supplies - 0.4% | ||||||||
Secom Co. Ltd. (Japan) | 16,300 | 1,352,094 | ||||||
|
| |||||||
Construction & Engineering - 0.4% | ||||||||
Vinci S.A. (France) | 17,695 | 1,455,097 | ||||||
|
| |||||||
Electrical Equipment - 0.4% | ||||||||
Schneider Electric S.E. (France) | 19,420 | 1,317,284 | ||||||
|
| |||||||
Industrial Conglomerates - 1.1% | ||||||||
Jardine Matheson Holdings Ltd. (Hong Kong) | 18,225 | 1,268,984 | ||||||
Siemens AG (Germany) | 23,680 | 2,642,729 | ||||||
|
| |||||||
| 3,911,713 | ||||||||
|
| |||||||
The accompanying notes are an integral part of the financial statements.
10
International Series
Investment Portfolio - December 31, 2018
| SHARES |
VALUE (NOTE 2) | |||||||
COMMON STOCKS(continued) | ||||||||
Industrials(continued) | ||||||||
Machinery - 2.7% | ||||||||
FANUC Corp. (Japan) | 10,640 | $ | 1,614,723 | |||||
Hyundai Heavy Industries Co. Ltd. (South Korea)* | 16,850 | 1,943,487 | ||||||
Hyundai Mipo Dockyard Co. Ltd. (South Korea)* | 44,930 | 2,421,835 | ||||||
Samsung Heavy Industries Co. Ltd. (South Korea)* | 149,865 | 997,524 | ||||||
WEG S.A. (Brazil) | 116,200 | 525,872 | ||||||
The Weir Group plc (United Kingdom) | 108,805 | 1,801,730 | ||||||
|
| |||||||
| 9,305,171 | ||||||||
|
| |||||||
Professional Services - 1.5% | ||||||||
Experian plc (United Kingdom) | 59,160 | 1,434,153 | ||||||
Recruit Holdings Co. Ltd. (Japan) | 46,500 | 1,123,381 | ||||||
RELX plc (United Kingdom) | 59,570 | 1,228,357 | ||||||
Wolters Kluwer N.V. (Netherlands) | 23,870 | 1,403,729 | ||||||
|
| |||||||
| 5,189,620 | ||||||||
|
| |||||||
Trading Companies & Distributors - 0.5% | ||||||||
Kanamoto Co. Ltd. (Japan) | 60,200 | 1,585,667 | ||||||
|
| |||||||
Total Industrials | 31,759,991 | |||||||
|
| |||||||
Information Technology - 5.6% | ||||||||
Electronic Equipment, Instruments & Components - 2.8% | ||||||||
Delta Electronics, Inc. (Taiwan) | 289,000 | 1,216,350 | ||||||
Halma plc (United Kingdom) | 124,780 | 2,173,721 | ||||||
Hexagon A.B. - Class B (Sweden) | 58,115 | 2,686,514 | ||||||
Keyence Corp. (Japan) | 6,918 | 3,496,675 | ||||||
|
| |||||||
| 9,573,260 | ||||||||
|
| |||||||
IT Services - 1.9% | ||||||||
Capgemini SE (France) | 4,920 | 489,369 | ||||||
HCL Technologies Ltd. (India) | 92,125 | 1,273,017 | ||||||
Infosys Ltd. (India) | 204,875 | 1,935,726 | ||||||
Tata Consultancy Services Ltd. (India) | 50,610 | 1,372,283 | ||||||
Wipro Ltd. (India) | 320,100 | 1,514,823 | ||||||
|
| |||||||
| 6,585,218 | ||||||||
|
| |||||||
Software - 0.9% | ||||||||
Check Point Software Technologies Ltd. (Israel)* | 24,485 | 2,513,385 | ||||||
Dassault Systemes S.E. (France) | 4,580 | 544,012 | ||||||
|
| |||||||
| 3,057,397 | ||||||||
|
| |||||||
Total Information Technology | 19,215,875 | |||||||
|
| |||||||
Materials - 4.3% | ||||||||
Chemicals - 2.0% | ||||||||
Air Liquide S.A. (France) | 14,380 | 1,785,648 | ||||||
Givaudan S.A. (Switzerland) | 585 | 1,356,422 | ||||||
The accompanying notes are an integral part of the financial statements.
11
International Series
Investment Portfolio - December 31, 2018
| SHARES |
VALUE (NOTE 2) | |||||||
COMMON STOCKS(continued) | ||||||||
Materials(continued) | ||||||||
Chemicals(continued) | ||||||||
Nissan Chemical Corp. (Japan) | 49,700 | $ | 2,593,492 | |||||
UPL Ltd. (India) | 116,465 | 1,264,113 | ||||||
|
| |||||||
| 6,999,675 | ||||||||
|
| |||||||
Metals & Mining - 2.3% | ||||||||
Antofagasta plc (Chile) | 358,020 | 3,580,744 | ||||||
Lundin Mining Corp. (Chile) | 435,585 | 1,799,516 | ||||||
Southern Copper Corp. (Peru) | 76,260 | 2,346,520 | ||||||
|
| |||||||
| 7,726,780 | ||||||||
|
| |||||||
Total Materials | 14,726,455 | |||||||
|
| |||||||
Utilities - 2.2% | ||||||||
Electric Utilities - 0.4% | ||||||||
Manila Electric Co. (Philippines) | 169,050 | 1,221,676 | ||||||
|
| |||||||
Gas Utilities - 0.4% | ||||||||
Petronas Gas Bhd (Malaysia) | 263,200 | 1,222,825 | ||||||
|
| |||||||
Independent Power and Renewable Electricity Producers - 0.4% | ||||||||
Engie Brasil Energia S.A. (Brazil) | 154,900 | 1,319,692 | ||||||
|
| |||||||
Multi-Utilities - 0.2% | ||||||||
Engie S.A. (France) | 57,155 | 821,200 | ||||||
|
| |||||||
Water Utilities - 0.8% | ||||||||
Guangdong Investment Ltd. (China) | 1,498,000 | 2,894,406 | ||||||
|
| |||||||
Total Utilities | 7,479,799 | |||||||
|
| |||||||
TOTAL COMMON STOCKS | ||||||||
(Identified Cost $324,527,841) | 306,080,314 | |||||||
|
| |||||||
FOREIGN GOVERNMENT SECURITIES - 3.2% | ||||||||
United Kingdom Treasury Bill2, 0.57%, 1/28/2019 | ||||||||
(Identified Cost $11,213,629) | 8,610,000 | 10,968,839 | ||||||
|
| |||||||
MUTUAL FUNDS - 6.4% | ||||||||
iShares FTSE 250 UCITS ETF (United States) | 311,360 | 6,627,660 | ||||||
iShares MSCI Europe Financials ETF (United States) | 500,965 | 8,491,357 | ||||||
iShares MSCI Thailand ETF (United States) | 84,796 | 7,021,957 | ||||||
|
| |||||||
TOTAL MUTUAL FUNDS | ||||||||
(Identified Cost $24,042,344) | 22,140,974 | |||||||
|
| |||||||
The accompanying notes are an integral part of the financial statements.
12
International Series
Investment Portfolio - December 31, 2018
| SHARES |
VALUE (NOTE 2) | |||||||
SHORT-TERM INVESTMENT - 1.6% | ||||||||
Dreyfus Government Cash Management, Institutional Shares, 2.29%3, | ||||||||
(Identified Cost $ 5,528,842) | 5,528,842 | $ | 5,528,842 | |||||
|
| |||||||
TOTAL INVESTMENTS - 99.8% | ||||||||
(Identified Cost $ 365,312,656) | 344,718,969 | |||||||
OTHER ASSETS, LESS LIABILITIES - 0.2% | 851,351 | |||||||
|
| |||||||
NET ASSETS - 100% | $ | 345,570,320 | ||||||
|
| |||||||
ADR - American Depositary Receipt
ETF - Exchange Traded Fund
*Non-income producing security.
1Restricted securities - Investment in securities that are restricted as to public resale under the Securities Act of 1933, as amended. These securities have been sold under Rule 144A and have been determined to be liquid under guidelines established by the Board of Directors. These securities amount to $8,155,225 or 2.4% of the Series’ net assets as of December 31, 2018 (See Note 2 to the financial statements).
2Represents the annualized yield at time of purchase.
3Rate shown is the current yield as of December 31, 2018.
The Series’ portfolio holds, as a percentage of net assets, greater than 10% in the following countries (based on country of risk): Japan 14.7%; France 11.1%.
The Global Industry Classification Standard (GICS) was developed by and is the exclusive property and a service mark of MSCI Inc. (MSCI) and Standard & Poor’s, a division of The McGraw-Hill Companies, Inc. (S&P), and is licensed for use by Manning & Napier when referencing GICS sectors. Neither MSCI, S&P, nor any third party involved in making or compiling the GICS or any GICS classifications makes any express or implied warranties or representations with respect to such standard or classification, nor shall any such party have any liability therefrom.
The accompanying notes are an integral part of the financial statements.
13
International Series
Statement of Assets & Liabilities
December 31, 2018
ASSETS: | ||||
Investments, at value (identified cost $365,312,656) (Note 2) | $ | 344,718,969 | ||
Foreign tax reclaims receivable | 844,236 | |||
Dividends receivable | 490,485 | |||
Receivable for fund shares sold | 375,077 | |||
Prepaid and other expenses | 12,266 | |||
|
| |||
TOTAL ASSETS | 346,441,033 | |||
|
| |||
LIABILITIES: | ||||
Accrued management fees (Note 3) | 245,527 | |||
Accrued custodian fees (Note 3) | 119,110 | |||
Accrued shareholder services fees (Class S) (Note 3) | 64,672 | |||
Accrued fund accounting and administration fees (Note 3) | 23,987 | |||
Accrued Chief Compliance Officer service fees (Note 3) | 427 | |||
Accrued foreign capital gains tax (Note 2) | 21,769 | |||
Payable for fund shares repurchased | 340,172 | |||
Other payables and accrued expenses | 55,049 | |||
|
| |||
TOTAL LIABILITIES | 870,713 | |||
|
| |||
TOTAL NET ASSETS | $ | 345,570,320 | ||
|
| |||
NET ASSETS CONSIST OF: | ||||
Capital stock | $ | 500,145 | ||
Additionalpaid-in-capital | 385,847,717 | |||
Total distributable earnings (loss) | (40,777,542 | ) | ||
|
| |||
TOTAL NET ASSETS | $ | 345,570,320 | ||
|
| |||
NET ASSET VALUE, OFFERING PRICE AND REDEMPTION PRICE PER SHARE - Class S | ||||
($299,695,832/ 44,764,051 shares) | $ | 6.70 | ||
|
| |||
NET ASSET VALUE, OFFERING PRICE AND REDEMPTION PRICE PER SHARE - Class I | ||||
($45,874,488/ 5,250,432 shares) | $ | 8.74 | ||
|
| |||
The accompanying notes are an integral part of the financial statements.
14
International Series
Statement of Operations
For the Year Ended December 31, 2018
INVESTMENT INCOME: | ||||
Dividends (net of foreign taxes withheld, $1,234,993) | $ | 11,221,194 | ||
Interest | 8,532 | |||
|
| |||
Total Investment Income | 11,229,726 | |||
|
| |||
EXPENSES: | ||||
Management fees (Note 3) | 3,476,490 | |||
Shareholder services fees (Class S) (Note 3) | 1,009,312 | |||
Fund accounting and administration fees (Note 3) | 98,114 | |||
Directors’ fees (Note 3) | 38,127 | |||
Chief Compliance Officer service fees (Note 3) | 4,634 | |||
Custodian fees | 234,267 | |||
Miscellaneous | 331,206 | |||
|
| |||
Total Expenses | 5,192,150 | |||
Less reduction of expenses (Note 3) | (242,816 | ) | ||
|
| |||
Net Expenses | 4,949,334 | |||
|
| |||
NET INVESTMENT INCOME | 6,280,392 | |||
|
| |||
REALIZED AND UNREALIZED GAIN (LOSS) ON INVESTMENTS AND FOREIGN CURRENCY: | ||||
Net realized gain (loss) on- | ||||
Investments (net of foreign capital gains tax of $173,554) | 5,461,953 | |||
Foreign currency and translation of other assets and liabilities | (682,869 | ) | ||
|
| |||
| 4,779,084 | ||||
|
| |||
Net change in unrealized appreciation (depreciation) on- | ||||
Investments (net of increase in accrued foreign capital gains tax of $1,117,356) | (97,988,323 | ) | ||
Foreign currency and translation of other assets and liabilities | (35,531 | ) | ||
|
| |||
| (98,023,854 | ) | |||
|
| |||
NET REALIZED AND UNREALIZED GAIN (LOSS) ON INVESTMENTS AND FOREIGN CURRENCY | (93,244,770 | ) | ||
|
| |||
NET DECREASE IN NET ASSETS RESULTING FROM OPERATIONS | $ | (86,964,378 | ) | |
|
| |||
The accompanying notes are an integral part of the financial statements.
15
International Series
Statements of Changes in Net Assets
FOR THE YEAR ENDED 12/31/18 | FOR THE YEAR ENDED 12/31/17 | |||||||
INCREASE (DECREASE) IN NET ASSETS: | ||||||||
OPERATIONS: | ||||||||
Net investment income | $ | 6,280,392 | $ | 3,288,964 | ||||
Net realized gain (loss) on investments and foreign currency | 4,779,084 | 35,881,834 | ||||||
Net change in unrealized appreciation (depreciation) on investments and foreign currency | (98,023,854 | ) | 76,809,993 | |||||
|
|
|
| |||||
Net increase (decrease) from operations | (86,964,378 | ) | 115,980,791 | |||||
|
|
|
| |||||
DISTRIBUTIONS TO SHAREHOLDERS (Note 9): | ||||||||
Class S | (37,801,984 | ) | (12,479,461 | ) | ||||
Class I | (4,669,055 | ) | (1,545,474 | ) | ||||
|
|
|
| |||||
Total distributions to shareholders | (42,471,039 | ) | (14,024,935 | )1 | ||||
|
|
|
| |||||
CAPITAL STOCK ISSUED AND REPURCHASED: | ||||||||
Net decrease from capital share transactions (Note 5) | (72,040,980 | ) | (29,348,236 | ) | ||||
|
|
|
| |||||
Net increase (decrease) in net assets | (201,476,397 | ) | 72,607,620 | |||||
NET ASSETS: | ||||||||
Beginning of year | 547,046,717 | 474,439,097 | ||||||
|
|
|
| |||||
End of year2 | $ | 345,570,320 | $ | 547,046,717 | ||||
|
|
|
| |||||
1 For the year ended December 31, 2017, the distributions to shareholder from net investment income and net realized gain were $2,304,209 and $10,175,252 (Class S), $390,614 and $1,154,860 (Class I), respectively.
2 Includes accumulated undistributed (overdistributed) net investment income of $6,897 as of December 31, 2017. The SEC eliminated the requirement to disclose undistributed net investment income in 2018.
The accompanying notes are an integral part of the financial statements.
16
International Series
Financial Highlights - Class S
| FOR THE YEAR ENDED | ||||||||||||||||||||
| 12/31/18 | 12/31/17 | 12/31/16 | 12/31/15 | 12/31/14 | ||||||||||||||||
Per share data (for a share outstanding throughout each year): | ||||||||||||||||||||
Net asset value - Beginning of year | $9.39 | $7.71 | $7.43 | $8.10 | $9.91 | |||||||||||||||
|
|
|
|
|
|
|
|
|
| |||||||||||
Income (loss) from investment operations: | ||||||||||||||||||||
Net investment income1 | 0.12 | 0.05 | 0.05 | 0.08 | 0.12 | |||||||||||||||
Net realized and unrealized gain (loss) on investments | (1.90 | ) | 1.88 | 0.29 | (0.39 | ) | (0.84 | ) | ||||||||||||
|
|
|
|
|
|
|
|
|
| |||||||||||
Total from investment operations | (1.78 | ) | 1.93 | 0.34 | (0.31 | ) | (0.72 | ) | ||||||||||||
|
|
|
|
|
|
|
|
|
| |||||||||||
Less distributions to shareholders: | ||||||||||||||||||||
From net investment income | (0.11 | ) | (0.05 | ) | (0.06 | ) | (0.07 | ) | (0.12 | ) | ||||||||||
From net realized gain on investments | (0.80 | ) | (0.20 | ) | — | (0.29 | ) | (0.97 | ) | |||||||||||
|
|
|
|
|
|
|
|
|
| |||||||||||
Total distributions to shareholders | (0.91 | ) | (0.25 | ) | (0.06 | ) | (0.36 | ) | (1.09 | ) | ||||||||||
|
|
|
|
|
|
|
|
|
| |||||||||||
Net asset value - End of year | $6.70 | $9.39 | $7.71 | $7.43 | $8.10 | |||||||||||||||
|
|
|
|
|
|
|
|
|
| |||||||||||
Net assets - End of year(000’s omitted) | $ | 299,696 | $ | 478,178 | $ | 411,927 | $ | 377,770 | $ | 490,833 | ||||||||||
|
|
|
|
|
|
|
|
|
| |||||||||||
Total return2 | (19.30% | ) | 25.13% | 4.55% | (3.72% | ) | (7.03% | ) | ||||||||||||
Ratios (to average net assets)/Supplemental Data: | ||||||||||||||||||||
Expenses* | 1.10% | 1.10% | 1.10% | 1.10% | 1.10% | |||||||||||||||
Net investment income | 1.33% | 0.59% | 0.65% | 0.96% | 1.20% | |||||||||||||||
Portfolio turnover | 129% | 125% | 47% | 33% | 22% | |||||||||||||||
| *The investment advisor did not impose all or a portion of its management and/or other fees, and in some periods may have paid a portion of the Series’ expenses. If these expenses had been incurred by the Class, the expense ratio (to average net assets) would have increased by the following amounts: |
| |||||||||||||||||||
| 0.05% | 0.05% | 0.05% | 0.03% | 0.04% | ||||||||||||||||
1Calculated based on average shares outstanding during the years.
2Represents aggregate total return for the year indicated, and assumes reinvestment of all distributions. Total return would have been lower had certain expenses not been waived or reimbursed.
The accompanying notes are an integral part of the financial statements.
17
International Series
Financial Highlights - Class I
| FOR THE YEAR ENDED | ||||||||||||||||||||
| 12/31/18 | 12/31/17 | 12/31/16 | 12/31/15 | 12/31/14 | ||||||||||||||||
Per share data (for a share outstanding throughout each year): | ||||||||||||||||||||
Net asset value - Beginning of year | $11.93 | $9.73 | $9.35 | $10.10 | $12.05 | |||||||||||||||
|
|
|
|
|
|
|
|
|
| |||||||||||
Income (loss) from investment operations: | ||||||||||||||||||||
Net investment income1 | 0.18 | 0.09 | 0.11 | 0.12 | 0.17 | |||||||||||||||
Net realized and unrealized gain (loss) on investments | (2.43 | ) | 2.38 | 0.35 | (0.49 | ) | (1.00 | ) | ||||||||||||
|
|
|
|
|
|
|
|
|
| |||||||||||
Total from investment operations | (2.25 | ) | 2.47 | 0.46 | (0.37 | ) | (0.83 | ) | ||||||||||||
|
|
|
|
|
|
|
|
|
| |||||||||||
Less distributions to shareholders: | ||||||||||||||||||||
From net investment income | (0.14 | ) | (0.07 | ) | (0.08 | ) | (0.09 | ) | (0.15 | ) | ||||||||||
From net realized gain on investments | (0.80 | ) | (0.20 | ) | — | (0.29 | ) | (0.97 | ) | |||||||||||
|
|
|
|
|
|
|
|
|
| |||||||||||
Total distributions to shareholders | (0.94 | ) | (0.27 | ) | (0.08 | ) | (0.38 | ) | (1.12 | ) | ||||||||||
|
|
|
|
|
|
|
|
|
| |||||||||||
Net asset value - End of year | $8.74 | $11.93 | $9.73 | $9.35 | $10.10 | |||||||||||||||
|
|
|
|
|
|
|
|
|
| |||||||||||
Net assets - End of year(000’s omitted) | $ | 45,874 | $ | 68,868 | $ | 62,513 | $ | 131,373 | $ | 126,321 | ||||||||||
|
|
|
|
|
|
|
|
|
| |||||||||||
Total return2 | (19.17% | ) | 25.50% | 4.89% | (3.55% | ) | (6.72% | ) | ||||||||||||
Ratios (to average net assets)/Supplemental Data: | ||||||||||||||||||||
Expenses* | 0.85% | 0.85% | 0.85% | 0.85% | 0.85% | |||||||||||||||
Net investment income | 1.55% | 0.85% | 1.16% | 1.18% | 1.42% | |||||||||||||||
Portfolio turnover | 129% | 125% | 47% | 33% | 22% | |||||||||||||||
| *The investment advisor did not impose all or a portion of its management and/or other fees during the period, and may have paid a portion of the Series’ expenses. If these expenses had been incurred by the Class, the expense ratio (to average net assets) would have increased by the following amounts: |
| |||||||||||||||||||
| 0.05% | 0.05% | 0.05% | 0.03% | 0.04% | ||||||||||||||||
1Calculated based on average shares outstanding during the years.
2Represents aggregate total return for the year indicated, and assumes reinvestment of all distributions. Total return would have been lower had certain expenses not been waived or reimbursed.
The accompanying notes are an integral part of the financial statements.
18
International Series
Notes to Financial Statements
| 1. | Organization |
International Series (the “Series”) is ano-load diversified series of Manning & Napier Fund, Inc. (the “Fund”). The Fund is organized in Maryland and is registered under the Investment Company Act of 1940, as amended, as anopen-end management investment company.
The Series’ investment objective is to provide long-term growth by investing principally in the common stocks of companies located outside the United States.
The Fund’s advisor is Manning & Napier Advisors, LLC (the “Advisor”). Shares of the Series are offered to investors, clients and employees of the Advisor and its affiliates. The Series is authorized to issue two classes of shares (Class S and Class I). Each class of shares is substantially the same, except that Class S shares bear shareholder services fees. The total authorized capital stock of the Fund consists of 15 billion shares of common stock each having a par value of $0.01. As of December 31, 2018, 10.4 billion shares have been designated in total among 34 series, of which 100 million have been designated as International Series Class I common stock, 250 million have been designated as International Series Class S common stock, 75 million have been designated as International Series Class W common stock, and 100 million have been designated as International Series Class Z common stock. Class W common stock and Class Z common stock are not currently offered for sale.
| 2. | Significant Accounting Policies |
The following is a summary of significant accounting policies followed by the Series. The Series is an investment company and, accordingly, follows the investment company accounting and reporting guidance of the Financial Accounting Standards Board Accounting Standards Codification Topic 946 - Investment Companies, which is part of accounting principles generally accepted in the United States of America (“GAAP”).
Security Valuation
Portfolio securities, including domestic equities, foreign equities, warrants and options, listed on an exchange other than the NASDAQ Stock Market are valued at the latest quoted sales price of the exchange on which the security is primarily traded. Securities not traded on valuation date or securities not listed on an exchange are valued at the latest quoted bid price provided by the Fund’s pricing service. Securities listed on the NASDAQ Stock Market are valued in accordance with the NASDAQ Official Closing Price.
Short-term investments that mature in sixty days or less may be valued at amortized cost, which approximates fair value. Investments inopen-end investment companies are valued at their net asset value per share on valuation date.
Volume and level of activity in established markets for an asset or liability are evaluated to determine whether recent transactions and quoted prices are determinative of fair value. Where there have been significant decreases in volume and level of activity, further analysis and adjustment may be necessary to estimate fair value. The Series measures fair value in these instances by the use of inputs and valuation techniques which may be based upon current market prices of securities that are comparable in coupon, rating, maturity and industry and/or expectation of future cash flows. As a result of trading in relatively thin markets and/or markets that experience significant volatility, the prices used by the Series to value these securities may differ from the value that would be realized if these securities were sold, and the differences could be material.
Securities for which representative valuations or prices are not available from the Series’ pricing service may be valued at fair value as determined in good faith by the Advisor under procedures approved by and under the general supervision and responsibility of the Fund’s Board of Directors (the “Board”). Due to the inherent uncertainty of valuations of such securities, the fair value may differ significantly from the values that would have been used had a ready market for such securities existed. If trading or events occurring after the close of the principal market in which securities are traded are expected to materially affect the value of those securities, then they may be valued at their fair value, taking this trading or these events into account. In accordance with the procedures approved by the Board, the values of certain securities trading outside the U.S. were adjusted following the close of local trading using a factor from a third party vendor. The third party vendor uses statistical analyses and quantitative models, which consider among other things subsequent movement and changes in the prices of indices, securities
19
International Series
Notes to Financial Statements (continued)
| 2. | Significant Accounting Policies (continued) |
Security Valuation(continued)
and exchange rates in other markets, to determine the factors which are used to adjust local market prices. The value of securities used for net asset value calculation under these procedures may differ from published prices for the same securities. It is the Fund’s policy to classify each foreign equity security where a factor from a third party vendor is provided as a Level 2 security.
Various inputs are used in determining the value of the Series’ assets or liabilities carried at fair value. These inputs are summarized in three broad levels. Level 1 includes quoted prices in active markets for identical assets and liabilities. Level 2 includes other significant observable inputs (including quoted prices for similar securities, interest rates, prepayment speeds, credit risk, etc.). Level 3 includes significant unobservable inputs (including the Series’ own assumptions in determining the fair value of investments). A financial instrument’s level within the fair value hierarchy is based on the lowest level of any input both individually and in aggregate that is significant to the fair value measurement. The inputs or methodology used for valuing securities are not necessarily an indication of the risk associated with investing in those securities.
The following is a summary of the valuation levels used for major security types as of December 31, 2018 in valuing the Series’ assets or liabilities carried at fair value:
| DESCRIPTION | TOTAL | LEVEL 1 | LEVEL 2 | LEVEL 3 | ||||||||||||
Assets: | ||||||||||||||||
Equity Securities: | ||||||||||||||||
Communication Services | $ | 16,974,443 | $ | 3,820,607 | $ | 13,153,836 | # | $ | — | |||||||
Consumer Discretionary | 56,244,992 | 14,781,616 | 41,463,376 | # | — | |||||||||||
Consumer Staples | 57,570,855 | 16,185,593 | 41,385,262 | # | — | |||||||||||
Energy | 45,312,446 | 14,558,408 | 30,754,038 | # | — | |||||||||||
Financials | 20,861,487 | 8,372,112 | 12,489,375 | # | — | |||||||||||
Health Care | 35,933,971 | 3,488,424 | 32,445,547 | # | — | |||||||||||
Industrials | 31,759,991 | 1,741,962 | 30,018,029 | # | — | |||||||||||
Information Technology | 19,215,875 | 2,513,385 | 16,702,490 | # | — | |||||||||||
Materials | 14,726,455 | 4,146,036 | 10,580,419 | # | — | |||||||||||
Utilities | 7,479,799 | 1,319,692 | 6,160,107 | # | — | |||||||||||
Debt Securities: | ||||||||||||||||
Foreign government securities | 10,968,839 | — | 10,968,839 | # | — | |||||||||||
Mutual funds | 27,669,816 | 21,042,156 | 6,627,660 | # | — | |||||||||||
|
|
|
|
|
|
|
| |||||||||
Total assets | $ | 344,718,969 | $ | 91,969,991 | $ | 252,748,978 | $ | — | ||||||||
|
|
|
|
|
|
|
| |||||||||
#Consists of certain foreign securities for which a factor from a third party vendor was applied to determine the securities’ fair value following the close of local trading.
There were no Level 3 securities held by the Series as of December 31, 2017 or December 31, 2018.
New Accounting Pronouncements
The Securities and Exchange Commission (SEC) adopted changes to RegulationS-X to simplify the reporting of information by registered investment companies in financial statements. The amendments require presentation of the total, rather than the components, of distributable earnings on the Statement of Assets and Liabilities and also require presentation of the total, rather than the components, of distributions to shareholders, except for tax return of capital distributions, if any, on the Statement of Changes in Net Assets. The amendments also removed the requirement for parenthetical disclosure of undistributed net investment income on the Statement of Changes in Net Assets. These RegulationS-X amendments are reflected in the Series financial statements for the year ended December 31, 2018. As a result of adopting these amendments, the distributions to shareholders in the December 31, 2017 Statement of Changes in Net Assets presented herein have been reclassified to conform to the current year presentation.
20
International Series
Notes to Financial Statements (continued)
| 2. | Significant Accounting Policies (continued) |
New Accounting Pronouncements(continued)
On August 28, 2018, the FASB issued ASU2018-13, “Disclosure Framework – Changes to the Disclosure Requirements for Fair Value Measurement,” which amends the fair value measurement disclosure requirements under U.S. GAAP. The amendments of ASU2018-13 include new, eliminated, and modified disclosure requirements. In addition, the amendments clarify that materiality is an appropriate consideration of entities when evaluating disclosure requirements. The ASU is effective for all entities for fiscal years beginning after December 15, 2019, including interim periods therein. An entity is permitted to early adopt any eliminated or modified disclosures upon issuance of this ASU and delay adoption of the new disclosures until their effective date. As such, each Series has early adopted the eliminated and modified disclosures, as permitted by this ASU.
Security Transactions, Investment Income and Expenses
Security transactions are accounted for on trade date. Dividend income is recorded on theex-dividend date, except that if theex-dividend date has passed, certain dividends from foreign securities are recorded as soon as the Series is informed of theex-dividend date.Non-cash dividends, if any, are recorded at the fair value of the securities received. Interest income, including amortization of premium and accretion of discounts using the effective interest method, is earned from settlement date and accrued daily.
Expenses are recorded on an accrual basis. Most expenses of the Fund can be attributed to a specific series. Expenses which cannot be directly attributed are apportioned among the series in the Fund in such a manner as deemed equitable by the Fund’s Board, taking into consideration, among other things, the nature and type of expense. Income, expenses (other than shareholder services fees), and realized and unrealized gains and losses are prorated among the classes based on the relative net assets of each class. Class specific expenses are directly charged to that Class.
The Series uses the identified cost method for determining realized gain or loss on investments for both financial statement and federal income tax reporting purposes.
Foreign Currency Translation
The books and records of the Series are maintained in U.S. dollars. Foreign currencies, investments and other assets and liabilities are translated into U.S. dollars at the current exchange rates. Purchases and sales of investment securities and income and expenses are translated on the respective dates of such transactions. The Series does not isolate realized and unrealized gains and losses attributable to changes in the exchange rates from gains and losses that arise from changes in the fair value of investments. Such fluctuations are included with net realized and unrealized gain or loss on investments. Net realized foreign currency gains and losses represent foreign currency gains and losses between trade date and settlement date on securities transactions, gains and losses on disposition of foreign currencies and the difference between the amount of income and foreign withholding taxes recorded on the books of the Series and the amounts actually received or paid.
Federal Taxes
The Series’ policy is to comply with the provisions of the Internal Revenue Code applicable to regulated investment companies. The Series is not subject to federal income tax or excise tax to the extent that the Series distributes to shareholders each year its taxable income, including any net realized gains on investments, in accordance with requirements of the Internal Revenue Code. Accordingly, no provision for federal income tax or excise tax has been made in the financial statements.
Management evaluates its tax positions to determine if the tax positions taken meet the minimum recognition threshold in connection with accounting for uncertainties in income tax positions taken or expected to be taken for the purposes of measuring and recognizing tax liabilities in the financial statements. Recognition of tax benefits of an uncertain tax position is required only when the position is “more likely than not” to be sustained assuming examination by taxing authorities. At December 31, 2018, the Series has recorded no liability for net unrecognized tax benefits relating to uncertain income tax positions taken or expected to be taken in future tax returns.
The Series files income tax returns in the U.S. federal jurisdiction, various states and foreign jurisdictions, as required. No income tax returns are currently under investigation. The statute of limitations on the Series’ tax returns remains open for the
21
International Series
Notes to Financial Statements (continued)
| 2. | Significant Accounting Policies (continued) |
Federal Taxes(continued)
years ended December 31, 2015 through December 31, 2018. The Series is not aware of any tax positions for which it is reasonably possible that the total amounts of unrecognized tax benefits will significantly change in the next twelve months.
Foreign Taxes
Based on the Series’ understanding of the tax rules and rates related to income, gains and currency purchase/repatriation transactions for foreign jurisdictions in which it invests, the Series will provide for foreign taxes, and where appropriate, deferred foreign tax. The Series is subject to a tax imposed on short and long term capital gains on securities of issuers domiciled in India. The Series records an estimated deferred tax liability for securities that have been held during the reporting period, assuming those positions were disposed of at the end of the period. This amount is reported in Accrued foreign capital gains tax in the accompanying Statement of Assets and Liabilities. To the extent permitted capital losses can be used to offset capital gains.
Distributions of Income and Gains
Distributions to shareholders of net investment income and net realized gains are made annually. An additional distribution may be necessary to avoid taxation of the Series. Distributions are recorded on theex-dividend date.
Indemnifications
The Fund’s organizational documents provide former and current directors and officers with a limited indemnification against liabilities arising in connection with the performance of their duties to the Fund. In the normal course of business, the Fund may also enter into contracts that provide general indemnifications. The Fund’s maximum exposure under these arrangements is unknown as this would be dependent on future claims that may be made against the Fund. The risk of material loss from such claims is considered remote.
Other
The preparation of financial statements in conformity with GAAP requires management to make estimates and assumptions that affect the reported amounts of assets and liabilities and the disclosure of contingent assets and liabilities at the date of the financial statements and the reported amounts of income and expenses during the reporting period. Actual results could differ from those estimates.
| 3. | Transactions with Affiliates |
The Fund has an Investment Advisory Agreement (the “Agreement”) with the Advisor, for which the Series pays a fee, computed daily and payable monthly, at an annual rate of 0.75% of the Series’ average daily net assets.
Under the Agreement, personnel of the Advisor provide the Series with advice and assistance in the choice of investments and the execution of securities transactions, and otherwise maintain the Series’ organization. The Advisor also provides the Fund with necessary office space and fund administration and support services. The salaries of all officers of the Fund (except a percentage of the Fund’s Chief Compliance Officer’s salary, which is paid by the Fund), and of all Directors who are “affiliated persons” of the Fund, or of the Advisor, and all personnel of the Fund, or of the Advisor, performing services relating to research, statistical and investment activities, are paid by the Advisor. Each“non-affiliated” Director receives an annual stipend, which is allocated among all the active series of the Fund. In addition, these Directors also receive a fee per Board meeting attended plus a fee for each committee meeting attended and are reimbursed for travel and otherout-of-pocket expenses incurred by them in connection with attending such meetings. The Fund also has an Audit Committee Chair, Governance & Nominating Committee Chair and Lead Independent Director, who each receive an additional annual stipend for these roles.
The Class S shares of the Series are subject to a shareholder services fee in accordance with a shareholder services plan adopted by the Board. The shareholder services fee is intended to compensate financial intermediaries, including affiliates of the Fund, in connection with the provision of direct client service, personal services, maintenance of shareholder accounts and reporting services. For these services, Class S of the Series pays a fee, computed daily and payable monthly, at an annual rate of 0.25% of the average daily net assets of Class S. The Fund has a Shareholder Services Agreement with the Advisor, for which the Advisor receives the shareholder services fee as stated above.
22
International Series
Notes to Financial Statements (continued)
| 3. | Transactions with Affiliates (continued) |
The Advisor has contractually agreed, until at least April 30, 2019, to waive its management fee and, if necessary, pay other operating expenses of the Series in order to maintain total direct annual fund operating expenses for the Series, exclusive of a Class’s Shareholder Services Fee, at no more than 0.85% of average daily net assets. Accordingly, the Advisor waived fees of $242,816 for the year ended December 31, 2018, which is included as a reduction of expenses on the Statement of Operations. The Advisor is not eligible to recoup any expenses that have been waived or reimbursed in prior years.
Manning & Napier Investor Services, Inc., a registered broker-dealer affiliate of the Advisor, acts as distributor for the Fund’s shares. The services of Manning & Napier Investor Services, Inc. are provided at no additional cost to the Series.
Pursuant to a master services agreement dated March 1, 2017, as amended, the Fund pays the Advisor an annual fee related to fund accounting and administration of 0.0085% on the first $25 billion of average daily net assets (excluding Target Series and Income Series); 0.0075% on the next $15 billion of average daily net assets (excluding Target Series and Income Series); and 0.0065% of average daily net assets in excess of $40 billion (excluding Target Series and Income Series); plus a base fee of $30,400 per series. Additionally, certain transaction andout-of-pocket expenses, including charges for reporting relating to the Fund’s compliance program, are charged. The Advisor has agreements with BNY Mellon Investment Servicing (U.S.) Inc. (“BNY”) under which BNY serves assub-accountant services agent.
| 4. | Purchases and Sales of Securities |
For the year ended December 31, 2018, purchases and sales of securities, other than U.S. Government securities and short-term securities, were $570,423,088 and $688,414,792, respectively. There were no purchases or sales of U.S. Government securities.
| 5. | Capital Stock Transactions |
Transactions in shares of Class S and I shares of International Series were:
| CLASS S | FOR THE YEAR ENDED 12/31/18 | FOR THE YEAR ENDED 12/31/17 | ||||||||||||||
| SHARES | AMOUNT | SHARES | AMOUNT | |||||||||||||
Sold | 2,636,028 | $ | 22,462,376 | 6,585,533 | $ | 57,042,523 | ||||||||||
Reinvested | 5,193,912 | 36,995,022 | 1,343,430 | 12,251,895 | ||||||||||||
Repurchased | (13,970,413 | ) | (124,351,848 | ) | (10,433,523 | ) | (90,569,947 | ) | ||||||||
|
|
|
|
|
|
|
| |||||||||
Total | (6,140,473 | ) | $ | (64,894,450 | ) | (2,504,560 | ) | $ | (21,275,529 | ) | ||||||
|
|
|
|
|
|
|
| |||||||||
| CLASS I | FOR THE YEAR ENDED 12/31/18 | FOR THE YEAR ENDED 12/31/17 | ||||||||||||||
| SHARES | AMOUNT | SHARES | AMOUNT | |||||||||||||
Sold | 835,446 | $ | 9,687,732 | 665,536 | $ | 7,239,569 | ||||||||||
Reinvested | 502,334 | 4,639,530 | 133,168 | 1,542,082 | ||||||||||||
Repurchased | (1,860,572 | ) | (21,473,792 | ) | (1,447,943 | ) | (16,854,358 | ) | ||||||||
|
|
|
|
|
|
|
| |||||||||
Total | (522,792 | ) | $ | (7,146,530 | ) | (649,239 | ) | $ | (8,072,707 | ) | ||||||
|
|
|
|
|
|
|
| |||||||||
Approximately 64% of the shares outstanding are fiduciary accounts where the Advisor has sole investment discretion.
| 6. | Line of Credit |
The Fund has entered into a364-day, $25 million credit agreement (the “line of credit”) with Bank of New York Mellon. Each series of the Fund may borrow under the line of credit for temporary or emergency purposes, including funding shareholder redemptions and other short-term liquidity purposes. The Fund pays an annual fee on the unused commitment amount, payable quarterly, and is allocated among all the series of the Fund and included in miscellaneous expenses in the Statement of
23
International Series
Notes to Financial Statements (continued)
| 6. | Line of Credit (continued) |
Operations for each series. The line of credit expires in August 2019 unless extended or renewed. During the year ended December 31, 2018, the Series did not borrow under the line of credit.
| 7. | Financial Instruments |
The Series may trade in instruments including written and purchased options, forward foreign currency exchange contracts and futures contracts and other derivatives in the normal course of investing activities to assist in managing exposure to various market risks. The Series may be subject to various elements of risk, which may involve, to a varying degree, elements of risk in excess of the amounts recognized for financial statement purposes. These risks include: the risk that changes in the value of a derivative may not correlate perfectly with the underlying asset, rate or index; counterparty credit risk related to over the counter derivative counterparties’ failure to perform under contract terms; liquidity risk related to the lack of a liquid market for these contracts allowing the fund to close out its position(s); and documentation risk relating to disagreement over contract terms. No such investments were held by the Series as of December 31, 2018.
| 8. | Foreign Securities |
Investing in securities of foreign companies and foreign governments involves special risks and considerations not typically associated with investing in securities of domestic companies and the U.S. Government. These risks include revaluation of currencies and future adverse political and economic developments. Moreover, securities of foreign companies and foreign governments and their markets may be less liquid and their prices more volatile than those of comparable domestic companies and the U.S. Government.
| 9. | Federal Income Tax Information |
The amount and characterization of certain income and capital gains to be distributed are determined in accordance with federal income tax regulations, which may differ from GAAP. These differences are primarily due to differing book and tax treatments in the timing and/or treatment of the recognition of net investment income or gains and losses, including foreign currency gains and losses, foreign taxes, losses deferred due to wash sales, investments in passive foreign investment companies (PFICs) and qualified late-year losses. The Series may periodically make reclassifications among its capital accounts to reflect income and gains available for distribution (or available capital loss carryovers) under income tax regulations without impacting the Series’ net asset value. Any such reclassifications are not reflected in the financial highlights.
The tax character of distributions paid were as follows:
| FOR THE YEAR ENDED 12/31/18 | FOR THE YEAR ENDED 12/31/17 | |||||||||||
| Ordinary income | $ | 11,093,450 | $ | 3,483,488 | |||||||
Long-term capital gains | $ | 31,377,589 | $ | 10,541,447 | ||||||||
At December 31, 2018, the tax basis of components of distributable earnings and the net unrealized depreciation based on the identified cost of investments for federal income tax purposes were as follows:
| Cost for federal income tax purposes | $ | 366,106,942 | |||
Unrealized appreciation | 9,992,953 | |||||
Unrealized depreciation | (31,380,926 | ) | ||||
|
| |||||
Net unrealized depreciation | $ | (21,387,973 | ) | |||
|
| |||||
Undistributed ordinary income | $ | 579,552 | ||||
Qualified late-year losses1 | $ | 19,945,493 |
1 The Series has elected to defer certain qualified late-year losses and recognize such losses in the year ending December 31, 2019.
24
International Series
Report of Independent Registered Public Accounting Firm
To the Board of Directors of Manning & Napier Fund, Inc. and Shareholders of International Series
Opinion on the Financial Statements
We have audited the accompanying statement of assets and liabilities, including the investment portfolio, of International Series (one of the series constituting Manning & Napier Fund, Inc., referred to hereafter as the “Fund”) as of December 31, 2018, the related statement of operations for the year ended December 31, 2018, the statement of changes in net assets for each of the two years in the period ended December 31, 2018, including the related notes, and the financial highlights for each of the five years in the period ended December 31, 2018 (collectively referred to as the “financial statements”). In our opinion, the financial statements present fairly, in all material respects, the financial position of the Fund as of December 31, 2018, the results of its operations for the year then ended, the changes in its net assets for each of the two years in the period ended December 31, 2018 and the financial highlights for each of the five years in the period ended December 31, 2018 in conformity with accounting principles generally accepted in the United States of America.
Basis for Opinion
These financial statements are the responsibility of the Fund’s management. Our responsibility is to express an opinion on the Fund’s financial statements based on our audits. We are a public accounting firm registered with the Public Company Accounting Oversight Board (United States) (PCAOB) and are required to be independent with respect to the Fund in accordance with the U.S. federal securities laws and the applicable rules and regulations of the Securities and Exchange Commission and the PCAOB.
We conducted our audits of these financial statements in accordance with the standards of the PCAOB. Those standards require that we plan and perform the audit to obtain reasonable assurance about whether the financial statements are free of material misstatement, whether due to error or fraud.
Our audits included performing procedures to assess the risks of material misstatement of the financial statements, whether due to error or fraud, and performing procedures that respond to those risks. Such procedures included examining, on a test basis, evidence regarding the amounts and disclosures in the financial statements. Our audits also included evaluating the accounting principles used and significant estimates made by management, as well as evaluating the overall presentation of the financial statements. Our procedures included confirmation of securities owned as of December 31, 2018 by correspondence with the custodian. We believe that our audits provide a reasonable basis for our opinion.

New York, New York
February 15, 2019
We have served as the auditor of one or more investment companies in Manning & Napier Mutual Funds since 1992.
25
International Series
Supplemental Tax Information
(unaudited)
All reportings are based on financial information available as of the date of this annual report and, accordingly are subject to change.
For federal income tax purposes, the Series reports for the current fiscal year $11,645,310 or, if different, the maximum amount allowable under the tax law as qualified dividend income.
The Series designates $27,224,793 as Long-Term Capital Gain dividends pursuant to Section 852(b)(3) of the Internal Revenue Code for the fiscal year ended December 31, 2018.
For corporate shareholders, the percentage of investment income (dividend income plus short-term gains, if any) that qualifies for the dividends received deduction for the current fiscal year is 6.14%, or if different, the maximum allowable under tax law.
The Series has elected to pass through to its shareholders the foreign taxes paid for the year ended December 31, 2018. The Series had $12,063,291 in foreign source income and paid foreign taxes of $1,304,129.
26
International Series
Renewal of Investment Advisory Agreement
(unaudited)
At the Manning & Napier Fund, Inc. (the “Fund”) Board of Directors’ (the “Board”) meeting, held on November 15, 2018, the Investment Advisory Agreement (the “Agreement”) between the Fund and Manning & Napier Advisors, LLC (the “Advisor”) was considered for renewal by the Board, including all of the Directors who are not “interested persons” (“Independent Directors”), within the meaning of the Investment Company Act of 1940, as amended (the “1940 Act”). In connection with the decision whether to renew the Agreement, a variety of material was provided to the Board in advance of the meeting for their review and consideration. The Board also held a working session on October 31, 2018 to review and discuss information provided to the Board, and for the Board to request additional information.
Representatives of the Advisor attended a portion of the working session and attended the Board meeting. The Advisor provided supplemental information requested by the Board and presented additional oral information to the Board to assist the Board in its considerations. In addition to the information furnished by the Advisor, the Board was provided with a legal memorandum discussing its fiduciary duties related to its approval of the continuation of the Agreement. Legal counsel for the Fund discussed with the Board the applicable legal considerations. In addition, the Board receivedin-person presentations about the Fund throughout the year.
The Independent Directors were advised by independent legal counsel with respect to these matters. The Independent Directors also met separately in an executive session with their legal counsel without any representatives of the Advisor present.
The Directors’ determinations at the meeting were made on the basis of each Director’s business judgment after consideration of all the information presented. In deciding to recommend the renewal of the Agreement with respect to each Series of the Fund, the Independent Directors did not identify any single or particular piece of information that, in isolation, was the controlling factor. Each Independent Director may also have weighed factors differently. This summary describes the most important, but not all, of the factors considered by the Board and the Independent Directors.
| • | The Board considered the nature and quality of services provided by the Advisor under the Agreement for over 30 years including, among others: deciding what securities to purchase and sell for each Series; arranging for the purchase and sale of such securities by placing orders with broker-dealers; administering the affairs of the Fund (including the books and records of the Fund not maintained by third party service providers such as the custodian or transfer agent); arranging for the insurance coverage for the Fund; and supervising the preparation of tax returns, SEC filings (including registration statements) and reports to shareholders for the Fund. The Board considered the numerous services performed by the Advisor and its affiliates beyond those stated in the Agreements. The Board also considered the Advisor’s personnel who perform services to the Fund, changes in senior or key personnel, the strength of the Advisor’s compliance infrastructure, policies and procedures relating to compliance with securities regulations, reputation, expertise and resources. The Board discussed the quality of these services with representatives from the Advisor and concluded that the Advisor was performing its services to the Fund required under the Agreement in a reasonable manner. |
| • | The Board considered the Advisor’s investments teams, including changes to the investment teams and investment team’s compensation during the past year, and the investment process. The Board considered the performance of each Series since its inception, as well as over multiple time periods including: one year, three year, five year, ten year, and current market cycle. A market cycle includes periods of both rising and falling markets. Returns for established benchmark indices for each Series were provided. In addition, the Board considered (and considers on a quarterly basis) a number of other factors relevant to performance at the meeting including: a peer group performance analysis consisting of Morningstar universes of mutual funds with similar investment objectives; the breadth of the Fund’s product offerings; and performance over reasonable time periods. The Board discussed with Representatives of the Advisor, short-term performance challenges in the Fund’s core strategies that have resulted in a downward trend in assets under management. After discussion, the Board concluded that notwithstanding the performance challenges of certain Series, the nature and quality of the investment management services provided by the Advisor to the Fund supported the renewal of the agreement. |
| • | The Board considered the fees and expenses of the various Series of the Fund. The Advisor presented the advisory fees and total expenses for each Series, including the advisory fee adjusted for any contractual expense waivers or reimbursements paid by the Advisor. The Advisor also presentedpro-forma information related to several management fee and overall expense reductions that were set to take effect in early 2019. These changes were approved by the Board in a prior meeting and by shareholders at a Shareholder Meeting in May 2018. |
| • | The Board considered whether the Advisor had achieved economies of scale with respect to its services to the Fund. The Board acknowledged the expense caps incorporated in the Fund’s current fee structure, which requires the Advisor to |
27
International Series
Renewal of Investment Advisory Agreement
(unaudited)
| subsidize the expenses of the Series operating above their expense cap, noting that 27 Series of the Fund are currently receiving expense reimbursements from the Advisor. The Board concluded that the Fund would need to grow in assets before the Advisor would be able to achieve meaningful economies of scale. |
| • | The Advisor provided the Board with information comparing each Series’ contractual management fees with the Advisor’s standard advisory fees for separate accounts and collective investment trusts. The Board considered that the range of services provided to the Series is more extensive than for the Advisor’s other clients due to additional infrastructure, administrative and regulatory requirements related to operating a mutual fund. |
| • | The current andpro-forma advisory fees,12b-1 Distribution and Service Fees, other expenses (e.g. a combination of Shareholder Services Fees, intermediarysub-transfer agent fees, routine operating expenses and Acquired Fund Fees and Expenses forfund-of-fund Series) and total expense ratios of each Series and share class were compared and ranked (on both a mean and median basis) against respective peer universes. Respective peer universes included funds of a similar size and with similar investment objectives and expense characteristics as disclosed on the Morningstar database. Representatives of the Advisor discussed with the Board the comparisons and rankings of fees and net expense ratios for each Series of the Fund and the methodology behind the comparison. The Board considered the Advisor’s active portfolio management that results in portfolios that are more differentiated than the construction of their benchmarks. Based on their review of the information provided, the Board concluded that the current andpro-forma fees and expenses of each Series of the Fund were reasonable on a comparative basis. |
| • | The Board considered the costs of the Advisor’s services and the profits of the Advisor as they relate to the Advisor’s services to the Fund under the Agreement. The Board was provided with information on the Advisor’s financial condition and profitability by mutual fund agreement and by Series. Information provided by the Advisor addressed the anticipated effects of the upcoming fee reductions. The Board discussed the Advisor’s revenues generated from the Fund and its expenses associated with providing the services under the Agreement. The Advisor presented the Board with information on firm wide investment management profitability to provide a comparison of the Advisor’s profitability from its Fund activities relative to its profitability from its other investment management business. In addition, the Board reviewed the Advisor’s expense allocation methodology used to calculate profitability since many of the Advisor’s resources and expenses are shared across the Advisor’s various investment management vehicles. The Board considered the Advisor’s expenses associated with Fund activities outside of the Agreement (such as expense reimbursements pursuant to expense caps and payments made by the Advisor to third party platforms on which shares of the Fund are available for purchase). After discussing the above costs and profits, the Board concluded that the Advisor’s profitability relating to its services provided under the Agreement was reasonable. |
| • | The Board also considered the other benefits the Advisor derives from its relationship with the Fund. Such other benefits include participation in a joint insurance program, sharing of compensation expenses for certain shared personnel, relationships with large service providers, the utilization of Series within the Advisor’s separately managed accounts and certain research services provided by soft dollars. The Board reviewed the broker-dealers who provided research to the Advisor and the products and services paid for, in whole or in part, using soft dollar commissions. The Board concluded that these additional benefits to the Advisor were reasonable. |
Based on the Board’s deliberations and their evaluation of the information described above, the Board, including a majority of the Independent Directors, concluded that the compensation under the Agreement was fair and reasonable with respect to each Series in light of the services and expenses and such other matters as the Directors considered to be relevant in the exercise of their reasonable judgment, and that the renewal of the Agreement would be in the best interests of each Series and its shareholders. The Board did not indicate that any single factor was determinative of its decision to approve the Agreement, but indicated that the Board based its determination on the total mix of information available to it.
28
International Series
Directors’ and Officers’ Information
(unaudited)
The Statement of Additional Information provides additional information about the Fund’s directors and officers and can be obtained without charge by calling1-800-466-3863, at www.manning-napier.com, or on the EDGAR Database on the SEC Internet web site (http://www.sec.gov). The following chart shows certain information about the Fund’s directors and officers, including their principal occupations during the last five years. Unless specific dates are provided, the individuals have held the listed positions for longer than five years.
Interested Director and Officer
| ||
| Name: | Paul Battaglia* | |
| Address: | 290 Woodcliff Drive | |
| Fairport, NY 14450 | ||
| Age: | 40 | |
| Current Position(s) Held with Fund: | Principal Executive Officer, President, Chairman and Director | |
| Term of Office & Length of Time Served: | Indefinite – Chairman and Director since November 20181 | |
| Principal Occupation(s) During Past 5 Years: | Chief Financial Officer (2018 – Present); Vice President of Finance (2016 – 2018); Director of Finance (2011 – 2016); Financial Analyst/Internal Auditor (2004-2006) – Manning & Napier Advisors, LLC and affiliates Holds one or more of the following titles for various subsidiaries and affiliates: Chief Financial Officer | |
| Number of Portfolios Overseen within Fund Complex: | 34 | |
Other Directorships Held Outside Fund Complex During Past 5 Years: | N/A
|
| Independent Directors | ||
| Name: | Stephen B. Ashley | |
| Address: | 290 Woodcliff Drive | |
| Fairport, NY 14450 | ||
| Age: | 78 | |
| Current Position(s) Held with Fund: | Director, Audit Committee Member, Governance & Nominating Committee Member | |
| Term of Office & Length of Time Served: | Indefinite – Since 1996 | |
| Principal Occupation(s) During Past 5 Years: | Chairman, Director & Chief Executive Officer (1997 to present) - The Ashley Group (property management and investment). Director (1995-2008) and Chairman(non-executive) (2004-2008) - Fannie Mae (mortgage) | |
| Number of Portfolios Overseen within Fund Complex: | 34 | |
Other Directorships Held Outside Fund Complex During Past 5 Years: | Fannie Mae (1995-2008) The Ashley Group (1995-2008) Genesee Corporation (1987-2007)
| |
| Name: | Paul A. Brooke | |
| Address: | 290 Woodcliff Drive | |
| Fairport, NY 14450 | ||
| Age: | 73 | |
| Current Position(s) Held with Fund: | Lead Independent Director, Audit Committee Member, Governance & Nominating Committee Chairman | |
| Term of Office & Length of Time Served: | Indefinite – Director, Audit Committee Member, Governance & Nominating Committee Member since 2007; Governance & Nominating Committee Chairman since 2016; Lead Independent Director since 2017 | |
| Principal Occupation(s) During Past 5 Years: | Chairman & CEO (2005-2009) - Ithaka Acquisition Corporation (investments); Chairman (2007-2009) - Alsius Corporation (investments); Managing Member (1991-present) - PMSV Holdings LLC (investments); Managing Member (2010-2016) - Venbio (investments). | |
| Number of Portfolios Overseen within Fund Complex: | 34 | |
Other Directorships Held Outside Fund Complex During Past 5 Years: | Incyte Corp. (biotech)(2000-present); ViroPharma, Inc. (speciality pharmaceuticals)(2000-2014); HLTH (WebMD)(information)(2000-2010); Cheyne Capital International (investment)(2000-2017); GMP Companies (investment)(2000-2011); Cytos Biotechnology Ltd (biotechnology)(2012-2014); Cerus (biomedical)(2016-present);PureEarth(non-profit)(2012-present); Caelum BioSciences (biomedical)(2018-present)
|
29
International Series
Directors’ and Officers’ Information
(unaudited)
Independent Directors (continued)
| Name: | Peter L. Faber | |
| Address: | 290 Woodcliff Drive | |
| Fairport, NY 14450 | ||
| Age: | 80 | |
| Current Position(s) Held with Fund: | Director, Governance & Nominating Committee Member | |
| Term of Office & Length of Time Served: | Indefinite – Since 1987 | |
| Principal Occupation(s) During Past 5 Years: | Senior Counsel (2006-2012), Partner (1995-2006 & 2013-2018) - McDermott, Will & Emery LLP (law firm) | |
| Number of Portfolios Overseen within Fund Complex: | 34 | |
| Other Directorships Held Outside Fund Complex During Past 5 Years: | Boston Early Music Festival(non-profit)(2007-present); Amherst Early Music, Inc.(non-profit)(2009-present); Gotham Early Music Scene, Inc.(non-profit)(2009-present); Partnership for New York City, Inc.(non-profit)(1989-2010); New York Collegium(non-profit)(2004-2011); S’Cool Sounds, Inc.(non-profit)(2017-present)
|
| Name: | Harris H. Rusitzky | |
| Address: | 290 Woodcliff Drive | |
| Fairport, NY 14450 | ||
| Age: | 83 | |
| Current Position(s) Held with Fund: | Director, Audit Committee Member, Governance & Nominating Committee Member | |
| Term of Office & Length of Time Served: | Indefinite – Since 1985 | |
| Principal Occupation(s) During Past 5 Years: | President (1994- present) - The Greening Group (business consultants); Partner (2006-present) - The Restaurant Group (restaurants) | |
| Number of Portfolios Overseen within Fund Complex: | 34 | |
| Other Directorships Held Outside Fund Complex During Past 5 Years: | Rochester Institute of Technology (university)(1972-present); Culinary Institute of America(non-profit college)(1985-present); George Eastman Museum (museum)(1988-present); National Restaurant Association (restaurant trade organization)(1978-present)
|
| Name: | Chester N. Watson | |
| Address: | 290 Woodcliff Drive | |
| Fairport, NY 14450 | ||
| Age: | 68 | |
| Current Position(s) Held with Fund: | Director, Audit Committee Chairman, Governance & Nominating Committee Member | |
| Term of Office & Length of Time Served: | Indefinite – Director, Audit Committee Member, Governance & Nominating Committee Member Since 2012; Audit Committee Chairman since 2013 | |
| Principal Occupation(s) During Past 5 Years: | General Auditor (2003-2011) - General Motors Company (auto manufacturer) | |
| Number of Portfolios Overseen within Fund Complex: | 34 | |
| Other Directorships Held Outside Fund Complex During Past 5 Years: | Rochester Institute of Technology (university)(2005-present); Town of Greenburgh, NY Planning Board (municipal government) (2015-2018)
|
| Officers: | ||
| Name: | Jeffrey S. Coons, Ph.D., CFA® | |
| Address: | 290 Woodcliff Drive | |
| Fairport, NY 14450 | ||
| Age: | 55 | |
| Current Position(s) Held with Fund: | Vice President | |
| Term of Office1& Length of Time Served: | Since 2004 | |
| Principal Occupation(s) During Past 5 Years: | President since 2010,Co-CEO since 2018,Co-Director of Research (2002 – 2015) - Manning & Napier Advisors, LLC Holds one or more of the following titles for various subsidiaries and affiliates: President, Director, Treasurer, or Senior Trust Officer
| |
30
International Series
Directors’ and Officers’ Information
(unaudited)
Officers: (continued)
| Name: | Elizabeth Craig | |
| Address: | 290 Woodcliff Drive | |
| Fairport, NY 14450 | ||
| Age: | 31 | |
| Current Position(s) Held with Fund: | Corporate Secretary | |
| Term of Office1& Length of Time Served: | Since 2016 | |
| Principal Occupation(s) During Past 5 Years: | Fund Administration Manager since 2015; Mutual Fund Compliance Specialist (2009-2015) - Manning & Napier Advisors, LLC; Assistant Corporate Secretary (2011-2016) - Manning & Napier Fund, Inc.
|
| Name: | Christine Glavin | |
| Address: | 290 Woodcliff Drive | |
| Fairport, NY 14450 | ||
| Age: | 52 | |
| Current Position(s) Held with Fund: | Principal Financial Officer, Chief Financial Officer | |
| Term of Office1& Length of Time Served: | Principal Financial Officer since 2002; Chief Financial Officer since 2001 | |
| Principal Occupation(s) During Past 5 Years: | Director of Fund Reporting since 2011; Fund Reporting Manager (1997-2011) - Manning & Napier Advisors, LLC; Assistant Treasurer since 2008 - Exeter Trust Company; Chief Financial Officer (2017-2018) - Rainier Investment Management Mutual Funds, Inc.
|
| Name: | Jodi L. Hedberg | |
| Address: | 290 Woodcliff Drive | |
| Fairport, NY 14450 | ||
| Age: | 51 | |
| Current Position(s) Held with Fund: | Chief Compliance Officer, Anti-Money Laundering Compliance Officer | |
| Term of Office1& Length of Time Served: | Chief Compliance Officer since 2004; Anti-Money Laundering Officer since 2002; Corporate Secretary (1997-2016) - Manning & Napier Fund, Inc.; Chief Compliance Officer and Anti-Money Laundering Officer (2017-2018) – Rainier Investment Management Mutual Funds, Inc. | |
| Principal Occupation(s) During Past 5 Years: | Managing Director, Compliance & Regulatory Affairs since 2018; Director of Compliance (2005-2018); Compliance Manager (1995-2005) – Manning & Napier Advisors, LLC and affiliates; Corporate Secretary – Manning & Napier Investor Services, Inc. since 2006
|
| Name: | Scott Morabito | |
| Address: | 290 Woodcliff Drive | |
| Fairport, NY 14450 | ||
| Age: | 31 | |
| Current Position(s) Held with Fund: | Assistant Vice President | |
| Term of Office1& Length of Time Served: | Since 2017 | |
| Principal Occupation(s) During Past 5 Years: | Director of Funds Group since 2017; Fund Product and Strategy Manager (2014-2017); Senior Product and Strategy Analyst (2013-2014); Product and Strategy Analyst (2011-2013) - Manning & Napier Advisors, LLC; President, Director – Manning & Napier Investor Services, Inc. since 2018
|
| Name: | Sarah Turner | |
| Address: | 290 Woodcliff Drive | |
| Fairport, NY 14450 | ||
| Age: | 36 | |
| Current Position(s) Held with Fund: | Chief Legal Officer; Assistant Corporate Secretary | |
| Term of Office1& Length of Time Served: | Since 2018 | |
| Principal Occupation(s) During Past 5 Years: | General Counsel since 2018 - Manning & Napier Advisors, LLC and affiliates; Counsel (2017-2018) – Harter Secrest and Emery LLP; Legal Counsel (2010-2017) – Manning & Napier Advisors, LLC and affiliates Holds one or more of the following titles for various affiliates: Corporate Secretary, General Counsel
|
31
International Series
Directors’ and Officers’ Information
(unaudited)
Officers: (continued)
| Name: | Amy Williams | |
| Address: | 290 Woodcliff Drive | |
| Fairport, NY 14450 | ||
| Age: | 57 | |
| Current Position(s) Held with Fund: | Assistant Corporate Secretary | |
| Term of Office1& Length of Time Served: | Since 2016 | |
| Principal Occupation(s) During Past 5 Years: | Director of Fund Documentation - Manning & Napier Advisors, LLC since 2009 | |
| Holds one or more of the following titles for various affiliates: Director |
*Interested Director, within the meaning of the 1940 Act by reason of her positions with the Fund’s investment advisor, Manning & Napier Advisors, LLC and Distributor, Manning & Napier Investor Services, Inc.
1The term of office of all officers shall be one year and until their respective successors are chosen and qualified, or his or her earlier resignation or removal as provided in the Fund’sBy-Laws.
32
{This page intentionally left blank}
33
International Series
Literature Requests
(unaudited)
Proxy Voting Policies and Procedures
A description of the policies and procedures that the Fund uses to determine how to vote proxies relating to portfolio securities is available, without charge, upon request:
| By phone | 1-800-466-3863 | |||
| On the Securities and Exchange | ||||
| Commission’s (SEC) web site | http://www.sec.gov |
Proxy Voting Record
Information regarding how the Fund voted proxies relating to portfolio securities during the most recent12-month period ended June 30th is available, without charge, upon request:
| By phone | 1-800-466-3863 | |||
| On the SEC’s web site | http://www.sec.gov |
Quarterly Portfolio Holdings
The Series’ complete schedule of portfolio holdings for the 1st and 3rd quarters of each fiscal year are provided on FormN-Q, and are available, without charge, upon request:
| By phone | 1-800-466-3863 | |||
| On the SEC’s web site | http://www.sec.gov |
Prospectus and Statement of Additional Information (SAI)
For more information about any of the Manning & Napier Fund, Inc. Series, you may obtain a prospectus and SAI at www.manning-napier.com or by calling (800)466-3863. Before investing, carefully consider the objectives, risks, charges and expenses of the investment and read the prospectus carefully as it contains this and other information about the investment company.In addition, this information can be found on the SEC’s web site, http://www.sec.gov.
Additional information available at www.manning-napier.com
1. Fund Holdings -Month-End
2. Fund Holdings -Quarter-End
3. Shareholder Report - Annual
4. Shareholder Report - Semi-Annual
The Fund also offers electronic notification or“e-delivery” when certain documents are availableon-line to be downloaded or reviewed. Direct shareholders can elect to receive electronic notification when shareholder reports, prospectus updates, and/or statements are available. If you do not currently haveon-line access to your account, you can establish access by going to www.manning-napier.com, click on “Login” in the top corner of the page, and follow the prompts to self-enroll. Once enrolled, you can set your electronic notification preferences by clicking on the Account Options tab located within the green toolbar and then selectE-Delivery Option. Should you have any questions on either how to establishon-line access or how to update your account settings, please contact Investor Services at1-800-466-3863.
The Manning & Napier Fund, Inc. is managed by Manning & Napier Advisors, LLC. Manning & Napier Investor Services, Inc., an affiliate of Manning & Napier Advisors, LLC, is the distributor of the Fund shares.
MNINT-12/18-AR

Manning & Napier Fund, Inc.
Diversified Tax Exempt Series
Beginning on February 25, 2021, as permitted by Securities and Exchange Commission regulations, paper copies of the Series’ annual and semi-annual shareholder reports will no longer be sent by mail, unless you specifically request paper copies of the reports from the Fund or from your financial intermediary, such as a broker-dealer or bank. Instead, the reports will be made available on a website, and you will be notified by mail each time a report is posted and provided with a website link to access the report.
If you already elected to receive shareholder reports electronically, you will not be affected by this change and you need not take any action. You may elect to receive shareholder reports and other communications from the Fund electronically by contacting your financial intermediary or, if you are a direct investor, by visiting www.manning-napier.com or calling1-800-466-3863.
You may elect to receive all future annual and semi-annual reports in paper free of charge. If you invest through a financial intermediary, you can contact your financial intermediary to request that you continue to receive paper copies of your shareholder reports. If you invest directly with the Fund, you can inform the Fund that you wish to continue receiving paper copies of your shareholder reports by visiting www.manning-napier.com or calling1-800-466-3863. Your election to receive reports in paper will apply to all funds held with your financial intermediary if you invest through a financial intermediary or all series of the Fund if you invest directly with the Fund. |
Diversified Tax Exempt Series
Management Discussion and Analysis
(unaudited)
Dear Shareholders:
The investment environment we witnessed over the past twelve months was far more volatile than in prior years. It resulted in a sharp drawdown in global equity markets during the fourth quarter of 2018.
For the fiscal year ending on December 31, 2018, US equities experienced negative returns, with the S&P 500 Total Return Index falling 4.38%. International equity performance was somewhat worse, with the MSCI ACWI ex USA Index returning negative 14.20%.
In fixed income, domestic investment-grade bond performance was essentially flat for the year, as measured by the Bloomberg Barclays U.S. Aggregate Bond Index, rising 0.01% as income generated over the period was offset by rising interest rates (when interest rates rise, bond prices fall).
We believe recent volatility, both at the beginning and end of last year, is reflective of what investors should expect going forward. While we do not believe we are immediately heading for a recession, we see recent developments within the US and abroad as an indication that we are entering a higher risk period for financial markets.
The US economy is likely approaching a period of peak growth. It continues to show signs of progressing toward the later stages of its economic and market cycle (typical characteristics of anend-of-cycle phase are an economic recession and financial market selloff).
As economic growth decelerates to more sustainable levels, we believe that investors are facing a growing risk of disappointment. At the same time, key global risks remain, including trade tensions, geopolitical uncertainty, and tightening monetary policy.
Considering the current economic and market backdrop, we believe investors should temper their performance expectations. The returns experienced over the latter half of the post-Global Financial Crisis bull market are unlikely to continue.
Additionally, given our cautious outlook, we are reviewing current and prospective investments for excessive risk exposures, and we have adjusted our positioning across many of our portfolios. Going forward, we will continue to follow our disciplines, focusing on flexibility and selectivity in today’s incredibly dynamic investment environment.
With this in mind, in the enclosed we discuss recent fund performance, highlight our positioning, and briefly provide our outlook amid the current investment environment.
We hope that you find this information helpful, and we look forward to working with you in the years ahead. Thank you for your continued confidence in Manning & Napier.
Sincerely,
Manning & Napier Advisors, LLC
The S&P 500 Index is an unmanaged, capitalization-weighted measure comprised of 500 leading U.S. companies to gauge U.S. large cap equities. The Index returns do not reflect any fees or expenses. The Index includes dividends, but not the reinvestment of dividends. Index returns provided by Bloomberg. S&P Dow Jones Indices LLC, a subsidiary of the McGraw Hill Financial, Inc., is the publisher of various index based data products and services and has licensed certain of its products and services for use by Manning & Napier. All such content Copyright© 2019 by S&P Dow Jones Indices LLC and/or its affiliates. All rights reserved. Neither S&P Dow Jones Indices LLC, Dow Jones Trademark Holdings LLC, their affiliates nor their third party licensors make any representation or warranty, express or implied, as to the ability of any index to accurately represent the asset class or market sector that it purports to represent and none of these parties shall have any liability for any errors, omissions, or interruptions of any index or the data included therein.
The MSCI ACWI ex USA Index (ACWIxUS) is designed to measure large andmid-cap representation across 22 of 23 Developed Markets countries (excluding the U.S.) and 24 Emerging Markets countries. The Index returns do not reflect any fees or expenses. The Index is denominated in U.S. dollars. The Index returns are net of withholding taxes. They assume daily reinvestment of net dividends thus accounting for any applicable dividend taxation. Index returns provided by Bloomberg.
The Bloomberg Barclays U.S. Aggregate Bond Index is an unmanaged, market-value weighted index of U.S. domestic investment-grade debt issues, including government, corporate, asset-backed, and mortgage-backed securities, with maturities of one year or more. Index returns do not reflect any fees or expenses. Index returns provided by Interactive Data.
1
Diversified Tax Exempt Series
Fund Commentary
(unaudited)
Investment Objective
To provide as high a level of current income that is exempt from federal income taxes which the Advisor believes is consistent with the preservation of capital. The Series invests primarily in municipal bonds that provide income exempt from federal income tax.
Performance Commentary
The ICE Bank of America Merrill Lynch1-12 Year Municipal Bond Index experienced a positive return of 1.64% for 2018. Over the same time period, the Diversified Tax Exempt Series returned 0.65%.
During the year ended of December 31, 2018, the Series’ underperformance was primarily attributable to yield curve positioning. Specifically, the Series held a portion of longer duration securities, including securities with maturities greater than 12 years (fixed income securities with maturities beyond 12 years are not included in the benchmark). Due to this longer duration portion of the portfolio, as rates rose across the yield curve, the Series experienced underperformance.
We continue to believe a modest duration remains in investors’ best interest. Although we may see rates move lower in the near-term, we believe that, over the long-term, underlying economic factors will likely apply gradual pressure on rates to move higher and for the yield curve to flatten.
Going forward, our economic outlook remains constructive towards revenue bonds, which continue to offer attractive valuations while exhibiting stable credit fundamentals. Within revenue bonds, we maintain a focus on higher quality/essential service bonds (e.g., water and sewer authorities).
With respect to general obligations, at the state level, we believe that most states are in a relatively stable credit position. We do, however, believe it’s unlikely that we see broad credit improvement in the sector considering where we are in the cycle, tighter bond spreads, and potential impacts of elevated pension obligations, budgetary imbalances, political gridlocks, and medical expenses.
At the local level, our outlook also remains stable as property taxes are relatively healthy. That said, we continue to monitor states where there is the potential for credit deterioration due to pension underfunding and the impact on local governments (should costs be passed on).
With spreads atpre-crisis levels, we continue to invest in high-quality bonds due to the lack of adequate compensation for taking on risk.
Performance data quoted represents past performance and does not guarantee future results. The investment return and principal value of an investment will fluctuate, so that an investor’s shares, when redeemed, may be worth more or less than their original cost. Current performance may be higher or lower than that quoted; investors can obtain the most recentmonth-end performance at www.manning-napier.com or by calling (800)466-3863.
Please see the next page for additional performance information as of December 31, 2018.
For regulatory purposes, this is not an offering in all states.
All investments involve risks, including possible loss of principal. There is an inverse relationship between bond prices and interest rates; as interest rates rise, bond prices (and therefore the value of bond funds) fall. Likewise, as interest rates fall, bond prices and the value of bond funds rise. The income earned by the Series may be subject to the Alternative Minimum Tax (AMT), depending on your tax situation.
The Intercontinental Exchange (ICE) Bank of America Merrill Lynch1-12 Year Municipal Bond Index is a subset of the BofA Merrill Lynch U.S. Municipal Securities Index, an unmanaged, market-weighted index comprised of investment-grade, fixed rate, coupon bearing municipal bonds. The Index includes securities with maturities greater than one year but less than twelve years. The Index returns assume reinvestment of coupons and do not reflect any fees or expenses. Index returns provided by Interactive Data
2
Diversified Tax Exempt Series
Performance Update as of December 31, 2018
(unaudited)
| AVERAGE ANNUAL TOTAL RETURNS AS OF DECEMBER 31, 2018 | ||||||
ONE YEAR1 | FIVE YEAR | TEN YEAR | ||||
| Manning & Napier Fund, Inc. - Diversified Tax Exempt Series2 | 0.65% | 1.04% | 2.75% | |||
| Intercontinental Exchange (ICE) Bank of America Merrill Lynch (BofAML) 1-12 Year Municipal Bond Index3 | 1.64% | 2.28% | 3.23% | |||
The following graph compares the value of a $10,000 investment in the Manning & Napier Fund, Inc. - Diversified Tax Exempt Series for the ten years ended December 31, 2018 to the Intercontinental Exchange (ICE) BofA Merrill Lynch1-12 Year Municipal Bond Index.
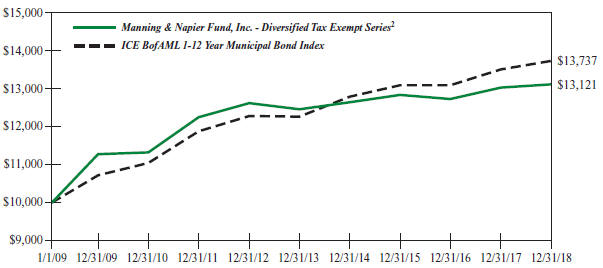
1The returns shown are based on net asset values calculated for shareholder transactions and may differ from the returns shown in the financial highlights, which reflect adjustments made to the net asset values in accordance with accounting principles generally accepted in the United States of America.
2The Series’ performance does not reflect the deduction of taxes that a shareholder would pay on fund distributions or the redemption of shares. The Series’ performance is historical and may not be indicative of future results. The performance returns shown are inclusive of the net expense ratio of the Series. For the year ended December 31, 2018, this net expense ratio was 0.59%. The gross expense ratio, which does not account for any voluntary or contractual waivers currently in effect, was 0.59% for the year ended December 31, 2018.
3The Intercontinental Exchange (ICE) Bank of America Merrill Lynch (BofAML)1-12 Year Municipal Bond Index is a subset of the ICE BofAML U.S. Municipal Securities Index. The Index includes all U.S. dollar denominated investment gradetax-exempt debt with a remaining term to final maturity greater than one year, but less than twelve years. Qualifying securities must have at least 18 months to final maturity at the time of issuance and a fixed coupon schedule. The Index returns do not reflect any fees or expenses. Index returns provided by Interactive Data.
3
Diversified Tax Exempt Series
Shareholder Expense Example
(unaudited)
As a shareholder of the Series, you incur ongoing costs, including management fees, shareholder service fees and other Series expenses. This example is intended to help you understand your ongoing costs (in dollars) of investing in the Series and to compare these costs with the ongoing costs of investing in other mutual funds.
The example is based on an investment of $1,000 invested at the beginning of the period and held for the entire period (July 1, 2018 to December 31, 2018).
Actual Expenses
The first line of the table below provides information about actual account values and actual expenses. You may use the information in this line, together with the amount you invested, to estimate the expenses that you paid over the period. Simply divide your account value by $1,000 (for example, an $8,600 account value divided by $1,000 = 8.6), then multiply the result by the number in the first line under the heading entitled “Expenses Paid During Period” to estimate the expenses you paid on your account during this period.
Hypothetical Example for Comparison Purposes
The second line of the table below provides information about hypothetical account values and hypothetical expenses based on the Series’ actual expense ratio and an assumed rate of return of 5% per year before expenses, which is not the Series’ actual return. The hypothetical account values and expenses may not be used to estimate the actual ending account balance or expenses you paid during the period. You may use this information to compare the ongoing costs of investing in the Series and other funds. To do so, compare this 5% hypothetical example with the 5% hypothetical examples that appear in the shareholder reports of the other funds.
Please note that the expenses shown in the table are meant to highlight your ongoing costs only and do not reflect any transaction costs, such as sales charges (loads), redemption fees, or exchange fees that you may incur in other mutual funds. Therefore, the second line of the table is useful in comparing ongoing costs only, and will not help you determine the relative total costs of owning different funds.
| BEGINNING ACCOUNT VALUE 7/1/18 | ENDING ACCOUNT VALUE 12/31/18 | EXPENSES PAID DURING PERIOD* 7/1/18-12/31/18 | ||||
Class A | ||||||
Actual | $1,000.00 | $1,009.71 | $2.99 | |||
Hypothetical | $1,000.00 | $1,022.23 | $3.01 |
*Expenses are equal to the Series’ annualized expense ratio (for thesix-month period) of 0.59%, multiplied by the average account value over the period, multiplied by 184/365 (to reflect theone-half year period). Expenses are based on the most recent fiscal half year; therefore; the expense ratio stated above may differ from the expense ratio stated in the financial highlights, which are based onone-year data.
4
Diversified Tax Exempt Series
Portfolio Composition as of December 31, 2018
(unaudited)
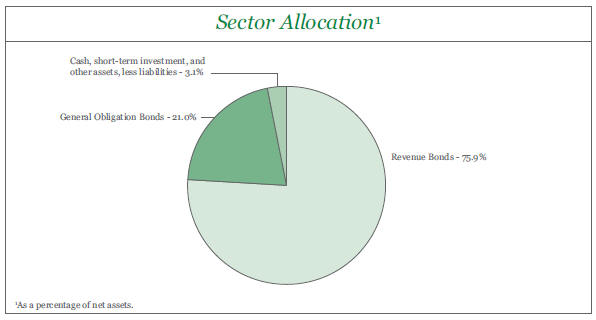
| Top Ten States2 | ||||||||||
New York | 10.5% | Oregon | 5.8% | |||||||
Washington | 8.5% | Georgia | 4.1% | |||||||
Texas | 7.4% | Arizona | 3.5% | |||||||
Florida | 6.9% | Pennsylvania | 3.4% | |||||||
Ohio | 6.1% | Massachusetts | 3.4% | |||||||
2As a percentage of total investments. | ||||||||||
5
Diversified Tax Exempt Series
Investment Portfolio - December 31, 2018
| CREDIT | ||||||||||||||||||||
| COUPON | MATURITY | RATING1 | PRINCIPAL | VALUE | ||||||||||||||||
| RATE | DATE | (UNAUDITED) | AMOUNT | (NOTE 2) | ||||||||||||||||
MUNICIPAL BONDS - 96.9% | ||||||||||||||||||||
ALASKA - 0.2% | ||||||||||||||||||||
Alaska Municipal Bond Bank Authority, Series 2, Revenue Bond | 5.000% | 9/1/2022 | A1 | $ | 500,000 | $ | 543,470 | |||||||||||||
|
| |||||||||||||||||||
ARIZONA - 3.5% | ||||||||||||||||||||
Mesa, Multiple Utility Impt., Revenue Bond | 5.000% | 7/1/2023 | Aa2 | 1,050,000 | 1,183,791 | |||||||||||||||
Mesa, Multiple Utility Impt., Revenue Bond | 5.000% | 7/1/2024 | Aa2 | 1,200,000 | 1,378,356 | |||||||||||||||
Mesa, Multiple Utility Impt., Revenue Bond | 3.000% | 7/1/2039 | Aa2 | 1,525,000 | 1,403,595 | |||||||||||||||
Pima County Sewer System, Series A, Revenue Bond | 5.000% | 7/1/2019 | AA2 | 1,000,000 | 1,015,880 | |||||||||||||||
Pima County Sewer System, Series B, Revenue Bond | 5.000% | 7/1/2020 | AA2 | 1,400,000 | 1,465,338 | |||||||||||||||
Salt River Project Agricultural Impt. & Power District, Series B, Revenue Bond | 5.000% | 12/1/2020 | Aa1 | 400,000 | 423,780 | |||||||||||||||
Tucson Water System Revenue, Water Utility Impt., Revenue Bond | 5.000% | 7/1/2021 | Aa2 | 1,000,000 | 1,076,700 | |||||||||||||||
Tucson Water System Revenue, Water Utility Impt., Revenue Bond | 5.000% | 7/1/2030 | Aa2 | 1,575,000 | 1,872,014 | |||||||||||||||
Yavapai County Industrial Development Authority, Northern Arizona Healthcare System, Revenue Bond | 5.000% | 10/1/2020 | | AA2 | | 460,000 | 484,909 | |||||||||||||
|
| |||||||||||||||||||
| 10,304,363 | ||||||||||||||||||||
|
| |||||||||||||||||||
COLORADO - 3.0% | ||||||||||||||||||||
Aurora Water, Green Bond, Revenue Bond | 4.000% | 8/1/2046 | AA2 | 2,000,000 | 2,052,600 | |||||||||||||||
Boulder County, Series A, Revenue Bond | 5.000% | 7/15/2026 | AA2 | 1,000,000 | 1,190,340 | |||||||||||||||
Boulder Water & Sewer, Revenue Bond | 5.000% | 12/1/2019 | Aa1 | 1,500,000 | 1,543,710 | |||||||||||||||
Colorado Springs Utilities System, SeriesC-1, Revenue Bond | 5.000% | 11/15/2019 | Aa2 | 2,435,000 | 2,502,303 | |||||||||||||||
Denver Wastewater Management Division Department of Public Works, Revenue Bond | 4.000% | 11/1/2020 | Aa1 | 1,500,000 | 1,559,040 | |||||||||||||||
|
| |||||||||||||||||||
| 8,847,993 | ||||||||||||||||||||
|
| |||||||||||||||||||
DELAWARE - 0.7% | ||||||||||||||||||||
Delaware River & Bay Authority, Series C, Revenue Bond | 5.000% | 1/1/2019 | A1 | 2,000,000 | 2,000,000 | |||||||||||||||
|
| |||||||||||||||||||
DISTRICT OF COLUMBIA - 2.7% | ||||||||||||||||||||
District of Columbia Water & Sewer Authority, Series A, Revenue Bond | 5.000% | 10/1/2029 | Aa2 | 1,380,000 | 1,596,370 | |||||||||||||||
District of Columbia Water & Sewer Authority, Series B, Revenue Bond | 5.000% | 10/1/2036 | Aa2 | 900,000 | 1,014,399 | |||||||||||||||
The accompanying notes are an integral part of the financial statements.
6
Diversified Tax Exempt Series
Investment Portfolio - December 31, 2018
| CREDIT | ||||||||||||||||||||
| COUPON | MATURITY | RATING1 | PRINCIPAL | VALUE | ||||||||||||||||
| RATE | DATE | (UNAUDITED) | AMOUNT | (NOTE 2) | ||||||||||||||||
MUNICIPAL BONDS(continued) | ||||||||||||||||||||
DISTRICT OF COLUMBIA(continued) | ||||||||||||||||||||
District of Columbia Water & Sewer Authority, Series C, Revenue Bond | 5.000% | 10/1/2022 | Aa2 | $ | 1,000,000 | $ | 1,107,680 | |||||||||||||
District of Columbia, Public Impt., Series C, Revenue Bond | 5.000% | 12/1/2021 | Aa1 | 2,120,000 | 2,308,383 | |||||||||||||||
District of Columbia, Public Impt., Series D, G.O. Bond | 5.000% | 6/1/2026 | Aaa | 750,000 | 894,570 | |||||||||||||||
District of Columbia, Public Impt., Series D, G.O. Bond | 5.000% | 6/1/2035 | Aaa | 1,000,000 | 1,156,530 | |||||||||||||||
|
| |||||||||||||||||||
| 8,077,932 | ||||||||||||||||||||
|
| |||||||||||||||||||
FLORIDA - 6.8% | ||||||||||||||||||||
Daytona Beach Utility System, Water Utility Impt., Revenue Bond, AGM | 5.000% | 11/1/2019 | A1 | 1,010,000 | 1,035,563 | |||||||||||||||
Florida State, G.O. Bond | 3.500% | 7/1/2046 | Aaa | 2,000,000 | 1,911,360 | |||||||||||||||
Florida’s Turnpike Enterprise, Series C, Revenue Bond | 5.000% | 7/1/2019 | Aa2 | 920,000 | 934,610 | |||||||||||||||
Fort Lauderdale, Water & Sewer, Revenue Bond | 5.000% | 9/1/2020 | Aa1 | 1,545,000 | 1,624,475 | |||||||||||||||
Fort Lauderdale, Water & Sewer, Revenue Bond | 2.000% | 9/1/2026 | Aa1 | 960,000 | 911,194 | |||||||||||||||
Fort Lauderdale, Water & Sewer, Revenue Bond | 2.000% | 3/1/2027 | Aa1 | 995,000 | 934,275 | |||||||||||||||
Fort Myers Utility System, Utility Impt., Revenue Bond | 5.000% | 10/1/2019 | Aa3 | 785,000 | 803,471 | |||||||||||||||
JEA Electric System, Series B, Revenue Bond | 5.000% | 10/1/2019 | A3 | 2,000,000 | 2,044,060 | |||||||||||||||
JEA Electric System, Swap Termination, Series B, Revenue Bond | 5.000% | 10/1/2019 | A3 | 1,500,000 | 1,533,045 | |||||||||||||||
JEA Water & Sewer System, Series A, Revenue Bond | 5.000% | 10/1/2027 | A2 | 1,000,000 | 1,177,190 | |||||||||||||||
Miami-Dade County, Water & Sewer System, Revenue Bond | 5.000% | 10/1/2023 | Aa3 | 2,000,000 | 2,260,540 | |||||||||||||||
Miami-Dade County, Water & Sewer System, Series B, Revenue Bond, AGM | 5.250% | 10/1/2019 | Aa3 | 500,000 | 512,420 | |||||||||||||||
Okaloosa County, Water & Sewer, Revenue Bond | 5.000% | 7/1/2023 | Aa3 | 2,065,000 | 2,322,444 | |||||||||||||||
Orlando-Orange County Expressway Authority, Revenue Bond | 5.000% | 7/1/2019 | A1 | 500,000 | 507,765 | |||||||||||||||
Orlando-Orange County Expressway Authority, Swap Termination, Series B, Revenue Bond | 5.000% | 7/1/2020 | A1 | 1,165,000 | 1,218,846 | |||||||||||||||
Port St. Lucie Utility System, Water Utility Impt., Revenue Bond, NATL | 5.250% | 9/1/2023 | A1 | 500,000 | 563,410 | |||||||||||||||
|
| |||||||||||||||||||
| 20,294,668 | ||||||||||||||||||||
|
| |||||||||||||||||||
GEORGIA - 4.0% | ||||||||||||||||||||
Atlanta, Water & Wastewater, Series B, Revenue Bond | 5.000% | 11/1/2019 | Aa2 | 1,160,000 | 1,190,821 | |||||||||||||||
The accompanying notes are an integral part of the financial statements.
7
Diversified Tax Exempt Series
Investment Portfolio - December 31, 2018
| CREDIT | ||||||||||||||||||||
| COUPON | MATURITY | RATING1 | PRINCIPAL | VALUE | ||||||||||||||||
| RATE | DATE | (UNAUDITED) | AMOUNT | (NOTE 2) | ||||||||||||||||
MUNICIPAL BONDS(continued) | ||||||||||||||||||||
GEORGIA(continued) | ||||||||||||||||||||
DeKalb County, Water & Sewerage, Revenue Bond | 5.000% | 10/1/2019 | Aa3 | $ | 500,000 | $ | 511,840 | |||||||||||||
Fulton County Water & Sewerage, Revenue Bond | 5.000% | 1/1/2019 | Aa2 | 1,200,000 | 1,200,000 | |||||||||||||||
Georgia State, Series E, G.O. Bond | 5.000% | 12/1/2025 | Aaa | 4,000,000 | 4,748,200 | |||||||||||||||
Municipal Electric Authority of Georgia, Series A, Revenue Bond | 5.250% | 1/1/2019 | A2 | 2,250,000 | 2,250,000 | |||||||||||||||
Municipal Electric Authority of Georgia, Series A, Revenue Bond | 5.250% | 1/1/2019 | A2 | 500,000 | 500,000 | |||||||||||||||
Municipal Electric Authority of Georgia, Series A, Revenue Bond | 5.000% | 11/1/2019 | A1 | 485,000 | 496,669 | |||||||||||||||
Municipal Electric Authority of Georgia, Series A, Revenue Bond | 5.000% | 11/1/2020 | A1 | 1,000,000 | 1,050,970 | |||||||||||||||
|
| |||||||||||||||||||
| 11,948,500 | ||||||||||||||||||||
|
| |||||||||||||||||||
HAWAII- 1.0% | ||||||||||||||||||||
Honolulu County Wastewater System, Sewer Impt., Series A, Revenue Bond | 5.000% | 7/1/2020 | Aa3 | 1,000,000 | 1,016,030 | |||||||||||||||
Honolulu County Wastewater System, Sewer Impt., Series A, Revenue Bond | 5.000% | 7/1/2023 | Aa3 | 1,750,000 | 1,972,180 | |||||||||||||||
|
| |||||||||||||||||||
| 2,988,210 | ||||||||||||||||||||
|
| |||||||||||||||||||
ILLINOIS - 2.0% | ||||||||||||||||||||
Aurora, Waterworks & Sewerage, Series B, Revenue Bond | 3.000% | 12/1/2022 | AA2 | 500,000 | 513,390 | |||||||||||||||
Aurora, Waterworks & Sewerage, Series B, Revenue Bond | 3.000% | 12/1/2023 | AA2 | 625,000 | 644,906 | |||||||||||||||
Central Lake County Joint Action Water Agency, Prerefunded Balance, Revenue Bond | 4.000% | 5/1/2019 | WR3 | 10,000 | 10,073 | |||||||||||||||
Central Lake County Joint Action Water Agency, Unrefunded Balance, Revenue Bond | 4.000% | 5/1/2019 | Aa2 | 750,000 | 755,175 | |||||||||||||||
Illinois Municipal Electric Agency, Series A, Revenue Bond | 5.000% | 2/1/2025 | A1 | 2,000,000 | 2,282,700 | |||||||||||||||
Illinois State Toll Highway Authority, Series A, Revenue Bond | 5.000% | 12/1/2019 | Aa3 | 1,000,000 | 1,027,950 | |||||||||||||||
Sangamon & Morgan Counties Community Unit School District No. 16 New Berlin, School Impt., G.O. Bond, NATL | 5.500% | 2/1/2019 | Baa2 | 725,000 | 726,965 | |||||||||||||||
|
| |||||||||||||||||||
| 5,961,159 | ||||||||||||||||||||
|
| |||||||||||||||||||
INDIANA - 1.4% | ||||||||||||||||||||
Fort Wayne Waterworks, Water Utility Impt., Revenue Bond | 2.000% | 12/1/2020 | Aa3 | 745,000 | 747,220 | |||||||||||||||
The accompanying notes are an integral part of the financial statements.
8
Diversified Tax Exempt Series
Investment Portfolio - December 31, 2018
| CREDIT | ||||||||||||||||||||
| COUPON | MATURITY | RATING1 | PRINCIPAL | VALUE | ||||||||||||||||
| RATE | DATE | (UNAUDITED) | AMOUNT | (NOTE 2) | ||||||||||||||||
MUNICIPAL BONDS(continued) | ||||||||||||||||||||
INDIANA(continued) | ||||||||||||||||||||
Indiana Municipal Power Agency, Series A, Revenue Bond | 5.000% | 1/1/2019 | A1 | $ | 2,540,000 | $ | 2,540,000 | |||||||||||||
Indiana Municipal Power Agency, Series A, Revenue Bond | 4.000% | 1/1/2020 | A1 | 750,000 | 766,193 | |||||||||||||||
|
| |||||||||||||||||||
| 4,053,413 | ||||||||||||||||||||
|
| |||||||||||||||||||
IOWA - 0.8% | ||||||||||||||||||||
Cedar Falls, Electric Utility, Revenue Bond | 5.000% | 12/1/2023 | Aa2 | 2,000,000 | 2,272,280 | |||||||||||||||
|
| |||||||||||||||||||
KANSAS - 2.7% | ||||||||||||||||||||
Kansas Development Finance Authority, Prerefunded Balance, Revenue Bond | 5.000% | 11/15/2020 | WR3 | 20,000 | 20,512 | |||||||||||||||
Kansas Development Finance Authority, Unrefunded Balance, Revenue Bond | 5.000% | 11/15/2020 | Aa2 | 480,000 | 493,056 | |||||||||||||||
Kansas Turnpike Authority, Series A, Revenue Bond | 5.000% | 9/1/2019 | AA2 | 2,965,000 | 3,026,998 | |||||||||||||||
Topeka Combined Utility, Series A, Revenue Bond | 4.000% | 8/1/2019 | Aa3 | 845,000 | 855,681 | |||||||||||||||
Wichita, Water & Sewer Utility, Series B, Revenue Bond | 5.000% | 10/1/2019 | AA2 | 2,000,000 | 2,046,920 | |||||||||||||||
Wyandotte County-Kansas City Unified Government Utility System, Water Utility Impt., Series A, Revenue Bond | 5.000% | 9/1/2020 | A2 | 1,495,000 | 1,569,630 | |||||||||||||||
|
| |||||||||||||||||||
| 8,012,797 | ||||||||||||||||||||
|
| |||||||||||||||||||
KENTUCKY - 0.6% | ||||||||||||||||||||
Kentucky Turnpike Authority, Series A, Revenue Bond | 5.000% | 7/1/2019 | Aa3 | 500,000 | 507,640 | |||||||||||||||
Louisville & Jefferson County, Sewer Impt., Series A, Revenue Bond | 5.000% | 5/15/2024 | Aa3 | 1,070,000 | 1,224,348 | |||||||||||||||
|
| |||||||||||||||||||
| 1,731,988 | ||||||||||||||||||||
|
| |||||||||||||||||||
LOUISIANA - 1.1% | ||||||||||||||||||||
Lafayette Utilities, Water & Sewer Impt., Revenue Bond | 5.000% | 11/1/2019 | A1 | 990,000 | 1,014,978 | |||||||||||||||
New Orleans, Sewer Impt., Revenue Bond | 5.000% | 6/1/2021 | A2 | 600,000 | 639,378 | |||||||||||||||
New Orleans, Water Utility Impt., Revenue Bond | 5.000% | 12/1/2020 | A2 | 1,700,000 | 1,790,542 | |||||||||||||||
|
| |||||||||||||||||||
| 3,444,898 | ||||||||||||||||||||
|
| |||||||||||||||||||
MAINE - 0.7% | ||||||||||||||||||||
Maine Municipal Bond Bank, Various Purposes Impt., Series E, Revenue Bond | 4.000% | 11/1/2021 | Aa2 | 570,000 | 603,277 | |||||||||||||||
The accompanying notes are an integral part of the financial statements.
9
Diversified Tax Exempt Series
Investment Portfolio - December 31, 2018
| CREDIT | ||||||||||||||||||||
| COUPON | MATURITY | RATING1 | PRINCIPAL | VALUE | ||||||||||||||||
| RATE | DATE | (UNAUDITED) | AMOUNT | (NOTE 2) | ||||||||||||||||
MUNICIPAL BONDS(continued) | ||||||||||||||||||||
MAINE(continued) | ||||||||||||||||||||
Maine, Public Impt., Series B, G.O. Bond | 5.000% | 6/1/2021 | Aa2 | $ | 1,355,000 | $ | 1,454,836 | |||||||||||||
|
| |||||||||||||||||||
| 2,058,113 | ||||||||||||||||||||
|
| |||||||||||||||||||
MARYLAND - 1.8% | ||||||||||||||||||||
Baltimore, Wastewater Projects, Series C, Revenue Bond | 5.000% | 7/1/2026 | Aa2 | 815,000 | 966,924 | |||||||||||||||
Maryland Health & Higher Educational Facilities Authority, Revenue Bond | 5.000% | 7/1/2019 | A2 | 500,000 | 507,590 | |||||||||||||||
Maryland, Series2-C, G.O. Bond | 5.000% | 8/1/2021 | AAA | 1,000,000 | 1,079,970 | |||||||||||||||
Montgomery County, Public Impt., Series A, G.O. Bond | 5.000% | 11/1/2032 | Aaa | 2,365,000 | 2,856,660 | |||||||||||||||
|
| |||||||||||||||||||
| 5,411,144 | ||||||||||||||||||||
|
| |||||||||||||||||||
MASSACHUSETTS - 3.4% | ||||||||||||||||||||
Boston, Public Impt., Series A, G.O. Bond | 5.000% | 5/1/2037 | AAA | 5,000,000 | 5,897,300 | |||||||||||||||
Commonwealth of Massachusetts, Series C, G.O. Bond | 3.625% | 10/1/2040 | Aa1 | 3,000,000 | 2,918,310 | |||||||||||||||
Massachusetts Water Resources Authority, Series B, Revenue Bond, AGM | 5.250% | 8/1/2032 | Aa1 | 970,000 | 1,243,210 | |||||||||||||||
|
| |||||||||||||||||||
| 10,058,820 | ||||||||||||||||||||
|
| |||||||||||||||||||
MICHIGAN - 1.1% | ||||||||||||||||||||
Ann Arbor Sewage Disposal System, Revenue Bond | 3.000% | 7/1/2020 | AA2 | 1,000,000 | 1,017,910 | |||||||||||||||
Ann Arbor Sewage Disposal System, Revenue Bond | 2.000% | 7/1/2027 | AA2 | 820,000 | 766,979 | |||||||||||||||
Walled Lake Consolidated School District, G.O. Bond | 5.000% | 5/1/2019 | Aa1 | 1,000,000 | 1,010,440 | |||||||||||||||
West Ottawa Public Schools, Series I, G.O. Bond | 5.000% | 5/1/2019 | Aa2 | 400,000 | 404,256 | |||||||||||||||
|
| |||||||||||||||||||
| 3,199,585 | ||||||||||||||||||||
|
| |||||||||||||||||||
MINNESOTA - 0.8% | ||||||||||||||||||||
Minnesota State, Series D, G.O. Bond | 5.000% | 8/1/2024 | Aa1 | 2,000,000 | 2,314,020 | |||||||||||||||
|
| |||||||||||||||||||
MISSOURI - 1.9% | ||||||||||||||||||||
Kansas City, Sanitary Sewer System, Sewer Impt., Series A, Revenue Bond | 4.000% | 1/1/2025 | Aa2 | 750,000 | 829,425 | |||||||||||||||
Kansas City, Sanitary Sewer System, Sewer Impt., Series A, Revenue Bond | 5.000% | 1/1/2027 | Aa2 | 1,590,000 | 1,831,998 | |||||||||||||||
Metropolitan St Louis Sewer District, Sewer Impt., Series C, Revenue Bond | 4.000% | 5/1/2041 | Aa1 | 2,000,000 | 2,068,000 | |||||||||||||||
The accompanying notes are an integral part of the financial statements.
10
Diversified Tax Exempt Series
Investment Portfolio - December 31, 2018
| CREDIT | ||||||||||||||||||||
| COUPON | MATURITY | RATING1 | PRINCIPAL | VALUE | ||||||||||||||||
| RATE | DATE | (UNAUDITED) | AMOUNT | (NOTE 2) | ||||||||||||||||
MUNICIPAL BONDS(continued) | ||||||||||||||||||||
MISSOURI(continued) | ||||||||||||||||||||
Missouri Housing Development Commission, Series A, Revenue Bond | 1.600% | 11/1/2019 | AA2 | $ | 225,000 | $ | 224,611 | |||||||||||||
Missouri State Health & Educational Facilities Authority, Revenue Bond | 5.000% | 1/1/2020 | Aa2 | 725,000 | 748,055 | |||||||||||||||
|
| |||||||||||||||||||
| 5,702,089 | ||||||||||||||||||||
|
| |||||||||||||||||||
NEBRASKA - 2.7% | ||||||||||||||||||||
Lincoln Electric System, Revenue Bond | 5.000% | 9/1/2021 | AA2 | 2,000,000 | 2,161,720 | |||||||||||||||
Nebraska Public Power District, Revenue Bond | 5.000% | 1/1/2019 | A1 | 1,000,000 | 1,000,000 | |||||||||||||||
Nebraska Public Power District, Series A, Revenue Bond | 5.000% | 1/1/2019 | A1 | 500,000 | 500,000 | |||||||||||||||
Nebraska Public Power District, Series B, Revenue Bond | 5.000% | 1/1/2020 | A1 | 1,000,000 | 1,031,100 | |||||||||||||||
Omaha Public Power District, Series A, Revenue Bond | 5.000% | 2/1/2030 | Aa2 | 1,000,000 | 1,161,230 | |||||||||||||||
Omaha Public Power District, Series A, Revenue Bond | 5.000% | 2/1/2031 | Aa2 | 900,000 | 1,069,227 | |||||||||||||||
Omaha Public Power District, Series C, Revenue Bond | 5.000% | 2/1/2019 | Aa2 | 1,265,000 | 1,268,200 | |||||||||||||||
|
| |||||||||||||||||||
| 8,191,477 | ||||||||||||||||||||
|
| |||||||||||||||||||
NEW HAMPSHIRE - 0.9% | ||||||||||||||||||||
New Hampshire State Turnpike System, Series B, Revenue Bond | 5.000% | 2/1/2020 | A1 | 2,575,000 | 2,661,391 | |||||||||||||||
|
| |||||||||||||||||||
NEW JERSEY - 0.8% | ||||||||||||||||||||
New Jersey State Turnpike Authority, Prerefunded Balance, Series H, Revenue Bond | 5.000% | 1/1/2020 | | WR3 | | 355,000 | 355,000 | |||||||||||||
New Jersey State Turnpike Authority, Series B, Revenue Bond | 5.000% | 1/1/2019 | A2 | 1,625,000 | 1,625,000 | |||||||||||||||
New Jersey State Turnpike Authority, Unrefunded Balance, Series H, Revenue Bond | 5.000% | 1/1/2020 | A2 | 560,000 | 561,400 | |||||||||||||||
|
| |||||||||||||||||||
| 2,541,400 | ||||||||||||||||||||
|
| |||||||||||||||||||
NEW MEXICO - 1.2% | ||||||||||||||||||||
Albuquerque Bernalillo County Water Utility Authority, Water Utility Impt., Revenue Bond | 5.000% | 7/1/2022 | Aa2 | 1,250,000 | 1,379,525 | |||||||||||||||
Albuquerque Bernalillo County Water Utility Authority, Water Utility Impt., Revenue Bond | 5.000% | 7/1/2023 | Aa2 | 2,000,000 | 2,258,520 | |||||||||||||||
|
| |||||||||||||||||||
| 3,638,045 | ||||||||||||||||||||
|
| |||||||||||||||||||
The accompanying notes are an integral part of the financial statements.
11
Diversified Tax Exempt Series
Investment Portfolio - December 31, 2018
| CREDIT | ||||||||||||||||||||
| COUPON | MATURITY | RATING1 | PRINCIPAL | VALUE | ||||||||||||||||
| RATE | DATE | (UNAUDITED) | AMOUNT | (NOTE 2) | ||||||||||||||||
MUNICIPAL BONDS (continued) | ||||||||||||||||||||
NEW YORK - 10.3% | ||||||||||||||||||||
Metropolitan Transportation Authority, SeriesD-1, Revenue Bond | 5.000% | 11/15/2024 | A1 | $ | 1,385,000 | $ | 1,576,047 | |||||||||||||
Metropolitan Transportation Authority, Series F, Revenue Bond | 5.000% | 11/15/2019 | A1 | 1,315,000 | 1,350,071 | |||||||||||||||
Nassau County, Public Impt., Series A, G.O. Bond | 5.000% | 4/1/2019 | A2 | 1,000,000 | 1,007,660 | |||||||||||||||
New York City Transitional Finance Authority, Future Tax Secured, Public Impt., SubseriesC-2, Revenue Bond | 5.000% | 5/1/2037 | Aa1 | 2,740,000 | 3,168,399 | |||||||||||||||
New York City Transitional Finance Authority, Future Tax Secured, Public Impt., SubseriesF-3, Revenue Bond | 3.000% | 2/1/2037 | Aa1 | 3,000,000 | 2,733,270 | |||||||||||||||
New York City Water & Sewer System, Series EE, Revenue Bond | 5.000% | 6/15/2040 | Aa1 | 3,500,000 | 3,989,790 | |||||||||||||||
New York City, Public Impt., SeriesF-1, G.O. Bond | 5.000% | 6/1/2024 | Aa2 | 2,880,000 | 3,308,227 | |||||||||||||||
New York City, Series 1, G.O. Bond | 5.000% | 8/1/2020 | Aa2 | 1,000,000 | 1,049,860 | |||||||||||||||
New York City, Series 1, G.O. Bond | 5.000% | 8/1/2023 | Aa2 | 2,000,000 | 2,260,260 | |||||||||||||||
New York City, Series A, G.O. Bond | 5.000% | 8/1/2023 | Aa2 | 2,000,000 | 2,260,260 | |||||||||||||||
New York State Dormitory Authority, School Impt., Series E, Revenue Bond, AGM | 5.000% | 10/1/2025 | A2 | 860,000 | 968,308 | |||||||||||||||
New York State Dormitory Authority, Series 1, Revenue Bond | 4.000% | 7/1/2020 | Aa3 | 420,000 | 434,070 | |||||||||||||||
New York State Thruway Authority, Highway Impt., Series I, Revenue Bond | 4.000% | 1/1/2019 | A2 | 1,000,000 | 1,000,000 | |||||||||||||||
New York State Urban Development Corp., Highway Impt., Series C, Revenue Bond | 5.000% | 3/15/2024 | Aa1 | 765,000 | 854,367 | |||||||||||||||
Triborough Bridge & Tunnel Authority, Series B, Revenue Bond | 4.000% | 11/15/2019 | Aa3 | 725,000 | 739,145 | |||||||||||||||
Triborough Bridge & Tunnel Authority, Series B, Revenue Bond | 5.000% | 11/15/2020 | Aa3 | 920,000 | 974,308 | |||||||||||||||
Triborough Bridge & Tunnel Authority, Subseries A, Revenue Bond | 5.000% | 11/15/2023 | A1 | 2,805,000 | 3,158,879 | |||||||||||||||
|
| |||||||||||||||||||
| 30,832,921 | ||||||||||||||||||||
|
| |||||||||||||||||||
NORTH CAROLINA - 2.7% | ||||||||||||||||||||
Charlotte, Water & Sewer System, Revenue Bond | 5.000% | 12/1/2020 | Aaa | 1,400,000 | 1,484,308 | |||||||||||||||
Charlotte, Water & Sewer System, Revenue Bond | 4.000% | 7/1/2047 | Aaa | 2,000,000 | 2,068,740 | |||||||||||||||
North Carolina Medical Care Commission, Moses Cone Health System, Revenue Bond | 5.000% | 10/1/2020 | AA2 | 580,000 | 611,407 | |||||||||||||||
North Carolina Municipal Power Agency No. 1, Series A, Revenue Bond | 5.000% | 1/1/2020 | A2 | 400,000 | 412,280 | |||||||||||||||
North Carolina Municipal Power Agency No. 1, Series A, Revenue Bond | 5.000% | 1/1/2024 | A2 | 3,000,000 | 3,402,840 | |||||||||||||||
|
| |||||||||||||||||||
| 7,979,575 | ||||||||||||||||||||
|
| |||||||||||||||||||
The accompanying notes are an integral part of the financial statements.
12
Diversified Tax Exempt Series
Investment Portfolio - December 31, 2018
| CREDIT | ||||||||||||||||||||
| COUPON | MATURITY | RATING1 | PRINCIPAL | VALUE | ||||||||||||||||
| RATE | DATE | (UNAUDITED) | AMOUNT | (NOTE 2) | ||||||||||||||||
MUNICIPAL BONDS(continued) | ||||||||||||||||||||
OHIO - 6.0% | ||||||||||||||||||||
American Municipal Power, Inc., Fremont Energy Center Project, Prerefunded Balance, Series B, Revenue Bond | 5.000% | 2/15/2023 | A1 | $ | 1,895,000 | $ | 2,068,317 | |||||||||||||
Cincinnati Water System, Series B, Revenue Bond | 5.000% | 12/1/2026 | Aaa | 500,000 | 600,735 | |||||||||||||||
Cincinnati Water System, Series C, Revenue Bond | 5.000% | 12/1/2025 | Aaa | 1,000,000 | 1,184,930 | |||||||||||||||
Columbus, Sewer Impt., Revenue Bond | 5.000% | 6/1/2026 | Aa1 | 520,000 | 601,843 | |||||||||||||||
Ohio State Turnpike Commission, Series A, Revenue Bond | 5.250% | 2/15/2027 | Aa2 | 600,000 | 731,844 | |||||||||||||||
Ohio State Turnpike Commission, Series A, Revenue Bond, NATL | 5.500% | 2/15/2019 | Aa2 | 3,735,000 | 3,751,583 | |||||||||||||||
Ohio State, Public Impt., Series B, G.O. Bond | 3.000% | 9/1/2021 | Aa1 | 2,000,000 | 2,057,840 | |||||||||||||||
Ohio State, School Impt., Prerefunded Balance, Series B, G.O. Bond | 5.000% | 6/15/2024 | Aa1 | 4,200,000 | 4,628,316 | |||||||||||||||
Toledo Water System, Water Utility Impt., Revenue Bond | 5.000% | 11/15/2019 | Aa3 | 1,010,000 | 1,037,644 | |||||||||||||||
Toledo Water System, Water Utility Impt., Series A, Revenue Bond | 5.000% | 11/15/2022 | Aa3 | 610,000 | 660,545 | |||||||||||||||
Toledo, Capital Impt., G.O. Bond | 5.000% | 12/1/2020 | A2 | 610,000 | 643,074 | |||||||||||||||
|
| |||||||||||||||||||
| 17,966,671 | ||||||||||||||||||||
|
| |||||||||||||||||||
OKLAHOMA - 1.7% | ||||||||||||||||||||
Oklahoma Turnpike Authority, Series A, Revenue Bond | 5.000% | 1/1/2020 | Aa3 | 2,750,000 | 2,837,450 | |||||||||||||||
Oklahoma Turnpike Authority, Series A, Revenue Bond | 5.000% | 1/1/2022 | Aa3 | 2,000,000 | 2,116,740 | |||||||||||||||
|
| |||||||||||||||||||
| 4,954,190 | ||||||||||||||||||||
|
| |||||||||||||||||||
OREGON - 5.7% | ||||||||||||||||||||
Bend, Water Utility Impt., Revenue Bond | 5.000% | 12/1/2030 | Aa2 | 1,435,000 | 1,669,967 | |||||||||||||||
Clackamas County Service District No. 1, Sewer Impt., Revenue Bond | 2.000% | 12/1/2029 | AAA2 | 1,000,000 | 927,880 | |||||||||||||||
Medford Hospital Facilities Authority, Asante Health System, Revenue Bond, AGM | 5.000% | 8/15/2019 | AA2 | 440,000 | 448,668 | |||||||||||||||
Oregon State Housing & Community Services Department, Series A, Revenue Bond | 1.950% | 7/1/2020 | Aa2 | 225,000 | 225,065 | |||||||||||||||
Oregon, Correctional Facility Impt., Series A, G.O. Bond | 5.000% | 5/1/2043 | Aa1 | 2,500,000 | 2,884,300 | |||||||||||||||
Portland Building Project, Series B, G.O. Bond | 5.000% | 6/15/2038 | Aaa | 4,000,000 | 4,686,320 | |||||||||||||||
Portland Sewer System, Series A, Revenue Bond | 5.000% | 8/1/2019 | Aa2 | 1,285,000 | 1,308,734 | |||||||||||||||
Portland Sewer System, Series A, Revenue Bond | 5.000% | 6/15/2026 | Aa1 | 2,480,000 | 2,947,232 | |||||||||||||||
Portland Sewer System, Series B, Revenue Bond | 2.125% | 6/15/2030 | Aa2 | 1,000,000 | 911,490 | |||||||||||||||
The accompanying notes are an integral part of the financial statements.
13
Diversified Tax Exempt Series
Investment Portfolio - December 31, 2018
| CREDIT | ||||||||||||||||||||
| COUPON | MATURITY | RATING1 | PRINCIPAL | VALUE | ||||||||||||||||
| RATE | DATE | (UNAUDITED) | AMOUNT | (NOTE 2) | ||||||||||||||||
MUNICIPAL BONDS(continued) | ||||||||||||||||||||
OREGON(continued) | ||||||||||||||||||||
Washington County Clean Water Services, Sewer Impt., Series B, Revenue Bond | 5.000% | 10/1/2021 | Aa1 | $ | 1,015,000 | $ | 1,098,727 | |||||||||||||
|
| |||||||||||||||||||
| 17,108,383 | ||||||||||||||||||||
|
| |||||||||||||||||||
PENNSYLVANIA - 3.4% | ||||||||||||||||||||
Allegheny County Hospital Development Authority, University of Pittsburgh Medical Center, Revenue Bond | 5.000% | 8/15/2019 | A1 | 640,000 | 652,134 | |||||||||||||||
Allegheny County Sanitary Authority, Revenue Bond, AGM | 5.000% | 12/1/2019 | A1 | 1,500,000 | 1,541,775 | |||||||||||||||
North Wales Water Authority, Series A, Revenue Bond | 5.000% | 11/1/2020 | AA2 | 1,000,000 | 1,057,070 | |||||||||||||||
Pennsylvania Turnpike Commission, Highway Impt., SeriesA-1, Revenue Bond | 5.000% | 12/1/2023 | A1 | 1,200,000 | 1,354,380 | |||||||||||||||
Pennsylvania Turnpike Commission, Series A, Revenue Bond, AGM | 5.250% | 7/15/2019 | A1 | 1,050,000 | 1,069,582 | |||||||||||||||
Pennsylvania Turnpike Commission, Series B, Revenue Bond | 5.000% | 12/1/2020 | A1 | 1,000,000 | 1,027,760 | |||||||||||||||
Philadelphia, Water & Wastewater, Swap Termination, Series A, Revenue Bond, AGM | 5.000% | 6/15/2019 | A1 | 1,000,000 | 1,014,490 | |||||||||||||||
Pittsburgh Water & Sewer Authority, Prerefunded Balance, Series B, Revenue Bond, AGM | 5.000% | 9/1/2019 | A2 | 1,000,000 | 1,021,110 | |||||||||||||||
University Area Joint Authority, Revenue Bond, AGM . | 2.250% | 11/1/2027 | AA2 | 1,500,000 | 1,409,655 | |||||||||||||||
|
| |||||||||||||||||||
| 10,147,956 | ||||||||||||||||||||
|
| |||||||||||||||||||
SOUTH CAROLINA - 0.4% | ||||||||||||||||||||
Charleston, Waterworks & Sewer System, | ||||||||||||||||||||
Prerefunded Balance, Revenue Bond | 5.000% | 1/1/2022 | Aaa | 530,000 | 563,077 | |||||||||||||||
Greenwood Metropolitan District, Sewer Impt., | ||||||||||||||||||||
Revenue Bond | 5.000% | 10/1/2026 | Aa3 | 500,000 | 590,970 | |||||||||||||||
South Carolina State Public Service Authority, Prerefunded Balance, Series B, Revenue Bond, NATL | 5.000% | 1/1/2019 | A2 | 85,000 | 85,000 | |||||||||||||||
|
| |||||||||||||||||||
| 1,239,047 | ||||||||||||||||||||
|
| |||||||||||||||||||
TENNESSEE - 2.0% | ||||||||||||||||||||
Knoxville Electric System Revenue, Electric Light & Power Impt., Series II, Revenue Bond | 3.000% | 7/1/2028 | Aa2 | 1,090,000 | 1,107,407 | |||||||||||||||
Knoxville Electric System Revenue, Series FF, Revenue Bond | 5.000% | 7/1/2023 | Aa2 | 800,000 | 881,184 | |||||||||||||||
Knoxville Electric System Revenue, Series FF, Revenue Bond | 5.000% | 7/1/2025 | Aa2 | 705,000 | 774,041 | |||||||||||||||
The accompanying notes are an integral part of the financial statements.
14
Diversified Tax Exempt Series
Investment Portfolio - December 31, 2018
| CREDIT | ||||||||||||||||||||
| COUPON | MATURITY | RATING1 | PRINCIPAL | VALUE | ||||||||||||||||
| RATE | DATE | (UNAUDITED) | AMOUNT | (NOTE 2) | ||||||||||||||||
MUNICIPAL BONDS(continued) | ||||||||||||||||||||
TENNESSEE(continued) | ||||||||||||||||||||
Knoxville Wastewater System, Series A, Revenue Bond | 4.000% | 4/1/2020 | Aa2 | $ | 685,000 | $ | 703,618 | |||||||||||||
Knoxville Wastewater System, Sewer Impt., Series B, Revenue Bond | 4.000% | 4/1/2024 | Aa2 | 400,000 | 424,224 | |||||||||||||||
Madison Suburban Utility District, Revenue Bond, AGM | 5.000% | 2/1/2019 | A1 | 655,000 | 656,611 | |||||||||||||||
Metropolitan Government of Nashville & Davidson County, Series A, Revenue Bond, AGM | 5.250% | 1/1/2019 | Aa2 | 1,505,000 | 1,505,000 | |||||||||||||||
|
| |||||||||||||||||||
| 6,052,085 | ||||||||||||||||||||
|
| |||||||||||||||||||
TEXAS - 7.3% | ||||||||||||||||||||
Austin Electric Utility, Revenue Bond | 5.000% | 11/15/2020 | Aa3 | 1,600,000 | 1,692,320 | |||||||||||||||
Austin Electric Utility, Series A, Revenue Bond | 5.000% | 11/15/2022 | Aa3 | 500,000 | 556,125 | |||||||||||||||
Austin Water & Wastewater System, Revenue Bond | 5.000% | 11/15/2026 | Aa2 | 1,500,000 | 1,786,320 | |||||||||||||||
Fort Worth Water & Sewer System, Revenue Bond | 5.000% | 2/15/2020 | Aa1 | 550,000 | 569,608 | |||||||||||||||
Fort Worth Water & Sewer System, Water Utility Impt., Revenue Bond | 4.000% | 2/15/2043 | Aa1 | 2,000,000 | 2,041,680 | |||||||||||||||
Harris County Cultural Education Facilities Finance Corp., Revenue Bond | 4.000% | 12/1/2019 | A1 | 500,000 | 509,205 | |||||||||||||||
Harris County, Senior Lien, Toll Road Impt., Series B, Revenue Bond | 5.000% | 8/15/2023 | Aa2 | 600,000 | 677,574 | |||||||||||||||
Houston Combined Utility System, Multi Utility Impt., Series D, Revenue Bond | 5.000% | 11/15/2025 | Aa2 | 1,265,000 | 1,458,912 | |||||||||||||||
Houston Combined Utility System, Series S, Revenue Bond, (MUNIPSA + 0.900%)4 | 2.530% | 5/15/2034 | AA2 | 1,000,000 | 1,004,080 | |||||||||||||||
Metropolitan Transit Authority of Harris County, Transit Impt., Prerefunded Balance, Revenue Bond | 5.000% | 11/1/2019 | Aa2 | 845,000 | 867,663 | |||||||||||||||
North Texas Municipal Water District, Sewer Impt., Revenue Bond | 3.500% | 6/1/2035 | Aa2 | 1,000,000 | 1,003,980 | |||||||||||||||
North Texas Municipal Water District, Water Utility Impt., Revenue Bond | 5.000% | 9/1/2023 | Aa2 | 2,535,000 | 2,869,366 | |||||||||||||||
North Texas Tollway Authority, Series A, Revenue Bond | 5.000% | 1/1/2026 | A1 | 500,000 | 561,595 | |||||||||||||||
San Antonio Water System, Junior Lien, Series A, Revenue Bond | 5.000% | 5/15/2026 | Aa2 | 500,000 | 590,245 | |||||||||||||||
San Antonio Water System, Junior Lien, Series A, Revenue Bond | 5.000% | 5/15/2032 | Aa2 | 2,170,000 | 2,482,610 | |||||||||||||||
Trinity River Authority Central Regional Wastewater System Revenue, Revenue Bond | 5.000% | 8/1/2024 | AAA2 | 2,200,000 | 2,490,400 | |||||||||||||||
Trinity River Authority LLC, Tarrant County Water Project, Revenue Bond | 5.000% | 2/1/2019 | AA2 | 500,000 | 501,260 | |||||||||||||||
|
| |||||||||||||||||||
| 21,662,943 | ||||||||||||||||||||
|
| |||||||||||||||||||
The accompanying notes are an integral part of the financial statements.
15
Diversified Tax Exempt Series
Investment Portfolio - December 31, 2018
| CREDIT | ||||||||||||||||||||
| COUPON | MATURITY | RATING1 | PRINCIPAL | VALUE | ||||||||||||||||
| RATE | DATE | (UNAUDITED) | AMOUNT | (NOTE 2) | ||||||||||||||||
MUNICIPAL BONDS(continued) | ||||||||||||||||||||
UTAH - 0.6% | ||||||||||||||||||||
Central Utah Water Conservancy District, Series B, Revenue Bond | 5.000% | 10/1/2025 | AA2 | $ | 500,000 | $ | 587,975 | |||||||||||||
Provo Energy System Revenue, Series A, Revenue Bond, BAM | 5.000% | 2/1/2026 | AA2 | 975,000 | 1,121,718 | |||||||||||||||
|
| |||||||||||||||||||
| 1,709,693 | ||||||||||||||||||||
|
| |||||||||||||||||||
VIRGINIA - 1.2% | ||||||||||||||||||||
Norfolk Water & Sewer System, Revenue Bond | 5.000% | 11/1/2029 | AA2 | 2,000,000 | 2,400,820 | |||||||||||||||
Virginia Resources Authority, Sewer Impt., Series B, Revenue Bond | 5.000% | 10/1/2019 | Aaa | 1,290,000 | 1,321,128 | |||||||||||||||
|
| |||||||||||||||||||
| 3,721,948 | ||||||||||||||||||||
|
| |||||||||||||||||||
WASHINGTON - 8.4% | ||||||||||||||||||||
Everett Water & Sewer, Revenue Bond | 5.000% | 12/1/2020 | AA2 | 1,330,000 | 1,409,840 | |||||||||||||||
Everett, Prerefunded Balance, G.O. Bond, (MUNIPSA + 0.400%)4 | 2.030% | 12/1/2034 | AA2 | 840,000 | 840,034 | |||||||||||||||
King County School District No. 414 Lake Washington, School Impt., Series E, G.O. Bond | 5.000% | 12/1/2031 | Aaa | 2,000,000 | 2,345,660 | |||||||||||||||
King County Sewer Revenue, Series B, Revenue Bond | 5.000% | 1/1/2020 | Aa1 | 750,000 | 774,000 | |||||||||||||||
King County, Series E, G.O. Bond | 5.000% | 6/1/2022 | Aaa | 2,000,000 | 2,205,900 | |||||||||||||||
Seattle Municipal Light & Power, Series A, Revenue Bond | 5.000% | 6/1/2019 | Aa2 | 1,675,000 | 1,697,311 | |||||||||||||||
Seattle Water System Revenue, Revenue Bond | 5.000% | 5/1/2026 | Aa1 | 4,000,000 | 4,660,680 | |||||||||||||||
Seattle, Drainage & Wastewater, Sewer Impt., Revenue Bond | 5.000% | 9/1/2021 | Aa1 | 2,000,000 | 2,163,340 | |||||||||||||||
Seattle, Drainage & Wastewater, Sewer Impt., Revenue Bond | 4.000% | 4/1/2034 | Aa1 | 2,435,000 | 2,582,634 | |||||||||||||||
Tacoma, Sewer Impt., Revenue Bond | 4.000% | 12/1/2019 | Aa2 | 1,095,000 | 1,117,163 | |||||||||||||||
Washington State, Series2011-A, G.O. Bond | 5.000% | 1/1/2020 | Aa1 | 2,000,000 | 2,063,600 | |||||||||||||||
Washington State, Series B, G.O. Bond | 5.000% | 2/1/2027 | Aa1 | 2,675,000 | 3,087,351 | |||||||||||||||
|
| |||||||||||||||||||
| 24,947,513 | ||||||||||||||||||||
|
| |||||||||||||||||||
WISCONSIN - 1.4% | ||||||||||||||||||||
Milwaukee Sewerage System, Sewer Impt., Series S1, Revenue Bond | 5.000% | 6/1/2021 | Aa3 | 470,000 | 504,630 | |||||||||||||||
Milwaukee Sewerage System, Sewer Impt., Series S7, Revenue Bond | 3.000% | 6/1/2031 | AA2 | 1,000,000 | 969,630 | |||||||||||||||
Wisconsin Health & Educational Facilities Authority, ProHealth Care, Inc., Revenue Bond | 3.000% | 8/15/2019 | A1 | 510,000 | 513,417 | |||||||||||||||
The accompanying notes are an integral part of the financial statements.
16
Diversified Tax Exempt Series
Investment Portfolio - December 31, 2018
| CREDIT | PRINCIPAL | |||||||||||||||||||
| COUPON | MATURITY | RATING1 | AMOUNT/ | VALUE | ||||||||||||||||
| RATE | DATE | (UNAUDITED) | SHARES | (NOTE 2) | ||||||||||||||||
MUNICIPAL BONDS(continued) | ||||||||||||||||||||
WISCONSIN(continued) | ||||||||||||||||||||
WPPI Energy, Series A, Revenue Bond | 5.000% | 7/1/2020 | A1 | $ | 2,000,000 | $ | 2,089,720 | |||||||||||||
|
| |||||||||||||||||||
| 4,077,397 | ||||||||||||||||||||
|
| |||||||||||||||||||
TOTAL MUNICIPAL BONDS | ||||||||||||||||||||
(Identified Cost $289,428,462) | 288,658,077 | |||||||||||||||||||
|
| |||||||||||||||||||
SHORT-TERM INVESTMENT - 1.9% | ||||||||||||||||||||
Dreyfus Government Cash Management, Institutional Shares | ||||||||||||||||||||
(Identified Cost $5,694,587) | 2.29%5 | 5,694,587 | 5,694,587 | |||||||||||||||||
|
| |||||||||||||||||||
TOTAL INVESTMENTS - 98.8% | ||||||||||||||||||||
(Identified Cost $295,123,049) | 294,352,664 | |||||||||||||||||||
OTHER ASSETS, LESS LIABILITIES - 1.2% | 3,460,932 | |||||||||||||||||||
|
| |||||||||||||||||||
NET ASSETS - 100% | $ | 297,813,596 | ||||||||||||||||||
|
| |||||||||||||||||||
KEY:
G.O. Bond - General Obligation Bond
Impt. - Improvement
No. - Number
Scheduled principal and interest payments are guaranteed by:
AGM (Assurance Guaranty Municipal Corp.)
BAM (Build America Mutual Assurance Co.)
NATL (National Public Finance Guarantee Corp.)
The insurance does not guarantee the market value of the municipal bonds.
1Credit ratings from Moody’s (unaudited).
2Credit ratings from S&P (unaudited).
3Credit rating has been withdrawn. As of December 31, 2018, there is no rating available (unaudited).
4Floating rate security. Rate shown is the rate in effect as of December 31, 2018.
5Rate shown is the current yield as of December 31, 2018.
The accompanying notes are an integral part of the financial statements.
17
Diversified Tax Exempt Series
Statement of Assets and Liabilities
December 31, 2018
ASSETS: | ||||
Investments, at value (identified cost $295,123,049) (Note 2) | $ | 294,352,664 | ||
Interest receivable | 3,615,413 | |||
Receivable for fund shares sold | 109,534 | |||
Dividends receivable | 11,246 | |||
Receivable for securities sold | 10,014 | |||
Prepaid expenses | 6,339 | |||
|
| |||
TOTAL ASSETS | 298,105,210 | |||
|
| |||
LIABILITIES: | ||||
Accrued management fees (Note 3) | 124,085 | |||
Accrued fund accounting and administration fees (Note 3) | 29,355 | |||
Accrued Chief Compliance Officer service fees (Note 3) | 426 | |||
Payable for fund shares repurchased | 119,394 | |||
Other payables and accrued expenses | 18,354 | |||
|
| |||
TOTAL LIABILITIES | 291,614 | |||
|
| |||
TOTAL NET ASSETS | $ | 297,813,596 | ||
|
| |||
NET ASSETS CONSIST OF: | ||||
Capital stock | $ | 273,251 | ||
Additionalpaid-in-capital | 299,051,504 | |||
Total distributable earnings (loss) | (1,511,159 | ) | ||
|
| |||
TOTAL NET ASSETS | $ | 297,813,596 | ||
|
| |||
NET ASSET VALUE, OFFERING PRICE AND REDEMPTION PRICE PER SHARE - | $ | 10.90 | ||
|
| |||
The accompanying notes are an integral part of the financial statements.
18
Diversified Tax Exempt Series
Statement of Operations
For the Year Ended December 31, 2018
INVESTMENT INCOME: | ||||
Interest | $ | 5,470,812 | ||
Dividends | 66,051 | |||
|
| |||
Total Investment Income | 5,536,863 | |||
|
| |||
EXPENSES: | ||||
Management fees (Note 3) | 1,378,941 | |||
Fund accounting and administration fees (Note 3) | 91,346 | |||
Directors’ fees (Note 3) | 22,126 | |||
Chief Compliance Officer service fees (Note 3) | 4,634 | |||
Custodian fees | 11,093 | |||
Miscellaneous | 111,883 | |||
|
| |||
Total Expenses | 1,620,023 | |||
|
| |||
NET INVESTMENT INCOME | 3,916,840 | |||
|
| |||
REALIZED AND UNREALIZED GAIN (LOSS) ON INVESTMENTS: | ||||
Net realized gain (loss) on investments | (297,506 | ) | ||
Net change in unrealized appreciation (depreciation) on investments | (1,870,441 | ) | ||
|
| |||
NET REALIZED AND UNREALIZED GAIN (LOSS) ON INVESTMENTS | (2,167,947 | ) | ||
|
| |||
NET INCREASE IN NET ASSETS RESULTING FROM OPERATIONS | $ | 1,748,893 | ||
|
| |||
The accompanying notes are an integral part of the financial statements.
19
Diversified Tax Exempt Series
Statements of Changes in Net Assets
| FOR THE YEAR ENDED 12/31/18 | FOR THE YEAR ENDED 12/31/17 | |||||||
INCREASE (DECREASE) IN NET ASSETS: | ||||||||
OPERATIONS: | ||||||||
Net investment income | $ | 3,916,840 | $ | 3,604,334 | ||||
Net realized gain (loss) on investments | (297,506) | 3,887 | ||||||
Net change in unrealized appreciation (depreciation) on investments | (1,870,441) | 3,658,653 | ||||||
|
|
|
| |||||
Net increase from operations | 1,748,893 | 7,266,874 | ||||||
|
|
|
| |||||
DISTRIBUTIONS TO SHAREHOLDERS (Note 9): | ||||||||
Class A | (3,880,794) | (3,610,853)1 | ||||||
|
|
|
| |||||
CAPITAL STOCK ISSUED AND REPURCHASED: | ||||||||
Net increase (decrease) from capital share transactions (Note 5) | 21,616,363 | (41,712,775) | ||||||
|
|
|
| |||||
Net increase (decrease) in net assets | 19,484,462 | (38,056,754) | ||||||
NET ASSETS: | ||||||||
Beginning of year | 278,329,134 | 316,385,888 | ||||||
|
|
|
| |||||
End of year2 | $ | 297,813,596 | $ | 278,329,134 | ||||
|
|
|
| |||||
1 For the year ended December 31, 2017, the distributions to shareholders from net investment income was $3,610,853.
2 Includes accumulated undistributed (overdistributed) net investment income of $247,895 as of December 31, 2017. The SEC eliminated the requirement to disclose undistributed net investment income in 2018.
The accompanying notes are an integral part of the financial statements.
20
Diversified Tax Exempt Series
Financial Highlights
| FOR THE YEAR ENDED | ||||||||||||||||||||
| 12/31/18 | 12/31/17 | 12/31/16 | 12/31/15 | 12/31/14 | ||||||||||||||||
Per share data (for a share outstanding throughout each year): | ||||||||||||||||||||
Net asset value - Beginning of year | $10.98 | $10.86 | $11.07 | $11.00 | $10.91 | |||||||||||||||
|
|
|
|
|
|
|
|
|
| |||||||||||
Income (loss) from investment operations: | ||||||||||||||||||||
Net investment income1 | 0.15 | 0.13 | 0.11 | 0.09 | 0.08 | |||||||||||||||
Net realized and unrealized gain (loss) on investments | (0.08 | ) | 0.13 | (0.20 | ) | 0.08 | 0.09 | |||||||||||||
|
|
|
|
|
|
|
|
|
| |||||||||||
Total from investment operations | 0.07 | 0.26 | (0.09 | ) | 0.17 | 0.17 | ||||||||||||||
|
|
|
|
|
|
|
|
|
| |||||||||||
Less distributions to shareholders: | ||||||||||||||||||||
From net investment income | (0.15 | ) | (0.14 | ) | (0.12 | ) | (0.10 | ) | (0.08 | ) | ||||||||||
|
|
|
|
|
|
|
|
|
| |||||||||||
Net asset value - End of year | $10.90 | $10.98 | $10.86 | $11.07 | $11.00 | |||||||||||||||
|
|
|
|
|
|
|
|
|
| |||||||||||
Net assets - End of year(000’s omitted) | $297,814 | $278,329 | $316,386 | $358,584 | $376,271 | |||||||||||||||
|
|
|
|
|
|
|
|
|
| |||||||||||
Total return2 | 0.65% | 2.37% | (0.83% | ) | 1.51% | 1.51% | ||||||||||||||
Ratios (to average net assets)/Supplemental Data: | ||||||||||||||||||||
Expenses | 0.59% | 0.58% | 0.57% | 0.57% | 0.56% | |||||||||||||||
Net investment income | 1.42% | 1.22% | 1.01% | 0.80% | 0.75% | |||||||||||||||
Portfolio turnover | 12% | 4% | 16% | 33% | 25% | |||||||||||||||
1Calculated based on average shares outstanding during the years.
2Represents aggregate total return for the years indicated, and assumes reinvestment of all distributions.
The accompanying notes are an integral part of the financial statements.
21
Diversified Tax Exempt Series
Notes to Financial Statements
| 1. | Organization |
Diversified Tax Exempt Series (the “Series”) is ano-load diversified series of Manning & Napier Fund, Inc. (the “Fund”). The Fund is organized in Maryland and is registered under the Investment Company Act of 1940, as amended, as anopen-end management investment company.
The Series’ investment objective is to provide as high a level of current income exempt from federal income tax as the Advisor believes is consistent with the preservation of capital.
The Fund’s advisor is Manning & Napier Advisors, LLC (the “Advisor”). Shares of the Series are offered to investors, clients and employees of the Advisor and its affiliates. The total authorized capital stock of the Fund consists of 15 billion shares of common stock each having a par value of $0.01. As of December 31, 2018, 10.4 billion shares have been designated in total among 34 series, of which 100 million have been designated as Diversified Tax Exempt Series Class A common stock and 50 million have been designated as Diversified Tax Exempt Series Class W common stock. Class W common stock is not currently offered for sale.
| 2. | Significant Accounting Policies |
The following is a summary of significant accounting policies followed by the Series. The Series is an investment company and, accordingly, follows the investment company accounting and reporting guidance of the Financial Accounting Standards Board Accounting Standards Codification Topic 946 - Investment Companies, which is part of accounting principles generally accepted in the United States of America (“GAAP”).
Security Valuation
Municipal securities will normally be valued on the basis of market valuations provided by an independent pricing service (the “Service”). The Service utilizes the latest price quotations and a matrix system (which considers such factors as security prices of similar securities, yields, maturities and ratings). The Service has been approved by the Fund’s Board of Directors (the “Board”).
Short-term investments that mature in sixty days or less may be valued at amortized cost, which approximates fair value. Investments inopen-end investment companies are valued at their net asset value per share on valuation date.
Volume and level of activity in established markets for an asset or liability are evaluated to determine whether recent transactions and quoted prices are determinative of fair value. Where there have been significant decreases in volume and level of activity, further analysis and adjustment may be necessary to estimate fair value. The Series measures fair value in these instances by the use of inputs and valuation techniques which may be based upon current market prices of securities that are comparable in coupon, rating, maturity and industry and/or expectation of future cash flows. As a result of trading in relatively thin markets and/or markets that experience significant volatility, the prices used by the Series to value these securities may differ from the value that would be realized if these securities were sold, and the differences could be material.
Securities for which representative valuations or prices are not available from the Series’ pricing service may be valued at fair value as determined in good faith by the Advisor under procedures approved by and under the general supervision and responsibility of the Board. Due to the inherent uncertainty of valuations of such securities, the fair value may differ significantly from the values that would have been used had a ready market for such securities existed. If trading or events occurring after the close of the principal market in which securities are traded are expected to materially affect the value of those securities, then they may be valued at their fair value, taking this trading or these events into account.
Various inputs are used in determining the value of the Series’ assets or liabilities carried at fair value. These inputs are summarized in three broad levels. Level 1 includes quoted prices in active markets for identical assets and liabilities. Level 2 includes other significant observable inputs (including quoted prices for similar securities, interest rates, prepayment speeds, credit risk, etc.). Level 3 includes significant unobservable inputs (including the Series’ own assumptions in determining the fair value of investments). A financial instrument’s level within the fair value hierarchy is based on the lowest level of any input both
22
Diversified Tax Exempt Series
Notes to Financial Statements (continued)
| 2. | Significant Accounting Policies (continued) |
Security Valuation(continued)
individually and in aggregate that is significant to the fair value measurement. The inputs or methodology used for valuing securities are not necessarily an indication of the risk associated with investing in those securities.
The following is a summary of the valuation levels used for major security types as of December 31, 2018 in valuing the Series’ assets or liabilities carried at fair value:
| DESCRIPTION | TOTAL | LEVEL 1 | LEVEL 2 | LEVEL 3 | ||||||||||||
Assets: | ||||||||||||||||
Debt securities: | ||||||||||||||||
States and political subdivisions | $ | 288,658,077 | $ | — | $ | 288,658,077 | $ | — | ||||||||
Mutual fund | 5,694,587 | 5,694,587 | — | — | ||||||||||||
|
|
|
|
|
|
|
| |||||||||
Total assets | $ | 294,352,664 | $ | 5,694,587 | $ | 288,658,077 | $ | — | ||||||||
|
|
|
|
|
|
|
| |||||||||
There were no Level 3 securities held by the Series as of December 31, 2017 or December 31, 2018.
New Accounting Pronouncements
The Securities and Exchange Commission (SEC) adopted changes to RegulationS-X to simplify the reporting of information by registered investment companies in financial statements. The amendments require presentation of the total, rather than the components, of distributable earnings on the Statement of Assets and Liabilities and also require presentation of the total, rather than the components, of distributions to shareholders, except for tax return of capital distributions, if any, on the Statement of Changes in Net Assets. The amendments also removed the requirement for parenthetical disclosure of undistributed net investment income on the Statement of Changes in Net Assets. These RegulationS-X amendments are reflected in the Series financial statements for the year ended December 31, 2018. As a result of adopting these amendments, the distributions to shareholders in the December 31, 2017 Statement of Changes in Net Assets presented herein have been reclassified to conform to the current year presentation.
In March 2017, the Financial Accounting Standards Board issued Accounting Standards UpdateNo. 2017-08, Receivables – Nonrefundable Fees and Other Costs (Subtopic310-320): “Premium Amortization of Purchased Callable Debt Securities” which shortens the amortized period for certain callable debt securities, held at a premium, to be amortized to the earliest call date rather than the contractual maturity date. The Series will adopt and apply ASU2017-08 on a modified retrospective basis through a cumulative-effect adjustment as of January 1, 2019. Due to the nature of the debt securities currently held by the Series, this adjustment is not expected to be material.
On August 28, 2018, the FASB issued ASU2018-13, “Disclosure Framework – Changes to the Disclosure Requirements for Fair Value Measurement,” which amends the fair value measurement disclosure requirements under U.S. GAAP. The amendments of ASU2018-13 include new, eliminated, and modified disclosure requirements. In addition, the amendments clarify that materiality is an appropriate consideration of entities when evaluating disclosure requirements. The ASU is effective for all entities for fiscal years beginning after December 15, 2019, including interim periods therein. An entity is permitted to early adopt any eliminated or modified disclosures upon issuance of this ASU and delay adoption of the new disclosures until their effective date. As such, each Series has early adopted the eliminated and modified disclosures, as permitted by this ASU.
Security Transactions, Investment Income and Expenses
Security transactions are accounted for on trade date. Dividend income is recorded on theex-dividend date, except that if theex-dividend date has passed, certain dividends from foreign securities are recorded as soon as the Series is informed of theex-dividend date.Non-cash dividends, if any, are recorded at the fair value of the securities received. Interest income, including amortization of premium and accretion of discounts using the effective interest method, is earned from settlement date and accrued daily.
23
Diversified Tax Exempt Series
Notes to Financial Statements (continued)
| 2. | Significant Accounting Policies (continued) |
Security Transactions, Investment Income and Expenses (continued)
Expenses are recorded on an accrual basis. Most expenses of the Fund can be attributed to a specific series. Expenses which cannot be directly attributed are apportioned among the series in the Fund in such a manner as deemed equitable by the Fund’s Board, taking into consideration, among other things, the nature and type of expense.
The Series uses the identified cost method for determining realized gain or loss on investments for both financial statement and federal income tax reporting purposes.
Federal Taxes
The Series’ policy is to comply with the provisions of the Internal Revenue Code applicable to regulated investment companies. The Series is not subject to federal income tax or excise tax to the extent that the Series distributes to shareholders each year its taxable income, including any net realized gains on investments, in accordance with requirements of the Internal Revenue Code. Accordingly, no provision for federal income tax or excise tax has been made in the financial statements.
Management evaluates its tax positions to determine if the tax positions taken meet the minimum recognition threshold in connection with accounting for uncertainties in income tax positions taken or expected to be taken for the purposes of measuring and recognizing tax liabilities in the financial statements. Recognition of tax benefits of an uncertain tax position is required only when the position is “more likely than not” to be sustained assuming examination by taxing authorities. At December 31, 2018, the Series has recorded no liability for net unrecognized tax benefits relating to uncertain income tax positions taken or expected to be taken in future tax returns.
The Series files income tax returns in the U.S. federal jurisdiction and various states, as required. No income tax returns are currently under investigation. The statute of limitations on the Series’ tax returns remains open for the years ended December 31, 2015 through December 31, 2018. The Series is not aware of any tax positions for which it is reasonably possible that the total amounts of unrecognized tax benefits will significantly change in the next twelve months.
Distributions of Income and Gains
Distributions to shareholders of net investment income are made quarterly. Distributions of net realized gains are made annually. An additional distribution may be necessary to avoid taxation of the Series. Distributions are recorded on theex-dividend date.
Indemnifications
The Fund’s organizational documents provide former and current directors and officers with a limited indemnification against liabilities arising in connection with the performance of their duties to the Fund. In the normal course of business, the Fund may also enter into contracts that provide general indemnifications. The Fund’s maximum exposure under these arrangements is unknown as this would be dependent on future claims that may be made against the Fund. The risk of material loss from such claims is considered remote.
Other
The preparation of financial statements in conformity with GAAP requires management to make estimates and assumptions that affect the reported amounts of assets and liabilities and the disclosure of contingent assets and liabilities at the date of the financial statements and the reported amounts of income and expenses during the reporting period. Actual results could differ from those estimates.
| 3. | Transactions with Affiliates |
The Fund has an Investment Advisory Agreement (the “Agreement”) with the Advisor, for which the Series pays a fee, computed daily and payable monthly, at an annual rate of 0.50% of the Series’ average daily net assets.
Under the Agreement, personnel of the Advisor provide the Series with advice and assistance in the choice of investments and the execution of securities transactions, and otherwise maintain the Series’ organization. The Advisor also provides the Fund with necessary office space and fund administration and support services. The salaries of all officers of the Fund (except a percentage of the Fund’s Chief Compliance Officer’s salary, which is paid by the Fund), and of all Directors who are “affiliated
24
Diversified Tax Exempt Series
Notes to Financial Statements (continued)
| 3. | Transactions with Affiliates (continued) |
persons” of the Fund, or of the Advisor, and all personnel of the Fund, or of the Advisor, performing services relating to research, statistical and investment activities, are paid by the Advisor. Each“non-affiliated” Director receives an annual stipend, which is allocated among all the active series of the Fund. In addition, these Directors also receive a fee per Board meeting attended plus a fee for each committee meeting attended and are reimbursed for travel and otherout-of-pocket expenses incurred by them in connection with attending such meetings. The Fund also has an Audit Committee Chair, Governance & Nominating Committee Chair and Lead Independent Director, who each receive an additional annual stipend for these roles.
The Advisor has contractually agreed, until at least April 30, 2019, to waive its management fee and, if necessary, pay other operating expenses of the Series in order to maintain total direct annual fund operating expenses for the Series at no more than 0.85% of average daily net assets each year. The Advisor did not waive any fees for the year ended December 31, 2018. The Advisor is not eligible to recoup any expenses that have been waived or reimbursed in prior years.
Manning & Napier Investor Services, Inc., a registered broker-dealer affiliate of the Advisor, acts as distributor for the Fund’s shares. The services of Manning & Napier Investor Services, Inc. are provided at no additional cost to the Series.
Pursuant to a master services agreement dated March 1, 2017, as amended, the Fund pays the Advisor an annual fee related to fund accounting and administration of 0.0085% on the first $25 billion of average daily net assets (excluding Target Series and Income Series); 0.0075% on the next $15 billion of average daily net assets (excluding Target Series and Income Series); and 0.0065% of average daily net assets in excess of $40 billion (excluding Target Series and Income Series); plus a base fee of $30,400 per series. Additionally, certain transaction andout-of-pocket expenses, including charges for reporting relating to the Fund’s compliance program, are charged. The Advisor has agreements with BNY Mellon Investment Servicing (U.S.) Inc. (“BNY”) under which BNY serves assub-accountant services agent.
| 4. | Purchases and Sales of Securities |
For the year ended December 31, 2018, purchases and sales of securities, other than U.S. Government securities and short-term securities, were $56,195,427 and $31,336,289, respectively. There were no purchases or sales of U.S. Government securities.
| 5. | Capital Stock Transactions |
Transactions in Class A shares of Diversified Tax Exempt Series were:
| FOR THE YEAR | FOR THE YEAR | |||||||||||||||
| ENDED 12/31/18 | ENDED 12/31/17 | |||||||||||||||
| SHARES | AMOUNT | SHARES | AMOUNT | |||||||||||||
Sold | 4,863,994 | $ | 52,900,167 | 2,939,836 | $ | 32,436,887 | ||||||||||
Reinvested | 310,100 | 3,362,079 | 288,983 | 3,186,628 | ||||||||||||
Repurchased | (3,192,267 | ) | (34,645,883 | ) | (7,018,912 | ) | (77,336,290 | ) | ||||||||
|
|
|
|
|
|
|
| |||||||||
Total | 1,981,827 | $ | 21,616,363 | (3,790,093 | ) | $ | (41,712,775 | ) | ||||||||
|
|
|
|
|
|
|
| |||||||||
Over 90% of the shares outstanding are fiduciary accounts where the Advisor has sole investment discretion.
| 6. | Line of Credit |
The Fund has entered into a364-day, $25 million credit agreement (the “line of credit”) with Bank of New York Mellon. Each series of the Fund may borrow under the line of credit for temporary or emergency purposes, including funding shareholder redemptions and other short-term liquidity purposes. The Fund pays an annual fee on the unused commitment amount, payable quarterly, and is allocated among all the series of the Fund and included in miscellaneous expenses in the Statement of Operations for each series. The line of credit expires in August 2019 unless extended or renewed. During the year ended December 31, 2018, the Series did not borrow under the line of credit.
25
Diversified Tax Exempt Series
Notes to Financial Statements (continued)
| 7. | Financial Instruments |
The Series may trade in instruments including written and purchased options, forward foreign currency exchange contracts and futures contracts and other derivatives in the normal course of investing activities to assist in managing exposure to various market risks. The Series may be subject to various elements of risk, which may involve, to a varying degree, elements of risk in excess of the amounts recognized for financial statement purposes. These risks include: the risk that changes in the value of a derivative may not correlate perfectly with the underlying asset, rate or index; counterparty credit risk related to over the counter derivative counterparties’ failure to perform under contract terms; liquidity risk related to the lack of a liquid market for these contracts allowing the fund to close out its position(s); and documentation risk relating to disagreement over contract terms. No such investments were held by the Series as of December 31, 2018.
| 8. | Federal Income Tax Information |
The amount and characterization of certain income and capital gains to be distributed are determined in accordance with federal income tax regulations, which may differ from GAAP. These differences are primarily due to differing book and tax treatments in the timing and/or treatment of the recognition of net investment income or gains and losses, including market discount on investments. The Series may periodically make reclassifications among its capital accounts to reflect income and gains available for distribution (or available capital loss carryovers) under income tax regulations without impacting the Series’ net asset value. Any such reclassifications are not reflected in the financial highlights.
The tax character of distributions paid were as follows:
| FOR THE YEAR | FOR THE YEAR | |||||||
| ENDED 12/31/18 | ENDED 12/31/17 | |||||||
Ordinary income | $ 56,979 | $ 25,186 | ||||||
Tax exempt income | $3,823,815 | $3,585,667 | ||||||
At December 31, 2018, the tax basis of components of distributable earnings and the net unrealized depreciation based on identified cost for federal income tax purposes were as follows:
Cost for federal income tax purposes | $ | 295,111,046 | ||
Unrealized appreciation | 1,356,620 | |||
Unrealized depreciation | (2,115,002 | ) | ||
|
| |||
Net unrealized depreciation | $ | (758,382 | ) | |
|
| |||
Undistributed tax exempt income | $ | 271,938 | ||
Capital loss carryforwards | $ | (1,024,715 | ) |
As of December 31, 2018, the Series had net short-term capital loss carryforwards of $432,031 and net long-term capital loss carryforwards of $592,684, which may be carried forward indefinitely.
26
Diversified Tax Exempt Series
Report of Independent Registered Public Accounting Firm
To the Board of Directors of Manning & Napier Fund, Inc. and Shareholders of Diversified Tax Exempt Series
Opinion on the Financial Statements
We have audited the accompanying statement of assets and liabilities, including the investment portfolio, of Diversified Tax Exempt Series (one of the series constituting Manning & Napier Fund, Inc., referred to hereafter as the “Fund”) as of December 31, 2018, the related statement of operations for the year ended December 31, 2018, the statement of changes in net assets for each of the two years in the period ended December 31, 2018, including the related notes, and the financial highlights for each of the five years in the period ended December 31, 2018 (collectively referred to as the “financial statements”). In our opinion, the financial statements present fairly, in all material respects, the financial position of the Fund as of December 31, 2018, the results of its operations for the year then ended, the changes in its net assets for each of the two years in the period ended December 31, 2018 and the financial highlights for each of the five years in the period ended December 31, 2018 in conformity with accounting principles generally accepted in the United States of America.
Basis for Opinion
These financial statements are the responsibility of the Fund’s management. Our responsibility is to express an opinion on the Fund’s financial statements based on our audits. We are a public accounting firm registered with the Public Company Accounting Oversight Board (United States) (PCAOB) and are required to be independent with respect to the Fund in accordance with the U.S. federal securities laws and the applicable rules and regulations of the Securities and Exchange Commission and the PCAOB.
We conducted our audits of these financial statements in accordance with the standards of the PCAOB. Those standards require that we plan and perform the audit to obtain reasonable assurance about whether the financial statements are free of material misstatement, whether due to error or fraud.
Our audits included performing procedures to assess the risks of material misstatement of the financial statements, whether due to error or fraud, and performing procedures that respond to those risks. Such procedures included examining, on a test basis, evidence regarding the amounts and disclosures in the financial statements. Our audits also included evaluating the accounting principles used and significant estimates made by management, as well as evaluating the overall presentation of the financial statements. Our procedures included confirmation of securities owned as of December 31, 2018 by correspondence with the custodian. We believe that our audits provide a reasonable basis for our opinion.

New York, New York
February 15, 2019
We have served as the auditor of one or more investment companies in Manning & Napier Mutual Funds since 1992.
27
Diversified Tax Exempt Series
Supplemental Tax Information
(unaudited)
All reportings are based on financial information available as of the date of this annual report, and accordingly are subject to change.
The Series hereby reports $3,823,815 as tax exempt dividends for the year ended December 31, 2018. It is the intention of the Series to designate the maximum allowable under tax law.
28
Diversified Tax Exempt Series
Renewal of Investment Advisory Agreement
(unaudited)
At the Manning & Napier Fund, Inc. (the “Fund”) Board of Directors’ (the “Board”) meeting, held on November 15, 2018, the Investment Advisory Agreement (the “Agreement”) between the Fund and Manning & Napier Advisors, LLC (the “Advisor”) was considered for renewal by the Board, including all of the Directors who are not “interested persons” (“Independent Directors”), within the meaning of the Investment Company Act of 1940, as amended (the “1940 Act”). In connection with the decision whether to renew the Agreement, a variety of material was provided to the Board in advance of the meeting for their review and consideration. The Board also held a working session on October 31, 2018 to review and discuss information provided to the Board, and for the Board to request additional information.
Representatives of the Advisor attended a portion of the working session and attended the Board meeting. The Advisor provided supplemental information requested by the Board and presented additional oral information to the Board to assist the Board in its considerations. In addition to the information furnished by the Advisor, the Board was provided with a legal memorandum discussing its fiduciary duties related to its approval of the continuation of the Agreement. Legal counsel for the Fund discussed with the Board the applicable legal considerations. In addition, the Board receivedin-person presentations about the Fund throughout the year.
The Independent Directors were advised by independent legal counsel with respect to these matters. The Independent Directors also met separately in an executive session with their legal counsel without any representatives of the Advisor present.
The Directors’ determinations at the meeting were made on the basis of each Director’s business judgment after consideration of all the information presented. In deciding to recommend the renewal of the Agreement with respect to each Series of the Fund, the Independent Directors did not identify any single or particular piece of information that, in isolation, was the controlling factor. Each Independent Director may also have weighed factors differently. This summary describes the most important, but not all, of the factors considered by the Board and the Independent Directors.
| • | The Board considered the nature and quality of services provided by the Advisor under the Agreement for over 30 years including, among others: deciding what securities to purchase and sell for each Series; arranging for the purchase and sale of such securities by placing orders with broker-dealers; administering the affairs of the Fund (including the books and records of the Fund not maintained by third party service providers such as the custodian or transfer agent); arranging for the insurance coverage for the Fund; and supervising the preparation of tax returns, SEC filings (including registration statements) and reports to shareholders for the Fund. The Board considered the numerous services performed by the Advisor and its affiliates beyond those stated in the Agreements. The Board also considered the Advisor’s personnel who perform services to the Fund, changes in senior or key personnel, the strength of the Advisor’s compliance infrastructure, policies and procedures relating to compliance with securities regulations, reputation, expertise and resources. The Board discussed the quality of these services with representatives from the Advisor and concluded that the Advisor was performing its services to the Fund required under the Agreement in a reasonable manner. |
| • | The Board considered the Advisor’s investments teams, including changes to the investment teams and investment team’s compensation during the past year, and the investment process. The Board considered the performance of each Series since its inception, as well as over multiple time periods including: one year, three year, five year, ten year, and current market cycle. A market cycle includes periods of both rising and falling markets. Returns for established benchmark indices for each Series were provided. In addition, the Board considered (and considers on a quarterly basis) a number of other factors relevant to performance at the meeting including: a peer group performance analysis consisting of Morningstar universes of mutual funds with similar investment objectives; the breadth of the Fund’s product offerings; and performance over reasonable time periods. The Board discussed with Representatives of the Advisor, short-term performance challenges in the Fund’s core strategies that have resulted in a downward trend in assets under management. After discussion, the Board concluded that notwithstanding the performance challenges of certain Series, the nature and quality of the investment management services provided by the Advisor to the Fund supported the renewal of the agreement. |
| • | The Board considered the fees and expenses of the various Series of the Fund. The Advisor presented the advisory fees and total expenses for each Series, including the advisory fee adjusted for any contractual expense waivers or reimbursements paid by the Advisor. The Advisor also presentedpro-forma information related to several management fee and overall expense reductions that were set to take effect in early 2019. These changes were approved by the Board in a prior meeting and by shareholders at a Shareholder Meeting in May 2018. |
| • | The Board considered whether the Advisor had achieved economies of scale with respect to its services to the Fund. The Board acknowledged the expense caps incorporated in the Fund’s current fee structure, which requires the Advisor to |
29
Diversified Tax Exempt Series
Renewal of Investment Advisory Agreement
(unaudited)
| subsidize the expenses of the Series operating above their expense cap, noting that 27 Series of the Fund are currently receiving expense reimbursements from the Advisor. The Board concluded that the Fund would need to grow in assets before the Advisor would be able to achieve meaningful economies of scale. |
| • | The Advisor provided the Board with information comparing each Series’ contractual management fees with the Advisor’s standard advisory fees for separate accounts and collective investment trusts. The Board considered that the range of services provided to the Series is more extensive than for the Advisor’s other clients due to additional infrastructure, administrative and regulatory requirements related to operating a mutual fund. |
| • | The current andpro-forma advisory fees,12b-1 Distribution and Service Fees, other expenses (e.g. a combination of Shareholder Services Fees, intermediarysub-transfer agent fees, routine operating expenses and Acquired Fund Fees and Expenses forfund-of-fund Series) and total expense ratios of each Series and share class were compared and ranked (on both a mean and median basis) against respective peer universes. Respective peer universes included funds of a similar size and with similar investment objectives and expense characteristics as disclosed on the Morningstar database. Representatives of the Advisor discussed with the Board the comparisons and rankings of fees and net expense ratios for each Series of the Fund and the methodology behind the comparison. The Board considered the Advisor’s active portfolio management that results in portfolios that are more differentiated than the construction of their benchmarks. Based on their review of the information provided, the Board concluded that the current andpro-forma fees and expenses of each Series of the Fund were reasonable on a comparative basis. |
| • | The Board considered the costs of the Advisor’s services and the profits of the Advisor as they relate to the Advisor’s services to the Fund under the Agreement. The Board was provided with information on the Advisor’s financial condition and profitability by mutual fund agreement and by Series. Information provided by the Advisor addressed the anticipated effects of the upcoming fee reductions. The Board discussed the Advisor’s revenues generated from the Fund and its expenses associated with providing the services under the Agreement. The Advisor presented the Board with information on firm wide investment management profitability to provide a comparison of the Advisor’s profitability from its Fund activities relative to its profitability from its other investment management business. In addition, the Board reviewed the Advisor’s expense allocation methodology used to calculate profitability since many of the Advisor’s resources and expenses are shared across the Advisor’s various investment management vehicles. The Board considered the Advisor’s expenses associated with Fund activities outside of the Agreement (such as expense reimbursements pursuant to expense caps and payments made by the Advisor to third party platforms on which shares of the Fund are available for purchase). After discussing the above costs and profits, the Board concluded that the Advisor’s profitability relating to its services provided under the Agreement was reasonable. |
| • | The Board also considered the other benefits the Advisor derives from its relationship with the Fund. Such other benefits include participation in a joint insurance program, sharing of compensation expenses for certain shared personnel, relationships with large service providers, the utilization of Series within the Advisor’s separately managed accounts and certain research services provided by soft dollars. The Board reviewed the broker-dealers who provided research to the Advisor and the products and services paid for, in whole or in part, using soft dollar commissions. The Board concluded that these additional benefits to the Advisor were reasonable. |
Based on the Board’s deliberations and their evaluation of the information described above, the Board, including a majority of the Independent Directors, concluded that the compensation under the Agreement was fair and reasonable with respect to each Series in light of the services and expenses and such other matters as the Directors considered to be relevant in the exercise of their reasonable judgment, and that the renewal of the Agreement would be in the best interests of each Series and its shareholders. The Board did not indicate that any single factor was determinative of its decision to approve the Agreement, but indicated that the Board based its determination on the total mix of information available to it.
30
Diversified Tax Exempt Series
Directors’ and Officers’ Information
(unaudited)
The Statement of Additional Information provides additional information about the Fund’s directors and officers and can be obtained without charge by calling1-800-466-3863, at www.manning-napier.com, or on the EDGAR Database on the SEC Internet web site (http://www.sec.gov). The following chart shows certain information about the Fund’s directors and officers, including their principal occupations during the last five years. Unless specific dates are provided, the individuals have held the listed positions for longer than five years.
Interested Director and Officer
| Name: | Paul Battaglia* | |
| Address: | 290 Woodcliff Drive Fairport, NY 14450 | |
| Age: | 40 | |
| Current Position(s) Held with Fund: | Principal Executive Officer, President, Chairman and Director | |
| Term of Office & Length of Time Served: | Indefinite – Chairman and Director since November 20181 | |
| Principal Occupation(s) During Past 5 Years: | Chief Financial Officer (2018 – Present); Vice President of Finance (2016 – 2018); Director of Finance (2011 – 2016); Financial Analyst/Internal Auditor (2004-2006) – Manning & Napier Advisors, LLC and affiliates Holds one or more of the following titles for various subsidiaries and affiliates: Chief Financial Officer | |
| Number of Portfolios Overseen within Fund Complex: | 34 | |
| Other Directorships Held Outside Fund Complex During | �� | N/A |
Past 5 Years: | ||
| Independent Directors | ||
| Name: | Stephen B. Ashley | |
| Address: | 290 Woodcliff Drive Fairport, NY 14450 | |
| Age: | 78 | |
| Current Position(s) Held with Fund: | Director, Audit Committee Member, Governance & Nominating Committee Member | |
| Term of Office & Length of Time Served: | Indefinite – Since 1996 | |
| Principal Occupation(s) During Past 5 Years: | Chairman, Director & Chief Executive Officer (1997 to present) - The Ashley Group (property management and investment). Director (1995-2008) and Chairman(non-executive) (2004-2008) - Fannie Mae (mortgage) | |
| Number of Portfolios Overseen within Fund Complex: | 34 | |
| Other Directorships Held Outside Fund Complex During | Fannie Mae (1995-2008) | |
| Past 5 Years: | The Ashley Group (1995-2008) Genesee Corporation (1987-2007) | |
| Name: | Paul A. Brooke | |
| Address: | 290 Woodcliff Drive Fairport, NY 14450 | |
| Age: | 73 | |
| Current Position(s) Held with Fund: | Lead Independent Director, Audit Committee Member, Governance & Nominating Committee Chairman | |
| Term of Office & Length of Time Served: | Indefinite – Director, Audit Committee Member, Governance & Nominating Committee Member since 2007; Governance & Nominating Committee Chairman since 2016; Lead Independent Director since 2017 | |
| Principal Occupation(s) During Past 5 Years: | Chairman & CEO (2005-2009) - Ithaka Acquisition Corporation (investments); Chairman (2007-2009) - Alsius Corporation (investments); Managing Member (1991-present) - PMSV Holdings LLC (investments); Managing Member (2010-2016) - Venbio (investments). | |
| Number of Portfolios Overseen within Fund Complex: | 34 | |
| Other Directorships Held Outside Fund Complex During Past 5 Years: | Incyte Corp. (biotech)(2000-present); ViroPharma, Inc. (speciality pharmaceuticals)(2000-2014); HLTH (WebMD)(information)(2000-2010); Cheyne Capital International (investment)(2000-2017); GMP Companies (investment)(2000-2011); Cytos Biotechnology Ltd (biotechnology)(2012-2014); Cerus (biomedical)(2016-present);PureEarth(non-profit)(2012-present); Caelum BioSciences (biomedical)(2018-present) | |
31
Diversified Tax Exempt Series
Directors’ and Officers’ Information
(unaudited)
| Independent | Directors (continued) |
| Name: | Peter L. Faber | |
| Address: | 290 Woodcliff Drive Fairport, NY 14450 | |
| Age: | 80 | |
| Current Position(s) Held with Fund: | Director, Governance & Nominating Committee Member | |
| Term of Office & Length of Time Served: | Indefinite – Since 1987 | |
| Principal Occupation(s) During Past 5 Years: | Senior Counsel (2006-2012), Partner (1995-2006 & 2013-2018) - McDermott, Will & Emery LLP (law firm) | |
| Number of Portfolios Overseen within Fund Complex: | 34 | |
Other Directorships Held Outside Fund Complex During Past 5 Years: | Boston Early Music Festival(non-profit)(2007-present); Amherst Early Music, Inc.(non-profit)(2009-present); Gotham Early Music Scene, Inc.(non-profit)(2009-present); Partnership for New York City, Inc.(non-profit)(1989-2010); New York Collegium(non-profit)(2004-2011); S’Cool Sounds, Inc.(non-profit)(2017-present) | |
| Name: | Harris H. Rusitzky | |
| Address: | 290 Woodcliff Drive Fairport, NY 14450 | |
| Age: | 83 | |
| Current Position(s) Held with Fund: | Director, Audit Committee Member, Governance & Nominating Committee Member | |
| Term of Office & Length of Time Served: | Indefinite – Since 1985 | |
| Principal Occupation(s) During Past 5 Years: | President (1994- present) - The Greening Group (business consultants); Partner (2006-present) - The Restaurant Group (restaurants) | |
| Number of Portfolios Overseen within Fund Complex: | 34 | |
Other Directorships Held Outside Fund Complex During Past 5 Years: | Rochester Institute of Technology (university)(1972-present); Culinary | |
| Institute of America(non-profit college)(1985-present); George Eastman Museum (museum)(1988-present); National Restaurant Association (restaurant trade organization)(1978-present) | ||
| Name: | Chester N. Watson | |
| Address: | 290 Woodcliff Drive Fairport, NY 14450 | |
| Age: | 68 | |
| Current Position(s) Held with Fund: | Director, Audit Committee Chairman, Governance & Nominating Committee Member | |
| Term of Office & Length of Time Served: | Indefinite – Director, Audit Committee Member, Governance & Nominating Committee Member Since 2012; Audit Committee Chairman since 2013 | |
| Principal Occupation(s) During Past 5 Years: | General Auditor (2003-2011) - General Motors Company (auto manufacturer) | |
| Number of Portfolios Overseen within Fund Complex: | 34 | |
| Other Directorships Held Outside Fund Complex During Past 5 Years: | Rochester Institute of Technology (university)(2005-present); Town of Greenburgh, NY Planning Board (municipal government) (2015-2018) | |
| Officers: | ||
| Name: | Jeffrey S. Coons, Ph.D., CFA® | |
| Address: | 290 Woodcliff Drive | |
| Fairport, NY 14450 | ||
| Age: | 55 | |
| Current Position(s) Held with Fund: | Vice President | |
| Term of Office1& Length of Time Served: | Since 2004 | |
| Principal Occupation(s) During Past 5 Years: | President since 2010,Co-CEO since 2018,Co-Director of Research (2002 – 2015) - Manning & Napier Advisors, LLC Holds one or more of the following titles for various subsidiaries and affiliates: President, Director, Treasurer, or Senior Trust Officer | |
32
Diversified Tax Exempt Series
Directors’ and Officers’ Information
(unaudited)
| Officers: | (continued) |
| Name: | Elizabeth Craig | |
| Address: | 290 Woodcliff Drive Fairport, NY 14450 | |
| Age: | 31 | |
| Current Position(s) Held with Fund: | Corporate Secretary | |
| Term of Office1& Length of Time Served: | Since 2016 | |
| Principal Occupation(s) During Past 5 Years: | Fund Administration Manager since 2015; Mutual Fund Compliance Specialist (2009-2015) - Manning & Napier Advisors, LLC; Assistant Corporate Secretary (2011-2016) - Manning & Napier Fund, Inc. | |
| Name: | Christine Glavin | |
| Address: | 290 Woodcliff Drive Fairport, NY 14450 | |
| Age: | 52 | |
| Current Position(s) Held with Fund: | Principal Financial Officer, Chief Financial Officer | |
| Term of Office1& Length of Time Served: | Principal Financial Officer since 2002; Chief Financial Officer since 2001 | |
| Principal Occupation(s) During Past 5 Years: | Director of Fund Reporting since 2011; Fund Reporting Manager (1997-2011) - Manning & Napier Advisors, LLC; Assistant Treasurer since 2008 - Exeter Trust Company; Chief Financial Officer (2017-2018) - Rainier Investment Management Mutual Funds, Inc. | |
| Name: | Jodi L. Hedberg | |
| Address: | 290 Woodcliff Drive | |
| Fairport, NY 14450 | ||
| Age: | 51 | |
| Current Position(s) Held with Fund: | Chief Compliance Officer, Anti-Money Laundering Compliance Officer | |
| Term of Office1& Length of Time Served: | Chief Compliance Officer since 2004; Anti-Money Laundering Officer since 2002; Corporate Secretary (1997-2016) - Manning & Napier Fund, Inc.; Chief Compliance Officer and Anti-Money Laundering Officer (2017-2018) – Rainier Investment Management Mutual Funds, Inc. | |
| Principal Occupation(s) During Past 5 Years: | Managing Director, Compliance & Regulatory Affairs since 2018; Director of Compliance (2005-2018); Compliance Manager (1995-2005) – Manning & Napier Advisors, LLC and affiliates; Corporate Secretary – Manning & Napier Investor Services, Inc. since 2006 | |
| Name: | Scott Morabito | |
| Address: | 290 Woodcliff Drive | |
| Fairport, NY 14450 | ||
| Age: | 31 | |
| Current Position(s) Held with Fund: | Assistant Vice President | |
| Term of Office1& Length of Time Served: | Since 2017 | |
| Principal Occupation(s) During Past 5 Years: | Director of Funds Group since 2017; Fund Product and Strategy Manager (2014-2017); Senior Product and Strategy Analyst (2013-2014); Product and Strategy Analyst (2011-2013) - Manning & Napier Advisors, LLC; President, Director – Manning & Napier Investor Services, Inc. since 2018 | |
| Name: | Sarah Turner | |
| Address: | 290 Woodcliff Drive | |
| Fairport, NY 14450 | ||
| Age: | 36 | |
| Current Position(s) Held with Fund: | Chief Legal Officer; Assistant Corporate Secretary | |
| Term of Office1& Length of Time Served: | Since 2018 | |
| Principal Occupation(s) During Past 5 Years: | General Counsel since 2018 - Manning & Napier Advisors, LLC and affiliates; Counsel (2017-2018) – Harter Secrest and Emery LLP; Legal Counsel (2010-2017) – Manning & Napier Advisors, LLC and affiliates Holds one or more of the following titles for various affiliates: Corporate Secretary, General Counsel | |
33
Diversified Tax Exempt Series
Directors’ and Officers’ Information
(unaudited)
| Officers: (continued) |
| Name: | Amy Williams | |
| Address: | 290 Woodcliff Drive | |
Fairport, NY 14450 | ||
| Age: | 57 | |
| Current Position(s) Held with Fund: | Assistant Corporate Secretary | |
| Term of Office1& Length of Time Served: | Since 2016 | |
| Principal Occupation(s) During Past 5 Years: | Director of Fund Documentation – Manning & Napier Advisors, LLC since 2009 Holds one or more of the following titles for various affiliates: Director |
*Interested Director, within the meaning of the 1940 Act by reason of her positions with the Fund’s investment advisor, Manning & Napier Advisors, LLC and Distributor, Manning & Napier Investor Services, Inc.
1The term of office of all officers shall be one year and until their respective successors are chosen and qualified, or his or her earlier resignation or removal as provided in the Fund’sBy-Laws.
34
Diversified Tax Exempt Series
Literature Requests
(unaudited)
Proxy Voting Policies and Procedures
A description of the policies and procedures that the Fund uses to determine how to vote proxies relating to portfolio securities is available, without charge, upon request:
| By phone | 1-800-466-3863 | |||
On the Securities and Exchange Commission’s (SEC) web site | http://www.sec.gov |
Proxy Voting Record
Information regarding how the Fund voted proxies relating to portfolio securities during the most recent12-month period ended June 30th is available, without charge, upon request:
| By phone | 1-800-466-3863 | |||
| On the SEC’s web site | http://www.sec.gov | |||
Quarterly Portfolio Holdings
The Series’ complete schedule of portfolio holdings for the 1st and 3rd quarters of each fiscal year are provided on FormN-Q, and are available, without charge, upon request:
| By phone | 1-800-466-3863 | |||
| On the SEC’s web site | http://www.sec.gov |
Prospectus and Statement of Additional Information (SAI)
For more information about any of the Manning & Napier Fund, Inc. Series, you may obtain a prospectus and SAI at www.manning-napier.com or by calling (800)466-3863. Before investing, carefully consider the objectives, risks, charges and expenses of the investment and read the prospectus carefully as it contains this and other information about the investment company.In addition, this information can be found on the SEC’s web site, http://www.sec.gov.
Additional information available at www.manning-napier.com
1. Fund Holdings -Month-End
2. Fund Holdings -Quarter-End
3. Shareholder Report - Annual
4. Shareholder Report - Semi-Annual
The Fund also offers electronic notification or“e-delivery” when certain documents are availableon-line to be downloaded or reviewed. Direct shareholders can elect to receive electronic notification when shareholder reports, prospectus updates, and/or statements are available. If you do not currently haveon-line access to your account, you can establish access by going to www.manning-napier.com, click on “Login” in the top corner of the page, and follow the prompts to self-enroll. Once enrolled, you can set your electronic notification preferences by clicking on the Account Options tab located within the green toolbar and then selectE-Delivery Option. Should you have any questions on either how to establishon-line access or how to update your account settings, please contact Investor Services at1-800-466-3863.
The Manning & Napier Fund, Inc. is managed by Manning & Napier Advisors, LLC. Manning & Napier Investor Services, Inc., an affiliate of Manning & Napier Advisors, LLC, is the distributor of the Fund shares.
MNDTE-12/18-AR

Manning & Napier Fund, Inc.
New York Tax Exempt Series
Beginning on February 25, 2021, as permitted by Securities and Exchange Commission regulations, paper copies of the Series’ annual and semi-annual shareholder reports will no longer be sent by mail, unless you specifically request paper copies of the reports from the Fund or from your financial intermediary, such as a broker-dealer or bank. Instead, the reports will be made available on a website, and you will be notified by mail each time a report is posted and provided with a website link to access the report.
If you already elected to receive shareholder reports electronically, you will not be affected by this change and you need not take any action. You may elect to receive shareholder reports and other communications from the Fund electronically by contacting your financial intermediary or, if you are a direct investor, by visiting www.manning-napier.com or calling1-800-466-3863.
You may elect to receive all future annual and semi-annual reports in paper free of charge. If you invest through a financial intermediary, you can contact your financial intermediary to request that you continue to receive paper copies of your shareholder reports. If you invest directly with the Fund, you can inform the Fund that you wish to continue receiving paper copies of your shareholder reports by visiting www.manning-napier.com or calling1-800-466-3863. Your election to receive reports in paper will apply to all funds held with your financial intermediary if you invest through a financial intermediary or all series of the Fund if you invest directly with the Fund. |
New York Tax Exempt Series
Management Discussion and Analysis
(unaudited)
Dear Shareholders:
The investment environment we witnessed over the past twelve months was far more volatile than in prior years. It resulted in a sharp drawdown in global equity markets during the fourth quarter of 2018.
For the fiscal year ending on December 31, 2018, US equities experienced negative returns, with the S&P 500 Total Return Index falling 4.38%. International equity performance was somewhat worse, with the MSCI ACWI ex USA Index returning negative 14.20%.
In fixed income, domestic investment-grade bond performance was essentially flat for the year, as measured by the Bloomberg Barclays U.S. Aggregate Bond Index, rising 0.01% as income generated over the period was offset by rising interest rates (when interest rates rise, bond prices fall).
We believe recent volatility, both at the beginning and end of last year, is reflective of what investors should expect going forward. While we do not believe we are immediately heading for a recession, we see recent developments within the US and abroad as an indication that we are entering a higher risk period for financial markets.
The US economy is likely approaching a period of peak growth. It continues to show signs of progressing toward the later stages of its economic and market cycle (typical characteristics of anend-of-cycle phase are an economic recession and financial market selloff).
As economic growth decelerates to more sustainable levels, we believe that investors are facing a growing risk of disappointment. At the same time, key global risks remain, including trade tensions, geopolitical uncertainty, and tightening monetary policy.
Considering the current economic and market backdrop, we believe investors should temper their performance expectations. The returns experienced over the latter half of the post-Global Financial Crisis bull market are unlikely to continue.
Additionally, given our cautious outlook, we are reviewing current and prospective investments for excessive risk exposures, and we have adjusted our positioning across many of our portfolios. Going forward, we will continue to follow our disciplines, focusing on flexibility and selectivity in today’s incredibly dynamic investment environment.
With this in mind, in the enclosed we discuss recent fund performance, highlight our positioning, and briefly provide our outlook amid the current investment environment.
We hope that you find this information helpful, and we look forward to working with you in the years ahead. Thank you for your continued confidence in Manning & Napier.
Sincerely,
Manning & Napier Advisors, LLC
The S&P 500 Index is an unmanaged, capitalization-weighted measure comprised of 500 leading U.S. companies to gauge U.S. large cap equities. The Index returns do not reflect any fees or expenses. The Index includes dividends, but not the reinvestment of dividends. Index returns provided by Bloomberg. S&P Dow Jones Indices LLC, a subsidiary of the McGraw Hill Financial, Inc., is the publisher of various index based data products and services and has licensed certain of its products and services for use by Manning & Napier. All such content Copyright© 2019 by S&P Dow Jones Indices LLC and/or its affiliates. All rights reserved. Neither S&P Dow Jones Indices LLC, Dow Jones Trademark Holdings LLC, their affiliates nor their third party licensors make any representation or warranty, express or implied, as to the ability of any index to accurately represent the asset class or market sector that it purports to represent and none of these parties shall have any liability for any errors, omissions, or interruptions of any index or the data included therein.
The MSCI ACWI ex USA Index (ACWIxUS) is designed to measure large andmid-cap representation across 22 of 23 Developed Markets countries (excluding the U.S.) and 24 Emerging Markets countries. The Index returns do not reflect any fees or expenses. The Index is denominated in U.S. dollars. The Index returns are net of withholding taxes. They assume daily reinvestment of net dividends thus accounting for any applicable dividend taxation. Index returns provided by Bloomberg.
The Bloomberg Barclays U.S. Aggregate Bond Index is an unmanaged, market-value weighted index of U.S. domestic investment-grade debt issues, including government, corporate, asset-backed, and mortgage-backed securities, with maturities of one year or more. Index returns do not reflect any fees or expenses. Index returns provided by Interactive Data.
1
New York Tax Exempt Series
Fund Commentary
(unaudited)
Investment Objective
To provide as high a level of current income exempt from federal income tax and New York State personal income tax as the Advisor believes is consistent with the preservation of capital. The Series invests primarily in municipal bonds that provide income exempt from federal income tax and New York State personal income tax.
Performance Commentary
The ICE Bank of America Merrill Lynch1-12 Year Municipal Bond Index experienced a positive return of 1.64% for 2018. Over the same time period, the New York Tax Exempt Series returned 0.54%.
During the year ended December 31, 2018, the Series’ underperformance was primarily attributable to yield curve positioning. Specifically, the Series held a portion of longer duration securities, including securities with maturities greater than 12 years (fixed income securities with maturities beyond 12 years are not included in the benchmark). Due to this longer duration portion of the portfolio, as rates rose across the yield curve, the Series experienced underperformance.
We continue to believe a modest duration remains in investors’ best interests. Although we may see rates move lower in the near-term, we believe that, over the long-term, underlying economic factors will likely apply gradual pressure on rates to move higher and for the yield curve to flatten.
Going forward, our economic outlook remains constructive towards revenue bonds, which continue to offer attractive valuations while exhibiting stable credit fundamentals. Within revenue bonds, we maintain a focus on higher quality/essential service bonds (e.g., water and sewer authorities). With respect to general obligations (specifically local obligations), our outlook remains stable as property taxes are relatively healthy. That said, we continue to monitor the potential for credit deterioration due to underlying economic factors.
With spreads atpre-crisis levels, we continue to invest in high-quality bonds due to the lack of adequate compensation for taking on risk.
Performance data quoted represents past performance and does not guarantee future results. The investment return and principal value of an investment will fluctuate, so that an investor’s shares, when redeemed, may be worth more or less than their original cost. Current performance may be higher or lower than that quoted; investors can obtain the most recentmonth-end performance at www.manning-napier.com or by calling (800)466-3863.
Please see the next page for additional performance information as of December 31, 2018.
For regulatory purposes, this is not an offering in all states.
All investments involve risks, including possible loss of principal. There is an inverse relationship between bond prices and interest rates; as interest rates rise, bond prices (and therefore the value of bond funds) fall. Likewise, as interest rates fall, bond prices and the value of bond funds rise. The income earned by the Series may be subject to the Alternative Minimum Tax (AMT), depending on your tax situation.
The Intercontinental Exchange (ICE) Bank of America Merrill Lynch1-12 Year Municipal Bond Index is a subset of the BofA Merrill Lynch U.S. Municipal Securities Index, an unmanaged, market-weighted index comprised of investment-grade, fixed rate, coupon bearing municipal bonds. The Index includes securities with maturities greater than one year but less than twelve years. The Index returns assume reinvestment of coupons and do not reflect any fees or expenses. Index returns provided by Interactive Data.
2
New York Tax Exempt Series
Performance Update as of December 31, 2018
(unaudited)
AVERAGE ANNUAL TOTAL RETURNS AS OF DECEMBER 31, 2018 | ||||||
| ONE | FIVE | TEN | ||||
| YEAR1 | YEAR | YEAR | ||||
| Manning & Napier Fund, Inc. - New York Tax Exempt Series2 | 0.54% | 0.96% | 2.68% | |||
Intercontinental Exchange (ICE) Bank of America Merrill Lynch (BofAML)1-12 Year Municipal Bond Index3 | 1.64% | 2.28% | 3.23% | |||
The following graph compares the value of a $10,000 investment in the Manning & Napier Fund, Inc. - New York Tax Exempt Series for the ten years ended December 31, 2018 to the Intercontinental Exchange (ICE) Bank of America Merrill Lynch (BofAML)1-12 Year Municipal Bond Index.
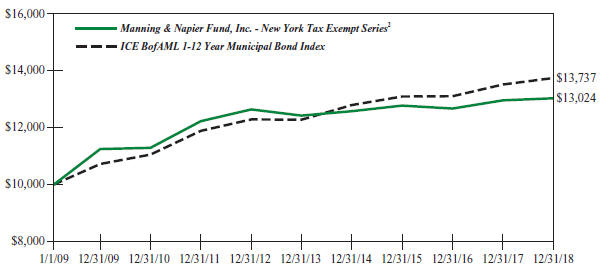
1The returns shown are based on net asset values calculated for shareholder transactions and may differ from the returns shown in the financial highlights, which reflect adjustments made to the net asset values in accordance with accounting principles generally accepted in the United States of America.
2The Series’ performance does not reflect the deduction of taxes that a shareholder would pay on fund distributions or the redemption of shares. The Series’ performance is historical and may not be indicative of future results. The performance returns shown are inclusive of the net expense ratio of the Series. For the year ended December 31, 2018, this net expense ratio was 0.62%. The gross expense ratio, which does not account for any voluntary or contractual waivers currently in effect, was 0.62% for the year ended December 31, 2018.
3The Intercontinental Exchange (ICE) Bank of America Merrill Lynch (BofAML)1-12 Year Municipal Bond Index is a subset of the ICE BofAML U.S. Municipal Securities Index. The Index includes all U.S. dollar denominated investment gradetax-exempt debt with a remaining term to final maturity greater than one year, but less than twelve years. Qualifying securities must have at least 18 months to final maturity at the time of issuance and a fixed coupon schedule. The Index returns do not reflect any fees or expenses. Index returns provided by Interactive Data.
3
New York Tax Exempt Series
Shareholder Expense Example
(unaudited)
As a shareholder of the Series, you incur ongoing costs, including management fees, shareholder service fees and other Series expenses. This example is intended to help you understand your ongoing costs (in dollars) of investing in the Series and to compare these costs with the ongoing costs of investing in other mutual funds.
The example is based on an investment of $1,000 invested at the beginning of the period and held for the entire period (July 1, 2018 to December 31, 2018).
Actual Expenses
The first line of the table below provides information about actual account values and actual expenses. You may use the information in this line, together with the amount you invested, to estimate the expenses that you paid over the period. Simply divide your account value by $1,000 (for example, an $8,600 account value divided by $1,000 = 8.6), then multiply the result by the number in the first line under the heading entitled “Expenses Paid During Period” to estimate the expenses you paid on your account during this period.
Hypothetical Example for Comparison Purposes
The second line of the table below provides information about hypothetical account values and hypothetical expenses based on the Series’ actual expense ratio and an assumed rate of return of 5% per year before expenses, which is not the Series’ actual return. The hypothetical account values and expenses may not be used to estimate the actual ending account balance or expenses you paid during the period. You may use this information to compare the ongoing costs of investing in the Series and other funds. To do so, compare this 5% hypothetical example with the 5% hypothetical examples that appear in the shareholder reports of the other funds.
Please note that the expenses shown in the table are meant to highlight your ongoing costs only and do not reflect any transaction costs such as sales charges (loads), redemption fees, or exchange fees that you may incur in other mutual funds. Therefore, the second line of the table is useful in comparing ongoing costs only, and will not help you determine the relative total costs of owning different funds.
BEGINNING ACCOUNT VALUE �� | ENDING ACCOUNT VALUE | EXPENSES PAID DURING PERIOD* | ||||
Actual | $1,000.00 | $1,009.76 | $3.14 | |||
Hypothetical (5% return before expenses) | $1,000.00 | $1,022.08 | $3.16 |
*Expenses are equal to the Series’ annualized expense ratio (for thesix-month period) of 0.62%, multiplied by the average account value over the period, multiplied by 184/365 (to reflect theone-half year period). Expenses are based on the most recent fiscal half year; therefore, the expense ratios stated above may differ from the expense ratios stated in the financial highlights, which are based onone-year data.
4
New York Tax Exempt Series
Portfolio Composition as of December 31, 2018
(unaudited)
5
New York Tax Exempt Series
Investment Portfolio - December 31, 2018
| CREDIT | ||||||||||||||||||||
| COUPON | MATURITY | RATING1 | PRINCIPAL | VALUE | ||||||||||||||||
| RATE | DATE | (UNAUDITED) | AMOUNT | (NOTE 2) | ||||||||||||||||
NEW YORK MUNICIPAL BONDS - 96.6% | ||||||||||||||||||||
Albany Municipal Water Finance Authority, Series A, Revenue Bond | 5.000% | 12/1/2019 | AA2 | $ | 1,125,000 | $ | 1,158,716 | |||||||||||||
Amherst, Public Impt., G.O. Bond | 2.125% | 11/1/2025 | Aa2 | 675,000 | 670,950 | |||||||||||||||
Arlington Central School District, G.O. Bond | 4.000% | 12/15/2020 | Aa2 | 400,000 | 417,176 | |||||||||||||||
Arlington Central School District, G.O. Bond | 4.000% | 12/15/2021 | Aa2 | 300,000 | 318,165 | |||||||||||||||
Babylon, Various Purposes, Public Impt., Series B, G.O. Bond | 2.250% | 12/1/2026 | Aaa | 705,000 | 707,693 | |||||||||||||||
Bedford Central School District, G.O. Bond | 2.000% | 10/15/2021 | Aa2 | 500,000 | 501,915 | |||||||||||||||
Briarcliff Manor, Public Impt., Series A, G.O. Bond | 3.000% | 2/1/2020 | Aa2 | 265,000 | 268,747 | |||||||||||||||
Brookhaven, Public Impt., Series A, G.O. Bond | 3.000% | 2/1/2019 | Aa1 | 1,385,000 | 1,386,565 | |||||||||||||||
Buffalo Municipal Water Finance Authority, Series A, Revenue Bond | 4.000% | 7/1/2022 | A2 | 300,000 | 320,154 | |||||||||||||||
Buffalo Municipal Water Finance Authority, Series A, Revenue Bond | 5.000% | 7/1/2023 | A2 | 300,000 | 337,263 | |||||||||||||||
Canandaigua City School District, G.O. Bond | 2.125% | 6/15/2026 | Aa3 | 540,000 | 535,027 | |||||||||||||||
Canandaigua, Public Impt., G.O. Bond | 3.000% | 12/15/2028 | AA2 | 570,000 | 581,337 | |||||||||||||||
Cattaraugus County, Highway Impt., G.O. Bond | 2.000% | 4/15/2019 | Aa3 | 405,000 | 405,405 | |||||||||||||||
Chappaqua Central School District, School Impt., G.O. Bond | 2.250% | 6/15/2025 | Aaa | 675,000 | 682,708 | |||||||||||||||
Chenango Valley Central School District, G.O. Bond, AGM | 2.125% | 6/15/2021 | A2 | 500,000 | 496,860 | |||||||||||||||
Clarence Central School District, G.O. Bond | 4.000% | 5/15/2021 | Aa2 | 250,000 | 262,920 | |||||||||||||||
Clarkstown Central School District, G.O. Bond | 4.000% | 10/15/2021 | Aa2 | 500,000 | 519,210 | |||||||||||||||
Clarkstown, G.O. Bond | 4.000% | 5/15/2019 | AA2 | 375,000 | 378,157 | |||||||||||||||
Corning City School District, G.O. Bond | 4.000% | 6/15/2028 | Aa3 | 995,000 | 1,106,589 | |||||||||||||||
Cortland County, Public Impt., G.O. Bond, BAM | 2.750% | 9/1/2019 | AA2 | 305,000 | 306,772 | |||||||||||||||
Dutchess County, G.O. Bond | 2.125% | 12/15/2023 | AA2 | 850,000 | 854,981 | |||||||||||||||
Erie County Fiscal Stability Authority, Public Impt., Series A, Revenue Bond | 4.000% | 3/15/2019 | Aa1 | 600,000 | 602,814 | |||||||||||||||
Essex County, Public Impt., G.O. Bond | 5.000% | 5/1/2020 | AA2 | 500,000 | 521,495 | |||||||||||||||
Gananda Central School District, G.O. Bond | 3.000% | 6/15/2019 | AA2 | 250,000 | 251,380 | |||||||||||||||
Gates Chili Central School District, School Impt., G.O. Bond | 2.000% | 6/15/2019 | Aa3 | 215,000 | 215,286 | |||||||||||||||
Greece Central School District, G.O. Bond, BAM | 2.500% | 6/15/2023 | Aa3 | 620,000 | 633,132 | |||||||||||||||
Iroquois Central School District, School Impt., G.O. Bond | 2.000% | 6/15/2021 | Aa2 | 500,000 | 501,565 | |||||||||||||||
Islip Union Free School District, School Impt., G.O. Bond | 2.250% | 3/1/2019 | Aa3 | 475,000 | 475,470 | |||||||||||||||
Jamestown City School District, G.O. Bond | 3.000% | 4/1/2019 | Aa3 | 200,000 | 200,588 | |||||||||||||||
Kings Park Central School District, G.O. Bond | 2.000% | 8/1/2020 | Aa2 | 500,000 | 502,010 | |||||||||||||||
Kings Park Central School District, School Impt., Series B, G.O. Bond | 2.000% | 7/15/2025 | Aa2 | 800,000 | 790,792 | |||||||||||||||
Lockport City School District, G.O. Bond, AGM | 2.000% | 8/1/2019 | Aa3 | 450,000 | 450,720 | |||||||||||||||
Mamaroneck, Various Purposes, Public Impt., G.O. Bond | 2.000% | 7/15/2020 | Aaa | 335,000 | 336,665 | |||||||||||||||
The accompanying notes are an integral part of the financial statements.
6
New York Tax Exempt Series
Investment Portfolio - December 31, 2018
| CREDIT | ||||||||||||||||||||
| COUPON | MATURITY | RATING1 | PRINCIPAL | VALUE | ||||||||||||||||
| RATE | DATE | (UNAUDITED) | AMOUNT | (NOTE 2) | ||||||||||||||||
NEW YORK MUNICIPAL BONDS(continued) | ||||||||||||||||||||
Metropolitan Transportation Authority, Climate Bond Certified Green Bond, SeriesB-2, Revenue Bond | 5.000% | 11/15/2025 | AA2 | $ | 1,350,000 | $ | 1,604,799 | |||||||||||||
Metropolitan Transportation Authority, SeriesA-2, Revenue Bond | 5.000% | 11/15/2025 | A1 | 750,000 | 865,050 | |||||||||||||||
Metropolitan Transportation Authority, Series F, Revenue Bond | 5.000% | 11/15/2019 | A1 | 1,000,000 | 1,026,670 | |||||||||||||||
Metropolitan Transportation Authority, Series F, Revenue Bond | 5.000% | 11/15/2022 | A1 | 250,000 | 275,025 | |||||||||||||||
Metropolitan Transportation Authority, Series F, Revenue Bond | 5.000% | 11/15/2025 | A1 | 505,000 | 551,435 | |||||||||||||||
Metropolitan Transportation Authority, SubseriesB-1, Revenue Bond | 5.000% | 11/15/2024 | AA2 | 1,885,000 | 2,143,132 | |||||||||||||||
Metropolitan Transportation Authority, Transit Impt., Series C, Revenue Bond | 5.000% | 11/15/2019 | A1 | 500,000 | 513,335 | |||||||||||||||
Metropolitan Transportation Authority, Transit Impt., SubseriesB-2, Revenue Bond | 5.000% | 11/15/2021 | A1 | 1,000,000 | 1,079,090 | |||||||||||||||
Middle Country Central School District At Centereach, School Impt., G.O. Bond | 2.000% | 8/15/2026 | Aa2 | 1,005,000 | 975,895 | |||||||||||||||
Monroe County Water Authority, Water Utility Impt., Revenue Bond | 5.000% | 8/1/2019 | Aa2 | 455,000 | 463,722 | |||||||||||||||
Naples Central School District, G.O. Bond, BAM | 2.500% | 6/15/2020 | AA2 | 710,000 | 717,995 | |||||||||||||||
Nassau County Sewer & Storm Water Finance Authority, Series A, Revenue Bond | 5.000% | 10/1/2022 | Aa3 | 500,000 | 557,480 | |||||||||||||||
Nassau County, Public Impt., Series A, G.O. Bond | 5.000% | 4/1/2019 | A2 | 2,425,000 | 2,443,575 | |||||||||||||||
New York City Transitional Finance Authority, Building Aid Revenue, Public Impt., SeriesS-1, Revenue Bond | 5.000% | 7/15/2026 | Aa2 | 1,250,000 | 1,465,350 | |||||||||||||||
New York City Transitional Finance Authority, Building Aid, Public Impt., Prerefunded Balance, SeriesS-1, Revenue Bond | 5.000% | 7/15/2019 | Aa2 | 1,000,000 | 1,017,820 | |||||||||||||||
New York City Transitional Finance Authority, Building Aid, Public Impt., SeriesS-2, Revenue Bond | 5.000% | 7/15/2023 | Aa2 | 2,000,000 | 2,261,560 | |||||||||||||||
New York City Transitional Finance Authority, Building Aid, School Impt., SeriesS-3, Revenue Bond | 5.000% | 7/15/2023 | Aa2 | 970,000 | 1,042,779 | |||||||||||||||
New York City Transitional Finance Authority, Building Aid, SeriesS-1, Revenue Bond | 5.000% | 7/15/2023 | Aa2 | 820,000 | 927,240 | |||||||||||||||
New York City Transitional Finance Authority, Building Aid, SeriesS-2A, Revenue Bond | 5.000% | 7/15/2033 | Aa2 | 1,000,000 | 1,172,900 | |||||||||||||||
New York City Transitional Finance Authority, Future Tax Secured, Public Impt., SeriesA-1, Revenue Bond | 3.250% | 8/1/2035 | Aa1 | 1,000,000 | 962,630 | |||||||||||||||
New York City Transitional Finance Authority, Future Tax Secured, Public Impt., SeriesE-1, Revenue Bond | 5.000% | 2/1/2026 | Aa1 | 475,000 | 549,974 | |||||||||||||||
The accompanying notes are an integral part of the financial statements.
7
New York Tax Exempt Series
Investment Portfolio - December 31, 2018
| CREDIT | ||||||||||||||||||||
| COUPON | MATURITY | RATING1 | PRINCIPAL | VALUE | ||||||||||||||||
| RATE | DATE | (UNAUDITED) | AMOUNT | (NOTE 2) | ||||||||||||||||
NEW YORK MUNICIPAL BONDS(continued) | ||||||||||||||||||||
New York City Transitional Finance Authority, Future | ||||||||||||||||||||
Tax Secured, Public Impt., Subseries B1, Revenue Bond | 5.000% | 11/1/2023 | Aa1 | $ | 2,000,000 | $ | 2,275,740 | |||||||||||||
New York City Transitional Finance Authority, Future Tax Secured, Series B, Revenue Bond | 5.000% | 11/1/2024 | Aa1 | 3,000,000 | 3,328,800 | |||||||||||||||
New York City Transitional Finance Authority, Future Tax Secured, Series C, Revenue Bond | 5.000% | 11/1/2025 | Aa1 | 750,000 | 874,357 | |||||||||||||||
New York City Water & Sewer System, Series A, Revenue Bond | 3.000% | 6/15/2036 | Aa1 | 1,250,000 | 1,172,000 | |||||||||||||||
New York City Water & Sewer System, Series GG, Revenue Bond | 4.000% | 6/15/2020 | Aa1 | 350,000 | 361,378 | |||||||||||||||
New York City Water & Sewer System, Series HH, Revenue Bond | 5.000% | 6/15/2025 | Aa1 | 3,000,000 | 3,544,050 | |||||||||||||||
New York City Water & Sewer System, Water Utility Impt., SubseriesBB-1, Revenue Bond | 5.000% | 6/15/2046 | Aa1 | 2,000,000 | 2,255,200 | |||||||||||||||
New York City, Series 1, G.O. Bond | 5.000% | 8/1/2023 | Aa2 | 2,700,000 | 3,051,351 | |||||||||||||||
New York City, Series B, G.O. Bond | 4.000% | 8/1/2021 | Aa2 | 1,935,000 | 2,036,723 | |||||||||||||||
New York City, Series C, G.O. Bond | 5.000% | 8/1/2031 | Aa2 | 1,500,000 | 1,772,115 | |||||||||||||||
New York Local Government Assistance Corp., Series A, Revenue Bond | 5.000% | 4/1/2022 | Aa1 | 2,500,000 | 2,598,250 | |||||||||||||||
New York Local Government Assistance Corp., SubseriesA-5/6, Revenue Bond | 5.500% | 4/1/2019 | Aa1 | 445,000 | 449,192 | |||||||||||||||
New York State Dormitory Authority, Consolidated Service Contract, Revenue Bond | 5.000% | 7/1/2019 | Aa2 | 750,000 | 762,360 | |||||||||||||||
New York State Dormitory Authority, Income Tax Revenue, Series A, Revenue Bond | 5.000% | 3/15/2025 | Aa1 | 500,000 | 581,970 | |||||||||||||||
New York State Dormitory Authority, Income Tax Revenue, Series B, Revenue Bond, AMBAC | 5.500% | 3/15/2026 | Aa1 | 1,200,000 | 1,454,304 | |||||||||||||||
New York State Dormitory Authority, Income Tax Revenue, Series E, Revenue Bond | 3.500% | 3/15/2037 | Aa1 | 850,000 | 835,346 | |||||||||||||||
New York State Dormitory Authority, School Impt., Series A, Revenue Bond | 5.000% | 3/15/2030 | Aa1 | 1,500,000 | 1,763,040 | |||||||||||||||
New York State Dormitory Authority, School Impt., Series A, Revenue Bond | 4.000% | 3/15/2047 | Aa1 | 1,050,000 | 1,074,297 | |||||||||||||||
New York State Dormitory Authority, School Impt., Series C, Revenue Bond | 5.000% | 3/15/2021 | Aa1 | 2,000,000 | 2,138,280 | |||||||||||||||
New York State Dormitory Authority, School Impt., Series E, Revenue Bond, AGM | 5.000% | 10/1/2025 | A2 | 1,000,000 | 1,125,940 | |||||||||||||||
New York State Dormitory Authority, Series A, Revenue Bond | 5.000% | 3/15/2021 | Aa1 | 1,400,000 | 1,496,796 | |||||||||||||||
New York State Dormitory Authority, Series A, Revenue Bond | 5.000% | 3/15/2025 | Aa1 | 500,000 | 583,865 | |||||||||||||||
New York State Dormitory Authority, Series A, Revenue Bond | 3.000% | 10/1/2026 | A2 | 1,000,000 | 1,040,000 | |||||||||||||||
New York State Dormitory Authority, Series B, Revenue Bond, AGM | 5.000% | 4/1/2019 | AA2 | 1,265,000 | 1,274,968 | |||||||||||||||
The accompanying notes are an integral part of the financial statements.
8
New York Tax Exempt Series
Investment Portfolio - December 31, 2018
| CREDIT | ||||||||||||||||||||
| COUPON | MATURITY | RATING1 | PRINCIPAL | VALUE | ||||||||||||||||
| RATE | DATE | (UNAUDITED) | AMOUNT | (NOTE 2) | ||||||||||||||||
NEW YORK MUNICIPAL BONDS(continued) | ||||||||||||||||||||
New York State Dormitory Authority, Series D, Revenue Bond | 5.000% | 2/15/2024 | Aa1 | $ | 4,000,000 | $ | 4,566,160 | |||||||||||||
New York State Dormitory Authority, Series D, Revenue Bond | 5.000% | 2/15/2027 | Aa1 | 300,000 | 355,830 | |||||||||||||||
New York State Dormitory Authority, University & College Impt., Prerefunded Balance, Series A, Revenue Bond | 5.000% | 7/1/2020 | Aa2 | 225,000 | 228,663 | |||||||||||||||
New York State Environmental Facilities Corp., Revenue Bond | 5.000% | 6/15/2025 | Aaa | 1,000,000 | 1,073,610 | |||||||||||||||
New York State Environmental Facilities Corp., Subseries A, Revenue Bond | 5.000% | 6/15/2020 | Aaa | 1,250,000 | 1,309,188 | |||||||||||||||
New York State Environmental Facilities Corp., Water Utility Impt., Revenue Bond | 5.000% | 6/15/2031 | Aaa | 1,000,000 | 1,164,530 | |||||||||||||||
New York State Environmental Facilities Corp., Water Utility Impt., Series A, Revenue Bond | 5.000% | 6/15/2035 | Aaa | 1,000,000 | 1,150,620 | |||||||||||||||
New York State Environmental Facilities Corp., Water Utility Impt., Series B, Revenue Bond | 4.000% | 8/15/2046 | Aaa | 2,000,000 | 2,066,300 | |||||||||||||||
New York State Thruway Authority, Highway Impt., Series A, Revenue Bond | 5.000% | 3/15/2020 | Aa1 | 550,000 | 570,586 | |||||||||||||||
New York State Thruway Authority, Highway Impt., Series I, Revenue Bond | 4.000% | 1/1/2019 | A2 | 525,000 | 525,000 | |||||||||||||||
New York State Urban Development Corp., Economic Impt., Series A, Revenue Bond | 5.000% | 3/15/2035 | Aa1 | 2,500,000 | 2,868,800 | |||||||||||||||
New York State Urban Development Corp., Highway Impt., Series A, Revenue Bond | 5.000% | 3/15/2037 | Aa1 | 500,000 | 561,235 | |||||||||||||||
New York State Urban Development Corp., Public Impt., Series C, Revenue Bond | 4.000% | 3/15/2043 | Aa1 | 2,250,000 | 2,298,038 | |||||||||||||||
New York State Urban Development Corp., Series A, Revenue Bond | 5.000% | 3/15/2026 | Aa1 | 1,050,000 | 1,240,911 | |||||||||||||||
New York State, Water Utility Impt., Series A, G.O. Bond | 5.000% | 3/1/2021 | Aa1 | 1,000,000 | 1,070,810 | |||||||||||||||
New York State, Water Utility Impt., Series E, G.O. Bond | 5.000% | 12/15/2019 | Aa1 | 565,000 | 582,543 | |||||||||||||||
Niagara County, Water Utility Impt., G.O. Bond | 2.000% | 2/1/2020 | Aa3 | 500,000 | 501,590 | |||||||||||||||
North Colonie Central School District, G.O. Bond | 4.000% | 7/15/2020 | AA2 | 400,000 | 413,804 | |||||||||||||||
Oneida County, Public Impt., G.O. Bond, AGM | 2.500% | 5/15/2019 | A1 | 500,000 | 501,280 | |||||||||||||||
Oneida County, Public Impt., G.O. Bond, AGM | 3.000% | 5/1/2020 | A1 | 400,000 | 401,316 | |||||||||||||||
Onondaga County, Public Impt., G.O. Bond | 5.000% | 5/1/2020 | Aa2 | 250,000 | 260,815 | |||||||||||||||
Onondaga County, Public Impt., G.O. Bond | 5.000% | 5/15/2022 | Aa2 | 1,000,000 | 1,104,400 | |||||||||||||||
Onondaga County, Public Impt., G.O. Bond | 5.000% | 5/15/2023 | Aa2 | 1,000,000 | 1,132,430 | |||||||||||||||
Onondaga County, Public Impt., G.O. Bond | 2.125% | 6/15/2030 | Aa2 | 715,000 | 643,336 | |||||||||||||||
Orange County, Various Purposes Impt., Series A, G.O. Bond, AGM | 5.000% | 3/1/2023 | Aa3 | 520,000 | 584,189 | |||||||||||||||
Pittsford Central School District, G.O. Bond | 4.000% | 10/1/2021 | Aa1 | 350,000 | 370,136 | |||||||||||||||
Pittsford, Public Impt., G.O. Bond | 2.000% | 11/1/2025 | Aaa | 580,000 | 578,521 | |||||||||||||||
Pittsford, Public Impt., G.O. Bond | 2.000% | 11/1/2026 | Aaa | 595,000 | 586,902 | |||||||||||||||
The accompanying notes are an integral part of the financial statements.
9
New York Tax Exempt Series
Investment Portfolio - December 31, 2018
| CREDIT | ||||||||||||||||||||
| COUPON | MATURITY | RATING1 | PRINCIPAL | VALUE | ||||||||||||||||
| RATE | DATE | (UNAUDITED) | AMOUNT | (NOTE 2) | ||||||||||||||||
NEW YORK MUNICIPAL BONDS(continued) | ||||||||||||||||||||
Port Authority of New York & New Jersey, Airport & Marina Impt., Consolidated Series 189, Revenue Bond | 5.000% | 5/1/2024 | Aa3 | $ | 800,000 | $ | 921,136 | |||||||||||||
Port Authority of New York & New Jersey, Airport & Marina Impt., Series 179, Revenue Bond | 5.000% | 12/1/2024 | Aa3 | 765,000 | 872,215 | |||||||||||||||
Port Authority of New York & New Jersey, Consolidated Series 184, Revenue Bond | 5.000% | 9/1/2025 | Aa3 | 2,500,000 | 2,892,225 | |||||||||||||||
Port Authority of New York & New Jersey, Series 180, Revenue Bond | 4.000% | 6/1/2019 | Aa3 | 200,000 | 201,930 | |||||||||||||||
Rensselaer County, Nursing Homes, Public Impt., G.O. Bond | 2.000% | 7/15/2020 | AA2 | 930,000 | 931,032 | |||||||||||||||
Rochester, School Impt., Series A, G.O. Bond, AMBAC | 5.000% | 8/15/2022 | Aa3 | 95,000 | 105,385 | |||||||||||||||
Rochester, School Impt., Series II, G.O. Bond | 5.000% | 2/1/2019 | Aa3 | 1,625,000 | 1,629,192 | |||||||||||||||
Roslyn Union Free School District, G.O. Bond | 5.000% | 10/15/2020 | Aa1 | 215,000 | 227,249 | |||||||||||||||
Shenendehowa Central School District, G.O. Bond 4.000% | 7/15/2020 | AA2 | 475,000 | 491,392 | ||||||||||||||||
South Jefferson Central School District, G.O. Bond, BAM | 2.000% | 6/15/2019 | AA2 | 710,000 | 711,108 | |||||||||||||||
Southold Union Free School District, School Impt., G.O. Bond3 | 3.000% | 6/15/2028 | Aa2 | 435,000 | 443,970 | |||||||||||||||
Suffolk County Water Authority, Prerefunded Balance, Revenue Bond | 5.000% | 6/1/2021 | AAA2 | 1,225,000 | 1,318,872 | |||||||||||||||
Suffolk County Water Authority, Prerefunded Balance, Revenue Bond | 4.000% | 6/1/2022 | WR4 | 25,000 | 26,553 | |||||||||||||||
Suffolk County Water Authority, Unrefunded Balance, Revenue Bond | 4.000% | 6/1/2022 | AAA2 | 175,000 | 185,561 | |||||||||||||||
Suffolk County Water Authority, Water Utility Impt., Prerefunded Balance, Revenue Bond | 5.000% | 6/1/2019 | AAA2 | 775,000 | 785,672 | |||||||||||||||
Suffolk County, Series B, G.O. Bond, AGM | 5.000% | 10/1/2019 | AA2 | 1,000,000 | 1,023,300 | |||||||||||||||
Sullivan County, Public Impt., G.O. Bond | 2.000% | 6/1/2019 | AA2 | 1,015,000 | 1,016,522 | |||||||||||||||
Sullivan County, Public Impt., G.O. Bond | 3.000% | 11/15/2023 | AA2 | 500,000 | 523,070 | |||||||||||||||
Tonawanda, Public Impt., G.O. Bond | 2.000% | 6/1/2019 | AA2 | 355,000 | 355,490 | |||||||||||||||
Triborough Bridge & Tunnel Authority, Highway Impt., Series A, Revenue Bond | 5.000% | 11/15/2019 | Aa3 | 1,075,000 | 1,105,186 | |||||||||||||||
Triborough Bridge & Tunnel Authority, Highway Impt., Series A, Revenue Bond | 5.000% | 11/15/2023 | Aa3 | 350,000 | 399,326 | |||||||||||||||
Triborough Bridge & Tunnel Authority, Series A, Revenue Bond | 5.000% | 11/15/2024 | Aa3 | 650,000 | 757,426 | |||||||||||||||
Triborough Bridge & Tunnel Authority, Series B, Revenue Bond | 5.000% | 11/15/2019 | Aa3 | 820,000 | 843,026 | |||||||||||||||
Triborough Bridge & Tunnel Authority, Series B, Revenue Bond | 5.000% | 11/15/2022 | Aa3 | 1,000,000 | 1,115,810 | |||||||||||||||
Triborough Bridge & Tunnel Authority, Series B, Revenue Bond | 5.000% | 11/15/2024 | Aa3 | 1,000,000 | 1,109,890 | |||||||||||||||
Ulster County, Public Impt., G.O. Bond | 4.000% | 11/15/2019 | AA2 | 510,000 | 520,174 | |||||||||||||||
Ulster County, Public Impt., G.O. Bond | 3.000% | 11/15/2027 | AA2 | 425,000 | 437,933 | |||||||||||||||
The accompanying notes are an integral part of the financial statements.
10
New York Tax Exempt Series
Investment Portfolio - December 31, 2018
| CREDIT | PRINCIPAL | |||||||||||||||||||
| COUPON | MATURITY | RATING1 | AMOUNT/ | VALUE | ||||||||||||||||
| RATE | DATE | (UNAUDITED) | SHARES | (NOTE 2) | ||||||||||||||||
NEW YORK MUNICIPAL BONDS(continued) | ||||||||||||||||||||
Ulster County, Public Impt., Series B, G.O. Bond | 2.000% | 11/15/2020 | AA2 | $ | 685,000 | $ | 688,630 | |||||||||||||
Union Endicott Central School District, G.O. Bond, BAM | 2.125% | 6/15/2019 | AA2 | 580,000 | 581,224 | |||||||||||||||
Valley Stream Central High School District, School Impt., G.O. Bond | 4.000% | 6/15/2033 | Aa2 | 870,000 | 932,492 | |||||||||||||||
Vestal Central School District, G.O. Bond | 2.000% | 6/15/2025 | Aa2 | 685,000 | 680,068 | |||||||||||||||
Voorheesville Central School District, G.O. Bond | 5.000% | 6/15/2021 | AA2 | 500,000 | 536,805 | |||||||||||||||
Warren County, Public Impt., G.O. Bond, AGM | 4.000% | 7/15/2020 | AA2 | 500,000 | 515,870 | |||||||||||||||
Wayne County, Public Impt., G.O. Bond | 3.000% | 6/1/2021 | Aa2 | 295,000 | 302,962 | |||||||||||||||
Webster Central School District, School Impt., G.O. Bond | 2.000% | 10/15/2021 | AA2 | 315,000 | 316,698 | |||||||||||||||
West Babylon Union Free School District, School Impt., G.O. Bond | 4.000% | 8/1/2028 | Aa2 | 1,075,000 | 1,188,714 | |||||||||||||||
Yonkers, Public Impt., Series C, G.O. Bond, AGM | 4.000% | 8/15/2020 | A2 | 350,000 | 361,868 | |||||||||||||||
|
| |||||||||||||||||||
TOTAL MUNICIPAL BONDS | ||||||||||||||||||||
(Identified Cost $133,908,984) | 133,934,524 | |||||||||||||||||||
|
| |||||||||||||||||||
SHORT-TERM INVESTMENT - 2.3% | ||||||||||||||||||||
Dreyfus Government Cash Management, Institutional Shares | ||||||||||||||||||||
(Identified Cost $3,275,553) | 2.29%5 | 3,275,553 | 3,275,553 | |||||||||||||||||
|
| |||||||||||||||||||
TOTAL INVESTMENTS - 98.9% | ||||||||||||||||||||
(Identified Cost $137,184,537) | 137,210,077 | |||||||||||||||||||
OTHER ASSETS, LESS LIABILITIES - 1.1% | 1,483,948 | |||||||||||||||||||
|
| |||||||||||||||||||
NET ASSETS - 100% | $ | 138,694,025 | ||||||||||||||||||
|
| |||||||||||||||||||
KEY:
G.O. Bond - General Obligation Bond
Impt. - Improvement
Scheduled principal and interest payments are guaranteed by:
AGM (Assurance Guaranty Municipal Corp.)
AMBAC (AMBAC Assurance Corp.)
BAM (Build America Mutual Assurance Co.)
The insurance does not guarantee the market value of the municipal bonds.
1Credit ratings from Moody’s (unaudited).
2Credit ratings from S&P (unaudited).
3Represents a security purchased on a when-issued basis.
4Credit rating has been withdrawn. As of December 31, 2018, there is no rating available (unaudited).
5Rate shown is the current yield as of December 31, 2018.
The accompanying notes are an integral part of the financial statements.
11
New York Tax Exempt Series
Statement of Assets and Liabilities
December 31, 2018
ASSETS: | ||||
Investments, at value (identified cost $137,184,537) (Note 2) | $ | 137,210,077 | ||
Interest receivable | 1,337,176 | |||
Receivable for fund shares sold | 232,536 | |||
Dividends receivable | 9,516 | |||
Prepaid expenses | 970 | |||
|
| |||
TOTAL ASSETS | 138,790,275 | |||
|
| |||
LIABILITIES: | ||||
Accrued management fees (Note 3) | 59,013 | |||
Accrued fund accounting and administration fees (Note 3) | 24,225 | |||
Accrued Chief Compliance Officer service fees (Note 3) | 426 | |||
Printing and postage fees payable | 5,553 | |||
Other payables and accrued expenses | 7,033 | |||
|
| |||
TOTAL LIABILITIES | 96,250 | |||
|
| |||
TOTAL NET ASSETS | $ | 138,694,025 | ||
|
| |||
NET ASSETS CONSIST OF: | ||||
Capital stock | $ | 134,167 | ||
Additionalpaid-in-capital | 138,517,366 | |||
Total distributable earnings (loss) | 42,492 | |||
|
| |||
TOTAL NET ASSETS | $ | 138,694,025 | ||
|
| |||
NET ASSET VALUE, OFFERING PRICE AND REDEMPTION PRICE PER SHARE - | $ | 10.34 | ||
|
| |||
The accompanying notes are an integral part of the financial statements.
12
New York Tax Exempt Series
Statement of Operations
For the Year Ended December 31, 2018
INVESTMENT INCOME: | ||||
Interest | $ | 2,866,007 | ||
Dividends | 54,600 | |||
|
| |||
Total Investment Income | 2,920,607 | |||
|
| |||
EXPENSES: | ||||
Management fees (Note 3) | 725,308 | |||
Fund accounting and administration fees (Note 3) | 76,205 | |||
Directors’ fees (Note 3) | 11,785 | |||
Chief Compliance Officer service fees (Note 3) | 4,634 | |||
Custodian fees | 5,565 | |||
Miscellaneous | 74,262 | |||
|
| |||
Total Expenses | 897,759 | |||
|
| |||
NET INVESTMENT INCOME | 2,022,848 | |||
|
| |||
REALIZED AND UNREALIZED GAIN (LOSS) ON INVESTMENTS: | ||||
Net realized gain (loss) on investments | (191,635 | ) | ||
Net change in unrealized appreciation (depreciation) on investments | (1,261,106 | ) | ||
|
| |||
NET REALIZED AND UNREALIZED GAIN (LOSS) ON INVESTMENTS | (1,452,741 | ) | ||
|
| |||
NET INCREASE IN NET ASSETS RESULTING FROM OPERATIONS | $ | 570,107 | ||
|
| |||
The accompanying notes are an integral part of the financial statements.
13
New York Tax Exempt Series
Statements of Changes in Net Assets
FOR THE YEAR ENDED | FOR THE YEAR ENDED | |||||||
INCREASE (DECREASE) IN NET ASSETS: | ||||||||
OPERATIONS: | ||||||||
Net investment income | $ | 2,022,848 | $ | 1,793,264 | ||||
Net realized gain (loss) on investments | (191,635 | ) | (1,393 | ) | ||||
Net change in unrealized appreciation (depreciation) on investments | (1,261,106 | ) | 1,803,574 | |||||
|
|
|
| |||||
Net increase from operations | 570,107 | 3,595,445 | ||||||
|
|
|
| |||||
DISTRIBUTIONS TO SHAREHOLDERS (Note 9): | ||||||||
Class A | (2,011,419 | ) | (1,723,348 | )1 | ||||
|
|
|
| |||||
CAPITAL STOCK ISSUED AND REPURCHASED: | ||||||||
Net decrease from capital share transactions (Note 5) | (13,882,426 | ) | (9,145,845 | ) | ||||
|
|
|
| |||||
Net decrease in net assets | (15,323,738 | ) | (7,273,748 | ) | ||||
NET ASSETS: | ||||||||
Beginning of year | 154,017,763 | 161,291,511 | ||||||
|
|
|
| |||||
End of year2 | $ | 138,694,025 | $ | 154,017,763 | ||||
|
|
|
| |||||
1 For the year ended December 31, 2017, the distributions to shareholders from net investment income and net realized gain were $1,694,530 and $28,818, respectively.
2 Includes accumulated undistributed (overdistributed) net investment income of $200,717 as of December 31, 2017. The SEC eliminated the requirement to disclose undistributed net investment income in 2018.
The accompanying notes are an integral part of the financial statements.
14
New York Tax Exempt Series
Financial Highlights
| FOR THE YEAR ENDED | ||||||||||||||||||||
| 12/31/18 | 12/31/17 | 12/31/16 | 12/31/15 | 12/31/14 | ||||||||||||||||
Per share data (for a share outstanding throughout each year): | ||||||||||||||||||||
Net asset value - Beginning of year | $10.43 | $10.31 | $10.50 | $10.42 | $10.40 | |||||||||||||||
|
|
|
|
|
|
|
|
|
| |||||||||||
Income (loss) from investment operations: | ||||||||||||||||||||
Net investment income1 | 0.14 | 0.12 | 0.10 | 0.08 | 0.07 | |||||||||||||||
Net realized and unrealized gain (loss) on investments | (0.08 | ) | 0.11 | (0.18 | ) | 0.08 | 0.07 | |||||||||||||
|
|
|
|
|
|
|
|
|
| |||||||||||
Total from investment operations | 0.06 | 0.23 | (0.08 | ) | 0.16 | 0.14 | ||||||||||||||
|
|
|
|
|
|
|
|
|
| |||||||||||
Less distributions to shareholders: | ||||||||||||||||||||
From net investment income | (0.15 | ) | (0.11 | ) | (0.11 | ) | (0.08 | ) | (0.07 | ) | ||||||||||
From net realized gain on investments | — | — | 2 | — | 2 | — | (0.05 | ) | ||||||||||||
|
|
|
|
|
|
|
|
|
| |||||||||||
Total distributions to shareholders | (0.15 | ) | (0.11 | ) | (0.11 | ) | (0.08 | ) | (0.12 | ) | ||||||||||
|
|
|
|
|
|
|
|
|
| |||||||||||
Net asset value - End of year | $10.34 | $10.43 | $10.31 | $10.50 | $10.42 | |||||||||||||||
|
|
|
|
|
|
|
|
|
| |||||||||||
Net assets - End of year(000’s omitted) | $138,694 | $154,018 | $161,292 | $174,603 | $180,729 | |||||||||||||||
|
|
|
|
|
|
|
|
|
| |||||||||||
Total return3 | 0.54% | 2.27% | (0.79% | ) | 1.54% | 1.28% | ||||||||||||||
Ratios (to average net assets)/Supplemental Data: | ||||||||||||||||||||
Expenses | 0.62% | 0.60% | 0.60% | 0.60% | 0.58% | |||||||||||||||
Net investment income | 1.39% | 1.12% | 0.93% | 0.74% | 0.68% | |||||||||||||||
Portfolio turnover | 21% | 9% | 19% | 35% | 43% | |||||||||||||||
1Calculated based on average shares outstanding during the years.
2Less than $0.01 per share.
3Represents aggregate total return for the years indicated, and assumes reinvestment of all distributions.
The accompanying notes are an integral part of the financial statements.
15
New York Tax Exempt Series
Notes to Financial Statements
| 1. | Organization |
New York Tax Exempt Series (the “Series”) is ano-load diversified series of Manning & Napier Fund, Inc. (the “Fund”). The Fund is organized in Maryland and is registered under the Investment Company Act of 1940, as amended, as anopen-end management investment company.
The Series’ investment objective is to provide as high a level of current income exempt from federal income tax and New York State personal income tax as the Advisor believes is consistent with the preservation of capital.
The Fund’s advisor is Manning & Napier Advisors, LLC (the “Advisor”). Shares of the Series are offered to investors, clients and employees of the Advisor and its affiliates. The total authorized capital stock of the Fund consists of 15 billion shares of common stock each having a par value of $0.01. As of December 31, 2018, 10.4 billion shares have been designated in total among 34 series, of which 100 million have been designated as New York Tax Exempt Series Class A common stock and 50 million have been designated as New York Tax Exempt Series Class W common stock. Class W common stock are not currently offered for sale.
| 2. | Significant Accounting Policies |
The following is a summary of significant accounting policies followed by the Series. The Series is an investment company and, accordingly, follows the investment company accounting and reporting guidance of the Financial Accounting Standards Board Accounting Standards Codification Topic 946 - Investment Companies, which is part of accounting principles generally accepted in the United States of America (“GAAP”).
Security Valuation
Municipal securities will normally be valued on the basis of market valuations provided by an independent pricing service (the “Service”). The Service utilizes the latest price quotations and a matrix system (which considers such factors as security prices of similar securities, yields, maturities and ratings). The Service has been approved by the Fund’s Board of Directors (the “Board”).
Short-term investments that mature in sixty days or less may be valued at amortized cost, which approximates fair value. Investments inopen-end investment companies are valued at their net asset value per share on valuation date.
Volume and level of activity in established markets for an asset or liability are evaluated to determine whether recent transactions and quoted prices are determinative of fair value. Where there have been significant decreases in volume and level of activity, further analysis and adjustment may be necessary to estimate fair value. The Series measures fair value in these instances by the use of inputs and valuation techniques which may be based upon current market prices of securities that are comparable in coupon, rating, maturity and industry and/or expectation of future cash flows. As a result of trading in relatively thin markets and/or markets that experience significant volatility, the prices used by the Series to value these securities may differ from the value that would be realized if these securities were sold, and the differences could be material.
Securities for which representative valuations or prices are not available from the Series’ pricing service may be valued at fair value as determined in good faith by the Advisor under procedures approved by and under the general supervision and responsibility of the Board. Due to the inherent uncertainty of valuations of such securities, the fair value may differ significantly from the values that would have been used had a ready market for such securities existed. If trading or events occurring after the close of the principal market in which securities are traded are expected to materially affect the value of those securities, then they may be valued at their fair value, taking this trading or these events into account.
Various inputs are used in determining the value of the Series’ assets or liabilities carried at fair value. These inputs are summarized in three broad levels. Level 1 includes quoted prices in active markets for identical assets and liabilities. Level 2 includes other significant observable inputs (including quoted prices for similar securities, interest rates, prepayment speeds, credit risk, etc.). Level 3 includes significant unobservable inputs (including the Series’ own assumptions in determining the fair value of investments). A financial instrument’s level within the fair value hierarchy is based on the lowest level of any input both
16
New York Tax Exempt Series
Notes to Financial Statements (continued)
| 2. | Significant Accounting Policies (continued) |
Security Valuation(continued)
individually and in aggregate that is significant to the fair value measurement. The inputs or methodology used for valuing securities are not necessarily an indication of the risk associated with investing in those securities.
The following is a summary of the valuation levels used for major security types as of December 31, 2018 in valuing the Series’ assets or liabilities carried at fair value:
| DESCRIPTION | TOTAL | LEVEL 1 | LEVEL 2 | LEVEL 3 | ||||||||||||
Assets: | ||||||||||||||||
Debt securities: | ||||||||||||||||
States and political subdivisions (municipals) | $ | 133,934,524 | $ | — | $ | 133,934,524 | $ | — | ||||||||
Mutual fund | 3,275,553 | 3,275,553 | — | — | ||||||||||||
|
|
|
|
|
|
|
| |||||||||
Total assets | $ | 137,210,077 | $ | 3,275,553 | $ | 133,934,524 | $ | — | ||||||||
|
|
|
|
|
|
|
| |||||||||
There were no Level 3 securities held by the Series as of December 31, 2017 or December 31, 2018.
New Accounting Pronouncements
The Securities and Exchange Commission (SEC) adopted changes to RegulationS-X to simplify the reporting of information by registered investment companies in financial statements. The amendments require presentation of the total, rather than the components, of distributable earnings on the Statement of Assets and Liabilities and also require presentation of the total, rather than the components, of distributions to shareholders, except for tax return of capital distributions, if any, on the Statement of Changes in Net Assets. The amendments also removed the requirement for parenthetical disclosure of undistributed net investment income on the Statement of Changes in Net Assets. These RegulationS-X amendments are reflected in the Series financial statements for the year ended December 31, 2018. As a result of adopting these amendments, the distributions to shareholders in the December 31, 2017 Statement of Changes in Net Assets presented herein have been reclassified to conform to the current year presentation.
In March 2017, the Financial Accounting Standards Board issued Accounting Standards UpdateNo. 2017-08, Receivables – Nonrefundable Fees and Other Costs (Subtopic310-320): “Premium Amortization of Purchased Callable Debt Securities” which shortens the amortized period for certain callable debt securities, held at a premium, to be amortized to the earliest call date rather than the contractual maturity date. The Series will adopt and apply ASU2017-08 on a modified retrospective basis through a cumulative-effect adjustment as of January 1, 2019. Due to the nature of the debt securities currently held by the Series, this adjustment is not expected to be material.
On August 28, 2018, the FASB issued ASU2018-13, “Disclosure Framework – Changes to the Disclosure Requirements for Fair Value Measurement,” which amends the fair value measurement disclosure requirements under U.S. GAAP. The amendments of ASU2018-13 include new, eliminated, and modified disclosure requirements. In addition, the amendments clarify that materiality is an appropriate consideration of entities when evaluating disclosure requirements. The ASU is effective for all entities for fiscal years beginning after December 15, 2019, including interim periods therein. An entity is permitted to early adopt any eliminated or modified disclosures upon issuance of this ASU and delay adoption of the new disclosures until their effective date. As such, each Series has early adopted the eliminated and modified disclosures, as permitted by this ASU.
Security Transactions, Investment Income and Expenses
Security transactions are accounted for on trade date. Dividend income is recorded on theex-dividend date, except that if theex-dividend date has passed, certain dividends from foreign securities are recorded as soon as the Series is informed of theex-dividend date.Non-cash dividends, if any, are recorded at the fair value of the securities received. Interest income, including amortization of premium and accretion of discounts using the effective interest method, is earned from settlement date and accrued daily.
17
New York Tax Exempt Series
Notes to Financial Statements (continued)
| 2. | Significant Accounting Policies (continued) |
Security Transactions, Investment Income and Expenses(continued)
Expenses are recorded on an accrual basis. Most expenses of the Fund can be attributed to a specific series. Expenses which cannot be directly attributed are apportioned among the series in the Fund in such a manner as deemed equitable by the Fund’s Board, taking into consideration, among other things, the nature and type of expense.
The Series uses the identified cost method for determining realized gain or loss on investments for both financial statement and federal income tax reporting purposes.
Federal Taxes
The Series’ policy is to comply with the provisions of the Internal Revenue Code applicable to regulated investment companies. The Series is not subject to federal income tax or excise tax to the extent that the Series distributes to shareholders each year its taxable income, including any net realized gains on investments, in accordance with requirements of the Internal Revenue Code. Accordingly, no provision for federal income tax or excise tax has been made in the financial statements.
Management evaluates its tax positions to determine if the tax positions taken meet the minimum recognition threshold in connection with accounting for uncertainties in income tax positions taken or expected to be taken for the purposes of measuring and recognizing tax liabilities in the financial statements. Recognition of tax benefits of an uncertain tax position is required only when the position is “more likely than not” to be sustained assuming examination by taxing authorities. At December 31, 2018, the Series has recorded no liability for net unrecognized tax benefits relating to uncertain income tax positions taken or expected to be taken in future tax returns.
The Series files income tax returns in the U.S. federal jurisdiction and various states, as required. No income tax returns are currently under investigation. The statute of limitations on the Series’ tax returns remains open for the years ended December 31, 2015 through December 31, 2018. The Series is not aware of any tax positions for which it is reasonably possible that the total amounts of unrecognized tax benefits will significantly change in the next twelve months.
Distributions of Income and Gains
Distributions to shareholders of net investment income are made quarterly. Distributions of net realized gains are made annually. An additional distribution may be necessary to avoid taxation of the Series. Distributions are recorded on theex-dividend date.
Indemnifications
The Fund’s organizational documents provide former and current directors and officers with a limited indemnification against liabilities arising in connection with the performance of their duties to the Fund. In the normal course of business, the Fund may also enter into contracts that provide general indemnifications. The Fund’s maximum exposure under these arrangements is unknown as this would be dependent on future claims that may be made against the Fund. The risk of material loss from such claims is considered remote.
Other
The preparation of financial statements in conformity with GAAP requires management to make estimates and assumptions that affect the reported amounts of assets and liabilities and the disclosure of contingent assets and liabilities at the date of the financial statements and the reported amounts of income and expenses during the reporting period. Actual results could differ from those estimates.
| 3. | Transactions with Affiliates |
The Fund has an Investment Advisory Agreement (the “Agreement”) with the Advisor, for which the Series pays a fee, computed daily and payable monthly, at an annual rate of 0.50% of the Series’ average daily net assets.
Under the Agreement, personnel of the Advisor provide the Series with advice and assistance in the choice of investments and the execution of securities transactions, and otherwise maintain the Series’ organization. The Advisor also provides the Fund with necessary office space and fund administration and support services. The salaries of all officers of the Fund (except a percentage of the Fund’s Chief Compliance Officer’s salary, which is paid by the Fund), and of all Directors who are “affiliated
18
New York Tax Exempt Series
Notes to Financial Statements (continued)
| 3. | Transactions with Affiliates (continued) |
persons” of the Fund, or of the Advisor, and all personnel of the Fund, or of the Advisor, performing services relating to research, statistical and investment activities, are paid by the Advisor. Each“non-affiliated” Director receives an annual stipend, which is allocated among all the active series of the Fund. In addition, these Directors also receive a fee per Board meeting attended plus a fee for each committee meeting attended and are reimbursed for travel and otherout-of-pocket expenses incurred by them in connection with attending such meetings. The Fund also has an Audit Committee Chair, Governance & Nominating Committee Chair and Lead Independent Director, who each receive an additional annual stipend for these roles.
The Advisor has contractually agreed, until at least April 30, 2019, to waive its management fee and, if necessary, pay other operating expenses of the Series in order to maintain total direct annual fund operating expenses for the Series at no more than 0.85% of average daily net assets each year. The Advisor did not waive any fees for the year ended December 31, 2018. The Advisor is not eligible to recoup any expenses that have been waived or reimbursed in prior years.
Manning & Napier Investor Services, Inc., a registered broker-dealer affiliate of the Advisor, acts as distributor for the Fund’s shares. The services of Manning & Napier Investor Services, Inc. are provided at no additional cost to the Series.
Pursuant to a master services agreement dated March 1, 2017, as amended, the Fund pays the Advisor an annual fee related to fund accounting and administration of 0.0085% on the first $25 billion of average daily net assets (excluding Target Series and Income Series); 0.0075% on the next $15 billion of average daily net assets (excluding Target Series and Income Series); and 0.0065% of average daily net assets in excess of $40 billion (excluding Target Series and Income Series); plus a base fee of $30,400 per series. Additionally, certain transaction andout-of-pocket expenses, including charges for reporting relating to the Fund’s compliance program, are charged. The Advisor has agreements with BNY Mellon Investment Servicing (U.S.) Inc. (“BNY”) under which BNY serves assub-accountant services agent.
| 4. | Purchases and Sales of Securities |
For the year ended December 31, 2018, purchases and sales of securities, other than U.S. Government securities and short-term securities, were $30,006,314 and $41,892,792, respectively. There were no purchases or sales of U.S. Government securities.
| 5. | Capital Stock Transactions |
Transactions in Class A shares of New York Tax Exempt Series were:
FOR THE YEAR ENDED 12/31/18 | FOR THE YEAR ENDED 12/31/17 | |||||||||||||||
| SHARES | AMOUNT | SHARES | AMOUNT | |||||||||||||
Sold | 716,982 | $ | 7,402,714 | 919,957 | $ | 9,622,095 | ||||||||||
Reinvested | 183,590 | 1,887,800 | 153,519 | 1,608,482 | ||||||||||||
Repurchased | (2,248,036 | ) | (23,172,940 | ) | (1,947,055 | ) | (20,376,422 | ) | ||||||||
|
|
|
|
|
|
|
| |||||||||
Total | (1,347,464 | ) | $ | (13,882,426 | ) | (873,579 | ) | $ | (9,145,845 | ) | ||||||
|
|
|
|
|
|
|
| |||||||||
Over 90% of the shares outstanding are fiduciary accounts where the Advisor has sole investment discretion.
| 6. | Line of Credit |
The Fund has entered into a364-day, $25 million credit agreement (the “line of credit”) with Bank of New York Mellon. Each series of the Fund may borrow under the line of credit for temporary or emergency purposes, including funding shareholder redemptions and other short-term liquidity purposes. The Fund pays an annual fee on the unused commitment amount, payable quarterly, and is allocated among all the series of the Fund and included in miscellaneous expenses in the Statement of Operations for each series. The line of credit expires in August 2019 unless extended or renewed. During the year ended December 31, 2018, the Series did not borrow under the line of credit.
19
New York Tax Exempt Series
Notes to Financial Statements (continued)
| 7. | Financial Instruments |
The Series may trade in instruments including written and purchased options, forward foreign currency exchange contracts and futures contracts and other derivatives in the normal course of investing activities to assist in managing exposure to various market risks. The Series may be subject to various elements of risk, which may involve, to a varying degree, elements of risk in excess of the amounts recognized for financial statement purposes. These risks include: the risk that changes in the value of a derivative may not correlate perfectly with the underlying asset, rate or index; counterparty credit risk related to over the counter derivative counterparties’ failure to perform under contract terms; liquidity risk related to the lack of a liquid market for these contracts allowing the fund to close out its position(s); and documentation risk relating to disagreement over contract terms. No such investments were held by the Series as of December 31, 2018.
| 8. | Concentration of Credit |
The Series primarily invests in debt obligations issued by the State of New York and its political subdivisions, agencies and public authorities to obtain funds for various public purposes. The Series is more susceptible to factors adversely affecting issues of New York municipal securities than is a municipal bond fund that is not concentrated in these issues to the same extent.
| 9. | Federal Income Tax Information |
The amount and characterization of certain income and capital gains to be distributed are determined in accordance with federal income tax regulations, which may differ from GAAP. These differences are primarily due to differing book and tax treatments in the timing and/or treatment of the recognition of net investment income or gains and losses, including market discount on investments. The Series may periodically make reclassifications among its capital accounts to reflect income and gains available for distribution (or available capital loss carryovers) under income tax regulations without impacting the Series’ net asset value. Any such reclassifications are not reflected in the financial highlights.
The tax character of distributions paid were as follows:
| FOR THE YEAR ENDED 12/31/18 | FOR THE YEAR ENDED 12/31/17 | |||||||||
Ordinary income | $ 45,982 | $ 15,464 | ||||||||
Tax exempt income | $1,965,437 | $1,679,081 | ||||||||
Long-term capital gains | — | $ 28,803 | ||||||||
At December 31, 2018, the tax basis of components of distributable earnings and the net unrealized appreciation based on identified cost for federal income tax purposes were as follows:
Cost for federal income tax purposes | $ | 137,160,416 | ||
Unrealized appreciation | 747,035 | |||
Unrealized depreciation | (697,374 | ) | ||
|
| |||
Net unrealized appreciation | $ | 49,661 | ||
|
| |||
Undistributed tax exempt income | $ | 188,025 | ||
Capital Loss Carryforwards | $ | (195,194 | ) |
As of December 31, 2018, the Series had net short-term capital loss carryforwards of $77,048 and net long-term capital loss carryforwards of $118,146, which may be carried forward indefinitely.
20
New York Tax Exempt Series
Report of Independent Registered Public Accounting Firm
To the Board of Directors of Manning & Napier Fund, Inc. and Shareholders of New York Tax Exempt Series
Opinion on the Financial Statements
We have audited the accompanying statement of assets and liabilities, including the investment portfolio, of New York Tax Exempt Series (one of the series constituting Manning & Napier Fund, Inc., referred to hereafter as the “Fund”) as of December 31, 2018, the related statement of operations for the year ended December 31, 2018, the statement of changes in net assets for each of the two years in the period ended December 31, 2018, including the related notes, and the financial highlights for each of the five years in the period ended December 31, 2018 (collectively referred to as the “financial statements”). In our opinion, the financial statements present fairly, in all material respects, the financial position of the Fund as of December 31, 2018, the results of its operations for the year then ended, the changes in its net assets for each of the two years in the period ended December 31, 2018 and the financial highlights for each of the five years in the period ended December 31, 2018 in conformity with accounting principles generally accepted in the United States of America.
Basis for Opinion
These financial statements are the responsibility of the Fund’s management. Our responsibility is to express an opinion on the Fund’s financial statements based on our audits. We are a public accounting firm registered with the Public Company Accounting Oversight Board (United States) (PCAOB) and are required to be independent with respect to the Fund in accordance with the U.S. federal securities laws and the applicable rules and regulations of the Securities and Exchange Commission and the PCAOB.
We conducted our audits of these financial statements in accordance with the standards of the PCAOB. Those standards require that we plan and perform the audit to obtain reasonable assurance about whether the financial statements are free of material misstatement, whether due to error or fraud.
Our audits included performing procedures to assess the risks of material misstatement of the financial statements, whether due to error or fraud, and performing procedures that respond to those risks. Such procedures included examining, on a test basis, evidence regarding the amounts and disclosures in the financial statements. Our audits also included evaluating the accounting principles used and significant estimates made by management, as well as evaluating the overall presentation of the financial statements. Our procedures included confirmation of securities owned as of December 31, 2018 by correspondence with the custodian. We believe that our audits provide a reasonable basis for our opinion.

New York, New York
February 15, 2019
We have served as the auditor of one or more investment companies in Manning & Napier Mutual Funds since 1992.
21
New York Tax Exempt Series
Supplemental Tax Information
(unaudited)
All reportings are based on financial information available as of the date of this annual report and, accordingly are subject to change.
The Series hereby reports $1,965,437 as tax exempt dividends for the year ended December 31, 2018. It is the intention of the Series to designate the maximum allowable under tax law.
22
New York Tax Exempt Series
Renewal of Investment Advisory Agreement
(unaudited)
At the Manning & Napier Fund, Inc. (the “Fund”) Board of Directors’ (the “Board”) meeting, held on November 15, 2018, the Investment Advisory Agreement (the “Agreement”) between the Fund and Manning & Napier Advisors, LLC (the “Advisor”) was considered for renewal by the Board, including all of the Directors who are not “interested persons” (“Independent Directors”), within the meaning of the Investment Company Act of 1940, as amended (the “1940 Act”). In connection with the decision whether to renew the Agreement, a variety of material was provided to the Board in advance of the meeting for their review and consideration. The Board also held a working session on October 31, 2018 to review and discuss information provided to the Board, and for the Board to request additional information.
Representatives of the Advisor attended a portion of the working session and attended the Board meeting. The Advisor provided supplemental information requested by the Board and presented additional oral information to the Board to assist the Board in its considerations. In addition to the information furnished by the Advisor, the Board was provided with a legal memorandum discussing its fiduciary duties related to its approval of the continuation of the Agreement. Legal counsel for the Fund discussed with the Board the applicable legal considerations. In addition, the Board receivedin-person presentations about the Fund throughout the year.
The Independent Directors were advised by independent legal counsel with respect to these matters. The Independent Directors also met separately in an executive session with their legal counsel without any representatives of the Advisor present.
The Directors’ determinations at the meeting were made on the basis of each Director’s business judgment after consideration of all the information presented. In deciding to recommend the renewal of the Agreement with respect to each Series of the Fund, the Independent Directors did not identify any single or particular piece of information that, in isolation, was the controlling factor. Each Independent Director may also have weighed factors differently. This summary describes the most important, but not all, of the factors considered by the Board and the Independent Directors.
| • | The Board considered the nature and quality of services provided by the Advisor under the Agreement for over 30 years including, among others: deciding what securities to purchase and sell for each Series; arranging for the purchase and sale of such securities by placing orders with broker-dealers; administering the affairs of the Fund (including the books and records of the Fund not maintained by third party service providers such as the custodian or transfer agent); arranging for the insurance coverage for the Fund; and supervising the preparation of tax returns, SEC filings (including registration statements) and reports to shareholders for the Fund. The Board considered the numerous services performed by the Advisor and its affiliates beyond those stated in the Agreements. The Board also considered the Advisor’s personnel who perform services to the Fund, changes in senior or key personnel, the strength of the Advisor’s compliance infrastructure, policies and procedures relating to compliance with securities regulations, reputation, expertise and resources. The Board discussed the quality of these services with representatives from the Advisor and concluded that the Advisor was performing its services to the Fund required under the Agreement in a reasonable manner. |
| • | The Board considered the Advisor’s investments teams, including changes to the investment teams and investment team’s compensation during the past year, and the investment process. The Board considered the performance of each Series since its inception, as well as over multiple time periods including: one year, three year, five year, ten year, and current market cycle. A market cycle includes periods of both rising and falling markets. Returns for established benchmark indices for each Series were provided. In addition, the Board considered (and considers on a quarterly basis) a number of other factors relevant to performance at the meeting including: a peer group performance analysis consisting of Morningstar universes of mutual funds with similar investment objectives; the breadth of the Fund’s product offerings; and performance over reasonable time periods. The Board discussed with Representatives of the Advisor, short-term performance challenges in the Fund’s core strategies that have resulted in a downward trend in assets under management. After discussion, the Board concluded that notwithstanding the performance challenges of certain Series, the nature and quality of the investment management services provided by the Advisor to the Fund supported the renewal of the agreement. |
| • | The Board considered the fees and expenses of the various Series of the Fund. The Advisor presented the advisory fees and total expenses for each Series, including the advisory fee adjusted for any contractual expense waivers or reimbursements paid by the Advisor. The Advisor also presentedpro-forma information related to several management fee and overall expense reductions that were set to take effect in early 2019. These changes were approved by the Board in a prior meeting and by shareholders at a Shareholder Meeting in May 2018. |
| • | The Board considered whether the Advisor had achieved economies of scale with respect to its services to the Fund. The Board acknowledged the expense caps incorporated in the Fund’s current fee structure, which requires the Advisor to |
23
New York Tax Exempt Series
Renewal of Investment Advisory Agreement
(unaudited)
| subsidize the expenses of the Series operating above their expense cap, noting that 27 Series of the Fund are currently receiving expense reimbursements from the Advisor. The Board concluded that the Fund would need to grow in assets before the Advisor would be able to achieve meaningful economies of scale. |
| • | The Advisor provided the Board with information comparing each Series’ contractual management fees with the Advisor’s standard advisory fees for separate accounts and collective investment trusts. The Board considered that the range of services provided to the Series is more extensive than for the Advisor’s other clients due to additional infrastructure, administrative and regulatory requirements related to operating a mutual fund. |
| • | The current andpro-forma advisory fees,12b-1 Distribution and Service Fees, other expenses (e.g. a combination of Shareholder Services Fees, intermediarysub-transfer agent fees, routine operating expenses and Acquired Fund Fees and Expenses forfund-of-fund Series) and total expense ratios of each Series and share class were compared and ranked (on both a mean and median basis) against respective peer universes. Respective peer universes included funds of a similar size and with similar investment objectives and expense characteristics as disclosed on the Morningstar database. Representatives of the Advisor discussed with the Board the comparisons and rankings of fees and net expense ratios for each Series of the Fund and the methodology behind the comparison. The Board considered the Advisor’s active portfolio management that results in portfolios that are more differentiated than the construction of their benchmarks. Based on their review of the information provided, the Board concluded that the current andpro-forma fees and expenses of each Series of the Fund were reasonable on a comparative basis. |
| • | The Board considered the costs of the Advisor’s services and the profits of the Advisor as they relate to the Advisor’s services to the Fund under the Agreement. The Board was provided with information on the Advisor’s financial condition and profitability by mutual fund agreement and by Series. Information provided by the Advisor addressed the anticipated effects of the upcoming fee reductions. The Board discussed the Advisor’s revenues generated from the Fund and its expenses associated with providing the services under the Agreement. The Advisor presented the Board with information on firm wide investment management profitability to provide a comparison of the Advisor’s profitability from its Fund activities relative to its profitability from its other investment management business. In addition, the Board reviewed the Advisor’s expense allocation methodology used to calculate profitability since many of the Advisor’s resources and expenses are shared across the Advisor’s various investment management vehicles. The Board considered the Advisor’s expenses associated with Fund activities outside of the Agreement (such as expense reimbursements pursuant to expense caps and payments made by the Advisor to third party platforms on which shares of the Fund are available for purchase). After discussing the above costs and profits, the Board concluded that the Advisor’s profitability relating to its services provided under the Agreement was reasonable. |
| • | The Board also considered the other benefits the Advisor derives from its relationship with the Fund. Such other benefits include participation in a joint insurance program, sharing of compensation expenses for certain shared personnel, relationships with large service providers, the utilization of Series within the Advisor’s separately managed accounts and certain research services provided by soft dollars. The Board reviewed the broker-dealers who provided research to the Advisor and the products and services paid for, in whole or in part, using soft dollar commissions. The Board concluded that these additional benefits to the Advisor were reasonable. |
Based on the Board’s deliberations and their evaluation of the information described above, the Board, including a majority of the Independent Directors, concluded that the compensation under the Agreement was fair and reasonable with respect to each Series in light of the services and expenses and such other matters as the Directors considered to be relevant in the exercise of their reasonable judgment, and that the renewal of the Agreement would be in the best interests of each Series and its shareholders. The Board did not indicate that any single factor was determinative of its decision to approve the Agreement, but indicated that the Board based its determination on the total mix of information available to it.
24
New York Tax Exempt Series
Directors’ and Officers’ Information
(unaudited)
The Statement of Additional Information provides additional information about the Fund’s directors and officers and can be obtained without charge by calling1-800-466-3863, at www.manning-napier.com, or on the EDGAR Database on the SEC Internet web site (http://www.sec.gov). The following chart shows certain information about the Fund’s directors and officers, including their principal occupations during the last five years. Unless specific dates are provided, the individuals have held the listed positions for longer than five years.
Interested Director and Officer
| ||
| Name: | Paul Battaglia* | |
| Address: | 290 Woodcliff Drive | |
| Fairport, NY 14450 | ||
| Age: | 40 | |
| Current Position(s) Held with Fund: | Principal Executive Officer, President, Chairman and Director | |
| Term of Office & Length of Time Served: | Indefinite – Chairman and Director since November 20181 | |
| Principal Occupation(s) During Past 5 Years: | Chief Financial Officer (2018 – Present); Vice President of Finance (2016 – 2018); Director of Finance (2011 – 2016); Financial Analyst/Internal Auditor (2004-2006) – Manning & Napier Advisors, LLC and affiliates Holds one or more of the following titles for various subsidiaries and affiliates: Chief Financial Officer | |
| Number of Portfolios Overseen within Fund Complex: | 34 | |
Other Directorships Held Outside Fund Complex During Past 5 Years: | N/A | |
Independent Directors
| ||
| Name: | Stephen B. Ashley | |
| Address: | 290 Woodcliff Drive | |
| Fairport, NY 14450 | ||
| Age: | 78 | |
| Current Position(s) Held with Fund: | Director, Audit Committee Member, Governance & Nominating Committee Member | |
| Term of Office & Length of Time Served: | Indefinite – Since 1996 | |
| Principal Occupation(s) During Past 5 Years: | Chairman, Director & Chief Executive Officer (1997 to present) - The Ashley Group (property management and investment). Director (1995-2008) and Chairman(non-executive) (2004-2008) - Fannie Mae (mortgage) | |
| Number of Portfolios Overseen within Fund Complex: | 34 | |
| Other Directorships Held Outside Fund Complex During | Fannie Mae (1995-2008) | |
| Past 5 Years: | The Ashley Group (1995-2008) Genesee Corporation (1987-2007) | |
| Name: | Paul A. Brooke | |
| Address: | 290 Woodcliff Drive | |
| Fairport, NY 14450 | ||
| Age: | 73 | |
| Current Position(s) Held with Fund: | Lead Independent Director, Audit Committee Member, Governance & Nominating Committee Chairman | |
| Term of Office & Length of Time Served: | Indefinite – Director, Audit Committee Member, Governance & Nominating Committee Member since 2007; Governance & Nominating Committee Chairman since 2016; Lead Independent Director since 2017 | |
| Principal Occupation(s) During Past 5 Years: | Chairman & CEO (2005-2009) - Ithaka Acquisition Corporation (investments); Chairman (2007-2009) - Alsius Corporation (investments); Managing Member (1991-present) - PMSV Holdings LLC (investments); Managing Member (2010-2016) - Venbio (investments). | |
| Number of Portfolios Overseen within Fund Complex: | 34 | |
Other Directorships Held Outside Fund Complex During Past 5 Years: | Incyte Corp. (biotech)(2000-present); ViroPharma, Inc. (speciality pharmaceuticals)(2000-2014); HLTH (WebMD)(information)(2000-2010); Cheyne Capital International (investment)(2000-2017); GMP Companies (investment)(2000-2011); Cytos Biotechnology Ltd (biotechnology)(2012-2014); Cerus (biomedical)(2016-present);PureEarth(non-profit)(2012-present); Caelum BioSciences (biomedical)(2018-present) | |
25
New York Tax Exempt Series
Directors’ and Officers’ Information
(unaudited)
Independent Directors (continued)
| ||
| Name: | Peter L. Faber | |
| Address: | 290 Woodcliff Drive | |
| Fairport, NY 14450 | ||
| Age: | 80 | |
| Current Position(s) Held with Fund: | Director, Governance & Nominating Committee Member | |
| Term of Office & Length of Time Served: | Indefinite – Since 1987 | |
| Principal Occupation(s) During Past 5 Years: | Senior Counsel (2006-2012), Partner (1995-2006 & 2013-2018) - McDermott, Will & Emery LLP (law firm) | |
| Number of Portfolios Overseen within Fund Complex: | 34 | |
Other Directorships Held Outside Fund Complex During Past 5 Years: | Boston Early Music Festival(non-profit)(2007-present); Amherst Early Music, Inc.(non-profit)(2009-present); Gotham Early Music Scene, Inc.(non-profit)(2009-present); Partnership for New York City, Inc.(non-profit)(1989-2010); New York Collegium(non-profit)(2004-2011); S’Cool Sounds, Inc.(non-profit)(2017-present) | |
| Name: | Harris H. Rusitzky | |
| Address: | 290 Woodcliff Drive | |
| Fairport, NY 14450 | ||
| Age: | 83 | |
| Current Position(s) Held with Fund: | Director, Audit Committee Member, Governance & Nominating Committee Member | |
| Term of Office & Length of Time Served: | Indefinite – Since 1985 | |
| Principal Occupation(s) During Past 5 Years: | President (1994- present) - The Greening Group (business consultants); Partner (2006-present) - The Restaurant Group (restaurants) | |
| Number of Portfolios Overseen within Fund Complex: | 34 | |
Other Directorships Held Outside Fund Complex During Past 5 Years: | Rochester Institute of Technology (university)(1972-present); Culinary Institute of America(non-profit college)(1985-present); George Eastman Museum (museum)(1988-present); National Restaurant Association (restaurant trade organization)(1978-present) | |
| Name: | Chester N. Watson | |
| Address: | 290 Woodcliff Drive | |
| Fairport, NY 14450 | ||
| Age: | 68 | |
| Current Position(s) Held with Fund: | Director, Audit Committee Chairman, Governance & Nominating Committee Member | |
| Term of Office & Length of Time Served: | Indefinite – Director, Audit Committee Member, Governance & Nominating Committee Member Since 2012; Audit Committee Chairman since 2013 | |
| Principal Occupation(s) During Past 5 Years: | General Auditor (2003-2011) - General Motors Company (auto manufacturer) | |
| Number of Portfolios Overseen within Fund Complex: | 34 | |
Other Directorships Held Outside Fund Complex During Past 5 Years: | Rochester Institute of Technology (university)(2005-present); Town of Greenburgh, NY Planning Board (municipal government) (2015-2018) | |
Officers:
| ||
| Name: | Jeffrey S. Coons, Ph.D., CFA® | |
| Address: | 290 Woodcliff Drive | |
| Fairport, NY 14450 | ||
| Age: | 55 | |
| Current Position(s) Held with Fund: | Vice President | |
| Term of Office1& Length of Time Served: | Since 2004 | |
| Principal Occupation(s) During Past 5 Years: | President since 2010,Co-CEO since 2018,Co-Director of Research (2002 – 2015) - Manning & Napier Advisors, LLC Holds one or more of the following titles for various subsidiaries and affiliates: President, Director, Treasurer, or Senior Trust Officer | |
26
New York Tax Exempt Series
Directors’ and Officers’ Information
(unaudited)
Officers: (continued)
| Name: | Elizabeth Craig | |
| Address: | 290 Woodcliff Drive | |
| Fairport, NY 14450 | ||
| Age: | 31 | |
| Current Position(s) Held with Fund: | Corporate Secretary | |
| Term of Office1& Length of Time Served: | Since 2016 | |
| Principal Occupation(s) During Past 5 Years: | Fund Administration Manager since 2015; Mutual Fund Compliance Specialist (2009-2015) - Manning & Napier Advisors, LLC; Assistant Corporate Secretary (2011-2016) - Manning & Napier Fund, Inc. | |
| Name: | Christine Glavin | |
| Address: | 290 Woodcliff Drive | |
| Fairport, NY 14450 | ||
| Age: | 52 | |
| Current Position(s) Held with Fund: | Principal Financial Officer, Chief Financial Officer | |
| Term of Office1& Length of Time Served: | Principal Financial Officer since 2002; Chief Financial Officer since 2001 | |
| Principal Occupation(s) During Past 5 Years: | Director of Fund Reporting since 2011; Fund Reporting Manager (1997-2011) - Manning & Napier Advisors, LLC; Assistant Treasurer since 2008 - Exeter Trust Company; Chief Financial Officer (2017-2018) - Rainier Investment Management Mutual Funds, Inc. | |
| Name: | Jodi L. Hedberg | |
| Address: | 290 Woodcliff Drive | |
| Fairport, NY 14450 | ||
| Age: | 51 | |
| Current Position(s) Held with Fund: | Chief Compliance Officer, Anti-Money Laundering Compliance Officer | |
| Term of Office1& Length of Time Served: | Chief Compliance Officer since 2004; Anti-Money Laundering Officer since 2002; Corporate Secretary (1997-2016) - Manning & Napier Fund, Inc.; Chief Compliance Officer and Anti-Money Laundering Officer (2017-2018) – Rainier Investment Management Mutual Funds, Inc. | |
| Principal Occupation(s) During Past 5 Years: | Managing Director, Compliance & Regulatory Affairs since 2018; Director of Compliance (2005-2018); Compliance Manager (1995-2005) – Manning & Napier Advisors, LLC and affiliates; Corporate Secretary – Manning & Napier Investor Services, Inc. since 2006 | |
| Name: | Scott Morabito | |
| Address: | 290 Woodcliff Drive | |
| Fairport, NY 14450 | ||
| Age: | 31 | |
| Current Position(s) Held with Fund: | Assistant Vice President | |
| Term of Office1& Length of Time Served: | Since 2017 | |
| Principal Occupation(s) During Past 5 Years: | Director of Funds Group since 2017; Fund Product and Strategy Manager (2014-2017); Senior Product and Strategy Analyst (2013-2014); Product and Strategy Analyst (2011-2013) - Manning & Napier Advisors, LLC; President, Director – Manning & Napier Investor Services, Inc. since 2018 | |
| Name: | Sarah Turner | |
| Address: | 290 Woodcliff Drive | |
| Fairport, NY 14450 | ||
| Age: | 36 | |
| Current Position(s) Held with Fund: | Chief Legal Officer; Assistant Corporate Secretary | |
| Term of Office1& Length of Time Served: | Since 2018 | |
| Principal Occupation(s) During Past 5 Years: | General Counsel since 2018 - Manning & Napier Advisors, LLC and affiliates; Counsel (2017-2018) – Harter Secrest and Emery LLP; Legal Counsel (2010-2017) – Manning & Napier Advisors, LLC and affiliates Holds one or more of the following titles for various affiliates: Corporate Secretary, General Counsel | |
27
New York Tax Exempt Series
Directors’ and Officers’ Information
(unaudited)
Officers: (continued)
| Name: | Amy Williams | |
| Address: | 290 Woodcliff Drive | |
| Fairport, NY 14450 | ||
| Age: | 57 | |
| Current Position(s) Held with Fund: | Assistant Corporate Secretary | |
| Term of Office1& Length of Time Served: | Since 2016 | |
| Principal Occupation(s) During Past 5 Years: | Director of Fund Documentation - Manning & Napier Advisors, LLC since 2009 Holds one or more of the following titles for various affiliates: Director | |
*Interested Director, within the meaning of the 1940 Act by reason of her positions with the Fund’s investment advisor, Manning & Napier Advisors, LLC and Distributor, Manning & Napier Investor Services, Inc.
1The term of office of all officers shall be one year and until their respective successors are chosen and qualified, or his or her earlier resignation or removal as provided in the Fund’sBy-Laws.
28
{This page intentionally left blank}
29
New York Tax Exempt Series
Literature Requests
(unaudited)
Proxy Voting Policies and Procedures
A description of the policies and procedures that the Fund uses to determine how to vote proxies relating to portfolio securities is available, without charge, upon request:
| By phone | 1-800-466-3863 | |||
| On the Securities and Exchange | ||||
| Commission’s (SEC) web site | http://www.sec.gov |
Proxy Voting Record
Information regarding how the Fund voted proxies relating to portfolio securities during the most recent12-month period ended June 30th is available, without charge, upon request:
| By phone | 1-800-466-3863 | |||
| On the SEC’s web site | http://www.sec.gov |
Quarterly Portfolio Holdings
The Series’ complete schedule of portfolio holdings for the 1st and 3rd quarters of each fiscal year are provided on FormN-Q, and are available, without charge, upon request:
| By phone | 1-800-466-3863 | |||
| On the SEC’s web site | http://www.sec.gov |
Prospectus and Statement of Additional Information (SAI)
For more information about any of the Manning & Napier Fund, Inc. Series, you may obtain a prospectus and SAI at www.manning-napier.com or by calling (800)466-3863. Before investing, carefully consider the objectives, risks, charges and expenses of the investment and read the prospectus carefully as it contains this and other information about the investment company.In addition, this information can be found on the SEC’s web site, http://www.sec.gov.
Additional information available at www.manning-napier.com
1. Fund Holdings -Month-End
2. Fund Holdings -Quarter-End
3. Shareholder Report - Annual
4. Shareholder Report - Semi-Annual
The Fund also offers electronic notification or“e-delivery” when certain documents are availableon-line to be downloaded or reviewed. Direct shareholders can elect to receive electronic notification when shareholder reports, prospectus updates, and/or statements are available. If you do not currently haveon-line access to your account, you can establish access by going to www.manning-napier.com, click on “Login” in the top corner of the page, and follow the prompts to self-enroll. Once enrolled, you can set your electronic notification preferences by clicking on the Account Options tab located within the green toolbar and then selectE-Delivery Option. Should you have any questions on either how to establishon-line access or how to update your account settings, please contact Investor Services at1-800-466-3863.
The Manning & Napier Fund, Inc. is managed by Manning & Napier Advisors, LLC. Manning & Napier Investor Services, Inc., an affiliate of Manning & Napier Advisors, LLC, is the distributor of the Fund shares.
MNNYT-12/18-AR

Manning & Napier Fund, Inc.
Core Bond Series
Beginning on February 25, 2021, as permitted by Securities and Exchange Commission regulations, paper copies of the Series’ annual and semi-annual shareholder reports will no longer be sent by mail, unless you specifically request paper copies of the reports from the Fund or from your financial intermediary, such as a broker-dealer or bank. Instead, the reports will be made available on a website, and you will be notified by mail each time a report is posted and provided with a website link to access the report.
If you already elected to receive shareholder reports electronically, you will not be affected by this change and you need not take any action. You may elect to receive shareholder reports and other communications from the Fund electronically by contacting your financial intermediary or, if you are a direct investor, by visiting www.manning-napier.com or calling1-800-466-3863.
You may elect to receive all future annual and semi-annual reports in paper free of charge. If you invest through a financial intermediary, you can contact your financial intermediary to request that you continue to receive paper copies of your shareholder reports. If you invest directly with the Fund, you can inform the Fund that you wish to continue receiving paper copies of your shareholder reports by visiting www.manning-napier.com or calling1-800-466-3863. Your election to receive reports in paper will apply to all funds held with your financial intermediary if you invest through a financial intermediary or all series of the Fund if you invest directly with the Fund. |
Core Bond Series
Management Discussion and Analysis
(unaudited)
Dear Shareholders:
The investment environment we witnessed over the past twelve months was far more volatile than in prior years. It resulted in a sharp drawdown in global equity markets during the fourth quarter of 2018.
For the fiscal year ending on December 31, 2018, US equities experienced negative returns, with the S&P 500 Total Return Index falling 4.38%. International equity performance was somewhat worse, with the MSCI ACWI ex USA Index returning negative 14.20%.
In fixed income, domestic investment-grade bond performance was essentially flat for the year, as measured by the Bloomberg Barclays U.S. Aggregate Bond Index, rising 0.01% as income generated over the period was offset by rising interest rates (when interest rates rise, bond prices fall).
We believe recent volatility, both at the beginning and end of last year, is reflective of what investors should expect going forward. While we do not believe we are immediately heading for a recession, we see recent developments within the US and abroad as an indication that we are entering a higher risk period for financial markets.
The US economy is likely approaching a period of peak growth. It continues to show signs of progressing toward the later stages of its economic and market cycle (typical characteristics of anend-of-cycle phase are an economic recession and financial market selloff).
As economic growth decelerates to more sustainable levels, we believe that investors are facing a growing risk of disappointment. At the same time, key global risks remain, including trade tensions, geopolitical uncertainty, and tightening monetary policy.
Considering the current economic and market backdrop, we believe investors should temper their performance expectations. The returns experienced over the latter half of the post-Global Financial Crisis bull market are unlikely to continue.
Additionally, given our cautious outlook, we are reviewing current and prospective investments for excessive risk exposures, and we have adjusted our positioning across many of our portfolios. Going forward, we will continue to follow our disciplines, focusing on flexibility and selectivity in today’s incredibly dynamic investment environment.
With this in mind, in the enclosed we discuss recent fund performance, highlight our positioning, and briefly provide our outlook amid the current investment environment.
We hope that you find this information helpful, and we look forward to working with you in the years ahead. Thank you for your continued confidence in Manning & Napier.
Sincerely,
Manning & Napier Advisors, LLC
The S&P 500 Index is an unmanaged, capitalization-weighted measure comprised of 500 leading U.S. companies to gauge U.S. large cap equities. The Index returns do not reflect any fees or expenses. The Index includes dividends, but not the reinvestment of dividends. Index returns provided by Bloomberg. S&P Dow Jones Indices LLC, a subsidiary of the McGraw Hill Financial, Inc., is the publisher of various index based data products and services and has licensed certain of its products and services for use by Manning & Napier. All such content Copyright© 2019 by S&P Dow Jones Indices LLC and/or its affiliates. All rights reserved. Neither S&P Dow Jones Indices LLC, Dow Jones Trademark Holdings LLC, their affiliates nor their third party licensors make any representation or warranty, express or implied, as to the ability of any index to accurately represent the asset class or market sector that it purports to represent and none of these parties shall have any liability for any errors, omissions, or interruptions of any index or the data included therein.
The MSCI ACWI ex USA Index (ACWIxUS) is designed to measure large andmid-cap representation across 22 of 23 Developed Markets countries (excluding the U.S.) and 24 Emerging Markets countries. The Index returns do not reflect any fees or expenses. The Index is denominated in U.S. dollars. The Index returns are net of withholding taxes. They assume daily reinvestment of net dividends thus accounting for any applicable dividend taxation. Index returns provided by Bloomberg.
The Bloomberg Barclays U.S. Aggregate Bond Index is an unmanaged, market-value weighted index of U.S. domestic investment-grade debt issues, including government, corporate, asset-backed, and mortgage-backed securities, with maturities of one year or more. Index returns do not reflect any fees or expenses. Index returns provided by Interactive Data.
1
Core Bond Series
Fund Commentary
(unaudited)
Investment Objective
To provide long-term total return by investing primarily in fixed income securities. Under normal circumstances, at least 80% of the Series’ assets will be invested in investment-grade bonds and other financial instruments with economic characteristics similar to bonds. Holdings will consist of US dollar denominated securities. The Series is not subject to maturity or duration restrictions.
Performance Commentary
US fixed income generated essentially no return in 2018, as the Bloomberg Barclays Aggregate Bond index generated 0.01% total return for the year. Over the same time period, the Core Bond Series Class shares returned negative 0.75%.
For the full year 2018, the Series’ underperformance was largely attributable to its corporate bond allocation. Specifically, the Series maintained an overweight to lower quality investment grade corporate bonds (i.e.,BBB-rated issuances). As corporate bond spreads widened, those issuances experienced the largest losses in the investment-grade corporate bond sector (bond spreads are the extra yield investors receive for owning a riskier bond versus a Treasury bond).
Going forward, we continue to believe a modest duration remains in investors’ best interests. Although we may see rates move lower in the near-term, we believe that, over the long-term, underlying economic factors will likely apply gradual pressure on rates to move higher and for the yield curve to flatten. We think the Federal Reserve will seek to remain flexible, looking to increase the federal funds target rate when economic and financial conditions allow, while remaining sensitive to domestic and global market conditions as they continue to reduce the size of their balance sheet.
On a sector basis, our outlook for growth in the US remains supportive of credit. We continue to view corporate bonds as moderately attractive, as they continue to adequately compensate investors on a fundamental basis. We also see securitized credit as attractive, specifically the shorter duration, higher quality consumer sectors (i.e., prime auto, credit cards, and student loans). Regarding US Treasuries, valuations on the long end of the curve have become less attractive over the past few months, and regarding mortgage securities, we see other parts of the fixed income market as offering better value.
Performance data quoted represents past performance and does not guarantee future results. The investment return and principal value of an investment will fluctuate, so that an investor’s shares, when redeemed, may be worth more or less than their original cost. Current performance may be higher or lower than that quoted; investors can obtain the most recentmonth-end performance at www.manning-napier.com or by calling (800)593-4353. Performance for the Core Bond Series Class S shares is provided above. Performance for the Class I shares will be higher based on the Class’ lower expenses.
Please see the next page for additional performance information as of December 31, 2018.
All investments involve risks, including possible loss of principal. There is an inverse relationship between bond prices and interest rates; as interest rates rise, bond prices (and therefore the value of bond funds) fall. Likewise, as interest rates fall, bond prices and the value of bond funds rise. Duration is defined as the average time it takes to collect a bond’s interest and principal repayment. It is a measure of the sensitivity of the price (the value of principal) of a fixed income investment to a change in interest rates.
The Bloomberg Barclays U.S. Aggregate Bond Index is an unmanaged, market-value weighted index of U.S. domestic investment-grade debt issues, including government, corporate, asset-backed, and mortgage-backed securities, with maturities of one year or more. Index returns do not reflect any fees or expenses. Index returns provided by Interactive Data.
2
Core Bond Series
Performance Update as of December 31, 2018
(unaudited)
AVERAGE ANNUAL TOTAL RETURNS AS OF DECEMBER 31, 2018 | ||||||
ONE YEAR1 | FIVE YEAR | TEN YEAR | ||||
| Manning & Napier Fund, Inc. - Core Bond Series - Class S2 | -0.75% | 1.74% | 4.30% | |||
| Manning & Napier Fund, Inc. - Core Bond Series - Class I2,3 | -0.53% | 1.91% | 4.39% | |||
| Bloomberg Barclays U.S. Aggregate Bond Index4 | 0.01% | 2.52% | 3.48% | |||
The following graph compares the value of a $10,000 investment in the Manning & Napier Fund, Inc. - Core Bond Series - Class S for the ten years ended December 31, 2018 to the Bloomberg Barclays U.S. Aggregate Bond Index.
1The returns shown are based on net asset values calculated for shareholder transactions and may differ from the returns shown in the financial highlights, which reflect adjustments made to the net asset values in accordance with accounting principles generally accepted in the United States of America.
2The Series’ performance does not reflect the deduction of taxes that a shareholder would pay on fund distributions or the redemption of shares. The Series’ performance is historical and may not be indicative of future results. The performance returns shown are inclusive of the net expense ratio of the Series. For the year ended December 31, 2018, this net expense ratio was 0.70% for Class S and 0.45% for Class I. The gross expense ratio, which does not account for any voluntary or contractual waivers currently in effect, was 0.78% for Class S and 0.53% for Class I for the year ended December 31, 2018.
3For periods through August 3, 2015 (the inception date of the Class I shares), performance for the Class I shares is based on historical performance of the Class S shares. Because Class I shares invest in the same portfolio of securities as Class S, performance will only be different to the extent that the Class S shares have a higher expense ratio.
4The Bloomberg Barclays U.S. Aggregate Bond Index is an unmanaged, market-value weighted index of U.S. domestic investment-grade debt issues, including government, corporate, asset backed, and mortgage-backed securities, with maturities of one year or more. Index returns do not reflect any fees or expenses. Index returns provided by Interactive Data.
3
Core Bond Series
Shareholder Expense Example
(unaudited)
As a shareholder of the Series, you incur ongoing costs, including management fees, shareholder service fees and other Series expenses. This example is intended to help you understand your ongoing costs (in dollars) of investing in the Series and to compare these costs with the ongoing costs of investing in other mutual funds.
The example is based on an investment of $1,000 invested in each class at the beginning of the period and held for the entire period (July 1, 2018 to December 31, 2018).
Actual Expenses
The Actual lines of the table below provide information about actual account values and actual expenses. You may use the information in this line, together with the amount you invested, to estimate the expenses that you paid over the period. Simply divide your account value by $1,000 (for example, an $8,600 account value divided by $1,000 = 8.6), then multiply the result by the number in the Actual line for the Class in which you have invested under the heading entitled “Expenses Paid During Period” to estimate the expenses you paid on your account during this period.
Hypothetical Example for Comparison Purposes
The Hypothetical lines of each class in the table below provide information about hypothetical account values and hypothetical expenses based on the Class’ actual expense ratio and an assumed rate of return of 5% per year before expenses, which is not the Class’ actual return. The hypothetical account values and expenses may not be used to estimate the actual ending account balance or expenses you paid during the period. You may use this information to compare the ongoing costs of investing in a class of the Series and other funds. To do so, compare this 5% hypothetical example for the class in which you have invested with the 5% hypothetical examples that appear in the shareholder reports of the other funds.
Please note that the expenses shown in the table are meant to highlight your ongoing costs only and do not reflect any transaction costs such as sales charges (loads), redemption fees, or exchange fees that you may incur in other mutual funds. Therefore, the second line of the table is useful in comparing ongoing costs only, and will not help you determine the relative total costs of owning different funds.
BEGINNING ACCOUNT VALUE 7/1/18 | ENDING ACCOUNT VALUE 12/31/18 | EXPENSES PAID DURING PERIOD* 7/1/18-12/31/18 | ANNUALIZED EXPENSE RATIO | |||||
Class S | ||||||||
Actual | $1,000.00 | $1,011.27 | $3.55 | 0.70% | ||||
Hypothetical | $1,000.00 | $1,021.68 | $3.57 | 0.70% | ||||
Class I | ||||||||
Actual | $1,000.00 | $1,011.63 | $2.28 | 0.45% | ||||
Hypothetical | $1,000.00 | $1,022.94 | $2.29 | 0.45% |
*Expenses are equal to each Class’ annualized expense ratio (for thesix-month period), multiplied by the average account value over the period, multiplied by 184/365 (to reflect theone-half year period). Expenses are based on the most recent fiscal half year; therefore, the expense ratios states above may differ from the expense ratios stated in the financial highlights, which is based onone-year data. The Class’ total return would have been lower had certain expenses not been waived during the period.
4
Core Bond Series
Portfolio Composition as of December 31, 2018
(unaudited)
5
Core Bond Series
Investment Portfolio - December 31, 2018
| CREDIT | ||||||||||||
| RATING1 | PRINCIPAL | VALUE | ||||||||||
| (UNAUDITED) | AMOUNT | (NOTE 2) | ||||||||||
CORPORATE BONDS - 26.5% | ||||||||||||
Non-Convertible Corporate Bonds - 26.5% | ||||||||||||
Communication Services - 3.5% | ||||||||||||
Diversified Telecommunication Services - 2.5% | ||||||||||||
AT&T, Inc., 4.25%, 3/1/2027 | Baa2 | $ | 1,820,000 | $ | 1,780,614 | |||||||
Verizon Communications, Inc., 5.50%, 3/16/2047 | Baa1 | 2,540,000 | 2,701,076 | |||||||||
|
| |||||||||||
| 4,481,690 | ||||||||||||
|
| |||||||||||
Media - 1.0% | ||||||||||||
Discovery Communications LLC, 5.20%, 9/20/2047 | Baa3 | 1,870,000 | 1,718,601 | |||||||||
|
| |||||||||||
Total Communication Services | 6,200,291 | |||||||||||
|
| |||||||||||
Consumer Discretionary - 3.5% | ||||||||||||
Automobiles - 1.0% | ||||||||||||
General Motors Co.2, (3 mo. LIBOR US + 0.900%), 3.667%, 9/10/2021 | Baa3 | 1,770,000 | 1,720,933 | |||||||||
|
| |||||||||||
Internet & Direct Marketing Retail - 1.5% | ||||||||||||
Booking Holdings, Inc., 3.60%, 6/1/2026 | Baa1 | 2,790,000 | 2,710,615 | |||||||||
|
| |||||||||||
Multiline Retail - 1.0% | ||||||||||||
Macy’s Retail Holdings, Inc., 7.00%, 2/15/2028 | Baa3 | 840,000 | 908,099 | |||||||||
Macy’s Retail Holdings, Inc., 6.90%, 4/1/2029 | Baa3 | 850,000 | 915,081 | |||||||||
|
| |||||||||||
| 1,823,180 | ||||||||||||
|
| |||||||||||
Total Consumer Discretionary | 6,254,728 | |||||||||||
|
| |||||||||||
Energy - 5.2% | ||||||||||||
Oil, Gas & Consumable Fuels - 5.2% | ||||||||||||
Boardwalk Pipelines LP, 5.95%, 6/1/2026 | Baa3 | 2,530,000 | 2,613,799 | |||||||||
Kinder Morgan Energy Partners LP, 6.95%, 1/15/2038 | Baa2 | 2,270,000 | 2,531,841 | |||||||||
Sabine Pass Liquefaction LLC, 5.875%, 6/30/2026 | Baa3 | 2,520,000 | 2,668,186 | |||||||||
The Williams Companies, Inc., 3.75%, 6/15/2027 | Baa3 | 1,495,000 | 1,416,629 | |||||||||
|
| |||||||||||
Total Energy | 9,230,455 | |||||||||||
|
| |||||||||||
Financials - 8.9% | ||||||||||||
Banks - 5.5% | ||||||||||||
Bank of America Corp., 4.00%, 1/22/2025 | Baa2 | 2,750,000 | 2,678,902 | |||||||||
Citigroup, Inc., 8.125%, 7/15/2039 | Baa1 | 960,000 | 1,331,856 | |||||||||
JPMorgan Chase & Co., 6.30%, 4/23/2019 | A2 | 2,630,000 | 2,655,710 | |||||||||
JPMorgan Chase & Co.3, (3 mo. LIBOR US + 1.000%), 4.023%, 12/5/2024 | A2 | 1,320,000 | 1,330,503 | |||||||||
Santander Holdings USA, Inc., 4.50%, 7/17/2025 | Baa3 | 1,780,000 | 1,762,388 | |||||||||
|
| |||||||||||
| 9,759,359 | ||||||||||||
|
| |||||||||||
Capital Markets - 1.5% | ||||||||||||
Morgan Stanley2, (3 mo. LIBOR US + 1.220%), 3.811%, 5/8/2024 | A3 | 2,670,000 | 2,630,217 | |||||||||
|
| |||||||||||
Diversified Financial Services - 0.9% | ||||||||||||
AerCap Ireland Capital DAC - AerCap Global Aviation Trust (Ireland), 4.45%, 10/1/2025 | Baa3 | 1,810,000 | 1,718,312 | |||||||||
|
| |||||||||||
The accompanying notes are an integral part of the financial statements.
6
Core Bond Series
Investment Portfolio - December 31, 2018
| CREDIT | ||||||||||||||||||||
| RATING1 | PRINCIPAL | VALUE | ||||||||||||||||||
| (UNAUDITED) | AMOUNT | (NOTE 2) | ||||||||||||||||||
CORPORATE BONDS(continued) | ||||||||||||||||||||
Non-Convertible Corporate Bonds(continued) | ||||||||||||||||||||
Financials(continued) | ||||||||||||||||||||
Insurance - 1.0% | ||||||||||||||||||||
Prudential Financial, Inc.3, (3 mo. LIBOR US + 4.175%), 5.875%, 9/15/2042 | Baa2 | $ | 1,710,000 | $ | 1,727,100 | |||||||||||||||
|
| |||||||||||||||||||
Total Financials | 15,834,988 | |||||||||||||||||||
|
| |||||||||||||||||||
Health Care - 0.5% | ||||||||||||||||||||
Health Care Providers & Services - 0.5% | ||||||||||||||||||||
Fresenius Medical Care US Finance II, Inc. (Germany)4, 5.625%, 7/31/2019 | Baa3 | 934,000 | 944,519 | |||||||||||||||||
|
| |||||||||||||||||||
Industrials - 2.6% | ||||||||||||||||||||
Industrial Conglomerates - 0.6% | ||||||||||||||||||||
General Electric Co.3,5, (3 mo. LIBOR US + 3.330%), 5.00% | Baa3 | 1,400,000 | 1,071,000 | |||||||||||||||||
|
| |||||||||||||||||||
Machinery - 1.0% | ||||||||||||||||||||
CNH Industrial Capital LLC, 3.375%, 7/15/2019 | Baa3 | 1,820,000 | 1,806,350 | |||||||||||||||||
|
| |||||||||||||||||||
Trading Companies & Distributors - 1.0% | ||||||||||||||||||||
International Lease Finance Corp., 6.25%, 5/15/2019 | Baa3 | 1,760,000 | 1,775,569 | |||||||||||||||||
|
| |||||||||||||||||||
Total Industrials | 4,652,919 | |||||||||||||||||||
|
| |||||||||||||||||||
Materials - 1.0% | ||||||||||||||||||||
Metals & Mining - 1.0% | ||||||||||||||||||||
Southern Copper Corp. (Peru), 5.375%, 4/16/2020 | Baa2 | 1,740,000 | 1,777,452 | |||||||||||||||||
|
| |||||||||||||||||||
Real Estate - 1.3% | ||||||||||||||||||||
Equity Real Estate Investment Trusts (REITS) - 1.3% | ||||||||||||||||||||
American Homes 4 Rent LP, 4.25%, 2/15/2028 | Baa3 | 1,870,000 | 1,807,097 | |||||||||||||||||
GTP Acquisition Partners I LLC4, 2.35%, 6/15/2020 | Aaa | 450,000 | 442,753 | |||||||||||||||||
|
| |||||||||||||||||||
Total Real Estate | 2,249,850 | |||||||||||||||||||
|
| |||||||||||||||||||
TOTAL CORPORATE BONDS | ||||||||||||||||||||
(Identified Cost $48,855,181) | 47,145,202 | |||||||||||||||||||
|
| |||||||||||||||||||
ASSET-BACKED SECURITIES - 5.4% | ||||||||||||||||||||
BMW Vehicle Owner Trust, Series2016-A, Class A3, 1.16%, 11/25/2020 | Aaa | 430,621 | 427,822 | |||||||||||||||||
Cazenovia Creek Funding I LLC, Series2015-1A, Class A4, 2.00%, 12/10/2023 | WR6 | 23,561 | 23,428 | |||||||||||||||||
Cazenovia Creek Funding II LLC, Series2018-1A, Class A4, 3.561%, 7/15/2030 | WR6 | 459,413 | 459,711 | |||||||||||||||||
Chesapeake Funding II LLC, Series2017-2A, Class A14, 1.99%, 5/15/2029 | Aaa | 1,027,070 | 1,016,305 | |||||||||||||||||
Chesapeake Funding II LLC, Series2017-4A, Class A14, 2.12%, 11/15/2029 | Aaa | 385,989 | 381,806 | |||||||||||||||||
Credit Acceptance Auto Loan Trust, Series2017-1A, Class A4, 2.56%, 10/15/2025 | AAA7 | 350,000 | 347,752 | |||||||||||||||||
The accompanying notes are an integral part of the financial statements.
7
Core Bond Series
Investment Portfolio - December 31, 2018
| CREDIT | ||||||||||||
| RATING1 | PRINCIPAL | VALUE | ||||||||||
| (UNAUDITED) | AMOUNT | (NOTE 2) | ||||||||||
ASSET-BACKED SECURITIES(continued) | ||||||||||||
Enterprise Fleet Financing LLC, Series2016-2, Class A24, 1.74%, 2/22/2022 | AAA7 | $ | 120,302 | $ | 119,854 | |||||||
Ford Credit Auto Lease Trust, Series2017-A, Class A3, 1.88%, 4/15/2020 | AAA7 | 803,081 | 801,091 | |||||||||
GM Financial Automobile Leasing Trust, Series2016-2, Class A4, 1.76%, 3/20/2020 | AAA7 | 507,986 | 507,463 | |||||||||
Invitation Homes Trust, Series 2017-SFR2, Class A2,4, (1 mo. LIBOR US + 0.850%), 3.305%, 12/17/2036 | Aaa | 151,761 | 149,908 | |||||||||
Invitation Homes Trust, Series 2017-SFR2, Class B2,4, (1 mo. LIBOR US + 1.150%), 3.605%, 12/17/2036 | Aa2 | 115,000 | 114,379 | |||||||||
Mercedes-Benz Auto Lease Trust, Series2016-B, Class A3, 1.35%, 8/15/2019 | Aaa | 42,296 | 42,275 | |||||||||
Progress Residential Trust, Series 2017-SFR2, Class A4, 2.897%, 12/17/2034 | Aaa | 400,000 | 392,794 | |||||||||
SBA Small Business Investment Companies, Series2015-10B, Class 1, 2.829%, 9/10/2025 | Aaa | 1,318,915 | 1,320,468 | |||||||||
SoFi Consumer Loan Program LLC, Series2017-5, Class A14, 2.14%, 9/25/2026 | AA7 | 132,295 | 131,634 | |||||||||
SoFi Professional Loan Program LLC, Series2014-A, Class A24, 3.02%, 10/25/2027 | AAA7 | 127,734 | 127,712 | |||||||||
SoFi Professional Loan Program LLC, Series2016-E, Class A2B4, 2.49%, 1/25/2036 | Aaa | 1,000,000 | 985,618 | |||||||||
SoFi Professional Loan Program LLC, Series2017-A, Class A2A4, 1.55%, 3/26/2040 | Aaa | 66,294 | 65,767 | |||||||||
SoFi Professional Loan Program LLC, Series2017-C, Class A2A4, 1.75%, 7/25/2040 | AAA7 | 186,613 | 185,113 | |||||||||
SoFi Professional Loan Program LLC, Series2017-F, Class A1FX4, 2.05%, 1/25/2041 | Aaa | 104,848 | 103,717 | |||||||||
SoFi Professional Loan Program LLC, Series2017-F, Class A2FX4, 2.84%, 1/25/2041 | Aaa | 150,000 | 146,622 | |||||||||
SoFi Professional Loan Program LLC, Series2018-C, Class A1FX4, 3.08%, 1/25/2048 | Aaa | 571,219 | 569,899 | |||||||||
Tax Ease Funding LLC, Series2016-1A, Class A4, 3.131%, 6/15/2028 | WR6 | 106,867 | 106,635 | |||||||||
Tricon American Homes Trust, Series 2016-SFR1, Class A4, 2.589%, 11/17/2033 | Aaa | 497,380 | 483,348 | |||||||||
Tricon American Homes Trust, Series 2017-SFR2, Class A4, 2.928%, 1/17/2036 | Aaa | 499,467 | 484,394 | |||||||||
|
| |||||||||||
TOTAL ASSET-BACKED SECURITIES | ||||||||||||
(Identified Cost $9,564,747) | 9,495,515 | |||||||||||
|
| |||||||||||
COMMERCIAL MORTGAGE-BACKED SECURITIES - 9.6% | ||||||||||||
Americold LLC Trust, Series 2010-ARTA, Class A14, 3.847%, 1/14/2029 | AA7 | 25,096 | 25,273 | |||||||||
BWAY Mortgage Trust, Series 2015-1740, Class A4, 2.917%, 1/10/2035 | AAA7 | 400,000 | 387,617 | |||||||||
Caesars Palace Las Vegas Trust, Series 2017-VICI, Class A4, 3.531%, 10/15/2034 | Aaa | 570,000 | 573,624 | |||||||||
The accompanying notes are an integral part of the financial statements.
8
Core Bond Series
Investment Portfolio - December 31, 2018
| CREDIT | ||||||||||||
| RATING1 | PRINCIPAL | VALUE | ||||||||||
| (UNAUDITED) | AMOUNT | (NOTE 2) | ||||||||||
COMMERCIAL MORTGAGE-BACKED SECURITIES(continued) | ||||||||||||
Commercial Mortgage Pass-Through Certificates, Series2015-3BP, Class A4, 3.178%, 2/10/2035 | WR6 | $ | 400,000 | $ | 393,991 | |||||||
Credit Suisse Mortgage Capital Trust, Series2013-6, Class 2A14,8, 3.50%, 8/25/2043 | AAA7 | 816,022 | 805,846 | |||||||||
Credit Suisse Mortgage Capital Trust, Series 2013-IVR3, Class A14,8, 2.50%, 5/25/2043 | AAA7 | 255,246 | 240,702 | |||||||||
Credit Suisse Mortgage Capital Trust, Series2013-TH1, Class A14,8, 2.13%, 2/25/2043 | AAA7 | 177,434 | 165,434 | |||||||||
Fannie Mae REMICS, Series2018-31, Class KP, 3.50%, 7/25/2047 | Aaa | 668,650 | 674,133 | |||||||||
FDIC Trust, Series2011-R1, Class A4, 2.672%, 7/25/2026 | WR6 | 18,044 | 17,960 | |||||||||
Freddie Mac Multifamily Structured Pass-Through Certificates, Series K014, Class X1 (IO)8, 1.149%, 4/25/2021 | Aaa | 6,978,733 | 159,720 | |||||||||
Freddie Mac Multifamily Structured Pass-Through Certificates, Series K016, Class X1 (IO)8, 1.492%, 10/25/2021 | Aaa | 1,070,348 | 37,529 | |||||||||
Freddie Mac Multifamily Structured Pass-Through Certificates, Series K021, Class X1 (IO)8, 1.442%, 6/25/2022 | Aaa | 9,034,855 | 378,965 | |||||||||
Freddie Mac Multifamily Structured Pass-Through Certificates, Series K030, Class X1 (IO)8, 0.196%, 4/25/2023 | Aaa | 13,495,807 | 101,739 | |||||||||
Freddie Mac Multifamily Structured Pass-Through Certificates, Series K032, Class X1 (IO)8, 0.103%, 5/25/2023 | Aaa | 7,918,608 | 36,916 | |||||||||
Freddie Mac REMICS, Series 4791, Class BA, 4.00%, 3/15/2044 | Aaa | 839,370 | 864,162 | |||||||||
Freddie Mac REMICS, Series 4801, Class BA, 4.50%, 5/15/2044 | Aaa | 847,040 | 881,745 | |||||||||
FREMF Mortgage Trust, Series2011-K15, Class B4,8, 4.948%, 8/25/2044 | WR6 | 170,000 | 176,989 | |||||||||
FREMF Mortgage Trust, Series 2012-K711, Class B4,8, 3.543%, 8/25/2045 | WR6 | 450,000 | 449,876 | |||||||||
FREMF Mortgage Trust, Series 2013-K712, Class B4,8, 3.358%, 5/25/2045 | AA7 | 360,000 | 359,640 | |||||||||
FREMF Mortgage Trust, Series 2014-K715, Class B4,8, 3.978%, 2/25/2046 | A1 | 465,000 | 471,746 | |||||||||
FREMF Mortgage Trust, Series2015-K42, Class B4,8, 3.851%, 12/25/2024 | A3 | 380,000 | 376,727 | |||||||||
FREMF Mortgage Trust, Series2015-K43, Class B4,8, 3.734%, 2/25/2048 | WR6 | 400,000 | 394,020 | |||||||||
FREMF Mortgage Trust, Series 2015-K720, Class B4,8, 3.39%, 7/25/2022 | Baa1 | 340,000 | 340,460 | |||||||||
GAHR Commercial Mortgage Trust, Series2015-NRF, Class BFX4,8, 3.382%, 12/15/2034 | AA7 | 400,000 | 398,197 | |||||||||
GAHR Commercial Mortgage Trust, Series2015-NRF, Class DFX4,8, 3.382%, 12/15/2034 | BBB7 | 220,000 | 217,171 | |||||||||
Government National Mortgage Association, Series2017-54, Class AH, 2.60%, 12/16/2056 | Aaa | 469,688 | 447,720 | |||||||||
JP Morgan Chase Commercial Mortgage Securities Trust, Series2010-C2, Class A34, 4.07%, 11/15/2043 | AAA7 | 175,153 | 177,215 | |||||||||
JP Morgan Mortgage Trust, Series2013-1, Class 1A24,8, 3.00%, 3/25/2043 | WR6 | 124,768 | 120,942 | |||||||||
The accompanying notes are an integral part of the financial statements.
9
Core Bond Series
Investment Portfolio - December 31, 2018
| CREDIT | ||||||||||||
| RATING1 | PRINCIPAL | VALUE | ||||||||||
| (UNAUDITED) | AMOUNT | (NOTE 2) | ||||||||||
COMMERCIAL MORTGAGE-BACKED SECURITIES(continued) | ||||||||||||
JP Morgan Mortgage Trust, Series2013-2, Class A24,8, 3.50%, 5/25/2043 | AAA7 | $ | 140,341 | $ | 137,879 | |||||||
JP Morgan Mortgage Trust, Series2014-2, Class 1A14,8, 3.00%, 6/25/2029 | AAA7 | 169,507 | 168,309 | |||||||||
JP Morgan Mortgage Trust, Series2017-3, Class 1A54,8, 3.50%, 8/25/2047 | Aaa | 813,682 | 803,289 | |||||||||
JP Morgan Mortgage Trust, Series2017-6, Class A34,8, 3.50%, 12/25/2048 | Aaa | 317,126 | 311,168 | |||||||||
JP Morgan Mortgage Trust, Series2017-6, Class A54,8, 3.50%, 12/25/2048 | Aaa | 529,556 | 522,474 | |||||||||
New Residential Mortgage Loan Trust, Series2014-1A, Class A4,8, 3.75%, 1/25/2054 | AAA7 | 295,846 | 296,404 | |||||||||
New Residential Mortgage Loan Trust, Series2014-3A, Class AFX34,8, 3.75%, 11/25/2054 | AA7 | 133,051 | 132,988 | |||||||||
New Residential Mortgage Loan Trust, Series2015-2A, Class A14,8, 3.75%, 8/25/2055 | Aaa | 287,985 | 288,139 | |||||||||
New Residential Mortgage Loan Trust, Series2016-4A, Class A14,8, 3.75%, 11/25/2056 | AAA7 | 237,943 | 237,612 | |||||||||
OBP Depositor LLC Trust, Series2010-OBP, Class A4, 4.646%, 7/15/2045 | AAA7 | 100,000 | 101,678 | |||||||||
SBA Small Business Investment Companies, Series2015-10A, Class 1, 2.517%, 3/10/2025 | Aaa | 484,013 | 479,931 | |||||||||
Sequoia Mortgage Trust, Series2012-3, Class A18, 3.50%, 7/25/2042 | Aaa | 361,304 | 359,145 | |||||||||
Sequoia Mortgage Trust, Series2013-7, Class A28, 3.00%, 6/25/2043 | AAA7 | 143,801 | 138,218 | |||||||||
Sequoia Mortgage Trust, Series2013-8, Class A18, 3.00%, 6/25/2043 | Aaa | 197,537 | 190,615 | |||||||||
Starwood Retail Property Trust, Series 2014-STAR, Class A2,4, (1mo. LIBOR US + 1.220%), 3.675%, 11/15/2027 | AAA7 | 371,990 | 361,192 | |||||||||
Towd Point Mortgage Trust, Series2016-5, Class A14,8, 2.50%, 10/25/2056 | Aaa | 548,236 | 531,494 | |||||||||
UBS-Barclays Commercial Mortgage Trust, Series2013-C5, Class A4, 3.185%, 3/10/2046 | Aaa | 800,000 | 799,803 | |||||||||
Vornado DP LLC Trust, Series2010-VNO, Class A2FX4, 4.004%, 9/13/2028 | AA7 | 245,000 | 249,620 | |||||||||
Wells Fargo Commercial Mortgage Trust, Series2010-C1, Class A24, 4.393%, 11/15/2043 | Aaa | 275,000 | 279,662 | |||||||||
WF-RBS Commercial Mortgage Trust, Series2011-C2, Class A44,8, 4.869%, 2/15/2044 | Aaa | 778,985 | 799,651 | |||||||||
WinWater Mortgage Loan Trust, Series2015-1, Class A14,8, 3.50%, 1/20/2045 | WR6 | 147,584 | 145,598 | |||||||||
WinWater Mortgage Loan Trust, Series2015-3, Class A54,8, 3.50%, 3/20/2045 | Aaa | 125,074 | 124,682 | |||||||||
|
| |||||||||||
TOTAL COMMERCIAL MORTGAGE-BACKED SECURITIES | ||||||||||||
(Identified Cost $17,068,710) | 17,135,610 | |||||||||||
|
| |||||||||||
The accompanying notes are an integral part of the financial statements.
10
Core Bond Series
Investment Portfolio - December 31, 2018
| CREDIT | ||||||||||||
| RATING1 | PRINCIPAL | VALUE | ||||||||||
| (UNAUDITED) | AMOUNT | (NOTE 2) | ||||||||||
FOREIGN GOVERNMENT BONDS - 1.9% | ||||||||||||
Export-Import Bank of Korea (South Korea), 2.625%, 12/30/2020 | Aa2 | $ | 2,000,000 | $ | 1,979,106 | |||||||
The Korea Development Bank (South Korea), 1.375%, 9/12/2019 | Aa2 | 1,000,000 | 988,816 | |||||||||
Province of Ontario (Canada), 1.25%, 6/17/2019 | Aa3 | 400,000 | 397,331 | |||||||||
|
| |||||||||||
TOTAL FOREIGN GOVERNMENT BONDS | ||||||||||||
(Identified Cost $3,393,899) | 3,365,253 | |||||||||||
|
| |||||||||||
U.S. TREASURY SECURITIES - 39.9% | ||||||||||||
U.S. Treasury Bonds - 12.5% | ||||||||||||
U.S. Treasury Bond, 6.25%, 5/15/2030 | 2,760,000 | 3,701,526 | ||||||||||
U.S. Treasury Bond, 4.75%, 2/15/2037 | 4,260,000 | 5,429,337 | ||||||||||
U.S. Treasury Bond, 2.50%, 2/15/2045 | 6,295,000 | 5,704,844 | ||||||||||
U.S. Treasury Bond, 3.00%, 5/15/2047 | 5,672,000 | 5,647,628 | ||||||||||
U.S. Treasury Inflation Indexed Bond, 0.75%, 2/15/2042 | 1,941,743 | 1,761,626 | ||||||||||
|
| |||||||||||
Total U.S. Treasury Bonds | ||||||||||||
(Identified Cost $22,507,455) | 22,244,961 | |||||||||||
|
| |||||||||||
U.S. Treasury Notes - 27.4% | ||||||||||||
U.S. Treasury Inflation Indexed Note, 0.125%, 4/15/2020 | 9,036,028 | 8,832,835 | ||||||||||
U.S. Treasury Inflation Indexed Note, 0.125%, 1/15/2023 | 1,928,221 | 1,862,373 | ||||||||||
U.S. Treasury Note, 1.75%, 4/30/2022 | 5,550,000 | 5,421,439 | ||||||||||
U.S. Treasury Note, 1.625%, 4/30/2023 | 5,419,000 | 5,225,313 | ||||||||||
U.S. Treasury Note, 2.00%, 4/30/2024 | 5,708,000 | 5,557,273 | ||||||||||
U.S. Treasury Note, 2.125%, 5/15/2025 | 5,623,000 | 5,471,882 | ||||||||||
U.S. Treasury Note, 1.625%, 5/15/2026 | 5,815,000 | 5,430,211 | ||||||||||
U.S. Treasury Note, 2.375%, 5/15/2027 | 5,625,000 | 5,507,227 | ||||||||||
U.S. Treasury Note, 2.75%, 2/15/2028 | 5,470,000 | 5,498,205 | ||||||||||
|
| |||||||||||
Total U.S. Treasury Notes | ||||||||||||
(Identified Cost $48,600,627) | 48,806,758 | |||||||||||
|
| |||||||||||
TOTAL U.S. TREASURY SECURITIES | ||||||||||||
(Identified Cost $71,108,082) | 71,051,719 | |||||||||||
|
| |||||||||||
U.S. GOVERNMENT AGENCIES - 15.3% | ||||||||||||
Mortgage-Backed Securities - 15.3% | ||||||||||||
Fannie Mae, Pool #888468, 5.50%, 9/1/2021 | 72,431 | 73,619 | ||||||||||
Fannie Mae, Pool #995233, 5.50%, 10/1/2021 | 3,566 | 3,607 | ||||||||||
Fannie Mae, Pool #888017, 6.00%, 11/1/2021 | 8,954 | 9,172 | ||||||||||
Fannie Mae, Pool #995329, 5.50%, 12/1/2021 | 50,864 | 51,755 | ||||||||||
Fannie Mae, Pool #888136, 6.00%, 12/1/2021 | 10,889 | 11,161 | ||||||||||
Fannie Mae, Pool #888810, 5.50%, 11/1/2022 | 88,557 | 90,030 | ||||||||||
Fannie Mae, Pool #AD0462, 5.50%, 10/1/2024 | 8,757 | 9,115 | ||||||||||
Fannie Mae, Pool #MA3463, 4.00%, 9/1/2033 | 814,439 | 835,791 | ||||||||||
Fannie Mae, Pool #MA1834, 4.50%, 2/1/2034 | 92,455 | 96,659 | ||||||||||
Fannie Mae, Pool #828377, 5.50%, 6/1/2035 | 329,175 | 354,450 | ||||||||||
The accompanying notes are an integral part of the financial statements.
11
Core Bond Series
Investment Portfolio - December 31, 2018
| PRINCIPAL | VALUE | |||||||||
| AMOUNT | (NOTE 2) | |||||||||
U.S. GOVERNMENT AGENCIES(continued) | ||||||||||
Mortgage-Backed Securities(continued) | ||||||||||
Fannie Mae, Pool #MA2587, 3.50%, 4/1/2036 | $ | 661,705 | $ | 670,339 | ||||||
Fannie Mae, Pool #889494, 5.50%, 1/1/2037 | 305,795 | 329,264 | ||||||||
Fannie Mae, Pool #889624, 5.50%, 5/1/2038 | 44,411 | 47,418 | ||||||||
Fannie Mae, Pool #995876, 6.00%, 11/1/2038 | 131,262 | 143,138 | ||||||||
Fannie Mae, Pool #AD0307, 5.50%, 1/1/2039 | 46,154 | 49,612 | ||||||||
Fannie Mae, Pool #AI5172, 4.00%, 8/1/2041 | 115,293 | 118,551 | ||||||||
Fannie Mae, Pool #AH3858, 4.50%, 8/1/2041 | 503,597 | 527,487 | ||||||||
Fannie Mae, Pool #AL7729, 4.00%, 6/1/2043 | 161,055 | 165,602 | ||||||||
Fannie Mae, Pool #AS3622, 3.50%, 10/1/2044 | 2,327,664 | 2,336,460 | ||||||||
Fannie Mae, Pool #AX1685, 3.50%, 11/1/2044 | 1,197,728 | 1,203,367 | ||||||||
Fannie Mae, Pool #AS4103, 4.50%, 12/1/2044 | 312,873 | 326,618 | ||||||||
Fannie Mae, Pool #AY8604, 3.50%, 4/1/2045 | 264,330 | 265,303 | ||||||||
Fannie Mae, Pool #AZ9215, 4.00%, 10/1/2045 | 892,578 | 912,949 | ||||||||
Fannie Mae, Pool #BC6764, 3.50%, 4/1/2046 | 144,294 | 144,728 | ||||||||
Fannie Mae, Pool #BC8677, 4.00%, 5/1/2046 | 122,056 | 124,510 | ||||||||
Fannie Mae, Pool #MA2670, 3.00%, 7/1/2046 | 371,311 | 362,133 | ||||||||
Fannie Mae, Pool #BD2179, 4.00%, 7/1/2046 | 307,706 | 313,894 | ||||||||
Fannie Mae, Pool #MA2705, 3.00%, 8/1/2046 | 1,058,782 | 1,032,611 | ||||||||
Fannie Mae, Pool #BD1191, 3.50%, 1/1/2047 | 530,347 | 531,258 | ||||||||
Fannie Mae, Pool #BE7845, 4.50%, 2/1/2047 | 282,573 | 295,383 | ||||||||
Fannie Mae, Pool #CA1922, 5.00%, 6/1/2048 | 967,292 | 1,014,430 | ||||||||
Fannie Mae, Pool #CA2056, 4.50%, 7/1/2048 | 581,374 | 602,439 | ||||||||
Fannie Mae, Pool #BK9366, 4.50%, 8/1/2048 | 427,889 | 443,393 | ||||||||
Fannie Mae, Pool #BK9598, 4.50%, 8/1/2048 | 398,120 | 412,546 | ||||||||
Fannie Mae, Pool #CA2219, 5.00%, 8/1/2048 | 396,403 | 415,701 | ||||||||
Fannie Mae, Pool #CA2373, 5.00%, 9/1/2048 | 847,959 | 889,239 | ||||||||
Fannie Mae, Pool #AL8674, 5.654%, 1/1/2049 | 616,510 | 667,853 | ||||||||
Freddie Mac, Pool #G11850, 5.50%, 7/1/2020 | 8,930 | 8,976 | ||||||||
Freddie Mac, Pool #G12610, 6.00%, 3/1/2022 | 11,774 | 12,045 | ||||||||
Freddie Mac, Pool #G12655, 6.00%, 5/1/2022 | 8,088 | 8,301 | ||||||||
Freddie Mac, Pool #G12988, 6.00%, 1/1/2023 | 6,575 | 6,787 | ||||||||
Freddie Mac, Pool #G13078, 6.00%, 3/1/2023 | 11,496 | 11,853 | ||||||||
Freddie Mac, Pool #D98711, 4.50%, 7/1/2031 | 124,755 | 130,377 | ||||||||
Freddie Mac, Pool #C91746, 4.50%, 12/1/2033 | 113,999 | 119,110 | ||||||||
Freddie Mac, Pool #C91771, 4.50%, 6/1/2034 | 138,587 | 145,194 | ||||||||
Freddie Mac, Pool #C91780, 4.50%, 7/1/2034 | 134,687 | 140,755 | ||||||||
Freddie Mac, Pool #C91832, 3.50%, 6/1/2035 | 683,192 | 691,842 | ||||||||
Freddie Mac, Pool #G07655, 5.50%, 12/1/2035 | 95,623 | 103,120 | ||||||||
Freddie Mac, Pool #G08268, 5.00%, 5/1/2038 | 745,652 | 789,210 | ||||||||
Freddie Mac, Pool #G05275, 5.50%, 2/1/2039 | 259,555 | 276,776 | ||||||||
Freddie Mac, Pool #G05900, 6.00%, 3/1/2040 | 46,771 | 50,576 | ||||||||
Freddie Mac, Pool #A92889, 4.50%, 7/1/2040 | 333,645 | 349,344 | ||||||||
Freddie Mac, Pool #A93451, 4.50%, 8/1/2040 | 886,311 | 928,021 | ||||||||
The accompanying notes are an integral part of the financial statements.
12
Core Bond Series
Investment Portfolio - December 31, 2018
| PRINCIPAL | ||||||||||||||||||
| AMOUNT/ | VALUE | |||||||||||||||||
| SHARES | (NOTE 2) | |||||||||||||||||
U.S. GOVERNMENT AGENCIES (continued) |
| |||||||||||||||||
Mortgage-Backed Securities(continued) |
| |||||||||||||||||
Freddie Mac, Pool #G60513, 5.00%, 7/1/2041 |
| $ | 766,105 | $ | 810,932 | |||||||||||||
Freddie Mac, Pool #G60071, 4.50%, 7/1/2042 |
| 335,545 | 351,315 | |||||||||||||||
Freddie Mac, Pool #Q17513, 3.50%, 4/1/2043 |
| 208,279 | 209,824 | |||||||||||||||
Freddie Mac, Pool #G60183, 4.00%, 12/1/2044 |
| 426,316 | 435,914 | |||||||||||||||
Freddie Mac, Pool #Q37592, 4.00%, 12/1/2045 |
| 817,330 | 835,313 | |||||||||||||||
Freddie Mac, Pool #Q37857, 4.00%, 12/1/2045 |
| 704,953 | 719,684 | |||||||||||||||
Freddie Mac, Pool #G60855, 4.50%, 12/1/2045 |
| 324,652 | 336,500 | |||||||||||||||
Freddie Mac, Pool #Q38388, 4.00%, 1/1/2046 |
| 869,586 | 889,626 | |||||||||||||||
Freddie Mac, Pool #Q47544, 4.00%, 3/1/2047 |
| 1,027,349 | 1,052,375 | |||||||||||||||
Freddie Mac, Pool #Q47130, 4.50%, 4/1/2047 |
| 374,088 | 387,542 | |||||||||||||||
Freddie Mac, Pool #G08786, 4.50%, 10/1/2047 |
| 382,364 | 397,488 | |||||||||||||||
Freddie Mac, Pool #Q59744, 4.50%, 11/1/2048 |
| 1,145,203 | 1,185,913 | |||||||||||||||
|
| |||||||||||||||||
TOTAL U.S. GOVERNMENT AGENCIES |
| |||||||||||||||||
(Identified Cost $27,631,002) | 27,266,298 | |||||||||||||||||
|
| |||||||||||||||||
SHORT-TERM INVESTMENT - 1.0% |
| |||||||||||||||||
Dreyfus Government Cash Management, Institutional Shares, 2.29%9, |
| |||||||||||||||||
(Identified Cost $1,814,963) | 1,814,963 | 1,814,963 | ||||||||||||||||
|
| |||||||||||||||||
TOTAL INVESTMENTS - 99.6% |
| |||||||||||||||||
(Identified Cost $179,436,584) |
| 177,274,560 | ||||||||||||||||
OTHER ASSETS, LESS LIABILITIES - 0.4% |
| 800,071 | ||||||||||||||||
|
| |||||||||||||||||
NET ASSETS - 100% | $ | 178,074,631 | ||||||||||||||||
|
| |||||||||||||||||
IO - Interest only
1Credit ratings from Moody’s (unaudited).
2Floating rate security. Rate shown is the rate in effect as of December 31, 2018.
3Variable rate security. Security may be issued at a fixed coupon rate, which converts to a variable rate at a specified date. Rate shown is the rate in effect as of December 31, 2018.
4Restricted securities - Investment in securities that are restricted as to public resale under the Securities Act of 1933, as amended. These securities have been sold under Rule 144A and have been determined to be liquid under guidelines established by the Board of Directors. These securities amount to $19,368,937 or 10.9% of the Series’ net assets as of December 31, 2018 (see Note 2 to the financial statements).
5Security is perpetual in nature and has no stated maturity date.
6Credit rating has been withdrawn. As of December 31, 2018, there is no rating available (unaudited).
7Credit ratings from S&P (unaudited).
8Variable or floating rate security, the interest rate of which adjusts periodically based on changes in current interest rates and prepayments on the underlying pool of assets. Rate shown is the rate in effect as of December 31, 2018.
9Rate shown is the current yield as of December 31, 2018.
The Global Industry Classification Standard (GICS) was developed by and is the exclusive property and a service mark of MSCI Inc. (MSCI) and Standard & Poor’s, a division of The McGraw-Hill Companies, Inc. (S&P), and is licensed for use by Manning & Napier when referencing GICS sectors. Neither MSCI, S&P, nor any third party involved in making or compiling the GICS or any GICS classifications makes any express or implied warranties or representations with respect to such standard or classification, nor shall any such party have any liability therefrom.
The accompanying notes are an integral part of the financial statements.
13
Core Bond Series
Statement of Assets and Liabilities
December 31, 2018
ASSETS: | ||||
Investments, at value (identified cost $179,436,584) (Note 2) | $ | 177,274,560 | ||
Interest receivable | 1,117,973 | |||
Receivable for fund shares sold | 8,360 | |||
Dividends receivable | 3,298 | |||
Prepaid and other expenses | 11,149 | |||
|
| |||
TOTAL ASSETS | 178,415,340 | |||
|
| |||
LIABILITIES: | ||||
Accrued management fees (Note 3) | 48,514 | |||
Accrued fund accounting and administration fees (Note 3) | 28,125 | |||
Accrued shareholder services fees (Class S) (Note 3) | 21,731 | |||
Accrued Chief Compliance Officer service fees (Note 3) | 427 | |||
Payable for fund shares repurchased | 225,376 | |||
Other payables and accrued expenses | 16,536 | |||
|
| |||
TOTAL LIABILITIES | 340,709 | |||
|
| |||
TOTAL NET ASSETS | $ | 178,074,631 | ||
|
| |||
NET ASSETS CONSIST OF: | ||||
Capital stock | $ | 179,025 | ||
Additionalpaid-in-capital | 183,422,636 | |||
Total distributable earnings (loss) | (5,527,030 | ) | ||
|
| |||
TOTAL NET ASSETS | $ | 178,074,631 | ||
|
| |||
NET ASSET VALUE, OFFERING PRICE AND REDEMPTION PRICE PER SHARE - Class S($101,313,945/ 9,839,031 shares) | $ | 10.30 | ||
|
| |||
NET ASSET VALUE, OFFERING PRICE AND REDEMPTION PRICE PER SHARE - Class I($76,760,686/ 8,063,507 shares) | $ | 9.52 | ||
|
| |||
The accompanying notes are an integral part of the financial statements.
14
Core Bond Series
Statement of Operations
For the Year Ended December 31, 2018
INVESTMENT INCOME: | ||||
Interest | $ | 5,491,659 | ||
Dividends | 51,341 | |||
|
| |||
Total Investment Income | 5,543,000 | |||
|
| |||
EXPENSES: | ||||
Management fees (Note 3) | 727,165 | |||
Shareholder services fees (Class S) (Note 3) | 270,577 | |||
Fund accounting and administration fees (Note 3) | 89,664 | |||
Directors’ fees (Note 3) | 14,786 | |||
Chief Compliance Officer service fees (Note 3) | 4,634 | |||
Custodian fees | 12,644 | |||
Miscellaneous | 120,281 | |||
|
| |||
Total Expenses | 1,239,751 | |||
Less reduction of expenses (Note 3) | (151,113 | ) | ||
|
| |||
Net Expenses | 1,088,638 | |||
|
| |||
NET INVESTMENT INCOME | 4,454,362 | |||
|
| |||
REALIZED AND UNREALIZED GAIN (LOSS) ON INVESTMENTS: | ||||
Net realized gain (loss) on investments | (3,218,080 | ) | ||
Net change in unrealized appreciation (depreciation) on investments | (2,665,981 | ) | ||
|
| |||
NET REALIZED AND UNREALIZED GAIN (LOSS) ON INVESTMENTS | (5,884,061 | ) | ||
|
| |||
NET DECREASE IN NET ASSETS RESULTING FROM OPERATIONS | $ | (1,429,699 | ) | |
|
| |||
The accompanying notes are an integral part of the financial statements.
15
Core Bond Series
Statements of Changes in Net Assets
| FOR THE | FOR THE | |||||||
| YEAR ENDED | YEAR ENDED | |||||||
| 12/31/18 | 12/31/17 | |||||||
INCREASE (DECREASE) IN NET ASSETS: | ||||||||
OPERATIONS: | ||||||||
Net investment income | $ | 4,454,362 | $ | 3,824,796 | ||||
Net realized gain (loss) on investments | (3,218,080 | ) | 159,678 | |||||
Net change in unrealized appreciation (depreciation) on investments | (2,665,981 | ) | 1,661,145 | |||||
|
|
|
| |||||
Net increase (decrease) from operations | (1,429,699 | ) | 5,645,619 | |||||
|
|
|
| |||||
DISTRIBUTIONS TO SHAREHOLDERS (Note 9): | ||||||||
Class S | (2,424,102 | ) | (2,245,477 | ) | ||||
Class I | (2,078,920 | ) | (1,884,623 | ) | ||||
|
|
|
| |||||
Total distributions to shareholders | (4,503,022 | ) | (4,130,100 | )1 | ||||
|
|
|
| |||||
CAPITAL STOCK ISSUED AND REPURCHASED: | ||||||||
Net increase (decrease) from capital share transactions (Note 5) | (11,536,671 | ) | 11,706,840 | |||||
|
|
|
| |||||
Net increase (decrease) in net assets | (17,469,392 | ) | 13,222,359 | |||||
NET ASSETS: | ||||||||
Beginning of year | 195,544,023 | 182,321,664 | ||||||
|
|
|
| |||||
End of year2 | $ | 178,074,631 | $ | 195,544,023 | ||||
|
|
|
| |||||
1 For the year ended December 31, 2017, the distributions to shareholders from net investment income and net realized gain were $2,098,656 and $146,821 (Class S), $1,773,042 and $111,581 (Class I), respectively.
2 Includes accumulated undistributed (overdistributed) net investment income of $0 as of December 31, 2017. The SEC eliminated the requirement to disclose undistributed net investment income in 2018.
The accompanying notes are an integral part of the financial statements.
16
Core Bond Series
Financial Highlights - Class S*
| FOR THE YEAR ENDED | ||||||||||||||||||||
| 12/31/18 | 12/31/17 | 12/31/16 | 12/31/15 | 12/31/14 | ||||||||||||||||
Per share data (for a share outstanding throughout each year): | ||||||||||||||||||||
Net asset value - Beginning of year | $10.62 | $10.52 | $10.48 | $10.69 | $10.74 | |||||||||||||||
|
|
|
|
|
|
|
|
|
| |||||||||||
Income (loss) from investment operations: | ||||||||||||||||||||
Net investment income1 | 0.24 | 0.20 | 0.17 | 0.22 | 0.31 | |||||||||||||||
Net realized and unrealized gain (loss) on investments | (0.32 | ) | 0.10 | 0.10 | (0.17 | ) | 0.08 | |||||||||||||
|
|
|
|
|
|
|
|
|
| |||||||||||
Total from investment operations | (0.08 | ) | 0.30 | 0.27 | 0.05 | 0.39 | ||||||||||||||
|
|
|
|
|
|
|
|
|
| |||||||||||
Less distributions to shareholders: | ||||||||||||||||||||
From net investment income | (0.24 | ) | (0.19 | ) | (0.17 | ) | (0.20 | ) | (0.32 | ) | ||||||||||
From net realized gain on investments | — | (0.01 | ) | (0.06 | ) | (0.06 | ) | (0.12 | ) | |||||||||||
|
|
|
|
|
|
|
|
|
| |||||||||||
Total distributions to shareholders | (0.24 | ) | (0.20 | ) | (0.23 | ) | (0.26 | ) | (0.44 | ) | ||||||||||
|
|
|
|
|
|
|
|
|
| |||||||||||
Net asset value - End of year | $10.30 | $10.62 | $10.52 | $10.48 | $10.69 | |||||||||||||||
|
|
|
|
|
|
|
|
|
| |||||||||||
Net assets - End of year(000’s omitted) | $101,314 | $119,137 | $117,559 | $147,074 | $153,018 | |||||||||||||||
|
|
|
|
|
|
|
|
|
| |||||||||||
Total return2 | (0.75% | ) | 2.91% | 2.53% | 0.44% | 3.62% | ||||||||||||||
Ratios (to average net assets)/Supplemental Data: | ||||||||||||||||||||
Expenses** | 0.70% | 0.70% | 0.70% | 0.69% | 0.70% | |||||||||||||||
Net investment income | 2.35% | 1.86% | 1.61% | 2.09% | 2.86% | |||||||||||||||
Portfolio turnover | 78% | 48% | 75% | 88% | 57% | |||||||||||||||
| *Effective August 3, 2015, the shares of the Series have been designated as Class S. |
| |||||||||||||||||||
| **The investment advisor did not impose all or a portion of its management and/or other fees, and in some years may have paid a portion of the Series’ expenses. If these expenses had been incurred by the Series, the expense ratio (to average net assets) would have increased by the following amounts: |
| |||||||||||||||||||
| 0.08% | 0.07% | 0.06% | 0.03% | N/A | ||||||||||||||||
1Calculated based on average shares outstanding during the year.
2Represents aggregate total return for the year indicated, and assumes reinvestment of all distributions. Total return would have been lower had certain expenses not been waived or reimbursed during certain years.
The accompanying notes are an integral part of the financial statements.
17
Core Bond Series
Financial Highlights - Class I
| FOR THE YEAR ENDED | FOR THE PERIOD | |||||||||||||||||||
| 8/3/151TO | ||||||||||||||||||||
| 12/31/18 | 12/31/17 | 12/31/16 | 12/31/15 | |||||||||||||||||
Per share data (for a share outstanding throughout each period): | ||||||||||||||||||||
Net asset value - Beginning of period | $9.84 | $9.77 | $9.75 | $10.00 | ||||||||||||||||
|
|
|
|
|
|
|
| |||||||||||||
Income (loss) from investment operations: | ||||||||||||||||||||
Net investment income2 | 0.25 | 0.21 | 0.18 | 0.08 | ||||||||||||||||
Net realized and unrealized gain (loss) on investments | (0.31 | ) | 0.09 | 0.10 | (0.13 | ) | ||||||||||||||
|
|
|
|
|
|
|
| |||||||||||||
Total from investment operations | (0.06 | ) | 0.30 | 0.28 | (0.05 | ) | ||||||||||||||
|
|
|
|
|
|
|
| |||||||||||||
Less distributions to shareholders: | ||||||||||||||||||||
From net investment income | (0.26 | ) | (0.22 | ) | (0.20 | ) | (0.14 | ) | ||||||||||||
From net realized gain on investments | — | (0.01 | ) | (0.06 | ) | (0.06 | ) | |||||||||||||
|
|
|
|
|
|
|
| |||||||||||||
Total distributions to shareholders | (0.26 | ) | (0.23 | ) | (0.26 | ) | (0.20 | ) | ||||||||||||
|
|
|
|
|
|
|
| |||||||||||||
Net asset value - End of period | $9.52 | $9.84 | $9.77 | $9.75 | ||||||||||||||||
|
|
|
|
|
|
|
| |||||||||||||
Net assets - End of period(000’s omitted) | $76,761 | $76,407 | $64,763 | $79,303 | ||||||||||||||||
|
|
|
|
|
|
|
| |||||||||||||
Total return3 | (0.53% | ) | 3.10% | 2.80% | (0.51% | ) | ||||||||||||||
Ratios (to average net assets)/Supplemental Data: | ||||||||||||||||||||
Expenses* | 0.45% | 0.45% | 0.45% | 0.46% | 4 | |||||||||||||||
Net investment income | 2.60% | 2.12% | 1.86% | 2.03% | 4 | |||||||||||||||
Portfolio turnover | 78% | 48% | 75% | 88% | ||||||||||||||||
| *The investment advisor did not impose all or a portion of its management and/or other fees, and in some years may have paid a portion of the Series’ expenses. If these expenses had been incurred by the Series, the expense ratio (to average net assets) would have increased by the following amount: |
| |||||||||||||||||||
| 0.08% | 0.07% | 0.06% | 0.06% | 4 | ||||||||||||||||
1Commencement of operations.
2Calculated based on average shares outstanding during the periods.
3Represents aggregate total return for the periods indicated, and assumes reinvestment of all distributions. Total return would have been lower had certain expenses not been waived during the periods. Periods less than one year are not annualized.
4Annualized.
The accompanying notes are an integral part of the financial statements.
18
Core Bond Series
Notes to Financial Statements
| 1. | Organization |
Core Bond Series (the “Series”) is ano-load diversified series of Manning & Napier Fund, Inc. (the “Fund”). The Fund is organized in Maryland and is registered under the Investment Company Act of 1940, as amended, as anopen-end management investment company.
The Series’ investment objective is to provide long-term total return by investing primarily in fixed income securities.
The Fund’s advisor is Manning & Napier Advisors, LLC (the “Advisor”). Shares of the Series are offered to investors, clients and employees of the Advisor and its affiliates. Each class of shares is substantially the same except the Class S shares bear shareholder services fees. The total authorized capital stock of the Fund consists of 15 billion shares of common stock each having a par value of $0.01. As of December 31, 2018, 10.4 billion shares have been designated in total among 34 series, of which 100 million have been designated as Core Bond Series Class I common stock, 125 million have been designated as Core Bond Series Class S common stock, 150 million have been designated as Core Bond Series Class W common stock, and 150 million have been designated as Core Bond Series Class Z common stock. Class W common stock and Class Z common stock are not currently offered for sale.
| 2. | Significant Accounting Policies |
The following is a summary of significant accounting policies followed by the Series. The Series is an investment company and, accordingly, follows the investment company accounting and reporting guidance of the Financial Accounting Standards Board Accounting Standards Codification Topic 946 - Investment Companies, which is part of accounting principles generally accepted in the United States of America (“GAAP”).
Security Valuation
Portfolio securities, including domestic equities, foreign equities, warrants and options, listed on an exchange other than the NASDAQ Stock Market are valued at the latest quoted sales price of the exchange on which the security is primarily traded. Securities not traded on valuation date or securities not listed on an exchange are valued at the latest quoted bid price provided by the Fund’s pricing service. Securities listed on the NASDAQ Stock Market are valued in accordance with the NASDAQ Official Closing Price.
Debt securities, including government bonds, foreign bonds, asset-backed securities, structured notes, supranational obligations, sovereign bonds, corporate bonds and mortgage-backed securities will normally be valued on the basis of evaluated bid prices provided directly by an independent pricing service (the “Service”). The pricing services use multiple valuation techniques to determine fair value. In instances where sufficient market activity exists, the pricing services may utilize a market-based approach through which quotes from market makers are used to determine fair value. In instances where sufficient market activity may not exist or is limited, the pricing services also utilize proprietary valuation models which may consider market characteristics such as benchmark yield curves, option-adjusted spreads, credit spreads, estimated default rates, coupon rates, anticipated timing of principal repayments, underlying collateral, and other unique security features in order to estimate the relevant cash flows, which are then discounted to calculate the fair value. Certain investments in securities held by the Series may be valued on a basis of a price provided directly by a principal market maker. These prices may differ from the value that would have been used had a broader market for securities existed.
Municipal securities will normally be valued on the basis of market valuations provided by the Service. The Service utilizes the latest price quotations and a matrix system (which considers such factors as security prices of similar securities, yields, maturities and ratings). The Service has been approved by the Fund’s Board of Directors (the “Board”).
Short-term investments that mature in sixty days or less may be valued at amortized cost, which approximates fair value. Investments inopen-end investment companies are valued at their net asset value per share on valuation date.
Volume and level of activity in established markets for an asset or liability are evaluated to determine whether recent transactions and quoted prices are determinative of fair value. Where there have been significant decreases in volume and level of activity, further analysis and adjustment may be necessary to estimate fair value. The Series measures fair value in these
19
Core Bond Series
Notes to Financial Statements (continued)
| 2. | Significant Accounting Policies (continued) |
Security Valuation(continued)
instances by the use of inputs and valuation techniques which may be based upon current market prices of securities that are comparable in coupon, rating, maturity and industry and/or expectation of future cash flows. As a result of trading in relatively thin markets and/or markets that experience significant volatility, the prices used by the Series to value these securities may differ from the value that would be realized if these securities were sold, and the differences could be material.
Securities for which representative valuations or prices are not available from the Series’ pricing service may be valued at fair value as determined in good faith by the Advisor under procedures approved by and under the general supervision and responsibility of the Fund’s Board. Due to the inherent uncertainty of valuations of such securities, the fair value may differ significantly from the values that would have been used had a ready market for such securities existed. If trading or events occurring after the close of the principal market in which securities are traded are expected to materially affect the value of those securities, then they may be valued at their fair value, taking this trading or these events into account.
Various inputs are used in determining the value of the Series’ assets or liabilities carried at fair value. These inputs are summarized in three broad levels. Level 1 includes quoted prices in active markets for identical assets and liabilities. Level 2 includes other significant observable inputs (including quoted prices for similar securities, interest rates, prepayment speeds, credit risk, etc.). Level 3 includes significant unobservable inputs (including the Series’ own assumptions in determining the fair value of investments). A financial instrument’s level within the fair value hierarchy is based on the lowest level of any input both individually and in aggregate that is significant to the fair value measurement. The inputs or methodology used for valuing securities are not necessarily an indication of the risk associated with investing in those securities.
The following is a summary of the valuation levels used for major security types as of December 31, 2018 in valuing the Series’ assets or liabilities carried at fair value:
| DESCRIPTION | TOTAL | LEVEL 1 | LEVEL 2 | LEVEL 3 | ||||||||||||
Assets: | ||||||||||||||||
Debt securities: | ||||||||||||||||
U.S. Treasury and other U.S. | ||||||||||||||||
Government agencies | $ | 98,318,017 | $ | — | $ | 98,318,017 | $ | — | ||||||||
Corporate debt: | ||||||||||||||||
Communication Services | 6,200,291 | — | 6,200,291 | — | ||||||||||||
Consumer Discretionary | 6,254,728 | — | 6,254,728 | — | ||||||||||||
Energy | 9,230,455 | — | 9,230,455 | — | ||||||||||||
Financials | 15,834,988 | — | 15,834,988 | — | ||||||||||||
Health Care | 944,519 | — | 944,519 | — | ||||||||||||
Industrials | 4,652,919 | — | 4,652,919 | — | ||||||||||||
Materials | 1,777,452 | — | 1,777,452 | — | ||||||||||||
Real Estate | 2,249,850 | — | 2,249,850 | — | ||||||||||||
Asset-backed securities | 9,495,515 | — | 9,495,515 | — | ||||||||||||
Commercial mortgage-backed securities | 17,135,610 | — | 17,135,610 | — | ||||||||||||
Foreign government bonds | 3,365,253 | — | 3,365,253 | — | ||||||||||||
Mutual fund | 1,814,963 | 1,814,963 | — | — | ||||||||||||
|
|
|
|
|
|
|
| |||||||||
Total assets | $ | 177,274,560 | $ | 1,814,963 | $ | 175,459,597 | $ | — | ||||||||
|
|
|
|
|
|
|
| |||||||||
There were no Level 3 securities held by the Series as of December 31, 2017 or December 31, 2018.
New Accounting Pronouncements
The Securities and Exchange Commission (SEC) adopted changes to RegulationS-X to simplify the reporting of information by registered investment companies in financial statements. The amendments require presentation of the total, rather than the components, of distributable earnings on the Statement of Assets and Liabilities and also require presentation of the total, rather than the components, of distributions to shareholders, except for tax return of capital distributions, if any, on the Statement of
20
Core Bond Series
Notes to Financial Statements (continued)
| 2. | Significant Accounting Policies (continued) |
New Accounting Pronouncements(continued)
Changes in Net Assets. The amendments also removed the requirement for parenthetical disclosure of undistributed net investment income on the Statement of Changes in Net Assets. These RegulationS-X amendments are reflected in the Series financial statements for the year ended December 31, 2018. As a result of adopting these amendments, the distributions to shareholders in the December 31, 2017 Statement of Changes in Net Assets presented herein have been reclassified to conform to the current year presentation.
In March 2017, the Financial Accounting Standards Board issued Accounting Standards UpdateNo. 2017-08, Receivables –Nonrefundable Fees and Other Costs (Subtopic310-320): “Premium Amortization of Purchased Callable Debt Securities” which shortens the amortized period for certain callable debt securities, held at a premium, to be amortized to the earliest call date rather than the contractual maturity date. The Series will adopt and apply ASU2017-08 on a modified retrospective basis through a cumulative-effect adjustment as of January 1, 2019. As a result of the adoption of ASU2017-08, as of January 1, 2019 the amortized cost basis of investments will be reduced and unrealized appreciation of investments will be increased, but there will be no impact on net assets or overall results of operations.
On August 28, 2018, the FASB issued ASU2018-13, “Disclosure Framework – Changes to the Disclosure Requirements for Fair Value Measurement,” which amends the fair value measurement disclosure requirements under U.S. GAAP. The amendments of ASU2018-13 include new, eliminated, and modified disclosure requirements. In addition, the amendments clarify that materiality is an appropriate consideration of entities when evaluating disclosure requirements. The ASU is effective for all entities for fiscal years beginning after December 15, 2019, including interim periods therein. An entity is permitted to early adopt any eliminated or modified disclosures upon issuance of this ASU and delay adoption of the new disclosures until their effective date. As such, each Series has early adopted the eliminated and modified disclosures, as permitted by this ASU.
Security Transactions, Investment Income and Expenses
Security transactions are accounted for on trade date. Dividend income is recorded on theex-dividend date, except that if theex-dividend date has passed, certain dividends from foreign securities are recorded as soon as the Series is informed of theex-dividend date.Non-cash dividends, if any, are recorded at the fair value of the securities received. Interest income, including amortization of premium and accretion of discounts using the effective interest method, is earned from settlement date and accrued daily.
Expenses are recorded on an accrual basis. Most expenses of the Fund can be attributed to a specific series. Expenses which cannot be directly attributed are apportioned among the series in the Fund in such a manner as deemed equitable by the Fund’s Board, taking into consideration, among other things, the nature and type of expense. Income, expenses (other than shareholder services fees), and realized and unrealized gains and losses are prorated among the classes based on the relative net assets of each class. Class specific expenses are directly charged to that Class.
The Series uses the identified cost method for determining realized gain or loss on investments for both financial statement and federal income tax reporting purposes.
Foreign Currency Translation
The books and records of the Series are maintained in U.S. dollars. Foreign currencies, investments and other assets and liabilities are translated into U.S. dollars at the current exchange rates. Purchases and sales of investment securities and income and expenses are translated on the respective dates of such transactions. The Series does not isolate realized and unrealized gains and losses attributable to changes in the exchange rates from gains and losses that arise from changes in the fair value of investments. Such fluctuations are included with net realized and unrealized gain or loss on investments. Net realized foreign currency gains and losses represent foreign currency gains and losses between trade date and settlement date on securities transactions, gains and losses on disposition of foreign currencies and the difference between the amount of income and foreign withholding taxes recorded on the books of the Series and the amounts actually received or paid.
21
Core Bond Series
Notes to Financial Statements (continued)
| 2. | Significant Accounting Policies (continued) |
Asset-Backed Securities
The Series may invest in asset-backed securities. Asset-backed securities are generally issued as pass-through certificates or as debt instruments. Asset-backed securities issued as pass-through certificates represent undivided fractional ownership interests in an underlying pool of assets. Asset-backed securities issued as debt instruments, which are also known as collateralized obligations, are typically issued as the debt of a special purpose entity organized solely for the purpose of owning such assets and issuing such debt. Asset-backed securities are often backed by a pool of assets representing the obligations of a number of different parties. The yield characteristics of certain asset-backed securities may differ from traditional debt securities. One such major difference is that all or a principal part of the obligations may be prepaid at any time because the underlying assets (i.e. loans) may be prepaid at any time. As a result, a decrease in interest rates in the market may result in increases in the level of prepayments as borrowers, particularly mortgagors, refinance and repay their loans. An increased prepayment rate with respect to an asset-backed security will have the effect of shortening the maturity of the security. In addition, the Series may subsequently have to reinvest the proceeds at lower interest rates. If the Series has purchased such an asset-backed security at a premium, a faster than anticipated prepayment rate could result in a loss of principal to the extent of the premium paid.
Mortgage-Backed Securities
The Series may invest in mortgage-backed securities (“MBS” or pass-through certificates) that represent an interest in a pool of specific underlying mortgage loans and entitle the Series to the periodic payments of principal and interest from those mortgages. MBS may be issued by government agencies or corporations, or private issuers. Most MBS issued by government agencies are guaranteed; however, the degree of protection differs based on the issuer. For MBS there are a number of important differences among the agencies and instrumentalities of the U.S. Government that issue mortgage-related securities and among the securities that they issue. For example, mortgage-related securities guaranteed by Ginnie Mae are guaranteed as to the timely payment of principal and interest by Ginnie Mae and such guarantee is backed by the full faith and credit of the United States. However, mortgage-related securities issued by Freddie Mac and Fannie Mae, including Freddie Mac and Fannie Mae guaranteed mortgage pass-through certificates, which are solely the obligations of Freddie Mac and Fannie Mae, are not backed by or entitled to the full faith and credit of the United States, but are supported by the right of the issuer to borrow from the U.S. Treasury.Non-agency mortgage-backed securities are securities issued bynon-governmental issuers and have no direct or indirect government guarantees of payment and are subject to various risks.Non-agency mortgage loans are obligations of the borrowers thereunder only and are not typically insured or guaranteed by any other person or entity. The ability of a borrower to repay a loan is dependent upon the income or assets of the borrower. A number of factors, including a general economic downturn, acts of God, terrorism, social unrest and civil disturbances, may impair a borrower’s ability to repay its loans.
Inflation-Indexed Bonds
The Series may invest in inflation-indexed bonds. Inflation-indexed bonds are fixed income securities whose principal value is periodically adjusted according to the rate of inflation. If the index measuring inflation rises or falls, the principal value of inflation-indexed bonds will be adjusted upward or downward, and consequently the interest payable on these securities (calculated with respect to a larger or smaller principal amount) will be increased or reduced, respectively. Any upward or downward adjustment in the principal amount of an inflation-indexed bond will be included as interest income in the Statement of Operations, even though investors do not receive their principal until maturity. Repayment of the original bond principal upon maturity (as adjusted for inflation) is guaranteed in the case of U.S. Treasury inflation-indexed bonds. For bonds that do not provide a similar guarantee, the adjusted principal value of the bond repaid at maturity may be less than the original principal.
Securities Purchased on a When-Issued Basis or Forward Commitment
The Series may purchase securities on a when-issued basis or forward commitment. These transactions involve a commitment by the Series to purchase securities for a predetermined price with payment and delivery taking place beyond the customary settlement period. When such purchases are outstanding, the Series will designate liquid assets in an amount sufficient to meet the purchase price. When purchasing a security on a delayed delivery basis, the Series assumes the rights and risks of ownership of the security, including the risk of price and yield fluctuations, and takes such fluctuations into account when determining its net asset value. The Series may sell the when-issued securities before they are delivered, which may result in a capital gain or loss. No such investments were held by the Series on December 31, 2018.
22
Core Bond Series
Notes to Financial Statements (continued)
| 2. | Significant Accounting Policies (continued) |
Securities Purchased on a When-Issued Basis or Forward Commitment(continued)
In connection with its ability to purchase or sell securities on a forward commitment basis, the Series may enter into forward roll transactions principally using To Be Announced (TBA) securities. Forward roll transactions require the sale of securities for delivery in the current month, and a simultaneous agreement to repurchase substantially similar (same type, coupon and maturity) securities on a specified future date. Risks of entering into forward roll transactions include the potential inability of the counterparty to meet the terms of the agreement; the potential of the Series to receive inferior securities at redelivery as compared to the securities sold to the counterparty; counterparty credit risk; and the potential pay down speed variance between the mortgage-backed pools. During the roll period, the Series forgoes principal and interest paid on the securities. The Series accounts for such dollar rolls as purchases and sales. Information regarding securities purchased on a when-issued basis is included in the Series’ Investment Portfolio. No such investments were held by the Series on December 31, 2018.
Restricted Securities
Restricted securities are purchased in private placement transactions, are not registered under the Securities Act of 1933, as amended, and may have contractual restrictions on resale. Information regarding restricted securities is included at the end of the Series’ Investment Portfolio.
Illiquid Securities
A security may be considered illiquid if so deemed in good faith by the Advisor under procedures approved by and under the general supervision and responsibility of the Fund’s Board. Securities that are illiquid are marked with the applicable footnote on the Investment Portfolio. No such investments were held by the Series on December 31, 2018.
Federal Taxes
The Series’ policy is to comply with the provisions of the Internal Revenue Code applicable to regulated investment companies. The Series is not subject to federal income tax or excise tax to the extent that the Series distributes to shareholders each year its taxable income, including any net realized gains on investments, in accordance with requirements of the Internal Revenue Code. Accordingly, no provision for federal income tax or excise tax has been made in the financial statements.
Management evaluates its tax positions to determine if the tax positions taken meet the minimum recognition threshold in connection with accounting for uncertainties in income tax positions taken or expected to be taken for the purposes of measuring and recognizing tax liabilities in the financial statements. Recognition of tax benefits of an uncertain tax position is required only when the position is “more likely than not” to be sustained assuming examination by taxing authorities. At December 31, 2018, the Series has recorded no liability for net unrecognized tax benefits relating to uncertain income tax positions taken or expected to be taken in future tax returns.
The Series files income tax returns in the U.S. federal jurisdiction, various states and foreign jurisdictions, as required. No income tax returns are currently under investigation. The statute of limitations on the Series’ tax returns remains open for the years ended December 31, 2015 through December 31, 2018. The Series is not aware of any tax positions for which it is reasonably possible that the total amounts of unrecognized tax benefits will significantly change in the next twelve months.
Foreign Taxes
Based on the Series’ understanding of the tax rules and rates related to income, gains and currency purchase/repatriation transactions for foreign jurisdictions in which it invests, the Series will provide for foreign taxes, and where appropriate, deferred foreign tax.
Distributions of Income and Gains
Distributions to shareholders of net investment income are made quarterly. Distributions of net realized gains are made annually. An additional distribution may be necessary to avoid taxation of the Series. Distributions are recorded on theex-dividend date.
Indemnifications
The Fund’s organizational documents provide former and current directors and officers with a limited indemnification against liabilities arising in connection with the performance of their duties to the Fund. In the normal course of business, the Fund may also enter into contracts that provide general indemnifications. The Fund’s maximum exposure under these arrangements is
23
Core Bond Series
Notes to Financial Statements (continued)
| 2. | Significant Accounting Policies (continued) |
Indemnifications (continued)
unknown as this would be dependent on future claims that may be made against the Fund. The risk of material loss from such claims is considered remote.
Other
The preparation of financial statements in conformity with GAAP requires management to make estimates and assumptions that affect the reported amounts of assets and liabilities and the disclosure of contingent assets and liabilities at the date of the financial statements and the reported amounts of income and expenses during the reporting period. Actual results could differ from those estimates.
| 3. | Transactions with Affiliates |
The Fund has an Investment Advisory Agreement (the “Agreement”) with the Advisor, for which the Series pays a fee, computed daily and payable monthly, at an annual rate of 0.40% of the Series’ average daily net assets.
Under the Agreement, personnel of the Advisor provide the Series with advice and assistance in the choice of investments and the execution of securities transactions, and otherwise maintain the Series’ organization. The Advisor also provides the Fund with necessary office space and fund administration and support services. The salaries of all officers of the Fund (except a percentage of the Fund’s Chief Compliance Officer’s salary, which is paid by the Fund), and of all Directors who are “affiliated persons” of the Fund, or of the Advisor, and all personnel of the Fund, or of the Advisor, performing services relating to research, statistical and investment activities, are paid by the Advisor. Each“non-affiliated” Director receives an annual stipend, which is allocated among all the active series of the Fund. In addition, these Directors also receive a fee per Board meeting attended plus a fee for each committee meeting attended and are reimbursed for travel and otherout-of-pocket expenses incurred by them in connection with attending such meetings. The Fund also has an Audit Committee Chair, Governance & Nominating Committee Chair and Lead Independent Director, who each receive an additional annual stipend for these roles.
The Class S shares of the Series are subject to a shareholder services fee in accordance with a shareholder services plan adopted by the Fund’s Board. The shareholder services fee is intended to compensate financial intermediaries, including affiliates of the Fund, in connection with the provision of direct client service, personal services, maintenance of shareholder accounts and reporting services. For these services, Class S of the Series pays a fee, computed daily and payable monthly, at an annual rate of 0.25% of the average daily net assets of Class S. The Fund has a Shareholder Services Agreement with the Advisor, for which the Advisor receives the shareholder services fee as stated above.
The Advisor has contractually agreed, until at least April 30, 2019, to waive its fee and, if necessary, pay other operating expenses of the Series in order to maintain total direct annual fund operating expenses for the Series, exclusive of a Class’s Shareholder Services Fee, at no more than 0.45% of average daily net assets. Accordingly, the Advisor waived fees of $151,113 for the year ended December 31, 2018, which is included as a reduction of expenses on the Statement of Operations. The Advisor is not eligible to recoup any expenses that have been waived or reimbursed in prior years.
Manning & Napier Investor Services, Inc., a registered broker-dealer affiliate of the Advisor, acts as distributor for the Fund’s shares. The services of Manning & Napier Investor Services, Inc. are provided at no additional cost to the Series.
Pursuant to a master services agreement dated March 1, 2017, as amended, the Fund pays the Advisor an annual fee related to fund accounting and administration of 0.0085% on the first $25 billion of average daily net assets (excluding Target Series and Income Series); 0.0075% on the next $15 billion of average daily net assets (excluding Target Series and Income Series); and 0.0065% of average daily net assets in excess of $40 billion (excluding Target Series and Income Series); plus a base fee of $30,400 per series. Additionally, certain transaction andout-of-pocket expenses, including charges for reporting relating to the Fund’s compliance program, are charged. The Advisor has agreements with BNY Mellon Investment Servicing (U.S.) Inc. (“BNY”) under which BNY serves assub-accountant services agent.
24
Core Bond Series
Notes to Financial Statements (continued)
| 4. | Purchases and Sales of Securities |
For the year ended December 31, 2018, purchases and sales of securities, other than U.S. Government securities and short-term securities, were $58,509,006 and $84,567,297, respectively. Purchases and sales of U.S. Government securities, other than short-term securities, were $77,655,236 and $60,725,463, respectively.
| 5. | Capital Stock Transactions |
Transactions in shares of Class S and I of Core Bond Series were:
| CLASS S: | FOR THE YEAR ENDED 12/31/18 | FOR THE YEAR ENDED 12/31/17 | ||||||||||||||
| SHARES | AMOUNT | SHARES | AMOUNT | |||||||||||||
Sold | 755,405 | $ | 7,789,737 | 1,026,314 | $ | 10,943,765 | ||||||||||
Reinvested | 233,967 | 2,406,471 | 209,180 | 2,229,490 | ||||||||||||
Repurchased | (2,366,041 | ) | (24,491,257 | ) | (1,189,385 | ) | (12,671,590 | ) | ||||||||
|
|
|
|
|
|
|
| |||||||||
Total | (1,376,669 | ) | $ | (14,295,049 | ) | 46,109 | $ | 501,665 | ||||||||
|
|
|
|
|
|
|
| |||||||||
| CLASS I: | FOR THE YEAR ENDED 12/31/18 | FOR THE YEAR ENDED 12/31/17 | ||||||||||||||
| SHARES | AMOUNT | SHARES | AMOUNT | |||||||||||||
Sold | 2,833,088 | $ | 27,002,772 | 3,683,528 | $ | 36,406,100 | ||||||||||
Reinvested | 149,244 | 1,419,524 | 129,474 | 1,279,736 | ||||||||||||
Repurchased | (2,682,885 | ) | (25,663,918 | ) | (2,679,046 | ) | (26,480,661 | ) | ||||||||
|
|
|
|
|
|
|
| |||||||||
Total | 299,447 | $ | 2,758,378 | 1,133,956 | $ | 11,205,175 | ||||||||||
|
|
|
|
|
|
|
| |||||||||
Approximately 85% of the shares outstanding are fiduciary accounts where the Advisor has sole investment discretion.
| 6. | Line of Credit |
The Fund has entered into a364-day, $25 million credit agreement (the “line of credit”) with Bank of New York Mellon. Each series of the Fund may borrow under the line of credit for temporary or emergency purposes, including funding shareholder redemptions and other short-term liquidity purposes. The Fund pays an annual fee on the unused commitment amount, payable quarterly, and is allocated among all the series of the Fund and included in miscellaneous expenses in the Statement of Operations for each series. The line of credit expires in August 2019 unless extended or renewed. During the year ended December 31, 2018, the Series did not borrow under the line of credit.
| 7. | Financial Instruments |
The Series may trade in instruments including written and purchased options, forward foreign currency exchange contracts and futures contracts and other derivatives in the normal course of investing activities to assist in managing exposure to various market risks. The Series may be subject to various elements of risk, which may involve, to a varying degree, elements of risk in excess of the amounts recognized for financial statement purposes. These risks include: the risk that changes in the value of a derivative may not correlate perfectly with the underlying asset, rate or index; counterparty credit risk related to over the counter derivative counterparties’ failure to perform under contract terms; liquidity risk related to the lack of a liquid market for these contracts allowing the fund to close out its position(s); and documentation risk relating to disagreement over contract terms. No such investments were held by the Series as of December 31, 2018.
| 8. | Foreign Securities |
Investing in securities of foreign companies and foreign governments involves special risks and considerations not typically associated with investing in securities of domestic companies and the U.S. Government. These risks include revaluation of
25
Core Bond Series
Notes to Financial Statements (continued)
| 8. | Foreign Securities (continued) |
currencies and future adverse political and economic developments. Moreover, securities of foreign companies and foreign governments and their markets may be less liquid and their prices more volatile than those of comparable domestic companies and the U.S. Government.
| 9. | Federal Income Tax Information |
The amount and characterization of certain income and capital gains to be distributed are determined in accordance with federal income tax regulations, which may differ from GAAP. These differences are primarily due to differing book and tax treatments in the timing and/or treatment of the recognition of net investment income or gains and losses including redesignation of distributions paid and wash sales. The Series may periodically make reclassifications among its capital accounts to reflect income and gains available for distribution (or available capital loss carryovers) under income tax regulations without impacting the Series’ net asset value. For the year ended December 31, 2018, $21,876 was reclassified within the capital accounts fromPaid-in Capital to Total Distributable Earnings (Loss). Any such reclassifications are not reflected in the financial highlights.
The tax character of distributions paid were as follows:
| FOR THE YEAR ENDED 12/31/18 | FOR THE YEAR ENDED 12/31/17 | |||
Ordinary income | $4,476,238 | $3,824,796 | ||
Long-term capital gains | $ 26,784 | $ 305,304 |
At December 31, 2018, the tax basis of components of distributable earnings and the net unrealized depreciation based on the identified cost of investments for federal income tax purposes were as follows:
Cost for federal income tax purposes | $ | 179,488,805 | ||
Unrealized appreciation | 1,076,386 | |||
Unrealized depreciation | (3,290,631 | ) | ||
|
| |||
Net unrealized depreciation | $ | (2,214,245 | ) | |
|
| |||
Capital loss carryforwards | $ | (3,312,785 | ) |
As of December 31, 2018, the Series had net short-term capital loss carryforwards of $2,136,551 and net long-term capital loss carryforwards of $1,176,234, which may be carried forward indefinitely.
26
Core Bond Series
Report of Independent Registered Public Accounting Firm
To the Board of Directors of Manning & Napier Fund, Inc. and Shareholders of Core Bond Series
Opinion on the Financial Statements
We have audited the accompanying statement of assets and liabilities, including the investment portfolio, of Core Bond Series (one of the series constituting Manning & Napier Fund, Inc., referred to hereafter as the “Fund”) as of December 31, 2018, the related statement of operations for the year ended December 31, 2018, the statement of changes in net assets for each of the two years in the period ended December 31, 2018, including the related notes, and the financial highlights for each of the periods indicated therein (collectively referred to as the “financial statements”). In our opinion, the financial statements present fairly, in all material respects, the financial position of the Fund as of December 31, 2018, the results of its operations for the year then ended, the changes in its net assets for each of the two years in the period ended December 31, 2018 and the financial highlights for each of the periods indicated therein in conformity with accounting principles generally accepted in the United States of America.
Basis for Opinion
These financial statements are the responsibility of the Fund’s management. Our responsibility is to express an opinion on the Fund’s financial statements based on our audits. We are a public accounting firm registered with the Public Company Accounting Oversight Board (United States) (PCAOB) and are required to be independent with respect to the Fund in accordance with the U.S. federal securities laws and the applicable rules and regulations of the Securities and Exchange Commission and the PCAOB.
We conducted our audits of these financial statements in accordance with the standards of the PCAOB. Those standards require that we plan and perform the audit to obtain reasonable assurance about whether the financial statements are free of material misstatement, whether due to error or fraud.
Our audits included performing procedures to assess the risks of material misstatement of the financial statements, whether due to error or fraud, and performing procedures that respond to those risks. Such procedures included examining, on a test basis, evidence regarding the amounts and disclosures in the financial statements. Our audits also included evaluating the accounting principles used and significant estimates made by management, as well as evaluating the overall presentation of the financial statements. Our procedures included confirmation of securities owned as of December 31, 2018 by correspondence with the custodian. We believe that our audits provide a reasonable basis for our opinion.

New York, New York
February 15, 2019
We have served as the auditor of one or more investment companies in Manning & Napier Mutual Funds since 1992.
27
Core Bond Series
Renewal of Investment Advisory Agreement
(unaudited)
At the Manning & Napier Fund, Inc. (the “Fund”) Board of Directors’ (the “Board”) meeting, held on November 15, 2018, the Investment Advisory Agreement (the “Agreement”) between the Fund and Manning & Napier Advisors, LLC (the “Advisor”) was considered for renewal by the Board, including all of the Directors who are not “interested persons” (“Independent Directors”), within the meaning of the Investment Company Act of 1940, as amended (the “1940 Act”). In connection with the decision whether to renew the Agreement, a variety of material was provided to the Board in advance of the meeting for their review and consideration. The Board also held a working session on October 31, 2018 to review and discuss information provided to the Board, and for the Board to request additional information.
Representatives of the Advisor attended a portion of the working session and attended the Board meeting. The Advisor provided supplemental information requested by the Board and presented additional oral information to the Board to assist the Board in its considerations. In addition to the information furnished by the Advisor, the Board was provided with a legal memorandum discussing its fiduciary duties related to its approval of the continuation of the Agreement. Legal counsel for the Fund discussed with the Board the applicable legal considerations. In addition, the Board receivedin-person presentations about the Fund throughout the year.
The Independent Directors were advised by independent legal counsel with respect to these matters. The Independent Directors also met separately in an executive session with their legal counsel without any representatives of the Advisor present.
The Directors’ determinations at the meeting were made on the basis of each Director’s business judgment after consideration of all the information presented. In deciding to recommend the renewal of the Agreement with respect to each Series of the Fund, the Independent Directors did not identify any single or particular piece of information that, in isolation, was the controlling factor. Each Independent Director may also have weighed factors differently. This summary describes the most important, but not all, of the factors considered by the Board and the Independent Directors.
| • | The Board considered the nature and quality of services provided by the Advisor under the Agreement for over 30 years including, among others: deciding what securities to purchase and sell for each Series; arranging for the purchase and sale of such securities by placing orders with broker-dealers; administering the affairs of the Fund (including the books and records of the Fund not maintained by third party service providers such as the custodian or transfer agent); arranging for the insurance coverage for the Fund; and supervising the preparation of tax returns, SEC filings (including registration statements) and reports to shareholders for the Fund. The Board considered the numerous services performed by the Advisor and its affiliates beyond those stated in the Agreements. The Board also considered the Advisor’s personnel who perform services to the Fund, changes in senior or key personnel, the strength of the Advisor’s compliance infrastructure, policies and procedures relating to compliance with securities regulations, reputation, expertise and resources. The Board discussed the quality of these services with representatives from the Advisor and concluded that the Advisor was performing its services to the Fund required under the Agreement in a reasonable manner. |
| • | The Board considered the Advisor’s investments teams, including changes to the investment teams and investment team’s compensation during the past year, and the investment process. The Board considered the performance of each Series since its inception, as well as over multiple time periods including: one year, three year, five year, ten year, and current market cycle. A market cycle includes periods of both rising and falling markets. Returns for established benchmark indices for each Series were provided. In addition, the Board considered (and considers on a quarterly basis) a number of other factors relevant to performance at the meeting including: a peer group performance analysis consisting of Morningstar universes of mutual funds with similar investment objectives; the breadth of the Fund’s product offerings; and performance over reasonable time periods. The Board discussed with Representatives of the Advisor, short-term performance challenges in the Fund’s core strategies that have resulted in a downward trend in assets under management. After discussion, the Board concluded that notwithstanding the performance challenges of certain Series, the nature and quality of the investment management services provided by the Advisor to the Fund supported the renewal of the agreement. |
| • | The Board considered the fees and expenses of the various Series of the Fund. The Advisor presented the advisory fees and total expenses for each Series, including the advisory fee adjusted for any contractual expense waivers or reimbursements paid by the Advisor. The Advisor also presentedpro-forma information related to several management fee and overall expense reductions that were set to take effect in early 2019. These changes were approved by the Board in a prior meeting and by shareholders at a Shareholder Meeting in May 2018. |
| • | The Board considered whether the Advisor had achieved economies of scale with respect to its services to the Fund. The Board acknowledged the expense caps incorporated in the Fund’s current fee structure, which requires the Advisor to |
28
Core Bond Series
Renewal of Investment Advisory Agreement
(unaudited)
| subsidize the expenses of the Series operating above their expense cap, noting that 27 Series of the Fund are currently receiving expense reimbursements from the Advisor. The Board concluded that the Fund would need to grow in assets before the Advisor would be able to achieve meaningful economies of scale. |
| • | The Advisor provided the Board with information comparing each Series’ contractual management fees with the Advisor’s standard advisory fees for separate accounts and collective investment trusts. The Board considered that the range of services provided to the Series is more extensive than for the Advisor’s other clients due to additional infrastructure, administrative and regulatory requirements related to operating a mutual fund. |
| • | The current andpro-forma advisory fees,12b-1 Distribution and Service Fees, other expenses (e.g. a combination of Shareholder Services Fees, intermediarysub-transfer agent fees, routine operating expenses and Acquired Fund Fees and Expenses forfund-of-fund Series) and total expense ratios of each Series and share class were compared and ranked (on both a mean and median basis) against respective peer universes. Respective peer universes included funds of a similar size and with similar investment objectives and expense characteristics as disclosed on the Morningstar database. Representatives of the Advisor discussed with the Board the comparisons and rankings of fees and net expense ratios for each Series of the Fund and the methodology behind the comparison. The Board considered the Advisor’s active portfolio management that results in portfolios that are more differentiated than the construction of their benchmarks. Based on their review of the information provided, the Board concluded that the current andpro-forma fees and expenses of each Series of the Fund were reasonable on a comparative basis. |
| • | The Board considered the costs of the Advisor’s services and the profits of the Advisor as they relate to the Advisor’s services to the Fund under the Agreement. The Board was provided with information on the Advisor’s financial condition and profitability by mutual fund agreement and by Series. Information provided by the Advisor addressed the anticipated effects of the upcoming fee reductions. The Board discussed the Advisor’s revenues generated from the Fund and its expenses associated with providing the services under the Agreement. The Advisor presented the Board with information on firm wide investment management profitability to provide a comparison of the Advisor’s profitability from its Fund activities relative to its profitability from its other investment management business. In addition, the Board reviewed the Advisor’s expense allocation methodology used to calculate profitability since many of the Advisor’s resources and expenses are shared across the Advisor’s various investment management vehicles. The Board considered the Advisor’s expenses associated with Fund activities outside of the Agreement (such as expense reimbursements pursuant to expense caps and payments made by the Advisor to third party platforms on which shares of the Fund are available for purchase). After discussing the above costs and profits, the Board concluded that the Advisor’s profitability relating to its services provided under the Agreement was reasonable. |
| • | The Board also considered the other benefits the Advisor derives from its relationship with the Fund. Such other benefits include participation in a joint insurance program, sharing of compensation expenses for certain shared personnel, relationships with large service providers, the utilization of Series within the Advisor’s separately managed accounts and certain research services provided by soft dollars. The Board reviewed the broker-dealers who provided research to the Advisor and the products and services paid for, in whole or in part, using soft dollar commissions. The Board concluded that these additional benefits to the Advisor were reasonable. |
Based on the Board’s deliberations and their evaluation of the information described above, the Board, including a majority of the Independent Directors, concluded that the compensation under the Agreement was fair and reasonable with respect to each Series in light of the services and expenses and such other matters as the Directors considered to be relevant in the exercise of their reasonable judgment, and that the renewal of the Agreement would be in the best interests of each Series and its shareholders. The Board did not indicate that any single factor was determinative of its decision to approve the Agreement, but indicated that the Board based its determination on the total mix of information available to it.
29
Core Bond Series
Directors’ and Officers’ Information
(unaudited)
The Statement of Additional Information provides additional information about the Fund’s directors and officers and can be obtained without charge by calling1-800-466-3863, at www.manning-napier.com, or on the EDGAR Database on the SEC Internet web site (http://www.sec.gov). The following chart shows certain information about the Fund’s directors and officers, including their principal occupations during the last five years. Unless specific dates are provided, the individuals have held the listed positions for longer than five years.
Interested Director and Officer
| Name: | Paul Battaglia* | |
| Address: | 290 Woodcliff Drive | |
| Fairport, NY 14450 | ||
| Age: | 40 | |
| Current Position(s) Held with Fund: | Principal Executive Officer, President, Chairman and Director | |
| Term of Office & Length of Time Served: | Indefinite – Chairman and Director since November 20181 | |
| Principal Occupation(s) During Past 5 Years: | Chief Financial Officer (2018 – Present); Vice President of Finance (2016 – 2018); Director of Finance (2011 – 2016); Financial Analyst/Internal Auditor (2004-2006) – Manning & Napier Advisors, LLC and affiliates Holds one or more of the following titles for various subsidiaries and affiliates: Chief Financial Officer | |
| Number of Portfolios Overseen within Fund Complex: | 34 | |
| Other Directorships Held Outside Fund Complex During Past 5 Years: | N/A | |
| Independent Directors | ||
| Name: | Stephen B. Ashley | |
| Address: | 290 Woodcliff Drive | |
| Fairport, NY 14450 | ||
| Age: | 78 | |
| Current Position(s) Held with Fund: | Director, Audit Committee Member, Governance & Nominating Committee Member | |
| Term of Office & Length of Time Served: | Indefinite – Since 1996 | |
| Principal Occupation(s) During Past 5 Years: | Chairman, Director & Chief Executive Officer (1997 to present) - The Ashley Group (property management and investment). Director (1995-2008) and Chairman(non-executive) (2004-2008) - Fannie Mae (mortgage) | |
| Number of Portfolios Overseen within Fund Complex: | 34 | |
| Other Directorships Held Outside Fund Complex During | Fannie Mae (1995-2008) | |
| Past 5 Years: | The Ashley Group (1995-2008) | |
Genesee Corporation (1987-2007)
| ||
| Name: | Paul A. Brooke | |
| Address: | 290 Woodcliff Drive | |
| Fairport, NY 14450 | ||
| Age: | 73 | |
| Current Position(s) Held with Fund: | Lead Independent Director, Audit Committee Member, Governance & Nominating Committee Chairman | |
| Term of Office & Length of Time Served: | Indefinite – Director, Audit Committee Member, Governance & Nominating Committee Member since 2007; Governance & Nominating Committee Chairman since 2016; Lead Independent Director since 2017 | |
| Principal Occupation(s) During Past 5 Years: | Chairman & CEO (2005-2009) - Ithaka Acquisition Corporation | |
| (investments); Chairman (2007-2009) - Alsius Corporation (investments); Managing Member (1991-present) - PMSV Holdings LLC (investments); | ||
| Managing Member (2010-2016) - Venbio (investments). | ||
| Number of Portfolios Overseen within Fund Complex: | 34 | |
| Other Directorships Held Outside Fund Complex During Past 5 Years: | Incyte Corp. (biotech)(2000-present); ViroPharma, Inc. (speciality pharmaceuticals)(2000-2014); HLTH (WebMD)(information)(2000-2010); Cheyne Capital International (investment)(2000-2017); GMP Companies (investment)(2000-2011); Cytos Biotechnology Ltd (biotechnology)(2012-2014); Cerus (biomedical)(2016-present);PureEarth(non-profit)(2012-present); Caelum BioSciences (biomedical)(2018-present)
| |
30
Core Bond Series
Directors’ and Officers’ Information
(unaudited)
Independent Directors (continued)
| Name: | Peter L. Faber | |
| Address: | 290 Woodcliff Drive | |
| Fairport, NY 14450 | ||
| Age: | 80 | |
| Current Position(s) Held with Fund: | Director, Governance & Nominating Committee Member | |
| Term of Office & Length of Time Served: | Indefinite – Since 1987 | |
| Principal Occupation(s) During Past 5 Years: | Senior Counsel (2006-2012), Partner (1995-2006 & 2013-2018) - McDermott, Will & Emery LLP (law firm) | |
| Number of Portfolios Overseen within Fund Complex: | 34 | |
Other Directorships Held Outside Fund Complex During Past 5 Years: | Boston Early Music Festival(non-profit)(2007-present); Amherst Early Music, Inc.(non-profit)(2009-present); Gotham Early Music Scene, Inc. | |
| (non-profit)(2009-present); Partnership for New York City, Inc. | ||
(non-profit)(1989-2010); New York Collegium(non-profit)(2004-2011); S’Cool Sounds, Inc.(non-profit)(2017-present)
| ||
| Name: | Harris H. Rusitzky | |
| Address: | 290 Woodcliff Drive | |
| Fairport, NY 14450 | ||
| Age: | 83 | |
| Current Position(s) Held with Fund: | Director, Audit Committee Member, Governance & Nominating Committee Member | |
| Term of Office & Length of Time Served: | Indefinite – Since 1985 | |
| Principal Occupation(s) During Past 5 Years: | President (1994- present) - The Greening Group (business consultants); | |
| Partner (2006-present) - The Restaurant Group (restaurants) | ||
| Number of Portfolios Overseen within Fund Complex: | 34 | |
Other Directorships Held Outside Fund Complex During Past 5 Years: | Rochester Institute of Technology (university)(1972-present); Culinary Institute of America(non-profit college)(1985-present); George Eastman | |
| Museum (museum)(1988-present); National Restaurant Association | ||
(restaurant trade organization)(1978-present)
| ||
| Name: | Chester N. Watson | |
| Address: | 290 Woodcliff Drive | |
| Fairport, NY 14450 | ||
| Age: | 68 | |
| Current Position(s) Held with Fund: | Director, Audit Committee Chairman, Governance & Nominating | |
| Committee Member | ||
| Term of Office & Length of Time Served: | Indefinite – Director, Audit Committee Member, Governance & Nominating | |
| Committee Member Since 2012; Audit Committee Chairman since 2013 | ||
| Principal Occupation(s) During Past 5 Years: | General Auditor (2003-2011) - General Motors Company (auto | |
| manufacturer) | ||
| Number of Portfolios Overseen within Fund Complex: | 34 | |
Other Directorships Held Outside Fund Complex During Past 5 Years: | Rochester Institute of Technology (university)(2005-present); Town of Greenburgh, NY Planning Board (municipal government) (2015-2018)
| |
| Officers: | ||
| Name: | Jeffrey S. Coons, Ph.D., CFA® | |
| Address: | 290 Woodcliff Drive | |
| Fairport, NY 14450 | ||
| Age: | 55 | |
| Current Position(s) Held with Fund: | Vice President | |
| Term of Office1& Length of Time Served: | Since 2004 | |
| Principal Occupation(s) During Past 5 Years: | President since 2010,Co-CEO since 2018,Co-Director of Research (2002 | |
| – 2015) - Manning & Napier Advisors, LLC | ||
Holds one or more of the following titles for various subsidiaries and affiliates: President, Director, Treasurer, or Senior Trust Officer
| ||
31
Core Bond Series
Directors’ and Officers’ Information
(unaudited)
Officers: (continued)
| Name: | Elizabeth Craig | |
| Address: | 290 Woodcliff Drive | |
| Fairport, NY 14450 | ||
| Age: | 31 | |
| Current Position(s) Held with Fund: | Corporate Secretary | |
| Term of Office1& Length of Time Served: | Since 2016 | |
| Principal Occupation(s) During Past 5 Years: | Fund Administration Manager since 2015; Mutual Fund Compliance Specialist (2009-2015) - Manning & Napier Advisors, LLC; Assistant Corporate Secretary (2011-2016) - Manning & Napier Fund, Inc. | |
| Name: | Christine Glavin | |
| Address: | 290 Woodcliff Drive | |
| Fairport, NY 14450 | ||
| Age: | 52 | |
| Current Position(s) Held with Fund: | Principal Financial Officer, Chief Financial Officer | |
| Term of Office1& Length of Time Served: | Principal Financial Officer since 2002; Chief Financial Officer since 2001 | |
| Principal Occupation(s) During Past 5 Years: | Director of Fund Reporting since 2011; Fund Reporting Manager (1997-2011) - Manning & Napier Advisors, LLC; Assistant Treasurer since 2008 - Exeter Trust Company; Chief Financial Officer (2017-2018) - Rainier Investment Management Mutual Funds, Inc. | |
| Name: | Jodi L. Hedberg | |
| Address: | 290 Woodcliff Drive | |
| Fairport, NY 14450 | ||
| Age: | 51 | |
| Current Position(s) Held with Fund: | Chief Compliance Officer, Anti-Money Laundering Compliance Officer | |
| Term of Office1& Length of Time Served: | Chief Compliance Officer since 2004; Anti-Money Laundering Officer since 2002; Corporate Secretary (1997-2016) - Manning & Napier Fund, Inc.; Chief Compliance Officer and Anti-Money Laundering Officer (2017-2018) – Rainier Investment Management Mutual Funds, Inc. | |
| Principal Occupation(s) During Past 5 Years: | Managing Director, Compliance & Regulatory Affairs since 2018; Director of Compliance (2005-2018); Compliance Manager (1995-2005) – Manning & Napier Advisors, LLC and affiliates; Corporate Secretary – Manning & | |
| Napier Investor Services, Inc. since 2006 | ||
| Name: | Scott Morabito | |
| Address: | 290 Woodcliff Drive | |
| Fairport, NY 14450 | ||
| Age: | 31 | |
| Current Position(s) Held with Fund: | Assistant Vice President | |
| Term of Office1& Length of Time Served: | Since 2017 | |
| Principal Occupation(s) During Past 5 Years: | Director of Funds Group since 2017; Fund Product and Strategy Manager | |
| (2014-2017); Senior Product and Strategy Analyst (2013-2014); Product | ||
| and Strategy Analyst (2011-2013) - Manning & Napier Advisors, LLC; | ||
| President, Director – Manning & Napier Investor Services, Inc. since 2018 | ||
| Name: | Sarah Turner | |
| Address: | 290 Woodcliff Drive | |
| Fairport, NY 14450 | ||
| Age: | 36 | |
| Current Position(s) Held with Fund: | Chief Legal Officer; Assistant Corporate Secretary | |
| Term of Office1& Length of Time Served: | Since 2018 | |
| Principal Occupation(s) During Past 5 Years: | General Counsel since 2018 - Manning & Napier Advisors, LLC and affiliates; Counsel (2017-2018) – Harter Secrest and Emery LLP; Legal Counsel (2010-2017) – Manning & Napier Advisors, LLC and affiliates Holds one or more of the following titles for various affiliates: Corporate Secretary, General Counsel | |
32
Core Bond Series
Directors’ and Officers’ Information
(unaudited)
Officers: (continued)
| Name: | Amy Williams | |
| Address: | 290 Woodcliff Drive | |
| Fairport, NY 14450 | ||
| Age: | 57 | |
| Current Position(s) Held with Fund: | Assistant Corporate Secretary | |
| Term of Office1& Length of Time Served: | Since 2016 | |
| Principal Occupation(s) During Past 5 Years: | Director of Fund Documentation - Manning & Napier Advisors, LLC since 2009 Holds one or more of the following titles for various affiliates: Director
|
*Interested Director, within the meaning of the 1940 Act by reason of her positions with the Fund’s investment advisor, Manning & Napier Advisors, LLC and Distributor, Manning & Napier Investor Services, Inc.
1The term of office of all officers shall be one year and until their respective successors are chosen and qualified, or his or her earlier resignation or removal as provided in the Fund’sBy-Laws.
33
Core Bond Series
Literature Requests
(unaudited)
Proxy Voting Policies and Procedures
A description of the policies and procedures that the Fund uses to determine how to vote proxies relating to portfolio securities is available, without charge, upon request:
| By phone | 1-800-466-3863 | |||
On the Securities and Exchange | ||||
Commission’s (SEC) web site | http://www.sec.gov |
Proxy Voting Record
Information regarding how the Fund voted proxies relating to portfolio securities during the most recent12-month period ended June 30th is available, without charge, upon request:
| By phone | 1-800-466-3863 | |||
| On the SEC’s web site | http://www.sec.gov |
Quarterly Portfolio Holdings
The Series’ complete schedule of portfolio holdings for the 1st and 3rd quarters of each fiscal year are provided on FormN-Q, and are available, without charge, upon request:
| By phone | 1-800-466-3863 | |||
| On the SEC’s web site | http://www.sec.gov |
Prospectus and Statement of Additional Information (SAI)
For more information about any of the Manning & Napier Fund, Inc. Series, you may obtain a prospectus and SAI at www.manning-napier.com or by calling (800)466-3863. Before investing, carefully consider the objectives, risks, charges and expenses of the investment and read the prospectus carefully as it contains this and other information about the investment company.In addition, this information can be found on the SEC’s web site, http://www.sec.gov.
Additional information available at www.manning-napier.com
1. Fund Holdings -Month-End
2. Fund Holdings -Quarter-End
3. Shareholder Report - Annual
4. Shareholder Report - Semi-Annual
The Fund also offers electronic notification or“e-delivery” when certain documents are availableon-line to be downloaded or reviewed. Direct shareholders can elect to receive electronic notification when shareholder reports, prospectus updates, and/or statements are available. If you do not currently haveon-line access to your account, you can establish access by going to www.manning-napier.com, click on “Login” in the top corner of the page, and follow the prompts to self-enroll. Once enrolled, you can set your electronic notification preferences by clicking on the Account Options tab located within the green toolbar and then selectE-Delivery Option. Should you have any questions on either how to establishon-line access or how to update your account settings, please contact Investor Services at1-800-466-3863.
The Manning & Napier Fund, Inc. is managed by Manning & Napier Advisors, LLC. Manning & Napier Investor Services, Inc., an affiliate of Manning & Napier Advisors, LLC, is the distributor of the Fund shares.
MNCOB-12/18-AR

Manning & Napier Fund, Inc.
High Yield Bond Series
Beginning on February 25, 2021, as permitted by Securities and Exchange Commission regulations, paper copies of the Series’ annual and semi-annual shareholder reports will no longer be sent by mail, unless you specifically request paper copies of the reports from the Fund or from your financial intermediary, such as a broker-dealer or bank. Instead, the reports will be made available on a website, and you will be notified by mail each time a report is posted and provided with a website link to access the report.
If you already elected to receive shareholder reports electronically, you will not be affected by this change and you need not take any action. You may elect to receive shareholder reports and other communications from the Fund electronically by contacting your financial intermediary or, if you are a direct investor, by visiting www.manning-napier.com or calling1-800-466-3863.
You may elect to receive all future annual and semi-annual reports in paper free of charge. If you invest through a financial intermediary, you can contact your financial intermediary to request that you continue to receive paper copies of your shareholder reports. If you invest directly with the Fund, you can inform the Fund that you wish to continue receiving paper copies of your shareholder reports by visiting www.manning-napier.com or calling1-800-466-3863. Your election to receive reports in paper will apply to all funds held with your financial intermediary if you invest through a financial intermediary or all series of the Fund if you invest directly with the Fund. |
High Yield Bond Series
Management Discussion and Analysis
(unaudited)
Dear Shareholders:
The investment environment we witnessed over the past twelve months was far more volatile than in prior years. It resulted in a sharp drawdown in global equity markets during the fourth quarter of 2018.
For the fiscal year ending on December 31, 2018, US equities experienced negative returns, with the S&P 500 Total Return Index falling 4.38%. International equity performance was somewhat worse, with the MSCI ACWI ex USA Index returning negative 14.20%.
In fixed income, domestic investment-grade bond performance was essentially flat for the year, as measured by the Bloomberg Barclays U.S. Aggregate Bond Index, rising 0.01% as income generated over the period was offset by rising interest rates (when interest rates rise, bond prices fall).
We believe recent volatility, both at the beginning and end of last year, is reflective of what investors should expect going forward. While we do not believe we are immediately heading for a recession, we see recent developments within the US and abroad as an indication that we are entering a higher risk period for financial markets.
The US economy is likely approaching a period of peak growth. It continues to show signs of progressing toward the later stages of its economic and market cycle (typical characteristics of anend-of-cycle phase are an economic recession and financial market selloff).
As economic growth decelerates to more sustainable levels, we believe that investors are facing a growing risk of disappointment. At the same time, key global risks remain, including trade tensions, geopolitical uncertainty, and tightening monetary policy.
Considering the current economic and market backdrop, we believe investors should temper their performance expectations. The returns experienced over the latter half of the post-Global Financial Crisis bull market are unlikely to continue.
Additionally, given our cautious outlook, we are reviewing current and prospective investments for excessive risk exposures, and we have adjusted our positioning across many of our portfolios. Going forward, we will continue to follow our disciplines, focusing on flexibility and selectivity in today’s incredibly dynamic investment environment.
With this in mind, in the enclosed we discuss recent fund performance, highlight our positioning, and briefly provide our outlook amid the current investment environment.
We hope that you find this information helpful, and we look forward to working with you in the years ahead. Thank you for your continued confidence in Manning & Napier.
Sincerely,
Manning & Napier Advisors, LLC
The S&P 500 Index is an unmanaged, capitalization-weighted measure comprised of 500 leading U.S. companies to gauge U.S. large cap equities. The Index returns do not reflect any fees or expenses. The Index includes dividends, but not the reinvestment of dividends. Index returns provided by Bloomberg. S&P Dow Jones Indices LLC, a subsidiary of the McGraw Hill Financial, Inc., is the publisher of various index based data products and services and has licensed certain of its products and services for use by Manning & Napier. All such content Copyright© 2019 by S&P Dow Jones Indices LLC and/or its affiliates. All rights reserved. Neither S&P Dow Jones Indices LLC, Dow Jones Trademark Holdings LLC, their affiliates nor their third party licensors make any representation or warranty, express or implied, as to the ability of any index to accurately represent the asset class or market sector that it purports to represent and none of these parties shall have any liability for any errors, omissions, or interruptions of any index or the data included therein.
The MSCI ACWI ex USA Index (ACWIxUS) is designed to measure large andmid-cap representation across 22 of 23 Developed Markets countries (excluding the U.S.) and 24 Emerging Markets countries. The Index returns do not reflect any fees or expenses. The Index is denominated in U.S. dollars. The Index returns are net of withholding taxes. They assume daily reinvestment of net dividends thus accounting for any applicable dividend taxation. Index returns provided by Bloomberg.
The Bloomberg Barclays U.S. Aggregate Bond Index is an unmanaged, market-value weighted index of U.S. domestic investment-grade debt issues, including government, corporate, asset-backed, and mortgage-backed securities, with maturities of one year or more. Index returns do not reflect any fees or expenses. Index returns provided by Interactive Data.
1
High Yield Bond Series
Fund Commentary
(unaudited)
Investment Objective
To provide a high level of long-term total return, which is a combination of income and capital appreciation. Under normal circumstances, the Series will invest at least 80% of its assets in bonds that are rated below investment-grade (junk bonds), and/or securities that are designed to track the performance ofnon-investment grade securities, principally exchange-traded funds.
Performance Commentary
The Series’ primary benchmark, the ICE Bank of America Merrill LynchBB-B US Cash Pay High Yield index experienced negative performance of 2.02% for 2018, while the ICE Bank of America Merrill Lynch US Cash Pay High Yield Index (the Series’ secondary benchmark) returned negative 2.26%. Over the same time period, the High Yield Bond Series Class I shares generated negative returns of 0.98% (Class S shares returned negative 1.31%).
In 2018, the Series’ outperformance was primarily attributable to strong security selection, particularly in basic industry, autos, and financial services. The Series also benefitted from an underweight to media and retail, as well as a slight overweight to energy.
Resulting from a notable corporate bond spread widening in the fourth quarter, we’ve seen a bit of a reset in the credit cycle as valuations have become more attractive (bond spreads are the extra yield investors receive for owning a riskier bond versus a Treasury bond). That said, we recognize that potential headwinds exist in the market going forward, including geopolitical concerns (trade wars, uncertainty regarding Brexit, etc.), decelerating economic growth, and tightening monetary policy globally. Both leverage and coverage remain high in credit markets.
As such, our principle focus is on higher quality companies with stronger balance sheets, stability of margins, and a demonstrated history of strong free cash flow generation throughout the cycle. We continue to be positioned in corporate issuers rather than leveraged buyouts, and have seen value in shorter-dated high yield securities (3 years and under).
Performance data quoted represents past performance and does not guarantee future results. The investment return and principal value of an investment will fluctuate, so that an investor’s shares, when redeemed, may be worth more or less than their original cost. Current performance may be higher or lower than that quoted; investors can obtain the most recentmonth-end performance at www.manning-napier.com or by calling (800)466-3863. Performance for the High Yield Bond Series Class S shares is provided above. Performance for the Class I shares will be higher based on the Class’ lower expenses.
Please see the next page for additional performance information as of December 31, 2018.
There is an inverse relationship between bond prices and interest rates; as interest rates rise, bond prices (and therefore the value of bond funds) fall. Likewise, as interest rates fall, bond prices and the value of bond funds rise. Investments in higher-yielding, lower-rated securities involve additional risks, including a higher risk of default and loss of principal.
The Intercontinental Exchange (ICE) Bank of America Merrill Lynch (BofAML) U.S. Cash Pay High Yield Index tracks the performance of U.S. dollar denominated below investment grade corporate debt, currently in a coupon paying period, issued in the U.S. domestic market. Qualifying securities must have at least one year remaining term to final maturity as of the rebalancing date, at least 18 months to final maturity at the time of issuance, a fixed coupon schedule, and a minimum amount outstanding of $250 million.
The ICE BofAMLBB-B U.S. Cash Pay High Yield Index is a subset of the ICE BofAML U.S. Cash Pay High Yield Index. The Index includes all U.S. dollar denominated below investment grade corporate debt securities currently in a coupon paying period rated BB1 through B3.
The Index returns do not reflect any fees or expenses. Index returns provided by Bloomberg.
2
High Yield Bond Series
Performance Update as of December 31, 2018
(unaudited)
AVERAGE ANNUAL TOTAL RETURNS AS OF DECEMBER 31, 2018 | ||||||||||||
ONE YEAR1 | FIVE YEAR | SINCE INCEPTION2 | ||||||||||
Manning & Napier Fund, Inc. - High Yield Bond Series - Class S3 | -1.31 | % | 3.68 | % | 6.75 | % | ||||||
Manning & Napier Fund, Inc. - High Yield Bond Series - Class I3,4 | -0.98 | % | 3.96 | % | 6.94 | % | ||||||
Intercontinental Exchange (ICE) Bank of America Merrill Lynch (BofAML)BB-B U.S. Cash Pay High Yield Index5 | -2.02 | % | 3.86 | % | 7.22 | % | ||||||
Intercontinental Exchange (ICE) Bank of America Merrill Lynch (BofAML) U.S. Cash Pay High Yield Index6 | -2.26 | % | 3.81 | % | 7.54 | % | ||||||
The following graph compares the value of a $10,000 investment in the Manning & Napier Fund, Inc. - High Yield Bond Series Class S from its inception2 (September 14, 2009) to present (December 31, 2018) to the Intercontinental Exchange (ICE) Bank of America Merrill Lynch (BofAML)BB-B U.S. Cash Pay High Yield Index and Intercontinental Exchange (ICE) Bank of America Merrill Lynch (BofAML) U.S. Cash Pay High Yield Index.

1The returns shown are based on net asset values calculated for shareholder transactions and may differ from the returns shown in the financial highlights, which reflect adjustments made to the net asset values in accordance with accounting principles generally accepted in the United States of America.
2Performance numbers for the Series and Index are calculated from September 14, 2009, the Class S inception date.
3The Series’ performance does not reflect the deduction of taxes that a shareholder would pay on fund distributions or the redemption of shares. The Series’ performance is historical and may not be indicative of future results. The performance returns shown are inclusive of the net expense ratio of the Series. For the year ended December 31, 2018, this net expense ratio was 0.90% for Class S and 0.65% for Class I. The gross expense ratio, which does not account for any voluntary or contractual waivers currently in effect, was 0.98% for Class S and 0.73% for Class I for the year ended December 31, 2018.
4For periods through August 1, 2012 (the inception date of the Class I shares), performance for the Class I shares is based on historical performance of the Class S shares. Because Class I shares invest in the same portfolio of securities as Class S, performance will only be different to the extent that the Class S shares have a higher expense ratio.
5The Intercontinental Exchange (ICE) Bank of America Merrill Lynch (BofAML)BB-B U.S. Cash Pay High Yield Index is a subset of the ICE BofAML U.S. Cash Pay High Yield Index. The Index includes all U.S. dollar denominated below investment grade corporate debt securities currently in a coupon paying period rated BB1 through B3. Qualifying securities must have at least one year remaining term to final maturity, at least 18 months to final maturity at point of issuance, a fixed coupon schedule, and a minimum amount outstanding of $250 million. The Index returns do not reflect any fees or expenses. Index returns provided by Bloomberg.
3
High Yield Bond Series
Performance Update as of December 31, 2018
(unaudited)
6The Intercontinental Exchange (ICE) Bank of America Merrill Lynch (BofAML) U.S. Cash Pay High Yield Index tracks the performance of U.S. dollar denominated below investment grade corporate debt, currently in a coupon paying period, issued in the U.S. domestic market. Qualifying securities must have at least one year remaining term to final maturity as of the rebalancing date, at least 18 months to final maturity at the time of issuance, a fixed coupon schedule, and a minimum amount outstanding of $250 million. The Index returns do not reflect any fees or expenses. Index returns provided by Bloomberg
4
High Yield Bond Series
Shareholder Expense Example
(unaudited)
As a shareholder of the Series, you incur ongoing costs, including management fees, shareholder service fees and other Series expenses. This example is intended to help you understand your ongoing costs (in dollars) of investing in the Series and to compare these costs with the ongoing costs of investing in other mutual funds.
The example is based on an investment of $1,000 invested in each class at the beginning of the period and held for the entire period (July 1, 2018 to December 31, 2018).
Actual Expenses
The Actual lines of the table below provide information about actual account values and actual expenses. You may use the information in this line, together with the amount you invested, to estimate the expenses that you paid over the period. Simply divide your account value by $1,000 (for example, an $8,600 account value divided by $1,000 = 8.6), then multiply the result by the number in the Actual line for the Class in which you have invested under the heading entitled “Expenses Paid During Period” to estimate the expenses you paid on your account during this period.
Hypothetical Example for Comparison Purposes
The Hypothetical lines of each class in the table below provide information about hypothetical account values and hypothetical expenses based on the Class’ actual expense ratio and an assumed rate of return of 5% per year before expenses, which is not the Class’ actual return. The hypothetical account values and expenses may not be used to estimate the actual ending account balance or expenses you paid during the period. You may use this information to compare the ongoing costs of investing in a class of the Series and other funds. To do so, compare this 5% hypothetical example for the class in which you have invested with the 5% hypothetical examples that appear in the shareholder reports of the other funds.
Please note that the expenses shown in the table are meant to highlight your ongoing costs only and do not reflect any transaction costs, such as sales charges (loads), redemption fees, or exchange fees that you may incur in other mutual funds. Therefore, the second line of the table is useful in comparing ongoing costs only, and will not help you determine the relative total costs of owning different funds.
| BEGINNING ACCOUNT VALUE 7/1/18 | ENDING ACCOUNT VALUE 12/31/18 | EXPENSES PAID DURING PERIOD* 7/1/18-12/31/18 | ANNUALIZED EXPENSE RATIO | |||||||||||||
Class S | ||||||||||||||||
Actual | $1,000.00 | $ 987.65 | $4.51 | 0.90% | ||||||||||||
Hypothetical |
|
$1,000.00 |
| $1,020.67 | $4.58 | 0.90% | ||||||||||
Class I | ||||||||||||||||
Actual | $1,000.00 | $ 988.58 | $3.26 | 0.65% | ||||||||||||
Hypothetical | $1,000.00 | $1,021.93 | $3.31 | 0.65% | ||||||||||||
*Expenses are equal to each Class’ annualized expense ratio (for thesix-month period), multiplied by the average account value over the period, multiplied by 184/365 (to reflect theone-half year period). Expenses are based on the most recent fiscal half year. therefore, the expense ratios stated above may differ from the expense ratios stated in the financial highlights, which are based onone-year data. The Class’ total return would have been lower had certain expenses not been waived during the period.
5
High Yield Bond Series
Portfolio Composition as of December 31, 2018
(unaudited)
6
High Yield Bond Series
Investment Portfolio - December 31, 2018
CREDIT (UNAUDITED) | PRINCIPAL AMOUNT | VALUE (NOTE 2) | ||||||||||
CORPORATE BONDS - 93.9% | ||||||||||||
Non-Convertible Corporate Bonds - 93.9% | ||||||||||||
Communication Services-8.2% | ||||||||||||
Media - 4.5% | ||||||||||||
CSC Holdings LLC2, 5.50%, 5/15/2026 | Ba2 | $ | 1,335,000 | $ | 1,258,238 | |||||||
Telenet Finance Luxembourg Notes S.A.R.L (Belgium)2, 5.50%, 3/1/2028 | Ba3 | 2,400,000 | 2,172,000 | |||||||||
UPCB Finance IV Ltd. (Netherlands)2, 5.375%, 1/15/2025 | Ba3 | 1,854,000 | 1,733,712 | |||||||||
|
| |||||||||||
| 5,163,950 | ||||||||||||
|
| |||||||||||
Wireless Telecommunication Services - 3.7% | ||||||||||||
Hughes Satellite Systems Corp., 5.25%, 8/1/2026 | Ba2 | 3,400,000 | 3,115,250 | |||||||||
Inmarsat Finance plc (United Kingdom)2, 4.875%, 5/15/2022 | Ba3 | 1,229,000 | 1,158,824 | |||||||||
|
| |||||||||||
| 4,274,074 | ||||||||||||
|
| |||||||||||
Total Communication Services | 9,438,024 | |||||||||||
|
| |||||||||||
Consumer Discretionary - 10.2% | ||||||||||||
Household Durables - 10.2% | ||||||||||||
Century Communities, Inc., 5.875%, 7/15/2025 | B2 | 2,805,000 | 2,468,400 | |||||||||
LGI Homes, Inc.2, 6.875%, 7/15/2026 | B1 | 1,960,000 | 1,759,100 | |||||||||
Meritage Homes Corp., 5.125%, 6/6/2027 | Ba2 | 1,535,000 | 1,304,750 | |||||||||
TRI Pointe Group, Inc. - TRI Pointe Homes, Inc., 4.375%, 6/15/2019 | Ba3 | 1,985,000 | 1,970,112 | |||||||||
TRI Pointe Group, Inc. - TRI Pointe Homes, Inc., 5.875%, 6/15/2024 | Ba3 | 1,960,000 | 1,749,300 | |||||||||
Weekley Homes LLC - Weekley Finance Corp., 6.00%, 2/1/2023 | B3 | 1,045,000 | 977,075 | |||||||||
Weekley Homes LLC - Weekley Finance Corp., 6.625%, 8/15/2025 | B3 | 1,620,000 | 1,486,350 | |||||||||
|
| |||||||||||
Total Consumer Discretionary | 11,715,087 | |||||||||||
|
| |||||||||||
Energy - 16.6% | ||||||||||||
Energy Equipment & Services - 2.5% | ||||||||||||
Shelf Drilling Holdings Ltd. (United Arab Emirates)2, 8.25%, 2/15/2025 | B2 | 1,945,000 | 1,662,975 | |||||||||
TerraForm Power Operating, LLC2, 5.00%, 1/31/2028 | B1 | 1,400,000 | 1,232,000 | |||||||||
|
| |||||||||||
| 2,894,975 | ||||||||||||
|
| |||||||||||
Oil, Gas & Consumable Fuels - 14.1% | ||||||||||||
American Midstream Partners LP - American Midstream Finance Corp.2, | Caa1 | 1,985,000 | 1,865,900 | |||||||||
DCP Midstream Operating LP2, 5.35%, 3/15/2020 | Ba2 | 1,200,000 | 1,204,500 | |||||||||
Dynagas LNG Partners LP - Dynagas Finance, Inc. (Monaco), 6.25%, | WR3 | 1,795,000 | 1,700,763 | |||||||||
GasLog Ltd. (Monaco), 8.875%, 3/22/2022 | WR3 | 2,615,000 | 2,641,150 | |||||||||
Genesis Energy LP - Genesis Energy Finance Corp., 5.625%, | B1 | 1,450,000 | 1,243,375 | |||||||||
Jonah Energy LLC - Jonah Energy Finance Corp.2, 7.25%, 10/15/2025 | B3 | 2,610,000 | 1,670,400 | |||||||||
Rockies Express Pipeline, LLC2, 5.625%, 4/15/2020 | Ba1 | 1,380,000 | 1,380,000 | |||||||||
Seven Generations Energy Ltd. (Canada)2, 5.375%, 9/30/2025 | Ba3 | 1,340,000 | 1,199,300 | |||||||||
Southwestern Energy Co.4, 6.20%, 1/23/2025 | Ba3 | 1,845,000 | 1,648,969 | |||||||||
The accompanying notes are an integral part of the financial statements.
7
High Yield Bond Series
Investment Portfolio - December 31, 2018
CREDIT (UNAUDITED) | PRINCIPAL AMOUNT | VALUE (NOTE 2) | ||||||||||
CORPORATE BONDS(continued) | ||||||||||||
Non-Convertible Corporate Bonds(continued) | ||||||||||||
Energy(continued) | ||||||||||||
Oil, Gas & Consumable Fuels(continued) | ||||||||||||
W&T Offshore, Inc.2, 9.75%, 11/1/2023 | B3 | $ | 1,940,000 | $ | 1,697,500 | |||||||
|
| |||||||||||
| 16,251,857 | ||||||||||||
|
| |||||||||||
Total Energy | 19,146,832 | |||||||||||
|
| |||||||||||
Financials - 9.2% | ||||||||||||
Capital Markets - 1.0% | ||||||||||||
LPL Holdings, Inc.2, 5.75%, 9/15/2025 | B2 | 1,260,000 | 1,181,250 | |||||||||
|
| |||||||||||
Consumer Finance - 2.7% | ||||||||||||
Navient Corp., 7.25%, 9/25/2023 | Ba3 | 1,235,000 | 1,133,112 | |||||||||
SLM Corp., 5.125%, 4/5/2022 | Ba2 | 2,029,000 | 1,968,130 | |||||||||
|
| |||||||||||
| 3,101,242 | ||||||||||||
|
| |||||||||||
Diversified Financial Services - 3.5% | ||||||||||||
FS Energy & Power Fund2, 7.50%, 8/15/2023 | Ba3 | 2,560,000 | 2,432,000 | |||||||||
Oxford Finance, LLC - Oxford Finance Co.- Issuer II, Inc.2, 6.375%, 12/15/2022 | Ba3 | 1,635,000 | 1,610,475 | |||||||||
|
| |||||||||||
| 4,042,475 | ||||||||||||
|
| |||||||||||
Insurance - 1.0% | ||||||||||||
CNO Financial Group, Inc., 5.25%, 5/30/2025 | Baa3 | 1,200,000 | 1,143,000 | |||||||||
|
| |||||||||||
Thrifts & Mortgage Finance - 1.0% | ||||||||||||
Ladder Capital Finance Holdings LLLP - Ladder Capital Finance Corp.2, | Ba3 | 1,130,000 | 1,127,175 | |||||||||
|
| |||||||||||
Total Financials | 10,595,142 | |||||||||||
|
| |||||||||||
Health Care - 4.8% | ||||||||||||
Health Care Providers & Services - 2.7% | ||||||||||||
DaVita, Inc., 5.00%, 5/1/2025 | Ba3 | 2,045,000 | 1,855,838 | |||||||||
MEDNAX, Inc.2, 6.25%, 1/15/2027 | Ba2 | 1,295,000 | 1,249,675 | |||||||||
|
| |||||||||||
| 3,105,513 | ||||||||||||
|
| |||||||||||
Pharmaceuticals - 2.1% | ||||||||||||
Horizon Pharma, Inc. - Horizon Pharma USA, Inc.2, 8.75%, 11/1/2024 | B3 | 2,450,000 | 2,486,750 | |||||||||
|
| |||||||||||
Total Health Care | 5,592,263 | |||||||||||
|
| |||||||||||
Industrials - 21.9% | ||||||||||||
Aerospace & Defense - 1.0% | ||||||||||||
Arconic, Inc., 5.125%, 10/1/2024 | Ba2 | 1,210,000 | 1,161,612 | |||||||||
|
| |||||||||||
Airlines - 2.2% | ||||||||||||
Allegiant Travel Co., 5.50%, 7/15/2019 | B1 | 1,229,000 | 1,229,000 | |||||||||
American Airlines Group, Inc.2, 5.50%, 10/1/2019 | B1 | 1,265,000 | 1,268,163 | |||||||||
|
| |||||||||||
| 2,497,163 | ||||||||||||
|
| |||||||||||
The accompanying notes are an integral part of the financial statements.
8
High Yield Bond Series
Investment Portfolio - December 31, 2018
CREDIT (UNAUDITED) | PRINCIPAL AMOUNT | VALUE (NOTE 2) | ||||||||||
CORPORATE BONDS(continued) | ||||||||||||
Non-Convertible Corporate Bonds(continued) | ||||||||||||
Industrials(continued) | ||||||||||||
Commercial Services & Supplies - 5.1% | ||||||||||||
The ADT Security Corp., 5.25%, 3/15/2020 | Ba3 | $ | 1,200,000 | $ | 1,203,000 | |||||||
The ADT Security Corp., 4.125%, 6/15/2023 | Ba3 | 1,400,000 | 1,281,000 | |||||||||
Covanta Holding Corp., 6.00%, 1/1/2027 | B1 | 1,685,000 | 1,508,075 | |||||||||
W/S Packaging Holdings, Inc.2, 9.00%, 4/15/2023 | B3 | 1,910,000 | 1,900,450 | |||||||||
|
| |||||||||||
| 5,892,525 | ||||||||||||
|
| |||||||||||
Construction & Engineering - 2.1% | ||||||||||||
Tutor Perini Corp.2, 6.875%, 5/1/2025 | B1 | 2,600,000 | 2,418,000 | |||||||||
|
| |||||||||||
Marine - 4.2% | ||||||||||||
Borealis Finance, LLC2, 7.50%, 11/16/2022 | WR3 | 2,650,000 | 2,451,250 | |||||||||
Global Ship Lease, Inc. (United Kingdom)2, 9.875%, 11/15/2022 | B3 | 2,515,000 | 2,389,250 | |||||||||
|
| |||||||||||
| 4,840,500 | ||||||||||||
|
| |||||||||||
Trading Companies & Distributors - 5.4% | ||||||||||||
Aircastle Ltd., 6.25%, 12/1/2019 | Baa3 | 1,295,000 | 1,325,844 | |||||||||
Fortress Transportation & Infrastructure Investors, LLC2, 6.50%, | B1 | 2,000,000 | 1,870,000 | |||||||||
International Lease Finance Corp., 6.25%, 5/15/2019 | Baa3 | 1,170,000 | 1,180,350 | |||||||||
Park Aerospace Holdings Ltd. (Ireland)2, 4.50%, 3/15/2023 | Ba2 | 1,980,000 | 1,851,300 | |||||||||
|
| |||||||||||
| 6,227,494 | ||||||||||||
|
| |||||||||||
Transportation Infrastructure - 1.9% | ||||||||||||
Eagle Bulk Shipco, LLC, 8.25%, 11/28/2022 | WR3 | 1,764,000 | 1,719,900 | |||||||||
MPC Container Ships Invest B.V. (Norway)5,6, (3 mo. LIBOR US + | WR | 3 | 500,000 | 487,320 | ||||||||
|
| |||||||||||
| 2,207,220 | ||||||||||||
|
| |||||||||||
Total Industrials | 25,244,514 | |||||||||||
|
| |||||||||||
Information Technology - 2.4% | ||||||||||||
Semiconductors & Semiconductor Equipment - 1.4% | ||||||||||||
MagnaChip Semiconductor Corp. (South Korea), 6.625%, 7/15/2021 | B2 | 1,780,000 | 1,584,200 | |||||||||
|
| |||||||||||
Software - 1.0% | ||||||||||||
Nuance Communications, Inc., 5.625%, 12/15/2026 | Ba3 | 1,230,000 | 1,168,500 | |||||||||
|
| |||||||||||
Total Information Technology | 2,752,700 | |||||||||||
|
| |||||||||||
Materials - 11.4% | ||||||||||||
Chemicals - 1.8% | ||||||||||||
LSB Industries, Inc.2, 9.625%, 5/1/2023 | Caa1 | 2,015,000 | 2,045,225 | |||||||||
|
| |||||||||||
Containers & Packaging - 1.6% | ||||||||||||
Ardagh Packaging Finance plc - Ardagh Holdings USA, Inc. (Ireland)2, 6.00%, 2/15/2025 | B3 | 2,060,000 | 1,901,627 | |||||||||
|
| |||||||||||
Metals & Mining - 8.0% | ||||||||||||
First Quantum Minerals Ltd. (Zambia)2, 7.25%, 4/1/2023 | B3 | 635,000 | 558,800 | |||||||||
The accompanying notes are an integral part of the financial statements.
9
High Yield Bond Series
Investment Portfolio - December 31, 2018
CREDIT (UNAUDITED) | PRINCIPAL SHARES | VALUE (NOTE 2) | ||||||||||
CORPORATE BONDS(continued) | ||||||||||||
Non-Convertible Corporate Bonds(continued) | ||||||||||||
Materials(continued) | ||||||||||||
Metals & Mining(continued) | ||||||||||||
Mountain Province Diamonds, Inc. (Canada)2, 8.00%, 12/15/2022 | B3 | $ | 2,949,000 | $ | 2,957,847 | |||||||
Northwest Acquisitions ULC - Dominion Finco, Inc.2, 7.125%, 11/1/2022 | Ba3 | 3,195,000 | 3,156,021 | |||||||||
Petra Diamonds US Treasury plc (South Africa)2, 7.25%, 5/1/2022 | B3 | 1,325,000 | 1,225,625 | |||||||||
Techniplas LLC2, 10.00%, 5/1/2020 | Caa2 | 1,395,000 | 1,283,400 | |||||||||
|
| |||||||||||
| 9,181,693 | ||||||||||||
|
| |||||||||||
Total Materials | 13,128,545 | |||||||||||
|
| |||||||||||
Real Estate - 3.8% | ||||||||||||
Equity Real Estate Investment Trusts (REITS) - 3.8% | ||||||||||||
Greystar Real Estate Partners, LLC2, 5.75%, 12/1/2025 | B1 | 2,020,000 | 1,974,550 | |||||||||
iStar, Inc., 5.25%, 9/15/2022 | Ba3 | 2,025,000 | 1,893,172 | |||||||||
SBA Communications Corp., 4.875%, 9/1/2024 | B2 | 615,000 | 578,100 | |||||||||
|
| |||||||||||
Total Real Estate | 4,445,822 | |||||||||||
|
| |||||||||||
Utilities - 5.4% | ||||||||||||
Gas Utilities - 1.7% | ||||||||||||
NGL Energy Partners LP - NGL Energy Finance Corp., 6.125%, 3/1/2025 | B2 | 2,252,000 | 1,936,720 | |||||||||
|
| |||||||||||
Independent Power and Renewable Electricity Producers - 3.7% | ||||||||||||
Atlantica Yield plc (Spain)2, 7.00%, 11/15/2019 | B1 | 1,740,000 | 1,761,750 | |||||||||
Drax Finco plc (United Kingdom)2, 6.625%, 11/1/2025 | BB | 7 | 2,555,000 | 2,510,288 | ||||||||
|
| |||||||||||
Total Utilities | 6,208,758 | |||||||||||
|
| |||||||||||
TotalNon-Convertible Corporate Bonds | 108,267,687 | |||||||||||
|
| |||||||||||
MUTUAL FUND - 1.9% | ||||||||||||
SPDR Bloomberg Barclays High Yield Bond ETF (Identified Cost $2,307,653) | 66,760 | 2,242,468 | ||||||||||
|
| |||||||||||
SHORT-TERM INVESTMENT - 2.9% | ||||||||||||
Dreyfus Government Cash Management, Institutional Shares, 2.29%8, (Identified Cost $3,297,223) | 3,297,223 | 3,297,223 | ||||||||||
|
| |||||||||||
TOTAL INVESTMENTS - 98.7% | 113,807,378 | |||||||||||
OTHER ASSETS, LESS LIABILITIES - 1.3% | 1,553,934 | |||||||||||
|
| |||||||||||
NET ASSETS - 100% | $ | 115,361,312 | ||||||||||
|
| |||||||||||
The accompanying notes are an integral part of the financial statements.
10
High Yield Bond Series
Investment Portfolio - December 31, 2018
ETF - Exchange-Traded Fund
1Credit ratings from Moody’s (unaudited).
2Restricted securities - Investment in securities that are restricted as to public resale under the Securities Act of 1933, as amended. These securities have been sold under Rule 144A and have been determined to be liquid under guidelines established by the Board of Directors. These securities amount to $63,605,320, or 55.1% of the Series’ net assets as of December 31, 2018.
3Credit rating has been withdrawn. As of December 31, 2018, there is no rating available (unaudited).
4Step coupon rate security - Rate steps up/down by 25 basis points upon rating downgrade/upgrade by Moody’s and S&P rating agencies (Subject to a maximum of 100 basis points per agency, 200 basis points maximum).
5Floating rate security. Rate shown is the rate in effect as of December 31, 2018.
6Illiquid security - This security was acquired on December 13, 2018 at a cost of $495,000 ($99.00 per share). This security has been determined to be illiquid under guidelines established by the Board of Directors. This security amounts to $487,320, or 0.4% of the Series’ net assets as of December 31, 2018.
7Credit ratings from S&P (unaudited).
8Rate shown is the current yield as of December 31, 2018.
The Global Industry Classification Standard (GICS) was developed by and is the exclusive property and a service mark of MSCI Inc. (MSCI) and Standard & Poor’s, a division of The McGraw-Hill Companies, Inc. (S&P), and is licensed for use by Manning & Napier when referencing GICS sectors. Neither MSCI, S&P, nor any third party involved in making or compiling the GICS or any GICS classifications makes any express or implied warranties or representations with respect to such standard or classification, nor shall any such party have any liability therefrom.
The accompanying notes are an integral part of the financial statements.
11
High Yield Bond Series
Statement of Assets and Liabilities
December 31, 2018
ASSETS: | ||||
Investments, at value (identified cost $120,739,685) (Note 2) | $ | 113,807,378 | ||
Interest receivable | 1,679,673 | |||
Receivable for fund shares sold | 58,495 | |||
Dividends receivable | 6,017 | |||
Prepaid expenses | 12,570 | |||
|
| |||
TOTAL ASSETS | 115,564,133 | |||
|
| |||
LIABILITIES: | ||||
Accrued management fees (Note 3) | 47,076 | |||
Accrued fund accounting and administration fees (Note 3) | 18,866 | |||
Accrued shareholder services fees (Class S) (Note 3) | 18,014 | |||
Accrued Chief Compliance Officer service fees (Note 3) | 427 | |||
Payable for fund shares repurchased | 100,375 | |||
Other payables and accrued expenses | 18,063 | |||
|
| |||
TOTAL LIABILITIES | 202,821 | |||
|
| |||
TOTAL NET ASSETS | $ | 115,361,312 | ||
|
| |||
NET ASSETS CONSIST OF: | ||||
Capital stock | $ | 127,184 | ||
Additionalpaid-in-capital | 128,490,746 | |||
Total distributable earnings (loss) | (13,256,618 | ) | ||
|
| |||
TOTAL NET ASSETS | $ | 115,361,312 | ||
|
| |||
NET ASSET VALUE, OFFERING PRICE AND REDEMPTION PRICE PER SHARE - Class S($82,399,404/ 8,698,837 shares) | $ | 9.47 | ||
|
| |||
NET ASSET VALUE, OFFERING PRICE AND REDEMPTION PRICE PER SHARE - Class I($32,961,908/ 4,019,514 shares) | $ | 8.20 | ||
|
| |||
The accompanying notes are an integral part of the financial statements.
12
High Yield Bond Series
Statement of Operations
For the Year Ended December 31, 2018
INVESTMENT INCOME: | ||||
Interest | $ | 7,122,505 | ||
Dividends | 201,847 | |||
|
| |||
Total Investment Income | 7,324,352 | |||
|
| |||
EXPENSES: | ||||
Management fees (Note 3) | 646,235 | |||
Shareholder services fees (Class S) (Note 3) | 221,075 | |||
Fund accounting and administration fees (Note 3) | 64,608 | |||
Directors’ fees (Note 3) | 9,607 | |||
Chief Compliance Officer service fees (Note 3) | 4,635 | |||
Custodian fees | 7,104 | |||
Miscellaneous | 129,106 | |||
|
| |||
Total Expenses | 1,082,370 | |||
Less reduction of expenses (Note 3) | (97,562 | ) | ||
|
| |||
Net Expenses | 984,808 | |||
|
| |||
NET INVESTMENT INCOME | 6,339,544 | |||
|
| |||
REALIZED AND UNREALIZED GAIN (LOSS) ON INVESTMENTS: | ||||
Net realized gain (loss) on investments | 480,420 | |||
Net change in unrealized appreciation (depreciation) on investments | (8,475,559 | ) | ||
|
| |||
NET REALIZED AND UNREALIZED GAIN (LOSS) ON INVESTMENTS | (7,995,139 | ) | ||
|
| |||
NET DECREASE IN NET ASSETS RESULTING FROM OPERATIONS | $ | (1,655,595 | ) | |
|
| |||
The accompanying notes are an integral part of the financial statements.
13
High Yield Bond Series
Statements of Changes in Net Assets
FOR THE YEAR ENDED | FOR THE YEAR ENDED | |||||||
INCREASE (DECREASE) IN NET ASSETS: | ||||||||
OPERATIONS: | ||||||||
Net investment income | $ | 6,339,544 | $ | 6,236,355 | ||||
Net realized gain (loss) on investments | 480,420 | 361,429 | ||||||
Net change in unrealized appreciation (depreciation) on investments | (8,475,559 | ) | 2,744,269 | |||||
|
|
|
| |||||
Net increase (decrease) from operations | (1,655,595 | ) | 9,342,053 | |||||
|
|
|
| |||||
DISTRIBUTIONS TO SHAREHOLDERS (Note 9): | ||||||||
Class S | (4,387,135 | ) | (4,727,141 | ) | ||||
Class I | (1,907,413 | ) | (1,589,639 | ) | ||||
From return of capital (Class S) | — | (48,416 | ) | |||||
From return of capital (Class I) | — | (16,281 | ) | |||||
|
|
|
| |||||
Total distributions to shareholders | (6,294,548 | ) | (6,316,780 | )1 | ||||
|
|
|
| |||||
CAPITAL STOCK ISSUED AND REPURCHASED: | ||||||||
Net increase from capital share transactions (Note 5) | 2,318,967 | 5,388,383 | ||||||
|
|
|
| |||||
Net increase (decrease) in net assets | (5,631,176 | ) | 8,413,656 | |||||
NET ASSETS: | ||||||||
Beginning of year | 120,992,488 | 112,578,832 | ||||||
|
|
|
| |||||
End of year2 | $ | 115,361,312 | $ | 120,992,488 | ||||
|
|
|
| |||||
1 For the year ended December 31, 2017, the distributions to shareholder from net investment income were $4,678,725 (Class S) and $1,573,358 (Class I), respectively.
2 Includes accumulated undistributed (overdistributed) net investment income of $0 as of December 31, 2017. The SEC eliminated the requirement to disclose undistributed net investment income in 2018.
The accompanying notes are an integral part of the financial statements.
14
High Yield Bond Series
Financial Highlights - Class S
| FOR THE YEAR ENDED | ||||||||||||||||||||
| 12/31/18 | 12/31/17 | 12/31/16 | 12/31/15 | 12/31/14 | ||||||||||||||||
Per share data (for a share outstanding throughout each year): | ||||||||||||||||||||
Net asset value - Beginning of year | $10.09 | $9.79 | $9.21 | $10.04 | $10.64 | |||||||||||||||
|
|
|
|
|
|
|
|
|
| |||||||||||
Income (loss) from investment operations: | ||||||||||||||||||||
Net investment income1 | 0.53 | 0.54 | 0.56 | 0.51 | 0.52 | |||||||||||||||
Net realized and unrealized gain (loss) on investments | (0.65 | ) | 0.28 | 0.66 | (0.82 | ) | (0.30 | ) | ||||||||||||
|
|
|
|
|
|
|
|
|
| |||||||||||
Total from investment operations | (0.12 | ) | 0.82 | 1.22 | (0.31 | ) | 0.22 | |||||||||||||
|
|
|
|
|
|
|
|
|
| |||||||||||
Less distributions to shareholders: | ||||||||||||||||||||
From net investment income | (0.50 | ) | (0.51 | ) | (0.64 | ) | (0.52 | ) | (0.50 | ) | ||||||||||
From net realized gain on investments | — | — | — | — | (0.32 | ) | ||||||||||||||
From return of capital | — | (0.01 | ) | — | — | — | ||||||||||||||
|
|
|
|
|
|
|
|
|
| |||||||||||
Total distributions to shareholders | (0.50 | ) | (0.52 | ) | (0.64 | ) | (0.52 | ) | (0.82 | ) | ||||||||||
|
|
|
|
|
|
|
|
|
| |||||||||||
Net asset value - End of year | $9.47 | $10.09 | $9.79 | $9.21 | $10.04 | |||||||||||||||
|
|
|
|
|
|
|
|
|
| |||||||||||
Net assets - End of year(000’s omitted) | $ | 82,399 | $ | 94,533 | $ | 89,921 | $ | 108,202 | $ | 202,772 | ||||||||||
|
|
|
|
|
|
|
|
|
| |||||||||||
Total return2 | (1.31 | %) | 8.49 | % | 13.41 | % | (3.28 | %) | 2.04 | % | ||||||||||
Ratios (to average net assets)/Supplemental Data: | ||||||||||||||||||||
Expenses* | 0.90 | % | 0.90 | % | 0.94 | % | 1.11 | % | 1.11 | % | ||||||||||
Net investment income | 5.32 | % | 5.31 | % | 5.82 | % | 5.04 | % | 4.78 | % | ||||||||||
Portfolio turnover | 100 | % | 106 | % | 77 | % | 109 | % | 104 | % | ||||||||||
| *For certain periods presented, the investment advisor did not impose all or a portion of its management and/or other fees, and in some periods may have paid a portion of the Series’ expenses. If these expenses had been incurred by the Class, the expense ratio (to average net assets) would have increased by the following amounts: |
| |||||||||||||||||||
| 0.08 | % | 0.07 | % | 0.02 | % | N/A | N/A | |||||||||||||
1Calculated based on average shares outstanding during the years.
2Represents aggregate total return for the year indicated, and assumes reinvestment of all distributions. Total return would have been lower had certain expenses not been waived during certain years.
The accompanying notes are an integral part of the financial statements.
15
High Yield Bond Series
Financial Highlights - Class I
| FOR THE YEAR ENDED | ||||||||||||||||||||
| 12/31/18 | 12/31/17 | 12/31/16 | 12/31/15 | 12/31/14 | ||||||||||||||||
Per share data (for a share outstanding throughout each year): | ||||||||||||||||||||
Net asset value - Beginning of year | $ | 8.80 | $ | 8.61 | $ | 8.18 | $ | 8.97 | $ | 9.59 | ||||||||||
|
|
|
|
|
|
|
|
|
| |||||||||||
Income (loss) from investment operations: | ||||||||||||||||||||
Net investment income1 | 0.49 | 0.49 | 0.52 | 0.47 | 0.49 | |||||||||||||||
Net realized and unrealized gain (loss) on investments | (0.57 | ) | 0.25 | 0.57 | (0.72 | ) | (0.26 | ) | ||||||||||||
|
|
|
|
|
|
|
|
|
| |||||||||||
Total from investment operations | (0.08 | ) | 0.74 | 1.09 | (0.25 | ) | 0.23 | |||||||||||||
|
|
|
|
|
|
|
|
|
| |||||||||||
Less distributions to shareholders: | ||||||||||||||||||||
From net investment income | (0.52 | ) | (0.54 | ) | (0.66 | ) | (0.54 | ) | (0.53 | ) | ||||||||||
From net realized gain on investments | — | — | — | — | (0.32 | ) | ||||||||||||||
From return of capital | — | (0.01 | ) | — | — | — | ||||||||||||||
|
|
|
|
|
|
|
|
|
| |||||||||||
Total distributions to shareholders | (0.52 | ) | (0.55 | ) | (0.66 | ) | (0.54 | ) | (0.85 | ) | ||||||||||
|
|
|
|
|
|
|
|
|
| |||||||||||
Net asset value - End of year | $ | 8.20 | $ | 8.80 | $ | 8.61 | $ | 8.18 | $ | 8.97 | ||||||||||
|
|
|
|
|
|
|
|
|
| |||||||||||
Net assets - End of year(000’s omitted) | $ | 32,962 | $ | 26,459 | $ | 22,658 | $ | 52,383 | $ | 41,586 | ||||||||||
|
|
|
|
|
|
|
|
|
| |||||||||||
Total return2 | (0.98 | %) | 8.68 | % | 13.60 | % | (2.93 | %) | 2.33 | % | ||||||||||
Ratios (to average net assets)/Supplemental Data: | ||||||||||||||||||||
Expenses* | 0.65 | % | 0.65 | % | 0.68 | % | 0.87 | % | 0.86 | % | ||||||||||
Net investment income | 5.63 | % | 5.57 | % | 6.04 | % | 5.34 | % | 5.05 | % | ||||||||||
Portfolio turnover | 100 | % | 106 | % | 77 | % | 109 | % | 104 | % | ||||||||||
| *For the certain periods presented, the investment advisor did not impose all or a portion of its management and/or other fees, and in some periods may have paid a portion of the Series’ expenses. If these expenses had been incurred by the Class, the expense ratio (to average net assets) would have increased by the following amounts: |
| |||||||||||||||||||
| 0.08 | % | 0.07 | % | 0.02 | % | N/A | N/A | |||||||||||||
1Calculated based on average shares outstanding during the years.
2Represents aggregate total return for the year indicated, and assumes reinvestment of all distributions. Total return would have been lower had certain expenses not been waived during certain years.
The accompanying notes are an integral part of the financial statements.
16
High Yield Bond Series
Notes to Financial Statements
| 1. | Organization |
High Yield Bond Series (the “Series”) is ano-load diversified series of Manning & Napier Fund, Inc. (the “Fund”). The Fund is organized in Maryland and is registered under the Investment Company Act of 1940, as amended, as anopen-end management investment company.
The Series’ investment objective is to provide a high level of long-term total return by investing principally innon-investment grade fixed income securities that are issued by government and corporate entities.
The Fund’s advisor is Manning & Napier Advisors, LLC (the “Advisor”). Shares of the Series are offered to investors, clients and employees of the Advisor and its affiliates. The series is authorized to issue two classes of shares (Class S & Class I). Each class of shares is substantially the same, except that Class S shares bear shareholder services fees. The total authorized capital stock of the Fund consists of 15 billion shares of common stock each having a par value of $0.01. As of December 31, 2018, 10.4 billion shares have been designated in total among 34 series, of which 100 million have been designated as High Yield Bond Series Class I common stock, 125 million have been designated as High Yield Bond Series Class S common stock, 50 million have been designated as High Yield Bond Series Class W common stock, and 100 million have been designated as High Yield Bond Series Class Z common stock. Class W common stock and Class Z common stock are not currently offered for sale.
| 2. | Significant Accounting Policies |
The following is a summary of significant accounting policies followed by the Series. The Series is an investment company and, accordingly, follows the investment company accounting and reporting guidance of the Financial Accounting Standards Board Accounting Standards Codification Topic 946 - Investment Companies, which is part of accounting principles generally accepted in the United States of America (“GAAP”).
Security Valuation
Portfolio securities, including domestic equities, foreign equities, warrants and options, listed on an exchange other than the NASDAQ Stock Market are valued at the latest quoted sales price of the exchange on which the security is primarily traded. Securities not traded on valuation date or securities not listed on an exchange are valued at the latest quoted bid price provided by the Fund’s pricing service. Securities listed on the NASDAQ Stock Market are valued in accordance with the NASDAQ Official Closing Price.
Debt securities, including government bonds, foreign bonds, asset-backed securities, structured notes, supranational obligations, sovereign bonds, corporate bonds, loan assignments, and mortgage-backed securities will normally be valued on the basis of evaluated bid prices provided directly by an independent pricing service. The pricing services use multiple valuation techniques to determine fair value. In instances where sufficient market activity exists, the pricing services may utilize a market-based approach through which quotes from market makers are used to determine fair value. In instances where sufficient market activity may not exist or is limited, the pricing services also utilize proprietary valuation models which may consider market characteristics such as benchmark yield curves, option-adjusted spreads, credit spreads, estimated default rates, coupon rates, anticipated timing of principal repayments, underlying collateral, and other unique security features in order to estimate the relevant cash flows, which are then discounted to calculate the fair value. Certain investments in securities held by the Series may be valued on a basis of a price provided directly by a principal market maker. These prices may differ from the value that would have been used had a broader market for securities existed.
The fair value of loan assignments is estimated using recently executed transactions, market price quotations, credit/market events, and cross-asset pricing. Inputs are generally observable market inputs obtained from independent sources. Loan assignments are generally categorized in Level 2 of the fair value hierarchy, unless key inputs are unobservable, in which case they would be categorized in Level 3.
Short-term investments that mature in sixty days or less may be valued at amortized cost, which approximates fair value. Investments inopen-end investment companies are valued at their net asset value per share on valuation date.
17
High Yield Bond Series
Notes to Financial Statements (continued)
| 2. | Significant Accounting Policies (continued) |
Security Valuation(continued)
Volume and level of activity in established markets for an asset or liability are evaluated to determine whether recent transactions and quoted prices are determinative of fair value. Where there have been significant decreases in volume and level of activity, further analysis and adjustment may be necessary to estimate fair value. The Series measures fair value in these instances by the use of inputs and valuation techniques which may be based upon current market prices of securities that are comparable in coupon, rating, maturity and industry and/or expectation of future cash flows. As a result of trading in relatively thin markets and/or markets that experience significant volatility, the prices used by the Series to value these securities may differ from the value that would be realized if these securities were sold, and the differences could be material.
Securities for which representative valuations or prices are not available from the Series’ pricing service may be valued at fair value as determined in good faith by the Advisor under procedures approved by and under the general supervision and responsibility of the Fund’s Board of Directors (the “Board”). Due to the inherent uncertainty of valuations of such securities, the fair value may differ significantly from the values that would have been used had a ready market for such securities existed. If trading or events occurring after the close of the principal market in which securities are traded are expected to materially affect the value of those securities, then they may be valued at their fair value, taking this trading or these events into account.
Various inputs are used in determining the value of the Series’ assets or liabilities carried at fair value. These inputs are summarized in three broad levels. Level 1 includes quoted prices in active markets for identical assets and liabilities. Level 2 includes other significant observable inputs (including quoted prices for similar securities, interest rates, prepayment speeds, credit risk, etc.). Level 3 includes significant unobservable inputs (including the Series’ own assumptions in determining the fair value of investments). A financial instrument’s level within the fair value hierarchy is based on the lowest level of any input both individually and in aggregate that is significant to the fair value measurement. The inputs or methodology used for valuing securities are not necessarily an indication of the risk associated with investing in those securities.
The following is a summary of the valuation levels used for major security types as of December 31, 2018 in valuing the Series’ assets or liabilities carried at fair value:
| DESCRIPTION | TOTAL | LEVEL 1 | LEVEL 2 | LEVEL 3 | ||||||||||||
Assets: | ||||||||||||||||
Debt Securities: | ||||||||||||||||
Corporate debt: | ||||||||||||||||
Communication Services | $ | 9,438,024 | $ | — | $ | 9,438,024 | $ | — | ||||||||
Consumer Discretionary | 11,715,087 | — | 11,715,087 | — | ||||||||||||
Energy | 19,146,832 | — | 19,146,832 | — | ||||||||||||
Financials | 10,595,142 | — | 10,595,142 | — | ||||||||||||
Health Care | 5,592,263 | — | 5,592,263 | — | ||||||||||||
Industrials | 25,244,514 | — | 25,244,514 | — | ||||||||||||
Information Technology | 2,752,700 | — | 2,752,700 | — | ||||||||||||
Materials | 13,128,545 | — | 13,128,545 | — | ||||||||||||
Real Estate | 4,445,822 | — | 4,445,822 | — | ||||||||||||
Utilities | 6,208,758 | — | 6,208,758 | — | ||||||||||||
Mutual fund | 5,539,691 | 5,539,691 | — | — | ||||||||||||
|
|
|
|
|
|
|
| |||||||||
Total assets | $ | 113,807,378 | $ | 5,539,691 | $ | 108,267,687 | $ | — | ||||||||
|
|
|
|
|
|
|
| |||||||||
There were no Level 3 securities held by the Series as of December 31, 2017 or December 31, 2018.
New Accounting Pronouncements
The Securities and Exchange Commission (SEC) adopted changes to RegulationS-X to simplify the reporting of information by registered investment companies in financial statements. The amendments require presentation of the total, rather than the components, of distributable earnings on the Statement of Assets and Liabilities and also require presentation of the total, rather
18
High Yield Bond Series
Notes to Financial Statements (continued)
| 2. | Significant Accounting Policies (continued) |
New Accounting Pronouncements(continued)
than the components, of distributions to shareholders, except for tax return of capital distributions, if any, on the Statement of Changes in Net Assets. The amendments also removed the requirement for parenthetical disclosure of undistributed net investment income on the Statement of Changes in Net Assets. These RegulationS-X amendments are reflected in the Series financial statements for the year ended December 31, 2018. As a result of adopting these amendments, the distributions to shareholders in the December 31, 2017 Statement of Changes in Net Assets presented herein have been reclassified to conform to the current year presentation.
In March 2017, the Financial Accounting Standards Board issued Accounting Standards UpdateNo. 2017-08, Receivables –Nonrefundable Fees and Other Costs (Subtopic310-320): “Premium Amortization of Purchased Callable Debt Securities” which shortens the amortized period for certain callable debt securities, held at a premium, to be amortized to the earliest call date rather than the contractual maturity date. The Series will adopt and apply ASU2017-08 on a modified retrospective basis through a cumulative-effect adjustment as of January 1, 2019. As a result of the adoption of ASU2017-08, as of January 1, 2019 the amortized cost basis of investments will be reduced and unrealized appreciation of investments will be increased, but there will be no impact on net assets or overall results of operations.
On August 28, 2018, the FASB issued ASU2018-13, “Disclosure Framework – Changes to the Disclosure Requirements for Fair Value Measurement,” which amends the fair value measurement disclosure requirements under U.S. GAAP. The amendments of ASU2018-13 include new, eliminated, and modified disclosure requirements. In addition, the amendments clarify that materiality is an appropriate consideration of entities when evaluating disclosure requirements. The ASU is effective for all entities for fiscal years beginning after December 15, 2019, including interim periods therein. An entity is permitted to early adopt any eliminated or modified disclosures upon issuance of this ASU and delay adoption of the new disclosures until their effective date. As such, each Series has early adopted the eliminated and modified disclosures, as permitted by this ASU.
Security Transactions, Investment Income and Expenses
Security transactions are accounted for on trade date. Dividend income is recorded on theex-dividend date, except that if theex-dividend date has passed, certain dividends from foreign securities are recorded as soon as the Series is informed of theex-dividend date.Non-cash dividends, if any, are recorded at the fair value of the securities received. Interest income, including amortization of premium and accretion of discounts using the effective interest method, is earned from settlement date and accrued daily.
Expenses are recorded on an accrual basis. Most expenses of the Fund can be attributed to a specific series. Expenses which cannot be directly attributed are apportioned among the series in the Fund in such a manner as deemed equitable by the Fund’s Board, taking into consideration, among other things, the nature and type of expense. Income, expenses (other than shareholder services fees), and realized and unrealized gains and losses are prorated among the classes based on the relative net assets of each class. Class specific expenses are directly charged to that Class.
The Series uses the identified cost method for determining realized gain or loss on investments for both financial statement and federal income tax reporting purposes.
Foreign Currency Translation
The books and records of the Series are maintained in U.S. dollars. Foreign currencies, investments and other assets and liabilities are translated into U.S. dollars at the current exchange rates. Purchases and sales of investment securities and income and expenses are translated on the respective dates of such transactions. The Series does not isolate realized and unrealized gains and losses attributable to changes in the exchange rates from gains and losses that arise from changes in the fair value of investments. Such fluctuations are included with net realized and unrealized gain or loss on investments. Net realized foreign currency gains and losses represent foreign currency gains and losses between trade date and settlement date on securities transactions, gains and losses on disposition of foreign currencies and the difference between the amount of income and foreign withholding taxes recorded on the books of the Series and the amounts actually received or paid.
19
High Yield Bond Series
Notes to Financial Statements (continued)
| 2. | Significant Accounting Policies (continued) |
Securities Purchased on a When-Issued Basis or Forward Commitment
The Series may purchase securities on a when-issued basis or forward commitment. These transactions involve a commitment by the Series to purchase securities for a predetermined price with payment and delivery taking place beyond the customary settlement period. When such purchases are outstanding, the Series will designate liquid assets in an amount sufficient to meet the purchase price. When purchasing a security on a delayed delivery basis, the Series assumes the rights and risks of ownership of the security, including the risk of price and yield fluctuations, and takes such fluctuations into account when determining its net asset value. The Series may sell the when-issued securities before they are delivered, which may result in a capital gain or loss. No such investments were held by the Series on December 31, 2018.
In connection with its ability to purchase or sell securities on a forward commitment basis, the Series may enter into forward roll transactions principally using To Be Announced (TBA) securities. Forward roll transactions require the sale of securities for delivery in the current month, and a simultaneous agreement to repurchase substantially similar (same type, coupon and maturity) securities on a specified future date. Risks of entering into forward roll transactions include the potential inability of the counterparty to meet the terms of the agreement; the potential of the Series to receive inferior securities at redelivery as compared to the securities sold to the counterparty; counterparty credit risk; and the potential pay down speed variance between the mortgage-backed pools. During the roll period, the Series forgoes principal and interest paid on the securities. The Series accounts for such dollar rolls as purchases and sales. Information regarding securities purchased on a when-issued basis is included in the Series’ Investment Portfolio. No such investments were held by the Series on December 31, 2018.
Asset-Backed Securities
The Series may invest in asset-backed securities. Asset-backed securities are generally issued as pass-through certificates or as debt instruments. Asset-backed securities issued as pass-through certificates represent undivided fractional ownership interests in an underlying pool of assets. Asset-backed securities issued as debt instruments, which are also known as collateralized obligations, are typically issued as the debt of a special purpose entity organized solely for the purpose of owning such assets and issuing such debt. Asset-backed securities are often backed by a pool of assets representing the obligations of a number of different parties. The yield characteristics of certain asset-backed securities may differ from traditional debt securities. One such major difference is that all or a principal part of the obligations may be prepaid at any time because the underlying assets (i.e. loans) may be prepaid at any time. As a result, a decrease in interest rates in the market may result in increases in the level of prepayments as borrowers, particularly mortgagors, refinance and repay their loans. An increased prepayment rate with respect to an asset-backed security will have the effect of shortening the maturity of the security. In addition, the Series may subsequently have to reinvest the proceeds at lower interest rates. If the Series has purchased such an asset-backed security at a premium, a faster than anticipated prepayment rate could result in a loss of principal to the extent of the premium paid.
Mortgage-Backed Securities
The Series may invest in mortgage-backed securities (“MBS” or pass-through certificates) that represent an interest in a pool of specific underlying mortgage loans and entitle the Series to the periodic payments of principal and interest from those mortgages. MBS may be issued by government agencies or corporations, or private issuers. Most MBS issued by government agencies are guaranteed; however, the degree of protection differs based on the issuer. For MBS, there are a number of important differences among the agencies and instrumentalities of the U.S. Government that issue mortgage-related securities and among the securities that they issue. For example, mortgage-related securities guaranteed by Ginnie Mae are guaranteed as to the timely payment of principal and interest by Ginnie Mae and such guarantee is backed by the full faith and credit of the United States. However, mortgage-related securities issued by Freddie Mac and Fannie Mae, including Freddie Mac and Fannie Mae guaranteed mortgage pass-through certificates, which are solely the obligations of Freddie Mac and Fannie Mae, are not backed by or entitled to the full faith and credit of the United States, but are supported by the right of the issuer to borrow from the U.S. Treasury.Non-agency mortgage-backed securities are securities issued bynon-governmental issuers and have no direct or indirect government guarantees of payment and are subject to various risks.Non-agency mortgage loans are obligations of the borrowers thereunder only and are not typically insured or guaranteed by any other person or entity. The ability of a borrower to repay a loan is dependent upon the income or assets of the borrower. A number of factors, including a general economic downturn, acts of God, terrorism, social unrest and civil disturbances, may impair a borrower’s ability to repay its loans.
20
High Yield Bond Series
Notes to Financial Statements (continued)
| 2. | Significant Accounting Policies (continued) |
Restricted Securities
Restricted securities are purchased in private placement transactions, are not registered under the Securities Act of 1933, as amended, and may have contractual restrictions on resale. Information regarding restricted securities is included at the end of the Series’ Investment Portfolio.
Illiquid Securities
A security may be considered illiquid if so deemed in good faith by the Advisor under procedures approved by and under the general supervision and responsibility of the Fund’s Board. Securities that are illiquid are marked with the applicable footnote on the Investment Portfolio.
Federal Taxes
The Series’ policy is to comply with the provisions of the Internal Revenue Code applicable to regulated investment companies. The Series is not subject to federal income tax or excise tax to the extent that the Series distributes to shareholders each year its taxable income, including any net realized gains on investments, in accordance with requirements of the Internal Revenue Code. Accordingly, no provision for federal income tax or excise tax has been made in the financial statements.
Management evaluates its tax positions to determine if the tax positions taken meet the minimum recognition threshold in connection with accounting for uncertainties in income tax positions taken or expected to be taken for the purposes of measuring and recognizing tax liabilities in the financial statements. Recognition of tax benefits of an uncertain tax position is required only when the position is “more likely than not” to be sustained assuming examination by taxing authorities. At December 31, 2018, the Series has recorded no liability for net unrecognized tax benefits relating to uncertain income tax positions taken or expected to be taken in future tax returns.
The Series files income tax returns in the U.S. federal jurisdiction, various states and foreign jurisdictions, as required. No income tax returns are currently under investigation. The statute of limitations on the Series’ tax returns remains open for the years ended December 31, 2015 through December 31, 2018. The Series is not aware of any tax positions for which it is reasonably possible that the total amounts of unrecognized tax benefits will significantly change in the next twelve months.
Foreign Taxes
Based on the Series’ understanding of the tax rules and rates related to income, gains and currency purchase/repatriation transactions for foreign jurisdictions in which it invests, the Series will provide for foreign taxes, and where appropriate, deferred foreign tax.
Distributions of Income and Gains
Distributions to shareholders of net investment income are made quarterly. Distributions of net realized gains are made annually. An additional distribution may be necessary to avoid taxation of the Series. Distributions are recorded on theex-dividend date.
Indemnifications
The Fund’s organizational documents provide former and current directors and officers with a limited indemnification against liabilities arising in connection with the performance of their duties to the Fund. In the normal course of business, the Fund may also enter into contracts that provide general indemnifications. The Fund’s maximum exposure under these arrangements is unknown as this would be dependent on future claims that may be made against the Fund. The risk of material loss from such claims is considered remote.
Other
The preparation of financial statements in conformity with GAAP requires management to make estimates and assumptions that affect the reported amounts of assets and liabilities and the disclosure of contingent assets and liabilities at the date of the financial statements and the reported amounts of income and expenses during the reporting period. Actual results could differ from those estimates.
21
High Yield Bond Series
Notes to Financial Statements (continued)
| 3. | Transactions with Affiliates |
The Fund has an Investment Advisory Agreement (the “Agreement”) with the Advisor, for which the Series pays a fee, computed daily and payable monthly, at an annual rate of 0.55% of the Series’ average daily net assets.
Under the Agreement, personnel of the Advisor provide the Series with advice and assistance in the choice of investments and the execution of securities transactions, and otherwise maintain the Series’ organization. The Advisor also provides the Fund with necessary office space and fund administration and support services. The salaries of all officers of the Fund (except a percentage of the Fund’s Chief Compliance Officer’s salary, which is paid by the Fund), and of all Directors who are “affiliated persons” of the Fund, or of the Advisor, and all personnel of the Fund, or of the Advisor, performing services relating to research, statistical and investment activities, are paid by the Advisor. Each“non-affiliated” Director receives an annual stipend, which is allocated among all the active series of the Fund. In addition, these Directors also receive a fee per Board meeting attended plus a fee for each committee meeting attended and are reimbursed for travel and otherout-of-pocket expenses incurred by them in connection with attending such meetings. The Fund also has an Audit Committee Chair, Governance & Nominating Committee Chair and Lead Independent Director, who each receive an additional annual stipend for these roles.
The Class S shares of the Series are subject to a shareholder services fee in accordance with a shareholder services plan adopted by the Board. The shareholder services fee is intended to compensate financial intermediaries, including affiliates of the Fund, in connection with the provision of direct client service, personal services, maintenance of shareholder accounts and reporting services. For these services, Class S of the Series pays a fee, computed daily and payable monthly, at an annual rate of 0.25% of the average daily net assets of Class S. The Fund has a Shareholder Services Agreement with the Advisor, for which the Advisor receives the shareholder services fee as stated above.
The Advisor has contractually agreed, until at least April 30, 2019, to waive its management fee and, if necessary, pay other operating expenses of the Series in order to maintain total direct annual fund operating expenses for the Series, exclusive of a Class’s Shareholder Services Fee, at no more than 0.65% of average daily net assets. Accordingly, the Advisor waived fees of $97,562 for the year ended December 31, 2018, which is included as a reduction of expenses on the Statement of Operations. The Advisor is not eligible to recoup any expenses that have been waived or reimbursed in prior years.
Manning & Napier Investor Services, Inc., a registered broker-dealer affiliate of the Advisor, acts as distributor for the Fund’s shares. The services of Manning & Napier Investor Services, Inc. are provided at no additional cost to the Series.
Pursuant to a master services agreement dated March 1, 2017, as amended, the Fund pays the Advisor an annual fee related to fund accounting and administration of 0.0085% on the first $25 billion of average daily net assets (excluding Target Series and Income Series); 0.0075% on the next $15 billion of average daily net assets (excluding Target Series and Income Series); and 0.0065% of average daily net assets in excess of $40 billion (excluding Target Series and Income Series); plus a base fee of $30,400 per series. Additionally, certain transaction andout-of-pocket expenses, including charges for reporting relating to the Fund’s compliance program, are charged. The Advisor has agreements with BNY Mellon Investment Servicing (U.S.) Inc. (“BNY”) under which BNY serves assub-accountant services agent.
| 4. | Purchases and Sales of Securities |
For the year ended December 31, 2018, purchases and sales of securities, other than U.S. Government securities and short-term securities, were $111,383,749 and $113,363,001, respectively. There were no purchases or sales of U.S. Government securities.
22
High Yield Bond Series
Notes to Financial Statements (continued)
| 5. | Capital Stock Transactions |
Transactions in shares of Class S and Class I shares of High Yield Bond Series were:
| CLASS S | FOR THE YEAR ENDED 12/31/18 | FOR THE YEAR ENDED 12/31/17 | ||||||||||||||
| SHARES | AMOUNT | SHARES | AMOUNT | |||||||||||||
Sold | 1,739,400 | $ | 17,402,185 | 2,254,918 | $ | 22,952,561 | ||||||||||
Reinvested | 413,607 | 4,067,430 | 444,442 | 4,480,038 | ||||||||||||
Repurchased | (2,824,655 | ) | (28,102,329 | ) | (2,513,638 | ) | (25,384,999 | ) | ||||||||
|
|
|
|
|
|
|
| |||||||||
Total | (671,648 | ) | $ | (6,632,714 | ) | 185,722 | $ | 2,047,600 | ||||||||
|
|
|
|
|
|
|
| |||||||||
| CLASS I | FOR THE YEAR ENDED 12/31/18 | FOR THE YEAR ENDED 12/31/17 | ||||||||||||||
| SHARES | AMOUNT | SHARES | AMOUNT | |||||||||||||
Sold | 3,138,986 | $ | 27,366,623 | 1,499,992 | $ | 13,370,960 | ||||||||||
Reinvested | 172,346 | 1,470,674 | 145,852 | 1,286,685 | ||||||||||||
Repurchased | (2,297,624 | ) | (19,885,616 | ) | (1,272,342 | ) | (11,316,862 | ) | ||||||||
|
|
|
|
|
|
|
| |||||||||
Total | 1,013,708 | $ | 8,951,681 | 373,502 | $ | 3,340,783 | ||||||||||
|
|
|
|
|
|
|
| |||||||||
Approximately 65% of the shares outstanding are fiduciary accounts where the Advisor has sole investment discretion.
| 6. | Line of Credit |
The Fund has entered into a364-day, $25 million credit agreement (the “line of credit”) with Bank of New York Mellon. Each series of the Fund may borrow under the line of credit for temporary or emergency purposes, including funding shareholder redemptions and other short-term liquidity purposes. The Fund pays an annual fee on the unused commitment amount, payable quarterly, and is allocated among all the series of the Fund and included in miscellaneous expenses in the Statement of Operations for each series. The line of credit expires in August 2019 unless extended or renewed. During the year ended December 31, 2018, the Series did not borrow under the line of credit.
| 7. | Financial Instruments and Loan Assignments |
The Series may trade in instruments including written and purchased options, forward foreign currency exchange contracts and futures contracts and other derivatives in the normal course of investing activities to assist in managing exposure to various market risks. The Series may be subject to various elements of risk, which may involve, to a varying degree, elements of risk in excess of the amounts recognized for financial statement purposes. These risks include: the risk that changes in the value of a derivative may not correlate perfectly with the underlying asset, rate or index; counterparty credit risk related to over the counter derivative counterparties’ failure to perform under contract terms; liquidity risk related to the lack of a liquid market for these contracts allowing the fund to close out its position(s); and documentation risk relating to disagreement over contract terms. No such investments were held by the Series as of December 31, 2018.
The Series may invest in a loan assignment of all or a portion of the loans. The Series has direct rights against the borrower on a loan when it purchases an assignment; however, the Series’ rights may be more limited than the lender from which it acquired the assignment and the Series may be able to enforce its rights only through an administrative agent. Loan assignments are vulnerable to market conditions and may become illiquid due to economic conditions or other events may reduce the demand for loan assignments and certain loan assignments which were liquid when purchased may become illiquid.
| 8. | Foreign Securities |
Investing in securities of foreign companies and foreign governments involves special risks and considerations not typically associated with investing in securities of domestic companies and the U.S. Government. These risks include revaluation of currencies and future adverse political and economic developments. Moreover, securities of foreign companies and foreign governments and their markets may be less liquid and their prices more volatile than those of comparable domestic companies and the U.S. Government.
23
High Yield Bond Series
Notes to Financial Statements (continued)
| 9. | Federal Income Tax Information |
The amount and characterization of certain income and capital gains to be distributed are determined in accordance with federal income tax regulations, which may differ from GAAP. These differences are primarily due to differing book and tax treatments in the timing and/or treatment of the recognition of net investment income or gains and losses, including losses deferred due to wash sales. The Series may periodically make reclassifications among its capital accounts to reflect income and gains available for distribution (or available capital loss carryovers) under income tax regulations without impacting the Series’ net asset value. Any such reclassifications are not reflected in the financial highlights.
The tax character of distributions paid were as follows:
FOR THE YEAR ENDED 12/31/18 | FOR THE YEAR ENDED 12/31/17 | |||||||
Ordinary income | $6,294,548 | $6,252,083 | ||||||
Return of capital | — | $ 64,697 | ||||||
At December 31, 2018, the tax basis of components of distributable earnings and the net unrealized depreciation based on the identified cost for federal income tax purposes were as follows:
Cost for federal income tax purposes | $ | 120,772,195 | ||
Unrealized appreciation | 80,147 | |||
Unrealized depreciation | (7,044,964 | ) | ||
|
| |||
Net unrealized depreciation | $ | (6,964,817 | ) | |
|
| |||
Undistributed ordinary income | $ | 44,996 | ||
Capital loss carryforwards | $ | (6,336,797 | ) |
The capital loss carryover utilized in the current year was $902,973.
As of December 31, 2018, the Series had net short-term capital loss carryforwards of $398,915 and net long-term capital loss carryforwards of $5,937,882, which may be carried forward indefinitely.
24
High Yield Bond Series
Report of Independent Registered Public Accounting Firm
To the Board of Directors of Manning & Napier Fund, Inc. and Shareholders of High Yield Bond Series
Opinion on the Financial Statements
We have audited the accompanying statement of assets and liabilities, including the investment portfolio, of High Yield Bond Series (one of the series constituting Manning & Napier Fund, Inc., referred to hereafter as the “Fund”) as of December 31, 2018, the related statement of operations for the year ended December 31, 2018, the statement of changes in net assets for each of the two years in the period ended December 31, 2018, including the related notes, and the financial highlights for each of the five years in the period ended December 31, 2018 (collectively referred to as the “financial statements”). In our opinion, the financial statements present fairly, in all material respects, the financial position of the Fund as of December 31, 2018, the results of its operations for the year then ended, the changes in its net assets for each of the two years in the period ended December 31, 2018 and the financial highlights for each of the five years in the period ended December 31, 2018 in conformity with accounting principles generally accepted in the United States of America.
Basis for Opinion
These financial statements are the responsibility of the Fund’s management. Our responsibility is to express an opinion on the Fund’s financial statements based on our audits. We are a public accounting firm registered with the Public Company Accounting Oversight Board (United States) (PCAOB) and are required to be independent with respect to the Fund in accordance with the U.S. federal securities laws and the applicable rules and regulations of the Securities and Exchange Commission and the PCAOB.
We conducted our audits of these financial statements in accordance with the standards of the PCAOB. Those standards require that we plan and perform the audit to obtain reasonable assurance about whether the financial statements are free of material misstatement, whether due to error or fraud.
Our audits included performing procedures to assess the risks of material misstatement of the financial statements, whether due to error or fraud, and performing procedures that respond to those risks. Such procedures included examining, on a test basis, evidence regarding the amounts and disclosures in the financial statements. Our audits also included evaluating the accounting principles used and significant estimates made by management, as well as evaluating the overall presentation of the financial statements. Our procedures included confirmation of securities owned as of December 31, 2018 by correspondence with the custodian. We believe that our audits provide a reasonable basis for our opinion.

New York, New York
February 15, 2019
We have served as the auditor of one or more investment companies in Manning & Napier Mutual Funds since 1992.
25
High Yield Bond Series
Supplemental Tax Information
(unaudited)
All reportings are based on financial information available as of the date of this annual report and, accordingly are subject to change.
For federal income tax purposes, the Series reports for the current fiscal year $111,711 or, if different, the maximum amount allowable under the tax law as qualified dividend income.
For corporate shareholders, the percentage of investment income (dividend income plus short-term gains, if any) that qualifies for the dividends received deduction for the current fiscal year is 1.97%, or if different, the maximum allowable under tax law.
26
High Yield Bond Series
Renewal of Investment Advisory Agreement
(unaudited)
At the Manning & Napier Fund, Inc. (the “Fund”) Board of Directors’ (the “Board”) meeting, held on November 15, 2018, the Investment Advisory Agreement (the “Agreement”) between the Fund and Manning & Napier Advisors, LLC (the “Advisor”) was considered for renewal by the Board, including all of the Directors who are not “interested persons” (“Independent Directors”), within the meaning of the Investment Company Act of 1940, as amended (the “1940 Act”). In connection with the decision whether to renew the Agreement, a variety of material was provided to the Board in advance of the meeting for their review and consideration. The Board also held a working session on October 31, 2018 to review and discuss information provided to the Board, and for the Board to request additional information.
Representatives of the Advisor attended a portion of the working session and attended the Board meeting. The Advisor provided supplemental information requested by the Board and presented additional oral information to the Board to assist the Board in its considerations. In addition to the information furnished by the Advisor, the Board was provided with a legal memorandum discussing its fiduciary duties related to its approval of the continuation of the Agreement. Legal counsel for the Fund discussed with the Board the applicable legal considerations. In addition, the Board receivedin-person presentations about the Fund throughout the year.
The Independent Directors were advised by independent legal counsel with respect to these matters. The Independent Directors also met separately in an executive session with their legal counsel without any representatives of the Advisor present.
The Directors’ determinations at the meeting were made on the basis of each Director’s business judgment after consideration of all the information presented. In deciding to recommend the renewal of the Agreement with respect to each Series of the Fund, the Independent Directors did not identify any single or particular piece of information that, in isolation, was the controlling factor. Each Independent Director may also have weighed factors differently. This summary describes the most important, but not all, of the factors considered by the Board and the Independent Directors.
| • | The Board considered the nature and quality of services provided by the Advisor under the Agreement for over 30 years including, among others: deciding what securities to purchase and sell for each Series; arranging for the purchase and sale of such securities by placing orders with broker-dealers; administering the affairs of the Fund (including the books and records of the Fund not maintained by third party service providers such as the custodian or transfer agent); arranging for the insurance coverage for the Fund; and supervising the preparation of tax returns, SEC filings (including registration statements) and reports to shareholders for the Fund. The Board considered the numerous services performed by the Advisor and its affiliates beyond those stated in the Agreements. The Board also considered the Advisor’s personnel who perform services to the Fund, changes in senior or key personnel, the strength of the Advisor’s compliance infrastructure, policies and procedures relating to compliance with securities regulations, reputation, expertise and resources. The Board discussed the quality of these services with representatives from the Advisor and concluded that the Advisor was performing its services to the Fund required under the Agreement in a reasonable manner. |
| • | The Board considered the Advisor’s investments teams, including changes to the investment teams and investment team’s compensation during the past year, and the investment process. The Board considered the performance of each Series since its inception, as well as over multiple time periods including: one year, three year, five year, ten year, and current market cycle. A market cycle includes periods of both rising and falling markets. Returns for established benchmark indices for each Series were provided. In addition, the Board considered (and considers on a quarterly basis) a number of other factors relevant to performance at the meeting including: a peer group performance analysis consisting of Morningstar universes of mutual funds with similar investment objectives; the breadth of the Fund’s product offerings; and performance over reasonable time periods. The Board discussed with Representatives of the Advisor, short-term performance challenges in the Fund’s core strategies that have resulted in a downward trend in assets under management. After discussion, the Board concluded that notwithstanding the performance challenges of certain Series, the nature and quality of the investment management services provided by the Advisor to the Fund supported the renewal of the agreement. |
| • | The Board considered the fees and expenses of the various Series of the Fund. The Advisor presented the advisory fees and total expenses for each Series, including the advisory fee adjusted for any contractual expense waivers or reimbursements paid by the Advisor. The Advisor also presentedpro-forma information related to several management fee and overall expense reductions that were set to take effect in early 2019. These changes were approved by the Board in a prior meeting and by shareholders at a Shareholder Meeting in May 2018. |
| • | The Board considered whether the Advisor had achieved economies of scale with respect to its services to the Fund. The Board acknowledged the expense caps incorporated in the Fund’s current fee structure, which requires the Advisor to |
27
High Yield Bond Series
Renewal of Investment Advisory Agreement
(unaudited)
| subsidize the expenses of the Series operating above their expense cap, noting that 27 Series of the Fund are currently receiving expense reimbursements from the Advisor. The Board concluded that the Fund would need to grow in assets before the Advisor would be able to achieve meaningful economies of scale. |
| • | The Advisor provided the Board with information comparing each Series’ contractual management fees with the Advisor’s standard advisory fees for separate accounts and collective investment trusts. The Board considered that the range of services provided to the Series is more extensive than for the Advisor’s other clients due to additional infrastructure, administrative and regulatory requirements related to operating a mutual fund. |
| • | The current andpro-forma advisory fees,12b-1 Distribution and Service Fees, other expenses (e.g. a combination of Shareholder Services Fees, intermediarysub-transfer agent fees, routine operating expenses and Acquired Fund Fees and Expenses forfund-of-fund Series) and total expense ratios of each Series and share class were compared and ranked (on both a mean and median basis) against respective peer universes. Respective peer universes included funds of a similar size and with similar investment objectives and expense characteristics as disclosed on the Morningstar database. Representatives of the Advisor discussed with the Board the comparisons and rankings of fees and net expense ratios for each Series of the Fund and the methodology behind the comparison. The Board considered the Advisor’s active portfolio management that results in portfolios that are more differentiated than the construction of their benchmarks. Based on their review of the information provided, the Board concluded that the current andpro-forma fees and expenses of each Series of the Fund were reasonable on a comparative basis. |
| • | The Board considered the costs of the Advisor’s services and the profits of the Advisor as they relate to the Advisor’s services to the Fund under the Agreement. The Board was provided with information on the Advisor’s financial condition and profitability by mutual fund agreement and by Series. Information provided by the Advisor addressed the anticipated effects of the upcoming fee reductions. The Board discussed the Advisor’s revenues generated from the Fund and its expenses associated with providing the services under the Agreement. The Advisor presented the Board with information on firm wide investment management profitability to provide a comparison of the Advisor’s profitability from its Fund activities relative to its profitability from its other investment management business. In addition, the Board reviewed the Advisor’s expense allocation methodology used to calculate profitability since many of the Advisor’s resources and expenses are shared across the Advisor’s various investment management vehicles. The Board considered the Advisor’s expenses associated with Fund activities outside of the Agreement (such as expense reimbursements pursuant to expense caps and payments made by the Advisor to third party platforms on which shares of the Fund are available for purchase). After discussing the above costs and profits, the Board concluded that the Advisor’s profitability relating to its services provided under the Agreement was reasonable. |
| • | The Board also considered the other benefits the Advisor derives from its relationship with the Fund. Such other benefits include participation in a joint insurance program, sharing of compensation expenses for certain shared personnel, relationships with large service providers, the utilization of Series within the Advisor’s separately managed accounts and certain research services provided by soft dollars. The Board reviewed the broker-dealers who provided research to the Advisor and the products and services paid for, in whole or in part, using soft dollar commissions. The Board concluded that these additional benefits to the Advisor were reasonable. |
Based on the Board’s deliberations and their evaluation of the information described above, the Board, including a majority of the Independent Directors, concluded that the compensation under the Agreement was fair and reasonable with respect to each Series in light of the services and expenses and such other matters as the Directors considered to be relevant in the exercise of their reasonable judgment, and that the renewal of the Agreement would be in the best interests of each Series and its shareholders. The Board did not indicate that any single factor was determinative of its decision to approve the Agreement, but indicated that the Board based its determination on the total mix of information available to it.
28
High Yield Bond Series
Directors’ and Officers’ Information
(unaudited)
The Statement of Additional Information provides additional information about the Fund’s directors and officers and can be obtained without charge by calling1-800-466-3863, at www.manning-napier.com, or on the EDGAR Database on the SEC Internet web site (http://www.sec.gov). The following chart shows certain information about the Fund’s directors and officers, including their principal occupations during the last five years. Unless specific dates are provided, the individuals have held the listed positions for longer than five years.
Interested Director and Officer
| Name: | Paul Battaglia* | |
| Address: | 290 Woodcliff Drive | |
| Fairport, NY 14450 | ||
| Age: | 40 | |
| Current Position(s) Held with Fund: | Principal Executive Officer, President, Chairman and Director | |
| Term of Office & Length of Time Served: | Indefinite – Chairman and Director since November 20181 | |
| Principal Occupation(s) During Past 5 Years: | Chief Financial Officer (2018 – Present); Vice President of Finance (2016 – 2018); Director of Finance (2011 – 2016); Financial Analyst/Internal Auditor (2004-2006) – Manning & Napier Advisors, LLC and affiliates Holds one or more of the following titles for various subsidiaries and affiliates: Chief Financial Officer | |
| Number of Portfolios Overseen within Fund Complex: | 34 | |
Other Directorships Held Outside Fund Complex During Past 5 Years: | N/A |
Independent Directors
| Name: | Stephen B. Ashley | |
| Address: | 290 Woodcliff Drive | |
| Fairport, NY 14450 | ||
| Age: | 78 | |
| Current Position(s) Held with Fund: | Director, Audit Committee Member, Governance & Nominating Committee Member | |
| Term of Office & Length of Time Served: | Indefinite – Since 1996 | |
| Principal Occupation(s) During Past 5 Years: | Chairman, Director & Chief Executive Officer (1997 to present) - The Ashley Group (property management and investment). Director (1995-2008) and Chairman(non-executive) (2004-2008) - Fannie Mae (mortgage) | |
| Number of Portfolios Overseen within Fund Complex: | 34 | |
| Other Directorships Held Outside Fund Complex During Past 5 Years: | Fannie Mae (1995-2008) The Ashley Group (1995-2008) Genesee Corporation (1987-2007) |
| Name: | Paul A. Brooke | |
| Address: | 290 Woodcliff Drive | |
| Fairport, NY 14450 | ||
| Age: | 73 | |
| Current Position(s) Held with Fund: | Lead Independent Director, Audit Committee Member, Governance & Nominating Committee Chairman | |
| Term of Office & Length of Time Served: | Indefinite – Director, Audit Committee Member, Governance & Nominating Committee Member since 2007; Governance & Nominating Committee Chairman since 2016; Lead Independent Director since 2017 | |
| Principal Occupation(s) During Past 5 Years: | Chairman & CEO (2005-2009) - Ithaka Acquisition Corporation (investments); Chairman (2007-2009) - Alsius Corporation (investments); Managing Member (1991-present) - PMSV Holdings LLC (investments); Managing Member (2010-2016) - Venbio (investments). | |
| Number of Portfolios Overseen within Fund Complex: | 34 | |
| Other Directorships Held Outside Fund Complex During Past 5 Years: | Incyte Corp. (biotech)(2000-present); ViroPharma, Inc. (speciality pharmaceuticals)(2000-2014); HLTH (WebMD)(information)(2000-2010); Cheyne Capital International (investment)(2000-2017); GMP Companies (investment)(2000-2011); Cytos Biotechnology Ltd (biotechnology)(2012-2014); Cerus (biomedical)(2016-present);PureEarth(non-profit)(2012-present); Caelum BioSciences (biomedical)(2018-present) |
29
High Yield Bond Series
Directors’ and Officers’ Information
(unaudited)
Independent Directors (continued)
| Name: | Peter L. Faber | |
| Address: | 290 Woodcliff Drive | |
| Fairport, NY 14450 | ||
| Age: | 80 | |
| Current Position(s) Held with Fund: | Director, Governance & Nominating Committee Member | |
| Term of Office & Length of Time Served: | Indefinite – Since 1987 | |
| Principal Occupation(s) During Past 5 Years: | Senior Counsel (2006-2012), Partner (1995-2006 & 2013-2018) - McDermott, Will & Emery LLP (law firm) | |
| Number of Portfolios Overseen within Fund Complex: | 34 | |
| Other Directorships Held Outside Fund Complex During Past 5 Years: | Boston Early Music Festival(non-profit)(2007-present); Amherst Early Music, Inc.(non-profit)(2009-present); Gotham Early Music Scene, Inc.(non-profit)(2009-present); Partnership for New York City, Inc.(non-profit)(1989-2010); New York Collegium(non-profit)(2004-2011); S’Cool Sounds, Inc.(non-profit)(2017-present) |
| Name: | Harris H. Rusitzky | |
| Address: | 290 Woodcliff Drive | |
| Fairport, NY 14450 | ||
| Age: | 83 | |
| Current Position(s) Held with Fund: | Director, Audit Committee Member, Governance & Nominating Committee Member | |
| Term of Office & Length of Time Served: | Indefinite – Since 1985 | |
| Principal Occupation(s) During Past 5 Years: | President (1994- present) - The Greening Group (business consultants); Partner (2006-present) - The Restaurant Group (restaurants) | |
| Number of Portfolios Overseen within Fund Complex: | 34 | |
| Other Directorships Held Outside Fund Complex During Past 5 Years: | Rochester Institute of Technology (university)(1972-present); Culinary Institute of America(non-profit college)(1985-present); George Eastman Museum (museum)(1988-present); National Restaurant Association (restaurant trade organization)(1978-present) |
| Name: | Chester N. Watson | |
| Address: | 290 Woodcliff Drive | |
| Fairport, NY 14450 | ||
| Age: | 68 | |
| Current Position(s) Held with Fund: | Director, Audit Committee Chairman, Governance & Nominating Committee Member | |
| Term of Office & Length of Time Served: | Indefinite – Director, Audit Committee Member, Governance & Nominating Committee Member Since 2012; Audit Committee Chairman since 2013 | |
| Principal Occupation(s) During Past 5 Years: | General Auditor (2003-2011) - General Motors Company (auto manufacturer) | |
| Number of Portfolios Overseen within Fund Complex: | 34 | |
| Other Directorships Held Outside Fund Complex During Past 5 Years: | Rochester Institute of Technology (university)(2005-present); Town of Greenburgh, NY Planning Board (municipal government) (2015-2018) |
Officers:
| Name: | Jeffrey S. Coons, Ph.D., CFA® | |
| Address: | 290 Woodcliff Drive | |
| Fairport, NY 14450 | ||
| Age: | 55 | |
| Current Position(s) Held with Fund: | Vice President | |
| Term of Office1& Length of Time Served: | Since 2004 | |
| Principal Occupation(s) During Past 5 Years: | President since 2010,Co-CEO since 2018,Co-Director of Research (2002 – 2015) - Manning & Napier Advisors, LLC Holds one or more of the following titles for various subsidiaries and affiliates: President, Director, Treasurer, or Senior Trust Officer |
30
High Yield Bond Series
Directors’ and Officers’ Information
(unaudited)
Officers: (continued)
| Name: | Elizabeth Craig | |
| Address: | 290 Woodcliff Drive | |
| Fairport, NY 14450 | ||
| Age: | 31 | |
| Current Position(s) Held with Fund: | Corporate Secretary | |
| Term of Office1& Length of Time Served: | Since 2016 | |
| Principal Occupation(s) During Past 5 Years: | Fund Administration Manager since 2015; Mutual Fund Compliance Specialist (2009-2015) - Manning & Napier Advisors, LLC; Assistant Corporate Secretary (2011-2016) - Manning & Napier Fund, Inc. |
| Name: | Christine Glavin | |
| Address: | 290 Woodcliff Drive | |
| Fairport, NY 14450 | ||
| Age: | 52 | |
| Current Position(s) Held with Fund: | Principal Financial Officer, Chief Financial Officer | |
| Term of Office1& Length of Time Served: | Principal Financial Officer since 2002; Chief Financial Officer since 2001 | |
| Principal Occupation(s) During Past 5 Years: | Director of Fund Reporting since 2011; Fund Reporting Manager (1997-2011) - Manning & Napier Advisors, LLC; Assistant Treasurer since 2008 - Exeter Trust Company; Chief Financial Officer (2017-2018) - Rainier Investment Management Mutual Funds, Inc. |
| Name: | Jodi L. Hedberg | |
| Address: | 290 Woodcliff Drive | |
| Fairport, NY 14450 | ||
| Age: | 51 | |
| Current Position(s) Held with Fund: | Chief Compliance Officer, Anti-Money Laundering Compliance Officer | |
| Term of Office1& Length of Time Served: | Chief Compliance Officer since 2004; Anti-Money Laundering Officer since 2002; Corporate Secretary (1997-2016) - Manning & Napier Fund, Inc.; Chief Compliance Officer and Anti-Money Laundering Officer (2017-2018) – Rainier Investment Management Mutual Funds, Inc. | |
| Principal Occupation(s) During Past 5 Years: | Managing Director, Compliance & Regulatory Affairs since 2018; Director of Compliance (2005-2018); Compliance Manager (1995-2005) – Manning & Napier Advisors, LLC and affiliates; Corporate Secretary – Manning & Napier Investor Services, Inc. since 2006 |
| Name: | Scott Morabito | |
| Address: | 290 Woodcliff Drive | |
| Fairport, NY 14450 | ||
| Age: | 31 | |
| Current Position(s) Held with Fund: | Assistant Vice President | |
| Term of Office1& Length of Time Served: | Since 2017 | |
| Principal Occupation(s) During Past 5 Years: | Director of Funds Group since 2017; Fund Product and Strategy Manager (2014-2017); Senior Product and Strategy Analyst (2013-2014); Product and Strategy Analyst (2011-2013) - Manning & Napier Advisors, LLC; President, Director – Manning & Napier Investor Services, Inc. since 2018 |
| Name: | Sarah Turner | |
| Address: | 290 Woodcliff Drive | |
| Fairport, NY 14450 | ||
| Age: | 36 | |
| Current Position(s) Held with Fund: | Chief Legal Officer; Assistant Corporate Secretary | |
| Term of Office1& Length of Time Served: | Since 2018 | |
| Principal Occupation(s) During Past 5 Years: | General Counsel since 2018 - Manning & Napier Advisors, LLC and affiliates; Counsel (2017-2018) – Harter Secrest and Emery LLP; Legal Counsel (2010-2017) – Manning & Napier Advisors, LLC and affiliates Holds one or more of the following titles for various affiliates: Corporate Secretary, General Counsel |
31
High Yield Bond Series
Directors’ and Officers’ Information
(unaudited)
Officers: (continued)
| Name: | Amy Williams | |
| Address: | 290 Woodcliff Drive | |
| Fairport, NY 14450 | ||
| Age: | 57 | |
| Current Position(s) Held with Fund: | Assistant Corporate Secretary | |
| Term of Office1& Length of Time Served: | Since 2016 | |
| Principal Occupation(s) During Past 5 Years: | Director of Fund Documentation - Manning & Napier Advisors, LLC since 2009 Holds one or more of the following titles for various affiliates: Director |
*Interested Director, within the meaning of the 1940 Act by reason of her positions with the Fund’s investment advisor, Manning & Napier Advisors, LLC and Distributor, Manning & Napier Investor Services, Inc.
1The term of office of all officers shall be one year and until their respective successors are chosen and qualified, or his or her earlier resignation or removal as provided in the Fund’sBy-Laws.
32
{This page intentionally left blank}
33
High Yield Bond Series
Literature Requests
(unaudited)
Proxy Voting Policies and Procedures
A description of the policies and procedures that the Fund uses to determine how to vote proxies relating to portfolio securities is available, without charge, upon request:
| By phone | 1-800-466-3863 | |||
| On the Securities and Exchange | ||||
Commission’s (SEC) web site | http://www.sec.gov |
Proxy Voting Record
Information regarding how the Fund voted proxies relating to portfolio securities during the most recent12-month period ended June 30th is available, without charge, upon request:
| By phone | 1-800-466-3863 | |||
| On the SEC’s web site | http://www.sec.gov |
Quarterly Portfolio Holdings
The Series’ complete schedule of portfolio holdings for the 1st and 3rd quarters of each fiscal year are provided on FormN-Q, and are available, without charge, upon request:
| By phone | 1-800-466-3863 | |||
| On the SEC’s web site | http://www.sec.gov |
Prospectus and Statement of Additional Information (SAI)
For more information about any of the Manning & Napier Fund, Inc. Series, you may obtain a prospectus and SAI at www.manning-napier.com or by calling (800)466-3863. Before investing, carefully consider the objectives, risks, charges and expenses of the investment and read the prospectus carefully as it contains this and other information about the investment company.In addition, this information can be found on the SEC’s web site, http://www.sec.gov.
Additional information available at www.manning-napier.com
1. Fund Holdings -Month-End
2. Fund Holdings -Quarter-End
3. Shareholder Report - Annual
4. Shareholder Report - Semi-Annual
The Fund also offers electronic notification or“e-delivery” when certain documents are availableon-line to be downloaded or reviewed. Direct shareholders can elect to receive electronic notification when shareholder reports, prospectus updates, and/or statements are available. If you do not currently haveon-line access to your account, you can establish access by going to www.manning-napier.com, click on “Login” in the top corner of the page, and follow the prompts to self-enroll. Once enrolled, you can set your electronic notification preferences by clicking on the Account Options tab located within the green toolbar and then selectE-Delivery Option. Should you have any questions on either how to establishon-line access or how to update your account settings, please contact Investor Services at1-800-466-3863.
The Manning & Napier Fund, Inc. is managed by Manning & Napier Advisors, LLC. Manning & Napier Investor Services, Inc., an affiliate of Manning & Napier Advisors, LLC, is the distributor of the Fund shares.
MNHYB-12/18-AR

Manning & Napier Fund, Inc.
Income Series
Beginning on February 25, 2021, as permitted by Securities and Exchange Commission regulations, paper copies of the Series’ annual and semi-annual shareholder reports will no longer be sent by mail, unless you specifically request paper copies of the reports from the Fund or from your financial intermediary, such as a broker-dealer or bank. Instead, the reports will be made available on a website, and you will be notified by mail each time a report is posted and provided with a website link to access the report.
If you already elected to receive shareholder reports electronically, you will not be affected by this change and you need not take any action. You may elect to receive shareholder reports and other communications from the Fund electronically by contacting your financial intermediary or, if you are a direct investor, by visiting www.manning-napier.com or calling1-800-466-3863.
You may elect to receive all future annual and semi-annual reports in paper free of charge. If you invest through a financial intermediary, you can contact your financial intermediary to request that you continue to receive paper copies of your shareholder reports. If you invest directly with the Fund, you can inform the Fund that you wish to continue receiving paper copies of your shareholder reports by visiting www.manning-napier.com or calling1-800-466-3863. Your election to receive reports in paper will apply to all funds held with your financial intermediary if you invest through a financial intermediary or all series of the Fund if you invest directly with the Fund.
Income Series
Management Discussion and Analysis
(unaudited)
Dear Shareholders:
The investment environment we witnessed over the past twelve months was far more volatile than in prior years. It resulted in a sharp drawdown in global equity markets during the fourth quarter of 2018.
For the fiscal year ending on December 31, 2018, US equities experienced negative returns, with the S&P 500 Total Return Index falling 4.38%. International equity performance was somewhat worse, with the MSCI ACWI ex USA Index returning negative 14.20%.
In fixed income, domestic investment-grade bond performance was essentially flat for the year, as measured by the Bloomberg Barclays U.S. Aggregate Bond Index, rising 0.01% as income generated over the period was offset by rising interest rates (when interest rates rise, bond prices fall).
We believe recent volatility, both at the beginning and end of last year, is reflective of what investors should expect going forward. While we do not believe we are immediately heading for a recession, we see recent developments within the US and abroad as an indication that we are entering a higher risk period for financial markets.
The US economy is likely approaching a period of peak growth. It continues to show signs of progressing toward the later stages of its economic and market cycle (typical characteristics of anend-of-cycle phase are an economic recession and financial market selloff).
As economic growth decelerates to more sustainable levels, we believe that investors are facing a growing risk of disappointment. At the same time, key global risks remain, including trade tensions, geopolitical uncertainty, and tightening monetary policy.
Considering the current economic and market backdrop, we believe investors should temper their performance expectations. The returns experienced over the latter half of the post-Global Financial Crisis bull market are unlikely to continue.
Additionally, given our cautious outlook, we are reviewing current and prospective investments for excessive risk exposures, and we have adjusted our positioning across many of our portfolios. Going forward, we will continue to follow our disciplines, focusing on flexibility and selectivity in today’s incredibly dynamic investment environment.
With this in mind, in the enclosed we discuss recent fund performance, highlight our positioning, and briefly provide our outlook amid the current investment environment.
We hope that you find this information helpful, and we look forward to working with you in the years ahead. Thank you for your continued confidence in Manning & Napier.
Sincerely,
Manning & Napier Advisors, LLC
The S&P 500 Index is an unmanaged, capitalization-weighted measure comprised of 500 leading U.S. companies to gauge U.S. large cap equities. The Index returns do not reflect any fees or expenses. The Index includes dividends, but not the reinvestment of dividends. Index returns provided by Bloomberg. S&P Dow Jones Indices LLC, a subsidiary of the McGraw Hill Financial, Inc., is the publisher of various index based data products and services and has licensed certain of its products and services for use by Manning & Napier. All such content Copyright© 2019 by S&P Dow Jones Indices LLC and/or its affiliates. All rights reserved. Neither S&P Dow Jones Indices LLC, Dow Jones Trademark Holdings LLC, their affiliates nor their third party licensors make any representation or warranty, express or implied, as to the ability of any index to accurately represent the asset class or market sector that it purports to represent and none of these parties shall have any liability for any errors, omissions, or interruptions of any index or the data included therein.
The MSCI ACWI ex USA Index (ACWIxUS) is designed to measure large andmid-cap representation across 22 of 23 Developed Markets countries (excluding the U.S.) and 24 Emerging Markets countries. The Index returns do not reflect any fees or expenses. The Index is denominated in U.S. dollars. The Index returns are net of withholding taxes. They assume daily reinvestment of net dividends thus accounting for any applicable dividend taxation. Index returns provided by Bloomberg.
The Bloomberg Barclays U.S. Aggregate Bond Index is an unmanaged, market-value weighted index of U.S. domestic investment-grade debt issues, including government, corporate, asset-backed, and mortgage-backed securities, with maturities of one year or more. Index returns do not reflect any fees or expenses. Index returns provided by Interactive Data.
1
Income Series
Fund Commentary
(unaudited)
Investment Objective
To manage against capital risk while generating income and pursuing long-term capital growth using a diversified multi-asset class portfolio constructed from a strategic blend of proprietary Manning & Napier mutual funds that utilize bothtop-down andbottom-up analysis.
Performance Commentary
The Income Series delivered negative absolute returns during 2018, with the Class S shares returning negative 2.33% (Class I shares returned negative 2.09%). However, the Series outperformed its blended benchmark, which returned negative 4.24%.
During the full year of 2018, selection was the primary driver of outperformance. Overall asset allocation also supported relative returns, specifically an underweight to equity and an overweight to fixed income, as fixed income outperformed equity during the year.
More specifically, the Series’ selections within Industrials, Consumer Discretionary, and Energy were the largest contributors to relative returns, and within Fixed Income, an underweight to high yield bonds and selection within high yield bonds were also positive contributors to returns over the year. Equity sector allocation was a key detractor from relative returns with an overweight to Industrials, an underweight to Utilities, and selection within Real Estate as the largest detractors from relative returns.
Regarding fixed income positioning, we continue to believe a modest duration remains in investors’ best interest. Although we may see rates move lower in the near-term, we believe that, over the long-term, underlying economic factors will likely apply gradual pressure on rates to move higher and for the yield curve to flatten. We think the Federal Reserve will seek to remain flexible, looking to increase the federal funds target rate when economic and financial conditions allow, while remaining sensitive to domestic and global market conditions as they continue to reduce the size of their balance sheet.
Within the equity portion of the Series, we are seeking to achieve competitive total return through a combination of capital appreciation and income. Many of these investments reflect an emphasis on businesses with high free cash flow yields, stable fundamentals, and a competitive dividend. By including companies with these characteristics, we help to manage risk for our clients while pursuing both growth and income generation opportunities. Historical evidence shows that over a full market cycle, companies with high free cash flow yields and high dividend yields have provided a greater level of downside protection than the overall stock market. We are also targeting companies that have the potential to provide a growing level of dividend income going forward, are trading at a meaningful discount from their intrinsic value (which is reflected by their current cash-generating ability), and/or are expected to be beneficiaries of special situations such as those driven by economic or capital market cycles.
The portfolio’s allocation to real estate is primarily focused on real estate investment trusts (REITs). We continue to emphasize companies with stable consistent cash flows, which we believe are positioned to benefit from anticipated improvements in supply/ demand dynamics, and/or exhibit a discount relative to value stored in hard assets. Currently the real estate portion of the portfolio is overweight to residential- and data storage-related REITs, while being underweight to retail- and hospitality-related REITs.
Performance data quoted represents past performance and does not guarantee future results. The investment return and principal value of an investment will fluctuate, so that an investor’s shares, when redeemed, may be worth more or less than their original cost. Current performance may be higher or lower than that quoted; investors can obtain the most recentmonth-end performance at www.manning-napier.com or by calling (800)466-3863. Performance for the Series’ Class S shares is provided above. Performance for the Series’ Class I shares will be higher based on the Class’ lower expenses.
2
Income Series
Fund Commentary
(unaudited)
Performance Commentary (continued)
Please see the next page for additional performance information as of December 31, 2018.
All investments involve risks, including possible loss of principal. An investment in the Series will fluctuate in response to stock market movements and changes in interest rates. Because the Series invests in a combination of other affiliated funds, it is subject to asset allocation risk as well as the risks associated with each underlying fund’s investment portfolio. These include, but are not limited to, the risk that dividends may be discontinued or decreased;small-cap/mid-cap risk, including the risk that stocks of small- andmid-cap companies may be subject to more abrupt or erratic market movements than the stocks of larger companies and may be less marketable than the stocks of larger companies; risks related to investments in options, which, like all derivatives, can be highly volatile and involve risks in addition to the risks of the underlying instrument on which the derivative is based, such as counterparty, correlation and liquidity risk; risks related to the direct ownership of real estate (including REITs) such as interest rate risk, liquidity risk, and changes in property value, among others; foreign investment risk, including fluctuating currency values, different accounting standards, and economic and political instability, as well as the risk that investments in emerging markets may be more volatile than investments in developed markets; issuer-specific risk; and the increased default risk associated with higher-yielding, lower-rated securities. There is an inverse relationship between bond prices and interest rates; as interest rates rise, bond prices (and therefore the value of bond funds) fall. Likewise, as interest rates fall, bond prices and the value of bond funds rise. For periods from August 1, 2012 through September 30, 2013, the Income Composite Benchmark consisted of 40% Russell 3000® Value Index (Russell 3000 Value), 10% MSCI ACWI ex USA Index (ACWIxUS), 10% MSCI U.S. Real Estate Investment Trust (REIT) Index, and 40% Bloomberg Barclays U.S. Aggregate Bond Index (BAB). From October 1, 2013 through August 31, 2018, it consisted of the 32% Russell 3000 Value, 8% ACWIxUS, 10% REIT Index, and 50% BAB. Beginning September 1, 2018,the Income Composite Benchmark consists of 35% Russell 3000 Value, 5% REIT Index, 35% BAB, and 25% Intercontinental Exchange (ICE) Bank of America Merrill Lynch (BofAML)BB-B U.S. Cash Pay High Yield Index. Russell 3000 Value Index is an unmanaged, market capitalization-weighted index consisting of those Russell 3000® Index companies with lowerprice-to-book ratios and lower forecasted growth values. The Index returns are based on a market capitalization-weighted average of relative price changes of the component stocks plus dividends whose reinvestments are compounded daily. Index returns provided by Bloomberg. ACWIxUS is designed to measure large andmid-cap representation across 22 of 23 Developed Markets countries (excluding the U.S.) and 24 Emerging Markets countries. The Index is denominated in U.S. dollars. The Index returns are net of withholding taxes. They assume daily reinvestment of net dividends thus accounting for any applicable dividend taxation. The REIT Index is a free float-adjusted market capitalization index that is comprised of equity REITs that are classified in the Equity REITs Industry under the GICS® Real Estate sector. The REIT Index is a subset of the MSCI USA Investable Market Index (IMI) which captures large, mid, andsmall-cap securities. The Index is denominated in U.S. dollars. The Index returns are net of withholding taxes. They assume daily reinvestment of net dividends thus accounting for any applicable dividend taxation. Index returns provided by Bloomberg. BAB is an unmanaged index that represents the U.S. domestic investment-grade bond market. It is a market value-weighted index of investment-grade debt issues, including government, corporate, asset-backed and mortgage-backed securities, with maturities of one year or more. Index returns provided by Interactive Data. ICE BofAMLBB-B U.S. Cash Pay High Yield Index is a subset of the ICE BofAML U.S. Cash Pay High Yield Index. The Index includes all U.S. dollar denominated below investment grade corporate debt securities currently in a coupon paying period rated BB1 through B3. Qualifying securities must have at least one year remaining term to final maturity, at least 18 months to final maturity at point of issuance, a fixed coupon schedule, and a minimum amount outstanding of $250 million. Index returns provided by Bloomberg. The returns of the indices do not reflect any fees or expenses. Returns provided are calculated monthly using a blended allocation. Because the fund’s asset allocation will vary over time, the composition of the fund’s portfolio may not match the composition of the comparative Indices.
3
Income Series
Performance Update - Income Series
(unaudited)
AVERAGE ANNUAL TOTAL RETURNS AS OF DECEMBER 31, 2018 | ||||||
ONE YEAR1 | FIVE YEAR | SINCE INCEPTION2 | ||||
Manning & Napier Fund, Inc. - Income Series - Class S3 | -2.33% | 4.43% | 5.73% | |||
Manning & Napier Fund, Inc. - Income Series - Class I3 | -2.09% | 4.68% | 5.97% | |||
Income Composite Benchmark4 | -4.24% | 4.03% | 5.66% | |||
Bloomberg Barclays U.S. Aggregate Bond Index5 | 0.01% | 2.52% | 1.73% | |||
The following graph compares the value of a $10,000 investment in the Manning & Napier Fund, Inc. - Income Series - Class S from its inception2 (August 1, 2012) to present (December 31, 2018) to the Income Composite Benchmark Index and the Bloomberg Barclays U.S. Aggregate Bond Index.

1The returns shown are based on net asset values calculated for shareholder transactions and may differ from the returns shown in the financial highlights, which reflect adjustments made to the net asset values in accordance with accounting principles generally accepted in the United States of America.
2Performance numbers for the Series and the Bloomberg Barclays U.S. Aggregate Bond Index are calculated from August 1, 2012, the Series’ inception date.
3The Series’ performance does not reflect the deduction of taxes that a shareholder would pay on fund distributions or the redemption of shares. The Series’ performance is historical and may not be indicative of future results. The performance returns shown are inclusive of the net expense ratio of the Series. For the year ended December 31, 2018, this net expense ratio was 0.30% for Class S and 0.05% for Class I. The gross expense ratio, which does not account for any voluntary or contractual waivers currently in effect, was 0.67% for Class S and 0.42% for Class I for the year ended December 31, 2018.
4For periods from August 1, 2012 through September 30, 2013, the Income Composite Benchmark previously known as the Strategic Income Moderate Benchmark consisted of 40% Russell 3000® Value Index (Russell 3000 Value), 10% MSCI ACWI ex USA Index (ACWIxUS), 10% MSCI U.S. Real Estate Investment Trust (REIT) Index, and 40% Bloomberg Barclays U.S. Aggregate Bond Index (BAB). From October 1, 2013 through August 31, 2018, it consists of the 32% Russell 3000 Value, 8% ACWIxUS, 10% REIT Index, and 50% BAB. Beginning September 1, 2018, the Income Composite Benchmark consists of 35% Russell 3000 Value, 5% REIT Index, 35% BAB, and the 25% Intercontinental Exchange (ICE) Bank of America Merrill Lynch (BofAML)BB-B U.S. Cash Pay High Yield Index. Russell 3000 Value Index is an unmanaged, market capitalization-weighted index consisting of those Russell 3000® Index companies with lowerprice-to-book ratios and lower forecasted growth values. The Index returns are based on a market capitalization-weighted average of relative price changes of the component stocks plus dividends whose reinvestments are compounded daily. Index returns provided by Bloomberg. ACWIxUS is designed to measure large andmid-cap representation across 22 of 23 Developed Markets countries (excluding the U.S.) and 24 Emerging Markets countries. The Index is denominated in U.S. dollars. The Index returns are net of withholding taxes. They assume daily reinvestment of net dividends thus accounting for any applicable dividend taxation. The MSCI U.S. REIT Index is a free float-adjusted market capitalization index that is comprised of equity REITs that are classified in the Equity REITs Industry under the GICS® Real Estate sector. The MSCI U.S. REIT Index is a subset of the MSCI USA Investable Market Index (IMI) which captures large, mid, andsmall-cap securities. The Index is denominated in U.S. dollars. The Index returns are net of withholding taxes. They assume daily reinvestment of net dividends thus accounting for any applicable dividend taxation. Index returns provided by Bloomberg. BAB is an unmanaged index that represents the U.S. domestic investment-grade bond market. It is a market value-weighted index of investment-grade debt issues, including government, corporate, asset-backed and mortgage-backed securities, with maturities of one year or more. Index returns provided by Interactive Data. ICE BofAMLBB-B U.S. Cash Pay High Yield Index is a subset of the ICE BofAML U.S. Cash Pay High Yield Index. The Index includes all U.S. dollar denominated below investment grade corporate debt securities currently in a coupon paying period rated BB1 through B3. Qualifying securities must have at least one year remaining term to final maturity, at least 18 months to final maturity at point of issuance, a fixed coupon schedule, and a minimum amount outstanding of $250 million. Index returns provided by Bloomberg. The returns of the indices do not reflect any fees or expenses. Returns provided are calculated monthly using a blended allocation. Because the fund’s asset allocation will vary over time, the composition of the fund’s portfolio may not match the composition of the comparative Indices.
4
Income Series
Performance Update - Income Series
(unaudited)
5The Bloomberg Barclays U.S Aggregate Bond Index is an unmanaged, market-value weighted index of U.S. domestic investment-grade debt issues, including government, corporate, asset-backed and mortgage-backed securities, with maturities greater than one year but less than ten years. Index returns do not reflect any fees or expenses. Index returns provided by Interactive Data.
5
Income Series
Shareholder Expense Example
(unaudited)
As a shareholder of the Series, you incur ongoing costs, including management fees, shareholder service fees and other Series expenses. This example is intended to help you understand your ongoing costs (in dollars) of investing in the Series and to compare these costs with the ongoing costs of investing in other mutual funds.
The example is based on an investment of $1,000 invested in each class at the beginning of the period and held for the entire period (July 1, 2018 to December 31, 2018).
Actual Expenses
The Actual lines of the tables below provide information about actual account values and actual expenses. You may use the information in these lines, together with the amount you invested, to estimate the expenses that you paid over the period. Simply divide your account value by $1,000 (for example, an $8,600 account value divided by $1,000 = 8.6), then multiply the result by the number in the Actual line for the Series and Class in which you have invested under the heading entitled “Expenses Paid During Period” to estimate the expenses you paid on your account during this period.
Hypothetical Example for Comparison Purposes
The Hypothetical lines of each class in the tables below provide information about hypothetical account values and hypothetical expenses based on the Class’ actual expense ratio and an assumed rate of return of 5% per year before expenses, which is not the Class’ actual return. The hypothetical account values and expenses may not be used to estimate the actual ending account balance or expenses you paid during the period. You may use this information to compare the ongoing costs of investing in a Class of the Series and other funds. To do so, compare this 5% hypothetical example for the Series and Class in which you have invested with the 5% hypothetical examples that appear in the shareholder reports of the other funds.
Please note that the expenses shown in the tables are meant to highlight your ongoing costs only and do not reflect any transaction costs, such as sales charges (loads), redemption fees, or exchange fees that you may incur in other mutual funds. Therefore, the Hypothetical lines of the tables are useful in comparing ongoing costs only, and will not help you determine the relative total costs of owning different funds.
BEGINNING ACCOUNT VALUE 7/1/18 | ENDING ACCOUNT VALUE 12/31/18 | EXPENSES PAID DURING PERIOD1 7/1/18-12/31/18 | ANNUALIZED EXPENSE RATIO2 | |||||||||||||
Class S | ||||||||||||||||
Actual | $1,000.00 | $ 985.56 | $1.50 | 0.30% | ||||||||||||
Hypothetical (5% return before expenses) | $1,000.00 | $1,023.69 | $1.53 | 0.30% | ||||||||||||
Class I | ||||||||||||||||
Actual | $1,000.00 | $ 986.79 | $0.25 | 0.05% | ||||||||||||
Hypothetical (5% return before expenses) | $1,000.00 | $1,024.95 | $0.26 | 0.05% | ||||||||||||
1Expenses are equal to each Class’ annualized expense ratio (for the six month period), multiplied by the average account value over the period, multiplied by 184/365 (to reflect theone-half year period). Expenses are based on the most recent fiscal half year; therefore, the expense ratios stated above may differ from the expense ratios stated in the financial highlights, which are based onone-year data. The Class’ total returns would have been lower had certain expenses not been reimbursed during the period.
2Expense ratios of each Class do not include fees and expenses indirectly incurred by the underlying funds. If these expenses were included, the expense ratios would have been higher.
6
Income Series
Portfolio Composition as of December 31, 2018
(unaudited)

7
Income Series
Investment Portfolio - December 31, 2018
| SHARES |
VALUE (NOTE 2) | |||||||
AFFILIATED INVESTMENT COMPANIES - 99.9% | ||||||||
Manning & Napier Fund, Inc. - Core Bond Series, Class I | 1,760,668 | $ | 16,761,563 | |||||
Manning & Napier Fund, Inc. - Disciplined Value Series, Class I | 589,167 | 7,158,376 | ||||||
Manning & Napier Fund, Inc. - Equity Income Series, Class I | 677,289 | 7,097,987 | ||||||
Manning & Napier Fund, Inc. - High Yield Bond Series, Class I | 992,776 | 8,140,765 | ||||||
Manning & Napier Fund, Inc. - Real Estate Series, Class I | 369,864 | 2,034,253 | ||||||
|
| |||||||
TOTAL AFFILIATED INVESTMENT COMPANIES - 99.9% (Identified Cost $44,545,894) | 41,192,944 | |||||||
OTHER ASSETS, LESS LIABILITIES - 0.1% | 29,215 | |||||||
|
| |||||||
NET ASSETS - 100% | $ | 41,222,159 | ||||||
|
| |||||||
The accompanying notes are an integral part of the financial statements.
8
Income Series
Statement of Assets and Liabilities
December 31, 2018
ASSETS: | ||||
Total investments in Underlying Series, at value (identified cost $44,545,894) (Note 2) | $ | 41,192,944 | ||
Receivable from Advisor (Note 3) | 11,706 | |||
Receivable for fund shares sold | 58,544 | |||
Prepaid expenses | 12,698 | |||
|
| |||
TOTAL ASSETS | 41,275,892 | |||
|
| |||
LIABILITIES: | ||||
Accrued fund accounting and administration fees (Note 3) | 12,451 | |||
Accrued shareholder services fees (Class S) (Note 3) | 5,534 | |||
Accrued Chief Compliance Officer service fees (Note 3) | 426 | |||
Payable for shares of Underlying Series purchased | 20,090 | |||
Printing and postage fees payable | 6,513 | |||
Custodian fees payable | 4,727 | |||
Audit fees payable | 3,420 | |||
Other payables and accrued expenses | 572 | |||
|
| |||
TOTAL LIABILITIES | 53,733 | |||
|
| |||
TOTAL NET ASSETS | $ | 41,222,159 | ||
|
| |||
NET ASSETS CONSIST OF: | ||||
Capital stock | 40,820 | |||
Additionalpaid-in-capital | 44,347,969 | |||
Total distributable earnings (loss) | (3,166,630 | ) | ||
|
| |||
TOTAL NET ASSETS | $ | 41,222,159 | ||
|
| |||
NET ASSET VALUE, OFFERING PRICE AND REDEMPTION PRICE PER SHARE - Class S ($26,315,337/2,605,712 shares) | $ | 10.10 | ||
|
| |||
NET ASSET VALUE, OFFERING PRICE AND REDEMPTION PRICE PER SHARE - Class I ($14,906,822/1,476,318 shares) | $ | 10.10 | ||
|
| |||
The accompanying notes are an integral part of the financial statements.
9
Income Series
Statement of Operations
For the Year Ended December 31, 2018
INVESTMENT INCOME: | ||||
Income distributions from Underlying Series | $ | 1,082,203 | ||
|
| |||
EXPENSES: | ||||
Shareholder services fees (Class S) (Note 3) | 57,759 | |||
Fund accounting and administration fees (Note 3) | 47,173 | |||
Chief Compliance Officer service fees (Note 3) | 4,634 | |||
Directors’ fees (Note 3) | 2,788 | |||
Registration and filing fees | 32,597 | |||
Audit fees | 18,020 | |||
Printing and postage fees | 13,001 | |||
Custodian fees | 12,671 | |||
Miscellaneous | 13,470 | |||
|
| |||
Total Expenses | 202,113 | |||
Less reduction of expenses (Note 3) | (127,037 | ) | ||
|
| |||
Net Expenses | 75,076 | |||
|
| |||
NET INVESTMENT INCOME | 1,007,127 | |||
|
| |||
REALIZED AND UNREALIZED GAIN (LOSS) ON UNDERLYING SERIES: | ||||
Net realized gain (loss) on Underlying Series | 86,662 | |||
Distributions of realized gains from Underlying Series | 1,214,047 | |||
Net change in unrealized appreciation (depreciation) on Underlying Series | (3,445,843 | ) | ||
|
| |||
NET REALIZED AND UNREALIZED GAIN (LOSS) ON UNDERLYING SERIES | (2,145,134 | ) | ||
|
| |||
NET DECREASE IN NET ASSETS RESULTING FROM OPERATIONS | $ | (1,138,007 | ) | |
|
| |||
The accompanying notes are an integral part of the financial statements.
10
Income Series
Statements of Changes in Net Assets
FOR THE YEAR ENDED | FOR THE YEAR ENDED | |||||||
INCREASE (DECREASE) IN NET ASSETS: | ||||||||
OPERATIONS: | ||||||||
Net investment income | $ | 1,007,127 | $ | 732,002 | ||||
Net realized gain (loss) on Underlying Series | 86,662 | (85,582 | ) | |||||
Distributions of realized gains from Underlying Series | 1,214,047 | 1,824,428 | ||||||
Net change in unrealized appreciation (depreciation) on Underlying Series | (3,445,843 | ) | 582,980 | |||||
|
|
|
| |||||
Net increase (decrease) from operations | (1,138,007 | ) | 3,053,828 | |||||
|
|
|
| |||||
DISTRIBUTIONS TO SHAREHOLDERS (Note 9): | ||||||||
Class S | (2,107,232 | ) | (888,512 | ) | ||||
Class I | (1,206,621 | ) | (328,425 | ) | ||||
|
|
|
| |||||
Total distributions to shareholders | (3,313,853 | ) | (1,216,937 | )1 | ||||
|
|
|
| |||||
CAPITAL STOCK ISSUED AND REPURCHASED: | ||||||||
Net increase (decrease) from capital share transactions (Note 6) | 12,523,376 | 8,500,418 | ||||||
|
|
|
| |||||
Net increase (decrease) in net assets | 8,071,516 | 10,337,309 | ||||||
NET ASSETS: | ||||||||
Beginning of year | 33,150,643 | 22,813,334 | ||||||
|
|
|
| |||||
End of year2 | $ | 41,222,159 | $ | 33,150,643 | ||||
|
|
|
| |||||
1 For the year ended December 31, 2017, the distributions to shareholders from net investment income and net realized gain were $620,933 and $267,579 (Class S) and $249,695 and $78,730 (Class I), respectively.
2 Includes accumulated undistributed (overdistributed) net investment income of $0 as of December 31, 2017. The SEC eliminated the requirement to disclose undistributed net investment income in 2018.
The accompanying notes are an integral part of the financial statements.
11
Income Series
Financial Highlights - Class S
| FOR THE YEAR ENDED | ||||||||||||||||||||
| 12/31/18 | 12/31/17 | 12/31/16 | 12/31/15 | 12/31/14 | ||||||||||||||||
Per share data (for a share outstanding throughout each year): | ||||||||||||||||||||
Net asset value - Beginning of year | $11.27 | $10.60 | $10.31 | $10.84 | $10.80 | |||||||||||||||
|
|
|
|
|
|
|
|
|
| |||||||||||
Income (loss) from investment operations: | ||||||||||||||||||||
Net investment income1,2 | 0.30 | 0.25 | 0.27 | 0.25 | 0.38 | |||||||||||||||
Net realized and unrealized gain (loss) on investments | (0.53 | ) | 0.84 | 0.66 | (0.36 | ) | 0.34 | |||||||||||||
|
|
|
|
|
|
|
|
|
| |||||||||||
Total from investment operations | (0.23 | ) | 1.09 | 0.93 | (0.11 | ) | 0.72 | |||||||||||||
|
|
|
|
|
|
|
|
|
| |||||||||||
Less distributions to shareholders: | ||||||||||||||||||||
From net investment income | (0.31 | ) | (0.30 | ) | (0.36 | ) | (0.20 | ) | (0.37 | ) | ||||||||||
From net realized gain on investments | (0.63 | ) | (0.12 | ) | (0.28 | ) | (0.22 | ) | (0.31 | ) | ||||||||||
|
|
|
|
|
|
|
|
|
| |||||||||||
Total distributions to shareholders | (0.94 | ) | (0.42 | ) | (0.64 | ) | (0.42 | ) | (0.68 | ) | ||||||||||
|
|
|
|
|
|
|
|
|
| |||||||||||
Net asset value - End of year | $10.10 | $11.27 | $10.60 | $10.31 | $10.84 | |||||||||||||||
|
|
|
|
|
|
|
|
|
| |||||||||||
Net assets - End of year (000’s omitted) | $26,315 | $23,581 | $19,062 | $16,040 | $15,751 | |||||||||||||||
|
|
|
|
|
|
|
|
|
| |||||||||||
Total return3 | (2.33% | ) | 10.39% | 9.10% | (1.01% | ) | 6.66% | |||||||||||||
Ratios (to average net assets)/Supplemental Data: | ||||||||||||||||||||
Expenses* | 0.30%4 | 0.30%4 | 0.30%4 | 0.30%5 | 0.30%6 | |||||||||||||||
Net investment income2 | 2.77% | 2.30% | 2.55% | 2.29% | 3.37% | |||||||||||||||
Series portfolio turnover7 | 51% | 12% | 28% | 74% | 35% | |||||||||||||||
* The investment advisor paid a portion of the Series’ expenses. If these expenses had been incurred by the Series, the expense ratios (to average net assets) would have been increased by the following amounts: |
| |||||||||||||||||||
| 0.37 | %4 | 0.38 | %4 | 0.56 | %4 | 0.57 | %5 | 0.73 | %6 | |||||||||||
1Calculated based on average shares outstanding during the years.
2Net investment income is affected by the timing of distributions from the Underlying Series in which the Series invest. The ratios do not include net investment income of the Underlying Series in which the Series invests.
3Represents aggregate total return for the years indicated, and assumes reinvestment of all distributions. Total return would have been lower had certain expenses not been waived or reimbursed during certain years.
4Expense ratios do not include expenses of the Underlying Series in which the Series invests. The average expense ratio of the Underlying Series was 0.59%.
5Expense ratios do not include expenses of the Underlying Series in which the Series invests. The average expense ratio of the Underlying Series was 0.57%.
6Expense ratios do not include expenses of the Underlying Series in which the Series invests. The average expense ratio of the Underlying Series was 0.49%.
7Reflects activity of the Series and does not include the activity of the Underlying Series.
The accompanying notes are an integral part of the financial statements.
12
Income Series
Financial Highlights - Class I
| FOR THE YEAR ENDED | ||||||||||||||||||||
| 12/31/18 | 12/31/17 | 12/31/16 | 12/31/15 | 12/31/14 | ||||||||||||||||
Per share data (for a share outstanding throughout each year): | ||||||||||||||||||||
Net asset value - Beginning of year | $11.27 | $10.60 | $10.31 | $10.84 | $10.80 | |||||||||||||||
|
|
|
|
|
|
|
|
|
| |||||||||||
Income (loss) from investment operations: | ||||||||||||||||||||
Net investment income1,2 | 0.35 | 0.29 | 0.28 | 0.30 | 0.41 | |||||||||||||||
Net realized and unrealized gain (loss) on investments | (0.56 | ) | 0.82 | 0.67 | (0.39 | ) | 0.34 | |||||||||||||
|
|
|
|
|
|
|
|
|
| |||||||||||
Total from investment operations | (0.21 | ) | 1.11 | 0.95 | (0.09 | ) | 0.75 | |||||||||||||
|
|
|
|
|
|
|
|
|
| |||||||||||
Less distributions to shareholders: | ||||||||||||||||||||
From net investment income | (0.33 | ) | (0.32 | ) | (0.38 | ) | (0.22 | ) | (0.40 | ) | ||||||||||
From net realized gain on investments | (0.63 | ) | (0.12 | ) | (0.28 | ) | (0.22 | ) | (0.31 | ) | ||||||||||
|
|
|
|
|
|
|
|
|
| |||||||||||
Total distributions to shareholders | (0.96 | ) | (0.44 | ) | (0.66 | ) | (0.44 | ) | (0.71 | ) | ||||||||||
|
|
|
|
|
|
|
|
|
| |||||||||||
Net asset value - End of year | $10.10 | $11.27 | $10.60 | $10.31 | $10.84 | |||||||||||||||
|
|
|
|
|
|
|
|
|
| |||||||||||
Net assets - End of year (000’s omitted) | $14,907 | $9,570 | $3,752 | $3,948 | $2,136 | |||||||||||||||
|
|
|
|
|
|
|
|
|
| |||||||||||
Total return3 | (2.09% | ) | 10.67% | 9.36% | (0.76% | ) | 6.90% | |||||||||||||
Ratios (to average net assets)/Supplemental Data: | ||||||||||||||||||||
Expenses* | 0.05% | 4 | 0.05% | 4 | 0.05% | 4 | 0.05% | 5 | 0.05% | 6 | ||||||||||
Net investment income2 | 3.19% | 2.66% | 2.63% | 2.76% | 3.65% | |||||||||||||||
Series portfolio turnover7 | 51% | 12% | 28% | 74% | 35% | |||||||||||||||
* The investment advisor paid a portion of the Series’ expenses. If these expenses had been incurred by the Series, the expense ratios (to average net assets) would have been increased by the following amounts: |
| |||||||||||||||||||
| 0.37% | 4 | 0.38% | 4 | 0.56% | 4 | 0.67% | 5 | 0.73% | 6 | |||||||||||
1Calculated based on average shares outstanding during the years.
2Net investment income is affected by the timing of distributions from the Underlying Series in which the Series invest. The ratios do not include net investment income of the Underlying Series in which the Series invests.
3Represents aggregate total return for the years indicated, and assumes reinvestment of all distributions. Total return would have been lower had certain expenses not been waived or reimbursed during certain years.
4Expense ratios do not include expenses of the Underlying Series in which the Series invests. The average expense ratio of the Underlying Series was 0.59%.
5Expense ratios do not include expenses of the Underlying Series in which the Series invests. The average expense ratio of the Underlying Series was 0.57%.
6Expense ratios do not include expenses of the Underlying Series in which the Series invests. The average expense ratio of the Underlying Series was 0.49%.
7Reflects activity of the Series and does not include the activity of the Underlying Series.
The accompanying notes are an integral part of the financial statements.
13
Income Series
Notes to Financial Statements
| 1. | Organization |
Income Series, formerly known as Strategic Income Moderate Series, (the “Series”) is ano-load diversified series of Manning & Napier Fund, Inc. (the “Fund”). The Fund is organized in Maryland and is registered under the Investment Company Act of 1940 (the “1940 Act”), as amended, as anopen-end management investment company.
Income Series’ investment objective is to manage against capital risk and generate income with a secondary goal of pursuing long-term capital growth.
The Series seeks to achieve its investment objective by investing in a combination of other Manning & Napier mutual funds (the “Underlying Series”). As of December 31, 2018, the Underlying Series include the Core Bond Series, Disciplined Value Series, High Yield Bond Series, Real Estate Series and Equity Income Series of the Fund. The financial statements of the Underlying Series, which are available at www.manning-napier.com, should be read in conjunction with the Series’ financial statements.
The Series is authorized to issue two classes of shares (Class S and I). Each class of shares is substantially the same, except that Class S shares bear a shareholder services fee.
The Fund’s advisor is Manning & Napier Advisors, LLC (the “Advisor”). Shares of the Series are offered to investors and employees of the Advisor and its affiliates. The total authorized capital stock of the Fund consists of 15 billion shares of common stock each having a par value of $0.01. As of December 31, 2018, 10.4 billion shares have been designated in total among 34 series, of which 100 million each have been designated as Income Series Class I common stock, Income Series Class S common stock and Income Series Class Z common stock. Class Z common stock are not currently offered for sale.
| 2. | Significant Accounting Policies |
The following is a summary of significant accounting policies followed by the Series. The Series is an investment company and, accordingly, follows the investment company accounting and reporting guidance of the Financial Accounting Standards Board Accounting Standards Codification Topic 946 - Investment Companies, which is part of accounting principles generally accepted in the United States of America (“GAAP”).
Security Valuation
Investments in the Underlying Series are valued at their net asset value per share on valuation date. In the absence of the availability of a net asset value per share on the Underlying Series, security valuations may be determined in good faith by the Advisor under procedures approved by and under the general supervision and responsibility of the Fund’s Board of Directors (the “Board”).
Volume and level of activity in established markets for an asset or liability are evaluated to determine whether recent transactions and quoted prices are determinative of fair value. Where there have been significant decreases in volume and level of activity, further analysis and adjustment may be necessary to estimate fair value. The Series measure fair value in these instances by the use of inputs and valuation techniques which may be based upon current market prices of securities that are comparable in coupon, rating, maturity and industry and/or expectation of future cash flows. As a result of trading in relatively thin markets and/or markets that experience significant volatility, the prices used by the Series to value these securities may differ from the value that would be realized if these securities were sold, and the differences could be material.
Securities for which representative valuations or prices are not available from the Series’ pricing service may be valued at fair value as determined in good faith by the Advisor under procedures approved by and under the general supervision and responsibility of the Board. Due to the inherent uncertainty of valuations of such securities, the fair value may differ significantly from the values that would have been used had a ready market for such securities existed. If trading or events occurring after the close of the principal market in which securities are traded are expected to materially affect the value of those securities, then they may be valued at their fair value, taking this trading or these events into account.
14
Income Series
Notes to Financial Statements (continued)
| 2. | Significant Accounting Policies (continued) |
Security Valuation(continued)
Various inputs are used in determining the value of the Series’ assets or liabilities carried at fair value. These inputs are summarized in three broad levels. Level 1 includes quoted prices in active markets for identical assets and liabilities. Level 2 includes other significant observable inputs (including quoted prices for similar securities, interest rates, prepayment speeds, credit risk, etc.). Level 3 includes significant unobservable inputs (including the Series’ own assumptions in determining the fair value of investments). A financial instrument’s level within the fair value hierarchy is based on the lowest level of any input both individually and in aggregate that is significant to the fair value measurement. The inputs or methodology used for valuing securities are not necessarily an indication of the risk associated with investing in those securities.
The following is a summary of the valuation levels used for major security types as of December 31, 2018 in valuing the Series’ assets or liabilities carried at fair value:
| DESCRIPTION | TOTAL | LEVEL 1 | LEVEL 2 | LEVEL 3 | ||||||||||||
Assets: | ||||||||||||||||
Mutual funds | $ | 41,192,944 | $ | 41,192,944 | $ | — | $ | — | ||||||||
|
|
|
|
|
|
|
| |||||||||
Total assets: | $ | 41,192,944 | $ | 41,192,944 | $ | — | $ | — | ||||||||
|
|
|
|
|
|
|
| |||||||||
There were no Level 2 or Level 3 securities held by the Series as of December 31, 2017 or December 31, 2018.
New Accounting Pronouncements
The Securities and Exchange Commission (SEC) adopted changes to RegulationS-X to simplify the reporting of information by registered investment companies in financial statements. The amendments require presentation of the total, rather than the components, of distributable earnings on the Statement of Assets and Liabilities and also require presentation of the total, rather than the components, of distributions to shareholders, except for tax return of capital distributions, if any, on the Statement of Changes in Net Assets. The amendments also removed the requirement for parenthetical disclosure of undistributed net investment income on the Statement of Changes in Net Assets. These RegulationS-X amendments are reflected in the Series financial statements for the year ended December 31, 2018. As a result of adopting these amendments, the distributions to shareholders in the December 31, 2017 Statement of Changes in Net Assets presented herein have been reclassified to conform to the current year presentation.
On August 28, 2018, the FASB issued ASU2018-13, “Disclosure Framework – Changes to the Disclosure Requirements for Fair Value Measurement,” which amends the fair value measurement disclosure requirements under U.S. GAAP. The amendments of ASU2018-13 include new, eliminated, and modified disclosure requirements. In addition, the amendments clarify that materiality is an appropriate consideration of entities when evaluating disclosure requirements. The ASU is effective for all entities for fiscal years beginning after December 15, 2019, including interim periods therein. An entity is permitted to early adopt any eliminated or modified disclosures upon issuance of this ASU and delay adoption of the new disclosures until their effective date. As such, each Series has early adopted the eliminated and modified disclosures, as permitted by this ASU.
Security Transactions, Investment Income and Expenses
Security transactions are accounted for on trade date. Dividend income is recorded on theex-dividend date.Non-cash dividends, if any, are recorded at the fair value of the securities received. Income and capital gains distributions from the Underlying Series, if any, are recorded on theex-dividend date.
Expenses are recorded on an accrual basis. Most expenses of the Fund can be attributed to a specific series. Expenses which cannot be directly attributed are apportioned among the series in the Fund in such a manner as deemed equitable by the Fund’s Board, taking into consideration, among other things, the nature and type of expense. Income, expenses (other than shareholder services fees), and realized and unrealized gains and losses are prorated among the classes based on the relative net assets of each class. Class specific expenses are directly charged to that class. Expenses included in the accompanying Statements of Operations do not include any expense of the Underlying Series.
15
Income Series
Notes to Financial Statements (continued)
| 2. | Significant Accounting Policies (continued) |
Security Transactions, Investment Income and Expenses(continued)
The Series uses the identified cost method for determining realized gain or loss on investments for both financial statement and federal income tax reporting purposes.
Federal Taxes
The Series’ policy is to comply with the provisions of the Internal Revenue Code applicable to regulated investment companies. The Series is not subject to federal income tax or excise tax to the extent that the Series distributes to shareholders each year its taxable income, including any net realized gains on investments, in accordance with requirements of the Internal Revenue Code. Accordingly, no provision for federal income tax or excise tax has been made in the financial statements.
Management evaluates its tax positions to determine if the tax positions taken meet the minimum recognition threshold in connection with accounting for uncertainties in income tax positions taken or expected to be taken for the purposes of measuring and recognizing tax liabilities in the financial statements. Recognition of tax benefits of an uncertain tax position is required only when the position is “more likely than not” to be sustained assuming examination by taxing authorities. At December 31, 2018, the Series has recorded no liability for net unrecognized tax benefits relating to uncertain income tax positions taken or expected to be taken in future tax returns.
The Series files income tax returns in the U.S. federal jurisdiction, various states and foreign jurisdictions, as required. No income tax returns are currently under investigation. The statute of limitations on the Series’ tax returns remains open for the years ended December 31, 2015 through December 31, 2018. The Series is not aware of any tax positions for which it is reasonably possible that the total amounts of unrecognized tax benefits will significantly change in the next twelve months.
Foreign Taxes
Based on the Series’ understanding of the tax rules and rates related to income, gains and currency purchase/repatriation transactions for foreign jurisdictions in which it invests, the Series will provide for foreign taxes, and where appropriate, deferred foreign tax.
Distributions of Income and Gains
Distributions to shareholders of net investment income are made quarterly. Distributions of net realized gains are made annually. An additional distribution may be necessary to avoid taxation of the Series. Distributions are recorded on theex-dividend date.
Indemnifications
The Fund’s organizational documents provide former and current directors and officers with a limited indemnification against liabilities arising in connection with the performance of their duties to the Fund. In the normal course of business, the Fund may also enter into contracts that provide general indemnifications. The Fund’s maximum exposure under these arrangements is unknown as this would be dependent on future claims that may be made against the Fund. The risk of material loss from such claims is considered remote.
Other
The preparation of financial statements in conformity with GAAP requires management to make estimates and assumptions that affect the reported amounts of assets and liabilities and the disclosure of contingent assets and liabilities at the date of the financial statements and the reported amounts of income and expenses during the reporting period. Actual results could differ from those estimates.
| 3. | Transactions with Affiliates |
The Fund has an Investment Advisory Agreement (the “Agreement”) with the Advisor, for which the Advisor does not receive an advisory fee for the services it performs for the Series. However, the Advisor is entitled to receive an advisory fee from each of the Underlying Series in which the Series invests.
Under the Agreement, personnel of the Advisor provide the Series with advice and assistance in the choice of investments and the execution of securities transactions, and otherwise maintain the Series’ organization. The Advisor also provides the Fund
16
Income Series
Notes to Financial Statements (continued)
| 3. | Transactions with Affiliates (continued) |
with necessary office space and fund administration and support services. The salaries of all officers of the Fund (except a percentage of the Fund’s Chief Compliance Officer’s salary, which is paid by the Fund), and of all Directors who are “affiliated persons” of the Fund, or of the Advisor, and all personnel of the Fund, or of the Advisor, performing services relating to research, statistical and investment activities, are paid by the Advisor. Each“non-affiliated” Director receives an annual stipend, which is allocated among all the active series of the Fund. In addition, these Directors also receive a fee per Board meeting attended plus a fee for each committee meeting attended and are reimbursed for travel and otherout-of-pocket expenses incurred by them in connection with attending such meetings. The Fund also has an Audit Committee Chair, Governance & Nominating Committee Chair and Lead Independent Director, who each receive an additional annual stipend for these roles.
The Class S shares of the Series are subject to a shareholder services fee in accordance with a shareholder service plan adopted by the Board. The shareholder services fee is intended to compensate financial intermediaries, including affiliates of the Fund, in connection with the provision of direct client services, personal services, maintenance of shareholder accounts and reporting services. For these services, the Class S shares of the Series pays a fee, computed daily and payable monthly, at an annual rate of 0.25% of the average daily net assets of Class S. The Fund has a Shareholder Services Agreement with the Advisor, for which the Advisor receives the shareholder services fee as stated above.
Manning & Napier Investor Services, Inc., a registered broker-dealer affiliate of the Advisor, acts as distributor for the Fund’s shares. The services of Manning & Napier Investor Services, Inc. are provided at no additional cost to the Series.
The Advisor has contractually agreed, until at least April 30, 2019, to limit each class’ total direct annual fund operating expenses for the Series at no more than 0.05% for each Class, exclusive of the Shareholder Services Fee, of average daily net assets each year. The Advisor’s agreement to limit each class’ operating expenses is limited to direct operating expenses and, therefore, does not apply to the indirect expenses incurred by the Series through their investments in the Underlying Series. For the year ended December 31, 2018, the Advisor reimbursed expenses of $127,037 which is included as a reduction of expenses on the Statement of Operations. The Advisor is not eligible to recoup any expenses that have been waived or reimbursed in prior years.
Pursuant to a master services agreement dated March 1, 2017, as amended, the Fund pays the Advisor an annual fee related to fund accounting and administration of 0.00225% of average daily net assets with an annual base fee of $39,400. Additionally, certain transaction andout-of-pocket expenses, including charges for reporting relating to the Fund’s compliance program, are charged. The Advisor has agreements with BNY Mellon Investment Servicing (U.S.) Inc. (“BNY”) under which BNY serves assub-accountant services agent.
| 4. | Purchases and Sales of Securities |
For the year ended December 31, 2018, purchases and sales of securities, other than U.S. Government securities and short-term securities, were $29,340,792 and $17,946,524, respectively. There were no purchases or sales of U.S. Government securities.
17
Income Series
Notes to Financial Statements (continued)
| 5. | Investments in Affiliated Issuers |
A summary of the Series’ transactions in the shares of affiliated issuers of Manning & Napier during the year ended December 31, 2018 is set forth below:
| VALUE AT 12/31/17 | PURCHASE COST | SALES PROCEEDS | VALUE AT 12/31/18 | SHARES HELD AT 12/31/18 | DIVIDEND INCOME 1/1/18 THROUGH 12/31/18 | DISTRIBUTIONS AND NET REALIZED GAIN/(LOSS) 1/1/18 THROUGH 12/31/18 | CHANGE IN UNREALIZED APPRECIATION (DEPRECIATON) | |||||||||||||||||||||||||||
| Core Bond Series - Class I | $ | 11,253,671 | $ | 10,139,971 | $ | 4,225,910 | $ | 16,761,563 | 1,760,668 | $ | 399,013 | $ (172,949 | ) | $ (230,697 | ) | ||||||||||||||||||
Disciplined Value Series - Class I | 6,975,296 | 4,712,449 | 3,446,874 | 7,158,376 | 589,167 | 99,532 | 794,307 | (1,111,100 | ) | |||||||||||||||||||||||||
Equity Income Series - Class I | 7,465,036 | 4,105,771 | 3,536,197 | 7,097,987 | 677,289 | 128,758 | 787,494 | (1,467,908 | ) | |||||||||||||||||||||||||
High Yield Bond Series - Class I | 1,664,746 | 7,977,181 | 932,313 | 8,140,765 | 992,776 | 335,675 | (12,494 | ) | (556,354 | ) | ||||||||||||||||||||||||
Real Estate Series - Class I | 2,480,962 | 1,714,620 | 1,821,230 | 2,034,253 | 369,864 | 83,750 | (52,799 | ) | (97,688 | ) | ||||||||||||||||||||||||
Unconstrained Bond Series - Class I | 3,318,146 | 690,800 | 3,984,000 | — | — | 35,475 | (42,850 | ) | 17,904 | |||||||||||||||||||||||||
|
|
|
|
|
|
|
|
|
|
|
|
|
|
|
| |||||||||||||||||||
| $ | 33,157,857 | $ | 29,340,792 | $ | 17,946,524 | $ | 41,192,944 | $ | 1,082,203 | $1,300,709 | $(3,445,843 | ) | ||||||||||||||||||||||
|
|
|
|
|
|
|
|
|
|
|
|
|
| |||||||||||||||||||||
| 6. | Capital Stock Transactions |
Transactions in shares of Class S and Class I shares of Income Series were:
| CLASS S | FOR THE YEAR ENDED 12/31/18 | FOR THE YEAR ENDED 12/31/17 | ||||||||||||||
| SHARES | AMOUNTS | SHARES | AMOUNTS | |||||||||||||
Sold | 992,538 | $ | 10,946,955 | 549,029 | $ | 5,973,649 | ||||||||||
Reinvested | 186,703 | 1,981,401 | 73,935 | 821,554 | ||||||||||||
Repurchased | (665,243 | ) | (7,355,700 | ) | (329,757 | ) | (3,653,492 | ) | ||||||||
|
|
|
|
|
|
|
| |||||||||
Total | 513,998 | $ | 5,572,656 | 293,207 | $ | 3,141,711 | ||||||||||
|
|
|
|
|
|
|
| |||||||||
| CLASS I | FOR THE YEAR ENDED 12/31/18 | FOR THE YEAR ENDED 12/31/17 | ||||||||||||||
| SHARES | AMOUNTS | SHARES | AMOUNTS | |||||||||||||
Sold | 762,335 | $ | 8,517,189 | 616,594 | $ | 6,687,602 | ||||||||||
Reinvested | 113,553 | 1,202,575 | 29,346 | 326,297 | ||||||||||||
Repurchased | (248,648 | ) | (2,769,044 | ) | (150,859 | ) | (1,655,192 | ) | ||||||||
|
|
|
|
|
|
|
| |||||||||
Total | 627,240 | $ | 6,950,720 | 495,081 | $ | 5,358,707 | ||||||||||
|
|
|
|
|
|
|
| |||||||||
Approximately 4% of the shares outstanding are fiduciary accounts where the Advisor has sole investment discretion.
| 7. | Line of Credit |
The Fund has entered into a364-day, $25 million credit agreement (the “line of credit”) with Bank of New York Mellon. Each series of the Fund may borrow under the line of credit for temporary or emergency purposes, including funding shareholder redemptions and other short-term liquidity purposes. The Fund pays an annual fee on the unused commitment amount, payable quarterly, and is allocated among all the series of the Fund and included in miscellaneous expenses in the Statement of Operations for each series. The line of credit expires in August 2019 unless extended or renewed. During the year ended December 31, 2018, the Series did not borrow under the line of credit.
18
Income Series
Notes to Financial Statements (continued)
| 8. | Financial Instruments |
The Underlying Series may trade in instruments including written and purchased options, forward foreign currency exchange contracts and futures contracts and other derivatives in the normal course of investing activities to assist in managing exposure to various market risks. The Underlying Series may be subject to various elements of risk which may involve, to a varying degree, elements of risk in excess of the amounts recognized for financial statement purposes. These risks include: the risk that changes in the value of a derivative may not correlate perfectly with the underlying asset, rate or index; counterparty credit risk related to over the counter derivative counterparties’ failure to perform under contract terms; liquidity risk related to the lack of a liquid market for these contracts allowing the Underlying Series to close out their position(s); and documentation risk relating to disagreement over contract terms. Unconstrained Bond Series held forward foreign currency exchange contracts, futures contracts and purchased options during the year ended December 31, 2018.
| 9. | Federal Income Tax Information |
The amount and characterization of certain income and capital gains to be distributed are determined in accordance with federal income tax regulations, which may differ from GAAP. These differences are primarily due to differing book and tax treatments in the timing and/or treatment of the recognition of net investment income or gains and losses, including losses deferred due to wash sales and distributions from the Underlying Series. The Series may periodically make reclassifications among its capital accounts to reflect income and gains available for distribution (or available capital loss carryovers) under income tax regulations without impacting the Series’ net asset value. Any such reclassifications are not reflected in the financial highlights.
The tax character of distributions paid were as follows:
| FOR THE YEAR ENDED 12/31/18 | FOR THE YEAR ENDED 12/31/17 | |||||||||
Ordinary income | $ | 1,120,143 | $ | 869,698 | ||||||
Long-term capital gain | $ | 2,193,710 | $ | 347,239 | ||||||
At December 31, 2018, the tax basis of components of distributable earnings and the net unrealized depreciation based on the identified cost of investments for federal income tax purposes were as follows:
Cost for federal income tax purposes | $ | 45,429,679 | ||
Unrealized appreciation | 8,721 | |||
Unrealized depreciation | (4,245,456 | ) | ||
|
| |||
Net unrealized depreciation | $ | (4,236,735 | ) | |
|
| |||
Undistributed long-term capital gains | $ | 1,070,105 |
19
Income Series
Report of Independent Registered Public Accounting Firm
To the Board of Directors of Manning & Napier Fund, Inc. and Shareholders of Income Series
Opinion on the Financial Statements
We have audited the accompanying statement of assets and liabilities, including the investment portfolio, of Income Series (one of the series constituting Manning & Napier Fund, Inc., referred to hereafter as the “Fund”) as of December 31, 2018, the related statement of operations for the year ended December 31, 2018, the statement of changes in net assets for each of the two years in the period ended December 31, 2018, including the related notes, and the financial highlights for each of the five years in the period ended December 31, 2018 (collectively referred to as the “financial statements”). In our opinion, the financial statements present fairly, in all material respects, the financial position of the Fund as of December 31, 2018, the results of its operations for the year then ended, the changes in its net assets for each of the two years in the period ended December 31, 2018 and the financial highlights for each of the five years in the period ended December 31, 2018 in conformity with accounting principles generally accepted in the United States of America.
Basis for Opinion
These financial statements are the responsibility of the Fund’s management. Our responsibility is to express an opinion on the Fund’s financial statements based on our audits. We are a public accounting firm registered with the Public Company Accounting Oversight Board (United States) (PCAOB) and are required to be independent with respect to the Fund in accordance with the U.S. federal securities laws and the applicable rules and regulations of the Securities and Exchange Commission and the PCAOB.
We conducted our audits of these financial statements in accordance with the standards of the PCAOB. Those standards require that we plan and perform the audit to obtain reasonable assurance about whether the financial statements are free of material misstatement, whether due to error or fraud.
Our audits included performing procedures to assess the risks of material misstatement of the financial statements, whether due to error or fraud, and performing procedures that respond to those risks. Such procedures included examining, on a test basis, evidence regarding the amounts and disclosures in the financial statements. Our audits also included evaluating the accounting principles used and significant estimates made by management, as well as evaluating the overall presentation of the financial statements. Our procedures included confirmation of securities owned as of December 31, 2018 by correspondence with the custodian and transfer agent. We believe that our audits provide a reasonable basis for our opinion.
New York, New York
February 15, 2019
We have served as the auditor of one or more investment companies in Manning & Napier Mutual Funds since 1992.
20
Income Series
Supplemental Tax Information
(unaudited)
All reportings are based on financial information available as of the date of this annual report and, accordingly, are subject to change.
For federal income tax purposes, the Series reports for the current fiscal year $317,709 or, if different, the maximum amount allowable under the tax law, as qualified dividend income.
For corporate shareholders, the percentage of investment income (dividend income plus short-term gains, if any) that qualifies for the dividends received deduction for the current fiscal year is 24.69%.
The Series designates $1,653,422 as Long-Term Capital Gain dividends pursuant to Section 852(b) of the Code for the fiscal year ended December 31, 2018.
21
Income Series
Renewal of Investment Advisory Agreement
(unaudited)
At the Manning & Napier Fund, Inc. (the “Fund”) Board of Directors’ (the “Board”) meeting, held on November 15, 2018, the Investment Advisory Agreement (the “Agreement”) between the Fund and Manning & Napier Advisors, LLC (the “Advisor”) was considered for renewal by the Board, including all of the Directors who are not “interested persons” (“Independent Directors”), within the meaning of the Investment Company Act of 1940, as amended (the “1940 Act”). In connection with the decision whether to renew the Agreement, a variety of material was provided to the Board in advance of the meeting for their review and consideration. The Board also held a working session on October 31, 2018 to review and discuss information provided to the Board, and for the Board to request additional information.
Representatives of the Advisor attended a portion of the working session and attended the Board meeting. The Advisor provided supplemental information requested by the Board and presented additional oral information to the Board to assist the Board in its considerations. In addition to the information furnished by the Advisor, the Board was provided with a legal memorandum discussing its fiduciary duties related to its approval of the continuation of the Agreement. Legal counsel for the Fund discussed with the Board the applicable legal considerations. In addition, the Board receivedin-person presentations about the Fund throughout the year.
The Independent Directors were advised by independent legal counsel with respect to these matters. The Independent Directors also met separately in an executive session with their legal counsel without any representatives of the Advisor present.
The Directors’ determinations at the meeting were made on the basis of each Director’s business judgment after consideration of all the information presented. In deciding to recommend the renewal of the Agreement with respect to each Series of the Fund, the Independent Directors did not identify any single or particular piece of information that, in isolation, was the controlling factor. Each Independent Director may also have weighed factors differently. This summary describes the most important, but not all, of the factors considered by the Board and the Independent Directors.
| • | The Board considered the nature and quality of services provided by the Advisor under the Agreement for over 30 years including, among others: deciding what securities to purchase and sell for each Series; arranging for the purchase and sale of such securities by placing orders with broker-dealers; administering the affairs of the Fund (including the books and records of the Fund not maintained by third party service providers such as the custodian or transfer agent); arranging for the insurance coverage for the Fund; and supervising the preparation of tax returns, SEC filings (including registration statements) and reports to shareholders for the Fund. The Board considered the numerous services performed by the Advisor and its affiliates beyond those stated in the Agreements. The Board also considered the Advisor’s personnel who perform services to the Fund, changes in senior or key personnel, the strength of the Advisor’s compliance infrastructure, policies and procedures relating to compliance with securities regulations, reputation, expertise and resources. The Board discussed the quality of these services with representatives from the Advisor and concluded that the Advisor was performing its services to the Fund required under the Agreement in a reasonable manner. |
| • | The Board considered the Advisor’s investments teams, including changes to the investment teams and investment team’s compensation during the past year, and the investment process. The Board considered the performance of each Series since its inception, as well as over multiple time periods including: one year, three year, five year, ten year, and current market cycle. A market cycle includes periods of both rising and falling markets. Returns for established benchmark indices for each Series were provided. In addition, the Board considered (and considers on a quarterly basis) a number of other factors relevant to performance at the meeting including: a peer group performance analysis consisting of Morningstar universes of mutual funds with similar investment objectives; the breadth of the Fund’s product offerings; and performance over reasonable time periods. The Board discussed with Representatives of the Advisor, short-term performance challenges in the Fund’s core strategies that have resulted in a downward trend in assets under management. After discussion, the Board concluded that notwithstanding the performance challenges of certain Series, the nature and quality of the investment management services provided by the Advisor to the Fund supported the renewal of the agreement. |
| • | The Board considered the fees and expenses of the various Series of the Fund. The Advisor presented the advisory fees and total expenses for each Series, including the advisory fee adjusted for any contractual expense waivers or reimbursements paid by the Advisor. The Advisor also presentedpro-forma information related to several management fee and overall expense reductions that were set to take effect in early 2019. These changes were approved by the Board in a prior meeting and by shareholders at a Shareholder Meeting in May 2018. |
| • | The Board considered whether the Advisor had achieved economies of scale with respect to its services to the Fund. The Board acknowledged the expense caps incorporated in the Fund’s current fee structure, which requires the Advisor to |
22
Income Series
Renewal of Investment Advisory Agreement
(unaudited)
| subsidize the expenses of the Series operating above their expense cap, noting that 27 Series of the Fund are currently receiving expense reimbursements from the Advisor. The Board concluded that the Fund would need to grow in assets before the Advisor would be able to achieve meaningful economies of scale. |
| • | The Advisor provided the Board with information comparing each Series’ contractual management fees with the Advisor’s standard advisory fees for separate accounts and collective investment trusts. The Board considered that the range of services provided to the Series is more extensive than for the Advisor’s other clients due to additional infrastructure, administrative and regulatory requirements related to operating a mutual fund. |
| • | The current andpro-forma advisory fees,12b-1 Distribution and Service Fees, other expenses (e.g. a combination of Shareholder Services Fees, intermediarysub-transfer agent fees, routine operating expenses and Acquired Fund Fees and Expenses forfund-of-fund Series) and total expense ratios of each Series and share class were compared and ranked (on both a mean and median basis) against respective peer universes. Respective peer universes included funds of a similar size and with similar investment objectives and expense characteristics as disclosed on the Morningstar database. Representatives of the Advisor discussed with the Board the comparisons and rankings of fees and net expense ratios for each Series of the Fund and the methodology behind the comparison. The Board considered the Advisor’s active portfolio management that results in portfolios that are more differentiated than the construction of their benchmarks. Based on their review of the information provided, the Board concluded that the current andpro-forma fees and expenses of each Series of the Fund were reasonable on a comparative basis. |
| • | The Board considered the costs of the Advisor’s services and the profits of the Advisor as they relate to the Advisor’s services to the Fund under the Agreement. The Board was provided with information on the Advisor’s financial condition and profitability by mutual fund agreement and by Series. Information provided by the Advisor addressed the anticipated effects of the upcoming fee reductions. The Board discussed the Advisor’s revenues generated from the Fund and its expenses associated with providing the services under the Agreement. The Advisor presented the Board with information on firm wide investment management profitability to provide a comparison of the Advisor’s profitability from its Fund activities relative to its profitability from its other investment management business. In addition, the Board reviewed the Advisor’s expense allocation methodology used to calculate profitability since many of the Advisor’s resources and expenses are shared across the Advisor’s various investment management vehicles. The Board considered the Advisor’s expenses associated with Fund activities outside of the Agreement (such as expense reimbursements pursuant to expense caps and payments made by the Advisor to third party platforms on which shares of the Fund are available for purchase). After discussing the above costs and profits, the Board concluded that the Advisor’s profitability relating to its services provided under the Agreement was reasonable. |
| • | The Board also considered the other benefits the Advisor derives from its relationship with the Fund. Such other benefits include participation in a joint insurance program, sharing of compensation expenses for certain shared personnel, relationships with large service providers, the utilization of Series within the Advisor’s separately managed accounts and certain research services provided by soft dollars. The Board reviewed the broker-dealers who provided research to the Advisor and the products and services paid for, in whole or in part, using soft dollar commissions. The Board concluded that these additional benefits to the Advisor were reasonable. |
Based on the Board’s deliberations and their evaluation of the information described above, the Board, including a majority of the Independent Directors, concluded that the compensation under the Agreement was fair and reasonable with respect to each Series in light of the services and expenses and such other matters as the Directors considered to be relevant in the exercise of their reasonable judgment, and that the renewal of the Agreement would be in the best interests of each Series and its shareholders. The Board did not indicate that any single factor was determinative of its decision to approve the Agreement, but indicated that the Board based its determination on the total mix of information available to it.
23
Income Series
Directors’ and Officers’ Information
(unaudited)
The Statement of Additional Information provides additional information about the Fund’s directors and officers and can be obtained without charge by calling1-800-466-3863, at www.manning-napier.com, or on the EDGAR Database on the SEC Internet web site (http://www.sec.gov). The following chart shows certain information about the Fund’s directors and officers, including their principal occupations during the last five years. Unless specific dates are provided, the individuals have held the listed positions for longer than five years.
Interested Director and Officer
| Name: | Paul Battaglia* | |
| Address: | 290 Woodcliff Drive | |
| Fairport, NY 14450 | ||
| Age: | 40 | |
| Current Position(s) Held with Fund: | Principal Executive Officer, President, Chairman and Director | |
| Term of Office & Length of Time Served: | Indefinite – Chairman and Director since November 20181 | |
| Principal Occupation(s) During Past 5 Years: | Chief Financial Officer (2018 – Present); Vice President of Finance (2016 – 2018); Director of Finance (2011 – 2016); Financial Analyst/Internal Auditor (2004-2006) – Manning & Napier Advisors, LLC and affiliates Holds one or more of the following titles for various subsidiaries and affiliates: Chief Financial Officer | |
| Number of Portfolios Overseen within Fund Complex: | 34 | |
Other Directorships Held Outside Fund Complex During Past 5 Years: | N/A |
Independent Directors
| Name: | Stephen B. Ashley | |
| Address: | 290 Woodcliff Drive | |
| Fairport, NY 14450 | ||
| Age: | 78 | |
| Current Position(s) Held with Fund: | Director, Audit Committee Member, Governance & Nominating Committee Member | |
| Term of Office & Length of Time Served: | Indefinite – Since 1996 | |
| Principal Occupation(s) During Past 5 Years: | Chairman, Director & Chief Executive Officer (1997 to present) - The Ashley Group (property management and investment). Director (1995-2008) and Chairman(non-executive) (2004-2008) - Fannie Mae (mortgage) | |
| Number of Portfolios Overseen within Fund Complex: | 34 | |
| Other Directorships Held Outside Fund Complex During Past 5 Years: | Fannie Mae (1995-2008) The Ashley Group (1995-2008) Genesee Corporation (1987-2007) |
| Name: | Paul A. Brooke | |
| Address: | 290 Woodcliff Drive | |
| Fairport, NY 14450 | ||
| Age: | 73 | |
| Current Position(s) Held with Fund: | Lead Independent Director, Audit Committee Member, Governance & Nominating Committee Chairman | |
| Term of Office & Length of Time Served: | Indefinite – Director, Audit Committee Member, Governance & Nominating Committee Member since 2007; Governance & Nominating Committee Chairman since 2016; Lead Independent Director since 2017 | |
| Principal Occupation(s) During Past 5 Years: | Chairman & CEO (2005-2009) - Ithaka Acquisition Corporation (investments); Chairman (2007-2009) - Alsius Corporation (investments); Managing Member (1991-present) - PMSV Holdings LLC (investments); Managing Member (2010-2016) - Venbio (investments). | |
| Number of Portfolios Overseen within Fund Complex: | 34 | |
| Other Directorships Held Outside Fund Complex During Past 5 Years: | Incyte Corp. (biotech)(2000-present); ViroPharma, Inc. (speciality pharmaceuticals)(2000-2014); HLTH (WebMD)(information)(2000-2010); Cheyne Capital International (investment)(2000-2017); GMP Companies (investment)(2000-2011); Cytos Biotechnology Ltd (biotechnology)(2012-2014); Cerus (biomedical)(2016-present);PureEarth(non-profit)(2012-present); Caelum BioSciences (biomedical)(2018-present) |
24
Income Series
Directors’ and Officers’ Information
(unaudited)
Independent Directors (continued)
| Name: | Peter L. Faber | |
| Address: | 290 Woodcliff Drive | |
| Fairport, NY 14450 | ||
| Age: | 80 | |
| Current Position(s) Held with Fund: | Director, Governance & Nominating Committee Member | |
| Term of Office & Length of Time Served: | Indefinite – Since 1987 | |
| Principal Occupation(s) During Past 5 Years: | Senior Counsel (2006-2012), Partner (1995-2006 & 2013-2018) - McDermott, Will & Emery LLP (law firm) | |
| Number of Portfolios Overseen within Fund Complex: | 34 | |
| Other Directorships Held Outside Fund Complex During Past 5 Years: | Boston Early Music Festival(non-profit)(2007-present); Amherst Early Music, Inc.(non-profit)(2009-present); Gotham Early Music Scene, Inc.(non-profit)(2009-present); Partnership for New York City, Inc.(non-profit)(1989-2010); New York Collegium(non-profit)(2004-2011); S’Cool Sounds, Inc.(non-profit)(2017-present)
|
| Name: |
Harris H. Rusitzky | |
| Address: | 290 Woodcliff Drive | |
| Fairport, NY 14450 | ||
| Age: | 83 | |
| Current Position(s) Held with Fund: | Director, Audit Committee Member, Governance & Nominating Committee Member | |
| Term of Office & Length of Time Served: | Indefinite – Since 1985 | |
| Principal Occupation(s) During Past 5 Years: | President (1994- present) - The Greening Group (business consultants); Partner (2006-present) - The Restaurant Group (restaurants) | |
| Number of Portfolios Overseen within Fund Complex: | 34 | |
| Other Directorships Held Outside Fund Complex During Past 5 Years: | Rochester Institute of Technology (university)(1972-present); Culinary Institute of America(non-profit college)(1985-present); George Eastman Museum (museum)(1988-present); National Restaurant Association (restaurant trade organization)(1978-present)
|
| Name: |
Chester N. Watson | |
| Address: | 290 Woodcliff Drive | |
| Fairport, NY 14450 | ||
| Age: | 68 | |
| Current Position(s) Held with Fund: | Director, Audit Committee Chairman, Governance & Nominating Committee Member | |
| Term of Office & Length of Time Served: | Indefinite – Director, Audit Committee Member, Governance & Nominating Committee Member Since 2012; Audit Committee Chairman since 2013 | |
| Principal Occupation(s) During Past 5 Years: | General Auditor (2003-2011) - General Motors Company (auto manufacturer) | |
| Number of Portfolios Overseen within Fund Complex: | 34 | |
| Other Directorships Held Outside Fund Complex During Past 5 Years: | Rochester Institute of Technology (university)(2005-present); Town of Greenburgh, NY Planning Board (municipal government) (2015-2018) |
Officers:
| Name: | Jeffrey S. Coons, Ph.D., CFA® | |
| Address: | 290 Woodcliff Drive | |
| Fairport, NY 14450 | ||
| Age: | 55 | |
| Current Position(s) Held with Fund: | Vice President | |
| Term of Office1& Length of Time Served: | Since 2004 | |
| Principal Occupation(s) During Past 5 Years: | President since 2010,Co-CEO since 2018,Co-Director of Research (2002 – 2015) - Manning & Napier Advisors, LLC Holds one or more of the following titles for various subsidiaries and affiliates: President, Director, Treasurer, or Senior Trust Officer |
25
Income Series
Directors’ and Officers’ Information
(unaudited)
| Officers: (continued) |
| Name: | Elizabeth Craig | |
| Address: | 290 Woodcliff Drive | |
| Fairport, NY 14450 | ||
| Age: | 31 | |
| Current Position(s) Held with Fund: | Corporate Secretary | |
| Term of Office1& Length of Time Served: | Since 2016 | |
| Principal Occupation(s) During Past 5 Years: | Fund Administration Manager since 2015; Mutual Fund Compliance Specialist (2009-2015) - Manning & Napier Advisors, LLC; Assistant Corporate Secretary (2011-2016) - Manning & Napier Fund, Inc.
|
| Name: | Christine Glavin | |
| Address: | 290 Woodcliff Drive | |
| Fairport, NY 14450 | ||
| Age: | 52 | |
| Current Position(s) Held with Fund: | Principal Financial Officer, Chief Financial Officer | |
| Term of Office1& Length of Time Served: | Principal Financial Officer since 2002; Chief Financial Officer since 2001 | |
| Principal Occupation(s) During Past 5 Years: | Director of Fund Reporting since 2011; Fund Reporting Manager (1997-2011) - Manning & Napier Advisors, LLC; Assistant Treasurer since 2008 - Exeter Trust Company; Chief Financial Officer (2017-2018) - Rainier Investment Management Mutual Funds, Inc. |
| Name: | Jodi L. Hedberg | |
| Address: | 290 Woodcliff Drive | |
| Fairport, NY 14450 | ||
| Age: | 51 | |
| Current Position(s) Held with Fund: | Chief Compliance Officer, Anti-Money Laundering Compliance Officer | |
| Term of Office1& Length of Time Served: | Chief Compliance Officer since 2004; Anti-Money Laundering Officer since 2002; Corporate Secretary (1997-2016) - Manning & Napier Fund, Inc.; Chief Compliance Officer and Anti-Money Laundering Officer (2017-2018) – Rainier Investment Management Mutual Funds, Inc. | |
| Principal Occupation(s) During Past 5 Years: | Managing Director, Compliance & Regulatory Affairs since 2018; Director of Compliance (2005-2018); Compliance Manager (1995-2005) – Manning & Napier Advisors, LLC and affiliates; Corporate Secretary – Manning & Napier Investor Services, Inc. since 2006 |
| Name: | Scott Morabito | |
| Address: | 290 Woodcliff Drive | |
| Fairport, NY 14450 | ||
| Age: | 31 | |
| Current Position(s) Held with Fund: | Assistant Vice President | |
| Term of Office1& Length of Time Served: | Since 2017 | |
| Principal Occupation(s) During Past 5 Years: | Director of Funds Group since 2017; Fund Product and Strategy Manager (2014-2017); Senior Product and Strategy Analyst (2013-2014); Product and Strategy Analyst (2011-2013) - Manning & Napier Advisors, LLC; President, Director – Manning & Napier Investor Services, Inc. since 2018 |
| Name: | Sarah Turner | |
| Address: | 290 Woodcliff Drive | |
| Fairport, NY 14450 | ||
| Age: | 36 | |
| Current Position(s) Held with Fund: | Chief Legal Officer; Assistant Corporate Secretary | |
| Term of Office1& Length of Time Served: | Since 2018 | |
| Principal Occupation(s) During Past 5 Years: | General Counsel since 2018 - Manning & Napier Advisors, LLC and affiliates; Counsel (2017-2018) – Harter Secrest and Emery LLP; Legal Counsel (2010-2017) – Manning & Napier Advisors, LLC and affiliates Holds one or more of the following titles for various affiliates: Corporate Secretary, General Counsel |
26
Income Series
Directors’ and Officers’ Information
(unaudited)
Officers: (continued)
| Name: | Amy Williams | |
| Address: | 290 Woodcliff Drive | |
| Fairport, NY 14450 | ||
| Age: | 57 | |
| Current Position(s) Held with Fund: | Assistant Corporate Secretary | |
| Term of Office1& Length of Time Served: | Since 2016 | |
| Principal Occupation(s) During Past 5 Years: | Director of Fund Documentation - Manning & Napier Advisors, LLC since 2009 | |
| Holds one or more of the following titles for various affiliates: Director |
*Interested Director, within the meaning of the 1940 Act by reason of her positions with the Fund’s investment advisor, Manning & Napier Advisors, LLC and Distributor, Manning & Napier Investor Services, Inc.
1The term of office of all officers shall be one year and until their respective successors are chosen and qualified, or his or her earlier resignation or removal as provided in the Fund’sBy-Laws.
27
{This page intentionally left blank}
28
{This page intentionally left blank}
29
Income Series
Literature Requests
(unaudited)
Proxy Voting Policies and Procedures
A description of the policies and procedures that the Fund uses to determine how to vote proxies relating to portfolio securities is available, without charge, upon request:
| By phone | 1-800-466-3863 | |||
| On the Securities and Exchange | ||||
Commission’s (SEC) web site | http://www.sec.gov |
Proxy Voting Record
Information regarding how the Fund voted proxies relating to portfolio securities during the most recent 12-month period ended June 30th is available, without charge, upon request:
| By phone | 1-800-466-3863 | |||
| On the SEC’s web site | http://www.sec.gov |
Quarterly Portfolio Holdings
The Series’ complete schedule of portfolio holdings for the 1st and 3rd quarters of each fiscal year are provided on Form N-Q, and are available, without charge, upon request:
| By phone | 1-800-466-3863 | |||
| On the SEC’s web site | http://www.sec.gov |
Prospectus and Statement of Additional Information (SAI)
For more information about any of the Manning & Napier Fund, Inc. Series, you may obtain a prospectus and SAI at www.manning-napier.com or by calling (800) 466-3863. Before investing, carefully consider the objectives, risks, charges and expenses of the investment and read the prospectus carefully as it contains this and other information about the investment company.In addition, this information can be found on the SEC’s web site, http://www.sec.gov.
Additional information available at www.manning-napier.com
1. Fund Holdings - Month-End
2. Fund Holdings - Quarter-End
3. Shareholder Report - Annual
4. Shareholder Report - Semi-Annual
The Fund also offers electronic notification or “e-delivery” when certain documents are available on-line to be downloaded or reviewed. Direct shareholders can elect to receive electronic notification when shareholder reports, prospectus updates, and/or statements are available. If you do not currently have on-line access to your account, you can establish access by going to www.manning-napier.com, click on “Login” in the top corner of the page, and follow the prompts to self-enroll. Once enrolled, you can set your electronic notification preferences by clicking on the Account Options tab located within the green toolbar and then select E-Delivery Option. Should you have any questions on either how to establish on-line access or how to update your account settings, please contact Investor Services at 1-800-466-3863.
The Manning & Napier Fund, Inc. is managed by Manning & Napier Advisors, LLC. Manning & Napier Investor Services, Inc., an affiliate of Manning & Napier Advisors, LLC, is the distributor of the Fund shares.
MNSTI-12/18-AR

Manning & Napier Fund, Inc.
| ||
| Equity Income Series |
Beginning on February 25, 2021, as permitted by Securities and Exchange Commission regulations, paper copies of the Series’ annual and semi-annual shareholder reports will no longer be sent by mail, unless you specifically request paper copies of the reports from the Fund or from your financial intermediary, such as a broker-dealer or bank. Instead, the reports will be made available on a website, and you will be notified by mail each time a report is posted and provided with a website link to access the report.
If you already elected to receive shareholder reports electronically, you will not be affected by this change and you need not take any action. You may elect to receive shareholder reports and other communications from the Fund electronically by contacting your financial intermediary or, if you are a direct investor, by visiting www.manning-napier.com or calling1-800-466-3863.
You may elect to receive all future annual and semi-annual reports in paper free of charge. If you invest through a financial intermediary, you can contact your financial intermediary to request that you continue to receive paper copies of your shareholder reports. If you invest directly with the Fund, you can inform the Fund that you wish to continue receiving paper copies of your shareholder reports by visiting www.manning-napier.com or calling1-800-466-3863. Your election to receive reports in paper will apply to all funds held with your financial intermediary if you invest through a financial intermediary or all series of the Fund if you invest directly with the Fund.
Equity Income Series
Management Discussion and Analysis
(unaudited)
Dear Shareholders:
The investment environment we witnessed over the past twelve months was far more volatile than in prior years. It resulted in a sharp drawdown in global equity markets during the fourth quarter of 2018.
For the fiscal year ending on December 31, 2018, US equities experienced negative returns, with the S&P 500 Total Return Index falling 4.38%. International equity performance was somewhat worse, with the MSCI ACWI ex USA Index returning negative 14.20%.
In fixed income, domestic investment-grade bond performance was essentially flat for the year, as measured by the Bloomberg Barclays U.S. Aggregate Bond Index, rising 0.01% as income generated over the period was offset by rising interest rates (when interest rates rise, bond prices fall).
We believe recent volatility, both at the beginning and end of last year, is reflective of what investors should expect going forward. While we do not believe we are immediately heading for a recession, we see recent developments within the US and abroad as an indication that we are entering a higher risk period for financial markets.
The US economy is likely approaching a period of peak growth. It continues to show signs of progressing toward the later stages of its economic and market cycle (typical characteristics of anend-of-cycle phase are an economic recession and financial market selloff).
As economic growth decelerates to more sustainable levels, we believe that investors are facing a growing risk of disappointment. At the same time, key global risks remain, including trade tensions, geopolitical uncertainty, and tightening monetary policy.
Considering the current economic and market backdrop, we believe investors should temper their performance expectations. The returns experienced over the latter half of the post-Global Financial Crisis bull market are unlikely to continue.
Additionally, given our cautious outlook, we are reviewing current and prospective investments for excessive risk exposures, and we have adjusted our positioning across many of our portfolios. Going forward, we will continue to follow our disciplines, focusing on flexibility and selectivity in today’s incredibly dynamic investment environment.
With this in mind, in the enclosed we discuss recent fund performance, highlight our positioning, and briefly provide our outlook amid the current investment environment.
We hope that you find this information helpful, and we look forward to working with you in the years ahead. Thank you for your continued confidence in Manning & Napier.
Sincerely,
Manning & Napier Advisors, LLC
The S&P 500 Index is an unmanaged, capitalization-weighted measure comprised of 500 leading U.S. companies to gauge U.S. large cap equities. The Index returns do not reflect any fees or expenses. The Index includes dividends, but not the reinvestment of dividends. Index returns provided by Bloomberg. S&P Dow Jones Indices LLC, a subsidiary of the McGraw Hill Financial, Inc., is the publisher of various index based data products and services and has licensed certain of its products and services for use by Manning & Napier. All such content Copyright © 2019 by S&P Dow Jones Indices LLC and/or its affiliates. All rights reserved. Neither S&P Dow Jones Indices LLC, Dow Jones Trademark Holdings LLC, their affiliates nor their third party licensors make any representation or warranty, express or implied, as to the ability of any index to accurately represent the asset class or market sector that it purports to represent and none of these parties shall have any liability for any errors, omissions, or interruptions of any index or the data included therein.
The MSCI ACWI ex USA Index (ACWIxUS) is designed to measure large andmid-cap representation across 22 of 23 Developed Markets countries (excluding the U.S.) and 24 Emerging Markets countries. The Index returns do not reflect any fees or expenses. The Index is denominated in U.S. dollars. The Index returns are net of withholding taxes. They assume daily reinvestment of net dividends thus accounting for any applicable dividend taxation. Index returns provided by Bloomberg.
The Bloomberg Barclays U.S. Aggregate Bond Index is an unmanaged, market-value weighted index of U.S. domestic investment-grade debt issues, including government, corporate, asset-backed, and mortgage-backed securities, with maturities of one year or more. Index returns do not reflect any fees or expenses. Index returns provided by Interactive Data.
1
Equity Income Series
Fund Commentary
(unaudited)
Investment Objective
Primarily to provide current income and income growth, with a secondary objective of providing long-term capital appreciation.
Performance Commentary
U.S. equity markets experienced negative performance during 2018 as a sharp selloff in the fourth quarter more than offset gains from earlier in the year. The Equity Income Series Class S returned negative 8.43%, slightly underperforming its benchmark, the Russell 1000 Value index, which returned negative 8.27%.
Regarding the Series performance, sector allocations detracted from relative returns, while stock selection aided relative returns. More specifically, stock selection in Financials and Real Estate detracted from performance, as did an overweight to Real Estate and underweights to Communication Services and Health Care. Stock selection in Consumer Discretionary, Energy, and Industrials aided relative returns.
During the year, we became increasingly concerned with the trajectory of global growth. Our concern for the macroeconomic environment led to meaningful shifts in the portfolio. The Series increased its allocations to less cyclical sectors including Health Care, Consumer Staples, Communication Services and Utilities, while reducing its allocation to more economically sensitive sectors such as Information Technology, Materials, and Energy. The Series also reduced its allocation to Real Estate.
The Series will continue to focus on companies that can generate sustainable and/or growing dividends, as well as on companies that have the potential to improve their income generation prospects in the future. Regarding thebottom-up stock selection strategies used in the Series, the portfolio primarily consists of companies with attractive, sustainable dividends, but also includes some companies with low current payouts that have the potential to grow dividends. The Series may also invest in companies that are beneficiaries of special situations, but does not have an allocation to that strategy at this time.
Performance data quoted represents past performance and does not guarantee future results. The investment return and principal value of an investment will fluctuate, so that an investor’s shares, when redeemed, may be worth more or less than their original cost. Current performance may be higher or lower than that quoted; investors can obtain the most recentmonth-end performance at www.manning-napier.com or by calling (800)466-3863. Performance for the Equity Income Series Class S shares is provided above. Performance for the Class I shares will be higher based on the Class’ lower expenses.
Please see the next page for additional performance information as of December 31, 2018.
All investments involve risks, including possible loss of principal. As with any stock fund, the value of your investment will fluctuate in response to stock market movements. Investing in the Series will also involve a number of other risks, including issuer-specific risk,small-cap/mid-cap risk, foreign investment risk, and the risk that the investment approach may not be successful. Additionally, like all derivatives, investments in options can be highly volatile and involve risks in addition to the risks of the underlying instrument on which the derivative is based, such as counterparty, correlation and liquidity risk. Stocks of small- andmid-cap companies may be subject to more abrupt or erratic market movements than the stocks of larger companies and may be less marketable than the stocks of larger companies. In addition, they may have limited product lines, markets, or financial resources, and they may depend on a small management group. As a result, they fail more often than larger companies. Funds that invest in foreign countries may be subject to the risks of adverse changes in foreign economic, political, regulatory and other conditions as well as risks related to the use of different financial standards. Investments in emerging markets may be more volatile than investments in more developed markets. The Equity Income Series invests primarily in income-producing equity securities. There is no assurance or guarantee that companies which issue dividends will declare, continue to pay, or increase dividends. Additionally, the Series may invest a portion of its assets in real estate investment trusts (REITs). Investments in real estate, including REITs, are subject to risks associated with the direct ownership of real estate: interest rate risk, liquidity risk, and changes in property value, among others. The Equity Income Series may also invest a portion of its assets in business development companies (BDCs) or master limited partnerships (MLPs). BDCs are subject to additional risks, as they generally invest in less mature private companies or thinly traded U.S. public companies which involve greater risk than well-established publicly-traded companies. MLPs are subject to additional risks, including risks associated with the specific industry or industries in which the partnership invests, such as the risks of investing in real estate, or oil and gas industries or other natural resources. To the extent that an MLP’s interests are all in a particular industry, the MLP will be negatively impacted by economic events adversely impacting that industry. Additionally, the potential tax benefits from investing in MLPs depend on their continued treatment as partnerships for federal income tax purposes.
The Russell 1000® Value Index is an unmanaged, market capitalization-weighted index consisting of those Russell 1000® Index companies with lowerprice-to-book ratios and lower forecasted growth values. The Index returns are based on a market capitalization-weighted average of relative price changes of the component stocks plus dividends whose reinvestments are compounded daily. The Index returns do not reflect any fees or expenses. Index returns provided by Bloomberg.
2
Equity Income Series
Performance Update as of December 31, 2018
(unaudited)
AGGREGATE TOTAL RETURNS AS OF DECEMBER 31, 2018 | ||||||
ONE YEAR1 | FIVE YEAR | SINCE INCEPTION2 | ||||
| Manning & Napier Fund, Inc. - Equity Income Series - Class S3 | -8.43% | 5.53% | 5.53% | |||
| Manning & Napier Fund, Inc. - Equity Income Series - Class I3 | -8.24% | 5.72% | 5.72% | |||
| Russell 1000®Value Index4 | -8.27% | 5.95% | 5.95% | |||
The following graph compares the value of a $10,000 investment in the Manning & Napier Fund, Inc. - Equity Income Series - Class S from its inception2 (December 31, 2013) to present (December 31, 2018) to the Russell 1000® Value Index.
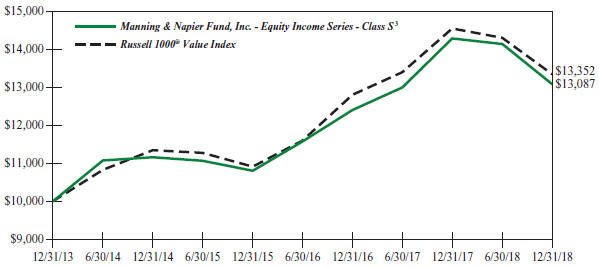
1The returns shown are based on net asset values calculated for shareholder transactions and may differ from the returns shown in the financial highlights, which reflect adjustments made to the net asset values in accordance with accounting principles generally accepted in the United States of America.
2Performance numbers for the Series and the Index are calculated from December 31, 2013, the Series’ inception date.
3The Series’ performance does not reflect the deduction of taxes that a shareholder would pay on fund distributions or the redemption of shares. The Series’ performance is historical and may not be indicative of future results. The performance returns shown are inclusive of the net expense ratio of the Series. For the year ended December 31, 2018, this net expense ratio was 0.95% for Class S and 0.75% for Class I. The gross expense ratio, which does not account for any voluntary or contractual waivers currently in effect, was 1.07% for Class S and 0.87% for Class I for the year ended December 31, 2018.
4The Russell 1000® Value Index is an unmanaged, market capitalization-weighted index consisting of those Russell 1000® Index companies with lowerprice-to-book ratios and lower forecasted growth values. The Index returns are based on a market capitalization-weighted average of relative price changes of the component stocks plus dividends whose reinvestments are compounded daily. The Index returns do not reflect any fees or expenses. Index returns provided by Bloomberg.
3
Equity Income Series
Shareholder Expense Example
(unaudited)
As a shareholder of the Series, you incur ongoing costs, including management fees, shareholder service fees and other Series expenses. This example is intended to help you understand your ongoing costs (in dollars) of investing in the Series and to compare these costs with the ongoing costs of investing in other mutual funds.
The example is based on an investment of $1,000 invested in each class at the beginning of the period and held for the entire period (July 1, 2018 to December 31, 2018).
Actual Expenses
The Actual lines of the table below provide information about actual account values and actual expenses. You may use the information in this line, together with the amount you invested, to estimate the expenses that you paid over the period. Simply divide your account value by $1,000 (for example, an $8,600 account value divided by $1,000 = 8.6), then multiply the result by the number in the Actual line for the Class in which you have invested under the heading entitled “Expenses Paid During Period” to estimate the expenses you paid on your account during this period.
Hypothetical Example for Comparison Purposes
The Hypothetical lines of each class in the table below provide information about hypothetical account values and hypothetical expenses based on the Class’ actual expense ratio and an assumed rate of return of 5% per year before expenses, which is not the Class’ actual return. The hypothetical account values and expenses may not be used to estimate the actual ending account balance or expenses you paid during the period. You may use this information to compare the ongoing costs of investing in a class of the Series and other funds. To do so, compare this 5% hypothetical example for the class in which you have invested with the 5% hypothetical examples that appear in the shareholder reports of the other funds.
Please note that the expenses shown in the table are meant to highlight your ongoing costs only and do not reflect any transaction costs, such as sales charges (loads), redemption fees, or exchange fees that you may incur in other mutual funds. Therefore, the second line of the table is useful in comparing ongoing costs only, and will not help you determine the relative total costs of owning different funds.
BEGINNING ACCOUNT VALUE 7/1/18 | ENDING ACCOUNT VALUE 12/31/18 | EXPENSES PAID DURING PERIOD* 7/1/18-12/31/18 | ANNUALIZED
| |||||||||||||
Class S | ||||||||||||||||
Actual | $1,000.00 | $ 924.84 | $4.61 | 0.95% | ||||||||||||
Hypothetical | ||||||||||||||||
(5% return before expenses) | $1,000.00 | $1,020.42 | $4.84 | 0.95% | ||||||||||||
Class I | ||||||||||||||||
Actual | $1,000.00 | $ 925.12 | $3.64 | 0.75% | ||||||||||||
Hypothetical | ||||||||||||||||
(5% return before expenses) | $1,000.00 | $1,021.42 | $3.82 | 0.75% | ||||||||||||
*Expenses are equal to each Class’ annualized expense ratio (for thesix-month period), multiplied by the average account value over the period, multiplied by 184/365 (to reflect theone-half year period). Expenses are based on the most recent fiscal half year. The Class’ total return would have been lower had certain expenses not been waived during the period.
4
Equity Income Series
Portfolio Composition as of December 31, 2018
(unaudited)
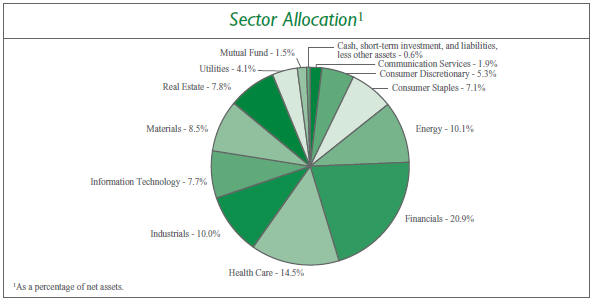
5
Equity Income Series
Investment Portfolio - December 31, 2018
SHARES
|
VALUE (NOTE 2)
| |||||||
COMMON STOCKS - 97.9% | ||||||||
Communication Services - 1.9% | ||||||||
Diversified Telecommunication Services - 1.9% | ||||||||
Verizon Communications, Inc. | 23,115 | $ | 1,299,524 | |||||
|
| |||||||
Consumer Discretionary - 5.3% | ||||||||
Household Durables - 1.3% | ||||||||
Newell Brands, Inc. | 48,945 | 909,888 | ||||||
|
| |||||||
Multiline Retail - 2.8% | ||||||||
Dollar General Corp. | 10,755 | 1,162,399 | ||||||
Target Corp. | 10,495 | 693,615 | ||||||
|
| |||||||
| 1,856,014 | ||||||||
|
| |||||||
Specialty Retail - 1.2% | ||||||||
O’Reilly Automotive, Inc.* | 2,285 | 786,794 | ||||||
|
| |||||||
Total Consumer Discretionary | 3,552,696 | |||||||
|
| |||||||
Consumer Staples - 7.1% | ||||||||
Beverages - 3.6% | ||||||||
Diageo plc (United Kingdom) | 20,910 | 747,206 | ||||||
Molson Coors Brewing Co. - Class B | 13,905 | 780,905 | ||||||
PepsiCo, Inc. | 7,860 | 868,373 | ||||||
|
| |||||||
| 2,396,484 | ||||||||
|
| |||||||
Food Products - 2.7% | ||||||||
J&J Snack Foods Corp. | 6,250 | 903,688 | ||||||
Mondelez International, Inc. - Class A | 23,460 | 939,104 | ||||||
|
| |||||||
| 1,842,792 | ||||||||
|
| |||||||
Household Products - 0.8% | ||||||||
Colgate-Palmolive Co. | 9,095 | 541,334 | ||||||
|
| |||||||
Total Consumer Staples | 4,780,610 | |||||||
|
| |||||||
Energy - 10.1% | ||||||||
Oil, Gas & Consumable Fuels - 10.1% | ||||||||
BP plc - ADR (United Kingdom) | 33,640 | 1,275,629 | ||||||
Chevron Corp. | 11,035 | 1,200,498 | ||||||
Exxon Mobil Corp. | 42,080 | 2,869,435 | ||||||
Hess Corp. | 20,140 | 815,670 | ||||||
Royal Dutch Shell plc - Class B - ADR (Netherlands) | 11,045 | 662,037 | ||||||
|
| |||||||
Total Energy | 6,823,269 | |||||||
|
| |||||||
Financials - 20.9% | ||||||||
Banks - 13.9% | ||||||||
Bank of America Corp. | 86,120 | 2,121,997 | ||||||
Citigroup, Inc. | 31,300 | 1,629,478 | ||||||
Fifth Third Bancorp. | 9,495 | 223,417 | ||||||
Huntington Bancshares, Inc. | 17,685 | 210,805 | ||||||
The accompanying notes are an integral part of the financial statements.
6
Equity Income Series
Investment Portfolio - December 31, 2018
SHARES
|
VALUE (NOTE 2)
| |||||||
COMMON STOCKS(continued) | ||||||||
Financials(continued) | ||||||||
Banks(continued) | ||||||||
JPMorgan Chase & Co. | 23,285 | $ | 2,273,082 | |||||
KeyCorp. | 35,300 | 521,734 | ||||||
The PNC Financial Services Group, Inc. | 3,265 | 381,711 | ||||||
Regions Financial Corp. | 22,240 | 297,571 | ||||||
SunTrust Banks, Inc. | 5,835 | 294,317 | ||||||
Wells Fargo & Co. | 30,110 | 1,387,469 | ||||||
|
| |||||||
| 9,341,581 | ||||||||
|
| |||||||
Capital Markets - 2.7% | ||||||||
Ares Management Corp. - Class A | 31,680 | 563,270 | ||||||
BlackRock, Inc. | 1,230 | 483,169 | ||||||
The Blackstone Group LP | 27,115 | 808,298 | ||||||
|
| |||||||
| 1,854,737 | ||||||||
|
| |||||||
Insurance - 4.3% | ||||||||
The Allstate Corp. | 4,315 | 356,549 | ||||||
Arthur J. Gallagher & Co. | 6,820 | 502,634 | ||||||
Chubb Ltd. | 4,410 | 569,684 | ||||||
Lincoln National Corp. | 5,755 | 295,289 | ||||||
Old Republic International Corp. | 20,890 | 429,707 | ||||||
Principal Financial Group, Inc. | 6,370 | 281,363 | ||||||
Willis Towers Watson plc | 2,830 | 429,764 | ||||||
|
| |||||||
| 2,864,990 | ||||||||
|
| |||||||
Total Financials | 14,061,308 | |||||||
|
| |||||||
Health Care - 14.5% | ||||||||
Health Care Equipment & Supplies - 1.5% | ||||||||
Medtronic plc | 11,065 | 1,006,472 | ||||||
|
| |||||||
Pharmaceuticals - 13.0% | ||||||||
AstraZeneca plc (United Kingdom) | 12,545 | 936,435 | ||||||
Bristol-Myers Squibb Co. | 20,930 | 1,087,941 | ||||||
Eli Lilly & Co. | 8,745 | 1,011,971 | ||||||
Johnson & Johnson | 16,915 | 2,182,881 | ||||||
Merck & Co., Inc. | 25,920 | 1,980,547 | ||||||
Novartis AG - ADR (Switzerland) | 10,190 | 874,404 | ||||||
Sanofi (France) | 7,605 | 659,734 | ||||||
|
| |||||||
| 8,733,913 | ||||||||
|
| |||||||
Total Health Care | 9,740,385 | |||||||
|
| |||||||
Industrials - 10.0% | ||||||||
Airlines - 1.4% | ||||||||
Delta Air Lines, Inc. | 10,510 | 524,449 | ||||||
The accompanying notes are an integral part of the financial statements.
7
Equity Income Series
Investment Portfolio - December 31, 2018
SHARES
|
VALUE (NOTE 2)
| |||||||
COMMON STOCKS(continued) | ||||||||
Industrials(continued) | ||||||||
Airlines(continued) | ||||||||
Southwest Airlines Co. | 9,655 | $ | 448,764 | |||||
|
| |||||||
| 973,213 | ||||||||
|
| |||||||
Building Products - 1.2% | ||||||||
Johnson Controls International plc | 27,355 | 811,076 | ||||||
|
| |||||||
Commercial Services & Supplies - 3.5% | ||||||||
Covanta Holding Corp. | 62,950 | 844,789 | ||||||
Waste Management, Inc. | 16,875 | 1,501,706 | ||||||
|
| |||||||
| 2,346,495 | ||||||||
|
| |||||||
Construction & Engineering - 0.7% | ||||||||
Comfort Systems USA, Inc. | 10,720 | 468,250 | ||||||
|
| |||||||
Industrial Conglomerates - 0.8% | ||||||||
3M Co. | 2,850 | 543,039 | ||||||
|
| |||||||
Machinery - 0.7% | ||||||||
Mueller Water Products, Inc. - Class A | 52,385 | 476,704 | ||||||
|
| |||||||
Road & Rail - 1.7% | ||||||||
Kansas City Southern | 11,845 | 1,130,605 | ||||||
|
| |||||||
Total Industrials | 6,749,382 | |||||||
|
| |||||||
Information Technology - 7.7% | ||||||||
Semiconductors & Semiconductor Equipment - 3.8% | ||||||||
Intel Corp. | 53,930 | 2,530,935 | ||||||
|
| |||||||
Software - 2.4% | ||||||||
Microsoft Corp. | 15,745 | 1,599,220 | ||||||
|
| |||||||
Technology Hardware, Storage & Peripherals - 1.5% | ||||||||
Apple, Inc. | 6,475 | 1,021,366 | ||||||
|
| |||||||
Total Information Technology | 5,151,521 | |||||||
|
| |||||||
Materials - 8.5% | ||||||||
Chemicals - 3.1% | ||||||||
DowDuPont, Inc. | 17,946 | 959,752 | ||||||
FMC Corp. | 15,180 | 1,122,713 | ||||||
|
| |||||||
| 2,082,465 | ||||||||
|
| |||||||
Containers & Packaging - 5.4% | ||||||||
Graphic Packaging Holding Co. | 115,660 | 1,230,622 | ||||||
Sealed Air Corp. | 22,845 | 795,920 | ||||||
Sonoco Products Co. | 29,835 | 1,585,134 | ||||||
|
| |||||||
| 3,611,676 | ||||||||
|
| |||||||
Total Materials | 5,694,141 | |||||||
|
| |||||||
The accompanying notes are an integral part of the financial statements.
8
Equity Income Series
Investment Portfolio - December 31, 2018
SHARES
|
VALUE (NOTE 2)
| |||||||
COMMON STOCKS(continued) | ||||||||
Real Estate - 7.8% | ||||||||
Equity Real Estate Investment Trusts (REITS) - 7.8% | ||||||||
AvalonBay Communities, Inc. | 1,875 | $ | 326,344 | |||||
Community Healthcare Trust, Inc. | 11,680 | 336,734 | ||||||
CoreCivic, Inc. | 15,995 | 285,191 | ||||||
Crown Castle International Corp. | 7,960 | 864,695 | ||||||
Digital Realty Trust, Inc. | 4,140 | 441,117 | ||||||
Equinix, Inc. | 2,030 | 715,697 | ||||||
Healthcare Realty Trust, Inc. | 11,965 | 340,285 | ||||||
Healthcare Trust of America, Inc. - Class A | 13,105 | 331,688 | ||||||
Independence Realty Trust, Inc. | 34,135 | 313,359 | ||||||
Jernigan Capital, Inc. | 22,315 | 442,283 | ||||||
Physicians Realty Trust | 21,090 | 338,073 | ||||||
Plymouth Industrial REIT, Inc. | 10,110 | 127,487 | ||||||
STAG Industrial, Inc. | 14,905 | 370,836 | ||||||
|
| |||||||
Total Real Estate | 5,233,789 | |||||||
|
| |||||||
Utilities - 4.1% | ||||||||
Electric Utilities - 0.8% | ||||||||
Exelon Corp. | 11,800 | 532,180 | ||||||
|
| |||||||
Independent Power and Renewable Electricity Producers - 2.0% | ||||||||
Boralex, Inc. - Class A (Canada) | 22,540 | 278,035 | ||||||
Innergex Renewable Energy, Inc. (Canada) | 37,355 | 343,123 | ||||||
Northland Power, Inc. (Canada) | 22,165 | 352,315 | ||||||
Pattern Energy Group, Inc. - Class A | 21,310 | 396,792 | ||||||
|
| |||||||
| 1,370,265 | ||||||||
|
| |||||||
Multi-Utilities - 1.3% | ||||||||
CMS Energy Corp. | 16,780 | 833,127 | ||||||
|
| |||||||
Total Utilities | 2,735,572 | |||||||
|
| |||||||
TOTAL COMMON STOCKS | ||||||||
(Identified Cost $62,311,482) | 65,822,197 | |||||||
|
| |||||||
MUTUAL FUND - 1.5% | ||||||||
iShares Russell 1000 Value ETF | ||||||||
(Identified Cost $1,005,355) | 9,075 | 1,007,779 | ||||||
|
| |||||||
The accompanying notes are an integral part of the financial statements.
9
Equity Income Series
Investment Portfolio - December 31, 2018
SHARES
|
VALUE (NOTE 2)
| |||||||
SHORT-TERM INVESTMENT - 2.1% | ||||||||
Dreyfus Government Cash Management, Institutional Shares, 2.29%1, | ||||||||
(Identified Cost $ 1,426,949) | 1,426,949 | $ | 1,426,949 | |||||
|
| |||||||
TOTAL INVESTMENTS - 101.5% | ||||||||
(Identified Cost $ 64,743,786) | 68,256,925 | |||||||
LIABILITIES, LESS OTHER ASSETS - (1.5%) | (984,332 | ) | ||||||
|
| |||||||
NET ASSETS - 100% | $ | 67,272,593 | ||||||
|
| |||||||
ADR - American Depositary Receipt
ETF - Exchange-Traded Fund
*Non-income producing security.
1Rate shown is the current yield as of December 31, 2018.
The Global Industry Classification Standard (GICS) was developed by and is the exclusive property and a service mark of MSCI Inc. (MSCI) and Standard & Poor’s, a division of The McGraw-Hill Companies, Inc. (S&P), and is licensed for use by Manning & Napier when referencing GICS sectors. Neither MSCI, S&P, nor any third party involved in making or compiling the GICS or any GICS classifications makes any express or implied warranties or representations with respect to such standard or classification, nor shall any such party have any liability therefrom.
The accompanying notes are an integral part of the financial statements.
10
Equity Income Series
Statement of Assets & Liabilities
December 31, 2018
ASSETS: | ||||
Investments, at value (identified cost $64,743,786) (Note 2) | $ | 68,256,925 | ||
Dividends receivable | 147,481 | |||
Foreign tax reclaims receivable | 8,184 | |||
Receivable for fund shares sold | 3,415 | |||
Prepaid expenses | 13,708 | |||
|
| |||
TOTAL ASSETS | 68,429,713 | |||
|
| |||
LIABILITIES: | ||||
Accrued management fees (Note 3) | 28,410 | |||
Accrued fund accounting and administration fees (Note 3) | 15,247 | |||
Accrued shareholder services fees (Class S) (Note 3) | 3,367 | |||
Accrued Chief Compliance Officer service fees (Note 3) | 426 | |||
Payable for securities purchased | 1,005,355 | |||
Payable for fund shares repurchased | 87,445 | |||
Other payables and accrued expenses | 16,870 | |||
|
| |||
TOTAL LIABILITIES | 1,157,120 | |||
|
| |||
TOTAL NET ASSETS | $ | 67,272,593 | ||
|
| |||
NET ASSETS CONSIST OF: | ||||
Capital stock | $ | 64,178 | ||
Additionalpaid-in-capital | 64,336,110 | |||
Total distributable earnings (loss) | 2,872,305 | |||
|
| |||
TOTAL NET ASSETS | $ | 67,272,593 | ||
|
| |||
NET ASSET VALUE, OFFERING PRICE AND REDEMPTION PRICE PER SHARE - Class S | ||||
($19,161,871/ 1,828,358 shares) | $ | 10.48 | ||
|
| |||
NET ASSET VALUE, OFFERING PRICE AND REDEMPTION PRICE PER SHARE - Class I | ||||
($48,110,722/ 4,589,399 shares) | $ | 10.48 | ||
|
| |||
The accompanying notes are an integral part of the financial statements.
11
Equity Income Series
Statement of Operations
For the Year Ended December 31, 2018
INVESTMENT INCOME: | ||||
Dividends (net of foreign taxes withheld, $19,865) | $ | 2,023,119 | ||
|
| |||
EXPENSES: | ||||
Management fees (Note 3) | 515,835 | |||
Fund accounting and administration fees (Note 3) | 56,032 | |||
Shareholder services fees (Class S) (Note 3) | 43,966 | |||
Directors’ fees (Note 3) | 6,482 | |||
Chief Compliance Officer service fees (Note 3) | 4,635 | |||
Custodian fees | 9,689 | |||
Miscellaneous | 98,439 | |||
|
| |||
Total Expenses | 735,078 | |||
Less reduction of expenses (Note 3) | (95,917 | ) | ||
|
| |||
Net Expenses | 639,161 | |||
|
| |||
NET INVESTMENT INCOME | 1,383,958 | |||
|
| |||
REALIZED AND UNREALIZED GAIN (LOSS) ON INVESTMENTS AND FOREIGN CURRENCY: | ||||
Net realized gain (loss) on- | ||||
Investments | 2,321,792 | |||
Foreign currency and translation of other assets and liabilities | 205 | |||
|
| |||
| 2,321,997 | ||||
|
| |||
Net change in unrealized appreciation (depreciation) on- | ||||
Investments | (9,703,520 | ) | ||
Foreign currency and translation of other assets and liabilities | (311 | ) | ||
|
| |||
| (9,703,831 | ) | |||
|
| |||
NET REALIZED AND UNREALIZED GAIN (LOSS) ON INVESTMENTS AND FOREIGN CURRENCY | (7,381,834 | ) | ||
|
| |||
NET DECREASE IN NET ASSETS RESULTING FROM OPERATIONS | $ | (5,997,876 | ) | |
|
| |||
The accompanying notes are an integral part of the financial statements.
12
Equity Income Series
Statements of Changes in Net Assets
| FOR THE YEAR ENDED 12/31/18 | FOR THE YEAR ENDED 12/31/17 | |||||||||
INCREASE (DECREASE) IN NET ASSETS: | ||||||||||
OPERATIONS: | ||||||||||
Net investment income | $ | 1,383,958 | $ | 1,443,393 | ||||||
Net realized gain (loss) on investments and foreign currency | 2,321,997 | 2,084,979 | ||||||||
Net change in unrealized appreciation (depreciation) on investments and foreign currency | (9,703,831 | ) | 8,208,446 | |||||||
|
|
|
| |||||||
Net increase (decrease) from operations | (5,997,876 | ) | 11,736,818 | |||||||
|
|
|
| |||||||
DISTRIBUTIONS TO SHAREHOLDERS (Note 9): | ||||||||||
Class S | (1,125,570 | ) | (1,039,784 | ) | ||||||
Class I | (2,920,043 | ) | (2,526,511 | ) | ||||||
|
|
|
| |||||||
Total distributions to shareholders | (4,045,613 | ) | (3,566,295 | )1 | ||||||
|
|
|
| |||||||
CAPITAL STOCK ISSUED AND REPURCHASED: | ||||||||||
Net increase (decrease) from capital share transactions (Note 5) | (11,121,565 | ) | 5,511,516 | |||||||
|
|
|
| |||||||
Net increase (decrease) in net assets | (21,165,054 | ) | 13,682,039 | |||||||
NET ASSETS: | ||||||||||
Beginning of year | 88,437,647 | 74,755,608 | ||||||||
|
|
|
| |||||||
End of year2 | $ | 67,272,593 | $ | 88,437,647 | ||||||
|
|
|
| |||||||
1 For the year ended December 31, 2017, the distributions to shareholders from net investment income and net realized gain were $463,860 and $575,924 (Class S) and $1,162,883 and $1,363,628 (Class I), respectively.
2 Includes accumulated undistributed (overdistributed) net investment income of $0 as of December 31, 2017. The SEC eliminated the requirement to disclose undistributed net investment income in 2018.
The accompanying notes are an integral part of the financial statements.
13
Equity Income Series
Financial Highlights - Class S
| FOR THE YEAR ENDED | ||||||||||||||||||||
| 12/31/18 | 12/31/17 | 12/31/16 | 12/31/15 | 12/31/14* | ||||||||||||||||
Per share data (for a share outstanding throughout each year): | ||||||||||||||||||||
Net asset value - Beginning of year | $12.12 | $10.96 | $10.13 | $10.78 | $10.00 | |||||||||||||||
|
|
|
|
|
|
|
|
|
| |||||||||||
Income (loss) from investment operations: | ||||||||||||||||||||
Net investment income1 | 0.19 | 0.19 | 0.22 | 0.20 | 0.29 | 2 | ||||||||||||||
Net realized and unrealized gain (loss) on investments | (1.19 | ) | 1.46 | 1.27 | (0.54 | ) | 0.86 | |||||||||||||
|
|
|
|
|
|
|
|
|
| |||||||||||
Total from investment operations | (1.00 | ) | 1.65 | 1.49 | (0.34 | ) | 1.15 | |||||||||||||
|
|
|
|
|
|
|
|
|
| |||||||||||
Less distributions to shareholders: | ||||||||||||||||||||
From net investment income | (0.20 | ) | (0.21 | ) | (0.24 | ) | (0.22 | ) | (0.23 | ) | ||||||||||
From net realized gain on investments | (0.44 | ) | (0.28 | ) | (0.42 | ) | (0.09 | ) | (0.14 | ) | ||||||||||
|
|
|
|
|
|
|
|
|
| |||||||||||
Total distributions to shareholders | (0.64 | ) | (0.49 | ) | (0.66 | ) | (0.31 | ) | (0.37 | ) | ||||||||||
|
|
|
|
|
|
|
|
|
| |||||||||||
Net asset value - End of year | $10.48 | $12.12 | $10.96 | $10.13 | $10.78 | |||||||||||||||
|
|
|
|
|
|
|
|
|
| |||||||||||
Net assets - End of year(000’s omitted) | $19,162 | $26,067 | $25,592 | $24,584 | $24,178 | |||||||||||||||
|
|
|
|
|
|
|
|
|
| |||||||||||
Total return3 | (8.43% | ) | 15.19% | 14.82% | (3.20% | ) | 11.63% | |||||||||||||
Ratios (to average net assets)/Supplemental Data: | ||||||||||||||||||||
Expenses** | 0.95% | 0.95% | 0.95% | 0.95% | 0.95% | |||||||||||||||
Net investment income | 1.59% | 1.63% | 2.04% | 1.92% | 2.68% | 2 | ||||||||||||||
Portfolio turnover | 40% | 52% | 45% | 58% | 55% | |||||||||||||||
| **The investment advisor did not impose all or a portion of its management and/or other fees, and in some periods may have paid a portion of the Series’ expenses. If these expenses had been incurred by the Class, the expense ratio (to average net assets) would have increased by the following amount: |
| |||||||||||||||||||
| 0.12% | 0.09% | 0.10% | 0.12% | 0.33% | ||||||||||||||||
*Commencement of operations was December 31, 2013.
1Calculated based on average shares outstanding during the years.
2Reflects a special dividend paid out during the period by two of the Series’ holdings. Had the Series not received the special dividends, the net investment income per share would have been $0.22 and the net investment income ratio would have been 2.07%.
3Represents aggregate total return for the year indicated, and assumes reinvestment of all distributions. Total return would have been lower had certain expenses not been waived during certain years.
The accompanying notes are an integral part of the financial statements.
14
Equity Income Series
Financial Highlights - Class I
| FOR THE YEAR ENDED | ||||||||||||||||||||
| 12/31/18 | 12/31/17 | 12/31/16 | 12/31/15 | 12/31/14 | ||||||||||||||||
Per share data (for a share outstanding throughout each year): | ||||||||||||||||||||
Net asset value - Beginning of year | $12.12 | $10.97 | $10.13 | $10.78 | $10.00 | |||||||||||||||
|
|
|
|
|
|
|
|
|
| |||||||||||
Income (loss) from investment operations: | ||||||||||||||||||||
Net investment income1 | 0.22 | 0.21 | 0.24 | 0.23 | 0.30 | 2 | ||||||||||||||
Net realized and unrealized gain (loss) on investments | (1.19 | ) | 1.46 | 1.29 | (0.55 | ) | 0.87 | |||||||||||||
|
|
|
|
|
|
|
|
|
| |||||||||||
Total from investment operations | (0.97 | ) | 1.67 | 1.53 | (0.32 | ) | 1.17 | |||||||||||||
|
|
|
|
|
|
|
|
|
| |||||||||||
Less distributions to shareholders: | ||||||||||||||||||||
From net investment income | (0.23 | ) | (0.24 | ) | (0.27 | ) | (0.24 | ) | (0.25 | ) | ||||||||||
From net realized gain on investments | (0.44 | ) | (0.28 | ) | (0.42 | ) | (0.09 | ) | (0.14 | ) | ||||||||||
|
|
|
|
|
|
|
|
|
| |||||||||||
Total distributions to shareholders | (0.67 | ) | (0.52 | ) | (0.69 | ) | (0.33 | ) | (0.39 | ) | ||||||||||
|
|
|
|
|
|
|
|
|
| |||||||||||
Net asset value - End of year | $10.48 | $12.12 | $10.97 | $10.13 | $10.78 | |||||||||||||||
|
|
|
|
|
|
|
|
|
| |||||||||||
Net assets - End of year(000’s omitted) | $48,111 | $62,371 | $49,164 | $51,763 | $38,506 | |||||||||||||||
|
|
|
|
|
|
|
|
|
| |||||||||||
Total return3 | (8.24% | ) | 15.31% | 15.13% | (3.00% | ) | 11.79% | |||||||||||||
Ratios (to average net assets)/Supplemental Data: | ||||||||||||||||||||
Expenses** | 0.75% | 0.75% | 0.75% | 0.75% | 0.75% | |||||||||||||||
Net investment income | 1.80% | 1.84% | 2.22% | 2.16% | 2.82% | 2 | ||||||||||||||
Portfolio turnover | 40% | 52% | 45% | 58% | 55% | |||||||||||||||
| **The investment advisor did not impose all or a portion of its management and/or other fees, and in some periods may have paid a portion of the Series’ expenses. If these expenses had been incurred by the Class, the expense ratio (to average net assets) would have increased by the following amount: |
| |||||||||||||||||||
| 0.12% | 0.09% | 0.10% | 0.11% | 0.30% | ||||||||||||||||
1Calculated based on average shares outstanding during the years.
2Reflects a special dividend paid out during the period by two of the Series’ holdings. Had the Series not received the special dividends, the net investment income per share would have been $0.24 and the net investment income ratio would have been 2.19%.
3Represents aggregate total return for the years indicated, and assumes reinvestment of all distributions. Total return would have been lower had certain expenses not been waived or reimbursed during certain years.
The accompanying notes are an integral part of the financial statements.
15
Equity Income Series
Notes to Financial Statements
| 1. | Organization |
Equity Income Series (the “Series”) is ano-load diversified series of Manning & Napier Fund, Inc. (the “Fund”). The Fund is organized in Maryland and is registered under the Investment Company Act of 1940, as amended, as anopen-end management investment company.
The Series’ primary investment objectives are to provide current income and income growth, and it has a secondary goal of providing long-term capital appreciation.
The Fund’s advisor is Manning & Napier Advisors, LLC (the “Advisor”). Shares of the Series are offered to investors, clients and employees of the Advisor and its affiliates. The Series is authorized to issue two classes of shares (Class S and Class I). Each class of shares is substantially the same, except that Class S shares bear shareholder services fees. The total authorized capital stock of the Fund consists of 15 billion shares of common stock each having a par value of $0.01. As of December 31, 2018, 10.4 billion shares have been designated in total among 34 series, of which 100 million have been designated as Equity Income Series Class I common stock, 100 million have been designated as Equity Income Series Class S common stock, 50 million have been designated as Equity Income Series Class W common stock, and 100 million have been designated as Equity Income Series Class Z common stock. Class W common stock and Class Z common stock are not currently offered for sale.
| 2. | Significant Accounting Policies |
The following is a summary of significant accounting policies followed by the Series. The Series is an investment company and, accordingly, follows the investment company accounting and reporting guidance of the Financial Accounting Standards Board Accounting Standards Codification Topic 946 - Investment Companies, which is part of accounting principles generally accepted in the United States of America (“GAAP”).
Security Valuation
Portfolio securities, including domestic equities, foreign equities, warrants and options, listed on an exchange other than the NASDAQ Stock Market are valued at the latest quoted sales price of the exchange on which the security is primarily traded. Securities not traded on valuation date or securities not listed on an exchange are valued at the latest quoted bid price provided by the Fund’s pricing service. Securities listed on the NASDAQ Stock Market are valued in accordance with the NASDAQ Official Closing Price.
Short-term investments that mature in sixty days or less may be valued at amortized cost, which approximates fair value. Investments inopen-end investment companies are valued at their net asset value per share on valuation date.
Volume and level of activity in established markets for an asset or liability are evaluated to determine whether recent transactions and quoted prices are determinative of fair value. Where there have been significant decreases in volume and level of activity, further analysis and adjustment may be necessary to estimate fair value. The Series measures fair value in these instances by the use of inputs and valuation techniques which may be based upon current market prices of securities that are comparable in coupon, rating, maturity and industry and/or expectation of future cash flows. As a result of trading in relatively thin markets and/or markets that experience significant volatility, the prices used by the Series to value these securities may differ from the value that would be realized if these securities were sold, and the differences could be material.
Securities for which representative valuations or prices are not available from the Series’ pricing service may be valued at fair value as determined in good faith by the Advisor under procedures approved by and under the general supervision and responsibility of the Fund’s Board of Directors (the “Board”). Due to the inherent uncertainty of valuations of such securities, the fair value may differ significantly from the values that would have been used had a ready market for such securities existed. If trading or events occurring after the close of the principal market in which securities are traded are expected to materially affect the value of those securities, then they may be valued at their fair value, taking this trading or these events into account. In accordance with the procedures approved by the Board, the values of certain securities trading outside the U.S. were adjusted following the close of local trading using a factor from a third party vendor. The third party vendor uses statistical analyses and quantitative models, which consider among other things subsequent movement and changes in the prices of indices, securities and exchange rates in other markets, to determine the factors which are used to adjust local market prices. The value of
16
Equity Income Series
Notes to Financial Statements (continued)
| 2. | Significant Accounting Policies (continued) |
Security Valuation(continued)
securities used for net asset value calculation under these procedures may differ from published prices for the same securities. It is the Fund’s policy to classify each foreign equity security where a factor from a third party vendor is provided as a Level 2 security.
Various inputs are used in determining the value of the Series’ assets or liabilities carried at fair value. These inputs are summarized in three broad levels. Level 1 includes quoted prices in active markets for identical assets and liabilities. Level 2 includes other significant observable inputs (including quoted prices for similar securities, interest rates, prepayment speeds, credit risk, etc.). Level 3 includes significant unobservable inputs (including the Series’ own assumptions in determining the fair value of investments). A financial instrument’s level within the fair value hierarchy is based on the lowest level of any input both individually and in aggregate that is significant to the fair value measurement. The inputs or methodology used for valuing securities are not necessarily an indication of the risk associated with investing in those securities.
The following is a summary of the valuation levels used for major security types as of December 31, 2018 in valuing the Series’ assets or liabilities carried at fair value:
| DESCRIPTION | TOTAL | LEVEL 1 | LEVEL 2 | LEVEL 3 | ||||||||||||
Assets: | ||||||||||||||||
Equity Securities: | ||||||||||||||||
Communication Services | $ | 1,299,524 | $ | 1,299,524 | $ | — | $ | — | ||||||||
Consumer Discretionary | 3,552,696 | 3,552,696 | — | — | ||||||||||||
Consumer Staples | 4,780,610 | 4,033,404 | 747,206 | # | — | |||||||||||
Energy | 6,823,269 | 6,823,269 | — | — | ||||||||||||
Financials | 14,061,308 | 14,061,308 | — | — | ||||||||||||
Health Care | 9,740,385 | 8,144,216 | 1,596,169 | # | — | |||||||||||
Industrials | 6,749,382 | 6,749,382 | — | — | ||||||||||||
Information Technology | 5,151,521 | 5,151,521 | — | — | ||||||||||||
Materials | 5,694,141 | 5,694,141 | — | — | ||||||||||||
Real Estate | 5,233,789 | 5,233,789 | — | — | ||||||||||||
Utilities | 2,735,572 | 2,735,572 | — | — | ||||||||||||
Mutual funds | 2,434,728 | 2,434,728 | — | — | ||||||||||||
|
|
|
|
|
|
|
| |||||||||
Total assets | $ | 68,256,925 | $ | 65,913,550 | $ | 2,343,375 | $ | — | ||||||||
|
|
|
|
|
|
|
| |||||||||
# Consists of certain foreign securities for which a factor from a third party vendor was applied to determine the securities’ fair value following the close of local trading.
There were no Level 3 securities held by the Series as of December 31, 2017 or December 31, 2018.
New Accounting Pronouncements
The Securities and Exchange Commission (SEC) adopted changes to RegulationS-X to simplify the reporting of information by registered investment companies in financial statements. The amendments require presentation of the total, rather than the components, of distributable earnings on the Statement of Assets and Liabilities and also require presentation of the total, rather than the components, of distributions to shareholders, except for tax return of capital distributions, if any, on the Statement of Changes in Net Assets. The amendments also removed the requirement for parenthetical disclosure of undistributed net investment income on the Statement of Changes in Net Assets. These RegulationS-X amendments are reflected in the Series financial statements for the year ended December 31, 2018. As a result of adopting these amendments, the distributions to shareholders in the December 31, 2017 Statement of Changes in Net Assets presented herein have been reclassified to conform to the current year presentation.
On August 28, 2018, the FASB issued ASU2018-13, “Disclosure Framework – Changes to the Disclosure Requirements for Fair Value Measurement,” which amends the fair value measurement disclosure requirements under U.S. GAAP. The amendments of ASU2018-13 include new, eliminated, and modified disclosure requirements. In addition, the amendments clarify that materiality
17
Equity Income Series
Notes to Financial Statements (continued)
| 2. | Significant Accounting Policies (continued) |
New Accounting Pronouncements(continued)
is an appropriate consideration of entities when evaluating disclosure requirements. The ASU is effective for all entities for fiscal years beginning after December 15, 2019, including interim periods therein. An entity is permitted to early adopt any eliminated or modified disclosures upon issuance of this ASU and delay adoption of the new disclosures until their effective date. As such, each Series has early adopted the eliminated and modified disclosures, as permitted by this ASU.
Security Transactions, Investment Income and Expenses
Security transactions are accounted for on trade date. Dividend income is recorded on theex-dividend date, except that if theex-dividend date has passed, certain dividends from foreign securities are recorded as soon as the Series is informed of theex-dividend date.Non-cash dividends, if any, are recorded at the fair value of the securities received. Interest income, including amortization of premium and accretion of discounts using the effective interest method, is earned from settlement date and accrued daily.
Expenses are recorded on an accrual basis. Most expenses of the Fund can be attributed to a specific series. Expenses which cannot be directly attributed are apportioned among the series in the Fund in such a manner as deemed equitable by the Fund’s Board, taking into consideration, among other things, the nature and type of expense. Income, expenses (other than shareholder services fees), and realized and unrealized gains and losses are prorated among the classes based on the relative net assets of each class. Class specific expenses are directly charged to that Class.
The Fund records distributions received in excess of income from underlying investments as a reduction of cost of investments and/or realized gain. Such amounts are based on estimates if actual amounts are not available and actual amounts of income, realized gain and return of capital may differ from the estimated amounts. The Fund adjusts the estimated amounts of components of distributions (and consequently its net investment income) as necessary once the issuers provide information about the actual composition of the distributions.
The Series uses the identified cost method for determining realized gain or loss on investments for both financial statement and federal income tax reporting purposes.
Foreign Currency Translation
The books and records of the Series are maintained in U.S. dollars. Foreign currencies, investments and other assets and liabilities are translated into U.S. dollars at the current exchange rates. Purchases and sales of investment securities and income and expenses are translated on the respective dates of such transactions. The Series does not isolate realized and unrealized gains and losses attributable to changes in the exchange rates from gains and losses that arise from changes in the fair value of investments. Such fluctuations are included with net realized and unrealized gain or loss on investments. Net realized foreign currency gains and losses represent foreign currency gains and losses between trade date and settlement date on securities transactions, gains and losses on disposition of foreign currencies and the difference between the amount of income and foreign withholding taxes recorded on the books of the Series and the amounts actually received or paid.
Federal Taxes
The Series’ policy is to comply with the provisions of the Internal Revenue Code applicable to regulated investment companies. The Series is not subject to federal income tax or excise tax to the extent that the Series distributes to shareholders each year its taxable income, including any net realized gains on investments, in accordance with requirements of the Internal Revenue Code. Accordingly, no provision for federal income tax or excise tax has been made in the financial statements.
Management evaluates its tax positions to determine if the tax positions taken meet the minimum recognition threshold in connection with accounting for uncertainties in income tax positions taken or expected to be taken for the purposes of measuring and recognizing tax liabilities in the financial statements. Recognition of tax benefits of an uncertain tax position is required only when the position is “more likely than not” to be sustained assuming examination by taxing authorities. At December 31, 2018, the Series has recorded no liability for net unrecognized tax benefits relating to uncertain income tax positions taken or expected to be taken in future tax returns.
18
Equity Income Series
Notes to Financial Statements (continued)
| 2. | Significant Accounting Policies (continued) |
Federal Taxes(continued)
The Series files income tax returns in the U.S. federal jurisdiction, various states and foreign jurisdictions, as required. No income tax returns are currently under investigation. The statute of limitations on the Series’ tax returns remains open for the years ended December 31, 2015 through December 31, 2018. The Series is not aware of any tax positions for which it is reasonably possible that the total amounts of unrecognized tax benefits will significantly change in the next twelve months.
Foreign Taxes
Based on the Series’ understanding of the tax rules and rates related to income, gains and currency purchase/repatriation transactions for foreign jurisdictions in which it invests, the Series will provide for foreign taxes, and where appropriate, deferred foreign tax.
Distributions of Income and Gains
Distributions to shareholders of net investment income and net realized gains are made annually. An additional distribution may be necessary to avoid taxation of the Series. Distributions are recorded on theex-dividend date.
Indemnifications
The Fund’s organizational documents provide former and current directors and officers with a limited indemnification against liabilities arising in connection with the performance of their duties to the Fund. In the normal course of business, the Fund may also enter into contracts that provide general indemnifications. The Fund’s maximum exposure under these arrangements is unknown as this would be dependent on future claims that may be made against the Fund. The risk of material loss from such claims is considered remote.
Other
The preparation of financial statements in conformity with GAAP requires management to make estimates and assumptions that affect the reported amounts of assets and liabilities and the disclosure of contingent assets and liabilities at the date of the financial statements and the reported amounts of income and expenses during the reporting period. Actual results could differ from those estimates.
| 3. | Transactions with Affiliates |
The Fund has an Investment Advisory Agreement (the “Agreement”) with the Advisor for which the Series pays a fee, computed daily and payable monthly, at an annual rate of 0.65% of the Series’ average daily net assets.
Under the Agreement, personnel of the Advisor provide the Series with advice and assistance in the choice of investments and the execution of securities transactions, and otherwise maintain the Series’ organization. The Advisor also provides the Fund with necessary office space and fund administration and support services. The salaries of all officers of the Fund (except a percentage of the Fund’s Chief Compliance Officer’s salary, which is paid by the Fund), and of all Directors who are “affiliated persons” of the Fund, or of the Advisor, and all personnel of the Fund, or of the Advisor, performing services relating to research, statistical and investment activities, are paid by the Advisor. Each“non-affiliated” Director receives an annual stipend, which is allocated among all the active series of the Fund. In addition, these Directors also receive a fee per Board meeting attended plus a fee for each committee meeting attended and are reimbursed for travel and otherout-of-pocket expenses incurred by them in connection with attending such meetings. The Fund also has an Audit Committee Chair, Governance & Nominating Committee Chair and Lead Independent Director, who each receive an additional annual stipend for these roles.
The Class S shares of the Series are subject to a shareholder services fee in accordance with a shareholder services plan adopted by the Fund’s Board. The shareholder services fee is intended to compensate financial intermediaries, including affiliates of the Fund, in connection with the provision of direct client service, personal services, maintenance of shareholder accounts and reporting services. For these services, Class S of the Series pays a fee, computed daily and payable monthly, at an annual rate of 0.20% of the average daily net assets of Class S. The Fund has a Shareholder Services Agreement with the Advisor, for which the Advisor receives the shareholder services fee as stated above.
19
Equity Income Series
Notes to Financial Statements (continued)
| 3. | Transactions with Affiliates (continued) |
The Advisor has contractually agreed, until at least April 30, 2019, to waive its fee and, if necessary, pay other operating expenses of the Series in order to maintain total direct annual fund operating expenses for the Series, exclusive of a Class’s Shareholder Services Fee, at no more than 0.75% of average daily net assets. Accordingly, the Advisor waived fees of $95,917 for the year ended December 31, 2018, which is included as a reduction of expenses on the Statement of Operations. The Advisor is not eligible to recoup any expenses that have been waived or reimbursed in prior years.
Manning & Napier Investor Services, Inc., a registered broker-dealer affiliate of the Advisor, acts as distributor for the Fund’s shares. The services of Manning & Napier Investor Services, Inc. are provided at no additional cost to the Series.
Pursuant to a master services agreement dated March 1, 2017, as amended, the Fund pays the Advisor an annual fee related to fund accounting and administration of 0.0085% on the first $25 billion of average daily net assets (excluding Target Series and Income Series); 0.0075% on the next $15 billion of average daily net assets (excluding Target Series and Income Series); and 0.0065% of average daily net assets in excess of $40 billion (excluding Target Series and Income Series); plus a base fee of $30,400 per series. Additionally, certain transaction andout-of-pocket expenses, including charges for reporting relating to the Fund’s compliance program, are charged. The Advisor has agreements with BNY Mellon Investment Servicing (U.S.) Inc. (“BNY”) under which BNY serves assub-accountant services agent.
| 4. | Purchases and Sales of Securities |
For the year ended December 31, 2018, purchases and sales of securities, other than U.S. Government securities and short-term securities, were $31,494,152 and $44,739,604, respectively. There were no purchases or sales of U.S. Government securities.
| 5. | Capital Stock Transactions |
Transactions in shares of Class S and Class I of Equity Income Series were:
| CLASS S | FOR THE YEAR ENDED 12/31/18 | FOR THE YEAR ENDED 12/31/17 | ||||||||||||||
| SHARES | AMOUNT | SHARES | AMOUNT | |||||||||||||
Sold | 41,183 | $ | 497,569 | 149,479 | $ | 1,716,173 | ||||||||||
Reinvested | 100,645 | 1,103,590 | 85,843 | 1,018,798 | ||||||||||||
Repurchased | (464,063 | ) | (5,474,190 | ) | (418,823 | ) | (4,803,807 | ) | ||||||||
|
|
|
|
|
|
|
| |||||||||
Total | (322,235 | ) | $ | (3,873,031 | ) | (183,501 | ) | $ | (2,068,836 | ) | ||||||
|
|
|
|
|
|
|
| |||||||||
| CLASS I | FOR THE YEAR ENDED 12/31/18 | FOR THE YEAR ENDED 12/31/17 | ||||||||||||||
| SHARES | AMOUNT | SHARES | AMOUNT | |||||||||||||
Sold | 860,229 | $ | 10,117,376 | 1,268,750 | $ | 14,551,330 | ||||||||||
Reinvested | 215,121 | 2,360,972 | 163,745 | 1,945,549 | ||||||||||||
Repurchased | (1,629,993 | ) | (19,726,882 | ) | (771,110 | ) | (8,916,527 | ) | ||||||||
|
|
|
|
|
|
|
| |||||||||
Total | (554,643 | ) | $ | (7,248,534 | ) | 661,385 | $ | 7,580,352 | ||||||||
|
|
|
|
|
|
|
| |||||||||
At December 31, 2018, the Income Series, another series of the Fund, owned 10.6% of the Series. Approximately 88% of the shares outstanding are fiduciary accounts where the Advisor has sole investment discretion.
| 6. | Line of Credit |
The Fund has entered into a364-day, $25 million credit agreement (the “line of credit”) with Bank of New York Mellon. Each series of the Fund may borrow under the line of credit for temporary or emergency purposes, including funding shareholder redemptions and other short-term liquidity purposes. The Fund pays an annual fee on the unused commitment amount, payable quarterly, and is allocated among all the series of the Fund and included in miscellaneous expenses in the Statement of
20
Equity Income Series
Notes to Financial Statements (continued)
Operations for each series. The line of credit expires in August 2019 unless extended or renewed. During the year ended December 31, 2018, the Series did not borrow under the line of credit.
| 7. | Financial Instruments |
The Series may trade in instruments including written and purchased options, forward foreign currency exchange contracts and futures contracts and other derivatives in the normal course of investing activities to assist in managing exposure to various market risks. The Series may be subject to various elements of risk, which may involve, to a varying degree, elements of risk in excess of the amounts recognized for financial statement purposes. These risks include: the risk that changes in the value of a derivative may not correlate perfectly with the underlying asset, rate or index; counterparty credit risk related to over the counter derivative counterparties’ failure to perform under contract terms; liquidity risk related to the lack of a liquid market for these contracts allowing the fund to close out its position(s); and documentation risk relating to disagreement over contract terms. No such investments were held by the Series as of December 31, 2018.
| 8. | Foreign Securities |
Investing in securities of foreign companies and foreign governments involves special risks and considerations not typically associated with investing in securities of domestic companies and the U.S. Government. These risks include revaluation of currencies and future adverse political and economic developments. Moreover, securities of foreign companies and foreign governments and their markets may be less liquid and their prices more volatile than those of comparable domestic companies and the U.S. Government.
| 9. | Federal Income Tax Information |
The amount and characterization of certain income and capital gains to be distributed are determined in accordance with federal income tax regulations, which may differ from GAAP. These differences are primarily due to differing book and tax treatments in the timing and/or treatment of the recognition of net investment income or gains and losses, including foreign currency gains and losses, losses deferred due to wash sales and qualified late-year losses. The Series may periodically make reclassifications among its capital accounts to reflect income and gains available for distribution (or available capital loss carryovers) under income tax regulations without impacting the Series’ net asset value. For the year ended December 31, 2018, $37,421 was reclassified within the capital accounts fromPaid-in Capital to Total Distributable Earnings (Loss). Any such reclassifications are not reflected in the financial highlights.
The tax character of distributions paid were as follows:
| FOR THE YEAR ENDED 12/31/18 | FOR THE YEAR ENDED 12/31/17 | |||||||||
Ordinary income | $2,032,277 | $1,852,762 | ||||||||
Long-term capital gains | $2,013,336 | $1,713,533 | ||||||||
At December 31, 2018, the tax basis of components of distributable earnings and the net unrealized appreciation based on the identified cost of investments for federal income tax purposes were as follows:
Cost for federal income tax purposes | $ | 65,054,073 | ||
Unrealized appreciation | 7,464,629 | |||
Unrealized depreciation | (4,261,777 | ) | ||
|
| |||
Net unrealized appreciation | $ | 3,202,852 | ||
|
| |||
Qualified late-year losses1 | $ | 330,669 |
1The Series has elected to defer certain qualified late-year losses and recognize such losses in the year ending December 31, 2019.
21
Equity Income Series
Report of Independent Registered Public Accounting Firm
To the Board of Directors of Manning & Napier Fund, Inc. and Shareholders of Equity Income Series
Opinion on the Financial Statements
We have audited the accompanying statement of assets and liabilities, including the investment portfolio, of Equity Income Series (one of the series constituting Manning & Napier Fund, Inc., referred to hereafter as the “Fund”) as of December 31, 2018, the related statement of operations for the year ended December 31, 2018, the statement of changes in net assets for each of the two years in the period ended December 31, 2018, including the related notes, and the financial highlights for each of the five years in the period ended December 31, 2018 (collectively referred to as the “financial statements”). In our opinion, the financial statements present fairly, in all material respects, the financial position of the Fund as of December 31, 2018, the results of its operations for the year then ended, the changes in its net assets for each of the two years in the period ended December 31, 2018 and the financial highlights for each of the five years in the period ended December 31, 2018 in conformity with accounting principles generally accepted in the United States of America.
Basis for Opinion
These financial statements are the responsibility of the Fund’s management. Our responsibility is to express an opinion on the Fund’s financial statements based on our audits. We are a public accounting firm registered with the Public Company Accounting Oversight Board (United States) (PCAOB) and are required to be independent with respect to the Fund in accordance with the U.S. federal securities laws and the applicable rules and regulations of the Securities and Exchange Commission and the PCAOB.
We conducted our audits of these financial statements in accordance with the standards of the PCAOB. Those standards require that we plan and perform the audit to obtain reasonable assurance about whether the financial statements are free of material misstatement, whether due to error or fraud.
Our audits included performing procedures to assess the risks of material misstatement of the financial statements, whether due to error or fraud, and performing procedures that respond to those risks. Such procedures included examining, on a test basis, evidence regarding the amounts and disclosures in the financial statements. Our audits also included evaluating the accounting principles used and significant estimates made by management, as well as evaluating the overall presentation of the financial statements. Our procedures included confirmation of securities owned as of December 31, 2018 by correspondence with the custodian and brokers; when replies were not received from brokers, we performed other auditing procedures. We believe that our audits provide a reasonable basis for our opinion.

New York, New York
February 15, 2019
We have served as the auditor of one or more investment companies in Manning & Napier Mutual Funds since 1992.
22
Equity Income Series
Supplemental Tax Information
(unaudited)
All reportings are based on financial information available as of the date of this annual report and, accordingly are subject to change.
For federal income tax purposes, the Series reports for the current fiscal year $2,032,277 or, if different, the maximum amount allowable under the tax law as qualified dividend income.
The Series designates $2,114,003 as Long-Term Capital Gain dividends pursuant to Section 852(b) of the Internal Revenue Code for the fiscal year ended December 31, 2018.
For corporate shareholders, the percentage of investment income (dividend income plus short-term gains, if any) that qualifies for the dividends received deduction for the current fiscal year is 82.86%, or if different, the maximum allowable under tax law.
23
Equity Income Series
Renewal of Investment Advisory Agreement
(unaudited)
At the Manning & Napier Fund, Inc. (the “Fund”) Board of Directors’ (the “Board”) meeting, held on November 15, 2018, the Investment Advisory Agreement (the “Agreement”) between the Fund and Manning & Napier Advisors, LLC (the “Advisor”) was considered for renewal by the Board, including all of the Directors who are not “interested persons” (“Independent Directors”), within the meaning of the Investment Company Act of 1940, as amended (the “1940 Act”). In connection with the decision whether to renew the Agreement, a variety of material was provided to the Board in advance of the meeting for their review and consideration. The Board also held a working session on October 31, 2018 to review and discuss information provided to the Board, and for the Board to request additional information.
Representatives of the Advisor attended a portion of the working session and attended the Board meeting. The Advisor provided supplemental information requested by the Board and presented additional oral information to the Board to assist the Board in its considerations. In addition to the information furnished by the Advisor, the Board was provided with a legal memorandum discussing its fiduciary duties related to its approval of the continuation of the Agreement. Legal counsel for the Fund discussed with the Board the applicable legal considerations. In addition, the Board receivedin-person presentations about the Fund throughout the year.
The Independent Directors were advised by independent legal counsel with respect to these matters. The Independent Directors also met separately in an executive session with their legal counsel without any representatives of the Advisor present.
The Directors’ determinations at the meeting were made on the basis of each Director’s business judgment after consideration of all the information presented. In deciding to recommend the renewal of the Agreement with respect to each Series of the Fund, the Independent Directors did not identify any single or particular piece of information that, in isolation, was the controlling factor. Each Independent Director may also have weighed factors differently. This summary describes the most important, but not all, of the factors considered by the Board and the Independent Directors.
| • | The Board considered the nature and quality of services provided by the Advisor under the Agreement for over 30 years including, among others: deciding what securities to purchase and sell for each Series; arranging for the purchase and sale of such securities by placing orders with broker-dealers; administering the affairs of the Fund (including the books and records of the Fund not maintained by third party service providers such as the custodian or transfer agent); arranging for the insurance coverage for the Fund; and supervising the preparation of tax returns, SEC filings (including registration statements) and reports to shareholders for the Fund. The Board considered the numerous services performed by the Advisor and its affiliates beyond those stated in the Agreements. The Board also considered the Advisor’s personnel who perform services to the Fund, changes in senior or key personnel, the strength of the Advisor’s compliance infrastructure, policies and procedures relating to compliance with securities regulations, reputation, expertise and resources. The Board discussed the quality of these services with representatives from the Advisor and concluded that the Advisor was performing its services to the Fund required under the Agreement in a reasonable manner. |
| • | The Board considered the Advisor’s investments teams, including changes to the investment teams and investment team’s compensation during the past year, and the investment process. The Board considered the performance of each Series since its inception, as well as over multiple time periods including: one year, three year, five year, ten year, and current market cycle. A market cycle includes periods of both rising and falling markets. Returns for established benchmark indices for each Series were provided. In addition, the Board considered (and considers on a quarterly basis) a number of other factors relevant to performance at the meeting including: a peer group performance analysis consisting of Morningstar universes of mutual funds with similar investment objectives; the breadth of the Fund’s product offerings; and performance over reasonable time periods. The Board discussed with Representatives of the Advisor, short-term performance challenges in the Fund’s core strategies that have resulted in a downward trend in assets under management. After discussion, the Board concluded that notwithstanding the performance challenges of certain Series, the nature and quality of the investment management services provided by the Advisor to the Fund supported the renewal of the agreement. |
| • | The Board considered the fees and expenses of the various Series of the Fund. The Advisor presented the advisory fees and total expenses for each Series, including the advisory fee adjusted for any contractual expense waivers or reimbursements paid by the Advisor. The Advisor also presentedpro-forma information related to several management fee and overall expense reductions that were set to take effect in early 2019. These changes were approved by the Board in a prior meeting and by shareholders at a Shareholder Meeting in May 2018. |
| • | The Board considered whether the Advisor had achieved economies of scale with respect to its services to the Fund. The Board acknowledged the expense caps incorporated in the Fund’s current fee structure, which requires the Advisor to |
24
Equity Income Series
Renewal of Investment Advisory Agreement
(unaudited)
| subsidize the expenses of the Series operating above their expense cap, noting that 27 Series of the Fund are currently receiving expense reimbursements from the Advisor. The Board concluded that the Fund would need to grow in assets before the Advisor would be able to achieve meaningful economies of scale. |
| • | The Advisor provided the Board with information comparing each Series’ contractual management fees with the Advisor’s standard advisory fees for separate accounts and collective investment trusts. The Board considered that the range of services provided to the Series is more extensive than for the Advisor’s other clients due to additional infrastructure, administrative and regulatory requirements related to operating a mutual fund. |
| • | The current andpro-forma advisory fees,12b-1 Distribution and Service Fees, other expenses (e.g. a combination of Shareholder Services Fees, intermediarysub-transfer agent fees, routine operating expenses and Acquired Fund Fees and Expenses forfund-of-fund Series) and total expense ratios of each Series and share class were compared and ranked (on both a mean and median basis) against respective peer universes. Respective peer universes included funds of a similar size and with similar investment objectives and expense characteristics as disclosed on the Morningstar database. Representatives of the Advisor discussed with the Board the comparisons and rankings of fees and net expense ratios for each Series of the Fund and the methodology behind the comparison. The Board considered the Advisor’s active portfolio management that results in portfolios that are more differentiated than the construction of their benchmarks. Based on their review of the information provided, the Board concluded that the current andpro-forma fees and expenses of each Series of the Fund were reasonable on a comparative basis. |
| • | The Board considered the costs of the Advisor’s services and the profits of the Advisor as they relate to the Advisor’s services to the Fund under the Agreement. The Board was provided with information on the Advisor’s financial condition and profitability by mutual fund agreement and by Series. Information provided by the Advisor addressed the anticipated effects of the upcoming fee reductions. The Board discussed the Advisor’s revenues generated from the Fund and its expenses associated with providing the services under the Agreement. The Advisor presented the Board with information on firm wide investment management profitability to provide a comparison of the Advisor’s profitability from its Fund activities relative to its profitability from its other investment management business. In addition, the Board reviewed the Advisor’s expense allocation methodology used to calculate profitability since many of the Advisor’s resources and expenses are shared across the Advisor’s various investment management vehicles. The Board considered the Advisor’s expenses associated with Fund activities outside of the Agreement (such as expense reimbursements pursuant to expense caps and payments made by the Advisor to third party platforms on which shares of the Fund are available for purchase). After discussing the above costs and profits, the Board concluded that the Advisor’s profitability relating to its services provided under the Agreement was reasonable. |
| • | The Board also considered the other benefits the Advisor derives from its relationship with the Fund. Such other benefits include participation in a joint insurance program, sharing of compensation expenses for certain shared personnel, relationships with large service providers, the utilization of Series within the Advisor’s separately managed accounts and certain research services provided by soft dollars. The Board reviewed the broker-dealers who provided research to the Advisor and the products and services paid for, in whole or in part, using soft dollar commissions. The Board concluded that these additional benefits to the Advisor were reasonable. |
Based on the Board’s deliberations and their evaluation of the information described above, the Board, including a majority of the Independent Directors, concluded that the compensation under the Agreement was fair and reasonable with respect to each Series in light of the services and expenses and such other matters as the Directors considered to be relevant in the exercise of their reasonable judgment, and that the renewal of the Agreement would be in the best interests of each Series and its shareholders. The Board did not indicate that any single factor was determinative of its decision to approve the Agreement, but indicated that the Board based its determination on the total mix of information available to it.
25
Equity Income Series
Directors’ and Officers’ Information
(unaudited)
The Statement of Additional Information provides additional information about the Fund’s directors and officers and can be obtained without charge by calling1-800-466-3863, at www.manning-napier.com, or on the EDGAR Database on the SEC Internet web site (http://www.sec.gov). The following chart shows certain information about the Fund’s directors and officers, including their principal occupations during the last five years. Unless specific dates are provided, the individuals have held the listed positions for longer than five years.
Interested Director and Officer
| Name: | Paul Battaglia* | |
| Address: | 290 Woodcliff Drive Fairport, NY 14450 | |
| Age: | 40 | |
| Current Position(s) Held with Fund: | Principal Executive Officer, President, Chairman and Director | |
| Term of Office & Length of Time Served: | Indefinite – Chairman and Director since November 20181 | |
| Principal Occupation(s) During Past 5 Years: | Chief Financial Officer (2018 – Present); Vice President of Finance (2016 – 2018); Director of Finance (2011 – 2016); Financial Analyst/Internal Auditor (2004-2006) – Manning & Napier Advisors, LLC and affiliates Holds one or more of the following titles for various subsidiaries and affiliates: Chief Financial Officer | |
| Number of Portfolios Overseen within Fund Complex: | 34 | |
| Other Directorships Held Outside Fund Complex During Past 5 Years: | N/A | |
| Independent Directors | ||
| Name: | Stephen B. Ashley | |
| Address: | 290 Woodcliff Drive Fairport, NY 14450 | |
| Age: | 78 | |
| Current Position(s) Held with Fund: | Director, Audit Committee Member, Governance & Nominating Committee Member | |
| Term of Office & Length of Time Served: | Indefinite – Since 1996 | |
| Principal Occupation(s) During Past 5 Years: | Chairman, Director & Chief Executive Officer (1997 to present) - The Ashley Group (property management and investment). Director (1995-2008) and Chairman(non-executive) (2004-2008) - Fannie Mae (mortgage) | |
| Number of Portfolios Overseen within Fund Complex: | 34 | |
| Other Directorships Held Outside Fund Complex During Past 5 Years: | Fannie Mae (1995-2008) The Ashley Group (1995-2008) Genesee Corporation (1987-2007) | |
| Name: | Paul A. Brooke | |
| Address: | 290 Woodcliff Drive Fairport, NY 14450 | |
| Age: | 73 | |
| Current Position(s) Held with Fund: | Lead Independent Director, Audit Committee Member, Governance & Nominating Committee Chairman | |
| Term of Office & Length of Time Served: | Indefinite – Director, Audit Committee Member, Governance & Nominating Committee Member since 2007; Governance & Nominating Committee Chairman since 2016; Lead Independent Director since 2017 | |
| Principal Occupation(s) During Past 5 Years: | Chairman & CEO (2005-2009) - Ithaka Acquisition Corporation (investments); Chairman (2007-2009) - Alsius Corporation (investments); Managing Member (1991-present) - PMSV Holdings LLC (investments); Managing Member (2010-2016) - Venbio (investments). | |
| Number of Portfolios Overseen within Fund Complex: | 34 | |
| Other Directorships Held Outside Fund Complex During Past 5 Years: | Incyte Corp. (biotech)(2000-present); ViroPharma, Inc. (speciality pharmaceuticals)(2000-2014); HLTH (WebMD)(information)(2000-2010); Cheyne Capital International (investment)(2000-2017); GMP Companies (investment)(2000-2011); Cytos Biotechnology Ltd (biotechnology)(2012-2014); Cerus (biomedical)(2016-present);PureEarth(non-profit)(2012-present); Caelum BioSciences (biomedical)(2018-present) | |
26
Equity Income Series
Directors’ and Officers’ Information
(unaudited)
| Independent Directors (continued) | ||
| Name: | Peter L. Faber | |
| Address: | 290 Woodcliff Drive | |
| Fairport, NY 14450 | ||
| Age: | 80 | |
| Current Position(s) Held with Fund: | Director, Governance & Nominating Committee Member | |
| Term of Office & Length of Time Served: | Indefinite – Since 1987 | |
| Principal Occupation(s) During Past 5 Years: | Senior Counsel (2006-2012), Partner (1995-2006 & 2013-2018) - McDermott, Will & Emery LLP (law firm) | |
| Number of Portfolios Overseen within Fund Complex: | 34 | |
| Other Directorships Held Outside Fund Complex During Past 5 Years: | Boston Early Music Festival(non-profit)(2007-present); Amherst Early Music, Inc.(non-profit)(2009-present); Gotham Early Music Scene, Inc.(non-profit)(2009-present); Partnership for New York City, Inc.(non-profit)(1989-2010); New York Collegium(non-profit)(2004-2011); S’Cool Sounds, Inc.(non-profit)(2017-present) | |
| Name: | Harris H. Rusitzky | |
| Address: | 290 Woodcliff Drive Fairport, NY 14450 | |
| Age: | 83 | |
| Current Position(s) Held with Fund: | Director, Audit Committee Member, Governance & Nominating Committee Member | |
| Term of Office & Length of Time Served: | Indefinite – Since 1985 | |
| Principal Occupation(s) During Past 5 Years: | President (1994- present) - The Greening Group (business consultants); Partner (2006-present) - The Restaurant Group (restaurants) | |
| Number of Portfolios Overseen within Fund Complex: | 34 | |
Other Directorships Held Outside Fund Complex During Past 5 Years: | Rochester Institute of Technology (university)(1972-present); Culinary Institute of America(non-profit college)(1985-present); George Eastman Museum (museum)(1988-present); National Restaurant Association (restaurant trade organization)(1978-present) | |
| Name: | Chester N. Watson | |
| Address: | 290 Woodcliff Drive | |
| Fairport, NY 14450 | ||
| Age: | 68 | |
| Current Position(s) Held with Fund: | Director, Audit Committee Chairman, Governance & Nominating Committee Member | |
| Term of Office & Length of Time Served: | Indefinite – Director, Audit Committee Member, Governance & Nominating Committee Member Since 2012; Audit Committee Chairman since 2013 | |
| Principal Occupation(s) During Past 5 Years: | General Auditor (2003-2011) - General Motors Company (auto manufacturer) | |
| Number of Portfolios Overseen within Fund Complex: | 34 | |
Other Directorships Held Outside Fund Complex During Past 5 Years: | Rochester Institute of Technology (university)(2005-present); Town of Greenburgh, NY Planning Board (municipal government) (2015-2018) | |
Officers: | ||
| Name: | Jeffrey S. Coons, Ph.D., CFA® | |
| Address: | 290 Woodcliff Drive Fairport, NY 14450 | |
| Age: | 55 | |
| Current Position(s) Held with Fund: | Vice President | |
| Term of Office1& Length of Time Served: | Since 2004 | |
| Principal Occupation(s) During Past 5 Years: | President since 2010,Co-CEO since 2018,Co-Director of Research (2002 – 2015) - Manning & Napier Advisors, LLC Holds one or more of the following titles for various subsidiaries and affiliates: President, Director, Treasurer, or Senior Trust Officer | |
27
Equity Income Series
Directors’ and Officers’ Information
(unaudited)
Officers: (continued)
| Name: | Elizabeth Craig | |
| Address: | 290 Woodcliff Drive | |
| Fairport, NY 14450 | ||
| Age: | 31 | |
| Current Position(s) Held with Fund: | Corporate Secretary | |
| Term of Office1& Length of Time Served: | Since 2016 | |
| Principal Occupation(s) During Past 5 Years: | Fund Administration Manager since 2015; Mutual Fund Compliance Specialist (2009-2015) - Manning & Napier Advisors, LLC; Assistant Corporate Secretary (2011-2016) - Manning & Napier Fund, Inc. | |
| Name: | Christine Glavin | |
| Address: | 290 Woodcliff Drive | |
| Fairport, NY 14450 | ||
| Age: | 52 | |
| Current Position(s) Held with Fund: | Principal Financial Officer, Chief Financial Officer | |
| Term of Office1& Length of Time Served: | Principal Financial Officer since 2002; Chief Financial Officer since 2001 | |
| Principal Occupation(s) During Past 5 Years: | Director of Fund Reporting since 2011; Fund Reporting Manager (1997-2011) - Manning & Napier Advisors, LLC; Assistant Treasurer since 2008 - Exeter Trust Company; Chief Financial Officer (2017-2018) - Rainier Investment Management Mutual Funds, Inc. | |
| Name: | Jodi L. Hedberg | |
| Address: | 290 Woodcliff Drive | |
| Fairport, NY 14450 | ||
| Age: | 51 | |
| Current Position(s) Held with Fund: | Chief Compliance Officer, Anti-Money Laundering Compliance Officer | |
| Term of Office1& Length of Time Served: | Chief Compliance Officer since 2004; Anti-Money Laundering Officer since 2002; Corporate Secretary (1997-2016) - Manning & Napier Fund, Inc.; Chief Compliance Officer and Anti-Money Laundering Officer (2017-2018) – Rainier Investment Management Mutual Funds, Inc. | |
| Principal Occupation(s) During Past 5 Years: | Managing Director, Compliance & Regulatory Affairs since 2018; Director of Compliance (2005-2018); Compliance Manager (1995-2005) – Manning & Napier Advisors, LLC and affiliates; Corporate Secretary – Manning & Napier Investor Services, Inc. since 2006 | |
| Name: | Scott Morabito | |
| Address: | 290 Woodcliff Drive | |
| Fairport, NY 14450 | ||
| Age: | 31 | |
| Current Position(s) Held with Fund: | Assistant Vice President | |
| Term of Office1& Length of Time Served: | Since 2017 | |
| Principal Occupation(s) During Past 5 Years: | Director of Funds Group since 2017; Fund Product and Strategy Manager (2014-2017); Senior Product and Strategy Analyst (2013-2014); Product and Strategy Analyst (2011-2013) - Manning & Napier Advisors, LLC; President, Director – Manning & Napier Investor Services, Inc. since 2018 | |
| Name: | Sarah Turner | |
| Address: | 290 Woodcliff Drive | |
| Fairport, NY 14450 | ||
| Age: | 36 | |
| Current Position(s) Held with Fund: | Chief Legal Officer; Assistant Corporate Secretary | |
| Term of Office1& Length of Time Served: | Since 2018 | |
| Principal Occupation(s) During Past 5 Years: | General Counsel since 2018 - Manning & Napier Advisors, LLC and affiliates; Counsel (2017-2018) – Harter Secrest and Emery LLP; Legal Counsel (2010-2017) – Manning & Napier Advisors, LLC and affiliates Holds one or more of the following titles for various affiliates: Corporate Secretary, General Counsel | |
28
Equity Income Series
Directors’ and Officers’ Information
(unaudited)
Officers: (continued)
| Name: | Amy Williams | |
| Address: | 290 Woodcliff Drive | |
| Fairport, NY 14450 | ||
| Age: | 57 | |
| Current Position(s) Held with Fund: | Assistant Corporate Secretary | |
| Term of Office1& Length of Time Served: | Since 2016 | |
| Principal Occupation(s) During Past 5 Years: | Director of Fund Documentation - Manning & Napier Advisors, LLC since 2009 Holds one or more of the following titles for various affiliates: Director | |
*Interested Director, within the meaning of the 1940 Act by reason of her positions with the Fund’s investment advisor, Manning & Napier Advisors, LLC and Distributor, Manning & Napier Investor Services, Inc.
1The term of office of all officers shall be one year and until their respective successors are chosen and qualified, or his or her earlier resignation or removal as provided in the Fund’sBy-Laws.
29
Equity Income Series
Literature Requests
(unaudited)
Proxy Voting Policies and Procedures
A description of the policies and procedures that the Fund uses to determine how to vote proxies relating to portfolio securities is available, without charge, upon request:
| By phone | 1-800-466-3863 | |||
| On the Securities and Exchange | ||||
| Commission’s (SEC) web site | http://www.sec.gov |
Proxy Voting Record
Information regarding how the Fund voted proxies relating to portfolio securities during the most recent12-month period ended June 30th is available, without charge, upon request:
| By phone | 1-800-466-3863 | |||
| On the SEC’s web site | http://www.sec.gov |
Quarterly Portfolio Holdings
The Series’ complete schedule of portfolio holdings for the 1st and 3rd quarters of each fiscal year are provided on FormN-Q, and are available, without charge, upon request:
| By phone | 1-800-466-3863 | |||
| On the SEC’s web site | http://www.sec.gov |
Prospectus and Statement of Additional Information (SAI)
For more information about any of the Manning & Napier Fund, Inc. Series, you may obtain a prospectus and SAI at www.manning-napier.com or by calling (800)466-3863. Before investing, carefully consider the objectives, risks, charges and expenses of the investment and read the prospectus carefully as it contains this and other information about the investment company.In addition, this information can be found on the SEC’s web site, http://www.sec.gov.
Additional information available at www.manning-napier.com
1. Fund Holdings -Month-End
2. Fund Holdings -Quarter-End
3. Shareholder Report - Annual
4. Shareholder Report - Semi-Annual
The Fund also offers electronic notification or“e-delivery” when certain documents are availableon-line to be downloaded or reviewed. Direct shareholders can elect to receive electronic notification when shareholder reports, prospectus updates, and/or statements are available. If you do not currently haveon-line access to your account, you can establish access by going to www.manning-napier.com, click on “Login” in the top corner of the page, and follow the prompts to self-enroll. Once enrolled, you can set your electronic notification preferences by clicking on the Account Options tab located within the green toolbar and then selectE-Delivery Option. Should you have any questions on either how to establishon-line access or how to update your account settings, please contact Investor Services at1-800-466-3863.
The Manning & Napier Fund, Inc. is managed by Manning & Napier Advisors, LLC. Manning & Napier Investor Services, Inc., an affiliate of Manning & Napier Advisors, LLC, is the distributor of the Fund shares.
MNEIN-12/18-AR

Manning & Napier Fund, Inc.
|
Unconstrained Bond Series
Beginning on February 25, 2021, as permitted by Securities and Exchange Commission regulations, paper copies of the Series’ annual and semi-annual shareholder reports will no longer be sent by mail, unless you specifically request paper copies of the reports from the Fund or from your financial intermediary, such as a broker-dealer or bank. Instead, the reports will be made available on a website, and you will be notified by mail each time a report is posted and provided with a website link to access the report.
If you already elected to receive shareholder reports electronically, you will not be affected by this change and you need not take any action. You may elect to receive shareholder reports and other communications from the Fund electronically by contacting your financial intermediary or, if you are a direct investor, by visiting www.manning-napier.com or calling1-800-466-3863.
You may elect to receive all future annual and semi-annual reports in paper free of charge. If you invest through a financial intermediary, you can contact your financial intermediary to request that you continue to receive paper copies of your shareholder reports. If you invest directly with the Fund, you can inform the Fund that you wish to continue receiving paper copies of your shareholder reports by visiting www.manning-napier.com or calling1-800-466-3863. Your election to receive reports in paper will apply to all funds held with your financial intermediary if you invest through a financial intermediary or all series of the Fund if you invest directly with the Fund.
Unconstrained Bond Series
Management Discussion and Analysis
(unaudited)
Dear Shareholders:
The investment environment we witnessed over the past twelve months was far more volatile than in prior years. It resulted in a sharp drawdown in global equity markets during the fourth quarter of 2018.
For the fiscal year ending on December 31, 2018, US equities experienced negative returns, with the S&P 500 Total Return Index falling 4.38%. International equity performance was somewhat worse, with the MSCI ACWI ex USA Index returning negative 14.20%.
In fixed income, domestic investment-grade bond performance was essentially flat for the year, as measured by the Bloomberg Barclays U.S. Aggregate Bond Index, rising 0.01% as income generated over the period was offset by rising interest rates (when interest rates rise, bond prices fall).
We believe recent volatility, both at the beginning and end of last year, is reflective of what investors should expect going forward. While we do not believe we are immediately heading for a recession, we see recent developments within the US and abroad as an indication that we are entering a higher risk period for financial markets.
The US economy is likely approaching a period of peak growth. It continues to show signs of progressing toward the later stages of its economic and market cycle (typical characteristics of anend-of-cycle phase are an economic recession and financial market selloff).
As economic growth decelerates to more sustainable levels, we believe that investors are facing a growing risk of disappointment. At the same time, key global risks remain, including trade tensions, geopolitical uncertainty, and tightening monetary policy.
Considering the current economic and market backdrop, we believe investors should temper their performance expectations. The returns experienced over the latter half of the post-Global Financial Crisis bull market are unlikely to continue.
Additionally, given our cautious outlook, we are reviewing current and prospective investments for excessive risk exposures, and we have adjusted our positioning across many of our portfolios. Going forward, we will continue to follow our disciplines, focusing on flexibility and selectivity in today’s incredibly dynamic investment environment.
With this in mind, in the enclosed we discuss recent fund performance, highlight our positioning, and briefly provide our outlook amid the current investment environment.
We hope that you find this information helpful, and we look forward to working with you in the years ahead. Thank you for your continued confidence in Manning & Napier.
Sincerely,
Manning & Napier Advisors, LLC
The S&P 500 Index is an unmanaged, capitalization-weighted measure comprised of 500 leading U.S. companies to gauge U.S. large cap equities. The Index returns do not reflect any fees or expenses. The Index includes dividends, but not the reinvestment of dividends. Index returns provided by Bloomberg. S&P Dow Jones Indices LLC, a subsidiary of the McGraw Hill Financial, Inc., is the publisher of various index based data products and services and has licensed certain of its products and services for use by Manning & Napier. All such content Copyright© 2019 by S&P Dow Jones Indices LLC and/or its affiliates. All rights reserved. Neither S&P Dow Jones Indices LLC, Dow Jones Trademark Holdings LLC, their affiliates nor their third party licensors make any representation or warranty, express or implied, as to the ability of any index to accurately represent the asset class or market sector that it purports to represent and none of these parties shall have any liability for any errors, omissions, or interruptions of any index or the data included therein.
The MSCI ACWI ex USA Index (ACWIxUS) is designed to measure large andmid-cap representation across 22 of 23 Developed Markets countries (excluding the U.S.) and 24 Emerging Markets countries. The Index returns do not reflect any fees or expenses. The Index is denominated in U.S. dollars. The Index returns are net of withholding taxes. They assume daily reinvestment of net dividends thus accounting for any applicable dividend taxation. Index returns provided by Bloomberg.
The Bloomberg Barclays U.S. Aggregate Bond Index is an unmanaged, market-value weighted index of U.S. domestic investment-grade debt issues, including government, corporate, asset-backed, and mortgage-backed securities, with maturities of one year or more. Index returns do not reflect any fees or expenses. Index returns provided by Interactive Data.
1
Unconstrained Bond Series
Fund Commentary
(unaudited)
Investment Objective
Primarily to provide long-term total return, with a secondary objective of preservation of capital. Under normal circumstances, at least 80% of the Series’ assets will be invested in bonds and other financial instruments with economic characteristics similar to bonds. Up to 50% of the Series may be invested in below investment-grade securities and/or innon-US dollar denominated securities, including securities issued by companies located in emerging markets. Derivatives, such as futures, options, swaps, and forwards, may also be used to manage interest rate exposure, duration, or currency risk.
Performance Commentary
The FTSE3-Month Treasury Bill index (the Series’ primary benchmark) returned 1.86% for 2018, while the Bloomberg Barclays Aggregate Bond Index (the Series’ secondary benchmark) was relatively flat, returning 0.01%. Over the same time period, the Unconstrained Bond Series Class I shares returned 0.40%.
Relative to the FTSE3-Month Treasury Bill index, the Series underperformed due to its longer relative duration as rates rose across the yield curve. Relative to the Bloomberg Barclays Aggregate Bond Index, which has a much longer absolute duration, the Series outperformed.
Going forward, from a benchmark agnostic perspective, we continue to believe a low absolute duration remains in investors’ best interests. Although we may see rates move lower in the near-term, we believe that, over the long-term, underlying economic factors will likely apply gradual pressure on rates to move higher and for the yield curve to flatten. We think the Federal Reserve will seek to remain flexible, looking to increase the federal funds target rate when economic and financial conditions allow, while also remaining sensitive to domestic and global market conditions as they continue to reduce the size of their balance sheet.
On a sector basis, our outlook for growth in the US remains supportive of credit. We continue to view corporate bonds as moderately attractive, as they continue to adequately compensate investors on a fundamental basis. With respect to high yield, we are more cautious on the sector as we are aware that we are in the later stages of an economic cycle and have seen tightening monetary policy globally. Within high yield, we are focused on companies with stronger balance sheets, free cash flow generation throughout the cycle, and positioned in corporate issues rather than LBOs (leveraged buyouts).
We also see securitized credit as attractive, specifically the shorter duration, higher quality consumer sectors (i.e., prime auto, credit cards, and student loans). Regarding US Treasuries, valuations on the long end of the curve have become less attractive over the past few months, and regarding mortgage securities, we see other parts of the fixed income market as offering better value.
Regarding foreign government debt, ournon-dollar exposure continues to be limited. We are, however, beginning to become more negative on the US dollar. This is a result of the scaling back of both monetary tightening and fiscal stimulus in the US, as well as the worsening deficit, which are coinciding along with tighter monetary policy and the potential for positive fiscal stimulus surprises outside the US.
Performance data quoted represents past performance and does not guarantee future results. The investment return and principal value of an investment will fluctuate, so that an investor’s shares, when redeemed, may be worth more or less than their original cost. Current performance may be higher or lower than that quoted; investors can obtain the most recentmonth-end performance at www.manning-napier.com or by calling (800)466-3863. Performance for the Unconstrained Bond Series Class S shares is provided above. Performance for the Class I shares will be higher based on the Class’ lower expenses..
Please see page 4 for additional performance information as of December 31, 2018.
Duration is a measure of the expected life of a fixed income security that is used to determine the sensitivity of a security’s price to changes in interest rates. The prices of fixed income securities with shorter durations generally will be less affected by changes in interest rates than the prices of fixed income securities with longer durations. For example, a 10 year duration means the fixed income security will decrease in value by 10% if interest rates rise 1% and increase in value by 10% if interest rates fall 1%. There is an inverse relationship between bond prices and interest rates; as interest rates rise, bond prices (and therefore the value of bond funds) fall. Likewise, as interest rates fall, bond prices and the value of bond funds rise. Investments in higher-yielding, lower-rated securities involve additional risks, including a higher risk of default and loss of principal. Funds that invest in foreign countries may be subject to the risks of adverse changes in foreign economic, political, regulatory and other conditions as well as risks related to the use of different financial standards. Investments in emerging markets may be more volatile than investments in more developed markets.
2
Unconstrained Bond Series
Fund Commentary
(unaudited)
| Performance | Commentary (continued) |
Investments in derivatives can be highly volatile and involve risks in addition to the risks of the underlying instrument on which the derivative is based, such as counterparty, correlation and liquidity risk. Also, the use of leverage increases exposure to the market and may magnify potential losses.
The FTSE3-Month Treasury Bill Index is an unmanaged index based on3-Month U.S. treasury bills. The Index measures the monthly return equivalents of yield averages that are not marked to market. The Index returns do not reflect any fees or expenses. Index returns provided by Interactive Data.
3
Unconstrained Bond Series
Performance Update as of December 31, 2018
(unaudited)
| AVERAGE ANNUAL TOTAL RETURNS AS OF DECEMBER 31, 2018 | ||||||
ONE YEAR1 | FIVE YEAR | TEN YEAR | ||||
Manning & Napier Fund, Inc. - Unconstrained Bond Series - Class S2 | 0.20% | 1.94% | 4.90% | |||
Manning & Napier Fund, Inc. - Unconstrained Bond Series - Class I2,3 | 0.40% | 2.17% | 5.03% | |||
FTSE3-Month Treasury Bill Index4 | 1.86% | 0.60% | 0.35% | |||
Bloomberg Barclays U.S. Aggregate Bond Index5 | 0.01% | 2.52% | 3.48% | |||
The following graph compares the value of a $10,000 investment in the Manning & Napier Fund, Inc. - Unconstrained Bond Series -Class S for the ten years ended December 31, 2018 to the FTSE3-Month Treasury Bill Index and Bloomberg Barclays U.S. Aggregate Bond Index.
1The returns shown are based on net asset values calculated for shareholder transactions and may differ from the returns shown in the financial highlights, which reflect adjustments made to the net asset values in accordance with accounting principles generally accepted in the United States of America.
2The Series’ performance does not reflect the deduction of taxes that a shareholder would pay on fund distributions or the redemption of shares. The Series’ performance is historical and may not be indicative of future results. The performance returns shown are inclusive of the net expense ratio of the Series. For the year ended December 31, 2018, this net expense ratio was 0.75% for Class S and 0.50% for Class I. The gross expense ratio, which does not account for any voluntary or contractual waivers currently in effect, was 0.76% for Class S and 0.51% for Class I for the year ended December 31, 2018.
3For periods through August 1, 2013 (the inception date of the Class I shares), performance for the Class I shares is based on the historical performance of the Class S shares. Because Class I shares invest in the same portfolio of securities as Class S, performance will only be different to the extent that the Class S shares have a higher expense ratio.
4The FTSE3-Month Treasury Bill Index is an unmanaged index based on3-Month U.S. treasury bills. The Index measures the monthly return equivalents of yield averages that are not marked to market. The Index returns do not reflect any fees or expenses. Index returns provided by Interactive Data.
5The Bloomberg Barclays U.S. Aggregate Bond Index is an unmanaged, market-value weighted index of U.S. domestic investment-grade debt issues, including government, corporate, asset-backed, and mortgage-backed securities, with maturities of one year or more. Index returns do not reflect any fees or expenses. Index returns provided by Interactive Data.
4
Unconstrained Bond Series
Shareholder Expense Example
(unaudited)
As a shareholder of the Series, you incur ongoing costs, including management fees, shareholder service fees and other Series expenses. This example is intended to help you understand your ongoing costs (in dollars) of investing in the Series and to compare these costs with the ongoing costs of investing in other mutual funds.
The example is based on an investment of $1,000 invested in each class at the beginning of the period and held for the entire period (July 1, 2018 to December 31, 2018).
Actual Expenses
The Actual lines of the table below provide information about actual account values and actual expenses. You may use the information in this line, together with the amount you invested, to estimate the expenses that you paid over the period. Simply divide your account value by $1,000 (for example, an $8,600 account value divided by $1,000 = 8.6), then multiply the result by the number in the Actual line for the Class in which you have invested under the heading entitled “Expenses Paid During Period” to estimate the expenses you paid on your account during this period.
Hypothetical Example for Comparison Purposes
The Hypothetical lines of each class in the table below provide information about hypothetical account values and hypothetical expenses based on the Class’ actual expense ratio and an assumed rate of return of 5% per year before expenses, which is not the Class’ actual return. The hypothetical account values and expenses may not be used to estimate the actual ending account balance or expenses you paid during the period. You may use this information to compare the ongoing costs of investing in a class of the Series and other funds. To do so, compare this 5% hypothetical example for the class in which you have invested with the 5% hypothetical examples that appear in the shareholder reports of the other funds.
Please note that the expenses shown in the table are meant to highlight your ongoing costs only and do not reflect any transaction costs such as sales charges (loads), redemption fees, or exchange fees that you may incur in other mutual funds. Therefore, the second line of the table is useful in comparing ongoing costs only, and will not help you determine the relative total costs of owning different funds.
BEGINNING VALUE 7/1/18 | ENDING 12/31/18 | EXPENSES PAID DURING PERIOD* 7/1/18-12/31/18 | ANNUALIZED EXPENSE RATIO | |||||||||||||
Class S | ||||||||||||||||
Actual | $1,000.00 | $1,006.73 | $3.79 | 0.75% | ||||||||||||
Hypothetical | ||||||||||||||||
(5% return before expenses) | $1,000.00 | $1,021.42 | $3.82 | 0.75% | ||||||||||||
Class I | ||||||||||||||||
Actual | $1,000.00 | $1,008.04 | $2.53 | 0.50% | ||||||||||||
Hypothetical | ||||||||||||||||
(5% return before expenses) | $1,000.00 | $1,022.68 | $2.55 | 0.50% | ||||||||||||
*Expenses are equal to each Class’ annualized expense ratio (for thesix-month period), multiplied by the average account value over the period, multiplied by 184/365 (to reflect theone-half year period). Expenses are based on the most recent fiscal half year; therefore, the expense ratios stated above may differ from the expense ratios stated in the financial highlights, which are based onone-year data. The Class’ total returns would have been lower had certain expenses not been waived during the period.
5
Unconstrained Bond Series
Portfolio Composition as of December 31, 2018
(unaudited)
6
Unconstrained Bond Series
Investment Portfolio - December 31, 2018
| CREDIT RATING1 (UNAUDITED) | PRINCIPAL AMOUNT2 | VALUE (NOTE 2) |
| |||||||||||||
CORPORATE BONDS - 58.3% | ||||||||||||||||
Non-Convertible Corporate Bonds - 58.3% | ||||||||||||||||
Communication Services - 8.4% | ||||||||||||||||
Diversified Telecommunication Services - 2.6% | ||||||||||||||||
AT&T, Inc.3, (3 mo. LIBOR US + 0.930%), 3.733%, 6/30/2020 | Baa2 | 8,000,000 | $ | 7,992,736 | ||||||||||||
AT&T, Inc., 2.45%, 6/30/2020 | Baa2 | 2,000,000 | 1,973,973 | |||||||||||||
Verizon Communications, Inc.3, (3 mo. LIBOR US + 0.770%), 3.558%, 6/17/2019 | Baa1 | 8,668,000 | 8,684,605 | |||||||||||||
|
| |||||||||||||||
| 18,651,314 | ||||||||||||||||
|
| |||||||||||||||
Interactive Media & Services - 0.6% | ||||||||||||||||
Tencent Holdings Ltd. (China)4, 3.375%, 5/2/2019 | A1 | 3,700,000 | 3,703,954 | |||||||||||||
Tencent Holdings Ltd. (China)4, 2.875%, 2/11/2020 | A1 | 200,000 | 199,184 | |||||||||||||
|
| |||||||||||||||
| 3,903,138 | ||||||||||||||||
|
| |||||||||||||||
Media - 2.2% | ||||||||||||||||
Cablevision Systems Corp., 8.00%, 4/15/2020 | B3 | 5,887,000 | 5,960,587 | |||||||||||||
CCO Holdings LLC - CCO Holdings Capital Corp.4, 5.50%, 5/1/2026 | B1 | 1,390,000 | 1,336,137 | |||||||||||||
CSC Holdings LLC, 8.625%, 2/15/2019 | B2 | 4,478,000 | 4,489,195 | |||||||||||||
CSC Holdings LLC4, 5.50%, 5/15/2026 | Ba2 | 1,015,000 | 956,637 | |||||||||||||
Telenet Finance Luxembourg Notes S.A.R.L (Belgium)4, 5.50%, 3/1/2028 | Ba3 | 2,000,000 | 1,810,000 | |||||||||||||
UPCB Finance IV Ltd. (Netherlands)4, 5.375%, 1/15/2025 | Ba3 | 1,355,000 | 1,267,088 | |||||||||||||
|
| |||||||||||||||
| 15,819,644 | ||||||||||||||||
|
| |||||||||||||||
Wireless Telecommunication Services - 3.0% | ||||||||||||||||
Hughes Satellite Systems Corp., 6.50%, 6/15/2019 | Ba2 | 7,325,000 | 7,389,094 | |||||||||||||
Hughes Satellite Systems Corp., 5.25%, 8/1/2026 | Ba2 | 2,630,000 | 2,409,738 | |||||||||||||
Inmarsat Finance plc (United Kingdom)4, 4.875%, 5/15/2022 | Ba3 | 940,000 | 886,326 | |||||||||||||
Sprint Capital Corp., 6.90%, 5/1/2019 | B3 | 7,540,000 | 7,577,700 | |||||||||||||
Sprint Communications, Inc.4, 7.00%, 3/1/2020 | B1 | 3,000,000 | 3,075,000 | |||||||||||||
|
| |||||||||||||||
| 21,337,858 | ||||||||||||||||
|
| |||||||||||||||
Total Communication Services | 59,711,954 | |||||||||||||||
|
| |||||||||||||||
Consumer Discretionary - 6.7% | ||||||||||||||||
Automobiles - 2.3% | ||||||||||||||||
Ford Motor Credit Co. LLC3, (3 mo. LIBOR US + 0.930%), 3.512%, 11/4/2019 | Baa3 | 9,000,000 | 8,967,446 | |||||||||||||
General Motors Co.3, (3 mo. LIBOR US + 0.900%), 3.667%, 9/10/2021 | Baa3 | 7,500,000 | 7,292,087 | |||||||||||||
|
| |||||||||||||||
| 16,259,533 | ||||||||||||||||
|
| |||||||||||||||
Household Durables - 2.8% | ||||||||||||||||
Century Communities, Inc., 5.875%, 7/15/2025 | B2 | 2,095,000 | 1,843,600 | |||||||||||||
Lennar Corp., 4.50%, 11/15/2019 | Ba1 | 700,000 | 694,750 | |||||||||||||
LGI Homes, Inc.4, 6.875%, 7/15/2026 | B1 | 1,635,000 | 1,467,412 | |||||||||||||
Meritage Homes Corp., 7.15%, 4/15/2020 | Ba2 | 4,000,000 | 4,080,000 | |||||||||||||
Meritage Homes Corp., 5.125%, 6/6/2027 | Ba2 | 1,020,000 | 867,000 | |||||||||||||
TRI Pointe Group, Inc. - TRI Pointe Homes, Inc., 4.375%, 6/15/2019 | Ba3 | 7,675,000 | 7,617,438 | |||||||||||||
The accompanying notes are an integral part of the financial statements.
7
Unconstrained Bond Series
Investment Portfolio - December 31, 2018
| CREDIT RATING1 (UNAUDITED) | PRINCIPAL AMOUNT2 | VALUE (NOTE 2) |
| |||||||||||||
CORPORATE BONDS(continued) | ||||||||||||||||
Non-Convertible Corporate Bonds(continued) | ||||||||||||||||
Consumer Discretionary(continued) | ||||||||||||||||
Household Durables(continued) | ||||||||||||||||
TRI Pointe Group, Inc. - TRI Pointe Homes, Inc., 5.875%, 6/15/2024 | Ba3 | 1,430,000 | $ | 1,276,275 | ||||||||||||
Weekley Homes LLC - Weekley Finance Corp., 6.00%, 2/1/2023 | B3 | 1,010,000 | 944,350 | |||||||||||||
Weekley Homes LLC - Weekley Finance Corp., 6.625%, 8/15/2025 | B3 | 1,470,000 | 1,348,725 | |||||||||||||
|
| |||||||||||||||
| 20,139,550 | ||||||||||||||||
|
| |||||||||||||||
Internet & Direct Marketing Retail - 1.6% | ||||||||||||||||
Booking Holdings, Inc., 3.60%, 6/1/2026 | Baa1 | 12,000,000 | 11,658,559 | |||||||||||||
|
| |||||||||||||||
Total Consumer Discretionary | 48,057,642 | |||||||||||||||
|
| |||||||||||||||
Consumer Staples - 1.7% | ||||||||||||||||
Beverages - 0.1% | ||||||||||||||||
Constellation Brands, Inc., 3.875%, 11/15/2019 | Baa3 | 545,000 | 547,026 | |||||||||||||
|
| |||||||||||||||
Food & Staples Retailing - 1.0% | ||||||||||||||||
Kraft Heinz Foods Co., 2.80%, 7/2/2020 | Baa3 | 7,040,000 | 6,988,828 | |||||||||||||
|
| |||||||||||||||
Food Products - 0.6% | ||||||||||||||||
The J.M. Smucker Co., 2.20%, 12/6/2019 | Baa2 | 4,800,000 | 4,757,765 | |||||||||||||
|
| |||||||||||||||
Total Consumer Staples | 12,293,619 | |||||||||||||||
|
| |||||||||||||||
Energy - 9.9% | ||||||||||||||||
Energy Equipment & Services - 0.3% | ||||||||||||||||
Shelf Drilling Holdings Ltd. (United Arab Emirates)4, 8.25%, 2/15/2025 | B2 | 1,335,000 | 1,141,425 | |||||||||||||
TerraForm Power Operating, LLC4, 5.00%, 1/31/2028 | B1 | 960,000 | 844,800 | |||||||||||||
|
| |||||||||||||||
| 1,986,225 | ||||||||||||||||
|
| |||||||||||||||
Oil, Gas & Consumable Fuels - 9.6% | ||||||||||||||||
American Midstream Partners LP - American Midstream Finance Corp.4, 9.50%, 12/15/2021 | Caa1 | 1,410,000 | 1,325,400 | |||||||||||||
Boardwalk Pipelines LP, 5.95%, 6/1/2026 | Baa3 | 12,000,000 | 12,397,464 | |||||||||||||
DCP Midstream Operating LP, 2.70%, 4/1/2019 | Ba2 | 7,715,000 | 7,652,316 | |||||||||||||
Dynagas LNG Partners LP - Dynagas Finance, Inc. (Monaco), 6.25%, 10/30/2019 | WR5 | 4,340,000 | 4,112,150 | |||||||||||||
Energy Transfer Partners LP, 9.70%, 3/15/2019 | Baa3 | 360,000 | 364,277 | |||||||||||||
Energy Transfer Partners LP, 9.00%, 4/15/2019 | Baa3 | 397,000 | 403,701 | |||||||||||||
GasLog Ltd. (Monaco), 8.875%, 3/22/2022 | WR5 | 1,889,000 | 1,907,890 | |||||||||||||
Genesis Energy LP - Genesis Energy Finance Corp., 5.625%, 6/15/2024 | B1 | 1,050,000 | 900,375 | |||||||||||||
Jonah Energy LLC - Jonah Energy Finance Corp.4, 7.25%, 10/15/2025 | B3 | 2,095,000 | 1,340,800 | |||||||||||||
Kinder Morgan Energy Partners LP, 2.65%, 2/1/2019 | Baa2 | 1,395,000 | 1,394,254 | |||||||||||||
Kinder Morgan Energy Partners LP, 6.85%, 2/15/2020 | Baa2 | 3,677,000 | 3,807,227 | |||||||||||||
Kinder Morgan Energy Partners LP, 6.50%, 4/1/2020 | Baa2 | 900,000 | 932,048 | |||||||||||||
Petroleos Mexicanos (Mexico), 8.00%, 5/3/2019 | Baa3 | 8,000,000 | 8,088,000 | |||||||||||||
Rockies Express Pipeline, LLC4, 6.00%, 1/15/2019 | Ba1 | 3,000,000 | 3,000,000 | |||||||||||||
Rockies Express Pipeline, LLC4, 5.625%, 4/15/2020 | Ba1 | 5,000,000 | 5,000,000 | |||||||||||||
The accompanying notes are an integral part of the financial statements.
8
Unconstrained Bond Series
Investment Portfolio - December 31, 2018
| CREDIT RATING1 (UNAUDITED) | PRINCIPAL AMOUNT2 | VALUE (NOTE 2) | ||||||||||||||
CORPORATE BONDS(continued) | ||||||||||||||||
Non-Convertible Corporate Bonds(continued) | ||||||||||||||||
Energy(continued) | ||||||||||||||||
Oil, Gas & Consumable Fuels(continued) | ||||||||||||||||
Sabine Pass Liquefaction, LLC, 5.625%, 2/1/2021 | Baa3 | 1,781,000 | $ | 1,835,014 | ||||||||||||
Sabine Pass Liquefaction, LLC, 5.75%, 5/15/2024 | Baa3 | 7,000,000 | 7,303,500 | |||||||||||||
Seven Generations Energy Ltd. (Canada)4, 5.375%, 9/30/2025 | Ba3 | 1,060,000 | 948,700 | |||||||||||||
Southwestern Energy Co.6, 6.20%, 1/23/2025 | Ba3 | 1,420,000 | 1,269,125 | |||||||||||||
W&T Offshore, Inc.4, 9.75%, 11/1/2023 | B3 | 1,305,000 | 1,141,875 | |||||||||||||
The Williams Companies, Inc., 3.75%, 6/15/2027 | Baa3 | 4,000,000 | 3,790,311 | |||||||||||||
|
| |||||||||||||||
| 68,914,427 | ||||||||||||||||
|
| |||||||||||||||
Total Energy | 70,900,652 | |||||||||||||||
|
| |||||||||||||||
Financials - 15.7% | ||||||||||||||||
Banks - 7.2% | ||||||||||||||||
Bank of America Corp.3, (3 mo. LIBOR US + 0.760%), 3.548%, 9/15/2026 | Baa2 | 4,811,000 | 4,376,147 | |||||||||||||
Intesa Sanpaolo S.p.A. (Italy), 3.875%, 1/15/2019 | Baa1 | 8,800,000 | 8,798,392 | |||||||||||||
JPMorgan Chase & Co., 6.30%, 4/23/2019 | A2 | 12,000,000 | 12,117,310 | |||||||||||||
JPMorgan Chase & Co., 4.95%, 3/25/2020 | A2 | 150,000 | 153,175 | |||||||||||||
Santander Holdings USA, Inc., 2.70%, 5/24/2019 | Baa3 | 9,446,000 | 9,407,455 | |||||||||||||
Santander Holdings USA, Inc., 2.65%, 4/17/2020 | Baa3 | 3,950,000 | 3,898,893 | |||||||||||||
The Toronto-Dominion Bank (Canada)4, 2.25%, 9/25/2019 | Aaa | 4,000,000 | 3,983,591 | |||||||||||||
Wells Fargo & Co., 2.15%, 1/15/2019 | A2 | 8,500,000 | 8,497,534 | |||||||||||||
|
| |||||||||||||||
| 51,232,497 | ||||||||||||||||
|
| |||||||||||||||
Capital Markets - 4.8% | ||||||||||||||||
The Goldman Sachs Group, Inc., 5.375%, 3/15/2020 | A3 | 7,800,000 | 7,974,414 | |||||||||||||
LPL Holdings, Inc.4, 5.75%, 9/15/2025 | B2 | 875,000 | 820,312 | |||||||||||||
Morgan Stanley, 2.50%, 1/24/2019 | A3 | 8,500,000 | 8,496,532 | |||||||||||||
Morgan Stanley3, (3 mo. LIBOR US + 1.140%), 3.649%, 1/27/2020 | A3 | 8,750,000 | 8,785,947 | |||||||||||||
UBS AG (Switzerland)3, (3 mo. LIBOR US + 0.850%), 3.588%, 6/1/2020 | Aa3 | 8,000,000 | 8,034,501 | |||||||||||||
|
| |||||||||||||||
| 34,111,706 | ||||||||||||||||
|
| |||||||||||||||
Consumer Finance - 2.6% | ||||||||||||||||
Ally Financial, Inc., 3.50%, 1/27/2019 | Ba3 | 4,940,000 | 4,936,912 | |||||||||||||
American Express Credit Corp.3, (3 mo. LIBOR US + 0.730%), 3.419%, 5/26/2020 | A2 | 7,500,000 | 7,518,939 | |||||||||||||
Navient Corp., 4.875%, 6/17/2019 | Ba3 | 2,891,000 | 2,880,159 | |||||||||||||
Navient Corp., 8.00%, 3/25/2020 | Ba3 | 1,000,000 | 1,016,100 | |||||||||||||
Navient Corp., 7.25%, 9/25/2023 | Ba3 | 880,000 | 807,400 | |||||||||||||
SLM Corp., 5.125%, 4/5/2022 | Ba2 | 1,420,000 | 1,377,400 | |||||||||||||
|
| |||||||||||||||
| 18,536,910 | ||||||||||||||||
|
| |||||||||||||||
Diversified Financial Services - 0.4% | ||||||||||||||||
FS Energy & Power Fund4, 7.50%, 8/15/2023 | Ba3 | 1,825,000 | 1,733,750 | |||||||||||||
The accompanying notes are an integral part of the financial statements.
9
Unconstrained Bond Series
Investment Portfolio - December 31, 2018
| CREDIT RATING1 (UNAUDITED) | PRINCIPAL AMOUNT2 | VALUE (NOTE 2) |
| |||||||||||||
CORPORATE BONDS(continued) | ||||||||||||||||
Non-Convertible Corporate Bonds(continued) | ||||||||||||||||
Financials(continued) | ||||||||||||||||
Diversified Financial Services(continued) | ||||||||||||||||
Oxford Finance, LLC - Oxford Finance Co.- Issuer II, Inc.4, 6.375%, 12/15/2022 | Ba3 | 1,570,000 | $ | 1,546,450 | ||||||||||||
|
| |||||||||||||||
| 3,280,200 | ||||||||||||||||
|
| |||||||||||||||
Insurance - 0.3% | ||||||||||||||||
Pricoa Global Funding I4, 1.45%, 9/13/2019 | A1 | 2,000,000 | 1,978,444 | |||||||||||||
|
| |||||||||||||||
Mortgage Real Estate Investment Trusts (REITS) - 0.3% | ||||||||||||||||
Starwood Property Trust, Inc., 3.625%, 2/1/2021 | Ba3 | 2,000,000 | 1,925,000 | |||||||||||||
|
| |||||||||||||||
Thrifts & Mortgage Finance - 0.1% | ||||||||||||||||
Ladder Capital Finance Holdings LLLP - Ladder Capital Finance Corp.4, 5.875%, 8/1/2021 | Ba3 | 970,000 | 967,575 | |||||||||||||
|
| |||||||||||||||
Total Financials | 112,032,332 | |||||||||||||||
|
| |||||||||||||||
Health Care - 2.7% | ||||||||||||||||
Health Care Providers & Services - 2.5% | ||||||||||||||||
DaVita, Inc., 5.00%, 5/1/2025 | Ba3 | 1,445,000 | 1,311,337 | |||||||||||||
Express Scripts Holding Co., 3.50%, 6/15/2024 | Baa2 | 6,500,000 | 6,312,273 | |||||||||||||
HCA, Inc., 4.25%, 10/15/2019 | Ba1 | 1,500,000 | 1,496,250 | |||||||||||||
HCA, Inc., 6.50%, 2/15/2020 | Ba1 | 7,650,000 | 7,841,250 | |||||||||||||
MEDNAX, Inc.4, 6.25%, 1/15/2027 | Ba2 | 915,000 | 882,975 | |||||||||||||
|
| |||||||||||||||
| 17,844,085 | ||||||||||||||||
|
| |||||||||||||||
Pharmaceuticals - 0.2% | ||||||||||||||||
Horizon Pharma, Inc. - Horizon Pharma USA, Inc.4, 8.75%, 11/1/2024 | B3 | 1,735,000 | 1,761,025 | |||||||||||||
|
| |||||||||||||||
Total Health Care | 19,605,110 | |||||||||||||||
|
| |||||||||||||||
Industrials - 6.0% | ||||||||||||||||
Aerospace & Defense - 0.1% | ||||||||||||||||
Arconic, Inc., 5.125%, 10/1/2024 | Ba2 | 875,000 | 840,009 | |||||||||||||
|
| |||||||||||||||
Airlines - 1.1% | ||||||||||||||||
Allegiant Travel Co., 5.50%, 7/15/2019 | B1 | 7,500,000 | 7,500,000 | |||||||||||||
|
| |||||||||||||||
Commercial Services & Supplies - 1.2% | ||||||||||||||||
The ADT Security Corp., 5.25%, 3/15/2020 | Ba3 | 4,077,000 | 4,087,192 | |||||||||||||
The ADT Security Corp., 4.125%, 6/15/2023 | Ba3 | 1,115,000 | 1,020,225 | |||||||||||||
Covanta Holding Corp., 6.00%, 1/1/2027 | B1 | 1,140,000 | 1,020,300 | |||||||||||||
W/S Packaging Holdings, Inc.4, 9.00%, 4/15/2023 | B3 | 2,555,000 | 2,542,225 | |||||||||||||
|
| |||||||||||||||
| 8,669,942 | ||||||||||||||||
|
| |||||||||||||||
Construction & Engineering - 0.2% | ||||||||||||||||
Tutor Perini Corp.4, 6.875%, 5/1/2025 | B1 | 1,665,000 | 1,548,450 | |||||||||||||
|
| |||||||||||||||
Marine - 0.5% | ||||||||||||||||
Borealis Finance, LLC4, 7.50%, 11/16/2022 | WR5 | 2,010,000 | 1,859,250 | |||||||||||||
The accompanying notes are an integral part of the financial statements.
10
Unconstrained Bond Series
Investment Portfolio - December 31, 2018
| CREDIT RATING1 (UNAUDITED) | PRINCIPAL AMOUNT2 | VALUE (NOTE 2) | ||||||||||||||
CORPORATE BONDS(continued) | ||||||||||||||||
Non-Convertible Corporate Bonds(continued) | ||||||||||||||||
Industrials(continued) | ||||||||||||||||
Marine(continued) | ||||||||||||||||
Global Ship Lease, Inc. (United Kingdom)4, 9.875%, 11/15/2022 | B3 | 1,973,000 | $ | 1,874,350 | ||||||||||||
|
| |||||||||||||||
| 3,733,600 | ||||||||||||||||
|
| |||||||||||||||
Trading Companies & Distributors - 2.6% | ||||||||||||||||
Aircastle Ltd., 6.25%, 12/1/2019 | Baa3 | 610,000 | 624,529 | |||||||||||||
Aircastle Ltd., 7.625%, 4/15/2020 | Baa3 | 6,375,000 | 6,667,990 | |||||||||||||
Fortress Transportation & Infrastructure Investors, LLC4, 6.50%, 10/1/2025 | B1 | 1,275,000 | 1,192,125 | |||||||||||||
International Lease Finance Corp., 6.25%, 5/15/2019 | Baa3 | 8,000,000 | 8,070,769 | |||||||||||||
Park Aerospace Holdings Ltd. (Ireland)4, 4.50%, 3/15/2023 | Ba2 | 1,640,000 | 1,533,400 | |||||||||||||
|
| |||||||||||||||
| 18,088,813 | ||||||||||||||||
|
| |||||||||||||||
Transportation Infrastructure - 0.3% | ||||||||||||||||
Eagle Bulk Shipco, LLC, 8.25%, 11/28/2022 | WR5 | 1,176,000 | 1,146,600 | |||||||||||||
MPC Container Ships Invest B.V. (Norway)3,7, (3 mo. LIBOR US + 4.750%), 7.572%, 9/22/2022 | WR5 | 1,000,000 | 974,640 | |||||||||||||
|
| |||||||||||||||
| 2,121,240 | ||||||||||||||||
|
| |||||||||||||||
Total Industrials | 42,502,054 | |||||||||||||||
|
| |||||||||||||||
Information Technology - 0.3% | ||||||||||||||||
Semiconductors & Semiconductor Equipment - 0.2% | ||||||||||||||||
MagnaChip Semiconductor Corp. (South Korea), 6.625%, 7/15/2021 | B2 | 1,635,000 | 1,455,150 | |||||||||||||
Software - 0.1% | ||||||||||||||||
Nuance Communications, Inc., 5.625%, 12/15/2026 | Ba3 | 945,000 | 897,750 | |||||||||||||
|
| |||||||||||||||
Total Information Technology | 2,352,900 | |||||||||||||||
|
| |||||||||||||||
Materials - 3.1% | ||||||||||||||||
Chemicals - 0.3% | ||||||||||||||||
LSB Industries, Inc.4, 9.625%, 5/1/2023 | Caa1 | 1,950,000 | 1,979,250 | |||||||||||||
|
| |||||||||||||||
Containers & Packaging - 0.2% | ||||||||||||||||
Ardagh Packaging Finance plc - Ardagh Holdings USA, Inc. (Ireland)4, 6.00%, 2/15/2025 | B3 | 1,410,000 | 1,301,599 | |||||||||||||
|
| |||||||||||||||
Metals & Mining - 2.6% | ||||||||||||||||
Corp Nacional del Cobre de Chile (Chile)4, 4.50%, 9/16/2025 | A3 | 8,000,000 | 8,101,434 | |||||||||||||
First Quantum Minerals Ltd. (Zambia)4, 7.25%, 4/1/2023 | B3 | 425,000 | 374,000 | |||||||||||||
Mountain Province Diamonds, Inc. (Canada)4, 8.00%, 12/15/2022 | B3 | 2,671,000 | 2,679,013 | |||||||||||||
Northwest Acquisitions ULC - Dominion Finco, Inc.4, 7.125%, 11/1/2022 | Ba3 | 2,520,000 | 2,489,256 | |||||||||||||
Petra Diamonds US Treasury plc (South Africa)4, 7.25%, 5/1/2022 | B3 | 950,000 | 878,750 | |||||||||||||
Southern Copper Corp. (Peru), 5.375%, 4/16/2020 | Baa2 | 3,000,000 | 3,064,572 | |||||||||||||
Techniplas LLC4, 10.00%, 5/1/2020 | Caa2 | 1,065,000 | 979,800 | |||||||||||||
|
| |||||||||||||||
| 18,566,825 | ||||||||||||||||
|
| |||||||||||||||
Total Materials | 21,847,674 | |||||||||||||||
|
| |||||||||||||||
The accompanying notes are an integral part of the financial statements.
11
Unconstrained Bond Series
Investment Portfolio - December 31, 2018
| CREDIT RATING1 (UNAUDITED) | PRINCIPAL AMOUNT2 | VALUE (NOTE 2) |
| |||||||||||||
CORPORATE BONDS(continued) | ||||||||||||||||
Non-Convertible Corporate Bonds(continued) | ||||||||||||||||
Real Estate - 2.3% | ||||||||||||||||
Equity Real Estate Investment Trusts (REITS) - 2.3% | ||||||||||||||||
American Tower Corp., 3.40%, 2/15/2019 | Baa3 | 1,400,000 | $ | 1,400,791 | ||||||||||||
American Tower Corp., 2.80%, 6/1/2020 | Baa3 | 4,500,000 | 4,465,419 | |||||||||||||
Greystar Real Estate Partners, LLC4, 5.75%, 12/1/2025 | B1 | 1,560,000 | 1,524,900 | |||||||||||||
iStar, Inc., 5.25%, 9/15/2022 | Ba3 | 1,530,000 | 1,430,397 | |||||||||||||
SBA Communications Corp., 4.875%, 9/1/2024 | B2 | 385,000 | 361,900 | |||||||||||||
Welltower, Inc., 4.125%, 4/1/2019 | Baa1 | 7,300,000 | 7,302,049 | |||||||||||||
|
| |||||||||||||||
Total Real Estate | 16,485,456 | |||||||||||||||
|
| |||||||||||||||
Utilities - 1.5% | ||||||||||||||||
Gas Utilities - 0.2% | ||||||||||||||||
NGL Energy Partners LP - NGL Energy Finance Corp., 6.125%, 3/1/2025 | B2 | 1,455,000 | 1,251,300 | |||||||||||||
|
| |||||||||||||||
Independent Power and Renewable Electricity Producers - 1.3% | ||||||||||||||||
Atlantica Yield plc (Spain)4, 7.00%, 11/15/2019 | B1 | 7,640,000 | 7,735,500 | |||||||||||||
Drax Finco plc (United Kingdom)4, 6.625%, 11/1/2025 | BB8 | 1,770,000 | 1,739,025 | |||||||||||||
|
| |||||||||||||||
| 9,474,525 | ||||||||||||||||
|
| |||||||||||||||
Total Utilities | 10,725,825 | |||||||||||||||
|
| |||||||||||||||
TOTAL CORPORATE BONDS | 416,515,218 | |||||||||||||||
|
| |||||||||||||||
ASSET-BACKED SECURITIES - 14.2% | ||||||||||||||||
Ally Auto Receivables Trust, Series2016-1, Class A4, 1.73%, 11/16/2020 | Aaa | 750,000 | 746,092 | |||||||||||||
Ally Auto Receivables Trust, Series2018-2, Class A2, 2.64%, 2/16/2021 | Aaa | 1,681,115 | 1,678,489 | |||||||||||||
BMW Vehicle Owner Trust, Series2016-A, Class A3, 1.16%, 11/25/2020 | Aaa | 1,994,454 | 1,981,493 | |||||||||||||
Capital One Multi-Asset Execution Trust, Series2016-A4, Class A4, 1.33%, 6/15/2022 | AAA8 | 3,337,000 | 3,303,276 | |||||||||||||
CarMax Auto Owner Trust, Series2016-2, Class A3, 1.52%, 2/16/2021 | AAA8 | 1,693,893 | 1,683,592 | |||||||||||||
CarMax Auto Owner Trust, Series2017-3, Class A3, 1.97%, 4/15/2022 | AAA8 | 3,800,000 | 3,758,512 | |||||||||||||
Cazenovia Creek Funding I LLC, Series2015-1A, Class A4, 2.00%, 12/10/2023 | WR5 | 68,797 | 68,410 | |||||||||||||
Cazenovia Creek Funding II LLC, Series2018-1A, Class A4, 3.561%, 7/15/2030 | WR5 | 7,454,630 | 7,459,455 | |||||||||||||
CCG Receivables Trust, Series2018-2, Class A14, 2.47%, 8/14/2019 | AAA8 | 2,907,827 | 2,905,772 | |||||||||||||
Chesapeake Funding II LLC, Series2017-2A, Class A14, 1.99%, 5/15/2029 | Aaa | 2,302,517 | 2,278,383 | |||||||||||||
Citibank Credit Card Issuance Trust, Series 2014, Class A6, 2.15%, 7/15/2021 | Aaa | 3,760,000 | 3,744,517 | |||||||||||||
Credit Acceptance Auto Loan Trust, Series2017-1A, Class A4, 2.56%, 10/15/2025 | AAA8 | 1,700,000 | 1,689,080 | |||||||||||||
The accompanying notes are an integral part of the financial statements.
12
Unconstrained Bond Series
Investment Portfolio - December 31, 2018
| CREDIT RATING1 (UNAUDITED) | PRINCIPAL AMOUNT2 | VALUE (NOTE 2) | ||||||||||||||
ASSET-BACKED SECURITIES(continued) | ||||||||||||||||
Daimler Trucks Retail Trust, Series2018-1, Class A24, 2.60%, 5/15/2020 | Aaa | 3,134,421 | $ | 3,130,344 | ||||||||||||
DT Auto Owner Trust, Series2018-3A, Class A4, 3.02%, 2/15/2022 | AAA8 | 5,683,121 | 5,666,216 | |||||||||||||
Enterprise Fleet Financing LLC, Series2016-2, Class A24, 1.74%, 2/22/2022 | AAA8 | 518,006 | 516,078 | |||||||||||||
Enterprise Fleet Financing LLC, Series2016-2, Class A34, 2.04%, 2/22/2022 | AAA8 | 3,900,000 | 3,849,119 | |||||||||||||
Enterprise Fleet Financing LLC, Series2017-1, Class A24, 2.13%, 7/20/2022 | AAA8 | 1,327,437 | 1,319,586 | |||||||||||||
Enterprise Fleet Financing LLC, Series2018-1, Class A14, 2.15%, 3/20/2019 | AAA8 | 565,432 | 565,257 | |||||||||||||
Ford Credit Auto Owner Trust, Series2017-B, Class A3, 1.69%, 11/15/2021 | Aaa | 300,000 | 296,303 | |||||||||||||
GLS Auto Receivables Trust, Series2018-3A, Class A4, 3.35%, 8/15/2022 | AA8 | 2,303,146 | 2,304,014 | |||||||||||||
GM Financial Automobile Leasing Trust, Series2016-3, Class A4, 1.78%, 5/20/2020 | Aaa | 4,000,000 | 3,986,867 | |||||||||||||
GM Financial Consumer Automobile Receivables Trust, Series2018-4, Class A2, 2.93%, 11/16/2021 | Aaa | 1,290,000 | 1,290,399 | |||||||||||||
Hertz Fleet Lease Funding LP, Series2018-1, Class A24, 3.23%, 5/10/2032 | Aaa | 7,000,000 | 7,023,104 | |||||||||||||
Hyundai Auto Lease Securitization Trust, Series2016-C, Class A34, 1.49%, 2/18/2020 | AAA8 | 186,160 | 185,994 | |||||||||||||
Hyundai Auto Receivables Trust, Series2017-A, Class A3, 1.76%, 8/16/2021 | AAA8 | 165,000 | 163,371 | |||||||||||||
Invitation Homes Trust, Series 2017-SFR2, Class A3,4, (1 mo. LIBOR US + 0.850%), 3.305%, 12/17/2036 | Aaa | 489,551 | 483,575 | |||||||||||||
Invitation Homes Trust, Series 2017-SFR2, Class B3,4, (1 mo. LIBOR US + 1.150%), 3.605%, 12/17/2036 | Aa2 | 400,000 | 397,839 | |||||||||||||
Kubota Credit Owner Trust, Series2018-1A, Class A14, 2.37%, 5/15/2019 | Aaa | 905,510 | 905,458 | |||||||||||||
Mercedes-Benz Auto Lease Trust, Series2016-B, Class A3, 1.35%, 8/15/2019 | Aaa | 206,782 | 206,679 | |||||||||||||
Navient Student Loan Trust, Series2018-2A, Class A13,4, (1 mo. LIBOR US + 0.240%), 2.746%, 3/25/2067 | Aaa | 1,928,457 | 1,928,623 | |||||||||||||
Nissan Auto Receivables Owner Trust, Series2016-C, Class A3, 1.18%, 1/15/2021 | Aaa | 2,400,565 | 2,378,041 | |||||||||||||
NYCTL Trust, Series2018-A, Class A4, 3.22%, 11/10/2031 | Aaa | 3,148,683 | 3,153,371 | |||||||||||||
Progress Residential Trust, Series 2017-SFR2, Class A4, 2.897%, 12/17/2034 | Aaa | 1,650,000 | 1,620,273 | |||||||||||||
SLC Student Loan Trust, Series2004-1, Class A63, (3 mo. LIBOR US + 0.160%), 2.776%, 5/15/2023 | Aaa | 2,001,307 | 2,000,260 | |||||||||||||
SLM Student Loan Trust, Series2004-10, Class A6A3,4, (3 mo. LIBOR US + 0.550%), 3.04%, 4/27/2026 | Aaa | 1,971,941 | 1,974,834 | |||||||||||||
SMB Private Education Loan Trust, Series2018-A, Class A13,4,(1 mo. LIBOR US + 0.350%), 2.805%, 3/16/2026 | Aaa | 2,601,302 | 2,599,372 | |||||||||||||
The accompanying notes are an integral part of the financial statements.
13
Unconstrained Bond Series
Investment Portfolio - December 31, 2018
| CREDIT RATING1 (UNAUDITED) | PRINCIPAL AMOUNT2 | VALUE (NOTE 2) |
| |||||||||||||
ASSET-BACKED SECURITIES(continued) | ||||||||||||||||
SoFi Consumer Loan Program LLC, Series2017-4, Class A4, 2.50%, 5/26/2026 | AA8 | 1,062,526 | $ | 1,050,223 | ||||||||||||
SoFi Consumer Loan Program LLC, Series2017-5, Class A14, 2.14%, 9/25/2026 | AA8 | 754,079 | 750,316 | |||||||||||||
SoFi Professional Loan Program LLC, Series2015-A, Class A24, 2.42%, 3/25/2030 | Aaa | 511,352 | 506,320 | |||||||||||||
SoFi Professional Loan Program LLC, Series2016-C, Class A2A4, 1.48%, 5/26/2031 | Aaa | 4,608 | 4,603 | |||||||||||||
SoFi Professional Loan Program LLC, Series2016-C, Class A2B4, 2.36%, 12/27/2032 | Aaa | 600,000 | 588,014 | |||||||||||||
SoFi Professional Loan Program LLC, Series2016-E, Class A2A4, 1.63%, 1/25/2036 | Aaa | 197,345 | 196,878 | |||||||||||||
SoFi Professional Loan Program LLC, Series2017-A, Class A2A4, 1.55%, 3/26/2040 | Aaa | 341,257 | 338,548 | |||||||||||||
SoFi Professional Loan Program LLC, Series2017-B, Class A1FX4, 1.83%, 5/25/2040 | Aaa | 118,937 | 118,197 | |||||||||||||
SoFi Professional Loan Program LLC, Series2017-C, Class A2A4, 1.75%, 7/25/2040 | AAA8 | 847,189 | 840,382 | |||||||||||||
SoFi Professional Loan Program LLC, Series2017-D, Class A1FX4, 1.72%, 9/25/2040 | Aaa | 1,236,924 | 1,228,201 | |||||||||||||
SoFi Professional Loan Program LLC, Series2017-F, Class A1FX4, 2.05%, 1/25/2041 | Aaa | 449,349 | 444,502 | |||||||||||||
SoFi Professional Loan Program LLC, Series2017-F, Class A2FX4, 2.84%, 1/25/2041 | Aaa | 750,000 | 733,108 | |||||||||||||
SoFi Professional Loan Program Trust, Series2018-B, Class A1FX4, 2.64%, 8/25/2047 | Aaa | 6,856,685 | 6,824,469 | |||||||||||||
Tax Ease Funding LLC, Series2016-1A, Class A4, 3.131%, 6/15/2028 | WR5 | 443,909 | 442,945 | |||||||||||||
Tricon American Homes Trust, Series 2016-SFR1, Class A4, 2.589%, 11/17/2033 | Aaa | 2,387,422 | 2,320,068 | |||||||||||||
United Auto Credit Securitization Trust, Series2018-2, Class A4, 2.89%, 3/10/2021 | AAA8 | 1,359,729 | 1,357,977 | |||||||||||||
Wheels SPV 2 LLC, Series2016-1A, Class A24, 1.59%, 5/20/2025 | AAA8 | 71,052 | 70,859 | |||||||||||||
World Omni Auto Receivables Trust, Series2017-A, Class A3, 1.93%, 9/15/2022 | AAA8 | 4,000,000 | 3,960,399 | |||||||||||||
World Omni Automobile Lease Securitization Trust, Series2017-A, Class A4, 2.32%, 8/15/2022 | Aaa | 750,000 | 745,105 | |||||||||||||
|
| |||||||||||||||
TOTAL ASSET-BACKED SECURITIES | 101,763,162 | |||||||||||||||
|
| |||||||||||||||
COMMERCIAL MORTGAGE-BACKED SECURITIES - 6.7% | ||||||||||||||||
Americold LLC Trust, Series 2010-ARTA, Class A14, 3.847%, 1/14/2029 . | AA8 | 109,166 | 109,936 | |||||||||||||
Credit Suisse Mortgage Capital Trust, Series2013-TH1, Class A14,9, 2.13%, 2/25/2043 | AAA8 | 618,094 | 576,291 | |||||||||||||
Fannie Mae REMICS, Series2018-31, Class KP, 3.50%, 7/25/2047 | Aaa | 3,123,622 | 3,149,233 | |||||||||||||
FDIC Trust, Series2011-R1, Class A4, 2.672%, 7/25/2026 | WR5 | 90,554 | 90,130 | |||||||||||||
The accompanying notes are an integral part of the financial statements.
14
Unconstrained Bond Series
Investment Portfolio - December 31, 2018
| CREDIT RATING1 (UNAUDITED) | PRINCIPAL AMOUNT2 | VALUE (NOTE 2) | ||||||||||||||
COMMERCIAL MORTGAGE-BACKED SECURITIES(continued) | ||||||||||||||||
Freddie Mac Multifamily Structured Pass-Through Certificates, Series K005, Class AX (IO)9, 1.344%, 11/25/2019 | Aaa | 6,874,616 | $ | 68,068 | ||||||||||||
Freddie Mac Multifamily Structured Pass-Through Certificates, Series K009, Class X1 (IO)9, 1.273%, 8/25/2020 | Aaa | 8,919,100 | 144,392 | |||||||||||||
Freddie Mac Multifamily Structured Pass-Through Certificates, Series K014, Class X1 (IO)9, 1.149%, 4/25/2021 | Aaa | 7,060,323 | 161,587 | |||||||||||||
Freddie Mac Multifamily Structured Pass-Through Certificates, Series K016, Class X1 (IO)9, 1.492%, 10/25/2021 | Aaa | 4,511,653 | 158,188 | |||||||||||||
Freddie Mac Multifamily Structured Pass-Through Certificates, Series K017, Class X1 (IO)9, 1.302%, 12/25/2021 | Aaa | 33,207,180 | 1,051,728 | |||||||||||||
Freddie Mac Multifamily Structured Pass-Through Certificates, Series K021, Class X1 (IO)9, 1.442%, 6/25/2022 | Aaa | 16,877,694 | 707,932 | |||||||||||||
Freddie Mac Multifamily Structured Pass-Through Certificates, Series K030, Class X1 (IO)9, 0.196%, 4/25/2023 | Aaa | 56,886,551 | 428,845 | |||||||||||||
Freddie Mac Multifamily Structured Pass-Through Certificates, Series K032, Class X1 (IO)9, 0.103%, 5/25/2023 | Aaa | 33,377,947 | 155,605 | |||||||||||||
Freddie Mac REMICS, Series 4791, Class BA, 4.00%, 3/15/2044 | Aaa | 3,786,288 | 3,898,123 | |||||||||||||
Freddie Mac REMICS, Series 4801, Class BA, 4.50%, 5/15/2044 | Aaa | 3,958,991 | 4,121,201 | |||||||||||||
FREMF Mortgage Trust, Series 2012-K711, Class B4,9, 3.543%, 8/25/2045 | WR5 | 2,175,000 | 2,174,401 | |||||||||||||
FREMF Mortgage Trust, Series2013-K28, Class X2A (IO) 4, 0.10%, 6/25/2046 | WR5 | 87,437,423 | 289,016 | |||||||||||||
FREMF Mortgage Trust, Series 2013-K712, Class B4,9, 3.358%, 5/25/2045 | AA8 | 1,300,000 | 1,298,701 | |||||||||||||
FREMF Mortgage Trust, Series 2014-K715, Class B4,9, 3.978%, 2/25/2046 | A1 | 2,185,000 | 2,216,699 | |||||||||||||
FREMF Mortgage Trust, Series 2014-K716, Class B4,9, 3.949%, 8/25/2047 | A1 | 2,550,000 | 2,594,043 | |||||||||||||
FREMF Mortgage Trust, Series2015-K42, Class B4,9, 3.851%, 12/25/2024 | A3 | 1,900,000 | 1,883,635 | |||||||||||||
FREMF Mortgage Trust, Series2015-K43, Class B4,9, 3.734%, 2/25/2048 | WR5 | 1,500,000 | 1,477,576 | |||||||||||||
GAHR Commercial Mortgage Trust, Series2015-NRF, Class BFX4,9, 3.382%, 12/15/2034 | AA8 | 2,000,000 | 1,990,984 | |||||||||||||
GAHR Commercial Mortgage Trust, Series2015-NRF, Class DFX4,9, 3.382%, 12/15/2034 | BBB8 | 1,150,000 | 1,135,211 | |||||||||||||
JP Morgan Chase Commercial Mortgage Securities Trust, Series2010-C2, Class A34, 4.07%, 11/15/2043 | AAA8 | 656,823 | 664,558 | |||||||||||||
JP Morgan Mortgage Trust, Series2013-1, Class 1A24,9, 3.00%, 3/25/2043 | WR5 | 434,631 | 421,303 | |||||||||||||
JP Morgan Mortgage Trust, Series2013-2, Class A24,9, 3.50%, 5/25/2043 | AAA8 | 516,532 | 507,473 | |||||||||||||
JP Morgan Mortgage Trust, Series2014-2, Class 1A14,9, 3.00%, 6/25/2029 | AAA8 | 762,784 | 757,391 | |||||||||||||
JP Morgan Mortgage Trust, Series2017-3, Class 1A54,9, 3.50%, 8/25/2047 | Aaa | 3,328,700 | 3,286,182 | |||||||||||||
The accompanying notes are an integral part of the financial statements.
15
Unconstrained Bond Series
Investment Portfolio - December 31, 2018
| CREDIT RATING1 (UNAUDITED) | PRINCIPAL AMOUNT2 | VALUE (NOTE 2) | ||||||||||||||
COMMERCIAL MORTGAGE-BACKED SECURITIES(continued) | ||||||||||||||||
New Residential Mortgage Loan Trust, Series2014-3A, Class AFX34,9, 3.75%, 11/25/2054 | AA8 | 661,567 | $ | 661,255 | ||||||||||||
New Residential Mortgage Loan Trust, Series2015-2A, Class A14,9, 3.75%, 8/25/2055 | Aaa | 1,055,947 | 1,056,509 | |||||||||||||
OBP Depositor LLC Trust, Series2010-OBP, Class A4, 4.646%, 7/15/2045 | AAA8 | 420,000 | 427,047 | |||||||||||||
Sequoia Mortgage Trust, Series2013-2, Class A9, 1.874%, 2/25/2043 | AAA8 | 637,232 | 569,616 | |||||||||||||
Sequoia Mortgage Trust, Series2013-7, Class A29, 3.00%, 6/25/2043 | AAA8 | 528,982 | 508,446 | |||||||||||||
Sequoia Mortgage Trust, Series2013-8, Class A19, 3.00%, 6/25/2043 | Aaa | 730,629 | 705,028 | |||||||||||||
Starwood Retail Property Trust, Series 2014-STAR, Class A3,4,(1 mo. LIBOR US + 1.220%), 3.675%, 11/15/2027 | AAA8 | 1,819,121 | 1,766,317 | |||||||||||||
Towd Point Mortgage Trust, Series2016-5, Class A14,9, 2.50%, 10/25/2056 | Aaa | 1,547,959 | 1,500,688 | |||||||||||||
Vornado DP LLC Trust, Series2010-VNO, Class A2FX4, 4.004%, 9/13/2028 | AA8 | 1,195,000 | 1,217,535 | |||||||||||||
Wells Fargo Commercial Mortgage Trust, Series2010-C1, Class A24, 4.393%, 11/15/2043 | Aaa | 1,350,000 | 1,372,888 | |||||||||||||
WF-RBS Commercial Mortgage Trust, Series2011-C2, Class A44,9, 4.869%, 2/15/2044 | Aaa | 1,490,650 | 1,530,197 | |||||||||||||
WinWater Mortgage Loan Trust, Series2015-1, Class A14,9, 3.50%, 1/20/2045 | WR5 | 737,920 | 727,992 | |||||||||||||
WinWater Mortgage Loan Trust, Series2015-3, Class A54,9, 3.50%, 3/20/2045 | Aaa | 625,368 | 623,410 | |||||||||||||
|
| |||||||||||||||
TOTAL COMMERCIAL MORTGAGE-BACKED SECURITIES | 48,185,360 | |||||||||||||||
|
| |||||||||||||||
FOREIGN GOVERNMENT BONDS - 5.0% | ||||||||||||||||
Brazilian Government International Bond (Brazil), 4.25%, 1/7/2025 | Ba2 | 1,300,000 | 1,283,802 | |||||||||||||
Chile Government Bond (Chile), 5.50%, 8/5/2020 | A1 | CLP | 1,800,000,000 | 2,665,522 | ||||||||||||
The Export-Import Bank of China (China)4, 2.50%, 7/31/2019 | A1 | 7,500,000 | 7,478,007 | |||||||||||||
The Export-Import Bank of China (China), 2.50%, 7/31/2019 | A1 | 630,000 | 628,153 | |||||||||||||
Export-Import Bank of Korea (South Korea), 1.75%, 5/26/2019 | Aa2 | 7,716,000 | 7,677,906 | |||||||||||||
Italy Buoni Poliennali Del Tesoro (Italy)4, 2.70%, 3/1/2047 | Baa3 | EUR | 8,000,000 | 8,130,597 | ||||||||||||
Mexican Government Bond (Mexico), 8.00%, 6/11/2020 | A3 | MXN | 35,000,000 | 1,767,726 | ||||||||||||
Mexican Government Bond (Mexico), 6.50%, 6/9/2022 | A3 | MXN | 126,000,000 | 6,017,199 | ||||||||||||
|
| |||||||||||||||
TOTAL FOREIGN GOVERNMENT BONDS | 35,648,912 | |||||||||||||||
|
| |||||||||||||||
The accompanying notes are an integral part of the financial statements.
16
Unconstrained Bond Series
Investment Portfolio - December 31, 2018
| SHARES/ PRINCIPAL AMOUNT2 | VALUE (NOTE 2) |
| ||||||||||
MUTUAL FUNDS - 2.0% | ||||||||||||
iShares iBoxx High Yield Corporate Bond ETF | 87,500 | $ | 7,096,250 | |||||||||
SPDR Bloomberg Barclays High Yield Bond ETF | 210,500 | 7,070,695 | ||||||||||
|
| |||||||||||
TOTAL MUTUAL FUNDS | ||||||||||||
(Identified Cost $14,079,015) | 14,166,945 | |||||||||||
|
| |||||||||||
U.S. TREASURY SECURITIES - 3.1% | ||||||||||||
U.S. Treasury Notes - 3.1% | ||||||||||||
U.S. Treasury Inflation Indexed Note, 0.125%, 4/15/2020 | ||||||||||||
(Identified Cost $22,433,439) | 22,677,270 | 22,167,327 | ||||||||||
|
| |||||||||||
U.S. GOVERNMENT AGENCIES - 6.2% | ||||||||||||
Mortgage-Backed Securities - 6.2% | ||||||||||||
Fannie Mae, Pool #888468, 5.50%, 9/1/2021 | 175,678 | 178,558 | ||||||||||
Fannie Mae, Pool #995233, 5.50%, 10/1/2021 | 9,333 | 9,439 | ||||||||||
Fannie Mae, Pool #888017, 6.00%, 11/1/2021 | 21,762 | 22,293 | ||||||||||
Fannie Mae, Pool #995329, 5.50%, 12/1/2021 | 123,664 | 125,829 | ||||||||||
Fannie Mae, Pool #888136, 6.00%, 12/1/2021 | 26,371 | 27,030 | ||||||||||
Fannie Mae, Pool #888810, 5.50%, 11/1/2022 | 214,848 | 218,422 | ||||||||||
Fannie Mae, Pool #AD0462, 5.50%, 10/1/2024 | 21,269 | 22,140 | ||||||||||
Fannie Mae, Pool #MA0115, 4.50%, 7/1/2029 | 82,888 | 86,559 | ||||||||||
Fannie Mae, Pool #MA1834, 4.50%, 2/1/2034 | 358,071 | 374,354 | ||||||||||
Fannie Mae, Pool #918516, 5.50%, 6/1/2037 | 108,535 | 116,493 | ||||||||||
Fannie Mae, Pool #889624, 5.50%, 5/1/2038 | 172,000 | 183,646 | ||||||||||
Fannie Mae, Pool #995876, 6.00%, 11/1/2038 | 462,287 | 504,113 | ||||||||||
Fannie Mae, Pool #AD0307, 5.50%, 1/1/2039 | 178,749 | 192,141 | ||||||||||
Fannie Mae, Pool #AA7236, 4.00%, 6/1/2039 | 928,490 | 954,629 | ||||||||||
Fannie Mae, Pool #AJ1989, 4.50%, 10/1/2041 | 1,824,925 | 1,910,659 | ||||||||||
Fannie Mae, Pool #AW5338, 4.50%, 6/1/2044 | 1,036,317 | 1,083,768 | ||||||||||
Fannie Mae, Pool #AS3878, 4.50%, 11/1/2044 | 971,241 | 1,012,156 | ||||||||||
Fannie Mae, Pool #BC5442, 4.00%, 4/1/2046 | 2,626,610 | 2,680,785 | ||||||||||
Fannie Mae, Pool #BC9568, 4.00%, 5/1/2046 | 3,761,822 | 3,837,668 | ||||||||||
Fannie Mae, Pool #BE7845, 4.50%, 2/1/2047 | 784,924 | 820,509 | ||||||||||
Fannie Mae, Pool #CA1922, 5.00%, 6/1/2048 | 4,159,355 | 4,362,051 | ||||||||||
Freddie Mac, Pool #G11850, 5.50%, 7/1/2020 | 21,708 | 21,820 | ||||||||||
Freddie Mac, Pool #G12610, 6.00%, 3/1/2022 | 28,572 | 29,229 | ||||||||||
Freddie Mac, Pool #G12655, 6.00%, 5/1/2022 | 19,646 | 20,163 | ||||||||||
Freddie Mac, Pool #G12988, 6.00%, 1/1/2023 | 15,985 | 16,500 | ||||||||||
Freddie Mac, Pool #G13078, 6.00%, 3/1/2023 | 27,865 | 28,730 | ||||||||||
Freddie Mac, Pool #G13331, 5.50%, 10/1/2023 | 13,071 | 13,449 | ||||||||||
Freddie Mac, Pool #C91359, 4.50%, 2/1/2031 | 204,099 | 213,295 | ||||||||||
Freddie Mac, Pool #D98711, 4.50%, 7/1/2031 | 568,329 | 593,941 | ||||||||||
Freddie Mac, Pool #C91746, 4.50%, 12/1/2033 | 504,581 | 527,203 | ||||||||||
Freddie Mac, Pool #C91760, 3.50%, 5/1/2034 | 2,686,671 | 2,735,467 | ||||||||||
The accompanying notes are an integral part of the financial statements.
17
Unconstrained Bond Series
Investment Portfolio - December 31, 2018
| PRINCIPAL AMOUNT2/ SHARES | VALUE (NOTE 2) |
| ||||||||||
U.S. GOVERNMENT AGENCIES(continued) | ||||||||||||
Mortgage-Backed Securities(continued) | ||||||||||||
Freddie Mac, Pool #G07655, 5.50%, 12/1/2035 | 484,053 | $ | 522,007 | |||||||||
Freddie Mac, Pool #G04176, 5.50%, 5/1/2038 | 206,892 | 221,151 | ||||||||||
Freddie Mac, Pool #A78227, 5.50%, 6/1/2038 | 221,133 | 235,998 | ||||||||||
Freddie Mac, Pool #G05900, 6.00%, 3/1/2040 | 89,932 | 97,248 | ||||||||||
Freddie Mac, Pool #A96363, 4.50%, 1/1/2041 | 3,247,948 | 3,398,531 | ||||||||||
Freddie Mac, Pool #G60342, 4.50%, 5/1/2042 | 2,966,924 | 3,106,372 | ||||||||||
Freddie Mac, Pool #G07998, 4.50%, 7/1/2044 | 3,359,604 | 3,489,051 | ||||||||||
Freddie Mac, Pool #Q38473, 4.00%, 1/1/2046 | 4,793,111 | 4,893,283 | ||||||||||
Freddie Mac, Pool #Q40375, 3.50%, 5/1/2046 | 5,240,295 | 5,255,914 | ||||||||||
|
| |||||||||||
TOTAL U.S. GOVERNMENT AGENCIES | ||||||||||||
(Identified Cost $45,566,854) | 44,142,594 | |||||||||||
|
| |||||||||||
SHORT-TERM INVESTMENT - 2.9% | ||||||||||||
Dreyfus Government Cash Management, Institutional Shares, 2.29%10, | ||||||||||||
(Identified Cost $20,402,022) | 20,402,022 | 20,402,022 | ||||||||||
|
| |||||||||||
TOTAL INVESTMENTS - 98.4% | ||||||||||||
(Identified Cost $718,253,978) | 702,991,540 | |||||||||||
OTHER ASSETS, LESS LIABILITIES - 1.6% | 11,157,056 | |||||||||||
|
| |||||||||||
NET ASSETS - 100% | $ | 714,148,596 | ||||||||||
|
| |||||||||||
| FUTURES CONTRACTS: LONG POSITIONS OPEN AT DECEMBER 31, 2018: | ||||||||||||||
| CONTRACTS PURCHASED | ISSUE | EXCHANGE | EXPIRATION | NOTIONAL VALUE2 | VALUE/UNREALIZED APPRECIATION/ (DEPRECIATION) | |||||||||
25 | CAD Currency | CME | March 2019 | 1,837,750 | $ (46,822) | |||||||||
14 | CHF Currency | CME | March 2019 | 1,792,700 | 10,635 | |||||||||
36 | Euro-BTP | Eurex | March 2019 | 5,272,196 | 230,933 | |||||||||
52 | Euro FX Currency | CME | March 2019 | 7,489,625 | 20,445 | |||||||||
90 | GBP Currency | CME | March 2019 | 7,194,375 | (30,635) | |||||||||
33 | JPY Currency | CME | March 2019 | 3,783,038 | 92,099 | |||||||||
875 | U.S. Treasury Notes (2 Year) | CBOT | March 2019 | 185,773,438 | 1,228,832 | |||||||||
131 | U.S. Long Bond U.S. Ultra Treasury | CBOT | March 2019 | 19,126,000 | 707,948 | |||||||||
131 | Bonds (10 Year) U.S. Ultra Treasury | CBOT | March 2019 | 17,040,235 | 510,428 | |||||||||
107 | Bonds (30 Year) | CBOT | March 2019 | 17,190,219 | 929,334 | |||||||||
|
|
| ||||||||||||
TOTAL LONG POSITIONS | 3,653,197 | |||||||||||||
|
|
| ||||||||||||
The accompanying notes are an integral part of the financial statements.
18
Unconstrained Bond Series
Investment Portfolio - December 31, 2018
| FUTURES CONTRACTS: SHORT POSITIONS OPEN AT DECEMBER 31, 2018: | ||||||||||||||
CONTRACTS SOLD | ISSUE | EXCHANGE | EXPIRATION | NOTIONAL VALUE2 | VALUE/UNREALIZED DEPRECIATION | |||||||||
265 | Euro-BOBL | Eurex | March 2019 | 40,236,254 | $ | (127,889) | ||||||||
164 | Euro-BUND | Eurex | March 2019 | 30,729,683 | (263,292) | |||||||||
44 | Euro-BUXL (30 Year) | Eurex | March 2019 | 9,105,604 | (221,970) | |||||||||
200 | Euro-SCHATZ | Eurex | March 2019 | 25,651,073 | (11,730) | |||||||||
135 | Short-TermEuro-BTP | Eurex | March 2019 | 17,125,769 | (236,839) | |||||||||
978 | U.S. Treasury Notes (5 Year) | CBOT | March 2019 | 112,164,375 | (1,475,785) | |||||||||
750 | Fed Fund 30 Day | CBOT | July 2019 | 292,725,000 | (406,673) | |||||||||
|
| |||||||||||||
TOTAL SHORT POSITIONS | (2,744,178) | |||||||||||||
|
| |||||||||||||
CBOT - Chicago Board of Trade
CLP - Chilean Peso
CME - Chicago Mercantile Exchange
ETF - Exchange-Traded Fund
EUR - Euro
EUREX - Eurex Exchange
IO - Interest only
MXN - Mexican Peso
1Credit ratings from Moody’s (unaudited).
2Amount is stated in USD unless otherwise noted.
3Floating rate security. Rate shown is the rate in effect as of December 31, 2018.
4Restricted securities - Investment in securities that are restricted as to public resale under the Securities Act of 1933, as amended. These securities have been sold under Rule 144A and have been determined to be liquid under guidelines established by the Board of Directors. These securities amount to $201,256,926, or 28.2% of the Series’ net assets as of December 31, 2018 (see Note 2 to the financial statements).
5Credit rating has been withdrawn. As of December 31, 2018, there is no rating available (unaudited).
6Step coupon rate security - Rate steps up/down by 25 basis points upon rating downgrade/upgrade by Moody’s and S&P rating agencies (Subject to a maximum of 100 basis points per agency, 200 basis points maximum).
7Illiquid security - This security was acquired on November 3, 2017 at a cost of $992,500 ($99.25 per share). This security has been determined to be illiquid under guidelines established by the Board of Directors. This security amounts to $974,640, or 0.1% of the Series’ net assets as of December 31, 2018 (see Note 2 to the financial statements).
8Credit ratings from S&P (unaudited).
9Variable or floating rate security, the interest rate of which adjusts periodically based on changes in current interest rates and prepayments on the underlying pool of assets. Rate shown is the rate in effect as of December 31, 2018.
10Rate shown is the current yield as of December 31, 2018.
The Global Industry Classification Standard (GICS) was developed by and is the exclusive property and a service mark of MSCI Inc. (MSCI) and Standard & Poor’s, a division of The McGraw-Hill Companies, Inc. (S&P), and is licensed for use by Manning & Napier when referencing GICS sectors. Neither MSCI, S&P, nor any third party involved in making or compiling the GICS or any GICS classifications makes any express or implied warranties or representations with respect to such standard or classification, nor shall any such party have any liability therefrom.
The accompanying notes are an integral part of the financial statements.
19
Unconstrained Bond Series
Statement of Assets and Liabilities
December 31, 2018
ASSETS: | ||||
Investments in securities, at value (identified cost $718,253,978) (Note 2) | $ | 702,991,540 | ||
Deposits at broker for futures contracts | 6,196,741 | |||
Interest receivable | 5,349,092 | |||
Receivable for fund shares sold | 978,960 | |||
Futures variation margin receivable | 373,318 | |||
Dividends receivable | 40,328 | |||
Prepaid and other expenses | 12,625 | |||
|
| |||
TOTAL ASSETS | 715,942,604 | |||
|
| |||
LIABILITIES: | ||||
Accrued management fees (Note 3) | 265,072 | |||
Accrued shareholder services fees (Class S) (Note 3) | 146,863 | |||
Accrued fund accounting and administration fees (Note 3) | 47,180 | |||
Accrued Chief Compliance Officer service fees (Note 3) | 427 | |||
Payable for fund shares repurchased | 1,041,552 | |||
Futures variation margin payable | 244,500 | |||
Other payables and accrued expenses | 48,414 | |||
|
| |||
TOTAL LIABILITIES | 1,794,008 | |||
|
| |||
TOTAL NET ASSETS | $ | 714,148,596 | ||
|
| |||
NET ASSETS CONSIST OF: | ||||
Capital stock | $ | 705,186 | ||
Additionalpaid-in-capital | 732,302,538 | |||
Total distributable earnings (loss) | (18,859,128 | ) | ||
|
| |||
TOTAL NET ASSETS | $ | 714,148,596 | ||
|
| |||
NET ASSET VALUE, OFFERING PRICE AND REDEMPTION PRICE PER SHARE - Class S | ||||
($685,649,450/67,382,367 shares) | $ | 10.18 | ||
|
| |||
NET ASSET VALUE, OFFERING PRICE AND REDEMPTION PRICE PER SHARE - Class I | ||||
($28,499,146/3,136,274 shares) | $ | 9.09 | ||
|
| |||
The accompanying notes are an integral part of the financial statements.
20
Unconstrained Bond Series
Statement of Operations
For the Year Ended December 31, 2018
INVESTMENT INCOME: | ||||
Interest | $ | 25,320,809 | ||
Dividends | 383,571 | |||
|
| |||
Total Investment Income | 25,704,380 | |||
|
| |||
EXPENSES: | ||||
Management fees (Note 3) | 3,502,586 | |||
Shareholder services fees (Class S) (Note 3) | 1,833,686 | |||
Fund accounting and administration fees (Note 3) | 156,833 | |||
Directors’ fees (Note 3) | 63,184 | |||
Chief Compliance Officer service fees (Note 3) | 4,634 | |||
Custodian fees | 47,638 | |||
Miscellaneous | 212,037 | |||
|
| |||
Total Expenses | 5,820,598 | |||
Less reduction of expenses (Note 3) | (95,149 | ) | ||
|
| |||
Net Expenses | 5,725,449 | |||
|
| |||
NET INVESTMENT INCOME | 19,978,931 | |||
|
| |||
REALIZED AND UNREALIZED GAIN (LOSS) ON INVESTMENTS AND FOREIGN CURRENCY: | ||||
Net realized gain (loss) on- | ||||
Investments | (5,197,937 | ) | ||
Forward foreign currency exchange contracts | (91,006 | ) | ||
Futures contracts | 79,854 | |||
Foreign currency and translation of other assets and liabilities | (222,127 | ) | ||
|
| |||
| (5,431,216 | ) | |||
|
| |||
Net change in unrealized appreciation (depreciation) on- | ||||
Investments | (14,086,074 | ) | ||
Forward foreign currency exchange contracts | (170,176 | ) | ||
Futures contracts | 661,160 | |||
Foreign currency and translation of other assets and liabilities | (1,799 | ) | ||
|
| |||
| (13,596,889 | ) | |||
|
| |||
NET REALIZED AND UNREALIZED GAIN (LOSS) ON INVESTMENTS AND FOREIGN CURRENCY | (19,028,105 | ) | ||
|
| |||
NET INCREASE IN NET ASSETS RESULTING FROM OPERATIONS | $ | 950,826 | ||
|
| |||
The accompanying notes are an integral part of the financial statements.
21
Unconstrained Bond Series
Statements of Changes in Net Assets
FOR THE YEAR ENDED | FOR THE YEAR ENDED | |||||||
INCREASE (DECREASE) IN NET ASSETS: | ||||||||
OPERATIONS: | ||||||||
Net investment income | $ | 19,978,931 | $ | 18,226,512 | ||||
Net realized gain (loss) on investments and foreign currency | (5,431,216 | ) | 3,853,547 | |||||
Net change in unrealized appreciation (depreciation) on investments and foreign currency | (13,596,889 | ) | 5,508,769 | |||||
|
|
|
| |||||
Net increase from operations | 950,826 | 27,588,828 | ||||||
|
|
|
| |||||
DISTRIBUTIONS TO SHAREHOLDERS (Note 9): | ||||||||
Class S | (18,048,897 | ) | (18,039,339 | ) | ||||
Class I | (1,144,935 | ) | (1,657,322 | ) | ||||
|
|
|
| |||||
Total distributions to shareholders | (19,193,832 | ) | (19,696,661 | )1 | ||||
|
|
|
| |||||
CAPITAL STOCK ISSUED AND REPURCHASED: | ||||||||
Net decrease from capital share transactions (Note 5) | (104,975,148 | ) | (64,800,948 | ) | ||||
|
|
|
| |||||
Net decrease in net assets | (123,218,154 | ) | (56,908,781 | ) | ||||
NET ASSETS: | ||||||||
Beginning of year | 837,366,750 | 894,275,531 | ||||||
|
|
|
| |||||
End of year2 | $ | 714,148,596 | $ | 837,366,750 | ||||
|
|
|
| |||||
1 For the year ended December 31, 2017, the distributions to shareholders from net investment income and net realized gain were $17,569,213 and $470,126 (Class S) and $1,612,127 and $45,195 (Class I), respectively.
2 Includes accumulated undistributed (overdistributed) net investment income of ($106,469) as of December 31, 2017. The SEC eliminated the requirement to disclose undistributed net investment income in 2018.
The accompanying notes are an integral part of the financial statements.
22
Unconstrained Bond Series
Financial Highlights - Class S
| FOR THE YEAR ENDED | ||||||||||||||||||||
| 12/31/18 | 12/31/17 | 12/31/16 | 12/31/15 | 12/31/14 | ||||||||||||||||
Per share data (for a share outstanding throughout each year): | ||||||||||||||||||||
Net asset value - Beginning of year | $10.42 | $10.33 | $10.12 | $10.53 | $10.65 | |||||||||||||||
|
|
|
|
|
|
|
|
|
| |||||||||||
Income (loss) from investment operations: | ||||||||||||||||||||
Net investment income1 | 0.26 | 0.22 | 0.22 | 0.27 | 0.34 | |||||||||||||||
Net realized and unrealized gain (loss) on investments | (0.24 | ) | 0.11 | 0.19 | (0.36 | ) | (0.00 | )2 | ||||||||||||
|
|
|
|
|
|
|
|
|
| |||||||||||
Total from investment operations | 0.02 | 0.33 | 0.41 | (0.09 | ) | 0.34 | ||||||||||||||
|
|
|
|
|
|
|
|
|
| |||||||||||
Less distributions to shareholders: | ||||||||||||||||||||
From net investment income | (0.25 | ) | (0.23 | ) | (0.20 | ) | (0.26 | ) | (0.34 | ) | ||||||||||
From net realized gain on investments | (0.01 | ) | (0.01 | ) | — | (0.05 | ) | (0.12 | ) | |||||||||||
From return of capital | — | — | — | (0.01 | ) | — | ||||||||||||||
|
|
|
|
|
|
|
|
|
| |||||||||||
Total distributions to shareholders | (0.26 | ) | (0.24 | ) | (0.20 | ) | (0.32 | ) | (0.46 | ) | ||||||||||
|
|
|
|
|
|
|
|
|
| |||||||||||
Net asset value - End of year | $10.18 | $10.42 | $10.33 | $10.12 | $10.53 | |||||||||||||||
|
|
|
|
|
|
|
|
|
| |||||||||||
Net assets - End of year(000’s omitted) | $685,649 | $770,824 | $845,043 | $835,610 | $680,719 | |||||||||||||||
|
|
|
|
|
|
|
|
|
| |||||||||||
Total return3 | 0.20% | 3.19% | 4.08% | (0.88%) | 3.18% | |||||||||||||||
Ratios (to average net assets)/Supplemental Data: | ||||||||||||||||||||
Expenses* | 0.75% | 0.75% | 0.75% | 0.75% | 0.75% | |||||||||||||||
Net investment income | 2.56% | 2.08% | 2.18% | 2.58% | 3.16% | |||||||||||||||
Portfolio turnover | 58% | 62% | 56% | 81% | 53% | |||||||||||||||
| *The investment advisor did not impose all or a portion of its management and/or other fees, and in some periods may have paid a portion of the Series’ expenses. If these expenses had been incurred by the Series, the expense ratio (to average net assets) would have increased by the following amounts: |
| |||||||||||||||||||
| 0.01% | 0.00%4 | N/A | N/A | N/A | ||||||||||||||||
1Calculated based on average shares outstanding during the years.
2Less than $(0.01).
3Represents aggregate total return for the years indicated, and assumes reinvestment of all distributions. Total return would have been lower had certain expenses not been waived or reimbursed during certain years.
4Less than 0.01%.
The accompanying notes are an integral part of the financial statements.
23
Unconstrained Bond Series
Financial Highlights - Class I
| FOR THE YEAR ENDED | ||||||||||||||||||||
| 12/31/18 | 12/31/17 | 12/31/16 | 12/31/15 | 12/31/14 | ||||||||||||||||
Per share data (for a share outstanding throughout each year): | ||||||||||||||||||||
Net asset value - Beginning of year | $9.34 | $9.28 | $9.12 | $9.52 | $9.68 | |||||||||||||||
|
|
|
|
|
|
|
|
|
| |||||||||||
Income (loss) from investment operations: | ||||||||||||||||||||
Net investment income1 | 0.26 | 0.22 | 0.23 | 0.29 | 0.34 | |||||||||||||||
Net realized and unrealized gain (loss) on investments | (0.22 | ) | 0.11 | 0.16 | (0.34 | ) | (0.02 | ) | ||||||||||||
|
|
|
|
|
|
|
|
|
| |||||||||||
Total from investment operations | 0.04 | 0.33 | 0.39 | (0.05 | ) | 0.32 | ||||||||||||||
|
|
|
|
|
|
|
|
|
| |||||||||||
Less distributions to shareholders: | ||||||||||||||||||||
From net investment income | (0.28 | ) | (0.26 | ) | (0.23 | ) | (0.29 | ) | (0.36 | ) | ||||||||||
From net realized gain on investments | (0.01 | ) | (0.01 | ) | — | (0.05 | ) | (0.12 | ) | |||||||||||
From return of capital | — | — | — | (0.01 | ) | — | ||||||||||||||
|
|
|
|
|
|
|
|
|
| |||||||||||
Total distributions to shareholders | (0.29 | ) | (0.27 | ) | (0.23 | ) | (0.35 | ) | (0.48 | ) | ||||||||||
|
|
|
|
|
|
|
|
|
| |||||||||||
Net asset value - End of year | $9.09 | $9.34 | $9.28 | $9.12 | $9.52 | |||||||||||||||
|
|
|
|
|
|
|
|
|
| |||||||||||
Net assets - End of year(000’s omitted) | $28,499 | $66,543 | $49,233 | $37,749 | $78,789 | |||||||||||||||
|
|
|
|
|
|
|
|
|
| |||||||||||
Total return2 | 0.40% | 3.52% | 4.27% | (0.59%) | 3.36% | |||||||||||||||
Ratios (to average net assets)/Supplemental Data: | ||||||||||||||||||||
Expenses* | 0.50% | 0.50% | 0.50% | 0.50% | 0.50% | |||||||||||||||
Net investment income | 2.75% | 2.33% | 2.50% | 3.00% | 3.42% | |||||||||||||||
Portfolio turnover | 58% | 62% | 56% | 81% | 53% | |||||||||||||||
| *The investment advisor did not impose all or a portion of its management and/or other fees, and in some periods may have paid a portion of the Series’ expenses. If these expenses had been incurred by the Series, the expense ratio (to average net assets) would have increased by the following amounts: |
| |||||||||||||||||||
| 0.01% | 0.00%3 | N/A | N/A | N/A | ||||||||||||||||
1Calculated based on average shares outstanding during the years.
2Represents aggregate total return for the years indicated, and assumes reinvestment of all distributions. Total return would have been lower had certain expenses not been waived or reimbursed during certain years.
3Less than 0.01%.
The accompanying notes are an integral part of the financial statements.
24
Unconstrained Bond Series
Notes to Financial Statements
| 1. | Organization |
Unconstrained Bond Series (the “Series”) is ano-load diversified series of Manning & Napier Fund, Inc. (the “Fund”). The Fund is organized in Maryland and is registered under the Investment Company Act of 1940, as amended, as anopen-end management investment company.
The Series’ primary investment objective is to provide long-term total return, and its secondary objective is to provide preservation of capital.
The Fund’s advisor is Manning & Napier Advisors, LLC (the “Advisor”). Shares of the Series are offered to investors, clients and employees of the Advisor and its affiliates. The Series is authorized to issue two classes of shares (Class S and Class I). Each class of shares is substantially the same except the Class S shares bear shareholder services fees. The total authorized capital stock of the Fund consists of 15 billion shares of common stock each having a par value of $0.01. As of December 31, 2018, 10.4 billion shares have been designated in total among 34 series, of which 100 million have been designated as Unconstrained Bond Series Class I common stock, 125 million have been designated as Unconstrained Bond Series Class S common stock, 125 million have been designated as Unconstrained Bond Series Class W common stock, and 100 million have been designated as Unconstrained Bond Series Class Z common stock. Class W common stock and Class Z common stock are not currently offered for sale.
| 2. | Significant Accounting Policies |
The following is a summary of significant accounting policies followed by the Series. The Series is an investment company and, accordingly, follows the investment company accounting and reporting guidance of the Financial Accounting Standards Board Accounting Standards Codification Topic 946 - Investment Companies, which is part of accounting principles generally accepted in the United States of America (“GAAP”).
Security Valuation
Portfolio securities, including domestic equities, foreign equities, warrants and options, listed on an exchange other than the NASDAQ Stock Market are valued at the latest quoted sales price of the exchange on which the security is primarily traded. Securities not traded on valuation date or securities not listed on an exchange are valued at the latest quoted bid price provided by the Fund’s pricing service. Securities listed on the NASDAQ Stock Market are valued in accordance with the NASDAQ Official Closing Price.
Debt securities, including government bonds, foreign bonds, asset-backed securities, structured notes, supranational obligations, sovereign bonds, corporate bonds, loan assignments, and mortgage-backed securities will normally be valued on the basis of evaluated bid prices provided directly by an independent pricing service (the “Service”). The pricing services use multiple valuation techniques to determine fair value. In instances where sufficient market activity exists, the pricing services may utilize a market-based approach through which quotes from market makers are used to determine fair value. In instances where sufficient market activity may not exist or is limited, the pricing services also utilize proprietary valuation models which may consider market characteristics such as benchmark yield curves, option-adjusted spreads, credit spreads, estimated default rates, coupon rates, anticipated timing of principal repayments, underlying collateral, and other unique security features in order to estimate the relevant cash flows, which are then discounted to calculate the fair value. Certain investments in securities held by the Series may be valued on a basis of a price provided directly by a principal market maker. These prices may differ from the value that would have been used had a broader market for securities existed.
The fair value of loan assignments is estimated using recently executed transactions, market price quotations, credit/market events, and cross-asset pricing. Inputs are generally observable market inputs obtained from independent sources. Loan assignments are generally categorized in Level 2 of the fair value hierarchy, unless key inputs are unobservable, in which case they would be categorized in Level 3.
Municipal securities will normally be valued on the basis of market valuations provided by the Service. The Service utilizes the latest price quotations and a matrix system (which considers such factors as security prices of similar securities, yields, maturities and ratings). The Service has been approved by the Fund’s Board of Directors (the “Board”).
25
Unconstrained Bond Series
Notes to Financial Statements (continued)
| 2. | Significant Accounting Policies (continued) |
Security Valuation(continued)
Short-term investments that mature in sixty days or less may be valued at amortized cost, which approximates fair value. Investments inopen-end investment companies are valued at their net asset value per share on valuation date.
Volume and level of activity in established markets for an asset or liability are evaluated to determine whether recent transactions and quoted prices are determinative of fair value. Where there have been significant decreases in volume and level of activity, further analysis and adjustment may be necessary to estimate fair value. The Series measures fair value in these instances by the use of inputs and valuation techniques which may be based upon current market prices of securities that are comparable in coupon, rating, maturity and industry and/or expectation of future cash flows. As a result of trading in relatively thin markets and/or markets that experience significant volatility, the prices used by the Series to value these securities may differ from the value that would be realized if these securities were sold, and the differences could be material.
Securities for which representative valuations or prices are not available from the Series’ pricing service may be valued at fair value as determined in good faith by the Advisor under procedures approved by and under the general supervision and responsibility of the Fund’s Board. Due to the inherent uncertainty of valuations of such securities, the fair value may differ significantly from the values that would have been used had a ready market for such securities existed. If trading or events occurring after the close of the principal market in which securities are traded are expected to materially affect the value of those securities, then they may be valued at their fair value, taking this trading or these events into account.
Various inputs are used in determining the value of the Series’ assets or liabilities carried at fair value. These inputs are summarized in three broad levels. Level 1 includes quoted prices in active markets for identical assets and liabilities. Level 2 includes other significant observable inputs (including quoted prices for similar securities, interest rates, prepayment speeds, credit risk, etc.). Level 3 includes significant unobservable inputs (including the Series’ own assumptions in determining the fair value of investments). A financial instrument’s level within the fair value hierarchy is based on the lowest level of any input both individually and in aggregate that is significant to the fair value measurement. The inputs or methodology used for valuing securities are not necessarily an indication of the risk associated with investing in those securities.
The following is a summary of the valuation levels used for major security types as of December 31, 2018 in valuing the Series’ assets or liabilities carried at fair value:
| DESCRIPTION | TOTAL | LEVEL 1 | LEVEL 2 | LEVEL 3 | ||||||||||||
Assets: | ||||||||||||||||
Debt securities: | ||||||||||||||||
U.S. Treasury and other U.S. Government agencies | $ | 66,309,921 | $ | — | $ | 66,309,921 | $ | — | ||||||||
Corporate debt: | ||||||||||||||||
Communication Services | 59,711,954 | — | 59,711,954 | — | ||||||||||||
Consumer Discretionary | 48,057,642 | — | 48,057,642 | — | ||||||||||||
Consumer Staples | 12,293,619 | — | 12,293,619 | — | ||||||||||||
Energy | 70,900,652 | — | 70,900,652 | — | ||||||||||||
Financials | 112,032,332 | — | 112,032,332 | — | ||||||||||||
Health Care | 19,605,110 | — | 19,605,110 | — | ||||||||||||
Industrials | 42,502,054 | — | 42,502,054 | — | ||||||||||||
Information Technology | 2,352,900 | — | 2,352,900 | — | ||||||||||||
Materials | 21,847,674 | — | 21,847,674 | — | ||||||||||||
Real Estate | 16,485,456 | — | 16,485,456 | — | ||||||||||||
Utilities | 10,725,825 | — | 10,725,825 | — | ||||||||||||
Asset-backed securities | 101,763,162 | — | 101,763,162 | — | ||||||||||||
Commercial mortgage-backed securities | 48,185,360 | — | 48,185,360 | — | ||||||||||||
26
Unconstrained Bond Series
Notes to Financial Statements (continued)
| 2. | Significant Accounting Policies (continued) |
Security Valuation(continued)
| DESCRIPTION | TOTAL | LEVEL 1 | LEVEL 2 | LEVEL 3 | ||||||||||||
Foreign government bonds | $ | 35,648,912 | $ | — | $ | 35,648,912 | $ | — | ||||||||
Mutual funds | 34,568,967 | 34,568,967 | — | — | ||||||||||||
Other financial instruments*: | ||||||||||||||||
Foreign currency exchange contracts | 123,179 | 123,179 | — | — | ||||||||||||
Interest rate contracts | 3,607,475 | 3,607,475 | — | — | ||||||||||||
|
|
|
|
|
|
|
| |||||||||
Total assets | 706,722,194 | 38,299,621 | 668,422,573 | — | ||||||||||||
|
|
|
|
|
|
|
| |||||||||
Liabilities: | ||||||||||||||||
Other financial instruments:* | ||||||||||||||||
Foreign currency exchange contracts | (77,457 | ) | (77,457 | ) | — | — | ||||||||||
Interest rate contracts | (2,744,178 | ) | (2,744,178 | ) | — | — | ||||||||||
|
|
|
|
|
|
|
| |||||||||
Total liabilities | (2,821,635 | ) | (2,821,635 | ) | — | — | ||||||||||
|
|
|
|
|
|
|
| |||||||||
Total | $ | 703,900,559 | $ | 35,477,986 | $ | 668,422,573 | $ | — | ||||||||
|
|
|
|
|
|
|
| |||||||||
There were no Level 3 securities held by the Series as of December 31, 2017 or December 31, 2018.
*Other financial instruments are futures (Level 1). Futures are valued at the unrealized appreciation (depreciation) on the instrument.
New Accounting Pronouncements
The Securities and Exchange Commission (SEC) adopted changes to RegulationS-X to simplify the reporting of information by registered investment companies in financial statements. The amendments require presentation of the total, rather than the components, of distributable earnings on the Statement of Assets and Liabilities and also require presentation of the total, rather than the components, of distributions to shareholders, except for tax return of capital distributions, if any, on the Statement of Changes in Net Assets. The amendments also removed the requirement for parenthetical disclosure of undistributed net investment income on the Statement of Changes in Net Assets. These RegulationS-X amendments are reflected in the Series financial statements for the year ended December 31, 2018. As a result of adopting these amendments, the distributions to shareholders in the December 31, 2017 Statement of Changes in Net Assets presented herein have been reclassified to conform to the current year presentation.
In March 2017, the Financial Accounting Standards Board issued Accounting Standards UpdateNo. 2017-08, Receivables – Nonrefundable Fees and Other Costs (Subtopic310-320): “Premium Amortization of Purchased Callable Debt Securities” which shortens the amortized period for certain callable debt securities, held at a premium, to be amortized to the earliest call date rather than the contractual maturity date. The Series will adopt and apply ASU2017-08 on a modified retrospective basis through a cumulative-effect adjustment as of January 1, 2019. As a result of the adoption of ASU2017-08, as of January 1, 2019 the amortized cost basis of investments will be reduced and unrealized appreciation of investments will be increased, but there will be no impact on net assets or overall results of operations.
On August 28, 2018, the FASB issued ASU2018-13, “Disclosure Framework – Changes to the Disclosure Requirements for Fair Value Measurement,” which amends the fair value measurement disclosure requirements under U.S. GAAP. The amendments of ASU2018-13 include new, eliminated, and modified disclosure requirements. In addition, the amendments clarify that materiality is an appropriate consideration of entities when evaluating disclosure requirements. The ASU is effective for all entities for fiscal years beginning after December 15, 2019, including interim periods therein. An entity is permitted to early adopt any eliminated or modified disclosures upon issuance of this ASU and delay adoption of the new disclosures until their effective date. As such, each Series has early adopted the eliminated and modified disclosures, as permitted by this ASU.
27
Unconstrained Bond Series
Notes to Financial Statements (continued)
| 2. | Significant Accounting Policies (continued) |
Security Transactions, Investment Income and Expenses
Security transactions are accounted for on trade date. Dividend income is recorded on theex-dividend date, except that if theex-dividend date has passed, certain dividends from foreign securities are recorded as soon as the Series is informed of theex-dividend date.Non-cash dividends, if any, are recorded at the fair value of the securities received. Interest income, including amortization of premium and accretion of discounts using the effective interest method, is earned from settlement date and accrued daily.
Expenses are recorded on an accrual basis. Most expenses of the Fund can be attributed to a specific series. Expenses which cannot be directly attributed are apportioned among the series in the Fund in such a manner as deemed equitable by the Fund’s Board, taking into consideration, among other things, the nature and type of expense. Income, expenses (other than shareholder services fees), and realized and unrealized gains and losses are prorated among the classes based on the relative net assets of each class. Class specific examples are directly charged to that Class.
The Series uses the identified cost method for determining realized gain or loss on investments for both financial statement and federal income tax reporting purposes.
Foreign Currency Translation
The books and records of the Series are maintained in U.S. dollars. Foreign currencies, investments and other assets and liabilities are translated into U.S. dollars at the current exchange rates. Purchases and sales of investment securities and income and expenses are translated on the respective dates of such transactions. The Series does not isolate realized and unrealized gains and losses attributable to changes in the exchange rates from gains and losses that arise from changes in the fair value of investments. Such fluctuations are included with net realized and unrealized gain or loss on investments. Net realized foreign currency gains and losses represent foreign currency gains and losses between trade date and settlement date on securities transactions, gains and losses on disposition of foreign currencies and the difference between the amount of income and foreign withholding taxes recorded on the books of the Series and the amounts actually received or paid.
Forward Foreign Currency Exchange Contracts
The Series may purchase or sell forward foreign currency exchange contracts in order to hedge a portfolio position or specific transaction. Risks may arise if the counterparties to a contract are unable to meet the terms of the contract or if the value of the foreign currency moves unfavorably.
All forward foreign currency exchange contracts are adjusted daily by the exchange rate of the underlying currency and, for financial statement purposes, any gain or loss is recorded as unrealized gain or loss until a contract has been closed.
The Series may regularly trade forward foreign currency exchange contracts withoff-balance sheet risk in the normal course of its investing activities to assist in managing exposure to changes in foreign currency exchange rates.
The notional or contractual amount of these instruments represents the investment the Series has in forward foreign currency exchange contracts and does not necessarily represent the amounts potentially at risk. The measurement of the risks associated with forward foreign currency exchange contracts is meaningful only when all related and offsetting transactions are considered. The Series’ forward foreign currency exchange contracts are not subject to master netting arrangements (the right to close out all transactions traded with a counterparty, and net amounts owed or due across transactions). The averagemonth-end balances for the year ended December 31, 2018, the period in which forward foreign currency exchange contracts were outstanding, as measured in terms of the notional amount, was approximately $9,123,887. No such investments were held by the Series on December 31, 2018.
Futures
The Series may purchase or sell exchange-traded futures contracts, which are contracts that obligate the Series to make or take delivery of a financial instrument or the cash value of a security index at a specified future date at a specified price. The Series may use futures contracts to manage exposure to the bond market or changes in interest rates and currency values, or for gaining exposure to markets. Risks of entering into futures contracts include the possibility that there may be an illiquid market
28
Unconstrained Bond Series
Notes to Financial Statements (continued)
| 2. | Significant Accounting Policies (continued) |
Futures(continued)
at the time the Advisor to the Series may be attempting to sell some or all the Series’ holdings or that a change in the value of the contract may not correlate with changes in the value of the underlying securities. Upon entering into a futures contract, a Series is required to deposit either cash or securities (initial margin). Subsequent payments (variation margin) are made or received by the Series, generally on a daily basis. The variation margin payments are equal to the daily changes in the contract value and are recorded as unrealized gains or losses. The Series recognize a realized gain or loss when the contract is closed or expires.
Futures transactions involve minimal counterparty risk since futures contracts are guaranteed against default by the exchange on which they trade. The Series’ futures contracts are not subject to master netting arrangements (the right to close out all transactions traded with a counterparty, and net amounts owed or due across transactions).
Option Contracts
The Series may write (sell) or buy call or put options on securities and other financial instruments. When the Series writes a call, the Series gives the purchaser the right to buy the underlying security from the Series at the price specified in the option contract (the “exercise price”) at any time during the option period. When the Series writes a put option, the Series gives the purchaser the right to sell to the Series the underlying security at the exercise price at any time during the option period. The Series will only write options on a “covered basis.” This means that the Series will own the underlying security when the Series writes a call or the Series will put aside cash, U.S. Government securities, or other liquid assets in an amount not less than the exercise price at all times the put option is outstanding.
When the Series writes an option, an amount equal to the premium received is reflected as a liability and is subsequentlymarked-to-market to reflect the current market value of the option. The Series, as a writer of an option, has no control over whether the underlying security or financial instrument may be sold (call) or purchased (put) and, as a result, bears the market risk of an unfavorable change in the price of the security or financial instrument underlying the written option. There is a risk that the Series may not be able to enter into a closing transaction because of an illiquid market.
The Series may also purchase options in an attempt to hedge against fluctuations in the value of its portfolio and to protect against declines in the value of the securities. The premium paid by the Series for the purchase of an option is reflected as an investment and subsequentlymarked-to-market to reflect the current market value of the option. The risk associated with purchasing options is limited to the premium paid.
When a security is purchased or sold through an exercise of an option, the related premium paid (or received) is added to (or deducted from) the basis of the security acquired or deducted from (or added to) the proceeds of the security sold. When an option expires (or the Series enters into a closing transaction), the Series realizes a gain or loss on the option to the extent of the premium received or paid (or gain or loss to the extent the cost of the closing transaction exceeds the premium paid or received).
The measurement of the risks associated with option contracts is meaningful only when all related and offsetting transactions are considered. The counterparty for the Series’ purchased options contracts outstanding during the year ended December 31, 2018 is Pershing LLC, a BNY Mellon Company. No such investments were held by the Series on December 31, 2018.
29
Unconstrained Bond Series
Notes to Financial Statements (continued)
| 2. | Significant Accounting Policies (continued) |
The following table presents the present value of derivatives held at December 31, 2018 as reflected on the Statement of Assets and Liabilities, and the effect of derivative instruments on the Statement of Operations:
| STATEMENT OF ASSETS AND LIABILITIES | ||||||
Derivative | Assets Location | |||||
Foreign currency exchange contracts | Net unrealized appreciation1 | $ | 123,179 | |||
Interest rate contracts | Net unrealized appreciation1 | $ | 3,607,475 | |||
Derivative | Liabilities Location | |||||
Foreign currency exchange contracts | Net unrealized depreciation1 | $ | (77,457 | ) | ||
Interest rate contracts | Net unrealized depreciation1 | $ | (2,744,178 | ) | ||
| ||||||
| STATEMENT OF OPERATIONS | ||||||
Derivative | Location of Gain or (Loss) on Derivatives | | Realized Gain (Loss) on Derivatives | | ||
Foreign currency exchange contracts | Net realized gain (loss) on forward foreign currency exchange contracts | $ | (91,006 | ) | ||
Foreign currency exchange contracts | Net realized gain (loss) on futures contracts | $ | (193,456 | ) | ||
Interest rate contracts | Net realized gain (loss) on futures contracts | $ | 273,310 | |||
Interest rate contracts | Net realized gain (loss) on options purchased2 | $ | (184,041 | ) | ||
Derivative | Location of Appreciation (Depreciation) on Derivatives | | Unrealized Appreciation (Depreciation) on Derivatives | | ||
Foreign currency exchange contracts | Net change in unrealized appreciation (depreciation) on forward foreign currency exchange contracts | $ | (170,176 | ) | ||
Foreign currency exchange contracts | Net change in unrealized appreciation (depreciation) on futures contracts | $ | 45,722 | |||
Interest rate contracts | Net change in unrealized appreciation (depreciation) on futures contracts | $ | 615,438 | |||
1 Includes cumulative appreciation/depreciation on futures contracts as reported in the Investment Portfolio, and is included within Net Assets as the components of capital are not required to be presented separately on the Statement of Assets and Liabilities. Only the current day’s variation margin is reported within the Statement of Assets and Liabilities.
2 Options purchased are included in net realized gain (loss) on investments.
The averagemonth-end balances for the year ended December 31, 2018, the period in which such derivatives were outstanding, were as follows:
Futures Contracts: | ||||||||||||
Average number of contracts purchased | 404 | |||||||||||
Average number of contracts sold | 755 | |||||||||||
Average notional value of contracts purchased | $ 65,106,852 | |||||||||||
Average notional value of contracts sold | $136,713,818 | |||||||||||
Options: | ||||||||||||
Average number of option contracts purchased | 798 | |||||||||||
Average notional value of option contracts purchased | $ 95,494,922 |
30
Unconstrained Bond Series
Notes to Financial Statements (continued)
| 2. | Significant Accounting Policies (continued) |
Asset-Backed Securities
The Series may invest in asset-backed securities. Asset-backed securities are generally issued as pass-through certificates or as debt instruments. Asset-backed securities issued as pass-through certificates represent undivided fractional ownership interests in an underlying pool of assets. Asset-backed securities issued as debt instruments, which are also known as collateralized obligations, are typically issued as the debt of a special purpose entity organized solely for the purpose of owning such assets and issuing such debt. Asset-backed securities are often backed by a pool of assets representing the obligations of a number of different parties. The yield characteristics of certain asset-backed securities may differ from traditional debt securities. One such major difference is that all or a principal part of the obligations may be prepaid at any time because the underlying assets (i.e. loans) may be prepaid at any time. As a result, a decrease in interest rates in the market may result in increases in the level of prepayments as borrowers, particularly mortgagors, refinance and repay their loans. An increased prepayment rate with respect to an asset-backed security will have the effect of shortening the maturity of the security. In addition, the Series may subsequently have to reinvest the proceeds at lower interest rates. If the Series has purchased such an asset-backed security at a premium, a faster than anticipated prepayment rate could result in a loss of principal to the extent of the premium paid.
Mortgage-Backed Securities
The Series may invest in mortgage-backed securities (“MBS” or pass-through certificates) that represent an interest in a pool of specific underlying mortgage loans and entitle the Series to the periodic payments of principal and interest from those mortgages. MBS may be issued by government agencies or corporations, or private issuers. Most MBS issued by government agencies are guaranteed; however, the degree of protection differs based on the issuer. For MBS there are a number of important differences among the agencies and instrumentalities of the U.S. Government that issue mortgage-related securities and among the securities that they issue. For example, mortgage-related securities guaranteed by Ginnie Mae are guaranteed as to the timely payment of principal and interest by Ginnie Mae and such guarantee is backed by the full faith and credit of the United States. However, mortgage-related securities issued by Freddie Mac and Fannie Mae, including Freddie Mac and Fannie Mae guaranteed mortgage pass-through certificates, which are solely the obligations of Freddie Mac and Fannie Mae, are not backed by or entitled to the full faith and credit of the United States, but are supported by the right of the issuer to borrow from the U.S. Treasury.Non-agency mortgage-backed securities are securities issued bynon-governmental issuers and have no direct or indirect government guarantees of payment and are subject to various risks.Non-agency mortgage loans are obligations of the borrowers thereunder only and are not typically insured or guaranteed by any other person or entity. The ability of a borrower to repay a loan is dependent upon the income or assets of the borrower. A number of factors, including a general economic downturn, acts of God, terrorism, social unrest and civil disturbances, may impair a borrower’s ability to repay its loans.
Inflation-Indexed Bonds
The Series may invest in inflation-indexed bonds. Inflation-indexed bonds are fixed income securities whose principal value is periodically adjusted according to the rate of inflation. If the index measuring inflation rises or falls, the principal value of inflation-indexed bonds will be adjusted upward or downward, and consequently the interest payable on these securities (calculated with respect to a larger or smaller principal amount) will be increased or reduced, respectively. Any upward or downward adjustment in the principal amount of an inflation-indexed bond will be included as interest income in the Statement of Operations, even though investors do not receive their principal until maturity. Repayment of the original bond principal upon maturity (as adjusted for inflation) is guaranteed in the case of U.S. Treasury inflation-indexed bonds. For bonds that do not provide a similar guarantee, the adjusted principal value of the bond repaid at maturity may be less than the original principal.
Securities Purchased on a When-Issued Basis or Forward Commitment
The Series may purchase securities on a when-issued basis or forward commitment. These transactions involve a commitment by the Series to purchase securities for a predetermined price with payment and delivery taking place beyond the customary settlement period. When such purchases are outstanding, the Series will designate liquid assets in an amount sufficient to meet the purchase price. When purchasing a security on a delayed delivery basis, the Series assumes the rights and risks of ownership of the security, including the risk of price and yield fluctuations, and takes such fluctuations into account when determining its net asset value. The Series may sell the when-issued securities before they are delivered, which may result in a capital gain or loss. No such investments were held by the Series on December 31, 2018.
31
Unconstrained Bond Series
Notes to Financial Statements (continued)
| 2. | Significant Accounting Policies (continued) |
Securities Purchased on a When-Issued Basis or Forward Commitment(continued)
In connection with its ability to purchase or sell securities on a forward commitment basis, the Series may enter into forward roll transactions principally using To Be Announced (TBA) securities. Forward roll transactions require the sale of securities for delivery in the current month, and a simultaneous agreement to repurchase substantially similar (same type, coupon and maturity) securities on a specified future date. Risks of entering into forward roll transactions include the potential inability of the counterparty to meet the terms of the agreement; the potential of the Series to receive inferior securities at redelivery as compared to the securities sold to the counterparty; counterparty credit risk; and the potential pay down speed variance between the mortgage-backed pools. During the roll period, the Series forgoes principal and interest paid on the securities. The Series accounts for such dollar rolls as purchases and sales. Information regarding securities purchased on a when-issued basis is included in the Series’ Investment Portfolio. No such investments were held by the Series on December 31, 2018.
Restricted Securities
Restricted securities are purchased in private placement transactions, are not registered under the Securities Act of 1933, as amended, and may have contractual restrictions on resale. Information regarding restricted securities is included at the end of the Series’ Investment Portfolio.
Illiquid Securities
A security may be considered illiquid if so deemed in good faith by the Advisor under procedures approved by and under the general supervision and responsibility of the Fund’s Board. Securities that are illiquid are marked with the applicable footnote on the Investment Portfolio.
Federal Taxes
The Series’ policy is to comply with the provisions of the Internal Revenue Code applicable to regulated investment companies. The Series is not subject to federal income tax or excise tax to the extent that the Series distributes to shareholders each year its taxable income, including any net realized gains on investments, in accordance with requirements of the Internal Revenue Code. Accordingly, no provision for federal income tax or excise tax has been made in the financial statements.
Management evaluates its tax positions to determine if the tax positions taken meet the minimum recognition threshold in connection with accounting for uncertainties in income tax positions taken or expected to be taken for the purposes of measuring and recognizing tax liabilities in the financial statements. Recognition of tax benefits of an uncertain tax position is required only when the position is “more likely than not” to be sustained assuming examination by taxing authorities. At December 31, 2018, the Series has recorded no liability for net unrecognized tax benefits relating to uncertain income tax positions taken or expected to be taken in future tax returns.
The Series files income tax returns in the U.S. federal jurisdiction, various states and foreign jurisdictions, as required. No income tax returns are currently under investigation. The statute of limitations on the Series’ tax returns remains open for the years ended December 31, 2015 through December 31, 2018. The Series is not aware of any tax positions for which it is reasonably possible that the total amounts of unrecognized tax benefits will significantly change in the next twelve months.
Foreign Taxes
Based on the Series’ understanding of the tax rules and rates related to income, gains and currency purchase/repatriation transactions for foreign jurisdictions in which it invests, the Series will provide for foreign taxes, and where appropriate, deferred foreign tax.
Distributions of Income and Gains
Distributions to shareholders of net investment income are made quarterly. Distributions of net realized gains are made annually. An additional distribution may be necessary to avoid taxation of the Series. Distributions are recorded on theex-dividend date.
Indemnifications
The Fund’s organizational documents provide former and current directors and officers with a limited indemnification against liabilities arising in connection with the performance of their duties to the Fund. In the normal course of business, the Fund may
32
Unconstrained Bond Series
Notes to Financial Statements (continued)
| 2. | Significant Accounting Policies (continued) |
Indemnifications (continued)
also enter into contracts that provide general indemnifications. The Fund’s maximum exposure under these arrangements is unknown as this would be dependent on future claims that may be made against the Fund. The risk of material loss from such claims is considered remote.
Other
The preparation of financial statements in conformity with GAAP requires management to make estimates and assumptions that affect the reported amounts of assets and liabilities and the disclosure of contingent assets and liabilities at the date of the financial statements and the reported amounts of income and expenses during the reporting period. Actual results could differ from those estimates.
| 3. | Transactions with Affiliates |
The Fund has an Investment Advisory Agreement (the “Agreement”) with the Advisor, for which the Series pays a fee, computed daily and payable monthly, at an annual rate of 0.45% of the Series’ average daily net assets.
Under the Agreement, personnel of the Advisor provide the Series with advice and assistance in the choice of investments and the execution of securities transactions, and otherwise maintain the Series’ organization. The Advisor also provides the Fund with necessary office space and fund administration and support services. The salaries of all officers of the Fund (except a percentage of the Fund’s Chief Compliance Officer’s salary, which is paid by the Fund), and of all Directors who are “affiliated persons” of the Fund, or of the Advisor, and all personnel of the Fund, or of the Advisor, performing services relating to research, statistical and investment activities, are paid by the Advisor. Each“non-affiliated” Director receives an annual stipend, which is allocated among all the active series of the Fund. In addition, these Directors also receive a fee per Board meeting attended plus a fee for each committee meeting attended and are reimbursed for travel and otherout-of-pocket expenses incurred by them in connection with attending such meetings. The Fund also has an Audit Committee Chair, Governance & Nominating Committee Chair and Lead Independent Director, who each receive an additional annual stipend for these roles.
The Class S shares of the Series are subject to a shareholder services fee in accordance with a shareholder services plan adopted by the Fund’s Board. The shareholder services fee is intended to compensate financial intermediaries, including affiliates of the Fund, in connection with the provision of direct client service, personal services, maintenance of shareholder accounts and reporting services. For these services, Class S of the Series pays a fee, computed daily and payable monthly, at an annual rate of 0.25% of the average daily net assets of Class S. The Fund has a Shareholder Services Agreement with the Advisor, for which the Advisor receives the shareholder services fee as stated above.
The Advisor has contractually agreed, until at least April 30, 2019, to waive its fee and, if necessary, pay other operating expenses of the Series in order to maintain total direct annual fund operating expenses for the Series, exclusive of shareholder services fee, at no more than 0.50% of average daily net assets each year. Accordingly, the Advisor waived fees of $95,149 for the year ended December 31, 2018, which is included as a reduction of expenses on the Statement of Operations. The Advisor is not eligible to recoup any expenses that have been waived or reimbursed in prior years.
Manning & Napier Investor Services, Inc., a registered broker-dealer affiliate of the Advisor, acts as distributor for the Fund’s shares. The services of Manning & Napier Investor Services, Inc. are provided at no additional cost to the Series.
Pursuant to a master services agreement dated March 1, 2017, as amended, the Fund pays the Advisor an annual fee related to fund accounting and administration of 0.0085% on the first $25 billion of average daily net assets (excluding Target Series and Income Series); 0.0075% on the next $15 billion of average daily net assets (excluding Target Series and Income Series); and 0.0065% of average daily net assets in excess of $40 billion (excluding Target Series and Income Series); plus a base fee of $30,400 per series. Additionally, certain transaction andout-of-pocket expenses, including charges for reporting relating to the Fund’s compliance program, are charged. The Advisor has agreements with BNY Mellon Investment Servicing (U.S.) Inc. (“BNY”) under which BNY serves assub-accountant services agent.
33
Unconstrained Bond Series
Notes to Financial Statements (continued)
| 4. | Purchases and Sales of Securities |
For the year ended December 31, 2018, purchases and sales of securities, other than U.S. Government securities and short-term securities, were $339,922,415 and $495,308,140, respectively. Purchases and sales of U.S. Government securities, other than short-term securities, were $75,578,233 and $73,208,333, respectively.
| 5. | Capital Stock Transactions |
Transactions in shares of Class S and Class I of Unconstrained Bond Series were:
| CLASS S: | FOR THE YEAR ENDED 12/31/18 | FOR THE YEAR ENDED 12/31/17 | ||||||||||||||
| SHARES | AMOUNT | SHARES | AMOUNT | |||||||||||||
Sold | 4,877,133 | $ | 50,378,294 | 4,408,089 | $ | 46,106,663 | ||||||||||
Reinvested | 1,724,906 | 17,659,603 | 1,698,360 | 17,702,224 | ||||||||||||
Repurchased | (13,213,873 | ) | (136,106,597 | ) | (13,932,605 | ) | (145,765,976 | ) | ||||||||
|
|
|
|
|
|
|
| |||||||||
Total | (6,611,834 | ) | $ | (68,068,700 | ) | (7,826,156 | ) | $ | (81,957,089 | ) | ||||||
|
|
|
|
|
|
|
| |||||||||
| ||||||||||||||||
| CLASS I: | FOR THE YEAR ENDED 12/31/18 | FOR THE YEAR ENDED 12/31/17 | ||||||||||||||
| SHARES | AMOUNT | SHARES | AMOUNT | |||||||||||||
Sold | 1,503,440 | $ | 13,926,808 | 2,630,911 | $ | 24,743,093 | ||||||||||
Reinvested | 72,094 | 660,419 | 138,462 | 1,294,253 | ||||||||||||
Repurchased | (5,567,142 | ) | (51,493,675 | ) | (944,890 | ) | (8,881,205 | ) | ||||||||
|
|
|
|
|
|
|
| |||||||||
Total | (3,991,608 | ) | $ | (36,906,448 | ) | 1,824,483 | $ | 17,156,141 | ||||||||
|
|
|
|
|
|
|
| |||||||||
Over 90% of the shares outstanding are fiduciary accounts where the Advisor has sole investment discretion.
| 6. | Line of Credit |
The Fund has entered into a364-day, $25 million credit agreement (the “line of credit”) with Bank of New York Mellon. Each series of the Fund may borrow under the line of credit for temporary or emergency purposes, including funding shareholder redemptions and other short-term liquidity purposes. The Fund pays an annual fee on the unused commitment amount, payable quarterly, and is allocated among all the series of the Fund and included in miscellaneous expenses in the Statement of Operations for each series. The line of credit expires in August 2019 unless extended or renewed. During year ended December 31, 2018, the series did not borrow under the line of credit.
| 7. | Financial Instruments and Loan Assignments |
The Series may trade in instruments including written and purchased options, forward foreign currency exchange contracts and futures contracts and other derivatives in the normal course of investing activities to assist in managing exposure to various market risks. The Series may be subject to various elements of risk, which may involve, to a varying degree, elements of risk in excess of the amounts recognized for financial statement purposes. These risks include: the risk that changes in the value of a derivative may not correlate perfectly with the underlying asset, rate or index; counterparty credit risk related to over the counter derivative counterparties’ failure to perform under contract terms; liquidity risk related to the lack of a liquid market for these contracts allowing the fund to close out its position(s); and documentation risk relating to disagreement over contract terms. During the year ended December 31, 2018, the Series invested in forward foreign currency exchange contracts (foreign currency exchange risk), futures contracts (foreign currency exchange risk and interest rate risk) and options purchased (interest rate risk).
The Series may invest in a loan assignment of all or a portion of the loans. The Series has direct rights against the borrower on a loan when it purchases an assignment; however, the Series’ rights may be more limited than the lender from which it acquired the assignment and the Series may be able to enforce its rights only through an administrative agent. Loan assignments are
34
Unconstrained Bond Series
Notes to Financial Statements (continued)
| 7. | Financial Instruments and Loan Assignments (continued) |
vulnerable to market conditions and may become illiquid due to economic conditions or other events may reduce the demand for loan assignments and certain loan assignments which were liquid when purchased may become illiquid.
| 8. | Foreign Securities |
Investing in securities of foreign companies and foreign governments involves special risks and considerations not typically associated with investing in securities of domestic companies and the U.S. Government. These risks include revaluation of currencies and future adverse political and economic developments. Moreover, securities of foreign companies and foreign governments and their markets may be less liquid and their prices more volatile than those of comparable domestic companies and the U.S. Government.
| 9. | Federal Income Tax Information |
The amount and characterization of certain income and capital gains to be distributed are determined in accordance with federal income tax regulations, which may differ from GAAP. These differences are primarily due to differing book and tax treatments in the timing and/or treatment of the recognition of net investment income or gains and losses, including wash sales and investments in Treasury Inflation Protected securities, foreign currency gains and losses, and the realization for tax purposes of unrealized gains/losses on certain futures. The Series may periodically make reclassifications among its capital accounts to reflect income and gains available for distribution (or available capital loss carryovers) under income tax regulations without impacting the Series’ net asset value. For the year ended December 31, 2018, $87,804 was reclassified within the capital accounts fromPaid-in Capital to Total Distributable Earnings (Loss). Any such reclassifications are not reflected in the financial highlights.
The tax character of distributions paid were as follows:
FOR THE YEAR ENDED 12/31/18 | FOR THE YEAR ENDED 12/31/17 | |||||||
Ordinary income | $19,193,832 | $19,696,661 | ||||||
At December 31, 2018, the tax basis of components of distributable earnings and the net unrealized depreciation based on identified cost for federal income tax purposes were as follows:
Cost for federal income tax purposes | $ | 719,164,725 | ||
Unrealized appreciation | 2,266,381 | |||
Unrealized depreciation | (17,530,547 | ) | ||
|
| |||
Net unrealized depreciation | $ | (15,264,166 | ) | |
|
| |||
Capital loss carryforwards | $ | (3,541,204 | ) | |
Qualified late-year losses1 | $ | 53,343 |
1The Series has elected to defer certain qualified late-year losses and recognize such losses in the year ending December 31, 2019.
As of December 31, 2018, the Series had net short-term capital loss carryforwards of $2,435,492 and net long-term capital loss carryforwards of $1,105,712, which may be carried forward indefinitely.
35
Unconstrained Bond Series
Report of Independent Registered Public Accounting Firm
To the Board of Directors of Manning & Napier Fund, Inc. and Shareholders of Unconstrained Bond Series
Opinion on the Financial Statements
We have audited the accompanying statement of assets and liabilities, including the investment portfolio, of Unconstrained Bond Series (one of the series constituting Manning & Napier Fund, Inc., referred to hereafter as the “Fund”) as of December 31, 2018, the related statement of operations for the year ended December 31, 2018, the statement of changes in net assets for each of the two years in the period ended December 31, 2018, including the related notes, and the financial highlights for each of the five years in the period ended December 31, 2018 (collectively referred to as the “financial statements”). In our opinion, the financial statements present fairly, in all material respects, the financial position of the Fund as of December 31, 2018, the results of its operations for the year then ended, the changes in its net assets for each of the two years in the period ended December 31, 2018 and the financial highlights for each of the five years in the period ended December 31, 2018 in conformity with accounting principles generally accepted in the United States of America.
Basis for Opinion
These financial statements are the responsibility of the Fund’s management. Our responsibility is to express an opinion on the Fund’s financial statements based on our audits. We are a public accounting firm registered with the Public Company Accounting Oversight Board (United States) (PCAOB) and are required to be independent with respect to the Fund in accordance with the U.S. federal securities laws and the applicable rules and regulations of the Securities and Exchange Commission and the PCAOB.
We conducted our audits of these financial statements in accordance with the standards of the PCAOB. Those standards require that we plan and perform the audit to obtain reasonable assurance about whether the financial statements are free of material misstatement, whether due to error or fraud.
Our audits included performing procedures to assess the risks of material misstatement of the financial statements, whether due to error or fraud, and performing procedures that respond to those risks. Such procedures included examining, on a test basis, evidence regarding the amounts and disclosures in the financial statements. Our audits also included evaluating the accounting principles used and significant estimates made by management, as well as evaluating the overall presentation of the financial statements. Our procedures included confirmation of securities owned as of December 31, 2018 by correspondence with the custodian and brokers; when replies were not received from brokers, we performed other auditing procedures. We believe that our audits provide a reasonable basis for our opinion.

New York, New York
February 15, 2019
We have served as the auditor of one or more investment companies in Manning & Napier Mutual Funds since 1992.
36
Unconstrained Bond Series
Renewal of Investment Advisory Agreement
(unaudited)
At the Manning & Napier Fund, Inc. (the “Fund”) Board of Directors’ (the “Board”) meeting, held on November 15, 2018, the Investment Advisory Agreement (the “Agreement”) between the Fund and Manning & Napier Advisors, LLC (the “Advisor”) was considered for renewal by the Board, including all of the Directors who are not “interested persons” (“Independent Directors”), within the meaning of the Investment Company Act of 1940, as amended (the “1940 Act”). In connection with the decision whether to renew the Agreement, a variety of material was provided to the Board in advance of the meeting for their review and consideration. The Board also held a working session on October 31, 2018 to review and discuss information provided to the Board, and for the Board to request additional information.
Representatives of the Advisor attended a portion of the working session and attended the Board meeting. The Advisor provided supplemental information requested by the Board and presented additional oral information to the Board to assist the Board in its considerations. In addition to the information furnished by the Advisor, the Board was provided with a legal memorandum discussing its fiduciary duties related to its approval of the continuation of the Agreement. Legal counsel for the Fund discussed with the Board the applicable legal considerations. In addition, the Board receivedin-person presentations about the Fund throughout the year.
The Independent Directors were advised by independent legal counsel with respect to these matters. The Independent Directors also met separately in an executive session with their legal counsel without any representatives of the Advisor present.
The Directors’ determinations at the meeting were made on the basis of each Director’s business judgment after consideration of all the information presented. In deciding to recommend the renewal of the Agreement with respect to each Series of the Fund, the Independent Directors did not identify any single or particular piece of information that, in isolation, was the controlling factor. Each Independent Director may also have weighed factors differently. This summary describes the most important, but not all, of the factors considered by the Board and the Independent Directors.
| • | The Board considered the nature and quality of services provided by the Advisor under the Agreement for over 30 years including, among others: deciding what securities to purchase and sell for each Series; arranging for the purchase and sale of such securities by placing orders with broker-dealers; administering the affairs of the Fund (including the books and records of the Fund not maintained by third party service providers such as the custodian or transfer agent); arranging for the insurance coverage for the Fund; and supervising the preparation of tax returns, SEC filings (including registration statements) and reports to shareholders for the Fund. The Board considered the numerous services performed by the Advisor and its affiliates beyond those stated in the Agreements. The Board also considered the Advisor’s personnel who perform services to the Fund, changes in senior or key personnel, the strength of the Advisor’s compliance infrastructure, policies and procedures relating to compliance with securities regulations, reputation, expertise and resources. The Board discussed the quality of these services with representatives from the Advisor and concluded that the Advisor was performing its services to the Fund required under the Agreement in a reasonable manner. |
| • | The Board considered the Advisor’s investments teams, including changes to the investment teams and investment team’s compensation during the past year, and the investment process. The Board considered the performance of each Series since its inception, as well as over multiple time periods including: one year, three year, five year, ten year, and current market cycle. A market cycle includes periods of both rising and falling markets. Returns for established benchmark indices for each Series were provided. In addition, the Board considered (and considers on a quarterly basis) a number of other factors relevant to performance at the meeting including: a peer group performance analysis consisting of Morningstar universes of mutual funds with similar investment objectives; the breadth of the Fund’s product offerings; and performance over reasonable time periods. The Board discussed with Representatives of the Advisor, short-term performance challenges in the Fund’s core strategies that have resulted in a downward trend in assets under management. After discussion, the Board concluded that notwithstanding the performance challenges of certain Series, the nature and quality of the investment management services provided by the Advisor to the Fund supported the renewal of the agreement. |
| • | The Board considered the fees and expenses of the various Series of the Fund. The Advisor presented the advisory fees and total expenses for each Series, including the advisory fee adjusted for any contractual expense waivers or reimbursements paid by the Advisor. The Advisor also presentedpro-forma information related to several management fee and overall expense reductions that were set to take effect in early 2019. These changes were approved by the Board in a prior meeting and by shareholders at a Shareholder Meeting in May 2018. |
| • | The Board considered whether the Advisor had achieved economies of scale with respect to its services to the Fund. The Board acknowledged the expense caps incorporated in the Fund’s current fee structure, which requires the Advisor to |
37
Unconstrained Bond Series
Renewal of Investment Advisory Agreement
(unaudited)
| subsidize the expenses of the Series operating above their expense cap, noting that 27 Series of the Fund are currently receiving expense reimbursements from the Advisor. The Board concluded that the Fund would need to grow in assets before the Advisor would be able to achieve meaningful economies of scale. |
| • | The Advisor provided the Board with information comparing each Series’ contractual management fees with the Advisor’s standard advisory fees for separate accounts and collective investment trusts. The Board considered that the range of services provided to the Series is more extensive than for the Advisor’s other clients due to additional infrastructure, administrative and regulatory requirements related to operating a mutual fund. |
| • | The current andpro-forma advisory fees,12b-1 Distribution and Service Fees, other expenses (e.g. a combination of Shareholder Services Fees, intermediarysub-transfer agent fees, routine operating expenses and Acquired Fund Fees and Expenses forfund-of-fund Series) and total expense ratios of each Series and share class were compared and ranked (on both a mean and median basis) against respective peer universes. Respective peer universes included funds of a similar size and with similar investment objectives and expense characteristics as disclosed on the Morningstar database. Representatives of the Advisor discussed with the Board the comparisons and rankings of fees and net expense ratios for each Series of the Fund and the methodology behind the comparison. The Board considered the Advisor’s active portfolio management that results in portfolios that are more differentiated than the construction of their benchmarks. Based on their review of the information provided, the Board concluded that the current andpro-forma fees and expenses of each Series of the Fund were reasonable on a comparative basis. |
| • | The Board considered the costs of the Advisor’s services and the profits of the Advisor as they relate to the Advisor’s services to the Fund under the Agreement. The Board was provided with information on the Advisor’s financial condition and profitability by mutual fund agreement and by Series. Information provided by the Advisor addressed the anticipated effects of the upcoming fee reductions. The Board discussed the Advisor’s revenues generated from the Fund and its expenses associated with providing the services under the Agreement. The Advisor presented the Board with information on firm wide investment management profitability to provide a comparison of the Advisor’s profitability from its Fund activities relative to its profitability from its other investment management business. In addition, the Board reviewed the Advisor’s expense allocation methodology used to calculate profitability since many of the Advisor’s resources and expenses are shared across the Advisor’s various investment management vehicles. The Board considered the Advisor’s expenses associated with Fund activities outside of the Agreement (such as expense reimbursements pursuant to expense caps and payments made by the Advisor to third party platforms on which shares of the Fund are available for purchase). After discussing the above costs and profits, the Board concluded that the Advisor’s profitability relating to its services provided under the Agreement was reasonable. |
| • | The Board also considered the other benefits the Advisor derives from its relationship with the Fund. Such other benefits include participation in a joint insurance program, sharing of compensation expenses for certain shared personnel, relationships with large service providers, the utilization of Series within the Advisor’s separately managed accounts and certain research services provided by soft dollars. The Board reviewed the broker-dealers who provided research to the Advisor and the products and services paid for, in whole or in part, using soft dollar commissions. The Board concluded that these additional benefits to the Advisor were reasonable. |
Based on the Board’s deliberations and their evaluation of the information described above, the Board, including a majority of the Independent Directors, concluded that the compensation under the Agreement was fair and reasonable with respect to each Series in light of the services and expenses and such other matters as the Directors considered to be relevant in the exercise of their reasonable judgment, and that the renewal of the Agreement would be in the best interests of each Series and its shareholders. The Board did not indicate that any single factor was determinative of its decision to approve the Agreement, but indicated that the Board based its determination on the total mix of information available to it.
38
Unconstrained Bond Series
Directors’ and Officers’ Information
(unaudited)
The Statement of Additional Information provides additional information about the Fund’s directors and officers and can be obtained without charge by calling1-800-466-3863, at www.manning-napier.com, or on the EDGAR Database on the SEC Internet web site (http://www.sec.gov). The following chart shows certain information about the Fund’s directors and officers, including their principal occupations during the last five years. Unless specific dates are provided, the individuals have held the listed positions for longer than five years.
| Interested Director and Officer | ||
| Name: | Paul Battaglia* | |
| Address: | 290 Woodcliff Drive | |
| Fairport, NY 14450 | ||
| Age: | 40 | |
| Current Position(s) Held with Fund: | Principal Executive Officer, President, Chairman and Director | |
| Term of Office & Length of Time Served: | Indefinite – Chairman and Director since November 20181 | |
| Principal Occupation(s) During Past 5 Years: | Chief Financial Officer (2018 – Present); Vice President of Finance (2016 – 2018); Director of Finance (2011 – 2016); Financial Analyst/Internal Auditor (2004-2006) – Manning & Napier Advisors, LLC and affiliates Holds one or more of the following titles for various subsidiaries and affiliates: Chief Financial Officer | |
| Number of Portfolios Overseen within Fund Complex: | 34 | |
Other Directorships Held Outside Fund Complex During Past 5 Years: | N/A | |
| Independent Directors | ||
| Name: | Stephen B. Ashley | |
| Address: | 290 Woodcliff Drive | |
| Fairport, NY 14450 | ||
| Age: | 78 | |
| Current Position(s) Held with Fund: | Director, Audit Committee Member, Governance & Nominating Committee Member | |
| Term of Office & Length of Time Served: | Indefinite – Since 1996 | |
| Principal Occupation(s) During Past 5 Years: | Chairman, Director & Chief Executive Officer (1997 to present) - The Ashley Group (property management and investment). Director (1995-2008) and Chairman(non-executive) (2004-2008) - Fannie Mae (mortgage) | |
| Number of Portfolios Overseen within Fund Complex: | 34 | |
| Other Directorships Held Outside Fund Complex During | Fannie Mae (1995-2008) | |
| Past 5 Years: | The Ashley Group (1995-2008) | |
| Genesee Corporation (1987-2007) | ||
| Name: | Paul A. Brooke | |
| Address: | 290 Woodcliff Drive | |
| Fairport, NY 14450 | ||
| Age: | 73 | |
| Current Position(s) Held with Fund: | Lead Independent Director, Audit Committee Member, Governance & Nominating Committee Chairman | |
| Term of Office & Length of Time Served: | Indefinite – Director, Audit Committee Member, Governance & Nominating | |
| Committee Member since 2007; Governance & Nominating Committee Chairman since 2016; Lead Independent Director since 2017 | ||
| Principal Occupation(s) During Past 5 Years: | Chairman & CEO (2005-2009) - Ithaka Acquisition Corporation (investments); Chairman (2007-2009) - Alsius Corporation (investments); Managing Member (1991-present) - PMSV Holdings LLC (investments); Managing Member (2010-2016) - Venbio (investments). | |
| Number of Portfolios Overseen within Fund Complex: | 34 | |
Other Directorships Held Outside Fund Complex During Past 5 Years: | Incyte Corp. (biotech)(2000-present); ViroPharma, Inc. (speciality pharmaceuticals)(2000-2014); HLTH (WebMD)(information)(2000-2010); Cheyne Capital International (investment)(2000-2017); GMP Companies (investment)(2000-2011); Cytos Biotechnology Ltd (biotechnology)(2012-2014); Cerus (biomedical)(2016-present);PureEarth(non-profit)(2012-present); Caelum BioSciences (biomedical)(2018-present) | |
39
Unconstrained Bond Series
Directors’ and Officers’ Information
(unaudited)
| Independent Directors (continued) | ||
| Name: | Peter L. Faber | |
| Address: | 290 Woodcliff Drive | |
| Fairport, NY 14450 | ||
| Age: | 80 | |
| Current Position(s) Held with Fund: | Director, Governance & Nominating Committee Member | |
| Term of Office & Length of Time Served: | Indefinite – Since 1987 | |
| Principal Occupation(s) During Past 5 Years: | Senior Counsel (2006-2012), Partner (1995-2006 & 2013-2018) - McDermott, Will & Emery LLP (law firm) | |
| Number of Portfolios Overseen within Fund Complex: | 34 | |
Other Directorships Held Outside Fund Complex During Past 5 Years: | Boston Early Music Festival(non-profit)(2007-present); Amherst Early Music, Inc.(non-profit)(2009-present); Gotham Early Music Scene, Inc.(non-profit)(2009-present); Partnership for New York City, Inc.(non-profit)(1989-2010); New York Collegium(non-profit)(2004-2011); S’Cool Sounds, Inc.(non-profit)(2017-present) | |
| Name: | Harris H. Rusitzky | |
| Address: | 290 Woodcliff Drive | |
| Fairport, NY 14450 | ||
| Age: | 83 | |
| Current Position(s) Held with Fund: | Director, Audit Committee Member, Governance & Nominating Committee Member | |
| Term of Office & Length of Time Served: | Indefinite – Since 1985 | |
| Principal Occupation(s) During Past 5 Years: | President (1994- present) - The Greening Group (business consultants); | |
| Partner (2006-present) - The Restaurant Group (restaurants) | ||
| Number of Portfolios Overseen within Fund Complex: | 34 | |
Other Directorships Held Outside Fund Complex During Past 5 Years: | Rochester Institute of Technology (university)(1972-present); Culinary Institute of America(non-profit college)(1985-present); George Eastman Museum (museum)(1988-present); National Restaurant Association (restaurant trade organization)(1978-present) | |
| Name: | Chester N. Watson | |
| Address: | 290 Woodcliff Drive | |
| Fairport, NY 14450 | ||
| Age: | 68 | |
| Current Position(s) Held with Fund: | Director, Audit Committee Chairman, Governance & Nominating | |
| Committee Member | ||
| Term of Office & Length of Time Served: | Indefinite – Director, Audit Committee Member, Governance & Nominating Committee Member Since 2012; Audit Committee Chairman since 2013 | |
| Principal Occupation(s) During Past 5 Years: | General Auditor (2003-2011) - General Motors Company (auto manufacturer) | |
| Number of Portfolios Overseen within Fund Complex: | 34 | |
| Other Directorships Held Outside Fund Complex During Past 5 Years: | Rochester Institute of Technology (university)(2005-present); Town of Greenburgh, NY Planning Board (municipal government) (2015-2018) | |
| Officers: | ||
| Name: | Jeffrey S. Coons, Ph.D., CFA® | |
| Address: | 290 Woodcliff Drive | |
| Fairport, NY 14450 | ||
| Age: | 55 | |
| Current Position(s) Held with Fund: | Vice President | |
| Term of Office1& Length of Time Served: | Since 2004 | |
| Principal Occupation(s) During Past 5 Years: | President since 2010,Co-CEO since 2018,Co-Director of Research (2002 – 2015) - Manning & Napier Advisors, LLC Holds one or more of the following titles for various subsidiaries and affiliates: President, Director, Treasurer, or Senior Trust Officer | |
40
Unconstrained Bond Series
Directors’ and Officers’ Information
(unaudited)
Officers: (continued)
| Name: | Elizabeth Craig | |
| Address: | 290 Woodcliff Drive | |
| Fairport, NY 14450 | ||
| Age: | 31 | |
| Current Position(s) Held with Fund: | Corporate Secretary | |
| Term of Office1& Length of Time Served: | Since 2016 | |
| Principal Occupation(s) During Past 5 Years: | Fund Administration Manager since 2015; Mutual Fund Compliance Specialist (2009-2015) - Manning & Napier Advisors, LLC; Assistant Corporate Secretary (2011-2016) - Manning & Napier Fund, Inc. | |
| Name: | Christine Glavin | |
| Address: | 290 Woodcliff Drive | |
| Fairport, NY 14450 | ||
| Age: | 52 | |
| Current Position(s) Held with Fund: | Principal Financial Officer, Chief Financial Officer | |
| Term of Office1& Length of Time Served: | Principal Financial Officer since 2002; Chief Financial Officer since 2001 | |
| Principal Occupation(s) During Past 5 Years: | Director of Fund Reporting since 2011; Fund Reporting Manager (1997-2011) - Manning & Napier Advisors, LLC; Assistant Treasurer since 2008 - Exeter Trust Company; Chief Financial Officer (2017-2018) - Rainier Investment Management Mutual Funds, Inc. | |
| Name: | Jodi L. Hedberg | |
| Address: | 290 Woodcliff Drive | |
| Fairport, NY 14450 | ||
| Age: | 51 | |
Current Position(s) Held with Fund:
Term of Office1& Length of Time Served:
Principal Occupation(s) During Past 5 Years: | Chief Compliance Officer, Anti-Money Laundering Compliance Officer Chief Compliance Officer since 2004; Anti-Money Laundering Officer since 2002; Corporate Secretary (1997-2016) - Manning & Napier Fund, Inc.; Chief Compliance Officer and Anti-Money Laundering Officer (2017-2018) – Rainier Investment Management Mutual Funds, Inc. Managing Director, Compliance & Regulatory Affairs since 2018; Director of Compliance (2005-2018); Compliance Manager (1995-2005) – Manning & Napier Advisors, LLC and affiliates; Corporate Secretary – Manning & Napier Investor Services, Inc. since 2006 | |
| Name: | Scott Morabito | |
| Address: | 290 Woodcliff Drive | |
| Fairport, NY 14450 | ||
| Age: | 31 | |
| Current Position(s) Held with Fund: | Assistant Vice President | |
| Term of Office1& Length of Time Served: | Since 2017 | |
| Principal Occupation(s) During Past 5 Years: | Director of Funds Group since 2017; Fund Product and Strategy Manager (2014-2017); Senior Product and Strategy Analyst (2013-2014); Product and Strategy Analyst (2011-2013) - Manning & Napier Advisors, LLC; President, Director – Manning & Napier Investor Services, Inc. since 2018 | |
| Name: | Sarah Turner | |
| Address: | 290 Woodcliff Drive | |
| Fairport, NY 14450 | ||
| Age: | 36 | |
| Current Position(s) Held with Fund: | Chief Legal Officer; Assistant Corporate Secretary | |
| Term of Office1& Length of Time Served: | Since 2018 | |
| Principal Occupation(s) During Past 5 Years: | General Counsel since 2018 - Manning & Napier Advisors, LLC and affiliates; Counsel (2017-2018) – Harter Secrest and Emery LLP; Legal Counsel (2010-2017) – Manning & Napier Advisors, LLC and affiliates Holds one or more of the following titles for various affiliates: Corporate Secretary, General Counsel | |
41
Unconstrained Bond Series
Directors’ and Officers’ Information
(unaudited)
Officers: (continued)
| Name: | Amy Williams | |
| Address: | 290 Woodcliff Drive | |
| Fairport, NY 14450 | ||
| Age: | 57 | |
| Current Position(s) Held with Fund: | Assistant Corporate Secretary | |
| Term of Office1& Length of Time Served: | Since 2016 | |
| Principal Occupation(s) During Past 5 Years: | Director of Fund Documentation - Manning & Napier Advisors, LLC since 2009 Holds one or more of the following titles for various affiliates: Director |
*Interested Director, within the meaning of the 1940 Act by reason of her positions with the Fund’s investment advisor, Manning & Napier Advisors, LLC and Distributor, Manning & Napier Investor Services, Inc.
1The term of office of all officers shall be one year and until their respective successors are chosen and qualified, or his or her earlier resignation or removal as provided in the Fund’sBy-Laws.
42
Unconstrained Bond Series
Literature Requests
(unaudited)
Proxy Voting Policies and Procedures
A description of the policies and procedures that the Fund uses to determine how to vote proxies relating to portfolio securities is available, without charge, upon request:
| By phone | 1-800-466-3863 | |||
| On the Securities and Exchange | ||||
Commission’s (SEC) web site | http://www.sec.gov | |||
Proxy Voting Record
Information regarding how the Fund voted proxies relating to portfolio securities during the most recent12-month period ended June 30th is available, without charge, upon request:
| By phone | 1-800-466-3863 | |||
| On the SEC’s web site | http://www.sec.gov |
Quarterly Portfolio Holdings
The Series’ complete schedule of portfolio holdings for the 1st and 3rd quarters of each fiscal year are provided on FormN-Q, and are available, without charge, upon request:
| By phone | 1-800-466-3863 | |||
| On the SEC’s web site | http://www.sec.gov |
Prospectus and Statement of Additional Information (SAI)
For more information about any of the Manning & Napier Fund, Inc. Series, you may obtain a prospectus and SAI at www.manning-napier.com or by calling (800)466-3863. Before investing, carefully consider the objectives, risks, charges and expenses of the investment and read the prospectus carefully as it contains this and other information about the investment company.In addition, this information can be found on the SEC’s web site, http://www.sec.gov.
Additional information available at www.manning-napier.com
1. Fund Holdings -Month-End
2. Fund Holdings -Quarter-End
3. Shareholder Report - Annual
4. Shareholder Report - Semi-Annual
The Fund also offers electronic notification or“e-delivery” when certain documents are availableon-line to be downloaded or reviewed. Direct shareholders can elect to receive electronic notification when shareholder reports, prospectus updates, and/or statements are available. If you do not currently haveon-line access to your account, you can establish access by going to www.manning-napier.com, click on “Login” in the top corner of the page, and follow the prompts to self-enroll. Once enrolled, you can set your electronic notification preferences by clicking on the Account Options tab located within the green toolbar and then selectE-Delivery Option. Should you have any questions on either how to establishon-line access or how to update your account settings, please contact Investor Services at1-800-466-3863.
The Manning & Napier Fund, Inc. is managed by Manning & Napier Advisors, LLC. Manning & Napier Investor Services, Inc., an affiliate of Manning & Napier Advisors, LLC, is the distributor of the Fund shares.
MNCPB-12/18-AR
ITEM 2: CODE OF ETHICS
(a) The registrant has adopted a code of ethics that applies to its principal executive officer, principal financial officer and principal accounting officer. A copy of the registrant’s code of ethics is filed herewith as Exhibit 13(a)(1).
(b) During the period covered by this report, no amendments were made to the provisions of the code of ethics adopted in 2 (a) above.
(c) During the period covered by this report, no implicit or explicit waivers to the provisions of the code of ethics adopted in 2 (a) above were granted.
(d) Not applicable to the registrant due to the response given in 2 (c) above.
ITEM 3: AUDIT COMMITTEE FINANCIAL EXPERT
All of the members of the Audit committee have been determined by the Registrant’s Board of Directors to be Audit Committee Financial Experts as defined in this item. The current members of the Audit Committee are: Stephen B. Ashley, Paul A. Brooke, Harris H. Rusitzky, and Chester N. Watson. All Audit Committee members are independent under applicable rules. This designation will not increase the designee’s duties, obligations or liability as compared to their duties, obligations and liability as a member of the Audit Committee and of the Board.
ITEM 4: PRINCIPAL ACCOUNTANT FEES AND SERVICES
| ● | Registrant may incorporate the following information by reference, if this information has been disclosed in the registrant’s definitive proxy statement or definitive information statement. The proxy statement or information statementmust be filed no later than 120 days after the end of the fiscal year covered by the Annual Report. |
Principal Accountant Fees and Services
Aggregate fees for professional services rendered for the Manning & Napier Fund, Inc. Real Estate Series, International Series, World Opportunities Series, Core Bond Series, Unconstrained Bond Series, High Yield Bond Series, Ohio Tax Exempt Series, Diversified Tax Exempt Series, New York Tax Exempt Series, Emerging Markets Series, Global Fixed Income Series, Strategic Income Moderate Series, Strategic Income Conservative Series, Dynamic Opportunities Series, and Equity Income Series, (collectively the “Fund”) by PricewaterhouseCoopers LLP (“PwC”) as of and for the years ended December 31, 2018 and 2017 were:
| 2018 | 2017 | |||||
| ||||||
Audit Fees (a) | $275,800 | $411,133 | ||||
Audit Related Fees (b) | $0 | $0 | ||||
Tax Fees (c) | $81,900 | $105,130 | ||||
All Other Fees (d) | $0 | $0 | ||||
| ||||||
| $357,700 | $516,263 | |||||
| ||||||
| (a) | Audit Fees |
These fees relate to professional services rendered by PwC for the audit of the Fund’s annual financial statements or services normally provided by the accountant in connection with statutory and regulatory filing or engagements. These services include the audits of the financial statements of the Fund, issuance of consents, income tax provision procedures and assistance with review of documents filed with the SEC.
| (b) | Audit-Related Fees |
These fees relate to assurance and related services by PwC that are reasonably related to the performance of the audit of the Fund’s financial statements and are not reported under “Audit Fees” above.
| (c) | Tax Fees |
These fees relate to professional services rendered by PwC for tax compliance, tax advice and tax planning. The tax services provided by PwC related to the review of the Fund’s federal and state income tax returns, excise tax calculations and returns, a review of the Fund’s calculations of capital gain and income distributions, and additional tax research for compliance purposes.
| (d) | All Other Fees |
These fees relate to products and services provided by PwC other than those reported above under “Audit Fees,” “Audit-Related Fees,” and “Tax Fees” above.
There were no amounts that were approved by the Audit Committee pursuant to the de minimus exception (Rule2-01(c)(7) of RegulationS-X) for the fiscal years ended December 31, 2018 and 2017.
Non-Audit Services to the Fund’s Service Affiliates that werePre-Approved by the Fund’s Audit Committee
The Fund’s Audit Committee is required topre-approvenon-audit services which meet both the following criteria:
| i) | Directly relate to the Fund’s operations and financial reporting; and |
| ii) | Rendered by PwC to the Fund’s advisor, Manning & Napier Advisors, LLC, and entities in a control relationship with the advisor (“service affiliate”) that provides ongoing services to the |
Fund. For purposes of disclosure, Manning & Napier Investor Services, Inc. is considered to be a service affiliate. |
| 2018 | 2017 | |||||
| ||||||
Audit Related Fees | $1,800 | $1,800 | ||||
Tax Fees | $0 | $0 | ||||
| ||||||
| $1,800 | $1,800 | |||||
| ||||||
The Audit Relatedfees for the years ended December 31, 2018 and 2017 were for a license for proprietary authoritative financial reporting and assurance literature library software.
There were no amounts that were approved by the Audit Committee pursuant to the de minimus exception (Rule2-01(c)(7) of RegulationS-X) for the fiscal years ended December 31, 2018 and 2017.
Aggregate Fees
Aggregate fees billed to the Fund fornon-audit services for 2018 and 2017 were $81,900 and $105,130, respectively. Aggregate fees billed to the Fund’s advisor and service affiliates fornon-audit services were $1,800 and $1,800, respectively. These amounts include fees fornon-audit services required to bepre-approved and fees fornon-audit services that did not requirepre-approval since they did not relate to the Fund’s operations and financial reporting.
The Fund’s Audit Committee has considered whether the provisions fornon-audit services to the Fund’s advisor and service affiliates, which did not requirepre-approval, are compatible with maintaining PwC’s independence.
ITEM 5: AUDIT COMMITTEE OF LISTED REGISTRANTS
Not applicable.
ITEM 6: INVESTMENTS
| (a) | See Investment Portfolios under Item 1 on this FormN-CSR. |
| ITEM 7: | DISCLOSURE OF PROXY VOTING POLICIES AND PROCEDURES FOR CLOSED-END MANAGEMENT INVESTMENT COMPANIES |
Not applicable.
| ITEM 8: | PORTFOLIO MANAGERS OFCLOSED-END MANAGEMENT INVESTMENT COMPANIES |
Not applicable.
| ITEM 9: | PURCHASES OF EQUITY SECURITIES BYCLOSED-END MANAGEMENT INVESTMENT COMPANY AND AFFILIATED PURCHASERS |
Not applicable.
| ITEM 10: | SUBMISSION OF MATTERS TO A VOTE OF SECURITY HOLDERS |
There have been no material changes to the procedure by which shareholders may recommend nominees to the registrant’s board of directors.
| ITEM 11: | CONTROLS AND PROCEDURES |
(a) Based on their evaluation of the Funds’ disclosure controls and procedures, as of a date within 90 days of the filing date, the Funds’ Principal Executive Officer and Principal Financial Officer have concluded that the Funds’ disclosure controls and procedures are: (i) reasonably designed to ensure that information required to be disclosed in this report is appropriately communicated to the Funds’ officers to allow timely decisions regarding disclosures required in this report; (ii) reasonably designed to ensure that information required to be disclosed in this report is recorded, processed, summarized and reported in a timely manner; and (iii) are effective in achieving the goals described in (i) and (ii) above.
(b) During the last fiscal quarter there have been no changes in the Funds’ internal control over financial reporting that the above officers believe to have materially affected, or to be reasonably likely to materially affect, the Funds’ internal control over financial reporting.
[Note that until the date that the registrant has filed its first report on FormN-PORT (17 CFR 270.150), the registrant’s disclosures required by this Item are limited to any change in the registrant’s internal control over financial reporting that occurred during the registrant’slast fiscal quarter that has materially affected or is reasonably likely to materially affect the registrant’s internal control over financial reporting.]
| ITEM 12: | DISCLOSURE OF SECURITIES LENDING ACTIVITIES FORCLOSED-END MANAGEMENT INVESTMENT COMPANIES. |
Not applicable.
| ITEM 13: | EXHIBITS |
| (a)(1) | Code of ethics that is subject to the disclosure of Item 2 above. |
| (a)(2) | Separate certifications for the Registrant’s principal executive officer and principal financial officer, as required by Section 302 of the Sarbanes-Oxley Act of 2002 and Rule30a-2(a) under the Investment Company Act of 1940, are attached asEX-99.CERT. |
[Note that until the date that the registrant has filed its first report on FormN-PORT (17 CFR 270.150), in the certification required by Item 13(a)(2), the registrant’s certifying officers must certify that they have disclosed in the report any change in the registrant’s internal control over financial reporting that occurred during the registrant’smost recent fiscal quarter that has materially affected, or is reasonably likely to materially affect the registrant’s internal control over financial reporting.]
| (a)(3) | Not applicable. |
| (a)(4) | Not applicable. |
| (b) | A certification of the Registrant’s principal executive officer and principal financial officer, as required by 18 U.S.C Section 1350, as adopted pursuant to Section 906 of the Sarbanes-Oxley Act of 2002, and Rule30a-2(b) under the Investment Company Act of 1940, is attached as EX-99.906CERT. The certification furnished pursuant to this paragraph is not deemed to be “filed” for purposes of Section 18 of the Securities Exchange Act of 1934, or otherwise subject to the liability of that section. Such certification is not deemed to be incorporated by reference into any filing under the Securities Act of 1933 or the Securities Exchange Act of 1934, except to the extent that the Registrant specifically incorporates them by reference. |
SIGNATURES
Pursuant to the requirements of the Securities Exchange Act of 1934 and the Investment Company Act of 1940, the registrant has duly caused this report to be signed on its behalf by the undersigned, thereunto duly authorized.
Manning & Napier Fund, Inc.
/s/ Paul J. Battaglia
Paul J. Battaglia
President & Principal Executive Officer of Manning & Napier Fund, Inc.
Date: 2/22/2019
Pursuant to the requirements of the Securities Exchange Act of 1934 and the Investment Company Act of 1940, this report has been signed below by the following persons on behalf of the registrant and in the capacities and on the dates indicated.
/s/ Paul J. Battaglia
Paul J. Battaglia
President & Principal Executive Officer of Manning & Napier Fund, Inc.
Date: 2/22/2019
/s/ Christine Glavin
Christine Glavin
Chief Financial Officer & Principal Financial Officer of Manning & Napier Fund, Inc.
Date: 2/22/2019