UNITED STATES
SECURITIES AND EXCHANGE COMMISSION
Washington, D.C. 20549
FORM N-CSR
CERTIFIED SHAREHOLDER REPORT OF REGISTERED MANAGEMENT
INVESTMENT COMPANIES
Investment Company Act file number 811-04101
Excelsior Tax-Exempt Funds, Inc.
(Exact name of registrant as specified in charter)
114 West 47th Street
New York, New York 10036
(Address of principal executive offices) (Zip code)
Michael R. Rosella, Esq.
Paul, Hastings, Janofsky & Walker LLP
75 East 55th Street
New York, New York 10022
(Name and address of agent for service)
Registrant’s telephone number, including area code: 1-800-446-1012
Date of fiscal year end: March 31, 2004
Date of reporting period: March 31, 2004
| Item 1. | Reports to Stockholders. |
Excelsior Tax-Exempt Funds, Inc. currently offers shares in seven managed investment portfolios: Tax-Exempt Money Fund, New York Tax-Exempt Money Fund, Long-Term Tax-Exempt Fund, Intermediate-Term Tax-Exempt Fund, Short-Term Tax-Exempt Securities Fund, New York Intermediate-Term Tax-Exempt Fund and California Tax-Exempt Income Fund. Each Portfolio is included in one of the two reports included herein.

MONEY MARKET
PORTFOLIOS
ANNUAL REPORT
March 31, 2004
TABLE OF CONTENTS
For shareholder account information, current price and yield quotations, or to make an initial purchase or obtain a prospectus, call 1-800-446-1012, from overseas, call 617-483-7297.
Internet Address: http://www.excelsiorfunds.com
This report must be preceded or accompanied by a current prospectus.
A description of the policies and procedures that Excelsior Funds use to determine how to vote proxies relating to portfolio securities is available (i) without charge, upon request, by calling 1-800-446-1012, and (ii) on the Excelsior Funds’ website.
You should consider the Fund’s investment objectives, risks, charges and expenses carefully before you invest. Information about these and other important subjects is in the Fund’s prospectus, which you should read carefully before investing.
Excelsior Funds, Inc. and Excelsior Tax-Exempt Funds, Inc. are distributed by Edgewood Services, Inc.
You may write to Excelsior Funds, Inc. and Excelsior Tax-Exempt Funds, Inc. at the following address:
Excelsior Funds
P.O. Box 8529
Boston, MA 02266-8529
SHARES IN THE FUNDS ARE NOT DEPOSITS OR OBLIGATIONS OF, OR GUARANTEED OR ENDORSED BY, UNITED STATES TRUST COMPANY OF NEW YORK, U.S. TRUST COMPANY, N.A., THEIR PARENT AND AFFILIATES AND SHARES ARE NOT INSURED BY THE FEDERAL DEPOSIT INSURANCE CORPORATION, THE FEDERAL RESERVE BOARD, OR ANY OTHER AGENCY. FUND SHARES ARE NOT INSURED OR GUARANTEED BY THE U.S. GOVERNMENT. ALTHOUGH THE FUNDS SEEK TO PRESERVE THE VALUE OF YOUR INVESTMENT AT $1.00 PER SHARE, IT IS POSSIBLE TO LOSE MONEY BY INVESTING IN THE FUNDS.
LETTER TO SHAREHOLDERS
December 15, 2004
Dear Valued Excelsior Shareholder:
We are reissuing our 2004 annual report following the termination of Ernst & Young (“E&Y”) as the Funds’ auditor. As previously communicated, on October 28, 2004 the Funds’ Boards of Directors/Trustees terminated E&Y as the Funds’ independent registered public accounting firm as a result of concerns regarding their independence at the time of the issuance of their report. The Boards and their Chief Financial Officer have reviewed the Funds March 31, 2004 financial statements and have concluded that they fairly represent, in all material respects, the financial position of the Funds.
In addition, the Boards of the Funds engaged Deloitte & Touche (“D&T”) as the Funds’ independent registered public accounting firm, and D&T has performed a re-audit of the Funds’ March 31, 2004 financial statements. As stated in the enclosed report, in Deloitte & Touche’s opinion, the financial statements present fairly, in all material respects, the financial position of the Funds as of March 31, 2004.
At Excelsior we are committed to helping our shareholders’ long term investments grow. We are defined by our ability to give our shareholders the reassurance and comfort of a steady return over the long term. As always, we value your confidence in selecting Excelsior to fulfill your investment needs.
Sincerely,

Mary Martinez
President
1
Excelsior Funds
Statements of Assets and Liabilities
March 31, 2004
| | | | | | | | | | | | | | | | | | | |
| | | Money
Fund
| | | Government
Money
Fund
| | | Treasury
Money
Fund
| | Tax-Exempt
Money
Fund
| | | New York
Tax-Exempt
Money
Fund
| |
| ASSETS: | | | | | | | | | | | | | | | | | | | |
Investments, at cost — see accompanying portfolios | | $ | 1,612,892,307 | | | $ | 545,159,207 | | | $ | 719,759,735 | | $ | 2,044,631,080 | | | $ | 493,963,223 | |
| | |
|
|
| |
|
|
| |
|
| |
|
|
| |
|
|
|
Investments, at value (excluding repurchase agreements) (Note 1) | | $ | 1,548,892,307 | | | $ | 528,159,207 | | | $ | 719,759,735 | | $ | 2,044,631,080 | | | $ | 493,963,223 | |
Repurchase agreements, at value (Note 1) | | | 64,000,000 | | | | 17,000,000 | | | | — | | | — | | | | — | |
Interest receivable | | | 247,746 | | | | 87,435 | | | | 34,426 | | | 3,451,054 | | | | 875,513 | |
Receivable for fund shares sold | | | 84,583 | | | | 430 | | | | 51 | | | 1,379 | | | | 90,006 | |
Due from investment adviser
(Note 2) | | | 84,189 | | | | — | | | | — | | | — | | | | — | |
| | |
|
|
| |
|
|
| |
|
| |
|
|
| |
|
|
|
Total Assets | | | 1,613,308,825 | | | | 545,247,072 | | | | 719,794,212 | | | 2,048,083,513 | | | | 494,928,742 | |
LIABILITIES: | | | | | | | | | | | | | | | | | | | |
Payable for dividends declared | | | 732,408 | | | | 265,752 | | | | 146,371 | | | 1,019,535 | | | | 168,577 | |
Payable for fund shares redeemed | | | 283,074 | | | | 30,000 | | | | 1,600 | | | 55,860 | | | | 403,014 | |
Payable for investments purchased | | | — | | | | — | | | | 199,688,014 | | | — | | | | 4,006,680 | |
Investment advisory fees payable
(Note 2) | | | — | | | | 121,008 | | | | 133,471 | | | 453,529 | | | | 120,804 | |
Administration fees payable (Note 2) | | | 158,086 | | | | 53,767 | | | | 49,456 | | | 201,597 | | | | 49,153 | |
Shareholder servicing fees payable
(Note 2) | | | 229,375 | | | | 15 | | | | 27 | | | 520 | | | | 20,076 | |
Directors’ fees payable (Note 2) | | | 77 | | | | 269 | | | | 229 | | | 2,481 | | | | 1,145 | |
Due to custodian bank | | | — | | | | — | | | | — | | | 1,489,786 | | | | 7,134 | |
Accrued expenses and other payables | | | 154,610 | | | | 54,946 | | | | 53,495 | | | 183,786 | | | | 53,386 | |
| | |
|
|
| |
|
|
| |
|
| |
|
|
| |
|
|
|
Total Liabilities | | | 1,557,630 | | | | 525,757 | | | | 200,072,663 | | | 3,407,094 | | | | 4,829,969 | |
| | |
|
|
| |
|
|
| |
|
| |
|
|
| |
|
|
|
NET ASSETS | | $ | 1,611,751,195 | | | $ | 544,721,315 | | | $ | 519,721,549 | | $ | 2,044,676,419 | | | $ | 490,098,773 | |
| | |
|
|
| |
|
|
| |
|
| |
|
|
| |
|
|
|
NET ASSETS consist of: | | | | | | | | | | | | | | | | | | | |
Undistributed net investment income | | $ | — | | | $ | — | | | $ | 2,747 | | $ | 56 | | | $ | — | |
Accumulated net realized (loss) on investments | | | (47,687 | ) | | | (34,615 | ) | | | — | | | (1,827 | ) | | | (908 | ) |
Par value (Note 4) | | | 1,611,998 | | | | 544,823 | | | | 519,729 | | | 2,044,928 | | | | 490,101 | |
Paid-in capital in excess of par value | | | 1,610,186,884 | | | | 544,211,107 | | | | 519,199,073 | | | 2,042,633,262 | | | | 489,609,580 | |
| | |
|
|
| |
|
|
| |
|
| |
|
|
| |
|
|
|
Total Net Assets | | $ | 1,611,751,195 | | | $ | 544,721,315 | | | $ | 519,721,549 | | $ | 2,044,676,419 | | | $ | 490,098,773 | |
| | |
|
|
| |
|
|
| |
|
| |
|
|
| |
|
|
|
Net Assets: | | | | | | | | | | | | | | | | | | | |
Shares | | $ | 1,141,562,354 | | | $ | 544,721,315 | | | $ | 519,721,549 | | $ | 2,044,676,419 | | | $ | 490,098,773 | |
Institutional Shares | | | 470,188,841 | | | | — | | | | — | | | — | | | | — | |
Shares of Common Stock Outstanding
(Note 4): | | | | | | | | | | | | | | | | | | | |
Shares | | | 1,141,807,272 | | | | 544,822,975 | | | | 519,728,929 | | | 2,044,928,039 | | | | 490,100,591 | |
Institutional Shares | | | 470,191,017 | | | | — | | | | — | | | — | | | | — | |
NET ASSET VALUE PER SHARE (net assets ÷ shares outstanding): | | | | | | | | | | | | | | | | | | | |
Shares | | | $1.00 | | | | $1.00 | | | | $1.00 | | | $1.00 | | | | $1.00 | |
| | |
|
|
| |
|
|
| |
|
| |
|
|
| |
|
|
|
Institutional Shares | | | $1.00 | | | | — | | | | — | | | — | | | | — | |
| | |
|
|
| |
|
|
| |
|
| |
|
|
| |
|
|
|
See Notes to Financial Statements.
2
Excelsior Funds
Statements of Operations
Year Ended March 31, 2004
| | | | | | | | | | | | | | | | | | | | |
| | | Money Fund
| | | Government
Money Fund
| | | Treasury
Money Fund
| | | Tax-Exempt
Money Fund
| | | New York
Tax-Exempt
Money Fund
| |
INVESTMENT INCOME: | | | | | | | | | | | | | | | | | | | | |
Interest income | | $ | 22,954,795 | | | $ | 6,776,856 | | | $ | 5,246,866 | | | $ | 21,272,107 | | | $ | 4,945,789 | |
| | |
|
|
| |
|
|
| |
|
|
| |
|
|
| |
|
|
|
EXPENSES: | | | | | | | | | | | | | | | | | | | | |
Investment advisory fees (Note 2) | | | 5,157,440 | | | | 1,585,953 | | | | 1,598,190 | | | | 5,295,803 | | | | 2,496,278 | |
Administration fees (Note 2) | | | 3,120,371 | | | | 958,964 | | | | 805,641 | | | | 3,204,676 | | | | 755,436 | |
Shareholder servicing fees (Note 2) | | | 1,155,681 | | | | — | | | | — | | | | — | | | | — | |
Shareholder servicing fees — Shares (Note 2) | | | 3,309,810 | | | | 548,093 | | | | 351,011 | | | | 2,677,048 | | | | 220,725 | |
Shareholder servicing fees — Institutional Shares (Note 2) | | | 132,150 | | | | — | | | | — | | | | — | | | | — | |
Legal and audit fees | | | 453,237 | | | | 149,051 | | | | 124,210 | | | | 469,254 | | | | 111,592 | |
Custodian fees | | | 183,780 | | | | 60,154 | | | | 63,022 | | | | 215,406 | | | | 58,916 | |
Transfer agent fees (Note 2) | | | 127,856 | | | | 18,111 | | | | 30,302 | | | | 25,483 | | | | 17,899 | |
Registration and filing fees | | | 51,718 | | | | 27,902 | | | | 22,924 | | | | 30,205 | | | | 16,300 | |
Directors’ fees and expenses (Note 2) | | | 32,899 | | | | 18,932 | | | | 15,937 | | | | 110,287 | | | | 26,300 | |
Shareholder reports | | | 12,156 | | | | 7,929 | | | | 7,176 | | | | 29,752 | | | | 7,157 | |
Miscellaneous expenses | | | 104,652 | | | | 39,641 | | | | 36,482 | | | | 143,259 | | | | 37,079 | |
| | |
|
|
| |
|
|
| |
|
|
| |
|
|
| |
|
|
|
Total Expenses | | | 13,841,750 | | | | 3,414,730 | | | | 3,054,895 | | | | 12,201,173 | | | | 3,747,682 | |
Fees waived and reimbursed by: | | | | | | | | | | | | | | | | | | | | |
Investment adviser (Note 2) | | | (3,813,686 | ) | | | (310,801 | ) | | | (187,511 | ) | | | (1,947,158 | ) | | | (1,058,879 | ) |
Administrator (Note 2) | | | (1,938,819 | ) | | | (253,755 | ) | | | (213,093 | ) | | | (847,336 | ) | | | (199,704 | ) |
| | |
|
|
| |
|
|
| |
|
|
| |
|
|
| |
|
|
|
Net Expenses | | | 8,089,245 | | | | 2,850,174 | | | | 2,654,291 | | | | 9,406,679 | | | | 2,489,099 | |
| | |
|
|
| |
|
|
| |
|
|
| |
|
|
| |
|
|
|
NET INVESTMENT INCOME | | | 14,865,550 | | | | 3,926,682 | | | | 2,592,575 | | | | 11,865,428 | | | | 2,456,690 | |
| | |
|
|
| |
|
|
| |
|
|
| |
|
|
| |
|
|
|
REALIZED GAIN (LOSS) ON INVESTMENTS (Note 1): | | | | | | | | | | | | | | | | | | | | |
Net realized gain (loss) on security transactions | | | (23,975 | ) | | | (6,483 | ) | | | 4,011 | | | | (780 | ) | | | 18,555 | |
| | |
|
|
| |
|
|
| |
|
|
| |
|
|
| |
|
|
|
Net increase in net assets resulting from operations | | $ | 14,841,575 | | | $ | 3,920,199 | | | $ | 2,596,586 | | | $ | 11,864,648 | | | $ | 2,475,245 | |
| | |
|
|
| |
|
|
| |
|
|
| |
|
|
| |
|
|
|
See Notes to Financial Statements.
3
Excelsior Funds
Statements of Changes in Net Assets
| | | | | | | | | | | | | | | | | | | | |
| | | Money
Fund
| | | Government
Money
Fund
| | | Treasury
Money
Fund
| | | Tax-Exempt
Money
Fund
| | | New York
Tax-Exempt
Money Fund
| |
Year Ended March 31, 2004 | | | | | | | | | | | | | | | | | | | | |
Net investment income | | $ | 14,865,550 | | | $ | 3,926,682 | | | $ | 2,592,575 | | | $ | 11,865,428 | | | $ | 2,456,690 | |
Net realized gain (loss) on security transactions | | | (23,975 | ) | | | (6,483 | ) | | | 4,011 | | | | (780 | ) | | | 18,555 | |
| | |
|
|
| |
|
|
| |
|
|
| |
|
|
| |
|
|
|
Net increase in net assets resulting from operations | | | 14,841,575 | | | | 3,920,199 | | | | 2,596,586 | | | | 11,864,648 | | | | 2,475,245 | |
Distributions to shareholders: | | | | | | | | | | | | | | | | | | | | |
From net investment income | | | | | | | | | | | | | | | | | | | | |
Shares | | | (9,962,795 | ) | | | (3,926,682 | ) | | | (2,592,576 | ) | | | (11,865,425 | ) | | | (2,456,690 | ) |
Institutional Shares | | | (4,902,755 | ) | | | — | | | | — | | | | — | | | | — | |
From net realized gain on investments | | | — | | | | — | | | | (4,586 | ) | | | (311,916 | ) | | | (31,105 | ) |
| | |
|
|
| |
|
|
| |
|
|
| |
|
|
| |
|
|
|
Total distributions | | | (14,865,550 | ) | | | (3,926,682 | ) | | | (2,597,162 | ) | | | (12,177,341 | ) | | | (2,487,795 | ) |
| | |
|
|
| |
|
|
| |
|
|
| |
|
|
| |
|
|
|
(Decrease) in net assets from fund share transactions (Note 4): | | | | | | | | | | | | | | | | | | | | |
Shares | | | (646,272,448 | ) | | | (49,768,352 | ) | | | (52,275,911 | ) | | | (236,273,538 | ) | | | (58,462,779 | ) |
Institutional Shares | | | (77,930,018 | ) | | | — | | | | — | | | | — | | | | — | |
| | |
|
|
| |
|
|
| |
|
|
| |
|
|
| |
|
|
|
Total from fund share transactions | | | (724,202,466 | ) | | | (49,768,352 | ) | | | (52,275,911 | ) | | | (236,273,538 | ) | | | (58,462,779 | ) |
| | |
|
|
| |
|
|
| |
|
|
| |
|
|
| |
|
|
|
Net (decrease) in net assets | | | (724,226,441 | ) | | | (49,774,835 | ) | | | (52,276,487 | ) | | | (236,586,231 | ) | | | (58,475,329 | ) |
NET ASSETS: | | | | | | | | | | | | | | | | | | | | |
Beginning of year | | | 2,335,977,636 | | | | 594,496,150 | | | | 571,998,036 | | | | 2,281,262,650 | | | | 548,574,102 | |
| | |
|
|
| |
|
|
| |
|
|
| |
|
|
| |
|
|
|
End of year (1) | | $ | 1,611,751,195 | | | $ | 544,721,315 | | | $ | 519,721,549 | | | $ | 2,044,676,419 | | | $ | 490,098,773 | |
| | |
|
|
| |
|
|
| |
|
|
| |
|
|
| |
|
|
|
(1) Including undistributed net investment income | | | — | | | | — | | | $ | 2,747 | | | $ | 56 | | | | — | |
| | |
|
|
| |
|
|
| |
|
|
| |
|
|
| |
|
|
|
Year Ended March 31, 2003 | | | | | | | | | | | | | | | | | | | | |
Net investment income | | $ | 32,216,854 | | | $ | 8,597,692 | | | $ | 6,332,776 | | | $ | 23,541,551 | | | $ | 5,261,693 | |
Net realized gain on security transactions | | | 900 | | | | 3,572 | | | | 3,323 | | | | 331,711 | | | | 53,989 | |
| | |
|
|
| |
|
|
| |
|
|
| |
|
|
| |
|
|
|
Net increase in net assets resulting from operations | | | 32,217,754 | | | | 8,601,264 | | | | 6,336,099 | | | | 23,873,262 | | | | 5,315,682 | |
Distributions to shareholders: | | | | | | | | | | | | | | | | | | | | |
From net investment income | | | | | | | | | | | | | | | | | | | | |
Shares | | | (22,588,431 | ) | | | (8,291,220 | ) | | | (6,364,693 | ) | | | (23,466,099 | ) | | | (5,188,979 | ) |
Institutional Shares | | | (9,382,533 | ) | | | — | | | | — | | | | — | | | | — | |
From net realized gain on investments | | | — | | | | — | | | | — | | | | (24,155 | ) | | | (23,128 | ) |
| | |
|
|
| |
|
|
| |
|
|
| |
|
|
| |
|
|
|
Total distributions | | | (31,970,964 | ) | | | (8,291,220 | ) | | | (6,364,693 | ) | | | (23,490,254 | ) | | | (5,212,107 | ) |
| | |
|
|
| |
|
|
| |
|
|
| |
|
|
| |
|
|
|
Increase (decrease) in net assets from fund share transactions (Note 4): | | | | | | | | | | | | | | | | | | | | |
Shares | | | (14,462,035 | ) | | | (201,100,703 | ) | | | (32,254,682 | ) | | | (241,575,086 | ) | | | (147,622,258 | ) |
Institutional Shares | | | 238,227,587 | | | | — | | | | — | | | | — | | | | — | |
| | |
|
|
| |
|
|
| |
|
|
| |
|
|
| |
|
|
|
Total from fund share transactions | | | 223,765,552 | | | | (201,100,703 | ) | | | (32,254,682 | ) | | | (241,575,086 | ) | | | (147,622,258 | ) |
| | |
|
|
| |
|
|
| |
|
|
| |
|
|
| |
|
|
|
Net increase (decrease) in net assets | | | 224,012,342 | | | | (200,790,659 | ) | | | (32,283,276 | ) | | | (241,192,078 | ) | | | (147,518,683 | ) |
NET ASSETS: | | | | | | | | | | | | | | | | | | | | |
Beginning of year | | | 2,111,965,294 | | | | 795,286,809 | | | | 604,281,312 | | | | 2,522,454,728 | | | | 696,092,785 | |
| | |
|
|
| |
|
|
| |
|
|
| |
|
|
| |
|
|
|
End of year | | $ | 2,335,977,636 | | | $ | 594,496,150 | | | $ | 571,998,036 | | | $ | 2,281,262,650 | | | $ | 548,574,102 | |
| | |
|
|
| |
|
|
| |
|
|
| |
|
|
| |
|
|
|
See Notes to Financial Statements.
4
[THIS PAGE INTENTIONALLY LEFT BLANK]
Excelsior Funds
Financial Highlights — Selected Per Share Data and Ratios
| | | | | | | | | | | | | | | | | | | | | |
| | | Net Asset Value,
Beginning of
Year
| | Net
Investment
Income
| | Net Realized
Gain (Loss)
on Investments
| | | Total From
Investment
Operations
| | Dividends
From Net
Investment
Income
| | | Distributions
From Net
Realized Gain
on Investments
| |
MONEY FUND | | | | | | | | | | | | | | | | | | | | | |
Shares — (5/3/85*)
| | | | | | | | | | | | | | | | | | | | | |
Year Ended March 31, | | | | | | | | | | | | | | | | | | | | | |
2000 | | $ | 1.00 | | $ | 0.05005 | | | — | | | $ | 0.05005 | | $ | (0.05005 | ) | | | — | |
2001 | | | 1.00 | | | 0.05804 | | | — | | | | 0.05804 | | | (0.05804 | ) | | | — | |
2002 | | | 1.00 | | | 0.02741 | | $ | 0.00010 | | | | 0.02751 | | | (0.02751 | ) | | | — | |
2003 | | | 1.00 | | | 0.01255 | | | (0.00010 | ) | | | 0.01245 | | | (0.01245 | ) | | | — | |
2004 | | | 1.00 | | | 0.00662 | | | — | | | | 0.00662 | | | (0.00662 | ) | | | — | |
GOVERNMENT MONEY FUND — (5/8/85*) | | | | | | | | | | | | | | | |
Year Ended March 31, | | | | | | | | | | | | | | | | | | | | | |
2000 | | $ | 1.00 | | $ | 0.05004 | | | — | | | $ | 0.05004 | | $ | (0.05004 | ) | | | — | |
2001 | | | 1.00 | | | 0.05752 | | | — | | | | 0.05752 | | | (0.05752 | ) | | | — | |
2002 | | | 1.00 | | | 0.02585 | | $ | 0.00038 | | | | 0.02623 | | | (0.02623 | ) | | | — | |
2003 | | | 1.00 | | | 0.01199 | | | (0.00039 | ) | | | 0.01160 | | | (0.01160 | ) | | | — | |
2004 | | | 1.00 | | | 0.00625 | | | — | | | | 0.00625 | | | (0.00625 | ) | | | — | |
TREASURY MONEY FUND — (2/13/91*) | | | | | | | | | | | | | | | | | | |
Year Ended March 31, | | | | | | | | | | | | | | | | | | | | | |
2000 | | $ | 1.00 | | $ | 0.04560 | | | — | | | $ | 0.04560 | | $ | (0.04560 | ) | | | — | |
2001 | | | 1.00 | | | 0.05339 | | | — | | | | 0.05339 | | | (0.05339 | ) | | | — | |
2002 | | | 1.00 | | | 0.02451 | | $ | (0.00002 | ) | | | 0.02449 | | | (0.02449 | ) | | | — | |
2003 | | | 1.00 | | | 0.01085 | | | 0.00004 | | | | 0.01089 | | | (0.01089 | ) | | | — | |
2004 | | | 1.00 | | | 0.00484 | | | 0.00002 | | | | 0.00486 | | | (0.00485 | ) | | $ | (0.00001 | ) |
TAX-EXEMPT MONEY FUND — (5/24/85*) | | | | | | | | | | | | | | | | | | |
Year Ended March 31, | | | | | | | | | | | | | | | | | | | | | |
2000 | | $ | 1.00 | | $ | 0.02946 | | $ | (0.00001 | ) | | $ | 0.02945 | | $ | (0.02945 | ) | | | — | |
2001 | | | 1.00 | | | 0.03580 | | | — | | | | 0.03580 | | | (0.03580 | ) | | | — | |
2002 | | | 1.00 | | | 0.01862 | | | 0.00013 | | | | 0.01875 | | | (0.01865 | ) | | $ | (0.00010 | ) |
2003 | | | 1.00 | | | 0.00967 | | | (0.00002 | ) | | | 0.00965 | | | (0.00964 | ) | | | (0.00001 | ) |
2004 | | | 1.00 | | | 0.00546 | | | 0.00029 | | | | 0.00575 | | | (0.00560 | ) | | | (0.00015 | ) |
NEW YORK TAX-EXEMPT MONEY FUND — (8/3/98*) | | | | | | | | | | | | | | | |
Year Ended March 31, | | | | | | | | | | | | | | | | | | | | | |
2000 | | $ | 1.00 | | $ | 0.02809 | | | — | | | $ | 0.02809 | | $ | (0.02809 | ) | | | — | |
2001 | | | 1.00 | | | 0.03431 | | | — | | | | 0.03431 | | | (0.03431 | ) | | | — | |
2002 | | | 1.00 | | | 0.01758 | | $ | 0.00011 | | | | 0.01769 | | | (0.01769 | ) | | | — | |
2003 | | | 1.00 | | | 0.00884 | | | (0.00007 | ) | | | 0.00877 | | | (0.00873 | ) | | $ | (0.00004 | ) |
2004 | | | 1.00 | | | 0.00491 | | | 0.00006 | | | | 0.00497 | | | (0.00490 | ) | | | (0.00007 | ) |
* Commencement of Operations
| (1) | Expense ratios before waiver of fees and reimbursement of expenses (if any) by adviser and administrator. |
See Notes to Financial Statements.
6
| | | | | | | | | | | | | | | | | | | | | | | |
Total
Distributions
| | | Net Asset Value,
End of Year
| | Total
Return
| | | Net Assets, End of Year (000’s)
| | Ratio of Net
Operating Expenses
to Average Net Assets
| | | Ratio of Gross
Operating Expenses
to Average Net Assets (1)
| | | Ratio of Net
Investment
Income to
Average Net Assets
| | | Fee
Waivers
(Note 2)
|
| | | | | | | |
| $ | (0.05005 | ) | | $ | 1.00 | | 5.08 | % | | $ | 1,467,183 | | 0.47 | % | | 0.58 | % | | 5.05 | % | | $ | 0.00104 |
| | (0.05804 | ) | | | 1.00 | | 5.96 | % | | | 1,891,042 | | 0.47 | % | | 0.71 | % | | 5.84 | % | | | 0.00238 |
| | (0.02751 | ) | | | 1.00 | | 2.79 | % | | | 1,802,136 | | 0.44 | % | | 0.74 | % | | 2.76 | % | | | 0.00295 |
| | (0.01245 | ) | | | 1.00 | | 1.25 | % | | | 1,787,852 | | 0.39 | % | | 0.43 | % | | 1.25 | % | | | 0.00033 |
| | (0.00662 | ) | | | 1.00 | | 0.66 | % | | | 1,141,562 | | 0.45 | % | | 0.73 | % | | 0.67 | % | | | 0.00279 |
| | | | | | | |
| $ | (0.05004 | ) | | $ | 1.00 | | 5.08 | % | | $ | 772,690 | | 0.47 | % | | 0.50 | % | | 5.01 | % | | $ | 0.00035 |
| | (0.05752 | ) | | | 1.00 | | 5.91 | % | | | 1,427,560 | | 0.46 | % | | 0.48 | % | | 5.76 | % | | | 0.00029 |
| | (0.02623 | ) | | | 1.00 | | 2.65 | % | | | 795,287 | | 0.43 | % | | 0.49 | % | | 2.72 | % | | | 0.00063 |
| | (0.01160 | ) | | | 1.00 | | 1.17 | % | | | 594,496 | | 0.39 | % | | 0.47 | % | | 1.21 | % | | | 0.00082 |
| | (0.00625 | ) | | | 1.00 | | 0.63 | % | | | 544,721 | | 0.45 | % | | 0.54 | % | | 0.62 | % | | | 0.00089 |
| | | | | | | |
| $ | (0.04560 | ) | | $ | 1.00 | | 4.62 | % | | $ | 525,394 | | 0.51 | % | | 0.53 | % | | 4.58 | % | | $ | 0.00021 |
| | (0.05339 | ) | | | 1.00 | | 5.47 | % | | | 615,926 | | 0.50 | % | | 0.55 | % | | 5.35 | % | | | 0.00046 |
| | (0.02449 | ) | | | 1.00 | | 2.48 | % | | | 604,281 | | 0.48 | % | | 0.54 | % | | 2.42 | % | | | 0.00062 |
| | (0.01089 | ) | | | 1.00 | | 1.09 | % | | | 571,998 | | 0.45 | % | | 0.53 | % | | 1.08 | % | | | 0.00075 |
| | (0.00486 | ) | | | 1.00 | | 0.49 | % | | | 519,722 | | 0.50 | % | | 0.57 | % | | 0.49 | % | | | 0.00075 |
| | | | | | | |
| $ | (0.02945 | ) | | $ | 1.00 | | 2.96 | % | | $ | 2,051,108 | | 0.46 | % | | 0.52 | % | | 2.97 | % | | $ | 0.00066 |
| | (0.03580 | ) | | | 1.00 | | 3.64 | % | | | 2,617,329 | | 0.45 | % | | 0.53 | % | | 3.59 | % | | | 0.00075 |
| | (0.01875 | ) | | | 1.00 | | 1.89 | % | | | 2,522,455 | | 0.44 | % | | 0.58 | % | | 1.85 | % | | | 0.00136 |
| | (0.00965 | ) | | | 1.00 | | 0.97 | % | | | 2,281,263 | | 0.39 | % | | 0.54 | % | | 0.97 | % | | | 0.00158 |
| | (0.00575 | ) | | | 1.00 | | 0.58 | % | | | 2,044,676 | | 0.44 | % | | 0.58 | % | | 0.56 | % | | | 0.00132 |
| | | | | | | |
| $ | (0.02809 | ) | | $ | 1.00 | | 2.82 | % | | $ | 421,393 | | 0.54 | % | | 0.71 | % | | 2.84 | % | | $ | 0.00174 |
| | (0.03431 | ) | | | 1.00 | | 3.49 | % | | | 682,445 | | 0.51 | % | | 0.72 | % | | 3.43 | % | | | 0.00214 |
| | (0.01769 | ) | | | 1.00 | | 1.78 | % | | | 696,093 | | 0.48 | % | | 0.71 | % | | 1.76 | % | | | 0.00228 |
| | (0.00877 | ) | | | 1.00 | | 0.88 | % | | | 548,574 | | 0.44 | % | | 0.49 | % | | 0.89 | % | | | 0.00043 |
| | (0.00497 | ) | | | 1.00 | | 0.50 | % | | | 490,099 | | 0.50 | % | | 0.75 | % | | 0.49 | % | | | 0.00253 |
See Notes to Financial Statements.
7
Excelsior Funds, Inc.
Portfolio of Investments — March 31, 2004
Money Fund
| | | | | | | |
Principal
Amount
| | | | Rate
| | | Value
(Note 1)
|
| CERTIFICATES OF DEPOSIT — 18.30% | | | |
| $75,000,000 | | Bank National of Paris, 06/11/04 | | 1.030 | % | | $ 75,000,000 |
| 70,000,000 | | CIBC, 06/08/04 | | 1.040 | | | 70,001,261 |
| 75,000,000 | | Toronto Dominion, 06/17/04 | | 1.035 | | | 75,000,781 |
| 75,000,000 | | Wells Fargo Co., 04/13/04 | | 1.020 | | | 75,000,000 |
| | | | | | | |
|
| | | TOTAL CERTIFICATES OF DEPOSIT
(Cost $295,002,042) | | | | | 295,002,042 |
| | | | | | | |
|
| COMMERCIAL PAPER — 54.24% | | | |
| 50,000,000 | | American Express Credit Corp., Discount Note,
04/07/04 | | 1.080 | | | 49,991,000 |
| 25,000,000 | | 04/20/04 | | 1.080 | | | 24,985,750 |
| 35,000,000 | | Bank of America Corp., Discount Note,
04/05/04 | | 1.060 | | | 34,995,878 |
| 50,000,000 | | 04/07/04 | | 1.100 | | | 49,990,833 |
| 20,000,000 | | CIT Group Inc., Discount Note,
05/24/04 | | 1.030 | | | 19,969,672 |
| 30,000,000 | | 06/14/04 | | 1.050 | | | 29,935,250 |
| 75,000,000 | | Citicorp, Discount Note, 06/16/04 | | 1.025 | | | 74,837,708 |
| 70,000,000 | | Falcon Asset Securities Corp., Discount Note, 04/20/04 | | 1.030 | | | 69,961,947 |
| 75,000,000 | | General Electric Capital Corp., Discount Note, 04/08/04 | | 1.110 | | | 74,983,813 |
| 50,000,000 | | *Goldman Sachs, 11/09/04 | | 1.080 | | | 50,000,000 |
| 50,000,000 | | HBOS Treasury Services, plc, Discount Note, 04/07/04 | | 1.110 | | | 49,990,750 |
| 50,000,000 | | Household Finance Corp., Discount Note, 05/06/04 | | 1.050 | | | 49,948,958 |
| 30,000,000 | | International Lease Finance Corp., Discount Note, 04/26/04 | | 1.020 | | | 29,978,750 |
| 40,000,000 | | Mortgage Interest Networking Trust, Discount Note, 05/24/04 | | 1.030 | | | 39,939,345 |
| 75,000,000 | | New Center Asset Trust, Discount Note, 06/16/04 | | 1.030 | | | 74,836,917 |
| 75,000,000 | | Preferred Receivable Funding, Discount Note, 04/19/04 | | 1.030 | | | 74,961,375 |
| 75,000,000 | | Receivables Capital, Discount Note, 04/19/04 | | 1.020 | | | 74,961,750 |
| | | | | | | |
|
| | | TOTAL COMMERCIAL PAPER
(Cost $874,269,696) | | | | | 874,269,696 |
| | | | | | | |
|
| | | | | | | | |
Principal
Amount
| | | | Rate
| | | Value
(Note 1)
|
| U.S. GOVERNMENT & AGENCY OBLIGATIONS — 23.55% |
| $100,000,000 | | Federal Home Loan Bank, Discount Note, 04/28/04 | | 0.995 | % | | $ | 99,925,375 |
| 60,000,000 | | Federal Home Loan Mortgage Corporation, Discount Note, 04/14/04 | | 0.990 | | | | 59,978,550 |
| 45,000,000 | | Federal National Mortgage Association, Discount Note, 06/02/04 | | 1.085 | | | | 44,915,912 |
| 100,000,000 | | 07/28/04 | | 1.020 | | | | 99,665,667 |
| 75,000,000 | | Student Loan Marketing Association, Discount Note, 04/01/04 | | 0.970 | | | | 75,000,000 |
| | | | | | | |
|
|
| | | TOTAL U.S. GOVERNMENT & AGENCY OBLIGATIONS
(Cost $379,485,504) | | | | 379,485,504 |
| | | | | | | |
|
|
| | | |
Shares
| | | | | | | |
| OTHER SHORT-TERM INVESTMENT — 0.01% |
| 135,065 | | @Dreyfus Government Cash Management Fund
(Cost $135,065) | | | | | | 135,065 |
| | | | | | | |
|
|
| | | |
Principal
Amount
| | | | | | | |
| REPURCHASE AGREEMENT — 3.97% | | | |
| $64,000,000 | | Morgan Stanley Dean Witter, 1.05%, dated 03/31/04, due 04/01/04, to be repurchased at $64,001,867
(collateralized by a U.S. Government Agency Obligation, total market value $65,280,727)
(Cost $64,000,000) | | | | | | 64,000,000 |
| | | | | | | |
|
|
| | | | | | |
TOTAL INVESTMENTS
(Cost $1,612,892,307) | | 100.07 | % | | $1,612,892,307 | |
OTHER ASSETS & LIABILITIES (NET) | | (0.07 | ) | | (1,141,112 | ) |
| | |
|
| |
|
|
NET ASSETS | | 100.00 | % | | $1,611,751,195 | |
| | |
|
| |
|
|
Discount Note—The rate reported is the discount rate at the time of purchase.
| * | Variable rate security—The rate disclosed is as of March 31, 2004. |
plc—public limited company
| @ | Registered Investment Company |
See Notes to Financial Statements.
8
Excelsior Funds, Inc.
Portfolio of Investments — March 31, 2004
Government Money Fund
| | | | | | | | |
Principal
Amount
| | | | Rate
| | | Value
(Note 1)
|
| U.S. GOVERNMENT & AGENCY OBLIGATIONS — 96.87% |
| $125,000,000 | | *Federal Farm Credit Bank, 04/07/04 | | 0.975 | % | | $ | 124,999,377 |
| 100,000,000 | | Federal Home Loan Bank, Discount Note, 04/28/04 | | 0.995 | | | | 99,925,375 |
| | | Federal Home Loan Mortgage Corporation, Discount Note, | | | | | | |
| 48,000,000 | | 04/02/04 | | 0.980 | | | | 47,998,693 |
| 70,000,000 | | 04/05/04 | | 0.980 | | | | 69,992,378 |
| 100,000,000 | | Federal National Mortgage Association, Discount Note, 06/30/04 | | 1.010 | | | | 99,747,500 |
| 85,000,000 | | Student Loan Marketing Association, Discount Note, 04/01/04 | | 0.970 | | | | 85,000,000 |
| | | | | | | |
|
|
| | | TOTAL U.S. GOVERNMENT & AGENCY OBLIGATIONS
(Cost $527,663,323) | | | | 527,663,323 |
| | | | | | | |
|
|
| | |
Shares
| | | | | |
| OTHER SHORT-TERM INVESTMENT — 0.09% |
| 495,884 | | @Dreyfus Treasury Prime Cash Management Fund
(Cost $495,884) | | | | 495,884 |
| | | | | | | |
|
|
| | | | | | | | | |
Principal
Amount
| | | | | | | | Value
(Note 1)
|
| REPURCHASE AGREEMENT — 3.12% | | | | | |
| $17,000,000 | | Morgan Stanley Dean Witter, 1.05%, dated 03/31/04, due 04/01/04, to be repurchased at $17,000,496 (collateralized by U.S. Government Agency Obligations, total market value $17,611,644)
(Cost $17,000,000) | | $ | 17,000,000 |
| | | | | | | | |
|
|
| | | | | | | | | |
TOTAL INVESTMENTS
(Cost $545,159,207) | | 100.08 | % | | $ | 545,159,207 | |
OTHER ASSETS & LIABILITIES (NET) | | (0.08 | ) | | | (437,892 | ) |
| | | | |
|
| |
|
|
|
NET ASSETS | | 100.00 | % | | $ | 544,721,315 | |
| | | | |
|
| |
|
|
|
| * | Variable rate security—The rate disclosed is as of March 31, 2004. |
Discount Note—The rate reported is the discount rate at the time of purchase.
| @ | Registered Investment Company |
See Notes to Financial Statements.
9
Excelsior Funds, Inc.
Portfolio of Investments — March 31, 2004
Treasury Money Fund
| | | | | | | | |
Principal
Amount
| | | | Rate
| | | Value
(Note 1)
|
| U.S. GOVERNMENT & AGENCY OBLIGATIONS — 137.97% |
| $ 40,000,000 | | *Federal Farm Credit Bank,
04/07/04 | | 0.975 | % | | $ | 39,999,800 |
| | | Federal Home Loan Bank,
Discount Note, | | | | | | |
| 7,500,000 | | 04/01/04 | | 0.910 | | | | 7,500,000 |
| 50,000,000 | | 04/14/04 | | 0.970 | | | | 49,982,486 |
30,000,000 | | **United States Treasury Bills,
04/01/04 | | 0.915 | | | | 30,000,000 |
| 50,000,000 | | 04/01/04 | | 0.910 | | | | 50,000,000 |
| 200,000,000 | | 04/01/04 | | 0.902 | | | | 200,000,000 |
| 20,000,000 | | 04/15/04 | | 0.916 | | | | 19,992,884 |
| 20,000,000 | | 04/15/04 | | 0.911 | | | | 19,992,922 |
| 100,000,000 | | 04/29/04 | | 0.941 | | | | 99,926,889 |
| 100,000,000 | | 05/06/04 | | 0.907 | | | | 99,912,014 |
| 100,000,000 | | 07/01/04 | | 0.947 | | | | 99,761,125 |
| | | | | | | |
|
|
| | | TOTAL U.S. GOVERNMENT &
AGENCY OBLIGATIONS
(Cost $717,068,120) | | | | 717,068,120 |
| | | | | | | |
|
|
| | | | | | | | | |
Shares
| | | | | | | Value
(Note 1)
| |
| OTHER SHORT-TERM INVESTMENT — 0.52% | |
| 2,691,615 | | @Dreyfus Treasury Prime Cash Management Fund
(Cost $2,691,615) | | | | | $ | 2,691,615 | |
| | | | | | | |
|
|
|
TOTAL INVESTMENTS
(Cost $719,759,735) | | 138.49 | % | | $ | 719,759,735 | |
| OTHER ASSETS & LIABILITIES (NET) | | (38.49 | ) | | | (200,038,186 | ) |
| | | | |
|
| |
|
|
|
| NET ASSETS | | 100.00 | % | | $ | 519,721,549 | |
| | | | |
|
| |
|
|
|
| * | Variable rate security—The rate disclosed is as of March 31, 2004. |
Discount Note—The rate reported is the discount rate at the time of purchase.
| ** | The rate shown is the effective yield at the time of purchase. |
| @ | Registered Investment Company |
See Notes to Financial Statements.
10
Excelsior Tax-Exempt Funds, Inc.
Portfolio of Investments — March 31, 2004
Tax-Exempt Money Fund
| | | | | |
Principal
Amount
| | | | Value (Note 1)
|
| TAX-EXEMPT CASH EQUIVALENT SECURITIES — 85.31% |
| $11,000,000 | | #Alaska State, Housing
Finance Authority, State Capital Project, Revenue Bonds, Series C, (MBIA),
1.020%, 07/01/22 | | $ | 11,000,000 |
| 20,000,000 | | Ann Arundel County, Maryland, Commercial Paper,
0.930%, 04/21/04 | | | 20,000,000 |
| 63,525,000 | | Burke County, Georgia, Commercial Paper,
0.950%, 05/11/04 | | | 63,525,000 |
| 4,800,000 | | #Carbon County, Wyoming, Pollution Control, Amoco Project, Revenue Bonds, 1.050%, 11/01/14 | | | 4,800,000 |
| 44,430,000 | | #Charlotte, North Carolina, Water & Sewer System, Revenue Bonds, Series B,
1.020%, 07/01/27 | | | 44,430,000 |
| 12,200,000 | | #Chicago, Illinois, Board of Education, General Obligation Bonds,
Series D, (FSA),
1.020%, 03/01/32 | | | 12,200,000 |
| 40,530,000 | | #Chicago, Illinois, Metropolitan Water Reclamation District Project, Capital Improvement, General Obligation Bonds, Series E,
1.030%, 12/01/22 | | | 40,530,000 |
| 53,800,000 | | #Chicago, Illinois, Metropolitan Water Reclamation District Project, General Obligation Bonds, Series A,
1.000%, 12/01/31 | | | 53,800,000 |
| 20,540,000 | | #Chicago, Illinois, Sales Tax, Revenue Bonds, (FGIC), 1.050%, 01/01/34 | | | 20,540,000 |
| 13,925,000 | | #Connecticut State, Health & Educational Facilities Board, Yale University, Revenue Bonds, Series X-3,
1.070%, 07/01/37 | | | 13,925,000 |
| | | | | |
Principal
Amount
| | | | Value (Note 1)
|
TAX-EXEMPT CASH EQUIVALENT
SECURITIES — (continued) |
| $37,395,000 | | #Dade County, Florida, Water
& Sewer System, Revenue Bonds, (FGIC),
1.000%, 10/05/22 | | $ | 37,395,000 |
| 7,510,000 | | #Dallas, Texas, General Obligation Bonds,
1.070%, 02/15/15 | | | 7,510,000 |
| 10,000,000 | | #Detroit, Michigan, Sewage Disposal, Revenue Bonds,
Series A, (MBIA),
1.030%, 07/01/23 | | | 10,000,000 |
| 39,170,000 | | #Detroit, Michigan, Sewage Disposal, Revenue Bonds, Series C-1, (FSA),
1.020%, 07/01/27 | | | 39,170,000 |
| 51,805,000 | | #Detroit, Michigan, Sewage Disposal, Revenue Bonds,
Series C-2, (FGIC),
1.020%, 07/01/29 | | | 51,805,000 |
| 23,900,000 | | #District of Columbia, General Obligation Bonds,
Series D, (FGIC),
1.050%, 06/01/29 | | | 23,900,000 |
| 5,705,000 | | Florence County, South Carolina, School District, Bond Anticipation Notes,
1.250%, 09/01/04 | | | 5,710,886 |
| 13,665,000 | | #Florida State, Board of Education, General Obligation Bonds, Series
374,
1.070%, 06/01/22 | | | 13,665,000 |
| 6,600,000 | | #Florida State, General Obligation Bonds, Class A,
1.080%, 07/01/33 | | | 6,600,000 |
| 9,265,000 | | #Frisco, Texas, Munitops Certificates Trust, General Obligation Bonds,
1.120%, 08/15/11 | | | 9,265,000 |
| 6,350,000 | | #Gwinnett County, Georgia, Development Authority, Civic & Cultural Project,
Revenue Bonds,
1.000%, 09/01/31 | | | 6,350,000 |
See Notes to Financial Statements.
11
Excelsior Tax-Exempt Funds, Inc.
Portfolio of Investments — March 31, 2004
Tax-Exempt Money Fund — (continued)
| | | | | |
Principal
Amount
| | | | Value (Note 1)
|
TAX-EXEMPT CASH EQUIVALENT
SECURITIES — (continued) |
| $10,420,000 | | #Hawaii State, Munitops Certificates Trust, General Obligation Bonds, (FSA), 1.080%, 07/01/10 | | $ | 10,420,000 |
| 10,000,000 | | #Hockley County, Texas, Industrial Development Authority, Amoco Project —Standard Oil Company, Revenue Bonds,
0.900%, 03/01/14 | | | 9,996,000 |
| 23,000,000 | | Intermountain Power Agency, Utah, Commercial Paper, Series B,
0.950%, 05/07/04 | | | 23,000,000 |
| 25,000,000 | | Intermountain Power Agency, Utah, Commercial Paper, Series B-5,
1.030%, 04/07/04 | | | 25,000,000 |
| | | #Intermountain Power Agency, Utah, Revenue Bonds,
Series F, (AMBAC), | | | |
| 9,925,000 | | 0.920%, 07/01/15 | | | 9,925,000 |
| 20,685,000 | | 1.050%, 07/01/18 | | | 20,685,000 |
| 30,000,000 | | Jacksonville, Florida, Commercial Paper,
Series 2001-C,
1.050%, 10/04/04 | | | 30,000,000 |
| 30,000,000 | | Jacksonville, Florida, Commercial Paper, Series A, 0.920%, 04/08/04 | | | 30,000,000 |
| 10,000,000 | | Jacksonville, Florida, Commercial Paper, Series C-1, 0.970%, 05/14/04 | | | 10,000,000 |
| 8,505,000 | | #Jacksonville, Florida, Water & Sewer System, Revenue Bonds, Series N-8,
1.130%, 10/01/23 | | | 8,505,000 |
| 8,955,000 | | #Judson, Texas, Munitops Certificates Trust, General Obligation Bonds,
1.120%, 02/01/11 | | | 8,955,000 |
| 27,105,000 | | #Kansas State, Department of Highway Transportation, Revenue Bonds, Series B-3, 1.000%, 09/01/19 | | | 27,105,000 |
| | | | | |
Principal
Amount
| | | | Value (Note 1)
|
TAX-EXEMPT CASH EQUIVALENT
SECURITIES — (continued) |
| $13,410,000 | | #Kansas State, Department of Highway Transportation, Revenue Bonds, Series C-1, 1.020%, 09/01/19 | | $ | 13,410,000 |
| 23,400,000 | | #Kansas State, Department of Highway Transportation, Revenue Bonds, Series C-2, 1.020%, 09/01/19 | | | 23,400,000 |
| 20,000,000 | | King County, Washington, Sewer Authority, Revenue Bonds, Series A,
1.000%, 07/22/04 | | | 20,000,000 |
| 5,950,000 | | #Lincoln County, Wyoming, Pollution Control, Amoco Project, Revenue Bonds, 1.050%, 10/01/12 | | | 5,950,000 |
| 17,300,000 | | #Mecklenburg County, North
Carolina, General Obligation Bonds, Series 1996B,
0.980%, 03/01/15 | | | 17,300,000 |
| 23,600,000 | | #Mecklenburg County, North Carolina, General Obligation Bonds, Series 1996C,
0.980%, 03/01/14 | | | 23,600,000 |
| | | Metropolitan Government Nashville & Davidson County, Commercial Paper, | | | |
| 8,300,000 | | 1.100%, 05/05/04 | | | 8,300,000 |
| 5,000,000 | | 0.980%, 09/10/04 | | | 5,000,000 |
| 40,000,000 | | #Metropolitan Government Nashville & Davidson County, Health & Educational Facilities Board, Revenue Bonds, Series A,
1.000%, 10/01/30 | | | 40,000,000 |
| 15,800,000 | | Michigan State,
Commercial Paper,
1.100%, 05/11/04 | | | 15,800,000 |
| 50,000,000 | | Michigan State, General Obligation Bonds, Series A, 2.000%, 09/30/04 | | | 50,252,820 |
| 18,365,000 | | #Michigan State, Municipal Board Authority, Revenue Bonds, Series 718,
1.070%, 10/01/20 | | | 18,365,000 |
See Notes to Financial Statements.
12
Excelsior Tax-Exempt Funds, Inc.
Portfolio of Investments — March 31, 2004
Tax-Exempt Money Fund — (continued)
| | | | | |
Principal
Amount
| | | | Value (Note 1)
|
TAX-EXEMPT CASH EQUIVALENT
SECURITIES — (continued) |
| $10,000,000 | | #Michigan State, Technological University, Revenue Bonds, Series A, (AMBAC),
1.030%, 10/01/18 | | $ | 10,000,000 |
| 11,600,000 | | #Minneapolis, Minnesota, General Obligation Bonds, 0.870%, 12/01/32 | | | 11,600,000 |
| 15,000,000 | | #New Hampshire State, Health & Educational Facilities Board, Dartmouth College,
Revenue Bonds,
0.980%, 06/01/23 | | | 15,000,000 |
| 4,595,000 | | #New Jersey State, Transportation Trust Fund Authority, Revenue
Bonds, Series 224,
1.020%, 06/15/16 | | | 4,595,000 |
| 36,400,000 | | New York City, New York, Revenue Anticipation
Notes, Series A,
2.000%, 04/15/04 | | | 36,414,398 |
| 6,800,000 | | New York State, Thruway Authority, General Revenue Bond Anticipation Notes, Commercial Paper,
0.950%, 10/12/04 | | | 6,800,000 |
| 20,000,000 | | #Ohio State, Higher Educational Facilities Authority, Case Western, Revenue Bonds,
1.000%, 10/01/31 | | | 20,000,000 |
| 27,100,000 | | #Ohio State, Infrastructure Import, General Obligation Bonds, Series B,
1.020%, 08/01/21 | | | 27,100,000 |
| 45,000,000 | | #Ohio State, Infrastructure Improvement Bonds, General Obligation Bonds, Series D, 1.000%, 02/01/19 | | | 45,000,000 |
| 22,445,000 | | #Oklahoma State, Water Resource Board,
Revenue Bonds,
1.020%, 09/01/32 | | | 22,445,000 |
| | | | | |
Principal
Amount
| | | | Value (Note 1)
|
TAX-EXEMPT CASH EQUIVALENT
SECURITIES — (continued) |
| | | Omaha, Nebraska, Commercial Paper, | | | |
| $30,000,000 | | 0.970%, 07/14/04 | | $ | 30,000,000 |
| 20,000,000 | | 1.000%, 08/12/04 | | | 20,000,000 |
| 56,800,000 | | #Orlando, Florida, Utilities Commission Water & Electric, Revenue Bonds, Series A,
1.030%, 10/01/17 | | | 56,800,000 |
| 40,640,000 | | #Pennsylvania State University, Revenue Bonds, Series A, 1.020%, 04/01/31 | | | 40,640,000 |
| 35,000,000 | | #Pennsylvania State, Turnpike Commission, Revenue
Bonds, Series A-2,
1.030%, 12/01/30 | | | 35,000,000 |
| 3,905,000 | | #Phoenix, Arizona, Civic Improvement, Revenue
Bonds, Class A,
1.080%, 07/01/17 | | | 3,905,000 |
| 1,500,000 | | #Port Authority of New York & New Jersey, Versatile Structure Obligations, Revenue Bonds, Series 3, 1.110%, 06/01/20 | | | 1,500,000 |
| 3,875,000 | | #Round Rock, Texas, Independent School District, General Obligation Bonds, Series 578,
1.070%, 08/01/20 | | | 3,875,000 |
| 50,000,000 | | Salt River, Arizona, Commercial Paper, Series B,
0.950%, 08/10/04 | | | 50,000,000 |
| | | San Antonio, Texas,
Commercial Paper, | | | |
| 8,000,000 | | 0.950%, 05/10/04 | | | 8,000,000 |
| 11,000,000 | | 1.000%, 06/10/04 | | | 11,000,000 |
| 15,000,000 | | San Antonio, Texas, Gas & Electric Authority, Commercial Paper, Series A,
0.950%, 04/06/04 | | | 15,000,000 |
See Notes to Financial Statements.
13
Excelsior Tax-Exempt Funds, Inc.
Portfolio of Investments — March 31, 2004
Tax-Exempt Money Fund — (continued)
| | | | | |
Principal
Amount
| | | | Value (Note 1)
|
TAX-EXEMPT CASH EQUIVALENT
SECURITIES — (continued) |
| $26,560,000 | | #Snohomish County, Washington, Public Utilities Authority, District No. 1 Generation System, Revenue Bonds, (MBIA),
1.000%, 01/01/25 | | $ | 26,560,000 |
| 27,600,000 | | #Snohomish County, Washington, Public Utilities Authority, District No. 1 Generation System, Revenue Bonds, Series A-1, (FSA),
1.030%, 12/01/19 | | | 27,600,000 |
| 39,000,000 | | St. James Parish,
Louisiana, Texaco,
Commercial Paper, Series B,
1.080%, 06/10/04 | | | 39,000,000 |
| | | #Texas State, Munitops Certificates Trust, General Obligation Bonds, | | | |
| 15,640,000 | | 1.080%, 02/15/11 | | | 15,640,000 |
| 11,800,000 | | 1.070%, 02/15/11 | | | 11,800,000 |
| 19,000,000 | | Texas State, Tax & Revenue Anticipation Notes,
2.000%, 08/31/04 | | | 19,074,929 |
| 14,800,000 | | #University of Delaware,
Revenue Bonds,
1.030%, 11/01/23 | | | 14,800,000 |
| 10,480,000 | | #University of Michigan, Board of Regents, Revenue Bonds, 1.000%, 04/01/32 | | | 10,480,000 |
| 18,160,000 | | #University of Minnesota,
Board of Regents, Revenue Bonds, Series A,
1.060%, 01/01/34 | | | 18,160,000 |
| 12,400,000 | | #University of Pittsburgh, Commonwealth of Higher Education, University
Capital Project, Revenue
Bonds, Series A,
1.000%, 09/15/29 | | | 12,400,000 |
| 3,300,000 | | #University of Virginia,
Revenue Bonds, Series A,
1.080%, 06/01/33 | | | 3,300,000 |
| | | | | |
Principal
Amount
| | | | Value (Note 1)
|
TAX-EXEMPT CASH EQUIVALENT
SECURITIES — (continued) |
| $ 4,450,000 | | #Valdez, Alaska, Marine Terminal, BP Pipelines Project, Revenue
Bonds, Series B,
1.120%, 07/01/37 | | $ | 4,450,000 |
| 18,130,000 | | #Washington State, Public Power Supply System, Revenue Bonds,
Series 2A-1, (MBIA),
1.000%, 07/01/12 | | | 18,130,000 |
| 4,420,000 | | #Whiting, Indiana, Pollution Control, Amoco Project, Revenue Bonds,
1.000%, 08/15/04 | | | 4,412,353 |
| 14,200,000 | | #Wilmington, North Carolina, General Obligation Bonds, 1.040%, 06/01/15 | | | 14,200,000 |
| 13,980,000 | | #Winston-Salem, North Carolina, Water & Sewer Systems Authority, Revenue Bonds, Series C,
1.050%, 06/01/28 | | | 13,980,000 |
| 30,020,000 | | Wisconsin State, Transportation Authority, Commercial Paper,
0.940%, 04/27/04 | | | 30,020,000 |
| 34,500,000 | | Wisconsin State, Transportation Authority, Commercial
Paper, Series 97A,
0.950%, 04/08/04 | | | 34,500,000 |
| | | | |
|
|
| | | TOTAL TAX-EXEMPT CASH EQUIVALENT SECURITIES (Cost $1,744,271,386) | | | 1,744,271,386 |
| | | | |
|
|
TAX-EXEMPT CASH EQUIVALENT SECURITIES —
BACKED BY LETTERS OF CREDIT — 14.48% |
| | | BANK OF AMERICA
| | | |
| 22,000,000 | | #Des Moines, Iowa, Hospital Facilities Authority, Methodist Medical Center Project, Revenue Bonds, 1.050%, 08/01/15 | | | 22,000,000 |
See Notes to Financial Statements.
14
Excelsior Tax-Exempt Funds, Inc.
Portfolio of Investments — March 31, 2004
Tax-Exempt Money Fund — (continued)
| | | | | |
Principal
Amount
| | | | Value (Note 1)
|
TAX-EXEMPT CASH EQUIVALENT SECURITIES —
BACKED BY LETTERS OF CREDIT — (continued) |
| | | BANK OF AMERICA — (continued)
|
| $15,000,000 | | #District of Columbia, Phillips College Issue, General Obligation Bonds,
1.050%, 08/01/33 | | $ | 15,000,000 |
| 20,000,000 | | #Washington State, Public Power, Revenue Bonds, Series A1-2,
1.010%, 07/01/17 | | | 20,000,000 |
| | | BANK OF NEW YORK
| | | |
| 30,000,000 | | Michigan State, Building Authority, Commercial Paper, Series B4,
0.980%, 06/10/04 | | | 30,000,000 |
| | | BANK ONE N.A.
| | | |
| 6,850,000 | | #Chicago, Illinois, Water Authority, Revenue Bonds, 1.000%, 11/01/30 | | | 6,850,000 |
| | | BANK ONE N.A.-75% / NORTHERN TRUST COMPANY-25%
|
| 9,000,000 | | #Illinois State, Development Financial Authority, Museum of Contemporary Art Project,
1.080%, 02/01/29 | | | 9,000,000 |
| | | BAYERISCHE LANDESBANK
| | | |
| 4,200,000 | | #Baltimore, Maryland,
Industrial Development Authority, Capital Acquisition Project, Revenue Bonds,
1.050%, 08/01/16 | | | 4,200,000 |
| 10,000,000 | | #Tri-County, Oregon, Metropolitan Transportation District, Interstate Max
Project, Revenue
Bonds, Series A,
1.020%, 12/01/21 | | | 10,000,000 |
| | | BAYERISCHE LANDESBANK-80% / LANDESBANK BADEN-WUERTTEMBERG-20%
|
| 19,334,000 | | #Long Island Power Authority, New York, Electrical Systems, Revenue Bonds, Series 1A,
1.050%, 05/01/33 | | | 19,334,000 |
| | | | | |
Principal
Amount
| | | | Value (Note 1)
|
TAX-EXEMPT CASH EQUIVALENT SECURITIES —
BACKED BY LETTERS OF CREDIT — (continued) |
| | | BNP PARIBAS
| | | |
| $29,900,000 | | #Baltimore, Maryland,
Port Facilities Authority,
Revenue Bonds,
1.000%, 10/14/11 | | $ | 29,900,000 |
| | | FIRST UNION NATIONAL BANK
|
| 16,200,000 | | #Virginia State, Capital Region Airport Community Authority, Revenue Bonds, Series B,
1.050%, 06/01/29 | | | 16,200,000 |
| | | LANDESBANK HESSEN
| | | |
| 17,600,000 | | #King County, Washington, Water & Sewage, Revenue Bonds, Series A,
1.000%, 01/01/32 | | | 17,600,000 |
| 13,000,000 | | #Northampton County, Pennsylvania, Higher Education Authority, Lafayette College Project, Revenue Bonds, Series A, 1.020%, 11/01/28 | | | 13,000,000 |
| 9,635,000 | | #Texas State, Southwest Higher Education Authority, Southern Methodist University, Revenue Bonds,
1.120%, 07/01/15 | | | 9,635,000 |
| | | MORGAN GUARANTY TRUST
|
| 7,000,000 | | #Kenton County, Kentucky, Industrial Building Authority, Redken Labs Incorporated Project, Revenue Bonds,
1.000%, 12/01/14 | | | 7,000,000 |
| | | NORTHERN TRUST COMPANY
|
| 14,800,000 | | #Illinois State, Health Facilities Authority, Ingalls Memorial Hospital Project, Revenue Bonds, Series 85-B,
1.030%, 01/01/16 | | | 14,800,000 |
| 11,600,000 | | #Illinois State, Health Facilities Authority, Ingalls Memorial Hospital Project, Revenue Bonds, Series C,
1.030%, 01/01/16 | | | 11,600,000 |
See Notes to Financial Statements.
15
Excelsior Tax-Exempt Funds, Inc.
Portfolio of Investments — March 31, 2004
Tax-Exempt Money Fund — (continued)
| | | | | |
Principal
Amount
| | | | Value (Note 1)
|
TAX-EXEMPT CASH EQUIVALENT SECURITIES —
BACKED BY LETTERS OF CREDIT — (continued) |
| | | STATE STREET BANK & TRUST
|
| $25,000,000 | | #Maryland State, Transportation Authority, Baltimore/Washington Airport, Revenue Bonds, Series A,
1.020%, 07/01/13 | | $ | 25,000,000 |
| | | WESTDEUTSCHE LANDESBANK
|
| 15,000,000 | | #Cleveland, Ohio, Waterworks Revenue Authority, Revenue Bonds, Series L, (FGIC), 1.000%, 01/01/33 | | | 15,000,000 |
| | | | |
|
|
| | | TOTAL TAX-EXEMPT CASH EQUIVALENT SECURITIES — BACKED BY LETTERS OF CREDIT
(Cost $296,119,000) | | | 296,119,000 |
| | | | |
|
|
Shares
| | | | |
| OTHER SHORT-TERM INVESTMENTS — 0.21% |
| 3,781,927 | | @BlackRock Muni Fund | | | 3,781,927 |
| 458,767 | | @Dreyfus Tax Exempt Fund | | | 458,767 |
| | | | |
|
|
| | | TOTAL OTHER SHORT-TERM INVESTMENTS
(Cost $4,240,694) | | | 4,240,694 |
| | | | |
|
|
| | | | | | |
TOTAL INVESTMENTS
(Cost $2,044,631,080) | | 100.00 | % | | $ | 2,044,631,080 |
OTHER ASSETS &
LIABILITIES (NET) | | 0.00 | | | | 45,339 |
| | |
|
| |
|
|
NET ASSETS | | 100.00 | % | | $ | 2,044,676,419 |
| | |
|
| |
|
|
| # | Variable rate demand bonds and notes are payable upon not more than seven business days notice. Rate disclosed is as of March 31, 2004. |
MBIA — Municipal Bond Insurance Assoc.
FSA — Financial Security Assurance
FGIC — Financial Guaranty Insurance Corp.
AMBAC — American Municipal Bond Assurance Corp.
| @ | Registered Investment Company |
Notes (The following notes have not been audited by Deloitte & Touche LLP):
These municipal securities meet the three highest ratings assigned by Moody’s Investors Services, Inc. or Standard and Poor’s Corporation or, where not rated, are determined by the Adviser, under the supervision of the Board of Directors, to be of comparable quality at the time of purchase to rated instruments that may be acquired by the Fund.
At March 31, 2004, approximately, 14% of the net assets are invested in municipal securities that have letter of credit enhancement features or escrows in U.S. Government securities backing them, on which the Fund relies. Without such features, the securities may or may not meet the quality standards of securities purchased by the Fund.
See Notes to Financial Statements.
16
Excelsior Tax-Exempt Funds, Inc.
Portfolio of Investments — March 31, 2004
Tax-Exempt Money Fund — (continued)
| | | | | | |
State Diversification
| | % of
Net Assets
| | | Value
|
Michigan | | 11.54 | % | | $ | 235,872,820 |
Florida | | 9.44 | | | | 192,965,000 |
Illinois | | 8.28 | | | | 169,320,000 |
Washington | | 6.35 | | | | 129,890,000 |
Texas | | 6.35 | | | | 129,750,929 |
North Carolina | | 5.55 | | | | 113,510,000 |
Ohio | | 5.24 | | | | 107,100,000 |
Pennsylvania | | 4.94 | | | | 101,040,000 |
Maryland | | 3.87 | | | | 79,100,000 |
Utah | | 3.84 | | | | 78,610,000 |
Georgia | | 3.42 | | | | 69,875,000 |
Wisconsin | | 3.15 | | | | 64,520,000 |
New York | | 3.13 | | | | 64,048,398 |
Kansas | | 3.12 | | | | 63,915,000 |
Arizona | | 2.64 | | | | 53,905,000 |
Tennessee | | 2.61 | | | | 53,300,000 |
Nebraska | | 2.44 | | | | 50,000,000 |
Louisiana | | 1.91 | | | | 39,000,000 |
District of Columbia | | 1.90 | | | | 38,900,000 |
Minnesota | | 1.46 | | | | 29,760,000 |
Oklahoma | | 1.10 | | | | 22,445,000 |
Iowa | | 1.08 | | | | 22,000,000 |
Virginia | | 0.95 | | | | 19,500,000 |
Alaska | | 0.76 | | | | 15,450,000 |
New Hampshire | | 0.73 | | | | 15,000,000 |
Delaware | | 0.72 | | | | 14,800,000 |
Connecticut | | 0.68 | | | | 13,925,000 |
Wyoming | | 0.53 | | | | 10,750,000 |
Hawaii | | 0.51 | | | | 10,420,000 |
Oregon | | 0.49 | | | | 10,000,000 |
Kentucky | | 0.34 | | | | 7,000,000 |
South Carolina | | 0.28 | | | | 5,710,886 |
New Jersey | | 0.22 | | | | 4,595,000 |
Indiana | | 0.22 | | | | 4,412,353 |
Registered Investment Companies | | 0.21 | | | | 4,240,694 |
| | |
|
| |
|
|
Total Investments | | 100.00 | % | | $ | 2,044,631,080 |
Other Assets & Liabilities (Net) | | 0.00 | | | | 45,339 |
| | |
|
| |
|
|
Net Assets | | 100.00 | % | | $ | 2,044,676,419 |
| | |
|
| |
|
|
See Notes to Financial Statements.
17
Excelsior Tax-Exempt Funds, Inc.
Portfolio of Investments — March 31, 2004
New York Tax-Exempt Money Fund
| | | | | |
Principal Amount
| | | | Value (Note 1)
|
| TAX-EXEMPT CASH EQUIVALENT SECURITIES — 83.41% |
| $ 3,095,000 | | #Babylon, New York, General Obligation Bonds, (AMBAC),
0.990%, 09/01/17 | | $ | 3,095,000 |
| 4,500,000 | | Carmel, New York, Central School District, Bond Anticipation Notes,
1.750%, 04/30/04 | | | 4,502,308 |
| 9,100,000 | | #Erie County, New York, Water Authority, Revenue Bonds,
Series A, (AMBAC),
0.990%, 12/01/16 | | | 9,100,000 |
| 10,000,000 | | Harborfields Centennial School District, New York, Bond Anticipation Notes,
1.250%, 11/04/04 | | | 10,017,537 |
| 15,000,000 | | Long Island Power Authority, New York, Commercial Paper, 0.950%, 08/09/04 | | | 15,000,000 |
| 17,870,000 | | #Nassau County, New York, Financial Authority, Sales Tax, Revenue Bonds, Series B, (FSA), 1.030%, 11/15/22 | | | 17,870,000 |
| 2,000,000 | | Nassau County, New York, Tax Anticipation Notes, Series A, 2.000%, 04/15/04 | | | 2,000,725 |
| 1,500,000 | | Nassau County, New York, Tax Anticipation Notes, Series B, 2.000%, 10/15/04 | | | 1,506,793 |
| 5,300,000 | | New York City, New York, Mass Transit Authority,
Commercial Paper,
1.000%, 10/14/04 | | | 5,300,000 |
| 17,500,000 | | #New York City, New York, Multi-Family Housing Development Corporation Authority, Parkgate Development Project,
Series A, (FNMA),
0.960%, 10/15/28 | | | 17,500,000 |
| 7,500,000 | | #New York City, New York, Municipal Water Financing Authority, Revenue Bonds,
Sub-Series C-2,
1.000%, 06/15/18 | | | 7,500,000 |
| 15,000,000 | | New York City, New York, Tax Anticipation Notes,
2.000%, 04/15/04 | | | 15,006,104 |
| | | | | |
Principal Amount
| | | | Value (Note 1)
|
TAX-EXEMPT CASH EQUIVALENT
SECURITIES —(continued) |
| $12,810,000 | | #New York City, New York, Transitional Finance Authority, Revenue Bonds, (MBIA), 1.050%, 05/01/15 | | $ | 12,810,000 |
| 10,870,000 | | #New York City, New York, Transitional Finance Authority, Revenue Bonds, Class A,
1.050%, 02/01/31 | | | 10,870,000 |
| 11,245,000 | | #New York City, New York, Transitional Finance Authority, Revenue Bonds, Series 283, 1.070%, 11/15/18 | | | 11,245,000 |
| 4,995,000 | | #New York City, New York, Transitional Finance Authority, Revenue Bonds,
Series 307, (AMBAC),
1.030%, 08/01/19 | | | 4,995,000 |
| 1,425,000 | | #New York City, New York, Transitional Finance Authority, Revenue Bonds, Series A-2, 1.050%, 11/15/27 | | | 1,425,000 |
| 105,000 | | #New York City, New York, Trust for Cultural Resources, American Museum of Natural History, Revenue Bonds,
Series A,
0.990%, 04/01/21 | | | 105,000 |
| 10,000,000 | | New York State, Dormitory Authority, Columbia University, Commercial Paper,
0.950%, 04/08/04 | | | 10,000,000 |
| 15,000,000 | | New York State, Dormitory Authority, Cornell University, Commercial Paper,
0.930%, 05/24/04 | | | 15,000,000 |
| 2,500,000 | | #New York State, Dormitory Authority, Cornell University, Revenue Bonds, Series B, 0.980%, 07/01/30 | | | 2,500,000 |
| 5,000,000 | | #New York State, Dormitory Authority, Mental Health Facilities, Revenue Bonds, (FSA),
1.000%, 02/15/21 | | | 5,000,000 |
See Notes to Financial Statements.
18
Excelsior Tax-Exempt Funds, Inc.
Portfolio of Investments — March 31, 2004
New York Tax-Exempt Money Fund — (continued)
| | | | | |
Principal Amount
| | | | Value (Note 1)
|
TAX-EXEMPT CASH EQUIVALENT
SECURITIES —(continued) |
| $15,720,000 | | #New York State, Dormitory Authority, Public Library Project, Revenue Bonds,
Series A, (MBIA),
1.030%, 07/01/28 | | $ | 15,720,000 |
| 2,000,000 | | New York State, Environmental Facilities Authority, Commercial Paper, Series 97-A,
1.000%, 07/22/04 | | | 2,000,000 |
| 8,966,000 | | #New York State, Environmental Facilities Authority, Revenue Bonds, Series 731,
1.050%, 06/15/22 | | | 8,966,000 |
| 9,800,000 | | #New York State, Environmental Facilities Authority, Revenue Bonds, Series A,
1.050%, 06/15/33 | | | 9,800,000 |
| 5,500,000 | | New York State, Environmental Facilities Corp., Solid Waste Disposal, Commercial Paper,
0.950%, 07/08/04 | | | 5,500,000 |
| 2,500,000 | | New York State, Gas & Electric Authority, Commercial Paper, 0.950%, 07/14/04 | | | 2,500,000 |
| 4,700,000 | | #New York State, Local Government Assistance, Revenue Bonds, Series 3V, (FGIC),
1.050%, 04/01/24 | | | 4,700,000 |
| 7,800,000 | | #New York State, Local Government Assistance, Revenue Bonds, Series 4V, (FSA),
1.050%, 04/01/22 | | | 7,800,000 |
| 12,300,000 | | #New York State, Metropolitan Transportation Authority, Revenue Bonds, Series B, (FSA),
1.010%, 11/01/22 | | | 12,300,000 |
| 4,120,000 | | #New York State, Metropolitan Transportation Authority, Revenue Bonds, Series D-1, (FSA),
1.000%, 11/01/29 | | | 4,120,000 |
| | | | | |
Principal Amount
| | | | Value (Note 1)
|
TAX-EXEMPT CASH EQUIVALENT
SECURITIES —(continued) |
| $ 9,320,000 | | #New York State, Metropolitan Transportation Authority, Revenue Bonds, Series D-2, (FSA),
1.000%, 11/01/32 | | $ | 9,320,000 |
| 8,000,000 | | #New York State, Power Authority, Revenue & General Purpose Obligation Bonds, 0.950%, 03/01/20 | | | 8,000,000 |
| 5,000,000 | | #New York State, Power Authority, Revenue Bonds, Sub-Series 5,
1.030%, 11/15/11 | | | 5,000,000 |
| 25,000,000 | | New York State, Thruway Authority, General Revenue Bond Anticipation Notes, Commercial Paper,
0.950%, 10/12/04 | | | 25,000,000 |
| 8,000,000 | | New York State, Thruway, Commercial Paper,
0.950%, 05/14/04 | | | 8,000,000 |
| 21,100,000 | | #New York State, Triborough Bridge & Tunnel Authority, Revenue Bonds, Series B, (AMBAC),
1.020%, 01/01/32 | | | 21,100,000 |
| 3,600,000 | | #New York State, Triborough Bridge & Tunnel Authority, Revenue Bonds, Series C, (AMBAC),
1.010%, 01/01/33 | | | 3,600,000 |
| 10,900,000 | | #New York State, Triborough Bridge & Tunnel Authority, Revenue Bonds, Series C, (FSA),
1.020%, 01/01/31 | | | 10,900,000 |
| 13,700,000 | | #Niagara Falls, New York, Bridge Community Toll Authority, Series A, (FGIC),
1.000%, 10/01/19 | | | 13,700,000 |
| 4,000,000 | | Pittsford, New York, Centennial School District, Bond Anticipation Notes,
1.250%, 10/17/04 | | | 4,006,680 |
| 5,928,528 | | 2.000%, 12/17/04 | | | 5,970,875 |
See Notes to Financial Statements.
19
Excelsior Tax-Exempt Funds, Inc.
Portfolio of Investments — March 31, 2004
New York Tax-Exempt Money Fund — (continued)
| | | | | |
Principal Amount
| | | | Value (Note 1)
|
TAX-EXEMPT CASH EQUIVALENT
SECURITIES —(continued) |
| $ 9,635,000 | | Port Authority of New York & New Jersey, Commercial Paper, 0.950%, 04/07/04 | | $ | 9,635,000 |
| 4,100,000 | | #Suffolk County, New York, Water Authority, Bond Anticipation Notes,
1.030%, 06/01/06 | | | 4,100,000 |
| 19,600,000 | | 1.030%, 01/01/08 | | | 19,600,000 |
| 5,100,000 | | Wantagh, New York, Union Free School District, Bond Anticipation Notes,
1.250%, 09/10/04 | | | 5,106,456 |
| | | | |
|
|
| | | TOTAL TAX-EXEMPT CASH EQUIVALENT SECURITIES
(Cost $408,793,478) | | | 408,793,478 |
| | | | |
|
|
TAX-EXEMPT CASH EQUIVALENT SECURITIES —
BACKED BY LETTERS OF CREDIT — 17.26% |
| | | BANK OF AMERICA
|
| 16,000,000 | | #New York City, New York, Industrial Development Agency, Revenue Bonds, New York Stock Exchange Project, Series B,
0.990%, 05/01/33 | | | 16,000,000 |
| | | BANK OF NEW YORK
|
| 10,000,000 | | #New York City, New York, General Obligation Bonds, Sub-Series H4,
1.100%, 03/01/34 | | | 10,000,000 |
| 4,200,000 | | #Yonkers, New York, Industrial Development Agency, Civic Facility Revenue Bonds, Consumers Union Facility, 1.020%, 07/01/19 | | | 4,200,000 |
| | | BAYERISCHE HYPOVEREINSBANK
|
| 8,000,000 | | Long Island Power Authority, New York, Commercial Paper,
1.080%, 08/10/04 | | | 8,000,000 |
| | | | | |
Principal Amount
| | | | Value (Note 1)
|
TAX-EXEMPT CASH EQUIVALENT SECURITIES —
BACKED BY LETTERS OF CREDIT — (continued) |
| | | BAYERISCHE LANDESBANK-50% / LANDESBANK HESSEN-50%
|
| $ 2,300,000 | | New York State, Environmental Facilities Authority, Commercial Paper,
0.930%, 07/14/04 | | $ | 2,300,000 |
| | | BAYERISCHE LANDESBANK-50% /WESTDEUTSCHE LANDESBANK-50%
|
| 100,000 | | #New York State, Local Government Assistance Corp., Revenue Bonds, Series A,
1.030%, 04/01/22 | | | 100,000 |
| | | CHASE MANHATTAN BANK
|
| 4,000,000 | | #New York City, New York, Trust for Cultural Preservation, Asia Society Project, Revenue Bonds, 1.000%, 04/01/30 | | | 4,000,000 |
| | | JP MORGAN CHASE BANK
|
| 9,500,000 | | #New York City, New York, Trust for Cultural Preservation, Pierpont Morgan Library, Revenue Bonds,
1.000%, 02/01/34 | | | 9,500,000 |
| | | LANDESBANK HESSEN
|
| 7,000,000 | | #New York State, Housing Finance Agency Services, Revenue Bonds, Series I,
1.050%, 03/15/31 | | | 7,000,000 |
| | | MANUFACTURERS & TRADERS
|
| 8,800,000 | | #New York City, New York, Industrial Development Agency, Civic Facility Revenue Bonds, Jewish Community Center Project,
1.070%, 03/01/30 | | | 8,800,000 |
| | | MORGAN GUARANTY TRUST
|
| 2,000,000 | | #New York City, New York, General Obligation Bonds, Series F-3, 1.020%, 02/15/13 | | | 2,000,000 |
See Notes to Financial Statements.
20
Excelsior Tax-Exempt Funds, Inc.
Portfolio of Investments — March 31, 2004
New York Tax-Exempt Money Fund — (continued)
| | | | | |
Principal Amount
| | | | Value (Note 1)
|
TAX-EXEMPT CASH EQUIVALENT SECURITIES —
BACKED BY LETTERS OF CREDIT — (continued) |
| | | WESTDEUTSCHE LANDESBANK
|
| $9,350,000 | | #Long Island Power Authority, New York, Revenue Bonds, Sub-Series 2A,
1.030%, 05/01/33 | | $ | 9,350,000 |
| 2,000,000 | | #New York City, New York, General Obligation Bonds, Sub-Series J2, 1.050%, 02/15/16 | | | 2,000,000 |
| | | WESTDEUTSCHE LANDESBANK-50% / BAYERISCHE LANDESBANK-50%
|
| 1,350,000 | | #New York State, Local Government Assistance Corp., Revenue Bonds, Series E,
1.030%, 04/01/23 | | | 1,350,000 |
| | | | |
|
|
| | | TOTAL TAX-EXEMPT CASH EQUIVALENT SECURITIES — BACKED BY LETTERS OF CREDIT
(Cost $84,600,000) | | | 84,600,000 |
| | | | |
|
|
Shares
| | | | |
| OTHER SHORT-TERM INVESTMENTS — 0.12% |
| 569,744 | | @BlackRock Institutional New York Money Market Fund | | | 569,744 |
| 1 | | @Dreyfus New York Tax Exempt Fund | | | 1 |
| | | | |
|
|
| | | TOTAL OTHER SHORT-TERM INVESTMENTS
(Cost $569,745) | | | 569,745 |
| | | | |
|
|
| | | | | | | |
TOTAL INVESTMENTS
(Cost $493,963,223) | | 100.79 | % | | $ | 493,963,223 | |
OTHER ASSETS &
LIABILITIES (NET) | | (0.79 | ) | | | (3,864,450 | ) |
| | |
|
| |
|
|
|
NET ASSETS | | 100.00 | % | | $ | 490,098,773 | |
| | |
|
| |
|
|
|
| # | Variable rate demand bonds and notes are payable upon not more than seven business days notice. Rate disclosed is as of March 31, 2004. |
AMBAC—American Municipal Bond Assurance Corp.
FSA—Financial Security Assurance
FNMA—Federal National Mortgage Association
MBIA—Municipal Bond Insurance Assoc.
FGIC—Financial Guaranty Insurance Corp.
| @ | Registered Investment Company |
Notes (The following notes have not been audited by Deloitte & Touche LLP):
These municipal securities meet the three highest ratings assigned by Moody’s Investors Services, Inc. or Standard and Poor’s Corporation or, where not rated, are determined by the Adviser, under the supervision of the Board of Directors, to be of comparable quality at the time of purchase to rated instruments that may be acquired by the Fund.
At March 31, 2004, approximately, 17% of the net assets are invested in municipal securities that have letter of credit enhancement features or escrows in U.S. Government securities backing them, on which the Fund relies. Without such features, the securities may or may not meet the quality standards of securities purchased by the Fund.
At March 31, 2004, approximately, 101% of the net assets are invested in New York municipal securities. Economic changes affecting the state and certain of its public bodies and municipalities may affect the ability of the issuers to pay the required principal and interest payments of the municipal securities.
At March 31, 2004, approximately, 59%, 20%, 17% and 5% of the net assets are invested in revenue bonds, anticipation notes, commercial paper and general obligation bonds, respectively.
See Notes to Financial Statements.
21
EXCELSIOR FUNDS
NOTES TO FINANCIAL STATEMENTS
1. Significant Accounting Policies:
Excelsior Funds, Inc. (“Excelsior Fund”) and Excelsior Tax-Exempt Funds, Inc. (“Excelsior Tax-Exempt Fund”) collectively (the “Funds”) were incorporated under the laws of the State of Maryland on August 2, 1984 and August 8, 1984, respectively, and are registered under the Investment Company Act of 1940, as amended, as open-end diversified management investment companies with the exception of Energy and Natural Resources Fund, Real Estate Fund, New York Intermediate-Term Tax-Exempt Fund, California Tax-Exempt Income Fund and New York Tax-Exempt Money Fund, each of which are non-diversified.
Excelsior Fund and Excelsior Tax-Exempt Fund currently offer shares in sixteen and seven managed investment portfolios, respectively, each having its own investment objectives and policies. The following is a summary of significant accounting policies for Money Fund, Government Money Fund, Treasury Money Fund, portfolios of Excelsior Fund, Tax-Exempt Money Fund and New York Tax-Exempt Money Fund, portfolios of Excelsior Tax-Exempt Fund (the “Portfolios”). Such policies are in conformity with accounting principles generally accepted in the United States of America and are consistently followed by the Funds in the preparation of their financial statements. The preparation of financial statements requires management to make estimates and assumptions that affect the reported amounts and disclosures in the financial statements. Actual results could differ from these estimates.
The Money Fund offers two classes of shares: Shares and Institutional Shares. The Financial Highlights of the Institutional Shares as well as the financial statements for the remaining portfolios of the Funds are presented separately.
With regard to the Portfolios, it is the Funds’ policy, to the extent possible, to maintain a continuous net asset value per share of $1.00. Each of the Portfolios has adopted certain investment portfolio valuation and dividend distribution policies to enable it to do so. However, there can be no assurance that the net asset value per share of the Portfolios will not vary.
(a) Portfolio valuation:
Securities are valued at amortized cost, which has been determined by each Fund’s Board of Directors to represent the fair value of the Portfolios’ investments. Amortized cost valuation involves valuing an instrument at its cost initially and, thereafter, assuming a constant amortization to maturity of any discount or premium.
(b) Security transactions and investment income:
Security transactions are recorded on a trade date basis. Realized gains and losses on investments sold are recorded on the basis of identified cost. Interest income, adjusted for amortization of premiums and discounts on investments, is earned from settlement date and is recorded on the accrual basis.
(c) Repurchase agreements:
Excelsior Fund may purchase portfolio securities from financial institutions deemed to be creditworthy by the investment adviser subject to the seller’s agreement to repurchase and Excelsior
22
Fund’s agreement to resell such securities at mutually agreed upon prices. Securities purchased subject to such repurchase agreements are deposited with Excelsior Fund’s custodian or subcustodian or are maintained in the Federal Reserve/Treasury book-entry system and must have, at all times, an aggregate market value not less than the repurchase price (including accrued interest).
If the value of the underlying securities falls below the value of the repurchase price, Excelsior Fund will require the seller to deposit additional collateral by the next business day. Default or bankruptcy of the seller may, however, expose the applicable Portfolio of Excelsior Fund to possible delay in connection with the disposition of the underlying securities or loss to the extent that proceeds from a sale of the underlying securities were less than the repurchase price under the agreement.
(d) Distributions to shareholders:
Dividends from net investment income are declared daily and paid monthly. Net realized capital gains, unless offset by any available capital loss carryforwards, are distributed to shareholders annually or more frequently to maintain a net asset value of $1.00 per share.
(e) Expense allocation:
Expenses directly attributable to a Portfolio are charged to that Portfolio. Other expenses are allocated to the respective Portfolios based on average daily net assets. Shareholder servicing fees relating to a specific class are charged directly to that class.
2. Investment Advisory Fee, Administration Fee, Shareholder Servicing Fees and Related Party Transactions:
United States Trust Company of New York (“U.S. Trust NY”) and U.S. Trust Company, N.A. (together, the “Adviser” or “U.S. Trust”), acting through their respective registered investment advisory divisions, U.S. Trust New York Asset Management Division and U.S. Trust Company, N.A. Asset Management Division, serve as the investment adviser to the Portfolios. For the services provided pursuant to the Investment Advisory Agreements, the Adviser receives a fee, computed daily and paid monthly, at the annual rates of 0.25% of the average daily net assets of the Money Fund, the Government Money Fund and the Tax-Exempt Money Fund, 0.30% of the average daily net assets of the Treasury Money Fund, and 0.50% of the average daily net assets of the New York Tax-Exempt Money Fund. U.S. Trust NY is a state-chartered bank and trust company and a member bank of the Federal Reserve System. U.S. Trust Company, N.A. is a national bank organized under the laws of the United States. Each is a wholly-owned subsidiary of U.S. Trust Corporation, a registered bank holding company. U.S. Trust Corporation is a wholly-owned subsidiary of The Charles Schwab Corporation (“Schwab”).
U.S. Trust Company, N.A., SEI Investments Global Funds Services and Federated Services Company (collectively, the “Administrators”) provide administrative services to the Funds. For the services provided to the Portfolios, the Administrators are entitled jointly to annual fees, computed daily and paid monthly, based on the combined aggregate average daily net assets of Excelsior Fund, Excelsior Tax-Exempt Fund and Excelsior Funds Trust (excluding the international equity portfolios of Excelsior
23
Fund and Excelsior Funds Trust), all of which are affiliated investment companies, as follows: 0.200% of the first $200 million, 0.175% of the next $200 million, and 0.150% over $400 million. Administration fees payable by each Portfolio of the three investment companies are determined in proportion to the relative average daily net assets of the respective Portfolios for the period paid. Until further notice to the Funds, U.S. Trust Company, N.A. has voluntarily agreed to waive a portion of its administration fee in an amount equal to an annual rate of 0.04% of the average daily net assets of each Portfolio. For the year ended March 31, 2004, administration fees charged by U.S. Trust Company, N.A., were as follows:
| | | | | | | | | |
| | | Administration
Fees
| | Waiver of
Administration
Fees
| | Net Administration
Fees
|
Money Fund | | $ | 2,477,640 | | $ | 825,198 | | $ | 1,652,442 |
Government Money Fund | | | 763,346 | | | 253,755 | | | 509,591 |
Treasury Money Fund | | | 640,389 | | | 213,093 | | | 427,296 |
Tax-Exempt Money Fund | | | 2,548,361 | | | 847,336 | | | 1,701,025 |
New York Tax-Exempt Money Fund | | | 600,090 | | | 199,704 | | | 400,386 |
From time to time, in their sole discretion, U.S. Trust may undertake to waive a portion or all of the fees payable to them and also may reimburse the Portfolios for a portion of other expenses. For the year ended March 31, 2004, U.S. Trust has contractually agreed to waive investment advisory fees and to reimburse other ordinary operating expenses to the extent necessary to keep total operating expenses from exceeding the following annual percentages of each Portfolio’s average daily net assets:
| | | |
Money Fund — Shares | | 0.50 | % |
Government Money Fund | | 0.50 | % |
Treasury Money Fund | | 0.55 | % |
Tax-Exempt Money Fund | | 0.50 | % |
New York Tax-Exempt Money Fund | | 0.60 | % |
With regard to the Institutional Shares of Money Fund, for the year ended March 31, 2004, and until further notice, U.S. Trust contractually agreed to waive fees and reimburse expenses to the extent necessary to maintain an annual expense ratio of not more than 0.25%.
For the year ended March 31, 2004, pursuant to the above, investment advisory fees waived by U.S. Trust were as follows:
| | | |
Money Fund | | $ | 3,771,626 |
New York Tax-Exempt Money Fund | | | 1,028,791 |
The Portfolios have entered into shareholder servicing agreements with various service organizations, which may include Schwab, U.S. Trust and affiliates of U.S. Trust. Services included in the servicing agreements are assisting in processing purchase, exchange, and redemption requests; transmitting and receiving funds in connection with customer orders to purchase, exchange or redeem shares; and providing periodic statements. Shareholder servicing fees are incurred on a Portfolio and class level (where applicable). As a consideration for these services, each service organization receives a fee, computed daily and paid monthly, at an annual rate up to 0.25% (0.40% prior to July 29, 2003) of the average daily net assets of the Portfolios’ shares held by each service organizations’ customers, with
24
the exception of the Institutional Shares of the Money Fund, which pays a fee of up to 0.15% of the average daily net assets of its shares.
U. S. Trust has voluntarily agreed to waive investment advisory and administration fees payable in an amount equal to the shareholder servicing fees payable to affiliates.
For the year ended March 31, 2004, shareholder servicing fees paid to Schwab, U.S. Trust and affiliates of U. S. Trust:
| | | | | | | | | |
| | | Amount Paid
| | Amount
Waived as
Investment
Advisory Fees
| | Amount
Waived as
Administration
Fees
|
Money Fund | | $ | 1,155,681 | | $ | 42,060 | | $ | 1,113,621 |
Government Money Fund | | | 310,801 | | | 310,801 | | | — |
Treasury Money Fund | | | 187,511 | | | 187,511 | | | — |
Tax-Exempt Money Fund | | | 1,947,158 | | | 1,947,158 | | | — |
New York Tax-Exempt Money Fund | | | 30,088 | | | 30,088 | | | — |
Edgewood Services, Inc. (“the Distributor”), a wholly-owned subsidiary of Federated Investors, Inc., serves as the distributor of the Funds. Shares of each Portfolio are sold without a sales charge on a continuous basis by the Distributor.
Boston Financial Data Services, Inc. (“BFDS”) serves as transfer agent to the Portfolios.
Each Independent Director of the Excelsior Fund receives an annual fee of $15,000, plus a meeting fee of $2,500 for each meeting attended. The Chairman receives an additional annual fee of $7,500. Each Independent Director of the Excelsior Tax-Exempt Fund receives an annual fee of $15,000, plus a meeting fee of $2,500 for each meeting attended. The Chairman receives an additional annual fee of $7,500. Each member of the Nominating Committee for Excelsior Fund, Excelsior Tax-Exempt Fund and Excelsior Funds Trust receives a fee of $3,000 for each meeting attended. The Chairman of the Nominating Committee also receives an annual fee of $5,000. In addition, Directors are reimbursed by the Excelsior Fund and Excelsior Tax-Exempt Fund, for reasonable expenses incurred when acting in their capacity as Directors.
3. Federal Taxes:
It is the policy of the Funds that each Portfolio continue to qualify as a regulated investment company, by complying with the requirements of the Internal Revenue Code applicable to regulated investment companies and by distributing substantially all of its taxable earnings to its shareholders.
In order to avoid a Federal excise tax, each Portfolio is required to distribute certain minimum amounts of net realized capital gain and net investment income for the respective periods ending October 31 and December 31 in each calendar year.
Dividends and distributions are determined in accordance with Federal income tax regulations which may differ from accounting principles generally accepted in the United States of America. These differences are primarily due to differing treatments for deferral of losses on wash sales and net capital losses incurred
25
after October 31 and within the taxable year (“Post-October losses”). To the extent these differences are permanent, adjustments are made to the appropriate equity accounts in the period that the differences arise. Accordingly, the following reclassifications have been made to/from the following accounts:
| | | | | | | | | | | |
| | | Undistributed
Net Investment
Income
| | Accumulated
Net Realized
Gain (Loss)
| | | Paid-In Capital
| |
Money Fund | | | — | | $ | 3,436 | | | $ | (3,436 | ) |
Government Money Fund | | | — | | | 1,189 | | | | (1,189 | ) |
Treasury Money Fund | | $ | 2,748 | | | (2,748 | ) | | | — | |
Tax-Exempt Money Fund | | | 53 | | | (53 | ) | | | — | |
The tax character of dividends and distributions declared during the years ended March 31, 2004 and March 31, 2003 were as follows:
| | | | | | | | | | | | |
| | | Ordinary
Income
| | Tax-Exempt
Income
| | Long-Term
Capital
Gains
| | Total
|
Money Fund | | | | | | | | | | | | |
2004 | | $ | 14,865,550 | | | — | | | — | | $ | 14,865,550 |
2003 | | | 31,970,964 | | | — | | | — | | | 31,970,964 |
Government Money Fund | | | | | | | | | | | | |
2004 | | | 3,926,682 | | | — | | | — | | | 3,926,682 |
2003 | | | 8,291,220 | | | — | | | — | | | 8,291,220 |
Treasury Money Fund | | | | | | | | | | | | |
2004 | | | 2,597,162 | | | — | | | — | | | 2,597,162 |
2003 | | | 6,364,693 | | | — | | | — | | | 6,364,693 |
Tax-Exempt Money Fund | | | | | | | | | | | | |
2004 | | | 38,469 | | $ | 11,865,305 | | $ | 273,567 | | | 12,177,341 |
2003 | | | 16,257 | | | 23,449,842 | | | 24,155 | | | 23,490,254 |
New York Tax-Exempt Money Fund | | | | | | | | | | | | |
2004 | | | 31,529 | | | 2,456,266 | | | — | | | 2,487,795 |
2003 | | | 4,787 | | | 5,184,192 | | | 23,128 | | | 5,212,107 |
As of March 31, 2004, the components of distributable earnings (accumulated losses) on a tax basis were as follows:
| | | | | | | | | | | | | | | | | | | | | | | | | | |
| | | Ordinary
Income
| | Tax-Exempt
Income
| | Capital Loss
Carryforward
| | | Post-October
Losses
| | | Wash
Sales
| | | Other
Temporary
Difference
| | | Total
| |
Money Fund | | $ | 946,177 | | | — | | $ | (47,687 | ) | | | — | | | | — | | | $ | (946,177 | ) | | $ | (47,687 | ) |
Government Money Fund | | | 284,088 | | | — | | | (33,689 | ) | | $ | (926 | ) | | | — | | | | (284,088 | ) | | | (34,615 | ) |
Treasury Money Fund | | | 187,791 | | | — | | | — | | | | — | | | | — | | | | (185,044 | ) | | | 2,747 | |
Tax-Exempt Money Fund | | | — | | $ | 1,049,537 | | | — | | | | — | | | $ | (1,823 | ) | | | (1,049,485 | ) | | | (1,771 | ) |
New York Tax-Exempt Money Fund | | | — | | | 200,652 | | | — | | | | (908 | ) | | | — | | | | (200,652 | ) | | | (908 | ) |
For Federal tax purposes, the Portfolios aggregate tax cost is equal to book cost, with the exception of the Tax-Exempt Money Fund, and its tax basis of investments aggregates $2,044,632,903.
26
Post-October losses are deemed to arise on the first business day of a Fund’s next taxable year.
For Federal income tax purposes, capital loss carryforwards may be carried forward and applied against future capital gains. To the extent that such carryforwards are utilized, capital gain distributions will be reduced. At March 31, 2004, the following Portfolios had capital loss carryforwards for Federal tax purposes available to offset future net capital gains through the indicated expiration dates:
| | | | | | |
| | | Money
Fund
| | Government Money Fund
|
Expiration Date March 31: | | | | | | |
2005 | | $ | 12,049 | | | — |
2006 | | | — | | $ | 5,931 |
2007 | | | — | | | 3,297 |
2008 | | | — | | | 18,904 |
2011 | | | 11,663 | | | — |
2012 | | | 23,975 | | | 5,557 |
| | |
|
| |
|
|
Total | | $ | 47,687 | | $ | 33,689 |
| | |
|
| |
|
|
4. Capital Transactions:
Excelsior Fund has authorized capital of 35 billion shares of Common Stock, 29.3756 billion of which is currently classified to represent interests in certain classes of shares. Excelsior Tax-Exempt Fund has authorized capital of 24 billion shares of Common Stock, 15 billion of which is currently classified to represent interests in one of seven separate investment portfolios. Authorized capital currently classified for each Portfolio is as follows: 4 billion shares each of Money Fund and Government Money Fund, 2.5 billion shares of Treasury Money Fund, 2 billion shares of New York Tax-Exempt Money Fund and 5.5 billion shares for Tax-Exempt Money Fund.
Each share has a par value of $0.001 and represents an equal proportionate interest in the particular Portfolio with other shares of the same Portfolio, and is entitled to such dividends and distributions of taxable earnings on the assets belonging to such Portfolio as are declared at the discretion of each Fund’s Board of Directors. Since the Portfolios have sold, reinvested and redeemed shares only at a constant net asset value of $1.00 per share, the number of shares represented by such sales, reinvestments and redemptions is the same as the amounts shown below for such transactions.
| | | | | | | | |
| | | Money Fund
| |
| | | Year Ended
03/31/04
| | | Year Ended 03/31/03
| |
Sold: | | | | | | | | |
Shares | | $ | 4,664,084,234 | | | $ | 5,589,273,181 | |
Institutional Shares | | | 2,751,605,010 | | | | 3,536,340,479 | |
Issued as reinvestment of dividends: | | | | | | | | |
Shares | | | 784,932 | | | | 1,812,339 | |
Institutional Shares | | | 2,186,353 | | | | 4,944,129 | |
Redeemed: | | | | | | | | |
Shares | | | (5,311,141,614 | ) | | | (5,605,547,555 | ) |
Institutional Shares | | | (2,831,721,381 | ) | | | (3,303,057,021 | ) |
| | |
|
|
| |
|
|
|
Net Increase (Decrease) | | $ | (724,202,466 | ) | | $ | 223,765,552 | |
| | |
|
|
| |
|
|
|
27
| | | | | | | | |
| | | Government Money Fund
| |
| | | Year Ended
03/31/04
| | | Year Ended 03/31/03
| |
Sold | | $ | 3,164,391,955 | | | $ | 3,904,759,634 | |
Issued as reinvestment of dividends | | | 271,873 | | | | 744,985 | |
Redeemed | | | (3,214,432,180 | ) | | | (4,106,605,322 | ) |
| | |
|
|
| |
|
|
|
Net (Decrease) | | $ | (49,768,352 | ) | | $ | (201,100,703 | ) |
| | |
|
|
| |
|
|
|
| |
| | | Treasury Money Fund
| |
| | | Year Ended
03/31/04
| | | Year Ended 03/31/03
| |
Sold | | $ | 2,924,119,256 | | | $ | 2,645,547,298 | |
Issued as reinvestment of dividends | | | 641,186 | | | | 1,846,537 | |
Redeemed | | | (2,977,036,353 | ) | | | (2,679,648,517 | ) |
| | |
|
|
| |
|
|
|
Net (Decrease) | | $ | (52,275,911 | ) | | $ | (32,254,682 | ) |
| | |
|
|
| |
|
|
|
| |
| | | Tax-Exempt Money Fund
| |
| | | Year Ended
03/31/04
| | | Year Ended
03/31/03
| |
Sold | | $ | 7,348,246,145 | | | $ | 7,097,135,009 | |
Issued as reinvestment of dividends | | | 360,212 | | | | 801,978 | |
Redeemed | | | (7,584,879,895 | ) | | | (7,339,512,073 | ) |
| | |
|
|
| |
|
|
|
Net (Decrease) | | $ | (236,273,538 | ) | | $ | (241,575,086 | ) |
| | |
|
|
| |
|
|
|
| |
| | | New York Tax-Exempt Money Fund
| |
| | | Year Ended
03/31/04
| | | Year Ended
03/31/03
| |
Sold | | $ | 1,700,208,458 | | | $ | 1,902,878,709 | |
Issued as reinvestment of dividends | | | 422,511 | | | | 832,736 | |
Redeemed | | | (1,759,093,748 | ) | | | (2,051,333,703 | ) |
| | |
|
|
| |
|
|
|
Net (Decrease) | | $ | (58,462,779 | ) | | $ | (147,622,258 | ) |
| | |
|
|
| |
|
|
|
5. Line of Credit:
The Portfolios and other affiliated funds participate in a $50 million unsecured line of credit provided by a syndication of banks, under a line of credit agreement. Borrowings may be made to temporarily finance the redemption of Portfolio shares. Interest is charged to each Portfolio, based on its borrowings, at a rate equal to the Federal Funds Rate plus 0.50% per year. In addition, a commitment fee, equal to an annual rate of 0.15% of the average daily unused portion of the line of credit, is allocated among the participating Portfolios at the end of each quarter, and is included in miscellaneous expenses on the Statements of Operations. For the year ended March 31, 2004, the Portfolios had no borrowings under the agreement.
28
6. Guarantees:
In the normal course of business, the Portfolios enter into contracts that provide general indemnifications. The Portfolios’ maximum exposure under these arrangements is dependent on future claims that may be made against the Portfolios, and therefore, cannot be established; however, based on experience, the risk of loss from such claim is considered remote.
7. Legal Proceedings:
The Adviser and Excelsior Funds, Inc., Excelsior Tax-Exempt Funds, Inc., and Excelsior Funds Trust (the “Companies”) were contacted in September, 2003 by the Office of the New York State Attorney General (the “NYAG”), and the Adviser was contacted by the Securities and Exchange Commission (the “SEC”) and later by the Attorney General of the State of West Virginia in connection with their investigations of practices in the mutual fund industry identified as “market timing” and “late trading” of mutual fund shares (the “Investigations”). The Adviser and the Companies have been cooperating with respect to these Investigations and continue to review the facts and circumstances relevant to the Investigations. As disclosed previously by the Adviser and its affiliates, with respect to the Adviser, these investigations have been focusing on circumstances in which a small number of parties were permitted to engage in short-term trading of certain Excelsior Funds. The short-term trading activities permitted under these arrangements have been terminated and the Adviser has strengthened its policies and procedures to deter frequent trading in the Companies.
Five class actions suits have been filed against the Companies and the Adviser: Mike Sayegh v. Janus Capital Corp.et al., (filed October 22, 2003 in Los Angeles Superior Court); James Page Jr. v. Charles Schwab et al. (filed on November 20, 2003 in the United States District Court for the Northern District of California); A. Joseph Szydlowski v. Charles Schwab et al. (filed December 4, 2003 in the United States District Court for the Southern District of New York); Wilson v. Excelsior Funds, et al. (filed December 10, 2003 in the United States District Court for the Southern District of New York); and John R. Granelli v. Charles Schwab, et al. (filed January 20, 2004 in the United States District Court for the Southern District of New York). While details in each suit vary, in general each alleges that the Adviser, certain of its affiliates, the Companies and others allowed certain parties to engage in illegal and improper mutual fund trading practices, which allegedly caused financial injury to the shareholders of the Companies. Each seeks unspecified monetary damages and related equitable relief.
In addition, two derivative actions, styled Richard Elliott v. Charles Schwab Corporation, et al., No 04 CV 2262 (S.D.N.Y.) and Lou Ann Murphy v. Charles Schwab Corporation et al., (No. 04 CV 3547 (E.D. Penn.), purportedly brought on behalf of Excelsior High Yield Fund and Excelsior Funds Trust, seek unspecific damages arising from alleged violations of Section 36 of the Investment Company Act, 15 U.S.C. § 80a-35(b) and breach of fiduciary duty in relation to allegedly illegal and improper mutual fund trading practices.
The class and derivative actions described above have been transferred to the United District Court for the District of Maryland for coordinated or consolidated pre-trial proceedings. Lead plaintiffs have been appointed and additional defendants have been added (generally consisting of current and former directors and officers of the Companies and entities who timed or facilitated timing in the Excelsior Funds). The seven lawsuits discussed above were consolidated into two new amended complaints, one for the class actions and one for the derivative actions, that were filed on or about September 29, 2004.
29
The plaintiffs in the consolidated class action are seeking unspecified monetary damages from claimed injuries arising from allegedly illegal and improper mutual fund trading practices, as well as disgorgement of investment advisory fees, rescission and restitution of unspecified funds. The plaintiffs in the consolidated derivative action are seeking on behalf of the Companies unspecified monetary damages for similar claimed injuries, as well as removal of Excelsior Fund directors, removal of U.S. Trust as advisor to the Excelsior Funds, rescission of its investment advisory contracts and disgorgement of management fees and compensation relating to the Excelsior Funds.
The Maryland court is expected to establish a briefing schedule prior to year end for motions to dismiss the actions, and the defendants will not be required to answer the complaints until such motions have been decided. Discovery in the actions is currently stayed, although a motion to lift the stay is expected to be filed on or about December 10, 2004 and decided on or after March 1, 2005.
While the ultimate outcome of these matters cannot be predicted with any certainty at this time, based on currently available information, the Adviser believes that the likelihood is remote that the pending private lawsuits and Investigations will have a material adverse financial impact on the Companies, and further believes that the pending Investigations and private lawsuits are not likely to materially affect the Adviser’s ability to provide investment management services to the Companies.
9. Subsequent Events:
Effective December 13, 2004, BISYS Fund Services Ohio, Inc. replaced SEI Investments Global Funds Services as Sub-Administrator of Excelsior Fund and Excelsior Tax-Exempt Fund.
Effective January 1, 2005, BISYS Fund Services Limited Partnership will replace Edgewood Services, Inc. as the Distributor of Excelsior Fund and Excelsior Tax-Exempt Fund.
30
REPORT OF INDEPENDENT REGISTERED PUBLIC ACCOUNTING FIRM
To the Board of Directors and Shareholders of
Excelsior Funds, Inc. and Excelsior Tax-Exempt Funds, Inc.
We have audited the accompanying statements of assets and liabilities, including the portfolios of investments, of the Money, Government Money, Treasury Money, Tax-Exempt Money, and New York Tax-Exempt Money Funds (three of the portfolios constituting the Excelsior Funds, Inc. and two of the portfolios constituting the Excelsior Tax-Exempt Funds, Inc.) (collectively, the “Funds”) as of March 31, 2004, and the related statements of operations, changes in net assets, and the financial highlights for the year then ended. These financial statements and financial highlights are the responsibility of the Funds’ management. Our responsibility is to express an opinion on these financial statements and financial highlights based on our audits. The statements of changes in net assets for the year ended March 31, 2003 and the financial highlights for each of the years in the four year period ended March 31, 2003 were audited by other auditors whose report, dated May 16, 2003, expressed an unqualified opinion on those statements and financial highlights.
We conducted our audits in accordance with standards of the Public Company Accounting Oversight Board (United States). Those standards require that we plan and perform the audit to obtain reasonable assurance about whether the financial statements and financial highlights are free of material misstatement. An audit includes examining, on a test basis, evidence supporting the amounts and disclosures in the financial statements. Our procedures included confirmation of securities owned as of March 31, 2004, by correspondence with the custodian and brokers. An audit also includes assessing the accounting principles used and significant estimates made by management, as well as evaluating the overall financial statement presentation. We believe that our audits provide a reasonable basis for our opinion.
In our opinion, the financial statements and financial highlights referred to above present fairly, in all material respects, the financial position of the Money, Government Money, Treasury Money, Tax-Exempt Money, and New York Tax-Exempt Money Funds as of March 31, 2004, the results of their operations, the changes in their net assets, and the financial highlights for the year then ended, in conformity with accounting principles generally accepted in the United States of America.
DELOITTE & TOUCHE LLP
New York, New York
December 15, 2004
31
CHANGE IN INDEPENDENT REGISTERED PUBLIC ACCOUNTING FIRM (Unaudited)
The Funds’ Boards of Directors/Trustees and Joint Audit Committee terminated Ernst & Young, LLP (“E&Y”) as the Funds’ independent registered public accounting firm on October 28, 2004 as a result of concerns regarding their independence at the time of the issuance of their report on the Funds’ March 31, 2004 financial statements. During the period in which E&Y served as independent registered public accounting firm for the Funds, there were no disagreements between E&Y and the Funds on any matter of accounting principles or practices, financial statement disclosure or auditing scope or procedures. At the request of the Boards and the Joint Audit Committee, Deloitte & Touche LLP has performed a re-audit of the Funds’ March 31, 2004 financial statements, which had previously been audited by E&Y. That report is included in this annual report.
32
Directors/Trustees and Officers of the Excelsior Funds Complex (Unaudited)
Information pertaining to the directors/trustees and officers of Excelsior Fund, Excelsior Tax-Exempt Fund and Excelsior Funds Trust (each a “Company” and collectively, the “Excelsior Funds Complex”) is set forth below. Directors/Trustees who are not deemed to be “interested persons” of the Excelsior Funds Complex as defined in the 1940 Act are referred to as “Independent Board Members.” Directors/Trustees who are deemed to be “interested persons” of the Excelsior Funds Complex are referred to as “Interested Board Members”. The following information is as of December 15, 2004.
| | | | | | | | | | |
Name, Address(1), Age
| | Position(s)
Held with the
Companies
| | Term of
Office and
Length of
Time Served(2)
| | Principal Occupation(s) During Past 5 Years
| | Number of
Portfolios in
Excelsior
Complex
Overseen by
Board Member(3)
| | Other Directorships Held by Board
Member(4)
|
DIRECTORS | | | | | | | | | | |
INDEPENDENT BOARD MEMBERS | | | | | | |
Frederick S. Wonham Age: 73 | | Director/
Trustee Chairman of the Boards | | Since 1997 | | Retired. Chairman of the Boards and Director (since 1997) and President and Treasurer (from 1995 to February 2002) of Excelsior Funds, Inc. and Excelsior Tax-Exempt Funds, Inc.; Chairman of the Board and Trustee (since 1997) and President and Treasurer (from 1995 to February 2002) of Excelsior Funds Trust. | | 31 | | None. |
| | | | | |
Rodman L. Drake
Age: 61 | | Director/Trustee | | Since 1994 | | Director of Excelsior Funds, Inc. and Excelsior Tax-Exempt Funds, Inc. (since 1996); Trustee of Excelsior Funds Trust (since 1994); Co-Founder of Baringo Capital LLC (since 2002); President, Continuation Investments Group, Inc. (from 1997 to 2001). | | 31 | | Director, Parsons Brinkerhoff, Inc. (engineering firm) (since 1995); Director, Clean Fuels Technology Corp. (since 1998); Director and Chairman, Hyperion Total Return Fund, Inc., Hyperion Strategic Mortgage Fund Inc., and Hyperion 2005 Term Trust Inc. (since 1991); Director, Jackson Hewitt Inc. (since June 2004). |
| | | | | |
Mel Hall
Age: 59 | | Director/Trustee | | Since 2000 | | Director of Excelsior Funds, Inc. and Excelsior Tax-Exempt Funds, Inc. (since 2000); Trustee of Excelsior Funds Trust (since 2000); Chief Executive Officer, Comprehensive Health Services, Inc. (health care management and administration) (since 1991). | | 31 | | Chairman, Comprehensive Health Services, Inc. (since 1991). |
| | | | | |
Roger M. Lynch
Age: 64 | | Director/Trustee | | Since 2001 | | Retired. Director of Excelsior Funds, Inc. and Excelsior Tax-Exempt Funds, Inc. and Trustee of Excelsior Funds Trust (since 2001); President, Corporate Asset Funding Co., Inc. (asset securitization) (from 1987 to 1999); Limited Partner (from 1986 to 1999), Goldman Sachs & Co. | | 31 | | Director, SLD Commodities, Inc. (importer of nuts) (since 1991). |
33
| | | | | | | | | | |
Name, Address(1), Age
| | Position(s)
Held with the
Companies
| | Term of
Office and
Length of
Time Served(2)
| | Principal Occupation(s) During Past 5 Years
| | Number of
Portfolios in
Excelsior
Complex
Overseen by
Board Member(3)
| | Other Directorships Held by Board
Member(4)
|
| | | | | |
Jonathan Piel
Age: 65 | | Director/Trustee | | Since 1994 | | Retired. Director, Excelsior Funds, Inc. and Excelsior Tax-Exempt Funds, Inc. (since 1996); Trustee, Excelsior Funds Trust (since 1994). | | 31 | | None. |
| | | |
INTERESTED BOARD MEMBER(5) | | | | | | |
| | | | | |
James L. Bailey
114 West 47th Street
New York, NY 10036 Age: 59 | | Director/Trustee | | Since February 2004 | | Chief Operating Officer of U.S. Trust Corporation (since December 2004) and Executive Vice President of U.S. Trust Corporation and United States Trust Company of New York (since 2003); President, Excelsior Funds, Inc., Excelsior Tax-Exempt Funds, Inc. and Excelsior Funds Trust (from 2003 to July 2004); Consultant in the financial services industry (from August 2000 to January 2003); Executive Vice President of Citicorp (from 1992 to August 2000). | | 31 | | None. |
| | | | | |
OFFICERS | | | | | | | | | | |
| | | | | |
Mary Martinez
114 West 47th Street New York, NY 10036 Age: 44 | | President | | Since July 2004 | | Managing Director of United States Trust Company of New York (since 2003) and Chief Executive Officer of National Private Banking (since October 2004); Managing Director and Director of Relationship Management Service, Marketing, Information and Technology at Bessemer Trust (from 1998 to 2003). | | N/A | | N/A |
| | | | | |
Joseph Trainor, CFA 114 West 47th Street New York, NY 10036 Age: 43 | | Vice President | | Since February 2004 | | Managing Director of United States Trust Company of New York (since 2003) and President, U.S. Trust Institutional; President of MFS Institutional Advisors (from 1998 to 2002). | | N/A | | N/A |
| | | | | |
Agnes Mullady
225 High Ridge Road
Stamford, CT 06905 Age: 45 | | Treasurer/Chief Financial and Chief Accounting Officer | | Since February 2004 | | Senior Vice President, U.S. Trust Company, N.A. (since 2004); Chief Financial Officer, AMIC Distribution Partners (from 2002 to 2004); Controller Reserve Management Corporation, Reserve Management Company, Inc. and Reserve Partners, Inc. (from 2000 to 2002); Vice President and Treasurer, Northstar Funds; Senior Vice President and Chief Financial Officer, Northstar Investment Management Corp.; President and Treasurer, Northstar Administrators Corp.; and Vice President and Treasurer, Northstar Distributors, Inc. (from 1993 to 2000). | | N/A | | N/A |
34
| | | | | | | | | | |
Name, Address(1), Age
| | Position(s)
Held with the
Companies
| | Term of
Office and
Length of
Time Served(2)
| | Principal Occupation(s) During Past 5 Years
| | Number of
Portfolios in
Excelsior
Complex
Overseen by
Board Member(3)
| | Other Directorships Held by Board
Member(4)
|
| | | | | |
Scott Rhodes
225 High Ridge Road
Stamford, CT 06905 Age: 45 | | Vice President and Assistant Treasurer | | Since November 2004 | | Vice President, U.S. Trust Company, N.A. (since August 2004); Vice President, BlackRock Financial Management Inc. (2004); Controller Mutual Funds, American Skandia Investment Services, Inc. and Assistant Treasurer, American Skandia Trust and American Skandia Advisor Funds, Inc. (from 1996 to 2003). | | N/A | | N/A |
| | | | | |
Alexandra Poe
114 West 47th Street
New York, NY 10036 Age: 44 | | Secretary and Chief Legal Officer | | Since May 2004 | | Senior Vice President and Assistant General Counsel, United States Trust Company of New York (since May 2004); Chief Legal Officer for Managed Accounts and Alternative Investment Strategies, Prudential Investments (from 2001 to 2004); Senior Vice President and General Counsel, US Investment Management and Global Hedge Funds and President of the Schroder Mutual Funds, Schroders (from 1996 to 2001). | | N/A | | N/A |
| | | | | |
Sharon M. Davison
114 West 47th Street
New York, NY 10036 Age: 50 | | Chief Compliance Officer | | Since September 2004 | | Senior Vice President of U.S. Trust Company of New York (since 2001); Director of Securities and Corporate Compliance (since 2001); Director of Special Investigations—New York Stock Exchange Division of Market Surveillance (from 2000 to 2001); Senior Counsel—New York Stock Exchange Division of Market Surveillance (from 1997 to 2000). | | N/A | | N/A |
| | | | | |
Wyndham Clark
225 High Ridge Road
Stamford, CT 06905 Age: 46 | | Anti-Money Laundering Officer | | Since May 2004 | | Vice President and AML Officer, U.S. Trust Company, N.A. (since 2003); Vice President and Deputy Director Risk Management, IBJ Whitehall (banking) (from 2001 to 2002); and Vice President and Chief Risk Officer, EMAC, LLC (commercial lender, asset backed security issuer) (from 1999 to 2001). | | N/A | | N/A |
| (1) | Each independent director/trustee may be contacted by writing to Excelsior Funds, 225 High Ridge Road, Stamford, CT 06905. |
| (2) | Each director/trustee shall hold office until the election and qualification of his or her successor, or until he or she sooner dies, resigns or is removed. The president, treasurer and secretary of each Company shall hold office for a one year term and until their respective successors are chosen and qualified, or in each case until he or she sooner dies, resigns, is removed, or becomes disqualified in accordance with each Company’s by-laws. |
| (3) | The Excelsior Funds Complex consists of all registered investment companies (Excelsior Funds Inc., Excelsior Tax-Exempt Funds, Inc. and Excelsior Funds Trust) for which U.S. Trust serves as investment adviser. As of December 15, 2004, the Excelsior Funds Complex consisted of 31 Funds. |
| (4) | Directorships of companies required to report to the Securities and Exchange Commission under the Securities Exchange Act of 1934 (i.e., “public companies”) or other investment companies registered under the 1940 Act. |
| (5) | “Interested person” of the Company is defined in the 1940 Act. Mr. Bailey is considered an “interested person” because of his affiliation with the Adviser. |
For more information regarding the Directors/Trustees and Officers, please refer to the Statement of Additional Information, which is available upon request by calling 1-800-446-1012.
35
Federal Tax Information (Unaudited)
For the year ended March 31, 2004, the designation of long-term capital gains and the percentage of income earned from direct treasury obligations were as follows:
| | | | | |
| | | 20%
Long-Term
Capital Gains
| | Treasury
Income
Earned
|
Money Fund | | | — | | 10.44% |
Government Money Fund | | | — | | 50.83% |
Treasury Money Fund | | | — | | 97.78% |
Tax-Exempt Money Fund | | $ | 273,594 | | — |
For the year ended March 31, 2004, the percentage of exempt interest dividends paid was approximated as follows:
| | |
Tax-Exempt Money Fund | | 97.53% |
New York Tax-Exempt Money Fund | | 98.84% |
36
[THIS PAGE INTENTIONALLY LEFT BLANK]
AR-MM-1204-42598

TAX-EXEMPT
FIXED INCOME
PORTFOLIOS
ANNUAL REPORT
March 31, 2004
TABLE OF CONTENTS
For shareholder account information, current price and yield quotations, or to make an initial purchase or obtain a prospectus, call 1-800-446-1012, from overseas, call 617-483-7297.
Internet Address: http://www.excelsiorfunds.com
This report must be preceded or accompanied by a current prospectus.
A description of the policies and procedures that Excelsior Funds use to determine how to vote proxies relating to portfolio securities is available (i) without charge, upon request, by calling 1-800-446-1012, and (ii) on the Excelsior Funds’ website.
You should consider the Fund’s investment objectives, risks, charges and expenses carefully before you invest. Information about these and other important subjects is in the fund’s prospectus, which you should read carefully before investing.
Excelsior Tax-Exempt Funds, Inc. are distributed by Edgewood Services, Inc.
You may write to Excelsior Tax-Exempt Funds, Inc. at the following address:
Excelsior Funds
P.O. Box 8529
Boston, MA 02266-8529
SHARES IN THE FUNDS ARE NOT DEPOSITS OR OBLIGATIONS OF, OR GUARANTEED OR ENDORSED BY, UNITED STATES TRUST COMPANY OF NEW YORK, U.S. TRUST COMPANY, N.A., THEIR PARENT OR AFFILIATES AND SHARES ARE NOT INSURED BY THE FEDERAL DEPOSIT INSURANCE CORPORATION, THE FEDERAL RESERVE BOARD, OR ANY OTHER AGENCY. INVESTMENTS IN THE FUNDS INVOLVE INVESTMENT RISKS, INCLUDING POSSIBLE LOSS OF PRINCIPAL. FUND SHARES ARE NOT INSURED OR GUARANTEED BY THE U.S. GOVERNMENT.
LETTER TO SHAREHOLDERS
December 15, 2004
Dear Valued Excelsior Shareholder:
We are reissuing our 2004 annual report following the termination of Ernst & Young (“E&Y”) as the Funds’ auditor. As previously communicated, on October 28, 2004 the Funds’ Boards of Directors/Trustees terminated E&Y as the Funds’ independent registered public accounting firm as a result of concerns regarding their independence at the time of the issuance of their report. The Boards and their Chief Financial Officer have reviewed the Funds March 31, 2004 financial statements and have concluded that they fairly represent, in all material respects, the financial position of the Funds.
In addition, the Boards of the Funds engaged Deloitte & Touche (“D&T”) as the Funds’ independent registered public accounting firm, and D&T has performed a re-audit of the Funds’ March 31, 2004 financial statements. As stated in the enclosed report, in Deloitte & Touche’s opinion, the financial statements present fairly, in all material respects, the financial position of the Funds as of March 31, 2004.
At Excelsior we are committed to helping our shareholders’ long term investments grow. We are defined by our ability to give our shareholders the reassurance and comfort of a steady return over the long term. As always, we value your confidence in selecting Excelsior to fulfill your investment needs.
Sincerely,

Mary Martinez
President
1
EXCELSIOR TAX-EXEMPT FUNDS, INC. ADVISER’S FIXED INCOME MARKET REVIEW |
In the fiscal first quarter of 2003, interest rates declined by 25 to 30 basis points (“bp”) across the yield curve. Higher yields in the beginning of the quarter (the 10 year Treasury was just over 4%), gave way to a sharp decline in rates in the middle of the quarter in response to weaker economic data. Interest rates bottomed out in the middle of June just prior to the 13th rate cut by the Federal Reserve. The federal funds rate was reduced by 25 bp to a generation low of 1%, while the discount rate was kept at 0.75%. After reaching record low yields (the 2 year Treasury came close to 2%), interest rates then rose 40 to 50 bp into quarter end. By the end of the quarter, the yield on the 2 year Treasury was 1.3%, while the 5 year and 10 year Treasury yields were at 2.4% and 3.5%, respectively. Adjusting for the roll of the newly issued Treasury securities during the quarter, the shape of the yield curve was relatively unchanged with the 2 year/30 year spread ending the quarter at 326 bp.
Municipal securities, on the other hand, rallied in mid-April, propelled by the increasing awareness that the economy had not been restrained by the Iraq war alone. The positive momentum continued into June, but then dwindled in the run up to the Federal Open Market Committee meeting on June 25th. In the final weeks of the quarter, interest rates ratcheted higher as investors focused their attention on prospects of a stronger economy fueled by a combination of fiscal and monetary stimulus as well as a weaker dollar.
The fiscal second quarter proved to be another extremely volatile period for the fixed-income markets. Treasury yields, for instance, saw notably wide swings. In the first two months of the quarter, interest rates rose by over 100 basis points for 3 to 10 year securities on signs of stronger economic growth. The yield on the 10 year Treasury note, for example, climbed to a high of 4.6% from 3.5% at the end of June. The last month of the quarter, however, saw a significant decline in the rise in yields on concern that the rebound in the economy could not be sustained at the same pace. In September, Treasury yields dropped by 30-60 bp. For the quarter, the Treasury yield curve steepened at the front end with the 2 year/5 year spread widening by 26 bp. The curve beyond 5 years flattened as the 5 year/30 year spread narrowed by 9 bp to 205 bp. Municipal securities followed a similar pattern, continuing trends that had been in place through much of the previous fiscal year.
In the fiscal third quarter, Treasury yields rose as a result of continued acceleration in economic growth and improvement in the equity markets. For the period, municipal securities decisively outperformed Treasuries, most notably on the longer end of the yield curve (beyond seven years), while municipal interest rates actually declined modestly for the period. In general, municipal interest rates rose through mid-October, and then began a volatile two-month decline, which ended in mid-December. During the quarter continued strong investor demand combined with lighter supply was the impetus for the strong relative performance of municipal securities as compared to Treasuries.
In the final quarter of the fiscal year, Treasuries rallied and yields declined overall. The yield on the 10 year Treasury note, for instance, declined by over 40 bp in the period, falling below 3.75% for the first time since last summer, to end the quarter at 3.85%. The intermediate part of the curve experienced the greatest drop in yields as the yield on the 5 year Treasury note declined more than 45 bp to 2.78%. Inflation remained low which, along with muted job growth, kept the Federal Reserve from raising its target interest rate of 1%. Reversing the trend, the Treasury yield curve flattened at the front end with the 2 year/5 year spread narrowing by approximately 22 bp. Beyond 5 years, there was further steepening in the yield curve as the 5 year/ 30 year spread widened an additional 17 bp to 199 bp. Municipal yields, on the other hand, were essentially flat across the board for the three month period, significantly underperforming Treasuries and taxable fixed-income securities in the period. As has been the case for some time now, the almost identical beginning and ending yield numbers mask considerable intra-quarter volatility.
2
EXCELSIOR TAX-EXEMPT FUNDS, INC. L ONG-TERM TAX-EXEMPT FUND |
For the fiscal first half of the year ended March 31, 2004, Fund investment activity was minimal, as we remained comfortable with the Fund’s barbell structure and strategy. We did sell several bonds with short calls. As all long bonds were by and large trading at their calls, we moved out toward bonds with longer (10-year) call provisions. Fund performance came in slightly below the Merrill Lynch 22+ Year Muni Index, its benchmark, in the first half of the year. In the fiscal third quarter, we raised cash to 40% and maintained a similarly defensive strategy in anticipation of higher long-term interest rates. In the final quarter, we did make a single purchase as the market rallied. We nevertheless maintained roughly 40% cash reserves. To sum up the fiscal year as a whole, we were expecting interest rates to rise and so had positioned the Fund defensively with large cash positions; unfortunately, rates declined, and thus the cash position proved to be a drag on the Fund’s performance. For the twelve months ended March 31, 2004, the Fund posted a total return of 4.01%* ranking 260 out of 299 funds, based on total return, in the Lipper General Municipal Debt Fund category**. The Fund ranked 153 and 13 among 229 and 120 funds, respectively, for the same Lipper category for the five and ten years ended March 31, 2004, with cumulative total returns of 23.43%* and 86.89%,* respectively.
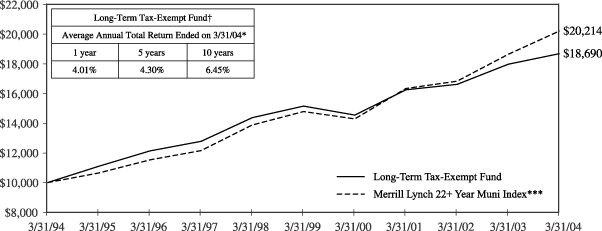
Past performance is not predictive of future performance. Investment returns and principal values will vary and shares may be worth more or less at redemption than their original cost. A portion of the Fund’s income may be subject to the Alternative Minimum Tax and some investors may be subject to certain state and local taxes.
The above illustration compares a $10,000 investment made in the Fund and a broad-based index over the past ten fiscal years. The chart assumes all dividends and capital gain distributions are reinvested. The Fund’s performance takes into account fees and expenses. The index does not take into account charges, fees and other expenses. Further, information relating to Fund performance is contained in the Financial Highlights section of the Prospectus and elsewhere in this report.
| * | | Total return represents the change during the period in a hypothetical account with dividends reinvested. |
| ** | | Source: Lipper, Inc.—Lipper is an independent mutual fund performance monitor. Lipper rankings do not consider sales charges. |
| *** | | Source: Merrill Lynch—the Merrill Lynch 22+ Year Muni Index consists of bonds with an outstanding par which is greater than or equal to 25 million and a maturity range greater than or equal to 22 years. |
| † | | Currently certain fees are waived. Had such fees not been waived, returns would have been lower. Returns do not reflect the deduction of taxes that a shareholder would pay on Fund distributions or the redemption of shares. |
3
EXCELSIOR TAX-EXEMPT FUNDS, INC. INTERMEDIATE-TERM TAX-EXEMPT FUND |
In the fiscal first quarter of the year ended March 31, 2004, we kept investment activity to a minimum as we were satisfied with the defensive structure of the Fund. Given the drop in interest rates, and the steepness of the yield curve, we continued to replace 5 and 6 year bonds with 10 year bonds. At the same time, we increased the Fund’s cash position by about 5% (to roughly 29%) while maintaining a 6.25 year average maturity. In the ensuing two fiscal quarters, we pursued a similar strategy, making relatively few changes to the Fund. During the final quarter of the fiscal year, we did extend the Fund’s average maturity by two to three months; we also put the Fund’s cash to work, bringing the number down to roughly 24%. We continued to maintain a slight barbell position, with 7 to 10 year non-callable bonds and cash, as we waited for the yield curve to flatten. For the fiscal year as a whole, the Fund’s cash position detracted from Fund performance; at the same time, however, the Fund’s roughly six year average maturity proved a partial offset, as did the fact that the yield curve between 5 and 10 year issues flattened modestly for the year. For the fiscal year ended, March 31, 2004, the Fund realized a total return of 4.19%* and ranked 77 out of 148 funds, based on total return, in the Lipper Intermediate Municipal Debt Fund category**. The Fund ranked 47 and 14 among 97 and 66 funds, respectively, for the same Lipper category for the five and ten years ended March 31, 2004, with cumulative total returns of 27.75%* and 76.68%,* respectively.
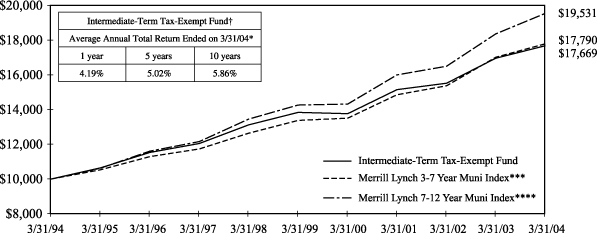
Past performance is not predictive of future performance. Investment returns and principal values will vary and shares may be worth more or less at redemption than their original cost. A portion of the Fund’s income may be subject to the Alternative Minimum Tax and some investors may be subject to certain state and local taxes.
The above illustration compares a $10,000 investment made in the Fund and broad-based indices over the past ten fiscal years. The chart assumes all dividends and capital gain distributions are reinvested. The Fund’s performance takes into account fees and expenses. The indices do not take into account charges, fees and other expenses. Further information relating to Fund performance is contained in the Financial Highlights section of the Prospectus and elsewhere in this report.
| * | | Total return represents the change during the period in a hypothetical account with dividends reinvested. |
| ** | | Source: Lipper, Inc.—Lipper is an independent mutual fund performance monitor. Lipper rankings do not consider sales charges. |
| *** | | Source: Merrill Lynch—the Merrill Lynch 3-7 Year Muni Index is a widely-accepted unmanaged market-weighted index comprised of fixed-rate, coupon-bearing bonds issued within five years of the most recent month-end with greater than $50 million principal amount having a Moody’s investment grade rating and maturities of three to seven years. |
| **** | | Source: Merrill Lynch—the Merrill Lynch 7-12 Year Muni Index is a widely-accepted unmanaged market-weighted index comprised of fixed-rate, coupon-bearing bonds issued within five years of the most recent month-end with greater than $50 million principal amount having a Moody’s investment grade rating and maturities of seven to twelve years. |
| † | | Currently certain fees are waived. Had such fees not been waived, returns would have been lower. Returns do not reflect the deduction of taxes that a shareholder would pay on Fund distributions or the redemption of shares. |
4
EXCELSIOR TAX-EXEMPT FUNDS, INC. SHORT-TERM TAX-EXEMPT SECURITIES FUND |
In the fiscal first quarter, of the year ended March 31, 2004, while cash inflows to the Fund continued at a rapid pace, putting the money to work effectively in two or three year bonds proved challenging as rates dropped sharply in the period. We saw little to be gained at that point—in terms of higher yields—by extending the Fund’s average maturity. In other words, as the yield spread between the very short end and the one to two year area was virtually flat, we saw little incentive to extend. That said, given the cash inflows, we did make several purchases in the 1.5-2 year range in the fiscal first quarter. At the end of this period, the average life of the Fund stood at roughly 5 months, down from about 8 months. We maintained roughly a 45% cash level as we awaited an upturn in rates. In the fiscal second and third quarters, as short rates did indeed back up, we deployed cash and equivalents, bringing the number from 48% to 25%, and extended the Fund’s average maturity from 4 months to approximately 2 years. These moves contributed positively to the Fund’s performance. In the fiscal fourth quarter, cash inflows to the Fund continued at a rapid rate. Even so, although we put the cash to work wherever possible, between cash inflows and maturing issues, the cash level had grown to 45% by the end of the fiscal year. By year end, the average maturity had declined from 2.0 years to 1.5 years, much of it caused merely by the passage of time.
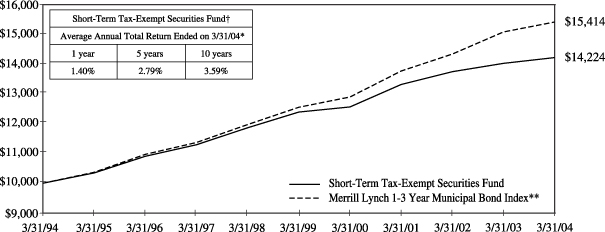
Past performance is not predictive of future performance. Investment returns and principal values will vary and shares may be worth more or less at redemption than their original cost. A portion of the Fund’s income may be subject to the Alternative Minimum Tax and some investors may be subject to certain state and local taxes.
The above illustration compares a $10,000 investment made in the Fund and a broad-based index over the past ten fiscal years. The chart assumes all dividends and capital gain distributions are reinvested. The Fund’s performance takes into account fees and expenses. The index does not take into account charges, fees and other expenses. Further information relating to Fund performance is contained in the Financial Highlights section of the Prospectus and elsewhere in this report.
| * | | Total return represents the change during the period in a hypothetical account with dividends reinvested. |
| ** | | Source: Merrill Lynch—the Merrill Lynch 1-3 Year Municipal Bond Index is a widely-accepted unmanaged market-weighted index comprised of fixed-rate, coupon-bearing bonds issued within five years of the most recent month-end with greater than $50 million principal amount having a Moody’s investment grade rating and maturities of one to three years. |
| † | | Currently certain fees are waived. Had such fees not been waived, returns would have been lower. Returns do not reflect the deduction of taxes that a shareholder would pay on Fund distributions or the redemption of shares. |
5
EXCELSIOR TAX-EXEMPT FUNDS, INC. NEW YORK INTERMEDIATE-TERM TAX-EXEMPT FUND |
In the fiscal first quarter of the year ended March 31, 2004, we kept Fund activity to a minimum as we were satisfied with its structure, which was positioned defensively to wait for an increase in interest rates. Given the drop in rates, and the steepness of the yield curve, we continued to replace 5 and 6 year bonds with 10 year bonds. At the same time, we increased cash by about 5% (to roughly 29%) while maintaining an approximate 6.25 year average maturity. In the ensuing two fiscal quarters, we pursued a similar strategy, making relatively few changes to the Fund. In the final fiscal quarter, we made a single purchase, extending the average maturity of the Fund by roughly two to three months, bringing cash from 29% to approximately 25%. We continued to maintain a slight barbell position, with 7 to 10 year non-callable bonds and cash, as we waited for the yield curve to flatten. For the fiscal year as a whole, the Fund’s cash position detracted from Fund performance; at the same time, however, the Fund’s approximate six year average maturity proved a partial offset, as did the fact that the yield curve between 5 and 10 year issues flattened modestly for the year. Finally, New York credit-related issues had no impact on the Fund’s performance as the average rating on the Fund’s holding was AA-plus.
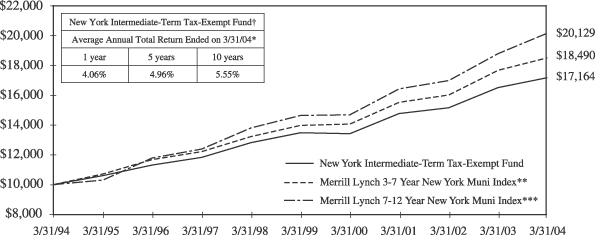
Past performance is not predictive of future performance. Investment returns and principal values will vary and shares may be worth more or less at redemption than their original cost. A portion of the Fund’s income may be subject to the Alternative Minimum Tax.
The above illustration compares a $10,000 investment made in the Fund and broad-based indices over the past ten fiscal years. The chart assumes all dividends and capital gain distributions are reinvested. The Fund’s performance takes into account fees and expenses. The indices do not take into account charges, fees and other expenses. Further information relating to Fund performance is contained in the Financial Highlights section of the Prospectus and elsewhere in this report.
| * | | Total return represents the change during the period in a hypothetical account with dividends reinvested. |
| ** | | Source: Merrill Lynch—the Merrill Lynch 3-7 Year New York Muni Index is a widely-accepted unmanaged market-weighted index comprised of fixed-rate, coupon-bearing bonds of New York Municipalities issued within five years of the most recent month-end with greater than $50 million principal amount having a Moody’s investment grade rating and maturities of three to seven years. |
| *** | | Source: Merrill Lynch—the Merrill Lynch 7-12 Year New York Muni Index is a widely-accepted unmanaged market-weighted index comprised of fixed-rate, coupon-bearing bonds of New York Municipalities issued within five years of the most recent month-end with greater than $50 million principal amount having a Moody’s investment grade rating and maturities of seven to twelve years. |
| † | | Currently certain fees are waived. Had such fees not been waived, returns would have been lower. Returns do not reflect the deduction of taxes that a shareholder would pay on Fund distributions or the redemption of shares. |
6
EXCELSIOR TAX-EXEMPT FUNDS, INC. CALIFORNIA TAX-EXEMPT INCOME FUND |
Although tax-exempt yields were very similar at the end of the fiscal year of March 31, 2004, to the beginning, there was still a fair amount of volatility throughout the year. Yields rose sharply across all markets in late June and July, 2003, and otherwise trended generally lower, ending with little change for the fiscal year. The yield spread between California and national bonds remained very narrow in intermediate maturities. California bond yields historically are lower than national bonds by 15-25 basis points, but with the budget difficulties the State has endured over the last few years, that relationship has changed to 5 to 10 basis points. As California finances improve, and the yield relationship returns to historical norms, the relative performance of California portfolios should also improve. Over the past year we have emphasized high quality, short to intermediate California bonds, with higher coupons in an effort to protect the Fund from high volatility. With interest rates remaining low, our strategy has been to keep the duration of the Fund shorter than our comparable national benchmark, to be defensively positioned in the event that rates rose. Duration is a measure of a security’s price sensitivity to changes in interest rates. The Fund had a duration of 3.48 at the end of the fiscal year, compared to 4.38 for the Merrill Lynch 3-7 Year Municipal Index, the Fund’s benchmark. Because rates did not rise significantly over the year, longer bonds performed somewhat better than the Fund’s more defensive shorter to intermediate term bonds, negatively impacting Fund performance.
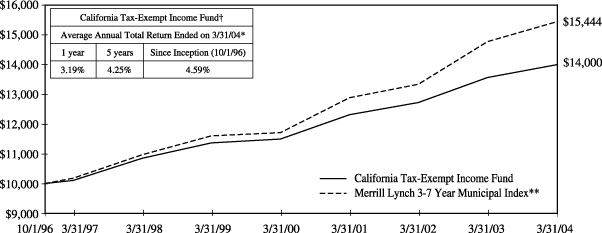
Past performance is not predictive of future performance. Investment returns and principal values will vary and shares may be worth more or less at redemption than their original cost. A portion of the Fund’s income may be subject to the Alternative Minimum Tax.
The above illustration compares a $10,000 investment made in the Fund and a broad-based index since 10/1/96 (inception date). The chart assumes all dividends and capital gain distributions are reinvested. The Fund’s performance takes into account fees and expenses. The index does not take into account charges, fees and other expenses. Further information relating to Fund performance is contained in the Financial Highlights section of the Prospectus and elsewhere in this report.
| * | | Total return represents the change during the period in a hypothetical account with dividends reinvested. |
| ** | | Source: Merrill Lynch—the Merrill Lynch 3-7 Year Municipal Index is a widely-accepted unmanaged market-weighted index comprised of fixed-rate, coupon-bearing bonds issued within five years of the most recent month-end with greater than $50 million principal amount having a Moody’s investment grade rating and maturities of three to seven years. |
| † | | Currently certain fees are waived. Had such fees not been waived, returns would have been lower. Returns do not reflect the deduction of taxes that a shareholder would pay on Fund distributions or the redemption of shares. |
7
Excelsior Tax-Exempt Funds, Inc.
Statements of Assets and Liabilities
March 31, 2004
| | | | | | | | | | | | | | | | | |
| | | | | |
| | | Long-Term
Tax-Exempt
Fund
| | | Intermediate-
Term
Tax-Exempt
Fund
| | Short-Term
Tax-Exempt
Securities
Fund
| | New York
Intermediate-
Term
Tax-Exempt
Fund
| | California
Tax-Exempt
Income
Fund
| |
ASSETS: | | | | | | | | | | | | | | | | | |
Investments, at cost–see accompanying portfolios | | $ | 70,893,065 | | | $ | 368,382,039 | | $ | 359,682,386 | | $ | 170,982,472 | | $ | 64,463,629 | |
| | |
|
|
| |
|
| |
|
| |
|
| |
|
|
|
Investments, at value (Note 1) | | $ | 72,303,672 | | | $ | 384,464,086 | | $ | 361,112,928 | | $ | 176,358,201 | | $ | 67,380,775 | |
Interest receivable | | | 661,591 | | | | 4,033,763 | | | 3,234,966 | | | 2,213,021 | | | 743,045 | |
Receivable for fund shares sold | | | 40 | | | | 222,118 | | | 495,115 | | | 50 | | | 45,000 | |
| | |
|
|
| |
|
| |
|
| |
|
| |
|
|
|
Total Assets | | | 72,965,303 | | | | 388,719,967 | | | 364,843,009 | | | 178,571,272 | | | 68,168,820 | |
LIABILITIES: | | | | | | | | | | | | | | | | | |
Payable for dividends declared | | | 124,769 | | | | 780,631 | | | 268,034 | | | 308,484 | | | 155,650 | |
Payable for fund shares redeemed | | | 2,813 | | | | 121,003 | | | 3,809,927 | | | 41,592 | | | 2,027 | |
Payable for investments purchased | | | — | | | | — | | | — | | | — | | | 1,083,130 | |
Investment advisory fees payable
(Note 2) | | | 31,417 | | | | 115,577 | | | 91,663 | | | 76,525 | | | 13,711 | |
Administration fees payable (Note 2) | | | 6,984 | | | | 36,704 | | | 33,968 | | | 17,010 | | | 6,326 | |
Shareholder servicing fees payable
(Note 2) | | | 3,044 | | | | 2,317 | | | 468 | | | 968 | | | 531 | |
Directors’ fees payable (Note 2) | | | 78 | | | | 576 | | | 962 | | | 279 | | | 131 | |
Accrued expenses and other payables | | | 13,108 | | | | 39,383 | | | 34,350 | | | 19,343 | | | 12,938 | |
| | |
|
|
| |
|
| |
|
| |
|
| |
|
|
|
Total Liabilities | | | 182,213 | | | | 1,096,191 | | | 4,239,372 | | | 464,201 | | | 1,274,444 | |
| | |
|
|
| |
|
| |
|
| |
|
| |
|
|
|
NET ASSETS | | $ | 72,783,090 | | | $ | 387,623,776 | | $ | 360,603,637 | | $ | 178,107,071 | | $ | 66,894,376 | |
| | |
|
|
| |
|
| |
|
| |
|
| |
|
|
|
NET ASSETS consist of: | | | | | | | | | | | | | | | | | |
Undistributed net investment income | | $ | 124 | | | $ | 5,545 | | $ | 12,685 | | $ | 2,025 | | $ | 1,264 | |
Accumulated net realized gain (loss) on investments | | | (548,190 | ) | | | 1,544,163 | | | 47,830 | | | 893,417 | | | (664 | ) |
Unrealized appreciation of investments | | | 1,410,607 | | | | 16,082,047 | | | 1,430,542 | | | 5,375,729 | | | 2,917,146 | |
Par value (Note 5) | | | 7,218 | | | | 39,982 | | | 49,972 | | | 19,865 | | | 8,933 | |
Paid-in capital in excess of par value | | | 71,913,331 | | | | 369,952,039 | | | 359,062,608 | | | 171,816,035 | | | 63,967,697 | |
| | |
|
|
| |
|
| |
|
| |
|
| |
|
|
|
Total Net Assets | | $ | 72,783,090 | | | $ | 387,623,776 | | $ | 360,603,637 | | $ | 178,107,071 | | $ | 66,894,376 | |
| | |
|
|
| |
|
| |
|
| |
|
| |
|
|
|
Shares of Common Stock Outstanding | | | 7,217,714 | | | | 39,982,381 | | | 49,971,986 | | | 19,865,164 | | | 8,932,643 | |
NET ASSET VALUE PER SHARE (net assets ÷ shares outstanding): | | | $10.08 | | | | $9.69 | | | $7.22 | | | $8.97 | | | $7.49 | |
| | |
|
|
| |
|
| |
|
| |
|
| |
|
|
|
See Notes to Financial Statements.
8
Excelsior Tax-Exempt Funds, Inc.
Statements of Operations
Year Ended March 31, 2004
| | | | | | | | | | | | | | | | | | | | |
| | | | | |
| | | Long-Term
Tax-Exempt
Fund
| | | Intermediate-
Term Tax-Exempt
Fund
| | | Short-Term
Tax-Exempt
Securities
Fund
| | | New York
Intermediate-
Term Tax-Exempt
Fund
| | | California
Tax-Exempt
Income Fund
| |
INVESTMENT INCOME: | | | | | | | | | | | | | | | | | | | | |
Interest income | | $ | 2,810,719 | | | $ | 12,628,806 | | | $ | 4,945,214 | | | $ | 5,629,472 | | | $ | 2,351,581 | |
| | |
|
|
| |
|
|
| |
|
|
| |
|
|
| |
|
|
|
EXPENSES: | | | | | | | | | | | | | | | | | | | | |
Investment advisory fees (Note 2) | | | 418,154 | | | | 1,402,773 | | | | 935,193 | | | | 911,564 | | | | 323,741 | |
Administration fees (Note 2) | | | 126,532 | | | | 606,366 | | | | 471,612 | | | | 275,827 | | | | 97,957 | |
Shareholder servicing fees (Note 2) | | | 39,400 | | | | 275,566 | | | | 245,730 | | | | 24,543 | | | | 103,599 | |
Transfer agent fees (Note 2) | | | 23,933 | | | | 27,451 | | | | 7,484 | | | | 8,913 | | | | 3,422 | |
Registration and filing fees | | | 18,746 | | | | 22,172 | | | | 15,269 | | | | 16,286 | | | | 12,413 | |
Legal and audit fees | | | 18,439 | | | | 92,999 | | | | 74,471 | | | | 43,054 | | | | 14,861 | |
Custodian fees | | | 11,388 | | | | 44,455 | | | | 35,351 | | | | 21,204 | | | | 9,000 | |
Directors’ fees and expenses (Note 2) | | | 4,347 | | | | 20,566 | | | | 16,023 | | | | 9,440 | | | | 3,356 | |
Shareholder reports | | | 1,761 | | | | 11,226 | | | | 10,686 | | | | 5,061 | | | | 2,014 | |
Miscellaneous expenses | | | 7,035 | | | | 29,303 | | | | 23,641 | | | | 14,001 | | | | 10,169 | |
| | |
|
|
| |
|
|
| |
|
|
| |
|
|
| |
|
|
|
Total Expenses | | | 669,735 | | | | 2,532,877 | | | | 1,835,460 | | | | 1,329,893 | | | | 580,532 | |
Fees waived and reimbursed by: | | | | | | | | | | | | | | | | | | | | |
Investment adviser (Note 2) | | | (25,555 | ) | | | (135,324 | ) | | | (234,580 | ) | | | (15,817 | ) | | | (230,672 | ) |
Administrator (Note 2) | | | (33,453 | ) | | | (160,319 | ) | | | (124,693 | ) | | | (72,926 | ) | | | (25,899 | ) |
| | |
|
|
| |
|
|
| |
|
|
| |
|
|
| |
|
|
|
Net Expenses | | | 610,727 | | | | 2,237,234 | | | | 1,476,187 | | | | 1,241,150 | | | | 323,961 | |
| | |
|
|
| |
|
|
| |
|
|
| |
|
|
| |
|
|
|
NET INVESTMENT INCOME | | | 2,199,992 | | | | 10,391,572 | | | | 3,469,027 | | | | 4,388,322 | | | | 2,027,620 | |
| | |
|
|
| |
|
|
| |
|
|
| |
|
|
| |
|
|
|
REALIZED AND UNREALIZED GAIN (LOSS) ON INVESTMENTS (Note 1): | | | | | | | | | | | | | | | | | | | | |
Net realized gain (loss) on security transactions | | | 2,026,982 | | | | 6,421,021 | | | | 138,268 | | | | 4,269,437 | | | | (664 | ) |
Change in unrealized appreciation/depreciation of investments during the year | | | (1,032,776 | ) | | | (435,500 | ) | | | 573,155 | | | | (1,558,337 | ) | | | (12,855 | ) |
| | |
|
|
| |
|
|
| |
|
|
| |
|
|
| |
|
|
|
Net realized and unrealized gain (loss) on investments | | | 994,206 | | | | 5,985,521 | | | | 711,423 | | | | 2,711,100 | | | | (13,519 | ) |
| | |
|
|
| |
|
|
| |
|
|
| |
|
|
| |
|
|
|
Net increase in net assets resulting from operations | | $ | 3,194,198 | | | $ | 16,377,093 | | | $ | 4,180,450 | | | $ | 7,099,422 | | | $ | 2,014,101 | |
| | |
|
|
| |
|
|
| |
|
|
| |
|
|
| |
|
|
|
See Notes to Financial Statements.
9
Excelsior Tax-Exempt Funds, Inc.
Statements of Changes in Net Assets
| | | | | | | | | | | | | | | | | | | | |
| | | | | |
| | | Long-Term
Tax-Exempt
Fund
| | | Intermediate-
Term
Tax-Exempt
Fund
| | | Short-Term
Tax-Exempt
Securities
Fund
| | | New York
Intermediate-
Term
Tax-Exempt
Fund
| | | California
Tax-Exempt
Income
Fund
| |
Year Ended March 31, 2004 | | | | | | | | | | | | | | | | | | | | |
Net investment income | | $ | 2,199,992 | | | $ | 10,391,572 | | | $ | 3,469,027 | | | $ | 4,388,322 | | | $ | 2,027,620 | |
Net realized gain (loss) on security transactions | | | 2,026,982 | | | | 6,421,021 | | | | 138,268 | | | | 4,269,437 | | | | (664 | ) |
Change in unrealized appreciation/depreciation of investments during the year | | | (1,032,776 | ) | | | (435,500 | ) | | | 573,155 | | | | (1,558,337 | ) | | | (12,855 | ) |
| | |
|
|
| |
|
|
| |
|
|
| |
|
|
| |
|
|
|
Net increase in net assets resulting from operations | | | 3,194,198 | | | | 16,377,093 | | | | 4,180,450 | | | | 7,099,422 | | | | 2,014,101 | |
Distributions to shareholders: | | | | | | | | | | | | | | | | | | | | |
From net investment income | | | (2,199,868 | ) | | | (10,386,027 | ) | | | (3,456,342 | ) | | | (4,385,426 | ) | | | (2,026,301 | ) |
From net realized gain on investments | | | — | | | | (13,530,881 | ) | | | — | | | | (5,786,218 | ) | | | — | |
| | |
|
|
| |
|
|
| |
|
|
| |
|
|
| |
|
|
|
Total distributions to shareholders | | | (2,199,868 | ) | | | (23,916,908 | ) | | | (3,456,342 | ) | | | (10,171,644 | ) | | | (2,026,301 | ) |
| | |
|
|
| |
|
|
| |
|
|
| |
|
|
| |
|
|
|
Increase (decrease) in net assets from fund share transactions (Note 5) | | | (23,176,722 | ) | | | (11,938,064 | ) | | | 68,597,584 | | | | (6,220,877 | ) | | | 712,830 | |
| | |
|
|
| |
|
|
| |
|
|
| |
|
|
| |
|
|
|
Net increase (decrease) in net assets | | | (22,182,392 | ) | | | (19,477,879 | ) | | | 69,321,692 | | | | (9,293,099 | ) | | | 700,630 | |
NET ASSETS: | | | | | | | | | | | | | | | | | | | | |
Beginning of year | | $ | 94,965,482 | | | $ | 407,101,655 | | | $ | 291,281,945 | | | $ | 187,400,170 | | | $ | 66,193,746 | |
| | |
|
|
| |
|
|
| |
|
|
| |
|
|
| |
|
|
|
End of year (1) | | $ | 72,783,090 | | | $ | 387,623,776 | | | $ | 360,603,637 | | | $ | 178,107,071 | | | $ | 66,894,376 | |
| | |
|
|
| |
|
|
| |
|
|
| |
|
|
| |
|
|
|
(1) Including undistributed net
investment income | | $ | 124 | | | $ | 5,545 | | | $ | 12,685 | | | $ | 2,025 | | | $ | 1,264 | |
| | |
|
|
| |
|
|
| |
|
|
| |
|
|
| |
|
|
|
Year Ended March 31, 2003 | | | | | | | | | | | | | | | | | | | | |
Net investment income | | $ | 3,287,309 | | | $ | 12,324,648 | | | $ | 3,701,564 | | | $ | 5,630,120 | | | $ | 2,096,862 | |
Net realized gain on security transactions | | | 1,512,685 | | | | 11,353,856 | | | | 1,826 | | | | 5,908,606 | | | | 23 | |
Change in unrealized appreciation/depreciation of investments during the year | | | 4,049,677 | | | | 11,066,477 | | | | 679,319 | | | | 4,637,865 | | | | 1,810,327 | |
| | |
|
|
| |
|
|
| |
|
|
| |
|
|
| |
|
|
|
Net increase in net assets resulting from operations | | | 8,849,671 | | | | 34,744,981 | | | | 4,382,709 | | | | 16,176,591 | | | | 3,907,212 | |
Distributions to shareholders: | | | | | | | | | | | | | | | | | | | | |
From net investment income | | | (3,310,944 | ) | | | (12,412,447 | ) | | | (3,712,472 | ) | | | (5,629,628 | ) | | | (2,115,423 | ) |
From net realized gain on investments | | | — | | | | (2,583,052 | ) | | | — | | | | (2,636,726 | ) | | | (11,988 | ) |
| | |
|
|
| |
|
|
| |
|
|
| |
|
|
| |
|
|
|
Total distributions to shareholders | | | (3,310,944 | ) | | | (14,995,499 | ) | | | (3,712,472 | ) | | | (8,266,354 | ) | | | (2,127,411 | ) |
| | |
|
|
| |
|
|
| |
|
|
| |
|
|
| |
|
|
|
Increase (decrease) in net assets from fund share transactions (Note 5) | | | (25,750,812 | ) | | | 17,333,876 | | | | 124,921,748 | | | | 882,030 | | | | 6,184,103 | |
| | |
|
|
| |
|
|
| |
|
|
| |
|
|
| |
|
|
|
Net increase (decrease) in net assets | | | (20,212,085 | ) | | | 37,083,358 | | | | 125,591,985 | | | | 8,792,267 | | | | 7,963,904 | |
NET ASSETS: | | | | | | | | | | | | | | | | | | | | |
Beginning of year | | $ | 115,177,567 | | | $ | 370,018,297 | | | $ | 165,689,960 | | | $ | 178,607,903 | | | $ | 58,229,842 | |
| | |
|
|
| |
|
|
| |
|
|
| |
|
|
| |
|
|
|
End of year (2) | | $ | 94,965,482 | | | $ | 407,101,655 | | | $ | 291,281,945 | | | $ | 187,400,170 | | | $ | 66,193,746 | |
| | |
|
|
| |
|
|
| |
|
|
| |
|
|
| |
|
|
|
(2) Including distributions in excess of net
investment income | | | — | | | | — | | | | — | | | | — | | | $ | (1,611 | ) |
| | |
|
|
| |
|
|
| |
|
|
| |
|
|
| |
|
|
|
See Notes to Financial Statements.
10
[THIS PAGE INTENTIONALLY LEFT BLANK]
Excelsior Tax-Exempt Funds, Inc.
Financial Highlights — Selected Per Share Data and Ratios
| | | | | | | | | | | | | | | | | | | | | | |
| | | Net Asset Value,
Beginning of
Year
| | Net
Investment
Income
| | Net Realized and
Unrealized Gain (Loss)
on Investments
| | | Total From
Investment
Operations
| | | Dividends
From Net
Investment
Income
| | | Distributions From Net Realized Gain
on Investments
| |
LONG-TERM TAX-EXEMPT FUND — (2/5/86*) | | | | | | | | | | | | | |
Year Ended March 31, | | | | | | | | | | | | | | | | | | | | | | |
2000 | | $ | 9.87 | | $ | 0.42 | | $ | (0.82 | ) | | $ | (0.40 | ) | | $ | (0.42 | ) | | $ | (0.06 | ) |
2001 | | | 8.99 | | | 0.40 | | | 0.63 | | | | 1.03 | | | | (0.40 | ) | | | — | |
2002 | | | 9.62 | | | 0.36 | | | (0.14 | ) | | | 0.22 | | | | (0.36 | ) | | | — | |
2003 | | | 9.48 | | | 0.29 | | | 0.47 | | | | 0.76 | | | | (0.29 | ) | | | — | |
2004 | | | 9.95 | | | 0.26 | | | 0.13 | | | | 0.39 | | | | (0.26 | ) | | | — | |
INTERMEDIATE-TERM TAX-EXEMPT FUND — (12/3/85*) | | | | | | | | | | | | | |
Year Ended March 31, | | | | | | | | | | | | | | | | | | | | | | |
2000 | | $ | 9.49 | | $ | 0.37 | | $ | (0.43 | ) | | $ | (0.06 | ) | | $ | (0.37 | ) | | | — | |
2001 | | | 9.06 | | | 0.38 | | | 0.51 | | | | 0.89 | | | | (0.38 | ) | | | — | |
2002 | | | 9.57 | | | 0.35 | | | (0.12 | ) | | | 0.23 | | | | (0.35 | ) | | $ | (0.06 | ) |
2003 | | | 9.39 | | | 0.31 | | | 0.55 | | | | 0.86 | | | | (0.31 | ) | | | (0.06 | ) |
2004 | | | 9.88 | | | 0.26 | | | 0.15 | | | | 0.41 | | | | (0.26 | ) | | | (0.34 | ) |
SHORT-TERM TAX-EXEMPT SECURITIES FUND — (12/31/92*) | | | | | | | | | | | | | |
Year Ended March 31, | | | | | | | | | | | | | | | | | | | | | | |
2000 | | $ | 7.17 | | $ | 0.25 | | $ | (0.15 | ) | | $ | 0.10 | | | $ | (0.25 | ) | | | — | |
2001 | | | 7.02 | | | 0.28 | | | 0.13 | | | | 0.41 | | | | (0.28 | ) | | | — | |
2002 | | | 7.15 | | | 0.20 | | | 0.03 | | | | 0.23 | | | | (0.20 | ) | | $ | (0.01 | ) |
2003 | | | 7.17 | | | 0.12 | | | 0.03 | | | | 0.15 | | | | (0.12 | ) | | | — | |
2004 | | | 7.20 | | | 0.08 | | | 0.02 | | | | 0.10 | | | | (0.08 | ) | | | — | |
NEW YORK INTERMEDIATE-TERM TAX-EXEMPT FUND — (5/31/90*) | | | | | | | | | |
Year Ended March 31, | | | | | | | | | | | | | | | | | | | | | | |
2000 | | $ | 8.80 | | $ | 0.32 | | $ | (0.37 | ) | | $ | (0.05 | ) | | $ | (0.32 | ) | | $ | (0.09 | ) |
2001 | | | 8.34 | | | 0.33 | | | 0.49 | | | | 0.82 | | | | (0.33 | ) | | | — | |
2002 | | | 8.83 | | | 0.31 | | | (0.09 | ) | | | 0.22 | | | | (0.31 | ) | | | — | |
2003 | | | 8.74 | | | 0.27 | | | 0.51 | | | | 0.78 | | | | (0.27 | ) | | | (0.13 | ) |
2004 | | | 9.12 | | | 0.22 | | | 0.14 | | | | 0.36 | | | | (0.22 | ) | | | (0.29 | ) |
CALIFORNIA TAX-EXEMPT INCOME FUND — (10/1/96*) | | | | | | | | | | | | | |
Year Ended March 31, | | | | | | | | | | | | | | | | | | | | | | |
2000 | | $ | 7.25 | | $ | 0.26 | | $ | (0.18 | ) | | $ | 0.08 | | | $ | (0.26 | ) | | | — | |
2001 | | | 7.07 | | | 0.26 | | | 0.23 | | | | 0.49 | | | | (0.26 | ) | | | — | |
2002 | | | 7.30 | | | 0.26 | | | (0.02 | ) | | | 0.24 | | | | (0.26 | ) | | $ | (0.01 | ) |
2003 | | | 7.27 | | | 0.25 | | | 0.22 | | | | 0.47 | | | | (0.25 | ) | | | — | (2) |
2004 | | | 7.49 | | | 0.24 | | | — | | | | 0.24 | | | | (0.24 | ) | | | — | |
* Commencement of Operations
| (1) | Expense ratios before waiver of fees and reimbursement of expenses (if any) by adviser and administrator. |
| (2) | Amount represents less than $0.01 per share. |
See Notes to Financial Statements.
12
| | | | | | | | | | | | | | | | | | | | | | | | | | |
Total
Distributions
| | | Net Asset Value,
End of Year
| | Total
Return
| | | Net Assets, End
of Year (000’s)
| | Ratio of Net
Operating Expenses
to Average
Net Assets
| | Ratio of Gross
Operating Expenses
to Average
Net Assets (1)
| | | Ratio of Net
Investment
Income to
Average Net Assets
| | | Portfolio
Turnover
Rate
| | | Fee
Waivers
(Note 2)
| |
| | | | | | | | | | | | | | | | | | | | | | | | | | | |
| | | | | | | | | | | | | | | | | | | | | | | | | | | |
| $ | (0.48 | ) | | $ | 8.99 | | (4.01 | )% | | $ | 121,998 | | 0.75% | | 0.83 | % | | 4.54 | % | | 78 | % | | $ | 0.01 | |
| | (0.40 | ) | | | 9.62 | | 11.69 | % | | | 135,515 | | 0.77% | | 0.83 | % | | 4.33 | % | | 60 | % | | | 0.01 | |
| | (0.36 | ) | | | 9.48 | | 2.29 | % | | | 115,178 | | 0.72% | | 0.82 | % | | 3.66 | % | | 35 | % | | | 0.01 | |
| | (0.29 | ) | | | 9.95 | | 8.12 | % | | | 94,965 | | 0.70% | | 0.77 | % | | 2.99 | % | | 51 | % | | | 0.01 | |
| | (0.26 | ) | | | 10.08 | | 4.01 | % | | | 72,783 | | 0.73% | | 0.80 | % | | 2.64 | % | | 111 | % | | | 0.01 | |
| | | | | | | | | | | | | | | | | | | | | | | | | | | |
| | | | | | | | | | | | | | | | | | | | | | | | | | | |
| $ | (0.37 | ) | | $ | 9.06 | | (0.58 | )% | | $ | 292,671 | | 0.57% | | 0.64 | % | | 4.06 | % | | 91 | % | | $ | 0.01 | |
| | (0.38 | ) | | | 9.57 | | 10.07 | % | | | 341,170 | | 0.57% | | 0.64 | % | | 4.17 | % | | 84 | % | | | 0.01 | |
| | (0.41 | ) | | | 9.39 | | 2.41 | % | | | 370,018 | | 0.52% | | 0.64 | % | | 3.67 | % | | 67 | % | | | 0.01 | |
| | (0.37 | ) | | | 9.88 | | 9.31 | % | | | 407,102 | | 0.51% | | 0.59 | % | | 3.15 | % | | 48 | % | | | 0.01 | |
| | (0.60 | ) | | | 9.69 | | 4.19 | % | | | 387,624 | | 0.56% | | 0.63 | % | | 2.60 | % | | 31 | % | | | 0.01 | |
| | | |
| | | | | | | | | | | | | | | | | | | | | | | | | | | |
| $ | (0.25 | ) | | $ | 7.02 | | 1.39 | % | | $ | 54,226 | | 0.56% | | 0.63 | % | | 3.54 | % | | 130 | % | | | — | |
| | (0.28 | ) | | | 7.15 | | 5.94 | % | | | 83,336 | | 0.58% | | 0.65 | % | | 3.97 | % | | 42 | % | | | — | |
| | (0.21 | ) | | | 7.17 | | 3.20 | % | | | 165,690 | | 0.48% | | 0.55 | % | | 2.60 | % | | 111 | % | | $ | 0.01 | |
| | (0.12 | ) | | | 7.20 | �� | 2.04 | % | | | 291,282 | | 0.46% | | 0.58 | % | | 1.57 | % | | 31 | % | | | 0.01 | |
| | (0.08 | ) | | | 7.22 | | 1.40 | % | | | 360,604 | | 0.47% | | 0.59 | % | | 1.12 | % | | 99 | % | | | 0.01 | |
| | | | | | | | | | | | | | | | | | | | | | | | | | | |
| | | | | | | | | | | | | | | | | | | | | | | | | | | |
| $ | (0.41 | ) | | $ | 8.34 | | (0.51 | )% | | $ | 126,378 | | 0.73% | | 0.75 | % | | 3.82 | % | | 64 | % | | | — | |
| | (0.33 | ) | | | 8.83 | | 10.02 | % | | | 144,421 | | 0.73% | | 0.75 | % | | 3.90 | % | | 39 | % | | | — | |
| | (0.31 | ) | | | 8.74 | | 2.54 | % | | | 178,608 | | 0.67% | | 0.72 | % | | 3.53 | % | | 45 | % | | | — | |
| | (0.40 | ) | | | 9.12 | | 8.96 | % | | | 187,400 | | 0.67% | | 0.72 | % | | 2.96 | % | | 43 | % | | | — | (2) |
| | (0.51 | ) | | | 8.97 | | 4.06 | % | | | 178,107 | | 0.68% | | 0.73 | % | | 2.41 | % | | 42 | % | | | — | (2) |
| | | | | | | | | | | | | | | | | | | | | | | | | | | |
| | | | | | | | | | | | | | | | | | | | | | | | | | | |
| $ | (0.26 | ) | | $ | 7.07 | | 1.13 | % | | $ | 65,034 | | 0.50% | | 0.95 | % | | 3.67 | % | | 16 | % | | $ | 0.03 | |
| | (0.26 | ) | | | 7.30 | | 7.09 | % | | | 54,605 | | 0.50% | | 0.97 | % | | 3.69 | % | | 6 | % | | | 0.03 | |
| | (0.27 | ) | | | 7.27 | | 3.32 | % | | | 58,230 | | 0.50% | | 0.87 | % | | 3.55 | % | | 4 | % | | | 0.03 | |
| | (0.25 | ) | | | 7.49 | | 6.59 | % | | | 66,194 | | 0.46% | | 0.50 | % | | 3.36 | % | | 9 | % | | | — | (2) |
| | (0.24 | ) | | | 7.49 | | 3.19 | % | | | 66,894 | | 0.50% | | 0.90 | % | | 3.14 | % | | 15 | % | | | 0.03 | |
See Notes to Financial Statements.
13
Excelsior Tax-Exempt Funds, Inc.
Portfolio of Investments — March 31, 2004
Long-Term Tax-Exempt Fund
| | | | | |
Principal
Amount
| | | | Value
(Note 1)
|
| TAX-EXEMPT SECURITIES — 87.50% | | |
| $4,000,000 | | Connecticut State Health & Education, Connecticut State University Revenue Bonds, Series E, (FGIC),
5.000%, 11/01/33 | | $ | 4,166,800 |
| 3,500,000 | | #East Baton Rouge, Louisiana, Pollution Control Authority Revenue Bonds, Exxon Project, 1.090%, 03/01/22 | | | 3,500,000 |
| 4,000,000 | | Florida State Jea St. Johns River Power Park System Revenue Bonds, 17th Series,
5.250%, 10/01/13 | | | 4,508,160 |
| 4,000,000 | | Houston, Texas, Water & Sewer Revenue Bonds, Series A, (FSA),
5.000%, 12/01/30 | | | 4,130,240 |
| 3,500,000 | | #Kansas State Department of Transportation Highway Revenue Bonds, Series B-1,
1.000%, 09/01/19 | | | 3,500,000 |
| 4,000,000 | | Los Angeles, California, Department of Water & Power Revenue Bonds, Series A, (FGIC),
5.000%, 07/01/36 | | | 4,133,360 |
| 3,500,000 | | #Marshall County, West Virginia, Pollution Control Authority, Mountaineer Carbon
Revenue Bonds,
1.120%, 12/01/20 | | | 3,500,000 |
| 4,000,000 | | New York State Metropolitan Transportation Authority Revenue Bonds, Series A,
5.750%, 07/01/31 | | | 4,547,080 |
| 4,000,000 | | Orange County, California, Sanitation District Certificates of Participation, (FGIC),
5.000%, 02/01/33 | | | 4,147,560 |
| 4,000,000 | | Orlando & Orange County Expressway Authority Revenue Bonds, Series B, (AMBAC),
5.000%, 07/01/35 | | | 4,183,400 |
| 4,000,000 | | Pennsylvania State General Obligation Bonds,
2nd Series, (FSA),
5.500%, 05/01/16 | | | 4,579,400 |
| 3,500,000 | | #Pennsylvania State University Revenue Bonds, Series A,
1.020%, 04/01/31 | | | 3,500,000 |
| | | | | |
Principal
Amount
| | | | Value
(Note 1)
|
| TAX-EXEMPT SECURITIES — (continued) | | |
| $3,565,000 | | #Port Authority of New York & New Jersey Special Obligation Revenue Bonds, Versatile Structure Obligations, Series 5,
1.110%, 08/01/24 | | $ | 3,565,000 |
| 4,000,000 | | Seattle, Washington, Municipal Light & Power Revenue
Bonds, (FSA),
5.000%, 11/01/28 | | | 4,150,880 |
| 4,000,000 | | University of California Revenue Bonds, Multi-Purpose Projects, Series Q, (FSA),
5.000%, 09/01/34 | | | 4,133,240 |
| 3,445,000 | | #University of Missouri Revenue Bonds, System Facilities, Series A,
1.120%, 11/01/31 | | | 3,445,000 |
| | | | |
|
|
| | | | | | 63,690,120 |
| | | | |
|
|
TAX-EXEMPT SECURITIES — BACKED BY
LETTERS OF CREDIT — 9.62% | | |
| | | BANK OF AMERICA
| | | |
| 3,500,000 | | #Washington State Public Power Supply Revenue Bonds, Nuclear Project No. 1, Series 1A-1,
1.010%, 07/01/17 | | | 3,500,000 |
| | | MORGAN GUARANTY TRUST
| | | |
| 3,500,000 | | #New York City, New York, General Obligation Bonds, Sub-Series A-7,
1.100%, 08/01/21 | | | 3,500,000 |
| | | | |
|
|
| | | | | | 7,000,000 |
| | | | |
|
|
| | |
Shares
| | | | |
| SHORT-TERM INVESTMENTS — 2.22% | | |
| 5,634 | | @BlackRock Muni Fund | | | 5,634 |
| 1,607,918 | | @Dreyfus Tax Exempt Cash Fund | | | 1,607,918 |
| | | | |
|
|
| | | | | | 1,613,552 |
| | | | |
|
|
| | | | | | |
TOTAL INVESTMENTS
(Cost $70,893,065) | | 99.34 | % | | $ | 72,303,672 |
OTHER ASSETS &
LIABILITIES (NET) | | 0.66 | | | | 479,418 |
| | |
|
| |
|
|
NET ASSETS | | 100.00 | % | | $ | 72,783,090 |
| | |
|
| |
|
|
See Notes to Financial Statements.
14
Excelsior Tax-Exempt Funds, Inc.
Portfolio of Investments — March 31, 2004
Long-Term Tax-Exempt Fund — (continued)
FGIC—Financial Guaranty Insurance Corp.
| # | Variable rate demand bonds and notes are payable upon not more than seven business days notice. Rate shown is as of March 31, 2004. |
FSA—Financial Security Assurance
AMBAC—American Municipal Bond Assurance Corp.
| @ | Registered Investment Company |
Notes (The following notes have not been audited by Deloitte & Touche LLP):
These municipal securities meet the three highest ratings assigned by Moody’s Investors Services, Inc. or Standard and Poor’s Corporation or, where not rated, are determined by the Adviser, under the supervision of the Board of Directors, to be of comparable quality at the time of purchase to rated instruments that may be acquired by the Fund.
At March 31, 2004, approximately 10% of the net assets are invested in municipal securities that have letter of credit enhancement features or escrows in U.S. Government securities backing them, on which the Fund relies. Without such features, the securities may or may not meet the quality standards of securities purchased by the Fund.
| | | | | | |
| | |
State Diversification
| | % of
Net
Assets
| | | Value
|
California | | 17.06 | % | | $ | 12,414,160 |
New York | | 15.95 | | | | 11,612,080 |
Florida | | 11.94 | | | | 8,691,560 |
Pennsylvania | | 11.10 | | | | 8,079,400 |
Washington | | 10.51 | | | | 7,650,880 |
Connecticut | | 5.72 | | | | 4,166,800 |
Texas | | 5.68 | | | | 4,130,240 |
Kansas | | 4.81 | | | | 3,500,000 |
Louisiana | | 4.81 | | | | 3,500,000 |
West Virginia | | 4.81 | | | | 3,500,000 |
Missouri | | 4.73 | | | | 3,445,000 |
Short-Term Investments | | 2.22 | | | | 1,613,552 |
| | |
|
| |
|
|
Total Investments | | 99.34 | % | | $ | 72,303,672 |
Other Assets & Liabilities (Net) | | 0.66 | | | | 479,418 |
| | |
|
| |
|
|
Net Assets | | 100.00 | % | | $ | 72,783,090 |
| | |
|
| |
|
|
See Notes to Financial Statements.
15
Excelsior Tax-Exempt Funds, Inc.
Portfolio of Investments — March 31, 2004
Intermediate-Term Tax-Exempt Fund
| | | | | |
Principal
Amount
| | | | Value
(Note 1)
|
| TAX-EXEMPT SECURITIES — 89.17% |
| $10,000,000 | | #Alaska State Housing Finance Authority, Capital Project Revenue Bonds, Series C, (MBIA),
1.020%, 07/01/22 | | $ | 10,000,000 |
| 10,000,000 | | Clark County, Nevada, School District General Obligation Bonds, Series B, (FSA),
5.000%, 06/15/12 | | | 11,257,300 |
| 10,000,000 | | Colorado Springs, Colorado, Utilities Revenue Bonds, Series A,
5.250%, 11/15/10 | | | 11,475,500 |
| 10,000,000 | | #Connecticut State Health & Education, Yale University Revenue Bonds, Series X-3, 1.070%, 07/01/37 | | | 10,000,000 |
| 10,000,000 | | Connecticut State Special Tax Obligation Revenue Bonds, Transportation Infrastructure, Series A, (FGIC),
5.500%, 10/01/10 | | | 11,630,500 |
| 10,000,000 | | Cook County, Illinois, General Obligation Bonds,
Series D, (AMBAC),
5.250%, 11/15/11 | | | 11,469,300 |
| 10,000,000 | | Dallas, Texas, Water Works & Sewer System Revenue
Bonds, (FSA),
5.375%, 10/01/12 | | | 11,533,300 |
| 10,000,000 | | Detroit, Michigan, Sewer Disposal Revenue Bonds,
Series A, (FSA),
5.000%, 07/01/14 | | | 11,141,400 |
| 10,000,000 | | Florida State Division Board Finance Department, General Services Revenue Bonds,
Series A, Department of Environmental Protection-Preservation 2000, (FSA),
6.000%, 07/01/13 | | | 12,072,500 |
| 10,000,000 | | Florida State Jea St. Johns River Power Park System Revenue Bonds, 17th Series,
5.250%, 10/01/13 | | | 11,270,400 |
| 10,000,000 | | Hawaii State General Obligation Bonds, Series CY, (FSA),
5.500%, 02/01/12 | | | 11,550,100 |
| | | | | |
Principal
Amount
| | | | Value
(Note 1)
|
| TAX-EXEMPT SECURITIES — (continued) |
| $10,000,000 | | Illinois State General Obligation Bonds, First Series, (MBIA), 5.500%, 08/01/14 | | $ | 11,653,600 |
| 10,000,000 | | Illinois State Sales Tax Revenue Bonds, First Series, (FSA), 5.250%, 06/15/13 | | | 11,449,800 |
| 14,800,000 | | #Iowa State, Finance Authority, Multifamily Housing Village Court Association Revenue Bonds, Series B,
1.020%, 11/01/15 | | | 14,800,000 |
| 10,000,000 | | Jefferson County, Colorado, School District General Obligation Bonds, (MBIA), 6.500%, 12/15/11 | | | 12,365,100 |
| 10,000,000 | | #Kansas State Department of Transportation Highway Revenue Bonds, Series C-1, 1.020%, 09/01/19 | | | 10,000,000 |
| 10,000,000 | | Los Angeles, California, Department of Water & Power Revenue Bonds, Series B, (MBIA),
5.000%, 07/01/13 | | | 11,309,800 |
| 10,000,000 | | #Loudon County, Virginia, Industrial Development Authority Revenue Bonds, Howard Hughes Medical, Series A,
1.090%, 02/15/38 | | | 10,000,000 |
| 10,000,000 | | Maryland State General Obligation Bonds, State & Local Facilities Loan, 1st Series, 5.250%, 03/01/13 | | | 11,527,100 |
| 10,000,000 | | Michigan State Building Authority Revenue Bonds, Facilities Program, Series I, (FSA),
5.250%, 10/15/14 | | | 11,372,600 |
| 10,000,000 | | #Missouri State Health & Education, Washington University Revenue
Bonds, Series B,
1.050%, 02/15/33 | | | 10,000,000 |
| 10,000,000 | | New Jersey State General Obligation Bonds, Series D, 6.000%, 02/15/11 | | | 11,827,000 |
See Notes to Financial Statements.
16
Excelsior Tax-Exempt Funds, Inc.
Portfolio of Investments — March 31, 2004
Intermediate-Term Tax-Exempt Fund — (continued)
| | | | | |
Principal
Amount
| | | | Value
(Note 1)
|
| TAX-EXEMPT SECURITIES — (continued) |
| $20,000,000 | | New Jersey State Transportation Trust Fund Authority, Transportation Systems Revenue Bonds, Series C, (FSA),
5.500%, 12/15/10 | | $ | 23,248,200 |
| 10,000,000 | | New York State Dormitory Authority, State University Educational Facilities Revenue Bonds, Series B, (FSA), 5.250%, 05/15/11 | | | 11,410,300 |
| 10,000,000 | | Pennsylvania State General Obligation Bonds,
5.500%, 02/01/13 | | | 11,654,900 |
| 10,000,000 | | Pennsylvania State General Obligation Bonds,
First Series, (MBIA),
5.250%, 02/01/12 | | | 11,475,300 |
| 10,000,000 | | Pennsylvania State General Obligation Bonds, Second Series, (FGIC),
5.250%, 10/01/14 | | | 11,601,500 |
| 10,000,000 | | South Carolina State Public Services Authority Revenue Bonds, Series A, (FSA), 5.500%, 01/01/11 | | | 11,534,400 |
| 15,000,000 | | #Valdez, Alaska, Marine Terminal Revenue Bonds, BP Pipelines Project, Series B,
1.120%, 07/01/37 | | | 15,000,000 |
| | | | |
|
|
| | | | | | 345,629,900 |
| | | | |
|
|
TAX-EXEMPT SECURITY — BACKED BY
LETTERS OF CREDIT — 2.58% |
| | | PNC BANK N.A.
| | | |
| 10,000,000 | | #Pennsylvania State, Higher Educational Facilities Authority, Association of Independent Colleges Revenue Bonds, Series E-3,
1.020%, 11/01/14 | | | 10,000,000 |
| | | | |
|
|
TAX-EXEMPT SECURITIES — ESCROWED IN
U.S. GOVERNMENTS — 5.93% |
| 10,000,000 | | Chicago, Illinois, Metropolitan Water Reclamation District Authority General Obligation Bonds, Series A,
5.250%, 12/01/10
(Escrowed to Maturity) | | | 11,530,400 |
| | | | | |
Principal
Amount
| | | | Value
(Note 1)
|
TAX-EXEMPT SECURITIES — ESCROWED IN
U.S. GOVERNMENTS — (continued) |
| $10,000,000 | | New Jersey State Transportation Trust Fund Authority, Transportation Systems Revenue Bonds, Series A, 5.250%, 06/15/11
(Escrowed to Maturity) | | $ | 11,466,700 |
| | | | |
|
|
| | | | | | 22,997,100 |
| | | | |
|
|
| | |
Shares
| | | | |
| SHORT-TERM INVESTMENTS — 1.50% | | |
| 630,612 | | @BlackRock Muni Fund | | | 630,612 |
| 5,206,474 | | @Dreyfus Tax Exempt Cash Fund | | | 5,206,474 |
| | | | |
|
|
| | | | | | 5,837,086 |
| | | | |
|
|
| | | | | | |
TOTAL INVESTMENTS (Cost $368,382,039) | | 99.18 | % | | $ | 384,464,086 |
OTHER ASSETS & LIABILITIES (NET) | | 0.82 | | | | 3,159,690 |
| | |
|
| |
|
|
NET ASSETS | | 100.00 | % | | $ | 387,623,776 |
| | |
|
| |
|
|
| # | Variable rate demand bonds and notes are payable upon not more than seven business days notice. Rate shown is as of March 31, 2004. |
MBIA—Municipal Bond Insurance Assoc.
FSA—Financial Security Assurance
FGIC—Financial Guaranty Insurance Corp.
AMBAC—American Municipal Bond Assurance Corp.
| @ | Registered Investment Company |
Notes (The following notes have not been audited by Deloitte & Touche, LLP):
These municipal securities meet the three highest ratings assigned by Moody’s Investors Services, Inc. or Standard and Poor’s Corporation or, where not rated, are determined by the Adviser, under the supervision of the Board of Directors, to be of comparable quality at the time of purchase to rated instruments that may be acquired by the Fund.
At March 31, 2004, approximately, 9% of the net assets are invested in municipal securities that have letter of credit enhancement features or escrows in U.S. Government securities backing them, on which the Fund relies. Without such features, the securities may or may not meet the quality standards of securities purchased by the Fund.
See Notes to Financial Statements.
17
Excelsior Tax-Exempt Funds, Inc.
Portfolio of Investments — March 31, 2004
Intermediate-Term Tax-Exempt Fund — (continued)
| | | | | | |
| | |
State Diversification
| | % of
Net
Assets
| | | Value
|
New Jersey | | 12.01 | % | | $ | 46,541,900 |
Illinois | | 11.89 | | | | 46,103,100 |
Pennsylvania | | 11.54 | | | | 44,731,700 |
Alaska | | 6.45 | | | | 25,000,000 |
Colorado | | 6.15 | | | | 23,840,600 |
Florida | | 6.02 | | | | 23,342,900 |
Michigan | | 5.81 | | | | 22,514,000 |
Connecticut | | 5.58 | | | | 21,630,500 |
Iowa | | 3.82 | | | | 14,800,000 |
Hawaii | | 2.98 | | | | 11,550,100 |
South Carolina | | 2.98 | | | | 11,534,400 |
Texas | | 2.98 | | | | 11,533,300 |
Maryland | | 2.97 | | | | 11,527,100 |
New York | | 2.94 | | | | 11,410,300 |
California | | 2.92 | | | | 11,309,800 |
Nevada | | 2.90 | | | | 11,257,300 |
Kansas | | 2.58 | | | | 10,000,000 |
Missouri | | 2.58 | | | | 10,000,000 |
Virginia | | 2.58 | | | | 10,000,000 |
Short-Term Investments | | 1.50 | | | | 5,837,086 |
| | |
|
| |
|
|
Total Investments | | 99.18 | % | | $ | 384,464,086 |
Other Assets & Liabilities (Net) | | 0.82 | | | | 3,159,690 |
| | |
|
| |
|
|
Net Assets | | 100.00 | % | | $ | 387,623,776 |
| | |
|
| |
|
|
See Notes to Financial Statements.
18
Excelsior Tax-Exempt Funds, Inc.
Portfolio of Investments — March 31, 2004
Short-Term Tax-Exempt Securities Fund
| | | | | |
Principal
Amount
| | | | Value
(Note 1)
|
| TAX-EXEMPT SECURITIES — 92.47% | | |
| $ 5,985,000 | | #Clark County, Nevada, School District General Obligation Bonds, Series A, (FSA), 1.100%, 06/15/21 | | $ | 5,985,000 |
| 17,000,000 | | #Connecticut State Health & Education, Yale University Revenue Bonds, Series T-1, 1.070%, 07/01/29 | | | 17,000,000 |
| 10,000,000 | | #Detroit, Michigan, Water Supply System Revenue Bonds, Series C, (FGIC),
1.010%, 07/01/29 | | | 10,000,000 |
| 13,000,000 | | Florida State Board of Education Capital Outlay General Obligation Bonds, Series A, 5.000%, 06/01/07 | | | 14,278,680 |
| 6,000,000 | | Georgia State Road & Thruway Authority Revenue Bonds, 4.000%, 10/01/07 | | | 6,446,520 |
| 14,000,000 | | #Gwinnett County, Georgia, Development Authority Revenue Bonds, Civic & Cultural Center Project, 1.000%, 09/01/31 | | | 14,000,000 |
| 11,700,000 | | #Hurley, New Mexico, Pollution Control Authority Revenue Bonds, Kennecott Santa Fe, 1.120%, 12/01/15 | | | 11,700,000 |
| 20,000,000 | | Massachusetts State General Obligation Bonds, Series B, 4.000%, 08/01/06 | | | 21,052,000 |
| 22,500,000 | | Memphis, Tennessee, Electric System Revenue Bonds,
Series A, (FSA),
5.000%, 12/01/07 | | | 24,875,775 |
| 10,200,000 | | #Metropolitan Government of Nashville & Davidson County, Tennessee, Health & Educational Facilities Revenue Bonds, Vanderbilt
University, Series C-2,
0.920%, 10/01/30 | | | 10,200,000 |
| 14,000,000 | | #Minneapolis, Minnesota, General Obligation Bonds, 0.870%, 12/01/18 | | | 14,000,000 |
| | | | | |
Principal
Amount
| | | | Value
(Note 1)
|
| TAX-EXEMPT SECURITIES — (continued) | | |
| $ 2,000,000 | | #Minneapolis, Minnesota, Guthrie Parking Ramp General Obligation Bonds,
0.870%, 12/01/28 | | $ | 2,000,000 |
| 11,000,000 | | Montgomery County, Maryland, General Obligation
Bonds, Series A,
5.000%, 11/01/07 | | | 12,236,620 |
| 5,000,000 | | Nassau County, New York, Interim Finance Authority Revenue Bonds, Series B, 4.000%, 11/15/05 | | | 5,206,350 |
| 12,000,000 | | New Jersey State, Economic Development Authority Revenue Bonds, School Facilities, Series F,
5.000%, 06/15/07 | | | 13,139,520 |
| 15,000,000 | | New York City, New York, Transitional Finance Authority Revenue Bonds, Future Tax, Sub-Series D-1,
5.000%, 11/01/07 | | | 16,582,050 |
| 10,000,000 | | #New York State Local Government Assistance Revenue Bonds, Series 4V, (FSA),
1.050%, 04/01/22 | | | 10,000,000 |
| 5,000,000 | | Ohio State Highway Capital Improvements Authority General Obligation
Bonds, Series F,
5.000%, 05/01/04 | | | 5,014,400 |
| 14,500,000 | | #Orlando, Florida, Utilities Commission Water & Electric Revenue Bonds, Series A, 1.030%, 10/01/17 | | | 14,500,000 |
| 15,000,000 | | #Pennsylvania State Higher Educational Facilities Authority Revenue Bonds, Carnegie Mellon University
Project, Series C,
1.120%, 11/01/29 | | | 15,000,000 |
| 10,350,000 | | #Pennsylvania State University Revenue Bonds, Series A,
1.020%, 03/01/32 | | | 10,350,000 |
See Notes to Financial Statements.
19
Excelsior Tax-Exempt Funds, Inc.
Portfolio of Investments — March 31, 2004
Short-Term Tax-Exempt Securities Fund — (continued)
| | | | | |
Principal
Amount
| | | | Value
(Note 1)
|
| TAX-EXEMPT SECURITIES — (continued) | | |
| $ 8,700,000 | | #Port Authority of New York & New Jersey Special Obligation Revenue Bonds, Versatile Structure Obligations, Series 3, 1.110%, 06/01/20 | | $ | 8,700,000 |
| 12,000,000 | | Seattle, Washington, Municipal Light & Power Revenue
Bonds, (FSA),
5.000%, 11/01/06 | | | 12,995,520 |
| 11,000,000 | | Texas State Public Finance Authority General Obligation Bonds, Series A,
5.250%, 10/01/07 | | | 12,214,620 |
| 25,000,000 | | Texas State Public Finance Authority Revenue Bonds, Series A, (FSA),
5.000%, 12/15/07 | | | 27,666,750 |
| 8,000,000 | | University of Maryland Revenue Bonds, Auxiliary Facility & Tuition, Series A,
5.000%, 04/01/05 | | | 8,309,280 |
| 10,000,000 | | #Valdez, Alaska, Marine Terminal Revenue Bonds, Exxon Pipeline Project, Series C, 1.000%, 12/01/33 | | | 10,000,000 |
| | | | |
|
|
| | | | | | 333,453,085 |
| | | | |
|
|
TAX-EXEMPT SECURITY — BACKED BY
LETTERS OF CREDIT — 2.77% |
| | | BNP PARIBAS
| | | |
| 10,000,000 | | #New York State Housing Finance Agency Service Revenue Bonds, Series E,
1.050%, 03/15/27 | | | 10,000,000 |
| | | | |
|
|
TAX-EXEMPT SECURITIES — ESCROWED IN
U.S. GOVERNMENTS — 4.30% |
| 5,000,000 | | Harris County, Texas, Toll Road Revenue Bonds, Series A, (MBIA),
6.375%, 08/15/24 (Prerefunded 08/15/04 @ 102) | | | 5,198,050 |
| 10,000,000 | | New Jersey State Economic Development, Authority Market Transition Facilities Revenue Bonds, Series A, (MBIA),
5.875%, 07/01/11 (Prerefunded 07/01/04 @ 102) | | | 10,317,800 |
| | | | |
|
|
| | | | | | 15,515,850 |
| | | | |
|
|
| | | | | |
Shares
| | | | Value
(Note 1)
|
| SHORT-TERM INVESTMENTS — 0.60% | | |
| 1,186,927 | | @BlackRock Muni Fund | | $ | 1,186,927 |
| 957,066 | | @Dreyfus Tax Exempt Cash Fund | | | 957,066 |
| | | | |
|
|
| | | | | | 2,143,993 |
| | | | |
|
|
| | | | | | | |
TOTAL INVESTMENTS
(Cost $359,682,386) | | 100.14 | % | | $ | 361,112,928 | |
OTHER ASSETS &
LIABILITIES (NET) | | (0.14 | ) | | | (509,291 | ) |
| | |
|
| |
|
|
|
NET ASSETS | | 100.00 | % | | $ | 360,603,637 | |
| | |
|
| |
|
|
|
| # | Variable rate demand bonds and notes are payable upon not more than seven business days notice. Rate shown is as of March 31, 2004. |
FSA—Financial Security Assurance
FGIC—Financial Guaranty Insurance Corp.
MBIA—Municipal Bond Insurance Assoc.
| @ | Registered Investment Company |
Notes (The following notes have not been audited by Deloitte & Touche LLP):
These municipal securities meet the three highest ratings assigned by Moody’s Investors Services, Inc. or Standard and Poor’s Corporation or, where not rated, are determined by the Adviser, under the supervision of the Board of Directors, to be of comparable quality at the time of purchase to rated instruments that may be acquired by the Fund.
At March 31, 2004, approximately, 7% of the net assets are invested in municipal securities that have letter of credit enhancement features or escrows in U.S. Government securities backing them, on which the Fund relies. Without such features, the securities may or may not meet the quality standards of securities purchased by the Fund.
See Notes to Financial Statements.
20
Excelsior Tax-Exempt Funds, Inc.
Portfolio of Investments — March 31, 2004
Short-Term Tax-Exempt Securities Fund — (continued)
| | | | | | | |
| | |
State Diversification
| | % of
Net
Assets
| | | Value
| |
New York | | 14.00 | % | | $ | 50,488,400 | |
Texas | | 12.50 | | | | 45,079,420 | |
Tennessee | | 9.73 | | | | 35,075,775 | |
Florida | | 7.98 | | | | 28,778,680 | |
Pennsylvania | | 7.03 | | | | 25,350,000 | |
New Jersey | | 6.51 | | | | 23,457,320 | |
Massachusetts | | 5.84 | | | | 21,052,000 | |
Maryland | | 5.70 | | | | 20,545,900 | |
Georgia | | 5.67 | | | | 20,446,520 | |
Connecticut | | 4.71 | | | | 17,000,000 | |
Minnesota | | 4.44 | | | | 16,000,000 | |
Washington | | 3.60 | | | | 12,995,520 | |
Mexico | | 3.24 | | | | 11,700,000 | |
Alaska | | 2.77 | | | | 10,000,000 | |
Michigan | | 2.77 | | | | 10,000,000 | |
Nevada | | 1.66 | | | | 5,985,000 | |
Ohio | | 1.39 | | | | 5,014,400 | |
Short-Term Investments | | 0.60 | | | | 2,143,993 | |
| | |
|
| |
|
|
|
Total Investments | | 100.14 | % | | $ | 361,112,928 | |
Other Assets & Liabilities (Net) | | (0.14 | ) | | | (509,291 | ) |
| | |
|
| |
|
|
|
Net Assets | | 100.00 | % | | $ | 360,603,637 | |
| | |
|
| |
|
|
|
See Notes to Financial Statements.
21
Excelsior Tax-Exempt Funds, Inc.
Portfolio of Investments — March 31, 2004
New York Intermediate-Term Tax-Exempt Fund
| | | | | |
Principal
Amount
| | | | Value
(Note 1)
|
| TAX-EXEMPT SECURITIES — 86.60% | | |
| $ 8,095,000 | | #Babylon, New York, General Obligation Bonds, (AMBAC),
0.990%, 09/01/17 | | $ | 8,095,000 |
| | | Long Island Power Authority, New York Electric Authority Revenue Bonds,
Series A, (AMBAC), | | | |
| 10,000,000 | | 5.500%, 12/01/09 | | | 11,487,400 |
| 10,000,000 | | 5.500%, 12/01/11 | | | 11,565,000 |
| 15,000,000 | | Nassau County, New York, Interim Finance Authority Revenue Bonds,
Series B, (AMBAC),
5.000%, 11/15/12 | | | 16,909,350 |
| 7,000,000 | | New York City, New York, Transitional Finance Authority Revenue Bonds, Series A,
5.250%, 11/01/10 | | | 7,977,760 |
| 3,605,000 | | #New York City, New York, Trust for Cultural Resources Revenue Bonds, American Museum of Natural History, Series A,
0.990%, 04/01/21 | | | 3,605,000 |
| 10,000,000 | | New York State Dormitory Authority Revenue
Bonds, Series B,
5.250%, 11/15/23 | | | 11,181,200 |
| 5,000,000 | | New York State Dormitory Authority, New York University Revenue Bonds,
Series A, (AMBAC),
5.750%, 07/01/12 | | | 5,908,750 |
| 7,000,000 | | New York State Dormitory Authority, State Personal Income Tax Revenue
Bonds, Series A,
5.500%, 03/15/12 | | | 8,036,770 |
| 7,000,000 | | New York State Environmental Facilities Revenue Bonds, Municipal Water
Project, Series K,
5.000%, 06/15/12 | | | 7,880,110 |
| 5,000,000 | | New York State Local Government Assistance Authority Revenue Bonds,
Series A-1, (FSA),
5.000%, 04/01/12 | | | 5,611,300 |
| | | | | |
Principal
Amount
| | | | Value
(Note 1)
|
| TAX-EXEMPT SECURITIES — (continued) | | |
| $7,000,000 | | New York State Thruway Authority Revenue Bonds, Local Highway & Bridge
Project, Series C,
5.500%, 04/01/12 | | $ | 8,105,650 |
| 5,000,000 | | New York State Thruway Authority Revenue Bonds,
Series A, (MBIA),
5.000%, 04/01/11 | | | 5,616,200 |
| 10,000,000 | | New York State Thruway Authority Service Construction Revenue Bonds, Local Highway & Bridge Project,
5.500%, 04/01/14 | | | 11,338,600 |
| 5,000,000 | | New York State Urban Development Revenue Bonds, Correctional Facilities, Series A, 6.500%, 01/01/10 | | | 5,921,800 |
| 3,000,000 | | #Port Authority of New York & New Jersey Special Obligation Revenue Bonds, Versatile Structure Obligations, Series 5,
1.110%, 08/01/24 | | | 3,000,000 |
| 5,000,000 | | Puerto Rico Electric Power Authority Revenue Bonds,
Series BB, (MBIA),
6.000%, 07/01/11 | | | 5,994,450 |
| 8,000,000 | | #Suffolk County, New York, Water Authority, Bond Anticipation Notes,
1.030%, 01/01/08 | | | 8,000,000 |
| 8,000,000 | | #Westchester County, New York, Health Revenue Bonds,
Series C-1,
0.880%, 11/01/19 | | | 8,000,000 |
| | | | |
|
|
| | | | | | 154,234,340 |
| | | | |
|
|
TAX-EXEMPT SECURITIES — BACKED BY
LETTERS OF CREDIT — 7.13% |
| | | JP MORGAN CHASE BANK
| | | |
| 8,400,000 | | #New York City, New York, Trust for Cultural Resources
Revenue Bonds, Pierpont Morgan Library,
1.000%, 02/01/34 | | | 8,400,000 |
See Notes to Financial Statements.
22
Excelsior Tax-Exempt Funds, Inc.
Portfolio of Investments — March 31, 2004
New York Intermediate-Term Tax-Exempt Fund — (continued)
| | | | | |
Principal
Amount
| | | | Value
(Note 1)
|
TAX-EXEMPT SECURITIES — BACKED BY
LETTERS OF CREDIT — (continued) | | |
| | | WESTDEUTSCHE LANDESBANK
| | | |
| $4,300,000 | | #New York City, New York, General Obligation Bonds, Sub-Series A-4,
1.100%, 08/01/23 | | $ | 4,300,000 |
| | | | |
|
|
| | | | | | 12,700,000 |
| | | | |
|
|
TAX-EXEMPT SECURITY — ESCROWED IN
U.S. GOVERNMENTS — 4.57% |
| 7,000,000 | | New York State Metropolitan Transportation Authority Revenue Bonds, Service Contract, Series 8, (FSA),
5.375%, 07/01/21
(Prefunded 07/01/13 @ 100) | | | 8,148,210 |
| | | | |
|
|
| | |
Shares
| | | | |
| SHORT-TERM INVESTMENTS — 0.72% | | |
| 1,275,650 | | @BlackRock Institutional New York Money Market Fund | | | 1,275,650 |
| 1 | | @Dreyfus New York Tax Exempt Cash Fund | | | 1 |
| | | | |
|
|
| | | | | | 1,275,651 |
| | | | |
|
|
| | | | | | |
TOTAL INVESTMENTS
(Cost $170,982,472) | | 99.02 | % | | $ | 176,358,201 |
OTHER ASSETS &
LIABILITIES (NET) | | 0.98 | | | | 1,748,870 |
| | |
|
| |
|
|
NET ASSETS | | 100.00 | % | | $ | 178,107,071 |
| | |
|
| |
|
|
| # | Variable rate demand bonds and notes are payable upon not more than seven business days notice. Rate shown is as of March 31, 2004. |
AMBAC—American Municipal Bond Assurance Corp.
FSA—Financial Security Assurance
MBIA—Municipal Bond Insurance Assoc.
| @ | Registered Investment Company |
Notes (The following notes have not been audited by Deloitte & Touche LLP):
These municipal securities meet the three highest ratings assigned by Moody’s Investors Services, Inc. or Standard and Poor’s Corporation or, where not rated, are determined by the Adviser, under the supervision of the Board of Directors, to be of comparable quality at the time of purchase to rated instruments that may be acquired by the Fund.
At March 31, 2004, approximately, 12% of the net assets are invested in municipal securities that have letter of credit enhancement features or escrows in U.S. Government securities backing them, on which the Fund relies. Without such features, the securities may or may not meet the quality standards of securities purchased by the Fund.
At March 31, 2004, approximately, 95% of the net assets are invested in New York municipal securities. Economic changes affecting the state and certain of its public bodies and municipalities may affect the ability of issuers to pay the required principal and interest payments of the municipal securities.
At March 31, 2004, approximately, 87%, 7% and 4% of the net assets are invested in revenue bonds, general obligation bonds and anticipation notes, respectively.
See Notes to Financial Statements.
23
Excelsior Tax-Exempt Funds, Inc.
Portfolio of Investments — March 31, 2004
California Tax-Exempt Income Fund
| | | | | |
Principal
Amount
| | | | Value
(Note 1)
|
| TAX-EXEMPT SECURITIES — 89.39% | | |
| $ 545,000 | | Alameda-Contra Costa, California, Certificates of Participation, Transportation District, (AMBAC), 4.000%, 08/01/12 | | $ | 574,332 |
| 595,000 | | Berkeley, California, Unified School District, General Obligation Bonds, (FGIC), 4.375%, 08/01/06 | | | 635,014 |
| 35,000 | | California Educational Facilities Authority, Santa Clara University Revenue Bonds, (MBIA),
4.900%, 09/01/06 | | | 37,870 |
| 750,000 | | California Educational Facilities Authority, Stanford University Revenue Bonds, Series R,
5.000%, 11/01/11 | | | 856,372 |
| 1,000,000 | | California State Department of Transportation Revenue Bonds, Federal Highway Grant Anticipation Bonds, Series A, (FGIC), 4.500%, 02/01/13 | | | 1,087,970 |
| 1,000,000 | | California State Department of Water Resources Central Valley Project Revenue Bonds, Series T,
5.000%, 12/01/11 | | | 1,116,700 |
| 500,000 | | California State Department of Water Resources Central Valley Project Revenue Bonds, Series U,
4.000%, 12/01/06 | | | 532,820 |
| 750,000 | | California State Infrastructure & Economic Revenue Bonds, Bay Area Toll Bridges, Series A, (FSA), 5.000%, 07/01/11 | | | 853,192 |
| 250,000 | | California State Public Works Board, Lease Revenue Bonds, Department of Corrections, Series D, (MBIA),
4.850%, 09/01/08 | | | 275,822 |
| 750,000 | | California State, General Obligation Bonds,
6.250%, 04/01/08 | | | 852,480 |
| 750,000 | | California State, General Obligation Bonds, (MBIA),
7.500%, 10/01/07 | | | 888,337 |
| 1,000,000 | | California Statewide Communities Development Authority Revenue Bonds, California Endowment, 5.000%, 07/01/13 | | | 1,130,980 |
| | | | | |
Principal
Amount
| | | | Value
(Note 1)
|
| TAX-EXEMPT SECURITIES — (continued) | | |
| $ 315,000 | | Central Coast, Water Authority, California, Revenue Bonds, State Water Project, Series A, (AMBAC), 6.000%, 10/01/05 | | $ | 337,488 |
| 1,000,000 | | Central Valley School District Financing Authority, California, School District General Obligation Bonds,
Series A, (MBIA),
6.150%, 08/01/09 | | | 1,186,270 |
| 550,000 | | 5.850%, 08/01/04 | | | 558,657 |
| 1,100,000 | | Cerritos, California, Public Financing Authority Tax Allocation Bonds, Redevelopment Project, Series A, (AMBAC), 3.000%, 11/01/10 | | | 1,117,743 |
| 545,000 | | Chino Basin, California, Regional Financing Authority Municipal Water District Sewer System Project, (AMBAC),
7.000%, 08/01/05 | | | 587,009 |
| 350,000 | | Contra Costa County, California, Certificates of Participation, Capital Projects, (AMBAC),
4.625%, 02/01/07 | | | 378,591 |
| | | Contra Costa, California, Transportation Authority Sales Tax Revenue Bonds,
Series A, (FGIC), | | | |
| 550,000 | | 6.000%, 03/01/07 | | | 616,093 |
| 1,000,000 | | 6.000%, 03/01/08 | | | 1,145,480 |
| 750,000 | | East Bay, California, Regional Park District Authority General Obligation Bonds,
5.000%, 09/01/07 | | | 830,235 |
| 250,000 | | Escondido, California, Unified School District General Obligation Bonds,
Series A, (FGIC),
5.000%, 09/01/08 | | | 278,800 |
| 1,150,000 | | Fairfield-Suisun, Unified School District, California, General Obligation Bonds, (MBIA),
4.250%, 08/01/10 | | | 1,257,824 |
| 155,000 | | Fresno, California, Sewer Revenue Bonds, Series A-1, (AMBAC), 4.800%, 09/01/06 | | | 167,344 |
See Notes to Financial Statements.
24
Excelsior Tax-Exempt Funds, Inc.
Portfolio of Investments — March 31, 2004
California Tax-Exempt Income Fund — (continued)
| | | | | |
Principal
Amount
| | | | Value
(Note 1)
|
| TAX-EXEMPT SECURITIES — (continued) | | |
| $ 750,000 | | Glendale, California, Unified School District General Obligation Bonds, Series D, (MBIA),
4.500%, 09/01/13 | | $ | 806,640 |
| 745,000 | | Los Altos, California, School District General Obligation Bonds,
Series A, (FSA),
5.000%, 08/01/06 | | | 805,703 |
| 300,000 | | Los Angeles County, California, Public Works Financing Authority, Revenue Bonds, Regional Park & Open Space District, Series A,
5.250%, 10/01/05 | | | 318,888 |
| 655,000 | | 5.000%, 10/01/04 | | | 667,812 |
| 500,000 | | Los Angeles, California, Department of Airports Revenue Bonds, Series A, (FGIC),
6.000%, 05/15/05 | | | 526,690 |
| 150,000 | | Los Angeles, California, Municipal Improvement Revenue Bonds,
Series A, (FSA),
4.875%, 02/01/06 | | | 159,679 |
| 750,000 | | Los Angeles, California, Municipal Improvement Revenue Bonds,
Series B, (AMBAC),
4.600%, 02/01/06 | | | 794,693 |
| 1,000,000 | | Los Angeles, California, Sanitation Equipment Revenue Bonds,
Series A, (FSA),
5.000%, 02/01/10 | | | 1,131,170 |
| 400,000 | | Los Angeles, California, State Building Authority Revenue Bonds, State of California Department of General
Services, Series A,
5.600%, 05/01/04 | | | 401,120 |
| 500,000 | | Los Angeles, California, Unified School District General Obigation Bonds, Series F, (FSA),
4.500%, 07/01/13 | | | 545,760 |
| 1,000,000 | | Los Angeles, California, Wastewater System Revenue Bonds,
Series A, (FGIC),
5.500%, 06/01/10 | | | 1,162,090 |
| 1,000,000 | | Los Angeles, California, Water & Power Revenue Bonds, Power System, Series A, Sub-Series A-1, 5.000%, 07/01/14 | | | 1,116,820 |
| | | | | |
Principal
Amount
| | | | Value
(Note 1)
|
| TAX-EXEMPT SECURITIES — (continued) | | |
| $ 370,000 | | Marin, California, Municipal Water District Revenue Bonds, (AMBAC), 4.000%, 07/01/10 | | $ | 397,876 |
| 700,000 | | Metropolitan Water District of Southern California, General Obligation Bonds,
4.250%, 03/01/08 | | | 760,249 |
| 1,000,000 | | Metropolitan Water District of Southern California, General Obligation Bonds, Series A, 3.000%, 03/01/08 | | | 1,039,290 |
| 960,000 | | Metropolitan Water District of Southern California, Revenue Bonds,
5.750%, 07/01/09 | | | 1,119,965 |
| 200,000 | | Metropolitan Water District of Southern California, Revenue Bonds, Series B, (MBIA),
5.250%, 07/01/07 | | | 220,550 |
| 1,000,000 | | Modesto, California, Irrigation District Financing Authority Certificates of Participation,
Series A, (MBIA),
4.000%, 07/01/09 | | | 1,078,300 |
| 975,000 | | Modesto, California, Irrigation District Financing Authority Revenue Bonds, Series A, (MBIA), 5.450%, 10/01/07 | | | 1,091,376 |
| 1,000,000 | | Moulton-Niguel, California, Water District General Obligation
Bonds, (AMBAC),
4.000%, 09/01/10 | | | 1,077,200 |
| 500,000 | | Napa County, California, Flood Protection & Watershed Improvement Revenue Bonds, Series A, (FGIC),
5.000%, 06/15/13 | | | 552,285 |
| 250,000 | | Northern California Power Agency, Public Power Revenue Bonds, Geothermal Project,
Series A, (AMBAC),
5.500%, 07/01/05 | | | 263,525 |
| 125,000 | | Northern California Power Agency, Public Power Revenue Bonds, Series A, (AMBAC),
5.600%, 07/01/06 | | | 136,471 |
| 250,000 | | Novato, California, General Obligation Bonds, Series A, (MBIA),
6.250%, 08/01/07 | | | 284,553 |
See Notes to Financial Statements.
25
Excelsior Tax-Exempt Funds, Inc.
Portfolio of Investments — March 31, 2004
California Tax-Exempt Income Fund — (continued)
| | | | | |
Principal
Amount
| | | | Value
(Note 1)
|
| TAX-EXEMPT SECURITIES — (continued) | | |
| $1,100,000 | | Orange County, California, Local Transportation Authority Sales Tax Revenue Bonds, 1st Senior, (AMBAC),
6.000%, 02/15/08 | | $ | 1,258,268 |
| 1,000,000 | | Orange County, California, Local Transportation Authority Sales Tax Revenue Bonds, 2nd Senior, (FGIC),
6.000%, 02/15/07 | | | 1,118,070 |
| 1,500,000 | | #Orange County, California, Sanitation District, Certificates of Participation, Series A,
1.100%, 08/01/29 | | | 1,500,000 |
| 1,000,000 | | Oxnard, California, Wastewater District Financing Authority Revenue Bonds, (FGIC),
3.500%, 06/01/09 | | | 1,055,510 |
| 1,000,000 | | Rancho, California, Water District Financing Authority Revenue Bonds, Series A, (FSA),
5.500%, 08/01/10 | | | 1,162,960 |
| 250,000 | | Sacramento County, California, Certificates of Participation, Public Facilities Project, (MBIA),
4.875%, 02/01/05 | | | 257,953 |
| 255,000 | | Sacramento, California, City Financing Authority Lease Revenue Bonds, Series A, (AMBAC),
5.050%, 11/01/06 | | | 278,297 |
| 300,000 | | San Bernardino County, California, Certificates of Participation, Medical Center Financing
Project, (MBIA),
5.500%, 08/01/07 | | | 335,631 |
| 255,000 | | San Bernardino County, California, Transportation Authority Sales Tax Revenue Bonds, Series A, (MBIA),
4.625%, 03/01/05 | | | 263,333 |
| 1,000,000 | | San Diego County, California, Certificates of Participation, (AMBAC),
5.000%, 11/01/11 | | | 1,139,640 |
| 250,000 | | San Diego, California, General Obligation Bonds, Public Safety Communication Project,
6.500%, 07/15/08 | | | 294,770 |
| 1,000,000 | | San Diego, California, Public Facilities Financing Authority Sewer Revenue Bonds, (FGIC),
5.200%, 05/15/13 | | | 1,060,970 |
| | | | | |
Principal
Amount
| | | | Value
(Note 1)
|
| TAX-EXEMPT SECURITIES — (continued) | | |
| $ 300,000 | | San Diego, California, Public Facilities Financing Authority Sewer Revenue Bonds,
Series B, (FGIC),
5.000%, 05/15/08 | | $ | 331,752 |
| 1,000,000 | | San Diego, California, Public Facilities Financing Authority Water Revenue Bonds, (MBIA),
5.000%, 08/01/11 | | | 1,135,480 |
| 875,000 | | San Francisco, California, Bay Area Rapid Transit District, Sales Tax Revenue Bonds,
5.500%, 07/01/07 | | | 976,395 |
| 1,500,000 | | San Francisco, California, City & County Airports Commission Airport Revenue Bonds, 2nd Series, Issue 20, (MBIA),
5.000%, 05/01/06 | | | 1,610,850 |
| 1,000,000 | | San Francisco, California, City & County General Obligation
Bonds, (FSA),
5.000%, 06/15/08 | | | 1,117,960 |
| 680,000 | | San Francisco, California, City & County General Obligation Bonds, Series 1, (FGIC),
4.500%, 06/15/05 | | | 707,601 |
| 1,020,000 | | San Francisco, California, City & County Parking Authority Revenue Bonds, Parking Meter Project, Series 1, (FGIC),
4.000%, 06/01/06 | | | 1,076,773 |
| 325,000 | | San Francisco, California, City & County Public Utilities Commission Water Revenue Bonds, Series A,
6.500%, 11/01/04 | | | 334,620 |
| 500,000 | | San Jose, California, Redevelopment Agency Tax Allocation Bonds, Merged Area Redevelopment Project, (AMBAC),
5.000%, 08/01/07 | | | 551,360 |
| 625,000 | | 4.750%, 08/01/05 | | | 654,769 |
| 300,000 | | San Mateo County, California, Joint Powers Financing Authority Revenue Bonds, San Mateo County Health Care Center, Series A, (FSA),
5.600%, 07/15/04 | | | 303,777 |
See Notes to Financial Statements.
26
Excelsior Tax-Exempt Funds, Inc.
Portfolio of Investments — March 31, 2004
California Tax-Exempt Income Fund — (continued)
| | | | | |
Principal
Amount
| | | | Value
(Note 1)
|
| TAX-EXEMPT SECURITIES — (continued) | | |
| $ 500,000 | | San Mateo County, California, Transportation Authority Revenue Bonds, Series A, (MBIA),
4.200%, 06/01/04 | | $ | 502,520 |
| 750,000 | | San Mateo County, California, Transportation District, Sales Tax Revenue Bonds, Series A, (FSA), 5.000%, 06/01/09 | | | 847,898 |
| 510,000 | | Santa Barbara, California, Waterfront Certificates of Participation, (AMBAC),
4.125%, 10/01/12 | | | 546,001 |
| 1,075,000 | | Santa Clara County, California, Financing Authority,
Series A, (AMBAC),
4.500%, 05/15/12 | | | 1,139,113 |
| 500,000 | | Santa Clara County, California, Transportation District, Sales Tax Revenue Bonds, Series A,
4.500%, 06/01/06 | | | 532,020 |
| 1,000,000 | | Santa Rosa, California, Wastewater System Revenue Bonds, Series B, 4.000%, 09/01/11 | | | 1,071,250 |
| 1,000,000 | | Southern California Public Power Authority Revenue Bonds,
Series A, (MBIA),
5.250%, 07/01/09 | | | 1,131,880 |
| 1,000,000 | | Southern California Public Power Authority Revenue Bonds, Southern Transmission,
Series B, (FSA),
4.250%, 07/01/11 | | | 1,085,500 |
| 600,000 | | University of California Revenue Bonds, Multi-Purpose Projects, Series F, (FGIC),
5.000%, 09/01/08 | | | 655,212 |
| | | | |
|
|
| | | | | | 59,800,261 |
| | | | |
|
|
TAX-EXEMPT SECURITIES — ESCROWED IN
U.S. GOVERNMENTS — 6.32% | | |
| 100,000 | | California Educational Facilities Authority Revenue Bonds, Santa Clara University Project, (MBIA), 4.900%, 09/01/06
(Escrowed to Maturity) | | | 108,448 |
| | | | | |
Principal
Amount
| | | | Value
(Note 1)
|
TAX-EXEMPT SECURITIES — ESCROWED IN
U.S. GOVERNMENTS — (continued) | | |
| $ 750,000 | | California State, General Obligation Bonds, (FGIC),
6.000%, 08/01/19
(Prerefunded 08/01/04 @ 102) | | $ | 777,225 |
| 1,000,000 | | Long Beach, California, Water Revenue Bonds,
6.250%, 05/01/24
(Prerefunded 05/01/04 @ 102) | | | 1,023,870 |
| 125,000 | | Los Angeles, California, Department of Water & Power Revenue Bonds, (AMBAC), 4.600%, 08/15/06
(Escrowed to Maturity) | | | 127,722 |
| 40,000 | | Metropolitan Water District of Southern California,
Revenue Bonds,
5.750%, 07/01/09
(Escrowed to Maturity) | | | 46,989 |
| 125,000 | | Northern California Power Agency, Public Power Revenue Bonds, Series A, (AMBAC),
5.600%, 07/01/06
(Escrowed to Maturity) | | | 137,111 |
| 400,000 | | Sacramento County, California, Sanitation District Revenue Bonds, 5.500%, 12/01/05
(Escrowed to Maturity) | | | 429,132 |
| 825,000 | | San Bernardino County, California, Certificates of Participation, Medical Center Financing Project,
Series A, (MBIA),
5.500%, 08/01/22
(Prerefunded 08/01/05 @ 102) | | | 890,258 |
| 500,000 | | San Francisco, California, Bay Area Rapid Transit District, Sales Tax Revenue Bonds, (FGIC),
5.500%, 07/01/20
(Prerefunded 07/01/05 @ 101) | | | 532,760 |
| 150,000 | | Santa Barbara County, California, Local Transportation Authority Sales Tax Revenue Bonds, (FGIC), 4.900%, 04/01/06
(Prerefunded 04/01/04 @ 101) | | | 151,500 |
| | | | |
|
|
| | | | | | 4,225,015 |
| | | | |
|
|
See Notes to Financial Statements.
27
Excelsior Tax-Exempt Funds, Inc.
Portfolio of Investments — March 31, 2004
California Tax-Exempt Income Fund — (continued)
| | | | | |
Shares
| | | | Value
(Note 1)
|
| SHORT-TERM INVESTMENTS — 5.02% | | |
| 1,718,793 | | @BlackRock California Money Fund | | $ | 1,718,793 |
| 1,636,706 | | @Federated California Money Fund | | | 1,636,706 |
| | | | |
|
|
| | | | | | 3,355,499 |
| | | | |
|
|
| | | | | | | |
TOTAL INVESTMENTS
(Cost $64,463,629) | | 100.73 | % | | $ | 67,380,775 | |
OTHER ASSETS &
LIABILITIES (NET) | | (0.73 | ) | | | (486,399 | ) |
| | |
|
| |
|
|
|
NET ASSETS | | 100.00 | % | | $ | 66,894,376 | |
| | |
|
| |
|
|
|
AMBAC—American Municipal Bond Assurance Corp.
FGIC—Financial Guaranty Insurance Corp.
MBIA—Municipal Bond Insurance Assoc.
FSA—Financial Security Assurance
| # | Variable rate demand bonds and notes are payable upon not more than seven business days notice. Rate shown is as of March 31, 2004. |
| @ | Registered Investment Company |
Notes (The following notes have not been audited by Deloitte & Touche LLP):
These municipal securities meet the three highest ratings assigned by Moody’s Investors Services, Inc. or Standard and Poor’s Corporation or, where not rated, are determined by the Adviser, under the supervision of the Board of Directors, to be of comparable quality at the time of purchase to rated instruments that may be acquired by the Fund.
At March 31, 2004, approximately 6% of the net assets are invested in municipal securities that have letter of credit enhancement features or escrows in U.S. Government securities backing them, on which the Fund relies. Without such features, the securities may or may not meet the quality standards of securities purchased by the Fund.
At March 31, 2004, approximately, 96% of the net assets are invested in California municipal securities. Economic changes affecting the state and certain of its public bodies and municipalities may affect the ability of issuers to pay the required principal and interest payments of the municipal securities.
At March 31, 2004, approximately, 60%, 22%, 10% and 3% of the net assets are invested in revenue bonds, general obligation bonds, certificates of participation and tax allocation bonds, respectively.
See Notes to Financial Statements.
28
EXCELSIOR TAX-EXEMPT FUNDS, INC.
NOTES TO FINANCIAL STATEMENTS
1. Significant Accounting Policies:
Excelsior Tax-Exempt Funds, Inc. (“Excelsior Tax-Exempt Fund”) was incorporated under the laws of the State of Maryland on August 8, 1984 and is registered under the Investment Company Act of 1940, as amended (the “1940 Act”), as open-end diversified management investment companies with the exception of New York Intermediate-Term Tax-Exempt Fund, California Tax-Exempt Income Fund and New York Tax-Exempt Money Fund, each of which are non-diversified.
Excelsior Tax-Exempt Fund currently offers shares in seven managed investment portfolios, each having its own investment objectives and policies. The following is a summary of significant accounting policies for Long-Term Tax-Exempt Fund, Intermediate-Term Tax-Exempt Fund, Short-Term Tax-Exempt Securities Fund, New York Intermediate-Term Tax-Exempt Fund and California Tax-Exempt Income Fund (the “Portfolios”). Such policies are in conformity with accounting principles generally accepted in the United States of America and are consistently followed by Excelsior Tax-Exempt Fund in the preparation of the financial statements. The preparation of financial statements requires management to make estimates and assumptions that affect the reported amounts and disclosures in the financial statements. Actual results could differ from those estimates. The financial statements for the remaining portfolios of Excelsior Tax-Exempt Fund are presented separately.
(a) Portfolio valuation:
Securities are valued each business day as of the close of the New York Stock Exchange after consultation with an independent pricing service (the “Service”). When in the judgement of the Service, quoted bid prices for securities are readily available and are representative of the bid side of the market, these investments are valued at the mean between the quoted bid prices (as obtained by the Service from dealers in such securities) and ask prices (as calculated by the Service based upon its evaluation of the market for such securities). Short-term debt instruments with remaining maturities of 60 days or less, and variable rate demand notes and securities with put options exercisable within one year, are valued at amortized cost, which approximates market value. Securities for which market quotations are not readily available are valued at fair value pursuant to guidelines adopted by Excelsior Tax-Exempt Fund’s Board of Directors.
(b) Security transactions and investment income:
Security transactions are recorded on a trade date basis. Realized gains and losses on investments sold are recorded on the basis of identified cost. Interest income, adjusted for amortization of premiums and discounts on investments, is earned from settlement date and is recorded on the accrual basis.
(c) Distributions to shareholders:
Dividends from net investment income are declared daily and paid monthly. Net realized capital gains, unless offset by any available capital loss carryforwards, are distributed at least annually. Dividends and distributions are recorded on the ex-dividend date.
29
(d) Expense allocation:
Expenses directly attributable to a Portfolio are charged to that Portfolio. Other expenses are allocated to the respective Portfolios based on average daily net assets.
2. Investment Advisory Fee, Administration Fee, Shareholder Servicing Fees and Related Party Transactions:
United States Trust Company of New York (“U.S. Trust NY”) and U.S. Trust Company, N.A. (together the “Adviser” or “U.S. Trust”), acting through their respective registered investment advisory divisions, U.S. Trust New York Asset Management Division and U.S. Trust Company, N.A. Asset Management Division, serve as the investment adviser to the Portfolios. For the services provided pursuant to the Investment Advisory Agreements, the Adviser receives a fee, computed daily and paid monthly, at the annual rates of 0.30% of the average daily net assets of Short-Term Tax-Exempt Securities Fund, 0.35% of the average daily net assets of Intermediate-Term Tax-Exempt Fund and 0.50% of the average daily net assets of each of Long-Term Tax-Exempt Fund, New York Intermediate-Term Tax-Exempt Fund and California Tax-Exempt Income Fund. U.S. Trust NY is a state-chartered bank and trust company and a member bank of the Federal Reserve System. U.S. Trust Company, N.A. is a national bank organized under the laws of the United States. Each is a wholly-owned subsidiary of U.S. Trust Corporation, a registered bank holding company. U.S. Trust Corporation is a wholly-owned subsidiary of The Charles Schwab Corporation (“Schwab”).
U.S. Trust Company, N.A., SEI Investments Global Funds Services and Federated Services Company (collectively, the “Administrators”) provide administrative services to Excelsior Tax-Exempt Fund. For the services provided to the Portfolios, the Administrators are entitled jointly to annual fees, computed daily and paid monthly, based on the combined aggregate average daily net assets of Excelsior Tax-Exempt Fund, Excelsior Funds, Inc. and Excelsior Funds Trust (excluding the international equity portfolios of Excelsior Funds, Inc. and Excelsior Funds Trust), all of which are affiliated investment companies, as follows: 0.200% of the first $200 million, 0.175% of the next $200 million, and 0.150% over $400 million. Administration fees payable by each Portfolio of the three investment companies are determined in proportion to the relative average daily net assets of the respective Portfolios for the period paid. Until further notice to the Portfolios, U.S. Trust Company, N.A. has voluntarily agreed to waive a portion of its administration fee in an amount equal to an annual rate of 0.04% of the average daily net assets of each Portfolio. For the year ended March 31, 2004, administration fees charged by U.S. Trust Company, N.A., were as follows:
| | | | | | | | | |
| | | Administration Fees
| | Waiver of Administration Fees
| | Net
Administration
Fees
|
Long-Term Tax-Exempt Fund | | $ | 100,382 | | $ | 33,453 | | $ | 66,929 |
Intermediate-Term Tax-Exempt Fund | | | 481,916 | | | 160,319 | | | 321,597 |
Short-Term Tax-Exempt Securities Fund | | | 375,395 | | | 124,693 | | | 250,702 |
New York Intermediate-Term Tax-Exempt Fund | | | 219,233 | | | 72,926 | | | 146,307 |
California Tax-Exempt Income Fund | | | 77,884 | | | 25,899 | | | 51,985 |
From time to time, in their sole discretion, U.S. Trust may undertake to waive a portion or all of the fees payable to them and also may reimburse the Portfolios for a portion of other expenses. For the year ended March 31, 2004, U.S. Trust has contractually agreed to waive investment advisory fees and to
30
reimburse other ordinary operating expenses to the extent necessary to keep total operating expenses from exceeding the following annual percentages of each Portfolio’s average daily net assets:
| | | |
Long-Term Tax-Exempt Fund | | 0.80 | % |
Intermediate-Term Tax-Exempt Fund | | 0.65 | % |
Short-Term Tax-Exempt Securities Fund | | 0.60 | % |
New York Intermediate-Term Tax-Exempt Fund | | 0.80 | % |
California Tax-Exempt Income Fund | | 0.50 | % |
For the year ended March 31, 2004, pursuant to the above, U.S. Trust waived investment advisory fees totaling $133,830 for the California Tax-Exempt Income Fund.
The Portfolios have entered into shareholder servicing agreements with various service organizations, which may include Schwab, U.S. Trust and affiliates of U.S. Trust. Services included in the servicing agreements are assisting in processing purchase, exchange, and redemption requests; transmitting and receiving funds in connection with customer orders to purchase, exchange or redeem shares; and providing periodic statements. Shareholder servicing fees are incurred on a Portfolio and class level (where applicable). As a consideration for these services, each service organization receives a fee, computed daily and paid monthly, at an annual rate up to 0.25% (0.40% prior to July 29, 2003) of the average daily net assets of its shares held by each service organizations’ customers.
U.S. Trust has voluntarily agreed to waive investment advisory and administration fees payable in an amount equal to the shareholder servicing fees payable to affiliates.
For the year ended March 31, 2004, shareholder servicing fees paid to Schwab, U.S. Trust and affiliates of U.S. Trust:
| | | | | | |
| | | Amount
Paid
| | Amount
Waived as
Investment
Advisory
Fees
|
Long-Term Tax-Exempt Fund | | $ | 34,897 | | $ | 25,555 |
Intermediate-Term Tax-Exempt Fund | | | 147,989 | | | 135,324 |
Short-Term Tax-Exempt Securities Fund | | | 244,572 | | | 234,580 |
New York Intermediate-Term Tax-Exempt Fund | | | 22,614 | | | 15,817 |
California Tax-Exempt Income Fund | | | 101,934 | | | 96,842 |
Edgewood Services, Inc. (the “Distributor”), a wholly-owned subsidiary of Federated Investors, Inc., serves as the distributor of Excelsior Tax-Exempt Fund. Shares of each Portfolio are sold without a sales charge on a continuous basis by the Distributor.
Boston Financial Data Services, Inc. (“BFDS”) serves as transfer agent to the Portfolios.
Each Independent Director of the Portfolios receives an annual fee of $15,000, plus a meeting fee of $2,500 for each meeting attended. The Chairman receives an additional annual fee of $7,500. Each member of the Nominating Committee for Excelsior Tax-Exempt Fund, Excelsior Funds Trust and
31
Excelsior Fund, Inc. receives a fee of $3,000 for each meeting attended. The Chairman of the Nominating Committee also receives an annual fee of $5,000. In addition, Directors are reimbursed by the Excelsior Tax-Exempt Fund, for reasonable expenses incurred when acting in their capacity as Directors.
3. Purchases, Sales and Maturities of Securities:
For the year ended March 31, 2004, purchases, sales and maturities of securities, excluding short-term investments, for the Portfolios aggregated:
| | | | | | |
| | | Purchases
| | Sales and
Maturities
|
Long-Term Tax-Exempt Fund | | $ | 58,417,098 | | $ | 70,429,053 |
Intermediate-Term Tax-Exempt Fund | | | 89,768,800 | | | 103,729,185 |
Short-Term Tax-Exempt Securities Fund | | | 210,188,520 | | | 177,126,760 |
New York Intermediate-Term Tax-Exempt Fund | | | 55,607,380 | | | 58,534,890 |
California Tax-Exempt Income Fund | | | 11,182,543 | | | 9,009,883 |
4. Federal Taxes:
It is the policy of Excelsior Tax-Exempt Fund that each Portfolio continue to qualify as a regulated investment company, by complying with the requirements of the Internal Revenue Code applicable to regulated investment companies and by distributing substantially all of its taxable earnings to its shareholders.
In order to avoid a Federal excise tax, each Portfolio is required to distribute certain minimum amounts of net realized capital gain and net investment income for the respective periods ending October 31 and December 31 in each calendar year.
Dividends and distributions are determined in accordance with Federal income tax regulations which may differ from generally accepted accounting principles. These differences are primarily due to differing treatments for deferral of losses on wash sales and net capital losses incurred after October 31 and within the taxable year (“Post-October losses”). To the extent these differences are permanent, adjustments are made to the appropriate equity accounts in the period that the differences arise. Accordingly, the following reclassifications have been made to/from the following accounts:
| | | | | | | | |
| | | Undistributed Net Investment Income
| | | Accumulated Net Realized Gain (Loss)
| |
New York Intermediate-Term Tax-Exempt Fund | | $ | (871 | ) | | $ | 871 | |
California Tax-Exempt Income Fund | | | 1,556 | | | | (1,556 | ) |
32
The tax character of dividends and contributions declared during the years ended March 31, 2004 and March 31, 2003 were as follows:
| | | | | | | | | | | | |
| | | Tax-Exempt Income
| | Ordinary Income
| | Long-Term Capital Gains
| | Total
|
Long-Term Tax-Exempt Fund | | | | | | | | | | | | |
2004 | | $ | 2,199,868 | | | — | | | — | | $ | 2,199,868 |
2003 | | | 3,309,713 | | $ | 1,231 | | | — | | | 3,310,944 |
Intermediate-Term Tax-Exempt Fund | | | | | | | | | | | | |
2004 | | | 10,386,027 | | | 1,128,243 | | $ | 12,402,638 | | | 23,916,908 |
2003 | | | 12,412,447 | | | — | | | 2,583,052 | | | 14,995,499 |
Short-Term Tax-Exempt Securities Fund | | | | | | | | | | | | |
2004 | | | 3,456,342 | | | — | | | — | | | 3,456,342 |
2003 | | | 3,712,472 | | | — | | | — | | | 3,712,472 |
New York Intermediate-Term Tax-Exempt Fund | | | | | | | | | | | | |
2004 | | | 4,386,298 | | | 303,039 | | | 5,482,307 | | | 10,171,644 |
2003 | | | 5,629,628 | | | — | | | 2,636,726 | | | 8,266,354 |
California Tax-Exempt Income Fund | | | | | | | | | | | | |
2004 | | | 2,026,301 | | | — | | | — | | | 2,026,301 |
2003 | | | 2,115,479 | | | — | | | 11,932 | | | 2,127,411 |
As of March 31, 2004, the components of distributable earnings on a tax basis were as follows:
| | | | | | | | | | | | | | | | | | | | | | | |
| | | Ordinary
Income
| | Tax-Exempt Income
| | Long-Term Capital Gains
| | Capital Loss Carryforward
| | | Unrealized Appreciation
| | Other Temporary Difference
| | | Total
|
Long-Term Tax-Exempt Fund | | | — | | $ | 147,924 | | | — | | $ | (548,194 | ) | | $ | 1,410,607 | | $ | (147,796 | ) | | $ | 862,541 |
Intermediate-Term Tax-Exempt Fund | | $ | 256,062 | | | 851,303 | | $ | 1,288,102 | | | — | | | | 16,082,047 | | | (845,759 | ) | | | 17,631,755 |
Short-Term Tax-Exempt Securities Fund | | | 24,949 | | | 295,012 | | | 22,878 | | | — | | | | 1,430,542 | | | (282,324 | ) | | | 1,491,057 |
New York Intermediate-Term Tax-Exempt Fund | | | — | | | 345,043 | | | 893,415 | | | — | | | | 5,375,729 | | | (343,016 | ) | | | 6,271,171 |
California Tax-Exempt Income Fund | | | — | | | 171,112 | | | — | | | (664 | ) | | | 2,917,146 | | | (169,848 | ) | | | 2,917,746 |
33
For Federal income tax purposes, capital loss carryforwards may be carried forward and applied against future capital gains. To the extent that such carryforwards are utilized, capital gain distributions will be reduced. At March 31, 2004, the following Portfolios had capital loss carryforwards for Federal tax purposes available to offset future net capital gains through the indicated expiration dates:
| | | | | | | | | |
| | | Expiration Date
| | |
| | | March 31, 2009
| | March 31, 2012
| | Total
|
Long-Term Tax-Exempt Fund | | $ | 548,194 | | | — | | $ | 548,194 |
California Tax-Exempt Income Fund | | | — | | $ | 664 | | | 664 |
During the year ended March 31, 2004, the Long-Term Tax-Exempt Fund and Short-Term Tax-Exempt Fund utilized capital loss carryforwards totaling $1,999,078 and $90,440, respectively, to offset realized capital gains.
At March 31, 2004, aggregate gross unrealized appreciation for all securities for which there was an excess of value over tax cost and aggregate gross unrealized depreciation for all securities for which there was an excess of tax cost over value is as follows:
| | | | | | | | | | | | | |
| | | Federal Tax Cost
| | Tax Basis Unrealized Appreciation
| | Tax Basis Unrealized (Depreciation)
| | | Net Unrealized
Appreciation
|
Long-Term Tax-Exempt Fund | | $ | 70,893,065 | | $ | 1,410,607 | | | — | | | $ | 1,410,607 |
Intermediate-Term Tax-Exempt Fund | | | 368,382,039 | | | 16,276,249 | | $ | (194,202 | ) | | | 16,082,047 |
Short-Term Tax-Exempt Securities Fund | | | 359,682,386 | | | 1,435,061 | | | (4,519 | ) | | | 1,430,542 |
New York Intermediate-Term Tax-Exempt Fund | | | 170,982,472 | | | 5,516,163 | | | (140,434 | ) | | | 5,375,729 |
California Tax-Exempt Income Fund | | | 64,463,629 | | | 2,952,520 | | | (35,374 | ) | | | 2,917,146 |
5. Common Stock:
Excelsior Tax-Exempt Fund currently has authorized capital of 24 billion shares of Common Stock, 15 billion of which is currently classified to represent interests in certain classes of shares. Authorized capital currently classified for each Portfolio is as follows: 1.5 billion shares each of Long-Term Tax-Exempt Fund, Intermediate-Term Tax-Exempt Fund, Short-Term Tax-Exempt Securities Fund, New York Intermediate-Term Tax-Exempt Fund, and California Tax-Exempt Income Fund.
Each share has a par value of $0.001 and represents an equal proportionate interest in the particular Portfolio with other shares of the same Portfolio, and is entitled to such dividends and distributions of taxable and tax-exempt earnings on the assets belonging to such Portfolio as are declared at the discretion of Excelsior Tax-Exempt Fund’s Board of Directors.
34
| | | | | | | | | | | | | | |
| | | Long-Term Tax-Exempt Fund
| |
| | | Year Ended
03/31/04
| | | Year Ended
03/31/03
| |
| | | Shares
| | | Amount
| | | Shares
| | | Amount
| |
Sold | | 1,973,824 | | | $ | 19,719,700 | | | 5,081,297 | | | $ | 49,458,276 | |
Issued as reinvestment of dividends | | 33,235 | | | | 330,955 | | | 48,822 | | | | 477,558 | |
Redeemed | | (4,333,803 | ) | | | (43,227,377 | ) | | (7,739,473 | ) | | | (75,686,646 | ) |
| | |
|
| |
|
|
| |
|
| |
|
|
|
Net (Decrease) | | (2,326,744 | ) | | $ | (23,176,722 | ) | | (2,609,354 | ) | | $ | (25,750,812 | ) |
| | |
|
| |
|
|
| |
|
| |
|
|
|
| |
| | | Intermediate-Term Tax-Exempt Fund
| |
| | | Year Ended
03/31/04
| | | Year Ended
03/31/03
| |
| | | Shares
| | | Amount
| | | Shares
| | | Amount
| |
Sold | | 10,553,521 | | | $ | 104,290,828 | | | 15,584,952 | | | $ | 152,155,618 | |
Issued as reinvestment of dividends | | 183,521 | | | | 1,779,145 | | | 107,316 | | | | 1,050,586 | |
Redeemed | | (11,939,158 | ) | | | (118,008,037 | ) | | (13,904,896 | ) | | | (135,872,328 | ) |
| | |
|
| |
|
|
| |
|
| |
|
|
|
Net Increase (Decrease) | | (1,202,116 | ) | | $ | (11,938,064 | ) | | 1,787,372 | | | $ | 17,333,876 | |
| | |
|
| |
|
|
| |
|
| |
|
|
|
| |
| | | Short-Term Tax-Exempt Securities Fund
| |
| | | Year Ended
03/31/04
| | | Year Ended
03/31/03
| |
| | | Shares
| | | Amount
| | | Shares
| | | Amount
| |
Sold | | 29,901,468 | | | $ | 215,547,037 | | | 30,230,078 | | | $ | 217,600,870 | |
Issued as reinvestment of dividends | | 17,156 | | | | 123,645 | | | 13,775 | | | | 99,187 | |
Redeemed | | (20,414,339 | ) | | | (147,073,098 | ) | | (12,887,229 | ) | | | (92,778,309 | ) |
| | |
|
| |
|
|
| |
|
| |
|
|
|
Net Increase | | 9,504,285 | | | $ | 68,597,584 | | | 17,356,624 | | | $ | 124,921,748 | |
| | |
|
| |
|
|
| |
|
| |
|
|
|
| |
| | | New York Intermediate-Term Tax-Exempt Fund
| |
| | | Year Ended
03/31/04
| | | Year Ended
03/31/03
| |
| | | Shares
| | | Amount
| | | Shares
| | | Amount
| |
Sold | | 4,175,816 | | | $ | 38,017,393 | | | 6,548,542 | | | $ | 59,361,443 | |
Issued as reinvestment of dividends | | 120,743 | | | | 1,083,430 | | | 76,380 | | | | 692,836 | |
Redeemed | | (4,975,150 | ) | | | (45,321,700 | ) | | (6,515,400 | ) | | | (59,172,249 | ) |
| | |
|
| |
|
|
| |
|
| |
|
|
|
Net Increase (Decrease) | | (678,591 | ) | | $ | (6,220,877 | ) | | 109,522 | | | $ | 882,030 | |
| | |
|
| |
|
|
| |
|
| |
|
|
|
| |
| | | California Tax-Exempt Income Fund
| |
| | | Year Ended
03/31/04
| | | Year Ended
03/31/03
| |
| | | Shares
| | | Amount
| | | Shares
| | | Amount
| |
Sold | | 2,479,328 | | | $ | 18,593,918 | | | 2,748,255 | | | $ | 20,492,940 | |
Issued as reinvestment of dividends | | 17,600 | | | | 131,929 | | | 13,055 | | | | 97,474 | |
Redeemed | | (2,405,845 | ) | | | (18,013,017 | ) | | (1,931,582 | ) | | | (14,406,311 | ) |
| | |
|
| |
|
|
| |
|
| |
|
|
|
Net Increase | | 91,083 | | | $ | 712,830 | | | 829,728 | | | $ | 6,184,103 | |
| | |
|
| |
|
|
| |
|
| |
|
|
|
35
6. Line of Credit:
The Portfolios and other affiliated funds participate in a $50 million unsecured line of credit provided by a syndication of banks, under a line of credit agreement. Borrowings may be made to temporarily finance the redemption of Portfolio shares. Interest is charged to each Portfolio, based on its borrowings, at a rate equal to the Federal Funds Rate plus 0.50% per year. In addition, a commitment fee, equal to an annual rate of 0.15% of the average daily unused portion of the line of credit, is allocated among the participating Portfolios at the end of each quarter, and is included in miscellaneous expenses on the Statements of Operations. For the year ended March 31, 2004, the Portfolios had no borrowings under the agreement.
In the normal course of business, the Portfolios enter into contracts that provide general indemnifications. The Portfolios’ maximum exposure under these arrangements is dependent on future claims that may be made against the Portfolios, and therefore, cannot be established; however, based on experience, the risk of loss from such claim is considered remote.
The Adviser and Excelsior Funds, Inc., Excelsior Tax-Exempt Funds, Inc., and Excelsior Funds Trust (the “Companies”) were contacted in September, 2003 by the Office of the New York State Attorney General (the “NYAG”), and the Adviser was contacted by the Securities and Exchange Commission (the “SEC”) and later by the Attorney General of the State of West Virginia in connection with their investigations of practices in the mutual fund industry identified as “market timing” and “late trading” of mutual fund shares (the “Investigations”). The Adviser and the Companies have been cooperating with respect to these Investigations and continue to review the facts and circumstances relevant to the Investigations. As disclosed previously by the Adviser and its affiliates, with respect to the Adviser, these investigations have been focusing on circumstances in which a small number of parties were permitted to engage in short-term trading of certain Excelsior Funds. The short-term trading activities permitted under these arrangements have been terminated and the Adviser has strengthened its policies and procedures to deter frequent trading in the Companies.
Five class actions suits have been filed against the Companies and the Adviser: Mike Sayegh v. Janus Capital Corp.et al., (filed October 22, 2003 in Los Angeles Superior Court); James Page Jr. v. Charles Schwab et al. (filed on November 20, 2003 in the United States District Court for the Northern District of California); A. Joseph Szydlowski v. Charles Schwab et al. (filed December 4, 2003 in the United States District Court for the Southern District of New York); Wilson v. Excelsior Funds, et al. (filed December 10, 2003 in the United States District Court for the Southern District of New York); and John R. Granelli v. Charles Schwab, et al. (filed January 20, 2004 in the United States District Court for the Southern District of New York). While details in each suit vary, in general each alleges that the Adviser, certain of its affiliates, the Companies and others allowed certain parties to engage in illegal and improper mutual fund trading practices, which allegedly caused financial injury to the shareholders of the Companies. Each seeks unspecified monetary damages and related equitable relief.
In addition, two derivative actions, styled Richard Elliott v. Charles Schwab Corporation, et al., No 04 CV 2262 (S.D.N.Y.) and Lou Ann Murphy v. Charles Schwab Corporation et al., (No. 04 CV 3547 (E.D. Penn.),
36
purportedly brought on behalf of Excelsior High Yield Fund and Excelsior Funds Trust, seek unspecific damages arising from alleged violations of Section 36 of the Investment Company Act, 15 U.S.C. § 80a-35(b) and breach of fiduciary duty in relation to allegedly illegal and improper mutual fund trading practices.
The class and derivative actions described above have been transferred to the United District Court for the District of Maryland for coordinated or consolidated pre-trial proceedings. Lead plaintiffs have been appointed and additional defendants have been added (generally consisting of current and former directors and officers of the Companies and entities who timed or facilitated timing in the Excelsior Funds). The seven lawsuits discussed above were consolidated into two new amended complaints, one for the class actions and one for the derivative actions, that were filed on or about September 29, 2004.
The plaintiffs in the consolidated class action are seeking unspecified monetary damages from claimed injuries arising from allegedly illegal and improper mutual fund trading practices, as well as disgorgement of investment advisory fees, rescission and restitution of unspecified funds. The plaintiffs in the consolidated derivative action are seeking on behalf of the Companies unspecified monetary damages for similar claimed injuries, as well as removal of Excelsior Fund directors, removal of U.S. Trust as advisor to the Excelsior Funds, rescission of its investment advisory contracts and disgorgement of management fees and compensation relating to the Excelsior Funds.
The Maryland court is expected to establish a briefing schedule prior to year end for motions to dismiss the actions, and the defendants will not be required to answer the complaints until such motions have been decided. Discovery in the actions is currently stayed, although a motion to lift the stay is expected to be filed on or about December 10, 2004 and decided on or after March 1, 2005.
While the ultimate outcome of these matters cannot be predicted with any certainty at this time, based on currently available information, the Adviser believes that the likelihood is remote that the pending private lawsuits and Investigations will have a material adverse financial impact on the Companies, and further believes that the pending Investigations and private lawsuits are not likely to materially affect the Adviser’s ability to provide investment management services to the Companies.
Effective December 13, 2004, BISYS Fund Services Ohio, Inc. replaced SEI Investments Global Funds Services as Sub-Administrator of Excelsior Tax-Exempt Fund.
Effective January 1, 2005, BISYS Fund Services Limited Partnership will replace Edgewood Services, Inc. as the Distributor of Excelsior Tax-Exempt Fund.
37
REPORT OF INDEPENDENT REGISTERED PUBLIC ACCOUNTING FIRM
To the Board of Directors and Shareholders of
Excelsior Tax-Exempt Funds, Inc.
We have audited the accompanying statements of assets and liabilities, including the portfolios of investments, of the Long-Term Tax-Exempt, Intermediate-Term Tax-Exempt, Short Term Tax-Exempt Securities, New York Intermediate-Term Tax-Exempt, and California Tax-Exempt Income Funds (five of the funds constituting the Excelsior Tax-Exempt Funds, Inc.) (collectively, the “Funds”) as of March 31, 2004, and the related statements of operations, changes in net assets, and the financial highlights for the year then ended. These financial statements and financial highlights are the responsibility of the Funds’ management. Our responsibility is to express an opinion on these financial statements and financial highlights based on our audits. The statements of changes in net assets for the year ended March 31, 2003 and the financial highlights for each of the years in the four year period ended March 31, 2003 were audited by other auditors whose report, dated May 16, 2003, expressed an unqualified opinion on those statements and financial highlights.
We conducted our audits in accordance with standards of the Public Company Accounting Oversight Board (United States). Those standards require that we plan and perform the audit to obtain reasonable assurance about whether the financial statements and financial highlights are free of material misstatement. An audit includes examining, on a test basis, evidence supporting the amounts and disclosures in the financial statements. Our procedures included confirmation of securities owned as of March 31, 2004, by correspondence with the custodian and brokers. An audit also includes assessing the accounting principles used and significant estimates made by management, as well as evaluating the overall financial statement presentation. We believe that our audits provide a reasonable basis for our opinion.
In our opinion, the financial statements and financial highlights referred to above present fairly, in all material respects, the financial position of the Long-Term Tax-Exempt, Intermediate-Term Tax-Exempt, Short Term Tax-Exempt Securities, New York Intermediate-Term Tax-Exempt, and California Tax-Exempt Income Funds as of March 31, 2004, the results of their operations, the changes in their net assets, and the financial highlights for the year then ended, in conformity with accounting principles generally accepted in the United States of America.
DELOITTE & TOUCHE LLP
| | |
| New York, New York | | |
| December 15, 2004 | | |
38
CHANGE IN INDEPENDENT REGISTERED PUBLIC ACCOUNTING FIRM (Unaudited)
The Funds’ Boards of Directors/Trustees and Joint Audit Committee terminated Ernst & Young, LLP (“E&Y”) as the Funds’ independent registered public accounting firm on October 28, 2004 as a result of concerns regarding their independence at the time of the issuance of their report on the Funds’ March 31, 2004 financial statements. During the period in which E&Y served as independent registered public accounting firm for the Funds, there were no disagreements between E&Y and the Funds on any matter of accounting principles or practices, financial statement disclosure or auditing scope or procedures. At the request of the Boards and the Joint Audit Committee, Deloitte & Touche LLP has performed a re-audit of the Funds’ March 31, 2004 financial statements, which had previously been audited by E&Y. That report is included in this annual report.
39
Directors/Trustees and Officers of the Excelsior Funds Complex (Unaudited)
Information pertaining to the directors/trustees and officers of Excelsior Fund, Excelsior Tax-Exempt Fund and Excelsior Funds Trust (each a “Company” and collectively, the “Excelsior Funds Complex”) is set forth below. Directors/Trustees who are not deemed to be “interested persons” of the Excelsior Funds Complex as defined in the 1940 Act are referred to as “Independent Board Members.” Directors/Trustees who are deemed to be “interested persons” of the Excelsior Funds Complex are referred to as “Interested Board Members.” The following information is as of December 15, 2004.
| | | | | | | | | | |
Name, Address, Age(1)
| | Position(s)
Held with
the
Companies
| | Term of
Office and
Length of
Time
Served(2)
| | Principal Occupation(s)
During Past 5 Years
| | Number of
Portfolios in
Excelsior
Complex
Overseen by
Board
Member(3)
| | Other
Directorships
Held by Board
Member(4)
|
DIRECTORS
INDEPENDENT BOARD MEMBERS | | | | |
Frederick S. Wonham
Age: 73 | | Director/Trustee Chairman of the Boards | | Since 1997 | | Retired. Chairman of the Boards and Director (since 1997) and President and Treasurer (from 1995 to February 2002) of Excelsior Funds, Inc. and Excelsior Tax-Exempt Funds, Inc.; Chairman of the Board and Trustee (since 1997) and President and Treasurer (from 1995 to February 2002) of Excelsior Funds Trust. | | 31 | | None. |
| | | | | |
Rodman L. Drake Age: 61 | | Director/Trustee | | Since 1994 | | Director of Excelsior Funds, Inc. and Excelsior Tax-Exempt Funds, Inc. (since 1996); Trustee of Excelsior Funds Trust (since 1994); Co-Founder of Baringo Capital LLC (since 2002); President, Continuation Investments Group, Inc. (from 1997 to 2001). | | 31 | | Director, Parsons Brinkerhoff, Inc. (engineering firm) (since 1995); Director, Clean Fuels Technology Corp. (since 1998); Director and Chairman, Hyperion Total Return Fund, Inc., Hyperion Strategic Mortgage Fund Inc., and Hyperion 2005 Term Trust Inc. (since 1991); Director, Jackson Hewitt Inc. (since June 2004). |
| | | | | |
Mel Hall
Age: 59 | | Director/Trustee | | Since 2000 | | Director of Excelsior Funds, Inc. and Excelsior Tax-Exempt Funds, Inc. (since 2000); Trustee of Excelsior Funds Trust (since 2000); Chief Executive Officer, Comprehensive Health Services, Inc. (health care management and administration) (since 1991). | | 31 | | Chairman, Comprehensive Health Services, Inc. (since 1991). |
| | | | | |
Roger M. Lynch
Age: 64 | | Director/Trustee | | Since 2001 | | Retired. Director of Excelsior Funds, Inc. and Excelsior Tax-Exempt Funds, Inc. and Trustee of Excelsior Funds Trust (since 2001); President, Corporate Asset Funding Co., Inc. (asset securitization) (from 1987 to 1999); Limited Partner (from 1986 to 1999), Goldman Sachs & Co. | | 31 | | Director, SLD Commodities, Inc. (importer of nuts) (since 1991). |
40
| | | | | | | | | | |
Name, Address, Age(1)
| | Position(s)
Held with
the
Companies
| | Term of
Office and
Length of
Time
Served(2)
| | Principal Occupation(s)
During Past 5 Years
| | Number of
Portfolios in
Excelsior
Complex
Overseen by
Board
Member(3)
| | Other
Directorships
Held by Board
Member(4)
|
Jonathan Piel
Age: 65 | | Director/Trustee | | Since 1994 | | Retired. Director, Excelsior Funds, Inc. and Excelsior Tax-Exempt Funds, Inc. (since 1996); Trustee, Excelsior Funds Trust (since 1994). | | 31 | | None. |
| INTERESTED BOARD MEMBER(5) | | | | | | |
James L. Bailey
114 West 47th Street
New York, NY 10036
Age: 59 | | Director/Trustee | | Since February 2004 | | Chief Operating Officer of U.S. Trust Corporation (since December 2004) and Executive Vice President of U.S. Trust Corporation and United States Trust Company of New York (since 2003); President, Excelsior Funds, Inc., Excelsior Tax-Exempt Funds, Inc. and Excelsior Funds Trust (from 2003 to July 2004); Consultant in the financial services industry (from August 2000 to January 2003); Executive Vice President of Citicorp (from 1992 to August 2000). | | 31 | | None. |
| | | | | |
| OFFICERS | | | | | | | | | | |
Mary Martinez
114 West 47th Street
New York, NY 10036
Age: 44 | | President | | Since
July 2004 | | Managing Director of United States Trust Company of New York (since 2003) and Chief Executive Officer of National Private Banking (since October 2004); Managing Director and Director of Relationship Management Service, Marketing, Information and Technology at Bessemer Trust (from 1998 to 2003). | | N/A | | N/A |
| | | | | |
Joseph Trainor, CFA 114 West 47th Street
New York, NY 10036
Age: 43 | | Vice President | | Since February 2004 | | Managing Director of United States Trust Company of New York (since 2003) and President, U.S. Trust Institutional; President of MFS Institutional Advisors (from 1998 to 2002). | | N/A | | N/A |
| | | | | |
Agnes Mullady
225 High Ridge Road
Stamford, CT 06905
Age: 45 | | Treasurer/Chief Financial and Chief Accounting Officer | | Since February 2004 | | Senior Vice President, U.S. Trust Company, N.A. (since 2004); Chief Financial Officer, AMIC Distribution Partners (from 2002 to 2004); Controller Reserve Management Corporation, Reserve Management Company, Inc. and Reserve Partners, Inc. (from 2000 to 2002); Vice President and Treasurer, Northstar Funds; Senior Vice President and Chief Financial Officer, Northstar Investment Management Corp.; President and Treasurer, Northstar Administrators Corp.; and Vice President and Treasurer, Northstar Distributors, Inc. (from 1993 to 2000). | | N/A | | N/A |
| | | | | |
Scott Rhodes
225 High Ridge Road
Stamford, CT 06905
Age: 45 | | Vice President and Assistant Treasurer | | Since November 2004 | | Vice President, U.S. Trust Company, N.A. (since August 2004); Vice President, BlackRock Financial Management Inc. (2004); Controller Mutual Funds, American Skandia Investment Services, Inc. and Assistant Treasurer, American Skandia Trust and American Skandia Advisor Funds, Inc. (from 1996 to 2003). | | N/A | | N/A |
41
| | | | | | | | | | |
Name, Address, Age(1)
| | Position(s)
Held with
the
Companies
| | Term of
Office and
Length of
Time
Served(2)
| | Principal Occupation(s)
During Past 5 Years
| | Number of
Portfolios in
Excelsior
Complex
Overseen by
Board
Member(3)
| | Other
Directorships
Held by Board
Member(4)
|
Alexandra Poe
114 West 47th Street
New York, NY 10036
Age: 44 | | Secretary and Chief Legal Officer | | Since May 2004 | | Senior Vice President and Assistant General Counsel, United States Trust Company of New York (since May 2004); Chief Legal Officer for Managed Accounts and Alternative Investment Strategies, Prudential Investments (from 2001 to 2004); Senior Vice President and General Counsel, US Investment Management and Global Hedge Funds and President of the Schroder Mutual Funds, Schroders (from 1996 to 2001). | | N/A | | N/A |
| | | | | |
Sharon M. Davison 114 West 47th Street
New York, NY 10036
Age: 50 | | Chief Compliance Officer | | Since September 2004 | | Senior Vice President of U.S. Trust Company of New York (since 2001); Director of Securities and Corporate Compliance (since 2001); Director of Special Investigations – New York Stock Exchange Division of Market Surveillance (from 2000 to 2001); Senior Counsel – New York Stock Exchange Division of Market Surveillance (from 1997 to 2000). | | N/A | | N/A |
| | | | | |
Wyndham Clark
225 High Ridge Road
Stamford, CT 06905
Age: 46 | | Anti-Money Laundering Officer | | Since May 2004 | | Vice President and AML Officer, U.S. Trust Company, N.A. (since 2003); Vice President and Deputy Director Risk Management, IBJ Whitehall (banking) (from 2001 to 2002); and Vice President and Chief Risk Officer, EMAC, LLC (commercial lender, asset backed security issuer) (from 1999 to 2001). | | N/A | | N/A |
| (1) | Each independent director/trustee may be contacted by writing to Excelsior Funds, 225 High Ridge Road, Stamford, CT 06905. |
| (2) | Each director/trustee shall hold office until the election and qualification of his or her successor, or until he or she sooner dies, resigns or is removed. The president, treasurer and secretary of each Company shall hold office for a one year term and until their respective successors are chosen and qualified, or in each case until he or she sooner dies, resigns, is removed, or becomes disqualified in accordance with each Company’s by-laws. |
| (3) | The Excelsior Funds Complex consists of all registered investment companies (Excelsior Funds Inc., Excelsior Tax-Exempt Funds, Inc. and Excelsior Funds Trust) for which U.S. Trust serves as investment adviser. As of December 15, 2004, the Excelsior Funds Complex consisted of 31 Funds. |
| (4) | Directorships of companies required to report to the Securities and Exchange Commission under the Securities Exchange Act of 1934 (i.e., “public companies”) or other investment companies registered under the 1940 Act. |
| (5) | “Interested person” of the Company is defined in the 1940 Act. Mr. Bailey is considered an “interested person” because of his affiliation with the Adviser. |
For more information regarding the Directors/Trustees and Officers, please refer to the Statement of Additional Information, which is available upon request by calling 1-800-446-1012.
42
Federal Tax Information: (Unaudited)
For the year ended March 31, 2004, the designation of long-term capital gains and percentage of exempt interest dividends paid are approximated as follows:
| | | | | | | | | |
| | | 20%
Long-Term
Capital Gain
| | 15% Long-Term Capital Gain
| | Exempt
Interest Dividends
| |
Long-Term Tax-Exempt Fund | | | — | | | — | | 100.00 | % |
Intermediate-Term Tax-Exempt Fund | | $ | 9,182,172 | | $ | 3,220,466 | | 43.77 | % |
Short-Term Tax-Exempt Securities Fund | | | — | | | — | | 100.00 | % |
New York Intermediate-Term Tax-Exempt Fund | | | 2,212,274 | | | 3,270,033 | | 43.61 | % |
California Tax-Exempt Income Fund | | | — | | | — | | 100.00 | % |
43
[THIS PAGE INTENTIONALLY LEFT BLANK]
[THIS PAGE INTENTIONALLY LEFT BLANK]
AR-TXEX-1204-42597
The registrant has adopted a Code of Business Conduct and Ethics for principal executive officers and senior financial officers.
| Item 3. | Audit Committee Financial Expert. |
(a)(1) & (2) The registrant’s board of directors has determined that audit committee financial experts serving on the audit committee are Frederick S. Wonham and Rodman L. Drake, who are independent as defined in Form N-CSR Item 3(a)(2).
| Item 4. | Principal Accountant Fees and Services. |
The Funds’ Boards of Directors/Trustees and Joint Audit Committee terminated Ernst & Young, LLP (“E&Y”) as the Funds’ independent registered public accounting firm on October 28, 2004 as a result of concerns regarding their independence at the time of the issuance of their report on the Funds’ March 31, 2004 financial statements. During the period in which E&Y served as independent registered public accounting firm for the Funds, there were no disagreements between E&Y and the Funds on any matter of accounting principles or practices, financial statement disclosure or auditing scope or procedures. At the request of the Boards and the Joint Audit Committee, Deloitte & Touche LLP has performed a re-audit of the Funds’ March 31, 2004 financial statements, which had previously been audited by E&Y.
For the fiscal year ended March 31, 2004, the aggregate fees billed by Deloitte & Touche LLP for professional services rendered for the audits of the financial statements, or services that are normally provided in connection with statutory and regulatory filings or engagements for the fiscal year for Excelsior Tax-Exempt Funds, Inc. are shown in the table below. These Fees will be Reimbursed by the Advisor.
| | | | | | | | | |
| | | | | 2004
|
| | | | | All fees and
services to
the Registrant
that were pre-
approved
| | | All fees and
services to
service affiliates
that were pre-
approved
|
(a) | | Audit Fees(1) | | $ | 210,009 | | | | N/A |
(b) | | Audit-Related Fees (2) | | $ | 0 | | | $ | 0 |
(c) | | Tax Fees (3) | | $ | 0 | | | $ | 0 |
(d) | | All Other Fees | | $ | 0 | (4) | | $ | 0 |
Notes:
| (1) | Audit fees include amounts related to the audit of the Registrant’s annual financial statements and services normally provided by the accountant in connection with statutory and regulatory filings. |
| (2) | For the fiscal year ended March 31, 2004, there were no fees for assurance and related services by D&T reasonably related to the performance of the audit of the Registrant’s financial statements that were not reported under (a) of this Item. |
| (3) | For the fiscal year ended March 31, 2004, there were no aggregate tax fees billed for professional services rendered by D&T for tax compliance, tax advice, and tax planning. |
| (4) | For the fiscal year ending March 31, 2004, there were no fees billed for professional services rendered by D&T for products and services provided by D&T to the Registrant, other than the services reported in (a) through (c) of this Item. |
For the fiscal year ended March 31, 2003, the aggregate fees billed by Deloitte & Touche, LLP for professional services rendered for the audits of the financial statements, or services that are normally provided in connection with statutory and regulatory filings or engagements for the fiscal year for Excelsior Tax-Exempt Funds, Inc. are shown in the table below.
| | | | | | | | | |
| | | | | 2003(5)
|
| | | | | All fees and
services to
the Registrant
that were pre-
approved
| | | All fees and
services to
service affiliates
that were pre-
approved
|
(a) | | Audit Fees(1) | | $ | 0 | | | | N/A |
(b) | | Audit-Related Fees (2) | | $ | 0 | | | $ | 0 |
(c) | | Tax Fees (3) | | $ | 0 | | | $ | 0 |
(d) | | All Other Fees | | $ | 0 | (4) | | $ | 0 |
Notes:
| (1) | Audit fees include amounts related to the audit of the Registrant’s annual financial statements and services normally provided by the accountant in connection with statutory and regulatory filings. |
| (2) | For the fiscal year ended March 31, 2003, there were no fees for assurance and related services by D&T reasonably related to the performance of the audit of the Registrant’s financial statements that were not reported under (a) of this Item. |
| (3) | For the fiscal year ended March 31, 2003, there were no aggregate tax fees billed for professional services rendered by D&T for tax compliance, tax advice, and tax planning. |
| (4) | For the fiscal year ending March 31, 2003, there were no fees billed for professional services rendered by D&T for products and services provided by D&T to the Registrant, other than the services reported in (a) through (c) of this Item. |
| (5) | Principal auditor did not audit the Registrant’s financial statements in 2003. |
(e)(1) The audit committee has adopted policies and procedures that require pre-approval of audit and non-audit services for the Funds and certain other services provided to the Fund’s affiliates in accordance with Rule 2-01(c)(7) of Regulation S-X. The pre-approval requirement for non-audit services for the Funds, the Funds’ investment adviser and the adviser’s control affiliates may be waived if: (i) the aggregate amount of all services provided constitutes not more than 5% of the total amount of revenues paid to the Funds’ independent accountant by the Funds and the Funds’ investment adviser and its control affiliates that provide ongoing services to the Funds during the fiscal year in which the services are provided that would have to be pre-approved by the Funds’ Audit Committee; (ii) such services were not recognized at the time of the engagement to be non-audit services; and (iii) such services are promptly brought to the attention of the Audit Committee and approved prior to the completion of the audit by the Audit Committee or by its designated Audit Committee member(s).
(e)(2) Percentage of fees billed applicable to non-audit services pursuant to waiver of pre-approval requirement were as follows:
| | | | |
| | | 2004
| | 2003
|
Audit-Related Fees | | N/A | | N/A |
Tax Fees | | N/A | | N/A |
All Other Fees | | N/A | | N/A |
(f) Not Applicable.
(g) For the fiscal years ended March 31, 2004 and March 31, 2003, the aggregate non-audit fees billed by D&T for services rendered to the Registrant and the Advisers and any entity controlling, controlled by, or under common control with the Advisers that provided ongoing services to the Registrant were $1,025,000 and $500,000, respectively.
(h) The registrant’s audit committee has considered whether its principal accountant’s provision of non-audit services that were rendered to the registrant’s investment adviser, and any control persons of the investment adviser that provides ongoing services to the registrant, that were not pre-approved pursuant to paragraph (c)(7)(ii) of Rule 2-01 of Regulation S-X, is compatible with maintaining the principal accountant’s independence.
| Item 5. | Audit Committee of Listed Registrants. |
Not applicable.
| Item 6. | Schedule of Investments. |
Not applicable. Effective for filings made for fiscal periods ending on or after July 9, 2004.
| Item 7. | Disclosure of Proxy Voting Policies and Procedures for Closed-End Management Investment Companies. |
Not applicable.
| Item 8. | Purchases of Equity Securities by Closed-End Management Company and Affiliated Purchasers. |
Not applicable.
| Item 9. | Submissions of Matters to a Vote of Security Holders. |
There have been no material changes to the procedures by which shareholders may recommend nominees to the Registrant’s board of directors after Registrant last provided disclosure in response to the requirement of Item 7(d)(2)(ii)(G) of Schedule 14A, or this Item 9.
| Item 10. | Controls and Procedures. |
(a) The certifying officers, whose certifications are included herewith, have evaluated the registrant’s disclosure controls and procedures within 90 days of the filing date of this report. In their opinion, based on their evaluation, the registrant’s disclosure controls and procedures are adequately designed, and are operating effectively to ensure, that information required to be disclosed by the registrant in the reports it files or submits under the Securities Exchange Act of 1934 is recorded, processed, summarized and reported within the time periods specified in the Securities and Exchange Commission’s rules and forms.
(b) There were no significant changes in the registrant’s internal control over financial reporting that occurred during the registrant’s last fiscal half-year that has materially affected, or is reasonably likely to materially affect, the registrants internal control over financial reporting.
(a)(1) Code of Business Conduct and Ethics for principal executive and senior financial officers, attached hereto.
(a)(2) A separate certification for the principal executive officer and the principal financial officer of the registrant as required by Rule 30a-2(a) under the Investment Company Act of 1940, as amended (17 CFR 270.30a-2(a)), are filed herewith.
(b) Officer certifications as required by Rule 30a-2(b) under the Investment Company Act of 1940, as amended (17 CFR 270.30a-2(b)) also accompany this filing as an Exhibit.
SIGNATURES
Pursuant to the requirements of the securities Exchange Act of 1934 and the Investment Company Act of 1940, the registrant has duly caused this report to be signed on its behalf by the undersigned, thereunto duly authorized.
| | | | |
(Registrant) | | | | Excelsior Tax-Exempt Funds, Inc. |
| | |
By (Signature and Title)* | | | | /s/ Mary Martinez |
| | | | | Mary Martinez President |
Date 12/29/04
Pursuant to the requirements of the Securities Exchange Act of 1934 and the Investment Company Act of 1940, this report has been signed below by the following persons on behalf of the registrant and in the capacities and on the dates indicated.
| | | | |
| | |
By (Signature and Title)* | | | | /s/ Mary Martinez |
| | | | | Mary Martinez President |
Date 12/29/04
| | | | |
| | |
By (Signature and Title)* | | | | /s/ Agnes Mullady |
| | | | | Agnes Mullady Treasurer, Chief Financial Officer and Chief Accounting Officer |
Date 12/29/04
| * | Print the name and title of each signing officer under his or her signature. |