| | |
OMB APPROVAL |
OMB Number: | | 3235-0570 |
Expires: | | September 30, 2007 |
Estimated average burden |
hours per response. . . . . .. | | 19.4 |
UNITED STATES
SECURITIES AND EXCHANGE COMMISSION
Washington, D.C. 20549
FORM N-CSR
CERTIFIED SHAREHOLDER REPORT OF REGISTERED
MANAGEMENT INVESTMENT COMPANIES
Investment Company Act file number 811-04101
Excelsior Tax-Exempt Funds, Inc.
(Exact name of registrant as specified in charter)
United States Trust Company of New York
114 West 47th Street
New York, New York 10036
(Address of principal executive offices) (Zip code)
BISYS Fund Services
3435 Stelzer Road
Columbus, Ohio 43219
(Name and address of agent for service)
Registrant’s telephone number, including area code: 1-212-852-1000
Date of fiscal year end: March 31, 2006
Date of reporting period: March 31, 2006
| Item 1. | Reports to Stockholders. |

FIXED INCOMEFUNDS
ANNUAL REPORT
March 31, 2006
TABLE OF CONTENTS
For shareholder account information, current price and yield quotations, or to make an initial purchase or obtain a prospectus, call 1-800-446-1012, from overseas, call 617-483-7297.
| · | Internet Address: http://www.excelsiorfunds.com |
This report must be preceded or accompanied by a current prospectus.
A description of the policies and procedures that Excelsior Funds use to determine how to vote proxies relating to portfolio securities, as well as information relating to how a Fund voted proxies relating to portfolio securities during the most recent 12-month period ended June 30, is available (i) without charge, upon request, by calling 1-800-446-1012, or (ii) by accessing the Excelsior Funds’ internet address and (iii) on the Commission’s website at http://www.sec.gov.
Excelsior Funds file their June 30 and December 31 schedule of portfolio holdings with the Securities and Exchange Commission, on Form N-Q, within sixty days after the applicable reporting period. Excelsior Funds Form N-Q is available on the Commission’s website at http://www.sec.gov, and may be reviewed and copied at the Commission’s Public Reference Room in Washington, DC. Information on the operation of the Public Reference Room may be obtained by calling 1-800-SEC-0330.
A schedule of each Fund’s portfolio holdings, as of the end of the prior month, is also available on the Funds’ website. This schedule is updated monthly, typically by the 15th calendar day, after the end of each month. The Funds may terminate or modify this policy at anytime.
You should consider the Funds’ investment objectives, risks and expenses carefully before you invest. Information about these and other important subjects is in the Funds’ prospectus, which you should read carefully before investing.
Excelsior Funds, Inc., Excelsior Funds Trust and Excelsior Tax-Exempt Funds, Inc. are distributed by BISYS Fund Services Limited Partnership.
You may write to Excelsior Funds, Inc., Excelsior Funds Trust and Excelsior Tax-Exempt Funds, Inc. at the following address:
Excelsior Funds
P.O. Box 8529
Boston, MA 02266-8529
SHARES IN THE FUNDS ARE NOT DEPOSITS OR OBLIGATIONS OF, OR GUARANTEED OR ENDORSED BY, UNITED STATES TRUST COMPANY OF NEW YORK, U.S. TRUST COMPANY, N.A., THEIR PARENT AND AFFILIATES AND SHARES ARE NOT INSURED BY THE FEDERAL DEPOSIT INSURANCE CORPORATION, THE FEDERAL RESERVE BOARD, OR ANY OTHER AGENCY. INVESTMENTS IN THE FUNDS INVOLVE INVESTMENT RISKS, INCLUDING POSSIBLE LOSS OF PRINCIPAL. FUND SHARES ARE NOT INSURED OR GUARANTEED BY THE U.S. GOVERNMENT.
LETTER TO SHAREHOLDERS
March 31, 2006
Dear Valued Excelsior Fund Shareholder,
I am pleased to bring you the annual report for the year ended March 31, 2006 for the Excelsior Funds. The funds in this report are part of the Excelsior Fund family which had over $18 billion in assets as of the end of the report period and includes a wide array of asset classes and investment strategies designed to meet the individual investor’s needs for performance and tax sensitivity.
By now, you would have received information about changes to the administrative and non-advisory services provided to the Excelsior Funds. As a result, the Excelsior Funds and the Laudus Funds, an affiliated fund family, now share certain complex-wide administrative, compliance, marketing and other functions.
We are pleased with the transition, and remain optimistic that shareholders will approve the board of directors’ recommendation to elect members to jointly oversee the two fund families. It is anticipated that the new unified board will strengthen the oversight provided on behalf of fund shareholders and may result in certain long-term cost and operating efficiencies. All votes are important, so I encourage you to vote your shares as soon as possible if you haven’t already done so.
Given these changes, I want to assure you that the most important aspects of the Excelsior Funds will remain the same. Specifically, the fund management and investment process provided by U.S. Trust, as advisor to the Funds, as well as the funds’ emphasis on enduring performance, will not change.
In closing, we at Excelsior Funds remain committed to helping you reach your long-term investment goals. Thank you for investing with us.
Sincerely,

Evelyn Dilsaver
President
1
FIXED INCOME MARKET REVIEW
The fixed income markets experienced three key trends over the course of the fiscal year ending March 31, 2006. Dominating the market was the Federal Reserve’s continuous monetary tightening, which culminated in its fifteenth federal funds target rate hike, to 4.75%, as the reporting period ended. The result was a shift to higher bond yields across the maturity spectrum.
The second critical aspect of the fixed-income market was the continued flattening of the yield curve, as we expected. The yield curve inverted, with shorter rates higher than longer rates, for a period from the end of 2005 into early 2006. An inverted curve has signaled future recessions in the past, but our thinking concurs with the Fed’s, which identifies a global liquidity surplus as the cause of the inversion. The last critical factor for the markets was limited to municipal bonds, with the first quarter of 2006 experiencing a drop in issuance as higher rates cut off refunding issues. Tighter muni supply is expected to continue over the new fiscal year.
Agency bonds modestly outperformed Treasuries for the past 12 months. Demand was strong from domestic investors who sought a high-quality reserve against future opportunities in other sectors. Foreign buying was very heavy. Inflation indexed bonds (TIPS) signaled an increase in inflation expectations as breakeven yields for 5-year and 10-year issues rose over the reporting period, in particular with short maturity issues. Commercial mortgage backed securities modestly outperformed due to healthy demand as investors moved some funds out of the corporate sector into this sector. Interest rate volatility, a key determinant of value in the mortgage-backed securities market, has continued to decline favoring the prospects for out-performance in this sector. Municipals outperformed Treasuries, as yields on the latter rose more on both an actual and a relative basis. This was caused by a well documented increase in demand on the part of non-traditional municipal investors, in addition to a reduction in new-issue supply. The result was much richer municipal/Treasury yield ratios. This has been especially true for maturities of 10+ years, although all comparative municipal/Treasury bond yield ratios fell to 5-year lows in the quarter.
The 10-year Treasury yield is nearing the high end of the expected range for 2006. Yields should begin to decline later in the year driven by an expected slowdown in economic activity, specifically with respect to housing and the consumer. The Fed’s new Chairman, Ben Bernanke, has stated that going forward, Fed policy will be more data dependent, which could see more tightening than expected, but we believe the Fed is aware of the potential for excessive tightening. Opportunity to profit from the yield curve returning to its more traditional steeper shape is now evident. From a duration standpoint, we are positioned slightly shorter to fixed-income benchmarks, looking for an easing to economic growth rates. We will look to position portfolios longer relative to the benchmarks after the Fed concludes its rate increases. We think a significant yield advantage exists in select mortgage-backed and asset-backed investments and continues to dictate an overweight position in the sector.
2
EXCELSIOR TAX-EXEMPT FUNDS, INC. | CALIFORNIA SHORT-INTERMEDIATE TERM |
TAX-EXEMPT INCOME FUND
Fiscal Year Annual Review
California, the world’s seventh-largest economy, continues to display expansive economic growth, and a new governmental emphasis on reining in deficits has earned the state and its counties, cities and fiscal authorities high marks from bond rating agencies. Our Fund invests primarily in California municipal bonds, including state-guaranteed issuance, where at least 80% of the assets held will be both federally tax-exempt and exempt from California state and local income taxes. Over the preceding twelve months, investors witnessed a rise in interest rates across the maturity spectrum, with the Fed going as far as its fifteenth 0.25% increase to the federal funds rate target, bringing it to 4.75% on March 31, at the end of the Fund’s fiscal year. The tax-exempt market outperformed its taxable counterpart, as long-term municipal yields fell while intermediate and long-term governments and corporates rose.
Performance Attribution
Our investment process is driven by the independent examination of individual securities rather than by an overarching economic view, and we believe the Fund’s high-quality, well-diversified fixed-income portfolio is an outcome of this process. Our portfolio tracks the Merrill Lynch 3-7 Year Muni Index, which we not only use as a benchmark, but also as a comparative quality standard. Underperformance relative to this benchmark reflected our commitment to higher quality issues with a higher basis. The “spread” or yield difference between national and California rates widened to a more normal 15-20 basis points. New issue supply was strong, but demand continued to exceed supply, owing to the presence of new institutional buyers. Average maturity in the portfolio was extended as the manager continued to implement a laddered strategy of distributing fund assets across its maturity range in line with its benchmark.
Outlook
The Fund is beginning to be repositioned to benefit from the end of Fed tightening and a trend towards easing that we expect to develop later this year. The yield curve orientation continues to favor flattening, though to a lesser extent than in past quarters. Our biggest concern is reduced issuance, as higher interest rates have dropped refinancings by 25% since the start of the year. However, California was the number one state issuer for the first quarter of 2006, as it was for all of 2005, and supply remains healthy in both the primary and secondary markets. Our research amply demonstrates the importance of tax-savings on fixed-income returns, and we continue with this emphasis for the benefit of our investors.
3
EXCELSIOR TAX-EXEMPT FUNDS, INC. | CALIFORNIA SHORT-INTERMEDIATE TERM TAX-EXEMPT INCOME FUND |
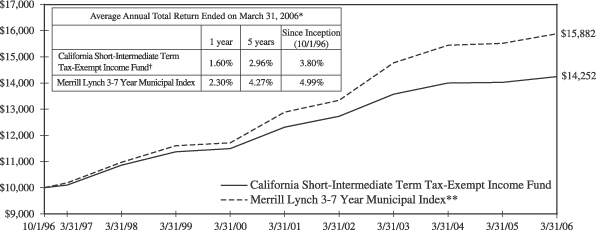
Past performance is not predictive of future performance. Investment returns and principal values will vary and shares may be worth more or less at redemption than their original cost. A portion of the Fund’s income may be subject to the Alternative Minimum Tax.
The above illustration compares a $10,000 investment made in the Fund and a broad-based index since 10/1/96 (inception date). The chart assumes all dividends and capital gain distributions are reinvested. The Fund’s performance takes into account fees and expenses. The index does not take into account charges, fees and other expenses. Further information relating to Fund performance is contained in the Financial Highlights section of the Prospectus and elsewhere in this report.
| * | | Total return represents the change during the period in a hypothetical account with dividends reinvested. |
| ** | | Source: Merrill Lynch—the Merrill Lynch 3-7 Year Municipal Index is a widely-accepted unmanaged market-weighted index comprised of fixed-rate, coupon-bearing bonds issued within five years of the most recent month-end with greater than $50 million principal amount having a Moody’s investment grade rating and maturities of three to seven years. |
| † | | Currently certain fees are waived. Had such fees not been waived, returns would have been lower. Returns do not reflect the deduction of taxes that a shareholder would pay on Fund distributions or the redemption of shares. |
4
EXCELSIOR FUNDS, INC. | CORE BOND FUND |
Fiscal Year Annual Review
The Fed’s FOMC increased the target short-term federal funds rate progressively over the past twelve months, culminating in the 15th rate hike since June 2004, to 4.75%. Treasury yields rose from the 3-month T-Bill to the 30-year bond, and the yield curve flattened and then inverted for more than a month. The Fed has said that further hikes under new Chairman Ben Bernanke will be data-dependent, signaling an end to tightening unless inflation numbers gap higher.
Performance Attribution
The Excelsior Core Bond Fund generated strong relative performance that was largely the result of the portfolio’s barbell position and shorter duration, which benefited as yields rose and the Treasury yield curve flattened. The Fund’s defensive posture to rising rates was additive to returns as yields rose. While our moderate underweight allocation in corporate bonds was a slight detractor from returns, our selective holdings in high yield debt aided relative performance. Allocations to asset-backed and commercial mortgage backed securities helped performance as well. Furthermore, the allocation to municipal bonds added value as the current refinancing supply has been light and demand has increased due to higher yields. Our average quality rating remains at AAA. The allocation to BBB rated securities remains minimal, with the portfolio emphasizing higher quality issues. There were no major changes to our sector allocations although some credit positions were selectively reduced while we added to our mortgage position. The moderate corporate underweight allocation was maintained. We have added to our position in hybrid ARMs (adjustable rate mortgages) with interest rates that are fixed for a set period and then float.
Outlook
We believe a significant yield advantage exists in select mortgage-backed and asset-backed investments, which continues to dictate an overweight position in these securities for the Fund. Interest rate volatility, a key determinant of value in the mortgage-backed securities market, has continued to decline, favoring the prospects for out-performance in this sector. Once the Fed ends the tightening phase, we see little change in the fed funds’ target rate for a considerable period thereafter. We continue to favor investments in high-quality commercial mortgages (CMBS), for their attractive yield levels, low event risk, and high quality.
5
EXCELSIOR FUNDS, INC. | CORE BOND FUND |
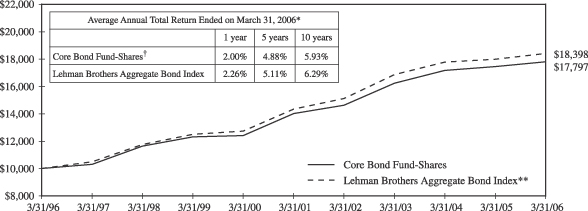
Past performance is not predictive of future performance. Investment returns and principal values will vary and shares may be worth more or less at redemption than their original cost.
The above illustration compares a $10,000 investment made in the Fund and a broad-based index over the past ten fiscal years. The chart assumes all dividends and capital gain distributions are reinvested. The Fund’s performance takes into account fees and expenses. The index does not take into account charges, fees and other expenses. Further information relating to Fund performance is contained in the Financial Highlights section of the Prospectus and elsewhere in this report.
| | * | Total return represents the change during the period in a hypothetical account with dividends reinvested. |
| | ** | Source: Lehman Brothers—the Lehman Brothers Aggregate Bond Index is an unmanaged, fixed income, market value-weighted index that includes treasury issues, agency issues, corporate bond issues and mortgage-backed securities. |
| | † | Currently certain fees are waived. Had such fees not been waived, returns would have been lower. Returns do not reflect the deduction of taxes that a shareholder would pay on Fund distributions or the redemption of shares. |
6
EXCELSIOR FUNDS, INC. | HIGH YIELD FUND |
Fiscal Year Annual Review
The fiscal year ending March 31 witnessed a rise in interest rates across the maturity spectrum, with the Fed going as far as its fifteenth 0.25% increase to the federal funds rate target, raising it to 4.75%. The high yield market extended its positive momentum from late last year through most of the first quarter of 2006. Solid economic growth and strong equity markets fueled enthusiasm for the high yield asset class. In addition, readily available bank credit allowed a number of high yield issuers to redeem outstanding subordinated debt thereby reducing the supply of fixed-coupon issues. Most importantly, default rates in the sector remained stable and at levels well below the long term average.
Performance Attribution
The key drivers of high yield market performance were the ongoing improvement in default rates and the increase in U.S. interest rates. Relative to the Merrill High Yield Index, we had overweight positions in paper/packaging, chemicals, and metals/mining (to benefit from strong economic growth) and in gaming (to reduce portfolio volatility). We positioned the portfolio for moderate volatility in an environment of solid economic growth and stable or moderately rising interest rates, holding issues with high coupons trading near their call prices. As a result, the Fund did not fully participate in the strong performance of the high yield sector. The Fund’s relative underperformance was almost entirely due to underweight exposure to high-volatility, lower-tier securities. Over the year, the CCC-rated sub sector significantly outperformed the B and particularly BB sub sectors. However, our underweighting of lower-tier credits reflected concerns surrounding possible principal risk from rising interest rates and uncertainty surrounding national and international political events. The best performing industry groups included metals/mining, telecom, automotive, and paper/packaging. The weakest performing groups include financials, food and beverage, gaming and broadcasting.
Outlook
The High Yield Fund has been migrating in the direction of greater diversification and higher overall quality. As a result, the Fund at the start of the year was underweight high-beta CCC and B-rated groups, which were the best performing sub sectors. Currently, the Fund has higher than average exposure to gaming and cyclical/commodity sectors such as metals/mining, and chemicals. Below-market weightings include finance, homebuilding, transportation, and autos/suppliers.
7
EXCELSIOR FUNDS, INC. | HIGH YIELD FUND |
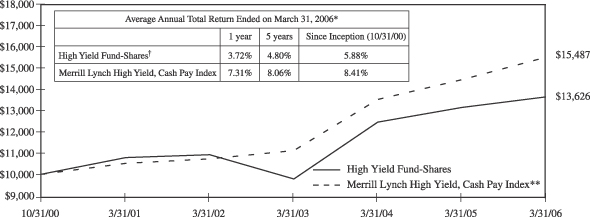
Past performance is not predictive of future performance. Investment returns and principal values will vary and shares may be worth more or less at redemption than their original cost. Securities rated below investment grade generally entail greater market, credit, and liquidity risks than investment grade securities.
The above illustration compares a $10,000 investment made in the Fund and a broad-based index since 10/31/00 (inception date). The chart assumes all dividends and capital gain distributions are reinvested. The Fund’s performance takes into account fees and expenses. The index does not take into account charges, fees and other expenses. Further information relating to Fund performance is contained in the Financial Highlights section of the Prospectus and elsewhere in this report.
| * | | Total return represents the change during the period in a hypothetical account with dividends reinvested. |
| ** | | Source: Merrill Lynch—The Merrill Lynch High Yield, Cash Pay Index is an unmanaged index comprised of publicly placed, non-convertible, coupon bearing domestic debt. Issues in the index are less than investment grade as rated by Standard & Poor’s Ratings Group or Moody’s Investors Service, Inc., and must not be in default. Issues have a term to maturity of at least one year. |
| † | | Currently certain fees are waived. Had such fees not been waived, returns would have been lower. Returns do not reflect the deduction of taxes that a shareholder would pay on Fund distributions or the redemption of shares. |
8
EXCELSIOR FUNDS, INC. | INTERMEDIATE-TERM BOND FUND |
Fiscal Year Annual Review
Over the preceding twelve months, investors witnessed a rise in interest rates across the maturity spectrum, with the Fed going as far as its fifteenth 0.25% increase to the federal funds rate target, bringing it to 4.75% on March 31. The move to higher interest rates has been in place since June 2003, and we believe this Fed tightening cycle is nearing its end. At that point, we anticipate greater opportunity, and will adjust our defensive strategy to take advantage of the new financial environment.
Performance Attribution
Positive contributors to performance during the fiscal year were holdings in mortgage-backed securities and commercial-mortgage backed securities (CMBS). Both sectors were over weighted and had strong performance relative to Treasury issues. An underweight in corporate securities was a drag on results. Securities with call features, such as, mortgages and callable agencies, were overweighted based on valuation levels, and the shorter duration of the overall portfolio aided relative returns. Mortgages and CMBS continue to be overweight for their added yield and high quality. Should the credit cycle turn more cautious, these sectors are expected to have better relative returns. Corporate bonds are under weight and the BBB-rated portion is particularly light at half the index weight. The yield advantage in corporate bonds compared to Treasury bonds is very narrow compared to historic levels.
Outlook
The Fund is beginning to be repositioned to benefit from the end of Fed tightening and a trend towards easing that we expect to develop later this year. The yield curve orientation continues to favor flattening, though to a lesser extent than in past quarters. At quarter end, the Fund had an average credit rating of AAA, a yield-to-worst of 5.38% and a duration of 3.7 years, in line with the benchmark and slightly long versus the Lipper category. We expect the Fund to perform well in the slower economic environment that we foresee.
9
EXCELSIOR FUNDS, INC. | INTERMEDIATE-TERM BOND FUND |
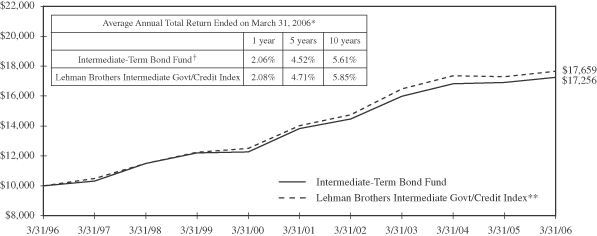
Past performance is not predictive of future performance. Investment returns and principal values will vary and shares may be worth more or less at redemption than their original cost.
The above illustration compares a $10,000 investment made in the Fund and a broad-based index over the past ten fiscal years. The chart assumes all dividends and capital gain distributions are reinvested. The Fund’s performance takes into account fees and expenses. The index does not take into account charges, fees and other expenses. Further information relating to Fund performance is contained in the Financial Highlights section of the Prospectus and elsewhere in this report.
| * | | Total return represents the change during the period in a hypothetical account with dividends reinvested. |
| ** | | Source: Lehman Brothers—The Lehman Brothers Intermediate Govt/Credit Index is an unmanaged total return performance benchmark composed of U.S. Government agencies and U.S. Treasury securities and investment grade corporate debt, selected as representative of the market with maturities of one to ten years. |
| † | | Currently certain fees are waived. Had such fees not been waived, returns would have been lower. Returns do not reflect the deduction of taxes that a shareholder would pay on Fund distributions or the redemption of shares. |
10
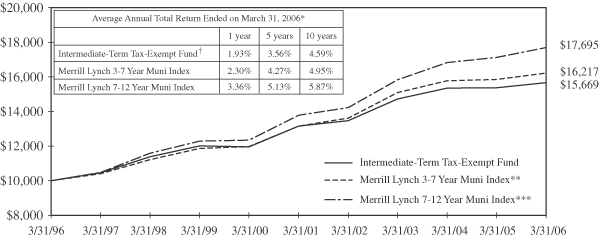
EXCELSIOR TAX-EXEMPT FUNDS, INC. | INTERMEDIATE-TERM TAX-EXEMPT FUND |
Fiscal Year Annual Review
The Fund invests primarily in municipal bonds, where at least 80% of the assets held in the Fund will be federally tax-exempt and have an average maturity of five to ten years. Over the fiscal year, we focused on extending the Fund’s average maturity, but we kept duration roughly the same. We sold several bonds with near call dates, and moved out toward bonds with longer (10-year) call provisions. Over the preceding twelve months, investors witnessed a rise in interest rates across the maturity spectrum, with the Fed going as far as its fifteenth 0.25% increase to the federal funds rate target, bringing it to 4.75% on March 31 at the end of the Fund’s fiscal year.
Performance Attribution
Relative underperformance with our benchmark reflects higher quality securities purchased with a higher basis. The Excelsior Intermediate-Term Tax-Exempt Fund ended the first quarter of 2006 almost fully invested, with 5% percent of assets in cash. Average maturity in the portfolio was extended to nearly 9.5 years, as the manager continued to implement a laddered strategy of distributing fund assets across a maturity range in line with our benchmark. Over the long term, this strategy should serve to deliver more stable returns. As the yield curve flattened, and particularly when the yield curve for 5- and 10- year issues leveled, our performance gained. Our investment process is driven by the independent examination of individual securities rather than by an overarching economic view, and we believe the Fund’s high-quality, well-diversified tax-exempt portfolio is an outcome of this process.
Outlook
The Fund is beginning to be repositioned to benefit from the end of Fed tightening and a trend towards easing that we expect to develop later this year. The yield curve orientation continues to favor flattening, though to a lesser extent than in past quarters. Our biggest concern is reduced issuance, as higher interest rates have dropped refinancings by 25% since the start of the year. Still, we expect to find high-quality opportunities in the municipal market.
11
EXCELSIOR TAX-EXEMPT FUNDS, INC. | INTERMEDIATE-TERM TAX-EXEMPT FUND |
Past performance is not predictive of future performance. Investment returns and principal values will vary and shares may be worth more or less at redemption than their original cost. A portion of the Fund’s income may be subject to the Alternative Minimum Tax and some investors may be subject to certain state and local taxes.
The above illustration compares a $10,000 investment made in the Fund and broad-based indices over the past ten fiscal years. The chart assumes all dividends and capital gain distributions are reinvested. The Fund’s performance takes into account fees and expenses. The indices do not take into account charges, fees and other expenses. Further information relating to Fund performance is contained in the Financial Highlights section of the Prospectus and elsewhere in this report.
| * | | Total return represents the change during the period in a hypothetical account with dividends reinvested. |
| ** | | Source: Merrill Lynch—the Merrill Lynch 3-7 Year Muni Index is a widely-accepted unmanaged market-weighted index comprised of fixed-rate, coupon-bearing bonds issued within five years of the most recent month-end with greater than $50 million principal amount having a Moody’s investment grade rating and maturities of three to seven years. |
| *** | | Source: Merrill Lynch—the Merrill Lynch 7-12 Year Muni Index is a widely-accepted unmanaged market-weighted index comprised of fixed-rate, coupon-bearing bonds issued within five years of the most recent month-end with greater than $50 million principal amount having a Moody’s investment grade rating and maturities of seven to twelve years. |
| † | | Currently certain fees are waived. Had such fees not been waived, returns would have been lower. Returns do not reflect the deduction of taxes that a shareholder would pay on Fund distributions or the redemption of shares. |
12
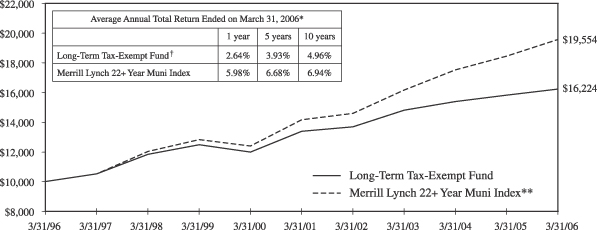
EXCELSIOR FUNDS, INC. | LONG-TERM TAX-EXEMPT FUND |
Fiscal Year Annual Review
Over the preceding twelve months, investors witnessed a rise in interest rates across the maturity spectrum, with the Fed going as far as its fifteenth 0.25% increase to the federal funds rate target, bringing it to 4.75% on March 31. The tax-exempt market outperformed its taxable counterpart, as long-term municipal yields fell while yields on long-term governments and corporates rose. The Fund invested primarily in municipal bonds as a minimum of 80% of the assets held in the Fund must be exempt from Federal income taxes. Demand kept prices of long-maturity municipals strong during the quarter. More attractive long-term tax-exempt yields created unusual demand from foreign and other non-traditional muni investors, as well as insurance companies and other financial institutions, making our bonds more attractive than their taxable equivalents.
Performance Attribution
In the course of the fiscal year, we focused on extending the Fund’s average maturity, but we kept duration roughly the same. Average maturity rose to nearly 14 years. Transactions during the fiscal year included tax swaps that served to reduce volatility, increase yield, improve quality and achieve diversification objectives. We sold several bonds with near call dates, and moved out toward bonds with longer call provisions. As the yield curve flattened, our performance gained. The Excelsior Long-Term Tax-Exempt Fund ended the annual reporting period almost fully invested with less than ten percent cash. We succeeded in our goal of implementing a laddered strategy of distributing fund assets across a maturity range in line with our benchmark. Relative underperformance with our benchmark reflects higher quality securities purchased with a higher basis.
Outlook
Municipal bond issuance set a record in 2005, at $408 billion, fueled by the refunding of older outstanding issues. The unexpected drop in long-term rates during the year and the lower absolute level of rates allowed more issuers to save on their cost of debt outstanding, driving volume higher. The pace of municipal issuance in 2006 is expected to decline to the $350 billion level, as higher interest rates, and the previous large-scale refunding reduce offerings. Reduced supply should add support, and we are confident in the portfolio’s structure. Finally, we expect the Fund to perform well in the slower economic environment that we foresee.
13
EXCELSIOR TAX-EXEMPT FUNDS, INC. | LONG-TERM TAX-EXEMPT FUND |
Past performance is not predictive of future performance. Investment returns and principal values will vary and shares may be worth more or less at redemption than their original cost. A portion of the Fund’s income may be subject to the Alternative Minimum Tax and some investors may be subject to certain state and local taxes.
The above illustration compares a $10,000 investment made in the Fund and a broad-based index over the past ten fiscal years. The chart assumes all dividends and capital gain distributions are reinvested. The Fund’s performance takes into account fees and expenses. The index does not take into account charges, fees and other expenses. Further, information relating to Fund performance is contained in the Financial Highlights section of the Prospectus and elsewhere in this report.
| * | | Total return represents the change during the period in a hypothetical account with dividends reinvested. |
| ** | | Source: Merrill Lynch—the Merrill Lynch 22+ Year Muni Index consists of bonds with an outstanding par which is greater than or equal to 25 million and a maturity range greater than or equal to 22 years. |
| † | | Currently certain fees are waived. Had such fees not been waived, returns would have been lower. Returns do not reflect the deduction of taxes that a shareholder would pay on Fund distributions or the redemption of shares. |
14
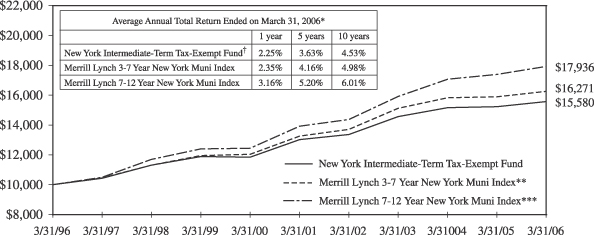
EXCELSIOR TAX-EXEMPT FUNDS, INC. | NEW YORK INTERMEDIATE-TERM TAX-EXEMPT FUND |
Fiscal Year Annual Review
Over the preceding twelve months, investors witnessed a rise in interest rates across the maturity spectrum, with the Fed going as far as its fifteenth 0.25% increase to the federal funds rate target, bringing it to 4.75% on March 31 at the close of the Fund’s fiscal year. The tax-exempt market outperformed its taxable counterpart, as long-term municipal yields fell while intermediate and long-term governments and corporates rose. The Fund invested primarily in municipal bonds issued by the state, counties, municipalities and other state agencies of New York, per our mandate. A minimum of 80% of the assets held in the Fund must be both federally tax-exempt and exempt from state and local income taxes.
Performance Attribution
The New York tax-exempt market was supported by strong new issue supply, but demand continued to exceed supply. The market outperformed the national market during the fiscal year, as prices rose and spreads tightened to a point well below their historical averages. New issue supply was strong, but demand continued to exceed supply, owing to the presence of new institutional buyers. The Excelsior New York Intermediate Tax-Exempt Fund ended the annual reporting period almost fully invested with less than 10 percent cash. Average maturity in the portfolio was extended as the manager continued to implement a laddered strategy of distributing fund assets across its maturity range in line with its benchmark. During the fiscal year, the Fund moved to increase yield while reducing volatility by investing in bonds with longer maturities but shorter call dates. Underperformance relative to this benchmark reflected our commitment to higher quality issues with a higher basis.
Outlook
The Fund is beginning to be repositioned to benefit from the end of Fed tightening and a trend towards easing that we expect to develop later this year. The yield curve orientation continues to favor flattening, though to a lesser extent than in past quarters. Our biggest concern is reduced issuance, as higher interest rates have dropped refinancings by 25% since the start of the year. While this has provided price support, we think short supply is problematic. We believe the outlook for New York State issuers is positive, as the National Conference of State Legislators confirms, and revenues are either meeting or exceeding budgeted levels. And we expect the Fund to perform well in the slower economic environment that we foresee.
15
EXCELSIOR TAX-EXEMPT FUNDS, INC. | NEW YORK INTERMEDIATE-TERM TAX-EXEMPT FUND |
Past performance is not predictive of future performance. Investment returns and principal values will vary and shares may be worth more or less at redemption than their original cost. A portion of the Fund’s income may be subject to the Alternative Minimum Tax.
The above illustration compares a $10,000 investment made in the Fund and broad-based indices over the past ten fiscal years. The chart assumes all dividends and capital gain distributions are reinvested. The Fund’s performance takes into account fees and expenses. The indices do not take into account charges, fees and other expenses. Further information relating to Fund performance is contained in the Financial Highlights section of the Prospectus and elsewhere in this report.
| | * | Total return represents the change during the period in a hypothetical account with dividends reinvested. |
| | ** | Source: Merrill Lynch—the Merrill Lynch 3-7 Year New York Muni Index is a widely-accepted unmanaged market-weighted index comprised of fixed-rate, coupon-bearing bonds of New York Municipalities issued within five years of the most recent month-end with greater than $50 million principal amount having a Moody’s investment grade rating and maturities of three to seven years. |
| | *** | Source: Merrill Lynch—the Merrill Lynch 7-12 Year New York Muni Index is a widely-accepted unmanaged market-weighted index comprised of fixed-rate, coupon-bearing bonds of New York Municipalities issued within five years of the most recent month-end with greater than $50 million principal amount having a Moody’s investment grade rating and maturities of seven to twelve years. |
| | † | Currently certain fees are waived. Had such fees not been waived, returns would have been lower. Returns do not reflect the deduction of taxes that a shareholder would pay on Fund distributions or the redemption of shares. |
16
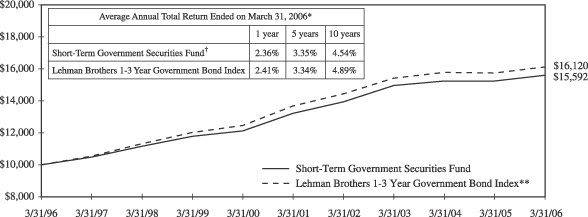
EXCELSIOR FUNDS, INC. | SHORT-TERM GOVERNMENT SECURITIES FUND |
Fiscal Year Annual Review
Inflation fears have risen over the fiscal year, with indicators, watched by the Fed, close to the upper end of acceptable ranges. Energy costs have climbed significantly, and inflation watchers are looking for pass through. Clearly, prospects of an end to Fed tightening will be dictated by the reported levels of consumer inflation going forward. Yields have increased across the maturity spectrum as the Federal Reserve Board has continued to raise the target rate for Fed funds, bringing it to 4.75% by March 31.
Performance Attribution
Volatility has been driven lower as market participants have begun to price in the prospect that the Federal Reserve is nearing the end of its tightening regimen and will leave the Fed Funds’ target rate unchanged for a considerable period thereafter. Mortgage-backed prices have an inverse relationship to the market level of volatility, and we have benefited with a strategy that focuses on this relationship. The Fund’s duration, or sensitivity to changes in interest rates, was 1.72 years at the end of the quarter, approximately neutral to the benchmark. We think a significant yield advantage exists in both mortgage-backed and asset-backed investments and continues to dictate an overweight position in the Fund. The combined percentage held of both sectors at the end of the period amounted to 62%. Interest rate volatility, a key determinant of value in the mortgage-backed securities market, has continued to decline favoring the prospects for outperformance in the mortgage-backed sector.
Outlook
The shape of the Treasury yield curve has become extremely flat. This situation may persist throughout the near term. An opportunity to profit from the yield curve returning to its more traditional steeper shape may present itself during the new fiscal year, but that possibility is not predicted. The flat yield curve shape eliminates the prospects of adding performance through security “rolldown.” Yield spread, we believe, is presently the best opportunity for excess returns.
17
EXCELSIOR FUNDS, INC. | SHORT-TERM GOVERNMENT SECURITIES FUND |
Past performance is not predictive of future performance. Investment returns and principal values will vary and shares may be worth more or less at redemption than their original cost.
The above illustration compares a $10,000 investment made in the Fund and a broad-based index over the past ten fiscal years. The chart assumes all dividends and capital gain distributions are reinvested. The Fund’s performance takes into account fees and expenses. The index does not take into account charges, fees and other expenses. Further information relating to Fund performance is contained in the Financial Highlights section of the Prospectus and elsewhere in this report.
| * | | Total return represents the change during the period in a hypothetical account with dividends reinvested. |
| ** | | Source: Lehman Brothers—The Lehman Brothers 1-3 Year Government Bond Index is an unmanaged total return performance benchmark composed of U.S. Government agencies and U.S. Treasury securities with maturities of one to three years. |
| † | | Currently certain fees are waived. Had such fees not been waived, returns would have been lower. Returns do not reflect the deduction of taxes that a shareholder would pay on Fund distributions or the redemption of shares. |
18
EXCELSIOR TAX-EXEMPT FUNDS, INC. | SHORT-TERM TAX-EXEMPT SECURITIES FUND |
Fiscal Year Annual Review
The Fund invests primarily in municipal bonds, with at least 80% of its assets qualifying for Federal tax-exempt status, and with an average maturity of one to three years. Over the course of the fiscal year, cash inflows to the Fund remained strong, but it was challenging to put cash to work. As the spread between the very short end of the yield curve and the one- to two-year segment was flat, we saw no incentive to relocate. But as rates rose, we extended the Fund’s average maturity, which contributed positively to performance. However, underperformance relative to this benchmark reflected our commitment to higher quality issues with a higher basis. Over the preceding twelve months, investors witnessed a rise in interest rates across the maturity spectrum, with the Fed going as far as its fifteenth 0.25% increase to the federal funds rate target, bringing it to 4.75% on March 31 at the end of the Fund’s fiscal year.
Performance Attribution
By adjusting its cash position during the quarter, the Excelsior Short-Term Tax-Exempt Securities Fund reinvested in the areas of its maturity range that experienced the biggest back-up in rates in response to Federal Reserve rate increases and supply/demand issues in the short-term tax-exempt markets. In anticipation that tax-related money market liquidations would put upward pressure on short-term yields as April 15 approached, the Fund invested 30% in cash equivalents and shortened average maturity to 2.3 years. Over the reporting period, the tax-exempt market outperformed its taxable counterpart, as long-term municipal yields fell while intermediate and long-term governments and corporates rose. The Excelsior Short-Term Tax-Exempt Securities Fund ended the quarter almost fully invested, with 5% percent of assets in cash.
Outlook
The Fund is beginning to be repositioned to benefit from the end of Fed tightening and a trend towards easing that we expect to develop later this year. The yield curve orientation continues to favor flattening, though to a lesser extent than in past quarters. Our biggest concern is reduced issuance, as higher interest rates have dropped refinancings by 25% since the start of the year. Still, we expect to find high-quality opportunities in the municipal market. During 2005, municipal interest rates rose by more than 1% at the short end, with the 2-year maturity rising from 2.20% to 3.20%. While the municipal yield curve did not invert at any time during the year (and is not expected to in 2006), by the end of December, rates across the first two years of the curve were almost identical at about 3.20%. Looking ahead, we’ll maintain the current barbell structure, until we get a better picture on exactly when Fed interest rate hikes are over, at which time we expect to deploy cash at the long-end of our maturity spectrum.
19
EXCELSIOR TAX-EXEMPT FUNDS, INC. | SHORT-TERM TAX-EXEMPT SECURITIES FUND |
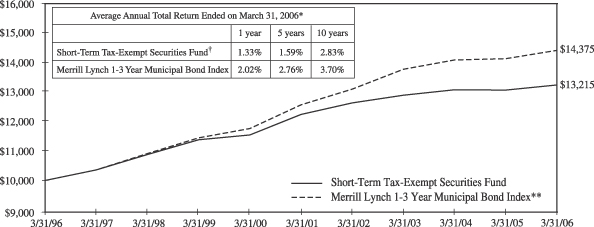
Past performance is not predictive of future performance. Investment returns and principal values will vary and shares may be worth more or less at redemption than their original cost. A portion of the Fund’s income may be subject to the Alternative Minimum Tax and some investors may be subject to certain state and local taxes.
The above illustration compares a $10,000 investment made in the Fund and a broad-based index over the past ten fiscal years. The chart assumes all dividends and capital gain distributions are reinvested. The Fund’s performance takes into account fees and expenses. The index does not take into account charges, fees and other expenses. Further information relating to Fund performance is contained in the Financial Highlights section of the Prospectus and elsewhere in this report.
| * | | Total return represents the change during the period in a hypothetical account with dividends reinvested. |
| ** | | Source: Merrill Lynch—the Merrill Lynch 1-3 Year Municipal Bond Index is a widely-accepted unmanaged market-weighted index comprised of fixed-rate, coupon-bearing bonds issued within five years of the most recent month-end with greater than $50 million principal amount having a Moody’s investment grade rating and maturities of one to three years. |
| † | | Currently certain fees are waived. Had such fees not been waived, returns would have been lower. Returns do not reflect the deduction of taxes that a shareholder would pay on Fund distributions or the redemption of shares. |
20
Excelsior Tax-Exempt Funds, Inc.
Portfolio of Investments — March 31, 2006
California Short-Intermediate Term Tax-Exempt Income Fund
| | | | | | | | | | | |
Principal Amount
| | | | Rate
| | | Maturity
Date
| | Value
|
| | | | | | | | | | | | |
| TAX-EXEMPT CASH EQUIVALENT SECURITIES —
BACKED BY LETTERS OF CREDIT (2.03%): | | | |
| $ | 800,000 | | California State General Obligation Bonds, Kindergarten-University, Series B-3, (Citibank N.A.-37%/ State Street Bank & Trust-37%/ National Australia Bank-25%)(a) | | 3.06 | % | | 05/01/34 | | $ | 800,000 |
| | 550,000 | | Orange County, California, Sanitation Districts, Certificate of Participation, (AMBAC) (Societe Generale)(a) | | 3.10 | | | 08/01/16 | | | 550,000 |
| | | | | | | | | | |
|
|
| | | | TOTAL TAX-EXEMPT CASH EQUIVALENT SECURITIES — BACKED BY LETTERS OF CREDIT
(Cost $1,350,000) | | | 1,350,000 |
| | | | | | | | | | |
|
|
| | TAX-EXEMPT SECURITIES (84.25%): | | | |
| | 1,500,000 | | Anaheim, California, Public Financing Authority Revenue Bonds, Distribution Systems, (AMBC) | | 5.00 | | | 10/01/13 | | | 1,615,350 |
| | 1,000,000 | | California State Department of Transportation Revenue Bonds, Federal Highway Grant Anticipation Bonds, Series A, (FGIC) | | 4.50 | | | 02/01/13 | | | 1,042,280 |
| | 1,000,000 | | California State Department of Water Resources Central Valley Project Revenue Bonds, Series Y | | 5.00 | | | 12/01/10 | | | 1,061,230 |
| | 3,000,000 | | California State Department of Water Resources Revenue Bonds, Series W, (AMBAC) | | 5.50 | | | 12/01/09 | | | 3,201,930 |
| | 1,000,000 | | California State Economic Recovery, Special Sales Tax Revenue Bonds, Series A, (FGIC) | | 5.25 | | | 07/01/14 | | | 1,089,870 |
| | 3,000,000 | | California State Economic Recovery, Special Sales Tax Revenue Bonds, Series B | | 5.00 | | | 07/01/23 | | | 3,052,830 |
| | 750,000 | | California State General Obligation Bonds | | 6.25 | | | 04/01/08 | | | 787,373 |
| | | | | | | | | | | |
Principal Amount
| | | | Rate
| | | Maturity
Date
| | Value
|
| | | | | | | | | | | | |
| | TAX-EXEMPT SECURITIES — (continued) | | | |
| $ | 3,000,000 | | California State General Obligation Bonds | | 5.00 | % | | 02/01/11 | | $ | 3,158,460 |
| | 750,000 | | California State General Obligation Bonds, (MBIA) | | 7.50 | | | 10/01/07 | | | 793,260 |
| | 1,000,000 | | California State University Systemwide Revenue Bonds, Series A, (AMBAC) | | 5.00 | | | 11/01/12 | | | 1,074,000 |
| | 1,000,000 | | California Statewide Communities Development Authority Revenue Bonds, California Endowment | | 5.00 | | | 07/01/13 | | | 1,072,650 |
| | 1,000,000 | | Central Valley, California, School District Financing Authority Revenue Bonds, Series A, (MBIA) | | 6.15 | | | 08/01/09 | | | 1,078,460 |
| | 1,000,000 | | Contra Costa, California, Transportation Authority Sales Tax Revenue Bonds, Series A, (FGIC) | | 6.00 | | | 03/01/08 | | | 1,046,220 |
| | 750,000 | | East Bay, California, Regional Park District Authority General Obligation Bonds | | 5.00 | | | 09/01/07 | | | 765,690 |
| | 975,000 | | Foothill- De Anza, California, Community College District General Obligation Bonds, (FGIC) | | 5.00 | | | 08/01/14 | | | 1,035,655 |
| | 1,000,000 | | Golden State Tobacco Securitization Corporation, California, Tobacco Settlement Revenue Bonds, Enhanced-Asset Backed, Series A | | 5.00 | | | 06/01/15 | | | 1,002,130 |
| | 3,500,000 | | Los Angeles County, California, Metropolitan Transportation Authority Sales Tax Revenue Bonds, Series A, (FSA) | | 5.25 | | | 07/01/10 | | | 3,709,369 |
| | 1,000,000 | | Los Angeles, California, Department of Water & Power Revenue Bonds, Power System, Series A, Sub-Series A-1, (MBIA) | | 5.00 | | | 07/01/14 | | | 1,070,040 |
See Notes to Financial Statements.
21
Excelsior Tax-Exempt Funds, Inc.
Portfolio of Investments — March 31, 2006
California Short-Intermediate Term Tax-Exempt Income Fund — (continued)
| | | | | | | | | | | |
Principal Amount
| | | | Rate
| | | Maturity
Date
| | Value
|
| | | | | | | | | | | | |
| | TAX-EXEMPT SECURITIES — (continued) | | | |
| $ | 1,000,000 | | Los Angeles, California, General Obligation Bonds, Series A, (MBIA) | | 4.00 | % | | 09/01/13 | | $ | 1,013,420 |
| | 1,000,000 | | Los Angeles, California, Sanitation Equipment Charge Revenue Bonds, (FGIC) | | 5.00 | | | 02/01/13 | | | 1,072,090 |
| | 1,000,000 | | Los Angeles, California, Sanitation Equipment Charge Revenue Bonds, Series A, (FSA) | | 5.00 | | | 02/01/10 | | | 1,051,720 |
| | 3,000,000 | | Los Angeles, California, Waste Water System Revenue Bonds, Series B, (MBIA) | | 5.00 | | | 06/01/10 | | | 3,167,730 |
| | 1,000,000 | | Metropolitan Water District of Southern California, General Obligation Bonds, Series A | | 3.00 | | | 03/01/08 | | | 987,190 |
| | 960,000 | | Metropolitan Water District of Southern California, Revenue Bonds | | 5.75 | | | 07/01/09 | | | 1,023,110 |
| | 975,000 | | Modesto, California, Irrigation District Financing Authority Revenue Bonds, Series A, (MBIA) | | 5.45 | | | 10/01/07 | | | 1,004,026 |
| | 1,000,000 | | Moulton-Niguel, California, Water District General Obligation Bonds, (AMBAC) | | 4.00 | | | 09/01/10 | | | 1,017,770 |
| | 1,000,000 | | Napa County, California, Flood Protection & Watershed Improvement Authority, General Obligation Bonds, (AMBAC) | | 4.50 | | | 06/15/12 | | | 1,043,880 |
| | 1,100,000 | | Orange County, California, Local Transportation Authority Sales Tax Revenue Bonds, 1st Senior, (AMBAC) | | 6.00 | | | 02/15/08 | | | 1,149,687 |
| | 1,000,000 | | Orange County, California, Local Transportation Authority Sales Tax Revenue Bonds, 2nd Senior, (FGIC) | | 6.00 | | | 02/15/07 | | | 1,021,750 |
| | | | | | | | | | | |
Principal Amount
| | | | Rate
| | | Maturity
Date
| | Value
|
| | | | | | | | | | | | |
| | TAX-EXEMPT SECURITIES — (continued) | | | |
| $ | 1,000,000 | | Oxnard, California, Wastewater District Financing Authority Revenue Bonds, (FGIC) | | 3.50 | % | | 06/01/09 | | $ | 999,670 |
| | 1,000,000 | | Rancho, California, Water District Financing Authority Revenue Bonds, Series A, (FSA) | | 5.50 | | | 08/01/10 | | | 1,077,030 |
| | 1,000,000 | | San Diego County, California, Certificates of Participation, (AMBAC) | | 5.00 | | | 11/01/11 | | | 1,066,970 |
| | 1,000,000 | | San Diego, California, Public Facilities Financing Authority Sewer Revenue Bonds, (FGIC) | | 5.20 | | | 05/15/13 | | | 1,012,110 |
| | 1,000,000 | | San Diego, California, Public Facilities Financing Authority Water Revenue Bonds, (MBIA) | | 5.00 | | | 08/01/11 | | | 1,066,710 |
| | 1,000,000 | | San Francisco, California, City & County General Obligation Bonds, (FSA) | | 5.00 | | | 06/15/08 | | | 1,031,800 |
| | 1,000,000 | | San Francisco, California, City & County Public Utilities Communication Clean Water Revenue Bond, (MBIA) | | 5.00 | | | 10/01/13 | | | 1,070,510 |
| | 3,000,000 | | San Francisco, California, State Building Authority Lease Revenue Bonds, California State & San Francisco Civic Center, Series A | | 5.00 | | | 12/01/12 | | | 3,173,640 |
| | 1,000,000 | | San Mateo, Foster City, California, School Facilities Financing Authority Revenue Bond, (FSA) | | 4.00 | | | 08/15/12 | | | 1,015,690 |
| | 1,075,000 | | Santa Clara County, California, Financing Authority Lease Revenue Bonds, Multiple Facilities Project, Series A, (AMBAC) | | 4.50 | | | 05/15/12 | | | 1,098,919 |
See Notes to Financial Statements.
22
Excelsior Tax-Exempt Funds, Inc.
Portfolio of Investments — March 31, 2006
California Short-Intermediate Term Tax-Exempt Income Fund — (continued)
| | | | | | | | | | | |
Principal Amount
| | | | Rate
| | | Maturity
Date
| | Value
|
| | | | | | | | | | | | |
| | TAX-EXEMPT SECURITIES — (continued) | | | |
| $ | 1,000,000 | | Southern California Public Power Authority Revenue Bonds, Transmission Project, Series A, (MBIA) | | 5.25 | % | | 07/01/09 | | $ | 1,045,910 |
| | 1,000,000 | | Southern California Public Power Authority Revenue Bonds, Transmission Project, Series B, (FSA) | | 4.25 | | | 07/01/11 | | | 1,030,250 |
| | | | | | | | | | |
|
|
| | | | TOTAL TAX-EXEMPT SECURITIES
(Cost $56,177,671) | | | 55,898,379 |
| | | | | | | | | | |
|
|
| TAX-EXEMPT SECURITIES — ESCROWED IN U.S.
GOVERNMENTS — 9.58% | | | |
| | 2,000,000 | | Riverside, California, Water Revenue Bonds, (FGIC) (Prerefunded 10/01/11 @ 101) | | 5.00 | | | 10/01/26 | | | 2,147,520 |
| | 1,000,000 | | Sacramento, California, City Financing Authority Revenue Bonds, City Hall, Series A, (FSA) (Prerefunded 12/01/12 @ 100) | | 5.25 | | | 12/01/17 | | | 1,087,580 |
| | 3,000,000 | | San Diego County, California, Water Authority Certificates of Participation, Series A, (FGIC) (Prerefunded 05/01/08 @ 101) | | 5.00 | | | 05/01/14 | | | 3,118,860 |
| | | | | | | | | | |
|
|
| | | | TOTAL TAX-EXEMPT SECURITIES — ESCROWED IN U.S. GOVERNMENTS (Cost $6,426,929) | | | 6,353,960 |
| | | | | | | | | | |
|
|
Shares
| | | | | | | | | |
| | REGISTERED INVESTMENT COMPANIES — 3.11% | | | |
| | 1,175,133 | | BlackRock California Money Fund | | $ | 1,175,133 |
| | 891,058 | | Federated California Money Fund | | | 891,058 |
| | | | | | | | | | |
|
|
| | | | TOTAL REGISTERED INVESTMENT COMPANIES
(Cost $2,066,191) | | | 2,066,191 |
| | | | | | | | | | |
|
|
| | | | | | |
| | | | | |
Value
|
TOTAL INVESTMENTS
(Cost $66,020,791)(b) | | 98.97 | % | | $ | 65,668,530 |
OTHER ASSETS IN EXCESS OF LIABILITIES | | 1.03 | | | | 686,633 |
| | |
|
| |
|
|
NET ASSETS | | 100.00 | % | | $ | 66,355,163 |
| | |
|
| |
|
|
| (a) | Variable Rate Security—The rate disclosed is as of March 31, 2006. |
| (b) | Unrealized appreciation (depreciation) of securities: |
| | | | |
Unrealized
Appreciation
| | Unrealized
(Depreciation)
| | Net Unrealized
Appreciation/
(Depreciation)
|
| $192,808 | | $(545,069) | | $(352,261) |
AMBAC—American Municipal Bond Assurance Corp.
FGIC—Financial Guaranty Insurance Corp.
FSA—Financial Security Assurance
MBIA—Municipal Bond Insurance Association
Notes (The following notes have not been audited by Deloitte & Touche LLP):
These municipal securities meet the three highest ratings assigned by Moody’s Investors Services, Inc. or Standard and Poor’s Corporation or, where not rated, are determined by the Advisor, under the supervision of the Board of Directors, to be of comparable quality at the time of purchase to rated instruments that may be acquired by the Fund.
At March 31, 2006, approximately 12% of the net assets are invested in municipal securities that have letter of credit enhancement features or escrows in U.S. Government securities backing them, on which the Fund relies. Without such features, the securities may or may not meet the quality standards of securities purchased by the Fund.
At March 31, 2006, approximately, 96% of the net assets are invested in California municipal securities. Economic changes affecting the state and certain of its public bodies and municipalities may affect the ability of issuers to pay the required principal and interest payments of the municipal securities.
See Notes to Financial Statements.
23
Excelsior Tax-Exempt Funds, Inc.
Portfolio of Investments — March 31, 2006
California Short-Intermediate Term Tax-Exempt Income Fund — (continued)
The summary of the Fund’s investments as of March 31, 2006 is as follows: (Unaudited)
| | | | | | |
Portfolio Diversification
| | % of
Net
Assets
| | | Value
|
Revenue Bonds | | 60.50 | % | | $ | 40,141,812 |
General Obligation Bonds | | 22.14 | | | | 14,689,597 |
Prerefunded . | | 9.58 | | | | 6,353,960 |
Registered Investment Companies | | 3.11 | | | | 2,066,191 |
Backed by Letter of Credit | | 2.03 | | | | 1,350,000 |
Certificates of Participation | | 1.61 | | | | 1,066,970 |
| | |
|
| |
|
|
Total Investments | | 98.97 | % | | $ | 65,668,530 |
Other Assets in Excess of Liabilities | | 1.03 | | | | 686,633 |
| | |
|
| |
|
|
Net Assets | | 100.00 | % | | $ | 66,355,163 |
| | |
|
| |
|
|
See Notes to Financial Statements.
24
Excelsior Funds, Inc.
Portfolio of Investments — March 31, 2006
Core Bond Fund
| | | | | | | | | | |
Principal Amount
| | | | Rate
| | | Maturity
Date
| | Value
|
ASSET BACKED SECURITIES — 0.10% | | | | | | |
| $ 294,473 | | CIT RV Trust,
1999-A A4 | | 6.16 | % | | 06/15/13 | | $ | 294,413 |
| | | | | | | | | |
|
|
| | | TOTAL ASSET BACKED SECURITIES
(Cost $288,434) | | | 294,413 |
| | | | | | | | | |
|
|
COLLATERALIZED MORTGAGE OBLIGATIONS — 13.02% |
| | | NON-GOVERNMENTAL AGENCY COLLATERALIZED MORTGAGE OBLIGATIONS — 8.61% |
| 2,295,956 | | Citigroup Mortgage Loan Trust, 2004-HYB4 WA(a) | | 4.46 | | | 12/25/34 | | | 2,243,580 |
| 2,192,522 | | Countrywide Alternative Loan Trust, 2004-16CB 1A2 | | 5.50 | | | 07/25/34 | | | 2,152,184 |
| 1,409,477 | | Countrywide Alternative Loan Trust, 2004-22CB 1A1 | | 6.00 | | | 10/25/34 | | | 1,395,569 |
| 7,158,083 | | Indymac Index Mortgage Loan Trust, 2004-AR4 3A(a) | | 4.80 | | | 08/25/34 | | | 7,005,424 |
| 9,127,959 | | JP Morgan Mortgage Trust, 2005-A6 1A1(a) | | 5.15 | | | 09/25/35 | | | 9,008,474 |
| 2,657,887 | | Wells Fargo Mortgage Backed Securities Trust, 2004-EE 3A1 | | 3.99 | | | 12/25/34 | | | 2,578,087 |
| | | | | | | | | |
|
|
| | | | | | | | | | | 24,383,318 |
| | | | | | | | | |
|
|
| | | FEDERAL HOME LOAN MORTGAGE CORPORATION — 3.03% |
| 5,208,627 | | 1602 PH | | 6.00 | | | 04/15/23 | | | 5,220,472 |
| 3,296,147 | | 2333 UZ | | 6.50 | | | 07/15/31 | | | 3,347,404 |
| | | | | | | | | |
|
|
| | | | | | | | | | | 8,567,876 |
| | | | | | | | | |
|
|
| | | FEDERAL NATIONAL MORTGAGE
ASSOCIATION— 0.50% |
| 1,430,000 | | 2003-17 QT | | 5.00 | | | 08/25/27 | | | 1,404,289 |
| | | | | | | | | |
|
|
| | | GOVERNMENT NATIONAL MORTGAGE ASSOCIATION — 0.88% |
| 2,450,621 | | 2005-25 B | | 6.21 | | | 03/16/21 | | | 2,486,037 |
| | | | | | | | | |
|
|
| | | TOTAL COLLATERALIZED MORTGAGE OBLIGATIONS
(Cost $37,574,710) | | | 36,841,520 |
| | | | | | | | | |
|
|
| | | | | | | | | | |
Principal Amount
| | | | Rate
| | | Maturity
Date
| | Value
|
COMMERCIAL MORTGAGE-BACKED SECURITIES — 14.54% |
| $ 1,477,000 | | Bank of America Commercial Mortgage, Inc., 2004-1 A4 | | 4.76 | % | | 11/10/39 | | $ | 1,400,650 |
| 3,705,581 | | Chase Commercial Mortgage Securities Corp., 1997-2 D | | 6.60 | | | 12/19/29 | | | 3,771,967 |
| 1,000,000 | | Credit Suisse First Boston Mortgage Securities Corp., 2002-CKS4 G(a)(b) | | 6.01 | | | 11/15/36 | | | 1,016,760 |
| 1,689,000 | | Greenwich Capital Commercial Funding Corp., 2004-GG1 A1 | | 5.32 | | | 06/10/36 | | | 1,659,529 |
| 2,000,000 | | Morgan Stanley Capital I, 1997-C1F(b) | | 6.85 | | | 02/15/20 | | | 2,010,911 |
| 3,601,000 | | Morgan Stanley Capital I, 1999-WF1 B | | 6.32 | | | 11/15/31 | | | 3,675,836 |
| 3,150,000 | | Morgan Stanley Dean Witter Capital I, 2000-LIF2 C | | 7.50 | | | 10/15/33 | | | 3,384,305 |
| 1,969,034 | | Mortgage Capital Funding, Inc., 1996-MC1 G | | 7.15 | | | 06/15/06 | | | 1,965,698 |
| 773,095 | | Mortgage Capital Funding, Inc., 1996-MC2 D | | 7.26 | | | 12/21/26 | | | 776,091 |
| 3,061,000 | | Mortgage Capital Funding, Inc., 1998-MC1 C | | 6.95 | | | 03/18/30 | | | 3,137,019 |
| 2,521,000 | | Nomura Asset Securities Corp., 1998-D6 A4(a) | | 6.92 | | | 03/15/30 | | | 2,828,507 |
| 3,601,000 | | Wachovia Bank Commercial Mortgage Trust, 2003-C9 A3 | | 4.61 | | | 12/15/35 | | | 3,463,240 |
| 2,305,000 | | Wachovia Bank Commercial Mortgage Trust, 2004-C12 A3 | | 5.23 | | | 07/15/41 | | | 2,282,884 |
| 10,000,000 | | Wachovia Bank Commercial Mortgage Trust, 2005-C20 A5(a)(c) | | 5.09 | | | 07/15/42 | | | 9,775,846 |
| | | | | | | | | |
|
|
| | | TOTAL COMMERCIAL MORTGAGE-BACKED SECURITIES
(Cost $41,540,424) | | | 41,149,243 |
| | | | | | | | | |
|
|
See Notes to Financial Statements.
25
Excelsior Funds, Inc.
Portfolio of Investments — March 31, 2006
Core Bond Fund — (continued)
| | | | | | | | | | |
Principal Amount
| | | | Rate
| | | Maturity
Date
| | Value
|
CORPORATE BONDS — 15.06% |
| $ 1,115,000 | | America Movil S.A. de C.V. | | 5.50 | % | | 03/01/14 | | $ | 1,068,607 |
| 2,000,000 | | Bank One Corp. | | 7.88 | | | 08/01/10 | | | 2,180,832 |
| 3,005,000 | | Bottling Group llc | | 5.50 | | | 04/01/16 | | | 2,966,407 |
| 700,000 | | British Telecommunications plc | | 8.88 | | | 12/15/30 | | | 895,497 |
| 2,800,000 | | Cisco Systems, Inc. | | 5.50 | | | 02/22/16 | | | 2,757,941 |
| 1,081,000 | | CIT Group, Inc. | | 5.88 | | | 10/15/08 | | | 1,093,756 |
| 2,000,000 | | Citigroup, INC. | | 4.25 | | | 07/29/09 | | | 1,937,164 |
| 1,441,000 | | Comcast Cable Communications | | 6.88 | | | 06/15/09 | | | 1,490,246 |
| 2,000,000 | | Comcast Cable Communications | | 6.75 | | | 01/30/11 | | | 2,079,016 |
| 1,441,000 | | DaimlerChrysler N.A. Holding Corp. | | 7.20 | | | 09/01/09 | | | 1,504,655 |
| 600,000 | | Entergy Gulf States | | 5.70 | | | 06/01/15 | | | 575,122 |
| 1,000,000 | | Ford Motor Credit Co. | | 8.63 | | | 11/01/10 | | | 958,056 |
| 2,773,000 | | Household Finance Corp. | | 8.00 | | | 07/15/10 | | | 3,025,750 |
| 1,437,000 | | International Lease Finance Corp. | | 4.50 | | | 05/01/08 | | | 1,412,935 |
| 250,000 | | Iron Mountain, Inc. | | 8.63 | | | 04/01/13 | | | 260,000 |
| 2,881,000 | | Merrill Lynch & Co. MTN | | 5.00 | | | 02/03/14 | | | 2,762,940 |
| 2,800,000 | | Morgan Stanley | | 4.75 | | | 04/01/14 | | | 2,612,380 |
| 2,000,000 | | Morgan Stanley Dean Witter | | 6.75 | | | 04/15/11 | | | 2,105,300 |
| 1,690,000 | | Oracle Corp./ Ozark Holdings(b) | | 5.25 | | | 01/15/16 | | | 1,621,205 |
| 1,441,000 | | Prudential Financial, Inc. | | 5.10 | | | 09/20/14 | | | 1,389,778 |
| 627,000 | | PSEG Energy Holdings, Inc. | | 8.63 | | | 02/15/08 | | | 653,648 |
| 2,000,000 | | RBS Capital Trust III(a) | | 5.51 | | | 09/29/49 | | | 1,929,116 |
| 1,596,000 | | Sprint Capital Corp. | | 8.38 | | | 03/15/12 | | | 1,803,320 |
| 1,153,000 | | Time Warner Cos., Inc. | | 7.25 | | | 10/15/17 | | | 1,233,772 |
| 1,441,000 | | Wal-Mart Stores | | 4.13 | | | 02/15/11 | | | 1,364,284 |
| 950,000 | | Xerox Corp. | | 6.40 | | | 03/15/16 | | | 942,875 |
| | | | | | | | | |
|
|
| | | TOTAL CORPORATE BONDS
(Cost $42,975,196) | | | 42,624,602 |
| | | | | | | | | |
|
|
TAX-EXEMPT SECURITIES — 1.31% |
| 3,600,000 | | University of Texas Revenue Bonds, Series B | | 5.00 | | | 08/15/33 | | | 3,702,456 |
| | | | | | | | | |
|
|
| | | TOTAL TAX-EXEMPT SECURITIES
(Cost $3,691,406) | | | 3,702,456 |
| | | | | | | | | |
|
|
| | | | | | | | | | |
Principal Amount
| | | | Rate
| | | Maturity
Date
| | Value
|
U.S. GOVERNMENT AGENCY BONDS & NOTES — 1.83% |
| | | FANNIE MAE (1.83%): |
| $ 5,000,000 | | MTN | | 6.25 | % | | 02/01/11 | | $ | 5,185,515 |
| | | | | | | | | |
|
|
| | | TOTAL U.S. GOVERNMENT AGENCY BONDS & NOTES
(Cost $5,341,117) | | | 5,185,515 |
| | | | | | | | | |
|
|
U.S. GOVERNMENT AGENCY MORTGAGE PASS THROUGH SECURITIES — 32.03% |
| | | FEDERAL HOME LOAN MORTGAGE CORPORATION — 17.14% |
| 10,000,000 | | TBA | | 4.50 | | | 04/01/21 | | | 9,543,751 |
| 2,888,445 | | Pool # A20105 | | 5.00 | | | 04/01/34 | | | 2,753,346 |
| 9,843,702 | | Pool # A47411 | | 4.50 | | | 10/01/35 | | | 9,080,373 |
| 4,901,581 | | Pool # A48132 | | 7.00 | | | 12/01/35 | | | 5,045,327 |
| 2,999,380 | | Pool # C01811 | | 5.00 | | | 04/01/34 | | | 2,859,092 |
| 133,535 | | Pool # C71221 | | 5.00 | | | 09/01/32 | | | 127,467 |
| 4,887,002 | | Pool # G01842 | | 4.50 | | | 06/01/35 | | | 4,508,040 |
| 15,004,026 | | Pool # G18105 | | 5.00 | | | 03/01/21 | | | 14,624,096 |
| | | | | | | | | |
|
|
| | | | | | | | | | | 48,541,492 |
| | | | | | | | | |
|
|
| | | FEDERAL NATIONAL MORTGAGE
ASSOCIATION — 12.51% |
| 11,809,993 | | Pool # 357824 | | 5.50 | | | 06/01/35 | | | 11,531,302 |
| 1,257,935 | | Pool # 387203 | | 4.80 | | | 01/01/12 | | | 1,227,747 |
| 1,074,138 | | Pool # 387204 | | 4.80 | | | 01/01/12 | | | 1,048,361 |
| 3,780,015 | | Pool # 618322 | | 6.00 | | | 12/01/31 | | | 3,785,055 |
| 4,974,463 | | Pool # 805386 ARM(a) | | 4.90 | | | 01/01/35 | | | 4,920,909 |
| 764,261 | | Pool # 812268 | | 5.50 | | | 05/01/35 | | | 746,227 |
| 911,766 | | Pool # 820989 | | 5.50 | | | 04/01/35 | | | 890,251 |
| 909,179 | | Pool # 821567 | | 5.50 | | | 06/01/35 | | | 887,724 |
| 11,234,831 | | Pool # 829321 | | 4.50 | | | 09/01/35 | | | 10,367,019 |
| | | | | | | | | |
|
|
| | | | | | | | | | | 35,404,595 |
| | | | | | | | | |
|
|
| | | GOVERNMENT NATIONAL MORTGAGE ASSOCIATION — 2.38% |
| 389,975 | | Pool # 2562 | | 6.00 | | | 03/20/28 | | | 394,022 |
| 596,534 | | Pool # 267812 | | 8.50 | | | 06/15/17 | | | 640,097 |
| 2,164,434 | | Pool # 3413 | | 4.50 | | | 07/20/33 | | | 2,018,927 |
| 1,983,052 | | Pool # 3442 | | 5.00 | | | 09/20/33 | | | 1,916,383 |
| 36,385 | | Pool # 532751 | | 9.00 | | | 08/15/30 | | | 39,616 |
| 109,246 | | Pool # 568670 | | 6.50 | | | 04/15/32 | | | 113,284 |
| 300,160 | | Pool # 780548 | | 8.50 | | | 12/15/17 | | | 321,070 |
| 291,452 | | Pool # 780865 | | 9.50 | | | 11/15/17 | | | 318,467 |
| 538,300 | | Pool # 781084 | | 9.00 | | | 12/15/17 | | | 577,178 |
| 390,606 | | Pool # 80311 ARM(a) | | 4.50 | | | 08/20/29 | | | 390,282 |
| | | | | | | | | |
|
|
| | | | | | | | | | | 6,729,326 |
| | | | | | | | | |
|
|
| | | TOTAL U.S. GOVERNMENT AGENCY MORTGAGE PASS THROUGH SECURITIES
(Cost $91,989,929) | | | 90,675,413 |
| | | | | | | | | |
|
|
See Notes to Financial Statements.
26
Excelsior Funds, Inc.
Portfolio of Investments — March 31, 2006
Core Bond Fund — (continued)
| | | | | | | | | | |
Principal Amount
| | | | Rate
| | | Maturity
Date
| | Value
|
U.S. GOVERNMENT SECURITIES — 17.81% |
| | | U.S. TREASURY STRIPS — 4.46% |
| $ 22,600,000 | | | | 0.00 | % | | 11/15/17 | | $ | 12,633,174 |
| | | | | | | | | |
|
|
| | | U.S. TREASURY INFLATION PROTECTED
BONDS — 0.83% |
| 300,000 | | | | 4.25 | | | 01/15/10 | | | 379,904 |
| 2,000,000 | | | | 0.88 | | | 04/15/10 | | | 1,982,919 |
| | | | | | | | | |
|
|
| | | | | | | | | | | 2,362,823 |
| | | | | | | | | |
|
|
| | | U.S. TREASURY NOTES — 12.52% |
| 7,700,000 | | | | 3.63 | | | 01/15/10 | | | 7,381,774 |
| 12,000,000 | | | | 4.50 | | | 11/15/10 | | | 11,838,720 |
| 11,955,000 | | (c) | | 7.63 | | | 11/15/22 | | | 15,346,299 |
| 885,000 | | | | 4.50 | | | 02/15/36 | | | 830,379 |
| | | | | | | | | |
|
|
| | | | | | | | | | | 35,397,172 |
| | | | | | | | | |
|
|
| | | TOTAL U.S. GOVERNMENT SECURITIES
(Cost $52,096,327) | | | 50,393,169 |
| | | | | | | | | |
|
|
| | | | |
Shares
| | | | | | | | | |
REGISTERED INVESTMENT COMPANIES — 2.16% |
| 3,052,268 | | Dreyfus Government Cash Management Fund | | | 3,052,268 |
| 3,052,268 | | Fidelity U.S. Treasury II Fund | | | 3,052,267 |
| | | | | | | | | |
|
|
| | | TOTAL REGISTERED INVESTMENT COMPANIES
(Cost $6,104,535) | | | 6,104,535 |
| | | | | | | | | |
|
|
| | | | | | |
| | |
| | | | | | Value
|
TOTAL INVESTMENTS
(Cost $281,602,078)(d) | | 97.86 | % | | $ | 276,970,866 |
OTHER ASSETS IN EXCESS OF LIABILITIES | | 2.14 | | | | 6,045,059 |
| | |
|
| |
|
|
NET ASSETS | | 100.00 | % | | $ | 283,015,925 |
| | |
|
| |
|
|
| (a) | Variable Rate Security—The rate disclosed is as of March 31, 2006. |
| (b) | Security exempt from registration under Rule 144A of the Securities Act of 1933. This security may be resold in transactions exempt from registration, normally to qualified institutional buyers. At March 31, 2006, these securities amounted to $4,648,876 or 1.64% of net assets. |
| (c) | All or part of the security is segregated by the Fund’s custodian to cover future purchase commitments. |
| (d) | Unrealized appreciation (depreciation) of securities: |
| | | | | | | | | |
Unrealized
Appreciation
| | Unrealized
(Depreciation)
| | | Net Unrealized
Appreciation/
(Depreciation)
| |
| $ | 760,868 | | $ | (5,392,080 | ) | | $ | (4,631,212 | ) |
ARM—Adjustable Rate Mortgage
llc—limited liability company
MTN—Medium Term Note
plc—public limited company
STRIPS—Separately Traded Registered Interest and Principal Securities
The summary of the Fund’s investments as of March 31, 2006 is as follows: (Unaudited)
| | | | | | |
Portfolio Diversification
| | % of
Net
Assets
| | | Value
|
U.S. Government & Agency Securities | | 51.67 | % | | $ | 146,254,097 |
Corporate Bonds | | 15.06 | | | | 42,624,602 |
Commercial Mortgage-Backed Securities | | 14.54 | | | | 41,149,243 |
Collateralized Mortgage Obligations | | 13.02 | | | | 36,841,520 |
Registered Investment Companies | | 2.16 | | | | 6,104,535 |
Tax-Exempt Securities | | 1.31 | | | | 3,702,456 |
Asset Backed Securities | | 0.10 | | | | 294,413 |
| | |
|
| |
|
|
Total Investments | | 97.86 | % | | $ | 276,970,866 |
Other Assets in Excess of Liabilities | | 2.14 | | | | 6,045,059 |
| | |
|
| |
|
|
Net Assets | | 100.00 | % | | $ | 283,015,925 |
| | |
|
| |
|
|
See Notes to Financial Statements.
27
Excelsior Funds Trust
Portfolio of Investments — March 31, 2006
High Yield Fund
| | | | | | | | | | |
Principal
Amount
| | | | Rate
| | | Maturity
Date
| | Value
|
CORPORATE BONDS — 88.98% |
| | | ADVERTISING PERIODICALS — 2.16% |
| $2,000,000 | | Dex Media Finance/West | | 8.50 | % | | 08/15/10 | | $ | 2,115,000 |
| 1,000,000 | | RH Donnelley Finance Corp.(a) | | 10.88 | | | 12/15/12 | | | 1,108,750 |
| | | | | | | | | |
|
|
| | | | | | | | | | | 3,223,750 |
| | | | | | | | | |
|
|
| | | AGRICULTURAL CHEMICALS — 0.96% |
| 1,298,000 | | Terra Capital, Inc. | | 11.50 | | | 06/01/10 | | | 1,434,290 |
| | | | | | | | | |
|
|
| | | AUTO – TRUCK PARTS & EQUIPMENT — 0.67% |
| 1,000,000 | | Tenneco Automotive, Inc. | | 8.63 | | | 11/15/14 | | | 1,000,000 |
| | | | | | | | | |
|
|
| | | CABLE TV — 1.32% |
| 1,000,000 | | Charter Communications Holdings II | | 10.25 | | | 09/15/10 | | | 982,500 |
| 1,000,000 | | Echostar DBS Corp.(a) | | 7.13 | | | 02/01/16 | | | 983,750 |
| | | | | | | | | |
|
|
| | | | | | | | | | | 1,966,250 |
| | | | | | | | | |
|
|
| | | CASINO HOTELS — 10.25% |
| 1,000,000 | | Aztar Corp. | | 7.88 | | | 06/15/14 | | | 1,082,500 |
| 1,000,000 | | Boyd Gaming Corp. | | 8.75 | | | 04/15/12 | | | 1,067,500 |
| 2,000,000 | | Caesars Entertainment, Inc. | | 8.88 | | | 09/15/08 | | | 2,140,000 |
| 2,000,000 | | Kerzner International | | 6.75 | | | 10/01/15 | | | 2,105,000 |
| 2,000,000 | | MGM Mirage, Inc. | | 8.50 | | | 09/15/10 | | | 2,139,999 |
| 2,000,000 | | Poster Financial Group | | 8.75 | | | 12/01/11 | | | 2,105,000 |
| 1,000,000 | | Resorts International Hotel and Casino, Inc. | | 11.50 | | | 03/15/09 | | | 1,097,500 |
| 1,000,000 | | River Rock Entertainment | | 9.75 | | | 11/01/11 | | | 1,080,000 |
| 1,000,000 | | Station Casinos | | 6.50 | | | 02/01/14 | | | 988,750 |
| 1,500,000 | | Trump Entertainment Resorts | | 8.50 | | | 06/01/15 | | | 1,458,750 |
| | | | | | | | | |
|
|
| | | | | | | | | | | 15,264,999 |
| | | | | | | | | |
|
|
| | | CELLULAR TELECOM — 2.86% |
| 2,000,000 | | American Cellular Corp. | | 10.00 | | | 08/01/11 | | | 2,170,000 |
| 1,000,000 | | Centennial Cellular Operating Co./Centennial Communications Corp. | | 10.13 | | | 06/15/13 | | | 1,092,500 |
| 1,000,000 | | Dobson Communications Corp. | | 8.88 | | | 10/01/13 | | | 1,005,000 |
| | | | | | | | | |
|
|
| | | | | | | | | | | 4,267,500 |
| | | | | | | | | |
|
|
| | | | | | | | | | |
Principal
Amount
| | | | Rate
| | | Maturity
Date
| | Value
|
CORPORATE BONDS — (continued) |
| | | CHEMICALS – DIVERSIFIED — 3.54% |
| $2,000,000 | | Equistar Chemicals L.P./ Equistar Funding Corp. | | 10.63 | % | | 05/01/11 | | $ | 2,165,000 |
| 500,000 | | Lyondell Chemical Co. | | 9.50 | | | 12/15/08 | | | 520,000 |
| 1,000,000 | | Lyondell Chemical Co. | | 10.50 | | | 06/01/13 | | | 1,107,500 |
| 1,500,000 | | Nell AF Sarl(a) | | 8.38 | | | 08/15/15 | | | 1,488,750 |
| | | | | | | | | |
|
|
| | | | | | | | | | | 5,281,250 |
| | | | | | | | | |
|
|
| | | CHEMICALS – PLASTICS — 0.69% |
| 1,000,000 | | PolyOne Corp. | | 8.88 | | | 05/01/12 | | | 1,025,000 |
| | | | | | | | | |
|
|
| | | CHEMICALS – SPECIALTY — 1.39% |
| 1,000,000 | | Johnsondiversey, Inc., Series B | | 9.63 | | | 05/15/12 | | | 1,026,250 |
| 1,000,000 | | Tronox Worldwide(a) | | 9.50 | | | 12/01/12 | | | 1,050,000 |
| | | | | | | | | |
|
|
| | | | | | | | | | | 2,076,250 |
| | | | | | | | | |
|
|
| | | COAL — 0.33% |
| 500,000 | | Massey Energy Co.(a) | | 6.88 | | | 12/15/13 | | | 490,000 |
| | | | | | | | | |
|
|
| | | COMMERCIAL SERVICES — 2.07% |
| 2,000,000 | | Iron Mountain, Inc. | | 8.63 | | | 04/01/13 | | | 2,080,000 |
| 1,000,000 | | Iron Mountain, Inc. | | 7.75 | | | 01/15/15 | | | 1,007,500 |
| | | | | | | | | |
|
|
| | | | | | | | | | | 3,087,500 |
| | | | | | | | | |
|
|
| | | CONTAINERS – METAL/GLASS — 2.05% |
| 1,000,000 | | Crown Americas llc/Crown Americas Capital Corp.(a). | | 7.75 | | | 11/15/15 | | | 1,037,500 |
| 2,000,000 | | Owens-Illinois, Inc. | | 7.50 | | | 05/15/10 | | | 2,025,000 |
| | | | | | | | | |
|
|
| | | | | | | | | | | 3,062,500 |
| | | | | | | | | |
|
|
| | | CONTAINERS – PAPER/PLASTIC — 2.76% |
| 1,000,000 | | Graham Packaging Co. | | 8.50 | | | 10/15/12 | | | 1,010,000 |
| 1,000,000 | | Pregis Corp.(a) | | 12.38 | | | 10/15/13 | | | 1,050,000 |
| 2,000,000 | | Stone Container Corp. | | 9.75 | | | 02/01/11 | | | 2,055,000 |
| | | | | | | | | |
|
|
| | | | | | | | | | | 4,115,000 |
| | | | | | | | | |
|
|
| | | COSMETICS & TOILETRIES — 0.54% |
| 1,000,000 | | Del Laboratories, Inc. | | 8.00 | | | 02/01/12 | | | 810,000 |
| | | | | | | | | |
|
|
| | | DISTRIBUTION/WHOLESALE — 1.23% |
| 2,000,000 | | Nebraska Book Co. | | 8.63 | | | 03/15/12 | | | 1,840,000 |
| | | | | | | | | |
|
|
| | | ELECTRIC – GENERATION — 1.08% |
| 1,500,000 | | AES Corp. | | 9.50 | | | 06/01/09 | | | 1,616,250 |
| | | | | | | | | |
|
|
See Notes to Financial Statements.
28
Excelsior Funds Trust
Portfolio of Investments — March 31, 2006
High Yield Fund — (continued)
| | | | | | | | | | |
Principal
Amount
| | | | Rate
| | | Maturity
Date
| | Value
|
CORPORATE BONDS — (continued) |
| | | FINANCE – AUTO LOANS — 3.98% |
| $2,000,000 | | Ford Motor Credit Co. | | 6.50 | % | | 01/25/07 | | $ | 1,992,344 |
| 2,000,000 | | General Motors Acceptance Corp. | | 6.13 | | | 02/01/07 | | | 1,969,126 |
| 2,000,000 | | General Motors Acceptance Corp. | | 7.75 | | | 01/19/10 | | | 1,950,022 |
| | | | | | | | | |
|
|
| | | | | | | | | | | 5,911,492 |
| | | | | | | | | |
|
|
| | | FOOD – MISCELLANEOUS AND DIVERSIFIED — 0.71% |
| 1,000,000 | | Del Monte Corp. | | 8.63 | | | 12/15/12 | | | 1,056,250 |
| | | | | | | | | |
|
|
| | | FORESTRY — 0.61% | | | | | | |
| 1,500,000 | | Tembec Industries, Inc. | | 8.63 | | | 06/30/09 | | | 903,750 |
| | | | | | | | | |
|
|
| | | FUNERAL SERVICES & RELATED ITEMS — 1.02% |
| 1,500,000 | | Service Corp. International(a) | | 7.50 | | | 06/15/17 | | | 1,526,250 |
| | | | | | | | | |
|
|
| | | GAS – DISTRIBUTION — 1.39% |
| 2,000,000 | | SEMCO Energy, Inc. | | 7.75 | | | 05/15/13 | | | 2,072,824 |
| | | | | | | | | |
|
|
| | | HEAVY CONSTRUCTION EQUIPMENT
RENTAL — 0.35% |
| 500,000 | | Ahern Rentals, Inc.(b) | | 9.25 | | | 08/15/13 | | | 521,250 |
| | | | | | | | | |
|
|
| | | HOME FURNISHINGS — 2.70% |
| 2,000,000 | | Sealy Mattress Co. | | 8.25 | | | 06/15/14 | | | 2,090,000 |
| 2,000,000 | | Simmons Co. | | 7.88 | | | 01/15/14 | | | 1,935,000 |
| | | | | | | | | |
|
|
| | | | | | | | | | | 4,025,000 |
| | | | | | | | | |
|
|
| | | INDEPENDENT POWER PRODUCER — 0.68% |
| 1,000,000 | | NRG Energy, Inc. | | 7.25 | | | 02/01/14 | | | 1,016,250 |
| | | | | | | | | |
|
|
| | | LIFE/HEALTH INSURANCE — 1.35% |
| 2,000,000 | | Americo Life, Inc.(a) | | 7.88 | | | 05/01/13 | | | 2,015,928 |
| | | | | | | | | |
|
|
| | | MACHINERY – FARM — 0.33% |
| 500,000 | | Case New Holland, Inc.(a) | | 7.13 | | | 03/01/14 | | | 493,750 |
| | | | | | | | | |
|
|
| | | MACHINERY – GENERAL INDUSTRIAL — 0.68% |
| 1,000,000 | | The Manitowoc Co., Inc. | | 7.13 | | | 11/01/13 | | | 1,020,000 |
| | | | | | | | | |
|
|
| | | MEDICAL – HOSPITALS — 1.40% |
| 1,000,000 | | HCA, Inc. | | 8.75 | | | 09/01/10 | | | 1,084,663 |
| 1,000,000 | | IASIS Healthcare llc/ IASIS Capital Corp. | | 8.75 | | | 06/15/14 | | | 1,000,000 |
| | | | | | | | | |
|
|
| | | | | | | | | | | 2,084,663 |
| | | | | | | | | |
|
|
| | | MEDICAL – OUTPATIENT/HOME MEDICAL
CARE — 0.61% |
| 1,000,000 | | Select Medical Corp. | | 7.63 | | | 02/01/15 | | | 902,500 |
| | | | | | | | | |
|
|
| | | | | | | | | | |
Principal
Amount
| | | | Rate
| | | Maturity
Date
| | Value
|
CORPORATE BONDS — (continued) |
| | | MEDICAL PRODUCTS — 0.68% |
| $1,000,000 | | Encore Medical IHC, Inc. | | 9.75 | % | | 10/01/12 | | $ | 1,010,000 |
| | | | | | | | | |
|
|
| | | MISCELLANEOUS MANUFACTURING — 0.66% |
| 1,000,000 | | Intertape Polymer US, Inc. | | 8.50 | | | 08/01/14 | | | 985,000 |
| | | | | | | | | |
|
|
| | | MULTI-LINE INSURANCE — 1.44% |
| 2,128,000 | | Hanover Insurance Group | | 7.63 | | | 10/15/25 | | | 2,150,170 |
| | | | | | | | | |
|
|
| | | MULTIMEDIA — 1.30% |
| 2,000,000 | | Emmis Operating Co. | | 6.88 | | | 05/15/12 | | | 1,930,000 |
| | | | | | | | | |
|
|
| | | MUSIC — 1.06% |
| 1,600,000 | | Warner Music Group | | 7.38 | | | 04/15/14 | | | 1,584,000 |
| | | | | | | | | |
|
|
| | | NON-HAZARDOUS WASTE DISPOSAL — 1.41% |
| 2,000,000 | | Allied Waste North America | | 8.88 | | | 04/01/08 | | | 2,100,000 |
| | | | | | | | | |
|
|
| | | OFFICE AUTOMATION & EQUIPMENT — 2.45% |
| 1,000,000 | | Ikon Office Solutions | | 7.75 | | | 09/15/15 | | | 1,032,500 |
| 1,000,000 | | Xerox Capital Trust I | | 8.00 | | | 02/01/27 | | | 1,035,000 |
| 1,500,000 | | Xerox Corp. | | 7.63 | | | 06/15/13 | | | 1,578,750 |
| | | | | | | | | |
|
|
| | | | | | | | | | | 3,646,250 |
| | | | | | | | | |
|
|
| | | OIL COMPANY – EXPLORATION &
PRODUCTION — 1.35% |
| 1,000,000 | | Chesapeake Energy Corp. | | 6.50 | | | 08/15/17 | | | 987,500 |
| 1,000,000 | | Kerr-McGee Corp. | | 6.95 | | | 07/01/24 | | | 1,017,288 |
| | | | | | | | | |
|
|
| | | | | | | | | | | 2,004,788 |
| | | | | | | | | |
|
|
| | | OIL-FIELD SERVICES — 0.33% |
| 500,000 | | Allis-Chalmers Energy, Inc.(a) | | 9.00 | | | 01/15/14 | | | 492,500 |
| | | | | | | | | |
|
|
| | | PAPER & RELATED PRODUCTS — 1.20% |
| 1,000,000 | | Mercer International, Inc. | | 9.25 | | | 02/15/13 | | | 890,000 |
| 890,000 | | Norske Skog Canada, Series D | | 8.63 | | | 06/15/11 | | | 894,450 |
| | | | | | | | | |
|
|
| | | | | | | | | | | 1,784,450 |
| | | | | | | | | |
|
|
| | | PHYSICIANS PRACTICE MANAGEMENT — 2.44% |
| 2,000,000 | | Ameripath, Inc. | | 10.50 | | | 04/01/13 | | | 2,110,000 |
| 500,000 | | US Oncology Holdings, Inc. | | 9.00 | | | 08/15/12 | | | 517,500 |
| 1,000,000 | | US Oncology Holdings, Inc.(a)(c) | | 9.26 | | | 03/15/15 | | | 1,002,500 |
| | | | | | | | | |
|
|
| | | | | | | | | | | 3,630,000 |
| | | | | | | | | |
|
|
See Notes to Financial Statements.
29
Excelsior Funds Trust
Portfolio of Investments — March 31, 2006
High Yield Fund — (continued)
| | | | | | | | | | |
Principal
Amount
| | | | Rate
| | | Maturity
Date
| | Value
|
CORPORATE BONDS — (continued) |
| | | PIPELINES — 0.67% |
| $ 500,000 | | Semgroup L.P.(a) | | 8.75 | % | | 11/15/15 | | $ | 510,000 |
| 500,000 | | Williams Cos.(a) | | 6.38 | | | 10/01/10 | | | 495,000 |
| | | | | | | | | |
|
|
| | | | | | | | | | | 1,005,000 |
| | | | | | | | | |
|
|
| | | PRIVATE CORRECTIONS — 0.17% |
| 250,000 | | Corrections Corp. of America | | 6.75 | | | 01/31/14 | | | 252,813 |
| | | | | | | | | |
|
|
| | | RENTAL AUTO/EQUIPMENT — 2.41% |
| 1,000,000 | | Neff Rental/ Neff Finance(a) | | 11.25 | | | 06/15/12 | | | 1,085,000 |
| 2,500,000 | | United Rentals, Inc. | | 7.75 | | | 11/15/13 | | | 2,500,000 |
| | | | | | | | | |
|
|
| | | | | | | | | | | 3,585,000 |
| | | | | | | | | |
|
|
| | | RESORTS/THEME PARKS — 1.70% |
| 1,500,000 | | Six Flags, Inc. | | 9.63 | | | 06/01/14 | | | 1,511,250 |
| 1,000,000 | | Universal City Florida Holdings(c) | | 9.43 | | | 05/01/10 | | | 1,015,000 |
| | | | | | | | | |
|
|
| | | | | | | | | | | 2,526,250 |
| | | | | | | | | |
|
|
| | | RETAIL – DRUG STORE — 1.59% |
| 1,000,000 | | Jean Coutu Group, Inc. | | 8.50 | | | 08/01/14 | | | 917,500 |
| 1,500,000 | | Rite Aid Corp.(a) | | 6.13 | | | 12/15/08 | | | 1,458,750 |
| | | | | | | | | |
|
|
| | | | | | | | | | | 2,376,250 |
| | | | | | | | | |
|
|
| | | RETAIL – MAJOR DEPARTMENT STORE — 2.53% |
| 1,500,000 | | JC Penney Co., Inc. | | 8.00 | | | 03/01/10 | | | 1,614,870 |
| 1,000,000 | | Neiman Marcus Group, Inc.(a) | | 9.00 | | | 10/15/15 | | | 1,057,500 |
| 1,000,000 | | Saks, Inc. | | 9.88 | | | 10/01/11 | | | 1,105,000 |
| | | | | | | | | |
|
|
| | | | | | | | | | | 3,777,370 |
| | | | | | | | | |
|
|
| | | RETAIL – VIDEO RENTAL — 1.17% |
| 2,000,000 | | Blockbuster, Inc.(a) (c) | | 10.00 | | | 09/01/12 | | | 1,750,000 |
| | | | | | | | | |
|
|
| | | SATELLITE TELECOM — 1.14% |
| 650,000 | | Inmarsat Finance plc | | 7.63 | | | 06/30/12 | | | 666,250 |
| 1,000,000 | | Intelsat Ltd. | | 8.63 | | | 01/15/15 | | | 1,032,500 |
| | | | | | | | | |
|
|
| | | | | | | | | | | 1,698,750 |
| | | | | | | | | |
|
|
| | | SCHOOLS — 0.96% |
| 1,500,000 | | Knowledge Learning Center(a) | | 7.75 | | | 02/01/15 | | | 1,428,750 |
| | | | | | | | | |
|
|
| | | STEEL – PRODUCERS — 2.32% |
| 2,000,000 | | AK Steel Corp. | | 7.75 | | | 06/15/12 | | | 2,022,500 |
| 1,298,000 | | United States Steel, Inc. | | 10.75 | | | 08/01/08 | | | 1,427,800 |
| | | | | | | | | |
|
|
| | | | | | | | | | | 3,450,300 |
| | | | | | | | | |
|
|
| | | | | | | | | | |
Principal
Amount
| | | | Rate
| | | Maturity
Date
| | Value
|
CORPORATE BONDS — (continued) |
| | | TELEPHONE – INTERGRATED — 8.31% |
| $2,000,000 | | Cincinnati Bell, Inc. | | 8.38 | % | | 01/15/14 | | $ | 2,032,500 |
| 2,000,000 | | Citizens Communications | | 9.25 | | | 05/15/11 | | | 2,195,000 |
| 649,000 | | Consolidated Communications Holding | | 9.75 | | | 04/01/12 | | | 687,940 |
| 1,000,000 | | Eircom Funding | | 8.25 | | | 08/15/13 | | | 1,076,250 |
| 2,500,000 | | Hawaiian Telcom Communication(a) | | 12.50 | | | 05/01/15 | | | 2,475,000 |
| 777,000 | | Madison River Capital llc/ Madison River Financial Corp. | | 13.25 | | | 03/01/10 | | | 815,850 |
| 1,000,000 | | Qwest Capital Funding | | 7.75 | | | 02/15/31 | | | 1,017,500 |
| 1,000,000 | | Qwest Corp. | | 7.50 | | | 06/15/23 | | | 1,016,250 |
| 1,000,000 | | Valor Telecom Enterprise | | 7.75 | | | 02/15/15 | | | 1,047,500 |
| | | | | | | | | |
|
|
| | | | | | | | | | | 12,363,790 |
| | | | | | | | | |
|
|
| | | TRANSPORTATION – MARINE — 0.73% |
| 1,000,000 | | Overseas Shipholding Group | | 8.75 | | | 12/01/13 | | | 1,095,000 |
| | | | | | | | | |
|
|
| | | TRANSPORTATION – RAIL — 1.25% |
| 1,750,000 | | Kansas City Southern | | 9.50 | | | 10/01/08 | | | 1,868,125 |
| | | | | | | | | |
|
|
| | | TOTAL CORPORATE BONDS
(Cost $131,097,810) | | | 132,605,002 |
| | | | | | | | | |
|
|
BANK LOANS — 1.64% |
| | | CASINO HOTELS — 0.96% |
| 1,443,172 | | Resorts International Holdings llc(c) | | 12.47 | | | 04/26/13 | | | 1,435,956 |
| | | | | | | | | |
|
|
| | | MISCELLANEOUS MANUFACTURING — 0.68% |
| 1,000,000 | | IPC Acquistion Corp.(c) | | 12.09 | | | 08/05/12 | | | 1,015,000 |
| | | | | | | | | |
|
|
| | | TOTAL BANK LOANS
(Cost $2,451,766) | | | 2,450,956 |
| | | | | | | | | |
|
|
| | | | |
Shares
| | | | | | | | | |
COMMON STOCK — 2.82% |
| | | METAL – ALUMINUM — 2.82% |
| 28,047 | | Ormet Corp. (a) | | | 4,207,050 |
| | | | | | | | | |
|
|
| | | TOTAL COMMON STOCK
(Cost $7,704,681) | | | 4,207,050 |
| | | | | | | | | |
|
|
See Notes to Financial Statements.
30
Excelsior Funds Trust
Portfolio of Investments — March 31, 2006
High Yield Fund — (continued)
| | | | | | | | | | |
Principal
Amount
| | | | Rate
| | | Maturity
Date
| | Value
|
U.S. GOVERNMENT AGENCY BONDS & NOTES — 5.37% |
| | | FEDERAL HOME LOAN BANK — 5.37% |
| $8,000,000 | | Discount Note | | 4.60 | % | | 04/03/06 | | $ | 7,997,956 |
| | | | | | | | | |
|
|
| | | TOTAL U.S. GOVERNMENT
AGENCY BONDS & NOTES
(Cost $7,997,956) | | | 7,997,956 |
| | | | | | | | | |
|
|
| | | | | | |
TOTAL INVESTMENTS
(Cost $149,252,213) (d) | | 98.81 | % | | $ | 147,260,964 |
OTHER ASSETS IN EXCESS OF LIABILITIES | | 1.19 | | | | 1,774,875 |
| | |
|
| |
|
|
NET ASSETS | | 100.00 | % | | $ | 149,035,839 |
| | |
|
| |
|
|
| (a) | Security exempt from registration under Rule 144A of the Securities Act of 1933. This security may be resold in transactions exempt from registration, normally to qualified institutional buyers. At March 31, 2006, these securities amounted to $27,206,728 or 18.26% of net assets. |
| (b) | All or part of the security is segregated by the Fund’s custodian to cover future purchase commitments. |
| (c) | Variable Rate Security—The rate disclosed is as of March 31, 2006. |
| (d) | Unrealized appreciation (depreciation) of securities: |
| | | | |
Unrealized
Appreciation
| | Unrealized
(Depreciation)
| | Net Unrealized
Appreciation/
(Depreciation)
|
| $2,922,653 | | $(4,913,902) | | $(1,991,249) |
Discount Note—The rate reported on the Portfolio of Investments is the discount rate at the time of purchase.
llc—Limited Liability Company
L.P.—Limited Partnership
Ltd.—Limited
plc—public limited company
The summary of the Fund’s investments as of March 31, 2006 is as follows: (Unaudited)
| | | | | | |
Sector Diversification
| | % of
Net
Assets
| | | Value
|
Consumer Discretionary | | 37.97 | % | | $ | 56,588,193 |
Raw/Intermediate Materials | | 19.42 | | | | 28,936,090 |
Telecommunication | | 11.85 | | | | 17,663,790 |
Health Care | | 6.14 | | | | 9,153,413 |
Industrials | | 5.97 | | | | 8,901,563 |
U.S. Government & Agency Obligations | | 5.37 | | | | 7,997,956 |
Financials | | 2.79 | | | | 4,166,097 |
Energy | | 2.69 | | | | 4,003,538 |
Utilities | | 2.48 | | | | 3,689,074 |
Technology | | 2.20 | | | | 3,280,000 |
Consumer Staples | | 1.25 | | | | 1,866,250 |
Information Technology | | 0.68 | | | | 1,015,000 |
| | |
|
| |
|
|
Total Investments | | 98.81 | % | | $ | 147,260,964 |
Other Assets in Excess of Liabilities | | 1.19 | | | | 1,774,875 |
| | |
|
| |
|
|
Net Assets | | 100.00 | % | | $ | 149,035,839 |
| | |
|
| |
|
|
See Notes to Financial Statements.
31
Excelsior Funds, Inc.
Portfolio of Investments — March 31, 2006
Intermediate-Term Bond Fund
| | | | | | | | | | | |
Principal
Amount
| | | | Rate
| | | Maturity
Date
| | Value
|
| | ASSET BACKED SECURITIES — 3.48% |
| $ | 2,000,000 | | Capital One Master Trust, 2001-6 C(a) | | 6.70 | % | | 06/15/11 | | $ | 2,054,376 |
| | 346,368 | | Chase Funding Mortgage Loan Asset Backed Certificates, 2003-3 2A2(b) | | 5.09 | | | 04/25/33 | | | 347,062 |
| | 8,725,000 | | Citibank Credit Card Issuance Trust, 2003-A4, A4(b) | | 5.00 | | | 03/20/09 | | | 8,728,719 |
| | 4,092,323 | | JP Morgan Mortgage Acquisition Corp., 2006-HE1 A2(b) | | 4.65 | | | 05/25/28 | | | 4,092,292 |
| | | | | | | | | | |
|
|
| | | | TOTAL ASSET BACKED SECURITIES (Cost $15,330,187) | | | 15,222,449 |
| | | | | | | | | | |
|
|
| | COLLATERALIZED MORTGAGE OBLIGATIONS — 9.89% |
| | | | NON-GOVERNMENTAL AGENCY COLLATERALIZED MORTGAGE OBLIGATIONS — 4.26% |
| | 1,513,379 | | Bank of America Mortgage Securities, 2003-A 2A1 | | 3.98 | | | 02/25/33 | | | 1,490,737 |
| | 3,277,663 | | Bear Stearns ARM, 2004-1 11A3(b) | | 3.41 | | | 04/25/34 | | | 3,255,865 |
| | 4,062,793 | | Countrywide Alternative Loan Trust, 2004-22CB 1A1 | | 6.00 | | | 10/25/34 | | | 4,022,703 |
| | 462,597 | | Indymac Index Mortgage Loan Trust, 2004-AR4 3A(b) | | 4.80 | | | 08/25/34 | | | 452,731 |
| | 3,322,000 | | Washington Mutual, 2005-AR5 A3(b) | | 4.68 | | | 05/25/35 | | | 3,261,078 |
| | 2,537,841 | | Wells Fargo Mortgage Backed Securities Trust,
2004-EE 3A1(b) | | 3.99 | | | 12/25/34 | | | 2,461,645 |
| | 3,724,427 | | Wells Fargo Mortgage Backed Securities Trust,
2005-AR1 1A1(b) | | 4.55 | | | 02/25/35 | | | 3,632,429 |
| | | | | | | | | | |
|
|
| | | | | | | | | | | | 18,577,188 |
| | | | | | | | | | |
|
|
| | | | FEDERAL HOME LOAN MORTGAGE
CORPORATION — 1.01% |
| | 389,488 | | 2386 QH | | 6.50 | | | 10/15/30 | | | 389,402 |
| | 4,152,050 | | R001 AE | | 4.38 | | | 04/15/15 | | | 4,039,482 |
| | | | | | | | | | |
|
|
| | | | | | | | | | | | 4,428,884 |
| | | | | | | | | | |
|
|
| | | | | | | | | | | |
Principal
Amount
| | | | Rate
| | | Maturity
Date
| | Value
|
| | COLLATERALIZED MORTGAGE OBLIGATIONS — (continued) |
| | | | FEDERAL NATIONAL MORTGAGE
ASSOCIATION — 2.80% |
| $ | 9,000,000 | | 1997-M5 C | | 6.74 | % | | 08/25/07 | | $ | 9,115,044 |
| | 3,200,000 | | 2003-17 QT | | 5.00 | | | 08/25/27 | | | 3,142,465 |
| | | | | | | | | | |
|
|
| | | | | | | | | | | | 12,257,509 |
| | | | | | | | | | |
|
|
| | | | GOVERNMENT NATIONAL MORTGAGE ASSOCIATION — 1.82% |
| | 2,800,000 | | 2005-10 MW | | 4.67 | | | 09/16/25 | | | 2,685,214 |
| | 2,925,000 | | 2005-14 B | | 4.48 | | | 08/16/32 | | | 2,792,633 |
| | 2,555,000 | | 2006-8 A(b) | | 3.94 | | | 08/16/25 | | | 2,467,785 |
| | | | | | | | | | |
|
|
| | | | | | | | | | | | 7,945,632 |
| | | | | | | | | | |
|
|
| | | | TOTAL COLLATERALIZED MORTGAGE OBLIGATIONS
(Cost $44,084,637) | | | 43,209,213 |
| | | | | | | | | | |
|
|
| | COMMERCIAL MORTGAGE-BACKED SECURITIES — 15.70% |
| | 2,000,000 | | Commercial Mortgage Asset Trust, 1999-C1 B | | 7.23 | | | 01/17/32 | | | 2,208,046 |
| | 3,556,000 | | Commercial Mortgage Asset Trust, 1999-C2 C | | 7.80 | | | 11/17/32 | | | 4,072,543 |
| | 3,325,000 | | Credit Suisse First Boston Mortgage Securities Corp., 2002-CP5 G(a)(b) | | 5.88 | | | 12/15/35 | | | 3,338,801 |
| | 3,137,747 | | DLJ Mortgage Acceptance Corp., 1997-CF2 A1B(a) | | 6.82 | | | 10/15/30 | | | 3,180,216 |
| | 3,900,000 | | GMAC Commercial Mortgage Securities, Inc., 1999-C1 C | | 6.59 | | | 05/15/33 | | | 4,018,171 |
| | 7,197,000 | | JP Morgan Chase Commercial Mortgage Securities Corp.,
2005-CB12 AJ(b) | | 4.99 | | | 09/12/37 | | | 6,834,332 |
| | 4,500,000 | | JP Morgan Chase Commercial Mortgage Securities Corp., 2005-LDP2 A4 | | 4.74 | | | 07/15/42 | | | 4,225,403 |
| | 5,430,000 | | JP Morgan Chase Commercial Mortgage Securities Corp., 2005-LDP5 AJ(b) | | 5.30 | | | 12/15/44 | | | 5,314,536 |
| | 1,466,011 | | LB-UBS Commercial Mortgage Trust, 2001-C2 A1 | | 6.27 | | | 06/15/20 | | | 1,493,903 |
| | 3,085,000 | | Morgan Stanley Dean Witter Capital I, 2003-TOP9 A2 | | 4.74 | | | 11/13/36 | | | 2,956,066 |
See Notes to Financial Statements.
32
Excelsior Funds, Inc.
Portfolio of Investments — March 31, 2006
Intermediate-Term Bond Fund — (continued)
| | | | | | | | | | | |
Principal
Amount
| | | | Rate
| | | Maturity
Date
| | Value
|
| | COMMERCIAL MORTGAGE-BACKED SECURITIES — (continued) |
| $ | 3,104,000 | | Morgan Stanley Dean Witter Capital I, 2005-HQ5 A4 | | 5.17 | % | | 01/14/42 | | $ | 3,015,273 |
| | 1,476,776 | | Mortgage Capital Funding, Inc., 1996-MC1 G | | 7.15 | | | 06/15/06 | | | 1,474,274 |
| | 3,410,000 | | Nomura Asset Securities Corp., 1998-D6 A1B | | 6.59 | | | 03/15/30 | | | 3,489,008 |
| | 4,025,000 | | Nomura Asset Securities Corp., 1998-D6 A4(b) | | 6.92 | | | 03/15/30 | | | 4,515,962 |
| | 1,435,000 | | Wachovia Bank Commercial Mortgage Trust, 2002-C1 A4 | | 6.29 | | | 04/15/34 | | | 1,497,217 |
| | 6,525,000 | | Wachovia Bank Commercial Mortgage Trust, 2003-C9 A3 | | 4.61 | | | 12/15/35 | | | 6,275,380 |
| | 4,775,000 | | Wachovia Bank Commercial Mortgage Trust, 2004-C12 A3 | | 5.23 | | | 07/15/41 | | | 4,729,185 |
| | 6,150,000 | | Wachovia Bank Commercial Mortgage Trust, 2005-C20 A6A(b) | | 5.11 | | | 07/15/42 | | | 6,000,581 |
| | | | | | | | | | |
|
|
| | | | TOTAL COMMERCIAL MORTGAGE-BACKED SECURITIES (Cost $70,568,316) | | | 68,638,897 |
| | | | | | | | | | |
|
|
| | CORPORATE BONDS — 24.26% |
| | 2,300,000 | | Allstate Corp. | | 5.00 | | | 08/15/14 | | | 2,214,454 |
| | 1,720,000 | | America Movil S.A. de C.V. | | 5.50 | | | 03/01/14 | | | 1,648,434 |
| | 5,270,000 | | Bottling Group llc | | 5.50 | | | 04/01/16 | | | 5,202,317 |
| | 4,155,000 | | Caterpillar Financial Services Corp. MTN | | 2.35 | | | 09/15/06 | | | 4,103,237 |
| | 500,000 | | Cincinnati Bell, Inc. | | 8.38 | | | 01/15/14 | | | 508,125 |
| | 3,845,000 | | Cisco Systems, Inc. | | 5.50 | | | 02/22/16 | | | 3,787,244 |
| | 2,570,000 | | Cit Group, Inc. | | 5.00 | | | 02/01/15 | | | 2,427,992 |
| | 1,670,000 | | Comcast Cable Communications | | 6.75 | | | 01/30/11 | | | 1,735,978 |
| | 1,835,000 | | Credit Suisse First Boston (USA), Inc. | | 3.88 | | | 01/15/09 | | | 1,766,142 |
| | 2,991,353 | | CVS Lease Pass Through Trust(a) | | 5.88 | | | 01/10/28 | | | 2,892,997 |
| | 2,040,000 | | DaimlerChrysler NA Holding Corp. | | 4.05 | | | 06/04/08 | | | 1,976,764 |
| | 4,000,000 | | Diageo Capital plc | | 4.38 | | | 05/03/10 | | | 3,840,012 |
| | 3,000,000 | | Dominion Resources, Inc., Series B(b) | | 4.82 | | | 09/28/07 | | | 3,002,571 |
| | | | | | | | | | | |
Principal
Amount
| | | | Rate
| | | Maturity
Date
| | Value
|
| | CORPORATE BONDS — (continued) |
| $ | 1,170,000 | | Entergy Gulf States | | 5.70 | % | | 06/01/15 | | $ | 1,121,487 |
| | 1,400,000 | | Ford Motor Credit Co. | | 5.80 | | | 01/12/09 | | | 1,278,560 |
| | 2,635,821 | | Hainan Airways(b) | | 4.91 | | | 12/15/07 | | | 2,635,821 |
| | 5,645,000 | | Household Finance Corp. | | 8.00 | | | 07/15/10 | | | 6,159,525 |
| | 5,500,000 | | International Lease Finance Corp. | | 4.75 | | | 01/13/12 | | | 5,249,371 |
| | 500,000 | | Iron Mountain, Inc. | | 8.63 | | | 04/01/13 | | | 520,000 |
| | 5,000,000 | | JP Morgan Chase & Co. | | 5.15 | | | 10/01/15 | | | 4,784,650 |
| | 3,435,000 | | Legg Mason, Inc. | | 6.75 | | | 07/02/08 | | | 3,533,437 |
| | 5,000,000 | | Lehman Brothers Holdings, Inc. | | 4.25 | | | 01/27/10 | | | 4,788,065 |
| | 1,555,000 | | Limited Brands, Inc. | | 5.25 | | | 11/01/14 | | | 1,448,039 |
| | 3,150,000 | | Morgan Stanley | | 4.75 | | | 04/01/14 | | | 2,938,928 |
| | 2,000,000 | | Nationwide Life Global Funding, Inc.(a) | | 5.35 | | | 02/15/07 | | | 2,000,328 |
| | 1,955,000 | | Nisource Finance Corp. | | 7.88 | | | 11/15/10 | | | 2,120,600 |
| | 2,275,000 | | Oracle Corp./Ozark Holdings(a) | | 5.25 | | | 01/15/16 | | | 2,182,392 |
| | 3,000,000 | | RBS Capital Trust III(b)(c) | | 5.51 | | | 09/29/49 | | | 2,893,674 |
| | 1,425,000 | | Sprint Capital Corp. | | 8.38 | | | 03/15/12 | | | 1,610,108 |
| | 1,750,000 | | Susquehanna Bancshares, Inc. | | 6.05 | | | 11/01/12 | | | 1,767,750 |
| | 2,260,000 | | TCI Communications, Inc. | | 9.80 | | | 02/01/12 | | | 2,663,225 |
| | 1,915,000 | | Telefonos de Mexico S.A. | | 4.50 | | | 11/19/08 | | | 1,862,087 |
| | 4,185,000 | | Textron Financial Corp. MTN(b) | | 5.87 | | | 04/24/06 | | | 4,187,942 |
| | 2,415,000 | | Time Warner, Inc. | | 9.15 | | | 02/01/23 | | | 2,903,738 |
| | 2,660,000 | | Virginia Electric Power(d) | | 5.40 | | | 01/15/16 | | | 2,559,694 |
| | 5,075,000 | | Wachovia Corp. | | 3.50 | | | 08/15/08 | | | 4,885,392 |
| | 1,555,000 | | Wachovia Corp. | | 5.25 | | | 08/01/14 | | | 1,509,008 |
| | 1,000,000 | | Xerox Corp. | | 6.40 | | | 03/15/16 | | | 992,500 |
| | 2,400,000 | | Zions Bancorp | | 5.50 | | | 11/16/15 | | | 2,341,471 |
| | | | | | | | | | |
|
|
| | | | TOTAL CORPORATE BONDS (Cost $108,134,809) | | | 106,044,059 |
| | | | | | | | | | |
|
|
| | U.S. GOVERNMENT AGENCY BONDS & NOTES — 12.16% |
| | | | FANNIE MAE — 2.78% | | | | | | |
| | 11,330,000 | | | | 7.25 | | | 01/15/10 | | | 12,139,596 |
| | | | | | | | | | |
|
|
| | | | FEDERAL HOME LOAN BANK — 6.04% | | | |
| | 12,850,000 | | (e) | | 0.00 | | | 04/26/06 | | | 12,810,118 |
| | 5,000,000 | | | | 4.57 | | | 10/17/08 | | | 4,942,435 |
| | 8,700,000 | | | | 5.19 | | | 02/22/10 | | | 8,646,834 |
| | | | | | | | | | |
|
|
| | | | | | | | | | | | 26,399,387 |
| | | | | | | | | | |
|
|
| | | | FREDDIE MAC — 3.34% | | | | | | |
| | 5,845,000 | | | | 3.00 | | | 09/29/06 | | | 5,783,177 |
| | 3,355,000 | | | | 5.13 | | | 07/15/12 | | | 3,344,422 |
See Notes to Financial Statements.
33
Excelsior Funds, Inc.
Portfolio of Investments — March 31, 2006
Intermediate-Term Bond Fund — (continued)
| | | | | | | | | | |
Principal
Amount
| | | | Rate
| | | Maturity
Date
| | Value
|
U.S. GOVERNMENT AGENCY BONDS & NOTES — (continued) |
| | | FREDDIE MAC — (continued) | | | |
| $ 5,700,000 | | | | 5.30 | % | | 05/12/20 | | $ | 5,411,711 |
| 50,000 | | MTN | | 2.85 | | | 01/05/07 | | | 49,160 |
| | | | | | | | | |
|
|
| | | | | | | | | | | 14,588,470 |
| | | | | | | | | |
|
|
| | | TOTAL U.S. GOVERNMENT AGENCY BONDS & NOTES (Cost $53,909,369) | | | 53,127,453 |
| | | | | | | | | |
|
|
U.S. GOVERNMENT AGENCY MORTGAGE PASS THROUGH SECURITIES — 12.50% | | | |
| | | FEDERAL HOME LOAN MORTGAGE CORPORATION — 4.24% | | | |
| 19,500,000 | | TBA | | 5.00 | | | 04/15/21 | | | 18,549,375 |
| | | | | | | | | |
|
|
| | | FEDERAL NATIONAL MORTGAGE
ASSOCIATION — 5.86% | | | |
| 2,630,000 | | Pool # 385538 | | 4.79 | | | 11/01/12 | | | 2,536,617 |
| 808,426 | | Pool # 545290 | | 7.50 | | | 10/01/16 | | | 845,832 |
| 235,267 | | Pool # 577218 | | 6.00 | | | 04/01/31 | | | 235,581 |
| 3,321 | | Pool # 578823 | | 5.50 | | | 04/01/31 | | | 3,252 |
| 1,574,378 | | Pool # 624250 | | 6.00 | | | 01/01/17 | | | 1,596,405 |
| 202,548 | | Pool # 625797 | | 6.00 | | | 01/01/17 | | | 205,381 |
| 3,191,218 | | Pool # 704372 ARM(b) | | 4.51 | | | 05/01/33 | | | 3,130,086 |
| 883,265 | | Pool # 709693 | | 5.50 | | | 06/01/28 | | | 865,811 |
| 597,168 | | Pool # 709698 | | 5.50 | | | 06/01/33 | | | 584,072 |
| 6,320,112 | | Pool # 805386 ARM(b) | | 4.90 | | | 01/01/35 | | | 6,252,071 |
| 2,960,846 | | Pool # 811528 | | 5.00 | | | 11/01/20 | | | 2,887,826 |
| 6,652,910 | | Pool # 831192 | | 5.00 | | | 11/01/20 | | | 6,486,528 |
| | | | | | | | | |
|
|
| | | | | | | | | | | 25,629,462 |
| | | | | | | | | |
|
|
| | | GOVERNMENT NATIONAL MORTGAGE ASSOCIATION — 2.40% | | | |
| 20,310 | | Pool # 195801 | | 8.50 | | | 01/15/17 | | | 21,793 |
| 9,270 | | Pool # 195833 | | 8.50 | | | 04/15/17 | | | 9,947 |
| 2,951,242 | | Pool # 3319 | | 5.00 | | | 12/20/32 | | | 2,852,197 |
| 2,146 | | Pool # 334299 | | 8.00 | | | 05/15/23 | | | 2,296 |
| 3,595,149 | | Pool # 3442 | | 5.00 | | | 09/20/33 | | | 3,474,282 |
| 339,769 | | Pool # 367412 | | 6.00 | | | 11/15/23 | | | 344,204 |
| 1,515,495 | | Pool # 604726 | | 4.50 | | | 10/15/33 | | | 1,427,815 |
| 2,481,009 | | Pool # 608288 | | 4.50 | | | 09/15/33 | | | 2,337,469 |
| | | | | | | | | |
|
|
| | | | | | | | | | | 10,470,003 |
| | | | | | | | | |
|
|
| | | TOTAL U.S. GOVERNMENT AGENCY MORTGAGE PASS THROUGH SECURITIES (Cost $55,677,548) | | | 54,648,840 |
| | | | | | | | | |
|
|
U.S. GOVERNMENT SECURITIES — 18.57% | | | |
| | | U.S. TREASURY BILL — 4.11% | | | |
| 18,000,000 | | (e) | | 0.00 | | | 04/13/06 | | | 17,971,530 |
| | | | | | | | | |
|
|
| | | U.S. TREASURY STRIPS — 0.73% |
| 4,890,000 | | | | 0.00 | | | 11/15/14 | | | 3,203,292 |
| | | | | | | | | |
|
|
| | | U.S. TREASURY INFLATION PROTECTED BONDS — 2.11% | | | |
| 9,000,000 | | | | 2.00 | | | 07/15/14 | | | 9,233,973 |
| | | | | | | | | |
|
|
| | | | | | | | | | |
Principal
Amount
| | | | Rate
| | | Maturity
Date
| | Value
|
U.S. GOVERNMENT SECURITIES — (continued) |
| | | U.S. TREASURY NOTES — 11.62% | | | |
| $ 5,800,000 | | | | 3.00 | % | | 02/15/08 | | $ | 5,610,369 |
| 7,130,000 | | | | 3.13 | | | 04/15/09 | | | 6,791,325 |
| 28,200,000 | | (d) | | 5.00 | | | 02/15/11 | | | 28,428,985 |
| 9,720,000 | | | | 4.25 | | | 11/15/14 | | | 9,290,191 |
| 670,000 | | | | 4.25 | | | 08/15/15 | | | 638,255 |
| | | | | | | | | |
|
|
| | | | | | | | | | | 50,759,125 |
| | | | | | | | | |
|
|
| | | TOTAL U.S. GOVERNMENT SECURITIES
(Cost $82,519,080) | | | 81,167,920 |
| | | | | | | | | |
|
|
Shares
| | | | | | | | | |
REGISTERED INVESTMENT COMPANIES — 7.38% |
| 16,121,745 | | Dreyfus Government Cash Management Fund | | | 16,121,745 |
| 16,121,745 | | Fidelity U.S. Treasury II Fund | | | 16,121,744 |
| | | | | | | | | |
|
|
| | | TOTAL REGISTERED INVESTMENT COMPANIES
(Cost $32,243,489) | | | 32,243,489 |
| | | | | | | | | |
|
|
| | | | | | | |
TOTAL INVESTMENTS
(Cost $462,467,435) (f) | | 103.94 | % | | $ | 454,302,320 | |
LIABILITIES IN EXCESS OF OTHER ASSETS | | (3.94 | ) | | | (17,229,614 | ) |
| | |
|
| |
|
|
|
NET ASSETS | | 100.00 | % | | $ | 437,072,706 | |
| | |
|
| |
|
|
|
| (a) | Security exempt from registration under Rule 144A of the Securities Act of 1933. This security may be resold in transactions exempt from registration, normally to qualified institutional buyers. At March 31, 2006, these securities amounted to $15,649,110 or 3.58% of net assets. |
| (b) | Variable Rate Security—The rate disclosed is as of March 31, 2006. |
| (c) | Perpetual Security—Stated maturity is first par call date. |
| (d) | All or part of the security is segregated by the Fund’s custodian to cover future purchase commitments. |
| (f) | Unrealized appreciation (depreciation) of securities: |
| | | | |
Unrealized
Appreciation
| | Unrealized
(Depreciation)
| | Net Unrealized
Appreciation/
(Depreciation)
|
| $848,180 | | $(9,013,295) | | $(8,165,115) |
ARM—Adjustable Rate Mortgage
MTN—Medium Term Note
plc—Public Limited Company
llc—Limited Liability Company
STRIPS—Separately Traded Registered Interest and Principal Securities
See Notes to Financial Statements.
34
Excelsior Funds, Inc.
Portfolio of Investments — March 31, 2006
Intermediate-Term Bond Fund — (continued)
The summary of the Fund’s investments as of March 31, 2006 is as follows: (Unaudited)
| | | | | | | |
Portfolio Diversification
| | % of
Net
Assets
| | | Value
| |
U.S. Government & Agency Securities | | 43.23 | % | | $ | 188,944,213 | |
Corporate Bonds | | 24.26 | | | | 106,044,059 | |
Commercial Mortgage-Backed Securities | | 15.70 | | | | 68,638,897 | |
Collateralized Mortgage Obligations | | 9.89 | | | | 43,209,213 | |
Registered Investment Companies | | 7.38 | | | | 32,243,489 | |
Asset Backed Securities | | 3.48 | | | | 15,222,449 | |
| | |
|
| |
|
|
|
Total Investments. | | 103.94 | % | | $ | 454,302,320 | |
Liabilities in Excess of Other Assets | | (3.94 | ) | | | (17,229,614 | ) |
| | |
|
| |
|
|
|
Net Assets | | 100.00 | % | | $ | 437,072,706 | |
| | |
|
| |
|
|
|
See Notes to Financial Statements.
35
Excelsior Funds, Inc.
Portfolio of Investments — March 31, 2006
Intermediate-Term Tax-Exempt Fund
| | | | | | | | | | | |
Principal
Amount
| | | | Rate
| | | Maturity
Date
| | Value
|
| | TAX-EXEMPT CASH EQUIVALENT SECURITIES — 3.61% |
| $ | 6,300,000 | | Tulsa County, Oklahoma, Industrial Authority Health Care Revenue Bonds, St. Francis Health System, Series B(a) | | 3.33 | % | | 12/15/27 | | $ | 6,300,000 |
| | 6,425,000 | | West Virginia State Hospital Finance Authority Revenue Bonds, Series B, (AMBAC)(a) | | 3.30 | | | 09/01/32 | | | 6,425,000 |
| | | | | | | | | | |
|
|
| | | | TOTAL TAX-EXEMPT CASH EQUIVALENT SECURITIES (Cost $12,725,000) | | | 12,725,000 |
| | | | | | | | | | |
|
|
| | TAX-EXEMPT SECURITIES — 86.91% |
| | 4,740,000 | | California State, General Obligation Bonds | | 5.00 | | | 06/01/08 | | | 4,873,241 |
| | 10,000,000 | | California State, General Obligation Bonds, | | 5.00 | | | 05/01/13 | | | 10,623,100 |
| | 5,000,000 | | California State, General Obligation Bonds | | 5.00 | | | 08/01/21 | | | 5,223,200 |
| | 10,000,000 | | Colorado Springs, Colorado, Utilities Revenue Bonds, Series A | | 5.25 | | | 11/15/10 | | | 10,659,900 |
| | 5,000,000 | | Cook County, Illinois, General Obligation Bonds, Series A, (AMBAC) | | 5.00 | | | 11/15/23 | | | 5,246,650 |
| | 10,000,000 | | Dallas, Texas, Water Works & Sewer System Revenue Bonds, (FSA) | | 5.38 | | | 10/01/12 | | | 10,880,200 |
| | 2,820,000 | | Detroit, Michigan, Sewage Disposal Revenue Bonds, Senior Lien, Series A, (FSA)(b) | | 5.00 | | | 07/01/14 | | | 3,001,157 |
| | 6,200,000 | | Fairfax County, Virginia, Refunding & Public Improvements General Obligation Bonds, Series A | | 5.25 | | | 04/01/08 | | | 6,404,290 |
| | | | | | | | | | |
Principal
Amount
| | | | Rate
| | | Maturity
Date
| | Value
|
TAX-EXEMPT SECURITIES — (continued) |
| $10,000,000 | | Florida State Division Board Finance Department, General Services Revenue Bonds, Department of Environmental Protection—Preservation 2000, Series A, (FSA)(b) | | 6.00 | % | | 07/01/13 | | $ | 11,292,500 |
| 12,400,000 | | Fresno, California, Sewer Revenue Bonds, Series A-1, (AMBAC)(b) | | 5.25 | | | 09/01/19 | | | 13,649,796 |
| 5,535,000 | | Garland, Texas, Independent School District General Obligation Bonds, Series A, (PSF-GTD) | | 5.00 | | | 02/15/24 | | | 5,738,522 |
| 10,000,000 | | Hawaii State General Obligation Bonds, Series CY, (FSA) | | 5.50 | | | 02/01/12 | | | 10,836,400 |
| 10,000,000 | | Illinois State Sales Tax Revenue Bonds, First Series, (FSA) | | 5.25 | | | 06/15/13 | | | 10,793,600 |
| 10,000,000 | | Jefferson County, Colorado, School District General Obligation Bonds, (MBIA)(b) | | 6.50 | | | 12/15/11 | | | 11,397,600 |
| 10,000,000 | | Los Angeles, California, Department of Water & Power Revenue Bonds, Series B, (MBIA) | | 5.00 | | | 07/01/13 | | | 10,746,100 |
| 6,070,000 | | Los Angeles, California, Unified School District General Obligation Bonds, Election of 2004, Series F, (FGIC) | | 5.00 | | | 07/01/18 | | | 6,491,197 |
| 10,000,000 | | Michigan State Building Authority Revenue Bonds, Facilities Program, Series I, (FSA) | | 5.25 | | | 10/15/14 | | | 10,785,300 |
| 5,720,000 | | Nassau County, New York, Interim Finance Authority Revenue Bonds, Sales Tax Revenue, Series B | | 5.00 | | | 11/15/14 | | | 6,095,747 |
See Notes to Financial Statements.
36
Excelsior Funds, Inc.
Portfolio of Investments — March 31, 2006
Intermediate-Term Tax-Exempt Fund — (continued)
| | | | | | | | | | |
Principal
Amount
| | | | Rate
| | | Maturity
Date
| | Value
|
TAX-EXEMPT SECURITIES — (continued) |
| $10,000,000 | | New Jersey State General Obligation Bonds, Series D | | 6.00 | % | | 02/15/11 | | $ | 10,986,200 |
| 10,000,000 | | New Jersey State Transportation Corporation Certificate Participation, Federal Transportation Administration Grants, Series A, (FGIC) | | 5.00 | | | 09/15/19 | | | 10,483,000 |
| 12,000,000 | | New York City, New York, General Obligation Bonds, Series G | | 5.00 | | | 12/01/21 | | | 12,477,840 |
| 10,000,000 | | New York City, New York, Municipal Water Finance Authority, Water & Sewer System Revenue Bonds, Series A, (FSA) | | 5.38 | | | 06/15/16 | | | 10,769,900 |
| 10,000,000 | | New York State Dormitory Authority Revenue Bonds, State University Educational Facilities, Series B, (FSA) | | 5.25 | | | 05/15/11 | | | 10,705,800 |
| 3,000,000 | | New York State Thruway Authority Revenue Bonds, Highway & Bridge Trust Fund, Series B, (FSA) | | 5.00 | | | 04/01/15 | | | 3,212,940 |
| 9,735,000 | | Oklahoma State Capitol Improvement Authority Revenue Bonds, State Facilities, Higher Education Projects, Series F, (AMBAC) | | 5.00 | | | 07/01/22 | | | 10,287,461 |
| 10,000,000 | | Oklahoma State Capitol Improvement Authority Revenue Bonds, State Facilities, Higher Education Projects, Series F, (AMBAC) | | 5.00 | | | 07/01/23 | | | 10,544,000 |
| | | | | | | | | | |
Principal
Amount
| | | | Rate
| | | Maturity
Date
| | Value
|
TAX-EXEMPT SECURITIES — (continued) | | | |
| $10,000,000 | | Phoenix, Arizona, Civic Improvement Corporation Revenue Bonds, Water Systems, Junior Lien, (MBIA) | | 5.00 | % | | 07/01/20 | | $ | 10,567,500 |
| 7,500,000 | | Port Authority of New York & New Jersey, Construction Revenue Bonds, One Hundred Forty-Second Street Project | | 5.00 | | | 07/15/16 | | | 7,995,225 |
| 8,000,000 | | San Antonio, Texas, Electric & Gas Revenue Bonds, Series A | | 5.25 | | | 02/01/16 | | | 8,370,400 |
| 5,000,000 | | South Carolina State Highway General Obligation Bonds, Series B | | 5.00 | | | 04/01/16 | | | 5,279,050 |
| 10,000,000 | | South Carolina State Public Services Authority Revenue Bonds, Series A, (FSA) | | 5.50 | | | 01/01/11 | | | 10,761,700 |
| 7,050,000 | | South Carolina Transportation Infrastructure Revenue Bonds, Series A, (AMBAC) | | 5.00 | | | 10/01/15 | | | 7,602,086 |
| 4,815,000 | | Texas State Public Finance Authority General Obligation Bonds, Series A | | 5.00 | | | 10/01/23 | | | 5,019,445 |
| 6,000,000 | | Triborough Bridge & Tunnel Authority, New York, Highway Revenue Bonds, Series B | | 5.00 | | | 11/15/20 | | | 6,284,880 |
| 10,000,000 | | Washington State Various Purposes General Obligation Bonds, Series R-03-A, (MBIA) | | 5.00 | | | 01/01/18 | | | 10,460,700 |
| | | | | | | | | |
|
|
| | | TOTAL TAX-EXEMPT SECURITIES (Cost $305,614,852) | | | 306,546,627 |
| | | | | | | | | |
|
|
See Notes to Financial Statements.
37
Excelsior Funds, Inc.
Portfolio of Investments — March 31, 2006
Intermediate-Term Tax-Exempt Fund — (continued)
| | | | | | | | | | |
Principal
Amount
| | | | Rate
| | | Maturity
Date
| | Value
|
TAX-EXEMPT SECURITIES — ESCROWED IN
U.S. GOVERNMENTS — 5.73% |
| $12,000,000 | | Chicago, Illinois, Public Improvements General Obligation Bonds, (Prerefunded 01/01/8 @ 102) | | 5.25 | % | | 01/01/27 | | $ | 12,561,960 |
| 7,180,000 | | Detroit, Michigan, Sewage Disposal Revenue Bonds, Senior Lien, Series A, (Prerefunded 07/01/13 @ 100) | | 5.00 | | | 07/01/14 | | | 7,659,552 |
| | | | | | | | | |
|
|
| | | TOTAL TAX-EXEMPT SECURITIES — ESCROWED IN U.S. GOVERNMENTS (Cost $20,361,255) | | | 20,221,512 |
| | | | | | | | | |
|
|
| | | | |
Shares
| | | | | | | | | |
REGISTERED INVESTMENT COMPANIES — 0.24% |
| 0 | | BlackRock Muni Fund(c) | | | 0 |
| 838,204 | | Dreyfus Tax Exempt Cash Fund | | | 838,204 |
| | | | | | | | | |
|
|
| | | TOTAL REGISTERED INVESTMENT COMPANIES
(Cost $838,204) | | | 838,204 |
| | | | | | | | | |
|
|
| | | | | | |
TOTAL INVESTMENTS (Cost $339,539,311)(d) | | 96.49 | % | | $ | 340,331,343 |
OTHER ASSETS IN EXCESS OF LIABILITIES | | 3.51 | | | | 12,364,413 |
| | |
|
| |
|
|
NET ASSETS | | 100.00 | % | | $ | 352,695,756 |
| | |
|
| |
|
|
| (a) | Variable Rate Security—The rate disclosed is as of March 31, 2006. |
| (b) | All or part of the security is segregated by the Fund’s custodian to cover future purchase commitments. |
| (c) | Fractional shares—Amount less than one. |
| (d) | Unrealized appreciation (depreciation) of securities: |
| | | | | | | | |
Unrealized
Appreciation
| | Unrealized
(Depreciation)
| | | Net Unrealized
Appreciation/
(Depreciation)
|
| $ | 3,443,657 | | $ | (2,651,625 | ) | | $ | 792,032 |
AMBAC—American Municipal Bond Assurance Corp.
FGIC—Financial Guaranty Insurance Corp.
FSA—Financial Security Assurance
MBIA—Municipal Bond Insurance Association
PSF-GTD—Public School Fund—Guaranteed
SPA—Standby Purchase Agreement
Notes (The following notes have not been audited by Deloitte & Touche LLP):
These municipal securities meet the three highest ratings assigned by Moody’s Investors Services, Inc. or Standard and Poor’s Corporation or, where not rated, are determined by the Advisor, under the supervision of the Board of Directors, to be of comparable quality at the time of purchase to rated instruments that may be acquired by the Fund.
At March 31, 2006, approximately 6% of the net assets are invested in municipal securities that have letter of credit enhancement features or escrows in U.S. Government securities backing them, on which the Fund relies. Without such features, the securities may or may not meet the quality standards of securities purchased by the Fund.
See Notes to Financial Statements.
38
Excelsior Funds, Inc.
Portfolio of Investments — March 31, 2006
Intermediate-Term Tax-Exempt Fund — (continued)
The summary of the Fund’s investments as of March 31, 2006 is as follows: (Unaudited)
| | | | | | |
State Diversification
| | % of
Net
Assets
| | | Value
|
New York | | 16.31 | % | | $ | 57,542,332 |
California | | 14.63 | | | | 51,606,635 |
Texas | | 8.51 | | | | 30,008,567 |
Illinois | | 8.11 | | | | 28,602,210 |
Oklahoma | | 7.69 | | | | 27,131,461 |
South Carolina | | 6.70 | | | | 23,642,835 |
Colorado | | 6.25 | | | | 22,057,500 |
New Jersey | | 6.09 | | | | 21,469,200 |
Michigan | | 6.08 | | | | 21,446,009 |
Florida | | 3.20 | | | | 11,292,500 |
Hawaii | | 3.07 | | | | 10,836,400 |
Arizona | | 3.00 | | | | 10,567,500 |
Washington | | 2.97 | | | | 10,460,700 |
West Virginia | | 1.82 | | | | 6,425,000 |
Virginia | | 1.82 | | | | 6,404,290 |
Registered Investment Companies | | 0.24 | | | | 838,204 |
| | |
|
| |
|
|
Total Investments | | 96.49 | % | | $ | 340,331,343 |
Other Assets in Excess of Liabilities | | 3.51 | | | | 12,364,413 |
| | |
|
| |
|
|
Net Assets | | 100.00 | % | | $ | 352,695,756 |
| | |
|
| |
|
|
See Notes to Financial Statements.
39
Excelsior Tax-Exempt Funds, Inc.
Portfolio of Investments — March 31, 2006
Long-Term Tax-Exempt Fund
| | | | | | | | | | | |
Principal
Amount
| | | | Rate
| | | Maturity
Date
| | Value
|
| | TAX-EXEMPT CASH EQUIVALENT SECURITIES — 13.39% |
| $ | 500,000 | | Clackamas County, Oregon, Hospital Facilities Authority Revenue Bonds, Providence Health System, Series E(a) | | 3.33 | % | | 10/01/33 | | $ | 500,000 |
| | 1,500,000 | | Colorado Springs, Colorado, Utilities Revenue Bonds, Sub Lien, Series A, (SPA: Dexia Credit Local)(a) | | 3.17 | | | 11/01/23 | | | 1,500,000 |
| | 2,500,000 | | Illinois Health Facilities Authority, Health Care Revenue Bonds, (FSA)(a) | | 3.33 | | | 05/15/29 | | | 2,500,000 |
| | 1,500,000 | | Moffat County, Colorado, Pollution Control Revenue Bonds, Pacificorp Projects, (AMBAC)(a) | | 3.14 | | | 05/01/13 | | | 1,500,000 |
| | 2,200,000 | | Ohio State Higher Educational Facilities Revenue Bonds, Case Western Reserve University, (SPA: Landesbank Hessen-Thueringen)(a) | | 3.13 | | | 10/01/31 | | | 2,200,000 |
| | | | | | | | | | |
|
|
| | | | TOTAL TAX-EXEMPT CASH
EQUIVALENT SECURITIES
(Cost $8,200,000) | | | 8,200,000 |
| | | | | | | | | | |
|
|
| | TAX-EXEMPT SECURITIES — 63.98% | | | | | | |
| | 2,490,000 | | Burke County, Georgia, Development Authority Pollution Control Revenue Bonds, Georgia Power Company Plant, 1st Series, (FGIC) | | 4.75 | | | 05/01/34 | | | 2,494,482 |
| | 2,065,000 | | California State, General Obligation Bonds | | 5.00 | | | 08/01/21 | | | 2,157,182 |
| | 2,500,000 | | Chicago, Illinois, O’Hare International Airport Revenue Bonds, General Airport, Third Lien, Series A, (FGIC) | | 5.00 | | | 01/01/33 | | | 2,581,575 |
| | 3,000,000 | | Clark County, Nevada, School District General Obligation Bonds, Series A, (FSA)(b) | | 5.00 | | | 06/15/15 | | | 3,186,150 |
| | | | | | | | | | |
Principal
Amount
| | | | Rate
| | | Maturity
Date
| | Value
|
TAX-EXEMPT SECURITIES — (continued) |
| $2,500,000 | | Detroit, Michigan, City School District General Obligation Bonds, School Building & Improvement, Series A, (FSA) | | 5.00 | % | | 05/01/17 | | $ | 2,649,500 |
| 2,500,000 | | Indiana Health & Educational Facility Financing Authority Hospital Revenue Bonds, Clarian Health Obligation, Series A | | 5.00 | | | 02/15/39 | | | 2,479,900 |
| 2,500,000 | | Jea, Florida, Johns River Power Systems Revenue Bonds, Issue 2, Series 21, (MBIA) | | 5.00 | | | 10/01/20 | | | 2,636,950 |
| 2,000,000 | | Johnson City, Tennessee, Health & Educational Facilities Board Hospital Revenue Bonds, Mountain States Health Alliance, Series A | | 5.50 | | | 07/01/36 | | | 2,084,100 |
| 2,000,000 | | Massachusetts State Water Resource Authority Revenue Bonds, Series A, (MBIA) | | 5.00 | | | 08/01/23 | | | 2,120,660 |
| 2,000,000 | | New York City, New York General Obligation Bonds, Series M | | 5.00 | | | 04/01/22 | | | 2,077,740 |
| 2,000,000 | | New York State Environmental Facilities Revenue Bonds, Clean Water & Drinking Revolving Foods, 2nd Resolution | | 5.00 | | | 06/15/26 | | | 2,095,700 |
| 2,500,000 | | New York, Sales Tax Asset Receivable Revenue Bonds, Series A, (AMBAC) | | 5.00 | | | 10/15/29 | | | 2,614,725 |
| 2,500,000 | | Palm Beach County, Florida, Public Improvement Revenue Bonds, Biomedical Research Park Project, Series A, (AMBAC) | | 5.00 | | | 06/01/23 | | | 2,611,900 |
| 2,500,000 | | Port Authority of New York & New Jersey, Construction Revenue Bonds, One Hundred Forty-Second Street Project | | 5.00 | | | 07/15/16 | | | 2,665,075 |
See Notes to Financial Statements.
40
Excelsior Tax-Exempt Funds, Inc.
Portfolio of Investments — March 31, 2006
Long-Term Tax-Exempt Fund — (continued)
| | | | | | | | | | |
Principal
Amount
| | | | Rate
| | | Maturity
Date
| | Value
|
TAX-EXEMPT SECURITIES — (continued) |
| $2,500,000 | | Sherman, Texas, Independent School District General Obligation Bonds, Series A, (PSF-GTD) | | 5.00 | % | | 02/15/26 | | $ | 2,599,650 |
| 2,000,000 | | Washington State Economic Development Authority Revenue Bonds, Biomedical Research Properties II | | 5.25 | | | 06/01/24 | | | 2,138,940 |
| | | | | | | | | |
|
|
| | | TOTAL TAX-EXEMPT SECURITIES (Cost $39,282,950) | | | 39,194,229 |
| | | | | | | | | |
|
|
TAX-EXEMPT SECURITIES — ESCROWED IN
U.S. GOVERNMENTS — 20.37% |
| 3,000,000 | | Houston, Texas, Water & Sewer System Revenue Bonds, Series A, (FSA) (Prerefunded 12/01/12 @ 100) | | 5.00 | | | 12/01/30 | | | 3,182,640 |
| 2,500,000 | | Long Island Power Authority, New York Electric System Revenue Bonds, Series A, (FSA) (Escrowed to Maturity) | | 5.25 | | | 12/01/14 | | | 2,730,425 |
| 3,000,000 | | New Jersey State Transportation Trust Fund Authority Revenue Bonds, Transportation Systems, Series C, (Prerefunded 06/15/13 @ 100)(b) | | 5.50 | | | 06/15/23 | | | 3,292,500 |
| 3,000,000 | | Pennsylvania State General Obligation Bonds, 2nd Series, (FSA) (Prerefunded 05/01/12 @ 100) | | 5.50 | | | 05/01/16 | | | 3,272,460 |
| | | | | | | | | |
|
|
| | | TOTAL TAX-EXEMPT SECURITIES — ESCROWED IN U.S. GOVERNMENTS (Cost $12,349,082) | | | 12,478,025 |
| | | | | | | | | |
|
|
| | | | | | | | | |
Shares
| | | | Rate
| | Maturity
Date
| | Value
|
| REGISTERED INVESTMENT COMPANIES — 0.83% |
| 1 | | BlackRock Muni Fund | | $ | 1 |
| 506,636 | | Dreyfus Tax Exempt Cash Fund | | | 506,636 |
| | | | |
| |
| |
|
|
| | | TOTAL REGISTERED INVESTMENT COMPANIES
(Cost $506,637) | | | 506,637 |
| | | | | | | | |
|
|
| | | | | | |
TOTAL INVESTMENTS (Cost $60,338,669) (c) | | 98.57 | % | | $ | 60,378,891 |
OTHER ASSETS IN EXCESS OF LIABILITIES | | 1.43 | | | | 878,353 |
| | |
|
| |
|
|
NET ASSETS | | 100.00 | % | | $ | 61,257,244 |
| | |
|
| |
|
|
| (a) | Variable Rate Security—The rate disclosed is as of March 31, 2006. |
| (b) | All or part of the security is segregated by the Fund’s custodian to cover future purchase commitments. |
| (c) | Unrealized appreciation (depreciation) of securities: |
| | | | | | | | |
Unrealized
Appreciation
| | Unrealized
(Depreciation)
| | | Net Unrealized
Appreciation/
(Depreciation)
|
| $ | 375,723 | | $ | (335,501 | ) | | $ | 40,222 |
AMBAC—American Municipal Bond Assurance Corporation
FGIC—Financial Guaranty Insurance Corporation
FSA—Financial Security Assurance
MBIA—Municipal Bond Insurance Association
PSF-GTD—Public School Fund—Guaranteed
SPA—Standby Purchase Agreement
Notes (The following notes have not been audited by Deloitte & Touche LLP):
These municipal securities meet the three highest ratings assigned by Moody’s Investors Services, Inc. or Standard and Poor’s Corporation or, where not rated, are determined by the Advisor, under the supervision of the Board of Directors, to be of comparable quality at the time of purchase to rated instruments that may be acquired by the Fund.
At March 31, 2006, approximately 20% of the net assets are invested in municipal securities that have letter of credit enhancement features or escrows in U.S. Government securities backing them, on which the Fund relies. Without such features, the securities may or may not meet the quality standards of securities purchased by the Fund.
See Notes to Financial Statements.
41
Excelsior Tax-Exempt Funds, Inc.
Portfolio of Investments — March 31, 2006
Long-Term Tax-Exempt Fund — (continued)
The summary of the Fund’s investments as of March 31, 2006 is as follows: (Unaudited)
| | | | | | |
State Diversification
| | % of
Net
Assets
| | | Value
|
New York | | 19.89 | % | | $ | 12,183,665 |
Texas | | 9.44 | | | | 5,782,290 |
Florida | | 8.57 | | | | 5,248,850 |
Illinois | | 8.30 | | | | 5,081,575 |
New Jersey | | 5.37 | | | | 3,292,500 |
Pennsylvania | | 5.34 | | | | 3,272,460 |
Nevada | | 5.20 | | | | 3,186,150 |
Colorado | | 4.90 | | | | 3,000,000 |
Michigan | | 4.33 | | | | 2,649,500 |
Georgia | | 4.07 | | | | 2,494,482 |
Indiana | | 4.05 | | | | 2,479,900 |
Ohio | | 3.59 | | | | 2,200,000 |
California | | 3.52 | | | | 2,157,182 |
Washington | | 3.49 | | | | 2,138,940 |
Massachusetts | | 3.46 | | | | 2,120,660 |
Tennessee | | 3.40 | | | | 2,084,100 |
Registered Investment Companies | | 0.83 | | | | 506,637 |
Oregon | | 0.82 | | | | 500,000 |
| | |
|
| |
|
|
Total Investments | | 98.57 | % | | $ | 60,378,891 |
Other Assets in Excess of Liabilities | | 1.43 | | | | 878,353 |
| | |
|
| |
|
|
Net Assets | | 100.00 | % | | $ | 61,257,244 |
| | |
|
| |
|
|
See Notes to Financial Statements.
42
Excelsior Tax-Exempt Fund, Inc.
Portfolio of Investments — March 31, 2006
New York Intermediate-Term Tax-Exempt Fund
| | | | | | | | | | | |
Principal
Amount
| | | | Rate
| | | Maturity
Date
| | Value
|
| | TAX-EXEMPT CASH EQUIVALENT SECURITIES — 8.40% |
| $ | 5,000,000 | | New York State Triborough Bridge & Tunnel Authority Revenue Bonds, Series F, (SPA: ABN AMRO Bank N.V.)(a) | | 3.16 | % | | 11/01/32 | | $ | 5,000,000 |
| | 6,000,000 | | Port Authority of New York & New Jersey, Special Obligation Revenue Bonds, Versatile Structure Obligation, Series 3, (SPA: JP Morgan Chase & Co.)(a) | | 3.17 | | | 06/01/20 | | | 6,000,000 |
| | | | | | | | | | |
|
|
| | | | TOTAL TAX-EXEMPT CASH EQUIVALENT SECURITIES (Cost $11,000,000) | | | | | | 11,000,000 |
| | | | | | | | | | |
|
|
| TAX-EXEMPT CASH EQUIVALENT SECURITIES —
BACKED BY LETTERS OF CREDIT — 4.04% | | | |
| | 5,300,000 | | New York City, New York, General Obligation Bonds, Sub-Series C5, (Bank of New York)(a) | | 3.15 | | | 08/01/20 | | | 5,300,000 |
| | | | | | | | | | |
|
|
| | | | TOTAL TAX-EXEMPT CASH EQUIVALENT SECURITIES — BACKED BY LETTERS OF CREDIT (Cost $5,300,000) | | | | | | 5,300,000 |
| | | | | | | | | | |
|
|
| | TAX-EXEMPT SECURITIES — 72.93% | | | | | | |
| | 2,565,000 | | Babylon, New York, General Obligation Bonds, (AMBAC) | | 5.00 | | | 01/01/13 | | | 2,730,648 |
| | 7,000,000 | | Long Island Power Authority, New York Electric System Revenue Bonds, Series A, (FGIC) | | 5.00 | | | 12/01/23 | | | 7,369,950 |
| | 8,500,000 | | Nassau County, New York, Interim Finance Authority, Sales Tax Revenue Bonds, Series H, (AMBAC)(b) | | 5.25 | | | 11/15/15 | | | 9,234,909 |
| | 5,000,000 | | New York City, New York, Municipal Water Finance Authority, Water & Sewer System Revenue Bonds, Series A, (FSA) | | 5.38 | | | 06/15/16 | | | 5,384,950 |
| | | | | | | | | | | |
Principal
Amount
| | | | Rate
| | | Maturity
Date
| | Value
|
| | TAX-EXEMPT SECURITIES — (continued) | | | |
| $ | 4,000,000 | | New York City, New York, Municipal Water Finance Authority, Water & Sewer System Revenue Bonds, Series D | | 5.13 | % | | 06/15/19 | | $ | 4,243,440 |
| | 3,000,000 | | New York City, New York, Transitional Finance Authority Revenue Bonds, Series A-1 | | 5.00 | | | 11/01/19 | | | 3,170,130 |
| | 5,000,000 | | New York State Dormitory Authority, New York University Revenue Bonds, Series A, (AMBAC) | | 5.75 | | | 07/01/12 | | | 5,539,650 |
| | 1,015,000 | | New York State Dormitory Authority, State University Facilities Revenue Bonds, Series A, (FSA) | | 5.25 | | | 05/15/21 | | | 1,112,907 |
| | 6,000,000 | | New York State Environmental Facilities Revenue Bonds, Municipal Water, Project K | | 5.00 | | | 06/15/12 | | | 6,407,400 |
| | 5,000,000 | | New York State Local Government Assistance Corporation Revenue Bonds, Series A-1, (FSA) | | 5.00 | | | 04/01/12 | | | 5,315,900 |
| | 6,500,000 | | New York State Sales Tax Asset Receivable Corporation Revenue Bonds, Series A, (MBIA) | | 5.00 | | | 10/15/22 | | | 6,874,205 |
| | 5,000,000 | | New York State Thruway Authority, Highway & Bridge Trust Fund Revenue Bonds, Series B, (AMBAC) | | 5.00 | | | 04/01/19 | | | 5,310,350 |
| | 6,000,000 | | New York State Thruway Authority, State Personal Income Tax Revenue Bonds, Series A, (AMBAC) | | 5.00 | | | 03/15/16 | | | 6,386,400 |
| | 2,155,000 | | New York State Urban Development Corporation Revenue Bonds, (FSA)(b) | | 5.00 | | | 01/01/16 | | | 2,309,643 |
See Notes to Financial Statements.
43
Excelsior Tax-Exempt Fund, Inc.
Portfolio of Investments — March 31, 2006
New York Intermediate-Term Tax-Exempt Fund — (continued)
| | | | | | | | | | | |
Principal
Amount
| | | | Rate
| | | Maturity
Date
| | Value
|
| | TAX-EXEMPT SECURITIES — (continued) | | | |
| $ | 5,035,000 | | New York State Urban Development Corporation Revenue Bonds, (FSA) | | 5.00 | % | | 01/01/17 | | $ | 5,368,317 |
| | 670,000 | | Onondaga County, New York, Water Authority Revenue Bonds, Series A, (AMBAC) | | 5.00 | | | 09/15/16 | | | 718,441 |
| | 700,000 | | Onondaga County, New York, Water Authority Revenue Bonds, Series A, (AMBAC) | | 5.00 | | | 09/15/17 | | | 747,208 |
| | 700,000 | | Onondaga County, New York, Water Authority Revenue Bonds, Series A, (AMBAC) | | 5.00 | | | 09/15/19 | | | 744,394 |
| | 810,000 | | Onondaga County, New York, Water Authority Revenue Bonds, Series A, (AMBAC) | | 5.00 | | | 09/15/20 | | | 859,426 |
| | 850,000 | | Onondaga County, New York, Water Authority Revenue Bonds, Series A, (AMBAC) | | 5.00 | | | 09/15/21 | | | 899,827 |
| | 895,000 | | Onondaga County, New York, Water Authority Revenue Bonds, Series A, (AMBAC) | | 5.00 | | | 09/15/22 | | | 943,894 |
| | 940,000 | | Onondaga County, New York, Water Authority Revenue Bonds, Series A, (AMBAC) | | 5.00 | | | 09/15/23 | | | 992,104 |
| | 2,000,000 | | Puerto Rico Convention Center District Authority, Hotel Occupancy Tax Revenue Bonds, Series A, (AMBAC) | | 5.00 | | | 07/01/19 | | | 2,135,340 |
| | 5,000,000 | | Puerto Rico Electric Power Authority Revenue Bonds, Series BB, (MBIA) | | 6.00 | | | 07/01/11 | | | 5,525,250 |
| | 2,425,000 | | Yonkers, New York, General Obligation Bonds, Series B, (MBIA) | | 5.00 | | | 08/01/21 | | | 2,554,107 |
| | 2,545,000 | | Yonkers, New York, General Obligation Bonds, Series B, (MBIA) | | 5.00 | | | 08/01/22 | | | 2,674,490 |
| | | | | | | | | | |
|
|
| | | | TOTAL TAX-EXEMPT SECURITIES
(Cost $95,693,018) | | | 95,553,280 |
| | | | | | | | | | |
|
|
| | | | | | | | | | | |
Principal
Amount
| | | | Rate
| | | Maturity
Date
| | Value
|
| TAX-EXEMPT SECURITIES — ESCROWED IN
U.S. GOVERNMENTS — 13.34% | | | |
| $ | 10,000,000 | | Long Island Power Authority, New York Electric System Revenue Bonds, Series A, (FSA) (Escrowed to Maturity) | | 5.25 | % | | 12/01/14 | | $ | 10,921,700 |
| | 6,000,000 | | New York State Metropolitan Transportation Authority Revenue Bonds, Service Contract, Series 8, (FSA) (Prerefunded 07/01/13 @ 100) | | 5.38 | | | 07/01/21 | | | 6,561,000 |
| | | | | | | | | | |
|
|
| | | | TOTAL TAX-EXEMPT SECURITIES — ESCROWED IN U.S. GOVERNMENTS (Cost $17,879,583) | | | 17,482,700 |
| | | | | | | | | | |
|
|
Shares
| | | | | | | | | |
| | REGISTERED INVESTMENT COMPANIES — 0.14% | | | |
| | 1 | | Dreyfus New York Tax Exempt Cash Fund | | | 1 |
| | 177,293 | | Provident Institutional New York Money Market Fund | | | 177,293 |
| | | | | | | | | | |
|
|
| | | | TOTAL REGISTERED INVESTMENT COMPANIES
(Cost $177,294) | | | 177,294 |
| | | | | | | | | | |
|
|
| | | | | | |
TOTAL INVESTMENTS (Cost $130,049,895)(c) | | 98.85 | % | | | 129,513,274 |
OTHER ASSETS IN EXCESS OF LIABILITIES | | 1.15 | | | | 1,512,727 |
| | |
|
| |
|
|
NET ASSETS | | 100.00 | % | | $ | 131,026,001 |
| | |
|
| |
|
|
| (a) | Variable Rate Security—The rate disclosed is as of March 31, 2006. |
| (b) | All or part of the security is segregated by the Fund’s custodian to cover future purchase commitments. |
| (c) | Unrealized appreciation (depreciation) of securities: |
| | | | | | | | | |
Unrealized
Appreciation
| | Unrealized
(Depreciation)
| | | Net Unrealized
Appreciation/
(Depreciation)
| |
| $ | 428,503 | | $ | (965,124 | ) | | $ | (536,621 | ) |
AMBAC—American Municipal Bond Assurance Corp.
FGIC—Financial Guaranty Insurance Corp.
FSA—Financial Security Assurance
MBIA—Municipal Bond Insurance Association
SPA—Standby Purchase Agreement
See Notes to Financial Statements.
44
Excelsior Tax-Exempt Fund, Inc.
Portfolio of Investments — March 31, 2006
New York Intermediate-Term Tax-Exempt Fund — (continued)
Notes (The following notes have not been audited by Deloitte & Touche LLP):
These municipal securities meet the three highest ratings assigned by Moody’s Investors Services, Inc. or Standard and Poor’s Corporation or, where not rated, are determined by the Advisor, under the supervision of the Board of Directors, to be of comparable quality at the time of purchase to rated instruments that may be acquired by the Fund.
At March 31, 2006, approximately 17% of the net assets are invested in municipal securities that have letter of credit enhancement features or escrows in U.S. Government securities backing them, on which the Fund relies. Without such features, the securities may or may not meet the quality standards of securities purchased by the Fund.
At March 31, 2006, approximately 93% of the net assets are invested in New York municipal securities. Economic changes affecting the state and certain of its public bodies and municipalities may affect the ability of issuers to pay the required principal and interest payments of the municipal securities.
The summary of the Fund’s investments as of March 31, 2006 is as follows: (Unaudited)
| | | | | | |
Portfolio Diversification
| | % of
Net
Assets
| | | Value
|
Revenue Bonds | | 75.25 | % | | $ | 98,594,035 |
Escrowed to Maturity | | 8.34 | | | | 10,921,700 |
General Obligation Bonds | | 6.07 | | | | 7,959,245 |
Prerefunded | | 5.01 | | | | 6,561,000 |
Backed by Letters of Credit. | | 4.04 | | | | 5,300,000 |
Registered Investment Companies | | 0.14 | | | | 177,294 |
| | |
|
| |
|
|
Total Investments | | 98.85 | % | | $ | 129,513,274 |
Other Assets in Excess of Liabilities | | 1.15 | | | | 1,512,727 |
| | |
|
| |
|
|
Net Assets | | 100.00 | % | | $ | 131,026,001 |
| | |
|
| |
|
|
See Notes to Financial Statements.
45
Excelsior Funds, Inc.
Portfolio of Investments — March 31, 2006
Short-Term Government Securities Fund
| | | | | | | | | | | |
Principal
Amount
| | | | Rate
| | | Maturity
Date
| | Value
|
| | ASSET BACKED SECURITIES — 5.62% | | | | | | |
| $ | 4,000,000 | | Citibank Credit Card Issuance Trust, 2005-A10 A10(a) | | 4.76 | % | | 12/15/10 | | $ | 4,000,471 |
| | 1,100,000 | | Countrywide Asset Backed Certificates, 2005-13 AF2(a) | | 5.29 | | | 04/25/36 | | | 1,094,143 |
| | 5,000,000 | | Countrywide Asset Backed Certificates, 2005-4 AF3(a)(b) | | 4.46 | | | 10/25/35 | | | 4,889,487 |
| | 3,115,250 | | Countrywide Home Equity Loan Trust, 2005-G 2A(a) | | 4.98 | | | 12/15/35 | | | 3,118,988 |
| | 6,000,000 | | Residential Asset Mortgage Products, Inc., 2004-RS6 AI3 | | 4.54 | | | 08/25/28 | | | 5,967,711 |
| | | | | | | | | | |
|
|
| | | | TOTAL ASSET BACKED SECURITIES (Cost $19,288,354) | | | 19,070,800 |
| | | | | | | | | | |
|
|
| | COLLATERALIZED MORTGAGE OBLIGATIONS — 20.24% |
| | | | NON-GOVERNMENTAL AGENCY COLLATERALIZED MORTGAGE OBLIGATIONS — 8.08% | | | |
| | 5,895,480 | | Bank of America Mortgage Securities, 2004-B 2A2(a) | | 4.11 | | | 03/25/34 | | | 5,716,477 |
| | 3,331,963 | | Bank of America Mortgage Securities, 2005-J 2A3(a) | | 5.10 | | | 11/25/35 | | | 3,294,863 |
| | 3,786,134 | | Bear Stearns ARM, 2004-1 11A3(a) | | 3.41 | | | 04/25/34 | | | 3,760,954 |
| | 2,978,622 | | Bear Stearns ARM, 2004-9 3A1(a) | | 5.22 | | | 09/25/34 | | | 2,951,955 |
| | 3,835,315 | | Countrywide Alternative Loan Trust, 2004-16CB 1A2 | | 5.50 | | | 07/25/34 | | | 3,764,754 |
| | 500,036 | | Countrywide Alternative Loan Trust, 2004-22CB 1A1 | | 6.00 | | | 10/25/34 | | | 495,102 |
| | 2,881,121 | | IMPAC CMB Trust, 2005-5 A4(a) | | 5.20 | | | 08/25/35 | | | 2,862,681 |
| | 2,622,749 | | Indymac Index Mortgage Loan Trust, 2004-AR4 3A(a) | | 4.80 | | | 08/25/34 | | | 2,566,815 |
| | 2,000,000 | | Washington Mutual Mortgage Securities Corp., 2005-AR5 A2(a) | | 4.68 | | | 05/25/35 | | | 1,985,620 |
| | | | | | | | | | |
|
|
| | | | | | | | | | | | 27,399,221 |
| | | | | | | | | | |
|
|
| | | | | | | | | | |
Principal
Amount
| | | | Rate
| | | Maturity
Date
| | Value
|
COLLATERALIZED MORTGAGE OBLIGATIONS — (continued) |
| | | FEDERAL HOME LOAN MORTGAGE CORPORATION — 6.86% | | | |
| $ 2,842,393 | | 2608 GK | | 4.50 | % | | 03/15/17 | | $ | 2,777,544 |
| 3,010,824 | | 2743 HA | | 4.50 | | | 11/15/09 | | | 2,999,529 |
| 3,910,573 | | 2772 YA | | 3.50 | | | 12/15/11 | | | 3,891,126 |
| 4,839,941 | | 2807 NL | | 3.50 | | | 01/15/15 | | | 4,805,112 |
| 2,501,972 | | 2808 PA | | 4.00 | | | 09/15/12 | | | 2,494,323 |
| 6,321,540 | | 2836 TA | | 5.00 | | | 10/15/27 | | | 6,308,279 |
| | | | | | | | | |
|
|
| | | | | | | | | | | 23,275,913 |
| | | | | | | | | |
|
|
| | | FEDERAL NATIONAL MORTGAGE ASSOCIATION — 5.07% | | | |
| 7,869,000 | | 1997-M5 C | | 6.74 | | | 08/25/07 | | | 7,969,587 |
| 3,861,012 | | 2002-89 CA | | 5.00 | | | 04/25/16 | | | 3,825,824 |
| 3,565,700 | | 2004-1 HA | | 3.50 | | | 03/25/11 | | | 3,540,646 |
| 1,883,458 | | 2004-W4 A1 | | 2.75 | | | 06/25/34 | | | 1,867,073 |
| | | | | | | | | |
|
|
| | | | | | | | | | | 17,203,130 |
| | | | | | | | | |
|
|
| | | GOVERNMENT NATIONAL MORTGAGE ASSOCIATION — 0.23% | | | |
| 804,830 | | 2005-34 A(a) | | 3.96 | | | 09/16/21 | | | 782,113 |
| | | | | | | | | |
|
|
| | | TOTAL COLLATERALIZED MORTGAGE OBLIGATIONS (Cost $70,115,844) | | | 68,660,377 |
| | | | | | | | | |
|
|
COMMERCIAL MORTGAGE-BACKED SECURITIES — 4.90% |
| 6,990,000 | | Chase Commercial Mortgage Securities Corp., 1996-2 C | | 6.90 | | | 11/19/28 | | | 7,021,363 |
| 5,245,254 | | Greenwich Capital Commercial Funding Corp., 2004-GG1 A2 | | 3.84 | | | 06/10/36 | | | 5,127,315 |
| 1,795,512 | | JP Morgan Chase Commercial Mortgage Securities Corp., 2005-LDP2 A1(a) | | 4.33 | | | 07/15/42 | | | 1,758,774 |
| 2,758,563 | | Mortgage Capital Funding, Inc., 2005-HQ5 A1 | | 4.52 | | | 01/14/42 | | | 2,710,513 |
| | | | | | | | | |
|
|
| | | TOTAL COMMERCIAL MORTGAGE-BACKED SECURITIES (Cost $17,447,525) | | | 16,617,965 |
| | | | | | | | | |
|
|
U.S. GOVERNMENT AGENCY BONDS & NOTES — 13.82% |
| | | FEDERAL HOME LOAN BANK — 9.13% | | | |
| 11,500,000 | | (b) | | 3.38 | | | 09/14/07 | | | 11,229,071 |
| 9,425,000 | | (b) | | 4.63 | | | 02/08/08 | | | 9,349,270 |
| 2,500,000 | | | | 3.88 | | | 02/15/08 | | | 2,446,883 |
| 2,480,000 | | | | 5.19 | | | 02/22/10 | | | 2,464,845 |
| 1,000,000 | | Discount Note | | 4.60 | | | 04/03/06 | | | 999,744 |
| 4,470,000 | | Discount Note | | 4.51 | | | 04/05/06 | | | 4,467,203 |
| | | | | | | | | |
|
|
| | | | | | | | | | | 30,957,016 |
| | | | | | | | | |
|
|
See Notes to Financial Statements.
46
Excelsior Funds, Inc.
Portfolio of Investments — March 31, 2006
Short-Term Government Securities Fund — (continued)
| | | | | | | | | | |
Principal
Amount
| | | | Rate
| | | Maturity
Date
| | Value
|
U.S. GOVERNMENT AGENCY BONDS & NOTES — (continued) |
| | | FEDERAL NATIONAL MORTGAGE ASSOCIATION — 4.69% | | | |
| $10,000,000 | | | | 3.00 | % | | 11/22/06 | | $ | 9,867,361 |
| 2,100,000 | | | | 3.55 | | | 01/17/08 | | | 2,045,385 |
| 4,000,000 | | Discount Note | | 4.60 | | | 04/05/06 | | | 3,997,444 |
| | | | | | | | | |
|
|
| | | | | | | | | | | 15,910,190 |
| | | | | | | | | |
|
|
| | | TOTAL U.S. GOVERNMENT AGENCY BONDS & NOTES
(Cost $47,406,872) | | | 46,867,206 |
| | | | | | | | | |
|
|
U.S. GOVERNMENT AGENCY MORTGAGE PASS THROUGH SECURITIES — 31.49% |
| | | FEDERAL HOME LOAN MORTGAGE
CORPORATION — 13.42% |
| 1,105,543 | | Pool # 1B2846 ARM(a) | | 4.95 | | | 04/01/35 | | | 1,095,114 |
| 4,184,974 | | Pool # 1G0688(a) | | 5.82 | | | 01/01/36 | | | 4,214,817 |
| 9,977,785 | | Pool # 782645 ARM(a) | | 5.45 | | | 02/01/36 | | | 9,983,794 |
| 4,869,250 | | Pool # 847248 ARM(a) | | 3.69 | | | 03/01/34 | | | 4,844,495 |
| 560,353 | | Pool # C68593 | | 7.00 | | | 11/01/28 | | | 578,438 |
| 9,960,578 | | Pool # J00617 | | 5.50 | | | 12/01/20 | | | 9,895,117 |
| 15,000,000 | | TBA | | 5.50 | | | 04/01/21 | | | 14,896,875 |
| | | | | | | | | |
|
|
| | | | | | | | | | | 45,508,650 |
| | | | | | | | | |
|
|
| | | FEDERAL NATIONAL MORTGAGE
ASSOCIATION — 17.41% |
| 1,184,819 | | Pool # 253509 | | 7.50 | | | 11/01/15 | | | 1,239,641 |
| 963,456 | | Pool # 323572 | | 7.50 | | | 01/01/29 | | | 1,007,166 |
| 2,737,817 | | Pool # 375575 | | 6.60 | | | 12/01/07 | | | 2,767,424 |
| 472,330 | | Pool # 516210 | | 8.00 | | | 08/01/14 | | | 499,910 |
| 21,836 | | Pool # 517390 | | 8.00 | | | 11/01/11 | | | 22,731 |
| 468,372 | | Pool # 535377 | | 8.00 | | | 06/01/15 | | | 497,148 |
| 363,748 | | Pool # 535981 | | 8.00 | | | 01/01/16 | | | 386,096 |
| 204,824 | | Pool # 545362 ARM(a) | | 6.01 | | | 12/01/31 | | | 206,186 |
| 2,144,220 | | Pool # 634195 | | 7.50 | | | 10/01/28 | | | 2,241,500 |
| 3,986,493 | | Pool # 693018 ARM(a) | | 4.40 | | | 06/01/33 | | | 3,928,866 |
| 3,266,250 | | Pool # 766684 ARM(a) | | 4.41 | | | 03/01/34 | | | 3,207,839 |
| 4,331,018 | | Pool # 770870 ARM(a) | | 4.31 | | | 04/01/34 | | | 4,250,902 |
| 2,928,835 | | Pool # 780840 | | 4.50 | | | 06/01/34 | | | 2,874,664 |
| 4,281,811 | | Pool # 784134 ARM(a) | | 5.44 | | | 10/01/35 | | | 4,243,359 |
| 5,025,582 | | Pool # 786076 ARM(a) | | 4.78 | | | 07/01/34 | | | 4,977,509 |
| 7,620,692 | | Pool # 786423 ARM(a) | | 4.62 | | | 07/01/34 | | | 7,519,428 |
| 3,948,321 | | Pool # 805386 ARM(a) | | 4.90 | | | 01/01/35 | | | 3,905,814 |
| 6,208,597 | | Pool # 826528 | | 5.00 | | | 08/01/20 | | | 6,055,480 |
| 5,474,502 | | Pool # 840579 | | 5.00 | | | 10/01/20 | | | 5,339,489 |
| 3,954,053 | | Pool # 848816 | | 5.00 | | | 01/01/21 | | | 3,856,538 |
| | | | | | | | | |
|
|
| | | | | | | | | | | 59,027,690 |
| | | | | | | | | |
|
|
| | | | | | | | | | |
Principal
Amount
| | | | Rate
| | | Maturity
Date
| | Value
|
U.S. GOVERNMENT AGENCY MORTGAGE PASS THROUGH SECURITIES — (continued) |
| | | GOVERNMENT NATIONAL MORTGAGE ASSOCIATION — 0.66% |
| $ 346,712 | | Pool # 780240 | | 8.50 | % | | 09/15/09 | | $ | 350,917 |
| 71,736 | | Pool # 780752 | | 8.50 | | | 04/15/10 | | | 71,796 |
| 574,607 | | Pool # 781036 | | 8.00 | | | 10/15/17 | | | 608,215 |
| 545,485 | | Pool # 781181 | | 9.00 | | | 12/15/09 | | | 561,698 |
| 165,670 | | Pool # 80385(a) | | 4.25 | | | 03/20/30 | | | 166,498 |
| 477,354 | | Pool # 8378(a) | | 4.75 | | | 07/20/18 | | | 479,940 |
| | | | | | | | | |
|
|
| | | | | | | | | | | 2,239,064 |
| | | | | | | | | |
|
|
| | | TOTAL U.S. GOVERNMENT AGENCY MORTGAGE PASS THROUGH SECURITIES
(Cost $108,201,263) | | | 106,775,404 |
| | | | | | | | | |
|
|
U.S. GOVERNMENT SECURITIES — 25.74% |
| | | U.S. TREASURY NOTES — 25.74% | | | |
| 4,950,000 | | | | 4.38 | | | 05/15/07 | | | 4,923,315 |
| 35,000,000 | | | | 3.88 | | | 07/31/07 | | | 34,555,674 |
| 25,000,000 | | | | 4.00 | | | 09/30/07 | | | 24,693,350 |
| 11,500,000 | | (b) | | 4.25 | | | 10/31/07 | | | 11,394,879 |
| 2,800,000 | | | | 4.25 | | | 11/30/07 | | | 2,773,204 |
| 9,000,000 | | | | 4.63 | | | 03/31/08 | | | 8,966,250 |
| | | | | | | | | |
|
|
| | | | | | | | | | | 87,306,672 |
| | | | | | | | | |
|
|
| | | TOTAL U.S. GOVERNMENT SECURITIES (Cost $88,123,384) | | | 87,306,672 |
| | | | | | | | | |
|
|
| | | | |
Shares
| | | | | | | | | |
REGISTERED INVESTMENT COMPANIES — 0.30% |
| 514,226 | | Dreyfus Government Cash Management Fund | | | 514,226 |
| 514,228 | | Fidelity U.S. Treasury II Fund | | | 514,228 |
| | | | | | | | | |
|
|
| | | TOTAL REGISTERED INVESTMENT COMPANIES
(Cost $1,028,454) | | | 1,028,454 |
| | | | | | | | | |
|
|
| | | | | | | |
TOTAL INVESTMENTS
(Cost $351,611,696)(c) | | 102.11 | % | | $ | 346,326,878 | |
LIABILITIES IN EXCESS OF OTHER ASSETS | | (2.11 | ) | | | (7,160,064 | ) |
| | |
|
| |
|
|
|
NET ASSETS | | 100.00 | % | | $ | 339,166,814 | |
| | |
|
| |
|
|
|
| (a) | Variable Rate Security—The rate disclosed is as of March 31, 2006. |
| (b) | All or part of the security is segregated by the Fund’s custodian to cover future purchase commitments. |
| (c) | Unrealized appreciation (depreciation) of securities: |
| | | | | | | | | |
Unrealized
Appreciation
| | Unrealized
(Depreciation)
| | | Net Unrealized
Appreciation/
(Depreciation)
| |
| $ | 38,103 | | $ | (5,322,921 | ) | | $ | (5,284,818 | ) |
See Notes to Financial Statements.
47
Excelsior Funds, Inc.
Portfolio of Investments — March 31, 2006
Short-Term Government Securities Fund — (continued)
ARM—Adjustable Rate Mortgage
Discount Note—The rate reported is the discount rate at the time of purchase.
See Notes to Financial Statements.
48
The summary of the Fund’s investments as of March 31, 2006 is as follows: (Unaudited)
| | | | | | | |
Portfolio Diversification
| | % of
Net
Assets
| | | Value
| |
U.S. Government & Agency Securities | | 71.05 | % | | $ | 240,949,282 | |
Collateralized Mortgage Obligations | | 20.24 | | | | 68,660,377 | |
Commercial Mortgage-Backed Securities | | 4.90 | | | | 16,617,965 | |
Asset Backed Securities | | 5.62 | | | | 19,070,800 | |
Registered Investment Companies | | 0.30 | | | | 1,028,454 | |
| | |
|
| |
|
|
|
Total Investments. | | 102.11 | % | | $ | 346,326,878 | |
Liabilities in Excess of Other Assets | | (2.11 | ) | | | (7,160,064 | ) |
| | |
|
| |
|
|
|
Net Assets | | 100.00 | % | | $ | 339,166,814 | |
| | |
|
| |
|
|
|
Excelsior Tax-Exempt Funds, Inc.
Portfolio of Investments — March 31, 2006
Short-Term Tax-Exempt Securities Fund
| | | | | | | | | | | |
Principal
Amount
| | | | Rate
| | | Maturity
Date
| | Value
|
| | TAX-EXEMPT CASH EQUIVALENT SECURITIES — 30.66% |
| $ | 6,000,000 | | Clackamas County, Oregon, Hospital Facilities Authority Revenue Bonds, Providence Health System, Series E(a) | | 3.33 | % | | 10/01/33 | | $ | 6,000,000 |
| | 4,695,000 | | Denver, Colorado, City & County Certificates of Participation, Series C1, (AMBAC) (SPA: JP Morgan Chase Bank)(a) | | 3.17 | | | 12/01/29 | | | 4,695,000 |
| | 2,650,000 | | Fairfax County, Virginia, Economic Development Authority, Smithsonian Institution Revenue Bonds, Series A, (SPA: Bank of America N.A.)(a) | | 3.16 | | | 12/01/33 | | | 2,650,000 |
| | 6,000,000 | | Illinois Health Facilities Authority, Health Care Revenue Bonds, (FSA)(a) | | 3.33 | | | 05/15/29 | | | 6,000,000 |
| | 5,000,000 | | Jackson County, Mississippi, Pollution Control Revenue Bonds, Chevron (USA), Inc. Project(a) | | 3.15 | | | 06/01/23 | | | 5,000,000 |
| | 6,000,000 | | Kansas State Department of Transportation, Highway Revenue Bonds, Series C2, (SPA: Westdeutche Landesbank AG-Dexia Credit Local)(a) | | 3.12 | | | 09/01/19 | | | 6,000,000 |
| | 6,000,000 | | New York City, New York, Municipal Water Finance Authority, Water & Sewer System Revenue Bonds, Series G, (FGIC) (SPA: FGIC-SPI)(a) | | 3.13 | | | 06/15/24 | | | 6,000,000 |
| | 4,500,000 | | Ohio State General Obligation Bonds, Series B(a) | | 3.09 | | | 03/15/25 | | | 4,500,000 |
| | | | | | | | | | |
|
|
| | | | TOTAL TAX-EXEMPT CASH EQUIVALENT SECURITIES
(Cost $40,845,000) | | | 40,845,000 |
| | | | | | | | | | |
|
|
| | | | | | | | | | | |
Principal
Amount
| | | | Rate
| | | Maturity
Date
| | Value
|
| | TAX-EXEMPT SECURITIES — 57.34% |
| $ | 6,000,000 | | California State, General Obligation Bonds | | 5.00 | % | | 06/01/08 | | $ | 6,168,660 |
| | 5,000,000 | | Fairfax County, Virginia, Refunding & Public Improvements General Obligation Bonds, Series A | | 5.25 | | | 04/01/08 | | | 5,164,750 |
| | 3,850,000 | | Jacksonville, Florida, Electric Authority Revenue Bonds, Series 18 | | 5.00 | | | 10/01/08 | | | 3,969,812 |
| | 3,000,000 | | Jacksonville, Florida, Electric Authority Revenue Bonds, Series 21, (MBIA) | | 5.00 | | | 10/01/11 | | | 3,172,260 |
| | 5,000,000 | | Maryland State & Local Facilities General Obligation Bonds, Series B(b) | | 5.25 | | | 02/15/11 | | | 5,353,150 |
| | 5,035,000 | | Memphis, Tennessee, General Obligation Bonds, Series B, (MBIA) | | 5.00 | | | 11/01/08 | | | 5,209,060 |
| | 5,330,000 | | Multnomah County, Oregon, General Obligation Bonds, (AMBAC) | | 5.00 | | | 08/01/10 | | | 5,604,175 |
| | 7,405,000 | | New Jersey Economic Development Authority Revenue Bonds, Series F | | 5.00 | | | 06/15/07 | | | 7,519,556 |
| | 1,030,000 | | New York City, New York, General Obligation Bonds, Series C | | 5.25 | | | 08/01/09 | | | 1,076,144 |
| | 6,000,000 | | New York State Metropolitan Transportation Authority Revenue Bonds, Series H | | 5.25 | | | 11/15/10 | | | 6,348,960 |
| | 5,000,000 | | New York State Triborough Bridge & Tunnel Authority Revenue Bonds, (MBIA-IBC-BNY) | | 6.00 | | | 01/01/11 | | | 5,502,200 |
| | 5,000,000 | | New York State Urban Development Corporation, Correctional & Youth Facilities Revenue Bonds, Series A | | 5.25 | | | 01/01/21 | | | 5,183,950 |
See Notes to Financial Statements.
49
Excelsior Tax-Exempt Funds, Inc.
Portfolio of Investments — March 31, 2006
Short-Term Tax-Exempt Securities Fund — (continued)
| | | | | | | | | | |
Principal
Amount
| | | | Rate
| | | Maturity
Date
| | Value
|
TAX-EXEMPT SECURITIES — (continued) |
| $1,250,000 | | Puerto Rico Convention Center District Authority, Hotel Occupancy Tax Revenue Bonds, Series A | | 5.00 | % | | 07/01/11 | | $ | 1,307,875 |
| 3,000,000 | | Reedy Creek, Florida, Improvement District Utilities Revenue Bonds, Series 2, (MBIA) | | 5.25 | | | 10/01/10 | | | 3,190,680 |
| 3,995,000 | | South Carolina Transportation Infrastructure, Bank Revenue Bonds, Series A, (AMBAC)(b) | | 5.00 | | | 10/01/09 | | | 4,168,822 |
| 7,000,000 | | Southeastern Virginia Public Services Authority Revenue Bonds, Series A, (MBIA) | | 5.25 | | | 07/01/10 | | | 7,435,750 |
| | | | | | | | | |
|
|
| | | TOTAL TAX-EXEMPT SECURITIES
(Cost $76,898,451) | | | 76,375,804 |
| | | | | | | | | |
|
|
TAX-EXEMPT SECURITIES — ESCROWED IN U.S.
GOVERNMENTS — 10.55% |
| 4,565,000 | | Chicago, Illinois, Sales Tax Revenue Bonds, (FGIC) (Prerefunded 01/01/09 @ 101) | | 5.38 | | | 01/01/30 | | | 4,812,012 |
| 595,000 | | New Jersey Economic Development Authority Revenue Bonds, Series F (Escrowed to Maturity) | | 5.00 | | | 06/15/07 | | | 604,621 |
| 4,000,000 | | Oklahoma State Industrials Authority Revenue Bonds, Series A, (MBIA) (Prerefunded 08/15/09 @ 101) | | 5.75 | | | 08/15/29 | | | 4,285,520 |
| 4,000,000 | | University of Washington, Student Facilities Revenue Bonds, (FSA) (Prerefunded 06/01/10 @ 101) | | 5.75 | | | 06/01/25 | | | 4,352,160 |
| | | | | | | | | |
|
|
| | | TOTAL TAX-EXEMPT SECURITIES — ESCROWED IN U.S. GOVERNMENTS
(Cost $14,195,290) | | | 14,054,313 |
| | | | | | | | | |
|
|
| | | | | | | | | |
Shares
| | | |
| |
| | Value
|
| REGISTERED INVESTMENT COMPANIES — 0.37% |
| 1 | | BlackRock Muni Fund | | $ | 1 |
| 493,725 | | Dreyfus Tax Exempt Cash Fund | | | 493,725 |
| | | | | | | | |
|
|
| | | TOTAL REGISTERED INVESTMENT COMPANIES
(Cost $493,726) | | | 493,726 |
| | | | | | | | |
|
|
| | | | | | |
TOTAL INVESTMENTS
(Cost $132,432,467)(c) | | 98.92 | % | | $ | 131,768,843 |
OTHER ASSETS IN EXCESS OF LIABILITIES | | 1.08 | | | | 1,442,636 |
| | |
|
| |
|
|
NET ASSETS | | 100.00 | % | | $ | 133,211,479 |
| | |
|
| |
|
|
| (a) | Variable Rate Security—The rate disclosed is as of March 31, 2006. |
| (b) | All or part of the security is segregated by the Fund’s custodian to cover future purchase commitments. |
| (c) | Unrealized appreciation (depreciation) of securities: |
| | | | | | | | | |
Unrealized
Appreciation
| | Unrealized
(Depreciation)
| | | Net Unrealized
Appreciation/
(Depreciation)
| |
| $ | — | | $ | (663,624 | ) | | $ | (663,624 | ) |
AMBAC—American Municipal Bond Assurance Corp.
FGIC—Financial Guaranty Insurance Corp.
FGIC-SPI—Financial Guaranty Insurance Corp. Securities Purchase, Inc.
FSA—Financial Security Assurance
MBIA—Municipal Bond Insurance Association
SPA—Standby Purchase Agreement
See Notes to Financial Statements.
50
Excelsior Tax-Exempt Funds, Inc.
Portfolio of Investments — March 31, 2006
Short-Term Tax-Exempt Securities Fund — (continued)
Notes (The following notes have not been audited by Deloitte & Touche LLP):
These municipal securities meet the three highest ratings assigned by Moody’s Investors Services, Inc. or Standard and Poor’s Corporation or, where not rated, are determined by the Advisor, under the supervision of the Board of Directors, to be of comparable quality at the time of purchase to rated instruments that may be acquired by the Fund.
At March 31,2006, approximately 11% of the net assets are invested in municipal securities that have letter of credit enhancement features or escrows in U.S. Government securities backing them, on which the Fund relies. Without such features, the securities may or may not meet the quality standards of securities purchased by the Fund.
The summary of the Fund’s investments as of March 31, 2006 is as follows: (Unaudited)
| | | | | | |
State Diversification
| | % of
Net
Assets
| | | Value
|
New York | | 18.10 | % | | $ | 24,111,254 |
Virginia | | 11.45 | | | | 15,250,500 |
Oregon | | 8.71 | | | | 11,604,175 |
Illinois | | 8.12 | | | | 10,812,012 |
Florida | | 7.76 | | | | 10,332,752 |
New Jersey | | 6.10 | | | | 8,124,177 |
California | | 4.63 | | | | 6,168,660 |
Kansas | | 4.50 | | | | 6,000,000 |
Maryland | | 4.02 | | | | 5,353,150 |
Tennessee | | 3.91 | | | | 5,209,060 |
Mississippi | | 3.75 | | | | 5,000,000 |
Colorado | | 3.52 | | | | 4,695,000 |
Ohio | | 3.38 | | | | 4,500,000 |
Washington | | 3.27 | | | | 4,352,160 |
Oklahoma | | 3.22 | | | | 4,285,520 |
South Carolina | | 3.13 | | | | 4,168,822 |
Puerto Rico | | 0.98 | | | | 1,307,875 |
Registered Investment Companies | | 0.37 | | | | 493,726 |
| | |
|
| |
|
|
Total Investments | | 98.92 | % | | $ | 131,768,843 |
Other Assets in Excess of Liabilities | | 1.08 | | | | 1,442,636 |
| | |
|
| |
|
|
Net Assets | | 100.00 | % | | $ | 133,211,479 |
| | |
|
| |
|
|
See Notes to Financial Statements.
51
Excelsior Funds
Statements of Assets and Liabilities
March 31, 2006
| | | | | | | | | | | | | | | | |
| | | | |
| | | California
Short-Intermediate
Term Tax-Exempt
Income Fund
| | | Core Bond
Fund
| | | High Yield
Fund
| | | Intermediate-
Term Bond
Fund
| |
ASSETS: | | | | | | | | | | | | | | | | |
Investments, at cost — see accompanying portfolios | | $ | 66,020,791 | | | $ | 281,602,078 | | | $ | 149,252,213 | | | $ | 462,467,435 | |
| | |
|
|
| |
|
|
| |
|
|
| |
|
|
|
Investments, at value (Note 1) | | $ | 65,668,530 | | | $ | 276,970,866 | | | $ | 147,260,964 | | | $ | 454,302,320 | |
Cash | | | — | | | | 55,120 | | | | 67,667 | | | | 33,814 | |
Interest receivable | | | 876,561 | | | | 2,035,637 | | | | 3,099,231 | | | | 2,983,348 | |
Receivable for investments sold | | | — | | | | 23,572,035 | | | | 516,729 | | | | — | |
Receivable for fund shares sold | | | 60,929 | | | | 1,379,977 | | | | 269,603 | | | | 1,303,042 | |
Prepaid expenses and other assets | | | 2,369 | | | | 10,629 | | | | 7,499 | | | | 15,058 | |
| | |
|
|
| |
|
|
| |
|
|
| |
|
|
|
Total Assets | | | 66,608,389 | | | | 304,024,264 | | | | 151,221,693 | | | | 458,637,582 | |
LIABILITIES: | | | | | | | | | | | | | | | | |
Payable for dividends declared | | | 175,455 | | | | 1,033,843 | | | | 884,504 | | | | 1,597,063 | |
Payable for investments purchased | | | — | | | | 19,196,094 | | | | 1,012,500 | | | | 19,349,492 | |
Payable for fund shares redeemed | | | 21,094 | | | | 514,125 | | | | 91,496 | | | | 247,953 | |
Investment advisory fees payable (Note 2) | | | — | | | | 40,687 | | | | 72,065 | | | | 109,191 | |
Administration fees payable (Note 2) | | | 7,389 | | | | 36,260 | | | | 19,448 | | | | 56,080 | |
Distribution and shareholder servicing fees payable (Note 2) | | | 13,184 | | | | 87,672 | | | | 33,176 | | | | 78,041 | |
Directors’/Trustees’ fees and expenses payable (Note 2) | | | 60 | | | | 213 | | | | 127 | | | | 341 | |
Accrued expenses and other payables | | | 36,044 | | | | 99,445 | | | | 72,538 | | | | 126,715 | |
| | |
|
|
| |
|
|
| |
|
|
| |
|
|
|
Total Liabilities | | | 253,226 | | | | 21,008,339 | | | | 2,185,854 | | | | 21,564,876 | |
| | |
|
|
| |
|
|
| |
|
|
| |
|
|
|
NET ASSETS | | $ | 66,355,163 | | | $ | 283,015,925 | | | $ | 149,035,839 | | | $ | 437,072,706 | |
| | |
|
|
| |
|
|
| |
|
|
| |
|
|
|
NET ASSETS consist of: | | | | | | | | | | | | | | | | |
Undistributed (distributions in excess of) net investment income | | $ | 492 | | | $ | 2,407 | | | $ | (691,493 | ) | | $ | (10,852 | ) |
Accumulated net realized gain (loss) on investments | | | 214,251 | | | | (529,099 | ) | | | (65,200,572 | ) | | | (2,171,014 | ) |
Unrealized appreciation (depreciation) of investments | | | (352,261 | ) | | | (4,631,212 | ) | | | (1,991,249 | ) | | | (8,165,115 | ) |
Par value (Note 5) | | | 9,273 | | | | 32,015 | | | | 330 | | | | 62,340 | |
Paid in capital in excess of par value | | | 66,483,408 | | | | 288,141,814 | | | | 216,918,823 | | | | 447,357,347 | |
| | |
|
|
| |
|
|
| |
|
|
| |
|
|
|
Net Assets | | $ | 66,355,163 | | | $ | 283,015,925 | | | $ | 149,035,839 | | | $ | 437,072,706 | |
| | |
|
|
| |
|
|
| |
|
|
| |
|
|
|
Net Assets: | | | | | | | | | | | | | | | | |
Shares | | $ | 66,355,163 | | | $ | 281,766,940 | | | $ | 136,990,531 | | | $ | 437,072,706 | |
Institutional Shares | | | — | | | | 1,247,970 | | | | 12,045,308 | | | | — | |
Retirement Shares | | | — | | | | 1,015 | | | | — | | | | — | |
Shares Outstanding (Note 5): | | | | | | | | | | | | | | | | |
Shares | | | 9,272,624 | | | | 31,873,492 | | | | 30,260,155 | | | | 62,340,103 | |
Institutional Shares | | | — | | | | 141,213 | | | | 2,662,208 | | | | — | |
Retirement Shares | | | — | | | | 115 | | | | — | | | | — | |
NET ASSET VALUE PER SHARE (net assets ÷ shares outstanding) | | | | | | | | | | | | | | | | |
Shares | | | $7.16 | | | | $8.84 | | | | $4.53 | | | | $7.01 | |
| | |
|
|
| |
|
|
| |
|
|
| |
|
|
|
Institutional Shares | | | — | | | | $8.84 | | | | $4.52 | | | | — | |
| | |
|
|
| |
|
|
| |
|
|
| |
|
|
|
Retirement Shares | | | — | | | | $8.85 | (a) | | | — | | | | — | |
| | |
|
|
| |
|
|
| |
|
|
| |
|
|
|
See Notes to Financial Statements.
52
| | | | | | | | | | | | | | | | |
| | | | |
Intermediate-
Term
Tax-Exempt
Fund
| | Long-Term
Tax-Exempt
Fund
| | New York
Intermediate-
Term Tax-Exempt
Fund
| | | Short-Term
Government
Securities
Fund
| | | Short-Term
Tax-Exempt
Securities
Fund
| |
| | | | |
| $ | 339,539,311 | | $ | 60,338,669 | | $ | 130,049,895 | | | $ | 351,611,696 | | | $ | 132,432,467 | |
|
| |
|
| |
|
|
| |
|
|
| |
|
|
|
| $ | 340,331,343 | | $ | 60,378,891 | | $ | 129,513,274 | | | $ | 346,326,878 | | | $ | 131,768,843 | |
| | — | | | — | | | — | | | | 1 | | | | — | |
| | 4,653,572 | | | 812,796 | | | 1,549,914 | | | | 1,725,250 | | | | 1,385,315 | |
| | 7,000,767 | | | — | | | — | | | | 14,992,603 | | | | — | |
| | 2,017,361 | | | 316,867 | | | 425,293 | | | | 683,733 | | | | 539,952 | |
| | 13,306 | | | 2,428 | | | 5,524 | | | | 16,079 | | | | 9,907 | |
|
| |
|
| |
|
|
| |
|
|
| |
|
|
|
| | 354,016,349 | | | 61,510,982 | | | 131,494,005 | | | | 363,744,544 | | | | 133,704,017 | |
| | | | |
| | 1,001,757 | | | 176,517 | | | 335,677 | | | | 1,178,443 | | | | 299,445 | |
| | — | | | — | | | — | | | | 21,832,087 | | | | — | |
| | 35,774 | | | 5,322 | | | 1,673 | | | | 1,208,369 | | | | 89,611 | |
| | 63,595 | | | 12,118 | | | 37,810 | | | | 63,706 | | | | 16,411 | |
| | 45,275 | | | 7,919 | | | 16,820 | | | | 44,028 | | | | 17,362 | |
|
77,920 | | | 17,926 | | | 26,043 | | | | 113,470 | | | | 8,529 | |
| | | | |
| | 269 | | | 45 | | | 97 | | | | 274 | | | | 113 | |
| | 96,003 | | | 33,891 | | | 49,884 | | | | 137,353 | | | | 61,067 | |
|
| |
|
| |
|
|
| |
|
|
| |
|
|
|
| | 1,320,593 | | | 253,738 | | | 468,004 | | | | 24,577,730 | | | | 492,538 | |
|
| |
|
| |
|
|
| |
|
|
| |
|
|
|
| $ | 352,695,756 | | $ | 61,257,244 | | $ | 131,026,001 | | | $ | 339,166,814 | | | $ | 133,211,479 | |
|
| |
|
| |
|
|
| |
|
|
| |
|
|
|
| | | | |
| $ | 215 | | $ | 1,401 | | $ | 121 | | | $ | (29,336 | ) | | $ | — | |
| | | | |
| | 730,630 | | | 392,494 | | | (524,525 | ) | | | (12,499,867 | ) | | | (2,641,880 | ) |
| | | | |
| | 792,032 | | | 40,222 | | | (536,621 | ) | | | (5,284,818 | ) | | | (663,624 | ) |
| | 37,985 | | | 6,105 | | | 15,332 | | | | 49,032 | | | | 18,812 | |
| | 351,134,894 | | | 60,817,022 | | | 132,071,694 | | | | 356,931,803 | | | | 136,498,171 | |
|
| |
|
| |
|
|
| |
|
|
| |
|
|
|
| $ | 352,695,756 | | $ | 61,257,244 | | $ | 131,026,001 | | | $ | 339,166,814 | | | $ | 133,211,479 | |
|
| |
|
| |
|
|
| |
|
|
| |
|
|
|
| | | | |
| $ | 352,695,756 | | $ | 61,257,244 | | $ | 131,026,001 | | | $ | 339,166,814 | | | $ | 133,211,479 | |
| | — | | | — | | | — | | | | — | | | | — | |
| | — | | | — | | | — | | | | — | | | | — | |
| | | | |
| | 37,985,164 | | | 6,105,217 | | | 15,331,918 | | | | 49,032,451 | | | | 18,812,380 | |
| | — | | | — | | | — | | | | — | | | | — | |
| | — | | | — | | | — | | | | — | | | | — | |
| | | | |
| | $9.29 | | | $10.03 | | | $8.55 | | | | $6.92 | | | | $7.08 | |
|
| |
|
| |
|
|
| |
|
|
| |
|
|
|
| | — | | | — | | | — | | | | — | | | | — | |
|
| |
|
| |
|
|
| |
|
|
| |
|
|
|
| | — | | | — | | | — | | | | — | | | | — | |
|
| |
|
| |
|
|
| |
|
|
| |
|
|
|
| (a) | Due to rounding net assets divided by shares outstanding does not equal the net asset value per share. |
See Notes to Financial Statements.
53
Excelsior Funds
Statements of Operations
Year Ended March 31, 2006
| | | | | | | | | | | | | | | | |
| | | | |
| | | California
Short-Intermediate
Term Tax-Exempt
Income Fund
| | | Core Bond
Fund
| | | High Yield
Fund
| | | Intermediate-
Term Bond
Fund
| |
INVESTMENT INCOME: | | | | | | | | | | | | | | | | |
Interest income | | $ | 2,323,264 | | | $ | 11,931,800 | | | $ | 12,974,846 | | | $ | 18,730,659 | |
Dividend income | | | 68,100 | | | | 363,045 | | | | — | | | | 741,872 | |
| | |
|
|
| |
|
|
| |
|
|
| |
|
|
|
Total Income | | | 2,391,364 | | | | 12,294,845 | | | | 12,974,846 | | | | 19,472,531 | |
| | |
|
|
| |
|
|
| |
|
|
| |
|
|
|
EXPENSES: | | | | | | | | | | | | | | | | |
Investment advisory fees (Note 2) | | | 331,058 | | | | 1,861,068 | | | | 1,315,469 | | | | 1,527,786 | |
Administration fees (Note 2) | | | 99,992 | | | | 374,736 | | | | 248,330 | | | | 659,217 | |
Shareholder servicing fees — Shares (Note 2) | | | 165,477 | | | | 619,871 | | | | 373,757 | | | | 1,090,940 | |
Distribution and shareholder servicing fees — Retirement Shares (Note 2) | | | — | | | | 8 | | | | — | | | | — | |
Legal and audit fees | | | 26,238 | | | | 21,339 | | | | 33,451 | | | | 65,104 | |
Custodian fees | | | 6,955 | | | | 31,771 | | | | 8,896 | | | | 25,083 | |
Transfer agent fees | | | 12,196 | | | | 115,087 | | | | 29,777 | | | | 25,335 | |
Directors’/Trustees’ fees and expenses (Note 2) | | | 2,736 | | | | 10,076 | | | | 7,319 | | | | 18,499 | |
Miscellaneous expenses | | | 38,943 | | | | 186,792 | | | | 71,429 | | | | 104,480 | |
| | |
|
|
| |
|
|
| |
|
|
| |
|
|
|
Total Expenses | | | 683,595 | | | | 3,220,748 | | | | 2,088,428 | | | | 3,516,444 | |
Fees waived and reimbursed by: | | | | | | | | | | | | | | | | |
Investment adviser (Note 2) | | | (331,058 | ) | | | (987,738 | ) | | | (399,394 | ) | | | (384,019 | ) |
Administrator (Note 2) | | | (21,478 | ) | | | — | | | | — | | | | — | |
| | |
|
|
| |
|
|
| |
|
|
| |
|
|
|
Net Expenses | | | 331,059 | | | | 2,233,010 | | | | 1,689,034 | | | | 3,132,425 | |
| | |
|
|
| |
|
|
| |
|
|
| |
|
|
|
NET INVESTMENT INCOME | | | 2,060,305 | | | | 10,061,835 | | | | 11,285,812 | | | | 16,340,106 | |
| | |
|
|
| |
|
|
| |
|
|
| |
|
|
|
REALIZED AND UNREALIZED GAIN (LOSS) ON INVESTMENTS (Note 1): | | | | | | | | | | | | | | | | |
Net realized gain (loss) on security transactions | | | 215,226 | | | | 1,284,930 | | | | (4,085,478 | ) | | | (1,475,445 | ) |
Change in unrealized appreciation (depreciation) of investments during the year | | | (1,292,978 | ) | | | (7,274,735 | ) | | | (1,518,767 | ) | | | (6,389,324 | ) |
| | |
|
|
| |
|
|
| |
|
|
| |
|
|
|
Net realized and unrealized gain (loss) on investments | | | (1,077,752 | ) | | | (5,989,805 | ) | | | (5,604,245 | ) | | | (7,864,769 | ) |
| | |
|
|
| |
|
|
| |
|
|
| |
|
|
|
Net increase in net assets resulting from operations | | $ | 982,553 | | | $ | 4,072,030 | | | $ | 5,681,567 | | | $ | 8,475,337 | |
| | |
|
|
| |
|
|
| |
|
|
| |
|
|
|
See Notes to Financial Statements.
54
| | | | | | | | | | | | | | | | | | |
| | | | |
Intermediate-
Term
Tax-Exempt
Fund
| | | Long-Term
Tax-Exempt
Fund
| | | New York
Intermediate-
Term Tax-Exempt
Fund
| | | Short-Term
Government
Securities
Fund
| | | Short-Term
Tax-Exempt
Securities
Fund
| |
| | | | | | | | | | | | | | | | | | | |
| $ | 13,143,900 | | | $ | 2,308,647 | | | $ | 4,733,836 | | | $ | 12,821,448 | | | $ | 4,434,469 | |
| | 99,093 | | | | 34,532 | | | | 52,315 | | | | 241,725 | | | | 72,928 | |
|
|
| |
|
|
| |
|
|
| |
|
|
| |
|
|
|
| | 13,242,993 | | | | 2,343,179 | | | | 4,786,151 | | | | 13,063,173 | | | | 4,507,397 | |
|
|
| |
|
|
| |
|
|
| |
|
|
| |
|
|
|
| | | | | | | | | | | | | | | | | | | |
| | 1,239,032 | | | | 307,592 | | | | 682,344 | | | | 1,126,517 | | | | 526,290 | |
| | 534,627 | | | | 92,906 | | | | 206,097 | | | | 567,094 | | | | 264,945 | |
| | 884,881 | | | | 142,536 | | | | 341,058 | | | | 938,760 | | | | 438,376 | |
| | | | |
| | — | | | | — | | | | — | | | | — | | | | — | |
| | 48,762 | | | | 21,469 | | | | 32,446 | | | | 52,630 | | | | 34,917 | |
| | 17,757 | | | | 5,553 | | | | 9,426 | | | | 22,215 | | | | 9,035 | |
| | 18,704 | | | | 20,590 | | | | 13,991 | | | | 91,998 | | | | 14,016 | |
| | 14,944 | | | | 2,522 | | | | 5,845 | | | | 16,531 | | | | 8,573 | |
| | 73,079 | | | | 32,347 | | | | 39,538 | | | | 92,072 | | | | 48,442 | |
|
|
| |
|
|
| |
|
|
| |
|
|
| |
|
|
|
| | 2,831,786 | | | | 625,515 | | | | 1,330,745 | | | | 2,907,817 | | | | 1,344,594 | |
| | | | | | | | | | | | | | | | | | | |
| | (530,735 | ) | | | (133,366 | ) | | | (238,995 | ) | | | (474,679 | ) | | | (292,016 | ) |
| | — | | | | — | | | | — | | | | — | | | | — | |
|
|
| |
|
|
| |
|
|
| |
|
|
| |
|
|
|
| | 2,301,051 | | | | 492,149 | | | | 1,091,750 | | | | 2,433,138 | | | | 1,052,578 | |
|
|
| |
|
|
| |
|
|
| |
|
|
| |
|
|
|
| | 10,941,942 | | | | 1,851,030 | | | | 3,694,401 | | | | 10,630,035 | | | | 3,454,819 | |
|
|
| |
|
|
| |
|
|
| |
|
|
| |
|
|
|
| | | | |
| | | | | | | | | | | | | | | | | | | |
| | 730,630 | | | | 654,816 | | | | (524,525 | ) | | | (2,723,414 | ) | | | (2,252,492 | ) |
| | | | |
| | (5,288,523 | ) | | | (820,799 | ) | | | (227,681 | ) | | | 503,856 | | | | 1,341,352 | |
|
|
| |
|
|
| |
|
|
| |
|
|
| |
|
|
|
| | | | |
| | (4,557,893 | ) | | | (165,983 | ) | | | (752,206 | ) | | | (2,219,558 | ) | | | (911,140 | ) |
|
|
| |
|
|
| |
|
|
| |
|
|
| |
|
|
|
| | | | |
| $ | 6,384,049 | | | $ | 1,685,047 | | | $ | 2,942,195 | | | $ | 8,410,477 | | | $ | 2,543,679 | |
|
|
| |
|
|
| |
|
|
| |
|
|
| |
|
|
|
See Notes to Financial Statements.
55
Excelsior Funds
Statements of Changes in Net Assets
| | | | | | | | | | | | | | | | |
| | |
| | | California Short-
Intermediate Term Tax-
Exempt Income Fund
| | | Core Bond Fund
| |
| | | Year Ended March 31,
| | | Year Ended March 31,
| |
| | | 2006
| | | 2005
| | | 2006
| | | 2005
| |
Net investment income | | $ | 2,060,305 | | | $ | 2,022,209 | | | $ | 10,061,835 | | | $ | 10,538,687 | |
Net realized gain (loss) on security transactions | | | 215,226 | | | | (311 | ) | | | 1,284,930 | | | | 3,809,789 | |
Change in unrealized appreciation (depreciation) of investments during the year | | | (1,292,978 | ) | | | (1,976,428 | ) | | | (7,274,735 | ) | | | (9,984,664 | ) |
| | |
|
|
| |
|
|
| |
|
|
| |
|
|
|
Net increase in net assets resulting from operations | | | 982,553 | | | | 45,470 | | | | 4,072,030 | | | | 4,363,812 | |
| | |
|
|
| |
|
|
| |
|
|
| |
|
|
|
Distributions to shareholders: | | | | | | | | | | | | | | | | |
From net investment income | | | | | | | | | | | | | | | | |
Shares | | | (2,061,472 | ) | | | (2,021,815 | ) | | | (10,218,978 | ) | | | (10,706,658 | ) |
Institutional Shares | | | — | | | | — | | | | (6,254 | ) | | | — | |
Retirement Shares | | | — | | | | — | | | | (38 | ) | | | (4 | ) |
From net realized gain on investments | | | | | | | | | | | | | | | | |
Shares | | | — | | | | — | | | | (3,571,500 | ) | | | (1,392,832 | ) |
Institutional Shares | | | — | | | | — | | | | (13 | ) | | | — | |
Retirement Shares | | | — | | | | — | | | | (13 | ) | | | — | |
From tax return of capital | | | | | | | | | | | | | | | | |
Shares | | | — | | | | — | | | | — | | | | — | |
Institutional Shares | | | — | | | | — | | | | — | | | | — | |
| | |
|
|
| |
|
|
| |
|
|
| |
|
|
|
Total distributions | | | (2,061,472 | ) | | | (2,021,815 | ) | | | (13,796,796 | ) | | | (12,099,494 | ) |
| | |
|
|
| |
|
|
| |
|
|
| |
|
|
|
Increase (decrease) in net assets from fund share transactions (Note 5) | | | 4,484,991 | | | | (1,968,940 | ) | | | 80,807,705 | | | | (49,358,178 | ) |
| | |
|
|
| |
|
|
| |
|
|
| |
|
|
|
Net increase (decrease) in net assets | | | 3,406,072 | | | | (3,945,285 | ) | | | 71,082,939 | | | | (57,093,860 | ) |
| | |
|
|
| |
|
|
| |
|
|
| |
|
|
|
NET ASSETS: | | | | | | | | | | | | | | | | |
Beginning of year | | | 62,949,091 | | | | 66,894,376 | | | | 211,932,986 | | | | 269,026,846 | |
| | |
|
|
| |
|
|
| |
|
|
| |
|
|
|
End of year (1) | | $ | 66,355,163 | | | $ | 62,949,091 | | | $ | 283,015,925 | | | $ | 211,932,986 | |
| | |
|
|
| |
|
|
| |
|
|
| |
|
|
|
(1) Including undistributed (distributions in excess of) net investment income | | $ | 492 | | | $ | 1,659 | | | $ | 2,407 | | | $ | 9,744 | |
| | |
|
|
| |
|
|
| |
|
|
| |
|
|
|
See Notes to Financial Statements.
56
| | | | | | | | | | | | | | | | | | | | | | |
| | |
High Yield Fund
| | | Intermediate-Term Bond Fund
| | | Intermediate-Term
Tax-Exempt Fund
| |
Year Ended March 31,
| | | Year Ended March 31,
| | | Year Ended March 31,
| |
2006
| | | 2005
| | | 2006
| | | 2005
| | | 2006
| | | 2005
| |
| $ | 11,285,812 | | | $ | 12,382,052 | | | $ | 16,340,106 | | | $ | 13,952,666 | | | $ | 10,941,942 | | | $ | 9,734,186 | |
| | (4,085,478 | ) | | | 1,684,436 | | | | (1,475,445 | ) | | | 1,414,970 | | | | 730,630 | | | | 374,010 | |
| | | | | |
| | (1,518,767 | ) | | | (3,437,364 | ) | | | (6,389,324 | ) | | | (14,217,960 | ) | | | (5,288,523 | ) | | | (10,001,492 | ) |
|
|
| |
|
|
| |
|
|
| |
|
|
| |
|
|
| |
|
|
|
| | 5,681,567 | | | | 10,629,124 | | | | 8,475,337 | | | | 1,149,676 | | | | 6,384,049 | | | | 106,704 | |
|
|
| |
|
|
| |
|
|
| |
|
|
| |
|
|
| |
|
|
|
| | | | | | | | | | | | | | | | | | | | | | | |
| | | | | | | | | | | | | | | | | | | | | | | |
| | (9,681,268 | ) | | | (10,208,446 | ) | | | (17,107,462 | ) | | | (14,239,514 | ) | | | (10,946,366 | ) | | | (9,735,305 | ) |
| | (1,002,532 | ) | | | (1,404,626 | ) | | | — | | | | — | | | | — | | | | — | |
| | — | | | | — | | | | — | | | | — | | | | — | | | �� | — | |
| | | | | | | | | | | | | | | | | | | | | | | |
| | — | | | | — | | | | (1,062,921 | ) | | | (572,247 | ) | | | (367,682 | ) | | | (1,550,278 | ) |
| | — | | | | — | | | | — | | | | — | | | | — | | | | — | |
| | — | | | | — | | | | — | | | | — | | | | — | | | | — | |
| | | | | | | | | | | | | | | | | | | | | | | |
| | (325,252 | ) | | | — | | | | — | | | | — | | | | — | | | | — | |
| | (28,599 | ) | | | — | | | | — | | | | — | | | | — | | | | — | |
|
|
| |
|
|
| |
|
|
| |
|
|
| |
|
|
| |
|
|
|
| | (11,037,651 | ) | | | (11,613,072 | ) | | | (18,170,383 | ) | | | (14,811,761 | ) | | | (11,314,048 | ) | | | (11,285,583 | ) |
|
|
| |
|
|
| |
|
|
| |
|
|
| |
|
|
| |
|
|
|
| | | | | |
| | (15,055,145 | ) | | | (3,685,731 | ) | | | 36,375,391 | | | | 10,787,119 | | | | 8,085,957 | | | | (26,905,099 | ) |
|
|
| |
|
|
| |
|
|
| |
|
|
| |
|
|
| |
|
|
|
| | (20,411,229 | ) | | | (4,669,679 | ) | | | 26,680,345 | | | | (2,874,966 | ) | | | 3,155,958 | | | | (38,083,978 | ) |
|
|
| |
|
|
| |
|
|
| |
|
|
| |
|
|
| |
|
|
|
| | | | | | | | | | | | | | | | | | | | | | | |
| | 169,447,068 | | | | 174,116,747 | | | | 410,392,361 | | | | 413,267,327 | | | | 349,539,798 | | | | 387,623,776 | |
|
|
| |
|
|
| |
|
|
| |
|
|
| |
|
|
| |
|
|
|
| $ | 149,035,839 | | | $ | 169,447,068 | | | $ | 437,072,706 | | | $ | 410,392,361 | | | $ | 352,695,756 | | | $ | 349,539,798 | |
|
|
| |
|
|
| |
|
|
| |
|
|
| |
|
|
| |
|
|
|
| | | | | |
| $ | (691,493 | ) | | $ | (1,124,014 | ) | | $ | (10,852 | ) | | $ | 108,371 | | | $ | 215 | | | $ | 4,425 | |
|
|
| |
|
|
| |
|
|
| |
|
|
| |
|
|
| |
|
|
|
See Notes to Financial Statements.
57
Excelsior Funds
Statements of Changes in Net Assets
| | | | | | | | | | | | | | | | |
| | |
| | | Long-Term Tax-
Exempt Fund
| | | New York Intermediate-Term
Tax-Exempt Fund
| |
| | | Year Ended March 31,
| | | Year Ended March 31,
| |
| | | 2006
| | | 2005
| | | 2006
| | | 2005
| |
Net investment income | | $ | 1,851,030 | | | $ | 1,807,013 | | | $ | 3,694,401 | | | $ | 3,795,659 | |
Net realized gain (loss) on security transactions | | | 654,816 | | | | 285,872 | | | | (524,525 | ) | | | 2,398,438 | |
Change in unrealized appreciation (depreciation) of investments during the year | | | (820,799 | ) | | | (549,586 | ) | | | (227,681 | ) | | | (5,684,669 | ) |
| | |
|
|
| |
|
|
| |
|
|
| |
|
|
|
Net increase (decrease) in net assets resulting from operations | | | 1,685,047 | | | | 1,543,299 | | | | 2,942,195 | | | | 509,428 | |
| | |
|
|
| |
|
|
| |
|
|
| |
|
|
|
Distributions to shareholders: | | | | | | | | | | | | | | | | |
From net investment income | | | | | | | | | | | | | | | | |
Shares | | | (1,851,155 | ) | | | (1,805,611 | ) | | | (3,697,161 | ) | | | (3,794,893 | ) |
From net realized gain on investments | | | | | | | | | | | | | | | | |
Shares | | | — | | | | — | | | | (1,825,117 | ) | | | (1,466,615 | ) |
| | |
|
|
| |
|
|
| |
|
|
| |
|
|
|
Total distributions | | | (1,851,155 | ) | | | (1,805,611 | ) | | | (5,522,278 | ) | | | (5,261,508 | ) |
| | |
|
|
| |
|
|
| |
|
|
| |
|
|
|
Increase (decrease) in net assets from fund share transactions (Note 5) | | | (1,393,785 | ) | | | (9,703,641 | ) | | | (4,646,822 | ) | | | (35,102,085 | ) |
| | |
|
|
| |
|
|
| |
|
|
| |
|
|
|
Net increase (decrease) in net assets | | | (1,559,893 | ) | | | (9,965,953 | ) | | | (7,226,905 | ) | | | (39,854,165 | ) |
| | |
|
|
| |
|
|
| |
|
|
| |
|
|
|
NET ASSETS: | | | | | | | | | | | | | | | | |
Beginning of year | | | 62,817,137 | | | | 72,783,090 | | | | 138,252,906 | | | | 178,107,071 | |
| | |
|
|
| |
|
|
| |
|
|
| |
|
|
|
End of year (1) | | $ | 61,257,244 | | | $ | 62,817,137 | | | $ | 131,026,001 | | | $ | 138,252,906 | |
| | |
|
|
| |
|
|
| |
|
|
| |
|
|
|
(1) Including undistributed (distributions in excess of) net investment income | | $ | 1,401 | | | $ | 1,526 | | | $ | 121 | | | $ | 2,760 | |
| | |
|
|
| |
|
|
| |
|
|
| |
|
|
|
See Notes to Financial Statements.
58
| | | | | | | | | | | | | | |
| |
Short-Term Government
Securities Fund
| | | Short-Term Tax-Exempt
Securities Fund
| |
Year Ended March 31,
| | | Year Ended March 31,
| |
2006
| | | 2005
| | | 2006
| | | 2005
| |
| $ | 10,630,035 | | | $ | 11,334,520 | | | $ | 3,454,819 | | | $ | 3,403,244 | |
| | (2,723,414 | ) | | | (3,590,260 | ) | | | (2,252,492 | ) | | | (389,388 | ) |
| | | |
| | 503,856 | | | | (7,603,787 | ) | | | 1,341,352 | | | | (3,435,518 | ) |
|
|
| |
|
|
| |
|
|
| |
|
|
|
| | | |
| | 8,410,477 | | | | 140,473 | | | | 2,543,679 | | | | (421,662 | ) |
|
|
| |
|
|
| |
|
|
| |
|
|
|
| | | | | | | | | | | | | | | |
| | | | | | | | | | | | | | | |
| | (13,063,721 | ) | | | (13,634,235 | ) | | | (3,460,145 | ) | | | (3,408,178 | ) |
| | | | | | | | | | | | | | | |
| | — | | | | — | | | | — | | | | (50,253 | ) |
|
|
| |
|
|
| |
|
|
| |
|
|
|
| | (13,063,721 | ) | | | (13,634,235 | ) | | | (3,460,145 | ) | | | (3,458,431 | ) |
|
|
| |
|
|
| |
|
|
| |
|
|
|
| | | |
| | (58,697,749 | ) | | | (53,206,126 | ) | | | (104,932,090 | ) | | | (117,663,509 | ) |
|
|
| |
|
|
| |
|
|
| |
|
|
|
| | (63,350,993 | ) | | | (66,699,888 | ) | | | (105,848,556 | ) | | | (121,543,602 | ) |
|
|
| |
|
|
| |
|
|
| |
|
|
|
| | | | | | | | | | | | | | | |
| | 402,517,807 | | | | 469,217,695 | | | | 239,060,035 | | | | 360,603,637 | |
|
|
| |
|
|
| |
|
|
| |
|
|
|
| $ | 339,166,814 | | | $ | 402,517,807 | | | $ | 133,211,479 | | | $ | 239,060,035 | |
|
|
| |
|
|
| |
|
|
| |
|
|
|
| | | |
| $ | (29,336 | ) | | $ | 35,416 | | | $ | — | | | $ | 5,326 | |
|
|
| |
|
|
| |
|
|
| |
|
|
|
See Notes to Financial Statements.
59
Excelsior Funds
Financial Highlights — Selected Per Share Data and Ratios
| | | | | | | | | | | | | | | | | | | | | | | | | | | |
| | | | | | | |
| | | Net Asset Value
Beginning of
Year
| | Net
Investment
Income
| | | Net Realized and
Unrealized Gain
(Loss) on
Investments
| | | Total From
Investment
Operations
| | | Distributions
From Net
Investment
Income
| | | Distributions
From Net
Realized
Gain on
Investments
| | | Total
Distributions
| |
CALIFORNIA TAX-EXEMPT INCOME FUND | | | | | | | | | | | | | | | | | |
Shares — (10/01/96*) | | | | | | | | | | | | | | | | | | | | | | | | |
Year Ended March 31, | | | | | | | | | | | | | | | | | | | | | | | | |
2006 | | $ | 7.27 | | $ | 0.23 | (2) | | $ | (0.11 | )(2) | | $ | 0.12 | | | $ | (0.23 | ) | | | — | | | $ | (0.23 | ) |
2005 | | | 7.49 | | | 0.23 | (2) | | | (0.22 | )(2) | | | 0.01 | | | | (0.23 | ) | | | — | | | | (0.23 | ) |
2004 | | | 7.49 | | | 0.24 | | | | — | | | | 0.24 | | | | (0.24 | ) | | | — | | | | (0.24 | ) |
2003 | | | 7.27 | | | 0.25 | | | | 0.22 | | | | 0.47 | | | | (0.25 | ) | | | — | (3) | | | (0.25 | ) |
2002 | | | 7.30 | | | 0.26 | | | | (0.02 | ) | | | 0.24 | | | | (0.26 | ) | | $ | (0.01 | ) | | | (0.27 | ) |
CORE BOND FUND | | | | | | | | | | | | | | | | | | | | | |
Shares — (01/09/86*) | | | | | | | | | | | | | | | | | | | | | | | | |
Year Ended March 31, | | | | | | | | | | | | | | | | | | | | | | | | |
2006 | | $ | 9.15 | | $ | 0.37 | (2) | | $ | (0.18 | )(2) | | $ | 0.19 | | | $ | (0.38 | ) | | $ | (0.12 | ) | | $ | (0.50 | ) |
2005 | | | 9.43 | | | 0.37 | (2) | | | (0.23 | )(2) | | | 0.14 | | | | (0.37 | ) | | | (0.05 | ) | | | (0.42 | ) |
2004 | | | 9.43 | | | 0.38 | | | | 0.14 | | | | 0.52 | | | | (0.38 | ) | | | (0.14 | ) | | | (0.52 | ) |
2003 | | | 8.95 | | | 0.47 | | | | 0.50 | | | | 0.97 | | | | (0.48 | ) | | | (0.01 | ) | | | (0.49 | ) |
2002 | | | 9.11 | | | 0.49 | | | | (0.10 | ) | | | 0.39 | | | | (0.50 | ) | | | (0.05 | ) | | | (0.55 | ) |
HIGH YIELD FUND | | | | | | | | | | | | | | | | | | | | | |
Shares — (10/31/00*) | | | | | | | | | | | | | | | | | | | | | | | | |
Year Ended March 31, | | | | | | | | | | | | | | | | | | | | | | | | |
2006 | | $ | 4.67 | | $ | 0.31 | (2) | | $ | (0.14 | )(2) | | $ | 0.17 | | | $ | (0.31 | )(4) | | | — | | | $ | (0.31 | ) |
2005 | | | 4.71 | | | 0.34 | (2) | | | (0.08 | )(2) | | | 0.26 | | | | (0.30 | ) | | | — | | | | (0.30 | ) |
2004 | | | 3.99 | | | 0.35 | (2) | | | 0.71 | (2) | | | 1.06 | | | | (0.34 | )(5) | | | — | | | | (0.34 | ) |
2003 | | | 6.20 | | | 0.88 | (2) | | | (1.54 | )(2) | | | (0.66 | ) | | | (1.55 | )(6) | | | — | | | | (1.55 | ) |
2002 | | | 7.26 | | | 1.08 | | | | (1.01 | ) | | | 0.07 | | | | (1.09 | ) | | $ | (0.04 | ) | | | (1.13 | ) |
INTERMEDIATE-TERM BOND FUND | | | | | | | | | | | | | | | | | | | | | |
Shares — (12/31/92*) | | | | | | | | | | | | | | | | | | | | | | | | |
Year Ended March 31, | | | | | | | | | | | | | | | | | | | | | | | | |
2006 | | $ | 7.16 | | $ | 0.27 | (2) | | $ | (0.12 | )(2) | | $ | 0.15 | | | $ | (0.28 | ) | | $ | (0.02 | ) | | $ | (0.30 | ) |
2005 | | | 7.40 | | | 0.26 | (2) | | | (0.22 | )(2) | | | 0.03 | | | | (0.26 | ) | | | (0.01 | ) | | | (0.27 | ) |
2004 | | | 7.39 | | | 0.26 | | | | 0.11 | | | | 0.37 | | | | (0.26 | ) | | | (0.10 | ) | | | (0.36 | ) |
2003 | | | 7.10 | | | 0.37 | | | | 0.36 | | | | 0.73 | | | | (0.40 | ) | | | (0.04 | ) | | | (0.44 | ) |
2002 | | | 7.18 | | | 0.39 | | | | (0.06 | ) | | | 0.33 | | | | (0.39 | ) | | | (0.02 | ) | | | (0.41 | ) |
INTERMEDIATE-TERM TAX-EXEMPT FUND | | | | | | | | | | | | | | | | | |
Shares — (12/03/85*) | | | | | | | | | | | | | | | | | | | | | | | | |
Year Ended March 31, | | | | | | | | | | | | | | | | | | | | | | | | |
2006 | | $ | 9.41 | | $ | 0.29 | (2) | | $ | (0.11 | )(2) | | $ | 0.18 | | | $ | (0.29 | ) | | $ | (0.01 | ) | | $ | (0.30 | ) |
2005 | | | 9.69 | | | 0.26 | (2) | | | (0.24 | )(2) | | | 0.02 | | | | (0.26 | ) | | | (0.04 | ) | | | (0.30 | ) |
2004 | | | 9.88 | | | 0.26 | | | | 0.15 | | | | 0.41 | | | | (0.26 | ) | | | (0.34 | ) | | | (0.60 | ) |
2003 | | | 9.39 | | | 0.31 | | | | 0.55 | | | | 0.86 | | | | (0.31 | ) | | | (0.06 | ) | | | (0.37 | ) |
2002 | | | 9.57 | | | 0.35 | | | | (0.12 | ) | | | 0.23 | | | | (0.35 | ) | | | (0.06 | ) | | | (0.41 | ) |
| * | Commencement of operations. |
| (1) | Expense ratios before waiver of fees and reimbursement of expenses (if any) by adviser and administrator. |
| (2) | For comparative purposes, per share amounts are based on average shares outstanding. |
| (3) | Amount represents less than $0.01 per share. |
| (4) | Includes a tax return of capital of $(0.01). |
| (5) | Includes a tax return of capital of $(0.08). |
| (6) | Includes a tax return of capital of $(0.51). |
See Notes to Financial Statements.
60
| | | | | | | | | | | | | | | | | | | |
| | | | | | |
Net Asset
Value,
End of
Year
| | Total
Return
| | | Net Assets,
End of
Year
(000’s)
| | Ratio of Net
Operating
Expenses to
Average Net
Assets
| | | Ratio of Gross
Operating
Expenses to
Average Net
Assets (1)
| | | Ratio of Net
Investment
Income to
Average Net
Assets
| | | Portfolio
Turnover
Rate
| |
| | | | | | | | | | | | | | | | | | | | |
| | | | | | | | | | | | | | | | | | | | |
| | | | | | | | | | | | | | | | | | | | |
| $ | 7.16 | | 1.60 | % | | $ | 66,355 | | 0.50 | % | | 1.03 | % | | 3.11 | % | | 48 | % |
| | 7.27 | | 0.20 | % | | | 62,949 | | 0.50 | % | | 1.05 | % | | 3.18 | % | | 10 | % |
| | 7.49 | | 3.19 | % | | | 66,894 | | 0.50 | % | | 0.90 | % | | 3.14 | % | | 15 | % |
| | 7.49 | | 6.59 | % | | | 66,194 | | 0.46 | % | | 0.50 | % | | 3.36 | % | | 9 | % |
| | 7.27 | | 3.32 | % | | | 58,230 | | 0.50 | % | | 0.87 | % | | 3.55 | % | | 4 | % |
| | | | | | | | | | | | | | | | | | | | |
| | | | | | | | | | | | | | | | | | | | |
| | | | | | | | | | | | | | | | | | | | |
| $ | 8.84 | | 2.00 | % | | $ | 281,767 | | 0.90 | % | | 1.30 | % | | 4.05 | % | | 95 | % |
| | 9.15 | | 1.55 | % | | | 211,932 | | 0.90 | % | | 1.27 | % | | 3.99 | % | | 90 | % |
| | 9.43 | | 5.74 | % | | | 269,027 | | 0.87 | % | | 1.11 | % | | 4.06 | % | | 84 | % |
| | 9.43 | | 11.07 | % | | | 293,182 | | 0.84 | % | | 0.95 | % | | 5.10 | % | | 120 | % |
| | 8.95 | | 4.34 | % | | | 247,804 | | 0.87 | % | | 1.04 | % | | 5.39 | % | | 129 | % |
| | | | | | | | | | | | | | | | | | | | |
| | | | | | | | | | | | | | | | | | | | |
| | | | | | | | | | | | | | | | | | | | |
| $ | 4.53 | | 3.72 | % | | $ | 136,991 | | 1.05 | % | | 1.29 | % | | 6.84 | % | | 62 | % |
| | 4.67 | | 5.54 | % | | | 156,139 | | 1.04 | % | | 1.30 | % | | 6.50 | % | | 70 | % |
| | 4.71 | | 27.45 | % | | | 151,476 | | 1.05 | % | | 1.36 | % | | 7.79 | % | | 170 | % |
| | 3.99 | | (10.49 | %) | | | 131,342 | | 1.08 | % | | 1.35 | % | | 18.06 | % | | 153 | % |
| | 6.20 | | 1.27 | % | | | 172,890 | | 1.03 | % | | 1.35 | % | | 17.56 | % | | 310 | % |
| | | | | | | | | | | | | | | | | | | | |
| | | | | | | | | | | | | | | | | | | | |
| | | | | | | | | | | | | | | | | | | | |
| $ | 7.01 | | 2.06 | % | | $ | 437,073 | | 0.72 | % | | 0.81 | % | | 3.74 | % | | 75 | % |
| | 7.16 | | 0.45 | % | | | 410,392 | | 0.60 | % | | 0.81 | % | | 3.53 | % | | 59 | % |
| | 7.40 | | 5.25 | % | | | 413,267 | | 0.56 | % | | 0.69 | % | | 3.56 | % | | 85 | % |
| | 7.39 | | 10.50 | % | | | 404,627 | | 0.53 | % | | 0.69 | % | | 4.56 | % | | 98 | % |
| | 7.10 | | 4.60 | % | | | 273,267 | | 0.52 | % | | 0.69 | % | | 5.47 | % | | 117 | % |
| | | | | | | | | | | | | | | | | | | | |
| | | | | | | | | | | | | | | | | | | | |
| | | | | | | | | | | | | | | | | | | | |
| $ | 9.29 | | 1.93 | % | | $ | 352,696 | | 0.65 | % | | 0.80 | % | | 3.09 | % | | 69 | % |
| | 9.41 | | 0.20 | % | | | 349,540 | | 0.65 | % | | 0.81 | % | | 2.69 | % | | 0 | % |
| | 9.69 | | 4.19 | % | | | 387,624 | | 0.56 | % | | 0.63 | % | | 2.60 | % | | 31 | % |
| | 9.88 | | 9.31 | % | | | 407,102 | | 0.51 | % | | 0.59 | % | | 3.15 | % | | 48 | % |
| | 9.39 | | 2.41 | % | | | 370,018 | | 0.52 | % | | 0.64 | % | | 3.67 | % | | 67 | % |
See Notes to Financial Statements.
61
Excelsior Funds
Financial Highlights — Selected Per Share Data and Ratios
| | | | | | | | | | | | | | | | | | | | | | | | | | |
| | | | | | | |
| | | Net Asset Value
Beginning of
Year
| | Net
Investment
Income
| | | Net Realized and
Unrealized Gain
(Loss) on
Investments
| | | Total From
Investment
Operations
| | Dividends
From Net
Investment
Income
| | | Distributions
From Net
Realized
Gain on
Investments
| | | Total
Distributions
| |
LONG-TERM TAX-EXEMPT FUND | | | | | | | | | | | | | | | | | | | | |
Shares — (02/05/86*) | | | | | | | | | | | | | | | | | | | | | | | |
Year Ended March 31, | | | | | | | | | | | | | | | | | | | | | | | |
2006 | | $ | 10.07 | | $ | 0.31 | (2) | | $ | (0.04 | )(2) | | $ | 0.27 | | $ | (0.31 | ) | | $ | — | | | $ | (0.31 | ) |
2005 | | | 10.08 | | | 0.27 | (2) | | | (0.01 | )(2) | | | 0.27 | | | (0.28 | ) | | | — | | | | (0.28 | ) |
2004 | | | 9.95 | | | 0.26 | | | | 0.13 | | | | 0.39 | | | (0.26 | ) | | | — | | | | (0.26 | ) |
2003 | | | 9.48 | | | 0.29 | | | | 0.47 | | | | 0.76 | | | (0.29 | ) | | | — | | | | (0.29 | ) |
2002 | | | 9.62 | | | 0.36 | | | | (0.14 | ) | | | 0.22 | | | (0.36 | ) | | | — | | | | (0.36 | ) |
NEW YORK INTERMEDIATE-TERM TAX-EXEMPT FUND | | | | | | | | | | | | | | | | |
Shares — (05/31/90*) | | | | | | | | | | | | | | | | | | | | | | | |
Year Ended March 31, | | | | | | | | | | | | | | | | | | | | | | | |
2006 | | $ | 8.71 | | $ | 0.24 | (2) | | $ | (0.04 | )(2) | | $ | 0.20 | | $ | (0.24 | ) | | $ | (0.12 | ) | | $ | (0.36 | ) |
2005 | | | 8.97 | | | 0.22 | (2) | | | (0.17 | )(2) | | | 0.05 | | | (0.22 | ) | | | (0.09 | ) | | | (0.31 | ) |
2004 | | | 9.12 | | | 0.22 | | | | 0.14 | | | | 0.36 | | | (0.22 | ) | | | (0.29 | ) | | | (0.51 | ) |
2003 | | | 8.74 | | | 0.27 | | | | 0.51 | | | | 0.78 | | | (0.27 | ) | | | (0.13 | ) | | | (0.40 | ) |
2002 | | | 8.83 | | | 0.31 | | | | (0.09 | ) | | | 0.22 | | | (0.31 | ) | | | — | | | | (0.31 | ) |
SHORT-TERM GOVERNMENT SECURITIES FUND | | | | | | | | | | | | | | | | |
Shares — (12/31/92*) | | | | | | | | | | | | | | | | | | | | | | | |
Year Ended March 31, | | | | | | | | | | | | | | | | | | | | | | | |
2006 | | $ | 7.00 | | $ | 0.20 | (2) | | $ | (0.04 | )(2) | | $ | 0.16 | | $ | (0.24 | ) | | $ | — | | | $ | (0.24 | ) |
2005 | | | 7.22 | | | 0.18 | (2) | | | 0.18 | (2) | | | — | | | (0.22 | ) | | | — | | | | (0.22 | ) |
2004 | | | 7.31 | | | 0.16 | | | | (0.03 | ) | | | 0.13 | | | (0.20 | ) | | | (0.02 | ) | | | (0.22 | ) |
2003 | | | 7.11 | | | 0.26 | | | | 0.25 | | | | 0.51 | | | (0.26 | ) | | | (0.05 | ) | | | (0.31 | ) |
2002 | | | 7.09 | | | 0.33 | | | | 0.05 | | | | 0.38 | | | (0.34 | ) | | | (0.02 | ) | | | (0.36 | ) |
SHORT-TERM TAX-EXEMPT SECURITIES FUND | | | | | | | | | | | | | | | | |
Shares — (12/31/92*) | | | | | | | | | | | | | | | | | | | | | | | |
Year Ended March 31, | | | | | | | | | | | | | | | | | | | | | | | |
2006 | | $ | 7.13 | | $ | 0.14 | (2) | | $ | (0.05 | )(2) | | $ | 0.09 | | $ | (0.14 | ) | | $ | — | | | $ | (0.14 | ) |
2005 | | | 7.22 | | | 0.09 | (2) | | | (0.09 | )(2) | | | — | | | (0.09 | ) | | | — | (3) | | | (0.09 | ) |
2004 | | | 7.20 | | | 0.08 | | | | 0.02 | | | | 0.10 | | | (0.08 | ) | | | — | | | | (0.08 | ) |
2003 | | | 7.17 | | | 0.12 | | | | 0.03 | | | | 0.15 | | | (0.12 | ) | | | — | | | | (0.12 | ) |
2002 | | | 7.15 | | | 0.20 | | | | 0.03 | | | | 0.23 | | | (0.20 | ) | | | (0.01 | ) | | | (0.21 | ) |
| * | Commencement of operations. |
| (1) | Expense ratios before waiver of fees and reimbursement of expenses (if any) by adviser and administrator. |
| (2) | For comparative purposes, per share amounts are based on average shares outstanding. |
| (3) | Amount represents less than $0.01 per share. |
See Notes to Financial Statements.
62
| | | | | | | | | | | | | | | | | | | |
| | | | | | |
Net Asset
Value,
End of
Year
| | Total
Return
| | | Net Assets,
End of
Year
(000’s)
| | Ratio of Net
Operating
Expenses to
Average Net
Assets
| | | Ratio of Gross
Operating
Expenses to
Average Net
Assets (1)
| | | Ratio of Net
Investement
Income to
Average Net
Assets
| | | Portfolio
Turnover
Rate
| |
| | | | | | | | | | | | | | | | | | | | |
| | | | | | | | | | | | | | | | | | | | |
| | | | | | | | | | | | | | | | | | | | |
| $ | 10.03 | | 2.64 | % | | $ | 61,257 | | 0.80 | % | | 1.02 | % | | 3.01 | % | | 88 | % |
| | 10.07 | | 2.68 | % | | | 62,817 | | 0.80 | % | | 1.05 | % | | 2.74 | % | | 87 | % |
| | 10.08 | | 4.01 | % | | | 72,783 | | 0.73 | % | | 0.80 | % | | 2.64 | % | | 111 | % |
| | 9.95 | | 8.12 | % | | | 94,965 | | 0.70 | % | | 0.77 | % | | 2.99 | % | | 51 | % |
| | 9.48 | | 2.29 | % | | | 115,178 | | 0.72 | % | | 0.82 | % | | 3.66 | % | | 35 | % |
| | | | | | | | | | | | | | | | | | | | |
| | | | | | | | | | | | | | | | | | | | |
| | | | | | | | | | | | | | | | | | | | |
| $ | 8.55 | | 2.25 | % | | $ | 131,026 | | 0.80 | % | | 0.98 | % | | 2.71 | % | | 83 | % |
| | 8.71 | | 0.52 | % | | | 138,253 | | 0.80 | % | | 0.98 | % | | 2.46 | % | | 15 | % |
| | 8.97 | | 4.06 | % | | | 178,107 | | 0.68 | % | | 0.73 | % | | 2.41 | % | | 42 | % |
| | 9.12 | | 8.96 | % | | | 187,400 | | 0.67 | % | | 0.72 | % | | 2.96 | % | | 43 | % |
| | 8.74 | | 2.54 | % | | | 178,608 | | 0.67 | % | | 0.72 | % | | 3.53 | % | | 45 | % |
| | | | | | | | | | | | | | | | | | | | |
| | | | | | | | | | | | | | | | | | | | |
| | | | | | | | | | | | | | | | | | | | |
| $ | 6.92 | �� | 2.36 | % | | $ | 339,167 | | 0.65 | % | | 0.77 | % | | 2.83 | % | | 118 | % |
| | 7.00 | | 0.01 | % | | | 402,518 | | 0.60 | % | | 0.79 | % | | 2.57 | % | | 106 | % |
| | 7.22 | | 1.90 | % | | | 469,218 | | 0.53 | % | | 0.67 | % | | 2.26 | % | | 231 | % |
| | 7.31 | | 7.27 | % | | | 499,519 | | 0.49 | % | | 0.64 | % | | 3.22 | % | | 170 | % |
| | 7.11 | | 5.35 | % | | | 193,780 | | 0.51 | % | | 0.61 | % | | 4.33 | % | | 75 | % |
| | | | | | | | | | | | | | | | | | | | |
| | | | | | | | | | | | | | | | | | | | |
| | | | | | | | | | | | | | | | | | | | |
| $ | 7.08 | | 1.33 | % | | $ | 133,211 | | 0.60 | % | | 0.77 | % | | 1.97 | % | | 111 | % |
| | 7.13 | | (0.01 | )% | | | 239,060 | | 0.60 | % | | 0.76 | % | | 1.21 | % | | 10 | % |
| | 7.22 | | 1.40 | % | | | 360,604 | | 0.47 | % | | 0.59 | % | | 1.12 | % | | 99 | % |
| | 7.20 | | 2.04 | % | | | 291,282 | | 0.46 | % | | 0.58 | % | | 1.57 | % | | 31 | % |
| | 7.17 | | 3.20 | % | | | 165,690 | | 0.48 | % | | 0.55 | % | | 2.60 | % | | 111 | % |
See Notes to Financial Statements.
63
EXCELSIOR FUNDS
NOTES TO FINANCIAL STATEMENTS
1. Significant Accounting Policies:
Excelsior Funds, Inc. (“Excelsior Fund”) was incorporated under the laws of the State of Maryland on August 2, 1984. Excelsior Tax-Exempt Funds, Inc. (“Excelsior Tax-Exempt Fund”) was incorporated under the laws of the State of Maryland on August 8, 1984. Excelsior Funds Trust (the “Trust”) is a statutory trust organized under the laws of the State of Delaware on April 27, 1994. Excelsior Fund, Excelsior Tax-Exempt Fund and the Trust are registered under the Investment Company Act of 1940, as amended (the “1940 Act”), as open-ended diversified management investment companies with the exception of California Short-Intermediate Term Tax-Exempt Income Fund (formerly California Tax-Exempt Income Fund), New York Intermediate-Term Tax-Exempt Fund, New York Tax-Exempt Money Fund, Energy and Natural Resources Fund and Real Estate Fund, each of which are non-diversified.
Excelsior Fund, Excelsior Tax-Exempt Fund and the Trust currently offer shares in fifteen, seven and seven managed investment portfolios, respectively, each having its own investment objectives and policies. The following is a summary of significant accounting policies for Core Bond Fund (formerly Managed Income Fund), Intermediate-Term Bond Fund (formerly Intermediate-Term Managed Income Fund) and Short-Term Government Securities Fund, portfolios of Excelsior Fund, California Short-Intermediate Term Tax-Exempt Income Fund, Intermediate-Term Tax-Exempt Fund, Long-Term Tax-Exempt Fund, New York Intermediate-Term Tax-Exempt Fund and Short-Term Tax-Exempt Securities Fund, portfolios of Excelsior Tax-Exempt Fund, and High Yield Fund, a portfolio of the Trust (each a “Fund”, collectively, the “Funds”). Such policies are in conformity with accounting principles generally accepted in the United States of America and are consistently followed by Excelsior Fund, Excelsior Tax-Exempt Fund and the Trust in the preparation of their financial statements. The preparation of financial statements requires management to make estimates and assumptions that affect the reported amounts and disclosures in the financial statements. Actual results could differ from these estimates.
The California Short-Intermediate Term Tax-Exempt Income Fund, Intermediate-Term Bond Fund, Intermediate-Term Tax-Exempt Fund, Long-Term Tax-Exempt Fund, New York Intermediate-Term Tax-Exempt Fund, Short-Term Government Securities Fund and Short-Term Tax-Exempt Securities Fund offer one class of shares: Shares. The Core Bond Fund offers three classes of shares: Shares, Institutional Shares and Retirement Shares. The High Yield Fund offers two classes of shares: Shares and Institutional Shares. The Financial Highlights of the Institutional shares and Retirement Shares as well as the financial statements for the remaining portfolios of Excelsior Fund, Excelsior Tax-Exempt Fund and the Trust are presented separately.
(a) Portfolio valuation:
Investments in securities that are traded on recognized domestic and foreign stock exchanges are valued at the last sale price on the exchange on which such securities are primarily traded or at the last quoted sale price on a national securities market. Securities traded over-the-counter are valued each business day on the basis of closing over-the-counter sale prices. Equity securities that are traded on the NASDAQ National Market System for which quotations are readily available are valued at the official closing price. Securities for which there were no transactions are valued at the last quoted sales price for
64
the most recent day such prices were available. Securities for which market quotations are not readily available are valued in good faith at fair value pursuant to procedures adopted by the Board of Directors with regard to Excelsior Fund and the Board of Trustees with regard to the Trust.
Short-term debt instruments that mature in 60 days or less are valued at amortized cost, which approximates market value. If available, debt securities are priced based upon valuations provided by independent, third-party pricing agents. The third-party pricing agents value debt securities at an evaluated price by employing methodologies that utilize actual market transactions, broker-supplied valuations, or other methodologies designed to identify the market value for such securities.
(b) Concentration of risks:
The High Yield Fund is subject to special risks associated with investments in high yield bonds, which involve greater risk of default or downgrade and are more volatile than investment grade securities due to actual or perceived changes in an issuer’s creditworthiness. In addition, issuers of high yield bonds may be more susceptible than other issuers to economic downturns. High yield bonds are subject to the risk that the issuer may not be able to pay interest or dividends and ultimately repay principal upon maturity. Discontinuation of these payments could adversely affect the market value of the security.
At March 31, 2006, approximately, 96% of the net assets of the California Short-Intermediate Term Tax-Exempt Income Fund is invested in California municipal securities and 93% of the net assets of the New York Intermediate-Term Tax-Exempt Fund is invested in New York municipal securities. Economic changes affecting the states and certain of its public bodies and municipalities may affect the ability of issuers to pay the required principal and interest payments of the municipal securities.
(c) Security transactions and investment income:
Security transactions are recorded on a trade date basis. Realized gains and losses on investments sold are recorded on the basis of identified cost. Interest income, adjusted for amortization of premiums and, when appropriate, discounts on investments, is earned from settlement date and is recorded on the accrual basis. Dividend income is recorded on the ex-dividend date, except for certain dividends from foreign securities, which are recorded as soon as the Funds are informed of the dividend.
(d) Repurchase agreements:
The Funds may purchase portfolio securities from financial institutions deemed to be creditworthy by the investment adviser subject to the seller’s agreement to repurchase and the Funds’ agreement to resell such securities at mutually agreed upon prices. Securities purchased subject to such repurchase agreements are deposited with the Funds’ custodian or sub-custodian or are maintained in the Federal Reserve/Treasury book-entry system and must have, at all times, an aggregate market value not less than the repurchase price (including accrued interest).
Default or bankruptcy of the seller may, however, expose the applicable Fund to possible delay in connection with the disposition of the securities or loss to the extent that proceeds from a sale of the underlying securities were less than the repurchase price under the agreement.
65
(e) TBA purchase commitments:
Certain Funds may enter into “TBA” (To Be Announced) purchase commitments to purchase securities for a fixed price at a future date, typically not exceeding 45 days. TBA purchase commitments may be considered securities in themselves, and involve risk of loss if the value of the security to be purchased declines prior to settlement date. The Funds must maintain liquid securities having a value not less than the purchase price (including accrued interest) for such purchase commitments. Unsettled TBA purchase commitments are valued at the current market value of the underlying securities, according to the procedures described under “Portfolio Valuation” above.
(f) Mortgage dollar rolls:
Certain Funds may enter into mortgage dollar rolls (principally in securities referred to as TBA, (see note 1(e)) in which the Funds sell mortgage securities for delivery in the current month and simultaneously contract to repurchase similar, but not identical, securities at an agreed upon price on a fixed date. The Funds account for such dollar rolls as purchases and sales and receive compensation in consideration for entering into the commitment to repurchase. The Funds must maintain liquid securities having a value not less that the repurchase price (including accrued interest) for such dollar rolls. The market value of the securities that the Funds are required to repurchase may decline below the agreed upon repurchase price of those securities.
(g) Distributions to shareholders:
Dividends from net investment income are declared daily and paid monthly. Net realized capital gains, unless offset by any available capital loss carryforward, are distributed at least annually. Dividends and distributions are recorded on the ex-dividend date.
(h) Expense allocation:
Expenses directly attributable to a Fund are charged to that Fund. Other expenses are allocated to the respective Fund based on average daily net assets. Expenses attributable to a specific class of shares, such as shareholder servicing fees, are charged directly to that class.
2. Investment Advisory Fee, Administration Fee, Shareholder Servicing Fees and Related Party Transactions:
Prior to December 16, 2005, the Funds were advised jointly by United States Trust Company of New York and U.S. Trust Company, N.A., through their respective separate identifiable divisions. Effective December 16, 2005, U.S. Trust Company, N.A.’s separately identifiable division was reorganized into a separate corporate entity named UST Advisers, Inc., a Delaware corporation that is a wholly-owned subsidiary of U.S. Trust Company, N.A. and the Funds were advised by either UST Advisers, Inc. or U.S. Trust New York Asset Management Division (“NYAMD”), the separately identifiable division of United States Trust Company of New York.
Effective March 31, 2006, United States Trust Company of New York converted to a national charter and changed its name to United States Trust Company, National Association (“USTC-NA”) and merged with U.S. Trust Company, N.A., with USTC-NA as the surviving entity. As of March 31, 2006, the Funds
66
are advised by NYAMD, a separate identifiable division of USTC-NA, or UST Advisers, Inc. (together with NYAMD, the “Advisers”), a wholly-owned subsidiary of USTC-NA. USTC-NA is a wholly-owned subsidiary of US Trust Corporation, a registered bank holding company, which, in turn, is a wholly-owned subsidiary of The Charles Schwab Corporation. For the services provided pursuant to the Investment Advisory Agreements, each Adviser receives a fee, computed daily and paid monthly, as follows:
| | | |
California Short-Intermediate Term Tax-Exempt Income Fund | | 0.50 | % |
Core Bond Fund | | 0.75 | % |
High Yield Fund | | 0.80 | % |
Intermediate-Term Bond Fund | | 0.35 | % |
Intermediate-Term Tax-Exempt Fund | | 0.35 | % |
Long-Term Tax-Exempt Fund | | 0.50 | % |
New York Intermediate-Term Tax-Exempt Fund | | 0.50 | % |
Short-Term Government Securities Fund | | 0.30 | % |
Short-Term Tax-Exempt Securities Fund | | 0.30 | % |
UST Advisers, Inc. and BISYS Fund Services Ohio, Inc. (collectively, the “Administrators”) provide administrative services to the Funds. For the services provided to the Funds, the Administrators are entitled jointly to annual fees, computed daily and paid monthly, based on the combined aggregate average daily net assets of Excelsior Fund, Excelsior Tax-Exempt Fund and the Trust (excluding the international equity portfolios of Excelsior Fund and the Trust), all of which are affiliated investment companies, as follows: 0.200% of the first $200 million, 0.175% of the next $200 million and 0.150% over $400 million. The Administrators are entitled jointly to annual fees, computed daily and paid monthly, at the annual rate of 0.20% of the average daily net assets of the Emerging Markets Fund, International Equity Fund, International Fund and Pacific/Asia Fund. Administration fees payable by each Fund of the Excelsior Fund, Excelsior Tax-Exempt Fund and the Trust are determined in proportion to the relative average daily net assets of the respective Funds for the period paid. For the year ended March 31, 2006, administration fees charged to the Funds were as follows:
| | | | | | | | | | |
| | | Administration
Fees
| | Waiver
Administration
Fees
| | | Net
Administration
Fees
|
California Short-Intermediate Term Tax-Exempt Income Fund | | $ | 99,992 | | $ | (21,478 | ) | | $ | 78,514 |
Core Bond Fund | | | 374,736 | | | — | | | | 374,736 |
High Yield Fund | | | 248,330 | | | — | | | | 248,330 |
Intermediate-Term Bond Fund | | | 659,217 | | | — | | | | 659,217 |
Intermediate-Term Tax-Exempt Fund | | | 534,627 | | | — | | | | 534,627 |
Long-Term Tax-Exempt Fund | | | 92,906 | | | — | | | | 92,906 |
New York Intermediate-Term Tax-Exempt Fund | | | 206,097 | | | — | | | | 206,097 |
Short-Term Government Securities Fund | | | 567,094 | | | — | | | | 567,094 |
Short-Term Tax-Exempt Securities Fund | | | 264,945 | | | — | | | | 264,945 |
From time to time, in its sole discretion, each Adviser may undertake to waive a portion or all of the fees payable to it and may also reimburse the Funds for a portion of other expenses. For the four months ended July 31, 2005 and the eight months ended March 31, 2006, the Advisers have contractually agreed
67
to waive investment advisory fees and to reimburse other ordinary operating expenses to the extent necessary to keep total operating expenses from exceeding the following annual percentages of each Fund’s average daily net assets:
| | | | | | |
| | | Four Months
Ended
July 31,
2005
| | | Eight Months
Ended
March 31,
2006
| |
California Short-Intermediate Term Tax-Exempt Income Fund —Shares | | 0.50 | % | | 0.50 | % |
Core Bond Fund — Shares | | 0.90 | % | | 0.90 | % |
High Yield Fund — Shares | | 1.05 | % | | 1.05 | % |
Intermediate-Term Bond Fund — Shares | | 0.65 | % | | 0.75 | % |
Intermediate-Term Tax-Exempt Fund — Shares | | 0.65 | % | | 0.65 | % |
Long-Term Tax-Exempt Fund — Shares | | 0.80 | % | | 0.80 | % |
New York Intermediate-Term Tax-Exempt
Fund — Shares | | 0.80 | % | | 0.80 | % |
Short-Term Government Securities Fund — Shares* | | 0.60 | % | | 0.75 | % |
Short-Term Tax-Exempt Securities Fund — Shares | | 0.60 | % | | 0.60 | % |
Core Bond Fund — Institutional Shares** | | N/A | | | 0.65 | % |
High Yield Fund — Institutional Shares | | 0.80 | % | | 0.80 | % |
Core Bond Fund — Retirement Shares | | 1.40 | % | | 1.40 | % |
| * | From August 1, 2005 through November 30, 2005, the Advisers voluntarily capped the Short-Term Government Securities Fund at 0.65%, from December 1, 2005 through March 31, 2006, the Fund was voluntarily capped at 0.70%. Effective April 1, 2006, the Adviser has capped the Fund at 0.75%. |
| ** | Institutional Shares commenced operations on November 29, 2005. |
For the year ended March 31, 2006, pursuant to the above, investment advisory fees waived by the Advisers were as follows:
| | | | |
California Short-Intermediate Term Tax-Exempt Income Fund | | $ | (331,058 | ) |
Core Bond Fund | | | (987,738 | ) |
High Yield Fund | | | (399,394 | ) |
Intermediate-Term Bond Fund | | | (384,019 | ) |
Intermediate-Term Tax-Exempt Fund | | | (530,735 | ) |
Long-Term Tax-Exempt Fund | | | (133,366 | ) |
New York Intermediate-Term Tax-Exempt Fund | | | (238,995 | ) |
Short-Term Government Securities Fund | | | (474,679 | ) |
Short-Term Tax-Exempt Securities Fund | | | (292,016 | ) |
The Funds have entered into shareholder servicing agreements with various service organizations, which include Charles Schwab & Co. Inc. (“CS & Co.”) and UST Advisers, Inc. Services included in the servicing agreements are assisting in processing purchase, exchange and redemption requests; transmitting and receiving funds in connection with customer orders to purchase, exchange or redeem shares; and providing periodic statements. Shareholder servicing fees are incurred on a Fund or class level (where applicable). In consideration for these services, each service organization receives a fee
68
from the Funds, computed daily and paid monthly, at an annual rate up to 0.25% of the average daily net assets of the Funds’ shares held by each service organization’s customers. The Advisers, out of their own resources, may additionally compensate certain organizations for providing these and other services.
For the year ended March 31, 2006, shareholder servicing fees paid to CS & Co. and the Advisers were as follows:
| | | |
California Short-Intermediate Term Tax-Exempt Income Fund | | $ | 168,155 |
Core Bond Fund | | | 473,281 |
High Yield Fund | | | 377,405 |
Intermediate-Term Bond Fund | | | 1,143,128 |
Intermediate-Term Tax-Exempt Fund | | | 933,129 |
Long-Term Tax-Exempt Fund | | | 146,527 |
New York Intermediate-Term Tax-Exempt Fund | | | 356,046 |
Short-Term Government Securities Fund | | | 857,188 |
Short-Term Tax-Exempt Securities Fund | | | 476,448 |
BISYS Fund Services Limited Partnership (the “Distributor”) serves as the Distributor of the Funds. Shares of each Fund are sold without a sales charge on a continuous basis by the Distributor.
Certain Funds have adopted a Distribution Plan pursuant to Rule 12b-1 under the 1940 Act, under which they may compensate the Distributor monthly for its services that are intended to result in the sale of Fund Shares (in the case of High Yield Fund) or Retirement Shares (in the case of Core Bond Fund), in an amount not to exceed the annual rate of 0.25% or 0.50%, respectively, of the average daily net asset value of such Fund’s Shares or Retirement Shares. For the year ended March 31, 2006, fees charged for Retirement Shares of Core Bond Fund were $4.
Each Independent Director/Trustee of the Funds receives a total annual fee of $100,000 paid by the Funds and other affiliated registered investment companies managed by the Advisers. The Chairman of the Board receives an additional $30,000, the Chairman of the Audit Committee receives an additional $15,000, and the Chairman of the Nominating Committee receives an additional $5,000 for serving in those capacities. In addition, Directors and Trustees are reimbursed by Excelsior Fund, Excelsior Tax-Exempt Fund and the Trust, respectively, for reasonable expenses incurred when acting in their capacity as Directors and Trustees.
69
3. Purchases, Sales and Maturities of Securities:
For the year ended March 31, 2006, purchases, sales and maturities of securities, excluding short-term investments, for the Funds aggregated:
| | | | | | |
| | | Purchases
| | Sales and
Maturities
|
California Short-Intermediate Term Tax-Exempt Income Fund | | $ | 34,414,300 | | $ | 29,746,597 |
Core Bond Fund | | | | | | |
U.S. Government | | | 234,143,975 | | | 174,000,688 |
Other | | | 72,340,542 | | | 48,360,840 |
High Yield Fund | | | 94,851,386 | | | 111,074,059 |
Intermediate-Term Bond Fund | | | | | | |
U.S. Government | | | 209,556,658 | | | 182,867,647 |
Other | | | 110,467,593 | | | 113,301,103 |
Intermediate-Term Tax-Exempt Fund | | | 277,935,725 | | | 204,958,140 |
Long-Term Tax-Exempt Fund | | | 51,188,308 | | | 39,937,890 |
New York Intermediate-Term Tax-Exempt Fund | | | 102,284,925 | | | 88,816,328 |
Short-Term Government Securities Fund | | | | | | |
U.S. Government | | | 397,078,888 | | | 450,351,865 |
Other | | | 35,417,247 | | | 33,202,159 |
Short-Term Tax-Exempt Securities Fund | | | 128,189,243 | | | 168,786,516 |
4. Federal Taxes:
It is the policy of Excelsior Fund, Excelsior Tax-Exempt Fund and the Trust that each Fund qualify or continue to qualify as a regulated investment company, by complying with the requirements of the Internal Revenue Code applicable to regulated investment companies, and by distributing substantially all of its taxable earnings to its shareholders.
In order to avoid a federal excise tax, each Fund is required to distribute certain minimum amounts of net realized capital gain and net investment income for the respective twelve-month periods ending October 31 and December 31 each calendar year.
Net realized gains of the Funds derived in certain countries are subject to certain foreign taxation.
70
Dividends and distributions are determined in accordance with federal income tax regulations and may differ from accounting principles generally accepted in the United States of America. These differences are primarily due to differing treatments for deferral of losses on wash sales and net capital losses incurred after October 31 and within the taxable year (“Post-October losses”). To the extent these differences are permanent, adjustments are made to the appropriate equity accounts in the period that these differences arise. Accordingly, the following reclassifications have been made to/from the following accounts:
| | | | | | | | | | | |
| | | Undistributed Net Investment Income
| | Accumulated Net Realized Gain (Loss)
| | | Paid-In-Capital
| |
California Short-Intermediate Term Tax-Exempt Income Fund | | $ | — | | $ | — | | | $ | — | |
Core Bond Fund | | | 156,098 | | | (156,098 | ) | | | — | |
High Yield Fund | | | 184,360 | | | 169,492 | | | | (353,852 | ) |
Intermediate-Term Bond Fund | | | 648,133 | | | (648,133 | ) | | | — | |
Intermediate-Term Tax-Exempt Fund | | | 214 | | | (214 | ) | | | — | |
Long-Term Tax-Exempt Fund | | | — | | | — | | | | — | |
New York Intermediate-Term Tax-Exempt Fund | | | 121 | | | (121 | ) | | | — | |
Short-Term Government Securities Fund | | | 2,368,934 | | | (2,368,934 | ) | | | — | |
Short-Term Tax-Exempt Securities Fund | | | — | | | — | | | | — | |
71
The tax character of dividends and distributions declared during the years ended March 31, 2006 and March 31, 2005 were as follows:
| | | | | | | | | | | | | | | |
| | | Ordinary
Income
| | Tax-Exempt
Income
| | Long-Term
Capital Gain
| | Return of
Capital
| | Total
|
California Short-Intermediate Term Tax-Exempt Income Fund | | | | | | | | | | | | | | | |
Year ended March 31, 2006 | | $ | — | | $ | 2,014,082 | | $ | — | | $ | — | | $ | 2,014,082 |
Year ended March 31, 2005 | | | — | | | 2,063,597 | | | — | | | — | | | 2,063,597 |
Core Bond Fund | | | | | | | | | | | | | | | |
Year ended March 31, 2006 | | | 11,105,896 | | | — | | | 2,085,376 | | | — | | | 13,191,272 |
Year ended March 31, 2005 | | | 11,633,310 | | | — | | | 1,031,057 | | | — | | | 12,664,367 |
High Yield Fund | | | | | | | | | | | | | | | |
Year ended March 31, 2006 | | | 10,553,157 | | | — | | | — | | | 353,851 | | | 10,907,008 |
Year ended March 31, 2005 | | | 11,801,334 | | | — | | | — | | | — | | | 11,801,334 |
Intermediate-Term Bond Fund | | | | | | | | | | | | | | | |
Year ended March 31, 2006 | | | 16,649,941 | | | — | | | 1,063,363 | | | — | | | 17,713,304 |
Year ended March 31, 2005 | | | 14,305,244 | | | — | | | 572,247 | | | — | | | 14,877,491 |
Intermediate-Term Tax-Exempt Fund | | | | | | | | | | | | | | | |
Year ended March 31, 2006 | | | — | | | 10,697,181 | | | 367,896 | | | — | | | 11,065,077 |
Year ended March 31, 2005 | | | 256,062 | | | 9,828,278 | | | 1,294,216 | | | — | | | 11,378,556 |
Long-Term Tax-Exempt Fund | | | | | | | | | | | | | | | |
Year ended March 31, 2006 | | | — | | | 1,794,756 | | | — | | | — | | | 1,794,756 |
Year ended March 31, 2005 | | | — | | | 1,833,293 | | | — | | | — | | | 1,833,293 |
New York Intermediate-Term Tax-Exempt Fund | | | | | | | | | | | | | | | |
Year ended March 31, 2006 | | | — | | | 3,604,795 | | | 1,825,238 | | | — | | | 5,430,033 |
Year ended March 31, 2005 | | | — | | | 3,894,510 | | | 1,466,615 | | | — | | | 5,361,125 |
Short-Term Government Securities Fund | | | | | | | | | | | | | | | |
Year ended March 31, 2006 | | | 12,770,972 | | | — | | | — | | | — | | | 12,770,972 |
Year ended March 31, 2005 | | | 13,966,986 | | | — | | | — | | | — | | | 13,966,986 |
Short-Term Tax-Exempt Securities Fund | | | | | | | | | | | | | | | |
Year ended March 31, 2006 | | | — | | | 3,428,764 | | | — | | | — | | | 3,428,764 |
Year ended March 31, 2005 | | | 24,949 | | | 3,424,866 | | | 22,878 | | | — | | | 3,472,693 |
72
As of March 31, 2006, the components of distributable earnings (accumulated losses) on a tax basis were as follows:
| | | | | | | | | | | | | | | | | | | | | | | | | | | | | |
| | | Undistributed
Ordinary
Income
| | Undistributed
Tax-Exempt
Income
| | Undistributed
Long-Term
Capital Gains
| | Distributions
Payable
| | | Accumulated
Capital and
Other
Losses
| | | Post-
October
Losses
| | | Unrealized
Appreciation
(Depreciation)
| | | Total
Accumulated
Earnings/
(Deficit)
| |
California Short-Intermediate Term Tax-Exempt Income
Fund | | $ | — | | $ | 175,454 | | $ | 214,251 | | $ | (175,455 | ) | | $ | — | | | $ | — | | | $ | (351,768 | ) | | $ | (137,518 | ) |
Core Bond Fund | | | 1,036,250 | | | — | | | — | | | (1,033,843 | ) | | | — | | | | (529,099 | ) | | | (4,631,212 | ) | | | (5,157,904 | ) |
High Yield Fund | | | — | | | — | | | — | | | (884,504 | ) | | | (67,220,796 | ) | | | (1,126,388 | ) | | | 1,348,374 | | | | (67,883,314 | ) |
Intermediate-Term Bond Fund | | | 1,586,211 | | | — | | | — | | | (1,597,063 | ) | | | (481,322 | ) | | | (1,596,591 | ) | | | (8,258,216 | ) | | | (10,346,981 | ) |
Intermediate-Term Tax-Exempt Fund | | | — | | | 1,001,972 | | | 730,630 | | | (1,001,757 | ) | | | — | | | | — | | | | 792,032 | | | | 1,522,877 | |
Long-Term Tax-Exempt Fund | | | — | | | 176,516 | | | 392,494 | | | (176,517 | ) | | | — | | | | — | | | | 41,624 | | | | 434,117 | |
New York Intermediate-Term Tax-Exempt Fund | | | — | | | 335,798 | | | — | | | (335,677 | ) | | | (165,776 | ) | | | (358,749 | ) | | | (536,621 | ) | | | (1,061,025 | ) |
Short-Term Government Securities Fund | | | 1,149,107 | | | — | | | — | | | (1,178,443 | ) | | | (10,712,075 | ) | | | (1,785,815 | ) | | | (5,286,795 | ) | | | (17,814,021 | ) |
Short-Term Tax-Exempt Securities Fund | | | — | | | 299,445 | | | — | | | (299,445 | ) | | | (805,304 | ) | | | (1,836,576 | ) | | | (663,624 | ) | | | (3,305,504 | ) |
Post-October losses are deemed to arise on the first business day of a Fund’s next taxable year.
73
For federal income tax purposes, capital loss carryforwards may be carried forward and applied against future capital gains. To the extent that such carryforwards are utilized, capital gains distributions will be reduced. At March 31, 2006, the following Funds had capital loss carryforwards available to offset future net capital gains through the indicated expiration dates.
| | | | | | | | | | | | | | | | | | |
| | | Expires
| | Total
|
| | | 2010
| | 2011
| | 2012
| | 2013
| | 2014
| |
High Yield Fund | | $ | 2,181,571 | | $ | 17,456,849 | | $ | 40,103,941 | | $ | 1,461,417 | | $ | 6,017,018 | | $ | 67,220,796 |
Intermediate-Term Bond Fund | | | — | | | — | | | — | | | — | | | 481,322 | | | 481,322 |
New York Intermediate-Term
Tax-Exempt Fund | | | — | | | — | | | — | | | — | | | 165,776 | | | 165,776 |
Short-Term Government Securities Fund | | | — | | | — | | | 1,481,228 | | | 4,260,524 | | | 4,970,323 | | | 10,712,075 |
Short-Term Tax-Exempt Securities Fund | | | — | | | — | | | — | | | 287,228 | | | 518,076 | | | 805,304 |
At March 31, 2006, aggregate gross unrealized appreciation for all securities and call options written for which there was an excess of value over estimated tax cost and aggregate gross unrealized depreciation for all securities for which there was an excess of estimated tax cost over value is as follows:
| | | | | | | | | | | | | | |
| | | Federal
Tax
Cost
| | Tax Basis
Unrealized
Appreciation
| | Tax Basis
Unrealized
(Depreciation)
| | | Net
Unrealized
Appreciation
(Depreciation)
| |
California Short-Intermediate Term Tax-Exempt Income Fund | | $ | 66,020,298 | | $ | 192,810 | | $ | (544,578 | ) | | $ | (351,768 | ) |
Core Bond Fund | | | 281,602,078 | | | 761,879 | | | (5,393,091 | ) | | | (4,631,212 | ) |
High Yield Fund | | | 145,912,590 | | | 6,262,276 | | | (4,913,902 | ) | | | 1,348,374 | |
Intermediate-Term Bond Fund | | | 462,560,536 | | | 755,079 | | | (9,013,295 | ) | | | (8,258,216 | ) |
Intermediate-Term Tax-Exempt Fund | | | 339,539,311 | | | 3,443,657 | | | (2,651,625 | ) | | | 792,032 | |
Long-Term Tax-Exempt Fund | | | 60,337,267 | | | 377,125 | | | (335,501 | ) | | | 41,624 | |
New York Intermediate-Term Tax-Exempt Fund | | | 130,049,895 | | | 428,503 | | | (965,124 | ) | | | (536,621 | ) |
Short-Term Government Securities Fund | | | 351,613,673 | | | 36,126 | | | (5,322,921 | ) | | | (5,286,795 | ) |
Short-Term Tax-Exempt Securities Fund | | | 132,432,467 | | | — | | | (663,624 | ) | | | (663,624 | ) |
5. Capital Transactions:
Excelsior Fund has authorized capital of 35 billion shares of Common Stock, 29.3756 billion of which is currently classified to represent interests in certain classes of shares. Authorized capital currently offered for each Fund is as follows: 750 million shares of the Core Bond Fund; 1.5 billion shares of the Intermediate-Term Bond Fund; and 1 billion shares of the Short-Term Government Securities Fund. Each share has a par value of $0.001 and represents an equal proportionate interest in the particular Fund with other shares of the same Fund, and is entitled to such dividends and distributions of taxable earnings on the assets belonging to such Fund as are declared at the discretion of Excelsior Fund’s Board of Directors.
74
Excelsior Tax-Exempt Fund has authorized capital of 24 billion shares of Common Stock, 15 billion of which is currently classified to represent interests in certain classes of shares. Authorized capital currently offered for each Fund is as follows: 1.5 billion shares each of California Short-Intermediate Term Tax-Exempt Income Fund, Intermediate-Term Tax-Exempt Fund, Long-Term Tax-Exempt Fund, New York Intermediate-Term Tax-Exempt Fund and Short-Term Tax-Exempt Securities Fund. Each share has a par value of $0.001 and represents an equal proportionate interest in the particular Fund with other shares of the same Fund, and is entitled to such dividends and distributions of taxable and tax-exempt earnings on the assets belonging to such Fund as are declared at the discretion of Excelsior Tax-Exempt Fund’s Board of Directors.
The Trust has authorized an unlimited number of shares of beneficial interest of each class of each Fund. Each share has a par value of $0.00001 and represents an equal proportionate interest in the particular Fund with other shares of the same Fund, and is entitled to such dividends and distributions of taxable earnings on the assets belonging to such Fund as are declared at the discretion of the Trust’s Board of Trustees.
Capital Share Transactions
| | | | | | | | | | | | | | |
| | | California Short-Intermediate Term Tax-Exempt Income Fund
| |
| | | Year Ended March 31,
| |
| | | 2006
| | | 2005
| |
| | | Shares
| | | Amount
| | | Shares
| | | Amount
| |
Sold | | 3,993,301 | | | $ | 28,933,240 | | | 3,278,532 | | | $ | 24,146,853 | |
Issued as reinvestment of dividends | | 87,807 | | | | 635,525 | | | 42,748 | | | | 314,174 | |
Redeemed | | (3,467,123 | ) | | | (25,083,774 | ) | | (3,595,284 | ) | | | (26,429,967 | ) |
| | |
|
| |
|
|
| |
|
| |
|
|
|
Net Increase (Decrease) | | 613,985 | | | $ | 4,484,991 | | | (274,004 | ) | | $ | (1,968,940 | ) |
| | |
|
| |
|
|
| |
|
| |
|
|
|
| |
| | | Core Bond Fund*
| |
| | | Year Ended March 31,
| |
| | | 2006
| | | 2005
| |
| | | Shares
| | | Amount
| | | Shares
| | | Amount
| |
Sold: | | | | | | | | | | | | | | |
Shares | | 13,774,392 | | | $ | 125,488,152 | | | 7,544,152 | | | $ | 69,875,602 | |
Institutional Shares | | 141,024 | | | | 1,262,505 | | | — | | | | — | |
Retirement Shares | | — | | | | — | | | 126 | | | | 1,050 | |
Issued as reinvestment of dividends: | | | | | | | | | | | | | | |
Shares | | 681,642 | | | | 6,160,386 | | | 331,579 | | | | 3,062,096 | |
Institutional Shares | | 189 | | | | 1,685 | | | — | | | | — | |
Retirement Shares | | 5 | | | | 50 | | | — | | | | 4 | |
Redeemed: | | | | | | | | | | | | | | |
Shares | | (5,733,515 | ) | | | (52,104,922 | ) | | (4,431,412 | ) | | | (40,768,322 | ) |
Retirement Shares | | (16 | ) | | | (151 | ) | | — | | | | — | |
Redemption in-kind | | — | | | | — | | | (8,833,002 | ) | | | (81,528,608 | ) |
| | |
|
| |
|
|
| |
|
| |
|
|
|
Net Increase (Decrease) | | 8,863,721 | | | $ | 80,807,705 | | | (5,388,557 | ) | | $ | (49,358,178 | ) |
| | |
|
| |
|
|
| |
|
| |
|
|
|
75
| | | | | | | | | | | | | | |
| | | High Yield Fund
| |
| | | Year Ended March 31,
| |
| | | 2006
| | | 2005
| |
| | | Shares
| | | Amount
| | | Shares
| | | Amount
| |
Sold: | | | | | | | | | | | | | | |
Shares | | 13,700,176 | | | $ | 62,544,844 | | | 21,515,855 | | | $ | 101,230,357 | |
Institutional Shares | | 853,862 | | | | 3,892,678 | | | 1,316,771 | | | | 6,247,385 | |
Issued as reinvestment of dividends: | | | | | | | | | | | | | | |
Shares | | 304,113 | | | | 1,384,476 | | | 414,836 | | | | 1,961,707 | |
Institutional Shares | | 107,579 | | | | 488,209 | | | 8,493 | | | | 40,222 | |
Redeemed: | | | | | | | | | | | | | | |
Shares | | (17,199,458 | ) | | | (78,172,561 | ) | | (20,658,816 | ) | | | (97,478,269 | ) |
Institutional Shares | | (1,152,309 | ) | | | (5,192,791 | ) | | (3,282,976 | ) | | | (15,687,133 | ) |
| | |
|
| |
|
|
| |
|
| |
|
|
|
Net Increase (Decrease) | | (3,386,037 | ) | | $ | (15,055,145 | ) | | (685,837 | ) | | $ | (3,685,731 | ) |
| | |
|
| |
|
|
| |
|
| |
|
|
|
| |
| | | Intermediate-Term Bond Fund
| |
| | | Year Ended March 31,
| |
| | | 2006
| | | 2005
| |
| | | Shares
| | | Amount
| | | Shares
| | | Amount
| |
Sold | | 22,398,525 | | | $ | 160,313,146 | | | 15,055,086 | | | $ | 109,213,526 | |
Contribution in-kind | | — | | | | — | | | 1,044,029 | | | | 7,590,091 | |
Issued as reinvestment of dividends | | 315,931 | | | | 2,254,952 | | | 158,208 | | | | 1,145,388 | |
Redeemed | | (17,689,147 | ) | | | (126,192,707 | ) | | (14,791,878 | ) | | | (107,161,886 | ) |
| | |
|
| |
|
|
| |
|
| |
|
|
|
Net Increase (Decrease) | | 5,025,309 | | | $ | 36,375,391 | | | 1,465,445 | | | $ | 10,787,119 | |
| | |
|
| |
|
|
| |
|
| |
|
|
|
| |
| | | Intermediate-Term Tax-Exempt Fund
| |
| | | Year Ended March 31,
| |
| | | 2006
| | | 2005
| |
| | | Shares
| | | Amount
| | | Shares
| | | Amount
| |
Sold | | 11,552,408 | | | $ | 108,911,261 | | | 7,418,489 | | | $ | 70,630,402 | |
Issued as reinvestment of dividends | | 109,248 | | | | 1,029,354 | | | 107,050 | | | | 1,019,228 | |
Redeemed | | (10,822,740 | ) | | | (101,854,658 | ) | | (10,361,672 | ) | | | (98,554,729 | ) |
| | |
|
| |
|
|
| |
|
| |
|
|
|
Net Increase (Decrease) | | 838,916 | | | $ | 8,085,957 | | | (2,836,133 | ) | | $ | (26,905,099 | ) |
| | |
|
| |
|
|
| |
|
| |
|
|
|
| |
| | | Long-Term Tax-Exempt Fund
| |
| | | Year Ended March 31,
| |
| | | 2006
| | | 2005
| |
| | | Shares
| | | Amount
| | | Shares
| | | Amount
| |
Sold | | 706,825 | | | $ | 7,162,254 | | | 1,003,168 | | | $ | 9,987,153 | |
Issued as reinvestment of dividends | | 35,734 | | | | 362,312 | | | 31,144 | | | | 312,137 | |
Redeemed | | (878,007 | ) | | | (8,918,351 | ) | | (2,011,361 | ) | | | (20,002,931 | ) |
| | |
|
| |
|
|
| |
|
| |
|
|
|
Net Increase (Decrease) | | (135,448 | ) | | $ | (1,393,785 | ) | | (977,049 | ) | | $ | (9,703,641 | ) |
| | |
|
| |
|
|
| |
|
| |
|
|
|
76
| | | | | | | | | | | | | | |
| | | New York Intermediate-Term Tax-Exempt Fund
| |
| | | Year Ended March 31,
| |
| | | 2006
| | | 2005
| |
| | | Shares
| | | Amount
| | | Shares
| | | Amount
| |
Sold | | 4,652,138 | | | $ | 40,444,981 | | | 2,053,754 | | | $ | 18,150,200 | |
Issued as reinvestment of dividends | | 78,342 | | | | 678,293 | | | 67,207 | | | | 593,357 | |
Redeemed | | (5,273,634 | ) | | | (45,770,096 | ) | | (6,111,053 | ) | | | (53,845,642 | ) |
| | |
|
| |
|
|
| |
|
| |
|
|
|
Net Increase (Decrease) | | (543,154 | ) | | $ | (4,646,822 | ) | | (3,990,092 | ) | | $ | (35,102,085 | ) |
| | |
|
| |
|
|
| |
|
| |
|
|
|
| |
| | | Short-Term Government Securities Fund
| |
| | | Year Ended March 31,
| |
| | | 2006
| | | 2005
| |
| | | Shares
| | | Amount
| | | Shares
| | | Amount
| |
Sold | | 14,063,143 | | | $ | 98,248,597 | | | 28,457,660 | | | $ | 201,824,477 | |
Issued as reinvestment of dividends | | 448,563 | | | | 3,127,286 | | | 289,189 | | | | 2,044,988 | |
Redeemed | | (22,948,344 | ) | | | (160,073,632 | ) | | (36,290,718 | ) | | | (257,075,591 | ) |
| | |
|
| |
|
|
| |
|
| |
|
|
|
Net Increase (Decrease) | | (8,436,638 | ) | | $ | (58,697,749 | ) | | (7,543,869 | ) | | $ | (53,206,126 | ) |
| | |
|
| |
|
|
| |
|
| |
|
|
|
| |
| | | Short-Term Tax-Exempt Securities Fund
| |
| | | Year Ended March 31,
| |
| | | 2006
| | | 2005
| |
| | | Shares
| | | Amount
| | | Shares
| | | Amount
| |
Sold | | 4,626,627 | | | $ | 32,965,430 | | | 13,545,164 | | | $ | 97,050,761 | |
Issued as reinvestment of dividends | | 27,420 | | | | 195,121 | | | 23,592 | | | | 168,982 | |
Redeemed | | (19,386,165 | ) | | | (138,092,641 | ) | | (29,996,244 | ) | | | (214,883,252 | ) |
| | |
|
| |
|
|
| |
|
| |
|
|
|
Net Increase (Decrease) | | (14,732,118 | ) | | $ | (104,932,090 | ) | | (16,427,488 | ) | | $ | (117,663,509 | ) |
| | |
|
| |
|
|
| |
|
| |
|
|
|
| * | Institutional Shares commenced operations on November 29, 2005. |
6. Guarantees:
In the normal course of business, the Funds enter into contracts that provide general indemnifications. The Funds’ maximum exposure under these arrangements is dependent on future claims that may be made against the Funds and, therefore, cannot be established; however, based on experience, the risk of loss from such claims is considered remote.
7. Legal Proceedings:
The Adviser and Excelsior Funds, Inc., Excelsior Tax-Exempt Funds, Inc., and Excelsior Funds Trust (the “Companies”) were contacted in September, 2003 by the Office of the New York State Attorney General (the “NYAG”), and the Adviser was contacted by the Securities and Exchange Commission (the “SEC”) and later by the Attorney General of the State of West Virginia, in connection with their investigations of practices in the mutual fund industry identified as “market timing” and “late trading” of mutual fund shares (the “Investigations”). The Adviser and the Companies have provided full
77
cooperation with respect to these Investigations and continue to review the facts and circumstances relevant to the Investigations. As disclosed previously by the Adviser and its affiliates, with respect to the Adviser, these investigations have been focusing on circumstances in which a small number of parties were permitted to engage in short-term trading of shares of certain of the Excelsior Funds. The short-term trading activities permitted under these arrangements have been terminated and the Adviser has strengthened its policies and procedures to deter frequent trading of shares of the Excelsior Funds.
The Adviser, certain of its affiliates, the Companies and others have also been named in several class action and derivative lawsuits which allege that the Adviser, certain of its affiliates, the Companies and others allowed certain parties to engage in illegal and improper mutual fund trading practices, which allegedly caused financial injury to the shareholders of certain of the Excelsior Funds managed by the Adviser. Each seeks unspecified monetary damages and related equitable relief.
The class and derivative actions described above have been transferred to the United States District Court for the District of Maryland for coordinated and consolidated pre-trial proceedings. In November 2005, the Maryland court dismissed many of the plaintiffs’ claims in both the investor class action and the derivative lawsuits. Plaintiffs’ claims under Sections 10(b) and 20(a) of the Securities Exchange Act and under Section 36(b) and 48(a) of the Investment Company Act, however, have not been dismissed. Discovery has commenced with respect to plaintiffs’ remaining claims.
While the ultimate outcome of these matters cannot be predicted with any certainty at this time, based on currently available information and consultation with counsel, the Adviser believes that the resolution of the pending Investigations and private lawsuits will not have a material adverse financial impact on the Companies, and further believes that the pending Investigations and private lawsuits are not likely to materially affect the Adviser’s ability to provide investment management services to the Companies.
78
REPORT OF INDEPENDENT REGISTERED PUBLIC ACCOUNTING FIRM
To the Board of Directors/Trustees and Shareholders of
Excelsior Funds, Inc., Excelsior Funds Trust, and Excelsior Tax-Exempt Funds, Inc.
We have audited the accompanying statements of assets and liabilities, including the portfolios of investments, of the Core Bond Fund (formerly, Managed Income Fund), Intermediate-Term Bond Fund (formerly, Intermediate-Term Managed Income Fund), Short-Term Government Securities Fund, High Yield Fund, Long-Term Tax-Exempt Fund, Intermediate-Term Tax-Exempt Fund, Short-Term Tax-Exempt Securities Fund, New York Intermediate-Term Tax-Exempt Fund, and California Short-Intermediate Term Tax-Exempt Income Fund (formerly, California Tax-Exempt Income Fund) (three of the portfolios constituting the Excelsior Funds, Inc., one of the portfolios constituting the Excelsior Funds Trust, and five of the portfolios constituting the Excelsior Tax-Exempt Funds, Inc.) (collectively, the “Funds”) as of March 31, 2006, and the related statements of operations for the year then ended, the statements of changes in net assets for each of the two years in the period then ended, and the financial highlights (Shares) for each of the three years in the period then ended. These financial statements and financial highlights are the responsibility of the Funds’ management. Our responsibility is to express an opinion on these financial statements and financial highlights based on our audits. The financial highlights for each of the years in the two year period ended March 31, 2003 were audited by other auditors whose reports dated May 16, 2003, expressed an unqualified opinion on those financial highlights.
We conducted our audits in accordance with the standards of the Public Company Accounting Oversight Board (United States). Those standards require that we plan and perform the audit to obtain reasonable assurance about whether the financial statements and financial highlights are free of material misstatement. The funds are not required to have, nor were we engaged to perform, an audit of their internal control over financial reporting. Our audits included consideration of internal control over financial reporting as a basis for designing audit procedures that are appropriate in the circumstances, but not for the purpose of expressing an opinion on the effectiveness of the Funds’ internal control over financial reporting. Accordingly, we express no such opinion. An audit also includes examining, on a test basis, evidence supporting the amounts and disclosures in the financial statements, assessing the accounting principles used and significant estimates made by management, as well as evaluating the overall financial statement presentation. Our procedures included confirmation of securities owned as of March 31, 2006, by correspondence with the custodian and brokers; where replies were not received from brokers, we performed other auditing procedures. We believe that our audits provide a reasonable basis for our opinion.
In our opinion, the financial statements and financial highlights referred to above present fairly, in all material respects, the financial position of Core Bond Fund, Intermediate-Term Bond Fund, Short-Term Government Securities Fund, High Yield Fund, Long-Term Tax-Exempt Fund, Intermediate-Term Tax-Exempt Fund, Short-Term Tax-Exempt Securities Fund, New York Intermediate-Term Tax-Exempt Fund, and California Short-Intermediate Tax-Exempt Income Fund as of March 31, 2006, the results of their operations for the year then ended, the changes in their net assets for each of the two years in the period then ended, and the financial highlights for each of the three years in the period then ended, in conformity with accounting principles generally accepted in the United States of America.
DELOITTE & TOUCHE LLP
New York, New York
May 22, 2006
79
Directors/Trustees and Officers of the Excelsior Funds Complex (Unaudited)
Information pertaining to the Directors/Trustees and Officers of Excelsior Fund, Excelsior Tax-Exempt Fund and Excelsior Funds Trust (each a “Company” and collectively, the “Excelsior Funds Complex”) is set forth below. Directors/Trustees who are not deemed to be “interested persons” of the Excelsior Funds Complex as defined in the 1940 Act are referred to as “Independent Board Members.” Directors/Trustees who are deemed to be “interested persons” of the Excelsior Funds Complex are referred to as “Interested Board Members”. The following information is as of May 20, 2006.
On February 24, 2006, the Boards of Directors/Trustees (the “Boards”) of the Companies approved an increase in the size of the Boards to ten (10) directors/trustees (together, the “Directors”) and approved the nomination of Mariann Byerwalter, Nils Hakansson, William A. Hasler and Randall W. Merk (the “Candidates”) as Directors of the Companies, subject to shareholder approval at an upcoming Special Meeting of Shareholders of the Companies (the “Meeting”). Each of the Candidates is currently a director/trustee of the Laudus Funds, the Laudus Variable Insurance Trust (together, the “Laudus Funds”) and of other funds included in the Schwab mutual fund complex for which Charles Schwab Investment Management acts as investment adviser (together, the “Fund Complex”). The Companies are in the same Fund Complex as the Laudus Funds. If approved by Shareholders at the Meeting, Ms. Byerwalter and Messrs. Hakansson and Hasler would become disinterested persons of the Companies under the Investment Company Act of 1940, as amended. Mr. Merk would become an interested person of the Companies.
The Boards also approved the nominations of six existing Directors to be submitted to shareholders for approval at the Meeting: Messrs. Bailey, Collins, Drake, Hall, Lynch and Piel (the “Existing Directors” and, together with the Candidates, the “Nominees”). Frederick S. Wonham, a current Director of the Companies and Chairman of the Board of each Company, has notified the Boards that he intends to resign from the Boards, consistent with the Companies’ retirement age policy, effective as of the date of the Meeting. The Boards have elected Rodman Drake, currently a Director of the Companies and Chairman of their Joint Audit Committee, as the Chairman of the Boards of the Companies effective upon Mr. Wonham’s resignation.
The Boards have proposed to increase the size of each Board from seven to ten so that a single group of Directors (i.e., a unitary board) can oversee each of the Companies and the Laudus Funds. At a meeting held on March 16, 2006, the Laudus Funds’ Boards approved the nominations of the Existing Directors for election to the Laudus Funds’ Boards, subject to approval by shareholders of each of the Laudus Funds. Each of the Candidates has notified the Boards that, even if approved by the Companies’ shareholders at the Meeting, the Candidates will not serve as members of the Boards unless the shareholders of each of the Companies and the Laudus Funds approve the election of each of the other Nominees. Similarly, each of the existing Directors has informed the Laudus Funds Boards that, even if approved by shareholders of the Laudus Funds at their shareholders meeting, the Existing Directors will not serve as members of the Laudus Funds Boards unless the shareholders of each of the Companies and the Laudus Funds approve the election of each of the other Nominees.
80
| | | | | | |
Name and Address(1) Age Time Served with the Excelsior Funds Complex
| | Principal Occupation
During the Past Five Years
| | Number of
Portfolios in Fund Complex Overseen by Director/Trustee(3)
| | Other Directorships Held by Director/Trustee(4)
|
DIRECTORS/TRUSTEES(2) INDEPENDENT BOARD MEMBERS | | | | |
Frederick S. Wonham
Age: 75
Since 1997 | | Retired. Chairman of the Boards and Director (since 1997) and President and Treasurer (from 1995 to February 2002) of Excelsior Funds, Inc. and Excelsior Tax-Exempt Funds, Inc.; Chairman of the Board and Trustee (since 1997) and President and Treasurer (from 1995 to February 2002) of Excelsior Funds Trust. | | 29 | | None. |
| | | |
Rodman L. Drake
Age: 63
Since 1994 | | Director and Chairman of Audit Committee of Excelsior Funds, Inc. and Excelsior Tax-Exempt Funds, Inc. (since 1996); Trustee of Excelsior Funds Trust (since 1994); Co-Founder of Baringo Capital LLC (since 2002); President, Continuation Investments Group, Inc. (from 1997 to 2001). | | 29 | | Director and Chairman, Hyperion Total Return Fund, Inc., and Hyperion Strategic Mortgage Fund Inc. (since 1991); Director, Jackson Hewitt Tax Services, Inc. (since June 2004); Director, Student Loan Corporation (since May 2005). |
| | | |
Morrill Melton ("Mel") Hall, Jr.
Age: 61
Since 2000 | | Director of Excelsior Funds, Inc. and Excelsior Tax-Exempt Funds, Inc. (since 2000); Trustee of Excelsior Funds Trust (since 2000); Chairman (since 1984) and Chief Executive Officer (since 1991), Comprehensive Health Services, Inc. (health care management and administration). | | 29 | | None. |
| | | |
Roger M. Lynch
Age: 64
Since 2001 | | Retired. Director of Excelsior Funds, Inc. and Excelsior Tax- Exempt Funds, Inc. and Trustee of Excelsior Funds Trust (since 2001); President, Corporate Asset Funding Co., Inc. (asset securitization) (from 1987 to 1999); Limited Partner (from 1986 to 1999), Goldman Sachs & Co. | | 29 | | None. |
| | | |
Jonathan Piel
Age: 67
Since 1994 | | Director and Chairman of Nominating Committee, Excelsior Funds, Inc. and Excelsior Tax-Exempt Funds, Inc. (since 1996); Trustee, Excelsior Funds Trust (since 1994); Cable Television producer and website designer. The Editor Scientific American (from 1984 to 1986), and Vice President, Scientific American, Inc. (from 1986 to 1994); Director, National Institute of Social Sciences; member, Advisory Board. The Stone Age Institute, Bloomington Indiana. | | 29 | | None. |
81
| | | | | | |
Name and Address(1) Age Time Served with the Excelsior Funds Complex
| | Principal Occupation
During the Past Five Years
| | Number of
Portfolios in Fund Complex Overseen by Director/Trustee(3)
| | Other Directorships Held by Director/Trustee(4)
|
John. D. Collins
Age: 67
Since 2005 | | Retired. Director, Excelsior Funds, Inc. and Excelsior Tax-Exempt Funds, Inc. (since 2005); Trustee, Excelsior Funds Trust (since 2005). Consultant, KPMG, LLP (from July 1999 to June 2000); Partner, KPMG, LLP (from March 1962 to June 1999). | | 29 | | Director, Mrs. Fields’ Famous Brands LLC (consumer products) (since December 2004). |
| INTERESTED BOARD MEMBER(5) | | | | |
James L. Bailey
114 West 47th Street
New York, NY 10036
Age: 60
Since 2004 | | Chief Operating Officer of U.S. Trust Corporation (since December 2004) and Executive Vice President of U.S. Trust Corporation and United States Trust Company of New York (since 2003); President, Excelsior Funds, Inc., Excelsior Tax-Exempt Funds, Inc. and Excelsior Funds Trust (from 2003 to July 2004); Consultant in the financial services industry (from August 2000 to January 2003); Executive Vice President of Citicorp (from 1992 to August 2000). | | 29 | | None. |
| OFFICERS | | | | | | |
Joseph Trainor, CFA
Age: 44
114 West 47th Street
New York, NY 10036 | | Managing Director of United States Trust Company of New York (since 2003) and President, U.S. Trust Institutional; President of MFS Institutional Advisors (from 1998 to 2002). | | N/A | | N/A |
| | | |
George Pereira
Age: 42
101 Montgomery St.
San Francisco, CA 94104 | | Senior Vice President and Chief Financial Officer, Charles Schwab Investment Management, Inc.; Director, Charles Schwab Asset Management (Ireland) Limited. From December 1999 to November 2004, Sr. Vice President, Financial Reporting. Charles Schwab & Co., Inc. From September 1999 to December 1999, Chief Financial Officer, Commerzbank Capital Markets. Prior to September 1999, Managing Director at the New York Stock Exchange. | | N/A | | N/A |
| | | |
Stefanie A. Firtell
Age: 32
114 West 47th Street
New York, NY 10036 | | Vice President, United States Trust Company of New York (since April 2005); Compliance Officer and Head of Regulatory Responses, Assistant Vice President, Deutsche Asset Management (from 2003 to 2005); Assistant Corporate Secretary, Triare Companies, Inc. (from 2002 to 2003); Attorney, Paul, Weiss, Rifkind, Wharton & Garrison (from 2001 to 2002); and Attorney, Cadwalder Wickersham & Taft (from 2000 to 2001). | | N/A | | N/A |
82
| | | | | | |
Name and Address(1) Age Time Served with the Excelsior Funds Complex
| | Principal Occupation
During the Past Five Years
| | Number of
Portfolios in Fund Complex Overseen by Director/Trustee(3)
| | Other Directorships Held by Director/Trustee(4)
|
Wyndham Clark
Age: 47
225 High Ridge Road
Stamford, CT 06905 | | Vice President and AML Officer, U.S. Trust Company, N.A. (since 2003); Vice President and Deputy Director Risk Management. IBJ Whitehall (banking) (from 2001 to 2002); and Vice President and Chief Risk Officer, EMAC, LLC (commercial lender, asset backed security issuer) (from 1999 to 2001). | | N/A | | N/A |
| | | |
Petros (Peter) L. Tsirigotis
Age: 37
114 West 47th Street
New York, NY 10036 | | Senior Vice President and Assistant General Counsel, U.S. Trust (since September 2005); Vice President and Corporate Counsel, Prudential Financial (September 2004 to September 2005); Associate, Schulte Roth and Zabel LLP (November 2002 to September 2004) and Dechert LLP (August 2000 to November 2002). Prior to August 2000, Mr. Tsirigotis was an Attorney/Advisor (Division of Investment Management) and Financial Economist (Office of Economic Analysis) with the Securities and Exchange Commission in Washington, D.C. | | N/A | | N/A |
| (1) | Each independent director/trustee may be contacted by writing to Excelsior Funds, 225 High Ridge Road, Stamford, CT 06905. |
| (2) | Each director/trustee shall hold office until the election and qualification of his or her successor, or until he or she sooner dies, resigns or is removed. The officers of each Company shall hold office for a one year term and until their respective successors are chosen and qualified, or in each case until he or she sooner dies, resigns, is removed, or becomes disqualified in accordance with each Company’s by-laws. |
| (3) | The Excelsior Funds Complex consists of all registered investment companies (Excelsior Funds Inc., Excelsior Tax-Exempt Funds, Inc. and Excelsior Funds Trust) for which U.S. Trust serves as investment adviser. As of May 20, 2006, the Excelsior Funds Complex consisted of 29 Funds. |
| (4) | Directorships of companies required to report to the Securities and Exchange Commission under the Securities Exchange Act of 1934 (i.e., “public companies”) or other investment companies registered under the 1940 Act. |
| (5) | “Interested person” of the Company is defined in the 1940 Act. Mr. Bailey is considered an “interested person” because of his affiliation with the Adviser. |
For more information regarding the Directors/Trustees and Officers, please refer to the Statement of Additional Information, which is available upon request by calling 1-800-446-1012.
83
DISCLOSURE OF FUND EXPENSES (Unaudited)
We believe it is important for you to understand the impact of fees regarding your investment. As a shareholder of the fund, you incur ongoing, or operating costs, which include costs for portfolio management, administrative services, and shareholder reports (like this one), among others. Operating expenses, which are deducted from a fund’s gross income, directly reduce the investment return of the fund. A fund’s expenses are expressed as a percentage of its average net assets. This figure is known as the expense ratio. The following examples are intended to help you understand the ongoing costs (in dollars) of investing in your fund and to compare these costs with those of other mutual funds. The examples are based on an investment of $1,000 made at the beginning of the period shown and held for the entire period.
The table on the following page illustrates your fund’s costs in two ways.
| | • | | Actual expenses. This section provides information about actual account values and actual expenses based on the Funds’ actual return for the period. This section is designed to help you to estimate the actual expenses after fee waivers that you paid over the period. The “Ending Account Value” shown is derived from the fund’s actual return, and the fourth column shows the dollar amount that would have been paid by an investor who started with $1,000 in the fund. You may use the information here, together with the amount you invested, to estimate the expenses that you paid over the period. |
To do so, simply divide your account value by $1,000 (for example, an $8,600 account value divided by $1,000 = $8.6), then multiply the result by the number given for your fund under the heading “Expenses Paid During Period”.
| | • | | Hypothetical expenses. This section provides information about hypothetical account values and hypothetical expenses that would have been incurred by an investor in the Fund based on an assumed rate of return of 5% per year before expenses. This section is designed to help you compare your fund’s costs with those of other mutual funds. It assumes that the fund had a return of 5% before expenses during the year, but that the expense ratio is unchanged. In this case, because the return used is not the fund’s actual return, the results cannot be used to estimate the actual ending account balance or expenses you paid for the period. You may use this information to compare the ongoing costs of investing in your Fund and other funds. To do so, compare this 5% hypothetical example with the 5% hypothetical examples that appear in shareholder reports of other funds. |
84
DISCLOSURE OF FUND EXPENSES (Unaudited) (Continued)
Please note that the expenses shown in the table are meant to highlight and help you compare ongoing costs only, which are described in the Prospectus. Therefore, the hypothetical example is useful in comparing ongoing costs only, and will not help you determine the relative total costs of owning different funds.
| | | | | | | | | | | | |
| | | Beginning
Account
Value
10/01/2005
| | Ending
Account
Value
03/31/2006
| | Annualized
Expense
Ratios*
| | | Expenses
Paid
During
Period**
|
Actual Fund Return | | | | | | | | | | | | |
California Short-Intermediate Term Tax-Exempt Income Fund — Shares | | $ | 1,000.00 | | $ | 1,001.70 | | 0.50 | % | | $ | 2.50 |
Core Bond Fund — Shares | | | 1,000.00 | | | 998.40 | | 0.90 | | | | 4.48 |
High Yield Fund — Shares | | | 1,000.00 | | | 1,030.00 | | 1.05 | | | | 5.31 |
Intermediate-Term Bond Fund — Shares | | | 1,000.00 | | | 1,001.20 | | 0.75 | | | | 3.74 |
Intermediate-Term Tax-Exempt Fund — Shares | | | 1,000.00 | | | 1,002.40 | | 0.65 | | | | 3.24 |
Long-Term Tax-Exempt Fund — Shares | | | 1,000.00 | | | 1,006.90 | | 0.80 | | | | 4.00 |
New York Intermediate-Term Tax-Exempt Fund — Shares | | | 1,000.00 | | | 1,005.10 | | 0.80 | | | | 4.00 |
Short-Term Government Securities Fund — Shares | | | 1,000.00 | | | 1,010.60 | | 0.68 | | | | 3.41 |
Short-Term Tax-Exempt Securities Fund — Shares | | | 1,000.00 | | | 1,004.50 | | 0.60 | | | | 3.00 |
| | | | |
Hypothetical 5% Return | | | | | | | | | | | | |
California Short-Intermediate Term Tax-Exempt Income Fund — Shares | | | 1,000.00 | | | 1,022.44 | | 0.50 | | | | 2.52 |
Core Bond Fund — Shares | | | 1,000.00 | | | 1,020.44 | | 0.90 | | | | 4.53 |
High Yield Fund — Shares | | | 1,000.00 | | | 1,019.70 | | 1.05 | | | | 5.29 |
Intermediate-Term Bond Fund — Shares | | | 1,000.00 | | | 1,021.19 | | 0.75 | | | | 3.78 |
Intermediate-Term Tax-Exempt Fund — Shares | | | 1,000.00 | | | 1,021.69 | | 0.65 | | | | 3.28 |
Long-Term Tax-Exempt Fund — Shares | | | 1,000.00 | | | 1,020.94 | | 0.80 | | | | 4.03 |
New York Intermediate-Term Tax-Exempt Fund — Shares | | | 1,000.00 | | | 1,020.94 | | 0.80 | | | | 4.03 |
Short-Term Government Securities Fund — Shares | | | 1,000.00 | | | 1,021.54 | | 0.68 | | | | 3.43 |
Short-Term Tax-Exempt Securities Fund — Shares | | | 1,000.00 | | | 1,021.94 | | 0.60 | | | | 3.02 |
| * | Annualized expense ratios of certain funds are after fee waivers and expense reimbursements by the investment adviser. Absent such waivers and reimbursements, expenses paid during the period would have been greater. |
| ** | Expenses are equal to the Fund’s annualized expense ratio multiplied by the average account value over the period, multiplied by the number of days in the most recent fiscal half-year (182) then divided by 365. |
85
AR-FIXEDINC-0306

MONEY MARKET
FUNDS
ANNUAL REPORT
March 31, 2006
TABLE OF CONTENTS
For shareholder account information, current price and yield quotations, or to make an initial purchase or obtain a prospectus, call 1-800-446-1012, from overseas, call 617-483-7297.
| · | | Internet Address: http://www.excelsiorfunds.com |
This report must be preceded or accompanied by a current prospectus.
A description of the policies and procedures that Excelsior Funds use to determine how to vote proxies relating to portfolio securities, as well as information relating to how a Fund voted proxies relating to portfolio securities during the most recent 12-month period ended June 30, is available (i) without charge, upon request, by calling 1-800-446-1012, or (ii) by accessing the Excelsior Funds’ internet address and (iii) on the Commission’s website at http://www.sec.gov.
Excelsior Funds file their June 30 and December 31 schedule of portfolio holdings with the Securities and Exchange Commission, on Form N-Q, within sixty days after the applicable reporting period. Excelsior Funds Form N-Q is available on the Commission’s website at http://www.sec.gov, and may be reviewed and copied at the Commission’s Public Reference Room in Washington, DC. Information on the operation of the Public Reference Room may be obtained by calling 1-800-SEC-0330.
A schedule of each Fund’s portfolio holdings, as of the end of the prior month, is also available on the Funds’ website. This schedule is updated monthly, typically by the 15th calendar day, after the end of each month. The Funds may terminate or modify this policy at anytime.
You should consider the Funds’ investment objectives, risks and expenses carefully before you invest. Information about these and other important subjects is in the Funds’ prospectus, which you should read carefully before investing.
Excelsior Funds, Inc. and Excelsior Tax-Exempt Funds, Inc. are distributed by BISYS Fund Services Limited Partnership.
You may write to Excelsior Funds, Inc. and Excelsior Tax-Exempt Funds, Inc. at the following address:
Excelsior Funds
P.O. Box 8529
Boston, MA 02266-8529
SHARES IN THE FUNDS ARE NOT DEPOSITS OR OBLIGATIONS OF, OR GUARANTEED OR ENDORSED BY, UNITED STATES TRUST COMPANY OF NEW YORK, U.S. TRUST COMPANY, N.A., THEIR PARENT AND AFFILIATES AND SHARES ARE NOT INSURED BY THE FEDERAL DEPOSIT INSURANCE CORPORATION, THE FEDERAL RESERVE BOARD, OR ANY OTHER AGENCY. FUND SHARES ARE NOT INSURED OR GUARANTEED BY THE U.S. GOVERNMENT. ALTHOUGH THE FUNDS SEEK TO PRESERVE THE VALUE OF YOUR INVESTMENT AT $1.00 PER SHARE, IT IS POSSIBLE TO LOSE MONEY BY INVESTING IN THE FUNDS.
LETTER TO SHAREHOLDERS
March 31, 2006
Dear Valued Excelsior Fund Shareholder,
I am pleased to bring you the annual report for the year ended March 31, 2006 for the Excelsior Funds. The funds in this report are part of the Excelsior Fund family which had over $18 billion in assets as of the end of the report period and includes a wide array of asset classes and investment strategies designed to meet the individual investor’s needs for performance and tax sensitivity.
By now, you would have received information about changes to the administrative and non-advisory services provided to the Excelsior Funds. As a result, the Excelsior Funds and the Laudus Funds, an affiliated fund family, now share certain complex-wide administrative, compliance, marketing and other functions.
We are pleased with the transition, and remain optimistic that shareholders will approve the board of directors’ recommendation to elect members to jointly oversee the two fund families. It is anticipated that the new unified board will strengthen the oversight provided on behalf of fund shareholders and may result in certain long-term cost and operating efficiencies. All votes are important, so I encourage you to vote your shares as soon as possible if you haven’t already done so.
Given these changes, I want to assure you that the most important aspects of the Excelsior Funds will remain the same. Specifically, the fund management and investment process provided by U.S. Trust, as advisor to the Funds, as well as the funds’ emphasis on enduring performance, will not change.
In closing, we at Excelsior Funds remain committed to helping you reach your long-term investment goals. Thank you for investing with us.
Sincerely,

Evelyn Dilsaver
President
1
Excelsior Funds, Inc.
Portfolio of Investments — March 31, 2006
Government Money Fund
| | | | | |
Principal Amount
| | Security
Description
| | Value
|
| | | | | | |
| U.S. GOVERNMENT & AGENCY OBLIGATIONS — 96.48% |
| $ 96,400,000 | | Federal Home Loan Bank, Discount Note, 2.13%, 04/03/06 | | $ | 96,375,254 |
| 50,000,000 | | Federal Home Loan Bank, Discount Note, 4.52%, 04/05/06 | | | 49,974,889 |
| 150,000,000 | | Federal Home Loan Bank, Discount Note, 4.67%, 04/26/06 | | | 149,513,541 |
| 100,000,000 | | Tennessee Valley Authority, Discount Note, 4.67%, 04/06/06 | | | 99,935,139 |
| | | | |
|
|
| | | TOTAL U.S. GOVERNMENT & AGENCY OBLIGATIONS
(Cost $395,798,823) | | | 395,798,823 |
| | | | |
|
|
Shares
| | | | |
| REGISTERED INVESTMENT COMPANY — 0.30% |
| 1,224,917 | | Dreyfus Treasury Prime Cash Management Fund | | | 1,224,917 |
| | | | |
|
|
| | | TOTAL REGISTERED INVESTMENT COMPANY
(Cost $1,224,917) | | | 1,224,917 |
| | | | |
|
|
| | | | | |
Principal Amount
| | Security
Description
| | Value
|
| | | | | | |
| REPURCHASE AGREEMENT — 3.66% |
| $ 15,000,000 | | Morgan Stanley, 4.80%, dated 03/31/06, due 04/03/06, to be repurchased at $15,006,000 (collateralized by U.S. Government obligations, ranging in par value $725,000-$9,685,000, 0.00%-5.15%, 07/24/06-03/08/12; total market value $15,335,814) | | $ | 15,000,000 |
| | | | |
|
|
| | | TOTAL REPURCHASE AGREEMENT
(Cost $15,000,000) | | | 15,000,000 |
| | | | |
|
|
| | | | | | | |
TOTAL INVESTMENTS
(Cost $412,023,740) | | 100.44 | % | | $ | 412,023,740 | |
LIABILITIES IN EXCESS OF OTHER ASSETS | | (0.44 | ) | | | (1,795,785 | ) |
| | |
|
| |
|
|
|
NET ASSETS | | 100.00 | % | | $ | 410,227,955 | |
| | |
|
| |
|
|
|
Discount Note—The rate reported is the discount rate at the time of purchase.
The summary of the Fund’s investments as of March 31, 2006 is as follows: (Unaudited)
| | | | | | | |
Portfolio Diversification
| | % of
Net
Assets
| | | Value
| |
U.S. Government & Agency Obligations | | 96.48 | % | | $ | 395,798,823 | |
Repurchase Agreement | | 3.66 | | | | 15,000,000 | |
Registered Investment Company | | 0.30 | | | | 1,224,917 | |
| | |
|
| |
|
|
|
Total Investments | | 100.44 | % | | $ | 412,023,740 | |
Liabilities in Excess of Other Assets | | (0.44 | ) | | | (1,795,785 | ) |
| | |
|
| |
|
|
|
Net Assets | | 100.00 | % | | $ | 410,227,955 | |
| | |
|
| |
|
|
|
See Notes to Financial Statements.
2
Excelsior Funds, Inc.
Portfolio of Investments — March 31, 2006
Money Fund
| | | | | |
Principal Amount
| | Security
Description
| | Value
|
| | | | | | |
| CERTIFICATES OF DEPOSIT — 12.86% |
| $75,000,000 | | First Tennessee Bank, 4.78%, 04/28/06 | | $ | 75,000,000 |
| 75,000,000 | | Washington Mutual Corp., 4.80%, 05/11/06 | | | 75,000,000 |
| 50,000,000 | | Wells Fargo Co., 4.76%, 04/10/06 | | | 50,000,000 |
| | | | |
|
|
| | | TOTAL CERTIFICATES OF DEPOSIT
(Cost $200,000,000) | | | 200,000,000 |
| | | | |
|
|
| COMMERCIAL PAPER — 84.78% |
| 75,000,000 | | American Express Credit Corp., Discount Note, 4.54%, 04/03/06 | | | 74,981,082 |
| 50,000,000 | | Bank of America Corp., Discount Note,
4.53%, 04/03/06 | | | 49,987,417 |
| 75,000,000 | | CIT Group, Inc., Discount Note,
4.55%, 04/03/06 | | | 74,981,042 |
| 75,000,000 | | Citigroup Funding, Inc., Discount Note,
4.54%, 04/03/06 | | | 74,981,082 |
| 50,000,000 | | Dexia Delaware, Discount Note,
4.54%, 04/03/06 | | | 49,987,389 |
| 70,000,000 | | Gannett Co., Discount Note,
4.54%, 04/04/06(a) | | | 69,973,517 |
| 70,000,000 | | General Electric Capital Corp., Discount Note,
4.53%, 04/03/06 | | | 69,982,383 |
| 75,000,000 | | Goldman Sachs Group, Inc., Discount Note,
4.77%, 04/05/06 | | | 74,960,250 |
| 75,000,000 | | HSBC, Discount Note,
4.55%, 04/03/06 | | | 74,981,042 |
| 50,000,000 | | International Lease Finance Corp., Discount Note,
4.53%, 04/04/06 | | | 49,981,125 |
| 75,000,000 | | Merrill Lynch & Co., Inc., Discount Note,
4.68%, 04/03/06 | | | 74,980,500 |
| 50,000,000 | | Preferred Receivables Funding Corp., Discount Note,
4.75%, 04/03/06(a) | | | 49,986,806 |
| | | | | |
Principal Amount
| | Security
Description
| | Value
|
| | | | | | |
| COMMERCIAL PAPER — (continued) |
| $75,000,000 | | Prudential Funding Corp., Discount Note,
4.55%, 04/03/06 | | $ | 74,981,042 |
| 73,925,000 | | Ranger Funding Co. llc, Discount Note,
4.56%, 04/03/06(a) | | | 73,906,272 |
| 50,000,000 | | Royal Bank of Scotland plc, Discount Note, 4.55%, 04/03/06 | | | 49,987,361 |
| 75,000,000 | | Societe Generale, Discount Note,
4.55%, 04/03/06 | | | 74,981,021 |
| 75,000,000 | | Three Pillars Funding, Discount Note,
4.58%, 04/03/06(a) | | | 74,980,917 |
| 70,000,000 | | UBS Finance Corp., Discount
Note, 4.55%, 04/03/06 | | | 69,982,325 |
| 60,000,000 | | Windmill Funding Corp., Discount Note,
4.55%, 04/03/06(a) | | | 59,984,833 |
| 50,000,000 | | Yorktown Capital, Discount Note,
4.61%, 04/05/06(a) | | | 49,974,389 |
| | | | |
|
|
| | | TOTAL COMMERCIAL PAPER
(Cost $1,318,541,795) | | | 1,318,541,795 |
| | | | |
|
|
Shares
| | | | |
| REGISTERED INVESTMENT COMPANY — 0.08% |
| 1,178,553 | | Dreyfus Government Cash Management Fund | | | 1,178,553 |
| | | | |
|
|
| | | TOTAL REGISTERED INVESTMENT COMPANY
(Cost $1,178,553) | | | 1,178,553 |
| | | | |
|
|
See Notes to Financial Statements.
3
Excelsior Funds, Inc.
Portfolio of Investments — March 31, 2006
Money Fund — (continued)
| | | | | |
Principal Amount
| | Security
Description
| | Value
|
| | | | | | |
| REPURCHASE AGREEMENT — 2.64% | | |
| $41,000,000 | | Morgan Stanley, 4.80%, dated 03/31/06, due 04/03/06, to be repurchased at $41,016,400 (collateralized by U.S. Government obligations ranging in par value $15,000-$20,000,000, 2.75%-4.725%, 06/30/06-03/30/07; total market value $41,832,384) | | $ | 41,000,000 |
| | | | |
|
|
| | | TOTAL REPURCHASE AGREEMENT
(Cost $41,000,000) | | | 41,000,000 |
| | | | |
|
|
| | | | | | | |
TOTAL INVESTMENTS
(Cost $1,560,720,348) | | 100.36 | % | | $ | 1,560,720,348 | |
LIABILITIES IN EXCESS OF OTHER ASSETS | | (0.36 | ) | | | (5,584,676 | ) |
| | |
|
| |
|
|
|
NET ASSETS | | 100.00 | % | | $ | 1,555,135,672 | |
| | |
|
| |
|
|
|
| (a) | Security exempt from registration under Rule 144A of the Securities Act of 1933. This security may be resold in transactions exempt from registration, normally to qualified institutional buyers. At March 31, 2006, these securities amounted to $378,806,734 or 24.36% of net assets. |
Discount Note—The rate reported is the discount rate at the time of purchase.
llc—Limited Liability Company
plc—Public Limited Company
The summary of the Fund’s investments as of March 31, 2006 is as follows: (Unaudited)
| | | | | | | |
Portfolio Diversification
| | % of
Net
Assets
| | | Value
| |
Commercial Paper | | 84.78 | % | | $ | 1,318,541,795 | |
Certificates of Deposit | | 12.86 | | | | 200,000,000 | |
Repurchase Agreement | | 2.64 | | | | 41,000,000 | |
Registered Investment Company | | 0.08 | | | | 1,178,553 | |
| | |
|
| |
|
|
|
Total Investments | | 100.36 | % | | $ | 1,560,720,348 | |
Liabilities in Excess of Other Assets | | (0.36 | ) | | | (5,584,676 | ) |
| | |
|
| |
|
|
|
Net Assets | | 100.00 | % | | $ | 1,555,135,672 | |
| | |
|
| |
|
|
|
See Notes to Financial Statements.
4
Excelsior Tax-Exempt Funds, Inc.
Portfolio of Investments — March 31, 2006
New York Tax-Exempt Money Fund
| | | | | |
Principal Amount
| | Security Description
| | Value
|
| | | | | | |
| TAX-EXEMPT CASH EQUIVALENT SECURITIES — 67.31% |
| $9,500,000 | | Carmel, New York, Central School District General Obligation Bonds, Bond Anticipation Notes,
4.50%, 07/21/06 | | $ | 9,535,565 |
| 2,500,000 | | Corning, New York, City School District General Obligation Bonds, Bond Anticipation Notes, 3.75%, 07/12/06 | | | 2,501,083 |
| 15,710,000 | | Erie County, New York, Industrial Development Agency Revenue Bonds, School Facilities, TOCS, Series J, (FSA),
3.20%, 05/01/12(a)(b) | | | 15,710,000 |
| 5,800,000 | | Long Island Power Authority, New York, Electric Systems Revenue Bonds, Series 7B, (MBIA),
3.14%, 04/01/25(a) | | | 5,800,000 |
| 9,955,000 | | New York City, New York, Municipal Water Finance Authority Revenue Bonds, PUTTER, Series 622, (AMBAC),
3.21%, 06/15/12(a)(b) | | | 9,955,000 |
| 8,995,000 | | New York City, New York, Municipal Water Finance Authority Revenue Bonds, Water & Sewer Systems Floating Rate Trust Certificates, Series 726X, (MBIA),
3.19%, 06/15/27(a)(b) | | | 8,995,000 |
| 2,700,000 | | New York City, New York, Municipal Water Finance Authority, Water & Sewer Systems Revenue Bonds,
Series F-1,
3.18%, 06/15/33(a) | | | 2,700,000 |
| 10,870,000 | | New York City, New York, Transitional Finance Authority Revenue Bonds,
EAGLE, Class A,
3.20%, 02/01/31(a)(b) | | | 10,870,000 |
| | | | | |
Principal Amount
| | Security Description
| | Value
|
| | | | | | |
TAX-EXEMPT CASH EQUIVALENT
SECURITIES — (continued) |
| $9,000,000 | | New York City, New York, Transitional Finance Authority Revenue Bonds, Floating Rate Certificates, Series 283,
3.19%, 11/15/18(a)(b) | | $ | 9,000,000 |
| 10,000,000 | | New York City, New York, Transitional Finance Authority Revenue Bonds, Floating Rate Certificates, Series 536, (MBIA),
3.19%, 05/01/15(a)(b) | | | 10,000,000 |
| 4,995,000 | | New York City, New York, Transitional Finance Authority Revenue Bonds, PUTTER, Series 307, (AMBAC),
3.21%, 08/01/19(a)(b) | | | 4,995,000 |
| 5,485,000 | | New York City, New York, Transitional Finance Authority Revenue Bonds, PUTTER, Series 471, (FGIC),
3.21%, 02/01/11(a)(b) | | | 5,485,000 |
| 8,000,000 | | New York State, Dormitory Authority Commercial Paper,
3.30%, 05/10/06 | | | 8,000,000 |
| 9,830,000 | | New York State, Dormitory Authority Commercial Paper, Columbia University,
3.14%, 04/11/06 | | | 9,830,000 |
| 10,420,000 | | New York State, Dormitory Authority Commercial Paper, Cornell University,
3.16%, 04/10/06 | | | 10,420,000 |
| 8,295,000 | | New York State, Housing
Finance Agency Revenue
Bonds, 10 Barclay Street,
Series A, (Fannie Mae),
3.16%, 11/15/37(a) | | | 8,295,000 |
| 2,300,000 | | New York State, Housing Finance Agency, State Personal Income Tax Revenue Bonds, Series C, (FGIC),
3.16%, 03/15/33(a) | | | 2,300,000 |
See Notes to Financial Statements.
5
Excelsior Tax-Exempt Funds, Inc.
Portfolio of Investments — March 31, 2006
New York Tax-Exempt Money Fund — (continued)
| | | | | |
Principal Amount
| | Security Description
| | Value
|
| | | | | | |
TAX-EXEMPT CASH EQUIVALENT
SECURITIES — (continued) |
| $ 4,740,000 | | New York State, Mortgage Agency Revenue Bonds, Floating Rate Certificates, Series 1199,
3.19%, 10/01/27(a)(b) | | $ | 4,740,000 |
| 10,000,000 | | New York State, Munitops Certificates Trust, Revenue Bonds, (FSA),
3.20%, 12/15/12(a)(b) | | | 10,000,000 |
| 15,000,000 | | New York State, Munitops Certificates Trust, Revenue Bonds, (FSA),
3.20%, 08/01/13(a)(b) | | | 15,000,000 |
| 9,000,000 | | New York State, Power Authority Commercial Paper,
3.23%, 05/04/06 | | | 9,000,000 |
| 9,250,000 | | New York State, Power Authority General Obligation Bonds,
3.35%, 03/01/16(a) | | | 9,250,000 |
| 8,265,000 | | New York State, Sales Tax Asset Receivable Corporation Revenue Bonds, PUTTER, Series 564, (MBIA),
3.21%, 10/15/12(a)(b) | | | 8,265,000 |
| 23,225,000 | | New York State, Thruway Authority Revenue Bonds, EAGLE, Class A, (AMBAC),
3.20%, 01/01/30(a)(b) | | | 23,224,999 |
| 3,100,000 | | New York State, Thruway Authority Revenue Bonds, Highway & Bridge Trust Fund, PUTTER, Series 1047, (AMBAC),
3.21%, 04/01/13(a)(b) | | | 3,100,000 |
| 6,100,000 | | New York State, Thruway Authority Revenue Bonds, Highway & Bridge Trust Fund, TOCS, Series JJ, (FGIC),
3.20%, 10/10/13(a)(b) | | | 6,100,000 |
| 16,000,000 | | New York State, Triborough Bridge & Tunnel Authority Revenue Bonds, EAGLE, Class A, (MBIA),
3.20%, 01/01/32(a)(b) | | | 16,000,000 |
| | | | | |
Principal Amount
| | Security Description
| | Value
|
| | | | | | |
TAX-EXEMPT CASH EQUIVALENT
SECURITIES — (continued) |
| $ 2,760,000 | | New York State, Triborough Bridge & Tunnel Authority Revenue Bonds, Series B,
3.17%, 01/01/33(a) | | $ | 2,760,000 |
| 10,000,000 | | Newburgh, New York, City School District General Obligation Bonds, Bond Anticipation Notes,
4.00%, 09/28/06 | | | 10,036,711 |
| 5,000,000 | | Niagara Falls, New York, Bridge Commission Toll Authority Revenue Bonds, Series A, (FGIC),
3.13%, 10/01/19(a) | | | 5,000,000 |
| 10,000,000 | | Suffolk County, New York, General Obligation Bonds, Tax Anticipation Notes,
4.00%, 08/16/06 | | | 10,029,908 |
| 12,600,000 | | Suffolk County, New York, Water Authority Revenue Bonds, Bond Anticipation Notes,
3.12%, 01/01/08(a) | | | 12,600,000 |
| 9,420,000 | | Sullivan County, New York, General Obligation Bond Anticipation Notes,
3.75%, 07/20/06 | | | 9,425,969 |
| 12,500,000 | | Syosset, New York, Central School District General Obligation Bonds, Tax Anticipation Notes,
3.75%, 06/29/06 | | | 12,515,618 |
| | | | |
|
|
| | | TOTAL TAX-EXEMPT CASH EQUIVALENT SECURITIES (Cost $301,439,853) | | | 301,439,853 |
| | | | |
|
|
TAX-EXEMPT CASH EQUIVALENT SECURITIES —
BACKED BY LETTERS OF CREDIT — 25.90% |
| 2,500,000 | | Allegany County, New York, General Obligation Bonds, Bond Anticipation Notes, (JP MORGAN CHASE & CO.),
4.25%, 09/27/06 | | | 2,511,944 |
See Notes to Financial Statements.
6
Excelsior Tax-Exempt Funds, Inc.
Portfolio of Investments — March 31, 2006
New York Tax-Exempt Money Fund — (continued)
| | | | | |
Principal Amount
| | Security Description
| | Value
|
| | | | | | |
TAX-EXEMPT CASH EQUIVALENT
SECURITIES — (continued) |
| $ 6,400,000 | | Long Island Power Authority, New York, Electric Systems Revenue Bonds, Series 1A, (BAYERISCHE LANDESBANK-80%/LANDESBANK BADEN-WUERTTEMBERG-20%),
3.16%, 05/01/33(a) | | $ | 6,400,000 |
| 4,660,000 | | Monroe County, New York, Industrial Development Agency Revenue Bonds, Civic Facilities, Greater Rochester YMCA Project, (MANUFACTURERS & TRADERS),
3.22%, 04/01/31(a) | | | 4,660,000 |
| 9,630,000 | | New York City, New York, General Obligation Bonds, Sub-Series B8, (BAYERISCHE LANDESBANK),
3.15%, 08/15/24(a) | | | 9,630,000 |
| 8,800,000 | | New York City, New York, Industrial Development Agency Revenue Bonds, Civic Facilities, Jewish Community Center Project, (MANUFACTURERS & TRADERS),
3.23%, 03/01/30(a) | | | 8,800,000 |
| 15,320,000 | | New York City, New York, Industrial Development Agency Revenue Bonds, Special Facilities, New York Stock Exchange Project, Series B, (BANK OF AMERICA N.A.),
3.15%, 05/01/33(a) | | | 15,320,000 |
| 10,000,000 | | New York City, New York, Trust For Cultural Restoration Revenue Bonds, WNYC Radio, Inc., (WACHOVIA BANK N.A.),
3.14%, 04/01/26(a) | | | 10,000,000 |
| 10,000,000 | | New York City, New York, Water & Sewage Authority Commercial Paper, Series 1, (DEXIA CREDIT LOCAL-50%/JP MORGAN CHASE & CO.-50%),
3.11%, 04/13/06 | | | 10,000,000 |
| | | | | |
Principal Amount
| | Security Description
| | Value
|
| | | | | | |
TAX-EXEMPT CASH EQUIVALENT
SECURITIES — (continued) |
| $ 1,200,000 | | New York State, Commercial Paper, (BAYERISCHE LANDESBANK-33%/JP MORGAN CHASE & CO.-33%/LANDESBANK HESSEN-THURINGEN-33%),
3.24%, 06/07/06 | | $ | 1,200,000 |
| 3,100,000 | | New York State, Dormitory Authority Commercial Paper, Mt. Sinai, (JP MORGAN CHASE & CO.),
3.30%, 05/10/06 | | | 3,100,000 |
| 300,000 | | New York State, Dormitory Authority Revenue Bonds, Oxford University Press Inc., (LANDESBANK HESSEN-THURINGEN),
3.10%, 07/01/25(a) | | | 300,000 |
| 3,000,000 | | New York State, Energy Research & Development Authority Facilities Revenue Bonds,
Sub-series A-1,
(WACHOVIA BANK N.A.),
3.15%, 05/01/39(a) | | | 3,000,000 |
| 7,500,000 | | New York State, Housing Finance Agency Revenue Bonds, Service Contracts, Series E, (BNP PARIBAS),
3.15%, 03/15/27(a) | | | 7,500,000 |
| 13,500,000 | | New York State, Housing Finance Agency Revenue Bonds, Service Contracts, Series I, (LANDESBANK HESSEN-THURINGEN),
3.16%, 03/15/31(a) | | | 13,500,000 |
| 20,000,000 | | Puerto Rico Commonwealth Revenue Bonds, Tax & Revenue Anticipation Notes (BANK OF NOVA SCOTIA-23%/CITIBANK-17%/BNP PARIBAS-17%/DEXIA CREDIT LOCAL-17%/FORTIS BANK-12%/RBC-8%/STATE STREET BANK & TRUST-6%),
4.50%, 07/28/06 | | | 20,080,866 |
| | | | |
|
|
| | | TOTAL TAX-EXEMPT CASH EQUIVALENT SECURITIES —BACKED BY LETTERS OF CREDIT
(Cost $116,002,810) | | | 116,002,810 |
| | | | |
|
|
See Notes to Financial Statements.
7
Excelsior Tax-Exempt Funds, Inc.
Portfolio of Investments — March 31, 2006
New York Tax-Exempt Money Fund — (continued)
| | | | | |
Shares
| | Security Description
| | Value
|
| | | | | | |
| REGISTERED INVESTMENT COMPANIES — 0.09% |
| 394,900 | | BlackRock Institutional New York
Money Market Fund | | $ | 394,900 |
| 1 | | Dreyfus New York Tax Exempt Fund | | | 1 |
| | | | |
|
|
| | | TOTAL REGISTERED INVESTMENT COMPANIES
(Cost $394,901) | | | 394,901 |
| | | | |
|
|
| | | | | | |
TOTAL INVESTMENTS
(Cost $417,837,564) | | 93.30 | % | | $ | 417,837,564 |
OTHER ASSETS IN EXCESS
OF LIABILITIES | | 6.70 | | | | 30,027,545 |
| | |
|
| |
|
|
NET ASSETS | | 100.00 | % | | $ | 447,865,109 |
| | |
|
| |
|
|
| (a) | Variable Rate Security—The rate disclosed is as of March 31, 2006. |
| (b) | Security exempt from registration under Rule 144A of the Securities Act of 1933. This security may be resold in transactions exempt from registration, normally to qualified institutional buyers. At March 31, 2006, these securities amounted to $161,439,999 or 36.05% of net assets. |
AMBAC—American Municipal Bond Assurance Corp.
Fannie Mae—Federal National Mortgage Association
FGIC—Financial Guaranty Insurance Corp.
FSA—Financial Security Assurance
MBIA—Municipal Bond Insurance Association
Notes (The following notes have not been audited by Deloitte & Touche LLP):
These municipal securities meet the three highest ratings assigned by Moody’s Investors Services, Inc. or Standard and Poor’s Corporation or, where not rated, are determined by the Advisor, under the supervision of the Board of Directors, to be of comparable quality at the time of purchase to rated instruments that may be acquired by the Fund.
At March 31, 2006, approximately 26% of the net assets are invested in municipal securities that have letter of credit enhancement features or escrows in U.S. Government securities backing them, on which the Fund relies. Without such features, the securities may or may not meet the quality standards of securities purchased by the Fund.
At March 31, 2006, approximately 89% of the net assets are invested in New York municipal securities. Economic changes affecting the state and certain of its public bodies and municipalities may affect the ability of the issuers to pay the required principal and interest payments of the municipal securities.
The summary of the Fund’s investments as of March 31, 2006 is as follows: (Unaudited)
| | | | | | |
Portfolio Diversification
| | % of Net Assets
| | | Value
|
Revenue Bonds | | 61.63 | % | | $ | 276,016,431 |
General Obligation Bonds | | 20.07 | | | | 89,876,232 |
Commercial Paper | | 11.51 | | | | 51,550,000 |
Registered Investment Companies | | 0.09 | | | | 394,901 |
| | |
|
| |
|
|
Total Investments | | 93.30 | % | | $ | 417,837,564 |
Other Assets in Excess of Liabilities | | 6.70 | | | | 30,027,545 |
| | |
|
| |
|
|
Net Assets | | 100.00 | % | | $ | 447,865,109 |
| | |
|
| |
|
|
See Notes to Financial Statements.
8
Excelsior Tax-Exempt Funds, Inc.
Portfolio of Investments — March 31, 2006
Tax-Exempt Money Fund
| | | | | |
Principal Amount
| | Security Description
| | Value
|
| | | | | | |
| TAX-EXEMPT CASH EQUIVALENT SECURITIES — 89.00% |
| $ 17,620,000 | | Alaska State, Housing Finance Authority Revenue Bonds, State Capital Project, Series C, (MBIA),
3.17%, 07/01/22(a) | | $ | 17,620,000 |
| 12,500,000 | | Anne Arundel County, Maryland, Commercial Paper,
3.15%, 04/06/06 | | | 12,500,000 |
| 21,000,000 | | Arizona State, Salt River Project Commercial Paper,
3.25%, 05/03/06 | | | 21,000,000 |
| 17,900,000 | | Arizona State, Salt River Project Commercial Paper,
3.20%, 08/04/06 | | | 17,900,000 |
| 51,660,000 | | Austin, Texas, Water & Wastewater System Revenue Bonds, (FSA),
3.22%, 05/15/24(a) | | | 51,660,000 |
| 25,900,000 | | Baltimore County, Maryland, Commercial Paper,
3.50%, 08/18/06 | | | 25,900,000 |
| 15,640,000 | | Bastrop, Texas, Munitops Certificates Trust, Independent School District General Obligation Bonds, Series 2003-23,
3.22%, 02/15/11(a)(b) | | | 15,640,000 |
| 6,000,000 | | Bristol, Connecticut, General Obligation Bonds, Bond Anticipation Notes,
4.00%, 12/06/06 | | | 6,022,640 |
| 14,065,000 | | Bryan, Texas, Munitops Certificates Trust, Independent School District General Obligation Bonds, Series 2005-16,
3.22%, 02/15/13(a)(b) | | | 14,065,000 |
| 45,000,000 | | Burke County, Georgia, Olgethorpe Power Authority, Commercial Paper, Series 98-A, (AMBAC),
3.27%, 04/07/06 | | | 45,000,000 |
| | | | | |
Principal Amount
| | Security Description
| | Value
|
| | | | | | |
TAX-EXEMPT CASH EQUIVALENT
SECURITIES — (continued) |
| $ 43,395,000 | | California State, General Obligation Bonds, TOCS, Series HH, (FSA),
3.20%, 07/03/13(a)(b) | | $ | 43,395,000 |
| 15,835,000 | | Cedar Hill, Texas, Munitops Certificates Trust, Independent School District General Obligation Bonds, Series 2005-19,
3.22%, 07/01/13(a)(b) | | | 15,835,000 |
| 44,430,000 | | Charlotte, North Carolina, Water & Sewer System Revenue Bonds, Series B,
3.18%, 07/01/27(a) | | | 44,430,000 |
| 55,575,000 | | Chicago, Illinois, Capital Improvement General Obligation Bonds, Metropolitan Water Reclamation District Project, Series A,
3.18%, 12/01/31(a) | | | 55,575,000 |
| 28,100,000 | | Chicago, Illinois, General Obligation Bonds, PUTTERS, Series 1277, (FSA),
3.21%, 01/01/14(a)(b) | | | 28,100,000 |
| 29,895,000 | | Chicago, Illinois, General Obligation Bonds, Series B, (FGIC),
3.19%, 01/01/37(a) | | | 29,895,000 |
| 40,000,000 | | Chicago, Illinois, General Obligation Bonds, Series D (FSA),
3.17%, 01/01/40(a) | | | 40,000,000 |
| 66,300,000 | | Chicago, Illinois, Water Revenue Bonds, Second Lien, (MBIA),
3.17%, 11/01/31(a) | | | 66,300,000 |
| 14,700,000 | | Colorado Springs, Colorado, School Disctrict No. 11 Facilities Corp. Certificate Participation, (FSA),
3.19%, 12/01/17(a) | | | 14,700,000 |
See Notes to Financial Statements.
9
Excelsior Tax-Exempt Funds, Inc.
Portfolio of Investments — March 31, 2006
Tax-Exempt Money Fund — (continued)
| | | | | |
Principal Amount
| | Security Description
| | Value
|
| | | | | | |
TAX-EXEMPT CASH EQUIVALENT
SECURITIES — (continued) |
| $ 6,520,000 | | Connecticut State, Special Tax Obligation Revenue Bonds, Floating Rate Certificates, Series 735, (AMBAC),
3.19%, 12/01/19(a)(b) | | $ | 6,520,000 |
| 10,755,000 | | Cook County, Illinois, General Obligation Bonds, PUTTERS, Series 766, (AMBAC),
3.46%, 05/15/12(a)(b) | | | 10,755,000 |
| 6,000,000 | | Curators of the University of Missouri, Systems Facility Revenue Bonds, Series B,
3.13%, 11/01/35(a) | | | 6,000,000 |
| 25,995,000 | | Cypress Fairbanks, Texas, Munitops Certificates Trust, Independent School District General Obligation Bonds, Series 2003-22,
3.22%, 02/15/11(a)(b) | | | 25,995,000 |
| 16,685,000 | | Dallas, Texas, Munitops Certificates Trust, General Obligation Bonds,
Series 2004-6,
3.22%, 02/15/12(a)(b) | | | 16,685,000 |
| 29,630,000 | | Dallas, Texas, Munitops Certificates Trust, Independent School District General Obligation Bonds, Series 2005-1,
3.22%, 08/15/12(a)(b) | | | 29,630,000 |
| 17,446,000 | | Dallas, Texas, Water & Sewer Commercial Paper, Series B,
3.30%, 05/11/06 | | | 17,446,000 |
| 12,935,000 | | Denton, Texas, Munitops Certificates Trust, General Obligation Bonds,
Series 2004-21,
3.22%, 08/15/12(a)(b) | | | 12,935,000 |
| 14,635,000 | | Detroit, Michigan, Munitops Certificates Trust, City School District General Obligation Bonds, Series 2004-39, (FGIC),
3.20%, 05/01/11(a)(b) | | | 14,635,000 |
| | | | | |
Principal Amount
| | Security Description
| | Value
|
| | | | | | |
TAX-EXEMPT CASH EQUIVALENT
SECURITIES — (continued) |
| $51,660,000 | | Detroit, Michigan, Sewage Disposal, Revenue Bonds, Series C-2, (FGIC),
3.17%, 07/01/29(a) | | $ | 51,660,000 |
| 23,635,000 | | District of Columbia, General Obligation Bonds, Series D, (FGIC),
3.19%, 06/01/29(a) | | | 23,635,000 |
| 13,475,000 | | District of Columbia, Revenue Bonds, George Washington University, Series C, (MBIA),
3.17%, 09/15/29(a) | | | 13,475,000 |
| 6,145,000 | | Duval County, Florida, School Board Certificates of Participation, Floating Rate Certificates, Series 1246, (FGIC),
3.20%, 07/01/25(a)(b) | | | 6,145,000 |
| 6,500,000 | | East Hampton, New York, Union Free School District General Obligation Bonds, Tax Anticipation Notes,
4.00%, 06/29/06 | | | 6,512,349 |
| 3,500,000 | | Fort Bend, Texas, Munitops Certificates Trust, Independent School District General Obligation Bonds, Series 1999-6,
3.20%, 03/07/07(a)(b) | | | 3,500,000 |
| 9,265,000 | | Frisco, Texas, Munitops Certificates Trust, General Obligation Bonds,
3.22%, 08/15/11(a)(b) | | | 9,265,000 |
| 17,280,000 | | Fulton County, Georgia, Water & Sewage Revenue Bonds, Floating Rate Certificates, Series 1120, (FGIC),
3.43%, 01/01/30(a)(b) | | | 17,280,000 |
| 8,500,000 | | Garden State Preservation Trust, New Jersey, Open Space & Farmland Revenue Bonds, Floating Rate Certificates, Series 860, (FSA),
3.19%, 11/01/17(a)(b) | | | 8,500,000 |
See Notes to Financial Statements.
10
Excelsior Tax-Exempt Funds, Inc.
Portfolio of Investments — March 31, 2006
Tax-Exempt Money Fund — (continued)
| | | | | |
Principal Amount
| | Security Description
| | Value
|
| | | | | | |
TAX-EXEMPT CASH EQUIVALENT
SECURITIES — (continued) |
| $ 8,745,000 | | Georgia State, General Obligation Bonds, Floating Rate Certificates, Series 647,
3.20%, 05/01/22(a)(b) | | $ | 8,745,000 |
| 9,995,000 | | Harlandale, Texas, Munitops Certificates Trust, General Obligation Bonds,
Series 2005-22,
3.22%, 08/15/13(a)(b) | | | 9,995,000 |
| 10,420,000 | | Hawaii State, Munitops Certificates Trust, General Obligation Bonds (FSA),
3.20%, 07/01/10(a)(b) | | | 10,420,000 |
| 10,000,000 | | Hockley County, Texas, Industrial Development Corporation, Pollution Control Revenue Bonds, Amoco Project — Standard Oil Co.,
3.20%, 03/01/14(a) | | | 9,986,700 |
| 19,300,000 | | Hockley County, Texas, Industrial Development Corporation, Pollution Control Revenue Bonds, Amoco Project — Standard Oil Co.,
2.98%, 11/01/19(a) | | | 19,300,000 |
| 9,995,000 | | Houston, Texas, Munitops Certificates Trust, Independent School District General Obligation Bonds, Series 2005-35, (PSF-GTD),
3.22%, 02/15/13(a)(b) | | | 9,995,000 |
| 12,600,000 | | Houston, Texas, Utility System Revenue Bonds, TOCS, Series A, (FSA),
3.21%, 05/15/12(a)(b) | | | 12,600,000 |
| 40,000,000 | | Illinois State, General Obligation Notes,
4.50%, 04/28/06 | | | 40,039,967 |
| | | | | |
Principal Amount
| | Security Description
| | Value
|
| | | | | | |
TAX-EXEMPT CASH EQUIVALENT
SECURITIES — (continued) |
| $13,800,000 | | Intermountain Power Agency, Utah, Commercial Paper, Series 85-F, (AMBAC),
3.25%, 04/03/06 | | $ | 13,800,000 |
| 25,000,000 | | Intermountain Power Agency, Utah, Commercial Paper, Series B,
3.30%, 05/17/06 | | | 25,000,000 |
| 12,330,000 | | Intermountain Power Agency, Utah, Power Supply Revenue Bonds, Series E, (AMBAC),
3.20%, 06/01/06(a) | | | 12,330,000 |
| 25,000,000 | | Intermountain Power Agency, Utah, Power Supply Revenue Bonds, Series E, (AMBAC),
3.45%, 07/01/14(a) | | | 25,000,000 |
| 10,750,000 | | Intermountain Power Agency, Utah, Power Supply Revenue Bonds, Series F, (AMBAC),
3.45%, 07/01/15(a) | | | 10,750,000 |
| 5,700,000 | | Jackson County, Mississippi, Port Facilities Revenue Bonds, Chevron Corp.,
3.18%, 06/01/23(a) | | | 5,700,000 |
| 12,340,000 | | Jackson County, Mississippi, Water Systems General Obligation Bonds,
Chervon Corp.,
3.20%, 11/01/24(a) | | | 12,340,000 |
| 8,505,000 | | Jacksonville, Florida, Electric Authority Revenue Bonds, Floating Rate Certificates, Series N-8,
3.28%, 10/01/23(a)(b) | | | 8,505,000 |
| 30,000,000 | | Jacksonville, Florida, Electrical System Commercial Paper, Series 2000-A,
3.18%, 07/20/06 | | | 30,000,000 |
| 35,000,000 | | Jacksonville, Florida, Electrical System Commercial Paper, Series 2000-F,
3.18%, 07/19/06 | | | 35,000,000 |
See Notes to Financial Statements.
11
Excelsior Tax-Exempt Funds, Inc.
Portfolio of Investments — March 31, 2006
Tax-Exempt Money Fund — (continued)
| | | | | |
Principal Amount
| | Security Description
| | Value
|
| | | | | | |
TAX-EXEMPT CASH EQUIVALENT
SECURITIES — (continued) |
| $ 8,955,000 | | Judson, Texas, Munitops Certificates Trust, General Obligation Bonds, Series 2003-36,
3.22%, 02/01/11(a)(b) | | $ | 8,955,000 |
| 8,800,000 | | Massachusetts Bay, Transportation Authority, Sales Tax Revenue Bonds, EAGLE, Series 2006-37, Class A,
3.21%, 07/01/34(a)(b) | | | 8,800,000 |
| 22,500,000 | | Massachusetts State, General Obligation Bonds, Series A,
3.14%, 09/01/16(a) | | | 22,500,000 |
| 10,000,000 | | Metropolitan Government Nashville & Davidson County, Tennessee, Commercial Paper, Vanderbilt University,
3.30%, 05/04/06 | | | 10,000,000 |
| 15,000,000 | | Metropolitan Government Nashville & Davidson County, Tennessee, Commercial Paper, Vanderbilt University,
3.30%, 05/15/06 | | | 15,000,000 |
| 10,750,000 | | Michigan State University, College & University Revenue Bonds,
3.14%, 02/15/34 (a) | | | 10,750,000 |
| 7,510,000 | | Michigan State, Building Authority Revenue Bonds, Floating Rate Certificates, Series 886, (MBIA),
3.20%, 10/15/17(a)(b) | | | 7,510,000 |
| 5,210,000 | | Michigan State, Municipal Bond Authority Revenue Bonds, PUTTER, Series 453,
3.21%, 05/01/12(a)(b) | | | 5,210,000 |
| 11,097,000 | | Milford, Connecticut, General Obligation Bond Anticipation Notes, Lot B,
3.75%, 05/04/06 | | | 11,105,558 |
| | | | | |
Principal Amount
| | Security Description
| | Value
|
| | | | | | |
| | | | | | |
TAX-EXEMPT CASH EQUIVALENT
SECURITIES — (continued) |
| $14,100,000 | | New Hampshire State, Health & Education Factilities, Dartmouth College Issue Revenue Bonds,
3.17%, 06/01/32(a) | | $ | 14,100,000 |
| 8,760,000 | | New York City, New York, Transitional Finance Authority Revenue Bonds, PUTTER, Series 468, (MBIA),
3.21%, 02/01/11(a)(b) | | | 8,760,000 |
| 22,300,000 | | New York State, Housing Finance Agency Revenue Bonds, 10 Barclay Street, Series A, (Fannie Mae),
3.16%, 11/15/37(a) | | | 22,300,000 |
| 11,345,000 | | New York State, Metropolitan Transit Authority Revenue Bonds, Floating Rate Certificates, Series 848-D, (FGIC),
3.19%, 11/15/21(a)(b) | | | 11,345,000 |
| 11,050,000 | | New York State, Power Authority General Obligation Bonds,
3.35%, 03/01/20(a) | | | 11,050,000 |
| 34,800,000 | | New York State, Triborough Bridge & Tunnel Authority Revenue Bonds,
Sub-Series B2,
3.16%, 01/01/32(a) | | | 34,800,000 |
| 11,000,000 | | New York State, Triborough Bridge & Tunnel Authority Revenue Bonds,
Sub-Series B3,
3.15%, 01/01/32(a) | | | 11,000,000 |
| 12,195,000 | | North Carolina State, General Obligation Bonds, PUTTER, Series 465,
3.21%, 05/01/11(a)(b) | | | 12,195,000 |
| 10,275,000 | | North Carolina State, General Obligation Bonds, PUTTER, Series 466,
3.21%, 03/01/12(a)(b) | | | 10,275,000 |
See Notes to Financial Statements.
12
Excelsior Tax-Exempt Funds, Inc.
Portfolio of Investments — March 31, 2006
Tax-Exempt Money Fund — (continued)
| | | | | |
Principal Amount
| | Security Description
| | Value
|
| | | | | | |
TAX-EXEMPT CASH EQUIVALENT
SECURITIES — (continued) |
| $31,085,000 | | Ohio State, Infrastructure Improvement General Obligations Bonds, Series D,
3.18%, 02/01/19(a) | | $ | 31,085,000 |
| 5,770,000 | | Oklahoma State, Water Resource Board Revenue Bonds, Loan Program,
3.35%, 09/01/26(a) | | | 5,770,000 |
| 26,490,000 | | Oklahoma State, Water Resource Board Revenue Bonds, Loan Program,
3.38%, 09/01/32(a) | | | 26,490,000 |
| 45,700,000 | | Omaha, Nebraska, Public Power Distribution Commercial Paper,
3.32%, 05/05/06 | | | 45,700,000 |
| 64,800,000 | | Orlando, Florida, Utilities Commission Water & Electric Revenue Bonds, Series A,
3.15%, 10/01/17(a) | | | 64,800,000 |
| 9,995,000 | | Pennsylvania State, Munitops Certificates Trust, Independent School District General Obligation Bonds, Series 2003-8, (FGIC),
3.19%, 03/15/11(a)(b) | | | 9,995,000 |
| 36,000,000 | | Pennsylvania State, Turnpike Commission Revenue Bonds, Series A-2,
3.22%, 12/01/30(a) | | | 36,000,000 |
| 16,700,000 | | Pennsylvania State, University Revenue Bonds, Series A,
3.18%, 04/01/31(a) | | | 16,700,000 |
| 9,460,000 | | Pflugerville, Texas, Munitops Certificates Trust, Independent School District General Obligation Bonds, Series 2005-17,
3.22%, 02/15/13(a)(b) | | | 9,460,000 |
| 3,905,000 | | Phoenix, Arizona, Civic Improvement Corp., Excise Tax Revenue Bonds, EAGLE, Class A,
3.21%, 07/01/17(a)(b) | | | 3,905,000 |
| | | | | |
Principal Amount
| | Security Description
| | Value
|
| | | | | | |
TAX-EXEMPT CASH EQUIVALENT
SECURITIES — (continued) |
| $36,800,000 | | Private Colleges & Universities, Georgia, Revenue Bonds, Emory University, Series B-2,
3.15%, 09/01/35(a) | | $ | 36,800,000 |
| 7,330,000 | | Puerto Rico Commonwealth, Infrastructure Financing Authority Revenue Bonds, Floating Rate Certificates, Series 139, (AMBAC),
3.18%, 07/01/28(a)(b) | | | 7,330,000 |
| 14,500,000 | | San Antonio, Texas, Water Revenue Bonds, EAGLE, Class A, (MBIA),
3.21%, 05/15/40(a)(b) | | | 14,500,000 |
| 14,600,000 | | San Antonio, Texas, Water Systems Commercial Paper, Series A,
3.35%, 05/10/06 | | | 14,600,000 |
| 13,235,000 | | South Carolina State, Public Services Authority Revenue Bonds, PUTTER, Series 1198, (MBIA),
3.45%, 07/01/13(a)(b) | | | 13,235,000 |
| 44,000,000 | | St. James Parish, Louisiana, Pollution Control Commercial Paper, Texaco Project, Series B,
3.32%, 05/11/06 | | | 44,000,000 |
| 12,000,000 | | Tennessee State, School Building Authority Commercial Paper,
3.20%, 06/08/06 | | | 12,000,000 |
| 11,945,000 | | Texas State, General Obligation Bonds, PUTTERS, Series 935,
3.45%, 04/01/13(a)(b) | | | 11,945,000 |
| 12,000,000 | | Texas State, Public Finance Authority Commercial Paper, Series 2003,
3.15%, 05/05/06 | | | 12,000,000 |
| 22,760,000 | | Texas State, Tax & Revenue Authority, General Obligation Bond Anticipation Notes,
4.50%, 08/31/06 | | | 22,868,018 |
See Notes to Financial Statements.
13
Excelsior Tax-Exempt Funds, Inc.
Portfolio of Investments — March 31, 2006
Tax-Exempt Money Fund — (continued)
| | | | | |
Principal Amount
| | Security Description
| | Value
|
| | | | | | |
TAX-EXEMPT CASH EQUIVALENT
SECURITIES — (continued) |
| $15,000,000 | | Texas State, Water Development Board Revenue Bonds, State Revolving Fund,
3.13%, 07/15/26(a) | | $ | 15,000,000 |
| 5,535,000 | | University of Texas, University Revenue Bonds, PUTTER, Series 592,
3.21%, 08/15/12(a)(b) | | | 5,535,000 |
| 3,300,000 | | University of Virginia, University Revenue Bonds, EAGLE, Series A,
3.21%, 06/01/33(a)(b) | | | 3,300,000 |
| 8,400,000 | | Virginia Commonwealth, Transportation Board, Revenue Bonds, Floating Rate Certificates, Series 727,
3.20%, 05/15/19(a)(b) | | | 8,400,000 |
| 9,745,000 | | Washoe County, Nevada, General Obligation Bonds, Floating Rate Certificates, Series 1241, (MBIA),
3.20%, 01/01/35(a)(b) | | | 9,745,000 |
| 13,000,000 | | Wilmington, North Carolina, General Obligation Bonds,
3.19%, 06/01/15(a) | | | 13,000,000 |
| 35,428,000 | | Wisconsin State, Transportation Revenue Commercial Paper,
Series 1997-A,
3.15%, 04/05/06 | | | 35,428,000 |
| 5,265,000 | | Yoakum County, Texas, Industrial Development Corporation, Pollution Control Revenue Bonds, Amoco Project,
2.98%, 11/01/19(a) | | | 5,265,000 |
| 8,140,000 | | York County, South Carolina, School District 4 General Obligation Bonds, Fort Mill, TOCS, Series F,
3.21%, 03/09/12(a)(b) | | | 8,140,000 |
| | | | |
|
|
| | | TOTAL TAX-EXEMPT CASH EQUIVALENT SECURITIES
(Cost $1,924,269,232) | | | 1,924,269,232 |
| | | | |
|
|
| | | | | |
Principal Amount
| | Security Description
| | Value
|
| | | | | | |
TAX-EXEMPT CASH EQUIVALENT SECURITIES —
BACKED BY LETTERS OF CREDIT — 8.19% |
| $14,200,000 | | Austin, Texas, Utilities Commercial Paper, Series A, (JP MORGAN CHASE BANK-40.8%/STATE STREET BANK & TRUST-33.5%/BAYERISCHE LANDESBANK-25.7%),
3.18%, 04/07/06 | | $ | 14,200,000 |
| 29,900,000 | | Baltimore, Maryland, Port Facilities Authority Revenue Bonds, (BNP PARIBAS),
3.25%, 10/14/11(a) | | | 29,900,000 |
| 20,000,000 | | Colorado State, Regional Transportation District Commercial Paper, Series A, (WESTDEUTSCHE LANDESBANK),
3.20%, 04/06/06 | | | 20,000,000 |
| 17,100,000 | | Des Moines, Iowa, Hospital Facilities Authority Revenue Bonds, Methodist Medical Center Project, (BANK OF AMERICA N.A.),
3.19%, 08/01/15(a) | | | 17,100,000 |
| 13,300,000 | | District of Columbia, Phillips College Issue Revenue Bonds, (BANK OF AMERICA N.A.),
3.18%, 08/01/33(a) | | | 13,300,000 |
| 31,900,000 | | Illinois State, Development Finance Authority Revenue Bonds, Chicago Symphony Orchestra, (NORTHERN TRUST COMPANY),
3.17%, 12/01/28(a) | | | 31,900,000 |
| 20,000,000 | | Indiana State, Municipal Power Agency, Power Supply System Revenue Bonds, Series A, (DEXIA CREDIT LOCAL),
3.18%, 01/01/18(a) | | | 20,000,000 |
| 12,000,000 | | Indiana State, Museum of Art Revenue Bonds, (JP MORGAN CHASE BANK),
3.22%, 02/01/39(a) | | | 12,000,000 |
See Notes to Financial Statements.
14
Excelsior Tax-Exempt Funds, Inc.
Portfolio of Investments — March 31, 2006
Tax-Exempt Money Fund — (continued)
| | | | | |
Principal Amount
| | Security Description
| | Value
|
TAX-EXEMPT CASH EQUIVALENT SECURITIES —
BACKED BY LETTERS OF CREDIT — (continued) |
| $ 7,000,000 | | Kenton County, Kentucky, Industrial Building Authority Revenue Bonds, Redken Labs, Inc. Project, (JP MORGAN CHASE BANK),
3.25%, 12/01/14(a) | | $ | 7,000,000 |
| 11,500,000 | | New York State, Commercial Paper, (BAYERISCHE LANDESBANK-33.3%/JP MORGAN CHASE BANK-33.3%/LANDESBANK HESSEN-33.3%),
3.23%, 04/05/06 | | | 11,500,000 |
| 155,000 | | Richmond, Virginia, Individual Development Authority, Educational Facilities, Church Schools, Revenue Bonds, (SUNTRUST BANK),
3.17%, 05/01/35(a) | | | 155,000 |
| | | | |
|
|
| | | TOTAL TAX-EXEMPT
CASH EQUIVALENT SECURITIES — BACKED BY LETTERS OF CREDIT
(Cost $177,055,000) | | | 177,055,000 |
| | | | |
|
|
Shares
| | | | |
| REGISTERED INVESTMENT COMPANIES — 0.03% |
| 1 | | BlackRock Muni Fund | | | 1 |
| 732,168 | | Dreyfus Tax Exempt Cash Fund | | | 732,168 |
| | | | |
|
|
| | | TOTAL REGISTERED INVESTMENT COMPANIES
(Cost $732,169) | | | 732,169 |
| | | | |
|
|
| | | | | | |
TOTAL INVESTMENTS
(Cost $2,102,056,401) | | 97.22 | % | | $ | 2,102,056,401 |
OTHER ASSETS IN EXCESS
OF LIABILITIES | | 2.78 | | | | 60,116,934 |
| | |
|
| |
|
|
NET ASSETS | | 100.00 | % | | $ | 2,162,173,335 |
| | |
|
| |
|
|
| (a) | Variable Rate Security—The rate disclosed is as of March 31, 2006. |
| (b) | Security exempt from registration under Rule 144A of the Securities Act of 1933. This security may be resold in transactions exempt from registration, normally to qualified institutional buyers. At March 31, 2006, these securities amounted to $517,680,000 or 23.94% of net assets. |
AMBAC—American Municipal Bond Assurance Corp.
FGIC—Financial Guaranty Insurance Corp.
FSA—Financial Security Assurance
MBIA—Municipal Bond Insurance Association
PSF-GTD—Permanent School Fund – Guaranteed
Notes (The following notes have not been audited by Deloitte & Touche LLP):
These municipal securities meet the three highest ratings assigned by Moody’s Investors Services, Inc. or Standard and Poor’s Corporation or, where not rated, are determined by the Advisor, under the supervision of the Board of Directors, to be of comparable quality at the time of purchase to rated instruments that may be acquired by the Fund.
At March 31, 2006, approximately 8% of the net assets are invested in municipal securities that have letter of credit enhancement features or escrows in U.S. Government securities backing them, on which the Fund relies. Without such features, the securities may or may not meet the quality standards of securities purchased by the Fund.
See Notes to Financial Statements.
15
Excelsior Tax-Exempt Funds, Inc.
Portfolio of Investments — March 31, 2006
Tax-Exempt Money Fund — (continued)
The summary of the Fund’s investments as of March 31, 2006 is as follows: (Unaudited)
| | | | | | |
State Diversification
| | % of Net Assets
| | | Value
|
Texas | | 18.76 | % | | $ | 405,360,718 |
Illinois | | 13.67 | | | | 295,309,967 |
Florida | | 6.68 | | | | 144,450,000 |
New York | | 5.42 | | | | 117,267,349 |
Georgia | | 4.99 | | | | 107,825,000 |
Utah | | 4.02 | | | | 86,880,000 |
North Carolina | | 3.70 | | | | 79,900,000 |
Michigan | | 3.65 | | | | 79,015,000 |
Maryland | | 3.16 | | | | 68,300,000 |
Pennsylvania | | 2.90 | | | | 62,695,000 |
District of Columbia | | 2.83 | | | | 61,165,000 |
Nebraska | | 2.11 | | | | 45,700,000 |
Louisiana | | 2.03 | | | | 44,000,000 |
California | | 2.01 | | | | 43,395,000 |
Arizona | | 1.98 | | | | 42,805,000 |
Tennessee | | 1.71 | | | | 37,000,000 |
Wisconsin | | 1.64 | | | | 35,428,000 |
Colorado | | 1.60 | | | | 34,700,000 |
Oklahoma | | 1.49 | | | | 32,260,000 |
Indiana | | 1.48 | | | | 32,000,000 |
Massachusetts | | 1.45 | | | | 31,300,000 |
Ohio | | 1.44 | | | | 31,085,000 |
New Hampshire | | 1.15 | | | | 24,850,000 |
Connecticut | | 1.09 | | | | 23,648,198 |
South Carolina | | 0.99 | | | | 21,375,000 |
Mississippi | | 0.83 | | | | 18,040,000 |
Arkansas | | 0.81 | | | | 17,620,000 |
Iowa | | 0.79 | | | | 17,100,000 |
Virginia | | 0.55 | | | | 11,855,000 |
Hawaii | | 0.48 | | | | 10,420,000 |
Nevada | | 0.45 | | | | 9,745,000 |
New Jersey | | 0.39 | | | | 8,500,000 |
Puerto Rico | | 0.34 | | | | 7,330,000 |
Kentucky | | 0.32 | | | | 7,000,000 |
Missouri | | 0.28 | | | | 6,000,000 |
Registered Investment Companies | | 0.03 | | | | 732,169 |
| | |
|
| |
|
|
Total Investments | | 97.22 | % | | $ | 2,102,056,401 |
Other Assets in Excess of Liabilities | | 2.78 | | | | 60,116,934 |
| | |
|
| |
|
|
Net Assets | �� | 100.00 | % | | $ | 2,162,173,335 |
| | |
|
| |
|
|
See Notes to Financial Statements.
16
Excelsior Funds, Inc.
Portfolio of Investments — March 31, 2006
Treasury Money Fund
| | | | | |
Principal Amount
| | Security
Description
| | Value
|
| | | | | | |
| U.S. GOVERNMENT & AGENCY OBLIGATIONS — 17.77% |
| $ 65,000,000 | | Federal Home Loan Bank, Discount Note, 4.63%, 04/03/06 | | $ | 64,983,281 |
| | | | |
|
|
| | | TOTAL U.S. GOVERNMENT & AGENCY OBLIGATIONS
(Cost $64,983,281) | | | 64,983,281 |
| | | | |
|
|
| U.S. TREASURY OBLIGATIONS — 81.99% |
| 300,000,000 | | 4.37%, 04/06/06(a) | | | 299,818,333 |
| | | | |
|
|
| | | TOTAL U.S. TREASURY OBLIGATIONS
(Cost $299,818,333) | | | 299,818,333 |
| | | | |
|
|
| | | | | |
Shares
| | Security
Description
| | Value
|
| | | | | | |
| REGISTERED INVESTMENT COMPANY — 0.57% |
| 2,089,320 | | Dreyfus Treasury Prime Cash Management Fund | | $ | 2,089,320 |
| | | | |
|
|
| | | TOTAL REGISTERED INVESTMENT COMPANY
(Cost $2,089,320) | | | 2,089,320 |
| | | | |
|
|
| | | | | | | |
TOTAL INVESTMENTS
(Cost $366,890,934) | | 100.33 | % | | $ | 366,890,934 | |
LIABILITIES IN EXCESS OF OTHER ASSETS | | (0.33 | ) | | | (1,203,123 | ) |
| | |
|
| |
|
|
|
NET ASSETS | | 100.00 | % | | $ | 365,687,811 | |
| | |
|
| |
|
|
|
| (a) | The rate shown is the effective yield at the time of purchase. |
Discount Note—The rate reported is the discount rate at the time of purchase.
The summary of the Fund’s investments as of March 31, 2006 is as follows: (Unaudited)
| | | | | | | |
Portfolio Diversification
| | % of
Net
Assets
| | | Value
| |
U.S. Treasury Obligations | | 81.99 | % | | $ | 299,818,333 | |
U.S. Government & Agency Obligations | | 17.77 | | | | 64,983,281 | |
Registered Investment Company | | 0.57 | | | | 2,089,320 | |
| | |
|
| |
|
|
|
Total Investments | | 100.33 | % | | $ | 366,890,934 | |
Liabilities in Excess of Other Assets | | (0.33 | ) | | | (1,203,123 | ) |
| | |
|
| |
|
|
|
Net Assets | | 100.00 | % | | $ | 365,687,811 | |
| | |
|
| |
|
|
|
See Notes to Financial Statements.
17
Excelsior Funds
Statements of Assets and Liabilities
March 31, 2006
| | | | | | | | | | | | | | | | | | |
| | | | | |
| | | Government
Money Fund
| | | Money Fund
| | | New York
Tax-Exempt
Money Fund
| | Tax-Exempt
Money Fund
| | | Treasury
Money Fund
|
ASSETS: | | | | | | | | | | | | | | | | | | |
Investments, at cost — see accompanying portfolios | | $ | 412,023,740 | | | $ | 1,560,720,348 | | | $ | 417,837,564 | | $ | 2,102,056,401 | | | $ | 366,890,934 |
| | |
|
|
| |
|
|
| |
|
| |
|
|
| |
|
|
Investments, at value (including Repurchase Agreements) (Note 1) | | $ | 412,023,740 | | | $ | 1,560,720,348 | | | $ | 417,837,564 | | $ | 2,102,056,401 | | | $ | 366,890,934 |
Cash | | | — | | | | 1 | | | | 30,826 | | | — | | | | — |
Dividends and interest receivable | | | 5,031 | | | | 119,649 | | | | 3,603,502 | | | 11,011,268 | | | | 9,648 |
Receivable for investments sold | | | — | | | | — | | | | 27,517,568 | | | 55,110,000 | | | | — |
Receivable for fund shares sold | | | 57,982 | | | | 1,219,952 | | | | 155,718 | | | 239,960 | | | | 207,122 |
Prepaid expenses and other assets | | | 19,085 | | | | 58,578 | | | | 15,317 | | | 81,029 | | | | 15,795 |
| | |
|
|
| |
|
|
| |
|
| |
|
|
| |
|
|
Total Assets | | | 412,105,838 | | | | 1,562,118,528 | | | | 449,160,495 | | | 2,168,498,658 | | | | 367,123,499 |
LIABILITIES: | | | | | | | | | | | | | | | | | | |
Payable for dividends declared | | | 1,552,616 | | | | 5,955,217 | | | | 975,168 | | | 4,894,160 | | | | 1,141,474 |
Investment advisory fees payable (Note 2) | | | 35,173 | | | | 151,152 | | | | 60,329 | | | 243,262 | | | | 44,721 |
Administration fees payable (Note2) | | | 58,155 | | | | 215,260 | | | | 58,341 | | | 283,957 | | | | 44,733 |
Shareholder servicing fees payable (Note2) | | | 101,926 | | | | 256,357 | | | | 116,167 | | | 471,885 | | | | 102,729 |
Directors’ fees and expense payable (Note 2) | | | 365 | | | | 1,256 | | | | 356 | | | 1,768 | | | | 263 |
Accrued expenses and other payables | | | 129,648 | | | | 403,614 | | | | 85,025 | | | 430,291 | | | | 101,768 |
| | |
|
|
| |
|
|
| |
|
| |
|
|
| |
|
|
Total Liabilities | | | 1,877,883 | | | | 6,982,856 | | | | 1,295,386 | | | 6,325,323 | | | | 1,435,688 |
| | |
|
|
| |
|
|
| |
|
| |
|
|
| |
|
|
NET ASSETS | | $ | 410,227,955 | | | $ | 1,555,135,672 | | | $ | 447,865,109 | | $ | 2,162,173,335 | | | $ | 365,687,811 |
| | |
|
|
| |
|
|
| |
|
| |
|
|
| |
|
|
NET ASSETS consist of: | | | | | | | | | | | | | | | | | | |
Undistributed (distributions in excess of) net investment income | | $ | — | | | $ | — | | | $ | 4,841 | | $ | (9,820 | ) | | $ | 558 |
Accumulated net realized gain (loss) on investments | | | (27,980 | ) | | | (40,526 | ) | | | — | | | 94,049 | | | | — |
Par value (Note 4) | | | 410,328 | | | | 1,555,381 | | | | 447,861 | | | 2,162,339 | | | | 365,697 |
Paid in capital in excess of par value | | | 409,845,607 | | | | 1,553,620,817 | | | | 447,412,407 | | | 2,159,926,767 | | | | 365,321,556 |
| | |
|
|
| |
|
|
| |
|
| |
|
|
| |
|
|
Net Assets | | $ | 410,227,955 | | | $ | 1,555,135,672 | | | $ | 447,865,109 | | $ | 2,162,173,335 | | | $ | 365,687,811 |
| | |
|
|
| |
|
|
| |
|
| |
|
|
| |
|
|
Net Assets: | | | | | | | | | | | | | | | | | | |
Shares | | $ | 410,227,955 | | | $ | 1,032,384,476 | | | $ | 447,865,109 | | $ | 2,162,173,335 | | | $ | 365,687,811 |
Institutional Shares | | | — | | | | 522,751,196 | | | | — | | | — | | | | — |
Shares outstanding (Note 4): | | | | | | | | | | | | | | | | | | |
Shares | | | 410,327,672 | | | | 1,032,627,312 | | | | 447,861,178 | | | 2,162,338,958 | | | | 365,697,380 |
Institutional Shares | | | — | | | | 522,753,455 | | | | — | | | — | | | | — |
NET ASSET VALUE PER SHARE
(net assets ÷ shares outstanding): | | | | | | | | | | | | | | | | | | |
Shares | | | $1.00 | | | | $1.00 | | | | $1.00 | | | $1.00 | | | | $1.00 |
| | |
|
|
| |
|
|
| |
|
| |
|
|
| |
|
|
Institutional Shares | | | — | | | | $1.00 | | | | — | | | — | | | | — |
| | |
|
|
| |
|
|
| |
|
| |
|
|
| |
|
|
See Notes to Financial Statements.
18
Excelsior Funds
Statements of Operations
Year Ended March 31, 2006
| | | | | | | | | | | | | | | | | | | | |
| | | Government
Money
Fund
| | | Money
Fund
| | | New York
Tax-Exempt
Money
Fund
| | | Tax-Exempt
Money
Fund
| | | Treasury
Money
Fund
| |
INVESTMENT INCOME: | | | | | | | | | | | | | | | | | | | | |
Interest income | | $ | 16,742,928 | | | $ | 59,433,288 | | | $ | 11,621,075 | | | $ | 58,878,211 | | | $ | 12,704,515 | |
| | |
|
|
| |
|
|
| |
|
|
| |
|
|
| |
|
|
|
EXPENSES: | | | | | | | | | | | | | | | | | | | | |
Investment advisory fees (Note 2) | | | 1,136,338 | | | | 3,938,657 | | | | 2,113,247 | | | | 5,328,046 | | | | 1,108,784 | |
Administration fees (Note 2) | | | 686,450 | | | | 2,379,752 | | | | 638,281 | | | | 3,218,552 | | | | 558,168 | |
Shareholder servicing fees — Shares
(Note 2) | | | 1,136,237 | | | | 2,539,555 | | | | 1,056,626 | | | | 5,327,870 | | | | 923,967 | |
Transfer agent fees | | | 18,900 | | | | 77,271 | | | | 19,199 | | | | 22,294 | | | | 19,013 | |
Legal and audit fees | | | 59,746 | | | | 186,695 | | | | 63,443 | | | | 213,438 | | | | 53,857 | |
Custodian fees | | | 22,864 | | | | 78,967 | | | | 23,043 | | | | 107,033 | | | | 11,749 | |
Directors’ fees and expenses (Note 2) | | | 19,120 | | | | 67,918 | | | | 17,283 | | | | 88,669 | | | | 16,080 | |
Miscellaneous expenses | | | 61,593 | | | | 229,616 | | | | 59,623 | | | | 211,046 | | | | 55,180 | |
| | |
|
|
| |
|
|
| |
|
|
| |
|
|
| |
|
|
|
Total Expenses | | | 3,141,248 | | | | 9,498,431 | | | | 3,990,745 | | | | 14,516,948 | | | | 2,746,798 | |
Fees waived and reimbursed by:
Investment Adviser (Note 2) | | | (724,624 | ) | | | (2,481,701 | ) | | | (1,454,850 | ) | | | (3,143,406 | ) | | | (595,431 | ) |
| | |
|
|
| |
|
|
| |
|
|
| |
|
|
| |
|
|
|
Net Expenses | | | 2,416,624 | | | | 7,016,730 | | | | 2,535,895 | | | | 11,373,542 | | | | 2,151,367 | |
| | |
|
|
| |
|
|
| |
|
|
| |
|
|
| |
|
|
|
NET INVESTMENT INCOME | | | 14,326,304 | | | | 52,416,558 | | | | 9,085,180 | | | | 47,504,669 | | | | 10,553,148 | |
| | |
|
|
| |
|
|
| |
|
|
| |
|
|
| |
|
|
|
REALIZED GAIN (LOSS) ON INVESTMENTS (Note 1): | | | | | | | | | | | | | | | | | | | | |
Net realized gain (loss) on security transactions | | | (224 | ) | | | (4,889 | ) | | | 7,841 | | | | 177,930 | | | | 19,089 | |
| | |
|
|
| |
|
|
| |
|
|
| |
|
|
| |
|
|
|
Net increase in net assets resulting from operations | | $ | 14,326,080 | | | $ | 52,411,669 | | | $ | 9,093,021 | | | $ | 47,682,599 | | | $ | 10,572,237 | |
| | |
|
|
| |
|
|
| |
|
|
| |
|
|
| |
|
|
|
See Notes to Financial Statements.
19
Excelsior Funds
Statements of Changes in Net Assets
| | | | | | | | | | | | | | | | |
| | |
| | | Government Money Fund
| | |
Money Fund
| |
| | | Year Ended March 31,
| | | Year Ended March 31,
| |
| | | 2006
| | | 2005
| | | 2006
| | | 2005
| |
Net investment income | | $ | 14,326,304 | | | $ | 6,447,253 | | | $ | 52,416,558 | | | $ | 21,599,947 | |
Net realized gain (loss) on security transactions | | | (224 | ) | | | 2,167 | | | | (4,889 | ) | | | 6,919 | |
| | |
|
|
| |
|
|
| |
|
|
| |
|
|
|
Net increase in net assets resulting from operations | | | 14,326,080 | | | | 6,449,420 | | | | 52,411,669 | | | | 21,606,866 | |
| | |
|
|
| |
|
|
| |
|
|
| |
|
|
|
Distributions to shareholders: | | | | | | | | | | | | | | | | |
From net investment income | | | | | | | | | | | | | | | | |
Shares | | | (14,326,304 | ) | | | (6,447,253 | ) | | | (32,581,762 | ) | | | (14,621,112 | ) |
Institutional Shares | | | — | | | | — | | | | (19,834,796 | ) | | | (6,978,835 | ) |
From net realized gain on investment | | | | | | | | | | | | | | | | |
Shares | | | — | | | | — | | | | — | | | | — | |
| | |
|
|
| |
|
|
| |
|
|
| |
|
|
|
Total distributions | | | (14,326,304 | ) | | | (6,447,253 | ) | | | (52,416,558 | ) | | | (21,599,947 | ) |
| | |
|
|
| |
|
|
| |
|
|
| |
|
|
|
Increase (decrease) in net assets from fund share transactions (Note 4) | | | (85,798,349 | ) | | | (48,696,954 | ) | | | (175,199,854 | ) | | | 118,582,301 | |
| | |
|
|
| |
|
|
| |
|
|
| |
|
|
|
Net increase (decrease) in net assets | | | (85,798,573 | ) | | | (48,694,787 | ) | | | (175,204,743 | ) | | | 118,589,220 | |
| | |
|
|
| |
|
|
| |
|
|
| |
|
|
|
NET ASSETS: | | | | | | | | | | | | | | | | |
Beginning of year | | | 496,026,528 | | | | 544,721,315 | | | | 1,730,340,415 | | | | 1,611,751,195 | |
| | |
|
|
| |
|
|
| |
|
|
| |
|
|
|
End of year(1) | | $ | 410,227,955 | | | $ | 496,026,528 | | | $ | 1,555,135,672 | | | $ | 1,730,340,415 | |
| | |
|
|
| |
|
|
| |
|
|
| |
|
|
|
| | | | | | | | | | | | | | | | |
(1) Including undistributed (distributions in excess of) net investment income | | $ | — | | | $ | — | | | $ | — | | | $ | — | |
| | |
|
|
| |
|
|
| |
|
|
| |
|
|
|
See Notes to Financial Statements.
20
| | | | | | | | | | | | | | | | | | | | | | |
| | |
New York Tax-Exempt Money Fund
| | | Tax-Exempt Money Fund
| | | Treasury Money Fund
| |
Year Ended March 31,
| | | Year Ended March 31,
| | | Year Ended March 31,
| |
2006
| | | 2005
| | | 2006
| | | 2005
| | | 2006
| | | 2005
| |
| $ | 9,085,180 | | | $ | 3,553,633 | | | $ | 47,504,669 | | | $ | 20,230,126 | | | $ | 10,553,148 | | | $ | 4,239,423 | |
| | 7,841 | | | | 1,894 | | | | 177,930 | | | | 38,044 | | | | 19,089 | | | | 6,094 | |
|
|
| |
|
|
| |
|
|
| |
|
|
| |
|
|
| |
|
|
|
| | 9,093,021 | | | | 3,555,527 | | | | 47,682,599 | | | | 20,268,170 | | | | 10,572,237 | | | | 4,245,517 | |
|
|
| |
|
|
| |
|
|
| |
|
|
| |
|
|
| |
|
|
|
| | | | | | | | | | | | | | | | | | | | | | | |
| | | | | | | | | | | | | | | | | | | | | | | |
| | (9,089,166 | ) | | | (3,553,633 | ) | | | (47,540,889 | ) | | | (20,240,002 | ) | | | (10,559,242 | ) | | | (4,245,864 | ) |
| | — | | | | — | | | | — | | | | — | | | | — | | | | — | |
|
— |
| | | — | | | | (83,881 | ) | | | — | | | | (14,837 | ) | | | — | |
|
|
| |
|
|
| |
|
|
| |
|
|
| |
|
|
| |
|
|
|
| | (9,089,166 | ) | | | (3,553,633 | ) | | | (47,624,770 | ) | | | (20,240,002 | ) | | | (10,574,079 | ) | | | (4,245,864 | ) |
|
|
| |
|
|
| |
|
|
| |
|
|
| |
|
|
| |
|
|
|
|
38,609,252 |
| | | (80,848,665 | ) | | | 124,313,013 | | | | (6,902,094 | ) | | | (62,318,509 | ) | | | (91,713,040 | ) |
|
|
| |
|
|
| |
|
|
| |
|
|
| |
|
|
| |
|
|
|
| | 38,613,107 | | | | (80,846,771 | ) | | | 124,370,842 | | | | (6,873,926 | ) | | | (62,320,351 | ) | | | (91,713,387 | ) |
|
|
| |
|
|
| |
|
|
| |
|
|
| |
|
|
| |
|
|
|
| | | | | | | | | | | | | | | | | | | | | | | |
| | 409,252,002 | | | | 490,098,773 | | | | 2,037,802,493 | | | | 2,044,676,419 | | | | 428,008,162 | | | | 519,721,549 | |
|
|
| |
|
|
| |
|
|
| |
|
|
| |
|
|
| |
|
|
|
| $ | 447,865,109 | | | $ | 409,252,002 | | | $ | 2,162,173,335 | | | $ | 2,037,802,493 | | | $ | 365,687,811 | | | $ | 428,008,162 | |
|
|
| |
|
|
| |
|
|
| |
|
|
| |
|
|
| |
|
|
|
| | | | | |
| $ | 4,841 | | | $ | 986 | | | $ | (9,820 | ) | | $ | 26,400 | | | $ | 558 | | | $ | 2,400 | |
|
|
| |
|
|
| |
|
|
| |
|
|
| |
|
|
| |
|
|
|
See Notes to Financial Statements.
21
Excelsior Funds
Financial Highlights — Selected Per Share Data and Ratios
| | | | | | | | | | | | | | | | | | | | | | |
| | | Net Asset Value,
Beginning of
Year
| | Net
Investment
Income
| | | Net Realized Gain (Loss) on
Investments
| | | Total From
Investment
Operations
| | Dividends
From Net
Investment
Income
| | | Distributions
From Net
Realized
Gain on
Investments
| |
GOVERNMENT MONEY FUND — (5/8/85*) | | | | | | | | | | | | | | | | | | | |
Shares: | | | | | | | | | | | | | | | | | | | | | | |
Year Ended March 31, | | | | | | | | | | | | | | | | | | | | | | |
2006 | | $ | 1.00 | | $ | 0.03152 | (2) | | $ | 0.00024 | (2) | | $ | 0.03176 | | $ | (0.03176 | ) | | $ | — | |
2005 | | | 1.00 | | | 0.01250 | (2) | | | 0.00003 | | | | 0.01253 | | | (0.01253 | ) | | | — | |
2004 | | | 1.00 | | | 0.00625 | | | | — | | | | 0.00625 | | | (0.00625 | ) | | | — | |
2003 | | | 1.00 | | | 0.01199 | | | | (0.00039 | ) | | | 0.01160 | | | (0.01160 | ) | | | — | |
2002 | | | 1.00 | | | 0.02585 | | | | 0.00038 | | | | 0.02623 | | | (0.02623 | ) | | | — | |
MONEY FUND — (5/3/85*) | | | | | | | | | | | | | | | | | | | | | | |
Shares: | | | | | | | | | | | | | | | | | | | | | | |
Year Ended March 31, | | | | | | | | | | | | | | | | | | | | | | |
2006 | | $ | 1.00 | | $ | 0.03207 | (2) | | $ | 0.00015 | (2) | | $ | 0.03222 | | $ | (0.03222 | ) | | $ | — | |
2005 | | | 1.00 | | | 0.01275 | (2) | | | 0.00010 | | | | 0.01285 | | | (0.01285 | ) | | | — | |
2004 | | | 1.00 | | | 0.00662 | | | | — | | | | 0.00662 | | | (0.00662 | ) | | | — | |
2003 | | | 1.00 | | | 0.01255 | | | | (0.00010 | ) | | | 0.01245 | | | (0.01245 | ) | | | — | |
2002 | | | 1.00 | | | 0.02741 | | | | 0.00010 | | | | 0.02751 | | | (0.02751 | ) | | | — | |
NEW YORK TAX-EXEMPT MONEY FUND — (8/3/98*) | | | | | | | | | | | | | | | | |
Shares: | | | | | | | | | | | | | | | | | | | | | | |
Year Ended March 31, | | | | | | | | | | | | | | | | | | | | | | |
2006 | | $ | 1.00 | | $ | 0.02150 | (2) | | $ | (0.00012 | )(2) | | $ | 0.02138 | | $ | (0.02138 | ) | | $ | — | |
2005 | | | 1.00 | | | 0.00822 | (2) | | | 0.00023 | | | | 0.00845 | | | (0.00845 | ) | | | — | |
2004 | | | 1.00 | | | 0.00491 | | | | 0.00006 | | | | 0.00497 | | | (0.00490 | ) | | | (0.00007 | ) |
2003 | | | 1.00 | | | 0.00884 | | | | (0.00007 | ) | | | 0.00877 | | | (0.00873 | ) | | | (0.00004 | ) |
2002 | | | 1.00 | | | 0.01758 | | | | 0.00011 | | | | 0.01769 | | | (0.01769 | ) | | | — | |
TAX-EXEMPT MONEY FUND — (5/24/85*) | | | | | | | | | | | | | | | | | | | |
Shares: | | | | | | | | | | | | | | | | | | | | | | |
Year Ended March 31, | | | | | | | | | | | | | | | | | | | | | | |
2006 | | $ | 1.00 | | $ | 0.02229 | (2) | | $ | — | (2) | | $ | 0.02229 | | $ | (0.02225 | ) | | $ | (0.00004 | ) |
2005 | | | 1.00 | | | 0.00966 | (2) | | | — | | | | 0.00966 | | | (0.00966 | ) | | | — | |
2004 | | | 1.00 | | | 0.00546 | | | | 0.00029 | | | | 0.00575 | | | (0.00560 | ) | | | (0.00015 | ) |
2003 | | | 1.00 | | | 0.00967 | | | | (0.00002 | ) | | | 0.00965 | | | (0.00964 | ) | | | (0.00001 | ) |
2002 | | | 1.00 | | | 0.01862 | | | | 0.00013 | | | | 0.01875 | | | (0.01865 | ) | | | (0.00010 | ) |
TREASURY MONEY FUND — (2/13/91*) | | | | | | | | | | | | | | | | | | | |
Shares: | | | | | | | | | | | | | | | | | | | | | | |
Year Ended March 31, | | | | | | | | | | | | | | | | | | | | | | |
2006 | | $ | 1.00 | | $ | 0.02855 | (2) | | $ | 0.00036 | (2) | | $ | 0.02891 | | $ | (0.02887 | ) | | $ | (0.00004 | ) |
2005 | | | 1.00 | | | 0.00988 | (2) | | | 0.00031 | | | | 0.01019 | | | (0.01019 | ) | | | — | |
2004 | | | 1.00 | | | 0.00484 | | | | 0.00002 | | | | 0.00486 | | | (0.00485 | ) | | | (0.00001 | ) |
2003 | | | 1.00 | | | 0.01085 | | | | 0.00004 | | | | 0.01089 | | | (0.01089 | ) | | | — | |
2002 | | | 1.00 | | | 0.02451 | | | | (0.00002 | ) | | | 0.02449 | | | (0.02449 | ) | | | — | |
| * | Commencement of Operations. |
| (1) | Expense ratios before waiver of fees and reimbursement of expenses (if any) by adviser and administrator. |
| (2) | For comparative purposes per share amounts are based on average shares outstanding. |
See Notes to Financial Statements.
22
| | | | | | | | | | | | | | | | | | | | |
Total
Distributions
| | | Net Asset
Value,
End of
Year
| | Total
Return
| | | Net Assets,
End of
Year
(000’s)
| | Ratio of Net
Operating
Expenses to Average Net Assets
| | | Ratio of Gross
Operating
Expenses to
Average Net Assets (1)
| | | Ratio of Net
Investment
Income to Average
Net Assets
| |
| | | | | | | | | | | | | | | | | | | | | |
| | | | | | | | | | | | | | | | | | | | | |
| | | | | | | | | | | | | | | | | | | | | |
| $ | (0.03176 | ) | | $ | 1.00 | | 3.22 | % | | $ | 410,228 | | 0.53 | % | | 0.69 | % | | 3.15 | % |
| | (0.01253 | ) | | | 1.00 | | 1.26 | % | | | 496,027 | | 0.46 | % | | 0.71 | % | | 1.25 | % |
| | (0.00625 | ) | | | 1.00 | | 0.63 | % | | | 544,721 | | 0.45 | % | | 0.54 | % | | 0.62 | % |
| | (0.01160 | ) | | | 1.00 | | 1.17 | % | | | 594,496 | | 0.39 | % | | 0.47 | % | | 1.21 | % |
| | (0.02623 | ) | | | 1.00 | | 2.65 | % | | | 795,287 | | 0.43 | % | | 0.49 | % | | 2.72 | % |
| | | | | | | | | | | | | | | | | | | | | |
| | | | | | | | | | | | | | | | | | | | | |
| | | | | | | | | | | | | | | | | | | | | |
| $ | (0.03222 | ) | | $ | 1.00 | | 3.27 | % | | $ | 1,032,384 | | 0.53 | % | | 0.69 | % | | 3.21 | % |
| | (0.01285 | ) | | | 1.00 | | 1.29 | % | | | 1,105,053 | | 0.46 | % | | 0.70 | % | | 1.28 | % |
| | (0.00662 | ) | | | 1.00 | | 0.66 | % | | | 1,141,562 | | 0.45 | % | | 0.73 | % | | 0.67 | % |
| | (0.01245 | ) | | | 1.00 | | 1.25 | % | | | 1,787,852 | | 0.39 | % | | 0.43 | % | | 1.25 | % |
| | (0.02751 | ) | | | 1.00 | | 2.79 | % | | | 1,802,136 | | 0.44 | % | | 0.74 | % | | 2.76 | % |
| | | | | | | | | | | | | | | | | | | | | |
| | | | | | | | | | | | | | | | | | | | | |
| | | | | | | | | | | | | | | | | | | | | |
| $ | (0.02138 | ) | | $ | 1.00 | | 2.16 | % | | $ | 447,865 | | 0.60 | % | | 0.94 | % | | 2.15 | % |
| | (0.00845 | ) | | | 1.00 | | 0.85 | % | | | 409,252 | | 0.55 | % | | 0.97 | % | | 0.82 | % |
| | (0.00497 | ) | | | 1.00 | | 0.50 | % | | | 490,099 | | 0.50 | % | | 0.75 | % | | 0.49 | % |
| | (0.00877 | ) | | | 1.00 | | 0.88 | % | | | 548,574 | | 0.44 | % | | 0.49 | % | | 0.89 | % |
| | (0.01769 | ) | | | 1.00 | | 1.78 | % | | | 696,093 | | 0.48 | % | | 0.71 | % | | 1.76 | % |
| | | | | | | | | | | | | | | | | | | | | |
| | | | | | | | | | | | | | | | | | | | | |
| | | | | | | | | | | | | | | | | | | | | |
| $ | (0.02229 | ) | | $ | 1.00 | | 2.25 | % | | $ | 2,162,173 | | 0.53 | % | | 0.68 | % | | 2.23 | % |
| | (0.00966 | ) | | | 1.00 | | 0.97 | % | | | 2,037,802 | | 0.46 | % | | 0.69 | % | | 0.97 | % |
| | (0.00575 | ) | | | 1.00 | | 0.58 | % | | | 2,044,676 | | 0.44 | % | | 0.58 | % | | 0.56 | % |
| | (0.00965 | ) | | | 1.00 | | 0.97 | % | | | 2,281,263 | | 0.39 | % | | 0.54 | % | | 0.97 | % |
| | (0.01875 | ) | | | 1.00 | | 1.89 | % | | | 2,522,455 | | 0.44 | % | | 0.58 | % | | 1.85 | % |
| | | | | | | | | | | | | | | | | | | | | |
| | | | | | | | | | | | | | | | | | | | | |
| | | | | | | | | | | | | | | | | | | | | |
| $ | (0.02891 | ) | | $ | 1.00 | | 2.93 | % | | $ | 365,688 | | 0.58 | % | | 0.74 | % | | 2.86 | % |
| | (0.01019 | ) | | | 1.00 | | 1.02 | % | | | 428,008 | | 0.55 | % | | 0.75 | % | | 0.99 | % |
| | (0.00486 | ) | | | 1.00 | | 0.49 | % | | | 519,722 | | 0.50 | % | | 0.57 | % | | 0.49 | % |
| | (0.01089 | ) | | | 1.00 | | 1.09 | % | | | 571,998 | | 0.45 | % | | 0.53 | % | | 1.08 | % |
| | (0.02449 | ) | | | 1.00 | | 2.48 | % | | | 604,281 | | 0.48 | % | | 0.54 | % | | 2.42 | % |
See Notes to Financial Statements.
23
EXCELSIOR FUNDS
NOTES TO FINANCIAL STATEMENTS
1. Significant Accounting Policies:
Excelsior Funds, Inc. (“Excelsior Fund”) and Excelsior Tax-Exempt Funds, Inc. (“Excelsior Tax-Exempt Fund”) were incorporated under the laws of the State of Maryland on August 2, 1984 and August 8, 1984, respectively, and are registered under the Investment Company Act of 1940, as amended (the “1940 Act”), as open-ended diversified management investment companies with the exception of Energy and Natural Resources Fund, Real Estate Fund, California Short-Intermediate Term Tax-Exempt Income Fund (formerly California Tax-Exempt Income Fund), New York Intermediate-Term Tax-Exempt Fund and New York Tax-Exempt Money Fund, each of which are non-diversified.
Excelsior Fund and Excelsior Tax-Exempt Fund currently offer shares in fifteen and seven managed investment portfolios, respectively, each having its own investment objectives and policies. The following is a summary of significant accounting policies for Government Money Fund, Money Fund and Treasury Money Fund, portfolios of Excelsior Fund, and for New York Tax-Exempt Money Fund and Tax-Exempt Money Fund, portfolios of Excelsior Tax-Exempt Fund (each a “Fund”, collectively, the “Funds”). Such policies are in conformity with accounting principles generally accepted in the United States of America and are consistently followed by the Funds in the preparation of their financial statements. The preparation of financial statements requires management to make estimates and assumptions that affect the reported amounts and disclosures in the financial statements. Actual results could differ from these estimates.
All Funds except for Money Fund offer one class of shares: Shares. The Money Fund offers two classes of shares: Shares and Institutional Shares. The financial highlights of the Institutional Shares as well as the financial statements for the remaining portfolios of Excelsior Fund and Excelsior Tax-Exempt Fund are presented separately.
It is each Fund’s policy, to the extent possible, to maintain a continuous net asset value per share of $1.00. Each Fund has adopted certain investment portfolio valuation and dividend distribution policies to enable it to do so. However, there can be no assurance that the net asset value per share of the Fund will not vary.
(a) Portfolio valuation:
Securities are valued at amortized cost, which has been determined by each Fund’s Board of Directors to represent the fair value of the Funds’ investments. Amortized cost valuation involves valuing an instrument at its cost initially and, thereafter, assuming a constant amortization to maturity of any discount or premium.
(b) Security transactions and investment income:
Security transactions are recorded on a trade date basis. Realized gains and losses on investments sold are recorded on the basis of identified cost. Interest income, adjusted for amortization of premiums and, when appropriate, discounts on investments, is earned from settlement date and is recorded on the accrual basis.
24
(c) Repurchase agreements:
The Funds may purchase portfolio securities from financial institutions deemed to be creditworthy by the investment adviser subject to the seller’s agreement to repurchase and the Funds’ agreement to resell such securities at mutually agreed upon prices. Securities purchased subject to such repurchase agreements are deposited with the Funds’ custodian or sub-custodian or are maintained in the Federal Reserve/Treasury book-entry system and must have, at all times, an aggregate market value not less than the repurchase price (including accrued interest).
Default or bankruptcy of the seller may, however, expose the applicable Fund to possible delay in connection with the disposition of the underlying securities or loss to the extent that proceeds from a sale of the underlying securities were less than the repurchase price under the agreement.
(d) Distributions to shareholders:
Dividends from net investment income are declared daily and paid monthly. Net realized capital gains, unless offset by any available capital loss carryforward, are distributed to shareholders annually or more frequently to maintain a net asset value of $1.00 per share.
(e) Expense allocation:
Expenses directly attributable to a Fund are charged to that Fund. Other expenses are allocated to the respective Funds based on average daily net assets. Expenses attributable to a specific class of shares, such as shareholder servicing fees, are charged directly to that class.
2. Investment Advisory Fee, Administration Fee, Shareholder Servicing Fees and Related Party
Transactions:
Prior to December 16, 2005, the Funds were advised jointly by United States Trust Company of New York and U.S. Trust Company, N.A., through their respective separate identifiable divisions. Effective December 16, 2005, U.S. Trust Company, N.A.’s separately identifiable division was reorganized into a separate corporate entity named UST Advisers, Inc., a Delaware corporation that is a wholly-owned subsidiary of U.S. Trust Company, N.A. and the Funds were advised by either UST Advisers, Inc. or U.S. Trust New York Asset Management Division (“NYAMD”), the separately identifiable division of United States Trust Company of New York.
Effective March 31, 2006, United States Trust Company of New York converted to a national charter and changed its name to United States Trust Company, National Association (“USTC-NA”) and merged with U.S. Trust Company, N.A., with USTC-NA as the surviving entity. As of March 31, 2006, the Funds are advised by NYAMD, a separate identifiable division of USTC-NA, or UST Advisers, Inc. (together with NYAMD, the “Advisers”), a wholly-owned subsidiary of USTC-NA. USTC-NA is a wholly-owned subsidiary of US Trust Corporation, a registered bank holding company, which, in turn, is a wholly-owned subsidiary of The Charles Schwab Corporation. For the services provided pursuant to the Investment Advisory Agreements, each Adviser receives a fee, computed daily and paid monthly, as follows:
| | | |
Government Money Fund | | 0.25 | % |
Money Fund | | 0.25 | % |
New York Tax-Exempt Money Fund | | 0.50 | % |
Tax-Exempt Money Fund | | 0.25 | % |
Treasury Money Fund | | 0.30 | % |
25
UST Advisers, Inc. and BISYS Fund Services Ohio, Inc. (collectively, the “Administrators”) provide administrative services to the Funds. For the services provided to the Funds, the Administrators are entitled jointly to annual fees, computed daily and paid monthly, based on the combined aggregate average daily net assets of Excelsior Fund, Excelsior Tax-Exempt Fund and Excelsior Funds Trust (excluding the international equity portfolios of Excelsior Fund and Excelsior Funds Trust), all of which are affiliated investment companies, as follows: 0.200% of the first $200 million, 0.175% of the next $200 million and 0.150% over $400 million. The Administrators are entitled jointly to annual fees, computed daily and paid monthly, at the annual rate of 0.20% of the average daily net assets of the Emerging Markets Fund, International Equity Fund, International Fund and Pacific/Asia Fund. Administration fees payable by each Fund of the Excelsior Fund, Excelsior Tax-Exempt Fund and Excelsior Funds Trust are determined in proportion to the relative average daily net assets of the respective Funds for the period paid. For the year ended March 31, 2006, administration fees charged to the Funds were as follows:
| | | |
| | | Administration
Fees
|
Government Money Fund | | $ | 686,450 |
Money Fund | | | 2,379,752 |
New York Tax-Exempt Money Fund | | | 638,281 |
Tax-Exempt Money Fund | | | 3,218,552 |
Treasury Money Fund | | | 558,168 |
From time to time, in its sole discretion, each Adviser may undertake to waive a portion or all of the fees payable to it and may also reimburse the Funds for a portion of other expenses. For the four months ended July 31, 2005 and the eight months ended March 31, 2006, the Advisers have contractually agreed to waive investment advisory fees and to reimburse other ordinary operating expenses to the extent necessary to keep total operating expenses from exceeding the following annual percentages of each Fund’s average daily net assets:
| | | | | | |
| | | Four Months
Ended
July 31, 2005
| | | Eight Months
Ended
March 31,
2006
| |
Government Money Fund | | 0.50 | % | | 0.55 | % |
Money Fund | | 0.50 | % | | 0.55 | % |
New York Tax-Exempt Money Fund | | 0.60 | % | | 0.60 | % |
Tax-Exempt Money Fund | | 0.50 | % | | 0.55 | % |
Treasury Money Fund | | 0.55 | % | | 0.60 | % |
Money Fund-Institutional Shares | | 0.25 | % | | 0.30 | % |
For the year ended March 31, 2006, pursuant to the above, investment advisory fees waived by the Advisers were as follows:
| | | | |
Government Money Fund | | $ | (724,624 | ) |
Money Fund | | | (2,481,701 | ) |
New York Tax-Exempt Money Fund | | | (1,454,850 | ) |
Tax-Exempt Money Fund | | | (3,143,406 | ) |
Treasury Money Fund | | | (595,431 | ) |
26
The Funds have entered into shareholder servicing agreements with various service organizations, which include Charles Schwab & Co. Inc. (“CS & Co.”) and UST Advisers, Inc. Services included in the servicing agreements are assisting in processing purchase, exchange and redemption requests; transmitting and receiving funds in connection with customer orders to purchase, exchange or redeem shares; and providing periodic statements. Shareholder servicing fees are incurred on a Fund or class level (where applicable). In consideration for these services, each service organization receives a fee from the Funds, computed daily and paid monthly, at an annual rate up to 0.25% of the average daily net assets of the Funds’ shares held by each service organization’s customers, with the exception of the Institutional Shares of the Money Fund, which pays a fee of up to 0.15% of the average daily net assets of its shares. The Advisers, out of their own resources, may additionally compensate certain organizations for providing these and other services.
For the year ended March 31, 2006, shareholder servicing fees paid to CS & Co. and the Advisers were as follows:
| | | |
Government Money Fund | | $ | 1,232,461 |
Money Fund | | | 2,736,566 |
New York Tax-Exempt Money Fund | | | 1,107,384 |
Tax-Exempt Money Fund | | | 5,747,190 |
Treasury Money Fund | | | 986,793 |
BISYS Fund Services Limited Partnership (the “Distributor”) serves as the Distributor of the Funds. Shares of each Fund are sold without a sales charge on a continuous basis by the Distributor.
Each Independent Director of the Funds receives a total annual fee of $100,000 paid by the Funds and other affiliated registered investment companies managed by the Advisers. The Chairman of the Board receives an additional $30,000, the Chairman of the Audit Committee receives an additional $15,000, and the Chairman of the Nominating Committee receives an additional $5,000 for serving in those capacities. In addition, Directors are reimbursed by the Excelsior Fund and Excelsior Tax-Exempt Fund for reasonable expenses incurred when acting in their capacity as Directors.
3. Federal Taxes:
It is the policy of the Excelsior Fund and Excelsior Tax-Exempt Fund that each Fund qualify or continue to qualify as a regulated investment company, by complying with the requirements of the Internal Revenue Code applicable to regulated investment companies and by distributing substantially all of its taxable earnings to its shareholders.
In order to avoid a federal excise tax, each Fund is required to distribute certain minimum amounts of net realized capital gain and net investment income for the respective twelve-month periods ending October 31 and December 31 each calendar year.
Dividends and distributions are determined in accordance with federal income tax regulations and may differ from accounting principles generally accepted in the United States of America. These differences are primarily due to differing treatments for deferral of losses on wash sales and net capital losses incurred after October 31 and within the taxable year (“Post-October losses”). To the extent these
27
differences are permanent, adjustments are made to the appropriate equity accounts in the period that these differences arise. Accordingly, the following reclassifications have been made to/from the following accounts:
| | | | | | | | | | | |
| | | Undistributed
Net Investment
Income
| | Accumulated
Net Realized
Gain (Loss)
| | | Paid-In-Capital
| |
Government Money Fund | | | — | | $ | 4,692 | | | $ | (4,692 | ) |
Money Fund | | | — | | | — | | | | — | |
New York Tax-Exempt Money Fund | | $ | 7,841 | | | (7,841 | ) | | | — | |
Tax-Exempt Money Fund | | | — | | | — | | | | — | |
Treasury Money Fund | | | 4,252 | | | (4,252 | ) | | | — | |
The tax character of dividends and distributions declared during the years ended March 31, 2006 and March 31, 2005 were as follows:
| | | | | | | | | | | | |
| | | Ordinary
Income
| | Tax-Exempt
Income
| | Long-Term
Capital Gain
| | Total
|
Government Money Fund | | | | | | | | | | | | |
Year ended March 31, 2006 | | $ | 13,620,350 | | | — | | | — | | $ | 13,620,350 |
Year ended March 31, 2005 | | | 5,884,680 | | | — | | | — | | | 5,884,680 |
Money Fund | | | | | | | | | | | | |
Year ended March 31, 2006 | | | 49,048,464 | | | — | | | — | | | 49,048,464 |
Year ended March 31, 2005 | | | 19,959,001 | | | — | | | — | | | 19,959,001 |
New York Tax-Exempt Money Fund | | | | | | | | | | | | |
Year ended March 31, 2006 | | | 3,001 | | $ | 8,506,753 | | $ | 4,840 | | | 8,514,594 |
Year ended March 31, 2005 | | | 988 | | | 3,352,703 | | | — | | | 3,353,691 |
Tax-Exempt Money Fund | | | | | | | | | | | | |
Year ended March 31, 2006 | | | 84,887 | | | 45,217,987 | | | 20,970 | | | 45,323,844 |
Year ended March 31, 2005 | | | 28,575 | | | 18,660,028 | | | 7,646 | | | 18,696,249 |
Treasury Money Fund | | | | | | | | | | | | |
Year ended March 31, 2006 | | | 9,920,151 | | | — | | | — | | | 9,920,151 |
Year ended March 31, 2005 | | | 3,943,362 | | | — | | | — | | | 3,943,362 |
28
As of March 31, 2006, the components of distributable earnings (accumulated losses) on a tax basis were as follows:
| | | | | | | | | | | | | | | | | | | | | | | | |
| | | Undistributed
Ordinary
Income
| | Undistributed
Long-Term
Capital Gain
| | Undistributed
Tax-Exempt
Income
| | Accumulated
Earnings
| | Distributions
Payable
| | | Accumulated
Capital and
Other Losses
| | | Total
Accumulated
Earnings/
(Deficit)
| |
Government Money Fund | | $ | 1,552,616 | | | — | | | — | | $ | 1,552,616 | | $ | (1,552,616 | ) | | $ | (27,980 | ) | | $ | (27,980 | ) |
Money Fund | | | 5,955,217 | | | — | | | — | | | 5,955,217 | | | (5,955,217 | ) | | | (40,526 | ) | | | (40,526 | ) |
New York Tax-Exempt Money Fund | | | — | | | — | | $ | 980,009 | | | 980,009 | | | (975,168 | ) | | | — | | | | 4,841 | |
Tax-Exempt Money Fund | | | 63,655 | | $ | 30,394 | | | 4,884,340 | | | 4,978,389 | | | (4,894,160 | ) | | | — | | | | 84,229 | |
Treasury Money Fund | | | 1,142,032 | | | — | | | — | | | 1,142,032 | | | (1,141,474 | ) | | | — | | | | 558 | |
Post-October losses are deemed to arise on the first business day of a Fund’s next taxable year.
For federal income tax purposes, capital loss carryforwards may be carried forward and applied against future capital gains. To the extent that such carryforwards are utilized, capital gains distributions will be reduced. At March 31, 2006, the following Funds had capital loss carryforwards available to offset future net capital gains through the indicated expiration dates.
| | | | | | | | | | | | | | | | | | |
| | | Expires
|
| | | 2007
| | 2008
| | 2011
| | 2012
| | 2014
| | Total
|
Government Money Fund | | $ | 3,297 | | $ | 18,903 | | | — | | $ | 5,556 | | $ | 224 | | $ | 27,980 |
Money Fund | | | — | | | — | | $ | 11,662 | | | 23,975 | | | 4,889 | | | 40,526 |
4. Capital Transactions:
Excelsior Fund has authorized capital of 35 billion shares of Common Stock, 29.3756 billion of which is currently classified to represent interests in certain classes of shares. Excelsior Tax-Exempt Fund has authorized capital of 24 billion shares of Common Stock, 15 billion of which is currently classified to represent interests in certain classes of shares. Authorized capital currently classified for each Fund is as follows: 4 billion shares each of the Government Money Fund and Money Fund, 2.5 billion shares of Treasury Money Fund, 2 billion shares of New York Tax-Exempt Money Fund and 5.5 billion shares for Tax-Exempt Money Fund.
Each share has a par value of $0.001 and represents an equal proportionate interest in the particular Fund with other shares of the same Fund, and is entitled to such dividends and distributions of taxable earnings on the assets belonging to such Fund as are declared at the discretion of each Fund’s Board of Directors. Since the Funds have sold, reinvested and redeemed shares only at a constant net asset value of $1.00 per share, the number of shares represented by such sales, reinvestments and redemptions is the same as the amounts shown below for such transactions.
29
| | | | | | | | |
| | | Government Money Fund
| |
| | | Year Ended March 31,
| |
| | | 2006
| | | 2005
| |
Sold | | $ | 2,577,232,059 | | | $ | 2,736,097,238 | |
Issued as reinvestment of dividends | | | 735,293 | | | | 377,287 | |
Redeemed | | | (2,663,765,701 | ) | | | (2,785,171,479 | ) |
| | |
|
|
| |
|
|
|
Net Increase (Decrease) | | $ | (85,798,349 | ) | | $ | (48,696,954 | ) |
| | |
|
|
| |
|
|
|
| | | | | | | | | | | | | | |
| |
| | | Money Fund
| |
| | | Year Ended March 31,
| |
| | | 2006
| | | 2005
| |
| | | Shares
| | | Amount
| | | Shares
| | | Amount
| |
Sold: | | | | | | | | | | | | | | |
Shares | | 3,427,610,450 | | | $ | 3,427,610,450 | | | 3,782,584,603 | | | $ | 3,782,584,603 | |
Institutional Shares | | 4,731,250,373 | | | | 4,731,250,373 | | | 4,191,107,467 | | | | 4,191,107,467 | |
Issued as reinvestment of dividends: | | | | | | | | | | | | | | |
Shares | | 2,259,420 | | | | 2,259,420 | | | 1,188,525 | | | | 1,188,499 | |
Institutional Shares | | 7,428,066 | | | | 7,428,066 | | | 2,099,572 | | | | 2,099,573 | |
Redeemed: | | | | | | | | | | | | | | |
Shares | | (3,502,534,923 | ) | | | (3,502,534,923 | ) | | (3,820,288,035 | ) | | | (3,820,288,036 | ) |
Institutional Shares | | (4,841,213,240 | ) | | | (4,841,213,240 | ) | | (4,038,109,800 | ) | | | (4,038,109,805 | ) |
| | |
|
| |
|
|
| |
|
| |
|
|
|
Net Increase (Decrease) | | (175,199,854 | ) | | $ | (175,199,854 | ) | | 118,582,332 | | | $ | 118,582,301 | |
| | |
|
| |
|
|
| |
|
| |
|
|
|
| | | | | | | | |
| |
| | | New York Tax-Exempt Money Fund
| |
| | | Year Ended March 31,
| |
| | | 2006
| | | 2005
| |
Sold | | $ | 2,399,705,970 | | | $ | 1,870,092,958 | |
Issued as reinvestment of dividends | | | 1,554,586 | | | | 460,208 | |
Redeemed | | | (2,362,651,304 | ) | | | (1,951,401,831 | ) |
| | |
|
|
| |
|
|
|
Net Increase (Decrease) | | $ | 38,609,252 | | | $ | (80,848,665 | ) |
| | |
|
|
| |
|
|
|
| |
| | | Tax-Exempt Money Fund
| |
| | | Year Ended March 31,
| |
| | | 2006
| | | 2005
| |
Sold | | $ | 10,547,799,881 | | | $ | 8,993,982,009 | |
Issued as reinvestment of dividends | | | 2,207,894 | | | | 573,372 | |
Redeemed | | | (10,425,694,762 | ) | | | (9,001,457,475 | ) |
| | |
|
|
| |
|
|
|
Net Increase (Decrease) | | $ | 124,313,013 | | | $ | (6,902,094 | ) |
| | |
|
|
| |
|
|
|
| |
| | | Treasury Money Fund
| |
| | | Year Ended March 31,
| |
| | | 2006
| | | 2005
| |
Sold | | $ | 3,260,733,468 | | | $ | 3,255,632,599 | |
Issued as reinvestment of dividends | | | 2,191,117 | | | | 968,644 | |
Redeemed | | | (3,325,243,094 | ) | | | (3,348,314,283 | ) |
| | |
|
|
| |
|
|
|
Net Increase (Decrease) | | $ | (62,318,509 | ) | | $ | (91,713,040 | ) |
| | |
|
|
| |
|
|
|
30
5. Guarantees:
In the normal course of business, the Funds enter into contracts that provide general indemnifications. The Funds’ maximum exposure under these arrangements is dependent on future claims that may be made against the Funds and, therefore, cannot be established; however, based on experience, the risk of loss from such claims is considered remote.
6. Legal Proceedings:
The Adviser and Excelsior Funds, Inc., Excelsior Tax-Exempt Funds, Inc., and Excelsior Funds Trust (the “Companies”) were contacted in September, 2003 by the Office of the New York State Attorney General (the “NYAG”), and the Adviser was contacted by the Securities and Exchange Commission (the “SEC”) and later by the Attorney General of the State of West Virginia, in connection with their investigations of practices in the mutual fund industry identified as “market timing” and “late trading” of mutual fund shares (the “Investigations”). The Adviser and the Companies have provided full cooperation with respect to these Investigations and continue to review the facts and circumstances relevant to the Investigations. As disclosed previously by the Adviser and its affiliates, with respect to the Adviser, these investigations have been focusing on circumstances in which a small number of parties were permitted to engage in short-term trading of shares of certain of the Excelsior Funds. The short-term trading activities permitted under these arrangements have been terminated and the Adviser has strengthened its policies and procedures to deter frequent trading of shares of the Excelsior Funds.
The Adviser, certain of its affiliates, the Companies and others have also been named in several class action and derivative lawsuits which allege that the Adviser, certain of its affiliates, the Companies and others allowed certain parties to engage in illegal and improper mutual fund trading practices, which allegedly caused financial injury to the shareholders of certain of the Excelsior Funds managed by the Adviser. Each seeks unspecified monetary damages and related equitable relief.
The class and derivative actions described above have been transferred to the United States District Court for the District of Maryland for coordinated and consolidated pre-trial proceedings. In November 2005, the Maryland court dismissed many of the plaintiffs’ claims in both the investor class action and the derivative lawsuits. Plaintiffs’ claims under Sections 10(b) and 20(a) of the Securities Exchange Act and under Section 36(b) and 48(a) of the Investment Company Act, however, have not been dismissed. Discovery has commenced with respect to plaintiffs’ remaining claims.
While the ultimate outcome of these matters cannot be predicted with any certainty at this time, based on currently available information and consultation with counsel, the Adviser believes that the resolution of the pending Investigations and private lawsuits will not have a material adverse financial impact on the Companies, and further believes that the pending Investigations and private lawsuits are not likely to materially affect the Adviser’s ability to provide investment management services to the Companies.
31
REPORT OF INDEPENDENT REGISTERED PUBLIC ACCOUNTING FIRM
To the Board of Directors and Shareholders of
Excelsior Funds, Inc. and Excelsior Tax-Exempt Funds, Inc.
We have audited the accompanying statements of assets and liabilities, including the portfolios of investments, of the Money Fund, Government Money Fund, Treasury Money Fund, Tax-Exempt Money Fund, and New York Tax-Exempt Money Fund (three of the portfolios constituting the Excelsior Funds, Inc. and two of the portfolios constituting the Excelsior Tax-Exempt Funds, Inc.) (collectively, the “Funds”) as of March 31, 2006, and the related statements of operations for the year then ended, the statements of changes in net assets for each of the two years in the period then ended, and the financial highlights (Shares) for each of the three years in the period then ended. These financial statements and financial highlights are the responsibility of the Funds’ management. Our responsibility is to express an opinion on these financial statements and financial highlights based on our audits. The financial highlights for each of the years in the two year period ended March 31, 2003 were audited by other auditors whose reports dated May 16, 2003, expressed an unqualified opinion on those financial highlights.
We conducted our audits in accordance with the standards of the Public Company Accounting Oversight Board (United States). Those standards require that we plan and perform the audit to obtain reasonable assurance about whether the financial statements and financial highlights are free of material misstatement. The Funds are not required to have, nor were we engaged to perform, an audit of their internal control over financial reporting. Our audits included consideration of internal control over financial reporting as a basis for designing audit procedures that are appropriate in the circumstances, but not for the purpose of expressing an opinion on the effectiveness of the Funds’ internal control over financial reporting. Accordingly, we express no such opinion. An audit also includes examining, on a test basis, evidence supporting the amounts and disclosures in the financial statements, assessing the accounting principles used and significant estimates made by management, as well as evaluating the overall financial statement presentation. Our procedures included confirmation of securities owned as of March 31, 2006, by correspondence with the custodian and brokers; where replies were not received from brokers, we performed other auditing procedures. We believe that our audits provide a reasonable basis for our opinion.
In our opinion, the financial statements and financial highlights referred to above present fairly, in all material respects, the financial position of Money Fund, Government Money Fund, Treasury Money Fund, Tax-Exempt Money Fund, and New York Tax-Exempt Money Fund as of March 31, 2006, the results of their operations for the year then ended, the changes in their net assets for each of the two years in the period then ended, and the financial highlights for each of the three years in the period then ended, in conformity with accounting principles generally accepted in the United States of America.
DELOITTE & TOUCHE LLP
New York, New York
May 22, 2006
32
Directors/Trustees and Officers of the Excelsior Funds Complex (Unaudited)
Information pertaining to the Directors/Trustees and Officers of Excelsior Fund, Excelsior Tax-Exempt Fund and Excelsior Funds Trust (each a “Company” and collectively, the “Excelsior Funds Complex”) is set forth below. Directors/Trustees who are not deemed to be “interested persons” of the Excelsior Funds Complex as defined in the 1940 Act are referred to as “Independent Board Members.” Directors/Trustees who are deemed to be “interested persons” of the Excelsior Funds Complex are referred to as “Interested Board Members”. The following information is as of May 20, 2006.
On February 24, 2006, the Boards of Directors/Trustees (the “Boards”) of the Companies approved an increase in the size of the Boards to ten (10) directors/trustees (together, the “Directors”) and approved the nomination of Mariann Byerwalter, Nils Hakansson, William A. Hasler and Randall W. Merk (the “Candidates”) as Directors of the Companies, subject to shareholder approval at an upcoming Special Meeting of Shareholders of the Companies (the “Meeting”). Each of the Candidates is currently a director/trustee of the Laudus Funds, the Laudus Variable Insurance Trust (together, the “Laudus Funds”) and of other funds included in the Schwab mutual fund complex for which Charles Schwab Investment Management acts as investment adviser (together, the “Fund Complex”). The Companies are in the same Fund Complex as the Laudus Funds. If approved by Shareholders at the Meeting, Ms. Byerwalter and Messrs. Hakansson and Hasler would become disinterested persons of the Companies under the Investment Company Act of 1940, as amended. Mr. Merk would become an interested person of the Companies.
The Boards also approved the nominations of six existing Directors to be submitted to shareholders for approval at the Meeting: Messrs. Bailey, Collins, Drake, Hall, Lynch and Piel (the “Existing Directors” and, together with the Candidates, the “Nominees”). Frederick S. Wonham, a current Director of the Companies and Chairman of the Board of each Company, has notified the Boards that he intends to resign from the Boards, consistent with the Companies’ retirement age policy, effective as of the date of the Meeting. The Boards have elected Rodman Drake, currently a Director of the Companies and Chairman of their Joint Audit Committee, as the Chairman of the Boards of the Companies effective upon Mr. Wonham’s resignation.
The Boards have proposed to increase the size of each Board from seven to ten so that a single group of Directors (i.e., a unitary board) can oversee each of the Companies and the Laudus Funds. At a meeting held on March 16, 2006, the Laudus Funds’ Boards approved the nominations of the Existing Directors for election to the Laudus Funds’ Boards, subject to approval by shareholders of each of the Laudus Funds. Each of the Candidates has notified the Boards that, even if approved by the Companies’ shareholders at the Meeting, the Candidates will not serve as members of the Boards unless the shareholders of each of the Companies and the Laudus Funds approve the election of each of the other Nominees. Similarly, each of the existing Directors has informed the Laudus Funds Boards that, even if approved by shareholders of the Laudus Funds at their shareholders meeting, the Existing Directors will not serve as members of the Laudus Funds Boards unless the shareholders of each of the Companies and the Laudus Funds approve the election of each of the other Nominees.
33
| | | | | | |
Name and Address(1) Age Time Served with the Excelsior Funds Complex
| | Principal Occupation
During the Past Five Years
| | Number of
Portfolios in Fund Complex Overseen by Director/Trustee(3)
| | Other Directorships Held by Director/Trustee(4)
|
DIRECTORS/TRUSTEES(2) INDEPENDENT BOARD MEMBERS | | | | |
Frederick S. Wonham
Age: 75
Since 1997 | | Retired. Chairman of the Boards and Director (since 1997) and President and Treasurer (from 1995 to February 2002) of Excelsior Funds, Inc. and Excelsior Tax-Exempt Funds, Inc.; Chairman of the Board and Trustee (since 1997) and President and Treasurer (from 1995 to February 2002) of Excelsior Funds Trust. | | 29 | | None. |
| | | |
Rodman L. Drake
Age: 63
Since 1994 | | Director and Chairman of Audit Committee of Excelsior Funds, Inc. and Excelsior Tax-Exempt Funds, Inc. (since 1996); Trustee of Excelsior Funds Trust (since 1994); Co-Founder of Baringo Capital LLC (since 2002); President, Continuation Investments Group, Inc. (from 1997 to 2001). | | 29 | | Director and Chairman, Hyperion Total Return Fund, Inc., and Hyperion Strategic Mortgage Fund Inc. (since 1991); Director, Jackson Hewitt Tax Services, Inc. (since June 2004); Director, Student Loan Corporation (since May 2005). |
| | | |
Morrill Melton ("Mel") Hall, Jr.
Age: 61
Since 2000 | | Director of Excelsior Funds, Inc. and Excelsior Tax-Exempt Funds, Inc. (since 2000); Trustee of Excelsior Funds Trust (since 2000); Chairman (since 1984) and Chief Executive Officer (since 1991), Comprehensive Health Services, Inc. (health care management and administration). | | 29 | | None. |
| | | |
Roger M. Lynch
Age: 64
Since 2001 | | Retired. Director of Excelsior Funds, Inc. and Excelsior Tax- Exempt Funds, Inc. and Trustee of Excelsior Funds Trust (since 2001); President, Corporate Asset Funding Co., Inc. (asset securitization) (from 1987 to 1999); Limited Partner (from 1986 to 1999), Goldman Sachs & Co. | | 29 | | None. |
| | | |
Jonathan Piel
Age: 67
Since 1994 | | Director and Chairman of Nominating Committee Excelsior Funds, Inc. and Excelsior Tax-Exempt Funds, Inc. (since 1996); Trustee, Excelsior Funds Trust (since 1994); Cable Television producer and website designer. The Editor Scientific American (from 1984 to 1986), and Vice President, Scientific American, Inc. (from 1986 to 1994); Director, National Institute of Social Sciences; member, Advisory Board, The Stone Age Institute, Bloomington Indiana. | | 29 | | None. |
34
| | | | | | |
Name and Address(1) Age Time Served with the Excelsior Funds Complex
| | Principal Occupation
During the Past Five Years
| | Number of
Portfolios in Fund Complex Overseen by Director/Trustee(3)
| | Other Directorships Held by Director/Trustee(4)
|
John. D. Collins
Age: 67
Since 2005 | | Retired. Director, Excelsior Funds, Inc. and Excelsior Tax-Exempt Funds, Inc. (since 2005); Trustee, Excelsior Funds Trust (since 2005). Consultant, KPMG, LLP (from July 1999 to June 2000); Partner, KPMG, LLP (from March 1962 to June 1999). | | 29 | | Director, Mrs. Fields’ Famous Brands LLC (consumer products) (since December 2004). |
| INTERESTED BOARD MEMBER(5) | | | | |
James L. Bailey
114 West 47th Street
New York, NY 10036
Age: 60
Since 2004 | | Chief Operating Officer of U.S. Trust Corporation (since December 2004) and Executive Vice President of U.S. Trust Corporation and United States Trust Company of New York (since 2003); President, Excelsior Funds, Inc., Excelsior Tax-Exempt Funds, Inc. and Excelsior Funds Trust (from 2003 to July 2004); Consultant in the financial services industry (from August 2000 to January 2003); Executive Vice President of Citicorp (from 1992 to August 2000). | | 29 | | None. |
| OFFICERS | | | | | | |
Joseph Trainor, CFA
Age: 44
114 West 47th Street
New York, NY 10036 | | Managing Director of United States Trust Company of New York (since 2003) and President, U.S. Trust Institutional; President of MFS Institutional Advisors (from 1998 to 2002). | | N/A | | N/A |
| | | |
George Pereira
Age: 42
101 Montgomery St.
San Francisco, CA 94104 | | Senior Vice President and Chief Financial Officer, Charles Schwab Investment Management, Inc.; Director, Charles Schwab Asset Management (Ireland) Limited. From December 1999 to November 2004, Sr. Vice President, Financial Reporting. Charles Schwab & Co., Inc. From September 1999 to December 1999, Chief Financial Officer, Commerzbank Capital Markets. Prior to September 1999, Managing Director at the New York Stock Exchange. | | N/A | | N/A |
| | | |
Stefanie A. Firtell
Age: 32
114 West 47th Street
New York, NY 10036 | | Vice President, United States Trust Company of New York (since April 2005); Compliance Officer and Head of Regulatory Responses, Assistant Vice President, Deutsche Asset Management (from 2003 to 2005); Assistant Corporate Secretary, Triare Companies, Inc. (from 2002 to 2003); Attorney, Paul, Weiss, Rifkind, Wharton & Garrison (from 2001 to 2002); and Attorney, Cadwalder Wickersham & Taft (from 2000 to 2001). | | N/A | | N/A |
35
| | | | | | |
Name and Address(1) Age Time Served with the Excelsior Funds Complex
| | Principal Occupation
During the Past Five Years
| | Number of
Portfolios in Fund Complex Overseen by Director/Trustee(3)
| | Other Directorships Held by Director/Trustee(4)
|
Wyndham Clark
Age: 47
225 High Ridge Road
Stamford, CT 06905 | | Vice President and AML Officer, U.S. Trust Company, N.A. (since 2003); Vice President and Deputy Director Risk Management. IBJ Whitehall (banking) (from 2001 to 2002); and Vice President and Chief Risk Officer, EMAC, LLC (commercial lender, asset backed security issuer) (from 1999 to 2001). | | N/A | | N/A |
| | | |
Petros (Peter) L. Tsirigotis
Age: 37
114 West 47th Street
New York, NY 10036 | | Senior Vice President and Assistant General Counsel, U.S. Trust (since September 2005); Vice President and Corporate Counsel, Prudential Financial (September 2004 to September 2005); Associate, Schulte Roth and Zabel LLP (November 2002 to September 2004) and Dechert LLP (August 2000 to November 2002). Prior to August 2000, Mr. Tsirigotis was an Attorney/Advisor (Division of Investment Management) and Financial Economist (Office of Economic Analysis) with the Securities and Exchange Commission in Washington, D.C. | | N/A | | N/A |
| (1) | Each independent director/trustee may be contacted by writing to Excelsior Funds, 225 High Ridge Road, Stamford, CT 06905. |
| (2) | Each director/trustee shall hold office until the election and qualification of his or her successor, or until he or she sooner dies, resigns or is removed. The officers of each Company shall hold office for a one year term and until their respective successors are chosen and qualified, or in each case until he or she sooner dies, resigns, is removed, or becomes disqualified in accordance with each Company’s by-laws. |
| (3) | The Excelsior Funds Complex consists of all registered investment companies (Excelsior Funds Inc., Excelsior Tax-Exempt Funds, Inc. and Excelsior Funds Trust) for which U.S. Trust serves as investment adviser. As of May 20, 2006, the Excelsior Funds Complex consisted of 29 Funds. |
| (4) | Directorships of companies required to report to the Securities and Exchange Commission under the Securities Exchange Act of 1934 (i.e., “public companies”) or other investment companies registered under the 1940 Act. |
| (5) | “Interested person” of the Company is defined in the 1940 Act. Mr. Bailey is considered an “interested person” because of his affiliation with the Adviser. |
For more information regarding the Directors/Trustees and Officers, please refer to the Statement of Additional Information, which is available upon request by calling 1-800-446-1012.
36
DISCLOSURE OF FUND EXPENSES (Unaudited)
We believe it is important for you to understand the impact of fees regarding your investment. As a shareholder of the fund, you incur ongoing, or operating costs, which include costs for portfolio management, administrative services, and shareholder reports (like this one), among others. Operating expenses, which are deducted from a fund’s gross income, directly reduce the investment return of the fund. A fund’s expenses are expressed as a percentage of its average net assets. This figure is known as the expense ratio. The following examples are intended to help you understand the ongoing costs (in dollars) of investing in your fund and to compare these costs with those of other mutual funds. The examples are based on an investment of $1,000 made at the beginning of the period shown and held for the entire period.
The table on the following page illustrates your fund’s costs in two ways.
| | • | | Actual expenses. This section provides information about actual account values and actual expenses based on the Funds’ actual return for the period. This section is designed to help you to estimate the actual expenses after fee waivers that you paid over the period. The “Ending Account Value” shown is derived from the fund’s actual return, and the fourth column shows the dollar amount that would have been paid by an investor who started with $1,000 in the fund. You may use the information here, together with the amount you invested, to estimate the expenses that you paid over the period. |
To do so, simply divide your account value by $1,000 (for example, an $8,600 account value divided by $1,000=$8.6), then multiply the result by the number given for your fund under the heading “Expenses Paid During Period”.
| | • | | Hypothetical expenses. This section provides information about hypothetical account values and hypothetical expenses that would have been incurred by an investor in the Fund based on an assumed rate of return of 5% per year before expenses. This section is designed to help you compare your fund’s costs with those of other mutual funds. It assumes that the fund had a return of 5% before expenses during the year, but that the expense ratio is unchanged. In this case, because the return used is not the fund’s actual return, the results cannot be used to estimate the actual ending account balance or expenses you paid for the period. You may use this information to compare the ongoing costs of investing in your Fund and other funds. To do so, compare this 5% hypothetical example with the 5% hypothetical examples that appear in shareholder reports of other funds. |
37
DISCLOSURE OF FUND EXPENSES (Unaudited) (Continued)
Please note that the expenses shown in the table are meant to highlight and help you compare ongoing costs only, which are described in the Prospectus. Therefore, the hypothetical example is useful in comparing ongoing costs only, and will not help you determine the relative total costs of owning different funds.
| | | | | | | | | | | | |
| | | Beginning
Account
Value
10/01/2005
| | Ending
Account
Value
03/31/2006
| | Annualized
Expense
Ratios*
| | | Expenses
Paid
During
Period**
|
Actual Fund Return | | | | | | | | | | | | |
Government Money Fund — Shares | | $ | 1,000.00 | | $ | 1,018.40 | | 0.55 | % | | $ | 2.77 |
Money Fund — Shares | | | 1,000.00 | | | 1,018.70 | | 0.55 | | | | 2.77 |
New York Tax-Exempt Money Fund — Shares | | | 1,000.00 | | | 1,011.90 | | 0.60 | | | | 3.01 |
Tax-Exempt Money Fund — Shares | | | 1,000.00 | | | 1,012.30 | | 0.55 | | | | 2.76 |
Treasury Money Fund — Shares | | | 1,000.00 | | | 1,016.90 | | 0.60 | | | | 3.02 |
| | | | |
Hypothetical 5% Return | | | | | | | | | | | | |
Government Money Fund — Shares | | | 1,000.00 | | | 1,022.19 | | 0.55 | | | | 2.77 |
Money Fund — Shares | | | 1,000.00 | | | 1,022.19 | | 0.55 | | | | 2.77 |
New York Tax-Exempt Money Fund — Shares | | | 1,000.00 | | | 1,021.94 | | 0.60 | | | | 3.02 |
Tax-Exempt Money Fund — Shares | | | 1,000.00 | | | 1,022.19 | | 0.55 | | | | 2.77 |
Treasury Money Fund — Shares | | | 1,000.00 | | | 1,021.94 | | 0.60 | | | | 3.02 |
| * | | Annualized expense ratios of certain funds are after fee waivers and expense reimbursements by the investment adviser. Absent such waivers and reimbursements, expenses paid during the period would have been greater. |
| **Expenses | | are equal to the Fund’s annualized expense ratio multiplied by the average account value over the period, multiplied by the number of days in the most recent fiscal half-year (182) then divided by 365. |
38
AR-MM-0306
The registrant has adopted a code of ethics that applies to the registrant’s principal executive officer, principal financial officer, principal accounting officer or controller, or persons performing similar functions. This code of ethics is included as an Exhibit.
During the period covered by the report, with respect to the registrant’s code of ethics that applies to its principal executive officer, principal financial officer, principal accounting officer or controller, or persons performing similar functions; there have been no amendments to, nor any waivers granted from, a provision that relates to any element of the code of ethics definition enumerated in paragraph (b) of this Item 2.
| Item 3. | Audit Committee Financial Expert. |
3(a)(1) The registrant’s board of directors has determined that the registrant has at least one audit committee financial expert serving on its audit committee.
3(a)(2) The audit committee financial experts are Frederick S. Wonham and Rodman L. Drake, who are “independent” for purposes of this Item 3 of Form N-CSR.
| Item 4. | Principal Accountant Fees and Services. |
For the fiscal years ended March 31, 2006 and March 31, 2005, the aggregate fees billed by Deloitte & Touche LLP for professional services rendered for the audits of the financial statements, or services that are normally provided in connection with statutory and regulatory filings or engagements for the fiscal year for the Registrant are shown in the table below.
| | | | | | |
| | | 2006 |
| | | All fees and services to the Registrant that were pre-approved | | All fees and services to services Affiliates that were pre-approved |
(a) Audit Fees (1) | | $ | 166,425 | | | N/A |
(b) Audit-Related Fees (2) | | $ | 0 | | $ | 0 |
(c) Tax Fees (3) | | $ | 45,500 | | $ | 0 |
(d) All Other Fees (4) | | $ | 0 | | $ | 0 |
| |
| | | 2005 |
| | | All fees and services to the Registrant that were pre-approved | | All fees and services to services Affiliates that were pre-approved |
(a) Audit Fees (1) | | $ | 170,365 | | | N/A |
(b) Audit-Related Fees (2) | | $ | 7,332 | | $ | 0 |
(c) Tax Fees (3) | | $ | 45,500 | | $ | 0 |
(d) All Other Fees (4) | | $ | 0 | | $ | 0 |
| (1) | Audit fees include amounts related to the audit of the Registrant’s annual financial statements and services normally provided by the accountant in connection with statutory and regulatory filings. |
| (2) | For the fiscal year ended March 31, 2006, there were no fees for assurance and related services by Deloitte & Touche LLP reasonably related to the performance of the audit of the Registrant’s financial statements that were not reported under (a) of this item. For the fiscal year ended March 31, 2005, there were audit related fees of $7,332 for assurance and related services by Deloitte & Touche. Such assurance services included a review of the accounting conversion on December 13, 2004 for the Registrant. |
| (3) | For the fiscal year ended March 31, 2006, the aggregate tax fees billed for professional services rendered by Deloitte & Touche LLP for tax compliance, tax advice, and tax planning were $45,500. Such tax services included the review of income and excise tax returns for the Registrant. For the fiscal year ended March 31, 2005, the aggregate tax fees billed for professional services rendered by Deloitte & Touche LLP for tax compliance, tax advice, and tax planning were $45,500. Such tax services included the review of income and excise tax returns for the Registrant. |
| (4) | For the fiscal years ended March 31, 2005 and March 31, 2004, there were no fees billed for professional services rendered by Deloitte & Touche LLP, to the Registrant, other than the services reported in (a) through (c) of this Item. |
(e)(1) The audit committee has adopted policies and procedures that require pre-approval of audit and non-audit services for the Funds and certain other services provided to the Fund’s affiliates in accordance with Rule 2-01 (c) (7) of Regulation S-X. The pre-approval requirement for non-audit services for the Funds, the Funds’ investment adviser and the adviser’s control affiliates may be waived if: (i) the aggregate amount of all services provided constitutes not more than 5% of the total amount of revenues paid to the Funds’ independent accountant by the Funds and the Funds’ investment adviser and its control affiliates that provide ongoing services to the Funds during the fiscal year in which the services are provided that would have to be pre-approved by the Funds’ Audit Committee; (ii) such services were not recognized at the time of the engagement to be
non-audit services; and (iii) such services are promptly brought to the attention of the Audit Committee and approved prior to the completion of the audit by the Audit Committee or by its designated Audit Committee member (s).
(e)(2) Percentage of fees billed applicable to non-audit services pursuant to waiver of pre-approval requirement were as follows:
| | | | |
| | | 2006 | | 2005 |
Audit-Related Fees | | N/A | | N/A |
Tax Fees | | N/A | | N/A |
All Other Fees | | N/A | | N/A |
(f) Not applicable.
(g) For the fiscal years ended March 31, 2006 and March 31, 2005, the aggregate non-audit fees billed by Deloitte & Touche LLP for services rendered to the Registrant and the Advisers and any entity controlling, controlled by, or under common control with the Advisers that provided ongoing services to the Registrant were $1,187,420 and $1, 248,972, respectively.
(h) The Registrant’s Audit Committee has considered whether its principal accountant’s provision of non-audit services that were rendered to the Registrant’s investment adviser, and any control persons of the investment adviser that provides ongoing services to the Registrant, that were not pre-approved pursuant to paragraph (c) (7)(ii) of Rule 2-01 of Regulation S-X, is compatible with maintaining the principal accountant’s independence.
| Item 5. | Audit Committee of Listed Registrants. |
Not applicable.
| Item 6. | Schedule of Investments. |
Complete schedule of investments is included in Item 1.
| Item 7. | Disclosure of Proxy Voting Policies and Procedures for Closed-End Management Investment Companies. |
Not applicable.
| Item 8. | Portfolio Managers of Closed-End Management Investment Companies. |
Not applicable.
| Item 9. | Purchases of Equity Securities by Closed-End Management Investment Company and Affiliated Purchasers. |
Not applicable.
| Item 10. | Submission of Matters to a Vote of Security Holders. |
There have been no material changes to the procedures by which shareholders may recommend nominees to the Registrant’s board of directors after Registrant last provided disclosure in response to the requirement of Item 7(d) (2) (ii) (G) of Schedule 14A, or this Item 10.
| Item 11. | Controls and Procedures. |
The registrant’s principal executive officer and principal financial officer have concluded, based on their evaluation of the registrant’s disclosure controls and procedures as conducted within 90 days of the filing date of this report, that these disclosure controls and procedures are adequately designed and are operating effectively to ensure that information required to be disclosed by the registrant on Form N-CSR is recorded, processed, summarized and reported within the time periods specified in the Securities and Exchange Commission’s rules and forms.
There were no changes in the registrant’s internal control over financial reporting that occurred during the second fiscal quarter of the period covered by this report that have materially affected or are reasonably likely to materially affect, the registrant’s internal control over financial reporting.
(a) (1) The code of ethics that is the subject of the disclosure required by Item 2 is attached hereto.
(a)(2) A separate certification for the principal executive officer and the principal financial officer of the registrant as required by Rule 30a-2 (a) under the Investment Company Act of 1940, as amended (17 CFR 270.30a-2(a)), are filed herewith.
(b) Officer certifications as required by Rule 30a-2 (b) under the Investment Company Act of 1940, as amended (17 CFR 270.30a-2(b)) also accompany this filing as an Exhibit.
SIGNATURES
Pursuant to the requirements of the Securities Exchange Act of 1934 and the Investment Company Act of 1940, the registrant has duly caused this report to be signed on its behalf by the undersigned, thereunto duly authorized.
| | |
(Registrant) Excelsior Tax-Exempt Funds, Inc. |
| |
| By (Signature and Title)* | | /s/ Evelyn Dilsaver |
| | Evelyn Dilsaver |
| | President |
Date June 2, 2006
Pursuant to the requirements of the Securities Exchange Act of 1934 and the Investment Company Act of 1940, this report has been signed below by the following persons on behalf of the registrant and in the capacities and on the dates indicated.
| | |
| |
| By (Signature and Title)* | | /s/ Evelyn Dilsaver |
| | Evelyn Dilsaver |
| | President |
| | |
| |
| By (Signature and Title)* | | /s/ George Pereira |
| | George Pereira |
| | Treasurer |
Date June 2, 2006
| * | Print the name and title of each signing officer under his or her signature. |