| | |
| OMB APPROVAL |
OMB Number: | | 3235-0570 |
Expires: | | September 30, 2007 |
Estimated average burden
|
hours per response . . . 19.4 |
UNITED STATES
SECURITIES AND EXCHANGE COMMISSION
Washington, D.C. 20549
FORM N-CSR
CERTIFIED SHAREHOLDER REPORT OF REGISTERED
MANAGEMENT INVESTMENT COMPANIES
Investment Company Act file number 811-04101
Excelsior Tax-Exempt Funds, Inc.
(Exact name of registrant as specified in charter)
101 Montgomery Street
San Francisco, CA 94104
(Address of principal executive offices) (Zip code)
BISYS Fund Services
3435 Stelzer Road
Columbus, Ohio 43219
(Name and address of agent for service)
Registrant’s telephone number, including area code: 1-415-627-7000
Date of fiscal year end: March 31, 2007
Date of reporting period: March 31, 2007
| Item 1. | Reports to Stockholders. |

FIXED INCOMEFUNDS
ANNUAL REPORT
March 31, 2007
TABLE OF CONTENTS
For shareholder account information, current price and yield quotations, or to make an initial purchase or obtain a prospectus, call (800) 446-1012, from overseas, call (617) 483-7297.
| · | | Internet Address: http://www.excelsiorfunds.com |
This report must be preceded or accompanied by a current prospectus.
You should consider the Funds’ investment objectives, risks and expenses carefully before you invest. Information about these and other important subjects is in the Funds’ prospectus, which you should read carefully before investing.
Nothing in this report represents a recommendation of a security by the investment adviser. Manager views and portfolio holdings may have changed since the report date.
Investments in fixed income securities are subject to interest rate risks. The principal value of a bond falls when interest rates rise and rise when interest rates fall. During periods of rising interest rates, the value of a bond investment is at greater risk than during periods of stable or falling rates.
A description of the policies and procedures that Excelsior Funds use to determine how to vote proxies relating to portfolio securities, as well as information relating to how a Fund voted proxies relating to portfolio securities during the most recent 12-month period ended June 30, is available (i) without charge, upon request, by calling (800) 446-1012, or (ii) by accessing the Excelsior Funds’ internet address and (iii) on the Commission’s website at http://www.sec.gov.
Excelsior Funds file their June 30 and December 31 schedule of portfolio holdings with the Securities and Exchange Commission, on Form N-Q, within sixty days after the applicable reporting period. Excelsior Funds Form N-Q is available on the Commission’s website at http://www.sec.gov, and may be reviewed and copied at the Commission’s Public Reference Room in Washington, DC. Information on the operation of the Public Reference Room may be obtained by calling (800) SEC-0330.
A schedule of each Fund’s portfolio holdings, as of the end of the prior month, is also available on the Funds’ website at www.excelsiorfunds.com. This schedule is updated monthly, typically by the 15th calendar day, after the end of each month. The Funds may terminate or modify this policy at anytime.
Excelsior Funds, Inc., Excelsior Funds Trust and Excelsior Tax-Exempt Funds, Inc. are distributed by BISYS Fund Services Limited Partnership.
You may write to Excelsior Funds, Inc., Excelsior Funds Trust and Excelsior Tax-Exempt Funds, Inc. at the following address:
Excelsior Funds
P.O. Box 8529
Boston, MA 02266-8529
Notice About Duplicate Mailings
The Excelsior Funds have adopted a policy that allows the Funds to send only one copy of a Fund’s prospectus and annual and semi-annual reports to certain shareholders residing at the same “household.” This reduces Fund expenses, which benefits you and other shareholders. If you do not want your mailings to be “householded,” please call (800) 542-1061 or contact your financial intermediary.
SHARES OF THE FUNDS ARE NOT DEPOSITS OR OBLIGATIONS OF, OR GUARANTEED OR ENDORSED BY, ANY BANK, AND THE SHARES ARE NOT FEDERALLY INSURED BY THE FEDERAL DEPOSIT INSURANCE CORPORATION, BANK INSURANCE FUND, FEDERAL RESERVE BOARD, OR ANY OTHER GOVERNMENTAL AGENCY. FUND SHARES ARE NOT INSURED OR GUARANTEED BY THE U.S. GOVERNMENT. AN INVESTMENT IN A FUND IS SUBJECT TO RISK OF PRINCIPAL.
LETTER TO SHAREHOLDERS
March 31, 2007
Dear Valued Excelsior Fund Shareholder,
I am pleased to bring you the annual report for the year ended March 31, 2007 for the Excelsior Funds. The funds in this report are part of the Excelsior Fund family which has over $20 billion in assets as of the end of the reporting period and includes a wide array of asset classes and investment strategies designed to meet the individual investor’s investment needs.
By now, you have received notification that on November 20, 2006, The Charles Schwab Corporation (“Schwab”) announced an agreement to sell the U.S. Trust Corporation (“U.S. Trust”), a wholly-owned subsidiary of Schwab, to the Bank of America Corporation (“Bank of America”) (the “Sale”). The Sale involves all of U.S. Trust’s subsidiaries, including the Excelsior Funds’ investment advisers, UST Advisers, Inc. (“USTA”) and United States Trust Company National Association, on behalf of its asset management division, U.S. Trust New York Asset Management (“USTNA”). Consequently, the Excelsior Funds will need to enter into new investment advisory agreements with USTA and USTNA.
At a meeting held on January 8, 2007, the Board approved new investment advisory agreements under which, subject to approval by the Excelsior Funds’ shareholders, USTA and USTNA will continue to serve as investment advisers to the Excelsior Funds after the Sale is completed. At the same meeting, the Board directed that the new investment advisory agreements be submitted to the shareholders of each Fund for approval.
A Special Meeting of Shareholders of Excelsior Funds, Inc., Excelsior Tax-Exempt Funds, Inc. and Excelsior Funds Trust and each of their funds was held on March 30, 2007. The number of votes necessary to conduct the Special Meeting and approve the new investment advisory agreements was obtained for each fund except the Value and Restructuring, Energy and Natural Resources and Treasury Money Funds. The Special Meeting for Value and Restructuring, Energy and Natural Resources and Treasury Money Funds was adjourned for the purpose of soliciting additional proxies, and we anticipate that the new investment advisory agreements will be approved by the shareholders of these funds at a subsequent Special Meeting.
The integration of U.S. Trust, Bank of America’s private bank and its ultra high net worth extension will create the nation’s largest private wealth management firm with assets under management of over $260 billion and total client assets of almost $420 billion.
We at the Excelsior Funds are excited about our future within Bank of America and remain committed to helping you with your long-term investment goals. Thank you for investing with us.
Sincerely,

Evelyn Dilsaver
President
1
EXCELSIOR FUNDS FIXED INCOME MARKET REVIEW | |
Bond Market Review
Yields generally declined across intermediate and longer maturity levels but rose on the front end of the curve over the course of the fiscal year ended March 31, 2007. The Federal Reserve (Fed) increased the target short-term federal funds rate twice in the period (both times in the second quarter of 2006), raising it from 4.75% to 5.25%, which is where it still stands.
The yield curve ended the fiscal year inverted as money-market rates continued to out-yield longer maturity Treasury issues. After remaining flat for most of the past year, the yield curve steepened towards a more normalized shape from the two-year to 30-year maturity range. In March, the ten-year yield was above the two-year yield, the first time in over six months.
Overall for the fiscal year, bonds earned a solid return of 6.59% as represented by the Lehman Aggregate Index. Investment grade corporate bonds, as represented by the Lehman U.S. Credit Index, returned 7.1% and posted positive excess returns (over duration equivalent Treasuries) of almost 1%. The spread between corporate bond yields and Treasuries remained narrow over the course of the fiscal year, a reflection of continued strong investor demand as corporate default rates hovered near historic lows. A record $1.07 trillion in corporate bonds were issued in 2006, versus $770 billion in 2005, as companies took advantage of relatively low borrowing costs. Commercial mortgage-backed securities (CMBS) was another strong spread sector over the period, generating 0.67% of excess returns. So far in this credit cycle, strong fundamentals and heavy buying by foreign investors have contributed to spread compression.
In the municipal market, low interest rates, narrow intermarket long-term yield spreads, tighter credit spreads and issuer use of swaps and other derivatives for funding purposes combined to create one of the highest-volume years on record. Foreign buyers, seeking to take advantage of spreads between BMA (the Bond Market Association synthetic municipal yield curve) and LIBOR (the London Interbank Offered Rate), were significant municipal market participants. While the municipal curve is flat by historical domestic market standards, it has been steeper than alternative fixed income vehicles; thus, many foreign and domestic buyers leveraged their holdings. For the same reasons, numerous municipal hedge funds were birthed, adding additional buying support to the market.
Outlook
We believe the U.S. economy is in a period of below-trend growth levels. Going forward much will depend on the employment situation, which continues to hold firm. The timing of any lowering of rates by the Fed will be a function of equity market strength and unemployment reports. We do believe that weakness in the economy will eventually cause the yield curve to steepen and rates to fall, especially at the shorter end of the yield curve. History has shown that after a long period of a stable Fed funds rate (such as we have seen in the past nine months), a reversal of policy (in this case, from tightening to easing) carries a very high probability.
Inflation-protected Treasury securities (TIPSs) are close to their breakeven highs over the near-term. Breakevens should remain near these current levels as the Fed continues to take a vigilant stance towards inflation regardless of the market’s view on forward rates. There should be opportunities to add to this sector later in the year at relatively attractive levels should the Fed enter a period of sustained easing.
2
EXCELSIOR FUNDS FIXED INCOME MARKET REVIEW | |
In lower-grade credits, some caution seems appropriate in the high-yield market. We believe high yield spreads will remain range bound over the quarter as economic activity moderates and the housing situation becomes clearer. Despite spreads widening over the quarter, they remain significantly lower than long-term averages. Should a weak economy materialize, default rates will increase faster than currently expected and high yield spreads likely would expand.
In terms of both residential and commercial mortgage backed securities, the tremors from the sub-prime market have been relatively contained so far this year. Prepayment volatility should remain low as MBS refinancing will not meaningfully accelerate unless rates decline substantially at the longer end of the curve. CMBS spreads appear very attractive relative to corporate bonds, offering similar yield with higher credit quality. We favor shorter-maturity adjustable-rate (Hybrid ARM’s) issues as they continue to offer satisfactory return expectations with substantial protection from volatile markets.
In the municipal bond market, as long as the forces of low interest rates, a flat yield curve and tighter spreads persist, we anticipate that the refunding of municipal bonds will continue and may put pressure on secondary market profits, particularly in the long end of the market. Should profitability of leveraged tender option bond programs continue to compress, forcing the sale of securities, the long end could come under even greater pressure. Our current view is to maintain a shorter duration profile than the index, with overweightings concentrated on the front end of the yield curve.
3
EXCELSIOR TAX-EXEMPT FUNDS, INC. | CALIFORNIA SHORT-INTERMEDIATE TERM |
TAX-EXEMPT INCOME FUND
Performance Summary
For the first time in many years, the municipal yield curve inverted from zero to five years, with five-year rates offering lower yields than one-year rates. Alternative Minimum Tax (AMT) outperformed non-AMT slightly, and short non-investment grade outperformed high grades. Along the yield curve spectrum, the two- to four-year part of the curve outperformed all other maturities.
Low interest rates, narrow inter-market long-term yield spreads, tighter credit spreads and issuer use of swaps and other derivatives for funding purposes combined to create one of the highest-volume years on record, with new issue municipal bond supply surging over 49% in Q1 2007 over Q1 2006. In the last quarter of the fiscal year, California was the largest issuer, bringing to market over $20 billion in new bonds. As a result, yields on in-state securities increased slightly more than those on national bonds, narrowing the yield differential between California and national municipals.
Foreign buyers, seeking to take advantage of spreads between BMA and LIBOR, were significant municipal market participants. While the municipal curve is flat by historical domestic market standards, one- to 30-year yields are steeper than alternative fixed income vehicles; thus, many foreign and domestic buyers have leveraged their holdings. For the same reasons, numerous municipal hedge funds were birthed, adding additional buying support to the market.
Performance Attribution and Portfolio Positioning
For the year, the Fund underperformed its benchmark on a net-of-fees basis. Early in the year, the Fund was neutral to slightly short duration relative to the index, and extended out on the yield curve when the Fed began to migrate to a neutral stance on interest rates. The Fund maintained a longer duration until the first calendar quarter of 2007, when duration and average maturity were shortened in anticipation of increased California supply along with seasonal yield increases. The Fund’s underperformance was primarily due to the high overall quality of securities held and its avoidance of purchasing securities which are subject to AMT. Additionally, the Fund did not hold any leveraged securities. Cash was maintained at minimal levels.
Outlook
As long as the forces of low interest rates, a flat yield curve and tighter spreads persist, we anticipate that refunding of municipal bonds will continue, and may put pressure on secondary market profits, particularly in the long end of the market. Should profitability of leveraged tender option bond programs continue to compress, forcing the sale of securities, the long and long/intermediate part of the curve could come under even greater pressure. We plan to maintain a shorter-duration profile than the index, with curve overweights concentrated on the front end of the yield curve. Although the high yield market has had a stellar run, we believe that credit spreads are too compressed, and so are unwilling to add securities for little return.
Kathleen Meyer
Senior Vice President and
Senior Portfolio Manager
4
EXCELSIOR TAX-EXEMPT FUNDS, INC. | CALIFORNIA SHORT-INTERMEDIATE TERM TAX-EXEMPT INCOME FUND |
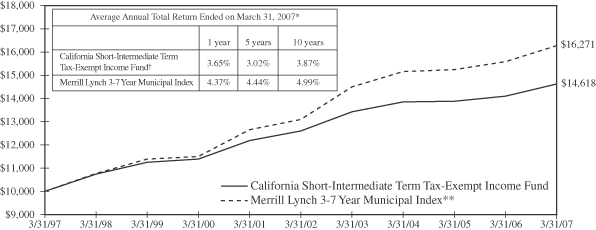
Past performance is not predictive of future performance. Investment returns and principal values will vary and shares may be worth more or less at redemption than their original cost. A portion of the Fund’s income may be subject to the Alternative Minimum Tax.
The above illustration compares a $10,000 investment made in the Fund and a broad-based index for the past ten fiscal year. The chart assumes all dividends and capital gain distributions are reinvested. The Fund’s performance takes into account fees and expenses. The index does not take into account charges, fees and other expenses. Further information relating to Fund performance is contained in the Financial Highlights section of the Prospectus and elsewhere in this report.
| | | |
| | |
Expense Ratio
(As of 7/31/06) | | Shares | |
Gross Expense Ratio | | 1.03 | % |
Net Expense Ratio | | 0.50 | % |
The expense information in the table reflects contractual fee waivers currently in effect. This information is included in the most current prospectus available to current and prospective shareholders of the Fund. The Adviser has contractually agreed to waive fees or reimburse expenses in order to keep total operating expenses from exceeding 0.50%. The waiver agreement may not be terminated before July 31, 2007. In addition, this agreement will renew automatically for an additional 12 month term unless the Adviser terminates the agreement by providing written notice to the Fund prior to the expiration of the current term.
| * | | Total return represents the change during the period in a hypothetical account with dividends reinvested. |
| ** | | Source: Merrill Lynch—the Merrill Lynch 3-7 Year Municipal Index is a widely-accepted unmanaged market-weighted index comprised of fixed-rate, coupon-bearing bonds issued within five years of the most recent month-end with greater than $50 million principal amount having a Moody’s investment grade rating and maturities of three to seven years. |
| † | | Currently certain fees are waived. Had such fees not been waived, returns would have been lower. Returns do not reflect the deduction of taxes that a shareholder would pay on Fund distributions or the redemption of shares. |
5
EXCELSIOR FUNDS, INC. | CORE BOND FUND |
Performance Summary
The Excelsior Core Bond Fund underperformed the Lehman Brothers Aggregate Bond Index for the Fund’s fiscal year ending March 31, 2007.
Yields generally declined across intermediate and longer maturity levels but rose on the front end of the curve over the course of the fiscal year. The Fed increased the target short-term federal funds rate twice in the period, bringing it to 5.25% from 4.75%. Both rate hikes occurred in the second calendar quarter of 2006, and the Fed has left its target short-term interest rate unchanged since that time.
The yield curve ended the fiscal year inverted as money-market rates continue to out-yield longer-maturity Treasury issues. After remaining flat for most of the past year, the yield curve steepened towards a more normalized shape from the two-year to 30-year maturity range. In March, the ten-year yield was above the two-year yield—the first time that’s happened in more than six months.
Overall for the fiscal year, bonds earned a solid return of 6.59% as represented by the Lehman Brothers Aggregate Bond Index. Investment-grade corporate bonds, as represented by the Lehman U.S. Credit Index, returned 7.1% and posted positive excess returns (over duration-equivalent Treasuries) of almost 1%. The spread between corporate bond yields and Treasuries remained narrow throughout the year, a reflection of continued strong investor demand as corporate default rates hovered near historic lows. A record $1.07 trillion in corporate bonds were issued in 2006, compared with $770 billion in 2005 as companies took advantage of relatively low borrowing costs. The commercial mortgage-backed securities (CMBS) sector was also strong in the period, generating 0.67% of excess returns. So far in this credit cycle, strong fundamentals and heavy buying by foreign investors have contributed to spread compression.
Performance Attribution and Portfolio Positioning
Within sectors, the decision to overweight commercial mortgage backed securities proved beneficial as the sector generated strong excess returns in the period. Furthermore, allocation and selection in residential mortgages added to returns, specifically in floating-rate, shorter-maturity issues. Conversely, while the underweight allocation to investment-grade credit detracted from results; issue selection within this sector and exposure to select high yield issues helped results during the year.
We continue to hold overweight positions in mortgages to maintain portfolio yield levels and a high credit quality relative to the benchmark. Portfolios are generally underweight in Treasury and Agency securities. Our strategy has been to underweight the agency and corporate bonds favored by the foreign buyers and find better values in commercial mortgages (CMBS) and residential adjustable-rate mortgages.
During the fiscal year, the Fund’s duration and curve positioning were additive to results. The Fund typically maintained a narrow duration band around the benchmark, yet its tactical moves (longer than benchmark for the second half of 2006) were additive to results. The Fund has been positioned for an eventual steepening of the Treasury yield curve. This positioning has not hurt returns and should be rewarded in the coming months.
The Fund ended the fiscal year positioned slightly shorter duration than the benchmark from a tactical perspective. We expect an end to Fed rate hikes, and ultimately a move to lower market rates, which would warrant moving the Fund to a slightly longer-than-benchmark duration position later in the year. Fund positions have been migrated to better capitalize on our expectation of lower yields and a
6
EXCELSIOR FUNDS, INC. | CORE BOND FUND |
steepening yield curve. We have made no major changes to our overall allocation in the credit sector, although we have actively eliminated select issuers in the auto sector and added to positions in the consumer sector. Throughout the year, the Fund maintained a minimum allocation to securities rated less than single-A, choosing to emphasize higher-quality issues.
The Portfolio yield exceeded that of the benchmark over the course of the year.
Outlook
We believe the U.S. economy is in a period of below-trend growth. Going forward, much will depend on the employment situation, which continues to hold firm. The timing of any lowering of rates by the Fed will be a function of equity market strength and unemployment reports. We do believe that weakness in the economy will eventually cause the yield curve to steepen and rates to fall, especially at the shorter end of the yield curve. History has shown that after a long period of a stable federal funds rate (such as the past nine months), a reversal of policy (in this case, from tightening to easing) carries a high probability.
From a duration standpoint, the Fund is positioned slightly short-duration from its benchmark on a tactical basis due to favorable seasonal patterns. We are positioned for further spread widening and yield-curve steepening in response to the more volatile equity markets and slower economic growth. We have positioned the Fund for a more normally sloped yield curve, which we believe offers the potential for significant reward.
Inflation-protected Treasury securities (TIPSs) are close to their breakeven highs over the near term. Breakevens should remain near these levels as the Fed continues to take a vigilant stance toward inflation regardless of the market’s view on forward rates. There should be opportunities to add to this sector later in the year at relatively attractive levels should the Fed enter a period of sustained easing.
We remain underweight the credit sector in general; corporate bonds present little value at present spread levels. Even with the widening of spreads in the first quarter (fiscal fourth quarter), we are still near the historic tight levels seen over the past decade. Leveraged buyouts and shareholder enhancement activities remain threats for corporate bonds. With event risk already high, the environment could worsen given a sell-off in equities as private equity groups should inevitably increase LBO-related activities.
In lower-grade credits, some caution seems appropriate in the high-yield market, although we do believe it’s prudent to maintain a minimal allocation. We believe high yield spreads will remain range bound over the quarter as economic activity moderates and the housing situation becomes clearer. Despite spreads widening during the first quarter of 2007, they remain significantly lower than long-term averages. Should a weak economy materialize, default rates would increase faster than currently expected and high yield spreads likely would expand.
The Fund remains overweight in both residential and commercial mortgage backed securities. The tremors from the sub-prime market have been relatively contained so far. Prepayment volatility should remain low as MBS refinancing will not meaningfully accelerate unless rates decline substantially at the longer end of the curve. CMBS spreads appear attractive relative to corporate bonds, offering similar yield with higher credit quality. We continue to concentrate on adding older deals that feature better underwriting standards than are prevalent in the current market. We favor shorter-maturity adjustable-rate (Hybrid ARMs) issues as they continue to offer satisfactory return expectations with substantial protection from volatile markets.
Alexander R. Powers
Managing Director
Portfolio Manager and Head of Fixed
Income Investments
7
EXCELSIOR FUNDS, INC. | CORE BOND FUND |
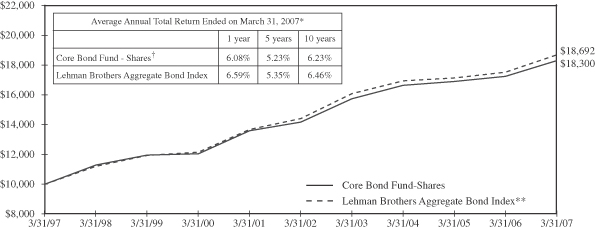
Past performance is not predictive of future performance. Investment returns and principal values will vary and shares may be worth more or less at redemption than their original cost.
The above illustration compares a $10,000 investment made in the Fund and a broad-based index over the past ten fiscal years. The chart assumes all dividends and capital gain distributions are reinvested. The Fund’s performance takes into account fees and expenses. The index does not take into account charges, fees and other expenses. Further information relating to Fund performance is contained in the Financial Highlights section of the Prospectus and elsewhere in this report.
| | | |
| | |
Expense Ratio
(As of 7/31/06) | | Shares | |
Gross Expense Ratio | | 1.30 | % |
Net Expense Ratio | | 0.90 | % |
The expense information in the table reflects contractual fee waivers currently in effect. This information is included in the most current prospectus available to current and prospective shareholders of the Fund. The Adviser has contractually agreed to waive fees or reimburse expenses in order to keep total operating expenses from exceeding 0.90%. The waiver agreement may not be terminated before July 31, 2007. In addition, this agreement will renew automatically for an additional 12 month term unless the Adviser terminates the agreement by providing written notice to the Fund prior to the expiration of the current term.
| * | | Total return represents the change during the period in a hypothetical account with dividends reinvested. |
| ** | | Source: Lehman Brothers—the Lehman Brothers Aggregate Bond Index is an unmanaged, fixed income, market value-weighted index that includes treasury issues, agency issues, corporate bond issues and mortgage-backed securities. |
| † | | Currently certain fees are waived. Had such fees not been waived, returns would have been lower. Returns do not reflect the deduction of taxes that a shareholder would pay on Fund distributions or the redemption of shares. |
8
EXCELSIOR FUNDS TRUST | HIGH YIELD FUND |
Performance Summary
For the year ended March 31, 2007, the Merrill Lynch High Yield, Cash Pay Index returned almost 12%, with each quarter generating a positive return. Lower-rated credits (CCC and below) significantly outperformed, generating an 18% return for the year; BB-rated debt lagged modestly, returning about 10%. Declining interest rates, particularly in the September quarter, and stable equity markets from August through February were significant contributors to strong performance in high yield. Over the year, the spread of high yield versus U.S. Treasuries declined modestly, with a sharp contraction beginning in September, ending the year at 3.20%. That level is well below the longer term average of 4.75%. Default rates, a key driver of high yield spreads, declined from 2.8% to 1.6% during the year, to near record lows. The best performing sectors during the year were entertainment, automotive, retail, airlines, and cable TV. Rails, gaming, leisure, aerospace, and energy were the weakest performers. Every category generated a positive return for the year. New issue supply was $163 billion. Rating upgrades versus downgrades were fairly constant and slightly positive during the year.
Performance Attribution and Portfolio Positioning
For the fiscal year, the Excelsior High Yield Fund outperformed the Merrill Lynch High Yield, Cash Pay Index. Based on industry categories, the Fund was overweight some underperforming groups; but individual security selection, primarily low single B-rated and CCC-rated issuers in retail and telecom in particular, outperformed their industry categories and the Index. About 1.30% of the Fund’s performance was generated by Ormet Aluminum, a company that emerged from bankruptcy in April 2005; the Fund has held this name for several years. Several developments related to this holding in the 3rd and 4th calendar quarters of 2006 contributed importantly to the outperformance of this name. First, a significant distribution of common equity to original creditors (which included the Fund) was made. Second, a successful rights offering and a 10:1 stock split substantially enhanced the enterprise and per share value of Ormet. The Fund pared its holding in this name when the position grew to over 5% of the Fund as the valuation increased. The objective was to take some profits and moderate Fund volatility. At the end of the year, the holding was reduced to about 3%. We continue to believe there is significant potential upside in this name although probably not before the 3rd calendar quarter of this year.
Outlook
In spite of the current low spread versus U.S. Treasuries and the slowing economy, we remain moderately constructive on the high yield asset class. Over several decades, high yield spreads have tracked closely with default rates, with periods of divergence infrequent and short lived. For a number of recent months, high yield spreads have significantly exceeded default rates. We believe this is due to investor concern that default rates may rise sharply as a consequence of a slowing economy and the result of the recent sharp increase in low-rated debt (historically a precursor of rising defaults). Default rates over the last twelve months currently are near record low levels. We believe that the enormous refinancing of debt maturities at low interest rates that has occurred over the last several years will mitigate the negative effects of slow economic growth, particularly if the economy accelerates in the 2nd half of this year. High yield default rates projected out 12 months by Moody’s and S & P have continued to moderate and now are at levels that remain well below longer term averages. Current high yield spread levels are comparable to projected defaults a year from now. We believe actual defaults likely will fall below current estimates and thereby rationalize or even reduce current spreads. This assumes a modest and temporary economic slowdown. However, until investors become more confident that default rates will not increase sharply, a more cautious approach to high yield is appropriate.
A.K. Rodgers Ratcliffe, CFA
Senior Vice President and Senior Portfolio Manager
Adam Moss
Senior Vice President and Senior Portfolio Manager
9
EXCELSIOR FUNDS TRUST | HIGH YIELD FUND |
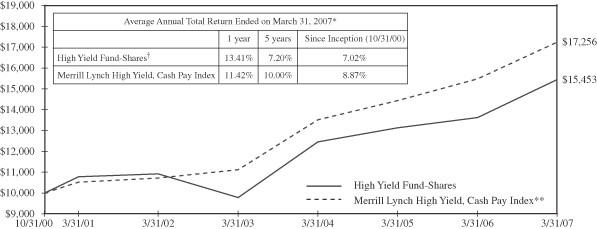
Past performance is not predictive of future performance. Investment returns and principal values will vary and shares may be worth more or less at redemption than their original cost. Securities rated below investment grade generally entail greater market, credit, and liquidity risks than investment grade securities.
The above illustration compares a $10,000 investment made in the Fund and a broad-based index since 10/31/00 (inception date). The chart assumes all dividends and capital gain distributions are reinvested. The Fund’s performance takes into account fees and expenses. The index does not take into account charges, fees and other expenses. Further information relating to Fund performance is contained in the Financial Highlights section of the Prospectus and elsewhere in this report.
| | | |
| | |
Expense Ratio
(As of 7/31/06) | | Shares | |
Gross Expense Ratio | | 1.29 | % |
Net Expense Ratio | | 1.05 | % |
The expense information in the table reflects contractual fee waivers currently in effect. This information is included in the most current prospectus available to current and prospective shareholders of the Fund. The Adviser has contractually agreed to waive fees or reimburse expenses in order to keep total operating expenses from exceeding 1.05%. The waiver agreement may not be terminated before July 31, 2007. In addition, this agreement will renew automatically for an additional 12 month term unless the Adviser terminates the agreement by providing written notice to the Fund prior to the expiration of the current term.
| * | | Total return represents the change during the period in a hypothetical account with dividends reinvested. |
| ** | | Source: Merrill Lynch—The Merrill Lynch High Yield, Cash Pay Index is an unmanaged index comprised of publicly placed, non-convertible, coupon bearing domestic debt. Issues in the index are less than investment grade as rated by Standard & Poor’s Ratings Group or Moody’s Investors Service, Inc., and must not be in default. Issues have a term to maturity of at least one year. |
| † | | Currently certain fees are waived. Had such fees not been waived, returns would have been lower. Returns do not reflect the deduction of taxes that a shareholder would pay on Fund distributions or the redemption of shares. Returns do not reflect the 2% fee imposed on shares redeemed 30 days or less after their date of purchase. |
10
EXCELSIOR FUNDS, INC. | INTERMEDIATE-TERM BOND FUND |
Performance Summary
The Excelsior Intermediate-Term Bond Fund underperformed the Lehman Intermediate Government/Credit Index for the fiscal year ended March 31, 2007.
Yields generally declined across intermediate and longer maturity levels but rose on the front end of the curve over the course of the fiscal year. The Fed increased the target short-term federal funds rate twice in the period, bringing it to 5.25% from 4.75%. Both rate hikes occurred in the second calendar quarter of 2006, and the Fed has left its target short-term interest rate unchanged since that time.
The yield curve ended the fiscal year inverted as money-market rates continue to out-yield longer-maturity Treasury issues. After remaining flat for most of the past year, the yield curve steepened towards a more normalized shape from the two-year to 30-year maturity range. In March, the ten-year yield was above the two-year yield—the first time that’s happened in more than six months.
Overall for the fiscal year, bonds earned a solid return of 6.59% as represented by the Lehman Brothers Aggregate Bond Index. Investment-grade corporate bonds, as represented by the Lehman U.S. Credit Index, returned 7.1% and posted positive excess returns (over duration-equivalent Treasuries) of almost 1%. The spread between corporate bond yields and Treasuries remained narrow throughout the year, a reflection of continued strong investor demand as corporate default rates hovered near historic lows. A record $1.07 trillion in corporate bonds were issued in 2006, compared with $770 billion in 2005 as companies took advantage of relatively low borrowing costs. The commercial mortgage-backed securities (CMBS) sector was also strong in the period, generating 0.67% of excess returns. So far in this credit cycle, strong fundamentals and heavy buying by foreign investors have contributed to spread compression.
Performance Attribution and Portfolio Positioning
Within sectors, the decision to overweight commercial mortgage backed securities proved beneficial as the sector generated strong excess returns in the period. Furthermore, allocation and selection in residential mortgages added to returns, specifically in floating-rate, shorter-maturity issues. Conversely, while the underweight allocation to investment-grade credit detracted from results; issue selection within this sector and exposure to select high yield issues helped results during the year.
We continue to hold overweight positions in mortgages to maintain portfolio yield levels and a high credit quality relative to the benchmark. Portfolios are generally underweight in Treasury and Agency securities. Our strategy has been to underweight the agency and corporate bonds favored by the foreign buyers and find better values in commercial mortgages (CMBS) and residential adjustable-rate mortgages.
During the fiscal year, the Fund’s duration and curve positioning were additive to results. The Fund typically maintained a narrow duration band around the benchmark, yet its tactical moves (longer than benchmark for the second half of 2006) were additive to results. The Fund has been positioned for an eventual steepening of the Treasury yield curve. This positioning has not hurt returns and should be rewarded in the coming months.
The Fund ended the fiscal year positioned slightly shorter duration than the benchmark from a tactical perspective. We expect an end to Fed rate hikes, and ultimately a move to lower market rates, which would warrant moving the Fund to a slightly longer-than-benchmark duration position later in the year. Fund positions have been migrated to better capitalize on our expectation of lower yields and a
11
EXCELSIOR FUNDS, INC. | INTERMEDIATE-TERM BOND FUND |
steepening yield curve. We have made no major changes to our overall allocation in the credit sector, although we have actively eliminated select issuers in the auto sector and added to positions in the consumer sector. Throughout the year, the Fund maintained a minimum allocation to securities rated less than single-A, choosing to emphasize higher-quality issues.
Outlook
We believe the U.S. economy is in a period of below-trend growth. Going forward, much will depend on the employment situation, which continues to hold firm. The timing of any lowering of rates by the Fed will be a function of equity market strength and unemployment reports. We do believe that weakness in the economy will eventually cause the yield curve to steepen and rates to fall, especially at the shorter end of the yield curve. History has shown that after a long period of a stable federal funds rate (such as the past nine months), a reversal of policy (in this case, from tightening to easing) carries a high probability.
From a duration standpoint, the Fund is positioned slightly short-duration from its benchmark on a tactical basis due to favorable seasonal patterns. We are positioned for further spread widening and yield-curve steepening in response to the more volatile equity markets and slower economic growth. We have positioned the Fund for a more normally sloped yield curve, which we believe offers the potential for significant reward.
Inflation-protected Treasury securities (TIPSs) are close to their breakeven highs over the near term. Breakevens should remain near these levels as the Fed continues to take a vigilant stance toward inflation regardless of the market’s view on forward rates. There should be opportunities to add to this sector later in the year at relatively attractive levels should the Fed enter a period of sustained easing.
We remain underweight the credit sector in general; corporate bonds present little value at present spread levels. Even with the widening of spreads in the first quarter (fiscal fourth quarter), we are still near the historic tight levels seen over the past decade. Leveraged buyouts and shareholder enhancement activities remain threats for corporate bonds. With event risk already high, the environment could worsen given a sell-off in equities as private equity groups would inevitably increase LBO-related activities.
In lower-grade credits, some caution seems appropriate in the high-yield market, although we do believe it’s prudent to maintain a minimal allocation. We believe high yield spreads will remain range bound over the quarter as economic activity moderates and the housing situation becomes clearer. Despite spreads widening during the first quarter of 2007, they remain significantly lower than long-term averages. Should a weak economy materialize, default rates would increase faster than currently expected and high yield spreads likely would expand.
The Fund remains overweight in both residential and commercial mortgage backed securities. The tremors from the sub-prime market have been relatively contained so far. Prepayment volatility should remain low as MBS refinancing will not meaningfully accelerate unless rates decline substantially at the longer end of the curve. CMBS spreads appear attractive relative to corporate bonds, offering similar yield with higher credit quality. We continue to concentrate on adding older deals that feature better underwriting standards than are prevalent in the current market. We favor shorter-maturity adjustable-rate (Hybrid ARMs) issues as they continue to offer satisfactory return expectations with substantial protection from volatile markets.
Alexander R. Powers
Managing Director
Portfolio Manager and Head of Fixed Income Investments
12
EXCELSIOR FUNDS, INC. | INTERMEDIATE-TERM BOND FUND |
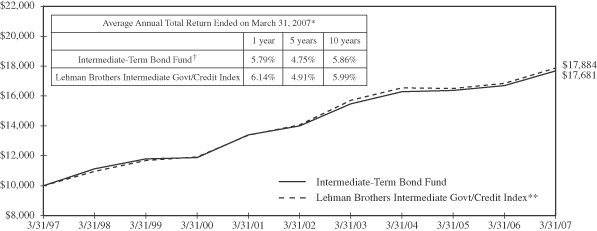
Past performance is not predictive of future performance. Investment returns and principal values will vary and shares may be worth more or less at redemption than their original cost.
The above illustration compares a $10,000 investment made in the Fund and a broad-based index over the past ten fiscal years. The chart assumes all dividends and capital gain distributions are reinvested. The Fund’s performance takes into account fees and expenses. The index does not take into account charges, fees and other expenses. Further information relating to Fund performance is contained in the Financial Highlights section of the Prospectus and elsewhere in this report.
| | | |
| | |
Expense Ratio
(As of 7/31/06) | | Shares | |
Gross Expense Ratio | | 0.81 | % |
Net Expense Ratio | | 0.75 | % |
The expense information in the table reflects contractual fee waivers currently in effect. This information is included in the most current prospectus available to current and prospective shareholders of the Fund. The Adviser has contractually agreed to waive fees or reimburse expenses in order to keep total operating expenses from exceeding 0.75%. The waiver agreement may not be terminated before July 31, 2007. In addition, this agreement will renew automatically for an additional 12 month term unless the Adviser terminates the agreement by providing written notice to the Fund prior to the expiration of the current term.
| * | | Total return represents the change during the period in a hypothetical account with dividends reinvested. |
| ** | | Source: Lehman Brothers—The Lehman Brothers Intermediate Govt/Credit Index is an unmanaged total return performance benchmark composed of U.S. Government agencies and U.S. Treasury securities and investment grade corporate debt, selected as representative of the market with maturities of one to ten years. |
| † | | Currently certain fees are waived. Had such fees not been waived, returns would have been lower. Returns do not reflect the deduction of taxes that a shareholder would pay on Fund distributions or the redemption of shares. |
13
EXCELSIOR TAX-EXEMPT FUNDS, INC. | INTERMEDIATE-TERM TAX-EXEMPT FUND |
Performance Summary
For the first time in many years, the municipal yield curve inverted from zero to five years, with five-year rates offering lower yields than one-year rates. Non-investment-grade securities significantly outperformed investment-grade bonds, and AMT bonds slightly outperformed non-AMT. Low interest rates, narrow intermarket long-term yield spreads, tighter credit spreads and issuer use of swaps and other derivatives for funding purposes combined to create one of the highest volume years on record, with new issue municipal bond supply surging over 49% in Q1 2007 over Q1 2006. Foreign buyers, seeking to take advantage of spreads between BMA (the Bond Market Association synthetic municipal yield curve) and LIBOR, were significant municipal market participants. While the municipal curve is flat by historical domestic market standards, one to 30-year yields are steeper than alternative fixed income vehicles; thus, many foreign and domestic buyers leveraged their holdings. For the same reasons, numerous municipal hedge funds were birthed, adding additional buying support to the market.
Performance Attribution and Portfolio Positioning
For the year, the Fund underperformed its benchmark on a net-of-fees basis. The Fund remained neutral to slightly long duration for most of the year, with most of the overweighting occurring in both the longer and four to six year part of the yield curve. Additionally, the Fund had a slight underweight in two- to three- years, which underperformed during the first half of the year, but significantly outperformed later in the year. Cash was kept in the 3% range in order to maximize yield. Although we strived to increase the Fund’s overall yield through the inclusion of higher yielding securities, the Fund remains of high investment quality. Thus, the Fund maintained a slightly lower yield than the Index throughout the year, with much of the gap due to AMT bonds and higher yielding sectors inherent in the Index. The Fund avoids holding bonds that are subject to the AMT. Additionally, our underweight in housing and airport bonds negatively impacted performance (note that the majority of bonds issued in these sectors are subject to the AMT). The Fund did not hold any leveraged securities during the fiscal year ending March 31, 2007.
Purchases were concentrated on bonds, with long maturities priced to a short call or to a short/intermediate average life. The Fund purchased both New Jersey Tobacco and Golden State Tobacco bonds, which were priced attractively relative to similar bonds issued by other states. While they carry long-term maturities, their turbo sinking fund nature results in an average life of 4.5 years. We believe these bonds offer higher than market yield, with the defensive characteristics of shorter securities. While we held a neutral position in California bonds throughout much of the year, more recently we sold in-state securities in anticipation of large new issue volume during the first half of 2007.
Outlook
As long as the forces of low interest rates, a flat yield curve and tighter spreads persist, we anticipate that the refunding of municipal bonds will continue and may put pressure on secondary market profits, particularly in the long end of the market. Should profitability of leveraged tender option bond programs continue to compress, forcing the sale of securities, the long and long/intermediate part of the curve could come under even greater pressure. We plan to maintain our overweight in New York relative to California, as the former has initiated long-term planning and proactive budget management,
14
EXCELSIOR TAX-EXEMPT FUNDS, INC. | INTERMEDIATE-TERM TAX-EXEMPT FUND |
which should help provide ballast against any regional economic downturns, while the latter is expected to increase debt issuance over the coming quarter. We plan to maintain a shorter duration profile than the index, with curve overweightings concentrated on the front end of the yield curve. Although the high yield market has had a stellar run, we believe that credit spreads are too compressed; we are not willing to add securities for little return. We also expect to maintain approximately 5% in cash.
Pamela Hunter
Managing Director and Senior Portfolio Manager
15
EXCELSIOR TAX-EXEMPT FUNDS, INC. | INTERMEDIATE-TERM TAX-EXEMPT FUND |

Past performance is not predictive of future performance. Investment returns and principal values will vary and shares may be worth more or less at redemption than their original cost. A portion of the Fund’s income may be subject to the Alternative Minimum Tax and some investors may be subject to certain state and local taxes.
The above illustration compares a $10,000 investment made in the Fund and broad-based indices over the past ten fiscal years. The chart assumes all dividends and capital gain distributions are reinvested. The Fund’s performance takes into account fees and expenses. The indices do not take into account charges, fees and other expenses. Further information relating to Fund performance is contained in the Financial Highlights section of the Prospectus and elsewhere in this report.
| | | |
| | |
Expense Ratio
(As of 7/31/06) | | Shares | |
Gross Expense Ratio | | 0.80 | % |
Net Expense Ratio | | 0.65 | % |
The expense information in the table reflects contractual fee waivers currently in effect. This information is included in the most current prospectus available to current and prospective shareholders of the Fund. The Adviser has contractually agreed to waive fees or reimburse expenses in order to keep total operating expenses from exceeding 0.65%. The waiver agreement may not be terminated before July 31, 2007. In addition, this agreement will renew automatically for an additional 12 month term unless the Adviser terminates the agreement by providing written notice to the Fund prior to the expiration of the current term.
| * | | Total return represents the change during the period in a hypothetical account with dividends reinvested. |
| ** | | Source: Merrill Lynch—the Merrill Lynch 3-7 Year Muni Index is a widely-accepted unmanaged market-weighted index comprised of fixed-rate, coupon-bearing bonds issued within five years of the most recent month-end with greater than $50 million principal amount having a Moody’s investment grade rating and maturities of three to seven years. |
| *** | | Source: Merrill Lynch—the Merrill Lynch 7-12 Year Muni Index is a widely-accepted unmanaged market-weighted index comprised of fixed-rate, coupon-bearing bonds issued within five years of the most recent month-end with greater than $50 million principal amount having a Moody’s investment grade rating and maturities of seven to twelve years. |
| † | | Currently certain fees are waived. Had such fees not been waived, returns would have been lower. Returns do not reflect the deduction of taxes that a shareholder would pay on Fund distributions or the redemption of shares. |
16
EXCELSIOR TAX-EXEMPT FUNDS, INC. | LONG-TERM TAX-EXEMPT FUND |
Performance Summary
For the first time in many years, the municipal yield curve inverted from zero to five years, with five-year rates offering lower yields than one-year rates. Non-investment-grade securities significantly outperformed investment-grade bonds, and AMT bonds slightly outperformed non-AMT. Low interest rates, narrow intermarket long-term yield spreads, tighter credit spreads and issuer use of swaps and other derivatives for funding purposes combined to create one of the highest-volume years on record, with new issue municipal bond supply surging over 49% in Q1 2007 over Q1 2006. Foreign buyers, seeking to take advantage of spreads between BMA and LIBOR, were significant municipal market participants. While the municipal curve is flat by historical domestic market standards, one to 30-year yields are steeper than alternative fixed income vehicles; thus, many foreign and domestic buyers leveraged their holdings. For the same reasons, numerous municipal hedge funds were birthed, adding additional buying support to the market.
Performance Attribution and Portfolio Positioning
For the year, the Fund was in line with its benchmark, net of fees. A duration that was slightly longer than the Merrill Lynch 22+ Year Municipal Index was maintained through much of the year. During the first half, the Fund maintained a duration underweight in the short end and an underweight in the long end. Yield remained lower than the Index, due to an underweighting in bonds subject to the AMT, as the Fund avoids holding securities which are subject to this tax. Additionally, AMT bonds are issued in higher-yielding sectors. Finally, the Fund was overweighted in California and New York bonds, both of which outperformed the market. Additionally, the Fund did not hold any leveraged securities.
The Fund’s management strove to increase the overall yield by increasing exposure to the health care sector, and to new issuers to the market that carried higher rates than the overall market, including bonds issued to build stadiums (Queens and Yankee stadiums), regional redevelopment (Hudson Yards, NY) and Bay Area Tolls. Additionally, the Fund purchased tobacco bonds in New Jersey and California that were priced attractively relative to similar bonds issued by other states. Their turbo sinking fund nature results in an average life significantly shorter than the overall maturity, and offers the defensive characteristics of shorter bonds.
In addition to increasing yield, purchases were focused across the yield curve in an attempt to diversify risk. As long bonds were the year’s top performers, we overweighted that part of the curve relative to the Index for much of the year. As the curve flattened, we concentrated purchases in the front end of the yield curve and maintained a cash position of approximately 5%, as the spread between short-term and long-term yields compressed.
Outlook
As long as the forces of low interest rates, a flat yield curve and tighter spreads persist, we anticipate that the refunding of municipal bonds will continue and may put pressure on secondary market profits, particularly in the long end of the market. Should profitability of leveraged tender option bond programs continue to compress, forcing the sale of securities, the long end could come under even greater pressure. We plan to maintain our overweight in New York relative to California, as the former has initiated long term planning and proactive budget management, which will help provide ballast
17
EXCELSIOR TAX-EXEMPT FUNDS, INC. | LONG-TERM TAX-EXEMPT FUND |
against any regional economic downturns. We plan to maintain a shorter duration profile than the index, with overweightings concentrated on the front end of the yield curve. Although the high yield market has had a stellar run, we believe that credit spreads are too compressed and we thus are not willing to add securities for little return. While we expect to maintain cash in the 5% area, over the near-term we will increase our cash exposure to take advantage of seasonal, tax related short-term yield hikes.
Pamela Hunter
Managing Director and Senior Portfolio Manager
18
EXCELSIOR TAX-EXEMPT FUNDS, INC. | LONG-TERM TAX-EXEMPT FUND |
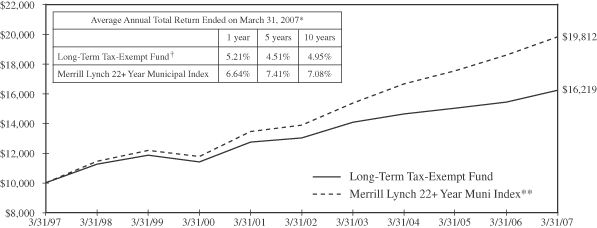
Past performance is not predictive of future performance. Investment returns and principal values will vary and shares may be worth more or less at redemption than their original cost. A portion of the Fund’s income may be subject to the Alternative Minimum Tax and some investors may be subject to certain state and local taxes.
The above illustration compares a $10,000 investment made in the Fund and a broad-based index over the past ten fiscal years. The chart assumes all dividends and capital gain distributions are reinvested. The Fund’s performance takes into account fees and expenses. The index does not take into account charges, fees and other expenses. Further, information relating to Fund performance is contained in the Financial Highlights section of the Prospectus and elsewhere in this report.
| | | |
| | |
Expense Ratio
(As of 7/31/06) | | Shares | |
Gross Expense Ratio | | 1.02 | % |
Net Expense Ratio | | 0.80 | % |
The expense information in the table reflects contractual fee waivers currently in effect. This information is included in the most current prospectus available to current and prospective shareholders of the Fund. The Adviser has contractually agreed to waive fees or reimburse expenses in order to keep total operating expenses from exceeding 0.80%. The waiver agreement may not be terminated before July 31, 2007. In addition, this agreement will renew automatically for an additional 12 month term unless the Adviser terminates the agreement by providing written notice to the Fund prior to the expiration of the current term.
| * | | Total return represents the change during the period in a hypothetical account with dividends reinvested. |
| ** | | Source: Merrill Lynch—the Merrill Lynch 22+ Year Muni Index consists of bonds with an outstanding par which is greater than or equal to 25 million and a maturity range greater than or equal to 22 years. |
| † | | Currently certain fees are waived. Had such fees not been waived, returns would have been lower. Returns do not reflect the deduction of taxes that a shareholder would pay on Fund distributions or the redemption of shares. |
19
EXCELSIOR TAX-EXEMPT FUNDS, INC. | NEW YORK INTERMEDIATE-TERM TAX-EXEMPT FUND |
Performance Summary
For the first time in many years, the municipal yield curve inverted from zero to five years, with five-year rates offering lower yields than one-year rates. Non-investment-grade securities significantly outperformed investment-grade bonds, with New York high yield securities returning slightly more than national. AMT bonds slightly outperformed non-AMT. Low interest rates, narrow intermarket long-term yield spreads, tighter credit spreads and issuer use of swaps and other derivatives for funding purposes combined to create one of the highest-volume years on record, with new issue municipal bond supply surging over 49% in Q1 2007 over Q1 2006. New York new issue supply increased by 40% in the last quarter alone. Foreign buyers, seeking to take advantage of spreads between BMA and LIBOR, were significant municipal market participants. While the municipal curve is flat by historical domestic market standards, one to 30-year yields are steeper than alternative fixed income vehicles; thus, many foreign and domestic buyers leveraged their holdings. For the same reasons, numerous municipal hedge funds were birthed, adding additional buying support to the market.
Performance Attribution and Portfolio Positioning
For the year, the Fund underperformed its benchmarks net of fees. We maintained a duration slightly longer than the Indices for much of the year, until early December, when we switched to a neutral, and then slightly short duration. Much of the later underweighting occurred in the eight to twelve year part of the curve. Additionally, the Fund had a slight underweight in the top performing two to four year part of the curve. This was countered by an overweight in cash and five-year duration exposure. As BMA rates increased, the effect muted curve underperformance, which resulted in an overall positive curve contribution for the year. Although we have increased the Fund’s overall yield, the Fund remained lower in yield relative to the Indices; however, much of the gap was due to an underweight in AMT paper and the higher yielding sectors inherent in the Indices. The Fund avoids holding bonds that are subject to the AMT. The Fund was underweighted in the transportation sector, due to the concentration of NY agency issuers that fell under the auspices of the same obligor. Additionally, the Fund did not hold any leveraged securities.
Purchases were concentrated on bonds maturing across the yield curve, in order to diversify risk. The Fund’s management strove to increase the overall yield by increasing exposure to the health care sector, and to new issuers to the market that carried higher rates than the overall market, including bonds issued to build stadiums (Queens and Yankee stadiums), as well as regional redevelopment (Hudson Yards Redevelopment Project). As long bonds were the year’s top performers, we overweighted that part of the curve relative to the Indices for much of the year. As the curve flattened, we concentrated purchases in the front end of the yield curve and maintained a cash position of approximately 5%, as the spread between short term and long term yields compressed.
Later in the year, we sold some of our long positions in order to hedge against potential mass liquidation of the similar securities by leveraged arbitrageurs. Additionally, agency sales were concentrated in the ten-year part of the yield curve, thus shortening the average maturity of the fund by half a year.
20
EXCELSIOR TAX-EXEMPT FUNDS, INC. | NEW YORK INTERMEDIATE-TERM TAX-EXEMPT FUND |
Outlook
As long as the forces of low interest rates, a flat yield curve and tighter spreads persist, we anticipate that the refunding of municipal bonds will continue and may put pressure on secondary market profits, particularly in the long end of the market. Should the profitability of leveraged tender option bond programs continue to compress, forcing the sale of securities, the long and long/intermediate part of the curve could come under even greater pressure. We will continue to migrate down the curve to take advantage of steepening from the short end. The State of New York has initiated long term planning and proactive budget management, which should help to provide ballast against any regional economic downturns. In anticipation of potential upgrades, we are concentrating our purchase on state agency debt, keeping in mind diversification restrictions. We plan to maintain a shorter duration profile than the index, with curve overweightings concentrated on the front end of the yield curve. Although the New York high yield market has had a stellar run, we believe that credit spreads are too compressed and are thus unwilling to add securities for little return. We also expect to maintain approximately 5% in cash.
Pamela Hunter
Managing Director and Senior Portfolio Manager
21
EXCELSIOR TAX-EXEMPT FUNDS, INC. | NEW YORK INTERMEDIATE-TERM TAX-EXEMPT FUND |
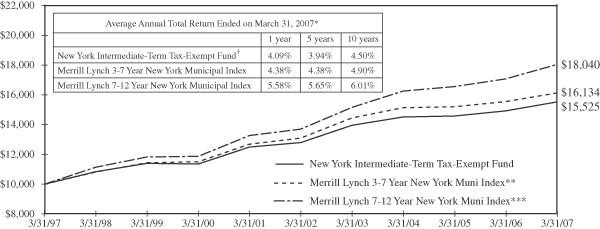
Past performance is not predictive of future performance. Investment returns and principal values will vary and shares may be worth more or less at redemption than their original cost. A portion of the Fund’s income may be subject to the Alternative Minimum Tax.
The above illustration compares a $10,000 investment made in the Fund and broad-based indices over the past ten fiscal years. The chart assumes all dividends and capital gain distributions are reinvested. The Fund’s performance takes into account fees and expenses. The indices do not take into account charges, fees and other expenses. Further information relating to Fund performance is contained in the Financial Highlights section of the Prospectus and elsewhere in this report.
| | | |
| | |
Expense Ratio
(As of 7/31/06) | | Shares | |
Gross Expense Ratio | | 0.98 | % |
Net Expense Ratio | | 0.80 | % |
The expense information in the table reflects contractual fee waivers currently in effect. This information is included in the most current prospectus available to current and prospective shareholders of the Fund. The Adviser has contractually agreed to waive fees or reimburse expenses in order to keep total operating expenses from exceeding 0.80%. The waiver agreement may not be terminated before July 31, 2007. In addition, this agreement will renew automatically for an additional 12 month term unless the Adviser terminates the agreement by providing written notice to the Fund prior to the expiration of the current term.
| * | | Total return represents the change during the period in a hypothetical account with dividends reinvested. |
| ** | | Source: Merrill Lynch—the Merrill Lynch 3-7 Year New York Muni Index is a widely-accepted unmanaged market-weighted index comprised of fixed-rate, coupon-bearing bonds of New York Municipalities issued within five years of the most recent month-end with greater than $50 million principal amount having a Moody’s investment grade rating and maturities of three to seven years. |
| *** | | Source: Merrill Lynch—the Merrill Lynch 7-12 Year New York Muni Index is a widely-accepted unmanaged market-weighted index comprised of fixed-rate, coupon-bearing bonds of New York Municipalities issued within five years of the most recent month-end with greater than $50 million principal amount having a Moody’s investment grade rating and maturities of seven to twelve years. |
| † | | Currently certain fees are waived. Had such fees not been waived, returns would have been lower. Returns do not reflect the deduction of taxes that a shareholder would pay on Fund distributions or the redemption of shares. |
22
EXCELSIOR FUNDS, INC. | SHORT-TERM GOVERNMENT SECURITIES FUND |
Performance Summary
The Excelsior Short-Term Government Fund in the fiscal year ending March 31, 2007, performed in line with its benchmark. The yield-to-maturity of 5.21% at the end of the period represented a yield advantage relative to the Lehman Brothers 1-3 Year Government Bond Index and a slightly longer duration.
Performance Attribution and Portfolio Positioning
The Fund remained overweight mortgage-backed securities throughout the period in an effort to capitalize on the significant yield advantage mortgages offer, especially in periods where rate volatility remains contained. Investments in this asset class included substantial concentrations in hybrid ARMs, so-called because of the fixed/floating-rate nature of their underlying loans. Hybrid ARMs offer similar yield advantages to fixed-rate mortgages but with a lower sensitivity to changes in interest rates. The floating rate nature of the underlying loans offers additional protection to the Fund should rates move substantially in either direction. Positions in callable agency debentures were added midway through the period. They too offer substantial benefits versus their non-callable counterparts when rates remain subdued.
The Fund currently maintains no exposure TIPs. TIPs have performed well of late, but continued vigilance on the part of the Fed should cap breakevens near current levels. We do not expect the circumstances that caused energy prices to spike recently to continue indefinitely. Positive carry seasonally prevalent in the TIPs sector does present an opportunity for the near term.
The combined percentage of mortgage-backed and asset-backed investments in the Fund is currently 58%. In addition to the hybrid ARMs mentioned earlier, positions exist in both premium-priced, non-amortizing fixed-rate mortgage securities and structured mortgage-backed assets with short final maturity dates. Both represent mortgage-backed cash flows that are more bulleted in nature than would otherwise be available in the mortgage-backed market and should perform well in the bull-steepening scenario that we expect to take place. Futures positions exist in the Fund to help protect against losses, should a steepening scenario transpire. The longer rates remain at current levels, the more pressure will begin to build.
Outlook
The U.S. economy has remained resilient in spite of continued deterioration in the housing sector. The Fed has resisted lowering rates in deference to increased concerns regarding the outlook for inflation. Uncertainty regarding the timing of this policy change has kept interest rates range-bound. Moreover, the Fed’s stance has subsequently caused the Treasury yield curve to remain inverted, with yields at the shorter end of the maturity spectrum higher than those at the longer end.
We believe, and market expectations are, that the Federal Reserve will eventually need to lower rates to keep the economy growing. Fallout from the current housing crisis has caused a general tightening of credit, which should ultimately cause the Fed to respond by cutting interest rates, thereby lowering all yields and steepening the yield curve.
Michael Zazzarino
Managing Director and Senior
Portfolio Manager
23
EXCELSIOR FUNDS, INC. | SHORT-TERM GOVERNMENT SECURITIES FUND |
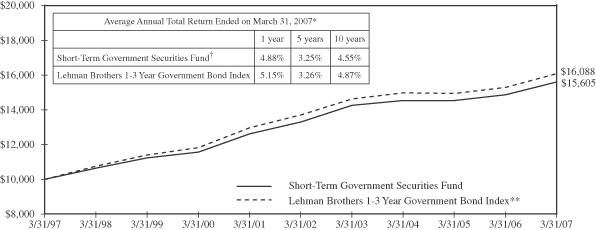
Past performance is not predictive of future performance. Investment returns and principal values will vary and shares may be worth more or less at redemption than their original cost.
The above illustration compares a $10,000 investment made in the Fund and a broad-based index over the past ten fiscal years. The chart assumes all dividends and capital gain distributions are reinvested. The Fund’s performance takes into account fees and expenses. The index does not take into account charges, fees and other expenses. Further information relating to Fund performance is contained in the Financial Highlights section of the Prospectus and elsewhere in this report.
| | | |
| | |
Expense Ratio
(As of 7/31/06) | | Shares | |
Gross Expense Ratio | | 0.77 | % |
Net Expense Ratio | | 0.75 | % |
The expense information in the table reflects contractual fee waivers currently in effect. This information is included in the most current prospectus available to current and prospective shareholders of the Fund. The Adviser has contractually agreed to waive fees or reimburse expenses in order to keep total operating expenses from exceeding 0.75%. The waiver agreement may not be terminated before July 31, 2007. In addition, this agreement will renew automatically for an additional 12 month term unless the Adviser terminates the agreement by providing written notice to the Fund prior to the expiration of the current term.
| * | | Total return represents the change during the period in a hypothetical account with dividends reinvested. |
| ** | | Source: Lehman Brothers—The Lehman Brothers 1-3 Year Government Bond Index is an unmanaged total return performance benchmark composed of U.S. Government agencies and U.S. Treasury securities with maturities of one to three years. |
| † | | Currently certain fees are waived. Had such fees not been waived, returns would have been lower. Returns do not reflect the deduction of taxes that a shareholder would pay on Fund distributions or the redemption of shares. |
24
EXCELSIOR TAX-EXEMPT FUNDS, INC. | SHORT-TERM TAX-EXEMPT SECURITIES FUND |
Performance Summary
For the first time in many years, the municipal yield curve inverted from zero to five years, with five-year rates offering lower yields than one-year rates. Non-investment-grade securities significantly outperformed investment-grade bonds on the short end of the curve, doubling the return of investment-grades, and AMT bonds slightly outperformed non-AMT. Along the yield curve spectrum, the four to six year part of the curve was the short end’s top-performing maturity range.
Low interest rates, narrow intermarket long-term yield spreads, tighter credit spreads and issuer use of swaps and other derivatives for funding purposes combined to create one of the highest-volume years on record, with new issue municipal bond supply surging over 49% in Q1 2007 over Q1 2006. Foreign buyers, seeking to take advantage of spreads between BMA and LIBOR, were significant municipal market participants. While the municipal curve is flat by historical domestic market standards, one to 30-year yields are steeper than alternative fixed income vehicles; thus, many foreign and domestic buyers leveraged their holdings. For the same reasons, numerous municipal hedge funds were birthed, adding additional buying support to the market. As a result, the increase in tender option bond programs created for this buying universe also resulted in new variable rate demand note programs (the floating rate portion of tender option bonds), resulting in higher short term yields, as measured by the Bond Market Association’s Index of tax-exempt money market rates.
Performance Attribution and Portfolio Positioning
For the year, the Fund underperformed the benchmark net of fees. The Fund’s duration remained approximately a half year short relative to the Index, with most of the underweighting occurring in the five-year part of the yield curve. As a result, the Fund underperformed the Index. Yields were slightly lower than the Index, due primarily to the AMT holdings in the Index as well as the shorter maturity. Newly created variable rate demand note programs (the floating side of tender option securities) kept BMA rates relatively high; thus, the Fund did not suffer yield underperformance. The Fund avoids holding bonds that are subject to the AMT. Most of the high-yielding sectors fall within the AMT; thus, we did not gain the price appreciation realized by much of the non- and lower-investment-grade sectors. Additionally, the Fund did not hold any leveraged securities. At year end, the Fund held a cash equivalent position of 7%.
Purchases were concentrated on bonds offering higher yields within non-AMT sectors. The Fund added exposure to the tobacco bond sector by purchasing New Jersey Tobaccos with a final maturity of 2010. As the yield curve inverted, we sold longer securities that yielded less than the BMA cash rate.
Outlook
As long as the forces of low interest rates, a flat yield curve and tighter spreads persist, we anticipate that the refunding of municipal bonds will continue, and may put pressure on secondary market profits, particularly in the long end of the market. Should leveraged tender option bond programs begin to unwind, it is likely that variable-rate demand note programs (the floating rate piece of fixed rate synthetics) would be collapsed in turn, creating less cash equivalent supply in the municipal bond market. As we approach the tax season, seasonal selling of municipal money market funds to meet tax
25
EXCELSIOR TAX-EXEMPT FUNDS, INC. | SHORT-TERM TAX-EXEMPT SECURITIES FUND |
obligations should keep pressure on BMA rates near term. Because the forces of supply and demand may be neutralized this year, the Fund is likely to keep cash at around 10% until the high tax season has passed.
Pamela Hunter
Managing Director and Senior Portfolio Manager
26
EXCELSIOR TAX-EXEMPT FUNDS, INC. | SHORT-TERM TAX-EXEMPT SECURITIES FUND |
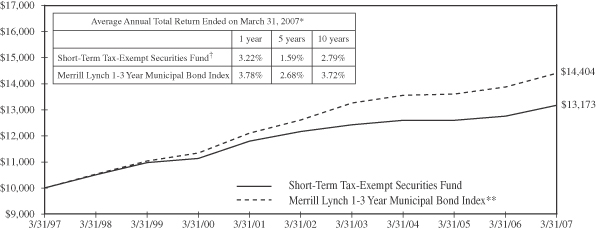
Past performance is not predictive of future performance. Investment returns and principal values will vary and shares may be worth more or less at redemption than their original cost. A portion of the Fund’s income may be subject to the Alternative Minimum Tax and some investors may be subject to certain state and local taxes.
The above illustration compares a $10,000 investment made in the Fund and a broad-based index over the past ten fiscal years. The chart assumes all dividends and capital gain distributions are reinvested. The Fund’s performance takes into account fees and expenses. The index does not take into account charges, fees and other expenses. Further information relating to Fund performance is contained in the Financial Highlights section of the Prospectus and elsewhere in this report.
| | | |
| | |
Expense Ratio
(As of 7/31/06) | | Shares | |
Gross Expense Ratio | | 0.77 | % |
Net Expense Ratio | | 0.60 | % |
The expense information in the table reflects contractual fee waivers currently in effect. This information is included in the most current prospectus available to current and prospective shareholders of the Fund. The Adviser has contractually agreed to waive fees or reimburse expenses in order to keep total operating expenses from exceeding 0.60%. The waiver agreement may not be terminated before July 31, 2007. In addition, this agreement will renew automatically for an additional 12 month term unless the Adviser terminates the agreement by providing written notice to the Fund prior to the expiration of the current term.
| * | | Total return represents the change during the period in a hypothetical account with dividends reinvested. |
| ** | | Source: Merrill Lynch—the Merrill Lynch 1-3 Year Municipal Bond Index is a widely-accepted unmanaged market-weighted index comprised of fixed-rate, coupon-bearing bonds issued within five years of the most recent month-end with greater than $50 million principal amount having a Moody’s investment grade rating and maturities of one to three years. |
| † | | Currently certain fees are waived. Had such fees not been waived, returns would have been lower. Returns do not reflect the deduction of taxes that a shareholder would pay on Fund distributions or the redemption of shares. |
27
Excelsior Tax-Exempt Funds, Inc.
Portfolio of Investments — March 31, 2007
California Short-Intermediate Tax-Exempt Income Fund
| | | | | | | | | | | |
Principal
Amount | | | | Rate | | | Maturity
Date | | Value |
| | | | | | | | | | | |
| | TAX-EXEMPT SECURITIES — 85.19% | | | |
| $ | 1,500,000 | | Anaheim, California, Public Financing Authority Revenue Bonds, Distribution Systems, (AMBAC) | | 5.00 | % | | 10/01/13 | | $ | 1,619,700 |
| | 1,000,000 | | California State Department of Transportation Revenue Bonds, Federal Highway Grant Anticipation Bonds, Series A, (FGIC) | | 4.50 | | | 02/01/13 | | | 1,046,330 |
| | 1,000,000 | | California State Department of Water Resources Central Valley Project Revenue Bonds, Series Y | | 5.00 | | | 12/01/10 | | | 1,051,040 |
| | 1,500,000 | | California State Department of Water Resources Revenue Bonds, Series W, (AMBAC) | | 5.50 | | | 12/01/09 | | | 1,576,620 |
| | 3,000,000 | | California State Economic Recovery, General Obligation Bonds, Series B, (Mandatory Put 07/01/07 @ 100) | | 5.00 | | | 07/01/23 | | | 3,009,720 |
| | 1,000,000 | | California State Economic Recovery, Special Sales Tax Revenue Bonds, Series A, (FGIC) | | 5.25 | | | 07/01/14 | | | 1,096,950 |
| | 750,000 | | California State General Obligation Bonds | | 6.25 | | | 04/01/08 | | | 769,928 |
| | 2,000,000 | | California State General Obligation Bonds | | 5.00 | | | 02/01/11 | | | 2,095,480 |
| | 1,000,000 | | California State University Systemwide Revenue Bonds, Series A, (AMBAC) | | 5.00 | | | 11/01/12 | | | 1,069,600 |
| | 1,000,000 | | California Statewide Communities Development Authority Revenue Bonds, California Endowment | | 5.00 | | | 07/01/13 | | | 1,074,110 |
| | 3,000,000 | | California Statewide Communities Development Authority Revenue Bonds, John Muir Health, Series A | | 5.00 | | | 08/15/17 | | | 3,203,250 |
| | | | | | | | | | | |
Principal
Amount | | | | Rate | | | Maturity
Date | | Value |
| | | | | | | | | | | |
| | TAX-EXEMPT SECURITIES — (continued) | | | |
| $ | 1,000,000 | | Central Valley, California, School District Financing Authority Revenue Bonds, Series A, (MBIA) | | 6.15 | % | | 08/01/09 | | $ | 1,057,010 |
| | 1,000,000 | | Contra Costa, California, Transportation Authority Sales Tax Revenue Bonds, Series A, (FGIC) | | 6.00 | | | 03/01/08 | | | 1,022,300 |
| | 975,000 | | Foothill- De Anza, California, Community College District General Obligation Bonds, (FGIC) | | 5.00 | | | 08/01/14 | | | 1,037,644 |
| | 1,000,000 | | Golden State Tobacco Securitization Corporation, California, Tobacco Settlement Revenue Bonds, Enhanced-Asset Backed, Series A | | 5.00 | | | 06/01/15 | | | 1,007,180 |
| | 3,500,000 | | Los Angeles County, California, Metropolitan Transportation Authority Sales Tax Revenue Bonds, Series A, (FSA) | | 5.25 | | | 07/01/10 | | | 3,664,674 |
| | 1,000,000 | | Los Angeles, California, Department of Water & Power Revenue Bonds, Power System, Series A, Sub-Series A-1, (MBIA) | | 5.00 | | | 07/01/14 | | | 1,074,110 |
| | 1,000,000 | | Los Angeles, California, General Obligation Bonds, Series A, (MBIA) | | 4.00 | | | 09/01/13 | | | 1,022,110 |
| | 1,000,000 | | Los Angeles, California, Sanitation Equipment Charge Revenue Bonds, (FGIC) | | 5.00 | | | 02/01/13 | | | 1,072,380 |
| | 1,000,000 | | Los Angeles, California, Sanitation Equipment Charge Revenue Bonds, Series A, (FSA) | | 5.00 | | | 02/01/10 | | | 1,039,970 |
| | 1,500,000 | | Los Angeles, California, Waste Water System Revenue Bonds, Series B, (MBIA) | | 5.00 | | | 06/01/10 | | | 1,566,660 |
See Notes to Financial Statements.
28
Excelsior Tax-Exempt Funds, Inc.
Portfolio of Investments — March 31, 2007
California Short-Intermediate Tax-Exempt Income Fund — (continued)
| | | | | | | | | | | |
Principal
Amount | | | | Rate | | | Maturity
Date | | Value |
| | | | | | | | | | | |
| | TAX-EXEMPT SECURITIES — (continued) | | | |
| $ | 1,000,000 | | Napa County, California, Flood Protection & Watershed Improvement Authority, General Obligation Bonds, (AMBAC) | | 4.50 | % | | 06/15/12 | | $ | 1,044,200 |
| | 1,150,000 | | Orange County, California, Local Transportation Authority Sales Tax Revenue Bonds, (AMBAC) | | 6.20 | | | 02/14/11 | | | 1,240,770 |
| | 1,100,000 | | Orange County, California, Local Transportation Authority Sales Tax Revenue Bonds, 1st Senior, (AMBAC) | | 6.00 | | | 02/15/08 | | | 1,123,331 |
| | 1,000,000 | | Rancho, California, Water District Financing Authority Revenue Bonds, Series A, (FSA) | | 5.50 | | | 08/01/10 | | | 1,062,210 |
| | 1,000,000 | | San Diego County, California, Certificates of Participation, (AMBAC) | | 5.00 | | | 11/01/11 | | | 1,059,840 |
| | 1,000,000 | | San Diego, California, Public Facilities Financing Authority Sewer Revenue Bonds, (FGIC) | | 5.20 | | | 05/15/13 | | | 1,001,730 |
| | 1,000,000 | | San Diego, California, Public Facilities Financing Authority Water Revenue Bonds, (MBIA) | | 5.00 | | | 08/01/11 | | | 1,058,850 |
| | 1,000,000 | | San Francisco, California, City & County General Obligation Bonds, (FSA) | | 5.00 | | | 06/15/08 | | | 1,018,210 |
| | 1,000,000 | | San Francisco, California, City & County Public Utilities Communication Clean Water Revenue Bond, (MBIA) | | 5.00 | | | 10/01/13 | | | 1,074,290 |
| | 3,000,000 | | San Francisco, California, State Building Authority Lease Revenue Bonds, California State & San Francisco Civic Center, Series A | | 5.00 | | | 12/01/12 | | | 3,187,860 |
| | | | | | | | | | | |
Principal
Amount | | | | Rate | | | Maturity
Date | | Value |
| | | | | | | | | | | |
| | TAX-EXEMPT SECURITIES — (continued) | | | |
| $ | 1,000,000 | | San Mateo, Foster City, California, School Facilities Financing Authority Revenue Bond, (FSA) | | 4.00 | % | | 08/15/12 | | $ | 1,021,280 |
| | 1,075,000 | | Santa Clara County, California, Financing Authority Lease Revenue Bonds, Multiple Facilities Project, Series A, (AMBAC) | | 4.50 | | | 05/15/12 | | | 1,094,468 |
| | 1,000,000 | | Southern California Public Power Authority Revenue Bonds, Transmission Project, Series A, (MBIA) | | 5.25 | | | 07/01/09 | | | 1,031,100 |
| | 1,000,000 | | Southern California Public Power Authority Revenue Bonds, Transmission Project, Series B, (FSA) | | 4.25 | | | 07/01/11 | | | 1,028,490 |
| | | | | | | | | | | |
| | | TOTAL TAX-EXEMPT SECURITIES
(Cost $48,162,886) | | | 48,223,395 |
| | | | | | | | | | | |
| TAX-EXEMPT SECURITIES – ESCROWED IN U.S.
GOVERNMENTS — 11.13% |
| | 2,000,000 | | Riverside, California, Water Revenue Bonds, (FGIC) (Prerefunded 10/01/11 @ 101) | | 5.00 | | | 10/01/26 | | | 2,138,220 |
| | 1,000,000 | | Sacramento, California, City Financing Authority Revenue Bonds, City Hall, Series A, (FSA) (Prerefunded 12/01/12 @ 100) | | 5.25 | | | 12/01/17 | | | 1,086,410 |
| | 3,000,000 | | San Diego County, California, Water Authority Certificates of Participation, Series A, (FGIC) (Prerefunded 05/01/08 @ 101) | | 5.00 | | | 05/01/14 | | | 3,076,860 |
| | | | | | | | | | | |
| | | TOTAL TAX-EXEMPT SECURITIES —ESCROWED IN U.S. GOVERNMENTS
(Cost $6,378,711) | | | 6,301,490 |
| | | | | | | | | | | |
See Notes to Financial Statements.
29
Excelsior Tax-Exempt Funds, Inc.
Portfolio of Investments — March 31, 2007
California Short-Intermediate Tax-Exempt Income Fund — (continued)
| | | | | | | | | |
| | | | |
| Shares | | | | | | | | | Value |
| REGISTERED INVESTMENT COMPANIES — 2.62% |
| 1,026,164 | | BlackRock California Money Fund | | $ | 1,026,164 |
| 455,820 | | Federated California Money Fund | | | 455,820 |
| | | | | | | | | |
| | TOTAL REGISTERED INVESTMENT COMPANIES
(Cost $1,481,984) | | | 1,481,984 |
| | | | | | | | | |
| | | | | | | | | | |
TOTAL INVESTMENTS
(Cost $56,023,581) | | 98.94 | % | | $ | 56,006,869 |
OTHER ASSETS IN EXCESS OF LIABILITIES | | 1.06 | | | | 598,358 |
| | | | | | |
NET ASSETS | | 100.00 | % | | $ | 56,605,227 |
| | | | | | |
AMBAC—American Municipal Bond Assurance Corp.
FGIC—Financial Guaranty Insurance Corp.
FSA—Financial Security Assurance
MBIA—Municipal Bond Insurance Association
Notes (The following notes have not been audited by PricewaterhouseCoopers LLP):
These municipal securities meet the three highest ratings assigned by Moody’s Investors Services, Inc. or Standard and Poor’s Corporation or, where not rated, are determined by the Advisor, under the supervision of the Board of Directors, to be of comparable quality at the time of purchase to rated instruments that may be acquired by the Fund.
At March 31, 2007, approximately 11% of the net assets are invested in municipal securities that have letter of credit enhancement features or escrows in U.S. Government securities backing them, on which the Fund relies. Without such features, the securities may or may not meet the quality standards of securities purchased by the Fund.
At March 31, 2007, approximately, 96% of the net assets are invested in California municipal securities. Economic changes affecting the state and certain of its public bodies and municipalities may affect the ability of issuers to pay the required principal and interest payments of the municipal securities.
The summary of the Fund’s investments as of March 31, 2007 is as follows: (Unaudited)
| | | | | | |
Portfolio Diversification | | % of
Net
Assets | | | Value |
Revenue Bonds | | 65.66 | % | | $ | 37,166,263 |
General Obligation Bonds | | 17.66 | | | | 9,997,292 |
Prerefunded | | 11.13 | | | | 6,301,490 |
Registered Investment Companies | | 2.62 | | | | 1,481,984 |
Certificates of Participation | | 1.87 | | | | 1,059,840 |
| | | | | | |
Total Investments | | 98.94 | % | | $ | 56,006,869 |
Other Assets in Excess of Liabilities | | 1.06 | | | | 598,358 |
| | | | | | |
Net Assets | | 100.00 | % | | $ | 56,605,227 |
| | | | | | |
See Notes to Financial Statements.
30
Excelsior Funds, Inc.
Portfolio of Investments — March 31, 2007
Core Bond Fund
| | | | | | | | | | | |
Principal
Amount | | | | Rate | | | Maturity
Date | | Value |
| | | | | | | | | | | |
| | ASSET BACKED SECURITIES — 0.77% |
| $ | 4,200,000 | | Capital Auto Receivables Asset Trust, 2006-SN1AC B(a) | | 5.50 | % | | 04/20/10 | | $ | 4,220,546 |
| | | | | | | | | | | |
| | | TOTAL ASSET BACKED SECURITIES
(Cost $4,199,070) | | | 4,220,546 |
| | | | | | | | | | | |
| | COLLATERALIZED MORTGAGE OBLIGATIONS — 7.74% |
| | | NON-GOVERNMENTAL AGENCY COLLATERALIZED MORTGAGE OBLIGATIONS — 6.71% |
| | 581,837 | | Bear Stearns Adjustable Rate Mortgage Trust, 2004-10, 15A1(b) | | 4.50 | | | 01/25/35 | | | 574,878 |
| | 1,970,974 | | Citigroup Mortgage Loan Trust, 2004-HYB4 WA(b) | | 4.46 | | | 12/25/34 | | | 1,947,220 |
| | 3,066,439 | | Countrywide Alternative Loan Trust, 2004-16CB 1A2 | | 5.50 | | | 07/25/34 | | | 3,034,154 |
| | 1,840,406 | | Countrywide Alternative Loan Trust, 2004-22CB 1A1 | | 6.00 | | | 10/25/34 | | | 1,845,870 |
| | 8,256,407 | | Indymac Index Mortgage Loan Trust, 2004-AR4 3A(b) | | 4.74 | | | 08/25/34 | | | 8,239,692 |
| | 7,906,553 | | JP Morgan Mortgage Trust, 2005-A6 1A1(b) | | 5.15 | | | 09/25/35 | | | 7,834,919 |
| | 10,915,388 | | Wells Fargo Mortgage Backed Securities Trust, 2004-EE 3A1 | | 3.99 | | | 12/25/34 | | | 10,709,611 |
| | 2,852,286 | | Wells Fargo Mortgage Backed Securities Trust, 2005-AR1 1A1(b) | | 5.54 | | | 02/25/35 | | | 2,806,770 |
| | | | | | | | | | | |
| | | | | | | | | | | 36,993,114 |
| | | | | | | | | | | |
| | | FEDERAL HOME LOAN MORTGAGE CORPORATION — 0.48% |
| | 2,580,601 | | 2333 UZ | | 6.50 | | | 07/15/31 | | | 2,644,186 |
| | | | | | | | | | | |
| | | FEDERAL NATIONAL MORTGAGE
ASSOCIATION — 0.55% |
| | 3,080,000 | | 2003-17 QT | | 5.00 | | | 08/25/27 | | | 3,058,976 |
| | | | | | | | | | | |
| | | TOTAL COLLATERALIZED MORTGAGE OBLIGATIONS
(Cost $43,170,173) | | | 42,696,276 |
| | | | | | | | | | | |
| | | | | | | | | | | |
Principal
Amount | | | | Rate | | | Maturity
Date | | Value |
| | | | | | | | | | | |
| | COMMERCIAL MORTGAGE-BACKED SECURITIES — 11.77% |
| $ | 4,225,000 | | Asset Securitization Corp., 1997-D4 A4(b) | | 7.26 | % | | 04/14/29 | | $ | 4,443,489 |
| | 2,497,000 | | Bank of America Commercial Mortgage, Inc., 2004-1 A4 | | 4.76 | | | 11/10/39 | | | 2,426,294 |
| | 5,000,000 | | Bear Stearns Commercial Mortgage Securities, 2006-PW13 A3(b) | | 5.52 | | | 09/11/41 | | | 5,064,335 |
| | 1,000,000 | | Credit Suisse First Boston Mortgage Securities Corp., 2002-CKS4 G(a)(b) | | 6.01 | | | 11/15/36 | | | 1,026,906 |
| | 1,781,000 | | GMAC Commercial Mortgage Securities, 1999-C1(b) | | 6.84 | | | 05/15/33 | | | 1,832,944 |
| | 3,449,000 | | Greenwich Capital Commercial Funding Corp., 2004-GG1 A1 | | 5.32 | | | 06/10/36 | | | 3,460,227 |
| | 3,150,000 | | Morgan Stanley Dean Witter Capital I, 2000-LIF2 C | | 7.50 | | | 10/15/33 | | | 3,370,250 |
| | 1,245,000 | | Morgan Stanley Dean Witter Capital I, 2003-TOP9 A2 | | 4.74 | | | 11/13/36 | | | 1,217,836 |
| | 5,571,000 | | Nomura Asset Securities Corp., 1998-D6 A4(b) | | 6.91 | | | 03/15/30 | | | 6,266,777 |
| | 4,225,000 | | Wachovia Bank Commercial Mortgage Trust, 2002-C1 A4 | | 6.29 | | | 04/15/34 | | | 4,427,224 |
| | 3,601,000 | | Wachovia Bank Commercial Mortgage Trust, 2003-C9 A3 | | 4.61 | | | 12/15/35 | | | 3,535,827 |
| | 6,099,000 | | Wachovia Bank Commercial Mortgage Trust, 2004-C12 A2 | | 5.00 | | | 07/15/41 | | | 6,069,355 |
| | 3,905,000 | | Wachovia Bank Commercial Mortgage Trust, 2004-C12 A3 | | 5.23 | | | 07/15/41 | | | 3,917,688 |
| | 17,926,000 | | Wachovia Bank Commercial Mortgage Trust, 2005-C20 A5 | | 5.09 | | | 07/15/42 | | | 17,862,640 |
| | | | | | | | | | | |
| | | TOTAL COMMERCIAL MORTGAGE-BACKED SECURITIES
(Cost $65,218,292) | | | 64,921,792 |
| | | | | | | | | | | |
See Notes to Financial Statements.
31
Excelsior Funds, Inc.
Portfolio of Investments — March 31, 2007
Core Bond Fund — (continued)
| | | | | | | | | | | |
Principal
Amount | | | | Rate | | | Maturity
Date | | Value |
| | | | | | | | | | | |
| | CORPORATE BONDS — 17.21% |
| $ | 2,665,000 | | Alcan, Inc. | | 5.00 | % | | 06/01/15 | | $ | 2,556,172 |
| | 2,615,000 | | America Movil S.A. de C.V. | | 5.50 | | | 03/01/14 | | | 2,586,792 |
| | 955,000 | | America Movil S.A. de C.V. | | 6.38 | | | 03/01/35 | | | 940,731 |
| | 5,700,000 | | Bank One Corp. | | 7.88 | | | 08/01/10 | | | 6,168,494 |
| | 4,000,000 | | Barlcays Bank plc(a)(b) | | 5.93 | | | 12/31/49 | | | 4,004,312 |
| | 3,245,000 | | Bear Stearns Co., Inc. | | 5.70 | | | 11/15/14 | | | 3,273,712 |
| | 5,520,000 | | Bottling Group LLC | | 5.50 | | | 04/01/16 | | | 5,551,072 |
| | 2,300,000 | | British Telecommunications plc | | 8.88 | | | 12/15/30 | | | 3,157,930 |
| | 2,000,000 | | Caterpillar, Inc. | | 5.70 | | | 08/15/16 | | | 2,040,552 |
| | 2,000,000 | | Citigroup, Inc. | | 4.25 | | | 07/29/09 | | | 1,967,694 |
| | 1,441,000 | | Comcast Cable Communications | | 6.88 | | | 06/15/09 | | | 1,491,932 |
| | 1,441,000 | | DaimlerChrysler N.A. Holding Corp. | | 7.20 | | | 09/01/09 | | | 1,504,165 |
| | 2,000,000 | | Deutsche Telekom International Finance | | 5.38 | | | 03/23/11 | | | 2,011,018 |
| | 1,310,000 | | Deutsche Telekom International Finance, Multi-Coupon Bond | | 8.00 | | | 06/15/10 | | | 1,420,061 |
| | 1,500,000 | | Deutsche Telekom International Finance, Multi-Coupon Bond | | 8.25 | | | 06/15/30 | | | 1,857,987 |
| | 1,700,000 | | Ford Motor Credit Co. | | 8.63 | | | 11/01/10 | | | 1,734,886 |
| | 2,000,000 | | General Electric Capital Corp. MTN | | 6.00 | | | 06/15/12 | | | 2,078,068 |
| | 1,400,000 | | General Electric Captial Corp. | | 5.00 | | | 11/15/11 | | | 1,395,871 |
| | 5,834,000 | | Household Finance Corp. | | 8.00 | | | 07/15/10 | | | 6,323,892 |
| | 1,388,000 | | JP Morgan Chase & Co. | | 5.75 | | | 01/02/13 | | | 1,423,488 |
| | 2,000,000 | | Lehman Brothers Holdings, Inc. | | 5.75 | | | 01/03/17 | | | 2,004,138 |
| | 885,000 | | Metlife, Inc. | | 5.00 | | | 11/24/13 | | | 876,299 |
| | 2,000,000 | | Morgan Stanley | | 6.75 | | | 04/15/11 | | | 2,115,350 |
| | 685,000 | | Nisource Finance Corp. | | 5.25 | | | 09/15/17 | | | 646,955 |
| | 3,825,000 | | Oracle Corp. | | 5.25 | | | 01/15/16 | | | 3,771,844 |
| | 1,441,000 | | Prudential Financial, Inc. | | 5.10 | | | 09/20/14 | | | 1,414,409 |
| | 4,500,000 | | RBS Capital Trust III(b)(c) | | 5.51 | | | 09/30/14 | | | 4,427,483 |
| | 1,670,000 | | Sprint Capital Corp.(d) | | 8.75 | | | 03/15/32 | | | 1,969,797 |
| | 4,100,000 | | Target Corp. | | 5.88 | | | 07/15/16 | | | 4,219,195 |
| | | | | | | | | | | |
Principal
Amount | | | | Rate | | | Maturity
Date | | Value |
| | | | | | | | | | | |
| | CORPORATE BONDS — (continued) |
| $ | 2,600,000 | | TCI Communications, Inc. | | 9.80 | % | | 02/01/12 | | $ | 3,078,156 |
| | 2,183,000 | | Time Warner Cos., Inc. | | 7.25 | | | 10/15/17 | | | 2,409,853 |
| | 2,000,000 | | UBS Preferred Funding Trust I | | 8.62 | | | 10/29/49 | | | 2,210,662 |
| | 2,441,000 | | Wal-Mart Stores, Inc. | | 4.13 | | | 02/15/11 | | | 2,365,151 |
| | 1,735,000 | | Wal-Mart Stores, Inc. | | 5.00 | | | 04/05/12 | | | 1,728,492 |
| | 5,350,000 | | Wells Fargo & Co. | | 5.00 | | | 11/15/14 | | | 5,196,273 |
| | 950,000 | | Xerox Corp. | | 6.40 | | | 03/15/16 | | | 977,099 |
| | 2,000,000 | | YUM! Brands, Inc. | | 6.25 | | | 04/15/16 | | | 2,055,456 |
| | | | | | | | | | | |
| | | TOTAL CORPORATE BONDS
(Cost $93,910,972) | | | 94,955,441 |
| | | | | | | | | | | |
| | TAX-EXEMPT SECURITIES — 0.32% |
| | 1,590,000 | | Massachusetts Bay Transition Authority, Massachusetts Sales Tax, Revenue Bonds, Series A | | 5.00 | | | 07/01/31 | | | 1,761,561 |
| | | | | | | | | | | |
| | | TOTAL TAX-EXEMPT SECURITIES (Cost $1,753,931) | | | 1,761,561 |
| | | | | | | | | | | |
| | U.S. GOVERNMENT AGENCY BONDS & NOTES — 2.38% |
| | | FANNIE MAE — 1.43% | | | |
| | 7,500,000 | | MTN | | 6.25 | | | 02/01/11 | | | 7,867,613 |
| | | | | | | | | | | |
| | | FREDDIE MAC — 0.50% | | | |
| | 2,440,000 | | | | 6.25 | | | 07/15/32 | | | 2,779,167 |
| | | | | | | | | | | |
| | | RESOLUTION FUNDING
CORPORATION — 0.45% |
| | 4,851,000 | | Principal Only STRIPS(e) | | 0.00 | | | 07/15/20 | | | 2,475,984 |
| | | | | | | | | | | |
| | | TOTAL U.S. GOVERNMENT AGENCY BONDS & NOTES
(Cost $12,830,645) | | | 13,122,764 |
| | | | | | | | | | | |
| U.S. GOVERNMENT AGENCY MORTGAGE PASS THROUGH
SECURITIES — 39.55% |
| | | FEDERAL HOME LOAN MORTGAGE
CORPORATION — 10.62% |
| | 6,330,169 | | Pool # 1G1898 ARM(b) | | 5.92 | | | 06/01/36 | | | 6,371,234 |
| | 2,546,198 | | Pool # A20105 | | 5.00 | | | 04/01/34 | | | 2,465,415 |
| | 9,347,243 | | Pool # A47411 | | 4.50 | | | 10/01/35 | | | 8,790,449 |
| | 2,294,453 | | Pool # A48132 | | 7.00 | | | 12/01/35 | | | 2,367,650 |
| | 5,494,792 | | Pool # B19861 | | 4.50 | | | 08/01/20 | | | 5,320,510 |
| | 2,721,826 | | Pool # C01811 | | 5.00 | | | 04/01/34 | | | 2,635,471 |
| | 130,854 | | Pool # C71221 | | 5.00 | | | 09/01/32 | | | 126,844 |
| | 20,702 | | Pool # C74339 | | 5.00 | | | 12/01/32 | | | 20,068 |
| | 162,308 | | Pool # C74469 | | 5.00 | | | 12/01/32 | | | 157,334 |
| | 32,310 | | Pool # C74676 | | 5.00 | | | 12/01/32 | | | 31,319 |
| | 2,320,547 | | Pool # E96460 | | 5.00 | | | 05/01/18 | | | 2,294,384 |
| | 4,527,416 | | Pool # G01842 | | 4.50 | | | 06/01/35 | | | 4,257,728 |
| | 18,109,227 | | Pool # G18105 | | 5.00 | | | 03/01/21 | | | 17,859,820 |
| | 2,496,422 | | Pool # J01383 | | 5.50 | | | 03/01/21 | | | 2,501,698 |
| | 3,518,057 | | Pool # J02497 | | 4.50 | | | 09/01/20 | | | 3,406,473 |
| | | | | | | | | | | |
| | | | | | | | | | | 58,606,397 |
| | | | | | | | | | | |
See Notes to Financial Statements.
32
Excelsior Funds, Inc.
Portfolio of Investments — March 31, 2007
Core Bond Fund — (continued)
| | | | | | | | | | | |
Principal
Amount | | | | Rate | | | Maturity
Date | | Value |
| | | | | | | | | | | |
| U.S. GOVERNMENT AGENCY MORTGAGE PASS THROUGH
SECURITIES — (continued) |
| | | FEDERAL NATIONAL MORTGAGE ASSOCIATION — 26.85% |
| $ | 203,140 | | Pool # 251502 | | 6.50 | % | | 02/01/13 | | $ | 208,079 |
| | 84,901 | | Pool # 252806 | | 7.50 | | | 10/01/29 | | | 88,996 |
| | 1,197,709 | | Pool # 255896 | | 6.50 | | | 08/01/35 | | | 1,222,557 |
| | 5,032,302 | | Pool # 256269 | | 5.50 | | | 06/01/36 | | | 4,979,818 |
| | 10,462,685 | | Pool # 357824 | | 5.50 | | | 06/01/35 | | | 10,363,931 |
| | 1,232,108 | | Pool # 387203 | | 4.80 | | | 01/01/12 | | | 1,220,457 |
| | 1,052,084 | | Pool # 387204 | | 4.80 | | | 01/01/12 | | | 1,042,136 |
| | 220,898 | | Pool # 443194 | | 5.50 | | | 10/01/28 | | | 219,820 |
| | 3,905 | | Pool # 450846 | | 5.50 | | | 12/01/28 | | | 3,886 |
| | 342,368 | | Pool # 452035 | | 5.50 | | | 11/01/28 | | | 340,697 |
| | 2,306 | | Pool # 454758 | | 5.50 | | | 12/01/28 | | | 2,295 |
| | 580,710 | | Pool # 561435 | | 5.50 | | | 11/01/29 | | | 577,876 |
| | 303,582 | | Pool # 578543 | | 5.50 | | | 04/01/31 | | | 301,098 |
| | 112,425 | | Pool # 627259 | | 5.50 | | | 02/01/32 | | | 111,518 |
| | 963,020 | | Pool # 632551 | | 5.50 | | | 02/01/32 | | | 955,252 |
| | 527,269 | | Pool # 632576 | | 5.50 | | | 02/01/32 | | | 522,955 |
| | 224,747 | | Pool # 694655 | | 5.50 | | | 04/01/33 | | | 222,905 |
| | 1,585,620 | | Pool # 702861 | | 5.00 | | | 04/01/18 | | | 1,567,896 |
| | 1,446,560 | | Pool # 704440 | | 5.00 | | | 05/01/18 | | | 1,430,391 |
| | 63,525 | | Pool # 710585 | | 5.50 | | | 05/01/33 | | | 63,004 |
| | 374,864 | | Pool # 735224 | | 5.50 | | | 02/01/35 | | | 371,792 |
| | 5,754,009 | | Pool # 745275 | | 5.00 | | | 02/01/36 | | | 5,564,857 |
| | 23,425,967 | | Pool # 745432 | | 5.50 | | | 04/01/36 | | | 23,204,855 |
| | 1,038,365 | | Pool # 781859 | | 4.50 | | | 12/01/34 | | | 977,121 |
| | 1,430,339 | | Pool # 786423 ARM(b) | | 4.59 | | | 07/01/34 | | | 1,430,408 |
| | 453,699 | | Pool # 797680 | | 4.50 | | | 10/01/35 | | | 426,940 |
| | 653,931 | | Pool # 805373 | | 4.50 | | | 01/01/35 | | | 615,362 |
| | 6,888,911 | | Pool # 805386 ARM(b) | | 4.86 | | | 01/01/35 | | | 6,887,599 |
| | 753,922 | | Pool # 812268 | | 5.50 | | | 05/01/35 | | | 746,806 |
| | 2,384,829 | | Pool # 815479 | | 4.50 | | | 03/01/35 | | | 2,242,304 |
| | 1,311,382 | | Pool # 819361 | | 4.50 | | | 04/01/35 | | | 1,232,440 |
| | 539,362 | | Pool # 820492 | | 5.50 | | | 05/01/35 | | | 534,271 |
| | 789,575 | | Pool # 820989 | | 5.50 | | | 04/01/35 | | | 782,123 |
| | 743,939 | | Pool # 821567 | | 5.50 | | | 06/01/35 | | | 736,917 |
| | 1,825,542 | | Pool # 822799 | | 4.50 | | | 04/01/35 | | | 1,716,442 |
| | 6,286,038 | | Pool # 829321 | | 4.50 | | | 09/01/35 | | | 5,910,363 |
| | 568,677 | | Pool # 835359 | | 4.50 | | | 09/01/35 | | | 534,691 |
| | 10,562,691 | | Pool # 835751 | | 4.50 | | | 08/01/35 | | | 9,931,429 |
| | 1,876,908 | | Pool # 835760 | | 4.50 | | | 09/01/35 | | | 1,764,738 |
| | 1,946,275 | | Pool # 836512 | | 4.50 | | | 10/01/20 | | | 1,884,356 |
| | 4,297,768 | | Pool # 839240 | | 4.50 | | | 09/01/35 | | | 4,040,919 |
| | 6,727,655 | | Pool # 840687 | | 5.00 | | | 09/01/35 | | | 6,506,496 |
| | 2,818,014 | | Pool # 843510 | | 4.50 | | | 11/01/20 | | | 2,728,362 |
| | 2,389,000 | | Pool # 844085 | | 5.00 | | | 11/01/35 | | | 2,310,466 |
| | 1,856,381 | | Pool # 844797 | | 4.50 | | | 10/01/35 | | | 1,745,438 |
| | 1,895,300 | | Pool # 844901 | | 4.50 | | | 10/01/20 | | | 1,835,003 |
| | 5,733,376 | | Pool # 867438 | | 4.50 | | | 05/01/36 | | | 5,388,279 |
| | 5,280,419 | | Pool # 880084 | | 6.00 | | | 03/01/36 | | | 5,319,669 |
| | 6,234,661 | | Pool # 883084 | | 6.50 | | | 07/01/36 | | | 6,360,137 |
| | 721,630 | | Pool # 893426 | | 6.00 | | | 09/01/36 | | | 726,994 |
| | 3,087,754 | | Pool # 895271 | | 6.50 | | | 09/01/36 | | | 3,149,897 |
| | 15,651,495 | | Pool #745515 | | 5.00 | | | 05/01/36 | | | 15,136,980 |
| | | | | | | | | | | |
| | | | | | | | | | | 148,190,021 |
| | | | | | | | | | | |
| | | | | | | | | | | |
Principal
Amount | | | | Rate | | | Maturity
Date | | Value |
| | | | | | | | | | | |
| U.S. GOVERNMENT AGENCY MORTGAGE PASS THROUGH
SECURITIES — (continued) |
| | | GOVERNMENT NATIONAL MORTGAGE ASSOCIATION — 2.08% |
| $ | 317,132 | | Pool # 2562 | | 6.00 | % | | 03/20/28 | | $ | 322,114 |
| | 427,574 | | Pool # 267812 | | 8.50 | | | 06/15/17 | | | 457,649 |
| | 1,826,845 | | Pool # 3413 | | 4.50 | | | 07/20/33 | | | 1,723,974 |
| | 1,692,191 | | Pool # 3442 | | 5.00 | | | 09/20/33 | | | 1,643,012 |
| | 3,126 | | Pool # 356873 | | 6.50 | | | 05/15/23 | | | 3,212 |
| | 29,602 | | Pool # 434772 | | 9.00 | | | 06/15/30 | | | 32,159 |
| | 62,379 | | Pool # 471660 | | 7.50 | | | 03/15/28 | | | 65,169 |
| | 138,881 | | Pool # 472028 | | 6.50 | | | 05/15/28 | | | 143,024 |
| | 59,613 | | Pool # 475847 | | 6.50 | | | 06/15/28 | | | 61,392 |
| | 20,827 | | Pool # 479087 | | 8.00 | | | 01/15/30 | | | 22,100 |
| | 301,056 | | Pool # 479088 | | 8.00 | | | 01/15/30 | | | 319,463 |
| | 117,882 | | Pool # 503711 | | 7.00 | | | 05/15/29 | | | 123,326 |
| | 41,810 | | Pool # 525556 | | 8.00 | | | 01/15/30 | | | 44,367 |
| | 10,943 | | Pool # 525945 | | 9.00 | | | 07/15/30 | | | 11,888 |
| | 11,128 | | Pool # 532751 | | 9.00 | | | 08/15/30 | | | 12,090 |
| | 107,703 | | Pool # 568670 | | 6.50 | | | 04/15/32 | | | 110,712 |
| | 200,931 | | Pool # 575441 | | 6.50 | | | 12/15/31 | | | 206,730 |
| | 648,104 | | Pool # 598127 | | 5.50 | | | 03/15/18 | | | 652,006 |
| | 1,382,950 | | Pool # 607668 | | 5.50 | | | 02/15/18 | | | 1,391,277 |
| | 804,063 | | Pool # 615639 | | 4.50 | | | 09/15/33 | | | 762,300 |
| | 159,755 | | Pool # 780086 | | 8.50 | | | 11/15/17 | | | 169,766 |
| | 730,469 | | Pool # 780548 | | 8.50 | | | 12/15/17 | | | 776,244 |
| | 558,792 | | Pool # 780865 | | 9.50 | | | 11/15/17 | | | 606,479 |
| | 184,481 | | Pool # 781036 | | 8.00 | | | 10/15/17 | | | 194,274 |
| | 690,973 | | Pool # 781084 | | 9.00 | | | 12/15/17 | | | 739,239 |
| | 178,286 | | Pool # 80185 ARM(b) | | 5.38 | | | 04/20/28 | | | 180,114 |
| | 205,478 | | Pool # 80205 ARM(b) | | 5.38 | | | 06/20/28 | | | 207,590 |
| | 487,576 | | Pool # 80311 ARM(b) | | 5.50 | | | 08/20/29 | | | 492,754 |
| | | | | | | | | | | |
| | | | | | | | | | | 11,474,424 |
| | | | | | | | | | | |
| | | TOTAL U.S. GOVERNMENT AGENCY MORTGAGE PASS THROUGH SECURITIES
(Cost $217,605,864) | | | 218,270,842 |
| | | | | | | | | | | |
| | U.S. GOVERNMENT SECURITIES — 12.34% |
| | | U.S. TREASURY INFLATION PROTECTED
BONDS — 0.86% |
| | 300,000 | | | | 4.25 | | | 01/15/10 | | | 383,812 |
| | 445,000 | | | | 3.50 | | | 01/15/11 | | | 546,429 |
| | 1,050,000 | | | | 2.00 | | | 01/15/14 | | | 1,139,021 |
| | 2,500,000 | | | | 2.38 | | | 01/15/25 | | | 2,702,006 |
| | | | | | | | | | | |
| | | | | | | | | | | 4,771,268 |
| | | | | | | | | | | |
| | | U.S. TREASURY NOTES — 11.48% |
| | 520,000 | | (f) | | 4.63 | | | 09/30/08 | | | 519,147 |
| | 3,970,000 | | | | 3.63 | | | 01/15/10 | | | 3,874,629 |
| | 26,285,000 | | | | 4.50 | | | 11/15/10 | | | 26,264,498 |
| | 24,450,000 | | | | 7.63 | | | 11/15/22 | | | 31,643,654 |
| | 885,000 | | | | 4.50 | | | 02/15/36 | | | 834,389 |
| | 200,000 | | | | 4.75 | | | 02/15/37 | | | 196,875 |
| | | | | | | | | | | |
| | | | | | | | | | | 63,333,192 |
| | | | | | | | | | | |
| | | TOTAL U.S. GOVERNMENT SECURITIES
(Cost $68,307,564) | | | 68,104,460 |
| | | | | | | | | | | |
See Notes to Financial Statements.
33
Excelsior Funds, Inc.
Portfolio of Investments — March 31, 2007
Core Bond Fund — (continued)
| | | | | | | | | |
| Contracts | | | | | | | | Value |
| CALL OPTION PURCHASED — 0.00% |
| 10 | | Euro Dollar Future, Expires 12/17/07 strike price 95.75 | | $ | 1,813 |
| | | | | | | | | |
| | TOTAL CALL OPTION PURCHASED (Cost $3,025) | | | 1,813 |
| | | | | | | | | |
| Shares | | | | | | | | |
| REGISTERED INVESTMENT COMPANIES — 7.67% |
| 21,150,173 | | Dreyfus Government Cash Management Fund | | | 21,150,173 |
| 21,150,172 | | Fidelity U.S. Treasury II Fund | | | 21,150,172 |
| | | | | | | | | |
| | TOTAL REGISTERED INVESTMENT COMPANIES
(Cost $42,300,345) | | | 42,300,345 |
| | | | | | | | | |
| | | | | | | | | | |
TOTAL INVESTMENTS
(Cost $549,299,881) | | 99.75 | % | | | | | | $ | 550,355,840 |
OTHER ASSETS IN EXCESS OF LIABILITIES | | 0.25 | | | | | | | | 1,363,933 |
| | | | | | | | | | |
NET ASSETS | | 100.00 | % | | | | | | $ | 551,719,773 |
| | | | | | | | | | |
| (a) | Security exempt from registration under Rule 144A of the Securities Act of 1933. This security may be resold in transactions exempt from registration, normally to qualified institutional buyers. At March 31, 2007, these securities amounted to $9,251,764 or 1.68% of net assets. |
| (b) | Variable Rate Security—The rate disclosed is as of March 31, 2007. |
| (c) | Perpetual Security—Stated maturity is first par call date. |
| (d) | All or part of the security is segregated by the Fund’s custodian to cover future purchase commitments. |
| (f) | All or part of the security serves as collateral for futures contracts. |
ARM—Adjustable Rate Mortgage
LLC—Limited Liability Company
MTN—Medium Term Note
Multi-Coupon Bond—Coupon rate may increase or decrease in response to a change in the quality rating by an independent rating agency.
plc—Public Limited Company
STRIPS—Separately Traded Registered Interest and Principal Securities
| | | | | | | | | | | |
| Contracts | | | | | Value | | | Unrealized
Appreciation/
Depreciation | |
| FUTURES CONTRACTS | |
| Long — | | | | | | | | | | | |
| 85 | | | U.S. 2 Year Treasury Note, expiring June 29, 2007 (notional amount $17,435,838) | | $ | 17,415,703 | | | $ | (20,135 | ) |
| Short — | | | | | | | | | | | |
| (30 | ) | | U.S. Long-Term Treasury Bond, expiring June 20, 2007 (notional amount $(3,398,363)) | | | (3,337,500 | ) | | | 60,863 | |
| | | | | | | | | | | |
| | | TOTAL FUTURES CONTRACTS (Total notional amount $14,037,475) | | $ | 14,078,203 | | | $ | 40,728 | |
| | | | | | | | | | | |
The summary of the Fund’s investments as of March 31, 2007 is as follows: (Unaudited)
| | | | | | |
Portfolio Diversification | | % of
Net
Assets | | | Value |
U.S. Government & Agency Securities | | 54.27 | % | | $ | 299,498,066 |
Corporate Bonds | | 17.21 | | | | 94,955,441 |
Commercial Mortgage-Backed Securities | | 11.77 | | | | 64,921,792 |
Collateralized Mortgage Obligations | | 7.74 | | | | 42,696,276 |
Registered Investment Companies | | 7.67 | | | | 42,300,345 |
Asset Backed Securities | | 0.77 | | | | 4,220,546 |
Tax-Exempt Securities | | 0.32 | | | | 1,761,561 |
Call Option | | 0.00 | | | | 1,813 |
| | | | | | |
Total Investments | | 99.75 | % | | $ | 550,355,840 |
Other Assets in Excess of Liabilities | | 0.25 | | | | 1,363,933 |
| | | | | | |
Net Assets | | 100.00 | % | | $ | 551,719,773 |
| | | | | | |
See Notes to Financial Statements
34
Excelsior Funds Trust
Portfolio of Investments — March 31, 2007
High Yield Fund
| | | | | | | | | | | |
Principal
Amount | | | | Rate | | | Maturity
Date | | Value |
| | | | | | | | | | | |
| | CORPORATE BONDS — 89.98% | | | | | | |
| | | ADVERTISING PERIODICALS — 2.74% |
| $ | 2,000,000 | | Dex Media Finance/West | | 8.50 | % | | 08/15/10 | | $ | 2,092,500 |
| | 1,000,000 | | RH Donnelley Finance Corp.(a) | | 10.88 | | | 12/15/12 | | | 1,080,000 |
| | | | | | | | | | | |
| | | | | | | | | | | 3,172,500 |
| | | | | | | | | | | |
| | | CABLE TV — 1.80% | | | |
| | 1,000,000 | | Echostar DBS Corp. | | 7.13 | | | 02/01/16 | | | 1,032,500 |
| | 1,000,000 | | NTL Cable plc | | 9.13 | | | 08/15/16 | | | 1,055,000 |
| | | | | | | | | | | |
| | | | | | | | | | | 2,087,500 |
| | | | | | | | | | | |
| | | CASINO HOTELS — 7.76% | | | |
| | 1,000,000 | | American Casino & Entertainment | | 7.85 | | | 02/01/12 | | | 1,040,000 |
| | 1,000,000 | | Boyd Gaming Corp. | | 7.13 | | | 02/01/16 | | | 980,000 |
| | 1,500,000 | | Majestic Star llc. | | 9.75 | | | 01/15/11 | | | 1,428,750 |
| | 1,000,000 | | MGM Mirage, Inc. | | 8.50 | | | 09/15/10 | | | 1,068,750 |
| | 2,000,000 | | Poster Financial Group | | 8.75 | | | 12/01/11 | | | 2,080,000 |
| | 1,000,000 | | Station Casinos, Inc. | | 6.63 | | | 03/15/18 | | | 890,000 |
| | 1,500,000 | | Trump Entertainment Resorts | | 8.50 | | | 06/01/15 | | | 1,515,000 |
| | | | | | | | | | | |
| | | | | | | | | | | 9,002,500 |
| | | | | | | | | | | |
| | | CELLULAR TELECOM — 1.19% |
| | 330,000 | | American Cellular Corp. | | 10.00 | | | 08/01/11 | | | 349,388 |
| | 1,000,000 | | Dobson Communications Corp. | | 8.88 | | | 10/01/13 | | | 1,030,000 |
| | | | | | | | | | | |
| | | | | | | | | | | 1,379,388 |
| | | | | | | | | | | |
| | | CHEMICALS – DIVERSIFIED — 1.39% |
| | 1,000,000 | | Lyondell Chemical Co. | | 10.50 | | | 06/01/13 | | | 1,095,000 |
| | 500,000 | | Nell AF Sarl(a) | | 8.38 | | | 08/15/15 | | | 521,250 |
| | | | | | | | | | | |
| | | | | | | | | | | 1,616,250 |
| | | | | | | | | | | |
| | | CHEMICALS – SPECIALTY — 0.91% |
| | 1,000,000 | | Tronox Worldwide LLC/Tronox Finance Corp. | | 9.50 | | | 12/01/12 | | | 1,060,000 |
| | | | | | | | | | | |
| | | COAL — 1.70% | | | |
| | 1,000,000 | | Massey Energy Co. | | 6.88 | | | 12/15/13 | | | 948,750 |
| | 1,000,000 | | Peabody Energy Corp., Series B | | 6.88 | | | 03/15/13 | | | 1,017,500 |
| | | | | | | | | | | |
| | | | | | | | | | | 1,966,250 |
| | | | | | | | | | | |
| | | COMMERCIAL SERVICES — 1.77% |
| | 1,000,000 | | Iron Mountain, Inc. | | 8.63 | | | 04/01/13 | | | 1,029,000 |
| | 1,000,000 | | Iron Mountain, Inc. | | 7.75 | | | 01/15/15 | | | 1,020,000 |
| | | | | | | | | | | |
| | | | | | | | | | | 2,049,000 |
| | | | | | | | | | | |
| | | | | | | | | | | |
Principal
Amount | | | | Rate | | | Maturity
Date | | Value |
| | | | | | | | | | | |
| | CORPORATE BONDS — (continued) | | | | | | |
| | | COMPUTER SERVICES — 0.94% |
| $ | 1,000,000 | | Sungard Data Systems, Inc. | | 10.25 | % | | 08/15/15 | | $ | 1,091,250 |
| | | | | | | | | | | |
| | | CONTAINERS – METAL/GLASS — 1.78% |
| | 1,000,000 | | Crown Americas | | 7.75 | | | 11/15/15 | | | 1,040,000 |
| | 1,000,000 | | Owens-Brockway Glass Containers | | 8.88 | | | 02/15/09 | | | 1,020,000 |
| | | | | | | | | | | |
| | | | | | | | | | | 2,060,000 |
| | | | | | | | | | | |
| | | CONTAINERS – PAPER/PLASTIC — 2.66% |
| | 1,000,000 | | Graham Packaging Co. | | 8.50 | | | 10/15/12 | | | 1,015,000 |
| | 1,000,000 | | Jefferson Smurfit Corp. | | 7.50 | | | 06/01/13 | | | 970,000 |
| | 1,000,000 | | Pregis Corp.(a) | | 12.38 | | | 10/15/13 | | | 1,100,000 |
| | | | | | | | | | | |
| | | | | | | | | | | 3,085,000 |
| | | | | | | | | | | |
| | | COSMETICS & TOILETRIES — 1.21% |
| | 1,500,000 | | Del Laboratories, Inc. | | 8.00 | | | 02/01/12 | | | 1,398,750 |
| | | | | | | | | | | |
| | | DISTRIBUTION/WHOLESALE — 0.87% |
| | 1,000,000 | | Nebraska Book Co. | | 8.63 | | | 03/15/12 | | | 1,007,500 |
| | | | | | | | | | | |
| | | DIVERSIFIED MANUFACTURING
OPERATIONS — 0.89% |
| | 1,000,000 | | Bombardier, Inc.(a) | | 8.00 | | | 11/15/14 | | | 1,035,000 |
| | | | | | | | | | | |
| | | ELECTRIC – GENERATION — 1.38% |
| | 1,500,000 | | AES Corp. | | 9.50 | | | 06/01/09 | | | 1,597,500 |
| | | | | | | | | | | |
| | | ELECTRONIC COMPONENTS – SEMICONDUCTORS — 2.19% |
| | 1,000,000 | | Amkor Technologies, Inc. | | 9.25 | | | 06/01/16 | | | 1,042,500 |
| | 500,000 | | Freescale Semiconductor(a) | | 8.88 | | | 12/15/14 | | | 500,625 |
| | 1,000,000 | | Freescale Semiconductor(a) | | 9.13 | | | 12/15/14 | | | 992,500 |
| | | | | | | | | | | |
| | | | | | | | | | | 2,535,625 |
| | | | | | | | | | | |
| | | FINANCE – AUTO LOANS — 3.00% |
| | 1,354,000 | | Ford Motor Credit Co.(a) | | 9.75 | | | 09/15/10 | | | 1,426,225 |
| | 2,000,000 | | General Motors Acceptance Corp. | | 7.75 | | | 01/19/10 | | | 2,052,842 |
| | | | | | | | | | | |
| | | | | | | | | | | 3,479,067 |
| | | | | | | | | | | |
| | | FINANCE – INVESTMENT BNKR/BRKR — 0.06% |
| | 60,000 | | BCP Crystal Holdings Corp. | | 9.63 | | | 06/15/14 | | | 68,155 |
| | | | | | | | | | | |
| | | FOOD & KINDRED PRODUCTS — 0.85% |
| | 1,000,000 | | Pinnacle Foods Finance LLC(a) | | 9.25 | | | 04/01/15 | | | 982,500 |
| | | | | | | | | | | |
See Notes to Financial Statements.
35
Excelsior Funds Trust
Portfolio of Investments — March 31, 2007
High Yield Fund — (continued)
| | | | | | | | | | | |
Principal
Amount | | | | Rate | | | Maturity
Date | | Value |
| | | | | | | | | | | |
| | CORPORATE BONDS — (continued) | | | | | | |
| | | FOOD – MISCELLANEOUS AND DIVERSIFIED — 1.78% |
| $ | 1,000,000 | | Del Monte Corporation | | 8.63 | % | | 12/15/12 | | $ | 1,040,000 |
| | 1,000,000 | | Del Monte Corporation | | 6.75 | | | 02/15/15 | | | 988,750 |
| | 40,000 | | Dole Foods Co. | | 7.25 | | | 06/15/10 | | | 38,200 |
| | | | | | | | | | | |
| | | | | | | | | | | 2,066,950 |
| | | | | | | | | | | |
| | | FUNERAL SERVICES & RELATED ITEMS — 1.30% |
| | 1,500,000 | | Service Corp. International | | 7.00 | | | 06/15/17 | | | 1,511,250 |
| | | | | | | | | | | |
| | | HEAVY CONSTRUCTION EQUIPMENT
RENTAL — 0.90% |
| | 1,000,000 | | Ahern Rentals, Inc. | | 9.25 | | | 08/15/13 | | | 1,043,750 |
| | | | | | | | | | | |
| | | HOME FURNISHINGS — 1.79% |
| | 1,000,000 | | Sealy Mattress Co. | | 8.25 | | | 06/15/14 | | | 1,052,500 |
| | 1,000,000 | | Simmons Co. | | 7.88 | | | 01/15/14 | | | 1,025,000 |
| | | | | | | | | | | |
| | | | | | | | | | | 2,077,500 |
| | | | | | | | | | | |
| | | MACHINERY – FARM — 0.45% |
| | 500,000 | | Case New Holland, Inc. | | 7.13 | | | 03/01/14 | | | 520,000 |
| | | | | | | | | | | |
| | | MACHINERY – GENERAL INDUSTRIAL — 0.88% |
| | 1,000,000 | | The Manitowoc Co., Inc. | | 7.13 | | | 11/01/13 | | | 1,020,000 |
| | | | | | | | | | | |
| | | MEDICAL – HOSPITALS — 0.90% |
| | 1,000,000 | | HCA, Inc. | | 8.75 | | | 09/01/10 | | | 1,048,750 |
| | | | | | | | | | | |
| | | MULTI-LINE INSURANCE — 1.97% |
| | 2,128,000 | | Hanover Insurance Group | | 7.63 | | | 10/15/25 | | | 2,285,349 |
| | | | | | | | | | | |
| | | MUSIC — 1.31% |
| | 1,600,000 | | Warner Music Group | | 7.38 | | | 04/15/14 | | | 1,524,000 |
| | | | | | | | | | | |
| | | OFFICE AUTOMATION & EQUIPMENT — 3.14% |
| | 1,000,000 | | Ikon Office Solutions | | 7.75 | | | 09/15/15 | | | 1,045,000 |
| | 1,000,000 | | Xerox Capital Trust I | | 8.00 | | | 02/01/27 | | | 1,020,000 |
| | 1,500,000 | | Xerox Corp. | | 7.63 | | | 06/15/13 | | | 1,573,125 |
| | | | | | | | | | | |
| | | | | | | | | | | 3,638,125 |
| | | | | | | | | | | |
| | | PAPER & RELATED PRODUCTS — 0.86% |
| | 1,000,000 | | Mercer International, Inc. | | 9.25 | | | 02/15/13 | | | 1,002,500 |
| | | | | | | | | | | |
| | | PHYSICIANS PRACTICE MANAGEMENT — 3.18% |
| | 2,000,000 | | Ameripath, Inc. | | 10.50 | | | 04/01/13 | | | 2,140,000 |
| | 500,000 | | US Oncology Holdings, Inc. | | 9.00 | | | 08/15/12 | | | 533,750 |
| | 1,000,000 | | US Oncology Holdings, Inc.(b) | | 10.58 | | | 03/15/15 | | | 1,020,000 |
| | | | | | | | | | | |
| | | | | | | | | | | 3,693,750 |
| | | | | | | | | | | |
| | | | | | | | | | | |
Principal
Amount | | | | Rate | | | Maturity
Date | | Value |
| | | | | | | | | | | |
| | CORPORATE BONDS — (continued) | | | | | | |
| | | PIPELINES — 1.75% |
| $ | 1,500,000 | | Semgroup L.P.(a) | | 8.75 | % | | 11/15/15 | | $ | 1,522,500 |
| | 500,000 | | Williams Cos.(a) | | 6.38 | | | 10/01/10 | | | 506,875 |
| | | | | | | | | | | |
| | | | | | | | | | | 2,029,375 |
| | | | | | | | | | | |
| | | RACETRACKS — 0.84% |
| | 1,000,000 | | Penn National Gaming, Inc. | | 6.75 | | | 03/01/15 | | | 970,000 |
| | | | | | | | | | | |
| | | RENTAL AUTO/EQUIPMENT — 2.68% |
| | 1,000,000 | | Avis Budget Car Rental(a) | | 7.75 | | | 05/15/16 | | | 1,020,000 |
| | 1,000,000 | | Rental Service Corp.(a) | | 9.50 | | | 12/01/14 | | | 1,065,000 |
| | 1,000,000 | | United Rentals, Inc. | | 7.75 | | | 11/15/13 | | | 1,027,500 |
| | | | | | | | | | | |
| | | | | | | | | | | 3,112,500 |
| | | | | | | | | | | |
| | | RESORTS/THEME PARKS — 0.89% |
| | 1,000,000 | | Universal City Florida Holdings(b) | | 10.11 | | | 05/01/10 | | | 1,031,250 |
| | | | | | | | | | | |
| | | RETAIL – APPAREL/SHOE — 1.10% |
| | 1,250,000 | | Burlington Coat Factory | | 11.13 | | | 04/15/14 | | | 1,275,000 |
| | | | | | | | | | | |
| | | RETAIL – ARTS & CRAFTS — 0.93% |
| | 1,000,000 | | Michaels Stores, Inc.(a) | | 11.38 | | | 11/01/16 | | | 1,077,500 |
| | | | | | | | | | | |
| | | RETAIL – DRUG STORE — 2.51% |
| | 1,000,000 | | Jean Coutu Group, Inc. | | 8.50 | | | 08/01/14 | | | 1,085,000 |
| | 1,000,000 | | Rite Aid Corp. | | 8.63 | | | 03/01/15 | | | 946,250 |
| | 1,000,000 | | Rite-Aid Corp. | | 6.88 | | | 08/15/13 | | | 880,000 |
| | | | | | | | | | | |
| | | | | | | | | | | 2,911,250 |
| | | | | | | | | | | |
| | | RETAIL – MAJOR DEPARTMENT STORE — 1.90% |
| | 1,000,000 | | Neiman Marcus Group, Inc. | | 9.00 | | | 10/15/15 | | | 1,095,000 |
| | 1,000,000 | | Saks, Inc. | | 9.88 | | | 10/01/11 | | | 1,112,500 |
| | | | | | | | | | | |
| | | | | | | | | | | 2,207,500 |
| | | | | | | | | | | |
| | | RETAIL – TOY STORE — 1.11% |
| | 1,500,000 | | Toys R Us | | 7.38 | | | 10/15/18 | | | 1,290,000 |
| | | | | | | | | | | |
| | | RETAIL – VIDEO RENTAL — 1.74% |
| | 2,000,000 | | Blockbuster, Inc.(b) | | 9.00 | | | 09/01/12 | | | 2,020,000 |
| | | | | | | | | | | |
| | | SATELLITE TELECOM — 2.54% |
| | 650,000 | | Inmarsat Finance plc | | 7.63 | | | 06/30/12 | | | 677,625 |
| | 2,000,000 | | Intelsat Bermuda Ltd. | | 11.25 | | | 06/15/16 | | | 2,270,000 |
| | | | | | | | | | | |
| | | | | | | | | | | 2,947,625 |
| | | | | | | | | | | |
| | | SCHOOLS — 1.27% |
| | 1,500,000 | | Knowledge Learning Center(a) | | 7.75 | | | 02/01/15 | | | 1,473,750 |
| | | | | | | | | | | |
See Notes to Financial Statements.
36
Excelsior Funds Trust
Portfolio of Investments — March 31, 2007
High Yield Fund — (continued)
| | | | | | | | | | | |
Principal
Amount | | | | Rate | | | Maturity
Date | | Value |
| | | | | | | | | | | |
| | CORPORATE BONDS — (continued) | | | | | | |
| | | SPECIAL PURPOSE ENTITY — 6.62% |
| $ | 5,580,000 | | Targeted Return Index Securities Trust (TRAIN), Series HY-1-2006(a)(b) | | 7.55 | % | | 05/01/16 | | $ | 5,673,856 |
| | 2,000,000 | | Wimar OPCO LLC(a)(c) | | 9.63 | | | 12/15/14 | | | 2,007,500 |
| | | | | | | | | | | |
| | | | | | | | | | | 7,681,356 |
| | | | | | | | | | | |
| | | TELECOM SERVICES — 0.89% |
| | 1,000,000 | | West Corp(a) | | 9.50 | | | 10/15/14 | | | 1,035,000 |
| | | | | | | | | | | |
| | | TELEPHONE – INTERGRATED — 8.71% |
| | 2,000,000 | | Cincinnati Bell, Inc. | | 8.38 | | | 01/15/14 | | | 2,045,000 |
| | 2,000,000 | | Citizens Communications | | 9.25 | | | 05/15/11 | | | 2,229,999 |
| | 649,000 | | Consolidated Communications Holding | | 9.75 | | | 04/01/12 | | | 687,129 |
| | 1,500,000 | | Hawaiian Telcom Communication | | 12.50 | | | 05/01/15 | | | 1,642,500 |
| | 1,250,000 | | Nordic Telephone Co. Holdings(a) | | 8.88 | | | 05/01/16 | | | 1,337,500 |
| | 1,000,000 | | Valor Telecom Enterprise | | 7.75 | | | 02/15/15 | | | 1,077,500 |
| | 1,000,000 | | Windstream Corp. | | 8.63 | | | 08/01/16 | | | 1,093,750 |
| | | | | | | | | | | |
| | | | | | | | | | | 10,113,378 |
| | | | | | | | | | | |
| | | TRAVEL SERVICES — 0.95% |
| | 1,000,000 | | Travelport, Inc.(a) | | 11.88 | | | 09/01/16 | | | 1,096,250 |
| | | | | | | | | | | |
| | | TOTAL CORPORATE BONDS
(Cost $101,609,771) | | | 104,377,393 |
| | | | | | | | | | | |
| | BANK LOANS — 0.44% | | | | | | | | |
| | | MISCELLANEOUS MANUFACTURING — 0.44% |
| | 500,000 | | IPC Acquisition Corp.(b)(d) | | 11.86 | | | 09/29/14 | | | 507,500 |
| | | | | | | | | | | |
| | | TOTAL BANK LOANS
(Cost $500,000) | | | 507,500 |
| | | | | | | | | | | |
| Shares | | | | | | | | | |
| | COMMON STOCK — 2.57% | | | | | | | | |
| | | METAL – ALUMINUM — 2.57% |
| | 152,380 | | Ormet Corp. | | | 2,979,029 |
| | | | | | | | | | | |
| | | TOTAL COMMON STOCK
(Cost $1,219,040) | | | 2,979,029 |
| | | | | | | | | | | |
| | | | | | | | | | | |
Principal
Amount | | | | Rate | | | Maturity
Date | | Value |
| | | | | | | | | | | |
| | U.S. GOVERNMENT AGENCY BONDS & NOTES — 6.12% |
| | | FEDERAL HOME LOAN BANK — 6.12% |
| $ | 7,100,000 | | Discount Note | | 0.00 | % | | 04/02/07 | | $ | 7,097,059 |
| | | | | | | | | | | |
| | | TOTAL U.S. GOVERNMENT AGENCY BONDS & NOTES
(Cost $7,099,020) | | | 7,097,059 |
| | | | | | | | | | | |
| | | | | | |
TOTAL INVESTMENTS
(Cost $110,427,831) | | 99.11 | % | | $ | 114,960,981 |
OTHER ASSETS IN EXCESS OF LIABILITIES | | 0.89 | | | | 1,035,924 |
| | | | | | |
NET ASSETS | | 100.00 | % | | $ | 115,996,905 |
| | | | | | |
| (a) | Security exempt from registration under Rule 144A of the Securities Act of 1933. This security may be resold in transactions exempt from registration, normally to qualified institutional buyers. At March 31, 2007, these securities amounted to $25,453,831 or 21.94% of net assets. |
| (b) | Variable Rate Security—The rate disclosed is as of March 31, 2007. |
| (c) | All or part of the security is segregated by the Fund’s custodian to cover future purchase commitments. |
| (d) | Fair valued as of March 31, 2007. |
Discount Note—The rate reported on the Portfolio of Investments is the discount rate at the time of purchase.
LLC—limited liability company
L.P.—Limited Partnership
Ltd.—Limited
plc—public limited company
See Notes to Financial Statements.
37
Excelsior Funds Trust
Portfolio of Investments — March 31, 2007
High Yield Fund — (continued)
The summary of the Fund’s investments as of March 31, 2007 is as follows: (Unaudited)
| | | | | | |
Sector Diversification | | % of
Net
Assets | | | Value |
Consumer Discretionary | | 39.66 | % | | $ | 46,015,698 |
Telecommunication | | 11.71 | | | | 13,582,766 |
Materials | | 9.73 | | | | 11,281,529 |
Information Technology | | 8.34 | | | | 9,675,125 |
Industrials | | 7.99 | | | | 9,263,375 |
U.S. Government & Agency Obligations | | 6.12 | | | | 7,097,059 |
Health Care | | 5.39 | | | | 6,253,750 |
Consumer Staples | | 3.83 | | | | 4,448,200 |
Financials | | 3.26 | | | | 3,779,729 |
Energy | | 1.70 | | | | 1,966,250 |
Utilities | | 1.38 | | | | 1,597,500 |
| | | | | | |
Total Investment | | 99.11 | % | | $ | 114,960,981 |
Other Assets in Excess of Liabilities | | 0.89 | | | | 1,035,924 |
| | | | | | |
Net Assets | | 100.00 | % | | $ | 115,996,905 |
| | | | | | |
See Notes to Financial Statements
38
Excelsior Funds, Inc.
Portfolio of Investments — March 31, 2007
Intermediate-Term Bond Fund
| | | | | | | | | | | |
Principal Amount | | | | Rate | | | Maturity Date | | Value |
| | | | | | | | | | | |
| | ASSET BACKED SECURITIES — 0.96% | | | | | | |
| $ | 2,200,000 | | Capital Auto Receivables Asset Trust 2006-SN1AC B(a) | | 5.50 | % | | 04/20/10 | | $ | 2,210,762 |
| | 2,000,000 | | Capital One Master Trust, 2001-6 C(a) | | 6.70 | | | 06/15/11 | | | 2,037,420 |
| | 233,473 | | Chase Funding Mortgage Loan Asset Backed Certificates, 2003-3 2A2(b) | | 5.59 | | | 04/25/33 | | | 233,618 |
| | | | | | | | | | | |
| | | TOTAL ASSET BACKED SECURITIES
(Cost $4,564,135) | | | 4,481,800 |
| | | | | | | | | | | |
| | COLLATERALIZED MORTGAGE OBLIGATIONS — 8.43% |
| | | NON-GOVERNMENTAL AGENCY COLLATERALIZED MORTGAGE OBLIGATIONS — 2.87% |
| | 1,572,211 | | Bear Stearns ARM, 2004-1 11A3(b) | | 6.09 | | | 04/25/34 | | | 1,587,991 |
| | 3,185,790 | | Countrywide Alternative Loan Trust, 2004-22CB 1A1 | | 6.00 | | | 10/25/34 | | | 3,195,248 |
| | 3,322,000 | | Washington Mutual, 2005-AR5 A3(b) | | 4.68 | | | 05/25/35 | | | 3,277,431 |
| | 2,213,850 | | Wells Fargo Mortgage Backed Securities Trust, 2004-EE 3A1 | | 3.99 | | | 12/25/34 | | | 2,172,114 |
| | 3,249,439 | | Wells Fargo Mortgage Backed Securities Trust, 2005-AR1 1A(b) | | 5.54 | | | 02/25/35 | | | 3,197,586 |
| | | | | | | | | | | |
| | | | | | | | | | | 13,430,370 |
| | | | | | | | | | | |
| | | FEDERAL HOME LOAN MORTGAGE
CORPORATION — 0.70% |
| | 3,316,447 | | R001 AE | | 4.38 | | | 04/15/15 | | | 3,253,628 |
| | | | | | | | | | | |
| | | FEDERAL NATIONAL MORTGAGE ASSOCIATION — 0.68% | | | |
| | 3,200,000 | | 2003-17 QT | | 5.00 | | | 08/25/27 | | | 3,178,156 |
| | | | | | | | | | | |
| | | GOVERNMENT NATIONAL MORTGAGE ASSOCIATION — 4.18% |
| | 10,355,000 | | 2004-45 B | | 5.18 | | | 05/16/28 | | | 10,340,594 |
| | 2,800,000 | | 2005-10 MW | | 4.67 | | | 09/16/25 | | | 2,742,903 |
| | 2,925,000 | | 2005-14 B | | 4.48 | | | 08/16/32 | | | 2,861,550 |
| | 3,573,957 | | 2006-55 AB | | 5.25 | | | 07/16/29 | | | 3,577,522 |
| | | | | | | | | | | |
| | | TOTAL COLLATERALIZED MORTGAGE OBLIGATIONS
(Cost $39,806,101) | | | 19,522,569 |
| | | | | | | | | | | |
| | | | | | | | | | | 39,384,723 |
| | | | | | | | | | | |
| | | | | | | | | | | |
Principal Amount | | | | Rate | | | Maturity Date | | Value |
| | | | | | | | | | | |
| | COMMERCIAL MORTGAGE-BACKED SECURITIES — 15.26% |
| $ | 4,350,000 | | Bank of America Commercial Mortgage, Inc., 2004-1 A4 | | 4.76 | % | | 11/10/39 | | $ | 4,226,824 |
| | 2,000,000 | | Commercial Mortgage Asset Trust, 1999-C1 B | | 7.23 | | | 01/17/32 | | | 2,208,973 |
| | 3,556,000 | | Commercial Mortgage Asset Trust, 1999-C2 C | | 7.80 | | | 11/17/32 | | | 4,044,938 |
| | 3,325,000 | | Credit Suisse First Boston Mortgage Securities Corp., 2002-CP5 G(a)(b) | | 5.88 | | | 12/15/35 | | | 3,401,175 |
| | 1,292,475 | | DLJ Mortgage Acceptance Corp., 1997-CF2 A1B(a) | | 6.82 | | | 10/15/30 | | | 1,293,703 |
| | 3,900,000 | | GMAC Commercial Mortgage Securities, Inc., 1999-C1C | | 6.59 | | | 05/15/33 | | | 3,988,095 |
| | 7,197,000 | | JP Morgan Chase Commercial Mortgage Securities Corp., 2005-CB12 AJ(b) | | 4.99 | | | 09/12/37 | | | 6,993,127 |
| | 4,500,000 | | JP Morgan Chase Commercial Mortgage Securities Corp., 2005-LDP2 A4 | | 4.74 | | | 07/15/42 | | | 4,324,239 |
| | 5,430,000 | | JP Morgan Chase Commercial Mortgage Securities Corp., 2005-LDP5 AJ(b) | | 5.30 | | | 12/15/44 | | | 5,421,837 |
| | 3,085,000 | | Morgan Stanley Dean Witter Capital I, 2003-TOP9 A2 | | 4.74 | | | 11/13/36 | | | 3,017,691 |
| | 3,104,000 | | Morgan Stanley Dean Witter Capital I, 2005-HQ5 A4 | | 5.17 | | | 01/14/42 | | | 3,072,803 |
| | 4,025,000 | | Nomura Asset Securities Corp., 1998-D6 A4(b) | | 6.91 | | | 03/15/30 | | | 4,527,693 |
| | 1,435,000 | | Wachovia Bank Commercial Mortgage Trust, 2002-C1 A4 | | 6.29 | | | 04/15/34 | | | 1,503,684 |
See Notes to Financial Statements.
39
Excelsior Funds, Inc.
Portfolio of Investments — March 31, 2007
Intermediate-Term Bond Fund — (continued)
| | | | | | | | | | | |
Principal Amount | | | | Rate | | | Maturity Date | | Value |
| | | | | | | | | | | |
| | COMMERCIAL MORTGAGE-BACKED SECURITIES — (continued) |
| $ | 6,525,000 | | Wachovia Bank Commercial Mortgage Trust, 2003-C9 A3 | | 4.61 | % | | 12/15/35 | | $ | 6,406,907 |
| | 1,719,000 | | Wachovia Bank Commercial Mortgage Trust, 2004-C12 A2 | | 5.00 | | | 07/15/41 | | | 1,710,645 |
| | 4,775,000 | | Wachovia Bank Commercial Mortgage Trust, 2004-C12 A3 | | 5.23 | | | 07/15/41 | | | 4,790,514 |
| | 6,150,000 | | Wachovia Bank Commercial Mortgage Trust, 2005-C20 A6A | | 5.11 | | | 07/15/42 | | | 6,118,731 |
| | 4,267,000 | | Wachovia Bank Commercial Mortgage Trust, 2005-C20 A5 | | 5.09 | | | 07/15/42 | | | 4,251,918 |
| | | | | | | | | | | |
| | | TOTAL COMMERCIAL MORTGAGE-BACKED SECURITIES
(Cost $72,484,005) | | | 71,303,497 |
| | | | | | | | | | | |
| | CORPORATE BONDS — 16.93% | | | | | | | | |
| | 2,550,000 | | Alcan, Inc | | 5.00 | | | 06/01/15 | | | 2,445,868 |
| | 1,720,000 | | America Movil S.A. de C.V. | | 5.50 | | | 03/01/14 | | | 1,701,446 |
| | 1,900,000 | | Bear Stearns Co., Inc. | | 5.35 | | | 02/01/12 | | | 1,903,724 |
| | 2,680,000 | | Bottling Group LLC | | 5.50 | | | 04/01/16 | | | 2,695,087 |
| | 1,190,000 | | Caterpillar, Inc. | | 5.70 | | | 08/15/16 | | | 1,214,128 |
| | 500,000 | | Cincinnati Bell, Inc. | | 8.38 | | | 01/15/14 | | | 511,250 |
| | 3,845,000 | | Cisco Systems, Inc | | 5.50 | | | 02/22/16 | | | 3,871,600 |
| | 890,000 | | CIT Group, Inc.(b) | | 6.10 | | | 03/15/67 | | | 857,877 |
| | 3,000,000 | | CVS Lease Pass Through Trust | | 6.13 | | | 08/15/16 | | | 3,102,273 |
| | 4,750,000 | | Deutsche Telekom International Finance | | 5.38 | | | 03/23/11 | | | 4,776,169 |
| | 4,000,000 | | Diageo Capital plc | | 4.38 | | | 05/03/10 | | | 3,921,408 |
| | 2,380,000 | | Federal Express Corp. | | 5.50 | | | 08/15/09 | | | 2,398,171 |
| | 1,000,000 | | Federated Retail Holding | | 5.35 | | | 03/15/12 | | | 997,382 |
| | 1,400,000 | | Ford Motor Credit Co. | | 8.63 | | | 11/01/10 | | | 1,428,729 |
| | 3,955,000 | | General Electric Capital Corp., MTN | | 5.40 | | | 02/15/17 | | | 3,958,389 |
| | 500,000 | | Iron Mountain, Inc. | | 8.63 | | | 04/01/13 | | | 514,500 |
| | | | | | | | | | | |
Principal Amount | | | | Rate | | | Maturity Date | | Value |
| | | | | | | | | | | |
| | CORPORATE BONDS — (continued) | | | | | | |
| $ | 3,790,000 | | JP Morgan Chase & Co. | | 5.15 | % | | 10/01/15 | | $ | 3,705,961 |
| | 2,960,000 | | Lehman Brothers Holdings, Inc. | | 4.25 | | | 01/27/10 | | | 2,899,501 |
| | 780,000 | | Lehman Brothers Holdings, Inc. | | 5.75 | | | 01/03/17 | | | 781,614 |
| | 2,645,000 | | Nisource Finance Corp. | | 5.25 | | | 09/15/17 | | | 2,498,097 |
| | 4,025,000 | | Oracle Corp. | | 5.25 | | | 01/15/16 | | | 3,969,065 |
| | 5,150,000 | | RBS Capital Trust III(b)(c) | | 5.51 | | | 09/30/14 | | | 5,067,007 |
| | 2,050,000 | | Southern Co. | | 5.30 | | | 01/15/12 | | | 2,063,663 |
| | 1,530,000 | | Sprint Capital Corp. | | 8.38 | | | 03/15/12 | | | 1,707,065 |
| | 4,290,000 | | Target Corp. | | 5.88 | | | 07/15/16 | | | 4,414,718 |
| | 3,595,000 | | TCI Communications, Inc. | | 9.80 | | | 02/01/12 | | | 4,256,142 |
| | 1,125,000 | | Telefonica Emisiones Sau | | 6.42 | | | 06/20/16 | | | 1,174,190 |
| | 2,415,000 | | Time Warner, Inc. | | 9.15 | | | 02/01/23 | | | 3,007,984 |
| | 1,110,000 | | Virginia Electric Power | | 5.40 | | | 01/15/16 | | | 1,098,449 |
| | 2,000,000 | | Wal-Mart Stores, Inc. | | 5.00 | | | 04/05/12 | | | 1,992,498 |
| | 1,000,000 | | Xerox Corp | | 6.40 | | | 03/15/16 | | | 1,028,525 |
| | 2,125,000 | | YUM! Brands, Inc. | | 6.25 | | | 04/15/16 | | | 2,183,922 |
| | 975,000 | | Zions Bancorp | | 5.50 | | | 11/16/15 | | | 958,445 |
| | | | | | | | | | | |
| | | TOTAL CORPORATE BONDS
(Cost $78,815,235) | | | 79,104,847 |
| | | | | | | | | | | |
| | U.S. GOVERNMENT AGENCY BONDS & NOTES — 11.51% |
| | | FEDERAL HOME LOAN BANK — 9.71% |
| | 10,000,000 | | | | 5.00 | | | 10/16/09 | | | 9,977,570 |
| | 8,700,000 | | | | 5.19 | | | 02/22/10 | | | 8,681,791 |
| | 26,525,000 | | | | 5.30 | | | 10/27/11 | | | 26,710,622 |
| | | | | | | | | | | |
| | | | | | | | | | | 45,369,983 |
| | | | | | | | | | | |
| | | FREDDIE MAC — 1.80% |
| | 3,355,000 | | | | 5.13 | | | 07/15/12 | | | 3,400,158 |
| | 5,000,000 | | MTN | | 5.25 | | | 02/24/11 | | | 5,011,315 |
| | | | | | | | | | | |
| | | TOTAL U.S. GOVERNMENT AGENCY BONDS & NOTES
(Cost $53,547,635) | | | 53,781,456 |
| | | | | | | | | | | |
| U.S. GOVERNMENT AGENCY MORTGAGE PASS THROUGH
SECURITIES — 13.08% |
| | | FEDERAL HOME LOAN MORTGAGE
CORPORATION — 1.76% |
| | 3,578,819 | | Pool # 1G1026 ARM(b) | | 5.91 | | | 07/01/36 | | | 3,602,168 |
| | 3,135,818 | | Pool # A36827 | | 5.00 | | | 08/01/35 | | | 3,033,669 |
| | 379,129 | | Pool # G18136 | | 6.00 | | | 08/01/21 | | | 385,438 |
| | 1,204,495 | | Pool # J03619 | | 6.00 | | | 10/01/21 | | | 1,224,542 |
| | | | | | | | | | | |
| | | | | | | | | | | 8,245,817 |
| | | | | | | | | | | |
See Notes to Financial Statements.
40
Excelsior Funds, Inc.
Portfolio of Investments — March 31, 2007
Intermediate-Term Bond Fund — (continued)
| | | | | | | | | | | |
Principal Amount | | | | Rate | | | Maturity Date | | Value |
| | | | | | | | | | | |
| U.S. GOVERNMENT AGENCY MORTGAGE PASS THROUGH
SECURITIES — (continued) |
| | | FEDERAL NATIONAL MORTGAGE
ASSOCIATION — 9.37% |
| $ | 2,630,000 | | Pool # 385538 | | 4.79 | % | | 11/01/12 | | $ | 2,571,221 |
| | 586,322 | | Pool # 545290 | | 7.50 | | | 10/01/16 | | | 604,267 |
| | 3,260 | | Pool # 578823 | | 5.50 | | | 04/01/31 | | | 3,233 |
| | 2,465,257 | | Pool # 704372 ARM(b) | | 4.51 | | | 05/01/33 | | | 2,437,649 |
| | 5,003,739 | | Pool # 805386 ARM(b) | | 4.86 | | | 01/01/35 | | | 5,002,786 |
| | 2,506,462 | | Pool # 811528 | | 5.00 | | | 11/01/20 | | | 2,472,702 |
| | 5,981,172 | | Pool # 831192 | | 5.00 | | | 11/01/20 | | | 5,898,093 |
| | 8,989,624 | | Pool # 851149 | | 5.00 | | | 04/01/21 | | | 8,865,670 |
| | 2,290,402 | | Pool # 868986(d) | | 5.00 | | | 05/01/21 | | | 2,258,821 |
| | 179,451 | | Pool # 872534 | | 6.00 | | | 06/01/36 | | | 180,782 |
| | 9,400,924 | | Pool # 879122 | | 5.00 | | | 05/01/21 | | | 9,271,299 |
| | 4,190,123 | | Pool # 892882 ARM(b) | | 5.86 | | | 07/01/36 | | | 4,223,082 |
| | | | | | | | | | | |
| | | | | | | | | | | 43,789,605 |
| | | | | | | | | | | |
| | GOVERNMENT NATIONAL MORTGAGE ASSOCIATION — 1.95% |
| | 12,609 | | Pool # 195801 | | 8.50 | | | 01/15/17 | | | 13,496 |
| | 8,473 | | Pool # 195833 | | 8.50 | | | 04/15/17 | | | 9,069 |
| | 2,493,668 | | Pool # 3319 | | 5.00 | | | 12/20/32 | | | 2,421,277 |
| | 1,398 | | Pool # 334299 | | 8.00 | | | 05/15/23 | | | 1,481 |
| | 3,067,835 | | Pool # 3442 | | 5.00 | | | 09/20/33 | | | 2,978,679 |
| | 302,203 | | Pool # 367412 | | 6.00 | | | 11/15/23 | | | 306,523 |
| | 1,316,805 | | Pool # 604726 | | 4.50 | | | 10/15/33 | | | 1,248,410 |
| | 2,237,273 | | Pool # 608288 | | 4.50 | | | 09/15/33 | | | 2,121,069 |
| | | | | | | | | | | |
| | | | | | | | | | | 9,100,004 |
| | | | | | | | | | | |
| | | TOTAL U.S. GOVERNMENT AGENCY MORTGAGE PASS THROUGH SECURITIES
(Cost $61,068,386) | | | 61,135,426 |
| | | | | | | | | | | |
| | U.S. TREASURY NOTES — 27.16% | | | |
| | 5,130,000 | | | | 3.13 | | | 04/15/09 | | | 4,983,513 |
| | 10,440,000 | | | | 4.00 | | | 04/15/10 | | | 10,280,143 |
| | 110,310,000 | | (e) | | 4.50 | | | 02/28/11 | | | 110,159,207 |
| | 1,540,000 | | | | 4.25 | | | 11/15/14 | | | 1,503,425 |
| | | | | | | | | | | |
| | | | | | | | | | | 121,942,775 |
| | | | | | | | | | | |
| | | TOTAL U.S. GOVERNMENT SECURITIES
(Cost $125,470,139 ) | | | 126,926,288 |
| | | | | | | | | | | |
| | | | | | | | | |
| Shares | | | | | | | | Value |
| REGISTERED INVESTMENT COMPANIES — 6.26% | | | |
| 14,615,789 | | Dreyfus Government Cash Management Fund | | | | | | $ | 14,615,789 |
| 14,615,788 | | Fidelity U.S. Treasury II Fund | | | | | | | 14,615,788 |
| | | | | | | | | |
| | TOTAL REGISTERED INVESTMENT COMPANIES
(Cost $29,231,577) | | | 29,231,577 |
| | | | | | | | | |
| | | | | | |
TOTAL INVESTMENTS
(Cost $464,987,213) | | 99.59 | % | | $ | 465,349,614 |
OTHER ASSETS IN EXCESS OF LIABILITIES | | 0.41 | | | | 1,926,229 |
| | | | | | |
NET ASSETS | | 100.00 | % | | $ | 467,275,843 |
| | | | | | |
| (a) | Security exempt from registration under Rule 144A of the Securities Act of 1933. This security may be resold in transactions exempt from registration, normally to qualified institutional buyers. At March 31, 2007, these securities amounted to $8,943,060 or 1.91% of net assets. |
| (b) | Variable Rate Security—The rate disclosed is as of March 31, 2007. |
| (c) | Perpetual Security—Stated maturity is first par call date. |
| (d) | All or part of the security is segregated by the Fund’s custodian to cover future purchase commitments. |
| (e) | All or part of the security serves as collateral for futures contracts. |
| ARM—Adjustable | Rate Mortgage |
| LLC—Limited | Liability Company |
| plc—Public | Limited Company |
| | | | | | | | | | |
| Contracts | | | | | Value | | | Unrealized
Appreciation/
Depreciation |
| FUTURES CONTRACTS | | | | | |
| Long — | | | | | |
| 120 | | | U.S. 2 Year Treasury Note, expiring June 29, 2007 (notional amount $24,543,862) | | $ | 24,586,875 | | | $ | 43,013 |
| Short — | | | | | |
| (40 | ) | | U.S. Long-Term Treasury Bond, expiring June 20, 2007 (notional amount $(4,475,681)) | | | (4,450,000 | ) | | | 25,681 |
| | | | | | | | | | |
| | | TOTAL FUTURES CONTRACTS
(Total notional amount $20,068,181) | | $ | 20,136,875 | | | $ | 68,694 |
| | | | | | | | | | |
See Notes to Financial Statements.
41
Excelsior Funds, Inc.
Portfolio of Investments — March 31, 2007
Intermediate-Term Bond Fund — (continued)
The summary of the Fund’s investments as of March 31, 2007 is as follows: (Unaudited)
| | | | | | |
Portfolio Diversification | | % of
Net
Assets | | | Value |
U.S. Government & Agency Securities | | 51.75 | % | | $ | 241,843,170 |
Corporate Bonds | | 16.93 | | | | 79,104,847 |
Commercial Mortgage-Backed Securities | | 15.26 | | | | 71,303,497 |
Collateralized Mortgage Obligations | | 8.43 | | | | 39,384,723 |
Registered Investment Companies | | 6.26 | | | | 29,231,577 |
Asset Backed Securities | | 0.96 | | | | 4,481,800 |
| | | | | | |
Total Investments | | 99.59 | % | | $ | 465,349,614 |
Other Assets in Excess of Liabilities | | 0.41 | | | | 1,926,229 |
| | | | | | |
Net Assets | | 100.00 | % | | $ | 467,275,843 |
| | | | | | |
See Notes to Financial Statements.
42
Excelsior Tax-Exempt Funds, Inc.
Portfolio of Investments — March 31, 2007
Intermediate-Term Tax-Exempt Fund
| | | | | | | | | | | |
Principal
Amount | | | | Rate | | | Maturity
Date | | Value |
| | | | | | | | | | | |
| | TAX-EXEMPT CASH EQUIVALENT SECURITIES — 4.43% |
| $ | 9,000,000 | | Tulsa County, Oklahoma, Industrial Authority Health Care Revenue Bonds, St. Francis Health System, Series B(a) | | 3.75 | % | | 12/15/27 | | $ | 9,000,000 |
| | 8,400,000 | | Valdez, Alaska, Marine Terminal Revenue Bonds, BP Pipelines Project, Series B(a) | | 3.80 | | | 07/01/37 | | | 8,400,000 |
| | | | | | | | | | | |
| | | TOTAL TAX-EXEMPT CASH EQUIVALENT SECURITIES
(Cost $17,400,000) | | | 17,400,000 |
| | | | | | | | | | | |
| | TAX-EXEMPT SECURITIES — 87.99% |
| | 1,000,000 | | Arkansas State Development Finance Authority, Tobacco Settlement Revenue Bonds, Arkansas Cancer Research Center Project, (AMBAC)(b) | | 0.00 | | | 07/01/23 | | | 492,710 |
| | 10,000,000 | | California State Bay Area Infrastructure Financing Authority Revenue Bonds, State Payment Acceleration Notes, (FGIC) | | 5.00 | | | 08/01/17 | | | 10,753,900 |
| | 4,740,000 | | California State General Obligation Bonds | | 5.00 | | | 06/01/08 | | | 4,819,822 |
| | 10,000,000 | | California State General Obligation Bonds | | 5.00 | | | 12/01/16 | | | 10,844,200 |
| | 5,000,000 | | California State General Obligation Bonds | | 5.00 | | | 08/01/21 | | | 5,292,700 |
| | 10,000,000 | | Colorado Springs, Colorado, Utilities Revenue Bonds, Series A | | 5.25 | | | 11/15/10 | | | 10,543,700 |
| | 10,000,000 | | Dallas, Texas, Water Works & Sewer System Revenue Bonds, (FSA) | | 5.38 | | | 10/01/12 | | | 10,841,000 |
| | 2,820,000 | | Detroit, Michigan, Sewage Disposal Revenue Bonds, Senior Lien, Series A, (FSA) | | 5.00 | | | 07/01/14 | | | 3,016,018 |
| | | | | | | | | | | |
Principal
Amount | | | | Rate | | | Maturity
Date | | Value |
| | | | | | | | | | | |
| | TAX-EXEMPT SECURITIES — (continued) |
| $ | 6,200,000 | | Fairfax County, Virginia, Refunding & Public Improvement General Obligation Bonds, Series A | | 5.25 | % | | 04/01/08 | | $ | 6,300,564 |
| | 10,000,000 | | Florida State Division Board Finance Department, General Services Revenue Bonds Department of Environmental Protection- Preservation 2000, Series A, (FSA) | | 6.00 | | | 07/01/13 | | | 11,246,999 |
| | 10,000,000 | | Florida State Hurricane Catastrophe Fund Finance Corporation Revenue Bonds, Series A | | 5.00 | | | 07/01/10 | | | 10,386,900 |
| | 5,000,000 | | Fresno, California, Sewer Revenue Bonds, Series A-1, (AMBAC) | | 5.25 | | | 09/01/19 | | | 5,550,050 |
| | 4,000,000 | | Golden State Tobacco Securitization Corp., California Tobacco Settlement Revenue Bonds, Series A-1 | | 4.50 | | | 06/01/27 | | | 3,901,480 |
| | 10,000,000 | | Hawaii State General Obligation Bonds, Series CY, (FSA) | | 5.50 | | | 02/01/12 | | | 10,815,700 |
| | 5,000,000 | | Houston, Texas, Independent School District General Obligation Bonds, (PSF-GTD) | | 4.50 | | | 02/15/25 | | | 5,023,500 |
| | 2,000,000 | | Illinois State Toll Highway Authority Revenue Bonds, Senior Priority, Series A-1, (FSA) | | 5.00 | | | 01/01/18 | | | 2,159,560 |
| | 5,000,000 | | Indiana Health & Educational Facilities Financing Authority Revenue Bonds, Clarian Health Obligation Group, Series B | | 5.00 | | | 02/15/22 | | | 5,232,900 |
| | 10,375,000 | | Jackson County, Missouri, Special Obligation Revenue Bonds, Harry S. Truman Sports Complex, (AMBAC) | | 5.00 | | | 12/01/09 | | | 10,739,578 |
See Notes to Financial Statements.
43
Excelsior Tax-Exempt Funds, Inc.
Portfolio of Investments — March 31, 2007
Intermediate-Term Tax-Exempt Fund — (continued)
| | | | | | | | | | | |
Principal
Amount | | | | Rate | | | Maturity
Date | | Value |
| | | | | | | | | | | |
| | TAX-EXEMPT SECURITIES — (continued) |
| $ | 10,000,000 | | Jefferson County, Colorado, School District General Obligation Bonds (MBIA) | | 6.50 | % | | 12/15/11 | | $ | 11,228,500 |
| | 10,000,000 | | Los Angeles, California, Department of Water & Power Revenue Bonds, Series B, (MBIA) | | 5.00 | | | 07/01/13 | | | 10,770,100 |
| | 5,370,000 | | Massachusetts State Construction Loan General Obligaton Bonds, Series C | | 5.00 | | | 05/01/16 | | | 5,821,939 |
| | 5,040,000 | | Miami-Dade County, Florida, Transit Sales Surtax Revenue Bonds, (XLCA) | | 5.00 | | | 07/01/19 | | | 5,405,753 |
| | 10,000,000 | | Michigan State Building Authority Revenue Bonds, Facilities Program Series I, (FSA) | | 5.25 | | | 10/15/14 | | | 10,843,500 |
| | 5,720,000 | | Nassau County, New York, Interim Finance Authority Revenue Bonds, Sales Tax Revenue, Series B, (AMBAC) | | 5.00 | | | 11/15/14 | | | 6,149,000 |
| | 10,000,000 | | New Jersey State General Obligation Bonds, Series D | | 6.00 | | | 02/15/11 | | | 10,831,700 |
| | 3,000,000 | | New Jersey State Tobacco Settlement Financing Corporation Revenue Bonds, Series 1A | | 4.25 | | | 06/01/11 | | | 3,001,770 |
| | 10,000,000 | | New Jersey State Tobacco Settlement Financing Corporation Revenue Bonds, Series 1A | | 4.50 | | | 06/01/23 | | | 9,817,800 |
| | 4,000,000 | | New Jersey State Transportation Trust Fund Authority Revenue Bonds, (FSA-CR) | | 5.25 | | | 12/15/22 | | | 4,513,480 |
| | 9,530,000 | | New Jersey State Transportation Trust Fund Authority Revenue Bonds, Grant Anticipation Bonds, Series A, (FGIC) | | 5.00 | | | 06/15/10 | | | 9,902,718 |
| | | | | | | | | | | |
Principal
Amount | | | | Rate | | | Maturity
Date | | Value |
| | | | | | | | | | | |
| | TAX-EXEMPT SECURITIES — (continued) |
| $ | 10,000,000 | | New York City, New York, Municipal Water Finance Authority, Water & Sewer System Revenue Bonds, Series A, (FSA) | | 5.38 | % | | 06/15/16 | | $ | 10,794,600 |
| | 10,000,000 | | New York State Dormitory Authority Revenue Bonds, State University Educational Facilities, Series B, (FSA) | | 5.25 | | | 05/15/11 | | | 10,617,400 |
| | 5,790,000 | | Palm Beach County, Florida, Public Improvement Revenue Bonds, Parking Facilities Expansion Project, (MBIA) | | 5.00 | | | 12/01/26 | | | 6,154,307 |
| | 5,070,000 | | Pennsylvania State, General Obligation Bonds, Series 4 | | 5.00 | | | 07/01/09 | | | 5,215,763 |
| | 5,000,000 | | Puerto Rico Commonwealth Public Improvement General Obligation Bonds, Series B | | 5.25 | | | 07/01/16 | | | 5,438,300 |
| | 10,000,000 | | San Antonio, Texas, Electric & Gas Revenue Bonds | | 5.00 | | | 02/01/17 | | | 10,707,300 |
| | 8,000,000 | | San Antonio, Texas, Electric & Gas Revenue Bonds, Series A | | 5.25 | | | 02/01/16 | | | 8,291,280 |
| | 7,600,000 | | San Joaquin Hills, California, Transportation Corridor Agency Toll Road Revenue Bonds, Series A, (MBIA)(b) | | 0.00 | | | 01/15/12 | | | 6,345,316 |
| | 5,000,000 | | South Carolina State Highway General Obligation Bonds, Series B | | 5.00 | | | 04/01/16 | | | 5,282,350 |
| | 10,000,000 | | South Carolina State Public Services Authority Revenue Bonds, Series A, (FSA) | | 5.50 | | | 01/01/11 | | | 10,623,000 |
| | 12,150,000 | | St. Louis, Missouri, Airport Revenue Bonds, Lambert International Airport Series A, (FSA) | | 5.00 | | | 07/01/21 | | | 13,056,268 |
See Notes to Financial Statements.
44
Excelsior Tax-Exempt Funds, Inc.
Portfolio of Investments — March 31, 2007
Intermediate-Term Tax-Exempt Fund — (continued)
| | | | | | | | | | | |
Principal
Amount | | | | Rate | | | Maturity
Date | | Value |
| | | | | | | | | | | |
| | TAX-EXEMPT SECURITIES — (continued) |
| $ | 2,000,000 | | St. Louis, Missouri, Airport Revenue Bonds, Lambert International Airport Series A, (FSA) | | 5.00 | % | | 07/01/25 | | $ | 2,130,220 |
| | 2,000,000 | | Texas Municipal Gas Acquisition & Supply Corp., Gas Supply Revenue Bonds, Senior Lien, Series A | | 5.25 | | | 12/15/23 | | | 2,211,940 |
| | 4,815,000 | | Texas State Public Finance Authority General Obligation Bonds, Series A | | 5.00 | | | 10/01/23 | | | 5,071,014 |
| | 3,500,000 | | Texas State Transportation Commission Revenue Bonds, First Tier | | 5.00 | | | 04/01/08 | | | 3,546,620 |
| | 6,000,000 | | Triborough Bridge & Tunnel Authority, New York, Highway Revenue Bonds, Series B | | 5.00 | | | 11/15/20 | | | 6,308,040 |
| | 6,285,000 | | Virginia State Public School Authority Revenue Bonds, 1997 Resolution, Series C | | 5.00 | | | 08/01/16 | | | 6,813,946 |
| | 10,000,000 | | Washington State Various Purposes General Obligation Bonds, Series R-03-A, (MBIA) | | 5.00 | | | 01/01/18 | | | 10,493,500 |
| | | | | | | | | | | |
| | | TOTAL TAX-EXEMPT SECURITIES
(Cost $341,055,657) | | | 345,348,705 |
| | | | | | | | | | | |
| TAX-EXEMPT SECURITIES – ESCROWED IN
U.S. GOVERNMENTS — 6.48% |
| | 12,000,000 | | Chicago, Illinois, Public Improvements General Obligation Bonds, (Prerefunded 01/01/08 @ 102) | | 5.25 | | | 01/01/27 | | | 12,376,680 |
| | 7,180,000 | | Detroit, Michigan, Sewage Disposal Revenue Bonds, Senior Lien, Series A, (Prerefunded 07/01/13 @ 100) | | 5.00 | | | 07/01/14 | | | 7,691,431 |
| | | | | | | | | | | |
Principal
Amount | | | | Rate | | | Maturity
Date | | Value |
| TAX-EXEMPT SECURITIES – ESCROWED IN U.S.
GOVERNMENTS — (continued) |
| $ | 5,000,000 | | New York State Tobacco Settlement Asset Securitizaton Corporation Revenue Bonds, Series 1, (Prerefunded 07/15/09 @ 101) | | 6.38 | % | | 07/15/39 | | $ | 5,344,650 |
| | | | | | | | | | | |
| | | TOTAL TAX-EXEMPT SECURITIES — ESCROWED IN U.S. GOVERNMENTS
(Cost $25,457,385) | | | 25,412,761 |
| | | | | | | | | | | |
| | | | |
| Shares | | | | | | | | | |
| | REGISTERED INVESTMENT COMPANIES — 0.03% |
| | 102,148 | | BlackRock Muni Fund | | | 102,148 |
| | 1 | | Dreyfus Tax Exempt Cash Fund | | | 1 |
| | | | | | | | | | | |
| | | TOTAL REGISTERED INVESTMENT COMPANIES
(Cost $102,149) | | | 102,149 |
| | | | | | | | | | | |
| | | | | | |
TOTAL INVESTMENTS
(Cost $384,015,191) | | 98.93 | % | | $ | 388,263,615 |
OTHER ASSETS IN EXCESS OF LIABILITIES | | 1.07 | | | | 4,199,410 |
| | | | | | |
NET ASSETS | | 100.00 | % | | $ | 392,463,025 |
| | | | | | |
| (a) | Variable Rate Security—The rate disclosed is as of March 31, 2007. |
AMBAC—American Municipal Bond Assurance Corp.
FGIC—Financial Guaranty Insurance Corp.
FSA—Financial Security Assurance
FSA-CR—Financial Security Assurance Custodial Receipts
MBIA—Municipal Bond Insurance Association
SPA—Standby Purchase Agreement
XLCA—XL Capital Assurance
PSF-GTD—Public School Fund—Guaranteed
Notes (The following notes have not been audited by PricewaterhouseCoopers LLP):
These municipal securities meet the three highest ratings assigned by Moody’s Investors Services, Inc. or Standard and Poor’s Corporation or, where not rated, are determined by the Advisor, under the supervision of the Board of Directors, to be of comparable quality at the time of purchase to rated instruments that may be acquired by the Fund.
See Notes to Financial Statements.
45
Excelsior Tax-Exempt Funds, Inc.
Portfolio of Investments — March 31, 2007
Intermediate-Term Tax-Exempt Fund — (continued)
At March 31, 2007, approximately 6% of the net assets are invested in municipal securities that have letter of credit enhancement features or escrows in U.S. Government securities backing them, on which the Fund relies. Without such features, the securities may or may not meet the quality standards of securities purchased by the Fund.
The summary of the Fund’s investments as of March 31, 2007 is as follows: (Unaudited)
| | | | | | |
State Diversification | | % of
Net
Assets | | | Value |
California | | 14.85 | % | | $ | 58,277,568 |
Texas | | 11.64 | | | | 45,692,653 |
New York | | 9.99 | | | | 39,213,690 |
New Jersey | | 9.70 | | | | 38,067,468 |
Florida | | 8.46 | | | | 33,193,960 |
Missouri | | 6.61 | | | | 25,926,066 |
Colorado | | 5.55 | | | | 21,772,200 |
Michigan | | 5.49 | | | | 21,550,950 |
South Carolina | | 4.05 | | | | 15,905,350 |
Illinois | | 3.70 | | | | 14,536,240 |
Virginia | | 3.34 | | | | 13,114,510 |
Hawaii | | 2.76 | | | | 10,815,700 |
Washington | | 2.67 | | | | 10,493,500 |
Oklahoma | | 2.29 | | | | 9,000,000 |
Alaska | | 2.14 | | | | 8,400,000 |
Massachusetts | | 1.48 | | | | 5,821,939 |
Puerto Rico | | 1.39 | | | | 5,438,300 |
Indiana | | 1.33 | | | | 5,232,900 |
Pennsylvania | | 1.33 | | | | 5,215,762 |
Arkansas | | 0.13 | | | | 492,710 |
Registered Investment Companies | | 0.03 | | | | 102,149 |
| | | | | | |
Total Investments | | 98.93 | % | | $ | 388,263,615 |
Other Assets in Excess of Liabilities | | 1.07 | | | | 4,199,410 |
| | | | | | |
Net Assets | | 100.00 | % | | $ | 392,463,025 |
| | | | | | |
See Notes to Financial Statements
46
Excelsior Tax-Exempt Funds, Inc.
Portfolio of Investments — March 31, 2007
Long-Term Tax-Exempt Fund
| | | | | | | | | | | |
Principal
Amount | | | | Rate | | | Maturity
Date | | Value |
| | | | | | | | | | | |
| | TAX-EXEMPT CASH EQUIVALENT SECURITIES — 3.98% |
| $ | 1,400,000 | | Tulsa County, Oklahoma, Industrial Authority Health Care Revenue Bonds, St. Francis Health System, Series B(a) | | 3.75 | % | | 12/15/27 | | $ | 1,400,000 |
| | 1,200,000 | | Valdez, Alaska, Marine Terminal Revenue Bonds, BP Pipelines Project, Series B(a) | | 3.80 | | | 07/01/37 | | | 1,200,000 |
| | | | | | | | | | | |
| | | TOTAL TAX-EXEMPT CASH EQUIVALENT SECURITIES
(Cost $2,600,000) | | | 2,600,000 |
| | | | | | | | | | | |
| | TAX-EXEMPT SECURITIES — 75.50% | | | | | | |
| | 2,500,000 | | California Statewide Communities Development Authority Revenue Bonds, Southern California Edison Co., Series A, (XLCA), (Mandatory Put 04/01/13 @ 100) | | 4.10 | | | 04/01/28 | | | 2,538,500 |
| | 2,000,000 | | Chicago, Illinois, General Obligation Bonds, (FGIC) | | 5.25 | | | 01/01/28 | | | 2,069,420 |
| | 1,000,000 | | Cincinnati, Ohio, City School District General Obligation Bonds, Classroom Construction & Improvements (FGIC) | | 5.25 | | | 12/01/30 | | | 1,156,430 |
| | 3,000,000 | | Clark County, Nevada, School District General Obligation Bonds, Series A, (FSA) | | 5.00 | | | 06/15/15 | | | 3,226,620 |
| | 2,500,000 | | Detroit, Michigan, City School District General Obligation Bonds School Building & Improvement, Series A, (FSA) | | 5.00 | | | 05/01/17 | | | 2,683,475 |
| | 2,000,000 | | District Of Columbia, General Obligation Bonds, Series A, (MBIA) | | 5.25 | | | 06/01/27 | | | 2,046,780 |
| | 2,000,000 | | Florida State Hurricane Catastrophe Fund Finance Corporation Revenue Bonds, Series A | | 5.00 | | | 07/01/10 | | | 2,077,380 |
| | | | | | | | | | | |
Principal
Amount | | | | Rate | | | Maturity
Date | | Value |
| | | | | | | | | | | |
| | TAX-EXEMPT SECURITIES — (continued) | | | | | | |
| $ | 1,800,000 | | Fort Bend, Texas, Independent School District General Obligation Bonds,
(PSF-GTD) | | 5.38 | % | | 02/15/24 | | $ | 1,846,548 |
| | 650,000 | | Indiana Health & Educational Facility Financing Authority Hospital Revenue Bonds, Clarian Health Obligation, Series A | | 5.00 | | | 02/15/39 | | | 666,335 |
| | 3,000,000 | | Johnson City, Tennessee, Health & Educational Facilities Board Hospital Revenue Bonds, Mountain States Health Alliance, Series A | | 5.50 | | | 07/01/36 | | | 3,212,850 |
| | 1,500,000 | | Mashantucket Western Pequot Tribe, Connecticut, Special Revenue Bonds(b)(c) | | 5.50 | | | 09/01/36 | | | 1,573,770 |
| | 1,000,000 | | Massachusetts State Construction Loan General Obligation Bonds, Series C | | 5.00 | | | 05/01/16 | | | 1,084,160 |
| | 2,000,000 | | Michigan State Hospital Finance Authority Revenue Bonds, Henry Ford Health Systems, Series A | | 5.25 | | | 11/15/32 | | | 2,127,160 |
| | 1,000,000 | | Montgomery, Alabama, Medical Clinic Board Health Care Facility Revenue Bonds, Jackson Hospital & Clinic | | 4.75 | | | 03/01/36 | | | 984,500 |
| | 500,000 | | New Hampshire Health & Education Facilities Authority Revenue Bonds, The Memorial Hospital | | 5.25 | | | 06/01/36 | | | 518,995 |
| | 2,000,000 | | New Jersey State Tobacco Settlement Financing Corporation Revenue Bonds, Series 1A | | 4.50 | | | 06/01/23 | | | 1,963,560 |
| | 2,000,000 | | New York City, New York, General Obligation Bonds, Series M | | 5.00 | | | 04/01/22 | | | 2,110,440 |
| | 2,000,000 | | New York City, New York, Industrial Development Agency Revenue Bonds, Queens Baseball Stadium — Pilot, (AMBAC) | | 5.00 | | | 01/01/46 | | | 2,107,080 |
See Notes to Financial Statements.
47
Excelsior Tax-Exempt Funds, Inc.
Portfolio of Investments — March 31, 2007
Long-Term Tax-Exempt Fund — (continued)
| | | | | | | | | | | |
Principal
Amount | | | | Rate | | | Maturity
Date | | Value |
| | | | | | | | | | | |
| | TAX-EXEMPT SECURITIES — (continued) | | | | | | |
| $ | 2,000,000 | | New York Metropolitan Transportation Authority Revenue Bonds, Series A, (AMBAC) | | 5.50 | % | | 11/15/14 | | $ | 2,235,480 |
| | 2,000,000 | | New York State Dormitory Authority Revenue Bonds, Non-State Supported Debt, New York University Hospital Center, Series A | | 5.00 | | | 07/01/20 | | | 2,085,180 |
| | 2,000,000 | | New York State Environmental Facilities Revenue Bonds, Clean Water & Drinking Revolving Foods, 2nd Resolution | | 5.00 | | | 06/15/26 | | | 2,117,480 |
| | 2,000,000 | | Purdue University, Indiana, Certificates of Participation | | 5.25 | | | 07/01/22 | | | 2,251,360 |
| | 2,500,000 | | San Joaquin Hills, California, Transportation Corridor Agency Toll Road Revenue Bonds, Series A, (MBIA)(d) | | 0.00 | | | 01/15/12 | | | 2,087,275 |
| | 1,500,000 | | St. Louis, Missouri, Airport Revenue Bonds, Lambert International Airport, Series A, (FSA) | | 5.00 | | | 07/01/20 | | | 1,614,495 |
| | 1,250,000 | | Tennessee Energy Acquisition Corp. Gas Revenue Bonds, Series A | | 5.25 | | | 09/01/26 | | | 1,384,200 |
| | 1,500,000 | | University of California Revenue Bonds, Series J, (MBIA) | | 5.00 | | | 05/15/12 | | | 1,596,510 |
| | | | | | | | | | | |
| | | TOTAL TAX-EXEMPT SECURITIES
(Cost $48,810,333) | | | 49,365,983 |
| | | | | | | | | | | |
| TAX-EXEMPT SECURITIES – ESCROWED IN U.S.
GOVERNMENTS — 18.28% |
| | 3,000,000 | | Houston, Texas, Water & Sewer System Revenue Bonds, Series A, (FSA) (Prerefunded 12/01/12 @ 100) | | 5.00 | | | 12/01/30 | | | 3,197,310 |
| | 2,000,000 | | Long Island Power Authority, New York Electric System Revenue Bonds, Series A, (FSA) (Escrowed to Maturity) | | 5.25 | | | 12/01/14 | | | 2,200,800 |
| | | | | | | | | | | |
Principal
Amount | | | | Rate | | | Maturity
Date | | Value |
| | | | | | | | | | | |
| TAX-EXEMPT SECURITIES – ESCROWED IN U.S.
GOVERNMENTS — (continued) |
| $ | 3,000,000 | | New Jersey State Transportation Trust Fund Authority Revenue Bonds, Transportation Systems, Series C, (Prerefunded 06/15/13 @ 100) | | 5.50 | % | | 06/15/23 | | $ | 3,299,940 |
| | 3,000,000 | | Pennsylvania State General Obligation Bonds, 2nd Series, (FSA) (Prerefunded 05/01/12 @ 100) | | 5.50 | | | 05/01/16 | | | 3,250,560 |
| | | | | | | | | | | |
| | | TOTAL TAX-EXEMPT SECURITIES — ESCROWED IN U.S. GOVERNMENTS (Cost $11,695,844) | | | 11,948,610 |
| | | | | | | | | | | |
| | | | |
| Shares | | | | | | | | | |
| | REGISTERED INVESTMENT COMPANIES — 0.49% | | | |
| | 319,451 | | BlackRock Muni Fund | | | 319,451 |
| | 1 | | Dreyfus Tax Exempt Cash Fund | | | 1 |
| | | | | | | | | | | |
| | | TOTAL REGISTERED INVESTMENT COMPANIES
(Cost $319,452) | | | 319,452 |
| | | | | | | | | | | |
| | | | | | | | | | |
TOTAL INVESTMENTS
(Cost $63,425,629) | | 98.25 | % | | $ | 64,234,045 |
OTHER ASSETS IN EXCESS OF LIABILITIES | | 1.75 | | | | 1,142,205 |
| | | | | | | | | | |
NET ASSETS | | 100.00 | % | | $ | 65,376,250 |
| | | | | | | | | | |
| (a) | Variable Rate Security—The rate disclosed is as of March 31, 2007 |
| (b) | Security exempt from registration under Rule 144A of the Securities Act of 1933. This security may be resold in transactions exempt from registration, normally to qualified institutional buyers. At March 31, 2007, these securities amounted to $1,573,770 or 2.41% of net assets. |
| (c) | Represents an illiquid security as of March 31, 2007. |
AMBAC—American Municipal Bond Assurance Corporation
FGIC—Financial Guaranty Insurance Corporation
FSA—Financial Security Assurance
MBIA—Municipal Bond Insurance Association
PSF-GTD—Public School Fund—Guaranteed
XLCA—XL Capital Assurance
See Notes to Financial Statements.
48
Excelsior Tax-Exempt Funds, Inc.
Portfolio of Investments — March 31, 2007
Long-Term Tax-Exempt Fund — (continued)
Notes (The following notes have not been audited by PricewaterhouseCoopers LLP):
These municipal securities meet the three highest ratings assigned by Moody’s Investors Services, Inc. or Standard and Poor’s Corporation or, where not rated, are determined by the Advisor, under the supervision of the Board of Directors, to be of comparable quality at the time of purchase to rated instruments that may be acquired by the Fund.
At March 31, 2007, approximately 18% of the net assets are invested in municipal securities that have letter of credit enhancement features or escrows in U.S. Government securities backing them, on which the Fund relies. Without such features, the securities may or may not meet the quality standards of securities purchased by the Fund.
The summary of the Fund’s investments as of March 31, 2007 is as follows: (Unaudited)
| | | | | | |
State Diversification | | % of
Net
Assets | | | Value |
New York | | 19.66 | % | | $ | 12,856,460 |
California | | 9.52 | | | | 6,222,285 |
New Jersey | | 8.05 | | | | 5,263,500 |
Texas | | 7.71 | | | | 5,043,858 |
Michigan | | 7.36 | | | | 4,810,635 |
Tennessee | | 7.03 | | | | 4,597,050 |
Pennsylvania | | 4.97 | | | | 3,250,560 |
Nevada | | 4.93 | | | | 3,226,620 |
Indiana | | 4.46 | | | | 2,917,695 |
Florida | | 3.18 | | | | 2,077,380 |
Illinois | | 3.17 | | | | 2,069,420 |
District Of Columbia | | 3.13 | | | | 2,046,780 |
Missouri | | 2.47 | | | | 1,614,495 |
Connecticut | | 2.41 | | | | 1,573,770 |
Oklahoma | | 2.14 | | | | 1,400,000 |
Alaska | | 1.84 | | | | 1,200,000 |
Ohio | | 1.77 | | | | 1,156,430 |
Massachusetts | | 1.66 | | | | 1,084,160 |
Alabama | | 1.51 | | | | 984,500 |
New Hampshire | | 0.79 | | | | 518,995 |
Registered Investment Companies | | 0.49 | | | | 319,452 |
| | | | | | |
Total Investments | | 98.25 | % | | $ | 64,234,045 |
Other Assets in Excess of Liabilities | | 1.75 | | | | 1,142,205 |
| | | | | | |
Net Assets | | 100.00 | % | | $ | 65,376,250 |
| | | | | | |
See Notes to Financial Statements
49
Excelsior Tax-Exempt Fund, Inc.
Portfolio of Investments — March 31, 2007
New York Intermediate-Term Tax-Exempt Fund
| | | | | | | | | | | |
Principal
Amount | | | | Rate | | | Maturity
Date | | Value |
| | | | | | | | | | | |
| | TAX-EXEMPT CASH EQUIVALENT SECURITIES — 2.97% |
| $ | 2,000,000 | | New York State Triborough Bridge & Tunnel Authority Revenue Bonds, Series A, (SPA: Dexia Credit Local)(a) | | 3.65 | % | | 11/01/35 | | $ | 2,000,000 |
| | 1,700,000 | | Port Authority of New York & New Jersey, Special Obligation Revenue Bonds, Versatile Structure Obligation, Series 2, (SPA: JP Morgan Chase & Co.)(a) | | 3.76 | | | 05/01/19 | | | 1,700,000 |
| | 500,000 | | Port Authority of New York & New Jersey, Special Obligation Revenue Bonds, Versatile Structure Obligation Series 5, (SPA: Bayerische Landesbank)(a) | | 3.75 | | | 08/01/24 | | | 500,000 |
| | | | | | | | | | | |
| | | TOTAL TAX-EXEMPT CASH EQUIVALENT SECURITIES
(Cost $4,200,000) | | | 4,200,000 |
| | | | | | | | | | | |
| TAX-EXEMPT CASH EQUIVALENT SECURITIES – BACKED BY
LETTERS OF CREDIT — 4.17% |
| | 1,400,000 | | Long Island Power Authority, New York Electric System Revenue Bonds, Sub-Series 2B, (BAYERISCHE LANDESBANK)(a) | | 3.74 | | | 05/01/33 | | | 1,400,000 |
| | 3,500,000 | | New York State Dormitory Authority Revenue Bonds, Oxford University, (LANDESBANK HESSEN)(a) | | 3.80 | | | 07/01/23 | | | 3,500,000 |
| | 1,000,000 | | New York State Metropolitan Transportation Authority Revenue Bonds, Sub-Series G2, (BNP PARIBAS)(a) | | 3.79 | | | 11/01/26 | | | 1,000,000 |
| | | | | | | | | | | |
| | | TOTAL TAX-EXEMPT CASH EQUIVALENT SECURITIES — BACKED BY LETTERS OF CREDIT
(Cost $5,900,000) | | | 5,900,000 |
| | | | | | | | | | | |
| | TAX-EXEMPT SECURITIES — 74.07% |
| | 2,565,000 | | Babylon, New York, General Obligation Bonds, (AMBAC) | | 5.00 | | | 01/01/13 | | | 2,738,651 |
| | | | | | | | | | | |
Principal
Amount | | | | Rate | | | Maturity
Date | | Value |
| | | | | | | | | | | |
| | TAX-EXEMPT SECURITIES — (continued) |
| $ | 5,000,000 | | Nassau County, New York, Interim Finance Authority, Sales Tax Revenue Bonds, Series H, (AMBAC) | | 5.25 | % | | 11/15/15 | | $ | 5,489,100 |
| | 4,000,000 | | New York City, New York, General Obligation Bonds, Series C | | 5.00 | | | 01/01/15 | | | 4,285,840 |
| | 2,430,000 | | New York City, New York, General Obligation Bonds, Series G | | 5.00 | | | 12/01/19 | | | 2,572,374 |
| | 850,000 | | New York City, New York, Industrial Development Agency Revenue Bonds, Queens Baseball Stadium, (AMBAC) | | 5.00 | | | 01/01/19 | | | 917,261 |
| | 1,000,000 | | New York City, New York, Industrial Development Agency Revenue Bonds, Queens Baseball Stadium, (AMBAC) | | 5.00 | | | 01/01/20 | | | 1,074,950 |
| | 2,280,000 | | New York City, New York, Metropolitan Transportation Authority Revenue Bonds, (CIFG) | | 5.00 | | | 11/15/22 | | | 2,441,584 |
| | 5,000,000 | | New York City, New York, Municipal Water Finance Authority, Water & Sewer System Revenue Bonds, Series A, (FSA) | | 5.38 | | | 06/15/16 | | | 5,397,300 |
| | 4,000,000 | | New York City, New York, Municipal Water Finance Authority, Water & Sewer System Revenue Bonds, Series D | | 5.13 | | | 06/15/19 | | | 4,236,160 |
| | 2,150,000 | | New York City, New York, Transitional Finance Authority Revenue Bonds, Series A | | 5.25 | | | 11/01/10 | | | 2,266,466 |
| | 3,000,000 | | New York City, New York, Transitional Finance Authority Revenue Bonds, Series A-1 | | 5.00 | | | 11/01/19 | | | 3,207,330 |
See Notes to Financial Statements.
50
Excelsior Tax-Exempt Fund, Inc.
Portfolio of Investments — March 31, 2007
New York Intermediate-Term Tax-Exempt Fund — (continued)
| | | | | | | | | | | |
Principal
Amount | | | | Rate | | | Maturity
Date | | Value |
| | | | | | | | | | | |
| | TAX-EXEMPT SECURITIES — (continued) |
| $ | 2,000,000 | | New York City, New York, Transitional Finance Authority Revenue Bonds, Series B | | 5.25 | % | | 08/01/17 | | $ | 2,154,580 |
| | 3,000,000 | | New York City, New York, Transitional Finance Authority Revenue Bonds, Series S-1 | | 5.00 | | | 07/15/11 | | | 3,151,710 |
| | 1,000,000 | | New York State Dormitory Authority Revenue Bonds, New York University, Series A | | 5.00 | | | 07/01/10 | | | 1,022,420 |
| | 1,000,000 | | New York State Dormitory Authority Revenue Bonds, New York University, Series A | | 5.00 | | | 07/01/12 | | | 1,031,400 |
| | 5,000,000 | | New York State Dormitory Authority Revenue Bonds, New York University, Series A, (AMBAC) | | 5.75 | | | 07/01/12 | | | 5,503,999 |
| | 4,720,000 | | New York State Dormitory Authority Revenue Bonds, State Personal Income Tax, Series D, (FGIC) | | 5.00 | | | 03/15/09 | | | 4,844,891 |
| | 3,525,000 | | New York State Energy Research & Development Authority, Pollution Control Revenue Bonds, Niagara Mohawk Power Project, Series A, (AMBAC) | | 5.15 | | | 11/01/25 | | | 3,666,740 |
| | 6,000,000 | | New York State Environmental Facilties Revenue Bonds, NYC Municipal Water Project, Series K | | 5.00 | | | 06/15/12 | | | 6,397,559 |
| | 5,000,000 | | New York State Local Government Assistance Corporation Revenue Bonds, Series A-1, (FSA) | | 5.00 | | | 04/01/12 | | | 5,314,850 |
| | 6,500,000 | | New York State Sales Tax Asset Receivable Corporation Revenue Bonds, Series A, (MBIA) | | 5.00 | | | 10/15/22 | | | 6,918,989 |
| | 2,500,000 | | New York State Tollway Authority, Highway & Bridge Trust Fund Revenue Bonds, Series B, (AMBAC) | | 5.00 | | | 04/01/19 | | | 2,685,950 |
| | | | | | | | | | | |
Principal
Amount | | | | Rate | | | Maturity
Date | | Value |
| | | | | | | | | | | |
| | TAX-EXEMPT SECURITIES — (continued) |
| $ | 2,015,000 | | New York State Triborough Bridge & Tunnel Authority Revenue Bonds, Series B | | 5.25 | % | | 11/15/13 | | $ | 2,195,443 |
| | 4,500,000 | | New York State Urban Development Corp. Revenue Bonds, State Personal Income Tax, Series B | | 5.00 | | | 03/15/22 | | | 4,831,830 |
| | 500,000 | | Oneida County, New York Industrial Developmental Agency, Civic Facility Revenue Bonds, Hamilton College PJ-Series A(b) | | 0.00 | | | 07/01/18 | | | 313,015 |
| | 895,000 | | Onondaga County, New York, Water Authority Revenue Bonds, Series A, (AMBAC) | | 5.00 | | | 09/15/22 | | | 953,972 |
| | 940,000 | | Onondaga County, New York, Water Authority Revenue Bonds, Series A (AMBAC) | | 5.00 | | | 09/15/23 | | | 1,001,937 |
| | 5,000,000 | | Puerto Rico Electric Power Authority Revenue Bonds, Series BB, (MBIA) | | 6.00 | | | 07/01/11 | | | 5,453,450 |
| | 1,500,000 | | Puerto Rico Public Improvement General Obligation Bonds, Series A | | 5.25 | | | 07/01/22 | | | 1,620,705 |
| | 2,000,000 | | Suffolk County, New York, Public Improvement General Obligation Bonds, Series A, (CIFG) | | 5.00 | | | 05/01/08 | | | 2,031,320 |
| | 3,750,000 | | Troy, New York, Industrial Development Authority Civic Facility Revenue Bonds, Rensselaer Polytech, Series E, (XLCA), (Mandatory Put 09/01/11 @ 100) | | 4.05 | | | 04/01/37 | | | 3,770,963 |
| | 2,425,000 | | Yonkers, New York, General Obligation Bonds, Series B, (MBIA) | | 5.00 | | | 08/01/21 | | | 2,582,771 |
| | 2,545,000 | | Yonkers, New York, General Obligation Bonds, Series B, (MBIA) | | 5.00 | | | 08/01/22 | | | 2,706,887 |
| | | | | | | | | | | |
| | | TOTAL TAX-EXEMPT SECURITIES
(Cost $103,763,301) | | | 104,782,397 |
| | | | | | | | | | | |
See Notes to Financial Statements.
51
Excelsior Tax-Exempt Fund, Inc.
Portfolio of Investments — March 31, 2007
New York Intermediate-Term Tax-Exempt Fund — (continued)
| | | | | | | | | | | |
Principal
Amount | | | | Rate | | | Maturity
Date | | Value |
| | | | | | | | | | | |
| | | TAX-EXEMPT SECURITIES – ESCROWED IN U.S. GOVERNMENTS — 17.86% |
| $ | 5,000,000 | | Long Island Power Authority, New York Electric System Revenue Bonds, Series A, (FSA) (Escrowed to Maturity) | | 5.25 | % | | 12/01/14 | | $ | 5,502,000 |
| | 3,300,000 | | New York State Metropolitan Transportation Authority Dedicated Tax Revenue Bonds, Series A, (FGIC) (Prerefunded 04/01/2010 @100) | | 5.88 | | | 04/01/21 | | | 3,514,005 |
| | 6,000,000 | | New York State Metropolitan Transportation Authority Revenue Bonds, Service Contract, Series 8, (FSA) (Prerefunded 07/01/13 @ 100) | | 5.38 | | | 07/01/21 | | | 6,579,720 |
| | 4,210,000 | | New York State Tobacco Settlement Asset Securitizaton Corporation Revenue Bonds, Series 1, (Prerefunded 07/15/09 @ 101) | | 6.38 | | | 07/15/39 | | | 4,500,195 |
| | 5,000,000 | | New York State Tollway Authority , Highway & Bridge Trust Fund Revenue Bonds, Series B, AMBAC (Prerefunded 04/01/09 @ 100) | | 5.25 | | | 04/01/24 | | | 5,162,050 |
| | | | | | | | | | | |
| | | TOTAL TAX-EXEMPT SECURITIES —ESCROWED IN U.S. GOVERNMENTS
(Cost $25,317,683) | | | 25,257,970 |
| | | | | | | | | | | |
| Shares | | | | | | | | | |
| | REGISTERED INVESTMENT COMPANIES — 0.04% | | | |
| | 1 | | Dreyfus New York Tax Exempt Cash Fund | | | 1 |
| | 55,645 | | Provident Institutional New York Money Market Fund | | | 55,645 |
| | | | | | | | | | | |
| | | TOTAL REGISTERED INVESTMENT COMPANIES
(Cost $55,646) | | | 55,646 |
| | | | | | | | | | | |
| | | | | | | | | | |
TOTAL INVESTMENTS
(Cost $139,236,630) | | 99.11 | % | | | | | | $ | 140,196,013 |
OTHER ASSETS IN EXCESS OF LIABILITIES | | 0.89 | | | | | | | | 1,258,238 |
| | | | | | | | | | |
NET ASSETS | | 100.00 | % | | | | | | $ | 141,454,251 |
| | | | | | | | | | |
| (a) | Variable Rate Security The rate disclosed is as of March 31, 2007. |
AMBAC—American Municipal Bond Assurance Corp.
CIFG—CDC IXIS Financial Guaranty
FGIC—Financial Guaranty Insurance Corp.
FSA—Financial Security Assurance
MBIA—Municipal Bond Insurance Association
SPA—Standby Purchase Agreement
XLCA—XL Capital Assurance
Notes (The following notes have not been audited by PricewaterhouseCoopers LLP):
These municipal securities meet the three highest ratings assigned by Moody’s Investors Services, Inc. or Standard and Poor’s Corporation or, where not rated, are determined by the Advisor, under the supervision of the Board of Directors, to be of comparable quality at the time of purchase to rated instruments that may be acquired by the Fund.
At March 31, 2007, approximately 22 % of the net assets are invested in municipal securities that have letter of credit enhancement features or escrows in U.S. Government securities backing them, on which the Fund relies. Without such features, the securities may or may not meet the quality standards of securities purchased by the Fund.
At March 31, 2007, approximately 99% of the net assets are invested in New York municipal securities. Economic changes affecting the state and certain of its public bodies and municipalities may affect the ability of issuers to pay the required principal and interest payments of the municipal securities.
See Notes to Financial Statements.
52
Excelsior Tax-Exempt Fund, Inc.
Portfolio of Investments — March 31, 2007
New York Intermediate-Term Tax-Exempt Fund — (continued)
The summary of the Fund’s investments as of March 31st, 2007 is as follows: (Unaudited)
| | | | | | |
Portfolio Diversification | | % of
Net
Assets | | | Value |
Revenue Bonds | | 63.93 | % | | $ | 90,443,850 |
Prerefunded | | 13.97 | | | | 19,755,970 |
General Obligation Bonds | | 13.11 | | | | 18.538,547 |
Backed by Letters of Credit | | 4.17 | | | | 5,900,000 |
Escrowed to Maturity | | 3.89 | | | | 5,502,000 |
Registered Investment Companies | | 0.04 | | | | 55,646 |
| | | | | | |
Total Investments | | 99.11 | % | | $ | 140,196,013 |
Other Assets in Excess of Liabilities | | 0.89 | | | | 1,258,238 |
| | | | | | |
Net Assets | | 100.00 | % | | $ | 141,454,251 |
| | | | | | |
See Notes to Financial Statements.
53
Excelsior Funds, Inc.
Portfolio of Investments — March 31, 2007
Short-Term Government Securities Fund
| | | | | | | | | | | |
Principal
Amount | | | | Rate | | | Maturity
Date | | Value |
| | | | | | | | | | | |
| | ASSET BACKED SECURITIES — 0.99% |
| $ | 1,648,892 | | Countrywide Home Equity Loan Trust, 2005-G 2A(a) | | 5.55 | % | | 12/15/35 | | $ | 1,650,083 |
| | 902,954 | | Residential Asset Mortgage Products, Inc., 2004-RS6 AI3 | | 4.54 | | | 08/25/28 | | | 899,585 |
| | | | | | | | | | | |
| | | TOTAL ASSET BACKED SECURITIES
(Cost $2,562,105) | | | | | | | | 2,549,668 |
| | | | | | | | | | | |
| | COLLATERALIZED MORTGAGE OBLIGATIONS — 13.70% |
| | | NON-GOVERNMENTAL AGENCY COLLATERALIZED MORTGAGE OBLIGATIONS — 10.09% |
| | 5,083,404 | | Bank of America Mortgage Securities, 2004-B 2A2(a) | | 4.10 | | | 03/25/34 | | | 5,043,531 |
| | 2,767,478 | | Bank of America Mortgage Securities, 2005-J 2A3(a) | | 5.09 | | | 11/25/35 | | | 2,743,586 |
| | 1,816,112 | | Bear Stearns ARM, 2004-1 11A3(a) | | 6.09 | | | 04/25/34 | | | 1,834,339 |
| | 2,254,902 | | Bear Stearns ARM, 2004-9 3A1(a) | | 5.24 | | | 09/25/34 | | | 2,259,732 |
| | 2,911,176 | | Countrywide Alternative Loan Trust, 2004-16CB 1A2 | | 5.50 | | | 07/25/34 | | | 2,880,526 |
| | 1,920,264 | | IMPAC CMB Trust, 2005-5 A4(a) | | 5.70 | | | 08/25/35 | | | 1,909,230 |
| | 2,138,180 | | Indymac Index Mortgage Loan Trust, 2004-AR4 3A(a) | | 4.74 | | | 08/25/34 | | | 2,133,851 |
| | 2,000,000 | | Washington Mutual Mortgage Securities Corp.,
2005-AR5 A2(a) | | 4.68 | | | 05/25/35 | | | 1,986,450 |
| | 2,882,844 | | Wells Fargo Mortgage Backed Securities Trust,
2004-AA A2(a) | | 5.00 | | | 12/25/34 | | | 2,854,448 |
| | 2,435,000 | | Wells Fargo Mortgage Backed Securities Trust, 2004-N A6 | | 4.00 | | | 08/25/34 | | | 2,383,679 |
| | | | | | | | | | | |
| | | | | | | | | | | 26,029,372 |
| | | | | | | | | | | |
| | | FEDERAL HOME LOAN MORTGAGE CORPORATION — 2.53% | | | |
| | 2,257,318 | | 2608 GK | | 4.50 | | | 03/15/17 | | | 2,224,003 |
| | 4,309,897 | | 2836 TA | | 5.00 | | | 10/15/27 | | | 4,305,752 |
| | | | | | | | | | | |
| | | | | | | | | | | 6,529,755 |
| | | | | | | | | | | |
| | | FEDERAL NATIONAL MORTGAGE
ASSOCIATION — 1.08% |
| | 2,808,107 | | 2002-89 CA | | 5.00 | | | 04/25/16 | | | 2,789,485 |
| | | | | | | | | | | |
| | | TOTAL COLLATERALIZED MORTGAGE OBLIGATIONS
(Cost $35,671,518) | | | 35,348,612 |
| | | | | | | | | | | |
| | | | | | | | | | | |
Principal
Amount | | | | Rate | | | Maturity
Date | | Value |
| | | | | | | | | | | |
| | COMMERCIAL MORTGAGE-BACKED SECURITIES — 3.25% |
| $ | 3,940,352 | | GE Capital Commercial Mortgage Corp., Series 2002-2A,
Class A2 | | 4.97 | % | | 08/11/36 | | $ | 3,927,199 |
| | 811,819 | | Greenwich Capital Commercial Funding Corp., 2004-GG1 A2 | | 3.84 | | | 06/10/36 | | | 807,308 |
| | 1,216,020 | | JP Morgan Chase Commercial Mortgage Securities Corp.,
2005-LDP2 A1(a) | | 4.33 | | | 07/15/42 | | | 1,201,152 |
| | 2,476,271 | | Mortgage Capital Funding, Inc., 2005-HQ5 A1 | | 4.52 | | | 01/14/42 | | | 2,451,591 |
| | | | | | | | | | | |
| | | TOTAL COMMERCIAL MORTGAGE-BACKED SECURITIES
(Cost $8,443,426) | | | 8,387,250 |
| | | | | | | | | | | |
| | U.S. GOVERNMENT AGENCY BONDS & NOTES — 24.69% |
| | | FANNIE MAE — 0.80% | | | |
| | 2,100,000 | | | | 3.55 | | | 01/17/08 | | | 2,074,283 |
| | | | | | | | | | | |
| | | FEDERAL HOME LOAN BANK — 17.25% |
| | 2,500,000 | | | | 3.88 | | | 02/15/08 | | | 2,473,893 |
| | 15,500,000 | | | | 4.75 | | | 06/11/08 | | | 15,454,739 |
| | 4,500,000 | | | | 5.13 | | | 07/30/08 | | | 4,509,149 |
| | 9,500,000 | | | | 5.38 | | | 07/17/09 | | | 9,604,975 |
| | 10,000,000 | | | | 5.00 | | | 10/16/09 | | | 9,977,570 |
| | 2,480,000 | | | | 5.19 | | | 02/22/10 | | | 2,474,809 |
| | | | | | | | | | | |
| | | | | | | | | | | 44,495,135 |
| | | | | | | | | | | |
| | | FREDDIE MAC — 6.64% | | | |
| | 7,150,000 | | | | 5.45 | | | 09/02/11 | | | 7,160,425 |
| | 10,000,000 | | | | 5.25 | | | 10/06/11 | | | 9,982,620 |
| | | | | | | | | | | |
| | | TOTAL U.S. GOVERNMENT AGENCY BONDS & NOTES
(Cost $63,697,313) | | | 17,143,045 |
| | | | | | | | | | | |
| | | | | | | | | | | 63,712,463 |
| | | | | | | | | | | |
| U.S. GOVERNMENT AGENCY MORTGAGE PASS THROUGH
SECURITIES — 39.96% |
| | | FEDERAL HOME LOAN MORTGAGE
CORPORATION — 17.90% |
| | 931,556 | | Pool # 1B2846 ARM(a) | | 4.95 | | | 04/01/35 | | | 931,936 |
| | 3,726,365 | | Pool # 1G0688 ARM(a) | | 5.76 | | | 01/01/36 | | | 3,754,140 |
| | 153,358 | | Pool # 1G1026 ARM(a) | | 5.91 | | | 07/01/36 | | | 154,358 |
| | 8,109,715 | | Pool # 1G1471 ARM(a) | | 5.50 | | | 01/01/37 | | | 8,151,861 |
| | 7,666,917 | | Pool # 782645 ARM(a) | | 5.43 | | | 02/01/36 | | | 7,727,457 |
| | 3,603,310 | | Pool # 847248 ARM(a) | | 5.24 | | | 03/01/34 | | | 3,642,747 |
See Notes to Financial Statements.
54
Excelsior Funds, Inc.
Portfolio of Investments — March 31, 2007
Short-Term Government Securities Fund — (continued)
| | | | | | | | | | | |
Principal
Amount | | | | Rate | | | Maturity
Date | | Value |
| | | | | | | | | | | |
| U.S. GOVERNMENT AGENCY MORTGAGE PASS THROUGH
SECURITIES — (continued) |
| | | FEDERAL HOME LOAN MORTGAGE
CORPORATION — (continued) |
| $ | 476,918 | | Pool # C68593 | | 7.00 | % | | 11/01/28 | | $ | 496,017 |
| | 2,919,895 | | Pool # G18136 | | 6.00 | | | 08/01/21 | | | 2,968,491 |
| | 8,915,289 | | Pool # J00617 | | 5.50 | | | 12/01/20 | | | 8,933,539 |
| | 9,276,531 | | Pool # J03619 | | 6.00 | | | 10/01/21 | | | 9,430,922 |
| | | | | | | | | | | |
| | | | | | | | | | | 46,191,468 |
| | | | | | | | | | | |
| | | FEDERAL NATIONAL MORTGAGE ASSOCIATION — 21.49% | | | |
| | 3,992,906 | | Pool # 256651 | | 6.00 | | | 03/01/37 | | | 4,007,546 |
| | 728,974 | | Pool # 323572 | | 7.50 | | | 01/01/29 | | | 764,730 |
| | 2,684,051 | | Pool # 375575 | | 6.60 | | | 12/01/07 | | | 2,680,937 |
| | 16,060 | | Pool # 517390 | | 8.00 | | | 11/01/11 | | | 16,485 |
| | 262,926 | | Pool # 535981 | | 8.00 | | | 01/01/16 | | | 275,040 |
| | 109,609 | | Pool # 545362 ARM(a) | | 5.96 | | | 12/01/31 | | | 109,771 |
| | 1,736,064 | | Pool # 634195 | | 7.50 | | | 10/01/28 | | | 1,821,217 |
| | 3,294,927 | | Pool # 693018 ARM(a) | | 4.36 | | | 06/01/33 | | | 3,326,851 |
| | 3,801,671 | | Pool # 735709 ARM(a) | | 4.82 | | | 06/01/35 | | | 3,761,096 |
| | 4,001,402 | | Pool # 745525 | | 5.50 | | | 05/01/21 | | | 4,011,567 |
| | 2,709,692 | | Pool # 766684 ARM(a) | | 4.42 | | | 03/01/34 | | | 2,697,130 |
| | 3,402,575 | | Pool # 770870 ARM(a) | | 4.28 | | | 04/01/34 | | | 3,372,016 |
| | 2,308,280 | | Pool # 780840 | | 4.50 | | | 06/01/34 | | | 2,307,122 |
| | 2,987,634 | | Pool # 784134 ARM(a) | | 5.46 | | | 10/01/35 | | | 3,003,494 |
| | 3,599,556 | | Pool # 786076 ARM(a) | | 4.74 | | | 07/01/34 | | | 3,597,430 |
| | 6,241,477 | | Pool # 786423 ARM(a) | | 4.59 | | | 07/01/34 | | | 6,241,780 |
| | 3,125,952 | | Pool # 805386 ARM(a) | | 4.86 | | | 01/01/35 | | | 3,125,357 |
| | 3,843,296 | | Pool # 828704 ARM(a) | | 5.00 | | | 07/01/35 | | | 3,823,994 |
| | 6,264,901 | | Pool # 871499 ARM(a) | | 5.60 | | | 04/01/36 | | | 6,321,292 |
| | 179,554 | | Pool # 892882 ARM(a) | | 5.86 | | | 07/01/36 | | | 180,966 |
| | | | | | | | | | | |
| | | | | | | | | | | 55,445,821 |
| | | | | | | | | | | |
| | | GOVERNMENT NATIONAL MORTGAGE ASSOCIATION — 0.57% |
| | 159,792 | | Pool # 780240 | | 8.50 | | | 09/15/09 | | | 159,871 |
| | 28,673 | | Pool # 780752 | | 8.50 | | | 04/15/10 | | | 28,695 |
| | 457,071 | | Pool # 781036 | | 8.00 | | | 10/15/17 | | | 481,335 |
| | 281,583 | | Pool # 781181 | | 9.00 | | | 12/15/09 | | | 287,018 |
| | 115,704 | | Pool # 80385 ARM(a) | | 5.25 | | | 03/20/30 | | | 116,710 |
| | 382,211 | | Pool # 8378 ARM(a) | | 5.75 | | | 07/20/18 | | | 386,027 |
| | | | | | | | | | | |
| | | | | | | | | | | 1,459,656 |
| | | | | | | | | | | |
| | | TOTAL U.S. GOVERNMENT AGENCY MORTGAGE PASS THROUGH SECURITIES
(Cost $103,237,952) | | | 103,096,945 |
| | | | | | | | | | | |
| | U.S. GOVERNMENT SECURITIES — 15.03% | | | |
| | | U.S. TREASURY NOTES — 15.03% | | | |
| | 250,000 | | (b) | | 4.88 | | | 04/30/08 | | | 249,971 |
| | 1,250,000 | | | | 4.88 | | | 05/31/08 | | | 1,250,586 |
| | 5,000,000 | | | | 5.00 | | | 07/31/08 | | | 5,013,280 |
| | 3,000,000 | | | | 4.63 | | | 11/15/09 | | | 3,004,569 |
| | | | | | | | | | | |
Principal
Amount | | | | Rate | | | Maturity
Date | | Value |
| | | | | | | | | | |
| | U.S. GOVERNMENT SECURITIES — (continued) | | | |
| | | U.S. TREASURY NOTES — (continued) | | | |
| $ | 29,105,000 | | | | 4.75 | % | | 02/15/10 | | $ | 29,270,986 |
| | | | | | | | | | | |
| | | | | | | | | | | 38,789,392 |
| | | | | | | | | | | |
| | | TOTAL U.S. GOVERNMENT SECURITIES (Cost $38,800,806) | | | 38,789,392 |
| | | | | | | | | | | |
| | | | |
| Shares | | | | | | | | | |
| | REGISTERED INVESTMENT COMPANIES — 1.64% |
| | 2,118,300 | | Dreyfus Government Cash Management Fund | | | 2,118,300 |
| | 2,118,302 | | Fidelity U.S. Treasury II Fund | | | 2,118,302 |
| | | | | | | | | | | |
| | | TOTAL REGISTERED INVESTMENT COMPANIES
(Cost $4,236,602) | | | 4,236,602 |
| | | | | | | | | | | |
| | | | | | |
TOTAL INVESTMENTS
(Cost $256,649,722) | | 99.26 | % | | $ | 256,120,932 |
OTHER ASSETS IN EXCESS OF LIABILITIES | | 0.74 | | | | 1,897,935 |
| | | | | | |
NET ASSETS | | 100.00 | % | | $ | 258,018,867 |
| | | | | | |
| (a) | Variable Rate Security—The rate disclosed is as of March 31, 2007. |
| (b) | All or part of security serves as collateral for futures contracts. |
ARM—Adjustable Rate Mortgage
| | | | | | | | | | | |
| Contracts | | | | | Value | | | Unrealized
Appreciation/
Depreciation | |
| FUTURES CONTRACTS | | | | | | | | |
| Long — | | | | | | | | | | | |
| 300 | | | U.S. 2 Year Treasury Note, expiring June 29, 2007 (notional amount $61,433,250) | | $ | 61,467,187 | | | $ | 33,937 | |
| 70 | | | U.S. 5 Year Treasury Note, expiring June 29, 2007 (notional amount $7,424,550) | | | 7,405,781 | | | | (18,769 | ) |
| Short — | | | | | | | | | | | |
| (180 | ) | | U.S. 10 Year Treasury Note, expiring June 20, 2007 (notional amount $(19,488,300)) | | | (19,462,500 | ) | | | 25,800 | |
| | | | | | | | | | | |
TOTAL FUTURES CONTRACTS
(Total notional amount $49,369,500) | | $ | 49,410,468 | | | $ | 40,968 | |
| | | | | | | | | | | |
See Notes to Financial Statements.
55
Excelsior Funds, Inc.
Portfolio of Investments — March 31, 2007
Short-Term Government Securities Fund — (continued)
The summary of the Fund’s investments as of March 31, 2007 is as follows: (Unaudited)
| | | | | | |
Portfolio Diversification | | % of
Net
Assets | | | Value |
U.S. Government & Agency Securities | | 79.68 | % | | $ | 205,598,800 |
Collateralized Mortgage Obligations | | 13.70 | | | | 35,348,612 |
Commercial Mortgage-Backed Securities | | 3.25 | | | | 8,387,250 |
Registered Investment Companies | | 1.64 | | | | 4,236,602 |
Asset Backed Securities | | 0.99 | | | | 2,549,668 |
| | | | | | |
Total Investments | | 99.26 | % | | $ | 256,120,932 |
Other Assets in Excess of Liabilities | | 0.74 | | | | 1,897,935 |
| | | | | | |
Net Assets | | 100.00 | % | | $ | 258,018,867 |
| | | | | | |
See Notes to Financial Statements.
56
Excelsior Tax-Exempt Funds, Inc.
Portfolio of Investments — March 31, 2007
Short-Term Tax-Exempt Securities Fund
| | | | | | | | | | | |
Principal
Amount | | | | Rate | | | Maturity
Date | | Value |
| | | | | | | | | | | |
| | TAX-EXEMPT CASH EQUIVALENT SECURITIES — 1.92% |
| $ | 2,000,000 | | Maryland State Economic Developmental Corporation Revenue Bonds(a) | | 3.80 | % | | 07/01/34 | | $ | 2,000,000 |
| | | | | | | | | | | |
| | | TOTAL TAX-EXEMPT CASH EQUIVALENT SECURITIES
(Cost $2,000,000) | | | 2,000,000 |
| | | | | | | | | | | |
| TAX-EXEMPT CASH EQUIVALENT SECURITIES — BACKED BY
LETTERS OF CREDIT — 4.42% |
| | 4,600,000 | | Ohio State Air Quality Development Authority Revenue Bonds, Ohio Edison Co., Series C, (WACHOVIA BANK N.A.)(a) | | 3.80 | | | 06/01/23 | | | 4,600,000 |
| | | | | | | | | | | |
| | | TOTAL TAX-EXEMPT CASH EQUIVALENT SECURITIES — BACKED BY LETTERS OF CREDIT
(Cost $4,600,000) | | | 4,600,000 |
| | | | | | | | | | | |
| | TAX-EXEMPT SECURITIES — 83.30% |
| | 6,000,000 | | California State General Obligation Bonds | | 5.00 | | | 06/01/08 | | | 6,101,040 |
| | 4,070,000 | | Clark County, Nevada, School District General Obligation Bonds, Series A, (FSA) | | 5.50 | | | 06/15/07 | | | 4,084,408 |
| | 5,000,000 | | Fairfax County, Virginia, Refunding & Public Improvement General Obligation Bonds, Series A | | 5.25 | | | 04/01/08 | | | 5,081,100 |
| | 890,000 | | Illinois State Housing Development Authority Multi-Family Revenue Bonds, Series G | | 3.70 | | | 07/01/08 | | | 889,430 |
| | 800,000 | | Illinois State Housing Development Authority Multi-Family Revenue Bonds, Series G | | 3.85 | | | 01/01/09 | | | 800,328 |
| | 1,810,000 | | Illinois State Housing Development Authority Multi-Family Revenue Bonds, Series G | | 3.90 | | | 01/01/10 | | | 1,807,122 |
| | 870,000 | | Illinois State Housing Development Authority Multi-Family Revenue Bonds, Series G | | 3.65 | | | 07/01/07 | | | 869,600 |
| | | | | | | | | | | |
Principal
Amount | | | | Rate | | | Maturity
Date | | Value |
| | | | | | | | | | | |
| | TAX-EXEMPT SECURITIES — (continued) |
| $ | 3,850,000 | | Jacksonville, Florida, Electric Authority Revenue Bonds,
Series 18 | | 5.00 | % | | 10/01/08 | | $ | 3,922,534 |
| | 5,035,000 | | Memphis, Tennessee, General Obligation Bonds, Series B, (MBIA) | | 5.00 | | | 11/01/08 | | | 5,140,282 |
| | 2,000,000 | | Montgomery County, Texas, General Obligation Bonds, Series B, (FSA), (Mandatory Put 09/01/08 @ 100) | | 5.00 | | | 03/01/28 | | | 2,037,500 |
| | 2,500,000 | | Montgomery County, Texas, General Obligation Bonds, Series B, (FSA), (Mandatory Put 09/01/10 @ 100) | | 5.00 | | | 03/01/29 | | | 2,597,400 |
| | 7,405,000 | | New Jersey State Economic Development Authority Revenue Bonds, Series F | | 5.00 | | | 06/15/07 | | | 7,423,512 |
| | 2,000,000 | | New Jersey State Tobacco Settlement Financing Corporation Revenue Bonds, Series 1A | | 4.13 | | | 06/01/10 | | | 1,999,020 |
| | 6,000,000 | | New York State Metropolitan Transportation Authority Revenue Bonds, Series H | | 5.25 | | | 11/15/10 | | | 6,319,980 |
| | 5,000,000 | | New York State Triborough Bridge & Tunnel Authority Revenue Bonds, (MBIA-IBC-BNY) | | 6.00 | | | 01/01/11 | | | 5,412,600 |
| | 1,250,000 | | Puerto Rico Convention Center District Authority, Hotel Occupancy Tax Revenue Bonds, Series A | | 5.00 | | | 07/01/11 | | | 1,300,725 |
| | 3,000,000 | | Reedy Creek, Florida, Improvement District Utilities Revenue Bonds, Series 2, (MBIA) | | 5.25 | | | 10/01/10 | | | 3,156,030 |
| | 5,000,000 | | San Antonio, Texas, Electric & Gas Systems Revenue Bonds,
Series A | | 5.00 | | | 02/01/10 | | | 5,193,000 |
See Notes to Financial Statements.
57
Excelsior Tax-Exempt Funds, Inc.
Portfolio of Investments — March 31, 2007
Short-Term Tax-Exempt Securities Fund — (continued)
| | | | | | | | | | | |
Principal
Amount | | | | Rate | | | Maturity
Date | | Value |
| | | | | | | | | | | |
| | TAX-EXEMPT SECURITIES — (continued) |
| $ | 3,995,000 | | South Carolina State Transportation Infrastructure, Bank Revenue Bonds,
Series A, (AMBAC) | | 5.00 | % | | 10/01/09 | | $ | 4,127,155 |
| | 7,000,000 | | Southeastern Virginia Public Services Authority Revenue Bonds, Series A, (MBIA) | | 5.25 | | | 07/01/10 | | | 7,354,410 |
| | 3,750,000 | | Tennessee State Energy Acquisition Corporation Gas Revenue Bonds,
Series A | | 5.00 | | | 09/01/09 | | | 3,849,900 |
| | 1,500,000 | | Texas State Municipal Gas Acquisition & Supply Corp., Gas Supply Revenue
Bonds, Senior Lien, Series A | | 5.00 | | | 12/15/10 | | | 1,558,830 |
| | 3,000,000 | | Texas State Transportation Commission Revenue Bonds, First Tier, Series A | | 5.00 | | | 04/01/12 | | | 3,173,460 |
| | 2,500,000 | | Troy, New York, Industrial Development Authority Civic Facility Revenue Bonds, Rensselaer Polytech, Series E, (XLCA), (Mandatory Put 09/01/11 @ 100) | | 4.05 | | | 04/01/37 | | | 2,513,975 |
| | | | | | | | | | | |
| | | TOTAL TAX-EXEMPT SECURITIES (Cost $86,770,633) | | | 86,713,341 |
| | | | | | | | | | | |
| TAX-EXEMPT SECURITIES – ESCROWED IN U.S.
GOVERNMENTS — 9.03% |
| | 4,565,000 | | Chicago, Illinois, Sales Tax Revenue Bonds, (FGIC) (Prerefunded 01/01/09 @ 101) | | 5.38 | | | 01/01/30 | | | 4,740,889 |
| | 595,000 | | New Jersey State Economic Development Authority Revenue Bonds, Series F
(Escrowed to Maturity) | | 5.00 | | | 06/15/07 | | | 596,601 |
| | | | | | | | | | | |
Principal
Amount | | | | Rate | | | Maturity
Date | | Value |
| | | | | | | | | | | |
| TAX-EXEMPT SECURITIES — ESCROWED IN U.S.
GOVERNMENTS — (continued) |
| $ | 4,030,000 | | New York City, New York, Transitional Finance Authority Revenue Bonds, Series A, (Escrowed to Maturity) | | 5.00 | % | | 11/01/07 | | $ | 4,064,013 |
| | | | | | | | | | | |
| | | TOTAL TAX-EXEMPT SECURITIES — ESCROWED IN U.S. GOVERNMENTS
(Cost $9,418,705) | | | 9,401,503 |
| | | | | | | | | | | |
| | | | |
| Shares | | | | | | | | | |
| | REGISTERED INVESTMENT COMPANIES — 0.28% |
| | 291,929 | | BlackRock Muni Fund | | | 291,929 |
| | 1 | | Dreyfus Tax Exempt Cash Fund | | | 1 |
| | | | | | | | | | | |
| | | TOTAL REGISTERED INVESTMENT COMPANIES
(Cost $291,930) | | | 291,930 |
| | | | | | | | | | | |
| | | | | | | | | | |
TOTAL INVESTMENTS
(Cost $103,081,268) | | 98.95 | % | | $ | 103,006,774 |
OTHER ASSETS IN EXCESS OF
LIABILITIES | | 1.05 | | | | 1,088,697 |
| | | | | | | | | | |
NET ASSETS | | 100.00 | % | | $ | 104,095,471 |
| | | | | | | | | | |
| (a) | Variable Rate Security—The rate disclosed is as of March 31, 2007. |
AMBAC—American Municipal Bond Assurance Corp.
BNY—Bank of New York
FGIC—Financial Guaranty Insurance Corp.
FSA—Financial Security Assurance
IBC—Insured Bond Certificates
MBIA—Municipal Bond Insurance Association
XLCA—XL Capital Assurance
Notes (The following notes have not been audited by PricewaterhouseCoopers LLP):
These municipal securities meet the three highest ratings assigned by Moody’s Investors Services, Inc. or Standard and Poor’s Corporation or, where not rated, are determined by the Advisor, under the supervision of the Board of Directors, to be of comparable quality at the time of purchase to rated instruments that may be acquired by the Fund.
At March 31, 2007, approximately 13% of the net assets are invested in municipal securities that have letter of credit enhancement features or escrows in U.S. Government securities backing them, on which the Fund relies. Without such features, the securities may or may not meet the quality standards of securities purchased by the Fund.
See Notes to Financial Statements.
58
Excelsior Tax-Exempt Funds, Inc.
Portfolio of Investments — March 31, 2007
Short-Term Tax-Exempt Securities Fund — (continued)
The summary of the Fund’s investments as of March 31, 2007 is as follows: (Unaudited)
| | | | | | |
State Diversification | | % of
Net
Assets | | | Value |
New York | | 17.59 | % | | $ | 18,310,568 |
Texas | | 13.99 | | | | 14,560,190 |
Virginia | | 11.95 | | | | 12,435,510 |
New Jersey | | 9.62 | | | | 10,019,133 |
Illinois | | 8.75 | | | | 9,107,370 |
Tennessee | | 8.64 | | | | 8,990,182 |
Florida | | 6.80 | | | | 7,078,564 |
California | | 5.86 | | | | 6,101,040 |
Ohio | | 4.42 | | | | 4,600,000 |
South Carolina | | 3.96 | | | | 4,127,154 |
Nevada | | 3.92 | | | | 4,084,408 |
Maryland | | 1.92 | | | | 2,000,000 |
Puerto Rico | | 1.25 | | | | 1,300,725 |
Registered Investment Companies | | 0.28 | | | | 291,930 |
| | | | | | |
Total Investments | | 98.95 | % | | $ | 103,006,774 |
Other Assets in Excess of Liabilities | | 1.05 | | | | 1,088,697 |
| | | | | | |
Net Assets | | 100.00 | % | | $ | 104,095,471 |
| | | | | | |
See Notes to Financial Statements.
59
Excelsior Funds
Statements of Assets and Liabilities
March 31, 2007
| | | | | | | | | | | | | | | | |
| | | | |
| | | California Short-Intermediate Term Tax-Exempt Income Fund | | | Core Bond
Fund | | | High Yield
Fund | | | Intermediate- Term Bond
Fund | |
ASSETS: | | | | | | | | | | | | | | | | |
Investments, at cost–see accompanying portfolios | | $ | 56,023,581 | | | $ | 549,299,881 | | | $ | 110,427,831 | | | $ | 464,987,213 | |
| | | | | | | | | | | | | | | | |
Investments, at value (Note 1) | | $ | 56,006,869 | | | $ | 550,355,840 | | | $ | 114,960,981 | | | $ | 465,349,614 | |
Cash | | | — | | | | 172,942 | | | | 131,318 | | | | 214,611 | |
Interest receivable | | | 732,717 | | | | 4,413,659 | | | | 2,376,317 | | | | 3,413,504 | |
Receivable for investments sold | | | — | | | | 333,651 | | | | 1,136,514 | | | | 1,999,838 | |
Receivable for fund shares sold | | | 46,540 | | | | 506,201 | | | | 503,500 | | | | 582,812 | |
Receivable from advisor | | | — | | | | — | | | | 114,221 | | | | — | |
Net receivable for variation margin on futures contracts | | | — | | | | 5,391 | | | | — | | | | 6,875 | |
Reclaims receivable | | | — | | | | — | | | | — | | | | — | |
Prepaid expenses | | | 825 | | | | 9,532 | | | | 1,593 | | | | 6,434 | |
| | | | | | | | | | | | | | | | |
Total Assets | | | 56,786,951 | | | | 555,797,216 | | | | 119,224,444 | | | | 471,573,688 | |
LIABILITIES: | | | | | | | | | | | | | | | | |
Payable for dividends declared | | | 113,224 | | | | 1,360,741 | | | | 583,926 | | | | 1,520,466 | |
Payable for investments purchased | | | — | | | | 1,742,048 | | | | 1,496,875 | | | | 2,008,125 | |
Payable for fund shares redeemed | | | 20,302 | | | | 450,371 | | | | 989,855 | | | | 423,418 | |
Investment advisory fees payable (Note 2) | | | — | | | | 170,085 | | | | — | | | | 109,044 | |
Administration fees payable (Note 2) | | | — | | | | 71,583 | | | | 1,451 | | | | 60,940 | |
Distribution and shareholder servicing fees payable (Note 2) | | | 11,567 | | | | 67,066 | | | | 25,911 | | | | 82,006 | |
Accrued expenses and other payables | | | 36,631 | | | | 215,549 | | | | 129,521 | | | | 93,846 | |
| | | | | | | | | | | | | | | | |
Total Liabilities | | | 181,724 | | | | 4,077,443 | | | | 3,227,539 | | | | 4,297,845 | |
| | | | | | | | | | | | | | | | |
NET ASSETS | | $ | 56,605,227 | | | $ | 551,719,773 | | | $ | 115,996,905 | | | $ | 467,275,843 | |
| | | | | | | | | | | | | | | | |
NET ASSETS consist of: | | | | | | | | | | | | | | | | |
Undistributed (distributions in excess of) net investment income | | $ | 741 | | | $ | 23,250 | | | $ | (496,938 | ) | | $ | (45,974 | ) |
Accumulated net realized gain (loss) on investments | | | (29,603 | ) | | | (1,867,299 | ) | | | (65,480,709 | ) | | | (5,229,655 | ) |
Unrealized appreciation (depreciation) of investments | | | (16,712 | ) | | | 1,096,687 | | | | 4,533,150 | | | | 431,095 | |
Par value (Note 5) | | | 7,904 | | | | 61,436 | | | | 241 | | | | 65,831 | |
Paid in capital in excess of par value | | | 56,642,897 | | | | 552,405,699 | | | | 177,441,161 | | | | 472,054,546 | |
| | | | | | | | | | | | | | | | |
Net Assets | | $ | 56,605,227 | | | $ | 551,719,773 | | | $ | 115,996,905 | | | $ | 467,275,843 | |
| | | | | | | | | | | | | | | | |
Net Assets: | | | | | | | | | | | | | | | | |
Shares | | $ | 56,605,227 | | | $ | 313,966,821 | | | $ | 111,687,408 | | | $ | 467,275,843 | |
Institutional Shares | | | — | | | | 237,751,881 | | | | 4,309,497 | | | | — | |
Retirement Shares | | | — | | | | 1,071 | | | | — | | | | — | |
Shares Outstanding (Note 5): | | | | | | | | | | | | | | | | |
Shares | | | 7,903,871 | | | | 34,965,727 | | | | 23,247,564 | | | | 65,831,298 | |
Institutional Shares | | | — | | | | 26,469,879 | | | | 897,626 | | | | — | |
Retirement Shares | | | — | | | | 119 | | | | — | | | | — | |
NET ASSET VALUE PER SHARE (net assets ÷ shares outstanding) | | | | | | | | | | | | | | | | |
Shares | | | $7.16 | | | | $8.98 | | | | $4.80 | | | | $7.10 | |
| | | | | | | | | | | | | | | | |
Institutional Shares | | | — | | | | $8.98 | | | | $4.80 | | | | — | |
| | | | | | | | | | | | | | | | |
Retirement Shares | | | — | | | | $8.98 | (a) | | | — | | | | — | |
| | | | | | | | | | | | | | | | |
| (a) | | Due to rounding net assets divided by shares outstanding does not equal the net asset value per share. |
See Notes to Financial Statements.
60
| | | | | | | | | | | | | | | | | |
| | | | |
Intermediate-
Term
Tax-Exempt
Fund | | | Long-Term
Tax-Exempt
Fund | | New York
Intermediate-
Term Tax-Exempt
Fund | | | Short-Term
Government
Securities
Fund | | | Short-Term
Tax-Exempt
Securities
Fund | |
| | | | | | | | | | | | | | | | | |
| $ | 384,015,191 | | | $ | 63,425,629 | | $ | 139,236,630 | | | $ | 256,649,722 | | | $ | 103,081,268 | |
| | | | | | | | | | | | | | | | | | |
| $ | 388,263,615 | | | $ | 64,234,045 | | $ | 140,196,013 | | | $ | 256,120,932 | | | $ | 103,006,774 | |
| | — | | | | — | | | — | | | | 37,614 | | | | — | |
| | 4,981,613 | | | | 854,413 | | | 1,979,702 | | | | 1,969,821 | | | | 1,476,373 | |
| | — | | | | — | | | — | | | | 756,724 | | | | — | |
| | 727,477 | | | | 522,766 | | | 50,000 | | | | 756,805 | | | | — | |
| | — | | | | — | | | — | | | | — | | | | — | |
| | — | | | | — | | | — | | | | 4,844 | | | | — | |
| | — | | | | — | | | — | | | | — | | | | — | |
| | 5,204 | | | | 923 | | | 1,902 | | | | 3,801 | | | | 1,575 | |
| | | | | | | | | | | | | | | | | | |
| | 393,977,909 | | | | 65,612,147 | | | 142,227,617 | | | | 259,650,541 | | | | 104,484,722 | |
| | | | | | | | | | | | | | | | | |
| | 1,035,945 | | | | 150,672 | | | 322,226 | | | | 689,127 | | | | 234,363 | |
| | — | | | | — | | | — | | | | — | | | | — | |
| | 189,999 | | | | 4,317 | | | 312,691 | | | | 671,543 | | | | 70,711 | |
| | 61,403 | | | | 8,403 | | | 31,907 | | | | 46,886 | | | | 307 | |
| | 51,194 | | | | 8,479 | | | 18,528 | | | | 33,750 | | | | 13,748 | |
| | 86,636 | | | | 16,553 | | | 33,607 | | | | 81,017 | | | | 3,182 | |
| | 89,707 | | | | 47,473 | | | 54,407 | | | | 109,351 | | | | 66,940 | |
| | | | | | | | | | | | | | | | | | |
| | 1,514,884 | | | | 235,897 | | | 773,366 | | | | 1,631,674 | | | | 389,251 | |
| | | | | | | | | | | | | | | | | | |
| $ | 392,463,025 | | | $ | 65,376,250 | | $ | 141,454,251 | | | $ | 258,018,867 | | | $ | 104,095,471 | |
| | | | | | | | | | | | | | | | | | |
| | | | | | | | | | | | | | | | | |
| $ | 48,700 | | | $ | 27,130 | | $ | 1,189 | | | $ | (27,406 | ) | | $ | 3,061 | |
| | (789,548 | ) | | | 268,755 | | | (746,293 | ) | | | (15,179,011 | ) | | | (2,843,991 | ) |
| | 4,248,424 | | | | 808,416 | | | 959,383 | | | | (487,822 | ) | | | (74,494 | ) |
| | 42,031 | | | | 6,449 | | | 16,398 | | | | 37,008 | | | | 14,653 | |
| | 388,913,418 | | | | 64,265,500 | | | 141,223,574 | | | | 273,676,098 | | | | 106,996,242 | |
| | | | | | | | | | | | | | | | | | |
| $ | 392,463,025 | | | $ | 65,376,250 | | $ | 141,454,251 | | | $ | 258,018,867 | | | $ | 104,095,471 | |
| | | | | | | | | | | | | | | | | | |
| | | | | | | | | | | | | | | | | |
| $ | 392,463,025 | | | $ | 65,376,250 | | $ | 141,454,251 | | | $ | 258,018,867 | | | $ | 104,095,471 | |
| | — | | | | — | | | — | | | | — | | | | — | |
| | — | | | | — | | | — | | | | — | | | | — | |
| | | | | | | | | | | | | | | | | |
| | 42,031,446 | | | | 6,448,625 | | | 16,398,410 | | | | 37,008,349 | | | | 14,652,563 | |
| | — | | | | — | | | — | | | | — | | | | — | |
| | — | | | | — | | | — | | | | — | | | | — | |
| | | | | | | | | | | | | | | | | |
| | $9.34 | | | | $10.14 | | | $8.63 | | | | $6.97 | | | | $7.10 | |
| | | | | | | | | | | | | | | | | | |
| | — | | | | — | | | — | | | | — | | | | — | |
| | | | | | | | | | | | | | | | | | |
| | — | | | | — | | | — | | | | — | | | | — | |
| | | | | | | | | | | | | | | | | | |
See Notes to Financial Statements.
61
Excelsior Funds
Statements of Operations
For the Year Ended March 31, 2007
| | | | | | | | | | | | | | | | |
| | | | |
| | | California
Short-Intermediate
Term Tax-Exempt
Income Fund | | | Core Bond
Fund | | | High Yield
Fund | | | Intermediate-
Term Bond
Fund | |
INVESTMENT INCOME: | | | | | | | | | | | | | | | | |
Interest income | | $ | 2,187,428 | | | $ | 21,099,384 | | | $ | 9,698,634 | | | $ | 22,219,156 | |
Dividend income | | | 58,763 | | | | 999,150 | | | | 65,635 | | | | 818,435 | |
| | | | | | | | | | | | | | | | |
Total Income | | | 2,246,191 | | | | 22,098,534 | | | | 9,764,269 | | | | 23,037,591 | |
EXPENSES: | | | | | | | | | | | | | | | | |
Investment advisory fees (Note 2) | | | 307,162 | | | | 2,873,544 | | | | 978,058 | | | | 1,573,622 | |
Administration fees (Note 2) | | | 92,710 | | | | 633,088 | | | | 184,503 | | | | 678,515 | |
Shareholder servicing fees- Shares (Note 2) | | | 153,581 | | | | 738,959 | | | | 286,507 | | | | 1,124,018 | |
Distribution and shareholder servicing fees- Retirement Shares (Note 2) | | | — | | | | 7 | | | | — | | | | — | |
Legal and audit fees | | | 30,033 | | | | 61,650 | | | | 481,103 | | | | 44,215 | |
Custodian fees | | | 4,287 | | | | 43,655 | | | | 14,279 | | | | 31,890 | |
Transfer agent fees | | | 14,895 | | | | 165,543 | | | | 34,437 | | | | 29,198 | |
Directors’/ Trustees’ fees and expenses (Note 2) | | | 7,397 | | | | 17,725 | | | | 9,095 | | | | 17,608 | |
Miscellaneous expenses | | | 36,329 | | | | 149,636 | | | | 66,401 | | | | 93,854 | |
| | | | | | | | | | | | | | | | |
Total Expenses | | | 646,394 | | | | 4,683,807 | | | | 2,054,383 | | | | 3,592,920 | |
Fees waived and reimbursed by: | | | | | | | | | | | | | | | | |
Investment Adviser (Note 2) | | | (307,162 | ) | | | (1,217,980 | ) | | | (522,552 | ) | | | (220,858 | ) |
Administrator (Note 2) | | | (32,228 | ) | | | (4,685 | ) | | | (271,220 | ) | | | (3,986 | ) |
Custody earning credits | | | (812 | ) | | | (8,001 | ) | | | (8,165 | ) | | | (8,412 | ) |
| | | | | | | | | | | | | | | | |
Net Expenses | | | 306,192 | | | | 3,453,141 | | | | 1,252,446 | | | | 3,359,664 | |
| | | | | | | | | | | | | | | | |
NET INVESTMENT INCOME | | | 1,939,999 | | | | 18,645,393 | | | | 8,511,823 | | | | 19,677,927 | |
| | | | | | | | | | | | | | | | |
REALIZED AND UNREALIZED GAIN (LOSS) ON INVESTMENTS (Note 1): | | | | | | | | | | | | | | | | |
Net realized gain (loss) on: | | | | | | | | | | | | | | | | |
Security transactions | | | 12,011 | | | | (67,050 | ) | | | (309,422 | ) | | | (3,117,415 | ) |
Futures | | | — | | | | — | | | | — | | | | (11,964 | ) |
| | | | | | | | | | | | | | | | |
Total net realized gain (loss) | | | 12,011 | | | | (67,050 | ) | | | (309,422 | ) | | | (3,129,379 | ) |
| | | | | | | | | | | | | | | | |
Change in unrealized appreciation (depreciation) of investments, futures and options during the year | | | 335,549 | | | | 5,359,028 | | | | 6,524,399 | | | | 8,596,210 | |
| | | | | | | | | | | | | | | | |
Net realized and unrealized gain (loss) on investments | | | 347,560 | | | | 5,291,978 | | | | 6,214,977 | | | | 5,466,831 | |
| | | | | | | | | | | | | | | | |
Net increase in net assets resulting from operations | | $ | 2,287,559 | | | $ | 23,937,371 | | | $ | 14,726,800 | | | $ | 25,144,758 | |
| | | | | | | | | | | | | | | | |
See Notes to Financial Statements.
62
| | | | | | | | | | | | | | | | | | |
| | | | |
Intermediate-
Term
Tax-Exempt
Fund | | | Long-Term
Tax-Exempt
Fund | | | New York
Intermediate-
Term Tax-Exempt
Fund | | | Short-Term
Government
Securities
Fund | | | Short-Term
Tax-Exempt
Securities
Fund | |
| | | | | | | | | | | | | | | | | | |
| $ | 14,699,859 | | | $ | 2,600,657 | | | $ | 5,214,718 | | | $ | 12,357,359 | | | $ | 4,064,636 | |
| | 110,298 | | | | 44,055 | | | | 39,308 | | | | 101,683 | | | | 24,497 | |
| | | | | | | | | | | | | | | | | | | |
| | 14,810,157 | | | | 2,644,712 | | | | 5,254,026 | | | | 12,459,042 | | | | 4,089,133 | |
| | | | | | | | | | | | | | | | | | |
| | 1,296,023 | | | | 315,596 | | | | 676,050 | | | | 849,998 | | | | 351,768 | |
| | 558,818 | | | | 95,255 | | | | 204,049 | | | | 427,588 | | | | 176,955 | |
| | 925,733 | | | | 146,753 | | | | 338,025 | | | | 708,328 | | | | 293,138 | |
| | | | | | | | | | | | | | | | | | |
| | — | | | | — | | | | — | | | | — | | | | — | |
| | 29,918 | | | | 32,861 | | | | 31,068 | | | | 29,366 | | | | 30,363 | |
| | 24,412 | | | | 7,366 | | | | 14,657 | | | | 36,651 | | | | 11,736 | |
| | 21,745 | | | | 24,736 | | | | 16,049 | | | | 97,265 | | | | 16,307 | |
| | 15,384 | | | | 7,394 | | | | 9,291 | | | | 13,609 | | | | 8,951 | |
| | 85,449 | | | | 41,825 | | | | 48,612 | | | | 73,067 | | | | 49,601 | |
| | | | | | | | | | | | | | | | | | | |
| | 2,957,482 | | | | 671,786 | | | | 1,337,801 | | | | 2,235,872 | | | | 938,819 | |
| | | | | | | | | | | | | | | | | | |
| | (550,546 | ) | | | (166,831 | ) | | | (256,114 | ) | | | (110,584 | ) | | | (235,286 | ) |
| | (1,075 | ) | | | (177 | ) | | | (388 | ) | | | (2,197 | ) | | | (286 | ) |
| | (5,895 | ) | | | (539 | ) | | | (1,535 | ) | | | (10,691 | ) | | | (4,142 | ) |
| | | | | | | | | | | | | | | | | | | |
| | 2,399,966 | | | | 504,239 | | | | 1,079,764 | | | | 2,112,400 | | | | 699,105 | |
| | | | | | | | | | | | | | | | | | | |
| | 12,410,191 | | | | 2,140,473 | | | | 4,174,262 | | | | 10,346,642 | | | | 3,390,028 | |
| | | | | | | | | | | | | | | | | | | |
| | | | | | | | | | | | | | | | | | |
| | | | | | | | | | | | | | | | | | |
| | | | | | | | | | | | | | | | | | |
| | (789,548 | ) | | | 267,714 | | | | (221,768 | ) | | | (1,580,994 | ) | | | (202,111 | ) |
| | — | | | | — | | | | — | | | | (18,146 | ) | | | — | |
| | | | | | | | | | | | | | | | | | | |
| | (789,548 | ) | | | 267,714 | | | | (221,768 | ) | | | (1,599,140 | ) | | | (202,111 | ) |
| | | | | | | | | | | | | | | | | | | |
| | | | | | | | | | | | | | | | | | |
| | | | |
| | 3,456,392 | | | | 768,194 | | | | 1,496,004 | | | | 4,796,996 | | | | 589,130 | |
| | | | | | | | | | | | | | | | | | | |
| | | | | | | | | | | | | | | | | | |
| | 2,666,844 | | | | 1,035,908 | | | | 1,274,236 | | | | 3,197,856 | | | | 387,019 | |
| | | | | | | | | | | | | | | | | | | |
| | | | | | | | | | | | | | | | | | |
| $ | 15,077,035 | | | $ | 3,176,381 | | | $ | 5,448,498 | | | $ | 13,544,498 | | | $ | 3,777,047 | |
| | | | | | | | | | | | | | | | | | | |
See Notes to Financial Statements.
63
Excelsior Funds
Statements of Changes in Net Assets
| | | | | | | | | | | | | | | | |
| | |
| | | California Short-
Intermediate Term
Tax-Exempt Income Fund | | | Core Bond Fund | |
| | | Year Ended March 31, | | | Year Ended March 31, | |
| | | 2007 | | | 2006 | | | 2007 | | | 2006 | |
Net investment income | | $ | 1,939,999 | | | $ | 2,060,305 | | | $ | 18,645,393 | | | $ | 10,061,835 | |
Net realized gain (loss) on security transactions | | | 12,011 | | | | 215,226 | | | | (67,050 | ) | | | 1,284,930 | |
Net realized gain (loss) on futures | | | — | | | | — | | | | — | | | | — | |
Change in unrealized appreciation (depreciation) of investments, futures and options during the year | | | 335,549 | | | | (1,292,978 | ) | | | 5,359,028 | | | | (7,274,735 | ) |
| | | | | | | | | | | | | | | | |
Net increase in net assets resulting from operations | | | 2,287,559 | | | | 982,553 | | | | 23,937,371 | | | | 4,072,030 | |
| | | | | | | | | | | | | | | | |
Distributions to shareholders: | | | | | | | | | | | | | | | | |
From net investment income | | | | | | | | | | | | | | | | |
Shares | | | (1,939,807 | ) | | | (2,061,472 | ) | | | (12,851,594 | ) | | | (10,218,978 | ) |
Institutional Shares | | | — | | | | — | | | | (5,693,159 | ) | | | (6,254 | ) |
Retirement Shares | | | — | | | | — | | | | (40 | ) | | | (38 | ) |
From net realized gain on investments | | | | | | | | | | | | | | | | |
Shares | | | (255,808 | ) | | | — | | | | — | | | | (3,571,500 | ) |
Institutional Shares | | | — | | | | — | | | | — | | | | (13 | ) |
Retirement Shares | | | — | | | | — | | | | — | | | | (13 | ) |
From tax return of capital | | | | | | | | | | | | | | | | |
Shares | | | — | | | | — | | | | — | | | | — | |
Institutional Shares | | | — | | | | — | | | | — | | | | — | |
| | | | | | | | | | | | | | | | |
Total distributions | | | (2,195,615 | ) | | | (2,061,472 | ) | | | (18,544,793 | ) | | | (13,796,796 | ) |
| | | | | | | | | | | | | | | | |
Increase (decrease) in net assets from fund share transactions (Note 5) | | | (9,841,880 | ) | | | 4,484,991 | | | | 263,311,270 | | | | 80,807,705 | |
| | | | | | | | | | | | | | | | |
Net increase (decrease) in net assets | | | (9,749,936 | ) | | | 3,406,072 | | | | 268,703,848 | | | | 71,082,939 | |
| | | | | | | | | | | | | | | | |
NET ASSETS: | | | | | | | | | | | | | | | | |
Beginning of year | | | 66,355,163 | | | | 62,949,091 | | | | 283,015,925 | | | | 211,932,986 | |
| | | | | | | | | | | | | | | | |
End of year(1) | | $ | 56,605,227 | | | $ | 66,355,163 | | | $ | 551,719,773 | | | $ | 283,015,925 | |
| | | | | | | | | | | | | | | | |
(1) Including undistributed (distributions in excess of) net investment income | | $ | 741 | | | $ | 492 | | | $ | 23,250 | | | $ | 2,407 | |
| | | | | | | | | | | | | | | | |
See Notes to Financial Statements.
64
| | | | | | | | | | | | | | | | | | | | | | |
| | |
| High Yield Fund | | | Intermediate-Term Bond Fund | | | Intermediate-Term
Tax-Exempt Fund | |
| Year Ended March 31, | | | Year Ended March 31, | | | Year Ended March 31, | |
| 2007 | | | 2006 | | | 2007 | | | 2006 | | | 2007 | | | 2006 | |
| $ | 8,511,823 | | | $ | 11,285,812 | | | $ | 19,677,927 | | | $ | 16,340,106 | | | $ | 12,410,191 | | | $ | 10,941,942 | |
| | (309,422 | ) | | | (4,085,478 | ) | | | (3,117,415 | ) | | | (1,475,445 | ) | | | (789,548 | ) | | | 730,630 | |
| | — | | | | — | | | | (11,964 | ) | | | — | | | | — | | | | | |
| | 6,524,399 | | | | (1,518,767 | ) | | | 8,596,210 | | | | (6,389,324 | ) | | | 3,456,392 | | | | (5,288,523 | ) |
| | | | | | | | | | | | | | | | | | | | | | | |
| | 14,726,800 | | | | 5,681,567 | | | | 25,144,758 | | | | 8,475,337 | | | | 15,077,035 | | | | 6,384,049 | |
| | | | | | | | | | | | | | | | | | | | | | | |
| | | | | | | | | | | | | | | | | | | | | | |
| | | | | | | | | | | | | | | | | | | | | | |
| | (7,813,910 | ) | | | (9,681,268 | ) | | | (19,642,311 | ) | | | (17,107,462 | ) | | | (12,408,623 | ) | | | (10,946,366 | ) |
| | (539,707 | ) | | | (1,002,532 | ) | | | — | | | | — | | | | — | | | | — | |
| | — | | | | — | | | | — | | | | — | | | | — | | | | — | |
| | | | | | | | | | | | | | | | | | | | | | |
| | — | | | | — | | | | — | | | | (1,062,921 | ) | | | (730,446 | ) | | | (367,682 | ) |
| | — | | | | — | | | | — | | | | — | | | | — | | | | — | |
| | — | | | | — | | | | — | | | | — | | | | — | | | | — | |
| | | | | | | | | | | | | | | | | | | | | | |
| | — | | | | (325,252 | ) | | | — | | | | — | | | | — | | | | — | |
| | — | | | | (28,599 | ) | | | — | | | | — | | | | — | | | | — | |
| | | | | | | | | | | | | | | | | | | | | | | |
| | (8,353,617 | ) | | | (11,037,651 | ) | | | (19,642,311 | ) | | | (18,170,383 | ) | | | (13,139,069 | ) | | | (11,314,048 | ) |
| | | | | | | | | | | | | | | | | | | | | | | |
| | (39,412,117 | ) | | | (15,055,145 | ) | | | 24,700,690 | | | | 36,375,391 | | | | 37,829,303 | | | | 8,085,957 | |
| | | | | | | | | | | | | | | | | | | | | | | |
| | (33,038,934 | ) | | | (20,411,229 | ) | | | 30,203,137 | | | | 26,680,345 | | | | 39,767,269 | | | | 3,155,958 | |
| | | | | | | | | | | | | | | | | | | | | | | |
| | | | | | | | | | | | | | | | | | | | | | |
| | 149,035,839 | | | | 169,447,068 | | | | 437,072,706 | | | | 410,392,361 | | | | 352,695,756 | | | | 349,539,798 | |
| | | | | | | | | | | | | | | | | | | | | | | |
| $ | 115,996,905 | | | $ | 149,035,839 | | | $ | 467,275,843 | | | $ | 437,072,706 | | | $ | 392,463,025 | | | $ | 352,695,756 | |
| | | | | | | | | | | | | | | | | | | | | | | |
$ | (496,938 | ) | | $ | (691,493 | ) | | $ | (45,974 | ) | | $ | (10,852 | ) | | $ | 48,700 | | | $ | 215 | |
| | | | | | | | | | | | | | | | | | | | | | | |
See Notes to Financial Statements.
65
Excelsior Funds
Statements of Changes in Net Assets
| | | | | | | | | | | | | | | | |
| | |
| | | Long-Term Tax-Exempt
Fund | | | New York Intermediate-Term
Tax-Exempt Fund | |
| | | Year Ended March 31, | | | Year Ended March 31, | |
| | | 2007 | | | 2006 | | | 2007 | | | 2006 | |
Net investment income | | $ | 2,140,473 | | | $ | 1,851,030 | | | $ | 4,174,262 | | | $ | 3,694,401 | |
Net realized gain (loss) on security transactions | | | 267,714 | | | | 654,816 | | | | (221,768 | ) | | | (524,525 | ) |
Net realized gain (loss) on futures | | | — | | | | — | | | | — | | | | — | |
Change in unrealized appreciation (depreciation) of investments during the year | | | 768,194 | | | | (820,799 | ) | | | 1,496,004 | | | | (227,681 | ) |
| | | | | | | | | | | | | | | | |
Net increase in net assets resulting from operations | | | 3,176,381 | | | | 1,685,047 | | | | 5,448,498 | | | | 2,942,195 | |
| | | | | | | | | | | | | | | | |
Ditributions to shareholders: | | | | | | | | | | | | | | | | |
From net investment income | | | | | | | | | | | | | | | | |
Shares | | | (2,140,560 | ) | | | (1,851,155 | ) | | | (4,173,194 | ) | | | (3,697,161 | ) |
From net realized gain on investments | | | | | | | | | | | | | | | | |
Shares | | | (392,493 | ) | | | — | | | | — | | | | (1,825,117 | ) |
| | | | | | | | | | | | | | | | |
Total distributions | | | (2,533,053 | ) | | | (1,851,155 | ) | | | (4,173,194 | ) | | | (5,522,278 | ) |
| | | | | | | | | | | | | | | | |
Increase (decrease) in net assets from fund share transactions (Note 5) | | | 3,475,678 | | | | (1,393,785 | ) | | | 9,152,946 | | | | (4,646,822 | ) |
| | | | | | | | | | | | | | | | |
Net increase (decrease) in net assets | | | 4,119,006 | | | | (1,559,893 | ) | | | 10,428,250 | | | | (7,226,905 | ) |
| | | | | | | | | | | | | | | | |
NET ASSETS: | | | | | | | | | | | | | | | | |
Beginning of year | | | 61,257,244 | | | | 62,817,137 | | | | 131,026,001 | | | | 138,252,906 | |
| | | | | | | | | | | | | | | | |
End of year(1) | | $ | 65,376,250 | | | $ | 61,257,244 | | | $ | 141,454,251 | | | $ | 131,026,001 | |
| | | | | | | | | | | | | | | | |
(1) Including undistributed (distributions in excess
of) net investment income | | $ | 27,130 | | | $ | 1,401 | | | $ | 1,189 | | | $ | 121 | |
| | | | | | | | | | | | | | | | |
See Notes to Financial Statements.
66
| | | | | | | | | | | | | | |
| |
Short-Term Government
Securities Fund | | | Short-Term Tax-Exempt
Securities | |
| Year Ended March 31, | | | Fund Year Ended March 31, | |
| 2007 | | | 2006 | | | 2007 | | | 2006 | |
| $ | 10,346,642 | | | $ | 10,630,035 | | | $ | 3,390,028 | | | $ | 3,454,819 | |
| | (1,580,994 | ) | | | (2,723,414 | ) | | | (202,111 | ) | | | (2,252,492 | ) |
| | (18,146 | ) | | | — | | | | — | | | | — | |
| | | | | | | | | | | | | | |
| | 4,796,996 | | | | 503,856 | | | | 589,130 | | | | 1,341,352 | |
| | | | | | | | | | | | | | | |
| | 13,544,498 | | | | 8,410,477 | | | | 3,777,047 | | | | 2,543,679 | |
| | | | | | | | | | | | | | | |
| | | | | | | | | | | | | | |
| | | | | | | | | | | | | | |
| | (11,425,192 | ) | | | (13,063,721 | ) | | | (3,386,967 | ) | | | (3,460,145 | ) |
| | | | | | | | | | | | | | |
| | — | | | | — | | | | — | | | | — | |
| | | | | | | | | | | | | | | |
| | (11,425,192 | ) | | | (13,063,721 | ) | | | (3,386,967 | ) | | | (3,460,145 | ) |
| | | | | | | | | | | | | | | |
| | | | | | | | | | | | | | |
| | (83,267,253 | ) | | | (58,697,749 | ) | | | (29,506,088 | ) | | | (104,932,090 | ) |
| | | | | | | | | | | | | | | |
| | (81,147,947 | ) | | | (63,350,993 | ) | | | (29,116,008 | ) | | | (105,848,556 | ) |
| | | | | | | | | | | | | | | |
| | | | | | | | | | | | | | |
| | 339,166,814 | | | | 402,517,807 | | | | 133,211,479 | | | | 239,060,035 | |
| | | | | | | | | | | | | | | |
| $ | 258,018,867 | | | $ | 339,166,814 | | | $ | 104,095,471 | | | $ | 133,211,479 | |
| | | | | | | | | | | | | | | |
$ | (27,406 | ) | | $ | (29,336 | ) | | $ | 3,061 | | | $ | — | |
| | | | | | | | | | | | | | | |
See Notes to Financial Statements.
67
Excelsior Funds
Financial Highlights — Selected Per Share Data and Ratios
| | | | | | | | | | | | | | | | | | | | | | | |
| | | | | | |
| | | Net Asset Value,
Beginning of
Year | | Net
Investment
Income | | | Net Realized and
Unrealized
Gain (Loss) on
Investments | | | Total From
Investment
Operations | | | Distributions
From Net
Investment
Income | | | Distributions
From Net
Realized
Gain on
Investments | |
CALIFORNIA SHORT-INTERMEDIATE TERM TAX-EXEMPT INCOME FUND — (10/01/96*) | |
Shares: | | | | | | | | | | | | | | | | | | | | | | | |
Year Ended March 31, | | | | | | | | | | | | | | | | | |
2007 | | $ | 7.16 | | $ | 0.23 | (2) | | $ | 0.03 | (2) | | $ | 0.26 | | | $ | (0.23 | ) | | $ | (0.03 | ) |
2006 | | | 7.27 | | | 0.23 | (2) | | | (0.11 | )(2) | | | 0.12 | | | | (0.23 | ) | | | — | |
2005 | | | 7.49 | | | 0.23 | (2) | | | (0.22 | )(2) | | | 0.01 | | | | (0.23 | ) | | | — | |
2004 | | | 7.49 | | | 0.24 | | | | — | | | | 0.24 | | | | (0.24 | ) | | | — | |
2003 | | | 7.27 | | | 0.25 | | | | 0.22 | | | | 0.47 | | | | (0.25 | ) | | | — | (3) |
CORE BOND FUND — (01/09/86*) | |
Shares: | | | | | | | | | | | | | | | | | | | | | | | |
Year Ended March 31, | | | | | | | | | | | | | | | | | |
2007 | | $ | 8.84 | | $ | 0.39 | (2) | | $ | 0.14 | (2) | | $ | 0.53 | | | $ | (0.39 | ) | | | — | |
2006 | | | 9.15 | | | 0.37 | (2) | | | (0.18 | )(2) | | | 0.19 | | | | (0.38 | ) | | $ | (0.12 | ) |
2005 | | | 9.43 | | | 0.37 | (2) | | | (0.23 | )(2) | | | 0.14 | | | | (0.37 | ) | | | (0.05 | ) |
2004 | | | 9.43 | | | 0.38 | | | | 0.14 | | | | 0.52 | | | | (0.38 | ) | | | (0.14 | ) |
2003 | | | 8.95 | | | 0.47 | | | | 0.50 | | | | 0.97 | | | | (0.48 | ) | | | (0.01 | ) |
HIGH YIELD FUND — (10/31/00*) | |
Shares: | | | | | | | | | | | | | | | | | | | | | | | |
Year Ended March 31, | | | | | | | | | | | | | | | | | |
2007 | | $ | 4.53 | | $ | 0.32 | (2) | | $ | 0.26 | (2) | | $ | 0.58 | | | $ | (0.31 | ) | | | — | |
2006 | | | 4.67 | | | 0.31 | (2) | | | (0.14 | )(2) | | | 0.17 | | | | (0.31 | )(4) | | | — | |
2005 | | | 4.71 | | | 0.34 | (2) | | | (0.08 | )(2) | | | 0.26 | | | | (0.30 | ) | | | — | |
2004 | | | 3.99 | | | 0.35 | (2) | | | 0.71 | (2) | | | 1.06 | | | | (0.34 | )(5) | | | — | |
2003 | | | 6.20 | | | 0.88 | (2) | | | (1.54 | )(2) | | | (0.66 | ) | | | (1.55 | )(6) | | | — | |
INTERMEDIATE-TERM BOND FUND — (12/31/92*) | |
Shares: | | | | | | | | | | | | | | | | | | | | | | | |
Year Ended March 31, | | | | | | | | | | | | | | | | | |
2007 | | $ | 7.01 | | $ | 0.31 | (2) | | $ | 0.09 | (2) | | $ | 0.40 | | | $ | (0.31 | ) | | | — | |
2006 | | | 7.16 | | | 0.27 | (2) | | | (0.12 | )(2) | | | 0.15 | | | | (0.28 | ) | | $ | (0.02 | ) |
2005 | | | 7.40 | | | 0.26 | (2) | | | (0.22 | )(2) | | | 0.03 | | | | (0.26 | ) | | | (0.01 | ) |
2004 | | | 7.39 | | | 0.26 | | | | 0.11 | | | | 0.37 | | | | (0.26 | ) | | | (0.10 | ) |
2003 | | | 7.10 | | | 0.37 | | | | 0.36 | | | | 0.73 | | | | (0.40 | ) | | | (0.04 | ) |
INTERMEDIATE-TERM TAX-EXEMPT FUND — (12/03/85*) | |
Shares: | | | | | | | | | | | | | | | | | | | | | | | |
Year Ended March 31, | | | | | | | | | | | | | | | | | |
2007 | | $ | 9.29 | | $ | 0.31 | (2) | | $ | 0.07 | (2) | | $ | 0.38 | | | $ | (0.31 | ) | | $ | (0.02 | ) |
2006 | | | 9.41 | | | 0.29 | (2) | | | (0.11 | )(2) | | | 0.18 | | | | (0.29 | ) | | | (0.01 | ) |
2005 | | | 9.69 | | | 0.26 | (2) | | | (0.24 | )(2) | | | 0.02 | | | | (0.26 | ) | | | (0.04 | ) |
2004 | | | 9.88 | | | 0.26 | | | | 0.15 | | | | 0.41 | | | | (0.26 | ) | | | (0.34 | ) |
2003 | | | 9.39 | | | 0.31 | | | | 0.55 | | | | 0.86 | | | | (0.31 | ) | | | (0.06 | ) |
| * | Commencement of operations. |
| (1) | Expense ratios before waiver of fees and reimbursement of expenses (if any) by adviser and administrator. |
| (2) | For comparative purposes, per share amounts are based on average shares outstanding. |
| (3) | Amount represents less than $0.01 per share. |
| (4) | Includes a tax return of capital of $(0.01). |
| (5) | Includes a tax return of capital of $(0.08). |
| (6) | Includes a tax return of capital of $(0.51). |
See Notes to Financial Statements.
68
| | | | | | | | | | | | | | | | | | | | | | | |
| | | | | | | |
Total
Distributions | | | Net Asset
Value,
End of
Year | | Total
Return | | | Net Assets,
End of
Year
(000’s) | | Ratio of Net
Operating
Expenses
to Average
Net Assets | | | Ratio of Gross
Operating
Expenses to
Average
Net Assets (1) | | | Ratio of Net
Investment
Income
to Average
Net Assets | | | Portfolio
Turnover
Rate | |
| | | | | | | | | | | | | | | | | | | | | | | |
| | | | | | | | | | | | | | | | | | | | | | | |
| | | | | | | | | | | | | | | | | | | | | | | |
| $ | (0.26 | ) | | $ | 7.16 | | 3.65 | % | | $ | 56,605 | | 0.50 | % | | 1.05 | % | | 3.16 | % | | 7 | % |
| | (0.23 | ) | | | 7.16 | | 1.60 | % | | | 66,355 | | 0.50 | % | | 1.03 | % | | 3.11 | % | | 48 | % |
| | (0.23 | ) | | | 7.27 | | 0.20 | % | | | 62,949 | | 0.50 | % | | 1.05 | % | | 3.18 | % | | 10 | % |
| | (0.24 | ) | | | 7.49 | | 3.19 | % | | | 66,894 | | 0.50 | % | | 0.90 | % | | 3.14 | % | | 15 | % |
| | (0.25 | ) | | | 7.49 | | 6.59 | % | | | 66,194 | | 0.46 | % | | 0.50 | % | | 3.36 | % | | 9 | % |
| | | | | | | | | | | | | | | | | | | | | | | |
| | | | | | | | | | | | | | | | | | | | | | | |
| | | | | | | | | | | | | | | | | | | | | | | |
| $ | (0.39 | ) | | $ | 8.98 | | 6.08 | % | | $ | 313,967 | | 0.90 | % | | 1.20 | % | | 4.36 | % | | 49 | % |
| | (0.50 | ) | | | 8.84 | | 2.00 | % | | | 281,767 | | 0.90 | % | | 1.30 | % | | 4.05 | % | | 95 | % |
| | (0.42 | ) | | | 9.15 | | 1.55 | % | | | 211,932 | | 0.90 | % | | 1.27 | % | | 3.99 | % | | 90 | % |
| | (0.52 | ) | | | 9.43 | | 5.74 | % | | | 269,027 | | 0.87 | % | | 1.11 | % | | 4.06 | % | | 84 | % |
| | (0.49 | ) | | | 9.43 | | 11.07 | % | | | 293,182 | | 0.84 | % | | 0.95 | % | | 5.10 | % | | 120 | % |
| | | | | | | | | | | | | | | | | | | | | | | |
| | | | | | | | | | | | | | | | | | | | | | | |
| | | | | | | | | | | | | | | | | | | | | | | |
| $ | (0.31 | ) | | $ | 4.80 | | 13.41 | % | | $ | 111,687 | | 1.05 | % | | 1.69 | % | | 6.95 | % | | 75 | % |
| | (0.31 | ) | | | 4.53 | | 3.72 | % | | | 136,991 | | 1.05 | % | | 1.29 | % | | 6.84 | % | | 62 | % |
| | (0.30 | ) | | | 4.67 | | 5.54 | % | | | 156,139 | | 1.04 | % | | 1.30 | % | | 6.50 | % | | 70 | % |
| | (0.34 | ) | | | 4.71 | | 27.45 | % | | | 151,476 | | 1.05 | % | | 1.36 | % | | 7.79 | % | | 170 | % |
| | (1.55 | ) | | | 3.99 | | (10.49 | )% | | | 131,342 | | 1.08 | % | | 1.35 | % | | 18.06 | % | | 153 | % |
| | | | | | | | | | | | | | | | | | | | | | | |
| | | | | | | | | | | | | | | | | | | | | | | |
| | | | | | | | | | | | | | | | | | | | | | | |
| $ | (0.31 | ) | | $ | 7.10 | | 5.79 | % | | $ | 467,276 | | 0.75 | % | | 0.80 | % | | 4.38 | % | | 70 | % |
| | (0.30 | ) | | | 7.01 | | 2.06 | % | | | 437,073 | | 0.72 | % | | 0.81 | % | | 3.74 | % | | 75 | % |
| | (0.27 | ) | | | 7.16 | | 0.45 | % | | | 410,392 | | 0.60 | % | | 0.81 | % | | 3.53 | % | | 59 | % |
| | (0.36 | ) | | | 7.40 | | 5.25 | % | | | 413,267 | | 0.56 | % | | 0.69 | % | | 3.56 | % | | 85 | % |
| | (0.44 | ) | | | 7.39 | | 10.50 | % | | | 404,627 | | 0.53 | % | | 0.69 | % | | 4.56 | % | | 98 | % |
| | | | | | | | | | | | | | | | | | | | | | | |
| | | | | | | | | | | | | | | | | | | | | | | |
| | | | | | | | | | | | | | | | | | | | | | | |
| $ | (0.33 | ) | | $ | 9.34 | | 4.15 | % | | $ | 392,463 | | 0.65 | % | | 0.80 | % | | 3.36 | % | | 39 | % |
| | (0.30 | ) | | | 9.29 | | 1.93 | % | | | 352,696 | | 0.65 | % | | 0.80 | % | | 3.09 | % | | 69 | % |
| | (0.30 | ) | | | 9.41 | | 0.20 | % | | | 349,540 | | 0.65 | % | | 0.81 | % | | 2.69 | % | | 0 | % |
| | (0.60 | ) | | | 9.69 | | 4.19 | % | | | 387,624 | | 0.56 | % | | 0.63 | % | | 2.60 | % | | 31 | % |
| | (0.37 | ) | | | 9.88 | | 9.31 | % | | | 407,102 | | 0.51 | % | | 0.59 | % | | 3.15 | % | | 48 | % |
See Notes to Financial Statements.
69
Excelsior Funds
Financial Highlights — Selected Per Share Data and Ratios
| | | | | | | | | | | | | | | | | | | | | | |
| | | | | | |
| | | Net Asset Value,
Beginning of
Year | | Net
Investment
Income | | | Net Realized and
Unrealized
Gain (Loss) on
Investments | | | Total From
Investment
Operations | | Dividends
From Net
Investment
Income | | | Distributions
From Net
Realized
Gain on
Investments | |
LONG-TERM TAX-EXEMPT FUND — (02/05/86*) | | | | | | | | | | | | |
Shares: | | | | | | | | | | | | | | | | | | | | | | |
Year Ended March 31, | | | | | | | | | | | | | | | | |
2007 | | $ | 10.03 | | $ | 0.35 | (2) | | $ | 0.16 | (2) | | $ | 0.51 | | $ | (0.34 | ) | | $ | (0.06 | ) |
2006 | | | 10.07 | | | 0.31 | (2) | | | (0.04 | )(2) | | | 0.27 | | | (0.31 | ) | | | — | |
2005 | | | 10.08 | | | 0.27 | (2) | | | (0.01 | )(2) | | | 0.27 | | | (0.28 | ) | | | — | |
2004 | | | 9.95 | | | 0.26 | | | | 0.13 | | | | 0.39 | | | (0.26 | ) | | | — | |
2003 | | | 9.48 | | | 0.29 | | | | 0.47 | | | | 0.76 | | | (0.29 | ) | | | — | |
NEW YORK INTERMEDIATE-TERM TAX-EXEMPT FUND — (05/31/90*) | | | | | |
Shares: | | | | | | | | | | | | | | | | | | | | | | |
Year Ended March 31, | | | | | | | | | | | | | | | | |
2007 | | $ | 8.55 | | $ | 0.27 | (2) | | $ | 0.08 | (2) | | $ | 0.35 | | $ | (0.27 | ) | | | — | |
2006 | | | 8.71 | | | 0.24 | (2) | | | (0.04 | )(2) | | | 0.20 | | | (0.24 | ) | | $ | (0.12 | ) |
2005 | | | 8.97 | | | 0.22 | (2) | | | (0.17 | )(2) | | | 0.05 | | | (0.22 | ) | | | (0.09 | ) |
2004 | | | 9.12 | | | 0.22 | | | | 0.14 | | | | 0.36 | | | (0.22 | ) | | | (0.29 | ) |
2003 | | | 8.74 | | | 0.27 | | | | 0.51 | | | | 0.78 | | | (0.27 | ) | | | (0.13 | ) |
SHORT-TERM GOVERNMENT SECURITIES FUND — (12/31/92*) | | | | | | | | |
Shares: | | | | | | | | | | | | | | | | | | | | | | |
Year Ended March 31, | | | | | | | | | | | | | | | | |
2007 | | $ | 6.92 | | $ | 0.25 | (2) | | $ | 0.08 | (2) | | $ | 0.33 | | $ | (0.28 | ) | | | — | |
2006 | | | 7.00 | | | 0.20 | (2) | | | (0.04 | )(2) | | | 0.16 | | | (0.24 | ) | | | — | |
2005 | | | 7.22 | | | 0.18 | (2) | | | (0.18 | )(2) | | | — | | | (0.22 | ) | | | — | |
2004 | | | 7.31 | | | 0.16 | | | | (0.03 | ) | | | 0.13 | | | (0.20 | ) | | $ | (0.02 | ) |
2003 | | | 7.11 | | | 0.26 | | | | 0.25 | | | | 0.51 | | | (0.26 | ) | | | (0.05 | ) |
SHORT-TERM TAX-EXEMPT SECURITIES FUND — (12/31/92*) | | | | | |
Shares: | | | | | | | | | | | | | | | | | | | | | | |
Year Ended March 31, | | | | | | | | | | | | | | | | |
2007 | | $ | 7.08 | | $ | 0.21 | (2) | | $ | 0.02 | (2) | | $ | 0.23 | | $ | (0.21 | ) | | | — | |
2006 | | | 7.13 | | | 0.14 | (2) | | | (0.05 | )(2) | | | 0.09 | | | (0.14 | ) | | | — | |
2005 | | | 7.22 | | | 0.09 | (2) | | | (0.09 | )(2) | | | — | | | (0.09 | ) | | | — | (3) |
2004 | | | 7.20 | | | 0.08 | | | | 0.02 | | | | 0.10 | | | (0.08 | ) | | | — | |
2003 | | | 7.17 | | | 0.12 | | | | 0.03 | | | | 0.15 | | | (0.12 | ) | | | — | |
| * | Commencement of operations. |
| (1) | Expense ratios before waiver of fees and reimbursement of expenses (if any) by adviser and administrator. |
| (2) | For comparative purposes, per share amounts are based on average shares outstanding. |
| (3) | Amount represents less than $0.01 per share. |
See Notes to Financial Statements.
70
| | | | | | | | | | | | | | | | | | | | | | | |
| | | | | | | |
Total
Distributions | | | Net Asset
Value,
End of
Year | | Total
Return | | | Net Assets,
End of
Year
(000’s) | | Ratio of Net
Operating
Expenses
to Average
Net Assets | | | Ratio of Gross
Operating
Expenses to
Average
Net Assets (1) | | | Ratio of Net
Investement
Income
to Average
Net Assets | | | Portfolio
Turnover
Rate | |
| | | | | | | | | | | | | | | | | | | | | | | |
| | | | | | | | | | | | | | | | | | | | | | | |
| | | | | | | | | | | | | | | | | | | | | | | |
| $ | (0.40 | ) | | $ | 10.14 | | 5.21 | % | | $ | 65,376 | | 0.80 | % | | 1.06 | % | | 3.39 | % | | 92 | % |
| | (0.31 | ) | | | 10.03 | | 2.64 | % | | | 61,257 | | 0.80 | % | | 1.02 | % | | 3.01 | % | | 88 | % |
| | (0.28 | ) | | | 10.07 | | 2.68 | % | | | 62,817 | | 0.80 | % | | 1.05 | % | | 2.74 | % | | 87 | % |
| | (0.26 | ) | | | 10.08 | | 4.01 | % | | | 72,783 | | 0.73 | % | | 0.80 | % | | 2.64 | % | | 111 | % |
| | (0.29 | ) | | | 9.95 | | 8.12 | % | | | 94,965 | | 0.70 | % | | 0.77 | % | | 2.99 | % | | 51 | % |
| | | | | | | | | | | | | | | | | | | | | | | |
| | | | | | | | | | | | | | | | | | | | | | | |
| | | | | | | | | | | | | | | | | | | | | | | |
| $ | (0.27 | ) | | $ | 8.63 | | 4.09 | % | | $ | 141,454 | | 0.80 | % | | 0.99 | % | | 3.09 | % | | 51 | % |
| | (0.36 | ) | | | 8.55 | | 2.25 | % | | | 131,026 | | 0.80 | % | | 0.98 | % | | 2.71 | % | | 83 | % |
| | (0.31 | ) | | | 8.71 | | 0.52 | % | | | 138,253 | | 0.80 | % | | 0.98 | % | | 2.46 | % | | 15 | % |
| | (0.51 | ) | | | 8.97 | | 4.06 | % | | | 178,107 | | 0.68 | % | | 0.73 | % | | 2.41 | % | | 42 | % |
| | (0.40 | ) | | | 9.12 | | 8.96 | % | | | 187,400 | | 0.67 | % | | 0.72 | % | | 2.96 | % | | 43 | % |
| | | | | | | | | | | | | | | | | | | | | | | |
| | | | | | | | | | | | | | | | | | | | | | | |
| | | | | | | | | | | | | | | | | | | | | | | |
| $ | (0.28 | ) | | $ | 6.97 | | 4.88 | % | | $ | 258,019 | | 0.75 | % | | 0.79 | % | | 3.65 | % | | 128 | % |
| | (0.24 | ) | | | 6.92 | | 2.36 | % | | | 339,167 | | 0.65 | % | | 0.77 | % | | 2.83 | % | | 118 | % |
| | (0.22 | ) | | | 7.00 | | 0.01 | % | | | 402,518 | | 0.60 | % | | 0.79 | % | | 2.57 | % | | 106 | % |
| | (0.22 | ) | | | 7.22 | | 1.90 | % | | | 469,218 | | 0.53 | % | | 0.67 | % | | 2.26 | % | | 231 | % |
| | (0.31 | ) | | | 7.31 | | 7.27 | % | | | 499,519 | | 0.49 | % | | 0.64 | % | | 3.22 | % | | 170 | % |
| | | | | | | | | | | | | | | | | | | | | | | |
| | | | | | | | | | | | | | | | | | | | | | | |
| | | | | | | | | | | | | | | | | | | | | | | |
| $ | (0.21 | ) | | $ | 7.10 | | 3.22 | % | | $ | 104,095 | | 0.60 | % | | 0.80 | % | | 2.89 | % | | 38 | % |
| | (0.14 | ) | | | 7.08 | | 1.33 | % | | | 133,211 | | 0.60 | % | | 0.77 | % | | 1.97 | % | | 111 | % |
| | (0.09 | ) | | | 7.13 | | (0.01 | )% | | | 239,060 | | 0.60 | % | | 0.76 | % | | 1.21 | % | | 10 | % |
| | (0.08 | ) | | | 7.22 | | 1.40 | % | | | 360,604 | | 0.47 | % | | 0.59 | % | | 1.12 | % | | 99 | % |
| | (0.12 | ) | | | 7.20 | | 2.04 | % | | | 291,282 | | 0.46 | % | | 0.58 | % | | 1.57 | % | | 31 | % |
See Notes to Financial Statements.
71
EXCELSIOR FUNDS
NOTES TO FINANCIAL STATEMENTS
| 1. | Significant Accounting Policies: |
Excelsior Funds, Inc. (“Excelsior Fund”) was incorporated under the laws of the State of Maryland on August 2, 1984. Excelsior Tax-Exempt Funds, Inc. (“Excelsior Tax-Exempt Fund”) was incorporated under the laws of the State of Maryland on August 8, 1984. Excelsior Funds Trust (the “Trust”) is a statutory trust organized under the laws of the State of Delaware on April 27, 1994. Excelsior Fund, Excelsior Tax-Exempt Fund and the Trust are registered under the Investment Company Act of 1940, as amended (the “1940 Act”), as open-ended diversified management investment companies with the exception of California Short-Intermediate Term Tax-Exempt Income Fund, New York Intermediate-Term Tax-Exempt Fund, New York Tax-Exempt Money Fund, Energy and Natural Resources Fund and Real Estate Fund, each of which is non-diversified.
Excelsior Fund, Excelsior Tax-Exempt Fund and the Trust currently offer shares in fifteen, seven and five managed investment portfolios, respectively, each having its own investment objectives and policies. The following is a summary of significant accounting policies for Core Bond Fund, Intermediate-Term Bond Fund and Short-Term Government Securities Fund, portfolios of Excelsior Fund, California Short-Intermediate Term Tax-Exempt Income Fund, Intermediate-Term Tax-Exempt Fund, Long-Term Tax-Exempt Fund, New York Intermediate-Term Tax-Exempt Fund and Short-Term Tax-Exempt Securities Fund, portfolios of Excelsior Tax-Exempt Fund, and High Yield Fund, a portfolio of the Trust (each a “Fund”, collectively, the “Funds”). Such policies are in conformity with accounting principles generally accepted in the United States of America and are consistently followed by Excelsior Fund, Excelsior Tax-Exempt Fund and the Trust in the preparation of their financial statements. The preparation of financial statements requires management to make estimates and assumptions that affect the reported amounts and disclosures in the financial statements. Actual results could differ from these estimates.
The California Short-Intermediate Term Tax-Exempt Income Fund, Intermediate-Term Bond Fund, Intermediate-Term Tax-Exempt Fund, Long-Term Tax-Exempt Fund, New York Intermediate-Term Tax-Exempt Fund, Short-Term Government Securities Fund and Short-Term Tax-Exempt Securities Fund offer one class of shares: Shares. The Core Bond Fund offers three classes of shares: Shares, Institutional Shares and Retirement Shares. The High Yield Fund offers two classes of shares: Shares and Institutional Shares. The Financial Highlights of the Institutional shares and Retirement Shares as well as the financial statements for the remaining portfolios of Excelsior Fund, Excelsior Tax-Exempt Fund and the Trust are presented separately.
Under a plan of reorganization adopted by the Trust, all of the assets and liabilities of the Income Fund and Total Return Bond Fund were transferred to the Institutional Shares of the Core Bond Fund. The reorganization, which qualified as a tax-free exchange for federal income tax purposes, was completed at the close of business on September 27, 2006. The following is a summary of shares outstanding, net assets, net asset value per share issued and unrealized appreciation/depreciation immediately before and after the reorganization.
72
| | | | | | | | | | | | | |
| | | Before Reorganization | | After
Reorganization |
| | | Income
Fund | | | Total Return
Bond Fund | | Core Bond
Fund | | Core Bond
Fund |
Shares: | | | | | | | | | | | | | |
Shares | | | — | | | | — | | | 32,810,661 | | | 32,810,661 |
Institutional Shares | | | 13,965,104 | | | | 18,165,949 | | | 1,824,521 | | | 26,973,187 |
Retirement Shares | | | — | | | | — | | | 117 | | | 117 |
Net Assets: | | | | | | | | | | | | | |
Shares | | $ | — | | | $ | — | | $ | 294,116,361 | | $ | 294,116,361 |
Institutional Shares | | $ | 96,434,781 | | | $ | 129,070,075 | | $ | 16,360,288 | | $ | 241,865,144 |
Retirement Shares | | $ | — | | | $ | — | | $ | 1,046 | | $ | 1,046 |
Net Asset Value: | | | | | | | | | | | | | |
Shares | | $ | — | | | $ | — | | $ | 8.96 | | $ | 8.96 |
Institutional Shares | | $ | 6.91 | | | $ | 7.11 | | $ | 8.97 | | $ | 8.97 |
Retirement Shares | | $ | — | | | $ | — | | $ | 8.97 | | $ | 8.97 |
Net unrealized appreciation/(depreciation) | | $ | (248,669 | ) | | $ | 617,540 | | $ | 740,329 | | $ | 1,109,200 |
(a) Portfolio valuation:
Short-term debt instruments that mature in 60 days or less are valued at amortized cost, which approximates market value. If available, debt securities are priced based upon valuations provided by independent, third-party pricing agents. The third-party pricing agents value debt securities at an evaluated price by employing methodologies that utilize actual market transactions, broker-supplied valuations, or other methodologies designed to identify the market value for such securities.
Investments in securities that are traded on recognized domestic and foreign stock exchanges are valued at the last sale price on the exchange on which such securities are primarily traded or at the last quoted sale price on a national securities market. Securities traded over-the-counter are valued each business day on the basis of closing over-the-counter sale prices. Equity securities that are traded on the NASDAQ National Market System for which quotations are readily available are valued at the official closing price. Securities for which market quotations or valuation by pricing agent are not readily available are valued in good faith at fair value pursuant to procedures adopted by the Board of Directors with regard to Excelsior Fund and Excelsior Tax-Exempt Fund and the Board of Trustees with regard to the Trust.
Mutual funds are valued at their respective net asset values as determined by those Funds in accordance with the 1940 Act.
(b) Concentration of risks:
The High Yield Fund is subject to special risks associated with investments in high yield bonds, which involve greater risk of default or downgrade and are more volatile than investment grade securities due to actual or perceived changes in an issuer’s creditworthiness. In addition, issuers of high yield bonds may be more susceptible than other issuers to economic downturns. High yield bonds are subject to the risk that the issuer may not be able to pay interest or dividends and ultimately repay principal upon maturity. Discontinuation of these payments could adversely affect the market value of the security.
73
At March 31, 2007, approximately 96% of the net assets of the California Short-Intermediate Term Tax-Exempt Income Fund are invested in California municipal securities and 99% of the net assets of the New York Intermediate-Term Tax-Exempt Fund are invested in New York municipal securities. Economic changes affecting a state and certain of its public bodies and municipalities may affect the ability of issuers to pay the required principal and interest payments of the municipal securities.
(c) Security transactions and investment income:
Security transactions are recorded on a trade date basis. Realized gains and losses on investments sold are recorded on the basis of identified cost. Interest income, adjusted for amortization of premiums and discounts on investments, is earned from settlement date and is recorded on the accrual basis. Dividend income is recorded on the ex-dividend date, except for certain dividends from foreign securities, which are recorded as soon as the Funds are informed of the dividend.
(d) Repurchase agreements:
The Funds may enter into agreements with financial institutions deemed to be creditworthy by the investment adviser subject to the seller’s agreement to repurchase and the Funds’ agreement to resell such securities at mutually agreed upon prices. The repurchase agreements are collateralized by U.S. Government obligations. The value of the collateral underlying the repurchase agreements will always be at least equal to the repurchase price, including any accrued interest earned on the repurchase agreement. If the counter-party defaults, and the fair value of the collateral declines, realization of the collateral by the Funds may be delayed or limited.
Default or bankruptcy of the seller may, however, expose the applicable Fund to possible delay in connection with the disposition of the securities or loss to the extent that proceeds from a sale of the underlying securities were less than the repurchase price under the agreement.
(e) Futures contracts:
Certain Funds may enter into futures contracts. Upon entering into a futures contract, the Funds deposit and maintain as cash collateral such initial margin as may be required by the exchanges on which the transaction is affected. Pursuant to the contracts, the Funds agree to receive from or pay to the broker an amount of cash equal to the daily fluctuation in the value of the contract. Such receipts or payments are known as “variation margin” and are recorded by the Funds as variation margin receivable or payable on futures contracts. During the period the futures contracts are open, changes in the value of the contracts are recognized on a daily basis to reflect the market value for the contracts at the end of each day’s trading and are recorded as unrealized gains or losses. When the contract is closed, the Funds record a realized gain or loss equal to the difference between the value of the contract at the time it was opened and the value at the time it was closed.
(f) TBA purchase commitments:
Certain Funds may enter into “TBA” (To Be Announced) purchase commitments to purchase securities for a fixed price at a future date, typically not exceeding 45 days. TBA purchase commitments may be considered securities in themselves, and involve risk of loss if the value of the security to be purchased declines prior to settlement date. The Funds must maintain liquid
74
securities having a value not less than the purchase price (including accrued interest) for such purchase commitments. Unsettled TBA purchase commitments are valued at the current market value of the underlying securities, according to the procedures described under “Portfolio Valuation” above.
(g) Mortgage dollar rolls:
Certain Funds may enter into mortgage dollar rolls (principally in securities referred to as TBA, (see note 1(f)) in which the Funds sell mortgage securities for delivery in the current month and simultaneously contract to repurchase similar, but not identical, securities at an agreed upon price on a fixed date. The Funds account for such dollar rolls as purchases and sales and receive compensation in consideration for entering into the commitment to repurchase. The Funds must maintain liquid securities having a value not less that the repurchase price (including accrued interest) for such dollar rolls. The market value of the securities that the Funds are required to repurchase may decline below the agreed upon repurchase price of those securities.
(h) Distributions to shareholders:
Dividends from net investment income are declared daily and paid monthly. Net realized capital gains, unless offset by any available capital loss carryforward, are distributed at least annually. Dividends and distributions are recorded on the ex-dividend date.
(i) Expense allocation:
Expenses directly attributable to a Fund are charged to that Fund. Other expenses are allocated to the respective Fund based on average daily net assets. Expenses attributable to a specific class of shares, such as shareholder servicing and distribution fees, are charged directly to that class.
(j) Borrowing:
The funds may obtain temporary bank loans from banks and custodians to use for meeting shareholder redemptions or for temporary or emergency purposes. The board of trustees approved an agreement between Excelsior Fund, Excelsior Tax-Exempt Fund and the Trust and their custodian, JPMorgan Chase Bank, N.A., under which the funds may participate in an uncommitted line of credit in the aggregate principal amount of $150 million. The funds pay interest on the amounts they borrow at negotiated rates based on the terms of the agreement. There was no borrowing from the line of credit for any funds during the year ended March 31, 2007.
(k) Custody Credits:
Each Fund has an arrangement with its custodian bank under which the Fund receives a credit for its uninvested cash balance to offset its custody fees. The credit amounts (if any) are disclosed in the statement of operations as a reduction to the Fund’s operating expenses.
(l) New accounting standards:
In September 2006, the Financial Accounting Standards Board (FASB) issued Statement of Financial Accounting Standards No. 157, “Fair Value Measurements” (SFAS No. 157). SFAS No. 157 defines fair value, establishes a framework for measuring fair value in accordance with generally accepted accounting principles and expands disclosure about fair value measurements. SFAS No. 157 is effective for fiscal years beginning after November 15, 2007. Management is currently evaluating the impact the adoption of SFAS No. 157 will have on the Fund’s financial statements.
75
In July 2006, the FASB released FASB Interpretation No. 48 “Accounting for Uncertainty in Income Taxes” (“FIN 48”). FIN 48 provides guidance for how uncertain tax positions should be recognized, measured, presented and disclosed in the financial statements. FIN 48 requires the evaluation of tax positions taken or expected to be taken in the course of preparing the Fund’s tax return to determine whether the tax positions are “more-likely-than-not” of being sustained by the applicable tax authority. Tax positions not deemed to meet the more-likely-than-not threshold would be recorded as a tax benefit or expense in the period of determination. Adoption of FIN 48 is required no later than the last business day of the first financial statement reporting period for fiscal years beginning after December 15, 2006. A Fund with a fiscal year ending March 31 will implement FIN 48 no later than September 28, 2007, and it is to be applied to all open tax years as of the effective date. Management is currently evaluating the impact of the adoption of FIN 48 to the financial statements.
| 2. | Investment Advisory Fee, Administration Fee, Shareholder Servicing Fees and Related Party Transactions: |
The Funds are advised by U.S. Trust New York Asset Management Division (“NYAMD”), a separate identifiable division of United States Trust Company, National Association (“USTNA”), or UST Advisers, Inc. (“USTA” and together with NYAMD, the “Advisers”). USTA is a wholly-owned subsidiary of USTNA. USTNA is a wholly-owned subsidiary of U.S. Trust Corporation, a registered bank holding company, which, in turn, is a wholly-owned subsidiary of The Charles Schwab Corporation. For the services provided pursuant to the Investment Advisory Agreements, each Adviser receives a fee, computed daily and paid monthly, as follows:
| | | |
California Short-Intermediate Term Tax-Exempt Income Fund | | 0.50 | % |
Core Bond Fund | | 0.65 | %* |
High Yield Fund | | 0.80 | % |
Intermediate-Term Bond Fund | | 0.35 | % |
Intermediate-Term Tax-Exempt Fund | | 0.35 | % |
Long-Term Tax-Exempt Fund | | 0.50 | % |
New York Intermediate-Term Tax-Exempt Fund | | 0.50 | % |
Short-Term Government Securities Fund | | 0.30 | % |
Short-Term Tax-Exempt Securities Fund | | 0.30 | % |
| * | On September 28, 2006, the Core Bond Fund changed its Investment Advisory fee to 0.65% from 0.75%. |
On November 20, 2006, The Charles Schwab Corporation (“Schwab”) announced an agreement to sell the U.S. Trust Corporation (“U.S. Trust”) a wholly-owned subsidiary of Schwab, to the Bank of America Corporation (the “Sale”). The Sale includes all of U.S. Trust’s subsidiaries, including USTA and USTNA. The completion of the Sale may result in the assignment of the current investment advisory agreements and termination in accordance with their terms. Therefore, the Board of Trustees/Directors approved the new investment advisory agreements at the same advisory fee rates disclosed above in January 2007 and Shareholders of each Fund approved the new agreements during meetings held in March and April 2007. It is anticipated that the Sale will close early in the third quarter of 2007.
76
USTA and BISYS Fund Services Ohio, Inc. (collectively, the “Administrators”) provide administrative services to the Funds. For the services provided to the Funds, the Administrators are entitled jointly to annual fees, computed daily and paid monthly, based on the combined aggregate average daily net assets of Excelsior Fund, Excelsior Tax-Exempt Fund and the Trust (excluding the international equity portfolios of Excelsior Fund and the Trust), all of which are affiliated investment companies, as follows: 0.200% of the first $200 million, 0.175% of the next $200 million and 0.150% over $400 million. The Administrators are entitled jointly to annual fees, computed daily and paid monthly, at the annual rate of 0.20% of the average daily net assets of the Emerging Markets Fund, International Equity Fund, International Fund and Pacific/Asia Fund. Administration fees payable by each Fund of the Excelsior Fund, Excelsior Tax-Exempt Fund and the Trust are determined in proportion to the relative average daily net assets of the respective Funds for the period paid. For the year ended March 31, 2007, administration fees paid to USTA were as follows:
| | | |
| | | Administration
Fees Paid to UST
Advisers, Inc. |
California Short-Intermediate Term Tax-Exempt Income Fund | | $ | 51,558 |
Core Bond Fund | | | 571,558 |
High Yield Fund | | | 114,852 |
Intermediate-Term Bond Fund | | | 612,071 |
Intermediate-Term Tax-Exempt Fund | | | 504,098 |
Long-Term Tax-Exempt Fund | | | 85,927 |
New York Intermediate-Term Tax-Exempt Fund | | | 184,067 |
Short-Term Government Securities Fund | | | 385,703 |
Short-Term Tax-Exempt Securities Fund | | | 159,621 |
BISYS Fund Services Ohio, Inc., waived Administration fees as presented on the Statements of Operations, excluding the California Short-Intermediate Term Tax-Exempt Income Fund and High Yield Fund which BISYS Fund Services Ohio, Inc., waived $158 and $3,952, respectively. USTNA waived the balance of Administration fees as presented on the Statements of Operations.
From time to time, in its sole discretion, each Adviser may undertake to waive a portion or all of the fees payable to it and may also reimburse the Funds for a portion of other expenses. For the year ended March 31, 2007, the Advisers have contractually agreed to waive investment advisory fees through, at least, July 31, 2007, and to reimburse other operating expenses to the extent necessary to keep total operating expenses from exceeding the following annual percentages of each Fund’s average daily net assets:
| | | |
California Short-Intermediate Term Tax-Exempt Income Fund — Shares | | 0.50 | % |
Core Bond Fund — Shares | | 0.90 | % |
High Yield Fund — Shares | | 1.05 | % |
Intermediate-Term Bond Fund — Shares | | 0.75 | % |
Intermediate-Term Tax-Exempt Fund — Shares | | 0.65 | % |
Long-Term Tax-Exempt Fund — Shares | | 0.80 | % |
New York Intermediate-Term Tax-Exempt Fund — Shares | | 0.80 | % |
Short-Term Government Securities Fund — Shares | | 0.75 | % |
Short-Term Tax-Exempt Securities Fund — Shares | | 0.60 | % |
Core Bond Fund — Institutional Shares | | 0.65 | % |
High Yield Fund — Institutional Shares | | 0.80 | % |
Core Bond Fund — Retirement Shares | | 1.40 | % |
77
For the year ended March 31, 2007, pursuant to the above, investment advisory fees waived by the Advisers were as follows:
| | | |
California Short-Intermediate Term Tax-Exempt Income Fund | | $ | 307,162 |
Core Bond Fund | | | 1,217,980 |
High Yield Fund | | | 522,552 |
Intermediate-Term Bond Fund | | | 220,858 |
Intermediate-Term Tax-Exempt Fund | | | 550,546 |
Long-Term Tax-Exempt Fund | | | 166,831 |
New York Intermediate-Term Tax-Exempt Fund | | | 256,114 |
Short-Term Government Securities Fund | | | 110,584 |
Short-Term Tax-Exempt Securities Fund | | | 235,286 |
The Funds have entered into shareholder servicing agreements with various service organizations, which include Charles Schwab & Co. Inc. (“CS & Co.”) and USTA. Services included in the servicing agreements include assistance in processing purchase, exchange and redemption requests; transmitting and receiving funds in connection with customer orders to purchase, exchange or redeem shares; and providing periodic statements. Shareholder servicing fees are incurred on a Fund or class level (where applicable). In consideration for these services, each service organization receives a fee from the Funds, computed daily and paid monthly, at an annual rate up to 0.25% of the average daily net assets of the Funds’ shares held by each service organization’s customers. The Advisers, out of their own resources, may additionally compensate certain organizations for providing these and other services.
For the year ended March 31, 2007, shareholder servicing fees paid to CS & Co. and USTA were as follows:
| | | |
California Short-Intermediate Term Tax-Exempt Income Fund | | $ | 144,953 |
Core Bond Fund | | | 496,810 |
High Yield Fund | | | 274,600 |
Intermediate-Term Bond Fund | | | 1,103,507 |
Intermediate-Term Tax-Exempt Fund | | | 909,928 |
Long-Term Tax-Exempt Fund | | | 140,871 |
New York Intermediate-Term Tax-Exempt Fund | | | 326,149 |
Short-Term Government Securities Fund | | | 588,475 |
Short-Term Tax-Exempt Securities Fund | | | 282,780 |
BISYS Fund Services Limited Partnership (the “Distributor”) serves as the Distributor of the Funds. Shares of each Fund are sold without a sales charge on a continuous basis by the Distributor.
Certain Funds have adopted a Distribution Plan pursuant to Rule 12b-1 under the 1940 Act, under which they may compensate the Distributor monthly for its services that are intended to result in the sale of Fund Shares (in the case of High Yield Fund) or Retirement Shares (in the case of Core Bond Fund), in an amount not to exceed the annual rate of 0.25% or 0.50%, respectively, of the average daily net asset value of such Fund’s Shares or Retirement Shares. For the year ended March 31, 2007, fees paid for Retirement Shares of Core Bond Fund were $4.
The board of trustees/directors may include people who are officers and/or trustees of other fund families affiliated to the investment adviser. Federal securities law limits the percentage of the “interested
78
persons” who may serve on a trust’s board, and the Funds are in compliance with these limitations. The funds did not pay any of the interested persons for their service as trustees/directors, but did pay non-interested persons (independent trustees), as noted in each fund’s Statement of Operations.
On June 12, 2006, the Excelsior High Yield and Intermediate-Term Bond Funds filed a lawsuit in connection with the bankruptcy of a security in which the Funds had invested. The ongoing legal expenses associated with the lawsuit are paid for by the Funds, but due to the expense limitation agreements currently in place, a significant portion of these legal expenses are being reimbursed by the Adviser. The Board has agreed that, should the Funds be successful in the lawsuit or otherwise receive compensation related to settling the case, the Advisers may request and receive reimbursement for such legal expenses that have been reimbursed to the Funds, to the extent that proceeds are available to cover such expenses. At this time, the outcome of the lawsuit cannot be determined.
| 3. | Purchases, Sales and Maturities of Securities: |
For the year ended March 31, 2007, purchases, sales and maturities of securities for the Funds, excluding short-term investments, aggregated:
| | | | | | |
| | | Purchases | | Sales and
Maturities |
California Short-Intermediate Term Tax-Exempt Income Fund | | $ | 4,383,090 | | $ | 11,806,866 |
Core Bond Fund | | | | | | |
U.S. Government | | | 143,164,160 | | | 130,390,053 |
Other | | | 56,826,501 | | | 58,962,109 |
High Yield Fund | | | 85,146,374 | | | 122,668,623 |
Intermediate-Term Bond Fund | | | | | | |
U.S. Government | | | 259,803,345 | | | 175,438,509 |
Other | | | 77,989,169 | | | 120,682,031 |
Intermediate-Term Tax-Exempt Fund | | | 179,514,181 | | | 135,503,723 |
Long-Term Tax-Exempt Fund | | | 62,297,704 | | | 53,439,363 |
New York Intermediate-Term Tax-Exempt Fund | | | 79,017,972 | | | 62,200,224 |
Short-Term Government Securities Fund | | | | | | |
U.S. Government | | | 348,251,692 | | | 409,656,572 |
Other | | | 9,665,205 | | | 36,344,895 |
Short-Term Tax-Exempt Securities Fund | | | 43,933,328 | | | 38,068,453 |
It is the policy of Excelsior Fund, Excelsior Tax-Exempt Fund and the Trust that each Fund continue to qualify as a regulated investment company, by complying with the requirements of the Internal Revenue Code applicable to regulated investment companies, and by distributing substantially all of its taxable earnings to its shareholders.
In order to avoid a federal excise tax, each Fund is required to distribute certain minimum amounts of net realized capital gain and net investment income for the respective twelve-month periods ending October 31 and December 31 each calendar year.
79
Net realized gains of the Funds derived in certain countries are subject to certain foreign taxation.
Dividends and distributions are determined in accordance with federal income tax regulations and may differ from accounting principles generally accepted in the United States of America. These differences are primarily due to differing treatments for deferral of losses on wash sales and net capital losses incurred after October 31 and within the taxable year (“Post-October losses”). To the extent these differences are permanent in nature (i.e. paydown reclasses), such amounts are reclassified within the composition of net assets based on their federal tax-basis treatment; temporary differences do not require reclassification. Accordingly, the following reclassifications have been made to/from the following accounts:
| | | | | | | | | | | | |
| | | Undistributed Net Investment
Income | | | Accumulated Net Realized Gain (Loss) | | | Paid-In-Capital | |
California Short-Intermediate Term Tax-Exempt Income Fund | | $ | 57 | | | $ | (57 | ) | | $ | — | |
Core Bond Fund | | | (79,757 | ) | | | 79,739 | | | | 18 | |
High Yield | | | 36,349 | | | | 29,285 | | | | (65,634 | ) |
Intermediate-Term Bond Fund | | | (70,738 | ) | | | 70,738 | | | | — | |
Intermediate-Term Tax-Exempt Fund | | | 46,917 | | | | (184 | ) | | | (46,733 | ) |
Long-Term Tax-Exempt Fund | | | 25,816 | | | | 1,040 | | | | (26,856 | ) |
Short-Term Government Securities Fund | | | 1,080,480 | | | | (1,080,004 | ) | | | (476 | ) |
The tax character of dividends and distributions declared during the years ended March 31, 2007 and March 31, 2006 were as follows:
| | | | | | | | | | | | | | | |
| | | Ordinary Income | | Tax-Exempt Income | | Long-Term Capital Gain | | Return of Capital | | Total* |
California Short-Intermediate Term Tax-Exempt Income Fund | | | | | | | | | | | | | | | |
Year ended March 31, 2007 | | $ | — | | $ | 1,958,947 | | $ | 255,865 | | $ | — | | $ | 2,214,812 |
Year ended March 31, 2006 | | | — | | | 2,014,082 | | | — | | | — | | | 2,014,082 |
Core Bond Fund | | | | | | | | | | | | | | | |
Year ended March 31, 2007 | | | 17,474,254 | | | — | | | — | | | — | | | 17,474,254 |
Year ended March 31, 2006 | | | 11,105,896 | | | — | | | 2,085,376 | | | — | | | 13,191,272 |
High Yield Fund | | | | | | | | | | | | | | | |
Year ended March 31, 2007 | | | 8,535,124 | | | — | | | — | | | — | | | 8,535,124 |
Year ended March 31, 2006 | | | 10,553,157 | | | — | | | — | | | 353,851 | | | 10,907,008 |
Intermediate-Term Bond Fund | | | | | | | | | | | | | | | |
Year ended March 31, 2007 | | | 19,470,592 | | | — | | | — | | | — | | | 19,470,592 |
Year ended March 31, 2006 | | | 16,649,941 | | | — | | | 1,063,363 | | | — | | | 17,713,304 |
Intermediate-Term Tax-Exempt Fund | | | | | | | | | | | | | | | |
Year ended March 31, 2007 | | | 40,388 | | | 12,244,881 | | | 730,630 | | | — | | | 13,015,899 |
Year ended March 31, 2006 | | | — | | | 10,697,181 | | | 367,896 | | | — | | | 11,065,077 |
Long-Term Tax-Exempt Fund | | | | | | | | | | | | | | | |
Year ended March 31, 2007 | | | 22,291 | | | 2,109,421 | | | 392,494 | | | — | | | 2,524,206 |
Year ended March 31, 2006 | | | — | | | 1,794,756 | | | — | | | — | | | 1,794,756 |
80
| | | | | | | | | | |
| | | Ordinary Income | | Tax-Exempt Income | | Long-Term Capital
Gain | | Return
of Capital | | Total* |
New York Intermediate-Term Tax-Exempt Fund | | | | | | | | | | |
Year ended March 31, 2007 | | — | | 4,137,826 | | — | | — | | 4,137,826 |
Year ended March 31, 2006 | | — | | 3,604,795 | | 1,825,238 | | — | | 5,430,033 |
Short-Term Government Securities Fund | | | | | | | | | | |
Year ended March 31, 2007 | | 11,619,856 | | — | | — | | — | | 11,619,856 |
Year ended March 31, 2006 | | 12,770,972 | | — | | — | | — | | 12,770,972 |
Short-Term Tax-Exempt Securities Fund | | | | | | | | | | |
Year ended March 31, 2007 | | — | | 3,424,308 | | — | | — | | 3,424,308 |
Year ended March 31, 2006 | | — | | 3,428,764 | | — | | — | | 3,428,764 |
| * | The total distributions paid may differ from the Statement of Changes in Net Assets because for tax purposes, dividends are recognized when actually paid. |
As of March 31, 2007, the components of distributable earnings (accumulated losses) on a tax basis were as follows:
| | | | | | | | | | | | | | | | | | | | | | |
| | | Undistributed
Ordinary
Income | | Undistributed
Tax-Exempt
Income | | Distributions
Payable* | | | Accumulated
Capital and
Other
Losses | | | Unrealized
Appreciation
(Depreciation)
| | | Total
Accumulated
Earnings/
(Deficit) | |
California Short-Intermediate Term Tax-Exempt Income Fund | | $ | — | | $ | 156,507 | | $ | (156,258 | ) | | $ | (29,602 | ) | | $ | (16,219 | ) | | $ | 45,574 | |
Core Bond Fund | | | 2,127,629 | | | — | | | (2,104,382 | ) | | | (1,634,009 | ) | | | 863,400 | | | | (733,365 | ) |
High Yield Fund | | | 26,428 | | | — | | | (702,997 | ) | | | (65,479,459 | ) | | | 4,698,152 | | | | (61,457,876 | ) |
Intermediate-Term Bond Fund | | | 1,722,807 | | | — | | | (1,768,781 | ) | | | (5,128,301 | ) | | | 329,741 | | | | (4,844,534 | ) |
Intermediate-Term Tax-Exempt Fund | | | — | | | 1,173,627 | | | (1,124,927 | ) | | | (789,548 | ) | | | 4,248,424 | | | | 3,507,576 | |
Long-Term Tax-Exempt Fund | | | 268,755 | | | 211,092 | | | (185,364 | ) | | | — | | | | 809,818 | | | | 1,104,301 | |
New York Intermediate-Term Tax-Exempt Fund | | | — | | | 372,234 | | | (371,045 | ) | | | (746,293 | ) | | | 959,383 | | | | 214,279 | |
Short-Term Government Securities Fund | | | 956,373 | | | — | | | (983,779 | ) | | | (15,138,043 | ) | | | (528,790 | ) | | | (15,694,239 | ) |
Short-Term Tax-Exempt Securities Fund | | | — | | | 265,165 | | | (262,104 | ) | | | (2,843,991 | ) | | | (74,494 | ) | | | (2,915,424 | ) |
| * | The total distributions payable may differ from the Statement of Assets and Liabilities because for tax purposes, dividends are recognized when actually paid. |
Post-October losses are deemed to arise on the first business day of a Fund’s next taxable year. As of March 31, 2007, the California Short-Intermediate Term Tax-Exempt Income Fund, Short-Term Government Securities Fund and, Short-Term Tax-Exempt Securities Fund deferred, on a tax basis, post-October losses of $29,602, $68,960 and $69,910, respectively.
For federal income tax purposes, capital loss carryforwards may be carried forward and applied against future capital gains. To the extent that such carryforwards are utilized, capital gains distributions
81
will be reduced. At March 31, 2007, the following Funds had capital loss carryforwards available to offset future net capital gains through the indicated expiration dates.
| | | | | | | | | | | | | | | | | | | | | |
| | | Expires |
| | | 2010 | | 2011 | | 2012 | | 2013 | | 2014 | | 2015 | | Total |
Core Bond Fund | | $ | — | | $ | — | | $ | — | | $ | — | | $ | 1,303,908 | | $ | 330,101 | | $ | 1,634,009 |
High Yield Fund | | | 440,234 | | | 17,456,849 | | | 40,103,941 | | | 1,461,417 | | | 6,017,018 | | | — | | | 65,479,459 |
Intermediate-Term Bond Fund | | | — | | | — | | | — | | | — | | | 481,322 | | | 4,646,979 | | | 5,128,301 |
Intermediate-Term Tax-Exempt Fund | | | — | | | — | | | — | | | — | | | — | | | 789,548 | | | 789,548 |
New York Intermediate-Term Tax-Exempt Fund | | | — | | | — | | | — | | | — | | | 165,776 | | | 580,517 | | | 746,293 |
Short-Term Government Securities Fund | | | — | | | — | | | 1,481,228 | | | 4,260,524 | | | 4,970,323 | | | 4,357,008 | | | 15,069,083 |
Short-Term Tax-Exempt Securities Fund | | | — | | | — | | | — | | | 287,228 | | | 518,076 | | | 1,968,777 | | | 2,774,081 |
At March 31, 2007, aggregate gross unrealized appreciation for all securities for which there was an excess of value over estimated tax cost and aggregate gross unrealized depreciation for all securities for which there was an excess of estimated tax cost over value is as follows:
| | | | | | | | | | | | | | |
| | | Federal
Tax
Cost | | Tax Basis
Unrealized
Appreciation | | Tax Basis
Unrealized
(Depreciation) | | | Net
Unrealized
Appreciation
(Depreciation) | |
California Short-Intermediate Term Tax-Exempt Income Fund | | $ | 56,023,090 | | $ | 226,511 | | $ | (242,730 | ) | | $ | (16,219 | ) |
Core Bond Fund | | | 549,492,440 | | | 4,344,919 | | | (3,481,519 | ) | | | 863,400 | |
High Yield Fund | | | 110,262,829 | | | 5,181,793 | | | (483,641 | ) | | | 4,698,152 | |
Intermediate-Term Bond Fund | | | 465,019,873 | | | 3,035,294 | | | (2,705,553 | ) | | | 329,741 | |
Intermediate-Term Tax-Exempt Fund | | | 384,015,191 | | | 4,730,854 | | | (482,430 | ) | | | 4,248,424 | |
Long-Term Tax-Exempt Fund | | | 63,424,227 | | | 897,230 | | | (87,412 | ) | | | 809,818 | |
New York Intermediate-Term Tax-Exempt Fund | | | 139,236,630 | | | 1,168,253 | | | (208,870 | ) | | | 959,383 | |
Short-Term Government Securities Fund | | | 256,649,722 | | | 590,725 | | | (1,119,515 | ) | | | (528,790 | ) |
Short-Term Tax-Exempt Securities Fund | | | 103,081,268 | | | 92,431 | | | (166,925 | ) | | | (74,494 | ) |
Excelsior Fund has authorized capital of 35 billion shares of Common Stock, 29.3756 billion of which is currently classified to represent interests in certain classes of shares. Authorized capital currently offered for each Fund is as follows: 750 million shares of the Core Bond Fund; 1.5 billion shares of the Intermediate-Term Bond Fund; and 1 billion shares of the Short-Term Government Securities Fund. Each share has a par value of $0.001 and represents an equal proportionate interest in the particular Fund with other shares of the same Fund, and is entitled to such dividends and distributions of taxable earnings on the assets belonging to such Fund as are declared at the discretion of Excelsior Fund’s Board of Directors.
Excelsior Tax-Exempt Fund has authorized capital of 24 billion shares of Common Stock, 15 billion of which is currently classified to represent interests in certain classes of shares. Authorized capital
82
currently offered for each Fund is as follows: 1.5 billion shares each of California Short-Intermediate Term Tax-Exempt Income Fund, Intermediate-Term Tax-Exempt Fund, Long-Term Tax-Exempt Fund, New York Intermediate-Term Tax-Exempt Fund and Short-Term Tax-Exempt Securities Fund. Each share has a par value of $0.001 and represents an equal proportionate interest in the particular Fund with other shares of the same Fund, and is entitled to such dividends and distributions of taxable and tax-exempt earnings on the assets belonging to such Fund as are declared at the discretion of Excelsior Tax-Exempt Fund’s Board of Directors.
The Trust has authorized an unlimited number of shares of beneficial interest of each class of each Fund. Each share has a par value of $0.00001 and represents an equal proportionate interest in the particular Fund with other shares of the same Fund, and is entitled to such dividends and distributions of taxable earnings on the assets belonging to such Fund as are declared at the discretion of the Trust’s Board of Trustees.
On shares purchased on or after October 16, 2006, a redemption fee of 2% of the value of the shares redeemed or exchanged was imposed on shares of the High Yield Fund redeemed or exchanged 30 days or less after their date of purchase. The redemption fee is intended to limit short-term trading in the Fund.
Capital Share Transactions
| | | | | | | | | | | | | | |
| | | California Short-Intermediate Term Tax-Exempt Income Fund | |
| | | Year Ended March 31, | |
| | | 2007 | | | 2006 | |
| | | Shares | | | Amounts | | | Shares | | | Amounts | |
Sold | | 2,429,521 | | | $ | 17,401,512 | | | 3,993,301 | | | $ | 28,933,240 | |
Issued as reinvestment of dividends | | 92,381 | | | | 662,564 | | | 87,807 | | | | 635,525 | |
Redeemed | | (3,890,655 | ) | | | (27,905,956 | ) | | (3,467,123 | ) | | | (25,083,774 | ) |
| | | | | | | | | | | | | | |
Net Increase (Decrease) | | (1,368,753 | ) | | $ | (9,841,880 | ) | | 613,985 | | | $ | 4,484,991 | |
| | | | | | | | | | | | | | |
| |
| | | Core Bond Fund | |
| | | Year Ended March 31, | |
| | | 2007 | | | 2006 | |
| | | Shares | | | Amounts | | | Shares | | | Amounts | |
Sold: | | | | | | | | | | | | | | |
Shares | | 9,986,679 | | | $ | 88,776,364 | | | 13,774,392 | | | $ | 125,488,152 | |
Institutional Shares | | 2,772,888 | | | | 24,623,459 | | | 141,024 | | | | 1,262,505 | |
Retirement Shares | | — | | | | — | | | — | | | | — | |
Issued in connection with merger(a) | | 25,148,666 | | | | 225,504,856 | | | — | | | | — | |
Issued as reinvestment of dividends: | | | | | | | | | | | | | | |
Shares | | 673,001 | | | | 5,989,211 | | | 681,642 | | | | 6,160,386 | |
Institutional Shares | | 113,170 | | | | 1,016,339 | | | 189 | | | | 1,685 | |
Retirement Shares | | 4 | | | | 40 | | | 5 | | | | 50 | |
Redeemed: | | | | | | | | | | | | | | |
Shares | | (7,567,445 | ) | | | (67,312,972 | ) | | (5,733,515 | ) | | | (52,104,922 | ) |
Institutional Shares | | (1,706,058 | ) | | | (15,286,027 | ) | | — | | | | — | |
Retirement Shares | | — | | | | — | | | (16 | ) | | | (151 | ) |
| | | | | | | | | | | | | | |
Net Increase (Decrease) | | 29,420,905 | | | $ | 263,311,270 | | | 8,863,721 | | | $ | 80,807,705 | |
| | | | | | | | | | | | | | |
| (a) | Effective at the close of business on September 27, 2006, the Core Bond Fund (Institutional Shares Class) acquired all of the net assets of the Income Fund and Total Return Bond Fund. |
83
| | | | | | | | | | | | | | |
| | | High Yield Fund | |
| | | Year Ended March 31, | |
| | | 2007 | | | 2006 | |
| | | Shares | | | Amounts | | | Shares | | | Amounts | |
Sold: | | | | | | | | | | | | | | |
Shares | | 6,072,661 | | | $ | 28,550,138 | | | 13,700,176 | | | $ | 62,544,844 | |
Institutional Shares | | 155,243 | | | | 699,379 | | | 853,862 | | | | 3,892,678 | |
Issued as reinvestment of dividends: | | | | | | | | | | | | | | |
Shares | | 217,741 | | | | 1,004,402 | | | 304,113 | | | | 1,384,476 | |
Institutional Shares | | 32,619 | | | | 149,603 | | | 107,579 | | | | 488,209 | |
Redeemed: | | | | | | | | | | | | | | |
Shares | | (13,302,993 | ) | | | (60,913,343 | ) | | (17,199,458 | ) | | | (78,172,561 | ) |
Institutional Shares | | (1,952,444 | ) | | | (8,902,311 | ) | | (1,152,309 | ) | | | (5,192,791 | ) |
Redemption fee | | — | | | | 15 | | | — | | | | — | |
| | | | | | | | | | | | | | |
Net Increase (Decrease) | | (8,777,173 | ) | | $ | (39,412,117 | ) | | (3,386,037 | ) | | $ | (15,055,145 | ) |
| | | | | | | | | | | | | | |
| | | | | | | | | | | | | | |
| |
| | | Intermediate-Term Bond Fund | |
| | | Year Ended March 31, | |
| | | 2007 | | | 2006 | |
| | | Shares | | | Amounts | | | Shares | | | Amounts | |
Sold | | 18,049,503 | | | $ | 127,159,970 | | | 22,398,525 | | | $ | 160,313,146 | |
Issued as reinvestment of dividends | | 362,756 | | | | 2,558,710 | | | 315,931 | | | | 2,254,952 | |
Redeemed | | (14,921,064 | ) | | | (105,017,990 | ) | | (17,689,147 | ) | | | (126,192,707 | ) |
| | | | | | | | | | | | | | |
Net Increase (Decrease) | | 3,491,195 | | | $ | 24,700,690 | | | 5,025,309 | | | $ | 36,375,391 | |
| | | | | | | | | | | | | | |
| |
| | | Intermediate-Term Tax-Exempt Fund | |
| | | Year Ended March 31, | |
| | | 2007 | | | 2006 | |
| | | Shares | | | Amounts | | | Shares | | | Amounts | |
Sold | | 12,042,682 | | | $ | 112,338,953 | | | 11,552,408 | | | $ | 108,911,261 | |
Issued as reinvestment of dividends | | 126,628 | | | | 1,181,763 | | | 109,248 | | | | 1,029,354 | |
Redeemed | | (8,123,028 | ) | | | (75,691,413 | ) | | (10,822,740 | ) | | | (101,854,658 | ) |
| | | | | | | | | �� | | | | | |
Net Increase (Decrease) | | 4,046,282 | | | $ | 37,829,303 | | | 838,916 | | | $ | 8,085,957 | |
| | | | | | | | | | | | | | |
| |
| | | Long-Term Tax-Exempt Fund | |
| | | Year Ended March 31, | |
| | | 2007 | | | 2006 | |
| | | Shares | | | Amounts | | | Shares | | | Amounts | |
Sold | | 912,996 | | | $ | 9,224,461 | | | 706,825 | | | $ | 7,162,254 | |
Issued as reinvestment of dividends | | 49,954 | | | | 506,450 | | | 35,734 | | | | 362,312 | |
Redeemed | | (619,542 | ) | | | (6,255,233 | ) | | (878,007 | ) | | | (8,918,351 | ) |
| | | | | | | | | | | | | | |
Net Increase (Decrease) | | 343,408 | | | $ | 3,475,678 | | | (135,448 | ) | | $ | (1,393,785 | ) |
| | | | | | | | | | | | | | |
84
| | | | | | | | | | | | | | |
| | | New York Intermediate-Term Tax-Exempt Fund | |
| | | Year Ended March 31, | |
| | | 2007 | | | 2006 | |
| | | Shares | | | Amounts | | | Shares | | | Amounts | |
Sold | | 4,902,368 | | | $ | 42,183,360 | | | 4,652,138 | | | $ | 40,444,981 | |
Issued as reinvestment of dividends | | 62,837 | | | | 540,239 | | | 78,342 | | | | 678,293 | |
Redeemed | | (3,898,713 | ) | | | (33,570,653 | ) | | (5,273,634 | ) | | | (45,770,096 | ) |
| | | | | | | | | | | | | | |
Net Increase (Decrease) | | 1,066,492 | | | $ | 9,152,946 | | | (543,154 | ) | | $ | (4,646,822 | ) |
| | | | | | | | | | | | | | |
| |
| | | Short-Term Government Securities Fund | |
| | | Year Ended March 31, | |
| | | 2007 | | | 2006 | |
| | | Shares | | | Amounts | | | Shares | | | Amounts | |
Sold | | 6,885,151 | | | $ | 47,777,743 | | | 14,063,143 | | | $ | 98,248,597 | |
Issued as reinvestment of dividends | | 430,742 | | | | 2,989,949 | | | 448,563 | | | | 3,127,286 | |
Redeemed | | (19,339,995 | ) | | | (134,034,945 | ) | | (22,948,344 | ) | | | (160,073,632 | ) |
| | | | | | | | | | | | | | |
Net Increase (Decrease) | | (12,024,102 | ) | | $ | (83,267,253 | ) | | (8,436,638 | ) | | $ | (58,697,749 | ) |
| | | | | | | | | | | | | | |
| |
| | | Short-Term Tax-Exempt Securities Fund | |
| | | Year Ended March 31, | |
| | | 2007 | | | 2006 | |
| | | Shares | | | Amounts | | | Shares | | | Amounts | |
Sold | | 2,756,608 | | | $ | 19,549,512 | | | 4,626,627 | | | $ | 32,965,430 | |
Issued as reinvestment of dividends | | 44,926 | | | | 318,627 | | | 27,420 | | | | 195,121 | |
Redeemed | | (6,961,351 | ) | | | (49,374,227 | ) | | (19,386,165 | ) | | | (138,092,641 | ) |
| | | | | | | | | | | | | | |
Net Increase (Decrease) | | (4,159,817 | ) | | $ | (29,506,088 | ) | | (14,732,118 | ) | | $ | (104,932,090 | ) |
| | | | | | | | | | | | | | |
In the normal course of business, the Funds enter into contracts that provide general indemnifications. The Funds’ maximum exposure under these arrangements is dependent on future claims that may be made against the Funds and, therefore, cannot be established; however, based on experience, the risk of loss from such claims is considered remote.
United States Trust Company of New York and U.S. Trust Company, N.A. (formerly, co-investment advisers to the Funds, together referred to herein as “U.S. Trust”), Excelsior Funds, Excelsior Tax-Exempt Funds and Trust (the “Companies”), U.S. Trust, Schwab and several individuals and third parties were named in four fund shareholder class actions and two derivative actions which alleged that U.S. Trust, the Companies, and others allowed certain parties to engage in illegal and improper mutual fund trading practices, which allegedly caused financial injury to the shareholders of certain of the Funds advised by U.S. Trust. Each seeks unspecified monetary damages and related equitable relief.
85
The class and derivative actions described above were transferred to the United States District Court for the District of Maryland for coordinated and consolidated pre-trial proceedings. In November 2005, the Maryland court dismissed many of the plaintiffs’ claims in both the class and derivative actions. The court entered implementing orders on February 24, 2006. All claims against the Companies have been dismissed. Plaintiffs’ claims against U.S. Trust and certain individuals under Sections 10(b) and 20(a) of the Securities Exchange Act and Sections 36(b) and 48(a) of the Investment Company Act, however, have not been dismissed. Plaintiffs’ Section 48(a) claims against parent entities U.S. Trust and Schwab also remain.
While the ultimate outcome of these matters cannot be predicted with any certainty at this time, based on currently available information, U.S. Trust believes that the likelihood is remote that the pending litigation will have a material adverse financial impact on the Companies, or materially affect U.S. Trust’s ability to provide investment management services to the Companies.
86
REPORT OF INDEPENDENT REGISTERED PUBLIC ACCOUNTING FIRM
To the Board of Directors/Trustees and Shareholders of
Excelsior Funds, Inc., Excelsior Funds Trust, and Excelsior Tax-Exempt Funds, Inc.
In our opinion, the accompanying statements of assets and liabilities, including the portfolios of investments, and the related statements of operations and of changes in net assets and the financial highlights present fairly, in all material respects, the financial position of the California Short Intermediate Term Tax-Exempt Income Fund, Core Bond Fund, High Yield Fund, Intermediate-Term Bond Fund, Intermediate Term Tax-Exempt Fund, Long-Term Tax-Exempt Fund, New York Intermediate Term-Tax Exempt Fund, Short-Term Government Securities Fund and Short-Term Tax-Exempt Securities Fund (three portfolios of Excelsior Funds, Inc., five portfolios of Excelsior Tax-Exempt Funds, Inc. and one portfolio of Excelsior Funds Trust, hereafter referred to as the “Funds”) at March 31, 2007, and the results of each of their operations, the changes in each of their net assets and the financial highlights for the year then ended, in conformity with accounting principles generally accepted in the United States of America. These financial statements and financial highlights (hereafter referred to as “financial statements”) are the responsibility of the Funds’ management; our responsibility is to express an opinion on these financial statements based on our audit. We conducted our audit of these financial statements in accordance with the standards of the Public Company Accounting Oversight Board (United States). Those standards require that we plan and perform the audit to obtain reasonable assurance about whether the financial statements are free of material misstatement. An audit includes examining, on a test basis, evidence supporting the amounts and disclosures in the financial statements, assessing the accounting principles used and significant estimates made by management, and evaluating the overall financial statement presentation. We believe that our audit, which included confirmation of securities at March 31, 2007 by correspondence with the custodian and brokers, provides a reasonable basis for our opinion. The statements of changes in net assets and financial highlights of the Funds for each of the years in the period ended March 31, 2006 were audited by other auditors whose report dated May 22, 2006, expressed an unqualified opinion on those statements.
PRICEWATERHOUSECOOPERS LLP
San Francisco, California
May 18, 2007
87
PROXY VOTING RESULTS (Unaudited)
On November 20, 2006, Schwab announced an agreement to sell U.S. Trust, a wholly-owned subsidiary of Schwab, to the Bank of America (the “Sale”). The Sale includes all of U.S. Trust’s subsidiaries, including USTA and USTNA.
Under Section 15 of the 1940 Act, the change in ownership of U.S. Trust may result in the assignment, and automatic termination, of the Funds’ current investment advisory agreements with USTA and USTNA (the “Current Advisory Agreements”). Consequently, the Funds will need to enter into new investment advisory agreements with USTA and USTNA upon the closing of the Sale (the “New Advisory Agreements”), which requires the approval of both the Board of Directors and the shareholders of the Funds. At a meeting held on January 8, 2007, the Board approved New Advisory Agreements under which, subject to approval by the Funds’ shareholders, USTA and USTNA will continue to serve as investment advisers to the Funds after the Sale is completed. At the same meeting, the Board directed that the New Advisory Agreements be submitted to the shareholders of each Fund for approval.
A Special Meeting of Shareholders of Excelsior Funds, Excelsior Tax-Exempt Funds and Trust and each of their Funds was held on March 30, 2007, for the purpose of seeking shareholder approval of the following proposal: to approve new investment advisory agreements by and among USTA, USTNA and the Companies, on behalf of the Funds. The Special Meeting for Excelsior Funds with respect to the Value and Restructuring Fund, Energy and Natural Resources and Treasury Money Funds was adjourned for the purpose of soliciting additional proxies, and subsequently held on April 30, 2007. The number of votes necessary to conduct the Special Meetings and approve the proposal was obtained. The results of the votes of shareholders are listed below:
EXCELSIOR FUNDS, INC.
| | | | | | |
Fund | | For | | Against | | Abstain |
Blended Equity Fund | | 6,164,047.545 | | 67,952.751 | | 73,977.210 |
Core Bond Fund | | 42,419,131.502 | | 102,811.034 | | 103,300.208 |
Emerging Markets Fund | | 40,519,375.591 | | 385,533.770 | | 2,387,530.558 |
Energy and Natural Resources Fund | | 10,149,963.059 | | 261,710.922 | | 349,760.892 |
Government Money Fund | | 172,737,336.070 | | 747,772.190 | | 420,358.000 |
Intermediate-Term Bond Fund | | 44,858,545.970 | | 241,685.152 | | 66,016.000 |
International Fund | | 21,282,762.400 | | 54,899.414 | | 128,924.192 |
Large Cap Growth Fund | | 42,848,198.375 | | 89,295.014 | | 404,672.705 |
Money Fund | | 674,980,999.600 | | 1,166,673.210 | | 410,474.540 |
Pacific/Asia Fund | | 12,624,395.052 | | 35,293.746 | | 146,970.828 |
Real Estate Fund | | 6,828,766.866 | | 23,944.228 | | 74,532.837 |
Short-Term Government Securities Fund | | 19,900,726.363 | | 26,705.441 | | 160,992.698 |
Small Cap Fund | | 20,778,531.495 | | 77,734.183 | | 230,771.291 |
Treasury Money Fund | | 147,661,994.420 | | 8,327.040 | | 953,491.100 |
Value and Restructuring Fund | | 71,659,202.229 | | 1,308,059.398 | | 2,313,244.343 |
88
PROXY VOTING RESULTS (Continued)
EXCELSIOR TAX-EXEMPT FUNDS, INC.
| | | | | | |
Fund | | For | | Against | | Abstain |
California Short-Intermediate Term Tax-Exempt Income Fund | | 5,620,954.755 | | 30,312.000 | | 19,754.000 |
Intermediate-Term Tax-Exempt Fund | | 25,090,015.155 | | 30,070.577 | | 76,826.198 |
Long-Term Tax-Exempt Fund | | 3,628,610.926 | | 33,702.423 | | 40,804.648 |
New York Intermediate-Term Tax-Exempt Fund | | 9,319,329.057 | | 13,806.000 | | 36,899.000 |
New York Tax-Exempt Money Fund | | 275,209,603.310 | | 4,686,548.000 | | 63,196.000 |
Short-Term Tax-Exempt Securities Fund | | 8,452,657.301 | | 72,849.000 | | 359,587.000 |
Tax-Exempt Money Fund | | 1,356,339,634.110 | | 11,586,764.280 | | 2,023,751.550 |
EXCELSIOR FUNDS TRUST
| | | | | | |
Fund | | For | | Against | | Abstain |
Equity Income Fund | | 15,004,710.199 | | 69,167.666 | | 28,045.000 |
Equity Opportunities Fund | | 15,890,842.151 | | 16,544.962 | | 771.000 |
High Yield Fund | | 15,794,959.655 | | 30,927.324 | | 249,577.222 |
International Equity Fund | | 5,138,808.000 | | .000 | | .000 |
Mid Cap Value and Restructuring Fund | | 7,879,533.211 | | 19,517.123 | | 87,756.460 |
89
ADDITIONAL FEDERAL TAX INFORMATION
Other Federal Tax Information (Unaudited):
The funds designate the following percentage of the distributions paid from net investment income as exempt-interest dividends for the fiscal year ended March 31, 2007.
| | | |
| | | Percentage | |
California Short-Intermediate Term Tax-Exempt Income Fund | | 100 | % |
Intermediate-Term Tax-Exempt Fund | | 100 | % |
Long-Term Tax-Exempt Fund | | 100 | % |
New York Intermediate-Term Tax-Exempt Fund | | 100 | % |
Short-Term Tax-Exempt Securities Fund | | 100 | % |
The following Funds paid out the amounts of Long Term Capital Gains for the year ended March 31, 2007:
| | | |
| | | Long Term Capital Gains |
California Short-Intermediate Term Tax-Exempt Income Fund | | $ | 255,865 |
Intermediate-Term Tax-Exempt Fund | | | 730,630 |
Long-Term Tax-Exempt Fund | | | 392,494 |
90
APPROVAL OF INVESTMENT ADVISORY AGREEMENTS (Unaudited)
In November 2006, representatives of Schwab, U.S. Trust, and the Funds’ investment advisers, USTA and USTNA (together, USTA and USTNA are referred to as the “Advisers) informed the Board that Schwab had entered into a stock purchase agreement with the Bank of America under which Schwab would sell U.S. Trust to Bank of America (the “Sale”). Representatives of Schwab, U.S. Trust, and the Advisers also informed the Board that, because the Sale includes all of U.S. Trust’s subsidiaries, such as USTA and USTNA, the completion of the Sale may be deemed to be an “assignment” (as defined in the 1940 Act) of the Funds’ current investment advisory agreements (the “Current Advisory Agreements”) resulting in the termination of the Current Advisory Agreements in accordance with their terms. To provide continuity in investment advisory services, representatives of U.S. Trust, the Advisers, and Bank of America proposed that the Board approve new investment advisory agreements (the “New Advisory Agreements”) under which, subject to shareholder approval, USTA and USTNA would continue to serve as investment advisers to the Funds after the completion of the Sale.
In advance of its December 6-7, 2006 meeting, the Board of Directors/Trustees requested and received from Bank of America, U.S. Trust, and the Advisers, various materials providing information regarding the Sale and its impact on (i) the Funds and their shareholders, (ii) the investment advisory services provided to the Funds by the USTA and USTNA and (iii) the administration services provided to the Funds by USTA. After receiving and reviewing these materials, the Board discussed at their December 6-7, 2006 meeting, the proposal to approve the New Advisory Agreements. Representatives from Bank of America, U.S. Trust, the Advisers, and Schwab attended the meeting and presented additional oral and written information to the Board to assist the Board in its considerations. These representatives assured the Board that Bank of America did not anticipate that there will be any reduction in the scope of or material adverse change in the nature or quality of, the investment advisory services to the Funds under the New Advisory Agreements. These representatives noted that a plan would be put into place designed to provide for the continuity of the investment advisory services under the New Advisory Agreements.
Additionally, representatives from Bank of America discussed the extensive experience and resources dedicated to Bank of America’s large mutual fund business, assuring the Board that Bank of America would seek to provide the Funds with the same or better quality of services with respect to the administration services currently provided by USTA. Representatives from Bank of America noted that: (i) the size and scale of Bank of America’s mutual fund business could produce potential savings for the Funds’ shareholders through reduced administrative costs and (ii) there was the potential for significant negotiating power in any future vendor discussions resulting from the Funds being part of the larger Bank of America fund complex.
The Board then discussed the written materials that the Board received before the meeting and the oral presentations and all other information that the Board received or discussed at the December 6-7, 2006 meeting. At the conclusion of the meeting, the Board decided to schedule another in-person Board meeting on January 8, 2007 to allow the Board to further consider the proposal to approve the New Advisory Agreements.
91
APPROVAL OF INVESTMENT ADVISORY AGREEMENTS (Continued)
In anticipation of the January 8, 2007 Board meeting, legal counsel for the Directors/Trustees who are not interested persons (as defined in the 1940 Act) (“Independent Directors”) sent an information request letter to U.S. Trust and Schwab to solicit further information that the Board deemed to be relevant to their consideration of the New Advisory Agreements, including a discussion of, among other matters, (a) a detailed timeline and plan for the orderly transition of the administration and oversight of the Funds; (b) the extent to which key personnel of the Advisers who manage day-to-day investment operations of the Funds are expected to continue to be employed by the Advisers after the Sale; (c) the experience and qualifications of new key administrative personnel that Bank of America proposes to involve in Fund matters; (d) any enhanced compliance policies and procedures adopted by Bank of America in response to mutual fund regulatory and compliance issues; (e) any anticipated financial benefits of the Sale to Fund shareholders; (f) any anticipated changes in the Funds’ fees and operating expenses; (g) any anticipated structural changes to the Excelsior Funds complex; (h) any conflicts of interest between the other business interests of Bank of America and its affiliates and the operations of the Funds; and (i) any limitations on the Funds’ investment operations that would arise as a result of the Funds’ being affiliated with Bank of America. The responses by Bank of America, U.S. Trust, the Advisers and Schwab were provided to the Board for their review prior to the January 8, 2007 Board meeting, and the Board was provided with the opportunity to request any additional materials.
At the Board’s meeting on January 8, 2007, Bank of America, U.S. Trust, the Advisers, and Schwab provided additional written and oral information on the Sale and the impact of the Sale on the Advisers and the Funds and their shareholders. During the meeting, representatives from Bank of America and the Advisers, who were present at the meeting, assured the Board that Bank of America does not anticipate that there will be any reduction in the scope of, or material adverse change in the nature or quality of, the investment advisory services to the Funds under the New Advisory Agreements. Additionally, representatives from Bank of America, and the Advisers represented to the Board that Bank of America personnel would seek to provide the same or better quality of services with respect to the administration services currently provided by USTA. It was noted that a plan for the orderly transition of the administration and oversight of the Funds had been developed to ensure that there would be no disruption of Fund operations or other adverse consequences to the Funds and their shareholders. In addition, Bank of America provided, and the Board discussed, information regarding the potential applicability of certain regulatory orders relating to the Columbia Funds and the legacy Nations Funds.
The Board then deliberated on the approval of the New Advisory Agreements in light of all the information it had received. The Independent Directors, assisted by their independent legal counsel, met in executive session to discuss the New Advisory Agreements. After deliberating in executive session, the entire Board reconvened to discuss the approval of the New Advisory Agreements.
At the conclusion of the January 8, 2007 Board meeting, the Board, including all of the Independent Directors, unanimously concluded (a) that the approval of the New Advisory Agreements would be in the best interests of the shareholders and the Funds and (b) to recommend the approval of the New Advisory Agreements to shareholders. In concluding to approve the New Advisory Agreements and to recommend their approval to shareholders, the Board considered, with the assistance of
92
APPROVAL OF INVESTMENT ADVISORY AGREEMENTS (Continued)
independent legal counsel, the information and materials provided to the Board and a variety of specific factors discussed at the meetings, including, as discussed below, the Board’s prior conclusions when determining whether to approve the continuation of the Current Advisory Agreements.
At the January 8, 2007 Board meeting, the Board concluded it was reasonable to take into account the conclusions the Board made when considering and evaluating the renewal of the Current Advisory Agreements (the “Annual Review”), which occurred at the September 29, 2006 in-person Board meeting, as part of its considerations to approve the New Advisory Agreements. The Board’s conclusion in this regard was based on (i) the fact that the New Advisory Agreements are identical to the Current Advisory Agreements in all material respects, including the investment advisory fees payable by the Funds to the Advisers and (ii) assurances by Bank of America and the Advisers that there would be no reduction or material adverse change in the nature or quality of the investment advisory services to the Funds under the New Advisory Agreements.
In addition to the conclusions formed with respect to the Annual Review, the Board considered specific information at the January 8, 2007 Board meeting concerning the Sale and its impact on the Advisers and the Funds and their shareholders, as they considered appropriate, including but not limited to the following:
| | • | | a detailed timeline and plan for the orderly transition of the administration and oversight of the Funds; |
| | • | | assurances by Bank of America and the Advisers that Bank of America does not anticipate that there will be any reduction in the scope of, or material adverse change in the nature or quality of, the investment advisory services to the Funds under the New Advisory Agreements; |
| | • | | an explanation of the extent to which key personnel of the Advisers who manage the day-to-day investment operations of the Funds are expected to continue to be employed by the Advisers after the Sale; |
| | • | | the experience and qualifications of new key administrative, financial, compliance and legal personnel that Bank of America proposes to involve in Fund matters; |
| | • | | the enhanced compliance policies and procedures adopted by Bank of America in response to mutual fund regulatory and compliance issues; |
| | • | | the anticipated financial benefits of the Sale to Fund shareholders including (i) access for the Funds to a large distribution network both on the retail, institutional and retirement platforms, as well as to Bank of America’s Private Bank and Wealth Management areas; (ii) the potential for a positive impact on Fund operating expenses resulting from an increase in assets; and (iii) the potential for significant negotiating power in any future vendor discussions resulting from the Funds being part of the larger Bank of America fund complex; |
| | • | | a representation from the Advisers and Bank of America that neither the Companies nor their shareholders would bear any costs of the Meeting or the costs of any solicitation in connection with the Meeting; |
93
APPROVAL OF INVESTMENT ADVISORY AGREEMENTS (Continued)
| | • | | a representation from Bank of America that Bank of America would extend the Advisers’ commitments under the Expense Limitation Agreements currently in place with the Funds for a period of two years following the closing of the Sale, subject to the Board’s prior approval of any changes to those Expense Limitation Agreements; |
| | • | | a discussion of the anticipated structural changes to the Excelsior Funds complex and a representation from Bank of America that the class structure of the Excelsior Funds was currently being evaluated by its product teams and that the results of that analysis would be presented to the Board for consideration at a future meeting; |
| | • | | the policies and procedures adopted by Bank of America that are intended to identify, monitor and mitigate any conflicts of interest between the other business interests of Bank of America and its affiliates and the operations of the Funds; and |
| | • | | a representation from U.S. Trust and Schwab that no material adverse impact on the Funds’ investment operations is expected as a result of the Funds being affiliated with Bank of America. |
The Board concluded, within the context of its full deliberations, that each of the representations, assurances and informational items provided by the Advisers, U.S. Trust, Bank of America and Schwab set forth above supported the approval of the New Advisory Agreements.
In the course of their deliberations, the Board did not identify any particular information or factor that was all-important or controlling. Based on its evaluation of the information and the conclusions with respect thereto at its meetings on September 29, 2006, December 6-7, 2006 and January 8, 2007, the Board, including all of the Independent Directors, unanimously: (a) concluded that the terms of the New Advisory Agreements are fair and reasonable; (b) concluded that the Advisers’ fees are reasonable in light of the services to be provided by the Advisers to the Companies; (c) concluded that the approval of the New Advisory Agreements would be in the best interests of the shareholders and the Funds; and (d) concluded to recommend the approval of the New Advisory Agreements to shareholders.
94
Directors/Trustees and Officers (Unaudited)
The tables below provide information pertaining to the Directors/Trustees and Officers of the Companies. The mailing address for each Director/Trustee is Excelsior Funds, 101 Montgomery Street, San Francisco, CA 94104.
| | | | | | | | | | |
Name and
Year of Birth | | Position(s) Held
with the
Company(1) | | Term of
Office(2) and
Length of Time
Served | | Principal Occupation(s)
During Past Five Years | | Number of
Funds in the
Fund Complex
Overseen by
Board Member | | Other
Directorships
Held by Board Member(6) |
| INDEPENDENT DIRECTORS/TRUSTEES | | | | | | |
Rodman L. Drake
Year of Birth: 1943 | | Director/Trustee; Chairman, Full Board | | Trustee of Excelsior Funds Trust since 1994; Director of Excelsior Funds, Inc. and Excelsior Tax Exempt Funds Inc. since 1996 | | Co-Founder of Baringo Capital LLC (since 2002); President, Continuation Investments Group, Inc. (1997 to 2001). | | 38(3) | | BOARD 1 — Director and Chairman, Hyperion Total Return Fund, Inc. and Hyperion Strategic Mortgage Fund Inc. (since 1991). BOARD 2 — Director, Jackson Hewitt Tax Service Inc. (since June 2004). BOARD 3 — Director, Student Loan Corporation (since May 2005). BOARD 4 — Celgene Corporation (since April 2006). |
| | | | | |
Morrill Melton Hall, Jr.
Year of Birth: 1944 | | Director/Trustee; Chairman, Investment Oversight Committee | | Director/Trustee of each Company since 2000 | | Chairman (since 1984) and Chief Executive Officer (since 1991), Comprehensive Health Services, Inc. (health care management and administration). | | 38(3) | | None |
| | | | | |
Jonathan Piel
Year of Birth: 1938 | | Director/Trustee | | Trustee of Excelsior Funds Trust since 1994; Director of Excelsior Funds, Inc. and Excelsior Tax Exempt Funds Inc. since 1996 | | Cable television producer and website designer; Editor, Scientific American (1984-1986), and Vice President, Scientific American Inc., (1986-1994); Director, National Institute of Social Sciences; Member Advisory Board, The Stone Age Institute, Bloomington, Indiana. | | 38(3) | | None |
| | | | | |
John D. Collins
Year of Birth: 1938 | | Director/Trustee; Chairman, Audit and Compliance Committee | | Director/Trustee of each Company since 2005 | | Retired. Consultant, KPMG, LLP (July 1999 to June 2000); Partner, KPMG, LLP (March 1962 to June 1999). | | 38(3) | | BOARD 1 — Director, Mrs. Fields Famous Brands LLC (consumer products) (since December 2004). |
95
| | | | | | | | | | |
Name and
Year of Birth | | Position(s) Held
with the
Company(1) | | Term of
Office(2) and
Length of Time
Served | | Principal Occupation(s)
During Past Five Years | | Number of
Funds in the
Fund Complex
Overseen by
Board Member | | Other
Directorships
Held by Board Member(6) |
Mariann Byerwalter
Year of Birth: 1960 | | Director/Trustee; Chairman, Marketing, Distribution and Shareholder Services Committee | | Director/Trustee of each Company since 2006 | | Chairman of JDN Corporate Advisory LLC (1996 to 2001); Vice President for Business Affairs and Chief Financial Officer of Stanford University (1996-2001); Special Adviser to the President of Stanford University (2001). | | 95(4) | | BOARD 1 — Director, Redwood Trust, Inc. (mortgage finance). BOARD 2 — Director, PMI Group, Inc. (mortgage insurance). |
| | | | | |
Nils H. Hakansson
Year of Birth: 1937 | | Director/Trustee | | Director/Trustee of each Company since 2006 | | Sylvan C. Coleman Professor of Finance and Accounting, Emeritus, Haas School of Business University of California, Berkeley (since 2003); Sylvan C. Coleman Professor of Finance and Accounting, Haas School of Business, University of California, Berkeley (July 1977 to January 2003). | | 38(3) | | None |
| | | | | |
William A. Hasler
Year of Birth: 1941 | | Director/Trustee; Chairman, Governance Committee | | Director/Trustee of each Company since 2006 | | Retired. Dean Emeritus of the Haas School of Business at the University of California, Berkeley; until February 2004, Co-Chief Executive Officer, Aphton Corporation (bio-pharmaceuticals). | | 95(4) | | BOARD 1 — Director, Aphton Corporation BOARD 2 — Director, Mission West Properties (commercial real estate). BOARD 3 — Director, TOUSA (home building). BOARD 4 — Director, Harris-Stratex Networks (a network equipment corporation). BOARD 5 — Director, Genitope Corp. (bio-pharmaceuticals). BOARD 6 — Director, Solectron Corporation where he is also Non-Executive Chairman (manufacturing). BOARD 7 — Director, Ditech Communications Corporation (voice communications technology). |
96
| | | | | | | | | | |
Name and
Year of Birth | | Position(s) Held
with the
Company(1) | | Term of
Office(2) and
Length of Time
Served | | Principal Occupation(s)
During Past Five Years | | Number of
Funds in the
Fund Complex
Overseen by
Board Member | | Other
Directorships
Held by Board Member(6) |
| INTERESTED DIRECTORS/TRUSTEES | | | | | | |
| | | | | |
Randall W. Merk(5)
Year of Birth: 1954 | | Director/Trustee | | Director/Trustee of each Company since 2006 | | Executive Vice President, Charles Schwab & Co., Inc. (2002-present); President, Schwab Financial Product, Charles Schwab & Co., Inc. (2002-present); Director, Charles Schwab Asset Management (Ireland) Limited; Charles Schwab Worldwide Funds PLC; Director, Charles Schwab Bank N.A. (since 2006). Prior to September 2002, President and Chief Investment Officer, American Century Investment Management, and Director, American Century Companies, Inc.; Until June 2001, Chief Investment Officer — Fixed Income, American Century Companies, Inc. | | 95(4) | | None |
97
| | | | | | |
Name, Address and Year of Birth | | Position(s) Held
with the
Company(1) | | Term of
Office(2) and
Length of
Time Served | | Principal Occupation(s)
During Past Five Years |
| OFFICERS | | | | | | |
Evelyn Dilsaver
101 Montgomery St.
San Francisco, CA 94104
Year of Birth: 1955 | | President | | Since
February
2006 | | President and Chief Executive Officer, Laudus Variable Insurance Trust, Laudus Trust, The Charles Schwab Family of Funds, Schwab Investments, Schwab Annuity Portfolios and Schwab Capital Trust; President, Chief Executive Officer, and Director, Charles Schwab Investment Management, Inc. President, UST Advisers, Inc.’s Mutual Fund Division since March 2006.From June 2003 to July 2004, Senior Vice President, Asset Management Products and Services Enterprise, Charles Schwab & Co., Inc. Prior to June 2003, Executive Vice President, Chief Financial Officer, and Chief Administrative Officer, U.S. Trust, a subsidiary of The Charles Schwab Corporation. |
| | | |
Leo Grohowski
114 West 47th Street
New York, NY 10036
Year of Birth: 1958 | | Vice President | | Since
February
2006 | | Executive Vice President and Chief Investment Officer, U.S. Trust (October 2005 to present); Chief Investment Officer, Deutsche Asset Management Americas and Scudder Investments (2002-2005); and Chief Investment Officer, Deutsche Bank Private Banking (1999-2002). |
| | | |
Mary Martinez
114 West 47th Street
New York, NY 10036
Year of Birth: 1960 | | Vice President | | Since
February
2006 | | Managing Director of United States Trust Company, National Association (since 2003) and Chief Operating Officer of Asset Management (since December 2005) and Chief Executive Officer of National Private Banking (October 2004 to December 2005); Managing Director and Director of Relationship Management Service, Marketing, Information and Technology at Bessemer Trust (1998 to 2003). |
| | | |
Catherine MacGregor
101 Montgomery St.
San Francisco, CA 94104
Year of Birth: 1964 | | Vice President | | Since
September
2006 | | Vice President, Charles Schwab & Co., Inc. and Charles Schwab Investment Management, Inc. (since July 2005); Chief Counsel, Laudus Variable Insurance Trust and Laudus Trust (since September 2006); Chief Legal Officer, Vice President, Laudus Variable Insurance Trust and Laudus Trust (since March 2007); Vice President, The Charles Schwab Family of Funds, Schwab Investments, Schwab Capital Trust and Schwab Annuity Portfolios; Senior Associate, Paul Hastings Janofsky & Walker LLP (1999 to July 2005). |
| | | |
Joseph Trainor, CFA
114 West 47th Street
New York, NY 10036
Year of Birth: 1961 | | Vice President | | Since
February
2004 | | Managing Director of United States Trust Company, National Association (since 2003) and President, U.S. Trust Institutional; President of MFS Institutional Advisors (1998 to 2002). |
| | | |
George Pereira
101 Montgomery St.
San Francisco, CA 94104
Year of Birth: 1964 | | Treasurer/Chief Financial and Chief Accounting Officer | | Since
December
2005 | | Chief Financial Officer, Laudus Variable Insurance Trust, Laudus Trust, The Charles Schwab Family of Funds, Schwab Investments, Schwab Annuity Portfolios and Schwab Capital Trust; Senior Vice President and Chief Financial Officer, Charles Schwab Investment Management, Inc.; Director, Charles Schwab Asset Management (Ireland) Limited; Sr. Vice President, Financial Reporting, Charles Schwab & Co., Inc. (December 1999 to November 2004); Chief Financial Officer, UST Advisers, Inc.’s Mutual Fund Division (since March 2006). |
| | | |
Randall Fillmore
101 Montgomery St.
San Francisco, CA 94104
Year of Birth: 1960 | | Chief Compliance Officer | | Since
June
2006 | | Senior Vice President, Institutional Compliance and Chief Compliance Officer, Charles Schwab Investment Management, Inc. Chief Compliance Officer, The Charles Schwab Family of Funds, Schwab Investments, Schwab Capital Trust and Schwab Annuity Portfolios, Laudus Trust and Laudus Variable Insurance Trust; Vice President, Charles Schwab & Co., Inc., and Charles Schwab Investment Management, Inc. (2002-2003); Vice President, Internal Audit, Charles Schwab and Co., Inc. (2000-2002). |
98
| | | | | | |
Name, Address and Year of Birth | | Position(s) Held
with the
Company(1) | | Term of
Office(2) and
Length of
Time Served | | Principal Occupation(s)
During Past Five Years |
Wyndham Clark
225 High Ridge Road
Stamford, CT 06905
Year of Birth: 1958 | | Anti-Money Laundering Officer | | Since
May
2004 | | Vice President and AML Officer, UST Advisers, Inc. (since 2003); Vice President and Deputy Director Risk Management, IBJ Whitehall (banking) (2001 to 2002); Vice President and Chief Risk Officer, EMAC, LLC (commercial lender, asset backed security issuer) (1999 to 2001). |
| | | |
Koji E. Felton
101 Montgomery St.
San Francisco, CA 94104
Year of Birth: 1961 | | Secretary and Chief Legal Officer | | Since
June
2006 | | Secretary and Chief Legal Officer, The Charles Schwab Family of Funds, Schwab Investments, Schwab Capital Trust and Schwab Annuity Portfolios; Senior Vice President, Chief Counsel and Corporate Secretary, Charles Schwab Investment Management, Inc.; Senior Vice President and Deputy General Counsel, Charles Schwab & Co., Inc. Prior to June 1998, Branch Chief in Enforcement at U.S. Securities and Exchange Commission in San Francisco. |
| (1) | Each Director/Trustee serves in the same capacity as described above for each registered investment company included in the Excelsior Funds family (Excelsior Funds Inc., Excelsior Tax-Exempt Funds, Inc. and Excelsior Funds Trust) (together, the “Excelsior Funds Family”) and the Laudus Funds family (Laudus Trust and Laudus Variable Insurance Trust) (together, the “Laudus Funds Family”). Each officer serves in the same capacity as described above for each registered investment company included in the Excelsior Funds Family. |
| (2) | Each Director/Trustee shall hold office until the election and qualification of his or her successor, or until he or she dies, resigns or is removed. The Excelsior Funds retirement policy requires that Independent Directors/Trustees retire no later than December 31st of the year during which he or she reaches 72 years of age. The officers of each Company hold office for a one-year term and until their respective successors are chosen and qualified, or, in each case, until he or she sooner dies, resigns, is removed, or becomes disqualified in accordance with the Company’s by-laws. |
| (3) | This number includes all registered investment companies included in the Excelsior Funds Family and the Laudus Funds Family, each of which is part of the Schwab Mutual Fund Family (as defined below). As of March 31, 2007, the Excelsior Funds Family and the Laudus Funds Family, in the aggregate, consisted of 38 funds. As of March 31, 2007, the Excelsior Funds Family consisted of 27 funds. |
| (4) | This number includes all registered investment companies included in the Schwab Mutual Fund family (Excelsior Funds, Inc., Excelsior Tax-Exempt Funds Inc., Excelsior Funds Trust, Laudus Trust, Laudus Variable Insurance Trust, The Charles Schwab Family of Funds, Schwab Investments, Schwab Annuity Portfolios and Schwab Capital Trust) (together, the “Schwab Mutual Fund Family”). As of March 31, 2007, the Schwab Mutual Fund Family consisted of 95 funds. |
| (5) | Mr. Merk is considered an “interested person” of the Companies (as defined in the 1940 Act) because of his affiliation with the Companies’ Advisers. |
| (6) | This column includes only directorships of companies required to report to the SEC under the Securities Exchange Act of 1934 (i.e., public companies) or other investment companies registered under the 1940 Act that are not part of the Schwab Mutual Fund Family. |
99
DISCLOSURE OF FUND EXPENSES (Unaudited)
We believe it is important for you to understand the impact of fees regarding your investment. As a shareholder of the fund, you incur ongoing, or operating costs, which include costs for portfolio management, administrative services, and shareholder reports (like this one), among others. Operating expenses, which are deducted from a fund’s gross income, directly reduce the investment return of the fund. A fund’s expenses are expressed as a percentage of its average net assets. This figure is known as the expense ratio. The following examples are intended to help you understand the ongoing costs (in dollars) of investing in your fund and to compare these costs with those of other mutual funds. The examples are based on an investment of $1,000 made at the beginning of the period shown and held for the entire period.
The table on the following page illustrates your fund’s costs in two ways.
| | • | | Actual expenses. This section provides information about actual account values and actual expenses based on the Funds’ actual return for the period. This section is designed to help you to estimate the actual expenses after fee waivers that you paid over the period. The “Ending Account Value” shown is derived from the fund’s actual return, and the fourth column shows the dollar amount that would have been paid by an investor who started with $1,000 in the fund. You may use the information here, together with the amount you invested, to estimate the expenses that you paid over the period. |
To do so, simply divide your account value by $1,000 (for example, an $8,600 account value divided by $1,000 = 8.6), then multiply the result by the number given for your fund under the heading “Expenses Paid During Period”.
| | • | | Hypothetical expenses. This section provides information about hypothetical account values and hypothetical expenses that would have been incurred by an investor in the Fund based on an assumed rate of return of 5% per year before expenses. This section is designed to help you compare your fund’s costs with those of other mutual funds. It assumes that the fund had a return of 5% before expenses during the year, but that the expense ratio is unchanged. In this case, because the return used is not the fund’s actual return, the results cannot be used to estimate the actual ending account balance or expenses you paid for the period. You may use this information to compare the ongoing costs of investing in your Fund and other funds. To do so, compare this 5% hypothetical example with the 5% hypothetical examples that appear in shareholder reports of other funds. |
100
DISCLOSURE OF FUND EXPENSES (Continued)
Please note that the expenses shown in the table are meant to highlight and help you compare ongoing costs only, which are described in the Prospectus. Therefore, the hypothetical example is useful in comparing ongoing costs only, and will not help you determine the relative total costs of owning different funds.
| | | | | | | | | | | | |
| | | Beginning
Account
Value
10/01/2006 | | Ending
Account
Value
03/31/2007 | | Annualized
Expense
Ratios* | | | Expenses
Paid
During
Period** |
| | | | |
Actual Fund Return | | | | | | | | | | | | |
California Short-Intermediate Term Tax-Exempt Income Fund — Shares | | $ | 1,000.00 | | $ | 1,013.20 | | 0.50 | % | | $ | 2.51 |
Core Bond Fund — Shares | | | 1,000.00 | | | 1,025.20 | | 0.90 | | | | 4.54 |
High Yield Fund — Shares | | | 1,000.00 | | | 1,103.10 | | 1.03 | | | | 5.40 |
Intermediate-Term Bond Fund — Shares | | | 1,000.00 | | | 1,025.00 | | 0.74 | | | | 3.74 |
Intermediate-Term Tax-Exempt Fund — Shares | | | 1,000.00 | | | 1,013.30 | | 0.65 | | | | 3.26 |
Long-Term Tax-Exempt Fund — Shares | | | 1,000.00 | | | 1,017.00 | | 0.80 | | | | 4.02 |
New York Intermediate-Term Tax-Exempt Fund — Shares | | | 1,000.00 | | | 1,011.90 | | 0.80 | | | | 4.01 |
Short-Term Government Securities Fund — Shares | | | 1,000.00 | | | 1,024.20 | | 0.74 | | | | 3.73 |
Short-Term Tax-Exempt Securities Fund — Shares | | | 1,000.00 | | | 1,013.20 | | 0.59 | | | | 2.96 |
| | | | |
Hypothetical 5% Return | | | | | | | | | | | | |
California Short-Intermediate Term Tax-Exempt Income Fund — Shares | | | 1,000.00 | | | 1,022.44 | | 0.50 | | | | 2.52 |
Core Bond Fund — Shares | | | 1,000.00 | | | 1,020.44 | | 0.90 | | | | 4.53 |
High Yield Fund — Shares | | | 1,000.00 | | | 1,019.80 | | 1.03 | | | | 5.19 |
Intermediate-Term Bond Fund — Shares | | | 1,000.00 | | | 1,021.24 | | 0.74 | | | | 3.73 |
Intermediate-Term Tax-Exempt Fund — Shares | | | 1,000.00 | | | 1,021.69 | | 0.65 | | | | 3.28 |
Long-Term Tax-Exempt Fund — Shares | | | 1,000.00 | | | 1,020.94 | | 0.80 | | | | 4.03 |
New York Intermediate-Term Tax-Exempt Fund — Shares | | | 1,000.00 | | | 1,020.94 | | 0.80 | | | | 4.03 |
Short-Term Government Securities Fund — Shares | | | 1,000.00 | | | 1,021.24 | | 0.74 | | | | 3.73 |
Short-Term Tax-Exempt Securities Fund — Shares | | | 1,000.00 | | | 1,021.99 | | 0.59 | | | | 2.97 |
| * | Annualized expense ratios of certain funds are after fee waivers and expense reimbursements by the investment adviser. Absent such waivers and reimbursements, expenses paid during the period would have been greater. |
| ** | Expenses are equal to the Fund’s annualized expense ratio multiplied by the average account value over the period, multiplied by the number of days in the most recent fiscal half-year (182) then divided by 365. |
101
AR-FIXEDINC-0307

MONEY MARKET
FUNDS
ANNUAL REPORT
March 31, 2007
TABLE OF CONTENTS
For shareholder account information, current price and yield quotations, or to make an initial purchase or obtain a prospectus, call (800) 446-1012, from overseas, call (617) 483-7297.
| · | | Internet Address: http://www.excelsiorfunds.com |
This report must be preceded or accompanied by a current prospectus.
You should consider the Funds’ investment objectives, risks and expenses carefully before you invest. Information about these and other important subjects is in the Funds’ prospectus, which you should read carefully before investing.
Nothing in this report represents a recommendation of a security by the investment adviser. Manager views and portfolio holdings may have changed since the report date.
A description of the policies and procedures that Excelsior Funds use to determine how to vote proxies relating to portfolio securities, as well as information relating to how a Fund voted proxies relating to portfolio securities during the most recent 12-month period ended June 30, is available (i) without charge, upon request, by calling (800) 446-1012, or (ii) by accessing the Excelsior Funds’ internet address and (iii) on the Commission’s website at http://www.sec.gov.
Excelsior Funds file their June 30 and December 31 schedule of portfolio holdings with the Securities and Exchange Commission, on Form N-Q, within sixty days after the applicable reporting period. Excelsior Funds Form N-Q is available on the Commission’s website at http://www.sec.gov, and may be reviewed and copied at the Commission’s Public Reference Room in Washington, DC. Information on the operation of the Public Reference Room may be obtained by calling (800) SEC-0330.
A schedule of each Fund’s portfolio holdings, as of the end of the prior month, is also available on the Funds’ website at www.excelsiorfunds.com. This schedule is updated monthly, typically by the 15th calendar day, after the end of each month. The Funds may terminate or modify this policy at anytime.
Excelsior Funds, Inc. and Excelsior Tax-Exempt Funds, Inc. are distributed by BISYS Fund Services Limited Partnership.
You may write to Excelsior Funds, Inc. and Excelsior Tax-Exempt Funds, Inc. at the following address:
Excelsior Funds
P.O. Box 8529
Boston, MA 02266-8529
Notice About Duplicate Mailings
The Excelsior Funds have adopted a policy that allows the Funds to send only one copy of a Fund’s prospectus and annual and semi-annual reports to certain shareholders residing at the same “household.” This reduces Fund expenses, which benefits you and other shareholders. If you do not want your mailings to be “householded,” please call (800) 542-1061 or contact your financial intermediary.
SHARES OF THE FUNDS ARE NOT DEPOSITS OR OBLIGATIONS OF, OR GUARANTEED OR ENDORSED BY, ANY BANK, AND THE SHARES ARE NOT FEDERALLY INSURED BY THE FEDERAL DEPOSIT INSURANCE CORPORATION, BANK INSURANCE FUND, FEDERAL RESERVE BOARD, OR ANY OTHER GOVERNMENTAL AGENCY. FUND SHARES ARE NOT INSURED OR GUARANTEED BY THE U.S. GOVERNMENT. ALTHOUGH THE FUNDS SEEK TO PRESERVE THE VALUE OF YOUR INVESTMENT AT $1.00 PER SHARE, IT IS POSSIBLE TO LOSE MONEY BY INVESTING IN THE FUNDS.
LETTER TO SHAREHOLDERS
March 31, 2007
Dear Valued Excelsior Fund Shareholder:
I am pleased to bring you the annual report for the year ended March 31, 2007 for the Excelsior Funds. The funds in this report are part of the Excelsior Fund family which has over $20 billion in assets as of the end of the reporting period and includes a wide array of asset classes and investment strategies designed to meet the individual investor’s investment needs.
By now, you have received notification that on November 20, 2006, The Charles Schwab Corporation (“Schwab”) announced an agreement to sell the U.S. Trust Corporation (“U.S. Trust”), a wholly-owned subsidiary of Schwab, to the Bank of America Corporation (“Bank of America”) (the “Sale”). The Sale involves all of U.S. Trust’s subsidiaries, including the Excelsior Funds’ investment advisers, UST Advisers, Inc. (“USTA”) and United States Trust Company National Association, on behalf of its asset management division, U.S. Trust New York Asset Management (“USTNA”). Consequently, the Excelsior Funds will need to enter into new investment advisory agreements with USTA and USTNA.
At a meeting held on January 8, 2007, the Board approved new investment advisory agreements under which, subject to approval by the Excelsior Funds’ shareholders, USTA and USTNA will continue to serve as investment advisers to the Excelsior Funds after the Sale is completed. At the same meeting, the Board directed that the new investment advisory agreements be submitted to the shareholders of each Fund for approval.
A Special Meeting of Shareholders of Excelsior Funds, Inc., Excelsior Tax-Exempt Funds, Inc. and Excelsior Funds Trust and each of their funds was held on March 30, 2007. The number of votes necessary to conduct the Special Meeting and approve the new investment advisory agreements was obtained for each fund except the Value and Restructuring, Energy and Natural Resources and Treasury Money Funds. The Special Meeting for Value and Restructuring, Energy and Natural Resources and Treasury Money Funds was adjourned for the purpose of soliciting additional proxies, and we anticipate that the new investment advisory agreements will be approved by the shareholders of these funds at a subsequent Special Meeting.
The integration of U.S. Trust, Bank of America’s private bank and its ultra high net worth extension will create the nation’s largest private wealth management firm with assets under management of over $260 billion and total client assets of almost $420 billion.
We at the Excelsior Funds are excited about our future within Bank of America and remain committed to helping you with your long-term investment goals. Thank you for investing with us.
Sincerely,

Evelyn Dilsaver
President
1
Excelsior Funds, Inc.
Portfolio of Investments — March 31, 2007
Government Money Fund
| | | | | | |
Principal
Amount | | | | Value |
| U.S. GOVERNMENT & AGENCY OBLIGATIONS — 67.31% |
| $ | 4,660,000 | | Federal Home Loan Bank, 5.13%, 05/01/07 | | $ | 4,659,604 |
| | 5,000,000 | | Federal Home Loan Bank, 5.28%, 03/14/08(a) | | | 5,000,000 |
| | 50,000,000 | | Federal Home Loan Bank, Discount Note, 5.15%, 04/11/07 | | | 49,928,473 |
| | 35,000,000 | | Federal Home Loan Mortgage Corporation, Discount Note, 5.13%, 06/18/07 | | | 34,610,596 |
| | 9,801,000 | | Federal National Mortgage Association, 5.25%, 04/15/07 | | | 9,800,834 |
| | 10,000,000 | | Federal National Mortgage Association, 5.30%, 01/08/08 | | | 10,000,000 |
| | 5,000,000 | | Federal National Mortgage Association, 5.50%, 01/15/08 | | | 5,010,867 |
| | 8,500,000 | | Federal National Mortgage Association, Discount Note, 5.07%, 04/04/07 | | | 8,496,409 |
| | 16,000,000 | | Federal National Mortgage Association, Discount Note, 5.15%, 04/18/07 | | | 15,961,112 |
| | 20,000,000 | | Federal National Mortgage Association, Discount Note, 5.05%, 07/03/07 | | | 19,739,083 |
| | | | | | |
| | | TOTAL U.S. GOVERNMENT & AGENCY OBLIGATIONS
(Cost $163,206,978) | | | 163,206,978 |
| | | | | | |
| | | | | |
| Shares | | | | Value |
| REGISTERED INVESTMENT COMPANY — 1.59% |
| 3,854,364 | | Dreyfus Treasury Prime Cash Management Fund | | $ | 3,854,364 |
| | | | | |
| | TOTAL REGISTERED INVESTMENT COMPANY
(Cost $3,854,364) | | | 3,854,364 |
| | | | | |
| | | | | | |
Principal
Amount | | | | |
| REPURCHASE AGREEMENT — 31.34% |
| $ | 76,000,000 | | Morgan Stanley, 5.30% dated 03/30/07, due 04/02/07, to be repurchased at $76,033,567 (collateralized by U.S. Government Obligations, ranging in par value $7,935,000-$50,000,000, 5.25%-5.50%, 02/25/08-02/18/09; total market value $77,769,302) | | $ | 76,000,000 |
| | | | | | |
| | | TOTAL REPURCHASE AGREEMENT
(Cost $76,000,000) | | | 76,000,000 |
| | | | | | |
| | | | | | | |
TOTAL INVESTMENTS
(Cost $243,061,342)(b) | | 100.24 | % | | $ | 243,061,342 | |
LIABILITIES IN EXCESS OF
OTHER ASSETS | | (0.24 | ) | | | (584,193 | ) |
| | | | | | | |
NET ASSETS | | 100.00 | % | | $ | 242,477,149 | |
| | | | | | | |
| (a) | Variable Rate Security—The rate disclosed is as of March 31, 2007. |
| (b) | Represents cost for financial reporting and federal income tax purposes. |
Discount Note—The rate reported is the discount rate at the time of purchase.
The summary of the Fund’s investments as of March 31, 2007 is as follows: (Unaudited)
| | | | | | | |
Portfolio Diversification | | % of
Net
Assets | | | Value | |
U.S. Government & Agency Obligations | | 67.31 | % | | $ | 163,206,978 | |
Repurchase Agreement | | 31.34 | | | | 76,000,000 | |
Registered Investment Company | | 1.59 | | | | 3,854,364 | |
| | | | | | | |
Total Investments | | 100.24 | % | | $ | 243,061,342 | |
Liabilities in Excess of Other Assets | | (0.24 | ) | | | (584,193 | ) |
| | | | | | | |
Net Assets | | 100.00 | % | | $ | 242,477,149 | |
| | | | | | | |
See Notes to Financial Statements.
2
Excelsior Funds, Inc.
Portfolio of Investments — March 31, 2007
Money Fund
| | | | | | |
Principal
Amount | | | | Value |
| | | | | | |
| CERTIFICATES OF DEPOSIT — 17.90% | | |
| $ | 45,000,000 | | Barclay Bank plc,
5.30%, 04/04/07 | | $ | 45,000,000 |
| | 50,000,000 | | Citibank,
5.31%, 04/30/07 | | | 50,000,000 |
| | 50,000,000 | | First Tennessee Bank,
5.29%, 06/05/07 | | | 50,000,000 |
| | 30,000,000 | | HSBC Bank,
5.30%, 05/14/07 | | | 30,000,000 |
| | 50,000,000 | | Washington Mutual Corp.,
5.26%, 06/06/07 | | | 50,000,000 |
| | | | | | |
| | | TOTAL CERTIFICATES OF DEPOSIT
(Cost $225,000,000) | | | 225,000,000 |
| | | | | | |
| COMMERCIAL PAPER — 71.77% | | |
| | 25,000,000 | | Abbott Laboratories,
Discount Note,
5.19%, 04/02/07 | | | 24,996,396 |
| | 25,000,000 | | Abbott Laboratories,
Discount Note,
5.24%, 04/10/07 | | | 24,967,250 |
| | 50,000,000 | | American General Finance Co., Discount Note,
5.27%, 04/05/07 | | | 49,970,721 |
| | 9,200,000 | | CIT Group Funding, Inc., Discount Note,
5.24%, 04/25/07 | | | 9,167,861 |
| | 15,000,000 | | CIT Group Funding, Inc., Discount Note,
5.22%, 06/29/07 | | | 14,806,425 |
| | 5,000,000 | | CIT Group Funding, Inc., Discount Note,
5.20%, 08/09/07 | | | 4,906,111 |
| | 50,000,000 | | Corporate Asset Funding Co., Inc., Discount Note,
5.25%, 04/20/07(a) | | | 49,861,458 |
| | 15,000,000 | | Falcon Asset Securitization Corp., Discount Note,
5.24%, 04/09/07(a) | | | 14,982,533 |
| | 20,000,000 | | Falcon Asset Securitization Corp., Discount Note,
5.26%, 04/18/07(a) | | | 19,950,322 |
| | | | | | |
Principal
Amount | | | | Value |
| | | | | | |
| COMMERCIAL PAPER — (continued) | | |
| $ | 14,000,000 | | Falcon Asset Securitization Corp., Discount Note,
5.24%, 04/25/07(a) | | $ | 13,951,093 |
| | 20,000,000 | | General Electric Capital Corp., Discount Note,
5.17%, 06/05/07 | | | 19,813,306 |
| | 40,000,000 | | Goldman Sachs Group, Inc., Discount Note,
5.30%, 04/03/07 | | | 39,988,222 |
| | 28,000,000 | | Govco, Inc., Discount Note,
5.25%, 04/27/07(a) | | | 27,893,833 |
| | 15,000,000 | | Govco, Inc., Discount Note,
5.24%, 05/11/07(a) | | | 14,912,667 |
| | 10,000,000 | | Govco, Inc., Discount Note,
5.23%, 05/15/07(a) | | | 9,936,078 |
| | 35,000,000 | | HBOS plc, Discount Note,
5.20%, 05/11/07 | | | 34,797,583 |
| | 20,000,000 | | HSBC Finance Corp.,
Discount Note,
5.24%, 04/12/07 | | | 19,967,978 |
| | 20,000,000 | | International Lease Finance Corp., Discount Note,
5.23%, 04/10/07 | | | 19,973,850 |
| | 30,000,000 | | John Deere Capital Corp.,
Discount Note,
5.25%, 05/11/07 | | | 29,825,000 |
| | 15,000,000 | | John Deere Capital Corp.,
Discount Note,
5.20%, 05/21/07 | | | 14,891,667 |
| | 25,000,000 | | JP Morgan Chase & Co.,
Discount Note,
5.24%, 04/11/07 | | | 24,963,611 |
| | 40,000,000 | | Procter & Gamble Co.,
Discount Note,
5.22%, 05/22/07 | | | 39,704,200 |
| | 15,000,000 | | Procter & Gamble Co.,
Discount Note,
5.21%, 06/18/07 | | | 14,830,675 |
| | 50,000,000 | | Prudential Funding Corp.,
Discount Note,
5.24%, 05/03/07 | | | 49,767,111 |
| | 55,000,000 | | Rabobank Corp.,
Discount Note,
5.39%, 04/02/07 | | | 54,991,757 |
See Notes to Financial Statements.
3
Excelsior Funds, Inc.
Portfolio of Investments — March 31, 2007
Money Fund — (continued)
| | | | | | |
Principal
Amount | | | | Value |
| | | | | | |
| COMMERCIAL PAPER — (continued) | | |
| $ | 25,000,000 | | Ranger Funding Co., LLC,
Discount Note,
5.27%, 04/09/07(a) | | $ | 24,970,722 |
| | 25,000,000 | | Ranger Funding Co., LLC,
Discount Note,
5.25%, 05/17/07(a) | | | 24,832,292 |
| | 25,000,000 | | Societe Generale,
Discount Note,
5.31%, 04/05/07 | | | 24,985,250 |
| | 15,000,000 | | Three Pillar Funding LLC,
Discount Note,
5.26%, 04/09/07(a) | | | 14,982,467 |
| | 20,000,000 | | Three Pillar Funding LLC,
Discount Note,
5.27%, 04/25/07(a) | | | 19,929,687 |
| | 12,000,000 | | Three Pillar Funding LLC,
Discount Note,
5.28%, 04/27/07(a) | | | 11,954,240 |
| | 15,000,000 | | UBS Finance Corp.,
Discount Note,
5.23%, 05/01/07 | | | 14,934,563 |
| | 35,000,000 | | UBS Finance Corp.,
Discount Note,
5.23%, 05/14/07 | | | 34,781,148 |
| | 7,595,000 | | Windmill Funding Corp.,
Discount Note,
5.25%, 04/03/07(a) | | | 7,592,785 |
| | 27,000,000 | | Windmill Funding Corp.,
Discount Note,
5.25%, 04/11/07(a) | | | 26,960,625 |
| | 20,000,000 | | Windmill Funding Corp.,
Discount Note,
5.25%, 05/03/07(a) | | | 19,906,667 |
| | 15,000,000 | | Yorktown Capital LLC,
Discount Note,
5.25%, 04/12/07(a) | | | 14,975,938 |
| | 17,619,000 | | Yorktown Capital LLC,
Discount Note,
5.26%, 04/26/07(a) | | | 17,554,642 |
| | | | | | |
| | | TOTAL COMMERCIAL PAPER
(Cost $902,178,734) | | | 902,178,734 |
| | | | | | |
| | | | | | |
Principal
Amount | | | | Value |
| | | | | | |
| U.S. GOVERNMENT & AGENCY OBLIGATIONS — 2.78% |
| $ | 20,000,000 | | Federal Home Loan Bank,
5.28%, 03/14/08(b) | | $ | 20,000,000 |
| | 15,000,000 | | Federal National Mortgage Association,
5.30%, 01/08/08 | | | 15,000,000 |
| | | | | | |
| | | TOTAL U.S. GOVERNMENT & AGENCY OBLIGATIONS
(Cost $35,000,000) | | | 35,000,000 |
| | | | | | |
| Shares | | | | |
| REGISTERED INVESTMENT COMPANY — 0.29% |
| | 3,706,303 | | Dreyfus Government Cash Management Fund | | | 3,706,303 |
| | | | | | |
| | | TOTAL REGISTERED INVESTMENT COMPANY
(Cost $3,706,303) | | | 3,706,303 |
| | | | | | |
Principal
Amount | | | | |
| REPURCHASE AGREEMENT — 7.48% | | |
| $ | 94,000,000 | | Morgan Stanley, 5.30% dated 03/30/07, due 04/02/07, to be repurchased at $94,041,517 (collateralized by U.S. Government Obligations, ranging in par value $42,065,000-$53,385,000, 5.00%-5.40%, 02/25/08-06/15/12; total market value $95,882,844) | | $ | 94,000,000 |
| | | | | | |
| | | TOTAL REPURCHASE AGREEMENT
(Cost $94,000,000) | | | 94,000,000 |
| | | | | | |
| | | | | | | |
TOTAL INVESTMENTS
(Cost $1,259,885,037)(c) | | 100.22 | % | | $ | 1,259,885,037 | |
LIABILITIES IN EXCESS OF OTHER ASSETS | | (0.22 | ) | | | (2,808,450 | ) |
| | | | | | | |
NET ASSETS | | 100.00 | % | | $ | 1,257,076,587 | |
| | | | | | | |
| (a) | Security exempt from registration under Rule 144A of the Securities Act of 1933. This security may be resold in transactions exempt from registration, normally to qualified institutional buyers. At March 31, 2007 these securities amounted to $335,148,049 or 26.66% of net assets. |
| (b) | Variable Rate Security—The rate disclosed is as of March 31, 2007. |
| (c) | Represents cost for financial reporting and federal income tax purposes. |
See Notes to Financial Statements.
4
Excelsior Funds, Inc.
Portfolio of Investments — March 31, 2007
Money Fund — (continued)
Discount Note—The rate reported is the discount rate at the time of purchase.
LLC—Limited Liability Company
plc—Public Limited Company
The summary of the Fund’s investments as of March 31, 2007 is as follows: (Unaudited)
| | | | | | | |
Portfolio Diversification | | % of
Net
Assets | | | Value | |
Commercial Paper | | 71.77 | % | | $ | 902,178,734 | |
Certificates of Deposit | | 17.90 | | | | 225,000,000 | |
Repurchase Agreement | | 7.48 | | | | 94,000,000 | |
U.S. Government & Agency Obligations | | 2.78 | | | | 35,000,000 | |
Registered Investment Company | | 0.29 | | | | 3,706,303 | |
| | | | | | | |
Total Investments | | 100.22 | % | | $ | 1,259,885,037 | |
Liabilities in Excess of Other Assets | | (0.22 | ) | | | (2,808,450 | ) |
| | | | | | | |
Net Assets | | 100.00 | % | | $ | 1,257,076,587 | |
| | | | | | | |
See Notes to Financial Statements.
5
Excelsior Tax-Exempt Funds, Inc.
Portfolio of Investments — March 31, 2007
New York Tax-Exempt Money Fund
| | | | | | |
Principal
Amount | | | | Value |
| | | | | | |
| TAX-EXEMPT CASH EQUIVALENT SECURITIES — 74.06% |
| $ | 5,000,000 | | Albany, New York, City School District General Obligations Bond Anticipation Notes, 3.75%, 07/19/07 | | $ | 5,001,881 |
| | 5,000,000 | | Albany, New York, City School District General Obligations Tax Bond Anticipation Notes, 3.75%, 10/17/07 | | | 5,003,400 |
| | 4,070,000 | | East Hampton Township, New York, General Obligation Bond Anticipation Notes, Series C, 4.13%, 08/31/07 | | | 4,080,137 |
| | 2,000,000 | | Hauppauge County, New York, School District General Obligation Bonds, Tax Anticipation Notes, 4.25%, 06/28/07 | | | 2,003,042 |
| | 4,350,000 | | Hudson Yards, New York, Infrastructure Corp. Revenue Bonds, PUTTERS, Series 1667T (FGIC), 3.69%, 08/15/14(a)(b) | | | 4,350,000 |
| | 10,000,000 | | Long Island, New York, Power Authority, Electrical Systems Revenue Bonds, P-Floats, Series 360, (FGIC), 3.69%, 12/01/17 (a)(b) | | | 10,000,000 |
| | 19,900,000 | | New York City, New York, Housing Development Corporation, Multi Family Mortgage Revenue Bonds, Series A, (FNMA), 3.63%, 10/15/41(a) | | | 19,900,000 |
| | 1,595,000 | | New York City, New York, Municipal Water Finance Authority Revenue Bonds, PUTTERS, Series 622, (AMBAC), 3.69%, 06/15/12(a)(b) | | | 1,595,000 |
| | 1,000,000 | | New York City, New York, Municipal Water Finance Authority Revenue Bonds, PUTTERS, Series 624, (AMBAC), 3.69%, 06/15/12(a)(b) | | | 1,000,000 |
| | | | | | |
Principal
Amount | | | | Value |
| | | | | | |
TAX-EXEMPT CASH EQUIVALENT
SECURITIES — (continued) |
| $ | 9,995,000 | | New York City, New York, Municipal Water Finance Authority Revenue Bonds, Water & Sewer Systems, FLOATERS, Series 726X, (MBIA), 3.68%, 06/15/27(a)(b) | | $ | 9,995,000 |
| | 8,000,000 | | New York City, New York, Transitional Finance Authority Revenue Bond Anticipation Notes, 4.25%, 06/29/07 | | | 8,013,602 |
| | 10,870,000 | | New York City, New York, Transitional Finance Authority Revenue Bonds, EAGLE, Class A, 3.71%, 02/01/31(a)(b) | | | 10,870,000 |
| | 10,485,000 | | New York City, New York, Transitional Finance Authority Revenue Bonds, FLOATERS, Series 536, (MBIA), 3.68%, 05/01/15(a)(b) | | | 10,485,000 |
| | 3,275,000 | | New York City, New York, Transitional Finance Authority Revenue Bonds, FLOATERS, Series N-11, 3.67%, 02/01/14 (a)(b) | | | 3,275,000 |
| | 8,725,000 | | New York City, New York, Transitional Finance Authority Revenue Bonds, PUTTERS, Series 468, (MBIA), 3.69%, 02/01/11(a)(b) | | | 8,725,000 |
| | 5,455,000 | | New York City, New York, Transitional Finance Authority Revenue Bonds, PUTTERS, Series 471, (FGIC), 3.69%, 02/01/11(a)(b) | | | 5,455,000 |
| | 5,000,000 | | New York State, Dormitory Authority Commercial Paper, Columbia University, 3.60%, 07/09/07 | | | 5,000,000 |
| | 10,000,000 | | New York State, Dormitory Authority Commercial Paper, Cornell University, 3.62%, 08/09/07 | | | 10,000,000 |
See Notes to Financial Statements.
6
Excelsior Tax-Exempt Funds, Inc.
Portfolio of Investments — March 31, 2007
New York Tax-Exempt Money Fund — (continued)
| | | | | | |
Principal
Amount | | | | Value |
| | | | | | |
TAX-EXEMPT CASH EQUIVALENT
SECURITIES — (continued) |
| $ | 4,500,000 | | New York State, Dormitory Authority Revenue Bonds, Secondary Issues, FLOATERS, Series 1520, 3.68%, 12/15/23(a)(b) | | $ | 4,500,000 |
| | 9,930,000 | | New York State, Dormitory Authority Revenue Bonds, Secondary Issues, P-Floats, Series 1330, (FGIC), 3.69%, 02/01/28(a)(b) | | | 9,930,000 |
| | 11,650,000 | | New York State, Environmental Facilities Corporation, Clean Water Revenue Bonds, P-Floats, Series 1165, 3.69%, 07/15/33(a)(b) | | | 11,650,000 |
| | 7,735,000 | | New York State, Environmental Facilities Corporation, Clean Water Revenue Bonds, PUTTERS, Series 1372, 3.69%, 06/15/14(a)(b) | | | 7,735,000 |
| | 11,283,000 | | New York State, Metropolitan Transportation Authority Revenue Bonds, FLOATERS, Series 848-D, (FGIC), 3.68%, 11/15/21(a)(b) | | | 11,283,000 |
| | 10,000,000 | | New York State, Metropolitan Transportation Authority Revenue Bonds, NY Dedicated Tax Fund, FLOATERS, Series 1385, (MBIA), 3.68%, 11/15/35(a)(b) | | | 10,000,000 |
| | 2,000,000 | | New York State, Mortgage Agency Revenue Bonds, FLOATERS, Series 1199, 3.68%, 10/01/27(a)(b) | | | 2,000,000 |
| | 9,995,000 | | New York State, Munitops Certificates Trust, General Obligation Bonds, (AMBAC), 3.68%, 02/01/14(a)(b) | | | 9,995,000 |
| | 11,500,000 | | New York State, Munitops Certificates Trust, Revenue Bonds, (FSA), 3.68%, 12/15/12(a)(b) | | | 11,500,000 |
| | 15,000,000 | | New York State, Munitops Certificates Trust, Revenue Bonds, (FSA), 3.68%, 08/01/13(a)(b) | | | 15,000,000 |
| | | | | | |
Principal
Amount | | | | Value |
| | | | | | |
TAX-EXEMPT CASH EQUIVALENT
SECURITIES — (continued) |
| $ | 6,500,000 | | New York State, Power Authority Extendable Commercial Paper, General Obligation Bonds, 3.65%, 06/05/07 | | $ | 6,500,000 |
| | 12,000,000 | | New York State, Power Authority General Obligation Bonds, 3.65%, 03/01/20(a) | | | 12,000,000 |
| | 8,220,000 | | New York State, Sales Tax Asset Receivable Corporation Revenue Bonds, PUTTERS, Series 564, (MBIA), 3.69%, 10/15/12(a)(b) | | | 8,220,000 |
| | 23,225,000 | | New York State, Thruway Authority Revenue Bonds, EAGLE, Class A, (AMBAC), 3.71%, 01/01/30(a)(b) | | | 23,225,000 |
| | 2,995,000 | | New York State, Triborough Bridge & Tunnel Authority Revenue Bonds, Series B, 3.64%, 01/01/33(a) | | | 2,995,000 |
| | 7,960,000 | | New York State, Triborough Bridge & Tunnel Authority Revenue Bonds, Sub-Series B3, 3.64%, 01/01/32(a) | | | 7,960,000 |
| | 18,460,000 | | New York State, Urban Development Corporation Revenue Bonds, EAGLE, Class A, 3.71%, 03/15/35(a)(b) | | | 18,460,000 |
| | 6,100,000 | | Niagara Falls, New York, Bridge Commission Toll Authority Revenue Bonds, Series A, (FGIC), 3.60%, 10/01/19(a) | | | 6,100,000 |
| | 3,235,000 | | Oneida County, New York, Industrial Development Agency Revenue Bonds, Hamilton College, (MBIA), 3.60%, 09/15/32(a) | | | 3,235,000 |
| | 1,500,000 | | Rocky Point, New York, School District General Obligation Bonds, Tax Anticipation Notes, 4.00%, 06/29/07 | | | 1,501,472 |
See Notes to Financial Statements.
7
Excelsior Tax-Exempt Funds, Inc.
Portfolio of Investments — March 31, 2007
New York Tax-Exempt Money Fund — (continued)
| | | | | | |
Principal
Amount | | | | Value |
| | | | | | |
TAX-EXEMPT CASH EQUIVALENT
SECURITIES — (continued) |
| $ | 6,000,000 | | Sag Harbor, New York, School District General Obligation Bonds, Tax Anticipation Notes, 4.25%, 06/29/07 | | $ | 6,010,272 |
| | 15,000,000 | | Suffolk County, New York, General Obligation Bonds, Tax Anticipation Notes, 4.25%, 08/16/07 | | | 15,041,465 |
| | 5,000,000 | | Suffolk County, New York, General Obligation Bonds, Tax Anticipation Notes, Series 2, 4.00%, 09/18/07(c) | | | 5,010,625 |
| | 4,225,000 | | Vestal, New York, General Obligation Bond Anticipation Notes,
3.75%, 05/25/07 | | | 4,226,407 |
| | | | | | |
| | | TOTAL TAX-EXEMPT CASH EQUIVALENT SECURITIES (Cost $338,830,303) | | | 338,830,303 |
| | | | | | |
TAX-EXEMPT CASH EQUIVALENT SECURITIES —
BACKED BY LETTERS OF CREDIT — 23.17% |
| | 4,660,000 | | Monroe County, New York, Industrial Development Agency Revenue Bonds, Civic Facilities, Greater Rochester YMCA Project, (MANUFACTURERS & TRADERS), 3.70%, 04/01/31(a) | | | 4,660,000 |
| | 1,800,000 | | New York City, New York, General Obligation Bonds, Sub-Series E3, (BANK OF AMERICA N.A.), 3.64%, 08/01/34(a) | | | 1,800,000 |
| | 8,500,000 | | New York City, New York, General Obligation Bonds, Sub-Series H1, (BANK OF NEW YORK), 3.67%, 03/01/34(a) | | | 8,500,000 |
| | 8,800,000 | | New York City, New York, Industrial Development Agency Revenue Bonds, Civic Facilities, Jewish Community Center Project, (MANUFACTURERS & TRADERS), 3.70%, 03/01/30(a) | | | 8,800,000 |
| | | | | | |
Principal
Amount | | | | Value |
| | | | | | |
TAX-EXEMPT CASH EQUIVALENT SECURITIES —
BACKED BY LETTERS OF CREDIT — (continued) |
| $ | 10,000,000 | | New York City, New York, Industrial Development Agency Revenue Bonds, Special Facilities, New York Stock Exchange Project, Series B, (BANK OF AMERICA N.A.),
3.62%, 05/01/33(a) | | $ | 10,000,000 |
| | 8,800,000 | | New York State, Commercial Paper, Series 98A, (JP MORGAN CHASE BANK-33%/BAYERISHE LANDESBANK-33%/LANDESBANK HESSEN-33%),
3.60%, 07/10/07 | | | 8,800,000 |
| | 6,730,000 | | New York State, Dormitory Authority Revenue Bonds, Catholic Health Systems Obligations, Series C, (HSBC BANK USA N.A.),
3.63%, 07/01/22(a) | | | 6,730,000 |
| | 6,600,000 | | New York State, Energy Research & Development Authority Facilities Revenue Bonds, Sub-series A-1, (WACHOVIA BANK N.A.),
3.61%, 05/01/39(a) | | | 6,600,000 |
| | 6,000,000 | | New York State, Environmental Commercial Paper, Series 97A, (BAYERISCHE LANDESBANK-50%/LANDESBANK HESSEN-50%,
3.60%, 05/16/07 | | | 6,000,000 |
| | 5,000,000 | | New York State, Environmental Commercial Paper, Series 97A, (BAYERISCHE LANDESBANK-50%/LANDESBANK HESSEN-50%),
3.62%, 05/16/07 | | | 5,000,000 |
| | 3,600,000 | | New York State, Environmental Commercial Paper, Series 97A, (BAYERISCHE LANDESBANK-50%/LANDESBANK HESSEN-50%),
3.65%, 07/11/07 | | | 3,600,000 |
| | 15,000,000 | | New York State, Environmental Quality General Obligation Bonds, Series G, (WESTDEUTSCHE LANDESBANK),
3.58%, 11/30/18(a) | | | 15,000,000 |
See Notes to Financial Statements.
8
Excelsior Tax-Exempt Funds, Inc.
Portfolio of Investments — March 31, 2007
New York Tax-Exempt Money Fund — (continued)
| | | | | | |
Principal
Amount | | | | Value |
| | | | | | |
TAX-EXEMPT CASH EQUIVALENT SECURITIES —
BACKED BY LETTERS OF CREDIT — (continued) |
| $ | 20,500,000 | | New York State, Housing Finance Agency Revenue Bonds, Service Contracts, Series I, (LANDESBANK HESSEN-THURINGEN), 3.65%, 03/15/31(a) | | $ | 20,500,000 |
| | | | | | |
| | | TOTAL TAX-EXEMPT CASH EQUIVALENT SECURITIES — BACKED BY LETTERS OF CREDIT
(Cost $105,990,000) | | | 105,990,000 |
| | | | | | |
| Shares | | | | |
| REGISTERED INVESTMENT COMPANIES — 0.09% |
| | 395,675 | | BlackRock Institutional New York Money Market Fund | | | 395,675 |
| | 1 | | Dreyfus New York Tax Exempt Fund | | | 1 |
| | | | | | |
| | | TOTAL REGISTERED INVESTMENT COMPANIES (Cost $395,676) | | | 395,676 |
| | | | | | |
| | | | | | |
TOTAL INVESTMENTS
(Cost $445,215,979)(d) | | 97.32 | % | | $ | 445,215,979 |
OTHER ASSETS IN EXCESS OF LIABILITIES | | 2.68 | | | | 12,238,616 |
| | | | | | |
NET ASSETS | | 100.00 | % | | $ | 457,454,595 |
| | | | | | |
| (a) | Variable Rate Security—The rate disclosed is as of March 31, 2007. |
| (b) | Security exempt from registration under Rule 144A of the Securities Act of 1933. This security may be resold in transactions exempt from registration, normally to qualified institutional buyers. At March 31, 2007, these securities amounted to $209,248,000 or 45.74% net assets. |
| (c) | All or part of the security is segregated by the Fund’s custodian to cover future purchase commitments. |
| (d) | Represents cost for financial reporting and federal income tax purposes. |
AMBAC—American Municipal Bond Assurance Corp.
FGIC—Financial Guaranty Insurance Corp.
FNMA—Federal National Mortgage Association
FSA—Financial Security Assurance
MBIA—Municipal Bond Insurance Association
Notes (The following notes have not been audited by PricewaterhouseCoopers LLP):
These municipal securities meet the three highest ratings assigned by Moody’s Investors Services, Inc. or Standard and Poor’s Corporation or, where not rated, are determined by the Advisor, under the supervision of the Board of Directors, to be of comparable quality at the time of purchase to rated instruments that may be acquired by the Fund.
At March 31, 2007, approximately 23% of the net assets are invested in municipal securities that have letter of credit enhancement features or escrows in U.S. Government securities backing them, on which the Fund relies. Without such features, the securities may or may not meet the quality standards of securities purchased by the Fund.
At March 31, 97% of the net assets are invested in New York municipal securities. Economic changes affecting the state and certain of its public bodies and municipalities may affect the ability of the issuers to pay the required principal and interest payments of the municipal securities.
The summary of the Fund’s investments as of March 31, 2007 is as follows: (Unaudited)
| | | | | | |
Portfolio Diversification | | % of
Net
Assets | | | Value |
Revenue Bonds | | 59.35 | % | | $ | 271,523,074 |
General Obligation Bonds | | 28.06 | | | | 128,397,229 |
Commercial Paper | | 9.82 | | | | 44,900,000 |
Registered Investment Companies | | 0.09 | | | | 395,676 |
| | | | | | |
Total Investments | | 97.32 | % | | $ | 445,215,979 |
Other Assets in Excess of Liabilities | | 2.68 | | | | 12,238,616 |
| | | | | | |
Net Assets | | 100.00 | % | | $ | 457,454,595 |
| | | | | | |
See Notes to Financial Statements.
9
Excelsior Tax-Exempt Funds, Inc.
Portfolio of Investments — March 31, 2007
Tax-Exempt Money Fund
| | | | | | |
Principal
Amount | | | | Value |
| | | | | | |
| TAX-EXEMPT CASH EQUIVALENT SECURITIES — 91.79% |
| $ | 17,385,000 | | Adams County, Colorado, School District No. 050 General Obligation Bonds, FLOATERS, Series 3804, (MBIA), 3.72%, 12/01/26(a)(b) | | $ | 17,385,000 |
| | 14,000,000 | | Anne Arundel County, Maryland, Commercial Paper, Bond Anticipation Notes, Series B,
3.55%, 04/05/07 | | | 14,000,000 |
| | 12,880,000 | | Arizona State, Agricultural Improvement & Power Distribution, Electrical Systems Revenue Bonds, Salt River Project, ROCS, 3.71%, 01/01/31(a)(b) | | | 12,880,000 |
| | 11,673,000 | | Arizona State, Highway Transportation Board Revenue Bonds, FLOATERS, Series 1539, 3.69%, 07/01/23(a)(b) | | | 11,673,000 |
| | 21,000,000 | | Arizona State, Salt River Project Commercial Paper, Series C,
3.48%, 04/05/07 | | | 21,000,000 |
| | 44,000,000 | | Austin, Texas, Water & Wastewater System Revenue Bonds, (FSA), 3.70%, 05/15/24(a) | | | 44,000,000 |
| | 10,000,000 | | Austin,Texas, Independent School District Commercial Paper, Series 2005-A, 3.61%, 04/09/07 | | | 10,000,000 |
| | 25,900,000 | | Baltimore County, Maryland, Commercial Paper, 3.65%, 04/03/07 | | | 25,900,000 |
| | 15,640,000 | | Bastrop, Texas, Munitops Certificates Trust, Independent School District General Obligation Bonds, Series 2003-23, 3.70%, 02/15/11(a)(b) | | | 15,640,000 |
| | 26,560,000 | | Boulder, Larimer, & Weld County, Colorado, School District General Obligation Bonds, FLOATERS, Series 1540, (FSA), 3.69%, 12/15/26(a)(b) | | | 26,560,000 |
| | | | | | |
Principal
Amount | | | | Value |
| | | | | | |
TAX-EXEMPT CASH EQUIVALENT
SECURITIES — (continued) |
| $ | 11,920,000 | | Brownsville, Texas, Utility Systems Revenue Bonds, PUTTERS, Series 1132, (AMBAC), 3.70%, 09/01/13(a)(b) | | $ | 11,920,000 |
| | 14,065,000 | | Bryan, Texas, Munitops Certificates Trust, Independent School District General Obligation Bonds, Series 2005-16, 3.70%, 02/15/13(a)(b) | | | 14,065,000 |
| | 40,025,000 | | California State, General Obligation Bonds, TOCS, Series HH, (FSA), 3.68%, 07/03/13(a)(b) | | | 40,025,000 |
| | 4,800,000 | | Carbon County, Wyoming, Pollution Control Revenue Bonds, Amoco Project, 3.55%, 11/01/14(a) | | | 4,800,000 |
| | 15,835,000 | | Cedar Hill, Texas, Munitops Certificates Trust, Independent School District General Obligation Bonds, Series 2005-19, 3.70%, 07/01/13(a)(b) | | | 15,835,000 |
| | 28,005,000 | | Chicago, Illinois, General Obligation Bonds, PUTTERS, Series 1277, (FSA), 3.70%, 01/01/14(a)(b) | | | 28,005,000 |
| | 20,000,000 | | Colorado State, Regional Transportation District Commercial Paper, 3.62%,10/05/07 | | | 20,000,000 |
| | 10,000,000 | | Colorado State, Regional Transportation District, Sales Tax Revenue Bonds, EAGLE, Class A, (AMBAC), 3.72%, 11/01/36(a)(b) | | | 10,000,000 |
| | 14,800,000 | | Colorado State, Regional Transportation District, Sales Tax Revenue Bonds, EAGLE, Class A, (AMBAC), 3.72%, 11/01/36(a)(b) | | | 14,800,000 |
See Notes to Financial Statements.
10
Excelsior Tax-Exempt Funds, Inc.
Portfolio of Investments — March 31, 2007
Tax-Exempt Money Fund — (continued)
| | | | | | |
Principal
Amount | | | | Value |
| | | | | | |
TAX-EXEMPT CASH EQUIVALENT
SECURITIES — (continued) |
| $ | 25,000,000 | | Colorado State, Regional Transportation District, Sales Tax Revenue Bonds, EAGLE, Class A, (AMBAC), 3.72%, 11/01/36(a)(b) | | $ | 25,000,000 |
| | 25,995,000 | | Cypress Fairbanks, Texas, Munitops Certificates Trust, Independent School District General Obligation Bonds, Series 2003-22, 3.69%, 02/15/11(a)(b) | | | 25,995,000 |
| | 10,000,000 | | Dallas, Texas, Area Rapid Transit Sales Tax Commercial Paper, Series 2001, 3.65%, 09/10/07 | | | 10,000,000 |
| | 10,000,000 | | Dallas, Texas, Area Rapid Transit Sales Tax Commercial Paper, Series 2001, 3.63%, 11/05/07 | | | 10,000,000 |
| | 16,685,000 | | Dallas, Texas, Munitops Certificates Trust, General Obligation Bonds, Series 2004-6, (PSF-GTD), 3.70%, 02/15/12(a)(b) | | | 16,685,000 |
| | 29,630,000 | | Dallas, Texas, Munitops Certificates Trust, Independent School District General Obligation Bonds, Series 2005-1, 3.70%, 08/15/12(a)(b) | | | 29,630,000 |
| | 30,851,000 | | Dallas, Texas, Water & Sewer Commercial Paper, Series B, 3.60%, 04/16/07 | | | 30,851,000 |
| | 1,404,000 | | Dallas, Texas, Water & Sewer Commercial Paper, Series B, 3.70%, 04/16/07 | | | 1,404,000 |
| | 12,500,000 | | De Soto, Texas, Independent School District, P-Float, Series 19, 3.72%, 08/15/29(a)(b) | | | 12,500,000 |
| | 12,935,000 | | Denton, Texas, Munitops Certificates Trust, General Obligation Bonds, Series 2004-21, 3.70%, 08/15/12(a)(b) | | | 12,935,000 |
| | | | | | |
Principal
Amount | | | | Value |
| | | | | | |
TAX-EXEMPT CASH EQUIVALENT
SECURITIES — (continued) |
| $ | 14,635,000 | | Detroit, Michigan, Munitops Certificates Trust, City School District General Obligation Bonds, Series 2004-39, (FGIC), 3.70%, 05/01/11(a)(b) | | $ | 14,635,000 |
| | 8,695,000 | | Detroit, Michigan, Water Supply Systems Revenue Bonds, FLOATERS, Series 1445, (FSA), 3.69%, 07/01/29(a)(b) | | | 8,695,000 |
| | 23,000,000 | | District of Columbia, Tax & Revenue Anticipation Notes, 4.25%, 09/28/07 | | | 23,061,349 |
| | 17,130,000 | | Florida State, Board of Education Lottery Revenue Bonds, ROCS, Series 542, (AMBAC), 3.71%, 07/01/25(a)(b) | | | 17,130,000 |
| | 10,480,000 | | Florida State, Munitops Certificates Trust, Revenue Bonds, (FGIC), 3.70%, 01/01/11(a)(b) | | | 10,480,000 |
| | 9,265,000 | | Frisco, Texas, Munitops Certificates Trust, General Obligation Bonds, 3.70%, 08/15/11(a)(b) | | | 9,265,000 |
| | 17,185,000 | | Fulton County, Georgia, Water & Sewage Revenue Bonds, Floating Rate Certificates, Series 1120, (FGIC), 3.69%, 01/01/30(a)(b) | | | 17,185,000 |
| | 8,500,000 | | Garden State Preservation Trust, New Jersey, Open Space & Farmland Revenue Bonds, Floating Rate Certificates, Series 860, (FSA), 3.67%, 11/01/17(a)(b) | | | 8,500,000 |
| | 9,995,000 | | Harlandale, Texas, Munitops Certificates Trust, General Obligation Bonds, Series 2005-22, 3.70%, 08/15/13(a)(b) | | | 9,995,000 |
See Notes to Financial Statements.
11
Excelsior Tax-Exempt Funds, Inc.
Portfolio of Investments — March 31, 2007
Tax-Exempt Money Fund — (continued)
| | | | | | |
Principal
Amount | | | | Value |
| | | | | | |
TAX-EXEMPT CASH EQUIVALENT
SECURITIES — (continued) |
| $ | 14,260,000 | | Hawaii State, General Obligation Bonds, ROCS, Series 6062, (FSA), 3.71%, 03/01/26(a)(b) | | $ | 14,260,000 |
| | 25,000,000 | | Hockley County, Texas, Industrial Development Corporation, Pollution Control Revenue Bonds, Amoco Project - Standard Oil Co., 3.60%, 03/01/14(a) | | | 25,000,000 |
| | 19,300,000 | | Hockley County, Texas, Industrial Development Corporation, Pollution Control Revenue Bonds, Amoco Project - Standard Oil Co., 3.55%, 11/01/19(a) | | | 19,300,000 |
| | 9,995,000 | | Houston, Texas, Munitops Certificates Trust, Independent School District General Obligation Bonds, Series 2005-35, (PSF-GTD), 3.70%, 02/15/13(a)(b) | | | 9,995,000 |
| | 12,100,000 | | Houston, Texas, Utility System Revenue Bonds, TOCS, Series A, (FSA), 3.69%, 05/15/12(a)(b) | | | 12,100,000 |
| | 8,000,000 | | Illinois State, Finance Authority Revenue Bonds, FLOATERS, Series 1489, 3.69%, 12/01/42(a)(b) | | | 8,000,000 |
| | 15,000,000 | | Indiana State, Transportation Revenue Bonds, P-Floats, PT 3980, (FGIC), 3.72%, 06/01/29(a)(b) | | | 15,000,000 |
| | 60,200,000 | | Intermountain Power Agency, Utah, Commercial Paper, Series B-2, 3.68%, 08/09/07 | | | 60,199,999 |
| | 14,500,000 | | Intermountain Power Agency, Utah, Power Supply Revenue Bonds, Series E, (AMBAC), 3.64%, 07/01/14 | | | 14,500,000 |
| | | | | | |
Principal
Amount | | | | Value |
| | | | | | |
TAX-EXEMPT CASH EQUIVALENT
SECURITIES — (continued) |
| $ | 14,700,000 | | Iowa State, Finance Authority Small Business Development Revenue Bonds, Multi-Family Housing, Village Court Associates, DuPont, Series B, 3.72%, 11/01/15(a) | | $ | 14,700,000 |
| | 1,300,000 | | Jacksonville, Florida, Electrical Systems Commercial Paper, 3.60%, 04/10/07 | | | 1,300,000 |
| | 20,000,000 | | Jacksonville, Florida, Electrical Systems Commercial Paper, 3.65%, 07/11/07 | | | 20,000,000 |
| | 18,700,000 | | Jacksonville, Florida, Electrical Systems Commercial Paper, 3.64%, 08/15/07 | | | 18,700,000 |
| | 14,000,000 | | Jacksonville, Florida, Electrical Systems Commercial Paper, Series 2000-A, 3.53%, 04/10/07 | | | 14,000,000 |
| | 35,000,000 | | Jacksonville, Florida, Electrical Systems Commercial Paper, Series 2000-F, 3.58%, 04/10/07 | | | 35,000,000 |
| | 16,145,000 | | Jacksonville, Florida, St. Johns River, Power Systems Revenue Bonds, PUTTERS, Series 1182, (MBIA), 3.70%, 04/01/13(a)(b) | | | 16,145,000 |
| | 8,955,000 | | Judson, Texas, Munitops Certificates Trust, General Obligation Bonds, Series 2003-36, 3.70%, 02/01/11(a)(b) | | | 8,955,000 |
| | 50,100,000 | | Kansas City, Missouri, Industrial Development Authority Revenue Bonds, Downtown Arena Project, Series C, (AMBAC), 3.68%, 04/01/40(a) | | | 50,100,000 |
| | 13,500,000 | | Kansas City, Missouri, Industrial Development Authority Revenue Bonds, Downtown Redevelopment District, Series A, (AMBAC), 3.68%, 12/01/32(a) | | | 13,500,000 |
See Notes to Financial Statements.
12
Excelsior Tax-Exempt Funds, Inc.
Portfolio of Investments — March 31, 2007
Tax-Exempt Money Fund — (continued)
| | | | | | |
Principal
Amount | | | | Value |
| | | | | | |
TAX-EXEMPT CASH EQUIVALENT
SECURITIES — (continued) |
| $ | 9,585,000 | | King County, Washington, General Obligation Bonds, PUTTERS, Series 1184, (FGIC), 3.70%, 01/01/13(a)(b) | | $ | 9,585,000 |
| | 12,800,000 | | Las Vegas, Nevada, Water District General Obligation Bonds, Series C, 3.78%, 06/01/36(a) | | | 12,800,000 |
| | 3,675,000 | | Massachusetts State, General Obligation Bonds, Series B, 3.78%, 03/01/26(a) | | | 3,675,000 |
| | 17,715,000 | | Memphis, Tennessee, Electric Systems Revenue Bonds, PUTTERS, Series 378, (MBIA), 3.70%, 12/01/11(a)(b) | | | 17,715,000 |
| | 14,200,000 | | Michigan State, Building Authority Revenue Bonds, EAGLE, Class A, (FGIC), 3.72%, 10/15/36(a)(b) | | | 14,200,000 |
| | 7,510,000 | | Michigan State, Building Authority Revenue Bonds, FLOATERS, Series 886, (MBIA), 3.69%, 10/15/17(a)(b) | | | 7,510,000 |
| | 5,185,000 | | Michigan State, Municipal Bond Authority Revenue Bonds, PUTTERS, Series 453, 3.72%, 05/01/12(a)(b) | | | 5,185,000 |
| | 25,000,000 | | Milwaukee, Wisconsin, School Revenue Anticipation Notes, 4.50%, 08/30/07 | | | 25,077,073 |
| | 45,000,000 | | New York City, New York, Municipal Water Finance Authority Commercial Paper, Series 5B, 3.65%, 06/11/07 | | | 45,000,000 |
| | 13,000,000 | | North Carolina State, Capital Facilities Finance Agency Revenue Bonds, EAGLE, Class A, 3.72%, 10/01/44(a)(b) | | | 13,000,000 |
| | | | | | |
Principal
Amount | | | | Value |
| | | | | | |
TAX-EXEMPT CASH EQUIVALENT
SECURITIES — (continued) |
| $ | 12,130,000 | | North Carolina State, General Obligation Bonds, PUTTERS, Series 465,
3.69%, 05/01/11(a)(b) | | $ | 12,130,000 |
| | 10,245,000 | | North Carolina State, General Obligation Bonds, PUTTERS, Series 466,
3.69%, 03/01/12(a)(b) | | | 10,245,000 |
| | 7,330,000 | | North Texas, Municipal Water District, Water Systems Revenue Bonds, ROCS, Series 6074, (MBIA),
3.71%, 09/01/26(a)(b) | | | 7,330,000 |
| | 7,665,000 | | Ohio State, General Obligation Bonds, PUTTERS, Series 1295,
3.70%, 05/01/14(a)(b) | | | 7,665,000 |
| | 8,400,000 | | Oklahoma State, Water Resource Board Revenue Bonds, Loan Program,
3.65%, 09/01/24(a) | | | 8,400,000 |
| | 30,000,000 | | Omaha, Nebraska, Public Power Distribution Commercial Paper,
3.68%, 04/02/07 | | | 30,000,000 |
| | 9,300,000 | | Orlando, Florida, Communication Utility Systems Revenue Bonds, PUTTERS, Series 1557,
3.70%, 10/01/13(a)(b) | | | 9,300,000 |
| | 36,200,000 | | Pennsylvania State, Turnpike Commission Revenue Bonds, Series A-2,
3.70%, 12/01/30(a) | | | 36,200,000 |
| | 9,460,000 | | Pflugerville, Texas, Munitops Certificates Trust, Independent School District General Obligation Bonds, Series 2005-17,
3.70%, 02/15/13(a)(b) | | | 9,460,000 |
| | 3,905,000 | | Phoenix, Arizona, Civic Improvement Corp., Excise Tax Revenue Bonds, EAGLE, Class A,
3.72%, 07/01/17(a)(b) | | | 3,905,000 |
See Notes to Financial Statements.
13
Excelsior Tax-Exempt Funds, Inc.
Portfolio of Investments — March 31, 2007
Tax-Exempt Money Fund — (continued)
| | | | | | |
Principal
Amount | | | | Value |
| | | | | | |
TAX-EXEMPT CASH EQUIVALENT
SECURITIES — (continued) |
| $ | 18,050,000 | | Richland County, South Carolina, School District No. 002 General Obligation Bonds, FLOATERS, Series 1646, (FGIC), 3.72%, 02/01/10(a)(b) | | $ | 18,050,000 |
| | 8,115,000 | | San Antonio, Texas, Hotel Occupancy Revenue Bonds, PUTTERS, Series 1693, (FSA), 3.70%, 02/15/12(a)(b) | | | 8,115,000 |
| | 40,000,000 | | San Antonio, Texas, Water Revenue Bonds, EAGLE, Class A, (MBIA), 3.72%, 05/15/40(a)(b) | | | 40,000,000 |
| | 14,500,000 | | San Antonio, Texas, Water Revenue Bonds, EAGLE, Class A, (MBIA), 3.72%, 05/15/40(a)(b) | | | 14,500,000 |
| | 14,000,000 | | South Carolina State, Munitops Certificates Trust, General Obligation Bonds, (FSA), 3.70%, 03/01/11(a)(b) | | | 14,000,000 |
| | 13,175,000 | | South Carolina State, Public Service Authority Revenue Bonds, PUTTERS, Series 1198, (MBIA), 3.70%, 07/01/13(a)(b) | | | 13,175,000 |
| | 44,000,000 | | St. James Parish, Louisiana, Pollution Control Commercial Paper, Texaco Project,
3.72%, 07/12/07 | | | 44,000,000 |
| | 18,715,000 | | Tarrant, Texas, Regulation Water District Revenue Bonds, FLOATERS, Series 3425. (FGIC), 3.72%, 03/01/28(a)(b) | | | 18,715,000 |
| | 7,000,000 | | Tennessee State, School Building Authority Commercial Paper, Series A, 3.60%, 04/09/07 | | | 7,000,000 |
| | | | | | |
Principal
Amount | | | | Value |
| | | | | | |
TAX-EXEMPT CASH EQUIVALENT
SECURITIES — (continued) |
| $ | 9,240,000 | | Texas State, General Obligation Bonds, PUTTERS, Series 1645,
3.72%, 10/01/14(a)(b) | | $ | 9,240,000 |
| | 22,000,000 | | Texas State, General Obligation Bonds, Series B, 3.52%, 04/01/36 | | | 22,000,000 |
| | 39,200,000 | | Texas State, Tax & Revenue Anticipation Notes, 4.50%, 08/31/07 | | | 39,331,635 |
| | 10,990,000 | | Texas State, Transportation Commission Revenue Bonds, PUTTERS, Series 1324, 3.70%, 04/01/14(a)(b) | | | 10,990,000 |
| | 9,000,000 | | Texas State, Water Development Board Revenue Bonds, State Revolving Fund, 3.82%, 07/15/26(a) | | | 9,000,000 |
| | 8,720,000 | | Thurston County, Washington, School District General Obligation Bonds, PUTTERS, Series 1108, (MBIA), 3.72%, 06/01/13(a)(b) | | | 8,720,000 |
| | 8,840,000 | | Tyler, Texas, Junior College District Revenue Bonds, FLOATERS, Series 1560, (AMBAC), 3.69%, 08/15/36(a)(b) | | | 8,840,000 |
| | 21,500,000 | | University of Hawaii, Revenue Bonds, FLOATERS, Series 1546, (MBIA), 3.69%, 10/01/36(a)(b) | | | 21,500,000 |
| | 32,000,000 | | University of North Carolina, Board of Governors Commercial Paper, Series 2004-B, 3.65%, 07/17/07 | | | 32,000,000 |
| | 13,700,000 | | University of Texas, Commercial Paper, Series A, 3.58%, 04/05/07 | | | 13,700,000 |
| | 16,800,000 | | University of Texas, Permanent University Fund Revenue Bonds, FLOATER, Series 1574, 3.69%, 07/01/26(a)(b) | | | 16,800,000 |
See Notes to Financial Statements.
14
Excelsior Tax-Exempt Funds, Inc.
Portfolio of Investments — March 31, 2007
Tax-Exempt Money Fund — (continued)
| | | | | | |
Principal
Amount | | | | Value |
| | | | | | |
TAX-EXEMPT CASH EQUIVALENT
SECURITIES — (continued) |
| $ | 8,260,000 | | University of Texas, Permanent University Fund Revenue Bonds, PUTTERS, Series 1676, 3.70%, 07/01/14(a)(b) | | $ | 8,260,000 |
| | 18,810,000 | | University of Texas, University Revenue Bonds, EAGLE, Class A, 3.72%, 08/15/37(a)(b) | | | 18,810,000 |
| | 14,150,000 | | University of Texas, University Revenue Bonds, P-Floats, MT 354, 3.71%, 08/15/20(a)(b) | | | 14,150,000 |
| | 5,535,000 | | University of Texas, University Revenue Bonds, PUTTERS, Series 592, 3.70%, 08/15/12(a)(b) | | | 5,535,000 |
| | 3,015,000 | | University of Vermont, Commercial Paper, 3.63%, 07/10/07 | | | 3,015,000 |
| | 3,300,000 | | University of Virginia, University Revenue Bonds, EAGLE, Series A, 3.72%, 06/01/33(a)(b) | | | 3,300,000 |
| | 14,288,500 | | Virginia Commonwealth, Transportation Board, Revenue Bonds, Floating Rate Certificates, Series 727, 3.69%, 05/15/19(a)(b) | | | 14,288,500 |
| | 25,000,000 | | Wake County, North Carolina, General Obligation Commercial Paper, 3.65%, 05/30/07 | | | 25,000,000 |
| | 26,075,000 | | Washington State, General Obligation Bonds, FLOATERS, Series 1161, (AMBAC), 3.69%, 07/01/24(a)(b) | | | 26,075,000 |
| | 7,590,000 | | Washington State, General Obligation Bonds, P-Floats, PT 3863, (AMBAC), 3.72%, 01/01/22(a)(b) | | | 7,590,000 |
| | | | | | |
Principal
Amount | | | | Value |
| | | | | | |
TAX-EXEMPT CASH EQUIVALENT
SECURITIES — (continued) |
| $ | 12,145,000 | | Washington State, General Obligation Bonds, P-Floats, PT 3874, (FSA), 3.72%, 01/01/30(a)(b) | | $ | 12,145,000 |
| | 9,745,000 | | Washoe County, Nevada, General Obligation Bonds, Floating Rate Certificates, Series 1241, (MBIA), 3.69%, 01/01/35(a)(b) | | | 9,745,000 |
| | 15,180,000 | | Wisconsin State, Clean Water Revenue Bonds, PUTTERS, Series 1509, 3.70%, 06/01/13(a)(b) | | | 15,180,000 |
| | 11,275,000 | | Wisconsin State, Transportation Authority Revenue Commercial Paper, 3.63%, 08/07/07 | | | 11,275,000 |
| | 39,643,000 | | Wisconsin State, Transportation Authority Revenue Commercial Paper, 3.62%, 10/05/07 | | | 39,643,000 |
| | 25,000,000 | | Wisconsin State, Transportation Authority Revenue Commercial Paper, Series 2006-B, 3.55%, 04/04/07 | | | 25,000,000 |
| | 6,830,000 | | Wisconsin State, Transportation Revenue Bonds, P-Floats, PT 3929, (FGIC), 3.72%, 07/01/26(a)(b) | | | 6,830,000 |
| | 10,240,000 | | York County, South Carolina, School District 4 General Obligation Bonds, Fort Mill, TOCS, Series F, 3.69%, 03/09/12(a)(b) | | | 10,240,000 |
| | | | | | |
| | | TOTAL TAX-EXEMPT CASH EQUIVALENT SECURITIES (Cost $1,937,329,556) | | | 1,937,329,556 |
| | | | | | |
See Notes to Financial Statements.
15
Excelsior Tax-Exempt Funds, Inc.
Portfolio of Investments — March 31, 2007
Tax-Exempt Money Fund — (continued)
| | | | | | |
Principal
Amount | | | | Value |
| | | | | | |
TAX-EXEMPT CASH EQUIVALENT SECURITIES —
BACKED BY LETTERS OF CREDIT — 7.66% |
| $ | 30,000,000 | | Atlanta, Georgia, Metropolitan Transit Authority, Sales Tax Commercial Paper, (DEXIA CREDIT LOCAL), 3.53%, 04/05/07 | | $ | 30,000,000 |
| | 15,000,000 | | Atlanta, Georgia, Metropolitan Transit Authority, Sales Tax Commercial Paper, (DEXIA CREDIT LOCAL), 3.65%, 08/08/07 | | | 15,000,000 |
| | 29,900,000 | | Baltimore, Maryland, Port Facilities Authority Revenue Bonds, (BNP PARIBAS), 3.60%, 10/14/11(a) | | | 29,900,000 |
| | 18,000,000 | | Des Moines, Iowa, Hospital Facilities Authority Revenue Bonds, Methodist Medical Center Project, (WACHOVIA BANK N.A.), 3.67%, 08/01/15(a) | | | 18,000,000 |
| | 7,000,000 | | Kenton County, Kentucky, Industrial Building Authority Revenue Bonds, Redken Labs, Inc. Project, (JP MORGAN CHASE BANK), 3.50%, 12/01/14(a) | | | 7,000,000 |
| | 36,700,000 | | Michigan State, General Obligation Anticipation Notes, Series A, (DEPFA BANK PLC), 4.25%, 09/28/07 | | | 36,807,342 |
| | 11,900,000 | | Michigan State, Municipal Bond Authority Revenue Bonds, Series B-2, (BANK OF NOVA SCOTIA), 4.50%, 08/20/07 | | | 11,937,700 |
| | 13,000,000 | | New York City, New York, Trust For Cultural Restoration Revenue Bonds, WNYC Radio, Inc., (WACHOVIA BANK N.A.), 3.63%, 04/01/26(a) | | | 13,000,000 |
| | | | | | |
| | | TOTAL TAX-EXEMPT CASH EQUIVALENT SECURITIES — BACKED BY LETTERS OF CREDIT
(Cost $161,645,042) | | | 161,645,042 |
| | | | | | |
| | | | | |
| Shares | | | | Value |
| | | | | |
| REGISTERED INVESTMENT COMPANIES — 0.05% |
| 1,143,685 | | BlackRock Muni Fund | | $ | 1,143,685 |
| 1 | | Dreyfus Tax Exempt Cash Fund | | | 1 |
| | | | | |
| | TOTAL REGISTERED INVESTMENT COMPANIES
(Cost $1,143,686) | | | 1,143,686 |
| | | | | |
| | | | | | |
TOTAL INVESTMENTS (Cost $2,100,118,284)(c) | | 99.50 | % | | $ | 2,100,118,284 |
OTHER ASSETS IN EXCESS OF LIABILITIES | | 0.50 | | | | 10,492,468 |
| | | | | | |
NET ASSETS | | 100.00 | % | | $ | 2,110,610,752 |
| | | | | | |
| (a) | Variable Rate Security—The rate disclosed is as of March 31, 2007. |
| (b) | Security exempt from registration under Rule 144A of the Securities Act of 1933. This security may be resold in transactions exempt from registration, normally to qualified institutional buyers. At March 31, 2007, these securities amounted to $1,003,896,500 or 47.56% of net assets. |
| (c) | The cost basis for federal income tax purposes is $2,100,167,823, with gross unrealized appreciation of $— and gross unrealized depreciation of $(49,539). |
AMBAC—American Municipal Bond Assurance Corp.
FGIC—Financial Guaranty Insurance Corp.
FSA—Financial Security Assurance
MBIA—Municipal Bond Insurance Association
PSF-GTD—Permanent School Fund – Guaranteed
Notes (The following notes have not been audited by PricewaterhouseCoopers LLP):
These municipal securities meet the three highest ratings assigned by Moody’s Investors Services, Inc. or Standard and Poor’s Corporation or, where not rated, are determined by the Advisor, under the supervision of the Board of Directors, to be of comparable quality at the time of purchase to rated instruments that may be acquired by the Fund.
At March 31, 2007, approximately 8% of the net assets are invested in municipal securities that have letter of credit enhancement features or escrows in U.S. Government securities backing them, on which the Fund relies. Without such features, the securities may or may not meet the quality standards of securities purchased by the Fund.
See Notes to Financial Statements.
16
Excelsior Tax-Exempt Funds, Inc.
Portfolio of Investments — March 31, 2007
Tax-Exempt Money Fund — (continued)
The summary of the Fund’s investments as of March 31, 2007 is as follows: (Unaudited)
| | | | | | |
State Diversification | | % of
Net
Assets | | | Value |
Texas | | 29.89 | % | | $ | 630,846,635 |
Florida | | 6.73 | | | | 142,055,000 |
Wisconsin | | 5.83 | | | | 123,005,073 |
Colorado | | 5.39 | | | | 113,745,000 |
Michigan | | 4.69 | | | | 98,970,042 |
North Carolina | | 4.38 | | | | 92,375,000 |
Utah | | 3.54 | | | | 74,700,000 |
Maryland | | 3.31 | | | | 69,800,000 |
Washington | | 3.04 | | | | 64,115,000 |
Missouri | | 3.01 | | | | 63,600,000 |
Georgia | | 2.95 | | | | 62,185,000 |
New York | | 2.75 | | | | 58,000,000 |
South Carolina | | 2.63 | | | | 55,465,000 |
Arizona | | 2.34 | | | | 49,458,000 |
Louisiana | | 2.08 | | | | 44,000,000 |
California | | 1.90 | | | | 40,025,000 |
Pennsylvania | | 1.72 | | | | 36,200,000 |
Illinois | | 1.71 | | | | 36,005,000 |
Hawaii | | 1.69 | | | | 35,760,000 |
Iowa | | 1.55 | | | | 32,700,000 |
Nebraska | | 1.42 | | | | 30,000,000 |
Tennessee | | 1.17 | | | | 24,715,000 |
District of Columbia | | 1.09 | | | | 23,061,350 |
Nevada | | 1.07 | | | | 22,545,000 |
Virginia | | 0.83 | | | | 17,588,500 |
Indiana | | 0.71 | | | | 15,000,000 |
New Jersey | | 0.40 | | | | 8,500,000 |
Oklahoma | | 0.40 | | | | 8,400,000 |
Ohio | | 0.36 | | | | 7,665,000 |
Kentucky | | 0.33 | | | | 7,000,000 |
Wyoming | | 0.23 | | | | 4,800,000 |
Massachusetts | | 0.17 | | | | 3,675,000 |
Vermont | | 0.14 | | | | 3,015,000 |
Registered Investment Companies | | 0.05 | | | | 1,143,684 |
| | | | | | |
Total Investments | | 99.50 | % | | $ | 2,100,118,284 |
Other Assets in Excess of Liabilities | | 0.50 | | | | 10,492,468 |
| | | | | | |
Net Assets | | 100.00 | % | | $ | 2,110,610,752 |
| | | | | | |
See Notes to Financial Statements.
17
Excelsior Funds, Inc.
Portfolio of Investments — March 31, 2007
Treasury Money Fund
| | | | | | |
Principal
Amount | | | | Value |
| U.S. GOVERNMENT & AGENCY OBLIGATION — 6.53% |
| $ | 20,000,000 | | Federal Home Loan Bank, Discount Note,
5.00%, 04/02/07 | | $ | 19,997,222 |
| | | | | | |
| | | TOTAL U.S. GOVERNMENT & AGENCY OBLIGATION
(Cost $19,997,222) | | | 19,997,222 |
| | | | | | |
| U.S. TREASURY OBLIGATIONS — 93.01% | | |
| | 90,000,000 | | 5.09%, 04/05/07(a) | | | 89,949,486 |
| | 50,000,000 | | 5.17%, 04/12/07(a) | | | 49,921,320 |
| | 56,000,000 | | 5.16%, 04/19/07(a) | | | 55,856,221 |
| | 30,000,000 | | 5.09%, 04/26/07(a) | | | 29,894,479 |
| | 30,000,000 | | 5.02%, 06/07/07(a) | | | 29,723,486 |
| | 15,000,000 | | 5.01%, 08/30/07(a) | | | 14,691,708 |
| | 15,000,000 | | 4.99%, 09/27/07(a) | | | 14,637,152 |
| | | | | | |
| | | TOTAL U.S. TREASURY OBLIGATIONS (Cost $284,673,852) | | | 284,673,852 |
| | | | | | |
| | | | | |
Shares | | | | Value |
| REGISTERED INVESTMENT COMPANY — 0.80% |
| 2,447,861 | | Dreyfus Treasury Prime Cash Management Fund | | $ | 2,447,861 |
| | | | | |
| | TOTAL REGISTERED INVESTMENT COMPANY
(Cost $2,447,861) | | | 2,447,861 |
| | | | | |
| | | | | | | |
TOTAL INVESTMENTS
(Cost $307,118,935)(b) | | 100.34 | % | | $ | 307,118,935 | |
LIABILITIES IN EXCESS OF OTHER ASSETS | | (0.34 | ) | | | (1,049,020 | ) |
| | | | | | | |
NET ASSETS | | 100.00 | % | | $ | 306,069,915 | |
| | | | | | | |
| (a) | The rate shown is the effective yield at the time of purchase. |
| (b) | Represents cost for financial reporting and federal income tax purposes. |
Discount Note—The rate reported is the discount rate at the time of purchase.
The summary of the Fund’s investments as of March 31, 2007 is as follows: (Unaudited)
| | | | | | | |
Portfolio Diversification | | % of
Net
Assets | | | Value | |
U.S. Treasury Obligations | | 93.01 | % | | $ | 284,673,852 | |
U.S. Government & Agency Obligations | | 6.53 | | | | 19,997,222 | |
Registered Investment Company | | 0.80 | | | | 2,447,861 | |
| | | | | | | |
Total Investments | | 100.34 | % | | $ | 307,118,935 | |
Liabilities in Excess of Other Assets | | (0.34 | ) | | | (1,049,020 | ) |
| | | | | | | |
Net Assets | | 100.00 | % | | $ | 306,069,915 | |
| | | | | | | |
See Notes to Financial Statements.
18
Excelsior Funds
Statements of Assets and Liabilities
March 31, 2007
| | | | | | | | | | | | | | | | | | |
| | | | | |
| | | Government
Money
Fund | | | Money
Fund | | | New York
Tax-Exempt
Money
Fund | | Tax-Exempt
Money
Fund | | | Treasury
Money
Fund |
ASSETS: | | | | | | | | | | | | | | | | | | |
Investments, at cost — see accompanying portfolios | | $ | 167,061,342 | | | $ | 1,165,885,037 | | | $ | 445,215,979 | | $ | 2,100,118,284 | | | $ | 307,118,935 |
Repurchase Agreements, at cost | | | 76,000,000 | | | | 94,000,000 | | | | — | | | — | | | | — |
| | | | | | | | | | | | | | | | | | |
Investments, at value (including Repurchase Agreements) (Note 1) | | $ | 243,061,342 | | | $ | 1,259,885,037 | | | $ | 445,215,979 | | $ | 2,100,118,284 | | | $ | 307,118,935 |
Cash | | | 970 | | | | — | | | | — | | | 494,020 | | | | — |
Dividends and interest receivable | | | 617,069 | | | | 1,925,463 | | | | 3,286,809 | | | 16,711,074 | | | | 9,732 |
Receivable for investments sold | | | — | | | | — | | | | 15,339,549 | | | — | | | | — |
Receivable for fund shares sold | | | — | | | | 449 | | | | — | | | — | | | | — |
Prepaid expenses and other assets | | | 3,045 | | | | 15,202 | | | | 6,279 | | | 28,863 | | | | 3,936 |
| | | | | | | | | | | | | | | | | | |
Total Assets | | | 243,682,426 | | | | 1,261,826,151 | | | | 463,848,616 | | | 2,117,352,241 | | | | 307,132,603 |
LIABILITIES: | | | | | | | | | | | | | | | | | | |
Payable for dividends declared | | | 992,168 | | | | 3,971,809 | | | | 1,059,061 | | | 5,500,323 | | | | 792,129 |
Payable for investments purchased | | | — | | | | — | | | | 5,003,400 | | | — | | | | — |
Cash overdraft | | | — | | | | — | | | | — | | | — | | | | 970 |
Investment advisory fees payable (Note 2) | | | 14,952 | | | | 101,971 | | | | 55,108 | | | 214,702 | | | | 37,268 |
Administration fees payable (Note 2) | | | 34,336 | | | | 158,874 | | | | 63,572 | | | 284,582 | | | | 40,753 |
Shareholder servicing fees payable (Note 2) | | | 61,645 | | | | 213,594 | | | | 137,161 | | | 476,937 | | | | 116,004 |
Accrued expenses and other payables | | | 102,176 | | | | 303,316 | | | | 75,719 | | | 264,945 | | | | 75,564 |
| | | | | | | | | | | | | | | | | | |
Total Liabilities | | | 1,205,277 | | | | 4,749,564 | | | | 6,394,021 | | | 6,741,489 | | | | 1,062,688 |
| | | | | | | | | | | | | | | | | | |
NET ASSETS | | $ | 242,477,149 | | | $ | 1,257,076,587 | | | $ | 457,454,595 | | $ | 2,110,610,752 | | | $ | 306,069,915 |
| | | | | | | | | | | | | | | | | | |
NET ASSETS consist of: | | | | | | | | | | | | | | | | | | |
Undistributed (distributions in excess of) net investment income | | $ | 8,635 | | | $ | 27,558 | | | $ | 10,638 | | $ | 9,439 | | | $ | 2,654 |
Accumulated net realized gain (loss) on investments | | | (24,683 | ) | | | (43,438 | ) | | | — | | | (49,539 | ) | | | — |
Par value (Note 4) | | | 242,565 | | | | 1,257,297 | | | | 457,445 | | | 2,110,752 | | | | 306,077 |
Paid in capital in excess of par value | | | 242,250,632 | | | | 1,255,835,170 | | | | 456,986,512 | | | 2,108,540,100 | | | | 305,761,184 |
| | | | | | | | | | | | | | | | | | |
Net Assets | | $ | 242,477,149 | | | $ | 1,257,076,587 | | | $ | 457,454,595 | | $ | 2,110,610,752 | | | $ | 306,069,915 |
| | | | | | | | | | | | | | | | | | |
Net Assets: | | | | | | | | | | | | | | | | | | |
Shares | | $ | 242,477,149 | | | $ | 644,514,478 | | | $ | 457,454,595 | | $ | 2,110,610,752 | | | $ | 306,069,915 |
Institutional Shares | | | — | | | | 612,562,109 | | | | — | | | — | | | | — |
Shares outstanding (Note 4): | | | | | | | | | | | | | | | | | | |
Shares | | | 242,565,327 | | | | 644,743,985 | | | | 457,444,867 | | | 2,110,751,842 | | | | 306,077,388 |
Institutional Shares | | | — | | | | 612,553,051 | | | | — | | | — | | | | — |
NET ASSET VALUE PER SHARE (net assets÷shares outstanding): | | | | | | | | | | | | | | | | | | |
Shares | | | $1.00 | | | | $1.00 | | | | $1.00 | | | $1.00 | | | | $1.00 |
| | | | | | | | | | | | | | | | | | |
Institutional Shares | | | — | | | | $1.00 | | | | — | | | — | | | | — |
| | | | | | | | | | | | | | | | | | |
See Notes to Financial Statements.
19
Excelsior Funds
Statements of Operations
For the Year Ended March 31, 2007
| | | | | | | | | | | | | | | | | | | | |
| | | | | |
| | | Government
Money
Fund | | | Money
Fund | | | New York
Tax-Exempt
Money
Fund | | | Tax-Exempt
Money
Fund | | | Treasury
Money
Fund | |
INVESTMENT INCOME: | | | | | | | | | | | | | | | | | | | | |
Interest income | | $ | 16,706,594 | | | $ | 70,627,174 | | | $ | 15,486,648 | | | $ | 75,609,571 | | | $ | 15,819,070 | |
Dividend income | | | 133,302 | | | | 194,029 | | | | 61,708 | | | | 225,102 | | | | 153,067 | |
| | | | | | | | | | | | | | | | | | | | |
Total Income | | | 16,839,896 | | | | 70,821,203 | | | | 15,548,356 | | | | 75,834,673 | | | | 15,972,137 | |
EXPENSES: | | | | | | | | | | | | | | | | | | | | |
Investment advisory fees (Note 2) | | | 816,378 | | | | 3,375,831 | | | | 2,193,088 | | | | 5,334,766 | | | | 973,354 | |
Administration fees (Note 2) | | | 492,820 | | | | 2,037,855 | | | | 661,928 | | | | 3,220,343 | | | | 489,640 | |
Shareholder servicing fees—Shares (Note 2) | | | 816,378 | | | | 2,058,929 | | | | 1,096,547 | | | | 5,334,766 | | | | 811,101 | |
Transfer agent fees | | | 22,985 | | | | 98,041 | | | | 22,956 | | | | 30,236 | | | | 22,039 | |
Legal and audit fees | | | 27,090 | | | | 34,136 | | | | 27,725 | | | | 49,003 | | | | 22,996 | |
Custodian fees | | | 28,718 | | | | 100,758 | | | | 45,558 | | | | 146,127 | | | | 26,816 | |
Directors’ fees and expenses (Note 2) | | | 14,037 | | | | 40,964 | | | | 17,369 | | | | 62,180 | | | | 13,578 | |
Miscellaneous expenses | | | 58,421 | | | | 174,493 | | | | 57,527 | | | | 189,531 | | | | 56,325 | |
| | | | | | | | | | | | | | | | | | | | |
Total Expenses | | | 2,276,827 | | | | 7,921,007 | | | | 4,122,698 | | | | 14,366,952 | | | | 2,415,849 | |
Fees waived and reimbursed by: | | | | | | | | | | | | | | | | | | | | |
Investment Adviser (Note 2) | | | (480,791 | ) | | | (1,811,067 | ) | | | (1,490,998 | ) | | | (2,630,445 | ) | | | (469,157 | ) |
Administrator (Note 2) | | | (2,173 | ) | | | (10,503 | ) | | | (1,336 | ) | | | (6,011 | ) | | | (2,637 | ) |
Custody earning credits | | | (7,677 | ) | | | (33,235 | ) | | | (14,641 | ) | | | (39,420 | ) | | | (2,749 | ) |
| | | | | | | | | | | | | | | | | | | | |
Net Expenses | | | 1,786,186 | | | | 6,066,202 | | | | 2,615,723 | | | | 11,691,076 | | | | 1,941,306 | |
| | | | | | | | | | | | | | | | | | | | |
NET INVESTMENT INCOME | | | 15,053,710 | | | | 64,755,001 | | | | 12,932,633 | | | | 64,143,597 | | | | 14,030,831 | |
| | | | | | | | | | | | | | | | | | | | |
REALIZED GAIN (LOSS) ON INVESTMENTS (Note 1): | | | | | | | | | | | | | | | | | | | | |
Net realized gain (loss) on security transactions | | | 2,904 | | | | (2,912 | ) | | | 770 | | | | (5,092 | ) | | | 5,100 | |
| | | | | | | | | | | | | | | | | | | | |
Net increase in net assets resulting from operations | | $ | 15,056,614 | | | $ | 64,752,089 | | | $ | 12,933,403 | | | $ | 64,138,505 | | | $ | 14,035,931 | |
| | | | | | | | | | | | | | | | | | | | |
See Notes to Financial Statements.
20
[THIS PAGE INTENTIONALLY LEFT BLANK]
Excelsior Funds
Statements of Changes in Net Assets
| | | | | | | | | | | | | | | | |
| | |
| | |
Government Money Fund | | | Money Fund | |
| | | Year Ended March 31, | | | Year Ended March 31, | |
| | | 2007 | | | 2006 | | | 2007 | | | 2006 | |
Net investment income | | $ | 15,053,710 | | | $ | 14,326,304 | | | $ | 64,755,001 | | | $ | 52,416,558 | |
Net realized gain (loss) on security transactions | | | 2,904 | | | | (224 | ) | | | (2,912 | ) | | | (4,889 | ) |
| | | | | | | | | | | | | | | | |
Net increase in net assets resulting from operations | | | 15,056,614 | | | | 14,326,080 | | | | 64,752,089 | | | | 52,411,669 | |
| | | | | | | | | | | | | | | | |
Distributions to shareholders: | | | | | | | | | | | | | | | | |
From net investment income | | | | | | | | | | | | | | | | |
Shares | | | (15,045,075 | ) | | | (14,326,304 | ) | | | (38,623,273 | ) | | | (32,581,762 | ) |
Institutional Shares | | | — | | | | — | | | | (26,104,170 | ) | | | (19,834,796 | ) |
From net realized gain on investments | | | | | | | | | | | | | | | | |
Shares | | | — | | | | — | | | | — | | | | — | |
| | | | | | | | | | | | | | | | |
Total distributions | | | (15,045,075 | ) | | | (14,326,304 | ) | | | (64,727,443 | ) | | | (52,416,558 | ) |
| | | | | | | | | | | | | | | | |
Increase (decrease) in net assets from fund share transactions (Note 4) | | | (167,762,345 | ) | | | (85,798,349 | ) | | | (298,083,731 | ) | | | (175,199,854 | ) |
| | | | | | | | | | | | | | | | |
Net increase (decrease) in net assets | | | (167,750,806 | ) | | | (85,798,573 | ) | | | (298,059,085 | ) | | | (175,204,743 | ) |
| | | | | | | | | | | | | | | | |
NET ASSETS: | | | | | | | | | | | | | | | | |
Beginning of year | | | 410,227,955 | | | | 496,026,528 | | | | 1,555,135,672 | | | | 1,730,340,415 | |
| | | | | | | | | | | | | | | | |
End of year(1) | | $ | 242,477,149 | | | $ | 410,227,955 | | | $ | 1,257,076,587 | | | $ | 1,555,135,672 | |
| | | | | | | | | | | | | | | | |
(1) Including undistributed (distributions in excess of) net investment income | | $ | 8,635 | | | $ | — | | | $ | 27,558 | | | $ | — | |
| | | | | | | | | | | | | | | | |
See Notes to Financial Statements.
22
| | | | | | | | | | | | | | | | | | | | | | |
| | |
New York Tax-Exempt
Money Fund | | | Tax-Exempt Money Fund | | | Treasury Money Fund | |
| Year Ended March 31, | | | Year Ended March 31, | | | Year Ended March 31, | |
| 2007 | | | 2006 | | | 2007 | | | 2006 | | | 2007 | | | 2006 | |
| $ | 12,932,633 | | | $ | 9,085,180 | | | $ | 64,143,597 | | | $ | 47,504,669 | | | $ | 14,030,831 | | | $ | 10,553,148 | |
| | 770 | | | | 7,841 | | | | (5,092 | ) | | | 177,930 | | | | 5,100 | | | | 19,089 | |
| | | | | | | | | | | | | | | | | | | | | | | |
| | 12,933,403 | | | | 9,093,021 | | | | 64,138,505 | | | | 47,682,599 | | | | 14,035,931 | | | | 10,572,237 | |
| | | | | | | | | | | | | | | | | | | | | | | |
| | | | | | | | | | | | | | | | | | | | | | |
| | | | | | | | | | | | | | | | | | | | | | |
| | (12,927,606 | ) | | | (9,089,166 | ) | | | (64,113,972 | ) | | | (47,540,889 | ) | | | (14,033,835 | ) | | | (10,559,242 | ) |
| | — | | | | — | | | | — | | | | — | | | | — | | | | — | |
| | | | | | | | | | | | | | | | | | | | | | |
| | — | | | | — | | | | — | | | | (83,881 | ) | | | — | | | | (14,837 | ) |
| | | | | | | | | | | | | | | | | | | | | | | |
| | (12,927,606 | ) | | | (9,089,166 | ) | | | (64,113,972 | ) | | | (47,624,770 | ) | | | (14,033,835 | ) | | | (10,574,079 | ) |
| | | | | | | | | | | | | | | | | | | | | | | |
|
9,583,689 |
| | | 38,609,252 | | | | (51,587,116 | ) | | | 124,313,013 | | | | (59,619,992 | ) | | | (62,318,509 | ) |
| | | | | | | | | | | | | | | | | | | | | | | |
| | 9,589,486 | | | | 38,613,107 | | | | (51,562,583 | ) | | | 124,370,842 | | | | (59,617,896 | ) | | | (62,320,351 | ) |
| | | | | | | | | | | | | | | | | | | | | | | |
| | | | | | | | | | | | | | | | | | | | | | |
| | 447,865,109 | | | | 409,252,002 | | | | 2,162,173,335 | | | | 2,037,802,493 | | | | 365,687,811 | | | | 428,008,162 | |
| | | | | | | | | | | | | | | | | | | | | | | |
| $ | 457,454,595 | | | $ | 447,865,109 | | | $ | 2,110,610,752 | | | $ | 2,162,173,335 | | | $ | 306,069,915 | | | $ | 365,687,811 | |
| | | | | | | | | | | | | | | | | | | | | | | |
| | | | | |
| $ | 10,638 | | | $ | 4,841 | | | $ | 9,439 | | | $ | (9,820 | ) | | $ | 2,654 | | | $ | 558 | |
| | | | | | | | | | | | | | | | | | | | | | | |
See Notes to Financial Statements.
23
Excelsior Funds
Financial Highlights — Selected Per Share Data and Ratios
| | | | | | | | | | | | | | | | | | | | | | |
| | | Net Asset Value,
Beginning of
Year | | Net
Investment
Income | | | Net Realized
Gain (Loss) on
Investments | | | Total From
Investment
Operations | | Dividends
From Net
Investment
Income | | | Distributions
From Net
Realized
Gain on
Investments | |
GOVERNMENT MONEY FUND — (05/08/85*) | | | | | | | | | | | | | | | | |
Shares: | | | | | | | | | | | | | | | | | | | | | | |
Year Ended March 31, | | | | | | | | | | | | | | | | | | | | | | |
2007 | | $ | 1.00 | | $ | 0.04610 | (2) | | $ | 0.00025 | (2) | | $ | 0.04635 | | $ | (0.04635 | ) | | | — | |
2006 | | | 1.00 | | | 0.03152 | (2) | | | 0.00024 | (2) | | | 0.03176 | | | (0.03176 | ) | | | — | |
2005 | | | 1.00 | | | 0.01250 | (2) | | | 0.00003 | | | | 0.01253 | | | (0.01253 | ) | | | — | |
2004 | | | 1.00 | | | 0.00625 | | | | — | | | | 0.00625 | | | (0.00625 | ) | | | — | |
2003 | | | 1.00 | | | 0.01199 | | | | (0.00039 | ) | | | 0.01160 | | | (0.01160 | ) | | | — | |
MONEY FUND — (05/03/85*) | | | | | | | | | | | | | | | | |
Shares: | | | | | | | | | | | | | | | | | | | | | | |
Year Ended March 31, | | | | | | | | | | | | | | | | | | | | | | |
2007 | | $ | 1.00 | | $ | 0.04691 | (2) | | $ | 0.00019 | (2) | | $ | 0.04710 | | $ | (0.04710 | ) | | | — | |
2006 | | | 1.00 | | | 0.03207 | (2) | | | 0.00015 | (2) | | | 0.03222 | | | (0.03222 | ) | | | — | |
2005 | | | 1.00 | | | 0.01275 | (2) | | | 0.00010 | | | | 0.01285 | | | (0.01285 | ) | | | — | |
2004 | | | 1.00 | | | 0.00662 | | | | — | | | | 0.00662 | | | (0.00662 | ) | | | — | |
2003 | | | 1.00 | | | 0.01255 | | | | (0.00010 | ) | | | 0.01245 | | | (0.01245 | ) | | | — | |
NEW YORK TAX-EXEMPT MONEY FUND — (08/03/98*) | | | | | | | | | | | | |
Shares: | | | | | | | | | | | | | | | | | | | | | | |
Year Ended March 31, | | | | | | | | | | | | | | | | | | | | | | |
2007 | | $ | 1.00 | | $ | 0.02948 | (2) | | $ | (0.00002 | )(2) | | $ | 0.02946 | | $ | (0.02946 | ) | | | — | |
2006 | | | 1.00 | | | 0.02150 | (2) | | | (0.00012 | )(2) | | | 0.02138 | | | (0.02138 | ) | | | — | |
2005 | | | 1.00 | | | 0.00822 | (2) | | | 0.00023 | | | | 0.00845 | | | (0.00845 | ) | | | — | |
2004 | | | 1.00 | | | 0.00491 | | | | 0.00006 | | | | 0.00497 | | | (0.00490 | ) | | $ | (0.00007 | ) |
2003 | | | 1.00 | | | 0.00884 | | | | (0.00007 | ) | | | 0.00877 | | | (0.00873 | ) | | | (0.00004 | ) |
TAX-EXEMPT MONEY FUND — (05/24/85*) | | | | | | | | | | | | | | | | |
Shares: | | | | | | | | | | | | | | | | | | | | | | |
Year Ended March 31, | | | | | | | | | | | | | | | | | | | | | | |
2007 | | $ | 1.00 | | $ | 0.03006 | (2) | | $ | (0.00001 | )(2) | | $ | 0.03005 | | $ | (0.03005 | ) | | | — | |
2006 | | | 1.00 | | | 0.02229 | (2) | | | — | (2) | | | 0.02229 | | | (0.02225 | ) | | $ | (0.00004 | ) |
2005 | | | 1.00 | | | 0.00966 | (2) | | | — | | | | 0.00966 | | | (0.00966 | ) | | | — | |
2004 | | | 1.00 | | | 0.00546 | | | | 0.00029 | | | | 0.00575 | | | (0.00560 | ) | | | (0.00015 | ) |
2003 | | | 1.00 | | | 0.00967 | | | | (0.00002 | ) | | | 0.00965 | | | (0.00964 | ) | | | (0.00001 | ) |
TREASURY MONEY FUND — (02/13/91*) | | | | | | | | | | | | | | | | |
Shares: | | | | | | | | | | | | | | | | | | | | | | |
Year Ended March 31, | | | | | | | | | | | | | | | | | | | | | | |
2007 | | $ | 1.00 | | $ | 0.04324 | (2) | | $ | 0.00013 | (2) | | $ | 0.04337 | | $ | (0.04337 | ) | | | — | |
2006 | | | 1.00 | | | 0.02855 | (2) | | | 0.00036 | (2) | | | 0.02891 | | | (0.02887 | ) | | $ | (0.00004 | ) |
2005 | | | 1.00 | | | 0.00988 | (2) | | | 0.00031 | | | | 0.01019 | | | (0.01019 | ) | | | — | |
2004 | | | 1.00 | | | 0.00484 | | | | 0.00002 | | | | 0.00486 | | | (0.00485 | ) | | | (0.00001 | ) |
2003 | | | 1.00 | | | 0.01085 | | | | 0.00004 | | | | 0.01089 | | | (0.01089 | ) | | | — | |
| * | Commencement of Operations. |
| (1) | Expense ratios before waiver of fees and reimbursement of expenses (if any) by adviser and administrator. |
| (2) | For comparative purposes per share amounts are based on average shares outstanding. |
See Notes to Financial Statements.
24
| | | | | | | | | | | | | | | | | | | | |
Total
Distributions | | | Net Asset
Value,
End of
Year | | Total
Return | | | Net Assets,
End of
Year
(000’s) | | Ratio of Net
Operating
Expenses
to Average
Net Assets | | | Ratio of Gross
Operating
Expenses to
Average
Net Assets (1) | | | Ratio of Net
Investment
Income
to Average
Net Assets | |
| | | | | | | | | | | | | | | | | | | | |
| | | | | | | | | | | | | | | | | | | | |
| | | | | | | | | | | | | | | | | | | | |
| $ | (0.04635 | ) | | $ | 1.00 | | 4.74 | % | | $ | 242,477 | | 0.55 | % | | 0.70 | % | | 4.61 | % |
| | (0.03176 | ) | | | 1.00 | | 3.22 | % | | | 410,228 | | 0.53 | % | | 0.69 | % | | 3.15 | % |
| | (0.01253 | ) | | | 1.00 | | 1.26 | % | | | 496,027 | | 0.46 | % | | 0.71 | % | | 1.25 | % |
| | (0.00625 | ) | | | 1.00 | | 0.63 | % | | | 544,721 | | 0.45 | % | | 0.54 | % | | 0.62 | % |
| | (0.01160 | ) | | | 1.00 | | 1.17 | % | | | 594,496 | | 0.39 | % | | 0.47 | % | | 1.21 | % |
| | | | | | | | | | | | | | | | | | | | |
| | | | | | | | | | | | | | | | | | | | |
| | | | | | | | | | | | | | | | | | | | |
| $ | (0.04710 | ) | | $ | 1.00 | | 4.81 | % | | $ | 644,514 | | 0.55 | % | | 0.68 | % | | 4.69 | % |
| | (0.03222 | ) | | | 1.00 | | 3.27 | % | | | 1,032,384 | | 0.53 | % | | 0.69 | % | | 3.21 | % |
| | (0.01285 | ) | | | 1.00 | | 1.29 | % | | | 1,105,053 | | 0.46 | % | | 0.70 | % | | 1.28 | % |
| | (0.00662 | ) | | | 1.00 | | 0.66 | % | | | 1,141,562 | | 0.45 | % | | 0.73 | % | | 0.67 | % |
| | (0.01245 | ) | | | 1.00 | | 1.25 | % | | | 1,787,852 | | 0.39 | % | | 0.43 | % | | 1.25 | % |
| | | | | | | | | | | | | | | | | | | | |
| | | | | | | | | | | | | | | | | | | | |
| | | | | | | | | | | | | | | | | | | | |
| $ | (0.02946 | ) | | $ | 1.00 | | 2.99 | % | | $ | 457,455 | | 0.60 | % | | 0.94 | % | | 2.95 | % |
| | (0.02138 | ) | | | 1.00 | | 2.16 | % | | | 447,865 | | 0.60 | % | | 0.94 | % | | 2.15 | % |
| | (0.00845 | ) | | | 1.00 | | 0.85 | % | | | 409,252 | | 0.55 | % | | 0.97 | % | | 0.82 | % |
| | (0.00497 | ) | | | 1.00 | | 0.50 | % | | | 490,099 | | 0.50 | % | | 0.75 | % | | 0.49 | % |
| | (0.00877 | ) | | | 1.00 | | 0.88 | % | | | 548,574 | | 0.44 | % | | 0.49 | % | | 0.89 | % |
| | | | | | | | | | | | | | | | | | | | |
| | | | | | | | | | | | | | | | | | | | |
| | | | | | | | | | | | | | | | | | | | |
| $ | (0.03005 | ) | | $ | 1.00 | | 3.05 | % | | $ | 2,110,611 | | 0.55 | % | | 0.67 | % | | 3.01 | % |
| | (0.02229 | ) | | | 1.00 | | 2.25 | % | | | 2,162,173 | | 0.53 | % | | 0.68 | % | | 2.23 | % |
| | (0.00966 | ) | | | 1.00 | | 0.97 | % | | | 2,037,802 | | 0.46 | % | | 0.69 | % | | 0.97 | % |
| | (0.00575 | ) | | | 1.00 | | 0.58 | % | | | 2,044,676 | | 0.44 | % | | 0.58 | % | | 0.56 | % |
| | (0.00965 | ) | | | 1.00 | | 0.97 | % | | | 2,281,263 | | 0.39 | % | | 0.54 | % | | 0.97 | % |
| | | | | | | | | | | | | | | | | | | | |
| | | | | | | | | | | | | | | | | | | | |
| | | | | | | | | | | | | | | | | | | | |
| $ | (0.04337 | ) | | $ | 1.00 | | 4.42 | % | | $ | 306,070 | | 0.60 | % | | 0.74 | % | | 4.32 | % |
| | (0.02891 | ) | | | 1.00 | | 2.93 | % | | | 365,688 | | 0.58 | % | | 0.74 | % | | 2.86 | % |
| | (0.01019 | ) | | | 1.00 | | 1.02 | % | | | 428,008 | | 0.55 | % | | 0.75 | % | | 0.99 | % |
| | (0.00486 | ) | | | 1.00 | | 0.49 | % | | | 519,722 | | 0.50 | % | | 0.57 | % | | 0.49 | % |
| | (0.01089 | ) | | | 1.00 | | 1.09 | % | | | 571,998 | | 0.45 | % | | 0.53 | % | | 1.08 | % |
See Notes to Financial Statements.
25
EXCELSIOR FUNDS
NOTES TO FINANCIAL STATEMENTS
| 1. | Significant Accounting Policies: |
Excelsior Funds, Inc. (“Excelsior Fund”) and Excelsior Tax-Exempt Funds, Inc. (“Excelsior Tax-Exempt Fund”) were incorporated under the laws of the State of Maryland on August 2, 1984 and August 8, 1984, respectively, and are registered under the Investment Company Act of 1940, as amended (the “1940 Act”), as open-ended diversified management investment companies with the exception of Energy and Natural Resources Fund, Real Estate Fund, California Short-Intermediate Term Tax-Exempt Income Fund, New York Intermediate-Term Tax-Exempt Fund and New York Tax-Exempt Money Fund, each of which is non-diversified.
Excelsior Fund and Excelsior Tax-Exempt Fund currently offer shares in fifteen and seven managed investment portfolios, respectively, each having its own investment objectives and policies. The following is a summary of significant accounting policies for Government Money Fund, Money Fund and Treasury Money Fund, portfolios of Excelsior Fund, and for New York Tax-Exempt Money Fund and Tax-Exempt Money Fund, portfolios of Excelsior Tax-Exempt Fund (each a “Fund”, collectively, the “Funds”). Such policies are in conformity with accounting principles generally accepted in the United States of America and are consistently followed by the Funds in the preparation of their financial statements. The preparation of financial statements requires management to make estimates and assumptions that affect the reported amounts and disclosures in the financial statements. Actual results could differ from these estimates.
All Funds except for Money Fund offer one class of shares: Shares. The Money Fund offers two classes of shares: Shares and Institutional Shares. The financial highlights of the Institutional Shares as well as the financial statements for the remaining portfolios of Excelsior Fund and Excelsior Tax-Exempt Fund are presented separately.
It is each Fund’s policy, to the extent possible, to maintain a continuous net asset value per share of $1.00. Each Fund has adopted certain investment portfolio valuation and dividend distribution policies to enable it to do so. However, there can be no assurance that the net asset value per share of the Fund will not vary.
(a) Portfolio valuation:
Securities are valued at amortized cost, which has been determined by each Fund’s Board of Directors to represent the fair value of the Funds’ investments. Amortized cost valuation involves valuing an instrument at its cost initially and, thereafter, assuming a constant amortization to maturity of any discount or premium.
Mutual funds are valued at their respective net asset values as determined by those Funds in accordance with the 1940 Act.
(b) Concentration of risks:
At March 31, 2007, approximately 97% of the net assets of the New York Tax-Exempt Money Fund were invested in New York municipal securities. Economic changes affecting New York state and certain of its public bodies and municipalities may affect the ability of issuers to pay the required principal and interest payments of the municipal securities.
26
(c) Security transactions and investment income:
Security transactions are recorded on a trade date basis. Realized gains and losses on investments sold are recorded on the basis of identified cost. Interest income, adjusted for amortization of premiums and discounts on investments, is earned from settlement date and is recorded on the accrual basis.
(d) Repurchase agreements:
The Funds may enter into agreements with financial institutions deemed to be creditworthy by the investment adviser subject to the seller’s agreement to repurchase and the Funds’ agreement to resell such securities at mutually agreed upon prices. The repurchase agreements are collateralized by U.S. Government obligations. The value of the collateral underlying the repurchase agreements will always be at least equal to the repurchase price, including any accrued interest earned on the repurchase agreement. If the counter-party defaults, and the fair value of the collateral declines, realization of the collateral by the Funds may be delayed or limited.
Default or bankruptcy of the seller may, however, expose the applicable Fund to possible delay in connection with the disposition of the underlying securities or loss to the extent that proceeds from a sale of the underlying securities were less than the repurchase price under the agreement.
(e) Distributions to shareholders:
Dividends from net investment income are declared daily and paid monthly. Net realized capital gains, unless offset by any available capital loss carryforward, are distributed to shareholders at least annually, or more frequently to maintain a net asset value of $1.00 per share.
(f) Expense allocation:
Expenses directly attributable to a Fund are charged to that Fund. Other expenses are allocated to the respective Funds based on average daily net assets. Expenses attributable to a specific class of shares, such as shareholder servicing fees, are charged directly to that class.
(g) Borrowing:
The funds may obtain temporary bank loans from banks and custodians to use for meeting shareholder redemptions or for temporary or emergency purposes. The board of trustees approved an agreement between Excelsior Fund and Excelsior Tax-Exempt Fund and their custodian, JPMorgan Chase Bank, N.A., under which the funds may participate in an uncommitted line of credit in the aggregate principal amount of $150 million. The funds pay interest on the amounts they borrow at negotiated rates based on the terms of the agreement. There was no borrowing from the line of credit for any funds during the year ended March 31, 2007.
(h) Custody Credits:
Each Fund has an arrangement with its custodian bank under which the Fund receives a credit for its uninvested cash balance to offset its custody fees. The credit amounts (if any) are disclosed in the statement of operations as a reduction to the Fund’s operating expenses.
(i) New Accounting Standards:
In September 2006, the Financial Accounting Standards Board (FASB) issued Statement of Financial Accounting Standards No. 157, “Fair Value Measurements” (SFAS No. 157). SFAS No. 157
27
defines fair value, establishes a framework for measuring fair value in accordance with generally accepted accounting principles and expands disclosure about fair value measurements. SFAS No. 157 is effective for fiscal years beginning after November 15, 2007. Management is currently evaluating the impact the adoption of SFAS No. 157 will have on the Fund’s financial statements.
In July 2006, the FASB released FASB Interpretation No. 48 “Accounting for Uncertainty in Income Taxes” (“FIN 48”). FIN 48 provides guidance for how uncertain tax positions should be recognized, measured, presented and disclosed in the financial statements. FIN 48 requires the evaluation of tax positions taken or expected to be taken in the course of preparing the Fund’s tax return to determine whether the tax positions are “more-likely-than-not” of being sustained by the applicable tax authority. Tax positions not deemed to meet the more-likely-than-not threshold would be recorded as a tax benefit or expense in the period of determination. Adoption of FIN 48 is required no later than the last business day of the first financial statement reporting period for fiscal years beginning after December 15, 2006. A fund with a fiscal year ending March 31 will implement FIN 48 no later than September 28, 2007, and it is to be applied to all open tax years as of the effective date. Management is currently evaluating the impact of the adoption of FIN 48 to the financial statements.
| 2. | Investment Advisory Fee, Administration Fee, Shareholder Servicing Fees and Related Party Transactions: |
The Funds are advised by U.S. Trust New York Asset Management Division (“NYAMD”), a separate identifiable division of United States Trust Company, National Association (“USTNA”), or UST Advisers, Inc. (“USTA” and together with NYAMD, the “Advisers”) USTA is a wholly-owned subsidiary of USTNA. USTNA is a wholly-owned subsidiary of U.S. Trust Corporation, a registered bank holding company, which, in turn, is a wholly-owned subsidiary of The Charles Schwab Corporation. For the services provided pursuant to the Investment Advisory Agreements, each Adviser receives a fee, computed daily and paid monthly, as follows:
| | | |
Government Money Fund | | 0.25 | % |
Money Fund | | 0.25 | % |
New York Tax-Exempt Money Fund | | 0.50 | % |
Tax-Exempt Money Fund | | 0.25 | % |
Treasury Money Fund | | 0.30 | % |
On November 20, 2006, The Charles Schwab Corporation (“Schwab”) announced an agreement to sell the U.S. Trust Corporation (“U.S. Trust”) a wholly-owned subsidiary of Schwab, to the Bank of America Corporation (the “Sale”). The Sale includes all of U.S. Trust’s subsidiaries, including USTA and USTNA. The completion of the Sale may result in the assignment of the current investment advisory agreements and termination in accordance with their terms. Therefore, the Board of Trustees/Directors approved the new investment advisory agreements at the same advisory fee rates disclosed above in January 2007 and Shareholders of each Fund approved the new agreements during meetings held in March and April 2007. It is anticipated that the Sale will close early in the third quarter of 2007.
USTA and BISYS Fund Services Ohio, Inc. (collectively, the “Administrators”) provide administrative services to the Funds. For the services provided to the Funds, the Administrators are
28
entitled jointly to annual fees, computed daily and paid monthly, based on the combined aggregate average daily net assets of Excelsior Fund, Excelsior Tax-Exempt Fund and Excelsior Funds Trust (excluding the international equity portfolios of Excelsior Fund and Excelsior Funds Trust), all of which are affiliated investment companies, as follows: 0.200% of the first $200 million, 0.175% of the next $200 million and 0.150% over $400 million. The Administrators are entitled jointly to annual fees, computed daily and paid monthly, at the annual rate of 0.20% of the average daily net assets of the Emerging Markets Fund, International Equity Fund, International Fund and Pacific/Asia Fund. Administration fees payable by each Fund of the Excelsior Fund, Excelsior Tax-Exempt Fund and Excelsior Funds Trust are determined in proportion to the relative average daily net assets of the respective Funds for the period paid. For the year ended March 31, 2007, administration fees paid to USTA were as follows:
| | | |
| | | Administration
Fees paid to UST
Advisers, Inc. |
Government Money Fund | | $ | 444,394 |
Money Fund | | | 1,837,900 |
New York Tax-Exempt Money Fund | | | 597,118 |
Tax-Exempt Money Fund | | | 2,904,770 |
Treasury Money Fund | | | 441,670 |
BISYS Fund Services Ohio, Inc., waived Administration fees as presented on the Statements of Operations.
From time to time, in its sole discretion, each Adviser may undertake to waive a portion or all of the fees payable to it and may also reimburse the Funds for a portion of other expenses. For the year ended March 31, 2007, the Advisers have contractually agreed to waive investment advisory fees through, at least, July 31, 2007, and to reimburse other operating expenses to the extent necessary to keep total operating expenses from exceeding the following annual percentages of each Fund’s average daily net assets:
| | | |
Government Money Fund — Shares | | 0.55 | % |
Money Fund — Shares | | 0.55 | % |
New York Tax-Exempt Money Fund — Shares | | 0.60 | % |
Tax-Exempt Money Fund — Shares | | 0.55 | % |
Treasury Money Fund — Shares | | 0.60 | % |
Money Fund — Institutional Shares | | 0.30 | % |
For the year ended March 31, 2007, pursuant to the above, investment advisory fees waived by the Advisers were as follows:
| | | |
Government Money Fund | | $ | 480,791 |
Money Fund | | | 1,811,067 |
New York Tax-Exempt Money Fund | | | 1,490,998 |
Tax-Exempt Money Fund | | | 2,630,445 |
Treasury Money Fund | | | 469,157 |
29
The Funds have entered into shareholder servicing agreements with various service organizations, which include Charles Schwab & Co. Inc. (“CS & Co.”) and USTA. Services included in the servicing agreements include assistance in processing purchase, exchange and redemption requests; transmitting and receiving funds in connection with customer orders to purchase, exchange or redeem shares; and providing periodic statements. Shareholder servicing fees are incurred on a Fund or class level (where applicable). In consideration for these services, each service organization receives a fee from the Funds, computed daily and paid monthly, at an annual rate up to 0.25% of the average daily net assets of the Funds’ shares held by each service organization’s customers, with the exception of the Institutional Shares of the Money Fund, which pays a fee of up to 0.15% of the average daily net assets of its shares. The Advisers, out of their own resources, may additionally compensate certain organizations for providing these and other services.
For the year ended March 31, 2007, shareholder servicing fees paid to CS & Co. and USTA were as follows:
| | | |
Government Money Fund | | $ | 810,283 |
Money Fund | | | 2,027,190 |
New York Tax-Exempt Money Fund | | | 1,082,994 |
Tax-Exempt Money Fund | | | 5,323,397 |
Treasury Money Fund | | | 790,082 |
BISYS Fund Services Limited Partnership (the “Distributor”) serves as the Distributor of the Funds. Shares of each Fund are sold without a sales charge on a continuous basis by the Distributor.
The board of trustees/directors may include people who are officers and/or trustees of other fund families affiliated to the investment adviser. Federal securities law limits the percentage of the “interested persons” who may serve on a trust’s board, and the Funds are in compliance with these limitations. The funds did not pay any of the interested persons for their service as trustees/directors, but did pay non-interested persons (independent trustees), as noted in each fund’s Statement of Operations.
It is the policy of the Excelsior Fund and Excelsior Tax-Exempt Fund that each Fund continue to qualify as a regulated investment company, by complying with the requirements of the Internal Revenue Code applicable to regulated investment companies and by distributing substantially all of its taxable earnings to its shareholders.
In order to avoid a federal excise tax, each Fund is required to distribute certain minimum amounts of net realized capital gain and net investment income for the respective twelve-month periods ending October 31 and December 31 each calendar year.
Dividends and distributions are determined in accordance with federal income tax regulations and may differ from accounting principles generally accepted in the United States of America. These differences are primarily due to differing dividend characterization and the expiration of capital loss
30
carryforwards. To the extent these differences are permanent in nature, such amounts are reclassified within the composition of net assets based on their federal tax-basis treatment; temporary differences do not require reclassification. Accordingly, the following reclassifications have been made to/from the following accounts:
| | | | | | | | | | | | |
| | | Undistributed
Net
Investment
Income | | | Accumulated
Net Realized
Gain (Loss) | | | Paid-In-Capital | |
Government Money Fund | | $ | — | | | $ | 393 | | | $ | (393 | ) |
New York Tax-Exempt Money Fund | | | 770 | | | | (770 | ) | | | — | |
Tax-Exempt Money Fund | | | (10,368 | ) | | | (138,496 | ) | | | 148,864 | |
Treasury Money Fund | | | 5,100 | | | | (5,100 | ) | | | — | |
The tax character of dividends and distributions declared during the years ended March 31, 2007 and March 31, 2006 were as follows:
| | | | | | | | | | | | |
| | | Ordinary
Income | | Tax-Exempt
Income | | Long-Term
Capital Gain | | Total* |
Government Money Fund | | | | | | | | | | | | |
Year ended March 31, 2007 | | $ | 15,546,941 | | $ | — | | $ | — | | $ | 15,546,941 |
Year ended March 31, 2006 | | | 13,620,350 | | | — | | | — | | | 13,620,350 |
Money Fund | | | | | | | | | | | | |
Year ended March 31, 2007 | | | 65,587,427 | | | — | | | — | | | 65,587,427 |
Year ended March 31, 2006 | | | 49,048,464 | | | — | | | — | | | 49,048,464 |
New York Tax-Exempt Money Fund | | | | | | | | | | | | |
Year ended March 31, 2007 | | | 770 | | | 12,662,681 | | | — | | | 12,663,451 |
Year ended March 31, 2006 | | | 3,001 | | | 8,506,753 | | | 4,840 | | | 8,514,594 |
Tax-Exempt Money Fund | | | | | | | | | | | | |
Year ended March 31, 2007 | | | — | | | 63,305,228 | | | — | | | 63,305,228 |
Year ended March 31, 2006 | | | 84,887 | | | 45,217,987 | | | 20,970 | | | 45,323,844 |
Treasury Money Fund | | | | | | | | | | | | |
Year ended March 31, 2007 | | | 13,964,644 | | | — | | | 5 | | | 13,964,649 |
Year ended March 31, 2006 | | | 9,920,151 | | | — | | | — | | | 9,920,151 |
* The total distributions paid may differ from the Statement of Changes in Net Assets because for tax purposes, dividends are recognized when actually paid.
31
As of March 31, 2007, the components of distributable earnings (accumulated losses) on a tax basis were as follows:
| | | | | | | | | | | | | | | | | | | | | | | | | | | | |
| | | Undistributed
Ordinary
Income | | Undistributed
Long-Term
Capital Gain | | Undistributed
Tax-Exempt
Income | | Accumulated
Earnings | | Distributions
Payable* | | | Accumulated
Capital and
Other
Losses | | | Unrealized
Depreciation | | | Total
Accumulated
Earnings/
(Deficit) | |
Government Money Fund | | $ | 1,059,385 | | $ | — | | $ | — | | $ | 1,059,385 | | $ | (1,050,750 | ) | | $ | (24,683 | ) | | $ | — | | | $ | (16,048 | ) |
Money Fund | | | 5,122,791 | | | — | | | — | | | 5,122,791 | | | (5,095,233 | ) | | | (43,438 | ) | | | — | | | | (15,880 | ) |
New York Tax-Exempt Money Fund | | | — | | | — | | | 1,249,960 | | | 1,249,960 | | | (1,239,322 | ) | | | — | | | | — | | | | 10,638 | |
Tax-Exempt Money Fund | | | — | | | — | | | 5,712,343 | | | 5,712,343 | | | (5,702,904 | ) | | | — | | | | (49,539 | ) | | | (40,100 | ) |
Treasury Money Fund | | | 1,213,314 | | | — | | | — | | | 1,213,314 | | | (1,210,660 | ) | | | — | | | | — | | | | 2,654 | |
* The total distributions payable may differ from the statement of Assets and Liabilities because for tax purposes, dividends are recognized when actually paid.
For federal income tax purposes, capital loss carryforwards may be carried forward and applied against future capital gains. To the extent that such carryforwards are utilized, capital gains distributions will be reduced. At March 31, 2007, the following Funds had capital loss carryforwards available to offset future net capital gains through the indicated expiration dates.
| | | | | | | | | | | | | | | | | | | | | |
| | | Expires |
| | | 2008 | | 2011 | | 2012 | | 2013 | | 2014 | | 2015 | | Total |
Government Money Fund | | $ | 18,903 | | $ | — | | $ | 5,556 | | $ | — | | $ | 224 | | $ | — | | $ | 24,683 |
Money Fund | | | — | | | 11,662 | | | 23,975 | | | — | | | 4,889 | | | 2,912 | | | 43,438 |
Excelsior Fund has authorized capital of 35 billion shares of Common Stock, 29.3756 billion of which is currently classified to represent interests in certain classes of shares. Excelsior Tax-Exempt Fund has authorized capital of 24 billion shares of Common Stock, 15 billion of which is currently classified to represent interests in certain classes of shares. Authorized capital currently classified for each Fund is as follows: 4 billion shares each of the Government Money Fund and Money Fund, 2.5 billion shares of Treasury Money Fund, 2 billion shares of New York Tax-Exempt Money Fund and 5.5 billion shares for Tax-Exempt Money Fund.
32
Each share has a par value of $0.001 and represents an equal proportionate interest in the particular Fund with other shares of the same Fund, and is entitled to such dividends and distributions of taxable earnings on the assets belonging to such Fund as are declared at the discretion of each Fund’s Board of Directors. Since the Funds have sold, reinvested and redeemed shares only at a constant net asset value of $1.00 per share, the number of shares represented by such sales, reinvestments and redemptions is the same as the amounts shown below for such transactions.
Capital Share Transactions
| | | | | | | | | | | | | | |
| | | Government Money Fund | |
| | | Year Ended
03/31/07 | | | Year Ended
03/31/06 | |
| | | Shares | | | Amounts | | | Shares | | | Amounts | |
Sold | | 2,027,068,990 | | | $ | 2,027,068,990 | | | 2,577,232,059 | | | $ | 2,577,232,059 | |
Issued as reinvestment of dividends | | 697,510 | | | | 697,510 | | | 735,293 | | | | 735,293 | |
Redeemed | | (2,195,528,845 | ) | | | (2,195,528,845 | ) | | (2,663,765,701 | ) | | | (2,663,765,701 | ) |
| | | | | | | | | | | | | | |
Net Increase (Decrease) | | (167,762,345 | ) | | $ | (167,762,345 | ) | | (85,798,349 | ) | | $ | (85,798,349 | ) |
| | | | | | | | | | | | | | |
| |
| | | Money Fund | |
| | | Year Ended
03/31/07 | | | Year Ended
03/31/06 | |
| | | Shares | | | Amounts | | | Shares | | | Amounts | |
Sold: | | | | | | | | | | | | | | |
Shares | | 2,599,472,390 | | | $ | 2,599,472,390 | | | 3,427,610,450 | | | $ | 3,427,610,450 | |
Institutional Shares | | 4,262,737,772 | | | | 4,262,737,772 | | | 4,731,250,373 | | | | 4,731,250,373 | |
Issued as reinvestment of dividends: | | | | | | | | | | | | | | |
Shares | | 3,330,030 | | | | 3,330,030 | | | 2,259,420 | | | | 2,259,420 | |
Institutional Shares | | 9,160,704 | | | | 9,160,704 | | | 7,428,066 | | | | 7,428,066 | |
Redeemed: | | | | | | | | | | | | | | |
Shares | | (2,990,685,747 | ) | | | (2,990,685,747 | ) | | (3,502,534,923 | ) | | | (3,502,534,923 | ) |
Institutional Shares | | (4,182,098,880 | ) | | | (4,182,098,880 | ) | | (4,841,213,240 | ) | | | (4,841,213,240 | ) |
| | | | | | | | | | | | | | |
Net Increase (Decrease) | | (298,083,731 | ) | | $ | (298,083,731 | ) | | (175,199,854 | ) | | $ | (175,199,854 | ) |
| | | | | | | | | | | | | | |
33
| | | | | | | | | | | | | | |
| | | New York Tax-Exempt Money Fund | |
| | | Year Ended
03/31/07 | | | Year Ended
03/31/06 | |
| | | Shares | | | Amounts | | | Shares | | | Amounts | |
Sold | | 2,519,812,784 | | | $ | 2,519,812,784 | | | 2,399,705,970 | | | $ | 2,399,705,970 | |
Issued as reinvestment of dividends | | 1,815,110 | | | | 1,815,110 | | | 1,554,586 | | | | 1,554,586 | |
Redeemed | | (2,512,044,205 | ) | | | (2,512,044,205 | ) | | (2,362,651,304 | ) | | | (2,362,651,304 | ) |
| | | | | | | | | | | | | | |
Net Increase (Decrease) | | 9,583,689 | | | $ | 9,583,689 | | | 38,609,252 | | | $ | 38,609,252 | |
| | | | | | | | | | | | | | |
| |
| | | Tax-Exempt Money Fund | |
| | | Year Ended
03/31/07 | | | Year Ended
03/31/06 | |
| | | Shares | | | Amounts | | | Shares | | | Amounts | |
Sold | | 9,783,446,469 | | | $ | 9,783,446,469 | | | 10,547,799,881 | | | $ | 10,547,799,881 | |
Issued as reinvestment of dividends | | 2,484,144 | | | | 2,484,144 | | | 2,207,894 | | | | 2,207,894 | |
Redeemed | | (9,837,517,729 | ) | | | (9,837,517,729 | ) | | (10,425,694,762 | ) | | | (10,425,694,762 | ) |
| | | | | | | | | | | | | | |
Net Increase (Decrease) | | (51,587,116 | ) | | $ | (51,587,116 | ) | | 124,313,013 | | | $ | 124,313,013 | |
| | | | | | | | | | | | | | |
| |
| | | Treasury Money Fund | |
| | | Year Ended
03/31/07 | | | Year Ended
03/31/06 | |
| | | Shares | | | Amounts | | | Shares | | | Amounts | |
Sold | | 1,744,655,262 | | | $ | 1,744,655,262 | | | 3,260,733,468 | | | $ | 3,260,733,468 | |
Issued as reinvestment of dividends | | 4,178,107 | | | | 4,178,107 | | | 2,191,117 | | | | 2,191,117 | |
Redeemed | | (1,808,453,361 | ) | | | (1,808,453,361 | ) | | (3,325,243,094 | ) | | | (3,325,243,094 | ) |
| | | | | | | | | | | | | | |
Net Increase (Decrease) | | (59,619,992 | ) | | $ | (59,619,992 | ) | | (62,318,509 | ) | | $ | (62,318,509 | ) |
| | | | | | | | | | | | | | |
In the normal course of business, the Funds enter into contracts that provide general indemnifications. The Funds’ maximum exposure under these arrangements is dependent on future claims that may be made against the Funds and, therefore, cannot be established; however, based on experience, the risk of loss from such claims is considered remote.
United States Trust Company of New York and U.S. Trust Company, N.A. (formerly, co-investment advisers to the Funds, together referred to herein as “U.S. Trust”), Excelsior Funds, Excelsior Tax-Exempt Funds and Trust (the “Companies”), U.S. Trust, Schwab and several individuals and third parties were named in four fund shareholder class actions and two derivative actions which alleged that U.S. Trust, the Companies, and others allowed certain parties to engage in illegal and improper mutual
34
fund trading practices, which allegedly caused financial injury to the shareholders of certain of the Funds advised by U.S. Trust. Each seeks unspecified monetary damages and related equitable relief.
The class and derivative actions described above were transferred to the United States District Court for the District of Maryland for coordinated and consolidated pre-trial proceedings. In November 2005, the Maryland court dismissed many of the plaintiffs’ claims in both the class and derivative actions. The court entered implementing orders on February 24, 2006. All claims against the Companies have been dismissed. Plaintiffs’ claims against U.S. Trust and certain individuals under Sections 10(b) and 20(a) of the Securities Exchange Act and Sections 36(b) and 48(a) of the Investment Company Act, however, have not been dismissed. Plaintiffs’ Section 48(a) claims against parent entities U.S. Trust and Schwab also remain.
While the ultimate outcome of these matters cannot be predicted with any certainty at this time, based on currently available information, U.S. Trust believes that the likelihood is remote that the pending litigation will have a material adverse financial impact on the Companies, or materially affect U.S. Trust’s ability to provide investment management services to the Companies.
35
REPORT OF INDEPENDENT REGISTERED PUBLIC ACCOUNTING FIRM
To the Board of Directors and Shareholders of
Excelsior Funds, Inc. and Excelsior Tax-Exempt Funds, Inc.
In our opinion, the accompanying statements of assets and liabilities, including the portfolios of investments, and the related statements of operations and of changes in net assets and the financial highlights present fairly, in all material respects, the financial position of the Government Money Fund, Money Fund, New York Tax-Exempt Money Fund, Tax-Exempt Money Fund and Treasury Money Fund (three portfolios of Excelsior Funds, Inc. and two portfolios of Excelsior Tax-Exempt Funds, Inc., hereafter referred to as the “Funds”) at March 31, 2007, and the results of each of their operations, the changes in each of their net assets and the financial highlights for the year then ended, in conformity with accounting principles generally accepted in the United States of America. These financial statements and financial highlights (hereafter referred to as “financial statements”) are the responsibility of the Funds’ management; our responsibility is to express an opinion on these financial statements based on our audit. We conducted our audit of these financial statements in accordance with the standards of the Public Company Accounting Oversight Board (United States). Those standards require that we plan and perform the audit to obtain reasonable assurance about whether the financial statements are free of material misstatement. An audit includes examining, on a test basis, evidence supporting the amounts and disclosures in the financial statements, assessing the accounting principles used and significant estimates made by management, and evaluating the overall financial statement presentation. We believe that our audit, which included confirmation of securities at March 31, 2007 by correspondence with the custodian and brokers, provides a reasonable basis for our opinion. The statements of changes in net assets and financial highlights of the Funds for each of the four years in the period ended March 31, 2006 were audited by other auditors whose report dated May 22, 2006 expressed an unqualified opinion on those statements.
PRICEWATERHOUSECOOPERS LLP
San Francisco, California
May 18, 2007
36
PROXY VOTING RESULTS (Unaudited)
On November 20, 2006, Schwab announced an agreement to sell U.S. Trust, a wholly-owned subsidiary of Schwab, to the Bank of America (the “Sale”). The Sale involves all of U.S. Trust’s subsidiaries, including USTA and USTNA.
Under Section 15 of the 1940 Act, the change in ownership of U.S. Trust may result in the assignment, and automatic termination, of the Funds’ current investment advisory agreements with USTA and USTNA (the “Current Advisory Agreements”). Consequently, the Funds will need to enter into new investment advisory agreements with USTA and USTNA upon the closing of the Sale (the “New Advisory Agreements”), which requires the approval of both the Board of Directors and the shareholders of the Funds. At a meeting held on January 8, 2007, the Board approved New Advisory Agreements under which, subject to approval by the Funds’ shareholders, USTA and USTNA will continue to serve as investment advisers to the Funds after the Sale is completed. At the same meeting, the Board directed that the New Advisory Agreements be submitted to the shareholders of each Fund for approval.
A Special Meeting of Shareholders of Excelsior Funds, Excelsior Tax-Exempt Funds and Trust and each of their Funds was held on March 30, 2007, for the purpose of seeking shareholder approval of the following proposal: to approve new investment advisory agreements by and among USTA, USTNA and the Companies, on behalf of the Funds. The Special Meeting for Excelsior Funds with respect to the Value and Restructuring Fund, Energy and Natural Resources and Treasury Money Funds was adjourned for the purpose of soliciting additional proxies, and subsequently held on April 30, 2007. The number of votes necessary to conduct the Special Meetings and approve the proposal was obtained. The results of the votes of shareholders are listed below:
EXCELSIOR FUNDS, INC.
| | | | | | |
Fund | | For | | Against | | Abstain |
Blended Equity Fund | | 6,164,047.545 | | 67,952.751 | | 73,977.210 |
Core Bond Fund | | 42,419,131.502 | | 102,811.034 | | 103,300.208 |
Emerging Markets Fund | | 40,519,375.591 | | 385,533.770 | | 2,387,530.558 |
Energy and Natural Resources Fund | | 10,149,963.059 | | 261,710.922 | | 349,760.892 |
Government Money Fund | | 172,737,336.070 | | 747,772.190 | | 420,358.000 |
Intermediate-Term Bond Fund | | 44,858,545.970 | | 241,685.152 | | 66,016.000 |
International Fund | | 21,282,762.400 | | 54,899.414 | | 128,924.192 |
Large Cap Growth Fund | | 42,848,198.375 | | 89,295.014 | | 404,672.705 |
Money Fund | | 674,980,999.600 | | 1,166,673.210 | | 410,474.540 |
Pacific/Asia Fund | | 12,624,395.052 | | 35,293.746 | | 146,970.828 |
Real Estate Fund | | 6,828,766.866 | | 23,944.228 | | 74,532.837 |
Short-Term Government Securities Fund | | 19,900,726.363 | | 26,705.441 | | 160,992.698 |
Small Cap Fund | | 20,778,531.495 | | 77,734.183 | | 230,771.291 |
Treasury Money Fund | | 147,661,994.420 | | 8,327.040 | | 953,491.100 |
Value and Restructuring Fund | | 71,659,202.229 | | 1,308,059.398 | | 2,313,244.343 |
37
PROXY VOTING RESULTS (Continued)
EXCELSIOR TAX-EXEMPT FUNDS, INC.
| | | | | | |
Fund | | For | | Against | | Abstain |
California Short-Intermediate Term Tax-Exempt Income Fund | | 5,620,954.755 | | 30,312.000 | | 19,754.000 |
Intermediate-Term Tax-Exempt Fund | | 25,090,015.155 | | 30,070.577 | | 76,826.198 |
Long-Term Tax-Exempt Fund | | 3,628,610.926 | | 33,702.423 | | 40,804.648 |
New York Intermediate-Term Tax-Exempt Fund | | 9,319,329.057 | | 13,806.000 | | 36,899.000 |
New York Tax-Exempt Money Fund | | 275,209,603.310 | | 4,686,548.000 | | 63,196.000 |
Short-Term Tax-Exempt Securities Fund | | 8,452,657.301 | | 72,849.000 | | 359,587.000 |
Tax-Exempt Money Fund | | 1,356,339,634.110 | | 11,586,764.280 | | 2,023,751.550 |
EXCELSIOR FUNDS TRUST
| | | | | | |
Fund | | For | | Against | | Abstain |
Equity Income Fund | | 15,004,710.199 | | 69,167.666 | | 28,045.000 |
Equity Opportunities Fund | | 15,890,842.151 | | 16,544.962 | | 771.000 |
High Yield Fund | | 15,794,959.655 | | 30,927.324 | | 249,577.222 |
International Equity Fund | | 5,138,808.000 | | .000 | | .000 |
Mid Cap Value and Restructuring Fund | | 7,879,533.211 | | 19,517.123 | | 87,756.460 |
38
ADDITIONAL FEDERAL TAX INFORMATION
Other Federal Tax Information (Unaudited):
The funds designate the following percentage of the distributions paid from net investment income as exempt-interest dividends for the fiscal year ended March 31, 2007.
| | | |
| | | Percentage | |
New York Tax-Exempt Money Fund | | 100 | % |
Tax-Exempt Money Fund | | 100 | % |
The funds designate the following amounts as long-term capital gain distribution. The amount designated may not agree with the long term capital gains in the tax character of distribution table due to utilization of earnings and profits distributed to shareholders on redemption of shares.
| | | |
| | | Amount |
Tax-Exempt Money Fund | | $ | 26,019 |
Treasury Money Fund | | | 5 |
39
APPROVAL OF INVESTMENT ADVISORY AGREEMENTS (Unaudited)
In November 2006, representatives of Schwab, U.S. Trust and the Funds’ investment advisers, USTA and USTNA (together, USTA and USTNA are referred to as the “Advisers) informed the Board that Schwab had entered into a stock purchase agreement with the Bank of America under which Schwab would sell U.S. Trust to Bank of America (the “Sale”). Representatives of Schwab, U.S. Trust, and the Advisers also informed the Board that, because the Sale includes all of U.S. Trust’s subsidiaries, such as USTA and USTNA, the completion of the Sale may be deemed to be an “assignment” (as defined in the 1940 Act) of the Funds’ current investment advisory agreements (the “Current Advisory Agreements”) resulting in the termination of the Current Advisory Agreements in accordance with their terms. To provide continuity in investment advisory services, representatives of U.S. Trust, the Advisers, and Bank of America proposed that the Board approve new investment advisory agreements (the “New Advisory Agreements”) under which, subject to shareholder approval, USTA and USTNA would continue to serve as investment advisers to the Funds after the completion of the Sale.
In advance of its December 6-7, 2006 meeting, the Board of Directors/Trustees requested and received from Bank of America, U.S. Trust, and the Advisers, various materials providing information regarding the Sale and its impact on (i) the Funds and their shareholders, (ii) the investment advisory services provided to the Funds by the USTA and USTNA and (iii) the administration services provided to the Funds by USTA. After receiving and reviewing these materials, the Board discussed at their December 6-7, 2006 meeting, the proposal to approve the New Advisory Agreements. Representatives from Bank of America, U.S. Trust, the Advisers, and Schwab attended the meeting and presented additional oral and written information to the Board to assist the Board in its considerations. These representatives assured the Board that Bank of America did not anticipate that there will be any reduction in the scope of or material adverse change in the nature or quality of, the investment advisory services to the Funds under the New Advisory Agreements. These representatives noted that a plan would be put into place designed to provide for the continuity of the investment advisory services under the New Advisory Agreements.
Additionally, representatives from Bank of America discussed the extensive experience and resources dedicated to Bank of America’s large mutual fund business, assuring the Board that Bank of America would seek to provide the Funds with the same or better quality of services with respect to the administration services currently provided by USTA. Representatives from Bank of America noted that: (i) the size and scale of Bank of America’s mutual fund business could produce potential savings for the Funds’ shareholders through reduced administrative costs and (ii) there was the potential for significant negotiating power in any future vendor discussions resulting from the Funds being part of the larger Bank of America fund complex.
The Board then discussed the written materials that the Board received before the meeting and the oral presentations and all other information that the Board received or discussed at the December 6-7, 2006 meeting. At the conclusion of the meeting, the Board decided to schedule another in-person Board meeting on January 8, 2007 to allow the Board to further consider the proposal to approve the New Advisory Agreements.
40
APPROVAL OF INVESTMENT ADVISORY AGREEMENTS (Continued)
In anticipation of the January 8, 2007 Board meeting, legal counsel for the Directors/Trustees who are not interested persons (as defined in the 1940 Act) (“Independent Directors”) sent an information request letter to U.S. Trust and Schwab to solicit further information that the Board deemed to be relevant to their consideration of the New Advisory Agreements, including a discussion of, among other matters, (a) a detailed timeline and plan for the orderly transition of the administration and oversight of the Funds; (b) the extent to which key personnel of the Advisers who manage day-to-day investment operations of the Funds are expected to continue to be employed by the Advisers after the Sale; (c) the experience and qualifications of new key administrative personnel that Bank of America proposes to involve in Fund matters; (d) any enhanced compliance policies and procedures adopted by Bank of America in response to mutual fund regulatory and compliance issues; (e) any anticipated financial benefits of the Sale to Fund shareholders; (f) any anticipated changes in the Funds’ fees and operating expenses; (g) any anticipated structural changes to the Excelsior Funds complex; (h) any conflicts of interest between the other business interests of Bank of America and its affiliates and the operations of the Funds; and (i) any limitations on the Funds’ investment operations that would arise as a result of the Funds’ being affiliated with Bank of America. The responses by Bank of America, U.S. Trust, the Advisers and Schwab were provided to the Board for their review prior to the January 8, 2007 Board meeting, and the Board was provided with the opportunity to request any additional materials.
At the Board’s meeting on January 8, 2007, Bank of America, U.S. Trust, the Advisers, and Schwab provided additional written and oral information on the Sale and the impact of the Sale on the Advisers and the Funds and their shareholders. During the meeting, representatives from Bank of America and the Advisers, who were present at the meeting, assured the Board that Bank of America does not anticipate that there will be any reduction in the scope of, or material adverse change in the nature or quality of, the investment advisory services to the Funds under the New Advisory Agreements. Additionally, representatives from Bank of America, and the Advisers represented to the Board that Bank of America personnel would seek to provide the same or better quality of services with respect to the administration services currently provided by USTA. It was noted that a plan for the orderly transition of the administration and oversight of the Funds had been developed to ensure that there would be no disruption of Fund operations or other adverse consequences to the Funds and their shareholders. In addition, Bank of America provided, and the Board discussed, information regarding the potential applicability of certain regulatory orders relating to the Columbia Funds and the legacy Nations Funds.
The Board then deliberated on the approval of the New Advisory Agreements in light of all the information it had received. The Independent Directors, assisted by their independent legal counsel, met in executive session to discuss the New Advisory Agreements. After deliberating in executive session, the entire Board reconvened to discuss the approval of the New Advisory Agreements.
At the conclusion of the January 8, 2007 Board meeting, the Board, including all of the Independent Directors, unanimously concluded (a) that the approval of the New Advisory Agreements would be in the best interests of the shareholders and the Funds and (b) to recommend the approval of the New Advisory Agreements to shareholders. In concluding to approve the New Advisory Agreements and to recommend their approval to shareholders, the Board considered, with the assistance of independent legal counsel, the information and materials provided to the Board and a variety of specific factors discussed at the meetings, including, as discussed below, the Board’s prior conclusions when determining whether to approve the continuation of the Current Advisory Agreements.
41
APPROVAL OF INVESTMENT ADVISORY AGREEMENTS (Continued)
At the January 8, 2007 Board meeting, the Board concluded it was reasonable to take into account the conclusions the Board made when considering and evaluating the renewal of the Current Advisory Agreements (the “Annual Review”), which occurred at the September 29, 2006 in-person Board meeting, as part of its considerations to approve the New Advisory Agreements. The Board’s conclusion in this regard was based on (i) the fact that the New Advisory Agreements are identical to the Current Advisory Agreements in all material respects, including the investment advisory fees payable by the Funds to the Advisers and (ii) assurances by Bank of America and the Advisers that there would be no reduction or material adverse change in the nature or quality of the investment advisory services to the Funds under the New Advisory Agreements.
In addition to the conclusions formed with respect to the Annual Review, the Board considered specific information at the January 8, 2007 Board meeting concerning the Sale and its impact on the Advisers and the Funds and their shareholders, as they considered appropriate, including but not limited to the following:
| | • | | a detailed timeline and plan for the orderly transition of the administration and oversight of the Funds; |
| | • | | assurances by Bank of America and the Advisers that Bank of America does not anticipate that there will be any reduction in the scope of, or material adverse change in the nature or quality of, the investment advisory services to the Funds under the New Advisory Agreements; |
| | • | | an explanation of the extent to which key personnel of the Advisers who manage the day-to-day investment operations of the Funds are expected to continue to be employed by the Advisers after the Sale; |
| | • | | the experience and qualifications of new key administrative, financial, compliance and legal personnel that Bank of America proposes to involve in Fund matters; |
| | • | | the enhanced compliance policies and procedures adopted by Bank of America in response to mutual fund regulatory and compliance issues; |
| | • | | the anticipated financial benefits of the Sale to Fund shareholders including (i) access for the Funds to a large distribution network both on the retail, institutional and retirement platforms, as well as to Bank of America’s Private Bank and Wealth Management areas; (ii) the potential for a positive impact on Fund operating expenses resulting from an increase in assets; and (iii) the potential for significant negotiating power in any future vendor discussions resulting from the Funds being part of the larger Bank of America fund complex; |
| | • | | a representation from the Advisers and Bank of America that neither the Companies nor their shareholders would bear any costs of the Meeting or the costs of any solicitation in connection with the Meeting; |
| | • | | a representation from Bank of America that Bank of America would extend the Advisers’ commitments under the Expense Limitation Agreements currently in place with the Funds for a period of two years following the closing of the Sale, subject to the Board’s prior approval of any changes to those Expense Limitation Agreements; |
| | • | | a discussion of the anticipated structural changes to the Excelsior Funds complex and a representation from Bank of America that the class structure of the Excelsior Funds was currently being evaluated by its product teams and that the results of that analysis would be presented to the Board for consideration at a future meeting; |
42
APPROVAL OF INVESTMENT ADVISORY AGREEMENTS (Continued)
| | • | | the policies and procedures adopted by Bank of America that are intended to identify, monitor and mitigate any conflicts of interest between the other business interests of Bank of America and its affiliates and the operations of the Funds; and |
| | • | | a representation from U.S. Trust and Schwab that no material adverse impact on the Funds’ investment operations is expected as a result of the Funds being affiliated with Bank of America. |
The Board concluded, within the context of its full deliberations, that each of the representations, assurances and informational items provided by the Advisers, U.S. Trust, Bank of America and Schwab set forth above supported the approval of the New Advisory Agreements.
In the course of their deliberations, the Board did not identify any particular information or factor that was all-important or controlling. Based on its evaluation of the information and the conclusions with respect thereto at its meetings on September 29, 2006, December 6-7, 2006 and January 8, 2007, the Board, including all of the Independent Directors, unanimously: (a) concluded that the terms of the New Advisory Agreements are fair and reasonable; (b) concluded that the Advisers’ fees are reasonable in light of the services to be provided by the Advisers to the Companies; (c) concluded that the approval of the New Advisory Agreements would be in the best interests of the shareholders and the Funds; and (d) concluded to recommend the approval of the New Advisory Agreements to shareholders.
43
Directors/Trustees and Officers (Unaudited)
The tables below provide information pertaining to the Directors/Trustees and Officers of the Companies. The mailing address for each Director/Trustee Excelsior Funds, 101 Montgomery Street, San Francisco, CA 94104.
| | | | | | | | | | |
Name and
Year of Birth | | Position(s) Held
with the
Company(1) | | Term of
Office(2) and
Length of Time
Served | | Principal Occupation(s)
During Past Five Years | | Number of
Funds in the
Fund Complex
Overseen by
Board Member | | Other
Directorships
Held by Board Member(6) |
| INDEPENDENT DIRECTORS/TRUSTEES | | | | | | |
Rodman L. Drake
Year of Birth: 1943 | | Director/Trustee; Chairman, Full Board | | Trustee of Excelsior Funds Trust since 1994; Director of Excelsior Funds, Inc. and Excelsior Tax Exempt Funds Inc. since 1996 | | Co-Founder of Baringo Capital LLC (since 2002); President, Continuation Investments Group, Inc. (1997 to 2001). | | 38(3) | | BOARD 1 — Director and Chairman, Hyperion Total Return Fund, Inc. and Hyperion Strategic Mortgage Fund Inc. (since 1991). BOARD 2 — Director, Jackson Hewitt Tax Service Inc. (since June 2004). BOARD 3 — Director, Student Loan Corporation (since May 2005). BOARD 4 — Celgene Corporation (since April 2006). |
| | | | | |
Morrill Melton Hall, Jr.
Year of Birth: 1944 | | Director/Trustee; Chairman, Investment Oversight Committee | | Director/Trustee of each Company since 2000 | | Chairman (since 1984) and Chief Executive Officer (since 1991), Comprehensive Health Services, Inc. (health care management and administration). | | 38(3) | | None. |
| | | | | |
Jonathan Piel
Year of Birth: 1938 | | Director/Trustee | | Trustee of Excelsior Funds Trust since 1994; Director of Excelsior Funds, Inc. and Excelsior Tax Exempt Funds Inc. since 1996 | | Cable television producer and website designer; Editor, Scientific American (1984-1986), and Vice President, Scientific American Inc., (1986-1994); Director, National Institute of Social Sciences; Member Advisory Board, The Stone Age Institute, Bloomington, Indiana. | | 38(3) | | None. |
| | | | | |
John D. Collins
Year of Birth: 1938 | | Director/Trustee; Chairman, Audit and Compliance Committee | | Director/Trustee of each Company since 2005 | | Retired. Consultant, KPMG, LLP (July 1999 to June 2000); Partner, KPMG, LLP (March 1962 to June 1999). | | 38(3) | | BOARD 1 — Director, Mrs. Fields Famous Brands LLC (consumer products) (since December 2004). |
44
| | | | | | | | | | |
Name and
Year of Birth | | Position(s) Held
with the
Company(1) | | Term of
Office(2) and
Length of Time
Served | | Principal Occupation(s)
During Past Five Years | | Number of
Funds in the
Fund Complex
Overseen by
Board Member | | Other
Directorships
Held by Board Member(6) |
Mariann Byerwalter
Year of Birth: 1960 | | Director/Trustee; Chairman, Marketing, Distribution and Shareholder Services Committee | | Director/Trustee of each Company since 2006 | | Chairman of JDN Corporate Advisory LLC (1996 to 2001); Vice President for Business Affairs and Chief Financial Officer of Stanford University (1996-2001); Special Adviser to the President of Stanford University (2001). | | 95(4) | | BOARD 1 — Director, Redwood Trust, Inc. (mortgage finance). BOARD 2 — Director, PMI Group, Inc. (mortgage insurance). |
| | | | | |
Nils H. Hakansson
Year of Birth: 1937 | | Director/Trustee | | Director/Trustee of each Company since 2006 | | Sylvan C. Coleman Professor of Finance and Accounting, Emeritus, Haas School of Business University of California, Berkeley (since 2003); Sylvan C. Coleman Professor of Finance and Accounting, Haas School of Business, University of California, Berkeley (July 1977 to January 2003). | | 38(3) | | None. |
| | | | | |
William A. Hasler
Year of Birth: 1941 | | Director/Trustee; Chairman, Governance Committee | | Director/Trustee of each Company since 2006 | | Retired. Dean Emeritus of the Haas School of Business at the University of California, Berkeley; until February 2004, Co-Chief Executive Officer, Aphton Corporation (bio-pharmaceuticals). | | 95(4) | | BOARD 1 — Director, Aphton Corporation.
BOARD 2 — Director, Mission West Properties (commercial real estate). BOARD 3 — Director, TOUSA (home building). BOARD 4 — Director, Harris- Stratex Networks (a network equipment corporation). BOARD 5 — Director, Genitope Corp. (bio-pharmaceuticals). BOARD 6 — Director, Solectron Corporation where he is also Non-Executive Chairman (manufacturing). BOARD 7 — Director, Ditech Communications Corporation (voice communications technology). |
45
| | | | | | | | | | |
Name and
Year of Birth | | Position(s) Held
with the
Company(1) | | Term of
Office(2) and
Length of Time
Served | | Principal Occupation(s)
During Past Five Years | | Number of
Funds in the
Fund Complex
Overseen by
Board Member | | Other
Directorships
Held by Board Member(6) |
| INTERESTED DIRECTORS/TRUSTEES | | | | | | |
Randall W. Merk(5)
Year of Birth: 1954 | | Director/Trustee | | Director/Trustee of each Company since 2006 | | Executive Vice President, Charles Schwab & Co., Inc. (2002-present); President, Schwab Financial Product, Charles Schwab & Co., Inc. (2002-present); Director, Charles Schwab Asset Management (Ireland) Limited; Charles Schwab Worldwide Funds PLC; Director, Charles Schwab Bank N.A. (since 2006). Prior to September 2002, President and Chief Investment Officer, American Century Investment Management, and Director, American Century Companies, Inc.; Until June 2001, Chief Investment Officer — Fixed Income, American Century Companies, Inc. | | 95(4) | | None. |
46
| | | | | | |
Name, Address and Year of Birth | | Position(s) Held
with the
Company(1) | | Term of
Office(2) and
Length of Time
Served | | Principal Occupation(s)
During Past Five Years |
| OFFICERS | | | | | | |
Evelyn Dilsaver
101 Montgomery St.
San Francisco, CA 94104
Year of Birth: 1955 | | President | | Since
February
2006 | | President and Chief Executive Officer. Laudus Variable Insurance Trust. Laudus Trust. The Charles Schwab Family of Funds. Schwab Investments. Schwab Annuity Portfolios and Schwab Capital Trust: President. Chief Executive Officer, and Director. Charles Schwab Investment Management. Inc. President. UST Advisers. Inc.’s Mutual Fund Division since March 2006. From June 2003 to July 2004. Senior Vice President. Asset Management Products and Services Enterprise. Charles Schwab & Co. Inc. Prior to June 2003. Executive Vice President. Chief Financial Officer and Chief Administrative Officer. U.S. Trust, a subsidiary of The Charles Schwab Corporation. |
| | | |
Leo Grohowski
114 West 47th Street
New York, NY 10036
Year of Birth: 1958 | | Vice President | | Since
February
2006 | | Executive Vice President and Chief Investment Officer, U.S. Trust (October 2005 to present); Chief Investment Officer, Deutsche Asset Management Americas and Scudder Investments (2002-2005); and Chief Investment Officer, Deutsche Bank Private Banking (1999-2002). |
| | | |
Mary Martinez
114 West 47th Street
New York, NY 10036
Year of Birth: 1960 | | Vice President | | Since
February
2006 | | Managing Director of United States Trust Company, National Association (since 2003) and Chief Operating Officer of Asset Management (since December 2005) and Chief Executive Officer of National Private Banking (October 2004 to December 2005); Managing Director and Director of Relationship Management Service, Marketing, Information and Technology at Bessemer Trust (1998 to 2003). |
| | | |
Catherine MacGregor
101 Montgomery St.
San Francisco, CA 94104
Year of Birth: 1964 | | Vice President | | Since
September
2006 | | Vice President, Charles Schwab & Co., Inc. and Charles Schwab Investment Management, Inc. (since July 2005); Chief Counsel, Laudus Variable Insurance Trust and Laudus Trust (since September 2006); Chief Legal Officer, Vice President, Laudus Variable Insurance Trust and Laudus Trust (since March 2007); Vice President, The Charles Schwab Family of Funds, Schwab Investments, Schwab Capital Trust and Schwab Annuity Portfolios; Senior Associate, Paul Hastings Janofsky & Walker LLP (1999 to July 2005). |
| | | |
Joseph Trainor, CFA
114 West 47th Street
New York, NY 10036
Year of Birth: 1961 | | Vice President | | Since
February
2004 | | Managing Director of United States Trust Company, National Association (since 2003) and President, U.S. Trust Institutional; President of MFS Institutional Advisors (1998 to 2002). |
| | | |
George Pereira
101 Montgomery St.
San Francisco, CA 94104
Year of Birth: 1964 | | Treasurer/Chief Financial and Chief Accounting Officer | | Since
December
2005 | | Chief Financial Officer, Laudus Variable Insurance Trust, Laudus Trust, The Charles Schwab Family of Funds, Schwab Investments, Schwab Annuity Portfolios and Schwab Capital Trust; Senior Vice President and Chief Financial Officer, Charles Schwab Investment Management, Inc.; Director, Charles Schwab Asset Management (Ireland) Limited; Sr. Vice President, Financial Reporting, Charles Schwab & Co., Inc. (December 1999 to November 2004); Chief Financial Officer, UST Advisers, Inc.’s Mutual Fund Division (since March 2006). |
47
| | | | | | |
Name, Address and Year of Birth | | Position(s) Held
with the
Company(1) | | Term of
Office(2) and
Length of Time
Served | | Principal Occupation(s)
During Past Five Years |
Randall Fillmore
101 Montgomery St.
San Francisco, CA 94104
Year of Birth: 1960 | | Chief Compliance Officer | | Since
June
2006 | | Senior Vice President, Institutional Compliance and Chief Compliance Officer, Charles Schwab Investment Management, Inc. Chief Compliance Officer, The Charles Schwab Family of Funds, Schwab Investments, Schwab Capital Trust and Schwab Annuity Portfolios, Laudus Trust and Laudus Variable Insurance Trust; Vice President, Charles Schwab & Co., Inc., and Charles Schwab Investment Management, Inc. (2002-2003); Vice President, Internal Audit, Charles Schwab and Co., Inc. (2000-2002). |
| | | |
Wyndham Clark
225 High Ridge Road
Stamford, CT 06905
Year of Birth: 1958 | | Anti-Money Laundering Officer | | Since
May
2004 | | Vice President and AML Officer, UST Advisers, Inc. (since 2003); Vice President and Deputy Director Risk Management, IBJ Whitehall (banking) (2001 to 2002); Vice President and Chief Risk Officer, EMAC, LLC (commercial lender, asset backed security issuer) (1999 to 2001). |
| | | |
Koji E. Felton
101 Montgomery St.
San Francisco, CA 94104
Year of Birth: 1961 | | Secretary and Chief Legal Officer | | Since
June
2006 | | Secretary and Chief Legal Officer, The Charles Schwab Family of Funds, Schwab Investments, Schwab Capital Trust and Schwab Annuity Portfolios; Senior Vice President, Chief Counsel and Corporate Secretary, Charles Schwab Investment Management, Inc.; Senior Vice President and Deputy General Counsel, Charles Schwab & Co., Inc. Prior to June 1998, Branch Chief in Enforcement at U.S. Securities and Exchange Commission in San Francisco. |
| (1) | Each Director/Trustee serves in the same capacity as described above for each registered investment company included in the Excelsior Funds family (Excelsior Funds Inc., Excelsior Tax-Exempt Funds, Inc. and Excelsior Funds Trust) (together, the “Excelsior Funds Family”) and the Laudus Funds family (Laudus Trust and Laudus Variable Insurance Trust) (together, the “Laudus Funds Family”). Each officer serves in the same capacity as described above for each registered investment company included in the Excelsior Funds Family. |
(2) | Each Director/Trustee shall hold office until the election and qualification of his or her successor, or until he or she dies, resigns or is removed. The Excelsior Funds retirement policy requires that Independent Directors/Trustees retire no later than December 31st of the year during which he or she reaches 72 years of age. The officers of each Company hold office for a one-year term and until their respective successors are chosen and qualified, or, in each case, until he or she sooner dies, resigns, is removed, or becomes disqualified in accordance with the Company’s by-laws. |
| (3) | This number includes all registered investment companies included in the Excelsior Funds Family and the Laudus Funds Family, each of which is part of the Schwab Mutual Fund Family (as defined below). As of March 31, 2007, the Excelsior Funds Family and the Laudus Funds Family, in the aggregate, consisted of 38 funds. As of March 31, 2007, the Excelsior Funds Family consisted of 27 funds. |
| (4) | This number includes all registered investment companies included in the Schwab Mutual Fund family (Excelsior Funds, Inc., Excelsior Tax-Exempt Funds Inc., Excelsior Funds Trust, Laudus Trust, Laudus Variable Insurance Trust, The Charles Schwab Family of Funds, Schwab Investments, Schwab Annuity Portfolios and Schwab Capital Trust) (together, the “Schwab Mutual Fund Family”). As of March 31, 2007, the Schwab Mutual Fund Family consisted of 95 funds. |
| (5) | Mr. Merk is considered an “interested person” of the Companies (as defined in the 1940 Act) because of his affiliation with the Companies’ Advisers. |
| (6) | This column includes only directorships of companies required to report to the SEC under the Securities Exchange Act of 1934 (i.e., public companies) or other investment companies registered under the 1940 Act that are not part of the Schwab Mutual Fund Family. |
48
DISCLOSURE OF FUND EXPENSES (Unaudited)
We believe it is important for you to understand the impact of fees regarding your investment. As a shareholder of the fund, you incur ongoing, or operating costs, which include costs for portfolio management, administrative services, and shareholder reports (like this one), among others. Operating expenses, which are deducted from a fund’s gross income, directly reduce the investment return of the fund. A fund’s expenses are expressed as a percentage of its average net assets. This figure is known as the expense ratio. The following examples are intended to help you understand the ongoing costs (in dollars) of investing in your fund and to compare these costs with those of other mutual funds. The examples are based on an investment of $1,000 made at the beginning of the period shown and held for the entire period.
The table on the following page illustrates your fund’s costs in two ways.
| | • | | Actual expenses. This section provides information about actual account values and actual expenses based on the Funds’ actual return for the period. This section is designed to help you to estimate the actual expenses after fee waivers that you paid over the period. The “Ending Account Value” shown is derived from the fund’s actual return, and the fourth column shows the dollar amount that would have been paid by an investor who started with $1,000 in the fund. You may use the information here, together with the amount you invested, to estimate the expenses that you paid over the period. |
To do so, simply divide your account value by $1,000 (for example, an $8,600 account value divided by $1,000 = 8.6), then multiply the result by the number given for your fund under the heading “Expenses Paid During Period”.
| | • | | Hypothetical expenses. This section provides information about hypothetical account values and hypothetical expenses that would have been incurred by an investor in the Fund based on an assumed rate of return of 5% per year before expenses. This section is designed to help you compare your fund’s costs with those of other mutual funds. It assumes that the fund had a return of 5% before expenses during the year, but that the expense ratio is unchanged. In this case, because the return used is not the fund’s actual return, the results cannot be used to estimate the actual ending account balance or expenses you paid for the period. You may use this information to compare the ongoing costs of investing in your Fund and other funds. To do so, compare this 5% hypothetical example with the 5% hypothetical examples that appear in shareholder reports of other funds. |
49
DISCLOSURE OF FUND EXPENSES (Continued)
Please note that the expenses shown in the table are meant to highlight and help you compare ongoing costs only, which are described in the Prospectus. Therefore, the hypothetical example is useful in comparing ongoing costs only, and will not help you determine the relative total costs of owning different funds.
| | | | | | | | | | | | |
| | | Beginning
Account
Value
10/01/2006 | | Ending
Account
Value
03/31/2007 | | Annualized
Expense
Ratios* | | | Expenses
Paid
During
Period** |
| | | | |
Actual Fund Return | | | | | | | | | | | | |
Government Money Fund — Shares | | $ | 1,000.00 | | $ | 1,023.80 | | 0.54 | % | | $ | 2.72 |
Money Fund — Shares | | | 1,000.00 | | | 1,024.20 | | 0.54 | | | | 2.73 |
New York Tax-Exempt Money Fund — Shares | | | 1,000.00 | | | 1,015.00 | | 0.59 | | | | 2.96 |
Tax-Exempt Money Fund — Shares | | | 1,000.00 | | | 1,015.20 | | 0.55 | | | | 2.76 |
Treasury Money Fund — Shares | | | 1,000.00 | | | 1,022.30 | | 0.60 | | | | 3.03 |
| | | | |
Hypothetical 5% Return | | | | | | | | | | | | |
Government Money Fund — Shares | | | 1,000.00 | | | 1,022.24 | | 0.54 | | | | 2.72 |
Money Fund — Shares | | | 1,000.00 | | | 1,022.24 | | 0.54 | | | | 2.72 |
New York Tax-Exempt Money Fund — Shares | | | 1,000.00 | | | 1,021.99 | | 0.59 | | | | 2.97 |
Tax-Exempt Money Fund — Shares | | | 1,000.00 | | | 1,022.19 | | 0.55 | | | | 2.77 |
Treasury Money Fund — Shares | | | 1,000.00 | | | 1,021.94 | | 0.60 | | | | 3.02 |
| * | Annualized expense ratios of certain funds are after fee waivers and expense reimbursements by the investment adviser. Absent such waivers and reimbursements, expenses paid during the period would have been greater. |
| ** | Expenses are equal to the Fund’s annualized expense ratio multiplied by the average account value over the period, multiplied by the number of days in the most recent fiscal half-year (182) then divided by 365. |
50
AR-MM-0307
The registrant has adopted a code of ethics that applies to the registrant’s principal executive officer, principal financial officer, principal accounting officer or controller, or persons performing similar functions. This code of ethics is included as an Exhibit.
During the period covered by the report, with respect to the registrant’s code of ethics that applies to its principal executive officer, principal financial officer, principal accounting officer or controller, or persons performing similar functions; there have been no amendments to, nor any waivers granted from, a provision that relates to any element of the code of ethics definition enumerated in paragraph (b) of this Item 2.
| Item 3. | Audit Committee Financial Expert. |
3(a)(1) The registrant’s board of directors has determined that the registrant has at least one audit committee financial expert serving on its audit committee.
3(a)(2) The audit committee financial experts are Rodman L. Drake and John Collins, who are “independent” for purposes of this Item 3 of Form N-CSR.
| Item 4. | Principal Accountant Fees and Services. |
For the fiscal years ended March 31, 2007 and March 31, 2006, the aggregate fees billed by PricewaterhouseCoopers LLP and Deloitte & Touche LLP for professional services rendered for the audits of the financial statements, or services that are normally provided in connection with statutory and regulatory filings or engagements for the fiscal year for the Registrant are shown in the table below.
2007
| | | | | | |
| | | All fees and services to the
Registrant that were pre-approved | | All fees and services to services
Affiliates that were pre-approved |
(a) Audit Fees (1) | | $ | 174,000 | | | N/A |
(b) Audit-Related Fees (2) | | $ | 0 | | $ | 0 |
( c) Tax Fees (3) | | $ | 39,800 | | $ | 0 |
(d) All Other Fees (4) | | $ | 0 | | $ | 0 |
2006
| | | | | | |
| | | All fees and services to the
Registrant that were pre-approved | | All fees and services to services
Affiliates that were pre-approved |
(a) Audit Fees (1) | | $ | 166,425 | | | N/A |
(b) Audit-Related Fees (2) | | $ | 0 | | $ | 0 |
( c) Tax Fees (3) | | $ | 45,500 | | $ | 0 |
(d) All Other Fees (4) | | $ | 0 | | $ | 0 |
| (1) | Audit fees include amounts related to the audit of the Registrant’s annual financial statements and services normally provided by the accountant in connection with statutory and regulatory filings. |
| (2) | For the fiscal year ended March 31, 2007, there were no fees for assurance and related services by PricewaterhouseCoopers LLP reasonably related to the performance of the audit of the Registrant’s financial statements that were not reported under (a) of this item. For the fiscal year ended March 31, 2006, there were no fees for assurance and related services by Deloitte & Touche LLP reasonably related to the performance of the audit of the Registrant’s financial statements that were not reported under (a) of this item. |
| (3) | For the fiscal year ended March 31, 2007, the aggregate tax fees billed for professional services rendered by PricewaterhouseCoopers LLP for tax compliance, tax advice, and tax planning were $39,800. Such tax services included the review of income and excise tax returns for the Registrant. For the fiscal year ended March 31, 2006, the aggregate tax fees billed for professional services rendered by Deloitte & Touche LLP for tax compliance, tax advice, and tax planning were $45,500. Such tax services included the review of income and excise tax returns for the Registrant. |
| (4) | For the fiscal years ended March 31, 2007 and March 31, 2006, there were no fees billed for professional services rendered by PricewaterhouseCoopers LLP or Deloitte & Touche LLP, respectively, to the Registrant, other than the services reported in (a) through (c) of this Item. |
(e) (1) The audit committee has adopted policies and procedures that require pre-approval of audit and non-audit services for the Funds and certain other services provided to the Fund’s affiliates in accordance with Rule 2-01 (c) (7) of Regulation S-X. The pre-approval requirement for non-audit services for the Funds, the Funds’ investment adviser and the adviser’s control affiliates may be waived if: (i) the aggregate amount of all services provided constitutes not more than 5% of the total amount of revenues paid to the Funds’ independent accountant by the Funds and the Funds’ investment adviser and its control
affiliates that provide ongoing services to the Funds during the fiscal year in which the services are provided that would have to be pre-approved by the Funds’ Audit Committee; (ii) such services were not recognized at the time of the engagement to be non-audit services; and (iii) such services are promptly brought to the attention of the Audit Committee and approved prior to the completion of the audit by the Audit Committee or by its designated Audit Committee member (s).
(e)(2) Percentage of fees billed applicable to non-audit services pursuant to waiver of pre-approval requirement were as follows:
| | | | |
| | | 2007 | | 2006 |
Audit-Related Fees | | N/A | | N/A |
Tax Fees | | N/A | | N/A |
All Other Fees | | N/A | | N/A |
(f) Not applicable.
(g) For the fiscal years ended March 31, 2007 and March 31, 2006, the aggregate non-audit fees billed by PricewaterhouseCoopers LLP and Deloitte & Touche LLP for services rendered to the Registrant and the Advisers and any entity controlling, controlled by, or under common control with the Advisers that provided ongoing services to the Registrant were $4,221,564 and $1,187,420, respectively.
(h) The Registrant’s Audit Committee has considered whether its principal accountant’s provision of non-audit services that were rendered to the Registrant’s investment adviser, and any control persons of the investment adviser that provides ongoing services to the Registrant, that were not pre-approved pursuant to paragraph (c) (7)(ii) of Rule 2-01 of Regulation S-X, is compatible with maintaining the principal accountant’s independence.
| Item 5. | Audit Committee of Listed Registrants. |
Not applicable.
| Item 6. | Schedule of Investments. |
Complete schedule of investments is included in Item 1.
| Item 7. | Disclosure of Proxy Voting Policies and Procedures for Closed-End Management Investment Companies. |
Not applicable.
| Item 8. | Portfolio Managers of Closed-End Management Investment Companies. |
Not applicable.
| Item 9. | Purchases of Equity Securities by Closed-End Management Investment Company and Affiliated Purchasers. |
Not applicable.
| Item 10. | Submission of Matters to a Vote of Security Holders. |
There have been no material changes to the procedures by which shareholders may recommend nominees to the Registrant’s board of directors after Registrant last provided disclosure in response to the requirement of Item 7(d) (2) (ii) (G) of Schedule 14A, or this Item 10.
| Item 11. | Controls and Procedures. |
The registrant’s principal executive officer and principal financial officer have concluded, based on their evaluation of the registrant’s disclosure controls and procedures as conducted within 90 days of the filing date of this report, that these disclosure controls and procedures are adequately designed and are operating effectively to ensure that information required to be disclosed by the registrant on Form N-CSR is recorded, processed, summarized and reported within the time periods specified in the Securities and Exchange Commission’s rules and forms.
There were no changes in the registrant’s internal control over financial reporting that occurred during the second fiscal quarter of the period covered by this report that have materially affected or are reasonably likely to materially affect, the registrant’s internal control over financial reporting.
(a) (1) The code of ethics that is the subject of the disclosure required by Item 2 is attached hereto.
(a)(2) A separate certification for the principal executive officer and the principal financial officer of the registrant as required by Rule 30a-2 (a) under the Investment Company Act of 1940, as amended (17 CFR 270.30a-2(a)), are filed herewith.
(b) Officer certifications as required by Rule 30a-2 (b) under the Investment Company Act of 1940, as amended (17 CFR 270.30a-2(b)) also accompany this filing as an Exhibit.
SIGNATURES
Pursuant to the requirements of the Securities Exchange Act of 1934 and the Investment Company Act of 1940, the registrant has duly caused this report to be signed on its behalf by the undersigned, thereunto duly authorized.
| | |
| (Registrant) | | Excelsior Tax-Exempt Funds, Inc |
| | |
| |
By (Signature and Title)* | | /s/ Evelyn Dilsaver |
| | Evelyn Dilsaver |
| | President |
Pursuant to the requirements of the Securities Exchange Act of 1934 and the Investment Company Act of 1940, this report has been signed below by the following persons on behalf of the registrant and in the capacities and on the dates indicated.
| | |
| By (Signature and Title)* | | /s/ Evelyn Dilsaver |
| | Evelyn Dilsaver |
| | President |
| | |
| |
| By (Signature and Title)* | | /s/ George Pereira |
| | George Pereira |
| | Treasurer |
| * | Print the name and title of each signing officer under his or her signature. |