| | |
OMB APPROVAL |
OMB Number: | | 3235-0570 |
| |
Expires: | | September 30, 2007 |
|
Estimated average burden |
hours per response. . . . . . . | | 19.4 |
UNITED STATES
SECURITIES AND EXCHANGE COMMISSION
Washington, D.C. 20549
FORM N-CSR
CERTIFIED SHAREHOLDER REPORT OF REGISTERED
MANAGEMENT INVESTMENT COMPANIES
Investment Company Act file number 811-04101
Excelsior Tax-Exempt Funds, Inc.
(Exact name of registrant as specified in charter)
|
United States Trust Company of New York 114 West 47th Street New York, New York 10036 |
| (Address of principal executive offices) (Zip code) |
BISYS Fund Services
3435 Stelzer Road
Columbus, Ohio 43219
(Name and address of agent for service)
Registrant’s telephone number, including area code: 1-212-852-1000
Date of fiscal year end: March 31, 2005
Date of reporting period: March 31, 2005
| Item 1. | Reports to Stockholders. |

MONEY MARKET
FUNDS
ANNUAL REPORT
March 31, 2005
TABLE OF CONTENTS
For shareholder account information, current price and yield quotations, or to make an initial purchase or obtain a prospectus, call 1-800-446-1012, from overseas, call 617-483-7297.
| Internet | Address: http://www.excelsiorfunds.com |
This report must be preceded or accompanied by a current prospectus.
A description of the policies and procedures that Excelsior Funds use to determine how to vote proxies relating to portfolio securities, as well as information relating to how a Fund voted proxies relating to portfolio securities during the most recent 12-month period ended June 30, is available (i) without charge, upon request, by calling 1-800-446-1012, or (ii) by accessing the Excelsior Funds’ internet address and (iii) on the Commission’s website at http://www.sec.gov.
Excelsior Funds file their June 30 and December 31 schedule of portfolio holdings with the Securities and Exchange Commission, on Form N-Q, within sixty days after the applicable reporting period. Excelsior Funds Form N-Q is available on the Commission’s website at http://www.sec.gov, and may be reviewed and copied at the Commission’s Public Reference Room in Washington, DC. Information on the operation of the Public Reference Room may be obtained by calling 1-800-SEC-0330.
You should consider the Fund’s investment objectives, risks and expenses carefully before you invest. Information about these and other important subjects is in the Fund’s prospectus, which you should read carefully before investing.
Excelsior Funds, Inc. and Excelsior Tax-Exempt Funds, Inc. are distributed by BISYS Fund Services Limited Partnership.
You may write to Excelsior Funds, Inc. and Excelsior Tax-Exempt Funds, Inc. at the following address:
Excelsior Funds
P.O. Box 8529
Boston, MA 02266-8529
SHARES IN THE FUNDS ARE NOT DEPOSITS OR OBLIGATIONS OF, OR GUARANTEED OR ENDORSED BY, UNITED STATES TRUST COMPANY OF NEW YORK, U.S. TRUST COMPANY, N.A., THEIR PARENT AND AFFILIATES AND SHARES ARE NOT INSURED BY THE FEDERAL DEPOSIT INSURANCE CORPORATION, THE FEDERAL RESERVE BOARD, OR ANY OTHER AGENCY. FUND SHARES ARE NOT INSURED OR GUARANTEED BY THE U.S. GOVERNMENT. ALTHOUGH THE FUNDS SEEK TO PRESERVE THE VALUE OF YOUR INVESTMENT AT $1.00 PER SHARE, IT IS POSSIBLE TO LOSE MONEY BY INVESTING IN THE FUNDS.
LETTER TO SHAREHOLDERS
March 31, 2005
Dear Fellow Shareholder:
The fiscal year ended March 31, 2005 was marked by a continuing uptrend in broad based market indices. Financial markets spent much of 2004 waiting to see who would win the U.S. Presidential election. Stocks rose in the post-election period, posting gains from the first week of November to year end. The markets held their ground despite higher than anticipated energy prices. On December 14th, the Standard & Poor’s 500 Index closed above 1200 for the first time since August of 2001, and stocks retained most of their year-end 2004 gains during the first quarter of 2005. Also, the Federal Reserve monetary policy took hold, with its seventh increase in the Federal Funds rate to 2.75% as of the end of the first quarter of 2005.
Going forward, our overall investment theme reflects a preference for goods versus services, real versus financial assets, and “old economy” sectors and industries stocks versus the so-called “new economy”. Creating the cities and the infrastructure that are springing up in giant global emerging economies has raised overall levels of demand for commodities that are in relatively short supply, particularly after a decade or more of capital under investment in tangible producing sectors. We expect to focus on opportunities for above-market returns, and our portfolio managers will aim to capitalize on these prospects as they take shape.
As always, we value your confidence in selecting Excelsior to fulfill your investment needs. We strongly believe that Excelsior’s array of funds will help meet the full range of your financial objectives.
Sincerely,

Mary Martinez
President
1
Excelsior Funds, Inc.
Portfolio of Investments — March 31, 2005
Money Fund
| | | | | |
Principal
| | Security Description
| | Value
|
| | | | | | |
| BANK NOTES — 4.05% | | | |
| $ 70,000,000 | | Bank of America,
2.75%, 05/17/05 | | $ | 70,000,000 |
| | | | |
|
|
| | | TOTAL BANK NOTES
(Cost $70,000,000) | | | 70,000,000 |
| | | | |
|
|
| CERTIFICATES OF DEPOSIT — 23.12% | | | |
| 50,000,000 | | Barclay Bank,
3.02%, 06/30/05 | | | 50,000,000 |
| 75,000,000 | | BNP Paribas,
2.78%, 04/06/05 | | | 75,000,000 |
| 75,000,000 | | First Tennessee Bank,
2.80%, 05/03/05 | | | 74,999,899 |
| 50,000,000 | | HSBC, 2.71%, 05/09/05 | | | 50,001,048 |
| 75,000,000 | | Washington Mutual Corp.,
2.81%, 05/03/05 | | | 75,000,000 |
| 75,000,000 | | Wells Fargo Co.,
2.80%, 05/06/05 | | | 75,000,000 |
| | | | |
|
|
| | | TOTAL CERTIFICATES OF DEPOSIT
(Cost $400,000,947) | | | 400,000,947 |
| | | | |
|
|
| COMMERCIAL PAPER — 34.06% | | | |
| 50,000,000 | | Allied Irish Bank, Discount Note,
2.70%, 05/05/05 | | | 49,872,500 |
| 75,000,000 | | American Express Credit Corp., Discount Note,
2.58%, 04/01/05 | | | 75,000,000 |
| 15,000,000 | | Dupont, Discount Note,
2.83%, 04/01/05 | | | 15,000,000 |
| 75,000,000 | | General Electric Capital Corp., Discount Note,
2.75%, 04/01/05 | | | 75,000,000 |
| 50,000,000 | | HBOS Treasury Services plc, Discount Note,
2.69%, 05/09/05 | | | 49,858,028 |
| 50,000,000 | | International Lease Finance, Discount Note,
2.81%, 05/09/05 | | | 49,851,694 |
| 75,000,000 | | New Center Asset Trust, Discount Note, 2.85%, 05/04/05 | | | 74,804,063 |
| 75,000,000 | | Prudential Funding, Discount Note, 2.82%, 04/01/05 | | | 75,000,000 |
| 75,000,000 | | SLM Corp., Discount Note,
2.76%, 04/06/05(a) | | | 74,971,250 |
| | | | | |
Principal/
Shares
| | Security Description
| | Value
|
| | | | | | |
| COMMERCIAL PAPER — (continued) | | | |
| $ 50,000,000 | | UBS Finance Corp., Discount Note, 2.58%, 04/01/05 | | $ | 50,000,000 |
| | | | |
|
|
| | | TOTAL COMMERCIAL PAPER
(Cost $589,357,535) | | | 589,357,535 |
| | | | |
|
|
| U.S. GOVERNMENT & AGENCY OBLIGATIONS — 26.87% |
| 265,000,000 | | Federal Home Loan Bank, Discount Note,
2.58%, 04/01/05 | | | 265,000,000 |
| 200,000,000 | | Federal National Mortgage Association, Discount Note,
2.50%, 04/01/05 | | | 200,000,000 |
| | | | |
|
|
| | | TOTAL U.S. GOVERNMENT & AGENCY OBLIGATIONS
(Cost $465,000,000) | | | 465,000,000 |
| | | | |
|
|
| REGISTERED INVESTMENT COMPANY — 0.00% |
| 36,433 | | Dreyfus Government Cash Management Fund | | | 36,433 |
| | | | |
|
|
| | | TOTAL REGISTERED INVESTMENT COMPANY
(Cost $36,433) | | | 36,433 |
| | | | |
|
|
| REPURCHASE AGREEMENT — 4.17% | | | |
| 72,200,000 | | Morgan Stanley Dean Witter 2.82%, dated 3/31/05, due 4/1/05, to be repurchased at $72,205,656 (collateralized by U.S. Government obligations ranging in par value $75,000-$31,290,000, 0.00%-6.88%, 4/21/05-9/15/10; total market value $73,920,184) | | | 72,200,000 |
| | | | |
|
|
| | | TOTAL REPURCHASE AGREEMENT
(Cost $72,200,000) | | | 72,200,000 |
| | | | |
|
|
| | | | | | |
TOTAL INVESTMENTS
(Cost $1,596,594,915) | | 92.27 | % | | $ | 1,596,594,915 |
OTHER ASSETS IN EXCESS OF LIABILITIES | | 7.73 | | | | 133,745,500 |
| | |
|
| |
|
|
NET ASSETS | | 100.00 | % | | $ | 1,730,340,415 |
| | |
|
| |
|
|
See Notes to Financial Statements.
2
Excelsior Funds, Inc.
Portfolio of Investments — March 31, 2005
Money Fund — (continued)
| (a) | Security exempt from registration under Rule 144A of the Securities Act of 1933. This security may be resold in transactions exempt from registration, normally to qualified institutional buyers. At March 31, 2005, these securities amounted to $74,971,250 or 4.33% of net assets. |
Discount Note—The rate reported is the discount rate at the time of purchase.
plc—public liability company
The summary of the Fund’s investments as of March 31, 2005 is as follows: (Unaudited)
| | | | | | |
Portfolio Diversification
| | % of
Net
Assets
| | | Value
|
Commercial Paper | | 34.06 | % | | $ | 589,357,535 |
U.S. Government Agency Mortgage Obligations | | 26.87 | | | | 465,000,000 |
Certificates of Deposit | | 23.12 | | | | 400,000,947 |
Repurchase Agreement | | 4.17 | | | | 72,200,000 |
Bank Notes | | 4.05 | | | | 70,000,000 |
Registered Investment Company | | 0.00 | | | | 36,433 |
| | |
|
| |
|
|
Total Investments | | 92.27 | % | | $ | 1,596,594,915 |
Other Assets and Liabilities (Net) | | 7.73 | | | | 133,745,500 |
| | |
|
| |
|
|
Net Assets | | 100.00 | % | | $ | 1,730,340,415 |
| | |
|
| |
|
|
See Notes to Financial Statements.
3
Excelsior Funds, Inc.
Portfolio of Investments — March 31, 2005
Government Money Fund
| | | | | |
Principal/
Shares
| | Security Description
| | Value
|
| U.S. GOVERNMENT & AGENCY OBLIGATIONS — 65.34% |
| $ 70,000,000 | | Federal Farm Credit Bank, Discount Note, 2.56%, 04/04/05 | | $ | 69,985,067 |
| 54,100,000 | | Federal Home Loan Bank, Discount Note, 2.58%, 04/01/05 | | | 54,100,000 |
| 200,000,000 | | Federal National Mortgage Association, Discount Note, 2.50%, 04/01/05 | | | 199,999,999 |
| | | | |
|
|
| | | TOTAL U.S. GOVERNMENT & AGENCY OBLIGATIONS
(Cost $324,085,066) | | | 324,085,066 |
| | | | |
|
|
| REGISTERED INVESTMENT COMPANY — 0.01% |
| 66,578 | | Dreyfus Treasury Prime Cash Management Fund | | | 66,578 |
| | | | |
|
|
| | | TOTAL REGISTERED INVESTMENT COMPANY
(Cost $66,578) | | | 66,578 |
| | | | |
|
|
| | | | | |
Principal
| | Security Description
| | Value
|
| REPURCHASE AGREEMENT — 4.11% |
| $ 20,400,000 | | Morgan Stanley Dean Witter 2.82%, dated 03/31/05, due 04/01/05, to be repurchased at $20,401,598 (collateralized by U.S. Treasury Obligation, total market value $20,855,310) | | $ | 20,400,000 |
| | | | |
|
|
| | | TOTAL REPURCHASE AGREEMENT
(Cost $20,400,000) | | | 20,400,000 |
| | | | |
|
|
| | | | | | |
TOTAL INVESTMENTS
(Cost $344,551,644) | | 69.46 | % | | $ | 344,551,644 |
OTHER ASSETS IN EXCESS OF LIABILITIES | | 30.54 | | | | 151,474,884 |
| | |
|
| |
|
|
NET ASSETS | | 100.00 | % | | $ | 496,026,528 |
| | |
|
| |
|
|
Discount Note—The rate reported is the discount rate at the time of purchase.
The summary of the Fund’s investments as of March 31, 2005 is as follows: (Unaudited)
| | | | | | |
Portfolio Diversification
| | % of
Net
Assets
| | | Value
|
U.S. Government & Agency Obligations | | 65.34 | % | | $ | 324,085,066 |
Repurchase Agreement | | 4.11 | | | | 20,400,000 |
Registered Investment Company | | 0.01 | | | | 66,578 |
| | |
|
| |
|
|
Total Investments | | 69.46 | % | | $ | 344,551,644 |
Other Assets and Liabilities (Net) | | 30.54 | | | | 151,474,884 |
| | |
|
| |
|
|
Net Assets | | 100.00 | % | | $ | 496,026,528 |
| | |
|
| |
|
|
See Notes to Financial Statements.
4
Excelsior Funds, Inc.
Portfolio of Investments — March 31, 2005
Treasury Money Fund
| | | | | |
Principal
| | Security
Description
| | Value
|
| U.S. GOVERNMENT & AGENCY OBLIGATIONS — 13.90% |
| $ 25,000,000 | | Federal Farm Credit Bank, Discount Note,
2.56%, 04/04/05 | | $ | 24,994,667 |
| 34,500,000 | | Federal Home Loan Bank, Discount Note,
2.52%, 04/01/05 | | | 34,500,000 |
| | | | |
|
|
| | | TOTAL U.S. GOVERNMENT & AGENCY OBLIGATIONS
(Cost $59,494,667) | | | 59,494,667 |
| | | | |
|
|
| U.S. TREASURY OBLIGATIONS — 72.29% |
| 10,000,000 | | 2.65%, 04/15/05(a) | | | 9,989,694 |
| 300,000,000 | | 2.65%, 04/28/05(a) | | | 299,406,000 |
| | | | |
|
|
| | | TOTAL U.S. TREASURY OBLIGATIONS
(Cost $309,395,694) | | | 309,395,694 |
| | | | |
|
|
| | | | | |
Shares
| | Security
Description
| | Value
|
| REGISTERED INVESTMENT COMPANY — 0.01% |
| 57,568 | | Dreyfus Treasury Prime Cash Management Fund | | $ | 57,568 |
| | | | |
|
|
| | | TOTAL REGISTERED
INVESTMENT COMPANY
(Cost $57,568) | | | 57,568 |
| | | | |
|
|
| | | | | | |
TOTAL INVESTMENTS
(Cost $368,947,929) | | 86.20 | % | | $ | 368,947,929 |
OTHER ASSETS IN EXCESS OF LIABILITIES | | 13.80 | | | | 59,060,233 |
| | |
|
| |
|
|
NET ASSETS | | 100.00 | % | | $ | 428,008,162 |
| | |
|
| |
|
|
| (a) | The rate shown is the effective yield at the time of purchase. |
Discount Note—The rate reported is the discount rate at the time of purchase.
The summary of the Fund’s investments as of March 31, 2005 is as follows: (Unaudited)
| | | | | | |
Portfolio Diversification
| | % of
Net
Assets
| | | Value
|
U.S. Treasury Obligations | | 72.29 | % | | $ | 309,395,694 |
U.S. Government & Agency Obligations | | 13.90 | | | | 59,494,667 |
Registered Investment Company | | 0.01 | | | | 57,568 |
| | |
|
| |
|
|
Total Investments | | 86.20 | % | | $ | 368,947,929 |
Other Assets and Liabilities (Net) | | 13.80 | | | | 59,060,233 |
| | |
|
| |
|
|
Net Assets | | 100.00 | % | | $ | 428,008,162 |
| | |
|
| |
|
|
See Notes to Financial Statements.
5
Excelsior Tax-Exempt Funds, Inc.
Portfolio of Investments — March 31, 2005
Tax-Exempt Money Fund
| | | | | |
Principal
| | Security
Description
| | Value
|
| TAX-EXEMPT CASH EQUIVALENT SECURITIES — 88.47% |
| $12,775,000 | | Alaska State, Housing Finance Authority, State Capital Project, Revenue Bonds, Series C, (MBIA), 2.25%, 07/01/22(a) | | $ | 12,775,000 |
| 56,765,000 | | Austin, Texas, Water & Wastewater System, Revenue Bonds, (FSA), 2.30%, 05/15/24(a) | | | 56,765,000 |
| 15,640,000 | | Bastrop, Texas, Independent School District, Munitops Certificates Trust, General Obligation Bonds,
Series 2003-23, 2.03%, 02/15/11(a)(b) | | | 15,640,000 |
| 16,500,000 | | Brownsville, Texas, Utilities System, Revenue Bonds, Series B, (MBIA), 2.05%, 09/01/25(a) | | | 16,500,000 |
| 40,500,000 | | Burke County, Georgia, Olgethorpe Power Authority, Commercial Paper, (AMBAC), 1.88%, 04/04/05 | | | 40,500,000 |
| 24,000,000 | | Burke County, Georgia, Olgethorpe Power Authority, Commercial Paper, (AMBAC), 1.97%, 04/06/05 | | | 24,000,000 |
| 10,000,000 | | Burke County, Georgia, Olgethorpe Power Authority, Commercial Paper, (AMBAC), 1.95%, 04/07/05 | | | 10,000,000 |
| 20,000,000 | | Burke County, Georgia, Olgethorpe Power Authority, Commercial Paper, (AMBAC), 1.98%, 04/08/05 | | | 20,000,000 |
| 44,430,000 | | Charlotte, North Carolina, Water & Sewer System, Revenue Bonds, Series B, 2.30%, 07/01/27(a) | | | 44,430,000 |
| | | | | |
Principal
| | Security
Description
| | Value
|
TAX-EXEMPT CASH EQUIVALENT
SECURITIES — (continued) |
| $12,200,000 | | Chicago, Illinois, Board of Education, General Obligation Bonds, Series D, (FSA),2.30%, 03/01/32(a) | | $ | 12,200,000 |
| 16,500,000 | | Chicago, Illinois, General Obligation Bonds, Series B, (FGIC),2.29%, 01/01/37(a) | | | 16,500,000 |
| 11,900,000 | | Chicago, Illinois, General Obligation Bonds, TOCS, Series A, (FSA), 2.31%, 03/19/12(a)(b) | | | 11,900,000 |
| 55,575,000 | | Chicago, Illinois, Metropolitan Water Reclamation District Project, Capital Improvement, General Obligation Bonds, Series A, 2.29%, 12/01/31(a) | | | 55,575,000 |
| 46,730,000 | | Chicago, Illinois, Metropolitan Water Reclamation District Project, Capital Improvement, General Obligation Bonds, Series E, 2.27%, 12/01/22(a) | | | 46,730,000 |
| 28,565,000 | | Chicago, Illinois, Sales Tax, Revenue Bonds, (FGIC), 2.30%, 01/01/34(a) | | | 28,565,000 |
| 15,000,000 | | Cleveland, Ohio, Waterworks, Revenue Bonds, Series L, (FGIC), 2.30%, 01/01/33(a) | | | 15,000,000 |
| 20,000,000 | | Colorado Springs, Colorado, School District No. 11 Facilities Corp., Certificate Participation, (FSA), 2.30%, 12/01/17(a) | | | 20,000,000 |
| 16,000,000 | | Colorado Springs, Colorado, Utilities, Revenue Bonds, Series A, 2.22%, 11/01/29(a) | | | 16,000,000 |
| 11,100,000 | | Colorado Springs, Colorado, Utilities, Revenue Bonds, TOCS, Series E, 2.32%, 11/09/12(a)(b) | | | 11,100,000 |
See Notes to Financial Statements.
6
Excelsior Tax-Exempt Funds, Inc.
Portfolio of Investments — March 31, 2005
Tax-Exempt Money Fund — (continued)
| | | | | |
Principal
| | Security
Description
| | Value
|
TAX-EXEMPT CASH EQUIVALENT
SECURITIES — (continued) |
| $ 9,000,000 | | Colorado, Department of Transportation, Revenue Bonds, PUTTER, Series 249Z, (AMBAC), 2.32%, 06/15/14(a)(b) | | $ | 9,000,000 |
| 8,160,000 | | Curators of the University Missouri, Systems Facility, Revenue Bonds, Series A, 2.30%, 11/01/32(a) | | | 8,160,000 |
| 25,995,000 | | Cypress Fairbanks, Texas, Independent School District, Munitops Certificates Trust, General Obligation Bonds, Series 2003-22, 2.03%, 02/15/11(a)(b) | | | 25,995,000 |
| 7,510,000 | | Dallas, Texas, Floating Rate Trust Certificates, General Obligation Bonds, Series 93, 2.32%, 02/15/15(a)(b) | | | 7,510,000 |
| 29,630,000 | | Dallas, Texas, Independent School District, Munitops Certificates Trust, General Obligation Bonds, Series 2005-1, 2.33%, 08/15/12(a)(b) | | | 29,630,000 |
| 16,685,000 | | Dallas, Texas, Munitops Certificates Trust, General Obligation Bonds, Series 2004-6, 2.33%, 02/15/12(a)(b) | | | 16,685,000 |
| 12,935,000 | | Denton, Texas, Munitops Certificates Trust, General Obligation Bonds, Series 2004-21, 2.33%, 08/15/12(a)(b) | | | 12,935,000 |
| 10,735,000 | | Detroit, Michigan, City School District, Munitops Certificates Trust, General Obligation Bonds, Series 2004-39, (FGIC), 2.32%, 05/01/11(a)(b) | | | 10,735,000 |
| | | | | |
Principal
| | Security
Description
| | Value
|
TAX-EXEMPT CASH EQUIVALENT
SECURITIES — (continued) |
| $41,620,000 | | Detroit, Michigan, Sewage Disposal, Revenue Bonds, Series C-1, (FSA), 2.25%, 07/01/27(a) | | $ | 41,620,000 |
| 51,780,000 | | Detroit, Michigan, Sewage Disposal, Revenue Bonds, Series C-2, (FGIC), 2.25%, 07/01/29(a) | | | 51,780,000 |
| 23,000,000 | | District of Columbia, General Obligation Bonds, Series B, (FSA), 2.27%, 06/01/30(a) | | | 23,000,000 |
| 23,740,000 | | District of Columbia, General Obligation Bonds, Series D, (FGIC), 2.25%, 06/01/29(a) | | | 23,740,000 |
| 5,985,000 | | Fairfax County, Virginia, General Obligation Bonds, PUTTER, Series 461, 2.30%, 04/01/12(a)(b) | | | 5,985,000 |
| 13,665,000 | | Florida State, Board of Education, Capital Outlay, General Obligation Bonds, Series 374, 2.32%, 06/01/22(a)(b) | | | 13,665,000 |
| 3,500,000 | | Fort Bend, Texas, Independent School District, Munitops Certificates Trust, General Obligation Bonds, Series 1999-6, 2.33%, 03/07/07(a)(b) | | | 3,500,000 |
| 9,265,000 | | Frisco, Texas, Munitops Certificates Trust, General Obligation Bonds, 2.33%, 08/15/11(a)(b) | | | 9,265,000 |
| 8,385,000 | | Grand Rapids, Michigan, Sanitation & Sewer Systems, Revenue Bonds, TOCS, Series G, (FGIC), 2.31%, 07/23/12(a)(b) | | | 8,385,000 |
| 8,131,000 | | Harvard University, Commercial Paper, Series E, 2.00%, 05/12/05 | | | 8,131,000 |
See Notes to Financial Statements.
7
Excelsior Tax-Exempt Funds, Inc.
Portfolio of Investments — March 31, 2005
Tax-Exempt Money Fund — (continued)
| | | | | |
Principal
| | Security
Description
| | Value
|
TAX-EXEMPT CASH EQUIVALENT
SECURITIES — (continued) |
| $10,420,000 | | Hawaii State, Munitops Certificates Trust, General Obligation Bonds (FSA), 2.32%, 07/01/10(a)(b) | | $ | 10,420,000 |
| 10,000,000 | | Hockley County, Texas, Industrial Development Corporation, Pollution Control, Amoco Project — Standard Oil Company, Revenue Bonds, 2.10%, 03/01/14(a) | | | 10,000,000 |
| 10,300,000 | | Hockley County, Texas, Industrial Development Corporation, Pollution Control, Amoco Project, Revenue Bonds, 1.80%, 11/01/19(a) | | | 10,300,000 |
| 12,600,000 | | Houston, Texas, Utility System, Revenue Bonds, TOCS, Series A, (FSA), 2.33%, 05/15/12(a)(b) | | | 12,600,000 |
| 25,000,000 | | Intermountain Power Agency, Utah, Commercial Paper, Series B, 1.90%, 04/07/05 | | | 25,000,000 |
| 13,000,000 | | Ipa, Utah, Commercial Paper, Series 98-B5, 2.03%, 05/11/05 | | | 13,000,000 |
| 28,000,000 | | Jacksonville, Florida, Commercial Paper, 1.97%, 04/06/05 | | | 28,000,000 |
| 8,505,000 | | Jacksonville, Florida, Electric Authority, Floating Rate Trust Certificates, Revenue Bonds, Series N-8, 2.36%, 10/01/23(a)(b) | | | 8,505,000 |
| 21,900,000 | | Jacksonville, Florida, Electric Authority, Sub Electric Systems, Revenue Bonds, Series B, 2.30%, 10/01/30(a) | | | 21,900,000 |
| 7,825,000 | | Jefferson County, Alabama, Sewer Revenue, Revenue Bonds, Series A, (FGIC), 2.30%, 02/01/42(a) | | | 7,825,000 |
| | | | | |
Principal
| | Security
Description
| | Value
|
TAX-EXEMPT CASH EQUIVALENT
SECURITIES — (continued) |
| $13,288,000 | | Johns Hopkins University, Commercial Paper,
1.90%, 04/08/05 | | $ | 13,288,000 |
| 8,955,000 | | Judson, Texas, Munitops Certificates Trust, General Obligation Bonds, Series 2003-36, 2.33%, 02/01/11(a)(b) | | | 8,955,000 |
| 22,500,000 | | Massachusetts State, General Obligations, Series A, 2.24%, 09/01/16(a) | | | 22,500,000 |
| 23,600,000 | | Mecklenburg County, North Carolina, General Obligation Bonds, Series 1996C,
2.29%, 03/01/14(a) | | | 23,600,000 |
| 15,500,000 | | Metropolitan Government Nashville & Davidson County, Tennessee, Commercial Paper,
1.90%, 04/14/05 | | | 15,500,000 |
| 10,000,000 | | Metropolitan Government Nashville & Davidson County, Tennessee, Commercial Paper,
1.92%, 05/09/05 | | | 10,000,000 |
| 5,000,000 | | Metropolitan Government Nashville & Davidson County, Tennessee, Commercial Paper,
2.20%, 07/15/05 | | | 5,000,000 |
| 5,000,000 | | Metropolitan Government Nashville & Davidson County, Tennessee, Commercial Paper,
2.25%, 08/15/05 | | | 5,000,000 |
| 9,495,000 | | Michigan State, Municipal Bond Authority, Revenue Bonds, PUTTER, Series 419,
2.30%, 04/01/12(a)(b) | | | 9,495,000 |
| 5,230,000 | | Michigan State, Municipal Bond Authority, Revenue Bonds, PUTTER, Series 453,
2.32%, 05/01/12(a)(b) | | | 5,230,000 |
See Notes to Financial Statements.
8
Excelsior Tax-Exempt Funds, Inc.
Portfolio of Investments — March 31, 2005
Tax-Exempt Money Fund — (continued)
| | | | | |
Principal
| | Security
Description
| | Value
|
TAX-EXEMPT CASH EQUIVALENT
SECURITIES — (continued) |
| $18,297,000 | | Michigan State, Municipal Bond Authority, Revenue Bonds, Series 718, 2.32%, 10/01/20(a)(b) | | $ | 18,297,000 |
| 15,800,000 | | Michigan State, School Loan, Commercial Paper,
2.20%, 10/05/05 | | | 15,800,000 |
| 25,000,000 | | New Hampshire State, Anticipation Notes, 2.20%, 06/01/05(b) | | | 25,004,087 |
| 16,995,000 | | New York City, New York, Municipal Water Finance Authority, Water & Sewer Systems, Floating Rate Trust Certificates, Revenue Bonds, Series 726X, (MBIA),
2.30%, 06/15/27(a)(b) | | | 16,995,000 |
| 8,795,000 | | New York City, New York, Transitional Finance Authority, Revenue Bonds, PUTTER, Series 468, (MBIA),
2.30%, 02/01/11(a)(b) | | | 8,795,000 |
| 12,255,000 | | North Carolina State, General Obligation Bonds, PUTTER, Series 465, 2.30%, 05/01/11(a)(b) | | | 12,255,000 |
| 10,305,000 | | North Carolina State, General Obligation Bonds, PUTTER, Series 466, 2.30%, 03/01/12(a)(b) | | | 10,305,000 |
| 37,600,000 | | Ohio State University, Commercial Paper, Series F,
2.05%, 05/16/05 | | | 37,600,000 |
| 50,585,000 | | Ohio State, Infrastructure Improvement, General Obligations Bonds, Series D,
2.25%, 02/01/19(a) | | | 50,585,000 |
| 16,000,000 | | Oklahoma State Water Resource Board, Loan Program, Revenue Bonds, 2.20%, 09/01/32(a) | | | 16,000,000 |
| | | | | |
Principal
| | Security
Description
| | Value
|
TAX-EXEMPT CASH EQUIVALENT
SECURITIES — (continued) |
| $25,700,000 | | Omaha, Nebraska, Commercial Paper, 1.98%, 04/13/05 | | $ | 25,700,000 |
| 63,800,000 | | Orlando, Florida, Utilities Commission Water & Electric, Revenue Bonds, Series A,
2.23%, 10/01/17(a) | | | 63,800,000 |
| 22,000,000 | | Pennsylvania State University, Revenue Bonds, Series A,
2.26%, 04/01/31(a) | | | 22,000,000 |
| 36,000,000 | | Pennsylvania State, Turnpike Commission, Revenue Bonds, Series A-2, 2.30%, 12/01/30(a) | | | 36,000,000 |
| 3,905,000 | | Phoenix, Arizona, Civic Improvement Corp., Excise Tax, Revenue Bonds, EAGLE, Class A, 2.32%, 07/01/17(a)(b) | | | 3,905,000 |
| 3,100,000 | | Port Authority of New York & New Jersey, Special Obligation, Versatile Structure Obligation, Revenue Bonds, Series 3,
2.30%, 06/01/20(a) | | | 3,100,000 |
| 3,875,000 | | Round Rock, Texas, Independent School District, General Obligation Bonds, Series 578, 2.32%, 08/01/20(a)(b) | | | 3,875,000 |
| 20,800,000 | | Salt River, Arizona, Commercial Paper, Series B, 1.90%, 04/01/05 | | | 20,800,000 |
| 16,560,000 | | Snohomish County, Washington, Public Utilities Authority, District No. 1 Generation System, Revenue Bonds, (MBIA), 2.28%, 01/01/25(a) | | | 16,560,000 |
See Notes to Financial Statements.
9
Excelsior Tax-Exempt Funds, Inc.
Portfolio of Investments — March 31, 2005
Tax-Exempt Money Fund — (continued)
| | | | | |
Principal
| | Security
Description
| | Value
|
TAX-EXEMPT CASH EQUIVALENT
SECURITIES — (continued) |
| $27,600,000 | | Snohomish County, Washington, Public Utilities Authority, District No. 1 Generation System, Revenue Bonds, Series A-1, (FSA),
2.29%, 12/01/19(a) | | $ | 27,600,000 |
| 39,000,000 | | St. James Parish, Louisiana, Pollution Control, Texaco Project, Commercial Paper, Series B, 2.10%, 05/12/05 | | | 39,000,000 |
| 17,700,000 | | Suffolk County, New York, Water Authority, Bond Anticipation Notes, 2.22%, 01/01/08(a) | | | 17,700,000 |
| 14,425,000 | | Tennessee State, School Board Authority, Higher Education, Commercial Paper,
1.81%, 04/01/05 | | | 14,425,000 |
| 8,000,000 | | Tennessee State, School Board Authority, Higher Education, Commercial Paper, Series A, 1.97%, 04/04/05 | | | 8,000,000 |
| 8,000,000 | | Texas State, Public Finance Authority, Commercial Paper, Series 2003, 1.85%, 04/06/05 | | | 8,000,000 |
| 42,000,000 | | Triborough Bridge & Tunnel Authority, New York, General Purpose, Revenue Bonds, Series C, (AMBAC),
2.27%, 01/01/32(a) | | | 42,000,000 |
| 17,000,000 | | University of Arizona, Certificates of Participation, Series B, (AMBAC), 2.28%, 06/01/31(a) | | | 17,000,000 |
| 18,020,000 | | University of Minnesota, Board of Regents, Revenue Bonds, Series A, 2.30%, 01/01/34(a) | | | 18,020,000 |
| | | | | |
Principal
| | Security
Description
| | Value
|
TAX-EXEMPT CASH EQUIVALENT
SECURITIES — (continued) |
| $12,500,000 | | University of Pittsburgh, Commonwealth of Higher Education, University Capital Project, Revenue Bonds, Series A, 2.25%, 09/15/29(a) | | $ | 12,500,000 |
| 14,125,000 | | University of Texas, Permanent University Fund, Floating Rate Trust Certificates, Revenue Bonds, Series 1023,
2.32%, 07/01/30(a)(b) | | | 14,125,000 |
| 9,330,000 | | University of Texas, Revenue Bonds, PUTTER, Series 592,
2.32%, 08/15/12(a)(b) | | | 9,330,000 |
| 3,300,000 | | University of Virginia, Revenue Bonds, EAGLE, Series A,
2.32%, 06/01/33(a)(b) | | | 3,300,000 |
| 54,730,000 | | Valdez, Alaska, Marine Terminal, BP Pipelines Project, Revenue Bonds, Series B, 2.30%, 07/01/37(a) | | | 54,730,000 |
| 13,300,000 | | Virginia College Building Authority, Educational Facilities, University of Richmond Project, Revenue Bonds, 2.29%, 08/01/34(a) | | | 13,300,000 |
| 13,800,000 | | Wilmington, North Carolina, General Obligation Bonds, 2.30%, 06/01/15(a) | | | 13,800,000 |
| 32,720,000 | | Wisconsin State, Transportation Revenue, Commercial Paper, Series 97A, 1.98%, 04/22/05 | | | 32,720,000 |
| | | | |
|
|
| | | TOTAL TAX-EXEMPT CASH EQUIVALENT SECURITIES (Cost $1,802,945,087) | | | 1,802,945,087 |
| | | | |
|
|
See Notes to Financial Statements.
10
Excelsior Tax-Exempt Funds, Inc.
Portfolio of Investments — March 31, 2005
Tax-Exempt Money Fund — (continued)
| | | | | |
Principal
| | Security
Description
| | Value
|
TAX-EXEMPT CASH EQUIVALENT
SECURITIES — BACKED BY LETTERS OF
CREDIT — 12.16% |
| $29,900,000 | | Baltimore, Maryland, Port Facilities Authority, Revenue Bonds, (BNP PARIBAS),
1.98%, 10/14/11(a) | | $ | 29,900,000 |
| 18,300,000 | | Brownsville, Texas, Commercial Paper, (STATE STREET BANK & TRUST), 1.88%, 04/07/05 | | | 18,300,000 |
| 15,000,000 | | Chicago, Illinois, Tender Notes, General Obligation Bonds, (STATE STREET BANK & TRUST), 2.20%, 01/27/06 | | | 15,000,000 |
| 22,000,000 | | Des Moines, Iowa, Hospital Facilities Authority, Methodist Medical Center Project, Revenue Bonds, (BANK OF AMERICA N.A.), 2.25%, 08/01/15(a) | | | 22,000,000 |
| 15,000,000 | | District of Columbia, Phillips College Issue, Revenue Bond, (BANK OF AMERICA N.A.), 2.30%, 08/01/33(a) | | | 15,000,000 |
| 19,500,000 | | Illinois State Development Finance Authority, Chicago Symphony Orchestra, Revenue Bonds, (NORTHERN TRUST COMPANY),
2.25%, 12/01/28(a) | | | 19,500,000 |
| 7,000,000 | | Kenton County, Kentucky, Industrial Building Authority, Redken Labs, Inc. Project, Revenue Bonds, (JP MORGAN CHASE BANK),
1.90%, 12/01/14(a) | | | 7,000,000 |
| 17,600,000 | | King County, Washington, Sewer Authority, Revenue Bonds, Series A, (LANDESBANK HESSEN), 2.25%, 01/01/32(a) | | | 17,600,000 |
| | | | | |
Principal
| | Security
Description
| | Value
|
TAX-EXEMPT CASH EQUIVALENT
SECURITIES — BACKED BY LETTERS OF
CREDIT — (continued) |
| $13,034,000 | | Long Island Power Authority, New York, Electrical Systems, Revenue Bonds, Series 1A, (BAYERISCHE LANDESBANK-80%/LANDESBANK BADEN-WUERTTEMBERG-20%),
2.28%, 05/01/33(a) | | $ | 13,034,000 |
| 30,800,000 | | Michigan State, Building Authority, Commercial Paper, Series 4, (BANK OF NEW YORK-70%/STATE STREET BANK & TRUST-30%),
1.95%, 04/27/05 | | | 30,800,000 |
| 13,550,000 | | New York City, New York, General Obligation Bonds, Series F-3, (JP MORGAN CHASE BANK), 2.23%, 02/15/13(a) | | | 13,550,000 |
| 10,800,000 | | New York City, New York, General Obligation Bonds, Sub-Series H-3, (BANK OF NEW YORK),
2.21%, 03/01/34(a) | | | 10,800,000 |
| 16,200,000 | | Virginia State, Capital Region Airport Community Authority, Revenue Bonds, Series B, (FIRST UNION NATIONAL BANK), 2.30%, 06/01/29(a) | | | 16,200,000 |
| 19,030,000 | | Washington State, Public Power Supply System, Nuclear Project No. 1, Revenue Bonds, Series 1A-2, (BANK OF AMERICA N.A.), 2.29%, 07/01/17(a) | | | 19,030,000 |
| | | | |
|
|
| | | TOTAL TAX-EXEMPT
CASH EQUIVALENT SECURITIES — BACKED BY LETTERS OF CREDIT
(Cost $247,714,000) | | | 247,714,000 |
| | | | |
|
|
See Notes to Financial Statements.
11
Excelsior Tax-Exempt Funds, Inc.
Portfolio of Investments — March 31, 2005
Tax-Exempt Money Fund — (continued)
| | | | | |
Shares
| | Security
Description
| | Value
|
| REGISTERED INVESTMENT COMPANIES — 0.00% |
| 1 | | BlackRock Muni Fund | | $ | 1 |
| 1 | | Dreyfus Tax Exempt Cash Fund | | | 1 |
| | | | |
|
|
| | | TOTAL REGISTERED INVESTMENT COMPANIES
(Cost $2) | | | 2 |
| | | | |
|
|
| | | | | | | |
TOTAL INVESTMENTS
(Cost $2,050,659,089) | | 100.63 | % | | $ | 2,050,659,089 | |
LIABILITIES IN EXCESS OF OTHER ASSETS | | (0.63 | ) | | | (12,856,596 | ) |
| | |
|
| |
|
|
|
NET ASSETS | | 100.00 | % | | $ | 2,037,802,493 | |
| | |
|
| |
|
|
|
| (a) | Variable Rate Security—The rate disclosed is as of March 31, 2005. |
| (b) | Security exempt from registration under Rule 144A of the Securities Act of 1933. This security may be resold in transactions exempt from registration, normally to qualified institutional buyers. At March 31, 2005, these securities amounted to $373,321,087 or 18.32% of net assets. |
AMBAC—American Municipal Bond Assurance Corp.
FGIC—Financial Guaranty Insurance Corp.
FSA—Financial Security Assurance
MBIA—Municipal Bond Insurance Association
Notes (The following notes have not been audited by Deloitte & Touche LLP):
These municipal securities meet the three highest ratings assigned by Moody’s Investors Services, Inc. or Standard and Poor’s Corporation or, where not rated, are determined by the Advisor, under the supervision of the Board of Directors, to be of comparable quality at the time of purchase to rated instruments that may be acquired by the Fund.
At March 31, 2005, approximately 12% of the net assets are invested in municipal securities that have letter of credit enhancement features or escrows in U.S. Government securities backing them, on which the Fund relies. Without such features, the securities may or may not meet the quality standards of securities purchased by the Fund.
See Notes to Financial Statements.
12
Excelsior Tax-Exempt Funds, Inc.
Portfolio of Investments — March 31, 2005
Tax-Exempt Money Fund — (continued)
The summary of the Fund’s investments as of March 31, 2005 is as follows: (Unaudited)
| | | | | | | |
State Diversification
| | % of
Net
Assets
| | | Market Value
| |
Texas | | 12.65 | % | | $ | 257,810,000 | |
Illinois | | 10.28 | | | | 209,470,000 | |
Michigan | | 9.43 | | | | 192,142,000 | |
Florida | | 6.67 | | | | 135,870,000 | |
New York | | 6.18 | | | | 125,974,000 | |
Georgia | | 5.54 | | | | 112,800,000 | |
North Carolina | | 5.12 | | | | 104,390,000 | |
Ohio | | 5.06 | | | | 103,185,000 | |
Washington | | 3.97 | | | | 80,790,000 | |
Pennsylvania | | 3.46 | | | | 70,500,000 | |
Tennessee | | 3.35 | | | | 68,225,000 | |
Alaska | | 3.31 | | | | 67,505,000 | |
District of Columbia | | 3.03 | | | | 61,740,000 | |
Colorado | | 2.75 | | | | 56,100,000 | |
Maryland | | 2.12 | | | | 43,188,000 | |
Arizona | | 2.05 | | | | 41,705,000 | |
Louisiana | | 1.91 | | | | 39,000,000 | |
Virginia | | 1.90 | | | | 38,785,000 | |
Utah | | 1.87 | | | | 38,000,000 | |
Wisconsin | | 1.61 | | | | 32,720,000 | |
Massachusetts | | 1.50 | | | | 30,631,000 | |
Nebraska | | 1.26 | | | | 25,700,000 | |
New Hampshire | | 1.23 | | | | 25,004,087 | |
Iowa | | 1.08 | | | | 22,000,000 | |
Minnesota | | 0.88 | | | | 18,020,000 | |
Oklahoma | | 0.79 | | | | 16,000,000 | |
Hawaii | | 0.51 | | | | 10,420,000 | |
Missouri | | 0.40 | | | | 8,160,000 | |
Alabama | | 0.38 | | | | 7,825,000 | |
Kentucky | | 0.34 | | | | 7,000,000 | |
Registered Investment Company | | 0.00 | | | | 2 | |
| | |
|
| |
|
|
|
Total Investments | | 100.63 | % | | $ | 2,050,659,089 | |
Other Assets and Liabilities (Net) | | (0.63 | ) | | | (12,856,596 | ) |
| | |
|
| |
|
|
|
Net Assets | | 100.00 | % | | $ | 2,037,802,493 | |
| | |
|
| |
|
|
|
See Notes to Financial Statements.
13
Excelsior Tax-Exempt Funds, Inc.
Portfolio of Investments — March 31, 2005
New York Tax-Exempt Money Fund
| | | | | |
Principal
| | Security
Description
| | Value
|
| TAX-EXEMPT CASH EQUIVALENT SECURITIES — 67.93% |
| $ 5,500,000 | | Albany, New York, City School District, Tax Anticipation Notes, 2.75%, 10/28/05 | | $ | 5,513,351 |
| 10,000,000 | | Broome County, New York, Bond Anticipation Notes,
2.00%, 04/21/05 | | | 10,000,874 |
| 15,400,000 | | Metropolitan Transition Authority, New York, Transition Revenue, BANS, Commercial Paper, Series A, CP-1,
1.95%, 04/06/05 | | | 15,400,000 |
| 8,485,000 | | New York City, New York, Municipal Water Finance Authority, Eagle Project 20040027, Revenue Bonds, Class A,
2.30%, 06/15/34(a)(b) | | | 8,485,000 |
| 5,000,000 | | New York City, New York, Municipal Water Finance Authority, Extendable Commercial Paper,
2.05%, 04/11/05 | | | 5,000,000 |
| 10,000,000 | | New York City, New York, Municipal Water Finance Authority, Revenue Bonds, PUTTER, Series 622, (AMBAC), 2.30%, 06/15/12(a)(b) | | | 10,000,000 |
| 7,300,000 | | New York City, New York, Municipal Water Finance Authority, Revenue Bonds, Series A, (FGIC),
2.25%, 06/15/25(a) | | | 7,300,000 |
| 2,100,000 | | New York City, New York, Municipal Water Finance Authority, Revenue Bonds, Series C, (FGIC),
2.24%, 06/15/23(a) | | | 2,100,000 |
| 10,870,000 | | New York City, New York, Transitional Finance Authority, Eagle Project 20030036, Revenue Bonds, Class A,
2.30%, 02/01/31(a)(b) | | | 10,870,000 |
| | | | | |
Principal
| | Security
Description
| | Value
|
TAX-EXEMPT CASH EQUIVALENT
SECURITIES — (continued) |
| $ 4,995,000 | | New York City, New York, Transitional Finance Authority, Revenue Bonds, PUTTER,
Series 307, (AMBAC),
2.30%, 08/01/19(a)(b) | | $ | 4,995,000 |
| 5,515,000 | | New York City, New York, Transitional Finance Authority, Revenue Bonds, PUTTER,
Series 471, (FGIC),
2.30%, 02/01/11(a)(b) | | | 5,515,000 |
| 9,000,000 | | New York City, New York, Transitional Finance Authority, Revenue Bonds, Series 283,
2.30%, 11/15/18(a)(b) | | | 9,000,000 |
| 12,685,000 | | New York City, New York, Transitional Finance Authority, Revenue Bonds, Series 536, (MBIA),
2.30%, 05/01/15(a)(b) | | | 12,685,000 |
| 4,000,000 | | New York State Thruway, Tax Exempt, Commercial Paper, 1.95%, 04/07/05 | | | 4,000,000 |
| 11,000,000 | | New York State, Dormitory Authority, Columbia University, Series 1997, Commercial Paper, 1.95%, 04/11/05 | | | 11,000,000 |
| 1,600,000 | | New York State, Dormitory Authority, Cornell University, Commercial Paper,
1.90%, 04/08/05 | | | 1,600,000 |
| 10,000,000 | | New York State, Dormitory Authority, Cornell University, Revenue Bonds, Series B,
2.24%, 07/01/30(a) | | | 10,000,000 |
| 5,000,000 | | New York State, Dormitory Authority, Mental Health Facilities, Revenue Bonds, (FSA), 2.28%, 02/15/21(a) | | | 5,000,000 |
| 15,350,000 | | New York State, Dormitory Authority, Public Library Project, Revenue Bonds,
Series A, (MBIA),
2.23%, 07/01/28(a) | | | 15,350,000 |
See Notes to Financial Statements.
14
Excelsior Tax-Exempt Funds, Inc.
Portfolio of Investments — March 31, 2005
New York Tax-Exempt Money Fund — (continued)
| | | | | |
Principal
| | Security
Description
| | Value
|
TAX-EXEMPT CASH EQUIVALENT
SECURITIES — (continued) |
| $ 1,500,000 | | New York State, Dormitory Authority, Rockefeller University, Revenue Bonds, Series A2,
2.24%, 07/01/32(a) | | $ | 1,500,000 |
| 11,417,500 | | New York State, Environmental Facilities Authority, Revenue Bonds, Series 731,
2.30%, 06/15/22(a)(b) | | | 11,417,500 |
| 5,695,000 | | New York State, Metropolitan Transportation Authority, Floating Rate Trust Certificate, Revenue Bonds, Series 9, (FGIC),
2.31%, 07/01/26(a)(b) | | | 5,695,000 |
| 13,165,000 | | New York State, Metropolitan Transportation Authority, Revenue Bonds, Series B, (FSA), 2.25%, 11/01/22(a) | | | 13,165,000 |
| 5,000,000 | | New York State, Power Authority, Revenue Bonds, Sub-Series 5, 2.23%, 11/15/11(a) | | | 5,000,000 |
| 8,200,000 | | New York State, Sales Tax Asset Receivable Corp., Revenue Bonds, PUTTER, Series 564, (MBIA),
2.30%, 10/15/12(a)(b) | | | 8,200,000 |
| 10,000,000 | | New York State, Triborough Bridge & Tunnel Authority, Revenue Bonds, Series C, (AMBAC),
2.23%, 01/01/33(a) | | | 10,000,000 |
| 9,100,000 | | Niagara Falls, New York, Bridge Community Toll Authority, Revenue Bonds, Series A, (FGIC), 2.26%, 10/01/19(a) | | | 9,100,000 |
| 7,430,000 | | North Hempstead, New York, Bond Anticipation Notes,
2.00%, 04/28/05 | | | 7,431,379 |
| | | | | |
Principal
| | Security
Description
| | Value
|
TAX-EXEMPT CASH EQUIVALENT
SECURITIES — (continued) |
| $ 6,325,000 | | Port Authority of New York & New Jersey, Special Obligation, Revenue Bonds, Versatile Structure Obligation, Series 5, 2.30%, 08/01/24(a) | | $ | 6,325,000 |
| 13,910,000 | | Sales Tax Asset Receivable Corporation, New York, Floating Rate Trust Certificate, Revenue Bonds, Series 984, (AMBAC), 2.30%, 10/15/32(a)(b) | | | 13,910,000 |
| 12,500,000 | | Suffolk County, New York, Tax Anticipation Notes, Series I, 3.25%, 08/16/05 | | | 12,561,498 |
| 6,900,000 | | Suffolk County, New York, Water Authority, Bond Anticipation Notes, 2.22%, 06/01/06(a) | | | 6,900,000 |
| 5,000,000 | | Suffolk County, New York, Water Authority, Bond Anticipation Notes, 2.22%, 01/01/08(a) | | | 5,000,000 |
| 8,000,000 | | Suffolk County, New York, Water Authority, Bond Anticipation Notes, 2.22%, 12/01/09(a) | | | 8,000,000 |
| | | | |
|
|
| | | TOTAL TAX-EXEMPT CASH EQUIVALENT SECURITIES (Cost $278,019,602) | | | 278,019,602 |
| | | | |
|
|
TAX-EXEMPT CASH EQUIVALENT SECURITIES —
BACKED BY LETTERS OF CREDIT — 31.93% |
| 7,000,000 | | Long Island Power Authority, New York, Commercial Paper, Series 1, (JP MORGAN CHASE BANK), 2.05%, 04/06/05 | | | 7,000,000 |
| 1,050,000 | | Long Island Power Authority, New York, Revenue Bonds, Sub-Series 1B, (STATE STREET BANK & TRUST),
2.28%, 05/01/33(a) | | | 1,050,000 |
| 4,350,000 | | Long Island Power Authority, New York, Revenue Bonds, Sub-Series 2A, (WESTDEUTSCHE LANDESBANK),
2.23%, 05/01/33(a) | | | 4,350,000 |
See Notes to Financial Statements.
15
Excelsior Tax-Exempt Funds, Inc.
Portfolio of Investments — March 31, 2005
New York Tax-Exempt Money Fund — (continued)
| | | | | |
Principal
| | Security
Description
| | Value
|
TAX-EXEMPT CASH EQUIVALENT SECURITIES —
BACKED BY LETTERS OF CREDIT — (continued) |
| $ 8,000,000 | | Long Island Power Authority, New York, Revenue Bonds, Sub-Series 3B, (WESTDEUTSCHE LANDESBANK),
2.25%, 05/01/33 | | $ | 8,000,000 |
| 17,255,000 | | Nassau County, New York, Interim Finance Authority, Sales Tax, Revenue Bonds, Series B, (BNP PARIBAS),
2.21%, 11/15/22(a) | | | 17,255,000 |
| 5,000,000 | | New York City, New York, General Obligation Bonds, Sub-Series A2, (BANK OF AMERICA N.A.), 2.23%, 08/01/31(a) | | | 5,000,000 |
| 9,630,000 | | New York City, New York, General Obligation Bonds, Sub-Series B8, (BAYERISCHE LANDESBANK),
2.23%, 08/15/24(a) | | | 9,630,000 |
| 1,300,000 | | New York City, New York, General Obligation Bonds, Sub-Series C5, (BANK OF NEW YORK),
2.28%, 08/01/20(a) | | | 1,300,000 |
| 1,300,000 | | New York City, New York, General Obligation Bonds, Sub-Series E5, (JP MORGAN CHASE BANK), 2.25%, 08/01/16(a) | | | 1,300,000 |
| 2,900,000 | | New York City, New York, General Obligation Bonds, Sub-Series G3, (WESTDEUTSCHE LANDESBANK),
2.21%, 08/01/14(a) | | | 2,900,000 |
| 6,850,000 | | New York City, New York, General Obligation Bonds, Sub-Series H6, (FLEET NATIONAL BANK), 2.24%, 03/01/34(a) | | | 6,850,000 |
| | | | | |
Principal
| | Security
Description
| | Value
|
TAX-EXEMPT CASH EQUIVALENT SECURITIES —
BACKED BY LETTERS OF CREDIT — (continued) |
| $ 8,800,000 | | New York City, New York, Industrial Development Agency, Civic Facility Revenue Bonds, Jewish Community Center Project, (MANUFACTURERS & TRADERS),
2.38%, 03/01/30(a) | | $ | 8,800,000 |
| 10,000,000 | | New York City, New York, Industrial Development Agency, Revenue Bonds, New York Stock Exchange Project, Series B, (BANK OF AMERICA N.A.),
2.30%, 05/01/33(a) | | | 10,000,000 |
| 6,300,000 | | New York City, New York, Mass Transportation Authority, Commercial Paper, Series A-1, (ABN AMRO),
1.92%, 04/06/05 | | | 6,300,000 |
| 5,400,000 | | New York City, New York, Mass Transportation Authority, Commercial Paper, Series A-1, (ABN AMRO),
1.93%, 04/07/05 | | | 5,400,000 |
| 13,500,000 | | New York State, Housing Finance Agency Services, Revenue Bonds, Series I, (LANDESBANK HESSEN),
2.28%, 03/15/31(a) | | | 13,500,000 |
| 11,000,000 | | New York State, Local Government Assistance, Revenue Bonds, Series E, (LANDESBANK HESSEN), 2.18%, 04/01/25(a) | | | 11,000,000 |
| 6,800,000 | | New York State, Local Government Assistance, Revenue Bonds, Series F, (SOCIETE GENERALE),
2.21%, 04/01/25(a) | | | 6,800,000 |
See Notes to Financial Statements.
16
Excelsior Tax-Exempt Funds, Inc.
Portfolio of Investments — March 31, 2005
New York Tax-Exempt Money Fund — (continued)
| | | | | |
Principal/
Shares
| | Security
Description
| | Value
|
TAX-EXEMPT CASH EQUIVALENT SECURITIES —
BACKED BY LETTERS OF CREDIT — (continued) |
| $ 4,238,000 | | Yonkers, New York, Industrial Development Agency, Civic Facility Revenue Bonds, Consumers Union Facility, (BANK OF NEW YORK),
2.30%, 07/01/19(a) | | $ | 4,238,000 |
| | | | |
|
|
| | | TOTAL TAX-EXEMPT CASH EQUIVALENT SECURITIES — BACKED BY LETTERS OF CREDIT
(Cost $130,673,000) | | | 130,673,000 |
| | | | |
|
|
| REGISTERED INVESTMENT COMPANIES — 0.24% |
| 972,255 | | BlackRock Institutional New York Money Market Fund | | | 972,255 |
| 1 | | Dreyfus New York Tax Exempt Fund | | | 1 |
| | | | |
|
|
| | | TOTAL REGISTERED INVESTMENT COMPANIES
(Cost $972,256) | | | 972,256 |
| | | | |
|
|
| | | | | | | |
TOTAL INVESTMENTS
(Cost $409,664,858) | | 100.10 | % | | $ | 409,664,858 | |
LIABILITIES IN EXCESS
OF OTHER ASSETS | | (0.10 | ) | | | (412,856 | ) |
| | |
|
| |
|
|
|
NET ASSETS | | 100.00 | % | | $ | 409,252,002 | |
| | |
|
| |
|
|
|
| (a) | Variable Rate Security—The rate disclosed is as of March 31, 2005. |
| (b) | Security exempt from registration under Rule 144A of the Securities Act of 1933. This security may be resold in transactions exempt from registration, normally to qualified institutional buyers. At March 31, 2005, these securities amounted to $100,772,500 or 24.62% net assets. |
AMBAC—American Municipal Bond Assurance Corp.
FGIC—Financial Guaranty Insurance Corp.
FGIC-SPI—Financial Guaranty Insurance Corp. Securities Purchase, Inc.
FSA—Financial Security Assurance
MBIA—Municipal Bond Insurance Association
Notes (The following notes have not been audited by Deloitte & Touche LLP):
These municipal securities meet the three highest ratings assigned by Moody’s Investors Services, Inc. or Standard and Poor’s Corporation or, where not rated, are determined by the Advisor, under the supervision of the Board of Directors, to be of comparable quality at the time of purchase to rated instruments that may be acquired by the Fund.
At March 31, 2005, approximately 32% of the net assets are invested in municipal securities that have letter of credit enhancement features or escrows in U.S. Government securities backing them, on which the Fund relies. Without such features, the securities may or may not meet the quality standards of securities purchased by the Fund.
At March 31, 2005, approximately 99% of the net assets are invested in New York municipal securities. Economic changes affecting the state and certain of its public bodies and municipalities may affect the ability of the issuers to pay the required principal and interest payments of the municipal securities.
The summary of the Fund’s investments as of March 31, 2005 is as follows: (Unaudited)
| | | | | | | |
Portfolio Diversification
| | % of
Net
Assets
| | | Value
| |
Revenue Bonds | | 66.12 | % | | $ | 270,605,500 | |
Commercial Paper | | 13.61 | | | | 55,700,000 | |
Anticipation Notes | | 13.54 | | | | 55,407,102 | |
General Obligation Bonds | | 6.59 | | | | 26,980,000 | |
Registered Investment Company | | 0.24 | | | | 972,256 | |
| | |
|
| |
|
|
|
Total Investments | | 100.10 | % | | $ | 409,664,858 | |
Other Assets and Liabilities (Net) | | (0.10 | ) | | | (412,856 | ) |
| | |
|
| |
|
|
|
Net Assets | | 100.00 | % | | $ | 409,252,002 | |
| | |
|
| |
|
|
|
See Notes to Financial Statements.
17
Excelsior Funds
Statements of Assets and Liabilities
March 31, 2005
| | | | | | | | | | | | | | | | | |
| | | | | |
| | | Money
Fund
| | | Government
Money
Fund
| | | Treasury
Money
Fund
| | Tax-Exempt
Money
Fund
| | New York
Tax-Exempt
Money
Fund
|
ASSETS: | | | | | | | | | | | | | | | | | |
Investments, at cost — see accompanying portfolios | | $ | 1,596,594,915 | | | $ | 344,551,644 | | | $ | 368,947,929 | | $ | 2,050,659,089 | | $ | 409,664,858 |
| | |
|
|
| |
|
|
| |
|
| |
|
| |
|
|
Investments, at value (including repurchase agreements) (Note 1) | | $ | 1,596,594,915 | | | $ | 344,551,644 | | | $ | 368,947,929 | | $ | 2,050,659,089 | | $ | 409,664,858 |
Cash | | | — | | | | — | | | | — | | | — | | | 71,657 |
Interest receivable | | | 584,798 | | | | 3,146 | | | | 5,882 | | | 5,483,434 | | | 1,512,371 |
Receivable for investments sold | | | 149,704,688 | | | | 149,704,688 | | | | 39,983,667 | | | — | | | 3,500,000 |
Receivable for fund shares sold | | | 26,723,967 | | | | 22,451,522 | | | | 35,581,274 | | | 35,803,920 | | | 5,075,543 |
| | |
|
|
| |
|
|
| |
|
| |
|
| |
|
|
Total Assets | | | 1,773,608,368 | | | | 516,711,000 | | | | 444,518,752 | | | 2,091,946,443 | | | 419,824,429 |
| | |
|
|
| |
|
|
| |
|
| |
|
| |
|
|
LIABILITIES: | | | | | | | | | | | | | | | | | |
Payable for dividends declared | | | 2,587,123 | | | | 846,662 | | | | 487,546 | | | 2,593,234 | | | 400,596 |
Payable for investments purchased | | | — | | | | — | | | | 9,989,695 | | | — | | | — |
Payable for fund shares redeemed | | | 39,937,498 | | | | 19,570,559 | | | | 5,787,969 | | | 48,891,504 | | | 9,942,627 |
Investment advisory fees payable
(Note 2) | | | 35,632 | | | | 6,038 | | | | 40,500 | | | 59,518 | | | 32,716 |
Administration fees payable (Note 2) | | | 205,957 | | | | 64,070 | | | | 50,743 | | | 272,907 | | | 51,823 |
Shareholder servicing fees payable
(Note 2) | | | 240,885 | | | | 103,004 | | | | 93,006 | | | 420,492 | | | 71,765 |
Directors’/Trustees’ fees and expense payable (Note 2) | | | — | | | | 349 | | | | 47 | | | — | | | — |
Cash overdraft | | | — | | | | — | | | | — | | | 1,634,162 | | | — |
Accrued expenses and other payables | | | 260,858 | | | | 93,790 | | | | 61,084 | | | 272,133 | | | 72,900 |
| | |
|
|
| |
|
|
| |
|
| |
|
| |
|
|
Total Liabilities | | | 43,267,953 | | | | 20,684,472 | | | | 16,510,590 | | | 54,143,950 | | | 10,572,427 |
| | |
|
|
| |
|
|
| |
|
| |
|
| |
|
|
NET ASSETS | | $ | 1,730,340,415 | | | $ | 496,026,528 | | | $ | 428,008,162 | | $ | 2,037,802,493 | | $ | 409,252,002 |
| | |
|
|
| |
|
|
| |
|
| |
|
| |
|
|
NET ASSETS consist of: | | | | | | | | | | | | | | | | | |
Undistributed net investment income | | $ | — | | | $ | — | | | $ | 2,400 | | $ | 26,400 | | $ | 986 |
Accumulated net realized gain (loss) on investments | | | (35,637 | ) | | | (32,448 | ) | | | — | | | — | | | — |
Par value (Note 4) | | | 1,730,581 | | | | 496,126 | | | | 428,016 | | | 2,038,026 | | | 409,252 |
Paid-in capital in excess of par value | | | 1,728,645,471 | | | | 495,562,850 | | | | 427,577,746 | | | 2,035,738,067 | | | 408,841,764 |
| | |
|
|
| |
|
|
| |
|
| |
|
| |
|
|
Net Assets | | $ | 1,730,340,415 | | | $ | 496,026,528 | | | $ | 428,008,162 | | $ | 2,037,802,493 | | $ | 409,252,002 |
| | |
|
|
| |
|
|
| |
|
| |
|
| |
|
|
Net Assets: | | | | | | | | | | | | | | | | | |
Shares | | $ | 1,105,053,164 | | | $ | 496,026,528 | | | $ | 428,008,162 | | $ | 2,037,802,493 | | $ | 409,252,002 |
Institutional Shares | | | 625,287,251 | | | | — | | | | — | | | — | | | — |
Shares of Common Stock Outstanding (Note 4): | | | | | | | | | | | | | | | | | |
Shares | | | 1,105,292,365 | | | | 496,126,021 | | | | 428,015,889 | | | 2,038,025,945 | | | 409,251,926 |
Institutional Shares | | | 625,288,256 | | | | — | | | | — | | | — | | | — |
NET ASSET VALUE PER SHARE
(net assets ÷ shares outstanding): | | | | | | | | | | | | | | | | | |
Shares | | | $1.00 | | | | $1.00 | | | | $1.00 | | | $1.00 | | | $1.00 |
| | |
|
|
| |
|
|
| |
|
| |
|
| |
|
|
Institutional Shares | | | $1.00 | | | | — | | | | — | | | — | | | — |
| | |
|
|
| |
|
|
| |
|
| |
|
| |
|
|
See Notes to Financial Statements.
18
Excelsior Funds
Statements of Operations
Year Ended March 31, 2005
| | | | | | | | | | | | | | | | | | | | |
| | | | | |
| | | Money
Fund
| | | Government
Money
Fund
| | | Treasury
Money
Fund
| | | Tax-Exempt
Money
Fund
| | | New York
Tax-Exempt
Money
Fund
| |
INVESTMENT INCOME: | | | | | | | | | | | | | | | | | | | | |
Interest income | | $ | 27,818,905 | | | $ | 8,814,263 | | | $ | 6,599,273 | | | $ | 29,840,070 | | | $ | 5,931,020 | |
| | |
|
|
| |
|
|
| |
|
|
| |
|
|
| |
|
|
|
EXPENSES: | | | | | | | | | | | | | | | | | | | | |
Investment advisory fees (Note 2) | | | 4,004,089 | | | | 1,286,537 | | | | 1,284,515 | | | | 5,222,568 | | | | 2,156,839 | |
Administration fees (Note 2) | | | 2,424,662 | | | | 779,389 | | | | 648,495 | | | | 3,162,252 | | | | 653,423 | |
Shareholder servicing fees — Shares (Note 2) | | | 2,860,544 | | | | 1,286,283 | | | | 1,070,408 | | | | 5,195,400 | | | | 1,072,136 | |
Legal and audit fees | | | 315,004 | | | | 118,125 | | | | 98,475 | | | | 412,711 | | | | 97,205 | |
Re-audit expenses (Note 2) | | | 118,853 | | | | 42,607 | | | | 39,434 | | | | 146,285 | | | | 41,921 | |
Custodian fees | | | 66,509 | | | | 25,883 | | | | — | | | | 101,085 | | | | 34,851 | |
Registration and filing fees | | | 49,104 | | | | 23,553 | | | | 17,888 | | | | 25,689 | | | | 18,302 | |
Shareholder reports | | | 72,274 | | | | 11,373 | | | | 8,387 | | | | 46,801 | | | | 9,545 | |
Transfer agent fees | | | 127,811 | | | | 26,245 | | | | 24,071 | | | | 33,088 | | | | 24,616 | |
Directors’/Trustees fees and expenses (Note 2) | | | 45,115 | | | | 14,216 | | | | 11,862 | | | | 78,693 | | | | 16,155 | |
Miscellaneous expenses | | | 82,346 | | | | 28,689 | | | | 22,312 | | | | 112,881 | | | | 30,711 | |
| | |
|
|
| |
|
|
| |
|
|
| |
|
|
| |
|
|
|
Total Expenses | | | 10,166,311 | | | | 3,642,900 | | | | 3,225,847 | | | | 14,537,453 | | | | 4,155,704 | |
Fees waived and reimbursed by: | | | | | | | | | | | | | | | | | | | | |
Investment Adviser (Note 2) | | | (3,555,089 | ) | | | (1,146,409 | ) | | | (750,805 | ) | | | (4,432,905 | ) | | | (1,657,746 | ) |
Administrator (Note 2) | | | (273,411 | ) | | | (86,874 | ) | | | (75,758 | ) | | | (348,319 | ) | | | (78,650 | ) |
Re-audit expenses paid by Investment Adviser (Note 2) | | | (118,853 | ) | | | (42,607 | ) | | | (39,434 | ) | | | (146,285 | ) | | | (41,921 | ) |
| | |
|
|
| |
|
|
| |
|
|
| |
|
|
| |
|
|
|
Net Expenses | | | 6,218,958 | | | | 2,367,010 | | | | 2,359,850 | | | | 9,609,944 | | | | 2,377,387 | |
| | |
|
|
| |
|
|
| |
|
|
| |
|
|
| |
|
|
|
NET INVESTMENT INCOME | | | 21,599,947 | | | | 6,447,253 | | | | 4,239,423 | | | | 20,230,126 | | | | 3,553,633 | |
| | |
|
|
| |
|
|
| |
|
|
| |
|
|
| |
|
|
|
REALIZED GAIN ON INVESTMENTS (Note 1): | | | | | | | | | | | | | | | | | | | | |
Net realized gain on security transactions | | | 6,919 | | | | 2,167 | | | | 6,094 | | | | 38,044 | | | | 1,894 | |
| | |
|
|
| |
|
|
| |
|
|
| |
|
|
| |
|
|
|
Net increase in net assets resulting from operations | | $ | 21,606,866 | | | $ | 6,449,420 | | | $ | 4,245,517 | | | $ | 20,268,170 | | | $ | 3,555,527 | |
| | |
|
|
| |
|
|
| |
|
|
| |
|
|
| |
|
|
|
See Notes to Financial Statements.
19
Excelsior Funds
Statements of Changes in Net Assets
| | | | | | | | | | | | | | | | |
| | |
| | |
Money Fund
| | | Government Money Fund
| |
| | | Year Ended March 31,
| | | Year Ended March 31,
| |
| | | 2005
| | | 2004
| | | 2005
| | | 2004
| |
Net investment income | | $ | 21,599,947 | | | $ | 14,865,550 | | | $ | 6,447,253 | | | $ | 3,926,682 | |
Net realized gain (loss) on security transactions | | | 6,919 | | | | (23,975 | ) | | | 2,167 | | | | (6,483 | ) |
| | |
|
|
| |
|
|
| |
|
|
| |
|
|
|
Net increase in net assets resulting from operations | | | 21,606,866 | | | | 14,841,575 | | | | 6,449,420 | | | | 3,920,199 | |
| | |
|
|
| |
|
|
| |
|
|
| |
|
|
|
Distributions to shareholders: | | | | | | | | | | | | | | | | |
From net investment income | | | | | | | | | | | | | | | | |
Shares | | | (14,621,112 | ) | | | (9,962,795 | ) | | | (6,447,253 | ) | | | (3,926,682 | ) |
Institutional Shares | | | (6,978,835 | ) | | | (4,902,755 | ) | | | — | | | | — | |
From net realized gain on investment | | | — | | | | — | | | | — | | | | — | |
| | |
|
|
| |
|
|
| |
|
|
| |
|
|
|
Total distributions | | | (21,599,947 | ) | | | (14,865,550 | ) | | | (6,447,253 | ) | | | (3,926,682 | ) |
| | |
|
|
| |
|
|
| |
|
|
| |
|
|
|
Change in net assets from fund shares transactions (Note 4): | | | | | | | | | | | | | | | | |
Shares | | | (36,514,934 | ) | | | (646,272,448 | ) | | | (48,696,954 | ) | | | (49,768,352 | ) |
Institutional Shares | | | 155,097,235 | | | | (77,930,018 | ) | | | — | | | | — | |
| | |
|
|
| |
|
|
| |
|
|
| |
|
|
|
Total from fund share transactions | | | 118,582,301 | | | | (724,202,466 | ) | | | (48,696,954 | ) | | | (49,768,352 | ) |
| | |
|
|
| |
|
|
| |
|
|
| |
|
|
|
Net change in net assets | | | 118,589,220 | | | | (724,226,441 | ) | | | (48,694,787 | ) | | | (49,774,835 | ) |
| | |
|
|
| |
|
|
| |
|
|
| |
|
|
|
NET ASSETS: | | | | | | | | | | | | | | | | |
Beginning of period | | | 1,611,751,195 | | | | 2,335,977,636 | | | | 544,721,315 | | | | 594,496,150 | |
| | |
|
|
| |
|
|
| |
|
|
| |
|
|
|
End of period(1) | | $ | 1,730,340,415 | | | $ | 1,611,751,195 | | | $ | 496,026,528 | | | $ | 544,721,315 | |
| | |
|
|
| |
|
|
| |
|
|
| |
|
|
|
(1) Including undistributed net investment income | | $ | — | | | $ | — | | | $ | — | | | $ | — | |
| | |
|
|
| |
|
|
| |
|
|
| |
|
|
|
See Notes to Financial Statements.
20
| | | | | | | | | | | | | | | | | | | | | | |
| | |
Treasury Money Fund
| | | Tax-Exempt Money Fund
| | | New York Tax-Exempt
Money Fund
| |
Year Ended March 31,
| | | Year Ended March 31,
| | | Year Ended March 31,
| |
2005
| | | 2004
| | | 2005
| | | 2004
| | | 2005
| | | 2004
| |
| $ | 4,239,423 | | | $ | 2,592,575 | | | $ | 20,230,126 | | | $ | 11,865,428 | | | $ | 3,553,633 | | | $ | 2,456,690 | |
| | 6,094 | | | | 4,011 | | | | 38,044 | | | | (780 | ) | | | 1,894 | | | | 18,555 | |
|
|
| |
|
|
| |
|
|
| |
|
|
| |
|
|
| |
|
|
|
| | 4,245,517 | | | | 2,596,586 | | | | 20,268,170 | | | | 11,864,648 | | | | 3,555,527 | | | | 2,475,245 | |
|
|
| |
|
|
| |
|
|
| |
|
|
| |
|
|
| |
|
|
|
| | | | | | | | | | | | | | | | | | | | | | | |
| | | | | | | | | | | | | | | | | | | | | | | |
| | (4,245,864 | ) | | | (2,592,576 | ) | | | (20,240,002 | ) | | | (11,865,425 | ) | | | (3,553,633 | ) | | | (2,456,690 | ) |
| | — | | | | — | | | | — | | | | — | | | | — | | | | — | |
| | — | | | | (4,586 | ) | | | — | | | | (311,916 | ) | | | — | | | | (31,105 | ) |
|
|
| |
|
|
| |
|
|
| |
|
|
| |
|
|
| |
|
|
|
| | (4,245,864 | ) | | | (2,597,162 | ) | | | (20,240,002 | ) | | | (12,177,341 | ) | | | (3,553,633 | ) | | | (2,487,795 | ) |
|
|
| |
|
|
| |
|
|
| |
|
|
| |
|
|
| |
|
|
|
| | | | | | | | | | | | | | | | | | | | | | | |
| | | | | | | | | | | | | | | | | | | | | | | |
| | (91,713,040 | ) | | | (52,275,911 | ) | | | (6,902,094 | ) | | | (236,273,538 | ) | | | (80,848,665 | ) | | | (58,462,779 | ) |
| | — | | | | — | | | | — | | | | — | | | | — | | | | — | |
|
|
| |
|
|
| |
|
|
| |
|
|
| |
|
|
| |
|
|
|
| | (91,713,040 | ) | | | (52,275,911 | ) | | | (6,902,094 | ) | | | (236,273,538 | ) | | | (80,848,665 | ) | | | (58,462,779 | ) |
|
|
| |
|
|
| |
|
|
| |
|
|
| |
|
|
| |
|
|
|
| | (91,713,387 | ) | | | (52,276,487 | ) | | | (6,873,926 | ) | | | (236,586,231 | ) | | | (80,846,771 | ) | | | (58,475,329 | ) |
|
|
| |
|
|
| |
|
|
| |
|
|
| |
|
|
| |
|
|
|
| | | | | | | | | | | | | | | | | | | | | | | |
| | 519,721,549 | | | | 571,998,036 | | | | 2,044,676,419 | | | | 2,281,262,650 | | | | 490,098,773 | | | | 548,574,102 | |
|
|
| |
|
|
| |
|
|
| |
|
|
| |
|
|
| |
|
|
|
| $ | 428,008,162 | | | $ | 519,721,549 | | | $ | 2,037,802,493 | | | $ | 2,044,676,419 | | | $ | 409,252,002 | | | $ | 490,098,773 | |
|
|
| |
|
|
| |
|
|
| |
|
|
| |
|
|
| |
|
|
|
| $ | 2,400 | | | $ | 2,747 | | | $ | 26,400 | | | $ | 56 | | | $ | 986 | | | $ | — | |
|
|
| |
|
|
| |
|
|
| |
|
|
| |
|
|
| |
|
|
|
See Notes to Financial Statements.
21
Excelsior Funds
Financial Highlights — Selected Per Share Data and Ratios
| | | | | | | | | | | | | | | | | | | | | | |
| | | | | | |
| | | Net Asset Value,
Beginning of
Period
| | Net
Investment
Income
| | | Net Realized
Gain (Loss)
on Investments
| | | Total From
Investment
Operations
| | Dividends
From Net
Investment
Income
| | | Distributions From
Net Realized Gain
on Investments
| |
MONEY FUND | | | | | | | | | | | | | | | | | | | | | | |
Shares — (5/3/85*) | | | | | | | | | | | | | | | | | | | |
Year Ended March 31, | | | | | | | | | | | | | | | | | | | |
2005 | | $ | 1.00 | | $ | 0.01275 | (2) | | $ | 0.00010 | | | $ | 0.01285 | | $ | (0.01285 | ) | | | — | |
2004 | | | 1.00 | | | 0.00662 | | | | — | | | | 0.00662 | | | (0.00662 | ) | | | — | |
2003 | | | 1.00 | | | 0.01255 | | | | (0.00010 | ) | | | 0.01245 | | | (0.01245 | ) | | | — | |
2002 | | | 1.00 | | | 0.02741 | | | | 0.00010 | | | | 0.02751 | | | (0.02751 | ) | | | — | |
2001 | | | 1.00 | | | 0.05804 | | | | — | | | | 0.05804 | | | (0.05804 | ) | | | — | |
GOVERNMENT MONEY FUND | | | | | | | | | | | | |
Shares — (5/8/85*) | | | | | | | | | | | | | | | | | | | |
Year Ended March 31, | | | | | | | | | | | | | | | | | | | |
2005 | | $ | 1.00 | | $ | 0.01250 | (2) | | $ | 0.00003 | | | $ | 0.01253 | | $ | (0.01253 | ) | | | — | |
2004 | | | 1.00 | | | 0.00625 | | | | — | | | | 0.00625 | | | (0.00625 | ) | | | — | |
2003 | | | 1.00 | | | 0.01199 | | | | (0.00039 | ) | | | 0.01160 | | | (0.01160 | ) | | | — | |
2002 | | | 1.00 | | | 0.02585 | | | | 0.00038 | | | | 0.02623 | | | (0.02623 | ) | | | — | |
2001 | | | 1.00 | | | 0.05752 | | | | — | | | | 0.05752 | | | (0.05752 | ) | | | — | |
TREASURY MONEY FUND | | | | | | | | | | | | |
Shares — (2/13/91*) | | | | | | | | | | | | | | | | | | | |
Year Ended March 31, | | | | | | | | | | | | | | | | | | | |
2005 | | $ | 1.00 | | $ | 0.00988 | (2) | | $ | 0.00031 | | | $ | 0.01019 | | $ | (0.01019 | ) | | | — | |
2004 | | | 1.00 | | | 0.00484 | | | | 0.00002 | | | | 0.00486 | | | (0.00485 | ) | | $ | (0.00001 | ) |
2003 | | | 1.00 | | | 0.01085 | | | | 0.00004 | | | | 0.01089 | | | (0.01089 | ) | | | — | |
2002 | | | 1.00 | | | 0.02451 | | | | (0.00002 | ) | | | 0.02449 | | | (0.02449 | ) | | | — | |
2001 | | | 1.00 | | | 0.05339 | | | | — | | | | 0.05339 | | | (0.05339 | ) | | | — | |
TAX-EXEMPT MONEY FUND | | | | | | | | | | | | |
Shares — (5/24/85*) | | | | | | | | | | | | | | | | | | | |
Year Ended March 31, | | | | | | | | | | | | | | | | | | | |
2005 | | $ | 1.00 | | $ | 0.00966 | (2) | | | — | | | $ | 0.00966 | | $ | (0.00966 | ) | | | — | |
2004 | | | 1.00 | | | 0.00546 | | | $ | 0.00029 | | | | 0.00575 | | | (0.00560 | ) | | $ | (0.00015 | ) |
2003 | | | 1.00 | | | 0.00967 | | | | (0.00002 | ) | | | 0.00965 | | | (0.00964 | ) | | | (0.00001 | ) |
2002 | | | 1.00 | | | 0.01862 | | | | 0.00013 | | | | 0.01875 | | | (0.01865 | ) | | | (0.00010 | ) |
2001 | | | 1.00 | | | 0.03580 | | | | — | | | | 0.03580 | | | (0.03580 | ) | | | — | |
NEW YORK TAX-EXEMPT MONEY FUND | | | | | | | | |
Shares — (8/3/98*) | | | | | | | | | | | | | | | | | | | |
Year Ended March 31, | | | | | | | | | | | | | | | | | | | |
2005 | | $ | 1.00 | | $ | 0.00822 | (2) | | $ | 0.00023 | | | $ | 0.00845 | | $ | (0.00845 | ) | | | — | |
2004 | | | 1.00 | | | 0.00491 | | | | 0.00006 | | | | 0.00497 | | | (0.00490 | ) | | $ | (0.00007 | ) |
2003 | | | 1.00 | | | 0.00884 | | | | (0.00007 | ) | | | 0.00877 | | | (0.00873 | ) | | | (0.00004 | ) |
2002 | | | 1.00 | | | 0.01758 | | | | 0.00011 | | | | 0.01769 | | | (0.01769 | ) | | | — | |
2001 | | | 1.00 | | | 0.03431 | | | | — | | | | 0.03431 | | | (0.03431 | ) | | | — | |
| * | Commencement of Operations |
| (1) | Expense ratios before waiver of fees and reimbursement of expenses by adviser and administrator. |
| (2) | For comparative purposes, per share amounts are based on average shares outstanding. |
See Notes to Financial Statements.
22
| | | | | | | | | | | | | | | | | | | | | | | | |
| | | | | | | |
Total
Distributions
| | | Net Asst Value,
End of Period
| | Total
Return
| | | Net Assets, End
of Period (000's)
| | Ratio of Net
Operating Expenses
to Average
Net Assets
| | | Ratio of Gross
Operating Expenses
to Average Net
Assets(1)
| | | Ratio of Net
Investment
Income to
Average Net Assets
| | | Fee
Wavier
(Note 2)
| |
| | | | | | | | | | | | | | | | | | | | | | | | | |
| | | | | | | | | | | | | | | | | | | | | | | | | |
| | | | | | | | | | | | | | | | | | | | | | | | | |
| $ | (0.01285 | ) | | $ | 1.00 | | 1.29 | % | | $ | 1,105,053 | | 0.46 | % | | 0.70 | % | | 1.28 | % | | $ | 0.00249 | (2) |
| | (0.00662 | ) | | | 1.00 | | 0.66 | % | | | 1,141,562 | | 0.45 | % | | 0.73 | % | | 0.67 | % | | | 0.00279 | |
| | (0.01245 | ) | | | 1.00 | | 1.25 | % | | | 1,787,852 | | 0.39 | % | | 0.43 | % | | 1.25 | % | | | 0.00033 | |
| | (0.02751 | ) | | | 1.00 | | 2.79 | % | | | 1,802,136 | | 0.44 | % | | 0.74 | % | | 2.76 | % | | | 0.00295 | |
| | (0.05804 | ) | | | 1.00 | | 5.96 | % | | | 1,891,042 | | 0.47 | % | | 0.71 | % | | 5.84 | % | | | 0.00238 | |
| | | | | | | | | | | | | | | | | | | | | | | | | |
| | | | | | | | | | | | | | | | | | | | | | | | | |
| | | | | | | | | | | | | | | | | | | | | | | | | |
| $ | (0.01253 | ) | | $ | 1.00 | | 1.26 | % | | $ | 496,027 | | 0.46 | % | | 0.71 | % | | 1.25 | % | | $ | 0.00247 | (2) |
| | (0.00625 | ) | | | 1.00 | | 0.63 | % | | | 544,721 | | 0.45 | % | | 0.54 | % | | 0.62 | % | | | 0.00089 | |
| | (0.01160 | ) | | | 1.00 | | 1.17 | % | | | 594,496 | | 0.39 | % | | 0.47 | % | | 1.21 | % | | | 0.00082 | |
| | (0.02623 | ) | | | 1.00 | | 2.65 | % | | | 795,287 | | 0.43 | % | | 0.49 | % | | 2.72 | % | | | 0.00063 | |
| | (0.05752 | ) | | | 1.00 | | 5.91 | % | | | 1,427,560 | | 0.46 | % | | 0.48 | % | | 5.76 | % | | | 0.00029 | |
| | | | | | | | | | | | | | | | | | | | | | | | | |
| | | | | | | | | | | | | | | | | | | | | | | | | |
| | | | | | | | | | | | | | | | | | | | | | | | | |
| $ | (0.01019 | ) | | $ | 1.00 | | 1.02 | % | | $ | 428,008 | | 0.55 | % | | 0.75 | % | | 0.99 | % | | $ | 0.00202 | (2) |
| | (0.00486 | ) | | | 1.00 | | 0.49 | % | | | 519,722 | | 0.50 | % | | 0.57 | % | | 0.49 | % | | | 0.00075 | |
| | (0.01089 | ) | | | 1.00 | | 1.09 | % | | | 571,998 | | 0.45 | % | | 0.53 | % | | 1.08 | % | | | 0.00075 | |
| | (0.02449 | ) | | | 1.00 | | 2.48 | % | | | 604,281 | | 0.48 | % | | 0.54 | % | | 2.42 | % | | | 0.00062 | |
| | (0.05339 | ) | | | 1.00 | | 5.47 | % | | | 615,926 | | 0.50 | % | | 0.55 | % | | 5.35 | % | | | 0.00046 | |
| | | | | | | | | | | | | | | | | | | | | | | | | |
| | | | | | | | | | | | | | | | | | | | | | | | | |
| | | | | | | | | | | | | | | | | | | | | | | | | |
| $ | (0.00966 | ) | | $ | 1.00 | | 0.97 | % | | $ | 2,037,802 | | 0.46 | % | | 0.69 | % | | 0.97 | % | | $ | 0.00235 | (2) |
| | (0.00575 | ) | | | 1.00 | | 0.58 | % | | | 2,044,676 | | 0.44 | % | | 0.58 | % | | 0.56 | % | | | 0.00132 | |
| | (0.00965 | ) | | | 1.00 | | 0.97 | % | | | 2,281,263 | | 0.39 | % | | 0.54 | % | | 0.97 | % | | | 0.00158 | |
| | (0.01875 | ) | | | 1.00 | | 1.89 | % | | | 2,522,455 | | 0.44 | % | | 0.58 | % | | 1.85 | % | | | 0.00136 | |
| | (0.03580 | ) | | | 1.00 | | 3.64 | % | | | 2,617,329 | | 0.45 | % | | 0.53 | % | | 3.59 | % | | | 0.00075 | |
| | | | | | | | | | | | | | | | | | | | | | | | | |
| | | | | | | | | | | | | | | | | | | | | | | | | |
| | | | | | | | | | | | | | | | | | | | | | | | | |
| $ | (0.00845 | ) | | $ | 1.00 | | 0.85 | % | | $ | 409,252 | | 0.55 | % | | 0.97 | % | | 0.82 | % | | $ | 0.00411 | (2) |
| | (0.00497 | ) | | | 1.00 | | 0.50 | % | | | 490,099 | | 0.50 | % | | 0.75 | % | | 0.49 | % | | | 0.00253 | |
| | (0.00877 | ) | | | 1.00 | | 0.88 | % | | | 548,574 | | 0.44 | % | | 0.49 | % | | 0.89 | % | | | 0.00043 | |
| | (0.01769 | ) | | | 1.00 | | 1.78 | % | | | 696,093 | | 0.48 | % | | 0.71 | % | | 1.76 | % | | | 0.00228 | |
| | (0.03431 | ) | | | 1.00 | | 3.49 | % | | | 682,445 | | 0.51 | % | | 0.72 | % | | 3.43 | % | | | 0.00214 | |
See Notes to Financial Statements.
23
EXCELSIOR FUNDS
NOTES TO FINANCIAL STATEMENTS
1. Significant Accounting Policies:
Excelsior Funds, Inc. (“Excelsior Fund”) and Excelsior Tax-Exempt Funds, Inc. (“Excelsior Tax-Exempt Fund”) were incorporated under the laws of the State of Maryland on August 2, 1984 and August 8, 1984, respectively, and are registered under the Investment Company Act of 1940 (the “1940 Act”), as amended, as open-ended diversified management investment companies with the exception of Energy and Natural Resources Fund, Real Estate Fund, New York Intermediate-Term Tax-Exempt Fund, California Tax-Exempt Income Fund and New York Tax-Exempt Money Fund, each of which are non-diversified.
Excelsior Fund and Excelsior Tax-Exempt Fund currently offer shares in fifteen and seven managed investment portfolios, respectively, each having its own investment objectives and policies. The following is a summary of significant accounting policies for Money Fund, Government Money Fund and Treasury Money Fund, portfolios of Excelsior Fund, and for Tax-Exempt Money Fund and New York Tax-Exempt Money Fund, portfolios of Excelsior Tax-Exempt Fund (collectively, the “Funds”). Such policies are in conformity with accounting principles generally accepted in the United States of America and are consistently followed by the Funds in the preparation of their financial statements. The preparation of financial statements requires management to make estimates and assumptions that affect the reported amounts and disclosures in the financial statements. Actual results could differ from these estimates.
The Money Fund offers two classes of shares: Institutional Shares and Shares. The Financial Highlights of the Institutional Shares as well as the financial statements for the remaining portfolios of Excelsior Fund and Excelsior Tax-Exempt Fund are presented separately.
It is each Fund’s policy, to the extent possible, to maintain a continuous net asset value per share of $1.00. Each Fund has adopted certain investment portfolio valuation and dividend distribution policies to enable it to do so. However, there can be no assurance that the net asset value per share of the Fund will not vary.
(a) Portfolio valuation:
Securities are valued at amortized cost, which has been determined by each Fund’s Board of Directors to represent the fair value of the Funds’ investments. Amortized cost valuation involves valuing an instrument at its cost initially and, thereafter, assuming a constant amortization to maturity of any discount or premium.
(b) Security transactions and investment income:
Security transactions are recorded on a trade date basis. Realized gains and losses on investments sold are recorded on the basis of identified cost. Interest income, adjusted for amortization of premiums and, when appropriate, discounts on investments, is earned from settlement date and is recorded on the accrual basis.
24
(c) Repurchase agreements:
The Funds may purchase portfolio securities from financial institutions deemed to be creditworthy by the investment adviser subject to the seller’s agreement to repurchase and the Funds’ agreement to resell such securities at mutually agreed upon prices. Securities purchased subject to such repurchase agreements are deposited with the Funds’ custodian or sub-custodian or are maintained in the Federal Reserve/Treasury book-entry system and must have, at all times, an aggregate market value not less than the repurchase price (including accrued interest).
Default or bankruptcy of the seller may, however, expose the applicable Fund to possible delay in connection with the disposition of the underlying securities or loss to the extent that proceeds from a sale of the underlying securities were less than the repurchase price under the agreement.
(d) Distributions to shareholders:
Dividends from net investment income are declared daily and paid monthly. Net realized capital gains, unless offset by any available capital loss carryforward, are distributed to shareholders annually or more frequently to maintain a net asset value of $1.00 per share.
(e) Expense allocation:
Expenses directly attributable to a Fund are charged to that Fund. Other expenses are allocated to the respective Funds based on average daily net assets. Expenses attributable to a specific class of shares, such as shareholder servicing fees, are charged directly to that class.
2. Investment Advisory Fee, Administration Fee, Shareholder Servicing Fees and Related Party Transactions:
United States Trust Company of New York (“U.S. Trust NY”) and U.S. Trust Company, N.A. (together, the “Adviser” or “U.S. Trust”), acting through their respective registered investment advisory divisions, U.S. Trust New York Asset Management Division and U.S. Trust Company, N.A. Asset Management Division, serve as the investment adviser to the Funds. For the services provided pursuant to the Investment Advisory Agreements, the Adviser receives a fee, computed daily and paid monthly as follows:
| | | |
Money Fund | | 0.25 | % |
Government Money Fund | | 0.25 | % |
Treasury Money Fund | | 0.30 | % |
Tax-Exempt Money Fund | | 0.25 | % |
New York Tax-Exempt Money Fund | | 0.50 | % |
U.S. Trust NY is a state-chartered bank and trust company and a member bank of the Federal Reserve System. U.S. Trust Company, N.A. is a national bank organized under the laws of the United States. Each is a wholly-owned subsidiary of U.S. Trust Corporation, a registered bank holding company. U.S. Trust Corporation is a wholly-owned subsidiary of The Charles Schwab Corporation (“Schwab”).
U.S. Trust Company, N.A., and BISYS Fund Services Ohio, Inc. (collectively, the “Administrators”) provide administrative services to the Funds. For the services provided to the Funds, the Administrators
25
are entitled jointly to annual fees, computed daily and paid monthly, based on the combined aggregate average daily net assets of Excelsior Fund, Excelsior Tax-Exempt Fund and Excelsior Funds Trust (excluding the international equity portfolios of Excelsior Fund and Excelsior Funds Trust), all of which are affiliated investment companies, as follows: 0.200% of the first $200 million, 0.175% of the next $200 million and 0.150% over $400 million. The Administrators are entitled jointly to annual fees, computed daily and paid monthly, at the annual rate of 0.20% of the average daily net assets of the International Equity Fund, International Fund, Pacific/Asia Fund and Emerging Markets Fund. Administration fees payable by each Fund of the three investment companies are determined in proportion to the relative average daily net assets of the respective Funds for the period paid. For the five month period ended August 31, 2004, U.S. Trust Company, N.A. voluntarily agreed to waive a portion of its administration fee in an amount equal to an annual rate of 0.04% of the average daily net assets of each Fund. For the year ended March 31, 2005, administration fees charged to the Funds by U.S. Trust Company, N.A. were as follows:
| | | | | | | | | | |
| | | Administration
Fees
| | Waiver
Administration
Fees
| | | Net
Administration
Fees
|
Money Fund | | $ | 2,424,662 | | $ | (273,411 | ) | | $ | 2,151,251 |
Government Money Fund | | | 779,389 | | | (86,874 | ) | | | 692,515 |
Treasury Money Fund | | | 648,495 | | | (75,758 | ) | | | 572,737 |
Tax-Exempt Money Fund | | | 3,162,252 | | | (348,319 | ) | | | 2,813,933 |
New York Tax-Exempt Money Fund | | | 653,423 | | | (78,650 | ) | | | 574,773 |
From time to time, in its sole discretion, U.S. Trust may undertake to waive a portion or all of the fees payable to it and may also reimburse the Funds for a portion of other expenses. For the year ended March 31, 2005, U.S. Trust has contractually agreed to waive investment advisory fees and to reimburse other ordinary operating expenses to the extent necessary to keep total operating expenses from exceeding the following annual percentages of each Fund’s average daily net assets:
| | | |
Money Fund | | 0.50 | % |
Government Money Fund | | 0.50 | % |
Treasury Money Fund | | 0.55 | % |
Tax-Exempt Money Fund | | 0.50 | % |
New York Tax-Exempt Money Fund | | 0.60 | % |
With regard to the Institutional Shares of Money Fund, for the period ended March 31, 2005, and until further notice, U.S. Trust contractually agreed to waive fees and reimburse expenses to the extent necessary to maintain an annual expense ratio of not more than 0.25%.
For the year ended March 31, 2005, pursuant to the above, investment advisory fees waived by U.S. Trust were as follows:
| | | | |
Money Fund | | $ | (3,555,089 | ) |
Government Money Fund | | | (1,146,409 | ) |
Treasury Money Fund | | | (750,805 | ) |
Tax-Exempt Money Fund | | | (4,432,905 | ) |
New York Tax-Exempt Money Fund | | | (1,657,746 | ) |
26
The Funds have entered into shareholder servicing agreements with various service organizations, which may include Charles Schwab & Co. Inc. (“CS & Co.”) and U.S. Trust. Services included in the servicing agreements are assisting in processing purchase, exchange and redemption requests; transmitting and receiving funds in connection with customer orders to purchase, exchange or redeem shares; and providing periodic statements. Shareholder servicing fees are incurred on a Fund or class level (where applicable). In consideration for these services, each service organization receives a fee, computed daily and paid monthly, at an annual rate up to 0.25% of the average daily net assets of the Funds’ shares held by each service organizations’ customers, with the exception of the Institutional Shares of the Money Fund, which pays a fee of up to 0.15% of the average daily net assets of its shares. The Adviser, out of its own resources, may additionally compensate certain organizations for providing these services.
For the year ended March 31, 2005, shareholder servicing fees paid to CS & Co. and U.S. Trust were as follows:
| | | |
Money Fund | | $ | 2,833,215 |
Government Money Fund | | | 1,284,129 |
Treasury Money Fund | | | 1,055,676 |
Tax-Exempt Money Fund | | | 5,223,666 |
New York Tax-Exempt Fund | | | 1,082,177 |
Effective January 1, 2005, BISYS Fund Services Limited Partnership became the Distributor for the Funds. Prior to January 1, 2005, Edgewood Services, Inc. (a wholly-owned subsidiary of Federated Investors, Inc.), served as the Distributor of the Funds. Shares of each Fund are sold without a sales charge on a continuous basis by the Distributor.
Effective July 31, 2004, each Independent Director/Trustee of the Funds receives a total annual fee of $100,000 paid by the Funds and other affiliated investment companies managed by U.S. Trust. The Chairman of the Board receives an additional $30,000, the Chairman of the Audit Committee receives an additional $15,000, and the Chairman of the Nominating Committee receives an additional $5,000 for serving in those capacities. Prior to July 31, 2004, each Independent Director of Excelsior Fund received an annual fee of $15,000, plus a meeting fee of $2,500 for each meeting attended. The Chairman received an additional annual fee of $7,500. Each Independent Director of the Excelsior Tax-Exempt Fund received an annual fee of $15,000, plus a meeting fee of $2,500 for each meeting attended. The Chairman receives an additional annual fee of $7,500. Each member of the Nominating Committee for Excelsior Fund, Excelsior Tax-Exempt Fund and Excelsior Funds Trust receives a fee of $3,000 for each meeting attended. The Chairman of the Nominating Committee received an additional annual fee of $5,000. In addition, Directors and Trustees are reimbursed by the Excelsior Fund and Excelsior Tax-Exempt Fund for reasonable expenses incurred when acting in their capacity as Directors and Trustees.
The Funds’ Board of Directors/Trustees selected Deloitte & Touche LLP in November of 2004 to be their registered public accounting firm and to re-audit the Funds’ March 31, 2004 financial statements. All expenses in connection with the re-audit, including costs of audit, legal services, and printing and mailing of the financial statements, were paid by the Adviser. Such expenses are reflected in the Statements of Operations as “re-audit expenses” and the corresponding expense waiver “re-audit expenses paid by Investment Adviser.”
27
3. Federal Taxes:
It is the policy of the Excelsior Fund and Excelsior Tax-Exempt Fund that each Fund qualify or continue to qualify as a regulated investment company, by complying with the requirements of the Internal Revenue Code applicable to regulated investment companies and by distributing substantially all of its taxable earnings to its shareholders.
In order to avoid a federal excise tax, each Fund is required to distribute certain minimum amounts of net realized capital gain and net investment income for the respective twelve-month periods ending October 31 and December 31 in each calendar year.
Dividends and distributions are determined in accordance with federal income tax regulations and may differ from accounting principles generally accepted in the United States of America. These differences are primarily due to differing treatments for deferral of losses on wash sales and net capital losses incurred after October 31 and within the taxable year (“Post-October losses”). To the extent these differences are permanent, adjustments are made to the appropriate equity accounts in the period that these differences arise. Accordingly, the following reclassifications have been made to/from the following accounts:
| | | | | | | | | | |
| | | Undistributed
Net Investment
Income
| | Accumulated
Net Realized
Gain (Loss)
| | | Paid-In
Capital
| |
Money Fund | | — | | $ | 5,131 | | | $ | (5,131 | ) |
Treasury Money Fund | | 6,094 | | | (6,094 | ) | | | — | |
Tax-Exempt Money Fund | | 36,220 | | | (36,217 | ) | | | (3 | ) |
New York Tax-Exempt Money Fund | | 986 | | | (986 | ) | | | — | |
The tax character of dividends and distributions declared during the years ended March 31, 2005 and March 31, 2004 were as follows:
| | | | | | | | | | | | |
| | | Ordinary
Income
| | Tax-Exempt
Income
| | Long-Term
Capital
Gain
| | Total
|
Money Fund | | | | | | | | | | | | |
2005 | | $ | 19,959,001 | | | — | | | — | | $ | 19,959,001 |
2004 | | | 14,865,550 | | | — | | | — | | | 14,865,550 |
Government Money Fund | | | | | | | | | | | | |
2005 | | | 5,884,680 | | | — | | | — | | | 5,884,680 |
2004 | | | 3,926,682 | | | — | | | — | | | 3,926,682 |
Treasury Money Fund | | | | | | | | | | | | |
2005 | | | 3,943,362 | | | — | | | — | | | 3,943,362 |
2004 | | | 2,597,162 | | | — | | | — | | | 2,597,162 |
Tax-Exempt Money Fund | | | | | | | | | | | | |
2005 | | | 28,575 | | $ | 18,660,028 | | $ | 7,646 | | | 18,696,249 |
2004 | | | 38,469 | | | 11,865,305 | | | 273,567 | | | 12,177,341 |
New York Tax-Exempt Money Fund | | | | | | | | | | | | |
2005 | | | 988 | | | 3,352,703 | | | — | | | 3,353,691 |
2004 | | | 31,529 | | | 2,456,266 | | | — | | | 2,487,795 |
28
As of March 31, 2005, the components of distributable earnings (accumulated losses) on a tax basis were as follows:
| | | | | | | | | | | | | | | | | | | | | |
| | | Undistributed
Ordinary
Income
| | Undistributed
Tax-Exempt
Income
| | Accumulated
Earnings
| | Distributions
Payable
| | | Accumulated
Capital and
Other Losses
| | | Total
Accumulated
Earnings
| |
Money Fund | | $ | 2,587,123 | | | — | | $ | 2,587,123 | | $ | (2,587,123 | ) | | $ | (35,637 | ) | | $ | (35,637 | ) |
Government Money Fund | | | 846,662 | | | — | | | 846,662 | | | (846,662 | ) | | | (32,448 | ) | | | (32,448 | ) |
Treasury Money Fund | | | 489,946 | | | — | | | 489,946 | | | (487,546 | ) | | | — | | | | 2,400 | |
Tax-Exempt Money Fund | | | — | | $ | 2,619,634 | | | 2,619,634 | | | (2,593,234 | ) | | | — | | | | 26,400 | |
New York Tax-Exempt Money Fund | | | — | | | 401,582 | | | 401,582 | | | (400,596 | ) | | | — | | | | 986 | |
Post-October losses are deemed to arise on the first business day of a Fund’s next taxable year.
For federal income tax purposes, capital loss carryforwards may be carried forward and applied against future capital gains. To the extent that such carryforwards are utilized, capital gain distributions will be reduced. At March 31, 2005, the following Funds had capital loss carryforwards available to offset future net capital gains through the indicated expiration dates:
| | | | | | | | | | | | | | | | | | |
| | | Expires
| |
|
| | | 2006
| | 2007
| | 2008
| | 2011
| | 2012
| | Total
|
Money Fund | | | — | | | — | | | — | | $ | 11,662 | | $ | 23,975 | | $ | 35,637 |
Government Money Fund | | $ | 4,692 | | $ | 3,297 | | $ | 18,903 | | | — | | | 5,556 | | | 32,448 |
4. Capital Transactions:
Excelsior Fund has authorized capital of 35 billion shares of Common Stock, 29.3756 billion of which is currently classified to represent interests in certain classes of shares. Excelsior Tax-Exempt Fund has authorized capital of 24 billion shares of Common Stock, 15 billion of which is currently classified to represent interests in certain classes of shares. Authorized capital currently classified for each Fund is as follows: 4 billion shares each of the Money Fund and Government Money Fund, 2.5 billion shares of Treasury Money Fund, 2 billion shares of New York Tax-Exempt Money Fund and 5.5 billion shares for Tax-Exempt Money Fund.
Each share has a par value of $0.001 and represents an equal proportionate interest in the particular Fund with other shares of the same Fund, and is entitled to such dividends and distributions of taxable earnings on the assets belonging to such Fund as are declared at the discretion of each Fund’s Board of Directors. Since the Funds have sold, reinvested and redeemed shares only at a constant net asset value of $1.00 per share, the number of shares represented by such sales, reinvestments and redemptions is the same as the amounts shown below for such transactions.
29
| | | | | | | | | | | |
| | | Money Fund
| |
| | | Year Ended March 31,
| |
| | | 2005
| | | 2004
| |
| | | Shares
| | | Amount
| | | Amount
| |
Sold: | | | | | | | | | | | |
Shares | | 3,782,584,603 | | | $ | 3,782,584,603 | | | $ | 4,664,084,234 | |
Institutional Shares | | 4,191,107,467 | | | | 4,191,107,467 | | | | 2,751,605,010 | |
Issued as reinvestment of dividends: | | | | | | | | | | | |
Shares | | 1,188,525 | | | | 1,188,499 | | | | 784,932 | |
Institutional Shares | | 2,099,572 | | | | 2,099,573 | | | | 2,186,353 | |
Redeemed: | | | | | | | | | | | |
Shares | | (3,820,288,035 | ) | | | (3,820,288,036 | ) | | | (5,311,141,614 | ) |
Institutional Shares | | (4,038,109,800 | ) | | | (4,038,109,805 | ) | | | (2,831,721,381 | ) |
| | |
|
| |
|
|
| |
|
|
|
Change in net assets | | 118,582,332 | | | $ | 118,582,301 | | | $ | (724,202,466 | ) |
| | |
|
| |
|
|
| |
|
|
|
| | | | | | | | |
| |
| | | Government Money Fund
| |
| | | Year Ended March 31,
| |
| | | 2005
| | | 2004
| |
Sold | | $ | 2,736,097,238 | | | $ | 3,164,391,955 | |
Issued as reinvestment of dividends | | | 377,287 | | | | 271,873 | |
Redeemed | | | (2,785,171,479 | ) | | | (3,214,432,180 | ) |
| | |
|
|
| |
|
|
|
Change in net assets | | $ | (48,696,954 | ) | | $ | (49,768,352 | ) |
| | |
|
|
| |
|
|
|
| |
| | | Treasury Money Fund
| |
| | | Year Ended March 31,
| |
| | | 2005
| | | 2004
| |
Sold | | $ | 3,255,632,599 | | | $ | 2,924,119,256 | |
Issued as reinvestment of dividends | | | 968,644 | | | | 641,186 | |
Redeemed | | | (3,348,314,283 | ) | | | (2,977,036,353 | ) |
| | |
|
|
| |
|
|
|
Change in net assets | | $ | (91,713,040 | ) | | $ | (52,275,911 | ) |
| | |
|
|
| |
|
|
|
| |
| | | Tax-Exempt Money Fund
| |
| | | Year Ended March 31,
| |
| | | 2005
| | | 2004
| |
Sold | | $ | 8,993,982,009 | | | $ | 7,348,246,145 | |
Issued as reinvestment of dividends | | | 573,372 | | | | 360,212 | |
Redeemed | | | (9,001,457,475 | ) | | | (7,584,879,895 | ) |
| | |
|
|
| |
|
|
|
Change in net assets | | $ | (6,902,094 | ) | | $ | (236,273,538 | ) |
| | |
|
|
| |
|
|
|
| |
| | | New York Tax-Exempt Money Fund
| |
| | | Year Ended March 31,
| |
| | | 2005
| | | 2004
| |
Sold | | $ | 1,870,092,958 | | | $ | 1,700,208,458 | |
Issued as reinvestment of dividends | | | 460,208 | | | | 422,511 | |
Redeemed | | | (1,951,401,831 | ) | | | (1,759,093,748 | ) |
| | |
|
|
| |
|
|
|
Change in net assets | | $ | (80,848,665 | ) | | $ | (58,462,779 | ) |
| | |
|
|
| |
|
|
|
30
5. Line of Credit:
During the year ended March 31, 2005, the Funds and other affiliated funds participated in a $50 million unsecured line of credit provided by a syndication of banks under a line of credit agreement. A commitment fee, equal to an annual rate of 0.15% of the average daily unused portion of the line of credit, is allocated among the participating Funds at the end of each quarter, and is included in miscellaneous expenses on the statements of operations. For the year ended March 31, 2005, the Funds had no borrowings under the agreement. Effective March 9, 2005, the unsecured line of credit was terminated.
6. Guarantees:
In the normal course of business, the Funds enter into contracts that provide general indemnifications. The Funds’ maximum exposure under these arrangements is dependent on future claims that may be made against the Funds, and therefore, cannot be established; however, based on experience, the risk of loss from such claims is considered remote.
7. Legal Proceedings:
The Adviser and Excelsior Funds, Inc., Excelsior Tax-Exempt Funds, Inc., and Excelsior Funds Trust (the “Companies”) were contacted in September, 2003 by the Office of the New York State Attorney General (the “NYAG”), and the Adviser was contacted by the Securities and Exchange Commission (the “SEC”) in connection with their investigations of practices in the mutual fund industry identified as “market timing” and “late trading” of mutual fund shares (the “Investigations”). The Adviser and the Companies have cooperated with respect to these Investigations. As disclosed previously by the Adviser and its affiliates, with respect to the Adviser, these investigations have focused on circumstances in which a small number of parties were permitted to engage in short-term trading of certain Excelsior Funds. The short-term trading activities permitted under these arrangements have been terminated and the Adviser has strengthened its policies and procedures to deter frequent trading in the Companies.
Five class actions filed against the Companies and two derivative actions purportedly brought on behalf of each of the Companies and each of the funds have been transferred to the United District Court for the District of Maryland for coordinated or consolidated pre-trial proceedings in a matter styled In Re Mutual Funds Investment Litigation, MDL Docket No. 1586. Lead plaintiffs were appointed and additional defendants were added (generally consisting of current and former directors and officers of the Companies). The five class actions were then consolidated and a single amended complaint was filed on or about September 29, 2004. Plaintiffs in the consolidated class action are seeking unspecified monetary damages from claimed injuries arising from allegedly illegal and improper mutual fund trading practices, as well as disgorgement of investment advisory fees, rescission and restitution of unspecified funds. The two derivative actions were also consolidated into a new amended complaint, also filed on or about September 29, 2004. Plaintiffs in the consolidated derivative action are seeking, on behalf of the Companies, unspecified monetary damages for similar claimed injuries, as well as removal of Excelsior Fund directors, removal of U.S. Trust as advisor to the Excelsior Funds, rescission of its investment advisory contracts and disgorgement of management fees and compensation relating to the Excelsior Funds.
31
The defendants in the consolidated actions have moved to dismiss such actions, and the Maryland court is scheduled to hear oral argument on the motions to dismiss on June 16-17, 2005. The defendants will not be required to answer the complaints until such motions have been decided, and discovery in the actions is currently stayed.
While the ultimate outcome of these matters cannot be predicted with any certainty at this time, based on currently available information, the Adviser believes that the likelihood is remote that the pending private lawsuits and Investigations will have a material adverse financial impact on the Companies, and further believes that the pending Investigations and private lawsuits are not likely to materially affect the Adviser’s ability to provide investment management services to the Companies.
32
REPORT OF INDEPENDENT REGISTERED PUBLIC ACCOUNTING FIRM
To the Board of Directors and Shareholders of
Excelsior Funds, Inc. and Excelsior Tax-Exempt Funds, Inc.
We have audited the accompanying statements of assets and liabilities, including the portfolios of investments, of the Money Fund, Government Money Fund, Treasury Money Fund, Tax-Exempt Money Fund, and New York Tax-Exempt Money Fund (three of the portfolios constituting the Excelsior Funds, Inc. and two of the portfolios constituting the Excelsior Tax-Exempt Funds, Inc.) (collectively, the “Funds”) as of March 31, 2005, and the related statements of operations for the year then ended, the statements of changes in net assets and the financial highlights (Shares) for each of the two years in the period then ended. These financial statements and financial highlights are the responsibility of the Funds’ management. Our responsibility is to express an opinion on these financial statements and financial highlights based on our audits. The financial highlights for each of the years in the three year period ended March 31, 2003 were audited by other auditors whose reports dated May 16, 2003, expressed an unqualified opinion on those financial highlights.
We conducted our audits in accordance with the standards of the Public Company Accounting Oversight Board (United States). Those standards require that we plan and perform the audit to obtain reasonable assurance about whether the financial statements and financial highlights are free of material misstatement. The Funds are not required to have, nor were we engaged to perform, an audit of their internal control over financial reporting. Our audit included consideration of internal control over financial reporting as a basis for designing audit procedures that are appropriate in the circumstances, but not for the purpose of expressing an opinion on the effectiveness of the Funds’ internal control over financial reporting. Accordingly, we express no such opinion. An audit also includes examining, on a test basis, evidence supporting the amounts and disclosures in the financial statements, assessing the accounting principles used and significant estimates made by management, as well as evaluating the overall financial statement presentation. Our procedures included confirmation of securities owned as of March 31, 2005, by correspondence with the custodian and brokers; where replies were not received from brokers, we performed other auditing procedures. We believe that our audits provide a reasonable basis for our opinion.
In our opinion, the financial statements and financial highlights referred to above present fairly, in all material respects, the financial position of Money Fund, Government Money Fund, Treasury Money Fund, Tax-Exempt Money Fund, and New York Tax-Exempt Money Fund as of March 31, 2005, the results of their operations for the year then ended, and the changes in their net assets and the financial highlights for each of the two years in the period then ended, in conformity with accounting principles generally accepted in the United States of America.
DELOITTE & TOUCHE LLP
New York, New York
May 27, 2005
33
Directors/Trustees and Officers of the Excelsior Funds Complex (Unaudited)
Information pertaining to the Directors/Trustees and Officers of Excelsior Fund, Excelsior Tax-Exempt Fund and Excelsior Funds Trust (each a “Company” and collectively, the “Excelsior Funds Complex”) is set forth below. Directors/Trustees who are not deemed to be “interested persons” of the Excelsior Funds Complex as defined in the 1940 Act are referred to as “Independent Board Members.” Directors/Trustees who are deemed to be “interested persons” of the Excelsior Funds Complex are referred to as “Interested Board Members”. The following information is as of May 20, 2005.
| | | | | | |
Name and Address(1) Age Time Served with the Excelsior Funds Complex
| | Principal Occupation During the Past Five Years
| | Number of Portfolios in Fund Complex Overseen by Director/ Trustee(3)
| | Other Directorships Held by Director/Trustee(4)
|
DIRECTORS/TRUSTEES(2) INDEPENDENT BOARD MEMBERS | | | | |
Frederick S. Wonham
Age: 74
Since 1997 | | Retired. Chairman of the Boards and Director (since 1997) and President and Treasurer (from 1995 to February 2002) of Excelsior Funds, Inc. and Excelsior Tax-Exempt Funds, Inc.; Chairman of the Board and Trustee (since 1997) and President and Treasurer (from 1995 to February 2002) of Excelsior Funds Trust. | | 29 | | None. |
| | | |
Rodman L. Drake
Age: 62
Since 1994 | | Director of Excelsior Funds, Inc. and Excelsior Tax-Exempt Funds, Inc. (since 1996); Trustee of Excelsior Funds Trust (since 1994); Director, Crystal River Capital Inc. (a private REIT) (since March 2005); Director, Parson Brinkerhoff, Inc. (engineering firm) (since 1995); Co-Founder of Baringo Capital LLC (since 2002); President, Continuation Investments Group, Inc. (from 1997 to 2001). | | 29 | | Director and Chairman, Hyperion Total Return Fund, Inc., Hyperion Strategic Mortgage Fund Inc., and Hyperion 2005 Term Trust Inc. (since 1991); Director, Jackson Hewitt Inc. (since June 2004). |
| | | |
Morrill Melton (“Mel”) Hall, Jr.
Age: 60
Since 2000 | | Director of Excelsior Funds, Inc. and Excelsior Tax-Exempt Funds, Inc. (since 2000); Trustee of Excelsior Funds Trust (since 2000); Chairman and Chief Executive Officer, Comprehensive Health Services, Inc. (health care management and administration) (since 1991). | | 29 | | None. |
| | | |
Roger M. Lynch
Age: 64
Since 2001 | | Retired. Director of Excelsior Funds, Inc. and Excelsior Tax- Exempt Funds, Inc. and Trustee of Excelsior Funds Trust (since 2001); Director, SLD Commodities, Inc. (importer of nuts) (since 1991); President, Corporate Asset Funding Co., Inc. (asset securitization) (from 1987 to 1999); Limited Partner (from 1986 to 1999), Goldman Sachs & Co. | | 29 | | None. |
| | | |
Jonathan Piel
Age: 66
Since 1994 | | Retired. Director, Excelsior Funds, Inc. and Excelsior Tax-Exempt Funds, Inc. (since 1996); Trustee, Excelsior Funds Trust (since 1994). | | 29 | | None. |
34
| | | | | | |
Name and Address(1) Age Time Served with the Excelsior Funds Complex
| | Principal Occupation During the Past Five Years
| | Number of Portfolios in Fund Complex Overseen by Director/ Trustee(3)
| | Other Directorships Held by Director/Trustee(4)
|
John. D. Collins
Age: 66
Since 2005 | | Retired. Director, Excelsior Funds, Inc. and Excelsior Tax-Exempt Funds, Inc. (since 2005); Trustee, Excelsior Funds Trust (since 2005). Consultant, KPMG, LLP (from July 1999 to June 2000); Partner, KPMG, LLP (from March 1962 to June 1999). | | 29 | | Director, CCC Information Services Inc. (software to automate process of settling automobile claims) (since September 2004); Director, Mrs. Fields’ Companies, Inc. (consumer products) (since December 2004). |
| | |
| INTERESTED BOARD MEMBER(5) | | | | |
James L. Bailey
114 West 47th Street
New York, NY 10036
Age: 59
Since 2004 | | Chief Operating Officer of U.S. Trust Corporation (since December 2004) and Executive Vice President of U.S. Trust Corporation and United States Trust Company of New York (since 2003); President, Excelsior Funds, Inc., Excelsior Tax-Exempt Funds, Inc. and Excelsior Funds Trust (from 2003 to July 2004); Consultant in the financial services industry (from August 2000 to January 2003); Executive Vice President of Citicorp (from 1992 to August 2000). | | 29 | | None. |
| | | |
| OFFICERS | | | | | | |
Mary Martinez
114 West 47th Street
New York, NY 10036
Age: 45
President
Since July 2004 | | Managing Director of United States Trust Company of New York (since 2003) and Chief Executive Officer of National Private Banking (since October 2004); Managing Director and Director of Relationship Management Service, Marketing, Information and Technology at Bessemer Trust (from 1998 to 2003). | | N/A | | N/A |
| | | |
Joseph Trainor, CFA
114 West 47th Street
New York, NY 10036
Age: 44
Vice President
Since February 2004 | | Managing Director of United States Trust Company of New York and President, U.S. Trust Institutional (since 2003); President of MFS Institutional Advisors (from 1998 to 2002). | | N/A | | N/A |
| | | |
Agnes Mullady
225 High Ridge Road
Stamford, CT 06905
Age: 46
Treasurer/Chief Financial
and Chief Accounting Officer
Since February 2004 | | Senior Vice President, U.S. Trust Company, N.A. (since 2004); Chief Financial Officer, AMIC Distribution Partners (from 2002 to 2004); Controller Reserve Management Corporation, Reserve Management Company, Inc. and Reserve Partners, Inc. (from 2000 to 2002); Vice President and Treasurer, Northstar Funds; Senior Vice President and Chief Financial Officer, Northstar Investment Management Corp.; President and Treasurer, Northstar Administrators Corp.; and Vice President and Treasurer, Northstar Distributors, Inc. (from 1993 to 2000). | | N/A | | N/A |
35
| | | | | | |
Name and Address(1) Age Time Served with the Excelsior Funds Complex
| | Principal Occupation During the Past Five Years
| | Number of Portfolios in Fund Complex Overseen by Director/ Trustee(3)
| | Other Directorships Held by Director/Trustee(4)
|
Scott Rhodes
225 High Ridge Road
Stamford, CT 06905
Age: 46
Vice President and Assistant Treasurer
Since November 2004 | | Vice President, U.S. Trust Company, N.A. (since August 2004); Vice President, BlackRock Financial Management, Inc. (2004); Controller, Mutual Funds, American Skandia Investment Services, Inc. and Assistant Treasurer, American Skandia Trust and American Skandia Advisor Funds, Inc. (from 1996 to 2003). | | N/A | | N/A |
| | | |
Alexandra Poe
114 West 47th Street
New York, NY 10036
Age: 44
Secretary and
Chief Legal Officer
Since May 2004 | | Senior Vice President and Assistant General Counsel, United States Trust Company of New York (since May 2004); Chief Legal Officer for Managed Accounts and Alternative Investment Strategies, Prudential Investments (from 2001 to 2004); Senior Vice President and General Counsel, US Investment Management and Global Hedge Funds and President of the Schroder Mutual Funds, Schroders (from 1996 to 2001). | | N/A | | N/A |
| | | |
Sharon M. Davison
114 West 47th Street
New York, NY 10036
Age: 50
Chief Compliance Officer Since September 2004 | | Senior Vice President of U.S. Trust Company of New York (since 2001); Director of Securities and Corporate Compliance (since 2001); Director of Special Investigations-New York Stock Exchange Division of Market Surveillance (from 2000 to 2001); Senior Counsel-New York Stock Exchange Division of Market Surveillance (from 1997 to 2000). | | N/A | | N/A |
| | | |
Wyndham Clark
225 High Ridge Road
Stamford, CT 06905
Age: 47
Anti-Money Laundering Officer
Since May 2004 | | Vice President and AML Officer, U.S. Trust Company, N.A. (since 2003); Vice President and Deputy Director Risk Management, IBJ Whitehall (banking) (from 2001 to 2002); and Vice President and Chief Risk Officer, EMAC, LLC (commercial lender, asset backed security issuer) (from 1999 to 2001). | | N/A | | N/A |
| | | |
Ralph Pastore
225 High Ridge Road
Stamford, CT 06905
Age: 35
Vice President
Since May 2005 | | Vice President, U.S. Trust Company, N.A. (since 2001); Director, Mutual Fund Operations, American Skandia Investment Services, Inc. (from 1998 to 2001) | | N/A | | N/A |
36
| (1) | Each independent director/trustee may be contacted by writing to Excelsior Funds, 225 High Ridge Road, Stamford, CT 06905. |
| (2) | Each director/trustee shall hold office until the election and qualification of his or her successor, or until he or she sooner dies, resigns or is removed. The officers of each Company shall hold office for a one year term and until their respective successors are chosen and qualified, or in each case until he or she sooner dies, resigns, is removed, or becomes disqualified in accordance with each Company’s by-laws. |
| (3) | The Excelsior Funds Complex consists of all registered investment companies (Excelsior Funds Inc., Excelsior Tax-Exempt Funds, Inc. and Excelsior Funds Trust) for which U.S. Trust serves as investment adviser. As of May 20, 2005, the Excelsior Funds Complex consisted of 29 Funds. |
| (4) | Directorships of companies required to report to the Securities and Exchange Commission under the Securities Exchange Act of 1934 (i.e., “public companies”) or other investment companies registered under the 1940 Act. |
| (5) | “Interested person” of the Company is defined in the 1940 Act. Mr. Bailey is considered an “interested person” because of his affiliation with the Adviser. |
For more information regarding the Directors/Trustees and Officers, please refer to the Statement of Additional Information, which is available upon request by calling 1-800-446-1012.
37
DISCLOSURE OF FUND EXPENSES (Unaudited)
We believe it is important for you to understand the impact of fees regarding your investment. As a shareholder of the fund, you incur ongoing, or operating costs, which include costs for portfolio management, administrative services, and shareholder reports (like this one), among others. Operating expenses, which are deducted from a fund’s gross income, directly reduce the investment return of the fund. A fund’s expenses are expressed as a percentage of its average net assets. This figure is known as the expense ratio. The following examples are intended to help you understand the ongoing costs (in dollars) of investing in your fund and to compare these costs with those of other mutual funds. The examples are based on an investment of $1,000 made at the beginning of the period shown and held for the entire period.
The table on the following page illustrates your fund’s costs in two ways.
| | • | | Actual expenses. This section provides information about actual account values and actual expenses based on the Funds’ actual return for the period. This section is designed to help you to estimate the actual expenses after fee waivers that you paid over the period. The “Ending Account Value” shown is derived from the fund’s actual return, and the fourth column shows the dollar amount that would have been paid by an investor who started with $1,000 in the fund. You may use the information here, together with the amount you invested, to estimate the expenses that you paid over the period. |
To do so, simply divide your account value by $1,000 (for example, an $8,600 account value divided by $1,000=$8.6), then multiply the result by the number given for your fund under the heading “Expenses Paid During Period”.
| | • | | Hypothetical expenses. This section provides information about hypothetical account values and hypothetical expenses that would have been incurred by an investor in the Fund based on an assumed rate of return of 5% per year before expenses. This section is designed to help you compare your fund’s costs with those of other mutual funds. It assumes that the fund had a return of 5% before expenses during the year, but that the expense ratio is unchanged. In this case, because the return used is not the fund’s actual return, the results cannot be used to estimate the actual ending account balance or expenses you paid for the period. You may use this information to compare the ongoing costs of investing in your Fund and other funds. To do so, compare this 5% hypothetical example with the 5% hypothetical examples that appear in shareholder reports of other funds. |
38
DISCLOSURE OF FUND EXPENSES (Unaudited) (Continued)
Please note that the expenses shown in the table are meant to highlight and help you compare ongoing costs only, which are described in the Prospectus. Therefore, the hypothetical example is useful in comparing ongoing costs only, and will not help you determine the relative total costs of owning different funds.
| | | | | | | | | | | | |
| | | Beginning
Account
Value
9/30/2004
| | Ending
Account
Value
3/31/2005
| | Annualized
Expense
Ratios*
| | | Expenses
Paid
During
Period**
|
Actual Fund Return | | | | | | | | | | | | |
Money Fund — Shares | | $ | 1,000.00 | | $ | 1,008.90 | | 0.46 | % | | $ | 2.31 |
Government Money Fund — Shares | | | 1,000.00 | | | 1,008.70 | | 0.46 | | | | 2.31 |
Treasury Money Fund — Shares | | | 1,000.00 | | | 1,007.30 | | 0.55 | | | | 2.76 |
Tax-Exempt Money Fund — Shares | | | 1,000.00 | | | 1,006.40 | | 0.46 | | | | 2.31 |
New York Tax-Exempt Money Fund — Shares | | | 1,000.00 | | | 1,005.80 | | 0.55 | | | | 2.76 |
| | | | |
Hypothetical 5% Return | | | | | | | | | | | | |
Money Fund — Shares | | | 1,000.00 | | | 1,022.68 | | 0.46 | | | | 2.32 |
Government Money Fund — Shares | | | 1,000.00 | | | 1,022.68 | | 0.46 | | | | 2.32 |
Treasury Money Fund — Shares | | | 1,000.00 | | | 1,022.22 | | 0.55 | | | | 2.78 |
Tax-Exempt Money Fund — Shares | | | 1,000.00 | | | 1,022.68 | | 0.46 | | | | 2.32 |
New York Tax-Exempt Money Fund — Shares | | | 1,000.00 | | | 1,022.22 | | 0.55 | | | | 2.78 |
| * | | Annualized expense ratios of certain funds are after fee waivers and expense reimbursements by the investment adviser. Absent such waivers and reimbursements, expenses paid during the period would have been greater. |
| **Expenses | | are equal to the Fund’s annualized expense ratio multiplied by the average account value over the period, multiplied by the number of days in the most recent fiscal half-year (182) then divided by 365. |
39
AR-MM-0305/43798

FIXED INCOMEFUNDS
ANNUAL REPORT
March 31, 2005
TABLE OF CONTENTS
For shareholder account information, current price and yield quotations, or to make an initial purchase or obtain a prospectus, call 1-800-446-1012, from overseas, call 617-483-7297.
| · | Internet Address: http://www.excelsiorfunds.com |
This report must be preceded or accompanied by a current prospectus.
A description of the policies and procedures that Excelsior Funds use to determine how to vote proxies relating to portfolio securities, as well as information relating to how a Fund voted proxies relating to portfolio securities during the most recent 12-month period ended June 30, is available (i) without charge, upon request, by calling 1-800-446-1012, or (ii) by accessing the Excelsior Funds’ internet address and (iii) on the Commission’s website at http://www.sec.gov.
Excelsior Funds file their June 30 and December 31 schedule of portfolio holdings with the Securities and Exchange Commission, on Form N-Q, within sixty days after the applicable reporting period. Excelsior Funds Form N-Q is available on the Commission’s website at http://www.sec.gov, and may be reviewed and copied at the Commission’s Public Reference Room in Washington, DC. Information on the operation of the Public Reference Room may be obtained by calling 1-800-SEC-0330.
You should consider the Fund’s investment objectives, risks and expenses carefully before you invest. Information about these and other important subjects is in the Fund’s prospectus, which you should read carefully before investing.
Excelsior Funds, Inc., Excelsior Funds Trust and Excelsior Tax-Exempt Funds, Inc. are distributed by BISYS Fund Services Limited Partnership.
You may write to Excelsior Funds, Inc., Excelsior Funds Trust and Excelsior Tax-Exempt Funds, Inc. at the following address:
Excelsior Funds
P.O. Box 8529
Boston, MA 02266-8529
SHARES IN THE FUNDS ARE NOT DEPOSITS OR OBLIGATIONS OF, OR GUARANTEED OR ENDORSED BY, UNITED STATES TRUST COMPANY OF NEW YORK, U.S. TRUST COMPANY, N.A., THEIR PARENT AND AFFILIATES AND SHARES ARE NOT INSURED BY THE FEDERAL DEPOSIT INSURANCE CORPORATION, THE FEDERAL RESERVE BOARD, OR ANY OTHER AGENCY. INVESTMENTS IN THE FUNDS INVOLVE INVESTMENT RISKS, INCLUDING POSSIBLE LOSS OF PRINCIPAL. FUND SHARES ARE NOT INSURED OR GUARANTEED BY THE U.S. GOVERNMENT.
LETTER TO SHAREHOLDERS
March 31, 2005
Dear Fellow Shareholder:
The fiscal year ended March 31, 2005 was marked by a continuing uptrend in broad based market indices. Financial markets spent much of 2004 waiting to see who would win the U.S. Presidential election. Stocks rose in the post-election period, posting gains from the first week of November to year end. The markets held their ground despite higher than anticipated energy prices. On December 14th, the Standard & Poor’s 500 Index closed above 1200 for the first time since August of 2001, and stocks retained most of their year-end 2004 gains during the first quarter of 2005. Also, the Federal Reserve monetary policy took hold, with its seventh increase in the Federal Funds rate to 2.75% as of the end of the first quarter of 2005.
Going forward, our overall investment theme reflects a preference for goods versus services, real versus financial assets, and “old economy” sectors and industries stocks versus the so-called “new economy”. Creating the cities and the infrastructure that are springing up in giant global emerging economies has raised overall levels of demand for commodities that are in relatively short supply, particularly after a decade or more of capital under investment in tangible producing sectors. We expect to focus on opportunities for above-market returns, and our portfolio managers will aim to capitalize on these prospects as they take shape.
As always, we value your confidence in selecting Excelsior to fulfill your investment needs. We strongly believe that Excelsior’s array of funds will help meet the full range of your financial objectives.
Sincerely,

Mary Martinez
President
1
| | FIXED INCOME MARKET REVIEW |
Despite the strong crosscurrents of rising market interest rates and growing inflationary pressures, the fixed-income marketplace held up relatively well for the twelve-month period ended March 31, 2005. Whether corporate or municipal, long or short-term, high quality or high yield, the fixed-income market indices generally trended upwards during the reporting period.
During the first fiscal quarter, U.S. Treasuries declined in price, suffering one of the worst three-month periods in a decade as the economy and the jobs market heated up. The Federal Reserve raised its federal funds target by 25 basis points, or one-quarter of one percent, to 1.25%, the first increase since May 2000.
After performing strongly earlier in 2004, asset-backed and commercial-mortgage-backed securities (CMBS) posted weaker returns relative to Treasuries. The underperformance was primarily due to the rise in interest rate swap spreads since these sectors are tightly correlated to swap spread movements. In addition, a surge in CMBS issuance in June also negatively impacted spreads. Meanwhile, residential mortgage-backed securities posted stronger relative results.
Prices for U.S. Treasury securities rebounded in the second fiscal quarter, pushing bond yields lower. This decrease in yields occurred even as the Federal Reserve continued to raise its target short-term interest rate. The Fed’s rate-setting committee increased its target short-term federal funds rate twice during the quarter, to 1.75%. Although short Treasury rates moderately declined in the quarter, the intermediate to long end of the Treasury curve experienced a decline in yields and the yield curve continued to flatten.
The third fiscal quarter saw further interest rate hikes on the part of the Federal Reserve, with two additional increases of 25 basis points bringing the target federal funds rate to 2.25%. These moves brought short-term rates to their highest levels in more than three years, although the yield curve flattened even further as the intermediate and long end of the Treasury curve experienced a less dramatic rise in yields.
Meanwhile, the municipal market took the Federal Reserve’s actions in stride with surprisingly little movement in residential mortgage rates. After jumping last spring when the Fed signaled its intention to raise short-term interest rates, longer-term municipal yields actually came back down when the Fed’s tightening began in earnest in June.
The reporting period’s final quarter proved challenging for the fixed-income markets. The Fed raised rates twice more, bringing the federal funds rate to 2.75%. A market sell-off in bonds was precipitated by Federal Reserve Chairman Alan Greenspan’s pronouncement mid-way through the quarter that low long-term yields, combined with rising short-term yields, posed a “conundrum” in the market. Then in March, the Fed indicated for the first time in this tightening cycle that it is concerned about inflationary pressures. The fixed-income market’s sentiment worsened further after General Motors announced that its earnings and cash flow for 2005 would be much lower than anticipated. As a result, the majority of fixed-income indices came under pressure during the quarter.
2
EXCELSIOR FUNDS, INC. | MANAGED INCOME FUND |
The Fund’s strong relative performance in the first fiscal quarter was largely the result of the portfolio’s barbell position and shorter duration, which benefited as yields rose and the Treasury yield curve flattened. In the second fiscal quarter, the portfolio’s barbell position continued to benefit from further flattening in the Treasury yield curve. Another positive contributor that benefited from declining interest rates was the portfolio’s higher weighted coupon in the mortgage sector. In the third fiscal quarter, the Fund maintained its defensive positioning to rising interest rates and the bias to a continued flattening of the yield curve. This strategy was a positive contributor to returns along with the portfolio’s allocation to residential mortgages and commercial mortgage backed securities. Our allocation to high yield securities again added value over the quarter and throughout the year as below investment grade corporate spreads continued to tighten throughout this period. In the final quarter of the reporting period, the Fund declined but held up better than its index. The Fund’s defensive posture to rising rates and positioning for a flattening yield curve were the largest contributors to its outperformance. A moderately underweight allocation in investment grade corporate bonds also aided returns this quarter as the investment grade corporate market lost ground over the period.
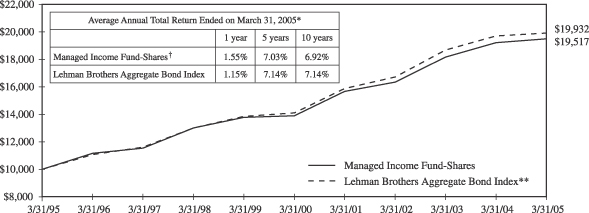
Past performance is not predictive of future performance. Investment returns and principal values will vary and shares may be worth more or less at redemption than their original cost.
The above illustration compares a $10,000 investment made in the Fund and a broad-based index over the past ten fiscal years. The chart assumes all dividends and capital gain distributions are reinvested. The Fund’s performance takes into account fees and expenses. The index does not take into account charges, fees and other expenses. Further information relating to Fund performance is contained in the Financial Highlights section of the Prospectus and elsewhere in this report.
| * | | Total return represents the change during the period in a hypothetical account with dividends reinvested. |
| ** | | Source: Lehman Brothers—the Lehman Brothers Aggregate Bond Index is an unmanaged, fixed income, market value-weighted index that includes treasury issues, agency issues, corporate bond issues and mortgage-backed securities. |
| † | | Currently certain fees are waived. Had such fees not been waived, returns would have been lower. Returns do not reflect the deduction of taxes that a shareholder would pay on Fund distributions or the redemption of shares. |
3
EXCELSIOR FUNDS, INC. | INTERMEDIATE-TERM MANAGED INCOME FUND |
In the first fiscal quarter, the Fund maintained a defensive posture to interest rate increases. Sector exposure favored non-Treasury issues for their added yield and positive relative performance versus Treasury securities in a strengthening economy. Securities with call features, such as, mortgages and callable agencies, were overweighted based on valuation levels, and the shorter duration of the overall portfolio aided relative returns. In the second fiscal quarter, the Fund reestablished a more defensive posture due to rising interest rates by shortening duration and improving quality. The Fund maintained its shorter-than-benchmark duration in the third fiscal quarter and was underweighted to corporates as the sector appeared fully valued. However, underweight exposure to corporate bonds proved to be a drag on performance. In the reporting period’s final quarter, the Fund remained defensively positioned with a duration below its benchmark with an underweight concentrated in 2-year to 5-year maturities, which generally perform poorly when the Fed is raising rates. The “barbell” structure continued to be employed with an overweight in 10-year and longer maturity securities and cash equivalents.
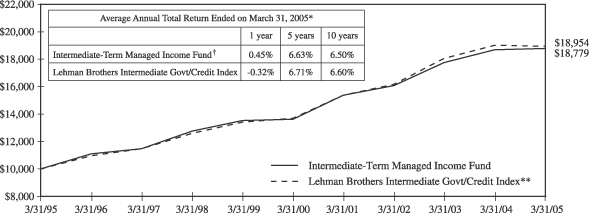
Past performance is not predictive of future performance. Investment returns and principal values will vary and shares may be worth more or less at redemption than their original cost.
The above illustration compares a $10,000 investment made in the Fund and a broad-based index over the past ten fiscal years. The chart assumes all dividends and capital gain distributions are reinvested. The Fund’s performance takes into account fees and expenses. The index does not take into account charges, fees and other expenses. Further information relating to Fund performance is contained in the Financial Highlights section of the Prospectus and elsewhere in this report.
| * | | Total return represents the change during the period in a hypothetical account with dividends reinvested. |
| ** | | Source: Lehman Brothers—The Lehman Brothers Intermediate Govt/Credit Index is an unmanaged total return performance benchmark composed of U.S. Government agencies and U.S. Treasury securities and investment grade corporate debt, selected as representative of the market with maturities of one to ten years. |
| † | | Currently certain fees are waived. Had such fees not been waived, returns would have been lower. Returns do not reflect the deduction of taxes that a shareholder would pay on Fund distributions or the redemption of shares. |
4
EXCELSIOR FUNDS, INC. | SHORT-TERM GOVERNMENT SECURITIES FUND |
The Fund moderately outperformed its benchmark in the first fiscal quarter as we increased the allocation to agency mortgage-backed securities and slightly trimmed the portfolio’s weighting to Treasury securities. Meanwhile, duration began the reporting period relatively close to the benchmark’s. Durations were reduced to a very short average life in the second fiscal quarter. During the third fiscal quarter, the Fund maintained its exposure to higher-yielding mortgage and asset-backed sectors, while duration was shortened even further as the yield curve flattened further. Meanwhile, spread sectors delivered strong performance again and the Fund continued to hold these securities for their added income. In the reporting period’s final quarter, the Fund outperformed its index as holdings of higher-yielding mortgage and asset-backed securities benefited returns. U.S. Treasury rates increased during the first quarter as the economy exhibited signs of continued strength. But declining levels of implied volatility seem to suggest that rates would remain more subdued for the time being unless the inflation picture or the valuation of the U.S. dollar became more problematic. At period’s end, the Fund’s duration was 1.61 years with an average yield that exceeded the benchmark’s.
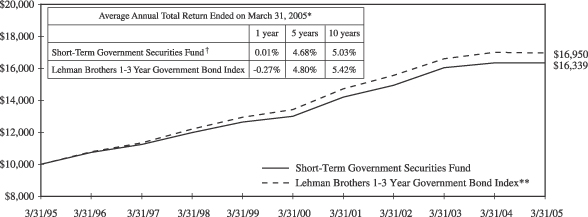
Past performance is not predictive of future performance. Investment returns and principal values will vary and shares may be worth more or less at redemption than their original cost.
The above illustration compares a $10,000 investment made in the Fund and a broad-based index over the past ten fiscal years. The chart assumes all dividends and capital gain distributions are reinvested. The Fund’s performance takes into account fees and expenses. The index does not take into account charges, fees and other expenses. Further information relating to Fund performance is contained in the Financial Highlights section of the Prospectus and elsewhere in this report.
| * | | Total return represents the change during the period in a hypothetical account with dividends reinvested. |
| ** | | Source: Lehman Brothers—The Lehman Brothers 1-3 Year Government Bond Index is an unmanaged total return performance benchmark composed of U.S. Government agencies and U.S. Treasury securities with maturities of one to three years. |
| † | | Currently certain fees are waived. Had such fees not been waived, returns would have been lower. Returns do not reflect the deduction of taxes that a shareholder would pay on Fund distributions or the redemption of shares. |
5
EXCELSIOR FUNDS TRUST | HIGH YIELD FUND |
The key drivers of high yield market performance in the first fiscal quarter were the ongoing improvement in default rates and the nearly 100-basis-point increase in U.S. interest rates. Relative to the Merrill High Yield Index, we had overweight positions in paper/packaging, chemicals, and metals/mining to benefit from strong economic growth and in gaming to reduce portfolio volatility. In the second fiscal quarter, we positioned the portfolio for moderate volatility in an environment of solid economic growth and stable or moderately rising interest rates, holding issues with high coupons trading near their call prices. As a result, the Fund did not fully participate in the strong performance of the high yield sector during the quarter as interest rates fell. The Fund’s relative underperformance in the third fiscal quarter was almost entirely due to underweight exposure to high-volatility, lower-tier securities. However, it is important to note that our underweighting of lower-tier credits reflected concerns surrounding possible principal risk from rising interest rates and uncertainty surrounding national and international political events. In the reporting period’s final quarter, the Fund’s performance was notably mixed with January and particularly March suffering negative returns. During the quarter, our positions in chemicals and metals, along with certain telecom holdings, helped the Fund outperform the Index. However, our underweight in energy as well as holdings in automotive suppliers modestly impaired performance. Finally, the Fund’s shorter duration relative to the Index was somewhat beneficial to performance, as Treasury yields continued to rise throughout the quarter.
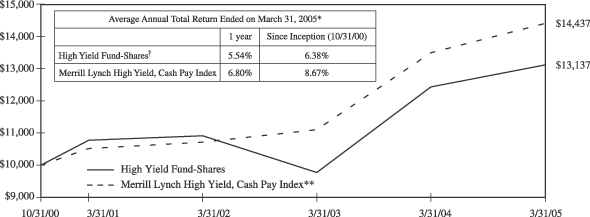
Past performance is not predictive of future performance. Investment returns and principal values will vary and shares may be worth more or less at redemption than their original cost. Securities rated below investment grade generally entail greater market, credit, and liquidity risks than investment grade securities.
The above illustration compares a $10,000 investment made in the Fund and a broad-based index since October 31, 2000 (inception date). The chart assumes all dividends and capital gain distributions are reinvested. The Fund’s performance takes into account fees and expenses. The index does not take into account charges, fees and other expenses. Further information relating to Fund performance is contained in the Financial Highlights section of the Prospectus and elsewhere in this report.
| * | | Total return represents the change during the period in a hypothetical account with dividends reinvested. |
| ** | | Source: Merrill Lynch—The Merrill Lynch High Yield, Cash Pay Index is an unmanaged index comprised of publicly placed, non-convertible, coupon bearing domestic debt. Issues in the index are less than investment grade as rated by Standard & Poor’s Ratings Group or Moody’s Investors Service, Inc., and must not be in default. Issues have a term to maturity of at least one year. |
| † | | Currently certain fees are waived. Had such fees not been waived, returns would have been lower. Returns do not reflect the deduction of taxes that a shareholder would pay on Fund distributions or the redemption of shares. |
6
EXCELSIOR TAX-EXEMPT FUNDS, INC. | LONG-TERM TAX-EXEMPT FUND |
The Excelsior Long-Term Tax-Exempt Fund began the second quarter of 2004 with roughly 42% cash; early in the period, as the market sold off, we began to put money back to work; at its lowest point, cash stood at 25%. As the market picked up, however, we sold into the recovery, bringing the cash level back up to 40%. Essentially, while we did engage in some opportunistic trading in the quarter—which benefited the Fund—we largely maintained a defensive structure to the portfolio. Additional portfolio activity in the period included selling of several higher-coupon (5.75%) bonds and the purchase of several 5% coupon bonds, structuring heavily in the 25- to 30-year range.
The Fund began the third quarter of 2004 with roughly 43% cash. We began to put the money back to work, bringing cash down to roughly 23% by quarter end. We focused on a combination of longer and intermediate issues, and higher coupons with longer calls. Discount bonds were virtually impossible to find in the period. Most of the money was put into the 12- to 13-year range; the average maturity of the portfolio increased by roughly a year to the 16-year area. This number is deceptive, however, as the bonds are trading to 8-, 9-, or 10-year calls. The Fund had a solid quarter overall, given some advance refundings.
Through the fourth quarter of 2004, the Fund maintained its largely defensive posture in continued expectation of rising interest rates. On December 31, the portfolio’s average maturity was about 15 years, with most bonds trading to 8- or 9-year call dates, and the cash equivalent position was 27%. Both numbers were virtually the same when the quarter began. With the exception of a few opportunistic December trades that contributed positively to the Fund’s performance, the portfolio was largely unchanged during the period. The impact of the year’s rate hikes was not felt at the long end of the yield curve, where rates closed the year not far from where they started despite some interim volatility. By keeping a significant percentage of fund assets in cash equivalents, the Fund benefited from rising rates at the short end, while maintaining the flexibility to invest further out should the yield curve steepen and reward investors for the added risk of longer maturities.
For the first quarter of 2005, the Excelsior Long-Term Tax-Exempt Fund maintained the defensive posture it has held for some time in anticipation of higher interest rates. The cash position increased from 26% on December 31, 2004 to 36% three months later. This rise resulted from a combination of result of new cash coming into the Fund as transactions intended to bring the Fund’s average maturity from down 15 years at the beginning of the quarter to 13 years at the end. Call dates on bonds in the portfolio were between seven and nine years.
7
EXCELSIOR TAX-EXEMPT FUNDS, INC. | LONG-TERM TAX-EXEMPT FUND |
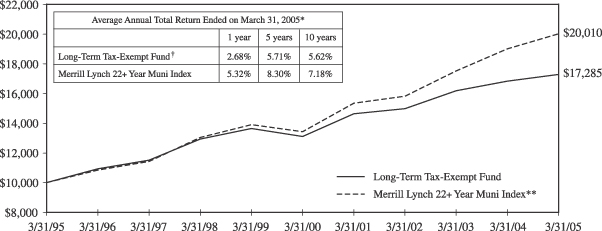
Past performance is not predictive of future performance. Investment returns and principal values will vary and shares may be worth more or less at redemption than their original cost. A portion of the Fund’s income may be subject to the Alternative Minimum Tax and some investors may be subject to certain state and local taxes.
The above illustration compares a $10,000 investment made in the Fund and a broad-based index over the past ten fiscal years. The chart assumes all dividends and capital gain distributions are reinvested. The Fund’s performance takes into account fees and expenses. The index does not take into account charges, fees and other expenses. Further, information relating to Fund performance is contained in the Financial Highlights section of the Prospectus and elsewhere in this report.
| * | | Total return represents the change during the period in a hypothetical account with dividends reinvested. |
| ** | | Source: Merrill Lynch—the Merrill Lynch 22+ Year Muni Index consists of bonds with an outstanding par which is greater than or equal to 25 million and a maturity range greater than or equal to 22 years. |
| † | | Currently certain fees are waived. Had such fees not been waived, returns would have been lower. Returns do not reflect the deduction of taxes that a shareholder would pay on Fund distributions or the redemption of shares. |
8
EXCELSIOR TAX-EXEMPT FUNDS, INC. | INTERMEDIATE-TERM TAX-EXEMPT FUND |
During the second quarter of 2004, redemptions reduced the Excelsior Intermediate-Term Tax-Exempt Fund’s cash by about 3%. The Fund’s average life—at roughly six years—finished the quarter where it started. The Fund’s slight underperformance relative to peers can be attributed to its longer average maturity relative to the average of other Funds in the group.
Portfolio activity for the Excelsior Intermediate-Term Tax-Exempt Fund was minimal during the third quarter, as we were satisfied with the structure of the Fund. During the period, we lost about 4% cash to redemptions, which brought the number from 23.5% to 19.5%. The average maturity of the Fund has remained at roughly 6.2 years even with the passage of time because of refunding.
Managers of the Fund had no reason to change strategies during the 2004 fourth quarter, maintaining roughly 80% of fund assets in non-callable bonds with an average life of close to 6 years and a 20% cash position. Virtually no trades occurred in the portfolio during the quarter, other than one sale to cover redemptions without changing the cash position. Although the Federal Reserve increased the federal funds rate by a total of 50 basis points during the quarter—and 125 basis points during the year—the moves have yet to make any significant impact on intermediate- to long-term rates. As a result, the Fund remains positioned for a rising rate environment with a healthy portion of cash and an average life near the midpoint of the 3-10 year range defined by the Fund’s investment objective. With a curve where a 10-year muni yields only about 80 basis points more than one maturing in five years, the Fund favors shorter life and lower risk.
The first quarter of 2005 was exceptionally quiet for Excelsior Intermediate Tax-Exempt Fund. The portfolio remained in a holding pattern, with no purchases or sales in the period. With expectations for a continued rise in interest rates, and virtually no incentive to trade, we held our defensive posture. New money coming into the Fund increased the cash position from 21% to 23% and reduced the average maturity to 5.5 years. The reward of extending maturities any further at this point falls short of the risk that prices will fall as the market pushes longer-term rates up.
9
EXCELSIOR TAX-EXEMPT FUNDS, INC. | INTERMEDIATE-TERM TAX-EXEMPT FUND |
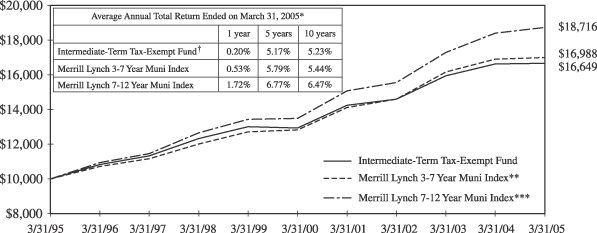
Past performance is not predictive of future performance. Investment returns and principal values will vary and shares may be worth more or less at redemption than their original cost. A portion of the Fund’s income may be subject to the Alternative Minimum Tax and some investors may be subject to certain state and local taxes.
The above illustration compares a $10,000 investment made in the Fund and broad-based indices over the past ten fiscal years. The chart assumes all dividends and capital gain distributions are reinvested. The Fund’s performance takes into account fees and expenses. The indices do not take into account charges, fees and other expenses. Further information relating to Fund performance is contained in the Financial Highlights section of the Prospectus and elsewhere in this report.
| * | | Total return represents the change during the period in a hypothetical account with dividends reinvested. |
| ** | | Source: Merrill Lynch—the Merrill Lynch 3-7 Year Muni Index is a widely-accepted unmanaged market-weighted index comprised of fixed-rate, coupon-bearing bonds issued within five years of the most recent month-end with greater than $50 million principal amount having a Moody’s investment grade rating and maturities of three to seven years. |
| *** | | Source: Merrill Lynch—the Merrill Lynch 7-12 Year Muni Index is a widely-accepted unmanaged market-weighted index comprised of fixed-rate, coupon-bearing bonds issued within five years of the most recent month-end with greater than $50 million principal amount having a Moody’s investment grade rating and maturities of seven to twelve years. |
| † | | Currently certain fees are waived. Had such fees not been waived, returns would have been lower. Returns do not reflect the deduction of taxes that a shareholder would pay on Fund distributions or the redemption of shares. |
10
EXCELSIOR TAX-EXEMPT FUNDS, INC. | SHORT-TERM TAX-EXEMPT SECURITIES FUND |
After a first quarter marked by significant cash inflows for the Excelsior Short-Term Tax-Exempt Fund, the second quarter, on the other hand, saw redemptions mount, bringing cash levels down; we sold securities as a result in an effort to maintain cash at roughly 40%, with a 1.7-year average life, most due in the three-year area.
The third quarter saw minimal portfolio activity in the Fund. We maintained roughly 40% cash and equivalents in the period; the drag here was negligible as the yield (at about 1.4%-1.5%) was similar to yields obtainable out in the 1-year area and not much lower than what we could get out at two years. We maintained an average maturity of 1.5 years and remain cautious.
The Fund ended the year close to where it began in terms of portfolio structure. Although considerable cash came into the Fund during the first half of 2004 as market-shy investors sought liquidity and tax-exempt yield, redemptions became more the norm as the stock market gained momentum. The barbell strategy, deployed when inflows were strong, continues to serve the portfolio well, however. Approximately 45% of Fund assets were held in cash equivalents, reaping the benefit of short-term rate hikes while creating the flexibility to invest when the yield curve warrants an extension of maturities. Most of the remainder of the portfolio was invested primarily in triple-A-rated securities closer to the three-year maximum average maturity, resulting in a short average life of 19 months. The Fund astutely avoided investing too many assets in the two-four year maturity range, where returns did not compensate for risk.
The Fund finished the first quarter of 2005 in a barbell formation, with about 44% in cash and the remainder invested in the two-to-two-and-a-half- year maturity range where yields ended the quarter about 40 basis points higher than they began. With a short average maturity in the fund of about 15 months, the Fund has the flexibility to take advantage of the market’s anticipation of future rate hikes.
11
EXCELSIOR TAX-EXEMPT FUNDS, INC. | SHORT-TERM TAX-EXEMPT SECURITIES FUND |
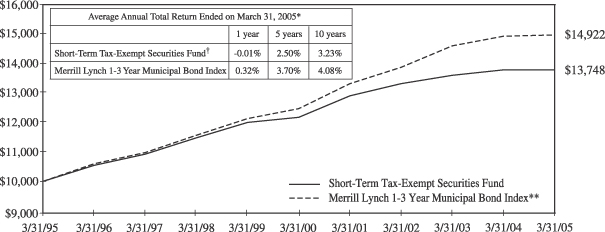
Past performance is not predictive of future performance. Investment returns and principal values will vary and shares may be worth more or less at redemption than their original cost. A portion of the Fund’s income may be subject to the Alternative Minimum Tax and some investors may be subject to certain state and local taxes.
The above illustration compares a $10,000 investment made in the Fund and a broad-based index over the past ten fiscal years. The chart assumes all dividends and capital gain distributions are reinvested. The Fund’s performance takes into account fees and expenses. The index does not take into account charges, fees and other expenses. Further information relating to Fund performance is contained in the Financial Highlights section of the Prospectus and elsewhere in this report.
| * | | Total return represents the change during the period in a hypothetical account with dividends reinvested. |
| ** | | Source: Merrill Lynch—the Merrill Lynch 1-3 Year Municipal Bond Index is a widely-accepted unmanaged market-weighted index comprised of fixed-rate, coupon-bearing bonds issued within five years of the most recent month-end with greater than $50 million principal amount having a Moody’s investment grade rating and maturities of one to three years. |
| † | | Currently certain fees are waived. Had such fees not been waived, returns would have been lower. Returns do not reflect the deduction of taxes that a shareholder would pay on Fund distributions or the redemption of shares. |
12
EXCELSIOR TAX-EXEMPT FUNDS, INC. | NEW YORK INTERMEDIATE-TERM TAX-EXEMPT FUND |
During the second quarter of 2004, redemptions reduced the Excelsior New York Intermediate-Term Tax-Exempt Fund’s cash from 26% to roughly 20%. The Fund’s average life—at roughly six years—finished the quarter where it started. The Fund’s slight underperformance relative to peers can be attributed to its longer average maturity relative to the average of other Funds in the group.
Portfolio activity for the Fund was minimal during the third quarter, as we were satisfied with the structure of the Fund. During the period, we lost about 4% cash to redemptions, bringing the number from 20% to 16%. The average maturity of the Fund has remained at roughly 6 years even with the passage of time because of refunding.
The Fund performed in line with its peer group during the fourth quarter of 2004, with a strategy that continued to anticipate a rising interest rate environment. Over 80% of the portfolio was invested in non-callable bonds from New York state and municipal issuers. A cash-equivalent position of close to 20% brings the fund’s average life to approximately six years, consistent with where it began the quarter. Minimal trading during the period achieved diversification objectives with a neutral impact on performance.
During the first quarter of 2005, the only transaction in the Excelsior New York Intermediate-Term Tax-Exempt Fund was one sale that realized a gain and brought the portfolio’s average maturity down to 5.5 years. In a market that had been waiting for longer-term rates to rise for some time, the Fund was best positioned at this point on the yield curve, given its investment objectives, maturity parameters and the risk-reward relationships in the bond market. The cash position grew from 22% to 26% of the portfolio as the result of this sale, positioning the Fund to act when conditions warrant. Except for this one transaction, the portfolio was in a holding pattern for the quarter.
13
EXCELSIOR TAX-EXEMPT FUNDS, INC. | NEW YORK INTERMEDIATE-TERM TAX-EXEMPT FUND |
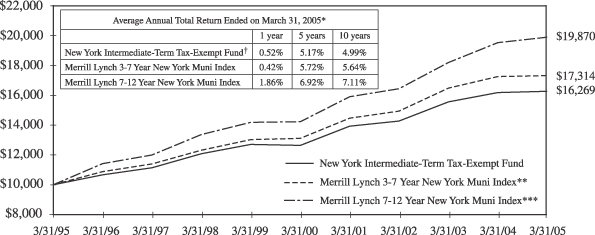
Past performance is not predictive of future performance. Investment returns and principal values will vary and shares may be worth more or less at redemption than their original cost. A portion of the Fund’s income may be subject to the Alternative Minimum Tax.
The above illustration compares a $10,000 investment made in the Fund and broad-based indices over the past ten fiscal years. The chart assumes all dividends and capital gain distributions are reinvested. The Fund’s performance takes into account fees and expenses. The indices do not take into account charges, fees and other expenses. Further information relating to Fund performance is contained in the Financial Highlights section of the Prospectus and elsewhere in this report.
| * | | Total return represents the change during the period in a hypothetical account with dividends reinvested. |
| ** | | Source: Merrill Lynch—the Merrill Lynch 3-7 Year New York Muni Index is a widely-accepted unmanaged market-weighted index comprised of fixed-rate, coupon-bearing bonds of New York Municipalities issued within five years of the most recent month-end with greater than $50 million principal amount having a Moody’s investment grade rating and maturities of three to seven years. |
| *** | | Source: Merrill Lynch—the Merrill Lynch 7-12 Year New York Muni Index is a widely-accepted unmanaged market-weighted index comprised of fixed-rate, coupon-bearing bonds of New York Municipalities issued within five years of the most recent month-end with greater than $50 million principal amount having a Moody’s investment grade rating and maturities of seven to twelve years. |
| † | | Currently certain fees are waived. Had such fees not been waived, returns would have been lower. Returns do not reflect the deduction of taxes that a shareholder would pay on Fund distributions or the redemption of shares. |
14
EXCELSIOR TAX-EXEMPT FUNDS, INC. | CALIFORNIA TAX-EXEMPT INCOME FUND |
During the first fiscal quarter, the successful new issuance of $7.9 billion California Economic Recovery bonds was instrumental in changing the tone of the California market. The record bond sale averted a cash shortage. Moodys, citing that the trend of economic recovery is now well established, raised the State’s general obligation debt to A3 from Baa1 and has given it a positive outlook. By quarter-end, yields on AAA California bonds maturing less than 10 years were lower than AAA national bonds with similar maturities and structure. As a result intermediate, high quality California bonds performed better than comparable national bonds. The Excelsior California Tax-Exempt Income Fund took advantage of the higher yields and modestly lengthened the portfolio to an average maturity of just under 4.5 years.
During the second fiscal quarter, California’s general obligation debt was raised three levels by Standard & Poor’s. The liquidity concerns of the last year dissipated while the economy and tax revenues improved. The secondary market was the source of bonds purchased in the Fund. Though California was the largest issuer of bonds through the quarter, the sectors and structure of the new issues did not meet our needs. In the low interest rate environment of the quarter, we looked for relative value along the yield curve. The intermediate range (5 to 10 years) provided the highest incremental yield pick-up. The average maturity remained at just over four years and we continued to manage the portfolio defensively and purchase bonds inside of ten years.
For the third fiscal quarter the spread between California yields and national yields remained within historical norms. California yields were slightly lower than national yields, but California bonds remained the choice for clients in the highest Federal and California tax brackets. The Fund was managed to defend the portfolio against higher interest rates. While we did see rates rise in the quarter and for the year, we did not see the large increase in bond rates that many expected in 2004. The average maturity remained at approximately 4 years while we maintained our somewhat defensive position.
During the fourth fiscal quarter, ending March 31, 2005, the Federal Open Market Committee maintained the stance that the risk of heightened inflationary pressures versus the risk of economic weakness remained “balanced”. They continued a series of increases and raised the Fed Funds rate at each of the two meetings during the quarter to 2.75%.
In the fourth quarter, the yield curve continued to flatten as short-term yields followed the Fed Funds higher, while longer-term yields were slower-moving. Two-year Treasury yields increased by 71 basis points to 3.78%. 10-year Treasury yields rose a more modest 26 basis points to yield 4. 48%. Five- year AAA municipal bond yields were higher by approximately 50 basis points to 2.79%. Ten-year AAA yields increased about 28 basis points to yield 3.92%. Thirty-year bonds were unchanged at 4.58%. Intermediate portfolios underperformed versus longer term portfolios as a result of the further flattening of the yield curve. Price declines in intermediate bonds exceeded coupon income, resulting in negative total returns. The yield spread between California and national bonds was mixed during the quarter. In the 5-year range, California yields increased slightly more than their national counterparts and in the 10-year maturity range, national bond yields increased slightly more than California bonds. The spread between national and California bonds remained within historical norms. As rates moved up during the quarter, we took advantage of the higher rates and purchased bonds at higher yields. The intention was to slowly increase the average maturity of the portfolio, which ended the quarter at 4.3 years, and to purchase bonds where the incremental yield pick-up is of the most value.
15
EXCELSIOR TAX-EXEMPT FUNDS, INC. | CALIFORNIA TAX-EXEMPT INCOME FUND |
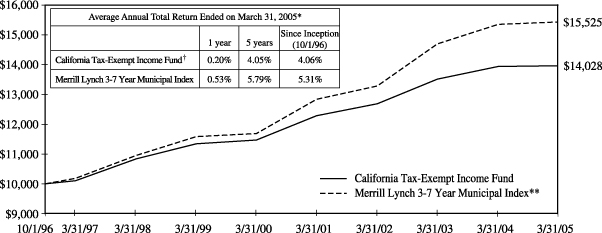
Past performance is not predictive of future performance. Investment returns and principal values will vary and shares may be worth more or less at redemption than their original cost. A portion of the Fund’s income may be subject to the Alternative Minimum Tax.
The above illustration compares a $10,000 investment made in the Fund and a broad-based index since 10/1/96 (inception date). The chart assumes all dividends and capital gain distributions are reinvested. The Fund’s performance takes into account fees and expenses. The index does not take into account charges, fees and other expenses. Further information relating to Fund performance is contained in the Financial Highlights section of the Prospectus and elsewhere in this report.
| * | | Total return represents the change during the period in a hypothetical account with dividends reinvested. |
| ** | | Source: Merrill Lynch—the Merrill Lynch 3-7 Year Municipal Index is a widely-accepted unmanaged market-weighted index comprised of fixed-rate, coupon-bearing bonds issued within five years of the most recent month-end with greater than $50 million principal amount having a Moody’s investment grade rating and maturities of three to seven years. |
| † | | Currently certain fees are waived. Had such fees not been waived, returns would have been lower. Returns do not reflect the deduction of taxes that a shareholder would pay on Fund distributions or the redemption of shares. |
16
Excelsior Funds, Inc.
Portfolio of Investments — March 31, 2005
Managed Income Fund
| | | | | | | | | | | |
| | | | | | | | | | | | |
Principal
| | | | Rate
| | | Maturity
Date
| | Value
|
| | ASSET BACKED SECURITIES — 2.04% |
| $ | 2,156,712 | | CIT RV Trust,
1999-A A4 | | 6.16 | % | | 06/15/13 | | $ | 2,177,136 |
| | 2,161,000 | | Residential Asset Mortgage Products, Inc.,
2003-FZ4 A2(a) | | 2.81 | | | 07/25/27 | | | 2,144,814 |
| | | | | | | | | | |
|
|
| | | | TOTAL ASSET BACKED SECURITIES
(Cost $4,273,185) | | | 4,321,950 |
| | | | | | | | | | |
|
|
| | COLLATERALIZED MORTGAGE OBLIGATIONS — 13.76% |
| | 2,701,071 | | Citigroup Mortgage Loan Trust,
2004-HYB4 WA(a) | | 4.49 | | | 12/25/34 | | | 2,687,565 |
| | 3,062,141 | | Countrywide Alternative Loan Trust,
2004-16CB 1A2 | | 5.50 | | | 07/25/34 | | | 3,077,796 |
| | 2,034,936 | | Countrywide Alternative Loan Trust,
2004-22CB 1A1 | | 6.00 | | | 10/25/34 | | | 2,076,568 |
| | 3,265,044 | | Wells Fargo Mortgage Backed Securities Trust, 2004-EE 3A1 | | 3.99 | | | 01/25/35 | | | 3,204,434 |
| | | | | | | | | | |
|
|
| | | | | 11,046,363 |
| | | | | | | | | | |
|
|
| | | | FEDERAL HOME LOAN MORTGAGE
CORPORATION — 7.07% |
| | 9,568,125 | | 1602 PH | | 6.00 | | | 04/15/23 | | | 9,738,026 |
| | 5,033,552 | | 2333 UZ | | 6.50 | | | 07/15/31 | | | 5,248,183 |
| | | | | | | | | | |
|
|
| | | | | | | | | | | | 14,986,209 |
| | | | | | | | | | |
|
|
| | | | GOVERNMENT NATIONAL MORTGAGE ASSOCIATION — 1.48% |
| | 3,000,000 | | 2005-25 B | | 6.21 | | | 03/16/21 | | | 3,127,349 |
| | | | | | | | | | |
|
|
| | | | TOTAL COLLATERALIZED MORTGAGE OBLIGATIONS
(Cost $29,294,034) | | | 29,159,921 |
| | | | | | | | | | |
|
|
| | COMMERCIAL MORTGAGE-BACKED SECURITIES — 16.33% |
| | 1,477,000 | | Bank of America Commercial Mortgage, Inc.,
2004-1 A4 | | 4.76 | | | 11/10/39 | | | 1,445,378 |
| | 3,705,581 | | Chase Commercial Mortgage Securities Corp., 1997-2 D
| | 6.60 | | | 12/19/29 | | | 3,899,755 |
| | 1,689,000 | | Greenwich Capital Commercial Funding Corp.,
2004-GG1 A1 | | 5.32 | | | 06/10/36 | | | 1,718,354 |
| | 2,000,000 | | Morgan Stanley Capital I, 1997-C1F(b) | | 6.85 | | | 02/15/20 | | | 2,100,107 |
| | 3,601,000 | | Morgan Stanley Capital I, 1999-WF1 B | | 6.32 | | | 11/15/31 | | | 3,798,947 |
| | 3,150,000 | | Morgan Stanley Dean Witter Capital I,
2000-LIF2 C | | 7.50 | | | 10/15/33 | | | 3,524,429 |
| | 4,000,000 | | Mortgage Capital Funding, Inc.,
1996-MC1 G | | 7.15 | | | 06/15/06 | | | 4,125,009 |
| | | | | | | | | | | |
| | | | | | | | | | | | |
Principal
| | | | Rate
| | | Maturity
Date
| | Value
|
| | COMMERCIAL MORTGAGE-BACKED SECURITIES — (continued) |
| $ | 1,009,000 | | Mortgage Capital Funding, Inc.,
1996-MC2 D | | 7.26 | % | | 10/20/06 | | $ | 1,052,172 |
| | 836,000 | | Mortgage Capital Funding, Inc.,
1997-MC2 C(a) | | 6.88 | | | 11/20/27 | | | 881,797 |
| | 3,061,000 | | Mortgage Capital Funding, Inc.,
1998-MC1 C | | 6.95 | | | 03/18/30 | | | 3,252,450 |
| | 2,521,000 | | Nomura Asset Securities Corp.,
1998-D6 A4(a) | | 7.61 | | | 03/15/30 | | | 2,892,223 |
| | 3,601,000 | | Wachovia Bank Commercial Mortgage Trust,
2003-C9 A3 | | 4.61 | | | 12/15/35 | | | 3,560,007 |
| | 2,305,000 | | Wachovia Bank Commercial Mortgage Trust,
2004-C12 A3 | | 5.23 | | | 07/15/41 | | | 2,353,477 |
| | | | | | | | | | |
|
|
| | | | TOTAL COMMERCIAL MORTGAGE-BACKED SECURITIES
(Cost $33,891,204) | | | 34,604,105 |
| | | | | | | | | | |
|
|
| | CORPORATE BONDS — 14.11% |
| | 505,000 | | AK Steel Corp. | | 7.75 | | | 06/15/12 | | | 486,063 |
| | 1,117,000 | | America Movil S.A. | | 4.13 | | | 03/01/09 | | | 1,074,240 |
| | 3,421,000 | | Bank One Texas N.A. | | 6.25 | | | 02/15/08 | | | 3,587,344 |
| | 700,000 | | British Telecommunications plc | | 8.88 | | | 12/15/30 | | | 932,742 |
| | 1,081,000 | | CIT Group, Inc. | | 5.88 | | | 10/15/08 | | | 1,122,056 |
| | 961,000 | | CMS Energy Corp. | | 9.88 | | | 10/15/07 | | | 1,042,685 |
| | 1,441,000 | | Comcast Cable Communications | | 6.88 | | | 06/15/09 | | | 1,546,122 |
| | 1,441,000 | | DaimlerChrysler N.A. Holding Corp. | | 7.20 | | | 09/01/09 | | | 1,550,876 |
| | 1,081,000 | | Deutsche Telekom International Finance | | 8.75 | | | 06/15/30 | | | 1,413,408 |
| | 181,000 | | Hercules, Inc. | | 11.13 | | | 11/15/07 | | | 207,245 |
| | 2,773,000 | | Household Finance Corp. | | 8.00 | | | 07/15/10 | | | 3,172,220 |
| | 649,000 | | IMC Global, Inc.,
Series B | | 10.88 | | | 06/01/08 | | | 743,105 |
| | 1,437,000 | | International Lease Finance Corp. | | 4.50 | | | 05/01/08 | | | 1,427,721 |
| | 2,881,000 | | Merrill Lynch & Co. MTN | | 5.00 | | | 02/03/14 | | | 2,822,461 |
| | 1,441,000 | | Prudential Financial, Inc. | | 5.10 | | | 09/20/14 | | | 1,426,740 |
| | 627,000 | | PSEG Energy Holdings, Inc. | | 8.63 | | | 02/15/08 | | | 661,485 |
| | 800,000 | | Qwest Services Corp.(b) | | 14.00 | | | 12/15/10 | | | 926,000 |
| | 1,596,000 | | Sprint Capital Corp. | | 8.38 | | | 03/15/12 | | | 1,865,242 |
| | 1,153,000 | | Time Warner Cos., Inc. | | 7.25 | | | 10/15/17 | | | 1,307,450 |
See Notes to Financial Statements.
17
Excelsior Funds, Inc.
Portfolio of Investments — March 31, 2005
Managed Income Fund — (continued)
| | | | | | | | | | | |
| | | | | | | | | | | | |
Principal
| | | | Rate
| | | Maturity
Date
| | Value
|
| | CORPORATE BONDS — (continued) |
| $ | 1,441,000 | | Wal-Mart Stores | | 4.13 | % | | 02/15/11 | | $ | 1,395,861 |
| | 1,081,000 | | Weyerhaeuser Co. | | 6.88 | | | 12/15/33 | | | 1,200,497 |
| | | | | | | | | | |
|
|
| | | | TOTAL CORPORATE BONDS
(Cost $28,568,554) | | | 29,911,563 |
| | | | | | | | | | |
|
|
| | TAX-EXEMPT SECURITIES — 4.22% |
| | 3,169,000 | | New York State Dormitory Authority, Personal Income Tax Revenue Bonds, Series B,
(AMBAC) | | 5.50 | | | 03/15/28 | | | 3,624,544 |
| | 1,441,000 | | New York State Dormitory Authority, Personal Income Tax Revenue Bonds, Series B,
(AMBAC) | | 5.50 | | | 03/15/30 | | | 1,648,144 |
| | 3,601,000 | | University of Texas Revenue Bonds, Series B | | 5.00 | | | 08/15/33 | | | 3,677,521 |
| | | | | | | | | | |
|
|
| | | | TOTAL TAX-EXEMPT SECURITIES
(Cost $9,257,739) | | | 8,950,209 |
| | | | | | | | | | |
|
|
| | FOREIGN GOVERNMENT OBLIGATION — 1.06% |
| | 2,161,000 | | United Mexican States | | 6.38 | | | 01/16/13 | | | 2,242,038 |
| | | | | | | | | | |
|
|
| | | | TOTAL FOREIGN GOVERNMENT OBLIGATION
(Cost $2,198,956) | | | 2,242,038 |
| | | | | | | | | | |
|
|
| | U.S. GOVERNMENT AGENCY BONDS & NOTES — 10.64% |
| | | | FANNIE MAE — 10.64% | | | |
| | 2,000,000 | | | | 6.25 | | | 02/01/11 | | | 2,137,068 |
| | 18,000,000 | | Discount Note(c) | | 2.73 | | | 05/04/05 | | | 17,954,955 |
| | 5,329,000 | | Discount Note | | 6.25 | | | 10/09/19 | | | 2,455,710 |
| | | | | | | | | | |
|
|
| | | | | | | | | | | | 22,547,733 |
| | | | | | | | | | |
|
|
| | | | TOTAL U.S. GOVERNMENT AGENCY BONDS & NOTES
(Cost $22,250,923) | | | 22,547,733 |
| | | | | | | | | | |
|
|
| U.S. GOVERNMENT AGENCY MORTGAGE PASS THROUGH
SECURITIES — 26.19% |
| | | | FEDERAL HOME LOAN MORTGAGE
CORPORATION — 3.18% |
| | 3,355,322 | | Pool # A20105 | | 5.00 | | | 04/01/34 | | | 3,285,094 |
| | 3,397,249 | | Pool # C01811 | | 5.00 | | | 04/01/34 | | | 3,326,143 |
| | 136,304 | | Pool # C71221 | | 5.00 | | | 09/01/32 | | | 133,860 |
| | | | | | | | | | |
|
|
| | | | | | | | | | | | 6,745,097 |
| | | | | | | | | | |
|
|
| | | | FEDERAL NATIONAL MORTGAGE
ASSOCIATION — 18.92% |
| | 23,988,889 | | Pool # 11996,
May TBA | | 5.00 | | | 05/01/35 | | | 23,381,682 |
| | 1,282,401 | | Pool # 387203 | | 4.80 | | | 01/01/12 | | | 1,286,394 |
| | 1,095,029 | | Pool # 387204 | | 4.80 | | | 01/01/12 | | | 1,098,439 |
| | 5,182,934 | | Pool # 618322 | | 6.00 | | | 12/01/31 | | | 5,304,508 |
| | | | | | | | | | | |
| | | | | | | | | | | | |
Principal/
Shares
| | | | Rate
| | | Maturity
Date
| | Value
|
| U.S. GOVERNMENT AGENCY MORTGAGE PASS THROUGH
SECURITIES — (continued) |
| | | | FEDERAL NATIONAL MORTGAGE
ASSOCIATION — (continued) |
| $ | 2,724,099 | | Pool # 728826 ARM(a) | | 4.10 | % | | 07/01/33 | | $ | 2,705,560 |
| | 6,299,361 | | Pool # 805386 ARM(a) | | 4.94 | | | 01/01/35 | | | 6,307,357 |
| | | | | | | | | | |
|
|
| | | | | | | | | | | | 40,083,940 |
| | | | | | | | | | |
|
|
| | | | GOVERNMENT NATIONAL MORTGAGE
ASSOCIATION — 4.09% |
| | 548,861 | | Pool # 2562 | | 6.00 | | | 03/20/28 | | | 564,684 |
| | 771,468 | | Pool # 267812 | | 8.50 | | | 06/15/17 | | | 841,436 |
| | 2,571,829 | | Pool # 3413 | | 4.50 | | | 07/20/33 | | | 2,457,698 |
| | 2,414,218 | | Pool # 3442 | | 5.00 | | | 09/20/33 | | | 2,381,738 |
| | 36,755 | | Pool # 532751 | | 9.00 | | | 08/15/30 | | | 40,672 |
| | 136,374 | | Pool # 568670 | | 6.50 | | | 04/15/32 | | | 142,611 |
| | 398,889 | | Pool # 780548 | | 8.50 | | | 12/15/17 | | | 433,731 |
| | 391,833 | | Pool # 780865 | | 9.50 | | | 11/15/17 | | | 432,724 |
| | 717,221 | | Pool # 781084 | | 9.00 | | | 12/15/17 | | | 781,102 |
| | 578,818 | | Pool # 80311
ARM(a) | | 3.50 | | | 08/20/29 | | | 586,391 |
| | | | | | | | | | |
|
|
| | | | | | | | | | | | 8,662,787 |
| | | | | | | | | | |
|
|
| | | | TOTAL U.S. GOVERNMENT AGENCY MORTGAGE PASS THROUGH SECURITIES
(Cost $55,007,487) | | | 55,491,824 |
| | | | | | | | | | |
|
|
| | U.S. GOVERNMENT SECURITIES — 11.17% |
| | | | U.S. TREASURY PRINCIPAL ONLY STRIPS — 4.44% |
| | 4,836,000 | | | | 0.00 | | | 05/15/17 | | | 2,714,785 |
| | 4,545,000 | | | | 0.00 | | | 05/15/17 | | | 2,539,382 |
| | 8,642,000 | | | | 0.00 | | | 02/15/20 | | | 4,164,182 |
| | | | | | | | | | |
|
|
| | | | | | | | | | | | 9,418,349 |
| | | | | | | | | | |
|
|
| | | | U.S. TREASURY INFLATION PROTECTED
BONDS — 2.70% |
| | 1,675,595 | | | | 3.88 | | | 01/15/09 | | | 1,847,846 |
| | 3,000,000 | | | | 4.25 | | | 01/15/10 | | | 3,870,789 |
| | | | | | | | | | |
|
|
| | | | | | | | | | | | 5,718,635 |
| | | | | | | | | | |
|
|
| | | | U.S. TREASURY NOTES — 4.03% |
| | 7,000,000 | | (c) | | 3.63 | | | 01/15/10 | | | 6,833,750 |
| | 1,285,000 | | | | 7.63 | | | 11/15/22 | | | 1,701,970 |
| | | | | | | | | | |
|
|
| | | | | | | | | | | | 8,535,720 |
| | | | | | | | | | |
|
|
| | | | TOTAL U.S. GOVERNMENT SECURITIES
(Cost $23,517,454) | | | 23,672,704 |
| | | | | | | | | | |
|
|
| | REGISTERED INVESTMENT COMPANIES — 0.72% |
| | 764,706 | | Dreyfus Government Cash Management Fund | | | 764,706 |
| | 764,706 | | Fidelity U.S. Treasury II Fund | | | 764,705 |
| | | | | | | | | | |
|
|
| | | | TOTAL REGISTERED INVESTMENT COMPANIES
(Cost $1,529,411) | | | 1,529,411 |
| | | | | | | | | | |
|
|
See Notes to Financial Statements.
18
Excelsior Funds, Inc.
Portfolio of Investments — March 31, 2005
Managed Income Fund — (continued)
| | | | | | | |
| | | | | | Value
| |
TOTAL INVESTMENTS
(Cost $209,787,935)(d) | | 100.24 | % | | $ | 212,431,458 | |
| | | | | | | | |
LIABILITIES IN EXCESS OF OTHER ASSETS | | 0.24 | | | | (498,472 | ) |
| | |
|
| |
|
|
|
NET ASSETS | | 100.00 | % | | $ | 211,932,986 | |
| | |
|
| |
|
|
|
| (a) | Variable Rate Security—The rate disclosed is as of March 31, 2005. |
| (b) | Security exempt from registration under Rule 144A of the Securities Act of 1933. This security may be resold in transactions exempt from registration, normally to qualified institutional buyers. At March 31, 2005, these securities amounted to $3,026,107 or 1.43% of net assets. |
| (c) | All or part of the security is segregated by the fund’s custodian to cover future purchase commitments. |
| (d) | Unrealized appreciation (depreciation) of securities: |
| | | | |
Unrealized
Appreciation
| | Unrealized
(Depreciation)
| | Net Unrealized
Appreciation/
(Depreciation)
|
| $3,669,100 | | $(1,025,577) | | $2,643,523 |
AMBAC—American Municipal Bond Assurance Corp.
ARM—Adjustable Rate Mortgage
Discount Note—The rate reported is the discount rate at the time of purchase.
MTN—Medium Term Note
plc—public limited company
STRIPS—Separately Traded Registered Interest and Principal Securities
TBA—To Be Announced
The summary of the Fund’s investments as of March 31, 2005 is as follows: (Unaudited)
| | | | | | | |
Portfolio Diversification
| | % of
Net
Assets
| | | Value
| |
U.S. Government & Agency Securities | | 48.00 | % | | $ | 101,712,261 | |
Commercial Mortgage-Backed Securities | | 16.33 | | | | 34,604,105 | |
Corporate Bonds | | 14.11 | | | | 29,911,563 | |
Collateralized Mortgage Obligations | | 13.76 | | | | 29,159,921 | |
Tax-Exempt Securities | | 4.22 | | | | 8,950,209 | |
Asset Backed Securities | | 2.04 | | | | 4,321,950 | |
Foreign Government Obligation | | 1.06 | | | | 2,242,038 | |
Registered Investment Company | | 0.72 | | | | 1,529,411 | |
| | |
|
| |
|
|
|
Total Investments | | 100.24 | % | | $ | 212,431,458 | |
Other Assets and Liabilities (Net) | | (0.24 | ) | | | (498,472 | ) |
| | |
|
| |
|
|
|
Net Assets | | 100.00 | % | | $ | 211,932,986 | |
| | |
|
| |
|
|
|
See Notes to Financial Statements.
19
Excelsior Funds, Inc.
Portfolio of Investments — March 31, 2005
Intermediate-Term Managed Income Fund
| | | | | | | | | | | |
| | | | | | | | | | | | |
Principal
| | | | Rate
| | | Maturity
Date
| | Value
|
| | ASSET BACKED SECURITIES — 3.21% |
| $ | 2,000,000 | | Capital One Master Trust, 2001-6 C(a) | | 6.70 | % | | 06/15/11 | | $ | 2,108,750 |
| | 3,485,000 | | Capital One Multi-Asset Execution Trust,
2003-A1 A1(b) | | 3.20 | | | 01/15/09 | | | 3,497,569 |
| | 1,625,000 | | Capital One Multi-Asset Execution Trust,
2003-B1 B1(b) | | 3.98 | | | 02/17/09 | | | 1,641,058 |
| | 2,670,000 | | Chase Credit Card Master Trust,
2001-1 C(b) | | 3.66 | | | 06/16/08 | | | 2,683,687 |
| | 1,071,614 | | Chase Funding Mortgage Loan Asset Backed Certificates, 2003-3 2A2(b) | | 3.12 | | | 04/25/33 | | | 1,074,939 |
| | 2,000,000 | | MBNA Master Credit Card Trust USA, 2000-K C(a)(b) | | 3.61 | | | 03/17/08 | | | 1,999,688 |
| | 180,055 | | Residential Asset Mortgage Products, Inc.,
2003-RS8 AI1(b) | | 3.01 | | | 08/25/21 | | | 180,060 |
| | | | | | | | | | |
|
|
| | | | TOTAL ASSET BACKED SECURITIES
(Cost $13,192,026) | | | 13,185,751 |
| | | | | | | | | | |
|
|
| | COLLATERALIZED MORTGAGE OBLIGATIONS — 9.62% |
| | 2,138,663 | | Bank of America Mortgage Securities 2003-A 2A1 | | 3.98 | | | 02/25/33 | | | 2,111,645 |
| | 5,031,932 | | Bear Stearns ARM,
2004-1 11A3(b) | | 3.50 | | | 04/25/34 | | | 4,996,464 |
| | 5,865,669 | | Countrywide Alternative Loan Trust,
2004-22CB 1A1 | | 6.00 | | | 10/25/34 | | | 5,985,673 |
| | 3,117,575 | | Wells Fargo Mortgage Backed Securities Trust,
2004-EE 3A1 | | 3.99 | | | 01/25/35 | | | 3,059,702 |
| | 4,435,466 | | Wells Fargo Mortgage Backed Securities Trust,
2005-AR1 1A1 | | 4.57 | | | 02/25/35 | | | 4,392,550 |
| | | | | | | | | | |
|
|
| | | | | | | | | | | | 20,546,034 |
| | | | | | | | | | |
|
|
| | | | FEDERAL HOME LOAN MORTGAGE
CORPORATION — 2.37% |
| | 2,999,098 | | 2386 QH | | 6.50 | | | 10/15/30 | | | 3,042,935 |
| | 6,647,678 | | 2406 PE | | 6.50 | | | 08/15/30 | | | 6,693,869 |
| | | | | | | | | | |
|
|
| | | | | | | | | | | | 9,736,804 |
| | | | | | | | | | |
|
|
| | | | FEDERAL NATIONAL MORTGAGE
ASSOCIATION — 0.87% |
| | 3,557,543 | | 2001-42 QG | | 6.50 | | | 07/25/30 | | | 3,564,948 |
| | | | | | | | | | |
|
|
| | | | | | | | | | | |
| | | | | | | | | | | | |
Principal
| | | | Rate
| | | Maturity
Date
| | Value
|
| | COLLATERALIZED MORTGAGE OBLIGATIONS — (continued) |
| | | | GOVERNMENT NATIONAL MORTGAGE
ASSOCIATION — 1.37% |
| $ | 2,800,000 | | 2005-10 MW | | 4.67 | % | | 09/16/25 | | $ | 2,753,931 |
| | 2,925,000 | | 2005-14 B | | 4.48 | | | 08/16/32 | | | 2,856,947 |
| | | | | | | | | | |
|
|
| | | | | | | | | | | | 5,610,878 |
| | | | | | | | | | |
|
|
| | | | TOTAL COLLATERALIZED
MORTGAGE OBLIGATIONS
(Cost $39,876,165) | | | 39,458,664 |
| | | | | | | | | | |
|
|
| | COMMERCIAL MORTGAGE-BACKED SECURITIES — 14.75% |
| | 4,327,000 | | Bear Stearns Commercial Mortgage Securities, 2005-PWR7 A3 | | 5.12 | | | 02/11/41 | | | 4,325,648 |
| | 2,000,000 | | Commercial Mortgage Asset Trust,
1999-C1 B | | 7.23 | | | 01/17/32 | | | 2,296,213 |
| | 3,556,000 | | Commercial Mortgage Asset Trust,
1999-C2 C | | 7.80 | | | 11/17/32 | | | 4,246,677 |
| | 2,667,506 | | DLJ Mortgage Acceptance Corp., 1996-CF2 A3(a) | | 7.38 | | | 11/12/21 | | | 2,733,006 |
| | 3,955,456 | | DLJ Mortgage Acceptance Corp., 1997-CF2 A1B(a) | | 6.82 | | | 10/15/30 | | | 4,137,189 |
| | 3,900,000 | | GMAC Commercial Mortgage Securities, Inc., 1999-C1 C | | 6.59 | | | 05/15/33 | | | 4,167,427 |
| | 1,847,468 | | LB-UBS Commercial Mortgage Trust,
2001-C2 A1 | | 6.27 | | | 06/15/20 | | | 1,928,667 |
| | 3,713,081 | | Midland Realty Acceptance Corp., 1996-C2 B | | 7.34 | | | 01/25/29 | | | 3,855,134 |
| | 3,085,000 | | Morgan Stanley Dean Witter Capital I,
2003-TOP9 A2 | | 4.74 | | | 11/13/36 | | | 3,042,606 |
| | 3,104,000 | | Morgan Stanley Dean Witter Capital I,
2005-HQ5 A4 | | 5.17 | | | 01/14/42 | | | 3,114,185 |
| | 3,000,000 | | Mortgage Capital Funding, Inc.,
1996-MC1 G | | 7.15 | | | 06/15/06 | | | 3,093,758 |
| | 2,402,770 | | Mortgage Capital Funding, Inc.,
1996-MC2 C | | 7.22 | | | 12/21/26 | | | 2,500,914 |
| | 3,410,000 | | Nomura Asset Securities Corp.,
1998-D6 A1B | | 6.59 | | | 03/15/30 | | | 3,612,143 |
| | 4,025,000 | | Nomura Asset Securities Corp.,
1998-D6 A4(b) | | 7.61 | | | 03/15/30 | | | 4,617,691 |
| | 1,435,000 | | Wachovia Bank Commercial Mortgage Trust,
2002-C1 A4 | | 6.29 | | | 04/15/34 | | | 1,546,086 |
See Notes to Financial Statements.
20
Excelsior Funds, Inc.
Portfolio of Investments — March 31, 2005
Intermediate-Term Managed Income Fund — (continued)
| | | | | | | | | | | |
| | | | | | | | | | | | |
Principal
| | | | Rate
| | | Maturity
Date
| | Value
|
| | COMMERCIAL MORTGAGE-BACKED SECURITIES — (continued) |
| $ | 6,525,000 | | Wachovia Bank Commercial Mortgage Trust,
2003-C9 A3 | | 4.61 | % | | 12/15/35 | | $ | 6,450,720 |
| | 4,775,000 | | Wachovia Bank Commercial Mortgage Trust,
2004-C12 A3 | | 5.23 | | | 07/15/41 | | | 4,875,425 |
| | | | | | | | | | |
|
|
| | | | TOTAL COMMERCIAL MORTGAGE-BACKED SECURITIES
(Cost $60,534,913) | | | 60,543,489 |
| | | | | | | | | | |
|
|
| | CORPORATE BONDS — 28.78% |
| | 500,000 | | AK Steel Corp. | | 7.75 | | | 06/15/12 | | | 481,250 |
| | 3,150,000 | | Allstate Life Global Funding Trust | | 3.85 | | | 01/25/08 | | | 3,102,788 |
| | 1,720,000 | | America Movil S.A. | | 4.13 | | | 03/01/09 | | | 1,654,157 |
| | 1,810,000 | | Bank One Corp. | | 7.63 | | | 10/15/26 | | | 2,205,938 |
| | 4,155,000 | | Caterpillar Financial Services Corp. MTN | | 2.35 | | | 09/15/06 | | | 4,060,269 |
| | 500,000 | | Cincinnati Bell, Inc. | | 8.38 | | | 01/15/14 | | | 492,500 |
| | 2,570,000 | | Cit Group, Inc. | | 5.00 | | | 02/01/15 | | | 2,483,121 |
| | 1,100,000 | | CMS Energy Corp. | | 9.88 | | | 10/15/07 | | | 1,193,500 |
| | 167,000 | | Compagnie Generale de Geophysique S.A. | | 10.63 | | | 11/15/07 | | | 176,185 |
| | 2,975,000 | | Continental Cablevision | | 9.00 | | | 09/01/08 | | | 3,350,594 |
| | 1,835,000 | | Credit Suisse First Boston (USA), Inc. | | 3.88 | | | 01/15/09 | | | 1,785,272 |
| | 2,040,000 | | DaimlerChrysler NA Holding Corp. | | 4.05 | | | 06/04/08 | | | 1,981,126 |
| | 6,000,000 | | FedEx Corp. | | 2.65 | | | 04/01/07 | | | 5,814,264 |
| | 3,150,000 | | Ford Motor
Credit Co. | | 6.88 | | | 02/01/06 | | | 3,192,834 |
| | 2,290,000 | | Ford Motor
Credit Co. | | 5.80 | | | 01/12/09 | | | 2,187,124 |
| | 2,897,961 | | Hainan Airways(b) | | 3.01 | | | 12/15/07 | | | 2,897,961 |
| | 250,000 | | Hercules, Inc. | | 11.13 | | | 11/15/07 | | | 286,250 |
| | 5,645,000 | | Household Finance Corp. | | 8.00 | | | 07/15/10 | | | 6,457,694 |
| | 350,000 | | IMC Global, Inc., Series B | | 10.88 | | | 06/01/08 | | | 400,750 |
| | 5,500,000 | | International Lease Finance Corp. | | 4.75 | | | 01/13/12 | | | 5,331,189 |
| | 5,300,000 | | John Deere Capital Corp. MTN(b) | | 2.85 | | | 07/11/05 | | | 5,303,943 |
| | 2,685,000 | | John Deere Capital Corp. MTN | | 3.38 | | | 10/01/07 | | | 2,622,619 |
| | 4,130,000 | | JP Morgan Chase & Co. | | 5.25 | | | 05/30/07 | | | 4,211,373 |
| | 3,435,000 | | Legg Mason, Inc. | | 6.75 | | | 07/02/08 | | | 3,666,581 |
| | 5,000,000 | | Lehman Brothers Holdings, Inc. | | 4.25 | | | 01/27/10 | | | 4,873,100 |
| | 4,065,000 | | Limited Brands, Inc. | | 5.25 | | | 11/01/14 | | | 3,862,238 |
| | | | | | | | | | | |
| | | | | | | | | | | | |
Principal
| | | | Rate
| | | Maturity
Date
| | Value
|
| | CORPORATE BONDS — (continued) |
| $ | 2,130,000 | | Mercantile Bancorp | | 7.30 | % | | 06/15/07 | | $ | 2,261,031 |
| | 75,000 | | Merrill Lynch & Co. | | 3.00 | | | 04/30/07 | | | 73,385 |
| | 5,100,000 | | Morgan Stanley | | 4.75 | | | 04/01/14 | | | 4,855,807 |
| | 2,000,000 | | Nationwide Life Global Funding, Inc.(a) | | 5.35 | | | 02/15/07 | | | 2,037,292 |
| | 1,955,000 | | Nisource Finance Corp. | | 7.88 | | | 11/15/10 | | | 2,229,439 |
| | 3,625,000 | | Pepsi Bottling
Group, llc | | 2.45 | | | 10/16/06 | | | 3,541,614 |
| | 1,975,000 | | Prudential Financial, Inc. | | 5.10 | | | 09/20/14 | | | 1,955,455 |
| | 1,200,000 | | Qwest Services Corp(a) | | 14.00 | | | 12/15/10 | | | 1,389,000 |
| | 1,750,000 | | Susquehanna Bancshares, Inc. | | 6.05 | | | 11/01/12 | | | 1,818,313 |
| | 1,915,000 | | Telefonos de
Mexico S.A. | | 4.50 | | | 11/19/08 | | | 1,882,727 |
| | 4,185,000 | | Textron Financial Corp. MTN(b) | | 3.94 | | | 04/24/06 | | | 4,236,777 |
| | 2,415,000 | | Time Warner Entertainment | | 8.38 | | | 03/15/23 | | | 2,959,039 |
| | 3,850,000 | | US Bank NA | | 2.87 | | | 02/01/07 | | | 3,773,612 |
| | 5,075,000 | | Wachovia Corp. | | 3.50 | | | 08/15/08 | | | 4,925,414 |
| | 1,555,000 | | Wachovia Corp. | | 5.25 | | | 08/01/14 | | | 1,559,427 |
| | 2,225,000 | | Wells Fargo Bank NA | | 7.80 | | | 06/15/10 | | | 2,243,877 |
| | 2,268,000 | | Weyerhauser Co. | | 5.25 | | | 12/15/09 | | | 2,312,065 |
| | | | | | | | | | |
|
|
| | | | TOTAL CORPORATE BONDS
(Cost $118,812,620) | | | 118,128,894 |
| | | | | | | | | | |
|
|
| | TAX-EXEMPT SECURITIES — 0.69% |
| | 2,600,000 | | California State, Infrastructure & Economic Development Bank, Revenue Bonds, Bay Area Toll Bridges Project, Series A | | 5.25 | | | 07/01/16 | | | 2,830,750 |
| | | | | | | | | | |
|
|
| | | | TOTAL TAX-EXEMPT SECURITIES
(Cost $2,832,977) | | | 2,830,750 |
| | | | | | | | | | |
|
|
| | FOREIGN GOVERNMENT OBLIGATION — 0.51% |
| | 1,990,000 | | United Mexican States | | 6.63 | | | 03/03/15 | | | 2,073,580 |
| | | | | | | | | | |
|
|
| | | | TOTAL FOREIGN GOVERNMENT OBLIGATION
(Cost $1,947,209) | | | 2,073,580 |
| | | | | | | | | | |
|
|
| | U.S. GOVERNMENT AGENCY BONDS & NOTES — 11.91% |
| | | | FANNIE MAE — 9.66% | | | |
| | 8,125,000 | | | | 2.81 | | | 09/28/06 | | | 7,983,861 |
| | 6,150,000 | | | | 3.29 | | | 11/30/06 | | | 6,085,554 |
| | 8,125,000 | | | | 3.63 | | | 01/19/07 | | | 8,073,845 |
| | 775,000 | | | | 4.00 | | | 02/22/07 | | | 772,094 |
| | 11,330,000 | | | | 7.25 | | | 01/15/10 | | | 12,648,925 |
| | 4,050,000 | | | | 5.50 | | | 07/18/12 | | | 4,075,304 |
| | | | | | | | | | |
|
|
| | | | | | | | | | | | 39,639,583 |
| | | | | | | | | | |
|
|
See Notes to Financial Statements.
21
Excelsior Funds, Inc.
Portfolio of Investments — March 31, 2005
Intermediate-Term Managed Income Fund — (continued)
| | | | | | | | | | | | |
| | | | | | | | | | | | | |
Principal
| | | | Rate
| | | Maturity
Date
| | | Value
|
| | U.S. GOVERNMENT AGENCY BONDS & NOTES — (continued) |
| | | | FREDDIE MAC — 2.25% | | | | | | | |
| $ | 5,845,000 | | | | 3.00 | % | | 09/29/06 | | | $ | 5,754,186 |
| | 3,355,000 | | | | 5.13 | | | 07/15/12 | | | | 3,436,792 |
| | 50,000 | | MTN | | 2.85 | | | 01/05/07 | | | | 49,089 |
| | | | | | | | | | | |
|
|
| | | | | | | | | | | | | 9,240,067 |
| | | | | | | | | | | |
|
|
| | | | TOTAL U.S. GOVERNMENT AGENCY BONDS & NOTES
(Cost $49,223,440) | | | | 48,879,650 |
| | | | | | | | | | | |
|
|
| U.S. GOVERNMENT AGENCY MORTGAGE PASS THROUGH
SECURITIES — 11.08% |
| | | | FEDERAL NATIONAL MORTGAGE
ASSOCIATION — 7.90% |
| | 4,625,959 | | Pool # 254800 | | 5.50 | | | 07/01/23 | | | | 4,674,521 |
| | 2,350,000 | | Pool # 360500 | | 6.26 | | | 09/01/13 | | | | 2,548,611 |
| | 2,630,000 | | Pool # 385538 | | 4.79 | | | 11/01/12 | | | | 2,586,108 |
| | 1,221,678 | | Pool # 545290 | | 7.50 | | | 10/01/16 | | | | 1,288,913 |
| | 342,999 | | Pool # 577218 | | 6.00 | | | 04/01/31 | | | | 351,045 |
| | 6,335 | | Pool # 578823 | | 5.50 | | | 04/01/31 | | | | 6,365 |
| | 2,410,980 | | Pool # 624250 | | 6.00 | | | 01/01/17 | | | | 2,491,187 |
| | 261,344 | | Pool # 625797 | | 6.00 | | | 01/01/17 | | | | 270,038 |
| | 4,476,508 | | Pool # 704372 ARM(b) | | 4.51 | | | 05/01/33 | | | | 4,445,860 |
| | 1,076,375 | | Pool # 709693 | | 5.50 | | | 06/01/28 | | | | 1,083,956 |
| | 719,096 | | Pool # 709698 | | 5.50 | | | 06/01/33 | | | | 721,477 |
| | 1,581,202 | | Pool # 725786 | | 6.08 | | | 06/01/09 | | | | 1,653,506 |
| | 2,278,088 | | Pool # 728826 ARM(b) | | 4.10 | | | 07/01/33 | | | | 2,262,584 |
| | 8,003,410 | | Pool # 805386 ARM(b) | | 4.94 | | | 01/01/35 | | | | 8,013,568 |
| | | | | | | | | | | |
|
|
| | | | | | | | | | | | | 32,397,739 |
| | | | | | | | | | | |
|
|
| | | | GOVERNMENT NATIONAL MORTGAGE ASSOCIATION — 3.18% |
| | 21,891 | | Pool # 195801 | | 8.50 | | | 01/15/17 | | | | 23,818 |
| | 9,998 | | Pool # 195833 | | 8.50 | | | 04/15/17 | | | | 10,878 |
| | 3,744,731 | | Pool # 3319 | | 5.00 | | | 12/20/32 | | | | 3,694,557 |
| | 3,706 | | Pool # 334299 | | 8.00 | | | 05/15/23 | | | | 4,000 |
| | 4,376,825 | | Pool # 3442 | | 5.00 | | | 09/20/33 | | | | 4,317,941 |
| | 426,998 | | Pool # 367412 | | 6.00 | | | 11/15/23 | | | | 438,934 |
| | 1,824,860 | | Pool # 604726 | | 4.50 | | | 10/15/33 | | | | 1,749,589 |
| | 2,943,531 | | Pool # 608288 | | 4.50 | | | 09/15/33 | | | | 2,822,117 |
| | | | | | | | | | | |
|
|
| | | | | | | | | | | | | 13,061,834 |
| | | | | | | | | | | |
|
|
| | | | TOTAL U.S. GOVERNMENT AGENCY MORTGAGE PASS THROUGH SECURITIES
(Cost $45,790,398) | | | | 45,459,573 |
| | | | | | | | | | | |
|
|
| | U.S. GOVERNMENT SECURITIES — 15.97% | | | | |
| | | | U.S. TREASURY BILL — 1.22% | | | | |
| | 5,000,000 | | | | 2.46 | | | 05/05/05 | (c) | | | 4,987,873 |
| | | | | | | | | | | |
|
|
| | | | U.S. TREASURY PRINCIPAL ONLY STRIPS — 2.78% |
| | 23,690,000 | | | | 0.00 | | | 02/15/20 | | | | 11,415,121 |
| | | | | | | | | | | |
|
|
| | | | | | | | | | | |
| | | | | | | | | | | | |
Principal/
Shares
| | | | Rate
| | | Maturity
Date
| | Value
|
| | U.S. GOVERNMENT SECURITIES — (continued) |
| | | | U.S. TREASURY NOTES — 11.97% |
| $ | 25,830,000 | | | | 2.00 | % | | 08/31/05 | | $ | 25,721,024 |
| | 21,630,000 | | | | 5.00 | | | 02/15/11 | | | 22,465,567 |
| | 980,000 | | | | 4.25 | | | 11/15/13 | | | 964,879 |
| | | | | | | | | | |
|
|
| | | | | | | | | | | | 49,151,470 |
| | | | | | | | | | |
|
|
| | | | TOTAL U.S. GOVERNMENT
SECURITIES (Cost $65,680,856) | | | 65,554,464 |
| | | | | | | | | | |
|
|
| | REGISTERED INVESTMENT COMPANIES — 3.04% |
| | 6,243,085 | | Dreyfus Government Cash Management Fund | | | 6,243,085 |
| | 6,243,085 | | Fidelity U.S. Treasury II Fund | | | 6,243,084 |
| | | | | | | | | | |
|
|
| | | | TOTAL REGISTERED INVESTMENT COMPANIES
(Cost $12,486,169) | | | 12,486,169 |
| | | | | | | | | | |
|
|
| | | | | | | | |
TOTAL INVESTMENTS
(Cost $410,376,775)(d) | | 99.56 | % | | $ | 408,600,984 |
OTHER ASSETS IN EXCESS OF LIABILITIES | | 0.44 | | | | 1,791,377 |
| | |
|
| |
|
|
NET ASSETS | | 100.00 | % | | $ | 410,392,361 |
| | |
|
| |
|
|
| (a) | Security exempt from registration under Rule 144A of the Securities Act of 1933. This security may be resold in transactions exempt from registration, normally to qualified institutional buyers. At March 31, 2005, these securities amounted to $14,404,925 or 3.51% of net assets. |
| (b) | Variable Rate Security—The rate disclosed is as of March 31, 2005. |
| (c) | The rate shown is the effective yield at the time of purchase. |
| (d) | Unrealized appreciation (depreciation) of securities: |
| | | | |
Unrealized
Appreciation
| | Unrealized
(Depreciation)
| | Net Unrealized
Appreciation/
(Depreciation)
|
| $3,162,102 | | $(4,937,893) | | $(1,775,791) |
ARM—Adjustable Rate Mortgage
llc—Limited Liability Company
MTN—Medium Term Note
STRIPS—Separately Traded Registered Interest and Principal Securities
See Notes to Financial Statements.
22
Excelsior Funds, Inc.
Portfolio of Investments — March 31, 2005
Intermediate-Term Managed Income Fund — (continued)
The summary of the Fund’s investments as of March 31, 2005 is as follows: (Unaudited)
| | | | | | |
Portfolio Diversification
| | % of
Net
Assets
| | | Value
|
U.S. Government & Agency Securities | | 38.96 | % | | $ | 159,893,687 |
Corporate Bonds | | 28.78 | | | | 118,128,894 |
Commercial Mortgage-Backed Securities | | 14.75 | | | | 60,543,489 |
Collateralized Mortgage Obligations | | 9.62 | | | | 39,458,664 |
Asset Backed Securities | | 3.21 | | | | 13,185,751 |
Registered Investment Company | | 3.04 | | | | 12,486,169 |
Tax-Exempt Securities | | 0.69 | | | | 2,830,750 |
Foreign Government Obligation | | 0.51 | | | | 2,073,580 |
| | |
|
| |
|
|
Total Investments | | 99.56 | % | | $ | 408,600,984 |
Other Assets and Liabilities (Net) | | 0.44 | | | | 1,791,377 |
| | |
|
| |
|
|
Net Assets | | 100.00 | % | | $ | 410,392,361 |
| | |
|
| |
|
|
See Notes to Financial Statements.
23
Excelsior Funds, Inc.
Portfolio of Investments — March 31, 2005
Short-Term Government Securities Fund
| | | | | | | | | | | |
| | | | | | | | | | | | |
Principal
| | | | Rate
| | | Maturity
Date
| | Value
|
| | ASSET BACKED SECURITIES — 2.73% |
| $ | 5,000,000 | | Citifinancial Mortgage Securities, Inc., Step Bond, 2003-4 AF2 | | 2.66 | % | | 10/25/33 | | $ | 4,975,919 |
| | 6,000,000 | | Residential Asset Mortgage Products, Inc., 2004-RS6 AI3 | | 4.54 | | | 08/25/28 | | | 6,010,696 |
| | | | | | | | | | |
|
|
| | | | TOTAL ASSET BACKED SECURITIES
(Cost $11,071,784) | | | 10,986,615 |
| | | | | | | | | | |
|
|
| | COLLATERALIZED MORTGAGE OBLIGATIONS — 33.29% |
| | 7,374,995 | | Bank of America Mortgage Securities, 2004-B 2A2(a) | | 4.14 | | | 03/25/34 | | | 7,214,069 |
| | 5,812,546 | | Bear Stearns ARM, 2004-1 11A3(a) | | 3.50 | | | 04/25/34 | | | 5,771,575 |
| | 5,356,515 | | Countrywide Alternative Loan Trust,
2004-16CB 1A2 | | 5.50 | | | 07/25/34 | | | 5,383,899 |
| | | | | | | | | | |
|
|
| | | | | | | | | | | | 18,369,543 |
| | | | | | | | | | |
|
|
| | | | FEDERAL HOME LOAN MORTGAGE
CORPORATION — 15.79% |
| | 4,352,735 | | 2333 KA, | | 6.50 | | | 07/15/31 | | | 4,495,252 |
| | 4,044,557 | | 2659 NC | | 4.00 | | | 04/15/15 | | | 4,046,057 |
| | 9,900,371 | | 2731 EA | | 3.50 | | | 01/15/11 | | | 9,889,796 |
| | 6,391,827 | | 2743 HA | | 4.50 | | | 11/15/09 | | | 6,431,615 |
| | 6,200,000 | | 2752 PA | | 3.50 | | | 11/15/08 | | | 6,187,155 |
| | 6,500,000 | | 2772 YA | | 3.50 | | | 12/15/11 | | | 6,470,204 |
| | 8,835,000 | | 2807 NL | | 3.50 | | | 01/15/15 | | | 8,804,149 |
| | 8,835,000 | | 2808 PA | | 4.00 | | | 09/15/12 | | | 8,840,595 |
| | 8,239,471 | | 2836 TA | | 5.00 | | | 10/15/27 | | | 8,364,770 |
| | | | | | | | | | |
|
|
| | | | | | | | | | | | 63,529,593 |
| | | | | | | | | | |
|
|
| | | | FEDERAL NATIONAL MORTGAGE
ASSOCIATION — 12.94% |
| | 6,919,000 | | 1997-M5 C | | 6.74 | | | 08/25/07 | | | 7,242,798 |
| | 1,502,465 | | 2001-M2 A | | 6.22 | | | 01/25/09 | | | 1,530,563 |
| | 5,337,958 | | 2002-89 CA | | 5.00 | | | 04/25/16 | | | 5,381,683 |
| | 8,600,000 | | 2003-16 PB | | 4.50 | | | 11/25/12 | | | 8,617,038 |
| | 6,163,306 | | 2003-89 DX | | 3.50 | | | 05/25/15 | | | 6,144,237 |
| | 8,337,422 | | 2004-1 HA | | 3.50 | | | 03/25/11 | | | 8,322,248 |
| | 9,276,173 | | 2004-50 MA | | 4.50 | | | 05/25/19 | | | 9,298,159 |
| | 5,617,067 | | 2004-W4 A1 | | 2.75 | | | 06/25/34 | | | 5,563,490 |
| | | | | | | | | | |
|
|
| | | | | | | | | | | | 52,100,216 |
| | | | | | | | | | |
|
|
| | | | TOTAL COLLATERALIZED MORTGAGE OBLIGATIONS
(Cost $136,213,447) | | | 133,999,352 |
| | | | | | | | | | |
|
|
| | COMMERCIAL MORTGAGE-BACKED SECURITIES — 8.14% |
| | 6,990,000 | | Chase Commercial Mortgage Securities Corp., 1996-2 C | | 6.90 | | | 11/19/28 | | | 7,273,046 |
| | 6,000,000 | | Greenwich Capital Commercial Funding Corp.,
2004-GG1 A2 | | 3.84 | | | 06/10/36 | | | 5,933,662 |
| | | | | | | | | | | |
| | | | | | | | | | | | |
Principal
| | | | Rate
| | | Maturity
Date
| | Value
|
| | COMMERCIAL MORTGAGE-BACKED SECURITIES — (continued) |
| $ | 5,000,000 | | JP Morgan Chase Commercial Mortgage Securities Corp.,
2005-LDP1 A2 | | 4.63 | % | | 03/15/46 | | $ | 4,983,792 |
| | 316,905 | | LB Commercial Conduit Mortgage Trust,
1998-C1 A2 | | 6.40 | | | 02/18/30 | | | 318,625 |
| | 5,028,684 | | Morgan Stanley Capital, 1996-C1 C(b) | | 7.39 | | | 02/15/28 | | | 5,110,544 |
| | 5,000,000 | | Mortgage Capital Funding, Inc.,
1996-MC1 C | | 7.80 | | | 06/15/28 | | | 5,157,988 |
| | 3,000,000 | | Mortgage Capital Funding, Inc.,
2005-HQ5 A1 | | 4.52 | | | 01/14/42 | | | 3,001,406 |
| | 997,365 | | Nationslink Funding Corp., 1998-2 A1 | | 6.00 | | | 08/20/30 | | | 1,004,164 |
| | | | | | | | | | |
|
|
| | | | TOTAL COMMERCIAL MORTGAGE-BACKED SECURITIES
(Cost $34,041,834) | | | 32,783,227 |
| | | | | | | | | | |
|
|
| | U.S. GOVERNMENT AGENCY BONDS & NOTES — 11.46% |
| | | | FANNIE MAE — 5.40% | | | | | | |
| | 13,000,000 | | | | 3.00 | | | 11/22/06 | | | 12,806,430 |
| | 6,000,000 | | | | 3.29 | | | 11/30/06 | | | 5,937,126 |
| | 3,000,000 | | | | 3.63 | | | 01/19/07 | | | 2,981,112 |
| | | | | | | | | | |
|
|
| | | | | | | | | | | | 21,724,668 |
| | | | | | | | | | |
|
|
| | | | FEDERAL HOME LOAN BANK — 2.81% | | | |
| | 11,500,000 | | | | 3.38 | | | 09/14/07 | | | 11,320,002 |
| | | | | | | | | | |
|
|
| | | | FREDDIE MAC — 3.25% | | | | | | |
| | 13,250,000 | | MTN | | 2.15 | | | 02/17/06 | | | 13,077,710 |
| | | | | | | | | | |
|
|
| | | | TOTAL U.S. GOVERNMENT AGENCY BONDS & NOTES
(Cost $46,760,258) | | | 46,122,380 |
| | | | | | | | | | |
|
|
| U.S. GOVERNMENT AGENCY MORTGAGE PASS THROUGH
SECURITIES — 25.19% |
| | | | FEDERAL HOME LOAN MORTGAGE
CORPORATION — 3.49% |
| | 4,802,684 | | Pool # 1B1081 ARM(a) | | 3.81 | | | 09/01/33 | | | 4,882,832 |
| | 639,748 | | Pool # C68593 | | 7.00 | | | 11/01/28 | | | 676,713 |
| | 5,183,611 | | Pool # E01582 | | 6.00 | | | 01/01/19 | | | 5,357,419 |
| | 3,179,617 | | Pool # M90903 | | 4.00 | | | 03/01/09 | | | 3,150,808 |
| | | | | | | | | | |
|
|
| | | | | | | | | | | | 14,067,772 |
| | | | | | | | | | |
|
|
| | | | FEDERAL NATIONAL MORTGAGE
ASSOCIATION — 20.84% |
| | 1,604,868 | | Pool # 253509 | | 7.50 | | | 11/01/15 | | | 1,693,191 |
| | 1,498,623 | | Pool # 254196 | | 6.00 | | | 02/01/17 | | | 1,548,478 |
| | 4,039,962 | | Pool # 254475 | | 6.50 | | | 10/01/17 | | | 4,219,890 |
| | 4,919,227 | | Pool # 254800 | | 5.50 | | | 07/01/23 | | | 4,970,868 |
| | 1,316,419 | | Pool # 323572 | | 7.50 | | | 01/01/29 | | | 1,413,558 |
| | 2,111,872 | | Pool # 323597 | | 6.50 | | | 01/01/29 | | | 2,200,094 |
See Notes to Financial Statements.
24
Excelsior Funds, Inc.
Portfolio of Investments — March 31, 2005
Short-Term Government Securities Fund — (continued)
| | | | | | | | | | | |
| | | | | | | | | | | | |
Principal
| | | | Rate
| | | Maturity
Date
| | Value
|
| U.S. GOVERNMENT AGENCY MORTGAGE PASS THROUGH
SECURITIES — (continued) |
| | | | FEDERAL NATIONAL MORTGAGE
ASSOCIATION — (continued) |
| $ | 11,600,000 | | Pool # 34738, TBA | | 6.00 | % | | 05/01/35 | | $ | 11,828,380 |
| | 2,787,835 | | Pool # 375575 | | 6.60 | | | 12/01/07 | | | 2,906,188 |
| | 653,478 | | Pool # 516210 | | 8.00 | | | 08/01/14 | | | 691,393 |
| | 71,610 | | Pool # 517390 | | 8.00 | | | 11/01/11 | | | 75,783 |
| | 681,671 | | Pool # 535377 | | 8.00 | | | 06/01/15 | | | 721,105 |
| | 2,425,741 | | Pool # 535863 | | 6.00 | | | 03/01/16 | | | 2,507,152 |
| | 525,539 | | Pool # 535981 | | 8.00 | | | 01/01/16 | | | 555,940 |
| | 653,042 | | Pool # 545362 ARM(a) | | 5.86 | | | 12/01/31 | | | 666,117 |
| | 2,427,702 | | Pool # 555412 | | 6.00 | | | 04/01/18 | | | 2,508,530 |
| | 390,187 | | Pool # 612310 | | 6.00 | | | 09/01/16 | | | 403,168 |
| | 2,700,012 | | Pool # 634195 | | 7.50 | | | 10/01/28 | | | 2,899,249 |
| | 3,000,000 | | Pool # 725704 | | 6.00 | | | 08/01/34 | | | 3,067,251 |
| | 5,786,541 | | Pool # 766684 ARM(a) | | 4.45 | | | 03/01/34 | | | 5,764,687 |
| | 6,304,883 | | Pool # 770870 ARM(a) | | 4.35 | | | 04/01/34 | | | 6,238,235 |
| | 4,758,560 | | Pool # 780840 | | 4.50 | | | 06/01/34 | | | 4,733,486 |
| | 7,368,731 | | Pool # 786076 ARM(a) | | 4.79 | | | 07/01/34 | | | 7,345,877 |
| | 9,959,457 | | Pool # 786423 ARM(a) | | 4.63 | | | 07/01/34 | | | 9,911,658 |
| | 4,999,916 | | Pool # 805386 ARM(a) | | 4.94 | | | 01/01/35 | | | 5,006,263 |
| | | | | | | | | | |
|
|
| | | | | | | | | | | | 83,876,541 |
| | | | | | | | | | |
|
|
| | | | GOVERNMENT NATIONAL MORTGAGE ASSOCIATION — 0.86% |
| | 635,024 | | Pool # 780240 | | 8.50 | | | 09/15/09 | | | 656,554 |
| | 152,263 | | Pool # 780752 | | 8.50 | | | 04/15/10 | | | 153,753 |
| | 758,853 | | Pool # 781036 | | 8.00 | | | 10/15/17 | | | 815,671 |
| | 927,502 | | Pool # 781181 | | 9.00 | | | 12/15/09 | | | 976,828 |
| | 246,379 | | Pool # 80385(a) | | 3.25 | | | 03/20/30 | | | 248,963 |
| | 583,946 | | Pool # 8378(a) | | 3.75 | | | 07/20/18 | | | 590,881 |
| | | | | | | | | | |
|
|
| | | | | | | | | | | | 3,442,650 |
| | | | | | | | | | |
|
|
| | | | TOTAL U.S. GOVERNMENT AGENCY MORTGAGE PASS THROUGH SECURITIES
(Cost $102,239,175) | | | 101,386,963 |
| | | | | | | | | | |
|
|
| | U.S. GOVERNMENT SECURITIES — 16.51% |
| | | | U.S. TREASURY INFLATION PROTECTED
BONDS — 2.84% |
| | 10,623,600 | | | | 3.63 | | | 01/15/08 | | | 11,425,480 |
| | | | | | | | | | |
|
|
| | | | | | | | | | | |
| | | | | | | | | | | | |
Principal/
Shares
| | | | Rate
| | | Maturity
Date
| | Value
|
| | U.S. GOVERNMENT SECURITIES — (continued) |
| | | | U.S. TREASURY NOTES — 13.67% |
| $ | 9,500,000 | | | | 1.63 | % | | 02/28/06 | | $ | 9,348,589 |
| | 22,500,000 | | | | 2.50 | | | 05/31/06 | | | 22,231,057 |
| | 11,390,000 | | | | 2.75 | | | 07/31/06 | | | 11,262,307 |
| | 5,000,000 | | | | 3.13 | | | 01/31/07 | | | 4,943,360 |
| | 7,150,000 | | | | 4.38 | | | 05/15/07 | | | 7,229,880 |
| | | | | | | | | | |
|
|
| | | | | | | | | | | | 55,015,193 |
| | | | | | | | | | |
|
|
| | | | TOTAL U.S. GOVERNMENT SECURITIES
(Cost $67,181,386) | | | 66,440,673 |
| | | | | | | | | | |
|
|
| | REGISTERED INVESTMENT COMPANIES — 3.35% |
| | 6,738,974 | | Dreyfus Government Cash Management Fund | | | 6,738,974 |
| | 6,738,975 | | Fidelity U.S. Treasury II Fund | | | 6,738,976 |
| | | | | | | | | | |
|
|
| | | | TOTAL REGISTERED INVESTMENT COMPANIES
(Cost $13,477,950) | | | 13,477,950 |
| | | | | | | | | | |
|
|
| | | | | | | |
TOTAL INVESTMENTS
(Cost $410,985,834)(c) | | 100.67 | % | | $ | 405,197,160 | |
LIABILITIES IN EXCESS OF OTHER ASSETS | | (0.67 | ) | | | (2,679,353 | ) |
| | |
|
| |
|
|
|
NET ASSETS | | 100.00 | % | | $ | 402,517,807 | |
| | |
|
| |
|
|
|
| (a) | Variable Rate Security—The rate disclosed is as of March 31, 2005. |
| (b) | Security exempt from registration under Rule 144A of the Securities Act of 1933. This security may be resold in transactions exempt from registration, normally to qualified institutional buyers. At March 31, 2005, these securities amounted to $5,110,544 or 1.27% of net assets. |
| (c) | Unrealized appreciation (depreciation) of securities: |
| | | | |
Unrealized
Appreciation
| | Unrealized
(Depreciation)
| | Net Unrealized
Appreciation/
(Depreciation)
|
$209,593 | | $(5,998,267) | | $(5,788,674) |
ARM—Adjustable Rate Mortgage
MTN—Medium Term Note
Step Bond—Coupon rate increases in increments to maturity. Rate disclosed is as of March 31, 2005.
TBA—To Be Announced
See Notes to Financial Statements.
25
Excelsior Funds, Inc.
Portfolio of Investments — March 31, 2005
Short-Term Government Securities Fund — (continued)
The summary of the Fund’s investments as of March 31, 2005 is as follows: (Unaudited)
| | | | | | | |
Portfolio Diversification
| | % of
Net
Assets
| | | Value
| |
U.S. Government & Agency Securities | | 53.16 | % | | $ | 213,950,016 | |
Collateralized Mortgage Obligations | | 33.29 | | | | 133,999,352 | |
Commercial Mortgage-Backed Securities | | 8.14 | | | | 32,783,227 | |
Registered Investment Company | | 3.35 | | | | 13,477,950 | |
Asset Backed Securities | | 2.73 | | | | 10,986,615 | |
| | |
|
| |
|
|
|
Total Investments | | 100.67 | % | | $ | 405,197,160 | |
Other Assets and Liabilities (Net) | | (0.67 | ) | | | (2,679,353 | ) |
| | |
|
| |
|
|
|
Net Assets | | 100.00 | % | | $ | 402,517,807 | |
| | |
|
| |
|
|
|
See Notes to Financial Statements.
26
Excelsior Funds Trust
Portfolio of Investments — March 31, 2005
High Yield Fund
| | | | | | | | | | | |
Principal
| | | | Rate
| | | Maturity
Date
| | Value
|
| | | | | | | | | | | | |
| | CORPORATE BONDS — 95.78% | | | |
| | | | ADVERTISING PERIODICALS — 1.32% |
| $ | 976,000 | | Dex Media West llc/Dex Media Finance Co. | | 9.88 | % | | 08/15/13 | | $ | 1,088,240 |
| | 1,000,000 | | RH Donnelley Finance Corp.(a) | | 10.88 | | | 12/15/12 | | | 1,152,500 |
| | | | | | | | | | |
|
|
| | | | | | | | | | | | 2,240,740 |
| | | | | | | | | | |
|
|
| | | | AGRICULTURAL CHEMICALS — 2.53% |
| | 500,000 | | IMC Global, Inc., Series B | | 11.25 | | | 06/01/11 | | | 557,500 |
| | 2,000,000 | | IMC Global, Inc., Series B, Unsecured | | 11.25 | | | 06/01/11 | | | 2,230,000 |
| | 1,298,000 | | Terra Capital, Inc. | | 11.50 | | | 06/01/10 | | | 1,492,700 |
| | | | | | | | | | |
|
|
| | | | | | | | | | | | 4,280,200 |
| | | | | | | | | | |
|
|
| | | | AUTO – TRUCK PARTS & EQUIPMENT — 3.48% |
| | 1,000,000 | | Accuride Corp.(a) | | 8.50 | | | 02/01/15 | | | 980,000 |
| | 4,000,000 | | Collins & Aikman Products(a) | | 12.88 | | | 08/15/12 | | | 1,800,000 |
| | 2,000,000 | | Dana Corp. | | 9.00 | | | 08/15/11 | | | 2,190,976 |
| | 1,000,000 | | Dura Operating Corp. | | 8.63 | | | 04/15/12 | | | 922,500 |
| | | | | | | | | | |
|
|
| | | | | | | | | | | | 5,893,476 |
| | | | | | | | | | |
|
|
| | | | CABLE TV — 1.06% |
| | 1,000,000 | | Charter Communications Holdings II | | 10.25 | | | 09/15/10 | | | 1,020,000 |
| | 1,000,000 | | Charter Communications Holdings llc/ Charter Communications Holdings Capital Corp. | | 8.63 | | | 04/01/09 | | | 772,500 |
| | | | | | | | | | |
|
|
| | | | | | | | | | | | 1,792,500 |
| | | | | | | | | | |
|
|
| | | | CASINO HOTELS — 11.43% |
| | 2,000,000 | | Ameristar Casinos, Inc. | | 10.75 | | | 02/15/09 | | | 2,185,000 |
| | 2,000,000 | | Aztar Corp. | | 7.88 | | | 06/15/14 | | | 2,125,000 |
| | 1,000,000 | | Boyd Gaming Corp. | | 8.75 | | | 04/15/12 | | | 1,082,500 |
| | 2,000,000 | | Caesars Entertainment, Inc. | | 8.88 | | | 09/15/08 | | | 2,192,500 |
| | 1,680,000 | | Kerzner International, Ltd. | | 8.88 | | | 08/15/11 | | | 1,801,800 |
| | 2,000,000 | | MGM Mirage, Inc. | | 8.50 | | | 09/15/10 | | | 2,190,000 |
| | 2,000,000 | | Penn National Gaming, Inc. | | 8.88 | | | 03/15/10 | | | 2,120,000 |
| | 2,000,000 | | Poster Financial Group | | 8.75 | | | 12/01/11 | | | 2,080,000 |
| | 1,000,000 | | Resorts International Hotel and Casino, Inc. | | 11.50 | | | 03/15/09 | | | 1,138,750 |
| | 2,250,000 | | River Rock Entertainment | | 9.75 | | | 11/01/11 | | | 2,463,750 |
| | | | | | | | | | |
|
|
| | | | | | | | | | | | 19,379,300 |
| | | | | | | | | | |
|
|
| | | | | | | | | | | |
Principal
| | | | Rate
| | | Maturity
Date
| | Value
|
| | | | | | | | | | | | |
| | CORPORATE BONDS — (continued) | | | |
| | | | CELLULAR TELECOM — 3.18% |
| $ | 2,000,000 | | American Cellular Corp. | | 10.00 | % | | 08/01/11 | | $ | 1,840,000 |
| | 1,000,000 | | Centennial Cellular Operating Co./Centennial Communications Corp. | | 10.13 | | | 06/15/13 | | | 1,105,000 |
| | 1,000,000 | | Dobson Communications Corp. | | 8.88 | | | 10/01/13 | | | 785,000 |
| | 500,000 | | Rogers Wireless, Inc. | | 7.50 | | | 03/15/15 | | | 516,250 |
| | 1,000,000 | | Western Wireless Corp. | | 9.25 | | | 07/15/13 | | | 1,140,000 |
| | | | | | | | | | |
|
|
| | | | | | | | | | | | 5,386,250 |
| | | | | | | | | | |
|
|
| | | | CHEMICALS – DIVERSIFIED — 3.27% | | | |
| | 2,000,000 | | Equistar Chemicals L.P./ Equistar Funding Corp. | | 10.63 | | | 05/01/11 | | | 2,245,000 |
| | 2,000,000 | | Lyondell Chemical Co. | | 9.50 | | | 12/15/08 | | | 2,140,000 |
| | 1,000,000 | | Lyondell Chemical Co. | | 10.50 | | | 06/01/13 | | | 1,150,000 |
| | | | | | | | | | |
|
|
| | | | | | | | | | | | 5,535,000 |
| | | | | | | | | | |
|
|
| | | | CHEMICALS – PLASTICS — 1.29% | | | |
| | 1,000,000 | | PolyOne Corp. | | 10.63 | | | 05/15/10 | | | 1,110,000 |
| | 1,000,000 | | PolyOne Corp. | | 8.88 | | | 05/01/12 | | | 1,070,000 |
| | | | | | | | | | |
|
|
| | | | | | | | | | | | 2,180,000 |
| | | | | | | | | | |
|
|
| | | | CHEMICALS – SPECIALTY — 2.28% | | | |
| | 1,500,000 | | Crompton Corp. | | 9.88 | | | 08/01/12 | | | 1,717,500 |
| | 2,000,000 | | Johnsondiversey, Inc., Series B | | 9.63 | | | 05/15/12 | | | 2,150,000 |
| | | | | | | | | | |
|
|
| | | | | | | | | | | | 3,867,500 |
| | | | | | | | | | |
|
|
| | | | COMMERCIAL SERVICES — 1.77% | | | |
| | 2,000,000 | | Iron Mountain, Inc. | | 8.63 | | | 04/01/13 | | | 2,020,000 |
| | 1,000,000 | | Iron Mountain, Inc. | | 7.75 | | | 01/15/15 | | | 987,500 |
| | | | | | | | | | |
|
|
| | | | | | | | | | | | 3,007,500 |
| | | | | | | | | | |
|
|
| | | | COMPUTER SERVICES — 0.59% | | | |
| | 1,000,000 | | Unisys Corp. | | 7.88 | | | 04/01/08 | | | 1,005,000 |
| | | | | | | | | | |
|
|
| | | | CONSUMER PRODUCTS – MISCELLANEOUS — 1.26% |
| | 2,000,000 | | Armkel llc/ Armkel Finance | | 9.50 | | | 08/15/09 | | | 2,132,500 |
| | | | | | | | | | |
|
|
| | | | CONTAINERS – METAL/GLASS — 4.18% |
| | 2,500,000 | | Ball Corp. | | 6.88 | | | 12/15/12 | | | 2,578,125 |
| | 3,000,000 | | Crown European Holdings S.A. | | 10.88 | | | 03/01/13 | | | 3,480,000 |
| | 1,000,000 | | Owens-Illinois, Inc. | | 7.50 | | | 05/15/10 | | | 1,030,000 |
| | | | | | | | | | |
|
|
| | | | | | | | | | | | 7,088,125 |
| | | | | | | | | | |
|
|
See Notes to Financial Statements.
27
Excelsior Funds Trust
Portfolio of Investments — March 31, 2005
High Yield Fund — (continued)
| | | | | | | | | | | |
Principal
| | | | Rate
| | | Maturity
Date
| | Value
|
| | | | | | | | | | | | |
| | CORPORATE BONDS — (continued) | | | |
| | | | CONTAINERS – PAPER/PLASTIC — 3.32% |
| $ | 2,000,000 | | Graham Packaging Co.(a) | | 8.50 | % | | 10/15/12 | | $ | 2,000,000 |
| | 2,000,000 | | Radnor Holdings, Inc. | | 11.00 | | | 03/15/10 | | | 1,480,000 |
| | 2,000,000 | | Stone Container Corp. | | 9.75 | | | 02/01/11 | | | 2,140,000 |
| | | | | | | | | | |
|
|
| | | | | | | | | | | | 5,620,000 |
| | | | | | | | | | |
|
|
| | | | COSMETICS & TOILETRIES — 0.42% | | | |
| | 750,000 | | Del Laboratories, Inc.(a) | | 8.00 | | | 02/01/12 | | | 720,000 |
| | | | | | | | | | |
|
|
| | | | DISTRIBUTION/WHOLESALE — 1.14% | | | |
| | 2,000,000 | | Nebraska Book Co. | | 8.63 | | | 03/15/12 | | | 1,935,000 |
| | | | | | | | | | |
|
|
| | | | DIVERSIFIED OPERATIONS — 0.73% | | | |
| | 1,340,000 | | Stena AB | | 7.00 | | | 12/01/16 | | | 1,239,500 |
| | | | | | | | | | |
|
|
| | | | ELECTRIC – GENERATION — 0.97% | | | |
| | 1,500,000 | | AES Corp. | | 9.50 | | | 06/01/09 | | | 1,640,625 |
| | | | | | | | | | |
|
|
| | | | ELECTRIC – INTERGRATED — 2.68% | | | |
| | 2,000,000 | | CMS Energy Corp. | | 9.88 | | | 10/15/07 | | | 2,170,000 |
| | 2,305,000 | | PSEG Energy Holdings, Inc. | | 7.75 | | | 04/16/07 | | | 2,368,388 |
| | | | | | | | | | |
|
|
| | | | | | | | | | | | 4,538,388 |
| | | | | | | | | | |
|
|
| | | | FORESTRY — 0.57% | | | |
| | 1,000,000 | | Tembec Industries, Inc. | | 8.63 | | | 06/30/09 | | | 965,000 |
| | | | | | | | | | |
|
|
| | | | FUNERAL SERVICES & RELATED ITEMS — 1.22% |
| | 1,000,000 | | Service Corp. International | | 7.70 | | | 04/15/09 | | | 1,030,000 |
| | 1,000,000 | | Service Corp. International, Unsecured | | 7.70 | | | 04/15/09 | | | 1,030,000 |
| | | | | | | | | | |
|
|
| | | | | | | | | | | | 2,060,000 |
| | | | | | | | | | |
|
|
| | | | GAS – DISTRIBUTION — 1.22% |
| | 2,000,000 | | SEMCO Energy, Inc. | | 7.75 | | | 05/15/13 | | | 2,066,338 |
| | | | | | | | | | |
|
|
| | | | HOME FURNISHINGS — 0.62% |
| | 1,000,000 | | Sealy Mattress Co. | | 8.25 | | | 06/15/14 | | | 1,042,500 |
| | | | | | | | | | |
|
|
| | | | LIFE/HEALTH INSURANCE — 1.24% |
| | 2,000,000 | | Americo Life, Inc.(a) | | 7.88 | | | 05/01/13 | | | 2,099,464 |
| | | | | | | | | | |
|
|
| | | | MACHINE TOOLS & RELATED PRODUCTS — 0.71% |
| | 1,250,000 | | Thermadyne Holdings Corp. | | 9.25 | | | 02/01/14 | | | 1,200,000 |
| | | | | | | | | | |
|
|
| | | | MACHINERY – FARM — 1.24% |
| | 2,000,000 | | AGCO Corp. | | 9.50 | | | 05/01/08 | | | 2,095,000 |
| | | | | | | | | | |
|
|
| | | | MEDICAL – DRUGS — 0.30% |
| | 500,000 | | Warner Chilcott Corp.(a) | | 8.75 | | | 02/01/15 | | | 502,500 |
| | | | | | | | | | |
|
|
| | | | | | | | | | | |
Principal
| | | | Rate
| | | Maturity
Date
| | Value
|
| | | | | | | | | | | | |
| | CORPORATE BONDS — (continued) | | | |
| | | | MEDICAL – HOSPITALS — 0.62% |
| $ | 1,000,000 | | IASIS Healthcare llc/ IASIS Capital Corp. | | 8.75 | % | | 06/15/14 | | $ | 1,042,500 |
| | | | | | | | | | |
|
|
| | | | MEDICAL PRODUCTS — 0.58% |
| | 1,000,000 | | Encore Medical IHC, Inc.,(a) | | 9.75 | | | 10/01/12 | | | 975,000 |
| | | | | | | | | | |
|
|
| | | | METAL – ALUMINUM — 4.18% |
| | 12,033,000 | | Ormet Corp., In Default(a) | | 11.00 | | | 08/15/08 | | | 7,099,470 |
| | | | | | | | | | |
|
|
| | | | METAL PROCESSORS & FABRICATORS — 0.32% |
| | 500,000 | | Mueller Group, Inc. | | 10.00 | | | 05/01/12 | | | 540,000 |
| | | | | | | | | | |
|
|
| | | | MISCELLANEOUS MANUFACTURING — 1.63% |
| | 2,000,000 | | IPC Acquisition Corp. | | 11.50 | | | 12/15/09 | | | 2,200,000 |
| | 500,000 | | Reddy Ice Group, Inc. | | 8.88 | | | 08/01/11 | | | 556,250 |
| | | | | | | | | | |
|
|
| | | | | | | | | | | | 2,756,250 |
| | | | | | | | | | |
|
|
| | | | MULTI-LINE INSURANCE — 1.35% |
| | 2,128,000 | | Allmerica Financial Corp. | | 7.63 | | | 10/15/25 | | | 2,279,875 |
| | | | | | | | | | |
|
|
| | | | MUSIC — 1.58% |
| | 1,600,000 | | Warner Music Group | | 7.38 | | | 04/15/14 | | | 1,648,000 |
| | 1,000,000 | | WMG Holdings Corp.(a) | | 7.39 | | | 12/15/11 | | | 1,025,000 |
| | | | | | | | | | |
|
|
| | | | | | | | | | | | 2,673,000 |
| | | | | | | | | | |
|
|
| | | | OFFICE AUTOMATION & EQUIPMENT — 1.52% |
| | 1,000,000 | | Xerox Capital Trust I | | 8.00 | | | 02/01/27 | | | 1,000,000 |
| | 1,500,000 | | Xerox Corp. | | 7.63 | | | 06/15/13 | | | 1,567,500 |
| | | | | | | | | | |
|
|
| | | | | | | | | | | | 2,567,500 |
| | | | | | | | | | |
|
|
| | | | OIL – EXPLORATION & PRODUCTION — 0.94% |
| | 1,500,000 | | Baytex Energy, Ltd. | | 9.63 | | | 07/15/10 | | | 1,590,000 |
| | | | | | | | | | |
|
|
| | | | OIL REFINING & MARKETING — 1.32% |
| | 2,000,000 | | Premcor Refining Group, Inc. | | 9.50 | | | 02/01/13 | | | 2,235,000 |
| | | | | | | | | | |
|
|
| | | | PAPER & RELATED PRODUCTS — 4.88% |
| | 2,500,000 | | Caraustar Industries, Inc. | | 9.88 | | | 04/01/11 | | | 2,625,000 |
| | 2,000,000 | | Intertape Polymer US, Inc. | | 8.50 | | | 08/01/14 | | | 1,966,170 |
| | 2,000,000 | | Mercer International, Inc. | | 9.25 | | | 02/15/13 | | | 1,890,000 |
| | 1,750,000 | | Norske Skog Canada, Series D | | 8.63 | | | 06/15/11 | | | 1,811,250 |
| | | | | | | | | | |
|
|
| | | | | | | | | | | | 8,292,420 |
| | | | | | | | | | |
|
|
See Notes to Financial Statements.
28
Excelsior Funds Trust
Portfolio of Investments — March 31, 2005
High Yield Fund — (continued)
| | | | | | | | | | | |
Principal
| | | | Rate
| | | Maturity
Date
| | Value
|
| | | | | | | | | | | | |
| | CORPORATE BONDS — (continued) | | | |
| | | | PHYSICIANS PRACTICE MANAGEMENT — 2.04% |
| $ | 2,000,000 | | Ameripath, Inc. | | 10.50 | % | | 04/01/13 | | $ | 1,990,000 |
| | 1,000,000 | | US Oncology Holdings, Inc(a) | | 8.62 | | | 03/15/15 | | | 942,500 |
| | 500,000 | | US Oncology Holdings, Inc.(a) | | 9.00 | | | 08/15/12 | | | 527,500 |
| | | | | | | | | | |
|
|
| | | | | | | | | | | | 3,460,000 |
| | | | | | | | | | |
|
|
| | | | REITS – HOTELS — 0.64% |
| | 1,000,000 | | La Quinta Properties, Inc. | | 8.88 | | | 03/15/11 | | | 1,080,000 |
| | | | | | | | | | |
|
|
| | | | RENTAL AUTO/EQUIPMENT — 1.14% |
| | 2,000,000 | | United Rentals, Inc. | | 7.75 | | | 11/15/13 | | | 1,940,000 |
| | | | | | | | | | |
|
|
| | | | RESORTS/THEME PARKS — 0.54% |
| | 1,000,000 | | Six Flags, Inc. | | 9.63 | | | 06/01/14 | | | 922,500 |
| | | | | | | | | | |
|
|
| | | | RETAIL – ARTS & CRAFTS — 1.25% |
| | 2,000,000 | | Michaels Stores, Inc. | | 9.25 | | | 07/01/09 | | | 2,112,500 |
| | | | | | | | | | |
|
|
| | | | RETAIL – DISCOUNT — 0.61% |
| | 1,000,000 | | Shopko Stores | | 9.25 | | | 03/15/22 | | | 1,040,000 |
| | | | | | | | | | |
|
|
| | | | RETAIL – DRUG STORE — 1.15% |
| | 2,000,000 | | Jean Coutu Group, Inc. | | 8.50 | | | 08/01/14 | | | 1,942,500 |
| | | | | | | | | | |
|
|
| | | | RETAIL – MAJOR DEPARTMENT STORE — 1.20% |
| | 1,500,000 | | JC Penney Co., Inc. | | 8.00 | | | 03/01/10 | | | 1,500,000 |
| | 500,000 | | Saks, Inc. | | 8.25 | | | 11/15/08 | | | 527,500 |
| | | | | | | | | | |
|
|
| | | | | | | | | | | | 2,027,500 |
| | | | | | | | | | |
|
|
| | | | SATELLITE TELECOM — 1.19% |
| | 1,000,000 | | Inmarsat Finance plc | | 7.63 | | | 06/30/12 | | | 995,000 |
| | 1,000,000 | | Intelsat Bermuda, Ltd.(a) | | 8.63 | | | 01/15/15 | | | 1,020,000 |
| | | | | | | | | | |
|
|
| | | | | | | | | | | | 2,015,000 |
| | | | | | | | | | |
|
|
| | | | SCHOOLS — 0.57% |
| | 1,000,000 | | Knowledge Learning Center(a) | | 7.75 | | | 02/01/15 | | | 965,000 |
| | | | | | | | | | |
|
|
| | | | SEISMIC DATA COLLECTION — 1.24% |
| | 1,997,000 | | Compagnie Generale de Geophysique S.A. | | 10.63 | | | 11/15/07 | | | 2,106,835 |
| | | | | | | | | | |
|
|
| | | | STEEL – PRODUCERS — 1.45% |
| | 1,000,000 | | AK Steel Corp. | | 7.75 | | | 06/15/12 | | | 962,500 |
| | 1,298,000 | | United States Steel, Inc. | | 10.75 | | | 08/01/08 | | | 1,492,700 |
| | | | | | | | | | |
|
|
| | | | | | | | | | | | 2,455,200 |
| | | | | | | | | | |
|
|
| | | | TELEPHONE – INTERGRATED — 6.71% |
| | 3,000,000 | | Cincinnati Bell, Inc. | | 8.38 | | | 01/15/14 | | | 2,955,000 |
| | 500,000 | | Cincinnati Bell, Inc., MTN | | 6.33 | | | 12/30/05 | | | 497,500 |
| | 1,000,000 | | Citizens Communications | | 9.25 | | | 05/15/11 | | | 1,095,000 |
| | | | | | | | | | | |
Principal
| | | | Rate
| | | Maturity
Date
| | Value
|
| | | | | | | | | | | | |
| | CORPORATE BONDS — (continued) | | | |
| | | | TELEPHONE – INTERGRATED — (continued) |
| $ | 1,000,000 | | Consolidated Communications Holdings, Inc.(a) | | 9.75 | % | | 04/01/12 | | $ | 1,060,000 |
| | 1,000,000 | | Eircom Funding | | 8.25 | | | 08/15/13 | | | 1,087,500 |
| | 1,000,000 | | Madison River Capital llc/ Madison River Financial Corp. | | 13.25 | | | 03/01/10 | | | 1,070,000 |
| | 3,000,000 | | Qwest Services Corp.(a) | | 14.50 | | | 12/15/14 | | | 3,622,500 |
| | | | | | | | | | |
|
|
| | | | | | | | | | | | 11,387,500 |
| | | | | | | | | | |
|
|
| | | | TRANSPORTATION – MARINE — 1.98% |
| | 3,000,000 | | Overseas Shipholding Group | | 8.75 | | | 12/01/13 | | | 3,360,000 |
| | | | | | | | | | |
|
|
| | | | TRANSPORTATION – RAIL — 1.13% |
| | 1,750,000 | | Kansas City Southern | | 9.50 | | | 10/01/08 | | | 1,907,500 |
| | | | | | | | | | |
|
|
| | | | TOTAL CORPORATE BONDS
(Cost $162,745,201) | | | 162,285,456 |
| | | | | | | | | | |
|
|
| | U.S. GOVERNMENT & AGENCY OBLIGATION — 2.18% |
| | | | FEDERAL HOME LOAN BANK – DISCOUNT
NOTE — 2.18% |
| | 3,700,000 | | | | 2.38 | | | 04/01/05 | | | 3,699,755 |
| | | | | | | | | | |
|
|
| | | | TOTAL U.S. GOVERNMENT & AGENCY OBLIGATION (Cost $3,700,000) | | | 3,699,755 |
| | | | | | | | | | |
|
|
| | | | | | |
TOTAL INVESTMENTS
(Cost $166,457,693)(b) | | 97.96 | % | | $ | 165,985,211 |
OTHER ASSETS IN EXCESS OF LIABILITIES | | 2.04 | | | | 3,461,857 |
| | |
|
| |
|
|
NET ASSETS | | 100.00 | % | | $ | 169,447,068 |
| | |
|
| |
|
|
| (a) | Security exempt from registration under Rule 144A of the Securities Act of 1933. This security may be resold in transactions exempt from registration, normally to qualified institutional buyers. At March 31, 2005, these securities amounted to $26,491,434 or 15.63% of net assets. |
| (b) | Unrealized appreciation (depreciation) of securities: |
| | | | |
Unrealized
Appreciation
| | Unrealized
(Depreciation)
| | Net Unrealized
Appreciation/
(Depreciation)
|
| $4,824,005 | | $(5,296,487) | | $(472,482) |
Discount Note—The rate reported on the Portfolio of Investments is the discount rate at the time of purchase.
In Default—Security in default on interest payments
llc—Limited Liability Company
L.P.—Limited Partnership
Ltd.—Limited
MTN—Medium Term Note
plc—public limited company
Unsecured—Issued in exchange of 144A security
See Notes to Financial Statements.
29
Excelsior Funds Trust
Portfolio of Investments — March 31, 2005
High Yield Fund — (continued)
The summary of the Fund’s investments as of March 31, 2005 is as follows: (Unaudited)
| | | | | | |
Sector Diversification
| | % of
Net
Assets
| | | Market Value
|
Consumer Discretionary | | 30.20 | % | | $ | 51,174,016 |
Raw/Intermediate Materials | | 27.96 | | | | 47,382,915 |
Telecommunication | | 9.90 | | | | 16,773,750 |
Technology | | 5.25 | | | | 8,889,335 |
Industrials | | 5.10 | | | | 8,638,250 |
Energy | | 4.94 | | | | 8,363,388 |
Health Care | | 4.75 | | | | 8,040,000 |
Financials | | 2.58 | | | | 4,379,339 |
Utilities | | 2.19 | | | | 3,706,963 |
U.S. Government & Agency Obligations | | 2.18 | | | | 3,699,755 |
Consumer Staples | | 1.68 | | | | 2,852,500 |
Real Estate | | 0.64 | | | | 1,080,000 |
Information Technology | | 0.59 | | | | 1,005,000 |
| | |
|
| |
|
|
Total Investment | | 97.96 | % | | $ | 165,985,211 |
Other Assets and Liabilities (Net) | | 2.04 | | | | 3,461,857 |
| | |
|
| |
|
|
Net Assets | | 100.00 | % | | $ | 169,447,068 |
| | |
|
| |
|
|
See Notes to Financial Statements.
30
Excelsior Tax-Exempt Funds, Inc.
Portfolio of Investments — March 31, 2005
Long-Term Tax-Exempt Fund
| | | | | | | | | | | |
| | | | | | | | | | |
Principal
| | | | Rate
| | | Maturity
Date
| | Value
|
| TAX-EXEMPT CASH EQUIVALENT SECURITIES — 31.04% |
| $ | 2,500,000 | | Fairfax County, Virgina, Economic Development Authority, Smithsonian Institution Revenue Bonds, Series A, (SPA: Bank of America N.A.)(a) | | 2.20 | % | | 12/01/33 | | $ | 2,500,000 |
| | 2,500,000 | | Marshall County, West Virginia, Pollution Control, Mountaineer Carbon Revenue Bonds(a) | | 2.30 | | | 12/01/20 | | | 2,500,000 |
| | 2,500,000 | | Michigan State University Revenue Bonds, Series B, (SPA: Landesbank Hessen-Thueringen)(a) | | 2.22 | | | 02/15/26 | | | 2,500,000 |
| | 2,500,000 | | New Jersey State, Sports & Exposition Authority Revenue Bonds, Series B-1, (MBIA) (SPA: JP Morgan Chase Bank)(a) | | 2.20 | | | 03/01/21 | | | 2,500,000 |
| | 2,500,000 | | Palm Beach County, Florida, School Board Certificate Participation, (AMBAC) (SPA: Dexia Credit Local)(a) | | 2.23 | | | 08/01/29 | | | 2,500,000 |
| | 2,500,000 | | Pennsylvania State University Revenue Bonds, Series A, (SPA: JP Morgan Chase Bank)(a) | | 2.26 | | | 04/01/31 | | | 2,500,000 |
| | 2,000,000 | | Uinta County, Wyoming, Pollution Control, Chevron (USA), Inc. Project Revenue Bonds(a) | | 2.28 | | | 08/15/20 | | | 2,000,000 |
| | 2,500,000 | | University of Missouri Revenue Bonds, Systems Facilities, Series B(a) | | 2.30 | | | 11/01/30 | | | 2,500,000 |
| | | | | | | | | | |
|
|
| | | | TOTAL TAX-EXEMPT CASH EQUIVALENT SECURITIES
(Cost $19,500,000) | | | 19,500,000 |
| | | | | | | | | | |
|
|
| | | | | | | | | | | |
| | | | | | | | | | |
Principal
| | | | Rate
| | | Maturity
Date
| | Value
|
| TAX-EXEMPT SECURITIES — 49.98% | | |
| $ | 3,000,000 | | Clark County, Nevada, School District General Obligation Bonds, Series A, (FSA) | | 5.00 | % | | 06/15/15 | | $ | 3,245,520 |
| | 3,000,000 | | Connecticut State, Health & Educational Facilities Authority Revenue Bonds, Connecticut State University Systems, Series E, (FGIC) | | 5.00 | | | 11/01/33 | | | 3,093,300 |
| | 3,000,000 | | Maryland State, State & Local Facilities Loan General Obligation Bonds, 1st Series | | 5.00 | | | 08/01/16 | | | 3,263,010 |
| | 3,000,000 | | New York City, New York, Municipal Water Finance Authority Revenue Bonds, Water & Sewer Systems, Series C | | 5.00 | | | 06/15/35 | | | 3,084,420 |
| | 3,000,000 | | New York State, Environmental Facilities Revenue Bonds, Clean Water & Drinking Revolving Foods, 2nd Resolution | | 5.00 | | | 06/15/33 | | | 3,091,290 |
| | 3,000,000 | | North Carolina State, Public Improvement General Obligation Bonds, Series A | | 5.00 | | | 03/01/16 | | | 3,260,280 |
| | 3,000,000 | | Orlando & Orange County, Florida, Expressway Authority Revenue Bonds, Series B, (AMBAC) | | 5.00 | | | 07/01/35 | | | 3,091,680 |
| | 3,000,000 | | Seattle, Washington, Municipal Light & Power Revenue Bonds, (FSA) | | 5.00 | | | 11/01/28 | | | 3,094,830 |
| | 3,000,000 | | University of California Revenue Bonds, Multiple Purpose Projects, Series Q, (FSA) | | 5.00 | | | 09/01/34 | | | 3,078,540 |
| | 3,000,000 | | University of North Carolina Revenue Bonds, Series Q, (FSA) | | 5.00 | | | 12/01/33 | | | 3,089,040 |
| | | | | | | | | | |
|
|
| | | | TOTAL TAX-EXEMPT SECURITIES
(Cost $30,920,866) | | | 31,391,910 |
| | | | | | | | | | |
|
|
See Notes to Financial Statements.
31
Excelsior Tax-Exempt Funds, Inc.
Portfolio of Investments — March 31, 2005
Long-Term Tax-Exempt Fund — (continued)
| | | | | | | | | | | |
| | | | | | | | | | |
Principal/
Shares
| | | | Rate
| | | Maturity
Date
| | Value
|
| TAX-EXEMPT SECURITIES – ESCROWED IN U.S.
GOVERNMENTS — 14.96% |
| $ | 3,000,000 | | Houston, Texas, Water & Sewer System Revenue Bonds, Series A, (FSA), (Prerefunded 12/01/12 @ 100) | | 5.00 | % | | 12/01/30 | | $ | 3,257,790 |
| | 2,500,000 | | Long Island Power Authority, New York Electric System Revenue Bonds, Series A, (FSA), (Escrowed to Maturity) | | 5.25 | | | 12/01/14 | | | 2,786,300 |
| | 3,000,000 | | Pennsylvania State General Obligation Bonds, 2nd Series, (FSA), (Prerefunded 05/01/12 @ 100) | | 5.50 | | | 05/01/16 | | | 3,354,990 |
| | | | | | | | | | |
|
|
| | | | TOTAL TAX-EXEMPT SECURITIES –ESCROWED IN U.S. GOVERNMENTS (Cost $9,009,103) | | | 9,399,080 |
| | | | | | | | | | |
|
|
| | REGISTERED INVESTMENT COMPANIES — 1.26% |
| | 1 | | BlackRock Muni Fund | | | 1 |
| | 789,718 | | Dreyfus Tax Exempt Cash Fund | | | 789,718 |
| | | | | | | | | | |
|
|
| | | | TOTAL REGISTERED INVESTMENT COMPANIES
(Cost $789,719) | | | 789,719 |
| | | | | | | | | | |
|
|
| | | | | | |
TOTAL INVESTMENTS
(Cost $60,219,688)(b) | | 97.24 | % | | $ | 61,080,709 |
OTHER ASSETS IN EXCESS OF LIABILITIES | | 2.76 | | | | 1,736,428 |
| | |
|
| |
|
|
NET ASSETS | | 100.00 | % | | $ | 62,817,137 |
| | |
|
| |
|
|
| (a) | Variable Rate Security—The rate disclosed is as of March 31, 2005. |
| (b) | Unrealized appreciation (depreciation) of securities: |
| | | | |
Unrealized
Appreciation
| | Unrealized
(Depreciation)
| | Net Unrealized
Appreciation/
(Depreciation)
|
| $963,983 | | $(102,962) | | $861,021 |
AMBAC—American Municipal Bond Assurance Corp.
FGIC—Financial Guaranty Insurance Corp.
FSA—Financial Security Assurance
MBIA—Municipal Bond Insurance Association
SPA—Standby Purchase Agreement
Notes: (The following notes have not been audited by Deloitte & Touche LLP):
These municipal securities meet the three highest ratings assigned by Moody’s Investors Services, Inc. or Standard and Poor’s Corporation or, where not rated, are determined by the Advisor, under the supervision of the Board of Directors, to be of comparable quality at the time of purchase to rated instruments that may be acquired by the Fund.
At March 31, 2005, approximately 15% of the net assets are invested in municipal securities that have letter of credit enhancement features or escrows in U.S. Government securities backing them, on which the Fund relies. Without such features, the securities may or may not meet the quality standards of securities purchased by the Fund.
See Notes to Financial Statements.
32
Excelsior Tax-Exempt Funds, Inc.
Portfolio of Investments — March 31, 2005
Long-Term Tax-Exempt Fund — (continued)
The summary of the Fund’s investments as of March 31, 2005 is as follows: (Unaudited)
| | | | | | |
State Diversification
| | % of
Net
Assets
| | | Market Value
|
New York | | 14.27 | % | | $ | 8,962,010 |
North Carolina | | 10.11 | | | | 6,349,320 |
Pennsylvania | | 9.32 | | | | 5,854,990 |
Florida | | 8.90 | | | | 5,591,680 |
Maryland | | 5.19 | | | | 3,263,010 |
Texas | | 5.19 | | | | 3,257,790 |
Nevada | | 5.17 | | | | 3,245,520 |
Washington | | 4.93 | | | | 3,094,830 |
Connecticut | | 4.92 | | | | 3,093,300 |
California | | 4.90 | | | | 3,078,540 |
Michigan | | 3.98 | | | | 2,500,000 |
Missouri | | 3.98 | | | | 2,500,000 |
New Jersey | | 3.98 | | | | 2,500,000 |
Virginia | | 3.98 | | | | 2,500,000 |
West Virginia | | 3.98 | | | | 2,500,000 |
Wyoming | | 3.18 | | | | 2,000,000 |
Registered Investment Company | | 1.26 | | | | 789,719 |
| | |
|
| |
|
|
Total Investments | | 97.24 | % | | $ | 61,080,709 |
Other Assets and Liabilities (Net) | | 2.76 | | | | 1,736,428 |
| | |
|
| |
|
|
Net Assets | | 100.00 | % | | $ | 62,817,137 |
| | |
|
| |
|
|
See Notes to Financial Statements.
33
Excelsior Tax-Exempt Funds, Inc.
Portfolio of Investments — March 31, 2005
Intermediate-Term Tax-Exempt Fund
| | | | | | | | | | |
Principal
| | | | Rate
| | | Maturity
Date
| | Value
|
| | | | | | | | | | | |
TAX-EXEMPT CASH EQUIVALENT SECURITIES — 19.65% |
| $10,000,000 | | Alaska State Housing Finance Authority Revenue Bonds, Capital Project, Series C, (MBIA)(a) | | 2.25 | % | | 07/01/22 | | $ | 10,000,000 |
| 14,800,000 | | Iowa State Finance Authority Revenue Bonds, Multi-Family Housing, Village Court Association, Series B(a) | | 2.28 | | | 11/01/15 | | | 14,800,000 |
| 6,500,000 | | Jackson County, Mississippi, Pollution Control Revenue Bonds, Chevron (USA), Inc. Project(a) | | 2.28 | | | 06/01/23 | | | 6,500,000 |
| 14,710,000 | | Kansas State, Department of Transportation Highway Revenue Bonds, Series C-1, (SPA: Westdeutsche Landesbank/Dexia Credit Local)(a) | | 2.22 | | | 09/01/19 | | | 14,710,000 |
| 12,000,000 | | Massachusetts Bay Transportation Authority General Obligation Bonds, Transportation Systems, (SPA: Westdeutsche Landesbank)(a) | | 2.25 | | | 03/01/30 | | | 12,000,000 |
| 10,685,000 | | Valdez, Alaska, Marine Revenue Bonds, BP Pipelines, Inc. Project, Series C(a) | | 2.30 | | | 07/01/37 | | | 10,685,000 |
| | | | | | | | | |
|
|
| | | TOTAL TAX-EXEMPT CASH EQUIVALENT SECURITIES
(Cost $68,695,000) | | | 68,695,000 |
| | | | | | | | | |
|
|
TAX-EXEMPT SECURITIES — 69.78% |
| 10,000,000 | | Clark County, Nevada, School District General Obligation Bonds, Series B, (FSA) | | 5.00 | | | 06/15/12 | | | 10,840,300 |
| 10,000,000 | | Colorado Springs, Colorado, Utilities Revenue Bonds, Series A | | 5.25 | | | 11/15/10 | | | 10,937,400 |
| | | | | | | | | | |
Principal
| | | | Rate
| | | Maturity
Date
| | Value
|
| | | | | | | | | | | |
TAX-EXEMPT SECURITIES — (continued) |
| $10,000,000 | | Connecticut State Special Tax Obligation Revenue Bonds, Transportation Infrastructure, Series A, (FGIC) | | 5.50 | % | | 10/01/10 | | $ | 11,032,900 |
| 10,000,000 | | Cook County, Illinois, General Obligation Bonds, Series D, (AMBAC) | | 5.25 | | | 11/15/11 | | | 10,931,900 |
| 10,000,000 | | Dallas, Texas, Water Works & Sewer System Revenue Bonds, (FSA) | | 5.38 | | | 10/01/12 | | | 11,114,500 |
| 10,000,000 | | Detroit, Michigan, Sewer Disposal Revenue Bonds, Series A, (FSA) | | 5.00 | | | 07/01/14 | | | 10,782,800 |
| 10,000,000 | | Flordia State Division Board Finance Department, General Services Revenue Bonds, Department of Environmental Protection-Preservation 2000, Series A, (FSA) | | 6.00 | | | 07/01/13 | | | 11,581,400 |
| 10,000,000 | | Hawaii State General Obligation Bonds, Series CY, (FSA) | | 5.50 | | | 02/01/12 | | | 11,126,900 |
| 10,000,000 | | Illinois State General Obligation Bonds, First Series, (MBIA) | | 5.50 | | | 08/01/14 | | | 11,206,700 |
| 10,000,000 | | Illinois State Sales Tax Revenue Bonds, First Series, (FSA) | | 5.25 | | | 06/15/13 | | | 10,968,000 |
| 10,000,000 | | Jefferson County, Colorado, School District General Obligation Bonds, (MBIA) | | 6.50 | | | 12/15/11 | | | 11,730,400 |
| 10,000,000 | | Los Angeles, California, Department of Water & Power Revenue Bonds, Series B, (MBIA) | | 5.00 | | | 07/01/13 | | | 10,930,300 |
| 10,000,000 | | Maryland State Capital Improvement General Obligation Bonds, State & Local Facilities, 1st Lien, Series A | | 5.25 | | | 03/01/13 | | | 11,089,800 |
See Notes to Financial Statements.
34
Excelsior Tax-Exempt Funds, Inc.
Portfolio of Investments — March 31, 2005
Intermediate-Term Tax-Exempt Fund — (continued)
| | | | | | | | | | |
Principal
| | | | Rate
| | | Maturity
Date
| | Value
|
| | | | | | | | | | | |
TAX-EXEMPT SECURITIES — (continued) |
| $10,000,000 | | Michigan State Building Authority Revenue Bonds, Facilities Program, Series I, (FSA) | | 5.25 | % | | 10/15/14 | | $ | 10,986,500 |
| 10,000,000 | | New Jersey State General Obligation Bonds, Series D | | 6.00 | | | 02/15/11 | | | 11,291,300 |
| 20,000,000 | | New Jersey State Transportation Trust Fund Authority, Transportation Systems Revenue Bonds, Series C, (FSA) | | 5.50 | | | 12/15/10 | | | 22,069,600 |
| 10,000,000 | | New York State Dormitory Authority, State University Educational Facilities Revenue Bonds, Series B, (FSA) | | 5.25 | | | 05/15/11 | | | 10,960,700 |
| 10,000,000 | | Pennsylvania State General Obligation Bonds | | 5.50 | | | 02/01/13 | | | 11,162,000 |
| 10,000,000 | | Pennsylvania State General Obligation Bonds, First Series, (MBIA) | | 5.25 | | | 02/01/12 | | | 10,989,700 |
| 10,000,000 | | Pennsylvania State General Obligation Bonds, Second Series, (FGIC) | | 5.25 | | | 10/01/14 | | | 11,087,200 |
| 10,000,000 | | South Carolina State Public Services Authority Revenue Bonds, Series A, (FSA) | | 5.50 | | | 01/01/11 | | | 11,086,000 |
| | | | | | | | | |
|
|
| | | TOTAL TAX-EXEMPT SECURITIES
(Cost $238,749,771) | | | 243,906,300 |
| | | | | | | | | |
|
|
TAX-EXEMPT SECURITIES – BACKED BY LETTERS OF
CREDIT — 2.86% |
| 10,000,000 | | Pennsylvania State, Higher Educational Facilities Authority Revenue Bonds, Association of Independent Colleges, Series E-3 (PNC Bank N.A.)(a) | | 2.26 | | | 11/01/14 | | | 10,000,000 |
| | | | | | | | | |
|
|
| | | TOTAL TAX-EXEMPT SECURITIES – BACKED BY LETTERS OF CREDIT
(Cost $10,000,000) | | | 10,000,000 |
| | | | | | | | | |
|
|
| | | | | | | | | | |
Principal/
Shares
| | | | Rate
| | | Maturity
Date
| | Value
|
| | | | | | | | | | | |
TAX-EXEMPT SECURITIES – ESCROWED IN U.S.
GOVERNMENTS — 6.27% |
| $10,000,000 | | Chicago, Illinois, Metropolitan Water Reclamation District Authority General Obligation Bonds, Series A, (Escrowed to Maturity) | | 5.25 | % | | 12/01/10 | | $ | 10,938,700 |
| 10,000,000 | | New Jersey State Transportation Trust Fund Authority, Transportation Systems Revenue Bonds, Series A, (Escrowed to Maturity) | | 5.25 | | | 06/15/11 | | | 10,972,300 |
| | | | | | | | | |
|
|
| | | TOTAL TAX-EXEMPT SECURITIES – ESCROWED IN U.S. GOVERNMENTS
(Cost $20,986,974) | | | 21,911,000 |
| | | | | | | | | |
|
|
REGISTERED INVESTMENT COMPANIES — 0.58% |
| 443,400 | | BlackRock Muni Fund | | | 443,400 |
| 1,580,048 | | Dreyfus Tax Exempt Cash Fund | | | 1,580,048 |
| | | | | | | | | |
|
|
| | | TOTAL REGISTERED INVESTMENT COMPANIES
(Cost $2,023,448) | | | 2,023,448 |
| | | | | | | | | |
|
|
| | | | | | | | |
TOTAL INVESTMENTS
(Cost $340,455,193)(b) | | 99.14 | % | | $ | 346,535,748 |
OTHER ASSETS IN EXCESS OF LIABILITIES | | 0.86 | | | | 3,004,050 |
| | |
|
| |
|
|
NET ASSETS | | 100.00 | % | | $ | 349,539,798 |
| | |
|
| |
|
|
| (a) | Variable Rate Security—The rate disclosed is as of March 31, 2005. |
| (b) | Unrealized appreciation (depreciation) of securities: |
| | | | |
Unrealized
Appreciation
| | Unrealized
(Depreciation)
| | Net Unrealized
Appreciation/
(Depreciation)
|
$7,740,577 | | $(1,660,022) | | $6,080,555 |
AMBAC—American Municipal Bond Assurance Corp.
FGIC—Financial Guaranty Insurance Corp.
FSA—Financial Security Assurance
MBIA—Municipal Bond Insurance Association
SPA—Standby Purchase Agreement
See Notes to Financial Statements.
35
Excelsior Tax-Exempt Funds, Inc.
Portfolio of Investments — March 31, 2005
Intermediate-Term Tax-Exempt Fund — (continued)
Notes: (The following notes have not been audited by Deloitte & Touche LLP):
These municipal securities meet the three highest ratings assigned by Moody’s Investors Services, Inc. or Standard and Poor’s Corporation or, where not rated, are determined by the Advisor, under the supervision of the Board of Directors, to be of comparable quality at the time of purchase to rated instruments that may be acquired by the Fund.
At March 31, 2005, approximately 9% of the net assets are invested in municipal securities that have letter of credit enhancement features or escrows in U.S. Government securities backing them, on which the Fund relies. Without such features, the securities may or may not meet the quality standards of securities purchased by the Fund.
The summary of the Fund’s investments as of March 31, 2005 is as follows: (Unaudited)
| | | | | | |
State Diversification
| | % of
Net
Assets
| | | Market Value
|
New Jersey | | 12.68 | % | | $ | 44,333,200 |
Illinois | | 12.60 | | | | 44,045,300 |
Pennsylvania | | 12.37 | | | | 43,238,900 |
Colorado | | 6.48 | | | | 22,667,800 |
Michigan | | 6.23 | | | | 21,769,300 |
Alaska | | 5.92 | | | | 20,685,000 |
Iowa | | 4.23 | | | | 14,800,000 |
Kansas | | 4.21 | | | | 14,710,000 |
Massachusetts | | 3.43 | | | | 12,000,000 |
Florida | | 3.31 | | | | 11,581,400 |
Hawaii | | 3.18 | | | | 11,126,900 |
Texas | | 3.18 | | | | 11,114,500 |
Maryland | | 3.17 | | | | 11,089,800 |
South Carolina | | 3.17 | | | | 11,086,000 |
Connecticut | | 3.16 | | | | 11,032,900 |
New York | | 3.14 | | | | 10,960,700 |
California | | 3.14 | | | | 10,930,300 |
Nevada | | 3.10 | | | | 10,840,300 |
Mississippi | | 1.86 | | | | 6,500,000 |
Registered Investment Company | | 0.58 | | | | 2,023,448 |
| | |
|
| |
|
|
Total Investments | | 99.14 | % | | $ | 346,535,748 |
Other Assets and Liabilities (Net) | | 0.86 | | | | 3,004,050 |
| | |
|
| |
|
|
Net Assets | | 100.00 | % | | $ | 349,539,798 |
| | |
|
| |
|
|
See Notes to Financial Statements.
36
Excelsior Tax-Exempt Funds, Inc.
Portfolio of Investments — March 31, 2005
Short-Term Tax-Exempt Securities Fund
| | | | | | | | | | |
| | | | | | | | | | | |
Principal
| | | | Rate
| | | Maturity
Date
| | Value
|
TAX-EXEMPT CASH EQUIVALENT SECURITIES — 31.94% |
| $10,000,000 | | Detroit, Michigan,
Water Supply System Revenue Bonds,
Series C, (FGIC) (SPA: FGIC-SPI)(a) | | 2.27 | % | | 07/01/29 | | $ | 10,000,000 |
| 11,500,000 | | Gwinnett County, Georgia, Development Authority Revenue Bonds, Civic & Cultural Center Project (SPA: Landesbank Hessen)(a) | | 2.28 | | | 09/01/31 | | | 11,500,000 |
| 10,000,000 | | Michigan
Technological University Revenue Bonds, Series A, (AMBAC) (SPA: Bank of America)(a) | | 2.30 | | | 10/01/18 | | | 10,000,000 |
| 11,500,000 | | Orlando, Florida, Utilities Commission Water & Electric Revenue Bonds, Series A (SPA: Bayerische Landesbank)(a) | | 2.23 | | | 10/01/17 | | | 11,500,000 |
| 11,500,000 | | Pennsylvania Higher Education Facilities Authority Revenue Bonds, Carnegie Mellon University Project, Series C (SPA: Morgan Guaranty Trust)(a) | | 2.29 | | | 11/01/29 | | | 11,500,000 |
| 10,350,000 | | Pennsylvania State University Revenue Bonds, Series A (GO of University) (SPA: Westdeutsche Landesbank)(a) | | 2.26 | | | 03/01/32 | | | 10,350,000 |
| 11,500,000 | | Triborough Bridge & Tunnel Authority, New York, Revenue Bonds, Series B, (AMBAC) (SPA: State Street Bank and Trust)(a) | | 2.27 | | | 01/01/32 | | | 11,500,000 |
| | | | | | | | | |
|
|
| | | TOTAL TAX-EXEMPT CASH EQUIVALENT SECURITIES
(Cost $76,350,000) | | | 76,350,000 |
| | | | | | | | | |
|
|
| | | | | | | | | | |
| | | | | | | | | | | |
Principal
| | | | Rate
| | | Maturity
Date
| | Value
|
TAX-EXEMPT SECURITIES — 56.23% |
| $10,000,000 | | California State Economic Recovery General Obligation Bonds, Series A | | 5.00 | % | | 07/01/07 | | $ | 10,464,900 |
| 10,000,000 | | Florida State Board of Education Capital Outlay General Obligation Bonds, Series A | | 5.00 | | | 06/01/07 | | | 10,441,800 |
| 6,000,000 | | Georgia State Road & Thruway Authority Revenue Bonds | | 4.00 | | | 10/01/07 | | | 6,155,880 |
| 5,000,000 | | Massachusetts State General Obligation Bonds, Series B | | 4.00 | | | 08/01/06 | | | 5,086,350 |
| 20,000,000 | | Memphis, Tennessee, Electric System Revenue Bonds, Series A, (FSA) | | 5.00 | | | 12/01/07 | | | 21,028,599 |
| 10,000,000 | | Montgomery County, Maryland, General Obligation Bonds, Series A | | 5.00 | | | 11/01/07 | | | 10,542,100 |
| 5,000,000 | | Nassau County, New York, Interim Finance Authority Revenue Bonds, Series B | | 4.00 | | | 11/15/05 | | | 5,043,600 |
| 10,000,000 | | New Jersey State Economic Development Authority Revenue Bonds, School Facilities, Series F | | 5.00 | | | 06/15/07 | | | 10,436,400 |
| 10,000,000 | | New York City, New York, Transitional Finance Authority Revenue Bonds, Future Tax,
Sub-Series D1 | | 5.00 | | | 11/01/07 | | | 10,519,200 |
| 5,000,000 | | Seattle, Washington, Municipal Light & Power Revenue Bonds, (FSA) | | 5.00 | | | 11/01/06 | | | 5,166,400 |
| 10,000,000 | | Texas State Public Finance Authority General Obligation Bonds, Series A | | 5.25 | | | 10/01/07 | | | 10,552,900 |
| 20,000,000 | | Texas State Public Finance Authority Revenue Bonds, Series A, (FSA) | | 5.00 | | | 12/15/07 | | | 21,016,400 |
| 8,000,000 | | University of Maryland Revenue Bonds, Auxiliary Facility & Tuition, Series A | | 5.00 | | | 04/01/05 | | | 8,000,647 |
| | | | | | | | | |
|
|
| | | TOTAL TAX-EXEMPT SECURITIES
(Cost $136,460,152) | | | 134,455,176 |
| | | | | | | | | |
|
|
See Notes to Financial Statements.
37
Excelsior Tax-Exempt Funds, Inc.
Portfolio of Investments — March 31, 2005
Short-Term Tax-Exempt Securities Fund — (continued)
| | | | | | | | | | |
Principal/
Shares
| | | | Rate
| | | Maturity
Date
| | Value
|
| | | | | | | | | | | |
TAX-EXEMPT SECURITIES – BACKED BY LETTERS OF
CREDIT — 8.16% |
| $ 9,500,000 | | New York City, New York, General Obligation Bonds, Sub-Series C-4 (BNP Paribas)(a) | | 2.23 | % | | 08/01/20 | | $ | 9,500,000 |
| 10,000,000 | | New York State
Housing Finance Agency Service
Revenue Bonds,
Series E (BNP Paribas)(a) | | 2.23 | | | 03/15/27 | | | 10,000,000 |
| | | | | | | | | |
|
|
| | | TOTAL TAX-EXEMPT SECURITIES – BACKED BY LETTERS OF CREDIT
(Cost $19,500,000) | | | 19,500,000 |
| | | | | | | | | |
|
|
REGISTERED INVESTMENT COMPANIES — 0.77% |
| 1 | | BlackRock Muni Fund | | | 1 |
| 1,830,236 | | Dreyfus Tax Exempt Cash Fund | | | 1,830,236 |
| | | | | | | | | |
|
|
| | | TOTAL REGISTERED INVESTMENT COMPANIES
(Cost $1,830,237) | | | 1,830,237 |
| | | | | | | | | |
|
|
| | | | | | | | |
TOTAL INVESTMENTS
(Cost $234,140,389)(b) | | 97.10 | % | | $ | 232,135,413 |
OTHER ASSETS IN EXCESS OF
LIABILITIES | | 2.90 | | | | 6,924,622 |
| | |
|
| |
|
|
NET ASSETS | | 100.00 | % | | $ | 239,060,035 |
| | |
|
| |
|
|
| (a) | Variable Rate Security—The rate disclosed is as of March 31, 2005. |
| (b) | Unrealized appreciation (depreciation) of securities: |
| | | | |
Unrealized
Appreciation
| | Unrealized
(Depreciation)
| | Net Unrealized
Appreciation/
(Depreciation)
|
$647 | | $(2,005,623) | | $(2,004,976) |
AMBAC—American Municipal Bond Assurance Corp.
FGIC—Financial Guaranty Insurance Corp.
FGIC—SPI—Financial Guaranty Insurance Corp. Securities Purchase, Inc.
FSA—Financial Security Assurance
SPA—Standby Purchase Agreement
Notes (The following notes have not been audited by Deloitte & Touche LLP):
These municipal securities meet the three highest ratings assigned by Moody’s Investors Services, Inc. or Standard and Poor’s Corporation or, where not rated, are determined by the Advisor, under the supervision of the Board of Directors, to be of comparable quality at the time of purchase to rated instruments that may be acquired by the Fund.
At March 31, 2005, approximately 8% of the net assets are invested in municipal securities that have letter of credit enhancement features or escrows in U.S. Government securities backing them, on which the Fund relies. Without such features, the securities may or may not meet the quality standards of securities purchased by the Fund.
The summary of the Fund’s investments as of March 31, 2005 is as follows: (Unaudited)
| | | | | | |
State Diversification
| | % of
Net
Assets
| | | Market Value
|
New York | | 19.48 | % | | $ | 46,562,800 |
Texas | | 13.20 | | | | 31,569,300 |
Florida | | 9.18 | | | | 21,941,800 |
Pennsylvania | | 9.14 | | | | 21,850,000 |
Tennessee | | 8.80 | | | | 21,028,600 |
Michigan | | 8.37 | | | | 20,000,000 |
Maryland | | 7.76 | | | | 18,542,746 |
Georgia | | 7.38 | | | | 17,655,880 |
California | | 4.38 | | | | 10,464,900 |
New Jersey | | 4.36 | | | | 10,436,400 |
Washington | | 2.16 | | | | 5,166,400 |
Massachusetts | | 2.13 | | | | 5,086,350 |
Registered Investment Company | | 0.76 | | | | 1,830,237 |
| | |
|
| |
|
|
Total Investments | | 97.10 | % | | $ | 232,135,413 |
Other Assets and Liabilities (Net) | | 2.90 | | | | 6,924,622 |
| | |
|
| |
|
|
Net Assets | | 100.00 | % | | $ | 239,060,035 |
| | |
|
| |
|
|
See Notes to Financial Statements.
38
Excelsior Tax-Exempt Fund, Inc.
Portfolio of Investments — March 31, 2005
New York Intermediate-Term Tax-Exempt Fund
| | | | | | | | | | |
| | | | | | | | | | | |
Principal
| | | | Rate
| | | Maturity
Date
| | Value
|
TAX-EXEMPT CASH EQUIVALENT SECURITIES — 16.53% |
| $ 2,100,000 | | Erie County, New York, Water Authority Revenue Bonds,
Series A,
(AMBAC) (SPA: National Australia
Bank)(a) | | 2.26 | % | | 12/1/16 | | $ | 2,100,000 |
| 4,000,000 | | New York City, New York, Municipal Water Finance Authority, Water & Sewer Systems Revenue Bonds, Series C, (FGIC) (SPA:
FGIC-SPI)(a) | | 2.24 | | | 6/15/23 | | | 4,000,000 |
| 2,750,000 | | New York State Dormitory Authority, Mental Health Services Revenue Bonds, Sub-Series
D-2A, (MBIA) (SPA: JP Morgan Chase Bank)(a) | | 2.28 | | | 2/15/31 | | | 2,750,000 |
| 4,500,000 | | Niagara Falls, New York, Bridge Commission Toll Revenue Bonds, Series A, (FGIC) (SPA: Credit Local de France)(a) | | 2.26 | | | 10/1/19 | | | 4,500,000 |
| 3,000,000 | | Port Authority of New York & New Jersey, Special Obligation Revenue Bonds, Versatile Structure Obligations, Series 5, (SPA: Morgan Guaranty Trust)(a) | | 2.24 | | | 5/1/19 | | | 3,000,000 |
| 6,500,000 | | Suffolk County, New York, Water Authority, Bond Anticipation Notes, (SPA: Bank of Nova Scotia)(a) | | 2.22 | | | 1/1/08 | | | 6,500,000 |
| | | | | | | | | |
|
|
| | | TOTAL TAX-EXEMPT CASH EQUIVALENT SECURITIES
(Cost $22,850,000) | | | 22,850,000 |
| | | | | | | | | |
|
|
TAX-EXEMPT SECURITIES — 60.42% |
| 10,000,000 | | Long Island Power Authority, New York Electric Authority Revenue Bonds,
Series A, (AMBAC) | | 5.50 | | | 12/1/11 | | | 11,121,300 |
| | | | | | | | | | |
| | | | | | | | | | | |
Principal
| | | | Rate
| | | Maturity
Date
| | Value
|
TAX-EXEMPT SECURITIES — (continued) |
| $15,000,000 | | Nassau County, New York, Interim Finance Authority Revenue Bonds, Series B, (AMBAC) | | 5.00 | % | | 11/15/12 | | $ | 16,293,000 |
| 6,000,000 | | New York City, New York, Transitional Finance Authority Revenue Bonds, Series A | | 5.25 | | | 11/1/10 | | | 6,533,580 |
| 5,000,000 | | New York State Dormitory Authority, New York University Revenue Bonds, Series A, (AMBAC) | | 5.75 | | | 7/1/12 | | | 5,648,800 |
| 6,000,000 | | New York State Dormitory Authority, Revenue Bonds, Series B | | 5.25 | | | 11/15/23 | | | 6,471,480 |
| 6,000,000 | | New York State Dormitory Authority, State Personal Income Tax Revenue Bonds, Series A | | 5.50 | | | 3/15/12 | | | 6,648,180 |
| 6,000,000 | | New York State Environmental Facilties Revenue Bonds, Municipal Water, Project K | | 5.00 | | | 6/15/12 | | | 6,531,900 |
| 5,000,000 | | New York State Local Government Assistance Corporation Revenue Bonds, Series A-1, (FSA) | | 5.00 | | | 4/1/12 | | | 5,422,700 |
| 6,000,000 | | New York State Thruway Authority Revenue Bonds, Local Highway & Bridge Project, Series C, (MBIA) | | 5.50 | | | 4/1/12 | | | 6,663,660 |
| 6,000,000 | | New York State Thruway Authority, State Personal Income Tax Revenue Bonds, Series A, (AMBAC) | | 5.00 | | | 3/15/16 | | | 6,472,860 |
| 5,000,000 | | Puerto Rico Electric Power Authority Revenue Bonds, Series BB, (MBIA) | | 6.00 | | | 7/1/11 | | | 5,718,950 |
| | | | | | | | | |
|
|
| | | TOTAL TAX-EXEMPT SECURITIES
(Cost $83,610,786) | | | 83,526,410 |
| | | | | | | | | |
|
|
See Notes to Financial Statements.
39
Excelsior Tax-Exempt Fund, Inc.
Portfolio of Investments — March 31, 2005
New York Intermediate-Term Tax-Exempt Fund — (continued)
| | | | | | | | | | |
Principal/ Shares
| | | | Rate
| | | Maturity
Date
| | Value
|
| | | | | | | | | | | |
TAX-EXEMPT SECURITIES – BACKED BY LETTERS OF
CREDIT — 8.90% |
| $ 6,500,000 | | New York City, New York, General Obligation Bonds, Sub-Series H-3, (Bank of
New York)(a) | | 2.21 | % | | 3/1/34 | | $ | 6,500,000 |
| 5,800,000 | | New York State Dormitory Authority, Oxford University Revenue Bonds, (Landesbank Hessen)(a) | | 2.30 | | | 7/1/23 | | | 5,800,000 |
| | | | | | | | | |
|
|
| | | TOTAL TAX-EXEMPT SECURITIES –BACKED BY LETTERS OF CREDIT
(Cost $12,300,000) | | | 12,300,000 |
| | | | | | | | | |
|
|
TAX-EXEMPT SECURITIES – ESCROWED IN
U.S. GOVERNMENTS — 12.91% |
| 10,000,000 | | Long Island Power Authority, New York Electric System Revenue Bonds,
Series A, (FSA) (Escrowed to Maturity) | | 5.25 | | | 12/1/14 | | | 11,145,200 |
| 6,000,000 | | New York State Metropolitan Transportation Authority Revenue Bonds, Service Contract, Series 8, (FSA) (Prerefunded
07/01/13 @ 100) | | 5.38 | | | 7/1/21 | | | 6,707,760 |
| | | | | | | | | |
|
|
| | | TOTAL TAX-EXEMPT SECURITIES –ESCROWED IN U.S. GOVERNMENTS (Cost $18,077,523) | | | 17,852,960 |
| | | | | | | | | |
|
|
REGISTERED INVESTMENT COMPANIES — 0.32% |
| 1 | | Dreyfus New York Tax Exempt Cash Fund | | | 1 |
| 447,785 | | Provident Institutional New York Money Market Fund | | | 447,785 |
| | | | | | | | | |
|
|
| | | TOTAL REGISTERED INVESTMENT COMPANIES
(Cost $447,786) | | | 447,786 |
| | | | | | | | | |
|
|
| | | | | | | | | | |
TOTAL INVESTMENTS
(Cost $137,286,096)(b) | | 99.08 | % | | | | | | $ | 136,977,156 |
OTHER ASSETS IN EXCESS OF LIABILITIES | | 0.92 | | | | | | | | 1,275,750 |
| | |
|
| | | | | |
|
|
NET ASSETS | | 100.00 | % | | | | | | $ | 138,252,906 |
| | |
|
| | | | | |
|
|
| (a) | Variable Rate Security—The rate disclosed is as of March 31, 2005. |
| (b) | Unrealized appreciation (depreciation) of securities: |
| | | | |
Unrealized
Appreciation
| | Unrealized
(Depreciation)
| | Net
Unrealized
Appreciation/
(Depreciation)
|
| $950,876 | | $(1,259,816) | | $(308,940) |
AMBAC—American Municipal Bond Assurance Corp.
FGIC—Financial Guaranty Insurance Corp.
FSA—Financial Security Assurance
MBIA—Municipal Bond Insurance Association
SPA—Standby Purchase Agreement
Notes (The following notes have not been audited by Deloitte & Touche LLP):
These municipal securities meet the three highest ratings assigned by Moody’s Investors Services, Inc. or Standard and Poor’s Corporation or, where not rated, are determined by the Advisor, under the supervision of the Board of Directors, to be of comparable quality at the time of purchase to rated instruments that may be acquired by the Fund.
At March 31, 2005, approximately 22% of the net assets are invested in municipal securities that have letter of credit enhancement features or escrows in U.S. Government securities backing them, on which the Fund relies. Without such features, the securities may or may not meet the quality standards of securities purchased by the Fund.
At March 31,2005, approximately 96% of the net assets are invested in New York municipal securities. Economic changes affecting the state and certain of its public bodies and municipalities may affect the ability of issuers to pay the required principal and interest payments of the municipal securities.
See Notes to Financial Statements.
40
Excelsior Tax-Exempt Fund, Inc.
Portfolio of Investments — March 31, 2005
New York Intermediate-Term Tax-Exempt Fund — (continued)
The summary of the Fund’s investments as of March 31, 2005 is as follows: (Unaudited)
| | | | | | |
Portfolio Diversification
| | % of
Net
Assets
| | | Value
|
Revenue Bonds | | 67.55 | % | | $ | 93,376,410 |
Backed by Letters of Credit | | 8.90 | | | | 12,300,000 |
Escrowed to Maturity | | 8.06 | | | | 11,145,200 |
Prerefunded | | 4.85 | | | | 6,707,760 |
Anticipation Notes | | 4.70 | | | | 6,500,000 |
General Obligation Bonds | | 4.70 | | | | 6,500,000 |
Registered Investment Companies | | 0.32 | | | | 447,786 |
| | |
|
| |
|
|
Total Investments | | 99.08 | % | | $ | 136,977,156 |
Other Assets and Liabilities (Net) | | 0.92 | | | | 1,275,750 |
| | |
|
| |
|
|
Net Assets | | 100.00 | % | | $ | 138,252,906 |
| | |
|
| |
|
|
See Notes to Financial Statements.
41
Excelsior Tax-Exempt Funds, Inc.
Portfolio of Investments — March 31, 2005
California Tax-Exempt Income Fund
| | | | | | | | | | |
| | | | | | | | | | | |
Principal
| | | | Rate
| | | Maturity
Date
| | Value
|
TAX-EXEMPT SECURITIES — 91.81% |
| $ 545,000 | | Alameda-Contra Costa, California, Certificates of Participation, Transportation District, (AMBAC) | | 4.00 | % | | 08/01/12 | | $ | 557,824 |
| 595,000 | | Berkeley, California, Unified School District, General Obligation Bonds, (FGIC) | | 4.38 | | | 08/01/06 | | | 608,774 |
| 35,000 | | California Educational Facilities Authority, Santa Clara University Revenue Bonds, (MBIA) | | 4.90 | | | 09/01/06 | | | 36,108 |
| 750,000 | | California Educational Facilities Authority, Stanford University Revenue Bonds,
Series R | | 5.00 | | | 11/01/11 | | | 824,760 |
| 1,000,000 | | California State Department of Transportation Revenue Bonds, Federal Highway Grant Anticipation Bonds, Series A, (FGIC) | | 4.50 | | | 02/01/13 | | | 1,055,250 |
| 1,000,000 | | California State Department of Water Resources Central Valley Project Revenue Bonds, Series T | | 5.00 | | | 12/01/11 | | | 1,077,690 |
| 500,000 | | California State Department of Water Resources Central Valley Project Revenue Bonds, Series U | | 4.00 | | | 12/01/06 | | | 511,505 |
| 1,000,000 | | California State Department of Water Resources Central Valley Project Revenue Bonds, Series Y | | 5.00 | | | 12/01/10 | | | 1,092,400 |
| 1,000,000 | | California State Economic Recovery, General Obligation Bonds, Series A, (FGIC) | | 5.25 | | | 07/01/14 | | | 1,103,820 |
| 750,000 | | California State General Obligation Bonds | | 6.25 | | | 04/01/08 | | | 816,270 |
| 750,000 | | California State General Obligation Bonds, (MBIA) | | 7.50 | | | 10/01/07 | | | 833,408 |
| | | | | | | | | | |
| | | | | | | | | | | |
Principal
| | | | Rate
| | | Maturity
Date
| | Value
|
TAX-EXEMPT SECURITIES — (continued) |
| $ 750,000 | | California State Infrastructure & Economic Development Bank Revenue Bonds, Bay Area Toll Bridges, Series A, (FSA) | | 5.00 | % | | 07/01/11 | | $ | 819,113 |
| 250,000 | | California State Public Works Board, Lease Revenue Bonds, Department of Corrections, Series D, (MBIA) | | 4.85 | | | 09/01/08 | | | 265,695 |
| 1,000,000 | | California State University Systemwide Revenue Bonds, Series A, (AMBAC) | | 5.00 | | | 11/01/12 | | | 1,093,430 |
| 1,000,000 | | California Statewide Communities Development Authority Revenue Bonds, California Endowment | | 5.00 | | | 07/01/13 | | | 1,093,030 |
| 315,000 | | Central Coast Water Authority, California, Revenue Bonds, State Water Project,
Series A, (AMBAC) | | 6.00 | | | 10/01/05 | | | 320,509 |
| 1,000,000 | | Central Valley School District Financing Authority, California, School District General Obligation Bonds, Series A, (MBIA)(a) | | 6.15 | | | 08/01/09 | | | 1,123,300 |
| 1,100,000 | | Cerritos, California, Public Financing Authority Tax Allocation Bonds, Redevelopment Project, Series A, (AMBAC) | | 3.00 | | | 11/01/10 | | | 1,080,321 |
| 545,000 | | Chino Basin, California, Regional Financing Authority Revenue Bonds, Municipal Water District Sewer System Project, (AMBAC) | | 7.00 | | | 08/01/05 | | | 553,088 |
| 350,000 | | Contra Costa County, California, Certificates of Participation, Capital Projects, (AMBAC) | | 4.63 | | | 02/01/07 | | | 362,079 |
See Notes to Financial Statements.
42
Excelsior Tax-Exempt Funds, Inc.
Portfolio of Investments — March 31, 2005
California Tax-Exempt Income Fund — (continued)
| | | | | | | | | | |
| | | | | | | | | | | |
Principal
| | | | Rate
| | | Maturity
Date
| | Value
|
TAX-EXEMPT SECURITIES — (continued) |
| $ 550,000 | | Contra Costa, California, Transportation Authority Sales Tax Revenue Bonds, Series A, (FGIC) | | 6.00 | % | | 03/01/07 | | $ | 583,688 |
| 1,000,000 | | Contra Costa, California, Transportation Authority Sales Tax Revenue Bonds, Series A, (FGIC) | | 6.00 | | | 03/01/08 | | | 1,087,210 |
| 750,000 | | East Bay, California, Regional Park District Authority General Obligation Bonds | | 5.00 | | | 09/01/07 | | | 789,180 |
| 250,000 | | Escondido, California, Unified School District General Obligation Bonds, Series A, (FGIC) | | 5.00 | | | 09/01/08 | | | 267,075 |
| 1,150,000 | | Fairfield-Suisun, California, Unified School District General Obligation Bonds, (MBIA) | | 4.25 | | | 08/01/10 | | | 1,211,501 |
| 975,000 | | Foothill-De Anza, California, Community College District General Obligation Bonds, (FGIC) | | 5.00 | | | 08/01/14 | | | 1,049,120 |
| 155,000 | | Fresno, California, Sewer Revenue Bonds, Series A-1, (AMBAC) | | 4.80 | | | 09/01/06 | | | 159,695 |
| 750,000 | | Glendale, California, Unified School District General Obligation Bonds, Series D, (MBIA) | | 4.50 | | | 09/01/13 | | | 784,785 |
| 745,000 | | Los Altos, California, School District General Obligation Bonds, Series A, (FSA) | | 5.00 | | | 08/01/06 | | | 768,259 |
| 300,000 | | Los Angeles County, California, Public Works Financing Authority Revenue Bonds, Regional Park & Open Space District, Series A | | 5.25 | | | 10/01/05 | | | 304,128 |
| 500,000 | | Los Angeles, California, Department of Airports Revenue Bonds, Series A, (FGIC) | | 6.00 | | | 05/15/05 | | | 502,257 |
| | | | | | | | | | |
| | | | | | | | | | | |
Principal
| | | | Rate
| | | Maturity
Date
| | Value
|
TAX-EXEMPT SECURITIES — (continued) |
| $1,000,000 | | Los Angeles, California, Department of Water & Power Revenue Bonds, Power System, Series A,
Sub-Series A-1,
(MBIA) | | 5.00 | % | | 07/01/14 | | $ | 1,084,150 |
| 1,000,000 | | Los Angeles, California, General Obligation Bonds, Series A, (MBIA) | | 4.00 | | | 09/01/13 | | | 1,022,930 |
| 150,000 | | Los Angeles, California, Municipal Improvement Corporation Sanitation Equipment Charge Revenue Bonds, Series A, (FSA) | | 4.88 | | | 02/01/06 | | | 152,901 |
| 750,000 | | Los Angeles, California, Municipal Improvement Corporation Sanitation Equipment Charge Revenue Bonds, Series B, (AMBAC) | | 4.60 | | | 02/01/06 | | | 762,840 |
| 1,000,000 | | Los Angeles, California, Sanitation Equipment Charge Revenue Bonds, Series A, (FSA) | | 5.00 | | | 02/01/10 | | | 1,082,120 |
| 500,000 | | Los Angeles, California, Unified School District General Obligation Bonds, Series F, (FSA) | | 4.50 | | | 07/01/13 | | | 528,885 |
| 1,000,000 | | Los Angeles, California, Wastewater System Revenue Bonds, Series A, (FGIC) | | 5.50 | | | 06/01/10 | | | 1,110,980 |
| 370,000 | | Marin, California, Municipal Water District Revenue Bonds, (AMBAC) | | 4.00 | | | 07/01/10 | | | 385,066 |
| 700,000 | | Metropolitan Water District of Southern California, General Obligation Bonds | | 4.25 | | | 03/01/08 | | | 728,119 |
| 1,000,000 | | Metropolitan Water District of Southern California, General Obligation Bonds, Series A | | 3.00 | | | 03/01/08 | | | 1,005,530 |
| 960,000 | | Metropolitan Water District of Southern California, Revenue Bonds | | 5.75 | | | 07/01/09 | | | 1,061,078 |
See Notes to Financial Statements.
43
Excelsior Tax-Exempt Funds, Inc.
Portfolio of Investments — March 31, 2005
California Tax-Exempt Income Fund — (continued)
| | | | | | | | | | |
| | | | | | | | | | | |
Principal
| | | | Rate
| | | Maturity
Date
| | Value
|
TAX-EXEMPT SECURITIES — (continued) |
| $ 120,000 | | Metropolitan Water District of Southern California, Revenue Bonds, Series B, (MBIA) | | 5.25 | % | | 07/01/07 | | $ | 126,400 |
| 1,000,000 | | Modesto, California, Irrigation District Financing Authority Certificates of Participation,
Series A, (MBIA) | | 4.00 | | | 07/01/09 | | | 1,040,300 |
| 975,000 | | Modesto, California, Irrigation District Financing Authority Revenue Bonds, Series A, (MBIA) | | 5.45 | | | 10/01/07 | | | 1,034,085 |
| 1,000,000 | | Moulton-Niguel, California, Water District General Obligation Bonds, (AMBAC) | | 4.00 | | | 09/01/10 | | | 1,039,400 |
| 500,000 | | Napa County, California, Flood Protection & Watershed Improvement Revenue Bonds, Series A, (FGIC) | | 5.00 | | | 06/15/13 | | | 533,725 |
| 250,000 | | Northern California Power Agency, Public Power Revenue Bonds, Geothermal Project, Series A, (AMBAC) | | 5.50 | | | 07/01/05 | | | 251,863 |
| 125,000 | | Northern California Power Agency, Public Power Revenue Bonds, Series A, (AMBAC) | | 5.60 | | | 07/01/06 | | | 129,521 |
| 250,000 | | Novato, California, General Obligation Bonds, Series A, (MBIA) | | 6.25 | | | 08/01/07 | | | 269,400 |
| 1,100,000 | | Orange County, California, Local Transportation Authority Sales Tax Revenue Bonds, 1st Senior, (AMBAC) | | 6.00 | | | 02/15/08 | | | 1,194,511 |
| 1,000,000 | | Orange County, California, Local Transportation Authority Sales Tax Revenue Bonds, 2nd Senior, (FGIC) | | 6.00 | | | 02/15/07 | | | 1,060,030 |
| | | | | | | | | | |
| | | | | | | | | | | |
Principal
| | | | Rate
| | | Maturity
Date
| | Value
|
TAX-EXEMPT SECURITIES — (continued) |
| $1,000,000 | | Oxnard, California, Wastewater District Financing Authority Revenue Bonds, (FGIC) | | 3.50 | % | | 06/01/09 | | $ | 1,020,160 |
| 1,000,000 | | Rancho, California, Water District Financing Authority Revenue Bonds, Series A, (FSA) | | 5.50 | | | 08/01/10 | | | 1,114,280 |
| 255,000 | | Sacramento, California, City Financing Authority Lease Revenue Bonds, Series A, (AMBAC) | | 5.05 | | | 11/01/06 | | | 264,519 |
| 300,000 | | San Bernardino County, California, Certificates of Participation, Medical Center Financing Project, (MBIA) | | 5.50 | | | 08/01/07 | | | 318,147 |
| 1,000,000 | | San Diego County, California, Certificates of Participation, (AMBAC) | | 5.00 | | | 11/01/11 | | | 1,090,430 |
| 250,000 | | San Diego, California, General Obligation Bonds, Public Safety Communication Project | | 6.50 | | | 07/15/08 | | | 275,055 |
| 1,000,000 | | San Diego, California, Public Facilities Financing Authority Sewer Revenue Bonds, (FGIC) | | 5.20 | | | 05/15/13 | | | 1,023,460 |
| 300,000 | | San Diego, California, Public Facilities Financing Authority Sewer Revenue Bonds, Series B, (FGIC) | | 5.00 | | | 05/15/08 | | | 316,767 |
| 1,000,000 | | San Diego, California, Public Facilities Financing Authority Water Revenue Bonds, (MBIA) | | 5.00 | | | 08/01/11 | | | 1,093,260 |
| 875,000 | | San Francisco, California, Bay Area Rapid Transit District, Sales Tax Revenue Bonds | | 5.50 | | | 07/01/07 | | | 925,103 |
| 1,500,000 | | San Francisco, California, City & County Airports Commission, Airport Revenue Bonds, 2nd Series, Issue 20, (MBIA) | | 5.00 | | | 05/01/06 | | | 1,538,444 |
See Notes to Financial Statements.
44
Excelsior Tax-Exempt Funds, Inc.
Portfolio of Investments — March 31, 2005
California Tax-Exempt Income Fund — (continued)
| | | | | | | | | | |
| | | | | | | | | | | |
Principal
| | | | Rate
| | | Maturity
Date
| | Value
|
TAX-EXEMPT SECURITIES — (continued) |
| $1,000,000 | | San Francisco, California, City & County General Obligation Bonds, (FSA) | | 5.00 | % | | 06/15/08 | | $ | 1,066,740 |
| 680,000 | | San Francisco, California, City & County General Obligation Bonds, Series 1, (FGIC) | | 4.50 | | | 06/15/05 | | | 682,951 |
| 1,020,000 | | San Francisco, California, City & County Parking Authority Revenue Bonds, Parking Meter Project, Series 1, (FGIC) | | 4.00 | | | 06/01/06 | | | 1,036,942 |
| 625,000 | | San Jose, California, Redevelopment Agency Tax Allocation Bonds, Merged Area Redevelopment Project, (AMBAC) | | 4.75 | | | 08/01/05 | | | 629,800 |
| 500,000 | | San Jose, California, Redevelopment Agency Tax Allocation Bonds, Merged Area Redevelopment Project, (AMBAC) | | 5.00 | | | 08/01/07 | | | 525,815 |
| 750,000 | | San Mateo County, California, Transportation District, Sales Tax Revenue Bonds, Series A, (FSA) | | 5.00 | | | 06/01/09 | | | 808,778 |
| 800,000 | | San Mateo, Foster City, California, School District General Obligation Bonds, (FSA) | | 4.00 | | | 09/01/13 | | | 816,440 |
| 510,000 | | Santa Barbara, California, Waterfront Certificates of Participation, (AMBAC) | | 4.13 | | | 10/01/12 | | | 528,115 |
| 1,075,000 | | Santa Clara County, California, Financing Authority Revenue Bonds, Multiple Facilities Project, Series A, (AMBAC) | | 4.50 | | | 05/15/12 | | | 1,113,464 |
| 500,000 | | Santa Clara County, California, Transportation District, Sales Tax Revenue Bonds, Series A | | 4.50 | | | 06/01/06 | | | 511,305 |
| | | | | | | | | | |
| | | | | | | | | | | |
Principal
| | | | Rate
| | | Maturity
Date
| | Value
|
TAX-EXEMPT SECURITIES — (continued) |
| $1,000,000 | | Southern California Public Power Authority Revenue Bonds, Transmission Project, Series A, (MBIA) | | 5.25 | % | | 07/01/09 | | $ | 1,079,600 |
| 1,000,000 | | Southern California Public Power Authority Revenue Bonds, Transmission Project, Series B, (FSA) | | 4.25 | | | 07/01/11 | | | 1,050,250 |
| 600,000 | | University of California Revenue Bonds, Multi-Purpose Projects, Series F, (FGIC) | | 5.00 | | | 09/01/08 | | | 625,182 |
| | | | | | | | | |
|
|
| | | TOTAL TAX-EXEMPT SECURITIES
(Cost $56,881,446) | | | 57,794,113 |
| | | | | | | | | |
|
|
TAX-EXEMPT SECURITIES – ESCROWED IN U.S.
GOVERNMENTS — 3.58% |
| 100,000 | | California State Educational Facilities Authority Revenue Bonds, Santa Clara University, (MBIA) (Escrowed to Maturity) | | 4.90 | | | 09/01/06 | | | 103,222 |
| 125,000 | | Los Angeles, California, Department of Water & Power Electric Plant Revenue Bonds, (AMBAC) (Escrowed to Maturity) | | 4.60 | | | 08/15/06 | | | 126,089 |
| 40,000 | | Metropolitan Water District of Southern California, Waterworks Revenue Bonds (Escrowed to Maturity) | | 5.75 | | | 07/01/09 | | | 44,195 |
| 80,000 | | Metropolitan Water District of Southern California, Waterworks Revenue Bonds, Series B, (MBIA) (Prerefunded 07/01/06 @ 102) | | 5.25 | | | 07/01/07 | | | 84,165 |
| 125,000 | | Northern California Power Agency Revenue Bonds, Public Power,
Series A, (AMBAC) (Escrowed to Maturity) | | 5.60 | | | 07/01/06 | | | 129,615 |
See Notes to Financial Statements.
45
Excelsior Tax-Exempt Funds, Inc.
Portfolio of Investments — March 31, 2005
California Tax-Exempt Income Fund — (continued)
| | | | | | | | | | |
| | | | | | | | | | | |
Principal/ Shares
| | | | Rate
| | | Maturity
Date
| | Value
|
TAX-EXEMPT SECURITIES – ESCROWED IN U.S.
GOVERNMENTS — (continued) |
| $ 400,000 | | Sacramento County, California, Sanitation District Financing Authority Revenue Bonds (Escrowed to Maturity) | | 5.50 | % | | 12/01/05 | | $ | 408,136 |
| 825,000 | | San Bernardino County, California, Certificates of Participation, Medical Center Financing Project, Series A, (MBIA) (Prerefunded 08/01/05 @ 102) | | 5.50 | | | 08/01/22 | | | 849,898 |
| 500,000 | | San Francisco, California, Bay Area Rapid Transit District, Sales Tax Revenue Bonds, (FGIC) (Prerefunded 07/01/05 @ 101) | | 5.50 | | | 07/01/20 | | | 508,795 |
| | | | | | | | | |
|
|
| | | TOTAL TAX-EXEMPT SECURITIES –
ESCROWED IN U.S. GOVERNMENTS
(Cost $2,226,065) | | | 2,254,115 |
| | | | | | | | | |
|
|
REGISTERED INVESTMENT COMPANIES — 5.10% |
| 1,537,436 | | BlackRock California Money Fund | | | 1,537,436 |
| 1,670,387 | | Federated California Money Fund | | | 1,670,387 |
| | | | | | | | | |
|
|
| | | TOTAL REGISTERED INVESTMENT COMPANIES
(Cost $3,207,823) | | | 3,207,823 |
| | | | | | | | | |
|
|
| | | | | | | |
TOTAL INVESTMENTS
(Cost $62,315,334)(b) | | 100.49 | % | | $ | 63,256,051 | |
LIABILITIES IN EXCESS OF OTHER ASSETS | | (0.49 | ) | | | (306,960 | ) |
| | |
|
| |
|
|
|
NET ASSETS | | 100.00 | % | | $ | 62,949,091 | |
| | |
|
| |
|
|
|
| (a) | All or part of the security is segregated by the fund’s custodian to cover future purchase commitments. |
| (b) | Unrealized appreciation (depreciation) of securities: |
| | | | |
Unrealized
Appreciation
| | Unrealized
(Depreciation)
| | Net Unrealized
Appreciation/
(Depreciation)
|
$1,174,205 | | $(233,488) | | $940,717 |
AMBAC—American Municipal Bond Assurance Corp.
FGIC—Financial Guaranty Insurance Corp.
FSA—Financial Security Assurance
MBIA—Municipal Bond Insurance Association
Notes: (The following notes have not been audited by Deloitte & Touche LLP):
These municipal securities meet the three highest ratings assigned by Moody’s Investors Services, Inc. or Standard and Poor’s Corporation or, where not rated, are determined by the Advisor, under the supervision of the Board of Directors, to be of comparable quality at the time of purchase to rated instruments that may be acquired by the Fund.
At March 31, 2005, approximately 4% of the net assets are invested in municipal securities that have letter of credit enhancement features or escrows in U.S. Government securities backing them, on which the Fund relies. Without such features, the securities may or may not meet the quality standards of securities purchased by the Fund.
At March 31, 2005, approximately, 95% of the net assets are invested in California municipal securities. Economic changes affecting the state and certain of its public bodies and municipalities may affect the ability of issuers to pay the required principal and interest payments of the municipal securities.
See Notes to Financial Statements.
46
Excelsior Tax-Exempt Funds, Inc.
Portfolio of Investments — March 31, 2005
California Tax-Exempt Income Fund — (continued)
The summary of the Fund’s investments as of March 31, 2005 is as follows: (Unaudited)
| | | | | | | |
Portfolio Diversification
| | % of
Net
Assets
| | | Value
| |
Revenue Bonds | | 55.40 | % | | $ | 34,870,340 | |
General Obligation Bonds | | 26.67 | | | | 16,790,942 | |
Certificates of Participation | | 6.19 | | | | 3,896,895 | |
Registered Investment Companies | | 5.10 | | | | 3,207,823 | |
Tax Allocation Bonds | | 3.55 | | | | 2,235,936 | |
Prerefunded | | 2.29 | | | | 1,442,858 | |
Escrowed to Maturity | | 1.29 | | | | 811,257 | |
| | |
|
| |
|
|
|
Total Investments | | 100.49 | % | | $ | 63,256,051 | |
Other Assets and Liabilities (Net) | | (0.49 | ) | | | (306,960 | ) |
| | |
|
| |
|
|
|
Net Assets | | 100.00 | % | | $ | 62,949,091 | |
| | |
|
| |
|
|
|
See Notes to Financial Statements.
47
Excelsior Funds
Statements of Assets and Liabilities
March 31, 2005
| | | | | | | | | | | | | | | |
| | | | |
| | | Managed
Income
Fund
| | Intermediate-
Term
Managed
Income
Fund
| | | Short-Term
Government
Securities
Fund
| | | High
Yield
Fund
| |
ASSETS: | | | | | | | | | | | | | | | |
Investments, at cost — see accompanying portfolios | | $ | 209,787,935 | | $ | 410,376,775 | | | $ | 410,985,834 | | | $ | 166,457,693 | |
| | |
|
| |
|
|
| |
|
|
| |
|
|
|
Investments, at value (Note 1) | | $ | 212,431,458 | | $ | 408,600,984 | | | $ | 405,197,160 | | | $ | 165,985,211 | |
Cash | | | 12,563 | | | 17,876 | | | | 201,195 | | | | — | |
Interest receivable | | | 1,235,057 | | | 2,851,586 | | | | 1,901,807 | | | | 3,770,987 | |
Receivable for investments sold | | | 25,557,790 | | | — | | | | 7,803,586 | | | | 1,252,132 | |
Receivable for fund shares sold | | | 244,407 | | | 678,849 | | | | 823,236 | | | | 920,433 | |
| | |
|
| |
|
|
| |
|
|
| |
|
|
|
Total Assets: | | | 239,481,275 | | | 412,149,295 | | | | 415,926,984 | | | | 171,928,763 | |
LIABILITIES: | | | | | | | | | | | | | | | |
Payable for dividends declared | | | 428,319 | | | 1,139,984 | | | | 885,694 | | | | 753,861 | |
Payable for investments purchased | | | 26,389,789 | | | — | | | | 11,842,517 | | | | 525,028 | |
Payable for fund shares redeemed | | | 507,723 | | | 368,636 | | | | 387,397 | | | | 890,048 | |
Investment advisory fees payable (Note 2) | | | 65,342 | | | 67,836 | | | | 40,202 | | | | 78,832 | |
Administration fees payable (Note 2) | | | 27,375 | | | 52,175 | | | | 51,693 | | | | 23,025 | |
Shareholder servicing fees payable (Note 2) | | | 28,830 | | | 51,168 | | | | 90,853 | | | | 35,843 | |
Directors’/Trustees’ fees and expenses payable (Note 2) | | | 9 | | | 36 | | | | 301 | | | | 45 | |
Cash overdraft | | | — | | | — | | | | — | | | | 120,143 | |
Accrued expenses and other payables | | | 100,902 | | | 77,099 | | | | 110,520 | | | | 54,870 | |
| | |
|
| |
|
|
| |
|
|
| |
|
|
|
Total Liabilities: | | | 27,548,289 | | | 1,756,934 | | | | 13,409,177 | | | | 2,481,695 | |
| | |
|
| |
|
|
| |
|
|
| |
|
|
|
NET ASSETS: | | $ | 211,932,986 | | $ | 410,392,361 | | | $ | 402,517,807 | | | $ | 169,447,068 | |
| | |
|
| |
|
|
| |
|
|
| |
|
|
|
NET ASSETS consist of: | | | | | | | | | | | | | | | |
Undistributed (distributions in excess of) net investment income | | $ | 9,744 | | $ | 108,371 | | | $ | 35,416 | | | $ | (1,124,014 | ) |
Accumulated net realized gain (loss) on investment | | | 1,913,595 | | | 1,015,485 | | | | (7,407,519 | ) | | | (61,284,586 | ) |
Unrealized appreciation (depreciation) of investments | | | 2,643,523 | | | (1,775,791 | ) | | | (5,788,674 | ) | | | (472,482 | ) |
Par value (Note 5) | | | 23,151 | | | 57,315 | | | | 57,469 | | | | 363 | |
Paid in capital in excess of par value | | | 207,342,973 | | | 410,986,981 | | | | 415,621,115 | | | | 232,327,787 | |
| | |
|
| |
|
|
| |
|
|
| |
|
|
|
Net Assets | | $ | 211,932,986 | | $ | 410,392,361 | | | $ | 402,517,807 | | | $ | 169,447,068 | |
| | |
|
| |
|
|
| |
|
|
| |
|
|
|
Net Assets: | | | | | | | | | | | | | | | |
Shares | | $ | 211,931,836 | | $ | 410,392,361 | | | $ | 402,517,807 | | | $ | 156,139,159 | |
Institutional Shares | | | — | | | — | | | | — | | | | 13,307,909 | |
Retirement Shares | | | 1,150 | | | — | | | | — | | | | — | |
Shares outstanding (Note 5): | | | | | | | | | | | | | | | |
Shares | | | 23,150,973 | | | 57,314,794 | | | | 57,469,089 | | | | 33,455,324 | |
Institutional Shares | | | — | | | — | | | | — | | | | 2,853,076 | |
Retirement Shares | | | 126 | | | — | | | | — | | | | — | |
NET ASSET VALUE PER SHARE (net assets ÷ shares outstanding) | | | | | | | | | | | | | | | |
Shares | | | $9.15 | | | $7.16 | | | | $7.00 | | | | $4.67 | |
| | |
|
| |
|
|
| |
|
|
| |
|
|
|
Institutional Shares | | | — | | | — | | | | — | | | | $4.66 | |
| | |
|
| |
|
|
| |
|
|
| |
|
|
|
Retirement Shares | | | $9.16 | | | — | | | | — | | | | — | |
| | |
|
| |
|
|
| |
|
|
| |
|
|
|
See Notes to Financial Statements.
48
| | | | | | | | | | | | | | | | | |
| | | | |
Long-Term
Tax-Exempt
Fund
| | | Intermediate-
Term
Tax-Exempt
Fund
| | Short-Term
Tax-Exempt
Securities
Fund
| | | New York
Intermediate-
Term
Tax-Exempt
Fund
| | | California
Tax-Exempt
Income
Fund
| |
| | | | | | | | | | | | | | | | | | |
| $ | 60,219,688 | | | $ | 340,455,193 | | $ | 234,140,389 | | | $ | 137,286,096 | | | $ | 62,315,334 | |
|
|
| |
|
| |
|
|
| |
|
|
| |
|
|
|
| $ | 61,080,709 | | | $ | 346,535,748 | | $ | 232,135,413 | | | $ | 136,977,156 | | | $ | 63,256,051 | |
| | — | | | | 1,085 | | | — | | | | 9,392 | | | | — | |
| | 595,337 | | | | 3,983,393 | | | 2,460,483 | | | | 1,622,268 | | | | 690,377 | |
| | 1,406,819 | | | | — | | | 4,797,906 | | | | — | | | | — | |
| | 90 | | | | 183,890 | | | 826,267 | | | | — | | | | 310,000 | |
|
|
| |
|
| |
|
|
| |
|
|
| |
|
|
|
| | 63,082,955 | | | | 350,704,116 | | | 240,220,069 | | | | 138,608,816 | | | | 64,256,428 | |
| | | | | | | | | | | | | | | | | | |
| | 120,118 | | | | 752,786 | | | 268,064 | | | | 243,432 | | | | 128,065 | |
| | — | | | | — | | | — | | | | — | | | | 1,143,618 | |
| | 78,202 | | | | 169,533 | | | 756,597 | | | | 1,785 | | | | — | |
| | 13,223 | | | | 59,115 | | | 31,149 | | | | 39,140 | | | | — | |
| | 8,141 | | | | 45,049 | | | 31,827 | | | | 18,063 | | | | 5,238 | |
| | 16,136 | | | | 66,268 | | | 26,441 | | | | 19,878 | | | | 7,868 | |
| | 19 | | | | 108 | | | 75 | | | | 51 | | | | 19 | |
| | — | | | | — | | | — | | | | — | | | | — | |
| | 29,979 | | | | 71,459 | | | 45,881 | | | | 33,561 | | | | 22,529 | |
|
|
| |
|
| |
|
|
| |
|
|
| |
|
|
|
| | 265,818 | | | | 1,164,318 | | | 1,160,034 | | | | 355,910 | | | | 1,307,337 | |
|
|
| |
|
| |
|
|
| |
|
|
| |
|
|
|
| $ | 62,817,137 | | | $ | 349,539,798 | | $ | 239,060,035 | | | $ | 138,252,906 | | | $ | 62,949,091 | |
|
|
| |
|
| |
|
|
| |
|
|
| |
|
|
|
| | | | | | | | | | | | | | | | | | |
| $ | 1,526 | | | $ | 4,425 | | $ | 5,326 | | | $ | 2,760 | | | $ | 1,659 | |
| | (262,322 | ) | | | 367,896 | | | (389,388 | ) | | | 1,825,238 | | | | (975 | ) |
| | 861,021 | | | | 6,080,555 | | | (2,004,976 | ) | | | (308,940 | ) | | | 940,717 | |
| | 6,241 | | | | 37,146 | | | 33,544 | | | | 15,875 | | | | 8,659 | |
| | 62,210,671 | | | | 343,049,776 | | | 241,415,529 | | | | 136,717,973 | | | | 61,999,031 | |
|
|
| |
|
| |
|
|
| |
|
|
| |
|
|
|
| $ | 62,817,137 | | | $ | 349,539,798 | | $ | 239,060,035 | | | $ | 138,252,906 | | | $ | 62,949,091 | |
|
|
| |
|
| |
|
|
| |
|
|
| |
|
|
|
| | | | | | | | | | | | | | | | | | |
| $ | 62,817,137 | | | $ | 349,539,798 | | $ | 239,060,035 | | | $ | 138,252,906 | | | $ | 62,949,091 | |
| | — | | | | — | | | — | | | | — | | | | — | |
| | — | | | | — | | | — | | | | — | | | | — | |
| | | | | | | | | | | | | | | | | | |
| | 6,240,665 | | | | 37,146,248 | | | 33,544,498 | | | | 15,875,072 | | | | 8,658,639 | |
| | — | | | | — | | | — | | | | — | | | | — | |
| | — | | | | — | | | — | | | | — | | | | — | |
| | | | |
| | | | | | | | | | | | | | | | | | |
| | $10.07 | | | | $9.41 | | | $7.13 | | | | $8.71 | | | | $7.27 | |
|
|
| |
|
| |
|
|
| |
|
|
| |
|
|
|
| | — | | | | — | | | — | | | | — | | | | — | |
|
|
| |
|
| |
|
|
| |
|
|
| |
|
|
|
| | — | | | | — | | | — | | | | — | | | | — | |
|
|
| |
|
| |
|
|
| |
|
|
| |
|
|
|
See Notes to Financial Statements.
49
Excelsior Funds
Statements of Operations
Year Ended March 31, 2005
| | | | | | | | | | | | | | | | |
| | | | |
| | | Managed
Income
Fund
| | | Intermediate-
Term
Managed
Income
Fund
| | | Short-Term
Government
Securities
Fund
| | | High
Yield
Fund
| |
INVESTMENT INCOME: | | | | | | | | | | | | | | | | |
Interest | | $ | 12,833,462 | | | $ | 16,316,282 | | | $ | 13,976,881 | | | $ | 14,252,775 | |
Dividend | | | 82,331 | | | | — | | | | — | | | | — | |
| | |
|
|
| |
|
|
| |
|
|
| |
|
|
|
Total Income | | | 12,915,793 | | | | 16,316,282 | | | | 13,976,881 | | | | 14,252,775 | |
EXPENSES: | | | | | | | | | | | | | | | | |
Investment advisory fees (Note 2) | | | 1,976,828 | | | | 1,381,522 | | | | 1,318,396 | | | | 1,479,257 | |
Administration fees (Note 2) | | | 399,281 | | | | 597,889 | | | | 665,654 | | | | 280,116 | |
Shareholder servicing fees — Shares (Note 2) | | | 637,856 | | | | 947,335 | | | | 1,098,664 | | | | 391,840 | |
Legal and audit fees | | | 70,024 | | | | 93,603 | | | | 104,751 | | | | 54,921 | |
Re-audit expenses (Note 2) | | | 26,987 | | | | 36,315 | | | | 41,679 | | | | 17,634 | |
Custodian fees | | | 12,964 | | | | 23,928 | | | | 30,907 | | | | 8,603 | |
Registration and filing fees | | | 29,013 | | | | 23,029 | | | | 25,425 | | | | 41,659 | |
Shareholder reports | | | 20,156 | | | | 20,791 | | | | 27,200 | | | | 16,899 | |
Transfer agent fees | | | 153,507 | | | | 45,353 | | | | 102,367 | | | | 45,470 | |
Directors’/Trustees’ fees and expenses (Note 2) | | | 7,269 | | | | 10,639 | | | | 12,385 | | | | 8,164 | |
Miscellaneous expenses | | | 25,976 | | | | 37,565 | | | | 35,517 | | | | 24,568 | |
| | |
|
|
| |
|
|
| |
|
|
| |
|
|
|
Total Expenses | | | 3,359,861 | | | | 3,217,969 | | | | 3,462,945 | | | | 2,369,131 | |
Fees waived and reimbursed by: | | | | | | | | | | | | | | | | |
Investment Adviser (Note 2) | | | (912,503 | ) | | | (752,670 | ) | | | (703,376 | ) | | | (451,580 | ) |
Administrator (Note 2) | | | (43,265 | ) | | | (65,368 | ) | | | (75,529 | ) | | | (29,194 | ) |
Re-audit expenses paid by Investment Adviser (Note 2) | | | (26,987 | ) | | | (36,315 | ) | | | (41,679 | ) | | | (17,634 | ) |
| | |
|
|
| |
|
|
| |
|
|
| |
|
|
|
Net Expenses | | | 2,377,106 | | | | 2,363,616 | | | | 2,642,361 | | | | 1,870,723 | |
| | |
|
|
| |
|
|
| |
|
|
| |
|
|
|
NET INVESTMENT INCOME | | | 10,538,687 | | | | 13,952,666 | | | | 11,334,520 | | | | 12,382,052 | |
| | |
|
|
| |
|
|
| |
|
|
| |
|
|
|
REALIZED AND UNREALIZED GAIN (LOSS) ON INVESTMENTS (Note 1) | | | | | | | | | | | | | | | | |
Net realized gain (loss) on security transactions | | | 3,809,789 | | | | 1,414,970 | | | | (3,590,260 | ) | | | 1,684,436 | |
Change in unrealized appreciation/depreciation of investments during the period | | | (9,984,664 | ) | | | (14,217,960 | ) | | | (7,603,787 | ) | | | (3,437,364 | ) |
| | |
|
|
| |
|
|
| |
|
|
| |
|
|
|
Net realized and unrealized (loss) on investments | | | (6,174,875 | ) | | | (12,802,990 | ) | | | (11,194,047 | ) | | | (1,752,928 | ) |
| | |
|
|
| |
|
|
| |
|
|
| |
|
|
|
Net increase (decrease) in net assets resulting from operations | | $ | 4,363,812 | | | $ | 1,149,676 | | | $ | 140,473 | | | $ | 10,629,124 | |
| | |
|
|
| |
|
|
| |
|
|
| |
|
|
|
See Notes to Financial Statements.
50
| | | | | | | | | | | | | | | | | | |
| | | | |
Long-Term
Tax-Exempt
Fund
| | | Intermediate-
Term
Tax-Exempt
Fund
| | | Short-Term
Tax-Exempt
Securities
Fund
| | | New York
Intermediate-
Term
Tax-Exempt
Fund
| | | California
Tax-Exempt
Income
Fund
| |
| | | | | | | | | | | | | | | | | | | |
| $ | 2,333,844 | | | $ | 12,082,920 | | | $ | 5,097,711 | | | $ | 5,029,365 | | | $ | 2,340,593 | |
| | — | | | | — | | | | — | | | | — | | | | — | |
|
|
| |
|
|
| |
|
|
| |
|
|
| |
|
|
|
| | 2,333,844 | | | | 12,082,920 | | | | 5,097,711 | | | | 5,029,365 | | | | 2,340,593 | |
| | | | | | | | | | | | | | | | | | | |
| | 328,579 | | | | 1,262,089 | | | | 845,414 | | | | 769,441 | | | | 317,727 | |
| | 99,562 | | | | 546,216 | | | | 426,960 | | | | 233,154 | | | | 96,272 | |
| | 158,375 | | | | 883,466 | | | | 676,333 | | | | 369,332 | | | | 152,509 | |
| | 30,129 | | | | 86,664 | | | | 70,164 | | | | 46,855 | | | | 27,615 | |
| | 10,528 | | | | 31,092 | | | | 28,570 | | | | 16,850 | | | | 9,535 | |
| | 6,353 | | | | 15,671 | | | | 14,480 | | | | 9,614 | | | | 7,289 | |
| | 16,420 | | | | 20,812 | | | | 18,656 | | | | 16,498 | | | | 17,504 | |
| | 5,211 | | | | 24,558 | | | | 17,383 | | | | 10,173 | | | | 4,092 | |
| | 28,446 | | | | 35,264 | | | | 19,027 | | | | 16,671 | | | | 13,505 | |
| | 2,530 | | | | 13,545 | | | | 10,556 | | | | 5,908 | | | | 2,352 | |
| | 8,122 | | | | 23,821 | | | | 18,865 | | | | 12,168 | | | | 17,045 | |
|
|
| |
|
|
| |
|
|
| |
|
|
| |
|
|
|
| | 694,255 | | | | 2,943,198 | | | | 2,146,408 | | | | 1,506,664 | | | | 665,445 | |
| | | | | | | | | | | | | | | | | | | |
| | (145,612 | ) | | | (501,508 | ) | | | (371,474 | ) | | | (228,828 | ) | | | (309,048 | ) |
| | (11,284 | ) | | | (61,864 | ) | | | (51,897 | ) | | | (27,280 | ) | | | (28,478 | ) |
| | | | |
| | (10,528 | ) | | | (31,092 | ) | | | (28,570 | ) | | | (16,850 | ) | | | (9,535 | ) |
|
|
| |
|
|
| |
|
|
| |
|
|
| |
|
|
|
| | 526,831 | | | | 2,348,734 | | | | 1,694,467 | | | | 1,233,706 | | | | 318,384 | |
|
|
| |
|
|
| |
|
|
| |
|
|
| |
|
|
|
| | 1,807,013 | | | | 9,734,186 | | | | 3,403,244 | | | | 3,795,659 | | | | 2,022,209 | |
|
|
| |
|
|
| |
|
|
| |
|
|
| |
|
|
|
| | | | |
| | | | | | | | | | | | | | | | | | | |
| | 285,872 | | | | 374,010 | | | | (389,388 | ) | | | 2,398,438 | | | | (311 | ) |
| | | | | | | | | | | | | | | | | | | |
| | (549,586 | ) | | | (10,001,492 | ) | | | (3,435,518 | ) | | | (5,684,669 | ) | | | (1,976,428 | ) |
|
|
| |
|
|
| |
|
|
| |
|
|
| |
|
|
|
| | (263,714 | ) | | | (9,627,482 | ) | | | (3,824,906 | ) | | | (3,286,231 | ) | | | (1,976,739 | ) |
|
|
| |
|
|
| |
|
|
| |
|
|
| |
|
|
|
| | | | |
| $ | 1,543,299 | | | $ | 106,704 | | | $ | (421,662 | ) | | $ | 509,428 | | | $ | 45,470 | |
|
|
| |
|
|
| |
|
|
| |
|
|
| |
|
|
|
See Notes to Financial Statements.
51
Excelsior Funds
Statements of Changes in Net Assets
| | | | | | | | | | | | | | | | |
| | |
| | | Managed Income Fund
| | | Intermediate-Term Managed
Income Fund
| |
| | | Year Ended March 31,
| | | Year Ended March 31,
| |
| | | 2005
| | | 2004
| | | 2005
| | | 2004
| |
Net investment income | | $ | 10,538,687 | | | $ | 11,400,699 | | | $ | 13,952,666 | | | $ | 14,207,657 | |
Net realized gain (loss) on security transactions | | | 3,809,789 | | | | 2,230,517 | | | | 1,414,970 | | | | 4,745,495 | |
Change in unrealized appreciation (depreciation) of investments during the period | | | (9,984,664 | ) | | | 1,241,354 | | | | (14,217,960 | ) | | | 1,253,132 | |
| | |
|
|
| |
|
|
| |
|
|
| |
|
|
|
Net increase (decrease) in net assets resulting from operations | | | 4,363,812 | | | | 14,872,570 | | | | 1,149,676 | | | | 20,206,284 | |
| | |
|
|
| |
|
|
| |
|
|
| |
|
|
|
Distributions to shareholders: | | | | | | | | | | | | | | | | |
From net investment income | | | | | | | | | | | | | | | | |
Shares | | | (10,706,658 | ) | | | (11,408,944 | ) | | | (14,239,514 | ) | | | (14,252,672 | ) |
Institutional Shares | | | — | | | | — | | | | — | | | | — | |
Retirement Shares | | | (4 | ) | | | — | | | | — | | | | — | |
Tax Return of Capital | | | | | | | | | | | | | | | | |
Shares | | | — | | | | — | | | | — | | | | — | |
Institutional Shares | | | — | | | | — | | | | — | | | | — | |
From net realized gain on investments | | | (1,392,832 | ) | | | (4,038,025 | ) | | | (572,247 | ) | | | (5,570,809 | ) |
| | |
|
|
| |
|
|
| |
|
|
| |
|
|
|
Total distributions | | | (12,099,494 | ) | | | (15,446,969 | ) | | | (14,811,761 | ) | | | (19,823,481 | ) |
| | |
|
|
| |
|
|
| |
|
|
| |
|
|
|
Increase (decrease) in net assets from fund share transactions (Note 5) | | | | | | | | | | | | | | | | |
Shares | | | (49,359,232 | ) | | | (23,580,863 | ) | | | 10,787,119 | | | | 8,257,424 | |
Institutional Shares | | | — | | | | — | | | | — | | | | — | |
Retirement Shares | | | 1,054 | | | | — | | | | — | | | | — | |
| | |
|
|
| |
|
|
| |
|
|
| |
|
|
|
Total from fund share transactions | | | (49,358,178 | ) | | | (23,580,863 | ) | | | 10,787,119 | | | | 8,257,424 | |
| | |
|
|
| |
|
|
| |
|
|
| |
|
|
|
Net increase (decrease) in net assets | | | (57,093,860 | ) | | | (24,155,262 | ) | | | (2,874,966 | ) | | | 8,640,227 | |
| | |
|
|
| |
|
|
| |
|
|
| |
|
|
|
NET ASSETS: | | | | | | | | | | | | | | | | |
Beginning of period | | | 269,026,846 | | | | 293,182,108 | | | | 413,267,327 | | | | 404,627,100 | |
| | |
|
|
| |
|
|
| |
|
|
| |
|
|
|
End of period (1) | | $ | 211,932,986 | | | $ | 269,026,846 | | | $ | 410,392,361 | | | $ | 413,267,327 | |
| | |
|
|
| |
|
|
| |
|
|
| |
|
|
|
(1) Including undistributed (distributions in excess of) net investment income | | $ | 9,744 | | | $ | — | | | $ | 108,371 | | | $ | — | |
| | |
|
|
| |
|
|
| |
|
|
| |
|
|
|
See Notes to Financial Statements.
52
| | | | | | | | | | | | | | | | | | | | | | |
| | |
Short-Term Government
Securities Fund
| | | High Yield Fund
| | | Long-Term Tax-Exempt Fund
| |
Year Ended March 31,
| | | Year Ended March 31,
| | | Year Ended March 31,
| |
2005
| | | 2004
| | | 2005
| | | 2004
| | | 2005
| | | 2004
| |
| $ | 11,334,520 | | | $ | 10,940,751 | | | $ | 12,382,052 | | | $ | 14,179,264 | | | $ | 1,807,013 | | | $ | 2,199,992 | |
| | (3,590,260 | ) | | | 1,337,588 | | | | 1,684,436 | | | | (26,899,527 | ) | | | 285,872 | | | | 2,026,982 | |
| | (7,603,787 | ) | | | (3,868,234 | ) | | | (3,437,364 | ) | | | 57,311,938 | | | | (549,586 | ) | | | (1,032,776 | ) |
|
|
| |
|
|
| |
|
|
| |
|
|
| |
|
|
| |
|
|
|
| | 140,473 | | | | 8,410,105 | | | | 10,629,124 | | | | 44,591,675 | | | | 1,543,299 | | | | 3,194,198 | |
|
|
| |
|
|
| |
|
|
| |
|
|
| |
|
|
| |
|
|
|
| | | | | | | | | | | | | | | | | | | | | | | |
| | | | | | | | | | | | | | | | | | | | | | | |
| | (13,634,235 | ) | | | (13,530,916 | ) | | | (10,208,446 | ) | | | (8,984,610 | ) | | | (1,805,611 | ) | | | (2,199,868 | ) |
| | — | | | | — | | | | (1,404,626 | ) | | | (1,882,202 | ) | | | — | | | | — | |
| | — | | | | — | | | | — | | | | — | | | | — | | | | — | |
| | | | | | | | | | | | | | | | | | | | | | | |
| | — | | | | — | | | | — | | | | (2,649,803 | ) | | | — | | | | — | |
| | — | | | | — | | | | — | | | | (510,855 | ) | | | — | | | | — | |
| | — | | | | (1,503,956 | ) | | | — | | | | — | | | | — | | | | — | |
|
|
| |
|
|
| |
|
|
| |
|
|
| |
|
|
| |
|
|
|
| | (13,634,235 | ) | | | (15,034,872 | ) | | | (11,613,072 | ) | | | (14,027,470 | ) | | | (1,805,611 | ) | | | (2,199,868 | ) |
|
|
| |
|
|
| |
|
|
| |
|
|
| |
|
|
| |
|
|
|
| | | | | | | | | | | | | | | | | | | | | | | |
| | (53,206,126 | ) | | | (23,676,320 | ) | | | 5,713,795 | | | | (4,682,644 | ) | | | (9,703,641 | ) | | | (23,176,722 | ) |
| | — | | | | — | | | | (9,399,526 | ) | | | (20,356,959 | ) | | | — | | | | — | |
| | — | | | | — | | | | — | | | | — | | | | — | | | | — | |
|
|
| |
|
|
| |
|
|
| |
|
|
| |
|
|
| |
|
|
|
| | (53,206,126 | ) | | | (23,676,320 | ) | | | (3,685,731 | ) | | | (25,039,603 | ) | | | (9,703,641 | ) | | | (23,176,722 | ) |
|
|
| |
|
|
| |
|
|
| |
|
|
| |
|
|
| |
|
|
|
| | (66,699,888 | ) | | | (30,301,087 | ) | | | (4,669,679 | ) | | | 5,524,602 | | | | (9,965,953 | ) | | | (22,182,392 | ) |
|
|
| |
|
|
| |
|
|
| |
|
|
| |
|
|
| |
|
|
|
| | | | | | | | | | | | | | | | | | | | | | | |
| | 469,217,695 | | | | 499,518,782 | | | | 174,116,747 | | | | 168,592,145 | | | | 72,783,090 | | | | 94,965,482 | |
|
|
| |
|
|
| |
|
|
| |
|
|
| |
|
|
| |
|
|
|
| $ | 402,517,807 | | | $ | 469,217,695 | | | $ | 169,447,068 | | | $ | 174,116,747 | | | $ | 62,817,137 | | | $ | 72,783,090 | |
|
|
| |
|
|
| |
|
|
| |
|
|
| |
|
|
| |
|
|
|
$ |
35,416 |
| | $ | (900 | ) | | $ | (1,124,014 | ) | | $ | (1,621,594 | ) | | $ | 1,526 | | | $ | 124 | |
|
|
| |
|
|
| |
|
|
| |
|
|
| |
|
|
| |
|
|
|
See Notes to Financial Statements.
53
Excelsior Funds
Statements of Changes in Net Assets
| | | | | | | | | | | | | | | | |
| | |
| | | Intermediate-Term
Tax-Exempt Fund
| | | Short-Term Tax-Exempt
Securities Fund
| |
| | | Year Ended March 31,
| | | Year Ended March 31,
| |
| | | 2005
| | | 2004
| | | 2005
| | | 2004
| |
Net investment income | | $ | 9,734,186 | | | $ | 10,391,572 | | | $ | 3,403,244 | | | $ | 3,469,027 | |
Net realized gain (loss) on security transactions | | | 374,010 | | | | 6,421,021 | | | | (389,388 | ) | | | 138,268 | |
Change in unrealized appreciation (depreciation) of investments during the period | | | (10,001,492 | ) | | | (435,500 | ) | | | (3,435,518 | ) | | | 573,155 | |
| | |
|
|
| |
|
|
| |
|
|
| |
|
|
|
Net increase (decrease) in net assets resulting from operations | | | 106,704 | | | | 16,377,093 | | | | (421,662 | ) | | | 4,180,450 | |
| | |
|
|
| |
|
|
| |
|
|
| |
|
|
|
Distributions to shareholders: | | | | | | | | | | | | | | | | |
From net investment income | | | | | | | | | | | | | | | | |
Shares | | | (9,735,305 | ) | | | (10,386,027 | ) | | | (3,408,178 | ) | | | (3,456,342 | ) |
From net realized gain on investments | | | (1,550,278 | ) | | | (13,530,881 | ) | | | (50,253 | ) | | | — | |
| | |
|
|
| |
|
|
| |
|
|
| |
|
|
|
Total distributions | | | (11,285,583 | ) | | | (23,916,908 | ) | | | (3,458,431 | ) | | | (3,456,342 | ) |
| | |
|
|
| |
|
|
| |
|
|
| |
|
|
|
Increase (decrease) in net assets from fund share transactions (Note 5) | | | (26,905,099 | ) | | | (11,938,064 | ) | | | (117,663,509 | ) | | | 68,597,584 | |
| | |
|
|
| |
|
|
| |
|
|
| |
|
|
|
Net increase (decrease) in net assets | | | (38,083,978 | ) | | | (19,477,879 | ) | | | (121,543,602 | ) | | | 69,321,692 | |
| | |
|
|
| |
|
|
| |
|
|
| |
|
|
|
NET ASSETS: | | | | | | | | | | | | | | | | |
Beginning of period | | | 387,623,776 | | | | 407,101,655 | | | | 360,603,637 | | | | 291,281,945 | |
| | |
|
|
| |
|
|
| |
|
|
| |
|
|
|
End of period (1) | | $ | 349,539,798 | | | $ | 387,623,776 | | | $ | 239,060,035 | | | $ | 360,603,637 | |
| | |
|
|
| |
|
|
| |
|
|
| |
|
|
|
(1) Including undistributed net investment income | | $ | 4,425 | | | $ | 5,545 | | | $ | 5,326 | | | $ | 12,685 | |
| | |
|
|
| |
|
|
| |
|
|
| |
|
|
|
See Notes to Financial Statements.
54
| | | | | | | | | | | | | | |
| |
New York Intermediate-Term
Tax-Exempt Fund
| | | California Tax-Exempt
Income Fund
| |
Year Ended March 31,
| | | Year Ended March 31,
| |
2005
| | | 2004
| | | 2005
| | | 2004
| |
| $ | 3,795,659 | | | $ | 4,388,322 | | | $ | 2,022,209 | | | $ | 2,027,620 | |
| | 2,398,438 | | | | 4,269,437 | | | | (311 | ) | | | (664 | ) |
| | (5,684,669 | ) | | | (1,558,337 | ) | | | (1,976,428 | ) | | | (12,855 | ) |
|
|
| |
|
|
| |
|
|
| |
|
|
|
|
509,428 |
| | | 7,099,422 | | | | 45,470 | | | | 2,014,101 | |
|
|
| |
|
|
| |
|
|
| |
|
|
|
| | | | | | | | | | | | | | | |
| | | | | | | | | | | | | | | |
| | (3,794,893 | ) | | | (4,385,426 | ) | | | (2,021,815 | ) | | | (2,026,301 | ) |
| | (1,466,615 | ) | | | (5,786,218 | ) | | | — | | | | — | |
|
|
| |
|
|
| |
|
|
| |
|
|
|
| | (5,261,508 | ) | | | (10,171,644 | ) | | | (2,021,815 | ) | | | (2,026,301 | ) |
|
|
| |
|
|
| |
|
|
| |
|
|
|
| | | | | | | | | | | | | | | |
| | (35,102,085 | ) | | | (6,220,877 | ) | | | (1,968,940 | ) | | | 712,830 | |
|
|
| |
|
|
| |
|
|
| |
|
|
|
| | (39,854,165 | ) | | | (9,293,099 | ) | | | (3,945,285 | ) | | | 700,630 | |
|
|
| |
|
|
| |
|
|
| |
|
|
|
| | | | | | | | | | | | | | | |
| | 178,107,071 | | | | 187,400,170 | | | | 66,894,376 | | | | 66,193,746 | |
|
|
| |
|
|
| |
|
|
| |
|
|
|
| $ | 138,252,906 | | | $ | 178,107,071 | | | $ | 62,949,091 | | | $ | 66,894,376 | |
|
|
| |
|
|
| |
|
|
| |
|
|
|
| $ | 2,760 | | | $ | 2,025 | | | $ | 1,659 | | | $ | 1,264 | |
|
|
| |
|
|
| |
|
|
| |
|
|
|
See Notes to Financial Statements.
55
Excelsior Funds
Financial Highlights — Selected Per Share Data and Ratios
| | | | | | | | | | | | | | | | | | | | | | | | | | | |
| | | | | | | |
| | | Net Asset Value
Beginning of
Period
| | Net
Investment
Income
| | | Net Realized and
Unrealized Gain (Loss)
on Investments
| | | Total From
Investment
Operations
| | | Distributions
From Net
Investment
Income
| | | Distributions From
Net Realized Gain
on Investments
| | | Total
Distributions
| |
MANAGED INCOME FUND | | | | | | | | | | | | | | | | | | | | | |
Shares — (01/09/86*) | | | | | | | | | | | | | | | | | | | | | | | | | | | |
Year Ended March 31, | | | | | | | | | | | | | | | | | | | | | | | | | | | |
2005 | | $ | 9.43 | | $ | 0.37 | (2) | | $ | (0.23 | ) | | $ | 0.14 | | | $ | (0.37 | ) | | $ | (0.05 | ) | | $ | (0.42 | ) |
2004 | | | 9.43 | | | 0.38 | | | | 0.14 | | | | 0.52 | | | | (0.38 | ) | | | (0.14 | ) | | | (0.52 | ) |
2003 | | | 8.95 | | | 0.47 | | | | 0.50 | | | | 0.97 | | | | (0.48 | ) | | | (0.01 | ) | | | (0.49 | ) |
2002 | | | 9.11 | | | 0.49 | | | | (0.10 | ) | | | 0.39 | | | | (0.50 | ) | | | (0.05 | ) | | | (0.55 | ) |
2001 | | | 8.55 | | | 0.50 | | | | 0.56 | | | | 1.06 | | | | (0.50 | ) | | | — | | | | (0.50 | ) |
INTERMEDIATE-TERM MANAGED INCOME FUND | | | | | | | | | | | | | | | | | |
Shares — (12/31/92*) | | | | | | | | | | | | | | | | | | | | | | | | | | | |
Year Ended March 31, | | | | | | | | | | | | | | | | | | | | | | | | | | | |
2005 | | $ | 7.40 | | $ | 0.26 | (2) | | $ | (0.22 | ) | | $ | 0.03 | | | $ | (0.26 | ) | | $ | (0.01 | ) | | $ | (0.27 | ) |
2004 | | | 7.39 | | | 0.26 | | | | 0.11 | | | | 0.37 | | | | (0.26 | ) | | | (0.10 | ) | | | (0.36 | ) |
2003 | | | 7.10 | | | 0.37 | | | | 0.36 | | | | 0.73 | | | | (0.40 | ) | | | (0.04 | ) | | | (0.44 | ) |
2002 | | | 7.18 | | | 0.39 | | | | (0.06 | ) | | | 0.33 | | | | (0.39 | ) | | | (0.02 | ) | | | (0.41 | ) |
2001 | | | 6.77 | | | 0.42 | | | | 0.41 | | | | 0.83 | | | | (0.42 | ) | | | — | | | | (0.42 | ) |
SHORT-TERM GOVERNMENT SECURITIES FUND | | | | | | | | | | | | | | | | | |
Shares — (12/31/92*) | | | | | | | | | | | | | | | | | | | | | | | | | | | |
Year Ended March 31, | | | | | | | | | | | | | | | | | | | | | | | | | | | |
2005 | | $ | 7.22 | | $ | 0.18 | (2) | | $ | (0.18 | ) | | | — | | | $ | (0.22 | ) | | | — | | | $ | (0.22 | ) |
2004 | | | 7.31 | | | 0.16 | | | | (0.03 | ) | | $ | 0.13 | | | | (0.20 | ) | | $ | (0.02 | ) | | | (0.22 | ) |
2003 | | | 7.11 | | | 0.26 | | | | 0.25 | | | | 0.51 | | | | (0.26 | ) | | | (0.05 | ) | | | (0.31 | ) |
2002 | | | 7.09 | | | 0.33 | | | | 0.05 | | | | 0.38 | | | | (0.34 | ) | | | (0.02 | ) | | | (0.36 | ) |
2001 | | | 6.87 | | | 0.39 | | | | 0.22 | | | | 0.61 | | | | (0.39 | ) | | | — | | | | (0.39 | ) |
HIGH YIELD FUND | | | | | | | | | | | | | | | | | | | | | |
Shares — (10/31/00*) | | | | | | | | | | | | | | | | | | | | | | | | | | | |
Year Ended March 31, | | | | | | | | | | | | | | | | | | | | | | | | | | | |
2005 | | $ | 4.71 | | $ | 0.34 | (2) | | $ | (0.08 | ) | | $ | 0.26 | | | $ | (0.30 | ) | | | — | | | $ | (0.30 | ) |
2004 | | | 3.99 | | | 0.35 | (2) | | | 0.71 | (2) | | | 1.06 | | | | (0.34 | )(3) | | | — | | | | (0.34 | ) |
2003 | | | 6.20 | | | 0.88 | (2) | | | (1.54 | )(2) | | | (0.66 | ) | | | (1.55 | )(4) | | | — | | | | (1.55 | ) |
2002 | | | 7.26 | | | 1.08 | | | | (1.01 | ) | | | 0.07 | | | | (1.09 | ) | | $ | (0.04 | ) | | | (1.13 | ) |
2001 | | | 7.00 | | | 0.27 | | | | 0.26 | | | | 0.53 | | | | (0.27 | ) | | | — | | | | (0.27 | ) |
* Commencement of Operations.
| (1) | Expense ratios before waiver to fees and reimbursement of expenses by adviser and administrator. |
| (2) | For comparative purposes per share amounts are based on average shares outstanding. |
| (3) | Includes a tax return of capital of $(0.08). |
| (4) | Includes a tax return of capital of $(0.51). |
See Notes to Financial Statements.
56
| | | | | | | | | | | | | | | | | | | | | | | |
| | | | | | | |
Net Asset Value,
End of Period
| | Total
Return
| | | Net Assets, End
of Period (000’s)
| | Ratio of Net
Operating Expenses
to Average
Net Assets
| | | Ratio of Gross
Operating Expenses
to Average
Net Assets (1)
| | | Ratio of Net
Investement
Income to
Average Net Assets
| | | Portfolio
Turnover
Rate
| | | Fee
Waivers
(Note 2)
| |
| | | | | | | | | | | | | | | | | | |
| | | | | | | | | | | | | | | | | | | | | | | | |
| | | | | | | | | | | | | | | | | | | | | | | | |
| $ | 9.15 | | 1.55 | % | | $ | 211,932 | | 0.90 | % | | 1.27 | % | | 3.99 | % | | 90 | % | | $ | 0.03 | (2) |
| | 9.43 | | 5.74 | % | | | 269,027 | | 0.87 | % | | 1.11 | % | | 4.06 | % | | 84 | % | | | 0.02 | |
| | 9.43 | | 11.07 | % | | | 293,182 | | 0.84 | % | | 0.95 | % | | 5.10 | % | | 120 | % | | | 0.01 | |
| | 8.95 | | 4.34 | % | | | 247,804 | | 0.87 | % | | 1.04 | % | | 5.39 | % | | 129 | % | | | 0.02 | |
| | 9.11 | | 12.80 | % | | | 252,173 | | 0.88 | % | | 1.01 | % | | 5.81 | % | | 99 | % | | | 0.01 | |
| | | | | | | | | | | | | | | | | | | | | | | | |
| | | | | | | | | | | | | | | | | | | | | | | | |
| | | | | | | | | | | | | | | | | | | | | | | | |
| $ | 7.16 | | 0.45 | % | | $ | 410,392 | | 0.60 | % | | 0.81 | % | | 3.53 | % | | 59 | % | | $ | 0.02 | (2) |
| | 7.40 | | 5.25 | % | | | 413,267 | | 0.56 | % | | 0.69 | % | | 3.56 | % | | 85 | % | | | 0.01 | |
| | 7.39 | | 10.50 | % | | | 404,627 | | 0.53 | % | | 0.69 | % | | 4.56 | % | | 98 | % | | | 0.01 | |
| | 7.10 | | 4.60 | % | | | 273,267 | | 0.52 | % | | 0.69 | % | | 5.47 | % | | 117 | % | | | 0.01 | |
| | 7.18 | | 12.73 | % | | | 219,600 | | 0.56 | % | | 0.69 | % | | 6.11 | % | | 108 | % | | | 0.01 | |
| | | | | | | | | | | | | | | | | | |
| | | | | | | | | | | | | | | | | | | | | | | | |
| | | | | | | | | | | | | | | | | | | | | | | | |
| $ | 7.00 | | 0.01 | % | | $ | 402,518 | | 0.60 | % | | 0.79 | % | | 2.57 | % | | 106 | % | | $ | 0.01 | (2) |
| | 7.22 | | 1.90 | % | | | 469,218 | | 0.53 | % | | 0.67 | % | | 2.26 | % | | 231 | % | | | 0.01 | |
| | 7.31 | | 7.27 | % | | | 499,519 | | 0.49 | % | | 0.64 | % | | 3.22 | % | | 170 | % | | | 0.01 | |
| | 7.11 | | 5.35 | % | | | 193,780 | | 0.51 | % | | 0.61 | % | | 4.33 | % | | 75 | % | | | 0.01 | |
| | 7.09 | | 9.14 | % | | | 75,694 | | 0.57 | % | | 0.67 | % | | 5.59 | % | | 118 | % | | | 0.01 | |
| | | | | | | | | | | | | | | | | | |
| | | | | | | | | | | | | | | | | | | | | | | | |
| | | | | | | | | | | | | | | | | | | | | | | | |
| $ | 4.67 | | 5.54 | % | | $ | 156,139 | | 1.04 | % | | 1.30 | % | | 6.50 | % | | 70 | % | | $ | 0.01 | (2) |
| | 4.71 | | 27.45 | % | | | 151,476 | | 1.05 | % | | 1.36 | % | | 7.79 | % | | 170 | % | | | 0.01 | |
| | 3.99 | | (10.49 | )% | | | 131,342 | | 1.08 | % | | 1.35 | % | | 18.06 | % | | 153 | % | | | 0.01 | |
| | 6.20 | | 1.27 | % | | | 172,890 | | 1.03 | % | | 1.35 | % | | 17.56 | % | | 310 | % | | | 0.02 | |
| | 7.26 | | 7.76 | %(5) | | | 57,670 | | 1.05 | %(6) | | 1.55 | %(6) | | 9.43 | %(6) | | 169 | %(6) | | | 0.01 | |
See Notes to Financial Statements.
57
Excelsior Funds
Financial Highlights — Selected Per Share Data and Ratios
| | | | | | | | | | | | | | | | | | | | | | | | | | |
| | | | | | | |
| | | Net Asset Value
Beginning of
Period
| | Net
Investment
Income
| | | Net Realized and
Unrealized Gain (Loss)
on Investments
| | | Total From
Investment
Operations
| | Distributions From Net
Investment
Income
| | | Distributions From
Net Realized Gain
on Investments
| | | Total
Distributions
| |
LONG-TERM TAX-EXEMPT FUND | |
Shares — (02/05/86*) | | | | | | | | | | | | | | | | | | | | | | | | | | |
Year Ended March 31, | | | | | | | | | | | | | | | | | | | | | | | | | | |
2005 | | $ | 10.08 | | $ | 0.27 | (2) | | $ | (0.01 | ) | | $ | 0.27 | | $ | (0.28 | ) | | | — | | | $ | (0.28 | ) |
2004 | | | 9.95 | | | 0.26 | | | | 0.13 | | | | 0.39 | | | (0.26 | ) | | | — | | | | (0.26 | ) |
2003 | | | 9.48 | | | 0.29 | | | | 0.47 | | | | 0.76 | | | (0.29 | ) | | | — | | | | (0.29 | ) |
2002 | | | 9.62 | | | 0.36 | | | | (0.14 | ) | | | 0.22 | | | (0.36 | ) | | | — | | | | (0.36 | ) |
2001 | | | 8.99 | | | 0.40 | | | | 0.63 | | | | 1.03 | | | (0.40 | ) | | | — | | | | (0.40 | ) |
INTERMEDIATE-TERM TAX-EXEMPT FUND | |
Shares — (12/03/85*) | | | | | | | | | | | | | | | | | | | | | | | | | | |
Year Ended March 31, | | | | | | | | | | | | | | | | | | | | | | | | | | |
2005 | | $ | 9.69 | | $ | 0.26 | (2) | | $ | (0.24 | ) | | $ | 0.02 | | $ | (0.26 | ) | | $ | (0.04 | ) | | $ | (0.30 | ) |
2004 | | | 9.88 | | | 0.26 | | | | 0.15 | | | | 0.41 | | | (0.26 | ) | | | (0.34 | ) | | | (0.60 | ) |
2003 | | | 9.39 | | | 0.31 | | | | 0.55 | | | | 0.86 | | | (0.31 | ) | | | (0.06 | ) | | | (0.37 | ) |
2002 | | | 9.57 | | | 0.35 | | | | (0.12 | ) | | | 0.23 | | | (0.35 | ) | | | (0.06 | ) | | | (0.41 | ) |
2001 | | | 9.06 | | | 0.38 | | | | 0.51 | | | | 0.89 | | | (0.38 | ) | | | — | | | | (0.38 | ) |
SHORT-TERM TAX-EXEMPT SECURITIES FUND | |
Shares — (12/31/92*) | | | | | | | | | | | | | | | | | | | | | | | | | | |
Year Ended March 31, | | | | | | | | | | | | | | | | | | | | | | | | | | |
2005 | | $ | 7.22 | | $ | 0.09 | (2) | | $ | (0.09 | ) | | | — | | $ | (0.09 | ) | | | — | (3) | | $ | (0.09 | ) |
2004 | | | 7.20 | | | 0.08 | | | | 0.02 | | | $ | 0.10 | | | (0.08 | ) | | | — | | | | (0.08 | ) |
2003 | | | 7.17 | | | 0.12 | | | | 0.03 | | | | 0.15 | | | (0.12 | ) | | | — | | | | (0.12 | ) |
2002 | | | 7.15 | | | 0.20 | | | | 0.03 | | | | 0.23 | | | (0.20 | ) | | $ | (0.01 | ) | | | (0.21 | ) |
2001 | | | 7.02 | | | 0.28 | | | | 0.13 | | | | 0.41 | | | (0.28 | ) | | | — | | | | (0.28 | ) |
NEW YORK INTERMEDIATE-TERM TAX-EXEMPT FUND | |
Shares — (05/31/90*) | | | | | | | | | | | | | | | | | | | | | | | | | | |
Year Ended March 31, | | | | | | | | | | | | | | | | | | | | | | | | | | |
2005 | | $ | 8.97 | | $ | 0.22 | (2) | | $ | (0.17 | ) | | $ | 0.05 | | $ | (0.22 | ) | | $ | (0.09 | ) | | $ | (0.31 | ) |
2004 | | | 9.12 | | | 0.22 | | | | 0.14 | | | | 0.36 | | | (0.22 | ) | | | (0.29 | ) | | | (0.51 | ) |
2003 | | | 8.74 | | | 0.27 | | | | 0.51 | | | | 0.78 | | | (0.27 | ) | | | (0.13 | ) | | | (0.40 | ) |
2002 | | | 8.83 | | | 0.31 | | | | (0.09 | ) | | | 0.22 | | | (0.31 | ) | | | — | | | | (0.31 | ) |
2001 | | | 8.34 | | | 0.33 | | | | 0.49 | | | | 0.82 | | | (0.33 | ) | | | — | | | | (0.33 | ) |
CALIFORNIA TAX-EXEMPT INCOME FUND | |
Shares — (10/01/96*) | | | | | | | | | | | | | | | | | | | | | | | | | | |
Year Ended March 31, | | | | | | | | | | | | | | | | | | | | | | | | | | |
2005 | | $ | 7.49 | | $ | 0.23 | (2) | | $ | (0.22 | ) | | $ | 0.01 | | $ | (0.23 | ) | | | — | | | $ | (0.23 | ) |
2004 | | | 7.49 | | | 0.24 | | | | — | | | | 0.24 | | | (0.24 | ) | | | — | | | | (0.24 | ) |
2003 | | | 7.27 | | | 0.25 | | | | 0.22 | | | | 0.47 | | | (0.25 | ) | | | — | (3) | | | (0.25 | ) |
2002 | | | 7.30 | | | 0.26 | | | | (0.02 | ) | | | 0.24 | | | (0.26 | ) | | $ | (0.01 | ) | | | (0.27 | ) |
2001 | | | 7.07 | | | 0.26 | | | | 0.23 | | | | 0.49 | | | (0.26 | ) | | | — | | | | (0.26 | ) |
* Commencement of Operations.
| (1) | Expense ratios before waiver of fees and reimbursement of expenses by adviser and administrator. |
| (2) | For comparative purposes, per share amounts are based on average shares outstanding. |
| (3) | Amount represents less than $0.01 per share. |
See Notes to Financial Statements.
58
| | | | | | | | | | | | | | | | | | | | | | | |
| | | | | | | |
Net Asset Value,
End of Period
| | Total
Return
| | | Net Assets, End
of Period (000’s)
| | Ratio of Net
Operating Expenses
to Average
Net Assets
| | | Ratio of Gross
Operating Expenses
to Average
Net Assets (1)
| | | Ratio of Net
Investment
Income to
Average Net Assets
| | | Portfolio
Turnover
Rate
| | | Fee
Waivers
(Note 2)
| |
| | | | | | | | | | | | | | | | | | | | | | | | |
| | | | | | | | | | | | | | | | | | | | | | | | |
| | | | | | | | | | | | | | | | | | | | | | | | |
| $ | 10.07 | | 2.68 | % | | $ | 62,817 | | 0.80 | % | | 1.05 | % | | 2.74 | % | | 87 | % | | $ | 0.03 | (2) |
| | 10.08 | | 4.01 | % | | | 72,783 | | 0.73 | % | | 0.80 | % | | 2.64 | % | | 111 | % | | | 0.01 | |
| | 9.95 | | 8.12 | % | | | 94,965 | | 0.70 | % | | 0.77 | % | | 2.99 | % | | 51 | % | | | 0.01 | |
| | 9.48 | | 2.29 | % | | | 115,178 | | 0.72 | % | | 0.82 | % | | 3.66 | % | | 35 | % | | | 0.01 | |
| | 9.62 | | 11.69 | % | | | 135,515 | | 0.77 | % | | 0.83 | % | | 4.33 | % | | 60 | % | | | 0.01 | |
| | | | | | | | | | | | | | | | | | | | | | | | |
| | | | | | | | | | | | | | | | | | | | | | | | |
| | | | | | | | | | | | | | | | | | | | | | | | |
| $ | 9.41 | | 0.20 | % | | $ | 349,540 | | 0.65 | % | | 0.81 | % | | 2.69 | % | | — | | | $ | 0.02 | (2) |
| | 9.69 | | 4.19 | % | | | 387,624 | | 0.56 | % | | 0.63 | % | | 2.60 | % | | 31 | % | | | 0.01 | |
| | 9.88 | | 9.31 | % | | | 407,102 | | 0.51 | % | | 0.59 | % | | 3.15 | % | | 48 | % | | | 0.01 | |
| | 9.39 | | 2.41 | % | | | 370,018 | | 0.52 | % | | 0.64 | % | | 3.67 | % | | 67 | % | | | 0.01 | |
| | 9.57 | | 10.07 | % | | | 341,170 | | 0.57 | % | | 0.64 | % | | 4.17 | % | | 84 | % | | | 0.01 | |
| | | | | | | | | | | | | | | | | | | | | | | | |
| | | | | | | | | | | | | | | | | | | | | | | | |
| | | | | | | | | | | | | | | | | | | | | | | | |
| $ | 7.13 | | (0.01 | )% | | $ | 239,060 | | 0.60 | % | | 0.76 | % | | 1.21 | % | | 10 | % | | $ | 0.01 | (2) |
| | 7.22 | | 1.40 | % | | | 360,604 | | 0.47 | % | | 0.59 | % | | 1.12 | % | | 99 | % | | | 0.01 | |
| | 7.20 | | 2.04 | % | | | 291,282 | | 0.46 | % | | 0.58 | % | | 1.57 | % | | 31 | % | | | 0.01 | |
| | 7.17 | | 3.20 | % | | | 165,690 | | 0.48 | % | | 0.55 | % | | 2.60 | % | | 111 | % | | | 0.01 | |
| | 7.15 | | 5.94 | % | | | 83,336 | | 0.58 | % | | 0.65 | % | | 3.97 | % | | 42 | % | | | — | |
| | | | | | | | | | | | | | | | | | | | | | | | |
| | | | | | | | | | | | | | | | | | | | | | | | |
| | | | | | | | | | | | | | | | | | | | | | | | |
| $ | 8.71 | | 0.52 | % | | $ | 138,253 | | 0.80 | % | | 0.98 | % | | 2.46 | % | | 15 | % | | $ | 0.02 | (2) |
| | 8.97 | | 4.06 | % | | | 178,107 | | 0.68 | % | | 0.73 | % | | 2.41 | % | | 42 | % | | | — | (3) |
| | 9.12 | | 8.96 | % | | | 187,400 | | 0.67 | % | | 0.72 | % | | 2.96 | % | | 43 | % | | | — | (3) |
| | 8.74 | | 2.54 | % | | | 178,608 | | 0.67 | % | | 0.72 | % | | 3.53 | % | | 45 | % | | | — | |
| | 8.83 | | 10.02 | % | | | 144,421 | | 0.73 | % | | 0.75 | % | | 3.90 | % | | 39 | % | | | — | |
| | | | | | | | | | | | | | | | | | | | | | | | |
| | | | | | | | | | | | | | | | | | | | | | | | |
| | | | | | | | | | | | | | | | | | | | | | | | |
| $ | 7.27 | | 0.20 | % | | $ | 62,949 | | 0.50 | % | | 1.05 | % | | 3.18 | % | | 10 | % | | $ | 0.04 | (2) |
| | 7.49 | | 3.19 | % | | | 66,894 | | 0.50 | % | | 0.90 | % | | 3.14 | % | | 15 | % | | | 0.03 | |
| | 7.49 | | 6.59 | % | | | 66,194 | | 0.46 | % | | 0.50 | % | | 3.36 | % | | 9 | % | | | — | (3) |
| | 7.27 | | 3.32 | % | | | 58,230 | | 0.50 | % | | 0.87 | % | | 3.55 | % | | 4 | % | | | 0.03 | |
| | 7.30 | | 7.09 | % | | | 54,605 | | 0.50 | % | | 0.97 | % | | 3.69 | % | | 6 | % | | | 0.03 | |
See Notes to Financial Statements.
59
EXCELSIOR FUNDS
NOTES TO FINANCIAL STATEMENTS
1. Significant Accounting Policies:
Excelsior Funds, Inc. (“Excelsior Fund”) was incorporated under the laws of the State of Maryland on August 2, 1984. Excelsior Tax-Exempt Funds, Inc. (“Excelsior Tax-Exempt Fund”) was incorporated under the laws of the State of Maryland on August 8, 1984. Excelsior Funds Trust (the “Trust”) is a statutory trust organized under the laws of the State of Delaware on April 27, 1994. Excelsior Fund, Excelsior Tax-Exempt Fund and the Trust are registered under the Investment Company Act of 1940 (the “1940 Act”), as amended, as open-ended diversified management investment companies with the exception of New York Intermediate-Term Tax-Exempt Fund, California Tax-Exempt Income Fund, New York Tax-Exempt Money Fund, Energy and Natural Resources Fund and Real Estate Fund, each of which are non-diversified.
Excelsior Fund, Excelsior Tax-Exempt Fund and the Trust currently offer shares in fifteen, seven and seven managed investment portfolios, respectively, each having its own investment objectives and policies. The following is a summary of significant accounting policies for Managed Income Fund, Intermediate-Term Managed Income Fund and Short-Term Government Securities Fund, portfolios of Excelsior Fund, Long-Term Tax-Exempt Fund, Intermediate-Term Tax-Exempt Fund, Short-Term Tax-Exempt Securities Fund, New York Intermediate-Term Tax-Exempt Fund and California Tax-Exempt Income Fund, portfolios of Excelsior Tax-Exempt Fund, and High Yield Fund, a portfolio of the Trust (collectively, the “Funds”). Such policies are in conformity with accounting principles generally accepted in the United States of America and are consistently followed by Excelsior Fund, Excelsior Tax-Exempt Fund and the Trust in the preparation of their financial statements. The preparation of financial statements requires management to make estimates and assumptions that affect the reported amounts and disclosures in the financial statements. Actual results could differ from these estimates.
The High Yield Fund offers two classes of shares: Shares and Institutional Shares. The Managed Income Fund offers two classes of shares: Shares and Retirement Shares. The Financial Highlights of the Institutional Shares and Retirement Shares as well as the financial statements for the remaining portfolios of Excelsior Fund, Excelsior Tax-Exempt Fund and the Trust are presented separately.
(a) Portfolio valuation:
Investments in securities that are traded on recognized domestic and foreign stock exchanges are valued at the last sale price on the exchange on which such securities are primarily traded or at the last quoted sale price on a national securities market. Securities traded over-the-counter are valued each business day on the basis of closing over-the-counter bid prices. Securities for which there were no transactions are valued at the last quoted sales price for the most recent day such prices were available. Short-term debt instruments that mature in 60 days or less are valued at amortized cost, which approximates market value. The amortized cost method values a security at its cost at the time of purchase (or at its market value 61 days before maturity) and thereafter assumes a constant amortization to maturity of any bond premium or discount. Securities and other assets for which market quotations are not readily available are valued in good faith at fair value pursuant to procedures adopted by the Board of Directors with regard to Excelsior Fund and Excelsior Tax-Exempt Fund and the Board of Trustees with regard to the Trust.
60
Investments in securities that are primarily traded on foreign securities exchanges are generally valued at the preceding closing values of such securities on their respective exchanges, except that when a significant event has occurred subsequent to the close of such foreign exchange and prior to the time at which the Fund’s net asset value is determined, then such securities are valued in good faith at fair value in accordance with procedures adopted by the Board of Directors with regard to Excelsior Fund and the Board of Trustees with regard to the Trust.
Investment valuations and other assets and liabilities initially expressed in foreign currencies are converted each business day into U.S. dollars based upon current exchange rates. Purchases and sales of foreign investments and income and expenses are converted into U.S. dollars based upon currency exchange rates prevailing on the respective dates of such transactions. The Funds do not isolate the portion of gains and losses on investment securities that is due to changes in foreign exchange rates from that which is due to changes in market prices of such securities. The Funds report gains and losses on foreign currency related transactions as realized and unrealized gains and losses for financial reporting purposes, whereas such components are treated as ordinary income or loss for Federal income tax purposes.
(b) Concentration of risks:
The High Yield Fund is subject to special risks associated with investments in high yield bonds, which involve greater risk of default or downgrade and are more volatile than investment grade securities due to actual or perceived changes in an issuer’s creditworthiness. In addition, issuers of high yield bonds may be more susceptible than other issuers to economic downturns. High yield bonds are subject to the risk that the issuer may not be able to pay interest or dividends and ultimately repay principal upon maturity. Discontinuation of these payments could adversely affect the market value of the security.
At March 31, 2005, approximately, 96% of the net assets of the New York Intermediate-Term Tax-Exempt Fund is invested in New York municipal securities and 95% of the net assets of the California Tax-Exempt Income Fund is invested in California municipal securities. Economic changes affecting the states and certain of its public bodies and municipalities may affect the ability of issuers to pay the required principal and interest payments of the municipal securities.
(c) Security transactions and investment income:
Security transactions are recorded on a trade date basis. Realized gains and losses on investments sold are recorded on the basis of identified cost. Interest income, adjusted for amortization of premiums and, when appropriate, discounts on investments, is earned from settlement date and is recorded on the accrual basis. Dividend income is recorded on the ex-dividend date, except for certain dividends from foreign securities, which are recorded as soon as the Funds are informed of the dividend.
(d) Repurchase agreements:
The Funds may purchase portfolio securities from financial institutions deemed to be creditworthy by the investment adviser subject to the seller’s agreement to repurchase and the Funds’ agreement to resell such securities at mutually agreed upon prices. Securities purchased
61
subject to such repurchase agreements are deposited with the Funds’ custodian or sub-custodian or are maintained in the Federal Reserve/Treasury book-entry system and must have, at all times, an aggregate market value not less than the repurchase price (including accrued interest).
Default or bankruptcy of the seller may, however, expose the applicable Fund to possible delay in connection with the disposition of the securities or loss to the extent that proceeds from a sale of the underlying securities were less than the repurchase price under the agreement.
(e) TBA purchase commitments:
The Managed Income Fund, Intermediate-Term Managed Income Fund and Short-Term Government Securities Fund may enter into “TBA” (To Be Announced) purchase commitments to purchase securities for a fixed price at a future date, typically not exceeding 45 days. TBA purchase commitments may be considered securities in themselves, and involve risk of loss if the value of the security to be purchased declines prior to settlement date. The Funds must maintain liquid securities having a value not less than the purchase price (including accrued interest) for such purchase commitments. Unsettled TBA purchase commitments are valued at the current market value of the underlying securities, according to the procedures described under “Portfolio Valuation” above.
(f) Mortgage dollar rolls:
The Funds may enter into mortgage dollar rolls (principally in securities referred to as TBA, (see note 1(e)) in which the Funds sell mortgage securities for delivery in the current month and simultaneously contract to repurchase similar, but not identical, securities at an agreed upon price on a fixed date. The Funds account for such dollar rolls as repurchases and sales and receive compensation in consideration for entering into the commitment to repurchase. The Funds must maintain liquid securities having a value not less that the repurchase price (including accrued interest) for such dollar rolls. The market value of the securities that the Funds are required to repurchase may decline below the agreed upon repurchase price of those securities.
(g) Distributions to shareholders:
Dividends from net investment income are declared daily and paid monthly. Net realized capital gains, unless offset by any available capital loss carryforward, are distributed at least annually. Dividends and distributions are recorded on the ex-dividend date.
(h) Expense allocation:
Expenses directly attributable to a Fund are charged to that Fund. Other expenses are allocated to the respective Fund based on average daily net assets. Expenses attributable to a specific class of shares, such as shareholder servicing fees, are charged directly to that class.
2. Investment Advisory Fee, Administration Fee, Shareholder Servicing Fees and Related Party Transactions:
United States Trust Company of New York (“U.S. Trust NY”) and U.S. Trust Company, N.A. (together, the “Adviser” or “U.S. Trust”), acting through their respective registered investment advisory divisions, U.S. Trust NY Asset Management Division and U.S. Trust Company, N.A. Asset Management
62
Division, serve as the investment adviser to the Funds. For the services provided pursuant to the Investment Advisory Agreements, the Adviser receives a fee, computed daily and paid monthly, as follows:
| | | |
Managed Income Fund | | 0.75 | % |
Intermediate-Term Managed Income Fund | | 0.35 | % |
Short-Term Government Securities Fund | | 0.30 | % |
High Yield Fund | | 0.80 | % |
Long-Term Tax-Exempt Fund | | 0.50 | % |
Intermediate-Term Tax-Exempt Fund | | 0.35 | % |
Short-Term Tax-Exempt Securities Fund | | 0.30 | % |
New York Intermediate-Term Tax-Exempt Fund | | 0.50 | % |
California Tax-Exempt Income Fund | | 0.50 | % |
U.S. Trust NY is a state-chartered bank and trust company and a member bank of the Federal Reserve System. U.S. Trust Company, N.A. is a national bank organized under the laws of the United States. Each is a wholly-owned subsidiary of U.S. Trust Corporation, a registered bank holding company. U.S. Trust Corporation is a wholly-owned subsidiary of The Charles Schwab Corporation (“Schwab”).
U.S. Trust Company, N.A., and BISYS Fund Services Ohio, Inc. (collectively, the “Administrators”) provide administrative services to the Funds. For the services provided to the Funds, the Administrators are entitled jointly to annual fees, computed daily and paid monthly, based on the combined aggregate average daily net assets of Excelsior Fund, Excelsior Tax-Exempt Fund and the Trust (excluding the international equity portfolios of Excelsior Fund and the Trust), all of which are affiliated investment companies, as follows: 0.200% of the first $200 million, 0.175% of the next $200 million and 0.150% over $400 million. The Administrators are entitled jointly to annual fees, computed daily and paid monthly, at the annual rate of 0.20% of the average daily net assets of the International Equity Fund, International Fund, Pacific/Asia Fund and Emerging Markets Fund. Administration fees payable by each Fund of the three investment companies are determined in proportion to the relative average daily net assets of the respective Funds for the period paid. For the five month period ended August 31, 2004, U.S. Trust Company, N.A. voluntarily agreed to waive a portion of its administration fee in an amount equal to an annual rate of 0.04% of the average daily net assets of each Fund. For the year ended March 31, 2005, administration fees charged by U.S. Trust Company, N.A. were as follows:
| | | | | | | | | | |
| | | Administration
Fees
| | Waiver
Administration
Fees
| | | Net
Administration
Fees
|
Managed Income Fund | | $ | 399,281 | | $ | (43,265 | ) | | $ | 356,016 |
Intermediate-Term Managed Income Fund | | | 597,889 | | | (65,368 | ) | | | 532,521 |
Short-Term Government Securities Fund | | | 665,654 | | | (75,529 | ) | | | 590,125 |
High Yield Fund | | | 280,116 | | | (29,194 | ) | | | 250,922 |
Long-Term Tax-Exempt Fund | | | 99,562 | | | (11,284 | ) | | | 88,278 |
Intermediate-Term Tax-Exempt Fund | | | 546,216 | | | (61,864 | ) | | | 484,352 |
Short-Term Tax-Exempt Securities Fund | | | 426,960 | | | (51,897 | ) | | | 375,063 |
New York Intermediate-Term Tax-Exempt Fund | | | 233,154 | | | (27,280 | ) | | | 205,874 |
California Tax-Exempt Income Fund | | | 96,272 | | | (28,478 | ) | | | 67,794 |
63
From time to time, in its sole discretion, U.S. Trust may undertake to waive a portion or all of the fees payable to it and may also reimburse the Funds for a portion of other expenses. For the year ended March 31, 2005, U.S. Trust has contractually agreed to waive investment advisory fees and to reimburse other ordinary operating expenses to the extent necessary to keep total operating expenses from exceeding the following annual percentages of each Fund’s average daily net assets:
| | | |
Managed Income Fund — Shares | | 0.90 | % |
Intermediate-Term Managed Income Fund — Shares | | 0.65 | % |
Short-Term Government Securities Fund — Shares | | 0.60 | % |
High Yield Fund — Shares | | 1.05 | % |
Long-Term Tax-Exempt Fund — Shares | | 0.80 | % |
Intermediate-Term Tax-Exempt Fund — Shares | | 0.65 | % |
Short-Term Tax-Exempt Securities Fund — Shares | | 0.60 | % |
New York Intermediate-Term Tax-Exempt Fund — Shares | | 0.80 | % |
California Tax-Exempt Income Fund — Shares | | 0.50 | % |
High Yield Fund — Institutional Shares | | 0.80 | % |
Managed Income Fund — Retirement Shares | | 1.40 | % |
For the year ended March 31, 2005, pursuant to the above, investment advisory fees waived by U.S. Trust were as follows:
| | | | |
Managed Income Fund | | $ | (912,503 | ) |
Intermediate-Term Managed Income Fund | | | (752,670 | ) |
Short-Term Government Securities Fund | | | (703,376 | ) |
High Yield Fund | | | (451,580 | ) |
Long-Term Tax-Exempt Fund | | | (145,612 | ) |
Intermediate-Term Tax-Exempt Fund | | | (501,508 | ) |
Short-Term Tax-Exempt Securities Fund | | | (371,474 | ) |
New York Intermediate-Term Tax-Exempt Fund | | | (228,828 | ) |
California Tax-Exempt Income Fund | | | (309,048 | ) |
The Funds have entered into shareholder servicing agreements with various service organizations, which include Charles Schwab & Co. Inc. (“CS & Co.”) and U.S. Trust. Services included in the servicing agreements are assisting in processing purchase, exchange and redemption requests; transmitting and receiving funds in connection with customer orders to purchase, exchange or redeem shares; and providing periodic statements. Shareholder servicing fees are incurred on a Fund or class level (where applicable). In consideration for these services, each service organization receives a fee, computed daily and paid monthly, at an annual rate up to 0.25% of the average daily net assets of the Funds’ shares held by each service organizations’ customers. The Adviser, out of its own resources, may additionally compensate certain organizations for providing these services.
64
For the year ended March 31, 2005, shareholder servicing fees paid to CS & Co. and U.S. Trust were as follows:
| | | |
Managed Income Fund | | $ | 565,074 |
Intermediate-Term Managed Income Fund | | | 948,257 |
Short-Term Government Securities Fund | | | 997,890 |
High Yield Fund | | | 361,159 |
Long-Term Tax-Exempt Fund | | | 147,258 |
Intermediate-Term Tax-Exempt Fund | | | 863,787 |
Short-Term Tax-Exempt Securities Fund | | | 691,681 |
New York Intermediate-Term Tax-Exempt Fund | | | 372,282 |
California Tax-Exempt Income Fund | | | 154,220 |
Effective January 1, 2005, BISYS Fund Services Limited Partnership became the Distributor for the Funds. Prior to January 1, 2005, Edgewood Services, Inc. (a wholly-owned subsidiary of Federated Investors, Inc.), served as the Distributor of the Funds. Shares of each Fund are sold without a sales charge on a continuous basis by the Distributor.
Certain Funds have adopted a Distribution Plan pursuant to Rule 12b-1 under the 1940 Act, under which they may compensate the Distributor monthly for its services that are intended to result in the sale of Fund Shares (in the case of High Yield Fund) or Retirement Shares (in the case of Managed Income Fund), in an amount not to exceed the annual rate of 0.25% or 0.50%, respectively, of the average daily net asset value of such Fund’s Shares or Retirement Shares. There were no fees charged for the year ended March 31, 2005.
Effective July 31, 2004, each Independent Director/Trustee of the Funds receives a total annual fee of $100,000 paid by the Funds and other affiliated investment companies managed by the Adviser. The Chairman of the Board receives an additional $30,000, the Chairman of the Audit Committee receives an additional $15,000, and the Chairman of the Nominating Committee receives an additional $5,000 for serving in those capacities. Prior to July 31, 2004, each Independent Director of Excelsior Fund received an annual fee of $15,000, plus a meeting fee of $2,500 for each meeting attended. The Chairman received an additional annual fee of $7,500. Independent Trustees of the Trust received an annual fee of $6,000, plus a meeting fee of $1,000 for each meeting attended. The Chairman of the Board received an additional annual fee of $5,000. Each member of the Nominating Committee received a meeting fee of $3,000 for each meeting attended. In addition, Directors and Trustees are reimbursed by Excelsior Fund, Excelsior Tax-Exempt Fund and the Trust, respectively, for reasonable expenses incurred when acting in their capacity as Directors and Trustees.
The Funds’ Board of Directors/Trustees selected Deloitte & Touche LLP in November of 2004 to be their registered public accounting firm and to re-audit the Funds’ March 31, 2004 financial statements. All expenses in connection with the re-audit, including costs of audit, legal services, and printing and mailing of the financial statements, were paid by the Adviser. Such expenses are reflected in the Statements of Operations as “re-audit expenses” and the corresponding expense waiver “re-audit expenses paid by Investment Adviser.”
65
3. Purchases, Sales and Maturities of Securities:
For the year ended March 31, 2005, purchases, sales and maturities of securities, excluding short-term investments, for the Funds aggregated:
| | | | | | |
| | | Purchases
| | Sales and
Maturities
|
Managed Income Fund | | | | | | |
U.S. Government | | $ | 123,990,498 | | $ | 142,161,091 |
Other | | | 80,751,542 | | | 98,954,519 |
Intermediate-Term Managed Income Fund | | | | | | |
U.S. Government | | | 101,670,729 | | | 70,269,505 |
Other | | | 131,372,681 | | | 150,704,103 |
Short-Term Government Securities Fund | | | | | | |
U.S. Government | | | 332,687,164 | | | 350,063,590 |
Other | | | 113,237,475 | | | 135,051,623 |
High Yield Fund | | | 118,879,720 | | | 119,981,184 |
Long-Term Tax-Exempt Fund | | | 39,129,720 | | | 40,660,515 |
Intermediate-Term Tax-Exempt Fund | | | — | | | 11,026,950 |
Short-Term Tax-Exempt Securities Fund | | | 16,124,850 | | | 69,388,305 |
New York Intermediate-Term Tax-Exempt Fund | | | 17,942,400 | | | 43,735,160 |
California Tax-Exempt Income Fund | | | 6,222,667 | | | 6,249,111 |
4. Federal Taxes:
It is the policy of Excelsior Fund, Excelsior Tax-Exempt Fund and the Trust that each Fund qualify or continue to qualify as a regulated investment company, by complying with the requirements of the Internal Revenue Code applicable to regulated investment companies, and by distributing substantially all of its taxable earnings to its shareholders.
In order to avoid a federal excise tax, each Fund is required to distribute certain minimum amounts of net realized capital gain and net investment income for the respective twelve-month periods ending October 31 and December 31 each year.
Net realized gains of the Funds derived in certain countries are subject to certain foreign taxation.
Dividends and distributions are determined in accordance with federal income tax regulations and may differ from accounting principles generally accepted in the United States of America. These differences are primarily due to differing treatments for deferral of losses on wash sales and net capital losses incurred after October 31 and within the taxable year (“Post-October losses”). To the extent these differences are permanent, adjustments are made to the appropriate equity accounts in the period that these differences arise. Accordingly, the following reclassifications have been made to/from the following accounts:
66
| | | | | | | | | | | | |
| | | Undistributed
Net
Investment
Income
| | | Accumulated
Net Realized
Gain (Loss)
| | | Paid-In
Capital
| |
Managed Income Fund | | $ | 177,719 | | | $ | (1,724,997 | ) | | $ | 1,547,278 | |
Intermediate-Term Managed Income Fund | | | 395,219 | | | | (395,219 | ) | | | — | |
Short-Term Government Securities Fund | | | 2,336,031 | | | | (2,336,033 | ) | | | 2 | |
High Yield Fund | | | (271,400 | ) | | | 271,398 | | | | 2 | |
Long-Term Tax-Exempt Fund | | | — | | | | (4 | ) | | | 4 | |
Intermediate-Term Tax-Exempt Fund | | | (1 | ) | | | 1 | | | | — | |
Short-Term Tax-Exempt Securities Fund | | | (2,425 | ) | | | 2,423 | | | | 2 | |
New York Intermediate-Term Tax-Exempt Fund | | | (31 | ) | | | (2 | ) | | | 33 | |
California Tax-Exempt Income Fund | | | 1 | | | | — | | | | (1 | ) |
The tax character of dividends and distributions declared during the years ended March 31, 2005 and March 31, 2004 were as follows:
| | | | | | | | | | | | | | | |
| | | Ordinary
Income
| | Tax-Exempt
Income
| | Long-Term
Capital Gain
| | Return of
Capital
| | Total
|
Managed Income Fund | | | | | | | | | | | | | | | |
2005 | | $ | 11,633,310 | | | — | | $ | 1,031,057 | | | — | | $ | 12,664,367 |
2004 | | | 12,669,037 | | | — | | | 2,777,932 | | | — | | | 15,446,969 |
Intermediate-Term Managed
Income Fund | | | | | | | | | | | | | | | |
2005 | | | 14,305,244 | | | — | | | 572,247 | | | — | | | 14,877,491 |
2004 | | | 15,706,998 | | | — | | | 4,116,483 | | | — | | | 19,823,481 |
Short-Term Government
Securities Fund | | | | | | | | | | | | | | | |
2005 | | | 13,966,986 | | | — | | | — | | | — | | | 13,966,986 |
2004 | | | 15,034,872 | | | — | | | — | | | — | | | 15,034,872 |
High Yield Fund | | | | | | | | | | | | | | | |
2005 | | | 11,801,334 | | | — | | | — | | | — | | | 11,801,334 |
2004 | | | 10,866,812 | | | — | | | — | | $ | 3,160,658 | | | 14,027,470 |
Long-Term Tax-Exempt Fund | | | | | | | | | | | | | | | |
2005 | | | — | | $ | 1,833,293 | | | — | | | — | | | 1,833,293 |
2004 | | | — | | | 2,199,868 | | | — | | | — | | | 2,199,868 |
Intermediate-Term Tax-Exempt Fund | | | | | | | | | | | | | | | |
2005 | | | 256,062 | | | 9,828,278 | | | 1,294,216 | | | — | | | 11,378,556 |
2004 | | | 1,128,243 | | | 10,386,027 | | | 12,402,638 | | | — | | | 23,916,908 |
Short-Term Tax-Exempt
Securities Fund | | | | | | | | | | | | | | | |
2005 | | | 24,949 | | | 3,424,866 | | | 22,878 | | | — | | | 3,472,693 |
2004 | | | — | | | 3,456,342 | | | — | | | — | | | 3,456,342 |
New York Intermediate-Term
Tax-Exempt Fund | | | | | | | | | | | | | | | |
2005 | | | — | | | 3,894,510 | | | 1,466,615 | | | — | | | 5,361,125 |
2004 | | | 303,039 | | | 4,386,298 | | | 5,482,307 | | | — | | | 10,171,644 |
California Tax-Exempt Income Fund | | | | | | | | | | | | | | | |
2005 | | | — | | | 2,063,597 | | | — | | | — | | | 2,063,597 |
2004 | | | — | | | 2,026,301 | | | — | | | — | | | 2,026,301 |
67
As of March 31, 2005, the components of distributable earnings (accumulated losses) on a tax basis were as follows:
| | | | | | | | | | | | | | | | | | | | | | | | | | | | |
| | | Undistributed
Ordinary
Income
| | Undistributed
Tax-Exempt
Income
| | Undistributed
Long-Term
Capital Gains
| | Distributions
Payable
| | | Accumulated
Capital and
Other Losses
| | | Post
October
Losses
| | Unrealized
Appreciation/
(Depreciation)
| | | Total
| |
Managed Income Fund | | $ | 1,159,172 | | | — | | $ | 1,192,486 | | $ | (428,319 | ) | | | — | | | | — | | $ | 2,643,523 | | | $ | 4,566,862 | |
Intermediate-Term Managed Income Fund | | | 1,248,355 | | | — | | | 1,063,363 | | | (1,139,984 | ) | | | — | | | | — | | | (1,823,669 | ) | | | (651,935 | ) |
Short-Term Government Securities Fund | | | 921,110 | | | — | | | — | | | (885,694 | ) | | $ | (9,073,286 | ) | | $ | 1,665,767 | | | (5,788,674 | ) | | | (13,160,777 | ) |
High Yield Fund | | | 281,497 | | | — | | | — | | | (753,861 | ) | | | (61,203,778 | ) | | | — | | | (1,204,936 | ) | | | (62,881,078 | ) |
Long-Term Tax-Exempt Fund | | | — | | $ | 120,242 | | | — | | | (120,118 | ) | | | (262,322 | ) | | | — | | | 862,423 | | | | 600,225 | |
Intermediate-Term Tax-Exempt Fund | | | — | | | 757,211 | | | 367,896 | | | (752,786 | ) | | | — | | | | — | | | 6,080,555 | | | | 6,452,876 | |
Short-Term Tax-Exempt Securities Fund | | | — | | | 273,390 | | | — | | | (268,064 | ) | | | (491,548 | ) | | | 102,160 | | | (2,004,976 | ) | | | (2,389,038 | ) |
New York Intermediate-Term Tax-Exempt Fund | | | — | | | 246,192 | | | 1,825,238 | | | (243,432 | ) | | | — | | | | — | | | (308,940 | ) | | | 1,519,058 | |
California Tax-Exempt Income Fund | | | — | | | 129,231 | | | — | | | (128,065 | ) | | | (975 | ) | | | — | | | 941,210 | | | | 941,401 | |
Post-October losses are deemed to arise on the first business day of a Fund’s next taxable year.
For federal income tax purposes, capital loss carryforwards may be carried forward and applied against future capital gains. To the extent that such carryforwards are utilized, capital gains distributions will be reduced. At March 31, 2005, the following Funds had capital loss carryforwards available to offset future net capital gains through the indicated expiration dates:
| | | | | | | | | | | | | | | | | | |
| | | Expires
|
| | | 2009
| | 2010
| | 2011
| | 2012
| | 2013
| | Total
|
Short-Term Government Securities Fund | | | — | | | — | | | — | | $ | 1,481,228 | | $ | 4,260,524 | | $ | 5,741,752 |
High Yield Fund | | | — | | $ | 2,181,571 | | $ | 17,456,849 | | | 40,103,941 | | | 1,461,417 | | | 61,203,778 |
Long-Term Tax-Exempt Fund | | $ | 262,322 | | | — | | | — | | | — | | | — | | | 262,322 |
Short-Term Tax-Exempt Securities Fund | | | — | | | — | | | — | | | — | | | 287,228 | | | 287,228 |
California Tax-Exempt Income Fund | | | — | | | — | | | — | | | 664 | | | 311 | | | 975 |
68
At March 31, 2005, aggregate gross unrealized appreciation for all securities and call options written for which there was an excess of value over estimated tax cost and aggregate gross unrealized depreciation for all securities for which there was an excess of estimated tax cost over value is as follows:
| | | | | | | | | | | | | | |
| | | Federal Tax
Cost
| | Tax Basis
Unrealized
Appreciation
| | Tax Basis
Unrealized
(Depreciation)
| | | Net
Unrealized
Appreciation
(Depreciation)
| |
Managed Income Fund | | $ | 209,787,935 | | $ | 3,669,100 | | $ | (1,025,577 | ) | | $ | 2,643,523 | |
Intermediate-Term Managed Income Fund | | | 410,424,653 | | | 3,162,101 | | | (4,985,770 | ) | | | (1,823,669 | ) |
Short-Term Government Securities Fund | | | 410,985,834 | | | 209,593 | | | (5,998,267 | ) | | | (5,788,674 | ) |
High Yield Fund | | | 167,190,147 | | | 4,286,188 | | | (5,491,124 | ) | | | (1,204,936 | ) |
Long-Term Tax-Exempt Fund | | | 60,218,286 | | | 963,983 | | | (101,560 | ) | | | 862,423 | |
Intermediate-Term Tax-Exempt Fund | | | 340,455,193 | | | 7,740,577 | | | (1,660,022 | ) | | | 6,080,555 | |
Short-Term Tax-Exempt Securities Fund | | | 234,140,389 | | | 647 | | | (2,005,623 | ) | | | (2,004,976 | ) |
New York Intermediate-Term Tax-Exempt Fund | | | 137,286,096 | | | 950,875 | | | (1,259,815 | ) | | | (308,940 | ) |
California Tax-Exempt Income Fund | | | 62,314,841 | | | 1,174,698 | | | (233,488 | ) | | | 941,210 | |
5. Capital Transactions:
Excelsior Fund has authorized capital of 35 billion shares of Common Stock, 29.3756 billion of which is currently classified to represent interests in certain classes of shares. Authorized capital currently offered for each Fund is as follows: 750 million shares of the Managed Income Fund; 1.5 billion shares of the Intermediate-Term Managed Income Fund; and 1 billion shares of the Short-Term Government Securities Fund. Each share has a par value of $0.001 and represents an equal proportionate interest in the particular Fund with other shares of the same Fund, and is entitled to such dividends and distributions of taxable earnings on the assets belonging to such Fund as are declared at the discretion of Excelsior Fund’s Board of Directors.
Excelsior Tax-Exempt Fund has authorized capital of 24 billion shares of Common Stock, 15 billion of which is currently classified to represent interests in certain classes of shares. Authorized capital currently offered for each Fund is as follows: 1.5 billion shares each of Long-Term Tax-Exempt Fund, Intermediate-Term Tax-Exempt Fund, Short-Term Tax-Exempt Securities Fund, New York Intermediate-Term Tax-Exempt Fund and California Tax-Exempt Income Fund. Each share has a par value of $0.001 and represents an equal proportionate interest in the particular Fund with other shares of the same Fund, and is entitled to such dividends and distributions of taxable and tax-exempt earnings on the assets belonging to such Fund as are declared at the discretion of Excelsior Tax-Exempt Fund’s Board of Directors.
The Trust has authorized an unlimited number of shares of beneficial interest of each class of each Fund. Each share has a par value of $0.00001 and represents an equal proportionate interest in the particular Fund with other shares of the same Fund, and is entitled to such dividends and distributions of taxable earnings on the assets belonging to such Fund as are declared at the discretion of the Trust’s Board of Trustees.
69
| | | | | | | | | | | | | | |
| | | Managed Income Fund
| |
| | | Year Ended
3/31/05
| | | Year Ended
3/31/04
| |
| | | Shares
| | | Amount
| | | Shares
| | | Amount
| |
Sold | | | | | | | | | | | | | | |
Shares | | 7,544,152 | | | $ | 69,875,602 | | | 6,431,529 | | | $ | 60,736,685 | |
Retirement Shares | | 126 | | | | 1,050 | | | — | | | | — | |
Issued as reinvestment of dividends | | | | | | | | | | | | | | |
Shares | | 331,579 | | | | 3,062,096 | | | 447,581 | | | | 4,191,949 | |
Retirement Shares | | — | | | | 4 | | | — | | | | — | |
Redeemed | | | | | | | | | | | | | | |
Shares | | (4,431,412 | ) | | | (40,768,322 | ) | | (9,433,164 | ) | | | (88,509,497 | ) |
Redemption in-kind | | (8,833,002 | ) | | | (81,528,608 | ) | | | | | | | |
| | |
|
| |
|
|
| |
|
| |
|
|
|
Net Increase (Decrease) | | (5,388,557 | ) | | $ | (49,358,178 | ) | | (2,554,054 | ) | | $ | (23,580,863 | ) |
| | |
|
| |
|
|
| |
|
| |
|
|
|
| |
| | | Intermediate-Term Managed Income Fund
| |
| | | Year Ended
3/31/05
| | | Year Ended
3/31/04
| |
| | | Shares
| | | Amount
| | | Shares
| | | Amount
| |
Sold: | | 15,055,086 | | | $ | 109,213,526 | | | 17,987,899 | | | $ | 133,005,733 | |
Contribution in-kind | | 1,044,029 | | | | 7,590,091 | | | | | | | | |
Issued as reinvestment of dividends: | | 158,208 | | | | 1,145,388 | | | 161,101 | | | | 1,185,497 | |
Redeemed: | | (14,791,878 | ) | | | (107,161,886 | ) | | (17,028,047 | ) | | | (125,933,806 | ) |
| | |
|
| |
|
|
| |
|
| |
|
|
|
Change in net assets | | 1,465,445 | | | $ | 10,787,119 | | | 1,120,953 | | | $ | 8,257,424 | |
| | |
|
| |
|
|
| |
|
| |
|
|
|
| |
| | | Short-Term Government Securities Fund
| |
| | | Year Ended
03/31/05
| | | Year Ended
03/31/04
| |
| | | Shares
| | | Amount
| | | Shares
| | | Amount
| |
Sold | | 28,457,660 | | | $ | 201,824,477 | | | 52,359,121 | | | $ | 379,822,103 | |
Issued as reinvestment of dividends | | 289,189 | | | | 2,044,988 | | | 222,097 | | | | 1,603,649 | |
Redeemed | | (36,290,718 | ) | | | (257,075,591 | ) | | (55,936,678 | ) | | | (405,102,072 | ) |
| | |
|
| |
|
|
| |
|
| |
|
|
|
Change in net assets | | (7,543,869 | ) | | $ | (53,206,126 | ) | | (3,355,460 | ) | | $ | (23,676,320 | ) |
| | |
|
| |
|
|
| |
|
| |
|
|
|
70
| | | | | | | | | | | | | | |
| | | High Yield Fund
| |
| | | Year Ended
03/31/05
| | | Year Ended
03/31/04
| |
| | | Shares
| | | Amount
| | | Shares
| | | Amount
| |
Sold: | | | | | | | | | | | | | | |
Shares | | 21,515,855 | | | $ | 101,230,357 | | | 32,989,833 | | | $ | 146,064,602 | |
Institutional Shares | | 1,316,771 | | | | 6,247,385 | | | 1,199,226 | | | | 5,249,685 | |
Issued as reinvestment of dividends: | | | | | | | | | | | | | | |
Shares | | 414,836 | | | | 1,961,707 | | | 367,138 | | | | 1,637,682 | |
Institutional Shares | | 8,493 | | | | 40,222 | | | 6,757 | | | | 29,643 | |
Redeemed: | | | | | | | | | | | | | | |
Shares | | (20,658,816 | ) | | | (97,478,269 | ) | | (34,133,033 | ) | | | (152,384,928 | ) |
Institutional Shares | | (3,282,976 | ) | | | (15,687,133 | ) | | (5,737,764 | ) | | | (25,636,287 | ) |
| | |
|
| |
|
|
| |
|
| |
|
|
|
Change in net assets | | (685,837 | ) | | $ | (3,685,731 | ) | | (5,307,843 | ) | | $ | (25,039,603 | ) |
| | |
|
| |
|
|
| |
|
| |
|
|
|
| |
| | | Long-Term Tax-Exempt Fund
| |
| | | Year Ended
03/31/05
| | | Year Ended
03/31/04
| |
| | | Shares
| | | Amount
| | | Shares
| | | Amount
| |
Sold | | 1,003,168 | | | $ | 9,987,153 | | | 1,973,824 | | | $ | 19,719,700 | |
Issued as reinvestment of dividends | | 31,144 | | | | 312,137 | | | 33,235 | | | | 330,955 | |
Redeemed | | (2,011,361 | ) | | | (20,002,931 | ) | | (4,333,803 | ) | | | (43,227,377 | ) |
| | |
|
| |
|
|
| |
|
| |
|
|
|
Change in net assets | | (977,049 | ) | | $ | (9,703,641 | ) | | (2,326,744 | ) | | $ | (23,176,722 | ) |
| | |
|
| |
|
|
| |
|
| |
|
|
|
| |
| | | Intermediate-Term Tax-Exempt Fund
| |
| | | Year Ended
03/31/05
| | | Year Ended
03/31/04
| |
| | | Shares
| | | Amount
| | | Shares
| | | Amount
| |
Sold | | 7,418,489 | | | $ | 70,630,402 | | | 10,553,521 | | | $ | 104,290,828 | |
Issued as reinvestment of dividends | | 107,050 | | | | 1,019,228 | | | 183,521 | | | | 1,779,145 | |
Redeemed | | (10,361,672 | ) | | | (98,554,729 | ) | | (11,939,158 | ) | | | (118,008,037 | ) |
| | |
|
| |
|
|
| |
|
| |
|
|
|
Change in net assets | | (2,836,133 | ) | | $ | (26,905,099 | ) | | (1,202,116 | ) | | $ | (11,938,064 | ) |
| | |
|
| |
|
|
| |
|
| |
|
|
|
| |
| | | Short-Term Tax-Exempt Securities Fund
| |
| | | Year Ended
03/31/05
| | | Year Ended
03/31/04
| |
| | | Shares
| | | Amount
| | | Shares
| | | Amount
| |
Sold | | 13,545,164 | | | $ | 97,050,761 | | | 29,901,468 | | | $ | 215,547,037 | |
Issued as reinvestment of dividends | | 23,592 | | | | 168,982 | | | 17,156 | | | | 123,645 | |
Redeemed | | (29,996,244 | ) | | | (214,883,252 | ) | | (20,414,339 | ) | | | (147,073,098 | ) |
| | |
|
| |
|
|
| |
|
| |
|
|
|
Change in net assets | | (16,427,488 | ) | | $ | (117,663,509 | ) | | 9,504,285 | | | $ | 68,597,584 | |
| | |
|
| |
|
|
| |
|
| |
|
|
|
71
| | | | | | | | | | | | | | |
| | | New York Intermediate-Term Tax-Exempt Fund
| |
| | | Year Ended
03/31/05
| | | Year Ended
03/31/04
| |
| | | Shares
| | | Amount
| | | Shares
| | | Amount
| |
Sold | | 2,053,754 | | | $ | 18,150,200 | | | 4,175,816 | | | $ | 38,017,393 | |
Issued as reinvestment of dividends | | 67,207 | | | | 593,357 | | | 120,743 | | | | 1,083,430 | |
Redeemed | | (6,111,053 | ) | | | (53,845,642 | ) | | (4,975,150 | ) | | | (45,321,700 | ) |
| | |
|
| |
|
|
| |
|
| |
|
|
|
Change in net assets | | (3,990,092 | ) | | $ | (35,102,085 | ) | | (678,591 | ) | | $ | (6,220,877 | ) |
| | |
|
| |
|
|
| |
|
| |
|
|
|
| |
| | | California Tax-Exempt Income Fund
| |
| | | Year Ended
03/31/05
| | | Year Ended
03/31/04
| |
| | | Shares
| | | Amount
| | | Shares
| | | Amount
| |
Sold | | 3,278,532 | | | $ | 24,146,853 | | | 2,479,328 | | | $ | 18,593,918 | |
Issued as reinvestment of dividends | | 42,748 | | | | 314,174 | | | 17,600 | | | | 131,929 | |
Redeemed | | (3,595,284 | ) | | | (26,429,967 | ) | | (2,405,845 | ) | | | (18,013,017 | ) |
| | |
|
| |
|
|
| |
|
| |
|
|
|
Change in net assets | | (274,004 | ) | | $ | (1,968,940 | ) | | 91,083 | | | $ | 712,830 | |
| | |
|
| |
|
|
| |
|
| |
|
|
|
6. Line of Credit:
During the year ended March 31, 2005, the Funds and other affiliated funds participated in a $50 million unsecured line of credit provided by a syndication of banks under a line of credit agreement. A commitment fee, equal to an annual rate of 0.15% of the average daily unused portion of the line of credit, is allocated among the participating Funds at the end of each quarter, and is included in miscellaneous expenses on the statements of operations. For the year ended March 31, 2005, the Funds had no borrowings under the agreement. Effective March 9, 2005, the unsecured line of credit was terminated.
7. Guarantees:
In the normal course of business, the Funds enter into contracts that provide general indemnifications. The Funds’ maximum exposure under these arrangements is dependent on future claims that may be made against the Funds, and, therefore, cannot be established; however, based on experience, the risk of loss from such claims is considered remote.
8. Legal Proceedings:
The Adviser and Excelsior Funds, Inc., Excelsior Tax-Exempt Funds, Inc., and Excelsior Funds Trust (the “Companies”) were contacted in September, 2003 by the Office of the New York State Attorney General (the “NYAG”), and the Adviser was contacted by the Securities and Exchange Commission (the “SEC”) in connection with their investigations of practices in the mutual fund industry identified as “market timing” and “late trading” of mutual fund shares (the “Investigations”). The Adviser and the Companies have cooperated with respect to these Investigations. As disclosed previously by the Adviser and its affiliates, with respect to the Adviser, these investigations have focused on circumstances in which a small number of parties were permitted to engage in short-term trading of certain Excelsior Funds. The short-term trading activities permitted under these arrangements have been terminated and the Adviser has strengthened its policies and procedures to deter frequent trading in the Companies.
72
Five class actions filed against the Companies and two derivative actions purportedly brought on behalf of each of the Companies and each of the funds have been transferred to the United District Court for the District of Maryland for coordinated or consolidated pre-trial proceedings in a matter styled In Re Mutual Funds Investment Litigation, MDL Docket No. 1586. Lead plaintiffs were appointed and additional defendants were added (generally consisting of current and former directors and officers of the Companies). The five class actions were then consolidated and a single amended complaint was filed on or about September 29, 2004. Plaintiffs in the consolidated class action are seeking unspecified monetary damages from claimed injuries arising from allegedly illegal and improper mutual fund trading practices, as well as disgorgement of investment advisory fees, rescission and restitution of unspecified funds. The two derivative actions were also consolidated into a new amended complaint, also filed on or about September 29, 2004. Plaintiffs in the consolidated derivative action are seeking, on behalf of the Companies, unspecified monetary damages for similar claimed injuries, as well as removal of Excelsior Fund directors, removal of U.S. Trust as advisor to the Excelsior Funds, rescission of its investment advisory contracts and disgorgement of management fees and compensation relating to the Excelsior Funds.
The defendants in the consolidated actions have moved to dismiss such actions, and the Maryland court is scheduled to hear oral argument on the motions to dismiss on June 16-17, 2005. The defendants will not be required to answer the complaints until such motions have been decided, and discovery in the actions is currently stayed.
While the ultimate outcome of these matters cannot be predicted with any certainty at this time, based on currently available information, the Adviser believes that the likelihood is remote that the pending private lawsuits and Investigations will have a material adverse financial impact on the Companies, and further believes that the pending Investigations and private lawsuits are not likely to materially affect the Adviser’s ability to provide investment management services to the Companies.
73
REPORT OF INDEPENDENT REGISTERED PUBLIC ACCOUNTING FIRM
To the Board of Directors/Trustees and Shareholders of
Excelsior Funds, Inc., Excelsior Funds Trust, and Excelsior Tax-Exempt Funds, Inc.
We have audited the accompanying statements of assets and liabilities, including the portfolios of investments, of the Managed Income Fund, Intermediate-Term Managed Income Fund, Short-Term Government Securities Fund, High Yield Fund, Long-Term Tax-Exempt Fund, Intermediate-Term Tax-Exempt Fund, Short Term Tax-Exempt Securities Fund, New York Intermediate-Term Tax-Exempt Fund, and California Tax-Exempt Income Fund (three of the portfolios constituting the Excelsior Funds, Inc., one of the portfolios constituting the Excelsior Funds Trust, and five of the portfolios constituting the Excelsior Tax-Exempt Funds, Inc.) (collectively, the “Funds”) as of March 31, 2005, and the related statements of operations for the year then ended, and the statements of changes in net assets and the financial highlights (Shares) for each of the two years in the period then ended. These financial statements and financial highlights are the responsibility of the Funds’ management. Our responsibility is to express an opinion on these financial statements and financial highlights based on our audits. The financial highlights for each of the years in the three year period ended March 31, 2003 were audited by other auditors whose reports dated May 16, 2003, expressed an unqualified opinion on those financial highlights.
We conducted our audits in accordance with the standards of the Public Company Accounting Oversight Board (United States). Those standards require that we plan and perform the audit to obtain reasonable assurance about whether the financial statements and financial highlights are free of material misstatement. The Funds are not required to have, nor were we engaged to perform, an audit of their internal control over financial reporting. Our audit included consideration of internal control over financial reporting as a basis for designing audit procedures that are appropriate in the circumstances, but not for the purpose of expressing an opinion on the effectiveness of the Funds’ internal control over financial reporting. Accordingly, we express no such opinion. An audit also includes examining, on a test basis, evidence supporting the amounts and disclosures in the financial statements, assessing the accounting principles used and significant estimates made by management, as well as evaluating the overall financial statement presentation. Our procedures included confirmation of securities owned as of March 31, 2005, by correspondence with the custodian and brokers; where replies were not received from brokers, we performed other auditing procedures. We believe that our audits provide a reasonable basis for our opinion.
In our opinion, the financial statements and financial highlights referred to above present fairly, in all material respects, the financial position of Managed Income Fund, Intermediate-Term Managed Income Fund, Short-Term Government Securities Fund, High Yield Fund, Long-Term Tax-Exempt Fund, Intermediate-Term Tax-Exempt Fund, Short Term Tax-Exempt Securities Fund, New York Intermediate-Term Tax-Exempt Fund, and California Tax-Exempt Income Fund as of March 31, 2005, the results of their operations, and the changes in their net assets and the financial highlights for each of the two years in the period then ended, in conformity with accounting principles generally accepted in the United States of America.
DELOITTE & TOUCHE LLP
New York, New York
May 27, 2005
74
Directors/Trustees and Officers of the Excelsior Funds Complex (Unaudited)
Information pertaining to the Directors/Trustees and Officers of Excelsior Fund, Excelsior Tax-Exempt Fund and Excelsior Funds Trust (each a “Company” and collectively, the “Excelsior Funds Complex”) is set forth below. Directors/Trustees who are not deemed to be “interested persons” of the Excelsior Funds Complex as defined in the 1940 Act are referred to as “Independent Board Members.” Directors/Trustees who are deemed to be “interested persons” of the Excelsior Funds Complex are referred to as “Interested Board Members”. The following information is as of May 20, 2005.
| | | | | | |
Name and Address(1) Age Time Served with the Excelsior Funds Complex
| | Principal Occupation
During the Past Five Years
| | Number of
Portfolios in Fund
Complex Overseen by Director/
Trustee(3)
| | Other Directorships Held by Director/Trustee(4)
|
DIRECTORS/TRUSTEES(2) INDEPENDENT BOARD MEMBERS | | | | | | |
Frederick S. Wonham
Age: 74
Since 1997 | | Retired. Chairman of the Boards and Director (since 1997) and President and Treasurer (from 1995 to February 2002) of Excelsior Funds, Inc. and Excelsior Tax-Exempt Funds, Inc.; Chairman of the Board and Trustee (since 1997) and President and Treasurer (from 1995 to February 2002) of Excelsior Funds Trust. | | 29 | | None. |
| | | |
Rodman L. Drake
Age: 62
Since 1994 | | Director of Excelsior Funds, Inc. and Excelsior Tax-Exempt Funds, Inc. (since 1996); Trustee of Excelsior Funds Trust (since 1994); Director, Crystal River Capital Inc. (a private REIT) (since March 2005); Director, Parson Brinkerhoff, Inc. (engineering firm) (since 1995); Co-Founder of Baringo Capital LLC (since 2002); President, Continuation Investments Group, Inc. (from 1997 to 2001). | | 29 | | Director and Chairman, Hyperion Total Return Fund, Inc., Hyperion Strategic Mortgage Fund Inc., and Hyperion 2005 Term Trust Inc. (since 1991); Director, Jackson Hewitt Inc. (since June 2004). |
| | | |
Morrill Melton (“Mel”) Hall, Jr.
Age: 60
Since 2000 | | Director of Excelsior Funds, Inc. and Excelsior Tax-Exempt Funds, Inc. (since 2000); Trustee of Excelsior Funds Trust (since 2000); Chairman and Chief Executive Officer, Comprehensive Health Services, Inc. (health care management and administration) (since 1991). | | 29 | | None. |
| | | |
Roger M. Lynch
Age: 64
Since 2001 | | Retired. Director of Excelsior Funds, Inc. and Excelsior Tax- Exempt Funds, Inc. and Trustee of Excelsior Funds Trust (since 2001); Director, SLD Commodities, Inc. (importer of nuts) (since 1991); President, Corporate Asset Funding Co., Inc. (asset securitization) (from 1987 to 1999); Limited Partner (from 1986 to 1999), Goldman Sachs & Co. | | 29 | | None. |
75
| | | | | | |
Name and Address(1) Age Time Served with the Excelsior Funds Complex
| | Principal Occupation
During the Past Five Years
| | Number of
Portfolios in Fund
Complex Overseen by Director/
Trustee(3)
| | Other Directorships Held by Director/Trustee(4)
|
Jonathan Piel
Age: 66
Since 1994 | | Retired. Director, Excelsior Funds, Inc. and Excelsior Tax-Exempt Funds, Inc. (since 1996); Trustee, Excelsior Funds Trust (since 1994). | | 29 | | None. |
| | | |
John. D. Collins
Age: 66
Since 2005 | | Retired. Director, Excelsior Funds, Inc. and Excelsior Tax-Exempt Funds, Inc. (since 2005); Trustee, Excelsior Funds Trust (since 2005). Consultant, KPMG, LLP (from July 1999 to June 2000); Partner, KPMG, LLP (from March 1962 to June 1999). | | 29 | | Director, CCC Information Services Inc. (software to automate process of settling automobile claims)(since September 2004); Director, Mrs. Fields’ Companies, Inc. (consumer products)(since December 2004). |
| INTERESTED BOARD MEMBER(5) | | | | | | |
James L. Bailey
114 West 47th Street
New York, NY 10036
Age: 59
Since 2004 | | Chief Operating Officer of U.S. Trust Corporation (since December 2004) and Executive Vice President of U.S. Trust Corporation and United States Trust Company of New York (since 2003); President, Excelsior Funds, Inc., Excelsior Tax-Exempt Funds, Inc. and Excelsior Funds Trust (from 2003 to July 2004); Consultant in the financial services industry (from August 2000 to January 2003); Executive Vice President of Citicorp (from 1992 to August 2000). | | 29 | | None. |
| OFFICERS | | | | | | |
Mary Martinez
114 West 47th Street
New York, NY 10036
Age: 45
President
Since July 2004 | | Managing Director of United States Trust Company of New York (since 2003) and Chief Executive Officer of National Private Banking (since October 2004); Managing Director and Director of Relationship Management Service, Marketing, Information and Technology at Bessemer Trust (from 1998 to 2003). | | N/A | | N/A |
| | | |
Joseph Trainor, CFA
114 West 47th Street
New York, NY 10036
Age: 44
Vice President
Since February 2004 | | Managing Director of United States Trust Company of New York and President, U.S. Trust Institutional (since 2003); President of MFS Institutional Advisors (from 1998 to 2002). | | N/A | | N/A |
76
| | | | | | |
Name and Address(1) Age Time Served with the Excelsior Funds Complex
| | Principal Occupation
During the Past Five Years
| | Number of
Portfolios in Fund
Complex Overseen by Director/
Trustee(3)
| | Other Directorships Held by Director/Trustee(4)
|
Agnes Mullady
225 High Ridge Road Stamford, CT 06905
Age: 46
Treasurer/Chief Financial and Chief Accounting Officer
Since February 2004 | | Senior Vice President, U.S. Trust Company, N.A. (since 2004); Chief Financial Officer, AMIC Distribution Partners (from 2002 to 2004); Controller Reserve Management Corporation, Reserve Management Company, Inc. and Reserve Partners, Inc. (from 2000 to 2002); Vice President and Treasurer, Northstar Funds; Senior Vice President and Chief Financial Officer, Northstar Investment Management Corp.; President and Treasurer, Northstar Administrators Corp.; and Vice President and Treasurer, Northstar Distributors, Inc. (from 1993 to 2000). | | N/A | | N/A |
| | | |
Scott Rhodes
225 High Ridge Road Stamford, CT 06905
Age: 46
Vice President and Assistant Treasurer
Since November 2004 | | Vice President, U.S. Trust Company, N.A. (since August 2004); Vice President, BlackRock Financial Management, Inc. (2004); Controller, Mutual Funds, American Skandia Investment Services, Inc. and Assistant Treasurer, American Skandia Trust and American Skandia Advisor Funds, Inc. (from 1996 to 2003). | | N/A | | N/A |
| | | |
Alexandra Poe
114 West 47th Street
New York, NY 10036
Age: 44
Secretary and Chief Legal Officer
Since May 2004 | | Senior Vice President and Assistant General Counsel, United States Trust Company of New York (since May 2004); Chief Legal Officer for Managed Accounts and Alternative Investment Strategies, Prudential Investments (from 2001 to 2004); Senior Vice President and General Counsel, US Investment Management and Global Hedge Funds and President of the Schroder Mutual Funds, Schroders (from 1996 to 2001). | | N/A | | N/A |
| | | |
Sharon M. Davison
114 West 47th Street
New York, NY 10036
Age: 50
Chief Compliance Officer Since September 2004 | | Senior Vice President of U.S. Trust Company of New York (since 2001); Director of Securities and Corporate Compliance (since 2001); Director of Special Investigations-New York Stock Exchange Division of Market Surveillance (from 2000 to 2001); Senior Counsel-New York Stock Exchange Division of Market Surveillance (from 1997 to 2000). | | N/A | | N/A |
77
| | | | | | |
Name and Address(1) Age Time Served with the Excelsior Funds Complex
| | Principal Occupation
During the Past Five Years
| | Number of
Portfolios in Fund
Complex Overseen by Director/
Trustee(3)
| | Other Directorships Held by Director/Trustee(4)
|
Wyndham Clark
225 High Ridge Road Stamford, CT 06905
Age: 47
Anti-Money Laundering Officer
Since May 2004 | | Vice President and AML Officer, U.S. Trust Company, N.A. (since 2003); Vice President and Deputy Director Risk Management, IBJ Whitehall (banking) (from 2001 to 2002); and Vice President and Chief Risk Officer, EMAC, LLC (commercial lender, asset backed security issuer) (from 1999 to 2001). | | N/A | | N/A |
| | | |
Ralph Pastore
225 High Ridge Road
Stamford, CT 06905
Age: 35
Vice President
Since May 2005 | | Vice President, U.S. Trust Company, N.A. (since 2001); Director, Mutual Fund Operations, American Skandia Investment Services, Inc. (from 1998 to 2001) | | N/A | | N/A |
| (1) | Each independent director/trustee may be contacted by writing to Excelsior Funds, 225 High Ridge Road, Stamford, CT 06905. |
| (2) | Each director/trustee shall hold office until the election and qualification of his or her successor, or until he or she sooner dies, resigns or is removed. The officers of each Company shall hold office for a one year term and until their respective successors are chosen and qualified, or in each case until he or she sooner dies, resigns, is removed, or becomes disqualified in accordance with each Company’s by-laws. |
| (3) | The Excelsior Funds Complex consists of all registered investment companies (Excelsior Funds Inc., Excelsior Tax-Exempt Funds, Inc. and Excelsior Funds Trust) for which U.S. Trust serves as investment adviser. As of May 20, 2005, the Excelsior Funds Complex consisted of 29 Funds. |
| (4) | Directorships of companies required to report to the Securities and Exchange Commission under the Securities Exchange Act of 1934 (i.e., “public companies”) or other investment companies registered under the 1940 Act. |
| (5) | “Interested person” of the Company is defined in the 1940 Act. Mr. Bailey is considered an “interested person” because of his affiliation with the Adviser. |
For more information regarding the Directors/Trustees and Officers, please refer to the Statement of Additional Information, which is available upon request by calling 1-800-446-1012.
78
DISCLOSURE OF FUND EXPENSES (Unaudited)
We believe it is important for you to understand the impact of fees regarding your investment. As a shareholder of the fund, you incur ongoing, or operating costs, which include costs for portfolio management, administrative services, and shareholder reports (like this one), among others. Operating expenses, which are deducted from a fund’s gross income, directly reduce the investment return of the fund. A fund’s expenses are expressed as a percentage of its average net assets. This figure is known as the expense ratio. The following examples are intended to help you understand the ongoing costs (in dollars) of investing in your fund and to compare these costs with those of other mutual funds. The examples are based on an investment of $1,000 made at the beginning of the period shown and held for the entire period.
The table on the following page illustrates your fund’s costs in two ways.
| | • | | Actual expenses. This section provides information about actual account values and actual expenses based on the Funds’ actual return for the period. This section is designed to help you to estimate the actual expenses after fee waivers that you paid over the period. The “Ending Account Value” shown is derived from the fund’s actual return, and the fourth column shows the dollar amount that would have been paid by an investor who started with $1,000 in the fund. You may use the information here, together with the amount you invested, to estimate the expenses that you paid over the period. |
To do so, simply divide your account value by $1,000 (for example, an $8,600 account value divided by $1,000 = $8.6), then multiply the result by the number given for your fund under the heading “Expenses Paid During Period”.
| | • | | Hypothetical expenses. This section provides information about hypothetical account values and hypothetical expenses that would have been incurred by an investor in the Fund based on an assumed rate of return of 5% per year before expenses. This section is designed to help you compare your fund’s costs with those of other mutual funds. It assumes that the fund had a return of 5% before expenses during the year, but that the expense ratio is unchanged. In this case, because the return used is not the fund’s actual return, the results cannot be used to estimate the actual ending account balance or expenses you paid for the period. You may use this information to compare the ongoing costs of investing in your Fund and other funds. To do so, compare this 5% hypothetical example with the 5% hypothetical examples that appear in shareholder reports of other funds. |
79
DISCLOSURE OF FUND EXPENSES (Unaudited) (Continued)
Please note that the expenses shown in the table are meant to highlight and help you compare ongoing costs only, which are described in the Prospectus. Therefore, the hypothetical example is useful in comparing ongoing costs only, and will not help you determine the relative total costs of owning different funds.
| | | | | | | | | | | | |
| | | Beginning
Account
Value
09/30/04
| | Ending
Account
Value
03/31/05
| | Annualized
Expense
Ratios*
| | | Expenses
Paid
During
Period**
|
Actual Fund Return | | | | | | | | | | | | |
Managed Income Fund — Shares | | $ | 1,000.00 | | $ | 1,005.80 | | 0.90 | % | | $ | 4.50 |
Intermediate-Term Managed Income Fund — Shares | | | 1,000.00 | | | 1,000.20 | | 0.60 | | | | 2.99 |
Short-Term Government Securities Fund — Shares | | | 1,000.00 | | | 1,001.00 | | 0.60 | | | | 2.99 |
High Yield Fund — Shares | | | 1,000.00 | | | 1,020.70 | | 1.04 | | | | 5.24 |
Long-Term Tax-Exempt Fund — Shares | | | 1,000.00 | | | 1,012.30 | | 0.80 | | | | 4.01 |
Intermediate-Term Tax-Exempt Fund — Shares | | | 1,000.00 | | | 995.00 | | 0.65 | | | | 3.23 |
Short-Term Tax-Exempt Securities Fund — Shares | | | 1,000.00 | | | 998.60 | | 0.60 | | | | 2.99 |
New York Intermediate-Term Tax-Exempt Fund — Shares | | | 1,000.00 | | | 995.10 | | 0.80 | | | | 3.98 |
California Tax-Exempt Income Fund — Shares | | | 1,000.00 | | | 998.20 | | 0.50 | | | | 2.49 |
| | | | |
Hypothetical 5% Return | | | | | | | | | | | | |
Managed Income Fund — Shares | | | 1,000.00 | | | 1,020.44 | | 0.90 | | | | 4.53 |
Intermediate-Term Managed Income Fund — Shares | | | 1,000.00 | | | 1,021.94 | | 0.60 | | | | 3.02 |
Short-Term Government Securities Fund — Shares | | | 1,000.00 | | | 1,021.94 | | 0.60 | | | | 3.02 |
High Yield Fund — Shares | | | 1,000.00 | | | 1,019.75 | | 1.04 | | | | 5.24 |
Long-Term Tax-Exempt Fund — Shares | | | 1,000.00 | | | 1,020.94 | | 0.80 | | | | 4.03 |
Intermediate-Term Tax-Exempt Fund — Shares | | | 1,000.00 | | | 1,021.69 | | 0.65 | | | | 3.28 |
Short-Term Tax-Exempt Securities Fund — Shares | | | 1,000.00 | | | 1,021.94 | | 0.60 | | | | 3.02 |
New York Intermediate-Term Tax-Exempt Fund — Shares | | | 1,000.00 | | | 1,020.94 | | 0.80 | | | | 4.03 |
California Tax-Exempt Income Fund — Shares | | | 1,000.00 | | | 1,022.44 | | 0.50 | | | | 2.52 |
| * | Annualized expense ratios of certain funds are after fee waivers and expense reimbursements by the investment adviser. Absent such waivers and reimbursements, expenses paid during the period would have been greater. |
| ** | Expenses are equal to the Fund’s annualized expense ratio multiplied by the average account value over the period, multiplied by the number of days in the most recent fiscal half-year (182) then divided by 365. |
80
AR-FIXEDINC-0305/43797
The registrant has adopted a code of ethics that applies to the registrant’s principal executive officer, principal financial officer, principal accounting officer or controller, or persons performing similar functions. This code of ethics is included as an Exhibit 12 (a)(1).
During the period covered by the report, with respect to the registrant’s code of ethics that applies to its principal executive officer, principal financial officer, principal accounting officer or controller, or persons performing similar functions; there have been no amendments to, nor any waivers granted from, a provision that relates to any element of the code of ethics definition enumerated in paragraph (b) of this Item 2.
| Item 3. | Audit Committee Financial Expert. |
3(a)(1) The registrant’s board of directors has determined that the registrant has at least one audit committee financial expert serving on its audit committee.
3(a)(2) The audit committee financial experts are Frederick S. Wonham and Rodman L. Drake, who are “independent” for purposes of this Item 3 of Form N-CSR.
| Item 4. | Principal Accountant Fees and Services. |
For the fiscal years ended March 31, 2005 and March 31, 2004, the aggregate fees billed by Deloitte & Touche LLP for professional services rendered for the audits of the financial statements, or services that are normally provided in connection with statutory and regulatory filings or engagements for the fiscal year for the Registrant are shown in the table below.
| | | | |
| | | 2005
|
| | | All fees and services to the
Registrant that were pre-approved
| | All fees and services to services
Affiliates that were pre-approved
|
(a) Audit Fees (1) | | $170,365 | | N/A |
(b) Audit-Related Fees (2) | | $ 7,332 | | $0 |
(c) Tax Fees (3) | | $ 45,500 | | $0 |
(d) All Other Fees (4) | | $ 0 | | $0 |
| |
| | | 2004
|
| | | All fees and services to the
Registrant that were pre-approved
| | All fees and services to services
Affiliates that were pre-approved
|
(a) Audit Fees (1) | | $210,009 | | N/A |
(b) Audit-Related Fees (2) | | $ 0 | | $0 |
(c) Tax Fees (3) | | $ 0 | | $0 |
(d) All Other Fees (4) | | $ 0 | | $0 |
Notes:
| (1) | Audit fees include amounts related to the audit of the Registrant’s annual financial statements and services normally provided by the accountant in connection with statutory and regulatory filings. |
| (2) | For the fiscal year ended March 31, 2005, there were audit related fees of $7,332 for assurance and related services by Deloitte & Touche. Such assurance services included a review of the accounting conversion on December 13, 2004 for the Registrant. For the fiscal year ended March 31, 2004, there were no fees for assurance and related services by Deloitte & Touche LLP reasonably related to the performance of the audit of the Registrant’s financial statements that were not reported under (a) of this item. |
| (3) | For the fiscal year ended March 31, 2005, the aggregate tax fees billed for professional services rendered by Deloitte & Touche LLP for tax compliance, tax advice, and tax planning were $45,500. Such tax services included the review of income and excise tax returns for the Registrant. For the fiscal year ended March 31, 2004 there were no tax fees billed for professional services rendered by Deloitte & Touche LLP for tax compliance, tax advice, and tax planning. |
| (4) | For the fiscal years ended March 31, 2005 and March 31, 2004, there were no fees billed for professional services rendered by Deloitte & Touche LLP to the Registrant, other than the services reported in (a) through (c) of this Item. |
(e) (1) The audit committee has adopted policies and procedures that require pre-approval of audit and non-audit services for the Funds and certain other services provided to the Fund’s affiliates in accordance with Rule 2-01 (c) (7) of Regulation S-X. The pre-approval requirement for non-audit services for the Funds, the Funds’ investment adviser and the adviser’s control affiliates may be waived if: (i) the aggregate amount of all services provided constitutes not more than 5% of the total amount of revenues paid to the Funds’ independent accountant by the Funds and the Funds’ investment adviser and its control affiliates that provide ongoing services to the Funds during the fiscal year in which the services are provided that would have to be pre-approved by the Funds’ Audit Committee; (ii) such services were not recognized at the time of the engagement to be non-audit services; and (iii) such services are promptly brought to the attention of the Audit Committee and approved prior to the completion of the audit by the Audit Committee or by its designated Audit Committee member (s).
(e)(2) Percentage of fees billed applicable to non-audit services pursuant to waiver of pre-approval requirement were as follows:
| | | | |
| | | 2005
| | 2004
|
Audit-Related Fees | | N/A | | N/A |
Tax Fees | | N/A | | N/A |
All Other Fees | | N/A | | N/A |
(f) Not applicable.
(g) For the fiscal years ended March 31, 2005 and March 31, 2004, the aggregate non-audit fees billed by Deloitte & Touche LLP for services rendered to the Registrant and the Advisers and any entity controlling, controlled by, or under common control with the Advisers that provided ongoing services to the Registrant were $1,248,972 and $1,072,000, respectively.
(h) The Registrant’s Audit Committee has considered whether its principal accountant’s provision of non-audit services that were rendered to the Registrant’s investment adviser, and any control persons of the investment adviser that provides ongoing services to the Registrant, that were not pre-approved pursuant to paragraph (c) (7) (ii) of Rule 2-01 of Regulation S-X, is compatible with maintaining the principal accountant’s independence.
| Item 5. | Audit Committee of Listed Registrants. |
Not applicable.
| Item 6. | Schedule of Investments. |
Complete schedule of investments is included in Item 1.
| Item 7. | Disclosure of Proxy Voting Policies and Procedures for Closed-End Management Investment Companies. |
Not applicable.
| Item 8. | Portfolio Managers of Closed-End Management Investment Companies. |
Not applicable.
| Item 9. | Purchases of Equity Securities by Closed-End Management Investment Company and Affiliated Purchasers. |
Not applicable.
| Item 10. | Submission of Matters to a Vote of Security Holders. |
There have been no material changes to the procedures by which shareholders may recommend nominees to the Registrant’s board of directors after Registrant last provided disclosure in response to the requirement of Item 7(d) (2) (ii) (G) of Schedule 14A, or this Item 10.
| Item 11. | Controls and Procedures. |
The registrant’s principal executive officer and principal financial officer have concluded, based on their evaluation of the registrant’s disclosure controls and procedures as conducted within 90 days of the filing date of this report, that these disclosure controls and procedures are adequately designed and are operating effectively to ensure that information required to be disclosed by the registrant on Form N-CSR is (i) accumulated and communicated to the investment company’s management, including its certifying officers, to allow timely decisions regarding required disclosure; and (ii) recorded, processed, summarized and reported within the time periods specified in the Securities and Exchange Commission’s rules and forms.
There were no changes in the registrant’s internal control over financial reporting that occurred during the second fiscal quarter of the period covered by this report that have materially affected or are reasonably likely to materially affect, the registrant’s internal control over financial reporting.
(a)(1) Code of Business Conduct and Ethics for principle executive and senior financial officers, attached hereto.
(a)(2) A separate certification for the principal executive officer and the principal financial officer of the registrant as required by Rule 30a-2 (a) under the Investment Company Act of 1940, as amended (17 CFR 270.30a-2(a)), are filed herewith.
(b) Officer certifications as required by Rule 30a-2 (b) under the Investment Company Act of 1940, as amended (17 CFR 270.30a-2(b)) also accompany this filing as an Exhibit.
SIGNATURES
Pursuant to the requirements of the Securities Exchange Act of 1934 and the Investment Company Act of 1940, the registrant has duly caused this report to be signed on its behalf by the undersigned, thereunto duly authorized.
| | |
(Registrant) Excelsior Tax-Exempt Funds, Inc. |
| |
By (Signature and Title)* | | /s/ Mary Martinez |
| | | Mary Martinez |
| | | President |
Date 06/09/05 | | |
Pursuant to the requirements of the Securities Exchange Act of 1934 and the Investment Company Act of 1940, this report has been signed below by the following persons on behalf of the registrant and in the capacities and on the dates indicated.
| | |
| |
By (Signature and Title)* | | /s/ Mary Martinez |
| | | Mary Martinez |
| | | President |
Date 06/09/05 | | |
| | |
| |
By (Signature and Title)* | | /s/ Agnes Mullady |
| | | Agnes Mullady |
| | | Treasurer, Chief Financial Officer and |
| | | Chief Accounting Officer |
Date 06/09/05 | | |
| * | Print the name and title of each signing officer under his or her signature. |