UNITED STATES
SECURITIES AND EXCHANGE COMMISSION
Washington, D.C. 20549
FORM N-CSR
CERTIFIED SHAREHOLDER REPORT OF REGISTERED
MANAGEMENT INVESTMENT COMPANIES
Investment Company Act file number 811-4118
Fidelity Securities Fund
(Exact name of registrant as specified in charter)
82 Devonshire St., Boston, Massachusetts 02109
(Address of principal executive offices) (Zip code)
Eric D. Roiter, Secretary
82 Devonshire St.
Boston, Massachusetts 02109
(Name and address of agent for service)
Registrant's telephone number, including area code: 617-563-7000
Date of fiscal year end: | July 31 |
| |
Date of reporting period: | July 31, 2006 |
This report on Form N-CSR relates solely to the Registrant's Fidelity Small Cap Growth Fund and Fidelity Small Cap Value Fund series (each, a "Fund" and collectively, the "Funds").
Item 1. Reports to Stockholders
Fidelity®
Small Cap Growth
Fund
Annual Report
July 31, 2006
(2_fidelity_logos) (Registered_Trademark)
Contents
Chairman's Message | <Click Here> | Ned Johnson's message to shareholders. |
Performance | <Click Here> | How the fund has done over time. |
Management's Discussion | <Click Here> | The manager's review of fund performance, strategy and outlook |
Shareholder Expense Example | <Click Here> | An example of shareholder expenses. |
Investment Changes | <Click Here> | A summary of major shifts in the fund's investments over the past six months. |
Investments | <Click Here> | A complete list of the fund's investments with their market values. |
Financial Statements | <Click Here> | Statements of assets and liabilities, operations, and changes in net assets,
as well as financial highlights. |
Notes | <Click Here> | Notes to the financial statements. |
Report of Independent Registered Public Accounting Firm | <Click Here> | |
Trustees and Officers | <Click Here> | |
Distributions | <Click Here> | |
Proxy Voting Results | <Click Here> | |
Board Approval of Investment Advisory Contracts and Management Fees | <Click Here> | |
To view a fund's proxy voting guidelines and proxy voting record for the 12-month period ended June 30, visit www.fidelity.com/proxyvotingresults or visit the Securities and Exchange Commission's (SEC) web site at www.sec.gov. You may also call 1-800-544-8544 to request a free copy of the proxy voting guidelines.
Standard & Poor's, S&P and S&P 500 are registered service marks of The McGraw-Hill Companies, Inc. and have been licensed for use by Fidelity Distributors Corporation.
Other third party marks appearing herein are the property of their respective owners.
All other marks appearing herein are registered or unregistered trademarks or service marks of FMR Corp. or an affiliated company.
Annual Report
This report and the financial statements contained herein are submitted for the general information of the shareholders of the fund. This report is not authorized for distribution to prospective investors in the fund unless preceded or accompanied by an effective prospectus.
A fund files its complete schedule of portfolio holdings with the SEC for the first and third quarters of each fiscal year on Form N-Q. Forms N-Q are available on the SEC's web site at http://www.sec.gov. A fund's Forms N-Q may be reviewed and copied at the SEC's Public Reference Room in Washington, DC. Information regarding the operation of the SEC's Public Reference Room may be obtained by calling 1-800-SEC-0330. For a complete list of a fund's portfolio holdings, view the fund's most recent quarterly holdings report, semiannual report, or annual report on Fidelity's web site at http://www.fidelity.com/holdings.
NOT FDIC INSURED · MAY LOSE VALUE · NO BANK GUARANTEE
Neither the fund nor Fidelity Distributors Corporation is a bank.
Annual Report
Chairman's Message
(photo_of_Edward_C_Johnson_3d)
Dear Shareholder:
Although many securities markets made gains in early 2006, inflation concerns led to mixed results through the year's mid-point. Financial markets are always unpredictable. There are, however, a number of time-tested principles that can put the historical odds in your favor.
One of the basic tenets is to invest for the long term. Over time, riding out the markets' inevitable ups and downs has proven much more effective than selling into panic or chasing the hottest trend. Even missing only a few of the markets' best days can significantly diminish investor returns. Patience also affords the benefits of compounding - of earning interest on additional income or reinvested dividends and capital gains. There are tax advantages and cost benefits to consider as well. The more you sell, the more taxes you pay, and the more you trade, the higher the costs. While staying the course doesn't eliminate risk, it can considerably lessen the effect of short-term declines.
You can further manage your investing risk through diversification. And today, more than ever, geographic diversification should be taken into account. Studies indicate that asset allocation is the single most important determinant of a portfolio's long-term success. The right mix of stocks, bonds and cash - aligned to your particular risk tolerance and investment objective - is very important. Age-appropriate rebalancing is also an essential aspect of asset allocation. For younger investors, an emphasis on equities - which historically have been the best performing asset class over time - is encouraged. As investors near their specific goal, such as retirement or sending a child to college, consideration may be given to replacing volatile assets (e.g. common stocks) with more-stable fixed investments (bonds or savings plans).
A third investment principle - investing regularly - can help lower the average cost of your purchases. Investing a certain amount of money each month or quarter helps ensure you won't pay for all your shares at market highs. This strategy - known as dollar cost averaging - also reduces unconstructive "emotion" from investing, helping shareholders avoid selling weak performers just prior to an upswing, or chasing a hot performer just before a correction.
We invite you to contact us via the Internet, through our Investor Centers or over the phone. It is our privilege to provide you the information you need to make the investments that are right for you.
Sincerely,
/s/Edward C. Johnson 3d
Edward C. Johnson 3d
Annual Report
Performance: The Bottom Line
Average annual total return reflects the change in the value of an investment, assuming reinvestment of Small Cap Growth's dividend income and capital gains (the profits earned upon the sale of securities that have grown in value) and assuming a constant rate of performance each year. The $10,000 table and the fund's returns do not reflect the deduction of taxes that a shareholder would pay on fund distributions or the redemption of fund shares. During periods of reimbursement by Fidelity, a fund's total return will be greater than it would be had the reimbursement not occurred. How a fund did yesterday is no guarantee of how it will do tomorrow.
Average Annual Total Returns
Periods ended July 31, 2006 | Past 1
year | Life of
FundA |
Small Cap Growth | 1.01% | 16.85% |
A From November 3, 2004.
$10,000 Over Life of Fund
Let's say hypothetically that $10,000 was invested in Small Cap Growth on November 3, 2004, when the fund started. The chart shows how the value of your investment would have changed, and also shows how the Russell 2000® Growth Index performed over the same period.
Annual Report
Management's Discussion of Fund Performance
Comments from Lionel Harris, Portfolio Manager of Fidelity® Small Cap Growth Fund
As measured by the Dow Jones Wilshire 5000 Composite IndexSM - the broadest measure of U.S. equity market performance - stocks did well for most of the 12-month period ending July 31, 2006, before faltering. For the one-year time frame as a whole, the Dow Jones Wilshire benchmark rose 5.43%. That was nearly identical to the 5.38% gain of the Standard & Poor's 500SM Index, a broad market proxy that's a reflection of larger-cap stocks. Stocks were resilient early on, bouncing back quickly after Hurricanes Katrina and Rita caused energy prices to spike to record-high levels. Buoyed by strong corporate earnings and solid economic growth, the S&P 500® ran off six consecutive months of positive returns from November through April. However, stocks pulled back for most of the remainder of the period. A slowdown in economic expansion and consumer spending, reaccelerating energy prices and continued interest rate hikes by the Federal Reserve Board cooled equity performance. Among other widely quoted market yardsticks, the Dow Jones Industrial AverageSM returned 7.59%, while the NASDAQ Composite® Index dropped 3.47%.
Small Cap Growth returned 1.01% during the past year, trailing the Russell 2000® Growth Index, which rose 1.53%. The fund's overweighting in the lagging consumer discretionary sector, combined with disappointing stock selection there, detracted. Many consumer-related companies struggled as the market worried about the impact of rising energy costs and interest rates. One example was mattress maker Tempur-Pedic International, which warned of lower fiscal 2005 earnings and was sold from the portfolio. The portfolio's biggest individual detractor was education company EVCI Career Colleges, which fell after a surprise regulatory investigation. At period end, EVCI was no longer in the portfolio. In consumer staples, the fund was hurt by American Italian Pasta, also no longer in the fund. This maker of store-brand pasta struggled with intensifying competition, an overleveraged balance sheet and revelations of accounting problems. On the positive side, stock picking in health care was a major contributor, led by Abaxis, a maker of portable blood analysis devices, which did well after handily beating Wall Street's sales and earnings expectations. Abaxis was sold from the portfolio before period end. Our best relative performer during the period was oil refiner Holly Corporation, which continued to earn strong profits in the extremely favorable environment for energy stocks. Given the fund's investments in foreign stocks, favorable currency movements also helped boost returns.
The views expressed above reflect those of the portfolio manager(s) only through the end of the period as stated on the cover of this report and do not necessarily represent the views of Fidelity or any other person in the Fidelity organization. Any such views are subject to change at any time based upon market or other conditions and Fidelity disclaims any responsibility to update such views. These views may not be relied on as investment advice and, because investment decisions for a Fidelity fund are based on numerous factors, may not be relied on as an indication of trading intent on behalf of any Fidelity fund.
Annual Report
Shareholder Expense Example
As a shareholder of the Fund, you incur two types of costs: (1) transaction costs, including sales charges (loads) on purchase payments or redemption proceeds, redemption fees, and (2) ongoing costs, including management fees, distribution and/or service (12b-1) fees and other Fund expenses. This Example is intended to help you understand your ongoing costs (in dollars) of investing in the Fund and to compare these costs with the ongoing costs of investing in other mutual funds.
The Example is based on an investment of $1,000 invested at the beginning of the period and held for the entire period (February 1, 2006 to July 31, 2006).
Actual Expenses
The first line of the accompanying table for each class of the Fund provides information about actual account values and actual expenses. You may use the information in this line, together with the amount you invested, to estimate the expenses that you paid over the period. Simply divide your account value by $1,000.00 (for example, an $8,600 account value divided by $1,000.00 = 8.6), then multiply the result by the number in the first line for a class of the Fund under the heading entitled "Expenses Paid During Period" to estimate the expenses you paid on your account during this period. A small balance maintenance fee of $12.00 that is charged once a year may apply for certain accounts with a value of less than $2,000. This fee is not included in the table below. If it was, the estimate of expenses you paid during the period would be higher, and your ending account value lower, by this amount.
Hypothetical Example for Comparison Purposes
The second line of the accompanying table for each class of the Fund provides information about hypothetical account values and hypothetical expenses based on a Class' actual expense ratio and an assumed rate of return of 5% per year before expenses, which is not the Class' actual return. The hypothetical account values and expenses may not be used to estimate the actual ending account balance or expenses you paid for the period. You may use this information to compare the ongoing costs of investing in the Fund and other funds. To do so, compare this 5% hypothetical example with the 5% hypothetical examples that appear in the shareholder reports of the other funds. A small balance maintenance fee of $12.00 that is charged once a year may apply for certain accounts with a value of less than $2,000. This fee is not included in the table below. If it was, the estimate of expenses you paid during the period would be higher, and your ending account value lower, by this amount.
Annual Report
Shareholder Expense Example - continued
Please note that the expenses shown in the table are meant to highlight your ongoing costs only and do not reflect any transaction costs. Therefore, the second line of the table is useful in comparing ongoing costs only, and will not help you determine the relative total costs of owning different funds. In addition, if these transactional costs were included, your costs would have been higher.
| Beginning
Account Value
February 1, 2006 | Ending
Account Value
July 31, 2006 | Expenses Paid
During Period *
February 1, 2006
to July 31, 2006 |
Class A | | | |
Actual | $ 1,000.00 | $ 926.60 | $ 6.69 |
HypotheticalA | $ 1,000.00 | $ 1,017.85 | $ 7.00 |
Class T | | | |
Actual | $ 1,000.00 | $ 925.80 | $ 7.88 |
HypotheticalA | $ 1,000.00 | $ 1,016.61 | $ 8.25 |
Class B | | | |
Actual | $ 1,000.00 | $ 922.70 | $ 10.25 |
HypotheticalA | $ 1,000.00 | $ 1,014.13 | $ 10.74 |
Class C | | | |
Actual | $ 1,000.00 | $ 922.70 | $ 10.25 |
HypotheticalA | $ 1,000.00 | $ 1,014.13 | $ 10.74 |
Small Cap Growth | | | |
Actual | $ 1,000.00 | $ 927.50 | $ 5.50 |
HypotheticalA | $ 1,000.00 | $ 1,019.09 | $ 5.76 |
Institutional Class | | | |
Actual | $ 1,000.00 | $ 927.50 | $ 5.21 |
HypotheticalA | $ 1,000.00 | $ 1,019.39 | $ 5.46 |
A 5% return per year before expenses
* Expenses are equal to each Class' annualized expense ratio (shown in the table below); multiplied by the average account value over the period, multiplied by 181/365 (to reflect the one-half year period).
| Annualized
Expense Ratio |
Class A | 1.40% |
Class T | 1.65% |
Class B | 2.15% |
Class C | 2.15% |
Small Cap Growth | 1.15% |
Institutional Class | 1.09% |
Annual Report
Investment Changes
Top Ten Stocks as of July 31, 2006 |
| % of fund's
net assets | % of fund's net assets
6 months ago |
Omnicare, Inc. | 1.8 | 2.1 |
DJO, Inc. | 1.8 | 1.0 |
Harris Corp. | 1.7 | 1.3 |
Per-Se Technologies, Inc. | 1.5 | 1.7 |
Holly Corp. | 1.4 | 1.5 |
j2 Global Communications, Inc. | 1.4 | 1.0 |
Range Resources Corp. | 1.3 | 1.3 |
Amphenol Corp. Class A | 1.3 | 0.0 |
WESCO International, Inc. | 1.3 | 1.3 |
Ness Technologies, Inc. | 1.2 | 0.0 |
| 14.7 | |
Top Five Market Sectors as of July 31, 2006 |
| % of fund's
net assets | % of fund's net assets
6 months ago |
Information Technology | 26.5 | 22.5 |
Industrials | 17.1 | 10.5 |
Health Care | 15.7 | 19.9 |
Energy | 12.7 | 11.1 |
Consumer Discretionary | 10.1 | 18.7 |
Asset Allocation (% of fund's net assets) |
As of July 31, 2006 * | As of January 31, 2006 ** |
 | Stocks 94.4% | | | Stocks 97.3% | |
 | Short-Term
Investments and
Net Other Assets 5.6% | | | Short-Term
Investments and
Net Other Assets 2.7% | |
* Foreign investments | 9.8% | | ** Foreign investments | 8.9% | |

Annual Report
Investments July 31, 2006
Showing Percentage of Net Assets
Common Stocks - 94.4% |
| Shares | | Value (Note 1) |
CONSUMER DISCRETIONARY - 10.1% |
Diversified Consumer Services - 1.5% |
DeVry, Inc. (a) | 125,000 | | $ 2,637,500 |
Sothebys Class A (ltd. vtg.) (a) | 163,400 | | 4,514,742 |
| | 7,152,242 |
Hotels, Restaurants & Leisure - 1.9% |
Boyd Gaming Corp. | 85,000 | | 2,850,900 |
Domino's Pizza, Inc. | 133,800 | | 3,042,612 |
Penn National Gaming, Inc. (a) | 100,300 | | 3,316,921 |
| | 9,210,433 |
Household Durables - 0.5% |
Lifetime Brands, Inc. (d) | 124,077 | | 2,522,485 |
Internet & Catalog Retail - 0.8% |
Coldwater Creek, Inc. (a) | 180,600 | | 3,599,358 |
Leisure Equipment & Products - 0.6% |
MarineMax, Inc. (a)(d) | 124,100 | | 2,612,305 |
Media - 2.0% |
Focus Media Holding Ltd. ADR | 62,600 | | 3,919,386 |
New Frontier Media, Inc. (a) | 479,632 | | 3,280,683 |
R.H. Donnelley Corp. | 47,000 | | 2,453,870 |
| | 9,653,939 |
Specialty Retail - 2.2% |
Eddie Bauer Holdings, Inc. (a) | 235,000 | | 3,055,000 |
The Children's Place Retail Stores, Inc. (a) | 84,600 | | 4,722,372 |
Zumiez, Inc. (a) | 81,000 | | 2,424,330 |
| | 10,201,702 |
Textiles, Apparel & Luxury Goods - 0.6% |
Carter's, Inc. (a) | 134,200 | | 2,926,902 |
TOTAL CONSUMER DISCRETIONARY | | 47,879,366 |
CONSUMER STAPLES - 0.9% |
Personal Products - 0.9% |
Herbalife Ltd. (a) | 112,000 | | 4,000,640 |
ENERGY - 12.7% |
Energy Equipment & Services - 4.9% |
Basic Energy Services, Inc. | 122,200 | | 3,299,400 |
Hornbeck Offshore Services, Inc. (a) | 121,500 | | 4,222,125 |
Hydril Co. (a) | 35,300 | | 2,445,231 |
NATCO Group, Inc. Class A (a) | 71,600 | | 2,720,800 |
Common Stocks - continued |
| Shares | | Value (Note 1) |
ENERGY - continued |
Energy Equipment & Services - continued |
Oil States International, Inc. (a) | 94,200 | | $ 3,029,472 |
Pason Systems, Inc. | 283,900 | | 4,076,860 |
Superior Energy Services, Inc. (a) | 98,800 | | 3,383,900 |
| | 23,177,788 |
Oil, Gas & Consumable Fuels - 7.8% |
Comstock Resources, Inc. (a) | 116,000 | | 3,412,720 |
Forest Oil Corp. (a) | 125,800 | | 4,215,558 |
Foundation Coal Holdings, Inc. | 117,500 | | 4,481,450 |
Holly Corp. | 131,400 | | 6,648,840 |
Mariner Energy, Inc. (a) | 307,910 | | 5,545,459 |
Plains Exploration & Production Co. (a) | 75,000 | | 3,297,000 |
Range Resources Corp. | 226,350 | | 6,362,699 |
Tesoro Corp. | 38,400 | | 2,872,320 |
| | 36,836,046 |
TOTAL ENERGY | | 60,013,834 |
FINANCIALS - 5.6% |
Commercial Banks - 0.5% |
Center Financial Corp., California | 98,000 | | 2,442,160 |
Insurance - 5.1% |
American Equity Investment Life Holding Co. | 309,100 | | 3,366,099 |
Aspen Insurance Holdings Ltd. | 193,200 | | 4,559,520 |
National Financial Partners Corp. | 72,200 | | 3,251,888 |
RAM Holdings Ltd. | 200,000 | | 2,476,000 |
RLI Corp. | 72,000 | | 3,404,160 |
Universal American Financial Corp. (a) | 225,000 | | 2,790,000 |
Willis Group Holdings Ltd. | 131,500 | | 4,277,695 |
| | 24,125,362 |
TOTAL FINANCIALS | | 26,567,522 |
HEALTH CARE - 15.7% |
Biotechnology - 0.5% |
Myogen, Inc. (a) | 85,500 | | 2,638,530 |
Health Care Equipment & Supplies - 4.2% |
Cholestech Corp. (a) | 197,000 | | 2,115,780 |
DJO, Inc. (a) | 213,800 | | 8,438,686 |
Inverness Medical Innovations, Inc. (a) | 138,800 | | 4,127,912 |
Common Stocks - continued |
| Shares | | Value (Note 1) |
HEALTH CARE - continued |
Health Care Equipment & Supplies - continued |
Kinetic Concepts, Inc. (a) | 72,200 | | $ 3,217,232 |
Regeneration Technologies, Inc. (a) | 361,700 | | 2,112,328 |
| | 20,011,938 |
Health Care Providers & Services - 6.8% |
Amedisys, Inc. (a) | 90,700 | | 3,463,833 |
Chemed Corp. | 134,200 | | 4,935,876 |
Humana, Inc. (a) | 93,700 | | 5,240,641 |
Omnicare, Inc. (d) | 186,600 | | 8,445,515 |
Sierra Health Services, Inc. (a) | 108,400 | | 4,680,712 |
VCA Antech, Inc. (a) | 153,800 | | 5,378,386 |
| | 32,144,963 |
Health Care Technology - 1.5% |
Per-Se Technologies, Inc. (a) | 290,000 | | 6,922,300 |
Life Sciences Tools & Services - 0.9% |
ICON PLC sponsored ADR (a) | 63,995 | | 4,213,431 |
Pharmaceuticals - 1.8% |
Kos Pharmaceuticals, Inc. (a) | 80,800 | | 3,340,272 |
Medicis Pharmaceutical Corp. Class A | 184,900 | | 5,095,844 |
| | 8,436,116 |
TOTAL HEALTH CARE | | 74,367,278 |
INDUSTRIALS - 17.1% |
Aerospace & Defense - 2.4% |
Heico Corp. Class A | 120,000 | | 3,144,000 |
Hexcel Corp. (a) | 392,500 | | 5,640,225 |
Precision Castparts Corp. | 46,800 | | 2,791,620 |
| | 11,575,845 |
Air Freight & Logistics - 1.0% |
Hub Group, Inc. Class A | 216,000 | | 4,877,280 |
Building Products - 0.5% |
NCI Building Systems, Inc. (a) | 50,000 | | 2,337,000 |
Commercial Services & Supplies - 3.6% |
CDI Corp. | 125,000 | | 2,443,750 |
Clean Harbors, Inc. | 112,200 | | 4,139,058 |
Huron Consulting Group, Inc. (a) | 135,600 | | 4,702,608 |
Navigant Consulting, Inc. (a) | 150,000 | | 2,862,000 |
Tele Atlas NV (a)(d) | 173,900 | | 2,847,722 |
| | 16,995,138 |
Common Stocks - continued |
| Shares | | Value (Note 1) |
INDUSTRIALS - continued |
Electrical Equipment - 3.2% |
C&D Technologies, Inc. (d) | 389,110 | | $ 2,762,681 |
EnerSys (a) | 138,900 | | 2,504,367 |
Genlyte Group, Inc. (a) | 62,000 | | 4,312,100 |
Q-Cells AG | 48,000 | | 3,437,196 |
Ultralife Batteries, Inc. (a)(d) | 220,000 | | 2,127,400 |
| | 15,143,744 |
Industrial Conglomerates - 0.5% |
Raven Industries, Inc. | 81,373 | | 2,425,729 |
Machinery - 4.6% |
Bucyrus International, Inc. Class A | 70,300 | | 3,424,313 |
Flowserve Corp. (a) | 68,800 | | 3,563,840 |
Graco, Inc. (d) | 58,000 | | 2,278,820 |
Greenbrier Companies, Inc. | 83,000 | | 2,305,740 |
Manitowoc Co., Inc. | 85,000 | | 3,337,100 |
Wabtec Corp. | 90,000 | | 2,390,400 |
Watts Water Technologies, Inc. Class A | 146,000 | | 4,252,980 |
| | 21,553,193 |
Trading Companies & Distributors - 1.3% |
WESCO International, Inc. (a) | 105,000 | | 6,116,250 |
TOTAL INDUSTRIALS | | 81,024,179 |
INFORMATION TECHNOLOGY - 26.5% |
Communications Equipment - 3.5% |
CommScope, Inc. (a) | 92,800 | | 2,898,144 |
F5 Networks, Inc. (a) | 62,100 | | 2,877,714 |
Harris Corp. | 179,800 | | 8,189,890 |
MasTec, Inc. (a) | 209,000 | | 2,731,630 |
| | 16,697,378 |
Computers & Peripherals - 1.5% |
Neoware Systems, Inc. (a)(d) | 165,700 | | 2,051,366 |
Synaptics, Inc. (a) | 115,000 | | 2,417,300 |
Xyratex Ltd. (a) | 99,700 | | 2,317,028 |
| | 6,785,694 |
Electronic Equipment & Instruments - 4.2% |
Amphenol Corp. Class A | 109,600 | | 6,146,368 |
Cogent, Inc. (a)(d) | 236,900 | | 3,352,135 |
FARO Technologies, Inc. (a) | 123,593 | | 1,993,555 |
Common Stocks - continued |
| Shares | | Value (Note 1) |
INFORMATION TECHNOLOGY - continued |
Electronic Equipment & Instruments - continued |
ScanSource, Inc. (a) | 110,400 | | $ 3,284,400 |
Trimble Navigation Ltd. (a) | 107,400 | | 5,158,422 |
| | 19,934,880 |
Internet Software & Services - 3.6% |
CyberSource Corp. (a) | 283,666 | | 2,848,007 |
Digitas, Inc. (a) | 431,200 | | 3,557,400 |
Equinix, Inc. (a) | 72,200 | | 3,781,836 |
j2 Global Communications, Inc. (a) | 237,200 | | 6,641,600 |
| | 16,828,843 |
IT Services - 6.9% |
CACI International, Inc. Class A (a) | 49,500 | | 2,789,325 |
Iron Mountain, Inc. (a) | 124,000 | | 5,084,000 |
Lionbridge Technologies, Inc. (a) | 933,646 | | 5,611,212 |
Ness Technologies, Inc. (a) | 512,300 | | 5,655,792 |
Satyam Computer Services Ltd. sponsored ADR (d) | 122,000 | | 4,300,500 |
SI International, Inc. (a) | 144,647 | | 3,945,970 |
TALX Corp. | 250,725 | | 5,152,399 |
| | 32,539,198 |
Office Electronics - 0.6% |
Zebra Technologies Corp. Class A (a) | 95,000 | | 2,978,250 |
Semiconductors & Semiconductor Equipment - 4.3% |
California Micro Devices Corp. (a) | 509,000 | | 2,010,550 |
Entegris, Inc. (a) | 266,200 | | 2,515,590 |
FormFactor, Inc. (a) | 108,000 | | 4,629,960 |
MIPS Technologies, Inc. (a) | 134,300 | | 850,119 |
O2Micro International Ltd. sponsored ADR (a) | 154,000 | | 922,460 |
Rudolph Technologies, Inc. (a) | 237,000 | | 3,296,670 |
Silicon On Insulator Technologies SA (SOITEC) (a) | 8,500 | | 226,704 |
SiRF Technology Holdings, Inc. (a) | 109,300 | | 2,087,630 |
Tessera Technologies, Inc. (a) | 126,600 | | 3,984,102 |
| | 20,523,785 |
Software - 1.9% |
Blackbaud, Inc. | 236,259 | | 4,928,363 |
Moldflow Corp. (a) | 174,100 | | 2,090,941 |
Quality Systems, Inc. | 62,800 | | 2,079,936 |
| | 9,099,240 |
TOTAL INFORMATION TECHNOLOGY | | 125,387,268 |
Common Stocks - continued |
| Shares | | Value (Note 1) |
MATERIALS - 4.9% |
Metals & Mining - 4.9% |
Allegheny Technologies, Inc. | 73,000 | | $ 4,663,970 |
Carpenter Technology Corp. | 44,200 | | 4,349,280 |
Meridian Gold, Inc. (a) | 163,100 | | 4,397,473 |
Oregon Steel Mills, Inc. (a) | 96,600 | | 4,466,784 |
Titanium Metals Corp. | 191,500 | | 5,522,860 |
| | 23,400,367 |
TELECOMMUNICATION SERVICES - 0.1% |
Wireless Telecommunication Services - 0.1% |
Dobson Communications Corp. Class A (a) | 70,000 | | 469,700 |
UTILITIES - 0.8% |
Multi-Utilities - 0.8% |
CMS Energy Corp. (a) | 283,600 | | 3,973,236 |
TOTAL COMMON STOCKS (Cost $440,779,155) | 447,083,390 |
Money Market Funds - 6.9% |
| | | |
Fidelity Cash Central Fund, 5.3% (b) | 22,221,562 | | 22,221,562 |
Fidelity Securities Lending Cash Central Fund, 5.32% (b)(c) | 10,678,095 | | 10,678,095 |
TOTAL MONEY MARKET FUNDS (Cost $32,899,657) | 32,899,657 |
TOTAL INVESTMENT PORTFOLIO - 101.3% (Cost $473,678,812) | | 479,983,047 |
NET OTHER ASSETS - (1.3)% | | (6,214,449) |
NET ASSETS - 100% | $ 473,768,598 |
Legend |
(a) Non-income producing |
(b) Affiliated fund that is available only to investment companies and other accounts managed by Fidelity Investments. The rate quoted is the annualized seven-day yield of the fund at period end. A complete unaudited listing of the fund's holdings as of its most recent quarter end is available upon request. |
(c) Investment made with cash collateral received from securities on loan. |
(d) Security or a portion of the security is on loan at period end. |
Affiliated Central Funds |
Information regarding fiscal year to date income earned by the fund from the affiliated Central funds is as follows: |
Fund | Income earned |
Fidelity Cash Central Fund | $ 643,230 |
Fidelity Securities Lending Cash Central Fund | 40,744 |
Total | $ 683,974 |
See accompanying notes which are an integral part of the financial statements.
Annual Report
Financial Statements
Statement of Assets and Liabilities
| July 31, 2006 |
| | |
Assets | | |
Investment in securities, at value (including securities loaned of $10,469,382) - See accompanying schedule: Unaffiliated issuers (cost $440,779,155) | $ 447,083,390 | |
Affiliated Central Funds (cost $32,899,657) | 32,899,657 | |
Total Investments (cost $473,678,812) | | $ 479,983,047 |
Receivable for investments sold | | 11,599,201 |
Receivable for fund shares sold | | 1,152,874 |
Dividends receivable | | 8,410 |
Interest receivable | | 77,377 |
Prepaid expenses | | 283 |
Receivable from investment adviser for expense reductions | | 5,591 |
Other receivables | | 20,672 |
Total assets | | 492,847,455 |
| | |
Liabilities | | |
Payable to custodian bank | $ 821 | |
Payable for investments purchased | 6,434,677 | |
Payable for fund shares redeemed | 1,434,350 | |
Accrued management fee | 329,256 | |
Distribution fees payable | 28,023 | |
Other affiliated payables | 121,413 | |
Other payables and accrued expenses | 52,222 | |
Collateral on securities loaned, at value | 10,678,095 | |
Total liabilities | | 19,078,857 |
| | |
Net Assets | | $ 473,768,598 |
Net Assets consist of: | | |
Paid in capital | | $ 465,362,392 |
Accumulated undistributed net realized gain (loss) on investments and foreign currency transactions | | 2,101,971 |
Net unrealized appreciation (depreciation) on investments | | 6,304,235 |
Net Assets | | $ 473,768,598 |
See accompanying notes which are an integral part of the financial statements.
Annual Report
Financial Statements - continued
Statement of Assets and Liabilities - continued
| July 31, 2006 |
| | |
Calculation of Maximum Offering Price Class A:
Net Asset Value and redemption price per share ($18,104,024 ÷ 1,405,220 shares) | | $ 12.88 |
| | |
Maximum offering price per share (100/94.25 of $12.88) | | $ 13.67 |
Class T:
Net Asset Value and redemption price per share ($19,205,408 ÷ 1,493,589 shares) | | $ 12.86 |
| | |
Maximum offering price per share (100/96.50 of $12.86) | | $ 13.33 |
Class B:
Net Asset Value and offering price per share ($5,191,368 ÷ 406,298 shares)A | | $ 12.78 |
| | |
Class C:
Net Asset Value and offering price per share ($14,682,008 ÷ 1,149,741 shares)A | | $ 12.77 |
| | |
Small Cap Growth:
Net Asset Value, offering price and redemption price per share ($402,353,076 ÷ 31,124,219 shares) | | $ 12.93 |
| | |
Institutional Class:
Net Asset Value, offering price and redemption price per share ($14,232,714 ÷ 1,101,368 shares) | | $ 12.92 |
A Redemption price per share is equal to net asset value less any applicable contingent deferred sales charge.
See accompanying notes which are an integral part of the financial statements.
Annual Report
Statement of Operations
| Year ended July 31, 2006 |
| | |
Investment Income | | |
Dividends | | $ 1,243,646 |
Special dividends | | 241,463 |
Interest | | 1,708 |
Income from affiliated Central Funds | | 683,974 |
Total income | | 2,170,791 |
| | |
Expenses | | |
Management fee
Basic fee | $ 2,752,660 | |
Performance adjustment | 333,133 | |
Transfer agent fees | 902,095 | |
Distribution fees | 253,353 | |
Accounting and security lending fees | 159,035 | |
Independent trustees' compensation | 1,432 | |
Custodian fees and expenses | 26,104 | |
Registration fees | 122,023 | |
Audit | 43,577 | |
Legal | 9,380 | |
Miscellaneous | 16,396 | |
Total expenses before reductions | 4,619,188 | |
Expense reductions | (218,702) | 4,400,486 |
Net investment income (loss) | | (2,229,695) |
Realized and Unrealized Gain (Loss) Net realized gain (loss) on: | | |
Investment securities: | | |
Unaffiliated issuers | 5,460,071 | |
Foreign currency transactions | 13,859 | |
Total net realized gain (loss) | | 5,473,930 |
Change in net unrealized appreciation (depreciation) on: Investment securities | (13,283,751) | |
Assets and liabilities in foreign currencies | 32 | |
Total change in net unrealized appreciation (depreciation) | | (13,283,719) |
Net gain (loss) | | (7,809,789) |
Net increase (decrease) in net assets resulting from operations | | $ (10,039,484) |
See accompanying notes which are an integral part of the financial statements.
Annual Report
Financial Statements - continued
Statement of Changes in Net Assets
| Year ended
July 31,
2006 | For the period
November 3, 2004
(commencement
of operations) to
July 31, 2005 |
Increase (Decrease) in Net Assets | | |
Operations | | |
Net investment income (loss) | $ (2,229,695) | $ (434,724) |
Net realized gain (loss) | 5,473,930 | 3,381,102 |
Change in net unrealized appreciation (depreciation) | (13,283,719) | 19,587,954 |
Net increase (decrease) in net assets resulting
from operations | (10,039,484) | 22,534,332 |
Distributions to shareholders from net realized gain | (3,779,478) | - |
Share transactions - net increase (decrease) | 259,409,742 | 205,303,288 |
Redemption fees | 233,448 | 106,750 |
Total increase (decrease) in net assets | 245,824,228 | 227,944,370 |
| | |
Net Assets | | |
Beginning of period | 227,944,370 | - |
End of period (including undistributed net investment income of $0 and accumulated net investment loss of $14,971, respectively) | $ 473,768,598 | $ 227,944,370 |
See accompanying notes which are an integral part of the financial statements.
Annual Report
Financial Highlights - Class A
Years ended July 31, | 2006 | 2005 H |
Selected Per-Share Data | | |
Net asset value, beginning of period | $ 12.95 | $ 10.00 |
Income from Investment Operations | | |
Net investment income (loss) E | (.10) F | (.07) |
Net realized and unrealized gain (loss) | .18 G | 3.01 |
Total from investment operations | .08 | 2.94 |
Distributions from net realized gain | (.16) | - |
Redemption fees added to paid in capital E | .01 | .01 |
Net asset value, end of period | $ 12.88 | $ 12.95 |
Total Return B, C, D | .70% | 29.50% |
Ratios to Average Net Assets I | | |
Expenses before reductions | 1.53% | 1.55% A |
Expenses net of fee waivers, if any | 1.40% | 1.45% A |
Expenses net of all reductions | 1.35% | 1.36% A |
Net investment income (loss) | (.79)% F | (.78)% A |
Supplemental Data | | |
Net assets, end of period (000 omitted) | $ 18,104 | $ 4,719 |
Portfolio turnover rate | 129% | 93% A |
A Annualized
B Total returns for periods of less than one year are not annualized.
C Total returns would have been lower had certain expenses not been reduced during the periods shown.
D Total returns do not include the effect of the sales charges.
E Calculated based on average shares outstanding during the period.
F Investment income per share reflects a special dividend which amounted to $.01 per share. Excluding the special dividend, the ratio of net investment income (loss) to average net assets would have been (.85)%.
G The amount shown for a share outstanding does not correspond with the aggregate net gain (loss) on investments for the period due to the timing of sales and repurchases of shares in relation to fluctuating market values of the investments of the Fund.
H For the period November 3, 2004 (commencement of operations) to July 31, 2005.
I Expense ratios reflect operating expenses of the class. Expenses before reductions do not reflect amounts reimbursed by the investment adviser or reductions from brokerage service arrangements or other expense offset arrangements and do not represent the amount paid by the class during periods when reimbursements or reductions occur. Expense ratios before reductions for start-up periods may not be representative of longer-term operating periods. Expenses net of fee waivers reflect expenses after reimbursement by the investment adviser but prior to reductions from brokerage service arrangements or other expense offset arrangements. Expenses net of all reductions represent the net expenses paid by the class.
See accompanying notes which are an integral part of the financial statements.
Annual Report
Financial Highlights - Class T
Years ended July 31, | 2006 | 2005 H |
Selected Per-Share Data | | |
Net asset value, beginning of period | $ 12.93 | $ 10.00 |
Income from Investment Operations | | |
Net investment income (loss) E | (.14) F | (.09) |
Net realized and unrealized gain (loss) | .19 G | 3.01 |
Total from investment operations | .05 | 2.92 |
Distributions from net realized gain | (.13) | - |
Redemption fees added to paid in capital E | .01 | .01 |
Net asset value, end of period | $ 12.86 | $ 12.93 |
Total Return B, C, D | .48% | 29.30% |
Ratios to Average Net Assets I | | |
Expenses before reductions | 1.73% | 1.79% A |
Expenses net of fee waivers, if any | 1.65% | 1.70% A |
Expenses net of all reductions | 1.60% | 1.61% A |
Net investment income (loss) | (1.04)% F | (1.03)% A |
Supplemental Data | | |
Net assets, end of period (000 omitted) | $ 19,205 | $ 5,240 |
Portfolio turnover rate | 129% | 93% A |
A Annualized
B Total returns for periods of less than one year are not annualized.
C Total returns would have been lower had certain expenses not been reduced during the periods shown.
D Total returns do not include the effect of the sales charges.
E Calculated based on average shares outstanding during the period.
F Investment income per share reflects a special dividend which amounted to $.01 per share. Excluding the special dividend, the ratio of net investment income (loss) to average net assets would have been (1.10)%.
G The amount shown for a share outstanding does not correspond with the aggregate net gain (loss) on investments for the period due to the timing of sales and repurchases of shares in relation to fluctuating market values of the investments of the Fund.
H For the period November 3, 2004 (commencement of operations) to July 31, 2005.
I Expense ratios reflect operating expenses of the class. Expenses before reductions do not reflect amounts reimbursed by the investment adviser or reductions from brokerage service arrangements or other expense offset arrangements and do not represent the amount paid by the class during periods when reimbursements or reductions occur. Expense ratios before reductions for start-up periods may not be representative of longer-term operating periods. Expenses net of fee waivers reflect expenses after reimbursement by the investment adviser but prior to reductions from brokerage service arrangements or other expense offset arrangements. Expenses net of all reductions represent the net expenses paid by the class.
See accompanying notes which are an integral part of the financial statements.
Annual Report
Financial Highlights - Class B
Years ended July 31, | 2006 | 2005 H |
Selected Per-Share Data | | |
Net asset value, beginning of period | $ 12.87 | $ 10.00 |
Income from Investment Operations | | |
Net investment income (loss) E | (.20) F | (.13) |
Net realized and unrealized gain (loss) | .19 G | 2.99 |
Total from investment operations | (.01) | 2.86 |
Distributions from net realized gain | (.09) | - |
Redemption fees added to paid in capital E | .01 | .01 |
Net asset value, end of period | $ 12.78 | $ 12.87 |
Total Return B, C, D | (.03)% | 28.70% |
Ratios to Average Net Assets I | | |
Expenses before reductions | 2.28% | 2.33% A |
Expenses net of fee waivers, if any | 2.15% | 2.20% A |
Expenses net of all reductions | 2.10% | 2.11% A |
Net investment income (loss) | (1.54)% F | (1.53)% A |
Supplemental Data | | |
Net assets, end of period (000 omitted) | $ 5,191 | $ 2,055 |
Portfolio turnover rate | 129% | 93% A |
A Annualized
B Total returns for periods of less than one year are not annualized.
C Total returns would have been lower had certain expenses not been reduced during the periods shown.
D Total returns do not include the effect of the contingent deferred sales charge.
E Calculated based on average shares outstanding during the period.
F Investment income per share reflects a special dividend which amounted to $.01 per share. Excluding the special dividend, the ratio of net investment income (loss) to average net assets would have been (1.60)%.
G The amount shown for a share outstanding does not correspond with the aggregate net gain (loss) on investments for the period due to the timing of sales and repurchases of shares in relation to fluctuating market values of the investments of the Fund.
H For the period November 3, 2004 (commencement of operations) to July 31, 2005.
I Expense ratios reflect operating expenses of the class. Expenses before reductions do not reflect amounts reimbursed by the investment adviser or reductions from brokerage service arrangements or other expense offset arrangements and do not represent the amount paid by the class during periods when reimbursements or reductions occur. Expense ratios before reductions for start-up periods may not be representative of longer-term operating periods. Expenses net of fee waivers reflect expenses after reimbursement by the investment adviser but prior to reductions from brokerage service arrangements or other expense offset arrangements. Expenses net of all reductions represent the net expenses paid by the class.
See accompanying notes which are an integral part of the financial statements.
Annual Report
Financial Highlights - Class C
Years ended July 31, | 2006 | 2005 H |
Selected Per-Share Data | | |
Net asset value, beginning of period | $ 12.88 | $ 10.00 |
Income from Investment Operations | | |
Net investment income (loss) E | (.20) F | (.13) |
Net realized and unrealized gain (loss) | .18 G | 3.00 |
Total from investment operations | (.02) | 2.87 |
Distributions from net realized gain | (.10) | - |
Redemption fees added to paid in capital E | .01 | .01 |
Net asset value, end of period | $ 12.77 | $ 12.88 |
Total Return B, C, D | (.08)% | 28.80% |
Ratios to Average Net Assets I | | |
Expenses before reductions | 2.25% | 2.24% A |
Expenses net of fee waivers, if any | 2.15% | 2.17% A |
Expenses net of all reductions | 2.10% | 2.09% A |
Net investment income (loss) | (1.54)% F | (1.50)% A |
Supplemental Data | | |
Net assets, end of period (000 omitted) | $ 14,682 | $ 8,372 |
Portfolio turnover rate | 129% | 93% A |
A Annualized
B Total returns for periods of less than one year are not annualized.
C Total returns would have been lower had certain expenses not been reduced during the periods shown.
D Total returns do not include the effect of the contingent deferred sales charge.
E Calculated based on average shares outstanding during the period.
F Investment income per share reflects a special dividend which amounted to $.01 per share. Excluding the special dividend, the ratio of net investment income (loss) to average net assets would have been (1.60)%.
G The amount shown for a share outstanding does not correspond with the aggregate net gain (loss) on investments for the period due to the timing of sales and repurchases of shares in relation to fluctuating market values of the investments of the Fund.
H For the period November 3, 2004 (commencement of operations) to July 31, 2005.
I Expense ratios reflect operating expenses of the class. Expenses before reductions do not reflect amounts reimbursed by the investment adviser or reductions from brokerage service arrangements or other expense offset arrangements and do not represent the amount paid by the class during periods when reimbursements or reductions occur. Expense ratios before reductions for start-up periods may not be representative of longer-term operating periods. Expenses net of fee waivers reflect expenses after reimbursement by the investment adviser but prior to reductions from brokerage service arrangements or other expense offset arrangements. Expenses net of all reductions represent the net expenses paid by the class.
See accompanying notes which are an integral part of the financial statements.
Annual Report
Financial Highlights - Small Cap Growth
Years ended July 31, | 2006 | 2005 G |
Selected Per-Share Data | | |
Net asset value, beginning of period | $ 12.98 | $ 10.00 |
Income from Investment Operations | | |
Net investment income (loss) D | (.07) E | (.04) |
Net realized and unrealized gain (loss) | .19 F | 3.01 |
Total from investment operations | .12 | 2.97 |
Distributions from net realized gain | (.18) | - |
Redemption fees added to paid in capital D | .01 | .01 |
Net asset value, end of period | $ 12.93 | $ 12.98 |
Total Return B, C | 1.01% | 29.80% |
Ratios to Average Net Assets H | | |
Expenses before reductions | 1.13% | 1.16% A |
Expenses net of fee waivers, if any | 1.13% | 1.16% A |
Expenses net of all reductions | 1.08% | 1.08% A |
Net investment income (loss) | (.52)% E | (.49)% A |
Supplemental Data | | |
Net assets, end of period (000 omitted) | $ 402,353 | $ 205,652 |
Portfolio turnover rate | 129% | 93% A |
A Annualized
B Total returns for periods of less than one year are not annualized.
C Total returns would have been lower had certain expenses not been reduced during the periods shown.
D Calculated based on average shares outstanding during the period.
E Investment income per share reflects a special dividend which amounted to $.01 per share. Excluding the special dividend, the ratio of net investment income (loss) to average net assets would have been (.58)%.
F The amount shown for a share outstanding does not correspond with the aggregate net gain (loss) on investments for the period due to the timing of sales and repurchases of shares in relation to fluctuating market values of the investments of the Fund.
G For the period November 3, 2004 (commencement of operations) to July 31, 2005.
H Expense ratios reflect operating expenses of the class. Expenses before reductions do not reflect amounts reimbursed by the investment adviser or reductions from brokerage service arrangements or other expense offset arrangements and do not represent the amount paid by the class during periods when reimbursements or reductions occur. Expense ratios before reductions for start-up periods may not be representative of longer-term operating periods. Expenses net of fee waivers reflect expenses after reimbursement by the investment adviser but prior to reductions from brokerage service arrangements or other expense offset arrangements. Expenses net of all reductions represent the net expenses paid by the class.
See accompanying notes which are an integral part of the financial statements.
Annual Report
Financial Highlights - Institutional Class
Years ended July 31, | 2006 | 2005 G |
Selected Per-Share Data | | |
Net asset value, beginning of period | $ 12.97 | $ 10.00 |
Income from Investment Operations | | |
Net investment income (loss) D | (.07) E | (.04) |
Net realized and unrealized gain (loss) | .19 F | 3.00 |
Total from investment operations | .12 | 2.96 |
Distributions from net realized gain | (.18) | - |
Redemption fees added to paid in capital D | .01 | .01 |
Net asset value, end of period | $ 12.92 | $ 12.97 |
Total Return B, C | .97% | 29.70% |
Ratios to Average Net Assets H | | |
Expenses before reductions | 1.10% | 1.20% A |
Expenses net of fee waivers, if any | 1.10% | 1.18% A |
Expenses net of all reductions | 1.05% | 1.10% A |
Net investment income (loss) | (.49)% E | (.51)% A |
Supplemental Data | | |
Net assets, end of period (000 omitted) | $ 14,233 | $ 1,906 |
Portfolio turnover rate | 129% | 93% A |
A Annualized
B Total returns for periods of less than one year are not annualized.
C Total returns would have been lower had certain expenses not been reduced during the periods shown.
D Calculated based on average shares outstanding during the period.
E Investment income per share reflects a special dividend which amounted to $.01 per share. Excluding the special dividend, the ratio of net investment income (loss) to average net assets would have been (.55)%.
F The amount shown for a share outstanding does not correspond with the aggregate net gain (loss) on investments for the period due to the timing of sales and repurchases of shares in relation to fluctuating market values of the investments of the Fund.
G For the period November 3, 2004 (commencement of operations) to July 31, 2005.
H Expense ratios reflect operating expenses of the class. Expenses before reductions do not reflect amounts reimbursed by the investment adviser or reductions from brokerage service arrangements or other expense offset arrangements and do not represent the amount paid by the class during periods when reimbursements or reductions occur. Expense ratios before reductions for start-up periods may not be representative of longer-term operating periods. Expenses net of fee waivers reflect expenses after reimbursement by the investment adviser but prior to reductions from brokerage service arrangements or other expense offset arrangements. Expenses net of all reductions represent the net expenses paid by the class.
See accompanying notes which are an integral part of the financial statements.
Annual Report
Notes to Financial Statements
1. Significant Accounting Policies.
Fidelity Small Cap Growth Fund (the Fund) is a non-diversified fund of Fidelity Securities Fund (the trust) and is authorized to issue an unlimited number of shares. The trust is registered under the Investment Company Act of 1940, as amended (the 1940 Act), as an open-end management investment company organized as a Massachusetts business trust.
The Fund offers Class A, Class T, Class B, Class C, Small Cap Growth, and Institutional Class shares, each of which has equal rights as to assets and voting privileges. Each class has exclusive voting rights with respect to matters that affect that class. Class B shares will automatically convert to Class A shares after a holding period of seven years from the initial date of purchase. Investment income, realized and unrealized capital gains and losses, the common expenses of the Fund, and certain fund-level expense reductions, if any, are allocated on a pro rata basis to each class based on the relative net assets of each class to the total net assets of the Fund. Each class differs with respect to transfer agent and distribution and service plan fees incurred. Certain expense reductions also differ by class.
The Fund may invest in affiliated money market central funds (Money Market Central Funds), which are open-end investment companies available to investment companies and other accounts managed by Fidelity Management & Research Company (FMR) and its affiliates. The financial statements have been prepared in conformity with accounting principles generally accepted in the United States of America, which require management to make certain estimates and assumptions at the date of the financial statements. The following summarizes the significant accounting policies of the Fund:
Security Valuation. Investments are valued and net asset value (NAV) per share is calculated (NAV calculation) as of the close of business of the New York Stock Exchange (NYSE), normally 4:00 p.m. Eastern time. Wherever possible, the Fund uses independent pricing services approved by the Board of Trustees to value its investments.
Equity securities, including restricted securities, for which market quotations are readily available, are valued at the last reported sale price or official closing price as reported by an independent pricing service on the primary market or exchange on which they are traded. In the event there were no sales during the day or closing prices are not available, securities are valued at the last quoted bid price. Investments in open-end mutual funds are valued at their closing net asset value each business day. Short-term securities with remaining maturities of sixty days or less for which quotations are not readily available are valued at amortized cost, which approximates value.
When current market prices or quotations are not readily available or do not accurately reflect fair value, valuations may be determined in accordance with procedures adopted by the Board of Trustees. For example, when developments occur between the close of a market and the close of the NYSE that may materially affect the value of some or all of
Annual Report
Notes to Financial Statements - continued
1. Significant Accounting Policies - continued
Security Valuation - continued
the securities, or when trading in a security is halted, those securities may be fair valued. Factors used in the determination of fair value may include monitoring news to identify significant market or security specific events such as changes in the value of U.S. securities markets, reviewing developments in foreign markets and evaluating the performance of ADRs, futures contracts and exchange-traded funds. Because the Fund's utilization of fair value pricing depends on market activity, the frequency with which fair value pricing is used can not be predicted and may be utilized to a significant extent. The value of securities used for NAV calculation under fair value pricing may differ from published prices for the same securities.
Foreign Currency. The Fund uses foreign currency contracts to facilitate transactions in foreign-denominated securities. Losses from these transactions may arise from changes in the value of the foreign currency or if the counterparties do not perform under the contracts' terms.
Foreign-denominated assets, including investment securities, and liabilities are translated into U.S. dollars at the exchange rate at period end. Purchases and sales of investment securities, income and dividends received and expenses denominated in foreign currencies are translated into U.S. dollars at the exchange rate in effect on the transaction date.
The effects of exchange rate fluctuations on investments are included with the net realized and unrealized gain (loss) on investment securities. Other foreign currency transactions resulting in realized and unrealized gain (loss) are disclosed separately.
Investment Transactions and Income. Security transactions are accounted for as of trade date. Gains and losses on securities sold are determined on the basis of identified cost. Dividend income is recorded on the ex-dividend date, except for certain dividends from foreign securities where the ex-dividend date may have passed, which are recorded as soon as the Fund is informed of the ex-dividend date. Non-cash dividends included in dividend income, if any, are recorded at the fair market value of the securities received. Distributions received on securities that represent a return of capital or capital gain are recorded as a reduction of cost of investments and/or as a realized gain. The Fund estimates the components of distributions received that may be considered return of capital distributions or capital gain distributions. Large, non-recurring dividends recognized by the Fund are presented separately on the Statement of Operations as "Special Dividends" and the impact of these dividends is presented in the Financial Highlights. Interest income is accrued as earned. Interest income includes coupon interest and amortization of premium and accretion of discount on debt securities. Investment income is recorded net of foreign taxes withheld where recovery of such taxes is uncertain.
Annual Report
1. Significant Accounting Policies - continued
Expenses. Most expenses of the trust can be directly attributed to a fund. Expenses which cannot be directly attributed are apportioned among each Fund in the trust. Expense estimates are accrued in the period to which they relate and adjustments are made when actual amounts are known.
Income Tax Information and Distributions to Shareholders. Each year, the Fund intends to qualify as a regulated investment company by distributing all of its taxable income and realized gains under Subchapter M of the Internal Revenue Code. As a result, no provision for income taxes is required in the accompanying financial statements. Foreign taxes are provided for based on the Fund's understanding of the tax rules and rates that exist in the foreign markets in which it invests.
Distributions are recorded on the ex-dividend date. Income dividends and capital gain distributions are declared separately for each class. Income and capital gain distributions are determined in accordance with income tax regulations, which may differ from generally accepted accounting principles. In addition, the Fund will claim a portion of the payment made to redeeming shareholders as a distribution for income tax purposes.
Capital accounts within the financial statements are adjusted for permanent book-tax differences. These adjustments have no impact on net assets or the results of operations. Temporary book-tax differences will reverse in a subsequent period.
Book-tax differences are primarily due to net operating losses and losses deferred due to wash sales.
The tax-basis components of distributable earnings and the federal tax cost as of period end were as follows:
Unrealized appreciation | $ 43,314,354 | |
Unrealized depreciation | (37,939,754) | |
Net unrealized appreciation (depreciation) | 5,374,600 | |
Undistributed ordinary income | 1,284,226 | |
Undistributed long-term capital gain | 1,027,501 | |
| | |
Cost for federal income tax purposes | $ 474,608,447 | |
The tax character of distributions paid was as follows:
| July 31, 2006 | July 31, 2005 |
Ordinary Income | $ 3,779,478 | $ - |
New Accounting Pronouncement. In July 2006, Financial Accounting Standards Board Interpretation No. 48, Accounting for Uncertainty in Income Taxes - an interpretation of FASB Statement 109 (FIN 48) was issued and is effective for fiscal years
Annual Report
Notes to Financial Statements - continued
1. Significant Accounting Policies - continued
New Accounting Pronouncement - continued
beginning after December 15, 2006. FIN 48 sets forth a threshold for financial statement recognition, measurement and disclosure of a tax position taken or expected to be taken on a tax return. Management is currently evaluating the impact, if any, the adoption of FIN 48 will have on the Fund's net assets and results of operations.
Short-Term Trading (Redemption) Fees. Shares held in the Fund less than 90 days are subject to a redemption fee equal to 1.50% of the proceeds of the redeemed shares. All redemption fees, including any estimated redemption fees paid by FMR, are retained by the Fund and accounted for as an addition to paid in capital.
2. Operating Policies.
Repurchase Agreements. FMR has received an Exemptive Order from the Securities and Exchange Commission (the SEC) which permits the Fund and other affiliated entities of FMR to transfer uninvested cash balances into joint trading accounts which are then invested in repurchase agreements. The Fund may also invest directly with institutions in repurchase agreements. Repurchase agreements are collateralized by government or non-government securities. Upon settlement date, collateral is held in segregated accounts with custodian banks and may be obtained in the event of a default of the counterparty. The Fund monitors, on a daily basis, the value of the collateral to ensure it is at least equal to the principal amount of the repurchase agreement (including accrued interest). In the event of a default by the counterparty, realization of the collateral proceeds could be delayed, during which time the value of the collateral may decline.
3. Purchases and Sales of Investments.
Purchases and sales of securities, other than short-term securities, aggregated $713,692,604 and $477,814,143, respectively.
4. Fees and Other Transactions with Affiliates.
Management Fee. FMR and its affiliates provide the Fund with investment management related services for which the Fund pays a monthly management fee. The management fee is the sum of an individual fund fee rate that is based on an annual rate of .45% of the Fund's average net assets and a group fee rate that averaged ..27% during the period. The group fee rate is based upon the average net assets of all the mutual funds advised by FMR. The group fee rate decreases as assets under management increase and increases as assets under management decrease. In addition, the management fee is subject to a performance adjustment (up to a maximum of ± .20% of the Fund's average net assets over a 36 month performance period). The upward or downward adjustment
Annual Report
4. Fees and Other Transactions with Affiliates - continued
Management Fee - continued
to the management fee is based on the relative investment performance of the retail class of the Fund, Small Cap Growth, as compared to an appropriate benchmark index. The Fund's performance adjustment took effect in November 2005. Subsequent months will be added until the performance period includes 36 months. For the period, the total annual management fee rate, including the performance adjustment, was .81% of the Fund's average net assets.
Distribution and Service Plan. In accordance with Rule 12b-1 of the 1940 Act, the Fund has adopted separate Distribution and Service Plans for each class of shares. Certain classes pay Fidelity Distributors Corporation (FDC), an affiliate of FMR, separate Distribution and Service Fees, each of which is based on an annual percentage of each class' average net assets. In addition, FDC may pay financial intermediaries for selling shares of the Fund and providing shareholder support services. For the period, the Distribution and Service Fee rates and the total amounts paid to and retained by FDC were as follows:
| Distribution
Fee | Service
Fee | Paid to
FDC | Retained
by FDC |
Class A | 0% | .25% | $ 28,742 | $ 1,591 |
Class T | .25% | .25% | 60,604 | 6,378 |
Class B | .75% | .25% | 37,942 | 30,032 |
Class C | .75% | .25% | 126,065 | 55,601 |
| | | $ 253,353 | $ 93,602 |
Sales Load. FDC receives a front-end sales charge of up to 5.75% for selling Class A shares, and 3.50% for selling Class T shares, some of which is paid to financial intermediaries for selling shares of the Fund. FDC receives the proceeds of contingent deferred sales charges levied on Class A, Class T, Class B, and Class C redemptions. These charges depend on the holding period. The deferred sales charges range from 5% to 1% for Class B, 1% for Class C, 1.00% to .50% for certain purchases of Class A shares (.25% prior to February 24, 2006) and .25% for certain purchases of Class T shares.
For the period, sales charge amounts retained by FDC were as follows:
| Retained
by FDC |
Class A | $ 60,838 |
Class T | 10,628 |
Class B * | 3,795 |
Class C * | 2,471 |
| $ 77,732 |
* When Class B and Class C shares are initially sold, FDC pays commissions from its own resources to financial intermediaries through which the sales are made.
Annual Report
Notes to Financial Statements - continued
4. Fees and Other Transactions with Affiliates - continued
Transfer Agent Fees. Fidelity Investments Institutional Operations Company, Inc. (FIIOC), an affiliate of FMR, is the transfer, dividend disbursing and shareholder servicing agent for each class of the Fund, except for Small Cap Growth. Fidelity Service Company, Inc. (FSC), an affiliate of FMR, is the transfer agent for Small Cap Growth shares. FIIOC and FSC receive account fees and asset-based fees that vary according to the account size and type of account of the shareholders of the respective classes of the Fund. FIIOC and FSC pay for typesetting, printing and mailing of shareholder reports, except proxy statements. For the period the total transfer agent fees paid by each class to FIIOC or FSC, were as follows:
| Amount | % of
Average
Net Assets |
Class A | $ 42,555 | .37 |
Class T | 39,108 | .32 |
Class B | 13,971 | .37 |
Class C | 42,629 | .34 |
Small Cap Growth | 748,272 | .22 |
Institutional Class | 15,560 | .20 |
| $ 902,095 | |
Accounting and Security Lending Fees. FSC maintains the Fund's accounting records. The accounting fee is based on the level of average net assets for the month. Under a separate contract, FSC administers the security lending program. The security lending fee is based on the number and duration of lending transactions.
Affiliated Central Funds. The Fund may invest in Money Market Central Funds which seek preservation of capital and current income and are managed by Fidelity Investments Money Management, Inc. (FIMM), an affiliate of FMR.
The Money Market Central Funds do not pay a management fee.
Brokerage Commissions. The Fund placed a portion of its portfolio transactions with brokerage firms which are affiliates of the investment adviser. The commissions paid to these affiliated firms were $21,982 for the period.
5. Committed Line of Credit.
The Fund participates with other funds managed by FMR in a $4.2 billion credit facility (the "line of credit") to be utilized for temporary or emergency purposes to fund shareholder redemptions or for other short-term liquidity purposes. The Fund has agreed to pay commitment fees on its pro rata portion of the line of credit, which amounts to $1,010 and is reflected in Miscellaneous Expense on the Statement of Operations. During the period, there were no borrowings on this line of credit.
Annual Report
6. Security Lending.
The Fund lends portfolio securities from time to time in order to earn additional income. On the settlement date of the loan, the Fund receives collateral (in the form of U.S. Treasury obligations, letters of credit and/or cash) against the loaned securities and maintains collateral in an amount not less than 100% of the market value of the loaned securities during the period of the loan. The market value of the loaned securities is determined at the close of business of the Fund and any additional required collateral is delivered to the Fund on the next business day. If the borrower defaults on its obligation to return the securities loaned because of insolvency or other reasons, a fund could experience delays and costs in recovering the securities loaned or in gaining access to the collateral. Any cash collateral received is invested in the Fidelity Securities Lending Cash Central Fund. The value of loaned securities and cash collateral at period end are disclosed on the Fund's Statement of Assets and Liabilities. Security lending income represents the income earned on investing cash collateral, less fees and expenses associated with the loan, plus any premium payments that may be received on the loan of certain types of securities. Security lending income is presented in the Statement of Operations as a component of income from affiliated central funds. Net income from lending portfolio securities during the period amounted to $40,744.
7. Expense Reductions.
FMR voluntarily agreed to reimburse each class to the extent annual operating expenses exceeded certain levels of average net assets as noted in the table below. Some expenses, for example interest expense, are excluded from this reimbursement.
The following classes were in reimbursement during the period:
| Expense
Limitations | Reimbursement
from adviser |
Class A | 1.40% | $ 15,076 |
Class T | 1.65% | 10,160 |
Class B | 2.15% | 4,921 |
Class C | 2.15% | 12,289 |
| | $ 42,446 |
Many of the brokers with whom FMR places trades on behalf of the Fund provided services to the Fund in addition to trade execution. These services included payments of certain expenses on behalf of the Fund totaling $159,947 for the period. In addition, through arrangements with the Fund's custodian and each class' transfer agent, credits realized as a result of uninvested cash balances were used to reduce the Fund's expenses.
Annual Report
Notes to Financial Statements - continued
7. Expense Reductions - continued
During the period, these credits reduced the Fund's custody expenses by $8,200. During the period, credits reduced each class' transfer agent expense as noted in the table below.
| Transfer Agent
expense reduction | |
Small Cap Growth | $ 7,586 | |
Institutional Class | 523 | |
| $ 8,109 | |
8. Other.
The Fund's organizational documents provide former and current trustees and officers with a limited indemnification against liabilities arising in connection with the performance of their duties to the Fund. In the normal course of business, the Fund may also enter into contracts that provide general indemnifications. The Fund's maximum exposure under these arrangements is unknown as this would be dependent on future claims that may be made against the Fund. The risk of material loss from such claims is considered remote.
Subsequent to fiscal year end, the Fund's transfer agent, Fidelity Investments Institutional Operations Company, Inc. (FIIOC), an affiliate of Fidelity Management & Research Company, notified the Fund that the fund's books and records did not reflect a conversion of certain Class B to Class A shares upon their conversion date. Management has determined that this did not have a material impact to the Fund's reported net assets or results of operations in the accompanying financial statements. FIIOC will cause the books and records of the fund to reflect a conversion of the relevant Class B shares to Class A and is in the process of determining the impact to affected shareholder accounts for purposes of its remediation.
9. Distributions to Shareholders.
Distributions to shareholders of each class were as follows:
Years ended July 31, | 2006 | 2005 A |
From net realized gain | | |
Class A | $ 79,077 | $ - |
Class T | 63,628 | - |
Class B | 16,300 | - |
Class C | 71,634 | - |
Small Cap Growth | 3,518,781 | - |
Institutional Class | 30,058 | - |
Total | $ 3,779,478 | $ - |
A For the period November 3, 2004 (commencement of operations) to July 31, 2005
Annual Report
10. Share Transactions.
Transactions for each class of shares were as follows:
| Shares | Dollars |
Years ended July 31, | 2006 | 2005 A | 2006 | 2005 A |
Class A | | | | |
Shares sold | 1,304,587 | 377,650 | $ 17,497,379 | $ 4,304,515 |
Reinvestment of distributions | 5,381 | - | 70,354 | - |
Shares redeemed | (269,198) | (13,200) | (3,602,873) | (157,404) |
Net increase (decrease) | 1,040,770 | 364,450 | $ 13,964,860 | $ 4,147,111 |
Class T | | | | |
Shares sold | 1,397,985 | 432,704 | $ 18,995,409 | $ 4,904,069 |
Reinvestment of distributions | 4,866 | - | 63,445 | - |
Shares redeemed | (314,634) | (27,332) | (4,188,261) | (327,972) |
Net increase (decrease) | 1,088,217 | 405,372 | $ 14,870,593 | $ 4,576,097 |
Class B | | | | |
Shares sold | 392,448 | 169,626 | $ 5,275,913 | $ 1,864,130 |
Reinvestment of distributions | 1,204 | - | 15,614 | - |
Shares redeemed | (146,977) | (10,003) | (1,954,748) | (113,030) |
Net increase (decrease) | 246,675 | 159,623 | $ 3,336,779 | $ 1,751,100 |
Class C | | | | |
Shares sold | 952,568 | 664,094 | $ 12,739,552 | $ 7,429,424 |
Reinvestment of distributions | 5,289 | - | 68,594 | - |
Shares redeemed | (458,174) | (14,036) | (5,878,013) | (166,606) |
Net increase (decrease) | 499,683 | 650,058 | $ 6,930,133 | $ 7,262,818 |
Small Cap Growth | | | | |
Shares sold | 23,125,895 | 18,162,749 | $ 310,607,480 | $ 212,509,370 |
Reinvestment of distributions | 226,620 | - | 2,968,828 | - |
Shares redeemed | (8,070,732) | (2,320,313) | (106,295,770) | (26,565,039) |
Net increase (decrease) | 15,281,783 | 15,842,436 | $ 207,280,538 | $ 185,944,331 |
Institutional Class | | | | |
Shares sold | 1,082,924 | 170,585 | $ 14,760,969 | $ 1,883,777 |
Reinvestment of distributions | 1,705 | - | 22,327 | - |
Shares redeemed | (130,215) | (23,631) | (1,756,457) | (261,946) |
Net increase (decrease) | 954,414 | 146,954 | $ 13,026,839 | $ 1,621,831 |
A For the period November 3, 2004 (commencement of operations) to July 31, 2005.
Annual Report
Report of Independent Registered Public Accounting Firm
To the Trustees of Fidelity Securities Fund and the Shareholders of Fidelity Small Cap Growth Fund:
In our opinion, the accompanying statement of assets and liabilities, including the schedule of investments, and the related statements of operations and of changes in net assets and the financial highlights present fairly, in all material respects, the financial position of Fidelity Small Cap Growth Fund (a fund of Fidelity Securities Fund) at July 31, 2006, and the results of its operations, the changes in its net assets and the financial highlights for each of the periods indicated, in conformity with accounting principles generally accepted in the United States of America. These financial statements and financial highlights (hereafter referred to as "financial statements") are the responsibility of the Fidelity Small Cap Growth Fund's management; our responsibility is to express an opinion on these financial statements based on our audits. We conducted our audits of these financial statements in accordance with the standards of the Public Company Accounting Oversight Board (United States). Those standards require that we plan and perform the audit to obtain reasonable assurance about whether the financial statements are free of material misstatement. An audit includes examining, on a test basis, evidence supporting the amounts and disclosures in the financial statements, assessing the accounting principles used and significant estimates made by management, and evaluating the overall financial statement presentation. We believe that our audits, which included confirmation of securities at July 31, 2006 by correspondence with the custodian and brokers, provide a reasonable basis for our opinion.
/s/ PricewaterhouseCoopers LLP
PricewaterhouseCoopers LLP
Boston, Massachusetts
October 9, 2006
Annual Report
Trustees and Officers
The Trustees, Members of the Advisory Board, and executive officers of the trust and fund, as applicable, are listed below. The Board of Trustees governs each fund and is responsible for protecting the interests of shareholders. The Trustees are experienced executives who meet periodically throughout the year to oversee the fund's activities, review contractual arrangements with companies that provide services to the fund, and review the fund's performance. Except for William O. McCoy and Albert R. Gamper, Jr., each of the Trustees oversees 345 funds advised by FMR or an affiliate. Mr. McCoy oversees 347 funds advised by FMR or an affiliate. Mr. Gamper oversees 292 funds advised by FMR or an affiliate.
The Trustees hold office without limit in time except that (a) any Trustee may resign; (b) any Trustee may be removed by written instrument, signed by at least two-thirds of the number of Trustees prior to such removal; (c) any Trustee who requests to be retired or who has become incapacitated by illness or injury may be retired by written instrument signed by a majority of the other Trustees; and (d) any Trustee may be removed at any special meeting of shareholders by a two-thirds vote of the outstanding voting securities of the trust. Each Trustee who is not an interested person (as defined in the 1940 Act) (Independent Trustee), shall retire not later than the last day of the calendar year in which his or her 72nd birthday occurs. The Independent Trustees may waive this mandatory retirement age policy with respect to individual Trustees. The executive officers and Advisory Board Members hold office without limit in time, except that any officer and Advisory Board Member may resign or may be removed by a vote of a majority of the Trustees at any regular meeting or any special meeting of the Trustees. Except as indicated, each individual has held the office shown or other offices in the same company for the past five years.
The fund's Statement of Additional Information (SAI) includes more information about the Trustees. To request a free copy, call Fidelity at 1-800-544-8544.
Interested Trustees*:
Correspondence intended for each Trustee who is an interested person may be sent to Fidelity Investments, 82 Devonshire Street, Boston, Massachusetts 02109.
Name, Age; Principal Occupation |
Edward C. Johnson 3d (76) |
| Year of Election or Appointment: 1984 Mr. Johnson is Chairman of the Board of Trustees. Mr. Johnson serves as President (2006-present), Chief Executive Officer, Chairman, and a Director of FMR Corp.; Chairman and a Director of FMR; Chairman and a Director of Fidelity Research & Analysis Company (FRAC); Chairman and a Director of Fidelity Investments Money Management, Inc.; and Chairman (2001-present) and a Director (1999-present) of FMR Co., Inc. In addition, Mr. Johnson serves as Chairman and Director of Fidelity International Limited (FIL). |
Stephen P. Jonas (53) |
| Year of Election or Appointment: 2005 Mr. Jonas is Senior Vice President of Small Cap Growth (2005-Present). He also serves as Senior Vice President of other Fidelity funds (2005-present). Mr. Jonas is Executive Director of FMR (2005-present) and FMR Co., Inc. (2005-present). He also serves as a Director of Fidelity Investments Money Management, Inc. (2005-present) and FMR Corp. (2003-present). Previously, Mr. Jonas served as President of Fidelity Enterprise Operations and Risk Services (2004-2005), Chief Administrative Officer (2002-2004), and Chief Financial Officer of FMR Corp. (1998-2002). In addition, he serves on the Boards of Boston Ballet (2003-present) and Simmons College (2003-present). |
Robert L. Reynolds (54) |
| Year of Election or Appointment: 2003 Mr. Reynolds is President and a Director of FMR (2005-present), Fidelity Investments Money Management, Inc. (2005-present), and FMR Co., Inc. (2005-present). Mr. Reynolds also serves as a Director (2003-present) and Chief Operating Officer (2000-present) of FMR Corp. and a Director of Strategic Advisers, Inc. (2005-present). He also serves on the Board at Fidelity Investments Canada, Ltd. (2000-present). Previously, Mr. Reynolds served as President of Fidelity Investments Institutional Retirement Group (1996-2000). |
* Trustees have been determined to be "Interested Trustees" by virtue of, among other things, their affiliation with the trust or various entities under common control with FMR.
Annual Report
Independent Trustees:
Correspondence intended for each Independent Trustee (that is, the Trustees other than the Interested Trustees) may be sent to Fidelity Investments, P.O. Box 55235, Boston, Massachusetts 02205-5235.
Name, Age; Principal Occupation |
Dennis J. Dirks (58) |
| Year of Election or Appointment: 2005 Prior to his retirement in May 2003, Mr. Dirks was Chief Operating Officer and a member of the Board of The Depository Trust & Clearing Corporation (DTCC) (1999-2003). He also served as President, Chief Operating Officer, and Board member of The Depository Trust Company (DTC) (1999-2003) and President and Board member of the National Securities Clearing Corporation (NSCC) (1999-2003). In addition, Mr. Dirks served as Chief Executive Officer and Board member of the Government Securities Clearing Corporation (2001-2003) and Chief Executive Officer and Board member of the Mortgage-Backed Securities Clearing Corporation (2001-2003). Mr. Dirks also serves as a Trustee and a member of the Finance Committee of Manhattan College (2005-present) and a Trustee and a member of the Finance Committee of AHRC of Nassau County (2006-present). |
Albert R. Gamper, Jr. (64) |
| Year of Election or Appointment: 2006 Mr. Gamper also serves as a Trustee (2006-present) or Member of the Advisory Board (2005-present) of other investment companies advised by FMR. Prior to his retirement in December 2004, Mr. Gamper served as Chairman of the Board of CIT Group Inc. (commercial finance). During his tenure with CIT Group Inc. Mr. Gamper served in numerous senior management positions, including Chairman (1987-1989; 1999-2001; 2002-2004), Chief Executive Officer (1987-2004), and President (1989-2002). He currently serves as a member of the Board of Directors of Public Service Enterprise Group (utilities, 2001-present), Chairman of the Board of Governors, Rutgers University (2004-present), and Chairman of the Board of Saint Barnabas Health Care System. |
Robert M. Gates (62) |
| Year of Election or Appointment: 1997 Dr. Gates is Chairman of the Independent Trustees (2006-present). Dr. Gates is President of Texas A&M University (2002-present). He was Director of the Central Intelligence Agency (CIA) from 1991 to 1993. From 1989 to 1991, Dr. Gates served as Assistant to the President of the United States and Deputy National Security Advisor. Dr. Gates is a Director of NACCO Industries, Inc. (mining and manufacturing), Parker Drilling Co., Inc. (drilling and rental tools for the energy industry, 2001-present), and Brinker International (restaurant management, 2003-present). Previously, Dr. Gates served as a Director of LucasVarity PLC (automotive components and diesel engines), a Director of TRW Inc. (automotive, space, defense, and information technology), and Dean of the George Bush School of Government and Public Service at Texas A&M University (1999-2001). |
George H. Heilmeier (70) |
| Year of Election or Appointment: 2004 Dr. Heilmeier is Chairman Emeritus of Telcordia Technologies (communication software and systems), where prior to his retirement, he served as company Chairman and Chief Executive Officer. He currently serves on the Boards of Directors of The Mitre Corporation (systems engineering and information technology support for the government), and HRL Laboratories (private research and development, 2004-present). He is Chairman of the General Motors Science & Technology Advisory Board and a Life Fellow of the Institute of Electrical and Electronics Engineers (IEEE). Dr. Heilmeier is a member of the Defense Science Board and the National Security Agency Advisory Board. He is also a member of the National Academy of Engineering, the American Academy of Arts and Sciences, and the Board of Overseers of the School of Engineering and Applied Science of the University of Pennsylvania. Previously, Dr. Heilmeier served as a Director of TRW Inc. (automotive, space, defense, and information technology, 1992-2002), Compaq (1994-2002), Automatic Data Processing, Inc. (ADP) (technology-based business outsourcing, 1995-2002), INET Technologies Inc. (telecommunications network surveillance, 2001-2004), and Teletech Holdings (customer management services). He is the recipient of the 2005 Kyoto Prize in Advanced Technology for his invention of the liquid crystal display. |
Marie L. Knowles (59) |
| Year of Election or Appointment: 2001 Prior to Ms. Knowles' retirement in June 2000, she served as Executive Vice President and Chief Financial Officer of Atlantic Richfield Company (ARCO) (diversified energy, 1996-2000). From 1993 to 1996, she was a Senior Vice President of ARCO and President of ARCO Transportation Company. She served as a Director of ARCO from 1996 to 1998. She currently serves as a Director of Phelps Dodge Corporation (copper mining and manufacturing) and McKesson Corporation (healthcare service, 2002-present). Ms. Knowles is a Trustee of the Brookings Institution and the Catalina Island Conservancy and also serves as a member of the Advisory Board for the School of Engineering of the University of Southern California. |
Ned C. Lautenbach (62) |
| Year of Election or Appointment: 2000 Mr. Lautenbach has been a partner of Clayton, Dubilier & Rice, Inc. (private equity investment firm) since September 1998. Previously, Mr. Lautenbach was with the International Business Machines Corporation (IBM) from 1968 until his retirement in 1998. Mr. Lautenbach serves as a Director of Italtel Holding S.p.A. (telecommunications (Milan, Italy), 2004-present) and Eaton Corporation (diversified industrial) as well as the Philharmonic Center for the Arts in Naples, Florida. He also is a member of the Board of Trustees of Fairfield University (2005-present), as well as a member of the Council on Foreign Relations. |
William O. McCoy (72) |
| Year of Election or Appointment: 1997 Prior to his retirement in December 1994, Mr. McCoy was Vice Chairman of the Board of BellSouth Corporation (telecommunications) and President of BellSouth Enterprises. He is currently a Director of Duke Realty Corporation (real estate). He is also a partner of Franklin Street Partners (private investment management firm). In addition, Mr. McCoy served as the Interim Chancellor (1999-2000) and a member of the Board of Visitors for the University of North Carolina at Chapel Hill and currently serves as Chairman of the Board of Directors of the University of North Carolina Health Care System. He also served as Vice President of Finance for the University of North Carolina (16-school system). |
Cornelia M. Small (62) |
| Year of Election or Appointment: 2005 Ms. Small is a member (2000-present) and Chairperson (2002-present) of the Investment Committee, and a member (2002-present) of the Board of Trustees of Smith College. Previously, she served as Chief Investment Officer (1999-2000), Director of Global Equity Investments (1996-1999), and a member of the Board of Directors of Scudder, Stevens & Clark (1990-1997) and Scudder Kemper Investments (1997-1999). In addition, Ms. Small served as Co-Chair (2000-2003) of the Annual Fund for the Fletcher School of Law and Diplomacy. |
William S. Stavropoulos (67) |
| Year of Election or Appointment: 2002 Mr. Stavropoulos is Chairman Emeritus of the Board of Directors of The Dow Chemical Company. Since joining The Dow Chemical Company in 1967, Mr. Stavropoulos served in numerous senior management positions, including President (1993-2000; 2002-2003), CEO (1995-2000; 2002-2004), and Chairman of the Executive Committee (2000-2004). Currently, he is a Director of NCR Corporation (data warehousing and technology solutions), BellSouth Corporation (telecommunications), Chemical Financial Corporation, Maersk Inc. (industrial conglomerate, 2002-present), and Metalmark Capital (private equity investment firm, 2005-present). He also serves as a member of the Board of Trustees of the American Enterprise Institute for Public Policy Research. In addition, Mr. Stavropoulos is a member of The Business Council, J.P. Morgan International Council and the University of Notre Dame Advisory Council for the College of Science. |
Kenneth L. Wolfe (67) |
| Year of Election or Appointment: 2005 Prior to his retirement in 2001, Mr. Wolfe was Chairman and Chief Executive Officer of Hershey Foods Corporation (1993-2001). He currently serves as a member of the boards of Adelphia Communications Corporation (2003-present), Bausch & Lomb, Inc., and Revlon Inc. (2004-present). |
Annual Report
Advisory Board Members and Executive Officers:
Correspondence intended for Mr. Keyes may be sent to Fidelity Investments, P.O. Box 55235, Boston, Massachusetts 02205-5235. Correspondence intended for each executive officer and Mr. Lynch may be sent to Fidelity Investments, 82 Devonshire Street, Boston, Massachusetts 02109.
Name, Age; Principal Occupation |
James H. Keyes (65) |
| Year of Election or Appointment: 2006 Member of the Advisory Board of Fidelity Securities Fund. Prior to his retirement in 2003, Mr. Keyes was Chairman, President, and Chief Executive Officer of Johnson Controls, Inc. (automotive supplier, 1993-2003). He currently serves as a member of the boards of LSI Logic Corporation (semiconductor technologies, 1984-present), Navistar International Corporation (manufacture and sale of trucks, buses, and diesel engines, 2002-present), and Pitney Bowes, Inc. (integrated mail, messaging, and document management solutions, 1998-present). |
Peter S. Lynch (62) |
| Year of Election or Appointment: 2003 Member of the Advisory Board of Fidelity Securities Fund. Mr. Lynch is Vice Chairman and a Director of FMR, and Vice Chairman (2001-present) and a Director (1999-present) of FMR Co., Inc. Previously, Mr. Lynch served as a Trustee of the Fidelity funds (1990-2003). In addition, he serves as the Chairman of the Inner-City Scholarship Fund. |
Dwight D. Churchill (52) |
| Year of Election or Appointment: 2005 Vice President of Small Cap Growth. Mr. Churchill also serves as Vice President of certain Equity Funds (2005-present). Mr. Churchill is Executive Vice President of FMR (2005-present) and FMR Co., Inc. (2005-present). Previously, Mr. Churchill served as Vice President of Fidelity Investments Money Management, Inc. (2005-2006), Head of Fidelity's Fixed-Income Division (2000-2005), Vice President of Fidelity's Money Market Funds (2000-2005), Vice President of Fidelity's Bond Funds, and Senior Vice President of FMR. |
Bruce T. Herring (40) |
| Year of Election or Appointment: 2006 Vice President of Small Cap Growth. Mr. Herring also serves as Vice President of certain Equity Funds (2006-present). Mr. Herring is Senior Vice President of FMR (2006-present) and Vice President of FMR Co., Inc. (2001-present). Previously, Mr. Herring served as a portfolio manager for Fidelity U.S. Equity Funds (2001-2005). |
Lionel Harris (39) |
| Year of Election or Appointment: 2006 Vice President of Small Cap Growth. Prior to assuming his current responsibilities, Mr. Harris worked as a research analyst, high-income director of research, and portfolio manager. |
Eric D. Roiter (57) |
| Year of Election or Appointment: 2004 Secretary of Small Cap Growth. He also serves as Secretary of other Fidelity funds; Vice President, General Counsel, and Secretary of FMR Co., Inc. (2001-present) and FMR; Assistant Secretary of Fidelity Management & Research (U.K.) Inc. (2001-present), Fidelity Research & Analysis Company (2001-present), and Fidelity Investments Money Management, Inc. (2001-present). Mr. Roiter is an Adjunct Member, Faculty of Law, at Boston College Law School (2003-present). Previously, Mr. Roiter served as Vice President and Secretary of FDC (1998-2005). |
Stuart Fross (46) |
| Year of Election or Appointment: 2004 Assistant Secretary of Small Cap Growth. Mr. Fross also serves as Assistant Secretary of other Fidelity funds (2003-present), Vice President and Secretary of FDC (2005-present), and is an employee of FMR. |
Christine Reynolds (47) |
| Year of Election or Appointment: 2004 President and Treasurer of Small Cap Growth. Ms. Reynolds also serves as President and Treasurer of other Fidelity funds (2004-present) and is a Vice President (2003-present) and an employee (2002-present) of FMR. Before joining Fidelity Investments, Ms. Reynolds worked at PricewaterhouseCoopers LLP (PwC) (1980-2002), where she was most recently an audit partner with PwC's investment management practice. |
R. Stephen Ganis (40) |
| Year of Election or Appointment: 2006 Anti-Money Laundering (AML) officer of Small Cap Growth. Mr. Ganis also serves as AML officer of other Fidelity funds (2006-present) and FMR Corp. (2003-present). Before joining Fidelity Investments, Mr. Ganis practiced law at Goodwin Procter, LLP (2000-2002). |
Joseph B. Hollis (58) |
| Year of Election or Appointment: 2006 Chief Financial Officer of Small Cap Growth. Mr. Hollis also serves as Chief Financial Officer of other Fidelity funds. Mr. Hollis is President of Fidelity Pricing and Cash Management Services (FPCMS) (2005-present). Mr. Hollis also serves as President and Director of Fidelity Service Company, Inc. (2006-present). Previously, Mr. Hollis served as Senior Vice President of Cash Management Services (1999-2002) and Investment Management Operations (2002-2005). |
Kenneth A. Rathgeber (59) |
| Year of Election or Appointment: 2004 Chief Compliance Officer of Small Cap Growth. Mr. Rathgeber also serves as Chief Compliance Officer of other Fidelity funds (2004-present) and Executive Vice President of Risk Oversight for Fidelity Investments (2002-present). He is Chief Compliance Officer of FMR (2005-present), FMR Co., Inc. (2005-present), Fidelity Management & Research (U.K.) Inc. (2005-present), Fidelity Research & Analysis Company (2005-present), Fidelity Investments Money Management, Inc. (2005-present), and Strategic Advisers, Inc. (2005-present). Previously, Mr. Rathgeber served as Executive Vice President and Chief Operating Officer for Fidelity Investments Institutional Services Company, Inc. (1998-2002). |
Bryan A. Mehrmann (45) |
| Year of Election or Appointment: 2005 Deputy Treasurer of Small Cap Growth. Mr. Mehrmann also serves as Deputy Treasurer of other Fidelity funds (2005-present) and is an employee of FMR. Previously, Mr. Mehrmann served as Vice President of Fidelity Investments Institutional Services Group (FIIS)/Fidelity Investments Institutional Operations Corporation, Inc. (FIIOC) Client Services (1998-2004). |
Kimberley H. Monasterio (42) |
| Year of Election or Appointment: 2004 Deputy Treasurer of Small Cap Growth. Ms. Monasterio also serves as Deputy Treasurer of other Fidelity funds (2004) and is an employee of FMR (2004). Before joining Fidelity Investments, Ms. Monasterio served as Treasurer (2000-2004) and Chief Financial Officer (2002-2004) of the Franklin Templeton Funds and Senior Vice President of Franklin Templeton Services, LLC (2000-2004). |
Kenneth B. Robins (36) |
| Year of Election or Appointment: 2005 Deputy Treasurer of Small Cap Growth. Mr. Robins also serves as Deputy Treasurer of other Fidelity funds (2005-present) and is an employee of FMR (2004-present). Before joining Fidelity Investments, Mr. Robins worked at KPMG LLP, where he was a partner in KPMG's department of professional practice (2002-2004) and a Senior Manager (1999-2000). In addition, Mr. Robins served as Assistant Chief Accountant, United States Securities and Exchange Commission (2000-2002). |
Robert G. Byrnes (39) |
| Year of Election or Appointment: 2005 Assistant Treasurer of Small Cap Growth. Mr. Byrnes also serves as Assistant Treasurer of other Fidelity funds (2005-present) and is an employee of FMR (2005-present). Previously, Mr. Byrnes served as Vice President of FPCMS (2003-2005). Before joining Fidelity Investments, Mr. Byrnes worked at Deutsche Asset Management where he served as Vice President of the Investment Operations Group (2000-2003). |
John H. Costello (59) |
| Year of Election or Appointment: 2004 Assistant Treasurer of Small Cap Growth. Mr. Costello also serves as Assistant Treasurer of other Fidelity funds and is an employee of FMR. |
Peter L. Lydecker (52) |
| Year of Election or Appointment: 2004 Assistant Treasurer of Small Cap Growth. Mr. Lydecker also serves as Assistant Treasurer of other Fidelity funds (2004) and is an employee of FMR. |
Mark Osterheld (51) |
| Year of Election or Appointment: 2004 Assistant Treasurer of Small Cap Growth. Mr. Osterheld also serves as Assistant Treasurer of other Fidelity funds (2002) and is an employee of FMR. |
Gary W. Ryan (47) |
| Year of Election or Appointment: 2005 Assistant Treasurer of Small Cap Growth. Mr. Ryan also serves as Assistant Treasurer of other Fidelity funds (2005-present) and is an employee of FMR (2005-present). Previously, Mr. Ryan served as Vice President of Fund Reporting in FPCMS (1999-2005). |
Salvatore Schiavone (40) |
| Year of Election or Appointment: 2005 Assistant Treasurer of Small Cap Growth. Mr. Schiavone also serves as Assistant Treasurer of other Fidelity funds (2005-present) and is an employee of FMR (2005-present). Before joining Fidelity Investments, Mr. Schiavone worked at Deutsche Asset Management, where he most recently served as Assistant Treasurer (2003-2005) of the Scudder Funds and Vice President and Head of Fund Reporting (1996-2003). |
Annual Report
Distributions
The Board of Trustees of Advisor Small Cap Growth Fund voted to pay on September 11, 2006, to shareholders of record at the opening of business on September 08, 2006, a distribution of $0.07 per share derived from capital gains realized from sales of portfolio securities.
The fund hereby designates as a capital gain dividend with respect to the taxable year ended July 31, 2006, $1,027,501, or, if subsequently determined to be different, the net capital gain of such year.
The fund designates 9%, and 72% of the dividends distributed in September and December, respectively during the fiscal year as qualifying for the dividends-received deduction for corporate shareholders.
The fund designates 12%, and 79% of the dividends distributed in September and December, respectively during the fiscal year as amounts which may be taken into account as a dividend for the purposes of the maximum rate under section 1(h)(11) of the Internal Revenue Code.
The fund will notify shareholders in January 2007 of amounts for use in preparing 2006 income tax returns.
Annual Report
Proxy Voting Results
A special meeting of the funds' shareholders was held on May 17, 2006. The results of votes taken among shareholders on the proposal before them are reported below. Each vote reported represents one dollar of net asset value held on the record date for the meeting.
PROPOSAL 1 |
To elect a Board of Trustees. A |
| # of
Votes | % of
Votes |
Dennis J. Dirks |
Affirmative | 43,119,905,166.54 | 95.455 |
Withheld | 2,053,001,967.67 | 4.545 |
TOTAL | 45,172,907,134.21 | 100.000 |
Albert R. Gamper, Jr. |
Affirmative | 43,068,780,128.62 | 95.342 |
Withheld | 2,104,127,005.59 | 4.658 |
TOTAL | 45,172,907,134.21 | 100.000 |
Robert M. Gates |
Affirmative | 43,032,117,662.60 | 95.261 |
Withheld | 2,140,789,471.61 | 4.739 |
TOTAL | 45,172,907,134.21 | 100.000 |
George H. Heilmeier |
Affirmative | 43,023,368,882.30 | 95.242 |
Withheld | 2,149,538,251.91 | 4.758 |
TOTAL | 45,172,907,134.21 | 100.000 |
Edward C. Johnson 3d |
Affirmative | 42,881,915,819.70 | 94.928 |
Withheld | 2,290,991,314.51 | 5.072 |
TOTAL | 45,172,907,134.21 | 100.000 |
Stephen P. Jonas |
Affirmative | 43,081,912,066.37 | 95.371 |
Withheld | 2,090,995,067.84 | 4.629 |
TOTAL | 45,172,907,134.21 | 100.000 |
James H. KeyesB |
Affirmative | 43,049,050,093.79 | 95.298 |
Withheld | 2,123,857,040.42 | 4.702 |
TOTAL | 45,172,907,134.21 | 100.000 |
Marie L. Knowles |
Affirmative | 43,090,434,696.02 | 95.390 |
Withheld | 2,082,472,438.19 | 4.610 |
TOTAL | 45,172,907,134.21 | 100.000 |
| # of
Votes | % of
Votes |
Ned C. Lautenbach |
Affirmative | 43,082,185,255.05 | 95.372 |
Withheld | 2,090,721,879.16 | 4.628 |
TOTAL | 45,172,907,134.21 | 100.000 |
William O. McCoy |
Affirmative | 42,960,162,066.32 | 95.102 |
Withheld | 2,212,745,067.89 | 4.898 |
TOTAL | 45,172,907,134.21 | 100.000 |
Robert L. Reynolds |
Affirmative | 43,087,560,419.66 | 95.384 |
Withheld | 2,085,346,714.55 | 4.616 |
TOTAL | 45,172,907,134.21 | 100.000 |
Cornelia M. Small |
Affirmative | 43,092,070,014.53 | 95.394 |
Withheld | 2,080,837,119.68 | 4.606 |
TOTAL | 45,172,907,134.21 | 100.000 |
William S. Stavropoulos |
Affirmative | 43,002,032,676.43 | 95.194 |
Withheld | 2,170,874,457.78 | 4.806 |
TOTAL | 45,172,907,134.21 | 100.000 |
Kenneth L. Wolfe |
Affirmative | 43,047,241,852.81 | 95.294 |
Withheld | 2,125,665,281.40 | 4.706 |
TOTAL | 45,172,907,134.21 | 100.000 |
A Denotes trust-wide proposal and voting results. B Effective on or about January 1, 2007. |
Annual Report
Board Approval of Investment Advisory Contracts and Management Fees
Fidelity Small Cap Growth Fund
Each year, typically in July, the Board of Trustees, including the Independent Trustees (together, the Board), votes on the renewal of the management contract and sub-advisory agreements (together, the Advisory Contracts) for the fund. The Board, assisted by the advice of fund counsel and Independent Trustees' counsel, requests and considers a broad range of information throughout the year.
The Board meets regularly each month except August and takes into account throughout the year matters bearing on Advisory Contracts. The Board, acting directly and through its separate committees, considers at each of its meetings factors that are relevant to the annual renewal of the fund's Advisory Contracts, including the services and support provided to the fund and its shareholders. At the time of the renewal, the Board had 12 standing committees, each composed of Independent Trustees with varying backgrounds, to which the Board has assigned specific subject matter responsibilities in order to enhance effective decision-making by the Board. Each committee has adopted a written charter outlining the structure and purposes of the committee. One such committee, the Equity Contract Committee, meets periodically as needed throughout the year to consider matters specifically related to the annual renewal of Advisory Contracts. The committee requests and receives information on, and makes recommendations to the Independent Trustees concerning, the approval and annual review of the Advisory Contracts.
At its July 2006 meeting, the Board of Trustees, including the Independent Trustees, unanimously determined to renew the Advisory Contracts for the fund. In reaching its determination, the Board considered all factors it believed relevant, including (i) the nature, extent, and quality of the services to be provided to the fund and its shareholders (including the investment performance of the fund); (ii) the competitiveness of the management fee and total expenses of the fund; (iii) the total costs of the services to be provided by and the profits to be realized by the investment adviser and its affiliates from the relationship with the fund; (iv) the extent to which economies of scale would be realized as the fund grows; and (v) whether fee levels reflect these economies of scale, if any, for the benefit of fund shareholders.
In determining whether to renew the Advisory Contracts for the fund, the Board ultimately reached a determination, with the assistance of fund counsel and Independent Trustees' counsel, that the renewal of the Advisory Contracts and the compensation to be received by Fidelity under the management contract is consistent with Fidelity's fiduciary duty under applicable law. In addition to evaluating the specific factors noted above, the Board, in reaching its determination, is aware that shareholders in the fund have a broad range of investment choices available to them, including a wide choice among mutual funds offered by competitors to Fidelity, and that the fund's shareholders, with the opportunity to review and weigh the disclosure provided by the fund in its prospectus and other public disclosures, have chosen to invest in this fund, managed by Fidelity.
Annual Report
Nature, Extent, and Quality of Services Provided. The Board considered staffing within the investment adviser, FMR, and the sub-advisers (together, the Investment Advisers), including the background of the fund's portfolio manager and the fund's investment objective and discipline. The Independent Trustees also had discussions with senior management of Fidelity's investment operations and investment groups. The Board considered the structure of the portfolio manager compensation program and whether this structure provides appropriate incentives.
Resources Dedicated to Investment Management and Support Services. The Board reviewed the size, education, and experience of the Investment Advisers' investment staff, their use of technology, and the Investment Advisers' approach to recruiting, training, and retaining portfolio managers and other research, advisory, and management personnel. The Board considered Fidelity's extensive global research capabilities that enable the Investment Advisers to aggregate data from various sources in an effort to produce positive investment results. The Board noted that Fidelity's analysts have access to a variety of technological tools that enable them to perform both fundamental and quantitative analysis and to specialize in various disciplines. The Board also considered that Fidelity's portfolio managers and analysts have access to daily portfolio attribution that allows for monitoring of a fund's portfolio, as well as an electronic communication system that provides immediate real-time access to research concerning issuers and credit enhancers.
Shareholder and Administrative Services. The Board considered (i) the nature, extent, quality, and cost of administrative, distribution, and shareholder services performed by the Investment Advisers and their affiliates under the Advisory Contracts and under separate agreements covering transfer agency, pricing and bookkeeping, and securities lending services for the fund; (ii) the nature and extent of the Investment Advisers' supervision of third party service providers, principally custodians and subcustodians; and (iii) the resources devoted to, and the record of compliance with, the fund's compliance policies and procedures. The Board reviewed the allocation of fund brokerage, including allocations to brokers affiliated with the Investment Advisers, the use of brokerage commissions to pay fund expenses, and the use of "soft" commission dollars to pay for research services. The Board also considered that Fidelity voluntarily pays for market data out of its own resources.
The Board noted that the growth of fund assets across the complex allows Fidelity to reinvest in the development of services designed to enhance the value or convenience of the Fidelity funds as investment vehicles. These services include 24-hour access to account information and market information through phone representatives and over the Internet, and investor education materials and asset allocation tools.
Annual Report
Board Approval of Investment Advisory Contracts and
Management Fees - continued
Investment in a Large Fund Family. The Board considered the benefits to shareholders of investing in a Fidelity fund, including the benefits of investing in a fund that is part of a large family of funds offering a variety of investment disciplines and providing for a large variety of mutual fund investor services. For example, fund shareholders are offered the privilege of exchanging shares of the fund for shares of other Fidelity funds, as set forth in the fund's prospectus, without paying an additional sales charge. The Board noted that, since the last Advisory Contract renewals in July 2005, Fidelity has taken a number of actions that benefited particular funds, including (i) dedicating additional resources to investment research and to restructure the investment research teams; (ii) voluntarily entering into contractual arrangements with certain brokers pursuant to which Fidelity pays for research products and services separately out of its own resources, rather than bundling with fund commissions; (iii) launching the Fidelity Advantage Class of its five Spartan stock index funds and three Spartan bond index funds, which is a lower-fee class available to shareholders with higher account balances; (iv) contractually agreeing to impose expense limitations on Fidelity U.S. Bond Index Fund and reducing the fund's initial investment minimum; and (v) offering shareholders of each of the Fidelity Institutional Money Market Funds the privilege of exchanging shares of the fund for shares of other Fidelity funds.
Investment Performance and Compliance. The Board considered whether the fund has operated within its investment objective, as well as its record of compliance with its investment restrictions. It also reviewed the fund's absolute investment performance for each class, as well as the fund's relative investment performance for each class measured against (i) a broad-based securities market index, and (ii) a peer group of mutual funds deemed appropriate by the Board. Because the fund had been in existence less than three calendar years, the following chart considered by the Board shows, for the one-year period ended December 31, 2005, the total returns of Class C and Fidelity Small Cap Growth (retail class), the total return of a broad-based securities market index ("benchmark"), and a range of total returns of a peer group of mutual funds identified by Lipper Inc. as having an investment objective similar to that of the fund. The returns of Class C and Fidelity Small Cap Growth (retail class) represent the performance of classes with the highest and lowest 12b-1 fees, respectively (not necessarily with the highest and lowest total expenses). The box within the chart shows the 25th percentile return (bottom of box) and the 75th percentile return (top of box) of the Lipper peer group. Returns shown above the box are in the first quartile and returns shown below the box are in the fourth quartile. The percentage beaten numbers noted below the chart correspond to the percentile box and represent the percentage of funds in the Lipper peer group whose performance was equal to or lower than that of the class indicated.
Annual Report
Fidelity Small Cap Growth Fund

The Board reviewed the fund's relative investment performance against its Lipper peer group and stated that the performance of Fidelity Small Cap Growth (retail class) was in the first quartile for the period shown. The Board also stated that the relative investment performance of Fidelity Small Cap Growth (retail class) compared favorably to its benchmark for the period shown. The Board considered that the variations in performance among the fund's classes reflect the variations in class expenses, which result in lower performance for higher expense classes. The Board stated that it is difficult to evaluate in any comprehensive fashion the performance of the fund, in light of its relatively recent launch. The Board also reviewed the fund's relative investment performance against a peer group defined by Morningstar.
The Board also considered that the fund's management fee is subject to upward or downward adjustment depending upon whether, and to what extent, the fund's investment performance for the performance period exceeds, or is exceeded by, the record (over the same period) of a Board-approved performance adjustment index. The Board realizes that the performance adjustment provides FMR with a strong economic incentive to seek to achieve superior performance for the fund's shareholders and helps to more closely align the interests of FMR and the fund's shareholders.
The Board considered that FMR has taken steps to refocus and strengthen equity research, equity portfolio management, and compliance. The Board noted with favor FMR's reorganization of its senior management team in 2005 and FMR's dedication of additional resources to investment research, and participated in the process that led to those changes.
Annual Report
Board Approval of Investment Advisory Contracts and
Management Fees - continued
Based on its review, and giving particular weight to the nature and quality of the resources dedicated by the Investment Advisers to maintain and improve relative performance, the Board concluded that the nature, extent, and quality of the services provided to the fund will benefit the fund's shareholders, particularly in light of the Board's view that the fund's shareholders benefit from investing in a fund that is part of a large family of funds offering a variety of investment disciplines and services.
Competitiveness of Management Fee and Total Fund Expenses. The Board considered the fund's management fee and total expenses compared to "mapped groups" of competitive funds and classes. Fidelity creates "mapped groups" by combining similar Lipper investment objective categories that have comparable management fee characteristics. Combining Lipper investment objective categories aids the Board's management fee and total expense comparisons by broadening the competitive group used for comparison and by reducing the number of universes to which various Fidelity funds are compared.
The Board considered two proprietary management fee comparisons for the 12-month (or shorter) periods shown in the chart below. The group of Lipper funds used by the Board for management fee comparisons is referred to below as the "Total Mapped Group" and, for the reasons explained above, is broader than the Lipper peer group used by the Board for performance comparisons. The Total Mapped Group comparison focuses on a fund's standing relative to the total universe of comparable funds available to investors, in terms of gross management fees before expense reimbursements or caps, and without giving effect to the fund's performance adjustment. "TMG %" represents the percentage of funds in the Total Mapped Group that had management fees that were lower than the fund's. For example, a TMG % of 13% means that 87% of the funds in the Total Mapped Group had higher management fees than the fund. The "Asset-Size Peer Group" (ASPG) comparison focuses on a fund's standing relative to non-Fidelity funds similar in size to the fund within the Total Mapped Group. The ASPG represents at least 15% of the funds in the Total Mapped Group with comparable asset size and management fee characteristics, subject to a minimum of 50 funds (or all funds in the Total Mapped Group if fewer than 50). Additional information, such as the ASPG quartile in which the fund's management fee ranked and the impact of the fund's performance adjustment, is also included in the chart and considered by the Board.
Annual Report
Fidelity Small Cap Growth Fund

The Board noted that the fund's management fee ranked below the median of its Total Mapped Group and below the median of its ASPG for 2005. The Board also noted the effect of the fund's positive performance adjustment on the fund's management fee ranking.
Based on its review, the Board concluded that the fund's management fee was fair and reasonable in light of the services that the fund receives and the other factors considered.
In its review of each class's total expenses, the Board considered the fund's management fee as well as other fund or class expenses, as applicable, such as transfer agent fees, pricing and bookkeeping fees, fund-paid 12b-1 fees, and custodial, legal, and audit fees. The Board also noted the effects of any waivers and reimbursements on fees and expenses, as well as the fund's positive performance adjustment. As part of its review, the Board also considered current and historical total expenses of each class of the fund compared to competitive fund median expenses. Each class of the fund is compared to those funds and classes in the Total Mapped Group (used by the Board for management fee comparisons) that have a similar sales load structure.
The Board noted that the total expenses of each of Class A, Institutional Class, and Fidelity Small Cap Growth (retail class) ranked below its competitive median for 2005, and the total expenses of each of Class B, Class C, and Class T ranked above its competitive median for 2005. The Board considered that Class B and Class C were above median because of relatively high transfer agent fees resulting from small average account sizes. The Board noted that the fund offers multiple classes, each of which has a different sales load and 12b-1 fee structure, and that the multiple structures are intended to offer a range of pricing options for the intermediary market. The Board also noted that the total expenses of the classes vary primarily by the level of their 12b-1 fees, although differences in transfer agent fees may also cause expenses to vary from class to class.
Annual Report
Board Approval of Investment Advisory Contracts and
Management Fees - continued
In its review of total expenses, the Board also considered Fidelity fee structures and other information on clients that FMR and its affiliates service in other competitive markets, such as other mutual funds advised or subadvised by FMR or its affiliates, pension plan clients, and other institutional clients.
Based on its review, the Board concluded that the total expenses of each class of the fund were reasonable, although in some cases above the median of the universe presented for comparison, in light of the services that the fund and its shareholders receive and the other factors considered.
Costs of the Services and Profitability. The Board considered the revenues earned and the expenses incurred by Fidelity in conducting the business of developing, marketing, distributing, managing, administering and servicing the fund and its shareholders. The Board also considered the level of Fidelity's profits in respect of all the Fidelity funds.
On an annual basis, FMR presents to the Board Fidelity's profitability for the fund. Fidelity calculates the profitability for each fund, as well as aggregate profitability for groups of Fidelity funds and all Fidelity funds, using a series of detailed revenue and cost allocation methodologies which originate with the audited books and records of Fidelity. The Audit Committee of the Board reviews any significant changes from the prior year's methodologies.
PricewaterhouseCoopers LLP (PwC), independent registered accounting firm and auditor to Fidelity and certain Fidelity funds, has been engaged annually by the Board as part of the Board's assessment of the results of Fidelity's profitability analysis. PwC's engagement includes the review and assessment of Fidelity's methodologies used in determining the revenues and expenses attributable to Fidelity's mutual fund business, and completion of agreed-upon procedures surrounding the mathematical accuracy of fund profitability and its conformity to allocation methodologies. After considering PwC's reports issued under the engagement and information provided by Fidelity, the Board believes that while other allocation methods may also be reasonable, Fidelity's profitability methodologies are reasonable in all material respects.
The Board has also reviewed Fidelity's non-fund businesses and any fall-out benefits related to the mutual fund business as well as cases where Fidelity's affiliates may benefit from or be related to the fund's business.
Annual Report
The Board considered the costs of the services provided by and the profits realized by Fidelity in connection with the operation of the fund and determined that the amount of profit is a fair entrepreneurial profit for the management of the fund.
Economies of Scale. The Board considered whether there have been economies of scale in respect of the management of the Fidelity funds, whether the Fidelity funds (including the fund) have appropriately benefited from any such economies of scale, and whether there is potential for realization of any further economies of scale. The Board considered the extent to which the fund will benefit from economies of scale through increased services to the fund, through waivers or reimbursements, or through fee or expense reductions, including reductions that occur through operation of the transfer agent agreement. The transfer agent fee varies in part based on the number of accounts in the fund. If the number of accounts decreases or the average account size increases, the overall transfer agent fee rate decreases.
The Board recognized that the fund's management contract incorporates a "group fee" structure, which provides for lower fee rates as total fund assets under FMR's management increase, and for higher fee rates as total fund assets under FMR's management decrease. The Board considered that the group fee is designed to deliver the benefits of economies of scale to fund shareholders when total fund assets increase, even if assets of any particular fund are unchanged or have declined, because some portion of Fidelity's costs are attributable to services provided to all Fidelity funds, and all funds benefit if those costs can be allocated among more assets. The Board concluded that, given the group fee structure, fund shareholders will achieve a certain level of economies of scale as assets under FMR's management increase at the fund complex level, regardless of whether Fidelity achieves any such economies of scale.
The Board further concluded that any potential economies of scale are being shared between fund shareholders and Fidelity in an appropriate manner.
Additional Information Requested by the Board. In order to develop fully the factual basis for consideration of the Advisory Contracts, the Board requested additional information on several topics, including (i) Fidelity's fund profitability methodology and profitability trends within certain funds; (ii) portfolio manager compensation; (iii) the extent to which any economies of scale exist and are shared between the funds and Fidelity; (iv) the total expenses of certain funds and classes relative to competitors, including the extent to which the expenses of certain funds have been or could be capped; (v) fund performance trends; and (vi) Fidelity's fee structures, including use of performance fees.
Based on its evaluation of all of the conclusions noted above, and after considering all material factors, the Board ultimately concluded that the advisory fee structures are fair and reasonable, and that the fund's Advisory Contracts should be renewed.
Annual Report
Managing Your Investments
Fidelity offers several ways to conveniently manage your personal investments via your telephone or PC. You can access your account information, conduct trades and research your investments 24 hours a day.
By Phone
Fidelity Automated Service Telephone provides a single toll-free number to access account balances, positions, quotes and trading. It's easy to navigate the service, and on your first call, the system will help you create a personal identification number (PIN) for security.
(phone_graphic)
Fidelity Automated
Service Telephone (FAST®)
1-800-544-5555
Press
1 For mutual fund and brokerage trading.
2 For quotes.*
3 For account balances and holdings.
4 To review orders and mutual
fund activity.
5 To change your PIN.
*0 To speak to a Fidelity representative.
By PC
Fidelity's web site on the Internet provides a wide range of information, including daily financial news, fund performance, interactive planning tools and news about Fidelity products and services.
(computer_graphic)
Fidelity's Web Site
www.fidelity.com
* When you call the quotes line, please remember that a fund's yield and return will vary and, except for money market funds, share price will also vary. This means that you may have a gain or loss when you sell your shares. There is no assurance that money market funds will be able to maintain a stable $1 share price; an investment in a money market fund is not insured or guaranteed by the U.S. government. Total returns are historical and include changes in share price, reinvestment of dividends and capital gains, and the effects of any sales charges.
Annual Report
To Write Fidelity
We'll give your correspondence immediate attention and send you written confirmation upon completion of your request.
(letter_graphic)
Making Changes
To Your Account
(such as changing name, address, bank, etc.)
Fidelity Investments
P.O. Box 770001
Cincinnati, OH 45277-0002
(letter_graphic)
For Non-Retirement
Accounts
Buying shares
Fidelity Investments
P.O. Box 770001
Cincinnati, OH 45277-0003
Overnight Express
Fidelity Investments
Attn: Distribution Services
100 Crosby Parkway - KC1H
Covington, KY 41015
Selling shares
Fidelity Investments
P.O. Box 770001
Cincinnati, OH 45277-0035
Overnight Express
Fidelity Investments
Attn: Distribution Services
100 Crosby Parkway - KC1H
Covington, KY 41015
General Correspondence
Fidelity Investments
P.O. Box 500
Merrimack, NH 03054-0500
(letter_graphic)
For Retirement
Accounts
Buying shares
Fidelity Investments
P.O. Box 770001
Cincinnati, OH 45277-0003
Selling shares
Fidelity Investments
P.O. Box 770001
Cincinnati, OH 45277-0035
Overnight Express
Fidelity Investments
Attn: Distribution Services
100 Crosby Parkway - KC1H
Covington, KY 41015
General Correspondence
Fidelity Investments
P.O. Box 500
Merrimack, NH 03054-0500
Annual Report
To Visit Fidelity
For directions and hours,
please call 1-800-544-9797.
Arizona
7001 West Ray Road
Chandler, AZ
15445 N. Scottsdale Road
Scottsdale, AZ
California
815 East Birch Street
Brea, CA
1411 Chapin Avenue
Burlingame, CA
851 East Hamilton Avenue
Campbell, CA
19200 Von Karman Avenue
Irvine, CA
601 Larkspur Landing Circle
Larkspur, CA
10100 Santa Monica Blvd.
Los Angeles, CA
27101 Puerta Real
Mission Viejo, CA
73-575 El Paseo
Palm Desert, CA
251 University Avenue
Palo Alto, CA
123 South Lake Avenue
Pasadena, CA
16995 Bernardo Ctr. Drive
Rancho Bernardo, CA
1220 Roseville Parkway
Roseville, CA
1740 Arden Way
Sacramento, CA
7676 Hazard Center Drive
San Diego, CA
11943 El Camino Real
San Diego, CA
8 Montgomery Street
San Francisco, CA
3793 State Street
Santa Barbara, CA
1200 Wilshire Boulevard
Santa Monica, CA
21701 Hawthorne Boulevard
Torrance, CA
2001 North Main Street
Walnut Creek, CA
6300 Canoga Avenue
Woodland Hills, CA
Colorado
1625 Broadway
Denver, CO
9185 Westview Road
Lone Tree, CO
Connecticut
48 West Putnam Avenue
Greenwich, CT
265 Church Street
New Haven, CT
300 Atlantic Street
Stamford, CT
29 South Main Street
West Hartford, CT
Delaware
400 Delaware Avenue
Wilmington, DE
Florida
4400 N. Federal Highway
Boca Raton, FL
121 Alhambra Plaza
Coral Gables, FL
2948 N. Federal Highway
Ft. Lauderdale, FL
4671 Town Center Parkway
Jacksonville, FL
1907 West State Road 434
Longwood, FL
8880 Tamiami Trail, North
Naples, FL
3501 PGA Boulevard
Palm Beach Gardens, FL
3550 Tamiami Trail, South
Sarasota, FL
1502 N. Westshore Blvd.
Tampa, FL
2465 State Road 7
Wellington, FL
Georgia
3445 Peachtree Road, N.E.
Atlanta, GA
1000 Abernathy Road
Atlanta, GA
Illinois
One North LaSalle Street
Chicago, IL
875 North Michigan Ave.
Chicago, IL
1415 West 22nd Street
Oak Brook, IL
1572 East Golf Road
Schaumburg, IL
3232 Lake Avenue
Wilmette, IL
Indiana
4729 East 82nd Street
Indianapolis, IN
Kansas
5400 College Boulevard
Overland Park, KS
Maine
Three Canal Plaza
Portland, ME
Maryland
7315 Wisconsin Avenue
Bethesda, MD
One W. Pennsylvania Ave.
Towson, MD
Massachusetts
801 Boylston Street
Boston, MA
155 Congress Street
Boston, MA
300 Granite Street
Braintree, MA
44 Mall Road
Burlington, MA
238 Main Street
Cambridge, MA
405 Cochituate Road
Framingham, MA
416 Belmont Street
Worcester, MA
Annual Report
Michigan
500 E. Eisenhower Pkwy.
Ann Arbor, MI
280 Old N. Woodward Ave.
Birmingham, MI
43420 Grand River Avenue
Novi, MI
29155 Northwestern Hwy.
Southfield, MI
Minnesota
7600 France Avenue South
Edina, MN
Missouri
1524 South Lindbergh Blvd.
St. Louis, MO
Nevada
2225 Village Walk Drive
Henderson, NV
New Jersey
150 Essex Street
Millburn, NJ
56 South Street
Morristown, NJ
396 Route 17, North
Paramus, NJ
3518 Route 1 North
Princeton, NJ
530 Broad Street
Shrewsbury, NJ
New York
1055 Franklin Avenue
Garden City, NY
37 West Jericho Turnpike
Huntington Station, NY
1271 Avenue of the Americas
New York, NY
980 Madison Avenue
New York, NY
61 Broadway
New York, NY
350 Park Avenue
New York, NY
200 Fifth Avenue
New York, NY
733 Third Avenue
New York, NY
11 Penn Plaza
New York, NY
2070 Broadway
New York, NY
1075 Northern Blvd.
Roslyn, NY
799 Central Park Avenue
Scarsdale, NY
North Carolina
4611 Sharon Road
Charlotte, NC
7011 Fayetteville Road
Durham, NC
Ohio
3805 Edwards Road
Cincinnati, OH
1324 Polaris Parkway
Columbus, OH
28699 Chagrin Boulevard
Woodmere Village, OH
Oregon
7493 SW Bridgeport Road
Tigard, OR
Pennsylvania
600 West DeKalb Pike
King of Prussia, PA
1735 Market Street
Philadelphia, PA
12001 Perry Highway
Wexford, PA
Rhode Island
47 Providence Place
Providence, RI
Tennessee
6150 Poplar Avenue
Memphis, TN
Texas
10000 Research Boulevard
Austin, TX
4001 Northwest Parkway
Dallas, TX
12532 Memorial Drive
Houston, TX
2701 Drexel Drive
Houston, TX
6560 Fannin Street
Houston, TX
6500 N. MacArthur Blvd.
Irving, TX
6005 West Park Boulevard
Plano, TX
14100 San Pedro
San Antonio, TX
1576 East Southlake Blvd.
Southlake, TX
19740 IH 45 North
Spring, TX
Utah
279 West South Temple
Salt Lake City, UT
Virginia
1861 International Drive
McLean, VA
Washington
411 108th Avenue, N.E.
Bellevue, WA
1518 6th Avenue
Seattle, WA
Washington, DC
1900 K Street, N.W.
Washington, DC
Wisconsin
595 North Barker Road
Brookfield, WI
Fidelity Brokerage Services, Inc., 100 Summer St., Boston, MA 02110 Member NYSE/SIPC
Annual Report
Annual Report
Annual Report
Investment Adviser
Fidelity Management & Research Company
Boston, MA
Investment Sub-Advisers
FMR Co., Inc.
Fidelity Research & Analysis Company
(formerly Fidelity Management &
Research (Far East) Inc.)
Fidelity Management & Research
(U.K.) Inc.
Fidelity Investments Japan Limited
Fidelity International Investment
Advisors
Fidelity International Investment
Advisors (U.K.) Limited
General Distributor
Fidelity Distributors Corporation
Boston, MA
Transfer and Service Agent
Fidelity Service Company, Inc.
Boston, MA
Custodian
Citibank, N.A.
New York, NY
The Fidelity Telephone Connection
Mutual Fund 24-Hour Service
Exchanges/Redemptions
and Account Assistance 1-800-544-6666
Product Information 1-800-544-6666
Retirement Accounts 1-800-544-4774
(8 a.m. - 9 p.m.)
TDD Service 1-800-544-0118
for the deaf and hearing impaired
(9 a.m. - 9 p.m. Eastern time)
Fidelity Automated Service
Telephone (FAST®) (automated graphic) 1-800-544-5555
(automated graphic) Automated line for quickest service
SCP-UANN-0906
1.803694.101
(Fidelity Investment logo)(registered trademark)
Corporate Headquarters
82 Devonshire St., Boston, MA 02109
www.fidelity.com
(Fidelity Investment logo)(registered trademark)
FidelityAdvisor
Small Cap Growth
Fund - Class A, Class T,
Class B and Class C
Annual Report
July 31, 2006
Class A, Class T, Class B,
and Class C are classes
of Fidelity® Small Cap
Growth Fund
(2_fidelity_logos) (Registered_Trademark)
Contents
Chairman's Message | <Click Here> | Ned Johnson's message to shareholders. |
Performance | <Click Here> | How the fund has done over time. |
Management's Discussion | <Click Here> | The manager's review of fund performance, strategy and outlook |
Shareholder Expense Example | <Click Here> | An example of shareholder expenses. |
Investment Changes | <Click Here> | A summary of the fund's investments. |
Investments | <Click Here> | A complete list of the fund's investments with their market values. |
Financial Statements | <Click Here> | Statements of assets and liabilities, operations, and changes in net assets,
as well as financial highlights. |
Notes | <Click Here> | Notes to the financial statements. |
Report of Independent Registered Public Accounting Firm | <Click Here> | |
Trustees and Officers | <Click Here> | |
Distributions | <Click Here> | |
Proxy Voting Results | <Click Here> | |
Board Approval of Investment Advisory Contracts and Management Fees | <Click Here> | |
To view a fund's proxy voting guidelines and proxy voting record for the 12-month period ended June 30, visit www.fidelity.com/proxyvotingresults or visit the Securities and Exchange Commission's (SEC) web site at www.sec.gov. You may also call 1-877-208-0098 to request a free copy of the proxy voting guidelines.
Standard & Poor's, S&P and S&P 500 are registered service marks of The McGraw-Hill Companies, Inc. and have been licensed for use by Fidelity Distributors Corporation.
Other third party marks appearing herein are the property of their respective owners.
All other marks appearing herein are registered or unregistered trademarks or service marks of FMR Corp. or an affiliated company.
Annual Report
This report and the financial statements contained herein are submitted for the general information of the shareholders of the fund. This report is not authorized for distribution to prospective investors in the fund unless preceded or accompanied by an effective prospectus.
A fund files its complete schedule of portfolio holdings with the SEC for the first and third quarters of each fiscal year on Form N-Q. Forms N-Q are available on the SEC's web site at http://www.sec.gov. A fund's Forms N-Q may be reviewed and copied at the SEC's Public Reference Room in Washington, DC. Information regarding the operation of the SEC's Public Reference Room may be obtained by calling 1-800-SEC-0330. For a complete list of a fund's portfolio holdings, view the most recent quarterly holdings report, semiannual report, or annual report on Fidelity's web site at http://www.advisor.fidelity.com.
NOT FDIC INSURED · MAY LOSE VALUE · NO BANK GUARANTEE
Neither the fund nor Fidelity Distributors Corporation is a bank.
Annual Report
Chairman's Message
(photo_of_Edward_C_Johnson_3d)
Dear Shareholder:
Although many securities markets made gains in early 2006, inflation concerns led to mixed results through the year's mid-point. Financial markets are always unpredictable. There are, however, a number of time-tested principles that can put the historical odds in your favor.
One of the basic tenets is to invest for the long term. Over time, riding out the markets' inevitable ups and downs has proven much more effective than selling into panic or chasing the hottest trend. Even missing only a few of the markets' best days can significantly diminish investor returns. Patience also affords the benefits of compounding - of earning interest on additional income or reinvested dividends and capital gains. There are tax advantages and cost benefits to consider as well. The more you sell, the more taxes you pay, and the more you trade, the higher the costs. While staying the course doesn't eliminate risk, it can considerably lessen the effect of short-term declines.
You can further manage your investing risk through diversification. And today, more than ever, geographic diversification should be taken into account. Studies indicate that asset allocation is the single most important determinant of a portfolio's long-term success. The right mix of stocks, bonds and cash - aligned to your particular risk tolerance and investment objective - is very important. Age-appropriate rebalancing is also an essential aspect of asset allocation. For younger investors, an emphasis on equities - which historically have been the best performing asset class over time - is encouraged. As investors near their specific goal, such as retirement or sending a child to college, consideration may be given to replacing volatile assets (e.g. common stocks) with more-stable fixed investments (bonds or savings plans).
A third investment principle - investing regularly - can help lower the average cost of your purchases. Investing a certain amount of money each month or quarter helps ensure you won't pay for all your shares at market highs. This strategy - known as dollar cost averaging - also reduces unconstructive "emotion" from investing, helping shareholders avoid selling weak performers just prior to an upswing, or chasing a hot performer just before a correction.
We invite you to contact us via the Internet, through our Investor Centers or over the phone. It is our privilege to provide you the information you need to make the investments that are right for you.
Sincerely,
/s/Edward C. Johnson 3d
Edward C. Johnson 3d
Annual Report
Fidelity Advisor Small Cap Growth Fund - Class A, T, B, and C
Performance: The Bottom Line
Average annual total return reflects the change in the value of an investment, assuming reinvestment of the class' dividend income and capital gains (the profits earned upon the sale of securities that have grown in value) and assuming a constant rate of performance each year. The $10,000 table and the fund's returns do not reflect the deduction of taxes that a shareholder would pay on fund distributions or the redemption of fund shares. During periods of reimbursement by Fidelity, a fund's total return will be greater than it would be had the reimbursement not occurred. How a fund did yesterday is no guarantee of how it will do tomorrow.
Average Annual Total Returns
Periods ended July 31, 2006 | Past 1
year | Life of
FundA |
Class A (incl. 5.75% sales charge) | -5.09% | 12.59% |
Class T (incl. 3.50% sales charge) | -3.03% | 13.88% |
Class B (incl. contingent deferred sales charge) B | -4.99% | 13.51% |
Class C (incl. contingent deferred sales charge) C | -1.07% | 15.60% |
A From November 3, 2004.
B Class B shares' contingent deferred sales charges included in the past one year and life of fund total return figures are 5% and 4%, respectively.
C Class C shares' contingent deferred sales charges included in the past one year and life of fund total return figures are 1% and 0%, respectively.
Annual Report
Performance - continued
$10,000 Over Life of Fund
Let's say hypothetically that $10,000 was invested in Fidelity Advisor Small Cap Growth Fund - Class T on November 3, 2004, when the fund started, and the current 3.50% sales charge was paid. The chart shows how the value of your investment would have changed, and also shows how the Russell 2000® Growth Index performed over the same period.

Annual Report
Management's Discussion of Fund Performance
Comments from Lionel Harris, Portfolio Manager of Fidelity Advisor Small Cap Growth Fund
As measured by the Dow Jones Wilshire 5000 Composite IndexSM - the broadest measure of U.S. equity market performance - stocks did well for most of the 12-month period ending July 31, 2006, before faltering. For the one-year time frame as a whole, the Dow Jones Wilshire benchmark rose 5.43%. That was nearly identical to the 5.38% gain of the Standard & Poor's 500SM Index, a broad market proxy that's a reflection of larger-cap stocks. Stocks were resilient early on, bouncing back quickly after Hurricanes Katrina and Rita caused energy prices to spike to record-high levels. Buoyed by strong corporate earnings and solid economic growth, the S&P 500® ran off six consecutive months of positive returns from November through April. However, stocks pulled back for most of the remainder of the period. A slowdown in economic expansion and consumer spending, reaccelerating energy prices and continued interest rate hikes by the Federal Reserve Board cooled equity performance. Among other widely quoted market yardsticks, the Dow Jones Industrial AverageSM returned 7.59%, while the NASDAQ Composite® Index dropped 3.47%.
During the past year, the fund's Class A, Class T, Class B and Class C shares returned 0.70%, 0.48%, -0.03% and -0.08%, respectively (excluding sales charges), versus 1.53% for the Russell 2000® Growth Index. The fund's overweighting in the lagging consumer discretionary sector, combined with disappointing stock selection there detracted. Many consumer-related companies struggled as the market worried about the impact of rising energy costs and interest rates. One example was mattress maker Tempur-Pedic International, which warned of lower fiscal 2005 earnings and was sold from the portfolio. The portfolio's biggest individual detractor was education company EVCI Career Colleges, which fell after a surprise regulatory investigation. At period end, EVCI was no longer in the portfolio. In consumer staples, the fund was hurt by American Italian Pasta, also no longer in the fund. This maker of store-brand pasta struggled with intensifying competition, an overleveraged balance sheet and revelations of accounting problems. On the positive side, stock picking in health care was a major contributor, led by Abaxis, a maker of portable blood analysis devices, which did well after handily beating Wall Street's sales and earnings expectations. Abaxis was sold from the fund before period end. Our best relative performer during the period was oil refiner Holly Corporation, which continued to earn strong profits in the extremely favorable environment for energy stocks. Given the fund's investments in foreign stocks, favorable currency movements also helped boost returns.
The views expressed above reflect those of the portfolio manager(s) only through the end of the period as stated on the cover of this report and do not necessarily represent the views of Fidelity or any other person in the Fidelity organization. Any such views are subject to change at any time based upon market or other conditions and Fidelity disclaims any responsibility to update such views. These views may not be relied on as investment advice and, because investment decisions for a Fidelity fund are based on numerous factors, may not be relied on as an indication of trading intent on behalf of any Fidelity fund.
Annual Report
Shareholder Expense Example
As a shareholder of the Fund, you incur two types of costs: (1) transaction costs, including sales charges (loads) on purchase payments or redemption proceeds, redemption fees, and (2) ongoing costs, including management fees, distribution and/or service (12b-1) fees and other Fund expenses. This Example is intended to help you understand your ongoing costs (in dollars) of investing in the Fund and to compare these costs with the ongoing costs of investing in other mutual funds.
The Example is based on an investment of $1,000 invested at the beginning of the period and held for the entire period (February 1, 2006 to July 31, 2006).
Actual Expenses
The first line of the accompanying table for each class of the Fund provides information about actual account values and actual expenses. You may use the information in this line, together with the amount you invested, to estimate the expenses that you paid over the period. Simply divide your account value by $1,000.00 (for example, an $8,600 account value divided by $1,000.00 = 8.6), then multiply the result by the number in the first line for a class of the Fund under the heading entitled "Expenses Paid During Period" to estimate the expenses you paid on your account during this period. A small balance maintenance fee of $12.00 that is charged once a year may apply for certain accounts with a value of less than $2,000. This fee is not included in the table below. If it was, the estimate of expenses you paid during the period would be higher, and your ending account value lower, by this amount.
Hypothetical Example for Comparison Purposes
The second line of the accompanying table for each class of the Fund provides information about hypothetical account values and hypothetical expenses based on a Class' actual expense ratio and an assumed rate of return of 5% per year before expenses, which is not the Class' actual return. The hypothetical account values and expenses may not be used to estimate the actual ending account balance or expenses you paid for the period. You may use this information to compare the ongoing costs of investing in the Fund and other funds. To do so, compare this 5% hypothetical example with the 5% hypothetical examples that appear in the shareholder reports of the other funds. A small balance maintenance fee of $12.00 that is charged once a year may apply for certain accounts with a value of less than $2,000. This fee is not included in the table below. If it was, the estimate of expenses you paid during the period would be higher, and your ending account value lower, by this amount.
Annual Report
Please note that the expenses shown in the table are meant to highlight your ongoing costs only and do not reflect any transaction costs. Therefore, the second line of the table is useful in comparing ongoing costs only, and will not help you determine the relative total costs of owning different funds. In addition, if these transactional costs were included, your costs would have been higher.
| Beginning
Account Value
February 1, 2006 | Ending
Account Value
July 31, 2006 | Expenses Paid
During Period *
February 1, 2006
to July 31, 2006 |
Class A | | | |
Actual | $ 1,000.00 | $ 926.60 | $ 6.69 |
HypotheticalA | $ 1,000.00 | $ 1,017.85 | $ 7.00 |
Class T | | | |
Actual | $ 1,000.00 | $ 925.80 | $ 7.88 |
HypotheticalA | $ 1,000.00 | $ 1,016.61 | $ 8.25 |
Class B | | | |
Actual | $ 1,000.00 | $ 922.70 | $ 10.25 |
HypotheticalA | $ 1,000.00 | $ 1,014.13 | $ 10.74 |
Class C | | | |
Actual | $ 1,000.00 | $ 922.70 | $ 10.25 |
HypotheticalA | $ 1,000.00 | $ 1,014.13 | $ 10.74 |
Small Cap Growth | | | |
Actual | $ 1,000.00 | $ 927.50 | $ 5.50 |
HypotheticalA | $ 1,000.00 | $ 1,019.09 | $ 5.76 |
Institutional Class | | | |
Actual | $ 1,000.00 | $ 927.50 | $ 5.21 |
HypotheticalA | $ 1,000.00 | $ 1,019.39 | $ 5.46 |
A 5% return per year before expenses
* Expenses are equal to each Class' annualized expense ratio (shown in the table below); multiplied by the average account value over the period, multiplied by 181/365 (to reflect the one-half year period).
| Annualized
Expense Ratio |
Class A | 1.40% |
Class T | 1.65% |
Class B | 2.15% |
Class C | 2.15% |
Small Cap Growth | 1.15% |
Institutional Class | 1.09% |
Annual Report
Investment Changes
Top Ten Stocks as of July 31, 2006 |
| % of fund's
net assets | % of fund's net assets
6 months ago |
Omnicare, Inc. | 1.8 | 2.1 |
DJO, Inc. | 1.8 | 1.0 |
Harris Corp. | 1.7 | 1.3 |
Per-Se Technologies, Inc. | 1.5 | 1.7 |
Holly Corp. | 1.4 | 1.5 |
j2 Global Communications, Inc. | 1.4 | 1.0 |
Range Resources Corp. | 1.3 | 1.3 |
Amphenol Corp. Class A | 1.3 | 0.0 |
WESCO International, Inc. | 1.3 | 1.3 |
Ness Technologies, Inc. | 1.2 | 0.0 |
| 14.7 | |
Top Five Market Sectors as of July 31, 2006 |
| % of fund's
net assets | % of fund's net assets
6 months ago |
Information Technology | 26.5 | 22.5 |
Industrials | 17.1 | 10.5 |
Health Care | 15.7 | 19.9 |
Energy | 12.7 | 11.1 |
Consumer Discretionary | 10.1 | 18.7 |
Asset Allocation (% of fund's net assets) |
As of July 31, 2006 * | As of January 31, 2006 ** |
| Stocks 94.4% | | | Stocks 97.3% | |
| Short-Term
Investments and
Net Other Assets 5.6% | | | Short-Term
Investments and
Net Other Assets 2.7% | |
* Foreign investments | 9.8% | | ** Foreign investments | 8.9% | |

Annual Report
Investments July 31, 2006
Showing Percentage of Net Assets
Common Stocks - 94.4% |
| Shares | | Value (Note 1) |
CONSUMER DISCRETIONARY - 10.1% |
Diversified Consumer Services - 1.5% |
DeVry, Inc. (a) | 125,000 | | $ 2,637,500 |
Sothebys Class A (ltd. vtg.) (a) | 163,400 | | 4,514,742 |
| | 7,152,242 |
Hotels, Restaurants & Leisure - 1.9% |
Boyd Gaming Corp. | 85,000 | | 2,850,900 |
Domino's Pizza, Inc. | 133,800 | | 3,042,612 |
Penn National Gaming, Inc. (a) | 100,300 | | 3,316,921 |
| | 9,210,433 |
Household Durables - 0.5% |
Lifetime Brands, Inc. (d) | 124,077 | | 2,522,485 |
Internet & Catalog Retail - 0.8% |
Coldwater Creek, Inc. (a) | 180,600 | | 3,599,358 |
Leisure Equipment & Products - 0.6% |
MarineMax, Inc. (a)(d) | 124,100 | | 2,612,305 |
Media - 2.0% |
Focus Media Holding Ltd. ADR | 62,600 | | 3,919,386 |
New Frontier Media, Inc. (a) | 479,632 | | 3,280,683 |
R.H. Donnelley Corp. | 47,000 | | 2,453,870 |
| | 9,653,939 |
Specialty Retail - 2.2% |
Eddie Bauer Holdings, Inc. (a) | 235,000 | | 3,055,000 |
The Children's Place Retail Stores, Inc. (a) | 84,600 | | 4,722,372 |
Zumiez, Inc. (a) | 81,000 | | 2,424,330 |
| | 10,201,702 |
Textiles, Apparel & Luxury Goods - 0.6% |
Carter's, Inc. (a) | 134,200 | | 2,926,902 |
TOTAL CONSUMER DISCRETIONARY | | 47,879,366 |
CONSUMER STAPLES - 0.9% |
Personal Products - 0.9% |
Herbalife Ltd. (a) | 112,000 | | 4,000,640 |
ENERGY - 12.7% |
Energy Equipment & Services - 4.9% |
Basic Energy Services, Inc. | 122,200 | | 3,299,400 |
Hornbeck Offshore Services, Inc. (a) | 121,500 | | 4,222,125 |
Hydril Co. (a) | 35,300 | | 2,445,231 |
NATCO Group, Inc. Class A (a) | 71,600 | | 2,720,800 |
Common Stocks - continued |
| Shares | | Value (Note 1) |
ENERGY - continued |
Energy Equipment & Services - continued |
Oil States International, Inc. (a) | 94,200 | | $ 3,029,472 |
Pason Systems, Inc. | 283,900 | | 4,076,860 |
Superior Energy Services, Inc. (a) | 98,800 | | 3,383,900 |
| | 23,177,788 |
Oil, Gas & Consumable Fuels - 7.8% |
Comstock Resources, Inc. (a) | 116,000 | | 3,412,720 |
Forest Oil Corp. (a) | 125,800 | | 4,215,558 |
Foundation Coal Holdings, Inc. | 117,500 | | 4,481,450 |
Holly Corp. | 131,400 | | 6,648,840 |
Mariner Energy, Inc. (a) | 307,910 | | 5,545,459 |
Plains Exploration & Production Co. (a) | 75,000 | | 3,297,000 |
Range Resources Corp. | 226,350 | | 6,362,699 |
Tesoro Corp. | 38,400 | | 2,872,320 |
| | 36,836,046 |
TOTAL ENERGY | | 60,013,834 |
FINANCIALS - 5.6% |
Commercial Banks - 0.5% |
Center Financial Corp., California | 98,000 | | 2,442,160 |
Insurance - 5.1% |
American Equity Investment Life Holding Co. | 309,100 | | 3,366,099 |
Aspen Insurance Holdings Ltd. | 193,200 | | 4,559,520 |
National Financial Partners Corp. | 72,200 | | 3,251,888 |
RAM Holdings Ltd. | 200,000 | | 2,476,000 |
RLI Corp. | 72,000 | | 3,404,160 |
Universal American Financial Corp. (a) | 225,000 | | 2,790,000 |
Willis Group Holdings Ltd. | 131,500 | | 4,277,695 |
| | 24,125,362 |
TOTAL FINANCIALS | | 26,567,522 |
HEALTH CARE - 15.7% |
Biotechnology - 0.5% |
Myogen, Inc. (a) | 85,500 | | 2,638,530 |
Health Care Equipment & Supplies - 4.2% |
Cholestech Corp. (a) | 197,000 | | 2,115,780 |
DJO, Inc. (a) | 213,800 | | 8,438,686 |
Inverness Medical Innovations, Inc. (a) | 138,800 | | 4,127,912 |
Common Stocks - continued |
| Shares | | Value (Note 1) |
HEALTH CARE - continued |
Health Care Equipment & Supplies - continued |
Kinetic Concepts, Inc. (a) | 72,200 | | $ 3,217,232 |
Regeneration Technologies, Inc. (a) | 361,700 | | 2,112,328 |
| | 20,011,938 |
Health Care Providers & Services - 6.8% |
Amedisys, Inc. (a) | 90,700 | | 3,463,833 |
Chemed Corp. | 134,200 | | 4,935,876 |
Humana, Inc. (a) | 93,700 | | 5,240,641 |
Omnicare, Inc. (d) | 186,600 | | 8,445,515 |
Sierra Health Services, Inc. (a) | 108,400 | | 4,680,712 |
VCA Antech, Inc. (a) | 153,800 | | 5,378,386 |
| | 32,144,963 |
Health Care Technology - 1.5% |
Per-Se Technologies, Inc. (a) | 290,000 | | 6,922,300 |
Life Sciences Tools & Services - 0.9% |
ICON PLC sponsored ADR (a) | 63,995 | | 4,213,431 |
Pharmaceuticals - 1.8% |
Kos Pharmaceuticals, Inc. (a) | 80,800 | | 3,340,272 |
Medicis Pharmaceutical Corp. Class A | 184,900 | | 5,095,844 |
| | 8,436,116 |
TOTAL HEALTH CARE | | 74,367,278 |
INDUSTRIALS - 17.1% |
Aerospace & Defense - 2.4% |
Heico Corp. Class A | 120,000 | | 3,144,000 |
Hexcel Corp. (a) | 392,500 | | 5,640,225 |
Precision Castparts Corp. | 46,800 | | 2,791,620 |
| | 11,575,845 |
Air Freight & Logistics - 1.0% |
Hub Group, Inc. Class A | 216,000 | | 4,877,280 |
Building Products - 0.5% |
NCI Building Systems, Inc. (a) | 50,000 | | 2,337,000 |
Commercial Services & Supplies - 3.6% |
CDI Corp. | 125,000 | | 2,443,750 |
Clean Harbors, Inc. | 112,200 | | 4,139,058 |
Huron Consulting Group, Inc. (a) | 135,600 | | 4,702,608 |
Navigant Consulting, Inc. (a) | 150,000 | | 2,862,000 |
Tele Atlas NV (a)(d) | 173,900 | | 2,847,722 |
| | 16,995,138 |
Common Stocks - continued |
| Shares | | Value (Note 1) |
INDUSTRIALS - continued |
Electrical Equipment - 3.2% |
C&D Technologies, Inc. (d) | 389,110 | | $ 2,762,681 |
EnerSys (a) | 138,900 | | 2,504,367 |
Genlyte Group, Inc. (a) | 62,000 | | 4,312,100 |
Q-Cells AG | 48,000 | | 3,437,196 |
Ultralife Batteries, Inc. (a)(d) | 220,000 | | 2,127,400 |
| | 15,143,744 |
Industrial Conglomerates - 0.5% |
Raven Industries, Inc. | 81,373 | | 2,425,729 |
Machinery - 4.6% |
Bucyrus International, Inc. Class A | 70,300 | | 3,424,313 |
Flowserve Corp. (a) | 68,800 | | 3,563,840 |
Graco, Inc. (d) | 58,000 | | 2,278,820 |
Greenbrier Companies, Inc. | 83,000 | | 2,305,740 |
Manitowoc Co., Inc. | 85,000 | | 3,337,100 |
Wabtec Corp. | 90,000 | | 2,390,400 |
Watts Water Technologies, Inc. Class A | 146,000 | | 4,252,980 |
| | 21,553,193 |
Trading Companies & Distributors - 1.3% |
WESCO International, Inc. (a) | 105,000 | | 6,116,250 |
TOTAL INDUSTRIALS | | 81,024,179 |
INFORMATION TECHNOLOGY - 26.5% |
Communications Equipment - 3.5% |
CommScope, Inc. (a) | 92,800 | | 2,898,144 |
F5 Networks, Inc. (a) | 62,100 | | 2,877,714 |
Harris Corp. | 179,800 | | 8,189,890 |
MasTec, Inc. (a) | 209,000 | | 2,731,630 |
| | 16,697,378 |
Computers & Peripherals - 1.5% |
Neoware Systems, Inc. (a)(d) | 165,700 | | 2,051,366 |
Synaptics, Inc. (a) | 115,000 | | 2,417,300 |
Xyratex Ltd. (a) | 99,700 | | 2,317,028 |
| | 6,785,694 |
Electronic Equipment & Instruments - 4.2% |
Amphenol Corp. Class A | 109,600 | | 6,146,368 |
Cogent, Inc. (a)(d) | 236,900 | | 3,352,135 |
FARO Technologies, Inc. (a) | 123,593 | | 1,993,555 |
Common Stocks - continued |
| Shares | | Value (Note 1) |
INFORMATION TECHNOLOGY - continued |
Electronic Equipment & Instruments - continued |
ScanSource, Inc. (a) | 110,400 | | $ 3,284,400 |
Trimble Navigation Ltd. (a) | 107,400 | | 5,158,422 |
| | 19,934,880 |
Internet Software & Services - 3.6% |
CyberSource Corp. (a) | 283,666 | | 2,848,007 |
Digitas, Inc. (a) | 431,200 | | 3,557,400 |
Equinix, Inc. (a) | 72,200 | | 3,781,836 |
j2 Global Communications, Inc. (a) | 237,200 | | 6,641,600 |
| | 16,828,843 |
IT Services - 6.9% |
CACI International, Inc. Class A (a) | 49,500 | | 2,789,325 |
Iron Mountain, Inc. (a) | 124,000 | | 5,084,000 |
Lionbridge Technologies, Inc. (a) | 933,646 | | 5,611,212 |
Ness Technologies, Inc. (a) | 512,300 | | 5,655,792 |
Satyam Computer Services Ltd. sponsored ADR (d) | 122,000 | | 4,300,500 |
SI International, Inc. (a) | 144,647 | | 3,945,970 |
TALX Corp. | 250,725 | | 5,152,399 |
| | 32,539,198 |
Office Electronics - 0.6% |
Zebra Technologies Corp. Class A (a) | 95,000 | | 2,978,250 |
Semiconductors & Semiconductor Equipment - 4.3% |
California Micro Devices Corp. (a) | 509,000 | | 2,010,550 |
Entegris, Inc. (a) | 266,200 | | 2,515,590 |
FormFactor, Inc. (a) | 108,000 | | 4,629,960 |
MIPS Technologies, Inc. (a) | 134,300 | | 850,119 |
O2Micro International Ltd. sponsored ADR (a) | 154,000 | | 922,460 |
Rudolph Technologies, Inc. (a) | 237,000 | | 3,296,670 |
Silicon On Insulator Technologies SA (SOITEC) (a) | 8,500 | | 226,704 |
SiRF Technology Holdings, Inc. (a) | 109,300 | | 2,087,630 |
Tessera Technologies, Inc. (a) | 126,600 | | 3,984,102 |
| | 20,523,785 |
Software - 1.9% |
Blackbaud, Inc. | 236,259 | | 4,928,363 |
Moldflow Corp. (a) | 174,100 | | 2,090,941 |
Quality Systems, Inc. | 62,800 | | 2,079,936 |
| | 9,099,240 |
TOTAL INFORMATION TECHNOLOGY | | 125,387,268 |
Common Stocks - continued |
| Shares | | Value (Note 1) |
MATERIALS - 4.9% |
Metals & Mining - 4.9% |
Allegheny Technologies, Inc. | 73,000 | | $ 4,663,970 |
Carpenter Technology Corp. | 44,200 | | 4,349,280 |
Meridian Gold, Inc. (a) | 163,100 | | 4,397,473 |
Oregon Steel Mills, Inc. (a) | 96,600 | | 4,466,784 |
Titanium Metals Corp. | 191,500 | | 5,522,860 |
| | 23,400,367 |
TELECOMMUNICATION SERVICES - 0.1% |
Wireless Telecommunication Services - 0.1% |
Dobson Communications Corp. Class A (a) | 70,000 | | 469,700 |
UTILITIES - 0.8% |
Multi-Utilities - 0.8% |
CMS Energy Corp. (a) | 283,600 | | 3,973,236 |
TOTAL COMMON STOCKS (Cost $440,779,155) | 447,083,390 |
Money Market Funds - 6.9% |
| | | |
Fidelity Cash Central Fund, 5.3% (b) | 22,221,562 | | 22,221,562 |
Fidelity Securities Lending Cash Central Fund, 5.32% (b)(c) | 10,678,095 | | 10,678,095 |
TOTAL MONEY MARKET FUNDS (Cost $32,899,657) | 32,899,657 |
TOTAL INVESTMENT PORTFOLIO - 101.3% (Cost $473,678,812) | | 479,983,047 |
NET OTHER ASSETS - (1.3)% | | (6,214,449) |
NET ASSETS - 100% | $ 473,768,598 |
Legend |
(a) Non-income producing |
(b) Affiliated fund that is available only to investment companies and other accounts managed by Fidelity Investments. The rate quoted is the annualized seven-day yield of the fund at period end. A complete unaudited listing of the fund's holdings as of its most recent quarter end is available upon request. |
(c) Investment made with cash collateral received from securities on loan. |
(d) Security or a portion of the security is on loan at period end. |
Affiliated Central Funds |
Information regarding fiscal year to date income earned by the fund from the affiliated Central funds is as follows: |
Fund | Income earned |
Fidelity Cash Central Fund | $ 643,230 |
Fidelity Securities Lending Cash Central Fund | 40,744 |
Total | $ 683,974 |
See accompanying notes which are an integral part of the financial statements.
Annual Report
Financial Statements
Statement of Assets and Liabilities
| July 31, 2006 |
| | |
Assets | | |
Investment in securities, at value (including securities loaned of $10,469,382) - See accompanying schedule: Unaffiliated issuers (cost $440,779,155) | $ 447,083,390 | |
Affiliated Central Funds (cost $32,899,657) | 32,899,657 | |
Total Investments (cost $473,678,812) | | $ 479,983,047 |
Receivable for investments sold | | 11,599,201 |
Receivable for fund shares sold | | 1,152,874 |
Dividends receivable | | 8,410 |
Interest receivable | | 77,377 |
Prepaid expenses | | 283 |
Receivable from investment adviser for expense reductions | | 5,591 |
Other receivables | | 20,672 |
Total assets | | 492,847,455 |
| | |
Liabilities | | |
Payable to custodian bank | $ 821 | |
Payable for investments purchased | 6,434,677 | |
Payable for fund shares redeemed | 1,434,350 | |
Accrued management fee | 329,256 | |
Distribution fees payable | 28,023 | |
Other affiliated payables | 121,413 | |
Other payables and accrued expenses | 52,222 | |
Collateral on securities loaned, at value | 10,678,095 | |
Total liabilities | | 19,078,857 |
| | |
Net Assets | | $ 473,768,598 |
Net Assets consist of: | | |
Paid in capital | | $ 465,362,392 |
Accumulated undistributed net realized gain (loss) on investments and foreign currency transactions | | 2,101,971 |
Net unrealized appreciation (depreciation) on investments | | 6,304,235 |
Net Assets | | $ 473,768,598 |
See accompanying notes which are an integral part of the financial statements.
Annual Report
Statement of Assets and Liabilities - continued
July 31, 2006 |
| | |
Calculation of Maximum Offering Price Class A:
Net Asset Value and redemption price per share ($18,104,024 ÷ 1,405,220 shares) | | $ 12.88 |
| | |
Maximum offering price per share (100/94.25 of $12.88) | | $ 13.67 |
Class T:
Net Asset Value and redemption price per share ($19,205,408 ÷ 1,493,589 shares) | | $ 12.86 |
| | |
Maximum offering price per share (100/96.50 of $12.86) | | $ 13.33 |
Class B:
Net Asset Value and offering price per share ($5,191,368 ÷ 406,298 shares)A | | $ 12.78 |
| | |
Class C:
Net Asset Value and offering price per share ($14,682,008 ÷ 1,149,741 shares)A | | $ 12.77 |
| | |
Small Cap Growth:
Net Asset Value, offering price and redemption price per share ($402,353,076 ÷ 31,124,219 shares) | | $ 12.93 |
| | |
Institutional Class:
Net Asset Value, offering price and redemption price per share ($14,232,714 ÷ 1,101,368 shares) | | $ 12.92 |
A Redemption price per share is equal to net asset value less any applicable contingent deferred sales charge.
See accompanying notes which are an integral part of the financial statements.
Annual Report
Financial Statements - continued
Statement of Operations
| Year ended July 31, 2006 |
| | |
Investment Income | | |
Dividends | | $ 1,243,646 |
Special dividends | | 241,463 |
Interest | | 1,708 |
Income from affiliated Central Funds | | 683,974 |
Total income | | 2,170,791 |
| | |
Expenses | | |
Management fee
Basic fee | $ 2,752,660 | |
Performance adjustment | 333,133 | |
Transfer agent fees | 902,095 | |
Distribution fees | 253,353 | |
Accounting and security lending fees | 159,035 | |
Independent trustees' compensation | 1,432 | |
Custodian fees and expenses | 26,104 | |
Registration fees | 122,023 | |
Audit | 43,577 | |
Legal | 9,380 | |
Miscellaneous | 16,396 | |
Total expenses before reductions | 4,619,188 | |
Expense reductions | (218,702) | 4,400,486 |
Net investment income (loss) | | (2,229,695) |
Realized and Unrealized Gain (Loss) Net realized gain (loss) on: | | |
Investment securities: | | |
Unaffiliated issuers | 5,460,071 | |
Foreign currency transactions | 13,859 | |
Total net realized gain (loss) | | 5,473,930 |
Change in net unrealized appreciation (depreciation) on: Investment securities | (13,283,751) | |
Assets and liabilities in foreign currencies | 32 | |
Total change in net unrealized appreciation (depreciation) | | (13,283,719) |
Net gain (loss) | | (7,809,789) |
Net increase (decrease) in net assets resulting from operations | | $ (10,039,484) |
See accompanying notes which are an integral part of the financial statements.
Annual Report
Statement of Changes in Net Assets
| Year ended
July 31,
2006 | For the period
November 3, 2004
(commencement
of operations) to
July 31, 2005 |
Increase (Decrease) in Net Assets | | |
Operations | | |
Net investment income (loss) | $ (2,229,695) | $ (434,724) |
Net realized gain (loss) | 5,473,930 | 3,381,102 |
Change in net unrealized appreciation (depreciation) | (13,283,719) | 19,587,954 |
Net increase (decrease) in net assets resulting
from operations | (10,039,484) | 22,534,332 |
Distributions to shareholders from net realized gain | (3,779,478) | - |
Share transactions - net increase (decrease) | 259,409,742 | 205,303,288 |
Redemption fees | 233,448 | 106,750 |
Total increase (decrease) in net assets | 245,824,228 | 227,944,370 |
| | |
Net Assets | | |
Beginning of period | 227,944,370 | - |
End of period (including undistributed net investment income of $0 and accumulated net investment loss of $14,971, respectively) | $ 473,768,598 | $ 227,944,370 |
See accompanying notes which are an integral part of the financial statements.
Annual Report
Financial Highlights - Class A
Years ended July 31, | 2006 | 2005 H |
Selected Per-Share Data | | |
Net asset value, beginning of period | $ 12.95 | $ 10.00 |
Income from Investment Operations | | |
Net investment income (loss) E | (.10) F | (.07) |
Net realized and unrealized gain (loss) | .18 G | 3.01 |
Total from investment operations | .08 | 2.94 |
Distributions from net realized gain | (.16) | - |
Redemption fees added to paid in capital E | .01 | .01 |
Net asset value, end of period | $ 12.88 | $ 12.95 |
Total Return B, C, D | .70% | 29.50% |
Ratios to Average Net Assets I | | |
Expenses before reductions | 1.53% | 1.55% A |
Expenses net of fee waivers, if any | 1.40% | 1.45% A |
Expenses net of all reductions | 1.35% | 1.36% A |
Net investment income (loss) | (.79)% F | (.78)% A |
Supplemental Data | | |
Net assets, end of period (000 omitted) | $ 18,104 | $ 4,719 |
Portfolio turnover rate | 129% | 93% A |
A Annualized
B Total returns for periods of less than one year are not annualized.
C Total returns would have been lower had certain expenses not been reduced during the periods shown.
D Total returns do not include the effect of the sales charges.
E Calculated based on average shares outstanding during the period.
F Investment income per share reflects a special dividend which amounted to $.01 per share. Excluding the special dividend, the ratio of net investment income (loss) to average net assets would have been (.85)%.
G The amount shown for a share outstanding does not correspond with the aggregate net gain (loss) on investments for the period due to the timing of sales and repurchases of shares in relation to fluctuating market values of the investments of the Fund.
H For the period November 3, 2004 (commencement of operations) to July 31, 2005.
I Expense ratios reflect operating expenses of the class. Expenses before reductions do not reflect amounts reimbursed by the investment adviser or reductions from brokerage service arrangements or other expense offset arrangements and do not represent the amount paid by the class during periods when reimbursements or reductions occur. Expense ratios before reductions for start-up periods may not be representative of longer-term operating periods. Expenses net of fee waivers reflect expenses after reimbursement by the investment adviser but prior to reductions from brokerage service arrangements or other expense offset arrangements. Expenses net of all reductions represent the net expenses paid by the class.
See accompanying notes which are an integral part of the financial statements.
Annual Report
Financial Highlights - Class T
Years ended July 31, | 2006 | 2005 H |
Selected Per-Share Data | | |
Net asset value, beginning of period | $ 12.93 | $ 10.00 |
Income from Investment Operations | | |
Net investment income (loss) E | (.14) F | (.09) |
Net realized and unrealized gain (loss) | .19 G | 3.01 |
Total from investment operations | .05 | 2.92 |
Distributions from net realized gain | (.13) | - |
Redemption fees added to paid in capital E | .01 | .01 |
Net asset value, end of period | $ 12.86 | $ 12.93 |
Total Return B, C, D | .48% | 29.30% |
Ratios to Average Net Assets I | | |
Expenses before reductions | 1.73% | 1.79% A |
Expenses net of fee waivers, if any | 1.65% | 1.70% A |
Expenses net of all reductions | 1.60% | 1.61% A |
Net investment income (loss) | (1.04)% F | (1.03)% A |
Supplemental Data | | |
Net assets, end of period (000 omitted) | $ 19,205 | $ 5,240 |
Portfolio turnover rate | 129% | 93% A |
A Annualized
B Total returns for periods of less than one year are not annualized.
C Total returns would have been lower had certain expenses not been reduced during the periods shown.
D Total returns do not include the effect of the sales charges.
E Calculated based on average shares outstanding during the period.
F Investment income per share reflects a special dividend which amounted to $.01 per share. Excluding the special dividend, the ratio of net investment income (loss) to average net assets would have been (1.10)%.
G The amount shown for a share outstanding does not correspond with the aggregate net gain (loss) on investments for the period due to the timing of sales and repurchases of shares in relation to fluctuating market values of the investments of the Fund.
H For the period November 3, 2004 (commencement of operations) to July 31, 2005.
I Expense ratios reflect operating expenses of the class. Expenses before reductions do not reflect amounts reimbursed by the investment adviser or reductions from brokerage service arrangements or other expense offset arrangements and do not represent the amount paid by the class during periods when reimbursements or reductions occur. Expense ratios before reductions for start-up periods may not be representative of longer-term operating periods. Expenses net of fee waivers reflect expenses after reimbursement by the investment adviser but prior to reductions from brokerage service arrangements or other expense offset arrangements. Expenses net of all reductions represent the net expenses paid by the class.
See accompanying notes which are an integral part of the financial statements.
Annual Report
Financial Highlights - Class B
Years ended July 31, | 2006 | 2005 H |
Selected Per-Share Data | | |
Net asset value, beginning of period | $ 12.87 | $ 10.00 |
Income from Investment Operations | | |
Net investment income (loss) E | (.20) F | (.13) |
Net realized and unrealized gain (loss) | .19 G | 2.99 |
Total from investment operations | (.01) | 2.86 |
Distributions from net realized gain | (.09) | - |
Redemption fees added to paid in capital E | .01 | .01 |
Net asset value, end of period | $ 12.78 | $ 12.87 |
Total Return B, C, D | (.03)% | 28.70% |
Ratios to Average Net Assets I | | |
Expenses before reductions | 2.28% | 2.33% A |
Expenses net of fee waivers, if any | 2.15% | 2.20% A |
Expenses net of all reductions | 2.10% | 2.11% A |
Net investment income (loss) | (1.54)% F | (1.53)% A |
Supplemental Data | | |
Net assets, end of period (000 omitted) | $ 5,191 | $ 2,055 |
Portfolio turnover rate | 129% | 93% A |
A Annualized
B Total returns for periods of less than one year are not annualized.
C Total returns would have been lower had certain expenses not been reduced during the periods shown.
D Total returns do not include the effect of the contingent deferred sales charge.
E Calculated based on average shares outstanding during the period.
F Investment income per share reflects a special dividend which amounted to $.01 per share. Excluding the special dividend, the ratio of net investment income (loss) to average net assets would have been (1.60)%.
G The amount shown for a share outstanding does not correspond with the aggregate net gain (loss) on investments for the period due to the timing of sales and repurchases of shares in relation to fluctuating market values of the investments of the Fund.
H For the period November 3, 2004 (commencement of operations) to July 31, 2005.
I Expense ratios reflect operating expenses of the class. Expenses before reductions do not reflect amounts reimbursed by the investment adviser or reductions from brokerage service arrangements or other expense offset arrangements and do not represent the amount paid by the class during periods when reimbursements or reductions occur. Expense ratios before reductions for start-up periods may not be representative of longer-term operating periods. Expenses net of fee waivers reflect expenses after reimbursement by the investment adviser but prior to reductions from brokerage service arrangements or other expense offset arrangements. Expenses net of all reductions represent the net expenses paid by the class.
See accompanying notes which are an integral part of the financial statements.
Annual Report
Financial Highlights - Class C
Years ended July 31, | 2006 | 2005 H |
Selected Per-Share Data | | |
Net asset value, beginning of period | $ 12.88 | $ 10.00 |
Income from Investment Operations | | |
Net investment income (loss) E | (.20) F | (.13) |
Net realized and unrealized gain (loss) | .18 G | 3.00 |
Total from investment operations | (.02) | 2.87 |
Distributions from net realized gain | (.10) | - |
Redemption fees added to paid in capital E | .01 | .01 |
Net asset value, end of period | $ 12.77 | $ 12.88 |
Total Return B, C, D | (.08)% | 28.80% |
Ratios to Average Net Assets I | | |
Expenses before reductions | 2.25% | 2.24% A |
Expenses net of fee waivers, if any | 2.15% | 2.17% A |
Expenses net of all reductions | 2.10% | 2.09% A |
Net investment income (loss) | (1.54)% F | (1.50)% A |
Supplemental Data | | |
Net assets, end of period (000 omitted) | $ 14,682 | $ 8,372 |
Portfolio turnover rate | 129% | 93% A |
A Annualized
B Total returns for periods of less than one year are not annualized.
C Total returns would have been lower had certain expenses not been reduced during the periods shown.
D Total returns do not include the effect of the contingent deferred sales charge.
E Calculated based on average shares outstanding during the period.
F Investment income per share reflects a special dividend which amounted to $.01 per share. Excluding the special dividend, the ratio of net investment income (loss) to average net assets would have been (1.60)%.
G The amount shown for a share outstanding does not correspond with the aggregate net gain (loss) on investments for the period due to the timing of sales and repurchases of shares in relation to fluctuating market values of the investments of the Fund.
H For the period November 3, 2004 (commencement of operations) to July 31, 2005.
I Expense ratios reflect operating expenses of the class. Expenses before reductions do not reflect amounts reimbursed by the investment adviser or reductions from brokerage service arrangements or other expense offset arrangements and do not represent the amount paid by the class during periods when reimbursements or reductions occur. Expense ratios before reductions for start-up periods may not be representative of longer-term operating periods. Expenses net of fee waivers reflect expenses after reimbursement by the investment adviser but prior to reductions from brokerage service arrangements or other expense offset arrangements. Expenses net of all reductions represent the net expenses paid by the class.
See accompanying notes which are an integral part of the financial statements.
Annual Report
Financial Highlights - Small Cap Growth
Years ended July 31, | 2006 | 2005 G |
Selected Per-Share Data | | |
Net asset value, beginning of period | $ 12.98 | $ 10.00 |
Income from Investment Operations | | |
Net investment income (loss) D | (.07) E | (.04) |
Net realized and unrealized gain (loss) | .19 F | 3.01 |
Total from investment operations | .12 | 2.97 |
Distributions from net realized gain | (.18) | - |
Redemption fees added to paid in capital D | .01 | .01 |
Net asset value, end of period | $ 12.93 | $ 12.98 |
Total Return B, C | 1.01% | 29.80% |
Ratios to Average Net Assets H | | |
Expenses before reductions | 1.13% | 1.16% A |
Expenses net of fee waivers, if any | 1.13% | 1.16% A |
Expenses net of all reductions | 1.08% | 1.08% A |
Net investment income (loss) | (.52)% E | (.49)% A |
Supplemental Data | | |
Net assets, end of period (000 omitted) | $ 402,353 | $ 205,652 |
Portfolio turnover rate | 129% | 93% A |
A Annualized
B Total returns for periods of less than one year are not annualized.
C Total returns would have been lower had certain expenses not been reduced during the periods shown.
D Calculated based on average shares outstanding during the period.
E Investment income per share reflects a special dividend which amounted to $.01 per share. Excluding the special dividend, the ratio of net investment income (loss) to average net assets would have been (.58)%.
F The amount shown for a share outstanding does not correspond with the aggregate net gain (loss) on investments for the period due to the timing of sales and repurchases of shares in relation to fluctuating market values of the investments of the Fund.
G For the period November 3, 2004 (commencement of operations) to July 31, 2005.
H Expense ratios reflect operating expenses of the class. Expenses before reductions do not reflect amounts reimbursed by the investment adviser or reductions from brokerage service arrangements or other expense offset arrangements and do not represent the amount paid by the class during periods when reimbursements or reductions occur. Expense ratios before reductions for start-up periods may not be representative of longer-term operating periods. Expenses net of fee waivers reflect expenses after reimbursement by the investment adviser but prior to reductions from brokerage service arrangements or other expense offset arrangements. Expenses net of all reductions represent the net expenses paid by the class.
See accompanying notes which are an integral part of the financial statements.
Annual Report
Financial Highlights - Institutional Class
Years ended July 31, | 2006 | 2005 G |
Selected Per-Share Data | | |
Net asset value, beginning of period | $ 12.97 | $ 10.00 |
Income from Investment Operations | | |
Net investment income (loss) D | (.07) E | (.04) |
Net realized and unrealized gain (loss) | .19 F | 3.00 |
Total from investment operations | .12 | 2.96 |
Distributions from net realized gain | (.18) | - |
Redemption fees added to paid in capital D | .01 | .01 |
Net asset value, end of period | $ 12.92 | $ 12.97 |
Total Return B, C | .97% | 29.70% |
Ratios to Average Net Assets H | | |
Expenses before reductions | 1.10% | 1.20% A |
Expenses net of fee waivers, if any | 1.10% | 1.18% A |
Expenses net of all reductions | 1.05% | 1.10% A |
Net investment income (loss) | (.49)% E | (.51)% A |
Supplemental Data | | |
Net assets, end of period (000 omitted) | $ 14,233 | $ 1,906 |
Portfolio turnover rate | 129% | 93% A |
A Annualized
B Total returns for periods of less than one year are not annualized.
C Total returns would have been lower had certain expenses not been reduced during the periods shown.
D Calculated based on average shares outstanding during the period.
E Investment income per share reflects a special dividend which amounted to $.01 per share. Excluding the special dividend, the ratio of net investment income (loss) to average net assets would have been (.55)%.
F The amount shown for a share outstanding does not correspond with the aggregate net gain (loss) on investments for the period due to the timing of sales and repurchases of shares in relation to fluctuating market values of the investments of the Fund.
G For the period November 3, 2004 (commencement of operations) to July 31, 2005.
H Expense ratios reflect operating expenses of the class. Expenses before reductions do not reflect amounts reimbursed by the investment adviser or reductions from brokerage service arrangements or other expense offset arrangements and do not represent the amount paid by the class during periods when reimbursements or reductions occur. Expense ratios before reductions for start-up periods may not be representative of longer-term operating periods. Expenses net of fee waivers reflect expenses after reimbursement by the investment adviser but prior to reductions from brokerage service arrangements or other expense offset arrangements. Expenses net of all reductions represent the net expenses paid by the class.
See accompanying notes which are an integral part of the financial statements.
Annual Report
Notes to Financial Statements
1. Significant Accounting Policies.
Fidelity Small Cap Growth Fund (the Fund) is a non-diversified fund of Fidelity Securities Fund (the trust) and is authorized to issue an unlimited number of shares. The trust is registered under the Investment Company Act of 1940, as amended (the 1940 Act), as an open-end management investment company organized as a Massachusetts business trust.
The Fund offers Class A, Class T, Class B, Class C, Small Cap Growth, and Institutional Class shares, each of which has equal rights as to assets and voting privileges. Each class has exclusive voting rights with respect to matters that affect that class. Class B shares will automatically convert to Class A shares after a holding period of seven years from the initial date of purchase. Investment income, realized and unrealized capital gains and losses, the common expenses of the Fund, and certain fund-level expense reductions, if any, are allocated on a pro rata basis to each class based on the relative net assets of each class to the total net assets of the Fund. Each class differs with respect to transfer agent and distribution and service plan fees incurred. Certain expense reductions also differ by class.
The Fund may invest in affiliated money market central funds (Money Market Central Funds), which are open-end investment companies available to investment companies and other accounts managed by Fidelity Management & Research Company (FMR) and its affiliates. The financial statements have been prepared in conformity with accounting principles generally accepted in the United States of America, which require management to make certain estimates and assumptions at the date of the financial statements. The following summarizes the significant accounting policies of the Fund:
Security Valuation. Investments are valued and net asset value (NAV) per share is calculated (NAV calculation) as of the close of business of the New York Stock Exchange (NYSE), normally 4:00 p.m. Eastern time. Wherever possible, the Fund uses independent pricing services approved by the Board of Trustees to value its investments.
Equity securities, including restricted securities, for which market quotations are readily available, are valued at the last reported sale price or official closing price as reported by an independent pricing service on the primary market or exchange on which they are traded. In the event there were no sales during the day or closing prices are not available, securities are valued at the last quoted bid price. Investments in open-end mutual funds are valued at their closing net asset value each business day. Short-term securities with remaining maturities of sixty days or less for which quotations are not readily available are valued at amortized cost, which approximates value.
When current market prices or quotations are not readily available or do not accurately reflect fair value, valuations may be determined in accordance with procedures adopted by the Board of Trustees. For example, when developments occur between the close of a market and the close of the NYSE that may materially affect the value of some or all of
Annual Report
1. Significant Accounting Policies - continued
Security Valuation - continued
the securities, or when trading in a security is halted, those securities may be fair valued. Factors used in the determination of fair value may include monitoring news to identify significant market or security specific events such as changes in the value of U.S. securities markets, reviewing developments in foreign markets and evaluating the performance of ADRs, futures contracts and exchange-traded funds. Because the Fund's utilization of fair value pricing depends on market activity, the frequency with which fair value pricing is used can not be predicted and may be utilized to a significant extent. The value of securities used for NAV calculation under fair value pricing may differ from published prices for the same securities.
Foreign Currency. The Fund uses foreign currency contracts to facilitate transactions in foreign-denominated securities. Losses from these transactions may arise from changes in the value of the foreign currency or if the counterparties do not perform under the contracts' terms.
Foreign-denominated assets, including investment securities, and liabilities are translated into U.S. dollars at the exchange rate at period end. Purchases and sales of investment securities, income and dividends received and expenses denominated in foreign currencies are translated into U.S. dollars at the exchange rate in effect on the transaction date.
The effects of exchange rate fluctuations on investments are included with the net realized and unrealized gain (loss) on investment securities. Other foreign currency transactions resulting in realized and unrealized gain (loss) are disclosed separately.
Investment Transactions and Income. Security transactions are accounted for as of trade date. Gains and losses on securities sold are determined on the basis of identified cost. Dividend income is recorded on the ex-dividend date, except for certain dividends from foreign securities where the ex-dividend date may have passed, which are recorded as soon as the Fund is informed of the ex-dividend date. Non-cash dividends included in dividend income, if any, are recorded at the fair market value of the securities received. Distributions received on securities that represent a return of capital or capital gain are recorded as a reduction of cost of investments and/or as a realized gain. The Fund estimates the components of distributions received that may be considered return of capital distributions or capital gain distributions. Large, non-recurring dividends recognized by the Fund are presented separately on the Statement of Operations as "Special Dividends" and the impact of these dividends is presented in the Financial Highlights. Interest income is accrued as earned. Interest income includes coupon interest and amortization of premium and accretion of discount on debt securities. Investment income is recorded net of foreign taxes withheld where recovery of such taxes is uncertain.
Annual Report
Notes to Financial Statements - continued
1. Significant Accounting Policies - continued
Expenses. Most expenses of the trust can be directly attributed to a fund. Expenses which cannot be directly attributed are apportioned among each Fund in the trust. Expense estimates are accrued in the period to which they relate and adjustments are made when actual amounts are known.
Income Tax Information and Distributions to Shareholders. Each year, the Fund intends to qualify as a regulated investment company by distributing all of its taxable income and realized gains under Subchapter M of the Internal Revenue Code. As a result, no provision for income taxes is required in the accompanying financial statements. Foreign taxes are provided for based on the Fund's understanding of the tax rules and rates that exist in the foreign markets in which it invests.
Distributions are recorded on the ex-dividend date. Income dividends and capital gain distributions are declared separately for each class. Income and capital gain distributions are determined in accordance with income tax regulations, which may differ from generally accepted accounting principles. In addition, the Fund will claim a portion of the payment made to redeeming shareholders as a distribution for income tax purposes.
Capital accounts within the financial statements are adjusted for permanent book-tax differences. These adjustments have no impact on net assets or the results of operations. Temporary book-tax differences will reverse in a subsequent period.
Book-tax differences are primarily due to net operating losses and losses deferred due to wash sales.
The tax-basis components of distributable earnings and the federal tax cost as of period end were as follows:
Unrealized appreciation | $ 43,314,354 | |
Unrealized depreciation | (37,939,754) | |
Net unrealized appreciation (depreciation) | 5,374,600 | |
Undistributed ordinary income | 1,284,226 | |
Undistributed long-term capital gain | 1,027,501 | |
| | |
Cost for federal income tax purposes | $ 474,608,447 | |
The tax character of distributions paid was as follows:
| July 31, 2006 | July 31, 2005 |
Ordinary Income | $ 3,779,478 | $ - |
New Accounting Pronouncement. In July 2006, Financial Accounting Standards Board Interpretation No. 48, Accounting for Uncertainty in Income Taxes - an interpretation of FASB Statement 109 (FIN 48) was issued and is effective for fiscal years
Annual Report
1. Significant Accounting Policies - continued
New Accounting Pronouncement - continued
beginning after December 15, 2006. FIN 48 sets forth a threshold for financial statement recognition, measurement and disclosure of a tax position taken or expected to be taken on a tax return. Management is currently evaluating the impact, if any, the adoption of FIN 48 will have on the Fund's net assets and results of operations.
Short-Term Trading (Redemption) Fees. Shares held in the Fund less than 90 days are subject to a redemption fee equal to 1.50% of the proceeds of the redeemed shares. All redemption fees, including any estimated redemption fees paid by FMR, are retained by the Fund and accounted for as an addition to paid in capital.
2. Operating Policies.
Repurchase Agreements. FMR has received an Exemptive Order from the Securities and Exchange Commission (the SEC) which permits the Fund and other affiliated entities of FMR to transfer uninvested cash balances into joint trading accounts which are then invested in repurchase agreements. The Fund may also invest directly with institutions in repurchase agreements. Repurchase agreements are collateralized by government or non-government securities. Upon settlement date, collateral is held in segregated accounts with custodian banks and may be obtained in the event of a default of the counterparty. The Fund monitors, on a daily basis, the value of the collateral to ensure it is at least equal to the principal amount of the repurchase agreement (including accrued interest). In the event of a default by the counterparty, realization of the collateral proceeds could be delayed, during which time the value of the collateral may decline.
3. Purchases and Sales of Investments.
Purchases and sales of securities, other than short-term securities, aggregated $713,692,604 and $477,814,143, respectively.
4. Fees and Other Transactions with Affiliates.
Management Fee. FMR and its affiliates provide the Fund with investment management related services for which the Fund pays a monthly management fee. The management fee is the sum of an individual fund fee rate that is based on an annual rate of .45% of the Fund's average net assets and a group fee rate that averaged ..27% during the period. The group fee rate is based upon the average net assets of all the mutual funds advised by FMR. The group fee rate decreases as assets under management increase and increases as assets under management decrease. In addition, the management fee is subject to a performance adjustment (up to a maximum of ± .20% of the Fund's average net assets over a 36 month performance period). The upward or downward adjustment
Annual Report
Notes to Financial Statements - continued
4. Fees and Other Transactions with Affiliates - continued
Management Fee - continued
to the management fee is based on the relative investment performance of the retail class of the Fund, Small Cap Growth, as compared to an appropriate benchmark index. The Fund's performance adjustment took effect in November 2005. Subsequent months will be added until the performance period includes 36 months. For the period, the total annual management fee rate, including the performance adjustment, was .81% of the Fund's average net assets.
Distribution and Service Plan. In accordance with Rule 12b-1 of the 1940 Act, the Fund has adopted separate Distribution and Service Plans for each class of shares. Certain classes pay Fidelity Distributors Corporation (FDC), an affiliate of FMR, separate Distribution and Service Fees, each of which is based on an annual percentage of each class' average net assets. In addition, FDC may pay financial intermediaries for selling shares of the Fund and providing shareholder support services. For the period, the Distribution and Service Fee rates and the total amounts paid to and retained by FDC were as follows:
| Distribution
Fee | Service
Fee | Paid to
FDC | Retained
by FDC |
Class A | 0% | .25% | $ 28,742 | $ 1,591 |
Class T | .25% | .25% | 60,604 | 6,378 |
Class B | .75% | .25% | 37,942 | 30,032 |
Class C | .75% | .25% | 126,065 | 55,601 |
| | | $ 253,353 | $ 93,602 |
Sales Load. FDC receives a front-end sales charge of up to 5.75% for selling Class A shares, and 3.50% for selling Class T shares, some of which is paid to financial intermediaries for selling shares of the Fund. FDC receives the proceeds of contingent deferred sales charges levied on Class A, Class T, Class B, and Class C redemptions. These charges depend on the holding period. The deferred sales charges range from 5% to 1% for Class B, 1% for Class C, 1.00% to .50% for certain purchases of Class A shares (.25% prior to February 24, 2006) and .25% for certain purchases of Class T shares.
For the period, sales charge amounts retained by FDC were as follows:
| Retained
by FDC |
Class A | $ 60,838 |
Class T | 10,628 |
Class B * | 3,795 |
Class C * | 2,471 |
| $ 77,732 |
* When Class B and Class C shares are initially sold, FDC pays commissions from its own resources to financial intermediaries through which the sales are made.
Annual Report
4. Fees and Other Transactions with Affiliates - continued
Transfer Agent Fees. Fidelity Investments Institutional Operations Company, Inc. (FIIOC), an affiliate of FMR, is the transfer, dividend disbursing and shareholder servicing agent for each class of the Fund, except for Small Cap Growth. Fidelity Service Company, Inc. (FSC), an affiliate of FMR, is the transfer agent for Small Cap Growth shares. FIIOC and FSC receive account fees and asset-based fees that vary according to the account size and type of account of the shareholders of the respective classes of the Fund. FIIOC and FSC pay for typesetting, printing and mailing of shareholder reports, except proxy statements. For the period the total transfer agent fees paid by each class to FIIOC or FSC, were as follows:
| Amount | % of
Average
Net Assets |
Class A | $ 42,555 | .37 |
Class T | 39,108 | .32 |
Class B | 13,971 | .37 |
Class C | 42,629 | .34 |
Small Cap Growth | 748,272 | .22 |
Institutional Class | 15,560 | .20 |
| $ 902,095 | |
Accounting and Security Lending Fees. FSC maintains the Fund's accounting records. The accounting fee is based on the level of average net assets for the month. Under a separate contract, FSC administers the security lending program. The security lending fee is based on the number and duration of lending transactions.
Affiliated Central Funds. The Fund may invest in Money Market Central Funds which seek preservation of capital and current income and are managed by Fidelity Investments Money Management, Inc. (FIMM), an affiliate of FMR.
The Money Market Central Funds do not pay a management fee.
Brokerage Commissions. The Fund placed a portion of its portfolio transactions with brokerage firms which are affiliates of the investment adviser. The commissions paid to these affiliated firms were $21,982 for the period.
5. Committed Line of Credit.
The Fund participates with other funds managed by FMR in a $4.2 billion credit facility (the "line of credit") to be utilized for temporary or emergency purposes to fund shareholder redemptions or for other short-term liquidity purposes. The Fund has agreed to pay commitment fees on its pro rata portion of the line of credit, which amounts to $1,010 and is reflected in Miscellaneous Expense on the Statement of Operations. During the period, there were no borrowings on this line of credit.
Annual Report
Notes to Financial Statements - continued
6. Security Lending.
The Fund lends portfolio securities from time to time in order to earn additional income. On the settlement date of the loan, the Fund receives collateral (in the form of U.S. Treasury obligations, letters of credit and/or cash) against the loaned securities and maintains collateral in an amount not less than 100% of the market value of the loaned securities during the period of the loan. The market value of the loaned securities is determined at the close of business of the Fund and any additional required collateral is delivered to the Fund on the next business day. If the borrower defaults on its obligation to return the securities loaned because of insolvency or other reasons, a fund could experience delays and costs in recovering the securities loaned or in gaining access to the collateral. Any cash collateral received is invested in the Fidelity Securities Lending Cash Central Fund. The value of loaned securities and cash collateral at period end are disclosed on the Fund's Statement of Assets and Liabilities. Security lending income represents the income earned on investing cash collateral, less fees and expenses associated with the loan, plus any premium payments that may be received on the loan of certain types of securities. Security lending income is presented in the Statement of Operations as a component of income from affiliated central funds. Net income from lending portfolio securities during the period amounted to $40,744.
7. Expense Reductions.
FMR voluntarily agreed to reimburse each class to the extent annual operating expenses exceeded certain levels of average net assets as noted in the table below. Some expenses, for example interest expense, are excluded from this reimbursement.
The following classes were in reimbursement during the period:
| Expense
Limitations | Reimbursement
from adviser |
Class A | 1.40% | $ 15,076 |
Class T | 1.65% | 10,160 |
Class B | 2.15% | 4,921 |
Class C | 2.15% | 12,289 |
| | $ 42,446 |
Many of the brokers with whom FMR places trades on behalf of the Fund provided services to the Fund in addition to trade execution. These services included payments of certain expenses on behalf of the Fund totaling $159,947 for the period. In addition, through arrangements with the Fund's custodian and each class' transfer agent, credits realized as a result of uninvested cash balances were used to reduce the Fund's expenses.
Annual Report
7. Expense Reductions - continued
During the period, these credits reduced the Fund's custody expenses by $8,200. During the period, credits reduced each class' transfer agent expense as noted in the table below.
| Transfer Agent
expense reduction | |
Small Cap Growth | $ 7,586 | |
Institutional Class | 523 | |
| $ 8,109 | |
8. Other.
The Fund's organizational documents provide former and current trustees and officers with a limited indemnification against liabilities arising in connection with the performance of their duties to the Fund. In the normal course of business, the Fund may also enter into contracts that provide general indemnifications. The Fund's maximum exposure under these arrangements is unknown as this would be dependent on future claims that may be made against the Fund. The risk of material loss from such claims is considered remote.
Subsequent to fiscal year end, the Fund's transfer agent, Fidelity Investments Institutional Operations Company, Inc. (FIIOC), an affiliate of Fidelity Management & Research Company, notified the Fund that the fund's books and records did not reflect a conversion of certain Class B to Class A shares upon their conversion date. Management has determined that this did not have a material impact to the Fund's reported net assets or results of operations in the accompanying financial statements. FIIOC will cause the books and records of the fund to reflect a conversion of the relevant Class B shares to Class A and is in the process of determining the impact to affected shareholder accounts for purposes of its remediation.
9. Distributions to Shareholders.
Distributions to shareholders of each class were as follows:
Years ended July 31, | 2006 | 2005 A |
From net realized gain | | |
Class A | $ 79,077 | $ - |
Class T | 63,628 | - |
Class B | 16,300 | - |
Class C | 71,634 | - |
Small Cap Growth | 3,518,781 | - |
Institutional Class | 30,058 | - |
Total | $ 3,779,478 | $ - |
A For the period November 3, 2004 (commencement of operations) to July 31, 2005
Annual Report
Notes to Financial Statements - continued
10. Share Transactions.
Transactions for each class of shares were as follows:
| Shares | Dollars |
Years ended July 31, | 2006 | 2005 A | 2006 | 2005 A |
Class A | | | | |
Shares sold | 1,304,587 | 377,650 | $ 17,497,379 | $ 4,304,515 |
Reinvestment of distributions | 5,381 | - | 70,354 | - |
Shares redeemed | (269,198) | (13,200) | (3,602,873) | (157,404) |
Net increase (decrease) | 1,040,770 | 364,450 | $ 13,964,860 | $ 4,147,111 |
Class T | | | | |
Shares sold | 1,397,985 | 432,704 | $ 18,995,409 | $ 4,904,069 |
Reinvestment of distributions | 4,866 | - | 63,445 | - |
Shares redeemed | (314,634) | (27,332) | (4,188,261) | (327,972) |
Net increase (decrease) | 1,088,217 | 405,372 | $ 14,870,593 | $ 4,576,097 |
Class B | | | | |
Shares sold | 392,448 | 169,626 | $ 5,275,913 | $ 1,864,130 |
Reinvestment of distributions | 1,204 | - | 15,614 | - |
Shares redeemed | (146,977) | (10,003) | (1,954,748) | (113,030) |
Net increase (decrease) | 246,675 | 159,623 | $ 3,336,779 | $ 1,751,100 |
Class C | | | | |
Shares sold | 952,568 | 664,094 | $ 12,739,552 | $ 7,429,424 |
Reinvestment of distributions | 5,289 | - | 68,594 | - |
Shares redeemed | (458,174) | (14,036) | (5,878,013) | (166,606) |
Net increase (decrease) | 499,683 | 650,058 | $ 6,930,133 | $ 7,262,818 |
Small Cap Growth | | | | |
Shares sold | 23,125,895 | 18,162,749 | $ 310,607,480 | $ 212,509,370 |
Reinvestment of distributions | 226,620 | - | 2,968,828 | - |
Shares redeemed | (8,070,732) | (2,320,313) | (106,295,770) | (26,565,039) |
Net increase (decrease) | 15,281,783 | 15,842,436 | $ 207,280,538 | $ 185,944,331 |
Institutional Class | | | | |
Shares sold | 1,082,924 | 170,585 | $ 14,760,969 | $ 1,883,777 |
Reinvestment of distributions | 1,705 | - | 22,327 | - |
Shares redeemed | (130,215) | (23,631) | (1,756,457) | (261,946) |
Net increase (decrease) | 954,414 | 146,954 | $ 13,026,839 | $ 1,621,831 |
A For the period November 3, 2004 (commencement of operations) to July 31, 2005.
Annual Report
Report of Independent Registered Public Accounting Firm
To the Trustees of Fidelity Securities Fund and the Shareholders of Fidelity Small Cap Growth Fund:
In our opinion, the accompanying statement of assets and liabilities, including the schedule of investments, and the related statements of operations and of changes in net assets and the financial highlights present fairly, in all material respects, the financial position of Fidelity Small Cap Growth Fund (a fund of Fidelity Securities Fund) at July 31, 2006, and the results of its operations, the changes in its net assets and the financial highlights for each of the periods indicated, in conformity with accounting principles generally accepted in the United States of America. These financial statements and financial highlights (hereafter referred to as "financial statements") are the responsibility of the Fidelity Small Cap Growth Fund's management; our responsibility is to express an opinion on these financial statements based on our audits. We conducted our audits of these financial statements in accordance with the standards of the Public Company Accounting Oversight Board (United States). Those standards require that we plan and perform the audit to obtain reasonable assurance about whether the financial statements are free of material misstatement. An audit includes examining, on a test basis, evidence supporting the amounts and disclosures in the financial statements, assessing the accounting principles used and significant estimates made by management, and evaluating the overall financial statement presentation. We believe that our audits, which included confirmation of securities at July 31, 2006 by correspondence with the custodian and brokers, provide a reasonable basis for our opinion.
/s/ PricewaterhouseCoopers LLP
PricewaterhouseCoopers LLP
Boston, Massachusetts
October 9, 2006
Annual Report
Trustees and Officers
The Trustees, Members of the Advisory Board, and executive officers of the trust and fund, as applicable, are listed below. The Board of Trustees governs the fund and is responsible for protecting the interests of shareholders. The Trustees are experienced executives who meet periodically throughout the year to oversee the fund's activities, review contractual arrangements with companies that provide services to the fund, and review the fund's performance. Except for William O. McCoy and Albert R. Gamper, Jr., each of the Trustees oversees 345 funds advised by FMR or an affiliate. Mr. McCoy oversees 347 funds advised by FMR or an affiliate. Mr. Gamper oversees 292 funds advised by FMR or an affiliate.
The Trustees hold office without limit in time except that (a) any Trustee may resign; (b) any Trustee may be removed by written instrument, signed by at least two-thirds of the number of Trustees prior to such removal; (c) any Trustee who requests to be retired or who has become incapacitated by illness or injury may be retired by written instrument signed by a majority of the other Trustees; and (d) any Trustee may be removed at any special meeting of shareholders by a two-thirds vote of the outstanding voting securities of the trust. Each Trustee who is not an interested person (as defined in the 1940 Act) (Independent Trustee), shall retire not later than the last day of the calendar year in which his or her 72nd birthday occurs. The Independent Trustees may waive this mandatory retirement age policy with respect to individual Trustees. The executive officers and Advisory Board Members hold office without limit in time, except that any officer and Advisory Board Member may resign or may be removed by a vote of a majority of the Trustees at any regular meeting or any special meeting of the Trustees. Except as indicated, each individual has held the office shown or other offices in the same company for the past five years.
The fund's Statement of Additional Information (SAI) includes more information about the Trustees. To request a free copy, call Fidelity at 1-877-208-0098.
Interested Trustees*:
Correspondence intended for each Trustee who is an interested person may be sent to Fidelity Investments, 82 Devonshire Street, Boston, Massachusetts 02109
Name, Age; Principal Occupation |
Edward C. Johnson 3d (76) |
| Year of Election or Appointment: 1984 Mr. Johnson is Chairman of the Board of Trustees. Mr. Johnson serves as President (2006-present), Chief Executive Officer, Chairman, and a Director of FMR Corp.; Chairman and a Director of FMR; Chairman and a Director of Fidelity Research & Analysis Company (FRAC); Chairman and a Director of Fidelity Investments Money Management, Inc.; and Chairman (2001-present) and a Director (1999-present) of FMR Co., Inc. In addition, Mr. Johnson serves as Chairman and Director of Fidelity International Limited (FIL). |
Stephen P. Jonas (53) |
| Year of Election or Appointment: 2005 Mr. Jonas is Senior Vice President of the fund (2005-present). He also serves as Senior Vice President of other Fidelity funds (2005-present). Mr. Jonas is Executive Director of FMR (2005-present) and FMR Co., Inc. (2005-present). He also serves as a Director of Fidelity Investments Money Management, Inc. (2005-present) and FMR Corp. (2003-present). Previously, Mr. Jonas served as President of Fidelity Enterprise Operations and Risk Services (2004-2005), Chief Administrative Officer (2002-2004), and Chief Financial Officer of FMR Corp. (1998-2002). In addition, he serves on the Boards of Boston Ballet (2003-present) and Simmons College (2003-present). |
Robert L. Reynolds (54) |
| Year of Election or Appointment: 2003 Mr. Reynolds is President and a Director of FMR (2005-present), Fidelity Investments Money Management, Inc. (2005-present), and FMR Co., Inc. (2005-present). Mr. Reynolds also serves as a Director (2003-present) and Chief Operating Officer (2000-present) of FMR Corp. and a Director of Strategic Advisers, Inc. (2005-present). He also serves on the Board at Fidelity Investments Canada, Ltd. (2000-present). Previously, Mr. Reynolds served as President of Fidelity Investments Institutional Retirement Group (1996-2000). |
* Trustees have been determined to be "Interested Trustees" by virtue of, among other things, their affiliation with the trust or various entities under common control with FMR.
Annual Report
Independent Trustees:
Correspondence intended for each Independent Trustee (that is, the Trustees other than the Interested Trustees) may be sent to Fidelity Investments, P.O. Box 55235, Boston, Massachusetts 02205-5235.
Name, Age; Principal Occupation |
Dennis J. Dirks (58) |
| Year of Election or Appointment: 2005 Prior to his retirement in May 2003, Mr. Dirks was Chief Operating Officer and a member of the Board of The Depository Trust & Clearing Corporation (DTCC) (1999-2003). He also served as President, Chief Operating Officer, and Board member of The Depository Trust Company (DTC) (1999-2003) and President and Board member of the National Securities Clearing Corporation (NSCC) (1999-2003). In addition, Mr. Dirks served as Chief Executive Officer and Board member of the Government Securities Clearing Corporation (2001-2003) and Chief Executive Officer and Board member of the Mortgage-Backed Securities Clearing Corporation (2001-2003). Mr. Dirks also serves as a Trustee and a member of the Finance Committee of Manhattan College (2005-present) and a Trustee and a member of the Finance Committee of AHRC of Nassau County (2006-present). |
Albert R. Gamper, Jr. (64) |
| Year of Election or Appointment: 2006 Mr. Gamper also serves as a Trustee (2006-present) or Member of the Advisory Board (2005-present) of other investment companies advised by FMR. Prior to his retirement in December 2004, Mr. Gamper served as Chairman of the Board of CIT Group Inc. (commercial finance). During his tenure with CIT Group Inc. Mr. Gamper served in numerous senior management positions, including Chairman (1987-1989; 1999-2001; 2002-2004), Chief Executive Officer (1987-2004), and President (1989-2002). He currently serves as a member of the Board of Directors of Public Service Enterprise Group (utilities, 2001-present), Chairman of the Board of Governors, Rutgers University (2004-present), and Chairman of the Board of Saint Barnabas Health Care System. |
Robert M. Gates (62) |
| Year of Election or Appointment: 1997 Dr. Gates is Chairman of the Independent Trustees (2006-present). Dr. Gates is President of Texas A&M University (2002-present). He was Director of the Central Intelligence Agency (CIA) from 1991 to 1993. From 1989 to 1991, Dr. Gates served as Assistant to the President of the United States and Deputy National Security Advisor. Dr. Gates is a Director of NACCO Industries, Inc. (mining and manufacturing), Parker Drilling Co., Inc. (drilling and rental tools for the energy industry, 2001-present), and Brinker International (restaurant management, 2003-present). Previously, Dr. Gates served as a Director of LucasVarity PLC (automotive components and diesel engines), a Director of TRW Inc. (automotive, space, defense, and information technology), and Dean of the George Bush School of Government and Public Service at Texas A&M University (1999-2001). |
George H. Heilmeier (70) |
| Year of Election or Appointment: 2004 Dr. Heilmeier is Chairman Emeritus of Telcordia Technologies (communication software and systems), where prior to his retirement, he served as company Chairman and Chief Executive Officer. He currently serves on the Boards of Directors of The Mitre Corporation (systems engineering and information technology support for the government), and HRL Laboratories (private research and development, 2004-present). He is Chairman of the General Motors Science & Technology Advisory Board and a Life Fellow of the Institute of Electrical and Electronics Engineers (IEEE). Dr. Heilmeier is a member of the Defense Science Board and the National Security Agency Advisory Board. He is also a member of the National Academy of Engineering, the American Academy of Arts and Sciences, and the Board of Overseers of the School of Engineering and Applied Science of the University of Pennsylvania. Previously, Dr. Heilmeier served as a Director of TRW Inc. (automotive, space, defense, and information technology, 1992-2002), Compaq (1994-2002), Automatic Data Processing, Inc. (ADP) (technology-based business outsourcing, 1995-2002), INET Technologies Inc. (telecommunications network surveillance, 2001-2004), and Teletech Holdings (customer management services). He is the recipient of the 2005 Kyoto Prize in Advanced Technology for his invention of the liquid crystal display. |
Marie L. Knowles (59) |
| Year of Election or Appointment: 2001 Prior to Ms. Knowles' retirement in June 2000, she served as Executive Vice President and Chief Financial Officer of Atlantic Richfield Company (ARCO) (diversified energy, 1996-2000). From 1993 to 1996, she was a Senior Vice President of ARCO and President of ARCO Transportation Company. She served as a Director of ARCO from 1996 to 1998. She currently serves as a Director of Phelps Dodge Corporation (copper mining and manufacturing) and McKesson Corporation (healthcare service, 2002-present). Ms. Knowles is a Trustee of the Brookings Institution and the Catalina Island Conservancy and also serves as a member of the Advisory Board for the School of Engineering of the University of Southern California. |
Ned C. Lautenbach (62) |
| Year of Election or Appointment: 2000 Mr. Lautenbach has been a partner of Clayton, Dubilier & Rice, Inc. (private equity investment firm) since September 1998. Previously, Mr. Lautenbach was with the International Business Machines Corporation (IBM) from 1968 until his retirement in 1998. Mr. Lautenbach serves as a Director of Italtel Holding S.p.A. (telecommunications (Milan, Italy), 2004-present) and Eaton Corporation (diversified industrial) as well as the Philharmonic Center for the Arts in Naples, Florida. He also is a member of the Board of Trustees of Fairfield University (2005-present), as well as a member of the Council on Foreign Relations. |
William O. McCoy (72) |
| Year of Election or Appointment: 1997 Prior to his retirement in December 1994, Mr. McCoy was Vice Chairman of the Board of BellSouth Corporation (telecommunications) and President of BellSouth Enterprises. He is currently a Director of Duke Realty Corporation (real estate). He is also a partner of Franklin Street Partners (private investment management firm). In addition, Mr. McCoy served as the Interim Chancellor (1999-2000) and a member of the Board of Visitors for the University of North Carolina at Chapel Hill and currently serves as Chairman of the Board of Directors of the University of North Carolina Health Care System. He also served as Vice President of Finance for the University of North Carolina (16-school system). |
Cornelia M. Small (62) |
| Year of Election or Appointment 2005 Ms. Small is a member (2000-present) and Chairperson (2002-present) of the Investment Committee, and a member (2002-present) of the Board of Trustees of Smith College. Previously, she served as Chief Investment Officer (1999-2000), Director of Global Equity Investments (1996-1999), and a member of the Board of Directors of Scudder, Stevens & Clark (1990-1997) and Scudder Kemper Investments (1997-1999). In addition, Ms. Small served as Co-Chair (2000-2003) of the Annual Fund for the Fletcher School of Law and Diplomacy. |
William S. Stavropoulos (67) |
| Year of Election or Appointment: 2002 Mr. Stavropoulos is Chairman Emeritus of the Board of Directors of The Dow Chemical Company. Since joining The Dow Chemical Company in 1967, Mr. Stavropoulos served in numerous senior management positions, including President (1993-2000; 2002-2003), CEO (1995-2000; 2002-2004), and Chairman of the Executive Committee (2000-2004). Currently, he is a Director of NCR Corporation (data warehousing and technology solutions), BellSouth Corporation (telecommunications), Chemical Financial Corporation, Maersk Inc. (industrial conglomerate, 2002-present), and Metalmark Capital (private equity investment firm, 2005-present). He also serves as a member of the Board of Trustees of the American Enterprise Institute for Public Policy Research. In addition, Mr. Stavropoulos is a member of The Business Council, J.P. Morgan International Council and the University of Notre Dame Advisory Council for the College of Science. |
Kenneth L. Wolfe (66) |
| Year of Election or Appointment: 2005 Prior to his retirement in 2001, Mr. Wolfe was Chairman and Chief Executive Officer of Hershey Foods Corporation (1993-2001). He currently serves as a member of the boards of Adelphia Communications Corporation (2003-present), Bausch & Lomb, Inc., and Revlon Inc. (2004-present). |
Annual Report
Advisory Board Members and Executive Officers:
Correspondence intended for Mr. Keyes may be sent to Fidelity Investments, P.O. Box 55235, Boston, Massachusetts 02205-5235. Correspondence intended for each executive officer and Mr. Lynch may be sent to Fidelity Investments, 82 Devonshire Street, Boston, Massachusetts 02109.
Name, Age; Principal Occupation |
James H. Keyes (65) |
| Year of Election or Appointment: 2006 Member of the Advisory Board of Fidelity Securities Fund. Prior to his retirement in 2003, Mr. Keyes was Chairman, President, and Chief Executive Officer of Johnson Controls, Inc. (automotive supplier, 1993-2003). He currently serves as a member of the boards of LSI Logic Corporation (semiconductor technologies, 1984-present), Navistar International Corporation (manufacture and sale of trucks, buses, and diesel engines, 2002-present), and Pitney Bowes, Inc. (integrated mail, messaging, and document management solutions, 1998-present). |
Peter S. Lynch (62) |
| Year of Election or Appointment: 2003 Member of the Advisory Board of Fidelity Securities Fund. Mr. Lynch is Vice Chairman and a Director of FMR, and Vice Chairman (2001-present) and a Director (1999-present) of FMR Co., Inc. Previously, Mr. Lynch served as a Trustee of the Fidelity funds (1990-2003). In addition, he serves as the Chairman of the Inner-City Scholarship Fund. |
Dwight D. Churchill (52) |
| Year of Election or Appointment: 2005 Vice President of the fund. Mr. Churchill also serves as Vice President of certain Equity Funds (2005-present). Mr. Churchill is Executive Vice President of FMR (2005-present) and FMR Co., Inc. (2005-present). Previously, Mr. Churchill served as Senior Vice President of Fidelity Investments Money Management, Inc. (2005-2006), Head of Fidelity's Fixed-Income Division (2000-2005), Vice President of Fidelity's Money Market Funds (2000-2005), Vice President of Fidelity's Bond Funds, and Senior Vice President of FMR. |
Bruce T. Herring (41) |
| Year of Election or Appointment: 2006 Vice President of the fund. Mr. Herring also serves as Vice President of certain Equity Funds (2006-present). Mr. Herring is Senior Vice President of FMR (2006-present) and Vice President of FMR Co., Inc. (2001-present). Previously, Mr. Herring served as a portfolio manager for Fidelity U.S. Equity Funds (2001-2005). |
Lionel Harris (39) |
| Year of Election or Appointment: 2005 Manager of the fund. Mr. Harris also serves as Vice President of other funds advised by FMR. Prior to his current responsibilities, Mr. Harris worked as a research analyst, a high-income director of research, and portfolio manager. |
Eric D. Roiter (57) |
| Year of Election or Appointment: 2004 Secretary of the fund. Vice President, General Counsel, and Secretary of FMR Co., Inc. (2001-present) and FMR; Assistant Secretary of Fidelity Management & Research (U.K.) Inc. (2001-present), Fidelity Research & Analysis Company (2001-present), and Fidelity Investments Money Management, Inc. (2001-present). Mr. Roiter is an Adjunct Member, Faculty of Law, at Boston College Law School (2003-present). Previously, Mr. Roiter served as Vice President and Secretary of FDC (1998-2005). |
Stuart Fross (46) |
| Year of Election or Appointment: 2004 Assistant Secretary of the fund. Mr. Fross also serves as Assistant Secretary of other Fidelity funds (2003-present), Vice President and Secretary of FDC (2005-present), and is an employee of FMR. |
Christine Reynolds (47) |
| Year of Election or Appointment: 2004 President and Treasurer of the fund. Ms. Reynolds also serves as President and Treasurer of other Fidelity funds (2004-present) and is a Vice President (2003-present) and an employee (2002-present) of FMR. Before joining Fidelity Investments, Ms. Reynolds worked at PricewaterhouseCoopers LLP (PwC) (1980-2002), where she was most recently an audit partner with PwC's investment management practice. |
R. Stephen Ganis (40) |
| Year of Election or Appointment: 2006 Anti-Money Laundering (AML) officer of the fund. Mr. Ganis also serves as AML officer of other Fidelity funds (2006-present) and FMR Corp. (2003-present). Before joining Fidelity Investments, Mr. Ganis practiced law at Goodwin Procter, LLP (2000-2002). |
Joseph B. Hollis (58) |
| Year of Election or Appointment: 2006 Chief Financial Officer of the fund. Mr. Hollis also serves as Chief Financial Officer of other Fidelity funds. Mr. Hollis is President of Fidelity Pricing and Cash Management Services (FPCMS) (2005-present). Mr. Hollis also serves as President and Director of Fidelity Service Company, Inc. (2006-present). Previously, Mr. Hollis served as Senior Vice President of Cash Management Services (1999-2002) and Investment Management Operations (2002-2005). |
Kenneth A. Rathgeber (59) |
| Year of Election or Appointment: 2004 Chief Compliance Officer of the fund. Mr. Rathgeber also serves as Chief Compliance Officer of other Fidelity funds (2004-present) and Executive Vice President of Risk Oversight for Fidelity Investments (2002-present). He is Chief Compliance Officer of FMR (2005-present), FMR Co., Inc. (2005-present), Fidelity Management & Research (U.K.) Inc. (2005-present), Fidelity Research & Analysis Company (2005-present), Fidelity Investments Money Management, Inc. (2005-present), and Strategic Advisers, Inc. (2005-present). Previously, Mr. Rathgeber served as Executive Vice President and Chief Operating Officer for Fidelity Investments Institutional Services Company, Inc. (1998-2002). |
Bryan A. Mehrmann (45) |
| Year of Election or Appointment: 2005 Deputy Treasurer of the fund. Mr. Mehrmann also serves as Deputy Treasurer of other Fidelity funds (2005-present) and is an employee of FMR. Previously, Mr. Mehrmann served as Vice President of Fidelity Investments Institutional Services Group (FIIS)/Fidelity Investments Institutional Operations Corporation, Inc. (FIIOC) Client Services (1998-2004). |
Kimberley H. Monasterio (42) |
| Year of Election or Appointment: 2004 Deputy Treasurer of the fund. Ms. Monasterio also serves as Deputy Treasurer of other Fidelity funds (2004) and is an employee of FMR (2004). Before joining Fidelity Investments, Ms. Monasterio served as Treasurer (2000-2004) and Chief Financial Officer (2002-2004) of the Franklin Templeton Funds and Senior Vice President of Franklin Templeton Services, LLC (2000-2004). |
Kenneth B. Robins (36) |
| Year of Election or Appointment:: 2005 Deputy Treasurer of the fund. Mr. Robins also serves as Deputy Treasurer of other Fidelity funds (2005-present) and is an employee of FMR (2004-present). Before joining Fidelity Investments, Mr. Robins worked at KPMG LLP, where he was a partner in KPMG's department of professional practice (2002-2004) and a Senior Manager (1999-2000). In addition, Mr. Robins served as Assistant Chief Accountant, United States Securities and Exchange Commission (2000-2002). |
Robert G. Byrnes (39) |
| Year of Election or Appointment: 2005 Assistant Treasurer of the fund. Mr. Byrnes also serves as Assistant Treasurer of other Fidelity funds (2005-present) and is an employee of FMR (2005-present). Previously, Mr. Byrnes served as Vice President of FPCMS (2003-2005). Before joining Fidelity Investments, Mr. Byrnes worked at Deutsche Asset Management where he served as Vice President of the Investment Operations Group (2000-2003). |
John H. Costello (59) |
| Year of Election or Appointment: 2004 Assistant Treasurer of the fund. Mr. Costello also serves as Assistant Treasurer of other Fidelity funds and is an employee of FMR. |
Peter L. Lydecker (52) |
| Year of Election or Appointment 2004 Assistant Treasurer of the fund. Mr. Lydecker also serves as Assistant Treasurer of other Fidelity funds (2004) and is an employee of FMR. |
Mark Osterheld (51) |
| Year of Election or Appointment: 2004 Assistant Treasurer of the fund. Mr. Osterheld also serves as Assistant Treasurer of other Fidelity funds (2002) and is an employee of FMR. |
Gary W. Ryan (47) |
| Year of Election or Appointment: 2005 Assistant Treasurer of the fund. Mr. Ryan also serves as Assistant Treasurer of other Fidelity funds (2005-present) and is an employee of FMR (2005-present). Previously, Mr. Ryan served as Vice President of Fund Reporting in FPCMS (1999-2005). |
Salvatore Schiavone (40) |
| Year of Election or Appointment: 2005 Assistant Treasurer of the fund. Mr. Schiavone also serves as Assistant Treasurer of other Fidelity funds (2005-present) and is an employee of FMR (2005-present). Before joining Fidelity Investments, Mr. Schiavone worked at Deutsche Asset Management, where he most recently served as Assistant Treasurer (2003-2005) of the Scudder Funds and Vice President and Head of Fund Reporting (1996-2003). |
Annual Report
Distributions
The Board of Trustees of Advisor Small Cap Growth Fund voted to pay to shareholders of record at the opening of business on record date, the following distributions per share derived from capital gains realized from sales of portfolio securities, and dividends derived from net investment income:
| Pay Date | Record Date | Dividends | Capital Gains |
Class A | 09/11/06 | 09/08/06 | - | $0.059 |
Class T | 09/11/06 | 09/08/06 | - | $0.044 |
Class B | 09/11/06 | 09/08/06 | - | $0.03 |
Class C | 09/11/06 | 09/08/06 | - | $0.03 |
The fund hereby designates as a capital gain dividend with respect to the taxable year ended July 31 2006, $1,027,501, or, if subsequently determined to be different, the net capital gain of such year.
Class A designates 9%, and 92%; Class T designates 10%, and 100%; Class B designates 14%, and 0%; and Class C designates 12%, and 0%; of the dividends distributed in September and December, respectively during the fiscal year as qualifying for the dividends-received deduction for corporate shareholders.
Class A designates 13%, 100%; Class B designates 18%, 0%; Class C designates 16%, 0%; and Class T designates 14%, 100%; of dividend distributed in September and December, respectively during the fiscal year as amounts which may be taken into account as a dividend for purposes of the maximum rate under section 1(h)(11) of the Internal Revenue Code.
The fund will notify shareholders in January 2007 of amounts for use in preparing 2006 income tax returns.
Annual Report
Proxy Voting Results
A special meeting of the funds' shareholders was held on May 17, 2006. The results of votes taken among shareholders on the proposal before them are reported below. Each vote reported represents one dollar of net asset value held on the record date for the meeting.
PROPOSAL 1 |
To elect a Board of Trustees. A |
| # of
Votes | % of
Votes |
Dennis J. Dirks |
Affirmative | 43,119,905,166.54 | 95.455 |
Withheld | 2,053,001,967.67 | 4.545 |
TOTAL | 45,172,907,134.21 | 100.000 |
Albert R. Gamper, Jr. |
Affirmative | 43,068,780,128.62 | 95.342 |
Withheld | 2,104,127,005.59 | 4.658 |
TOTAL | 45,172,907,134.21 | 100.000 |
Robert M. Gates |
Affirmative | 43,032,117,662.60 | 95.261 |
Withheld | 2,140,789,471.61 | 4.739 |
TOTAL | 45,172,907,134.21 | 100.000 |
George H. Heilmeier |
Affirmative | 43,023,368,882.30 | 95.242 |
Withheld | 2,149,538,251.91 | 4.758 |
TOTAL | 45,172,907,134.21 | 100.000 |
Edward C. Johnson 3d |
Affirmative | 42,881,915,819.70 | 94.928 |
Withheld | 2,290,991,314.51 | 5.072 |
TOTAL | 45,172,907,134.21 | 100.000 |
Stephen P. Jonas |
Affirmative | 43,081,912,066.37 | 95.371 |
Withheld | 2,090,995,067.84 | 4.629 |
TOTAL | 45,172,907,134.21 | 100.000 |
James H. KeyesB |
Affirmative | 43,049,050,093.79 | 95.298 |
Withheld | 2,123,857,040.42 | 4.702 |
TOTAL | 45,172,907,134.21 | 100.000 |
Marie L. Knowles |
Affirmative | 43,090,434,696.02 | 95.390 |
Withheld | 2,082,472,438.19 | 4.610 |
TOTAL | 45,172,907,134.21 | 100.000 |
| # of
Votes | % of
Votes |
Ned C. Lautenbach |
Affirmative | 43,082,185,255.05 | 95.372 |
Withheld | 2,090,721,879.16 | 4.628 |
TOTAL | 45,172,907,134.21 | 100.000 |
William O. McCoy |
Affirmative | 42,960,162,066.32 | 95.102 |
Withheld | 2,212,745,067.89 | 4.898 |
TOTAL | 45,172,907,134.21 | 100.000 |
Robert L. Reynolds |
Affirmative | 43,087,560,419.66 | 95.384 |
Withheld | 2,085,346,714.55 | 4.616 |
TOTAL | 45,172,907,134.21 | 100.000 |
Cornelia M. Small |
Affirmative | 43,092,070,014.53 | 95.394 |
Withheld | 2,080,837,119.68 | 4.606 |
TOTAL | 45,172,907,134.21 | 100.000 |
William S. Stavropoulos |
Affirmative | 43,002,032,676.43 | 95.194 |
Withheld | 2,170,874,457.78 | 4.806 |
TOTAL | 45,172,907,134.21 | 100.000 |
Kenneth L. Wolfe |
Affirmative | 43,047,241,852.81 | 95.294 |
Withheld | 2,125,665,281.40 | 4.706 |
TOTAL | 45,172,907,134.21 | 100.000 |
A Denotes trust-wide proposal and voting results. B Effective on or about January 1, 2007. |
Annual Report
Board Approval of Investment Advisory Contracts and Management Fees
Fidelity Small Cap Growth Fund
Each year, typically in July, the Board of Trustees, including the Independent Trustees (together, the Board), votes on the renewal of the management contract and sub-advisory agreements (together, the Advisory Contracts) for the fund. The Board, assisted by the advice of fund counsel and Independent Trustees' counsel, requests and considers a broad range of information throughout the year.
The Board meets regularly each month except August and takes into account throughout the year matters bearing on Advisory Contracts. The Board, acting directly and through its separate committees, considers at each of its meetings factors that are relevant to the annual renewal of the fund's Advisory Contracts, including the services and support provided to the fund and its shareholders. At the time of the renewal, the Board had 12 standing committees, each composed of Independent Trustees with varying backgrounds, to which the Board has assigned specific subject matter responsibilities in order to enhance effective decision-making by the Board. Each committee has adopted a written charter outlining the structure and purposes of the committee. One such committee, the Equity Contract Committee, meets periodically as needed throughout the year to consider matters specifically related to the annual renewal of Advisory Contracts. The committee requests and receives information on, and makes recommendations to the Independent Trustees concerning, the approval and annual review of the Advisory Contracts.
At its July 2006 meeting, the Board of Trustees, including the Independent Trustees, unanimously determined to renew the Advisory Contracts for the fund. In reaching its determination, the Board considered all factors it believed relevant, including (i) the nature, extent, and quality of the services to be provided to the fund and its shareholders (including the investment performance of the fund); (ii) the competitiveness of the management fee and total expenses of the fund; (iii) the total costs of the services to be provided by and the profits to be realized by the investment adviser and its affiliates from the relationship with the fund; (iv) the extent to which economies of scale would be realized as the fund grows; and (v) whether fee levels reflect these economies of scale, if any, for the benefit of fund shareholders.
In determining whether to renew the Advisory Contracts for the fund, the Board ultimately reached a determination, with the assistance of fund counsel and Independent Trustees' counsel, that the renewal of the Advisory Contracts and the compensation to be received by Fidelity under the management contract is consistent with Fidelity's fiduciary duty under applicable law. In addition to evaluating the specific factors noted above, the Board, in reaching its determination, is aware that shareholders in the fund have a broad range of investment choices available to them, including a wide choice among mutual funds offered by competitors to Fidelity, and that the fund's shareholders, with the opportunity to review and weigh the disclosure provided by the fund in its prospectus and other public disclosures, have chosen to invest in this fund, managed by Fidelity.
Annual Report
Board Approval of Investment Advisory Contracts and
Management Fees - continued
Nature, Extent, and Quality of Services Provided. The Board considered staffing within the investment adviser, FMR, and the sub-advisers (together, the Investment Advisers), including the background of the fund's portfolio manager and the fund's investment objective and discipline. The Independent Trustees also had discussions with senior management of Fidelity's investment operations and investment groups. The Board considered the structure of the portfolio manager compensation program and whether this structure provides appropriate incentives.
Resources Dedicated to Investment Management and Support Services. The Board reviewed the size, education, and experience of the Investment Advisers' investment staff, their use of technology, and the Investment Advisers' approach to recruiting, training, and retaining portfolio managers and other research, advisory, and management personnel. The Board considered Fidelity's extensive global research capabilities that enable the Investment Advisers to aggregate data from various sources in an effort to produce positive investment results. The Board noted that Fidelity's analysts have access to a variety of technological tools that enable them to perform both fundamental and quantitative analysis and to specialize in various disciplines. The Board also considered that Fidelity's portfolio managers and analysts have access to daily portfolio attribution that allows for monitoring of a fund's portfolio, as well as an electronic communication system that provides immediate real-time access to research concerning issuers and credit enhancers.
Shareholder and Administrative Services. The Board considered (i) the nature, extent, quality, and cost of administrative, distribution, and shareholder services performed by the Investment Advisers and their affiliates under the Advisory Contracts and under separate agreements covering transfer agency, pricing and bookkeeping, and securities lending services for the fund; (ii) the nature and extent of the Investment Advisers' supervision of third party service providers, principally custodians and subcustodians; and (iii) the resources devoted to, and the record of compliance with, the fund's compliance policies and procedures. The Board reviewed the allocation of fund brokerage, including allocations to brokers affiliated with the Investment Advisers, the use of brokerage commissions to pay fund expenses, and the use of "soft" commission dollars to pay for research services. The Board also considered that Fidelity voluntarily pays for market data out of its own resources.
The Board noted that the growth of fund assets across the complex allows Fidelity to reinvest in the development of services designed to enhance the value or convenience of the Fidelity funds as investment vehicles. These services include 24-hour access to account information and market information through phone representatives and over the Internet, and investor education materials and asset allocation tools.
Annual Report
Investment in a Large Fund Family. The Board considered the benefits to shareholders of investing in a Fidelity fund, including the benefits of investing in a fund that is part of a large family of funds offering a variety of investment disciplines and providing for a large variety of mutual fund investor services. For example, fund shareholders are offered the privilege of exchanging shares of the fund for shares of other Fidelity funds, as set forth in the fund's prospectus, without paying an additional sales charge. The Board noted that, since the last Advisory Contract renewals in July 2005, Fidelity has taken a number of actions that benefited particular funds, including (i) dedicating additional resources to investment research and to restructure the investment research teams; (ii) voluntarily entering into contractual arrangements with certain brokers pursuant to which Fidelity pays for research products and services separately out of its own resources, rather than bundling with fund commissions; (iii) launching the Fidelity Advantage Class of its five Spartan stock index funds and three Spartan bond index funds, which is a lower-fee class available to shareholders with higher account balances; (iv) contractually agreeing to impose expense limitations on Fidelity U.S. Bond Index Fund and reducing the fund's initial investment minimum; and (v) offering shareholders of each of the Fidelity Institutional Money Market Funds the privilege of exchanging shares of the fund for shares of other Fidelity funds.
Investment Performance and Compliance. The Board considered whether the fund has operated within its investment objective, as well as its record of compliance with its investment restrictions. It also reviewed the fund's absolute investment performance for each class, as well as the fund's relative investment performance for each class measured against (i) a broad-based securities market index, and (ii) a peer group of mutual funds deemed appropriate by the Board. Because the fund had been in existence less than three calendar years, the following chart considered by the Board shows, for the one-year period ended December 31, 2005, the total returns of Class C and Fidelity Small Cap Growth (retail class), the total return of a broad-based securities market index ("benchmark"), and a range of total returns of a peer group of mutual funds identified by Lipper Inc. as having an investment objective similar to that of the fund. The returns of Class C and Fidelity Small Cap Growth (retail class) represent the performance of classes with the highest and lowest 12b-1 fees, respectively (not necessarily with the highest and lowest total expenses). The box within the chart shows the 25th percentile return (bottom of box) and the 75th percentile return (top of box) of the Lipper peer group. Returns shown above the box are in the first quartile and returns shown below the box are in the fourth quartile. The percentage beaten numbers noted below the chart correspond to the percentile box and represent the percentage of funds in the Lipper peer group whose performance was equal to or lower than that of the class indicated.
Annual Report
Board Approval of Investment Advisory Contracts and
Management Fees - continued
Fidelity Small Cap Growth Fund

The Board reviewed the fund's relative investment performance against its Lipper peer group and stated that the performance of Fidelity Small Cap Growth (retail class) was in the first quartile for the period shown. The Board also stated that the relative investment performance of Fidelity Small Cap Growth (retail class) compared favorably to its benchmark for the period shown. The Board considered that the variations in performance among the fund's classes reflect the variations in class expenses, which result in lower performance for higher expense classes. The Board stated that it is difficult to evaluate in any comprehensive fashion the performance of the fund, in light of its relatively recent launch. The Board also reviewed the fund's relative investment performance against a peer group defined by Morningstar.
The Board also considered that the fund's management fee is subject to upward or downward adjustment depending upon whether, and to what extent, the fund's investment performance for the performance period exceeds, or is exceeded by, the record (over the same period) of a Board-approved performance adjustment index. The Board realizes that the performance adjustment provides FMR with a strong economic incentive to seek to achieve superior performance for the fund's shareholders and helps to more closely align the interests of FMR and the fund's shareholders.
The Board considered that FMR has taken steps to refocus and strengthen equity research, equity portfolio management, and compliance. The Board noted with favor FMR's reorganization of its senior management team in 2005 and FMR's dedication of additional resources to investment research, and participated in the process that led to those changes.
Annual Report
Based on its review, and giving particular weight to the nature and quality of the resources dedicated by the Investment Advisers to maintain and improve relative performance, the Board concluded that the nature, extent, and quality of the services provided to the fund will benefit the fund's shareholders, particularly in light of the Board's view that the fund's shareholders benefit from investing in a fund that is part of a large family of funds offering a variety of investment disciplines and services.
Competitiveness of Management Fee and Total Fund Expenses. The Board considered the fund's management fee and total expenses compared to "mapped groups" of competitive funds and classes. Fidelity creates "mapped groups" by combining similar Lipper investment objective categories that have comparable management fee characteristics. Combining Lipper investment objective categories aids the Board's management fee and total expense comparisons by broadening the competitive group used for comparison and by reducing the number of universes to which various Fidelity funds are compared.
The Board considered two proprietary management fee comparisons for the 12-month (or shorter) periods shown in the chart below. The group of Lipper funds used by the Board for management fee comparisons is referred to below as the "Total Mapped Group" and, for the reasons explained above, is broader than the Lipper peer group used by the Board for performance comparisons. The Total Mapped Group comparison focuses on a fund's standing relative to the total universe of comparable funds available to investors, in terms of gross management fees before expense reimbursements or caps, and without giving effect to the fund's performance adjustment. "TMG %" represents the percentage of funds in the Total Mapped Group that had management fees that were lower than the fund's. For example, a TMG % of 13% means that 87% of the funds in the Total Mapped Group had higher management fees than the fund. The "Asset-Size Peer Group" (ASPG) comparison focuses on a fund's standing relative to non-Fidelity funds similar in size to the fund within the Total Mapped Group. The ASPG represents at least 15% of the funds in the Total Mapped Group with comparable asset size and management fee characteristics, subject to a minimum of 50 funds (or all funds in the Total Mapped Group if fewer than 50). Additional information, such as the ASPG quartile in which the fund's management fee ranked and the impact of the fund's performance adjustment, is also included in the chart and considered by the Board.
Annual Report
Board Approval of Investment Advisory Contracts and
Management Fees - continued
Fidelity Small Cap Growth Fund
The Board noted that the fund's management fee ranked below the median of its Total Mapped Group and below the median of its ASPG for 2005. The Board also noted the effect of the fund's positive performance adjustment on the fund's management fee ranking.
Based on its review, the Board concluded that the fund's management fee was fair and reasonable in light of the services that the fund receives and the other factors considered.
In its review of each class's total expenses, the Board considered the fund's management fee as well as other fund or class expenses, as applicable, such as transfer agent fees, pricing and bookkeeping fees, fund-paid 12b-1 fees, and custodial, legal, and audit fees. The Board also noted the effects of any waivers and reimbursements on fees and expenses, as well as the fund's positive performance adjustment. As part of its review, the Board also considered current and historical total expenses of each class of the fund compared to competitive fund median expenses. Each class of the fund is compared to those funds and classes in the Total Mapped Group (used by the Board for management fee comparisons) that have a similar sales load structure.
The Board noted that the total expenses of each of Class A, Institutional Class, and Fidelity Small Cap Growth (retail class) ranked below its competitive median for 2005, and the total expenses of each of Class B, Class C, and Class T ranked above its competitive median for 2005. The Board considered that Class B and Class C were above median because of relatively high transfer agent fees resulting from small average account sizes. The Board noted that the fund offers multiple classes, each of which has a different sales load and 12b-1 fee structure, and that the multiple structures are intended to offer a range of pricing options for the intermediary market. The Board also noted that the total expenses of the classes vary primarily by the level of their 12b-1 fees, although differences in transfer agent fees may also cause expenses to vary from class to class.
Annual Report
In its review of total expenses, the Board also considered Fidelity fee structures and other information on clients that FMR and its affiliates service in other competitive markets, such as other mutual funds advised or subadvised by FMR or its affiliates, pension plan clients, and other institutional clients.
Based on its review, the Board concluded that the total expenses of each class of the fund were reasonable, although in some cases above the median of the universe presented for comparison, in light of the services that the fund and its shareholders receive and the other factors considered.
Costs of the Services and Profitability. The Board considered the revenues earned and the expenses incurred by Fidelity in conducting the business of developing, marketing, distributing, managing, administering and servicing the fund and its shareholders. The Board also considered the level of Fidelity's profits in respect of all the Fidelity funds.
On an annual basis, FMR presents to the Board Fidelity's profitability for the fund. Fidelity calculates the profitability for each fund, as well as aggregate profitability for groups of Fidelity funds and all Fidelity funds, using a series of detailed revenue and cost allocation methodologies which originate with the audited books and records of Fidelity. The Audit Committee of the Board reviews any significant changes from the prior year's methodologies.
PricewaterhouseCoopers LLP (PwC), independent registered accounting firm and auditor to Fidelity and certain Fidelity funds, has been engaged annually by the Board as part of the Board's assessment of the results of Fidelity's profitability analysis. PwC's engagement includes the review and assessment of Fidelity's methodologies used in determining the revenues and expenses attributable to Fidelity's mutual fund business, and completion of agreed-upon procedures surrounding the mathematical accuracy of fund profitability and its conformity to allocation methodologies. After considering PwC's reports issued under the engagement and information provided by Fidelity, the Board believes that while other allocation methods may also be reasonable, Fidelity's profitability methodologies are reasonable in all material respects.
The Board has also reviewed Fidelity's non-fund businesses and any fall-out benefits related to the mutual fund business as well as cases where Fidelity's affiliates may benefit from or be related to the fund's business.
Annual Report
Board Approval of Investment Advisory Contracts and
Management Fees - continued
The Board considered the costs of the services provided by and the profits realized by Fidelity in connection with the operation of the fund and determined that the amount of profit is a fair entrepreneurial profit for the management of the fund.
Economies of Scale. The Board considered whether there have been economies of scale in respect of the management of the Fidelity funds, whether the Fidelity funds (including the fund) have appropriately benefited from any such economies of scale, and whether there is potential for realization of any further economies of scale. The Board considered the extent to which the fund will benefit from economies of scale through increased services to the fund, through waivers or reimbursements, or through fee or expense reductions, including reductions that occur through operation of the transfer agent agreement. The transfer agent fee varies in part based on the number of accounts in the fund. If the number of accounts decreases or the average account size increases, the overall transfer agent fee rate decreases.
The Board recognized that the fund's management contract incorporates a "group fee" structure, which provides for lower fee rates as total fund assets under FMR's management increase, and for higher fee rates as total fund assets under FMR's management decrease. The Board considered that the group fee is designed to deliver the benefits of economies of scale to fund shareholders when total fund assets increase, even if assets of any particular fund are unchanged or have declined, because some portion of Fidelity's costs are attributable to services provided to all Fidelity funds, and all funds benefit if those costs can be allocated among more assets. The Board concluded that, given the group fee structure, fund shareholders will achieve a certain level of economies of scale as assets under FMR's management increase at the fund complex level, regardless of whether Fidelity achieves any such economies of scale.
The Board further concluded that any potential economies of scale are being shared between fund shareholders and Fidelity in an appropriate manner.
Additional Information Requested by the Board. In order to develop fully the factual basis for consideration of the Advisory Contracts, the Board requested additional information on several topics, including (i) Fidelity's fund profitability methodology and profitability trends within certain funds; (ii) portfolio manager compensation; (iii) the extent to which any economies of scale exist and are shared between the funds and Fidelity; (iv) the total expenses of certain funds and classes relative to competitors, including the extent to which the expenses of certain funds have been or could be capped; (v) fund performance trends; and (vi) Fidelity's fee structures, including use of performance fees.
Based on its evaluation of all of the conclusions noted above, and after considering all material factors, the Board ultimately concluded that the advisory fee structures are fair and reasonable, and that the fund's Advisory Contracts should be renewed.
Annual Report
Annual Report
Annual Report
Annual Report
Investment Adviser
Fidelity Management & Research Company
Boston, MA
Investment Sub-Advisers
FMR Co., Inc.
Fidelity Management & Research
(U.K.) Inc.
Fidelity Research & Analysis Company
(formerly Fidelity Management & Research
(Far East) Inc.)
Fidelity International Investment Advisors
Fidelity Investments Japan Limited
Fidelity International Investment Advisors (U.K.) Limited
General Distributor
Fidelity Distributors Corporation
Boston, MA
Transfer and Service Agents
Fidelity Investments Institutional
Operations Company, Inc.
Boston, MA
Fidelity Service Company, Inc.
Boston, MA
Custodian
Citibank, N.A.
New York, NY
ASCP-UANN-0906
1.803713.101
(Fidelity Investment logo)(registered trademark)
(Fidelity Investment logo)(registered trademark)
FidelityAdvisor
Small Cap Growth
Fund - Institutional Class
Annual Report
July 31, 2006
Institutional Class
is a class of Fidelity®
Small Cap Growth
Fund
(2_fidelity_logos) (Registered_Trademark)
Contents
Chairman's Message | <Click Here> | Ned Johnson's message to shareholders. |
Performance | <Click Here> | How the fund has done over time. |
Management's Discussion | <Click Here> | The manager's review of fund performance, strategy and outlook |
Shareholder Expense Example | <Click Here> | An example of shareholder expenses. |
Investment Changes | <Click Here> | A summary of the fund's investments. |
Investments | <Click Here> | A complete list of the fund's investments with their market values. |
Financial Statements | <Click Here> | Statements of assets and liabilities, operations, and changes in net assets,
as well as financial highlights. |
Notes | <Click Here> | Notes to the financial statements. |
Report of Independent Registered Public Accounting Firm | <Click Here> | |
Trustees and Officers | <Click Here> | |
Distributions | <Click Here> | |
Proxy Voting Results | <Click Here> | |
Board Approval of Investment Advisory Contracts and Management Fees | <Click Here> | |
To view a fund's proxy voting guidelines and proxy voting record for the 12-month period ended June 30, visit www.fidelity.com/proxyvotingresults or visit the Securities and Exchange Commission's (SEC) web site at www.sec.gov. You may also call 1-877-208-0098 to request a free copy of the proxy voting guidelines.
Standard & Poor's, S&P and S&P 500 are registered service marks of The McGraw-Hill Companies, Inc. and have been licensed for use by Fidelity Distributors Corporation.
Other third party marks appearing herein are the property of their respective owners.
All other marks appearing herein are registered or unregistered trademarks or service marks of FMR Corp. or an affiliated company.
Annual Report
This report and the financial statements contained herein are submitted for the general information of the shareholders of the fund. This report is not authorized for distribution to prospective investors in the fund unless preceded or accompanied by an effective prospectus.
A fund files its complete schedule of portfolio holdings with the SEC for the first and third quarters of each fiscal year on Form N-Q. Forms N-Q are available on the SEC's web site at http://www.sec.gov. A fund's Forms N-Q may be reviewed and copied at the SEC's Public Reference Room in Washington, DC. Information regarding the operation of the SEC's Public Reference Room may be obtained by calling 1-800-SEC-0330. For a complete list of a fund's portfolio holdings, view the most recent quarterly holdings report, semiannual report, or annual report on Fidelity's web site at http://www.advisor.fidelity.com.
NOT FDIC INSURED · MAY LOSE VALUE · NO BANK GUARANTEE
Neither the fund nor Fidelity Distributors Corporation is a bank.
Annual Report
Chairman's Message
(photo_of_Edward_C_Johnson_3d)
Dear Shareholder:
Although many securities markets made gains in early 2006, inflation concerns led to mixed results through the year's mid-point. Financial markets are always unpredictable. There are, however, a number of time-tested principles that can put the historical odds in your favor.
One of the basic tenets is to invest for the long term. Over time, riding out the markets' inevitable ups and downs has proven much more effective than selling into panic or chasing the hottest trend. Even missing only a few of the markets' best days can significantly diminish investor returns. Patience also affords the benefits of compounding - of earning interest on additional income or reinvested dividends and capital gains. There are tax advantages and cost benefits to consider as well. The more you sell, the more taxes you pay, and the more you trade, the higher the costs. While staying the course doesn't eliminate risk, it can considerably lessen the effect of short-term declines.
You can further manage your investing risk through diversification. And today, more than ever, geographic diversification should be taken into account. Studies indicate that asset allocation is the single most important determinant of a portfolio's long-term success. The right mix of stocks, bonds and cash - aligned to your particular risk tolerance and investment objective - is very important. Age-appropriate rebalancing is also an essential aspect of asset allocation. For younger investors, an emphasis on equities - which historically have been the best performing asset class over time - is encouraged. As investors near their specific goal, such as retirement or sending a child to college, consideration may be given to replacing volatile assets (e.g. common stocks) with more-stable fixed investments (bonds or savings plans).
A third investment principle - investing regularly - can help lower the average cost of your purchases. Investing a certain amount of money each month or quarter helps ensure you won't pay for all your shares at market highs. This strategy - known as dollar cost averaging - also reduces unconstructive "emotion" from investing, helping shareholders avoid selling weak performers just prior to an upswing, or chasing a hot performer just before a correction.
We invite you to contact us via the Internet, through our Investor Centers or over the phone. It is our privilege to provide you the information you need to make the investments that are right for you.
Sincerely,
/s/Edward C. Johnson 3d
Edward C. Johnson 3d
Annual Report
Fidelity Advisor Small Cap Growth Fund - Institutional Class
Performance: The Bottom Line
Average annual total return reflects the change in the value of an investment, assuming reinvestment of the class' dividend income and capital gains (the profits earned upon the sale of securities that have grown in value) and assuming a constant rate of performance each year. The $10,000 table and the fund's returns do not reflect the deduction of taxes that a shareholder would pay on fund distributions or the redemption of fund shares. During periods of reimbursement by Fidelity, a fund's total return will be greater than it would be had the reimbursement not occurred. How a fund did yesterday is no guarantee of how it will do tomorrow.
Average Annual Total Returns
Periods ended July 31, 2006 | Past 1
year | Life of
FundA |
Institutional Class | 0.97% | 16.77% |
A From November 3, 2004.
$10,000 Over Life of Fund
Let's say hypothetically that $10,000 was invested in Fidelity Advisor Small Cap Growth Fund - Institutional Class on November 3, 2004, when the fund started. The chart shows how the value of your investment would have changed, and also shows how the Russell 2000® Growth Index performed over the same period.
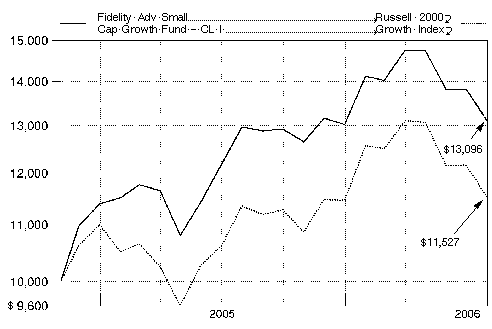
Annual Report
Management's Discussion of Fund Performance
Comments from Lionel Harris, Portfolio Manager of Fidelity Advisor Small Cap Growth Fund
As measured by the Dow Jones Wilshire 5000 Composite IndexSM - the broadest measure of U.S. equity market performance - stocks did well for most of the 12-month period ending July 31, 2006, before faltering. For the one-year time frame as a whole, the Dow Jones Wilshire benchmark rose 5.43%. That was nearly identical to the 5.38% gain of the Standard & Poor's 500SM Index, a broad market proxy that's a reflection of larger-cap stocks. Stocks were resilient early on, bouncing back quickly after Hurricanes Katrina and Rita caused energy prices to spike to record-high levels. Buoyed by strong corporate earnings and solid economic growth, the S&P 500® ran off six consecutive months of positive returns from November through April. However, stocks pulled back for most of the remainder of the period. A slowdown in economic expansion and consumer spending, reaccelerating energy prices and continued interest rate hikes by the Federal Reserve Board cooled equity performance. Among other widely quoted market yardsticks, the Dow Jones Industrial AverageSM returned 7.59%, while the NASDAQ Composite® Index dropped 3.47%.
The fund's Institutional Class shares were up 0.97% during the past year, trailing the Russell 2000® Growth Index, which rose 1.53%. The fund's overweighting in the lagging consumer discretionary sector, combined with disappointing stock selection there detracted. Many consumer-related companies struggled as the market worried about the impact of rising energy costs and interest rates. One example was mattress maker Tempur-Pedic International, which warned of lower fiscal 2005 earnings and was sold from the portfolio. The portfolio's biggest individual detractor was education company EVCI Career Colleges, which fell after a surprise regulatory investigation. At period end, EVCI was no longer in the portfolio. In consumer staples, the fund was hurt by American Italian Pasta, also no longer in the fund. This maker of store-brand pasta struggled with intensifying competition, an overleveraged balance sheet and revelations of accounting problems. On the positive side, stock picking in health care was a major contributor, led by Abaxis, a maker of portable blood analysis devices, which did well after handily beating Wall Street's sales and earnings expectations. Abaxis was sold from the fund before period end. Our best relative performer during the period was oil refiner Holly Corporation, which continued to earn strong profits in the extremely favorable environment for energy stocks. Given the fund's investments in foreign stocks, favorable currency movements also helped boost returns.
The views expressed above reflect those of the portfolio manager(s) only through the end of the period as stated on the cover of this report and do not necessarily represent the views of Fidelity or any other person in the Fidelity organization. Any such views are subject to change at any time based upon market or other conditions and Fidelity disclaims any responsibility to update such views. These views may not be relied on as investment advice and, because investment decisions for a Fidelity fund are based on numerous factors, may not be relied on as an indication of trading intent on behalf of any Fidelity fund.
Annual Report
Shareholder Expense Example
As a shareholder of the Fund, you incur two types of costs: (1) transaction costs, including sales charges (loads) on purchase payments or redemption proceeds, redemption fees, and (2) ongoing costs, including management fees, distribution and/or service (12b-1) fees and other Fund expenses. This Example is intended to help you understand your ongoing costs (in dollars) of investing in the Fund and to compare these costs with the ongoing costs of investing in other mutual funds.
The Example is based on an investment of $1,000 invested at the beginning of the period and held for the entire period (February 1, 2006 to July 31, 2006).
Actual Expenses
The first line of the accompanying table for each class of the Fund provides information about actual account values and actual expenses. You may use the information in this line, together with the amount you invested, to estimate the expenses that you paid over the period. Simply divide your account value by $1,000.00 (for example, an $8,600 account value divided by $1,000.00 = 8.6), then multiply the result by the number in the first line for a class of the Fund under the heading entitled "Expenses Paid During Period" to estimate the expenses you paid on your account during this period. A small balance maintenance fee of $12.00 that is charged once a year may apply for certain accounts with a value of less than $2,000. This fee is not included in the table below. If it was, the estimate of expenses you paid during the period would be higher, and your ending account value lower, by this amount.
Hypothetical Example for Comparison Purposes
The second line of the accompanying table for each class of the Fund provides information about hypothetical account values and hypothetical expenses based on a Class' actual expense ratio and an assumed rate of return of 5% per year before expenses, which is not the Class' actual return. The hypothetical account values and expenses may not be used to estimate the actual ending account balance or expenses you paid for the period. You may use this information to compare the ongoing costs of investing in the Fund and other funds. To do so, compare this 5% hypothetical example with the 5% hypothetical examples that appear in the shareholder reports of the other funds. A small balance maintenance fee of $12.00 that is charged once a year may apply for certain accounts with a value of less than $2,000. This fee is not included in the table below. If it was, the estimate of expenses you paid during the period would be higher, and your ending account value lower, by this amount.
Annual Report
Shareholder Expense Example - continued
Please note that the expenses shown in the table are meant to highlight your ongoing costs only and do not reflect any transaction costs. Therefore, the second line of the table is useful in comparing ongoing costs only, and will not help you determine the relative total costs of owning different funds. In addition, if these transactional costs were included, your costs would have been higher.
| Beginning
Account Value
February 1, 2006 | Ending
Account Value
July 31, 2006 | Expenses Paid
During Period *
February 1, 2006
to July 31, 2006 |
Class A | | | |
Actual | $ 1,000.00 | $ 926.60 | $ 6.69 |
HypotheticalA | $ 1,000.00 | $ 1,017.85 | $ 7.00 |
Class T | | | |
Actual | $ 1,000.00 | $ 925.80 | $ 7.88 |
HypotheticalA | $ 1,000.00 | $ 1,016.61 | $ 8.25 |
Class B | | | |
Actual | $ 1,000.00 | $ 922.70 | $ 10.25 |
HypotheticalA | $ 1,000.00 | $ 1,014.13 | $ 10.74 |
Class C | | | |
Actual | $ 1,000.00 | $ 922.70 | $ 10.25 |
HypotheticalA | $ 1,000.00 | $ 1,014.13 | $ 10.74 |
Small Cap Growth | | | |
Actual | $ 1,000.00 | $ 927.50 | $ 5.50 |
HypotheticalA | $ 1,000.00 | $ 1,019.09 | $ 5.76 |
Institutional Class | | | |
Actual | $ 1,000.00 | $ 927.50 | $ 5.21 |
HypotheticalA | $ 1,000.00 | $ 1,019.39 | $ 5.46 |
A 5% return per year before expenses
* Expenses are equal to each Class' annualized expense ratio (shown in the table below); multiplied by the average account value over the period, multiplied by 181/365 (to reflect the one-half year period).
| Annualized
Expense Ratio |
Class A | 1.40% |
Class T | 1.65% |
Class B | 2.15% |
Class C | 2.15% |
Small Cap Growth | 1.15% |
Institutional Class | 1.09% |
Annual Report
Investment Changes
Top Ten Stocks as of July 31, 2006 |
| % of fund's
net assets | % of fund's net assets
6 months ago |
Omnicare, Inc. | 1.8 | 2.1 |
DJO, Inc. | 1.8 | 1.0 |
Harris Corp. | 1.7 | 1.3 |
Per-Se Technologies, Inc. | 1.5 | 1.7 |
Holly Corp. | 1.4 | 1.5 |
j2 Global Communications, Inc. | 1.4 | 1.0 |
Range Resources Corp. | 1.3 | 1.3 |
Amphenol Corp. Class A | 1.3 | 0.0 |
WESCO International, Inc. | 1.3 | 1.3 |
Ness Technologies, Inc. | 1.2 | 0.0 |
| 14.7 | |
Top Five Market Sectors as of July 31, 2006 |
| % of fund's
net assets | % of fund's net assets
6 months ago |
Information Technology | 26.5 | 22.5 |
Industrials | 17.1 | 10.5 |
Health Care | 15.7 | 19.9 |
Energy | 12.7 | 11.1 |
Consumer Discretionary | 10.1 | 18.7 |
Asset Allocation (% of fund's net assets) |
As of July 31, 2006 * | As of January 31, 2006 ** |
| Stocks 94.4% | | | Stocks 97.3% | |
| Short-Term
Investments and
Net Other Assets 5.6% | | | Short-Term
Investments and
Net Other Assets 2.7% | |
* Foreign investments | 9.8% | | ** Foreign investments | 8.9% | |

Annual Report
Investments July 31, 2006
Showing Percentage of Net Assets
Common Stocks - 94.4% |
| Shares | | Value (Note 1) |
CONSUMER DISCRETIONARY - 10.1% |
Diversified Consumer Services - 1.5% |
DeVry, Inc. (a) | 125,000 | | $ 2,637,500 |
Sothebys Class A (ltd. vtg.) (a) | 163,400 | | 4,514,742 |
| | 7,152,242 |
Hotels, Restaurants & Leisure - 1.9% |
Boyd Gaming Corp. | 85,000 | | 2,850,900 |
Domino's Pizza, Inc. | 133,800 | | 3,042,612 |
Penn National Gaming, Inc. (a) | 100,300 | | 3,316,921 |
| | 9,210,433 |
Household Durables - 0.5% |
Lifetime Brands, Inc. (d) | 124,077 | | 2,522,485 |
Internet & Catalog Retail - 0.8% |
Coldwater Creek, Inc. (a) | 180,600 | | 3,599,358 |
Leisure Equipment & Products - 0.6% |
MarineMax, Inc. (a)(d) | 124,100 | | 2,612,305 |
Media - 2.0% |
Focus Media Holding Ltd. ADR | 62,600 | | 3,919,386 |
New Frontier Media, Inc. (a) | 479,632 | | 3,280,683 |
R.H. Donnelley Corp. | 47,000 | | 2,453,870 |
| | 9,653,939 |
Specialty Retail - 2.2% |
Eddie Bauer Holdings, Inc. (a) | 235,000 | | 3,055,000 |
The Children's Place Retail Stores, Inc. (a) | 84,600 | | 4,722,372 |
Zumiez, Inc. (a) | 81,000 | | 2,424,330 |
| | 10,201,702 |
Textiles, Apparel & Luxury Goods - 0.6% |
Carter's, Inc. (a) | 134,200 | | 2,926,902 |
TOTAL CONSUMER DISCRETIONARY | | 47,879,366 |
CONSUMER STAPLES - 0.9% |
Personal Products - 0.9% |
Herbalife Ltd. (a) | 112,000 | | 4,000,640 |
ENERGY - 12.7% |
Energy Equipment & Services - 4.9% |
Basic Energy Services, Inc. | 122,200 | | 3,299,400 |
Hornbeck Offshore Services, Inc. (a) | 121,500 | | 4,222,125 |
Hydril Co. (a) | 35,300 | | 2,445,231 |
NATCO Group, Inc. Class A (a) | 71,600 | | 2,720,800 |
Common Stocks - continued |
| Shares | | Value (Note 1) |
ENERGY - continued |
Energy Equipment & Services - continued |
Oil States International, Inc. (a) | 94,200 | | $ 3,029,472 |
Pason Systems, Inc. | 283,900 | | 4,076,860 |
Superior Energy Services, Inc. (a) | 98,800 | | 3,383,900 |
| | 23,177,788 |
Oil, Gas & Consumable Fuels - 7.8% |
Comstock Resources, Inc. (a) | 116,000 | | 3,412,720 |
Forest Oil Corp. (a) | 125,800 | | 4,215,558 |
Foundation Coal Holdings, Inc. | 117,500 | | 4,481,450 |
Holly Corp. | 131,400 | | 6,648,840 |
Mariner Energy, Inc. (a) | 307,910 | | 5,545,459 |
Plains Exploration & Production Co. (a) | 75,000 | | 3,297,000 |
Range Resources Corp. | 226,350 | | 6,362,699 |
Tesoro Corp. | 38,400 | | 2,872,320 |
| | 36,836,046 |
TOTAL ENERGY | | 60,013,834 |
FINANCIALS - 5.6% |
Commercial Banks - 0.5% |
Center Financial Corp., California | 98,000 | | 2,442,160 |
Insurance - 5.1% |
American Equity Investment Life Holding Co. | 309,100 | | 3,366,099 |
Aspen Insurance Holdings Ltd. | 193,200 | | 4,559,520 |
National Financial Partners Corp. | 72,200 | | 3,251,888 |
RAM Holdings Ltd. | 200,000 | | 2,476,000 |
RLI Corp. | 72,000 | | 3,404,160 |
Universal American Financial Corp. (a) | 225,000 | | 2,790,000 |
Willis Group Holdings Ltd. | 131,500 | | 4,277,695 |
| | 24,125,362 |
TOTAL FINANCIALS | | 26,567,522 |
HEALTH CARE - 15.7% |
Biotechnology - 0.5% |
Myogen, Inc. (a) | 85,500 | | 2,638,530 |
Health Care Equipment & Supplies - 4.2% |
Cholestech Corp. (a) | 197,000 | | 2,115,780 |
DJO, Inc. (a) | 213,800 | | 8,438,686 |
Inverness Medical Innovations, Inc. (a) | 138,800 | | 4,127,912 |
Common Stocks - continued |
| Shares | | Value (Note 1) |
HEALTH CARE - continued |
Health Care Equipment & Supplies - continued |
Kinetic Concepts, Inc. (a) | 72,200 | | $ 3,217,232 |
Regeneration Technologies, Inc. (a) | 361,700 | | 2,112,328 |
| | 20,011,938 |
Health Care Providers & Services - 6.8% |
Amedisys, Inc. (a) | 90,700 | | 3,463,833 |
Chemed Corp. | 134,200 | | 4,935,876 |
Humana, Inc. (a) | 93,700 | | 5,240,641 |
Omnicare, Inc. (d) | 186,600 | | 8,445,515 |
Sierra Health Services, Inc. (a) | 108,400 | | 4,680,712 |
VCA Antech, Inc. (a) | 153,800 | | 5,378,386 |
| | 32,144,963 |
Health Care Technology - 1.5% |
Per-Se Technologies, Inc. (a) | 290,000 | | 6,922,300 |
Life Sciences Tools & Services - 0.9% |
ICON PLC sponsored ADR (a) | 63,995 | | 4,213,431 |
Pharmaceuticals - 1.8% |
Kos Pharmaceuticals, Inc. (a) | 80,800 | | 3,340,272 |
Medicis Pharmaceutical Corp. Class A | 184,900 | | 5,095,844 |
| | 8,436,116 |
TOTAL HEALTH CARE | | 74,367,278 |
INDUSTRIALS - 17.1% |
Aerospace & Defense - 2.4% |
Heico Corp. Class A | 120,000 | | 3,144,000 |
Hexcel Corp. (a) | 392,500 | | 5,640,225 |
Precision Castparts Corp. | 46,800 | | 2,791,620 |
| | 11,575,845 |
Air Freight & Logistics - 1.0% |
Hub Group, Inc. Class A | 216,000 | | 4,877,280 |
Building Products - 0.5% |
NCI Building Systems, Inc. (a) | 50,000 | | 2,337,000 |
Commercial Services & Supplies - 3.6% |
CDI Corp. | 125,000 | | 2,443,750 |
Clean Harbors, Inc. | 112,200 | | 4,139,058 |
Huron Consulting Group, Inc. (a) | 135,600 | | 4,702,608 |
Navigant Consulting, Inc. (a) | 150,000 | | 2,862,000 |
Tele Atlas NV (a)(d) | 173,900 | | 2,847,722 |
| | 16,995,138 |
Common Stocks - continued |
| Shares | | Value (Note 1) |
INDUSTRIALS - continued |
Electrical Equipment - 3.2% |
C&D Technologies, Inc. (d) | 389,110 | | $ 2,762,681 |
EnerSys (a) | 138,900 | | 2,504,367 |
Genlyte Group, Inc. (a) | 62,000 | | 4,312,100 |
Q-Cells AG | 48,000 | | 3,437,196 |
Ultralife Batteries, Inc. (a)(d) | 220,000 | | 2,127,400 |
| | 15,143,744 |
Industrial Conglomerates - 0.5% |
Raven Industries, Inc. | 81,373 | | 2,425,729 |
Machinery - 4.6% |
Bucyrus International, Inc. Class A | 70,300 | | 3,424,313 |
Flowserve Corp. (a) | 68,800 | | 3,563,840 |
Graco, Inc. (d) | 58,000 | | 2,278,820 |
Greenbrier Companies, Inc. | 83,000 | | 2,305,740 |
Manitowoc Co., Inc. | 85,000 | | 3,337,100 |
Wabtec Corp. | 90,000 | | 2,390,400 |
Watts Water Technologies, Inc. Class A | 146,000 | | 4,252,980 |
| | 21,553,193 |
Trading Companies & Distributors - 1.3% |
WESCO International, Inc. (a) | 105,000 | | 6,116,250 |
TOTAL INDUSTRIALS | | 81,024,179 |
INFORMATION TECHNOLOGY - 26.5% |
Communications Equipment - 3.5% |
CommScope, Inc. (a) | 92,800 | | 2,898,144 |
F5 Networks, Inc. (a) | 62,100 | | 2,877,714 |
Harris Corp. | 179,800 | | 8,189,890 |
MasTec, Inc. (a) | 209,000 | | 2,731,630 |
| | 16,697,378 |
Computers & Peripherals - 1.5% |
Neoware Systems, Inc. (a)(d) | 165,700 | | 2,051,366 |
Synaptics, Inc. (a) | 115,000 | | 2,417,300 |
Xyratex Ltd. (a) | 99,700 | | 2,317,028 |
| | 6,785,694 |
Electronic Equipment & Instruments - 4.2% |
Amphenol Corp. Class A | 109,600 | | 6,146,368 |
Cogent, Inc. (a)(d) | 236,900 | | 3,352,135 |
FARO Technologies, Inc. (a) | 123,593 | | 1,993,555 |
Common Stocks - continued |
| Shares | | Value (Note 1) |
INFORMATION TECHNOLOGY - continued |
Electronic Equipment & Instruments - continued |
ScanSource, Inc. (a) | 110,400 | | $ 3,284,400 |
Trimble Navigation Ltd. (a) | 107,400 | | 5,158,422 |
| | 19,934,880 |
Internet Software & Services - 3.6% |
CyberSource Corp. (a) | 283,666 | | 2,848,007 |
Digitas, Inc. (a) | 431,200 | | 3,557,400 |
Equinix, Inc. (a) | 72,200 | | 3,781,836 |
j2 Global Communications, Inc. (a) | 237,200 | | 6,641,600 |
| | 16,828,843 |
IT Services - 6.9% |
CACI International, Inc. Class A (a) | 49,500 | | 2,789,325 |
Iron Mountain, Inc. (a) | 124,000 | | 5,084,000 |
Lionbridge Technologies, Inc. (a) | 933,646 | | 5,611,212 |
Ness Technologies, Inc. (a) | 512,300 | | 5,655,792 |
Satyam Computer Services Ltd. sponsored ADR (d) | 122,000 | | 4,300,500 |
SI International, Inc. (a) | 144,647 | | 3,945,970 |
TALX Corp. | 250,725 | | 5,152,399 |
| | 32,539,198 |
Office Electronics - 0.6% |
Zebra Technologies Corp. Class A (a) | 95,000 | | 2,978,250 |
Semiconductors & Semiconductor Equipment - 4.3% |
California Micro Devices Corp. (a) | 509,000 | | 2,010,550 |
Entegris, Inc. (a) | 266,200 | | 2,515,590 |
FormFactor, Inc. (a) | 108,000 | | 4,629,960 |
MIPS Technologies, Inc. (a) | 134,300 | | 850,119 |
O2Micro International Ltd. sponsored ADR (a) | 154,000 | | 922,460 |
Rudolph Technologies, Inc. (a) | 237,000 | | 3,296,670 |
Silicon On Insulator Technologies SA (SOITEC) (a) | 8,500 | | 226,704 |
SiRF Technology Holdings, Inc. (a) | 109,300 | | 2,087,630 |
Tessera Technologies, Inc. (a) | 126,600 | | 3,984,102 |
| | 20,523,785 |
Software - 1.9% |
Blackbaud, Inc. | 236,259 | | 4,928,363 |
Moldflow Corp. (a) | 174,100 | | 2,090,941 |
Quality Systems, Inc. | 62,800 | | 2,079,936 |
| | 9,099,240 |
TOTAL INFORMATION TECHNOLOGY | | 125,387,268 |
Common Stocks - continued |
| Shares | | Value (Note 1) |
MATERIALS - 4.9% |
Metals & Mining - 4.9% |
Allegheny Technologies, Inc. | 73,000 | | $ 4,663,970 |
Carpenter Technology Corp. | 44,200 | | 4,349,280 |
Meridian Gold, Inc. (a) | 163,100 | | 4,397,473 |
Oregon Steel Mills, Inc. (a) | 96,600 | | 4,466,784 |
Titanium Metals Corp. | 191,500 | | 5,522,860 |
| | 23,400,367 |
TELECOMMUNICATION SERVICES - 0.1% |
Wireless Telecommunication Services - 0.1% |
Dobson Communications Corp. Class A (a) | 70,000 | | 469,700 |
UTILITIES - 0.8% |
Multi-Utilities - 0.8% |
CMS Energy Corp. (a) | 283,600 | | 3,973,236 |
TOTAL COMMON STOCKS (Cost $440,779,155) | 447,083,390 |
Money Market Funds - 6.9% |
| | | |
Fidelity Cash Central Fund, 5.3% (b) | 22,221,562 | | 22,221,562 |
Fidelity Securities Lending Cash Central Fund, 5.32% (b)(c) | 10,678,095 | | 10,678,095 |
TOTAL MONEY MARKET FUNDS (Cost $32,899,657) | 32,899,657 |
TOTAL INVESTMENT PORTFOLIO - 101.3% (Cost $473,678,812) | | 479,983,047 |
NET OTHER ASSETS - (1.3)% | | (6,214,449) |
NET ASSETS - 100% | $ 473,768,598 |
Legend |
(a) Non-income producing |
(b) Affiliated fund that is available only to investment companies and other accounts managed by Fidelity Investments. The rate quoted is the annualized seven-day yield of the fund at period end. A complete unaudited listing of the fund's holdings as of its most recent quarter end is available upon request. |
(c) Investment made with cash collateral received from securities on loan. |
(d) Security or a portion of the security is on loan at period end. |
Affiliated Central Funds |
Information regarding fiscal year to date income earned by the fund from the affiliated Central funds is as follows: |
Fund | Income earned |
Fidelity Cash Central Fund | $ 643,230 |
Fidelity Securities Lending Cash Central Fund | 40,744 |
Total | $ 683,974 |
See accompanying notes which are an integral part of the financial statements.
Annual Report
Financial Statements
Statement of Assets and Liabilities
| July 31, 2006 |
| | |
Assets | | |
Investment in securities, at value (including securities loaned of $10,469,382) - See accompanying schedule: Unaffiliated issuers (cost $440,779,155) | $ 447,083,390 | |
Affiliated Central Funds (cost $32,899,657) | 32,899,657 | |
Total Investments (cost $473,678,812) | | $ 479,983,047 |
Receivable for investments sold | | 11,599,201 |
Receivable for fund shares sold | | 1,152,874 |
Dividends receivable | | 8,410 |
Interest receivable | | 77,377 |
Prepaid expenses | | 283 |
Receivable from investment adviser for expense reductions | | 5,591 |
Other receivables | | 20,672 |
Total assets | | 492,847,455 |
| | |
Liabilities | | |
Payable to custodian bank | $ 821 | |
Payable for investments purchased | 6,434,677 | |
Payable for fund shares redeemed | 1,434,350 | |
Accrued management fee | 329,256 | |
Distribution fees payable | 28,023 | |
Other affiliated payables | 121,413 | |
Other payables and accrued expenses | 52,222 | |
Collateral on securities loaned, at value | 10,678,095 | |
Total liabilities | | 19,078,857 |
| | |
Net Assets | | $ 473,768,598 |
Net Assets consist of: | | |
Paid in capital | | $ 465,362,392 |
Accumulated undistributed net realized gain (loss) on investments and foreign currency transactions | | 2,101,971 |
Net unrealized appreciation (depreciation) on investments | | 6,304,235 |
Net Assets | | $ 473,768,598 |
See accompanying notes which are an integral part of the financial statements.
Annual Report
Financial Statements - continued
Statement of Assets and Liabilities - continued
| July 31, 2006 |
| | |
Calculation of Maximum Offering Price Class A:
Net Asset Value and redemption price per share ($18,104,024 ÷ 1,405,220 shares) | | $ 12.88 |
| | |
Maximum offering price per share (100/94.25 of $12.88) | | $ 13.67 |
Class T:
Net Asset Value and redemption price per share ($19,205,408 ÷ 1,493,589 shares) | | $ 12.86 |
| | |
Maximum offering price per share (100/96.50 of $12.86) | | $ 13.33 |
Class B:
Net Asset Value and offering price per share ($5,191,368 ÷ 406,298 shares)A | | $ 12.78 |
| | |
Class C:
Net Asset Value and offering price per share ($14,682,008 ÷ 1,149,741 shares)A | | $ 12.77 |
| | |
Small Cap Growth:
Net Asset Value, offering price and redemption price per share ($402,353,076 ÷ 31,124,219 shares) | | $ 12.93 |
| | |
Institutional Class:
Net Asset Value, offering price and redemption price per share ($14,232,714 ÷ 1,101,368 shares) | | $ 12.92 |
A Redemption price per share is equal to net asset value less any applicable contingent deferred sales charge.
See accompanying notes which are an integral part of the financial statements.
Annual Report
Statement of Operations
| Year ended July 31, 2006 |
| | |
Investment Income | | |
Dividends | | $ 1,243,646 |
Special dividends | | 241,463 |
Interest | | 1,708 |
Income from affiliated Central Funds | | 683,974 |
Total income | | 2,170,791 |
| | |
Expenses | | |
Management fee
Basic fee | $ 2,752,660 | |
Performance adjustment | 333,133 | |
Transfer agent fees | 902,095 | |
Distribution fees | 253,353 | |
Accounting and security lending fees | 159,035 | |
Independent trustees' compensation | 1,432 | |
Custodian fees and expenses | 26,104 | |
Registration fees | 122,023 | |
Audit | 43,577 | |
Legal | 9,380 | |
Miscellaneous | 16,396 | |
Total expenses before reductions | 4,619,188 | |
Expense reductions | (218,702) | 4,400,486 |
Net investment income (loss) | | (2,229,695) |
Realized and Unrealized Gain (Loss) Net realized gain (loss) on: | | |
Investment securities: | | |
Unaffiliated issuers | 5,460,071 | |
Foreign currency transactions | 13,859 | |
Total net realized gain (loss) | | 5,473,930 |
Change in net unrealized appreciation (depreciation) on: Investment securities | (13,283,751) | |
Assets and liabilities in foreign currencies | 32 | |
Total change in net unrealized appreciation (depreciation) | | (13,283,719) |
Net gain (loss) | | (7,809,789) |
Net increase (decrease) in net assets resulting from operations | | $ (10,039,484) |
See accompanying notes which are an integral part of the financial statements.
Annual Report
Financial Statements - continued
Statement of Changes in Net Assets
| Year ended
July 31,
2006 | For the period
November 3, 2004
(commencement
of operations) to
July 31, 2005 |
Increase (Decrease) in Net Assets | | |
Operations | | |
Net investment income (loss) | $ (2,229,695) | $ (434,724) |
Net realized gain (loss) | 5,473,930 | 3,381,102 |
Change in net unrealized appreciation (depreciation) | (13,283,719) | 19,587,954 |
Net increase (decrease) in net assets resulting
from operations | (10,039,484) | 22,534,332 |
Distributions to shareholders from net realized gain | (3,779,478) | - |
Share transactions - net increase (decrease) | 259,409,742 | 205,303,288 |
Redemption fees | 233,448 | 106,750 |
Total increase (decrease) in net assets | 245,824,228 | 227,944,370 |
| | |
Net Assets | | |
Beginning of period | 227,944,370 | - |
End of period (including undistributed net investment income of $0 and accumulated net investment loss of $14,971, respectively) | $ 473,768,598 | $ 227,944,370 |
See accompanying notes which are an integral part of the financial statements.
Annual Report
Financial Highlights - Class A
Years ended July 31, | 2006 | 2005 H |
Selected Per-Share Data | | |
Net asset value, beginning of period | $ 12.95 | $ 10.00 |
Income from Investment Operations | | |
Net investment income (loss) E | (.10) F | (.07) |
Net realized and unrealized gain (loss) | .18 G | 3.01 |
Total from investment operations | .08 | 2.94 |
Distributions from net realized gain | (.16) | - |
Redemption fees added to paid in capital E | .01 | .01 |
Net asset value, end of period | $ 12.88 | $ 12.95 |
Total Return B, C, D | .70% | 29.50% |
Ratios to Average Net Assets I | | |
Expenses before reductions | 1.53% | 1.55% A |
Expenses net of fee waivers, if any | 1.40% | 1.45% A |
Expenses net of all reductions | 1.35% | 1.36% A |
Net investment income (loss) | (.79)% F | (.78)% A |
Supplemental Data | | |
Net assets, end of period (000 omitted) | $ 18,104 | $ 4,719 |
Portfolio turnover rate | 129% | 93% A |
A Annualized
B Total returns for periods of less than one year are not annualized.
C Total returns would have been lower had certain expenses not been reduced during the periods shown.
D Total returns do not include the effect of the sales charges.
E Calculated based on average shares outstanding during the period.
F Investment income per share reflects a special dividend which amounted to $.01 per share. Excluding the special dividend, the ratio of net investment income (loss) to average net assets would have been (.85)%.
G The amount shown for a share outstanding does not correspond with the aggregate net gain (loss) on investments for the period due to the timing of sales and repurchases of shares in relation to fluctuating market values of the investments of the Fund.
H For the period November 3, 2004 (commencement of operations) to July 31, 2005.
I Expense ratios reflect operating expenses of the class. Expenses before reductions do not reflect amounts reimbursed by the investment adviser or reductions from brokerage service arrangements or other expense offset arrangements and do not represent the amount paid by the class during periods when reimbursements or reductions occur. Expense ratios before reductions for start-up periods may not be representative of longer-term operating periods. Expenses net of fee waivers reflect expenses after reimbursement by the investment adviser but prior to reductions from brokerage service arrangements or other expense offset arrangements. Expenses net of all reductions represent the net expenses paid by the class.
See accompanying notes which are an integral part of the financial statements.
Annual Report
Financial Highlights - Class T
Years ended July 31, | 2006 | 2005 H |
Selected Per-Share Data | | |
Net asset value, beginning of period | $ 12.93 | $ 10.00 |
Income from Investment Operations | | |
Net investment income (loss) E | (.14) F | (.09) |
Net realized and unrealized gain (loss) | .19 G | 3.01 |
Total from investment operations | .05 | 2.92 |
Distributions from net realized gain | (.13) | - |
Redemption fees added to paid in capital E | .01 | .01 |
Net asset value, end of period | $ 12.86 | $ 12.93 |
Total Return B, C, D | .48% | 29.30% |
Ratios to Average Net Assets I | | |
Expenses before reductions | 1.73% | 1.79% A |
Expenses net of fee waivers, if any | 1.65% | 1.70% A |
Expenses net of all reductions | 1.60% | 1.61% A |
Net investment income (loss) | (1.04)% F | (1.03)% A |
Supplemental Data | | |
Net assets, end of period (000 omitted) | $ 19,205 | $ 5,240 |
Portfolio turnover rate | 129% | 93% A |
A Annualized
B Total returns for periods of less than one year are not annualized.
C Total returns would have been lower had certain expenses not been reduced during the periods shown.
D Total returns do not include the effect of the sales charges.
E Calculated based on average shares outstanding during the period.
F Investment income per share reflects a special dividend which amounted to $.01 per share. Excluding the special dividend, the ratio of net investment income (loss) to average net assets would have been (1.10)%.
G The amount shown for a share outstanding does not correspond with the aggregate net gain (loss) on investments for the period due to the timing of sales and repurchases of shares in relation to fluctuating market values of the investments of the Fund.
H For the period November 3, 2004 (commencement of operations) to July 31, 2005.
I Expense ratios reflect operating expenses of the class. Expenses before reductions do not reflect amounts reimbursed by the investment adviser or reductions from brokerage service arrangements or other expense offset arrangements and do not represent the amount paid by the class during periods when reimbursements or reductions occur. Expense ratios before reductions for start-up periods may not be representative of longer-term operating periods. Expenses net of fee waivers reflect expenses after reimbursement by the investment adviser but prior to reductions from brokerage service arrangements or other expense offset arrangements. Expenses net of all reductions represent the net expenses paid by the class.
See accompanying notes which are an integral part of the financial statements.
Annual Report
Financial Highlights - Class B
Years ended July 31, | 2006 | 2005 H |
Selected Per-Share Data | | |
Net asset value, beginning of period | $ 12.87 | $ 10.00 |
Income from Investment Operations | | |
Net investment income (loss) E | (.20) F | (.13) |
Net realized and unrealized gain (loss) | .19 G | 2.99 |
Total from investment operations | (.01) | 2.86 |
Distributions from net realized gain | (.09) | - |
Redemption fees added to paid in capital E | .01 | .01 |
Net asset value, end of period | $ 12.78 | $ 12.87 |
Total Return B, C, D | (.03)% | 28.70% |
Ratios to Average Net Assets I | | |
Expenses before reductions | 2.28% | 2.33% A |
Expenses net of fee waivers, if any | 2.15% | 2.20% A |
Expenses net of all reductions | 2.10% | 2.11% A |
Net investment income (loss) | (1.54)% F | (1.53)% A |
Supplemental Data | | |
Net assets, end of period (000 omitted) | $ 5,191 | $ 2,055 |
Portfolio turnover rate | 129% | 93% A |
A Annualized
B Total returns for periods of less than one year are not annualized.
C Total returns would have been lower had certain expenses not been reduced during the periods shown.
D Total returns do not include the effect of the contingent deferred sales charge.
E Calculated based on average shares outstanding during the period.
F Investment income per share reflects a special dividend which amounted to $.01 per share. Excluding the special dividend, the ratio of net investment income (loss) to average net assets would have been (1.60)%.
G The amount shown for a share outstanding does not correspond with the aggregate net gain (loss) on investments for the period due to the timing of sales and repurchases of shares in relation to fluctuating market values of the investments of the Fund.
H For the period November 3, 2004 (commencement of operations) to July 31, 2005.
I Expense ratios reflect operating expenses of the class. Expenses before reductions do not reflect amounts reimbursed by the investment adviser or reductions from brokerage service arrangements or other expense offset arrangements and do not represent the amount paid by the class during periods when reimbursements or reductions occur. Expense ratios before reductions for start-up periods may not be representative of longer-term operating periods. Expenses net of fee waivers reflect expenses after reimbursement by the investment adviser but prior to reductions from brokerage service arrangements or other expense offset arrangements. Expenses net of all reductions represent the net expenses paid by the class.
See accompanying notes which are an integral part of the financial statements.
Annual Report
Financial Highlights - Class C
Years ended July 31, | 2006 | 2005 H |
Selected Per-Share Data | | |
Net asset value, beginning of period | $ 12.88 | $ 10.00 |
Income from Investment Operations | | |
Net investment income (loss) E | (.20) F | (.13) |
Net realized and unrealized gain (loss) | .18 G | 3.00 |
Total from investment operations | (.02) | 2.87 |
Distributions from net realized gain | (.10) | - |
Redemption fees added to paid in capital E | .01 | .01 |
Net asset value, end of period | $ 12.77 | $ 12.88 |
Total Return B, C, D | (.08)% | 28.80% |
Ratios to Average Net Assets I | | |
Expenses before reductions | 2.25% | 2.24% A |
Expenses net of fee waivers, if any | 2.15% | 2.17% A |
Expenses net of all reductions | 2.10% | 2.09% A |
Net investment income (loss) | (1.54)% F | (1.50)% A |
Supplemental Data | | |
Net assets, end of period (000 omitted) | $ 14,682 | $ 8,372 |
Portfolio turnover rate | 129% | 93% A |
A Annualized
B Total returns for periods of less than one year are not annualized.
C Total returns would have been lower had certain expenses not been reduced during the periods shown.
D Total returns do not include the effect of the contingent deferred sales charge.
E Calculated based on average shares outstanding during the period.
F Investment income per share reflects a special dividend which amounted to $.01 per share. Excluding the special dividend, the ratio of net investment income (loss) to average net assets would have been (1.60)%.
G The amount shown for a share outstanding does not correspond with the aggregate net gain (loss) on investments for the period due to the timing of sales and repurchases of shares in relation to fluctuating market values of the investments of the Fund.
H For the period November 3, 2004 (commencement of operations) to July 31, 2005.
I Expense ratios reflect operating expenses of the class. Expenses before reductions do not reflect amounts reimbursed by the investment adviser or reductions from brokerage service arrangements or other expense offset arrangements and do not represent the amount paid by the class during periods when reimbursements or reductions occur. Expense ratios before reductions for start-up periods may not be representative of longer-term operating periods. Expenses net of fee waivers reflect expenses after reimbursement by the investment adviser but prior to reductions from brokerage service arrangements or other expense offset arrangements. Expenses net of all reductions represent the net expenses paid by the class.
See accompanying notes which are an integral part of the financial statements.
Annual Report
Financial Highlights - Small Cap Growth
Years ended July 31, | 2006 | 2005 G |
Selected Per-Share Data | | |
Net asset value, beginning of period | $ 12.98 | $ 10.00 |
Income from Investment Operations | | |
Net investment income (loss) D | (.07) E | (.04) |
Net realized and unrealized gain (loss) | .19 F | 3.01 |
Total from investment operations | .12 | 2.97 |
Distributions from net realized gain | (.18) | - |
Redemption fees added to paid in capital D | .01 | .01 |
Net asset value, end of period | $ 12.93 | $ 12.98 |
Total Return B, C | 1.01% | 29.80% |
Ratios to Average Net Assets H | | |
Expenses before reductions | 1.13% | 1.16% A |
Expenses net of fee waivers, if any | 1.13% | 1.16% A |
Expenses net of all reductions | 1.08% | 1.08% A |
Net investment income (loss) | (.52)% E | (.49)% A |
Supplemental Data | | |
Net assets, end of period (000 omitted) | $ 402,353 | $ 205,652 |
Portfolio turnover rate | 129% | 93% A |
A Annualized
B Total returns for periods of less than one year are not annualized.
C Total returns would have been lower had certain expenses not been reduced during the periods shown.
D Calculated based on average shares outstanding during the period.
E Investment income per share reflects a special dividend which amounted to $.01 per share. Excluding the special dividend, the ratio of net investment income (loss) to average net assets would have been (.58)%.
F The amount shown for a share outstanding does not correspond with the aggregate net gain (loss) on investments for the period due to the timing of sales and repurchases of shares in relation to fluctuating market values of the investments of the Fund.
G For the period November 3, 2004 (commencement of operations) to July 31, 2005.
H Expense ratios reflect operating expenses of the class. Expenses before reductions do not reflect amounts reimbursed by the investment adviser or reductions from brokerage service arrangements or other expense offset arrangements and do not represent the amount paid by the class during periods when reimbursements or reductions occur. Expense ratios before reductions for start-up periods may not be representative of longer-term operating periods. Expenses net of fee waivers reflect expenses after reimbursement by the investment adviser but prior to reductions from brokerage service arrangements or other expense offset arrangements. Expenses net of all reductions represent the net expenses paid by the class.
See accompanying notes which are an integral part of the financial statements.
Annual Report
Financial Highlights - Institutional Class
Years ended July 31, | 2006 | 2005 G |
Selected Per-Share Data | | |
Net asset value, beginning of period | $ 12.97 | $ 10.00 |
Income from Investment Operations | | |
Net investment income (loss) D | (.07) E | (.04) |
Net realized and unrealized gain (loss) | .19 F | 3.00 |
Total from investment operations | .12 | 2.96 |
Distributions from net realized gain | (.18) | - |
Redemption fees added to paid in capital D | .01 | .01 |
Net asset value, end of period | $ 12.92 | $ 12.97 |
Total Return B, C | .97% | 29.70% |
Ratios to Average Net Assets H | | |
Expenses before reductions | 1.10% | 1.20% A |
Expenses net of fee waivers, if any | 1.10% | 1.18% A |
Expenses net of all reductions | 1.05% | 1.10% A |
Net investment income (loss) | (.49)% E | (.51)% A |
Supplemental Data | | |
Net assets, end of period (000 omitted) | $ 14,233 | $ 1,906 |
Portfolio turnover rate | 129% | 93% A |
A Annualized
B Total returns for periods of less than one year are not annualized.
C Total returns would have been lower had certain expenses not been reduced during the periods shown.
D Calculated based on average shares outstanding during the period.
E Investment income per share reflects a special dividend which amounted to $.01 per share. Excluding the special dividend, the ratio of net investment income (loss) to average net assets would have been (.55)%.
F The amount shown for a share outstanding does not correspond with the aggregate net gain (loss) on investments for the period due to the timing of sales and repurchases of shares in relation to fluctuating market values of the investments of the Fund.
G For the period November 3, 2004 (commencement of operations) to July 31, 2005.
H Expense ratios reflect operating expenses of the class. Expenses before reductions do not reflect amounts reimbursed by the investment adviser or reductions from brokerage service arrangements or other expense offset arrangements and do not represent the amount paid by the class during periods when reimbursements or reductions occur. Expense ratios before reductions for start-up periods may not be representative of longer-term operating periods. Expenses net of fee waivers reflect expenses after reimbursement by the investment adviser but prior to reductions from brokerage service arrangements or other expense offset arrangements. Expenses net of all reductions represent the net expenses paid by the class.
See accompanying notes which are an integral part of the financial statements.
Annual Report
Notes to Financial Statements
1. Significant Accounting Policies.
Fidelity Small Cap Growth Fund (the Fund) is a non-diversified fund of Fidelity Securities Fund (the trust) and is authorized to issue an unlimited number of shares. The trust is registered under the Investment Company Act of 1940, as amended (the 1940 Act), as an open-end management investment company organized as a Massachusetts business trust.
The Fund offers Class A, Class T, Class B, Class C, Small Cap Growth, and Institutional Class shares, each of which has equal rights as to assets and voting privileges. Each class has exclusive voting rights with respect to matters that affect that class. Class B shares will automatically convert to Class A shares after a holding period of seven years from the initial date of purchase. Investment income, realized and unrealized capital gains and losses, the common expenses of the Fund, and certain fund-level expense reductions, if any, are allocated on a pro rata basis to each class based on the relative net assets of each class to the total net assets of the Fund. Each class differs with respect to transfer agent and distribution and service plan fees incurred. Certain expense reductions also differ by class.
The Fund may invest in affiliated money market central funds (Money Market Central Funds), which are open-end investment companies available to investment companies and other accounts managed by Fidelity Management & Research Company (FMR) and its affiliates. The financial statements have been prepared in conformity with accounting principles generally accepted in the United States of America, which require management to make certain estimates and assumptions at the date of the financial statements. The following summarizes the significant accounting policies of the Fund:
Security Valuation. Investments are valued and net asset value (NAV) per share is calculated (NAV calculation) as of the close of business of the New York Stock Exchange (NYSE), normally 4:00 p.m. Eastern time. Wherever possible, the Fund uses independent pricing services approved by the Board of Trustees to value its investments.
Equity securities, including restricted securities, for which market quotations are readily available, are valued at the last reported sale price or official closing price as reported by an independent pricing service on the primary market or exchange on which they are traded. In the event there were no sales during the day or closing prices are not available, securities are valued at the last quoted bid price. Investments in open-end mutual funds are valued at their closing net asset value each business day. Short-term securities with remaining maturities of sixty days or less for which quotations are not readily available are valued at amortized cost, which approximates value.
When current market prices or quotations are not readily available or do not accurately reflect fair value, valuations may be determined in accordance with procedures adopted by the Board of Trustees. For example, when developments occur between the close of a market and the close of the NYSE that may materially affect the value of some or all of
Annual Report
Notes to Financial Statements - continued
1. Significant Accounting Policies - continued
Security Valuation - continued
the securities, or when trading in a security is halted, those securities may be fair valued. Factors used in the determination of fair value may include monitoring news to identify significant market or security specific events such as changes in the value of U.S. securities markets, reviewing developments in foreign markets and evaluating the performance of ADRs, futures contracts and exchange-traded funds. Because the Fund's utilization of fair value pricing depends on market activity, the frequency with which fair value pricing is used can not be predicted and may be utilized to a significant extent. The value of securities used for NAV calculation under fair value pricing may differ from published prices for the same securities.
Foreign Currency. The Fund uses foreign currency contracts to facilitate transactions in foreign-denominated securities. Losses from these transactions may arise from changes in the value of the foreign currency or if the counterparties do not perform under the contracts' terms.
Foreign-denominated assets, including investment securities, and liabilities are translated into U.S. dollars at the exchange rate at period end. Purchases and sales of investment securities, income and dividends received and expenses denominated in foreign currencies are translated into U.S. dollars at the exchange rate in effect on the transaction date.
The effects of exchange rate fluctuations on investments are included with the net realized and unrealized gain (loss) on investment securities. Other foreign currency transactions resulting in realized and unrealized gain (loss) are disclosed separately.
Investment Transactions and Income. Security transactions are accounted for as of trade date. Gains and losses on securities sold are determined on the basis of identified cost. Dividend income is recorded on the ex-dividend date, except for certain dividends from foreign securities where the ex-dividend date may have passed, which are recorded as soon as the Fund is informed of the ex-dividend date. Non-cash dividends included in dividend income, if any, are recorded at the fair market value of the securities received. Distributions received on securities that represent a return of capital or capital gain are recorded as a reduction of cost of investments and/or as a realized gain. The Fund estimates the components of distributions received that may be considered return of capital distributions or capital gain distributions. Large, non-recurring dividends recognized by the Fund are presented separately on the Statement of Operations as "Special Dividends" and the impact of these dividends is presented in the Financial Highlights. Interest income is accrued as earned. Interest income includes coupon interest and amortization of premium and accretion of discount on debt securities. Investment income is recorded net of foreign taxes withheld where recovery of such taxes is uncertain.
Annual Report
1. Significant Accounting Policies - continued
Expenses. Most expenses of the trust can be directly attributed to a fund. Expenses which cannot be directly attributed are apportioned among each Fund in the trust. Expense estimates are accrued in the period to which they relate and adjustments are made when actual amounts are known.
Income Tax Information and Distributions to Shareholders. Each year, the Fund intends to qualify as a regulated investment company by distributing all of its taxable income and realized gains under Subchapter M of the Internal Revenue Code. As a result, no provision for income taxes is required in the accompanying financial statements. Foreign taxes are provided for based on the Fund's understanding of the tax rules and rates that exist in the foreign markets in which it invests.
Distributions are recorded on the ex-dividend date. Income dividends and capital gain distributions are declared separately for each class. Income and capital gain distributions are determined in accordance with income tax regulations, which may differ from generally accepted accounting principles. In addition, the Fund will claim a portion of the payment made to redeeming shareholders as a distribution for income tax purposes.
Capital accounts within the financial statements are adjusted for permanent book-tax differences. These adjustments have no impact on net assets or the results of operations. Temporary book-tax differences will reverse in a subsequent period.
Book-tax differences are primarily due to net operating losses and losses deferred due to wash sales.
The tax-basis components of distributable earnings and the federal tax cost as of period end were as follows:
Unrealized appreciation | $ 43,314,354 | |
Unrealized depreciation | (37,939,754) | |
Net unrealized appreciation (depreciation) | 5,374,600 | |
Undistributed ordinary income | 1,284,226 | |
Undistributed long-term capital gain | 1,027,501 | |
| | |
Cost for federal income tax purposes | $ 474,608,447 | |
The tax character of distributions paid was as follows:
| July 31, 2006 | July 31, 2005 |
Ordinary Income | $ 3,779,478 | $ - |
New Accounting Pronouncement. In July 2006, Financial Accounting Standards Board Interpretation No. 48, Accounting for Uncertainty in Income Taxes - an interpretation of FASB Statement 109 (FIN 48) was issued and is effective for fiscal years
Annual Report
Notes to Financial Statements - continued
1. Significant Accounting Policies - continued
New Accounting Pronouncement - continued
beginning after December 15, 2006. FIN 48 sets forth a threshold for financial statement recognition, measurement and disclosure of a tax position taken or expected to be taken on a tax return. Management is currently evaluating the impact, if any, the adoption of FIN 48 will have on the Fund's net assets and results of operations.
Short-Term Trading (Redemption) Fees. Shares held in the Fund less than 90 days are subject to a redemption fee equal to 1.50% of the proceeds of the redeemed shares. All redemption fees, including any estimated redemption fees paid by FMR, are retained by the Fund and accounted for as an addition to paid in capital.
2. Operating Policies.
Repurchase Agreements. FMR has received an Exemptive Order from the Securities and Exchange Commission (the SEC) which permits the Fund and other affiliated entities of FMR to transfer uninvested cash balances into joint trading accounts which are then invested in repurchase agreements. The Fund may also invest directly with institutions in repurchase agreements. Repurchase agreements are collateralized by government or non-government securities. Upon settlement date, collateral is held in segregated accounts with custodian banks and may be obtained in the event of a default of the counterparty. The Fund monitors, on a daily basis, the value of the collateral to ensure it is at least equal to the principal amount of the repurchase agreement (including accrued interest). In the event of a default by the counterparty, realization of the collateral proceeds could be delayed, during which time the value of the collateral may decline.
3. Purchases and Sales of Investments.
Purchases and sales of securities, other than short-term securities, aggregated $713,692,604 and $477,814,143, respectively.
4. Fees and Other Transactions with Affiliates.
Management Fee. FMR and its affiliates provide the Fund with investment management related services for which the Fund pays a monthly management fee. The management fee is the sum of an individual fund fee rate that is based on an annual rate of .45% of the Fund's average net assets and a group fee rate that averaged ..27% during the period. The group fee rate is based upon the average net assets of all the mutual funds advised by FMR. The group fee rate decreases as assets under management increase and increases as assets under management decrease. In addition, the management fee is subject to a performance adjustment (up to a maximum of ± .20% of the Fund's average net assets over a 36 month performance period). The upward or downward adjustment
Annual Report
4. Fees and Other Transactions with Affiliates - continued
Management Fee - continued
to the management fee is based on the relative investment performance of the retail class of the Fund, Small Cap Growth, as compared to an appropriate benchmark index. The Fund's performance adjustment took effect in November 2005. Subsequent months will be added until the performance period includes 36 months. For the period, the total annual management fee rate, including the performance adjustment, was .81% of the Fund's average net assets.
Distribution and Service Plan. In accordance with Rule 12b-1 of the 1940 Act, the Fund has adopted separate Distribution and Service Plans for each class of shares. Certain classes pay Fidelity Distributors Corporation (FDC), an affiliate of FMR, separate Distribution and Service Fees, each of which is based on an annual percentage of each class' average net assets. In addition, FDC may pay financial intermediaries for selling shares of the Fund and providing shareholder support services. For the period, the Distribution and Service Fee rates and the total amounts paid to and retained by FDC were as follows:
| Distribution
Fee | Service
Fee | Paid to
FDC | Retained
by FDC |
Class A | 0% | .25% | $ 28,742 | $ 1,591 |
Class T | .25% | .25% | 60,604 | 6,378 |
Class B | .75% | .25% | 37,942 | 30,032 |
Class C | .75% | .25% | 126,065 | 55,601 |
| | | $ 253,353 | $ 93,602 |
Sales Load. FDC receives a front-end sales charge of up to 5.75% for selling Class A shares, and 3.50% for selling Class T shares, some of which is paid to financial intermediaries for selling shares of the Fund. FDC receives the proceeds of contingent deferred sales charges levied on Class A, Class T, Class B, and Class C redemptions. These charges depend on the holding period. The deferred sales charges range from 5% to 1% for Class B, 1% for Class C, 1.00% to .50% for certain purchases of Class A shares (.25% prior to February 24, 2006) and .25% for certain purchases of Class T shares.
For the period, sales charge amounts retained by FDC were as follows:
| Retained
by FDC |
Class A | $ 60,838 |
Class T | 10,628 |
Class B * | 3,795 |
Class C * | 2,471 |
| $ 77,732 |
* When Class B and Class C shares are initially sold, FDC pays commissions from its own resources to financial intermediaries through which the sales are made.
Annual Report
Notes to Financial Statements - continued
4. Fees and Other Transactions with Affiliates - continued
Transfer Agent Fees. Fidelity Investments Institutional Operations Company, Inc. (FIIOC), an affiliate of FMR, is the transfer, dividend disbursing and shareholder servicing agent for each class of the Fund, except for Small Cap Growth. Fidelity Service Company, Inc. (FSC), an affiliate of FMR, is the transfer agent for Small Cap Growth shares. FIIOC and FSC receive account fees and asset-based fees that vary according to the account size and type of account of the shareholders of the respective classes of the Fund. FIIOC and FSC pay for typesetting, printing and mailing of shareholder reports, except proxy statements. For the period the total transfer agent fees paid by each class to FIIOC or FSC, were as follows:
| Amount | % of
Average
Net Assets |
Class A | $ 42,555 | .37 |
Class T | 39,108 | .32 |
Class B | 13,971 | .37 |
Class C | 42,629 | .34 |
Small Cap Growth | 748,272 | .22 |
Institutional Class | 15,560 | .20 |
| $ 902,095 | |
Accounting and Security Lending Fees. FSC maintains the Fund's accounting records. The accounting fee is based on the level of average net assets for the month. Under a separate contract, FSC administers the security lending program. The security lending fee is based on the number and duration of lending transactions.
Affiliated Central Funds. The Fund may invest in Money Market Central Funds which seek preservation of capital and current income and are managed by Fidelity Investments Money Management, Inc. (FIMM), an affiliate of FMR.
The Money Market Central Funds do not pay a management fee.
Brokerage Commissions. The Fund placed a portion of its portfolio transactions with brokerage firms which are affiliates of the investment adviser. The commissions paid to these affiliated firms were $21,982 for the period.
5. Committed Line of Credit.
The Fund participates with other funds managed by FMR in a $4.2 billion credit facility (the "line of credit") to be utilized for temporary or emergency purposes to fund shareholder redemptions or for other short-term liquidity purposes. The Fund has agreed to pay commitment fees on its pro rata portion of the line of credit, which amounts to $1,010 and is reflected in Miscellaneous Expense on the Statement of Operations. During the period, there were no borrowings on this line of credit.
Annual Report
6. Security Lending.
The Fund lends portfolio securities from time to time in order to earn additional income. On the settlement date of the loan, the Fund receives collateral (in the form of U.S. Treasury obligations, letters of credit and/or cash) against the loaned securities and maintains collateral in an amount not less than 100% of the market value of the loaned securities during the period of the loan. The market value of the loaned securities is determined at the close of business of the Fund and any additional required collateral is delivered to the Fund on the next business day. If the borrower defaults on its obligation to return the securities loaned because of insolvency or other reasons, a fund could experience delays and costs in recovering the securities loaned or in gaining access to the collateral. Any cash collateral received is invested in the Fidelity Securities Lending Cash Central Fund. The value of loaned securities and cash collateral at period end are disclosed on the Fund's Statement of Assets and Liabilities. Security lending income represents the income earned on investing cash collateral, less fees and expenses associated with the loan, plus any premium payments that may be received on the loan of certain types of securities. Security lending income is presented in the Statement of Operations as a component of income from affiliated central funds. Net income from lending portfolio securities during the period amounted to $40,744.
7. Expense Reductions.
FMR voluntarily agreed to reimburse each class to the extent annual operating expenses exceeded certain levels of average net assets as noted in the table below. Some expenses, for example interest expense, are excluded from this reimbursement.
The following classes were in reimbursement during the period:
| Expense
Limitations | Reimbursement
from adviser |
Class A | 1.40% | $ 15,076 |
Class T | 1.65% | 10,160 |
Class B | 2.15% | 4,921 |
Class C | 2.15% | 12,289 |
| | $ 42,446 |
Many of the brokers with whom FMR places trades on behalf of the Fund provided services to the Fund in addition to trade execution. These services included payments of certain expenses on behalf of the Fund totaling $159,947 for the period. In addition, through arrangements with the Fund's custodian and each class' transfer agent, credits realized as a result of uninvested cash balances were used to reduce the Fund's expenses.
Annual Report
Notes to Financial Statements - continued
7. Expense Reductions - continued
During the period, these credits reduced the Fund's custody expenses by $8,200. During the period, credits reduced each class' transfer agent expense as noted in the table below.
| Transfer Agent
expense reduction | |
Small Cap Growth | $ 7,586 | |
Institutional Class | 523 | |
| $ 8,109 | |
8. Other.
The Fund's organizational documents provide former and current trustees and officers with a limited indemnification against liabilities arising in connection with the performance of their duties to the Fund. In the normal course of business, the Fund may also enter into contracts that provide general indemnifications. The Fund's maximum exposure under these arrangements is unknown as this would be dependent on future claims that may be made against the Fund. The risk of material loss from such claims is considered remote.
Subsequent to fiscal year end, the Fund's transfer agent, Fidelity Investments Institutional Operations Company, Inc. (FIIOC), an affiliate of Fidelity Management & Research Company, notified the Fund that the fund's books and records did not reflect a conversion of certain Class B to Class A shares upon their conversion date. Management has determined that this did not have a material impact to the Fund's reported net assets or results of operations in the accompanying financial statements. FIIOC will cause the books and records of the fund to reflect a conversion of the relevant Class B shares to Class A and is in the process of determining the impact to affected shareholder accounts for purposes of its remediation.
9. Distributions to Shareholders.
Distributions to shareholders of each class were as follows:
Years ended July 31, | 2006 | 2005 A |
From net realized gain | | |
Class A | $ 79,077 | $ - |
Class T | 63,628 | - |
Class B | 16,300 | - |
Class C | 71,634 | - |
Small Cap Growth | 3,518,781 | - |
Institutional Class | 30,058 | - |
Total | $ 3,779,478 | $ - |
A For the period November 3, 2004 (commencement of operations) to July 31, 2005
Annual Report
10. Share Transactions.
Transactions for each class of shares were as follows:
| Shares | Dollars |
Years ended July 31, | 2006 | 2005 A | 2006 | 2005 A |
Class A | | | | |
Shares sold | 1,304,587 | 377,650 | $ 17,497,379 | $ 4,304,515 |
Reinvestment of distributions | 5,381 | - | 70,354 | - |
Shares redeemed | (269,198) | (13,200) | (3,602,873) | (157,404) |
Net increase (decrease) | 1,040,770 | 364,450 | $ 13,964,860 | $ 4,147,111 |
Class T | | | | |
Shares sold | 1,397,985 | 432,704 | $ 18,995,409 | $ 4,904,069 |
Reinvestment of distributions | 4,866 | - | 63,445 | - |
Shares redeemed | (314,634) | (27,332) | (4,188,261) | (327,972) |
Net increase (decrease) | 1,088,217 | 405,372 | $ 14,870,593 | $ 4,576,097 |
Class B | | | | |
Shares sold | 392,448 | 169,626 | $ 5,275,913 | $ 1,864,130 |
Reinvestment of distributions | 1,204 | - | 15,614 | - |
Shares redeemed | (146,977) | (10,003) | (1,954,748) | (113,030) |
Net increase (decrease) | 246,675 | 159,623 | $ 3,336,779 | $ 1,751,100 |
Class C | | | | |
Shares sold | 952,568 | 664,094 | $ 12,739,552 | $ 7,429,424 |
Reinvestment of distributions | 5,289 | - | 68,594 | - |
Shares redeemed | (458,174) | (14,036) | (5,878,013) | (166,606) |
Net increase (decrease) | 499,683 | 650,058 | $ 6,930,133 | $ 7,262,818 |
Small Cap Growth | | | | |
Shares sold | 23,125,895 | 18,162,749 | $ 310,607,480 | $ 212,509,370 |
Reinvestment of distributions | 226,620 | - | 2,968,828 | - |
Shares redeemed | (8,070,732) | (2,320,313) | (106,295,770) | (26,565,039) |
Net increase (decrease) | 15,281,783 | 15,842,436 | $ 207,280,538 | $ 185,944,331 |
Institutional Class | | | | |
Shares sold | 1,082,924 | 170,585 | $ 14,760,969 | $ 1,883,777 |
Reinvestment of distributions | 1,705 | - | 22,327 | - |
Shares redeemed | (130,215) | (23,631) | (1,756,457) | (261,946) |
Net increase (decrease) | 954,414 | 146,954 | $ 13,026,839 | $ 1,621,831 |
A For the period November 3, 2004 (commencement of operations) to July 31, 2005.
Annual Report
Report of Independent Registered Public Accounting Firm
To the Trustees of Fidelity Securities Fund and the Shareholders of Fidelity Small Cap Growth Fund:
In our opinion, the accompanying statement of assets and liabilities, including the schedule of investments, and the related statements of operations and of changes in net assets and the financial highlights present fairly, in all material respects, the financial position of Fidelity Small Cap Growth Fund (a fund of Fidelity Securities Fund) at July 31, 2006, and the results of its operations, the changes in its net assets and the financial highlights for each of the periods indicated, in conformity with accounting principles generally accepted in the United States of America. These financial statements and financial highlights (hereafter referred to as "financial statements") are the responsibility of the Fidelity Small Cap Growth Fund's management; our responsibility is to express an opinion on these financial statements based on our audits. We conducted our audits of these financial statements in accordance with the standards of the Public Company Accounting Oversight Board (United States). Those standards require that we plan and perform the audit to obtain reasonable assurance about whether the financial statements are free of material misstatement. An audit includes examining, on a test basis, evidence supporting the amounts and disclosures in the financial statements, assessing the accounting principles used and significant estimates made by management, and evaluating the overall financial statement presentation. We believe that our audits, which included confirmation of securities at July 31, 2006 by correspondence with the custodian and brokers, provide a reasonable basis for our opinion.
/s/ PricewaterhouseCoopers LLP
PricewaterhouseCoopers LLP
Boston, Massachusetts
October 9, 2006
Annual Report
Trustees and Officers
The Trustees, Members of the Advisory Board, and executive officers of the trust and fund, as applicable, are listed below. The Board of Trustees governs the fund and is responsible for protecting the interests of shareholders. The Trustees are experienced executives who meet periodically throughout the year to oversee the fund's activities, review contractual arrangements with companies that provide services to the fund, and review the fund's performance. Except for William O. McCoy and Albert R. Gamper, Jr., each of the Trustees oversees 345 funds advised by FMR or an affiliate. Mr. McCoy oversees 347 funds advised by FMR or an affiliate. Mr. Gamper oversees 292 funds advised by FMR or an affiliate.
The Trustees hold office without limit in time except that (a) any Trustee may resign; (b) any Trustee may be removed by written instrument, signed by at least two-thirds of the number of Trustees prior to such removal; (c) any Trustee who requests to be retired or who has become incapacitated by illness or injury may be retired by written instrument signed by a majority of the other Trustees; and (d) any Trustee may be removed at any special meeting of shareholders by a two-thirds vote of the outstanding voting securities of the trust. Each Trustee who is not an interested person (as defined in the 1940 Act) (Independent Trustee), shall retire not later than the last day of the calendar year in which his or her 72nd birthday occurs. The Independent Trustees may waive this mandatory retirement age policy with respect to individual Trustees. The executive officers and Advisory Board Members hold office without limit in time, except that any officer and Advisory Board Member may resign or may be removed by a vote of a majority of the Trustees at any regular meeting or any special meeting of the Trustees. Except as indicated, each individual has held the office shown or other offices in the same company for the past five years.
The fund's Statement of Additional Information (SAI) includes more information about the Trustees. To request a free copy, call Fidelity at 1-877-208-0098.
Interested Trustees*:
Correspondence intended for each Trustee who is an interested person may be sent to Fidelity Investments, 82 Devonshire Street, Boston, Massachusetts 02109
Name, Age; Principal Occupation |
Edward C. Johnson 3d (76) |
| Year of Election or Appointment: 1984 Mr. Johnson is Chairman of the Board of Trustees. Mr. Johnson serves as President (2006-present), Chief Executive Officer, Chairman, and a Director of FMR Corp.; Chairman and a Director of FMR; Chairman and a Director of Fidelity Research & Analysis Company (FRAC); Chairman and a Director of Fidelity Investments Money Management, Inc.; and Chairman (2001-present) and a Director (1999-present) of FMR Co., Inc. In addition, Mr. Johnson serves as Chairman and Director of Fidelity International Limited (FIL). |
Stephen P. Jonas (53) |
| Year of Election or Appointment: 2005 Mr. Jonas is Senior Vice President of the fund (2005-present). He also serves as Senior Vice President of other Fidelity funds (2005-present). Mr. Jonas is Executive Director of FMR (2005-present) and FMR Co., Inc. (2005-present). He also serves as a Director of Fidelity Investments Money Management, Inc. (2005-present) and FMR Corp. (2003-present). Previously, Mr. Jonas served as President of Fidelity Enterprise Operations and Risk Services (2004-2005), Chief Administrative Officer (2002-2004), and Chief Financial Officer of FMR Corp. (1998-2002). In addition, he serves on the Boards of Boston Ballet (2003-present) and Simmons College (2003-present). |
Robert L. Reynolds (54) |
| Year of Election or Appointment: 2003 Mr. Reynolds is President and a Director of FMR (2005-present), Fidelity Investments Money Management, Inc. (2005-present), and FMR Co., Inc. (2005-present). Mr. Reynolds also serves as a Director (2003-present) and Chief Operating Officer (2000-present) of FMR Corp. and a Director of Strategic Advisers, Inc. (2005-present). He also serves on the Board at Fidelity Investments Canada, Ltd. (2000-present). Previously, Mr. Reynolds served as President of Fidelity Investments Institutional Retirement Group (1996-2000). |
* Trustees have been determined to be "Interested Trustees" by virtue of, among other things, their affiliation with the trust or various entities under common control with FMR.
Annual Report
Independent Trustees:
Correspondence intended for each Independent Trustee (that is, the Trustees other than the Interested Trustees) may be sent to Fidelity Investments, P.O. Box 55235, Boston, Massachusetts 02205-5235.
Name, Age; Principal Occupation |
Dennis J. Dirks (58) |
| Year of Election or Appointment: 2005 Prior to his retirement in May 2003, Mr. Dirks was Chief Operating Officer and a member of the Board of The Depository Trust & Clearing Corporation (DTCC) (1999-2003). He also served as President, Chief Operating Officer, and Board member of The Depository Trust Company (DTC) (1999-2003) and President and Board member of the National Securities Clearing Corporation (NSCC) (1999-2003). In addition, Mr. Dirks served as Chief Executive Officer and Board member of the Government Securities Clearing Corporation (2001-2003) and Chief Executive Officer and Board member of the Mortgage-Backed Securities Clearing Corporation (2001-2003). Mr. Dirks also serves as a Trustee and a member of the Finance Committee of Manhattan College (2005-present) and a Trustee and a member of the Finance Committee of AHRC of Nassau County (2006-present). |
Albert R. Gamper, Jr. (64) |
| Year of Election or Appointment: 2006 Mr. Gamper also serves as a Trustee (2006-present) or Member of the Advisory Board (2005-present) of other investment companies advised by FMR. Prior to his retirement in December 2004, Mr. Gamper served as Chairman of the Board of CIT Group Inc. (commercial finance). During his tenure with CIT Group Inc. Mr. Gamper served in numerous senior management positions, including Chairman (1987-1989; 1999-2001; 2002-2004), Chief Executive Officer (1987-2004), and President (1989-2002). He currently serves as a member of the Board of Directors of Public Service Enterprise Group (utilities, 2001-present), Chairman of the Board of Governors, Rutgers University (2004-present), and Chairman of the Board of Saint Barnabas Health Care System. |
Robert M. Gates (62) |
| Year of Election or Appointment: 1997 Dr. Gates is Chairman of the Independent Trustees (2006-present). Dr. Gates is President of Texas A&M University (2002-present). He was Director of the Central Intelligence Agency (CIA) from 1991 to 1993. From 1989 to 1991, Dr. Gates served as Assistant to the President of the United States and Deputy National Security Advisor. Dr. Gates is a Director of NACCO Industries, Inc. (mining and manufacturing), Parker Drilling Co., Inc. (drilling and rental tools for the energy industry, 2001-present), and Brinker International (restaurant management, 2003-present). Previously, Dr. Gates served as a Director of LucasVarity PLC (automotive components and diesel engines), a Director of TRW Inc. (automotive, space, defense, and information technology), and Dean of the George Bush School of Government and Public Service at Texas A&M University (1999-2001). |
George H. Heilmeier (70) |
| Year of Election or Appointment: 2004 Dr. Heilmeier is Chairman Emeritus of Telcordia Technologies (communication software and systems), where prior to his retirement, he served as company Chairman and Chief Executive Officer. He currently serves on the Boards of Directors of The Mitre Corporation (systems engineering and information technology support for the government), and HRL Laboratories (private research and development, 2004-present). He is Chairman of the General Motors Science & Technology Advisory Board and a Life Fellow of the Institute of Electrical and Electronics Engineers (IEEE). Dr. Heilmeier is a member of the Defense Science Board and the National Security Agency Advisory Board. He is also a member of the National Academy of Engineering, the American Academy of Arts and Sciences, and the Board of Overseers of the School of Engineering and Applied Science of the University of Pennsylvania. Previously, Dr. Heilmeier served as a Director of TRW Inc. (automotive, space, defense, and information technology, 1992-2002), Compaq (1994-2002), Automatic Data Processing, Inc. (ADP) (technology-based business outsourcing, 1995-2002), INET Technologies Inc. (telecommunications network surveillance, 2001-2004), and Teletech Holdings (customer management services). He is the recipient of the 2005 Kyoto Prize in Advanced Technology for his invention of the liquid crystal display. |
Marie L. Knowles (59) |
| Year of Election or Appointment: 2001 Prior to Ms. Knowles' retirement in June 2000, she served as Executive Vice President and Chief Financial Officer of Atlantic Richfield Company (ARCO) (diversified energy, 1996-2000). From 1993 to 1996, she was a Senior Vice President of ARCO and President of ARCO Transportation Company. She served as a Director of ARCO from 1996 to 1998. She currently serves as a Director of Phelps Dodge Corporation (copper mining and manufacturing) and McKesson Corporation (healthcare service, 2002-present). Ms. Knowles is a Trustee of the Brookings Institution and the Catalina Island Conservancy and also serves as a member of the Advisory Board for the School of Engineering of the University of Southern California. |
Ned C. Lautenbach (62) |
| Year of Election or Appointment: 2000 Mr. Lautenbach has been a partner of Clayton, Dubilier & Rice, Inc. (private equity investment firm) since September 1998. Previously, Mr. Lautenbach was with the International Business Machines Corporation (IBM) from 1968 until his retirement in 1998. Mr. Lautenbach serves as a Director of Italtel Holding S.p.A. (telecommunications (Milan, Italy), 2004-present) and Eaton Corporation (diversified industrial) as well as the Philharmonic Center for the Arts in Naples, Florida. He also is a member of the Board of Trustees of Fairfield University (2005-present), as well as a member of the Council on Foreign Relations. |
William O. McCoy (72) |
| Year of Election or Appointment: 1997 Prior to his retirement in December 1994, Mr. McCoy was Vice Chairman of the Board of BellSouth Corporation (telecommunications) and President of BellSouth Enterprises. He is currently a Director of Duke Realty Corporation (real estate). He is also a partner of Franklin Street Partners (private investment management firm). In addition, Mr. McCoy served as the Interim Chancellor (1999-2000) and a member of the Board of Visitors for the University of North Carolina at Chapel Hill and currently serves as Chairman of the Board of Directors of the University of North Carolina Health Care System. He also served as Vice President of Finance for the University of North Carolina (16-school system). |
Cornelia M. Small (62) |
| Year of Election or Appointment 2005 Ms. Small is a member (2000-present) and Chairperson (2002-present) of the Investment Committee, and a member (2002-present) of the Board of Trustees of Smith College. Previously, she served as Chief Investment Officer (1999-2000), Director of Global Equity Investments (1996-1999), and a member of the Board of Directors of Scudder, Stevens & Clark (1990-1997) and Scudder Kemper Investments (1997-1999). In addition, Ms. Small served as Co-Chair (2000-2003) of the Annual Fund for the Fletcher School of Law and Diplomacy. |
William S. Stavropoulos (67) |
| Year of Election or Appointment: 2002 Mr. Stavropoulos is Chairman Emeritus of the Board of Directors of The Dow Chemical Company. Since joining The Dow Chemical Company in 1967, Mr. Stavropoulos served in numerous senior management positions, including President (1993-2000; 2002-2003), CEO (1995-2000; 2002-2004), and Chairman of the Executive Committee (2000-2004). Currently, he is a Director of NCR Corporation (data warehousing and technology solutions), BellSouth Corporation (telecommunications), Chemical Financial Corporation, Maersk Inc. (industrial conglomerate, 2002-present), and Metalmark Capital (private equity investment firm, 2005-present). He also serves as a member of the Board of Trustees of the American Enterprise Institute for Public Policy Research. In addition, Mr. Stavropoulos is a member of The Business Council, J.P. Morgan International Council and the University of Notre Dame Advisory Council for the College of Science. |
Kenneth L. Wolfe (66) |
| Year of Election or Appointment: 2005 Prior to his retirement in 2001, Mr. Wolfe was Chairman and Chief Executive Officer of Hershey Foods Corporation (1993-2001). He currently serves as a member of the boards of Adelphia Communications Corporation (2003-present), Bausch & Lomb, Inc., and Revlon Inc. (2004-present). |
Annual Report
Advisory Board Members and Executive Officers:
Correspondence intended for Mr. Keyes may be sent to Fidelity Investments, P.O. Box 55235, Boston, Massachusetts 02205-5235. Correspondence intended for each executive officer and Mr. Lynch may be sent to Fidelity Investments, 82 Devonshire Street, Boston, Massachusetts 02109.
Name, Age; Principal Occupation |
James H. Keyes (65) |
| Year of Election or Appointment: 2006 Member of the Advisory Board of Fidelity Securities Fund. Prior to his retirement in 2003, Mr. Keyes was Chairman, President, and Chief Executive Officer of Johnson Controls, Inc. (automotive supplier, 1993-2003). He currently serves as a member of the boards of LSI Logic Corporation (semiconductor technologies, 1984-present), Navistar International Corporation (manufacture and sale of trucks, buses, and diesel engines, 2002-present), and Pitney Bowes, Inc. (integrated mail, messaging, and document management solutions, 1998-present). |
Peter S. Lynch (62) |
| Year of Election or Appointment: 2003 Member of the Advisory Board of Fidelity Securities Fund. Mr. Lynch is Vice Chairman and a Director of FMR, and Vice Chairman (2001-present) and a Director (1999-present) of FMR Co., Inc. Previously, Mr. Lynch served as a Trustee of the Fidelity funds (1990-2003). In addition, he serves as the Chairman of the Inner-City Scholarship Fund. |
Dwight D. Churchill (52) |
| Year of Election or Appointment: 2005 Vice President of the fund. Mr. Churchill also serves as Vice President of certain Equity Funds (2005-present). Mr. Churchill is Executive Vice President of FMR (2005-present) and FMR Co., Inc. (2005-present). Previously, Mr. Churchill served as Senior Vice President of Fidelity Investments Money Management, Inc. (2005-2006), Head of Fidelity's Fixed-Income Division (2000-2005), Vice President of Fidelity's Money Market Funds (2000-2005), Vice President of Fidelity's Bond Funds, and Senior Vice President of FMR. |
Bruce T. Herring (41) |
| Year of Election or Appointment: 2006 Vice President of the fund. Mr. Herring also serves as Vice President of certain Equity Funds (2006-present). Mr. Herring is Senior Vice President of FMR (2006-present) and Vice President of FMR Co., Inc. (2001-present). Previously, Mr. Herring served as a portfolio manager for Fidelity U.S. Equity Funds (2001-2005). |
Lionel Harris (39) |
| Year of Election or Appointment: 2005 Manager of the fund. Mr. Harris also serves as Vice President of other funds advised by FMR. Prior to his current responsibilities, Mr. Harris worked as a research analyst, a high-income director of research, and portfolio manager. |
Eric D. Roiter (57) |
| Year of Election or Appointment: 2004 Secretary of the fund. Vice President, General Counsel, and Secretary of FMR Co., Inc. (2001-present) and FMR; Assistant Secretary of Fidelity Management & Research (U.K.) Inc. (2001-present), Fidelity Research & Analysis Company (2001-present), and Fidelity Investments Money Management, Inc. (2001-present). Mr. Roiter is an Adjunct Member, Faculty of Law, at Boston College Law School (2003-present). Previously, Mr. Roiter served as Vice President and Secretary of FDC (1998-2005). |
Stuart Fross (46) |
| Year of Election or Appointment: 2004 Assistant Secretary of the fund. Mr. Fross also serves as Assistant Secretary of other Fidelity funds (2003-present), Vice President and Secretary of FDC (2005-present), and is an employee of FMR. |
Christine Reynolds (47) |
| Year of Election or Appointment: 2004 President and Treasurer of the fund. Ms. Reynolds also serves as President and Treasurer of other Fidelity funds (2004-present) and is a Vice President (2003-present) and an employee (2002-present) of FMR. Before joining Fidelity Investments, Ms. Reynolds worked at PricewaterhouseCoopers LLP (PwC) (1980-2002), where she was most recently an audit partner with PwC's investment management practice. |
R. Stephen Ganis (40) |
| Year of Election or Appointment: 2006 Anti-Money Laundering (AML) officer of the fund. Mr. Ganis also serves as AML officer of other Fidelity funds (2006-present) and FMR Corp. (2003-present). Before joining Fidelity Investments, Mr. Ganis practiced law at Goodwin Procter, LLP (2000-2002). |
Joseph B. Hollis (58) |
| Year of Election or Appointment: 2006 Chief Financial Officer of the fund. Mr. Hollis also serves as Chief Financial Officer of other Fidelity funds. Mr. Hollis is President of Fidelity Pricing and Cash Management Services (FPCMS) (2005-present). Mr. Hollis also serves as President and Director of Fidelity Service Company, Inc. (2006-present). Previously, Mr. Hollis served as Senior Vice President of Cash Management Services (1999-2002) and Investment Management Operations (2002-2005). |
Kenneth A. Rathgeber (59) |
| Year of Election or Appointment: 2004 Chief Compliance Officer of the fund. Mr. Rathgeber also serves as Chief Compliance Officer of other Fidelity funds (2004-present) and Executive Vice President of Risk Oversight for Fidelity Investments (2002-present). He is Chief Compliance Officer of FMR (2005-present), FMR Co., Inc. (2005-present), Fidelity Management & Research (U.K.) Inc. (2005-present), Fidelity Research & Analysis Company (2005-present), Fidelity Investments Money Management, Inc. (2005-present), and Strategic Advisers, Inc. (2005-present). Previously, Mr. Rathgeber served as Executive Vice President and Chief Operating Officer for Fidelity Investments Institutional Services Company, Inc. (1998-2002). |
Bryan A. Mehrmann (45) |
| Year of Election or Appointment: 2005 Deputy Treasurer of the fund. Mr. Mehrmann also serves as Deputy Treasurer of other Fidelity funds (2005-present) and is an employee of FMR. Previously, Mr. Mehrmann served as Vice President of Fidelity Investments Institutional Services Group (FIIS)/Fidelity Investments Institutional Operations Corporation, Inc. (FIIOC) Client Services (1998-2004). |
Kimberley H. Monasterio (42) |
| Year of Election or Appointment: 2004 Deputy Treasurer of the fund. Ms. Monasterio also serves as Deputy Treasurer of other Fidelity funds (2004) and is an employee of FMR (2004). Before joining Fidelity Investments, Ms. Monasterio served as Treasurer (2000-2004) and Chief Financial Officer (2002-2004) of the Franklin Templeton Funds and Senior Vice President of Franklin Templeton Services, LLC (2000-2004). |
Kenneth B. Robins (36) |
| Year of Election or Appointment:: 2005 Deputy Treasurer of the fund. Mr. Robins also serves as Deputy Treasurer of other Fidelity funds (2005-present) and is an employee of FMR (2004-present). Before joining Fidelity Investments, Mr. Robins worked at KPMG LLP, where he was a partner in KPMG's department of professional practice (2002-2004) and a Senior Manager (1999-2000). In addition, Mr. Robins served as Assistant Chief Accountant, United States Securities and Exchange Commission (2000-2002). |
Robert G. Byrnes (39) |
| Year of Election or Appointment: 2005 Assistant Treasurer of the fund. Mr. Byrnes also serves as Assistant Treasurer of other Fidelity funds (2005-present) and is an employee of FMR (2005-present). Previously, Mr. Byrnes served as Vice President of FPCMS (2003-2005). Before joining Fidelity Investments, Mr. Byrnes worked at Deutsche Asset Management where he served as Vice President of the Investment Operations Group (2000-2003). |
John H. Costello (59) |
| Year of Election or Appointment: 2004 Assistant Treasurer of the fund. Mr. Costello also serves as Assistant Treasurer of other Fidelity funds and is an employee of FMR. |
Peter L. Lydecker (52) |
| Year of Election or Appointment 2004 Assistant Treasurer of the fund. Mr. Lydecker also serves as Assistant Treasurer of other Fidelity funds (2004) and is an employee of FMR. |
Mark Osterheld (51) |
| Year of Election or Appointment: 2004 Assistant Treasurer of the fund. Mr. Osterheld also serves as Assistant Treasurer of other Fidelity funds (2002) and is an employee of FMR. |
Gary W. Ryan (47) |
| Year of Election or Appointment: 2005 Assistant Treasurer of the fund. Mr. Ryan also serves as Assistant Treasurer of other Fidelity funds (2005-present) and is an employee of FMR (2005-present). Previously, Mr. Ryan served as Vice President of Fund Reporting in FPCMS (1999-2005). |
Salvatore Schiavone (40) |
| Year of Election or Appointment: 2005 Assistant Treasurer of the fund. Mr. Schiavone also serves as Assistant Treasurer of other Fidelity funds (2005-present) and is an employee of FMR (2005-present). Before joining Fidelity Investments, Mr. Schiavone worked at Deutsche Asset Management, where he most recently served as Assistant Treasurer (2003-2005) of the Scudder Funds and Vice President and Head of Fund Reporting (1996-2003). |
Annual Report
Distributions
The Board of Trustees of Advisor Small Cap Growth Fund voted to pay on September 11, 2006, to shareholders of record at the opening of business on September 08, 2006, a distribution of $0.076 per share derived from capital gains realized from sales of portfolio securities.
The fund hereby designates as a capital gain dividend with respect to the taxable year ended July 31, 2006, $1,027,501, or, if subsequently determined to be different, the net capital gain of such year.
The fund designates 9%, and 75% of the dividends distributed in September and December, respectively during the fiscal year as qualifying for the dividends-received deduction for corporate shareholders.
The fund designates 12%, and 82% of the dividends distributed in September and December, respectively during the fiscal year as amounts which may be taken into account as a dividend for the purposes of the maximum rate under section 1(h)(11) of the Internal Revenue Code.
The fund will notify shareholders in January 2007 of amounts for use in preparing 2006 income tax returns.
Annual Report
Proxy Voting Results
A special meeting of the funds' shareholders was held on May 17, 2006. The results of votes taken among shareholders on the proposal before them are reported below. Each vote reported represents one dollar of net asset value held on the record date for the meeting.
PROPOSAL 1 |
To elect a Board of Trustees. A |
| # of
Votes | % of
Votes |
Dennis J. Dirks |
Affirmative | 43,119,905,166.54 | 95.455 |
Withheld | 2,053,001,967.67 | 4.545 |
TOTAL | 45,172,907,134.21 | 100.000 |
Albert R. Gamper, Jr. |
Affirmative | 43,068,780,128.62 | 95.342 |
Withheld | 2,104,127,005.59 | 4.658 |
TOTAL | 45,172,907,134.21 | 100.000 |
Robert M. Gates |
Affirmative | 43,032,117,662.60 | 95.261 |
Withheld | 2,140,789,471.61 | 4.739 |
TOTAL | 45,172,907,134.21 | 100.000 |
George H. Heilmeier |
Affirmative | 43,023,368,882.30 | 95.242 |
Withheld | 2,149,538,251.91 | 4.758 |
TOTAL | 45,172,907,134.21 | 100.000 |
Edward C. Johnson 3d |
Affirmative | 42,881,915,819.70 | 94.928 |
Withheld | 2,290,991,314.51 | 5.072 |
TOTAL | 45,172,907,134.21 | 100.000 |
Stephen P. Jonas |
Affirmative | 43,081,912,066.37 | 95.371 |
Withheld | 2,090,995,067.84 | 4.629 |
TOTAL | 45,172,907,134.21 | 100.000 |
James H. KeyesB |
Affirmative | 43,049,050,093.79 | 95.298 |
Withheld | 2,123,857,040.42 | 4.702 |
TOTAL | 45,172,907,134.21 | 100.000 |
Marie L. Knowles |
Affirmative | 43,090,434,696.02 | 95.390 |
Withheld | 2,082,472,438.19 | 4.610 |
TOTAL | 45,172,907,134.21 | 100.000 |
| # of
Votes | % of
Votes |
Ned C. Lautenbach |
Affirmative | 43,082,185,255.05 | 95.372 |
Withheld | 2,090,721,879.16 | 4.628 |
TOTAL | 45,172,907,134.21 | 100.000 |
William O. McCoy |
Affirmative | 42,960,162,066.32 | 95.102 |
Withheld | 2,212,745,067.89 | 4.898 |
TOTAL | 45,172,907,134.21 | 100.000 |
Robert L. Reynolds |
Affirmative | 43,087,560,419.66 | 95.384 |
Withheld | 2,085,346,714.55 | 4.616 |
TOTAL | 45,172,907,134.21 | 100.000 |
Cornelia M. Small |
Affirmative | 43,092,070,014.53 | 95.394 |
Withheld | 2,080,837,119.68 | 4.606 |
TOTAL | 45,172,907,134.21 | 100.000 |
William S. Stavropoulos |
Affirmative | 43,002,032,676.43 | 95.194 |
Withheld | 2,170,874,457.78 | 4.806 |
TOTAL | 45,172,907,134.21 | 100.000 |
Kenneth L. Wolfe |
Affirmative | 43,047,241,852.81 | 95.294 |
Withheld | 2,125,665,281.40 | 4.706 |
TOTAL | 45,172,907,134.21 | 100.000 |
A Denotes trust-wide proposal and voting results. B Effective on or about January 1, 2007. |
Annual Report
Board Approval of Investment Advisory Contracts and Management Fees
Fidelity Small Cap Growth Fund
Each year, typically in July, the Board of Trustees, including the Independent Trustees (together, the Board), votes on the renewal of the management contract and sub-advisory agreements (together, the Advisory Contracts) for the fund. The Board, assisted by the advice of fund counsel and Independent Trustees' counsel, requests and considers a broad range of information throughout the year.
The Board meets regularly each month except August and takes into account throughout the year matters bearing on Advisory Contracts. The Board, acting directly and through its separate committees, considers at each of its meetings factors that are relevant to the annual renewal of the fund's Advisory Contracts, including the services and support provided to the fund and its shareholders. At the time of the renewal, the Board had 12 standing committees, each composed of Independent Trustees with varying backgrounds, to which the Board has assigned specific subject matter responsibilities in order to enhance effective decision-making by the Board. Each committee has adopted a written charter outlining the structure and purposes of the committee. One such committee, the Equity Contract Committee, meets periodically as needed throughout the year to consider matters specifically related to the annual renewal of Advisory Contracts. The committee requests and receives information on, and makes recommendations to the Independent Trustees concerning, the approval and annual review of the Advisory Contracts.
At its July 2006 meeting, the Board of Trustees, including the Independent Trustees, unanimously determined to renew the Advisory Contracts for the fund. In reaching its determination, the Board considered all factors it believed relevant, including (i) the nature, extent, and quality of the services to be provided to the fund and its shareholders (including the investment performance of the fund); (ii) the competitiveness of the management fee and total expenses of the fund; (iii) the total costs of the services to be provided by and the profits to be realized by the investment adviser and its affiliates from the relationship with the fund; (iv) the extent to which economies of scale would be realized as the fund grows; and (v) whether fee levels reflect these economies of scale, if any, for the benefit of fund shareholders.
In determining whether to renew the Advisory Contracts for the fund, the Board ultimately reached a determination, with the assistance of fund counsel and Independent Trustees' counsel, that the renewal of the Advisory Contracts and the compensation to be received by Fidelity under the management contract is consistent with Fidelity's fiduciary duty under applicable law. In addition to evaluating the specific factors noted above, the Board, in reaching its determination, is aware that shareholders in the fund have a broad range of investment choices available to them, including a wide choice among mutual funds offered by competitors to Fidelity, and that the fund's shareholders, with the opportunity to review and weigh the disclosure provided by the fund in its prospectus and other public disclosures, have chosen to invest in this fund, managed by Fidelity.
Annual Report
Nature, Extent, and Quality of Services Provided. The Board considered staffing within the investment adviser, FMR, and the sub-advisers (together, the Investment Advisers), including the background of the fund's portfolio manager and the fund's investment objective and discipline. The Independent Trustees also had discussions with senior management of Fidelity's investment operations and investment groups. The Board considered the structure of the portfolio manager compensation program and whether this structure provides appropriate incentives.
Resources Dedicated to Investment Management and Support Services. The Board reviewed the size, education, and experience of the Investment Advisers' investment staff, their use of technology, and the Investment Advisers' approach to recruiting, training, and retaining portfolio managers and other research, advisory, and management personnel. The Board considered Fidelity's extensive global research capabilities that enable the Investment Advisers to aggregate data from various sources in an effort to produce positive investment results. The Board noted that Fidelity's analysts have access to a variety of technological tools that enable them to perform both fundamental and quantitative analysis and to specialize in various disciplines. The Board also considered that Fidelity's portfolio managers and analysts have access to daily portfolio attribution that allows for monitoring of a fund's portfolio, as well as an electronic communication system that provides immediate real-time access to research concerning issuers and credit enhancers.
Shareholder and Administrative Services. The Board considered (i) the nature, extent, quality, and cost of administrative, distribution, and shareholder services performed by the Investment Advisers and their affiliates under the Advisory Contracts and under separate agreements covering transfer agency, pricing and bookkeeping, and securities lending services for the fund; (ii) the nature and extent of the Investment Advisers' supervision of third party service providers, principally custodians and subcustodians; and (iii) the resources devoted to, and the record of compliance with, the fund's compliance policies and procedures. The Board reviewed the allocation of fund brokerage, including allocations to brokers affiliated with the Investment Advisers, the use of brokerage commissions to pay fund expenses, and the use of "soft" commission dollars to pay for research services. The Board also considered that Fidelity voluntarily pays for market data out of its own resources.
The Board noted that the growth of fund assets across the complex allows Fidelity to reinvest in the development of services designed to enhance the value or convenience of the Fidelity funds as investment vehicles. These services include 24-hour access to account information and market information through phone representatives and over the Internet, and investor education materials and asset allocation tools.
Annual Report
Board Approval of Investment Advisory Contracts and
Management Fees - continued
Investment in a Large Fund Family. The Board considered the benefits to shareholders of investing in a Fidelity fund, including the benefits of investing in a fund that is part of a large family of funds offering a variety of investment disciplines and providing for a large variety of mutual fund investor services. For example, fund shareholders are offered the privilege of exchanging shares of the fund for shares of other Fidelity funds, as set forth in the fund's prospectus, without paying an additional sales charge. The Board noted that, since the last Advisory Contract renewals in July 2005, Fidelity has taken a number of actions that benefited particular funds, including (i) dedicating additional resources to investment research and to restructure the investment research teams; (ii) voluntarily entering into contractual arrangements with certain brokers pursuant to which Fidelity pays for research products and services separately out of its own resources, rather than bundling with fund commissions; (iii) launching the Fidelity Advantage Class of its five Spartan stock index funds and three Spartan bond index funds, which is a lower-fee class available to shareholders with higher account balances; (iv) contractually agreeing to impose expense limitations on Fidelity U.S. Bond Index Fund and reducing the fund's initial investment minimum; and (v) offering shareholders of each of the Fidelity Institutional Money Market Funds the privilege of exchanging shares of the fund for shares of other Fidelity funds.
Investment Performance and Compliance. The Board considered whether the fund has operated within its investment objective, as well as its record of compliance with its investment restrictions. It also reviewed the fund's absolute investment performance for each class, as well as the fund's relative investment performance for each class measured against (i) a broad-based securities market index, and (ii) a peer group of mutual funds deemed appropriate by the Board. Because the fund had been in existence less than three calendar years, the following chart considered by the Board shows, for the one-year period ended December 31, 2005, the total returns of Class C and Fidelity Small Cap Growth (retail class), the total return of a broad-based securities market index ("benchmark"), and a range of total returns of a peer group of mutual funds identified by Lipper Inc. as having an investment objective similar to that of the fund. The returns of Class C and Fidelity Small Cap Growth (retail class) represent the performance of classes with the highest and lowest 12b-1 fees, respectively (not necessarily with the highest and lowest total expenses). The box within the chart shows the 25th percentile return (bottom of box) and the 75th percentile return (top of box) of the Lipper peer group. Returns shown above the box are in the first quartile and returns shown below the box are in the fourth quartile. The percentage beaten numbers noted below the chart correspond to the percentile box and represent the percentage of funds in the Lipper peer group whose performance was equal to or lower than that of the class indicated.
Annual Report
Fidelity Small Cap Growth Fund
The Board reviewed the fund's relative investment performance against its Lipper peer group and stated that the performance of Fidelity Small Cap Growth (retail class) was in the first quartile for the period shown. The Board also stated that the relative investment performance of Fidelity Small Cap Growth (retail class) compared favorably to its benchmark for the period shown. The Board considered that the variations in performance among the fund's classes reflect the variations in class expenses, which result in lower performance for higher expense classes. The Board stated that it is difficult to evaluate in any comprehensive fashion the performance of the fund, in light of its relatively recent launch. The Board also reviewed the fund's relative investment performance against a peer group defined by Morningstar.
The Board also considered that the fund's management fee is subject to upward or downward adjustment depending upon whether, and to what extent, the fund's investment performance for the performance period exceeds, or is exceeded by, the record (over the same period) of a Board-approved performance adjustment index. The Board realizes that the performance adjustment provides FMR with a strong economic incentive to seek to achieve superior performance for the fund's shareholders and helps to more closely align the interests of FMR and the fund's shareholders.
The Board considered that FMR has taken steps to refocus and strengthen equity research, equity portfolio management, and compliance. The Board noted with favor FMR's reorganization of its senior management team in 2005 and FMR's dedication of additional resources to investment research, and participated in the process that led to those changes.
Annual Report
Board Approval of Investment Advisory Contracts and
Management Fees - continued
Based on its review, and giving particular weight to the nature and quality of the resources dedicated by the Investment Advisers to maintain and improve relative performance, the Board concluded that the nature, extent, and quality of the services provided to the fund will benefit the fund's shareholders, particularly in light of the Board's view that the fund's shareholders benefit from investing in a fund that is part of a large family of funds offering a variety of investment disciplines and services.
Competitiveness of Management Fee and Total Fund Expenses. The Board considered the fund's management fee and total expenses compared to "mapped groups" of competitive funds and classes. Fidelity creates "mapped groups" by combining similar Lipper investment objective categories that have comparable management fee characteristics. Combining Lipper investment objective categories aids the Board's management fee and total expense comparisons by broadening the competitive group used for comparison and by reducing the number of universes to which various Fidelity funds are compared.
The Board considered two proprietary management fee comparisons for the 12-month (or shorter) periods shown in the chart below. The group of Lipper funds used by the Board for management fee comparisons is referred to below as the "Total Mapped Group" and, for the reasons explained above, is broader than the Lipper peer group used by the Board for performance comparisons. The Total Mapped Group comparison focuses on a fund's standing relative to the total universe of comparable funds available to investors, in terms of gross management fees before expense reimbursements or caps, and without giving effect to the fund's performance adjustment. "TMG %" represents the percentage of funds in the Total Mapped Group that had management fees that were lower than the fund's. For example, a TMG % of 13% means that 87% of the funds in the Total Mapped Group had higher management fees than the fund. The "Asset-Size Peer Group" (ASPG) comparison focuses on a fund's standing relative to non-Fidelity funds similar in size to the fund within the Total Mapped Group. The ASPG represents at least 15% of the funds in the Total Mapped Group with comparable asset size and management fee characteristics, subject to a minimum of 50 funds (or all funds in the Total Mapped Group if fewer than 50). Additional information, such as the ASPG quartile in which the fund's management fee ranked and the impact of the fund's performance adjustment, is also included in the chart and considered by the Board.
Annual Report
Fidelity Small Cap Growth Fund

The Board noted that the fund's management fee ranked below the median of its Total Mapped Group and below the median of its ASPG for 2005. The Board also noted the effect of the fund's positive performance adjustment on the fund's management fee ranking.
Based on its review, the Board concluded that the fund's management fee was fair and reasonable in light of the services that the fund receives and the other factors considered.
In its review of each class's total expenses, the Board considered the fund's management fee as well as other fund or class expenses, as applicable, such as transfer agent fees, pricing and bookkeeping fees, fund-paid 12b-1 fees, and custodial, legal, and audit fees. The Board also noted the effects of any waivers and reimbursements on fees and expenses, as well as the fund's positive performance adjustment. As part of its review, the Board also considered current and historical total expenses of each class of the fund compared to competitive fund median expenses. Each class of the fund is compared to those funds and classes in the Total Mapped Group (used by the Board for management fee comparisons) that have a similar sales load structure.
The Board noted that the total expenses of each of Class A, Institutional Class, and Fidelity Small Cap Growth (retail class) ranked below its competitive median for 2005, and the total expenses of each of Class B, Class C, and Class T ranked above its competitive median for 2005. The Board considered that Class B and Class C were above median because of relatively high transfer agent fees resulting from small average account sizes. The Board noted that the fund offers multiple classes, each of which has a different sales load and 12b-1 fee structure, and that the multiple structures are intended to offer a range of pricing options for the intermediary market. The Board also noted that the total expenses of the classes vary primarily by the level of their 12b-1 fees, although differences in transfer agent fees may also cause expenses to vary from class to class.
Annual Report
Board Approval of Investment Advisory Contracts and
Management Fees - continued
In its review of total expenses, the Board also considered Fidelity fee structures and other information on clients that FMR and its affiliates service in other competitive markets, such as other mutual funds advised or subadvised by FMR or its affiliates, pension plan clients, and other institutional clients.
Based on its review, the Board concluded that the total expenses of each class of the fund were reasonable, although in some cases above the median of the universe presented for comparison, in light of the services that the fund and its shareholders receive and the other factors considered.
Costs of the Services and Profitability. The Board considered the revenues earned and the expenses incurred by Fidelity in conducting the business of developing, marketing, distributing, managing, administering and servicing the fund and its shareholders. The Board also considered the level of Fidelity's profits in respect of all the Fidelity funds.
On an annual basis, FMR presents to the Board Fidelity's profitability for the fund. Fidelity calculates the profitability for each fund, as well as aggregate profitability for groups of Fidelity funds and all Fidelity funds, using a series of detailed revenue and cost allocation methodologies which originate with the audited books and records of Fidelity. The Audit Committee of the Board reviews any significant changes from the prior year's methodologies.
PricewaterhouseCoopers LLP (PwC), independent registered accounting firm and auditor to Fidelity and certain Fidelity funds, has been engaged annually by the Board as part of the Board's assessment of the results of Fidelity's profitability analysis. PwC's engagement includes the review and assessment of Fidelity's methodologies used in determining the revenues and expenses attributable to Fidelity's mutual fund business, and completion of agreed-upon procedures surrounding the mathematical accuracy of fund profitability and its conformity to allocation methodologies. After considering PwC's reports issued under the engagement and information provided by Fidelity, the Board believes that while other allocation methods may also be reasonable, Fidelity's profitability methodologies are reasonable in all material respects.
The Board has also reviewed Fidelity's non-fund businesses and any fall-out benefits related to the mutual fund business as well as cases where Fidelity's affiliates may benefit from or be related to the fund's business.
Annual Report
The Board considered the costs of the services provided by and the profits realized by Fidelity in connection with the operation of the fund and determined that the amount of profit is a fair entrepreneurial profit for the management of the fund.
Economies of Scale. The Board considered whether there have been economies of scale in respect of the management of the Fidelity funds, whether the Fidelity funds (including the fund) have appropriately benefited from any such economies of scale, and whether there is potential for realization of any further economies of scale. The Board considered the extent to which the fund will benefit from economies of scale through increased services to the fund, through waivers or reimbursements, or through fee or expense reductions, including reductions that occur through operation of the transfer agent agreement. The transfer agent fee varies in part based on the number of accounts in the fund. If the number of accounts decreases or the average account size increases, the overall transfer agent fee rate decreases.
The Board recognized that the fund's management contract incorporates a "group fee" structure, which provides for lower fee rates as total fund assets under FMR's management increase, and for higher fee rates as total fund assets under FMR's management decrease. The Board considered that the group fee is designed to deliver the benefits of economies of scale to fund shareholders when total fund assets increase, even if assets of any particular fund are unchanged or have declined, because some portion of Fidelity's costs are attributable to services provided to all Fidelity funds, and all funds benefit if those costs can be allocated among more assets. The Board concluded that, given the group fee structure, fund shareholders will achieve a certain level of economies of scale as assets under FMR's management increase at the fund complex level, regardless of whether Fidelity achieves any such economies of scale.
The Board further concluded that any potential economies of scale are being shared between fund shareholders and Fidelity in an appropriate manner.
Additional Information Requested by the Board. In order to develop fully the factual basis for consideration of the Advisory Contracts, the Board requested additional information on several topics, including (i) Fidelity's fund profitability methodology and profitability trends within certain funds; (ii) portfolio manager compensation; (iii) the extent to which any economies of scale exist and are shared between the funds and Fidelity; (iv) the total expenses of certain funds and classes relative to competitors, including the extent to which the expenses of certain funds have been or could be capped; (v) fund performance trends; and (vi) Fidelity's fee structures, including use of performance fees.
Based on its evaluation of all of the conclusions noted above, and after considering all material factors, the Board ultimately concluded that the advisory fee structures are fair and reasonable, and that the fund's Advisory Contracts should be renewed.
Annual Report
Annual Report
Annual Report
Annual Report
Annual Report
Annual Report
Annual Report
Investment Adviser
Fidelity Management & Research Company
Boston, MA
Investment Sub-Advisers
FMR Co., Inc.
Fidelity Management & Research
(U.K.) Inc.
Fidelity Research & Analysis Company
(formerly Fidelity Management & Research
(Far East) Inc.)
Fidelity International Investment Advisors
Fidelity Investments Japan Limited
Fidelity International Investment Advisors (U.K.) Limited
General Distributor
Fidelity Distributors Corporation
Boston, MA
Transfer and Service Agents
Fidelity Investments Institutional
Operations Company, Inc.
Boston, MA
Fidelity Service Company, Inc.
Boston, MA
Custodian
Citibank, N.A.
New York, NY
ASCPI-UANN-0906
1.803721.101
(Fidelity Investment logo)(registered trademark)
Fidelity®
Small Cap Value
Fund
Annual Report
July 31, 2006
(2_fidelity_logos) (Registered_Trademark)
Contents
Chairman's Message | <Click Here> | Ned Johnson's message to shareholders. |
Performance | <Click Here> | How the fund has done over time. |
Management's Discussion | <Click Here> | The manager's review of fund performance, strategy and outlook |
Shareholder Expense Example | <Click Here> | An example of shareholder expenses. |
Investment Changes | <Click Here> | A summary of major shifts in the fund's investments over the past six months. |
Investments | <Click Here> | A complete list of the fund's investments with their market values. |
Financial Statements | <Click Here> | Statements of assets and liabilities, operations, and changes in net assets,
as well as financial highlights. |
Notes | <Click Here> | Notes to the financial statements. |
Report of Independent Registered Public Accounting Firm | <Click Here> | |
Trustees and Officers | <Click Here> | |
Distributions | <Click Here> | |
Proxy Voting Results | <Click Here> | |
Board Approval of Investment Advisory Contracts and Management Fees | <Click Here> | |
To view a fund's proxy voting guidelines and proxy voting record for the 12-month period ended June 30, visit www.fidelity.com/proxyvotingresults or visit the Securities and Exchange Commission's (SEC) web site at www.sec.gov. You may also call 1-800-544-8544 to request a free copy of the proxy voting guidelines.
Standard & Poor's, S&P and S&P 500 are registered service marks of The McGraw-Hill Companies, Inc. and have been licensed for use by Fidelity Distributors Corporation.
Other third party marks appearing herein are the property of their respective owners.
All other marks appearing herein are registered or unregistered trademarks or service marks of FMR Corp. or an affiliated company.
Annual Report
This report and the financial statements contained herein are submitted for the general information of the shareholders of the fund. This report is not authorized for distribution to prospective investors in the fund unless preceded or accompanied by an effective prospectus.
A fund files its complete schedule of portfolio holdings with the SEC for the first and third quarters of each fiscal year on Form N-Q. Forms N-Q are available on the SEC's web site at http://www.sec.gov. A fund's Forms N-Q may be reviewed and copied at the SEC's Public Reference Room in Washington, DC. Information regarding the operation of the SEC's Public Reference Room may be obtained by calling 1-800-SEC-0330. For a complete list of a fund's portfolio holdings, view the most recent quarterly holdings report, semiannual report, or annual report on Fidelity's web site at http://www.fidelity.com/holdings.
NOT FDIC INSURED · MAY LOSE VALUE · NO BANK GUARANTEE
Neither the fund nor Fidelity Distributors Corporation is a bank.
Annual Report
Chairman's Message
(photo_of_Edward_C_Johnson_3d)
Dear Shareholder:
Although many securities markets made gains in early 2006, inflation concerns led to mixed results through the year's mid-point. Financial markets are always unpredictable. There are, however, a number of time-tested principles that can put the historical odds in your favor.
One of the basic tenets is to invest for the long term. Over time, riding out the markets' inevitable ups and downs has proven much more effective than selling into panic or chasing the hottest trend. Even missing only a few of the markets' best days can significantly diminish investor returns. Patience also affords the benefits of compounding - of earning interest on additional income or reinvested dividends and capital gains. There are tax advantages and cost benefits to consider as well. The more you sell, the more taxes you pay, and the more you trade, the higher the costs. While staying the course doesn't eliminate risk, it can considerably lessen the effect of short-term declines.
You can further manage your investing risk through diversification. And today, more than ever, geographic diversification should be taken into account. Studies indicate that asset allocation is the single most important determinant of a portfolio's long-term success. The right mix of stocks, bonds and cash - aligned to your particular risk tolerance and investment objective - is very important. Age-appropriate rebalancing is also an essential aspect of asset allocation. For younger investors, an emphasis on equities - which historically have been the best performing asset class over time - is encouraged. As investors near their specific goal, such as retirement or sending a child to college, consideration may be given to replacing volatile assets (e.g. common stocks) with more-stable fixed investments (bonds or savings plans).
A third investment principle - investing regularly - can help lower the average cost of your purchases. Investing a certain amount of money each month or quarter helps ensure you won't pay for all your shares at market highs. This strategy - known as dollar cost averaging - also reduces unconstructive "emotion" from investing, helping shareholders avoid selling weak performers just prior to an upswing, or chasing a hot performer just before a correction.
We invite you to contact us via the Internet, through our Investor Centers or over the phone. It is our privilege to provide you the information you need to make the investments that are right for you.
Sincerely,
/s/Edward C. Johnson 3d
Edward C. Johnson 3d
Annual Report
Performance: The Bottom Line
Average annual total return reflects the change in the value of an investment, assuming reinvestment of Small Cap Value's dividend income and capital gains (the profits earned upon the sale of securities that have grown in value) and assuming a constant rate of performance each year. The $10,000 table and the fund's returns do not reflect the deduction of taxes that a shareholder would pay on fund distributions or the redemption of fund shares. During periods of reimbursement by Fidelity, a fund's total return will be greater than it would be had the reimbursement not occurred. How a fund did yesterday is no guarantee of how it will do tomorrow.
Average Annual Total Returns
Periods ended July 31, 2006 | Past 1
year | Life of
FundA |
Small Cap Value | 6.07% | 19.40% |
A From November 3, 2004.
$10,000 Over Life of Fund
Let's say hypothetically that $10,000 was invested in Small Cap Value on November 3, 2004, when the fund started. The chart shows how the value of your investment would have changed, and also shows how the Russell 2000® Value Index performed over the same period.
Annual Report
Management's Discussion of Fund Performance
Comments from Thomas Hense, Portfolio Manager of Fidelity® Small Cap Value Fund
As measured by the Dow Jones Wilshire 5000 Composite IndexSM - the broadest measure of U.S. equity market performance - stocks did well for most of the 12-month period ending July 31, 2006, before faltering. For the one-year time frame as a whole, the Dow Jones Wilshire benchmark rose 5.43%. That was nearly identical to the 5.38% gain of the Standard & Poor's 500SM Index, a broad market proxy that's a reflection of larger-cap stocks. Stocks were resilient early on, bouncing back quickly after Hurricanes Katrina and Rita caused energy prices to spike to record-high levels. Buoyed by strong corporate earnings and solid economic growth, the S&P 500® ran off six consecutive months of positive returns from November through April. However, stocks pulled back for most of the remainder of the period. A slowdown in economic expansion and consumer spending, reaccelerating energy prices and continued interest rate hikes by the Federal Reserve Board cooled equity performance. Among other widely quoted market yardsticks, the Dow Jones Industrial AverageSM returned 7.59%, while the NASDAQ Composite® Index dropped 3.47%.
Small Cap Value was up 6.07% during the past year, modestly underperforming the Russell 2000® Value Index, which returned 6.93%. Relative to its index, the fund was hurt by a lack of exposure to traditional deep value stocks, which the market favored as the economy slowed during the last several months of the period. Overweightings in the retailing and consumer durables groups and in the insurance sector also hurt performance, as did poor stock selection in insurance and retailing. Weak results in the transportation and health care equipment/services groups detracted as well. The fund was helped by its large overweighting in the strong performing energy sector, as well as its underweighting in the utilities sector. In terms of individual detractors, RC2 Corp., which makes learning toys and baby products, and consumer staples company Jarden held back the fund's relative return. Life insurance company American Equity Investment Life and retailer Cost Plus also hurt performance. Among the fund's top performers were oil refineries Holly and Tesoro, as well as energy equipment company Maverick Tube. WESCO International, which sells electrical equipment used in commercial and industrial construction, also boosted the fund's return. The fund no longer held some of these stocks at period end.
The views expressed above reflect those of the portfolio manager(s) only through the end of the period as stated on the cover of this report and do not necessarily represent the views of Fidelity or any other person in the Fidelity organization. Any such views are subject to change at any time based upon market or other conditions and Fidelity disclaims any responsibility to update such views. These views may not be relied on as investment advice and, because investment decisions for a Fidelity fund are based on numerous factors, may not be relied on as an indication of trading intent on behalf of any Fidelity fund.
Annual Report
Shareholder Expense Example
As a shareholder of the Fund, you incur two types of costs: (1) transaction costs, including sales charges (loads) on purchase payments or redemption proceeds, redemption fees, and (2) ongoing costs, including management fees, distribution and/or service (12b-1) fees and other Fund expenses. This Example is intended to help you understand your ongoing costs (in dollars) of investing in the Fund and to compare these costs with the ongoing costs of investing in other mutual funds.
The Example is based on an investment of $1,000 invested at the beginning of the period and held for the entire period (February 1, 2006 to July 31, 2006).
Actual Expenses
The first line of the accompanying table for each class of the Fund provides information about actual account values and actual expenses. You may use the information in this line, together with the amount you invested, to estimate the expenses that you paid over the period. Simply divide your account value by $1,000.00 (for example, an $8,600 account value divided by $1,000.00 = 8.6), then multiply the result by the number in the first line for a class of the Fund under the heading entitled "Expenses Paid During Period" to estimate the expenses you paid on your account during this period. A small balance maintenance fee of $12.00 that is charged once a year may apply for certain accounts with a value of less than $2,000. This fee is not included in the table below. If it was, the estimate of expenses you paid during the period would be higher, and your ending account value lower, by this amount.
Hypothetical Example for Comparison Purposes
The second line of the accompanying table for each class of the Fund provides information about hypothetical account values and hypothetical expenses based on a Class' actual expense ratio and an assumed rate of return of 5% per year before expenses, which is not the Class' actual return. The hypothetical account values and expenses may not be used to estimate the actual ending account balance or expenses you paid for the period. You may use this information to compare the ongoing costs of investing in the Fund and other funds. To do so, compare this 5% hypothetical example with the 5% hypothetical examples that appear in the shareholder reports of the other funds. A small balance maintenance fee of $12.00 that is charged once a year may apply for certain accounts with a value of less than $2,000. This fee is not included in the table below. If it was, the estimate of expenses you paid during the period would be higher, and your ending account value lower, by this amount.
Annual Report
Shareholder Expense Example - continued
Please note that the expenses shown in the table are meant to highlight your ongoing costs only and do not reflect any transaction costs. Therefore, the second line of the table is useful in comparing ongoing costs only, and will not help you determine the relative total costs of owning different funds. In addition, if these transactional costs were included, your costs would have been higher.
| Beginning
Account Value
February 1, 2006 | Ending
Account Value
July 31, 2006 | Expenses Paid
During Period*
February 1, 2006
to July 31, 2006 |
Class A | | | |
Actual | $ 1,000.00 | $ 967.70 | $ 6.78 |
HypotheticalA | $ 1,000.00 | $ 1,017.90 | $ 6.95 |
Class T | | | |
Actual | $ 1,000.00 | $ 966.20 | $ 8.00 |
HypotheticalA | $ 1,000.00 | $ 1,016.66 | $ 8.20 |
Class B | | | |
Actual | $ 1,000.00 | $ 963.90 | $ 10.42 |
HypotheticalA | $ 1,000.00 | $ 1,014.18 | $ 10.69 |
Class C | | | |
Actual | $ 1,000.00 | $ 963.90 | $ 10.42 |
HypotheticalA | $ 1,000.00 | $ 1,014.18 | $ 10.69 |
Small Cap Value | | | |
Actual | $ 1,000.00 | $ 969.20 | $ 5.47 |
HypotheticalA | $ 1,000.00 | $ 1,019.24 | $ 5.61 |
Institutional Class | | | |
Actual | $ 1,000.00 | $ 969.20 | $ 5.32 |
HypotheticalA | $ 1,000.00 | $ 1,019.39 | $ 5.46 |
A 5% return per year before expenses
* Expenses are equal to each Class' annualized expense ratio (shown in the table below); multiplied by the average account value over the period, multiplied by 181/365 (to reflect the one-half year period).
| Annualized
Expense Ratio |
Class A | 1.39% |
Class T | 1.64% |
Class B | 2.14% |
Class C | 2.14% |
Small Cap Value | 1.12% |
Institutional Class | 1.09% |
Annual Report
Investment Changes
Top Ten Stocks as of July 31, 2006 |
| % of fund's
net assets | % of fund's net assets
6 months ago |
Tesoro Corp. | 2.3 | 0.0 |
American Equity Investment Life Holding Co. | 2.0 | 0.0 |
RC2 Corp. | 1.8 | 3.3 |
Zenith National Insurance Corp. | 1.8 | 0.0 |
Compass Minerals International, Inc. | 1.8 | 2.2 |
Jarden Corp. | 1.8 | 2.1 |
Omnicare, Inc. | 1.8 | 0.0 |
Carpenter Technology Corp. | 1.7 | 0.0 |
UAP Holding Corp. | 1.6 | 2.4 |
Telvent GIT SA | 1.4 | 1.4 |
| 18.0 | |
Top Five Market Sectors as of July 31, 2006 |
| % of fund's
net assets | % of fund's net assets
6 months ago |
Financials | 26.3 | 19.5 |
Industrials | 16.2 | 18.8 |
Consumer Discretionary | 12.9 | 19.0 |
Information Technology | 12.2 | 9.0 |
Energy | 10.5 | 14.4 |
Asset Allocation (% of fund's net assets) |
As of July 31, 2006 * | As of January 31, 2006 ** |
| Stocks 94.6% | | | Stocks 94.0% | |
 | Bonds 0.0% | | | Bonds 0.1% | |
| Short-Term
Investments and
Net Other Assets 5.4% | | | Short-Term
Investments and
Net Other Assets 5.9% | |
* Foreign investments | 7.9% | | ** Foreign investments | 11.0% | |

Annual Report
Investments July 31, 2006
Showing Percentage of Net Assets
Common Stocks - 94.6% |
| Shares | | Value (Note 1) |
CONSUMER DISCRETIONARY - 12.9% |
Auto Components - 1.1% |
Hawk Corp. Class A (a) | 406,600 | | $ 5,098,764 |
Spartan Motors, Inc. | 399,710 | | 6,539,256 |
| | 11,638,020 |
Distributors - 0.5% |
Building Material Holding Corp. (d) | 249,100 | | 5,338,213 |
Diversified Consumer Services - 0.4% |
Steiner Leisure Ltd. (a) | 119,429 | | 4,798,657 |
Hotels, Restaurants & Leisure - 2.7% |
Domino's Pizza, Inc. | 275,000 | | 6,253,500 |
Gaylord Entertainment Co. (a) | 115,000 | | 4,395,300 |
Isle of Capri Casinos, Inc. (a) | 284,500 | | 6,722,735 |
Pinnacle Entertainment, Inc. (a) | 452,700 | | 12,417,561 |
| | 29,789,096 |
Household Durables - 4.0% |
Ethan Allen Interiors, Inc. | 35,300 | | 1,317,396 |
Interface, Inc. Class A (a) | 1,244,490 | | 15,269,892 |
Jarden Corp. (a)(d) | 675,000 | | 19,568,250 |
Kimball International, Inc. Class B | 235,000 | | 4,175,950 |
Lenox Group, Inc. (a) | 291,045 | | 2,025,673 |
Ryland Group, Inc. | 40,000 | | 1,634,000 |
| | 43,991,161 |
Leisure Equipment & Products - 2.1% |
Cybex International, Inc. (a) | 143,100 | | 788,481 |
MarineMax, Inc. (a) | 102,800 | | 2,163,940 |
RC2 Corp. (a) | 584,555 | | 19,798,878 |
| | 22,751,299 |
Specialty Retail - 1.6% |
Gymboree Corp. (a) | 135,000 | | 4,525,200 |
Sonic Automotive, Inc. Class A (sub. vtg.) | 242,500 | | 5,577,500 |
The Children's Place Retail Stores, Inc. (a) | 58,000 | | 3,237,560 |
Tween Brands, Inc. (a) | 105,000 | | 3,908,100 |
| | 17,248,360 |
Textiles, Apparel & Luxury Goods - 0.5% |
Warnaco Group, Inc. (a) | 290,000 | | 5,164,900 |
TOTAL CONSUMER DISCRETIONARY | | 140,719,706 |
Common Stocks - continued |
| Shares | | Value (Note 1) |
CONSUMER STAPLES - 1.9% |
Food Products - 1.0% |
Diamond Foods, Inc. | 580,400 | | $ 8,914,944 |
Gold Kist, Inc. Delaware (a) | 185,500 | | 2,595,145 |
| | 11,510,089 |
Personal Products - 0.9% |
Playtex Products, Inc. (a) | 200,000 | | 2,264,000 |
Prestige Brands Holdings, Inc. (a) | 812,838 | | 7,136,718 |
| | 9,400,718 |
TOTAL CONSUMER STAPLES | | 20,910,807 |
ENERGY - 10.5% |
Energy Equipment & Services - 2.8% |
Carbo Ceramics, Inc. | 121,200 | | 4,713,468 |
Hornbeck Offshore Services, Inc. (a) | 154,100 | | 5,354,975 |
Hydril Co. (a) | 37,717 | | 2,612,657 |
Oil States International, Inc. (a) | 244,760 | | 7,871,482 |
Superior Energy Services, Inc. (a) | 215,000 | | 7,363,750 |
W-H Energy Services, Inc. (a) | 50,000 | | 2,751,000 |
| | 30,667,332 |
Oil, Gas & Consumable Fuels - 7.7% |
Comstock Resources, Inc. (a) | 330,300 | | 9,717,426 |
Encore Acquisition Co. (a) | 89,820 | | 2,735,917 |
Forest Oil Corp. (a) | 140,000 | | 4,691,400 |
Gastar Exploration Ltd. (a)(e) | 1,509,607 | | 3,241,733 |
Holly Corp. | 207,400 | | 10,494,440 |
Mariner Energy, Inc. (a) | 530,000 | | 9,545,300 |
Overseas Shipholding Group, Inc. | 152,500 | | 9,819,475 |
Petroleum Development Corp. (a) | 94,500 | | 4,209,030 |
Tesoro Corp. | 340,800 | | 25,491,836 |
World Fuel Services Corp. | 65,000 | | 3,075,800 |
| | 83,022,357 |
TOTAL ENERGY | | 113,689,689 |
FINANCIALS - 26.3% |
Capital Markets - 1.0% |
American Capital Strategies Ltd. (d) | 158,700 | | 5,554,500 |
Common Stocks - continued |
| Shares | | Value (Note 1) |
FINANCIALS - continued |
Capital Markets - continued |
Technology Investment Capital Corp. | 87,948 | | $ 1,263,813 |
TradeStation Group, Inc. (a) | 280,000 | | 4,093,600 |
| | 10,911,913 |
Commercial Banks - 6.0% |
Boston Private Financial Holdings, Inc. | 425,000 | | 10,680,250 |
Cathay General Bancorp | 270,220 | | 9,930,585 |
Center Financial Corp., California | 468,352 | | 11,671,332 |
East West Bancorp, Inc. | 28,800 | | 1,162,080 |
Hanmi Financial Corp. | 245,040 | | 4,665,562 |
Home Bancshares, Inc. | 56,300 | | 1,227,340 |
Nara Bancorp, Inc. | 208,270 | | 3,834,251 |
Preferred Bank, Los Angeles California | 166,900 | | 9,565,039 |
UCBH Holdings, Inc. | 150,000 | | 2,502,000 |
Wintrust Financial Corp. | 209,360 | | 10,051,374 |
| | 65,289,813 |
Consumer Finance - 0.2% |
Advanta Corp. Class B | 50,000 | | 1,801,500 |
Diversified Financial Services - 0.9% |
Marlin Business Services Corp. (a) | 470,779 | | 9,773,372 |
Insurance - 13.5% |
American Equity Investment Life Holding Co. | 1,985,000 | | 21,616,650 |
Aspen Insurance Holdings Ltd. | 360,200 | | 8,500,720 |
HCC Insurance Holdings, Inc. | 175,920 | | 5,363,801 |
Hub International Ltd. | 100,000 | | 2,611,000 |
IPC Holdings Ltd. | 413,440 | | 11,886,400 |
National Financial Partners Corp. | 206,300 | | 9,291,752 |
Navigators Group, Inc. (a) | 69,862 | | 2,969,834 |
Ohio Casualty Corp. | 193,500 | | 5,015,520 |
Philadelphia Consolidated Holdings Corp. (a) | 274,140 | | 9,285,122 |
Platinum Underwriters Holdings Ltd. | 329,700 | | 9,327,213 |
RLI Corp. | 180,000 | | 8,510,400 |
Specialty Underwriters' Alliance, Inc. (a) | 339,130 | | 2,167,041 |
Tower Group, Inc. | 100,000 | | 3,002,000 |
United America Indemnity Ltd. Class A (a) | 310,012 | | 6,429,649 |
USI Holdings Corp. (a) | 1,194,448 | | 14,835,044 |
Willis Group Holdings Ltd. | 195,000 | | 6,343,350 |
Zenith National Insurance Corp. | 494,000 | | 19,750,120 |
| | 146,905,616 |
Common Stocks - continued |
| Shares | | Value (Note 1) |
FINANCIALS - continued |
Real Estate Investment Trusts - 2.9% |
Columbia Equity Trust, Inc. | 230,000 | | $ 3,489,100 |
Education Realty Trust, Inc. | 176,300 | | 2,755,569 |
Equity Lifestyle Properties, Inc. | 75,100 | | 3,227,047 |
GMH Communities Trust | 314,100 | | 3,938,814 |
Pennsylvania (REIT) (SBI) | 246,800 | | 9,718,984 |
Ramco-Gershenson Properties Trust (SBI) | 129,600 | | 3,814,128 |
Saxon Capital, Inc. | 158,000 | | 1,786,980 |
Taubman Centers, Inc. | 74,400 | | 3,087,600 |
| | 31,818,222 |
Real Estate Management & Development - 1.2% |
Far East Consortium International Ltd. | 61,287 | | 25,871 |
Jones Lang LaSalle, Inc. | 157,000 | | 12,826,900 |
| | 12,852,771 |
Thrifts & Mortgage Finance - 0.6% |
Farmer Mac Class C (non-vtg.) | 100,000 | | 2,683,000 |
FirstFed Financial Corp., Delaware (a)(d) | 60,000 | | 3,387,000 |
ITLA Capital Corp. | 21,483 | | 1,067,920 |
| | 7,137,920 |
TOTAL FINANCIALS | | 286,491,127 |
HEALTH CARE - 5.3% |
Health Care Providers & Services - 3.0% |
Chemed Corp. | 50,000 | | 1,839,000 |
Odyssey Healthcare, Inc. (a) | 440,000 | | 7,924,400 |
Omnicare, Inc. | 422,000 | | 19,099,720 |
VistaCare, Inc. Class A (a) | 292,000 | | 3,398,880 |
| | 32,262,000 |
Health Care Technology - 1.1% |
Per-Se Technologies, Inc. (a) | 505,700 | | 12,071,059 |
Life Sciences Tools & Services - 1.0% |
ICON PLC sponsored ADR (a) | 169,360 | | 11,150,662 |
Pharmaceuticals - 0.2% |
Cypress Bioscience, Inc. (a) | 282,000 | | 1,624,320 |
TOTAL HEALTH CARE | | 57,108,041 |
Common Stocks - continued |
| Shares | | Value (Note 1) |
INDUSTRIALS - 16.2% |
Aerospace & Defense - 2.6% |
AAR Corp. (a) | 477,300 | | $ 11,302,464 |
Ceradyne, Inc. (a) | 134,070 | | 6,554,682 |
DRS Technologies, Inc. | 113,000 | | 5,230,770 |
Hexcel Corp. (a) | 350,200 | | 5,032,374 |
| | 28,120,290 |
Air Freight & Logistics - 1.4% |
Forward Air Corp. | 80,000 | | 2,567,200 |
Hub Group, Inc. Class A | 180,000 | | 4,064,400 |
Park-Ohio Holdings Corp. (a) | 529,306 | | 8,860,582 |
| | 15,492,182 |
Airlines - 0.2% |
AirTran Holdings, Inc. (a) | 160,000 | | 2,006,400 |
Building Products - 1.5% |
Insteel Industries, Inc. (d) | 365,988 | | 7,575,952 |
NCI Building Systems, Inc. (a) | 162,700 | | 7,604,598 |
Quixote Corp. | 71,300 | | 1,138,661 |
| | 16,319,211 |
Commercial Services & Supplies - 2.7% |
Banta Corp. | 128,400 | | 4,536,372 |
FTI Consulting, Inc. (a) | 420,000 | | 11,025,000 |
Spherion Corp. (a) | 250,000 | | 1,900,000 |
Standard Parking Corp. (a) | 166,684 | | 5,210,542 |
Steelcase, Inc. Class A | 213,000 | | 3,128,970 |
Team, Inc. (a) | 144,628 | | 3,575,204 |
| | 29,376,088 |
Construction & Engineering - 1.4% |
Shaw Group, Inc. (a) | 353,000 | | 7,303,570 |
URS Corp. (a) | 197,800 | | 7,832,880 |
| | 15,136,450 |
Electrical Equipment - 1.7% |
Acuity Brands, Inc. | 100,350 | | 4,388,306 |
Belden CDT, Inc. | 275,000 | | 8,923,750 |
C&D Technologies, Inc. | 310,000 | | 2,201,000 |
GrafTech International Ltd. (a) | 510,000 | | 2,738,700 |
| | 18,251,756 |
Machinery - 1.2% |
Basin Water, Inc. | 63,500 | | 558,800 |
Common Stocks - continued |
| Shares | | Value (Note 1) |
INDUSTRIALS - continued |
Machinery - continued |
Manitowoc Co., Inc. | 171,520 | | $ 6,733,875 |
Tennant Co. | 272,200 | | 6,470,194 |
| | 13,762,869 |
Road & Rail - 0.2% |
Old Dominion Freight Lines, Inc. (a) | 60,000 | | 1,954,800 |
Trading Companies & Distributors - 3.3% |
Kaman Corp. | 528,822 | | 9,703,884 |
UAP Holding Corp. | 900,980 | | 17,749,306 |
WESCO International, Inc. (a) | 153,000 | | 8,912,250 |
| | 36,365,440 |
TOTAL INDUSTRIALS | | 176,785,486 |
INFORMATION TECHNOLOGY - 12.2% |
Computers & Peripherals - 0.2% |
Neoware Systems, Inc. (a) | 100,000 | | 1,238,000 |
Rackable Systems, Inc. (a) | 50,000 | | 1,066,000 |
| | 2,304,000 |
Electronic Equipment & Instruments - 6.3% |
Benchmark Electronics, Inc. (a) | 207,900 | | 5,058,207 |
CTS Corp. | 225,000 | | 3,242,250 |
Ingram Micro, Inc. Class A (a) | 727,700 | | 12,829,351 |
Insight Enterprises, Inc. (a) | 658,900 | | 11,161,766 |
KEMET Corp. (a) | 1,124,700 | | 9,413,739 |
Mettler-Toledo International, Inc. (a) | 113,700 | | 6,995,961 |
ScanSource, Inc. (a) | 67,530 | | 2,009,018 |
Tektronix, Inc. | 526,000 | | 14,344,020 |
Vishay Intertechnology, Inc. (a) | 247,491 | | 3,472,299 |
| | 68,526,611 |
Internet Software & Services - 1.2% |
j2 Global Communications, Inc. (a) | 400,800 | | 11,222,400 |
RealNetworks, Inc. (a) | 225,000 | | 2,247,750 |
| | 13,470,150 |
IT Services - 1.9% |
MPS Group, Inc. (a) | 170,000 | | 2,208,300 |
Ness Technologies, Inc. (a) | 252,000 | | 2,782,080 |
Telvent GIT SA (a) | 1,081,000 | | 15,501,540 |
| | 20,491,920 |
Common Stocks - continued |
| Shares | | Value (Note 1) |
INFORMATION TECHNOLOGY - continued |
Semiconductors & Semiconductor Equipment - 2.1% |
California Micro Devices Corp. (a) | 575,000 | | $ 2,271,250 |
Conexant Systems, Inc. (a) | 1,300,000 | | 2,327,000 |
Intevac, Inc. (a) | 551,000 | | 11,609,570 |
MKS Instruments, Inc. (a) | 213,900 | | 4,421,313 |
Rudolph Technologies, Inc. (a) | 165,244 | | 2,298,544 |
| | 22,927,677 |
Software - 0.5% |
Moldflow Corp. (a) | 427,898 | | 5,139,055 |
TOTAL INFORMATION TECHNOLOGY | | 132,859,413 |
MATERIALS - 7.8% |
Chemicals - 2.7% |
Albemarle Corp. | 158,300 | | 7,981,486 |
Arch Chemicals, Inc. | 280,000 | | 9,923,200 |
Cytec Industries, Inc. | 99,670 | | 5,323,375 |
Georgia Gulf Corp. | 245,800 | | 6,258,068 |
| | 29,486,129 |
Containers & Packaging - 0.3% |
Owens-Illinois, Inc. | 200,000 | | 3,026,000 |
Metals & Mining - 4.8% |
Carpenter Technology Corp. | 190,000 | | 18,696,000 |
Compass Minerals International, Inc. | 736,466 | | 19,671,007 |
Meridian Gold, Inc. (a) | 270,000 | | 7,279,692 |
Steel Dynamics, Inc. | 55,000 | | 3,191,100 |
Titanium Metals Corp. | 120,000 | | 3,460,800 |
| | 52,298,599 |
TOTAL MATERIALS | | 84,810,728 |
TELECOMMUNICATION SERVICES - 0.4% |
Wireless Telecommunication Services - 0.4% |
Syniverse Holdings, Inc. (a) | 334,000 | | 4,669,320 |
UTILITIES - 1.1% |
Independent Power Producers & Energy Traders - 0.5% |
Dynegy, Inc. Class A (a) | 900,000 | | 5,067,000 |
Common Stocks - continued |
| Shares | | Value (Note 1) |
UTILITIES - continued |
Multi-Utilities - 0.6% |
CMS Energy Corp. (a) | 500,000 | | $ 7,005,000 |
TOTAL UTILITIES | | 12,072,000 |
TOTAL COMMON STOCKS (Cost $1,004,318,234) | 1,030,116,317 |
Money Market Funds - 5.9% |
| | | |
Fidelity Cash Central Fund, 5.3% (b) | 45,491,708 | | 45,491,708 |
Fidelity Securities Lending Cash Central Fund, 5.32% (b)(c) | 19,229,000 | | 19,229,000 |
TOTAL MONEY MARKET FUNDS (Cost $64,720,708) | 64,720,708 |
TOTAL INVESTMENT PORTFOLIO - 100.5% (Cost $1,069,038,942) | | 1,094,837,025 |
NET OTHER ASSETS - (0.5)% | | (5,298,961) |
NET ASSETS - 100% | $ 1,089,538,064 |
Legend |
(a) Non-income producing |
(b) Affiliated fund that is available only to investment companies and other accounts managed by Fidelity Investments. The rate quoted is the annualized seven-day yield of the fund at period end. A complete unaudited listing of the fund's holdings as of its most recent quarter end is available upon request. |
(c) Investment made with cash collateral received from securities on loan. |
(d) Security or a portion of the security is on loan at period end. |
(e) Restricted securities - Investment in securities not registered under the Securities Act of 1933 (excluding 144A issues). At the end of the period, the value of restricted securities (excluding 144A issues) amounted to $3,241,733 or 0.3% of net assets. |
Additional information on each holding is as follows: |
Security | Acquisition Date | Acquisition Cost |
Gastar Exploration Ltd. | 6/13/05 | $ 3,999,855 |
Affiliated Central Funds |
Information regarding fiscal year to date income earned by the fund from the affiliated Central funds is as follows: |
Fund | Income earned |
Fidelity Cash Central Fund | $ 2,249,098 |
Fidelity Securities Lending Cash Central Fund | 38,326 |
Total | $ 2,287,424 |
Other Affiliated Issuers |
An affiliated company is a company in which the fund has ownership of at least 5% of the voting securities. Fiscal year to date transactions with companies which are or were affiliates are as follows: |
Affiliate | Value, beginning of period | Purchases | Sales Proceeds | Dividend Income | Value,
end of
period |
Innovo Group, Inc. | $ 3,902,134 | $ - | $ 1,357,802 | $ - | $ - |
Medtox Scientific, Inc. | 2,594,703 | 1,304,074 | 4,856,606 | - | - |
Park-Ohio Holdings Corp. | 9,985,654 | 4,636,566 | 3,883,350 | - | - |
Pioneer Companies, Inc. | 10,200,438 | 7,669,063 | 22,850,866 | - | - |
Total | $ 26,682,929 | $ 13,609,703 | $ 32,948,624 | $ - | $ - |
See accompanying notes which are an integral part of the financial statements.
Annual Report
Financial Statements
Statement of Assets and Liabilities
| July 31, 2006 |
Assets | | |
Investment in securities, at value (including securities loaned of $18,617,720) - See accompanying schedule: Unaffiliated issuers (cost $1,004,318,234) | $ 1,030,116,317 | |
Affiliated Central Funds (cost $64,720,708) | 64,720,708 | |
Total Investments (cost $1,069,038,942) | | $ 1,094,837,025 |
Cash | | 157,630 |
Receivable for investments sold | | 27,827,383 |
Receivable for fund shares sold | | 3,281,109 |
Dividends receivable | | 306,364 |
Interest receivable | | 208,552 |
Prepaid expenses | | 831 |
Receivable from investment adviser for expense reductions | | 7,516 |
Other receivables | | 44,646 |
Total assets | | 1,126,671,056 |
| | |
Liabilities | | |
Payable to custodian bank | $ 9,965 | |
Payable for investments purchased | 12,675,989 | |
Payable for fund shares redeemed | 4,094,324 | |
Accrued management fee | 738,544 | |
Distribution fees payable | 57,773 | |
Other affiliated payables | 253,771 | |
Other payables and accrued expenses | 73,626 | |
Collateral on securities loaned, at value | 19,229,000 | |
Total liabilities | | 37,132,992 |
| | |
Net Assets | | $ 1,089,538,064 |
Net Assets consist of: | | |
Paid in capital | | $ 1,010,860,195 |
Accumulated undistributed net realized gain (loss) on investments and foreign currency transactions | | 52,880,158 |
Net unrealized appreciation (depreciation) on investments and assets and liabilities in foreign currencies | | 25,797,711 |
Net Assets | | $ 1,089,538,064 |
See accompanying notes which are an integral part of the financial statements.
Annual Report
Financial Statements - continued
Statement of Assets and Liabilities - continued
| July 31, 2006 |
Calculation of Maximum Offering Price
Class A:
Net Asset Value and redemption price per share ($39,931,161 ÷ 3,032,281 shares) | | $ 13.17 |
| | |
Maximum offering price per share (100/94.25 of $13.17) | | $ 13.97 |
Class T:
Net Asset Value and redemption price per share ($45,460,462 ÷ 3,461,481 shares) | | $ 13.13 |
| | |
Maximum offering price per share (100/96.50 of $13.13) | | $ 13.61 |
Class B:
Net Asset Value and offering price per share ($10,214,248 ÷ 781,586 shares)A | | $ 13.07 |
| | |
Class C:
Net Asset Value and offering price per share ($26,790,532 ÷ 2,049,806 shares)A | | $ 13.07 |
| | |
| | |
Small Cap Value:
Net Asset Value, offering price and redemption price per share ($957,719,926 ÷ 72,437,835 shares) | | $ 13.22 |
| | |
Institutional Class:
Net Asset Value, offering price and redemption price per share ($9,421,735 ÷ 712,615 shares) | | $ 13.22 |
A Redemption price per share is equal to net asset value less any applicable contingent deferred sales charge.
See accompanying notes which are an integral part of the financial statements.
Annual Report
Statement of Operations
| Year ended July 31, 2006 |
Investment Income | | |
Dividends | | $ 7,592,341 |
Interest | | 267,751 |
Income from affiliated Central Funds | | 2,287,424 |
Total income | | 10,147,516 |
| | |
Expenses | | |
Management fee
Basic fee | $ 6,503,559 | |
Performance adjustment | 818,297 | |
Transfer agent fees | 2,021,820 | |
Distribution fees | 489,195 | |
Accounting and security lending fees | 327,010 | |
Independent trustees' compensation | 3,449 | |
Custodian fees and expenses | 46,559 | |
Registration fees | 176,894 | |
Audit | 46,223 | |
Legal | 11,083 | |
Miscellaneous | 40,350 | |
Total expenses before reductions | 10,484,439 | |
Expense reductions | (375,179) | 10,109,260 |
Net investment income (loss) | | 38,256 |
Realized and Unrealized Gain (Loss) Net realized gain (loss) on: | | |
Investment securities: | | |
Unaffiliated issuers (net of foreign taxes of $104,677) | 59,347,415 | |
Other affiliated issuers | (46,540) | |
Foreign currency transactions | (16,065) | |
Total net realized gain (loss) | | 59,284,810 |
Change in net unrealized appreciation (depreciation) on: Investment securities | (30,704,015) | |
Assets and liabilities in foreign currencies | 2,648 | |
Total change in net unrealized appreciation (depreciation) | | (30,701,367) |
Net gain (loss) | | 28,583,443 |
Net increase (decrease) in net assets resulting from operations | | $ 28,621,699 |
See accompanying notes which are an integral part of the financial statements.
Annual Report
Financial Statements - continued
Statement of Changes in Net Assets
| Year ended
July 31,
2006 | For the period
November 3, 2004
(commencement
of operations) to
July 31, 2005 |
Increase (Decrease) in Net Assets | | |
Operations | | |
Net investment income (loss) | $ 38,256 | $ (248,906) |
Net realized gain (loss) | 59,284,810 | 15,306,292 |
Change in net unrealized appreciation (depreciation) | (30,701,367) | 56,499,078 |
Net increase (decrease) in net assets resulting
from operations | 28,621,699 | 71,556,464 |
Distributions to shareholders from net investment income | (633,037) | (69,595) |
Distributions to shareholders from net realized gain | (20,371,695) | - |
Total distributions | (21,004,732) | (69,595) |
Share transactions - net increase (decrease) | 457,176,942 | 552,608,856 |
Redemption fees | 517,538 | 130,892 |
Total increase (decrease) in net assets | 465,311,447 | 624,226,617 |
| | |
Net Assets | | |
Beginning of period | 624,226,617 | - |
End of period (including undistributed net investment income of $0 and $5,374, respectively) | $ 1,089,538,064 | $ 624,226,617 |
See accompanying notes which are an integral part of the financial statements.
Annual Report
Financial Highlights - Class A
Years ended July 31, | 2006 | 2005 F |
Selected Per-Share Data | | |
Net asset value, beginning of period | $ 12.80 | $ 10.00 |
Income from Investment Operations | | |
Net investment income (loss) E | (.03) | (.04) |
Net realized and unrealized gain (loss) | .74 | 2.84 |
Total from investment operations | .71 | 2.80 |
Distributions from net investment income | - | (.01) |
Distributions from net realized gain | (.35) | - |
Total distributions | (.35) | (.01) |
Redemption fees added to paid in capital E | .01 | .01 |
Net asset value, end of period | $ 13.17 | $ 12.80 |
Total Return B, C ,D | 5.72% | 28.06% |
Ratios to Average Net Assets G | | |
Expenses before reductions | 1.51% | 1.46% A |
Expenses net of fee waivers, if any | 1.40% | 1.44% A |
Expenses net of all reductions | 1.36% | 1.38% A |
Net investment income (loss) | (.24)% | (.46)% A |
Supplemental Data | | |
Net assets, end of period (000 omitted) | $ 39,931 | $ 9,390 |
Portfolio turnover rate | 93% | 60% A |
A Annualized
B Total returns for periods of less than one year are not annualized.
C Total returns would have been lower had certain expenses not been reduced during the periods shown.
D Total returns do not include the effect of the sales charges.
E Calculated based on average shares outstanding during the period.
F For the period November 3, 2004 (commencement of operations) to July 31, 2005.
G Expense ratios reflect operating expenses of the class. Expenses before reductions do not reflect amounts reimbursed by the investment adviser or reductions from brokerage service arrangements or other expense offset arrangements and do not represent the amount paid by the class during periods when reimbursements or reductions occur. Expense ratios before reductions for start-up periods may not be representative of longer-term operating periods. Expenses net of fee waivers reflect expenses after reimbursement by the investment adviser but prior to reductions from brokerage service arrangements or other expense offset arrangements. Expenses net of all reductions represent the net expenses paid by the class.
See accompanying notes which are an integral part of the financial statements.
Annual Report
Financial Highlights - Class T
Years ended July 31, | 2006 | 2005F |
Selected Per-Share Data | | |
Net asset value, beginning of period | $ 12.78 | $ 10.00 |
Income from Investment Operations | | |
Net investment income (loss) E | (.07) | (.06) |
Net realized and unrealized gain (loss) | .74 | 2.83 |
Total from investment operations | .67 | 2.77 |
Distributions from net realized gain | (.33) | - |
Redemption fees added to paid in capitalE | .01 | .01 |
Net asset value, end of period | $ 13.13 | $ 12.78 |
Total Return B, C, D | 5.47% | 27.80% |
Ratios to Average Net Assets G | | |
Expenses before reductions | 1.67% | 1.72%A |
Expenses net of fee waivers, if any | 1.65% | 1.68%A |
Expenses net of all reductions | 1.61% | 1.62%A |
Net investment income (loss) | (.49)% | (.70)%A |
Supplemental Data | | |
Net assets, end of period (000 omitted) | $ 45,460 | $ 12,725 |
Portfolio turnover rate | 93% | 60%A |
A Annualized
B Total returns for periods of less than one year are not annualized.
C Total returns would have been lower had certain expenses not been reduced during the periods shown.
D Total returns do not include the effect of the sales charges.
E Calculated based on average shares outstanding during the period.
F For the period November 3, 2004 (commencement of operations) to July 31, 2005.
G Expense ratios reflect operating expenses of the class. Expenses before reductions do not reflect amounts reimbursed by the investment adviser or reductions from brokerage service arrangements or other expense offset arrangements and do not represent the amount paid by the class during periods when reimbursements or reductions occur. Expense ratios before reductions for start-up periods may not be representative of longer-term operating periods. Expenses net of fee waivers reflect expenses after reimbursement by the investment adviser but prior to reductions from brokerage service arrangements or other expense offset arrangements. Expenses net of all reductions represent the net expenses paid by the class.
See accompanying notes which are an integral part of the financial statements.
Annual Report
Financial Highlights - Class B
Years ended July 31, | 2006 | 2005F |
Selected Per-Share Data | | |
Net asset value, beginning of period | $ 12.73 | $ 10.00 |
Income from Investment Operations | | |
Net investment income (loss)E | (.13) | (.10) |
Net realized and unrealized gain (loss) | .74 | 2.82 |
Total from investment operations | .61 | 2.72 |
Distributions from net realized gain | (.28) | - |
Redemption fees added to paid in capitalE | .01 | .01 |
Net asset value, end of period | $ 13.07 | $ 12.73 |
Total Return B, C, D | 4.97% | 27.30% |
Ratios to Average Net AssetsG | | |
Expenses before reductions | 2.26% | 2.24%A |
Expenses net of fee waivers, if any | 2.15% | 2.19%A |
Expenses net of all reductions | 2.11% | 2.13%A |
Net investment income (loss) | (.99)% | (1.21)%A |
Supplemental Data | | |
Net assets, end of period (000 omitted) | $ 10,214 | $ 3,931 |
Portfolio turnover rate | 93% | 60%A |
A Annualized
B Total returns for periods of less than one year are not annualized.
C Total returns would have been lower had certain expenses not been reduced during the periods shown.
D Total returns do not include the effect of the contingent deferred sales charge.
E Calculated based on average shares outstanding during the period.
F For the period November 3, 2004 (commencement of operations) to July 31, 2005.
G Expense ratios reflect operating expenses of the class. Expenses before reductions do not reflect amounts reimbursed by the investment adviser or reductions from brokerage service arrangements or other expense offset arrangements and do not represent the amount paid by the class during periods when reimbursements or reductions occur. Expense ratios before reductions for start-up periods may not be representative of longer-term operating periods. Expenses net of fee waivers reflect expenses after reimbursement by the investment adviser but prior to reductions from brokerage service arrangements or other expense offset arrangements. Expenses net of all reductions represent the net expenses paid by the class.
See accompanying notes which are an integral part of the financial statements.
Annual Report
Financial Highlights - Class C
Years ended July 31, | 2006 | 2005F |
Selected Per-Share Data | | |
Net asset value, beginning of period | $ 12.74 | $ 10.00 |
Income from Investment Operations | | |
Net investment income (loss) E | (.13) | (.10) |
Net realized and unrealized gain (loss) | .74 | 2.83 |
Total from investment operations | .61 | 2.73 |
Distributions from net realized gain | (.29) | - |
Redemption fees added to paid in capital E | .01 | .01 |
Net asset value, end of period | $ 13.07 | $ 12.74 |
Total Return B, C, D | 4.92% | 27.40% |
Ratios to Average Net Assets G | | |
Expenses before reductions | 2.22% | 2.17%A |
Expenses net of fee waivers, if any | 2.15% | 2.17%A |
Expenses net of all reductions | 2.11% | 2.11%A |
Net investment income (loss) | (.99)% | (1.19)%A |
Supplemental Data | | |
Net assets, end of period (000 omitted) | $ 26,791 | $ 11,732 |
Portfolio turnover rate | 93% | 60%A |
A Annualized
B Total returns for periods of less than one year are not annualized.
C Total returns would have been lower had certain expenses not been reduced during the periods shown.
D Total returns do not include the effect of the contingent deferred sales charge.
E Calculated based on average shares outstanding during the period.
F For the period November 3, 2004 (commencement of operations) to July 31, 2005.
G Expense ratios reflect operating expenses of the class. Expenses before reductions do not reflect amounts reimbursed by the investment adviser or reductions from brokerage service arrangements or other expense offset arrangements and do not represent the amount paid by the class during periods when reimbursements or reductions occur. Expense ratios before reductions for start-up periods may not be representative of longer-term operating periods. Expenses net of fee waivers reflect expenses after reimbursement by the investment adviser but prior to reductions from brokerage service arrangements or other expense offset arrangements. Expenses net of all reductions represent the net expenses paid by the class.
See accompanying notes which are an integral part of the financial statements.
Annual Report
Financial Highlights - Small Cap Value
Years ended July 31, | 2006 | 2005E |
Selected Per-Share Data | | |
Net asset value, beginning of period | $ 12.83 | $ 10.00 |
Income from Investment Operations | | |
Net investment income (loss)D | .01 | (.01) |
Net realized and unrealized gain (loss) | .74 | 2.84 |
Total from investment operations | .75 | 2.83 |
Distributions from net investment income | (.01) | (.01) |
Distributions from net realized gain | (.36) | - |
Total distributions | (.37) | (.01) |
Redemption fees added to paid in capitalD | .01 | .01 |
Net asset value, end of period | $ 13.22 | $ 12.83 |
Total Return B, C | 6.07% | 28.36% |
Ratios to Average Net Assets F | | |
Expenses before reductions | 1.09% | 1.05%A |
Expenses net of fee waivers, if any | 1.09% | 1.05%A |
Expenses net of all reductions | 1.06% | .99%A |
Net investment income (loss) | .06% | (.08)%A |
Supplemental Data | | |
Net assets, end of period (000 omitted) | $ 957,720 | $ 582,689 |
Portfolio turnover rate | 93% | 60%A |
A Annualized
B Total returns for periods of less than one year are not annualized.
C Total returns would have been lower had certain expenses not been reduced during the periods shown.
D Calculated based on average shares outstanding during the period.
E For the period November 3, 2004 (commencement of operations) to July 31, 2005.
F Expense ratios reflect operating expenses of the class. Expenses before reductions do not reflect amounts reimbursed by the investment adviser or reductions from brokerage service arrangements or other expense offset arrangements and do not represent the amount paid by the class during periods when reimbursements or reductions occur. Expense ratios before reductions for start-up periods may not be representative of longer-term operating periods. Expenses net of fee waivers reflect expenses after reimbursement by the investment adviser but prior to reductions from brokerage service arrangements or other expense offset arrangements. Expenses net of all reductions represent the net expenses paid by the class.
See accompanying notes which are an integral part of the financial statements.
Annual Report
Financial Highlights - Institutional Class
Years ended July 31, | 2006 | 2005E |
Selected Per-Share Data | | |
Net asset value, beginning of period | $ 12.83 | $ 10.00 |
Income from Investment Operations | | |
Net investment income (loss) D | .01 | (.01) |
Net realized and unrealized gain (loss) | .74 | 2.84 |
Total from investment operations | .75 | 2.83 |
Distributions from net investment income | (.01) | (.01) |
Distributions from net realized gain | (.36) | - |
Total distributions | (.37) | (.01) |
Redemption fees added to paid in capital D | .01 | .01 |
Net asset value, end of period | $ 13.22 | $ 12.83 |
Total Return B, C | 6.08% | 28.36% |
Ratios to Average Net Assets F | | |
Expenses before reductions | 1.08% | 1.07%A |
Expenses net of fee waivers, if any | 1.08% | 1.07%A |
Expenses net of all reductions | 1.05% | 1.01%A |
Net investment income (loss) | .08% | (.10)%A |
Supplemental Data | | |
Net assets, end of period (000 omitted) | $ 9,422 | $ 3,761 |
Portfolio turnover rate | 93% | 60%A |
A Annualized
B Total returns for periods of less than one year are not annualized.
C Total returns would have been lower had certain expenses not been reduced during the periods shown.
D Calculated based on average shares outstanding during the period.
E For the period November 3, 2004 (commencement of operations) to July 31, 2005.
F Expense ratios reflect operating expenses of the class. Expenses before reductions do not reflect amounts reimbursed by the investment adviser or reductions from brokerage service arrangements or other expense offset arrangements and do not represent the amount paid by the class during periods when reimbursements or reductions occur. Expense ratios before reductions for start-up periods may not be representative of longer-term operating periods. Expenses net of fee waivers reflect expenses after reimbursement by the investment adviser but prior to reductions from brokerage service arrangements or other expense offset arrangements. Expenses net of all reductions represent the net expenses paid by the class.
See accompanying notes which are an integral part of the financial statements.
Annual Report
Notes to Financial Statements
For the period ended July 31, 2006
1. Significant Accounting Policies.
Fidelity Small Cap Value Fund (the Fund) is a non-diversified fund of Fidelity Securities Fund (the trust) and is authorized to issue an unlimited number of shares. The trust is registered under the Investment Company Act of 1940, as amended (the 1940 Act), as an open-end management investment company organized as a Massachusetts business trust.
The Fund offers Class A, Class T, Class B, Class C, Small Cap Value and Institutional Class shares, each of which has equal rights as to assets and voting privileges. Each class has exclusive voting rights with respect to matters that affect that class. Class B shares will automatically convert to Class A shares after a holding period of seven years from the initial date of purchase. Investment income, realized and unrealized capital gains and losses, the common expenses of the Fund, and certain fund-level expense reductions, if any, are allocated on a pro rata basis to each class based on the relative net assets of each class to the total net assets of the Fund. Each class differs with respect to transfer agent and distribution and service plan fees incurred. Certain expense reductions also differ by class.
The Fund may invest in affiliated money market central funds (Money Market Central Funds), which are open-end investment companies available to investment companies and other accounts managed by Fidelity Management & Research Company (FMR) and its affiliates. The financial statements have been prepared in conformity with accounting principles generally accepted in the United States of America, which require management to make certain estimates and assumptions at the date of the financial statements. The following summarizes the significant accounting policies of the Fund:
Security Valuation. Investments are valued and net asset value (NAV) per share is calculated (NAV calculation) as of the close of business of the New York Stock Exchange (NYSE), normally 4:00 p.m. Eastern time. Wherever possible, the Fund uses independent pricing services approved by the Board of Trustees to value its investments.
Equity securities, including restricted securities, for which market quotations are readily available, are valued at the last reported sale price or official closing price as reported by an independent pricing service on the primary market or exchange on which they are traded. In the event there were no sales during the day or closing prices are not available, securities are valued at the last quoted bid price. Investments in open-end mutual funds are valued at their closing net asset value each business day. Short-term securities with remaining maturities of sixty days or less for which quotations are not readily available are valued at amortized cost, which approximates value.
When current market prices or quotations are not readily available or do not accurately reflect fair value, valuations may be determined in accordance with procedures adopted by the Board of Trustees. For example, when developments occur between the close of a
Annual Report
Notes to Financial Statements - continued
1. Significant Accounting Policies - continued
Security Valuation - continued
market and the close of the NYSE that may materially affect the value of some or all of the securities, or when trading in a security is halted, those securities may be fair valued. Factors used in the determination of fair value may include monitoring news to identify significant market or security specific events such as changes in the value of U.S. securities markets, reviewing developments in foreign markets and evaluating the performance of ADRs, futures contracts and exchange-traded funds. Because the Fund's utilization of fair value pricing depends on market activity, the frequency with which fair value pricing is used can not be predicted and may be utilized to a significant extent. The value of securities used for NAV calculation under fair value pricing may differ from published prices for the same securities.
Foreign Currency. The Fund uses foreign currency contracts to facilitate transactions in foreign-denominated securities. Losses from these transactions may arise from changes in the value of the foreign currency or if the counterparties do not perform under the contracts' terms.
Foreign-denominated assets, including investment securities, and liabilities are translated into U.S. dollars at the exchange rate at period end. Purchases and sales of investment securities, income and dividends received and expenses denominated in foreign currencies are translated into U.S. dollars at the exchange rate in effect on the transaction date.
The effects of exchange rate fluctuations on investments are included with the net realized and unrealized gain (loss) on investment securities. Other foreign currency transactions resulting in realized and unrealized gain (loss) are disclosed separately.
Investment Transactions and Income. Security transactions are accounted for as of trade date. Gains and losses on securities sold are determined on the basis of identified cost. Dividend income is recorded on the ex-dividend date, except for certain dividends from foreign securities where the ex-dividend date may have passed, which are recorded as soon as the Fund is informed of the ex-dividend date. Non-cash dividends included in dividend income, if any, are recorded at the fair market value of the securities received. Distributions received on securities that represent a return of capital or capital gain are recorded as a reduction of cost of investments and/or as a realized gain. The Fund estimates the components of distributions received that may be considered return of capital distributions or capital gain distributions. Interest income is accrued as earned. Interest income includes coupon interest and amortization of premium and accretion of discount on debt securities. Investment income is recorded net of foreign taxes withheld where recovery of such taxes is uncertain.
Annual Report
1. Significant Accounting Policies - continued
Expenses. Most expenses of the trust can be directly attributed to a fund. Expenses which cannot be directly attributed are apportioned among each Fund in the trust. Expense estimates are accrued in the period to which they relate and adjustments are made when actual amounts are known.
Income Tax Information and Distributions to Shareholders. Each year, the Fund intends to qualify as a regulated investment company by distributing all of its taxable income and realized gains under Subchapter M of the Internal Revenue Code. As a result, no provision for income taxes is required in the accompanying financial statements. Foreign taxes are provided for based on the Fund's understanding of the tax rules and rates that exist in the foreign markets in which it invests.
Distributions are recorded on the ex-dividend date. Income dividends and capital gain distributions are declared separately for each class. Income and capital gain distributions are determined in accordance with income tax regulations, which may differ from generally accepted accounting principles. In addition, the Fund will claim a portion of the payment made to redeeming shareholders as a distribution for income tax purposes.
Capital accounts within the financial statements are adjusted for permanent book-tax differences. These adjustments have no impact on net assets or the results of operations. Temporary book-tax differences will reverse in a subsequent period.
Book-tax differences are primarily due to foreign currency transactions, passive foreign investment companies (PFIC), market discount and losses deferred due to wash sales.
The tax-basis components of distributable earnings and the federal tax cost as of period end were as follows:
Unrealized appreciation | $ 97,858,886 |
Unrealized depreciation | (72,280,850) |
Net unrealized appreciation (depreciation) | 25,578,036 |
Undistributed ordinary income | 15,623,083 |
Undistributed long-term capital gain | 27,867,547 |
Cost for federal income tax purposes | $ 1,069,258,989 |
The tax character of distributions paid was as follows:
| July 31, 2006 | July 31, 2005 |
Ordinary Income | $ 21,004,732 | $ 69,595 |
Annual Report
Notes to Financial Statements - continued
1. Significant Accounting Policies - continued
New Accounting Pronouncement. In July 2006, Financial Accounting Standards Board Interpretation No. 48, Accounting for Uncertainty in Income Taxes - an interpretation of FASB Statement 109 (FIN 48) was issued and is effective for fiscal years beginning after December 15, 2006. FIN 48 sets forth a threshold for financial statement recognition, measurement and disclosure of a tax position taken or expected to be taken on a tax return. Management is currently evaluating the impact, if any, the adoption of FIN 48 will have on the Fund's net assets and results of operations.
Short-Term Trading (Redemption) Fees. Shares held in the Fund less than 90 days are subject to a redemption fee equal to 1.50% of the proceeds of the redeemed shares. All redemption fees, including any estimated redemption fees paid by FMR, are retained by the Fund and accounted for as an addition to paid in capital.
2. Operating Policies.
Repurchase Agreements. FMR has received an Exemptive Order from the Securities and Exchange Commission (the SEC) which permits the Fund and other affiliated entities of FMR to transfer uninvested cash balances into joint trading accounts which are then invested in repurchase agreements. The Fund may also invest directly with institutions in repurchase agreements. Repurchase agreements are collateralized by government or non-government securities. Upon settlement date, collateral is held in segregated accounts with custodian banks and may be obtained in the event of a default of the counterparty. The Fund monitors, on a daily basis, the value of the collateral to ensure it is at least equal to the principal amount of the repurchase agreement (including accrued interest). In the event of a default by the counterparty, realization of the collateral proceeds could be delayed, during which time the value of the collateral may decline.
Restricted Securities. The Fund may invest in securities that are subject to legal or contractual restrictions on resale. These securities generally may be resold in transactions exempt from registration or to the public if the securities are registered. Disposal of these securities may involve time-consuming negotiations and expense, and prompt sale at an acceptable price may be difficult. Information regarding restricted securities is included at the end of the fund's Schedule of Investments.
3. Purchases and Sales of Investments.
Purchases and sales of securities, other than short-term securities, aggregated $1,221,750,834 and $795,822,091, respectively.
Annual Report
4. Fees and Other Transactions with Affiliates.
Management Fee. FMR and its affiliates provide the Fund with investment management related services for which the Fund pays a monthly management fee. The management fee is the sum of an individual fund fee rate that is based on an annual rate of .45% of the Fund's average net assets and a group fee rate that averaged ..27% during the period. The group fee rate is based upon the average net assets of all the mutual funds advised by FMR. The group fee rate decreases as assets under management increase and increases as assets under management decrease. In addition, the management fee is subject to a performance adjustment (up to a maximum of ± .20% of the Fund's average net assets over a 36 month performance period). The upward or downward adjustment to the management fee is based on the relative investment performance of the retail class of the Fund, Small Cap Value, as compared to an appropriate benchmark index. The Fund's performance adjustment took effect in November 2005. Subsequent months will be added until the performance period includes 36 months. For the period, the total annual management fee rate, including the performance adjustment, was .81% of the Fund's average net assets.
Distribution and Service Plan. In accordance with Rule 12b-1 of the 1940 Act, the Fund has adopted separate Distribution and Service Plans for each class of shares. Certain classes pay Fidelity Distributors Corporation (FDC), an affiliate of FMR, separate Distribution and Service Fees, each of which is based on an annual percentage of each class' average net assets. In addition, FDC may pay financial intermediaries for selling shares of the Fund and providing shareholder support services. For the period, the Distribution and Service Fee rates and the total amounts paid to and retained by FDC were as follows:
| Distribution
Fee | Service
Fee | Paid to
FDC | Retained
by FDC |
Class A | 0% | .25% | $ 61,478 | $ 2,797 |
Class T | .25% | .25% | 142,254 | 7,806 |
Class B | .75% | .25% | 77,771 | 59,490 |
Class C | .75% | .25% | 207,692 | 103,479 |
| | | $ 489,195 | $ 173,572 |
Sales Load. FDC receives a front-end sales charge of up to 5.75% for selling Class A shares, and 3.50% for selling Class T shares, some of which is paid to financial intermediaries for selling shares of the Fund. FDC receives the proceeds of contingent deferred sales charges levied on Class A, Class T, Class B, and Class C redemptions. These charges depend on the holding period. The deferred sales charges range from 5% to 1% for Class B, 1% for Class C, 1.00% to .50% for certain purchases of Class A shares (.25% prior to February 24, 2006) and .25% for certain purchases of Class T shares.
Annual Report
Notes to Financial Statements - continued
4. Fees and Other Transactions with Affiliates - continued
Sales Load - continued
For the period, sales charge amounts retained by FDC were as follows:
| Retained
by FDC |
Class A | 117,648 |
Class T | 26,701 |
Class B* | 11,040 |
Class C* | 3,291 |
| $ 158,680 |
* When Class B and Class C shares are initially sold, FDC pays commissions from its own resources to financial intermediaries through which the sales are made.
Transfer Agent Fees. Fidelity Investments Institutional Operations Company, Inc. (FIIOC), an affiliate of FMR, is the transfer, dividend disbursing and shareholder servicing agent for each class of the Fund, except for Small Cap Value. Fidelity Service Company, Inc. (FSC), an affiliate of FMR, is the transfer agent for Small Cap Value shares. FIIOC and FSC receive account fees and asset-based fees that vary according to the account size and type of account of the shareholders of the respective classes of the Fund. FIIOC and FSC pay for typesetting, printing and mailing of shareholder reports, except proxy statements. For the period the total transfer agent fees paid by each class to FIIOC or FSC, were as follows:
| Amount | % of
Average
Net Assets |
Class A | $ 90,401 | .37 |
Class T | 81,280 | .29 |
Class B | 28,609 | .37 |
Class C | 67,880 | .33 |
Small Cap Value | 1,739,453 | .21 |
Institutional Class | 14,197 | .19 |
| $ 2,021,820 | |
Accounting and Security Lending Fees. FSC maintains the Fund's accounting records. The accounting fee is based on the level of average net assets for the month. Under a separate contract, FSC administers the security lending program. The security lending fee is based on the number and duration of lending transactions.
Affiliated Central Funds. The Fund may invest in Money Market Central Funds which seek preservation of capital and current income and are managed by Fidelity Investments Money Management, Inc. (FIMM), an affiliate of FMR.
Annual Report
4. Fees and Other Transactions with Affiliates - continued
Affiliated Central Funds - continued
The Money Market Central Funds do not pay a management fee.
Brokerage Commissions. The Fund placed a portion of its portfolio transactions with brokerage firms which are affiliates of the investment adviser. The commissions paid to these affiliated firms were $49,673 for the period.
5. Committed Line of Credit.
The Fund participates with other funds managed by FMR in a $4.2 billion credit facility (the "line of credit") to be utilized for temporary or emergency purposes to fund shareholder redemptions or for other short-term liquidity purposes. The Fund has agreed to pay commitment fees on its pro rata portion of the line of credit, which amounts to $2,432 and is reflected in Miscellaneous Expense on the Statement of Operations. During the period, there were no borrowings on this line of credit.
6. Security Lending.
The Fund lends portfolio securities from time to time in order to earn additional income. On the settlement date of the loan, the Fund receives collateral (in the form of U.S. Treasury obligations, letters of credit and/or cash) against the loaned securities and maintains collateral in an amount not less than 100% of the market value of the loaned securities during the period of the loan. The market value of the loaned securities is determined at the close of business of the Fund and any additional required collateral is delivered to the Fund on the next business day. If the borrower defaults on its obligation to return the securities loaned because of insolvency or other reasons, a fund could experience delays and costs in recovering the securities loaned or in gaining access to the collateral. Any cash collateral received is invested in the Fidelity Securities Lending Cash Central Fund. The value of loaned securities and cash collateral at period end are disclosed on the Fund's Statement of Assets and Liabilities. Security lending income represents the income earned on investing cash collateral, less fees and expenses associated with the loan, plus any premium payments that may be received on the loan of certain types of securities. Security lending income is presented in the Statement of Operations as a component of income from affiliated central funds. Net income from lending portfolio securities during the period amounted to $38,326.
7. Expense Reductions.
FMR voluntarily agreed to reimburse each class to the extent annual operating expenses exceeded certain levels of average net assets as noted in the table below. Some expenses, for example interest expense, are excluded from this reimbursement.
Annual Report
Notes to Financial Statements - continued
7. Expense Reductions - continued
The following classes were in reimbursement during the period:
| Expense
Limitations | Reimbursement
from adviser |
Class A | 1.40% | $ 27,048 |
Class T | 1.65% | 7,760 |
Class B | 2.15% | 8,692 |
Class C | 2.15% | 14,182 |
| | $ 57,682 |
Many of the brokers with whom FMR places trades on behalf of the Fund provided services to the Fund in addition to trade execution. These services included payments of certain expenses on behalf of the Fund totaling $299,573 for the period. In addition, through arrangements with the Fund's custodian and each class' transfer agent, credits realized as a result of uninvested cash balances were used to reduce the Fund's expenses. During the period, these credits reduced the Fund's custody expenses by $7,938. During the period, credits reduced each class' transfer agent expense as noted in the table below.
| Transfer Agent
expense reduction |
Small Cap Value | $ 9,986 |
8. Other.
The Fund's organizational documents provide former and current trustees and officers with a limited indemnification against liabilities arising in connection with the performance of their duties to the Fund. In the normal course of business, the Fund may also enter into contracts that provide general indemnifications. The Fund's maximum exposure under these arrangements is unknown as this would be dependent on future claims that may be made against the Fund. The risk of material loss from such claims is considered remote.
Subsequent to fiscal year end, the Fund's transfer agent, Fidelity Investments Institutional Operations Company, Inc. (FIIOC), an affiliate of Fidelity Management & Research Company, notified the Fund that the fund's books and records did not reflect a conversion of certain Class B to Class A shares upon their conversion date. Management has determined that this did not have a material impact to the Fund's reported net assets or results of operations in the accompanying financial statements. FIIOC will cause the books and records of the fund to reflect a conversion of the relevant Class B shares to Class A and is in the process of determining the impact to affected shareholder accounts for purposes of its remediation.
Annual Report
9. Distributions to Shareholders.
Distributions to shareholders of each class were as follows:
Years ended July 31, | 2006 | 2005 A |
From net investment income | | |
Class A | $ - | $ 724 |
Small Cap Value | 627,853 | 68,438 |
Institutional Class | 5,184 | 433 |
Total | $ 633,037 | $ 69,595 |
From net realized gain | | |
Class A | $ 349,740 | $ - |
Class T | 411,098 | - |
Class B | 108,502 | - |
Class C | 314,711 | - |
Small Cap Value | 19,037,825 | - |
Institutional Class | 149,819 | - |
Total | $ 20,371,695 | $ - |
A For the period November 3, 2004 (commencement of operations) to July 31, 2005.
10. Share Transactions.
Transactions for each class of shares were as follows:
| Shares | Dollars |
Years ended July 31, | 2006 | 2005 A | 2006 | 2005 A |
Class A | | | | |
Shares sold | 2,792,696 | 750,692 | $ 37,292,766 | $ 8,523,912 |
Reinvestment of distributions | 23,154 | 54 | 292,886 | 590 |
Shares redeemed | (517,416) | (16,899) | (6,894,256) | (197,248) |
Net increase (decrease) | 2,298,434 | 733,847 | $ 30,691,396 | $ 8,327,254 |
Class T | | | | |
Shares sold | 2,906,186 | 1,010,520 | $ 38,920,414 | $ 11,960,654 |
Reinvestment of distributions | 20,934 | - | 264,080 | - |
Shares redeemed | (461,271) | (14,888) | (6,059,837) | (175,516) |
Net increase (decrease) | 2,465,849 | 995,632 | $ 33,124,657 | $ 11,785,138 |
Class B | | | | |
Shares sold | 646,292 | 314,195 | $ 8,494,362 | $ 3,487,462 |
Reinvestment of distributions | 7,808 | - | 98,271 | - |
Shares redeemed | (181,273) | (5,436) | (2,424,583) | (61,184) |
Net increase (decrease) | 472,827 | 308,759 | $ 6,168,050 | $ 3,426,278 |
Annual Report
Notes to Financial Statements - continued
10. Share Transactions - continued
| Shares | Dollars |
Years ended July 31, | 2006 | 2005 A | 2006 | 2005 A |
Class C | | | | |
Shares sold | 1,647,798 | 952,687 | $ 21,781,876 | $ 10,586,807 |
Reinvestment of distributions | 23,044 | - | 289,929 | - |
Shares redeemed | (542,172) | (31,551) | (7,009,701) | (363,557) |
Net increase (decrease) | 1,128,670 | 921,136 | $ 15,062,104 | $ 10,223,250 |
Small Cap Value | | | | |
Shares sold | 53,704,430 | 49,836,348 | $ 714,692,056 | $ 566,509,509 |
Reinvestment of distributions | 1,502,190 | 6,024 | 19,027,647 | 66,450 |
Shares redeemed | (28,179,009) | (4,432,148) | (367,110,557) | (50,921,377) |
Net increase (decrease) | 27,027,611 | 45,410,224 | $ 366,609,146 | $ 515,654,582 |
Institutional Class | | | | |
Shares sold | 585,637 | 315,268 | $ 7,784,992 | $ 3,439,515 |
Reinvestment of distributions | 4,421 | 39 | 56,037 | 433 |
Shares redeemed | (170,544) | (22,206) | (2,319,440) | (247,594) |
Net increase (decrease) | 419,514 | 293,101 | $ 5,521,589 | $ 3,192,354 |
A For the period November 3, 2004 (commencement of operations) to July 31, 2005.
Annual Report
Report of Independent Registered Public Accounting Firm
To the Trustees of Fidelity Securities Fund and the Shareholders of Fidelity Small Cap Value Fund:
In our opinion, the accompanying statement of assets and liabilities, including the schedule of investments, and the related statements of operations and of changes in net assets and the financial highlights present fairly, in all material respects, the financial position of Fidelity Small Cap Value Fund (a fund of Fidelity Securities Fund) at July 31, 2006, and the results of its operations for the year then ended, the changes in its net assets and the financial highlights for the periods indicated in conformity with accounting principles generally accepted in the United States of America. These financial statements and financial highlights (hereafter referred to as "financial statements") are the responsibility of the Fidelity Small Cap Value Fund's management; our responsibility is to express an opinion on these financial statements based on our audits. We conducted our audits of these financial statements in accordance with the standards of the Public Company Accounting Oversight Board (United States). Those standards require that we plan and perform the audit to obtain reasonable assurance about whether the financial statements are free of material misstatement. An audit includes examining, on a test basis, evidence supporting the amounts and disclosures in the financial statements, assessing the accounting principles used and significant estimates made by management, and evaluating the overall financial statement presentation. We believe that our audits, which included confirmation of securities at July 31, 2006 by correspondence with the custodian and brokers, provide a reasonable basis for our opinion.
/s/ PricewaterhouseCoopers LLP
PricewaterhouseCoopers LLP
Boston, Massachusetts
October 9, 2006
Annual Report
Trustees and Officers
The Trustees, Members of the Advisory Board, and executive officers of the trust and fund, as applicable, are listed below. The Board of Trustees governs the fund and is responsible for protecting the interests of shareholders. The Trustees are experienced executives who meet periodically throughout the year to oversee the fund's activities, review contractual arrangements with companies that provide services to the fund, and review the fund's performance. Except for William O. McCoy and Albert R. Gamper, Jr., each of the Trustees oversees 345 funds advised by FMR or an affiliate. Mr. McCoy oversees 347 funds advised by FMR or an affiliate. Mr. Gamper oversees 292 funds advised by FMR or an affiliate.
The Trustees hold office without limit in time except that (a) any Trustee may resign; (b) any Trustee may be removed by written instrument, signed by at least two-thirds of the number of Trustees prior to such removal; (c) any Trustee who requests to be retired or who has become incapacitated by illness or injury may be retired by written instrument signed by a majority of the other Trustees; and (d) any Trustee may be removed at any special meeting of shareholders by a two-thirds vote of the outstanding voting securities of the trust. Each Trustee who is not an interested person (as defined in the 1940 Act) (Independent Trustee), shall retire not later than the last day of the calendar year in which his or her 72nd birthday occurs. The Independent Trustees may waive this mandatory retirement age policy with respect to individual Trustees. The executive officers and Advisory Board Members hold office without limit in time, except that any officer and Advisory Board Member may resign or may be removed by a vote of a majority of the Trustees at any regular meeting or any special meeting of the Trustees. Except as indicated, each individual has held the office shown or other offices in the same company for the past five years.
The fund's Statement of Additional Information (SAI) includes more information about the Trustees. To request a free copy, call Fidelity at 1-800-544-8544.
Interested Trustees*:
Correspondence intended for each Trustee who is an interested person may be sent to Fidelity Investments, 82 Devonshire Street, Boston, Massachusetts 02109.
Name, Age; Principal Occupation |
Edward C. Johnson 3d (76) |
| Year of Election or Appointment: 1984 Mr. Johnson is Chairman of the Board of Trustees. Mr. Johnson serves as President (2006-present), Chief Executive Officer, Chairman, and a Director of FMR Corp.; Chairman and a Director of FMR; Chairman and a Director of Fidelity Research & Analysis Company (FRAC); Chairman and a Director of Fidelity Investments Money Management, Inc.; and Chairman (2001-present) and a Director (1999-present) of FMR Co., Inc. In addition, Mr. Johnson serves as Chairman and Director of Fidelity International Limited (FIL). |
Stephen P. Jonas (53) |
| Year of Election or Appointment: 2005 Mr. Jonas is Senior Vice President of Small Cap Value (2005-Present). He also serves as Senior Vice President of other Fidelity funds (2005-present). Mr. Jonas is Executive Director of FMR (2005-present) and FMR Co., Inc. (2005-present). He also serves as a Director of Fidelity Investments Money Management, Inc. (2005-present) and FMR Corp. (2003-present). Previously, Mr. Jonas served as President of Fidelity Enterprise Operations and Risk Services (2004-2005), Chief Administrative Officer (2002-2004), and Chief Financial Officer of FMR Corp. (1998-2002). In addition, he serves on the Boards of Boston Ballet (2003-present) and Simmons College (2003-present). |
Robert L. Reynolds (54) |
| Year of Election or Appointment: 2003 Mr. Reynolds is President and a Director of FMR (2005-present), Fidelity Investments Money Management, Inc. (2005-present), and FMR Co., Inc. (2005-present). Mr. Reynolds also serves as a Director (2003-present) and Chief Operating Officer (2000-present) of FMR Corp. and a Director of Strategic Advisers, Inc. (2005-present). He also serves on the Board at Fidelity Investments Canada, Ltd. (2000-present). Previously, Mr. Reynolds served as President of Fidelity Investments Institutional Retirement Group (1996-2000). |
* Trustees have been determined to be "Interested Trustees" by virtue of, among other things, their affiliation with the trust or various entities under common control with FMR.
Annual Report
Independent Trustees:
Correspondence intended for each Independent Trustee (that is, the Trustees other than the Interested Trustees) may be sent to Fidelity Investments, P.O. Box 55235, Boston, Massachusetts 02205-5235.
Name, Age; Principal Occupation |
Dennis J. Dirks (58) |
| Year of Election or Appointment: 2005 Prior to his retirement in May 2003, Mr. Dirks was Chief Operating Officer and a member of the Board of The Depository Trust & Clearing Corporation (DTCC) (1999-2003). He also served as President, Chief Operating Officer, and Board member of The Depository Trust Company (DTC) (1999-2003) and President and Board member of the National Securities Clearing Corporation (NSCC) (1999-2003). In addition, Mr. Dirks served as Chief Executive Officer and Board member of the Government Securities Clearing Corporation (2001-2003) and Chief Executive Officer and Board member of the Mortgage-Backed Securities Clearing Corporation (2001-2003). Mr. Dirks also serves as a Trustee and a member of the Finance Committee of Manhattan College (2005-present) and a Trustee and a member of the Finance Committee of AHRC of Nassau County (2006-present). |
Albert R. Gamper, Jr. (64) |
| Year of Election or Appointment: 2006 Mr. Gamper also serves as a Trustee (2006-present) or Member of the Advisory Board (2005-present) of other investment companies advised by FMR. Prior to his retirement in December 2004, Mr. Gamper served as Chairman of the Board of CIT Group Inc. (commercial finance). During his tenure with CIT Group Inc. Mr. Gamper served in numerous senior management positions, including Chairman (1987-1989; 1999-2001; 2002-2004), Chief Executive Officer (1987-2004), and President (1989-2002). He currently serves as a member of the Board of Directors of Public Service Enterprise Group (utilities, 2001-present), Chairman of the Board of Governors, Rutgers University (2004-present), and Chairman of the Board of Saint Barnabas Health Care System. |
Robert M. Gates (62) |
| Year of Election or Appointment: 1997 Dr. Gates is Chairman of the Independent Trustees (2006-present). Dr. Gates is President of Texas A&M University (2002-present). He was Director of the Central Intelligence Agency (CIA) from 1991 to 1993. From 1989 to 1991, Dr. Gates served as Assistant to the President of the United States and Deputy National Security Advisor. Dr. Gates is a Director of NACCO Industries, Inc. (mining and manufacturing), Parker Drilling Co., Inc. (drilling and rental tools for the energy industry, 2001-present), and Brinker International (restaurant management, 2003-present). Previously, Dr. Gates served as a Director of LucasVarity PLC (automotive components and diesel engines), a Director of TRW Inc. (automotive, space, defense, and information technology), and Dean of the George Bush School of Government and Public Service at Texas A&M University (1999-2001). |
George H. Heilmeier (70) |
| Year of Election or Appointment: 2004 Dr. Heilmeier is Chairman Emeritus of Telcordia Technologies (communication software and systems), where prior to his retirement, he served as company Chairman and Chief Executive Officer. He currently serves on the Boards of Directors of The Mitre Corporation (systems engineering and information technology support for the government), and HRL Laboratories (private research and development, 2004-present). He is Chairman of the General Motors Science & Technology Advisory Board and a Life Fellow of the Institute of Electrical and Electronics Engineers (IEEE). Dr. Heilmeier is a member of the Defense Science Board and the National Security Agency Advisory Board. He is also a member of the National Academy of Engineering, the American Academy of Arts and Sciences, and the Board of Overseers of the School of Engineering and Applied Science of the University of Pennsylvania. Previously, Dr. Heilmeier served as a Director of TRW Inc. (automotive, space, defense, and information technology, 1992-2002), Compaq (1994-2002), Automatic Data Processing, Inc. (ADP) (technology-based business outsourcing, 1995-2002), INET Technologies Inc. (telecommunications network surveillance, 2001-2004), and Teletech Holdings (customer management services). He is the recipient of the 2005 Kyoto Prize in Advanced Technology for his invention of the liquid crystal display. |
Marie L. Knowles (59) |
| Year of Election or Appointment: 2001 Prior to Ms. Knowles' retirement in June 2000, she served as Executive Vice President and Chief Financial Officer of Atlantic Richfield Company (ARCO) (diversified energy, 1996-2000). From 1993 to 1996, she was a Senior Vice President of ARCO and President of ARCO Transportation Company. She served as a Director of ARCO from 1996 to 1998. She currently serves as a Director of Phelps Dodge Corporation (copper mining and manufacturing) and McKesson Corporation (healthcare service, 2002-present). Ms. Knowles is a Trustee of the Brookings Institution and the Catalina Island Conservancy and also serves as a member of the Advisory Board for the School of Engineering of the University of Southern California. |
Ned C. Lautenbach (62) |
| Year of Election or Appointment: 2000 Mr. Lautenbach has been a partner of Clayton, Dubilier & Rice, Inc. (private equity investment firm) since September 1998. Previously, Mr. Lautenbach was with the International Business Machines Corporation (IBM) from 1968 until his retirement in 1998. Mr. Lautenbach serves as a Director of Italtel Holding S.p.A. (telecommunications (Milan, Italy), 2004-present) and Eaton Corporation (diversified industrial) as well as the Philharmonic Center for the Arts in Naples, Florida. He also is a member of the Board of Trustees of Fairfield University (2005-present), as well as a member of the Council on Foreign Relations. |
William O. McCoy (72) |
| Year of Election or Appointment: 1997 Prior to his retirement in December 1994, Mr. McCoy was Vice Chairman of the Board of BellSouth Corporation (telecommunications) and President of BellSouth Enterprises. He is currently a Director of Duke Realty Corporation (real estate). He is also a partner of Franklin Street Partners (private investment management firm). In addition, Mr. McCoy served as the Interim Chancellor (1999-2000) and a member of the Board of Visitors for the University of North Carolina at Chapel Hill and currently serves as Chairman of the Board of Directors of the University of North Carolina Health Care System. He also served as Vice President of Finance for the University of North Carolina (16-school system). |
Cornelia M. Small (62) |
| Year of Election or Appointment: 2005 Ms. Small is a member (2000-present) and Chairperson (2002-present) of the Investment Committee, and a member (2002-present) of the Board of Trustees of Smith College. Previously, she served as Chief Investment Officer (1999-2000), Director of Global Equity Investments (1996-1999), and a member of the Board of Directors of Scudder, Stevens & Clark (1990-1997) and Scudder Kemper Investments (1997-1999). In addition, Ms. Small served as Co-Chair (2000-2003) of the Annual Fund for the Fletcher School of Law and Diplomacy. |
William S. Stavropoulos (67) |
| Year of Election or Appointment: 2002 Mr. Stavropoulos is Chairman Emeritus of the Board of Directors of The Dow Chemical Company. Since joining The Dow Chemical Company in 1967, Mr. Stavropoulos served in numerous senior management positions, including President (1993-2000; 2002-2003), CEO (1995-2000; 2002-2004), and Chairman of the Executive Committee (2000-2004). Currently, he is a Director of NCR Corporation (data warehousing and technology solutions), BellSouth Corporation (telecommunications), Chemical Financial Corporation, Maersk Inc. (industrial conglomerate, 2002-present), and Metalmark Capital (private equity investment firm, 2005-present). He also serves as a member of the Board of Trustees of the American Enterprise Institute for Public Policy Research. In addition, Mr. Stavropoulos is a member of The Business Council, J.P. Morgan International Council and the University of Notre Dame Advisory Council for the College of Science. |
Kenneth L. Wolfe (67) |
| Year of Election or Appointment: 2005 Prior to his retirement in 2001, Mr. Wolfe was Chairman and Chief Executive Officer of Hershey Foods Corporation (1993-2001). He currently serves as a member of the boards of Adelphia Communications Corporation (2003-present), Bausch & Lomb, Inc., and Revlon Inc. (2004-present). |
Annual Report
Advisory Board Members and Executive Officers:
Correspondence intended for Mr. Keyes may be sent to Fidelity Investments, P.O. Box 55235, Boston, Massachusetts 02205-5235. Correspondence intended for each executive officer and Mr. Lynch may be sent to Fidelity Investments, 82 Devonshire Street, Boston, Massachusetts 02109.
Name, Age; Principal Occupation |
James H. Keyes (65) |
| Year of Election or Appointment: 2006 Member of the Advisory Board of Fidelity Securities Fund. Prior to his retirement in 2003, Mr. Keyes was Chairman, President, and Chief Executive Officer of Johnson Controls, Inc. (automotive supplier, 1993-2003). He currently serves as a member of the boards of LSI Logic Corporation (semiconductor technologies, 1984-present), Navistar International Corporation (manufacture and sale of trucks, buses, and diesel engines, 2002-present), and Pitney Bowes, Inc. (integrated mail, messaging, and document management solutions, 1998-present). |
Peter S. Lynch (62) |
| Year of Election or Appointment: 2003 Member of the Advisory Board of Fidelity Securities Fund. Mr. Lynch is Vice Chairman and a Director of FMR, and Vice Chairman (2001-present) and a Director (1999-present) of FMR Co., Inc. Previously, Mr. Lynch served as a Trustee of the Fidelity funds (1990-2003). In addition, he serves as the Chairman of the Inner-City Scholarship Fund. |
Dwight D. Churchill (52) |
| Year of Election or Appointment: 2005 Vice President of Small Cap Value. Mr. Churchill also serves as Vice President of certain Equity Funds (2005-present). Mr. Churchill is Executive Vice President of FMR (2005-present) and FMR Co., Inc. (2005-present). Previously, Mr. Churchill served as Vice President of Fidelity Investments Money Management, Inc. (2005-2006), Head of Fidelity's Fixed-Income Division (2000-2005), Vice President of Fidelity's Money Market Funds (2000-2005), Vice President of Fidelity's Bond Funds, and Senior Vice President of FMR. |
Bruce T. Herring (40) |
| Year of Election or Appointment: 2006 Vice President of Small Cap Value. Mr. Herring also serves as Vice President of certain Equity Funds (2006-present). Mr. Herring is Senior Vice President of FMR (2006-present) and Vice President of FMR Co., Inc. (2001-present). Previously, Mr. Herring served as a portfolio manager for Fidelity U.S. Equity Funds (2001-2005). |
Eric D. Roiter (57) |
| Year of Election or Appointment: 2004 Secretary of Small Cap Value. He also serves as Secretary of other Fidelity funds; Vice President, General Counsel, and Secretary of FMR Co., Inc. (2001-present) and FMR; Assistant Secretary of Fidelity Management & Research (U.K.) Inc. (2001-present), Fidelity Research & Analysis Company (2001-present), and Fidelity Investments Money Management, Inc. (2001-present). Mr. Roiter is an Adjunct Member, Faculty of Law, at Boston College Law School (2003-present). Previously, Mr. Roiter served as Vice President and Secretary of FDC (1998-2005). |
Stuart Fross (46) |
| Year of Election or Appointment: 2004 Assistant Secretary of Small Cap Value. Mr. Fross also serves as Assistant Secretary of other Fidelity funds (2003-present), Vice President and Secretary of FDC (2005-present), and is an employee of FMR. |
Christine Reynolds (47) |
| Year of Election or Appointment: 2004 President and Treasurer of Small Cap Value. Ms. Reynolds also serves as President and Treasurer of other Fidelity funds (2004-present) and is a Vice President (2003-present) and an employee (2002-present) of FMR. Before joining Fidelity Investments, Ms. Reynolds worked at PricewaterhouseCoopers LLP (PwC) (1980-2002), where she was most recently an audit partner with PwC's investment management practice. |
R. Stephen Ganis (40) |
| Year of Election or Appointment: 2006 Anti-Money Laundering (AML) officer of Small Cap Value. Mr. Ganis also serves as AML officer of other Fidelity funds (2006-present) and FMR Corp. (2003-present). Before joining Fidelity Investments, Mr. Ganis practiced law at Goodwin Procter, LLP (2000-2002). |
Joseph B. Hollis (58) |
| Year of Election or Appointment: 2006 Chief Financial Officer of Small Cap Value. Mr. Hollis also serves as Chief Financial Officer of other Fidelity funds. Mr. Hollis is President of Fidelity Pricing and Cash Management Services (FPCMS) (2005-present). Mr. Hollis also serves as President and Director of Fidelity Service Company, Inc. (2006-present). Previously, Mr. Hollis served as Senior Vice President of Cash Management Services (1999-2002) and Investment Management Operations (2002-2005). |
Kenneth A. Rathgeber (59) |
| Year of Election or Appointment: 2004 Chief Compliance Officer of Small Cap Value. Mr. Rathgeber also serves as Chief Compliance Officer of other Fidelity funds (2004-present) and Executive Vice President of Risk Oversight for Fidelity Investments (2002-present). He is Chief Compliance Officer of FMR (2005-present), FMR Co., Inc. (2005-present), Fidelity Management & Research (U.K.) Inc. (2005-present), Fidelity Research & Analysis Company (2005-present), Fidelity Investments Money Management, Inc. (2005-present), and Strategic Advisers, Inc. (2005-present). Previously, Mr. Rathgeber served as Executive Vice President and Chief Operating Officer for Fidelity Investments Institutional Services Company, Inc. (1998-2002). |
Bryan A. Mehrmann (45) |
| Year of Election or Appointment: 2005 Deputy Treasurer of Small Cap Value. Mr. Mehrmann also serves as Deputy Treasurer of other Fidelity funds (2005-present) and is an employee of FMR. Previously, Mr. Mehrmann served as Vice President of Fidelity Investments Institutional Services Group (FIIS)/Fidelity Investments Institutional Operations Corporation, Inc. (FIIOC) Client Services (1998-2004). |
Kimberley H. Monasterio (42) |
| Year of Election or Appointment: 2004 Deputy Treasurer of Small Cap Value. Ms. Monasterio also serves as Deputy Treasurer of other Fidelity funds (2004) and is an employee of FMR (2004). Before joining Fidelity Investments, Ms. Monasterio served as Treasurer (2000-2004) and Chief Financial Officer (2002-2004) of the Franklin Templeton Funds and Senior Vice President of Franklin Templeton Services, LLC (2000-2004). |
Kenneth B. Robins (36) |
| Year of Election or Appointment: 2005 Deputy Treasurer of Small Cap Value. Mr. Robins also serves as Deputy Treasurer of other Fidelity funds (2005-present) and is an employee of FMR (2004-present). Before joining Fidelity Investments, Mr. Robins worked at KPMG LLP, where he was a partner in KPMG's department of professional practice (2002-2004) and a Senior Manager (1999-2000). In addition, Mr. Robins served as Assistant Chief Accountant, United States Securities and Exchange Commission (2000-2002). |
Robert G. Byrnes (39) |
| Year of Election or Appointment: 2005 Assistant Treasurer of Small Cap Value. Mr. Byrnes also serves as Assistant Treasurer of other Fidelity funds (2005-present) and is an employee of FMR (2005-present). Previously, Mr. Byrnes served as Vice President of FPCMS (2003-2005). Before joining Fidelity Investments, Mr. Byrnes worked at Deutsche Asset Management where he served as Vice President of the Investment Operations Group (2000-2003). |
John H. Costello (59) |
| Year of Election or Appointment: 2004 Assistant Treasurer of Small Cap Value. Mr. Costello also serves as Assistant Treasurer of other Fidelity funds and is an employee of FMR. |
Peter L. Lydecker (52) |
| Year of Election or Appointment: 2004 Assistant Treasurer of Small Cap Value. Mr. Lydecker also serves as Assistant Treasurer of other Fidelity funds (2004) and is an employee of FMR. |
Mark Osterheld (51) |
| Year of Election or Appointment: 2004 Assistant Treasurer of Small Cap Value. Mr. Osterheld also serves as Assistant Treasurer of other Fidelity funds (2002) and is an employee of FMR. |
Gary W. Ryan (47) |
| Year of Election or Appointment: 2005 Assistant Treasurer of Small Cap Value. Mr. Ryan also serves as Assistant Treasurer of other Fidelity funds (2005-present) and is an employee of FMR (2005-present). Previously, Mr. Ryan served as Vice President of Fund Reporting in FPCMS (1999-2005). |
Salvatore Schiavone (40) |
| Year of Election or Appointment: 2005 Assistant Treasurer of Small Cap Value. Mr. Schiavone also serves as Assistant Treasurer of other Fidelity funds (2005-present) and is an employee of FMR (2005-present). Before joining Fidelity Investments, Mr. Schiavone worked at Deutsche Asset Management, where he most recently served as Assistant Treasurer (2003-2005) of the Scudder Funds and Vice President and Head of Fund Reporting (1996-2003). |
Annual Report
Distributions
The Board of Trustees of Small Cap Value Fund voted to pay on September 11, 2006, to shareholders of record at the opening of business on September 08, 2006, a distribution of $0.54 per share derived from capital gains realized from sales of portfolio securities.
The fund hereby designates as a capital gain dividend with respect to the taxable year ended July 31, 2006, $27,867,547, or, if subsequently determined to be different, the net capital gain of such year.
The fund designates 5% and 31% of the dividends distributed in September and December, respectively during the fiscal year as qualifying for the dividends-received deduction for corporate shareholders.
The fund designates 7% and 36% of the dividends distributed in September and December, respectively during the fiscal year as amounts which may be taken into account as a dividend for the purposes of the maximum rate under section 1(h)(11) of the Internal Revenue Code.
The fund will notify shareholders in January 2007 of amounts for use in preparing 2006 income tax returns.
Annual Report
Proxy Voting Results
A special meeting of the funds' shareholders was held on May 17, 2006. The results of votes taken among shareholders on the proposal before them are reported below. Each vote reported represents one dollar of net asset value held on the record date for the meeting.
PROPOSAL 1 |
To elect a Board of Trustees. A |
| # of
Votes | % of
Votes |
Dennis J. Dirks |
Affirmative | 43,119,905,166.54 | 95.455 |
Withheld | 2,053,001,967.67 | 4.545 |
TOTAL | 45,172,907,134.21 | 100.000 |
Albert R. Gamper, Jr. |
Affirmative | 43,068,780,128.62 | 95.342 |
Withheld | 2,104,127,005.59 | 4.658 |
TOTAL | 45,172,907,134.21 | 100.000 |
Robert M. Gates |
Affirmative | 43,032,117,662.60 | 95.261 |
Withheld | 2,140,789,471.61 | 4.739 |
TOTAL | 45,172,907,134.21 | 100.000 |
George H. Heilmeier |
Affirmative | 43,023,368,882.30 | 95.242 |
Withheld | 2,149,538,251.91 | 4.758 |
TOTAL | 45,172,907,134.21 | 100.000 |
Edward C. Johnson 3d |
Affirmative | 42,881,915,819.70 | 94.928 |
Withheld | 2,290,991,314.51 | 5.072 |
TOTAL | 45,172,907,134.21 | 100.000 |
Stephen P. Jonas |
Affirmative | 43,081,912,066.37 | 95.371 |
Withheld | 2,090,995,067.84 | 4.629 |
TOTAL | 45,172,907,134.21 | 100.000 |
James H. KeyesB |
Affirmative | 43,049,050,093.79 | 95.298 |
Withheld | 2,123,857,040.42 | 4.702 |
TOTAL | 45,172,907,134.21 | 100.000 |
Marie L. Knowles |
Affirmative | 43,090,434,696.02 | 95.390 |
Withheld | 2,082,472,438.19 | 4.610 |
TOTAL | 45,172,907,134.21 | 100.000 |
| # of
Votes | % of
Votes |
Ned C. Lautenbach |
Affirmative | 43,082,185,255.05 | 95.372 |
Withheld | 2,090,721,879.16 | 4.628 |
TOTAL | 45,172,907,134.21 | 100.000 |
William O. McCoy |
Affirmative | 42,960,162,066.32 | 95.102 |
Withheld | 2,212,745,067.89 | 4.898 |
TOTAL | 45,172,907,134.21 | 100.000 |
Robert L. Reynolds |
Affirmative | 43,087,560,419.66 | 95.384 |
Withheld | 2,085,346,714.55 | 4.616 |
TOTAL | 45,172,907,134.21 | 100.000 |
Cornelia M. Small |
Affirmative | 43,092,070,014.53 | 95.394 |
Withheld | 2,080,837,119.68 | 4.606 |
TOTAL | 45,172,907,134.21 | 100.000 |
William S. Stavropoulos |
Affirmative | 43,002,032,676.43 | 95.194 |
Withheld | 2,170,874,457.78 | 4.806 |
TOTAL | 45,172,907,134.21 | 100.000 |
Kenneth L. Wolfe |
Affirmative | 43,047,241,852.81 | 95.294 |
Withheld | 2,125,665,281.40 | 4.706 |
TOTAL | 45,172,907,134.21 | 100.000 |
A Denotes trust-wide proposal and voting results. B Effective on or about January 1, 2007. |
Annual Report
Board Approval of Investment Advisory Contracts and Management Fees
Fidelity Small Cap Value Fund
Each year, typically in July, the Board of Trustees, including the Independent Trustees (together, the Board), votes on the renewal of the management contract and sub-advisory agreements (together, the Advisory Contracts) for the fund. The Board, assisted by the advice of fund counsel and Independent Trustees' counsel, requests and considers a broad range of information throughout the year.
The Board meets regularly each month except August and takes into account throughout the year matters bearing on Advisory Contracts. The Board, acting directly and through its separate committees, considers at each of its meetings factors that are relevant to the annual renewal of the fund's Advisory Contracts, including the services and support provided to the fund and its shareholders. At the time of the renewal, the Board had 12 standing committees, each composed of Independent Trustees with varying backgrounds, to which the Board has assigned specific subject matter responsibilities in order to enhance effective decision-making by the Board. Each committee has adopted a written charter outlining the structure and purposes of the committee. One such committee, the Equity Contract Committee, meets periodically as needed throughout the year to consider matters specifically related to the annual renewal of Advisory Contracts. The committee requests and receives information on, and makes recommendations to the Independent Trustees concerning, the approval and annual review of the Advisory Contracts.
At its July 2006 meeting, the Board of Trustees, including the Independent Trustees, unanimously determined to renew the Advisory Contracts for the fund. In reaching its determination, the Board considered all factors it believed relevant, including (i) the nature, extent, and quality of the services to be provided to the fund and its shareholders (including the investment performance of the fund); (ii) the competitiveness of the management fee and total expenses of the fund; (iii) the total costs of the services to be provided by and the profits to be realized by the investment adviser and its affiliates from the relationship with the fund; (iv) the extent to which economies of scale would be realized as the fund grows; and (v) whether fee levels reflect these economies of scale, if any, for the benefit of fund shareholders.
In determining whether to renew the Advisory Contracts for the fund, the Board ultimately reached a determination, with the assistance of fund counsel and Independent Trustees' counsel, that the renewal of the Advisory Contracts and the compensation to be received by Fidelity under the management contract is consistent with Fidelity's fiduciary duty under applicable law. In addition to evaluating the specific factors noted above, the Board, in reaching its determination, is aware that shareholders in the fund have a broad range of investment choices available to them, including a wide choice among mutual funds offered by competitors to Fidelity, and that the fund's shareholders, with the opportunity to review and weigh the disclosure provided by the fund in its prospectus and other public disclosures, have chosen to invest in this fund, managed by Fidelity.
Annual Report
Nature, Extent, and Quality of Services Provided. The Board considered staffing within the investment adviser, FMR, and the sub-advisers (together, the Investment Advisers), including the background of the fund's portfolio manager and the fund's investment objective and discipline. The Independent Trustees also had discussions with senior management of Fidelity's investment operations and investment groups. The Board considered the structure of the portfolio manager compensation program and whether this structure provides appropriate incentives.
Resources Dedicated to Investment Management and Support Services. The Board reviewed the size, education, and experience of the Investment Advisers' investment staff, their use of technology, and the Investment Advisers' approach to recruiting, training, and retaining portfolio managers and other research, advisory, and management personnel. The Board considered Fidelity's extensive global research capabilities that enable the Investment Advisers to aggregate data from various sources in an effort to produce positive investment results. The Board noted that Fidelity's analysts have access to a variety of technological tools that enable them to perform both fundamental and quantitative analysis and to specialize in various disciplines. The Board also considered that Fidelity's portfolio managers and analysts have access to daily portfolio attribution that allows for monitoring of a fund's portfolio, as well as an electronic communication system that provides immediate real-time access to research concerning issuers and credit enhancers.
Shareholder and Administrative Services. The Board considered (i) the nature, extent, quality, and cost of administrative, distribution, and shareholder services performed by the Investment Advisers and their affiliates under the Advisory Contracts and under separate agreements covering transfer agency, pricing and bookkeeping, and securities lending services for the fund; (ii) the nature and extent of the Investment Advisers' supervision of third party service providers, principally custodians and subcustodians; and (iii) the resources devoted to, and the record of compliance with, the fund's compliance policies and procedures. The Board reviewed the allocation of fund brokerage, including allocations to brokers affiliated with the Investment Advisers, the use of brokerage commissions to pay fund expenses, and the use of "soft" commission dollars to pay for research services. The Board also considered that Fidelity voluntarily pays for market data out of its own resources.
The Board noted that the growth of fund assets across the complex allows Fidelity to reinvest in the development of services designed to enhance the value or convenience of the Fidelity funds as investment vehicles. These services include 24-hour access to account information and market information through phone representatives and over the Internet, and investor education materials and asset allocation tools.
Annual Report
Board Approval of Investment Advisory Contracts and
Management Fees - continued
Investment in a Large Fund Family. The Board considered the benefits to shareholders of investing in a Fidelity fund, including the benefits of investing in a fund that is part of a large family of funds offering a variety of investment disciplines and providing for a large variety of mutual fund investor services. For example, fund shareholders are offered the privilege of exchanging shares of the fund for shares of other Fidelity funds, as set forth in the fund's prospectus, without paying an additional sales charge. The Board noted that, since the last Advisory Contract renewals in July 2005, Fidelity has taken a number of actions that benefited particular funds, including (i) dedicating additional resources to investment research and to restructure the investment research teams; (ii) voluntarily entering into contractual arrangements with certain brokers pursuant to which Fidelity pays for research products and services separately out of its own resources, rather than bundling with fund commissions; (iii) launching the Fidelity Advantage Class of its five Spartan stock index funds and three Spartan bond index funds, which is a lower-fee class available to shareholders with higher account balances; (iv) contractually agreeing to impose expense limitations on Fidelity U.S. Bond Index Fund and reducing the fund's initial investment minimum; and (v) offering shareholders of each of the Fidelity Institutional Money Market Funds the privilege of exchanging shares of the fund for shares of other Fidelity funds.
Investment Performance and Compliance. The Board considered whether the fund has operated within its investment objective, as well as its record of compliance with its investment restrictions. It also reviewed the fund's absolute investment performance for each class, as well as the fund's relative investment performance for each class measured against (i) a broad-based securities market index, and (ii) a peer group of mutual funds deemed appropriate by the Board. Because the fund had been in existence less than three calendar years, the following chart considered by the Board shows, for the one-year period ended December 31, 2005, the total returns of Class C and Fidelity Small Cap Value (retail class), the total return of a broad-based securities market index ("benchmark"), and a range of total returns of a peer group of mutual funds identified by Lipper Inc. as having an investment objective similar to that of the fund. The returns of Class C and Fidelity Small Cap Value (retail class) represent the performance of classes with the highest and lowest 12b-1 fees, respectively (not necessarily with the highest and lowest total expenses). The box within the chart shows the 25th percentile return (bottom of box) and the 75th percentile return (top of box) of the Lipper peer group. Returns shown above the box are in the first quartile and returns shown below the box are in the fourth quartile. The percentage beaten numbers noted below the chart correspond to the percentile box and represent the percentage of funds in the Lipper peer group whose performance was equal to or lower than that of the class indicated.
Annual Report
Fidelity Small Cap Value Fund

The Board reviewed the fund's relative investment performance against its Lipper peer group and stated that the performance of Fidelity Small Cap Value (retail class) was in the first quartile for the period shown. The Board also stated that the relative investment performance of Fidelity Small Cap Value (retail class) compared favorably to its benchmark for the period shown. The Board considered that the variations in performance among the fund's classes reflect the variations in class expenses, which result in lower performance for higher expense classes. The Board stated that it is difficult to evaluate in any comprehensive fashion the performance of the fund, in light of its relatively recent launch. The Board also reviewed the fund's relative investment performance against a peer group defined by Morningstar.
The Board also considered that the fund's management fee is subject to upward or downward adjustment depending upon whether, and to what extent, the fund's investment performance for the performance period exceeds, or is exceeded by, the record (over the same period) of a Board-approved performance adjustment index. The Board realizes that the performance adjustment provides FMR with a strong economic incentive to seek to achieve superior performance for the fund's shareholders and helps to more closely align the interests of FMR and the fund's shareholders.
The Board considered that FMR has taken steps to refocus and strengthen equity research, equity portfolio management, and compliance. The Board noted with favor FMR's reorganization of its senior management team in 2005 and FMR's dedication of additional resources to investment research, and participated in the process that led to those changes.
Annual Report
Board Approval of Investment Advisory Contracts and
Management Fees - continued
Based on its review, and giving particular weight to the nature and quality of the resources dedicated by the Investment Advisers to maintain and improve relative performance, the Board concluded that the nature, extent, and quality of the services provided to the fund will benefit the fund's shareholders, particularly in light of the Board's view that the fund's shareholders benefit from investing in a fund that is part of a large family of funds offering a variety of investment disciplines and services.
Competitiveness of Management Fee and Total Fund Expenses. The Board considered the fund's management fee and total expenses compared to "mapped groups" of competitive funds and classes. Fidelity creates "mapped groups" by combining similar Lipper investment objective categories that have comparable management fee characteristics. Combining Lipper investment objective categories aids the Board's management fee and total expense comparisons by broadening the competitive group used for comparison and by reducing the number of universes to which various Fidelity funds are compared.
The Board considered two proprietary management fee comparisons for the 12-month (or shorter) periods shown in the chart below. The group of Lipper funds used by the Board for management fee comparisons is referred to below as the "Total Mapped Group" and, for the reasons explained above, is broader than the Lipper peer group used by the Board for performance comparisons. The Total Mapped Group comparison focuses on a fund's standing relative to the total universe of comparable funds available to investors, in terms of gross management fees before expense reimbursements or caps, and without giving effect to the fund's performance adjustment. "TMG %" represents the percentage of funds in the Total Mapped Group that had management fees that were lower than the fund's. For example, a TMG % of 13% means that 87% of the funds in the Total Mapped Group had higher management fees than the fund. The "Asset-Size Peer Group" (ASPG) comparison focuses on a fund's standing relative to non-Fidelity funds similar in size to the fund within the Total Mapped Group. The ASPG represents at least 15% of the funds in the Total Mapped Group with comparable asset size and management fee characteristics, subject to a minimum of 50 funds (or all funds in the Total Mapped Group if fewer than 50). Additional information, such as the ASPG quartile in which the fund's management fee ranked and the impact of the fund's performance adjustment, is also included in the chart and considered by the Board.
Annual Report
Fidelity Small Cap Value Fund
The Board noted that the fund's management fee ranked below the median of its Total Mapped Group and below the median of its ASPG for 2005. The Board also noted the effect of the fund's positive performance adjustment on the fund's management fee ranking.
Based on its review, the Board concluded that the fund's management fee was fair and reasonable in light of the services that the fund receives and the other factors considered.
In its review of each class's total expenses, the Board considered the fund's management fee as well as other fund or class expenses, as applicable, such as transfer agent fees, pricing and bookkeeping fees, fund-paid 12b-1 fees, and custodial, legal, and audit fees. The Board also noted the effects of any waivers and reimbursements on fees and expenses, as well as the fund's positive performance adjustment. As part of its review, the Board also considered current and historical total expenses of each class of the fund compared to competitive fund median expenses. Each class of the fund is compared to those funds and classes in the Total Mapped Group (used by the Board for management fee comparisons) that have a similar sales load structure.
The Board noted that the total expenses of each of Class A, Institutional Class, and Fidelity Small Cap Value (retail class) ranked below its competitive median for 2005, the total expenses of Class C ranked equal to its competitive median for 2005, and the total expenses of each of Class B and Class T ranked above its competitive median for 2005. The Board considered that Class B was above median because of relatively high transfer agent fees resulting from small average account sizes. The Board noted that the fund offers multiple classes, each of which has a different sales load and 12b-1 fee structure, and that the multiple structures are intended to offer a range of pricing options for the intermediary market. The Board also noted that the total expenses of the classes vary primarily by the level of their 12b-1 fees, although differences in transfer agent fees may also cause expenses to vary from class to class.
Annual Report
Board Approval of Investment Advisory Contracts and
Management Fees - continued
In its review of total expenses, the Board also considered Fidelity fee structures and other information on clients that FMR and its affiliates service in other competitive markets, such as other mutual funds advised or subadvised by FMR or its affiliates, pension plan clients, and other institutional clients.
Based on its review, the Board concluded that the total expenses of each class of the fund were reasonable, although in some cases above the median of the universe presented for comparison, in light of the services that the fund and its shareholders receive and the other factors considered.
Costs of the Services and Profitability. The Board considered the revenues earned and the expenses incurred by Fidelity in conducting the business of developing, marketing, distributing, managing, administering and servicing the fund and its shareholders. The Board also considered the level of Fidelity's profits in respect of all the Fidelity funds.
On an annual basis, FMR presents to the Board Fidelity's profitability for the fund. Fidelity calculates the profitability for each fund, as well as aggregate profitability for groups of Fidelity funds and all Fidelity funds, using a series of detailed revenue and cost allocation methodologies which originate with the audited books and records of Fidelity. The Audit Committee of the Board reviews any significant changes from the prior year's methodologies.
PricewaterhouseCoopers LLP (PwC), independent registered accounting firm and auditor to Fidelity and certain Fidelity funds, has been engaged annually by the Board as part of the Board's assessment of the results of Fidelity's profitability analysis. PwC's engagement includes the review and assessment of Fidelity's methodologies used in determining the revenues and expenses attributable to Fidelity's mutual fund business, and completion of agreed-upon procedures surrounding the mathematical accuracy of fund profitability and its conformity to allocation methodologies. After considering PwC's reports issued under the engagement and information provided by Fidelity, the Board believes that while other allocation methods may also be reasonable, Fidelity's profitability methodologies are reasonable in all material respects.
The Board has also reviewed Fidelity's non-fund businesses and any fall-out benefits related to the mutual fund business as well as cases where Fidelity's affiliates may benefit from or be related to the fund's business.
Annual Report
The Board considered the costs of the services provided by and the profits realized by Fidelity in connection with the operation of the fund and determined that the amount of profit is a fair entrepreneurial profit for the management of the fund.
Economies of Scale. The Board considered whether there have been economies of scale in respect of the management of the Fidelity funds, whether the Fidelity funds (including the fund) have appropriately benefited from any such economies of scale, and whether there is potential for realization of any further economies of scale. The Board considered the extent to which the fund will benefit from economies of scale through increased services to the fund, through waivers or reimbursements, or through fee or expense reductions, including reductions that occur through operation of the transfer agent agreement. The transfer agent fee varies in part based on the number of accounts in the fund. If the number of accounts decreases or the average account size increases, the overall transfer agent fee rate decreases.
The Board recognized that the fund's management contract incorporates a "group fee" structure, which provides for lower fee rates as total fund assets under FMR's management increase, and for higher fee rates as total fund assets under FMR's management decrease. The Board considered that the group fee is designed to deliver the benefits of economies of scale to fund shareholders when total fund assets increase, even if assets of any particular fund are unchanged or have declined, because some portion of Fidelity's costs are attributable to services provided to all Fidelity funds, and all funds benefit if those costs can be allocated among more assets. The Board concluded that, given the group fee structure, fund shareholders will achieve a certain level of economies of scale as assets under FMR's management increase at the fund complex level, regardless of whether Fidelity achieves any such economies of scale.
The Board further concluded that any potential economies of scale are being shared between fund shareholders and Fidelity in an appropriate manner.
Additional Information Requested by the Board. In order to develop fully the factual basis for consideration of the Advisory Contracts, the Board requested additional information on several topics, including (i) Fidelity's fund profitability methodology and profitability trends within certain funds; (ii) portfolio manager compensation; (iii) the extent to which any economies of scale exist and are shared between the funds and Fidelity; (iv) the total expenses of certain funds and classes relative to competitors, including the extent to which the expenses of certain funds have been or could be capped; (v) fund performance trends; and (vi) Fidelity's fee structures, including use of performance fees.
Based on its evaluation of all of the conclusions noted above, and after considering all material factors, the Board ultimately concluded that the advisory fee structures are fair and reasonable, and that the fund's Advisory Contracts should be renewed.
Annual Report
Managing Your Investments
Fidelity offers several ways to conveniently manage your personal investments via your telephone or PC. You can access your account information, conduct trades and research your investments 24 hours a day.
By Phone
Fidelity Automated Service Telephone provides a single toll-free number to access account balances, positions, quotes and trading. It's easy to navigate the service, and on your first call, the system will help you create a personal identification number (PIN) for security.
(phone_graphic)
Fidelity Automated
Service Telephone (FAST®)
1-800-544-5555
Press
1 For mutual fund and brokerage trading.
2 For quotes.*
3 For account balances and holdings.
4 To review orders and mutual
fund activity.
5 To change your PIN.
*0 To speak to a Fidelity representative.
By PC
Fidelity's web site on the Internet provides a wide range of information, including daily financial news, fund performance, interactive planning tools and news about Fidelity products and services.
(computer_graphic)
Fidelity's Web Site
www.fidelity.com
* When you call the quotes line, please remember that a fund's yield and return will vary and, except for money market funds, share price will also vary. This means that you may have a gain or loss when you sell your shares. There is no assurance that money market funds will be able to maintain a stable $1 share price; an investment in a money market fund is not insured or guaranteed by the U.S. government. Total returns are historical and include changes in share price, reinvestment of dividends and capital gains, and the effects of any sales charges.
Annual Report
To Write Fidelity
We'll give your correspondence immediate attention and send you written confirmation upon completion of your request.
(letter_graphic)
Making Changes
To Your Account
(such as changing name, address, bank, etc.)
Fidelity Investments
P.O. Box 770001
Cincinnati, OH 45277-0002
(letter_graphic)
For Non-Retirement
Accounts
Buying shares
Fidelity Investments
P.O. Box 770001
Cincinnati, OH 45277-0003
Overnight Express
Fidelity Investments
Attn: Distribution Services
100 Crosby Parkway - KC1H
Covington, KY 41015
Selling shares
Fidelity Investments
P.O. Box 770001
Cincinnati, OH 45277-0035
Overnight Express
Fidelity Investments
Attn: Distribution Services
100 Crosby Parkway - KC1H
Covington, KY 41015
General Correspondence
Fidelity Investments
P.O. Box 500
Merrimack, NH 03054-0500
(letter_graphic)
For Retirement
Accounts
Buying shares
Fidelity Investments
P.O. Box 770001
Cincinnati, OH 45277-0003
Selling shares
Fidelity Investments
P.O. Box 770001
Cincinnati, OH 45277-0035
Overnight Express
Fidelity Investments
Attn: Distribution Services
100 Crosby Parkway - KC1H
Covington, KY 41015
General Correspondence
Fidelity Investments
P.O. Box 500
Merrimack, NH 03054-0500
Annual Report
To Visit Fidelity
For directions and hours,
please call 1-800-544-9797.
Arizona
7001 West Ray Road
Chandler, AZ
15445 N. Scottsdale Road
Scottsdale, AZ
California
815 East Birch Street
Brea, CA
1411 Chapin Avenue
Burlingame, CA
851 East Hamilton Avenue
Campbell, CA
19200 Von Karman Avenue
Irvine, CA
601 Larkspur Landing Circle
Larkspur, CA
10100 Santa Monica Blvd.
Los Angeles, CA
27101 Puerta Real
Mission Viejo, CA
73-575 El Paseo
Palm Desert, CA
251 University Avenue
Palo Alto, CA
123 South Lake Avenue
Pasadena, CA
16995 Bernardo Ctr. Drive
Rancho Bernardo, CA
1220 Roseville Parkway
Roseville, CA
1740 Arden Way
Sacramento, CA
7676 Hazard Center Drive
San Diego, CA
11943 El Camino Real
San Diego, CA
8 Montgomery Street
San Francisco, CA
3793 State Street
Santa Barbara, CA
1200 Wilshire Boulevard
Santa Monica, CA
21701 Hawthorne Boulevard
Torrance, CA
2001 North Main Street
Walnut Creek, CA
6300 Canoga Avenue
Woodland Hills, CA
Colorado
1625 Broadway
Denver, CO
9185 Westview Road
Lone Tree, CO
Connecticut
48 West Putnam Avenue
Greenwich, CT
265 Church Street
New Haven, CT
300 Atlantic Street
Stamford, CT
29 South Main Street
West Hartford, CT
Delaware
400 Delaware Avenue
Wilmington, DE
Florida
4400 N. Federal Highway
Boca Raton, FL
121 Alhambra Plaza
Coral Gables, FL
2948 N. Federal Highway
Ft. Lauderdale, FL
4671 Town Center Parkway
Jacksonville, FL
1907 West State Road 434
Longwood, FL
8880 Tamiami Trail, North
Naples, FL
3501 PGA Boulevard
Palm Beach Gardens, FL
3550 Tamiami Trail, South
Sarasota, FL
1502 N. Westshore Blvd.
Tampa, FL
2465 State Road 7
Wellington, FL
Georgia
3445 Peachtree Road, N.E.
Atlanta, GA
1000 Abernathy Road
Atlanta, GA
Illinois
One North LaSalle Street
Chicago, IL
875 North Michigan Ave.
Chicago, IL
1415 West 22nd Street
Oak Brook, IL
1572 East Golf Road
Schaumburg, IL
3232 Lake Avenue
Wilmette, IL
Indiana
4729 East 82nd Street
Indianapolis, IN
Kansas
5400 College Boulevard
Overland Park, KS
Maine
Three Canal Plaza
Portland, ME
Maryland
7315 Wisconsin Avenue
Bethesda, MD
One W. Pennsylvania Ave.
Towson, MD
Massachusetts
801 Boylston Street
Boston, MA
155 Congress Street
Boston, MA
300 Granite Street
Braintree, MA
44 Mall Road
Burlington, MA
238 Main Street
Cambridge, MA
405 Cochituate Road
Framingham, MA
416 Belmont Street
Worcester, MA
Annual Report
Michigan
500 E. Eisenhower Pkwy.
Ann Arbor, MI
280 Old N. Woodward Ave.
Birmingham, MI
43420 Grand River Avenue
Novi, MI
29155 Northwestern Hwy.
Southfield, MI
Minnesota
7600 France Avenue South
Edina, MN
Missouri
1524 South Lindbergh Blvd.
St. Louis, MO
Nevada
2225 Village Walk Drive
Henderson, NV
New Jersey
150 Essex Street
Millburn, NJ
56 South Street
Morristown, NJ
396 Route 17, North
Paramus, NJ
3518 Route 1 North
Princeton, NJ
530 Broad Street
Shrewsbury, NJ
New York
1055 Franklin Avenue
Garden City, NY
37 West Jericho Turnpike
Huntington Station, NY
1271 Avenue of the Americas
New York, NY
980 Madison Avenue
New York, NY
61 Broadway
New York, NY
350 Park Avenue
New York, NY
200 Fifth Avenue
New York, NY
733 Third Avenue
New York, NY
11 Penn Plaza
New York, NY
2070 Broadway
New York, NY
1075 Northern Blvd.
Roslyn, NY
799 Central Park Avenue
Scarsdale, NY
North Carolina
4611 Sharon Road
Charlotte, NC
7011 Fayetteville Road
Durham, NC
Ohio
3805 Edwards Road
Cincinnati, OH
1324 Polaris Parkway
Columbus, OH
28699 Chagrin Boulevard
Woodmere Village, OH
Oregon
7493 SW Bridgeport Road
Tigard, OR
Pennsylvania
600 West DeKalb Pike
King of Prussia, PA
1735 Market Street
Philadelphia, PA
12001 Perry Highway
Wexford, PA
Rhode Island
47 Providence Place
Providence, RI
Tennessee
6150 Poplar Avenue
Memphis, TN
Texas
10000 Research Boulevard
Austin, TX
4001 Northwest Parkway
Dallas, TX
12532 Memorial Drive
Houston, TX
2701 Drexel Drive
Houston, TX
6560 Fannin Street
Houston, TX
6500 N. MacArthur Blvd.
Irving, TX
6005 West Park Boulevard
Plano, TX
14100 San Pedro
San Antonio, TX
1576 East Southlake Blvd.
Southlake, TX
19740 IH 45 North
Spring, TX
Utah
279 West South Temple
Salt Lake City, UT
Virginia
1861 International Drive
McLean, VA
Washington
411 108th Avenue, N.E.
Bellevue, WA
1518 6th Avenue
Seattle, WA
Washington, DC
1900 K Street, N.W.
Washington, DC
Wisconsin
595 North Barker Road
Brookfield, WI
Fidelity Brokerage Services, Inc., 100 Summer St., Boston, MA 02110 Member NYSE/SIPC
Annual Report
Investment Adviser
Fidelity Management & Research Company
Boston, MA
Investment Sub-Advisers
FMR Co., Inc.
Fidelity Research & Analysis Company
(formerly Fidelity Management &
Research (Far East) Inc.)
Fidelity Management & Research
(U.K.) Inc.
Fidelity Investments Japan Limited
Fidelity International Investment
Advisors
Fidelity International Investment
Advisors (U.K.) Limited
General Distributor
Fidelity Distributors Corporation
Boston, MA
Transfer and Service Agent
Fidelity Service Company, Inc.
Boston, MA
Custodian
Citibank, N.A.
New York, NY
The Fidelity Telephone Connection
Mutual Fund 24-Hour Service
Exchanges/Redemptions
and Account Assistance 1-800-544-6666
Product Information 1-800-544-6666
Retirement Accounts 1-800-544-4774
(8 a.m. - 9 p.m.)
TDD Service 1-800-544-0118
for the deaf and hearing impaired
(9 a.m. - 9 p.m. Eastern time)
Fidelity Automated Service
Telephone (FAST®) (automated graphic) 1-800-544-5555
(automated graphic) Automated line for quickest service
SCV-UANN-0906
1.803705.101
(Fidelity Investment logo)(registered trademark)
Corporate Headquarters
82 Devonshire St., Boston, MA 02109
www.fidelity.com
(Fidelity Investment logo)(registered trademark)
FidelityAdvisor
Small Cap Value
Fund - Class A, Class T,
Class B and Class C
Annual Report
July 31, 2006
Class A, Class T, Class B
and Class C are classes of
Fidelity® Small Cap Value Fund
(2_fidelity_logos) (Registered_Trademark)
Contents
Chairman's Message | <Click Here> | Ned Johnson's message to shareholders. |
Performance | <Click Here> | How the fund has done over time. |
Management's Discussion | <Click Here> | The manager's review of fund performance, strategy and outlook |
Shareholder Expense Example | <Click Here> | An example of shareholder expenses. |
Investment Changes | <Click Here> | A summary of the fund's investments. |
Investments | <Click Here> | A complete list of the fund's investments with their market values. |
Financial Statements | <Click Here> | Statements of assets and liabilities, operations, and changes in net assets,
as well as financial highlights. |
Notes | <Click Here> | Notes to the financial statements. |
Report of Independent Registered Public Accounting Firm | <Click Here> | |
Trustees and Officers | <Click Here> | |
Distributions | <Click Here> | |
Proxy Voting Results | <Click Here> | |
Board Approval of Investment Advisory Contracts and Management Fees | <Click Here> | |
To view a fund's proxy voting guidelines and proxy voting record for the 12-month period ended June 30, visit www.fidelity.com/proxyvotingresults or visit the Securities and Exchange Commission's (SEC) web site at www.sec.gov. You may also call 1-877-208-0098 to request a free copy of the proxy voting guidelines.
Standard & Poor's, S&P and S&P 500 are registered service marks of The McGraw-Hill Companies, Inc. and have been licensed for use by Fidelity Distributors Corporation.
Other third party marks appearing herein are the property of their respective owners.
All other marks appearing herein are registered or unregistered trademarks or service marks of FMR Corp. or an affiliated company.
Annual Report
This report and the financial statements contained herein are submitted for the general information of the shareholders of the fund. This report is not authorized for distribution to prospective investors in the fund unless preceded or accompanied by an effective prospectus.
A fund files its complete schedule of portfolio holdings with the SEC for the first and third quarters of each fiscal year on Form N-Q. Forms N-Q are available on the SEC's web site at http://www.sec.gov. A fund's Forms N-Q may be reviewed and copied at the SEC's Public Reference Room in Washington, DC. Information regarding the operation of the SEC's Public Reference Room may be obtained by calling 1-800-SEC-0330. For a complete list of a fund's portfolio holdings, view the most recent quarterly holdings report, semiannual report, or annual report on Fidelity's web site at http://www.advisor.fidelity.com.
NOT FDIC INSURED · MAY LOSE VALUE · NO BANK GUARANTEE
Neither the fund nor Fidelity Distributors Corporation is a bank.
Annual Report
Chairman's Message
(photo_of_Edward_C_Johnson_3d)
Dear Shareholder:
Although many securities markets made gains in early 2006, inflation concerns led to mixed results through the year's mid-point. Financial markets are always unpredictable. There are, however, a number of time-tested principles that can put the historical odds in your favor.
One of the basic tenets is to invest for the long term. Over time, riding out the markets' inevitable ups and downs has proven much more effective than selling into panic or chasing the hottest trend. Even missing only a few of the markets' best days can significantly diminish investor returns. Patience also affords the benefits of compounding - of earning interest on additional income or reinvested dividends and capital gains. There are tax advantages and cost benefits to consider as well. The more you sell, the more taxes you pay, and the more you trade, the higher the costs. While staying the course doesn't eliminate risk, it can considerably lessen the effect of short-term declines.
You can further manage your investing risk through diversification. And today, more than ever, geographic diversification should be taken into account. Studies indicate that asset allocation is the single most important determinant of a portfolio's long-term success. The right mix of stocks, bonds and cash - aligned to your particular risk tolerance and investment objective - is very important. Age-appropriate rebalancing is also an essential aspect of asset allocation. For younger investors, an emphasis on equities - which historically have been the best performing asset class over time - is encouraged. As investors near their specific goal, such as retirement or sending a child to college, consideration may be given to replacing volatile assets (e.g. common stocks) with more-stable fixed investments (bonds or savings plans).
A third investment principle - investing regularly - can help lower the average cost of your purchases. Investing a certain amount of money each month or quarter helps ensure you won't pay for all your shares at market highs. This strategy - known as dollar cost averaging - also reduces unconstructive "emotion" from investing, helping shareholders avoid selling weak performers just prior to an upswing, or chasing a hot performer just before a correction.
We invite you to contact us via the Internet, through our Investor Centers or over the phone. It is our privilege to provide you the information you need to make the investments that are right for you.
Sincerely,
/s/Edward C. Johnson 3d
Edward C. Johnson 3d
Annual Report
Fidelity Advisor Small Cap Value Fund - Class A, T, B, and C
Performance: The Bottom Line
Average annual total return reflects the change in the value of an investment, assuming reinvestment of the class' dividend income and capital gains (the profits earned upon the sale of securities that have grown in value) and assuming a constant rate of performance each year. The $10,000 table and the fund's returns do not reflect the deduction of taxes that a shareholder would pay on fund distributions or the redemption of fund shares. During periods of reimbursement by Fidelity, a fund's total return will be greater than it would be had the reimbursement not occurred. How a fund did yesterday is no guarantee of how it will do tomorrow.
Average Annual Total Returns
Periods ended July 31, 2006 | Past 1
year | Life of
FundA |
Class A (incl. 5.75% sales charge) | -0.36% | 15.03% |
Class T (incl. 3.50% sales charge) | 1.77% | 16.31% |
Class B (incl. contingent deferred sales charge) B | -0.03% | 16.08% |
Class C (incl. contingent deferred sales charge) C | 3.92% | 18.15% |
A From November 3, 2004.
B Class B shares' contingent deferred sales charges included in the past one year and life of fund total return figures are 5% and 4%, respectively.
C Class C's shares' contingent deferred sales charges included in the past one year and life of fund total return figures are 1% and 0%, respectively.
Annual Report
$10,000 Over Life of Fund
Let's say hypothetically that $10,000 was invested in Fidelity Advisor Small Cap Value Fund - Class T on November 3, 2004, when the fund started, and the current 3.50% sales charge was paid. The chart shows how the value of your investment would have changed, and also shows how the Russell 2000® Value Index performed over the same period.
Annual Report
Management's Discussion of Fund Performance
Comments from Thomas Hense, Portfolio Manager of Fidelity Advisor Small Cap Value Fund
As measured by the Dow Jones Wilshire 5000 Composite IndexSM - the broadest measure of U.S. equity market performance - stocks did well for most of the 12-month period ending July 31, 2006, before faltering. For the one-year time frame as a whole, the Dow Jones Wilshire benchmark rose 5.43%. That was nearly identical to the 5.38% gain of the Standard & Poor's 500SM Index, a broad market proxy that's a reflection of larger-cap stocks. Stocks were resilient early on, bouncing back quickly after Hurricanes Katrina and Rita caused energy prices to spike to record-high levels. Buoyed by strong corporate earnings and solid economic growth, the S&P 500® ran off six consecutive months of positive returns from November through April. However, stocks pulled back for most of the remainder of the period. A slowdown in economic expansion and consumer spending, reaccelerating energy prices and continued interest rate hikes by the Federal Reserve Board cooled equity performance. Among other widely quoted market yardsticks, the Dow Jones Industrial AverageSM returned 7.59%, while the NASDAQ Composite® Index dropped 3.47%.
The fund's Class A, Class T, Class B and Class C shares were up 5.72%, 5.47%, 4.97% and 4.92%, respectively (excluding sales charges), during the past year, while the Russell 2000® Value Index returned 6.93%. Relative to its index, the fund was hurt by a lack of exposure to traditional deep value stocks, which the market favored as the economy slowed during the last several months of the period. Overweightings in the retailing and consumer durables groups and in the insurance sector also hurt performance, as did poor stock selection in insurance and retailing. Weak results in the transportation and health care equipment/services groups detracted as well. The fund was helped by its large overweighting in the strong performing energy sector, as well as its underweighting in the utilities sector. In terms of individual detractors, RC2 Corp., which makes learning toys and baby products, and consumer staples company Jarden held back the fund's relative return. Life insurance company American Equity Investment Life and retailer Cost Plus also hurt performance. Among the fund's top performers were oil refineries Holly and Tesoro, as well as energy equipment company Maverick Tube. WESCO International, which sells electrical equipment used in commercial and industrial construction, also boosted the fund's return. The fund no longer held some of these stocks at period end.
The views expressed above reflect those of the portfolio manager(s) only through the end of the period as stated on the cover of this report and do not necessarily represent the views of Fidelity or any other person in the Fidelity organization. Any such views are subject to change at any time based upon market or other conditions and Fidelity disclaims any responsibility to update such views. These views may not be relied on as investment advice and, because investment decisions for a Fidelity fund are based on numerous factors, may not be relied on as an indication of trading intent on behalf of any Fidelity fund.
Annual Report
Shareholder Expense Example
As a shareholder of the Fund, you incur two types of costs: (1) transaction costs, including sales charges (loads) on purchase payments or redemption proceeds, redemption fees, and (2) ongoing costs, including management fees, distribution and/or service (12b-1) fees and other Fund expenses. This Example is intended to help you understand your ongoing costs (in dollars) of investing in the Fund and to compare these costs with the ongoing costs of investing in other mutual funds.
The Example is based on an investment of $1,000 invested at the beginning of the period and held for the entire period (February 1, 2006 to July 31, 2006).
Actual Expenses
The first line of the accompanying table for each class of the Fund provides information about actual account values and actual expenses. You may use the information in this line, together with the amount you invested, to estimate the expenses that you paid over the period. Simply divide your account value by $1,000.00 (for example, an $8,600 account value divided by $1,000.00 = 8.6), then multiply the result by the number in the first line for a class of the Fund under the heading entitled "Expenses Paid During Period" to estimate the expenses you paid on your account during this period. A small balance maintenance fee of $12.00 that is charged once a year may apply for certain accounts with a value of less than $2,000. This fee is not included in the table below. If it was, the estimate of expenses you paid during the period would be higher, and your ending account value lower, by this amount.
Hypothetical Example for Comparison Purposes
The second line of the accompanying table for each class of the Fund provides information about hypothetical account values and hypothetical expenses based on a Class' actual expense ratio and an assumed rate of return of 5% per year before expenses, which is not the Class' actual return. The hypothetical account values and expenses may not be used to estimate the actual ending account balance or expenses you paid for the period. You may use this information to compare the ongoing costs of investing in the Fund and other funds. To do so, compare this 5% hypothetical example with the 5% hypothetical examples that appear in the shareholder reports of the other funds. A small balance maintenance fee of $12.00 that is charged once a year may apply for certain accounts with a value of less than $2,000. This fee is not included in the table below. If it was, the estimate of expenses you paid during the period would be higher, and your ending account value lower, by this amount.
Annual Report
Please note that the expenses shown in the table are meant to highlight your ongoing costs only and do not reflect any transaction costs. Therefore, the second line of the table is useful in comparing ongoing costs only, and will not help you determine the relative total costs of owning different funds. In addition, if these transactional costs were included, your costs would have been higher.
| Beginning
Account Value
February 1, 2006 | Ending
Account Value
July 31, 2006 | Expenses Paid
During Period*
February 1, 2006
to July 31, 2006 |
Class A | | | |
Actual | $ 1,000.00 | $ 967.70 | $ 6.78 |
HypotheticalA | $ 1,000.00 | $ 1,017.90 | $ 6.95 |
Class T | | | |
Actual | $ 1,000.00 | $ 966.20 | $ 8.00 |
HypotheticalA | $ 1,000.00 | $ 1,016.66 | $ 8.20 |
Class B | | | |
Actual | $ 1,000.00 | $ 963.90 | $ 10.42 |
HypotheticalA | $ 1,000.00 | $ 1,014.18 | $ 10.69 |
Class C | | | |
Actual | $ 1,000.00 | $ 963.90 | $ 10.42 |
HypotheticalA | $ 1,000.00 | $ 1,014.18 | $ 10.69 |
Small Cap Value | | | |
Actual | $ 1,000.00 | $ 969.20 | $ 5.47 |
HypotheticalA | $ 1,000.00 | $ 1,019.24 | $ 5.61 |
Institutional Class | | | |
Actual | $ 1,000.00 | $ 969.20 | $ 5.32 |
HypotheticalA | $ 1,000.00 | $ 1,019.39 | $ 5.46 |
A 5% return per year before expenses
* Expenses are equal to each Class' annualized expense ratio (shown in the table below); multiplied by the average account value over the period, multiplied by 181/365 (to reflect the one-half year period).
| Annualized
Expense Ratio |
Class A | 1.39% |
Class T | 1.64% |
Class B | 2.14% |
Class C | 2.14% |
Small Cap Value | 1.12% |
Institutional Class | 1.09% |
Annual Report
Investment Changes
Top Ten Stocks as of July 31, 2006 |
| % of fund's
net assets | % of fund's net assets
6 months ago |
Tesoro Corp. | 2.3 | 0.0 |
American Equity Investment Life Holding Co. | 2.0 | 0.0 |
RC2 Corp. | 1.8 | 3.3 |
Zenith National Insurance Corp. | 1.8 | 0.0 |
Compass Minerals International, Inc. | 1.8 | 2.2 |
Jarden Corp. | 1.8 | 2.1 |
Omnicare, Inc. | 1.8 | 0.0 |
Carpenter Technology Corp. | 1.7 | 0.0 |
UAP Holding Corp. | 1.6 | 2.4 |
Telvent GIT SA | 1.4 | 1.4 |
| 18.0 | |
Top Five Market Sectors as of July 31, 2006 |
| % of fund's
net assets | % of fund's net assets
6 months ago |
Financials | 26.3 | 19.5 |
Industrials | 16.2 | 18.8 |
Consumer Discretionary | 12.9 | 19.0 |
Information Technology | 12.2 | 9.0 |
Energy | 10.5 | 14.4 |
Asset Allocation (% of fund's net assets) |
As of July 31, 2006 * | As of January 31, 2006 ** |
| Stocks 94.6% | | | Stocks 94.0% | |
| Bonds 0.0% | | | Bonds 0.1% | |
| Short-Term
Investments and
Net Other Assets 5.4% | | | Short-Term
Investments and
Net Other Assets 5.9% | |
* Foreign investments | 7.9% | | ** Foreign investments | 11.0% | |

Annual Report
Investments July 31, 2006
Showing Percentage of Net Assets
Common Stocks - 94.6% |
| Shares | | Value (Note 1) |
CONSUMER DISCRETIONARY - 12.9% |
Auto Components - 1.1% |
Hawk Corp. Class A (a) | 406,600 | | $ 5,098,764 |
Spartan Motors, Inc. | 399,710 | | 6,539,256 |
| | 11,638,020 |
Distributors - 0.5% |
Building Material Holding Corp. (d) | 249,100 | | 5,338,213 |
Diversified Consumer Services - 0.4% |
Steiner Leisure Ltd. (a) | 119,429 | | 4,798,657 |
Hotels, Restaurants & Leisure - 2.7% |
Domino's Pizza, Inc. | 275,000 | | 6,253,500 |
Gaylord Entertainment Co. (a) | 115,000 | | 4,395,300 |
Isle of Capri Casinos, Inc. (a) | 284,500 | | 6,722,735 |
Pinnacle Entertainment, Inc. (a) | 452,700 | | 12,417,561 |
| | 29,789,096 |
Household Durables - 4.0% |
Ethan Allen Interiors, Inc. | 35,300 | | 1,317,396 |
Interface, Inc. Class A (a) | 1,244,490 | | 15,269,892 |
Jarden Corp. (a)(d) | 675,000 | | 19,568,250 |
Kimball International, Inc. Class B | 235,000 | | 4,175,950 |
Lenox Group, Inc. (a) | 291,045 | | 2,025,673 |
Ryland Group, Inc. | 40,000 | | 1,634,000 |
| | 43,991,161 |
Leisure Equipment & Products - 2.1% |
Cybex International, Inc. (a) | 143,100 | | 788,481 |
MarineMax, Inc. (a) | 102,800 | | 2,163,940 |
RC2 Corp. (a) | 584,555 | | 19,798,878 |
| | 22,751,299 |
Specialty Retail - 1.6% |
Gymboree Corp. (a) | 135,000 | | 4,525,200 |
Sonic Automotive, Inc. Class A (sub. vtg.) | 242,500 | | 5,577,500 |
The Children's Place Retail Stores, Inc. (a) | 58,000 | | 3,237,560 |
Tween Brands, Inc. (a) | 105,000 | | 3,908,100 |
| | 17,248,360 |
Textiles, Apparel & Luxury Goods - 0.5% |
Warnaco Group, Inc. (a) | 290,000 | | 5,164,900 |
TOTAL CONSUMER DISCRETIONARY | | 140,719,706 |
Common Stocks - continued |
| Shares | | Value (Note 1) |
CONSUMER STAPLES - 1.9% |
Food Products - 1.0% |
Diamond Foods, Inc. | 580,400 | | $ 8,914,944 |
Gold Kist, Inc. Delaware (a) | 185,500 | | 2,595,145 |
| | 11,510,089 |
Personal Products - 0.9% |
Playtex Products, Inc. (a) | 200,000 | | 2,264,000 |
Prestige Brands Holdings, Inc. (a) | 812,838 | | 7,136,718 |
| | 9,400,718 |
TOTAL CONSUMER STAPLES | | 20,910,807 |
ENERGY - 10.5% |
Energy Equipment & Services - 2.8% |
Carbo Ceramics, Inc. | 121,200 | | 4,713,468 |
Hornbeck Offshore Services, Inc. (a) | 154,100 | | 5,354,975 |
Hydril Co. (a) | 37,717 | | 2,612,657 |
Oil States International, Inc. (a) | 244,760 | | 7,871,482 |
Superior Energy Services, Inc. (a) | 215,000 | | 7,363,750 |
W-H Energy Services, Inc. (a) | 50,000 | | 2,751,000 |
| | 30,667,332 |
Oil, Gas & Consumable Fuels - 7.7% |
Comstock Resources, Inc. (a) | 330,300 | | 9,717,426 |
Encore Acquisition Co. (a) | 89,820 | | 2,735,917 |
Forest Oil Corp. (a) | 140,000 | | 4,691,400 |
Gastar Exploration Ltd. (a)(e) | 1,509,607 | | 3,241,733 |
Holly Corp. | 207,400 | | 10,494,440 |
Mariner Energy, Inc. (a) | 530,000 | | 9,545,300 |
Overseas Shipholding Group, Inc. | 152,500 | | 9,819,475 |
Petroleum Development Corp. (a) | 94,500 | | 4,209,030 |
Tesoro Corp. | 340,800 | | 25,491,836 |
World Fuel Services Corp. | 65,000 | | 3,075,800 |
| | 83,022,357 |
TOTAL ENERGY | | 113,689,689 |
FINANCIALS - 26.3% |
Capital Markets - 1.0% |
American Capital Strategies Ltd. (d) | 158,700 | | 5,554,500 |
Common Stocks - continued |
| Shares | | Value (Note 1) |
FINANCIALS - continued |
Capital Markets - continued |
Technology Investment Capital Corp. | 87,948 | | $ 1,263,813 |
TradeStation Group, Inc. (a) | 280,000 | | 4,093,600 |
| | 10,911,913 |
Commercial Banks - 6.0% |
Boston Private Financial Holdings, Inc. | 425,000 | | 10,680,250 |
Cathay General Bancorp | 270,220 | | 9,930,585 |
Center Financial Corp., California | 468,352 | | 11,671,332 |
East West Bancorp, Inc. | 28,800 | | 1,162,080 |
Hanmi Financial Corp. | 245,040 | | 4,665,562 |
Home Bancshares, Inc. | 56,300 | | 1,227,340 |
Nara Bancorp, Inc. | 208,270 | | 3,834,251 |
Preferred Bank, Los Angeles California | 166,900 | | 9,565,039 |
UCBH Holdings, Inc. | 150,000 | | 2,502,000 |
Wintrust Financial Corp. | 209,360 | | 10,051,374 |
| | 65,289,813 |
Consumer Finance - 0.2% |
Advanta Corp. Class B | 50,000 | | 1,801,500 |
Diversified Financial Services - 0.9% |
Marlin Business Services Corp. (a) | 470,779 | | 9,773,372 |
Insurance - 13.5% |
American Equity Investment Life Holding Co. | 1,985,000 | | 21,616,650 |
Aspen Insurance Holdings Ltd. | 360,200 | | 8,500,720 |
HCC Insurance Holdings, Inc. | 175,920 | | 5,363,801 |
Hub International Ltd. | 100,000 | | 2,611,000 |
IPC Holdings Ltd. | 413,440 | | 11,886,400 |
National Financial Partners Corp. | 206,300 | | 9,291,752 |
Navigators Group, Inc. (a) | 69,862 | | 2,969,834 |
Ohio Casualty Corp. | 193,500 | | 5,015,520 |
Philadelphia Consolidated Holdings Corp. (a) | 274,140 | | 9,285,122 |
Platinum Underwriters Holdings Ltd. | 329,700 | | 9,327,213 |
RLI Corp. | 180,000 | | 8,510,400 |
Specialty Underwriters' Alliance, Inc. (a) | 339,130 | | 2,167,041 |
Tower Group, Inc. | 100,000 | | 3,002,000 |
United America Indemnity Ltd. Class A (a) | 310,012 | | 6,429,649 |
USI Holdings Corp. (a) | 1,194,448 | | 14,835,044 |
Willis Group Holdings Ltd. | 195,000 | | 6,343,350 |
Zenith National Insurance Corp. | 494,000 | | 19,750,120 |
| | 146,905,616 |
Common Stocks - continued |
| Shares | | Value (Note 1) |
FINANCIALS - continued |
Real Estate Investment Trusts - 2.9% |
Columbia Equity Trust, Inc. | 230,000 | | $ 3,489,100 |
Education Realty Trust, Inc. | 176,300 | | 2,755,569 |
Equity Lifestyle Properties, Inc. | 75,100 | | 3,227,047 |
GMH Communities Trust | 314,100 | | 3,938,814 |
Pennsylvania (REIT) (SBI) | 246,800 | | 9,718,984 |
Ramco-Gershenson Properties Trust (SBI) | 129,600 | | 3,814,128 |
Saxon Capital, Inc. | 158,000 | | 1,786,980 |
Taubman Centers, Inc. | 74,400 | | 3,087,600 |
| | 31,818,222 |
Real Estate Management & Development - 1.2% |
Far East Consortium International Ltd. | 61,287 | | 25,871 |
Jones Lang LaSalle, Inc. | 157,000 | | 12,826,900 |
| | 12,852,771 |
Thrifts & Mortgage Finance - 0.6% |
Farmer Mac Class C (non-vtg.) | 100,000 | | 2,683,000 |
FirstFed Financial Corp., Delaware (a)(d) | 60,000 | | 3,387,000 |
ITLA Capital Corp. | 21,483 | | 1,067,920 |
| | 7,137,920 |
TOTAL FINANCIALS | | 286,491,127 |
HEALTH CARE - 5.3% |
Health Care Providers & Services - 3.0% |
Chemed Corp. | 50,000 | | 1,839,000 |
Odyssey Healthcare, Inc. (a) | 440,000 | | 7,924,400 |
Omnicare, Inc. | 422,000 | | 19,099,720 |
VistaCare, Inc. Class A (a) | 292,000 | | 3,398,880 |
| | 32,262,000 |
Health Care Technology - 1.1% |
Per-Se Technologies, Inc. (a) | 505,700 | | 12,071,059 |
Life Sciences Tools & Services - 1.0% |
ICON PLC sponsored ADR (a) | 169,360 | | 11,150,662 |
Pharmaceuticals - 0.2% |
Cypress Bioscience, Inc. (a) | 282,000 | | 1,624,320 |
TOTAL HEALTH CARE | | 57,108,041 |
Common Stocks - continued |
| Shares | | Value (Note 1) |
INDUSTRIALS - 16.2% |
Aerospace & Defense - 2.6% |
AAR Corp. (a) | 477,300 | | $ 11,302,464 |
Ceradyne, Inc. (a) | 134,070 | | 6,554,682 |
DRS Technologies, Inc. | 113,000 | | 5,230,770 |
Hexcel Corp. (a) | 350,200 | | 5,032,374 |
| | 28,120,290 |
Air Freight & Logistics - 1.4% |
Forward Air Corp. | 80,000 | | 2,567,200 |
Hub Group, Inc. Class A | 180,000 | | 4,064,400 |
Park-Ohio Holdings Corp. (a) | 529,306 | | 8,860,582 |
| | 15,492,182 |
Airlines - 0.2% |
AirTran Holdings, Inc. (a) | 160,000 | | 2,006,400 |
Building Products - 1.5% |
Insteel Industries, Inc. (d) | 365,988 | | 7,575,952 |
NCI Building Systems, Inc. (a) | 162,700 | | 7,604,598 |
Quixote Corp. | 71,300 | | 1,138,661 |
| | 16,319,211 |
Commercial Services & Supplies - 2.7% |
Banta Corp. | 128,400 | | 4,536,372 |
FTI Consulting, Inc. (a) | 420,000 | | 11,025,000 |
Spherion Corp. (a) | 250,000 | | 1,900,000 |
Standard Parking Corp. (a) | 166,684 | | 5,210,542 |
Steelcase, Inc. Class A | 213,000 | | 3,128,970 |
Team, Inc. (a) | 144,628 | | 3,575,204 |
| | 29,376,088 |
Construction & Engineering - 1.4% |
Shaw Group, Inc. (a) | 353,000 | | 7,303,570 |
URS Corp. (a) | 197,800 | | 7,832,880 |
| | 15,136,450 |
Electrical Equipment - 1.7% |
Acuity Brands, Inc. | 100,350 | | 4,388,306 |
Belden CDT, Inc. | 275,000 | | 8,923,750 |
C&D Technologies, Inc. | 310,000 | | 2,201,000 |
GrafTech International Ltd. (a) | 510,000 | | 2,738,700 |
| | 18,251,756 |
Machinery - 1.2% |
Basin Water, Inc. | 63,500 | | 558,800 |
Common Stocks - continued |
| Shares | | Value (Note 1) |
INDUSTRIALS - continued |
Machinery - continued |
Manitowoc Co., Inc. | 171,520 | | $ 6,733,875 |
Tennant Co. | 272,200 | | 6,470,194 |
| | 13,762,869 |
Road & Rail - 0.2% |
Old Dominion Freight Lines, Inc. (a) | 60,000 | | 1,954,800 |
Trading Companies & Distributors - 3.3% |
Kaman Corp. | 528,822 | | 9,703,884 |
UAP Holding Corp. | 900,980 | | 17,749,306 |
WESCO International, Inc. (a) | 153,000 | | 8,912,250 |
| | 36,365,440 |
TOTAL INDUSTRIALS | | 176,785,486 |
INFORMATION TECHNOLOGY - 12.2% |
Computers & Peripherals - 0.2% |
Neoware Systems, Inc. (a) | 100,000 | | 1,238,000 |
Rackable Systems, Inc. (a) | 50,000 | | 1,066,000 |
| | 2,304,000 |
Electronic Equipment & Instruments - 6.3% |
Benchmark Electronics, Inc. (a) | 207,900 | | 5,058,207 |
CTS Corp. | 225,000 | | 3,242,250 |
Ingram Micro, Inc. Class A (a) | 727,700 | | 12,829,351 |
Insight Enterprises, Inc. (a) | 658,900 | | 11,161,766 |
KEMET Corp. (a) | 1,124,700 | | 9,413,739 |
Mettler-Toledo International, Inc. (a) | 113,700 | | 6,995,961 |
ScanSource, Inc. (a) | 67,530 | | 2,009,018 |
Tektronix, Inc. | 526,000 | | 14,344,020 |
Vishay Intertechnology, Inc. (a) | 247,491 | | 3,472,299 |
| | 68,526,611 |
Internet Software & Services - 1.2% |
j2 Global Communications, Inc. (a) | 400,800 | | 11,222,400 |
RealNetworks, Inc. (a) | 225,000 | | 2,247,750 |
| | 13,470,150 |
IT Services - 1.9% |
MPS Group, Inc. (a) | 170,000 | | 2,208,300 |
Ness Technologies, Inc. (a) | 252,000 | | 2,782,080 |
Telvent GIT SA (a) | 1,081,000 | | 15,501,540 |
| | 20,491,920 |
Common Stocks - continued |
| Shares | | Value (Note 1) |
INFORMATION TECHNOLOGY - continued |
Semiconductors & Semiconductor Equipment - 2.1% |
California Micro Devices Corp. (a) | 575,000 | | $ 2,271,250 |
Conexant Systems, Inc. (a) | 1,300,000 | | 2,327,000 |
Intevac, Inc. (a) | 551,000 | | 11,609,570 |
MKS Instruments, Inc. (a) | 213,900 | | 4,421,313 |
Rudolph Technologies, Inc. (a) | 165,244 | | 2,298,544 |
| | 22,927,677 |
Software - 0.5% |
Moldflow Corp. (a) | 427,898 | | 5,139,055 |
TOTAL INFORMATION TECHNOLOGY | | 132,859,413 |
MATERIALS - 7.8% |
Chemicals - 2.7% |
Albemarle Corp. | 158,300 | | 7,981,486 |
Arch Chemicals, Inc. | 280,000 | | 9,923,200 |
Cytec Industries, Inc. | 99,670 | | 5,323,375 |
Georgia Gulf Corp. | 245,800 | | 6,258,068 |
| | 29,486,129 |
Containers & Packaging - 0.3% |
Owens-Illinois, Inc. | 200,000 | | 3,026,000 |
Metals & Mining - 4.8% |
Carpenter Technology Corp. | 190,000 | | 18,696,000 |
Compass Minerals International, Inc. | 736,466 | | 19,671,007 |
Meridian Gold, Inc. (a) | 270,000 | | 7,279,692 |
Steel Dynamics, Inc. | 55,000 | | 3,191,100 |
Titanium Metals Corp. | 120,000 | | 3,460,800 |
| | 52,298,599 |
TOTAL MATERIALS | | 84,810,728 |
TELECOMMUNICATION SERVICES - 0.4% |
Wireless Telecommunication Services - 0.4% |
Syniverse Holdings, Inc. (a) | 334,000 | | 4,669,320 |
UTILITIES - 1.1% |
Independent Power Producers & Energy Traders - 0.5% |
Dynegy, Inc. Class A (a) | 900,000 | | 5,067,000 |
Common Stocks - continued |
| Shares | | Value (Note 1) |
UTILITIES - continued |
Multi-Utilities - 0.6% |
CMS Energy Corp. (a) | 500,000 | | $ 7,005,000 |
TOTAL UTILITIES | | 12,072,000 |
TOTAL COMMON STOCKS (Cost $1,004,318,234) | 1,030,116,317 |
Money Market Funds - 5.9% |
| | | |
Fidelity Cash Central Fund, 5.3% (b) | 45,491,708 | | 45,491,708 |
Fidelity Securities Lending Cash Central Fund, 5.32% (b)(c) | 19,229,000 | | 19,229,000 |
TOTAL MONEY MARKET FUNDS (Cost $64,720,708) | 64,720,708 |
TOTAL INVESTMENT PORTFOLIO - 100.5% (Cost $1,069,038,942) | | 1,094,837,025 |
NET OTHER ASSETS - (0.5)% | | (5,298,961) |
NET ASSETS - 100% | $ 1,089,538,064 |
Legend |
(a) Non-income producing |
(b) Affiliated fund that is available only to investment companies and other accounts managed by Fidelity Investments. The rate quoted is the annualized seven-day yield of the fund at period end. A complete unaudited listing of the fund's holdings as of its most recent quarter end is available upon request. |
(c) Investment made with cash collateral received from securities on loan. |
(d) Security or a portion of the security is on loan at period end. |
(e) Restricted securities - Investment in securities not registered under the Securities Act of 1933 (excluding 144A issues). At the end of the period, the value of restricted securities (excluding 144A issues) amounted to $3,241,733 or 0.3% of net assets. |
Additional information on each holding is as follows: |
Security | Acquisition Date | Acquisition Cost |
Gastar Exploration Ltd. | 6/13/05 | $ 3,999,855 |
Affiliated Central Funds |
Information regarding fiscal year to date income earned by the fund from the affiliated Central funds is as follows: |
Fund | Income earned |
Fidelity Cash Central Fund | $ 2,249,098 |
Fidelity Securities Lending Cash Central Fund | 38,326 |
Total | $ 2,287,424 |
Other Affiliated Issuers |
An affiliated company is a company in which the fund has ownership of at least 5% of the voting securities. Fiscal year to date transactions with companies which are or were affiliates are as follows: |
Affiliate | Value, beginning of period | Purchases | Sales Proceeds | Dividend Income | Value,
end of
period |
Innovo Group, Inc. | $ 3,902,134 | $ - | $ 1,357,802 | $ - | $ - |
Medtox Scientific, Inc. | 2,594,703 | 1,304,074 | 4,856,606 | - | - |
Park-Ohio Holdings Corp. | 9,985,654 | 4,636,566 | 3,883,350 | - | - |
Pioneer Companies, Inc. | 10,200,438 | 7,669,063 | 22,850,866 | - | - |
Total | $ 26,682,929 | $ 13,609,703 | $ 32,948,624 | $ - | $ - |
See accompanying notes which are an integral part of the financial statements.
Annual Report
Financial Statements
Statement of Assets and Liabilities
| July 31, 2006 |
Assets | | |
Investment in securities, at value (including securities loaned of $18,617,720) - See accompanying schedule: Unaffiliated issuers (cost $1,004,318,234) | $ 1,030,116,317 | |
Affiliated Central Funds (cost $64,720,708) | 64,720,708 | |
Total Investments (cost $1,069,038,942) | | $ 1,094,837,025 |
Cash | | 157,630 |
Receivable for investments sold | | 27,827,383 |
Receivable for fund shares sold | | 3,281,109 |
Dividends receivable | | 306,364 |
Interest receivable | | 208,552 |
Prepaid expenses | | 831 |
Receivable from investment adviser for expense reductions | | 7,516 |
Other receivables | | 44,646 |
Total assets | | 1,126,671,056 |
| | |
Liabilities | | |
Payable to custodian bank | $ 9,965 | |
Payable for investments purchased | 12,675,989 | |
Payable for fund shares redeemed | 4,094,324 | |
Accrued management fee | 738,544 | |
Distribution fees payable | 57,773 | |
Other affiliated payables | 253,771 | |
Other payables and accrued expenses | 73,626 | |
Collateral on securities loaned, at value | 19,229,000 | |
Total liabilities | | 37,132,992 |
| | |
Net Assets | | $ 1,089,538,064 |
Net Assets consist of: | | |
Paid in capital | | $ 1,010,860,195 |
Accumulated undistributed net realized gain (loss) on investments and foreign currency transactions | | 52,880,158 |
Net unrealized appreciation (depreciation) on investments and assets and liabilities in foreign currencies | | 25,797,711 |
Net Assets | | $ 1,089,538,064 |
See accompanying notes which are an integral part of the financial statements.
Annual Report
Statement of Assets and Liabilities - continued
| July 31, 2006 |
Calculation of Maximum Offering Price
Class A:
Net Asset Value and redemption price per share ($39,931,161 ÷ 3,032,281 shares) | | $ 13.17 |
| | |
Maximum offering price per share (100/94.25 of $13.17) | | $ 13.97 |
Class T:
Net Asset Value and redemption price per share ($45,460,462 ÷ 3,461,481 shares) | | $ 13.13 |
| | |
Maximum offering price per share (100/96.50 of $13.13) | | $ 13.61 |
Class B:
Net Asset Value and offering price per share ($10,214,248 ÷ 781,586 shares)A | | $ 13.07 |
| | |
Class C:
Net Asset Value and offering price per share ($26,790,532 ÷ 2,049,806 shares)A | | $ 13.07 |
| | |
| | |
Small Cap Value:
Net Asset Value, offering price and redemption price per share ($957,719,926 ÷ 72,437,835 shares) | | $ 13.22 |
| | |
Institutional Class:
Net Asset Value, offering price and redemption price per share ($9,421,735 ÷ 712,615 shares) | | $ 13.22 |
A Redemption price per share is equal to net asset value less any applicable contingent deferred sales charge.
See accompanying notes which are an integral part of the financial statements.
Annual Report
Financial Statements - continued
Statement of Operations
| Year ended July 31, 2006 |
Investment Income | | |
Dividends | | $ 7,592,341 |
Interest | | 267,751 |
Income from affiliated Central Funds | | 2,287,424 |
Total income | | 10,147,516 |
| | |
Expenses | | |
Management fee
Basic fee | $ 6,503,559 | |
Performance adjustment | 818,297 | |
Transfer agent fees | 2,021,820 | |
Distribution fees | 489,195 | |
Accounting and security lending fees | 327,010 | |
Independent trustees' compensation | 3,449 | |
Custodian fees and expenses | 46,559 | |
Registration fees | 176,894 | |
Audit | 46,223 | |
Legal | 11,083 | |
Miscellaneous | 40,350 | |
Total expenses before reductions | 10,484,439 | |
Expense reductions | (375,179) | 10,109,260 |
Net investment income (loss) | | 38,256 |
Realized and Unrealized Gain (Loss) Net realized gain (loss) on: | | |
Investment securities: | | |
Unaffiliated issuers (net of foreign taxes of $104,677) | 59,347,415 | |
Other affiliated issuers | (46,540) | |
Foreign currency transactions | (16,065) | |
Total net realized gain (loss) | | 59,284,810 |
Change in net unrealized appreciation (depreciation) on: Investment securities | (30,704,015) | |
Assets and liabilities in foreign currencies | 2,648 | |
Total change in net unrealized appreciation (depreciation) | | (30,701,367) |
Net gain (loss) | | 28,583,443 |
Net increase (decrease) in net assets resulting from operations | | $ 28,621,699 |
See accompanying notes which are an integral part of the financial statements.
Annual Report
Statement of Changes in Net Assets
| Year ended
July 31,
2006 | For the period
November 3, 2004
(commencement
of operations) to
July 31, 2005 |
Increase (Decrease) in Net Assets | | |
Operations | | |
Net investment income (loss) | $ 38,256 | $ (248,906) |
Net realized gain (loss) | 59,284,810 | 15,306,292 |
Change in net unrealized appreciation (depreciation) | (30,701,367) | 56,499,078 |
Net increase (decrease) in net assets resulting
from operations | 28,621,699 | 71,556,464 |
Distributions to shareholders from net investment income | (633,037) | (69,595) |
Distributions to shareholders from net realized gain | (20,371,695) | - |
Total distributions | (21,004,732) | (69,595) |
Share transactions - net increase (decrease) | 457,176,942 | 552,608,856 |
Redemption fees | 517,538 | 130,892 |
Total increase (decrease) in net assets | 465,311,447 | 624,226,617 |
| | |
Net Assets | | |
Beginning of period | 624,226,617 | - |
End of period (including undistributed net investment income of $0 and $5,374, respectively) | $ 1,089,538,064 | $ 624,226,617 |
See accompanying notes which are an integral part of the financial statements.
Annual Report
Financial Highlights - Class A
Years ended July 31, | 2006 | 2005 F |
Selected Per-Share Data | | |
Net asset value, beginning of period | $ 12.80 | $ 10.00 |
Income from Investment Operations | | |
Net investment income (loss) E | (.03) | (.04) |
Net realized and unrealized gain (loss) | .74 | 2.84 |
Total from investment operations | .71 | 2.80 |
Distributions from net investment income | - | (.01) |
Distributions from net realized gain | (.35) | - |
Total distributions | (.35) | (.01) |
Redemption fees added to paid in capital E | .01 | .01 |
Net asset value, end of period | $ 13.17 | $ 12.80 |
Total Return B, C ,D | 5.72% | 28.06% |
Ratios to Average Net Assets G | | |
Expenses before reductions | 1.51% | 1.46% A |
Expenses net of fee waivers, if any | 1.40% | 1.44% A |
Expenses net of all reductions | 1.36% | 1.38% A |
Net investment income (loss) | (.24)% | (.46)% A |
Supplemental Data | | |
Net assets, end of period (000 omitted) | $ 39,931 | $ 9,390 |
Portfolio turnover rate | 93% | 60% A |
A Annualized
B Total returns for periods of less than one year are not annualized.
C Total returns would have been lower had certain expenses not been reduced during the periods shown.
D Total returns do not include the effect of the sales charges.
E Calculated based on average shares outstanding during the period.
F For the period November 3, 2004 (commencement of operations) to July 31, 2005.
G Expense ratios reflect operating expenses of the class. Expenses before reductions do not reflect amounts reimbursed by the investment adviser or reductions from brokerage service arrangements or other expense offset arrangements and do not represent the amount paid by the class during periods when reimbursements or reductions occur. Expense ratios before reductions for start-up periods may not be representative of longer-term operating periods. Expenses net of fee waivers reflect expenses after reimbursement by the investment adviser but prior to reductions from brokerage service arrangements or other expense offset arrangements. Expenses net of all reductions represent the net expenses paid by the class.
See accompanying notes which are an integral part of the financial statements.
Annual Report
Financial Highlights - Class T
Years ended July 31, | 2006 | 2005F |
Selected Per-Share Data | | |
Net asset value, beginning of period | $ 12.78 | $ 10.00 |
Income from Investment Operations | | |
Net investment income (loss) E | (.07) | (.06) |
Net realized and unrealized gain (loss) | .74 | 2.83 |
Total from investment operations | .67 | 2.77 |
Distributions from net realized gain | (.33) | - |
Redemption fees added to paid in capitalE | .01 | .01 |
Net asset value, end of period | $ 13.13 | $ 12.78 |
Total Return B, C, D | 5.47% | 27.80% |
Ratios to Average Net Assets G | | |
Expenses before reductions | 1.67% | 1.72%A |
Expenses net of fee waivers, if any | 1.65% | 1.68%A |
Expenses net of all reductions | 1.61% | 1.62%A |
Net investment income (loss) | (.49)% | (.70)%A |
Supplemental Data | | |
Net assets, end of period (000 omitted) | $ 45,460 | $ 12,725 |
Portfolio turnover rate | 93% | 60%A |
A Annualized
B Total returns for periods of less than one year are not annualized.
C Total returns would have been lower had certain expenses not been reduced during the periods shown.
D Total returns do not include the effect of the sales charges.
E Calculated based on average shares outstanding during the period.
F For the period November 3, 2004 (commencement of operations) to July 31, 2005.
G Expense ratios reflect operating expenses of the class. Expenses before reductions do not reflect amounts reimbursed by the investment adviser or reductions from brokerage service arrangements or other expense offset arrangements and do not represent the amount paid by the class during periods when reimbursements or reductions occur. Expense ratios before reductions for start-up periods may not be representative of longer-term operating periods. Expenses net of fee waivers reflect expenses after reimbursement by the investment adviser but prior to reductions from brokerage service arrangements or other expense offset arrangements. Expenses net of all reductions represent the net expenses paid by the class.
See accompanying notes which are an integral part of the financial statements.
Annual Report
Financial Highlights - Class B
Years ended July 31, | 2006 | 2005F |
Selected Per-Share Data | | |
Net asset value, beginning of period | $ 12.73 | $ 10.00 |
Income from Investment Operations | | |
Net investment income (loss)E | (.13) | (.10) |
Net realized and unrealized gain (loss) | .74 | 2.82 |
Total from investment operations | .61 | 2.72 |
Distributions from net realized gain | (.28) | - |
Redemption fees added to paid in capitalE | .01 | .01 |
Net asset value, end of period | $ 13.07 | $ 12.73 |
Total Return B, C, D | 4.97% | 27.30% |
Ratios to Average Net AssetsG | | |
Expenses before reductions | 2.26% | 2.24%A |
Expenses net of fee waivers, if any | 2.15% | 2.19%A |
Expenses net of all reductions | 2.11% | 2.13%A |
Net investment income (loss) | (.99)% | (1.21)%A |
Supplemental Data | | |
Net assets, end of period (000 omitted) | $ 10,214 | $ 3,931 |
Portfolio turnover rate | 93% | 60%A |
A Annualized
B Total returns for periods of less than one year are not annualized.
C Total returns would have been lower had certain expenses not been reduced during the periods shown.
D Total returns do not include the effect of the contingent deferred sales charge.
E Calculated based on average shares outstanding during the period.
F For the period November 3, 2004 (commencement of operations) to July 31, 2005.
G Expense ratios reflect operating expenses of the class. Expenses before reductions do not reflect amounts reimbursed by the investment adviser or reductions from brokerage service arrangements or other expense offset arrangements and do not represent the amount paid by the class during periods when reimbursements or reductions occur. Expense ratios before reductions for start-up periods may not be representative of longer-term operating periods. Expenses net of fee waivers reflect expenses after reimbursement by the investment adviser but prior to reductions from brokerage service arrangements or other expense offset arrangements. Expenses net of all reductions represent the net expenses paid by the class.
See accompanying notes which are an integral part of the financial statements.
Annual Report
Financial Highlights - Class C
Years ended July 31, | 2006 | 2005F |
Selected Per-Share Data | | |
Net asset value, beginning of period | $ 12.74 | $ 10.00 |
Income from Investment Operations | | |
Net investment income (loss) E | (.13) | (.10) |
Net realized and unrealized gain (loss) | .74 | 2.83 |
Total from investment operations | .61 | 2.73 |
Distributions from net realized gain | (.29) | - |
Redemption fees added to paid in capital E | .01 | .01 |
Net asset value, end of period | $ 13.07 | $ 12.74 |
Total Return B, C, D | 4.92% | 27.40% |
Ratios to Average Net Assets G | | |
Expenses before reductions | 2.22% | 2.17%A |
Expenses net of fee waivers, if any | 2.15% | 2.17%A |
Expenses net of all reductions | 2.11% | 2.11%A |
Net investment income (loss) | (.99)% | (1.19)%A |
Supplemental Data | | |
Net assets, end of period (000 omitted) | $ 26,791 | $ 11,732 |
Portfolio turnover rate | 93% | 60%A |
A Annualized
B Total returns for periods of less than one year are not annualized.
C Total returns would have been lower had certain expenses not been reduced during the periods shown.
D Total returns do not include the effect of the contingent deferred sales charge.
E Calculated based on average shares outstanding during the period.
F For the period November 3, 2004 (commencement of operations) to July 31, 2005.
G Expense ratios reflect operating expenses of the class. Expenses before reductions do not reflect amounts reimbursed by the investment adviser or reductions from brokerage service arrangements or other expense offset arrangements and do not represent the amount paid by the class during periods when reimbursements or reductions occur. Expense ratios before reductions for start-up periods may not be representative of longer-term operating periods. Expenses net of fee waivers reflect expenses after reimbursement by the investment adviser but prior to reductions from brokerage service arrangements or other expense offset arrangements. Expenses net of all reductions represent the net expenses paid by the class.
See accompanying notes which are an integral part of the financial statements.
Annual Report
Financial Highlights - Small Cap Value
Years ended July 31, | 2006 | 2005E |
Selected Per-Share Data | | |
Net asset value, beginning of period | $ 12.83 | $ 10.00 |
Income from Investment Operations | | |
Net investment income (loss)D | .01 | (.01) |
Net realized and unrealized gain (loss) | .74 | 2.84 |
Total from investment operations | .75 | 2.83 |
Distributions from net investment income | (.01) | (.01) |
Distributions from net realized gain | (.36) | - |
Total distributions | (.37) | (.01) |
Redemption fees added to paid in capitalD | .01 | .01 |
Net asset value, end of period | $ 13.22 | $ 12.83 |
Total Return B, C | 6.07% | 28.36% |
Ratios to Average Net Assets F | | |
Expenses before reductions | 1.09% | 1.05%A |
Expenses net of fee waivers, if any | 1.09% | 1.05%A |
Expenses net of all reductions | 1.06% | .99%A |
Net investment income (loss) | .06% | (.08)%A |
Supplemental Data | | |
Net assets, end of period (000 omitted) | $ 957,720 | $ 582,689 |
Portfolio turnover rate | 93% | 60%A |
A Annualized
B Total returns for periods of less than one year are not annualized.
C Total returns would have been lower had certain expenses not been reduced during the periods shown.
D Calculated based on average shares outstanding during the period.
E For the period November 3, 2004 (commencement of operations) to July 31, 2005.
F Expense ratios reflect operating expenses of the class. Expenses before reductions do not reflect amounts reimbursed by the investment adviser or reductions from brokerage service arrangements or other expense offset arrangements and do not represent the amount paid by the class during periods when reimbursements or reductions occur. Expense ratios before reductions for start-up periods may not be representative of longer-term operating periods. Expenses net of fee waivers reflect expenses after reimbursement by the investment adviser but prior to reductions from brokerage service arrangements or other expense offset arrangements. Expenses net of all reductions represent the net expenses paid by the class.
See accompanying notes which are an integral part of the financial statements.
Annual Report
Financial Highlights - Institutional Class
Years ended July 31, | 2006 | 2005E |
Selected Per-Share Data | | |
Net asset value, beginning of period | $ 12.83 | $ 10.00 |
Income from Investment Operations | | |
Net investment income (loss) D | .01 | (.01) |
Net realized and unrealized gain (loss) | .74 | 2.84 |
Total from investment operations | .75 | 2.83 |
Distributions from net investment income | (.01) | (.01) |
Distributions from net realized gain | (.36) | - |
Total distributions | (.37) | (.01) |
Redemption fees added to paid in capital D | .01 | .01 |
Net asset value, end of period | $ 13.22 | $ 12.83 |
Total Return B, C | 6.08% | 28.36% |
Ratios to Average Net Assets F | | |
Expenses before reductions | 1.08% | 1.07%A |
Expenses net of fee waivers, if any | 1.08% | 1.07%A |
Expenses net of all reductions | 1.05% | 1.01%A |
Net investment income (loss) | .08% | (.10)%A |
Supplemental Data | | |
Net assets, end of period (000 omitted) | $ 9,422 | $ 3,761 |
Portfolio turnover rate | 93% | 60%A |
A Annualized
B Total returns for periods of less than one year are not annualized.
C Total returns would have been lower had certain expenses not been reduced during the periods shown.
D Calculated based on average shares outstanding during the period.
E For the period November 3, 2004 (commencement of operations) to July 31, 2005.
F Expense ratios reflect operating expenses of the class. Expenses before reductions do not reflect amounts reimbursed by the investment adviser or reductions from brokerage service arrangements or other expense offset arrangements and do not represent the amount paid by the class during periods when reimbursements or reductions occur. Expense ratios before reductions for start-up periods may not be representative of longer-term operating periods. Expenses net of fee waivers reflect expenses after reimbursement by the investment adviser but prior to reductions from brokerage service arrangements or other expense offset arrangements. Expenses net of all reductions represent the net expenses paid by the class.
See accompanying notes which are an integral part of the financial statements.
Annual Report
Notes to Financial Statements
For the period ended July 31, 2006
1. Significant Accounting Policies.
Fidelity Small Cap Value Fund (the Fund) is a non-diversified fund of Fidelity Securities Fund (the trust) and is authorized to issue an unlimited number of shares. The trust is registered under the Investment Company Act of 1940, as amended (the 1940 Act), as an open-end management investment company organized as a Massachusetts business trust.
The Fund offers Class A, Class T, Class B, Class C, Small Cap Value and Institutional Class shares, each of which has equal rights as to assets and voting privileges. Each class has exclusive voting rights with respect to matters that affect that class. Class B shares will automatically convert to Class A shares after a holding period of seven years from the initial date of purchase. Investment income, realized and unrealized capital gains and losses, the common expenses of the Fund, and certain fund-level expense reductions, if any, are allocated on a pro rata basis to each class based on the relative net assets of each class to the total net assets of the Fund. Each class differs with respect to transfer agent and distribution and service plan fees incurred. Certain expense reductions also differ by class.
The Fund may invest in affiliated money market central funds (Money Market Central Funds), which are open-end investment companies available to investment companies and other accounts managed by Fidelity Management & Research Company (FMR) and its affiliates. The financial statements have been prepared in conformity with accounting principles generally accepted in the United States of America, which require management to make certain estimates and assumptions at the date of the financial statements. The following summarizes the significant accounting policies of the Fund:
Security Valuation. Investments are valued and net asset value (NAV) per share is calculated (NAV calculation) as of the close of business of the New York Stock Exchange (NYSE), normally 4:00 p.m. Eastern time. Wherever possible, the Fund uses independent pricing services approved by the Board of Trustees to value its investments.
Equity securities, including restricted securities, for which market quotations are readily available, are valued at the last reported sale price or official closing price as reported by an independent pricing service on the primary market or exchange on which they are traded. In the event there were no sales during the day or closing prices are not available, securities are valued at the last quoted bid price. Investments in open-end mutual funds are valued at their closing net asset value each business day. Short-term securities with remaining maturities of sixty days or less for which quotations are not readily available are valued at amortized cost, which approximates value.
When current market prices or quotations are not readily available or do not accurately reflect fair value, valuations may be determined in accordance with procedures adopted by the Board of Trustees. For example, when developments occur between the close of a
Annual Report
1. Significant Accounting Policies - continued
Security Valuation - continued
market and the close of the NYSE that may materially affect the value of some or all of the securities, or when trading in a security is halted, those securities may be fair valued. Factors used in the determination of fair value may include monitoring news to identify significant market or security specific events such as changes in the value of U.S. securities markets, reviewing developments in foreign markets and evaluating the performance of ADRs, futures contracts and exchange-traded funds. Because the Fund's utilization of fair value pricing depends on market activity, the frequency with which fair value pricing is used can not be predicted and may be utilized to a significant extent. The value of securities used for NAV calculation under fair value pricing may differ from published prices for the same securities.
Foreign Currency. The Fund uses foreign currency contracts to facilitate transactions in foreign-denominated securities. Losses from these transactions may arise from changes in the value of the foreign currency or if the counterparties do not perform under the contracts' terms.
Foreign-denominated assets, including investment securities, and liabilities are translated into U.S. dollars at the exchange rate at period end. Purchases and sales of investment securities, income and dividends received and expenses denominated in foreign currencies are translated into U.S. dollars at the exchange rate in effect on the transaction date.
The effects of exchange rate fluctuations on investments are included with the net realized and unrealized gain (loss) on investment securities. Other foreign currency transactions resulting in realized and unrealized gain (loss) are disclosed separately.
Investment Transactions and Income. Security transactions are accounted for as of trade date. Gains and losses on securities sold are determined on the basis of identified cost. Dividend income is recorded on the ex-dividend date, except for certain dividends from foreign securities where the ex-dividend date may have passed, which are recorded as soon as the Fund is informed of the ex-dividend date. Non-cash dividends included in dividend income, if any, are recorded at the fair market value of the securities received. Distributions received on securities that represent a return of capital or capital gain are recorded as a reduction of cost of investments and/or as a realized gain. The Fund estimates the components of distributions received that may be considered return of capital distributions or capital gain distributions. Interest income is accrued as earned. Interest income includes coupon interest and amortization of premium and accretion of discount on debt securities. Investment income is recorded net of foreign taxes withheld where recovery of such taxes is uncertain.
Annual Report
Notes to Financial Statements - continued
1. Significant Accounting Policies - continued
Expenses. Most expenses of the trust can be directly attributed to a fund. Expenses which cannot be directly attributed are apportioned among each Fund in the trust. Expense estimates are accrued in the period to which they relate and adjustments are made when actual amounts are known.
Income Tax Information and Distributions to Shareholders. Each year, the Fund intends to qualify as a regulated investment company by distributing all of its taxable income and realized gains under Subchapter M of the Internal Revenue Code. As a result, no provision for income taxes is required in the accompanying financial statements. Foreign taxes are provided for based on the Fund's understanding of the tax rules and rates that exist in the foreign markets in which it invests.
Distributions are recorded on the ex-dividend date. Income dividends and capital gain distributions are declared separately for each class. Income and capital gain distributions are determined in accordance with income tax regulations, which may differ from generally accepted accounting principles. In addition, the Fund will claim a portion of the payment made to redeeming shareholders as a distribution for income tax purposes.
Capital accounts within the financial statements are adjusted for permanent book-tax differences. These adjustments have no impact on net assets or the results of operations. Temporary book-tax differences will reverse in a subsequent period.
Book-tax differences are primarily due to foreign currency transactions, passive foreign investment companies (PFIC), market discount and losses deferred due to wash sales.
The tax-basis components of distributable earnings and the federal tax cost as of period end were as follows:
Unrealized appreciation | $ 97,858,886 |
Unrealized depreciation | (72,280,850) |
Net unrealized appreciation (depreciation) | 25,578,036 |
Undistributed ordinary income | 15,623,083 |
Undistributed long-term capital gain | 27,867,547 |
Cost for federal income tax purposes | $ 1,069,258,989 |
The tax character of distributions paid was as follows:
| July 31, 2006 | July 31, 2005 |
Ordinary Income | $ 21,004,732 | $ 69,595 |
Annual Report
1. Significant Accounting Policies - continued
New Accounting Pronouncement. In July 2006, Financial Accounting Standards Board Interpretation No. 48, Accounting for Uncertainty in Income Taxes - an interpretation of FASB Statement 109 (FIN 48) was issued and is effective for fiscal years beginning after December 15, 2006. FIN 48 sets forth a threshold for financial statement recognition, measurement and disclosure of a tax position taken or expected to be taken on a tax return. Management is currently evaluating the impact, if any, the adoption of FIN 48 will have on the Fund's net assets and results of operations.
Short-Term Trading (Redemption) Fees. Shares held in the Fund less than 90 days are subject to a redemption fee equal to 1.50% of the proceeds of the redeemed shares. All redemption fees, including any estimated redemption fees paid by FMR, are retained by the Fund and accounted for as an addition to paid in capital.
2. Operating Policies.
Repurchase Agreements. FMR has received an Exemptive Order from the Securities and Exchange Commission (the SEC) which permits the Fund and other affiliated entities of FMR to transfer uninvested cash balances into joint trading accounts which are then invested in repurchase agreements. The Fund may also invest directly with institutions in repurchase agreements. Repurchase agreements are collateralized by government or non-government securities. Upon settlement date, collateral is held in segregated accounts with custodian banks and may be obtained in the event of a default of the counterparty. The Fund monitors, on a daily basis, the value of the collateral to ensure it is at least equal to the principal amount of the repurchase agreement (including accrued interest). In the event of a default by the counterparty, realization of the collateral proceeds could be delayed, during which time the value of the collateral may decline.
Restricted Securities. The Fund may invest in securities that are subject to legal or contractual restrictions on resale. These securities generally may be resold in transactions exempt from registration or to the public if the securities are registered. Disposal of these securities may involve time-consuming negotiations and expense, and prompt sale at an acceptable price may be difficult. Information regarding restricted securities is included at the end of the fund's Schedule of Investments.
3. Purchases and Sales of Investments.
Purchases and sales of securities, other than short-term securities, aggregated $1,221,750,834 and $795,822,091, respectively.
Annual Report
Notes to Financial Statements - continued
4. Fees and Other Transactions with Affiliates.
Management Fee. FMR and its affiliates provide the Fund with investment management related services for which the Fund pays a monthly management fee. The management fee is the sum of an individual fund fee rate that is based on an annual rate of .45% of the Fund's average net assets and a group fee rate that averaged ..27% during the period. The group fee rate is based upon the average net assets of all the mutual funds advised by FMR. The group fee rate decreases as assets under management increase and increases as assets under management decrease. In addition, the management fee is subject to a performance adjustment (up to a maximum of ± .20% of the Fund's average net assets over a 36 month performance period). The upward or downward adjustment to the management fee is based on the relative investment performance of the retail class of the Fund, Small Cap Value, as compared to an appropriate benchmark index. The Fund's performance adjustment took effect in November 2005. Subsequent months will be added until the performance period includes 36 months. For the period, the total annual management fee rate, including the performance adjustment, was .81% of the Fund's average net assets.
Distribution and Service Plan. In accordance with Rule 12b-1 of the 1940 Act, the Fund has adopted separate Distribution and Service Plans for each class of shares. Certain classes pay Fidelity Distributors Corporation (FDC), an affiliate of FMR, separate Distribution and Service Fees, each of which is based on an annual percentage of each class' average net assets. In addition, FDC may pay financial intermediaries for selling shares of the Fund and providing shareholder support services. For the period, the Distribution and Service Fee rates and the total amounts paid to and retained by FDC were as follows:
| Distribution
Fee | Service
Fee | Paid to
FDC | Retained
by FDC |
Class A | 0% | .25% | $ 61,478 | $ 2,797 |
Class T | .25% | .25% | 142,254 | 7,806 |
Class B | .75% | .25% | 77,771 | 59,490 |
Class C | .75% | .25% | 207,692 | 103,479 |
| | | $ 489,195 | $ 173,572 |
Sales Load. FDC receives a front-end sales charge of up to 5.75% for selling Class A shares, and 3.50% for selling Class T shares, some of which is paid to financial intermediaries for selling shares of the Fund. FDC receives the proceeds of contingent deferred sales charges levied on Class A, Class T, Class B, and Class C redemptions. These charges depend on the holding period. The deferred sales charges range from 5% to 1% for Class B, 1% for Class C, 1.00% to .50% for certain purchases of Class A shares (.25% prior to February 24, 2006) and .25% for certain purchases of Class T shares.
Annual Report
4. Fees and Other Transactions with Affiliates - continued
Sales Load - continued
For the period, sales charge amounts retained by FDC were as follows:
| Retained
by FDC |
Class A | 117,648 |
Class T | 26,701 |
Class B* | 11,040 |
Class C* | 3,291 |
| $ 158,680 |
* When Class B and Class C shares are initially sold, FDC pays commissions from its own resources to financial intermediaries through which the sales are made.
Transfer Agent Fees. Fidelity Investments Institutional Operations Company, Inc. (FIIOC), an affiliate of FMR, is the transfer, dividend disbursing and shareholder servicing agent for each class of the Fund, except for Small Cap Value. Fidelity Service Company, Inc. (FSC), an affiliate of FMR, is the transfer agent for Small Cap Value shares. FIIOC and FSC receive account fees and asset-based fees that vary according to the account size and type of account of the shareholders of the respective classes of the Fund. FIIOC and FSC pay for typesetting, printing and mailing of shareholder reports, except proxy statements. For the period the total transfer agent fees paid by each class to FIIOC or FSC, were as follows:
| Amount | % of
Average
Net Assets |
Class A | $ 90,401 | .37 |
Class T | 81,280 | .29 |
Class B | 28,609 | .37 |
Class C | 67,880 | .33 |
Small Cap Value | 1,739,453 | .21 |
Institutional Class | 14,197 | .19 |
| $ 2,021,820 | |
Accounting and Security Lending Fees. FSC maintains the Fund's accounting records. The accounting fee is based on the level of average net assets for the month. Under a separate contract, FSC administers the security lending program. The security lending fee is based on the number and duration of lending transactions.
Affiliated Central Funds. The Fund may invest in Money Market Central Funds which seek preservation of capital and current income and are managed by Fidelity Investments Money Management, Inc. (FIMM), an affiliate of FMR.
Annual Report
Notes to Financial Statements - continued
4. Fees and Other Transactions with Affiliates - continued
Affiliated Central Funds - continued
The Money Market Central Funds do not pay a management fee.
Brokerage Commissions. The Fund placed a portion of its portfolio transactions with brokerage firms which are affiliates of the investment adviser. The commissions paid to these affiliated firms were $49,673 for the period.
5. Committed Line of Credit.
The Fund participates with other funds managed by FMR in a $4.2 billion credit facility (the "line of credit") to be utilized for temporary or emergency purposes to fund shareholder redemptions or for other short-term liquidity purposes. The Fund has agreed to pay commitment fees on its pro rata portion of the line of credit, which amounts to $2,432 and is reflected in Miscellaneous Expense on the Statement of Operations. During the period, there were no borrowings on this line of credit.
6. Security Lending.
The Fund lends portfolio securities from time to time in order to earn additional income. On the settlement date of the loan, the Fund receives collateral (in the form of U.S. Treasury obligations, letters of credit and/or cash) against the loaned securities and maintains collateral in an amount not less than 100% of the market value of the loaned securities during the period of the loan. The market value of the loaned securities is determined at the close of business of the Fund and any additional required collateral is delivered to the Fund on the next business day. If the borrower defaults on its obligation to return the securities loaned because of insolvency or other reasons, a fund could experience delays and costs in recovering the securities loaned or in gaining access to the collateral. Any cash collateral received is invested in the Fidelity Securities Lending Cash Central Fund. The value of loaned securities and cash collateral at period end are disclosed on the Fund's Statement of Assets and Liabilities. Security lending income represents the income earned on investing cash collateral, less fees and expenses associated with the loan, plus any premium payments that may be received on the loan of certain types of securities. Security lending income is presented in the Statement of Operations as a component of income from affiliated central funds. Net income from lending portfolio securities during the period amounted to $38,326.
7. Expense Reductions.
FMR voluntarily agreed to reimburse each class to the extent annual operating expenses exceeded certain levels of average net assets as noted in the table below. Some expenses, for example interest expense, are excluded from this reimbursement.
Annual Report
7. Expense Reductions - continued
The following classes were in reimbursement during the period:
| Expense
Limitations | Reimbursement
from adviser |
Class A | 1.40% | $ 27,048 |
Class T | 1.65% | 7,760 |
Class B | 2.15% | 8,692 |
Class C | 2.15% | 14,182 |
| | $ 57,682 |
Many of the brokers with whom FMR places trades on behalf of the Fund provided services to the Fund in addition to trade execution. These services included payments of certain expenses on behalf of the Fund totaling $299,573 for the period. In addition, through arrangements with the Fund's custodian and each class' transfer agent, credits realized as a result of uninvested cash balances were used to reduce the Fund's expenses. During the period, these credits reduced the Fund's custody expenses by $7,938. During the period, credits reduced each class' transfer agent expense as noted in the table below.
| Transfer Agent
expense reduction |
Small Cap Value | $ 9,986 |
8. Other.
The Fund's organizational documents provide former and current trustees and officers with a limited indemnification against liabilities arising in connection with the performance of their duties to the Fund. In the normal course of business, the Fund may also enter into contracts that provide general indemnifications. The Fund's maximum exposure under these arrangements is unknown as this would be dependent on future claims that may be made against the Fund. The risk of material loss from such claims is considered remote.
Subsequent to fiscal year end, the Fund's transfer agent, Fidelity Investments Institutional Operations Company, Inc. (FIIOC), an affiliate of Fidelity Management & Research Company, notified the Fund that the fund's books and records did not reflect a conversion of certain Class B to Class A shares upon their conversion date. Management has determined that this did not have a material impact to the Fund's reported net assets or results of operations in the accompanying financial statements. FIIOC will cause the books and records of the fund to reflect a conversion of the relevant Class B shares to Class A and is in the process of determining the impact to affected shareholder accounts for purposes of its remediation.
Annual Report
Notes to Financial Statements - continued
9. Distributions to Shareholders.
Distributions to shareholders of each class were as follows:
Years ended July 31, | 2006 | 2005 A |
From net investment income | | |
Class A | $ - | $ 724 |
Small Cap Value | 627,853 | 68,438 |
Institutional Class | 5,184 | 433 |
Total | $ 633,037 | $ 69,595 |
From net realized gain | | |
Class A | $ 349,740 | $ - |
Class T | 411,098 | - |
Class B | 108,502 | - |
Class C | 314,711 | - |
Small Cap Value | 19,037,825 | - |
Institutional Class | 149,819 | - |
Total | $ 20,371,695 | $ - |
A For the period November 3, 2004 (commencement of operations) to July 31, 2005.
10. Share Transactions.
Transactions for each class of shares were as follows:
| Shares | Dollars |
Years ended July 31, | 2006 | 2005 A | 2006 | 2005 A |
Class A | | | | |
Shares sold | 2,792,696 | 750,692 | $ 37,292,766 | $ 8,523,912 |
Reinvestment of distributions | 23,154 | 54 | 292,886 | 590 |
Shares redeemed | (517,416) | (16,899) | (6,894,256) | (197,248) |
Net increase (decrease) | 2,298,434 | 733,847 | $ 30,691,396 | $ 8,327,254 |
Class T | | | | |
Shares sold | 2,906,186 | 1,010,520 | $ 38,920,414 | $ 11,960,654 |
Reinvestment of distributions | 20,934 | - | 264,080 | - |
Shares redeemed | (461,271) | (14,888) | (6,059,837) | (175,516) |
Net increase (decrease) | 2,465,849 | 995,632 | $ 33,124,657 | $ 11,785,138 |
Class B | | | | |
Shares sold | 646,292 | 314,195 | $ 8,494,362 | $ 3,487,462 |
Reinvestment of distributions | 7,808 | - | 98,271 | - |
Shares redeemed | (181,273) | (5,436) | (2,424,583) | (61,184) |
Net increase (decrease) | 472,827 | 308,759 | $ 6,168,050 | $ 3,426,278 |
Annual Report
10. Share Transactions - continued
| Shares | Dollars |
Years ended July 31, | 2006 | 2005 A | 2006 | 2005 A |
Class C | | | | |
Shares sold | 1,647,798 | 952,687 | $ 21,781,876 | $ 10,586,807 |
Reinvestment of distributions | 23,044 | - | 289,929 | - |
Shares redeemed | (542,172) | (31,551) | (7,009,701) | (363,557) |
Net increase (decrease) | 1,128,670 | 921,136 | $ 15,062,104 | $ 10,223,250 |
Small Cap Value | | | | |
Shares sold | 53,704,430 | 49,836,348 | $ 714,692,056 | $ 566,509,509 |
Reinvestment of distributions | 1,502,190 | 6,024 | 19,027,647 | 66,450 |
Shares redeemed | (28,179,009) | (4,432,148) | (367,110,557) | (50,921,377) |
Net increase (decrease) | 27,027,611 | 45,410,224 | $ 366,609,146 | $ 515,654,582 |
Institutional Class | | | | |
Shares sold | 585,637 | 315,268 | $ 7,784,992 | $ 3,439,515 |
Reinvestment of distributions | 4,421 | 39 | 56,037 | 433 |
Shares redeemed | (170,544) | (22,206) | (2,319,440) | (247,594) |
Net increase (decrease) | 419,514 | 293,101 | $ 5,521,589 | $ 3,192,354 |
A For the period November 3, 2004 (commencement of operations) to July 31, 2005.
Annual Report
Report of Independent Registered Public Accounting Firm
To the Trustees of Fidelity Securities Fund and the Shareholders of Fidelity Small Cap Value Fund:
In our opinion, the accompanying statement of assets and liabilities, including the schedule of investments, and the related statements of operations and of changes in net assets and the financial highlights present fairly, in all material respects, the financial position of Fidelity Small Cap Value Fund (a fund of Fidelity Securities Fund) at July 31, 2006, and the results of its operations for the year then ended, the changes in its net assets and the financial highlights for the periods indicated in conformity with accounting principles generally accepted in the United States of America. These financial statements and financial highlights (hereafter referred to as "financial statements") are the responsibility of the Fidelity Small Cap Value Fund's management; our responsibility is to express an opinion on these financial statements based on our audits. We conducted our audits of these financial statements in accordance with the standards of the Public Company Accounting Oversight Board (United States). Those standards require that we plan and perform the audit to obtain reasonable assurance about whether the financial statements are free of material misstatement. An audit includes examining, on a test basis, evidence supporting the amounts and disclosures in the financial statements, assessing the accounting principles used and significant estimates made by management, and evaluating the overall financial statement presentation. We believe that our audits, which included confirmation of securities at July 31, 2006 by correspondence with the custodian and brokers, provide a reasonable basis for our opinion.
/s/ PricewaterhouseCoopers LLP
PricewaterhouseCoopers LLP
Boston, Massachusetts
October 9, 2006
Annual Report
Trustees and Officers
The Trustees , Members of the Advisory Board, and executive officers of the trust and fund, as applicable, are listed below. The Board of Trustees governs the fund and is responsible for protecting the interests of shareholders. The Trustees are experienced executives who meet periodically throughout the year to oversee the fund's activities, review contractual arrangements with companies that provide services to the fund, and review the fund's performance. Except for William O. McCoy and Albert R. Gamper, Jr., each of the Trustees oversees 345 funds advised by FMR or an affiliate. Mr. McCoy oversees 347 funds advised by FMR or an affiliate. Mr. Gamper oversees 292 funds advised by FMR or an affiliate.
The Trustees hold office without limit in time except that (a) any Trustee may resign; (b) any Trustee may be removed by written instrument, signed by at least two-thirds of the number of Trustees prior to such removal; (c) any Trustee who requests to be retired or who has become incapacitated by illness or injury may be retired by written instrument signed by a majority of the other Trustees; and (d) any Trustee may be removed at any special meeting of shareholders by a two-thirds vote of the outstanding voting securities of the trust. Each Trustee who is not an interested person (as defined in the 1940 Act) (Independent Trustee), shall retire not later than the last day of the calendar year in which his or her 72nd birthday occurs. The Independent Trustees may waive this mandatory retirement age policy with respect to individual Trustees. The executive officers and Advisory Board Members hold office without limit in time, except that any officer and Advisory Board Member may resign or may be removed by a vote of a majority of the Trustees at any regular meeting or any special meeting of the Trustees. Except as indicated, each individual has held the office shown or other offices in the same company for the past five years.
The fund's Statement of Additional Information (SAI) includes more information about the Trustees. To request a free copy, call Fidelity at 1-877-208-0098.
Interested Trustees*:
Correspondence intended for each Trustee who is an interested person may be sent to Fidelity Investments, 82 Devonshire Street, Boston, Massachusetts 02109.
Name, Age; Principal Occupation |
Edward C. Johnson 3d (76) |
| Year of Election or Appointment: 1984 Mr. Johnson is Chairman of the Board of Trustees. Mr. Johnson serves as President (2006-present), Chief Executive Officer, Chairman, and a Director of FMR Corp.; Chairman and a Director of FMR; Chairman and a Director of Fidelity Research & Analysis Company (FRAC); Chairman and a Director of Fidelity Investments Money Management, Inc.; and Chairman (2001-present) and a Director (1999-present) of FMR Co., Inc. In addition, Mr. Johnson serves as Chairman and Director of Fidelity International Limited (FIL). |
Stephen P. Jonas (53) |
| Year of Election or Appointment: 2005 Mr. Jonas is Senior Vice President of the fund (2005-present). He also serves as Senior Vice President of other Fidelity funds (2005-present). Mr. Jonas is Executive Director of FMR (2005-present) and FMR Co., Inc. (2005-present). He also serves as a Director of Fidelity Investments Money Management, Inc. (2005-present) and FMR Corp. (2003-present). Previously, Mr. Jonas served as President of Fidelity Enterprise Operations and Risk Services (2004-2005), Chief Administrative Officer (2002-2004), and Chief Financial Officer of FMR Corp. (1998-2002). In addition, he serves on the Boards of Boston Ballet (2003-present) and Simmons College (2003-present). |
Robert L. Reynolds (54) |
| Year of Election or Appointment: 2003 Mr. Reynolds is President and a Director of FMR (2005-present), Fidelity Investments Money Management, Inc. (2005-present), and FMR Co., Inc. (2005-present). Mr. Reynolds also serves as a Director (2003-present) and Chief Operating Officer (2000-present) of FMR Corp. and a Director of Strategic Advisers, Inc. (2005-present). He also serves on the Board at Fidelity Investments Canada, Ltd. (2000-present). Previously, Mr. Reynolds served as President of Fidelity Investments Institutional Retirement Group (1996-2000). |
* Trustees have been determined to be "Interested Trustees" by virtue of, among other things, their affiliation with the trust or various entities under common control with FMR.
Annual Report
Independent Trustees:
Correspondence intended for each Independent Trustee (that is, the Trustees other than the Interested Trustees) may be sent to Fidelity Investments, P.O. Box 55235, Boston, Massachusetts 02205-5235.
Name, Age; Principal Occupation |
Dennis J. Dirks (58) |
| Year of Election or Appointment: 2005 Prior to his retirement in May 2003, Mr. Dirks was Chief Operating Officer and a member of the Board of The Depository Trust & Clearing Corporation (DTCC) (1999-2003). He also served as President, Chief Operating Officer, and Board member of The Depository Trust Company (DTC) (1999-2003) and President and Board member of the National Securities Clearing Corporation (NSCC) (1999-2003). In addition, Mr. Dirks served as Chief Executive Officer and Board member of the Government Securities Clearing Corporation (2001-2003) and Chief Executive Officer and Board member of the Mortgage-Backed Securities Clearing Corporation (2001-2003). Mr. Dirks also serves as a Trustee and a member of the Finance Committee of Manhattan College (2005-present) and a Trustee and a member of the Finance Committee of AHRC of Nassau County (2006-present). |
Albert R. Gamper, Jr. (64) |
| Year of Election or Appointment: 2006 Mr. Gamper also serves as a Trustee (2006-present) or Member of the Advisory Board (2005-present) of other investment companies advised by FMR. Prior to his retirement in December 2004, Mr. Gamper served as Chairman of the Board of CIT Group Inc. (commercial finance). During his tenure with CIT Group Inc. Mr. Gamper served in numerous senior management positions, including Chairman (1987-1989; 1999-2001; 2002-2004), Chief Executive Officer (1987-2004), and President (1989-2002). He currently serves as a member of the Board of Directors of Public Service Enterprise Group (utilities, 2001-present), Chairman of the Board of Governors, Rutgers University (2004-present), and Chairman of the Board of Saint Barnabas Health Care System. |
Robert M. Gates (62) |
| Year of Election or Appointment: 1997 Dr. Gates is Chairman of the Independent Trustees (2006-present). Dr. Gates is President of Texas A&M University (2002-present). He was Director of the Central Intelligence Agency (CIA) from 1991 to 1993. From 1989 to 1991, Dr. Gates served as Assistant to the President of the United States and Deputy National Security Advisor. Dr. Gates is a Director of NACCO Industries, Inc. (mining and manufacturing), Parker Drilling Co., Inc. (drilling and rental tools for the energy industry, 2001-present), and Brinker International (restaurant management, 2003-present). Previously, Dr. Gates served as a Director of LucasVarity PLC (automotive components and diesel engines), a Director of TRW Inc. (automotive, space, defense, and information technology), and Dean of the George Bush School of Government and Public Service at Texas A&M University (1999-2001). |
George H. Heilmeier (70) |
| Year of Election or Appointment: 2004 Dr. Heilmeier is Chairman Emeritus of Telcordia Technologies (communication software and systems), where prior to his retirement, he served as company Chairman and Chief Executive Officer. He currently serves on the Boards of Directors of The Mitre Corporation (systems engineering and information technology support for the government), and HRL Laboratories (private research and development, 2004-present). He is Chairman of the General Motors Science & Technology Advisory Board and a Life Fellow of the Institute of Electrical and Electronics Engineers (IEEE). Dr. Heilmeier is a member of the Defense Science Board and the National Security Agency Advisory Board. He is also a member of the National Academy of Engineering, the American Academy of Arts and Sciences, and the Board of Overseers of the School of Engineering and Applied Science of the University of Pennsylvania. Previously, Dr. Heilmeier served as a Director of TRW Inc. (automotive, space, defense, and information technology, 1992-2002), Compaq (1994-2002), Automatic Data Processing, Inc. (ADP) (technology-based business outsourcing, 1995-2002), INET Technologies Inc. (telecommunications network surveillance, 2001-2004), and Teletech Holdings (customer management services). He is the recipient of the 2005 Kyoto Prize in Advanced Technology for his invention of the liquid crystal display. |
Marie L. Knowles (59) |
| Year of Election or Appointment: 2001 Prior to Ms. Knowles' retirement in June 2000, she served as Executive Vice President and Chief Financial Officer of Atlantic Richfield Company (ARCO) (diversified energy, 1996-2000). From 1993 to 1996, she was a Senior Vice President of ARCO and President of ARCO Transportation Company. She served as a Director of ARCO from 1996 to 1998. She currently serves as a Director of Phelps Dodge Corporation (copper mining and manufacturing) and McKesson Corporation (healthcare service, 2002-present). Ms. Knowles is a Trustee of the Brookings Institution and the Catalina Island Conservancy and also serves as a member of the Advisory Board for the School of Engineering of the University of Southern California. |
Ned C. Lautenbach (62) |
| Year of Election or Appointment: 2000 Mr. Lautenbach has been a partner of Clayton, Dubilier & Rice, Inc. (private equity investment firm) since September 1998. Previously, Mr. Lautenbach was with the International Business Machines Corporation (IBM) from 1968 until his retirement in 1998. Mr. Lautenbach serves as a Director of Italtel Holding S.p.A. (telecommunications (Milan, Italy), 2004-present) and Eaton Corporation (diversified industrial) as well as the Philharmonic Center for the Arts in Naples, Florida. He also is a member of the Board of Trustees of Fairfield University (2005-present), as well as a member of the Council on Foreign Relations. |
William O. McCoy (72) |
| Year of Election or Appointment: 1997 Prior to his retirement in December 1994, Mr. McCoy was Vice Chairman of the Board of BellSouth Corporation (telecommunications) and President of BellSouth Enterprises. He is currently a Director of Duke Realty Corporation (real estate). He is also a partner of Franklin Street Partners (private investment management firm). In addition, Mr. McCoy served as the Interim Chancellor (1999-2000) and a member of the Board of Visitors for the University of North Carolina at Chapel Hill and currently serves as Chairman of the Board of Directors of the University of North Carolina Health Care System. He also served as Vice President of Finance for the University of North Carolina (16-school system). |
Cornelia M. Small (62) |
| Year of Election or Appointment: 2005 Ms. Small is a member (2000-present) and Chairperson (2002-present) of the Investment Committee, and a member (2002-present) of the Board of Trustees of Smith College. Previously, she served as Chief Investment Officer (1999-2000), Director of Global Equity Investments (1996-1999), and a member of the Board of Directors of Scudder, Stevens & Clark (1990-1997) and Scudder Kemper Investments (1997-1999). In addition, Ms. Small served as Co-Chair (2000-2003) of the Annual Fund for the Fletcher School of Law and Diplomacy. |
William S. Stavropoulos (67) |
| Year of Election or Appointment: 2002 Mr. Stavropoulos is Chairman Emeritus of the Board of Directors of The Dow Chemical Company. Since joining The Dow Chemical Company in 1967, Mr. Stavropoulos served in numerous senior management positions, including President (1993-2000; 2002-2003), CEO (1995-2000; 2002-2004), and Chairman of the Executive Committee (2000-2004). Currently, he is a Director of NCR Corporation (data warehousing and technology solutions), BellSouth Corporation (telecommunications), Chemical Financial Corporation, Maersk Inc. (industrial conglomerate, 2002-present), and Metalmark Capital (private equity investment firm, 2005-present). He also serves as a member of the Board of Trustees of the American Enterprise Institute for Public Policy Research. In addition, Mr. Stavropoulos is a member of The Business Council, J.P. Morgan International Council and the University of Notre Dame Advisory Council for the College of Science. |
Kenneth L. Wolfe (67) |
| Year of Election or Appointment: 2005 Prior to his retirement in 2001, Mr. Wolfe was Chairman and Chief Executive Officer of Hershey Foods Corporation (1993-2001). He currently serves as a member of the boards of Adelphia Communications Corporation (2003-present), Bausch & Lomb, Inc., and Revlon Inc. (2004-present). |
Annual Report
Advisory Board Members and Executive Officers:
Correspondence intended for Mr. Keyes may be sent to Fidelity Investments, P.O. Box 55235, Boston, Massachusetts 02205-5235. Correspondence intended for each executive officer and Mr. Lynch may be sent to Fidelity Investments, 82 Devonshire Street, Boston, Massachusetts 02109.
Name, Age; Principal Occupation |
James H. Keyes (65) |
| Year of Election or Appointment: 2006 Member of the Advisory Board of Fidelity Securities Fund. Prior to his retirement in 2003, Mr. Keyes was Chairman, President, and Chief Executive Officer of Johnson Controls, Inc. (automotive supplier, 1993-2003). He currently serves as a member of the boards of LSI Logic Corporation (semiconductor technologies, 1984-present), Navistar International Corporation (manufacture and sale of trucks, buses, and diesel engines, 2002-present), and Pitney Bowes, Inc. (integrated mail, messaging, and document management solutions, 1998-present). |
Peter S. Lynch (62) |
| Year of Election or Appointment: 2003 Member of the Advisory Board of Fidelity Securities Fund. Mr. Lynch is Vice Chairman and a Director of FMR, and Vice Chairman (2001-present) and a Director (1999-present) of FMR Co., Inc. Previously, Mr. Lynch served as a Trustee of the Fidelity funds (1990-2003). In addition, he serves as the Chairman of the Inner-City Scholarship Fund. |
Dwight D. Churchill (52) |
| Year of Election or Appointment: 2005 Vice President of the fund. Mr. Churchill also serves as Vice President of certain Equity Funds (2005-present) and certain High Income Funds (2005-present). Mr. Churchill is Executive Vice President of FMR (2005-present) and FMR Co., Inc. (2005-present). Previoulsy, Mr. Churchill served as Senior Vice President of Fidelity Investments Money Management, Inc. (2005-2006), Head of Fidelity's Fixed-Income Division (2000-2005), Vice President of Fidelity's Money Market Funds (2000-2005), Vice President of Fidelity's Bond Funds, and Senior Vice President of FMR. |
Bruce T. Herring (40) |
| Year of Election or Appointment: 2006 Vice President of the fund. Mr. Herring also serves as Vice President of certain Equity Funds (2006-present). Mr. Herring is Senior Vice President of FMR (2006-present) and Vice President of FMR Co., Inc. (2001-present). Previously, Mr. Herring served as Portfolio Manager for Fidelity U.S. Equity Funds (2001-2005). |
Eric D. Roiter (57) |
| Year of Election or Appointment: 2004 Secretary of the fund. He also serves as Secretary of other Fidelity funds; Vice President, General Counsel, and Secretary of FMR Co., Inc. (2001-present) and FMR; Assistant Secretary of Fidelity Management & Research (U.K.) Inc. (2001-present), Fidelity Research & Analysis Company (2001-present), and Fidelity Investments Money Management, Inc. (2001-present). Mr. Roiter is an Adjunct Member, Faculty of Law, at Boston College Law School (2003-present). Previously, Mr. Roiter served as Vice President and Secretary of Fidelity Distributors Corporation (FDC) (1998-2005). |
Stuart Fross (46) |
| Year of Election or Appointment: 2004 Assistant Secretary of the fund. Mr. Fross also serves as Assistant Secretary of other Fidelity funds (2003-present), Vice President and Secretary of FDC (2005-present), and is an employee of FMR. |
Christine Reynolds (47) |
| Year of Election or Appointment: 2004 President and Treasurer of the fund. Ms. Reynolds also serves as President and Treasurer of other Fidelity funds (2004-present) and is a Vice President (2003-present) and an employee (2002-present) of FMR. Before joining Fidelity Investments, Ms. Reynolds worked at PricewaterhouseCoopers LLP (PwC) (1980-2002), where she was most recently an audit partner with PwC's investment management practice. |
R. Stephen Ganis (40) |
| Year of Election or Appointment: 2006 Anti-Money Laundering (AML) officer of the fund. Mr. Ganis also serves as AML officer of other Fidelity funds (2006-present) and FMR Corp. (2003-present). Before joining Fidelity Investments, Mr. Ganis practiced law at Goodwin Procter, LLP (2000-2002). |
Joseph B. Hollis (58) |
| Year of Election or Appointment: 2006 Chief Financial Officer of the fund. Mr. Hollis also serves as Chief Financial Officer of other Fidelity funds. Mr. Hollis is President of Fidelity Pricing and Cash Management Services (FPCMS) (2005-present). Mr. Hollis also serves as President and Director of Fidelity Service Company, Inc. (2006-present). Previously, Mr. Hollis served as Senior Vice President of Cash Management Services (1999-2002) and Investment Management Operations (2002-2005). |
Kenneth A. Rathgeber (59) |
| Year of Election or Appointment: 2004 Chief Compliance Officer of the fund. Mr. Rathgeber also serves as Chief Compliance Officer of other Fidelity funds (2004-present) and Executive Vice President of Risk Oversight for Fidelity Investments (2002-present). He is Chief Compliance Officer of FMR (2005-present), FMR Co., Inc. (2005-present), Fidelity Management & Research (U.K.) Inc. (2005-present), Fidelity Research & Analysis Company (2005-present), Fidelity Investments Money Management, Inc. (2005-present), and Strategic Advisers, Inc. (2005-present). Previously, Mr. Rathgeber served as Executive Vice President and Chief Operating Officer for Fidelity Investments Institutional Services Company, Inc. (1998-2002). |
Bryan A. Mehrmann (45) |
| Year of Election or Appointment: 2005 Deputy Treasurer of the fund. Mr. Mehrmann also serves as Deputy Treasurer of other Fidelity funds (2005-present) and is an employee of FMR. Previously, Mr. Mehrmann served as Vice President of Fidelity Investments Institutional Services Group (FIIS)/Fidelity Investments Institutional Operations Corporation, Inc. (FIIOC) Client Services (1998-2004). |
Kimberley H. Monasterio (42) |
| Year of Election or Appointment: 2004 Deputy Treasurer of the fund. Ms. Monasterio also serves as Deputy Treasurer of other Fidelity funds (2004) and is an employee of FMR (2004). Before joining Fidelity Investments, Ms. Monasterio served as Treasurer (2000-2004) and Chief Financial Officer (2002-2004) of the Franklin Templeton Funds and Senior Vice President of Franklin Templeton Services, LLC (2000-2004). |
Kenneth B. Robins (36) |
| Year of Election or Appointment: 2005 Deputy Treasurer of the fund. Mr. Robins also serves as Deputy Treasurer of other Fidelity funds (2005-present) and is an employee of FMR (2004-present). Before joining Fidelity Investments, Mr. Robins worked at KPMG LLP, where he was a partner in KPMG's department of professional practice (2002-2004) and a Senior Manager (1999-2000). In addition, Mr. Robins served as Assistant Chief Accountant, United States Securities and Exchange Commission (2000-2002). |
Robert G. Byrnes (39) |
| Year of Election or Appointment: 2005 Assistant Treasurer of the fund. Mr. Byrnes also serves as Assistant Treasurer of other Fidelity funds (2005-present) and is an employee of FMR (2005-present). Previously, Mr. Byrnes served as Vice President of FPCMS (2003-2005). Before joining Fidelity Investments, Mr. Byrnes worked at Deutsche Asset Management where he served as Vice President of the Investment Operations Group (2000-2003). |
John H. Costello (59) |
| Year of Election or Appointment: 2004 Assistant Treasurer of the fund. Mr. Costello also serves as Assistant Treasurer of other Fidelity funds and is an employee of FMR. |
Peter L. Lydecker (52) |
| Year of Election or Appointment: 2004 Assistant Treasurer of the fund. Mr. Lydecker also serves as Assistant Treasurer of other Fidelity funds (2004) and is an employee of FMR. |
Mark Osterheld (51) |
| Year of Election or Appointment: 2004 Assistant Treasurer of the fund. Mr. Osterheld also serves as Assistant Treasurer of other Fidelity funds (2002) and is an employee of FMR. |
Gary W. Ryan (47) |
| Year of Election or Appointment: 2005 Assistant Treasurer of the fund. Mr. Ryan also serves as Assistant Treasurer of other Fidelity funds (2005-present) and is an employee of FMR (2005-present). Previously, Mr. Ryan served as Vice President of Fund Reporting in FPCMS (1999-2005). |
Salvatore Schiavone (40) |
| Year of Election or Appointment: 2005 Assistant Treasurer of the fund. Mr. Schiavone also serves as Assistant Treasurer of other Fidelity funds (2005-present) and is an employee of FMR (2005-present). Before joining Fidelity Investments, Mr. Schiavone worked at Deutsche Asset Management, where he most recently served as Assistant Treasurer (2003-2005) of the Scudder Funds and Vice President and Head of Fund Reporting (1996-2003). |
Annual Report
Distributions
The Board of Trustees of Advisor Small Cap Value Fund voted to pay to shareholders of record at the opening of business on record date, the following distributions per share derived from capital gains realized from sales of portfolio securities.
| Pay Date | Record Date | Capital Gains |
Class A | 09/11/06 | 09/08/06 | $.527 |
Class T | 09/11/06 | 09/08/06 | $.512 |
Class B | 09/11/06 | 09/08/06 | $.469 |
Class C | 09/11/06 | 09/08/06 | $.468 |
The fund hereby designates as a capital gain dividend with respect to the taxable year ended July 31 2006, $27,867,547, or, if subsequently determined to be different, the net capital gain of such year.
Class A designates 5% and 35%; Class T designates 5% and 42%; Class B designates 6% and 56%; Class C designates 6% and 56%; of the dividends distributed in September and December, respectively during the fiscal year as qualifying for the dividends-received deduction for corporate shareholders.
Class A designates 7% and 40%; Class T designates 7% and 47%; Class B designates 8% and 63%; Class C designates 8% and 63%; of dividends distributed in September and December, respectively during the fiscal year as amounts which may be taken into account as a dividend for purposes of the maximum rate under section 1(h)(11) of the Internal Revenue Code.
The fund will notify shareholders in January 2007 of amounts for use in preparing 2006 income tax returns.
Annual Report
Proxy Voting Results
A special meeting of the funds' shareholders was held on May 17, 2006. The results of votes taken among shareholders on the proposal before them are reported below. Each vote reported represents one dollar of net asset value held on the record date for the meeting.
PROPOSAL 1 |
To elect a Board of Trustees. A |
| # of
Votes | % of
Votes |
Dennis J. Dirks |
Affirmative | 43,119,905,166.54 | 95.455 |
Withheld | 2,053,001,967.67 | 4.545 |
TOTAL | 45,172,907,134.21 | 100.000 |
Albert R. Gamper, Jr. |
Affirmative | 43,068,780,128.62 | 95.342 |
Withheld | 2,104,127,005.59 | 4.658 |
TOTAL | 45,172,907,134.21 | 100.000 |
Robert M. Gates |
Affirmative | 43,032,117,662.60 | 95.261 |
Withheld | 2,140,789,471.61 | 4.739 |
TOTAL | 45,172,907,134.21 | 100.000 |
George H. Heilmeier |
Affirmative | 43,023,368,882.30 | 95.242 |
Withheld | 2,149,538,251.91 | 4.758 |
TOTAL | 45,172,907,134.21 | 100.000 |
Edward C. Johnson 3d |
Affirmative | 42,881,915,819.70 | 94.928 |
Withheld | 2,290,991,314.51 | 5.072 |
TOTAL | 45,172,907,134.21 | 100.000 |
Stephen P. Jonas |
Affirmative | 43,081,912,066.37 | 95.371 |
Withheld | 2,090,995,067.84 | 4.629 |
TOTAL | 45,172,907,134.21 | 100.000 |
James H. KeyesB |
Affirmative | 43,049,050,093.79 | 95.298 |
Withheld | 2,123,857,040.42 | 4.702 |
TOTAL | 45,172,907,134.21 | 100.000 |
Marie L. Knowles |
Affirmative | 43,090,434,696.02 | 95.390 |
Withheld | 2,082,472,438.19 | 4.610 |
TOTAL | 45,172,907,134.21 | 100.000 |
| # of
Votes | % of
Votes |
Ned C. Lautenbach |
Affirmative | 43,082,185,255.05 | 95.372 |
Withheld | 2,090,721,879.16 | 4.628 |
TOTAL | 45,172,907,134.21 | 100.000 |
William O. McCoy |
Affirmative | 42,960,162,066.32 | 95.102 |
Withheld | 2,212,745,067.89 | 4.898 |
TOTAL | 45,172,907,134.21 | 100.000 |
Robert L. Reynolds |
Affirmative | 43,087,560,419.66 | 95.384 |
Withheld | 2,085,346,714.55 | 4.616 |
TOTAL | 45,172,907,134.21 | 100.000 |
Cornelia M. Small |
Affirmative | 43,092,070,014.53 | 95.394 |
Withheld | 2,080,837,119.68 | 4.606 |
TOTAL | 45,172,907,134.21 | 100.000 |
William S. Stavropoulos |
Affirmative | 43,002,032,676.43 | 95.194 |
Withheld | 2,170,874,457.78 | 4.806 |
TOTAL | 45,172,907,134.21 | 100.000 |
Kenneth L. Wolfe |
Affirmative | 43,047,241,852.81 | 95.294 |
Withheld | 2,125,665,281.40 | 4.706 |
TOTAL | 45,172,907,134.21 | 100.000 |
A Denotes trust-wide proposal and voting results. B Effective on or about January 1, 2007. |
Annual Report
Board Approval of Investment Advisory Contracts and Management Fees
Fidelity Small Cap Value Fund
Each year, typically in July, the Board of Trustees, including the Independent Trustees (together, the Board), votes on the renewal of the management contract and sub-advisory agreements (together, the Advisory Contracts) for the fund. The Board, assisted by the advice of fund counsel and Independent Trustees' counsel, requests and considers a broad range of information throughout the year.
The Board meets regularly each month except August and takes into account throughout the year matters bearing on Advisory Contracts. The Board, acting directly and through its separate committees, considers at each of its meetings factors that are relevant to the annual renewal of the fund's Advisory Contracts, including the services and support provided to the fund and its shareholders. At the time of the renewal, the Board had 12 standing committees, each composed of Independent Trustees with varying backgrounds, to which the Board has assigned specific subject matter responsibilities in order to enhance effective decision-making by the Board. Each committee has adopted a written charter outlining the structure and purposes of the committee. One such committee, the Equity Contract Committee, meets periodically as needed throughout the year to consider matters specifically related to the annual renewal of Advisory Contracts. The committee requests and receives information on, and makes recommendations to the Independent Trustees concerning, the approval and annual review of the Advisory Contracts.
At its July 2006 meeting, the Board of Trustees, including the Independent Trustees, unanimously determined to renew the Advisory Contracts for the fund. In reaching its determination, the Board considered all factors it believed relevant, including (i) the nature, extent, and quality of the services to be provided to the fund and its shareholders (including the investment performance of the fund); (ii) the competitiveness of the management fee and total expenses of the fund; (iii) the total costs of the services to be provided by and the profits to be realized by the investment adviser and its affiliates from the relationship with the fund; (iv) the extent to which economies of scale would be realized as the fund grows; and (v) whether fee levels reflect these economies of scale, if any, for the benefit of fund shareholders.
In determining whether to renew the Advisory Contracts for the fund, the Board ultimately reached a determination, with the assistance of fund counsel and Independent Trustees' counsel, that the renewal of the Advisory Contracts and the compensation to be received by Fidelity under the management contract is consistent with Fidelity's fiduciary duty under applicable law. In addition to evaluating the specific factors noted above, the Board, in reaching its determination, is aware that shareholders in the fund have a broad range of investment choices available to them, including a wide choice among mutual funds offered by competitors to Fidelity, and that the fund's shareholders, with the opportunity to review and weigh the disclosure provided by the fund in its prospectus and other public disclosures, have chosen to invest in this fund, managed by Fidelity.
Annual Report
Board Approval of Investment Advisory Contracts and
Management Fees - continued
Nature, Extent, and Quality of Services Provided. The Board considered staffing within the investment adviser, FMR, and the sub-advisers (together, the Investment Advisers), including the background of the fund's portfolio manager and the fund's investment objective and discipline. The Independent Trustees also had discussions with senior management of Fidelity's investment operations and investment groups. The Board considered the structure of the portfolio manager compensation program and whether this structure provides appropriate incentives.
Resources Dedicated to Investment Management and Support Services. The Board reviewed the size, education, and experience of the Investment Advisers' investment staff, their use of technology, and the Investment Advisers' approach to recruiting, training, and retaining portfolio managers and other research, advisory, and management personnel. The Board considered Fidelity's extensive global research capabilities that enable the Investment Advisers to aggregate data from various sources in an effort to produce positive investment results. The Board noted that Fidelity's analysts have access to a variety of technological tools that enable them to perform both fundamental and quantitative analysis and to specialize in various disciplines. The Board also considered that Fidelity's portfolio managers and analysts have access to daily portfolio attribution that allows for monitoring of a fund's portfolio, as well as an electronic communication system that provides immediate real-time access to research concerning issuers and credit enhancers.
Shareholder and Administrative Services. The Board considered (i) the nature, extent, quality, and cost of administrative, distribution, and shareholder services performed by the Investment Advisers and their affiliates under the Advisory Contracts and under separate agreements covering transfer agency, pricing and bookkeeping, and securities lending services for the fund; (ii) the nature and extent of the Investment Advisers' supervision of third party service providers, principally custodians and subcustodians; and (iii) the resources devoted to, and the record of compliance with, the fund's compliance policies and procedures. The Board reviewed the allocation of fund brokerage, including allocations to brokers affiliated with the Investment Advisers, the use of brokerage commissions to pay fund expenses, and the use of "soft" commission dollars to pay for research services. The Board also considered that Fidelity voluntarily pays for market data out of its own resources.
The Board noted that the growth of fund assets across the complex allows Fidelity to reinvest in the development of services designed to enhance the value or convenience of the Fidelity funds as investment vehicles. These services include 24-hour access to account information and market information through phone representatives and over the Internet, and investor education materials and asset allocation tools.
Annual Report
Investment in a Large Fund Family. The Board considered the benefits to shareholders of investing in a Fidelity fund, including the benefits of investing in a fund that is part of a large family of funds offering a variety of investment disciplines and providing for a large variety of mutual fund investor services. For example, fund shareholders are offered the privilege of exchanging shares of the fund for shares of other Fidelity funds, as set forth in the fund's prospectus, without paying an additional sales charge. The Board noted that, since the last Advisory Contract renewals in July 2005, Fidelity has taken a number of actions that benefited particular funds, including (i) dedicating additional resources to investment research and to restructure the investment research teams; (ii) voluntarily entering into contractual arrangements with certain brokers pursuant to which Fidelity pays for research products and services separately out of its own resources, rather than bundling with fund commissions; (iii) launching the Fidelity Advantage Class of its five Spartan stock index funds and three Spartan bond index funds, which is a lower-fee class available to shareholders with higher account balances; (iv) contractually agreeing to impose expense limitations on Fidelity U.S. Bond Index Fund and reducing the fund's initial investment minimum; and (v) offering shareholders of each of the Fidelity Institutional Money Market Funds the privilege of exchanging shares of the fund for shares of other Fidelity funds.
Investment Performance and Compliance. The Board considered whether the fund has operated within its investment objective, as well as its record of compliance with its investment restrictions. It also reviewed the fund's absolute investment performance for each class, as well as the fund's relative investment performance for each class measured against (i) a broad-based securities market index, and (ii) a peer group of mutual funds deemed appropriate by the Board. Because the fund had been in existence less than three calendar years, the following chart considered by the Board shows, for the one-year period ended December 31, 2005, the total returns of Class C and Fidelity Small Cap Value (retail class), the total return of a broad-based securities market index ("benchmark"), and a range of total returns of a peer group of mutual funds identified by Lipper Inc. as having an investment objective similar to that of the fund. The returns of Class C and Fidelity Small Cap Value (retail class) represent the performance of classes with the highest and lowest 12b-1 fees, respectively (not necessarily with the highest and lowest total expenses). The box within the chart shows the 25th percentile return (bottom of box) and the 75th percentile return (top of box) of the Lipper peer group. Returns shown above the box are in the first quartile and returns shown below the box are in the fourth quartile. The percentage beaten numbers noted below the chart correspond to the percentile box and represent the percentage of funds in the Lipper peer group whose performance was equal to or lower than that of the class indicated.
Annual Report
Board Approval of Investment Advisory Contracts and
Management Fees - continued
Fidelity Small Cap Value Fund
The Board reviewed the fund's relative investment performance against its Lipper peer group and stated that the performance of Fidelity Small Cap Value (retail class) was in the first quartile for the period shown. The Board also stated that the relative investment performance of Fidelity Small Cap Value (retail class) compared favorably to its benchmark for the period shown. The Board considered that the variations in performance among the fund's classes reflect the variations in class expenses, which result in lower performance for higher expense classes. The Board stated that it is difficult to evaluate in any comprehensive fashion the performance of the fund, in light of its relatively recent launch. The Board also reviewed the fund's relative investment performance against a peer group defined by Morningstar.
The Board also considered that the fund's management fee is subject to upward or downward adjustment depending upon whether, and to what extent, the fund's investment performance for the performance period exceeds, or is exceeded by, the record (over the same period) of a Board-approved performance adjustment index. The Board realizes that the performance adjustment provides FMR with a strong economic incentive to seek to achieve superior performance for the fund's shareholders and helps to more closely align the interests of FMR and the fund's shareholders.
The Board considered that FMR has taken steps to refocus and strengthen equity research, equity portfolio management, and compliance. The Board noted with favor FMR's reorganization of its senior management team in 2005 and FMR's dedication of additional resources to investment research, and participated in the process that led to those changes.
Annual Report
Based on its review, and giving particular weight to the nature and quality of the resources dedicated by the Investment Advisers to maintain and improve relative performance, the Board concluded that the nature, extent, and quality of the services provided to the fund will benefit the fund's shareholders, particularly in light of the Board's view that the fund's shareholders benefit from investing in a fund that is part of a large family of funds offering a variety of investment disciplines and services.
Competitiveness of Management Fee and Total Fund Expenses. The Board considered the fund's management fee and total expenses compared to "mapped groups" of competitive funds and classes. Fidelity creates "mapped groups" by combining similar Lipper investment objective categories that have comparable management fee characteristics. Combining Lipper investment objective categories aids the Board's management fee and total expense comparisons by broadening the competitive group used for comparison and by reducing the number of universes to which various Fidelity funds are compared.
The Board considered two proprietary management fee comparisons for the 12-month (or shorter) periods shown in the chart below. The group of Lipper funds used by the Board for management fee comparisons is referred to below as the "Total Mapped Group" and, for the reasons explained above, is broader than the Lipper peer group used by the Board for performance comparisons. The Total Mapped Group comparison focuses on a fund's standing relative to the total universe of comparable funds available to investors, in terms of gross management fees before expense reimbursements or caps, and without giving effect to the fund's performance adjustment. "TMG %" represents the percentage of funds in the Total Mapped Group that had management fees that were lower than the fund's. For example, a TMG % of 13% means that 87% of the funds in the Total Mapped Group had higher management fees than the fund. The "Asset-Size Peer Group" (ASPG) comparison focuses on a fund's standing relative to non-Fidelity funds similar in size to the fund within the Total Mapped Group. The ASPG represents at least 15% of the funds in the Total Mapped Group with comparable asset size and management fee characteristics, subject to a minimum of 50 funds (or all funds in the Total Mapped Group if fewer than 50). Additional information, such as the ASPG quartile in which the fund's management fee ranked and the impact of the fund's performance adjustment, is also included in the chart and considered by the Board.
Annual Report
Board Approval of Investment Advisory Contracts and
Management Fees - continued
Fidelity Small Cap Value Fund

The Board noted that the fund's management fee ranked below the median of its Total Mapped Group and below the median of its ASPG for 2005. The Board also noted the effect of the fund's positive performance adjustment on the fund's management fee ranking.
Based on its review, the Board concluded that the fund's management fee was fair and reasonable in light of the services that the fund receives and the other factors considered.
In its review of each class's total expenses, the Board considered the fund's management fee as well as other fund or class expenses, as applicable, such as transfer agent fees, pricing and bookkeeping fees, fund-paid 12b-1 fees, and custodial, legal, and audit fees. The Board also noted the effects of any waivers and reimbursements on fees and expenses, as well as the fund's positive performance adjustment. As part of its review, the Board also considered current and historical total expenses of each class of the fund compared to competitive fund median expenses. Each class of the fund is compared to those funds and classes in the Total Mapped Group (used by the Board for management fee comparisons) that have a similar sales load structure.
The Board noted that the total expenses of each of Class A, Institutional Class, and Fidelity Small Cap Value (retail class) ranked below its competitive median for 2005, the total expenses of Class C ranked equal to its competitive median for 2005, and the total expenses of each of Class B and Class T ranked above its competitive median for 2005. The Board considered that Class B was above median because of relatively high transfer agent fees resulting from small average account sizes. The Board noted that the fund offers multiple classes, each of which has a different sales load and 12b-1 fee structure, and that the multiple structures are intended to offer a range of pricing options for the intermediary market. The Board also noted that the total expenses of the classes vary primarily by the level of their 12b-1 fees, although differences in transfer agent fees may also cause expenses to vary from class to class.
Annual Report
In its review of total expenses, the Board also considered Fidelity fee structures and other information on clients that FMR and its affiliates service in other competitive markets, such as other mutual funds advised or subadvised by FMR or its affiliates, pension plan clients, and other institutional clients.
Based on its review, the Board concluded that the total expenses of each class of the fund were reasonable, although in some cases above the median of the universe presented for comparison, in light of the services that the fund and its shareholders receive and the other factors considered.
Costs of the Services and Profitability. The Board considered the revenues earned and the expenses incurred by Fidelity in conducting the business of developing, marketing, distributing, managing, administering and servicing the fund and its shareholders. The Board also considered the level of Fidelity's profits in respect of all the Fidelity funds.
On an annual basis, FMR presents to the Board Fidelity's profitability for the fund. Fidelity calculates the profitability for each fund, as well as aggregate profitability for groups of Fidelity funds and all Fidelity funds, using a series of detailed revenue and cost allocation methodologies which originate with the audited books and records of Fidelity. The Audit Committee of the Board reviews any significant changes from the prior year's methodologies.
PricewaterhouseCoopers LLP (PwC), independent registered accounting firm and auditor to Fidelity and certain Fidelity funds, has been engaged annually by the Board as part of the Board's assessment of the results of Fidelity's profitability analysis. PwC's engagement includes the review and assessment of Fidelity's methodologies used in determining the revenues and expenses attributable to Fidelity's mutual fund business, and completion of agreed-upon procedures surrounding the mathematical accuracy of fund profitability and its conformity to allocation methodologies. After considering PwC's reports issued under the engagement and information provided by Fidelity, the Board believes that while other allocation methods may also be reasonable, Fidelity's profitability methodologies are reasonable in all material respects.
The Board has also reviewed Fidelity's non-fund businesses and any fall-out benefits related to the mutual fund business as well as cases where Fidelity's affiliates may benefit from or be related to the fund's business.
Annual Report
Board Approval of Investment Advisory Contracts and
Management Fees - continued
The Board considered the costs of the services provided by and the profits realized by Fidelity in connection with the operation of the fund and determined that the amount of profit is a fair entrepreneurial profit for the management of the fund.
Economies of Scale. The Board considered whether there have been economies of scale in respect of the management of the Fidelity funds, whether the Fidelity funds (including the fund) have appropriately benefited from any such economies of scale, and whether there is potential for realization of any further economies of scale. The Board considered the extent to which the fund will benefit from economies of scale through increased services to the fund, through waivers or reimbursements, or through fee or expense reductions, including reductions that occur through operation of the transfer agent agreement. The transfer agent fee varies in part based on the number of accounts in the fund. If the number of accounts decreases or the average account size increases, the overall transfer agent fee rate decreases.
The Board recognized that the fund's management contract incorporates a "group fee" structure, which provides for lower fee rates as total fund assets under FMR's management increase, and for higher fee rates as total fund assets under FMR's management decrease. The Board considered that the group fee is designed to deliver the benefits of economies of scale to fund shareholders when total fund assets increase, even if assets of any particular fund are unchanged or have declined, because some portion of Fidelity's costs are attributable to services provided to all Fidelity funds, and all funds benefit if those costs can be allocated among more assets. The Board concluded that, given the group fee structure, fund shareholders will achieve a certain level of economies of scale as assets under FMR's management increase at the fund complex level, regardless of whether Fidelity achieves any such economies of scale.
The Board further concluded that any potential economies of scale are being shared between fund shareholders and Fidelity in an appropriate manner.
Additional Information Requested by the Board. In order to develop fully the factual basis for consideration of the Advisory Contracts, the Board requested additional information on several topics, including (i) Fidelity's fund profitability methodology and profitability trends within certain funds; (ii) portfolio manager compensation; (iii) the extent to which any economies of scale exist and are shared between the funds and Fidelity; (iv) the total expenses of certain funds and classes relative to competitors, including the extent to which the expenses of certain funds have been or could be capped; (v) fund performance trends; and (vi) Fidelity's fee structures, including use of performance fees.
Based on its evaluation of all of the conclusions noted above, and after considering all material factors, the Board ultimately concluded that the advisory fee structures are fair and reasonable, and that the fund's Advisory Contracts should be renewed.
Annual Report
Annual Report
Investment Adviser
Fidelity Management & Research Company
Boston, MA
Investment Sub-Advisers
FMR Co., Inc.
Fidelity Management & Research
(U.K.) Inc.
Fidelity Research & Analysis Company
(formerly Fidelity Management &
Research (Far East) Inc.)
Fidelity International Investment Advisors
Fidelity Investments Japan Limited
Fidelity International Investment Advisors (U.K.) Limited
General Distributor
Fidelity Distributors Corporation
Boston, MA
Transfer and Service Agents
Fidelity Investments Institutional
Operations Company, Inc.
Boston, MA
Fidelity Service Company, Inc.
Boston, MA
Custodian
Citibank, N.A.
New York, NY
ASCV-UANN-0906
1.803731.101
(Fidelity Investment logo)(registered trademark)
(Fidelity Investment logo)(registered trademark)
FidelityAdvisor
Small Cap Value
Fund - Institutional Class
Annual Report
July 31, 2006
Institutional Class
is a class of Fidelity®
Small Cap Value Fund
(2_fidelity_logos) (Registered_Trademark)
Contents
Chairman's Message | <Click Here> | Ned Johnson's message to shareholders. |
Performance | <Click Here> | How the fund has done over time. |
Management's Discussion | <Click Here> | The manager's review of fund performance, strategy and outlook |
Shareholder Expense Example | <Click Here> | An example of shareholder expenses. |
Investment Changes | <Click Here> | A summary of the fund's investments. |
Investments | <Click Here> | A complete list of the fund's investments with their market values. |
Financial Statements | <Click Here> | Statements of assets and liabilities, operations, and changes in net assets,
as well as financial highlights. |
Notes | <Click Here> | Notes to the financial statements. |
Report of Independent Registered Public Accounting Firm | <Click Here> | |
Trustees and Officers | <Click Here> | |
Distributions | <Click Here> | |
Proxy Voting Results | <Click Here> | |
Board Approval of Investment Advisory Contracts and Management Fees | <Click Here> | |
To view a fund's proxy voting guidelines and proxy voting record for the 12-month period ended June 30, visit www.fidelity.com/proxyvotingresults or visit the Securities and Exchange Commission's (SEC) web site at www.sec.gov. You may also call 1-877-208-0098 to request a free copy of the proxy voting guidelines.
Standard & Poor's, S&P and S&P 500 are registered service marks of The McGraw-Hill Companies, Inc. and have been licensed for use by Fidelity Distributors Corporation.
Other third party marks appearing herein are the property of their respective owners.
All other marks appearing herein are registered or unregistered trademarks or service marks of FMR Corp. or an affiliated company.
Annual Report
This report and the financial statements contained herein are submitted for the general information of the shareholders of the fund. This report is not authorized for distribution to prospective investors in the fund unless preceded or accompanied by an effective prospectus.
A fund files its complete schedule of portfolio holdings with the SEC for the first and third quarters of each fiscal year on Form N-Q. Forms N-Q are available on the SEC's web site at http://www.sec.gov. A fund's Forms N-Q may be reviewed and copied at the SEC's Public Reference Room in Washington, DC. Information regarding the operation of the SEC's Public Reference Room may be obtained by calling 1-800-SEC-0330. For a complete list of a fund's portfolio holdings, view the most recent quarterly holdings report, semiannual report, or annual report on Fidelity's web site at http://www.advisor.fidelity.com.
NOT FDIC INSURED · MAY LOSE VALUE · NO BANK GUARANTEE
Neither the fund nor Fidelity Distributors Corporation is a bank.
Annual Report
Chairman's Message
(photo_of_Edward_C_Johnson_3d)
Dear Shareholder:
Although many securities markets made gains in early 2006, inflation concerns led to mixed results through the year's mid-point. Financial markets are always unpredictable. There are, however, a number of time-tested principles that can put the historical odds in your favor.
One of the basic tenets is to invest for the long term. Over time, riding out the markets' inevitable ups and downs has proven much more effective than selling into panic or chasing the hottest trend. Even missing only a few of the markets' best days can significantly diminish investor returns. Patience also affords the benefits of compounding - of earning interest on additional income or reinvested dividends and capital gains. There are tax advantages and cost benefits to consider as well. The more you sell, the more taxes you pay, and the more you trade, the higher the costs. While staying the course doesn't eliminate risk, it can considerably lessen the effect of short-term declines.
You can further manage your investing risk through diversification. And today, more than ever, geographic diversification should be taken into account. Studies indicate that asset allocation is the single most important determinant of a portfolio's long-term success. The right mix of stocks, bonds and cash - aligned to your particular risk tolerance and investment objective - is very important. Age-appropriate rebalancing is also an essential aspect of asset allocation. For younger investors, an emphasis on equities - which historically have been the best performing asset class over time - is encouraged. As investors near their specific goal, such as retirement or sending a child to college, consideration may be given to replacing volatile assets (e.g. common stocks) with more-stable fixed investments (bonds or savings plans).
A third investment principle - investing regularly - can help lower the average cost of your purchases. Investing a certain amount of money each month or quarter helps ensure you won't pay for all your shares at market highs. This strategy - known as dollar cost averaging - also reduces unconstructive "emotion" from investing, helping shareholders avoid selling weak performers just prior to an upswing, or chasing a hot performer just before a correction.
We invite you to contact us via the Internet, through our Investor Centers or over the phone. It is our privilege to provide you the information you need to make the investments that are right for you.
Sincerely,
/s/Edward C. Johnson 3d
Edward C. Johnson 3d
Annual Report
Fidelity Advisor Small Cap Value Fund - Institutional Class
Performance: The Bottom Line
Average annual total return reflects the change in the value of an investment, assuming reinvestment of the class' dividend income and capital gains (the profits earned upon the sale of securities that have grown in value) and assuming a constant rate of performance each year. The $10,000 table and the fund's returns do not reflect the deduction of taxes that a shareholder would pay on fund distributions or the redemption of fund shares. During periods of reimbursement by Fidelity, a fund's total return will be greater than it would be had the reimbursement not occurred. How a fund did yesterday is no guarantee of how it will do tomorrow.
Average Annual Total Returns
Periods ended July 31, 2006 | Past 1
year | Life of
FundA |
Institutional Class | 6.08% | 19.41% |
A From November 3, 2004.
$10,000 Over Life of Fund
Let's say hypothetically that $10,000 was invested in Fidelity Advisor Small Cap Value Fund - Institutional Class on November 3, 2004, when the fund started. The chart shows how the value of your investment would have changed, and also shows how the Russell 2000® Value Index performed over the same period.
Annual Report
Management's Discussion of Fund Performance
Comments from Thomas Hense, Portfolio Manager of Fidelity Advisor Small Cap Value Fund
As measured by the Dow Jones Wilshire 5000 Composite IndexSM - the broadest measure of U.S. equity market performance - stocks did well for most of the 12-month period ending July 31, 2006, before faltering. For the one-year time frame as a whole, the Dow Jones Wilshire benchmark rose 5.43%. That was nearly identical to the 5.38% gain of the Standard & Poor's 500SM Index, a broad market proxy that's a reflection of larger-cap stocks. Stocks were resilient early on, bouncing back quickly after Hurricanes Katrina and Rita caused energy prices to spike to record-high levels. Buoyed by strong corporate earnings and solid economic growth, the S&P 500® ran off six consecutive months of positive returns from November through April. However, stocks pulled back for most of the remainder of the period. A slowdown in economic expansion and consumer spending, reaccelerating energy prices and continued interest rate hikes by the Federal Reserve Board cooled equity performance. Among other widely quoted market yardsticks, the Dow Jones Industrial AverageSM returned 7.59%, while the NASDAQ Composite® Index dropped 3.47%.
The fund's Institutional Class shares were up 6.08% during the past year, while the Russell 2000® Value Index returned 6.93%. Relative to its index, the fund was hurt by a lack of exposure to traditional deep value stocks, which the market favored as the economy slowed during the last several months of the period. Overweightings in the retailing and consumer durables groups and in the insurance sector also hurt performance, as did poor stock selection in insurance and retailing. Weak results in the transportation and health care equipment/services groups detracted as well. The fund was helped by its large overweighting in the strong performing energy sector, as well as its underweighting in the utilities sector. In terms of individual detractors, RC2 Corp., which makes learning toys and baby products, and consumer staples company Jarden held back the fund's relative return. Life insurance company American Equity Investment Life and retailer Cost Plus also hurt performance. Among the fund's top performers were oil refineries Holly and Tesoro, as well as energy equipment company Maverick Tube. WESCO International, which sells electrical equipment used in commercial and industrial construction, also boosted the fund's return. The fund no longer held some of these stocks at period end.
The views expressed above reflect those of the portfolio manager(s) only through the end of the period as stated on the cover of this report and do not necessarily represent the views of Fidelity or any other person in the Fidelity organization. Any such views are subject to change at any time based upon market or other conditions and Fidelity disclaims any responsibility to update such views. These views may not be relied on as investment advice and, because investment decisions for a Fidelity fund are based on numerous factors, may not be relied on as an indication of trading intent on behalf of any Fidelity fund.
Annual Report
Shareholder Expense Example
As a shareholder of the Fund, you incur two types of costs: (1) transaction costs, including sales charges (loads) on purchase payments or redemption proceeds, redemption fees, and (2) ongoing costs, including management fees, distribution and/or service (12b-1) fees and other Fund expenses. This Example is intended to help you understand your ongoing costs (in dollars) of investing in the Fund and to compare these costs with the ongoing costs of investing in other mutual funds.
The Example is based on an investment of $1,000 invested at the beginning of the period and held for the entire period (February 1, 2006 to July 31, 2006).
Actual Expenses
The first line of the accompanying table for each class of the Fund provides information about actual account values and actual expenses. You may use the information in this line, together with the amount you invested, to estimate the expenses that you paid over the period. Simply divide your account value by $1,000.00 (for example, an $8,600 account value divided by $1,000.00 = 8.6), then multiply the result by the number in the first line for a class of the Fund under the heading entitled "Expenses Paid During Period" to estimate the expenses you paid on your account during this period. A small balance maintenance fee of $12.00 that is charged once a year may apply for certain accounts with a value of less than $2,000. This fee is not included in the table below. If it was, the estimate of expenses you paid during the period would be higher, and your ending account value lower, by this amount.
Hypothetical Example for Comparison Purposes
The second line of the accompanying table for each class of the Fund provides information about hypothetical account values and hypothetical expenses based on a Class' actual expense ratio and an assumed rate of return of 5% per year before expenses, which is not the Class' actual return. The hypothetical account values and expenses may not be used to estimate the actual ending account balance or expenses you paid for the period. You may use this information to compare the ongoing costs of investing in the Fund and other funds. To do so, compare this 5% hypothetical example with the 5% hypothetical examples that appear in the shareholder reports of the other funds. A small balance maintenance fee of $12.00 that is charged once a year may apply for certain accounts with a value of less than $2,000. This fee is not included in the table below. If it was, the estimate of expenses you paid during the period would be higher, and your ending account value lower, by this amount.
Annual Report
Shareholder Expense Example - continued
Please note that the expenses shown in the table are meant to highlight your ongoing costs only and do not reflect any transaction costs. Therefore, the second line of the table is useful in comparing ongoing costs only, and will not help you determine the relative total costs of owning different funds. In addition, if these transactional costs were included, your costs would have been higher.
| Beginning
Account Value
February 1, 2006 | Ending
Account Value
July 31, 2006 | Expenses Paid
During Period*
February 1, 2006
to July 31, 2006 |
Class A | | | |
Actual | $ 1,000.00 | $ 967.70 | $ 6.78 |
HypotheticalA | $ 1,000.00 | $ 1,017.90 | $ 6.95 |
Class T | | | |
Actual | $ 1,000.00 | $ 966.20 | $ 8.00 |
HypotheticalA | $ 1,000.00 | $ 1,016.66 | $ 8.20 |
Class B | | | |
Actual | $ 1,000.00 | $ 963.90 | $ 10.42 |
HypotheticalA | $ 1,000.00 | $ 1,014.18 | $ 10.69 |
Class C | | | |
Actual | $ 1,000.00 | $ 963.90 | $ 10.42 |
HypotheticalA | $ 1,000.00 | $ 1,014.18 | $ 10.69 |
Small Cap Value | | | |
Actual | $ 1,000.00 | $ 969.20 | $ 5.47 |
HypotheticalA | $ 1,000.00 | $ 1,019.24 | $ 5.61 |
Institutional Class | | | |
Actual | $ 1,000.00 | $ 969.20 | $ 5.32 |
HypotheticalA | $ 1,000.00 | $ 1,019.39 | $ 5.46 |
A 5% return per year before expenses
* Expenses are equal to each Class' annualized expense ratio (shown in the table below); multiplied by the average account value over the period, multiplied by 181/365 (to reflect the one-half year period).
| Annualized
Expense Ratio |
Class A | 1.39% |
Class T | 1.64% |
Class B | 2.14% |
Class C | 2.14% |
Small Cap Value | 1.12% |
Institutional Class | 1.09% |
Annual Report
Investment Changes
Top Ten Stocks as of July 31, 2006 |
| % of fund's
net assets | % of fund's net assets
6 months ago |
Tesoro Corp. | 2.3 | 0.0 |
American Equity Investment Life Holding Co. | 2.0 | 0.0 |
RC2 Corp. | 1.8 | 3.3 |
Zenith National Insurance Corp. | 1.8 | 0.0 |
Compass Minerals International, Inc. | 1.8 | 2.2 |
Jarden Corp. | 1.8 | 2.1 |
Omnicare, Inc. | 1.8 | 0.0 |
Carpenter Technology Corp. | 1.7 | 0.0 |
UAP Holding Corp. | 1.6 | 2.4 |
Telvent GIT SA | 1.4 | 1.4 |
| 18.0 | |
Top Five Market Sectors as of July 31, 2006 |
| % of fund's
net assets | % of fund's net assets
6 months ago |
Financials | 26.3 | 19.5 |
Industrials | 16.2 | 18.8 |
Consumer Discretionary | 12.9 | 19.0 |
Information Technology | 12.2 | 9.0 |
Energy | 10.5 | 14.4 |
Asset Allocation (% of fund's net assets) |
As of July 31, 2006 * | As of January 31, 2006 ** |
| Stocks 94.6% | | | Stocks 94.0% | |
| Bonds 0.0% | | | Bonds 0.1% | |
| Short-Term
Investments and
Net Other Assets 5.4% | | | Short-Term
Investments and
Net Other Assets 5.9% | |
* Foreign investments | 7.9% | | ** Foreign investments | 11.0% | |

Annual Report
Investments July 31, 2006
Showing Percentage of Net Assets
Common Stocks - 94.6% |
| Shares | | Value (Note 1) |
CONSUMER DISCRETIONARY - 12.9% |
Auto Components - 1.1% |
Hawk Corp. Class A (a) | 406,600 | | $ 5,098,764 |
Spartan Motors, Inc. | 399,710 | | 6,539,256 |
| | 11,638,020 |
Distributors - 0.5% |
Building Material Holding Corp. (d) | 249,100 | | 5,338,213 |
Diversified Consumer Services - 0.4% |
Steiner Leisure Ltd. (a) | 119,429 | | 4,798,657 |
Hotels, Restaurants & Leisure - 2.7% |
Domino's Pizza, Inc. | 275,000 | | 6,253,500 |
Gaylord Entertainment Co. (a) | 115,000 | | 4,395,300 |
Isle of Capri Casinos, Inc. (a) | 284,500 | | 6,722,735 |
Pinnacle Entertainment, Inc. (a) | 452,700 | | 12,417,561 |
| | 29,789,096 |
Household Durables - 4.0% |
Ethan Allen Interiors, Inc. | 35,300 | | 1,317,396 |
Interface, Inc. Class A (a) | 1,244,490 | | 15,269,892 |
Jarden Corp. (a)(d) | 675,000 | | 19,568,250 |
Kimball International, Inc. Class B | 235,000 | | 4,175,950 |
Lenox Group, Inc. (a) | 291,045 | | 2,025,673 |
Ryland Group, Inc. | 40,000 | | 1,634,000 |
| | 43,991,161 |
Leisure Equipment & Products - 2.1% |
Cybex International, Inc. (a) | 143,100 | | 788,481 |
MarineMax, Inc. (a) | 102,800 | | 2,163,940 |
RC2 Corp. (a) | 584,555 | | 19,798,878 |
| | 22,751,299 |
Specialty Retail - 1.6% |
Gymboree Corp. (a) | 135,000 | | 4,525,200 |
Sonic Automotive, Inc. Class A (sub. vtg.) | 242,500 | | 5,577,500 |
The Children's Place Retail Stores, Inc. (a) | 58,000 | | 3,237,560 |
Tween Brands, Inc. (a) | 105,000 | | 3,908,100 |
| | 17,248,360 |
Textiles, Apparel & Luxury Goods - 0.5% |
Warnaco Group, Inc. (a) | 290,000 | | 5,164,900 |
TOTAL CONSUMER DISCRETIONARY | | 140,719,706 |
Common Stocks - continued |
| Shares | | Value (Note 1) |
CONSUMER STAPLES - 1.9% |
Food Products - 1.0% |
Diamond Foods, Inc. | 580,400 | | $ 8,914,944 |
Gold Kist, Inc. Delaware (a) | 185,500 | | 2,595,145 |
| | 11,510,089 |
Personal Products - 0.9% |
Playtex Products, Inc. (a) | 200,000 | | 2,264,000 |
Prestige Brands Holdings, Inc. (a) | 812,838 | | 7,136,718 |
| | 9,400,718 |
TOTAL CONSUMER STAPLES | | 20,910,807 |
ENERGY - 10.5% |
Energy Equipment & Services - 2.8% |
Carbo Ceramics, Inc. | 121,200 | | 4,713,468 |
Hornbeck Offshore Services, Inc. (a) | 154,100 | | 5,354,975 |
Hydril Co. (a) | 37,717 | | 2,612,657 |
Oil States International, Inc. (a) | 244,760 | | 7,871,482 |
Superior Energy Services, Inc. (a) | 215,000 | | 7,363,750 |
W-H Energy Services, Inc. (a) | 50,000 | | 2,751,000 |
| | 30,667,332 |
Oil, Gas & Consumable Fuels - 7.7% |
Comstock Resources, Inc. (a) | 330,300 | | 9,717,426 |
Encore Acquisition Co. (a) | 89,820 | | 2,735,917 |
Forest Oil Corp. (a) | 140,000 | | 4,691,400 |
Gastar Exploration Ltd. (a)(e) | 1,509,607 | | 3,241,733 |
Holly Corp. | 207,400 | | 10,494,440 |
Mariner Energy, Inc. (a) | 530,000 | | 9,545,300 |
Overseas Shipholding Group, Inc. | 152,500 | | 9,819,475 |
Petroleum Development Corp. (a) | 94,500 | | 4,209,030 |
Tesoro Corp. | 340,800 | | 25,491,836 |
World Fuel Services Corp. | 65,000 | | 3,075,800 |
| | 83,022,357 |
TOTAL ENERGY | | 113,689,689 |
FINANCIALS - 26.3% |
Capital Markets - 1.0% |
American Capital Strategies Ltd. (d) | 158,700 | | 5,554,500 |
Common Stocks - continued |
| Shares | | Value (Note 1) |
FINANCIALS - continued |
Capital Markets - continued |
Technology Investment Capital Corp. | 87,948 | | $ 1,263,813 |
TradeStation Group, Inc. (a) | 280,000 | | 4,093,600 |
| | 10,911,913 |
Commercial Banks - 6.0% |
Boston Private Financial Holdings, Inc. | 425,000 | | 10,680,250 |
Cathay General Bancorp | 270,220 | | 9,930,585 |
Center Financial Corp., California | 468,352 | | 11,671,332 |
East West Bancorp, Inc. | 28,800 | | 1,162,080 |
Hanmi Financial Corp. | 245,040 | | 4,665,562 |
Home Bancshares, Inc. | 56,300 | | 1,227,340 |
Nara Bancorp, Inc. | 208,270 | | 3,834,251 |
Preferred Bank, Los Angeles California | 166,900 | | 9,565,039 |
UCBH Holdings, Inc. | 150,000 | | 2,502,000 |
Wintrust Financial Corp. | 209,360 | | 10,051,374 |
| | 65,289,813 |
Consumer Finance - 0.2% |
Advanta Corp. Class B | 50,000 | | 1,801,500 |
Diversified Financial Services - 0.9% |
Marlin Business Services Corp. (a) | 470,779 | | 9,773,372 |
Insurance - 13.5% |
American Equity Investment Life Holding Co. | 1,985,000 | | 21,616,650 |
Aspen Insurance Holdings Ltd. | 360,200 | | 8,500,720 |
HCC Insurance Holdings, Inc. | 175,920 | | 5,363,801 |
Hub International Ltd. | 100,000 | | 2,611,000 |
IPC Holdings Ltd. | 413,440 | | 11,886,400 |
National Financial Partners Corp. | 206,300 | | 9,291,752 |
Navigators Group, Inc. (a) | 69,862 | | 2,969,834 |
Ohio Casualty Corp. | 193,500 | | 5,015,520 |
Philadelphia Consolidated Holdings Corp. (a) | 274,140 | | 9,285,122 |
Platinum Underwriters Holdings Ltd. | 329,700 | | 9,327,213 |
RLI Corp. | 180,000 | | 8,510,400 |
Specialty Underwriters' Alliance, Inc. (a) | 339,130 | | 2,167,041 |
Tower Group, Inc. | 100,000 | | 3,002,000 |
United America Indemnity Ltd. Class A (a) | 310,012 | | 6,429,649 |
USI Holdings Corp. (a) | 1,194,448 | | 14,835,044 |
Willis Group Holdings Ltd. | 195,000 | | 6,343,350 |
Zenith National Insurance Corp. | 494,000 | | 19,750,120 |
| | 146,905,616 |
Common Stocks - continued |
| Shares | | Value (Note 1) |
FINANCIALS - continued |
Real Estate Investment Trusts - 2.9% |
Columbia Equity Trust, Inc. | 230,000 | | $ 3,489,100 |
Education Realty Trust, Inc. | 176,300 | | 2,755,569 |
Equity Lifestyle Properties, Inc. | 75,100 | | 3,227,047 |
GMH Communities Trust | 314,100 | | 3,938,814 |
Pennsylvania (REIT) (SBI) | 246,800 | | 9,718,984 |
Ramco-Gershenson Properties Trust (SBI) | 129,600 | | 3,814,128 |
Saxon Capital, Inc. | 158,000 | | 1,786,980 |
Taubman Centers, Inc. | 74,400 | | 3,087,600 |
| | 31,818,222 |
Real Estate Management & Development - 1.2% |
Far East Consortium International Ltd. | 61,287 | | 25,871 |
Jones Lang LaSalle, Inc. | 157,000 | | 12,826,900 |
| | 12,852,771 |
Thrifts & Mortgage Finance - 0.6% |
Farmer Mac Class C (non-vtg.) | 100,000 | | 2,683,000 |
FirstFed Financial Corp., Delaware (a)(d) | 60,000 | | 3,387,000 |
ITLA Capital Corp. | 21,483 | | 1,067,920 |
| | 7,137,920 |
TOTAL FINANCIALS | | 286,491,127 |
HEALTH CARE - 5.3% |
Health Care Providers & Services - 3.0% |
Chemed Corp. | 50,000 | | 1,839,000 |
Odyssey Healthcare, Inc. (a) | 440,000 | | 7,924,400 |
Omnicare, Inc. | 422,000 | | 19,099,720 |
VistaCare, Inc. Class A (a) | 292,000 | | 3,398,880 |
| | 32,262,000 |
Health Care Technology - 1.1% |
Per-Se Technologies, Inc. (a) | 505,700 | | 12,071,059 |
Life Sciences Tools & Services - 1.0% |
ICON PLC sponsored ADR (a) | 169,360 | | 11,150,662 |
Pharmaceuticals - 0.2% |
Cypress Bioscience, Inc. (a) | 282,000 | | 1,624,320 |
TOTAL HEALTH CARE | | 57,108,041 |
Common Stocks - continued |
| Shares | | Value (Note 1) |
INDUSTRIALS - 16.2% |
Aerospace & Defense - 2.6% |
AAR Corp. (a) | 477,300 | | $ 11,302,464 |
Ceradyne, Inc. (a) | 134,070 | | 6,554,682 |
DRS Technologies, Inc. | 113,000 | | 5,230,770 |
Hexcel Corp. (a) | 350,200 | | 5,032,374 |
| | 28,120,290 |
Air Freight & Logistics - 1.4% |
Forward Air Corp. | 80,000 | | 2,567,200 |
Hub Group, Inc. Class A | 180,000 | | 4,064,400 |
Park-Ohio Holdings Corp. (a) | 529,306 | | 8,860,582 |
| | 15,492,182 |
Airlines - 0.2% |
AirTran Holdings, Inc. (a) | 160,000 | | 2,006,400 |
Building Products - 1.5% |
Insteel Industries, Inc. (d) | 365,988 | | 7,575,952 |
NCI Building Systems, Inc. (a) | 162,700 | | 7,604,598 |
Quixote Corp. | 71,300 | | 1,138,661 |
| | 16,319,211 |
Commercial Services & Supplies - 2.7% |
Banta Corp. | 128,400 | | 4,536,372 |
FTI Consulting, Inc. (a) | 420,000 | | 11,025,000 |
Spherion Corp. (a) | 250,000 | | 1,900,000 |
Standard Parking Corp. (a) | 166,684 | | 5,210,542 |
Steelcase, Inc. Class A | 213,000 | | 3,128,970 |
Team, Inc. (a) | 144,628 | | 3,575,204 |
| | 29,376,088 |
Construction & Engineering - 1.4% |
Shaw Group, Inc. (a) | 353,000 | | 7,303,570 |
URS Corp. (a) | 197,800 | | 7,832,880 |
| | 15,136,450 |
Electrical Equipment - 1.7% |
Acuity Brands, Inc. | 100,350 | | 4,388,306 |
Belden CDT, Inc. | 275,000 | | 8,923,750 |
C&D Technologies, Inc. | 310,000 | | 2,201,000 |
GrafTech International Ltd. (a) | 510,000 | | 2,738,700 |
| | 18,251,756 |
Machinery - 1.2% |
Basin Water, Inc. | 63,500 | | 558,800 |
Common Stocks - continued |
| Shares | | Value (Note 1) |
INDUSTRIALS - continued |
Machinery - continued |
Manitowoc Co., Inc. | 171,520 | | $ 6,733,875 |
Tennant Co. | 272,200 | | 6,470,194 |
| | 13,762,869 |
Road & Rail - 0.2% |
Old Dominion Freight Lines, Inc. (a) | 60,000 | | 1,954,800 |
Trading Companies & Distributors - 3.3% |
Kaman Corp. | 528,822 | | 9,703,884 |
UAP Holding Corp. | 900,980 | | 17,749,306 |
WESCO International, Inc. (a) | 153,000 | | 8,912,250 |
| | 36,365,440 |
TOTAL INDUSTRIALS | | 176,785,486 |
INFORMATION TECHNOLOGY - 12.2% |
Computers & Peripherals - 0.2% |
Neoware Systems, Inc. (a) | 100,000 | | 1,238,000 |
Rackable Systems, Inc. (a) | 50,000 | | 1,066,000 |
| | 2,304,000 |
Electronic Equipment & Instruments - 6.3% |
Benchmark Electronics, Inc. (a) | 207,900 | | 5,058,207 |
CTS Corp. | 225,000 | | 3,242,250 |
Ingram Micro, Inc. Class A (a) | 727,700 | | 12,829,351 |
Insight Enterprises, Inc. (a) | 658,900 | | 11,161,766 |
KEMET Corp. (a) | 1,124,700 | | 9,413,739 |
Mettler-Toledo International, Inc. (a) | 113,700 | | 6,995,961 |
ScanSource, Inc. (a) | 67,530 | | 2,009,018 |
Tektronix, Inc. | 526,000 | | 14,344,020 |
Vishay Intertechnology, Inc. (a) | 247,491 | | 3,472,299 |
| | 68,526,611 |
Internet Software & Services - 1.2% |
j2 Global Communications, Inc. (a) | 400,800 | | 11,222,400 |
RealNetworks, Inc. (a) | 225,000 | | 2,247,750 |
| | 13,470,150 |
IT Services - 1.9% |
MPS Group, Inc. (a) | 170,000 | | 2,208,300 |
Ness Technologies, Inc. (a) | 252,000 | | 2,782,080 |
Telvent GIT SA (a) | 1,081,000 | | 15,501,540 |
| | 20,491,920 |
Common Stocks - continued |
| Shares | | Value (Note 1) |
INFORMATION TECHNOLOGY - continued |
Semiconductors & Semiconductor Equipment - 2.1% |
California Micro Devices Corp. (a) | 575,000 | | $ 2,271,250 |
Conexant Systems, Inc. (a) | 1,300,000 | | 2,327,000 |
Intevac, Inc. (a) | 551,000 | | 11,609,570 |
MKS Instruments, Inc. (a) | 213,900 | | 4,421,313 |
Rudolph Technologies, Inc. (a) | 165,244 | | 2,298,544 |
| | 22,927,677 |
Software - 0.5% |
Moldflow Corp. (a) | 427,898 | | 5,139,055 |
TOTAL INFORMATION TECHNOLOGY | | 132,859,413 |
MATERIALS - 7.8% |
Chemicals - 2.7% |
Albemarle Corp. | 158,300 | | 7,981,486 |
Arch Chemicals, Inc. | 280,000 | | 9,923,200 |
Cytec Industries, Inc. | 99,670 | | 5,323,375 |
Georgia Gulf Corp. | 245,800 | | 6,258,068 |
| | 29,486,129 |
Containers & Packaging - 0.3% |
Owens-Illinois, Inc. | 200,000 | | 3,026,000 |
Metals & Mining - 4.8% |
Carpenter Technology Corp. | 190,000 | | 18,696,000 |
Compass Minerals International, Inc. | 736,466 | | 19,671,007 |
Meridian Gold, Inc. (a) | 270,000 | | 7,279,692 |
Steel Dynamics, Inc. | 55,000 | | 3,191,100 |
Titanium Metals Corp. | 120,000 | | 3,460,800 |
| | 52,298,599 |
TOTAL MATERIALS | | 84,810,728 |
TELECOMMUNICATION SERVICES - 0.4% |
Wireless Telecommunication Services - 0.4% |
Syniverse Holdings, Inc. (a) | 334,000 | | 4,669,320 |
UTILITIES - 1.1% |
Independent Power Producers & Energy Traders - 0.5% |
Dynegy, Inc. Class A (a) | 900,000 | | 5,067,000 |
Common Stocks - continued |
| Shares | | Value (Note 1) |
UTILITIES - continued |
Multi-Utilities - 0.6% |
CMS Energy Corp. (a) | 500,000 | | $ 7,005,000 |
TOTAL UTILITIES | | 12,072,000 |
TOTAL COMMON STOCKS (Cost $1,004,318,234) | 1,030,116,317 |
Money Market Funds - 5.9% |
| | | |
Fidelity Cash Central Fund, 5.3% (b) | 45,491,708 | | 45,491,708 |
Fidelity Securities Lending Cash Central Fund, 5.32% (b)(c) | 19,229,000 | | 19,229,000 |
TOTAL MONEY MARKET FUNDS (Cost $64,720,708) | 64,720,708 |
TOTAL INVESTMENT PORTFOLIO - 100.5% (Cost $1,069,038,942) | | 1,094,837,025 |
NET OTHER ASSETS - (0.5)% | | (5,298,961) |
NET ASSETS - 100% | $ 1,089,538,064 |
Legend |
(a) Non-income producing |
(b) Affiliated fund that is available only to investment companies and other accounts managed by Fidelity Investments. The rate quoted is the annualized seven-day yield of the fund at period end. A complete unaudited listing of the fund's holdings as of its most recent quarter end is available upon request. |
(c) Investment made with cash collateral received from securities on loan. |
(d) Security or a portion of the security is on loan at period end. |
(e) Restricted securities - Investment in securities not registered under the Securities Act of 1933 (excluding 144A issues). At the end of the period, the value of restricted securities (excluding 144A issues) amounted to $3,241,733 or 0.3% of net assets. |
Additional information on each holding is as follows: |
Security | Acquisition Date | Acquisition Cost |
Gastar Exploration Ltd. | 6/13/05 | $ 3,999,855 |
Affiliated Central Funds |
Information regarding fiscal year to date income earned by the fund from the affiliated Central funds is as follows: |
Fund | Income earned |
Fidelity Cash Central Fund | $ 2,249,098 |
Fidelity Securities Lending Cash Central Fund | 38,326 |
Total | $ 2,287,424 |
Other Affiliated Issuers |
An affiliated company is a company in which the fund has ownership of at least 5% of the voting securities. Fiscal year to date transactions with companies which are or were affiliates are as follows: |
Affiliate | Value, beginning of period | Purchases | Sales Proceeds | Dividend Income | Value,
end of
period |
Innovo Group, Inc. | $ 3,902,134 | $ - | $ 1,357,802 | $ - | $ - |
Medtox Scientific, Inc. | 2,594,703 | 1,304,074 | 4,856,606 | - | - |
Park-Ohio Holdings Corp. | 9,985,654 | 4,636,566 | 3,883,350 | - | - |
Pioneer Companies, Inc. | 10,200,438 | 7,669,063 | 22,850,866 | - | - |
Total | $ 26,682,929 | $ 13,609,703 | $ 32,948,624 | $ - | $ - |
See accompanying notes which are an integral part of the financial statements.
Annual Report
Financial Statements
Statement of Assets and Liabilities
| July 31, 2006 |
Assets | | |
Investment in securities, at value (including securities loaned of $18,617,720) - See accompanying schedule: Unaffiliated issuers (cost $1,004,318,234) | $ 1,030,116,317 | |
Affiliated Central Funds (cost $64,720,708) | 64,720,708 | |
Total Investments (cost $1,069,038,942) | | $ 1,094,837,025 |
Cash | | 157,630 |
Receivable for investments sold | | 27,827,383 |
Receivable for fund shares sold | | 3,281,109 |
Dividends receivable | | 306,364 |
Interest receivable | | 208,552 |
Prepaid expenses | | 831 |
Receivable from investment adviser for expense reductions | | 7,516 |
Other receivables | | 44,646 |
Total assets | | 1,126,671,056 |
| | |
Liabilities | | |
Payable to custodian bank | $ 9,965 | |
Payable for investments purchased | 12,675,989 | |
Payable for fund shares redeemed | 4,094,324 | |
Accrued management fee | 738,544 | |
Distribution fees payable | 57,773 | |
Other affiliated payables | 253,771 | |
Other payables and accrued expenses | 73,626 | |
Collateral on securities loaned, at value | 19,229,000 | |
Total liabilities | | 37,132,992 |
| | |
Net Assets | | $ 1,089,538,064 |
Net Assets consist of: | | |
Paid in capital | | $ 1,010,860,195 |
Accumulated undistributed net realized gain (loss) on investments and foreign currency transactions | | 52,880,158 |
Net unrealized appreciation (depreciation) on investments and assets and liabilities in foreign currencies | | 25,797,711 |
Net Assets | | $ 1,089,538,064 |
See accompanying notes which are an integral part of the financial statements.
Annual Report
Financial Statements - continued
Statement of Assets and Liabilities - continued
| July 31, 2006 |
Calculation of Maximum Offering Price
Class A:
Net Asset Value and redemption price per share ($39,931,161 ÷ 3,032,281 shares) | | $ 13.17 |
| | |
Maximum offering price per share (100/94.25 of $13.17) | | $ 13.97 |
Class T:
Net Asset Value and redemption price per share ($45,460,462 ÷ 3,461,481 shares) | | $ 13.13 |
| | |
Maximum offering price per share (100/96.50 of $13.13) | | $ 13.61 |
Class B:
Net Asset Value and offering price per share ($10,214,248 ÷ 781,586 shares)A | | $ 13.07 |
| | |
Class C:
Net Asset Value and offering price per share ($26,790,532 ÷ 2,049,806 shares)A | | $ 13.07 |
| | |
| | |
Small Cap Value:
Net Asset Value, offering price and redemption price per share ($957,719,926 ÷ 72,437,835 shares) | | $ 13.22 |
| | |
Institutional Class:
Net Asset Value, offering price and redemption price per share ($9,421,735 ÷ 712,615 shares) | | $ 13.22 |
A Redemption price per share is equal to net asset value less any applicable contingent deferred sales charge.
See accompanying notes which are an integral part of the financial statements.
Annual Report
Statement of Operations
| Year ended July 31, 2006 |
Investment Income | | |
Dividends | | $ 7,592,341 |
Interest | | 267,751 |
Income from affiliated Central Funds | | 2,287,424 |
Total income | | 10,147,516 |
| | |
Expenses | | |
Management fee
Basic fee | $ 6,503,559 | |
Performance adjustment | 818,297 | |
Transfer agent fees | 2,021,820 | |
Distribution fees | 489,195 | |
Accounting and security lending fees | 327,010 | |
Independent trustees' compensation | 3,449 | |
Custodian fees and expenses | 46,559 | |
Registration fees | 176,894 | |
Audit | 46,223 | |
Legal | 11,083 | |
Miscellaneous | 40,350 | |
Total expenses before reductions | 10,484,439 | |
Expense reductions | (375,179) | 10,109,260 |
Net investment income (loss) | | 38,256 |
Realized and Unrealized Gain (Loss) Net realized gain (loss) on: | | |
Investment securities: | | |
Unaffiliated issuers (net of foreign taxes of $104,677) | 59,347,415 | |
Other affiliated issuers | (46,540) | |
Foreign currency transactions | (16,065) | |
Total net realized gain (loss) | | 59,284,810 |
Change in net unrealized appreciation (depreciation) on: Investment securities | (30,704,015) | |
Assets and liabilities in foreign currencies | 2,648 | |
Total change in net unrealized appreciation (depreciation) | | (30,701,367) |
Net gain (loss) | | 28,583,443 |
Net increase (decrease) in net assets resulting from operations | | $ 28,621,699 |
See accompanying notes which are an integral part of the financial statements.
Annual Report
Financial Statements - continued
Statement of Changes in Net Assets
| Year ended
July 31,
2006 | For the period
November 3, 2004
(commencement
of operations) to
July 31, 2005 |
Increase (Decrease) in Net Assets | | |
Operations | | |
Net investment income (loss) | $ 38,256 | $ (248,906) |
Net realized gain (loss) | 59,284,810 | 15,306,292 |
Change in net unrealized appreciation (depreciation) | (30,701,367) | 56,499,078 |
Net increase (decrease) in net assets resulting
from operations | 28,621,699 | 71,556,464 |
Distributions to shareholders from net investment income | (633,037) | (69,595) |
Distributions to shareholders from net realized gain | (20,371,695) | - |
Total distributions | (21,004,732) | (69,595) |
Share transactions - net increase (decrease) | 457,176,942 | 552,608,856 |
Redemption fees | 517,538 | 130,892 |
Total increase (decrease) in net assets | 465,311,447 | 624,226,617 |
| | |
Net Assets | | |
Beginning of period | 624,226,617 | - |
End of period (including undistributed net investment income of $0 and $5,374, respectively) | $ 1,089,538,064 | $ 624,226,617 |
See accompanying notes which are an integral part of the financial statements.
Annual Report
Financial Highlights - Class A
Years ended July 31, | 2006 | 2005 F |
Selected Per-Share Data | | |
Net asset value, beginning of period | $ 12.80 | $ 10.00 |
Income from Investment Operations | | |
Net investment income (loss) E | (.03) | (.04) |
Net realized and unrealized gain (loss) | .74 | 2.84 |
Total from investment operations | .71 | 2.80 |
Distributions from net investment income | - | (.01) |
Distributions from net realized gain | (.35) | - |
Total distributions | (.35) | (.01) |
Redemption fees added to paid in capital E | .01 | .01 |
Net asset value, end of period | $ 13.17 | $ 12.80 |
Total Return B, C ,D | 5.72% | 28.06% |
Ratios to Average Net Assets G | | |
Expenses before reductions | 1.51% | 1.46% A |
Expenses net of fee waivers, if any | 1.40% | 1.44% A |
Expenses net of all reductions | 1.36% | 1.38% A |
Net investment income (loss) | (.24)% | (.46)% A |
Supplemental Data | | |
Net assets, end of period (000 omitted) | $ 39,931 | $ 9,390 |
Portfolio turnover rate | 93% | 60% A |
A Annualized
B Total returns for periods of less than one year are not annualized.
C Total returns would have been lower had certain expenses not been reduced during the periods shown.
D Total returns do not include the effect of the sales charges.
E Calculated based on average shares outstanding during the period.
F For the period November 3, 2004 (commencement of operations) to July 31, 2005.
G Expense ratios reflect operating expenses of the class. Expenses before reductions do not reflect amounts reimbursed by the investment adviser or reductions from brokerage service arrangements or other expense offset arrangements and do not represent the amount paid by the class during periods when reimbursements or reductions occur. Expense ratios before reductions for start-up periods may not be representative of longer-term operating periods. Expenses net of fee waivers reflect expenses after reimbursement by the investment adviser but prior to reductions from brokerage service arrangements or other expense offset arrangements. Expenses net of all reductions represent the net expenses paid by the class.
See accompanying notes which are an integral part of the financial statements.
Annual Report
Financial Highlights - Class T
Years ended July 31, | 2006 | 2005F |
Selected Per-Share Data | | |
Net asset value, beginning of period | $ 12.78 | $ 10.00 |
Income from Investment Operations | | |
Net investment income (loss) E | (.07) | (.06) |
Net realized and unrealized gain (loss) | .74 | 2.83 |
Total from investment operations | .67 | 2.77 |
Distributions from net realized gain | (.33) | - |
Redemption fees added to paid in capitalE | .01 | .01 |
Net asset value, end of period | $ 13.13 | $ 12.78 |
Total Return B, C, D | 5.47% | 27.80% |
Ratios to Average Net Assets G | | |
Expenses before reductions | 1.67% | 1.72%A |
Expenses net of fee waivers, if any | 1.65% | 1.68%A |
Expenses net of all reductions | 1.61% | 1.62%A |
Net investment income (loss) | (.49)% | (.70)%A |
Supplemental Data | | |
Net assets, end of period (000 omitted) | $ 45,460 | $ 12,725 |
Portfolio turnover rate | 93% | 60%A |
A Annualized
B Total returns for periods of less than one year are not annualized.
C Total returns would have been lower had certain expenses not been reduced during the periods shown.
D Total returns do not include the effect of the sales charges.
E Calculated based on average shares outstanding during the period.
F For the period November 3, 2004 (commencement of operations) to July 31, 2005.
G Expense ratios reflect operating expenses of the class. Expenses before reductions do not reflect amounts reimbursed by the investment adviser or reductions from brokerage service arrangements or other expense offset arrangements and do not represent the amount paid by the class during periods when reimbursements or reductions occur. Expense ratios before reductions for start-up periods may not be representative of longer-term operating periods. Expenses net of fee waivers reflect expenses after reimbursement by the investment adviser but prior to reductions from brokerage service arrangements or other expense offset arrangements. Expenses net of all reductions represent the net expenses paid by the class.
See accompanying notes which are an integral part of the financial statements.
Annual Report
Financial Highlights - Class B
Years ended July 31, | 2006 | 2005F |
Selected Per-Share Data | | |
Net asset value, beginning of period | $ 12.73 | $ 10.00 |
Income from Investment Operations | | |
Net investment income (loss)E | (.13) | (.10) |
Net realized and unrealized gain (loss) | .74 | 2.82 |
Total from investment operations | .61 | 2.72 |
Distributions from net realized gain | (.28) | - |
Redemption fees added to paid in capitalE | .01 | .01 |
Net asset value, end of period | $ 13.07 | $ 12.73 |
Total Return B, C, D | 4.97% | 27.30% |
Ratios to Average Net AssetsG | | |
Expenses before reductions | 2.26% | 2.24%A |
Expenses net of fee waivers, if any | 2.15% | 2.19%A |
Expenses net of all reductions | 2.11% | 2.13%A |
Net investment income (loss) | (.99)% | (1.21)%A |
Supplemental Data | | |
Net assets, end of period (000 omitted) | $ 10,214 | $ 3,931 |
Portfolio turnover rate | 93% | 60%A |
A Annualized
B Total returns for periods of less than one year are not annualized.
C Total returns would have been lower had certain expenses not been reduced during the periods shown.
D Total returns do not include the effect of the contingent deferred sales charge.
E Calculated based on average shares outstanding during the period.
F For the period November 3, 2004 (commencement of operations) to July 31, 2005.
G Expense ratios reflect operating expenses of the class. Expenses before reductions do not reflect amounts reimbursed by the investment adviser or reductions from brokerage service arrangements or other expense offset arrangements and do not represent the amount paid by the class during periods when reimbursements or reductions occur. Expense ratios before reductions for start-up periods may not be representative of longer-term operating periods. Expenses net of fee waivers reflect expenses after reimbursement by the investment adviser but prior to reductions from brokerage service arrangements or other expense offset arrangements. Expenses net of all reductions represent the net expenses paid by the class.
See accompanying notes which are an integral part of the financial statements.
Annual Report
Financial Highlights - Class C
Years ended July 31, | 2006 | 2005F |
Selected Per-Share Data | | |
Net asset value, beginning of period | $ 12.74 | $ 10.00 |
Income from Investment Operations | | |
Net investment income (loss) E | (.13) | (.10) |
Net realized and unrealized gain (loss) | .74 | 2.83 |
Total from investment operations | .61 | 2.73 |
Distributions from net realized gain | (.29) | - |
Redemption fees added to paid in capital E | .01 | .01 |
Net asset value, end of period | $ 13.07 | $ 12.74 |
Total Return B, C, D | 4.92% | 27.40% |
Ratios to Average Net Assets G | | |
Expenses before reductions | 2.22% | 2.17%A |
Expenses net of fee waivers, if any | 2.15% | 2.17%A |
Expenses net of all reductions | 2.11% | 2.11%A |
Net investment income (loss) | (.99)% | (1.19)%A |
Supplemental Data | | |
Net assets, end of period (000 omitted) | $ 26,791 | $ 11,732 |
Portfolio turnover rate | 93% | 60%A |
A Annualized
B Total returns for periods of less than one year are not annualized.
C Total returns would have been lower had certain expenses not been reduced during the periods shown.
D Total returns do not include the effect of the contingent deferred sales charge.
E Calculated based on average shares outstanding during the period.
F For the period November 3, 2004 (commencement of operations) to July 31, 2005.
G Expense ratios reflect operating expenses of the class. Expenses before reductions do not reflect amounts reimbursed by the investment adviser or reductions from brokerage service arrangements or other expense offset arrangements and do not represent the amount paid by the class during periods when reimbursements or reductions occur. Expense ratios before reductions for start-up periods may not be representative of longer-term operating periods. Expenses net of fee waivers reflect expenses after reimbursement by the investment adviser but prior to reductions from brokerage service arrangements or other expense offset arrangements. Expenses net of all reductions represent the net expenses paid by the class.
See accompanying notes which are an integral part of the financial statements.
Annual Report
Financial Highlights - Small Cap Value
Years ended July 31, | 2006 | 2005E |
Selected Per-Share Data | | |
Net asset value, beginning of period | $ 12.83 | $ 10.00 |
Income from Investment Operations | | |
Net investment income (loss)D | .01 | (.01) |
Net realized and unrealized gain (loss) | .74 | 2.84 |
Total from investment operations | .75 | 2.83 |
Distributions from net investment income | (.01) | (.01) |
Distributions from net realized gain | (.36) | - |
Total distributions | (.37) | (.01) |
Redemption fees added to paid in capitalD | .01 | .01 |
Net asset value, end of period | $ 13.22 | $ 12.83 |
Total Return B, C | 6.07% | 28.36% |
Ratios to Average Net Assets F | | |
Expenses before reductions | 1.09% | 1.05%A |
Expenses net of fee waivers, if any | 1.09% | 1.05%A |
Expenses net of all reductions | 1.06% | .99%A |
Net investment income (loss) | .06% | (.08)%A |
Supplemental Data | | |
Net assets, end of period (000 omitted) | $ 957,720 | $ 582,689 |
Portfolio turnover rate | 93% | 60%A |
A Annualized
B Total returns for periods of less than one year are not annualized.
C Total returns would have been lower had certain expenses not been reduced during the periods shown.
D Calculated based on average shares outstanding during the period.
E For the period November 3, 2004 (commencement of operations) to July 31, 2005.
F Expense ratios reflect operating expenses of the class. Expenses before reductions do not reflect amounts reimbursed by the investment adviser or reductions from brokerage service arrangements or other expense offset arrangements and do not represent the amount paid by the class during periods when reimbursements or reductions occur. Expense ratios before reductions for start-up periods may not be representative of longer-term operating periods. Expenses net of fee waivers reflect expenses after reimbursement by the investment adviser but prior to reductions from brokerage service arrangements or other expense offset arrangements. Expenses net of all reductions represent the net expenses paid by the class.
See accompanying notes which are an integral part of the financial statements.
Annual Report
Financial Highlights - Institutional Class
Years ended July 31, | 2006 | 2005E |
Selected Per-Share Data | | |
Net asset value, beginning of period | $ 12.83 | $ 10.00 |
Income from Investment Operations | | |
Net investment income (loss) D | .01 | (.01) |
Net realized and unrealized gain (loss) | .74 | 2.84 |
Total from investment operations | .75 | 2.83 |
Distributions from net investment income | (.01) | (.01) |
Distributions from net realized gain | (.36) | - |
Total distributions | (.37) | (.01) |
Redemption fees added to paid in capital D | .01 | .01 |
Net asset value, end of period | $ 13.22 | $ 12.83 |
Total Return B, C | 6.08% | 28.36% |
Ratios to Average Net Assets F | | |
Expenses before reductions | 1.08% | 1.07%A |
Expenses net of fee waivers, if any | 1.08% | 1.07%A |
Expenses net of all reductions | 1.05% | 1.01%A |
Net investment income (loss) | .08% | (.10)%A |
Supplemental Data | | |
Net assets, end of period (000 omitted) | $ 9,422 | $ 3,761 |
Portfolio turnover rate | 93% | 60%A |
A Annualized
B Total returns for periods of less than one year are not annualized.
C Total returns would have been lower had certain expenses not been reduced during the periods shown.
D Calculated based on average shares outstanding during the period.
E For the period November 3, 2004 (commencement of operations) to July 31, 2005.
F Expense ratios reflect operating expenses of the class. Expenses before reductions do not reflect amounts reimbursed by the investment adviser or reductions from brokerage service arrangements or other expense offset arrangements and do not represent the amount paid by the class during periods when reimbursements or reductions occur. Expense ratios before reductions for start-up periods may not be representative of longer-term operating periods. Expenses net of fee waivers reflect expenses after reimbursement by the investment adviser but prior to reductions from brokerage service arrangements or other expense offset arrangements. Expenses net of all reductions represent the net expenses paid by the class.
See accompanying notes which are an integral part of the financial statements.
Annual Report
Notes to Financial Statements
For the period ended July 31, 2006
1. Significant Accounting Policies.
Fidelity Small Cap Value Fund (the Fund) is a non-diversified fund of Fidelity Securities Fund (the trust) and is authorized to issue an unlimited number of shares. The trust is registered under the Investment Company Act of 1940, as amended (the 1940 Act), as an open-end management investment company organized as a Massachusetts business trust.
The Fund offers Class A, Class T, Class B, Class C, Small Cap Value and Institutional Class shares, each of which has equal rights as to assets and voting privileges. Each class has exclusive voting rights with respect to matters that affect that class. Class B shares will automatically convert to Class A shares after a holding period of seven years from the initial date of purchase. Investment income, realized and unrealized capital gains and losses, the common expenses of the Fund, and certain fund-level expense reductions, if any, are allocated on a pro rata basis to each class based on the relative net assets of each class to the total net assets of the Fund. Each class differs with respect to transfer agent and distribution and service plan fees incurred. Certain expense reductions also differ by class.
The Fund may invest in affiliated money market central funds (Money Market Central Funds), which are open-end investment companies available to investment companies and other accounts managed by Fidelity Management & Research Company (FMR) and its affiliates. The financial statements have been prepared in conformity with accounting principles generally accepted in the United States of America, which require management to make certain estimates and assumptions at the date of the financial statements. The following summarizes the significant accounting policies of the Fund:
Security Valuation. Investments are valued and net asset value (NAV) per share is calculated (NAV calculation) as of the close of business of the New York Stock Exchange (NYSE), normally 4:00 p.m. Eastern time. Wherever possible, the Fund uses independent pricing services approved by the Board of Trustees to value its investments.
Equity securities, including restricted securities, for which market quotations are readily available, are valued at the last reported sale price or official closing price as reported by an independent pricing service on the primary market or exchange on which they are traded. In the event there were no sales during the day or closing prices are not available, securities are valued at the last quoted bid price. Investments in open-end mutual funds are valued at their closing net asset value each business day. Short-term securities with remaining maturities of sixty days or less for which quotations are not readily available are valued at amortized cost, which approximates value.
When current market prices or quotations are not readily available or do not accurately reflect fair value, valuations may be determined in accordance with procedures adopted by the Board of Trustees. For example, when developments occur between the close of a
Annual Report
Notes to Financial Statements - continued
1. Significant Accounting Policies - continued
Security Valuation - continued
market and the close of the NYSE that may materially affect the value of some or all of the securities, or when trading in a security is halted, those securities may be fair valued. Factors used in the determination of fair value may include monitoring news to identify significant market or security specific events such as changes in the value of U.S. securities markets, reviewing developments in foreign markets and evaluating the performance of ADRs, futures contracts and exchange-traded funds. Because the Fund's utilization of fair value pricing depends on market activity, the frequency with which fair value pricing is used can not be predicted and may be utilized to a significant extent. The value of securities used for NAV calculation under fair value pricing may differ from published prices for the same securities.
Foreign Currency. The Fund uses foreign currency contracts to facilitate transactions in foreign-denominated securities. Losses from these transactions may arise from changes in the value of the foreign currency or if the counterparties do not perform under the contracts' terms.
Foreign-denominated assets, including investment securities, and liabilities are translated into U.S. dollars at the exchange rate at period end. Purchases and sales of investment securities, income and dividends received and expenses denominated in foreign currencies are translated into U.S. dollars at the exchange rate in effect on the transaction date.
The effects of exchange rate fluctuations on investments are included with the net realized and unrealized gain (loss) on investment securities. Other foreign currency transactions resulting in realized and unrealized gain (loss) are disclosed separately.
Investment Transactions and Income. Security transactions are accounted for as of trade date. Gains and losses on securities sold are determined on the basis of identified cost. Dividend income is recorded on the ex-dividend date, except for certain dividends from foreign securities where the ex-dividend date may have passed, which are recorded as soon as the Fund is informed of the ex-dividend date. Non-cash dividends included in dividend income, if any, are recorded at the fair market value of the securities received. Distributions received on securities that represent a return of capital or capital gain are recorded as a reduction of cost of investments and/or as a realized gain. The Fund estimates the components of distributions received that may be considered return of capital distributions or capital gain distributions. Interest income is accrued as earned. Interest income includes coupon interest and amortization of premium and accretion of discount on debt securities. Investment income is recorded net of foreign taxes withheld where recovery of such taxes is uncertain.
Annual Report
1. Significant Accounting Policies - continued
Expenses. Most expenses of the trust can be directly attributed to a fund. Expenses which cannot be directly attributed are apportioned among each Fund in the trust. Expense estimates are accrued in the period to which they relate and adjustments are made when actual amounts are known.
Income Tax Information and Distributions to Shareholders. Each year, the Fund intends to qualify as a regulated investment company by distributing all of its taxable income and realized gains under Subchapter M of the Internal Revenue Code. As a result, no provision for income taxes is required in the accompanying financial statements. Foreign taxes are provided for based on the Fund's understanding of the tax rules and rates that exist in the foreign markets in which it invests.
Distributions are recorded on the ex-dividend date. Income dividends and capital gain distributions are declared separately for each class. Income and capital gain distributions are determined in accordance with income tax regulations, which may differ from generally accepted accounting principles. In addition, the Fund will claim a portion of the payment made to redeeming shareholders as a distribution for income tax purposes.
Capital accounts within the financial statements are adjusted for permanent book-tax differences. These adjustments have no impact on net assets or the results of operations. Temporary book-tax differences will reverse in a subsequent period.
Book-tax differences are primarily due to foreign currency transactions, passive foreign investment companies (PFIC), market discount and losses deferred due to wash sales.
The tax-basis components of distributable earnings and the federal tax cost as of period end were as follows:
Unrealized appreciation | $ 97,858,886 |
Unrealized depreciation | (72,280,850) |
Net unrealized appreciation (depreciation) | 25,578,036 |
Undistributed ordinary income | 15,623,083 |
Undistributed long-term capital gain | 27,867,547 |
Cost for federal income tax purposes | $ 1,069,258,989 |
The tax character of distributions paid was as follows:
| July 31, 2006 | July 31, 2005 |
Ordinary Income | $ 21,004,732 | $ 69,595 |
Annual Report
Notes to Financial Statements - continued
1. Significant Accounting Policies - continued
New Accounting Pronouncement. In July 2006, Financial Accounting Standards Board Interpretation No. 48, Accounting for Uncertainty in Income Taxes - an interpretation of FASB Statement 109 (FIN 48) was issued and is effective for fiscal years beginning after December 15, 2006. FIN 48 sets forth a threshold for financial statement recognition, measurement and disclosure of a tax position taken or expected to be taken on a tax return. Management is currently evaluating the impact, if any, the adoption of FIN 48 will have on the Fund's net assets and results of operations.
Short-Term Trading (Redemption) Fees. Shares held in the Fund less than 90 days are subject to a redemption fee equal to 1.50% of the proceeds of the redeemed shares. All redemption fees, including any estimated redemption fees paid by FMR, are retained by the Fund and accounted for as an addition to paid in capital.
2. Operating Policies.
Repurchase Agreements. FMR has received an Exemptive Order from the Securities and Exchange Commission (the SEC) which permits the Fund and other affiliated entities of FMR to transfer uninvested cash balances into joint trading accounts which are then invested in repurchase agreements. The Fund may also invest directly with institutions in repurchase agreements. Repurchase agreements are collateralized by government or non-government securities. Upon settlement date, collateral is held in segregated accounts with custodian banks and may be obtained in the event of a default of the counterparty. The Fund monitors, on a daily basis, the value of the collateral to ensure it is at least equal to the principal amount of the repurchase agreement (including accrued interest). In the event of a default by the counterparty, realization of the collateral proceeds could be delayed, during which time the value of the collateral may decline.
Restricted Securities. The Fund may invest in securities that are subject to legal or contractual restrictions on resale. These securities generally may be resold in transactions exempt from registration or to the public if the securities are registered. Disposal of these securities may involve time-consuming negotiations and expense, and prompt sale at an acceptable price may be difficult. Information regarding restricted securities is included at the end of the fund's Schedule of Investments.
3. Purchases and Sales of Investments.
Purchases and sales of securities, other than short-term securities, aggregated $1,221,750,834 and $795,822,091, respectively.
Annual Report
4. Fees and Other Transactions with Affiliates.
Management Fee. FMR and its affiliates provide the Fund with investment management related services for which the Fund pays a monthly management fee. The management fee is the sum of an individual fund fee rate that is based on an annual rate of .45% of the Fund's average net assets and a group fee rate that averaged ..27% during the period. The group fee rate is based upon the average net assets of all the mutual funds advised by FMR. The group fee rate decreases as assets under management increase and increases as assets under management decrease. In addition, the management fee is subject to a performance adjustment (up to a maximum of ± .20% of the Fund's average net assets over a 36 month performance period). The upward or downward adjustment to the management fee is based on the relative investment performance of the retail class of the Fund, Small Cap Value, as compared to an appropriate benchmark index. The Fund's performance adjustment took effect in November 2005. Subsequent months will be added until the performance period includes 36 months. For the period, the total annual management fee rate, including the performance adjustment, was .81% of the Fund's average net assets.
Distribution and Service Plan. In accordance with Rule 12b-1 of the 1940 Act, the Fund has adopted separate Distribution and Service Plans for each class of shares. Certain classes pay Fidelity Distributors Corporation (FDC), an affiliate of FMR, separate Distribution and Service Fees, each of which is based on an annual percentage of each class' average net assets. In addition, FDC may pay financial intermediaries for selling shares of the Fund and providing shareholder support services. For the period, the Distribution and Service Fee rates and the total amounts paid to and retained by FDC were as follows:
| Distribution
Fee | Service
Fee | Paid to
FDC | Retained
by FDC |
Class A | 0% | .25% | $ 61,478 | $ 2,797 |
Class T | .25% | .25% | 142,254 | 7,806 |
Class B | .75% | .25% | 77,771 | 59,490 |
Class C | .75% | .25% | 207,692 | 103,479 |
| | | $ 489,195 | $ 173,572 |
Sales Load. FDC receives a front-end sales charge of up to 5.75% for selling Class A shares, and 3.50% for selling Class T shares, some of which is paid to financial intermediaries for selling shares of the Fund. FDC receives the proceeds of contingent deferred sales charges levied on Class A, Class T, Class B, and Class C redemptions. These charges depend on the holding period. The deferred sales charges range from 5% to 1% for Class B, 1% for Class C, 1.00% to .50% for certain purchases of Class A shares (.25% prior to February 24, 2006) and .25% for certain purchases of Class T shares.
Annual Report
Notes to Financial Statements - continued
4. Fees and Other Transactions with Affiliates - continued
Sales Load - continued
For the period, sales charge amounts retained by FDC were as follows:
| Retained
by FDC |
Class A | 117,648 |
Class T | 26,701 |
Class B* | 11,040 |
Class C* | 3,291 |
| $ 158,680 |
* When Class B and Class C shares are initially sold, FDC pays commissions from its own resources to financial intermediaries through which the sales are made.
Transfer Agent Fees. Fidelity Investments Institutional Operations Company, Inc. (FIIOC), an affiliate of FMR, is the transfer, dividend disbursing and shareholder servicing agent for each class of the Fund, except for Small Cap Value. Fidelity Service Company, Inc. (FSC), an affiliate of FMR, is the transfer agent for Small Cap Value shares. FIIOC and FSC receive account fees and asset-based fees that vary according to the account size and type of account of the shareholders of the respective classes of the Fund. FIIOC and FSC pay for typesetting, printing and mailing of shareholder reports, except proxy statements. For the period the total transfer agent fees paid by each class to FIIOC or FSC, were as follows:
| Amount | % of
Average
Net Assets |
Class A | $ 90,401 | .37 |
Class T | 81,280 | .29 |
Class B | 28,609 | .37 |
Class C | 67,880 | .33 |
Small Cap Value | 1,739,453 | .21 |
Institutional Class | 14,197 | .19 |
| $ 2,021,820 | |
Accounting and Security Lending Fees. FSC maintains the Fund's accounting records. The accounting fee is based on the level of average net assets for the month. Under a separate contract, FSC administers the security lending program. The security lending fee is based on the number and duration of lending transactions.
Affiliated Central Funds. The Fund may invest in Money Market Central Funds which seek preservation of capital and current income and are managed by Fidelity Investments Money Management, Inc. (FIMM), an affiliate of FMR.
Annual Report
4. Fees and Other Transactions with Affiliates - continued
Affiliated Central Funds - continued
The Money Market Central Funds do not pay a management fee.
Brokerage Commissions. The Fund placed a portion of its portfolio transactions with brokerage firms which are affiliates of the investment adviser. The commissions paid to these affiliated firms were $49,673 for the period.
5. Committed Line of Credit.
The Fund participates with other funds managed by FMR in a $4.2 billion credit facility (the "line of credit") to be utilized for temporary or emergency purposes to fund shareholder redemptions or for other short-term liquidity purposes. The Fund has agreed to pay commitment fees on its pro rata portion of the line of credit, which amounts to $2,432 and is reflected in Miscellaneous Expense on the Statement of Operations. During the period, there were no borrowings on this line of credit.
6. Security Lending.
The Fund lends portfolio securities from time to time in order to earn additional income. On the settlement date of the loan, the Fund receives collateral (in the form of U.S. Treasury obligations, letters of credit and/or cash) against the loaned securities and maintains collateral in an amount not less than 100% of the market value of the loaned securities during the period of the loan. The market value of the loaned securities is determined at the close of business of the Fund and any additional required collateral is delivered to the Fund on the next business day. If the borrower defaults on its obligation to return the securities loaned because of insolvency or other reasons, a fund could experience delays and costs in recovering the securities loaned or in gaining access to the collateral. Any cash collateral received is invested in the Fidelity Securities Lending Cash Central Fund. The value of loaned securities and cash collateral at period end are disclosed on the Fund's Statement of Assets and Liabilities. Security lending income represents the income earned on investing cash collateral, less fees and expenses associated with the loan, plus any premium payments that may be received on the loan of certain types of securities. Security lending income is presented in the Statement of Operations as a component of income from affiliated central funds. Net income from lending portfolio securities during the period amounted to $38,326.
7. Expense Reductions.
FMR voluntarily agreed to reimburse each class to the extent annual operating expenses exceeded certain levels of average net assets as noted in the table below. Some expenses, for example interest expense, are excluded from this reimbursement.
Annual Report
Notes to Financial Statements - continued
7. Expense Reductions - continued
The following classes were in reimbursement during the period:
| Expense
Limitations | Reimbursement
from adviser |
Class A | 1.40% | $ 27,048 |
Class T | 1.65% | 7,760 |
Class B | 2.15% | 8,692 |
Class C | 2.15% | 14,182 |
| | $ 57,682 |
Many of the brokers with whom FMR places trades on behalf of the Fund provided services to the Fund in addition to trade execution. These services included payments of certain expenses on behalf of the Fund totaling $299,573 for the period. In addition, through arrangements with the Fund's custodian and each class' transfer agent, credits realized as a result of uninvested cash balances were used to reduce the Fund's expenses. During the period, these credits reduced the Fund's custody expenses by $7,938. During the period, credits reduced each class' transfer agent expense as noted in the table below.
| Transfer Agent
expense reduction |
Small Cap Value | $ 9,986 |
8. Other.
The Fund's organizational documents provide former and current trustees and officers with a limited indemnification against liabilities arising in connection with the performance of their duties to the Fund. In the normal course of business, the Fund may also enter into contracts that provide general indemnifications. The Fund's maximum exposure under these arrangements is unknown as this would be dependent on future claims that may be made against the Fund. The risk of material loss from such claims is considered remote.
Subsequent to fiscal year end, the Fund's transfer agent, Fidelity Investments Institutional Operations Company, Inc. (FIIOC), an affiliate of Fidelity Management & Research Company, notified the Fund that the fund's books and records did not reflect a conversion of certain Class B to Class A shares upon their conversion date. Management has determined that this did not have a material impact to the Fund's reported net assets or results of operations in the accompanying financial statements. FIIOC will cause the books and records of the fund to reflect a conversion of the relevant Class B shares to Class A and is in the process of determining the impact to affected shareholder accounts for purposes of its remediation.
Annual Report
9. Distributions to Shareholders.
Distributions to shareholders of each class were as follows:
Years ended July 31, | 2006 | 2005 A |
From net investment income | | |
Class A | $ - | $ 724 |
Small Cap Value | 627,853 | 68,438 |
Institutional Class | 5,184 | 433 |
Total | $ 633,037 | $ 69,595 |
From net realized gain | | |
Class A | $ 349,740 | $ - |
Class T | 411,098 | - |
Class B | 108,502 | - |
Class C | 314,711 | - |
Small Cap Value | 19,037,825 | - |
Institutional Class | 149,819 | - |
Total | $ 20,371,695 | $ - |
A For the period November 3, 2004 (commencement of operations) to July 31, 2005.
10. Share Transactions.
Transactions for each class of shares were as follows:
| Shares | Dollars |
Years ended July 31, | 2006 | 2005 A | 2006 | 2005 A |
Class A | | | | |
Shares sold | 2,792,696 | 750,692 | $ 37,292,766 | $ 8,523,912 |
Reinvestment of distributions | 23,154 | 54 | 292,886 | 590 |
Shares redeemed | (517,416) | (16,899) | (6,894,256) | (197,248) |
Net increase (decrease) | 2,298,434 | 733,847 | $ 30,691,396 | $ 8,327,254 |
Class T | | | | |
Shares sold | 2,906,186 | 1,010,520 | $ 38,920,414 | $ 11,960,654 |
Reinvestment of distributions | 20,934 | - | 264,080 | - |
Shares redeemed | (461,271) | (14,888) | (6,059,837) | (175,516) |
Net increase (decrease) | 2,465,849 | 995,632 | $ 33,124,657 | $ 11,785,138 |
Class B | | | | |
Shares sold | 646,292 | 314,195 | $ 8,494,362 | $ 3,487,462 |
Reinvestment of distributions | 7,808 | - | 98,271 | - |
Shares redeemed | (181,273) | (5,436) | (2,424,583) | (61,184) |
Net increase (decrease) | 472,827 | 308,759 | $ 6,168,050 | $ 3,426,278 |
Annual Report
Notes to Financial Statements - continued
10. Share Transactions - continued
| Shares | Dollars |
Years ended July 31, | 2006 | 2005 A | 2006 | 2005 A |
Class C | | | | |
Shares sold | 1,647,798 | 952,687 | $ 21,781,876 | $ 10,586,807 |
Reinvestment of distributions | 23,044 | - | 289,929 | - |
Shares redeemed | (542,172) | (31,551) | (7,009,701) | (363,557) |
Net increase (decrease) | 1,128,670 | 921,136 | $ 15,062,104 | $ 10,223,250 |
Small Cap Value | | | | |
Shares sold | 53,704,430 | 49,836,348 | $ 714,692,056 | $ 566,509,509 |
Reinvestment of distributions | 1,502,190 | 6,024 | 19,027,647 | 66,450 |
Shares redeemed | (28,179,009) | (4,432,148) | (367,110,557) | (50,921,377) |
Net increase (decrease) | 27,027,611 | 45,410,224 | $ 366,609,146 | $ 515,654,582 |
Institutional Class | | | | |
Shares sold | 585,637 | 315,268 | $ 7,784,992 | $ 3,439,515 |
Reinvestment of distributions | 4,421 | 39 | 56,037 | 433 |
Shares redeemed | (170,544) | (22,206) | (2,319,440) | (247,594) |
Net increase (decrease) | 419,514 | 293,101 | $ 5,521,589 | $ 3,192,354 |
A For the period November 3, 2004 (commencement of operations) to July 31, 2005.
Annual Report
Report of Independent Registered Public Accounting Firm
To the Trustees of Fidelity Securities Fund and the Shareholders of Fidelity Small Cap Value Fund:
In our opinion, the accompanying statement of assets and liabilities, including the schedule of investments, and the related statements of operations and of changes in net assets and the financial highlights present fairly, in all material respects, the financial position of Fidelity Small Cap Value Fund (a fund of Fidelity Securities Fund) at July 31, 2006, and the results of its operations for the year then ended, the changes in its net assets and the financial highlights for the periods indicated in conformity with accounting principles generally accepted in the United States of America. These financial statements and financial highlights (hereafter referred to as "financial statements") are the responsibility of the Fidelity Small Cap Value Fund's management; our responsibility is to express an opinion on these financial statements based on our audits. We conducted our audits of these financial statements in accordance with the standards of the Public Company Accounting Oversight Board (United States). Those standards require that we plan and perform the audit to obtain reasonable assurance about whether the financial statements are free of material misstatement. An audit includes examining, on a test basis, evidence supporting the amounts and disclosures in the financial statements, assessing the accounting principles used and significant estimates made by management, and evaluating the overall financial statement presentation. We believe that our audits, which included confirmation of securities at July 31, 2006 by correspondence with the custodian and brokers, provide a reasonable basis for our opinion.
/s/ PricewaterhouseCoopers LLP
PricewaterhouseCoopers LLP
Boston, Massachusetts
October 9, 2006
Annual Report
Trustees and Officers
The Trustees , Members of the Advisory Board, and executive officers of the trust and fund, as applicable, are listed below. The Board of Trustees governs the fund and is responsible for protecting the interests of shareholders. The Trustees are experienced executives who meet periodically throughout the year to oversee the fund's activities, review contractual arrangements with companies that provide services to the fund, and review the fund's performance. Except for William O. McCoy and Albert R. Gamper, Jr., each of the Trustees oversees 345 funds advised by FMR or an affiliate. Mr. McCoy oversees 347 funds advised by FMR or an affiliate. Mr. Gamper oversees 292 funds advised by FMR or an affiliate.
The Trustees hold office without limit in time except that (a) any Trustee may resign; (b) any Trustee may be removed by written instrument, signed by at least two-thirds of the number of Trustees prior to such removal; (c) any Trustee who requests to be retired or who has become incapacitated by illness or injury may be retired by written instrument signed by a majority of the other Trustees; and (d) any Trustee may be removed at any special meeting of shareholders by a two-thirds vote of the outstanding voting securities of the trust. Each Trustee who is not an interested person (as defined in the 1940 Act) (Independent Trustee), shall retire not later than the last day of the calendar year in which his or her 72nd birthday occurs. The Independent Trustees may waive this mandatory retirement age policy with respect to individual Trustees. The executive officers and Advisory Board Members hold office without limit in time, except that any officer and Advisory Board Member may resign or may be removed by a vote of a majority of the Trustees at any regular meeting or any special meeting of the Trustees. Except as indicated, each individual has held the office shown or other offices in the same company for the past five years.
The fund's Statement of Additional Information (SAI) includes more information about the Trustees. To request a free copy, call Fidelity at 1-877-208-0098.
Interested Trustees*:
Correspondence intended for each Trustee who is an interested person may be sent to Fidelity Investments, 82 Devonshire Street, Boston, Massachusetts 02109.
Name, Age; Principal Occupation |
Edward C. Johnson 3d (76) |
| Year of Election or Appointment: 1984 Mr. Johnson is Chairman of the Board of Trustees. Mr. Johnson serves as President (2006-present), Chief Executive Officer, Chairman, and a Director of FMR Corp.; Chairman and a Director of FMR; Chairman and a Director of Fidelity Research & Analysis Company (FRAC); Chairman and a Director of Fidelity Investments Money Management, Inc.; and Chairman (2001-present) and a Director (1999-present) of FMR Co., Inc. In addition, Mr. Johnson serves as Chairman and Director of Fidelity International Limited (FIL). |
Stephen P. Jonas (53) |
| Year of Election or Appointment: 2005 Mr. Jonas is Senior Vice President of the fund (2005-present). He also serves as Senior Vice President of other Fidelity funds (2005-present). Mr. Jonas is Executive Director of FMR (2005-present) and FMR Co., Inc. (2005-present). He also serves as a Director of Fidelity Investments Money Management, Inc. (2005-present) and FMR Corp. (2003-present). Previously, Mr. Jonas served as President of Fidelity Enterprise Operations and Risk Services (2004-2005), Chief Administrative Officer (2002-2004), and Chief Financial Officer of FMR Corp. (1998-2002). In addition, he serves on the Boards of Boston Ballet (2003-present) and Simmons College (2003-present). |
Robert L. Reynolds (54) |
| Year of Election or Appointment: 2003 Mr. Reynolds is President and a Director of FMR (2005-present), Fidelity Investments Money Management, Inc. (2005-present), and FMR Co., Inc. (2005-present). Mr. Reynolds also serves as a Director (2003-present) and Chief Operating Officer (2000-present) of FMR Corp. and a Director of Strategic Advisers, Inc. (2005-present). He also serves on the Board at Fidelity Investments Canada, Ltd. (2000-present). Previously, Mr. Reynolds served as President of Fidelity Investments Institutional Retirement Group (1996-2000). |
* Trustees have been determined to be "Interested Trustees" by virtue of, among other things, their affiliation with the trust or various entities under common control with FMR.
Annual Report
Independent Trustees:
Correspondence intended for each Independent Trustee (that is, the Trustees other than the Interested Trustees) may be sent to Fidelity Investments, P.O. Box 55235, Boston, Massachusetts 02205-5235.
Name, Age; Principal Occupation |
Dennis J. Dirks (58) |
| Year of Election or Appointment: 2005 Prior to his retirement in May 2003, Mr. Dirks was Chief Operating Officer and a member of the Board of The Depository Trust & Clearing Corporation (DTCC) (1999-2003). He also served as President, Chief Operating Officer, and Board member of The Depository Trust Company (DTC) (1999-2003) and President and Board member of the National Securities Clearing Corporation (NSCC) (1999-2003). In addition, Mr. Dirks served as Chief Executive Officer and Board member of the Government Securities Clearing Corporation (2001-2003) and Chief Executive Officer and Board member of the Mortgage-Backed Securities Clearing Corporation (2001-2003). Mr. Dirks also serves as a Trustee and a member of the Finance Committee of Manhattan College (2005-present) and a Trustee and a member of the Finance Committee of AHRC of Nassau County (2006-present). |
Albert R. Gamper, Jr. (64) |
| Year of Election or Appointment: 2006 Mr. Gamper also serves as a Trustee (2006-present) or Member of the Advisory Board (2005-present) of other investment companies advised by FMR. Prior to his retirement in December 2004, Mr. Gamper served as Chairman of the Board of CIT Group Inc. (commercial finance). During his tenure with CIT Group Inc. Mr. Gamper served in numerous senior management positions, including Chairman (1987-1989; 1999-2001; 2002-2004), Chief Executive Officer (1987-2004), and President (1989-2002). He currently serves as a member of the Board of Directors of Public Service Enterprise Group (utilities, 2001-present), Chairman of the Board of Governors, Rutgers University (2004-present), and Chairman of the Board of Saint Barnabas Health Care System. |
Robert M. Gates (62) |
| Year of Election or Appointment: 1997 Dr. Gates is Chairman of the Independent Trustees (2006-present). Dr. Gates is President of Texas A&M University (2002-present). He was Director of the Central Intelligence Agency (CIA) from 1991 to 1993. From 1989 to 1991, Dr. Gates served as Assistant to the President of the United States and Deputy National Security Advisor. Dr. Gates is a Director of NACCO Industries, Inc. (mining and manufacturing), Parker Drilling Co., Inc. (drilling and rental tools for the energy industry, 2001-present), and Brinker International (restaurant management, 2003-present). Previously, Dr. Gates served as a Director of LucasVarity PLC (automotive components and diesel engines), a Director of TRW Inc. (automotive, space, defense, and information technology), and Dean of the George Bush School of Government and Public Service at Texas A&M University (1999-2001). |
George H. Heilmeier (70) |
| Year of Election or Appointment: 2004 Dr. Heilmeier is Chairman Emeritus of Telcordia Technologies (communication software and systems), where prior to his retirement, he served as company Chairman and Chief Executive Officer. He currently serves on the Boards of Directors of The Mitre Corporation (systems engineering and information technology support for the government), and HRL Laboratories (private research and development, 2004-present). He is Chairman of the General Motors Science & Technology Advisory Board and a Life Fellow of the Institute of Electrical and Electronics Engineers (IEEE). Dr. Heilmeier is a member of the Defense Science Board and the National Security Agency Advisory Board. He is also a member of the National Academy of Engineering, the American Academy of Arts and Sciences, and the Board of Overseers of the School of Engineering and Applied Science of the University of Pennsylvania. Previously, Dr. Heilmeier served as a Director of TRW Inc. (automotive, space, defense, and information technology, 1992-2002), Compaq (1994-2002), Automatic Data Processing, Inc. (ADP) (technology-based business outsourcing, 1995-2002), INET Technologies Inc. (telecommunications network surveillance, 2001-2004), and Teletech Holdings (customer management services). He is the recipient of the 2005 Kyoto Prize in Advanced Technology for his invention of the liquid crystal display. |
Marie L. Knowles (59) |
| Year of Election or Appointment: 2001 Prior to Ms. Knowles' retirement in June 2000, she served as Executive Vice President and Chief Financial Officer of Atlantic Richfield Company (ARCO) (diversified energy, 1996-2000). From 1993 to 1996, she was a Senior Vice President of ARCO and President of ARCO Transportation Company. She served as a Director of ARCO from 1996 to 1998. She currently serves as a Director of Phelps Dodge Corporation (copper mining and manufacturing) and McKesson Corporation (healthcare service, 2002-present). Ms. Knowles is a Trustee of the Brookings Institution and the Catalina Island Conservancy and also serves as a member of the Advisory Board for the School of Engineering of the University of Southern California. |
Ned C. Lautenbach (62) |
| Year of Election or Appointment: 2000 Mr. Lautenbach has been a partner of Clayton, Dubilier & Rice, Inc. (private equity investment firm) since September 1998. Previously, Mr. Lautenbach was with the International Business Machines Corporation (IBM) from 1968 until his retirement in 1998. Mr. Lautenbach serves as a Director of Italtel Holding S.p.A. (telecommunications (Milan, Italy), 2004-present) and Eaton Corporation (diversified industrial) as well as the Philharmonic Center for the Arts in Naples, Florida. He also is a member of the Board of Trustees of Fairfield University (2005-present), as well as a member of the Council on Foreign Relations. |
William O. McCoy (72) |
| Year of Election or Appointment: 1997 Prior to his retirement in December 1994, Mr. McCoy was Vice Chairman of the Board of BellSouth Corporation (telecommunications) and President of BellSouth Enterprises. He is currently a Director of Duke Realty Corporation (real estate). He is also a partner of Franklin Street Partners (private investment management firm). In addition, Mr. McCoy served as the Interim Chancellor (1999-2000) and a member of the Board of Visitors for the University of North Carolina at Chapel Hill and currently serves as Chairman of the Board of Directors of the University of North Carolina Health Care System. He also served as Vice President of Finance for the University of North Carolina (16-school system). |
Cornelia M. Small (62) |
| Year of Election or Appointment: 2005 Ms. Small is a member (2000-present) and Chairperson (2002-present) of the Investment Committee, and a member (2002-present) of the Board of Trustees of Smith College. Previously, she served as Chief Investment Officer (1999-2000), Director of Global Equity Investments (1996-1999), and a member of the Board of Directors of Scudder, Stevens & Clark (1990-1997) and Scudder Kemper Investments (1997-1999). In addition, Ms. Small served as Co-Chair (2000-2003) of the Annual Fund for the Fletcher School of Law and Diplomacy. |
William S. Stavropoulos (67) |
| Year of Election or Appointment: 2002 Mr. Stavropoulos is Chairman Emeritus of the Board of Directors of The Dow Chemical Company. Since joining The Dow Chemical Company in 1967, Mr. Stavropoulos served in numerous senior management positions, including President (1993-2000; 2002-2003), CEO (1995-2000; 2002-2004), and Chairman of the Executive Committee (2000-2004). Currently, he is a Director of NCR Corporation (data warehousing and technology solutions), BellSouth Corporation (telecommunications), Chemical Financial Corporation, Maersk Inc. (industrial conglomerate, 2002-present), and Metalmark Capital (private equity investment firm, 2005-present). He also serves as a member of the Board of Trustees of the American Enterprise Institute for Public Policy Research. In addition, Mr. Stavropoulos is a member of The Business Council, J.P. Morgan International Council and the University of Notre Dame Advisory Council for the College of Science. |
Kenneth L. Wolfe (67) |
| Year of Election or Appointment: 2005 Prior to his retirement in 2001, Mr. Wolfe was Chairman and Chief Executive Officer of Hershey Foods Corporation (1993-2001). He currently serves as a member of the boards of Adelphia Communications Corporation (2003-present), Bausch & Lomb, Inc., and Revlon Inc. (2004-present). |
Annual Report
Advisory Board Members and Executive Officers:
Correspondence intended for Mr. Keyes may be sent to Fidelity Investments, P.O. Box 55235, Boston, Massachusetts 02205-5235. Correspondence intended for each executive officer and Mr. Lynch may be sent to Fidelity Investments, 82 Devonshire Street, Boston, Massachusetts 02109.
Name, Age; Principal Occupation |
James H. Keyes (65) |
| Year of Election or Appointment: 2006 Member of the Advisory Board of Fidelity Securities Fund. Prior to his retirement in 2003, Mr. Keyes was Chairman, President, and Chief Executive Officer of Johnson Controls, Inc. (automotive supplier, 1993-2003). He currently serves as a member of the boards of LSI Logic Corporation (semiconductor technologies, 1984-present), Navistar International Corporation (manufacture and sale of trucks, buses, and diesel engines, 2002-present), and Pitney Bowes, Inc. (integrated mail, messaging, and document management solutions, 1998-present). |
Peter S. Lynch (62) |
| Year of Election or Appointment: 2003 Member of the Advisory Board of Fidelity Securities Fund. Mr. Lynch is Vice Chairman and a Director of FMR, and Vice Chairman (2001-present) and a Director (1999-present) of FMR Co., Inc. Previously, Mr. Lynch served as a Trustee of the Fidelity funds (1990-2003). In addition, he serves as the Chairman of the Inner-City Scholarship Fund. |
Dwight D. Churchill (52) |
| Year of Election or Appointment: 2005 Vice President of the fund. Mr. Churchill also serves as Vice President of certain Equity Funds (2005-present) and certain High Income Funds (2005-present). Mr. Churchill is Executive Vice President of FMR (2005-present) and FMR Co., Inc. (2005-present). Previoulsy, Mr. Churchill served as Senior Vice President of Fidelity Investments Money Management, Inc. (2005-2006), Head of Fidelity's Fixed-Income Division (2000-2005), Vice President of Fidelity's Money Market Funds (2000-2005), Vice President of Fidelity's Bond Funds, and Senior Vice President of FMR. |
Bruce T. Herring (40) |
| Year of Election or Appointment: 2006 Vice President of the fund. Mr. Herring also serves as Vice President of certain Equity Funds (2006-present). Mr. Herring is Senior Vice President of FMR (2006-present) and Vice President of FMR Co., Inc. (2001-present). Previously, Mr. Herring served as Portfolio Manager for Fidelity U.S. Equity Funds (2001-2005). |
Eric D. Roiter (57) |
| Year of Election or Appointment: 2004 Secretary of the fund. He also serves as Secretary of other Fidelity funds; Vice President, General Counsel, and Secretary of FMR Co., Inc. (2001-present) and FMR; Assistant Secretary of Fidelity Management & Research (U.K.) Inc. (2001-present), Fidelity Research & Analysis Company (2001-present), and Fidelity Investments Money Management, Inc. (2001-present). Mr. Roiter is an Adjunct Member, Faculty of Law, at Boston College Law School (2003-present). Previously, Mr. Roiter served as Vice President and Secretary of Fidelity Distributors Corporation (FDC) (1998-2005). |
Stuart Fross (46) |
| Year of Election or Appointment: 2004 Assistant Secretary of the fund. Mr. Fross also serves as Assistant Secretary of other Fidelity funds (2003-present), Vice President and Secretary of FDC (2005-present), and is an employee of FMR. |
Christine Reynolds (47) |
| Year of Election or Appointment: 2004 President and Treasurer of the fund. Ms. Reynolds also serves as President and Treasurer of other Fidelity funds (2004-present) and is a Vice President (2003-present) and an employee (2002-present) of FMR. Before joining Fidelity Investments, Ms. Reynolds worked at PricewaterhouseCoopers LLP (PwC) (1980-2002), where she was most recently an audit partner with PwC's investment management practice. |
R. Stephen Ganis (40) |
| Year of Election or Appointment: 2006 Anti-Money Laundering (AML) officer of the fund. Mr. Ganis also serves as AML officer of other Fidelity funds (2006-present) and FMR Corp. (2003-present). Before joining Fidelity Investments, Mr. Ganis practiced law at Goodwin Procter, LLP (2000-2002). |
Joseph B. Hollis (58) |
| Year of Election or Appointment: 2006 Chief Financial Officer of the fund. Mr. Hollis also serves as Chief Financial Officer of other Fidelity funds. Mr. Hollis is President of Fidelity Pricing and Cash Management Services (FPCMS) (2005-present). Mr. Hollis also serves as President and Director of Fidelity Service Company, Inc. (2006-present). Previously, Mr. Hollis served as Senior Vice President of Cash Management Services (1999-2002) and Investment Management Operations (2002-2005). |
Kenneth A. Rathgeber (59) |
| Year of Election or Appointment: 2004 Chief Compliance Officer of the fund. Mr. Rathgeber also serves as Chief Compliance Officer of other Fidelity funds (2004-present) and Executive Vice President of Risk Oversight for Fidelity Investments (2002-present). He is Chief Compliance Officer of FMR (2005-present), FMR Co., Inc. (2005-present), Fidelity Management & Research (U.K.) Inc. (2005-present), Fidelity Research & Analysis Company (2005-present), Fidelity Investments Money Management, Inc. (2005-present), and Strategic Advisers, Inc. (2005-present). Previously, Mr. Rathgeber served as Executive Vice President and Chief Operating Officer for Fidelity Investments Institutional Services Company, Inc. (1998-2002). |
Bryan A. Mehrmann (45) |
| Year of Election or Appointment: 2005 Deputy Treasurer of the fund. Mr. Mehrmann also serves as Deputy Treasurer of other Fidelity funds (2005-present) and is an employee of FMR. Previously, Mr. Mehrmann served as Vice President of Fidelity Investments Institutional Services Group (FIIS)/Fidelity Investments Institutional Operations Corporation, Inc. (FIIOC) Client Services (1998-2004). |
Kimberley H. Monasterio (42) |
| Year of Election or Appointment: 2004 Deputy Treasurer of the fund. Ms. Monasterio also serves as Deputy Treasurer of other Fidelity funds (2004) and is an employee of FMR (2004). Before joining Fidelity Investments, Ms. Monasterio served as Treasurer (2000-2004) and Chief Financial Officer (2002-2004) of the Franklin Templeton Funds and Senior Vice President of Franklin Templeton Services, LLC (2000-2004). |
Kenneth B. Robins (36) |
| Year of Election or Appointment: 2005 Deputy Treasurer of the fund. Mr. Robins also serves as Deputy Treasurer of other Fidelity funds (2005-present) and is an employee of FMR (2004-present). Before joining Fidelity Investments, Mr. Robins worked at KPMG LLP, where he was a partner in KPMG's department of professional practice (2002-2004) and a Senior Manager (1999-2000). In addition, Mr. Robins served as Assistant Chief Accountant, United States Securities and Exchange Commission (2000-2002). |
Robert G. Byrnes (39) |
| Year of Election or Appointment: 2005 Assistant Treasurer of the fund. Mr. Byrnes also serves as Assistant Treasurer of other Fidelity funds (2005-present) and is an employee of FMR (2005-present). Previously, Mr. Byrnes served as Vice President of FPCMS (2003-2005). Before joining Fidelity Investments, Mr. Byrnes worked at Deutsche Asset Management where he served as Vice President of the Investment Operations Group (2000-2003). |
John H. Costello (59) |
| Year of Election or Appointment: 2004 Assistant Treasurer of the fund. Mr. Costello also serves as Assistant Treasurer of other Fidelity funds and is an employee of FMR. |
Peter L. Lydecker (52) |
| Year of Election or Appointment: 2004 Assistant Treasurer of the fund. Mr. Lydecker also serves as Assistant Treasurer of other Fidelity funds (2004) and is an employee of FMR. |
Mark Osterheld (51) |
| Year of Election or Appointment: 2004 Assistant Treasurer of the fund. Mr. Osterheld also serves as Assistant Treasurer of other Fidelity funds (2002) and is an employee of FMR. |
Gary W. Ryan (47) |
| Year of Election or Appointment: 2005 Assistant Treasurer of the fund. Mr. Ryan also serves as Assistant Treasurer of other Fidelity funds (2005-present) and is an employee of FMR (2005-present). Previously, Mr. Ryan served as Vice President of Fund Reporting in FPCMS (1999-2005). |
Salvatore Schiavone (40) |
| Year of Election or Appointment: 2005 Assistant Treasurer of the fund. Mr. Schiavone also serves as Assistant Treasurer of other Fidelity funds (2005-present) and is an employee of FMR (2005-present). Before joining Fidelity Investments, Mr. Schiavone worked at Deutsche Asset Management, where he most recently served as Assistant Treasurer (2003-2005) of the Scudder Funds and Vice President and Head of Fund Reporting (1996-2003). |
Annual Report
Distributions
The Board of Trustees of Advisor Small Cap Value Fund voted to pay on September 11, 2006, to shareholders of record at the opening of business on September 08, 2006, a distribution of $0.543 per share derived from capital gains realized from sales of portfolio securities.
The fund hereby designates as a capital gain dividend with respect to the taxable year ended July 31, 2006, $27,867,547, or, if subsequently determined to be different, the net capital gain of such year.
The fund designates 5% and 31% of the dividends distributed in September and December, respectively during the fiscal year as qualifying for the dividends-received deduction for corporate shareholders.
The fund designates 7% and 36% of the dividends distributed in September and December, respectively during the fiscal year as amounts which may be taken into account as a dividend for the purposes of the maximum rate under section 1(h)(11) of the Internal Revenue Code.
The fund will notify shareholders in January 2007 of amounts for use in preparing 2006 income tax returns.
Annual Report
Proxy Voting Results
A special meeting of the funds' shareholders was held on May 17, 2006. The results of votes taken among shareholders on the proposal before them are reported below. Each vote reported represents one dollar of net asset value held on the record date for the meeting.
PROPOSAL 1 |
To elect a Board of Trustees. A |
| # of
Votes | % of
Votes |
Dennis J. Dirks |
Affirmative | 43,119,905,166.54 | 95.455 |
Withheld | 2,053,001,967.67 | 4.545 |
TOTAL | 45,172,907,134.21 | 100.000 |
Albert R. Gamper, Jr. |
Affirmative | 43,068,780,128.62 | 95.342 |
Withheld | 2,104,127,005.59 | 4.658 |
TOTAL | 45,172,907,134.21 | 100.000 |
Robert M. Gates |
Affirmative | 43,032,117,662.60 | 95.261 |
Withheld | 2,140,789,471.61 | 4.739 |
TOTAL | 45,172,907,134.21 | 100.000 |
George H. Heilmeier |
Affirmative | 43,023,368,882.30 | 95.242 |
Withheld | 2,149,538,251.91 | 4.758 |
TOTAL | 45,172,907,134.21 | 100.000 |
Edward C. Johnson 3d |
Affirmative | 42,881,915,819.70 | 94.928 |
Withheld | 2,290,991,314.51 | 5.072 |
TOTAL | 45,172,907,134.21 | 100.000 |
Stephen P. Jonas |
Affirmative | 43,081,912,066.37 | 95.371 |
Withheld | 2,090,995,067.84 | 4.629 |
TOTAL | 45,172,907,134.21 | 100.000 |
James H. KeyesB |
Affirmative | 43,049,050,093.79 | 95.298 |
Withheld | 2,123,857,040.42 | 4.702 |
TOTAL | 45,172,907,134.21 | 100.000 |
Marie L. Knowles |
Affirmative | 43,090,434,696.02 | 95.390 |
Withheld | 2,082,472,438.19 | 4.610 |
TOTAL | 45,172,907,134.21 | 100.000 |
| # of
Votes | % of
Votes |
Ned C. Lautenbach |
Affirmative | 43,082,185,255.05 | 95.372 |
Withheld | 2,090,721,879.16 | 4.628 |
TOTAL | 45,172,907,134.21 | 100.000 |
William O. McCoy |
Affirmative | 42,960,162,066.32 | 95.102 |
Withheld | 2,212,745,067.89 | 4.898 |
TOTAL | 45,172,907,134.21 | 100.000 |
Robert L. Reynolds |
Affirmative | 43,087,560,419.66 | 95.384 |
Withheld | 2,085,346,714.55 | 4.616 |
TOTAL | 45,172,907,134.21 | 100.000 |
Cornelia M. Small |
Affirmative | 43,092,070,014.53 | 95.394 |
Withheld | 2,080,837,119.68 | 4.606 |
TOTAL | 45,172,907,134.21 | 100.000 |
William S. Stavropoulos |
Affirmative | 43,002,032,676.43 | 95.194 |
Withheld | 2,170,874,457.78 | 4.806 |
TOTAL | 45,172,907,134.21 | 100.000 |
Kenneth L. Wolfe |
Affirmative | 43,047,241,852.81 | 95.294 |
Withheld | 2,125,665,281.40 | 4.706 |
TOTAL | 45,172,907,134.21 | 100.000 |
A Denotes trust-wide proposal and voting results. B Effective on or about January 1, 2007. |
Annual Report
Board Approval of Investment Advisory Contracts and Management Fees
Fidelity Small Cap Value Fund
Each year, typically in July, the Board of Trustees, including the Independent Trustees (together, the Board), votes on the renewal of the management contract and sub-advisory agreements (together, the Advisory Contracts) for the fund. The Board, assisted by the advice of fund counsel and Independent Trustees' counsel, requests and considers a broad range of information throughout the year.
The Board meets regularly each month except August and takes into account throughout the year matters bearing on Advisory Contracts. The Board, acting directly and through its separate committees, considers at each of its meetings factors that are relevant to the annual renewal of the fund's Advisory Contracts, including the services and support provided to the fund and its shareholders. At the time of the renewal, the Board had 12 standing committees, each composed of Independent Trustees with varying backgrounds, to which the Board has assigned specific subject matter responsibilities in order to enhance effective decision-making by the Board. Each committee has adopted a written charter outlining the structure and purposes of the committee. One such committee, the Equity Contract Committee, meets periodically as needed throughout the year to consider matters specifically related to the annual renewal of Advisory Contracts. The committee requests and receives information on, and makes recommendations to the Independent Trustees concerning, the approval and annual review of the Advisory Contracts.
At its July 2006 meeting, the Board of Trustees, including the Independent Trustees, unanimously determined to renew the Advisory Contracts for the fund. In reaching its determination, the Board considered all factors it believed relevant, including (i) the nature, extent, and quality of the services to be provided to the fund and its shareholders (including the investment performance of the fund); (ii) the competitiveness of the management fee and total expenses of the fund; (iii) the total costs of the services to be provided by and the profits to be realized by the investment adviser and its affiliates from the relationship with the fund; (iv) the extent to which economies of scale would be realized as the fund grows; and (v) whether fee levels reflect these economies of scale, if any, for the benefit of fund shareholders.
In determining whether to renew the Advisory Contracts for the fund, the Board ultimately reached a determination, with the assistance of fund counsel and Independent Trustees' counsel, that the renewal of the Advisory Contracts and the compensation to be received by Fidelity under the management contract is consistent with Fidelity's fiduciary duty under applicable law. In addition to evaluating the specific factors noted above, the Board, in reaching its determination, is aware that shareholders in the fund have a broad range of investment choices available to them, including a wide choice among mutual funds offered by competitors to Fidelity, and that the fund's shareholders, with the opportunity to review and weigh the disclosure provided by the fund in its prospectus and other public disclosures, have chosen to invest in this fund, managed by Fidelity.
Annual Report
Nature, Extent, and Quality of Services Provided. The Board considered staffing within the investment adviser, FMR, and the sub-advisers (together, the Investment Advisers), including the background of the fund's portfolio manager and the fund's investment objective and discipline. The Independent Trustees also had discussions with senior management of Fidelity's investment operations and investment groups. The Board considered the structure of the portfolio manager compensation program and whether this structure provides appropriate incentives.
Resources Dedicated to Investment Management and Support Services. The Board reviewed the size, education, and experience of the Investment Advisers' investment staff, their use of technology, and the Investment Advisers' approach to recruiting, training, and retaining portfolio managers and other research, advisory, and management personnel. The Board considered Fidelity's extensive global research capabilities that enable the Investment Advisers to aggregate data from various sources in an effort to produce positive investment results. The Board noted that Fidelity's analysts have access to a variety of technological tools that enable them to perform both fundamental and quantitative analysis and to specialize in various disciplines. The Board also considered that Fidelity's portfolio managers and analysts have access to daily portfolio attribution that allows for monitoring of a fund's portfolio, as well as an electronic communication system that provides immediate real-time access to research concerning issuers and credit enhancers.
Shareholder and Administrative Services. The Board considered (i) the nature, extent, quality, and cost of administrative, distribution, and shareholder services performed by the Investment Advisers and their affiliates under the Advisory Contracts and under separate agreements covering transfer agency, pricing and bookkeeping, and securities lending services for the fund; (ii) the nature and extent of the Investment Advisers' supervision of third party service providers, principally custodians and subcustodians; and (iii) the resources devoted to, and the record of compliance with, the fund's compliance policies and procedures. The Board reviewed the allocation of fund brokerage, including allocations to brokers affiliated with the Investment Advisers, the use of brokerage commissions to pay fund expenses, and the use of "soft" commission dollars to pay for research services. The Board also considered that Fidelity voluntarily pays for market data out of its own resources.
The Board noted that the growth of fund assets across the complex allows Fidelity to reinvest in the development of services designed to enhance the value or convenience of the Fidelity funds as investment vehicles. These services include 24-hour access to account information and market information through phone representatives and over the Internet, and investor education materials and asset allocation tools.
Annual Report
Board Approval of Investment Advisory Contracts and
Management Fees - continued
Investment in a Large Fund Family. The Board considered the benefits to shareholders of investing in a Fidelity fund, including the benefits of investing in a fund that is part of a large family of funds offering a variety of investment disciplines and providing for a large variety of mutual fund investor services. For example, fund shareholders are offered the privilege of exchanging shares of the fund for shares of other Fidelity funds, as set forth in the fund's prospectus, without paying an additional sales charge. The Board noted that, since the last Advisory Contract renewals in July 2005, Fidelity has taken a number of actions that benefited particular funds, including (i) dedicating additional resources to investment research and to restructure the investment research teams; (ii) voluntarily entering into contractual arrangements with certain brokers pursuant to which Fidelity pays for research products and services separately out of its own resources, rather than bundling with fund commissions; (iii) launching the Fidelity Advantage Class of its five Spartan stock index funds and three Spartan bond index funds, which is a lower-fee class available to shareholders with higher account balances; (iv) contractually agreeing to impose expense limitations on Fidelity U.S. Bond Index Fund and reducing the fund's initial investment minimum; and (v) offering shareholders of each of the Fidelity Institutional Money Market Funds the privilege of exchanging shares of the fund for shares of other Fidelity funds.
Investment Performance and Compliance. The Board considered whether the fund has operated within its investment objective, as well as its record of compliance with its investment restrictions. It also reviewed the fund's absolute investment performance for each class, as well as the fund's relative investment performance for each class measured against (i) a broad-based securities market index, and (ii) a peer group of mutual funds deemed appropriate by the Board. Because the fund had been in existence less than three calendar years, the following chart considered by the Board shows, for the one-year period ended December 31, 2005, the total returns of Class C and Fidelity Small Cap Value (retail class), the total return of a broad-based securities market index ("benchmark"), and a range of total returns of a peer group of mutual funds identified by Lipper Inc. as having an investment objective similar to that of the fund. The returns of Class C and Fidelity Small Cap Value (retail class) represent the performance of classes with the highest and lowest 12b-1 fees, respectively (not necessarily with the highest and lowest total expenses). The box within the chart shows the 25th percentile return (bottom of box) and the 75th percentile return (top of box) of the Lipper peer group. Returns shown above the box are in the first quartile and returns shown below the box are in the fourth quartile. The percentage beaten numbers noted below the chart correspond to the percentile box and represent the percentage of funds in the Lipper peer group whose performance was equal to or lower than that of the class indicated.
Annual Report
Fidelity Small Cap Value Fund

The Board reviewed the fund's relative investment performance against its Lipper peer group and stated that the performance of Fidelity Small Cap Value (retail class) was in the first quartile for the period shown. The Board also stated that the relative investment performance of Fidelity Small Cap Value (retail class) compared favorably to its benchmark for the period shown. The Board considered that the variations in performance among the fund's classes reflect the variations in class expenses, which result in lower performance for higher expense classes. The Board stated that it is difficult to evaluate in any comprehensive fashion the performance of the fund, in light of its relatively recent launch. The Board also reviewed the fund's relative investment performance against a peer group defined by Morningstar.
The Board also considered that the fund's management fee is subject to upward or downward adjustment depending upon whether, and to what extent, the fund's investment performance for the performance period exceeds, or is exceeded by, the record (over the same period) of a Board-approved performance adjustment index. The Board realizes that the performance adjustment provides FMR with a strong economic incentive to seek to achieve superior performance for the fund's shareholders and helps to more closely align the interests of FMR and the fund's shareholders.
The Board considered that FMR has taken steps to refocus and strengthen equity research, equity portfolio management, and compliance. The Board noted with favor FMR's reorganization of its senior management team in 2005 and FMR's dedication of additional resources to investment research, and participated in the process that led to those changes.
Annual Report
Board Approval of Investment Advisory Contracts and
Management Fees - continued
Based on its review, and giving particular weight to the nature and quality of the resources dedicated by the Investment Advisers to maintain and improve relative performance, the Board concluded that the nature, extent, and quality of the services provided to the fund will benefit the fund's shareholders, particularly in light of the Board's view that the fund's shareholders benefit from investing in a fund that is part of a large family of funds offering a variety of investment disciplines and services.
Competitiveness of Management Fee and Total Fund Expenses. The Board considered the fund's management fee and total expenses compared to "mapped groups" of competitive funds and classes. Fidelity creates "mapped groups" by combining similar Lipper investment objective categories that have comparable management fee characteristics. Combining Lipper investment objective categories aids the Board's management fee and total expense comparisons by broadening the competitive group used for comparison and by reducing the number of universes to which various Fidelity funds are compared.
The Board considered two proprietary management fee comparisons for the 12-month (or shorter) periods shown in the chart below. The group of Lipper funds used by the Board for management fee comparisons is referred to below as the "Total Mapped Group" and, for the reasons explained above, is broader than the Lipper peer group used by the Board for performance comparisons. The Total Mapped Group comparison focuses on a fund's standing relative to the total universe of comparable funds available to investors, in terms of gross management fees before expense reimbursements or caps, and without giving effect to the fund's performance adjustment. "TMG %" represents the percentage of funds in the Total Mapped Group that had management fees that were lower than the fund's. For example, a TMG % of 13% means that 87% of the funds in the Total Mapped Group had higher management fees than the fund. The "Asset-Size Peer Group" (ASPG) comparison focuses on a fund's standing relative to non-Fidelity funds similar in size to the fund within the Total Mapped Group. The ASPG represents at least 15% of the funds in the Total Mapped Group with comparable asset size and management fee characteristics, subject to a minimum of 50 funds (or all funds in the Total Mapped Group if fewer than 50). Additional information, such as the ASPG quartile in which the fund's management fee ranked and the impact of the fund's performance adjustment, is also included in the chart and considered by the Board.
Annual Report
Fidelity Small Cap Value Fund

The Board noted that the fund's management fee ranked below the median of its Total Mapped Group and below the median of its ASPG for 2005. The Board also noted the effect of the fund's positive performance adjustment on the fund's management fee ranking.
Based on its review, the Board concluded that the fund's management fee was fair and reasonable in light of the services that the fund receives and the other factors considered.
In its review of each class's total expenses, the Board considered the fund's management fee as well as other fund or class expenses, as applicable, such as transfer agent fees, pricing and bookkeeping fees, fund-paid 12b-1 fees, and custodial, legal, and audit fees. The Board also noted the effects of any waivers and reimbursements on fees and expenses, as well as the fund's positive performance adjustment. As part of its review, the Board also considered current and historical total expenses of each class of the fund compared to competitive fund median expenses. Each class of the fund is compared to those funds and classes in the Total Mapped Group (used by the Board for management fee comparisons) that have a similar sales load structure.
The Board noted that the total expenses of each of Class A, Institutional Class, and Fidelity Small Cap Value (retail class) ranked below its competitive median for 2005, the total expenses of Class C ranked equal to its competitive median for 2005, and the total expenses of each of Class B and Class T ranked above its competitive median for 2005. The Board considered that Class B was above median because of relatively high transfer agent fees resulting from small average account sizes. The Board noted that the fund offers multiple classes, each of which has a different sales load and 12b-1 fee structure, and that the multiple structures are intended to offer a range of pricing options for the intermediary market. The Board also noted that the total expenses of the classes vary primarily by the level of their 12b-1 fees, although differences in transfer agent fees may also cause expenses to vary from class to class.
Annual Report
Board Approval of Investment Advisory Contracts and
Management Fees - continued
In its review of total expenses, the Board also considered Fidelity fee structures and other information on clients that FMR and its affiliates service in other competitive markets, such as other mutual funds advised or subadvised by FMR or its affiliates, pension plan clients, and other institutional clients.
Based on its review, the Board concluded that the total expenses of each class of the fund were reasonable, although in some cases above the median of the universe presented for comparison, in light of the services that the fund and its shareholders receive and the other factors considered.
Costs of the Services and Profitability. The Board considered the revenues earned and the expenses incurred by Fidelity in conducting the business of developing, marketing, distributing, managing, administering and servicing the fund and its shareholders. The Board also considered the level of Fidelity's profits in respect of all the Fidelity funds.
On an annual basis, FMR presents to the Board Fidelity's profitability for the fund. Fidelity calculates the profitability for each fund, as well as aggregate profitability for groups of Fidelity funds and all Fidelity funds, using a series of detailed revenue and cost allocation methodologies which originate with the audited books and records of Fidelity. The Audit Committee of the Board reviews any significant changes from the prior year's methodologies.
PricewaterhouseCoopers LLP (PwC), independent registered accounting firm and auditor to Fidelity and certain Fidelity funds, has been engaged annually by the Board as part of the Board's assessment of the results of Fidelity's profitability analysis. PwC's engagement includes the review and assessment of Fidelity's methodologies used in determining the revenues and expenses attributable to Fidelity's mutual fund business, and completion of agreed-upon procedures surrounding the mathematical accuracy of fund profitability and its conformity to allocation methodologies. After considering PwC's reports issued under the engagement and information provided by Fidelity, the Board believes that while other allocation methods may also be reasonable, Fidelity's profitability methodologies are reasonable in all material respects.
The Board has also reviewed Fidelity's non-fund businesses and any fall-out benefits related to the mutual fund business as well as cases where Fidelity's affiliates may benefit from or be related to the fund's business.
Annual Report
The Board considered the costs of the services provided by and the profits realized by Fidelity in connection with the operation of the fund and determined that the amount of profit is a fair entrepreneurial profit for the management of the fund.
Economies of Scale. The Board considered whether there have been economies of scale in respect of the management of the Fidelity funds, whether the Fidelity funds (including the fund) have appropriately benefited from any such economies of scale, and whether there is potential for realization of any further economies of scale. The Board considered the extent to which the fund will benefit from economies of scale through increased services to the fund, through waivers or reimbursements, or through fee or expense reductions, including reductions that occur through operation of the transfer agent agreement. The transfer agent fee varies in part based on the number of accounts in the fund. If the number of accounts decreases or the average account size increases, the overall transfer agent fee rate decreases.
The Board recognized that the fund's management contract incorporates a "group fee" structure, which provides for lower fee rates as total fund assets under FMR's management increase, and for higher fee rates as total fund assets under FMR's management decrease. The Board considered that the group fee is designed to deliver the benefits of economies of scale to fund shareholders when total fund assets increase, even if assets of any particular fund are unchanged or have declined, because some portion of Fidelity's costs are attributable to services provided to all Fidelity funds, and all funds benefit if those costs can be allocated among more assets. The Board concluded that, given the group fee structure, fund shareholders will achieve a certain level of economies of scale as assets under FMR's management increase at the fund complex level, regardless of whether Fidelity achieves any such economies of scale.
The Board further concluded that any potential economies of scale are being shared between fund shareholders and Fidelity in an appropriate manner.
Additional Information Requested by the Board. In order to develop fully the factual basis for consideration of the Advisory Contracts, the Board requested additional information on several topics, including (i) Fidelity's fund profitability methodology and profitability trends within certain funds; (ii) portfolio manager compensation; (iii) the extent to which any economies of scale exist and are shared between the funds and Fidelity; (iv) the total expenses of certain funds and classes relative to competitors, including the extent to which the expenses of certain funds have been or could be capped; (v) fund performance trends; and (vi) Fidelity's fee structures, including use of performance fees.
Based on its evaluation of all of the conclusions noted above, and after considering all material factors, the Board ultimately concluded that the advisory fee structures are fair and reasonable, and that the fund's Advisory Contracts should be renewed.
Annual Report
Annual Report
Annual Report
Annual Report
Annual Report
Investment Adviser
Fidelity Management & Research Company
Boston, MA
Investment Sub-Advisers
FMR Co., Inc.
Fidelity Management & Research
(U.K.) Inc.
Fidelity Research & Analysis Company
(formerly Fidelity Management &
Research (Far East) Inc.)
Fidelity International Investment Advisors
Fidelity Investments Japan Limited
Fidelity International Investment Advisors (U.K.) Limited
General Distributor
Fidelity Distributors Corporation
Boston, MA
Transfer and Service Agents
Fidelity Investments Institutional
Operations Company, Inc.
Boston, MA
Fidelity Service Company, Inc.
Boston, MA
Custodian
Citibank, N.A.
New York, NY
ASCVI-UANN-0906
1.803743.101
(Fidelity Investment logo)(registered trademark)
Item 2. Code of Ethics
As of the end of the period, July 31, 2006, Fidelity Securities Fund (the trust) has adopted a code of ethics, as defined in Item 2 of Form N-CSR, that applies to its President and Treasurer and its Chief Financial Officer. A copy of the code of ethics is filed as an exhibit to this Form N-CSR.
Item 3. Audit Committee Financial Expert
The Board of Trustees of the trust has determined that Marie L. Knowles is an audit committee financial expert, as defined in Item 3 of Form N-CSR. Ms. Knowles is independent for purposes of Item 3 of Form N-CSR.
Item 4. Principal Accountant Fees and Services
(a) Audit Fees.
For the fiscal years ended July 31, 2006 and July 31, 2005, the aggregate Audit Fees billed by PricewaterhouseCoopers LLP (PwC) for professional services rendered for the audits of the financial statements, or services that are normally provided in connection with statutory and regulatory filings or engagements for those fiscal years, for Fidelity Small Cap Growth Fund and Fidelity Small Cap Value Fund (the Funds) and for all funds in the Fidelity Group of Funds are shown in the table below.
Fund | 2006A | 2005A,B,C |
Fidelity Small Cap Growth Fund | $37,000 | $27,000 |
Fidelity Small Cap Value Fund | $38,000 | $27,000 |
All funds in the Fidelity Group of Funds audited by PwC | $12,800,000 | $11,600,000 |
A | Aggregate amounts may reflect rounding. |
B | Fidelity Small Cap Growth Fund commenced operations on November 3, 2004. |
C | Fidelity Small Cap Value Fund commenced operations on November 3, 2004. |
(b) Audit-Related Fees.
In each of the fiscal years ended July 31, 2006 and July 31, 2005, the aggregate Audit-Related Fees billed by PwC for services rendered for assurance and related services to each Fund that are reasonably related to the performance of the audit or review of the Fund's financial statements, but not reported as Audit Fees, are shown in the table below.
Fund | 2006A | 2005 A,B,C |
Fidelity Small Cap Growth Fund | $0 | $0 |
Fidelity Small Cap Value Fund | $0 | $0 |
A | Aggregate amounts may reflect rounding. |
B | Fidelity Small Cap Growth Fund commenced operations on November 3, 2004. |
C | Fidelity Small Cap Value Fund commenced operations on November 3, 2004. |
In each of the fiscal years ended July 31, 2006 and July 31, 2005, the aggregate Audit-Related Fees that were billed by PwC that were required to be approved by the Audit Committee for services rendered on behalf of Fidelity Management & Research Company (FMR) and entities controlling, controlled by, or under common control with FMR (not including any sub-adviser whose role is primarily portfolio management and is subcontracted with or overseen by another investment adviser) that provide ongoing services to the Funds ("Fund Service Providers") for assurance and related services that relate directly to the operations and financial reporting of each Fund that are reasonably related to the performance of the audit or review of the Fund's financial statements, but not reported as Audit Fees, are shown in the table below.
Billed By | 2006 A | 2005A |
PwC | $0 | $0 |
A | Aggregate amounts may reflect rounding. |
Fees included in the audit-related category comprise assurance and related services (e.g., due diligence services) that are traditionally performed by the independent registered public accounting firm. These audit-related services include due diligence related to mergers and acquisitions, accounting consultations and audits in connection with acquisitions, internal control reviews, attest services that are not required by statute or regulation and consultation concerning financial accounting and reporting standards.
(c) Tax Fees.
In each of the fiscal years ended July 31, 2006 and July 31, 2005, the aggregate Tax Fees billed by PwC for professional services rendered for tax compliance, tax advice, and tax planning for each Fund is shown in the table below.
Fund | 2006A | 2005A,B,C |
Fidelity Small Cap Growth Fund | $2,700 | $2,400 |
Fidelity Small Cap Value Fund | $2,700 | $2,400 |
A | Aggregate amounts may reflect rounding. |
B | Fidelity Small Cap Growth Fund commenced operations on November 3, 2004. |
C | Fidelity Small Cap Value Fund commenced operations on November 3, 2004. |
In each of the fiscal years ended July 31, 2006 and July 31, 2005, the aggregate Tax Fees billed by PwC that were required to be approved by the Audit Committee for professional services rendered on behalf of the Fund Service Providers for tax compliance, tax advice, and tax planning that relate directly to the operations and financial reporting of each Fund is shown in the table below.
Billed By | 2006A | 2005A |
PwC | $0 | $0 |
A | Aggregate amounts may reflect rounding. |
Fees included in the Tax Fees category comprise all services performed by professional staff in the independent registered public accounting firm's tax division except those services related to the audit. Typically, this category would include fees for tax compliance, tax planning, and tax advice. Tax compliance, tax advice, and tax planning services include preparation of original and amended tax returns, claims for refund and tax payment-planning services, assistance with tax audits and appeals, tax advice related to mergers and acquisitions and requests for rulings or technical advice from taxing authorities.
(d) All Other Fees.
In each of the fiscal years ended July 31, 2006 and July 31, 2005, the aggregate Other Fees billed by PwC for all other non-audit services rendered to the Funds is shown in the table below.
Fund | 2006 | 2005A,B,C |
Fidelity Small Cap Growth Fund | $1,700 | $1,000 |
Fidelity Small Cap Value Fund | $2,100 | $1,100 |
A | Aggregate amounts may reflect rounding. |
B | Fidelity Small Cap Growth Fund commenced operations on November 3, 2004. |
C | Fidelity Small Cap Value Fund commenced operations on November 3, 2004. |
In each of the fiscal years ended July 31, 2006 and July 31, 2005, the aggregate Other Fees billed by PwC that were required to be approved by the Audit Committee for all other non-audit services rendered on behalf of the Fund Service Providers that relate directly to the operations and financial reporting of each Fund is shown in the table below.
Billed By | 2006A | 2005A |
PwC | $155,000 | $280,000 |
A | Aggregate amounts may reflect rounding. |
Fees included in the All Other Fees category include services related to internal control reviews, strategy and other consulting, financial information systems design and implementation, consulting on other information systems, and other tax services unrelated to the Fund.
(e) (1) | Audit Committee Pre-Approval Policies and Procedures: |
The trust's Audit Committee must pre-approve all audit and non-audit services provided by the independent registered public accounting firm relating to the operations or financial reporting of the funds. Prior to the commencement of any audit or non-audit services to a fund, the Audit Committee reviews the services to determine whether they are appropriate and permissible under applicable law.
The trust's Audit Committee has adopted policies and procedures to, among other purposes, provide a framework for the Committee's consideration of non-audit services by the audit firms that audit the Fidelity funds. The policies and procedures require that any non-audit service provided by a fund audit firm to a Fidelity Fund and any non-audit service provided by a fund auditor to a Fund Service Provider that relates directly to the operations and financial reporting of a Fidelity fund (Covered Service) are subject to approval by the Audit Committee before such service is provided. Non-audit services provided by a fund audit firm for a Fund Service Provider that do not relate directly to the operations and financial reporting of a Fidelity fund (Non-Covered Service) but that are expected to exceed $50,000 are also subject to pre-approval by the Audit Committee.
All Covered Services, as well as Non-Covered Services that are expected to exceed $50,000, must be approved in advance of provision of the service either: (i) by formal resolution of the Audit Committee, or (ii) by oral or written approval of the service by the Chair of the Audit Committee (or if the Chair is unavailable, such other member of the Audit Committee as may be designated by the Chair to act in the Chair's absence). The approval contemplated by (ii) above is permitted where the Treasurer determines that action on such an engagement is necessary before the next meeting of the Audit Committee. Neither pre-approval nor advance notice of Non-Covered Service engagements for which fees are not expected to exceed $50,000 is required; such engagements are to be reported to the Audit Committee monthly.
(e) (2) | Services approved pursuant to paragraph (c)(7)(i)(C) of Rule 2-01 of Regulation S-X: |
Audit-Related Fees:
There were no amounts that were approved by the Audit Committee pursuant to the de minimis exception for the fiscal years ended July 31, 2006 and July 31, 2005 on behalf of each fund.
There were no amounts that were required to be approved by the Audit Committee pursuant to the de minimis exception for the fiscal years ended July 31, 2006 and July 31, 2005 on behalf of the Fund Service Providers that relate directly to the operations and financial reporting of each Fund.
Tax Fees:
There were no amounts that were approved by the Audit Committee pursuant to the de minimis exception for the fiscal years ended July 31, 2006 and July 31, 2005 on behalf of each Fund.
There were no amounts that were required to be approved by the Audit Committee pursuant to the de minimis exception for the fiscal years ended July 31, 2006 and July 31, 2005 on behalf of the Fund Service Providers that relate directly to the operations and financial reporting of each Fund.
All Other Fees:
There were no amounts that were approved by the Audit Committee pursuant to the de minimis exception for the fiscal years ended July 31, 2006 and July 31, 2005 on behalf of each Fund.
There were no amounts that were required to be approved by the Audit Committee pursuant to the de minimis exception for the fiscal years ended July 31, 2006 and July 31, 2005 on behalf of the Fund Service Providers that relate directly to the operations and financial reporting of each Fund.
(f) Not applicable.
(g) For the fiscal years ended July 31, 2006 and July 31, 2005, the aggregate fees billed by PwC of $1,165,000A and $1,400,000A,B for non-audit services rendered on behalf of the Funds, FMR (not including any sub-adviser whose role is primarily portfolio management and is subcontracted with or overseen by another investment adviser) and Fund Service Providers relating to Covered Services and Non-Covered Services are shown in the table below.
| 2006A | 2005A |
Covered Services | $165,000 | $300,000 |
Non-Covered Services | $1,000,000 | $1,100,000 B |
A | Aggregate amounts may reflect rounding. |
B | Reflects current period presentation. |
(h) The trust's Audit Committee has considered Non-Covered Services that were not pre-approved that were provided by PwC to Fund Service Providers to be compatible with maintaining the independence of PwC in its audit of the Funds, taking into account representations from PwC, in accordance with Independence Standards Board Standard No.1, regarding its independence from the Funds and their related entities.
Item 5. Audit Committee of Listed Registrants
Not applicable.
Item 6. Schedule of Investments
Not applicable.
Item 7. Disclosure of Proxy Voting Policies and Procedures for Closed-End Management Investment Companies
Not applicable.
Item 8. Portfolio Managers of Closed-End Management Investment Companies
Not applicable.
Item 9. Purchase of Equity Securities by Closed-End Management Investment Company and Affiliated Purchasers
Not applicable.
Item 10. Submission of Matters to a Vote of Security Holders
There were no material changes to the procedures by which shareholders may recommend nominees to the Board of Trustees.
Item 11. Controls and Procedures
(a)(i) The President and Treasurer and the Chief Financial Officer have concluded that the disclosure controls and procedures (as defined in Rule 30a-3(c) under the Investment Company Act) for each Fund provide reasonable assurances that material information relating to such Fund is made known to them by the appropriate persons, based on their evaluation of these controls and procedures as of a date within 90 days of the filing date of this report.
(a)(ii) There was no change in a Fund's internal control over financial reporting (as defined in Rule 30a-3(d) under the Investment Company Act) that occurred during the second fiscal quarter of the period covered by this report that has materially affected, or is reasonably likely to materially affect, a Fund's internal control over financial reporting.
Item 12. Exhibits
(a) | (1) | Code of Ethics pursuant to Item 2 of Form N-CSR is filed and attached hereto as EX-99.CODE ETH. |
(a) | (2) | Certification pursuant to Rule 30a-2(a) under the Investment Company Act of 1940 (17 CFR 270.30a-2(a)) is filed and attached hereto as Exhibit 99.CERT. |
(a) | (3) | Not applicable. |
(b) | | Certification pursuant to Rule 30a-2(b) under the Investment Company Act of 1940 (17 CFR 270.30a-2(b)) is furnished and attached hereto as Exhibit 99.906CERT. |
SIGNATURES
Pursuant to the requirements of the Securities Exchange Act of 1934 and the Investment Company Act of 1940, the registrant has duly caused this report to be signed on its behalf by the undersigned, thereunto duly authorized.
Fidelity Securities Fund
By: | /s/Kimberley Monasterio |
| Kimberley Monasterio |
| President and Treasurer |
| |
Date: | October 9, 2006 |
Pursuant to the requirements of the Securities Exchange Act of 1934 and the Investment Company Act of 1940, this report has been signed below by the following persons on behalf of the registrant and in the capacities and on the dates indicated.
By: | /s/Kimberley Monasterio |
| Kimberley Monasterio |
| President and Treasurer |
| |
Date: | October 9, 2006 |
By: | /s/Joseph B. Hollis |
| Joseph B. Hollis |
| Chief Financial Officer |
| |
Date: | October 9, 2006 |