UNITED STATES
SECURITIES AND EXCHANGE COMMISSION
Washington, D.C. 20549
FORM N-CSR
CERTIFIED SHAREHOLDER REPORT OF REGISTERED
MANAGEMENT INVESTMENT COMPANIES
Investment Company Act file number 811-4118
Fidelity Securities Fund
(Exact name of registrant as specified in charter)
245 Summer St., Boston, MA 02210
(Address of principal executive offices) (Zip code)
Marc Bryant, Secretary
245 Summer St.
Boston, Massachusetts 02210
(Name and address of agent for service)
Registrant's telephone number, including area code:
617-563-7000
| |
Date of fiscal year end: | July 31 |
|
|
Date of reporting period: | January 31, 2018 |
Item 1.
Reports to Stockholders
Fidelity® Blue Chip Growth Fund
Class K
Semi-Annual Report January 31, 2018 |
 |
Contents
To view a fund's proxy voting guidelines and proxy voting record for the 12-month period ended June 30, visit http://www.fidelity.com/proxyvotingresults or visit the Securities and Exchange Commission's (SEC) web site at http://www.sec.gov.
You may also call 1-800-835-5092 to request a free copy of the proxy voting guidelines.
Standard & Poor's, S&P and S&P 500 are registered service marks of The McGraw-Hill Companies, Inc. and have been licensed for use by Fidelity Distributors Corporation.
Other third-party marks appearing herein are the property of their respective owners.
All other marks appearing herein are registered or unregistered trademarks or service marks of FMR LLC or an affiliated company. © 2018 FMR LLC. All rights reserved.
This report and the financial statements contained herein are submitted for the general information of the shareholders of the Fund. This report is not authorized for distribution to prospective investors in the Fund unless preceded or accompanied by an effective prospectus.
A fund files its complete schedule of portfolio holdings with the SEC for the first and third quarters of each fiscal year on Form N-Q. Forms N-Q are available on the SEC’s web site at http://www.sec.gov. A fund's Forms N-Q may be reviewed and copied at the SEC’s Public Reference Room in Washington, DC. Information regarding the operation of the SEC's Public Reference Room may be obtained by calling 1-800-SEC-0330.
For a complete list of a fund's portfolio holdings, view the most recent holdings listing, semiannual report, or annual report on Fidelity's web site at http://www.fidelity.com, http://www.institutional.fidelity.com, or http://www.401k.com, as applicable.
NOT FDIC INSURED •MAY LOSE VALUE •NO BANK GUARANTEE
Neither the Fund nor Fidelity Distributors Corporation is a bank.
Investment Summary (Unaudited)
Top Ten Stocks as of January 31, 2018
| | % of fund's net assets |
| Alphabet, Inc. Class A | 6.6 |
| Amazon.com, Inc. | 6.6 |
| Apple, Inc. | 5.9 |
| Facebook, Inc. Class A | 4.1 |
| NVIDIA Corp. | 3.0 |
| Salesforce.com, Inc. | 2.3 |
| Tesla, Inc. | 2.2 |
| Microsoft Corp. | 2.1 |
| Visa, Inc. Class A | 2.0 |
| Home Depot, Inc. | 2.0 |
| | 36.8 |
Top Five Market Sectors as of January 31, 2018
| | % of fund's net assets |
| Information Technology | 41.9 |
| Consumer Discretionary | 27.0 |
| Health Care | 11.0 |
| Industrials | 5.9 |
| Consumer Staples | 4.7 |
Asset Allocation (% of fund's net assets)
| As of January 31, 2018* |
| | Stocks | 98.0% |
| | Convertible Securities | 2.0% |

* Foreign investments - 13.9%
Schedule of Investments January 31, 2018 (Unaudited)
Showing Percentage of Net Assets
| Common Stocks - 97.9% | | | |
| | | Shares | Value (000s) |
| CONSUMER DISCRETIONARY - 26.5% | | | |
| Auto Components - 0.1% | | | |
| Aptiv PLC | | 163,944 | $15,555 |
| Automobiles - 2.2% | | | |
| Tesla, Inc. (a)(b) | | 1,613,430 | 571,654 |
| Diversified Consumer Services - 0.4% | | | |
| Adtalem Global Education, Inc. (a) | | 204,386 | 9,402 |
| Chegg, Inc. (a)(b) | | 498,704 | 8,638 |
| Grand Canyon Education, Inc. (a) | | 56,972 | 5,298 |
| New Oriental Education & Technology Group, Inc. sponsored ADR | | 579,344 | 53,352 |
| ServiceMaster Global Holdings, Inc. (a) | | 431,558 | 22,752 |
| Weight Watchers International, Inc. (a) | | 78,200 | 5,027 |
| | | | 104,469 |
| Hotels, Restaurants & Leisure - 3.6% | | | |
| Alsea S.A.B. de CV | | 1,368,000 | 4,475 |
| Caesars Entertainment Corp. (a) | | 1,767,794 | 24,661 |
| Chipotle Mexican Grill, Inc. (a) | | 409,101 | 132,860 |
| Delta Corp. Ltd. (a) | | 839,330 | 4,566 |
| Eldorado Resorts, Inc. (a) | | 73,800 | 2,550 |
| Hilton Grand Vacations, Inc. (a) | | 111,655 | 5,021 |
| Hyatt Hotels Corp. Class A (a) | | 63,567 | 5,168 |
| Las Vegas Sands Corp. | | 433,954 | 33,640 |
| Marriott International, Inc. Class A | | 408,231 | 60,149 |
| Marriott Vacations Worldwide Corp. | | 52,700 | 8,028 |
| McDonald's Corp. | | 1,224,570 | 209,573 |
| Melco Crown Entertainment Ltd. sponsored ADR | | 472,153 | 14,061 |
| MGM Mirage, Inc. | | 1,864,333 | 67,955 |
| Penn National Gaming, Inc. (a) | | 1,093,477 | 34,893 |
| Royal Caribbean Cruises Ltd. | | 366,142 | 48,898 |
| Shake Shack, Inc. Class A (a)(b) | | 854,977 | 37,371 |
| Starbucks Corp. | | 1,729,913 | 98,276 |
| U.S. Foods Holding Corp. (a) | | 1,305,061 | 41,932 |
| Vail Resorts, Inc. | | 43,318 | 9,468 |
| Wyndham Worldwide Corp. | | 315,014 | 39,103 |
| Yum China Holdings, Inc. | | 597,424 | 27,714 |
| | | | 910,362 |
| Household Durables - 0.7% | | | |
| D.R. Horton, Inc. | | 446,467 | 21,899 |
| Forbo Holding AG (Reg.) | | 1,276 | 2,158 |
| Neinor Homes SLU (c) | | 187,300 | 4,302 |
| Newell Brands, Inc. | | 462,162 | 12,220 |
| Panasonic Corp. | | 452,700 | 6,721 |
| SodaStream International Ltd. (a) | | 813,665 | 63,978 |
| Sony Corp. | | 1,314,400 | 63,040 |
| | | | 174,318 |
| Internet & Direct Marketing Retail - 9.4% | | | |
| Amazon.com, Inc. (a) | | 1,141,883 | 1,656,747 |
| Blue Apron Holdings, Inc. Class B | | 624,302 | 1,848 |
| Boohoo.Com PLC (a) | | 3,839,686 | 10,105 |
| Expedia, Inc. | | 55,705 | 7,131 |
| JD.com, Inc. sponsored ADR (a) | | 3,930,642 | 193,506 |
| Netflix, Inc. (a) | | 1,013,669 | 273,995 |
| Priceline Group, Inc. (a) | | 111,232 | 212,681 |
| Start Today Co. Ltd. | | 252,900 | 7,473 |
| The Honest Co., Inc. (a)(d)(e) | | 150,143 | 2,772 |
| Wayfair LLC Class A (a) | | 78,402 | 7,214 |
| | | | 2,373,472 |
| Leisure Products - 0.1% | | | |
| Spin Master Corp. (a)(c) | | 389,130 | 16,777 |
| Media - 0.5% | | | |
| AMC Entertainment Holdings, Inc. Class A (b) | | 173,170 | 2,217 |
| CBS Corp. Class B | | 126,025 | 7,260 |
| China Literature Ltd. (a)(c) | | 1,313,327 | 13,607 |
| Live Nation Entertainment, Inc. (a) | | 164,140 | 7,396 |
| Naspers Ltd. Class N | | 159,958 | 45,673 |
| The Walt Disney Co. | | 334,898 | 36,393 |
| Vivendi SA | | 83,596 | 2,453 |
| WME Entertainment Parent, LLC Class A (a)(d)(e)(f) | | 9,407,380 | 23,518 |
| | | | 138,517 |
| Multiline Retail - 1.5% | | | |
| Avenue Supermarts Ltd. (c) | | 135,551 | 2,516 |
| B&M European Value Retail S.A. | | 1,340,565 | 7,916 |
| Dollar General Corp. | | 145,900 | 15,045 |
| Dollar Tree, Inc. (a) | | 2,683,656 | 308,620 |
| Macy's, Inc. | | 530,771 | 13,774 |
| Nordstrom, Inc. | | 97,559 | 4,811 |
| Ollie's Bargain Outlet Holdings, Inc. (a) | | 199,599 | 11,088 |
| Target Corp. | | 223,210 | 16,790 |
| V-Mart Retail Ltd. (a) | | 201,535 | 4,713 |
| | | | 385,273 |
| Specialty Retail - 3.8% | | | |
| Advance Auto Parts, Inc. | | 84,362 | 9,870 |
| Burlington Stores, Inc. (a) | | 256,950 | 31,273 |
| Dick's Sporting Goods, Inc. | | 303,906 | 9,561 |
| Floor & Decor Holdings, Inc. Class A | | 449,001 | 21,058 |
| Home Depot, Inc. | | 2,491,669 | 500,576 |
| Lowe's Companies, Inc. | | 1,255,706 | 131,510 |
| O'Reilly Automotive, Inc. (a) | | 92,432 | 24,466 |
| RH (a)(b) | | 787,044 | 73,974 |
| Ross Stores, Inc. | | 794,735 | 65,478 |
| The Children's Place Retail Stores, Inc. | | 91,778 | 13,748 |
| TJX Companies, Inc. | | 883,686 | 70,978 |
| | | | 952,492 |
| Textiles, Apparel & Luxury Goods - 4.2% | | | |
| adidas AG | | 1,230,959 | 286,250 |
| Canada Goose Holdings, Inc. | | 316,305 | 11,382 |
| Despegar.com Corp. | | 310,008 | 9,440 |
| G-III Apparel Group Ltd. (a) | | 414,588 | 15,485 |
| Kering SA | | 311,304 | 157,614 |
| lululemon athletica, Inc. (a) | | 1,452,034 | 113,564 |
| LVMH Moet Hennessy - Louis Vuitton SA | | 92,707 | 29,041 |
| Michael Kors Holdings Ltd. (a) | | 819,425 | 54,082 |
| NIKE, Inc. Class B | | 1,422,538 | 97,046 |
| Prada SpA | | 5,016,300 | 20,488 |
| PVH Corp. | | 625,318 | 96,974 |
| Shenzhou International Group Holdings Ltd. | | 577,000 | 5,956 |
| Skechers U.S.A., Inc. Class A (sub. vtg.) (a) | | 1,834,898 | 75,579 |
| Tapestry, Inc. | | 875,410 | 41,179 |
| Tory Burch LLC (d)(e)(f) | | 293,611 | 14,851 |
| Under Armour, Inc. Class C (non-vtg.) (a)(b) | | 893,910 | 11,487 |
| VF Corp. | | 187,231 | 15,192 |
| | | | 1,055,610 |
|
| TOTAL CONSUMER DISCRETIONARY | | | 6,698,499 |
|
| CONSUMER STAPLES - 4.4% | | | |
| Beverages - 1.1% | | | |
| Constellation Brands, Inc. Class A (sub. vtg.) | | 434,422 | 95,343 |
| Diageo PLC | | 375,669 | 13,521 |
| Dr. Pepper Snapple Group, Inc. | | 143,700 | 17,151 |
| Fever-Tree Drinks PLC | | 364,409 | 12,666 |
| Monster Beverage Corp. (a) | | 2,054,745 | 140,195 |
| | | | 278,876 |
| Food & Staples Retailing - 0.9% | | | |
| Costco Wholesale Corp. | | 820,474 | 159,886 |
| Kroger Co. | | 1,099,917 | 33,393 |
| Performance Food Group Co. (a) | | 721,486 | 24,783 |
| Walmart, Inc. | | 147,483 | 15,722 |
| | | | 233,784 |
| Food Products - 0.3% | | | |
| Blue Bottle Coffee, Inc. Class C (Escrow) (d)(e) | | 632,822 | 1,481 |
| Bunge Ltd. | | 209,029 | 16,603 |
| ConAgra Foods, Inc. | | 66,300 | 2,519 |
| Danone SA | | 79,537 | 6,845 |
| Darling International, Inc. (a) | | 380,645 | 7,057 |
| Lamb Weston Holdings, Inc. | | 220,954 | 12,948 |
| Pinnacle Foods, Inc. | | 41,400 | 2,564 |
| The Hain Celestial Group, Inc. (a) | | 732,747 | 27,947 |
| | | | 77,964 |
| Household Products - 0.1% | | | |
| Spectrum Brands Holdings, Inc. | | 199,089 | 23,584 |
| Personal Products - 1.1% | | | |
| Coty, Inc. Class A | | 2,153,281 | 42,226 |
| Estee Lauder Companies, Inc. Class A | | 299,400 | 40,407 |
| Herbalife Ltd. (a)(b) | | 1,153,211 | 95,705 |
| Kose Corp. | | 97,400 | 16,821 |
| Unilever NV (NY Reg.) | | 1,196,064 | 68,762 |
| | | | 263,921 |
| Tobacco - 0.9% | | | |
| British American Tobacco PLC: | | | |
| (United Kingdom) | | 62,517 | 4,273 |
| sponsored ADR | | 2,023,714 | 137,815 |
| Imperial Tobacco Group PLC | | 1,872 | 77 |
| Juul Labs, Inc. (e) | | 6,625 | 145 |
| Philip Morris International, Inc. | | 848,696 | 91,006 |
| | | | 233,316 |
|
| TOTAL CONSUMER STAPLES | | | 1,111,445 |
|
| ENERGY - 2.0% | | | |
| Energy Equipment & Services - 0.0% | | | |
| Shelf Drilling Ltd. (c) | | 741,565 | 6,253 |
| U.S. Silica Holdings, Inc. (b) | | 223,112 | 7,427 |
| | | | 13,680 |
| Oil, Gas & Consumable Fuels - 2.0% | | | |
| Anadarko Petroleum Corp. | | 1,265,244 | 75,978 |
| Andeavor | | 122,149 | 13,212 |
| Bharat Petroleum Corp. Ltd. | | 635,128 | 4,919 |
| Cenovus Energy, Inc. | | 924,434 | 8,816 |
| Cimarex Energy Co. | | 384,510 | 43,142 |
| Continental Resources, Inc. (a) | | 1,518,789 | 84,338 |
| Diamondback Energy, Inc. (a) | | 421,104 | 52,849 |
| EOG Resources, Inc. | | 469,883 | 54,037 |
| Marathon Petroleum Corp. | | 104,698 | 7,252 |
| Oasis Petroleum, Inc. (a) | | 806,325 | 6,983 |
| Petronet LNG Ltd. | | 655,750 | 2,628 |
| Phillips 66 Co. | | 18,903 | 1,936 |
| Pioneer Natural Resources Co. | | 330,982 | 60,540 |
| Reliance Industries Ltd. | | 2,979,759 | 45,067 |
| Valero Energy Corp. | | 176,579 | 16,946 |
| Whiting Petroleum Corp. (a) | | 924,548 | 25,813 |
| | | | 504,456 |
|
| TOTAL ENERGY | | | 518,136 |
|
| FINANCIALS - 4.4% | | | |
| Banks - 2.2% | | | |
| Bank of America Corp. | | 6,127,007 | 196,064 |
| Citigroup, Inc. | | 1,527,392 | 119,870 |
| First Republic Bank | | 53,474 | 4,789 |
| HDFC Bank Ltd. sponsored ADR | | 456,674 | 49,590 |
| JPMorgan Chase & Co. | | 1,413,951 | 163,552 |
| Kotak Mahindra Bank Ltd. (a) | | 615,886 | 10,746 |
| | | | 544,611 |
| Capital Markets - 1.9% | | | |
| BlackRock, Inc. Class A | | 176,888 | 99,376 |
| CBOE Holdings, Inc. | | 430,876 | 57,905 |
| Charles Schwab Corp. | | 824,862 | 43,998 |
| E*TRADE Financial Corp. (a) | | 195,795 | 10,318 |
| Fairfax India Holdings Corp. (a) | | 860,452 | 15,884 |
| Goldman Sachs Group, Inc. | | 473,389 | 126,816 |
| KKR & Co. LP | | 207,300 | 4,992 |
| Morgan Stanley | | 1,114,206 | 63,008 |
| MSCI, Inc. | | 56,776 | 7,905 |
| TD Ameritrade Holding Corp. | | 695,633 | 38,809 |
| The Blackstone Group LP | | 139,000 | 5,080 |
| | | | 474,091 |
| Consumer Finance - 0.0% | | | |
| Synchrony Financial | | 194,999 | 7,738 |
| Diversified Financial Services - 0.1% | | | |
| Berkshire Hathaway, Inc. Class B (a) | | 104,907 | 22,490 |
| GDS Holdings Ltd. ADR (a) | | 88,300 | 2,520 |
| | | | 25,010 |
| Insurance - 0.1% | | | |
| Chubb Ltd. | | 66,139 | 10,328 |
| MetLife, Inc. | | 186,530 | 8,966 |
| The Travelers Companies, Inc. | | 71,135 | 10,665 |
| | | | 29,959 |
| Thrifts & Mortgage Finance - 0.1% | | | |
| Housing Development Finance Corp. Ltd. | | 697,722 | 21,475 |
|
| TOTAL FINANCIALS | | | 1,102,884 |
|
| HEALTH CARE - 10.9% | | | |
| Biotechnology - 6.7% | | | |
| AC Immune SA (a) | | 723,942 | 9,672 |
| ACADIA Pharmaceuticals, Inc. (a) | | 266,297 | 7,965 |
| Acceleron Pharma, Inc. (a) | | 82,062 | 3,406 |
| Achaogen, Inc. (a)(b) | | 395,032 | 4,334 |
| Agios Pharmaceuticals, Inc. (a) | | 306,017 | 24,102 |
| Aimmune Therapeutics, Inc. (a) | | 468,605 | 16,500 |
| Alexion Pharmaceuticals, Inc. (a) | | 1,652,763 | 197,208 |
| Alkermes PLC (a) | | 1,003,437 | 57,366 |
| Alnylam Pharmaceuticals, Inc. (a) | | 749,174 | 97,378 |
| Amgen, Inc. | | 913,980 | 170,046 |
| AnaptysBio, Inc. | | 105,743 | 11,144 |
| Arena Pharmaceuticals, Inc. (a) | | 165,515 | 6,194 |
| Ascendis Pharma A/S sponsored ADR (a) | | 312,023 | 15,904 |
| BeiGene Ltd. ADR (a) | | 108,404 | 14,716 |
| Biogen, Inc. (a) | | 545,680 | 189,793 |
| BioMarin Pharmaceutical, Inc. (a) | | 394,274 | 35,575 |
| bluebird bio, Inc. (a) | | 294,095 | 60,260 |
| Blueprint Medicines Corp. (a) | | 44,969 | 3,537 |
| Celgene Corp. (a) | | 888,893 | 89,920 |
| Cellectis SA sponsored ADR (a) | | 62,973 | 1,981 |
| Chiasma, Inc. warrants (a) | | 55,391 | 13 |
| Chimerix, Inc. (a) | | 79,942 | 383 |
| Coherus BioSciences, Inc. (a) | | 596,627 | 6,026 |
| CytomX Therapeutics, Inc. (a) | | 155,668 | 4,164 |
| CytomX Therapeutics, Inc. (a)(c) | | 378,621 | 10,128 |
| DBV Technologies SA sponsored ADR (a) | | 101,129 | 2,342 |
| Denali Therapeutics, Inc. (a)(b) | | 781,221 | 18,171 |
| Editas Medicine, Inc. (a)(b) | | 558,873 | 20,404 |
| Epizyme, Inc. (a) | | 312,464 | 5,046 |
| Exact Sciences Corp. (a) | | 170,824 | 8,492 |
| Exelixis, Inc. (a) | | 2,489,886 | 75,468 |
| FibroGen, Inc. (a) | | 332,641 | 19,476 |
| Flexion Therapeutics, Inc. (a)(b) | | 83,549 | 1,887 |
| GenSight Biologics SA (a)(c) | | 599,743 | 4,840 |
| Global Blood Therapeutics, Inc. (a) | | 621,989 | 36,013 |
| Grifols SA ADR | | 103,434 | 2,570 |
| Heron Therapeutics, Inc. (a) | | 105,970 | 2,294 |
| Insmed, Inc. (a) | | 145,967 | 3,713 |
| Intellia Therapeutics, Inc. (a)(b) | | 570,606 | 14,665 |
| Intercept Pharmaceuticals, Inc. (a) | | 194,793 | 12,097 |
| Ionis Pharmaceuticals, Inc. (a) | | 118,688 | 6,233 |
| Ironwood Pharmaceuticals, Inc. Class A (a) | | 1,001,896 | 14,838 |
| La Jolla Pharmaceutical Co. (a) | | 165,809 | 5,681 |
| Merrimack Pharmaceuticals, Inc. | | 148,188 | 1,556 |
| Momenta Pharmaceuticals, Inc. (a) | | 90,832 | 1,544 |
| Neurocrine Biosciences, Inc. (a) | | 592,264 | 50,621 |
| Portola Pharmaceuticals, Inc. (a) | | 358,852 | 18,413 |
| Prothena Corp. PLC (a)(b) | | 97,697 | 4,084 |
| Radius Health, Inc. (a)(b) | | 79,648 | 3,000 |
| Regeneron Pharmaceuticals, Inc. (a) | | 523,756 | 192,035 |
| Sage Therapeutics, Inc. (a) | | 360,201 | 68,366 |
| Sarepta Therapeutics, Inc. (a) | | 124,083 | 8,132 |
| Seattle Genetics, Inc. (a) | | 358,526 | 18,751 |
| Seres Therapeutics, Inc. (a)(b) | | 46,200 | 467 |
| Trevena, Inc. (a) | | 976,088 | 1,591 |
| Ultragenyx Pharmaceutical, Inc. (a) | | 141,220 | 7,534 |
| Vertex Pharmaceuticals, Inc. (a) | | 175,224 | 29,240 |
| Xencor, Inc. (a) | | 266,935 | 6,075 |
| Zai Lab Ltd. ADR | | 172,389 | 4,648 |
| | | | 1,708,002 |
| Health Care Equipment & Supplies - 1.7% | | | |
| Becton, Dickinson & Co. | | 31,100 | 7,555 |
| Boston Scientific Corp. (a) | | 4,788,373 | 133,883 |
| Danaher Corp. | | 432,382 | 43,792 |
| Fisher & Paykel Healthcare Corp. | | 258,212 | 2,540 |
| Hoya Corp. | | 38,700 | 1,988 |
| Insulet Corp. (a) | | 196,752 | 15,057 |
| Intuitive Surgical, Inc. (a) | | 406,372 | 175,419 |
| Invuity, Inc. (a)(b) | | 573,468 | 2,982 |
| iRhythm Technologies, Inc. (a) | | 546,837 | 32,608 |
| Novocure Ltd. (a) | | 154,022 | 3,458 |
| Penumbra, Inc. (a) | | 14,257 | 1,420 |
| Quanterix Corp. (a) | | 149,995 | 3,121 |
| Stryker Corp. | | 14,354 | 2,360 |
| | | | 426,183 |
| Health Care Providers & Services - 1.3% | | | |
| Anthem, Inc. | | 101,667 | 25,198 |
| Apollo Hospitals Enterprise Ltd. | | 668,254 | 12,225 |
| Cigna Corp. | | 177,922 | 37,070 |
| Humana, Inc. | | 479,548 | 135,151 |
| OptiNose, Inc. (b) | | 440,971 | 8,356 |
| UnitedHealth Group, Inc. | | 464,323 | 109,942 |
| | | | 327,942 |
| Health Care Technology - 0.2% | | | |
| Cerner Corp. (a) | | 344,631 | 23,824 |
| Evolent Health, Inc. (a)(b) | | 312,143 | 4,401 |
| Teladoc, Inc. (a) | | 346,053 | 12,942 |
| | | | 41,167 |
| Pharmaceuticals - 1.0% | | | |
| Aclaris Therapeutics, Inc. (a) | | 160,406 | 3,548 |
| Akcea Therapeutics, Inc. (b) | | 822,563 | 17,808 |
| Allergan PLC | | 583,571 | 105,195 |
| Avexis, Inc. (a) | | 46,830 | 5,794 |
| Castle Creek Pharmaceuticals, LLC Class A-2 unit (a)(d)(e)(f)(g) | | 29,758 | 15,176 |
| Dermira, Inc. (a) | | 286,580 | 8,173 |
| Dova Pharmaceuticals, Inc. (b) | | 133,099 | 4,241 |
| GW Pharmaceuticals PLC ADR (a)(b) | | 154,411 | 21,329 |
| Intersect ENT, Inc. (a) | | 110,605 | 4,131 |
| Jazz Pharmaceuticals PLC (a) | | 192,201 | 28,011 |
| Nektar Therapeutics (a) | | 154,058 | 12,881 |
| Perrigo Co. PLC | | 54,900 | 4,975 |
| Revance Therapeutics, Inc. (a) | | 66,131 | 2,136 |
| The Medicines Company (a) | | 497,845 | 16,494 |
| Theravance Biopharma, Inc. (a) | | 58,053 | 1,535 |
| Zogenix, Inc. (a) | | 112,668 | 4,095 |
| | | | 255,522 |
|
| TOTAL HEALTH CARE | | | 2,758,816 |
|
| INDUSTRIALS - 5.8% | | | |
| Aerospace & Defense - 1.0% | | | |
| Bombardier, Inc. Class B (sub. vtg.) (a) | | 3,027,082 | 8,564 |
| Elbit Systems Ltd. | | 51,473 | 7,710 |
| General Dynamics Corp. | | 22,400 | 4,984 |
| Northrop Grumman Corp. | | 194,515 | 66,238 |
| Raytheon Co. | | 158,796 | 33,179 |
| Space Exploration Technologies Corp.: | | | |
| Class A (a)(d)(e) | | 242,545 | 32,744 |
| Class C (d)(e) | | 2,783 | 376 |
| The Boeing Co. | | 306,410 | 108,583 |
| | | | 262,378 |
| Air Freight & Logistics - 0.3% | | | |
| XPO Logistics, Inc. (a) | | 690,685 | 65,228 |
| Airlines - 1.4% | | | |
| Allegiant Travel Co. | | 31,000 | 4,937 |
| Azul SA sponsored ADR | | 402,049 | 11,736 |
| Delta Air Lines, Inc. | | 1,368,740 | 77,703 |
| InterGlobe Aviation Ltd. (c) | | 458,545 | 8,765 |
| JetBlue Airways Corp. (a) | | 781,259 | 16,297 |
| Ryanair Holdings PLC sponsored ADR (a) | | 39,488 | 4,846 |
| Southwest Airlines Co. | | 2,135,020 | 129,809 |
| Spirit Airlines, Inc. (a) | | 534,608 | 22,518 |
| United Continental Holdings, Inc. (a) | | 880,514 | 59,716 |
| Wizz Air Holdings PLC (a)(c) | | 253,046 | 12,442 |
| | | | 348,769 |
| Building Products - 0.1% | | | |
| Kajaria Ceramics Ltd. | | 825,080 | 8,200 |
| Masco Corp. | | 669,916 | 29,918 |
| | | | 38,118 |
| Commercial Services & Supplies - 0.1% | | | |
| Copart, Inc. (a) | | 116,901 | 5,152 |
| Evoqua Water Technologies Corp. (a) | | 350,493 | 8,012 |
| HomeServe PLC | | 966,632 | 10,746 |
| Novus Holdings Ltd. | | 55,375 | 23 |
| | | | 23,933 |
| Construction & Engineering - 0.0% | | | |
| Fluor Corp. | | 210,869 | 12,800 |
| Electrical Equipment - 0.3% | | | |
| AMETEK, Inc. | | 35,951 | 2,743 |
| Fortive Corp. | | 158,912 | 12,080 |
| Melrose Industries PLC | | 980,689 | 3,152 |
| Nidec Corp. | | 49,300 | 7,935 |
| Regal Beloit Corp. | | 375,526 | 29,253 |
| Sensata Technologies Holding BV (a) | | 179,069 | 10,073 |
| | | | 65,236 |
| Industrial Conglomerates - 0.4% | | | |
| Honeywell International, Inc. | | 437,001 | 69,776 |
| ITT, Inc. | | 395,917 | 22,171 |
| | | | 91,947 |
| Machinery - 1.5% | | | |
| Allison Transmission Holdings, Inc. | | 245,138 | 10,845 |
| Aumann AG (c) | | 149,839 | 12,390 |
| Caterpillar, Inc. | | 1,363,373 | 221,930 |
| Deere & Co. | | 75,000 | 12,482 |
| Eicher Motors Ltd. | | 14,288 | 6,052 |
| Fanuc Corp. | | 9,900 | 2,687 |
| Gardner Denver Holdings, Inc. | | 350,300 | 12,113 |
| Kennametal, Inc. | | 150,200 | 7,327 |
| Minebea Mitsumi, Inc. | | 106,600 | 2,426 |
| Parker Hannifin Corp. | | 33,889 | 6,826 |
| Rational AG | | 15,430 | 10,843 |
| SMC Corp. | | 5,100 | 2,513 |
| WABCO Holdings, Inc. (a) | | 311,789 | 48,137 |
| Xylem, Inc. | | 351,461 | 25,397 |
| | | | 381,968 |
| Professional Services - 0.1% | | | |
| IHS Markit Ltd. (a) | | 488,882 | 23,334 |
| Road & Rail - 0.3% | | | |
| Avis Budget Group, Inc. (a) | | 316,870 | 14,246 |
| J.B. Hunt Transport Services, Inc. | | 282,427 | 34,126 |
| Knight-Swift Transportation Holdings, Inc. Class A | | 270,325 | 13,459 |
| Landstar System, Inc. | | 70,331 | 7,810 |
| | | | 69,641 |
| Trading Companies & Distributors - 0.3% | | | |
| Ashtead Group PLC | | 186,896 | 5,586 |
| United Rentals, Inc. (a) | | 399,201 | 72,299 |
| Univar, Inc. (a) | | 303,820 | 9,072 |
| Wolseley PLC | | 30,457 | 2,351 |
| | | | 89,308 |
| Transportation Infrastructure - 0.0% | | | |
| Adani Ports & Special Economic Zone Ltd. | | 357,936 | 2,415 |
|
| TOTAL INDUSTRIALS | | | 1,475,075 |
|
| INFORMATION TECHNOLOGY - 40.8% | | | |
| Communications Equipment - 0.3% | | | |
| Arista Networks, Inc. (a) | | 142,062 | 39,184 |
| NETGEAR, Inc. (a) | | 670,419 | 46,728 |
| | | | 85,912 |
| Electronic Equipment & Components - 0.2% | | | |
| Amphenol Corp. Class A | | 26,815 | 2,488 |
| Corning, Inc. | | 428,701 | 13,384 |
| Dell Technologies, Inc. (a) | | 598,906 | 42,942 |
| SYNNEX Corp. | | 17,935 | 2,201 |
| | | | 61,015 |
| Internet Software & Services - 14.0% | | | |
| 2U, Inc. (a) | | 220,718 | 16,393 |
| Akamai Technologies, Inc. (a) | | 246,527 | 16,515 |
| Alibaba Group Holding Ltd. sponsored ADR (a) | | 1,096,081 | 223,918 |
| Alphabet, Inc.: | | | |
| Class A (a) | | 1,408,215 | 1,664,822 |
| Class C (a) | | 141,534 | 165,586 |
| ANGI Homeservices, Inc. Class A (a) | | 563,790 | 7,532 |
| CarGurus, Inc. Class A (b) | | 390,790 | 13,091 |
| Dropbox, Inc. Class B (a)(d)(e) | | 1,003,814 | 15,057 |
| Facebook, Inc. Class A (a) | | 5,542,148 | 1,035,772 |
| GoDaddy, Inc. (a) | | 195,278 | 10,785 |
| Gogo, Inc. (a)(b) | | 2,488,931 | 23,993 |
| GrubHub, Inc. (a)(b) | | 32,818 | 2,371 |
| IAC/InterActiveCorp (a) | | 17,778 | 2,577 |
| LogMeIn, Inc. | | 18,222 | 2,292 |
| Mail.Ru Group Ltd. GDR (Reg. S) (a) | | 537,390 | 17,626 |
| Match Group, Inc. (a)(b) | | 86,735 | 3,031 |
| Momo, Inc. ADR (a) | | 433,252 | 13,660 |
| NetEase, Inc. ADR | | 119,839 | 38,368 |
| New Relic, Inc. (a) | | 163,925 | 9,791 |
| Nutanix, Inc. Class B (c) | | 482,746 | 15,496 |
| Okta, Inc. | | 96,558 | 2,844 |
| Shopify, Inc. Class A (a) | | 292,979 | 37,406 |
| Stamps.com, Inc. (a) | | 123,866 | 25,250 |
| Tencent Holdings Ltd. | | 2,574,600 | 152,127 |
| Yandex NV Series A (a) | | 720,701 | 27,913 |
| | | | 3,544,216 |
| IT Services - 4.5% | | | |
| MasterCard, Inc. Class A | | 1,984,478 | 335,377 |
| PayPal Holdings, Inc. (a) | | 2,834,478 | 241,838 |
| Square, Inc. (a) | | 304,509 | 14,285 |
| Teradata Corp. (a) | | 30,821 | 1,248 |
| Vakrangee Ltd. | | 1,453,552 | 8,341 |
| Visa, Inc. Class A | | 4,054,962 | 503,748 |
| Worldpay, Inc. (a) | | 283,270 | 22,749 |
| | | | 1,127,586 |
| Semiconductors & Semiconductor Equipment - 7.2% | | | |
| ASM Pacific Technology Ltd. | | 961,700 | 13,130 |
| ASML Holding NV | | 46,725 | 9,483 |
| Broadcom Ltd. | | 1,931,281 | 479,016 |
| Cypress Semiconductor Corp. | | 375,777 | 6,497 |
| Inphi Corp. (a)(b) | | 815,098 | 24,347 |
| Intel Corp. | | 745,236 | 35,876 |
| Lam Research Corp. | | 329,377 | 63,082 |
| Marvell Technology Group Ltd. | | 4,432,577 | 103,412 |
| Micron Technology, Inc. (a) | | 4,482,214 | 195,962 |
| Monolithic Power Systems, Inc. | | 112,997 | 13,460 |
| NVIDIA Corp. | | 3,055,376 | 751,011 |
| Qualcomm, Inc. | | 1,022,989 | 69,819 |
| Renesas Electronics Corp. (a) | | 2,112,500 | 24,894 |
| WONIK IPS Co. Ltd. (a) | | 352,536 | 10,858 |
| Xilinx, Inc. | | 151,352 | 11,052 |
| | | | 1,811,899 |
| Software - 8.7% | | | |
| Activision Blizzard, Inc. | | 5,120,046 | 379,549 |
| Adobe Systems, Inc. (a) | | 1,051,611 | 210,070 |
| Altair Engineering, Inc. Class A (a) | | 92,515 | 2,461 |
| Appirio, Inc. (Escrow) (a)(d)(e) | | 87,529 | 22 |
| Atlassian Corp. PLC (a) | | 60,313 | 3,256 |
| Atom Tickets LLC (d)(e)(f) | | 1,204,239 | 7,000 |
| Autodesk, Inc. (a) | | 265,786 | 30,730 |
| Electronic Arts, Inc. (a) | | 750,554 | 95,290 |
| Globant SA (a)(b) | | 52,257 | 2,375 |
| HubSpot, Inc. (a) | | 49,242 | 4,779 |
| Intuit, Inc. | | 193,751 | 32,531 |
| Micro Focus International PLC | | 418,580 | 12,778 |
| Microsoft Corp. | | 5,620,838 | 534,036 |
| Nintendo Co. Ltd. | | 95,300 | 43,163 |
| Paycom Software, Inc. (a)(b) | | 457,633 | 41,937 |
| Red Hat, Inc. (a) | | 465,529 | 61,161 |
| RingCentral, Inc. (a) | | 93,243 | 5,063 |
| SailPoint Technologies Holding, Inc. (a) | | 293,792 | 4,915 |
| Salesforce.com, Inc. (a) | | 5,157,993 | 587,547 |
| SendGrid, Inc. (a) | | 137,542 | 3,091 |
| Snap, Inc. Class A (a)(b) | | 1,573,326 | 21,271 |
| Take-Two Interactive Software, Inc. (a) | | 100,843 | 12,774 |
| Talend SA ADR (a) | | 162,563 | 6,335 |
| Tanium, Inc. Class B (d)(e) | | 554,900 | 3,069 |
| VMware, Inc. Class A (a)(b) | | 195,680 | 24,223 |
| Workday, Inc. Class A (a) | | 382,267 | 45,830 |
| Zendesk, Inc. (a) | | 568,723 | 21,907 |
| | | | 2,197,163 |
| Technology Hardware, Storage & Peripherals - 5.9% | | | |
| Apple, Inc. | | 8,897,395 | 1,489,691 |
|
| TOTAL INFORMATION TECHNOLOGY | | | 10,317,482 |
|
| MATERIALS - 2.8% | | | |
| Chemicals - 2.3% | | | |
| Cabot Corp. | | 84,336 | 5,704 |
| CF Industries Holdings, Inc. | | 2,410,687 | 102,310 |
| DowDuPont, Inc. | | 1,158,501 | 87,560 |
| FMC Corp. | | 714,913 | 65,293 |
| LG Chemical Ltd. | | 34,120 | 13,778 |
| LyondellBasell Industries NV Class A | | 1,181,014 | 141,533 |
| Nutrien Ltd. (a) | | 136,932 | 7,164 |
| Orion Engineered Carbons SA | | 260,800 | 7,681 |
| PPG Industries, Inc. | | 42,300 | 5,022 |
| Sherwin-Williams Co. | | 22,690 | 9,464 |
| The Chemours Co. LLC | | 1,698,334 | 87,668 |
| The Mosaic Co. | | 94,000 | 2,566 |
| Tronox Ltd. Class A | | 1,351,129 | 26,523 |
| Westlake Chemical Corp. | | 152,745 | 17,199 |
| | | | 579,465 |
| Construction Materials - 0.4% | | | |
| Buzzi Unicem SpA | | 75,112 | 2,205 |
| Eagle Materials, Inc. | | 305,213 | 34,199 |
| Loma Negra Compania Industrial Argentina SA ADR (a) | | 350,493 | 8,328 |
| Summit Materials, Inc. | | 1,263,072 | 40,355 |
| | | | 85,087 |
| Metals & Mining - 0.1% | | | |
| China Molybdenum Co. Ltd. (H Shares) | | 24,333,000 | 18,726 |
| Franco-Nevada Corp. | | 56,629 | 4,330 |
| Glencore Xstrata PLC | | 1,375,978 | 7,887 |
| | | | 30,943 |
|
| TOTAL MATERIALS | | | 695,495 |
|
| REAL ESTATE - 0.1% | | | |
| Equity Real Estate Investment Trusts (REITs) - 0.1% | | | |
| Equinix, Inc. | | 29,370 | 13,369 |
| Real Estate Management & Development - 0.0% | | | |
| Parsvnath Developers Ltd. (a) | | 16,893,447 | 6,366 |
|
| TOTAL REAL ESTATE | | | 19,735 |
|
| TELECOMMUNICATION SERVICES - 0.2% | | | |
| Diversified Telecommunication Services - 0.1% | | | |
| Bharti Infratel Ltd. | | 4,669,859 | 25,829 |
| Wireless Telecommunication Services - 0.1% | | | |
| T-Mobile U.S., Inc. (a) | | 527,915 | 34,367 |
|
| TOTAL TELECOMMUNICATION SERVICES | | | 60,196 |
|
| UTILITIES - 0.0% | | | |
| Gas Utilities - 0.0% | | | |
| China Resource Gas Group Ltd. | | 744,000 | 2,449 |
| ENN Energy Holdings Ltd. | | 330,000 | 2,548 |
| | | | 4,997 |
| Water Utilities - 0.0% | | | |
| AquaVenture Holdings Ltd. (a) | | 163,648 | 2,489 |
|
| TOTAL UTILITIES | | | 7,486 |
|
| TOTAL COMMON STOCKS | | | |
| (Cost $12,687,971) | | | 24,765,249 |
|
| Preferred Stocks - 2.1% | | | |
| Convertible Preferred Stocks - 2.0% | | | |
| CONSUMER DISCRETIONARY - 0.4% | | | |
| Diversified Consumer Services - 0.1% | | | |
| Lyft, Inc. Series H (d)(e) | | 719,567 | 28,600 |
| Hotels, Restaurants & Leisure - 0.1% | | | |
| MOD Super Fast Pizza Holdings LLC Series 3 Preferred (a)(d)(e)(f) | | 74,995 | 10,494 |
| Topgolf International, Inc. Series F (d)(e) | | 415,730 | 5,751 |
| | | | 16,245 |
| Internet & Direct Marketing Retail - 0.2% | | | |
| China Internet Plus Holdings Ltd. Series A-11 (a)(d)(e) | | 3,163,704 | 17,682 |
| The Honest Co., Inc.: | | | |
| Series C (a)(d)(e) | | 350,333 | 10,947 |
| Series D (a)(d)(e) | | 77,448 | 2,613 |
| Series E (d)(e) | | 551,397 | 10,810 |
| | | | 42,052 |
| Leisure Products - 0.0% | | | |
| Peloton Interactive, Inc. Series E (d)(e) | | 335,429 | 8,315 |
| TOTAL CONSUMER DISCRETIONARY | | | 95,212 |
| CONSUMER STAPLES - 0.3% | | | |
| Food & Staples Retailing - 0.1% | | | |
| Roofoods Ltd. Series F (d)(e) | | 41,941 | 14,829 |
| Tobacco - 0.2% | | | |
| PAX Labs, Inc. Series C (a)(d)(e) | | 2,555,833 | 55,922 |
| TOTAL CONSUMER STAPLES | | | 70,751 |
| FINANCIALS - 0.0% | | | |
| Consumer Finance - 0.0% | | | |
| Oportun Finance Corp. Series H (a)(d)(e) | | 3,552,125 | 10,124 |
| HEALTH CARE - 0.1% | | | |
| Biotechnology - 0.1% | | | |
| 23andMe, Inc. Series F (d)(e) | | 800,982 | 11,121 |
| Axcella Health, Inc. Series C (a)(d)(e) | | 545,634 | 7,050 |
| Immunocore Ltd. Series A (a)(d)(e) | | 11,275 | 4,198 |
| | | | 22,369 |
| Health Care Providers & Services - 0.0% | | | |
| Mulberry Health, Inc. Series A8 (a)(d)(e) | | 2,728,716 | 17,600 |
| TOTAL HEALTH CARE | | | 39,969 |
| INDUSTRIALS - 0.1% | | | |
| Aerospace & Defense - 0.1% | | | |
| Space Exploration Technologies Corp.: | | | |
| Series G (a)(d)(e) | | 97,277 | 13,132 |
| Series H (d)(e) | | 25,767 | 3,479 |
| | | | 16,611 |
| Professional Services - 0.0% | | | |
| YourPeople, Inc. Series C (a)(d)(e) | | 692,196 | 3,876 |
| TOTAL INDUSTRIALS | | | 20,487 |
| INFORMATION TECHNOLOGY - 1.1% | | | |
| Internet Software & Services - 0.9% | | | |
| ContextLogic, Inc. Series G (d)(e) | | 133,922 | 18,017 |
| Jet.Com, Inc. Series B1 (Escrow) (a)(d)(e) | | 2,928,086 | 962 |
| Reddit, Inc. Series B (d)(e) | | 524,232 | 8,269 |
| Starry, Inc. Series C (d)(e) | | 5,833,836 | 5,379 |
| Uber Technologies, Inc.: | | | |
| Series D, 8.00% (a)(d)(e) | | 5,156,948 | 181,009 |
| Series E, 8.00% (a)(d)(e) | | 102,648 | 3,603 |
| | | | 217,239 |
| IT Services - 0.0% | | | |
| AppNexus, Inc. Series E (a)(d)(e) | | 646,522 | 12,995 |
| Software - 0.2% | | | |
| Appirio, Inc. Series E (Escrow) (a)(d)(e) | | 612,702 | 156 |
| Bracket Computing, Inc. Series C (a)(d)(e) | | 1,207,761 | 1,872 |
| Cloudflare, Inc. Series D, 8.00% (a)(d)(e) | | 696,025 | 4,169 |
| Compass, Inc. Series E (d)(e) | | 53,263 | 3,594 |
| Dataminr, Inc. Series D (a)(d)(e) | | 277,250 | 2,850 |
| Delphix Corp. Series D (a)(d)(e) | | 675,445 | 4,046 |
| Malwarebytes Corp. Series B (a)(d)(e) | | 1,056,193 | 14,322 |
| Taboola.Com Ltd. Series E (a)(d)(e) | | 634,902 | 9,758 |
| | | | 40,767 |
| TOTAL INFORMATION TECHNOLOGY | | | 271,001 |
|
| TOTAL CONVERTIBLE PREFERRED STOCKS | | | 507,544 |
|
| Nonconvertible Preferred Stocks - 0.1% | | | |
| CONSUMER DISCRETIONARY - 0.1% | | | |
| Automobiles - 0.1% | | | |
| Volkswagen AG | | 44,381 | 9,754 |
| CONSUMER STAPLES - 0.0% | | | |
| Tobacco - 0.0% | | | |
| PAX Labs, Inc. Series A (d)(e) | | 2,555,833 | 3,399 |
|
| TOTAL NONCONVERTIBLE PREFERRED STOCKS | | | 13,153 |
|
| TOTAL PREFERRED STOCKS | | | |
| (Cost $361,545) | | | 520,697 |
| | | Principal Amount (000s) | Value (000s) |
|
| Convertible Bonds - 0.0% | | | |
| CONSUMER STAPLES - 0.0% | | | |
| Tobacco - 0.0% | | | |
| PAX Labs, Inc. 10% 12/31/20 (c)(e) | | | |
| (Cost $5,825) | | 5,825 | 5,825 |
| | | Shares | Value (000s) |
|
| Money Market Funds - 1.8% | | | |
| Fidelity Cash Central Fund, 1.39% (h) | | 26,883,274 | 26,889 |
| Fidelity Securities Lending Cash Central Fund 1.40% (h)(i) | | 436,764,654 | 436,808 |
| TOTAL MONEY MARKET FUNDS | | | |
| (Cost $463,692) | | | 463,697 |
| TOTAL INVESTMENT IN SECURITIES - 101.8% | | | |
| (Cost $13,519,033) | | | 25,755,468 |
| NET OTHER ASSETS (LIABILITIES) - (1.8)% | | | (464,091) |
| NET ASSETS - 100% | | | $25,291,377 |
Legend
(a) Non-income producing
(b) Security or a portion of the security is on loan at period end.
(c) Security exempt from registration under Rule 144A of the Securities Act of 1933. These securities may be resold in transactions exempt from registration, normally to qualified institutional buyers. At the end of the period, the value of these securities amounted to $113,341,000 or 0.4% of net assets.
(d) Restricted securities - Investment in securities not registered under the Securities Act of 1933 (excluding 144A issues). At the end of the period, the value of restricted securities (excluding 144A issues) amounted to $627,008,000 or 2.5% of net assets.
(e) Level 3 security
(f) Investment is owned by a wholly-owned subsidiary (Subsidiary) that is treated as a corporation for U.S. tax purposes.
(g) Investment represents common shares and preferred shares.
(h) Affiliated fund that is generally available only to investment companies and other accounts managed by Fidelity Investments. The rate quoted is the annualized seven-day yield of the fund at period end. A complete unaudited listing of the fund's holdings as of its most recent quarter end is available upon request. In addition, each Fidelity Central Fund's financial statements are available on the SEC's website or upon request.
(i) Investment made with cash collateral received from securities on loan.
Additional information on each restricted holding is as follows:
| Security | Acquisition Date | Acquisition Cost (000s) |
| 23andMe, Inc. Series F | 8/31/17 | $11,121 |
| Appirio, Inc. (Escrow) | 7/7/17 | $20 |
| Appirio, Inc. Series E (Escrow) | 11/24/16 | $156 |
| AppNexus, Inc. Series E | 8/1/14 | $12,951 |
| Atom Tickets LLC | 8/15/17 | $7,000 |
| Axcella Health, Inc. Series C | 1/30/15 | $5,500 |
| Blue Bottle Coffee, Inc. Class C (Escrow) | 10/30/17 | $1,481 |
| Bracket Computing, Inc. Series C | 9/9/15 | $9,500 |
| Castle Creek Pharmaceuticals, LLC Class A-2 unit | 9/29/16 | $9,820 |
| China Internet Plus Holdings Ltd. Series A-11 | 1/26/15 | $10,000 |
| Cloudflare, Inc. Series D, 8.00% | 11/5/14 - 6/24/15 | $4,349 |
| Compass, Inc. Series E | 11/3/17 | $3,594 |
| ContextLogic, Inc. Series G | 10/24/17 | $18,017 |
| Dataminr, Inc. Series D | 3/6/15 | $3,535 |
| Delphix Corp. Series D | 7/10/15 | $6,079 |
| Dropbox, Inc. Class B | 5/2/12 | $9,084 |
| Immunocore Ltd. Series A | 7/27/15 | $2,122 |
| Jet.Com, Inc. Series B1 (Escrow) | 9/19/16 | $962 |
| Lyft, Inc. Series H | 11/22/17 | $28,600 |
| Malwarebytes Corp. Series B | 12/21/15 | $10,958 |
| MOD Super Fast Pizza Holdings LLC Series 3 Preferred | 11/3/16 - 12/14/17 | $10,293 |
| Mulberry Health, Inc. Series A8 | 1/20/16 | $18,432 |
| Oportun Finance Corp. Series H | 2/6/15 | $10,114 |
| PAX Labs, Inc. Series A | 5/22/15 | $1,891 |
| PAX Labs, Inc. Series C | 5/22/15 | $7,949 |
| Peloton Interactive, Inc. Series E | 3/31/17 | $7,266 |
| Reddit, Inc. Series B | 7/26/17 | $7,442 |
| Roofoods Ltd. Series F | 9/12/17 | $14,829 |
| Space Exploration Technologies Corp. Class A | 10/16/15 - 9/11/17 | $23,515 |
| Space Exploration Technologies Corp. Class C | 9/11/17 | $376 |
| Space Exploration Technologies Corp. Series G | 1/20/15 | $7,535 |
| Space Exploration Technologies Corp. Series H | 8/4/17 | $3,479 |
| Starry, Inc. Series C | 12/8/17 | $5,379 |
| Taboola.Com Ltd. Series E | 12/22/14 | $6,619 |
| Tanium, Inc. Class B | 4/21/17 | $2,755 |
| The Honest Co., Inc. | 8/21/14 | $4,062 |
| The Honest Co., Inc. Series C | 8/21/14 | $9,479 |
| The Honest Co., Inc. Series D | 8/3/15 | $3,544 |
| The Honest Co., Inc. Series E | 9/28/17 | $10,810 |
| Topgolf International, Inc. Series F | 11/10/17 | $5,751 |
| Tory Burch LLC | 5/14/15 | $20,890 |
| Uber Technologies, Inc. Series D, 8.00% | 6/6/14 | $80,000 |
| Uber Technologies, Inc. Series E, 8.00% | 12/5/14 | $3,420 |
| WME Entertainment Parent, LLC Class A | 4/13/16 - 8/16/16 | $19,025 |
| YourPeople, Inc. Series C | 5/1/15 | $10,314 |
Affiliated Central Funds
Information regarding fiscal year to date income earned by the Fund from investments in Fidelity Central Funds is as follows:
| Fund | Income earned |
| | (Amounts in thousands) |
| Fidelity Cash Central Fund | $88 |
| Fidelity Securities Lending Cash Central Fund | 2,823 |
| Total | $2,911 |
Amounts in the income column in the above table include any capital gain distributions from underlying funds, which are presented in the corresponding line-item in the Statement of Operations if applicable.
Other Affiliated Issuers
An affiliated company is a company in which the Fund has ownership of at least 5% of the voting securities. Fiscal year to date transactions with companies which are or were affiliates are as follows:
| Affiliate (Amounts in thousands) | Value, beginning of period | Purchases | Sales Proceeds* | Dividend Income | Realized Gain (loss) | Change in Unrealized appreciation (depreciation) | Value, end of period |
| RH | $82,844 | $-- | $27,600 | $-- | $957 | $17,773 | $-- |
| Total | $82,844 | $-- | $27,600 | $-- | $957 | $17,773 | $-- |
* Includes the value of securities delivered through in-kind transactions, if applicable.
Investment Valuation
The following is a summary of the inputs used, as of January 31, 2018, involving the Fund's assets and liabilities carried at fair value. The inputs or methodology used for valuing securities may not be an indication of the risk associated with investing in those securities. For more information on valuation inputs, and their aggregation into the levels used below, please refer to the Investment Valuation section in the accompanying Notes to Financial Statements.
| | Valuation Inputs at Reporting Date: |
| Description | Total | Level 1 | Level 2 | Level 3 |
| (Amounts in thousands) | | | | |
| Investments in Securities: | | | | |
| Equities: | | | | |
| Consumer Discretionary | $6,803,465 | $6,558,989 | $108,123 | $136,353 |
| Consumer Staples | 1,185,595 | 1,068,359 | 41,460 | 75,776 |
| Energy | 518,136 | 518,136 | -- | -- |
| Financials | 1,113,008 | 1,102,884 | -- | 10,124 |
| Health Care | 2,798,785 | 2,741,639 | 2,001 | 55,145 |
| Industrials | 1,495,562 | 1,426,394 | 15,561 | 53,607 |
| Information Technology | 10,588,483 | 10,072,150 | 220,184 | 296,149 |
| Materials | 695,495 | 695,495 | -- | -- |
| Real Estate | 19,735 | 19,735 | -- | -- |
| Telecommunication Services | 60,196 | 60,196 | -- | -- |
| Utilities | 7,486 | 7,486 | -- | -- |
| Corporate Bonds | 5,825 | -- | -- | 5,825 |
| Money Market Funds | 463,697 | 463,697 | -- | -- |
| Total Investments in Securities: | $25,755,468 | $24,735,160 | $387,329 | $632,979 |
The following is a reconciliation of Investments in Securities and Derivative Instruments for which Level 3 inputs were used in determining value:
| (Amounts in thousands) | | | | |
| Investments in Securities: | |
| Equities - Information Technology | |
| Beginning Balance | $338,669 |
| Net Realized Gain (Loss) on Investment Securities | (3) |
| Net Unrealized Gain (Loss) on Investment Securities | (76,507) |
| Cost of Purchases | 33,990 |
| Proceeds of Sales | -- |
| Amortization/Accretion | -- |
| Transfers into Level 3 | -- |
| Transfers out of Level 3 | -- |
| Ending Balance | $296,149 |
| The change in unrealized gain (loss) for the period attributable to Level 3 securities held at January 31, 2018 | $(76,507) |
| Other Investments in Securities | |
| Beginning Balance | $209,155 |
| Net Realized Gain (Loss) on Investment Securities | 8,252 |
| Net Unrealized Gain (Loss) on Investment Securities | 69,317 |
| Cost of Purchases | 85,927 |
| Proceeds of Sales | (29,339) |
| Amortization/Accretion | -- |
| Transfers into Level 3 | -- |
| Transfers out of Level 3 | (6,482) |
| Ending Balance | $336,830 |
| The change in unrealized gain (loss) for the period attributable to Level 3 securities held at January 31, 2018 | $56,609 |
The information used in the above reconciliations represents fiscal year to date activity for any Investments in Securities identified as using Level 3 inputs at either the beginning or the end of the current fiscal period. Transfers in or out of Level 3 represent the beginning value of any Security or Instrument where a change in the pricing level occurred from the beginning to the end of the period. The cost of purchases and the proceeds of sales may include securities received or delivered through corporate actions or exchanges. Realized and unrealized gains (losses) disclosed in the reconciliations are included in Net Gain (Loss) on the Fund's Statement of Operations.
Other Information
Distribution of investments by country or territory of incorporation, as a percentage of Total Net Assets, is as follows (Unaudited):
| United States of America | 86.1% |
| Cayman Islands | 3.6% |
| Singapore | 1.9% |
| Germany | 1.3% |
| Netherlands | 1.1% |
| Others (Individually Less Than 1%) | 6.0% |
| | 100.0% |
See accompanying notes which are an integral part of the financial statements.
Financial Statements
Statement of Assets and Liabilities
| Amounts in thousands (except per-share amounts) | | January 31, 2018 (Unaudited) |
| Assets | | |
Investment in securities, at value (including securities loaned of $431,174) — See accompanying schedule:
Unaffiliated issuers (cost $13,055,341) | $25,291,771 | |
| Fidelity Central Funds (cost $463,692) | 463,697 | |
| Total Investment in Securities (cost $13,519,033) | | $25,755,468 |
| Cash | | 1,372 |
| Restricted cash | | 132 |
| Foreign currency held at value (cost $1,496) | | 1,496 |
| Receivable for investments sold | | 101,537 |
| Receivable for fund shares sold | | 26,146 |
| Dividends receivable | | 5,292 |
| Interest receivable | | 66 |
| Distributions receivable from Fidelity Central Funds | | 425 |
| Prepaid expenses | | 32 |
| Other receivables | | 1,196 |
| Total assets | | 25,893,162 |
| Liabilities | | |
| Payable for investments purchased | $123,904 | |
| Payable for fund shares redeemed | 26,248 | |
| Accrued management fee | 11,199 | |
| Other affiliated payables | 2,489 | |
| Other payables and accrued expenses | 1,133 | |
| Collateral on securities loaned | 436,812 | |
| Total liabilities | | 601,785 |
| Net Assets | | $25,291,377 |
| Net Assets consist of: | | |
| Paid in capital | | $12,084,874 |
| Distributions in excess of net investment income | | (9,546) |
| Accumulated undistributed net realized gain (loss) on investments and foreign currency transactions | | 979,543 |
| Net unrealized appreciation (depreciation) on investments and assets and liabilities in foreign currencies | | 12,236,506 |
| Net Assets | | $25,291,377 |
| Blue Chip Growth: | | |
| Net Asset Value, offering price and redemption price per share ($19,556,017 ÷ 205,252 shares) | | $95.28 |
| Class K: | | |
| Net Asset Value, offering price and redemption price per share ($5,735,360 ÷ 60,125 shares) | | $95.39 |
See accompanying notes which are an integral part of the financial statements.
Statement of Operations
| Amounts in thousands | | Six months ended January 31, 2018 (Unaudited) |
| Investment Income | | |
| Dividends | | $76,454 |
| Interest | | 112 |
| Income from Fidelity Central Funds | | 2,911 |
| Total income | | 79,477 |
| Expenses | | |
| Management fee | | |
| Basic fee | $62,026 | |
| Performance adjustment | 1,230 | |
| Transfer agent fees | 13,818 | |
| Accounting and security lending fees | 947 | |
| Custodian fees and expenses | 227 | |
| Independent trustees' fees and expenses | 32 | |
| Appreciation in deferred trustee compensation account | 1 | |
| Registration fees | 173 | |
| Audit | 52 | |
| Legal | 45 | |
| Interest | 26 | |
| Miscellaneous | 75 | |
| Total expenses before reductions | 78,652 | |
| Expense reductions | (286) | 78,366 |
| Net investment income (loss) | | 1,111 |
| Realized and Unrealized Gain (Loss) | | |
| Net realized gain (loss) on: | | |
| Investment securities: | | |
| Unaffiliated issuers | 1,551,901 | |
| Fidelity Central Funds | 3 | |
| Other affiliated issuers | 957 | |
| Foreign currency transactions | 48 | |
| Total net realized gain (loss) | | 1,552,909 |
| Change in net unrealized appreciation (depreciation) on: | | |
| Investment securities: | | |
| Unaffiliated issuers | 2,597,840 | |
| Fidelity Central Funds | (10) | |
| Other affiliated issuers | 17,773 | |
| Assets and liabilities in foreign currencies | 18 | |
| Total change in net unrealized appreciation (depreciation) | | 2,615,621 |
| Net gain (loss) | | 4,168,530 |
| Net increase (decrease) in net assets resulting from operations | | $4,169,641 |
See accompanying notes which are an integral part of the financial statements.
Statement of Changes in Net Assets
| Amounts in thousands | Six months ended January 31, 2018 (Unaudited) | Year ended July 31, 2017 |
| Increase (Decrease) in Net Assets | | |
| Operations | | |
| Net investment income (loss) | $1,111 | $36,123 |
| Net realized gain (loss) | 1,552,909 | 1,207,375 |
| Change in net unrealized appreciation (depreciation) | 2,615,621 | 3,208,986 |
| Net increase (decrease) in net assets resulting from operations | 4,169,641 | 4,452,484 |
| Distributions to shareholders from net investment income | (24,826) | (49,380) |
| Distributions to shareholders from net realized gain | (955,924) | (700,248) |
| Total distributions | (980,750) | (749,628) |
| Share transactions - net increase (decrease) | (555,825) | (433,489) |
| Total increase (decrease) in net assets | 2,633,066 | 3,269,367 |
| Net Assets | | |
| Beginning of period | 22,658,311 | 19,388,944 |
| End of period | $25,291,377 | $22,658,311 |
| Other Information | | |
| Undistributed net investment income end of period | $– | $14,169 |
| Distributions in excess of net investment income end of period | $(9,546) | $– |
See accompanying notes which are an integral part of the financial statements.
Financial Highlights
Fidelity Blue Chip Growth Fund
| | Six months ended January 31, | Years endedJuly 31, | | | | |
| | 2018 | 2017 | 2016 | 2015 | 2014 | 2013 |
| Selected Per–Share Data | | | | | | |
| Net asset value, beginning of period | $83.20 | $69.52 | $75.25 | $66.72 | $59.65 | $47.38 |
| Income from Investment Operations | | | | | | |
| Net investment income (loss)A | (.01) | .11 | .09 | .05 | .15 | .39 |
| Net realized and unrealized gain (loss) | 15.85 | 16.30 | (2.16) | 12.56 | 11.63 | 12.79 |
| Total from investment operations | 15.84 | 16.41 | (2.07) | 12.61 | 11.78 | 13.18 |
| Distributions from net investment income | (.08) | (.15) | (.03) | (.09) | (.24) | (.23) |
| Distributions from net realized gain | (3.68) | (2.58) | (3.63) | (3.99) | (4.47) | (.68) |
| Total distributions | (3.76) | (2.73) | (3.66) | (4.08) | (4.71) | (.91) |
| Net asset value, end of period | $95.28 | $83.20 | $69.52 | $75.25 | $66.72 | $59.65 |
| Total ReturnB,C | 19.60% | 24.48% | (2.59)% | 19.72% | 21.07% | 28.25% |
| Ratios to Average Net AssetsD,E | | | | | | |
| Expenses before reductions | .71%F | .70% | .82% | .89% | .80% | .76% |
| Expenses net of fee waivers, if any | .71%F | .70% | .82% | .89% | .80% | .76% |
| Expenses net of all reductions | .71%F | .69% | .82% | .88% | .80% | .74% |
| Net investment income (loss) | (.01)%F | .15% | .13% | .07% | .23% | .75% |
| Supplemental Data | | | | | | |
| Net assets, end of period (in millions) | $19,556 | $16,993 | $14,230 | $15,346 | $11,970 | $12,927 |
| Portfolio turnover rateG | 37%F,H | 43%H | 50%H | 51%H | 57%H | 75% |
A Calculated based on average shares outstanding during the period.
B Total returns for periods of less than one year are not annualized.
C Total returns would have been lower if certain expenses had not been reduced during the applicable periods shown.
D Fees and expenses of any underlying Fidelity Central Funds are not included in the Fund's expense ratio. The Fund indirectly bears its proportionate share of the expenses of any underlying Fidelity Central Funds.
E Expense ratios reflect operating expenses of the class. Expenses before reductions do not reflect amounts reimbursed by the investment adviser or reductions from brokerage service arrangements or reductions from other expense offset arrangements and do not represent the amount paid by the class during periods when reimbursements or reductions occur. Expenses net of fee waivers reflect expenses after reimbursement by the investment adviser but prior to reductions from brokerage service arrangements or other expense offset arrangements. Expenses net of all reductions represent the net expenses paid by the class.
F Annualized
G Amount does not include the portfolio activity of any underlying Fidelity Central Funds.
H Portfolio turnover rate excludes securities received or delivered in-kind.
See accompanying notes which are an integral part of the financial statements.
Fidelity Blue Chip Growth Fund Class K
| | Six months ended January 31, | Years endedJuly 31, | | | | |
| | 2018 | 2017 | 2016 | 2015 | 2014 | 2013 |
| Selected Per–Share Data | | | | | | |
| Net asset value, beginning of period | $83.34 | $69.67 | $75.36 | $66.82 | $59.74 | $47.46 |
| Income from Investment Operations | | | | | | |
| Net investment income (loss)A | .04 | .19 | .16 | .13 | .23 | .47 |
| Net realized and unrealized gain (loss) | 15.85 | 16.32 | (2.15) | 12.57 | 11.64 | 12.79 |
| Total from investment operations | 15.89 | 16.51 | (1.99) | 12.70 | 11.87 | 13.26 |
| Distributions from net investment income | (.16) | (.27) | (.07) | (.17) | (.33) | (.30) |
| Distributions from net realized gain | (3.68) | (2.58) | (3.63) | (3.99) | (4.47) | (.68) |
| Total distributions | (3.84) | (2.84)B | (3.70) | (4.16) | (4.79)C | (.98) |
| Net asset value, end of period | $95.39 | $83.34 | $69.67 | $75.36 | $66.82 | $59.74 |
| Total ReturnD,E | 19.65% | 24.63% | (2.47)% | 19.84% | 21.23% | 28.42% |
| Ratios to Average Net AssetsF,G | | | | | | |
| Expenses before reductions | .61%H | .59% | .70% | .78% | .68% | .61% |
| Expenses net of fee waivers, if any | .61%H | .59% | .70% | .77% | .68% | .61% |
| Expenses net of all reductions | .61%H | .58% | .70% | .77% | .67% | .60% |
| Net investment income (loss) | .08%H | .26% | .25% | .19% | .36% | .89% |
| Supplemental Data | | | | | | |
| Net assets, end of period (in millions) | $5,735 | $5,665 | $5,158 | $5,898 | $4,612 | $3,506 |
| Portfolio turnover rateI | 37%H,J | 43%J | 50%J | 51%J | 57%J | 75% |
A Calculated based on average shares outstanding during the period.
B Total distributions of $2.84 per share is comprised of distributions from net investment income of $.267 and distributions from net realized gain of $2.576 per share.
C Total distributions of $4.79 per share is comprised of distributions from net investment income of $.325 and distributions from net realized gain of $4.466 per share.
D Total returns for periods of less than one year are not annualized.
E Total returns would have been lower if certain expenses had not been reduced during the applicable periods shown.
F Fees and expenses of any underlying Fidelity Central Funds are not included in the Fund's expense ratio. The Fund indirectly bears its proportionate share of the expenses of any underlying Fidelity Central Funds.
G Expense ratios reflect operating expenses of the class. Expenses before reductions do not reflect amounts reimbursed by the investment adviser or reductions from brokerage service arrangements or reductions from other expense offset arrangements and do not represent the amount paid by the class during periods when reimbursements or reductions occur. Expenses net of fee waivers reflect expenses after reimbursement by the investment adviser but prior to reductions from brokerage service arrangements or other expense offset arrangements. Expenses net of all reductions represent the net expenses paid by the class.
H Annualized
I Amount does not include the portfolio activity of any underlying Fidelity Central Funds.
J Portfolio turnover rate excludes securities received or delivered in-kind.
See accompanying notes which are an integral part of the financial statements.
Notes to Financial Statements (Unaudited)
For the period ended January 31, 2018
(Amounts in thousands except percentages)
1. Organization.
Fidelity Blue Chip Growth Fund (the Fund) is a fund of Fidelity Securities Fund (the Trust) and is authorized to issue an unlimited number of shares. The Trust is registered under the Investment Company Act of 1940, as amended (the 1940 Act), as an open-end management investment company organized as a Massachusetts business trust. The Fund offers Blue Chip Growth and Class K shares, each of which has equal rights as to assets and voting privileges. Each class has exclusive voting rights with respect to matters that affect that class.
2. Investments in Fidelity Central Funds.
The Fund invests in Fidelity Central Funds, which are open-end investment companies generally available only to other investment companies and accounts managed by the investment adviser and its affiliates. The Fund's Schedule of Investments lists each of the Fidelity Central Funds held as of period end, if any, as an investment of the Fund, but does not include the underlying holdings of each Fidelity Central Fund. As an Investing Fund, the Fund indirectly bears its proportionate share of the expenses of the underlying Fidelity Central Funds.
The Money Market Central Funds seek preservation of capital and current income and are managed by Fidelity Investments Money Management, Inc. (FIMM), an affiliate of the investment adviser. Annualized expenses of the Money Market Central Funds as of their most recent shareholder report date are less than .005%.
A complete unaudited list of holdings for each Fidelity Central Fund is available upon request or at the Securities and Exchange Commission (the SEC) website at www.sec.gov. In addition, the financial statements of the Fidelity Central Funds are available on the SEC website or upon request.
3. Significant Accounting Policies.
The Fund is an investment company and applies the accounting and reporting guidance of the Financial Accounting Standards Board (FASB) Accounting Standards Codification Topic 946 Financial Services – Investments Companies. The financial statements have been prepared in conformity with accounting principles generally accepted in the United States of America (GAAP), which require management to make certain estimates and assumptions at the date of the financial statements. Actual results could differ from those estimates. Subsequent events, if any, through the date that the financial statements were issued have been evaluated in the preparation of the financial statements. The following summarizes the significant accounting policies of the Fund:
Investment Valuation. Investments are valued as of 4:00 p.m. Eastern time on the last calendar day of the period. The Board of Trustees (the Board) has delegated the day to day responsibility for the valuation of the Fund's investments to the Fair Value Committee (the Committee) established by the Fund's investment adviser. In accordance with valuation policies and procedures approved by the Board, the Fund attempts to obtain prices from one or more third party pricing vendors or brokers to value its investments. When current market prices, quotations or currency exchange rates are not readily available or reliable, investments will be fair valued in good faith by the Committee, in accordance with procedures adopted by the Board. Factors used in determining fair value vary by investment type and may include market or investment specific events, changes in interest rates and credit quality. The frequency with which these procedures are used cannot be predicted and they may be utilized to a significant extent. The Committee oversees the Fund's valuation policies and procedures and reports to the Board on the Committee's activities and fair value determinations. The Board monitors the appropriateness of the procedures used in valuing the Fund's investments and ratifies the fair value determinations of the Committee.
The Fund categorizes the inputs to valuation techniques used to value its investments into a disclosure hierarchy consisting of three levels as shown below:
- Level 1 – quoted prices in active markets for identical investments
- Level 2 – other significant observable inputs (including quoted prices for similar investments, interest rates, prepayment speeds, etc.)
- Level 3 – unobservable inputs (including the Fund's own assumptions based on the best information available)
Valuation techniques used to value the Fund's investments by major category are as follows:
Equity securities, including restricted securities, for which market quotations are readily available, are valued at the last reported sale price or official closing price as reported by a third party pricing vendor on the primary market or exchange on which they are traded and are categorized as Level 1 in the hierarchy. In the event there were no sales during the day or closing prices are not available, securities are valued at the last quoted bid price or may be valued using the last available price and are generally categorized as Level 2 in the hierarchy. For foreign equity securities, when market or security specific events arise, comparisons to the valuation of American Depositary Receipts (ADRs), futures contracts, Exchange-Traded Funds (ETFs) and certain indexes as well as quoted prices for similar securities may be used and would be categorized as Level 2 in the hierarchy. Utilizing these techniques may result in transfers between Level 1 and Level 2. For equity securities, including restricted securities, where observable inputs are limited, assumptions about market activity and risk are used and these securities may be categorized as Level 3 in the hierarchy. Equity securities, including restricted securities, for which observable inputs are not available are valued using alternate valuation approaches, including the market approach and the income approach and are categorized as Level 3 in the hierarchy. The market approach generally consists of using comparable market transactions while the income approach generally consists of using the net present value of estimated future cash flows, adjusted as appropriate for liquidity, credit, market and/or other risk factors.
Debt securities, including restricted securities, are valued based on evaluated prices received from third party pricing vendors or from brokers who make markets in such securities. Corporate bonds are valued by pricing vendors who utilize matrix pricing which considers yield or price of bonds of comparable quality, coupon, maturity and type or by broker-supplied prices. When independent prices are unavailable or unreliable, debt securities may be valued utilizing pricing methodologies which consider similar factors that would be used by third party pricing vendors. Debt securities are generally categorized as Level 2 in the hierarchy but may be Level 3 depending on the circumstances.
Investments in open-end mutual funds, including the Fidelity Central Funds, are valued at their closing net asset value (NAV) each business day and are categorized as Level 1 in the hierarchy.
The following provides information on Level 3 securities held by the Fund that were valued at period end based on unobservable inputs. These amounts exclude valuations provided by a broker.
| Asset Type | Fair Value | Valuation Technique(s) | Unobservable Input | Amount or Range/Weighted Average | Impact to Valuation from an Increase in Input(a) |
| Corporate Bonds | $5,825 | Market approach | Transaction price | $100.00 | Increase |
| Equities | $627,154 | Market approach | Transaction price | $0.92- $353.57 / $55.66 | Increase |
| | | | Liquidity preference | $16.35 - $45.76 / $35.01 | Increase |
| | | Market comparable | Transaction price | $10.08- $330.00 / $216.05 | Increase |
| | | | Enterprise value/Sales multiple (EV/S) | 0.8 - 14.3 / 5.0 | Increase |
| | | | Discount rate | 7.5% - 69.1% / 17.9% | Decrease |
| | | | Enterprise value/EBITDA multiple (EV/EBITDA) | 9.1 | Increase |
| | | | Price/Earnings multiple (P/E) | 14.6 | Increase |
| | | | Enterprise value/Gross profit (EV/GP) | 5.5 | Increase |
| | | | Premium rate | 8.0% - 108.0% / 28.1% | Increase |
| | | | Discount for lack of marketability | 10.0% - 25.0% / 15.7% | Decrease |
| | | | Liquidity preference | $4.84 - $23.41 / $14.96 | Increase |
| | | | Proxy premium | 28.2% - 54.5% / 46.5% | Increase |
| | | Book value | Book value multiple | 1.0 | Increase |
| | | | Discount rate | 70.0% | Decrease |
| | | Recovery value | Recovery value | 0.2% - 2.3% / 1.5% | Increase |
(a) Represents the expected directional change in the fair value of the Level 3 investments that would result from an increase in the corresponding input. A decrease to the unobservable input would have the opposite effect. Significant changes in these inputs could result in significantly higher or lower fair value measurements.
Changes in valuation techniques may result in transfers in or out of an assigned level within the disclosure hierarchy. The aggregate value of investments by input level as of January 31, 2018, as well as a roll forward of Level 3 investments, is included at the end of the Fund's Schedule of Investments.
Foreign Currency. The Fund may use foreign currency contracts to facilitate transactions in foreign-denominated securities. Gains and losses from these transactions may arise from changes in the value of the foreign currency or if the counterparties do not perform under the contracts' terms.
Foreign-denominated assets, including investment securities, and liabilities are translated into U.S. dollars at the exchange rates at period end. Purchases and sales of investment securities, income and dividends received and expenses denominated in foreign currencies are translated into U.S. dollars at the exchange rate in effect on the transaction date.
The effects of exchange rate fluctuations on investments are included with the net realized and unrealized gain (loss) on investment securities. Other foreign currency transactions resulting in realized and unrealized gain (loss) are disclosed separately.
Investment Transactions and Income. For financial reporting purposes, the Fund's investment holdings and NAV include trades executed through the end of the last business day of the period. The NAV per share for processing shareholder transactions is calculated as of the close of business of the New York Stock Exchange (NYSE), normally 4:00 p.m. Eastern time and includes trades executed through the end of the prior business day. Gains and losses on securities sold are determined on the basis of identified cost and includes proceeds received from litigation. Dividend income is recorded on the ex-dividend date, except for certain dividends from foreign securities where the ex-dividend date may have passed, which are recorded as soon as the Fund is informed of the ex-dividend date. Non-cash dividends included in dividend income, if any, are recorded at the fair market value of the securities received. Income and capital gain distributions from Fidelity Central Funds, if any, are recorded on the ex-dividend date. Certain distributions received by the Fund represent a return of capital or capital gain. The Fund determines the components of these distributions subsequent to the ex-dividend date, based upon receipt of tax filings or other correspondence relating to the underlying investment. These distributions are recorded as a reduction of cost of investments and/or as a realized gain. Interest income is accrued as earned and includes coupon interest and amortization of premium and accretion of discount on debt securities as applicable. Investment income is recorded net of foreign taxes withheld where recovery of such taxes is uncertain.
Class Allocations and Expenses. Investment income, realized and unrealized capital gains and losses, common expenses of the Fund, and certain fund-level expense reductions, if any, are allocated daily on a pro-rata basis to each class based on the relative net assets of each class to the total net assets of the Fund. Each class differs with respect to transfer agent fees incurred. Certain expense reductions may also differ by class. For the reporting period, the allocated portion of income and expenses to each class as a percent of its average net assets may vary due to the timing of recording these transactions in relation to fluctuating net assets of the classes. Expenses directly attributable to a fund are charged to that fund. Expenses attributable to more than one fund are allocated among the respective funds on the basis of relative net assets or other appropriate methods. Expense estimates are accrued in the period to which they relate and adjustments are made when actual amounts are known.
Deferred Trustee Compensation. Under a Deferred Compensation Plan (the Plan), independent Trustees may elect to defer receipt of a portion of their annual compensation. Deferred amounts are invested in a cross-section of Fidelity funds, are marked-to-market and remain in the Fund until distributed in accordance with the Plan. The investment of deferred amounts and the offsetting payable to the Trustees are included in the accompanying Statement of Assets and Liabilities.
Income Tax Information and Distributions to Shareholders. Each year, the Fund intends to qualify as a regulated investment company under Subchapter M of the Internal Revenue Code, including distributing substantially all of its taxable income and realized gains. As a result, no provision for U.S. Federal income taxes is required. The Fund files a U.S. federal tax return, in addition to state and local tax returns as required. The Fund's federal income tax returns are subject to examination by the Internal Revenue Service (IRS) for a period of three fiscal years after they are filed. State and local tax returns may be subject to examination for an additional fiscal year depending on the jurisdiction. Foreign taxes are provided for based on the Fund's understanding of the tax rules and rates that exist in the foreign markets in which it invests.
Distributions are declared and recorded on the ex-dividend date. Income dividends and capital gain distributions are declared separately for each class. Income and capital gain distributions are determined in accordance with income tax regulations, which may differ from GAAP.
Capital accounts within the financial statements are adjusted for permanent book-tax differences. These adjustments have no impact on net assets or the results of operations. Capital accounts are not adjusted for temporary book-tax differences which will reverse in a subsequent period.
Book-tax differences are primarily due to foreign currency transactions, passive foreign investment companies (PFIC), redemptions in kind, partnerships, deferred trustees compensation and losses deferred due to wash sales.
As of period end, the cost and unrealized appreciation (depreciation) in securities, and derivatives if applicable, for federal income tax purposes were as follows:
| Gross unrealized appreciation | $12,497,060 |
| Gross unrealized depreciation | (283,454) |
| Net unrealized appreciation (depreciation) | $12,213,606 |
| Tax cost | $13,541,862 |
Restricted Securities. The Fund may invest in securities that are subject to legal or contractual restrictions on resale. These securities generally may be resold in transactions exempt from registration or to the public if the securities are registered. Disposal of these securities may involve time-consuming negotiations and expense, and prompt sale at an acceptable price may be difficult. Information regarding restricted securities is included at the end of the Fund's Schedule of Investments.
Consolidated Subsidiary. The Fund invests in certain investments through a wholly-owned subsidiary ("Subsidiary"), which may be subject to federal and state taxes upon disposition.
As of period end, the Fund held an investment of $71,171 in these Subsidiaries, representing .28% of the Fund's net assets. The financial statements have been consolidated and include accounts of the Fund and each Subsidiary. Accordingly, all inter-company transactions and balances have been eliminated.
Any cash held by the Subsidiaries is restricted as to its use and is presented as Restricted cash in the Statement of Assets and Liabilities.
4. Purchases and Sales of Investments.
Purchases and sales of securities, other than short-term securities and in-kind transactions, aggregated $4,304,353 and $4,939,838, respectively.
Redemptions In-Kind. During the period, 10,253 shares of the Fund held by unaffiliated entities were redeemed in-kind for investments and cash with a value of $893,990. The net realized gain of $540,912 on investments delivered through in-kind redemptions is included in the accompanying Statement of Operations. The amount of the in-kind redemptions is included in share transactions in the accompanying Statement of Changes in Net Assets as well as the Notes to Financial Statements. The Fund recognized no gain or loss for federal income tax purposes.
Prior Fiscal Year Redemptions In-Kind. During the prior period, 1,133 shares of the Fund held by an unaffiliated entity were redeemed in-kind for investments and cash with a value of $94,035. The Fund had a net realized gain of $55,844 on investments delivered through in-kind redemptions. The amount of the in-kind redemptions is included in share transactions in the accompanying Statement of Changes in Net Assets as well as the Notes to Financial Statements. The Fund recognized no gain or loss for federal income tax purposes.
5. Fees and Other Transactions with Affiliates.
Management Fee. Fidelity Management & Research Company (the investment adviser) and its affiliates provide the Fund with investment management related services for which the Fund pays a monthly management fee. The management fee is the sum of an individual fund fee rate that is based on an annual rate of .30% of the Fund's average net assets and an annualized group fee rate that averaged .24% during the period. The group fee rate is based upon the average net assets of all the mutual funds advised by the investment adviser, including any mutual funds previously advised by the investment adviser that are currently advised by Fidelity SelectCo, LLC, an affiliate of the investment adviser. The group fee rate decreases as assets under management increase and increases as assets under management decrease. In addition, the management fee is subject to a performance adjustment (up to a maximum of +/- .20% of the Fund's average net assets over a 36 month performance period). The upward or downward adjustment to the management fee is based on the relative investment performance of Blue Chip Growth as compared to its benchmark index, the Russell 1000 Growth Index, over the same 36 month performance period. For the reporting period, the total annualized management fee rate, including the performance adjustment, was .55% of the Fund's average net assets. The performance adjustment included in the management fee rate may be higher or lower than the maximum performance adjustment rate due to the difference between the average net assets for the reporting and performance periods.
Transfer Agent Fees. Fidelity Investments Institutional Operations Company, Inc., (FIIOC), an affiliate of the investment adviser, is the transfer, dividend disbursing and shareholder servicing agent for each class of the Fund. FIIOC receives account fees and asset-based fees that vary according to the account size and type of account of the shareholders of Blue Chip Growth. FIIOC receives an asset-based fee of Class K's average net assets. FIIOC pays for typesetting, printing and mailing of shareholder reports, except proxy statements.
For the period, transfer agent fees for each class were as follows:
| | Amount | % of Class-Level Average Net Assets(a) |
| Blue Chip Growth | $12,528 | .14 |
| Class K | 1,290 | .05 |
| | $13,818 | |
(a) Annualized
Accounting and Security Lending Fees. Fidelity Service Company, Inc. (FSC), an affiliate of the investment adviser, maintains the Fund's accounting records. The accounting fee is based on the level of average net assets for each month. Under a separate contract, FSC administers the security lending program. The security lending fee is based on the number and duration of lending transactions.
Brokerage Commissions. The Fund placed a portion of its portfolio transactions with brokerage firms which are affiliates of the investment adviser. Brokerage commissions are included in net realized gain (loss) and change in net unrealized appreciation (depreciation) in the Statement of Operations. The commissions paid to these affiliated firms were $78 for the period.
Interfund Lending Program. Pursuant to an Exemptive Order issued by the SEC, the Fund, along with other registered investment companies having management contracts with Fidelity Management & Research Company (FMR) or other affiliated entities of FMR, may participate in an interfund lending program. This program provides an alternative credit facility allowing the funds to borrow from, or lend money to, other participating affiliated funds. At period end, there were no interfund loans outstanding. The Fund's activity in this program during the period for which loans were outstanding was as follows:
| Borrower or Lender | Average Loan Balance | Weighted Average Interest Rate | Interest Expense |
| Borrower | $19,894 | 1.35% | $26 |
Interfund Trades. The Fund may purchase from or sell securities to other Fidelity Funds under procedures adopted by the Board. The procedures have been designed to ensure these interfund trades are executed in accordance with Rule 17a-7 of the 1940 Act. Interfund trades are included within the respective purchases and sales amounts shown in the Purchases and Sales of Investments note
Prior Fiscal Year Redemptions In-Kind. During the prior period, 2,142 shares of the Fund held by an affiliated entity were redeemed in-kind for investments and cash with a value of $179,817. The Fund had a net realized gain of $107,301 on investments delivered through in-kind redemptions. The amount of the in-kind redemptions is included in share transactions in the accompanying Statement of Changes in Net Assets as well as the Notes to Financial Statements. The Fund recognized no gain or loss for federal income tax purposes.
6. Committed Line of Credit.
The Fund participates with other funds managed by the investment adviser or an affiliate in a $4.25 billion credit facility (the "line of credit") to be utilized for temporary or emergency purposes to fund shareholder redemptions or for other short-term liquidity purposes. The Fund has agreed to pay commitment fees on its pro-rata portion of the line of credit, which amounted to $33 and is reflected in Miscellaneous expenses on the Statement of Operations. During the period, the Fund did not borrow on this line of credit.
7. Security Lending.
The Fund lends portfolio securities through a lending agent from time to time in order to earn additional income. For equity securities, a lending agent is used and may loan securities to certain qualified borrowers, including Fidelity Capital Markets (FCM), a broker-dealer affiliated with the Fund. On the settlement date of the loan, the Fund receives collateral (in the form of U.S. Treasury obligations, letters of credit and/or cash) against the loaned securities and maintains collateral in an amount not less than 100% of the market value of the loaned securities during the period of the loan. The market value of the loaned securities is determined at the close of business of the Fund and any additional required collateral is delivered to the Fund on the next business day. The Fund or borrower may terminate the loan at any time, and if the borrower defaults on its obligation to return the securities loaned because of insolvency or other reasons, the Fund may apply collateral received from the borrower against the obligation. The Fund may experience delays and costs in recovering the securities loaned. Any cash collateral received is invested in the Fidelity Securities Lending Cash Central Fund. The value of loaned securities and cash collateral at period end are disclosed on the Fund's Statement of Assets and Liabilities. The value of securities loaned to FCM at period end was $32,990. Security lending income represents the income earned on investing cash collateral, less rebates paid to borrowers and any lending agent fees associated with the loan, plus any premium payments received for lending certain types of securities. Security lending income is presented in the Statement of Operations as a component of income from Fidelity Central Funds. Total security lending income during the period amounted to $2,823, including $217 from securities loaned to FCM.
8. Expense Reductions.
Commissions paid to certain brokers with whom the investment adviser, or its affiliates, places trades on behalf of the Fund include an amount in addition to trade execution, which may be rebated back to the Fund to offset certain expenses. This amount totaled $165 for the period. In addition, through arrangements with the Fund's custodian, credits realized as a result of certain uninvested cash balances were used to reduce the Fund's expenses. During the period, these credits reduced the Fund's custody expenses by $5.
In addition, during the period the investment adviser reimbursed and/or waived a portion of fund-level operating expenses in the amount of $116.
9. Distributions to Shareholders.
Distributions to shareholders of each class were as follows:
| | Six months ended
January 31, 2018 | Year ended
July 31, 2017 |
| From net investment income | | |
| Blue Chip Growth | $14,640 | $30,042 |
| Class K | 10,186 | 19,338 |
| Total | $24,826 | $49,380 |
| From net realized gain | | |
| Blue Chip Growth | $722,426 | $514,584 |
| Class K | 233,498 | 185,664 |
| Total | $955,924 | $700,248 |
10. Share Transactions.
Share transactions for each class were as follows and may contain automatic conversions between classes or exchanges between affiliated funds:
| | Shares | Shares | Dollars | Dollars |
| | Six months ended January 31, 2018 | Year ended July 31, 2017 | Six months ended January 31, 2018 | Year ended July 31, 2017 |
| Blue Chip Growth | | | | |
| Shares sold | 20,961 | 32,630 | $1,849,583 | $2,453,411 |
| Reinvestment of distributions | 8,154 | 7,584 | 698,554 | 519,650 |
| Shares redeemed | (28,100) | (40,666) | (2,419,155) | (2,950,825) |
| Net increase (decrease) | 1,015 | (452) | $128,982 | $22,236 |
| Class K | | | | |
| Shares sold | 7,482 | 13,260 | $656,163 | $986,030 |
| Reinvestment of distributions | 2,843 | 2,988 | 243,684 | 205,002 |
| Shares redeemed | (18,175)(a) | (22,314)(b) | (1,584,654)(a) | (1,646,757)(b) |
| Net increase (decrease) | (7,850) | (6,066) | $(684,807) | $(455,725) |
(a) Amount includes in-kind redemptions (see the Redemptions In-Kind note for additional details).
(b) Amount includes in-kind redemptions (see the Prior Fiscal Year Redemptions In-Kind note for additional details).
11. Other.
The Fund's organizational documents provide former and current trustees and officers with a limited indemnification against liabilities arising in connection with the performance of their duties to the Fund. In the normal course of business, the Fund may also enter into contracts that provide general indemnifications. The Fund's maximum exposure under these arrangements is unknown as this would be dependent on future claims that may be made against the Fund. The risk of material loss from such claims is considered remote.
Shareholder Expense Example
As a shareholder of the Fund, you incur two types of costs: (1) transaction costs, and (2) ongoing costs, including management fees and other Fund expenses. This Example is intended to help you understand your ongoing costs (in dollars) of investing in the Fund and to compare these costs with the ongoing costs of investing in other mutual funds.
The Example is based on an investment of $1,000 invested at the beginning of the period and held for the entire period (August 1, 2017 to January 31, 2018).
Actual Expenses
The first line of the accompanying table for each class of the Fund provides information about actual account values and actual expenses. You may use the information in this line, together with the amount you invested, to estimate the expenses that you paid over the period. Simply divide your account value by $1,000.00 (for example, an $8,600 account value divided by $1,000.00 = 8.6), then multiply the result by the number in the first line for a class of the Fund under the heading entitled "Expenses Paid During Period" to estimate the expenses you paid on your account during this period. A small balance maintenance fee of $12.00 that is charged once a year may apply for certain accounts with a value of less than $2,000. This fee is not included in the table below. If it was, the estimate of expenses you paid during the period would be higher, and your ending account value lower, by this amount. In addition, the Fund, as a shareholder in the underlying Fidelity Central Funds, will indirectly bear its pro-rata share of the fees and expenses incurred by the underlying Fidelity Central Funds. These fees and expenses are not included in the Fund's annualized expense ratio used to calculate the expense estimate in the table below.
Hypothetical Example for Comparison Purposes
The second line of the accompanying table for each class of the Fund provides information about hypothetical account values and hypothetical expenses based on a Class' actual expense ratio and an assumed rate of return of 5% per year before expenses, which is not the Class' actual return. The hypothetical account values and expenses may not be used to estimate the actual ending account balance or expenses you paid for the period. You may use this information to compare the ongoing costs of investing in the Fund and other funds. To do so, compare this 5% hypothetical example with the 5% hypothetical examples that appear in the shareholder reports of the other funds. A small balance maintenance fee of $12.00 that is charged once a year may apply for certain accounts with a value of less than $2,000. This fee is not included in the table below. If it was, the estimate of expenses you paid during the period would be higher, and your ending account value lower, by this amount. In addition, the Fund, as a shareholder in the underlying Fidelity Central Funds, will indirectly bear its pro-rata share of the fees and expenses incurred by the underlying Fidelity Central Funds. These fees and expenses are not included in the Fund's annualized expense ratio used to calculate the expense estimate in the table below.
Please note that the expenses shown in the table are meant to highlight your ongoing costs only and do not reflect any transaction costs. Therefore, the second line of the table is useful in comparing ongoing costs only, and will not help you determine the relative total costs of owning different funds.
| | Annualized Expense Ratio-A | Beginning
Account Value
August 1, 2017 | Ending
Account Value
January 31, 2018 | Expenses Paid
During Period-B
August 1, 2017
to January 31, 2018 |
| Blue Chip Growth | .71% | | | |
| Actual | | $1,000.00 | $1,196.00 | $3.93 |
| Hypothetical-C | | $1,000.00 | $1,021.63 | $3.62 |
| Class K | .61% | | | |
| Actual | | $1,000.00 | $1,196.50 | $3.38 |
| Hypothetical-C | | $1,000.00 | $1,022.13 | $3.11 |
A Annualized expense ratio reflects expenses net of applicable fee waivers.
B Expenses are equal to each Class' annualized expense ratio, multiplied by the average account value over the period, multiplied by 184/365 (to reflect the one-half year period).
C 5% return per year before expenses

Corporate Headquarters
245 Summer St.
Boston, MA 02210
www.fidelity.com
BCF-K-SANN-0318
1.863116.109
Fidelity® Blue Chip Growth Fund
Semi-Annual Report January 31, 2018 |
|
Contents
To view a fund's proxy voting guidelines and proxy voting record for the 12-month period ended June 30, visit http://www.fidelity.com/proxyvotingresults or visit the Securities and Exchange Commission's (SEC) web site at http://www.sec.gov.
You may also call 1-800-544-8544 to request a free copy of the proxy voting guidelines.
Standard & Poor's, S&P and S&P 500 are registered service marks of The McGraw-Hill Companies, Inc. and have been licensed for use by Fidelity Distributors Corporation.
Other third-party marks appearing herein are the property of their respective owners.
All other marks appearing herein are registered or unregistered trademarks or service marks of FMR LLC or an affiliated company. © 2018 FMR LLC. All rights reserved.
This report and the financial statements contained herein are submitted for the general information of the shareholders of the Fund. This report is not authorized for distribution to prospective investors in the Fund unless preceded or accompanied by an effective prospectus.
A fund files its complete schedule of portfolio holdings with the SEC for the first and third quarters of each fiscal year on Form N-Q. Forms N-Q are available on the SEC’s web site at http://www.sec.gov. A fund's Forms N-Q may be reviewed and copied at the SEC’s Public Reference Room in Washington, DC. Information regarding the operation of the SEC's Public Reference Room may be obtained by calling 1-800-SEC-0330.
For a complete list of a fund's portfolio holdings, view the most recent holdings listing, semiannual report, or annual report on Fidelity's web site at http://www.fidelity.com, http://www.institutional.fidelity.com, or http://www.401k.com, as applicable.
NOT FDIC INSURED •MAY LOSE VALUE •NO BANK GUARANTEE
Neither the Fund nor Fidelity Distributors Corporation is a bank.
Investment Summary (Unaudited)
Top Ten Stocks as of January 31, 2018
| | % of fund's net assets |
| Alphabet, Inc. Class A | 6.6 |
| Amazon.com, Inc. | 6.6 |
| Apple, Inc. | 5.9 |
| Facebook, Inc. Class A | 4.1 |
| NVIDIA Corp. | 3.0 |
| Salesforce.com, Inc. | 2.3 |
| Tesla, Inc. | 2.2 |
| Microsoft Corp. | 2.1 |
| Visa, Inc. Class A | 2.0 |
| Home Depot, Inc. | 2.0 |
| | 36.8 |
Top Five Market Sectors as of January 31, 2018
| | % of fund's net assets |
| Information Technology | 41.9 |
| Consumer Discretionary | 27.0 |
| Health Care | 11.0 |
| Industrials | 5.9 |
| Consumer Staples | 4.7 |
Asset Allocation (% of fund's net assets)
| As of January 31, 2018* |
| | Stocks | 98.0% |
| | Convertible Securities | 2.0% |

* Foreign investments - 13.9%
Schedule of Investments January 31, 2018 (Unaudited)
Showing Percentage of Net Assets
| Common Stocks - 97.9% | | | |
| | | Shares | Value (000s) |
| CONSUMER DISCRETIONARY - 26.5% | | | |
| Auto Components - 0.1% | | | |
| Aptiv PLC | | 163,944 | $15,555 |
| Automobiles - 2.2% | | | |
| Tesla, Inc. (a)(b) | | 1,613,430 | 571,654 |
| Diversified Consumer Services - 0.4% | | | |
| Adtalem Global Education, Inc. (a) | | 204,386 | 9,402 |
| Chegg, Inc. (a)(b) | | 498,704 | 8,638 |
| Grand Canyon Education, Inc. (a) | | 56,972 | 5,298 |
| New Oriental Education & Technology Group, Inc. sponsored ADR | | 579,344 | 53,352 |
| ServiceMaster Global Holdings, Inc. (a) | | 431,558 | 22,752 |
| Weight Watchers International, Inc. (a) | | 78,200 | 5,027 |
| | | | 104,469 |
| Hotels, Restaurants & Leisure - 3.6% | | | |
| Alsea S.A.B. de CV | | 1,368,000 | 4,475 |
| Caesars Entertainment Corp. (a) | | 1,767,794 | 24,661 |
| Chipotle Mexican Grill, Inc. (a) | | 409,101 | 132,860 |
| Delta Corp. Ltd. (a) | | 839,330 | 4,566 |
| Eldorado Resorts, Inc. (a) | | 73,800 | 2,550 |
| Hilton Grand Vacations, Inc. (a) | | 111,655 | 5,021 |
| Hyatt Hotels Corp. Class A (a) | | 63,567 | 5,168 |
| Las Vegas Sands Corp. | | 433,954 | 33,640 |
| Marriott International, Inc. Class A | | 408,231 | 60,149 |
| Marriott Vacations Worldwide Corp. | | 52,700 | 8,028 |
| McDonald's Corp. | | 1,224,570 | 209,573 |
| Melco Crown Entertainment Ltd. sponsored ADR | | 472,153 | 14,061 |
| MGM Mirage, Inc. | | 1,864,333 | 67,955 |
| Penn National Gaming, Inc. (a) | | 1,093,477 | 34,893 |
| Royal Caribbean Cruises Ltd. | | 366,142 | 48,898 |
| Shake Shack, Inc. Class A (a)(b) | | 854,977 | 37,371 |
| Starbucks Corp. | | 1,729,913 | 98,276 |
| U.S. Foods Holding Corp. (a) | | 1,305,061 | 41,932 |
| Vail Resorts, Inc. | | 43,318 | 9,468 |
| Wyndham Worldwide Corp. | | 315,014 | 39,103 |
| Yum China Holdings, Inc. | | 597,424 | 27,714 |
| | | | 910,362 |
| Household Durables - 0.7% | | | |
| D.R. Horton, Inc. | | 446,467 | 21,899 |
| Forbo Holding AG (Reg.) | | 1,276 | 2,158 |
| Neinor Homes SLU (c) | | 187,300 | 4,302 |
| Newell Brands, Inc. | | 462,162 | 12,220 |
| Panasonic Corp. | | 452,700 | 6,721 |
| SodaStream International Ltd. (a) | | 813,665 | 63,978 |
| Sony Corp. | | 1,314,400 | 63,040 |
| | | | 174,318 |
| Internet & Direct Marketing Retail - 9.4% | | | |
| Amazon.com, Inc. (a) | | 1,141,883 | 1,656,747 |
| Blue Apron Holdings, Inc. Class B | | 624,302 | 1,848 |
| Boohoo.Com PLC (a) | | 3,839,686 | 10,105 |
| Expedia, Inc. | | 55,705 | 7,131 |
| JD.com, Inc. sponsored ADR (a) | | 3,930,642 | 193,506 |
| Netflix, Inc. (a) | | 1,013,669 | 273,995 |
| Priceline Group, Inc. (a) | | 111,232 | 212,681 |
| Start Today Co. Ltd. | | 252,900 | 7,473 |
| The Honest Co., Inc. (a)(d)(e) | | 150,143 | 2,772 |
| Wayfair LLC Class A (a) | | 78,402 | 7,214 |
| | | | 2,373,472 |
| Leisure Products - 0.1% | | | |
| Spin Master Corp. (a)(c) | | 389,130 | 16,777 |
| Media - 0.5% | | | |
| AMC Entertainment Holdings, Inc. Class A (b) | | 173,170 | 2,217 |
| CBS Corp. Class B | | 126,025 | 7,260 |
| China Literature Ltd. (a)(c) | | 1,313,327 | 13,607 |
| Live Nation Entertainment, Inc. (a) | | 164,140 | 7,396 |
| Naspers Ltd. Class N | | 159,958 | 45,673 |
| The Walt Disney Co. | | 334,898 | 36,393 |
| Vivendi SA | | 83,596 | 2,453 |
| WME Entertainment Parent, LLC Class A (a)(d)(e)(f) | | 9,407,380 | 23,518 |
| | | | 138,517 |
| Multiline Retail - 1.5% | | | |
| Avenue Supermarts Ltd. (c) | | 135,551 | 2,516 |
| B&M European Value Retail S.A. | | 1,340,565 | 7,916 |
| Dollar General Corp. | | 145,900 | 15,045 |
| Dollar Tree, Inc. (a) | | 2,683,656 | 308,620 |
| Macy's, Inc. | | 530,771 | 13,774 |
| Nordstrom, Inc. | | 97,559 | 4,811 |
| Ollie's Bargain Outlet Holdings, Inc. (a) | | 199,599 | 11,088 |
| Target Corp. | | 223,210 | 16,790 |
| V-Mart Retail Ltd. (a) | | 201,535 | 4,713 |
| | | | 385,273 |
| Specialty Retail - 3.8% | | | |
| Advance Auto Parts, Inc. | | 84,362 | 9,870 |
| Burlington Stores, Inc. (a) | | 256,950 | 31,273 |
| Dick's Sporting Goods, Inc. | | 303,906 | 9,561 |
| Floor & Decor Holdings, Inc. Class A | | 449,001 | 21,058 |
| Home Depot, Inc. | | 2,491,669 | 500,576 |
| Lowe's Companies, Inc. | | 1,255,706 | 131,510 |
| O'Reilly Automotive, Inc. (a) | | 92,432 | 24,466 |
| RH (a)(b) | | 787,044 | 73,974 |
| Ross Stores, Inc. | | 794,735 | 65,478 |
| The Children's Place Retail Stores, Inc. | | 91,778 | 13,748 |
| TJX Companies, Inc. | | 883,686 | 70,978 |
| | | | 952,492 |
| Textiles, Apparel & Luxury Goods - 4.2% | | | |
| adidas AG | | 1,230,959 | 286,250 |
| Canada Goose Holdings, Inc. | | 316,305 | 11,382 |
| Despegar.com Corp. | | 310,008 | 9,440 |
| G-III Apparel Group Ltd. (a) | | 414,588 | 15,485 |
| Kering SA | | 311,304 | 157,614 |
| lululemon athletica, Inc. (a) | | 1,452,034 | 113,564 |
| LVMH Moet Hennessy - Louis Vuitton SA | | 92,707 | 29,041 |
| Michael Kors Holdings Ltd. (a) | | 819,425 | 54,082 |
| NIKE, Inc. Class B | | 1,422,538 | 97,046 |
| Prada SpA | | 5,016,300 | 20,488 |
| PVH Corp. | | 625,318 | 96,974 |
| Shenzhou International Group Holdings Ltd. | | 577,000 | 5,956 |
| Skechers U.S.A., Inc. Class A (sub. vtg.) (a) | | 1,834,898 | 75,579 |
| Tapestry, Inc. | | 875,410 | 41,179 |
| Tory Burch LLC (d)(e)(f) | | 293,611 | 14,851 |
| Under Armour, Inc. Class C (non-vtg.) (a)(b) | | 893,910 | 11,487 |
| VF Corp. | | 187,231 | 15,192 |
| | | | 1,055,610 |
|
| TOTAL CONSUMER DISCRETIONARY | | | 6,698,499 |
|
| CONSUMER STAPLES - 4.4% | | | |
| Beverages - 1.1% | | | |
| Constellation Brands, Inc. Class A (sub. vtg.) | | 434,422 | 95,343 |
| Diageo PLC | | 375,669 | 13,521 |
| Dr. Pepper Snapple Group, Inc. | | 143,700 | 17,151 |
| Fever-Tree Drinks PLC | | 364,409 | 12,666 |
| Monster Beverage Corp. (a) | | 2,054,745 | 140,195 |
| | | | 278,876 |
| Food & Staples Retailing - 0.9% | | | |
| Costco Wholesale Corp. | | 820,474 | 159,886 |
| Kroger Co. | | 1,099,917 | 33,393 |
| Performance Food Group Co. (a) | | 721,486 | 24,783 |
| Walmart, Inc. | | 147,483 | 15,722 |
| | | | 233,784 |
| Food Products - 0.3% | | | |
| Blue Bottle Coffee, Inc. Class C (Escrow) (d)(e) | | 632,822 | 1,481 |
| Bunge Ltd. | | 209,029 | 16,603 |
| ConAgra Foods, Inc. | | 66,300 | 2,519 |
| Danone SA | | 79,537 | 6,845 |
| Darling International, Inc. (a) | | 380,645 | 7,057 |
| Lamb Weston Holdings, Inc. | | 220,954 | 12,948 |
| Pinnacle Foods, Inc. | | 41,400 | 2,564 |
| The Hain Celestial Group, Inc. (a) | | 732,747 | 27,947 |
| | | | 77,964 |
| Household Products - 0.1% | | | |
| Spectrum Brands Holdings, Inc. | | 199,089 | 23,584 |
| Personal Products - 1.1% | | | |
| Coty, Inc. Class A | | 2,153,281 | 42,226 |
| Estee Lauder Companies, Inc. Class A | | 299,400 | 40,407 |
| Herbalife Ltd. (a)(b) | | 1,153,211 | 95,705 |
| Kose Corp. | | 97,400 | 16,821 |
| Unilever NV (NY Reg.) | | 1,196,064 | 68,762 |
| | | | 263,921 |
| Tobacco - 0.9% | | | |
| British American Tobacco PLC: | | | |
| (United Kingdom) | | 62,517 | 4,273 |
| sponsored ADR | | 2,023,714 | 137,815 |
| Imperial Tobacco Group PLC | | 1,872 | 77 |
| Juul Labs, Inc. (e) | | 6,625 | 145 |
| Philip Morris International, Inc. | | 848,696 | 91,006 |
| | | | 233,316 |
|
| TOTAL CONSUMER STAPLES | | | 1,111,445 |
|
| ENERGY - 2.0% | | | |
| Energy Equipment & Services - 0.0% | | | |
| Shelf Drilling Ltd. (c) | | 741,565 | 6,253 |
| U.S. Silica Holdings, Inc. (b) | | 223,112 | 7,427 |
| | | | 13,680 |
| Oil, Gas & Consumable Fuels - 2.0% | | | |
| Anadarko Petroleum Corp. | | 1,265,244 | 75,978 |
| Andeavor | | 122,149 | 13,212 |
| Bharat Petroleum Corp. Ltd. | | 635,128 | 4,919 |
| Cenovus Energy, Inc. | | 924,434 | 8,816 |
| Cimarex Energy Co. | | 384,510 | 43,142 |
| Continental Resources, Inc. (a) | | 1,518,789 | 84,338 |
| Diamondback Energy, Inc. (a) | | 421,104 | 52,849 |
| EOG Resources, Inc. | | 469,883 | 54,037 |
| Marathon Petroleum Corp. | | 104,698 | 7,252 |
| Oasis Petroleum, Inc. (a) | | 806,325 | 6,983 |
| Petronet LNG Ltd. | | 655,750 | 2,628 |
| Phillips 66 Co. | | 18,903 | 1,936 |
| Pioneer Natural Resources Co. | | 330,982 | 60,540 |
| Reliance Industries Ltd. | | 2,979,759 | 45,067 |
| Valero Energy Corp. | | 176,579 | 16,946 |
| Whiting Petroleum Corp. (a) | | 924,548 | 25,813 |
| | | | 504,456 |
|
| TOTAL ENERGY | | | 518,136 |
|
| FINANCIALS - 4.4% | | | |
| Banks - 2.2% | | | |
| Bank of America Corp. | | 6,127,007 | 196,064 |
| Citigroup, Inc. | | 1,527,392 | 119,870 |
| First Republic Bank | | 53,474 | 4,789 |
| HDFC Bank Ltd. sponsored ADR | | 456,674 | 49,590 |
| JPMorgan Chase & Co. | | 1,413,951 | 163,552 |
| Kotak Mahindra Bank Ltd. (a) | | 615,886 | 10,746 |
| | | | 544,611 |
| Capital Markets - 1.9% | | | |
| BlackRock, Inc. Class A | | 176,888 | 99,376 |
| CBOE Holdings, Inc. | | 430,876 | 57,905 |
| Charles Schwab Corp. | | 824,862 | 43,998 |
| E*TRADE Financial Corp. (a) | | 195,795 | 10,318 |
| Fairfax India Holdings Corp. (a) | | 860,452 | 15,884 |
| Goldman Sachs Group, Inc. | | 473,389 | 126,816 |
| KKR & Co. LP | | 207,300 | 4,992 |
| Morgan Stanley | | 1,114,206 | 63,008 |
| MSCI, Inc. | | 56,776 | 7,905 |
| TD Ameritrade Holding Corp. | | 695,633 | 38,809 |
| The Blackstone Group LP | | 139,000 | 5,080 |
| | | | 474,091 |
| Consumer Finance - 0.0% | | | |
| Synchrony Financial | | 194,999 | 7,738 |
| Diversified Financial Services - 0.1% | | | |
| Berkshire Hathaway, Inc. Class B (a) | | 104,907 | 22,490 |
| GDS Holdings Ltd. ADR (a) | | 88,300 | 2,520 |
| | | | 25,010 |
| Insurance - 0.1% | | | |
| Chubb Ltd. | | 66,139 | 10,328 |
| MetLife, Inc. | | 186,530 | 8,966 |
| The Travelers Companies, Inc. | | 71,135 | 10,665 |
| | | | 29,959 |
| Thrifts & Mortgage Finance - 0.1% | | | |
| Housing Development Finance Corp. Ltd. | | 697,722 | 21,475 |
|
| TOTAL FINANCIALS | | | 1,102,884 |
|
| HEALTH CARE - 10.9% | | | |
| Biotechnology - 6.7% | | | |
| AC Immune SA (a) | | 723,942 | 9,672 |
| ACADIA Pharmaceuticals, Inc. (a) | | 266,297 | 7,965 |
| Acceleron Pharma, Inc. (a) | | 82,062 | 3,406 |
| Achaogen, Inc. (a)(b) | | 395,032 | 4,334 |
| Agios Pharmaceuticals, Inc. (a) | | 306,017 | 24,102 |
| Aimmune Therapeutics, Inc. (a) | | 468,605 | 16,500 |
| Alexion Pharmaceuticals, Inc. (a) | | 1,652,763 | 197,208 |
| Alkermes PLC (a) | | 1,003,437 | 57,366 |
| Alnylam Pharmaceuticals, Inc. (a) | | 749,174 | 97,378 |
| Amgen, Inc. | | 913,980 | 170,046 |
| AnaptysBio, Inc. | | 105,743 | 11,144 |
| Arena Pharmaceuticals, Inc. (a) | | 165,515 | 6,194 |
| Ascendis Pharma A/S sponsored ADR (a) | | 312,023 | 15,904 |
| BeiGene Ltd. ADR (a) | | 108,404 | 14,716 |
| Biogen, Inc. (a) | | 545,680 | 189,793 |
| BioMarin Pharmaceutical, Inc. (a) | | 394,274 | 35,575 |
| bluebird bio, Inc. (a) | | 294,095 | 60,260 |
| Blueprint Medicines Corp. (a) | | 44,969 | 3,537 |
| Celgene Corp. (a) | | 888,893 | 89,920 |
| Cellectis SA sponsored ADR (a) | | 62,973 | 1,981 |
| Chiasma, Inc. warrants (a) | | 55,391 | 13 |
| Chimerix, Inc. (a) | | 79,942 | 383 |
| Coherus BioSciences, Inc. (a) | | 596,627 | 6,026 |
| CytomX Therapeutics, Inc. (a) | | 155,668 | 4,164 |
| CytomX Therapeutics, Inc. (a)(c) | | 378,621 | 10,128 |
| DBV Technologies SA sponsored ADR (a) | | 101,129 | 2,342 |
| Denali Therapeutics, Inc. (a)(b) | | 781,221 | 18,171 |
| Editas Medicine, Inc. (a)(b) | | 558,873 | 20,404 |
| Epizyme, Inc. (a) | | 312,464 | 5,046 |
| Exact Sciences Corp. (a) | | 170,824 | 8,492 |
| Exelixis, Inc. (a) | | 2,489,886 | 75,468 |
| FibroGen, Inc. (a) | | 332,641 | 19,476 |
| Flexion Therapeutics, Inc. (a)(b) | | 83,549 | 1,887 |
| GenSight Biologics SA (a)(c) | | 599,743 | 4,840 |
| Global Blood Therapeutics, Inc. (a) | | 621,989 | 36,013 |
| Grifols SA ADR | | 103,434 | 2,570 |
| Heron Therapeutics, Inc. (a) | | 105,970 | 2,294 |
| Insmed, Inc. (a) | | 145,967 | 3,713 |
| Intellia Therapeutics, Inc. (a)(b) | | 570,606 | 14,665 |
| Intercept Pharmaceuticals, Inc. (a) | | 194,793 | 12,097 |
| Ionis Pharmaceuticals, Inc. (a) | | 118,688 | 6,233 |
| Ironwood Pharmaceuticals, Inc. Class A (a) | | 1,001,896 | 14,838 |
| La Jolla Pharmaceutical Co. (a) | | 165,809 | 5,681 |
| Merrimack Pharmaceuticals, Inc. | | 148,188 | 1,556 |
| Momenta Pharmaceuticals, Inc. (a) | | 90,832 | 1,544 |
| Neurocrine Biosciences, Inc. (a) | | 592,264 | 50,621 |
| Portola Pharmaceuticals, Inc. (a) | | 358,852 | 18,413 |
| Prothena Corp. PLC (a)(b) | | 97,697 | 4,084 |
| Radius Health, Inc. (a)(b) | | 79,648 | 3,000 |
| Regeneron Pharmaceuticals, Inc. (a) | | 523,756 | 192,035 |
| Sage Therapeutics, Inc. (a) | | 360,201 | 68,366 |
| Sarepta Therapeutics, Inc. (a) | | 124,083 | 8,132 |
| Seattle Genetics, Inc. (a) | | 358,526 | 18,751 |
| Seres Therapeutics, Inc. (a)(b) | | 46,200 | 467 |
| Trevena, Inc. (a) | | 976,088 | 1,591 |
| Ultragenyx Pharmaceutical, Inc. (a) | | 141,220 | 7,534 |
| Vertex Pharmaceuticals, Inc. (a) | | 175,224 | 29,240 |
| Xencor, Inc. (a) | | 266,935 | 6,075 |
| Zai Lab Ltd. ADR | | 172,389 | 4,648 |
| | | | 1,708,002 |
| Health Care Equipment & Supplies - 1.7% | | | |
| Becton, Dickinson & Co. | | 31,100 | 7,555 |
| Boston Scientific Corp. (a) | | 4,788,373 | 133,883 |
| Danaher Corp. | | 432,382 | 43,792 |
| Fisher & Paykel Healthcare Corp. | | 258,212 | 2,540 |
| Hoya Corp. | | 38,700 | 1,988 |
| Insulet Corp. (a) | | 196,752 | 15,057 |
| Intuitive Surgical, Inc. (a) | | 406,372 | 175,419 |
| Invuity, Inc. (a)(b) | | 573,468 | 2,982 |
| iRhythm Technologies, Inc. (a) | | 546,837 | 32,608 |
| Novocure Ltd. (a) | | 154,022 | 3,458 |
| Penumbra, Inc. (a) | | 14,257 | 1,420 |
| Quanterix Corp. (a) | | 149,995 | 3,121 |
| Stryker Corp. | | 14,354 | 2,360 |
| | | | 426,183 |
| Health Care Providers & Services - 1.3% | | | |
| Anthem, Inc. | | 101,667 | 25,198 |
| Apollo Hospitals Enterprise Ltd. | | 668,254 | 12,225 |
| Cigna Corp. | | 177,922 | 37,070 |
| Humana, Inc. | | 479,548 | 135,151 |
| OptiNose, Inc. (b) | | 440,971 | 8,356 |
| UnitedHealth Group, Inc. | | 464,323 | 109,942 |
| | | | 327,942 |
| Health Care Technology - 0.2% | | | |
| Cerner Corp. (a) | | 344,631 | 23,824 |
| Evolent Health, Inc. (a)(b) | | 312,143 | 4,401 |
| Teladoc, Inc. (a) | | 346,053 | 12,942 |
| | | | 41,167 |
| Pharmaceuticals - 1.0% | | | |
| Aclaris Therapeutics, Inc. (a) | | 160,406 | 3,548 |
| Akcea Therapeutics, Inc. (b) | | 822,563 | 17,808 |
| Allergan PLC | | 583,571 | 105,195 |
| Avexis, Inc. (a) | | 46,830 | 5,794 |
| Castle Creek Pharmaceuticals, LLC Class A-2 unit (a)(d)(e)(f)(g) | | 29,758 | 15,176 |
| Dermira, Inc. (a) | | 286,580 | 8,173�� |
| Dova Pharmaceuticals, Inc. (b) | | 133,099 | 4,241 |
| GW Pharmaceuticals PLC ADR (a)(b) | | 154,411 | 21,329 |
| Intersect ENT, Inc. (a) | | 110,605 | 4,131 |
| Jazz Pharmaceuticals PLC (a) | | 192,201 | 28,011 |
| Nektar Therapeutics (a) | | 154,058 | 12,881 |
| Perrigo Co. PLC | | 54,900 | 4,975 |
| Revance Therapeutics, Inc. (a) | | 66,131 | 2,136 |
| The Medicines Company (a) | | 497,845 | 16,494 |
| Theravance Biopharma, Inc. (a) | | 58,053 | 1,535 |
| Zogenix, Inc. (a) | | 112,668 | 4,095 |
| | | | 255,522 |
|
| TOTAL HEALTH CARE | | | 2,758,816 |
|
| INDUSTRIALS - 5.8% | | | |
| Aerospace & Defense - 1.0% | | | |
| Bombardier, Inc. Class B (sub. vtg.) (a) | | 3,027,082 | 8,564 |
| Elbit Systems Ltd. | | 51,473 | 7,710 |
| General Dynamics Corp. | | 22,400 | 4,984 |
| Northrop Grumman Corp. | | 194,515 | 66,238 |
| Raytheon Co. | | 158,796 | 33,179 |
| Space Exploration Technologies Corp.: | | | |
| Class A (a)(d)(e) | | 242,545 | 32,744 |
| Class C (d)(e) | | 2,783 | 376 |
| The Boeing Co. | | 306,410 | 108,583 |
| | | | 262,378 |
| Air Freight & Logistics - 0.3% | | | |
| XPO Logistics, Inc. (a) | | 690,685 | 65,228 |
| Airlines - 1.4% | | | |
| Allegiant Travel Co. | | 31,000 | 4,937 |
| Azul SA sponsored ADR | | 402,049 | 11,736 |
| Delta Air Lines, Inc. | | 1,368,740 | 77,703 |
| InterGlobe Aviation Ltd. (c) | | 458,545 | 8,765 |
| JetBlue Airways Corp. (a) | | 781,259 | 16,297 |
| Ryanair Holdings PLC sponsored ADR (a) | | 39,488 | 4,846 |
| Southwest Airlines Co. | | 2,135,020 | 129,809 |
| Spirit Airlines, Inc. (a) | | 534,608 | 22,518 |
| United Continental Holdings, Inc. (a) | | 880,514 | 59,716 |
| Wizz Air Holdings PLC (a)(c) | | 253,046 | 12,442 |
| | | | 348,769 |
| Building Products - 0.1% | | | |
| Kajaria Ceramics Ltd. | | 825,080 | 8,200 |
| Masco Corp. | | 669,916 | 29,918 |
| | | | 38,118 |
| Commercial Services & Supplies - 0.1% | | | |
| Copart, Inc. (a) | | 116,901 | 5,152 |
| Evoqua Water Technologies Corp. (a) | | 350,493 | 8,012 |
| HomeServe PLC | | 966,632 | 10,746 |
| Novus Holdings Ltd. | | 55,375 | 23 |
| | | | 23,933 |
| Construction & Engineering - 0.0% | | | |
| Fluor Corp. | | 210,869 | 12,800 |
| Electrical Equipment - 0.3% | | | |
| AMETEK, Inc. | | 35,951 | 2,743 |
| Fortive Corp. | | 158,912 | 12,080 |
| Melrose Industries PLC | | 980,689 | 3,152 |
| Nidec Corp. | | 49,300 | 7,935 |
| Regal Beloit Corp. | | 375,526 | 29,253 |
| Sensata Technologies Holding BV (a) | | 179,069 | 10,073 |
| | | | 65,236 |
| Industrial Conglomerates - 0.4% | | | |
| Honeywell International, Inc. | | 437,001 | 69,776 |
| ITT, Inc. | | 395,917 | 22,171 |
| | | | 91,947 |
| Machinery - 1.5% | | | |
| Allison Transmission Holdings, Inc. | | 245,138 | 10,845 |
| Aumann AG (c) | | 149,839 | 12,390 |
| Caterpillar, Inc. | | 1,363,373 | 221,930 |
| Deere & Co. | | 75,000 | 12,482 |
| Eicher Motors Ltd. | | 14,288 | 6,052 |
| Fanuc Corp. | | 9,900 | 2,687 |
| Gardner Denver Holdings, Inc. | | 350,300 | 12,113 |
| Kennametal, Inc. | | 150,200 | 7,327 |
| Minebea Mitsumi, Inc. | | 106,600 | 2,426 |
| Parker Hannifin Corp. | | 33,889 | 6,826 |
| Rational AG | | 15,430 | 10,843 |
| SMC Corp. | | 5,100 | 2,513 |
| WABCO Holdings, Inc. (a) | | 311,789 | 48,137 |
| Xylem, Inc. | | 351,461 | 25,397 |
| | | | 381,968 |
| Professional Services - 0.1% | | | |
| IHS Markit Ltd. (a) | | 488,882 | 23,334 |
| Road & Rail - 0.3% | | | |
| Avis Budget Group, Inc. (a) | | 316,870 | 14,246 |
| J.B. Hunt Transport Services, Inc. | | 282,427 | 34,126 |
| Knight-Swift Transportation Holdings, Inc. Class A | | 270,325 | 13,459 |
| Landstar System, Inc. | | 70,331 | 7,810 |
| | | | 69,641 |
| Trading Companies & Distributors - 0.3% | | | |
| Ashtead Group PLC | | 186,896 | 5,586 |
| United Rentals, Inc. (a) | | 399,201 | 72,299 |
| Univar, Inc. (a) | | 303,820 | 9,072 |
| Wolseley PLC | | 30,457 | 2,351 |
| | | | 89,308 |
| Transportation Infrastructure - 0.0% | | | |
| Adani Ports & Special Economic Zone Ltd. | | 357,936 | 2,415 |
|
| TOTAL INDUSTRIALS | | | 1,475,075 |
|
| INFORMATION TECHNOLOGY - 40.8% | | | |
| Communications Equipment - 0.3% | | | |
| Arista Networks, Inc. (a) | | 142,062 | 39,184 |
| NETGEAR, Inc. (a) | | 670,419 | 46,728 |
| | | | 85,912 |
| Electronic Equipment & Components - 0.2% | | | |
| Amphenol Corp. Class A | | 26,815 | 2,488 |
| Corning, Inc. | | 428,701 | 13,384 |
| Dell Technologies, Inc. (a) | | 598,906 | 42,942 |
| SYNNEX Corp. | | 17,935 | 2,201 |
| | | | 61,015 |
| Internet Software & Services - 14.0% | | | |
| 2U, Inc. (a) | | 220,718 | 16,393 |
| Akamai Technologies, Inc. (a) | | 246,527 | 16,515 |
| Alibaba Group Holding Ltd. sponsored ADR (a) | | 1,096,081 | 223,918 |
| Alphabet, Inc.: | | | |
| Class A (a) | | 1,408,215 | 1,664,822 |
| Class C (a) | | 141,534 | 165,586 |
| ANGI Homeservices, Inc. Class A (a) | | 563,790 | 7,532 |
| CarGurus, Inc. Class A (b) | | 390,790 | 13,091 |
| Dropbox, Inc. Class B (a)(d)(e) | | 1,003,814 | 15,057 |
| Facebook, Inc. Class A (a) | | 5,542,148 | 1,035,772 |
| GoDaddy, Inc. (a) | | 195,278 | 10,785 |
| Gogo, Inc. (a)(b) | | 2,488,931 | 23,993 |
| GrubHub, Inc. (a)(b) | | 32,818 | 2,371 |
| IAC/InterActiveCorp (a) | | 17,778 | 2,577 |
| LogMeIn, Inc. | | 18,222 | 2,292 |
| Mail.Ru Group Ltd. GDR (Reg. S) (a) | | 537,390 | 17,626 |
| Match Group, Inc. (a)(b) | | 86,735 | 3,031 |
| Momo, Inc. ADR (a) | | 433,252 | 13,660 |
| NetEase, Inc. ADR | | 119,839 | 38,368 |
| New Relic, Inc. (a) | | 163,925 | 9,791 |
| Nutanix, Inc. Class B (c) | | 482,746 | 15,496 |
| Okta, Inc. | | 96,558 | 2,844 |
| Shopify, Inc. Class A (a) | | 292,979 | 37,406 |
| Stamps.com, Inc. (a) | | 123,866 | 25,250 |
| Tencent Holdings Ltd. | | 2,574,600 | 152,127 |
| Yandex NV Series A (a) | | 720,701 | 27,913 |
| | | | 3,544,216 |
| IT Services - 4.5% | | | |
| MasterCard, Inc. Class A | | 1,984,478 | 335,377 |
| PayPal Holdings, Inc. (a) | | 2,834,478 | 241,838 |
| Square, Inc. (a) | | 304,509 | 14,285 |
| Teradata Corp. (a) | | 30,821 | 1,248 |
| Vakrangee Ltd. | | 1,453,552 | 8,341 |
| Visa, Inc. Class A | | 4,054,962 | 503,748 |
| Worldpay, Inc. (a) | | 283,270 | 22,749 |
| | | | 1,127,586 |
| Semiconductors & Semiconductor Equipment - 7.2% | | | |
| ASM Pacific Technology Ltd. | | 961,700 | 13,130 |
| ASML Holding NV | | 46,725 | 9,483 |
| Broadcom Ltd. | | 1,931,281 | 479,016 |
| Cypress Semiconductor Corp. | | 375,777 | 6,497 |
| Inphi Corp. (a)(b) | | 815,098 | 24,347 |
| Intel Corp. | | 745,236 | 35,876 |
| Lam Research Corp. | | 329,377 | 63,082 |
| Marvell Technology Group Ltd. | | 4,432,577 | 103,412 |
| Micron Technology, Inc. (a) | | 4,482,214 | 195,962 |
| Monolithic Power Systems, Inc. | | 112,997 | 13,460 |
| NVIDIA Corp. | | 3,055,376 | 751,011 |
| Qualcomm, Inc. | | 1,022,989 | 69,819 |
| Renesas Electronics Corp. (a) | | 2,112,500 | 24,894 |
| WONIK IPS Co. Ltd. (a) | | 352,536 | 10,858 |
| Xilinx, Inc. | | 151,352 | 11,052 |
| | | | 1,811,899 |
| Software - 8.7% | | | |
| Activision Blizzard, Inc. | | 5,120,046 | 379,549 |
| Adobe Systems, Inc. (a) | | 1,051,611 | 210,070 |
| Altair Engineering, Inc. Class A (a) | | 92,515 | 2,461 |
| Appirio, Inc. (Escrow) (a)(d)(e) | | 87,529 | 22 |
| Atlassian Corp. PLC (a) | | 60,313 | 3,256 |
| Atom Tickets LLC (d)(e)(f) | | 1,204,239 | 7,000 |
| Autodesk, Inc. (a) | | 265,786 | 30,730 |
| Electronic Arts, Inc. (a) | | 750,554 | 95,290 |
| Globant SA (a)(b) | | 52,257 | 2,375 |
| HubSpot, Inc. (a) | | 49,242 | 4,779 |
| Intuit, Inc. | | 193,751 | 32,531 |
| Micro Focus International PLC | | 418,580 | 12,778 |
| Microsoft Corp. | | 5,620,838 | 534,036 |
| Nintendo Co. Ltd. | | 95,300 | 43,163 |
| Paycom Software, Inc. (a)(b) | | 457,633 | 41,937 |
| Red Hat, Inc. (a) | | 465,529 | 61,161 |
| RingCentral, Inc. (a) | | 93,243 | 5,063 |
| SailPoint Technologies Holding, Inc. (a) | | 293,792 | 4,915 |
| Salesforce.com, Inc. (a) | | 5,157,993 | 587,547 |
| SendGrid, Inc. (a) | | 137,542 | 3,091 |
| Snap, Inc. Class A (a)(b) | | 1,573,326 | 21,271 |
| Take-Two Interactive Software, Inc. (a) | | 100,843 | 12,774 |
| Talend SA ADR (a) | | 162,563 | 6,335 |
| Tanium, Inc. Class B (d)(e) | | 554,900 | 3,069 |
| VMware, Inc. Class A (a)(b) | | 195,680 | 24,223 |
| Workday, Inc. Class A (a) | | 382,267 | 45,830 |
| Zendesk, Inc. (a) | | 568,723 | 21,907 |
| | | | 2,197,163 |
| Technology Hardware, Storage & Peripherals - 5.9% | | | |
| Apple, Inc. | | 8,897,395 | 1,489,691 |
|
| TOTAL INFORMATION TECHNOLOGY | | | 10,317,482 |
|
| MATERIALS - 2.8% | | | |
| Chemicals - 2.3% | | | |
| Cabot Corp. | | 84,336 | 5,704 |
| CF Industries Holdings, Inc. | | 2,410,687 | 102,310 |
| DowDuPont, Inc. | | 1,158,501 | 87,560 |
| FMC Corp. | | 714,913 | 65,293 |
| LG Chemical Ltd. | | 34,120 | 13,778 |
| LyondellBasell Industries NV Class A | | 1,181,014 | 141,533 |
| Nutrien Ltd. (a) | | 136,932 | 7,164 |
| Orion Engineered Carbons SA | | 260,800 | 7,681 |
| PPG Industries, Inc. | | 42,300 | 5,022 |
| Sherwin-Williams Co. | | 22,690 | 9,464 |
| The Chemours Co. LLC | | 1,698,334 | 87,668 |
| The Mosaic Co. | | 94,000 | 2,566 |
| Tronox Ltd. Class A | | 1,351,129 | 26,523 |
| Westlake Chemical Corp. | | 152,745 | 17,199 |
| | | | 579,465 |
| Construction Materials - 0.4% | | | |
| Buzzi Unicem SpA | | 75,112 | 2,205 |
| Eagle Materials, Inc. | | 305,213 | 34,199 |
| Loma Negra Compania Industrial Argentina SA ADR (a) | | 350,493 | 8,328 |
| Summit Materials, Inc. | | 1,263,072 | 40,355 |
| | | | 85,087 |
| Metals & Mining - 0.1% | | | |
| China Molybdenum Co. Ltd. (H Shares) | | 24,333,000 | 18,726 |
| Franco-Nevada Corp. | | 56,629 | 4,330 |
| Glencore Xstrata PLC | | 1,375,978 | 7,887 |
| | | | 30,943 |
|
| TOTAL MATERIALS | | | 695,495 |
|
| REAL ESTATE - 0.1% | | | |
| Equity Real Estate Investment Trusts (REITs) - 0.1% | | | |
| Equinix, Inc. | | 29,370 | 13,369 |
| Real Estate Management & Development - 0.0% | | | |
| Parsvnath Developers Ltd. (a) | | 16,893,447 | 6,366 |
|
| TOTAL REAL ESTATE | | | 19,735 |
|
| TELECOMMUNICATION SERVICES - 0.2% | | | |
| Diversified Telecommunication Services - 0.1% | | | |
| Bharti Infratel Ltd. | | 4,669,859 | 25,829 |
| Wireless Telecommunication Services - 0.1% | | | |
| T-Mobile U.S., Inc. (a) | | 527,915 | 34,367 |
|
| TOTAL TELECOMMUNICATION SERVICES | | | 60,196 |
|
| UTILITIES - 0.0% | | | |
| Gas Utilities - 0.0% | | | |
| China Resource Gas Group Ltd. | | 744,000 | 2,449 |
| ENN Energy Holdings Ltd. | | 330,000 | 2,548 |
| | | | 4,997 |
| Water Utilities - 0.0% | | | |
| AquaVenture Holdings Ltd. (a) | | 163,648 | 2,489 |
|
| TOTAL UTILITIES | | | 7,486 |
|
| TOTAL COMMON STOCKS | | | |
| (Cost $12,687,971) | | | 24,765,249 |
|
| Preferred Stocks - 2.1% | | | |
| Convertible Preferred Stocks - 2.0% | | | |
| CONSUMER DISCRETIONARY - 0.4% | | | |
| Diversified Consumer Services - 0.1% | | | |
| Lyft, Inc. Series H (d)(e) | | 719,567 | 28,600 |
| Hotels, Restaurants & Leisure - 0.1% | | | |
| MOD Super Fast Pizza Holdings LLC Series 3 Preferred (a)(d)(e)(f) | | 74,995 | 10,494 |
| Topgolf International, Inc. Series F (d)(e) | | 415,730 | 5,751 |
| | | | 16,245 |
| Internet & Direct Marketing Retail - 0.2% | | | |
| China Internet Plus Holdings Ltd. Series A-11 (a)(d)(e) | | 3,163,704 | 17,682 |
| The Honest Co., Inc.: | | | |
| Series C (a)(d)(e) | | 350,333 | 10,947 |
| Series D (a)(d)(e) | | 77,448 | 2,613 |
| Series E (d)(e) | | 551,397 | 10,810 |
| | | | 42,052 |
| Leisure Products - 0.0% | | | |
| Peloton Interactive, Inc. Series E (d)(e) | | 335,429 | 8,315 |
| TOTAL CONSUMER DISCRETIONARY | | | 95,212 |
| CONSUMER STAPLES - 0.3% | | | |
| Food & Staples Retailing - 0.1% | | | |
| Roofoods Ltd. Series F (d)(e) | | 41,941 | 14,829 |
| Tobacco - 0.2% | | | |
| PAX Labs, Inc. Series C (a)(d)(e) | | 2,555,833 | 55,922 |
| TOTAL CONSUMER STAPLES | | | 70,751 |
| FINANCIALS - 0.0% | | | |
| Consumer Finance - 0.0% | | | |
| Oportun Finance Corp. Series H (a)(d)(e) | | 3,552,125 | 10,124 |
| HEALTH CARE - 0.1% | | | |
| Biotechnology - 0.1% | | | |
| 23andMe, Inc. Series F (d)(e) | | 800,982 | 11,121 |
| Axcella Health, Inc. Series C (a)(d)(e) | | 545,634 | 7,050 |
| Immunocore Ltd. Series A (a)(d)(e) | | 11,275 | 4,198 |
| | | | 22,369 |
| Health Care Providers & Services - 0.0% | | | |
| Mulberry Health, Inc. Series A8 (a)(d)(e) | | 2,728,716 | 17,600 |
| TOTAL HEALTH CARE | | | 39,969 |
| INDUSTRIALS - 0.1% | | | |
| Aerospace & Defense - 0.1% | | | |
| Space Exploration Technologies Corp.: | | | |
| Series G (a)(d)(e) | | 97,277 | 13,132 |
| Series H (d)(e) | | 25,767 | 3,479 |
| | | | 16,611 |
| Professional Services - 0.0% | | | |
| YourPeople, Inc. Series C (a)(d)(e) | | 692,196 | 3,876 |
| TOTAL INDUSTRIALS | | | 20,487 |
| INFORMATION TECHNOLOGY - 1.1% | | | |
| Internet Software & Services - 0.9% | | | |
| ContextLogic, Inc. Series G (d)(e) | | 133,922 | 18,017 |
| Jet.Com, Inc. Series B1 (Escrow) (a)(d)(e) | | 2,928,086 | 962 |
| Reddit, Inc. Series B (d)(e) | | 524,232 | 8,269 |
| Starry, Inc. Series C (d)(e) | | 5,833,836 | 5,379 |
| Uber Technologies, Inc.: | | | |
| Series D, 8.00% (a)(d)(e) | | 5,156,948 | 181,009 |
| Series E, 8.00% (a)(d)(e) | | 102,648 | 3,603 |
| | | | 217,239 |
| IT Services - 0.0% | | | |
| AppNexus, Inc. Series E (a)(d)(e) | | 646,522 | 12,995 |
| Software - 0.2% | | | |
| Appirio, Inc. Series E (Escrow) (a)(d)(e) | | 612,702 | 156 |
| Bracket Computing, Inc. Series C (a)(d)(e) | | 1,207,761 | 1,872 |
| Cloudflare, Inc. Series D, 8.00% (a)(d)(e) | | 696,025 | 4,169 |
| Compass, Inc. Series E (d)(e) | | 53,263 | 3,594 |
| Dataminr, Inc. Series D (a)(d)(e) | | 277,250 | 2,850 |
| Delphix Corp. Series D (a)(d)(e) | | 675,445 | 4,046 |
| Malwarebytes Corp. Series B (a)(d)(e) | | 1,056,193 | 14,322 |
| Taboola.Com Ltd. Series E (a)(d)(e) | | 634,902 | 9,758 |
| | | | 40,767 |
| TOTAL INFORMATION TECHNOLOGY | | | 271,001 |
|
| TOTAL CONVERTIBLE PREFERRED STOCKS | | | 507,544 |
|
| Nonconvertible Preferred Stocks - 0.1% | | | |
| CONSUMER DISCRETIONARY - 0.1% | | | |
| Automobiles - 0.1% | | | |
| Volkswagen AG | | 44,381 | 9,754 |
| CONSUMER STAPLES - 0.0% | | | |
| Tobacco - 0.0% | | | |
| PAX Labs, Inc. Series A (d)(e) | | 2,555,833 | 3,399 |
|
| TOTAL NONCONVERTIBLE PREFERRED STOCKS | | | 13,153 |
|
| TOTAL PREFERRED STOCKS | | | |
| (Cost $361,545) | | | 520,697 |
| | | Principal Amount (000s) | Value (000s) |
|
| Convertible Bonds - 0.0% | | | |
| CONSUMER STAPLES - 0.0% | | | |
| Tobacco - 0.0% | | | |
| PAX Labs, Inc. 10% 12/31/20 (c)(e) | | | |
| (Cost $5,825) | | 5,825 | 5,825 |
| | | Shares | Value (000s) |
|
| Money Market Funds - 1.8% | | | |
| Fidelity Cash Central Fund, 1.39% (h) | | 26,883,274 | 26,889 |
| Fidelity Securities Lending Cash Central Fund 1.40% (h)(i) | | 436,764,654 | 436,808 |
| TOTAL MONEY MARKET FUNDS | | | |
| (Cost $463,692) | | | 463,697 |
| TOTAL INVESTMENT IN SECURITIES - 101.8% | | | |
| (Cost $13,519,033) | | | 25,755,468 |
| NET OTHER ASSETS (LIABILITIES) - (1.8)% | | | (464,091) |
| NET ASSETS - 100% | | | $25,291,377 |
Legend
(a) Non-income producing
(b) Security or a portion of the security is on loan at period end.
(c) Security exempt from registration under Rule 144A of the Securities Act of 1933. These securities may be resold in transactions exempt from registration, normally to qualified institutional buyers. At the end of the period, the value of these securities amounted to $113,341,000 or 0.4% of net assets.
(d) Restricted securities - Investment in securities not registered under the Securities Act of 1933 (excluding 144A issues). At the end of the period, the value of restricted securities (excluding 144A issues) amounted to $627,008,000 or 2.5% of net assets.
(e) Level 3 security
(f) Investment is owned by a wholly-owned subsidiary (Subsidiary) that is treated as a corporation for U.S. tax purposes.
(g) Investment represents common shares and preferred shares.
(h) Affiliated fund that is generally available only to investment companies and other accounts managed by Fidelity Investments. The rate quoted is the annualized seven-day yield of the fund at period end. A complete unaudited listing of the fund's holdings as of its most recent quarter end is available upon request. In addition, each Fidelity Central Fund's financial statements are available on the SEC's website or upon request.
(i) Investment made with cash collateral received from securities on loan.
Additional information on each restricted holding is as follows:
| Security | Acquisition Date | Acquisition Cost (000s) |
| 23andMe, Inc. Series F | 8/31/17 | $11,121 |
| Appirio, Inc. (Escrow) | 7/7/17 | $20 |
| Appirio, Inc. Series E (Escrow) | 11/24/16 | $156 |
| AppNexus, Inc. Series E | 8/1/14 | $12,951 |
| Atom Tickets LLC | 8/15/17 | $7,000 |
| Axcella Health, Inc. Series C | 1/30/15 | $5,500 |
| Blue Bottle Coffee, Inc. Class C (Escrow) | 10/30/17 | $1,481 |
| Bracket Computing, Inc. Series C | 9/9/15 | $9,500 |
| Castle Creek Pharmaceuticals, LLC Class A-2 unit | 9/29/16 | $9,820 |
| China Internet Plus Holdings Ltd. Series A-11 | 1/26/15 | $10,000 |
| Cloudflare, Inc. Series D, 8.00% | 11/5/14 - 6/24/15 | $4,349 |
| Compass, Inc. Series E | 11/3/17 | $3,594 |
| ContextLogic, Inc. Series G | 10/24/17 | $18,017 |
| Dataminr, Inc. Series D | 3/6/15 | $3,535 |
| Delphix Corp. Series D | 7/10/15 | $6,079 |
| Dropbox, Inc. Class B | 5/2/12 | $9,084 |
| Immunocore Ltd. Series A | 7/27/15 | $2,122 |
| Jet.Com, Inc. Series B1 (Escrow) | 9/19/16 | $962 |
| Lyft, Inc. Series H | 11/22/17 | $28,600 |
| Malwarebytes Corp. Series B | 12/21/15 | $10,958 |
| MOD Super Fast Pizza Holdings LLC Series 3 Preferred | 11/3/16 - 12/14/17 | $10,293 |
| Mulberry Health, Inc. Series A8 | 1/20/16 | $18,432 |
| Oportun Finance Corp. Series H | 2/6/15 | $10,114 |
| PAX Labs, Inc. Series A | 5/22/15 | $1,891 |
| PAX Labs, Inc. Series C | 5/22/15 | $7,949 |
| Peloton Interactive, Inc. Series E | 3/31/17 | $7,266 |
| Reddit, Inc. Series B | 7/26/17 | $7,442 |
| Roofoods Ltd. Series F | 9/12/17 | $14,829 |
| Space Exploration Technologies Corp. Class A | 10/16/15 - 9/11/17 | $23,515 |
| Space Exploration Technologies Corp. Class C | 9/11/17 | $376 |
| Space Exploration Technologies Corp. Series G | 1/20/15 | $7,535 |
| Space Exploration Technologies Corp. Series H | 8/4/17 | $3,479 |
| Starry, Inc. Series C | 12/8/17 | $5,379 |
| Taboola.Com Ltd. Series E | 12/22/14 | $6,619 |
| Tanium, Inc. Class B | 4/21/17 | $2,755 |
| The Honest Co., Inc. | 8/21/14 | $4,062 |
| The Honest Co., Inc. Series C | 8/21/14 | $9,479 |
| The Honest Co., Inc. Series D | 8/3/15 | $3,544 |
| The Honest Co., Inc. Series E | 9/28/17 | $10,810 |
| Topgolf International, Inc. Series F | 11/10/17 | $5,751 |
| Tory Burch LLC | 5/14/15 | $20,890 |
| Uber Technologies, Inc. Series D, 8.00% | 6/6/14 | $80,000 |
| Uber Technologies, Inc. Series E, 8.00% | 12/5/14 | $3,420 |
| WME Entertainment Parent, LLC Class A | 4/13/16 - 8/16/16 | $19,025 |
| YourPeople, Inc. Series C | 5/1/15 | $10,314 |
Affiliated Central Funds
Information regarding fiscal year to date income earned by the Fund from investments in Fidelity Central Funds is as follows:
| Fund | Income earned |
| | (Amounts in thousands) |
| Fidelity Cash Central Fund | $88 |
| Fidelity Securities Lending Cash Central Fund | 2,823 |
| Total | $2,911 |
Amounts in the income column in the above table include any capital gain distributions from underlying funds, which are presented in the corresponding line-item in the Statement of Operations if applicable.
Other Affiliated Issuers
An affiliated company is a company in which the Fund has ownership of at least 5% of the voting securities. Fiscal year to date transactions with companies which are or were affiliates are as follows:
| Affiliate (Amounts in thousands) | Value, beginning of period | Purchases | Sales Proceeds* | Dividend Income | Realized Gain (loss) | Change in Unrealized appreciation (depreciation) | Value, end of period |
| RH | $82,844 | $-- | $27,600 | $-- | $957 | $17,773 | $-- |
| Total | $82,844 | $-- | $27,600 | $-- | $957 | $17,773 | $-- |
* Includes the value of securities delivered through in-kind transactions, if applicable.
Investment Valuation
The following is a summary of the inputs used, as of January 31, 2018, involving the Fund's assets and liabilities carried at fair value. The inputs or methodology used for valuing securities may not be an indication of the risk associated with investing in those securities. For more information on valuation inputs, and their aggregation into the levels used below, please refer to the Investment Valuation section in the accompanying Notes to Financial Statements.
| | Valuation Inputs at Reporting Date: |
| Description | Total | Level 1 | Level 2 | Level 3 |
| (Amounts in thousands) | | | | |
| Investments in Securities: | | | | |
| Equities: | | | | |
| Consumer Discretionary | $6,803,465 | $6,558,989 | $108,123 | $136,353 |
| Consumer Staples | 1,185,595 | 1,068,359 | 41,460 | 75,776 |
| Energy | 518,136 | 518,136 | -- | -- |
| Financials | 1,113,008 | 1,102,884 | -- | 10,124 |
| Health Care | 2,798,785 | 2,741,639 | 2,001 | 55,145 |
| Industrials | 1,495,562 | 1,426,394 | 15,561 | 53,607 |
| Information Technology | 10,588,483 | 10,072,150 | 220,184 | 296,149 |
| Materials | 695,495 | 695,495 | -- | -- |
| Real Estate | 19,735 | 19,735 | -- | -- |
| Telecommunication Services | 60,196 | 60,196 | -- | -- |
| Utilities | 7,486 | 7,486 | -- | -- |
| Corporate Bonds | 5,825 | -- | -- | 5,825 |
| Money Market Funds | 463,697 | 463,697 | -- | -- |
| Total Investments in Securities: | $25,755,468 | $24,735,160 | $387,329 | $632,979 |
The following is a reconciliation of Investments in Securities and Derivative Instruments for which Level 3 inputs were used in determining value:
| (Amounts in thousands) | | | | |
| Investments in Securities: | |
| Equities - Information Technology | |
| Beginning Balance | $338,669 |
| Net Realized Gain (Loss) on Investment Securities | (3) |
| Net Unrealized Gain (Loss) on Investment Securities | (76,507) |
| Cost of Purchases | 33,990 |
| Proceeds of Sales | -- |
| Amortization/Accretion | -- |
| Transfers into Level 3 | -- |
| Transfers out of Level 3 | -- |
| Ending Balance | $296,149 |
| The change in unrealized gain (loss) for the period attributable to Level 3 securities held at January 31, 2018 | $(76,507) |
| Other Investments in Securities | |
| Beginning Balance | $209,155 |
| Net Realized Gain (Loss) on Investment Securities | 8,252 |
| Net Unrealized Gain (Loss) on Investment Securities | 69,317 |
| Cost of Purchases | 85,927 |
| Proceeds of Sales | (29,339) |
| Amortization/Accretion | -- |
| Transfers into Level 3 | -- |
| Transfers out of Level 3 | (6,482) |
| Ending Balance | $336,830 |
| The change in unrealized gain (loss) for the period attributable to Level 3 securities held at January 31, 2018 | $56,609 |
The information used in the above reconciliations represents fiscal year to date activity for any Investments in Securities identified as using Level 3 inputs at either the beginning or the end of the current fiscal period. Transfers in or out of Level 3 represent the beginning value of any Security or Instrument where a change in the pricing level occurred from the beginning to the end of the period. The cost of purchases and the proceeds of sales may include securities received or delivered through corporate actions or exchanges. Realized and unrealized gains (losses) disclosed in the reconciliations are included in Net Gain (Loss) on the Fund's Statement of Operations.
Other Information
Distribution of investments by country or territory of incorporation, as a percentage of Total Net Assets, is as follows (Unaudited):
| United States of America | 86.1% |
| Cayman Islands | 3.6% |
| Singapore | 1.9% |
| Germany | 1.3% |
| Netherlands | 1.1% |
| Others (Individually Less Than 1%) | 6.0% |
| | 100.0% |
See accompanying notes which are an integral part of the financial statements.
Financial Statements
Statement of Assets and Liabilities
| Amounts in thousands (except per-share amounts) | | January 31, 2018 (Unaudited) |
| Assets | | |
Investment in securities, at value (including securities loaned of $431,174) — See accompanying schedule:
Unaffiliated issuers (cost $13,055,341) | $25,291,771 | |
| Fidelity Central Funds (cost $463,692) | 463,697 | |
| Total Investment in Securities (cost $13,519,033) | | $25,755,468 |
| Cash | | 1,372 |
| Restricted cash | | 132 |
| Foreign currency held at value (cost $1,496) | | 1,496 |
| Receivable for investments sold | | 101,537 |
| Receivable for fund shares sold | | 26,146 |
| Dividends receivable | | 5,292 |
| Interest receivable | | 66 |
| Distributions receivable from Fidelity Central Funds | | 425 |
| Prepaid expenses | | 32 |
| Other receivables | | 1,196 |
| Total assets | | 25,893,162 |
| Liabilities | | |
| Payable for investments purchased | $123,904 | |
| Payable for fund shares redeemed | 26,248 | |
| Accrued management fee | 11,199 | |
| Other affiliated payables | 2,489 | |
| Other payables and accrued expenses | 1,133 | |
| Collateral on securities loaned | 436,812 | |
| Total liabilities | | 601,785 |
| Net Assets | | $25,291,377 |
| Net Assets consist of: | | |
| Paid in capital | | $12,084,874 |
| Distributions in excess of net investment income | | (9,546) |
| Accumulated undistributed net realized gain (loss) on investments and foreign currency transactions | | 979,543 |
| Net unrealized appreciation (depreciation) on investments and assets and liabilities in foreign currencies | | 12,236,506 |
| Net Assets | | $25,291,377 |
| Blue Chip Growth: | | |
| Net Asset Value, offering price and redemption price per share ($19,556,017 ÷ 205,252 shares) | | $95.28 |
| Class K: | | |
| Net Asset Value, offering price and redemption price per share ($5,735,360 ÷ 60,125 shares) | | $95.39 |
See accompanying notes which are an integral part of the financial statements.
Statement of Operations
| Amounts in thousands | | Six months ended January 31, 2018 (Unaudited) |
| Investment Income | | |
| Dividends | | $76,454 |
| Interest | | 112 |
| Income from Fidelity Central Funds | | 2,911 |
| Total income | | 79,477 |
| Expenses | | |
| Management fee | | |
| Basic fee | $62,026 | |
| Performance adjustment | 1,230 | |
| Transfer agent fees | 13,818 | |
| Accounting and security lending fees | 947 | |
| Custodian fees and expenses | 227 | |
| Independent trustees' fees and expenses | 32 | |
| Appreciation in deferred trustee compensation account | 1 | |
| Registration fees | 173 | |
| Audit | 52 | |
| Legal | 45 | |
| Interest | 26 | |
| Miscellaneous | 75 | |
| Total expenses before reductions | 78,652 | |
| Expense reductions | (286) | 78,366 |
| Net investment income (loss) | | 1,111 |
| Realized and Unrealized Gain (Loss) | | |
| Net realized gain (loss) on: | | |
| Investment securities: | | |
| Unaffiliated issuers | 1,551,901 | |
| Fidelity Central Funds | 3 | |
| Other affiliated issuers | 957 | |
| Foreign currency transactions | 48 | |
| Total net realized gain (loss) | | 1,552,909 |
| Change in net unrealized appreciation (depreciation) on: | | |
| Investment securities: | | |
| Unaffiliated issuers | 2,597,840 | |
| Fidelity Central Funds | (10) | |
| Other affiliated issuers | 17,773 | |
| Assets and liabilities in foreign currencies | 18 | |
| Total change in net unrealized appreciation (depreciation) | | 2,615,621 |
| Net gain (loss) | | 4,168,530 |
| Net increase (decrease) in net assets resulting from operations | | $4,169,641 |
See accompanying notes which are an integral part of the financial statements.
Statement of Changes in Net Assets
| Amounts in thousands | Six months ended January 31, 2018 (Unaudited) | Year ended July 31, 2017 |
| Increase (Decrease) in Net Assets | | |
| Operations | | |
| Net investment income (loss) | $1,111 | $36,123 |
| Net realized gain (loss) | 1,552,909 | 1,207,375 |
| Change in net unrealized appreciation (depreciation) | 2,615,621 | 3,208,986 |
| Net increase (decrease) in net assets resulting from operations | 4,169,641 | 4,452,484 |
| Distributions to shareholders from net investment income | (24,826) | (49,380) |
| Distributions to shareholders from net realized gain | (955,924) | (700,248) |
| Total distributions | (980,750) | (749,628) |
| Share transactions - net increase (decrease) | (555,825) | (433,489) |
| Total increase (decrease) in net assets | 2,633,066 | 3,269,367 |
| Net Assets | | |
| Beginning of period | 22,658,311 | 19,388,944 |
| End of period | $25,291,377 | $22,658,311 |
| Other Information | | |
| Undistributed net investment income end of period | $– | $14,169 |
| Distributions in excess of net investment income end of period | $(9,546) | $– |
See accompanying notes which are an integral part of the financial statements.
Financial Highlights
Fidelity Blue Chip Growth Fund
| | Six months ended January 31, | Years endedJuly 31, | | | | |
| | 2018 | 2017 | 2016 | 2015 | 2014 | 2013 |
| Selected Per–Share Data | | | | | | |
| Net asset value, beginning of period | $83.20 | $69.52 | $75.25 | $66.72 | $59.65 | $47.38 |
| Income from Investment Operations | | | | | | |
| Net investment income (loss)A | (.01) | .11 | .09 | .05 | .15 | .39 |
| Net realized and unrealized gain (loss) | 15.85 | 16.30 | (2.16) | 12.56 | 11.63 | 12.79 |
| Total from investment operations | 15.84 | 16.41 | (2.07) | 12.61 | 11.78 | 13.18 |
| Distributions from net investment income | (.08) | (.15) | (.03) | (.09) | (.24) | (.23) |
| Distributions from net realized gain | (3.68) | (2.58) | (3.63) | (3.99) | (4.47) | (.68) |
| Total distributions | (3.76) | (2.73) | (3.66) | (4.08) | (4.71) | (.91) |
| Net asset value, end of period | $95.28 | $83.20 | $69.52 | $75.25 | $66.72 | $59.65 |
| Total ReturnB,C | 19.60% | 24.48% | (2.59)% | 19.72% | 21.07% | 28.25% |
| Ratios to Average Net AssetsD,E | | | | | | |
| Expenses before reductions | .71%F | .70% | .82% | .89% | .80% | .76% |
| Expenses net of fee waivers, if any | .71%F | .70% | .82% | .89% | .80% | .76% |
| Expenses net of all reductions | .71%F | .69% | .82% | .88% | .80% | .74% |
| Net investment income (loss) | (.01)%F | .15% | .13% | .07% | .23% | .75% |
| Supplemental Data | | | | | | |
| Net assets, end of period (in millions) | $19,556 | $16,993 | $14,230 | $15,346 | $11,970 | $12,927 |
| Portfolio turnover rateG | 37%F,H | 43%H | 50%H | 51%H | 57%H | 75% |
A Calculated based on average shares outstanding during the period.
B Total returns for periods of less than one year are not annualized.
C Total returns would have been lower if certain expenses had not been reduced during the applicable periods shown.
D Fees and expenses of any underlying Fidelity Central Funds are not included in the Fund's expense ratio. The Fund indirectly bears its proportionate share of the expenses of any underlying Fidelity Central Funds.
E Expense ratios reflect operating expenses of the class. Expenses before reductions do not reflect amounts reimbursed by the investment adviser or reductions from brokerage service arrangements or reductions from other expense offset arrangements and do not represent the amount paid by the class during periods when reimbursements or reductions occur. Expenses net of fee waivers reflect expenses after reimbursement by the investment adviser but prior to reductions from brokerage service arrangements or other expense offset arrangements. Expenses net of all reductions represent the net expenses paid by the class.
F Annualized
G Amount does not include the portfolio activity of any underlying Fidelity Central Funds.
H Portfolio turnover rate excludes securities received or delivered in-kind.
See accompanying notes which are an integral part of the financial statements.
Fidelity Blue Chip Growth Fund Class K
| | Six months ended January 31, | Years endedJuly 31, | | | | |
| | 2018 | 2017 | 2016 | 2015 | 2014 | 2013 |
| Selected Per–Share Data | | | | | | |
| Net asset value, beginning of period | $83.34 | $69.67 | $75.36 | $66.82 | $59.74 | $47.46 |
| Income from Investment Operations | | | | | | |
| Net investment income (loss)A | .04 | .19 | .16 | .13 | .23 | .47 |
| Net realized and unrealized gain (loss) | 15.85 | 16.32 | (2.15) | 12.57 | 11.64 | 12.79 |
| Total from investment operations | 15.89 | 16.51 | (1.99) | 12.70 | 11.87 | 13.26 |
| Distributions from net investment income | (.16) | (.27) | (.07) | (.17) | (.33) | (.30) |
| Distributions from net realized gain | (3.68) | (2.58) | (3.63) | (3.99) | (4.47) | (.68) |
| Total distributions | (3.84) | (2.84)B | (3.70) | (4.16) | (4.79)C | (.98) |
| Net asset value, end of period | $95.39 | $83.34 | $69.67 | $75.36 | $66.82 | $59.74 |
| Total ReturnD,E | 19.65% | 24.63% | (2.47)% | 19.84% | 21.23% | 28.42% |
| Ratios to Average Net AssetsF,G | | | | | | |
| Expenses before reductions | .61%H | .59% | .70% | .78% | .68% | .61% |
| Expenses net of fee waivers, if any | .61%H | .59% | .70% | .77% | .68% | .61% |
| Expenses net of all reductions | .61%H | .58% | .70% | .77% | .67% | .60% |
| Net investment income (loss) | .08%H | .26% | .25% | .19% | .36% | .89% |
| Supplemental Data | | | | | | |
| Net assets, end of period (in millions) | $5,735 | $5,665 | $5,158 | $5,898 | $4,612 | $3,506 |
| Portfolio turnover rateI | 37%H,J | 43%J | 50%J | 51%J | 57%J | 75% |
A Calculated based on average shares outstanding during the period.
B Total distributions of $2.84 per share is comprised of distributions from net investment income of $.267 and distributions from net realized gain of $2.576 per share.
C Total distributions of $4.79 per share is comprised of distributions from net investment income of $.325 and distributions from net realized gain of $4.466 per share.
D Total returns for periods of less than one year are not annualized.
E Total returns would have been lower if certain expenses had not been reduced during the applicable periods shown.
F Fees and expenses of any underlying Fidelity Central Funds are not included in the Fund's expense ratio. The Fund indirectly bears its proportionate share of the expenses of any underlying Fidelity Central Funds.
G Expense ratios reflect operating expenses of the class. Expenses before reductions do not reflect amounts reimbursed by the investment adviser or reductions from brokerage service arrangements or reductions from other expense offset arrangements and do not represent the amount paid by the class during periods when reimbursements or reductions occur. Expenses net of fee waivers reflect expenses after reimbursement by the investment adviser but prior to reductions from brokerage service arrangements or other expense offset arrangements. Expenses net of all reductions represent the net expenses paid by the class.
H Annualized
I Amount does not include the portfolio activity of any underlying Fidelity Central Funds.
J Portfolio turnover rate excludes securities received or delivered in-kind.
See accompanying notes which are an integral part of the financial statements.
Notes to Financial Statements (Unaudited)
For the period ended January 31, 2018
(Amounts in thousands except percentages)
1. Organization.
Fidelity Blue Chip Growth Fund (the Fund) is a fund of Fidelity Securities Fund (the Trust) and is authorized to issue an unlimited number of shares. The Trust is registered under the Investment Company Act of 1940, as amended (the 1940 Act), as an open-end management investment company organized as a Massachusetts business trust. The Fund offers Blue Chip Growth and Class K shares, each of which has equal rights as to assets and voting privileges. Each class has exclusive voting rights with respect to matters that affect that class.
2. Investments in Fidelity Central Funds.
The Fund invests in Fidelity Central Funds, which are open-end investment companies generally available only to other investment companies and accounts managed by the investment adviser and its affiliates. The Fund's Schedule of Investments lists each of the Fidelity Central Funds held as of period end, if any, as an investment of the Fund, but does not include the underlying holdings of each Fidelity Central Fund. As an Investing Fund, the Fund indirectly bears its proportionate share of the expenses of the underlying Fidelity Central Funds.
The Money Market Central Funds seek preservation of capital and current income and are managed by Fidelity Investments Money Management, Inc. (FIMM), an affiliate of the investment adviser. Annualized expenses of the Money Market Central Funds as of their most recent shareholder report date are less than .005%.
A complete unaudited list of holdings for each Fidelity Central Fund is available upon request or at the Securities and Exchange Commission (the SEC) website at www.sec.gov. In addition, the financial statements of the Fidelity Central Funds are available on the SEC website or upon request.
3. Significant Accounting Policies.
The Fund is an investment company and applies the accounting and reporting guidance of the Financial Accounting Standards Board (FASB) Accounting Standards Codification Topic 946 Financial Services – Investments Companies. The financial statements have been prepared in conformity with accounting principles generally accepted in the United States of America (GAAP), which require management to make certain estimates and assumptions at the date of the financial statements. Actual results could differ from those estimates. Subsequent events, if any, through the date that the financial statements were issued have been evaluated in the preparation of the financial statements. The following summarizes the significant accounting policies of the Fund:
Investment Valuation. Investments are valued as of 4:00 p.m. Eastern time on the last calendar day of the period. The Board of Trustees (the Board) has delegated the day to day responsibility for the valuation of the Fund's investments to the Fair Value Committee (the Committee) established by the Fund's investment adviser. In accordance with valuation policies and procedures approved by the Board, the Fund attempts to obtain prices from one or more third party pricing vendors or brokers to value its investments. When current market prices, quotations or currency exchange rates are not readily available or reliable, investments will be fair valued in good faith by the Committee, in accordance with procedures adopted by the Board. Factors used in determining fair value vary by investment type and may include market or investment specific events, changes in interest rates and credit quality. The frequency with which these procedures are used cannot be predicted and they may be utilized to a significant extent. The Committee oversees the Fund's valuation policies and procedures and reports to the Board on the Committee's activities and fair value determinations. The Board monitors the appropriateness of the procedures used in valuing the Fund's investments and ratifies the fair value determinations of the Committee.
The Fund categorizes the inputs to valuation techniques used to value its investments into a disclosure hierarchy consisting of three levels as shown below:
- Level 1 – quoted prices in active markets for identical investments
- Level 2 – other significant observable inputs (including quoted prices for similar investments, interest rates, prepayment speeds, etc.)
- Level 3 – unobservable inputs (including the Fund's own assumptions based on the best information available)
Valuation techniques used to value the Fund's investments by major category are as follows:
Equity securities, including restricted securities, for which market quotations are readily available, are valued at the last reported sale price or official closing price as reported by a third party pricing vendor on the primary market or exchange on which they are traded and are categorized as Level 1 in the hierarchy. In the event there were no sales during the day or closing prices are not available, securities are valued at the last quoted bid price or may be valued using the last available price and are generally categorized as Level 2 in the hierarchy. For foreign equity securities, when market or security specific events arise, comparisons to the valuation of American Depositary Receipts (ADRs), futures contracts, Exchange-Traded Funds (ETFs) and certain indexes as well as quoted prices for similar securities may be used and would be categorized as Level 2 in the hierarchy. Utilizing these techniques may result in transfers between Level 1 and Level 2. For equity securities, including restricted securities, where observable inputs are limited, assumptions about market activity and risk are used and these securities may be categorized as Level 3 in the hierarchy. Equity securities, including restricted securities, for which observable inputs are not available are valued using alternate valuation approaches, including the market approach and the income approach and are categorized as Level 3 in the hierarchy. The market approach generally consists of using comparable market transactions while the income approach generally consists of using the net present value of estimated future cash flows, adjusted as appropriate for liquidity, credit, market and/or other risk factors.
Debt securities, including restricted securities, are valued based on evaluated prices received from third party pricing vendors or from brokers who make markets in such securities. Corporate bonds are valued by pricing vendors who utilize matrix pricing which considers yield or price of bonds of comparable quality, coupon, maturity and type or by broker-supplied prices. When independent prices are unavailable or unreliable, debt securities may be valued utilizing pricing methodologies which consider similar factors that would be used by third party pricing vendors. Debt securities are generally categorized as Level 2 in the hierarchy but may be Level 3 depending on the circumstances.
Investments in open-end mutual funds, including the Fidelity Central Funds, are valued at their closing net asset value (NAV) each business day and are categorized as Level 1 in the hierarchy.
The following provides information on Level 3 securities held by the Fund that were valued at period end based on unobservable inputs. These amounts exclude valuations provided by a broker.
| Asset Type | Fair Value | Valuation Technique(s) | Unobservable Input | Amount or Range/Weighted Average | Impact to Valuation from an Increase in Input(a) |
| Corporate Bonds | $5,825 | Market approach | Transaction price | $100.00 | Increase |
| Equities | $627,154 | Market approach | Transaction price | $0.92- $353.57 / $55.66 | Increase |
| | | | Liquidity preference | $16.35 - $45.76 / $35.01 | Increase |
| | | Market comparable | Transaction price | $10.08- $330.00 / $216.05 | Increase |
| | | | Enterprise value/Sales multiple (EV/S) | 0.8 - 14.3 / 5.0 | Increase |
| | | | Discount rate | 7.5% - 69.1% / 17.9% | Decrease |
| | | | Enterprise value/EBITDA multiple (EV/EBITDA) | 9.1 | Increase |
| | | | Price/Earnings multiple (P/E) | 14.6 | Increase |
| | | | Enterprise value/Gross profit (EV/GP) | 5.5 | Increase |
| | | | Premium rate | 8.0% - 108.0% / 28.1% | Increase |
| | | | Discount for lack of marketability | 10.0% - 25.0% / 15.7% | Decrease |
| | | | Liquidity preference | $4.84 - $23.41 / $14.96 | Increase |
| | | | Proxy premium | 28.2% - 54.5% / 46.5% | Increase |
| | | Book value | Book value multiple | 1.0 | Increase |
| | | | Discount rate | 70.0% | Decrease |
| | | Recovery value | Recovery value | 0.2% - 2.3% / 1.5% | Increase |
(a) Represents the expected directional change in the fair value of the Level 3 investments that would result from an increase in the corresponding input. A decrease to the unobservable input would have the opposite effect. Significant changes in these inputs could result in significantly higher or lower fair value measurements.
Changes in valuation techniques may result in transfers in or out of an assigned level within the disclosure hierarchy. The aggregate value of investments by input level as of January 31, 2018, as well as a roll forward of Level 3 investments, is included at the end of the Fund's Schedule of Investments.
Foreign Currency. The Fund may use foreign currency contracts to facilitate transactions in foreign-denominated securities. Gains and losses from these transactions may arise from changes in the value of the foreign currency or if the counterparties do not perform under the contracts' terms.
Foreign-denominated assets, including investment securities, and liabilities are translated into U.S. dollars at the exchange rates at period end. Purchases and sales of investment securities, income and dividends received and expenses denominated in foreign currencies are translated into U.S. dollars at the exchange rate in effect on the transaction date.
The effects of exchange rate fluctuations on investments are included with the net realized and unrealized gain (loss) on investment securities. Other foreign currency transactions resulting in realized and unrealized gain (loss) are disclosed separately.
Investment Transactions and Income. For financial reporting purposes, the Fund's investment holdings and NAV include trades executed through the end of the last business day of the period. The NAV per share for processing shareholder transactions is calculated as of the close of business of the New York Stock Exchange (NYSE), normally 4:00 p.m. Eastern time and includes trades executed through the end of the prior business day. Gains and losses on securities sold are determined on the basis of identified cost and includes proceeds received from litigation. Dividend income is recorded on the ex-dividend date, except for certain dividends from foreign securities where the ex-dividend date may have passed, which are recorded as soon as the Fund is informed of the ex-dividend date. Non-cash dividends included in dividend income, if any, are recorded at the fair market value of the securities received. Income and capital gain distributions from Fidelity Central Funds, if any, are recorded on the ex-dividend date. Certain distributions received by the Fund represent a return of capital or capital gain. The Fund determines the components of these distributions subsequent to the ex-dividend date, based upon receipt of tax filings or other correspondence relating to the underlying investment. These distributions are recorded as a reduction of cost of investments and/or as a realized gain. Interest income is accrued as earned and includes coupon interest and amortization of premium and accretion of discount on debt securities as applicable. Investment income is recorded net of foreign taxes withheld where recovery of such taxes is uncertain.
Class Allocations and Expenses. Investment income, realized and unrealized capital gains and losses, common expenses of the Fund, and certain fund-level expense reductions, if any, are allocated daily on a pro-rata basis to each class based on the relative net assets of each class to the total net assets of the Fund. Each class differs with respect to transfer agent fees incurred. Certain expense reductions may also differ by class. For the reporting period, the allocated portion of income and expenses to each class as a percent of its average net assets may vary due to the timing of recording these transactions in relation to fluctuating net assets of the classes. Expenses directly attributable to a fund are charged to that fund. Expenses attributable to more than one fund are allocated among the respective funds on the basis of relative net assets or other appropriate methods. Expense estimates are accrued in the period to which they relate and adjustments are made when actual amounts are known.
Deferred Trustee Compensation. Under a Deferred Compensation Plan (the Plan), independent Trustees may elect to defer receipt of a portion of their annual compensation. Deferred amounts are invested in a cross-section of Fidelity funds, are marked-to-market and remain in the Fund until distributed in accordance with the Plan. The investment of deferred amounts and the offsetting payable to the Trustees are included in the accompanying Statement of Assets and Liabilities.
Income Tax Information and Distributions to Shareholders. Each year, the Fund intends to qualify as a regulated investment company under Subchapter M of the Internal Revenue Code, including distributing substantially all of its taxable income and realized gains. As a result, no provision for U.S. Federal income taxes is required. The Fund files a U.S. federal tax return, in addition to state and local tax returns as required. The Fund's federal income tax returns are subject to examination by the Internal Revenue Service (IRS) for a period of three fiscal years after they are filed. State and local tax returns may be subject to examination for an additional fiscal year depending on the jurisdiction. Foreign taxes are provided for based on the Fund's understanding of the tax rules and rates that exist in the foreign markets in which it invests.
Distributions are declared and recorded on the ex-dividend date. Income dividends and capital gain distributions are declared separately for each class. Income and capital gain distributions are determined in accordance with income tax regulations, which may differ from GAAP.
Capital accounts within the financial statements are adjusted for permanent book-tax differences. These adjustments have no impact on net assets or the results of operations. Capital accounts are not adjusted for temporary book-tax differences which will reverse in a subsequent period.
Book-tax differences are primarily due to foreign currency transactions, passive foreign investment companies (PFIC), redemptions in kind, partnerships, deferred trustees compensation and losses deferred due to wash sales.
As of period end, the cost and unrealized appreciation (depreciation) in securities, and derivatives if applicable, for federal income tax purposes were as follows:
| Gross unrealized appreciation | $12,497,060 |
| Gross unrealized depreciation | (283,454) |
| Net unrealized appreciation (depreciation) | $12,213,606 |
| Tax cost | $13,541,862 |
Restricted Securities. The Fund may invest in securities that are subject to legal or contractual restrictions on resale. These securities generally may be resold in transactions exempt from registration or to the public if the securities are registered. Disposal of these securities may involve time-consuming negotiations and expense, and prompt sale at an acceptable price may be difficult. Information regarding restricted securities is included at the end of the Fund's Schedule of Investments.
Consolidated Subsidiary. The Fund invests in certain investments through a wholly-owned subsidiary ("Subsidiary"), which may be subject to federal and state taxes upon disposition.
As of period end, the Fund held an investment of $71,171 in these Subsidiaries, representing .28% of the Fund's net assets. The financial statements have been consolidated and include accounts of the Fund and each Subsidiary. Accordingly, all inter-company transactions and balances have been eliminated.
Any cash held by the Subsidiaries is restricted as to its use and is presented as Restricted cash in the Statement of Assets and Liabilities.
4. Purchases and Sales of Investments.
Purchases and sales of securities, other than short-term securities and in-kind transactions, aggregated $4,304,353 and $4,939,838, respectively.
Redemptions In-Kind. During the period, 10,253 shares of the Fund held by unaffiliated entities were redeemed in-kind for investments and cash with a value of $893,990. The net realized gain of $540,912 on investments delivered through in-kind redemptions is included in the accompanying Statement of Operations. The amount of the in-kind redemptions is included in share transactions in the accompanying Statement of Changes in Net Assets as well as the Notes to Financial Statements. The Fund recognized no gain or loss for federal income tax purposes.
Prior Fiscal Year Redemptions In-Kind. During the prior period, 1,133 shares of the Fund held by an unaffiliated entity were redeemed in-kind for investments and cash with a value of $94,035. The Fund had a net realized gain of $55,844 on investments delivered through in-kind redemptions. The amount of the in-kind redemptions is included in share transactions in the accompanying Statement of Changes in Net Assets as well as the Notes to Financial Statements. The Fund recognized no gain or loss for federal income tax purposes.
5. Fees and Other Transactions with Affiliates.
Management Fee. Fidelity Management & Research Company (the investment adviser) and its affiliates provide the Fund with investment management related services for which the Fund pays a monthly management fee. The management fee is the sum of an individual fund fee rate that is based on an annual rate of .30% of the Fund's average net assets and an annualized group fee rate that averaged .24% during the period. The group fee rate is based upon the average net assets of all the mutual funds advised by the investment adviser, including any mutual funds previously advised by the investment adviser that are currently advised by Fidelity SelectCo, LLC, an affiliate of the investment adviser. The group fee rate decreases as assets under management increase and increases as assets under management decrease. In addition, the management fee is subject to a performance adjustment (up to a maximum of +/- .20% of the Fund's average net assets over a 36 month performance period). The upward or downward adjustment to the management fee is based on the relative investment performance of Blue Chip Growth as compared to its benchmark index, the Russell 1000 Growth Index, over the same 36 month performance period. For the reporting period, the total annualized management fee rate, including the performance adjustment, was .55% of the Fund's average net assets. The performance adjustment included in the management fee rate may be higher or lower than the maximum performance adjustment rate due to the difference between the average net assets for the reporting and performance periods.
Transfer Agent Fees. Fidelity Investments Institutional Operations Company, Inc., (FIIOC), an affiliate of the investment adviser, is the transfer, dividend disbursing and shareholder servicing agent for each class of the Fund. FIIOC receives account fees and asset-based fees that vary according to the account size and type of account of the shareholders of Blue Chip Growth. FIIOC receives an asset-based fee of Class K's average net assets. FIIOC pays for typesetting, printing and mailing of shareholder reports, except proxy statements.
For the period, transfer agent fees for each class were as follows:
| | Amount | % of Class-Level Average Net Assets(a) |
| Blue Chip Growth | $12,528 | .14 |
| Class K | 1,290 | .05 |
| | $13,818 | |
(a) Annualized
Accounting and Security Lending Fees. Fidelity Service Company, Inc. (FSC), an affiliate of the investment adviser, maintains the Fund's accounting records. The accounting fee is based on the level of average net assets for each month. Under a separate contract, FSC administers the security lending program. The security lending fee is based on the number and duration of lending transactions.
Brokerage Commissions. The Fund placed a portion of its portfolio transactions with brokerage firms which are affiliates of the investment adviser. Brokerage commissions are included in net realized gain (loss) and change in net unrealized appreciation (depreciation) in the Statement of Operations. The commissions paid to these affiliated firms were $78 for the period.
Interfund Lending Program. Pursuant to an Exemptive Order issued by the SEC, the Fund, along with other registered investment companies having management contracts with Fidelity Management & Research Company (FMR) or other affiliated entities of FMR, may participate in an interfund lending program. This program provides an alternative credit facility allowing the funds to borrow from, or lend money to, other participating affiliated funds. At period end, there were no interfund loans outstanding. The Fund's activity in this program during the period for which loans were outstanding was as follows:
| Borrower or Lender | Average Loan Balance | Weighted Average Interest Rate | Interest Expense |
| Borrower | $19,894 | 1.35% | $26 |
Interfund Trades. The Fund may purchase from or sell securities to other Fidelity Funds under procedures adopted by the Board. The procedures have been designed to ensure these interfund trades are executed in accordance with Rule 17a-7 of the 1940 Act. Interfund trades are included within the respective purchases and sales amounts shown in the Purchases and Sales of Investments note
Prior Fiscal Year Redemptions In-Kind. During the prior period, 2,142 shares of the Fund held by an affiliated entity were redeemed in-kind for investments and cash with a value of $179,817. The Fund had a net realized gain of $107,301 on investments delivered through in-kind redemptions. The amount of the in-kind redemptions is included in share transactions in the accompanying Statement of Changes in Net Assets as well as the Notes to Financial Statements. The Fund recognized no gain or loss for federal income tax purposes.
6. Committed Line of Credit.
The Fund participates with other funds managed by the investment adviser or an affiliate in a $4.25 billion credit facility (the "line of credit") to be utilized for temporary or emergency purposes to fund shareholder redemptions or for other short-term liquidity purposes. The Fund has agreed to pay commitment fees on its pro-rata portion of the line of credit, which amounted to $33 and is reflected in Miscellaneous expenses on the Statement of Operations. During the period, the Fund did not borrow on this line of credit.
7. Security Lending.
The Fund lends portfolio securities through a lending agent from time to time in order to earn additional income. For equity securities, a lending agent is used and may loan securities to certain qualified borrowers, including Fidelity Capital Markets (FCM), a broker-dealer affiliated with the Fund. On the settlement date of the loan, the Fund receives collateral (in the form of U.S. Treasury obligations, letters of credit and/or cash) against the loaned securities and maintains collateral in an amount not less than 100% of the market value of the loaned securities during the period of the loan. The market value of the loaned securities is determined at the close of business of the Fund and any additional required collateral is delivered to the Fund on the next business day. The Fund or borrower may terminate the loan at any time, and if the borrower defaults on its obligation to return the securities loaned because of insolvency or other reasons, the Fund may apply collateral received from the borrower against the obligation. The Fund may experience delays and costs in recovering the securities loaned. Any cash collateral received is invested in the Fidelity Securities Lending Cash Central Fund. The value of loaned securities and cash collateral at period end are disclosed on the Fund's Statement of Assets and Liabilities. The value of securities loaned to FCM at period end was $32,990. Security lending income represents the income earned on investing cash collateral, less rebates paid to borrowers and any lending agent fees associated with the loan, plus any premium payments received for lending certain types of securities. Security lending income is presented in the Statement of Operations as a component of income from Fidelity Central Funds. Total security lending income during the period amounted to $2,823, including $217 from securities loaned to FCM.
8. Expense Reductions.
Commissions paid to certain brokers with whom the investment adviser, or its affiliates, places trades on behalf of the Fund include an amount in addition to trade execution, which may be rebated back to the Fund to offset certain expenses. This amount totaled $165 for the period. In addition, through arrangements with the Fund's custodian, credits realized as a result of certain uninvested cash balances were used to reduce the Fund's expenses. During the period, these credits reduced the Fund's custody expenses by $5.
In addition, during the period the investment adviser reimbursed and/or waived a portion of fund-level operating expenses in the amount of $116.
9. Distributions to Shareholders.
Distributions to shareholders of each class were as follows:
| | Six months ended
January 31, 2018 | Year ended
July 31, 2017 |
| From net investment income | | |
| Blue Chip Growth | $14,640 | $30,042 |
| Class K | 10,186 | 19,338 |
| Total | $24,826 | $49,380 |
| From net realized gain | | |
| Blue Chip Growth | $722,426 | $514,584 |
| Class K | 233,498 | 185,664 |
| Total | $955,924 | $700,248 |
10. Share Transactions.
Share transactions for each class were as follows and may contain automatic conversions between classes or exchanges between affiliated funds:
| | Shares | Shares | Dollars | Dollars |
| | Six months ended January 31, 2018 | Year ended July 31, 2017 | Six months ended January 31, 2018 | Year ended July 31, 2017 |
| Blue Chip Growth | | | | |
| Shares sold | 20,961 | 32,630 | $1,849,583 | $2,453,411 |
| Reinvestment of distributions | 8,154 | 7,584 | 698,554 | 519,650 |
| Shares redeemed | (28,100) | (40,666) | (2,419,155) | (2,950,825) |
| Net increase (decrease) | 1,015 | (452) | $128,982 | $22,236 |
| Class K | | | | |
| Shares sold | 7,482 | 13,260 | $656,163 | $986,030 |
| Reinvestment of distributions | 2,843 | 2,988 | 243,684 | 205,002 |
| Shares redeemed | (18,175)(a) | (22,314)(b) | (1,584,654)(a) | (1,646,757)(b) |
| Net increase (decrease) | (7,850) | (6,066) | $(684,807) | $(455,725) |
(a) Amount includes in-kind redemptions (see the Redemptions In-Kind note for additional details).
(b) Amount includes in-kind redemptions (see the Prior Fiscal Year Redemptions In-Kind note for additional details).
11. Other.
The Fund's organizational documents provide former and current trustees and officers with a limited indemnification against liabilities arising in connection with the performance of their duties to the Fund. In the normal course of business, the Fund may also enter into contracts that provide general indemnifications. The Fund's maximum exposure under these arrangements is unknown as this would be dependent on future claims that may be made against the Fund. The risk of material loss from such claims is considered remote.
Shareholder Expense Example
As a shareholder of the Fund, you incur two types of costs: (1) transaction costs, and (2) ongoing costs, including management fees and other Fund expenses. This Example is intended to help you understand your ongoing costs (in dollars) of investing in the Fund and to compare these costs with the ongoing costs of investing in other mutual funds.
The Example is based on an investment of $1,000 invested at the beginning of the period and held for the entire period (August 1, 2017 to January 31, 2018).
Actual Expenses
The first line of the accompanying table for each class of the Fund provides information about actual account values and actual expenses. You may use the information in this line, together with the amount you invested, to estimate the expenses that you paid over the period. Simply divide your account value by $1,000.00 (for example, an $8,600 account value divided by $1,000.00 = 8.6), then multiply the result by the number in the first line for a class of the Fund under the heading entitled "Expenses Paid During Period" to estimate the expenses you paid on your account during this period. A small balance maintenance fee of $12.00 that is charged once a year may apply for certain accounts with a value of less than $2,000. This fee is not included in the table below. If it was, the estimate of expenses you paid during the period would be higher, and your ending account value lower, by this amount. In addition, the Fund, as a shareholder in the underlying Fidelity Central Funds, will indirectly bear its pro-rata share of the fees and expenses incurred by the underlying Fidelity Central Funds. These fees and expenses are not included in the Fund's annualized expense ratio used to calculate the expense estimate in the table below.
Hypothetical Example for Comparison Purposes
The second line of the accompanying table for each class of the Fund provides information about hypothetical account values and hypothetical expenses based on a Class' actual expense ratio and an assumed rate of return of 5% per year before expenses, which is not the Class' actual return. The hypothetical account values and expenses may not be used to estimate the actual ending account balance or expenses you paid for the period. You may use this information to compare the ongoing costs of investing in the Fund and other funds. To do so, compare this 5% hypothetical example with the 5% hypothetical examples that appear in the shareholder reports of the other funds. A small balance maintenance fee of $12.00 that is charged once a year may apply for certain accounts with a value of less than $2,000. This fee is not included in the table below. If it was, the estimate of expenses you paid during the period would be higher, and your ending account value lower, by this amount. In addition, the Fund, as a shareholder in the underlying Fidelity Central Funds, will indirectly bear its pro-rata share of the fees and expenses incurred by the underlying Fidelity Central Funds. These fees and expenses are not included in the Fund's annualized expense ratio used to calculate the expense estimate in the table below.
Please note that the expenses shown in the table are meant to highlight your ongoing costs only and do not reflect any transaction costs. Therefore, the second line of the table is useful in comparing ongoing costs only, and will not help you determine the relative total costs of owning different funds.
| | Annualized Expense Ratio-A | Beginning
Account Value
August 1, 2017 | Ending
Account Value
January 31, 2018 | Expenses Paid
During Period-B
August 1, 2017
to January 31, 2018 |
| Blue Chip Growth | .71% | | | |
| Actual | | $1,000.00 | $1,196.00 | $3.93 |
| Hypothetical-C | | $1,000.00 | $1,021.63 | $3.62 |
| Class K | .61% | | | |
| Actual | | $1,000.00 | $1,196.50 | $3.38 |
| Hypothetical-C | | $1,000.00 | $1,022.13 | $3.11 |
A Annualized expense ratio reflects expenses net of applicable fee waivers.
B Expenses are equal to each Class' annualized expense ratio, multiplied by the average account value over the period, multiplied by 184/365 (to reflect the one-half year period).
C 5% return per year before expenses
Corporate Headquarters
245 Summer St.
Boston, MA 02210
www.fidelity.com
BCF-SANN-0318
1.700126.121
Fidelity® Blue Chip Growth K6 Fund
Semi-Annual Report January 31, 2018 |
|
Contents
To view a fund's proxy voting guidelines and proxy voting record for the 12-month period ended June 30, visit http://www.fidelity.com/proxyvotingresults or visit the Securities and Exchange Commission's (SEC) web site at http://www.sec.gov.
You may also call 1-800-835-5092 to request a free copy of the proxy voting guidelines.
Standard & Poor's, S&P and S&P 500 are registered service marks of The McGraw-Hill Companies, Inc. and have been licensed for use by Fidelity Distributors Corporation.
Other third-party marks appearing herein are the property of their respective owners.
All other marks appearing herein are registered or unregistered trademarks or service marks of FMR LLC or an affiliated company. © 2018 FMR LLC. All rights reserved.
This report and the financial statements contained herein are submitted for the general information of the shareholders of the Fund. This report is not authorized for distribution to prospective investors in the Fund unless preceded or accompanied by an effective prospectus.
A fund files its complete schedule of portfolio holdings with the SEC for the first and third quarters of each fiscal year on Form N-Q. Forms N-Q are available on the SEC’s web site at http://www.sec.gov. A fund's Forms N-Q may be reviewed and copied at the SEC’s Public Reference Room in Washington, DC. Information regarding the operation of the SEC's Public Reference Room may be obtained by calling 1-800-SEC-0330.
For a complete list of a fund's portfolio holdings, view the most recent holdings listing, semiannual report, or annual report on Fidelity's web site at http://www.fidelity.com, http://www.institutional.fidelity.com, or http://www.401k.com, as applicable.
NOT FDIC INSURED •MAY LOSE VALUE •NO BANK GUARANTEE
Neither the Fund nor Fidelity Distributors Corporation is a bank.
Investment Summary (Unaudited)
Top Ten Stocks as of January 31, 2018
| | % of fund's net assets |
| Amazon.com, Inc. | 6.7 |
| Alphabet, Inc. Class A | 6.6 |
| Apple, Inc. | 6.1 |
| Facebook, Inc. Class A | 4.2 |
| NVIDIA Corp. | 3.1 |
| Salesforce.com, Inc. | 2.4 |
| Tesla, Inc. | 2.3 |
| Microsoft Corp. | 2.1 |
| Visa, Inc. Class A | 2.0 |
| Home Depot, Inc. | 2.0 |
| | 37.5 |
Top Five Market Sectors as of January 31, 2018
| | % of fund's net assets |
| Information Technology | 41.6 |
| Consumer Discretionary | 27.2 |
| Health Care | 10.9 |
| Industrials | 6.3 |
| Consumer Staples | 4.6 |
Asset Allocation (% of fund's net assets)
| As of January 31, 2018* |
| | Stocks | 99.5% |
| | Convertible Securities | 0.5% |

* Foreign investments - 13.7%
Schedule of Investments January 31, 2018 (Unaudited)
Showing Percentage of Net Assets
| Common Stocks - 99.5% | | | |
| | | Shares | Value |
| CONSUMER DISCRETIONARY - 26.8% | | | |
| Auto Components - 0.1% | | | |
| Aptiv PLC | | 7,925 | $751,924 |
| Automobiles - 2.3% | | | |
| Tesla, Inc. (a) | | 79,049 | 28,007,851 |
| Diversified Consumer Services - 0.4% | | | |
| Adtalem Global Education, Inc. (a) | | 9,820 | 451,720 |
| Chegg, Inc. (a) | | 23,753 | 411,402 |
| Grand Canyon Education, Inc. (a) | | 2,683 | 249,492 |
| New Oriental Education & Technology Group, Inc. sponsored ADR | | 28,581 | 2,632,024 |
| ServiceMaster Global Holdings, Inc. (a) | | 20,666 | 1,089,512 |
| Weight Watchers International, Inc. (a) | | 3,600 | 231,444 |
| | | | 5,065,594 |
| Hotels, Restaurants & Leisure - 3.6% | | | |
| Alsea S.A.B. de CV | | 65,400 | 213,927 |
| Caesars Entertainment Corp. (a) | | 84,378 | 1,177,073 |
| Chipotle Mexican Grill, Inc. (a) | | 19,697 | 6,396,798 |
| Del Taco Restaurants, Inc. (a) | | 637 | 8,071 |
| Delta Corp. Ltd. (a) | | 31,848 | 173,270 |
| Eldorado Resorts, Inc. (a) | | 3,600 | 124,380 |
| Hilton Grand Vacations, Inc. (a) | | 5,300 | 238,341 |
| Hyatt Hotels Corp. Class A (a) | | 3,000 | 243,900 |
| Las Vegas Sands Corp. | | 21,168 | 1,640,943 |
| Marriott International, Inc. Class A | | 20,163 | 2,970,816 |
| Marriott Vacations Worldwide Corp. | | 2,500 | 380,825 |
| McDonald's Corp. | | 60,452 | 10,345,755 |
| Melco Crown Entertainment Ltd. sponsored ADR | | 23,217 | 691,402 |
| MGM Mirage, Inc. | | 94,745 | 3,453,455 |
| Penn National Gaming, Inc. (a) | | 48,430 | 1,545,401 |
| Royal Caribbean Cruises Ltd. | | 17,484 | 2,334,988 |
| Shake Shack, Inc. Class A (a)(b) | | 42,459 | 1,855,883 |
| Starbucks Corp. | | 86,723 | 4,926,734 |
| U.S. Foods Holding Corp. (a) | | 63,052 | 2,025,861 |
| Vail Resorts, Inc. | | 2,126 | 464,659 |
| Wyndham Worldwide Corp. | | 15,271 | 1,895,589 |
| Yum China Holdings, Inc. | | 29,023 | 1,346,377 |
| | | | 44,454,448 |
| Household Durables - 0.7% | | | |
| D.R. Horton, Inc. | | 21,276 | 1,043,588 |
| Forbo Holding AG (Reg.) | | 66 | 111,613 |
| Neinor Homes SLU (c) | | 8,900 | 204,421 |
| Newell Brands, Inc. | | 22,374 | 591,569 |
| Panasonic Corp. | | 21,500 | 319,215 |
| SodaStream International Ltd. (a) | | 40,352 | 3,172,878 |
| Sony Corp. | | 59,800 | 2,868,072 |
| | | | 8,311,356 |
| Internet & Direct Marketing Retail - 9.7% | | | |
| Amazon.com, Inc. (a) | | 56,634 | 82,169,689 |
| Boohoo.Com PLC (a) | | 183,603 | 483,187 |
| Expedia, Inc. | | 2,495 | 319,385 |
| JD.com, Inc. sponsored ADR (a) | | 198,183 | 9,756,549 |
| Netflix, Inc. (a) | | 50,110 | 13,544,733 |
| Priceline Group, Inc. (a) | | 5,790 | 11,070,770 |
| Start Today Co. Ltd. | | 12,030 | 355,454 |
| Wayfair LLC Class A (a) | | 3,259 | 299,861 |
| | | | 117,999,628 |
| Leisure Products - 0.1% | | | |
| Spin Master Corp. (a)(c) | | 17,008 | 733,280 |
| Media - 0.4% | | | |
| AMC Entertainment Holdings, Inc. Class A (b) | | 7,530 | 96,384 |
| CBS Corp. Class B | | 5,875 | 338,459 |
| China Literature Ltd. (a)(c) | | 61,788 | 640,182 |
| Live Nation Entertainment, Inc. (a) | | 7,985 | 359,804 |
| Naspers Ltd. Class N | | 7,689 | 2,195,453 |
| The Walt Disney Co. | | 15,570 | 1,691,992 |
| Vivendi SA | | 3,604 | 105,734 |
| | | | 5,428,008 |
| Multiline Retail - 1.6% | | | |
| Avenue Supermarts Ltd. (c) | | 3,665 | 68,021 |
| B&M European Value Retail S.A. | | 64,052 | 378,237 |
| Dollar General Corp. | | 7,200 | 742,464 |
| Dollar Tree, Inc. (a) | | 135,836 | 15,621,140 |
| Macy's, Inc. | | 25,209 | 654,174 |
| Nordstrom, Inc. | | 4,741 | 233,779 |
| Ollie's Bargain Outlet Holdings, Inc. (a) | | 9,610 | 533,836 |
| Target Corp. | | 11,634 | 875,109 |
| V-Mart Retail Ltd. (a) | | 6,054 | 141,563 |
| | | | 19,248,323 |
| Specialty Retail - 3.8% | | | |
| Advance Auto Parts, Inc. | | 4,238 | 495,804 |
| Burlington Stores, Inc. (a) | | 12,243 | 1,490,096 |
| Dick's Sporting Goods, Inc. | | 14,394 | 452,835 |
| Floor & Decor Holdings, Inc. Class A | | 21,518 | 1,009,194 |
| Home Depot, Inc. | | 123,323 | 24,775,591 |
| Lowe's Companies, Inc. | | 60,614 | 6,348,104 |
| O'Reilly Automotive, Inc. (a) | | 4,268 | 1,129,697 |
| RH (a) | | 37,439 | 3,518,892 |
| Ross Stores, Inc. | | 39,511 | 3,255,311 |
| The Children's Place Retail Stores, Inc. | | 4,117 | 616,727 |
| TJX Companies, Inc. | | 46,286 | 3,717,692 |
| | | | 46,809,943 |
| Textiles, Apparel & Luxury Goods - 4.1% | | | |
| adidas AG | | 61,374 | 14,272,052 |
| Canada Goose Holdings, Inc. | | 15,174 | 546,017 |
| Despegar.com Corp. | | 14,805 | 450,812 |
| G-III Apparel Group Ltd. (a) | | 20,059 | 749,204 |
| Kering SA | | 15,400 | 7,797,083 |
| lululemon athletica, Inc. (a) | | 61,938 | 4,844,171 |
| LVMH Moet Hennessy - Louis Vuitton SA | | 4,475 | 1,401,799 |
| Michael Kors Holdings Ltd. (a) | | 40,014 | 2,640,924 |
| NIKE, Inc. Class B | | 78,185 | 5,333,781 |
| Prada SpA | | 240,600 | 982,681 |
| PVH Corp. | | 30,919 | 4,794,919 |
| Shenzhou International Group Holdings Ltd. | | 28,000 | 289,032 |
| Skechers U.S.A., Inc. Class A (sub. vtg.) (a) | | 80,397 | 3,311,552 |
| Tapestry, Inc. | | 42,598 | 2,003,810 |
| Under Armour, Inc. Class C (non-vtg.) (a)(b) | | 41,820 | 537,387 |
| VF Corp. | | 8,969 | 727,745 |
| | | | 50,682,969 |
|
| TOTAL CONSUMER DISCRETIONARY | | | 327,493,324 |
|
| CONSUMER STAPLES - 4.5% | | | |
| Beverages - 1.1% | | | |
| Constellation Brands, Inc. Class A (sub. vtg.) | | 21,566 | 4,733,090 |
| Diageo PLC | | 18,054 | 649,806 |
| Dr. Pepper Snapple Group, Inc. | | 6,900 | 823,515 |
| Fever-Tree Drinks PLC | | 17,505 | 608,438 |
| Monster Beverage Corp. (a) | | 104,014 | 7,096,875 |
| | | | 13,911,724 |
| Food & Staples Retailing - 0.9% | | | |
| Costco Wholesale Corp. | | 41,516 | 8,090,223 |
| Kroger Co. | | 53,283 | 1,617,672 |
| Performance Food Group Co. (a) | | 34,850 | 1,197,098 |
| Walmart, Inc. | | 7,100 | 756,860 |
| | | | 11,661,853 |
| Food Products - 0.3% | | | |
| Bunge Ltd. | | 10,193 | 809,630 |
| ConAgra Foods, Inc. | | 3,200 | 121,600 |
| Danone SA | | 3,772 | 324,643 |
| Darling International, Inc. (a) | | 18,267 | 338,670 |
| Lamb Weston Holdings, Inc. | | 10,643 | 623,680 |
| Pinnacle Foods, Inc. | | 2,000 | 123,880 |
| The Hain Celestial Group, Inc. (a) | | 35,509 | 1,354,313 |
| | | | 3,696,416 |
| Household Products - 0.1% | | | |
| Spectrum Brands Holdings, Inc. | | 9,408 | 1,114,472 |
| Personal Products - 1.1% | | | |
| Coty, Inc. Class A | | 105,849 | 2,075,699 |
| Estee Lauder Companies, Inc. Class A | | 14,429 | 1,947,338 |
| Herbalife Ltd. (a) | | 58,296 | 4,837,985 |
| Kose Corp. | | 4,807 | 830,165 |
| Unilever NV (NY Reg.) | | 59,494 | 3,420,310 |
| | | | 13,111,497 |
| Tobacco - 1.0% | | | |
| British American Tobacco PLC: | | | |
| (United Kingdom) | | 3,071 | 209,893 |
| sponsored ADR | | 100,936 | 6,873,742 |
| Imperial Tobacco Group PLC | | 58 | 2,387 |
| Philip Morris International, Inc. | | 43,261 | 4,638,877 |
| | | | 11,724,899 |
|
| TOTAL CONSUMER STAPLES | | | 55,220,861 |
|
| ENERGY - 2.0% | | | |
| Energy Equipment & Services - 0.1% | | | |
| Shelf Drilling Ltd. (c) | | 32,504 | 274,068 |
| U.S. Silica Holdings, Inc. | | 10,773 | 358,633 |
| | | | 632,701 |
| Oil, Gas & Consumable Fuels - 1.9% | | | |
| Anadarko Petroleum Corp. | | 62,412 | 3,747,841 |
| Andeavor | | 5,751 | 622,028 |
| Bharat Petroleum Corp. Ltd. | | 19,080 | 147,783 |
| Cenovus Energy, Inc. | | 45,066 | 429,776 |
| Cimarex Energy Co. | | 18,908 | 2,121,478 |
| Continental Resources, Inc. (a) | | 75,498 | 4,192,404 |
| Diamondback Energy, Inc. (a) | | 20,633 | 2,589,442 |
| EOG Resources, Inc. | | 23,059 | 2,651,785 |
| Marathon Petroleum Corp. | | 5,235 | 362,628 |
| Oasis Petroleum, Inc. (a) | | 37,875 | 327,998 |
| Petronet LNG Ltd. | | 17,729 | 71,058 |
| Phillips 66 Co. | | 597 | 61,133 |
| Pioneer Natural Resources Co. | | 16,249 | 2,972,105 |
| Reliance Industries Ltd. | | 89,514 | 1,353,836 |
| Valero Energy Corp. | | 8,421 | 808,163 |
| Whiting Petroleum Corp. (a) | | 43,663 | 1,219,071 |
| | | | 23,678,529 |
|
| TOTAL ENERGY | | | 24,311,230 |
|
| FINANCIALS - 4.4% | | | |
| Banks - 2.2% | | | |
| Bank of America Corp. | | 308,519 | 9,872,608 |
| Citigroup, Inc. | | 75,819 | 5,950,275 |
| First Republic Bank | | 2,526 | 226,203 |
| HDFC Bank Ltd. sponsored ADR | | 22,686 | 2,463,473 |
| JPMorgan Chase & Co. | | 71,040 | 8,217,197 |
| Kotak Mahindra Bank Ltd. (a) | | 18,502 | 322,810 |
| | | | 27,052,566 |
| Capital Markets - 1.9% | | | |
| BlackRock, Inc. Class A | | 8,739 | 4,909,570 |
| CBOE Holdings, Inc. | | 21,083 | 2,833,344 |
| Charles Schwab Corp. | | 40,182 | 2,143,308 |
| E*TRADE Financial Corp. (a) | | 9,485 | 499,860 |
| Fairfax India Holdings Corp. (a) | | 37,831 | 698,360 |
| Goldman Sachs Group, Inc. | | 23,469 | 6,287,110 |
| KKR & Co. LP | | 10,000 | 240,800 |
| Morgan Stanley | | 54,435 | 3,078,299 |
| MSCI, Inc. | | 2,673 | 372,162 |
| TD Ameritrade Holding Corp. | | 33,569 | 1,872,815 |
| The Blackstone Group LP | | 6,800 | 248,540 |
| | | | 23,184,168 |
| Consumer Finance - 0.0% | | | |
| Synchrony Financial | | 9,473 | 375,889 |
| Diversified Financial Services - 0.1% | | | |
| Berkshire Hathaway, Inc. Class B (a) | | 5,015 | 1,075,116 |
| GDS Holdings Ltd. ADR (a) | | 4,300 | 122,722 |
| | | | 1,197,838 |
| Insurance - 0.1% | | | |
| Chubb Ltd. | | 3,161 | 493,590 |
| MetLife, Inc. | | 8,870 | 426,381 |
| The Travelers Companies, Inc. | | 3,365 | 504,481 |
| | | | 1,424,452 |
| Thrifts & Mortgage Finance - 0.1% | | | |
| Housing Development Finance Corp. Ltd. | | 20,960 | 645,123 |
|
| TOTAL FINANCIALS | | | 53,880,036 |
|
| HEALTH CARE - 10.9% | | | |
| Biotechnology - 6.7% | | | |
| AC Immune SA (a) | | 34,613 | 462,430 |
| ACADIA Pharmaceuticals, Inc. (a) | | 11,734 | 350,964 |
| Acceleron Pharma, Inc. (a) | | 3,918 | 162,636 |
| Achaogen, Inc. (a)(b) | | 18,905 | 207,388 |
| Agios Pharmaceuticals, Inc. (a) | | 13,606 | 1,071,609 |
| Aimmune Therapeutics, Inc. (a) | | 22,448 | 790,394 |
| Alexion Pharmaceuticals, Inc. (a) | | 83,230 | 9,931,004 |
| Alkermes PLC (a) | | 48,932 | 2,797,442 |
| Alnylam Pharmaceuticals, Inc. (a) | | 32,866 | 4,271,923 |
| Amgen, Inc. | | 46,792 | 8,705,652 |
| AnaptysBio, Inc. | | 4,882 | 514,514 |
| Arena Pharmaceuticals, Inc. (a) | | 7,958 | 297,788 |
| Ascendis Pharma A/S sponsored ADR (a) | | 13,728 | 699,716 |
| BeiGene Ltd. ADR (a) | | 5,096 | 691,782 |
| Biogen, Inc. (a) | | 26,945 | 9,371,740 |
| BioMarin Pharmaceutical, Inc. (a) | | 19,025 | 1,716,626 |
| bluebird bio, Inc. (a) | | 13,002 | 2,664,110 |
| Blueprint Medicines Corp. (a) | | 731 | 57,493 |
| Celgene Corp. (a) | | 44,900 | 4,542,084 |
| Cellectis SA sponsored ADR (a) | | 2,736 | 86,075 |
| Chimerix, Inc. (a) | | 3,552 | 17,014 |
| Coherus BioSciences, Inc. (a) | | 28,512 | 287,971 |
| CytomX Therapeutics, Inc. (a) | | 6,808 | 182,114 |
| DBV Technologies SA sponsored ADR (a) | | 4,833 | 111,932 |
| Denali Therapeutics, Inc. (a) | | 37,451 | 871,110 |
| Editas Medicine, Inc. (a)(b) | | 27,075 | 988,508 |
| Epizyme, Inc. (a) | | 14,920 | 240,958 |
| Exact Sciences Corp. (a) | | 8,241 | 409,660 |
| Exelixis, Inc. (a) | | 123,254 | 3,735,829 |
| FibroGen, Inc. (a) | | 16,171 | 946,812 |
| Flexion Therapeutics, Inc. (a) | | 3,607 | 81,482 |
| GenSight Biologics SA (a)(c) | | 28,713 | 231,716 |
| Global Blood Therapeutics, Inc. (a) | | 29,841 | 1,727,794 |
| Grifols SA ADR | | 4,988 | 123,952 |
| Heron Therapeutics, Inc. (a) | | 4,611 | 99,828 |
| Insmed, Inc. (a) | | 6,333 | 161,112 |
| Intellia Therapeutics, Inc. (a) | | 27,191 | 698,809 |
| Intercept Pharmaceuticals, Inc. (a) | | 8,614 | 534,929 |
| Ionis Pharmaceuticals, Inc. (a) | | 5,241 | 275,257 |
| Ironwood Pharmaceuticals, Inc. Class A (a) | | 47,917 | 709,651 |
| La Jolla Pharmaceutical Co. (a) | | 7,291 | 249,790 |
| Merrimack Pharmaceuticals, Inc. | | 6,485 | 68,093 |
| Momenta Pharmaceuticals, Inc. (a) | | 4,037 | 68,629 |
| Neurocrine Biosciences, Inc. (a) | | 25,883 | 2,212,220 |
| Portola Pharmaceuticals, Inc. (a) | | 17,134 | 879,146 |
| Prothena Corp. PLC (a) | | 4,280 | 178,904 |
| Radius Health, Inc. (a)(b) | | 3,836 | 144,464 |
| Regeneron Pharmaceuticals, Inc. (a) | | 26,955 | 9,883,051 |
| Sage Therapeutics, Inc. (a) | | 15,452 | 2,932,790 |
| Sarepta Therapeutics, Inc. (a) | | 6,056 | 396,910 |
| Seattle Genetics, Inc. (a) | | 17,336 | 906,673 |
| Seres Therapeutics, Inc. (a) | | 2,033 | 20,533 |
| Trevena, Inc. (a) | | 42,922 | 69,963 |
| Ultragenyx Pharmaceutical, Inc. (a) | | 6,821 | 363,900 |
| Vertex Pharmaceuticals, Inc. (a) | | 9,320 | 1,555,228 |
| Xencor, Inc. (a) | | 11,743 | 267,271 |
| Zai Lab Ltd. ADR | | 8,292 | 223,552 |
| | | | 82,250,925 |
| Health Care Equipment & Supplies - 1.7% | | | |
| Becton, Dickinson & Co. | | 1,500 | 364,410 |
| Boston Scientific Corp. (a) | | 237,735 | 6,647,071 |
| Danaher Corp. | | 20,831 | 2,109,764 |
| Fisher & Paykel Healthcare Corp. | | 12,317 | 121,178 |
| Hoya Corp. | | 1,600 | 82,181 |
| Insulet Corp. (a) | | 9,421 | 720,989 |
| Intuitive Surgical, Inc. (a) | | 20,355 | 8,786,643 |
| Invuity, Inc. (a) | | 27,560 | 143,312 |
| iRhythm Technologies, Inc. (a) | | 26,052 | 1,553,481 |
| Novocure Ltd. (a) | | 6,716 | 150,774 |
| Penumbra, Inc. (a) | | 657 | 65,437 |
| Quanterix Corp. (a) | | 7,306 | 152,038 |
| Stryker Corp. | | 731 | 120,162 |
| | | | 21,017,440 |
| Health Care Providers & Services - 1.3% | | | |
| Anthem, Inc. | | 4,840 | 1,199,594 |
| Apollo Hospitals Enterprise Ltd. | | 20,074 | 367,244 |
| Cigna Corp. | | 8,599 | 1,791,602 |
| Humana, Inc. | | 23,261 | 6,555,648 |
| OptiNose, Inc. | | 23,450 | 444,378 |
| UnitedHealth Group, Inc. | | 22,808 | 5,400,478 |
| | | | 15,758,944 |
| Health Care Technology - 0.2% | | | |
| Cerner Corp. (a) | | 16,538 | 1,143,272 |
| Evolent Health, Inc. (a)(b) | | 14,989 | 211,345 |
| Teladoc, Inc. (a) | | 15,149 | 566,573 |
| | | | 1,921,190 |
| Pharmaceuticals - 1.0% | | | |
| Aclaris Therapeutics, Inc. (a) | | 7,703 | 170,390 |
| Akcea Therapeutics, Inc. (b) | | 36,137 | 782,366 |
| Allergan PLC | | 28,985 | 5,224,836 |
| Avexis, Inc. (a) | | 2,070 | 256,121 |
| Dermira, Inc. (a) | | 13,725 | 391,437 |
| Dova Pharmaceuticals, Inc. | | 6,340 | 201,992 |
| GW Pharmaceuticals PLC ADR (a) | | 7,409 | 1,023,405 |
| Intersect ENT, Inc. (a) | | 5,345 | 199,636 |
| Jazz Pharmaceuticals PLC (a) | | 9,386 | 1,367,916 |
| Nektar Therapeutics (a) | | 7,397 | 618,463 |
| Perrigo Co. PLC | | 2,600 | 235,612 |
| Revance Therapeutics, Inc. (a) | | 3,269 | 105,589 |
| The Medicines Company (a) | | 21,779 | 721,538 |
| Theravance Biopharma, Inc. (a) | | 2,547 | 67,343 |
| Zogenix, Inc. (a) | | 5,483 | 199,307 |
| | | | 11,565,951 |
|
| TOTAL HEALTH CARE | | | 132,514,450 |
|
| INDUSTRIALS - 6.3% | | | |
| Aerospace & Defense - 1.4% | | | |
| Bombardier, Inc. Class B (sub. vtg.) (a) | | 142,318 | 402,656 |
| Elbit Systems Ltd. | | 2,429 | 363,840 |
| General Dynamics Corp. | | 1,000 | 222,480 |
| Northrop Grumman Corp. | | 9,581 | 3,262,618 |
| Raytheon Co. | | 7,772 | 1,623,882 |
| The Boeing Co. | | 31,753 | 11,252,311 |
| | | | 17,127,787 |
| Air Freight & Logistics - 0.3% | | | |
| XPO Logistics, Inc. (a) | | 33,563 | 3,169,690 |
| Airlines - 1.4% | | | |
| Allegiant Travel Co. | | 1,570 | 250,023 |
| Azul SA sponsored ADR | | 19,143 | 558,784 |
| Delta Air Lines, Inc. | | 68,395 | 3,882,784 |
| InterGlobe Aviation Ltd. (c) | | 13,776 | 263,328 |
| JetBlue Airways Corp. (a) | | 37,520 | 782,667 |
| Ryanair Holdings PLC sponsored ADR (a) | | 1,927 | 236,462 |
| Southwest Airlines Co. | | 106,392 | 6,468,634 |
| Spirit Airlines, Inc. (a) | | 25,790 | 1,086,275 |
| United Continental Holdings, Inc. (a) | | 42,687 | 2,895,032 |
| Wizz Air Holdings PLC (a)(c) | | 12,082 | 594,065 |
| | | | 17,018,054 |
| Building Products - 0.1% | | | |
| Kajaria Ceramics Ltd. | | 24,787 | 246,330 |
| Masco Corp. | | 32,203 | 1,438,186 |
| | | | 1,684,516 |
| Commercial Services & Supplies - 0.1% | | | |
| Copart, Inc. (a) | | 5,754 | 253,579 |
| Evoqua Water Technologies Corp. (a) | | 16,672 | 381,122 |
| HomeServe PLC | | 45,764 | 508,778 |
| Novus Holdings Ltd. | | 2,365 | 984 |
| | | | 1,144,463 |
| Construction & Engineering - 0.0% | | | |
| Fluor Corp. | | 9,831 | 596,742 |
| Electrical Equipment - 0.2% | | | |
| AMETEK, Inc. | | 1,690 | 128,947 |
| Fortive Corp. | | 7,717 | 586,646 |
| Melrose Industries PLC | | 46,928 | 150,852 |
| Nidec Corp. | | 2,400 | 386,265 |
| Regal Beloit Corp. | | 16,474 | 1,283,325 |
| Sensata Technologies Holding BV (a) | | 8,641 | 486,056 |
| | | | 3,022,091 |
| Industrial Conglomerates - 0.4% | | | |
| Honeywell International, Inc. | | 21,523 | 3,436,577 |
| ITT, Inc. | | 19,046 | 1,066,576 |
| | | | 4,503,153 |
| Machinery - 1.6% | | | |
| Allison Transmission Holdings, Inc. | | 11,193 | 495,178 |
| Aumann AG (c) | | 6,559 | 542,346 |
| Caterpillar, Inc. | | 70,592 | 11,490,966 |
| Deere & Co. | | 3,600 | 599,112 |
| Eicher Motors Ltd. | | 429 | 181,722 |
| Fanuc Corp. | | 300 | 81,426 |
| Gardner Denver Holdings, Inc. | | 16,900 | 584,402 |
| Kennametal, Inc. | | 7,200 | 351,216 |
| Minebea Mitsumi, Inc. | | 4,800 | 109,246 |
| Parker Hannifin Corp. | | 1,563 | 314,819 |
| Rational AG | | 764 | 536,876 |
| SMC Corp. | | 200 | 98,567 |
| WABCO Holdings, Inc. (a) | | 15,136 | 2,336,847 |
| Xylem, Inc. | | 16,655 | 1,203,490 |
| | | | 18,926,213 |
| Professional Services - 0.1% | | | |
| IHS Markit Ltd. (a) | | 23,495 | 1,121,416 |
| Road & Rail - 0.3% | | | |
| Avis Budget Group, Inc. (a) | | 15,252 | 685,730 |
| J.B. Hunt Transport Services, Inc. | | 13,791 | 1,666,367 |
| Knight-Swift Transportation Holdings, Inc. Class A | | 13,047 | 649,610 |
| Landstar System, Inc. | | 3,382 | 375,571 |
| | | | 3,377,278 |
| Trading Companies & Distributors - 0.4% | | | |
| Ashtead Group PLC | | 8,951 | 267,526 |
| United Rentals, Inc. (a) | | 21,047 | 3,811,822 |
| Univar, Inc. (a) | | 14,497 | 432,880 |
| Wolseley PLC | | 1,342 | 103,580 |
| | | | 4,615,808 |
| Transportation Infrastructure - 0.0% | | | |
| Adani Ports & Special Economic Zone Ltd. | | 9,677 | 65,292 |
|
| TOTAL INDUSTRIALS | | | 76,372,503 |
|
| INFORMATION TECHNOLOGY - 41.6% | | | |
| Communications Equipment - 0.3% | | | |
| Arista Networks, Inc. (a) | | 6,788 | 1,872,266 |
| NETGEAR, Inc. (a) | | 31,990 | 2,229,703 |
| | | | 4,101,969 |
| Electronic Equipment & Components - 0.2% | | | |
| Amphenol Corp. Class A | | 1,292 | 119,859 |
| Corning, Inc. | | 20,199 | 630,613 |
| Dell Technologies, Inc. (a) | | 28,854 | 2,068,832 |
| SYNNEX Corp. | | 865 | 106,161 |
| | | | 2,925,465 |
| Internet Software & Services - 14.2% | | | |
| 2U, Inc. (a) | | 10,658 | 791,570 |
| Akamai Technologies, Inc. (a) | | 11,734 | 786,061 |
| Alibaba Group Holding Ltd. sponsored ADR (a) | | 54,082 | 11,048,412 |
| Alphabet, Inc.: | | | |
| Class A (a) | | 68,550 | 81,041,181 |
| Class C (a) | | 8,397 | 9,823,986 |
| ANGI Homeservices, Inc. Class A (a) | | 26,610 | 355,510 |
| CarGurus, Inc. Class A | | 18,711 | 626,819 |
| Facebook, Inc. Class A (a) | | 274,899 | 51,375,874 |
| GoDaddy, Inc. (a) | | 9,421 | 520,322 |
| Gogo, Inc. (a)(b) | | 120,080 | 1,157,571 |
| GrubHub, Inc. (a) | | 1,582 | 114,300 |
| IAC/InterActiveCorp (a) | | 822 | 119,165 |
| LogMeIn, Inc. | | 828 | 104,162 |
| Mail.Ru Group Ltd. GDR (Reg. S) (a) | | 25,769 | 845,223 |
| Match Group, Inc. (a) | | 4,211 | 147,132 |
| Momo, Inc. ADR (a) | | 20,748 | 654,184 |
| NetEase, Inc. ADR | | 5,824 | 1,864,612 |
| New Relic, Inc. (a) | | 7,923 | 473,241 |
| Okta, Inc. | | 4,633 | 136,442 |
| Shopify, Inc. Class A (a) | | 14,302 | 1,826,005 |
| Stamps.com, Inc. (a) | | 5,919 | 1,206,588 |
| Tencent Holdings Ltd. | | 128,100 | 7,569,102 |
| Yandex NV Series A (a) | | 34,834 | 1,349,121 |
| | | | 173,936,583 |
| IT Services - 4.6% | | | |
| MasterCard, Inc. Class A | | 99,070 | 16,742,830 |
| PayPal Holdings, Inc. (a) | | 141,211 | 12,048,123 |
| Square, Inc. (a) | | 14,511 | 680,711 |
| Teradata Corp. (a) | | 1,420 | 57,510 |
| Vakrangee Ltd. | | 43,667 | 250,591 |
| Visa, Inc. Class A | | 200,741 | 24,938,054 |
| Worldpay, Inc. (a) | | 13,430 | 1,078,563 |
| | | | 55,796,382 |
| Semiconductors & Semiconductor Equipment - 7.4% | | | |
| ASM Pacific Technology Ltd. | | 46,000 | 628,022 |
| ASML Holding NV | | 2,692 | 546,368 |
| Broadcom Ltd. | | 97,016 | 24,062,878 |
| Cypress Semiconductor Corp. | | 22,624 | 391,169 |
| Inphi Corp. (a) | | 35,786 | 1,068,928 |
| Intel Corp. | | 35,642 | 1,715,806 |
| Lam Research Corp. | | 16,383 | 3,137,672 |
| Marvell Technology Group Ltd. | | 216,291 | 5,046,069 |
| Micron Technology, Inc. (a) | | 221,644 | 9,690,276 |
| Monolithic Power Systems, Inc. | | 5,502 | 655,398 |
| NVIDIA Corp. | | 152,112 | 37,389,130 |
| Qualcomm, Inc. | | 53,168 | 3,628,716 |
| Renesas Electronics Corp. (a) | | 101,400 | 1,194,920 |
| WONIK IPS Co. Ltd. (a) | | 8,259 | 254,380 |
| Xilinx, Inc. | | 7,242 | 528,811 |
| | | | 89,938,543 |
| Software - 8.8% | | | |
| Activision Blizzard, Inc. | | 246,015 | 18,237,092 |
| Adobe Systems, Inc. (a) | | 52,340 | 10,455,438 |
| Altair Engineering, Inc. Class A (a) | | 4,085 | 108,661 |
| Atlassian Corp. PLC (a) | | 2,825 | 152,522 |
| Autodesk, Inc. (a) | | 13,797 | 1,595,209 |
| Electronic Arts, Inc. (a) | | 41,680 | 5,291,693 |
| Globant SA (a) | | 2,478 | 112,600 |
| HubSpot, Inc. (a) | | 2,087 | 202,543 |
| Intuit, Inc. | | 8,932 | 1,499,683 |
| Micro Focus International PLC | | 19,654 | 599,973 |
| Microsoft Corp. | | 274,463 | 26,076,730 |
| Nintendo Co. Ltd. | | 4,412 | 1,998,260 |
| Paycom Software, Inc. (a) | | 22,202 | 2,034,591 |
| Red Hat, Inc. (a) | | 22,762 | 2,990,472 |
| RingCentral, Inc. (a) | | 4,530 | 245,979 |
| SailPoint Technologies Holding, Inc. (a) | | 10,061 | 168,321 |
| Salesforce.com, Inc. (a) | | 256,320 | 29,197,411 |
| SendGrid, Inc. (a) | | 6,599 | 148,280 |
| Snap, Inc. Class A (a)(b) | | 80,524 | 1,088,684 |
| Take-Two Interactive Software, Inc. (a) | | 4,760 | 602,949 |
| Talend SA ADR (a) | | 7,774 | 302,953 |
| VMware, Inc. Class A (a)(b) | | 9,074 | 1,123,270 |
| Workday, Inc. Class A (a) | | 18,561 | 2,225,278 |
| Zendesk, Inc. (a) | | 24,888 | 958,686 |
| | | | 107,417,278 |
| Technology Hardware, Storage & Peripherals - 6.1% | | | |
| Apple, Inc. | | 442,395 | 74,070,195 |
| Samsung Electronics Co. Ltd. | | 26 | 60,638 |
| | | | 74,130,833 |
|
| TOTAL INFORMATION TECHNOLOGY | | | 508,247,053 |
|
| MATERIALS - 2.7% | | | |
| Chemicals - 2.3% | | | |
| Cabot Corp. | | 4,300 | 290,852 |
| CF Industries Holdings, Inc. | | 118,602 | 5,033,469 |
| DowDuPont, Inc. | | 56,969 | 4,305,717 |
| FMC Corp. | | 34,770 | 3,175,544 |
| LG Chemical Ltd. | | 882 | 356,165 |
| LyondellBasell Industries NV Class A | | 58,396 | 6,998,177 |
| Nutrien Ltd. (a) | | 6,446 | 337,236 |
| Orion Engineered Carbons SA | | 12,700 | 374,015 |
| PPG Industries, Inc. | | 1,900 | 225,587 |
| Sherwin-Williams Co. | | 1,110 | 462,992 |
| The Chemours Co. LLC | | 83,809 | 4,326,221 |
| The Mosaic Co. | | 4,500 | 122,850 |
| Tronox Ltd. Class A | | 60,974 | 1,196,920 |
| Westlake Chemical Corp. | | 7,374 | 830,312 |
| | | | 28,036,057 |
| Construction Materials - 0.3% | | | |
| Buzzi Unicem SpA | | 3,316 | 97,367 |
| Eagle Materials, Inc. | | 14,249 | 1,596,600 |
| Loma Negra Compania Industrial Argentina SA ADR (a) | | 16,672 | 396,127 |
| Summit Materials, Inc. | | 60,957 | 1,947,576 |
| | | | 4,037,670 |
| Metals & Mining - 0.1% | | | |
| China Molybdenum Co. Ltd. (H Shares) | | 1,158,000 | 891,151 |
| Franco-Nevada Corp. | | 2,724 | 208,286 |
| Glencore Xstrata PLC | | 65,679 | 376,468 |
| | | | 1,475,905 |
|
| TOTAL MATERIALS | | | 33,549,632 |
|
| REAL ESTATE - 0.1% | | | |
| Equity Real Estate Investment Trusts (REITs) - 0.1% | | | |
| Equinix, Inc. | | 1,397 | 635,900 |
| TELECOMMUNICATION SERVICES - 0.2% | | | |
| Diversified Telecommunication Services - 0.1% | | | |
| Bharti Infratel Ltd. | | 140,286 | 775,921 |
| Wireless Telecommunication Services - 0.1% | | | |
| T-Mobile U.S., Inc. (a) | | 25,386 | 1,652,629 |
|
| TOTAL TELECOMMUNICATION SERVICES | | | 2,428,550 |
|
| UTILITIES - 0.0% | | | |
| Gas Utilities - 0.0% | | | |
| China Resource Gas Group Ltd. | | 36,000 | 118,502 |
| ENN Energy Holdings Ltd. | | 16,000 | 123,539 |
| | | | 242,041 |
| Water Utilities - 0.0% | | | |
| AquaVenture Holdings Ltd. (a) | | 7,919 | 120,448 |
|
| TOTAL UTILITIES | | | 362,489 |
|
| TOTAL COMMON STOCKS | | | |
| (Cost $1,078,158,207) | | | 1,215,016,028 |
|
| Preferred Stocks - 0.4% | | | |
| Convertible Preferred Stocks - 0.4% | | | |
| CONSUMER DISCRETIONARY - 0.4% | | | |
| Diversified Consumer Services - 0.4% | | | |
| Lyft, Inc. Series H (d)(e) | | 100,639 | 4,000,008 |
| Hotels, Restaurants & Leisure - 0.0% | | | |
| Topgolf International, Inc. Series F (d)(e) | | 9,181 | 127,005 |
| Internet & Direct Marketing Retail - 0.0% | | | |
| The Honest Co., Inc. Series E (d)(e) | | 11,802 | 231,376 |
| TOTAL CONSUMER DISCRETIONARY | | | 4,358,389 |
| CONSUMER STAPLES - 0.0% | | | |
| Food & Staples Retailing - 0.0% | | | |
| Roofoods Ltd. Series F (d)(e) | | 337 | 119,153 |
| HEALTH CARE - 0.0% | | | |
| Biotechnology - 0.0% | | | |
| 23andMe, Inc. Series F (d)(e) | | 6,504 | 90,303 |
| INFORMATION TECHNOLOGY - 0.0% | | | |
| Internet Software & Services - 0.0% | | | |
| ContextLogic, Inc. Series G (d)(e) | | 2,862 | 385,033 |
| Starry, Inc. Series C (d)(e) | | 158,250 | 145,907 |
| | | | 530,940 |
| Software - 0.0% | | | |
| Compass, Inc. Series E (d)(e) | | 1,181 | 79,692 |
| TOTAL INFORMATION TECHNOLOGY | | | 610,632 |
|
| TOTAL CONVERTIBLE PREFERRED STOCKS | | | 5,178,477 |
|
| Nonconvertible Preferred Stocks - 0.0% | | | |
| CONSUMER DISCRETIONARY - 0.0% | | | |
| Automobiles - 0.0% | | | |
| Volkswagen AG | | 1,919 | 421,756 |
| TOTAL PREFERRED STOCKS | | | |
| (Cost $5,593,470) | | | 5,600,233 |
| | | Principal Amount | Value |
|
| Convertible Bonds - 0.1% | | | |
| CONSUMER STAPLES - 0.1% | | | |
| Tobacco - 0.1% | | | |
| PAX Labs, Inc. 10% 12/31/20 (c)(e) | | | |
| (Cost $1,250,000) | | 1,250,000 | 1,250,000 |
| | | Shares | Value |
|
| Money Market Funds - 0.4% | | | |
| Fidelity Cash Central Fund, 1.39% (f) | | 549,789 | 549,899 |
| Fidelity Securities Lending Cash Central Fund 1.40% (f)(g) | | 3,878,427 | 3,878,815 |
| TOTAL MONEY MARKET FUNDS | | | |
| (Cost $4,428,714) | | | 4,428,714 |
| TOTAL INVESTMENT IN SECURITIES - 100.4% | | | |
| (Cost $1,089,430,391) | | | 1,226,294,975 |
| NET OTHER ASSETS (LIABILITIES) - (0.4)% | | | (4,727,079) |
| NET ASSETS - 100% | | | $1,221,567,896 |
Legend
(a) Non-income producing
(b) Security or a portion of the security is on loan at period end.
(c) Security exempt from registration under Rule 144A of the Securities Act of 1933. These securities may be resold in transactions exempt from registration, normally to qualified institutional buyers. At the end of the period, the value of these securities amounted to $4,801,427 or 0.4% of net assets.
(d) Restricted securities - Investment in securities not registered under the Securities Act of 1933 (excluding 144A issues). At the end of the period, the value of restricted securities (excluding 144A issues) amounted to $5,178,477 or 0.4% of net assets.
(e) Level 3 security
(f) Affiliated fund that is generally available only to investment companies and other accounts managed by Fidelity Investments. The rate quoted is the annualized seven-day yield of the fund at period end. A complete unaudited listing of the fund's holdings as of its most recent quarter end is available upon request. In addition, each Fidelity Central Fund's financial statements are available on the SEC's website or upon request.
(g) Investment made with cash collateral received from securities on loan.
Additional information on each restricted holding is as follows:
| Security | Acquisition Date | Acquisition Cost |
| 23andMe, Inc. Series F | 8/31/17 | $90,303 |
| Compass, Inc. Series E | 11/3/17 | $79,692 |
| ContextLogic, Inc. Series G | 10/24/17 | $385,033 |
| Lyft, Inc. Series H | 11/22/17 | $4,000,008 |
| Roofoods Ltd. Series F | 9/12/17 | $119,153 |
| Starry, Inc. Series C | 12/8/17 | $145,907 |
| The Honest Co., Inc. Series E | 9/28/17 | $231,376 |
| Topgolf International, Inc. Series F | 11/10/17 | $127,005 |
Affiliated Central Funds
Information regarding fiscal year to date income earned by the Fund from investments in Fidelity Central Funds is as follows:
| Fund | Income earned |
| Fidelity Cash Central Fund | $28,132 |
| Fidelity Securities Lending Cash Central Fund | 20,168 |
| Total | $48,300 |
Amounts in the income column in the above table include any capital gain distributions from underlying funds, which are presented in the corresponding line-item in the Statement of Operations if applicable.
Investment Valuation
The following is a summary of the inputs used, as of January 31, 2018, involving the Fund's assets and liabilities carried at fair value. The inputs or methodology used for valuing securities may not be an indication of the risk associated with investing in those securities. For more information on valuation inputs, and their aggregation into the levels used below, please refer to the Investment Valuation section in the accompanying Notes to Financial Statements.
| | Valuation Inputs at Reporting Date: |
| Description | Total | Level 1 | Level 2 | Level 3 |
| Investments in Securities: | | | | |
| Equities: | | | | |
| Consumer Discretionary | $332,273,469 | $322,970,540 | $4,944,540 | $4,358,389 |
| Consumer Staples | 55,340,014 | 53,206,354 | 2,014,507 | 119,153 |
| Energy | 24,311,230 | 24,311,230 | -- | -- |
| Financials | 53,880,036 | 53,880,036 | -- | -- |
| Health Care | 132,604,753 | 132,432,269 | 82,181 | 90,303 |
| Industrials | 76,372,503 | 75,696,999 | 675,504 | -- |
| Information Technology | 508,857,685 | 497,484,771 | 10,762,282 | 610,632 |
| Materials | 33,549,632 | 33,549,632 | -- | -- |
| Real Estate | 635,900 | 635,900 | -- | -- |
| Telecommunication Services | 2,428,550 | 2,428,550 | -- | -- |
| Utilities | 362,489 | 362,489 | -- | -- |
| Corporate Bonds | 1,250,000 | -- | -- | 1,250,000 |
| Money Market Funds | 4,428,714 | 4,428,714 | -- | -- |
| Total Investments in Securities: | $1,226,294,975 | $1,201,387,484 | $18,479,014 | $6,428,477 |
Other Information
Distribution of investments by country or territory of incorporation, as a percentage of Total Net Assets, is as follows (Unaudited):
| United States of America | 86.3% |
| Cayman Islands | 3.6% |
| Singapore | 2.0% |
| Germany | 1.4% |
| Netherlands | 1.0% |
| Others (Individually Less Than 1%) | 5.7% |
| | 100.0% |
See accompanying notes which are an integral part of the financial statements.
Financial Statements
Statement of Assets and Liabilities
| | | January 31, 2018 (Unaudited) |
| Assets | | |
Investment in securities, at value (including securities loaned of $3,790,932) — See accompanying schedule:
Unaffiliated issuers (cost $1,085,001,677) | $1,221,866,261 | |
| Fidelity Central Funds (cost $4,428,714) | 4,428,714 | |
| Total Investment in Securities (cost $1,089,430,391) | | $1,226,294,975 |
| Foreign currency held at value (cost $72,437) | | 72,437 |
| Receivable for investments sold | | 4,967,021 |
| Receivable for fund shares sold | | 1,227,110 |
| Dividends receivable | | 179,670 |
| Interest receivable | | 14,583 |
| Distributions receivable from Fidelity Central Funds | | 16,164 |
| Other receivables | | 2,140 |
| Total assets | | 1,232,774,100 |
| Liabilities | | |
| Payable for investments purchased | $5,459,231 | |
| Payable for fund shares redeemed | 1,458,441 | |
| Accrued management fee | 405,746 | |
| Other payables and accrued expenses | 4,061 | |
| Collateral on securities loaned | 3,878,725 | |
| Total liabilities | | 11,206,204 |
| Net Assets | | $1,221,567,896 |
| Net Assets consist of: | | |
| Paid in capital | | $1,086,570,939 |
| Distributions in excess of net investment income | | (239,745) |
| Accumulated undistributed net realized gain (loss) on investments and foreign currency transactions | | (1,623,560) |
| Net unrealized appreciation (depreciation) on investments and assets and liabilities in foreign currencies | | 136,860,262 |
| Net Assets, for 98,541,660 shares outstanding | | $1,221,567,896 |
| Net Asset Value, offering price and redemption price per share ($1,221,567,896 ÷ 98,541,660 shares) | | $12.40 |
See accompanying notes which are an integral part of the financial statements.
Statement of Operations
| | | Six months ended January 31, 2018 (Unaudited) |
| Investment Income | | |
| Dividends | | $1,769,846 |
| Interest | | 23,858 |
| Income from Fidelity Central Funds | | 48,300 |
| Total income | | 1,842,004 |
| Expenses | | |
| Management fee | $1,347,460 | |
| Independent trustees' fees and expenses | 758 | |
| Total expenses before reductions | 1,348,218 | |
| Expense reductions | (3,753) | 1,344,465 |
| Net investment income (loss) | | 497,539 |
| Realized and Unrealized Gain (Loss) | | |
| Net realized gain (loss) on: | | |
| Investment securities: | | |
| Unaffiliated issuers | (1,516,204) | |
| Fidelity Central Funds | 90 | |
| Foreign currency transactions | 8,747 | |
| Total net realized gain (loss) | | (1,507,367) |
| Change in net unrealized appreciation (depreciation) on: | | |
| Unaffiliated issuers (net of increase in deferred foreign taxes of $4,062) | 138,170,551 | |
| Assets and liabilities in foreign currencies | (260) | |
| Total change in net unrealized appreciation (depreciation) | | 138,170,291 |
| Net gain (loss) | | 136,662,924 |
| Net increase (decrease) in net assets resulting from operations | | $137,160,463 |
See accompanying notes which are an integral part of the financial statements.
Statement of Changes in Net Assets
| | Six months ended January 31, 2018 (Unaudited) | For the period
May 25, 2017 (commencement of operations) to July 31, 2017 |
| Increase (Decrease) in Net Assets | | |
| Operations | | |
| Net investment income (loss) | $497,539 | $(2,606) |
| Net realized gain (loss) | (1,507,367) | (159) |
| Change in net unrealized appreciation (depreciation) | 138,170,291 | (1,310,029) |
| Net increase (decrease) in net assets resulting from operations | 137,160,463 | (1,312,794) |
| Distributions to shareholders from net investment income | (737,284) | – |
| Distributions to shareholders from net realized gain | (113,428) | – |
| Total distributions | (850,712) | – |
| Share transactions | | |
| Proceeds from sales of shares | 977,788,444 | 181,817,461 |
| Reinvestment of distributions | 850,712 | – |
| Cost of shares redeemed | (73,604,261) | (281,417) |
| Net increase (decrease) in net assets resulting from share transactions | 905,034,895 | 181,536,044 |
| Total increase (decrease) in net assets | 1,041,344,646 | 180,223,250 |
| Net Assets | | |
| Beginning of period | 180,223,250 | – |
| End of period | $1,221,567,896 | $180,223,250 |
| Other Information | | |
| Distributions in excess of net investment income end of period | $(239,745) | $– |
| Shares | | |
| Sold | 87,474,258 | 17,490,141 |
| Issued in reinvestment of distributions | 75,151 | – |
| Redeemed | (6,470,621) | (27,269) |
| Net increase (decrease) | 81,078,788 | 17,462,872 |
See accompanying notes which are an integral part of the financial statements.
Financial Highlights
Fidelity Blue Chip Growth K6 Fund
| | Six months ended (Unaudited) January 31, | Years endedJuly 31, |
| | 2018 | 2017 A |
| Selected Per–Share Data | | |
| Net asset value, beginning of period | $10.32 | $10.00 |
| Income from Investment Operations | | |
| Net investment income (loss)B | .01 | –C |
| Net realized and unrealized gain (loss) | 2.09 | .32D |
| Total from investment operations | 2.10 | .32 |
| Distributions from net investment income | (.01) | – |
| Distributions from net realized gain | –C | – |
| Total distributions | (.02)E | – |
| Net asset value, end of period | $12.40 | $10.32 |
| Total ReturnF,G | 20.31% | 3.20% |
| Ratios to Average Net AssetsH,I | | |
| Expenses before reductions | .45%J | .45%J |
| Expenses net of fee waivers, if any | .45%J | .45%J |
| Expenses net of all reductions | .45%J | .45%J |
| Net investment income (loss) | .17%J | (.24)%J |
| Supplemental Data | | |
| Net assets, end of period (000 omitted) | $1,221,568 | $180,223 |
| Portfolio turnover rateK,L | 38%J | 0%M |
A For the period May 25, 2017 (commencement of operations) to July 31, 2017.
B Calculated based on average shares outstanding during the period.
C Amount represents less than $.005 per share.
D The amount shown for a share outstanding does not correspond with the aggregate net gain (loss) on investments for the period due to the timing of sales and repurchases of shares in relation to fluctuating market values of the investments of the Fund.
E Total distributions of $.02 per share is comprised of distributions from net investment income of $.013 and distributions from net realized gain of $.002 per share.
F Total returns for periods of less than one year are not annualized.
G Total returns would have been lower if certain expenses had not been reduced during the applicable periods shown.
H Fees and expenses of any underlying Fidelity Central Funds are not included in the Fund's expense ratio. The Fund indirectly bears its proportionate share of the expenses of any underlying Fidelity Central Funds.
I Expense ratios reflect operating expenses of the Fund. Expenses before reductions do not reflect amounts reimbursed by the investment adviser or reductions from brokerage service arrangements or reductions from other expense offset arrangements and do not represent the amount paid by the Fund during periods when reimbursements or reductions occur. Expense ratios before reductions for start-up periods may not be representative of longer term operating periods. Expenses net of fee waivers reflect expenses after reimbursement by the investment adviser but prior to reductions from brokerage service arrangements or other expense offset arrangements. Expenses net of all reductions represent the net expenses paid by the Fund.
J Annualized
K Amount does not include the portfolio activity of any underlying Fidelity Central Funds.
L Portfolio turnover rate excludes securities received or delivered in-kind.
M Amount not annualized.
See accompanying notes which are an integral part of the financial statements.
Notes to Financial Statements (Unaudited)
For the period ended January 31, 2018
1. Organization.
Fidelity Blue Chip Growth K6 Fund (the Fund) is a fund of Fidelity Securities Fund (the Trust) and is authorized to issue an unlimited number of shares. Share transactions on the Statement of Changes in Net Assets may contain exchanges between affiliated funds. The Trust is registered under the Investment Company Act of 1940, as amended (the 1940 Act), as an open-end management investment company organized as a Massachusetts business trust. Shares generally are available only to employer-sponsored retirement plans that are recordkept by Fidelity, or to certain employer-sponsored retirement plans that are not recordkept by Fidelity.
2. Investments in Fidelity Central Funds.
The Fund invests in Fidelity Central Funds, which are open-end investment companies generally available only to other investment companies and accounts managed by the investment adviser and its affiliates. The Fund's Schedule of Investments lists each of the Fidelity Central Funds held as of period end, if any, as an investment of the Fund, but does not include the underlying holdings of each Fidelity Central Fund. As an Investing Fund, the Fund indirectly bears its proportionate share of the expenses of the underlying Fidelity Central Funds.
The Money Market Central Funds seek preservation of capital and current income and are managed by Fidelity Investments Money Management, Inc. (FIMM), an affiliate of the investment adviser. Annualized expenses of the Money Market Central Funds as of their most recent shareholder report date are less than .005%.
A complete unaudited list of holdings for each Fidelity Central Fund is available upon request or at the Securities and Exchange Commission (the SEC) website at www.sec.gov. In addition, the financial statements of the Fidelity Central Funds are available on the SEC website or upon request.
3. Significant Accounting Policies.
The Fund is an investment company and applies the accounting and reporting guidance of the Financial Accounting Standards Board (FASB) Accounting Standards Codification Topic 946 Financial Services – Investments Companies. The financial statements have been prepared in conformity with accounting principles generally accepted in the United States of America (GAAP), which require management to make certain estimates and assumptions at the date of the financial statements. Actual results could differ from those estimates. Subsequent events, if any, through the date that the financial statements were issued have been evaluated in the preparation of the financial statements. The following summarizes the significant accounting policies of the Fund:
Investment Valuation. Investments are valued as of 4:00 p.m. Eastern time on the last calendar day of the period. The Board of Trustees (the Board) has delegated the day to day responsibility for the valuation of the Fund's investments to the Fair Value Committee (the Committee) established by the Fund's investment adviser. In accordance with valuation policies and procedures approved by the Board, the Fund attempts to obtain prices from one or more third party pricing vendors or brokers to value its investments. When current market prices, quotations or currency exchange rates are not readily available or reliable, investments will be fair valued in good faith by the Committee, in accordance with procedures adopted by the Board. Factors used in determining fair value vary by investment type and may include market or investment specific events, changes in interest rates and credit quality. The frequency with which these procedures are used cannot be predicted and they may be utilized to a significant extent. The Committee oversees the Fund's valuation policies and procedures and reports to the Board on the Committee's activities and fair value determinations. The Board monitors the appropriateness of the procedures used in valuing the Fund's investments and ratifies the fair value determinations of the Committee.
The Fund categorizes the inputs to valuation techniques used to value its investments into a disclosure hierarchy consisting of three levels as shown below:
- Level 1 – quoted prices in active markets for identical investments
- Level 2 – other significant observable inputs (including quoted prices for similar investments, interest rates, prepayment speeds, etc.)
- Level 3 – unobservable inputs (including the Fund's own assumptions based on the best information available)
Valuation techniques used to value the Fund's investments by major category are as follows:
Equity securities, including restricted securities, for which market quotations are readily available, are valued at the last reported sale price or official closing price as reported by a third party pricing vendor on the primary market or exchange on which they are traded and are categorized as Level 1 in the hierarchy. In the event there were no sales during the day or closing prices are not available, securities are valued at the last quoted bid price or may be valued using the last available price and are generally categorized as Level 2 in the hierarchy. For foreign equity securities, when market or security specific events arise, comparisons to the valuation of American Depositary Receipts (ADRs), futures contracts, Exchange-Traded Funds (ETFs) and certain indexes as well as quoted prices for similar securities may be used and would be categorized as Level 2 in the hierarchy. Utilizing these techniques may result in transfers between Level 1 and Level 2. For equity securities, including restricted securities, where observable inputs are limited, assumptions about market activity and risk are used and these securities may be categorized as Level 3 in the hierarchy.
Debt securities, including restricted securities, are valued based on evaluated prices received from third party pricing vendors or from brokers who make markets in such securities. Corporate bonds are valued by pricing vendors who utilize matrix pricing which considers yield or price of bonds of comparable quality, coupon, maturity and type or by broker-supplied prices. When independent prices are unavailable or unreliable, debt securities may be valued utilizing pricing methodologies which consider similar factors that would be used by third party pricing vendors. Debt securities are generally categorized as Level 2 in the hierarchy but may be Level 3 depending on the circumstances.
Investments in open-end mutual funds, including the Fidelity Central Funds, are valued at their closing net asset value (NAV) each business day and are categorized as Level 1 in the hierarchy.
Changes in valuation techniques may result in transfers in or out of an assigned level within the disclosure hierarchy. The aggregate value of investments by input level as of January 31, 2018 is included at the end of the Fund's Schedule of Investments.
Foreign Currency. The Fund may use foreign currency contracts to facilitate transactions in foreign-denominated securities. Gains and losses from these transactions may arise from changes in the value of the foreign currency or if the counterparties do not perform under the contracts' terms.
Foreign-denominated assets, including investment securities, and liabilities are translated into U.S. dollars at the exchange rates at period end. Purchases and sales of investment securities, income and dividends received and expenses denominated in foreign currencies are translated into U.S. dollars at the exchange rate in effect on the transaction date.
The effects of exchange rate fluctuations on investments are included with the net realized and unrealized gain (loss) on investment securities. Other foreign currency transactions resulting in realized and unrealized gain (loss) are disclosed separately.
Investment Transactions and Income. For financial reporting purposes, the Fund's investment holdings and NAV include trades executed through the end of the last business day of the period. The NAV per share for processing shareholder transactions is calculated as of the close of business of the New York Stock Exchange (NYSE), normally 4:00 p.m. Eastern time and includes trades executed through the end of the prior business day. Gains and losses on securities sold are determined on the basis of identified cost. Dividend income is recorded on the ex-dividend date, except for certain dividends from foreign securities where the ex-dividend date may have passed, which are recorded as soon as the Fund is informed of the ex-dividend date. Non-cash dividends included in dividend income, if any, are recorded at the fair market value of the securities received. Income and capital gain distributions from Fidelity Central Funds, if any, are recorded on the ex-dividend date. Certain distributions received by the Fund represent a return of capital or capital gain. The Fund determines the components of these distributions subsequent to the ex-dividend date, based upon receipt of tax filings or other correspondence relating to the underlying investment. These distributions are recorded as a reduction of cost of investments and/or as a realized gain. Interest income is accrued as earned and includes coupon interest and amortization of premium and accretion of discount on debt securities as applicable. Investment income is recorded net of foreign taxes withheld where recovery of such taxes is uncertain.
Expenses. Expenses directly attributable to a fund are charged to that fund. Expenses attributable to more than one fund are allocated among the respective funds on the basis of relative net assets or other appropriate methods. Expense estimates are accrued in the period to which they relate and adjustments are made when actual amounts are known.
Income Tax Information and Distributions to Shareholders. Each year, the Fund intends to qualify as a regulated investment company under Subchapter M of the Internal Revenue Code, including distributing substantially all of its taxable income and realized gains. As a result, no provision for U.S. Federal income taxes is required. The Fund files a U.S. federal tax return, in addition to state and local tax returns as required. The Fund's federal income tax returns are subject to examination by the Internal Revenue Service (IRS) for a period of three fiscal years after they are filed. State and local tax returns may be subject to examination for an additional fiscal year depending on the jurisdiction. Foreign taxes are provided for based on the Fund's understanding of the tax rules and rates that exist in the foreign markets in which it invests. The Fund is subject to a tax imposed on capital gains by certain countries in which it invests. An estimated deferred tax liability for net unrealized appreciation on the applicable securities is included in Other payables and accrued expenses on the Statement of Assets & Liabilities.
Distributions are declared and recorded on the ex-dividend date. Income and capital gain distributions are determined in accordance with income tax regulations, which may differ from GAAP.
Capital accounts within the financial statements are adjusted for permanent book-tax differences. These adjustments have no impact on net assets or the results of operations. Capital accounts are not adjusted for temporary book-tax differences which will reverse in a subsequent period.
Book-tax differences are primarily due to foreign currency transactions, passive foreign investment companies (PFIC), and losses deferred due to wash sales.
As of period end, the cost and unrealized appreciation (depreciation) in securities, and derivatives if applicable, for federal income tax purposes were as follows:
| Gross unrealized appreciation | $147,974,213 |
| Gross unrealized depreciation | (11,695,304) |
| Net unrealized appreciation (depreciation) | $136,278,909 |
| Tax cost | $1,090,016,066 |
Restricted Securities. The Fund may invest in securities that are subject to legal or contractual restrictions on resale. These securities generally may be resold in transactions exempt from registration or to the public if the securities are registered. Disposal of these securities may involve time-consuming negotiations and expense, and prompt sale at an acceptable price may be difficult. Information regarding restricted securities is included at the end of the Fund's Schedule of Investments.
4. Purchases and Sales of Investments.
Purchases and sales of securities, other than short-term securities and in-kind transactions, aggregated $236,596,401 and $97,460,061, respectively.
Exchanges In-Kind. During the period, unaffiliated entities completed exchanges in-kind with the Fund. The unaffiliated entities delivered investments and cash valued at $766,582,959 in exchange for 68,876,454 shares of the Fund. The amount of in-kind exchanges is included in share transactions in the accompanying Statement of Changes in Net Assets. The Fund recognized no gain or loss for federal income tax purposes.
5. Fees and Other Transactions with Affiliates.
Management Fee. Fidelity Management & Research Company (the investment adviser) and its affiliates provide the Fund with investment management related services for which the Fund pays a monthly management fee that is based on an annual rate of .45% of average net assets. Under the management contract, the investment adviser or an affiliate pays all other expenses of the Fund, excluding fees and expenses of the independent Trustees, and certain miscellaneous expenses such as proxy and shareholder meeting expenses.
Brokerage Commissions. The Fund placed a portion of its portfolio transactions with brokerage firms which are affiliates of the investment adviser. Brokerage commissions are included in net realized gain (loss) and change in net unrealized appreciation (depreciation) in the Statement of Operations. The commissions paid to these affiliated firms were $2,551 for the period.
Interfund Trades. The Fund may purchase from or sell securities to other Fidelity Funds under procedures adopted by the Board. The procedures have been designed to ensure these interfund trades are executed in accordance with Rule 17a-7 of the 1940 Act. Interfund trades are included within the respective purchases and sales amounts shown in the Purchases and Sales of Investments note.
Prior Fiscal Year Exchanges In-Kind. During the prior period, an affiliated entity completed an exchange in-kind with the Fund. The affiliated entity delivered investments and cash valued at $179,817,385 in exchange for 17,290,133 shares of the Fund. The amount of in-kind exchanges is included in share transactions in the accompanying Statement of Changes in Net Assets. The Fund recognized no gain or loss for federal income tax purposes.
6. Security Lending.
The Fund lends portfolio securities through a lending agent from time to time in order to earn additional income. For equity securities, a lending agent is used and may loan securities to certain qualified borrowers, including Fidelity Capital Markets (FCM), a broker-dealer affiliated with the Fund. On the settlement date of the loan, the Fund receives collateral (in the form of U.S. Treasury obligations, letters of credit and/or cash) against the loaned securities and maintains collateral in an amount not less than 100% of the market value of the loaned securities during the period of the loan. The market value of the loaned securities is determined at the close of business of the Fund and any additional required collateral is delivered to the Fund on the next business day. The Fund or borrower may terminate the loan at any time, and if the borrower defaults on its obligation to return the securities loaned because of insolvency or other reasons, the Fund may apply collateral received from the borrower against the obligation. The Fund may experience delays and costs in recovering the securities loaned. Any cash collateral received is invested in the Fidelity Securities Lending Cash Central Fund. The value of loaned securities and cash collateral at period end are disclosed on the Fund's Statement of Assets and Liabilities. The value of securities loaned to FCM at period end was $485,923. Security lending income represents the income earned on investing cash collateral, less rebates paid to borrowers and any lending agent fees associated with the loan, plus any premium payments received for lending certain types of securities. Security lending income is presented in the Statement of Operations as a component of income from Fidelity Central Funds. Total security lending income during the period amounted to $20,168, including $379 from securities loaned to FCM.
7. Expense Reductions.
Commissions paid to certain brokers with whom the investment adviser, or its affiliates, places trades on behalf of the Fund include an amount in addition to trade execution, which may be rebated back to the Fund to offset certain expenses. This amount totaled $3,739 for the period. In addition, through arrangements with the Fund's custodian, credits realized as a result of certain uninvested cash balances were used to reduce the Fund's expenses. During the period, these credits reduced the Fund's expenses by $14.
8. Other.
The Fund's organizational documents provide former and current trustees and officers with a limited indemnification against liabilities arising in connection with the performance of their duties to the Fund. In the normal course of business, the Fund may also enter into contracts that provide general indemnifications. The Fund's maximum exposure under these arrangements is unknown as this would be dependent on future claims that may be made against the Fund. The risk of material loss from such claims is considered remote.
Shareholder Expense Example
As a shareholder of the Fund, you incur two types of costs: (1) transaction costs, and (2) ongoing costs, including management fees and other Fund expenses. This Example is intended to help you understand your ongoing costs (in dollars) of investing in the Fund and to compare these costs with the ongoing costs of investing in other mutual funds.
The Example is based on an investment of $1,000 invested at the beginning of the period and held for the entire period (August 1, 2017 to January 31, 2018).
Actual Expenses
The first line of the accompanying table provides information about actual account values and actual expenses. You may use the information in this line, together with the amount you invested, to estimate the expenses that you paid over the period. Simply divide your account value by $1,000.00 (for example, an $8,600 account value divided by $1,000.00 = 8.6), then multiply the result by the number in the first line under the heading entitled "Expenses Paid During Period" to estimate the expenses you paid on your account during this period. In addition, the Fund, as a shareholder in the underlying Fidelity Central Funds, will indirectly bear its pro-rata share of the fees and expenses incurred by the underlying Fidelity Central Funds. These fees and expenses are not included in the Fund's annualized expense ratio used to calculate the expense estimate in the table below.
Hypothetical Example for Comparison Purposes
The second line of the accompanying table provides information about hypothetical account values and hypothetical expenses based on the Fund's actual expense ratio and an assumed rate of return of 5% per year before expenses, which is not the Fund's actual return. The hypothetical account values and expenses may not be used to estimate the actual ending account balance or expenses you paid for the period. You may use this information to compare the ongoing costs of investing in the Fund and other funds. To do so, compare this 5% hypothetical example with the 5% hypothetical examples that appear in the shareholder reports of the other funds. In addition, the Fund, as a shareholder in the underlying Fidelity Central Funds, will indirectly bear its pro-rata share of the fees and expenses incurred by the underlying Fidelity Central Funds. These fees and expenses are not included in the Fund's annualized expense ratio used to calculate the expense estimate in the table below.
Please note that the expenses shown in the table are meant to highlight your ongoing costs only and do not reflect any transaction costs. Therefore, the second line of the table is useful in comparing ongoing costs only, and will not help you determine the relative total costs of owning different funds.
| | Annualized Expense Ratio-A | Beginning
Account Value
August 1, 2017 | Ending
Account Value
January 31, 2018 | Expenses Paid
During Period-B
August 1, 2017
to January 31, 2018 |
| Actual | .45% | $1,000.00 | $1,203.10 | $2.50 |
| Hypothetical-C | | $1,000.00 | $1,022.94 | $2.29 |
A Annualized expense ratio reflects expenses net of applicable fee waivers.
B Expenses are equal to the Fund's annualized expense ratio, multiplied by the average account value over the period, multiplied by 184/365 (to reflect the one-half year period).
C 5% return per year before expenses
Corporate Headquarters
245 Summer St.
Boston, MA 02210
www.fidelity.com
BCFK6-SANN-0318
1.9884006.100
Fidelity® Blue Chip Value Fund
Semi-Annual Report January 31, 2018 |
|
Contents
To view a fund's proxy voting guidelines and proxy voting record for the 12-month period ended June 30, visit http://www.fidelity.com/proxyvotingresults or visit the Securities and Exchange Commission's (SEC) web site at http://www.sec.gov.
You may also call 1-800-544-8544 to request a free copy of the proxy voting guidelines.
Standard & Poor's, S&P and S&P 500 are registered service marks of The McGraw-Hill Companies, Inc. and have been licensed for use by Fidelity Distributors Corporation.
Other third-party marks appearing herein are the property of their respective owners.
All other marks appearing herein are registered or unregistered trademarks or service marks of FMR LLC or an affiliated company. © 2018 FMR LLC. All rights reserved.
This report and the financial statements contained herein are submitted for the general information of the shareholders of the Fund. This report is not authorized for distribution to prospective investors in the Fund unless preceded or accompanied by an effective prospectus.
A fund files its complete schedule of portfolio holdings with the SEC for the first and third quarters of each fiscal year on Form N-Q. Forms N-Q are available on the SEC’s web site at http://www.sec.gov. A fund's Forms N-Q may be reviewed and copied at the SEC’s Public Reference Room in Washington, DC. Information regarding the operation of the SEC's Public Reference Room may be obtained by calling 1-800-SEC-0330.
For a complete list of a fund's portfolio holdings, view the most recent holdings listing, semiannual report, or annual report on Fidelity's web site at http://www.fidelity.com, http://www.institutional.fidelity.com, or http://www.401k.com, as applicable.
NOT FDIC INSURED •MAY LOSE VALUE •NO BANK GUARANTEE
Neither the Fund nor Fidelity Distributors Corporation is a bank.
Investment Summary (Unaudited)
Top Ten Stocks as of January 31, 2018
| | % of fund's net assets |
| Berkshire Hathaway, Inc. Class B | 6.6 |
| Wells Fargo & Co. | 5.0 |
| Amgen, Inc. | 3.8 |
| JPMorgan Chase & Co. | 3.8 |
| CVS Health Corp. | 3.4 |
| U.S. Bancorp | 3.1 |
| Cigna Corp. | 3.0 |
| Prudential PLC | 2.8 |
| CBRE Group, Inc. | 2.6 |
| United Technologies Corp. | 2.5 |
| | 36.6 |
Top Five Market Sectors as of January 31, 2018
| | % of fund's net assets |
| Financials | 33.2 |
| Health Care | 14.4 |
| Consumer Discretionary | 12.2 |
| Consumer Staples | 9.8 |
| Energy | 8.7 |
Asset Allocation (% of fund's net assets)
| As of January 31, 2018* |
| | Stocks | 98.5% |
| | Short-Term Investments and Net Other Assets (Liabilities) | 1.5% |

* Foreign investments - 22.6%
Schedule of Investments January 31, 2018 (Unaudited)
Showing Percentage of Net Assets
| Common Stocks - 98.5% | | | |
| | | Shares | Value |
| CONSUMER DISCRETIONARY - 12.2% | | | |
| Media - 10.2% | | | |
| CBS Corp. Class B | | 49,300 | $2,840,173 |
| Interpublic Group of Companies, Inc. | | 263,600 | 5,770,204 |
| Lions Gate Entertainment Corp. Class B (a) | | 163,377 | 5,228,064 |
| The Walt Disney Co. | | 84,600 | 9,193,482 |
| Time Warner, Inc. | | 111,000 | 10,583,850 |
| Twenty-First Century Fox, Inc. Class A | | 244,300 | 9,014,670 |
| | | | 42,630,443 |
| Textiles, Apparel & Luxury Goods - 2.0% | | | |
| PVH Corp. | | 54,000 | 8,374,320 |
|
| TOTAL CONSUMER DISCRETIONARY | | | 51,004,763 |
|
| CONSUMER STAPLES - 9.8% | | | |
| Beverages - 1.8% | | | |
| C&C Group PLC | | 2,059,712 | 7,710,065 |
| Food & Staples Retailing - 3.4% | | | |
| CVS Health Corp. | | 178,900 | 14,077,641 |
| Safeway, Inc.: | | | |
| rights (a)(b) | | 48,800 | 0 |
| rights (a)(b) | | 48,800 | 42,456 |
| | | | 14,120,097 |
| Food Products - 3.1% | | | |
| Kellogg Co. | | 68,800 | 4,685,968 |
| The J.M. Smucker Co. | | 65,700 | 8,336,673 |
| | | | 13,022,641 |
| Tobacco - 1.5% | | | |
| British American Tobacco PLC sponsored ADR | | 93,300 | 6,353,730 |
|
| TOTAL CONSUMER STAPLES | | | 41,206,533 |
|
| ENERGY - 8.7% | | | |
| Energy Equipment & Services - 1.6% | | | |
| Baker Hughes, a GE Co. Class A | | 202,800 | 6,520,020 |
| Oil, Gas & Consumable Fuels - 7.1% | | | |
| GasLog Partners LP | | 246,300 | 5,837,310 |
| Golar LNG Partners LP | | 219,800 | 4,824,610 |
| Teekay Corp. (c) | | 809,100 | 6,602,256 |
| Teekay LNG Partners LP | | 433,300 | 8,557,675 |
| Teekay Offshore Partners LP | | 1,554,200 | 3,885,500 |
| | | | 29,707,351 |
|
| TOTAL ENERGY | | | 36,227,371 |
|
| FINANCIALS - 33.2% | | | |
| Banks - 11.9% | | | |
| JPMorgan Chase & Co. | | 135,216 | 15,640,435 |
| U.S. Bancorp | | 228,897 | 13,079,175 |
| Wells Fargo & Co. | | 319,398 | 21,010,000 |
| | | | 49,729,610 |
| Capital Markets - 1.5% | | | |
| Goldman Sachs Group, Inc. | | 23,400 | 6,268,626 |
| Consumer Finance - 3.4% | | | |
| Capital One Financial Corp. | | 57,033 | 5,929,151 |
| Discover Financial Services | | 105,700 | 8,434,860 |
| | | | 14,364,011 |
| Diversified Financial Services - 6.6% | | | |
| Berkshire Hathaway, Inc. Class B (a) | | 130,000 | 27,869,399 |
| Insurance - 9.8% | | | |
| Allstate Corp. | | 90,400 | 8,928,808 |
| Chubb Ltd. | | 63,900 | 9,977,985 |
| Prudential PLC | | 426,798 | 11,553,458 |
| The Travelers Companies, Inc. | | 69,900 | 10,479,408 |
| | | | 40,939,659 |
|
| TOTAL FINANCIALS | | | 139,171,305 |
|
| HEALTH CARE - 14.4% | | | |
| Biotechnology - 5.3% | | | |
| Amgen, Inc. | | 86,300 | 16,056,115 |
| Dyax Corp. rights 12/31/19 (a)(b) | | 236,600 | 806,806 |
| Shire PLC sponsored ADR | | 37,068 | 5,191,003 |
| | | | 22,053,924 |
| Health Care Providers & Services - 6.1% | | | |
| Anthem, Inc. | | 41,100 | 10,186,635 |
| Cigna Corp. | | 59,300 | 12,355,155 |
| McKesson Corp. | | 17,700 | 2,989,176 |
| | | | 25,530,966 |
| Pharmaceuticals - 3.0% | | | |
| Allergan PLC | | 34,300 | 6,182,918 |
| Bayer AG | | 49,900 | 6,538,764 |
| | | | 12,721,682 |
|
| TOTAL HEALTH CARE | | | 60,306,572 |
|
| INDUSTRIALS - 5.7% | | | |
| Aerospace & Defense - 2.5% | | | |
| United Technologies Corp. | | 76,800 | 10,599,168 |
| Professional Services - 3.2% | | | |
| Dun & Bradstreet Corp. | | 56,200 | 6,953,626 |
| Nielsen Holdings PLC | | 170,500 | 6,378,405 |
| | | | 13,332,031 |
|
| TOTAL INDUSTRIALS | | | 23,931,199 |
|
| INFORMATION TECHNOLOGY - 7.0% | | | |
| Communications Equipment - 2.1% | | | |
| Cisco Systems, Inc. | | 214,985 | 8,930,477 |
| Internet Software & Services - 1.4% | | | |
| Alphabet, Inc. Class A (a) | | 4,900 | 5,792,878 |
| IT Services - 2.9% | | | |
| Cognizant Technology Solutions Corp. Class A | | 90,700 | 7,072,786 |
| The Western Union Co. | | 254,500 | 5,291,055 |
| | | | 12,363,841 |
| Technology Hardware, Storage & Peripherals - 0.6% | | | |
| Apple, Inc. | | 14,100 | 2,360,763 |
|
| TOTAL INFORMATION TECHNOLOGY | | | 29,447,959 |
|
| MATERIALS - 3.0% | | | |
| Chemicals - 3.0% | | | |
| LyondellBasell Industries NV Class A | | 51,800 | 6,207,712 |
| Monsanto Co. | | 53,700 | 6,540,660 |
| | | | 12,748,372 |
| REAL ESTATE - 2.6% | | | |
| Real Estate Management & Development - 2.6% | | | |
| CBRE Group, Inc. (a) | | 236,900 | 10,823,961 |
| UTILITIES - 1.9% | | | |
| Electric Utilities - 1.9% | | | |
| Exelon Corp. | | 200,900 | 7,736,659 |
| TOTAL COMMON STOCKS | | | |
| (Cost $326,817,508) | | | 412,604,694 |
|
| Money Market Funds - 2.8% | | | |
| Fidelity Cash Central Fund, 1.39% (d) | | 4,551,567 | 4,552,478 |
| Fidelity Securities Lending Cash Central Fund 1.40% (d)(e) | | 7,281,006 | 7,281,734 |
| TOTAL MONEY MARKET FUNDS | | | |
| (Cost $11,834,590) | | | 11,834,212 |
| TOTAL INVESTMENT IN SECURITIES - 101.3% | | | |
| (Cost $338,652,098) | | | 424,438,906 |
| NET OTHER ASSETS (LIABILITIES) - (1.3)% | | | (5,649,988) |
| NET ASSETS - 100% | | | $418,788,918 |
Legend
(a) Non-income producing
(b) Level 3 security
(c) Security or a portion of the security is on loan at period end.
(d) Affiliated fund that is generally available only to investment companies and other accounts managed by Fidelity Investments. The rate quoted is the annualized seven-day yield of the fund at period end. A complete unaudited listing of the fund's holdings as of its most recent quarter end is available upon request. In addition, each Fidelity Central Fund's financial statements are available on the SEC's website or upon request.
(e) Investment made with cash collateral received from securities on loan.
Affiliated Central Funds
Information regarding fiscal year to date income earned by the Fund from investments in Fidelity Central Funds is as follows:
| Fund | Income earned |
| Fidelity Cash Central Fund | $72,942 |
| Fidelity Securities Lending Cash Central Fund | 317,502 |
| Total | $390,444 |
Amounts in the income column in the above table include any capital gain distributions from underlying funds, which are presented in the corresponding line-item in the Statement of Operations if applicable.
Investment Valuation
The following is a summary of the inputs used, as of January 31, 2018, involving the Fund's assets and liabilities carried at fair value. The inputs or methodology used for valuing securities may not be an indication of the risk associated with investing in those securities. For more information on valuation inputs, and their aggregation into the levels used below, please refer to the Investment Valuation section in the accompanying Notes to Financial Statements.
| | Valuation Inputs at Reporting Date: |
| Description | Total | Level 1 | Level 2 | Level 3 |
| Investments in Securities: | | | | |
| Equities: | | | | |
| Consumer Discretionary | $51,004,763 | $51,004,763 | $-- | $-- |
| Consumer Staples | 41,206,533 | 41,164,077 | -- | 42,456 |
| Energy | 36,227,371 | 36,227,371 | -- | -- |
| Financials | 139,171,305 | 127,617,847 | 11,553,458 | -- |
| Health Care | 60,306,572 | 52,961,002 | 6,538,764 | 806,806 |
| Industrials | 23,931,199 | 23,931,199 | -- | -- |
| Information Technology | 29,447,959 | 29,447,959 | -- | -- |
| Materials | 12,748,372 | 12,748,372 | -- | -- |
| Real Estate | 10,823,961 | 10,823,961 | -- | -- |
| Utilities | 7,736,659 | 7,736,659 | -- | -- |
| Money Market Funds | 11,834,212 | 11,834,212 | -- | -- |
| Total Investments in Securities: | $424,438,906 | $405,497,422 | $18,092,222 | $849,262 |
The following is a summary of transfers between Level 1 and Level 2 for the period ended January 31, 2018. Transfers are assumed to have occurred at the beginning of the period, and are primarily attributable to the valuation techniques used for foreign equity securities, as discussed in the accompanying Notes to Financial Statements:
| Transfers | Total |
| Level 1 to Level 2 | $6,088,520 |
| Level 2 to Level 1 | $0 |
Other Information
Distribution of investments by country or territory of incorporation, as a percentage of Total Net Assets, is as follows (Unaudited):
| United States of America | 77.4% |
| Marshall Islands | 7.1% |
| United Kingdom | 4.3% |
| Ireland | 3.3% |
| Switzerland | 2.4% |
| Germany | 1.5% |
| Netherlands | 1.5% |
| Bailiwick of Jersey | 1.3% |
| Canada | 1.2% |
| | 100.0% |
See accompanying notes which are an integral part of the financial statements.
Financial Statements
Statement of Assets and Liabilities
| | | January 31, 2018 (Unaudited) |
| Assets | | |
Investment in securities, at value (including securities loaned of $6,601,440) — See accompanying schedule:
Unaffiliated issuers (cost $326,817,508) | $412,604,694 | |
| Fidelity Central Funds (cost $11,834,590) | 11,834,212 | |
| Total Investment in Securities (cost $338,652,098) | | $424,438,906 |
| Receivable for investments sold | | 1,681,485 |
| Receivable for fund shares sold | | 449,444 |
| Dividends receivable | | 188,812 |
| Distributions receivable from Fidelity Central Funds | | 44,399 |
| Prepaid expenses | | 583 |
| Other receivables | | 3,118 |
| Total assets | | 426,806,747 |
| Liabilities | | |
| Payable for fund shares redeemed | $453,412 | |
| Accrued management fee | 179,659 | |
| Other affiliated payables | 73,943 | |
| Other payables and accrued expenses | 29,815 | |
| Collateral on securities loaned | 7,281,000 | |
| Total liabilities | | 8,017,829 |
| Net Assets | | $418,788,918 |
| Net Assets consist of: | | |
| Paid in capital | | $385,061,981 |
| Distributions in excess of net investment income | | (293,926) |
| Accumulated undistributed net realized gain (loss) on investments and foreign currency transactions | | (51,765,942) |
| Net unrealized appreciation (depreciation) on investments and assets and liabilities in foreign currencies | | 85,786,805 |
| Net Assets, for 20,410,831 shares outstanding | | $418,788,918 |
| Net Asset Value, offering price and redemption price per share ($418,788,918 ÷ 20,410,831 shares) | | $20.52 |
See accompanying notes which are an integral part of the financial statements.
Statement of Operations
| | | Six months ended January 31, 2018 (Unaudited) |
| Investment Income | | |
| Dividends | | $3,210,299 |
| Income from Fidelity Central Funds (including $317,502 from security lending) | | 390,444 |
| Total income | | 3,600,743 |
| Expenses | | |
| Management fee | | |
| Basic fee | $1,090,347 | |
| Performance adjustment | (60,311) | |
| Transfer agent fees | 372,956 | |
| Accounting and security lending fees | 79,155 | |
| Custodian fees and expenses | 3,822 | |
| Independent trustees' fees and expenses | 783 | |
| Registration fees | 7,528 | |
| Audit | 33,775 | |
| Legal | 743 | |
| Miscellaneous | 1,411 | |
| Total expenses before reductions | 1,530,209 | |
| Expense reductions | (6,151) | 1,524,058 |
| Net investment income (loss) | | 2,076,685 |
| Realized and Unrealized Gain (Loss) | | |
| Net realized gain (loss) on: | | |
| Investment securities: | | |
| Unaffiliated issuers | 4,163,047 | |
| Fidelity Central Funds | 920 | |
| Foreign currency transactions | 3,795 | |
| Total net realized gain (loss) | | 4,167,762 |
| Change in net unrealized appreciation (depreciation) on: | | |
| Investment securities: | | |
| Unaffiliated issuers | 32,156,254 | |
| Fidelity Central Funds | (189) | |
| Total change in net unrealized appreciation (depreciation) | | 32,156,065 |
| Net gain (loss) | | 36,323,827 |
| Net increase (decrease) in net assets resulting from operations | | $38,400,512 |
See accompanying notes which are an integral part of the financial statements.
Statement of Changes in Net Assets
| | Six months ended January 31, 2018 (Unaudited) | Year ended July 31, 2017 |
| Increase (Decrease) in Net Assets | | |
| Operations | | |
| Net investment income (loss) | $2,076,685 | $4,330,903 |
| Net realized gain (loss) | 4,167,762 | 20,725,978 |
| Change in net unrealized appreciation (depreciation) | 32,156,065 | 41,416,367 |
| Net increase (decrease) in net assets resulting from operations | 38,400,512 | 66,473,248 |
| Distributions to shareholders from net investment income | (4,465,976) | (4,486,672) |
| Distributions to shareholders from net realized gain | (81,343) | – |
| Total distributions | (4,547,319) | (4,486,672) |
| Share transactions | | |
| Proceeds from sales of shares | 32,759,368 | 70,221,494 |
| Reinvestment of distributions | 4,381,389 | 4,351,879 |
| Cost of shares redeemed | (64,435,338) | (181,506,778) |
| Net increase (decrease) in net assets resulting from share transactions | (27,294,581) | (106,933,405) |
| Total increase (decrease) in net assets | 6,558,612 | (44,946,829) |
| Net Assets | | |
| Beginning of period | 412,230,306 | 457,177,135 |
| End of period | $418,788,918 | $412,230,306 |
| Other Information | | |
| Undistributed net investment income end of period | $– | $2,095,365 |
| Distributions in excess of net investment income end of period | $(293,926) | $– |
| Shares | | |
| Sold | 1,709,654 | 3,956,093 |
| Issued in reinvestment of distributions | 233,439 | 258,721 |
| Redeemed | (3,399,561) | (10,583,646) |
| Net increase (decrease) | (1,456,468) | (6,368,832) |
See accompanying notes which are an integral part of the financial statements.
Financial Highlights
Fidelity Blue Chip Value Fund
| | Six months ended (Unaudited) January 31, | Years endedJuly 31, | | | | |
| | 2018 | 2017 | 2016 | 2015 | 2014 | 2013 |
| Selected Per–Share Data | | | | | | |
| Net asset value, beginning of period | $18.85 | $16.19 | $16.88 | $15.22 | $13.32 | $10.26 |
| Income from Investment Operations | | | | | | |
| Net investment income (loss)A | .10 | .18 | .19 | .35B | .18 | .18 |
| Net realized and unrealized gain (loss) | 1.79 | 2.66 | (.59) | 1.54 | 1.81 | 3.17 |
| Total from investment operations | 1.89 | 2.84 | (.40) | 1.89 | 1.99 | 3.35 |
| Distributions from net investment income | (.21) | (.18) | (.28) | (.23) | (.09) | (.29) |
| Distributions from net realized gain | –C | – | (.01) | – | – | – |
| Total distributions | (.22)D | (.18) | (.29) | (.23) | (.09) | (.29) |
| Net asset value, end of period | $20.52 | $18.85 | $16.19 | $16.88 | $15.22 | $13.32 |
| Total ReturnE,F | 10.12% | 17.68% | (2.31)% | 12.52% | 14.99% | 33.33% |
| Ratios to Average Net AssetsG,H | | | | | | |
| Expenses before reductions | .76%I | .79% | .88% | .82% | .66% | .64% |
| Expenses net of fee waivers, if any | .76%I | .79% | .88% | .82% | .66% | .64% |
| Expenses net of all reductions | .76%I | .78% | .88% | .82% | .66% | .62% |
| Net investment income (loss) | 1.03%I | 1.04% | 1.23% | 2.15%B | 1.28% | 1.58% |
| Supplemental Data | | | | | | |
| Net assets, end of period (000 omitted) | $418,789 | $412,230 | $457,177 | $410,968 | $329,826 | $281,860 |
| Portfolio turnover rateJ | 25%I | 32% | 54% | 138% | 102%K | 88% |
A Calculated based on average shares outstanding during the period.
B Net Investment income per share reflects a large, non-recurring dividend which amounted to $.13 per share. Excluding this non-recurring dividend, the ratio of net investment income (loss) to average net assets would have been 1.35%.
C Amount represents less than $.005 per share.
D Total distributions of $.22 per share is comprised of distributions from net investment income of $.213 and distributions from net realized gain of $.004 per share.
E Total returns for periods of less than one year are not annualized.
F Total returns would have been lower if certain expenses had not been reduced during the applicable periods shown.
G Fees and expenses of any underlying Fidelity Central Funds are not included in the Fund's expense ratio. The Fund indirectly bears its proportionate share of the expenses of any underlying Fidelity Central Funds.
H Expense ratios reflect operating expenses of the Fund. Expenses before reductions do not reflect amounts reimbursed by the investment adviser or reductions from brokerage service arrangements or reductions from other expense offset arrangements and do not represent the amount paid by the Fund during periods when reimbursements or reductions occur. Expenses net of fee waivers reflect expenses after reimbursement by the investment adviser but prior to reductions from brokerage service arrangements or other expense offset arrangements. Expenses net of all reductions represent the net expenses paid by the Fund.
I Annualized
J Amount does not include the portfolio activity of any underlying Fidelity Central Funds.
K Portfolio turnover rate excludes securities received or delivered in-kind.
See accompanying notes which are an integral part of the financial statements.
Notes to Financial Statements (Unaudited)
For the period ended January 31, 2018
1. Organization.
Fidelity Blue Chip Value Fund (the Fund) is a fund of Fidelity Securities Fund (the Trust) and is authorized to issue an unlimited number of shares. Share transactions on the Statement of Changes in Net Assets may contain exchanges between affiliated funds. The Trust is registered under the Investment Company Act of 1940, as amended (the 1940 Act), as an open-end management investment company organized as a Massachusetts business trust.
2. Investments in Fidelity Central Funds.
The Fund invests in Fidelity Central Funds, which are open-end investment companies generally available only to other investment companies and accounts managed by the investment adviser and its affiliates. The Fund's Schedule of Investments lists each of the Fidelity Central Funds held as of period end, if any, as an investment of the Fund, but does not include the underlying holdings of each Fidelity Central Fund. As an Investing Fund, the Fund indirectly bears its proportionate share of the expenses of the underlying Fidelity Central Funds.
The Money Market Central Funds seek preservation of capital and current income and are managed by Fidelity Investments Money Management, Inc. (FIMM), an affiliate of the investment adviser. Annualized expenses of the Money Market Central Funds as of their most recent shareholder report date are less than .005%.
A complete unaudited list of holdings for each Fidelity Central Fund is available upon request or at the Securities and Exchange Commission (the SEC) website at www.sec.gov. In addition, the financial statements of the Fidelity Central Funds are available on the SEC website or upon request.
3. Significant Accounting Policies.
The Fund is an investment company and applies the accounting and reporting guidance of the Financial Accounting Standards Board (FASB) Accounting Standards Codification Topic 946 Financial Services – Investments Companies. The financial statements have been prepared in conformity with accounting principles generally accepted in the United States of America (GAAP), which require management to make certain estimates and assumptions at the date of the financial statements. Actual results could differ from those estimates. Subsequent events, if any, through the date that the financial statements were issued have been evaluated in the preparation of the financial statements. The following summarizes the significant accounting policies of the Fund:
Investment Valuation. Investments are valued as of 4:00 p.m. Eastern time on the last calendar day of the period. The Board of Trustees (the Board) has delegated the day to day responsibility for the valuation of the Fund's investments to the Fair Value Committee (the Committee) established by the Fund's investment adviser. In accordance with valuation policies and procedures approved by the Board, the Fund attempts to obtain prices from one or more third party pricing vendors or brokers to value its investments. When current market prices, quotations or currency exchange rates are not readily available or reliable, investments will be fair valued in good faith by the Committee, in accordance with procedures adopted by the Board. Factors used in determining fair value vary by investment type and may include market or investment specific events. The frequency with which these procedures are used cannot be predicted and they may be utilized to a significant extent. The Committee oversees the Fund's valuation policies and procedures and reports to the Board on the Committee's activities and fair value determinations. The Board monitors the appropriateness of the procedures used in valuing the Fund's investments and ratifies the fair value determinations of the Committee.
The Fund categorizes the inputs to valuation techniques used to value its investments into a disclosure hierarchy consisting of three levels as shown below:
- Level 1 – quoted prices in active markets for identical investments
- Level 2 – other significant observable inputs (including quoted prices for similar investments, interest rates, prepayment speeds, etc.)
- Level 3 – unobservable inputs (including the Fund's own assumptions based on the best information available)
Valuation techniques used to value the Fund's investments by major category are as follows:
Equity securities, including restricted securities, for which market quotations are readily available, are valued at the last reported sale price or official closing price as reported by a third party pricing vendor on the primary market or exchange on which they are traded and are categorized as Level 1 in the hierarchy. In the event there were no sales during the day or closing prices are not available, securities are valued at the last quoted bid price or may be valued using the last available price and are generally categorized as Level 2 in the hierarchy. For foreign equity securities, when market or security specific events arise, comparisons to the valuation of American Depositary Receipts (ADRs), futures contracts, Exchange-Traded Funds (ETFs) and certain indexes as well as quoted prices for similar securities may be used and would be categorized as Level 2 in the hierarchy. Utilizing these techniques may result in transfers between Level 1 and Level 2. For equity securities, including restricted securities, where observable inputs are limited, assumptions about market activity and risk are used and these securities may be categorized as Level 3 in the hierarchy.
Investments in open-end mutual funds, including the Fidelity Central Funds, are valued at their closing net asset value (NAV) each business day and are categorized as Level 1 in the hierarchy
Changes in valuation techniques may result in transfers in or out of an assigned level within the disclosure hierarchy. The aggregate value of investments by input level as of January 31, 2018, including information on transfers between Levels 1 and 2, is included at the end of the Fund's Schedule of Investments.
Foreign Currency. The Fund may use foreign currency contracts to facilitate transactions in foreign-denominated securities. Gains and losses from these transactions may arise from changes in the value of the foreign currency or if the counterparties do not perform under the contracts' terms.
Foreign-denominated assets, including investment securities, and liabilities are translated into U.S. dollars at the exchange rates at period end. Purchases and sales of investment securities, income and dividends received and expenses denominated in foreign currencies are translated into U.S. dollars at the exchange rate in effect on the transaction date.
The effects of exchange rate fluctuations on investments are included with the net realized and unrealized gain (loss) on investment securities. Other foreign currency transactions resulting in realized and unrealized gain (loss) are disclosed separately.
Investment Transactions and Income. For financial reporting purposes, the Fund's investment holdings and NAV include trades executed through the end of the last business day of the period. The NAV per share for processing shareholder transactions is calculated as of the close of business of the New York Stock Exchange (NYSE), normally 4:00 p.m. Eastern time and includes trades executed through the end of the prior business day. Gains and losses on securities sold are determined on the basis of identified cost and includes proceeds received from litigation. Dividend income is recorded on the ex-dividend date, except for certain dividends from foreign securities where the ex-dividend date may have passed, which are recorded as soon as the Fund is informed of the ex-dividend date. Non-cash dividends included in dividend income, if any, are recorded at the fair market value of the securities received. Income and capital gain distributions from Fidelity Central Funds, if any, are recorded on the ex-dividend date. Certain distributions received by the Fund represent a return of capital or capital gain. The Fund determines the components of these distributions subsequent to the ex-dividend date, based upon receipt of tax filings or other correspondence relating to the underlying investment. These distributions are recorded as a reduction of cost of investments and/or as a realized gain. Investment income is recorded net of foreign taxes withheld where recovery of such taxes is uncertain.
Expenses. Expenses directly attributable to a fund are charged to that fund. Expenses attributable to more than one fund are allocated among the respective funds on the basis of relative net assets or other appropriate methods. Expense estimates are accrued in the period to which they relate and adjustments are made when actual amounts are known.
Income Tax Information and Distributions to Shareholders. Each year, the Fund intends to qualify as a regulated investment company under Subchapter M of the Internal Revenue Code, including distributing substantially all of its taxable income and realized gains. As a result, no provision for U.S. Federal income taxes is required. The Fund files a U.S. federal tax return, in addition to state and local tax returns as required. The Fund's federal income tax returns are subject to examination by the Internal Revenue Service (IRS) for a period of three fiscal years after they are filed. State and local tax returns may be subject to examination for an additional fiscal year depending on the jurisdiction. Foreign taxes are provided for based on the Fund's understanding of the tax rules and rates that exist in the foreign markets in which it invests.
Distributions are declared and recorded on the ex-dividend date. Income and capital gain distributions are determined in accordance with income tax regulations, which may differ from GAAP.
Capital accounts within the financial statements are adjusted for permanent book-tax differences. These adjustments have no impact on net assets or the results of operations. Capital accounts are not adjusted for temporary book-tax differences which will reverse in a subsequent period.
Book-tax differences are primarily due to foreign currency transactions, partnerships, capital loss carryforwards and losses deferred due to wash sales.
As of period end, the cost and unrealized appreciation (depreciation) in securities, and derivatives if applicable, for federal income tax purposes were as follows:
| Gross unrealized appreciation | $94,056,835 |
| Gross unrealized depreciation | (11,411,731) |
| Net unrealized appreciation (depreciation) | $82,645,104 |
| Tax cost | $341,793,802 |
Capital loss carryforwards are only available to offset future capital gains of the Fund to the extent provided by regulations and may be limited. Under the Regulated Investment Company Modernization Act of 2010 (the Act), the Fund is permitted to carry forward capital losses incurred in taxable years beginning after December 22, 2010 for an unlimited period and such capital losses are required to be used prior to any losses that expire. The capital loss carryforward information presented below, including any applicable limitation, is estimated as of prior fiscal period end and is subject to adjustment.
| Fiscal year of expiration | |
| 2018 | $(52,900,254) |
4. Purchases and Sales of Investments.
Purchases and sales of securities, other than short-term securities, aggregated $50,036,088 and $80,004,058, respectively.
5. Fees and Other Transactions with Affiliates.
Management Fee. Fidelity Management & Research Company (the investment adviser) and its affiliates provide the Fund with investment management related services for which the Fund pays a monthly management fee. The management fee is the sum of an individual fund fee rate that is based on an annual rate of .30% of the Fund's average net assets and an annualized group fee rate that averaged .24% during the period. The group fee rate is based upon the average net assets of all the mutual funds advised by the investment adviser, including any mutual funds previously advised by the investment adviser that are currently advised by Fidelity SelectCo, LLC, an affiliate of the investment adviser. The group fee rate decreases as assets under management increase and increases as assets under management decrease. In addition, the management fee is subject to a performance adjustment (up to a maximum of +/- .20% of the Fund's average net assets over a 36 month performance period). The upward or downward adjustment to the management fee is based on the Fund's relative investment performance as compared to its benchmark index, the Russell 1000 Value Index, over the same 36 month performance period. For the reporting period, the total annualized management fee rate, including the performance adjustment, was .51% of the Fund's average net assets. The performance adjustment included in the management fee rate may be higher or lower than the maximum performance adjustment rate due to the difference between the average net assets for the reporting and performance periods.
Transfer Agent Fees. Fidelity Investments Institutional Operations Company, Inc. (FIIOC), an affiliate of the investment adviser, is the Fund's transfer, dividend disbursing and shareholder servicing agent. FIIOC receives account fees and asset-based fees that vary according to account size and type of account. FIIOC pays for typesetting, printing and mailing of shareholder reports, except proxy statements. For the period, the transfer agent fees were equivalent to an annualized rate of .19% of average net assets.
Accounting and Security Lending Fees. Fidelity Service Company, Inc. (FSC), an affiliate of the investment adviser, maintains the Fund's accounting records. The accounting fee is based on the level of average net assets for each month. Under a separate contract, FSC administers the security lending program. The security lending fee is based on the number and duration of lending transactions.
Brokerage Commissions. The Fund placed a portion of its portfolio transactions with brokerage firms which are affiliates of the investment adviser. Brokerage commissions are included in net realized gain (loss) and change in net unrealized appreciation (depreciation) in the Statement of Operations. The commissions paid to these affiliated firms were $977 for the period.
Interfund Trades. The Fund may purchase from or sell securities to other Fidelity Funds under procedures adopted by the Board. The procedures have been designed to ensure these interfund trades are executed in accordance with Rule 17a-7 of the 1940 Act. Interfund trades are included within the respective purchases and sales amounts shown in the Purchases and Sales of Investments note.
6. Committed Line of Credit.
The Fund participates with other funds managed by the investment adviser or an affiliate in a $4.25 billion credit facility (the "line of credit") to be utilized for temporary or emergency purposes to fund shareholder redemptions or for other short-term liquidity purposes. The Fund has agreed to pay commitment fees on its pro-rata portion of the line of credit, which amounted to $582 and is reflected in Miscellaneous expenses on the Statement of Operations. During the period, the Fund did not borrow on this line of credit.
7. Security Lending.
The Fund lends portfolio securities through a lending agent from time to time in order to earn additional income. For equity securities, a lending agent is used and may loan securities to certain qualified borrowers, including Fidelity Capital Markets (FCM), a broker-dealer affiliated with the Fund. On the settlement date of the loan, the Fund receives collateral (in the form of U.S. Treasury obligations, letters of credit and/or cash) against the loaned securities and maintains collateral in an amount not less than 100% of the market value of the loaned securities during the period of the loan. The market value of the loaned securities is determined at the close of business of the Fund and any additional required collateral is delivered to the Fund on the next business day. The Fund or borrower may terminate the loan at any time, and if the borrower defaults on its obligation to return the securities loaned because of insolvency or other reasons, the Fund may apply collateral received from the borrower against the obligation. The Fund may experience delays and costs in recovering the securities loaned. Any cash collateral received is invested in the Fidelity Securities Lending Cash Central Fund. The value of loaned securities and cash collateral at period end are disclosed on the Fund's Statement of Assets and Liabilities. Security lending income represents the income earned on investing cash collateral, less rebates paid to borrowers and any lending agent fees associated with the loan, plus any premium payments received for lending certain types of securities. Security lending income is presented in the Statement of Operations as a component of income from Fidelity Central Funds. During the period, there were no securities loaned to FCM.
8. Expense Reductions.
Commissions paid to certain brokers with whom the investment adviser, or its affiliates, places trades on behalf of the Fund include an amount in addition to trade execution, which may be rebated back to the Fund to offset certain expenses. This amount totaled $4,139 for the period. In addition, through arrangements with the Fund's custodian, credits realized as a result of certain uninvested cash balances were used to reduce the Fund's expenses. During the period, these credits reduced the Fund's custody expenses by $22.
In addition, during the period the investment adviser reimbursed and/or waived a portion of operating expenses in the amount of $1,990.
9. Other.
The Fund's organizational documents provide former and current trustees and officers with a limited indemnification against liabilities arising in connection with the performance of their duties to the Fund. In the normal course of business, the Fund may also enter into contracts that provide general indemnifications. The Fund's maximum exposure under these arrangements is unknown as this would be dependent on future claims that may be made against the Fund. The risk of material loss from such claims is considered remote.
Shareholder Expense Example
As a shareholder of the Fund, you incur two types of costs: (1) transaction costs, and (2) ongoing costs, including management fees and other Fund expenses. This Example is intended to help you understand your ongoing costs (in dollars) of investing in the Fund and to compare these costs with the ongoing costs of investing in other mutual funds.
The Example is based on an investment of $1,000 invested at the beginning of the period and held for the entire period (August 1, 2017 to January 31, 2018).
Actual Expenses
The first line of the accompanying table provides information about actual account values and actual expenses. You may use the information in this line, together with the amount you invested, to estimate the expenses that you paid over the period. Simply divide your account value by $1,000.00 (for example, an $8,600 account value divided by $1,000.00 = 8.6), then multiply the result by the number in the first line under the heading entitled "Expenses Paid During Period" to estimate the expenses you paid on your account during this period. A small balance maintenance fee of $12.00 that is charged once a year may apply for certain accounts with a value of less than $2,000. This fee is not included in the table below. If it was, the estimate of expenses you paid during the period would be higher, and your ending account value lower, by this amount. In addition, the Fund, as a shareholder in the underlying Fidelity Central Funds, will indirectly bear its pro-rata share of the fees and expenses incurred by the underlying Fidelity Central Funds. These fees and expenses are not included in the Fund's annualized expense ratio used to calculate the expense estimate in the table below.
Hypothetical Example for Comparison Purposes
The second line of the accompanying table provides information about hypothetical account values and hypothetical expenses based on the Fund's actual expense ratio and an assumed rate of return of 5% per year before expenses, which is not the Fund's actual return. The hypothetical account values and expenses may not be used to estimate the actual ending account balance or expenses you paid for the period. You may use this information to compare the ongoing costs of investing in the Fund and other funds. To do so, compare this 5% hypothetical example with the 5% hypothetical examples that appear in the shareholder reports of the other funds. A small balance maintenance fee of $12.00 that is charged once a year may apply for certain accounts with a value of less than $2,000. This fee is not included in the table below. If it was, the estimate of expenses you paid during the period would be higher, and your ending account value lower, by this amount. In addition, the Fund, as a shareholder in the underlying Fidelity Central Funds, will indirectly bear its pro-rata share of the fees and expenses incurred by the underlying Fidelity Central Funds. These fees and expenses are not included in the Fund's annualized expense ratio used to calculate the expense estimate in the table below.
Please note that the expenses shown in the table are meant to highlight your ongoing costs only and do not reflect any transaction costs. Therefore, the second line of the table is useful in comparing ongoing costs only, and will not help you determine the relative total costs of owning different funds.
| | Annualized Expense Ratio-A | Beginning
Account Value
August 1, 2017 | Ending
Account Value
January 31, 2018 | Expenses Paid
During Period-B
August 1, 2017
to January 31, 2018 |
| Actual | .76% | $1,000.00 | $1,101.20 | $4.03 |
| Hypothetical-C | | $1,000.00 | $1,021.37 | $3.87 |
A Annualized expense ratio reflects expenses net of applicable fee waivers.
B Expenses are equal to the Fund's annualized expense ratio, multiplied by the average account value over the period, multiplied by 184/365 (to reflect the one-half year period).
C 5% return per year before expenses
Corporate Headquarters
245 Summer St.
Boston, MA 02210
www.fidelity.com
BCV-SANN-0318
1.789715.115
Fidelity® Dividend Growth Fund
Class K
Semi-Annual Report January 31, 2018 |
|
Contents
To view a fund's proxy voting guidelines and proxy voting record for the 12-month period ended June 30, visit http://www.fidelity.com/proxyvotingresults or visit the Securities and Exchange Commission's (SEC) web site at http://www.sec.gov.
You may also call 1-800-835-5092 to request a free copy of the proxy voting guidelines.
Standard & Poor's, S&P and S&P 500 are registered service marks of The McGraw-Hill Companies, Inc. and have been licensed for use by Fidelity Distributors Corporation.
Other third-party marks appearing herein are the property of their respective owners.
All other marks appearing herein are registered or unregistered trademarks or service marks of FMR LLC or an affiliated company. © 2018 FMR LLC. All rights reserved.
This report and the financial statements contained herein are submitted for the general information of the shareholders of the Fund. This report is not authorized for distribution to prospective investors in the Fund unless preceded or accompanied by an effective prospectus.
A fund files its complete schedule of portfolio holdings with the SEC for the first and third quarters of each fiscal year on Form N-Q. Forms N-Q are available on the SEC’s web site at http://www.sec.gov. A fund's Forms N-Q may be reviewed and copied at the SEC’s Public Reference Room in Washington, DC. Information regarding the operation of the SEC's Public Reference Room may be obtained by calling 1-800-SEC-0330.
For a complete list of a fund's portfolio holdings, view the most recent holdings listing, semiannual report, or annual report on Fidelity's web site at http://www.fidelity.com, http://www.institutional.fidelity.com, or http://www.401k.com, as applicable.
NOT FDIC INSURED •MAY LOSE VALUE •NO BANK GUARANTEE
Neither the Fund nor Fidelity Distributors Corporation is a bank.
Investment Summary (Unaudited)
Top Ten Stocks as of January 31, 2018
| | % of fund's net assets |
| Wells Fargo & Co. | 2.9 |
| JPMorgan Chase & Co. | 2.9 |
| Bank of America Corp. | 2.8 |
| Comcast Corp. Class A | 2.4 |
| Exxon Mobil Corp. | 2.3 |
| Verizon Communications, Inc. | 2.1 |
| Chevron Corp. | 2.0 |
| Altria Group, Inc. | 1.9 |
| Amgen, Inc. | 1.7 |
| Cisco Systems, Inc. | 1.7 |
| | 22.7 |
Top Five Market Sectors as of January 31, 2018
| | % of fund's net assets |
| Consumer Discretionary | 19.7 |
| Financials | 16.6 |
| Industrials | 11.8 |
| Information Technology | 11.0 |
| Health Care | 10.7 |
Asset Allocation (% of fund's net assets)
| As of January 31, 2018 * |
| | Stocks | 91.7% |
| | Short-Term Investments and Net Other Assets (Liabilities) | 8.3% |

* Foreign investments - 6.5%
Schedule of Investments January 31, 2018 (Unaudited)
Showing Percentage of Net Assets
| Common Stocks - 91.7% | | | |
| | | Shares | Value (000s) |
| CONSUMER DISCRETIONARY - 19.7% | | | |
| Auto Components - 2.2% | | | |
| Adient PLC | | 52,100 | $3,376 |
| Aptiv PLC | | 340,100 | 32,269 |
| BorgWarner, Inc. | | 233,300 | 13,125 |
| Cooper Tire & Rubber Co. | | 116,200 | 4,543 |
| Delphi Technologies PLC | | 113,366 | 6,261 |
| Gentex Corp. | | 1,480,900 | 35,068 |
| Lear Corp. | | 169,600 | 32,757 |
| Tenneco, Inc. | | 278,200 | 16,138 |
| The Goodyear Tire & Rubber Co. | | 737,400 | 25,676 |
| | | | 169,213 |
| Automobiles - 0.7% | | | |
| General Motors Co. | | 891,600 | 37,813 |
| Thor Industries, Inc. | | 124,300 | 16,987 |
| | | | 54,800 |
| Distributors - 0.5% | | | |
| Genuine Parts Co. | | 343,900 | 35,790 |
| Diversified Consumer Services - 1.0% | | | |
| Graham Holdings Co. | | 60,100 | 35,726 |
| H&R Block, Inc. | | 1,592,300 | 42,260 |
| | | | 77,986 |
| Household Durables - 1.0% | | | |
| Lennar Corp.: | | | |
| Class A | | 718,800 | 45,040 |
| Class B | | 13,702 | 694 |
| Tupperware Brands Corp. | | 530,900 | 30,665 |
| | | | 76,399 |
| Leisure Products - 0.3% | | | |
| Brunswick Corp. | | 335,600 | 21,069 |
| Media - 7.2% | | | |
| CBS Corp. Class B | | 275,900 | 15,895 |
| Cinemark Holdings, Inc. | | 848,800 | 31,236 |
| Comcast Corp. Class A | | 4,293,292 | 182,594 |
| Interpublic Group of Companies, Inc. | | 1,975,600 | 43,246 |
| Omnicom Group, Inc. | | 529,400 | 40,579 |
| Sinclair Broadcast Group, Inc. Class A | | 567,900 | 21,069 |
| Tegna, Inc. | | 1,845,700 | 26,707 |
| The Walt Disney Co. | | 613,200 | 66,636 |
| Time Warner, Inc. | | 379,900 | 36,223 |
| Twenty-First Century Fox, Inc. Class A | | 2,011,100 | 74,210 |
| Viacom, Inc. Class B (non-vtg.) | | 649,600 | 21,710 |
| | | | 560,105 |
| Multiline Retail - 1.4% | | | |
| Dollar General Corp. | | 463,100 | 47,755 |
| Macy's, Inc. | | 502,700 | 13,045 |
| Target Corp. | | 659,100 | 49,578 |
| | | | 110,378 |
| Specialty Retail - 4.1% | | | |
| Bed Bath & Beyond, Inc. | | 341,900 | 7,891 |
| Best Buy Co., Inc. | | 432,900 | 31,628 |
| Dick's Sporting Goods, Inc. | | 353,200 | 11,112 |
| Foot Locker, Inc. | | 434,079 | 21,335 |
| Gap, Inc. | | 777,400 | 25,841 |
| L Brands, Inc. | | 227,200 | 11,380 |
| Lowe's Companies, Inc. | | 633,900 | 66,388 |
| Ross Stores, Inc. | | 614,500 | 50,629 |
| TJX Companies, Inc. | | 712,100 | 57,196 |
| Tractor Supply Co. | | 132,400 | 10,096 |
| Williams-Sonoma, Inc. (a) | | 490,600 | 25,133 |
| | | | 318,629 |
| Textiles, Apparel & Luxury Goods - 1.3% | | | |
| Carter's, Inc. | | 259,900 | 31,266 |
| Ralph Lauren Corp. | | 296,400 | 33,881 |
| Tapestry, Inc. | | 731,000 | 34,386 |
| | | | 99,533 |
|
| TOTAL CONSUMER DISCRETIONARY | | | 1,523,902 |
|
| CONSUMER STAPLES - 10.2% | | | |
| Beverages - 0.5% | | | |
| Dr. Pepper Snapple Group, Inc. | | 337,808 | 40,317 |
| Food & Staples Retailing - 3.5% | | | |
| CVS Health Corp. | | 963,900 | 75,849 |
| Kroger Co. | | 1,601,418 | 48,619 |
| Walgreens Boots Alliance, Inc. | | 661,400 | 49,777 |
| Walmart, Inc. | | 885,000 | 94,341 |
| | | | 268,586 |
| Food Products - 2.7% | | | |
| Campbell Soup Co. | | 906,800 | 42,212 |
| ConAgra Foods, Inc. | | 1,409,500 | 53,561 |
| General Mills, Inc. | | 468,200 | 27,385 |
| Ingredion, Inc. | | 178,700 | 25,668 |
| The J.M. Smucker Co. | | 238,400 | 30,251 |
| The Kraft Heinz Co. | | 41,300 | 3,238 |
| Tyson Foods, Inc. Class A | | 374,200 | 28,480 |
| | | | 210,795 |
| Household Products - 1.1% | | | |
| Energizer Holdings, Inc. | | 519,900 | 30,269 |
| Kimberly-Clark Corp. | | 427,000 | 49,959 |
| | | | 80,228 |
| Tobacco - 2.4% | | | |
| Altria Group, Inc. | | 2,105,600 | 148,108 |
| British American Tobacco PLC (United Kingdom) | | 532,760 | 36,412 |
| | | | 184,520 |
|
| TOTAL CONSUMER STAPLES | | | 784,446 |
|
| ENERGY - 6.2% | | | |
| Oil, Gas & Consumable Fuels - 6.2% | | | |
| Chevron Corp. | | 1,213,900 | 152,162 |
| Exxon Mobil Corp. | | 2,065,197 | 180,292 |
| Phillips 66 Co. | | 337,400 | 34,550 |
| Suncor Energy, Inc. | | 1,138,500 | 41,245 |
| Total SA sponsored ADR (a) | | 648,471 | 37,650 |
| Valero Energy Corp. | | 386,000 | 37,044 |
| | | | 482,943 |
| FINANCIALS - 16.6% | | | |
| Banks - 10.1% | | | |
| Bank of America Corp. | | 6,798,617 | 217,556 |
| JPMorgan Chase & Co. | | 1,912,535 | 221,223 |
| U.S. Bancorp | | 2,025,969 | 115,764 |
| Wells Fargo & Co. | | 3,441,793 | 226,396 |
| | | | 780,939 |
| Capital Markets - 0.2% | | | |
| Diamond Hill Investment Group, Inc. | | 56,538 | 11,893 |
| KKR & Co. LP | | 192,000 | 4,623 |
| | | | 16,516 |
| Consumer Finance - 0.0% | | | |
| Imperial Holdings, Inc. warrants 4/11/19 (b) | | 48,012 | 0 |
| Diversified Financial Services - 1.5% | | | |
| Berkshire Hathaway, Inc. Class B (b) | | 513,200 | 110,020 |
| Insurance - 4.8% | | | |
| Allstate Corp. | | 500,000 | 49,385 |
| Chubb Ltd. | | 674,900 | 105,386 |
| First American Financial Corp. | | 189,672 | 11,204 |
| Marsh & McLennan Companies, Inc. | | 414,100 | 34,586 |
| MetLife, Inc. | | 1,267,200 | 60,914 |
| The Travelers Companies, Inc. | | 734,700 | 110,146 |
| | | | 371,621 |
|
| TOTAL FINANCIALS | | | 1,279,096 |
|
| HEALTH CARE - 10.7% | | | |
| Biotechnology - 2.5% | | | |
| Amgen, Inc. | | 713,710 | 132,786 |
| Gilead Sciences, Inc. | | 688,700 | 57,713 |
| | | | 190,499 |
| Health Care Equipment & Supplies - 0.4% | | | |
| Medtronic PLC | | 399,503 | 34,313 |
| Health Care Providers & Services - 5.0% | | | |
| Aetna, Inc. | | 118,500 | 22,138 |
| AmerisourceBergen Corp. | | 411,300 | 40,994 |
| Anthem, Inc. | | 401,800 | 99,586 |
| Cardinal Health, Inc. | | 742,400 | 53,297 |
| Cigna Corp. | | 218,200 | 45,462 |
| McKesson Corp. | | 217,300 | 36,698 |
| Quest Diagnostics, Inc. | | 399,100 | 42,233 |
| UnitedHealth Group, Inc. | | 86,000 | 20,363 |
| Universal Health Services, Inc. Class B | | 202,000 | 24,543 |
| | | | 385,314 |
| Pharmaceuticals - 2.8% | | | |
| GlaxoSmithKline PLC | | 2,078,146 | 38,683 |
| Johnson & Johnson | | 553,243 | 76,453 |
| Pfizer, Inc. | | 1,977,900 | 73,261 |
| Sanofi SA | | 332,494 | 29,343 |
| | | | 217,740 |
|
| TOTAL HEALTH CARE | | | 827,866 |
|
| INDUSTRIALS - 11.8% | | | |
| Aerospace & Defense - 2.0% | | | |
| General Dynamics Corp. | | 224,400 | 49,925 |
| Rockwell Collins, Inc. | | 188,900 | 26,161 |
| United Technologies Corp. | | 559,600 | 77,230 |
| | | | 153,316 |
| Air Freight & Logistics - 0.7% | | | |
| United Parcel Service, Inc. Class B | | 410,700 | 52,290 |
| Airlines - 1.8% | | | |
| Allegiant Travel Co. | | 90,700 | 14,444 |
| American Airlines Group, Inc. | | 698,100 | 37,921 |
| Delta Air Lines, Inc. | | 1,012,700 | 57,491 |
| Southwest Airlines Co. | | 523,700 | 31,841 |
| | | | 141,697 |
| Building Products - 0.3% | | | |
| Johnson Controls International PLC | | 675,700 | 26,440 |
| Commercial Services & Supplies - 0.5% | | | |
| Deluxe Corp. | | 560,800 | 41,651 |
| Construction & Engineering - 0.1% | | | |
| Fluor Corp. | | 166,500 | 10,107 |
| Electrical Equipment - 0.4% | | | |
| Acuity Brands, Inc. | | 191,700 | 29,606 |
| Industrial Conglomerates - 0.8% | | | |
| Honeywell International, Inc. | | 387,300 | 61,840 |
| Machinery - 1.4% | | | |
| Allison Transmission Holdings, Inc. | | 382,002 | 16,900 |
| Crane Co. | | 426,500 | 42,624 |
| Snap-On, Inc. | | 269,200 | 46,117 |
| | | | 105,641 |
| Professional Services - 0.9% | | | |
| Dun & Bradstreet Corp. | | 288,200 | 35,659 |
| Korn/Ferry International | | 125,800 | 5,606 |
| Manpower, Inc. | | 219,300 | 28,814 |
| | | | 70,079 |
| Road & Rail - 2.4% | | | |
| Norfolk Southern Corp. | | 437,300 | 65,980 |
| Union Pacific Corp. | | 894,600 | 119,429 |
| | | | 185,409 |
| Trading Companies & Distributors - 0.5% | | | |
| W.W. Grainger, Inc. | | 127,900 | 34,490 |
|
| TOTAL INDUSTRIALS | | | 912,566 |
|
| INFORMATION TECHNOLOGY - 11.0% | | | |
| Communications Equipment - 2.1% | | | |
| Cisco Systems, Inc. | | 3,143,086 | 130,564 |
| InterDigital, Inc. | | 28,500 | 2,224 |
| Juniper Networks, Inc. | | 1,247,000 | 32,609 |
| | | | 165,397 |
| Electronic Equipment & Components - 0.2% | | | |
| Avnet, Inc. | | 186,500 | 7,926 |
| TE Connectivity Ltd. | | 101,200 | 10,376 |
| | | | 18,302 |
| IT Services - 1.0% | | | |
| CSRA, Inc. | | 1,193,200 | 39,710 |
| Leidos Holdings, Inc. | | 393,700 | 26,220 |
| The Western Union Co. | | 385,000 | 8,004 |
| | | | 73,934 |
| Semiconductors & Semiconductor Equipment - 2.4% | | | |
| Intel Corp. | | 2,143,400 | 103,183 |
| Qualcomm, Inc. | | 1,146,583 | 78,254 |
| | | | 181,437 |
| Software - 2.0% | | | |
| CA Technologies, Inc. | | 987,900 | 35,416 |
| Microsoft Corp. | | 428,816 | 40,742 |
| Oracle Corp. | | 1,515,000 | 78,159 |
| | | | 154,317 |
| Technology Hardware, Storage & Peripherals - 3.3% | | | |
| Apple, Inc. | | 521,718 | 87,351 |
| Hewlett Packard Enterprise Co. | | 2,748,700 | 45,079 |
| HP, Inc. | | 1,958,300 | 45,668 |
| NetApp, Inc. | | 221,100 | 13,598 |
| Seagate Technology LLC | | 595,500 | 32,872 |
| Xerox Corp. | | 947,100 | 32,325 |
| | | | 256,893 |
|
| TOTAL INFORMATION TECHNOLOGY | | | 850,280 |
|
| MATERIALS - 2.6% | | | |
| Chemicals - 1.5% | | | |
| Huntsman Corp. | | 135,700 | 4,691 |
| LyondellBasell Industries NV Class A | | 674,400 | 80,820 |
| Monsanto Co. | | 165,400 | 20,146 |
| The Chemours Co. LLC | | 226,600 | 11,697 |
| | | | 117,354 |
| Metals & Mining - 1.1% | | | |
| Nucor Corp. | | 580,200 | 38,850 |
| Steel Dynamics, Inc. | | 904,800 | 41,078 |
| | | | 79,928 |
|
| TOTAL MATERIALS | | | 197,282 |
|
| REAL ESTATE - 0.5% | | | |
| Equity Real Estate Investment Trusts (REITs) - 0.5% | | | |
| National Retail Properties, Inc. | | 322,600 | 12,801 |
| Spirit Realty Capital, Inc. | | 911,600 | 7,448 |
| Store Capital Corp. | | 565,800 | 13,868 |
| VEREIT, Inc. | | 1,095,200 | 7,885 |
| | | | 42,002 |
| TELECOMMUNICATION SERVICES - 2.1% | | | |
| Diversified Telecommunication Services - 2.1% | | | |
| Verizon Communications, Inc. | | 2,947,700 | 159,382 |
| UTILITIES - 0.3% | | | |
| Electric Utilities - 0.1% | | | |
| Great Plains Energy, Inc. | | 182,600 | 5,683 |
| Independent Power and Renewable Electricity Producers - 0.2% | | | |
| The AES Corp. | | 1,429,900 | 16,530 |
|
| TOTAL UTILITIES | | | 22,213 |
|
| TOTAL COMMON STOCKS | | | |
| (Cost $5,531,415) | | | 7,081,978 |
|
| Money Market Funds - 8.4% | | | |
| Fidelity Cash Central Fund, 1.39% (c) | | 630,358,601 | 630,485 |
| Fidelity Securities Lending Cash Central Fund 1.40% (c)(d) | | 22,715,415 | 22,718 |
| TOTAL MONEY MARKET FUNDS | | | |
| (Cost $653,198) | | | 653,203 |
| TOTAL INVESTMENT IN SECURITIES - 100.1% | | | |
| (Cost $6,184,613) | | | 7,735,181 |
| NET OTHER ASSETS (LIABILITIES) - (0.1)% | | | (8,807) |
| NET ASSETS - 100% | | | $7,726,374 |
Values shown as $0 may reflect amounts less than $500.
Legend
(a) Security or a portion of the security is on loan at period end.
(b) Non-income producing
(c) Affiliated fund that is generally available only to investment companies and other accounts managed by Fidelity Investments. The rate quoted is the annualized seven-day yield of the fund at period end. A complete unaudited listing of the fund's holdings as of its most recent quarter end is available upon request. In addition, each Fidelity Central Fund's financial statements are available on the SEC's website or upon request.
(d) Investment made with cash collateral received from securities on loan.
Affiliated Central Funds
Information regarding fiscal year to date income earned by the Fund from investments in Fidelity Central Funds is as follows:
| Fund | Income earned |
| | (Amounts in thousands) |
| Fidelity Cash Central Fund | $1,919 |
| Fidelity Securities Lending Cash Central Fund | 84 |
| Total | $2,003 |
Amounts in the income column in the above table include any capital gain distributions from underlying funds, which are presented in the corresponding line-item in the Statement of Operations if applicable.
Investment Valuation
The following is a summary of the inputs used, as of January 31, 2018, involving the Fund's assets and liabilities carried at fair value. The inputs or methodology used for valuing securities may not be an indication of the risk associated with investing in those securities. For more information on valuation inputs, and their aggregation into the levels used below, please refer to the Investment Valuation section in the accompanying Notes to Financial Statements.
| | Valuation Inputs at Reporting Date: |
| Description | Total | Level 1 | Level 2 | Level 3 |
| (Amounts in thousands) | | | | |
| Investments in Securities: | | | | |
| Equities: | | | | |
| Consumer Discretionary | $1,523,902 | $1,523,902 | $-- | $-- |
| Consumer Staples | 784,446 | 748,034 | 36,412 | -- |
| Energy | 482,943 | 482,943 | -- | -- |
| Financials | 1,279,096 | 1,279,096 | -- | -- |
| Health Care | 827,866 | 759,840 | 68,026 | -- |
| Industrials | 912,566 | 912,566 | -- | -- |
| Information Technology | 850,280 | 850,280 | -- | -- |
| Materials | 197,282 | 197,282 | -- | -- |
| Real Estate | 42,002 | 42,002 | -- | -- |
| Telecommunication Services | 159,382 | 159,382 | -- | -- |
| Utilities | 22,213 | 22,213 | -- | -- |
| Money Market Funds | 653,203 | 653,203 | -- | -- |
| Total Investments in Securities: | $7,735,181 | $7,630,743 | $104,438 | $-- |
See accompanying notes which are an integral part of the financial statements.
Financial Statements
Statement of Assets and Liabilities
| Amounts in thousands (except per-share amounts) | | January 31, 2018 (Unaudited) |
| Assets | | |
Investment in securities, at value (including securities loaned of $21,859) — See accompanying schedule:
Unaffiliated issuers (cost $5,531,415) | $7,081,978 | |
| Fidelity Central Funds (cost $653,198) | 653,203 | |
| Total Investment in Securities (cost $6,184,613) | | $7,735,181 |
| Receivable for investments sold | | 32,902 |
| Receivable for fund shares sold | | 1,735 |
| Dividends receivable | | 5,194 |
| Distributions receivable from Fidelity Central Funds | | 591 |
| Prepaid expenses | | 11 |
| Other receivables | | 859 |
| Total assets | | 7,776,473 |
| Liabilities | | |
| Payable to custodian bank | $4 | |
| Payable for investments purchased | 17,682 | |
| Payable for fund shares redeemed | 5,933 | |
| Accrued management fee | 2,190 | |
| Other affiliated payables | 907 | |
| Other payables and accrued expenses | 663 | |
| Collateral on securities loaned | 22,720 | |
| Total liabilities | | 50,099 |
| Net Assets | | $7,726,374 |
| Net Assets consist of: | | |
| Paid in capital | | $5,685,683 |
| Undistributed net investment income | | 6,208 |
| Accumulated undistributed net realized gain (loss) on investments and foreign currency transactions | | 483,875 |
| Net unrealized appreciation (depreciation) on investments and assets and liabilities in foreign currencies | | 1,550,608 |
| Net Assets | | $7,726,374 |
| Dividend Growth: | | |
| Net Asset Value, offering price and redemption price per share ($6,463,255 ÷ 187,903 shares) | | $34.40 |
| Class K: | | |
| Net Asset Value, offering price and redemption price per share ($1,263,119 ÷ 36,767 shares) | | $34.35 |
See accompanying notes which are an integral part of the financial statements.
Statement of Operations
| Amounts in thousands | | Six months ended January 31, 2018 (Unaudited) |
| Investment Income | | |
| Dividends | | $86,029 |
| Interest | | 1,030 |
| Income from Fidelity Central Funds | | 2,003 |
| Total income | | 89,062 |
| Expenses | | |
| Management fee | | |
| Basic fee | $20,251 | |
| Performance adjustment | (7,672) | |
| Transfer agent fees | 4,892 | |
| Accounting and security lending fees | 594 | |
| Custodian fees and expenses | 59 | |
| Independent trustees' fees and expenses | 15 | |
| Registration fees | 22 | |
| Audit | 42 | |
| Legal | 15 | |
| Miscellaneous | 22 | |
| Total expenses before reductions | 18,240 | |
| Expense reductions | (444) | 17,796 |
| Net investment income (loss) | | 71,266 |
| Realized and Unrealized Gain (Loss) | | |
| Net realized gain (loss) on: | | |
| Investment securities: | | |
| Unaffiliated issuers | 1,171,623 | |
| Fidelity Central Funds | 29 | |
| Foreign currency transactions | 268 | |
| Total net realized gain (loss) | | 1,171,920 |
| Change in net unrealized appreciation (depreciation) on: | | |
| Investment securities: | | |
| Unaffiliated issuers | (154,597) | |
| Fidelity Central Funds | (31) | |
| Assets and liabilities in foreign currencies | 18 | |
| Total change in net unrealized appreciation (depreciation) | | (154,610) |
| Net gain (loss) | | 1,017,310 |
| Net increase (decrease) in net assets resulting from operations | | $1,088,576 |
See accompanying notes which are an integral part of the financial statements.
Statement of Changes in Net Assets
| Amounts in thousands | Six months ended January 31, 2018 (Unaudited) | Year ended July 31, 2017 |
| Increase (Decrease) in Net Assets | | |
| Operations | | |
| Net investment income (loss) | $71,266 | $120,267 |
| Net realized gain (loss) | 1,171,920 | 505,117 |
| Change in net unrealized appreciation (depreciation) | (154,610) | 287,960 |
| Net increase (decrease) in net assets resulting from operations | 1,088,576 | 913,344 |
| Distributions to shareholders from net investment income | (127,264) | (120,213) |
| Distributions to shareholders from net realized gain | (1,053,472) | – |
| Total distributions | (1,180,736) | (120,213) |
| Share transactions - net increase (decrease) | 389,281 | (903,170) |
| Total increase (decrease) in net assets | 297,121 | (110,039) |
| Net Assets | | |
| Beginning of period | 7,429,253 | 7,539,292 |
| End of period | $7,726,374 | $7,429,253 |
| Other Information | | |
| Undistributed net investment income end of period | $6,208 | $62,206 |
See accompanying notes which are an integral part of the financial statements.
Financial Highlights
Fidelity Dividend Growth Fund
| | Six months ended (Unaudited) January 31, | Years endedJuly 31, | | | | |
| | 2018 | 2017 | 2016 | 2015 | 2014 | 2013 |
| Selected Per–Share Data | | | | | | |
| Net asset value, beginning of period | $35.06 | $31.51 | $34.46 | $37.27 | $35.33 | $28.61 |
| Income from Investment Operations | | | | | | |
| Net investment income (loss)A | .32 | .53 | .48 | .49 | .56 | .40 |
| Net realized and unrealized gain (loss) | 4.66 | 3.53 | (.61)B | 2.71 | 4.98 | 7.12 |
| Total from investment operations | 4.98 | 4.06 | (.13) | 3.20 | 5.54 | 7.52 |
| Distributions from net investment income | (.60) | (.51) | (.47) | (.51) | (.37) | (.30) |
| Distributions from net realized gain | (5.04) | – | (2.36) | (5.49) | (3.23) | (.50) |
| Total distributions | (5.64) | (.51) | (2.82)C | (6.01)D | (3.60) | (.80) |
| Net asset value, end of period | $34.40 | $35.06 | $31.51 | $34.46 | $37.27 | $35.33 |
| Total ReturnE,F | 15.65% | 13.06% | .26%B | 9.54% | 17.30% | 26.83% |
| Ratios to Average Net AssetsG,H | | | | | | |
| Expenses before reductions | .51%I | .52% | .62% | .69% | .56% | .63% |
| Expenses net of fee waivers, if any | .51%I | .52% | .61% | .68% | .56% | .63% |
| Expenses net of all reductions | .50%I | .52% | .61% | .68% | .56% | .62% |
| Net investment income (loss) | 1.89%I | 1.60% | 1.59% | 1.43% | 1.58% | 1.26% |
| Supplemental Data | | | | | | |
| Net assets, end of period (in millions) | $6,463 | $5,952 | $5,849 | $6,474 | $6,481 | $6,633 |
| Portfolio turnover rateJ | 104%I | 43% | 30% | 64% | 99% | 69% |
A Calculated based on average shares outstanding during the period.
B Net realized and unrealized gain (loss) per share reflects proceeds received from litigation which amounted to $.01 per share. Excluding these litigation proceeds, the total return would have been .22%.
C Total distributions of $2.82 per share is comprised of distributions from net investment income of $.465 and distributions from net realized gain of $2.358 per share.
D Total distributions of $6.01 per share is comprised of distributions from net investment income of $.512 and distributions from net realized gain of $5.493 per share. E Total returns for periods of less than one year are not annualized.
E Total returns for periods of less than one year are not annualized.
F Total returns would have been lower if certain expenses had not been reduced during the applicable periods shown.
G Fees and expenses of any underlying Fidelity Central Funds are not included in the Fund's expense ratio. The Fund indirectly bears its proportionate share of the expenses of any underlying Fidelity Central Funds.
H Expense ratios reflect operating expenses of the class. Expenses before reductions do not reflect amounts reimbursed by the investment adviser or reductions from brokerage service arrangements or reductions from other expense offset arrangements and do not represent the amount paid by the class during periods when reimbursements or reductions occur. Expenses net of fee waivers reflect expenses after reimbursement by the investment adviser but prior to reductions from brokerage service arrangements or other expense offset arrangements. Expenses net of all reductions represent the net expenses paid by the class.
I Annualized
J Amount does not include the portfolio activity of any underlying Fidelity Central Funds.
See accompanying notes which are an integral part of the financial statements.
Fidelity Dividend Growth Fund Class K
| | Six months ended (Unaudited) January 31, | Years endedJuly 31, | | | | |
| | 2018 | 2017 | 2016 | 2015 | 2014 | 2013 |
| Selected Per–Share Data | | | | | | |
| Net asset value, beginning of period | $35.04 | $31.50 | $34.45 | $37.27 | $35.34 | $28.62 |
| Income from Investment Operations | | | | | | |
| Net investment income (loss)A | .34 | .56 | .52 | .53 | .60 | .45 |
| Net realized and unrealized gain (loss) | 4.65 | 3.53 | (.61)B | 2.70 | 4.97 | 7.12 |
| Total from investment operations | 4.99 | 4.09 | (.09) | 3.23 | 5.57 | 7.57 |
| Distributions from net investment income | (.64) | (.55) | (.50) | (.56) | (.42) | (.35) |
| Distributions from net realized gain | (5.04) | – | (2.36) | (5.49) | (3.23) | (.50) |
| Total distributions | (5.68) | (.55) | (2.86) | (6.05) | (3.64)C | (.85) |
| Net asset value, end of period | $34.35 | $35.04 | $31.50 | $34.45 | $37.27 | $35.34 |
| Total ReturnD,E | 15.69% | 13.16% | .39%B | 9.65% | 17.44% | 27.04% |
| Ratios to Average Net AssetsF,G | | | | | | |
| Expenses before reductions | .40%H | .41% | .50% | .57% | .44% | .48% |
| Expenses net of fee waivers, if any | .40%H | .41% | .50% | .57% | .43% | .48% |
| Expenses net of all reductions | .39%H | .41% | .49% | .57% | .43% | .47% |
| Net investment income (loss) | 1.99%H | 1.71% | 1.71% | 1.54% | 1.70% | 1.41% |
| Supplemental Data | | | | | | |
| Net assets, end of period (in millions) | $1,263 | $1,477 | $1,691 | $1,942 | $2,057 | $1,639 |
| Portfolio turnover rateI | 104%H | 43% | 30% | 64% | 99% | 69% |
A Calculated based on average shares outstanding during the period.
B Net realized and unrealized gain (loss) per share reflects proceeds received from litigation which amounted to $.01 per share. Excluding these litigation proceeds, the total return would have been .35%.
C Total distributions of $3.64 per share is comprised of distributions from net investment income of $.419 and distributions from net realized gain of $3.225 per share.
D Total returns for periods of less than one year are not annualized.
E Total returns would have been lower if certain expenses had not been reduced during the applicable periods shown.
F Fees and expenses of any underlying Fidelity Central Funds are not included in the Fund's expense ratio. The Fund indirectly bears its proportionate share of the expenses of any underlying Fidelity Central Funds.
G Expense ratios reflect operating expenses of the class. Expenses before reductions do not reflect amounts reimbursed by the investment adviser or reductions from brokerage service arrangements or reductions from other expense offset arrangements and do not represent the amount paid by the class during periods when reimbursements or reductions occur. Expenses net of fee waivers reflect expenses after reimbursement by the investment adviser but prior to reductions from brokerage service arrangements or other expense offset arrangements. Expenses net of all reductions represent the net expenses paid by the class.
H Annualized
I Amount does not include the portfolio activity of any underlying Fidelity Central Funds.
See accompanying notes which are an integral part of the financial statements.
Notes to Financial Statements (Unaudited)
For the period ended January 31, 2018
(Amounts in thousands except percentages)
1. Organization.
Fidelity Dividend Growth Fund (the Fund) is a fund of Fidelity Securities Fund (the Trust) and is authorized to issue an unlimited number of shares. The Trust is registered under the Investment Company Act of 1940, as amended (the 1940 Act), as an open-end management investment company organized as a Massachusetts business trust. The Fund offers Dividend Growth and Class K shares, each of which has equal rights as to assets and voting privileges. Each class has exclusive voting rights with respect to matters that affect that class.
2. Investments in Fidelity Central Funds.
The Fund invests in Fidelity Central Funds, which are open-end investment companies generally available only to other investment companies and accounts managed by the investment adviser and its affiliates. The Fund's Schedule of Investments lists each of the Fidelity Central Funds held as of period end, if any, as an investment of the Fund, but does not include the underlying holdings of each Fidelity Central Fund. As an Investing Fund, the Fund indirectly bears its proportionate share of the expenses of the underlying Fidelity Central Funds.
The Money Market Central Funds seek preservation of capital and current income and are managed by Fidelity Investments Money Management, Inc. (FIMM), an affiliate of the investment adviser. Annualized expenses of the Money Market Central Funds as of their most recent shareholder report date are less than .005%.
A complete unaudited list of holdings for each Fidelity Central Fund is available upon request or at the Securities and Exchange Commission (the SEC) website at www.sec.gov. In addition, the financial statements of the Fidelity Central Funds are available on the SEC website or upon request.
3. Significant Accounting Policies.
The Fund is an investment company and applies the accounting and reporting guidance of the Financial Accounting Standards Board (FASB) Accounting Standards Codification Topic 946 Financial Services – Investments Companies. The financial statements have been prepared in conformity with accounting principles generally accepted in the United States of America (GAAP), which require management to make certain estimates and assumptions at the date of the financial statements. Actual results could differ from those estimates. Subsequent events, if any, through the date that the financial statements were issued have been evaluated in the preparation of the financial statements. The following summarizes the significant accounting policies of the Fund:
Investment Valuation. Investments are valued as of 4:00 p.m. Eastern time on the last calendar day of the period. The Board of Trustees (the Board) has delegated the day to day responsibility for the valuation of the Fund's investments to the Fair Value Committee (the Committee) established by the Fund's investment adviser. In accordance with valuation policies and procedures approved by the Board, the Fund attempts to obtain prices from one or more third party pricing vendors or brokers to value its investments. When current market prices, quotations or currency exchange rates are not readily available or reliable, investments will be fair valued in good faith by the Committee, in accordance with procedures adopted by the Board. Factors used in determining fair value vary by investment type and may include market or investment specific events. The frequency with which these procedures are used cannot be predicted and they may be utilized to a significant extent. The Committee oversees the Fund's valuation policies and procedures and reports to the Board on the Committee's activities and fair value determinations. The Board monitors the appropriateness of the procedures used in valuing the Fund's investments and ratifies the fair value determinations of the Committee.
The Fund categorizes the inputs to valuation techniques used to value its investments into a disclosure hierarchy consisting of three levels as shown below:
- Level 1 – quoted prices in active markets for identical investments
- Level 2 – other significant observable inputs (including quoted prices for similar investments, interest rates, prepayment speeds, etc.)
- Level 3 – unobservable inputs (including the Fund's own assumptions based on the best information available)
Valuation techniques used to value the Fund's investments by major category are as follows:
Equity securities, including restricted securities, for which market quotations are readily available, are valued at the last reported sale price or official closing price as reported by a third party pricing vendor on the primary market or exchange on which they are traded and are categorized as Level 1 in the hierarchy. In the event there were no sales during the day or closing prices are not available, securities are valued at the last quoted bid price or may be valued using the last available price and are generally categorized as Level 2 in the hierarchy. For foreign equity securities, when market or security specific events arise, comparisons to the valuation of American Depositary Receipts (ADRs), futures contracts, Exchange-Traded Funds (ETFs) and certain indexes as well as quoted prices for similar securities may be used and would be categorized as Level 2 in the hierarchy. Utilizing these techniques may result in transfers between Level 1 and Level 2. For equity securities, including restricted securities, where observable inputs are limited, assumptions about market activity and risk are used and these securities may be categorized as Level 3 in the hierarchy.
Investments in open-end mutual funds, including the Fidelity Central Funds, are valued at their closing net asset value (NAV) each business day and are categorized as Level 1 in the hierarchy.
Changes in valuation techniques may result in transfers in or out of an assigned level within the disclosure hierarchy. The aggregate value of investments by input level as of January 31, 2018 is included at the end of the Fund's Schedule of Investments.
Foreign Currency. The Fund may use foreign currency contracts to facilitate transactions in foreign-denominated securities. Gains and losses from these transactions may arise from changes in the value of the foreign currency or if the counterparties do not perform under the contracts' terms.
Foreign-denominated assets, including investment securities, and liabilities are translated into U.S. dollars at the exchange rates at period end. Purchases and sales of investment securities, income and dividends received and expenses denominated in foreign currencies are translated into U.S. dollars at the exchange rate in effect on the transaction date.
The effects of exchange rate fluctuations on investments are included with the net realized and unrealized gain (loss) on investment securities. Other foreign currency transactions resulting in realized and unrealized gain (loss) are disclosed separately.
Investment Transactions and Income. For financial reporting purposes, the Fund's investment holdings and NAV include trades executed through the end of the last business day of the period. The NAV per share for processing shareholder transactions is calculated as of the close of business of the New York Stock Exchange (NYSE), normally 4:00 p.m. Eastern time and includes trades executed through the end of the prior business day. Gains and losses on securities sold are determined on the basis of identified cost and includes proceeds received from litigation. Dividend income is recorded on the ex-dividend date, except for certain dividends from foreign securities where the ex-dividend date may have passed, which are recorded as soon as the Fund is informed of the ex-dividend date. Non-cash dividends included in dividend income, if any, are recorded at the fair market value of the securities received. Income and capital gain distributions from Fidelity Central Funds, if any, are recorded on the ex-dividend date. Certain distributions received by the Fund represent a return of capital or capital gain. The Fund determines the components of these distributions subsequent to the ex-dividend date, based upon receipt of tax filings or other correspondence relating to the underlying investment. These distributions are recorded as a reduction of cost of investments and/or as a realized gain. Interest income is accrued as earned and includes coupon interest and amortization of premium and accretion of discount on debt securities as applicable. Paid in Kind (PIK) income is recorded at the fair market value of the securities received. Investment income is recorded net of foreign taxes withheld where recovery of such taxes is uncertain.
Class Allocations and Expenses. Investment income, realized and unrealized capital gains and losses, common expenses of the Fund, and certain fund-level expense reductions, if any, are allocated daily on a pro-rata basis to each class based on the relative net assets of each class to the total net assets of the Fund. Each class differs with respect to transfer agent fees incurred. Certain expense reductions may also differ by class. For the reporting period, the allocated portion of income and expenses to each class as a percent of its average net assets may vary due to the timing of recording these transactions in relation to fluctuating net assets of the classes. Expenses directly attributable to a fund are charged to that fund. Expenses attributable to more than one fund are allocated among the respective funds on the basis of relative net assets or other appropriate methods. Expense estimates are accrued in the period to which they relate and adjustments are made when actual amounts are known.
Deferred Trustee Compensation. Under a Deferred Compensation Plan (the Plan), independent Trustees may elect to defer receipt of a portion of their annual compensation. Deferred amounts are invested in a cross-section of Fidelity funds, are marked-to-market and remain in the Fund until distributed in accordance with the Plan. The investment of deferred amounts and the offsetting payable to the Trustees are included in the accompanying Statement of Assets and Liabilities.
Income Tax Information and Distributions to Shareholders. Each year, the Fund intends to qualify as a regulated investment company under Subchapter M of the Internal Revenue Code, including distributing substantially all of its taxable income and realized gains. As a result, no provision for U.S. Federal income taxes is required. The Fund files a U.S. federal tax return, in addition to state and local tax returns as required. The Fund's federal income tax returns are subject to examination by the Internal Revenue Service (IRS) for a period of three fiscal years after they are filed. State and local tax returns may be subject to examination for an additional fiscal year depending on the jurisdiction. Foreign taxes are provided for based on the Fund's understanding of the tax rules and rates that exist in the foreign markets in which it invests.
Distributions are declared and recorded on the ex-dividend date. Income dividends and capital gain distributions are declared separately for each class. Income and capital gain distributions are determined in accordance with income tax regulations, which may differ from GAAP.
Capital accounts within the financial statements are adjusted for permanent book-tax differences. These adjustments have no impact on net assets or the results of operations. Capital accounts are not adjusted for temporary book-tax differences which will reverse in a subsequent period.
Book-tax differences are primarily due to foreign currency transactions, partnerships, deferred trustees compensation and losses deferred due to wash sales and excise tax regulations.
As of period end, the cost and unrealized appreciation (depreciation) in securities, and derivatives if applicable, for federal income tax purposes were as follows:
| Gross unrealized appreciation | $1,598,860 |
| Gross unrealized depreciation | (51,735) |
| Net unrealized appreciation (depreciation) | $1,547,125 |
| Tax cost | $6,188,056 |
4. Purchases and Sales of Investments.
Purchases and sales of securities, other than short-term securities, aggregated $3,722,122 and $4,817,450, respectively.
5. Fees and Other Transactions with Affiliates.
Management Fee. Fidelity Management & Research Company (the investment adviser) and its affiliates provide the Fund with investment management related services for which the Fund pays a monthly management fee. The management fee is the sum of an individual fund fee rate that is based on an annual rate of .30% of the Fund's average net assets and an annualized group fee rate that averaged .24% during the period. The group fee rate is based upon the average net assets of all the mutual funds advised by the investment adviser, including any mutual funds previously advised by the investment adviser that are currently advised by Fidelity SelectCo, LLC, an affiliate of the investment adviser. The group fee rate decreases as assets under management increase and increases as assets under management decrease. In addition, the management fee is subject to a performance adjustment (up to a maximum of +/- .20% of the Fund's average net assets over a 36 month performance period). The upward or downward adjustment to the management fee is based on the relative investment performance of Dividend Growth as compared to its benchmark index, the S&P 500 Index, over the same 36 month performance period. For the reporting period, the total annualized management fee rate, including the performance adjustment, was .34% of the Fund's average net assets. The performance adjustment included in the management fee rate may be higher or lower than the maximum performance adjustment rate due to the difference between the average net assets for the reporting and performance periods.
Transfer Agent Fees. Fidelity Investments Institutional Operations Company, Inc., (FIIOC), an affiliate of the investment adviser, is the transfer, dividend disbursing and shareholder servicing agent for each class of the Fund. FIIOC receives account fees and asset-based fees that vary according to the account size and type of account of the shareholders of Dividend Growth, except for Class K. FIIOC receives an asset-based fee of Class K's average net assets. FIIOC pays for typesetting, printing and mailing of shareholder reports, except proxy statements.
For the period, transfer agent fees for each class were as follows:
| | Amount | % of Class-Level Average Net Assets(a) |
| Dividend Growth | $4,572 | .15 |
| Class K | 320 | .05 |
| | $4,892 | |
(a) Annualized
Accounting and Security Lending Fees. Fidelity Service Company, Inc. (FSC), an affiliate of the investment adviser, maintains the Fund's accounting records. The accounting fee is based on the level of average net assets for each month. Under a separate contract, FSC administers the security lending program. The security lending fee is based on the number and duration of lending transactions.
Brokerage Commissions. The Fund placed a portion of its portfolio transactions with brokerage firms which are affiliates of the investment adviser. Brokerage commissions are included in net realized gain (loss) and change in net unrealized appreciation (depreciation) in the Statement of Operations. The commissions paid to these affiliated firms were $103 for the period.
Interfund Trades. The Fund may purchase from or sell securities to other Fidelity Funds under procedures adopted by the Board. The procedures have been designed to ensure these interfund trades are executed in accordance with Rule 17a-7 of the 1940 Act. Interfund trades are included within the respective purchases and sales amounts shown in the Purchases and Sales of Investments note.
6. Committed Line of Credit.
The Fund participates with other funds managed by the investment adviser or an affiliate in a $4.25 billion credit facility (the "line of credit") to be utilized for temporary or emergency purposes to fund shareholder redemptions or for other short-term liquidity purposes. The Fund has agreed to pay commitment fees on its pro-rata portion of the line of credit, which amounted to $11 and is reflected in Miscellaneous expenses on the Statement of Operations. During the period, the Fund did not borrow on this line of credit.
7. Security Lending.
The Fund lends portfolio securities through a lending agent from time to time in order to earn additional income. For equity securities, a lending agent is used and may loan securities to certain qualified borrowers, including Fidelity Capital Markets (FCM), a broker-dealer affiliated with the Fund. On the settlement date of the loan, the Fund receives collateral (in the form of U.S. Treasury obligations, letters of credit and/or cash) against the loaned securities and maintains collateral in an amount not less than 100% of the market value of the loaned securities during the period of the loan. The market value of the loaned securities is determined at the close of business of the Fund and any additional required collateral is delivered to the Fund on the next business day. The Fund or borrower may terminate the loan at any time, and if the borrower defaults on its obligation to return the securities loaned because of insolvency or other reasons, the Fund may apply collateral received from the borrower against the obligation. The Fund may experience delays and costs in recovering the securities loaned. Any cash collateral received is invested in the Fidelity Securities Lending Cash Central Fund. The value of loaned securities and cash collateral at period end are disclosed on the Fund's Statement of Assets and Liabilities. Security lending income represents the income earned on investing cash collateral, less rebates paid to borrowers and any lending agent fees associated with the loan, plus any premium payments received for lending certain types of securities. Security lending income is presented in the Statement of Operations as a component of income from Fidelity Central Funds. Total security lending income during the period amounted to $84. During the period, there were no securities loaned to FCM.
8. Expense Reductions.
Commissions paid to certain brokers with whom the investment adviser, or its affiliates, places trades on behalf of the Fund include an amount in addition to trade execution, which may be rebated back to the Fund to offset certain expenses. This amount totaled $405 for the period. In addition, through arrangements with the Fund's custodian, credits realized as a result of certain uninvested cash balances were used to reduce the Fund's expenses. During the period, these credits reduced the Fund's custody expenses by $2.
In addition, during the period the investment adviser reimbursed and/or waived a portion of fund-level operating expenses in the amount of $37.
9. Distributions to Shareholders.
Distributions to shareholders of each class were as follows:
| | Six months ended
January 31, 2018 | Year ended
July 31, 2017 |
| From net investment income | | |
| Dividend Growth | $102,569 | $92,313 |
| Class K | 24,695 | 27,900 |
| Total | $127,264 | $120,213 |
| From net realized gain | | |
| Dividend Growth | $860,821 | $– |
| Class K | 192,651 | – |
| Total | $1,053,472 | $– |
10. Share Transactions.
Share transactions for each class were as follows and may contain automatic conversions between classes or exchanges between affiliated funds:
| | Shares | Shares | Dollars | Dollars |
| | Six months ended January 31, 2018 | Year ended July 31, 2017 | Six months ended January 31, 2018 | Year ended July 31, 2017 |
| Dividend Growth | | | | |
| Shares sold | 3,665 | 6,358 | $125,124 | $209,135 |
| Reinvestment of distributions | 28,012 | 2,777 | 919,157 | 88,012 |
| Shares redeemed | (13,550) | (24,948) | (464,304) | (819,066) |
| Net increase (decrease) | 18,127 | (15,813) | $579,977 | $(521,919) |
| Class K | | | | |
| Shares sold | 3,085 | 6,119 | $105,097 | $201,106 |
| Reinvestment of distributions | 6,626 | 882 | 217,346 | 27,900 |
| Shares redeemed | (15,099) | (18,521) | (513,139) | (610,257) |
| Net increase (decrease) | (5,388) | (11,520) | $(190,696) | $(381,251) |
11. Other.
The Fund's organizational documents provide former and current trustees and officers with a limited indemnification against liabilities arising in connection with the performance of their duties to the Fund. In the normal course of business, the Fund may also enter into contracts that provide general indemnifications. The Fund's maximum exposure under these arrangements is unknown as this would be dependent on future claims that may be made against the Fund. The risk of material loss from such claims is considered remote.
Shareholder Expense Example
As a shareholder of the Fund, you incur two types of costs: (1) transaction costs and (2) ongoing costs, including management fees and other Fund expenses. This Example is intended to help you understand your ongoing costs (in dollars) of investing in the Fund and to compare these costs with the ongoing costs of investing in other mutual funds.
The Example is based on an investment of $1,000 invested at the beginning of the period and held for the entire period (August 1, 2017 to January 31, 2018).
Actual Expenses
The first line of the accompanying table for each class of the Fund provides information about actual account values and actual expenses. You may use the information in this line, together with the amount you invested, to estimate the expenses that you paid over the period. Simply divide your account value by $1,000.00 (for example, an $8,600 account value divided by $1,000.00 = 8.6), then multiply the result by the number in the first line for a class of the Fund under the heading entitled "Expenses Paid During Period" to estimate the expenses you paid on your account during this period. A small balance maintenance fee of $12.00 that is charged once a year may apply for certain accounts with a value of less than $2,000. This fee is not included in the table below. If it was, the estimate of expenses you paid during the period would be higher, and your ending account value lower, by this amount. In addition, the Fund, as a shareholder in the underlying Fidelity Central Funds, will indirectly bear its pro-rata share of the fees and expenses incurred by the underlying Fidelity Central Funds. These fees and expenses are not included in the Fund's annualized expense ratio used to calculate the expense estimate in the table below.
Hypothetical Example for Comparison Purposes
The second line of the accompanying table for each class of the Fund provides information about hypothetical account values and hypothetical expenses based on a Class' actual expense ratio and an assumed rate of return of 5% per year before expenses, which is not the Class' actual return. The hypothetical account values and expenses may not be used to estimate the actual ending account balance or expenses you paid for the period. You may use this information to compare the ongoing costs of investing in the Fund and other funds. To do so, compare this 5% hypothetical example with the 5% hypothetical examples that appear in the shareholder reports of the other funds. A small balance maintenance fee of $12.00 that is charged once a year may apply for certain accounts with a value of less than $2,000. This fee is not included in the table below. If it was, the estimate of expenses you paid during the period would be higher, and your ending account value lower, by this amount. In addition, the Fund, as a shareholder in the underlying Fidelity Central Funds, will indirectly bear its pro-rata share of the fees and expenses incurred by the underlying Fidelity Central Funds. These fees and expenses are not included in the Fund's annualized expense ratio used to calculate the expense estimate in the table below.
Please note that the expenses shown in the table are meant to highlight your ongoing costs only and do not reflect any transaction costs. Therefore, the second line of the table is useful in comparing ongoing costs only, and will not help you determine the relative total costs of owning different funds.
| | Annualized Expense Ratio-A | Beginning
Account Value
August 1, 2017 | Ending
Account Value
January 31, 2018 | Expenses Paid
During Period-B
August 1, 2017
to January 31, 2018 |
| Dividend Growth | .51% | | | |
| Actual | | $1,000.00 | $1,156.50 | $2.77 |
| Hypothetical-C | | $1,000.00 | $1,022.63 | $2.60 |
| Class K | .40% | | | |
| Actual | | $1,000.00 | $1,156.90 | $2.17 |
| Hypothetical-C | | $1,000.00 | $1,023.19 | $2.04 |
A Annualized expense ratio reflects expenses net of applicable fee waivers.
B Expenses are equal to each Class' annualized expense ratio, multiplied by the average account value over the period, multiplied by 184/365 (to reflect the one-half year period).
C 5% return per year before expenses
Corporate Headquarters
245 Summer St.
Boston, MA 02210
www.fidelity.com
DGF-K-SANN-0318
1.863068.109
Fidelity® Dividend Growth Fund
Semi-Annual Report January 31, 2018 |
|
Contents
To view a fund's proxy voting guidelines and proxy voting record for the 12-month period ended June 30, visit http://www.fidelity.com/proxyvotingresults or visit the Securities and Exchange Commission's (SEC) web site at http://www.sec.gov.
You may also call 1-800-544-8544 to request a free copy of the proxy voting guidelines.
Standard & Poor's, S&P and S&P 500 are registered service marks of The McGraw-Hill Companies, Inc. and have been licensed for use by Fidelity Distributors Corporation.
Other third-party marks appearing herein are the property of their respective owners.
All other marks appearing herein are registered or unregistered trademarks or service marks of FMR LLC or an affiliated company. © 2018 FMR LLC. All rights reserved.
This report and the financial statements contained herein are submitted for the general information of the shareholders of the Fund. This report is not authorized for distribution to prospective investors in the Fund unless preceded or accompanied by an effective prospectus.
A fund files its complete schedule of portfolio holdings with the SEC for the first and third quarters of each fiscal year on Form N-Q. Forms N-Q are available on the SEC’s web site at http://www.sec.gov. A fund's Forms N-Q may be reviewed and copied at the SEC’s Public Reference Room in Washington, DC. Information regarding the operation of the SEC's Public Reference Room may be obtained by calling 1-800-SEC-0330.
For a complete list of a fund's portfolio holdings, view the most recent holdings listing, semiannual report, or annual report on Fidelity's web site at http://www.fidelity.com, http://www.institutional.fidelity.com, or http://www.401k.com, as applicable.
NOT FDIC INSURED •MAY LOSE VALUE •NO BANK GUARANTEE
Neither the Fund nor Fidelity Distributors Corporation is a bank.
Investment Summary (Unaudited)
Top Ten Stocks as of January 31, 2018
| | % of fund's net assets |
| Wells Fargo & Co. | 2.9 |
| JPMorgan Chase & Co. | 2.9 |
| Bank of America Corp. | 2.8 |
| Comcast Corp. Class A | 2.4 |
| Exxon Mobil Corp. | 2.3 |
| Verizon Communications, Inc. | 2.1 |
| Chevron Corp. | 2.0 |
| Altria Group, Inc. | 1.9 |
| Amgen, Inc. | 1.7 |
| Cisco Systems, Inc. | 1.7 |
| | 22.7 |
Top Five Market Sectors as of January 31, 2018
| | % of fund's net assets |
| Consumer Discretionary | 19.7 |
| Financials | 16.6 |
| Industrials | 11.8 |
| Information Technology | 11.0 |
| Health Care | 10.7 |
Asset Allocation (% of fund's net assets)
| As of January 31, 2018 * |
| | Stocks | 91.7% |
| | Short-Term Investments and Net Other Assets (Liabilities) | 8.3% |

* Foreign investments - 6.5%
Schedule of Investments January 31, 2018 (Unaudited)
Showing Percentage of Net Assets
| Common Stocks - 91.7% | | | |
| | | Shares | Value (000s) |
| CONSUMER DISCRETIONARY - 19.7% | | | |
| Auto Components - 2.2% | | | |
| Adient PLC | | 52,100 | $3,376 |
| Aptiv PLC | | 340,100 | 32,269 |
| BorgWarner, Inc. | | 233,300 | 13,125 |
| Cooper Tire & Rubber Co. | | 116,200 | 4,543 |
| Delphi Technologies PLC | | 113,366 | 6,261 |
| Gentex Corp. | | 1,480,900 | 35,068 |
| Lear Corp. | | 169,600 | 32,757 |
| Tenneco, Inc. | | 278,200 | 16,138 |
| The Goodyear Tire & Rubber Co. | | 737,400 | 25,676 |
| | | | 169,213 |
| Automobiles - 0.7% | | | |
| General Motors Co. | | 891,600 | 37,813 |
| Thor Industries, Inc. | | 124,300 | 16,987 |
| | | | 54,800 |
| Distributors - 0.5% | | | |
| Genuine Parts Co. | | 343,900 | 35,790 |
| Diversified Consumer Services - 1.0% | | | |
| Graham Holdings Co. | | 60,100 | 35,726 |
| H&R Block, Inc. | | 1,592,300 | 42,260 |
| | | | 77,986 |
| Household Durables - 1.0% | | | |
| Lennar Corp.: | | | |
| Class A | | 718,800 | 45,040 |
| Class B | | 13,702 | 694 |
| Tupperware Brands Corp. | | 530,900 | 30,665 |
| | | | 76,399 |
| Leisure Products - 0.3% | | | |
| Brunswick Corp. | | 335,600 | 21,069 |
| Media - 7.2% | | | |
| CBS Corp. Class B | | 275,900 | 15,895 |
| Cinemark Holdings, Inc. | | 848,800 | 31,236 |
| Comcast Corp. Class A | | 4,293,292 | 182,594 |
| Interpublic Group of Companies, Inc. | | 1,975,600 | 43,246 |
| Omnicom Group, Inc. | | 529,400 | 40,579 |
| Sinclair Broadcast Group, Inc. Class A | | 567,900 | 21,069 |
| Tegna, Inc. | | 1,845,700 | 26,707 |
| The Walt Disney Co. | | 613,200 | 66,636 |
| Time Warner, Inc. | | 379,900 | 36,223 |
| Twenty-First Century Fox, Inc. Class A | | 2,011,100 | 74,210 |
| Viacom, Inc. Class B (non-vtg.) | | 649,600 | 21,710 |
| | | | 560,105 |
| Multiline Retail - 1.4% | | | |
| Dollar General Corp. | | 463,100 | 47,755 |
| Macy's, Inc. | | 502,700 | 13,045 |
| Target Corp. | | 659,100 | 49,578 |
| | | | 110,378 |
| Specialty Retail - 4.1% | | | |
| Bed Bath & Beyond, Inc. | | 341,900 | 7,891 |
| Best Buy Co., Inc. | | 432,900 | 31,628 |
| Dick's Sporting Goods, Inc. | | 353,200 | 11,112 |
| Foot Locker, Inc. | | 434,079 | 21,335 |
| Gap, Inc. | | 777,400 | 25,841 |
| L Brands, Inc. | | 227,200 | 11,380 |
| Lowe's Companies, Inc. | | 633,900 | 66,388 |
| Ross Stores, Inc. | | 614,500 | 50,629 |
| TJX Companies, Inc. | | 712,100 | 57,196 |
| Tractor Supply Co. | | 132,400 | 10,096 |
| Williams-Sonoma, Inc. (a) | | 490,600 | 25,133 |
| | | | 318,629 |
| Textiles, Apparel & Luxury Goods - 1.3% | | | |
| Carter's, Inc. | | 259,900 | 31,266 |
| Ralph Lauren Corp. | | 296,400 | 33,881 |
| Tapestry, Inc. | | 731,000 | 34,386 |
| | | | 99,533 |
|
| TOTAL CONSUMER DISCRETIONARY | | | 1,523,902 |
|
| CONSUMER STAPLES - 10.2% | | | |
| Beverages - 0.5% | | | |
| Dr. Pepper Snapple Group, Inc. | | 337,808 | 40,317 |
| Food & Staples Retailing - 3.5% | | | |
| CVS Health Corp. | | 963,900 | 75,849 |
| Kroger Co. | | 1,601,418 | 48,619 |
| Walgreens Boots Alliance, Inc. | | 661,400 | 49,777 |
| Walmart, Inc. | | 885,000 | 94,341 |
| | | | 268,586 |
| Food Products - 2.7% | | | |
| Campbell Soup Co. | | 906,800 | 42,212 |
| ConAgra Foods, Inc. | | 1,409,500 | 53,561 |
| General Mills, Inc. | | 468,200 | 27,385 |
| Ingredion, Inc. | | 178,700 | 25,668 |
| The J.M. Smucker Co. | | 238,400 | 30,251 |
| The Kraft Heinz Co. | | 41,300 | 3,238 |
| Tyson Foods, Inc. Class A | | 374,200 | 28,480 |
| | | | 210,795 |
| Household Products - 1.1% | | | |
| Energizer Holdings, Inc. | | 519,900 | 30,269 |
| Kimberly-Clark Corp. | | 427,000 | 49,959 |
| | | | 80,228 |
| Tobacco - 2.4% | | | |
| Altria Group, Inc. | | 2,105,600 | 148,108 |
| British American Tobacco PLC (United Kingdom) | | 532,760 | 36,412 |
| | | | 184,520 |
|
| TOTAL CONSUMER STAPLES | | | 784,446 |
|
| ENERGY - 6.2% | | | |
| Oil, Gas & Consumable Fuels - 6.2% | | | |
| Chevron Corp. | | 1,213,900 | 152,162 |
| Exxon Mobil Corp. | | 2,065,197 | 180,292 |
| Phillips 66 Co. | | 337,400 | 34,550 |
| Suncor Energy, Inc. | | 1,138,500 | 41,245 |
| Total SA sponsored ADR (a) | | 648,471 | 37,650 |
| Valero Energy Corp. | | 386,000 | 37,044 |
| | | | 482,943 |
| FINANCIALS - 16.6% | | | |
| Banks - 10.1% | | | |
| Bank of America Corp. | | 6,798,617 | 217,556 |
| JPMorgan Chase & Co. | | 1,912,535 | 221,223 |
| U.S. Bancorp | | 2,025,969 | 115,764 |
| Wells Fargo & Co. | | 3,441,793 | 226,396 |
| | | | 780,939 |
| Capital Markets - 0.2% | | | |
| Diamond Hill Investment Group, Inc. | | 56,538 | 11,893 |
| KKR & Co. LP | | 192,000 | 4,623 |
| | | | 16,516 |
| Consumer Finance - 0.0% | | | |
| Imperial Holdings, Inc. warrants 4/11/19 (b) | | 48,012 | 0 |
| Diversified Financial Services - 1.5% | | | |
| Berkshire Hathaway, Inc. Class B (b) | | 513,200 | 110,020 |
| Insurance - 4.8% | | | |
| Allstate Corp. | | 500,000 | 49,385 |
| Chubb Ltd. | | 674,900 | 105,386 |
| First American Financial Corp. | | 189,672 | 11,204 |
| Marsh & McLennan Companies, Inc. | | 414,100 | 34,586 |
| MetLife, Inc. | | 1,267,200 | 60,914 |
| The Travelers Companies, Inc. | | 734,700 | 110,146 |
| | | | 371,621 |
|
| TOTAL FINANCIALS | | | 1,279,096 |
|
| HEALTH CARE - 10.7% | | | |
| Biotechnology - 2.5% | | | |
| Amgen, Inc. | | 713,710 | 132,786 |
| Gilead Sciences, Inc. | | 688,700 | 57,713 |
| | | | 190,499 |
| Health Care Equipment & Supplies - 0.4% | | | |
| Medtronic PLC | | 399,503 | 34,313 |
| Health Care Providers & Services - 5.0% | | | |
| Aetna, Inc. | | 118,500 | 22,138 |
| AmerisourceBergen Corp. | | 411,300 | 40,994 |
| Anthem, Inc. | | 401,800 | 99,586 |
| Cardinal Health, Inc. | | 742,400 | 53,297 |
| Cigna Corp. | | 218,200 | 45,462 |
| McKesson Corp. | | 217,300 | 36,698 |
| Quest Diagnostics, Inc. | | 399,100 | 42,233 |
| UnitedHealth Group, Inc. | | 86,000 | 20,363 |
| Universal Health Services, Inc. Class B | | 202,000 | 24,543 |
| | | | 385,314 |
| Pharmaceuticals - 2.8% | | | |
| GlaxoSmithKline PLC | | 2,078,146 | 38,683 |
| Johnson & Johnson | | 553,243 | 76,453 |
| Pfizer, Inc. | | 1,977,900 | 73,261 |
| Sanofi SA | | 332,494 | 29,343 |
| | | | 217,740 |
|
| TOTAL HEALTH CARE | | | 827,866 |
|
| INDUSTRIALS - 11.8% | | | |
| Aerospace & Defense - 2.0% | | | |
| General Dynamics Corp. | | 224,400 | 49,925 |
| Rockwell Collins, Inc. | | 188,900 | 26,161 |
| United Technologies Corp. | | 559,600 | 77,230 |
| | | | 153,316 |
| Air Freight & Logistics - 0.7% | | | |
| United Parcel Service, Inc. Class B | | 410,700 | 52,290 |
| Airlines - 1.8% | | | |
| Allegiant Travel Co. | | 90,700 | 14,444 |
| American Airlines Group, Inc. | | 698,100 | 37,921 |
| Delta Air Lines, Inc. | | 1,012,700 | 57,491 |
| Southwest Airlines Co. | | 523,700 | 31,841 |
| | | | 141,697 |
| Building Products - 0.3% | | | |
| Johnson Controls International PLC | | 675,700 | 26,440 |
| Commercial Services & Supplies - 0.5% | | | |
| Deluxe Corp. | | 560,800 | 41,651 |
| Construction & Engineering - 0.1% | | | |
| Fluor Corp. | | 166,500 | 10,107 |
| Electrical Equipment - 0.4% | | | |
| Acuity Brands, Inc. | | 191,700 | 29,606 |
| Industrial Conglomerates - 0.8% | | | |
| Honeywell International, Inc. | | 387,300 | 61,840 |
| Machinery - 1.4% | | | |
| Allison Transmission Holdings, Inc. | | 382,002 | 16,900 |
| Crane Co. | | 426,500 | 42,624 |
| Snap-On, Inc. | | 269,200 | 46,117 |
| | | | 105,641 |
| Professional Services - 0.9% | | | |
| Dun & Bradstreet Corp. | | 288,200 | 35,659 |
| Korn/Ferry International | | 125,800 | 5,606 |
| Manpower, Inc. | | 219,300 | 28,814 |
| | | | 70,079 |
| Road & Rail - 2.4% | | | |
| Norfolk Southern Corp. | | 437,300 | 65,980 |
| Union Pacific Corp. | | 894,600 | 119,429 |
| | | | 185,409 |
| Trading Companies & Distributors - 0.5% | | | |
| W.W. Grainger, Inc. | | 127,900 | 34,490 |
|
| TOTAL INDUSTRIALS | | | 912,566 |
|
| INFORMATION TECHNOLOGY - 11.0% | | | |
| Communications Equipment - 2.1% | | | |
| Cisco Systems, Inc. | | 3,143,086 | 130,564 |
| InterDigital, Inc. | | 28,500 | 2,224 |
| Juniper Networks, Inc. | | 1,247,000 | 32,609 |
| | | | 165,397 |
| Electronic Equipment & Components - 0.2% | | | |
| Avnet, Inc. | | 186,500 | 7,926 |
| TE Connectivity Ltd. | | 101,200 | 10,376 |
| | | | 18,302 |
| IT Services - 1.0% | | | |
| CSRA, Inc. | | 1,193,200 | 39,710 |
| Leidos Holdings, Inc. | | 393,700 | 26,220 |
| The Western Union Co. | | 385,000 | 8,004 |
| | | | 73,934 |
| Semiconductors & Semiconductor Equipment - 2.4% | | | |
| Intel Corp. | | 2,143,400 | 103,183 |
| Qualcomm, Inc. | | 1,146,583 | 78,254 |
| | | | 181,437 |
| Software - 2.0% | | | |
| CA Technologies, Inc. | | 987,900 | 35,416 |
| Microsoft Corp. | | 428,816 | 40,742 |
| Oracle Corp. | | 1,515,000 | 78,159 |
| | | | 154,317 |
| Technology Hardware, Storage & Peripherals - 3.3% | | | |
| Apple, Inc. | | 521,718 | 87,351 |
| Hewlett Packard Enterprise Co. | | 2,748,700 | 45,079 |
| HP, Inc. | | 1,958,300 | 45,668 |
| NetApp, Inc. | | 221,100 | 13,598 |
| Seagate Technology LLC | | 595,500 | 32,872 |
| Xerox Corp. | | 947,100 | 32,325 |
| | | | 256,893 |
|
| TOTAL INFORMATION TECHNOLOGY | | | 850,280 |
|
| MATERIALS - 2.6% | | | |
| Chemicals - 1.5% | | | |
| Huntsman Corp. | | 135,700 | 4,691 |
| LyondellBasell Industries NV Class A | | 674,400 | 80,820 |
| Monsanto Co. | | 165,400 | 20,146 |
| The Chemours Co. LLC | | 226,600 | 11,697 |
| | | | 117,354 |
| Metals & Mining - 1.1% | | | |
| Nucor Corp. | | 580,200 | 38,850 |
| Steel Dynamics, Inc. | | 904,800 | 41,078 |
| | | | 79,928 |
|
| TOTAL MATERIALS | | | 197,282 |
|
| REAL ESTATE - 0.5% | | | |
| Equity Real Estate Investment Trusts (REITs) - 0.5% | | | |
| National Retail Properties, Inc. | | 322,600 | 12,801 |
| Spirit Realty Capital, Inc. | | 911,600 | 7,448 |
| Store Capital Corp. | | 565,800 | 13,868 |
| VEREIT, Inc. | | 1,095,200 | 7,885 |
| | | | 42,002 |
| TELECOMMUNICATION SERVICES - 2.1% | | | |
| Diversified Telecommunication Services - 2.1% | | | |
| Verizon Communications, Inc. | | 2,947,700 | 159,382 |
| UTILITIES - 0.3% | | | |
| Electric Utilities - 0.1% | | | |
| Great Plains Energy, Inc. | | 182,600 | 5,683 |
| Independent Power and Renewable Electricity Producers - 0.2% | | | |
| The AES Corp. | | 1,429,900 | 16,530 |
|
| TOTAL UTILITIES | | | 22,213 |
|
| TOTAL COMMON STOCKS | | | |
| (Cost $5,531,415) | | | 7,081,978 |
|
| Money Market Funds - 8.4% | | | |
| Fidelity Cash Central Fund, 1.39% (c) | | 630,358,601 | 630,485 |
| Fidelity Securities Lending Cash Central Fund 1.40% (c)(d) | | 22,715,415 | 22,718 |
| TOTAL MONEY MARKET FUNDS | | | |
| (Cost $653,198) | | | 653,203 |
| TOTAL INVESTMENT IN SECURITIES - 100.1% | | | |
| (Cost $6,184,613) | | | 7,735,181 |
| NET OTHER ASSETS (LIABILITIES) - (0.1)% | | | (8,807) |
| NET ASSETS - 100% | | | $7,726,374 |
Values shown as $0 may reflect amounts less than $500.
Legend
(a) Security or a portion of the security is on loan at period end.
(b) Non-income producing
(c) Affiliated fund that is generally available only to investment companies and other accounts managed by Fidelity Investments. The rate quoted is the annualized seven-day yield of the fund at period end. A complete unaudited listing of the fund's holdings as of its most recent quarter end is available upon request. In addition, each Fidelity Central Fund's financial statements are available on the SEC's website or upon request.
(d) Investment made with cash collateral received from securities on loan.
Affiliated Central Funds
Information regarding fiscal year to date income earned by the Fund from investments in Fidelity Central Funds is as follows:
| Fund | Income earned |
| | (Amounts in thousands) |
| Fidelity Cash Central Fund | $1,919 |
| Fidelity Securities Lending Cash Central Fund | 84 |
| Total | $2,003 |
Amounts in the income column in the above table include any capital gain distributions from underlying funds, which are presented in the corresponding line-item in the Statement of Operations if applicable.
Investment Valuation
The following is a summary of the inputs used, as of January 31, 2018, involving the Fund's assets and liabilities carried at fair value. The inputs or methodology used for valuing securities may not be an indication of the risk associated with investing in those securities. For more information on valuation inputs, and their aggregation into the levels used below, please refer to the Investment Valuation section in the accompanying Notes to Financial Statements.
| | Valuation Inputs at Reporting Date: |
| Description | Total | Level 1 | Level 2 | Level 3 |
| (Amounts in thousands) | | | | |
| Investments in Securities: | | | | |
| Equities: | | | | |
| Consumer Discretionary | $1,523,902 | $1,523,902 | $-- | $-- |
| Consumer Staples | 784,446 | 748,034 | 36,412 | -- |
| Energy | 482,943 | 482,943 | -- | -- |
| Financials | 1,279,096 | 1,279,096 | -- | -- |
| Health Care | 827,866 | 759,840 | 68,026 | -- |
| Industrials | 912,566 | 912,566 | -- | -- |
| Information Technology | 850,280 | 850,280 | -- | -- |
| Materials | 197,282 | 197,282 | -- | -- |
| Real Estate | 42,002 | 42,002 | -- | -- |
| Telecommunication Services | 159,382 | 159,382 | -- | -- |
| Utilities | 22,213 | 22,213 | -- | -- |
| Money Market Funds | 653,203 | 653,203 | -- | -- |
| Total Investments in Securities: | $7,735,181 | $7,630,743 | $104,438 | $-- |
See accompanying notes which are an integral part of the financial statements.
Financial Statements
Statement of Assets and Liabilities
| Amounts in thousands (except per-share amounts) | | January 31, 2018 (Unaudited) |
| Assets | | |
Investment in securities, at value (including securities loaned of $21,859) — See accompanying schedule:
Unaffiliated issuers (cost $5,531,415) | $7,081,978 | |
| Fidelity Central Funds (cost $653,198) | 653,203 | |
| Total Investment in Securities (cost $6,184,613) | | $7,735,181 |
| Receivable for investments sold | | 32,902 |
| Receivable for fund shares sold | | 1,735 |
| Dividends receivable | | 5,194 |
| Distributions receivable from Fidelity Central Funds | | 591 |
| Prepaid expenses | | 11 |
| Other receivables | | 859 |
| Total assets | | 7,776,473 |
| Liabilities | | |
| Payable to custodian bank | $4 | |
| Payable for investments purchased | 17,682 | |
| Payable for fund shares redeemed | 5,933 | |
| Accrued management fee | 2,190 | |
| Other affiliated payables | 907 | |
| Other payables and accrued expenses | 663 | |
| Collateral on securities loaned | 22,720 | |
| Total liabilities | | 50,099 |
| Net Assets | | $7,726,374 |
| Net Assets consist of: | | |
| Paid in capital | | $5,685,683 |
| Undistributed net investment income | | 6,208 |
| Accumulated undistributed net realized gain (loss) on investments and foreign currency transactions | | 483,875 |
| Net unrealized appreciation (depreciation) on investments and assets and liabilities in foreign currencies | | 1,550,608 |
| Net Assets | | $7,726,374 |
| Dividend Growth: | | |
| Net Asset Value, offering price and redemption price per share ($6,463,255 ÷ 187,903 shares) | | $34.40 |
| Class K: | | |
| Net Asset Value, offering price and redemption price per share ($1,263,119 ÷ 36,767 shares) | | $34.35 |
See accompanying notes which are an integral part of the financial statements.
Statement of Operations
| Amounts in thousands | | Six months ended January 31, 2018 (Unaudited) |
| Investment Income | | |
| Dividends | | $86,029 |
| Interest | | 1,030 |
| Income from Fidelity Central Funds | | 2,003 |
| Total income | | 89,062 |
| Expenses | | |
| Management fee | | |
| Basic fee | $20,251 | |
| Performance adjustment | (7,672) | |
| Transfer agent fees | 4,892 | |
| Accounting and security lending fees | 594 | |
| Custodian fees and expenses | 59 | |
| Independent trustees' fees and expenses | 15 | |
| Registration fees | 22 | |
| Audit | 42 | |
| Legal | 15 | |
| Miscellaneous | 22 | |
| Total expenses before reductions | 18,240 | |
| Expense reductions | (444) | 17,796 |
| Net investment income (loss) | | 71,266 |
| Realized and Unrealized Gain (Loss) | | |
| Net realized gain (loss) on: | | |
| Investment securities: | | |
| Unaffiliated issuers | 1,171,623 | |
| Fidelity Central Funds | 29 | |
| Foreign currency transactions | 268 | |
| Total net realized gain (loss) | | 1,171,920 |
| Change in net unrealized appreciation (depreciation) on: | | |
| Investment securities: | | |
| Unaffiliated issuers | (154,597) | |
| Fidelity Central Funds | (31) | |
| Assets and liabilities in foreign currencies | 18 | |
| Total change in net unrealized appreciation (depreciation) | | (154,610) |
| Net gain (loss) | | 1,017,310 |
| Net increase (decrease) in net assets resulting from operations | | $1,088,576 |
See accompanying notes which are an integral part of the financial statements.
Statement of Changes in Net Assets
| Amounts in thousands | Six months ended January 31, 2018 (Unaudited) | Year ended July 31, 2017 |
| Increase (Decrease) in Net Assets | | |
| Operations | | |
| Net investment income (loss) | $71,266 | $120,267 |
| Net realized gain (loss) | 1,171,920 | 505,117 |
| Change in net unrealized appreciation (depreciation) | (154,610) | 287,960 |
| Net increase (decrease) in net assets resulting from operations | 1,088,576 | 913,344 |
| Distributions to shareholders from net investment income | (127,264) | (120,213) |
| Distributions to shareholders from net realized gain | (1,053,472) | – |
| Total distributions | (1,180,736) | (120,213) |
| Share transactions - net increase (decrease) | 389,281 | (903,170) |
| Total increase (decrease) in net assets | 297,121 | (110,039) |
| Net Assets | | |
| Beginning of period | 7,429,253 | 7,539,292 |
| End of period | $7,726,374 | $7,429,253 |
| Other Information | | |
| Undistributed net investment income end of period | $6,208 | $62,206 |
See accompanying notes which are an integral part of the financial statements.
Financial Highlights
Fidelity Dividend Growth Fund
| | Six months ended (Unaudited) January 31, | Years endedJuly 31, | | | | |
| | 2018 | 2017 | 2016 | 2015 | 2014 | 2013 |
| Selected Per–Share Data | | | | | | |
| Net asset value, beginning of period | $35.06 | $31.51 | $34.46 | $37.27 | $35.33 | $28.61 |
| Income from Investment Operations | | | | | | |
| Net investment income (loss)A | .32 | .53 | .48 | .49 | .56 | .40 |
| Net realized and unrealized gain (loss) | 4.66 | 3.53 | (.61)B | 2.71 | 4.98 | 7.12 |
| Total from investment operations | 4.98 | 4.06 | (.13) | 3.20 | 5.54 | 7.52 |
| Distributions from net investment income | (.60) | (.51) | (.47) | (.51) | (.37) | (.30) |
| Distributions from net realized gain | (5.04) | – | (2.36) | (5.49) | (3.23) | (.50) |
| Total distributions | (5.64) | (.51) | (2.82)C | (6.01)D | (3.60) | (.80) |
| Net asset value, end of period | $34.40 | $35.06 | $31.51 | $34.46 | $37.27 | $35.33 |
| Total ReturnE,F | 15.65% | 13.06% | .26%B | 9.54% | 17.30% | 26.83% |
| Ratios to Average Net AssetsG,H | | | | | | |
| Expenses before reductions | .51%I | .52% | .62% | .69% | .56% | .63% |
| Expenses net of fee waivers, if any | .51%I | .52% | .61% | .68% | .56% | .63% |
| Expenses net of all reductions | .50%I | .52% | .61% | .68% | .56% | .62% |
| Net investment income (loss) | 1.89%I | 1.60% | 1.59% | 1.43% | 1.58% | 1.26% |
| Supplemental Data | | | | | | |
| Net assets, end of period (in millions) | $6,463 | $5,952 | $5,849 | $6,474 | $6,481 | $6,633 |
| Portfolio turnover rateJ | 104%I | 43% | 30% | 64% | 99% | 69% |
A Calculated based on average shares outstanding during the period.
B Net realized and unrealized gain (loss) per share reflects proceeds received from litigation which amounted to $.01 per share. Excluding these litigation proceeds, the total return would have been .22%.
C Total distributions of $2.82 per share is comprised of distributions from net investment income of $.465 and distributions from net realized gain of $2.358 per share.
D Total distributions of $6.01 per share is comprised of distributions from net investment income of $.512 and distributions from net realized gain of $5.493 per share. E Total returns for periods of less than one year are not annualized.
E Total returns for periods of less than one year are not annualized.
F Total returns would have been lower if certain expenses had not been reduced during the applicable periods shown.
G Fees and expenses of any underlying Fidelity Central Funds are not included in the Fund's expense ratio. The Fund indirectly bears its proportionate share of the expenses of any underlying Fidelity Central Funds.
H Expense ratios reflect operating expenses of the class. Expenses before reductions do not reflect amounts reimbursed by the investment adviser or reductions from brokerage service arrangements or reductions from other expense offset arrangements and do not represent the amount paid by the class during periods when reimbursements or reductions occur. Expenses net of fee waivers reflect expenses after reimbursement by the investment adviser but prior to reductions from brokerage service arrangements or other expense offset arrangements. Expenses net of all reductions represent the net expenses paid by the class.
I Annualized
J Amount does not include the portfolio activity of any underlying Fidelity Central Funds.
See accompanying notes which are an integral part of the financial statements.
Fidelity Dividend Growth Fund Class K
| | Six months ended (Unaudited) January 31, | Years endedJuly 31, | | | | |
| | 2018 | 2017 | 2016 | 2015 | 2014 | 2013 |
| Selected Per–Share Data | | | | | | |
| Net asset value, beginning of period | $35.04 | $31.50 | $34.45 | $37.27 | $35.34 | $28.62 |
| Income from Investment Operations | | | | | | |
| Net investment income (loss)A | .34 | .56 | .52 | .53 | .60 | .45 |
| Net realized and unrealized gain (loss) | 4.65 | 3.53 | (.61)B | 2.70 | 4.97 | 7.12 |
| Total from investment operations | 4.99 | 4.09 | (.09) | 3.23 | 5.57 | 7.57 |
| Distributions from net investment income | (.64) | (.55) | (.50) | (.56) | (.42) | (.35) |
| Distributions from net realized gain | (5.04) | – | (2.36) | (5.49) | (3.23) | (.50) |
| Total distributions | (5.68) | (.55) | (2.86) | (6.05) | (3.64)C | (.85) |
| Net asset value, end of period | $34.35 | $35.04 | $31.50 | $34.45 | $37.27 | $35.34 |
| Total ReturnD,E | 15.69% | 13.16% | .39%B | 9.65% | 17.44% | 27.04% |
| Ratios to Average Net AssetsF,G | | | | | | |
| Expenses before reductions | .40%H | .41% | .50% | .57% | .44% | .48% |
| Expenses net of fee waivers, if any | .40%H | .41% | .50% | .57% | .43% | .48% |
| Expenses net of all reductions | .39%H | .41% | .49% | .57% | .43% | .47% |
| Net investment income (loss) | 1.99%H | 1.71% | 1.71% | 1.54% | 1.70% | 1.41% |
| Supplemental Data | | | | | | |
| Net assets, end of period (in millions) | $1,263 | $1,477 | $1,691 | $1,942 | $2,057 | $1,639 |
| Portfolio turnover rateI | 104%H | 43% | 30% | 64% | 99% | 69% |
A Calculated based on average shares outstanding during the period.
B Net realized and unrealized gain (loss) per share reflects proceeds received from litigation which amounted to $.01 per share. Excluding these litigation proceeds, the total return would have been .35%.
C Total distributions of $3.64 per share is comprised of distributions from net investment income of $.419 and distributions from net realized gain of $3.225 per share.
D Total returns for periods of less than one year are not annualized.
E Total returns would have been lower if certain expenses had not been reduced during the applicable periods shown.
F Fees and expenses of any underlying Fidelity Central Funds are not included in the Fund's expense ratio. The Fund indirectly bears its proportionate share of the expenses of any underlying Fidelity Central Funds.
G Expense ratios reflect operating expenses of the class. Expenses before reductions do not reflect amounts reimbursed by the investment adviser or reductions from brokerage service arrangements or reductions from other expense offset arrangements and do not represent the amount paid by the class during periods when reimbursements or reductions occur. Expenses net of fee waivers reflect expenses after reimbursement by the investment adviser but prior to reductions from brokerage service arrangements or other expense offset arrangements. Expenses net of all reductions represent the net expenses paid by the class.
H Annualized
I Amount does not include the portfolio activity of any underlying Fidelity Central Funds.
See accompanying notes which are an integral part of the financial statements.
Notes to Financial Statements (Unaudited)
For the period ended January 31, 2018
(Amounts in thousands except percentages)
1. Organization.
Fidelity Dividend Growth Fund (the Fund) is a fund of Fidelity Securities Fund (the Trust) and is authorized to issue an unlimited number of shares. The Trust is registered under the Investment Company Act of 1940, as amended (the 1940 Act), as an open-end management investment company organized as a Massachusetts business trust. The Fund offers Dividend Growth and Class K shares, each of which has equal rights as to assets and voting privileges. Each class has exclusive voting rights with respect to matters that affect that class.
2. Investments in Fidelity Central Funds.
The Fund invests in Fidelity Central Funds, which are open-end investment companies generally available only to other investment companies and accounts managed by the investment adviser and its affiliates. The Fund's Schedule of Investments lists each of the Fidelity Central Funds held as of period end, if any, as an investment of the Fund, but does not include the underlying holdings of each Fidelity Central Fund. As an Investing Fund, the Fund indirectly bears its proportionate share of the expenses of the underlying Fidelity Central Funds.
The Money Market Central Funds seek preservation of capital and current income and are managed by Fidelity Investments Money Management, Inc. (FIMM), an affiliate of the investment adviser. Annualized expenses of the Money Market Central Funds as of their most recent shareholder report date are less than .005%.
A complete unaudited list of holdings for each Fidelity Central Fund is available upon request or at the Securities and Exchange Commission (the SEC) website at www.sec.gov. In addition, the financial statements of the Fidelity Central Funds are available on the SEC website or upon request.
3. Significant Accounting Policies.
The Fund is an investment company and applies the accounting and reporting guidance of the Financial Accounting Standards Board (FASB) Accounting Standards Codification Topic 946 Financial Services – Investments Companies. The financial statements have been prepared in conformity with accounting principles generally accepted in the United States of America (GAAP), which require management to make certain estimates and assumptions at the date of the financial statements. Actual results could differ from those estimates. Subsequent events, if any, through the date that the financial statements were issued have been evaluated in the preparation of the financial statements. The following summarizes the significant accounting policies of the Fund:
Investment Valuation. Investments are valued as of 4:00 p.m. Eastern time on the last calendar day of the period. The Board of Trustees (the Board) has delegated the day to day responsibility for the valuation of the Fund's investments to the Fair Value Committee (the Committee) established by the Fund's investment adviser. In accordance with valuation policies and procedures approved by the Board, the Fund attempts to obtain prices from one or more third party pricing vendors or brokers to value its investments. When current market prices, quotations or currency exchange rates are not readily available or reliable, investments will be fair valued in good faith by the Committee, in accordance with procedures adopted by the Board. Factors used in determining fair value vary by investment type and may include market or investment specific events. The frequency with which these procedures are used cannot be predicted and they may be utilized to a significant extent. The Committee oversees the Fund's valuation policies and procedures and reports to the Board on the Committee's activities and fair value determinations. The Board monitors the appropriateness of the procedures used in valuing the Fund's investments and ratifies the fair value determinations of the Committee.
The Fund categorizes the inputs to valuation techniques used to value its investments into a disclosure hierarchy consisting of three levels as shown below:
- Level 1 – quoted prices in active markets for identical investments
- Level 2 – other significant observable inputs (including quoted prices for similar investments, interest rates, prepayment speeds, etc.)
- Level 3 – unobservable inputs (including the Fund's own assumptions based on the best information available)
Valuation techniques used to value the Fund's investments by major category are as follows:
Equity securities, including restricted securities, for which market quotations are readily available, are valued at the last reported sale price or official closing price as reported by a third party pricing vendor on the primary market or exchange on which they are traded and are categorized as Level 1 in the hierarchy. In the event there were no sales during the day or closing prices are not available, securities are valued at the last quoted bid price or may be valued using the last available price and are generally categorized as Level 2 in the hierarchy. For foreign equity securities, when market or security specific events arise, comparisons to the valuation of American Depositary Receipts (ADRs), futures contracts, Exchange-Traded Funds (ETFs) and certain indexes as well as quoted prices for similar securities may be used and would be categorized as Level 2 in the hierarchy. Utilizing these techniques may result in transfers between Level 1 and Level 2. For equity securities, including restricted securities, where observable inputs are limited, assumptions about market activity and risk are used and these securities may be categorized as Level 3 in the hierarchy.
Investments in open-end mutual funds, including the Fidelity Central Funds, are valued at their closing net asset value (NAV) each business day and are categorized as Level 1 in the hierarchy.
Changes in valuation techniques may result in transfers in or out of an assigned level within the disclosure hierarchy. The aggregate value of investments by input level as of January 31, 2018 is included at the end of the Fund's Schedule of Investments.
Foreign Currency. The Fund may use foreign currency contracts to facilitate transactions in foreign-denominated securities. Gains and losses from these transactions may arise from changes in the value of the foreign currency or if the counterparties do not perform under the contracts' terms.
Foreign-denominated assets, including investment securities, and liabilities are translated into U.S. dollars at the exchange rates at period end. Purchases and sales of investment securities, income and dividends received and expenses denominated in foreign currencies are translated into U.S. dollars at the exchange rate in effect on the transaction date.
The effects of exchange rate fluctuations on investments are included with the net realized and unrealized gain (loss) on investment securities. Other foreign currency transactions resulting in realized and unrealized gain (loss) are disclosed separately.
Investment Transactions and Income. For financial reporting purposes, the Fund's investment holdings and NAV include trades executed through the end of the last business day of the period. The NAV per share for processing shareholder transactions is calculated as of the close of business of the New York Stock Exchange (NYSE), normally 4:00 p.m. Eastern time and includes trades executed through the end of the prior business day. Gains and losses on securities sold are determined on the basis of identified cost and includes proceeds received from litigation. Dividend income is recorded on the ex-dividend date, except for certain dividends from foreign securities where the ex-dividend date may have passed, which are recorded as soon as the Fund is informed of the ex-dividend date. Non-cash dividends included in dividend income, if any, are recorded at the fair market value of the securities received. Income and capital gain distributions from Fidelity Central Funds, if any, are recorded on the ex-dividend date. Certain distributions received by the Fund represent a return of capital or capital gain. The Fund determines the components of these distributions subsequent to the ex-dividend date, based upon receipt of tax filings or other correspondence relating to the underlying investment. These distributions are recorded as a reduction of cost of investments and/or as a realized gain. Interest income is accrued as earned and includes coupon interest and amortization of premium and accretion of discount on debt securities as applicable. Paid in Kind (PIK) income is recorded at the fair market value of the securities received. Investment income is recorded net of foreign taxes withheld where recovery of such taxes is uncertain.
Class Allocations and Expenses. Investment income, realized and unrealized capital gains and losses, common expenses of the Fund, and certain fund-level expense reductions, if any, are allocated daily on a pro-rata basis to each class based on the relative net assets of each class to the total net assets of the Fund. Each class differs with respect to transfer agent fees incurred. Certain expense reductions may also differ by class. For the reporting period, the allocated portion of income and expenses to each class as a percent of its average net assets may vary due to the timing of recording these transactions in relation to fluctuating net assets of the classes. Expenses directly attributable to a fund are charged to that fund. Expenses attributable to more than one fund are allocated among the respective funds on the basis of relative net assets or other appropriate methods. Expense estimates are accrued in the period to which they relate and adjustments are made when actual amounts are known.
Deferred Trustee Compensation. Under a Deferred Compensation Plan (the Plan), independent Trustees may elect to defer receipt of a portion of their annual compensation. Deferred amounts are invested in a cross-section of Fidelity funds, are marked-to-market and remain in the Fund until distributed in accordance with the Plan. The investment of deferred amounts and the offsetting payable to the Trustees are included in the accompanying Statement of Assets and Liabilities.
Income Tax Information and Distributions to Shareholders. Each year, the Fund intends to qualify as a regulated investment company under Subchapter M of the Internal Revenue Code, including distributing substantially all of its taxable income and realized gains. As a result, no provision for U.S. Federal income taxes is required. The Fund files a U.S. federal tax return, in addition to state and local tax returns as required. The Fund's federal income tax returns are subject to examination by the Internal Revenue Service (IRS) for a period of three fiscal years after they are filed. State and local tax returns may be subject to examination for an additional fiscal year depending on the jurisdiction. Foreign taxes are provided for based on the Fund's understanding of the tax rules and rates that exist in the foreign markets in which it invests.
Distributions are declared and recorded on the ex-dividend date. Income dividends and capital gain distributions are declared separately for each class. Income and capital gain distributions are determined in accordance with income tax regulations, which may differ from GAAP.
Capital accounts within the financial statements are adjusted for permanent book-tax differences. These adjustments have no impact on net assets or the results of operations. Capital accounts are not adjusted for temporary book-tax differences which will reverse in a subsequent period.
Book-tax differences are primarily due to foreign currency transactions, partnerships, deferred trustees compensation and losses deferred due to wash sales and excise tax regulations.
As of period end, the cost and unrealized appreciation (depreciation) in securities, and derivatives if applicable, for federal income tax purposes were as follows:
| Gross unrealized appreciation | $1,598,860 |
| Gross unrealized depreciation | (51,735) |
| Net unrealized appreciation (depreciation) | $1,547,125 |
| Tax cost | $6,188,056 |
4. Purchases and Sales of Investments.
Purchases and sales of securities, other than short-term securities, aggregated $3,722,122 and $4,817,450, respectively.
5. Fees and Other Transactions with Affiliates.
Management Fee. Fidelity Management & Research Company (the investment adviser) and its affiliates provide the Fund with investment management related services for which the Fund pays a monthly management fee. The management fee is the sum of an individual fund fee rate that is based on an annual rate of .30% of the Fund's average net assets and an annualized group fee rate that averaged .24% during the period. The group fee rate is based upon the average net assets of all the mutual funds advised by the investment adviser, including any mutual funds previously advised by the investment adviser that are currently advised by Fidelity SelectCo, LLC, an affiliate of the investment adviser. The group fee rate decreases as assets under management increase and increases as assets under management decrease. In addition, the management fee is subject to a performance adjustment (up to a maximum of +/- .20% of the Fund's average net assets over a 36 month performance period). The upward or downward adjustment to the management fee is based on the relative investment performance of Dividend Growth as compared to its benchmark index, the S&P 500 Index, over the same 36 month performance period. For the reporting period, the total annualized management fee rate, including the performance adjustment, was .34% of the Fund's average net assets. The performance adjustment included in the management fee rate may be higher or lower than the maximum performance adjustment rate due to the difference between the average net assets for the reporting and performance periods.
Transfer Agent Fees. Fidelity Investments Institutional Operations Company, Inc., (FIIOC), an affiliate of the investment adviser, is the transfer, dividend disbursing and shareholder servicing agent for each class of the Fund. FIIOC receives account fees and asset-based fees that vary according to the account size and type of account of the shareholders of Dividend Growth, except for Class K. FIIOC receives an asset-based fee of Class K's average net assets. FIIOC pays for typesetting, printing and mailing of shareholder reports, except proxy statements.
For the period, transfer agent fees for each class were as follows:
| | Amount | % of Class-Level Average Net Assets(a) |
| Dividend Growth | $4,572 | .15 |
| Class K | 320 | .05 |
| | $4,892 | |
(a) Annualized
Accounting and Security Lending Fees. Fidelity Service Company, Inc. (FSC), an affiliate of the investment adviser, maintains the Fund's accounting records. The accounting fee is based on the level of average net assets for each month. Under a separate contract, FSC administers the security lending program. The security lending fee is based on the number and duration of lending transactions.
Brokerage Commissions. The Fund placed a portion of its portfolio transactions with brokerage firms which are affiliates of the investment adviser. Brokerage commissions are included in net realized gain (loss) and change in net unrealized appreciation (depreciation) in the Statement of Operations. The commissions paid to these affiliated firms were $103 for the period.
Interfund Trades. The Fund may purchase from or sell securities to other Fidelity Funds under procedures adopted by the Board. The procedures have been designed to ensure these interfund trades are executed in accordance with Rule 17a-7 of the 1940 Act. Interfund trades are included within the respective purchases and sales amounts shown in the Purchases and Sales of Investments note.
6. Committed Line of Credit.
The Fund participates with other funds managed by the investment adviser or an affiliate in a $4.25 billion credit facility (the "line of credit") to be utilized for temporary or emergency purposes to fund shareholder redemptions or for other short-term liquidity purposes. The Fund has agreed to pay commitment fees on its pro-rata portion of the line of credit, which amounted to $11 and is reflected in Miscellaneous expenses on the Statement of Operations. During the period, the Fund did not borrow on this line of credit.
7. Security Lending.
The Fund lends portfolio securities through a lending agent from time to time in order to earn additional income. For equity securities, a lending agent is used and may loan securities to certain qualified borrowers, including Fidelity Capital Markets (FCM), a broker-dealer affiliated with the Fund. On the settlement date of the loan, the Fund receives collateral (in the form of U.S. Treasury obligations, letters of credit and/or cash) against the loaned securities and maintains collateral in an amount not less than 100% of the market value of the loaned securities during the period of the loan. The market value of the loaned securities is determined at the close of business of the Fund and any additional required collateral is delivered to the Fund on the next business day. The Fund or borrower may terminate the loan at any time, and if the borrower defaults on its obligation to return the securities loaned because of insolvency or other reasons, the Fund may apply collateral received from the borrower against the obligation. The Fund may experience delays and costs in recovering the securities loaned. Any cash collateral received is invested in the Fidelity Securities Lending Cash Central Fund. The value of loaned securities and cash collateral at period end are disclosed on the Fund's Statement of Assets and Liabilities. Security lending income represents the income earned on investing cash collateral, less rebates paid to borrowers and any lending agent fees associated with the loan, plus any premium payments received for lending certain types of securities. Security lending income is presented in the Statement of Operations as a component of income from Fidelity Central Funds. Total security lending income during the period amounted to $84. During the period, there were no securities loaned to FCM.
8. Expense Reductions.
Commissions paid to certain brokers with whom the investment adviser, or its affiliates, places trades on behalf of the Fund include an amount in addition to trade execution, which may be rebated back to the Fund to offset certain expenses. This amount totaled $405 for the period. In addition, through arrangements with the Fund's custodian, credits realized as a result of certain uninvested cash balances were used to reduce the Fund's expenses. During the period, these credits reduced the Fund's custody expenses by $2.
In addition, during the period the investment adviser reimbursed and/or waived a portion of fund-level operating expenses in the amount of $37.
9. Distributions to Shareholders.
Distributions to shareholders of each class were as follows:
| | Six months ended
January 31, 2018 | Year ended
July 31, 2017 |
| From net investment income | | |
| Dividend Growth | $102,569 | $92,313 |
| Class K | 24,695 | 27,900 |
| Total | $127,264 | $120,213 |
| From net realized gain | | |
| Dividend Growth | $860,821 | $– |
| Class K | 192,651 | – |
| Total | $1,053,472 | $– |
10. Share Transactions.
Share transactions for each class were as follows and may contain automatic conversions between classes or exchanges between affiliated funds:
| | Shares | Shares | Dollars | Dollars |
| | Six months ended January 31, 2018 | Year ended July 31, 2017 | Six months ended January 31, 2018 | Year ended July 31, 2017 |
| Dividend Growth | | | | |
| Shares sold | 3,665 | 6,358 | $125,124 | $209,135 |
| Reinvestment of distributions | 28,012 | 2,777 | 919,157 | 88,012 |
| Shares redeemed | (13,550) | (24,948) | (464,304) | (819,066) |
| Net increase (decrease) | 18,127 | (15,813) | $579,977 | $(521,919) |
| Class K | | | | |
| Shares sold | 3,085 | 6,119 | $105,097 | $201,106 |
| Reinvestment of distributions | 6,626 | 882 | 217,346 | 27,900 |
| Shares redeemed | (15,099) | (18,521) | (513,139) | (610,257) |
| Net increase (decrease) | (5,388) | (11,520) | $(190,696) | $(381,251) |
11. Other.
The Fund's organizational documents provide former and current trustees and officers with a limited indemnification against liabilities arising in connection with the performance of their duties to the Fund. In the normal course of business, the Fund may also enter into contracts that provide general indemnifications. The Fund's maximum exposure under these arrangements is unknown as this would be dependent on future claims that may be made against the Fund. The risk of material loss from such claims is considered remote.
Shareholder Expense Example
As a shareholder of the Fund, you incur two types of costs: (1) transaction costs and (2) ongoing costs, including management fees and other Fund expenses. This Example is intended to help you understand your ongoing costs (in dollars) of investing in the Fund and to compare these costs with the ongoing costs of investing in other mutual funds.
The Example is based on an investment of $1,000 invested at the beginning of the period and held for the entire period (August 1, 2017 to January 31, 2018).
Actual Expenses
The first line of the accompanying table for each class of the Fund provides information about actual account values and actual expenses. You may use the information in this line, together with the amount you invested, to estimate the expenses that you paid over the period. Simply divide your account value by $1,000.00 (for example, an $8,600 account value divided by $1,000.00 = 8.6), then multiply the result by the number in the first line for a class of the Fund under the heading entitled "Expenses Paid During Period" to estimate the expenses you paid on your account during this period. A small balance maintenance fee of $12.00 that is charged once a year may apply for certain accounts with a value of less than $2,000. This fee is not included in the table below. If it was, the estimate of expenses you paid during the period would be higher, and your ending account value lower, by this amount. In addition, the Fund, as a shareholder in the underlying Fidelity Central Funds, will indirectly bear its pro-rata share of the fees and expenses incurred by the underlying Fidelity Central Funds. These fees and expenses are not included in the Fund's annualized expense ratio used to calculate the expense estimate in the table below.
Hypothetical Example for Comparison Purposes
The second line of the accompanying table for each class of the Fund provides information about hypothetical account values and hypothetical expenses based on a Class' actual expense ratio and an assumed rate of return of 5% per year before expenses, which is not the Class' actual return. The hypothetical account values and expenses may not be used to estimate the actual ending account balance or expenses you paid for the period. You may use this information to compare the ongoing costs of investing in the Fund and other funds. To do so, compare this 5% hypothetical example with the 5% hypothetical examples that appear in the shareholder reports of the other funds. A small balance maintenance fee of $12.00 that is charged once a year may apply for certain accounts with a value of less than $2,000. This fee is not included in the table below. If it was, the estimate of expenses you paid during the period would be higher, and your ending account value lower, by this amount. In addition, the Fund, as a shareholder in the underlying Fidelity Central Funds, will indirectly bear its pro-rata share of the fees and expenses incurred by the underlying Fidelity Central Funds. These fees and expenses are not included in the Fund's annualized expense ratio used to calculate the expense estimate in the table below.
Please note that the expenses shown in the table are meant to highlight your ongoing costs only and do not reflect any transaction costs. Therefore, the second line of the table is useful in comparing ongoing costs only, and will not help you determine the relative total costs of owning different funds.
| | Annualized Expense Ratio-A | Beginning
Account Value
August 1, 2017 | Ending
Account Value
January 31, 2018 | Expenses Paid
During Period-B
August 1, 2017
to January 31, 2018 |
| Dividend Growth | .51% | | | |
| Actual | | $1,000.00 | $1,156.50 | $2.77 |
| Hypothetical-C | | $1,000.00 | $1,022.63 | $2.60 |
| Class K | .40% | | | |
| Actual | | $1,000.00 | $1,156.90 | $2.17 |
| Hypothetical-C | | $1,000.00 | $1,023.19 | $2.04 |
A Annualized expense ratio reflects expenses net of applicable fee waivers.
B Expenses are equal to each Class' annualized expense ratio, multiplied by the average account value over the period, multiplied by 184/365 (to reflect the one-half year period).
C 5% return per year before expenses
Corporate Headquarters
245 Summer St.
Boston, MA 02210
www.fidelity.com
DGF-SANN-0318
1.470802.121
Fidelity Flex℠ Funds Fidelity Flex℠ Large Cap Growth Fund
Semi-Annual Report January 31, 2018 |
|
Contents
To view a fund's proxy voting guidelines and proxy voting record for the 12-month period ended June 30, visit http://www.fidelity.com/proxyvotingresults or visit the Securities and Exchange Commission's (SEC) web site at http://www.sec.gov.
You may also call 1-800-835-5092 to request a free copy of the proxy voting guidelines.
Standard & Poor's, S&P and S&P 500 are registered service marks of The McGraw-Hill Companies, Inc. and have been licensed for use by Fidelity Distributors Corporation.
Other third-party marks appearing herein are the property of their respective owners.
All other marks appearing herein are registered or unregistered trademarks or service marks of FMR LLC or an affiliated company. © 2018 FMR LLC. All rights reserved.
This report and the financial statements contained herein are submitted for the general information of the shareholders of the Fund. This report is not authorized for distribution to prospective investors in the Fund unless preceded or accompanied by an effective prospectus.
A fund files its complete schedule of portfolio holdings with the SEC for the first and third quarters of each fiscal year on Form N-Q. Forms N-Q are available on the SEC’s web site at http://www.sec.gov. A fund's Forms N-Q may be reviewed and copied at the SEC’s Public Reference Room in Washington, DC. Information regarding the operation of the SEC's Public Reference Room may be obtained by calling 1-800-SEC-0330.
For a complete list of a fund's portfolio holdings, view the most recent holdings listing, semiannual report, or annual report on Fidelity's web site at http://www.fidelity.com, http://www.institutional.fidelity.com, or http://www.401k.com, as applicable.
NOT FDIC INSURED •MAY LOSE VALUE •NO BANK GUARANTEE
Neither the Fund nor Fidelity Distributors Corporation is a bank.
Investment Summary (Unaudited)
Top Ten Stocks as of January 31, 2018
| | % of fund's net assets |
| Alphabet, Inc. Class A | 6.7 |
| Amazon.com, Inc. | 6.7 |
| Apple, Inc. | 5.9 |
| Facebook, Inc. Class A | 4.2 |
| Microsoft Corp. | 3.7 |
| NVIDIA Corp. | 3.0 |
| Tesla, Inc. | 2.4 |
| Salesforce.com, Inc. | 2.4 |
| Broadcom Ltd. | 2.1 |
| Visa, Inc. Class A | 2.0 |
| | 39.1 |
Top Five Market Sectors as of January 31, 2018
| | % of fund's net assets |
| Information Technology | 43.2 |
| Consumer Discretionary | 26.6 |
| Health Care | 10.5 |
| Industrials | 5.5 |
| Consumer Staples | 4.7 |
Asset Allocation (% of fund's net assets)
| As of January 31, 2018 * |
| | Stocks | 98.7% |
| | Convertible Securities | 1.2% |
| | Net Other Assets (Liabilities) | 0.1% |

* Foreign investments - 13.4%
Schedule of Investments January 31, 2018 (Unaudited)
Showing Percentage of Net Assets
| Common Stocks - 98.7% | | | |
| | | Shares | Value |
| CONSUMER DISCRETIONARY - 25.8% | | | |
| Auto Components - 0.1% | | | |
| Aptiv PLC | | 83 | $7,875 |
| Automobiles - 2.4% | | | |
| Tesla, Inc.(a) | | 909 | 322,068 |
| Diversified Consumer Services - 0.4% | | | |
| Adtalem Global Education, Inc. (a) | | 107 | 4,922 |
| Chegg, Inc. (a) | | 298 | 5,161 |
| Grand Canyon Education, Inc. (a) | | 31 | 2,883 |
| New Oriental Education & Technology Group, Inc. sponsored ADR | | 312 | 28,732 |
| ServiceMaster Global Holdings, Inc. (a) | | 224 | 11,809 |
| Weight Watchers International, Inc. (a) | | 42 | 2,700 |
| | | | 56,207 |
| Hotels, Restaurants & Leisure - 3.5% | | | |
| Alsea S.A.B. de CV | | 700 | 2,290 |
| Caesars Entertainment Corp. (a) | | 928 | 12,946 |
| Chipotle Mexican Grill, Inc. (a) | | 197 | 63,978 |
| Delta Corp. Ltd. (a) | | 442 | 2,405 |
| Eldorado Resorts, Inc. (a) | | 40 | 1,382 |
| Hilton Grand Vacations, Inc. (a) | | 61 | 2,743 |
| Hyatt Hotels Corp. Class A (a) | | 33 | 2,683 |
| Las Vegas Sands Corp. | | 226 | 17,520 |
| Marriott International, Inc. Class A | | 217 | 31,973 |
| Marriott Vacations Worldwide Corp. | | 29 | 4,418 |
| McDonald's Corp. | | 678 | 116,033 |
| Melco Crown Entertainment Ltd. sponsored ADR | | 244 | 7,266 |
| MGM Mirage, Inc. | | 1,041 | 37,944 |
| Penn National Gaming, Inc. (a) | | 593 | 18,923 |
| Royal Caribbean Cruises Ltd. | | 187 | 24,974 |
| Shake Shack, Inc. Class A (a) | | 443 | 19,364 |
| Starbucks Corp. | | 943 | 53,572 |
| U.S. Foods Holding Corp. (a) | | 694 | 22,298 |
| Vail Resorts, Inc. | | 23 | 5,027 |
| Wyndham Worldwide Corp. | | 163 | 20,233 |
| Yum China Holdings, Inc. | | 321 | 14,891 |
| | | | 482,863 |
| Household Durables - 0.7% | | | |
| D.R. Horton, Inc. | | 253 | 12,410 |
| Forbo Holding AG (Reg.) | | 1 | 1,691 |
| Neinor Homes SLU (b) | | 95 | 2,182 |
| Newell Brands, Inc. | | 246 | 6,504 |
| Panasonic Corp. | | 239 | 3,548 |
| SodaStream International Ltd. (a) | | 397 | 31,216 |
| Sony Corp. | | 717 | 34,388 |
| | | | 91,939 |
| Internet & Direct Marketing Retail - 9.6% | | | |
| Amazon.com, Inc. (a) | | 630 | 914,061 |
| Boohoo.Com PLC (a) | | 2,018 | 5,311 |
| Expedia, Inc. | | 30 | 3,840 |
| JD.com, Inc. sponsored ADR (a) | | 2,182 | 107,420 |
| Netflix, Inc. (a) | | 543 | 146,773 |
| Priceline Group, Inc. (a) | | 61 | 116,635 |
| Start Today Co. Ltd. | | 99 | 2,925 |
| Wayfair LLC Class A (a) | | 48 | 4,416 |
| | | | 1,301,381 |
| Leisure Products - 0.0% | | | |
| Spin Master Corp. (a)(b) | | 111 | 4,786 |
| Media - 0.5% | | | |
| AMC Entertainment Holdings, Inc. Class A | | 94 | 1,203 |
| CBS Corp. Class B | | 68 | 3,917 |
| China Literature Ltd. (a)(b) | | 1,382 | 14,319 |
| Live Nation Entertainment, Inc. (a) | | 78 | 3,515 |
| Naspers Ltd. Class N | | 84 | 23,985 |
| The Walt Disney Co. | | 181 | 19,669 |
| Vivendi SA | | 45 | 1,320 |
| | | | 67,928 |
| Multiline Retail - 1.5% | | | |
| Avenue Supermarts Ltd. (b) | | 73 | 1,355 |
| B&M European Value Retail S.A. | | 704 | 4,157 |
| Dollar General Corp. | | 78 | 8,043 |
| Dollar Tree, Inc. (a) | | 1,483 | 170,545 |
| Macy's, Inc. | | 286 | 7,422 |
| Nordstrom, Inc. | | 53 | 2,613 |
| Ollie's Bargain Outlet Holdings, Inc. (a) | | 99 | 5,499 |
| Target Corp. | | 123 | 9,252 |
| V-Mart Retail Ltd. (a) | | 104 | 2,432 |
| | | | 211,318 |
| Specialty Retail - 3.6% | | | |
| Advance Auto Parts, Inc. | | 46 | 5,382 |
| Burlington Stores, Inc. (a) | | 140 | 17,039 |
| Dick's Sporting Goods, Inc. | | 165 | 5,191 |
| Floor & Decor Holdings, Inc. Class A | | 398 | 18,666 |
| Home Depot, Inc. | | 1,350 | 271,215 |
| Lowe's Companies, Inc. | | 699 | 73,206 |
| O'Reilly Automotive, Inc. (a) | | 50 | 13,235 |
| Ross Stores, Inc. | | 418 | 34,439 |
| The Children's Place Retail Stores, Inc. | | 45 | 6,741 |
| TJX Companies, Inc. | | 500 | 40,160 |
| | | | 485,274 |
| Textiles, Apparel & Luxury Goods - 3.5% | | | |
| adidas AG | | 674 | 156,734 |
| Canada Goose Holdings, Inc. | | 479 | 17,236 |
| Despegar.com Corp. | | 155 | 4,720 |
| G-III Apparel Group Ltd. (a) | | 217 | 8,105 |
| Kering SA | | 170 | 86,072 |
| LVMH Moet Hennessy - Louis Vuitton SA | | 48 | 15,036 |
| Michael Kors Holdings Ltd. (a) | | 419 | 27,654 |
| NIKE, Inc. Class B | | 939 | 64,059 |
| Prada SpA | | 2,666 | 10,889 |
| PVH Corp. | | 334 | 51,797 |
| Shenzhou International Group Holdings Ltd. | | 160 | 1,652 |
| Tapestry, Inc. | | 456 | 21,450 |
| Under Armour, Inc. Class C (non-vtg.) (a) | | 487 | 6,258 |
| VF Corp. | | 102 | 8,276 |
| | | | 479,938 |
|
| TOTAL CONSUMER DISCRETIONARY | | | 3,511,577 |
|
| CONSUMER STAPLES - 4.4% | | | |
| Beverages - 1.1% | | | |
| Constellation Brands, Inc. Class A (sub. vtg.) | | 239 | 52,453 |
| Diageo PLC | | 186 | 6,695 |
| Dr. Pepper Snapple Group, Inc. | | 77 | 9,190 |
| Fever-Tree Drinks PLC | | 193 | 6,708 |
| Monster Beverage Corp. (a) | | 1,121 | 76,486 |
| | | | 151,532 |
| Food & Staples Retailing - 1.0% | | | |
| Costco Wholesale Corp. | | 458 | 89,250 |
| Kroger Co. | | 596 | 18,095 |
| Performance Food Group Co. (a) | | 379 | 13,019 |
| Walmart, Inc. | | 75 | 7,995 |
| | | | 128,359 |
| Food Products - 0.3% | | | |
| Bunge Ltd. | | 113 | 8,976 |
| ConAgra Foods, Inc. | | 36 | 1,368 |
| Danone SA | | 40 | 3,443 |
| Darling International, Inc. (a) | | 183 | 3,393 |
| Lamb Weston Holdings, Inc. | | 118 | 6,915 |
| Pinnacle Foods, Inc. | | 22 | 1,363 |
| The Hain Celestial Group, Inc. (a) | | 382 | 14,569 |
| | | | 40,027 |
| Household Products - 0.1% | | | |
| Spectrum Brands Holdings, Inc. | | 107 | 12,675 |
| Personal Products - 1.0% | | | |
| Coty, Inc. Class A | | 1,189 | 23,316 |
| Estee Lauder Companies, Inc. Class A | | 149 | 20,109 |
| Herbalife Ltd. (a) | | 634 | 52,616 |
| Kose Corp. | | 31 | 5,354 |
| Unilever NV (NY Reg.) | | 634 | 36,449 |
| | | | 137,844 |
| Tobacco - 0.9% | | | |
| British American Tobacco PLC: | | | |
| (United Kingdom) | | 30 | 2,050 |
| sponsored ADR | | 1,103 | 75,114 |
| Philip Morris International, Inc. | | 471 | 50,505 |
| | | | 127,669 |
|
| TOTAL CONSUMER STAPLES | | | 598,106 |
|
| ENERGY - 2.0% | | | |
| Energy Equipment & Services - 0.0% | | | |
| Shelf Drilling Ltd. (b) | | 197 | 1,661 |
| U.S. Silica Holdings, Inc. | | 113 | 3,762 |
| | | | 5,423 |
| Oil, Gas & Consumable Fuels - 2.0% | | | |
| Anadarko Petroleum Corp. | | 668 | 40,113 |
| Andeavor | | 66 | 7,139 |
| Bharat Petroleum Corp. Ltd. | | 328 | 2,541 |
| Cenovus Energy, Inc. | | 506 | 4,826 |
| Cimarex Energy Co. | | 204 | 22,889 |
| Continental Resources, Inc. (a) | | 808 | 44,868 |
| Diamondback Energy, Inc. (a) | | 222 | 27,861 |
| EOG Resources, Inc. | | 249 | 28,635 |
| Marathon Petroleum Corp. | | 57 | 3,948 |
| Oasis Petroleum, Inc. (a) | | 437 | 3,784 |
| Petronet LNG Ltd. | | 338 | 1,355 |
| Pioneer Natural Resources Co. | | 177 | 32,375 |
| Reliance Industries Ltd. | | 1,492 | 22,565 |
| Valero Energy Corp. | | 98 | 9,405 |
| Whiting Petroleum Corp. (a) | | 502 | 14,016 |
| | | | 266,320 |
|
| TOTAL ENERGY | | | 271,743 |
|
| FINANCIALS - 4.4% | | | |
| Banks - 2.2% | | | |
| Bank of America Corp. | | 3,407 | 109,024 |
| Citigroup, Inc. | | 817 | 64,118 |
| First Republic Bank | | 29 | 2,597 |
| HDFC Bank Ltd. sponsored ADR | | 243 | 26,387 |
| JPMorgan Chase & Co. | | 785 | 90,801 |
| Kotak Mahindra Bank Ltd. (a) | | 305 | 5,321 |
| | | | 298,248 |
| Capital Markets - 1.9% | | | |
| BlackRock, Inc. Class A | | 94 | 52,809 |
| CBOE Holdings, Inc. | | 226 | 30,372 |
| Charles Schwab Corp. | | 423 | 22,563 |
| E*TRADE Financial Corp. (a) | | 101 | 5,323 |
| Fairfax India Holdings Corp. (a) | | 246 | 4,541 |
| Goldman Sachs Group, Inc. | | 263 | 70,455 |
| KKR & Co. LP | | 111 | 2,673 |
| Morgan Stanley | | 613 | 34,665 |
| MSCI, Inc. | | 28 | 3,898 |
| TD Ameritrade Holding Corp. | | 372 | 20,754 |
| The Blackstone Group LP | | 74 | 2,705 |
| | | | 250,758 |
| Consumer Finance - 0.0% | | | |
| Synchrony Financial | | 106 | 4,206 |
| Diversified Financial Services - 0.1% | | | |
| Berkshire Hathaway, Inc. Class B (a) | | 54 | 11,577 |
| GDS Holdings Ltd. ADR (a) | | 47 | 1,341 |
| | | | 12,918 |
| Insurance - 0.1% | | | |
| Chubb Ltd. | | 36 | 5,621 |
| MetLife, Inc. | | 100 | 4,807 |
| The Travelers Companies, Inc. | | 39 | 5,847 |
| | | | 16,275 |
| Thrifts & Mortgage Finance - 0.1% | | | |
| Housing Development Finance Corp. Ltd. | | 345 | 10,619 |
|
| TOTAL FINANCIALS | | | 593,024 |
|
| HEALTH CARE - 10.5% | | | |
| Biotechnology - 6.4% | | | |
| AC Immune SA (a) | | 332 | 4,436 |
| ACADIA Pharmaceuticals, Inc. (a) | | 144 | 4,307 |
| Acceleron Pharma, Inc. (a) | | 40 | 1,660 |
| Achaogen, Inc. (a) | | 192 | 2,106 |
| Agios Pharmaceuticals, Inc. (a) | | 39 | 3,072 |
| Aimmune Therapeutics, Inc. (a) | | 247 | 8,697 |
| Alexion Pharmaceuticals, Inc. (a) | | 915 | 109,178 |
| Alkermes PLC (a) | | 531 | 30,357 |
| Alnylam Pharmaceuticals, Inc. (a) | | 499 | 64,860 |
| Amgen, Inc. | | 505 | 93,955 |
| AnaptysBio, Inc. | | 57 | 6,007 |
| Arena Pharmaceuticals, Inc. (a) | | 75 | 2,807 |
| Ascendis Pharma A/S sponsored ADR (a) | | 55 | 2,803 |
| BeiGene Ltd. ADR (a) | | 59 | 8,009 |
| Biogen, Inc. (a) | | 293 | 101,908 |
| BioMarin Pharmaceutical, Inc. (a) | | 205 | 18,497 |
| bluebird bio, Inc. (a) | | 176 | 36,062 |
| Blueprint Medicines Corp. (a) | | 31 | 2,438 |
| Celgene Corp. (a) | | 485 | 49,063 |
| DBV Technologies SA sponsored ADR (a) | | 51 | 1,181 |
| Denali Therapeutics, Inc. (a) | | 422 | 9,816 |
| Editas Medicine, Inc. (a) | | 291 | 10,624 |
| Epizyme, Inc. (a) | | 139 | 2,245 |
| Exact Sciences Corp. (a) | | 86 | 4,275 |
| Exelixis, Inc. (a) | | 1,330 | 40,312 |
| FibroGen, Inc. (a) | | 175 | 10,246 |
| Flexion Therapeutics, Inc. (a) | | 44 | 994 |
| GenSight Biologics SA (a)(b) | | 263 | 2,122 |
| Global Blood Therapeutics, Inc. (a) | | 324 | 18,760 |
| Grifols SA ADR | | 46 | 1,143 |
| Insmed, Inc. (a) | | 75 | 1,908 |
| Intellia Therapeutics, Inc. (a) | | 300 | 7,710 |
| Ironwood Pharmaceuticals, Inc. Class A (a) | | 527 | 7,805 |
| Merrimack Pharmaceuticals, Inc. | | 82 | 861 |
| Neurocrine Biosciences, Inc. (a) | | 169 | 14,444 |
| Portola Pharmaceuticals, Inc. (a) | | 189 | 9,698 |
| Prothena Corp. PLC (a) | | 53 | 2,215 |
| Radius Health, Inc. (a) | | 35 | 1,318 |
| Regeneron Pharmaceuticals, Inc. (a) | | 292 | 107,062 |
| Sage Therapeutics, Inc. (a) | | 100 | 18,980 |
| Sarepta Therapeutics, Inc. (a) | | 68 | 4,457 |
| Seattle Genetics, Inc. (a) | | 188 | 9,832 |
| Trevena, Inc. (a) | | 430 | 701 |
| Ultragenyx Pharmaceutical, Inc. (a) | | 74 | 3,948 |
| Vertex Pharmaceuticals, Inc. (a) | | 114 | 19,023 |
| Xencor, Inc. (a) | | 112 | 2,549 |
| Zai Lab Ltd. ADR | | 97 | 2,615 |
| | | | 867,066 |
| Health Care Equipment & Supplies - 1.7% | | | |
| Becton, Dickinson & Co. | | 18 | 4,373 |
| Boston Scientific Corp. (a) | | 2,555 | 71,438 |
| Danaher Corp. | | 229 | 23,193 |
| Fisher & Paykel Healthcare Corp. | | 122 | 1,200 |
| Hoya Corp. | | 20 | 1,027 |
| Insulet Corp. (a) | | 107 | 8,189 |
| Intuitive Surgical, Inc. (a) | | 222 | 95,831 |
| Invuity, Inc. (a) | | 285 | 1,482 |
| iRhythm Technologies, Inc. (a) | | 281 | 16,756 |
| Novocure Ltd. (a) | | 84 | 1,886 |
| Penumbra, Inc. (a) | | 10 | 996 |
| Quanterix Corp. (a) | | 83 | 1,727 |
| Stryker Corp. | | 8 | 1,315 |
| | | | 229,413 |
| Health Care Providers & Services - 1.4% | | | |
| Anthem, Inc. | | 53 | 13,136 |
| Apollo Hospitals Enterprise Ltd. | | 331 | 6,055 |
| Cigna Corp. | | 92 | 19,168 |
| Humana, Inc. | | 265 | 74,685 |
| OptiNose, Inc. | | 707 | 13,398 |
| UnitedHealth Group, Inc. | | 251 | 59,432 |
| | | | 185,874 |
| Health Care Technology - 0.1% | | | |
| Cerner Corp. (a) | | 179 | 12,374 |
| Evolent Health, Inc. (a) | | 169 | 2,383 |
| Teladoc, Inc. (a) | | 169 | 6,321 |
| | | | 21,078 |
| Pharmaceuticals - 0.9% | | | |
| Aclaris Therapeutics, Inc. (a) | | 88 | 1,947 |
| Akcea Therapeutics, Inc. | | 446 | 9,656 |
| Allergan PLC | | 319 | 57,503 |
| Avexis, Inc. (a) | | 25 | 3,093 |
| Dermira, Inc. (a) | | 138 | 3,936 |
| Dova Pharmaceuticals, Inc. | | 54 | 1,720 |
| GW Pharmaceuticals PLC ADR (a) | | 77 | 10,636 |
| Intersect ENT, Inc. (a) | | 46 | 1,718 |
| Jazz Pharmaceuticals PLC (a) | | 108 | 15,740 |
| Nektar Therapeutics (a) | | 92 | 7,692 |
| Perrigo Co. PLC | | 30 | 2,719 |
| Revance Therapeutics, Inc. (a) | | 36 | 1,163 |
| Theravance Biopharma, Inc. (a) | | 20 | 529 |
| Zogenix, Inc. (a) | | 59 | 2,145 |
| | | | 120,197 |
|
| TOTAL HEALTH CARE | | | 1,423,628 |
|
| INDUSTRIALS - 5.5% | | | |
| Aerospace & Defense - 0.9% | | | |
| Bombardier, Inc. Class B (sub. vtg.) (a) | | 1,651 | 4,671 |
| Elbit Systems Ltd. | | 28 | 4,194 |
| General Dynamics Corp. | | 12 | 2,670 |
| Northrop Grumman Corp. | | 99 | 33,712 |
| Raytheon Co. | | 83 | 17,342 |
| The Boeing Co. | | 169 | 59,889 |
| | | | 122,478 |
| Air Freight & Logistics - 0.2% | | | |
| XPO Logistics, Inc. (a) | | 362 | 34,187 |
| Airlines - 1.4% | | | |
| Allegiant Travel Co. | | 16 | 2,548 |
| Azul SA sponsored ADR | | 218 | 6,363 |
| Delta Air Lines, Inc. | | 740 | 42,010 |
| InterGlobe Aviation Ltd. (b) | | 227 | 4,339 |
| JetBlue Airways Corp. (a) | | 404 | 8,427 |
| Ryanair Holdings PLC sponsored ADR (a) | | 17 | 2,086 |
| Southwest Airlines Co. | | 1,147 | 69,738 |
| Spirit Airlines, Inc. (a) | | 283 | 11,920 |
| United Continental Holdings, Inc. (a) | | 464 | 31,468 |
| Wizz Air Holdings PLC (a)(b) | | 131 | 6,441 |
| | | | 185,340 |
| Building Products - 0.1% | | | |
| Kajaria Ceramics Ltd. | | 409 | 4,065 |
| Masco Corp. | | 337 | 15,050 |
| | | | 19,115 |
| Commercial Services & Supplies - 0.1% | | | |
| Copart, Inc. (a) | | 63 | 2,776 |
| Evoqua Water Technologies Corp. (a) | | 178 | 4,069 |
| HomeServe PLC | | 441 | 4,903 |
| Novus Holdings Ltd. | | 30 | 12 |
| | | | 11,760 |
| Construction & Engineering - 0.0% | | | |
| Fluor Corp. | | 113 | 6,859 |
| Electrical Equipment - 0.1% | | | |
| AMETEK, Inc. | | 16 | 1,221 |
| Fortive Corp. | | 76 | 5,778 |
| Melrose Industries PLC | | 432 | 1,389 |
| Nidec Corp. | | 16 | 2,575 |
| Sensata Technologies Holding BV (a) | | 92 | 5,175 |
| | | | 16,138 |
| Industrial Conglomerates - 0.4% | | | |
| Honeywell International, Inc. | | 235 | 37,522 |
| ITT, Inc. | | 211 | 11,816 |
| | | | 49,338 |
| Machinery - 1.5% | | | |
| Allison Transmission Holdings, Inc. | | 144 | 6,371 |
| Aumann AG (b) | | 83 | 6,863 |
| Caterpillar, Inc. | | 757 | 123,224 |
| Deere & Co. | | 40 | 6,657 |
| Eicher Motors Ltd. | | 7 | 2,965 |
| Gardner Denver Holdings, Inc. | | 189 | 6,536 |
| Kennametal, Inc. | | 80 | 3,902 |
| Minebea Mitsumi, Inc. | | 57 | 1,297 |
| Parker Hannifin Corp. | | 20 | 4,028 |
| Rational AG | | 8 | 5,622 |
| SMC Corp. | | 3 | 1,479 |
| WABCO Holdings, Inc. (a) | | 166 | 25,629 |
| Xylem, Inc. | | 181 | 13,079 |
| | | | 207,652 |
| Professional Services - 0.1% | | | |
| IHS Markit Ltd. (a) | | 257 | 12,267 |
| Road & Rail - 0.3% | | | |
| Avis Budget Group, Inc. (a) | | 172 | 7,733 |
| J.B. Hunt Transport Services, Inc. | | 141 | 17,037 |
| Knight-Swift Transportation Holdings, Inc. Class A | | 137 | 6,821 |
| Landstar System, Inc. | | 32 | 3,554 |
| | | | 35,145 |
| Trading Companies & Distributors - 0.4% | | | |
| Ashtead Group PLC | | 93 | 2,780 |
| United Rentals, Inc. (a) | | 229 | 41,474 |
| Univar, Inc. (a) | | 144 | 4,300 |
| Wolseley PLC | | 9 | 695 |
| | | | 49,249 |
| Transportation Infrastructure - 0.0% | | | |
| Adani Ports & Special Economic Zone Ltd. | | 185 | 1,248 |
|
| TOTAL INDUSTRIALS | | | 750,776 |
|
| INFORMATION TECHNOLOGY - 43.1% | | | |
| Communications Equipment - 0.3% | | | |
| Arista Networks, Inc. (a) | | 73 | 20,135 |
| NETGEAR, Inc. (a) | | 347 | 24,186 |
| | | | 44,321 |
| Electronic Equipment & Components - 0.3% | | | |
| Amphenol Corp. Class A | | 13 | 1,206 |
| Corning, Inc. | | 233 | 7,274 |
| Dell Technologies, Inc. (a) | | 317 | 22,729 |
| SYNNEX Corp. | | 10 | 1,227 |
| | | | 32,436 |
| Internet Software & Services - 14.3% | | | |
| 2U, Inc. (a) | | 116 | 8,615 |
| Akamai Technologies, Inc. (a) | | 129 | 8,642 |
| Alibaba Group Holding Ltd. sponsored ADR (a) | | 603 | 123,187 |
| Alphabet, Inc.: | | | |
| Class A (a) | | 774 | 915,036 |
| Class C (a) | | 92 | 107,634 |
| ANGI Homeservices, Inc. Class A (a) | | 304 | 4,061 |
| CarGurus, Inc. Class A | | 519 | 17,387 |
| Facebook, Inc. Class A (a) | | 3,040 | 568,146 |
| GoDaddy, Inc. (a) | | 101 | 5,578 |
| Gogo, Inc. (a) | | 1,318 | 12,706 |
| GrubHub, Inc. (a) | | 18 | 1,301 |
| IAC/InterActiveCorp (a) | | 10 | 1,450 |
| LogMeIn, Inc. | | 9 | 1,132 |
| Mail.Ru Group Ltd. GDR (Reg. S) (a) | | 250 | 8,200 |
| Match Group, Inc. (a) | | 46 | 1,607 |
| Momo, Inc. ADR (a) | | 234 | 7,378 |
| NetEase, Inc. ADR | | 59 | 18,889 |
| New Relic, Inc. (a) | | 85 | 5,077 |
| Okta, Inc. | | 55 | 1,620 |
| Shopify, Inc. Class A (a) | | 151 | 19,279 |
| Stamps.com, Inc. (a) | | 63 | 12,843 |
| Tencent Holdings Ltd. | | 1,387 | 81,954 |
| Yandex NV Series A (a) | | 375 | 14,524 |
| | | | 1,946,246 |
| IT Services - 4.5% | | | |
| MasterCard, Inc. Class A | | 1,083 | 183,027 |
| PayPal Holdings, Inc. (a) | | 1,531 | 130,625 |
| Square, Inc. (a) | | 135 | 6,333 |
| Vakrangee Ltd. | | 720 | 4,132 |
| Visa, Inc. Class A | | 2,197 | 272,933 |
| Worldpay, Inc. (a) | | 153 | 12,287 |
| | | | 609,337 |
| Semiconductors & Semiconductor Equipment - 7.5% | | | |
| ASM Pacific Technology Ltd. | | 495 | 6,758 |
| ASML Holding NV | | 32 | 6,495 |
| Broadcom Ltd. | | 1,152 | 285,731 |
| Cypress Semiconductor Corp. | | 269 | 4,651 |
| Inphi Corp. (a) | | 385 | 11,500 |
| Intel Corp. | | 381 | 18,341 |
| Lam Research Corp. | | 189 | 36,197 |
| Marvell Technology Group Ltd. | | 2,367 | 55,222 |
| Micron Technology, Inc. (a) | | 2,507 | 109,606 |
| Monolithic Power Systems, Inc. | | 59 | 7,028 |
| NVIDIA Corp. | | 1,677 | 412,207 |
| Qualcomm, Inc. | | 602 | 41,087 |
| Renesas Electronics Corp. (a) | | 1,136 | 13,387 |
| WONIK IPS Co. Ltd. (a) | | 180 | 5,544 |
| Xilinx, Inc. | | 77 | 5,623 |
| | | | 1,019,377 |
| Software - 10.3% | | | |
| Activision Blizzard, Inc. | | 2,735 | 202,746 |
| Adobe Systems, Inc. (a) | | 591 | 118,058 |
| Altair Engineering, Inc. Class A (a) | | 260 | 6,916 |
| Atlassian Corp. PLC (a) | | 24 | 1,296 |
| Autodesk, Inc. (a) | | 148 | 17,112 |
| Electronic Arts, Inc. (a) | | 459 | 58,275 |
| Globant SA (a) | | 24 | 1,091 |
| Intuit, Inc. | | 98 | 16,454 |
| Micro Focus International PLC | | 214 | 6,533 |
| Microsoft Corp. | | 5,313 | 504,788 |
| Nintendo Co. Ltd. | | 12 | 5,435 |
| Paycom Software, Inc. (a) | | 239 | 21,902 |
| Red Hat, Inc. (a) | | 249 | 32,714 |
| RingCentral, Inc. (a) | | 51 | 2,769 |
| SailPoint Technologies Holding, Inc. (a) | | 372 | 6,224 |
| Salesforce.com, Inc. (a) | | 2,820 | 321,226 |
| SendGrid, Inc. (a) | | 156 | 3,505 |
| Snap, Inc. Class A (a) | | 867 | 11,722 |
| Take-Two Interactive Software, Inc. (a) | | 54 | 6,840 |
| Talend SA ADR (a) | | 84 | 3,273 |
| Tanium, Inc. Class B (c)(d) | | 131 | 724 |
| VMware, Inc. Class A (a) | | 113 | 13,988 |
| Workday, Inc. Class A (a) | | 205 | 24,577 |
| Zendesk, Inc. (a) | | 308 | 11,864 |
| | | | 1,400,032 |
| Technology Hardware, Storage & Peripherals - 5.9% | | | |
| Apple, Inc. | | 4,779 | 800,148 |
|
| TOTAL INFORMATION TECHNOLOGY | | | 5,851,897 |
|
| MATERIALS - 2.7% | | | |
| Chemicals - 2.3% | | | |
| Cabot Corp. | | 60 | 4,058 |
| CF Industries Holdings, Inc. | | 1,295 | 54,960 |
| DowDuPont, Inc. | | 605 | 45,726 |
| FMC Corp. | | 375 | 34,249 |
| LG Chemical Ltd. | | 17 | 6,865 |
| LyondellBasell Industries NV Class A | | 632 | 75,739 |
| Nutrien Ltd. (a) | | 74 | 3,871 |
| Orion Engineered Carbons SA | | 139 | 4,094 |
| PPG Industries, Inc. | | 22 | 2,612 |
| Sherwin-Williams Co. | | 12 | 5,005 |
| The Chemours Co. LLC | | 910 | 46,974 |
| The Mosaic Co. | | 50 | 1,365 |
| Tronox Ltd. Class A | | 729 | 14,310 |
| Westlake Chemical Corp. | | 79 | 8,895 |
| | | | 308,723 |
| Construction Materials - 0.3% | | | |
| Buzzi Unicem SpA | | 21 | 617 |
| Eagle Materials, Inc. | | 152 | 17,032 |
| Loma Negra Compania Industrial Argentina SA ADR (a) | | 178 | 4,229 |
| Summit Materials, Inc. | | 693 | 22,141 |
| | | | 44,019 |
| Metals & Mining - 0.1% | | | |
| China Molybdenum Co. Ltd. (H Shares) | | 14,579 | 11,219 |
| Franco-Nevada Corp. | | 28 | 2,141 |
| Glencore Xstrata PLC | | 626 | 3,588 |
| | | | 16,948 |
|
| TOTAL MATERIALS | | | 369,690 |
|
| REAL ESTATE - 0.1% | | | |
| Equity Real Estate Investment Trusts (REITs) - 0.1% | | | |
| Equinix, Inc. | | 15 | 6,828 |
| TELECOMMUNICATION SERVICES - 0.2% | | | |
| Diversified Telecommunication Services - 0.1% | | | |
| Bharti Infratel Ltd. | | 2,313 | 12,793 |
| Wireless Telecommunication Services - 0.1% | | | |
| T-Mobile U.S., Inc. (a) | | 271 | 17,642 |
|
| TOTAL TELECOMMUNICATION SERVICES | | | 30,435 |
|
| UTILITIES - 0.0% | | | |
| Gas Utilities - 0.0% | | | |
| China Resource Gas Group Ltd. | | 400 | 1,317 |
| ENN Energy Holdings Ltd. | | 177 | 1,367 |
| | | | 2,684 |
| Water Utilities - 0.0% | | | |
| AquaVenture Holdings Ltd. (a) | | 72 | 1,095 |
|
| TOTAL UTILITIES | | | 3,779 |
|
| TOTAL COMMON STOCKS | | | |
| (Cost $10,587,803) | | | 13,411,483 |
|
| Preferred Stocks - 1.0% | | | |
| Convertible Preferred Stocks - 1.0% | | | |
| CONSUMER DISCRETIONARY - 0.8% | | | |
| Diversified Consumer Services - 0.7% | | | |
| Lyft, Inc. Series H (c)(d) | | 2,516 | 100,001 |
| Hotels, Restaurants & Leisure - 0.0% | | | |
| Topgolf International, Inc. Series F (c)(d) | | 217 | 3,002 |
| Internet & Direct Marketing Retail - 0.1% | | | |
| The Honest Co., Inc. Series E (c)(d) | | 282 | 5,529 |
| TOTAL CONSUMER DISCRETIONARY | | | 108,532 |
| CONSUMER STAPLES - 0.1% | | | |
| Food & Staples Retailing - 0.1% | | | |
| Roofoods Ltd. Series F (c)(d) | | 17 | 6,011 |
| HEALTH CARE - 0.0% | | | |
| Biotechnology - 0.0% | | | |
| 23andMe, Inc. Series F (c)(d) | | 339 | 4,707 |
| INFORMATION TECHNOLOGY - 0.1% | | | |
| Internet Software & Services - 0.1% | | | |
| ContextLogic, Inc. Series G (c)(d) | | 67 | 9,014 |
| Starry, Inc. Series C (c)(d) | | 3,181 | 2,933 |
| | | | 11,947 |
| Software - 0.0% | | | |
| Compass, Inc. Series E (c)(d) | | 28 | 1,889 |
| TOTAL INFORMATION TECHNOLOGY | | | 13,836 |
|
| TOTAL CONVERTIBLE PREFERRED STOCKS | | | 133,086 |
|
| Nonconvertible Preferred Stocks - 0.0% | | | |
| CONSUMER DISCRETIONARY - 0.0% | | | |
| Automobiles - 0.0% | | | |
| Volkswagen AG | | 24 | 5,275 |
| TOTAL PREFERRED STOCKS | | | |
| (Cost $138,252) | | | 138,361 |
| | | Principal Amount | Value |
|
| Convertible Bonds - 0.2% | | | |
| CONSUMER STAPLES - 0.2% | | | |
| Tobacco - 0.2% | | | |
| PAX Labs, Inc. 10% 12/31/20(b)(d) | | | |
| (Cost $25,000) | | 25,000 | 25,000 |
| TOTAL INVESTMENT IN SECURITIES - 99.9% | | | |
| (Cost $10,751,055) | | | 13,574,844 |
| NET OTHER ASSETS (LIABILITIES) - 0.1% | | | 14,859 |
| NET ASSETS - 100% | | | $13,589,703 |
Legend
(a) Non-income producing
(b) Security exempt from registration under Rule 144A of the Securities Act of 1933. These securities may be resold in transactions exempt from registration, normally to qualified institutional buyers. At the end of the period, the value of these securities amounted to $69,068 or 0.5% of net assets.
(c) Restricted securities - Investment in securities not registered under the Securities Act of 1933 (excluding 144A issues). At the end of the period, the value of restricted securities (excluding 144A issues) amounted to $133,810 or 1.0% of net assets.
(d) Level 3 security
Additional information on each restricted holding is as follows:
| Security | Acquisition Date | Acquisition Cost |
| 23andMe, Inc. Series F | 8/31/17 | $4,707 |
| Compass, Inc. Series E | 11/3/17 | $1,889 |
| ContextLogic, Inc. Series G | 10/24/17 | $9,014 |
| Lyft, Inc. Series H | 11/22/17 | $100,001 |
| Roofoods Ltd. Series F | 9/12/17 | $6,011 |
| Starry, Inc. Series C | 12/8/17 | $2,933 |
| Tanium, Inc. Class B | 4/21/17 | $650 |
| The Honest Co., Inc. Series E | 9/28/17 | $5,529 |
| Topgolf International, Inc. Series F | 11/10/17 | $3,002 |
Affiliated Central Funds
Information regarding fiscal year to date income earned by the Fund from investments in Fidelity Central Funds is as follows:
| Fund | Income earned |
| Fidelity Cash Central Fund | $817 |
| Total | $817 |
Amounts in the income column in the above table include any capital gain distributions from underlying funds, which are presented in the corresponding line-item in the Statement of Operations if applicable.
Investment Valuation
The following is a summary of the inputs used, as of January 31, 2018, involving the Fund's assets and liabilities carried at fair value. The inputs or methodology used for valuing securities may not be an indication of the risk associated with investing in those securities. For more information on valuation inputs, and their aggregation into the levels used below, please refer to the Investment Valuation section in the accompanying Notes to Financial Statements.
| | Valuation Inputs at Reporting Date: |
| Description | Total | Level 1 | Level 2 | Level 3 |
| Investments in Securities: | | | | |
| Equities: | | | | |
| Consumer Discretionary | $3,625,384 | $3,460,955 | $55,897 | $108,532 |
| Consumer Staples | 604,117 | 580,564 | 17,542 | 6,011 |
| Energy | 271,743 | 271,743 | -- | -- |
| Financials | 593,024 | 593,024 | -- | -- |
| Health Care | 1,428,335 | 1,422,601 | 1,027 | 4,707 |
| Industrials | 750,776 | 745,425 | 5,351 | -- |
| Information Technology | 5,865,733 | 5,750,397 | 100,776 | 14,560 |
| Materials | 369,690 | 369,690 | -- | -- |
| Real Estate | 6,828 | 6,828 | -- | -- |
| Telecommunication Services | 30,435 | 30,435 | -- | -- |
| Utilities | 3,779 | 3,779 | -- | -- |
| Corporate Bonds | 25,000 | -- | -- | 25,000 |
| Total Investments in Securities: | $13,574,844 | $13,235,441 | $180,593 | $158,810 |
The following is a reconciliation of Investments in Securities for which Level 3 inputs were used in determining value:
| Investments in Securities: | |
| Beginning Balance | $2,304 |
| Net Realized Gain (Loss) on Investment Securities | -- |
| Net Unrealized Gain (Loss) on Investment Securities | 74 |
| Cost of Purchases | 158,086 |
| Proceeds of Sales | -- |
| Amortization/Accretion | -- |
| Transfers into Level 3 | -- |
| Transfers out of Level 3 | (1,654) |
| Ending Balance | $158,810 |
| The change in unrealized gain (loss) for the period attributable to Level 3 securities held at January 31, 2018 | $74 |
The information used in the above reconciliation represents fiscal year to date activity for any Investments in Securities identified as using Level 3 inputs at either the beginning or the end of the current fiscal period. Transfers in or out of Level 3 represent the beginning value of any Security or Instrument where a change in the pricing level occurred from the beginning to the end of the period. The cost of purchases and the proceeds of sales may include securities received or delivered through corporate actions or exchanges.
Other Information
Distribution of investments by country or territory of incorporation, as a percentage of Total Net Assets, is as follows (Unaudited):
| United States of America | 86.6% |
| Cayman Islands | 3.5% |
| Singapore | 2.1% |
| Germany | 1.2% |
| Netherlands | 1.1% |
| Others (Individually Less Than 1%) | 5.5% |
| | 100.0% |
See accompanying notes which are an integral part of the financial statements.
Financial Statements
Statement of Assets and Liabilities
| | | January 31, 2018 (Unaudited) |
| Assets | | |
Investment in securities, at value — See accompanying schedule:
Unaffiliated issuers (cost $10,751,055) | | $13,574,844 |
| Cash | | 12,752 |
| Receivable for investments sold | | 61,257 |
| Receivable for fund shares sold | | 5,377 |
| Dividends receivable | | 2,519 |
| Interest receivable | | 292 |
| Distributions receivable from Fidelity Central Funds | | 68 |
| Other receivables | | 89 |
| Total assets | | 13,657,198 |
| Liabilities | | |
| Payable for investments purchased | $59,735 | |
| Payable for fund shares redeemed | 7,760 | |
| Total liabilities | | 67,495 |
| Net Assets | | $13,589,703 |
| Net Assets consist of: | | |
| Paid in capital | | $10,729,724 |
| Undistributed net investment income | | 1,829 |
| Accumulated undistributed net realized gain (loss) on investments and foreign currency transactions | | 34,351 |
| Net unrealized appreciation (depreciation) on investments and assets and liabilities in foreign currencies | | 2,823,799 |
| Net Assets, for 1,007,550 shares outstanding | | $13,589,703 |
| Net Asset Value, offering price and redemption price per share ($13,589,703 ÷ 1,007,550 shares) | | $13.49 |
See accompanying notes which are an integral part of the financial statements.
Statement of Operations
| | | Six months ended January 31, 2018 (Unaudited) |
| Investment Income | | |
| Dividends | | $41,331 |
| Interest | | 477 |
| Income from Fidelity Central Funds | | 817 |
| Total income | | 42,625 |
| Expenses | | |
| Independent trustees' fees and expenses | $21 | |
| Miscellaneous | 15 | |
| Total expenses | | 36 |
| Net investment income (loss) | | 42,589 |
| Realized and Unrealized Gain (Loss) | | |
| Net realized gain (loss) on: | | |
| Investment securities: | | |
| Unaffiliated issuers | 46,796 | |
| Foreign currency transactions | (11) | |
| Total net realized gain (loss) | | 46,785 |
| Change in net unrealized appreciation (depreciation) on: | | |
| Investment securities: | | |
| Unaffiliated issuers | 2,138,357 | |
| Assets and liabilities in foreign currencies | 2 | |
| Total change in net unrealized appreciation (depreciation) | | 2,138,359 |
| Net gain (loss) | | 2,185,144 |
| Net increase (decrease) in net assets resulting from operations | | $2,227,733 |
See accompanying notes which are an integral part of the financial statements.
Statement of Changes in Net Assets
| | Six months ended January 31, 2018 (Unaudited) | For the period
March 8, 2017 (commencement of operations) to July 31, 2017 |
| Increase (Decrease) in Net Assets | | |
| Operations | | |
| Net investment income (loss) | $42,589 | $18,262 |
| Net realized gain (loss) | 46,785 | 20,535 |
| Change in net unrealized appreciation (depreciation) | 2,138,359 | 685,440 |
| Net increase (decrease) in net assets resulting from operations | 2,227,733 | 724,237 |
| Distributions to shareholders from net investment income | (59,022) | – |
| Distributions to shareholders from net realized gain | (32,969) | – |
| Total distributions | (91,991) | – |
| Share transactions | | |
| Proceeds from sales of shares | 5,321,134 | 8,053,459 |
| Reinvestment of distributions | 91,990 | – |
| Cost of shares redeemed | (2,535,505) | (201,354) |
| Net increase (decrease) in net assets resulting from share transactions | 2,877,619 | 7,852,105 |
| Total increase (decrease) in net assets | 5,013,361 | 8,576,342 |
| Net Assets | | |
| Beginning of period | 8,576,342 | – |
| End of period | $13,589,703 | $8,576,342 |
| Other Information | | |
| Undistributed net investment income end of period | $1,829 | $18,262 |
| Shares | | |
| Sold | 450,063 | 775,327 |
| Issued in reinvestment of distributions | 7,709 | – |
| Redeemed | (207,430) | (18,119) |
| Net increase (decrease) | 250,342 | 757,208 |
See accompanying notes which are an integral part of the financial statements.
Financial Highlights
Fidelity Flex Large Cap Growth Fund
| | Six months ended (Unaudited) January 31, | Years endedJuly 31, |
| | 2018 | 2017 A |
| Selected Per–Share Data | | |
| Net asset value, beginning of period | $11.33 | $10.00 |
| Income from Investment Operations | | |
| Net investment income (loss)B | .04 | .03 |
| Net realized and unrealized gain (loss) | 2.21 | 1.30 |
| Total from investment operations | 2.25 | 1.33 |
| Distributions from net investment income | (.06) | – |
| Distributions from net realized gain | (.04) | – |
| Total distributions | (.09)C | – |
| Net asset value, end of period | $13.49 | $11.33 |
| Total ReturnD | 20.01% | 13.30% |
| Ratios to Average Net AssetsE,F | | |
| Expenses before reductionsG | - %H | - %H |
| Expenses net of fee waivers, if anyG | - %H | - %H |
| Expenses net of all reductionsG | - %H | - %H |
| Net investment income (loss) | .72%H | .79%H |
| Supplemental Data | | |
| Net assets, end of period (000 omitted) | $13,590 | $8,576 |
| Portfolio turnover rateI | 48%H | 17%J |
A For the period March 8, 2017 (commencement of operations) to July 31, 2017.
B Calculated based on average shares outstanding during the period.
C Total distributions of $.09 per share is comprised of distributions from net investment income of $.059 and distributions from net realized gain of $.035 per share.
D Total returns for periods of less than one year are not annualized.
E Fees and expenses of any underlying Fidelity Central Funds are not included in the Fund's expense ratio. The Fund indirectly bears its proportionate share of the expenses of any underlying Fidelity Central Funds.
F Expense ratios reflect operating expenses of the Fund. Expenses before reductions do not reflect amounts reimbursed by the investment adviser or reductions from expense offset arrangements and do not represent the amount paid by the Fund during periods when reimbursements or reductions occur. Expense ratios before reductions for start-up periods may not be representative of longer term operating periods. Expenses net of fee waivers reflect expenses after reimbursement by the investment adviser but prior to reductions from expense offset arrangements. Expenses net of all reductions represent the net expenses paid by the Fund.
G Amount represents less than .005%.
H Annualized
I Amount does not include the portfolio activity of any underlying Fidelity Central Funds.
J Amount not annualized.
See accompanying notes which are an integral part of the financial statements.
Notes to Financial Statements (Unaudited)
For the period ended January 31, 2018
1. Organization.
Fidelity Flex Large Cap Growth Fund (the Fund) is a fund of Fidelity Securities Fund (the Trust) and is authorized to issue an unlimited number of shares. Share transactions on the Statement of Changes in Net Assets may contain exchanges between affiliated funds. The Trust is registered under the Investment Company Act of 1940, as amended (the 1940 Act), as an open-end management investment company organized as a Massachusetts business trust. The Fund is available only to certain fee-based accounts offered by Fidelity.
2. Investments in Fidelity Central Funds.
The Fund invests in Fidelity Central Funds, which are open-end investment companies generally available only to other investment companies and accounts managed by the investment adviser and its affiliates. The Fund's Schedule of Investments lists each of the Fidelity Central Funds held as of period end, if any, as an investment of the Fund, but does not include the underlying holdings of each Fidelity Central Fund. As an Investing Fund, the Fund indirectly bears its proportionate share of the expenses of the underlying Fidelity Central Funds.
The Money Market Central Funds seek preservation of capital and current income and are managed by Fidelity Investments Money Management, Inc. (FIMM), an affiliate of the investment adviser. Annualized expenses of the Money Market Central Funds as of their most recent shareholder report date are less than .005%.
A complete unaudited list of holdings for each Fidelity Central Fund is available upon request or at the Securities and Exchange Commission (the SEC) website at www.sec.gov. In addition, the financial statements of the Fidelity Central Funds are available on the SEC website or upon request.
3. Significant Accounting Policies.
The Fund is an investment company and applies the accounting and reporting guidance of the Financial Accounting Standards Board (FASB) Accounting Standards Codification Topic 946 Financial Services – Investments Companies. The financial statements have been prepared in conformity with accounting principles generally accepted in the United States of America (GAAP), which require management to make certain estimates and assumptions at the date of the financial statements. Actual results could differ from those estimates. Subsequent events, if any, through the date that the financial statements were issued have been evaluated in the preparation of the financial statements. The following summarizes the significant accounting policies of the Fund:
Investment Valuation. Investments are valued as of 4:00 p.m. Eastern time on the last calendar day of the period. The Board of Trustees (the Board) has delegated the day to day responsibility for the valuation of the Fund's investments to the Fair Value Committee (the Committee) established by the Fund's investment adviser. In accordance with valuation policies and procedures approved by the Board, the Fund attempts to obtain prices from one or more third party pricing vendors or brokers to value its investments. When current market prices, quotations or currency exchange rates are not readily available or reliable, investments will be fair valued in good faith by the Committee, in accordance with procedures adopted by the Board. Factors used in determining fair value vary by investment type and may include market or investment specific events, changes in interest rates and credit quality. The frequency with which these procedures are used cannot be predicted and they may be utilized to a significant extent. The Committee oversees the Fund's valuation policies and procedures and reports to the Board on the Committee's activities and fair value determinations. The Board monitors the appropriateness of the procedures used in valuing the Fund's investments and ratifies the fair value determinations of the Committee.
The Fund categorizes the inputs to valuation techniques used to value its investments into a disclosure hierarchy consisting of three levels as shown below:
- Level 1 – quoted prices in active markets for identical investments
- Level 2 – other significant observable inputs (including quoted prices for similar investments, interest rates, prepayment speeds, etc.)
- Level 3 – unobservable inputs (including the Fund's own assumptions based on the best information available)
Valuation techniques used to value the Fund's investments by major category are as follows:
Equity securities, including restricted securities, for which market quotations are readily available, are valued at the last reported sale price or official closing price as reported by a third party pricing vendor on the primary market or exchange on which they are traded and are categorized as Level 1 in the hierarchy. In the event there were no sales during the day or closing prices are not available, securities are valued at the last quoted bid price or may be valued using the last available price and are generally categorized as Level 2 in the hierarchy. For foreign equity securities, when market or security specific events arise, comparisons to the valuation of American Depositary Receipts (ADRs), futures contracts, Exchange-Traded Funds (ETFs) and certain indexes as well as quoted prices for similar securities may be used and would be categorized as Level 2 in the hierarchy. Utilizing these techniques may result in transfers between Level 1 and Level 2. For equity securities, including restricted securities, where observable inputs are limited, assumptions about market activity and risk are used and these securities may be categorized as Level 3 in the hierarchy. Equity securities, including restricted securities, for which observable inputs are not available are valued using alternate valuation approaches, including the market approach and the income approach and are categorized as Level 3 in the hierarchy. The market approach generally consists of using comparable market transactions while the income approach generally consists of using the net present value of estimated future cash flows, adjusted as appropriate for liquidity, credit, market and/or other risk factors.
Debt securities, including restricted securities, are valued based on evaluated prices received from third party pricing vendors or from brokers who make markets in such securities. Corporate bonds are valued by pricing vendors who utilize matrix pricing which considers yield or price of bonds of comparable quality, coupon, maturity and type or by broker-supplied prices. When independent prices are unavailable or unreliable, debt securities may be valued utilizing pricing methodologies which consider similar factors that would be used by third party pricing vendors. Debt securities are generally categorized as Level 2 in the hierarchy but may be Level 3 depending on the circumstances.
The following provides information on Level 3 securities held by the Fund that were valued at period end based on unobservable inputs. These amounts exclude valuations provided by a broker.
| Asset Type | Fair Value | Valuation Technique(s) | Unobservable Input | Amount or Range/Weighted Average | Impact to Valuation from an Increase in Input(a) |
| Corporate Bonds | $25,000 | Market approach | Transaction price | $100.00 | Increase |
| Equities | $133,810 | Market approach | Transaction price | $0.92-$353.57 / $57.54 | Increase |
| | | Market comparable | Enterprise value/Sales multiple (EV/S) | 14.3 | Increase |
| | | | Premium rate | 108.0% | Increase |
| | | | Discount for lack of marketability | 15.0% | Decrease |
| | | | Liquidity preference | $4.84 | Increase |
(a) Represents the expected directional change in the fair value of the Level 3 investments that would result from an increase in the corresponding input. A decrease to the unobservable input would have the opposite effect. Significant changes in these inputs could result in significantly higher or lower fair value measurements.
Changes in valuation techniques may result in transfers in or out of an assigned level within the disclosure hierarchy. The aggregate value of investments by input level as of January 31, 2018, as well as a roll forward of Level 3 investments, is included at the end of the Fund's Schedule of Investments.
Foreign Currency. The Fund may use foreign currency contracts to facilitate transactions in foreign-denominated securities. Gains and losses from these transactions may arise from changes in the value of the foreign currency or if the counterparties do not perform under the contracts' terms.
Foreign-denominated assets, including investment securities, and liabilities are translated into U.S. dollars at the exchange rates at period end. Purchases and sales of investment securities, income and dividends received and expenses denominated in foreign currencies are translated into U.S. dollars at the exchange rate in effect on the transaction date.
The effects of exchange rate fluctuations on investments are included with the net realized and unrealized gain (loss) on investment securities. Other foreign currency transactions resulting in realized and unrealized gain (loss) are disclosed separately.
Investment Transactions and Income. For financial reporting purposes, the Fund's investment holdings and NAV include trades executed through the end of the last business day of the period. The NAV per share for processing shareholder transactions is calculated as of the close of business of the New York Stock Exchange (NYSE), normally 4:00 p.m. Eastern time and includes trades executed through the end of the prior business day. Gains and losses on securities sold are determined on the basis of identified cost. Dividend income is recorded on the ex-dividend date, except for certain dividends from foreign securities where the ex-dividend date may have passed, which are recorded as soon as the Fund is informed of the ex-dividend date. Non-cash dividends included in dividend income, if any, are recorded at the fair market value of the securities received. Income and capital gain distributions from Fidelity Central Funds, if any, are recorded on the ex-dividend date. Certain distributions received by the Fund represent a return of capital or capital gain. The Fund determines the components of these distributions subsequent to the ex-dividend date, based upon receipt of tax filings or other correspondence relating to the underlying investment. These distributions are recorded as a reduction of cost of investments and/or as a realized gain. Interest income is accrued as earned and includes coupon interest and amortization of premium and accretion of discount on debt securities as applicable. Investment income is recorded net of foreign taxes withheld where recovery of such taxes is uncertain.
Expenses. Expenses directly attributable to a fund are charged to that fund. Expenses attributable to more than one fund are allocated among the respective funds on the basis of relative net assets or other appropriate methods. Expense estimates are accrued in the period to which they relate and adjustments are made when actual amounts are known.
Income Tax Information and Distributions to Shareholders. Each year, the Fund intends to qualify as a regulated investment company under Subchapter M of the Internal Revenue Code, including distributing substantially all of its taxable income and realized gains. As a result, no provision for U.S. Federal income taxes is required. The Fund files a U.S. federal tax return, in addition to state and local tax returns as required. The Fund's federal income tax returns are subject to examination by the Internal Revenue Service (IRS) for a period of three fiscal years after they are filed. State and local tax returns may be subject to examination for an additional fiscal year depending on the jurisdiction. Foreign taxes are provided for based on the Fund's understanding of the tax rules and rates that exist in the foreign markets in which it invests.
Distributions are declared and recorded on the ex-dividend date. Income and capital gain distributions are determined in accordance with income tax regulations, which may differ from GAAP.
Capital accounts within the financial statements are adjusted for permanent book-tax differences. These adjustments have no impact on net assets or the results of operations. Capital accounts are not adjusted for temporary book-tax differences which will reverse in a subsequent period.
Book-tax differences are primarily due to foreign currency transactions, passive foreign investment companies (PFIC) and losses deferred due to wash sales.
As of period end, the cost and unrealized appreciation (depreciation) in securities, and derivatives if applicable, for federal income tax purposes were as follows:
| Gross unrealized appreciation | $2,924,513 |
| Gross unrealized depreciation | (114,645) |
| Net unrealized appreciation (depreciation) | $2,809,868 |
| Tax cost | $10,764,976 |
Restricted Securities. The Fund may invest in securities that are subject to legal or contractual restrictions on resale. These securities generally may be resold in transactions exempt from registration or to the public if the securities are registered. Disposal of these securities may involve time-consuming negotiations and expense, and prompt sale at an acceptable price may be difficult. Information regarding restricted securities is included at the end of the Fund's Schedule of Investments.
4. Purchases and Sales of Investments.
Purchases and sales of securities, other than short-term securities, aggregated $5,591,507 and $2,762,344, respectively.
5. Fees and Other Transactions with Affiliates.
Management Fee. Fidelity Management & Research Company (the investment adviser) and its affiliates provide the Fund with investment management related services and the Fund does not pay any fees for these services. Under the management contract, the investment adviser or an affiliate pays all other expenses of the Fund, excluding fees and expenses of the independent Trustees, and certain miscellaneous expenses such as proxy and shareholder meeting expenses.
Brokerage Commissions. The Fund placed a portion of its portfolio transactions with brokerage firms which are affiliates of the investment adviser. Brokerage commissions are included in net realized gain (loss) and change in net unrealized appreciation (depreciation) in the Statement of Operations. The commissions paid to these affiliated firms were $174 for the period.
Interfund Trades. The Fund may purchase from or sell securities to other Fidelity Funds under procedures adopted by the Board. The procedures have been designed to ensure these interfund trades are executed in accordance with Rule 17a-7 of the 1940 Act. Interfund trades are included within the respective purchases and sales amounts shown in the Purchases and Sales of Investments note.
6. Committed Line of Credit.
The Fund participates with other funds managed by the investment adviser or an affiliate in a $4.25 billion credit facility (the "line of credit") to be utilized for temporary or emergency purposes to fund shareholder redemptions or for other short-term liquidity purposes. The Fund has agreed to pay commitment fees on its pro-rata portion of the line of credit, which amounted to $15 and is reflected in Miscellaneous expenses on the Statement of Operations. During the period, the Fund did not borrow on this line of credit.
7. Other.
The Fund's organizational documents provide former and current trustees and officers with a limited indemnification against liabilities arising in connection with the performance of their duties to the Fund. In the normal course of business, the Fund may also enter into contracts that provide general indemnifications. The Fund's maximum exposure under these arrangements is unknown as this would be dependent on future claims that may be made against the Fund. The risk of material loss from such claims is considered remote.
At the end of the period, the investment adviser or its affiliates were the owners of record of 50% of the total outstanding shares of the Fund.
Shareholder Expense Example
As a shareholder of the Fund, you incur two types of costs: (1) transaction costs and (2) ongoing costs, including other Fund expenses. This Example is intended to help you understand your ongoing costs (in dollars) of investing in the Fund and to compare these costs with the ongoing costs of investing in other mutual funds.
The Example is based on an investment of $1,000 invested at the beginning of the period and held for the entire period (August 1, 2017 to January 31, 2018).
Actual Expenses
The first line of the accompanying table provides information about actual account values and actual expenses. You may use the information in this line, together with the amount you invested, to estimate the expenses that you paid over the period. Simply divide your account value by $1,000.00 (for example, an $8,600 account value divided by $1,000.00 = 8.6), then multiply the result by the number in the first line under the heading entitled "Expenses Paid During Period" to estimate the expenses you paid on your account during this period. In addition, the Fund, as a shareholder in the underlying Fidelity Central Funds, will indirectly bear its pro-rata share of the fees and expenses incurred by the underlying Fidelity Central Funds. These fees and expenses are not included in the Fund's annualized expense ratio used to calculate the expense estimate in the table below.
Hypothetical Example for Comparison Purposes
The second line of the accompanying table provides information about hypothetical account values and hypothetical expenses based on the Fund's actual expense ratio and an assumed rate of return of 5% per year before expenses, which is not the Fund's actual return. The hypothetical account values and expenses may not be used to estimate the actual ending account balance or expenses you paid for the period. You may use this information to compare the ongoing costs of investing in the Fund and other funds. To do so, compare this 5% hypothetical example with the 5% hypothetical examples that appear in the shareholder reports of the other funds. In addition, the Fund, as a shareholder in the underlying Fidelity Central Funds, will indirectly bear its pro-rata share of the fees and expenses incurred by the underlying Fidelity Central Funds. These fees and expenses are not included in the Fund's annualized expense ratio used to calculate the expense estimate in the table below.
Please note that the expenses shown in the table are meant to highlight your ongoing costs only and do not reflect any transaction costs. Therefore, the second line of the table is useful in comparing ongoing costs only, and will not help you determine the relative total costs of owning different funds.
| | Annualized Expense Ratio-A | Beginning
Account Value
August 1, 2017 | Ending
Account Value
January 31, 2018 | Expenses Paid
During Period-B
August 1, 2017
to January 31, 2018 |
| Actual | - %C | $1,000.00 | $1,200.10 | $-D |
| Hypothetical-E | | $1,000.00 | $1,025.21 | $-D |
A Annualized expense ratio reflects expenses net of applicable fee waivers.
B Expenses are equal to the Fund's annualized expense ratio, multiplied by the average account value over the period, multiplied by 184/365 (to reflect the one-half year period).
C Amount represents less than .005%.
D Amount represents less than $.005.
E 5% return per year before expenses
Corporate Headquarters
245 Summer St.
Boston, MA 02210
www.fidelity.com
ZLG-SANN-0318
1.9881574.100
Fidelity® Growth & Income Portfolio
Class K
Semi-Annual Report January 31, 2018 |
|
Contents
To view a fund's proxy voting guidelines and proxy voting record for the 12-month period ended June 30, visit http://www.fidelity.com/proxyvotingresults or visit the Securities and Exchange Commission's (SEC) web site at http://www.sec.gov.
You may also call 1-800-835-5092 to request a free copy of the proxy voting guidelines.
Standard & Poor's, S&P and S&P 500 are registered service marks of The McGraw-Hill Companies, Inc. and have been licensed for use by Fidelity Distributors Corporation.
Other third-party marks appearing herein are the property of their respective owners.
All other marks appearing herein are registered or unregistered trademarks or service marks of FMR LLC or an affiliated company. © 2018 FMR LLC. All rights reserved.
This report and the financial statements contained herein are submitted for the general information of the shareholders of the Fund. This report is not authorized for distribution to prospective investors in the Fund unless preceded or accompanied by an effective prospectus.
A fund files its complete schedule of portfolio holdings with the SEC for the first and third quarters of each fiscal year on Form N-Q. Forms N-Q are available on the SEC’s web site at http://www.sec.gov. A fund's Forms N-Q may be reviewed and copied at the SEC’s Public Reference Room in Washington, DC. Information regarding the operation of the SEC's Public Reference Room may be obtained by calling 1-800-SEC-0330.
For a complete list of a fund's portfolio holdings, view the most recent holdings listing, semiannual report, or annual report on Fidelity's web site at http://www.fidelity.com, http://www.institutional.fidelity.com, or http://www.401k.com, as applicable.
NOT FDIC INSURED •MAY LOSE VALUE •NO BANK GUARANTEE
Neither the Fund nor Fidelity Distributors Corporation is a bank.
Investment Summary (Unaudited)
Top Ten Stocks as of January 31, 2018
| | % of fund's net assets |
| Microsoft Corp.(a) | 3.8 |
| Bank of America Corp. | 3.3 |
| JPMorgan Chase & Co.(a) | 3.1 |
| Citigroup, Inc.(a) | 3.0 |
| Comcast Corp. Class A | 2.4 |
| Wells Fargo & Co. | 2.2 |
| State Street Corp.(a) | 2.0 |
| Apple, Inc.(a) | 2.0 |
| ConocoPhillips Co.(a) | 1.8 |
| Chevron Corp.(a) | 1.8 |
| | 25.4 |
(a) Security or a portion of the security is pledged as collateral for call options written.
Top Five Market Sectors as of January 31, 2018
| | % of fund's net assets |
| Financials | 23.1 |
| Information Technology | 16.6 |
| Energy | 13.5 |
| Health Care | 12.2 |
| Industrials | 11.7 |
Asset Allocation (% of fund's net assets)
| As of January 31, 2018*,** |
| | Stocks | 99.4% |
| | Convertible Securities | 0.4% |
| | Other Investments | 0.2% |

* Foreign investments - 11.7%
** Written options - (0.1)%
Schedule of Investments January 31, 2018 (Unaudited)
Showing Percentage of Net Assets
| Common Stocks - 99.4% | | | |
| | | Shares | Value (000s) |
| CONSUMER DISCRETIONARY - 8.0% | | | |
| Auto Components - 0.1% | | | |
| Gentex Corp. | | 521,100 | $12,340 |
| Hotels, Restaurants & Leisure - 0.5% | | | |
| Cedar Fair LP (depositary unit) | | 32,700 | 2,217 |
| DineEquity, Inc. | | 119,300 | 6,607 |
| Dunkin' Brands Group, Inc. | | 354,100 | 22,893 |
| Marriott International, Inc. Class A | | 21,700 | 3,197 |
| Papa John's International, Inc. (a) | | 63,300 | 4,108 |
| | | | 39,022 |
| Media - 4.1% | | | |
| Comcast Corp. Class A | | 4,341,000 | 184,623 |
| Interpublic Group of Companies, Inc. | | 1,643,700 | 35,981 |
| Omnicom Group, Inc. | | 191,900 | 14,709 |
| The Walt Disney Co. | | 428,200 | 46,532 |
| Time Warner, Inc. | | 291,200 | 27,766 |
| Viacom, Inc. Class B (non-vtg.) | | 188,600 | 6,303 |
| | | | 315,914 |
| Multiline Retail - 0.6% | | | |
| Dollar General Corp. | | 161,100 | 16,613 |
| Target Corp. (b) | | 367,875 | 27,672 |
| | | | 44,285 |
| Specialty Retail - 2.7% | | | |
| L Brands, Inc. (b) | | 774,900 | 38,815 |
| Lowe's Companies, Inc. | | 869,779 | 91,092 |
| Ross Stores, Inc. | | 239,800 | 19,757 |
| TJX Companies, Inc. | | 588,900 | 47,300 |
| Williams-Sonoma, Inc. (a) | | 292,900 | 15,005 |
| | | | 211,969 |
|
| TOTAL CONSUMER DISCRETIONARY | | | 623,530 |
|
| CONSUMER STAPLES - 9.3% | | | |
| Beverages - 1.6% | | | |
| Molson Coors Brewing Co. Class B | | 312,200 | 26,231 |
| The Coca-Cola Co. | | 1,987,203 | 94,571 |
| | | | 120,802 |
| Food & Staples Retailing - 2.4% | | | |
| CVS Health Corp. | | 1,068,304 | 84,065 |
| Kroger Co. (b) | | 1,058,300 | 32,130 |
| Walmart, Inc. | | 681,200 | 72,616 |
| | | | 188,811 |
| Food Products - 0.7% | | | |
| Campbell Soup Co. | | 287,100 | 13,365 |
| Kellogg Co. | | 135,200 | 9,208 |
| Nestle SA (Reg. S) | | 45,170 | 3,902 |
| The J.M. Smucker Co. | | 198,600 | 25,200 |
| | | | 51,675 |
| Household Products - 1.9% | | | |
| Kimberly-Clark Corp. | | 199,300 | 23,318 |
| Procter & Gamble Co. (b) | | 1,009,915 | 87,196 |
| Reckitt Benckiser Group PLC | | 394,900 | 38,136 |
| | | | 148,650 |
| Personal Products - 0.3% | | | |
| Unilever NV (NY Reg.) | | 479,100 | 27,543 |
| Tobacco - 2.4% | | | |
| Altria Group, Inc. | | 1,736,700 | 122,159 |
| British American Tobacco PLC sponsored ADR | | 903,400 | 61,522 |
| | | | 183,681 |
|
| TOTAL CONSUMER STAPLES | | | 721,162 |
|
| ENERGY - 13.3% | | | |
| Energy Equipment & Services - 1.0% | | | |
| Baker Hughes, a GE Co. Class A | | 997,500 | 32,070 |
| Nabors Industries Ltd. | | 791,700 | 6,207 |
| National Oilwell Varco, Inc. | | 570,400 | 20,922 |
| Oceaneering International, Inc. | | 776,800 | 16,064 |
| Schlumberger Ltd. | | 22,600 | 1,663 |
| | | | 76,926 |
| Oil, Gas & Consumable Fuels - 12.3% | | | |
| Anadarko Petroleum Corp. | | 275,400 | 16,538 |
| Apache Corp. | | 945,511 | 42,425 |
| BP PLC sponsored ADR | | 808,200 | 34,583 |
| Cabot Oil & Gas Corp. | | 1,139,300 | 30,021 |
| Cenovus Energy, Inc. | | 6,107,700 | 58,247 |
| Cenovus Energy, Inc. | | 37,200 | 355 |
| Chevron Corp. (b) | | 1,100,296 | 137,922 |
| ConocoPhillips Co. (b) | | 2,418,900 | 142,256 |
| Exxon Mobil Corp. | | 381,800 | 33,331 |
| Golar LNG Ltd. | | 629,100 | 17,168 |
| Imperial Oil Ltd. | | 1,158,500 | 36,422 |
| Kinder Morgan, Inc. | | 2,731,700 | 49,116 |
| Legacy Reserves LP (c) | | 956,268 | 2,276 |
| Phillips 66 Co. | | 103,580 | 10,607 |
| Suncor Energy, Inc. | | 3,674,050 | 133,102 |
| Teekay LNG Partners LP | | 477,300 | 9,427 |
| The Williams Companies, Inc. | | 3,618,472 | 113,584 |
| Valero Energy Corp. | | 207,200 | 19,885 |
| Williams Partners LP | | 1,510,985 | 63,310 |
| | | | 950,575 |
|
| TOTAL ENERGY | | | 1,027,501 |
|
| FINANCIALS - 23.1% | | | |
| Banks - 15.4% | | | |
| Bank of America Corp. | | 7,890,156 | 252,485 |
| Citigroup, Inc. (b) | | 2,950,830 | 231,581 |
| Cullen/Frost Bankers, Inc. | | 16,200 | 1,724 |
| First Hawaiian, Inc. | | 24,900 | 720 |
| JPMorgan Chase & Co. (b) | | 2,060,192 | 238,302 |
| M&T Bank Corp. | | 20,300 | 3,873 |
| PNC Financial Services Group, Inc. (b) | | 461,154 | 72,872 |
| Regions Financial Corp. (b) | | 1,950,400 | 37,506 |
| SunTrust Banks, Inc. | | 1,481,266 | 104,726 |
| U.S. Bancorp | | 1,330,473 | 76,023 |
| Wells Fargo & Co. | | 2,610,341 | 171,708 |
| | | | 1,191,520 |
| Capital Markets - 6.8% | | | |
| Apollo Global Management LLC Class A | | 511,500 | 18,286 |
| Charles Schwab Corp. (b) | | 810,843 | 43,250 |
| KKR & Co. LP | | 2,335,043 | 56,228 |
| Morgan Stanley | | 1,127,897 | 63,783 |
| Northern Trust Corp. (b) | | 848,464 | 89,420 |
| Oaktree Capital Group LLC Class A | | 271,200 | 12,448 |
| S&P Global, Inc. | | 182,100 | 32,978 |
| State Street Corp. (b) | | 1,386,227 | 152,721 |
| The Blackstone Group LP | | 1,556,600 | 56,894 |
| | | | 526,008 |
| Insurance - 0.7% | | | |
| Marsh & McLennan Companies, Inc. | | 292,407 | 24,422 |
| MetLife, Inc. | | 603,100 | 28,991 |
| | | | 53,413 |
| Thrifts & Mortgage Finance - 0.2% | | | |
| Radian Group, Inc. | | 725,668 | 16,015 |
|
| TOTAL FINANCIALS | | | 1,786,956 |
|
| HEALTH CARE - 12.0% | | | |
| Biotechnology - 2.4% | | | |
| Alexion Pharmaceuticals, Inc. (c) | | 280,900 | 33,517 |
| Amgen, Inc. | | 638,093 | 118,717 |
| Biogen, Inc. (c) | | 43,100 | 14,991 |
| Gilead Sciences, Inc. | | 9,600 | 804 |
| Intercept Pharmaceuticals, Inc. (c) | | 121,626 | 7,553 |
| Shire PLC sponsored ADR | | 88,600 | 12,408 |
| | | | 187,990 |
| Health Care Equipment & Supplies - 1.5% | | | |
| Becton, Dickinson & Co. | | 19,000 | 4,616 |
| Boston Scientific Corp. (c) | | 531,900 | 14,872 |
| ConvaTec Group PLC (d) | | 665,200 | 1,910 |
| Danaher Corp. | | 341,100 | 34,547 |
| Fisher & Paykel Healthcare Corp. | | 388,032 | 3,818 |
| Medtronic PLC | | 210,530 | 18,082 |
| ResMed, Inc. | | 107,400 | 10,825 |
| Steris PLC | | 59,700 | 5,428 |
| Zimmer Biomet Holdings, Inc. | | 159,510 | 20,277 |
| | | | 114,375 |
| Health Care Providers & Services - 3.7% | | | |
| Aetna, Inc. | | 51,400 | 9,603 |
| AmerisourceBergen Corp. | | 281,100 | 28,017 |
| Anthem, Inc. | | 182,600 | 45,257 |
| Cardinal Health, Inc. | | 761,900 | 54,697 |
| Cigna Corp. | | 125,300 | 26,106 |
| Fresenius Medical Care AG & Co. KGaA sponsored ADR | | 190,300 | 10,944 |
| Humana, Inc. | | 64,600 | 18,206 |
| McKesson Corp. | | 292,087 | 49,328 |
| Patterson Companies, Inc. | | 309,970 | 11,125 |
| UnitedHealth Group, Inc. | | 132,100 | 31,279 |
| | | | 284,562 |
| Pharmaceuticals - 4.4% | | | |
| Allergan PLC | | 94,700 | 17,071 |
| AstraZeneca PLC sponsored ADR | | 677,500 | 23,753 |
| Bayer AG | | 190,300 | 24,936 |
| Eisai Co. Ltd. | | 13,700 | 780 |
| GlaxoSmithKline PLC sponsored ADR | | 2,908,322 | 109,091 |
| Innoviva, Inc. (c) | | 235,100 | 3,430 |
| Johnson & Johnson (b) | | 729,169 | 100,764 |
| Novartis AG sponsored ADR | | 42,444 | 3,823 |
| Sanofi SA | | 228,788 | 20,191 |
| Teva Pharmaceutical Industries Ltd. sponsored ADR | | 1,727,020 | 35,248 |
| | | | 339,087 |
|
| TOTAL HEALTH CARE | | | 926,014 |
|
| INDUSTRIALS - 11.6% | | | |
| Aerospace & Defense - 2.3% | | | |
| General Dynamics Corp. | | 103,000 | 22,915 |
| Meggitt PLC | | 211,968 | 1,397 |
| Rolls-Royce Holdings PLC | | 1,347,200 | 16,717 |
| The Boeing Co. (b) | | 44,289 | 15,695 |
| United Technologies Corp. | | 862,682 | 119,059 |
| | | | 175,783 |
| Air Freight & Logistics - 1.7% | | | |
| C.H. Robinson Worldwide, Inc. (b) | | 352,400 | 32,231 |
| Expeditors International of Washington, Inc. | | 311,000 | 20,199 |
| United Parcel Service, Inc. Class B | | 595,204 | 75,781 |
| | | | 128,211 |
| Commercial Services & Supplies - 0.1% | | | |
| KAR Auction Services, Inc. | | 65,000 | 3,545 |
| Ritchie Brothers Auctioneers, Inc. (a) | | 236,500 | 7,693 |
| | | | 11,238 |
| Construction & Engineering - 0.1% | | | |
| Fluor Corp. | | 148,000 | 8,984 |
| Electrical Equipment - 0.6% | | | |
| Acuity Brands, Inc. | | 148,100 | 22,873 |
| Hubbell, Inc. Class B | | 191,539 | 26,040 |
| | | | 48,913 |
| Industrial Conglomerates - 1.6% | | | |
| General Electric Co. | | 7,474,627 | 120,865 |
| Machinery - 1.1% | | | |
| Donaldson Co., Inc. | | 140,100 | 7,097 |
| Flowserve Corp. | | 829,000 | 37,570 |
| Snap-On, Inc. | | 120,000 | 20,557 |
| Wabtec Corp. (a) | | 220,500 | 17,869 |
| Zardoya Otis SA | | 115,600 | 1,320 |
| | | | 84,413 |
| Professional Services - 0.4% | | | |
| Intertrust NV (c)(d) | | 362,800 | 6,644 |
| Nielsen Holdings PLC | | 607,900 | 22,742 |
| | | | 29,386 |
| Road & Rail - 2.8% | | | |
| CSX Corp. (b) | | 927,320 | 52,644 |
| J.B. Hunt Transport Services, Inc. (b) | | 527,040 | 63,682 |
| Norfolk Southern Corp. | | 254,499 | 38,399 |
| Union Pacific Corp. | | 454,100 | 60,622 |
| | | | 215,347 |
| Trading Companies & Distributors - 0.9% | | | |
| Brenntag AG | | 25,800 | 1,673 |
| Bunzl PLC | | 133,700 | 3,911 |
| Fastenal Co. (a) | | 437,700 | 24,056 |
| Howden Joinery Group PLC | | 228,700 | 1,508 |
| MSC Industrial Direct Co., Inc. Class A | | 125,900 | 11,819 |
| Watsco, Inc. | | 164,592 | 29,592 |
| | | | 72,559 |
|
| TOTAL INDUSTRIALS | | | 895,699 |
|
| INFORMATION TECHNOLOGY - 16.6% | | | |
| Communications Equipment - 1.5% | | | |
| Cisco Systems, Inc. (b) | | 2,837,152 | 117,855 |
| Electronic Equipment & Components - 0.1% | | | |
| Avnet, Inc. | | 128,200 | 5,449 |
| Philips Lighting NV (d) | | 109,400 | 4,306 |
| | | | 9,755 |
| Internet Software & Services - 2.8% | | | |
| Alphabet, Inc.: | | | |
| Class A (c) | | 96,807 | 114,447 |
| Class C (c) | | 90,736 | 106,156 |
| | | | 220,603 |
| IT Services - 3.1% | | | |
| Accenture PLC Class A | | 96,700 | 15,540 |
| Cognizant Technology Solutions Corp. Class A | | 20,500 | 1,599 |
| IBM Corp. | | 23,900 | 3,912 |
| MasterCard, Inc. Class A | | 161,400 | 27,277 |
| Paychex, Inc. | | 1,066,752 | 72,806 |
| Unisys Corp. (a)(c) | | 1,314,818 | 11,702 |
| Visa, Inc. Class A | | 845,884 | 105,084 |
| | | | 237,920 |
| Semiconductors & Semiconductor Equipment - 2.0% | | | |
| Broadcom Ltd. | | 30,400 | 7,540 |
| Qualcomm, Inc. | | 2,020,246 | 137,882 |
| United Microelectronics Corp. sponsored ADR | | 1,575,900 | 3,845 |
| Xilinx, Inc. | | 59,700 | 4,359 |
| | | | 153,626 |
| Software - 5.1% | | | |
| Micro Focus International PLC | | 683,862 | 20,876 |
| Microsoft Corp. (b) | | 3,134,099 | 297,765 |
| Oracle Corp. | | 1,090,653 | 56,267 |
| SAP SE sponsored ADR | | 207,100 | 23,454 |
| | | | 398,362 |
| Technology Hardware, Storage & Peripherals - 2.0% | | | |
| Apple, Inc. (b) | | 902,794 | 151,155 |
|
| TOTAL INFORMATION TECHNOLOGY | | | 1,289,276 |
|
| MATERIALS - 2.1% | | | |
| Chemicals - 1.8% | | | |
| CF Industries Holdings, Inc. (b) | | 549,700 | 23,329 |
| LyondellBasell Industries NV Class A | | 422,800 | 50,668 |
| Monsanto Co. | | 132,015 | 16,079 |
| Nutrien Ltd. (c) | | 707,680 | 37,024 |
| PPG Industries, Inc. | | 17,600 | 2,090 |
| The Scotts Miracle-Gro Co. Class A | | 134,600 | 12,150 |
| | | | 141,340 |
| Metals & Mining - 0.3% | | | |
| BHP Billiton Ltd. sponsored ADR (a) | | 271,600 | 13,314 |
| Reliance Steel & Aluminum Co. | | 75,500 | 6,613 |
| | | | 19,927 |
|
| TOTAL MATERIALS | | | 161,267 |
|
| REAL ESTATE - 1.0% | | | |
| Equity Real Estate Investment Trusts (REITs) - 1.0% | | | |
| American Tower Corp. | | 98,600 | 14,563 |
| CoreSite Realty Corp. | | 164,600 | 17,829 |
| Equinix, Inc. | | 38,100 | 17,343 |
| Omega Healthcare Investors, Inc. (a) | | 149,400 | 4,040 |
| Public Storage | | 84,400 | 16,522 |
| Sabra Health Care REIT, Inc. | | 271,900 | 4,921 |
| Spirit Realty Capital, Inc. | | 745,700 | 6,092 |
| | | | 81,310 |
| TELECOMMUNICATION SERVICES - 1.3% | | | |
| Diversified Telecommunication Services - 1.3% | | | |
| Verizon Communications, Inc. | | 1,806,774 | 97,692 |
| UTILITIES - 1.1% | | | |
| Electric Utilities - 1.0% | | | |
| Exelon Corp. | | 1,648,400 | 63,480 |
| PPL Corp. | | 423,700 | 13,503 |
| Southern Co. | | 44,100 | 1,989 |
| | | | 78,972 |
| Independent Power and Renewable Electricity Producers - 0.0% | | | |
| The AES Corp. | | 135,100 | 1,562 |
| Multi-Utilities - 0.1% | | | |
| Public Service Enterprise Group, Inc. | | 50,600 | 2,625 |
|
| TOTAL UTILITIES | | | 83,159 |
|
| TOTAL COMMON STOCKS | | | |
| (Cost $6,272,377) | | | 7,693,566 |
|
| Preferred Stocks - 0.3% | | | |
| Convertible Preferred Stocks - 0.3% | | | |
| HEALTH CARE - 0.1% | | | |
| Health Care Equipment & Supplies - 0.1% | | | |
| Becton, Dickinson & Co. Series A, 6.125% | | 210,900 | 13,228 |
| INDUSTRIALS - 0.1% | | | |
| Commercial Services & Supplies - 0.1% | | | |
| Stericycle, Inc. 2.25% | | 117,279 | 6,904 |
| UTILITIES - 0.1% | | | |
| Independent Power and Renewable Electricity Producers - 0.1% | | | |
| Dynegy, Inc. 7.00% | | 66,200 | 5,485 |
|
| TOTAL CONVERTIBLE PREFERRED STOCKS | | | 25,617 |
|
| Nonconvertible Preferred Stocks - 0.0% | | | |
| INDUSTRIALS - 0.0% | | | |
| Aerospace & Defense - 0.0% | | | |
| Rolls-Royce Holdings PLC (C Shares) (c) | | 319,925,580 | 454 |
| TOTAL PREFERRED STOCKS | | | |
| (Cost $26,800) | | | 26,071 |
| | | Principal Amount (000s)(e) | Value (000s) |
|
| Convertible Bonds - 0.1% | | | |
| HEALTH CARE - 0.1% | | | |
| Pharmaceuticals - 0.1% | | | |
| Bayer Capital Corp. BV 5.625% 11/22/19(d) | | | |
| (Cost $7,157) | | EUR 6,700 | 9,414 |
| | | Shares | Value (000s) |
|
| Other - 0.2% | | | |
| ENERGY - 0.2% | | | |
| Oil, Gas & Consumable Fuels - 0.2% | | | |
| Utica Shale Drilling Program (non-operating revenue interest) (f)(g)(h) | | | |
| (Cost $18,052) | | 18,052,449 | 16,789 |
|
| Money Market Funds - 1.0% | | | |
| Fidelity Cash Central Fund, 1.39% (i) | | 26,822,614 | 26,828 |
| Fidelity Securities Lending Cash Central Fund 1.40% (i)(j) | | 50,523,591 | 50,529 |
| TOTAL MONEY MARKET FUNDS | | | |
| (Cost $77,361) | | | 77,357 |
| TOTAL INVESTMENT IN SECURITIES - 101.0% | | | |
| (Cost $6,401,747) | | | 7,823,197 |
| NET OTHER ASSETS (LIABILITIES) - (1.0)% | | | (78,737) |
| NET ASSETS - 100% | | | $7,744,460 |
| Written Options | | | | | | |
| | Counterparty | Number of Contracts | Notional Amount (000s) | Exercise Price | Expiration Date | Value (000s) |
| Call Options | | | | | | |
| Apple, Inc. | Chicago Board Options Exchange | 541 | $9,058 | $185.00 | 2/16/18 | $(40) |
| C.H. Robinson Worldwide, Inc. | Chicago Board Options Exchange | 633 | 5,789 | 92.50 | 2/16/18 | (81) |
| CF Industries Holdings, Inc. | Chicago Board Options Exchange | 541 | 2,296 | 40.00 | 2/16/18 | (164) |
| Charles Schwab Corp. | Chicago Board Options Exchange | 830 | 4,427 | 55.00 | 3/16/18 | (93) |
| Chevron Corp. | Chicago Board Options Exchange | 1,094 | 13,713 | 140.00 | 3/16/18 | (26) |
| Chevron Corp. | Chicago Board Options Exchange | 1,094 | 13,713 | 145.00 | 6/15/18 | (72) |
| Cisco Systems, Inc. | Chicago Board Options Exchange | 2,826 | 11,739 | 41.00 | 3/16/18 | (509) |
| Cisco Systems, Inc. | Chicago Board Options Exchange | 2,826 | 11,739 | 40.00 | 3/16/18 | (689) |
| Citigroup, Inc. | Chicago Board Options Exchange | 2,952 | 23,167 | 80.00 | 2/16/18 | (181) |
| ConocoPhillips Co. | Chicago Board Options Exchange | 3,768 | 22,160 | 65.00 | 5/18/18 | (379) |
| CSX Corp. | Chicago Board Options Exchange | 1,863 | 10,576 | 60.00 | 2/16/18 | (48) |
| CSX Corp. | Chicago Board Options Exchange | 1,861 | 10,565 | 62.50 | 2/16/18 | (9) |
| J.B. Hunt Transport Services, Inc. | Chicago Board Options Exchange | 546 | 6,597 | 120.00 | 2/16/18 | (154) |
| Johnson & Johnson | Chicago Board Options Exchange | 781 | 10,793 | 145.00 | 2/16/18 | (17) |
| JPMorgan Chase & Co. | Chicago Board Options Exchange | 3,279 | 37,928 | 115.00 | 3/16/18 | (1,172) |
| Kroger Co. | Chicago Board Options Exchange | 1,328 | 4,032 | 28.00 | 2/16/18 | (329) |
| Kroger Co. | Chicago Board Options Exchange | 2,491 | 7,563 | 29.00 | 2/16/18 | (402) |
| L Brands, Inc. | Chicago Board Options Exchange | 745 | 3,732 | 65.00 | 2/16/18 | (2) |
| Microsoft Corp. | Chicago Board Options Exchange | 1,564 | 14,860 | 90.00 | 2/16/18 | (974) |
| Microsoft Corp. | Chicago Board Options Exchange | 3,106 | 29,510 | 92.50 | 3/16/18 | (1,600) |
| Northern Trust Corp. | Chicago Board Options Exchange | 824 | 8,684 | 110.00 | 4/20/18 | (192) |
| PNC Financial Services Group, Inc. | Chicago Board Options Exchange | 421 | 6,653 | 145.00 | 2/16/18 | (574) |
| Procter & Gamble Co. | Chicago Board Options Exchange | 1,115 | 9,627 | 92.50 | 2/16/18 | (5) |
| Regions Financial Corp. | Chicago Board Options Exchange | 2,056 | 3,954 | 18.00 | 2/16/18 | (269) |
| State Street Corp. | Chicago Board Options Exchange | 1,365 | 15,038 | 115.00 | 5/18/18 | (437) |
| Target Corp. | Chicago Board Options Exchange | 754 | 5,672 | 65.00 | 3/16/18 | (805) |
| Target Corp. | Chicago Board Options Exchange | 734 | 5,521 | 70.00 | 3/16/18 | (472) |
| Target Corp. | Chicago Board Options Exchange | 1,853 | 13,938 | 85.00 | 4/20/18 | (200) |
| The Boeing Co. | Chicago Board Options Exchange | 301 | 10,667 | 300.00 | 3/16/18 | (1,667) |
| The Boeing Co. | Chicago Board Options Exchange | 61 | 2,162 | 370.00 | 3/16/18 | (34) |
| TOTAL WRITTEN OPTIONS | | | | | | $(11,596) |
Currency Abbreviations
EUR – European Monetary Unit
Legend
(a) Security or a portion of the security is on loan at period end.
(b) Security or a portion of the security is pledged as collateral for call options written. At period end, the value of securities pledged amounted to $335,873,000.
(c) Non-income producing
(d) Security exempt from registration under Rule 144A of the Securities Act of 1933. These securities may be resold in transactions exempt from registration, normally to qualified institutional buyers. At the end of the period, the value of these securities amounted to $22,274,000 or 0.3% of net assets.
(e) Amount is stated in United States dollars unless otherwise noted.
(f) Investment is owned by a wholly-owned subsidiary (Subsidiary) that is treated as a corporation for U.S. tax purposes.
(g) Restricted securities - Investment in securities not registered under the Securities Act of 1933 (excluding 144A issues). At the end of the period, the value of restricted securities (excluding 144A issues) amounted to $16,789,000 or 0.2% of net assets.
(h) Level 3 security
(i) Affiliated fund that is generally available only to investment companies and other accounts managed by Fidelity Investments. The rate quoted is the annualized seven-day yield of the fund at period end. A complete unaudited listing of the fund's holdings as of its most recent quarter end is available upon request. In addition, each Fidelity Central Fund's financial statements are available on the SEC's website or upon request.
(j) Investment made with cash collateral received from securities on loan.
Additional information on each restricted holding is as follows:
| Security | Acquisition Date | Acquisition Cost (000s) |
| Utica Shale Drilling Program (non-operating revenue interest) | 10/5/16 - 9/1/17 | $18,052 |
Affiliated Central Funds
Information regarding fiscal year to date income earned by the Fund from investments in Fidelity Central Funds is as follows:
| Fund | Income earned |
| | (Amounts in thousands) |
| Fidelity Cash Central Fund | $86 |
| Fidelity Securities Lending Cash Central Fund | 195 |
| Total | $281 |
Amounts in the income column in the above table include any capital gain distributions from underlying funds, which are presented in the corresponding line-item in the Statement of Operations if applicable.
Investment Valuation
The following is a summary of the inputs used, as of January 31, 2018, involving the Fund's assets and liabilities carried at fair value. The inputs or methodology used for valuing securities may not be an indication of the risk associated with investing in those securities. For more information on valuation inputs, and their aggregation into the levels used below, please refer to the Investment Valuation section in the accompanying Notes to Financial Statements.
| | Valuation Inputs at Reporting Date: |
| Description | Total | Level 1 | Level 2 | Level 3 |
| (Amounts in thousands) | | | | |
| Investments in Securities: | | | | |
| Equities: | | | | |
| Consumer Discretionary | $623,530 | $623,530 | $-- | $-- |
| Consumer Staples | 721,162 | 679,124 | 42,038 | -- |
| Energy | 1,027,501 | 1,027,501 | -- | -- |
| Financials | 1,786,956 | 1,786,956 | -- | -- |
| Health Care | 939,242 | 880,107 | 59,135 | -- |
| Industrials | 903,057 | 879,436 | 23,621 | -- |
| Information Technology | 1,289,276 | 1,289,276 | -- | -- |
| Materials | 161,267 | 161,267 | -- | -- |
| Real Estate | 81,310 | 81,310 | -- | -- |
| Telecommunication Services | 97,692 | 97,692 | -- | -- |
| Utilities | 88,644 | 83,159 | 5,485 | -- |
| Corporate Bonds | 9,414 | -- | 9,414 | -- |
| Other | 16,789 | -- | -- | 16,789 |
| Money Market Funds | 77,357 | 77,357 | -- | -- |
| Total Investments in Securities: | $7,823,197 | $7,666,715 | $139,693 | $16,789 |
| Derivative Instruments: | | | | |
| Liabilities | | | | |
| Written Options | $(11,596) | $(11,596) | $-- | $-- |
| Total Liabilities | $(11,596) | $(11,596) | $-- | $-- |
| Total Derivative Instruments: | $(11,596) | $(11,596) | $-- | $-- |
Value of Derivative Instruments
The following table is a summary of the Fund's value of derivative instruments by primary risk exposure as of January 31, 2018. For additional information on derivative instruments, please refer to the Derivative Instruments section in the accompanying Notes to Financial Statements.
| Primary Risk Exposure / Derivative Type | Value |
| | Asset | Liability |
| (Amounts in thousands) | | |
| Equity Risk | | |
| Written Options(a) | $0 | $(11,596) |
| Total Equity Risk | 0 | (11,596) |
| Total Value of Derivatives | $0 | $(11,596) |
(a) Gross value is presented in the Statement of Assets and Liabilities in the written options, at value line-item.
Other Information
Distribution of investments by country or territory of incorporation, as a percentage of Total Net Assets, is as follows (Unaudited):
| United States of America | 88.3% |
| United Kingdom | 3.6% |
| Canada | 3.6% |
| Netherlands | 1.1% |
| Others (Individually Less Than 1%) | 3.4% |
| | 100.0% |
See accompanying notes which are an integral part of the financial statements.
Financial Statements
Statement of Assets and Liabilities
| Amounts in thousands (except per-share amounts) | | January 31, 2018 (Unaudited) |
| Assets | | |
Investment in securities, at value (including securities loaned of $48,860) — See accompanying schedule:
Unaffiliated issuers (cost $6,324,386) | $7,745,840 | |
| Fidelity Central Funds (cost $77,361) | 77,357 | |
| Total Investment in Securities (cost $6,401,747) | | $7,823,197 |
| Restricted cash | | 223 |
| Receivable for investments sold | | 36,516 |
| Receivable for fund shares sold | | 1,669 |
| Dividends receivable | | 6,574 |
| Interest receivable | | 276 |
| Distributions receivable from Fidelity Central Funds | | 35 |
| Prepaid expenses | | 10 |
| Other receivables | | 841 |
| Total assets | | 7,869,341 |
| Liabilities | | |
| Payable for investments purchased | $52,785 | |
| Payable for fund shares redeemed | 5,334 | |
| Accrued management fee | 2,840 | |
| Written options, at value (premium received $5,293) | 11,596 | |
| Other affiliated payables | 948 | |
| Other payables and accrued expenses | 848 | |
| Collateral on securities loaned | 50,530 | |
| Total liabilities | | 124,881 |
| Net Assets | | $7,744,460 |
| Net Assets consist of: | | |
| Paid in capital | | $7,510,164 |
| Distributions in excess of net investment income | | (22,706) |
| Accumulated undistributed net realized gain (loss) on investments and foreign currency transactions | | (1,158,166) |
| Net unrealized appreciation (depreciation) on investments and assets and liabilities in foreign currencies | | 1,415,168 |
| Net Assets | | $7,744,460 |
| Growth and Income: | | |
| Net Asset Value, offering price and redemption price per share ($6,823,724 ÷ 171,520 shares) | | $39.78 |
| Class K: | | |
| Net Asset Value, offering price and redemption price per share ($920,736 ÷ 23,165 shares) | | $39.75 |
See accompanying notes which are an integral part of the financial statements.
Statement of Operations
| Amounts in thousands | | Six months ended January 31, 2018 (Unaudited) |
| Investment Income | | |
| Dividends | | $76,174 |
| Interest | | 225 |
| Income from Fidelity Central Funds | | 281 |
| Total income | | 76,680 |
| Expenses | | |
| Management fee | $16,124 | |
| Transfer agent fees | 5,046 | |
| Accounting and security lending fees | 595 | |
| Custodian fees and expenses | 66 | |
| Independent trustees' fees and expenses | 25 | |
| Appreciation in deferred trustee compensation account | 1 | |
| Registration fees | 35 | |
| Audit | 45 | |
| Legal | 15 | |
| Interest | 10 | |
| Miscellaneous | 23 | |
| Total expenses before reductions | 21,985 | |
| Expense reductions | (108) | 21,877 |
| Net investment income (loss) | | 54,803 |
| Realized and Unrealized Gain (Loss) | | |
| Net realized gain (loss) on: | | |
| Investment securities: | | |
| Unaffiliated issuers | 532,471 | |
| Fidelity Central Funds | 1 | |
| Foreign currency transactions | 14 | |
| Written options | 3,294 | |
| Total net realized gain (loss) | | 535,780 |
| Change in net unrealized appreciation (depreciation) on: | | |
| Investment securities: | | |
| Unaffiliated issuers | 382,154 | |
| Fidelity Central Funds | (2) | |
| Assets and liabilities in foreign currencies | 44 | |
| Written options | (3,891) | |
| Total change in net unrealized appreciation (depreciation) | | 378,305 |
| Net gain (loss) | | 914,085 |
| Net increase (decrease) in net assets resulting from operations | | $968,888 |
See accompanying notes which are an integral part of the financial statements.
Statement of Changes in Net Assets
| Amounts in thousands | Six months ended January 31, 2018 (Unaudited) | Year ended July 31, 2017 |
| Increase (Decrease) in Net Assets | | |
| Operations | | |
| Net investment income (loss) | $54,803 | $128,606 |
| Net realized gain (loss) | 535,780 | 555,075 |
| Change in net unrealized appreciation (depreciation) | 378,305 | 424,780 |
| Net increase (decrease) in net assets resulting from operations | 968,888 | 1,108,461 |
| Distributions to shareholders from net investment income | (89,704) | (97,619) |
| Share transactions - net increase (decrease) | (380,775) | (57,861) |
| Total increase (decrease) in net assets | 498,409 | 952,981 |
| Net Assets | | |
| Beginning of period | 7,246,051 | 6,293,070 |
| End of period | $7,744,460 | $7,246,051 |
| Other Information | | |
| Undistributed net investment income end of period | $– | $12,195 |
| Distributions in excess of net investment income end of period | $(22,706) | $– |
See accompanying notes which are an integral part of the financial statements.
Financial Highlights
Fidelity Growth & Income Portfolio
| | Six months ended (Unaudited) January 31, | Years endedJuly 31, | | | | |
| | 2018 | 2017 | 2016 | 2015 | 2014 | 2013 |
| Selected Per–Share Data | | | | | | |
| Net asset value, beginning of period | $35.31 | $30.48 | $30.85 | $29.02 | $25.66 | $20.13 |
| Income from Investment Operations | | | | | | |
| Net investment income (loss)A | .27 | .61 | .59 | .55 | .51 | .46 |
| Net realized and unrealized gain (loss) | 4.65 | 4.68 | (.37) | 1.82B | 3.35 | 5.54 |
| Total from investment operations | 4.92 | 5.29 | .22 | 2.37 | 3.86 | 6.00 |
| Distributions from net investment income | (.45) | (.46) | (.58) | (.54) | (.50) | (.44) |
| Distributions from net realized gain | – | – | (.01) | – | (.01) | (.03) |
| Total distributions | (.45) | (.46) | (.59) | (.54) | (.50)C | (.47) |
| Net asset value, end of period | $39.78 | $35.31 | $30.48 | $30.85 | $29.02 | $25.66 |
| Total ReturnD,E | 14.05% | 17.48% | .88% | 8.23%B | 15.16% | 30.15% |
| Ratios to Average Net AssetsF,G | | | | | | |
| Expenses before reductions | .62%H | .63% | .64% | .64% | .65% | .68% |
| Expenses net of fee waivers, if any | .61%H | .63% | .64% | .63% | .65% | .68% |
| Expenses net of all reductions | .61%H | .63% | .64% | .63% | .65% | .67% |
| Net investment income (loss) | 1.49%H | 1.84% | 2.05% | 1.83% | 1.86% | 2.04% |
| Supplemental Data | | | | | | |
| Net assets, end of period (in millions) | $6,824 | $6,356 | $5,529 | $6,563 | $6,550 | $6,060 |
| Portfolio turnover rateI | 40%H | 37% | 29% | 35% | 41%J | 49% |
A Calculated based on average shares outstanding during the period.
B Net realized and unrealized gain (loss) per share reflects proceeds received from litigation which amounted to $.06 per share. Excluding these litigation proceeds, the total return would have been 8.03%
C Total distributions of $.50 per share is comprised of distributions from net investment income of $.495 and distributions from net realized gain of $.006 per share.
D Total returns for periods of less than one year are not annualized.
E Total returns would have been lower if certain expenses had not been reduced during the applicable periods shown.
F Fees and expenses of any underlying Fidelity Central Funds are not included in the Fund's expense ratio. The Fund indirectly bears its proportionate share of the expenses of any underlying Fidelity Central Funds.
G Expense ratios reflect operating expenses of the class. Expenses before reductions do not reflect amounts reimbursed by the investment adviser or reductions from brokerage service arrangements or reductions from other expense offset arrangements and do not represent the amount paid by the class during periods when reimbursements or reductions occur. Expenses net of fee waivers reflect expenses after reimbursement by the investment adviser but prior to reductions from brokerage service arrangements or other expense offset arrangements. Expenses net of all reductions represent the net expenses paid by the class.
H Annualized
I Amount does not include the portfolio activity of any underlying Fidelity Central Funds.
J Portfolio turnover rate excludes securities received or delivered in-kind.
See accompanying notes which are an integral part of the financial statements.
Fidelity Growth & Income Portfolio Class K
| | Six months ended (Unaudited) January 31, | Years endedJuly 31, | | | | |
| | 2018 | 2017 | 2016 | 2015 | 2014 | 2013 |
| Selected Per–Share Data | | | | | | |
| Net asset value, beginning of period | $35.28 | $30.46 | $30.82 | $29.00 | $25.64 | $20.12 |
| Income from Investment Operations | | | | | | |
| Net investment income (loss)A | .29 | .65 | .62 | .59 | .54 | .50 |
| Net realized and unrealized gain (loss) | 4.65 | 4.67 | (.35) | 1.81B | 3.36 | 5.52 |
| Total from investment operations | 4.94 | 5.32 | .27 | 2.40 | 3.90 | 6.02 |
| Distributions from net investment income | (.47) | (.50) | (.62) | (.58) | (.53) | (.47) |
| Distributions from net realized gain | – | – | (.01) | – | (.01) | (.03) |
| Total distributions | (.47) | (.50) | (.63) | (.58) | (.54) | (.50) |
| Net asset value, end of period | $39.75 | $35.28 | $30.46 | $30.82 | $29.00 | $25.64 |
| Total ReturnC,D | 14.12% | 17.60% | 1.04% | 8.34%B | 15.32% | 30.28% |
| Ratios to Average Net AssetsE,F | | | | | | |
| Expenses before reductions | .51%G | .52% | .52% | .52% | .52% | .53% |
| Expenses net of fee waivers, if any | .51%G | .52% | .52% | .52% | .52% | .53% |
| Expenses net of all reductions | .51%G | .52% | .52% | .52% | .52% | .52% |
| Net investment income (loss) | 1.60%G | 1.95% | 2.17% | 1.95% | 1.99% | 2.19% |
| Supplemental Data | | | | | | |
| Net assets, end of period (in millions) | $921 | $890 | $765 | $862 | $960 | $1,016 |
| Portfolio turnover rateH | 40%G | 37% | 29% | 35% | 41%I | 49% |
A Calculated based on average shares outstanding during the period.
B Net realized and unrealized gain (loss) per share reflects proceeds received from litigation which amounted to $.06 per share. Excluding these litigation proceeds, the total return would have been 8.14%
C Total returns for periods of less than one year are not annualized.
D Total returns would have been lower if certain expenses had not been reduced during the applicable periods shown.
E Fees and expenses of any underlying Fidelity Central Funds are not included in the Fund's expense ratio. The Fund indirectly bears its proportionate share of the expenses of any underlying Fidelity Central Funds.
F Expense ratios reflect operating expenses of the class. Expenses before reductions do not reflect amounts reimbursed by the investment adviser or reductions from brokerage service arrangements or reductions from other expense offset arrangements and do not represent the amount paid by the class during periods when reimbursements or reductions occur. Expenses net of fee waivers reflect expenses after reimbursement by the investment adviser but prior to reductions from brokerage service arrangements or other expense offset arrangements. Expenses net of all reductions represent the net expenses paid by the class.
G Annualized
H Amount does not include the portfolio activity of any underlying Fidelity Central Funds.
I Portfolio turnover rate excludes securities received or delivered in-kind.
See accompanying notes which are an integral part of the financial statements.
Notes to Financial Statements (Unaudited)
For the period ended January 31, 2018
(Amounts in thousands except percentages)
1. Organization.
Fidelity Growth & Income Portfolio (the Fund) is a fund of Fidelity Securities Fund (the Trust) and is authorized to issue an unlimited number of shares. The Trust is registered under the Investment Company Act of 1940, as amended (the 1940 Act), as an open-end management investment company organized as a Massachusetts business trust. The Fund offers Growth & Income and Class K shares, each of which has equal rights as to assets and voting privileges. Each class has exclusive voting rights with respect to matters that affect that class.
2. Investments in Fidelity Central Funds.
The Fund invests in Fidelity Central Funds, which are open-end investment companies generally available only to other investment companies and accounts managed by the investment adviser and its affiliates. The Fund's Schedule of Investments lists each of the Fidelity Central Funds held as of period end, if any, as an investment of the Fund, but does not include the underlying holdings of each Fidelity Central Fund. As an Investing Fund, the Fund indirectly bears its proportionate share of the expenses of the underlying Fidelity Central Funds.
The Money Market Central Funds seek preservation of capital and current income and are managed by Fidelity Investments Money Management, Inc. (FIMM), an affiliate of the investment adviser. Annualized expenses of the Money Market Central Funds as of their most recent shareholder report date are less than .005%.
A complete unaudited list of holdings for each Fidelity Central Fund is available upon request or at the Securities and Exchange Commission (the SEC) website at www.sec.gov. In addition, the financial statements of the Fidelity Central Funds are available on the SEC website or upon request.
3. Significant Accounting Policies.
The Fund is an investment company and applies the accounting and reporting guidance of the Financial Accounting Standards Board (FASB) Accounting Standards Codification Topic 946 Financial Services – Investments Companies. The financial statements have been prepared in conformity with accounting principles generally accepted in the United States of America (GAAP), which require management to make certain estimates and assumptions at the date of the financial statements. Actual results could differ from those estimates. Subsequent events, if any, through the date that the financial statements were issued have been evaluated in the preparation of the financial statements. The following summarizes the significant accounting policies of the Fund:
Investment Valuation. Investments are valued as of 4:00 p.m. Eastern time on the last calendar day of the period. The Board of Trustees (the Board) has delegated the day to day responsibility for the valuation of the Fund's investments to the Fair Value Committee (the Committee) established by the Fund's investment adviser. In accordance with valuation policies and procedures approved by the Board, the Fund attempts to obtain prices from one or more third party pricing vendors or brokers to value its investments. When current market prices, quotations or currency exchange rates are not readily available or reliable, investments will be fair valued in good faith by the Committee, in accordance with procedures adopted by the Board. Factors used in determining fair value vary by investment type and may include market or investment specific events, changes in interest rates and credit quality. The frequency with which these procedures are used cannot be predicted and they may be utilized to a significant extent. The Committee oversees the Fund's valuation policies and procedures and reports to the Board on the Committee's activities and fair value determinations. The Board monitors the appropriateness of the procedures used in valuing the Fund's investments and ratifies the fair value determinations of the Committee.
The Fund categorizes the inputs to valuation techniques used to value its investments into a disclosure hierarchy consisting of three levels as shown below:
- Level 1 – quoted prices in active markets for identical investments
- Level 2 – other significant observable inputs (including quoted prices for similar investments, interest rates, prepayment speeds, etc.)
- Level 3 – unobservable inputs (including the Fund's own assumptions based on the best information available)
Valuation techniques used to value the Fund's investments by major category are as follows:
Equity securities, including restricted securities, for which market quotations are readily available, are valued at the last reported sale price or official closing price as reported by a third party pricing vendor on the primary market or exchange on which they are traded and are categorized as Level 1 in the hierarchy. In the event there were no sales during the day or closing prices are not available, securities are valued at the last quoted bid price or may be valued using the last available price and are generally categorized as Level 2 in the hierarchy. For foreign equity securities, when market or security specific events arise, comparisons to the valuation of American Depositary Receipts (ADRs), futures contracts, Exchange-Traded Funds (ETFs) and certain indexes as well as quoted prices for similar securities may be used and would be categorized as Level 2 in the hierarchy. Utilizing these techniques may result in transfers between Level 1 and Level 2. For equity securities, including restricted securities, where observable inputs are limited, assumptions about market activity and risk are used and these securities may be categorized as Level 3 in the hierarchy.
Debt securities, including restricted securities, are valued based on evaluated prices received from third party pricing vendors or from brokers who make markets in such securities. Corporate bonds are valued by pricing vendors who utilize matrix pricing which considers yield or price of bonds of comparable quality, coupon, maturity and type or by broker-supplied prices. When independent prices are unavailable or unreliable, debt securities may be valued utilizing pricing methodologies which consider similar factors that would be used by third party pricing vendors. Debt securities are generally categorized as Level 2 in the hierarchy but may be Level 3 depending on the circumstances.
Exchange-traded options are valued using the last sale price or, in the absence of a sale, the last offering price and are categorized as Level 1 in the hierarchy. Investments in open-end mutual funds, including the Fidelity Central Funds, are valued at their closing net asset value (NAV) each business day and are categorized as Level 1 in the hierarchy.
Changes in valuation techniques may result in transfers in or out of an assigned level within the disclosure hierarchy. The aggregate value of investments by input level as of January 31, 2018 is included at the end of the Fund's Schedule of Investments.
Foreign Currency. The Fund may use foreign currency contracts to facilitate transactions in foreign-denominated securities. Gains and losses from these transactions may arise from changes in the value of the foreign currency or if the counterparties do not perform under the contracts' terms.
Foreign-denominated assets, including investment securities, and liabilities are translated into U.S. dollars at the exchange rates at period end. Purchases and sales of investment securities, income and dividends received and expenses denominated in foreign currencies are translated into U.S. dollars at the exchange rate in effect on the transaction date.
The effects of exchange rate fluctuations on investments are included with the net realized and unrealized gain (loss) on investment securities. Other foreign currency transactions resulting in realized and unrealized gain (loss) are disclosed separately.
Investment Transactions and Income. For financial reporting purposes, the Fund's investment holdings and NAV include trades executed through the end of the last business day of the period. The NAV per share for processing shareholder transactions is calculated as of the close of business of the New York Stock Exchange (NYSE), normally 4:00 p.m. Eastern time and includes trades executed through the end of the prior business day. Gains and losses on securities sold are determined on the basis of identified cost and includes proceeds received from litigation. Dividend income is recorded on the ex-dividend date, except for certain dividends from foreign securities where the ex-dividend date may have passed, which are recorded as soon as the Fund is informed of the ex-dividend date. Non-cash dividends included in dividend income, if any, are recorded at the fair market value of the securities received. Income and capital gain distributions from Fidelity Central Funds, if any, are recorded on the ex-dividend date. Certain distributions received by the Fund represent a return of capital or capital gain. The Fund determines the components of these distributions subsequent to the ex-dividend date, based upon receipt of tax filings or other correspondence relating to the underlying investment. These distributions are recorded as a reduction of cost of investments and/or as a realized gain. Interest income is accrued as earned and includes coupon interest and amortization of premium and accretion of discount on debt securities as applicable. Investment income is recorded net of foreign taxes withheld where recovery of such taxes is uncertain.
Class Allocations and Expenses. Investment income, realized and unrealized capital gains and losses, common expenses of the Fund, and certain fund-level expense reductions, if any, are allocated daily on a pro-rata basis to each class based on the relative net assets of each class to the total net assets of the Fund. Each class differs with respect to transfer agent fees incurred. Certain expense reductions may also differ by class. For the reporting period, the allocated portion of income and expenses to each class as a percent of its average net assets may vary due to the timing of recording these transactions in relation to fluctuating net assets of the classes. Expenses directly attributable to a fund are charged to that fund. Expenses attributable to more than one fund are allocated among the respective funds on the basis of relative net assets or other appropriate methods. Expense estimates are accrued in the period to which they relate and adjustments are made when actual amounts are known.
Deferred Trustee Compensation. Under a Deferred Compensation Plan (the Plan), independent Trustees may elect to defer receipt of a portion of their annual compensation. Deferred amounts are invested in a cross-section of Fidelity funds, are marked-to-market and remain in the Fund until distributed in accordance with the Plan. The investment of deferred amounts and the offsetting payable to the Trustees are included in the accompanying Statement of Assets and Liabilities.
Income Tax Information and Distributions to Shareholders. Each year, the Fund intends to qualify as a regulated investment company under Subchapter M of the Internal Revenue Code, including distributing substantially all of its taxable income and realized gains. As a result, no provision for U.S. Federal income taxes is required. The Fund files a U.S. federal tax return, in addition to state and local tax returns as required. The Fund's federal income tax returns are subject to examination by the Internal Revenue Service (IRS) for a period of three fiscal years after they are filed. State and local tax returns may be subject to examination for an additional fiscal year depending on the jurisdiction. Foreign taxes are provided for based on the Fund's understanding of the tax rules and rates that exist in the foreign markets in which it invests.
Distributions are declared and recorded on the ex-dividend date. Income dividends and capital gain distributions are declared separately for each class. Income and capital gain distributions are determined in accordance with income tax regulations, which may differ from GAAP.
Capital accounts within the financial statements are adjusted for permanent book-tax differences. These adjustments have no impact on net assets or the results of operations. Capital accounts are not adjusted for temporary book-tax differences which will reverse in a subsequent period.
Book-tax differences are primarily due to foreign currency transactions, passive foreign investment companies (PFIC), market discount, partnerships, certain conversion ratio adjustments, equity-debt classifications, deferred trustees compensation, capital loss carryforwards and losses deferred due to wash sales.
As of period end, the cost and unrealized appreciation (depreciation) in securities, and derivatives if applicable, for federal income tax purposes were as follows:
| Gross unrealized appreciation | $1,835,496 |
| Gross unrealized depreciation | (422,405) |
| Net unrealized appreciation (depreciation) | $1,413,091 |
| Tax cost | $6,403,803 |
Capital loss carryforwards are only available to offset future capital gains of the Fund to the extent provided by regulations and may be limited. Under the Regulated Investment Company Modernization Act of 2010 (the Act), the Fund is permitted to carry forward capital losses incurred in taxable years beginning after December 22, 2010 for an unlimited period and such capital losses are required to be used prior to any losses that expire. The capital loss carryforward information presented below, including any applicable limitation, is estimated as of prior fiscal period end and is subject to adjustment.
| Fiscal year of expiration | |
| 2018 | $(1,723,247) |
Restricted Securities. The Fund may invest in securities that are subject to legal or contractual restrictions on resale. These securities generally may be resold in transactions exempt from registration or to the public if the securities are registered. Disposal of these securities may involve time-consuming negotiations and expense, and prompt sale at an acceptable price may be difficult. Information regarding restricted securities is included at the end of the Fund's Schedule of Investments.
Consolidated Subsidiary. The Fund invests in certain investments through a wholly-owned subsidiary ("Subsidiary"), which may be subject to federal and state taxes upon disposition.
As of period end, the Fund held an investment of $17,012 in this Subsidiary, representing .22% of the Fund's net assets. The financial statements have been consolidated and include accounts of the Fund and the Subsidiary. Accordingly, all inter-company transactions and balances have been eliminated.
Any cash held by the Subsidiary is restricted as to its use and is presented as Restricted cash in the Statement of Assets and Liabilities.
4. Derivative Instruments.
Risk Exposures and the Use of Derivative Instruments. The Fund's investment objective allows the Fund to enter into various types of derivative contracts, including options. Derivatives are investments whose value is primarily derived from underlying assets, indices or reference rates and may be transacted on an exchange or over-the-counter (OTC). Derivatives may involve a future commitment to buy or sell a specified asset based on specified terms, to exchange future cash flows at periodic intervals based on a notional principal amount, or for one party to make one or more payments upon the occurrence of specified events in exchange for periodic payments from the other party.
The Fund used derivatives to increase returns and to manage exposure to certain risks as defined below. The success of any strategy involving derivatives depends on analysis of numerous economic factors, and if the strategies for investment do not work as intended, the Fund may not achieve its objectives.
The Fund's use of derivatives increased or decreased its exposure to the following risk:
| Equity Risk | Equity risk relates to the fluctuations in the value of financial instruments as a result of changes in market prices (other than those arising from interest rate risk or foreign exchange risk), whether caused by factors specific to an individual investment, its issuer, or all factors affecting all instruments traded in a market or market segment.
|
The Fund is also exposed to additional risks from investing in derivatives, such as liquidity risk and counterparty credit risk. Liquidity risk is the risk that the Fund will be unable to close out the derivative in the open market in a timely manner. Counterparty credit risk is the risk that the counterparty will not be able to fulfill its obligation to the Fund. Derivative counterparty credit risk is managed through formal evaluation of the creditworthiness of all potential counterparties. On certain OTC derivatives such as options, the Fund attempts to reduce its exposure to counterparty credit risk by entering into an International Swaps and Derivatives Association, Inc. (ISDA) Master Agreement with each of its counterparties. The ISDA Master Agreement gives the Fund the right to terminate all transactions traded under such agreement upon the deterioration in the credit quality of the counterparty beyond specified levels. The ISDA Master Agreement gives each party the right, upon an event of default by the other party or a termination of the agreement, to close out all transactions traded under such agreement and to net amounts owed under each transaction to one net payable by one party to the other. To mitigate counterparty credit risk on bi-lateral OTC derivatives, the Fund receives collateral in the form of cash or securities once the Fund's net unrealized appreciation on outstanding derivative contracts under an ISDA Master Agreement exceeds certain applicable thresholds, subject to certain minimum transfer provisions. The collateral received is held in segregated accounts with the Fund's custodian bank in accordance with the collateral agreements entered into between the Fund, the counterparty and the Fund's custodian bank. The Fund could experience delays and costs in gaining access to the collateral even though it is held by the Fund's custodian bank. The Fund's maximum risk of loss from counterparty credit risk related to bi-lateral OTC derivatives is generally the aggregate unrealized appreciation and unpaid counterparty payments in excess of any collateral pledged by the counterparty to the Fund. The Fund may be required to pledge collateral for the benefit of the counterparties on bi-lateral OTC derivatives in an amount not less than each counterparty's unrealized appreciation on outstanding derivative contracts, subject to certain minimum transfer provisions, and any such pledged collateral is identified in the Schedule of Investments. Counterparty credit risk related to exchange-traded options may be mitigated by the protection provided by the exchange on which they trade.
Investing in derivatives may involve greater risks than investing in the underlying assets directly and, to varying degrees, may involve risk of loss in excess of any initial investment and collateral received and amounts recognized in the Statement of Assets and Liabilities. In addition, there may be the risk that the change in value of the derivative contract does not correspond to the change in value of the underlying instrument.
Options. Options give the purchaser the right, but not the obligation, to buy (call) or sell (put) an underlying security or financial instrument at an agreed exercise or strike price between or on certain dates. Options obligate the seller (writer) to buy (put) or sell (call) an underlying instrument at the exercise or strike price or cash settle an underlying derivative instrument if the holder exercises the option on or before the expiration date.
The Fund used exchange-traded and OTC written covered call options to manage its exposure to the market. When the Fund writes a covered call option, the Fund holds the underlying instrument which must be delivered to the holder upon the exercise of the option.
Upon entering into a written options contract, the Fund will receive a premium. Premiums received are reflected as a liability on the Statement of Assets and Liabilities. Options are valued daily and any unrealized appreciation (depreciation) is reflected on the Statement of Assets and Liabilities. When a written option is exercised, the premium is added to the proceeds from the sale of the underlying instrument in determining the gain or loss realized on that investment. When an option is closed the Fund will realize a gain or loss depending on whether the proceeds or amount paid for the closing sale transaction are greater or less than the premium received. When an option expires, gains and losses are realized to the extent of premiums received. The net realized gain (loss) on closed and expired written options and the change in net unrealized appreciation (depreciation) on written options are presented in the Statement of Operations.
Writing call options tends to decrease exposure to the underlying instrument and risk of loss is the change in value in excess of the premium received.
Any open options at period end are presented in the Schedule of Investments under the caption "Written Options" and are representative of volume of activity during the period.
5. Purchases and Sales of Investments.
Purchases and sales of securities, other than short-term securities, aggregated $1,471,394 and $1,864,408, respectively.
6. Fees and Other Transactions with Affiliates.
Management Fee. Fidelity Management & Research Company (the investment adviser) and its affiliates provide the Fund with investment management related services for which the Fund pays a monthly management fee. The management fee is the sum of an individual fund fee rate that is based on an annual rate of .20% of the Fund's average net assets and an annualized group fee rate that averaged .24% during the period. The group fee rate is based upon the average net assets of all the mutual funds advised by the investment adviser, including any mutual funds previously advised by the investment adviser that are currently advised by Fidelity SelectCo, LLC, an affiliate of the investment adviser. The group fee rate decreases as assets under management increase and increases as assets under management decrease. For the reporting period, the total annualized management fee rate was .44% of the Fund's average net assets.
Transfer Agent Fees. Fidelity Investments Institutional Operations Company, Inc., (FIIOC), an affiliate of the investment adviser, is the transfer, dividend disbursing and shareholder servicing agent for each class of the Fund. FIIOC receives account fees and asset-based fees that vary according to the account size and type of account of the shareholders of Growth & Income, except for Class K. FIIOC receives an asset-based fee of Class K's average net assets. FIIOC pays for typesetting, printing and mailing of shareholder reports, except proxy statements.
For the period, transfer agent fees for each class were as follows:
| | Amount | % of Class-Level Average Net Assets(a) |
| Growth and Income | $4,843 | .15 |
| Class K | 203 | .05 |
| | $5,046 | |
(a) Annualized
Accounting and Security Lending Fees. Fidelity Service Company, Inc. (FSC), an affiliate of the investment adviser, maintains the Fund's accounting records. The accounting fee is based on the level of average net assets for each month. Under a separate contract, FSC administers the security lending program. The security lending fee is based on the number and duration of lending transactions.
Brokerage Commissions. The Fund placed a portion of its portfolio transactions with brokerage firms which are affiliates of the investment adviser. Brokerage commissions are included in net realized gain (loss) and change in net unrealized appreciation (depreciation) in the Statement of Operations. The commissions paid to these affiliated firms were $29 for the period.
Interfund Lending Program. Pursuant to an Exemptive Order issued by the SEC, the Fund, along with other registered investment companies having management contracts with Fidelity Management & Research Company (FMR) or other affiliated entities of FMR, may participate in an interfund lending program. This program provides an alternative credit facility allowing the funds to borrow from, or lend money to, other participating affiliated funds. At period end, there were no interfund loans outstanding. The Fund's activity in this program during the period for which loans were outstanding was as follows:
| Borrower or Lender | Average Loan Balance | Weighted Average Interest Rate | Interest Expense |
| Borrower | $5,610 | 1.37% | $8 |
Interfund Trades. The Fund may purchase from or sell securities to other Fidelity Funds under procedures adopted by the Board. The procedures have been designed to ensure these interfund trades are executed in accordance with Rule 17a-7 of the 1940 Act. Interfund trades are included within the respective purchases and sales amounts shown in the Purchases and Sales of Investments note.
7. Committed Line of Credit.
The Fund participates with other funds managed by the investment adviser or an affiliate in a $4.25 billion credit facility (the "line of credit") to be utilized for temporary or emergency purposes to fund shareholder redemptions or for other short-term liquidity purposes. The Fund has agreed to pay commitment fees on its pro-rata portion of the line of credit, which amounted to $10 and is reflected in Miscellaneous expenses on the Statement of Operations. During the period, the Fund did not borrow on this line of credit.
8. Security Lending.
The Fund lends portfolio securities through a lending agent from time to time in order to earn additional income. For equity securities, a lending agent is used and may loan securities to certain qualified borrowers, including Fidelity Capital Markets (FCM), a broker-dealer affiliated with the Fund. On the settlement date of the loan, the Fund receives collateral (in the form of U.S. Treasury obligations, letters of credit and/or cash) against the loaned securities and maintains collateral in an amount not less than 100% of the market value of the loaned securities during the period of the loan. The market value of the loaned securities is determined at the close of business of the Fund and any additional required collateral is delivered to the Fund on the next business day. The Fund or borrower may terminate the loan at any time, and if the borrower defaults on its obligation to return the securities loaned because of insolvency or other reasons, the Fund may apply collateral received from the borrower against the obligation. The Fund may experience delays and costs in recovering the securities loaned. Any cash collateral received is invested in the Fidelity Securities Lending Cash Central Fund. The value of loaned securities and cash collateral at period end are disclosed on the Fund's Statement of Assets and Liabilities. The value of securities loaned to FCM at period end was $1,711. Security lending income represents the income earned on investing cash collateral, less rebates paid to borrowers and any lending agent fees associated with the loan, plus any premium payments received for lending certain types of securities. Security lending income is presented in the Statement of Operations as a component of income from Fidelity Central Funds. Total security lending income during the period amounted to $195, including $8 from securities loaned to FCM.
9. Bank Borrowings.
The Fund is permitted to have bank borrowings for temporary or emergency purposes to fund shareholder redemptions or for other short-term liquidity requirements. The Fund has established borrowing arrangements with certain banks. The interest rate on the borrowings is the bank's base rate, as revised from time to time. The average loan balance during the period for which loans were outstanding amounted to $11,831. The weighted average interest rate was 1.66%. The interest expense amounted to $2 under the bank borrowing program. At period end, there were no bank borrowings outstanding.
10. Expense Reductions.
Commissions paid to certain brokers with whom the investment adviser, or its affiliates, places trades on behalf of the Fund include an amount in addition to trade execution, which may be rebated back to the Fund to offset certain expenses. This amount totaled $71 for the period.
In addition, during the period the investment adviser reimbursed and/or waived a portion of fund-level operating expenses in the amount of $37.
11. Distributions to Shareholders.
Distributions to shareholders of each class were as follows:
| | Six months ended
January 31, 2018 | Year ended
July 31, 2017 |
| From net investment income | | |
| Growth and Income | $78,502 | $84,860 |
| Class K | 11,202 | 12,759 |
| Total | $89,704 | $97,619 |
12. Share Transactions.
Share transactions for each class were as follows and may contain automatic conversions between classes or exchanges between affiliated funds:
| | Shares | Shares | Dollars | Dollars |
| | Six months ended January 31, 2018 | Year ended July 31, 2017 | Six months ended January 31, 2018 | Year ended July 31, 2017 |
| Growth and Income | | | | |
| Shares sold | 3,524 | 18,794 | $130,095 | $607,315 |
| Reinvestment of distributions | 2,035 | 2,473 | 74,379 | 80,649 |
| Shares redeemed | (14,031) | (22,631) | (511,155) | (748,252) |
| Net increase (decrease) | (8,472) | (1,364) | $(306,681) | $(60,288) |
| Class K | | | | |
| Shares sold | 1,853 | 7,100 | $68,694 | $234,427 |
| Reinvestment of distributions | 307 | 391 | 11,202 | 12,759 |
| Shares redeemed | (4,223) | (7,363) | (153,990) | (244,759) |
| Net increase (decrease) | (2,063) | 128 | $(74,094) | $2,427 |
13. Other.
The Fund's organizational documents provide former and current trustees and officers with a limited indemnification against liabilities arising in connection with the performance of their duties to the Fund. In the normal course of business, the Fund may also enter into contracts that provide general indemnifications. The Fund's maximum exposure under these arrangements is unknown as this would be dependent on future claims that may be made against the Fund. The risk of material loss from such claims is considered remote.
Shareholder Expense Example
As a shareholder of the Fund, you incur two types of costs: (1) transaction costs, and (2) ongoing costs, including management fees and other Fund expenses. This Example is intended to help you understand your ongoing costs (in dollars) of investing in the Fund and to compare these costs with the ongoing costs of investing in other mutual funds.
The Example is based on an investment of $1,000 invested at the beginning of the period and held for the entire period (August 1, 2017 to January 31, 2018).
Actual Expenses
The first line of the accompanying table for each class of the Fund provides information about actual account values and actual expenses. You may use the information in this line, together with the amount you invested, to estimate the expenses that you paid over the period. Simply divide your account value by $1,000.00 (for example, an $8,600 account value divided by $1,000.00 = 8.6), then multiply the result by the number in the first line for a class of the Fund under the heading entitled "Expenses Paid During Period" to estimate the expenses you paid on your account during this period. A small balance maintenance fee of $12.00 that is charged once a year may apply for certain accounts with a value of less than $2,000. This fee is not included in the table below. If it was, the estimate of expenses you paid during the period would be higher, and your ending account value lower, by this amount. In addition, the Fund, as a shareholder in the underlying Fidelity Central Funds, will indirectly bear its pro-rata share of the fees and expenses incurred by the underlying Fidelity Central Funds. These fees and expenses are not included in the Fund's annualized expense ratio used to calculate the expense estimate in the table below.
Hypothetical Example for Comparison Purposes
The second line of the accompanying table for each class of the Fund provides information about hypothetical account values and hypothetical expenses based on a Class' actual expense ratio and an assumed rate of return of 5% per year before expenses, which is not the Class' actual return. The hypothetical account values and expenses may not be used to estimate the actual ending account balance or expenses you paid for the period. You may use this information to compare the ongoing costs of investing in the Fund and other funds. To do so, compare this 5% hypothetical example with the 5% hypothetical examples that appear in the shareholder reports of the other funds. A small balance maintenance fee of $12.00 that is charged once a year may apply for certain accounts with a value of less than $2,000. This fee is not included in the table below. If it was, the estimate of expenses you paid during the period would be higher, and your ending account value lower, by this amount. In addition, the Fund, as a shareholder in the underlying Fidelity Central Funds, will indirectly bear its pro-rata share of the fees and expenses incurred by the underlying Fidelity Central Funds. These fees and expenses are not included in the Fund's annualized expense ratio used to calculate the expense estimate in the table below.
Please note that the expenses shown in the table are meant to highlight your ongoing costs only and do not reflect any transaction costs. Therefore, the second line of the table is useful in comparing ongoing costs only, and will not help you determine the relative total costs of owning different funds.
| | Annualized Expense Ratio-A | Beginning
Account Value
August 1, 2017 | Ending
Account Value
January 31, 2018 | Expenses Paid
During Period-B
August 1, 2017
to January 31, 2018 |
| Growth and Income | .61% | | | |
| Actual | | $1,000.00 | $1,140.50 | $3.29 |
| Hypothetical-C | | $1,000.00 | $1,022.13 | $3.11 |
| Class K | .51% | | | |
| Actual | | $1,000.00 | $1,141.20 | $2.75 |
| Hypothetical-C | | $1,000.00 | $1,022.63 | $2.60 |
A Annualized expense ratio reflects expenses net of applicable fee waivers.
B Expenses are equal to each Class' annualized expense ratio, multiplied by the average account value over the period, multiplied by 184/365 (to reflect the one-half year period).
C 5% return per year before expenses
Corporate Headquarters
245 Summer St.
Boston, MA 02210
www.fidelity.com
GAI-K-SANN-0318
1.863233.109
Fidelity® Growth & Income Portfolio
Semi-Annual Report January 31, 2018 |
|
Contents
To view a fund's proxy voting guidelines and proxy voting record for the 12-month period ended June 30, visit http://www.fidelity.com/proxyvotingresults or visit the Securities and Exchange Commission's (SEC) web site at http://www.sec.gov.
You may also call 1-800-544-8544 to request a free copy of the proxy voting guidelines.
Standard & Poor's, S&P and S&P 500 are registered service marks of The McGraw-Hill Companies, Inc. and have been licensed for use by Fidelity Distributors Corporation.
Other third-party marks appearing herein are the property of their respective owners.
All other marks appearing herein are registered or unregistered trademarks or service marks of FMR LLC or an affiliated company. © 2018 FMR LLC. All rights reserved.
This report and the financial statements contained herein are submitted for the general information of the shareholders of the Fund. This report is not authorized for distribution to prospective investors in the Fund unless preceded or accompanied by an effective prospectus.
A fund files its complete schedule of portfolio holdings with the SEC for the first and third quarters of each fiscal year on Form N-Q. Forms N-Q are available on the SEC’s web site at http://www.sec.gov. A fund's Forms N-Q may be reviewed and copied at the SEC’s Public Reference Room in Washington, DC. Information regarding the operation of the SEC's Public Reference Room may be obtained by calling 1-800-SEC-0330.
For a complete list of a fund's portfolio holdings, view the most recent holdings listing, semiannual report, or annual report on Fidelity's web site at http://www.fidelity.com, http://www.institutional.fidelity.com, or http://www.401k.com, as applicable.
NOT FDIC INSURED •MAY LOSE VALUE •NO BANK GUARANTEE
Neither the Fund nor Fidelity Distributors Corporation is a bank.
Investment Summary (Unaudited)
Top Ten Stocks as of January 31, 2018
| | % of fund's net assets |
| Microsoft Corp.(a) | 3.8 |
| Bank of America Corp. | 3.3 |
| JPMorgan Chase & Co.(a) | 3.1 |
| Citigroup, Inc.(a) | 3.0 |
| Comcast Corp. Class A | 2.4 |
| Wells Fargo & Co. | 2.2 |
| State Street Corp.(a) | 2.0 |
| Apple, Inc.(a) | 2.0 |
| ConocoPhillips Co.(a) | 1.8 |
| Chevron Corp.(a) | 1.8 |
| | 25.4 |
(a) Security or a portion of the security is pledged as collateral for call options written.
Top Five Market Sectors as of January 31, 2018
| | % of fund's net assets |
| Financials | 23.1 |
| Information Technology | 16.6 |
| Energy | 13.5 |
| Health Care | 12.2 |
| Industrials | 11.7 |
Asset Allocation (% of fund's net assets)
| As of January 31, 2018*,** |
| | Stocks | 99.4% |
| | Convertible Securities | 0.4% |
| | Other Investments | 0.2% |

* Foreign investments - 11.7%
** Written options - (0.1)%
Schedule of Investments January 31, 2018 (Unaudited)
Showing Percentage of Net Assets
| Common Stocks - 99.4% | | | |
| | | Shares | Value (000s) |
| CONSUMER DISCRETIONARY - 8.0% | | | |
| Auto Components - 0.1% | | | |
| Gentex Corp. | | 521,100 | $12,340 |
| Hotels, Restaurants & Leisure - 0.5% | | | |
| Cedar Fair LP (depositary unit) | | 32,700 | 2,217 |
| DineEquity, Inc. | | 119,300 | 6,607 |
| Dunkin' Brands Group, Inc. | | 354,100 | 22,893 |
| Marriott International, Inc. Class A | | 21,700 | 3,197 |
| Papa John's International, Inc. (a) | | 63,300 | 4,108 |
| | | | 39,022 |
| Media - 4.1% | | | |
| Comcast Corp. Class A | | 4,341,000 | 184,623 |
| Interpublic Group of Companies, Inc. | | 1,643,700 | 35,981 |
| Omnicom Group, Inc. | | 191,900 | 14,709 |
| The Walt Disney Co. | | 428,200 | 46,532 |
| Time Warner, Inc. | | 291,200 | 27,766 |
| Viacom, Inc. Class B (non-vtg.) | | 188,600 | 6,303 |
| | | | 315,914 |
| Multiline Retail - 0.6% | | | |
| Dollar General Corp. | | 161,100 | 16,613 |
| Target Corp. (b) | | 367,875 | 27,672 |
| | | | 44,285 |
| Specialty Retail - 2.7% | | | |
| L Brands, Inc. (b) | | 774,900 | 38,815 |
| Lowe's Companies, Inc. | | 869,779 | 91,092 |
| Ross Stores, Inc. | | 239,800 | 19,757 |
| TJX Companies, Inc. | | 588,900 | 47,300 |
| Williams-Sonoma, Inc. (a) | | 292,900 | 15,005 |
| | | | 211,969 |
|
| TOTAL CONSUMER DISCRETIONARY | | | 623,530 |
|
| CONSUMER STAPLES - 9.3% | | | |
| Beverages - 1.6% | | | |
| Molson Coors Brewing Co. Class B | | 312,200 | 26,231 |
| The Coca-Cola Co. | | 1,987,203 | 94,571 |
| | | | 120,802 |
| Food & Staples Retailing - 2.4% | | | |
| CVS Health Corp. | | 1,068,304 | 84,065 |
| Kroger Co. (b) | | 1,058,300 | 32,130 |
| Walmart, Inc. | | 681,200 | 72,616 |
| | | | 188,811 |
| Food Products - 0.7% | | | |
| Campbell Soup Co. | | 287,100 | 13,365 |
| Kellogg Co. | | 135,200 | 9,208 |
| Nestle SA (Reg. S) | | 45,170 | 3,902 |
| The J.M. Smucker Co. | | 198,600 | 25,200 |
| | | | 51,675 |
| Household Products - 1.9% | | | |
| Kimberly-Clark Corp. | | 199,300 | 23,318 |
| Procter & Gamble Co. (b) | | 1,009,915 | 87,196 |
| Reckitt Benckiser Group PLC | | 394,900 | 38,136 |
| | | | 148,650 |
| Personal Products - 0.3% | | | |
| Unilever NV (NY Reg.) | | 479,100 | 27,543 |
| Tobacco - 2.4% | | | |
| Altria Group, Inc. | | 1,736,700 | 122,159 |
| British American Tobacco PLC sponsored ADR | | 903,400 | 61,522 |
| | | | 183,681 |
|
| TOTAL CONSUMER STAPLES | | | 721,162 |
|
| ENERGY - 13.3% | | | |
| Energy Equipment & Services - 1.0% | | | |
| Baker Hughes, a GE Co. Class A | | 997,500 | 32,070 |
| Nabors Industries Ltd. | | 791,700 | 6,207 |
| National Oilwell Varco, Inc. | | 570,400 | 20,922 |
| Oceaneering International, Inc. | | 776,800 | 16,064 |
| Schlumberger Ltd. | | 22,600 | 1,663 |
| | | | 76,926 |
| Oil, Gas & Consumable Fuels - 12.3% | | | |
| Anadarko Petroleum Corp. | | 275,400 | 16,538 |
| Apache Corp. | | 945,511 | 42,425 |
| BP PLC sponsored ADR | | 808,200 | 34,583 |
| Cabot Oil & Gas Corp. | | 1,139,300 | 30,021 |
| Cenovus Energy, Inc. | | 6,107,700 | 58,247 |
| Cenovus Energy, Inc. | | 37,200 | 355 |
| Chevron Corp. (b) | | 1,100,296 | 137,922 |
| ConocoPhillips Co. (b) | | 2,418,900 | 142,256 |
| Exxon Mobil Corp. | | 381,800 | 33,331 |
| Golar LNG Ltd. | | 629,100 | 17,168 |
| Imperial Oil Ltd. | | 1,158,500 | 36,422 |
| Kinder Morgan, Inc. | | 2,731,700 | 49,116 |
| Legacy Reserves LP (c) | | 956,268 | 2,276 |
| Phillips 66 Co. | | 103,580 | 10,607 |
| Suncor Energy, Inc. | | 3,674,050 | 133,102 |
| Teekay LNG Partners LP | | 477,300 | 9,427 |
| The Williams Companies, Inc. | | 3,618,472 | 113,584 |
| Valero Energy Corp. | | 207,200 | 19,885 |
| Williams Partners LP | | 1,510,985 | 63,310 |
| | | | 950,575 |
|
| TOTAL ENERGY | | | 1,027,501 |
|
| FINANCIALS - 23.1% | | | |
| Banks - 15.4% | | | |
| Bank of America Corp. | | 7,890,156 | 252,485 |
| Citigroup, Inc. (b) | | 2,950,830 | 231,581 |
| Cullen/Frost Bankers, Inc. | | 16,200 | 1,724 |
| First Hawaiian, Inc. | | 24,900 | 720 |
| JPMorgan Chase & Co. (b) | | 2,060,192 | 238,302 |
| M&T Bank Corp. | | 20,300 | 3,873 |
| PNC Financial Services Group, Inc. (b) | | 461,154 | 72,872 |
| Regions Financial Corp. (b) | | 1,950,400 | 37,506 |
| SunTrust Banks, Inc. | | 1,481,266 | 104,726 |
| U.S. Bancorp | | 1,330,473 | 76,023 |
| Wells Fargo & Co. | | 2,610,341 | 171,708 |
| | | | 1,191,520 |
| Capital Markets - 6.8% | | | |
| Apollo Global Management LLC Class A | | 511,500 | 18,286 |
| Charles Schwab Corp. (b) | | 810,843 | 43,250 |
| KKR & Co. LP | | 2,335,043 | 56,228 |
| Morgan Stanley | | 1,127,897 | 63,783 |
| Northern Trust Corp. (b) | | 848,464 | 89,420 |
| Oaktree Capital Group LLC Class A | | 271,200 | 12,448 |
| S&P Global, Inc. | | 182,100 | 32,978 |
| State Street Corp. (b) | | 1,386,227 | 152,721 |
| The Blackstone Group LP | | 1,556,600 | 56,894 |
| | | | 526,008 |
| Insurance - 0.7% | | | |
| Marsh & McLennan Companies, Inc. | | 292,407 | 24,422 |
| MetLife, Inc. | | 603,100 | 28,991 |
| | | | 53,413 |
| Thrifts & Mortgage Finance - 0.2% | | | |
| Radian Group, Inc. | | 725,668 | 16,015 |
|
| TOTAL FINANCIALS | | | 1,786,956 |
|
| HEALTH CARE - 12.0% | | | |
| Biotechnology - 2.4% | | | |
| Alexion Pharmaceuticals, Inc. (c) | | 280,900 | 33,517 |
| Amgen, Inc. | | 638,093 | 118,717 |
| Biogen, Inc. (c) | | 43,100 | 14,991 |
| Gilead Sciences, Inc. | | 9,600 | 804 |
| Intercept Pharmaceuticals, Inc. (c) | | 121,626 | 7,553 |
| Shire PLC sponsored ADR | | 88,600 | 12,408 |
| | | | 187,990 |
| Health Care Equipment & Supplies - 1.5% | | | |
| Becton, Dickinson & Co. | | 19,000 | 4,616 |
| Boston Scientific Corp. (c) | | 531,900 | 14,872 |
| ConvaTec Group PLC (d) | | 665,200 | 1,910 |
| Danaher Corp. | | 341,100 | 34,547 |
| Fisher & Paykel Healthcare Corp. | | 388,032 | 3,818 |
| Medtronic PLC | | 210,530 | 18,082 |
| ResMed, Inc. | | 107,400 | 10,825 |
| Steris PLC | | 59,700 | 5,428 |
| Zimmer Biomet Holdings, Inc. | | 159,510 | 20,277 |
| | | | 114,375 |
| Health Care Providers & Services - 3.7% | | | |
| Aetna, Inc. | | 51,400 | 9,603 |
| AmerisourceBergen Corp. | | 281,100 | 28,017 |
| Anthem, Inc. | | 182,600 | 45,257 |
| Cardinal Health, Inc. | | 761,900 | 54,697 |
| Cigna Corp. | | 125,300 | 26,106 |
| Fresenius Medical Care AG & Co. KGaA sponsored ADR | | 190,300 | 10,944 |
| Humana, Inc. | | 64,600 | 18,206 |
| McKesson Corp. | | 292,087 | 49,328 |
| Patterson Companies, Inc. | | 309,970 | 11,125 |
| UnitedHealth Group, Inc. | | 132,100 | 31,279 |
| | | | 284,562 |
| Pharmaceuticals - 4.4% | | | |
| Allergan PLC | | 94,700 | 17,071 |
| AstraZeneca PLC sponsored ADR | | 677,500 | 23,753 |
| Bayer AG | | 190,300 | 24,936 |
| Eisai Co. Ltd. | | 13,700 | 780 |
| GlaxoSmithKline PLC sponsored ADR | | 2,908,322 | 109,091 |
| Innoviva, Inc. (c) | | 235,100 | 3,430 |
| Johnson & Johnson (b) | | 729,169 | 100,764 |
| Novartis AG sponsored ADR | | 42,444 | 3,823 |
| Sanofi SA | | 228,788 | 20,191 |
| Teva Pharmaceutical Industries Ltd. sponsored ADR | | 1,727,020 | 35,248 |
| | | | 339,087 |
|
| TOTAL HEALTH CARE | | | 926,014 |
|
| INDUSTRIALS - 11.6% | | | |
| Aerospace & Defense - 2.3% | | | |
| General Dynamics Corp. | | 103,000 | 22,915 |
| Meggitt PLC | | 211,968 | 1,397 |
| Rolls-Royce Holdings PLC | | 1,347,200 | 16,717 |
| The Boeing Co. (b) | | 44,289 | 15,695 |
| United Technologies Corp. | | 862,682 | 119,059 |
| | | | 175,783 |
| Air Freight & Logistics - 1.7% | | | |
| C.H. Robinson Worldwide, Inc. (b) | | 352,400 | 32,231 |
| Expeditors International of Washington, Inc. | | 311,000 | 20,199 |
| United Parcel Service, Inc. Class B | | 595,204 | 75,781 |
| | | | 128,211 |
| Commercial Services & Supplies - 0.1% | | | |
| KAR Auction Services, Inc. | | 65,000 | 3,545 |
| Ritchie Brothers Auctioneers, Inc. (a) | | 236,500 | 7,693 |
| | | | 11,238 |
| Construction & Engineering - 0.1% | | | |
| Fluor Corp. | | 148,000 | 8,984 |
| Electrical Equipment - 0.6% | | | |
| Acuity Brands, Inc. | | 148,100 | 22,873 |
| Hubbell, Inc. Class B | | 191,539 | 26,040 |
| | | | 48,913 |
| Industrial Conglomerates - 1.6% | | | |
| General Electric Co. | | 7,474,627 | 120,865 |
| Machinery - 1.1% | | | |
| Donaldson Co., Inc. | | 140,100 | 7,097 |
| Flowserve Corp. | | 829,000 | 37,570 |
| Snap-On, Inc. | | 120,000 | 20,557 |
| Wabtec Corp. (a) | | 220,500 | 17,869 |
| Zardoya Otis SA | | 115,600 | 1,320 |
| | | | 84,413 |
| Professional Services - 0.4% | | | |
| Intertrust NV (c)(d) | | 362,800 | 6,644 |
| Nielsen Holdings PLC | | 607,900 | 22,742 |
| | | | 29,386 |
| Road & Rail - 2.8% | | | |
| CSX Corp. (b) | | 927,320 | 52,644 |
| J.B. Hunt Transport Services, Inc. (b) | | 527,040 | 63,682 |
| Norfolk Southern Corp. | | 254,499 | 38,399 |
| Union Pacific Corp. | | 454,100 | 60,622 |
| | | | 215,347 |
| Trading Companies & Distributors - 0.9% | | | |
| Brenntag AG | | 25,800 | 1,673 |
| Bunzl PLC | | 133,700 | 3,911 |
| Fastenal Co. (a) | | 437,700 | 24,056 |
| Howden Joinery Group PLC | | 228,700 | 1,508 |
| MSC Industrial Direct Co., Inc. Class A | | 125,900 | 11,819 |
| Watsco, Inc. | | 164,592 | 29,592 |
| | | | 72,559 |
|
| TOTAL INDUSTRIALS | | | 895,699 |
|
| INFORMATION TECHNOLOGY - 16.6% | | | |
| Communications Equipment - 1.5% | | | |
| Cisco Systems, Inc. (b) | | 2,837,152 | 117,855 |
| Electronic Equipment & Components - 0.1% | | | |
| Avnet, Inc. | | 128,200 | 5,449 |
| Philips Lighting NV (d) | | 109,400 | 4,306 |
| | | | 9,755 |
| Internet Software & Services - 2.8% | | | |
| Alphabet, Inc.: | | | |
| Class A (c) | | 96,807 | 114,447 |
| Class C (c) | | 90,736 | 106,156 |
| | | | 220,603 |
| IT Services - 3.1% | | | |
| Accenture PLC Class A | | 96,700 | 15,540 |
| Cognizant Technology Solutions Corp. Class A | | 20,500 | 1,599 |
| IBM Corp. | | 23,900 | 3,912 |
| MasterCard, Inc. Class A | | 161,400 | 27,277 |
| Paychex, Inc. | | 1,066,752 | 72,806 |
| Unisys Corp. (a)(c) | | 1,314,818 | 11,702 |
| Visa, Inc. Class A | | 845,884 | 105,084 |
| | | | 237,920 |
| Semiconductors & Semiconductor Equipment - 2.0% | | | |
| Broadcom Ltd. | | 30,400 | 7,540 |
| Qualcomm, Inc. | | 2,020,246 | 137,882 |
| United Microelectronics Corp. sponsored ADR | | 1,575,900 | 3,845 |
| Xilinx, Inc. | | 59,700 | 4,359 |
| | | | 153,626 |
| Software - 5.1% | | | |
| Micro Focus International PLC | | 683,862 | 20,876 |
| Microsoft Corp. (b) | | 3,134,099 | 297,765 |
| Oracle Corp. | | 1,090,653 | 56,267 |
| SAP SE sponsored ADR | | 207,100 | 23,454 |
| | | | 398,362 |
| Technology Hardware, Storage & Peripherals - 2.0% | | | |
| Apple, Inc. (b) | | 902,794 | 151,155 |
|
| TOTAL INFORMATION TECHNOLOGY | | | 1,289,276 |
|
| MATERIALS - 2.1% | | | |
| Chemicals - 1.8% | | | |
| CF Industries Holdings, Inc. (b) | | 549,700 | 23,329 |
| LyondellBasell Industries NV Class A | | 422,800 | 50,668 |
| Monsanto Co. | | 132,015 | 16,079 |
| Nutrien Ltd. (c) | | 707,680 | 37,024 |
| PPG Industries, Inc. | | 17,600 | 2,090 |
| The Scotts Miracle-Gro Co. Class A | | 134,600 | 12,150 |
| | | | 141,340 |
| Metals & Mining - 0.3% | | | |
| BHP Billiton Ltd. sponsored ADR (a) | | 271,600 | 13,314 |
| Reliance Steel & Aluminum Co. | | 75,500 | 6,613 |
| | | | 19,927 |
|
| TOTAL MATERIALS | | | 161,267 |
|
| REAL ESTATE - 1.0% | | | |
| Equity Real Estate Investment Trusts (REITs) - 1.0% | | | |
| American Tower Corp. | | 98,600 | 14,563 |
| CoreSite Realty Corp. | | 164,600 | 17,829 |
| Equinix, Inc. | | 38,100 | 17,343 |
| Omega Healthcare Investors, Inc. (a) | | 149,400 | 4,040 |
| Public Storage | | 84,400 | 16,522 |
| Sabra Health Care REIT, Inc. | | 271,900 | 4,921 |
| Spirit Realty Capital, Inc. | | 745,700 | 6,092 |
| | | | 81,310 |
| TELECOMMUNICATION SERVICES - 1.3% | | | |
| Diversified Telecommunication Services - 1.3% | | | |
| Verizon Communications, Inc. | | 1,806,774 | 97,692 |
| UTILITIES - 1.1% | | | |
| Electric Utilities - 1.0% | | | |
| Exelon Corp. | | 1,648,400 | 63,480 |
| PPL Corp. | | 423,700 | 13,503 |
| Southern Co. | | 44,100 | 1,989 |
| | | | 78,972 |
| Independent Power and Renewable Electricity Producers - 0.0% | | | |
| The AES Corp. | | 135,100 | 1,562 |
| Multi-Utilities - 0.1% | | | |
| Public Service Enterprise Group, Inc. | | 50,600 | 2,625 |
|
| TOTAL UTILITIES | | | 83,159 |
|
| TOTAL COMMON STOCKS | | | |
| (Cost $6,272,377) | | | 7,693,566 |
|
| Preferred Stocks - 0.3% | | | |
| Convertible Preferred Stocks - 0.3% | | | |
| HEALTH CARE - 0.1% | | | |
| Health Care Equipment & Supplies - 0.1% | | | |
| Becton, Dickinson & Co. Series A, 6.125% | | 210,900 | 13,228 |
| INDUSTRIALS - 0.1% | | | |
| Commercial Services & Supplies - 0.1% | | | |
| Stericycle, Inc. 2.25% | | 117,279 | 6,904 |
| UTILITIES - 0.1% | | | |
| Independent Power and Renewable Electricity Producers - 0.1% | | | |
| Dynegy, Inc. 7.00% | | 66,200 | 5,485 |
|
| TOTAL CONVERTIBLE PREFERRED STOCKS | | | 25,617 |
|
| Nonconvertible Preferred Stocks - 0.0% | | | |
| INDUSTRIALS - 0.0% | | | |
| Aerospace & Defense - 0.0% | | | |
| Rolls-Royce Holdings PLC (C Shares) (c) | | 319,925,580 | 454 |
| TOTAL PREFERRED STOCKS | | | |
| (Cost $26,800) | | | 26,071 |
| | | Principal Amount (000s)(e) | Value (000s) |
|
| Convertible Bonds - 0.1% | | | |
| HEALTH CARE - 0.1% | | | |
| Pharmaceuticals - 0.1% | | | |
| Bayer Capital Corp. BV 5.625% 11/22/19(d) | | | |
| (Cost $7,157) | | EUR 6,700 | 9,414 |
| | | Shares | Value (000s) |
|
| Other - 0.2% | | | |
| ENERGY - 0.2% | | | |
| Oil, Gas & Consumable Fuels - 0.2% | | | |
| Utica Shale Drilling Program (non-operating revenue interest) (f)(g)(h) | | | |
| (Cost $18,052) | | 18,052,449 | 16,789 |
|
| Money Market Funds - 1.0% | | | |
| Fidelity Cash Central Fund, 1.39% (i) | | 26,822,614 | 26,828 |
| Fidelity Securities Lending Cash Central Fund 1.40% (i)(j) | | 50,523,591 | 50,529 |
| TOTAL MONEY MARKET FUNDS | | | |
| (Cost $77,361) | | | 77,357 |
| TOTAL INVESTMENT IN SECURITIES - 101.0% | | | |
| (Cost $6,401,747) | | | 7,823,197 |
| NET OTHER ASSETS (LIABILITIES) - (1.0)% | | | (78,737) |
| NET ASSETS - 100% | | | $7,744,460 |
| Written Options | | | | | | |
| | Counterparty | Number of Contracts | Notional Amount (000s) | Exercise Price | Expiration Date | Value (000s) |
| Call Options | | | | | | |
| Apple, Inc. | Chicago Board Options Exchange | 541 | $9,058 | $185.00 | 2/16/18 | $(40) |
| C.H. Robinson Worldwide, Inc. | Chicago Board Options Exchange | 633 | 5,789 | 92.50 | 2/16/18 | (81) |
| CF Industries Holdings, Inc. | Chicago Board Options Exchange | 541 | 2,296 | 40.00 | 2/16/18 | (164) |
| Charles Schwab Corp. | Chicago Board Options Exchange | 830 | 4,427 | 55.00 | 3/16/18 | (93) |
| Chevron Corp. | Chicago Board Options Exchange | 1,094 | 13,713 | 140.00 | 3/16/18 | (26) |
| Chevron Corp. | Chicago Board Options Exchange | 1,094 | 13,713 | 145.00 | 6/15/18 | (72) |
| Cisco Systems, Inc. | Chicago Board Options Exchange | 2,826 | 11,739 | 41.00 | 3/16/18 | (509) |
| Cisco Systems, Inc. | Chicago Board Options Exchange | 2,826 | 11,739 | 40.00 | 3/16/18 | (689) |
| Citigroup, Inc. | Chicago Board Options Exchange | 2,952 | 23,167 | 80.00 | 2/16/18 | (181) |
| ConocoPhillips Co. | Chicago Board Options Exchange | 3,768 | 22,160 | 65.00 | 5/18/18 | (379) |
| CSX Corp. | Chicago Board Options Exchange | 1,863 | 10,576 | 60.00 | 2/16/18 | (48) |
| CSX Corp. | Chicago Board Options Exchange | 1,861 | 10,565 | 62.50 | 2/16/18 | (9) |
| J.B. Hunt Transport Services, Inc. | Chicago Board Options Exchange | 546 | 6,597 | 120.00 | 2/16/18 | (154) |
| Johnson & Johnson | Chicago Board Options Exchange | 781 | 10,793 | 145.00 | 2/16/18 | (17) |
| JPMorgan Chase & Co. | Chicago Board Options Exchange | 3,279 | 37,928 | 115.00 | 3/16/18 | (1,172) |
| Kroger Co. | Chicago Board Options Exchange | 1,328 | 4,032 | 28.00 | 2/16/18 | (329) |
| Kroger Co. | Chicago Board Options Exchange | 2,491 | 7,563 | 29.00 | 2/16/18 | (402) |
| L Brands, Inc. | Chicago Board Options Exchange | 745 | 3,732 | 65.00 | 2/16/18 | (2) |
| Microsoft Corp. | Chicago Board Options Exchange | 1,564 | 14,860 | 90.00 | 2/16/18 | (974) |
| Microsoft Corp. | Chicago Board Options Exchange | 3,106 | 29,510 | 92.50 | 3/16/18 | (1,600) |
| Northern Trust Corp. | Chicago Board Options Exchange | 824 | 8,684 | 110.00 | 4/20/18 | (192) |
| PNC Financial Services Group, Inc. | Chicago Board Options Exchange | 421 | 6,653 | 145.00 | 2/16/18 | (574) |
| Procter & Gamble Co. | Chicago Board Options Exchange | 1,115 | 9,627 | 92.50 | 2/16/18 | (5) |
| Regions Financial Corp. | Chicago Board Options Exchange | 2,056 | 3,954 | 18.00 | 2/16/18 | (269) |
| State Street Corp. | Chicago Board Options Exchange | 1,365 | 15,038 | 115.00 | 5/18/18 | (437) |
| Target Corp. | Chicago Board Options Exchange | 754 | 5,672 | 65.00 | 3/16/18 | (805) |
| Target Corp. | Chicago Board Options Exchange | 734 | 5,521 | 70.00 | 3/16/18 | (472) |
| Target Corp. | Chicago Board Options Exchange | 1,853 | 13,938 | 85.00 | 4/20/18 | (200) |
| The Boeing Co. | Chicago Board Options Exchange | 301 | 10,667 | 300.00 | 3/16/18 | (1,667) |
| The Boeing Co. | Chicago Board Options Exchange | 61 | 2,162 | 370.00 | 3/16/18 | (34) |
| TOTAL WRITTEN OPTIONS | | | | | | $(11,596) |
Currency Abbreviations
EUR – European Monetary Unit
Legend
(a) Security or a portion of the security is on loan at period end.
(b) Security or a portion of the security is pledged as collateral for call options written. At period end, the value of securities pledged amounted to $335,873,000.
(c) Non-income producing
(d) Security exempt from registration under Rule 144A of the Securities Act of 1933. These securities may be resold in transactions exempt from registration, normally to qualified institutional buyers. At the end of the period, the value of these securities amounted to $22,274,000 or 0.3% of net assets.
(e) Amount is stated in United States dollars unless otherwise noted.
(f) Investment is owned by a wholly-owned subsidiary (Subsidiary) that is treated as a corporation for U.S. tax purposes.
(g) Restricted securities - Investment in securities not registered under the Securities Act of 1933 (excluding 144A issues). At the end of the period, the value of restricted securities (excluding 144A issues) amounted to $16,789,000 or 0.2% of net assets.
(h) Level 3 security
(i) Affiliated fund that is generally available only to investment companies and other accounts managed by Fidelity Investments. The rate quoted is the annualized seven-day yield of the fund at period end. A complete unaudited listing of the fund's holdings as of its most recent quarter end is available upon request. In addition, each Fidelity Central Fund's financial statements are available on the SEC's website or upon request.
(j) Investment made with cash collateral received from securities on loan.
Additional information on each restricted holding is as follows:
| Security | Acquisition Date | Acquisition Cost (000s) |
| Utica Shale Drilling Program (non-operating revenue interest) | 10/5/16 - 9/1/17 | $18,052 |
Affiliated Central Funds
Information regarding fiscal year to date income earned by the Fund from investments in Fidelity Central Funds is as follows:
| Fund | Income earned |
| | (Amounts in thousands) |
| Fidelity Cash Central Fund | $86 |
| Fidelity Securities Lending Cash Central Fund | 195 |
| Total | $281 |
Amounts in the income column in the above table include any capital gain distributions from underlying funds, which are presented in the corresponding line-item in the Statement of Operations if applicable.
Investment Valuation
The following is a summary of the inputs used, as of January 31, 2018, involving the Fund's assets and liabilities carried at fair value. The inputs or methodology used for valuing securities may not be an indication of the risk associated with investing in those securities. For more information on valuation inputs, and their aggregation into the levels used below, please refer to the Investment Valuation section in the accompanying Notes to Financial Statements.
| | Valuation Inputs at Reporting Date: |
| Description | Total | Level 1 | Level 2 | Level 3 |
| (Amounts in thousands) | | | | |
| Investments in Securities: | | | | |
| Equities: | | | | |
| Consumer Discretionary | $623,530 | $623,530 | $-- | $-- |
| Consumer Staples | 721,162 | 679,124 | 42,038 | -- |
| Energy | 1,027,501 | 1,027,501 | -- | -- |
| Financials | 1,786,956 | 1,786,956 | -- | -- |
| Health Care | 939,242 | 880,107 | 59,135 | -- |
| Industrials | 903,057 | 879,436 | 23,621 | -- |
| Information Technology | 1,289,276 | 1,289,276 | -- | -- |
| Materials | 161,267 | 161,267 | -- | -- |
| Real Estate | 81,310 | 81,310 | -- | -- |
| Telecommunication Services | 97,692 | 97,692 | -- | -- |
| Utilities | 88,644 | 83,159 | 5,485 | -- |
| Corporate Bonds | 9,414 | -- | 9,414 | -- |
| Other | 16,789 | -- | -- | 16,789 |
| Money Market Funds | 77,357 | 77,357 | -- | -- |
| Total Investments in Securities: | $7,823,197 | $7,666,715 | $139,693 | $16,789 |
| Derivative Instruments: | | | | |
| Liabilities | | | | |
| Written Options | $(11,596) | $(11,596) | $-- | $-- |
| Total Liabilities | $(11,596) | $(11,596) | $-- | $-- |
| Total Derivative Instruments: | $(11,596) | $(11,596) | $-- | $-- |
Value of Derivative Instruments
The following table is a summary of the Fund's value of derivative instruments by primary risk exposure as of January 31, 2018. For additional information on derivative instruments, please refer to the Derivative Instruments section in the accompanying Notes to Financial Statements.
| Primary Risk Exposure / Derivative Type | Value |
| | Asset | Liability |
| (Amounts in thousands) | | |
| Equity Risk | | |
| Written Options(a) | $0 | $(11,596) |
| Total Equity Risk | 0 | (11,596) |
| Total Value of Derivatives | $0 | $(11,596) |
(a) Gross value is presented in the Statement of Assets and Liabilities in the written options, at value line-item.
Other Information
Distribution of investments by country or territory of incorporation, as a percentage of Total Net Assets, is as follows (Unaudited):
| United States of America | 88.3% |
| United Kingdom | 3.6% |
| Canada | 3.6% |
| Netherlands | 1.1% |
| Others (Individually Less Than 1%) | 3.4% |
| | 100.0% |
See accompanying notes which are an integral part of the financial statements.
Financial Statements
Statement of Assets and Liabilities
| Amounts in thousands (except per-share amounts) | | January 31, 2018 (Unaudited) |
| Assets | | |
Investment in securities, at value (including securities loaned of $48,860) — See accompanying schedule:
Unaffiliated issuers (cost $6,324,386) | $7,745,840 | |
| Fidelity Central Funds (cost $77,361) | 77,357 | |
| Total Investment in Securities (cost $6,401,747) | | $7,823,197 |
| Restricted cash | | 223 |
| Receivable for investments sold | | 36,516 |
| Receivable for fund shares sold | | 1,669 |
| Dividends receivable | | 6,574 |
| Interest receivable | | 276 |
| Distributions receivable from Fidelity Central Funds | | 35 |
| Prepaid expenses | | 10 |
| Other receivables | | 841 |
| Total assets | | 7,869,341 |
| Liabilities | | |
| Payable for investments purchased | $52,785 | |
| Payable for fund shares redeemed | 5,334 | |
| Accrued management fee | 2,840 | |
| Written options, at value (premium received $5,293) | 11,596 | |
| Other affiliated payables | 948 | |
| Other payables and accrued expenses | 848 | |
| Collateral on securities loaned | 50,530 | |
| Total liabilities | | 124,881 |
| Net Assets | | $7,744,460 |
| Net Assets consist of: | | |
| Paid in capital | | $7,510,164 |
| Distributions in excess of net investment income | | (22,706) |
| Accumulated undistributed net realized gain (loss) on investments and foreign currency transactions | | (1,158,166) |
| Net unrealized appreciation (depreciation) on investments and assets and liabilities in foreign currencies | | 1,415,168 |
| Net Assets | | $7,744,460 |
| Growth and Income: | | |
| Net Asset Value, offering price and redemption price per share ($6,823,724 ÷ 171,520 shares) | | $39.78 |
| Class K: | | |
| Net Asset Value, offering price and redemption price per share ($920,736 ÷ 23,165 shares) | | $39.75 |
See accompanying notes which are an integral part of the financial statements.
Statement of Operations
| Amounts in thousands | | Six months ended January 31, 2018 (Unaudited) |
| Investment Income | | |
| Dividends | | $76,174 |
| Interest | | 225 |
| Income from Fidelity Central Funds | | 281 |
| Total income | | 76,680 |
| Expenses | | |
| Management fee | $16,124 | |
| Transfer agent fees | 5,046 | |
| Accounting and security lending fees | 595 | |
| Custodian fees and expenses | 66 | |
| Independent trustees' fees and expenses | 25 | |
| Appreciation in deferred trustee compensation account | 1 | |
| Registration fees | 35 | |
| Audit | 45 | |
| Legal | 15 | |
| Interest | 10 | |
| Miscellaneous | 23 | |
| Total expenses before reductions | 21,985 | |
| Expense reductions | (108) | 21,877 |
| Net investment income (loss) | | 54,803 |
| Realized and Unrealized Gain (Loss) | | |
| Net realized gain (loss) on: | | |
| Investment securities: | | |
| Unaffiliated issuers | 532,471 | |
| Fidelity Central Funds | 1 | |
| Foreign currency transactions | 14 | |
| Written options | 3,294 | |
| Total net realized gain (loss) | | 535,780 |
| Change in net unrealized appreciation (depreciation) on: | | |
| Investment securities: | | |
| Unaffiliated issuers | 382,154 | |
| Fidelity Central Funds | (2) | |
| Assets and liabilities in foreign currencies | 44 | |
| Written options | (3,891) | |
| Total change in net unrealized appreciation (depreciation) | | 378,305 |
| Net gain (loss) | | 914,085 |
| Net increase (decrease) in net assets resulting from operations | | $968,888 |
See accompanying notes which are an integral part of the financial statements.
Statement of Changes in Net Assets
| Amounts in thousands | Six months ended January 31, 2018 (Unaudited) | Year ended July 31, 2017 |
| Increase (Decrease) in Net Assets | | |
| Operations | | |
| Net investment income (loss) | $54,803 | $128,606 |
| Net realized gain (loss) | 535,780 | 555,075 |
| Change in net unrealized appreciation (depreciation) | 378,305 | 424,780 |
| Net increase (decrease) in net assets resulting from operations | 968,888 | 1,108,461 |
| Distributions to shareholders from net investment income | (89,704) | (97,619) |
| Share transactions - net increase (decrease) | (380,775) | (57,861) |
| Total increase (decrease) in net assets | 498,409 | 952,981 |
| Net Assets | | |
| Beginning of period | 7,246,051 | 6,293,070 |
| End of period | $7,744,460 | $7,246,051 |
| Other Information | | |
| Undistributed net investment income end of period | $– | $12,195 |
| Distributions in excess of net investment income end of period | $(22,706) | $– |
See accompanying notes which are an integral part of the financial statements.
Financial Highlights
Fidelity Growth & Income Portfolio
| | Six months ended (Unaudited) January 31, | Years endedJuly 31, | | | | |
| | 2018 | 2017 | 2016 | 2015 | 2014 | 2013 |
| Selected Per–Share Data | | | | | | |
| Net asset value, beginning of period | $35.31 | $30.48 | $30.85 | $29.02 | $25.66 | $20.13 |
| Income from Investment Operations | | | | | | |
| Net investment income (loss)A | .27 | .61 | .59 | .55 | .51 | .46 |
| Net realized and unrealized gain (loss) | 4.65 | 4.68 | (.37) | 1.82B | 3.35 | 5.54 |
| Total from investment operations | 4.92 | 5.29 | .22 | 2.37 | 3.86 | 6.00 |
| Distributions from net investment income | (.45) | (.46) | (.58) | (.54) | (.50) | (.44) |
| Distributions from net realized gain | – | – | (.01) | – | (.01) | (.03) |
| Total distributions | (.45) | (.46) | (.59) | (.54) | (.50)C | (.47) |
| Net asset value, end of period | $39.78 | $35.31 | $30.48 | $30.85 | $29.02 | $25.66 |
| Total ReturnD,E | 14.05% | 17.48% | .88% | 8.23%B | 15.16% | 30.15% |
| Ratios to Average Net AssetsF,G | | | | | | |
| Expenses before reductions | .62%H | .63% | .64% | .64% | .65% | .68% |
| Expenses net of fee waivers, if any | .61%H | .63% | .64% | .63% | .65% | .68% |
| Expenses net of all reductions | .61%H | .63% | .64% | .63% | .65% | .67% |
| Net investment income (loss) | 1.49%H | 1.84% | 2.05% | 1.83% | 1.86% | 2.04% |
| Supplemental Data | | | | | | |
| Net assets, end of period (in millions) | $6,824 | $6,356 | $5,529 | $6,563 | $6,550 | $6,060 |
| Portfolio turnover rateI | 40%H | 37% | 29% | 35% | 41%J | 49% |
A Calculated based on average shares outstanding during the period.
B Net realized and unrealized gain (loss) per share reflects proceeds received from litigation which amounted to $.06 per share. Excluding these litigation proceeds, the total return would have been 8.03%
C Total distributions of $.50 per share is comprised of distributions from net investment income of $.495 and distributions from net realized gain of $.006 per share.
D Total returns for periods of less than one year are not annualized.
E Total returns would have been lower if certain expenses had not been reduced during the applicable periods shown.
F Fees and expenses of any underlying Fidelity Central Funds are not included in the Fund's expense ratio. The Fund indirectly bears its proportionate share of the expenses of any underlying Fidelity Central Funds.
G Expense ratios reflect operating expenses of the class. Expenses before reductions do not reflect amounts reimbursed by the investment adviser or reductions from brokerage service arrangements or reductions from other expense offset arrangements and do not represent the amount paid by the class during periods when reimbursements or reductions occur. Expenses net of fee waivers reflect expenses after reimbursement by the investment adviser but prior to reductions from brokerage service arrangements or other expense offset arrangements. Expenses net of all reductions represent the net expenses paid by the class.
H Annualized
I Amount does not include the portfolio activity of any underlying Fidelity Central Funds.
J Portfolio turnover rate excludes securities received or delivered in-kind.
See accompanying notes which are an integral part of the financial statements.
Fidelity Growth & Income Portfolio Class K
| | Six months ended (Unaudited) January 31, | Years endedJuly 31, | | | | |
| | 2018 | 2017 | 2016 | 2015 | 2014 | 2013 |
| Selected Per–Share Data | | | | | | |
| Net asset value, beginning of period | $35.28 | $30.46 | $30.82 | $29.00 | $25.64 | $20.12 |
| Income from Investment Operations | | | | | | |
| Net investment income (loss)A | .29 | .65 | .62 | .59 | .54 | .50 |
| Net realized and unrealized gain (loss) | 4.65 | 4.67 | (.35) | 1.81B | 3.36 | 5.52 |
| Total from investment operations | 4.94 | 5.32 | .27 | 2.40 | 3.90 | 6.02 |
| Distributions from net investment income | (.47) | (.50) | (.62) | (.58) | (.53) | (.47) |
| Distributions from net realized gain | – | – | (.01) | – | (.01) | (.03) |
| Total distributions | (.47) | (.50) | (.63) | (.58) | (.54) | (.50) |
| Net asset value, end of period | $39.75 | $35.28 | $30.46 | $30.82 | $29.00 | $25.64 |
| Total ReturnC,D | 14.12% | 17.60% | 1.04% | 8.34%B | 15.32% | 30.28% |
| Ratios to Average Net AssetsE,F | | | | | | |
| Expenses before reductions | .51%G | .52% | .52% | .52% | .52% | .53% |
| Expenses net of fee waivers, if any | .51%G | .52% | .52% | .52% | .52% | .53% |
| Expenses net of all reductions | .51%G | .52% | .52% | .52% | .52% | .52% |
| Net investment income (loss) | 1.60%G | 1.95% | 2.17% | 1.95% | 1.99% | 2.19% |
| Supplemental Data | | | | | | |
| Net assets, end of period (in millions) | $921 | $890 | $765 | $862 | $960 | $1,016 |
| Portfolio turnover rateH | 40%G | 37% | 29% | 35% | 41%I | 49% |
A Calculated based on average shares outstanding during the period.
B Net realized and unrealized gain (loss) per share reflects proceeds received from litigation which amounted to $.06 per share. Excluding these litigation proceeds, the total return would have been 8.14%
C Total returns for periods of less than one year are not annualized.
D Total returns would have been lower if certain expenses had not been reduced during the applicable periods shown.
E Fees and expenses of any underlying Fidelity Central Funds are not included in the Fund's expense ratio. The Fund indirectly bears its proportionate share of the expenses of any underlying Fidelity Central Funds.
F Expense ratios reflect operating expenses of the class. Expenses before reductions do not reflect amounts reimbursed by the investment adviser or reductions from brokerage service arrangements or reductions from other expense offset arrangements and do not represent the amount paid by the class during periods when reimbursements or reductions occur. Expenses net of fee waivers reflect expenses after reimbursement by the investment adviser but prior to reductions from brokerage service arrangements or other expense offset arrangements. Expenses net of all reductions represent the net expenses paid by the class.
G Annualized
H Amount does not include the portfolio activity of any underlying Fidelity Central Funds.
I Portfolio turnover rate excludes securities received or delivered in-kind.
See accompanying notes which are an integral part of the financial statements.
Notes to Financial Statements (Unaudited)
For the period ended January 31, 2018
(Amounts in thousands except percentages)
1. Organization.
Fidelity Growth & Income Portfolio (the Fund) is a fund of Fidelity Securities Fund (the Trust) and is authorized to issue an unlimited number of shares. The Trust is registered under the Investment Company Act of 1940, as amended (the 1940 Act), as an open-end management investment company organized as a Massachusetts business trust. The Fund offers Growth & Income and Class K shares, each of which has equal rights as to assets and voting privileges. Each class has exclusive voting rights with respect to matters that affect that class.
2. Investments in Fidelity Central Funds.
The Fund invests in Fidelity Central Funds, which are open-end investment companies generally available only to other investment companies and accounts managed by the investment adviser and its affiliates. The Fund's Schedule of Investments lists each of the Fidelity Central Funds held as of period end, if any, as an investment of the Fund, but does not include the underlying holdings of each Fidelity Central Fund. As an Investing Fund, the Fund indirectly bears its proportionate share of the expenses of the underlying Fidelity Central Funds.
The Money Market Central Funds seek preservation of capital and current income and are managed by Fidelity Investments Money Management, Inc. (FIMM), an affiliate of the investment adviser. Annualized expenses of the Money Market Central Funds as of their most recent shareholder report date are less than .005%.
A complete unaudited list of holdings for each Fidelity Central Fund is available upon request or at the Securities and Exchange Commission (the SEC) website at www.sec.gov. In addition, the financial statements of the Fidelity Central Funds are available on the SEC website or upon request.
3. Significant Accounting Policies.
The Fund is an investment company and applies the accounting and reporting guidance of the Financial Accounting Standards Board (FASB) Accounting Standards Codification Topic 946 Financial Services – Investments Companies. The financial statements have been prepared in conformity with accounting principles generally accepted in the United States of America (GAAP), which require management to make certain estimates and assumptions at the date of the financial statements. Actual results could differ from those estimates. Subsequent events, if any, through the date that the financial statements were issued have been evaluated in the preparation of the financial statements. The following summarizes the significant accounting policies of the Fund:
Investment Valuation. Investments are valued as of 4:00 p.m. Eastern time on the last calendar day of the period. The Board of Trustees (the Board) has delegated the day to day responsibility for the valuation of the Fund's investments to the Fair Value Committee (the Committee) established by the Fund's investment adviser. In accordance with valuation policies and procedures approved by the Board, the Fund attempts to obtain prices from one or more third party pricing vendors or brokers to value its investments. When current market prices, quotations or currency exchange rates are not readily available or reliable, investments will be fair valued in good faith by the Committee, in accordance with procedures adopted by the Board. Factors used in determining fair value vary by investment type and may include market or investment specific events, changes in interest rates and credit quality. The frequency with which these procedures are used cannot be predicted and they may be utilized to a significant extent. The Committee oversees the Fund's valuation policies and procedures and reports to the Board on the Committee's activities and fair value determinations. The Board monitors the appropriateness of the procedures used in valuing the Fund's investments and ratifies the fair value determinations of the Committee.
The Fund categorizes the inputs to valuation techniques used to value its investments into a disclosure hierarchy consisting of three levels as shown below:
- Level 1 – quoted prices in active markets for identical investments
- Level 2 – other significant observable inputs (including quoted prices for similar investments, interest rates, prepayment speeds, etc.)
- Level 3 – unobservable inputs (including the Fund's own assumptions based on the best information available)
Valuation techniques used to value the Fund's investments by major category are as follows:
Equity securities, including restricted securities, for which market quotations are readily available, are valued at the last reported sale price or official closing price as reported by a third party pricing vendor on the primary market or exchange on which they are traded and are categorized as Level 1 in the hierarchy. In the event there were no sales during the day or closing prices are not available, securities are valued at the last quoted bid price or may be valued using the last available price and are generally categorized as Level 2 in the hierarchy. For foreign equity securities, when market or security specific events arise, comparisons to the valuation of American Depositary Receipts (ADRs), futures contracts, Exchange-Traded Funds (ETFs) and certain indexes as well as quoted prices for similar securities may be used and would be categorized as Level 2 in the hierarchy. Utilizing these techniques may result in transfers between Level 1 and Level 2. For equity securities, including restricted securities, where observable inputs are limited, assumptions about market activity and risk are used and these securities may be categorized as Level 3 in the hierarchy.
Debt securities, including restricted securities, are valued based on evaluated prices received from third party pricing vendors or from brokers who make markets in such securities. Corporate bonds are valued by pricing vendors who utilize matrix pricing which considers yield or price of bonds of comparable quality, coupon, maturity and type or by broker-supplied prices. When independent prices are unavailable or unreliable, debt securities may be valued utilizing pricing methodologies which consider similar factors that would be used by third party pricing vendors. Debt securities are generally categorized as Level 2 in the hierarchy but may be Level 3 depending on the circumstances.
Exchange-traded options are valued using the last sale price or, in the absence of a sale, the last offering price and are categorized as Level 1 in the hierarchy. Investments in open-end mutual funds, including the Fidelity Central Funds, are valued at their closing net asset value (NAV) each business day and are categorized as Level 1 in the hierarchy.
Changes in valuation techniques may result in transfers in or out of an assigned level within the disclosure hierarchy. The aggregate value of investments by input level as of January 31, 2018 is included at the end of the Fund's Schedule of Investments.
Foreign Currency. The Fund may use foreign currency contracts to facilitate transactions in foreign-denominated securities. Gains and losses from these transactions may arise from changes in the value of the foreign currency or if the counterparties do not perform under the contracts' terms.
Foreign-denominated assets, including investment securities, and liabilities are translated into U.S. dollars at the exchange rates at period end. Purchases and sales of investment securities, income and dividends received and expenses denominated in foreign currencies are translated into U.S. dollars at the exchange rate in effect on the transaction date.
The effects of exchange rate fluctuations on investments are included with the net realized and unrealized gain (loss) on investment securities. Other foreign currency transactions resulting in realized and unrealized gain (loss) are disclosed separately.
Investment Transactions and Income. For financial reporting purposes, the Fund's investment holdings and NAV include trades executed through the end of the last business day of the period. The NAV per share for processing shareholder transactions is calculated as of the close of business of the New York Stock Exchange (NYSE), normally 4:00 p.m. Eastern time and includes trades executed through the end of the prior business day. Gains and losses on securities sold are determined on the basis of identified cost and includes proceeds received from litigation. Dividend income is recorded on the ex-dividend date, except for certain dividends from foreign securities where the ex-dividend date may have passed, which are recorded as soon as the Fund is informed of the ex-dividend date. Non-cash dividends included in dividend income, if any, are recorded at the fair market value of the securities received. Income and capital gain distributions from Fidelity Central Funds, if any, are recorded on the ex-dividend date. Certain distributions received by the Fund represent a return of capital or capital gain. The Fund determines the components of these distributions subsequent to the ex-dividend date, based upon receipt of tax filings or other correspondence relating to the underlying investment. These distributions are recorded as a reduction of cost of investments and/or as a realized gain. Interest income is accrued as earned and includes coupon interest and amortization of premium and accretion of discount on debt securities as applicable. Investment income is recorded net of foreign taxes withheld where recovery of such taxes is uncertain.
Class Allocations and Expenses. Investment income, realized and unrealized capital gains and losses, common expenses of the Fund, and certain fund-level expense reductions, if any, are allocated daily on a pro-rata basis to each class based on the relative net assets of each class to the total net assets of the Fund. Each class differs with respect to transfer agent fees incurred. Certain expense reductions may also differ by class. For the reporting period, the allocated portion of income and expenses to each class as a percent of its average net assets may vary due to the timing of recording these transactions in relation to fluctuating net assets of the classes. Expenses directly attributable to a fund are charged to that fund. Expenses attributable to more than one fund are allocated among the respective funds on the basis of relative net assets or other appropriate methods. Expense estimates are accrued in the period to which they relate and adjustments are made when actual amounts are known.
Deferred Trustee Compensation. Under a Deferred Compensation Plan (the Plan), independent Trustees may elect to defer receipt of a portion of their annual compensation. Deferred amounts are invested in a cross-section of Fidelity funds, are marked-to-market and remain in the Fund until distributed in accordance with the Plan. The investment of deferred amounts and the offsetting payable to the Trustees are included in the accompanying Statement of Assets and Liabilities.
Income Tax Information and Distributions to Shareholders. Each year, the Fund intends to qualify as a regulated investment company under Subchapter M of the Internal Revenue Code, including distributing substantially all of its taxable income and realized gains. As a result, no provision for U.S. Federal income taxes is required. The Fund files a U.S. federal tax return, in addition to state and local tax returns as required. The Fund's federal income tax returns are subject to examination by the Internal Revenue Service (IRS) for a period of three fiscal years after they are filed. State and local tax returns may be subject to examination for an additional fiscal year depending on the jurisdiction. Foreign taxes are provided for based on the Fund's understanding of the tax rules and rates that exist in the foreign markets in which it invests.
Distributions are declared and recorded on the ex-dividend date. Income dividends and capital gain distributions are declared separately for each class. Income and capital gain distributions are determined in accordance with income tax regulations, which may differ from GAAP.
Capital accounts within the financial statements are adjusted for permanent book-tax differences. These adjustments have no impact on net assets or the results of operations. Capital accounts are not adjusted for temporary book-tax differences which will reverse in a subsequent period.
Book-tax differences are primarily due to foreign currency transactions, passive foreign investment companies (PFIC), market discount, partnerships, certain conversion ratio adjustments, equity-debt classifications, deferred trustees compensation, capital loss carryforwards and losses deferred due to wash sales.
As of period end, the cost and unrealized appreciation (depreciation) in securities, and derivatives if applicable, for federal income tax purposes were as follows:
| Gross unrealized appreciation | $1,835,496 |
| Gross unrealized depreciation | (422,405) |
| Net unrealized appreciation (depreciation) | $1,413,091 |
| Tax cost | $6,403,803 |
Capital loss carryforwards are only available to offset future capital gains of the Fund to the extent provided by regulations and may be limited. Under the Regulated Investment Company Modernization Act of 2010 (the Act), the Fund is permitted to carry forward capital losses incurred in taxable years beginning after December 22, 2010 for an unlimited period and such capital losses are required to be used prior to any losses that expire. The capital loss carryforward information presented below, including any applicable limitation, is estimated as of prior fiscal period end and is subject to adjustment.
| Fiscal year of expiration | |
| 2018 | $(1,723,247) |
Restricted Securities. The Fund may invest in securities that are subject to legal or contractual restrictions on resale. These securities generally may be resold in transactions exempt from registration or to the public if the securities are registered. Disposal of these securities may involve time-consuming negotiations and expense, and prompt sale at an acceptable price may be difficult. Information regarding restricted securities is included at the end of the Fund's Schedule of Investments.
Consolidated Subsidiary. The Fund invests in certain investments through a wholly-owned subsidiary ("Subsidiary"), which may be subject to federal and state taxes upon disposition.
As of period end, the Fund held an investment of $17,012 in this Subsidiary, representing .22% of the Fund's net assets. The financial statements have been consolidated and include accounts of the Fund and the Subsidiary. Accordingly, all inter-company transactions and balances have been eliminated.
Any cash held by the Subsidiary is restricted as to its use and is presented as Restricted cash in the Statement of Assets and Liabilities.
4. Derivative Instruments.
Risk Exposures and the Use of Derivative Instruments. The Fund's investment objective allows the Fund to enter into various types of derivative contracts, including options. Derivatives are investments whose value is primarily derived from underlying assets, indices or reference rates and may be transacted on an exchange or over-the-counter (OTC). Derivatives may involve a future commitment to buy or sell a specified asset based on specified terms, to exchange future cash flows at periodic intervals based on a notional principal amount, or for one party to make one or more payments upon the occurrence of specified events in exchange for periodic payments from the other party.
The Fund used derivatives to increase returns and to manage exposure to certain risks as defined below. The success of any strategy involving derivatives depends on analysis of numerous economic factors, and if the strategies for investment do not work as intended, the Fund may not achieve its objectives.
The Fund's use of derivatives increased or decreased its exposure to the following risk:
| Equity Risk | Equity risk relates to the fluctuations in the value of financial instruments as a result of changes in market prices (other than those arising from interest rate risk or foreign exchange risk), whether caused by factors specific to an individual investment, its issuer, or all factors affecting all instruments traded in a market or market segment.
|
The Fund is also exposed to additional risks from investing in derivatives, such as liquidity risk and counterparty credit risk. Liquidity risk is the risk that the Fund will be unable to close out the derivative in the open market in a timely manner. Counterparty credit risk is the risk that the counterparty will not be able to fulfill its obligation to the Fund. Derivative counterparty credit risk is managed through formal evaluation of the creditworthiness of all potential counterparties. On certain OTC derivatives such as options, the Fund attempts to reduce its exposure to counterparty credit risk by entering into an International Swaps and Derivatives Association, Inc. (ISDA) Master Agreement with each of its counterparties. The ISDA Master Agreement gives the Fund the right to terminate all transactions traded under such agreement upon the deterioration in the credit quality of the counterparty beyond specified levels. The ISDA Master Agreement gives each party the right, upon an event of default by the other party or a termination of the agreement, to close out all transactions traded under such agreement and to net amounts owed under each transaction to one net payable by one party to the other. To mitigate counterparty credit risk on bi-lateral OTC derivatives, the Fund receives collateral in the form of cash or securities once the Fund's net unrealized appreciation on outstanding derivative contracts under an ISDA Master Agreement exceeds certain applicable thresholds, subject to certain minimum transfer provisions. The collateral received is held in segregated accounts with the Fund's custodian bank in accordance with the collateral agreements entered into between the Fund, the counterparty and the Fund's custodian bank. The Fund could experience delays and costs in gaining access to the collateral even though it is held by the Fund's custodian bank. The Fund's maximum risk of loss from counterparty credit risk related to bi-lateral OTC derivatives is generally the aggregate unrealized appreciation and unpaid counterparty payments in excess of any collateral pledged by the counterparty to the Fund. The Fund may be required to pledge collateral for the benefit of the counterparties on bi-lateral OTC derivatives in an amount not less than each counterparty's unrealized appreciation on outstanding derivative contracts, subject to certain minimum transfer provisions, and any such pledged collateral is identified in the Schedule of Investments. Counterparty credit risk related to exchange-traded options may be mitigated by the protection provided by the exchange on which they trade.
Investing in derivatives may involve greater risks than investing in the underlying assets directly and, to varying degrees, may involve risk of loss in excess of any initial investment and collateral received and amounts recognized in the Statement of Assets and Liabilities. In addition, there may be the risk that the change in value of the derivative contract does not correspond to the change in value of the underlying instrument.
Options. Options give the purchaser the right, but not the obligation, to buy (call) or sell (put) an underlying security or financial instrument at an agreed exercise or strike price between or on certain dates. Options obligate the seller (writer) to buy (put) or sell (call) an underlying instrument at the exercise or strike price or cash settle an underlying derivative instrument if the holder exercises the option on or before the expiration date.
The Fund used exchange-traded and OTC written covered call options to manage its exposure to the market. When the Fund writes a covered call option, the Fund holds the underlying instrument which must be delivered to the holder upon the exercise of the option.
Upon entering into a written options contract, the Fund will receive a premium. Premiums received are reflected as a liability on the Statement of Assets and Liabilities. Options are valued daily and any unrealized appreciation (depreciation) is reflected on the Statement of Assets and Liabilities. When a written option is exercised, the premium is added to the proceeds from the sale of the underlying instrument in determining the gain or loss realized on that investment. When an option is closed the Fund will realize a gain or loss depending on whether the proceeds or amount paid for the closing sale transaction are greater or less than the premium received. When an option expires, gains and losses are realized to the extent of premiums received. The net realized gain (loss) on closed and expired written options and the change in net unrealized appreciation (depreciation) on written options are presented in the Statement of Operations.
Writing call options tends to decrease exposure to the underlying instrument and risk of loss is the change in value in excess of the premium received.
Any open options at period end are presented in the Schedule of Investments under the caption "Written Options" and are representative of volume of activity during the period.
5. Purchases and Sales of Investments.
Purchases and sales of securities, other than short-term securities, aggregated $1,471,394 and $1,864,408, respectively.
6. Fees and Other Transactions with Affiliates.
Management Fee. Fidelity Management & Research Company (the investment adviser) and its affiliates provide the Fund with investment management related services for which the Fund pays a monthly management fee. The management fee is the sum of an individual fund fee rate that is based on an annual rate of .20% of the Fund's average net assets and an annualized group fee rate that averaged .24% during the period. The group fee rate is based upon the average net assets of all the mutual funds advised by the investment adviser, including any mutual funds previously advised by the investment adviser that are currently advised by Fidelity SelectCo, LLC, an affiliate of the investment adviser. The group fee rate decreases as assets under management increase and increases as assets under management decrease. For the reporting period, the total annualized management fee rate was .44% of the Fund's average net assets.
Transfer Agent Fees. Fidelity Investments Institutional Operations Company, Inc., (FIIOC), an affiliate of the investment adviser, is the transfer, dividend disbursing and shareholder servicing agent for each class of the Fund. FIIOC receives account fees and asset-based fees that vary according to the account size and type of account of the shareholders of Growth & Income, except for Class K. FIIOC receives an asset-based fee of Class K's average net assets. FIIOC pays for typesetting, printing and mailing of shareholder reports, except proxy statements.
For the period, transfer agent fees for each class were as follows:
| | Amount | % of Class-Level Average Net Assets(a) |
| Growth and Income | $4,843 | .15 |
| Class K | 203 | .05 |
| | $5,046 | |
(a) Annualized
Accounting and Security Lending Fees. Fidelity Service Company, Inc. (FSC), an affiliate of the investment adviser, maintains the Fund's accounting records. The accounting fee is based on the level of average net assets for each month. Under a separate contract, FSC administers the security lending program. The security lending fee is based on the number and duration of lending transactions.
Brokerage Commissions. The Fund placed a portion of its portfolio transactions with brokerage firms which are affiliates of the investment adviser. Brokerage commissions are included in net realized gain (loss) and change in net unrealized appreciation (depreciation) in the Statement of Operations. The commissions paid to these affiliated firms were $29 for the period.
Interfund Lending Program. Pursuant to an Exemptive Order issued by the SEC, the Fund, along with other registered investment companies having management contracts with Fidelity Management & Research Company (FMR) or other affiliated entities of FMR, may participate in an interfund lending program. This program provides an alternative credit facility allowing the funds to borrow from, or lend money to, other participating affiliated funds. At period end, there were no interfund loans outstanding. The Fund's activity in this program during the period for which loans were outstanding was as follows:
| Borrower or Lender | Average Loan Balance | Weighted Average Interest Rate | Interest Expense |
| Borrower | $5,610 | 1.37% | $8 |
Interfund Trades. The Fund may purchase from or sell securities to other Fidelity Funds under procedures adopted by the Board. The procedures have been designed to ensure these interfund trades are executed in accordance with Rule 17a-7 of the 1940 Act. Interfund trades are included within the respective purchases and sales amounts shown in the Purchases and Sales of Investments note.
7. Committed Line of Credit.
The Fund participates with other funds managed by the investment adviser or an affiliate in a $4.25 billion credit facility (the "line of credit") to be utilized for temporary or emergency purposes to fund shareholder redemptions or for other short-term liquidity purposes. The Fund has agreed to pay commitment fees on its pro-rata portion of the line of credit, which amounted to $10 and is reflected in Miscellaneous expenses on the Statement of Operations. During the period, the Fund did not borrow on this line of credit.
8. Security Lending.
The Fund lends portfolio securities through a lending agent from time to time in order to earn additional income. For equity securities, a lending agent is used and may loan securities to certain qualified borrowers, including Fidelity Capital Markets (FCM), a broker-dealer affiliated with the Fund. On the settlement date of the loan, the Fund receives collateral (in the form of U.S. Treasury obligations, letters of credit and/or cash) against the loaned securities and maintains collateral in an amount not less than 100% of the market value of the loaned securities during the period of the loan. The market value of the loaned securities is determined at the close of business of the Fund and any additional required collateral is delivered to the Fund on the next business day. The Fund or borrower may terminate the loan at any time, and if the borrower defaults on its obligation to return the securities loaned because of insolvency or other reasons, the Fund may apply collateral received from the borrower against the obligation. The Fund may experience delays and costs in recovering the securities loaned. Any cash collateral received is invested in the Fidelity Securities Lending Cash Central Fund. The value of loaned securities and cash collateral at period end are disclosed on the Fund's Statement of Assets and Liabilities. The value of securities loaned to FCM at period end was $1,711. Security lending income represents the income earned on investing cash collateral, less rebates paid to borrowers and any lending agent fees associated with the loan, plus any premium payments received for lending certain types of securities. Security lending income is presented in the Statement of Operations as a component of income from Fidelity Central Funds. Total security lending income during the period amounted to $195, including $8 from securities loaned to FCM.
9. Bank Borrowings.
The Fund is permitted to have bank borrowings for temporary or emergency purposes to fund shareholder redemptions or for other short-term liquidity requirements. The Fund has established borrowing arrangements with certain banks. The interest rate on the borrowings is the bank's base rate, as revised from time to time. The average loan balance during the period for which loans were outstanding amounted to $11,831. The weighted average interest rate was 1.66%. The interest expense amounted to $2 under the bank borrowing program. At period end, there were no bank borrowings outstanding.
10. Expense Reductions.
Commissions paid to certain brokers with whom the investment adviser, or its affiliates, places trades on behalf of the Fund include an amount in addition to trade execution, which may be rebated back to the Fund to offset certain expenses. This amount totaled $71 for the period.
In addition, during the period the investment adviser reimbursed and/or waived a portion of fund-level operating expenses in the amount of $37.
11. Distributions to Shareholders.
Distributions to shareholders of each class were as follows:
| | Six months ended
January 31, 2018 | Year ended
July 31, 2017 |
| From net investment income | | |
| Growth and Income | $78,502 | $84,860 |
| Class K | 11,202 | 12,759 |
| Total | $89,704 | $97,619 |
12. Share Transactions.
Share transactions for each class were as follows and may contain automatic conversions between classes or exchanges between affiliated funds:
| | Shares | Shares | Dollars | Dollars |
| | Six months ended January 31, 2018 | Year ended July 31, 2017 | Six months ended January 31, 2018 | Year ended July 31, 2017 |
| Growth and Income | | | | |
| Shares sold | 3,524 | 18,794 | $130,095 | $607,315 |
| Reinvestment of distributions | 2,035 | 2,473 | 74,379 | 80,649 |
| Shares redeemed | (14,031) | (22,631) | (511,155) | (748,252) |
| Net increase (decrease) | (8,472) | (1,364) | $(306,681) | $(60,288) |
| Class K | | | | |
| Shares sold | 1,853 | 7,100 | $68,694 | $234,427 |
| Reinvestment of distributions | 307 | 391 | 11,202 | 12,759 |
| Shares redeemed | (4,223) | (7,363) | (153,990) | (244,759) |
| Net increase (decrease) | (2,063) | 128 | $(74,094) | $2,427 |
13. Other.
The Fund's organizational documents provide former and current trustees and officers with a limited indemnification against liabilities arising in connection with the performance of their duties to the Fund. In the normal course of business, the Fund may also enter into contracts that provide general indemnifications. The Fund's maximum exposure under these arrangements is unknown as this would be dependent on future claims that may be made against the Fund. The risk of material loss from such claims is considered remote.
Shareholder Expense Example
As a shareholder of the Fund, you incur two types of costs: (1) transaction costs, and (2) ongoing costs, including management fees and other Fund expenses. This Example is intended to help you understand your ongoing costs (in dollars) of investing in the Fund and to compare these costs with the ongoing costs of investing in other mutual funds.
The Example is based on an investment of $1,000 invested at the beginning of the period and held for the entire period (August 1, 2017 to January 31, 2018).
Actual Expenses
The first line of the accompanying table for each class of the Fund provides information about actual account values and actual expenses. You may use the information in this line, together with the amount you invested, to estimate the expenses that you paid over the period. Simply divide your account value by $1,000.00 (for example, an $8,600 account value divided by $1,000.00 = 8.6), then multiply the result by the number in the first line for a class of the Fund under the heading entitled "Expenses Paid During Period" to estimate the expenses you paid on your account during this period. A small balance maintenance fee of $12.00 that is charged once a year may apply for certain accounts with a value of less than $2,000. This fee is not included in the table below. If it was, the estimate of expenses you paid during the period would be higher, and your ending account value lower, by this amount. In addition, the Fund, as a shareholder in the underlying Fidelity Central Funds, will indirectly bear its pro-rata share of the fees and expenses incurred by the underlying Fidelity Central Funds. These fees and expenses are not included in the Fund's annualized expense ratio used to calculate the expense estimate in the table below.
Hypothetical Example for Comparison Purposes
The second line of the accompanying table for each class of the Fund provides information about hypothetical account values and hypothetical expenses based on a Class' actual expense ratio and an assumed rate of return of 5% per year before expenses, which is not the Class' actual return. The hypothetical account values and expenses may not be used to estimate the actual ending account balance or expenses you paid for the period. You may use this information to compare the ongoing costs of investing in the Fund and other funds. To do so, compare this 5% hypothetical example with the 5% hypothetical examples that appear in the shareholder reports of the other funds. A small balance maintenance fee of $12.00 that is charged once a year may apply for certain accounts with a value of less than $2,000. This fee is not included in the table below. If it was, the estimate of expenses you paid during the period would be higher, and your ending account value lower, by this amount. In addition, the Fund, as a shareholder in the underlying Fidelity Central Funds, will indirectly bear its pro-rata share of the fees and expenses incurred by the underlying Fidelity Central Funds. These fees and expenses are not included in the Fund's annualized expense ratio used to calculate the expense estimate in the table below.
Please note that the expenses shown in the table are meant to highlight your ongoing costs only and do not reflect any transaction costs. Therefore, the second line of the table is useful in comparing ongoing costs only, and will not help you determine the relative total costs of owning different funds.
| | Annualized Expense Ratio-A | Beginning
Account Value
August 1, 2017 | Ending
Account Value
January 31, 2018 | Expenses Paid
During Period-B
August 1, 2017
to January 31, 2018 |
| Growth and Income | .61% | | | |
| Actual | | $1,000.00 | $1,140.50 | $3.29 |
| Hypothetical-C | | $1,000.00 | $1,022.13 | $3.11 |
| Class K | .51% | | | |
| Actual | | $1,000.00 | $1,141.20 | $2.75 |
| Hypothetical-C | | $1,000.00 | $1,022.63 | $2.60 |
A Annualized expense ratio reflects expenses net of applicable fee waivers.
B Expenses are equal to each Class' annualized expense ratio, multiplied by the average account value over the period, multiplied by 184/365 (to reflect the one-half year period).
C 5% return per year before expenses
Corporate Headquarters
245 Summer St.
Boston, MA 02210
www.fidelity.com
GAI-SANN-0318
1.700483.121
Fidelity® Leveraged Company Stock Fund
Class K
Semi-Annual Report January 31, 2018 |
|
Contents
To view a fund's proxy voting guidelines and proxy voting record for the 12-month period ended June 30, visit http://www.fidelity.com/proxyvotingresults or visit the Securities and Exchange Commission's (SEC) web site at http://www.sec.gov.
You may also call 1-800-835-5092 to request a free copy of the proxy voting guidelines.
Standard & Poor's, S&P and S&P 500 are registered service marks of The McGraw-Hill Companies, Inc. and have been licensed for use by Fidelity Distributors Corporation.
Other third-party marks appearing herein are the property of their respective owners.
All other marks appearing herein are registered or unregistered trademarks or service marks of FMR LLC or an affiliated company. © 2018 FMR LLC. All rights reserved.
This report and the financial statements contained herein are submitted for the general information of the shareholders of the Fund. This report is not authorized for distribution to prospective investors in the Fund unless preceded or accompanied by an effective prospectus.
A fund files its complete schedule of portfolio holdings with the SEC for the first and third quarters of each fiscal year on Form N-Q. Forms N-Q are available on the SEC’s web site at http://www.sec.gov. A fund's Forms N-Q may be reviewed and copied at the SEC’s Public Reference Room in Washington, DC. Information regarding the operation of the SEC's Public Reference Room may be obtained by calling 1-800-SEC-0330.
For a complete list of a fund's portfolio holdings, view the most recent holdings listing, semiannual report, or annual report on Fidelity's web site at http://www.fidelity.com, http://www.institutional.fidelity.com, or http://www.401k.com, as applicable.
NOT FDIC INSURED •MAY LOSE VALUE •NO BANK GUARANTEE
Neither the Fund nor Fidelity Distributors Corporation is a bank.
Investment Summary (Unaudited)
Top Ten Stocks as of January 31, 2018
| | % of fund's net assets |
| T-Mobile U.S., Inc. | 2.3 |
| Alphabet, Inc. Class A | 2.3 |
| ON Semiconductor Corp. | 2.3 |
| Air Canada | 2.0 |
| Bank of America Corp. | 2.0 |
| Broadcom Ltd. | 2.0 |
| Citigroup, Inc. | 1.9 |
| Facebook, Inc. Class A | 1.8 |
| Melco Crown Entertainment Ltd. sponsored ADR | 1.8 |
| JPMorgan Chase & Co. | 1.8 |
| | 20.2 |
Top Five Market Sectors as of January 31, 2018
| | % of fund's net assets |
| Information Technology | 26.9 |
| Consumer Discretionary | 23.1 |
| Financials | 10.6 |
| Industrials | 10.5 |
| Materials | 9.9 |
Asset Allocation (% of fund's net assets)
| As of January 31, 2018* |
| | Stocks | 98.3% |
| | Short-Term Investments and Net Other Assets (Liabilities) | 1.7% |

* Foreign investments – 20.0%
Schedule of Investments January 31, 2018 (Unaudited)
Showing Percentage of Net Assets
| Common Stocks - 98.3% | | | |
| | | Shares | Value (000s) |
| CONSUMER DISCRETIONARY - 23.1% | | | |
| Auto Components - 2.5% | | | |
| Aptiv PLC | | 220,900 | $20,959 |
| Delphi Technologies PLC | | 73,633 | 4,067 |
| Lear Corp. | | 193,600 | 37,392 |
| Tenneco, Inc. | | 289,100 | 16,771 |
| | | | 79,189 |
| Automobiles - 1.2% | | | |
| Fiat Chrysler Automobiles NV | | 1,566,100 | 37,853 |
| Hotels, Restaurants & Leisure - 11.0% | | | |
| Boyd Gaming Corp. | | 1,038,600 | 40,994 |
| Eldorado Resorts, Inc. (a) | | 1,056,500 | 36,502 |
| Extended Stay America, Inc. unit | | 715,400 | 14,473 |
| Las Vegas Sands Corp. | | 245,200 | 19,008 |
| Melco Crown Entertainment Ltd. sponsored ADR | | 1,910,900 | 56,907 |
| MGM Mirage, Inc. | | 750,300 | 27,348 |
| Penn National Gaming, Inc. (a) | | 1,284,200 | 40,979 |
| Red Rock Resorts, Inc. | | 5,847 | 203 |
| Royal Caribbean Cruises Ltd. | | 254,300 | 33,962 |
| Scientific Games Corp. Class A (a) | | 532,500 | 24,841 |
| U.S. Foods Holding Corp. (a) | | 443,900 | 14,263 |
| Wyndham Worldwide Corp. | | 289,100 | 35,886 |
| | | | 345,366 |
| Household Durables - 2.3% | | | |
| CalAtlantic Group, Inc. | | 375,300 | 21,066 |
| Lennar Corp. Class A | | 201,600 | 12,632 |
| Newell Brands, Inc. | | 604,547 | 15,984 |
| Toll Brothers, Inc. | | 513,000 | 23,896 |
| | | | 73,578 |
| Internet & Direct Marketing Retail - 1.6% | | | |
| JD.com, Inc. sponsored ADR (a) | | 381,900 | 18,801 |
| Priceline Group, Inc. (a) | | 16,700 | 31,931 |
| | | | 50,732 |
| Media - 4.5% | | | |
| Gray Television, Inc. (a) | | 1,869,664 | 30,569 |
| Naspers Ltd.: | | | |
| Class N | | 135,500 | 38,690 |
| Class N sponsored ADR | | 160,400 | 9,236 |
| Nexstar Broadcasting Group, Inc. Class A | | 482,098 | 36,206 |
| Sinclair Broadcast Group, Inc. Class A (b) | | 699,000 | 25,933 |
| | | | 140,634 |
|
| TOTAL CONSUMER DISCRETIONARY | | | 727,352 |
|
| CONSUMER STAPLES - 4.1% | | | |
| Beverages - 1.2% | | | |
| Constellation Brands, Inc. Class A (sub. vtg.) | | 86,500 | 18,984 |
| Monster Beverage Corp. (a) | | 280,500 | 19,139 |
| | | | 38,123 |
| Food & Staples Retailing - 0.9% | | | |
| CVS Health Corp. | | 361,400 | 28,439 |
| Food Products - 2.0% | | | |
| Darling International, Inc. (a) | | 1,685,383 | 31,247 |
| JBS SA | | 9,507,900 | 29,992 |
| | | | 61,239 |
|
| TOTAL CONSUMER STAPLES | | | 127,801 |
|
| ENERGY - 6.0% | | | |
| Energy Equipment & Services - 0.0% | | | |
| SAExploration Holdings, Inc. (a)(c) | | 419,175 | 914 |
| Oil, Gas & Consumable Fuels - 6.0% | | | |
| Anadarko Petroleum Corp. | | 307,800 | 18,483 |
| Carrizo Oil & Gas, Inc. (a) | | 57,702 | 1,160 |
| Cheniere Energy, Inc. (a) | | 594,640 | 33,633 |
| Diamondback Energy, Inc. (a) | | 281,900 | 35,378 |
| EQT Corp. | | 306,506 | 16,640 |
| Parsley Energy, Inc. Class A (a) | | 579,600 | 13,679 |
| Pioneer Natural Resources Co. | | 145,200 | 26,559 |
| QEP Resources, Inc. (a) | | 458,700 | 4,293 |
| Range Resources Corp. (b) | | 323,900 | 4,616 |
| RSP Permian, Inc. (a) | | 270,900 | 10,749 |
| Scorpio Tankers, Inc. | | 1,959,100 | 5,211 |
| Teekay Corp. (b) | | 917,300 | 7,485 |
| Whiting Petroleum Corp. (a) | | 359,973 | 10,050 |
| | | | 187,936 |
|
| TOTAL ENERGY | | | 188,850 |
|
| FINANCIALS - 10.6% | | | |
| Banks - 7.5% | | | |
| Bank of America Corp. | | 1,955,999 | 62,592 |
| Citigroup, Inc. | | 780,847 | 61,281 |
| Huntington Bancshares, Inc. | | 1,154,180 | 18,675 |
| JPMorgan Chase & Co. | | 481,600 | 55,707 |
| Regions Financial Corp. | | 987,780 | 18,995 |
| SunTrust Banks, Inc. | | 271,500 | 19,195 |
| | | | 236,445 |
| Capital Markets - 0.4% | | | |
| MSCI, Inc. | | 94,600 | 13,171 |
| Consumer Finance - 1.6% | | | |
| OneMain Holdings, Inc. (a) | | 1,547,200 | 50,609 |
| Diversified Financial Services - 1.1% | | | |
| GDS Holdings Ltd. ADR (a)(b) | | 1,173,700 | 33,497 |
|
| TOTAL FINANCIALS | | | 333,722 |
|
| HEALTH CARE - 3.2% | | | |
| Health Care Equipment & Supplies - 0.5% | | | |
| Boston Scientific Corp. (a) | | 613,956 | 17,166 |
| Health Care Providers & Services - 0.6% | | | |
| HCA Holdings, Inc. | | 179,579 | 18,166 |
| Life Sciences Tools & Services - 0.5% | | | |
| PRA Health Sciences, Inc. (a) | | 168,000 | 15,298 |
| Pharmaceuticals - 1.6% | | | |
| Allergan PLC | | 128,100 | 23,091 |
| Jazz Pharmaceuticals PLC (a) | | 168,500 | 24,557 |
| Valeant Pharmaceuticals International, Inc. (Canada) (a) | | 56,100 | 1,038 |
| | | | 48,686 |
|
| TOTAL HEALTH CARE | | | 99,316 |
|
| INDUSTRIALS - 10.5% | | | |
| Air Freight & Logistics - 0.8% | | | |
| XPO Logistics, Inc. (a) | | 282,000 | 26,632 |
| Airlines - 4.1% | | | |
| Air Canada (a) | | 3,279,900 | 63,758 |
| Allegiant Travel Co. | | 144,246 | 22,971 |
| Delta Air Lines, Inc. | | 745,301 | 42,311 |
| | | | 129,040 |
| Building Products - 1.3% | | | |
| Fortune Brands Home & Security, Inc. | | 278,100 | 19,726 |
| Masco Corp. | | 475,400 | 21,231 |
| | | | 40,957 |
| Commercial Services & Supplies - 0.0% | | | |
| Novus Holdings Ltd. | | 46,866 | 20 |
| Electrical Equipment - 0.2% | | | |
| Regal Beloit Corp. | | 81,158 | 6,322 |
| Machinery - 0.9% | | | |
| Allison Transmission Holdings, Inc. | | 627,700 | 27,769 |
| Marine - 0.0% | | | |
| Genco Shipping & Trading Ltd. (a) | | 831 | 11 |
| Trading Companies & Distributors - 3.2% | | | |
| AerCap Holdings NV (a) | | 352,700 | 19,081 |
| HD Supply Holdings, Inc. (a) | | 1,117,500 | 43,460 |
| United Rentals, Inc. (a) | | 207,000 | 37,490 |
| | | | 100,031 |
|
| TOTAL INDUSTRIALS | | | 330,782 |
|
| INFORMATION TECHNOLOGY - 26.9% | | | |
| Electronic Equipment & Components - 1.5% | | | |
| CDW Corp. | | 280,200 | 20,956 |
| TE Connectivity Ltd. | | 154,100 | 15,800 |
| TTM Technologies, Inc. (a) | | 589,200 | 9,716 |
| | | | 46,472 |
| Internet Software & Services - 5.4% | | | |
| Alibaba Group Holding Ltd. sponsored ADR (a) | | 182,000 | 37,181 |
| Alphabet, Inc. Class A (a) | | 62,000 | 73,298 |
| Facebook, Inc. Class A (a) | | 309,300 | 57,805 |
| LogMeIn, Inc. | | 31,550 | 3,969 |
| Qudian, Inc. ADR (b) | | 7,000 | 98 |
| | | | 172,351 |
| IT Services - 3.4% | | | |
| EPAM Systems, Inc. (a) | | 243,700 | 28,630 |
| First Data Corp. Class A (a) | | 976,600 | 17,286 |
| Global Payments, Inc. | | 397,500 | 44,433 |
| PayPal Holdings, Inc. (a) | | 196,900 | 16,800 |
| | | | 107,149 |
| Semiconductors & Semiconductor Equipment - 11.8% | | | |
| Analog Devices, Inc. | | 194,000 | 17,825 |
| Broadcom Ltd. | | 252,200 | 62,553 |
| Marvell Technology Group Ltd. | | 1,097,200 | 25,598 |
| Micron Technology, Inc. (a) | | 976,100 | 42,675 |
| Microsemi Corp. (a) | | 859,500 | 53,109 |
| NVIDIA Corp. | | 99,100 | 24,359 |
| ON Semiconductor Corp. (a) | | 2,941,500 | 72,773 |
| Qorvo, Inc. (a) | | 365,300 | 26,218 |
| Semtech Corp. (a) | | 408,100 | 14,610 |
| Skyworks Solutions, Inc. | | 325,300 | 31,622 |
| | | | 371,342 |
| Software - 4.8% | | | |
| Adobe Systems, Inc. (a) | | 181,800 | 36,316 |
| Electronic Arts, Inc. (a) | | 287,900 | 36,552 |
| Nuance Communications, Inc. (a) | | 1,410,400 | 25,119 |
| Salesforce.com, Inc. (a) | | 147,800 | 16,836 |
| Take-Two Interactive Software, Inc. (a) | | 223,800 | 28,349 |
| TiVo Corp. | | 533,331 | 7,440 |
| | | | 150,612 |
|
| TOTAL INFORMATION TECHNOLOGY | | | 847,926 |
|
| MATERIALS - 9.9% | | | |
| Chemicals - 6.1% | | | |
| DowDuPont, Inc. | | 475,821 | 35,963 |
| Ingevity Corp. (a) | | 254,788 | 18,485 |
| LyondellBasell Industries NV Class A | | 460,555 | 55,193 |
| Olin Corp. | | 395,300 | 14,737 |
| Platform Specialty Products Corp. (a) | | 2,635,400 | 30,861 |
| The Chemours Co. LLC | | 727,000 | 37,528 |
| | | | 192,767 |
| Containers & Packaging - 1.4% | | | |
| Ardagh Group SA | | 73,966 | 1,479 |
| Berry Global Group, Inc. (a) | | 113,700 | 6,730 |
| Crown Holdings, Inc. (a) | | 277,300 | 16,097 |
| Graphic Packaging Holding Co. | | 1,170,100 | 18,897 |
| | | | 43,203 |
| Metals & Mining - 2.4% | | | |
| First Quantum Minerals Ltd. | | 2,322,400 | 34,628 |
| Freeport-McMoRan, Inc. (a) | | 1,107,900 | 21,604 |
| Nucor Corp. | | 282,600 | 18,923 |
| | | | 75,155 |
|
| TOTAL MATERIALS | | | 311,125 |
|
| TELECOMMUNICATION SERVICES - 3.3% | | | |
| Diversified Telecommunication Services - 1.0% | | | |
| Altice U.S.A., Inc. Class A (b) | | 1,435,600 | 30,822 |
| Wireless Telecommunication Services - 2.3% | | | |
| T-Mobile U.S., Inc. (a) | | 1,148,300 | 74,748 |
|
| TOTAL TELECOMMUNICATION SERVICES | | | 105,570 |
|
| UTILITIES - 0.7% | | | |
| Electric Utilities - 0.6% | | | |
| Vistra Energy Corp. (a) | | 938,500 | 18,301 |
| Independent Power and Renewable Electricity Producers - 0.1% | | | |
| Dynegy, Inc. (a) | | 273,413 | 3,423 |
|
| TOTAL UTILITIES | | | 21,724 |
|
| TOTAL COMMON STOCKS | | | |
| (Cost $2,235,932) | | | 3,094,168 |
| | | Principal Amount (000s) | Value (000s) |
|
| Nonconvertible Bonds - 0.0% | | | |
| ENERGY - 0.0% | | | |
| Oil, Gas & Consumable Fuels - 0.0% | | | |
| Jupiter Resources, Inc. 8.5% 10/1/22(c) | | | |
| (Cost $690) | | 825 | 503 |
| | | Shares | Value (000s) |
|
| Money Market Funds - 3.9% | | | |
| Fidelity Cash Central Fund, 1.39% (d) | | 75,268,320 | 75,283 |
| Fidelity Securities Lending Cash Central Fund 1.40% (d)(e) | | 47,056,538 | 47,061 |
| TOTAL MONEY MARKET FUNDS | | | |
| (Cost $122,342) | | | 122,344 |
| TOTAL INVESTMENT IN SECURITIES - 102.2% | | | |
| (Cost $2,358,964) | | | 3,217,015 |
| NET OTHER ASSETS (LIABILITIES) - (2.2)% | | | (69,022) |
| NET ASSETS - 100% | | | $3,147,993 |
Legend
(a) Non-income producing
(b) Security or a portion of the security is on loan at period end.
(c) Security exempt from registration under Rule 144A of the Securities Act of 1933. These securities may be resold in transactions exempt from registration, normally to qualified institutional buyers. At the end of the period, the value of these securities amounted to $1,417,000 or 0.0% of net assets.
(d) Affiliated fund that is generally available only to investment companies and other accounts managed by Fidelity Investments. The rate quoted is the annualized seven-day yield of the fund at period end. A complete unaudited listing of the fund's holdings as of its most recent quarter end is available upon request. In addition, each Fidelity Central Fund's financial statements are available on the SEC's website or upon request.
(e) Includes investment made with cash collateral received from securities on loan.
Affiliated Central Funds
Information regarding fiscal year to date income earned by the Fund from investments in Fidelity Central Funds is as follows:
| Fund | Income earned |
| | (Amounts in thousands) |
| Fidelity Cash Central Fund | $290 |
| Fidelity Securities Lending Cash Central Fund | 349 |
| Total | $639 |
Amounts in the income column in the above table include any capital gain distributions from underlying funds, which are presented in the corresponding line-item in the Statement of Operations if applicable.
Investment Valuation
The following is a summary of the inputs used, as of January 31, 2018, involving the Fund's assets and liabilities carried at fair value. The inputs or methodology used for valuing securities may not be an indication of the risk associated with investing in those securities. For more information on valuation inputs, and their aggregation into the levels used below, please refer to the Investment Valuation section in the accompanying Notes to Financial Statements.
| | Valuation Inputs at Reporting Date: |
| Description | Total | Level 1 | Level 2 | Level 3 |
| (Amounts in thousands) | | | | |
| Investments in Securities: | | | | |
| Equities: | | | | |
| Consumer Discretionary | $727,352 | $727,352 | $-- | $-- |
| Consumer Staples | 127,801 | 127,801 | -- | -- |
| Energy | 188,850 | 188,850 | -- | -- |
| Financials | 333,722 | 333,722 | -- | -- |
| Health Care | 99,316 | 99,316 | -- | -- |
| Industrials | 330,782 | 330,782 | -- | -- |
| Information Technology | 847,926 | 847,926 | -- | -- |
| Materials | 311,125 | 311,125 | -- | -- |
| Telecommunication Services | 105,570 | 105,570 | -- | -- |
| Utilities | 21,724 | 21,724 | -- | -- |
| Corporate Bonds | 503 | -- | 503 | -- |
| Money Market Funds | 122,344 | 122,344 | -- | -- |
| Total Investments in Securities: | $3,217,015 | $3,216,512 | $503 | $-- |
Other Information
Distribution of investments by country or territory of incorporation, as a percentage of Total Net Assets, is as follows (Unaudited):
| United States of America | 80.0% |
| Cayman Islands | 3.6% |
| Netherlands | 3.5% |
| Canada | 3.1% |
| Singapore | 2.0% |
| Ireland | 1.6% |
| South Africa | 1.5% |
| Liberia | 1.1% |
| Brazil | 1.0% |
| Others (Individually Less Than 1%) | 2.6% |
| | 100.0% |
See accompanying notes which are an integral part of the financial statements.
Financial Statements
Statement of Assets and Liabilities
| Amounts in thousands (except per-share amounts) | | January 31, 2018 (Unaudited) |
| Assets | | |
Investment in securities, at value (including securities loaned of $45,347) — See accompanying schedule:
Unaffiliated issuers (cost $2,236,622) | $3,094,671 | |
| Fidelity Central Funds (cost $122,342) | 122,344 | |
| Total Investment in Securities (cost $2,358,964) | | $3,217,015 |
| Receivable for investments sold | | 13,132 |
| Receivable for fund shares sold | | 739 |
| Dividends receivable | | 244 |
| Interest receivable | | 23 |
| Distributions receivable from Fidelity Central Funds | | 128 |
| Prepaid expenses | | 4 |
| Other receivables | | 62 |
| Total assets | | 3,231,347 |
| Liabilities | | |
| Payable to custodian bank | $9,483 | |
| Payable for investments purchased | 20,397 | |
| Payable for fund shares redeemed | 4,385 | |
| Accrued management fee | 1,565 | |
| Other affiliated payables | 421 | |
| Other payables and accrued expenses | 37 | |
| Collateral on securities loaned | 47,066 | |
| Total liabilities | | 83,354 |
| Net Assets | | $3,147,993 |
| Net Assets consist of: | | |
| Paid in capital | | $2,197,636 |
| Distributions in excess of net investment income | | (926) |
| Accumulated undistributed net realized gain (loss) on investments and foreign currency transactions | | 93,232 |
| Net unrealized appreciation (depreciation) on investments and assets and liabilities in foreign currencies | | 858,051 |
| Net Assets | | $3,147,993 |
| Leveraged Company Stock: | | |
| Net Asset Value, offering price and redemption price per share ($2,655,947 ÷ 75,162 shares) | | $35.34 |
| Class K: | | |
| Net Asset Value, offering price and redemption price per share ($492,046 ÷ 13,895 shares) | | $35.41 |
See accompanying notes which are an integral part of the financial statements.
Statement of Operations
| Amounts in thousands | | Six months ended January 31, 2018 (Unaudited) |
| Investment Income | | |
| Dividends | | $12,970 |
| Interest | | 45 |
| Income from Fidelity Central Funds | | 639 |
| Total income | | 13,654 |
| Expenses | | |
| Management fee | $9,140 | |
| Transfer agent fees | 2,109 | |
| Accounting and security lending fees | 458 | |
| Custodian fees and expenses | 25 | |
| Independent trustees' fees and expenses | 6 | |
| Registration fees | 32 | |
| Audit | 35 | |
| Legal | 7 | |
| Miscellaneous | 11 | |
| Total expenses before reductions | 11,823 | |
| Expense reductions | (128) | 11,695 |
| Net investment income (loss) | | 1,959 |
| Realized and Unrealized Gain (Loss) | | |
| Net realized gain (loss) on: | | |
| Investment securities: | | |
| Unaffiliated issuers | 201,735 | |
| Fidelity Central Funds | (2) | |
| Foreign currency transactions | 63 | |
| Total net realized gain (loss) | | 201,796 |
| Change in net unrealized appreciation (depreciation) on: | | |
| Investment securities: | | |
| Unaffiliated issuers | 208,331 | |
| Fidelity Central Funds | (3) | |
| Total change in net unrealized appreciation (depreciation) | | 208,328 |
| Net gain (loss) | | 410,124 |
| Net increase (decrease) in net assets resulting from operations | | $412,083 |
See accompanying notes which are an integral part of the financial statements.
Statement of Changes in Net Assets
| Amounts in thousands | Six months ended January 31, 2018 (Unaudited) | Year ended July 31, 2017 |
| Increase (Decrease) in Net Assets | | |
| Operations | | |
| Net investment income (loss) | $1,959 | $17,016 |
| Net realized gain (loss) | 201,796 | 1,032,712 |
| Change in net unrealized appreciation (depreciation) | 208,328 | (535,359) |
| Net increase (decrease) in net assets resulting from operations | 412,083 | 514,369 |
| Distributions to shareholders from net investment income | (6,187) | (31,094) |
| Distributions to shareholders from net realized gain | (529,539) | (719,647) |
| Total distributions | (535,726) | (750,741) |
| Share transactions - net increase (decrease) | 138,508 | (65,270) |
| Redemption fees | – | 27 |
| Total increase (decrease) in net assets | 14,865 | (301,615) |
| Net Assets | | |
| Beginning of period | 3,133,128 | 3,434,743 |
| End of period | $3,147,993 | $3,133,128 |
| Other Information | | |
| Undistributed net investment income end of period | $– | $3,302 |
| Distributions in excess of net investment income end of period | $(926) | $– |
See accompanying notes which are an integral part of the financial statements.
Financial Highlights
Fidelity Leveraged Company Stock Fund
| | Six months ended (Unaudited) January 31, | Years endedJuly 31, | | | | |
| | 2018 | 2017 | 2016 | 2015 | 2014 | 2013 |
| Selected Per–Share Data | | | | | | |
| Net asset value, beginning of period | $37.25 | $40.68 | $46.90 | $45.82 | $39.44 | $28.22 |
| Income from Investment Operations | | | | | | |
| Net investment income (loss)A | .02 | .19 | .41 | .41 | .34 | .42B |
| Net realized and unrealized gain (loss) | 4.45 | 5.53 | (3.77) | 1.01 | 6.31 | 10.92 |
| Total from investment operations | 4.47 | 5.72 | (3.36) | 1.42 | 6.65 | 11.34 |
| Distributions from net investment income | (.07) | (.37) | (.40) | (.34) | (.27) | (.12) |
| Distributions from net realized gain | (6.32) | (8.78) | (2.46) | – | – | – |
| Total distributions | (6.38)C | (9.15) | (2.86) | (.34) | (.27) | (.12) |
| Redemption fees added to paid in capitalA | – | –D | –D | –D | –D | –D |
| Net asset value, end of period | $35.34 | $37.25 | $40.68 | $46.90 | $45.82 | $39.44 |
| Total ReturnE,F | 14.24% | 17.45% | (7.23)% | 3.12% | 16.96% | 40.31% |
| Ratios to Average Net AssetsG,H | | | | | | |
| Expenses before reductions | .78%I | .80% | .80% | .79% | .79% | .82% |
| Expenses net of fee waivers, if any | .78%I | .79% | .80% | .78% | .79% | .82% |
| Expenses net of all reductions | .77%I | .78% | .80% | .78% | .79% | .82% |
| Net investment income (loss) | .11%I | .51% | 1.03% | .87% | .81% | 1.25%B |
| Supplemental Data | | | | | | |
| Net assets, end of period (in millions) | $2,656 | $2,644 | $2,861 | $3,755 | $4,207 | $4,227 |
| Portfolio turnover rateJ | 64%I | 100% | 9% | 4% | 10% | 21% |
A Calculated based on average shares outstanding during the period.
B Net Investment income per share reflects a large, non-recurring dividend which amounted to $.08 per share. Excluding this non-recurring dividend, the ratio of net investment income (loss) to average net assets would have been 1.03%.
C Total distributions of $6.38 per share is comprised of distributions from net investment income of $.066 and distributions from net realized gain of $6.318 per share.
D Amount represents less than $.005 per share.
E Total returns for periods of less than one year are not annualized.
F Total returns would have been lower if certain expenses had not been reduced during the applicable periods shown.
G Fees and expenses of any underlying Fidelity Central Funds are not included in the Fund's expense ratio. The Fund indirectly bears its proportionate share of the expenses of any underlying Fidelity Central Funds.
H Expense ratios reflect operating expenses of the class. Expenses before reductions do not reflect amounts reimbursed by the investment adviser or reductions from brokerage service arrangements or reductions from other expense offset arrangements and do not represent the amount paid by the class during periods when reimbursements or reductions occur. Expenses net of fee waivers reflect expenses after reimbursement by the investment adviser but prior to reductions from brokerage service arrangements or other expense offset arrangements. Expenses net of all reductions represent the net expenses paid by the class.
I Annualized
J Amount does not include the portfolio activity of any underlying Fidelity Central Funds.
See accompanying notes which are an integral part of the financial statements.
Fidelity Leveraged Company Stock Fund Class K
| | Six months ended (Unaudited) January 31, | Years endedJuly 31, | | | | |
| | 2018 | 2017 | 2016 | 2015 | 2014 | 2013 |
| Selected Per–Share Data | | | | | | |
| Net asset value, beginning of period | $37.34 | $40.76 | $47.00 | $45.91 | $39.52 | $28.26 |
| Income from Investment Operations | | | | | | |
| Net investment income (loss)A | .04 | .23 | .46 | .46 | .40 | .47B |
| Net realized and unrealized gain (loss) | 4.45 | 5.55 | (3.79) | 1.03 | 6.31 | 10.93 |
| Total from investment operations | 4.49 | 5.78 | (3.33) | 1.49 | 6.71 | 11.40 |
| Distributions from net investment income | (.11) | (.42) | (.45) | (.40) | (.32) | (.14) |
| Distributions from net realized gain | (6.32) | (8.78) | (2.46) | – | – | – |
| Total distributions | (6.42)C | (9.20) | (2.91) | (.40) | (.32) | (.14) |
| Redemption fees added to paid in capitalA | – | –D | –D | –D | –D | –D |
| Net asset value, end of period | $35.41 | $37.34 | $40.76 | $47.00 | $45.91 | $39.52 |
| Total ReturnE,F | 14.27% | 17.60% | (7.14)% | 3.26% | 17.10% | 40.47% |
| Ratios to Average Net AssetsG,H | | | | | | |
| Expenses before reductions | .68%I | .68% | .68% | .67% | .67% | .69% |
| Expenses net of fee waivers, if any | .67%I | .68% | .68% | .67% | .67% | .69% |
| Expenses net of all reductions | .67%I | .67% | .68% | .67% | .67% | .68% |
| Net investment income (loss) | .22%I | .63% | 1.15% | .99% | .92% | 1.39%B |
| Supplemental Data | | | | | | |
| Net assets, end of period (in millions) | $492 | $489 | $573 | $991 | $1,173 | $1,053 |
| Portfolio turnover rateJ | 64%I | 100% | 9% | 4% | 10% | 21% |
A Calculated based on average shares outstanding during the period.
B Net Investment income per share reflects a large, non-recurring dividend which amounted to $.08 per share. Excluding this non-recurring dividend, the ratio of net investment income (loss) to average net assets would have been 1.17%.
C Total distributions of $6.42 per share is comprised of distributions from net investment income of $.106 and distributions from net realized gain of $6.318 per share.
D Amount represents less than $.005 per share.
E Total returns for periods of less than one year are not annualized.
F Total returns would have been lower if certain expenses had not been reduced during the applicable periods shown.
G Fees and expenses of any underlying Fidelity Central Funds are not included in the Fund's expense ratio. The Fund indirectly bears its proportionate share of the expenses of any underlying Fidelity Central Funds.
H Expense ratios reflect operating expenses of the class. Expenses before reductions do not reflect amounts reimbursed by the investment adviser or reductions from brokerage service arrangements or reductions from other expense offset arrangements and do not represent the amount paid by the class during periods when reimbursements or reductions occur. Expenses net of fee waivers reflect expenses after reimbursement by the investment adviser but prior to reductions from brokerage service arrangements or other expense offset arrangements. Expenses net of all reductions represent the net expenses paid by the class.
I Annualized
J Amount does not include the portfolio activity of any underlying Fidelity Central Funds.
See accompanying notes which are an integral part of the financial statements.
Notes to Financial Statements (Unaudited)
For the period ended January 31, 2018
(Amounts in thousands except percentages)
1. Organization.
Fidelity Leveraged Company Stock Fund (the Fund) is a fund of Fidelity Securities Fund (the Trust) and is authorized to issue an unlimited number of shares. The Trust is registered under the Investment Company Act of 1940, as amended (the 1940 Act), as an open-end management investment company organized as a Massachusetts business trust. The Fund offers Leveraged Company Stock and Class K shares, each of which has equal rights as to assets and voting privileges. Each class has exclusive voting rights with respect to matters that affect that class.
2. Investments in Fidelity Central Funds.
The Fund invests in Fidelity Central Funds, which are open-end investment companies generally available only to other investment companies and accounts managed by the investment adviser and its affiliates. The Fund's Schedule of Investments lists each of the Fidelity Central Funds held as of period end, if any, as an investment of the Fund, but does not include the underlying holdings of each Fidelity Central Fund. As an Investing Fund, the Fund indirectly bears its proportionate share of the expenses of the underlying Fidelity Central Funds.
The Money Market Central Funds seek preservation of capital and current income and are managed by Fidelity Investments Money Management, Inc. (FIMM), an affiliate of the investment adviser. Annualized expenses of the Money Market Central Funds as of their most recent shareholder report date are less than .005%.
A complete unaudited list of holdings for each Fidelity Central Fund is available upon request or at the Securities and Exchange Commission (the SEC) website at www.sec.gov. In addition, the financial statements of the Fidelity Central Funds are available on the SEC website or upon request.
3. Significant Accounting Policies.
The Fund is an investment company and applies the accounting and reporting guidance of the Financial Accounting Standards Board (FASB) Accounting Standards Codification Topic 946 Financial Services – Investments Companies. The financial statements have been prepared in conformity with accounting principles generally accepted in the United States of America (GAAP), which require management to make certain estimates and assumptions at the date of the financial statements. Actual results could differ from those estimates. Subsequent events, if any, through the date that the financial statements were issued have been evaluated in the preparation of the financial statements. The following summarizes the significant accounting policies of the Fund:
Investment Valuation. Investments are valued as of 4:00 p.m. Eastern time on the last calendar day of the period. The Board of Trustees (the Board) has delegated the day to day responsibility for the valuation of the Fund's investments to the Fair Value Committee (the Committee) established by the Fund's investment adviser. In accordance with valuation policies and procedures approved by the Board, the Fund attempts to obtain prices from one or more third party pricing vendors or brokers to value its investments. When current market prices, quotations or currency exchange rates are not readily available or reliable, investments will be fair valued in good faith by the Committee, in accordance with procedures adopted by the Board. Factors used in determining fair value vary by investment type and may include market or investment specific events, changes in interest rates and credit quality. The frequency with which these procedures are used cannot be predicted and they may be utilized to a significant extent. The Committee oversees the Fund's valuation policies and procedures and reports to the Board on the Committee's activities and fair value determinations. The Board monitors the appropriateness of the procedures used in valuing the Fund's investments and ratifies the fair value determinations of the Committee.
The Fund categorizes the inputs to valuation techniques used to value its investments into a disclosure hierarchy consisting of three levels as shown below:
- Level 1 – quoted prices in active markets for identical investments
- Level 2 – other significant observable inputs (including quoted prices for similar investments, interest rates, prepayment speeds, etc.)
- Level 3 – unobservable inputs (including the Fund's own assumptions based on the best information available)
Valuation techniques used to value the Fund's investments by major category are as follows:
Equity securities, including restricted securities, for which market quotations are readily available, are valued at the last reported sale price or official closing price as reported by a third party pricing vendor on the primary market or exchange on which they are traded and are categorized as Level 1 in the hierarchy. In the event there were no sales during the day or closing prices are not available, securities are valued at the last quoted bid price or may be valued using the last available price and are generally categorized as Level 2 in the hierarchy. For foreign equity securities, when market or security specific events arise, comparisons to the valuation of American Depositary Receipts (ADRs), futures contracts, Exchange-Traded Funds (ETFs) and certain indexes as well as quoted prices for similar securities may be used and would be categorized as Level 2 in the hierarchy. Utilizing these techniques may result in transfers between Level 1 and Level 2. For equity securities, including restricted securities, where observable inputs are limited, assumptions about market activity and risk are used and these securities may be categorized as Level 3 in the hierarchy.
Debt securities, including restricted securities, are valued based on evaluated prices received from third party pricing vendors or from brokers who make markets in such securities. Corporate bonds are valued by pricing vendors who utilize matrix pricing which considers yield or price of bonds of comparable quality, coupon, maturity and type or by broker-supplied prices. When independent prices are unavailable or unreliable, debt securities may be valued utilizing pricing methodologies which consider similar factors that would be used by third party pricing vendors. Debt securities are generally categorized as Level 2 in the hierarchy but may be Level 3 depending on the circumstances.
Investments in open-end mutual funds, including the Fidelity Central Funds, are valued at their closing net asset value (NAV) each business day and are categorized as Level 1 in the hierarchy.
Changes in valuation techniques may result in transfers in or out of an assigned level within the disclosure hierarchy. The aggregate value of investments by input level as of January 31, 2018 is included at the end of the Fund's Schedule of Investments.
Foreign Currency. The Fund may use foreign currency contracts to facilitate transactions in foreign-denominated securities. Gains and losses from these transactions may arise from changes in the value of the foreign currency or if the counterparties do not perform under the contracts' terms.
Foreign-denominated assets, including investment securities, and liabilities are translated into U.S. dollars at the exchange rates at period end. Purchases and sales of investment securities, income and dividends received and expenses denominated in foreign currencies are translated into U.S. dollars at the exchange rate in effect on the transaction date.
The effects of exchange rate fluctuations on investments are included with the net realized and unrealized gain (loss) on investment securities. Other foreign currency transactions resulting in realized and unrealized gain (loss) are disclosed separately.
Investment Transactions and Income. For financial reporting purposes, the Fund's investment holdings and NAV include trades executed through the end of the last business day of the period. The NAV per share for processing shareholder transactions is calculated as of the close of business of the New York Stock Exchange (NYSE), normally 4:00 p.m. Eastern time and includes trades executed through the end of the prior business day. Gains and losses on securities sold are determined on the basis of identified cost and includes proceeds received from litigation. Dividend income is recorded on the ex-dividend date, except for certain dividends from foreign securities where the ex-dividend date may have passed, which are recorded as soon as the Fund is informed of the ex-dividend date. Non-cash dividends included in dividend income, if any, are recorded at the fair market value of the securities received. Income and capital gain distributions from Fidelity Central Funds, if any, are recorded on the ex-dividend date. Certain distributions received by the Fund represent a return of capital or capital gain. The Fund determines the components of these distributions subsequent to the ex-dividend date, based upon receipt of tax filings or other correspondence relating to the underlying investment. These distributions are recorded as a reduction of cost of investments and/or as a realized gain. Interest income is accrued as earned and includes coupon interest and amortization of premium and accretion of discount on debt securities as applicable. Investment income is recorded net of foreign taxes withheld where recovery of such taxes is uncertain. Debt obligations may be placed on non-accrual status and related interest income may be reduced by ceasing current accruals and writing off interest receivables when the collection of all or a portion of interest has become doubtful based on consistently applied procedures. A debt obligation is removed from non-accrual status when the issuer resumes interest payments or when collectability of interest is reasonably assured.
Class Allocations and Expenses. Investment income, realized and unrealized capital gains and losses, common expenses of the Fund, and certain fund-level expense reductions, if any, are allocated daily on a pro-rata basis to each class based on the relative net assets of each class to the total net assets of the Fund. Each class differs with respect to transfer agent fees incurred. Certain expense reductions may also differ by class. For the reporting period, the allocated portion of income and expenses to each class as a percent of its average net assets may vary due to the timing of recording these transactions in relation to fluctuating net assets of the classes. Expenses directly attributable to a fund are charged to that fund. Expenses attributable to more than one fund are allocated among the respective funds on the basis of relative net assets or other appropriate methods. Expense estimates are accrued in the period to which they relate and adjustments are made when actual amounts are known.
Income Tax Information and Distributions to Shareholders. Each year, the Fund intends to qualify as a regulated investment company under Subchapter M of the Internal Revenue Code, including distributing substantially all of its taxable income and realized gains. As a result, no provision for U.S. Federal income taxes is required. The Fund files a U.S. federal tax return, in addition to state and local tax returns as required. The Fund's federal income tax returns are subject to examination by the Internal Revenue Service (IRS) for a period of three fiscal years after they are filed. State and local tax returns may be subject to examination for an additional fiscal year depending on the jurisdiction. Foreign taxes are provided for based on the Fund's understanding of the tax rules and rates that exist in the foreign markets in which it invests.
Distributions are declared and recorded on the ex-dividend date. Income dividends and capital gain distributions are declared separately for each class. Income and capital gain distributions are determined in accordance with income tax regulations, which may differ from GAAP.
Capital accounts within the financial statements are adjusted for permanent book-tax differences. These adjustments have no impact on net assets or the results of operations. Capital accounts are not adjusted for temporary book-tax differences which will reverse in a subsequent period.
Book-tax differences are primarily due to foreign currency transactions, market discount, partnerships and losses deferred due to wash sales.
As of period end, the cost and unrealized appreciation (depreciation) in securities, and derivatives if applicable, for federal income tax purposes were as follows:
| Gross unrealized appreciation | $953,088 |
| Gross unrealized depreciation | (99,287) |
| Net unrealized appreciation (depreciation) | $853,801 |
| Tax cost | $2,363,214 |
Restricted Securities. The Fund may invest in securities that are subject to legal or contractual restrictions on resale. These securities generally may be resold in transactions exempt from registration or to the public if the securities are registered. Disposal of these securities may involve time-consuming negotiations and expense, and prompt sale at an acceptable price may be difficult. Information regarding restricted securities is included at the end of the Fund's Schedule of Investments.
4. Purchases and Sales of Investments.
Purchases and sales of securities, other than short-term securities, aggregated $973,035 and $1,325,963, respectively.
5. Fees and Other Transactions with Affiliates.
Management Fee. Fidelity Management & Research Company (the investment adviser) and its affiliates provide the Fund with investment management related services for which the Fund pays a monthly management fee. The management fee is the sum of an individual fund fee rate that is based on an annual rate of .35% of the Fund's average net assets and an annualized group fee rate that averaged .24% during the period. The group fee rate is based upon the average net assets of all the mutual funds advised by the investment adviser, including any mutual funds previously advised by the investment adviser that are currently advised by Fidelity SelectCo, LLC, an affiliate of the investment adviser. The group fee rate decreases as assets under management increase and increases as assets under management decrease. For the reporting period, the total annualized management fee rate was .59% of the Fund's average net assets.
Transfer Agent Fees. Fidelity Investments Institutional Operations Company, Inc., (FIIOC), an affiliate of the investment adviser, is the transfer, dividend disbursing and shareholder servicing agent for each class of the Fund. FIIOC receives account fees and asset-based fees that vary according to the account size and type of account of the shareholders of Leveraged Company Stock. FIIOC receives an asset-based fee of Class K's average net assets. FIIOC pays for typesetting, printing and mailing of shareholder reports, except proxy statements.
For the period, transfer agent fees for each class were as follows:
| | Amount | % of Class-Level Average Net Assets(a) |
| Leveraged Company Stock | $1,998 | .15 |
| Class K | 111 | .05 |
| | $2,109 | |
(a) Annualized
Accounting and Security Lending Fees. Fidelity Service Company, Inc. (FSC), an affiliate of the investment adviser, maintains the Fund's accounting records. The accounting fee is based on the level of average net assets for each month. Under a separate contract, FSC administers the security lending program. The security lending fee is based on the number and duration of lending transactions.
Brokerage Commissions. The Fund placed a portion of its portfolio transactions with brokerage firms which are affiliates of the investment adviser. Brokerage commissions are included in net realized gain (loss) and change in net unrealized appreciation (depreciation) in the Statement of Operations. The commissions paid to these affiliated firms were $25 for the period.
Interfund Trades. The Fund may purchase from or sell securities to other Fidelity Funds under procedures adopted by the Board. The procedures have been designed to ensure these interfund trades are executed in accordance with Rule 17a-7 of the 1940 Act. Interfund trades are included within the respective purchases and sales amounts shown in the Purchases and Sales of Investments note.
6. Committed Line of Credit.
The Fund participates with other funds managed by the investment adviser or an affiliate in a $4.25 billion credit facility (the "line of credit") to be utilized for temporary or emergency purposes to fund shareholder redemptions or for other short-term liquidity purposes. The Fund has agreed to pay commitment fees on its pro-rata portion of the line of credit, which amounted to $4 and is reflected in Miscellaneous expenses on the Statement of Operations. During the period, the Fund did not borrow on this line of credit.
7. Security Lending.
The Fund lends portfolio securities through a lending agent from time to time in order to earn additional income. For equity securities, a lending agent is used and may loan securities to certain qualified borrowers, including Fidelity Capital Markets (FCM), a broker-dealer affiliated with the Fund. On the settlement date of the loan, the Fund receives collateral (in the form of U.S. Treasury obligations, letters of credit and/or cash) against the loaned securities and maintains collateral in an amount not less than 100% of the market value of the loaned securities during the period of the loan. The market value of the loaned securities is determined at the close of business of the Fund and any additional required collateral is delivered to the Fund on the next business day. The Fund or borrower may terminate the loan at any time, and if the borrower defaults on its obligation to return the securities loaned because of insolvency or other reasons, the Fund may apply collateral received from the borrower against the obligation. The Fund may experience delays and costs in recovering the securities loaned. Any cash collateral received is invested in the Fidelity Securities Lending Cash Central Fund. The value of loaned securities and cash collateral at period end are disclosed on the Fund's Statement of Assets and Liabilities. At period end, there were no security loans outstanding with FCM. Security lending income represents the income earned on investing cash collateral, less rebates paid to borrowers and any lending agent fees associated with the loan, plus any premium payments received for lending certain types of securities. Security lending income is presented in the Statement of Operations as a component of income from Fidelity Central Funds. Total security lending income during the period amounted to $349, including $2 from securities loaned to FCM.
8. Expense Reductions.
Commissions paid to certain brokers with whom the investment adviser, or its affiliates, places trades on behalf of the Fund include an amount in addition to trade execution, which may be rebated back to the Fund to offset certain expenses. This amount totaled $112 for the period. In addition, through arrangements with the Fund's custodian, credits realized as a result of certain uninvested cash balances were used to reduce the Fund's expenses. During the period, these credits reduced the Fund's custody expenses by $1.
In addition, during the period the investment adviser reimbursed and/or waived a portion of fund-level operating expenses in the amount of $15.
9. Distributions to Shareholders.
Distributions to shareholders of each class were as follows:
| | Six months ended
January 31, 2018 | Year ended
July 31, 2017 |
| From net investment income | | |
| Leveraged Company Stock | $4,788 | $25,432 |
| Class K | 1,399 | 5,662 |
| Total | $6,187 | $31,094 |
| From net realized gain | | |
| Leveraged Company Stock | $447,843 | $601,482 |
| Class K | 81,696 | 118,165 |
| Total | $529,539 | $719,647 |
10. Share Transactions.
Share transactions for each class were as follows and may contain automatic conversions between classes or exchanges between affiliated funds:
| | Shares | Shares | Dollars | Dollars |
| | Six months ended January 31, 2018 | Year ended July 31, 2017 | Six months ended January 31, 2018 | Year ended July 31, 2017 |
| Leveraged Company Stock | | | | |
| Shares sold | 1,353 | 3,277 | $46,300 | $119,066 |
| Reinvestment of distributions | 13,261 | 17,338 | 427,578 | 589,414 |
| Shares redeemed | (10,426) | (19,987) | (357,054) | (729,496) |
| Net increase (decrease) | 4,188 | 628 | $116,824 | $(21,016) |
| Class K | | | | |
| Shares sold | 604 | 1,480 | $20,808 | $53,751 |
| Reinvestment of distributions | 2,572 | 3,634 | 83,095 | 123,827 |
| Shares redeemed | (2,386) | (6,074) | (82,219) | (221,832) |
| Net increase (decrease) | 790 | (960) | $21,684 | $(44,254) |
11. Other.
The Fund's organizational documents provide former and current trustees and officers with a limited indemnification against liabilities arising in connection with the performance of their duties to the Fund. In the normal course of business, the Fund may also enter into contracts that provide general indemnifications. The Fund's maximum exposure under these arrangements is unknown as this would be dependent on future claims that may be made against the Fund. The risk of material loss from such claims is considered remote.
Shareholder Expense Example
As a shareholder of the Fund, you incur two types of costs: (1) transaction costs, and (2) ongoing costs, including management fees and other Fund expenses. This Example is intended to help you understand your ongoing costs (in dollars) of investing in the Fund and to compare these costs with the ongoing costs of investing in other mutual funds.
The Example is based on an investment of $1,000 invested at the beginning of the period and held for the entire period (August 1, 2017 to January 31, 2018).
Actual Expenses
The first line of the accompanying table for each class of the Fund provides information about actual account values and actual expenses. You may use the information in this line, together with the amount you invested, to estimate the expenses that you paid over the period. Simply divide your account value by $1,000.00 (for example, an $8,600 account value divided by $1,000.00 = 8.6), then multiply the result by the number in the first line for a class of the Fund under the heading entitled "Expenses Paid During Period" to estimate the expenses you paid on your account during this period. A small balance maintenance fee of $12.00 that is charged once a year may apply for certain accounts with a value of less than $2,000. This fee is not included in the table below. If it was, the estimate of expenses you paid during the period would be higher, and your ending account value lower, by this amount. In addition, the Fund, as a shareholder in the underlying Fidelity Central Funds, will indirectly bear its pro-rata share of the fees and expenses incurred by the underlying Fidelity Central Funds. These fees and expenses are not included in the Fund's annualized expense ratio used to calculate the expense estimate in the table below.
Hypothetical Example for Comparison Purposes
The second line of the accompanying table for each class of the Fund provides information about hypothetical account values and hypothetical expenses based on a Class' actual expense ratio and an assumed rate of return of 5% per year before expenses, which is not the Class' actual return. The hypothetical account values and expenses may not be used to estimate the actual ending account balance or expenses you paid for the period. You may use this information to compare the ongoing costs of investing in the Fund and other funds. To do so, compare this 5% hypothetical example with the 5% hypothetical examples that appear in the shareholder reports of the other funds. A small balance maintenance fee of $12.00 that is charged once a year may apply for certain accounts with a value of less than $2,000. This fee is not included in the table below. If it was, the estimate of expenses you paid during the period would be higher, and your ending account value lower, by this amount. In addition, the Fund, as a shareholder in the underlying Fidelity Central Funds, will indirectly bear its pro-rata share of the fees and expenses incurred by the underlying Fidelity Central Funds. These fees and expenses are not included in the Fund's annualized expense ratio used to calculate the expense estimate in the table below.
Please note that the expenses shown in the table are meant to highlight your ongoing costs only and do not reflect any transaction costs. Therefore, the second line of the table is useful in comparing ongoing costs only, and will not help you determine the relative total costs of owning different funds.
| | Annualized Expense Ratio-A | Beginning
Account Value
August 1, 2017 | Ending
Account Value
January 31, 2018 | Expenses Paid
During Period-B
August 1, 2017
to January 31, 2018 |
| Leveraged Company Stock | .78% | | | |
| Actual | | $1,000.00 | $1,142.40 | $4.21 |
| Hypothetical-C | | $1,000.00 | $1,021.27 | $3.97 |
| Class K | .67% | | | |
| Actual | | $1,000.00 | $1,142.70 | $3.62 |
| Hypothetical-C | | $1,000.00 | $1,021.83 | $3.41 |
A Annualized expense ratio reflects expenses net of applicable fee waivers.
B Expenses are equal to each Class' annualized expense ratio, multiplied by the average account value over the period, multiplied by 184/365 (to reflect the one-half year period).
C 5% return per year before expenses
Corporate Headquarters
245 Summer St.
Boston, MA 02210
www.fidelity.com
LSF-K-SANN-0318
1.863385.109
Fidelity® Leveraged Company Stock Fund
Semi-Annual Report January 31, 2018 |
|
Contents
To view a fund's proxy voting guidelines and proxy voting record for the 12-month period ended June 30, visit http://www.fidelity.com/proxyvotingresults or visit the Securities and Exchange Commission's (SEC) web site at http://www.sec.gov.
You may also call 1-800-544-8544 to request a free copy of the proxy voting guidelines.
Standard & Poor's, S&P and S&P 500 are registered service marks of The McGraw-Hill Companies, Inc. and have been licensed for use by Fidelity Distributors Corporation.
Other third-party marks appearing herein are the property of their respective owners.
All other marks appearing herein are registered or unregistered trademarks or service marks of FMR LLC or an affiliated company. © 2018 FMR LLC. All rights reserved.
This report and the financial statements contained herein are submitted for the general information of the shareholders of the Fund. This report is not authorized for distribution to prospective investors in the Fund unless preceded or accompanied by an effective prospectus.
A fund files its complete schedule of portfolio holdings with the SEC for the first and third quarters of each fiscal year on Form N-Q. Forms N-Q are available on the SEC’s web site at http://www.sec.gov. A fund's Forms N-Q may be reviewed and copied at the SEC’s Public Reference Room in Washington, DC. Information regarding the operation of the SEC's Public Reference Room may be obtained by calling 1-800-SEC-0330.
For a complete list of a fund's portfolio holdings, view the most recent holdings listing, semiannual report, or annual report on Fidelity's web site at http://www.fidelity.com, http://www.institutional.fidelity.com, or http://www.401k.com, as applicable.
NOT FDIC INSURED •MAY LOSE VALUE •NO BANK GUARANTEE
Neither the Fund nor Fidelity Distributors Corporation is a bank.
Investment Summary (Unaudited)
Top Ten Stocks as of January 31, 2018
| | % of fund's net assets |
| T-Mobile U.S., Inc. | 2.3 |
| Alphabet, Inc. Class A | 2.3 |
| ON Semiconductor Corp. | 2.3 |
| Air Canada | 2.0 |
| Bank of America Corp. | 2.0 |
| Broadcom Ltd. | 2.0 |
| Citigroup, Inc. | 1.9 |
| Facebook, Inc. Class A | 1.8 |
| Melco Crown Entertainment Ltd. sponsored ADR | 1.8 |
| JPMorgan Chase & Co. | 1.8 |
| | 20.2 |
Top Five Market Sectors as of January 31, 2018
| | % of fund's net assets |
| Information Technology | 26.9 |
| Consumer Discretionary | 23.1 |
| Financials | 10.6 |
| Industrials | 10.5 |
| Materials | 9.9 |
Asset Allocation (% of fund's net assets)
| As of January 31, 2018* |
| | Stocks | 98.3% |
| | Short-Term Investments and Net Other Assets (Liabilities) | 1.7% |

* Foreign investments – 20.0%
Schedule of Investments January 31, 2018 (Unaudited)
Showing Percentage of Net Assets
| Common Stocks - 98.3% | | | |
| | | Shares | Value (000s) |
| CONSUMER DISCRETIONARY - 23.1% | | | |
| Auto Components - 2.5% | | | |
| Aptiv PLC | | 220,900 | $20,959 |
| Delphi Technologies PLC | | 73,633 | 4,067 |
| Lear Corp. | | 193,600 | 37,392 |
| Tenneco, Inc. | | 289,100 | 16,771 |
| | | | 79,189 |
| Automobiles - 1.2% | | | |
| Fiat Chrysler Automobiles NV | | 1,566,100 | 37,853 |
| Hotels, Restaurants & Leisure - 11.0% | | | |
| Boyd Gaming Corp. | | 1,038,600 | 40,994 |
| Eldorado Resorts, Inc. (a) | | 1,056,500 | 36,502 |
| Extended Stay America, Inc. unit | | 715,400 | 14,473 |
| Las Vegas Sands Corp. | | 245,200 | 19,008 |
| Melco Crown Entertainment Ltd. sponsored ADR | | 1,910,900 | 56,907 |
| MGM Mirage, Inc. | | 750,300 | 27,348 |
| Penn National Gaming, Inc. (a) | | 1,284,200 | 40,979 |
| Red Rock Resorts, Inc. | | 5,847 | 203 |
| Royal Caribbean Cruises Ltd. | | 254,300 | 33,962 |
| Scientific Games Corp. Class A (a) | | 532,500 | 24,841 |
| U.S. Foods Holding Corp. (a) | | 443,900 | 14,263 |
| Wyndham Worldwide Corp. | | 289,100 | 35,886 |
| | | | 345,366 |
| Household Durables - 2.3% | | | |
| CalAtlantic Group, Inc. | | 375,300 | 21,066 |
| Lennar Corp. Class A | | 201,600 | 12,632 |
| Newell Brands, Inc. | | 604,547 | 15,984 |
| Toll Brothers, Inc. | | 513,000 | 23,896 |
| | | | 73,578 |
| Internet & Direct Marketing Retail - 1.6% | | | |
| JD.com, Inc. sponsored ADR (a) | | 381,900 | 18,801 |
| Priceline Group, Inc. (a) | | 16,700 | 31,931 |
| | | | 50,732 |
| Media - 4.5% | | | |
| Gray Television, Inc. (a) | | 1,869,664 | 30,569 |
| Naspers Ltd.: | | | |
| Class N | | 135,500 | 38,690 |
| Class N sponsored ADR | | 160,400 | 9,236 |
| Nexstar Broadcasting Group, Inc. Class A | | 482,098 | 36,206 |
| Sinclair Broadcast Group, Inc. Class A (b) | | 699,000 | 25,933 |
| | | | 140,634 |
|
| TOTAL CONSUMER DISCRETIONARY | | | 727,352 |
|
| CONSUMER STAPLES - 4.1% | | | |
| Beverages - 1.2% | | | |
| Constellation Brands, Inc. Class A (sub. vtg.) | | 86,500 | 18,984 |
| Monster Beverage Corp. (a) | | 280,500 | 19,139 |
| | | | 38,123 |
| Food & Staples Retailing - 0.9% | | | |
| CVS Health Corp. | | 361,400 | 28,439 |
| Food Products - 2.0% | | | |
| Darling International, Inc. (a) | | 1,685,383 | 31,247 |
| JBS SA | | 9,507,900 | 29,992 |
| | | | 61,239 |
|
| TOTAL CONSUMER STAPLES | | | 127,801 |
|
| ENERGY - 6.0% | | | |
| Energy Equipment & Services - 0.0% | | | |
| SAExploration Holdings, Inc. (a)(c) | | 419,175 | 914 |
| Oil, Gas & Consumable Fuels - 6.0% | | | |
| Anadarko Petroleum Corp. | | 307,800 | 18,483 |
| Carrizo Oil & Gas, Inc. (a) | | 57,702 | 1,160 |
| Cheniere Energy, Inc. (a) | | 594,640 | 33,633 |
| Diamondback Energy, Inc. (a) | | 281,900 | 35,378 |
| EQT Corp. | | 306,506 | 16,640 |
| Parsley Energy, Inc. Class A (a) | | 579,600 | 13,679 |
| Pioneer Natural Resources Co. | | 145,200 | 26,559 |
| QEP Resources, Inc. (a) | | 458,700 | 4,293 |
| Range Resources Corp. (b) | | 323,900 | 4,616 |
| RSP Permian, Inc. (a) | | 270,900 | 10,749 |
| Scorpio Tankers, Inc. | | 1,959,100 | 5,211 |
| Teekay Corp. (b) | | 917,300 | 7,485 |
| Whiting Petroleum Corp. (a) | | 359,973 | 10,050 |
| | | | 187,936 |
|
| TOTAL ENERGY | | | 188,850 |
|
| FINANCIALS - 10.6% | | | |
| Banks - 7.5% | | | |
| Bank of America Corp. | | 1,955,999 | 62,592 |
| Citigroup, Inc. | | 780,847 | 61,281 |
| Huntington Bancshares, Inc. | | 1,154,180 | 18,675 |
| JPMorgan Chase & Co. | | 481,600 | 55,707 |
| Regions Financial Corp. | | 987,780 | 18,995 |
| SunTrust Banks, Inc. | | 271,500 | 19,195 |
| | | | 236,445 |
| Capital Markets - 0.4% | | | |
| MSCI, Inc. | | 94,600 | 13,171 |
| Consumer Finance - 1.6% | | | |
| OneMain Holdings, Inc. (a) | | 1,547,200 | 50,609 |
| Diversified Financial Services - 1.1% | | | |
| GDS Holdings Ltd. ADR (a)(b) | | 1,173,700 | 33,497 |
|
| TOTAL FINANCIALS | | | 333,722 |
|
| HEALTH CARE - 3.2% | | | |
| Health Care Equipment & Supplies - 0.5% | | | |
| Boston Scientific Corp. (a) | | 613,956 | 17,166 |
| Health Care Providers & Services - 0.6% | | | |
| HCA Holdings, Inc. | | 179,579 | 18,166 |
| Life Sciences Tools & Services - 0.5% | | | |
| PRA Health Sciences, Inc. (a) | | 168,000 | 15,298 |
| Pharmaceuticals - 1.6% | | | |
| Allergan PLC | | 128,100 | 23,091 |
| Jazz Pharmaceuticals PLC (a) | | 168,500 | 24,557 |
| Valeant Pharmaceuticals International, Inc. (Canada) (a) | | 56,100 | 1,038 |
| | | | 48,686 |
|
| TOTAL HEALTH CARE | | | 99,316 |
|
| INDUSTRIALS - 10.5% | | | |
| Air Freight & Logistics - 0.8% | | | |
| XPO Logistics, Inc. (a) | | 282,000 | 26,632 |
| Airlines - 4.1% | | | |
| Air Canada (a) | | 3,279,900 | 63,758 |
| Allegiant Travel Co. | | 144,246 | 22,971 |
| Delta Air Lines, Inc. | | 745,301 | 42,311 |
| | | | 129,040 |
| Building Products - 1.3% | | | |
| Fortune Brands Home & Security, Inc. | | 278,100 | 19,726 |
| Masco Corp. | | 475,400 | 21,231 |
| | | | 40,957 |
| Commercial Services & Supplies - 0.0% | | | |
| Novus Holdings Ltd. | | 46,866 | 20 |
| Electrical Equipment - 0.2% | | | |
| Regal Beloit Corp. | | 81,158 | 6,322 |
| Machinery - 0.9% | | | |
| Allison Transmission Holdings, Inc. | | 627,700 | 27,769 |
| Marine - 0.0% | | | |
| Genco Shipping & Trading Ltd. (a) | | 831 | 11 |
| Trading Companies & Distributors - 3.2% | | | |
| AerCap Holdings NV (a) | | 352,700 | 19,081 |
| HD Supply Holdings, Inc. (a) | | 1,117,500 | 43,460 |
| United Rentals, Inc. (a) | | 207,000 | 37,490 |
| | | | 100,031 |
|
| TOTAL INDUSTRIALS | | | 330,782 |
|
| INFORMATION TECHNOLOGY - 26.9% | | | |
| Electronic Equipment & Components - 1.5% | | | |
| CDW Corp. | | 280,200 | 20,956 |
| TE Connectivity Ltd. | | 154,100 | 15,800 |
| TTM Technologies, Inc. (a) | | 589,200 | 9,716 |
| | | | 46,472 |
| Internet Software & Services - 5.4% | | | |
| Alibaba Group Holding Ltd. sponsored ADR (a) | | 182,000 | 37,181 |
| Alphabet, Inc. Class A (a) | | 62,000 | 73,298 |
| Facebook, Inc. Class A (a) | | 309,300 | 57,805 |
| LogMeIn, Inc. | | 31,550 | 3,969 |
| Qudian, Inc. ADR (b) | | 7,000 | 98 |
| | | | 172,351 |
| IT Services - 3.4% | | | |
| EPAM Systems, Inc. (a) | | 243,700 | 28,630 |
| First Data Corp. Class A (a) | | 976,600 | 17,286 |
| Global Payments, Inc. | | 397,500 | 44,433 |
| PayPal Holdings, Inc. (a) | | 196,900 | 16,800 |
| | | | 107,149 |
| Semiconductors & Semiconductor Equipment - 11.8% | | | |
| Analog Devices, Inc. | | 194,000 | 17,825 |
| Broadcom Ltd. | | 252,200 | 62,553 |
| Marvell Technology Group Ltd. | | 1,097,200 | 25,598 |
| Micron Technology, Inc. (a) | | 976,100 | 42,675 |
| Microsemi Corp. (a) | | 859,500 | 53,109 |
| NVIDIA Corp. | | 99,100 | 24,359 |
| ON Semiconductor Corp. (a) | | 2,941,500 | 72,773 |
| Qorvo, Inc. (a) | | 365,300 | 26,218 |
| Semtech Corp. (a) | | 408,100 | 14,610 |
| Skyworks Solutions, Inc. | | 325,300 | 31,622 |
| | | | 371,342 |
| Software - 4.8% | | | |
| Adobe Systems, Inc. (a) | | 181,800 | 36,316 |
| Electronic Arts, Inc. (a) | | 287,900 | 36,552 |
| Nuance Communications, Inc. (a) | | 1,410,400 | 25,119 |
| Salesforce.com, Inc. (a) | | 147,800 | 16,836 |
| Take-Two Interactive Software, Inc. (a) | | 223,800 | 28,349 |
| TiVo Corp. | | 533,331 | 7,440 |
| | | | 150,612 |
|
| TOTAL INFORMATION TECHNOLOGY | | | 847,926 |
|
| MATERIALS - 9.9% | | | |
| Chemicals - 6.1% | | | |
| DowDuPont, Inc. | | 475,821 | 35,963 |
| Ingevity Corp. (a) | | 254,788 | 18,485 |
| LyondellBasell Industries NV Class A | | 460,555 | 55,193 |
| Olin Corp. | | 395,300 | 14,737 |
| Platform Specialty Products Corp. (a) | | 2,635,400 | 30,861 |
| The Chemours Co. LLC | | 727,000 | 37,528 |
| | | | 192,767 |
| Containers & Packaging - 1.4% | | | |
| Ardagh Group SA | | 73,966 | 1,479 |
| Berry Global Group, Inc. (a) | | 113,700 | 6,730 |
| Crown Holdings, Inc. (a) | | 277,300 | 16,097 |
| Graphic Packaging Holding Co. | | 1,170,100 | 18,897 |
| | | | 43,203 |
| Metals & Mining - 2.4% | | | |
| First Quantum Minerals Ltd. | | 2,322,400 | 34,628 |
| Freeport-McMoRan, Inc. (a) | | 1,107,900 | 21,604 |
| Nucor Corp. | | 282,600 | 18,923 |
| | | | 75,155 |
|
| TOTAL MATERIALS | | | 311,125 |
|
| TELECOMMUNICATION SERVICES - 3.3% | | | |
| Diversified Telecommunication Services - 1.0% | | | |
| Altice U.S.A., Inc. Class A (b) | | 1,435,600 | 30,822 |
| Wireless Telecommunication Services - 2.3% | | | |
| T-Mobile U.S., Inc. (a) | | 1,148,300 | 74,748 |
|
| TOTAL TELECOMMUNICATION SERVICES | | | 105,570 |
|
| UTILITIES - 0.7% | | | |
| Electric Utilities - 0.6% | | | |
| Vistra Energy Corp. (a) | | 938,500 | 18,301 |
| Independent Power and Renewable Electricity Producers - 0.1% | | | |
| Dynegy, Inc. (a) | | 273,413 | 3,423 |
|
| TOTAL UTILITIES | | | 21,724 |
|
| TOTAL COMMON STOCKS | | | |
| (Cost $2,235,932) | | | 3,094,168 |
| | | Principal Amount (000s) | Value (000s) |
|
| Nonconvertible Bonds - 0.0% | | | |
| ENERGY - 0.0% | | | |
| Oil, Gas & Consumable Fuels - 0.0% | | | |
| Jupiter Resources, Inc. 8.5% 10/1/22(c) | | | |
| (Cost $690) | | 825 | 503 |
| | | Shares | Value (000s) |
|
| Money Market Funds - 3.9% | | | |
| Fidelity Cash Central Fund, 1.39% (d) | | 75,268,320 | 75,283 |
| Fidelity Securities Lending Cash Central Fund 1.40% (d)(e) | | 47,056,538 | 47,061 |
| TOTAL MONEY MARKET FUNDS | | | |
| (Cost $122,342) | | | 122,344 |
| TOTAL INVESTMENT IN SECURITIES - 102.2% | | | |
| (Cost $2,358,964) | | | 3,217,015 |
| NET OTHER ASSETS (LIABILITIES) - (2.2)% | | | (69,022) |
| NET ASSETS - 100% | | | $3,147,993 |
Legend
(a) Non-income producing
(b) Security or a portion of the security is on loan at period end.
(c) Security exempt from registration under Rule 144A of the Securities Act of 1933. These securities may be resold in transactions exempt from registration, normally to qualified institutional buyers. At the end of the period, the value of these securities amounted to $1,417,000 or 0.0% of net assets.
(d) Affiliated fund that is generally available only to investment companies and other accounts managed by Fidelity Investments. The rate quoted is the annualized seven-day yield of the fund at period end. A complete unaudited listing of the fund's holdings as of its most recent quarter end is available upon request. In addition, each Fidelity Central Fund's financial statements are available on the SEC's website or upon request.
(e) Includes investment made with cash collateral received from securities on loan.
Affiliated Central Funds
Information regarding fiscal year to date income earned by the Fund from investments in Fidelity Central Funds is as follows:
| Fund | Income earned |
| | (Amounts in thousands) |
| Fidelity Cash Central Fund | $290 |
| Fidelity Securities Lending Cash Central Fund | 349 |
| Total | $639 |
Amounts in the income column in the above table include any capital gain distributions from underlying funds, which are presented in the corresponding line-item in the Statement of Operations if applicable.
Investment Valuation
The following is a summary of the inputs used, as of January 31, 2018, involving the Fund's assets and liabilities carried at fair value. The inputs or methodology used for valuing securities may not be an indication of the risk associated with investing in those securities. For more information on valuation inputs, and their aggregation into the levels used below, please refer to the Investment Valuation section in the accompanying Notes to Financial Statements.
| | Valuation Inputs at Reporting Date: |
| Description | Total | Level 1 | Level 2 | Level 3 |
| (Amounts in thousands) | | | | |
| Investments in Securities: | | | | |
| Equities: | | | | |
| Consumer Discretionary | $727,352 | $727,352 | $-- | $-- |
| Consumer Staples | 127,801 | 127,801 | -- | -- |
| Energy | 188,850 | 188,850 | -- | -- |
| Financials | 333,722 | 333,722 | -- | -- |
| Health Care | 99,316 | 99,316 | -- | -- |
| Industrials | 330,782 | 330,782 | -- | -- |
| Information Technology | 847,926 | 847,926 | -- | -- |
| Materials | 311,125 | 311,125 | -- | -- |
| Telecommunication Services | 105,570 | 105,570 | -- | -- |
| Utilities | 21,724 | 21,724 | -- | -- |
| Corporate Bonds | 503 | -- | 503 | -- |
| Money Market Funds | 122,344 | 122,344 | -- | -- |
| Total Investments in Securities: | $3,217,015 | $3,216,512 | $503 | $-- |
Other Information
Distribution of investments by country or territory of incorporation, as a percentage of Total Net Assets, is as follows (Unaudited):
| United States of America | 80.0% |
| Cayman Islands | 3.6% |
| Netherlands | 3.5% |
| Canada | 3.1% |
| Singapore | 2.0% |
| Ireland | 1.6% |
| South Africa | 1.5% |
| Liberia | 1.1% |
| Brazil | 1.0% |
| Others (Individually Less Than 1%) | 2.6% |
| | 100.0% |
See accompanying notes which are an integral part of the financial statements.
Financial Statements
Statement of Assets and Liabilities
| Amounts in thousands (except per-share amounts) | | January 31, 2018 (Unaudited) |
| Assets | | |
Investment in securities, at value (including securities loaned of $45,347) — See accompanying schedule:
Unaffiliated issuers (cost $2,236,622) | $3,094,671 | |
| Fidelity Central Funds (cost $122,342) | 122,344 | |
| Total Investment in Securities (cost $2,358,964) | | $3,217,015 |
| Receivable for investments sold | | 13,132 |
| Receivable for fund shares sold | | 739 |
| Dividends receivable | | 244 |
| Interest receivable | | 23 |
| Distributions receivable from Fidelity Central Funds | | 128 |
| Prepaid expenses | | 4 |
| Other receivables | | 62 |
| Total assets | | 3,231,347 |
| Liabilities | | |
| Payable to custodian bank | $9,483 | |
| Payable for investments purchased | 20,397 | |
| Payable for fund shares redeemed | 4,385 | |
| Accrued management fee | 1,565 | |
| Other affiliated payables | 421 | |
| Other payables and accrued expenses | 37 | |
| Collateral on securities loaned | 47,066 | |
| Total liabilities | | 83,354 |
| Net Assets | | $3,147,993 |
| Net Assets consist of: | | |
| Paid in capital | | $2,197,636 |
| Distributions in excess of net investment income | | (926) |
| Accumulated undistributed net realized gain (loss) on investments and foreign currency transactions | | 93,232 |
| Net unrealized appreciation (depreciation) on investments and assets and liabilities in foreign currencies | | 858,051 |
| Net Assets | | $3,147,993 |
| Leveraged Company Stock: | | |
| Net Asset Value, offering price and redemption price per share ($2,655,947 ÷ 75,162 shares) | | $35.34 |
| Class K: | | |
| Net Asset Value, offering price and redemption price per share ($492,046 ÷ 13,895 shares) | | $35.41 |
See accompanying notes which are an integral part of the financial statements.
Statement of Operations
| Amounts in thousands | | Six months ended January 31, 2018 (Unaudited) |
| Investment Income | | |
| Dividends | | $12,970 |
| Interest | | 45 |
| Income from Fidelity Central Funds | | 639 |
| Total income | | 13,654 |
| Expenses | | |
| Management fee | $9,140 | |
| Transfer agent fees | 2,109 | |
| Accounting and security lending fees | 458 | |
| Custodian fees and expenses | 25 | |
| Independent trustees' fees and expenses | 6 | |
| Registration fees | 32 | |
| Audit | 35 | |
| Legal | 7 | |
| Miscellaneous | 11 | |
| Total expenses before reductions | 11,823 | |
| Expense reductions | (128) | 11,695 |
| Net investment income (loss) | | 1,959 |
| Realized and Unrealized Gain (Loss) | | |
| Net realized gain (loss) on: | | |
| Investment securities: | | |
| Unaffiliated issuers | 201,735 | |
| Fidelity Central Funds | (2) | |
| Foreign currency transactions | 63 | |
| Total net realized gain (loss) | | 201,796 |
| Change in net unrealized appreciation (depreciation) on: | | |
| Investment securities: | | |
| Unaffiliated issuers | 208,331 | |
| Fidelity Central Funds | (3) | |
| Total change in net unrealized appreciation (depreciation) | | 208,328 |
| Net gain (loss) | | 410,124 |
| Net increase (decrease) in net assets resulting from operations | | $412,083 |
See accompanying notes which are an integral part of the financial statements.
Statement of Changes in Net Assets
| Amounts in thousands | Six months ended January 31, 2018 (Unaudited) | Year ended July 31, 2017 |
| Increase (Decrease) in Net Assets | | |
| Operations | | |
| Net investment income (loss) | $1,959 | $17,016 |
| Net realized gain (loss) | 201,796 | 1,032,712 |
| Change in net unrealized appreciation (depreciation) | 208,328 | (535,359) |
| Net increase (decrease) in net assets resulting from operations | 412,083 | 514,369 |
| Distributions to shareholders from net investment income | (6,187) | (31,094) |
| Distributions to shareholders from net realized gain | (529,539) | (719,647) |
| Total distributions | (535,726) | (750,741) |
| Share transactions - net increase (decrease) | 138,508 | (65,270) |
| Redemption fees | – | 27 |
| Total increase (decrease) in net assets | 14,865 | (301,615) |
| Net Assets | | |
| Beginning of period | 3,133,128 | 3,434,743 |
| End of period | $3,147,993 | $3,133,128 |
| Other Information | | |
| Undistributed net investment income end of period | $– | $3,302 |
| Distributions in excess of net investment income end of period | $(926) | $– |
See accompanying notes which are an integral part of the financial statements.
Financial Highlights
Fidelity Leveraged Company Stock Fund
| | Six months ended (Unaudited) January 31, | Years endedJuly 31, | | | | |
| | 2018 | 2017 | 2016 | 2015 | 2014 | 2013 |
| Selected Per–Share Data | | | | | | |
| Net asset value, beginning of period | $37.25 | $40.68 | $46.90 | $45.82 | $39.44 | $28.22 |
| Income from Investment Operations | | | | | | |
| Net investment income (loss)A | .02 | .19 | .41 | .41 | .34 | .42B |
| Net realized and unrealized gain (loss) | 4.45 | 5.53 | (3.77) | 1.01 | 6.31 | 10.92 |
| Total from investment operations | 4.47 | 5.72 | (3.36) | 1.42 | 6.65 | 11.34 |
| Distributions from net investment income | (.07) | (.37) | (.40) | (.34) | (.27) | (.12) |
| Distributions from net realized gain | (6.32) | (8.78) | (2.46) | – | – | – |
| Total distributions | (6.38)C | (9.15) | (2.86) | (.34) | (.27) | (.12) |
| Redemption fees added to paid in capitalA | – | –D | –D | –D | –D | –D |
| Net asset value, end of period | $35.34 | $37.25 | $40.68 | $46.90 | $45.82 | $39.44 |
| Total ReturnE,F | 14.24% | 17.45% | (7.23)% | 3.12% | 16.96% | 40.31% |
| Ratios to Average Net AssetsG,H | | | | | | |
| Expenses before reductions | .78%I | .80% | .80% | .79% | .79% | .82% |
| Expenses net of fee waivers, if any | .78%I | .79% | .80% | .78% | .79% | .82% |
| Expenses net of all reductions | .77%I | .78% | .80% | .78% | .79% | .82% |
| Net investment income (loss) | .11%I | .51% | 1.03% | .87% | .81% | 1.25%B |
| Supplemental Data | | | | | | |
| Net assets, end of period (in millions) | $2,656 | $2,644 | $2,861 | $3,755 | $4,207 | $4,227 |
| Portfolio turnover rateJ | 64%I | 100% | 9% | 4% | 10% | 21% |
A Calculated based on average shares outstanding during the period.
B Net Investment income per share reflects a large, non-recurring dividend which amounted to $.08 per share. Excluding this non-recurring dividend, the ratio of net investment income (loss) to average net assets would have been 1.03%.
C Total distributions of $6.38 per share is comprised of distributions from net investment income of $.066 and distributions from net realized gain of $6.318 per share.
D Amount represents less than $.005 per share.
E Total returns for periods of less than one year are not annualized.
F Total returns would have been lower if certain expenses had not been reduced during the applicable periods shown.
G Fees and expenses of any underlying Fidelity Central Funds are not included in the Fund's expense ratio. The Fund indirectly bears its proportionate share of the expenses of any underlying Fidelity Central Funds.
H Expense ratios reflect operating expenses of the class. Expenses before reductions do not reflect amounts reimbursed by the investment adviser or reductions from brokerage service arrangements or reductions from other expense offset arrangements and do not represent the amount paid by the class during periods when reimbursements or reductions occur. Expenses net of fee waivers reflect expenses after reimbursement by the investment adviser but prior to reductions from brokerage service arrangements or other expense offset arrangements. Expenses net of all reductions represent the net expenses paid by the class.
I Annualized
J Amount does not include the portfolio activity of any underlying Fidelity Central Funds.
See accompanying notes which are an integral part of the financial statements.
Fidelity Leveraged Company Stock Fund Class K
| | Six months ended (Unaudited) January 31, | Years endedJuly 31, | | | | |
| | 2018 | 2017 | 2016 | 2015 | 2014 | 2013 |
| Selected Per–Share Data | | | | | | |
| Net asset value, beginning of period | $37.34 | $40.76 | $47.00 | $45.91 | $39.52 | $28.26 |
| Income from Investment Operations | | | | | | |
| Net investment income (loss)A | .04 | .23 | .46 | .46 | .40 | .47B |
| Net realized and unrealized gain (loss) | 4.45 | 5.55 | (3.79) | 1.03 | 6.31 | 10.93 |
| Total from investment operations | 4.49 | 5.78 | (3.33) | 1.49 | 6.71 | 11.40 |
| Distributions from net investment income | (.11) | (.42) | (.45) | (.40) | (.32) | (.14) |
| Distributions from net realized gain | (6.32) | (8.78) | (2.46) | – | – | – |
| Total distributions | (6.42)C | (9.20) | (2.91) | (.40) | (.32) | (.14) |
| Redemption fees added to paid in capitalA | – | –D | –D | –D | –D | –D |
| Net asset value, end of period | $35.41 | $37.34 | $40.76 | $47.00 | $45.91 | $39.52 |
| Total ReturnE,F | 14.27% | 17.60% | (7.14)% | 3.26% | 17.10% | 40.47% |
| Ratios to Average Net AssetsG,H | | | | | | |
| Expenses before reductions | .68%I | .68% | .68% | .67% | .67% | .69% |
| Expenses net of fee waivers, if any | .67%I | .68% | .68% | .67% | .67% | .69% |
| Expenses net of all reductions | .67%I | .67% | .68% | .67% | .67% | .68% |
| Net investment income (loss) | .22%I | .63% | 1.15% | .99% | .92% | 1.39%B |
| Supplemental Data | | | | | | |
| Net assets, end of period (in millions) | $492 | $489 | $573 | $991 | $1,173 | $1,053 |
| Portfolio turnover rateJ | 64%I | 100% | 9% | 4% | 10% | 21% |
A Calculated based on average shares outstanding during the period.
B Net Investment income per share reflects a large, non-recurring dividend which amounted to $.08 per share. Excluding this non-recurring dividend, the ratio of net investment income (loss) to average net assets would have been 1.17%.
C Total distributions of $6.42 per share is comprised of distributions from net investment income of $.106 and distributions from net realized gain of $6.318 per share.
D Amount represents less than $.005 per share.
E Total returns for periods of less than one year are not annualized.
F Total returns would have been lower if certain expenses had not been reduced during the applicable periods shown.
G Fees and expenses of any underlying Fidelity Central Funds are not included in the Fund's expense ratio. The Fund indirectly bears its proportionate share of the expenses of any underlying Fidelity Central Funds.
H Expense ratios reflect operating expenses of the class. Expenses before reductions do not reflect amounts reimbursed by the investment adviser or reductions from brokerage service arrangements or reductions from other expense offset arrangements and do not represent the amount paid by the class during periods when reimbursements or reductions occur. Expenses net of fee waivers reflect expenses after reimbursement by the investment adviser but prior to reductions from brokerage service arrangements or other expense offset arrangements. Expenses net of all reductions represent the net expenses paid by the class.
I Annualized
J Amount does not include the portfolio activity of any underlying Fidelity Central Funds.
See accompanying notes which are an integral part of the financial statements.
Notes to Financial Statements (Unaudited)
For the period ended January 31, 2018
(Amounts in thousands except percentages)
1. Organization.
Fidelity Leveraged Company Stock Fund (the Fund) is a fund of Fidelity Securities Fund (the Trust) and is authorized to issue an unlimited number of shares. The Trust is registered under the Investment Company Act of 1940, as amended (the 1940 Act), as an open-end management investment company organized as a Massachusetts business trust. The Fund offers Leveraged Company Stock and Class K shares, each of which has equal rights as to assets and voting privileges. Each class has exclusive voting rights with respect to matters that affect that class.
2. Investments in Fidelity Central Funds.
The Fund invests in Fidelity Central Funds, which are open-end investment companies generally available only to other investment companies and accounts managed by the investment adviser and its affiliates. The Fund's Schedule of Investments lists each of the Fidelity Central Funds held as of period end, if any, as an investment of the Fund, but does not include the underlying holdings of each Fidelity Central Fund. As an Investing Fund, the Fund indirectly bears its proportionate share of the expenses of the underlying Fidelity Central Funds.
The Money Market Central Funds seek preservation of capital and current income and are managed by Fidelity Investments Money Management, Inc. (FIMM), an affiliate of the investment adviser. Annualized expenses of the Money Market Central Funds as of their most recent shareholder report date are less than .005%.
A complete unaudited list of holdings for each Fidelity Central Fund is available upon request or at the Securities and Exchange Commission (the SEC) website at www.sec.gov. In addition, the financial statements of the Fidelity Central Funds are available on the SEC website or upon request.
3. Significant Accounting Policies.
The Fund is an investment company and applies the accounting and reporting guidance of the Financial Accounting Standards Board (FASB) Accounting Standards Codification Topic 946 Financial Services – Investments Companies. The financial statements have been prepared in conformity with accounting principles generally accepted in the United States of America (GAAP), which require management to make certain estimates and assumptions at the date of the financial statements. Actual results could differ from those estimates. Subsequent events, if any, through the date that the financial statements were issued have been evaluated in the preparation of the financial statements. The following summarizes the significant accounting policies of the Fund:
Investment Valuation. Investments are valued as of 4:00 p.m. Eastern time on the last calendar day of the period. The Board of Trustees (the Board) has delegated the day to day responsibility for the valuation of the Fund's investments to the Fair Value Committee (the Committee) established by the Fund's investment adviser. In accordance with valuation policies and procedures approved by the Board, the Fund attempts to obtain prices from one or more third party pricing vendors or brokers to value its investments. When current market prices, quotations or currency exchange rates are not readily available or reliable, investments will be fair valued in good faith by the Committee, in accordance with procedures adopted by the Board. Factors used in determining fair value vary by investment type and may include market or investment specific events, changes in interest rates and credit quality. The frequency with which these procedures are used cannot be predicted and they may be utilized to a significant extent. The Committee oversees the Fund's valuation policies and procedures and reports to the Board on the Committee's activities and fair value determinations. The Board monitors the appropriateness of the procedures used in valuing the Fund's investments and ratifies the fair value determinations of the Committee.
The Fund categorizes the inputs to valuation techniques used to value its investments into a disclosure hierarchy consisting of three levels as shown below:
- Level 1 – quoted prices in active markets for identical investments
- Level 2 – other significant observable inputs (including quoted prices for similar investments, interest rates, prepayment speeds, etc.)
- Level 3 – unobservable inputs (including the Fund's own assumptions based on the best information available)
Valuation techniques used to value the Fund's investments by major category are as follows:
Equity securities, including restricted securities, for which market quotations are readily available, are valued at the last reported sale price or official closing price as reported by a third party pricing vendor on the primary market or exchange on which they are traded and are categorized as Level 1 in the hierarchy. In the event there were no sales during the day or closing prices are not available, securities are valued at the last quoted bid price or may be valued using the last available price and are generally categorized as Level 2 in the hierarchy. For foreign equity securities, when market or security specific events arise, comparisons to the valuation of American Depositary Receipts (ADRs), futures contracts, Exchange-Traded Funds (ETFs) and certain indexes as well as quoted prices for similar securities may be used and would be categorized as Level 2 in the hierarchy. Utilizing these techniques may result in transfers between Level 1 and Level 2. For equity securities, including restricted securities, where observable inputs are limited, assumptions about market activity and risk are used and these securities may be categorized as Level 3 in the hierarchy.
Debt securities, including restricted securities, are valued based on evaluated prices received from third party pricing vendors or from brokers who make markets in such securities. Corporate bonds are valued by pricing vendors who utilize matrix pricing which considers yield or price of bonds of comparable quality, coupon, maturity and type or by broker-supplied prices. When independent prices are unavailable or unreliable, debt securities may be valued utilizing pricing methodologies which consider similar factors that would be used by third party pricing vendors. Debt securities are generally categorized as Level 2 in the hierarchy but may be Level 3 depending on the circumstances.
Investments in open-end mutual funds, including the Fidelity Central Funds, are valued at their closing net asset value (NAV) each business day and are categorized as Level 1 in the hierarchy.
Changes in valuation techniques may result in transfers in or out of an assigned level within the disclosure hierarchy. The aggregate value of investments by input level as of January 31, 2018 is included at the end of the Fund's Schedule of Investments.
Foreign Currency. The Fund may use foreign currency contracts to facilitate transactions in foreign-denominated securities. Gains and losses from these transactions may arise from changes in the value of the foreign currency or if the counterparties do not perform under the contracts' terms.
Foreign-denominated assets, including investment securities, and liabilities are translated into U.S. dollars at the exchange rates at period end. Purchases and sales of investment securities, income and dividends received and expenses denominated in foreign currencies are translated into U.S. dollars at the exchange rate in effect on the transaction date.
The effects of exchange rate fluctuations on investments are included with the net realized and unrealized gain (loss) on investment securities. Other foreign currency transactions resulting in realized and unrealized gain (loss) are disclosed separately.
Investment Transactions and Income. For financial reporting purposes, the Fund's investment holdings and NAV include trades executed through the end of the last business day of the period. The NAV per share for processing shareholder transactions is calculated as of the close of business of the New York Stock Exchange (NYSE), normally 4:00 p.m. Eastern time and includes trades executed through the end of the prior business day. Gains and losses on securities sold are determined on the basis of identified cost and includes proceeds received from litigation. Dividend income is recorded on the ex-dividend date, except for certain dividends from foreign securities where the ex-dividend date may have passed, which are recorded as soon as the Fund is informed of the ex-dividend date. Non-cash dividends included in dividend income, if any, are recorded at the fair market value of the securities received. Income and capital gain distributions from Fidelity Central Funds, if any, are recorded on the ex-dividend date. Certain distributions received by the Fund represent a return of capital or capital gain. The Fund determines the components of these distributions subsequent to the ex-dividend date, based upon receipt of tax filings or other correspondence relating to the underlying investment. These distributions are recorded as a reduction of cost of investments and/or as a realized gain. Interest income is accrued as earned and includes coupon interest and amortization of premium and accretion of discount on debt securities as applicable. Investment income is recorded net of foreign taxes withheld where recovery of such taxes is uncertain. Debt obligations may be placed on non-accrual status and related interest income may be reduced by ceasing current accruals and writing off interest receivables when the collection of all or a portion of interest has become doubtful based on consistently applied procedures. A debt obligation is removed from non-accrual status when the issuer resumes interest payments or when collectability of interest is reasonably assured.
Class Allocations and Expenses. Investment income, realized and unrealized capital gains and losses, common expenses of the Fund, and certain fund-level expense reductions, if any, are allocated daily on a pro-rata basis to each class based on the relative net assets of each class to the total net assets of the Fund. Each class differs with respect to transfer agent fees incurred. Certain expense reductions may also differ by class. For the reporting period, the allocated portion of income and expenses to each class as a percent of its average net assets may vary due to the timing of recording these transactions in relation to fluctuating net assets of the classes. Expenses directly attributable to a fund are charged to that fund. Expenses attributable to more than one fund are allocated among the respective funds on the basis of relative net assets or other appropriate methods. Expense estimates are accrued in the period to which they relate and adjustments are made when actual amounts are known.
Income Tax Information and Distributions to Shareholders. Each year, the Fund intends to qualify as a regulated investment company under Subchapter M of the Internal Revenue Code, including distributing substantially all of its taxable income and realized gains. As a result, no provision for U.S. Federal income taxes is required. The Fund files a U.S. federal tax return, in addition to state and local tax returns as required. The Fund's federal income tax returns are subject to examination by the Internal Revenue Service (IRS) for a period of three fiscal years after they are filed. State and local tax returns may be subject to examination for an additional fiscal year depending on the jurisdiction. Foreign taxes are provided for based on the Fund's understanding of the tax rules and rates that exist in the foreign markets in which it invests.
Distributions are declared and recorded on the ex-dividend date. Income dividends and capital gain distributions are declared separately for each class. Income and capital gain distributions are determined in accordance with income tax regulations, which may differ from GAAP.
Capital accounts within the financial statements are adjusted for permanent book-tax differences. These adjustments have no impact on net assets or the results of operations. Capital accounts are not adjusted for temporary book-tax differences which will reverse in a subsequent period.
Book-tax differences are primarily due to foreign currency transactions, market discount, partnerships and losses deferred due to wash sales.
As of period end, the cost and unrealized appreciation (depreciation) in securities, and derivatives if applicable, for federal income tax purposes were as follows:
| Gross unrealized appreciation | $953,088 |
| Gross unrealized depreciation | (99,287) |
| Net unrealized appreciation (depreciation) | $853,801 |
| Tax cost | $2,363,214 |
Restricted Securities. The Fund may invest in securities that are subject to legal or contractual restrictions on resale. These securities generally may be resold in transactions exempt from registration or to the public if the securities are registered. Disposal of these securities may involve time-consuming negotiations and expense, and prompt sale at an acceptable price may be difficult. Information regarding restricted securities is included at the end of the Fund's Schedule of Investments.
4. Purchases and Sales of Investments.
Purchases and sales of securities, other than short-term securities, aggregated $973,035 and $1,325,963, respectively.
5. Fees and Other Transactions with Affiliates.
Management Fee. Fidelity Management & Research Company (the investment adviser) and its affiliates provide the Fund with investment management related services for which the Fund pays a monthly management fee. The management fee is the sum of an individual fund fee rate that is based on an annual rate of .35% of the Fund's average net assets and an annualized group fee rate that averaged .24% during the period. The group fee rate is based upon the average net assets of all the mutual funds advised by the investment adviser, including any mutual funds previously advised by the investment adviser that are currently advised by Fidelity SelectCo, LLC, an affiliate of the investment adviser. The group fee rate decreases as assets under management increase and increases as assets under management decrease. For the reporting period, the total annualized management fee rate was .59% of the Fund's average net assets.
Transfer Agent Fees. Fidelity Investments Institutional Operations Company, Inc., (FIIOC), an affiliate of the investment adviser, is the transfer, dividend disbursing and shareholder servicing agent for each class of the Fund. FIIOC receives account fees and asset-based fees that vary according to the account size and type of account of the shareholders of Leveraged Company Stock. FIIOC receives an asset-based fee of Class K's average net assets. FIIOC pays for typesetting, printing and mailing of shareholder reports, except proxy statements.
For the period, transfer agent fees for each class were as follows:
| | Amount | % of Class-Level Average Net Assets(a) |
| Leveraged Company Stock | $1,998 | .15 |
| Class K | 111 | .05 |
| | $2,109 | |
(a) Annualized
Accounting and Security Lending Fees. Fidelity Service Company, Inc. (FSC), an affiliate of the investment adviser, maintains the Fund's accounting records. The accounting fee is based on the level of average net assets for each month. Under a separate contract, FSC administers the security lending program. The security lending fee is based on the number and duration of lending transactions.
Brokerage Commissions. The Fund placed a portion of its portfolio transactions with brokerage firms which are affiliates of the investment adviser. Brokerage commissions are included in net realized gain (loss) and change in net unrealized appreciation (depreciation) in the Statement of Operations. The commissions paid to these affiliated firms were $25 for the period.
Interfund Trades. The Fund may purchase from or sell securities to other Fidelity Funds under procedures adopted by the Board. The procedures have been designed to ensure these interfund trades are executed in accordance with Rule 17a-7 of the 1940 Act. Interfund trades are included within the respective purchases and sales amounts shown in the Purchases and Sales of Investments note.
6. Committed Line of Credit.
The Fund participates with other funds managed by the investment adviser or an affiliate in a $4.25 billion credit facility (the "line of credit") to be utilized for temporary or emergency purposes to fund shareholder redemptions or for other short-term liquidity purposes. The Fund has agreed to pay commitment fees on its pro-rata portion of the line of credit, which amounted to $4 and is reflected in Miscellaneous expenses on the Statement of Operations. During the period, the Fund did not borrow on this line of credit.
7. Security Lending.
The Fund lends portfolio securities through a lending agent from time to time in order to earn additional income. For equity securities, a lending agent is used and may loan securities to certain qualified borrowers, including Fidelity Capital Markets (FCM), a broker-dealer affiliated with the Fund. On the settlement date of the loan, the Fund receives collateral (in the form of U.S. Treasury obligations, letters of credit and/or cash) against the loaned securities and maintains collateral in an amount not less than 100% of the market value of the loaned securities during the period of the loan. The market value of the loaned securities is determined at the close of business of the Fund and any additional required collateral is delivered to the Fund on the next business day. The Fund or borrower may terminate the loan at any time, and if the borrower defaults on its obligation to return the securities loaned because of insolvency or other reasons, the Fund may apply collateral received from the borrower against the obligation. The Fund may experience delays and costs in recovering the securities loaned. Any cash collateral received is invested in the Fidelity Securities Lending Cash Central Fund. The value of loaned securities and cash collateral at period end are disclosed on the Fund's Statement of Assets and Liabilities. At period end, there were no security loans outstanding with FCM. Security lending income represents the income earned on investing cash collateral, less rebates paid to borrowers and any lending agent fees associated with the loan, plus any premium payments received for lending certain types of securities. Security lending income is presented in the Statement of Operations as a component of income from Fidelity Central Funds. Total security lending income during the period amounted to $349, including $2 from securities loaned to FCM.
8. Expense Reductions.
Commissions paid to certain brokers with whom the investment adviser, or its affiliates, places trades on behalf of the Fund include an amount in addition to trade execution, which may be rebated back to the Fund to offset certain expenses. This amount totaled $112 for the period. In addition, through arrangements with the Fund's custodian, credits realized as a result of certain uninvested cash balances were used to reduce the Fund's expenses. During the period, these credits reduced the Fund's custody expenses by $1.
In addition, during the period the investment adviser reimbursed and/or waived a portion of fund-level operating expenses in the amount of $15.
9. Distributions to Shareholders.
Distributions to shareholders of each class were as follows:
| | Six months ended
January 31, 2018 | Year ended
July 31, 2017 |
| From net investment income | | |
| Leveraged Company Stock | $4,788 | $25,432 |
| Class K | 1,399 | 5,662 |
| Total | $6,187 | $31,094 |
| From net realized gain | | |
| Leveraged Company Stock | $447,843 | $601,482 |
| Class K | 81,696 | 118,165 |
| Total | $529,539 | $719,647 |
10. Share Transactions.
Share transactions for each class were as follows and may contain automatic conversions between classes or exchanges between affiliated funds:
| | Shares | Shares | Dollars | Dollars |
| | Six months ended January 31, 2018 | Year ended July 31, 2017 | Six months ended January 31, 2018 | Year ended July 31, 2017 |
| Leveraged Company Stock | | | | |
| Shares sold | 1,353 | 3,277 | $46,300 | $119,066 |
| Reinvestment of distributions | 13,261 | 17,338 | 427,578 | 589,414 |
| Shares redeemed | (10,426) | (19,987) | (357,054) | (729,496) |
| Net increase (decrease) | 4,188 | 628 | $116,824 | $(21,016) |
| Class K | | | | |
| Shares sold | 604 | 1,480 | $20,808 | $53,751 |
| Reinvestment of distributions | 2,572 | 3,634 | 83,095 | 123,827 |
| Shares redeemed | (2,386) | (6,074) | (82,219) | (221,832) |
| Net increase (decrease) | 790 | (960) | $21,684 | $(44,254) |
11. Other.
The Fund's organizational documents provide former and current trustees and officers with a limited indemnification against liabilities arising in connection with the performance of their duties to the Fund. In the normal course of business, the Fund may also enter into contracts that provide general indemnifications. The Fund's maximum exposure under these arrangements is unknown as this would be dependent on future claims that may be made against the Fund. The risk of material loss from such claims is considered remote.
Shareholder Expense Example
As a shareholder of the Fund, you incur two types of costs: (1) transaction costs, and (2) ongoing costs, including management fees and other Fund expenses. This Example is intended to help you understand your ongoing costs (in dollars) of investing in the Fund and to compare these costs with the ongoing costs of investing in other mutual funds.
The Example is based on an investment of $1,000 invested at the beginning of the period and held for the entire period (August 1, 2017 to January 31, 2018).
Actual Expenses
The first line of the accompanying table for each class of the Fund provides information about actual account values and actual expenses. You may use the information in this line, together with the amount you invested, to estimate the expenses that you paid over the period. Simply divide your account value by $1,000.00 (for example, an $8,600 account value divided by $1,000.00 = 8.6), then multiply the result by the number in the first line for a class of the Fund under the heading entitled "Expenses Paid During Period" to estimate the expenses you paid on your account during this period. A small balance maintenance fee of $12.00 that is charged once a year may apply for certain accounts with a value of less than $2,000. This fee is not included in the table below. If it was, the estimate of expenses you paid during the period would be higher, and your ending account value lower, by this amount. In addition, the Fund, as a shareholder in the underlying Fidelity Central Funds, will indirectly bear its pro-rata share of the fees and expenses incurred by the underlying Fidelity Central Funds. These fees and expenses are not included in the Fund's annualized expense ratio used to calculate the expense estimate in the table below.
Hypothetical Example for Comparison Purposes
The second line of the accompanying table for each class of the Fund provides information about hypothetical account values and hypothetical expenses based on a Class' actual expense ratio and an assumed rate of return of 5% per year before expenses, which is not the Class' actual return. The hypothetical account values and expenses may not be used to estimate the actual ending account balance or expenses you paid for the period. You may use this information to compare the ongoing costs of investing in the Fund and other funds. To do so, compare this 5% hypothetical example with the 5% hypothetical examples that appear in the shareholder reports of the other funds. A small balance maintenance fee of $12.00 that is charged once a year may apply for certain accounts with a value of less than $2,000. This fee is not included in the table below. If it was, the estimate of expenses you paid during the period would be higher, and your ending account value lower, by this amount. In addition, the Fund, as a shareholder in the underlying Fidelity Central Funds, will indirectly bear its pro-rata share of the fees and expenses incurred by the underlying Fidelity Central Funds. These fees and expenses are not included in the Fund's annualized expense ratio used to calculate the expense estimate in the table below.
Please note that the expenses shown in the table are meant to highlight your ongoing costs only and do not reflect any transaction costs. Therefore, the second line of the table is useful in comparing ongoing costs only, and will not help you determine the relative total costs of owning different funds.
| | Annualized Expense Ratio-A | Beginning
Account Value
August 1, 2017 | Ending
Account Value
January 31, 2018 | Expenses Paid
During Period-B
August 1, 2017
to January 31, 2018 |
| Leveraged Company Stock | .78% | | | |
| Actual | | $1,000.00 | $1,142.40 | $4.21 |
| Hypothetical-C | | $1,000.00 | $1,021.27 | $3.97 |
| Class K | .67% | | | |
| Actual | | $1,000.00 | $1,142.70 | $3.62 |
| Hypothetical-C | | $1,000.00 | $1,021.83 | $3.41 |
A Annualized expense ratio reflects expenses net of applicable fee waivers.
B Expenses are equal to each Class' annualized expense ratio, multiplied by the average account value over the period, multiplied by 184/365 (to reflect the one-half year period).
C 5% return per year before expenses
Corporate Headquarters
245 Summer St.
Boston, MA 02210
www.fidelity.com
LSF-SANN-0318
1.753758.118
Fidelity® OTC Portfolio
Class K
Semi-Annual Report January 31, 2018 |
|
Contents
To view a fund's proxy voting guidelines and proxy voting record for the 12-month period ended June 30, visit http://www.fidelity.com/proxyvotingresults or visit the Securities and Exchange Commission's (SEC) web site at http://www.sec.gov.
You may also call 1-800-835-5092 to request a free copy of the proxy voting guidelines.
Standard & Poor's, S&P and S&P 500 are registered service marks of The McGraw-Hill Companies, Inc. and have been licensed for use by Fidelity Distributors Corporation.
Other third-party marks appearing herein are the property of their respective owners.
All other marks appearing herein are registered or unregistered trademarks or service marks of FMR LLC or an affiliated company. © 2018 FMR LLC. All rights reserved.
This report and the financial statements contained herein are submitted for the general information of the shareholders of the Fund. This report is not authorized for distribution to prospective investors in the Fund unless preceded or accompanied by an effective prospectus.
A fund files its complete schedule of portfolio holdings with the SEC for the first and third quarters of each fiscal year on Form N-Q. Forms N-Q are available on the SEC’s web site at http://www.sec.gov. A fund's Forms N-Q may be reviewed and copied at the SEC’s Public Reference Room in Washington, DC. Information regarding the operation of the SEC's Public Reference Room may be obtained by calling 1-800-SEC-0330.
For a complete list of a fund's portfolio holdings, view the most recent holdings listing, semiannual report, or annual report on Fidelity's web site at http://www.fidelity.com, http://www.institutional.fidelity.com, or http://www.401k.com, as applicable.
NOT FDIC INSURED •MAY LOSE VALUE •NO BANK GUARANTEE
Neither the Fund nor Fidelity Distributors Corporation is a bank.
Investment Summary (Unaudited)
Top Ten Stocks as of January 31, 2018
| | % of fund's net assets |
| Apple, Inc. | 7.7 |
| Alphabet, Inc. Class A | 6.5 |
| Amazon.com, Inc. | 6.3 |
| Activision Blizzard, Inc. | 4.3 |
| Facebook, Inc. Class A | 4.3 |
| Ubisoft Entertainment SA | 4.0 |
| Tesla, Inc. | 3.7 |
| NVIDIA Corp. | 3.4 |
| Amgen, Inc. | 3.1 |
| Microsoft Corp. | 2.9 |
| | 46.2 |
Top Five Market Sectors as of January 31, 2018
| | % of fund's net assets |
| Information Technology | 52.3 |
| Consumer Discretionary | 22.1 |
| Health Care | 11.8 |
| Financials | 4.9 |
| Consumer Staples | 4.3 |
Asset Allocation (% of fund's net assets)
| As of January 31, 2018 * |
| | Stocks | 97.5% |
| | Convertible Securities | 2.1% |
| | Short-Term Investments and Net Other Assets (Liabilities) | 0.4% |

* Foreign investments - 9.5%
Schedule of Investments January 31, 2018 (Unaudited)
Showing Percentage of Net Assets
| Common Stocks - 97.5% | | | |
| | | Shares | Value (000s) |
| CONSUMER DISCRETIONARY - 22.0% | | | |
| Automobiles - 3.7% | | | |
| Tesla, Inc. (a)(b) | | 2,038,321 | $722,198 |
| Diversified Consumer Services - 0.1% | | | |
| Adtalem Global Education, Inc. (a) | | 117,500 | 5,405 |
| Weight Watchers International, Inc. (a) | | 60,000 | 3,857 |
| | | | 9,262 |
| Hotels, Restaurants & Leisure - 2.8% | | | |
| Bluegreen Vacations Corp. | | 483,200 | 9,176 |
| Caesars Entertainment Corp. (a) | | 404,800 | 5,647 |
| Chipotle Mexican Grill, Inc. (a) | | 200,300 | 65,049 |
| Churchill Downs, Inc. | | 313,400 | 81,171 |
| Del Frisco's Restaurant Group, Inc. (a) | | 239,600 | 4,193 |
| Hilton Grand Vacations, Inc. (a) | | 85,068 | 3,826 |
| ILG, Inc. | | 57,100 | 1,794 |
| Marriott International, Inc. Class A | | 1,672,900 | 246,485 |
| Marriott Vacations Worldwide Corp. | | 27,400 | 4,174 |
| Royal Caribbean Cruises Ltd. | | 126,500 | 16,894 |
| Starbucks Corp. | | 493,700 | 28,047 |
| Texas Roadhouse, Inc. Class A | | 99,800 | 5,860 |
| The Cheesecake Factory, Inc. (b) | | 72,200 | 3,552 |
| U.S. Foods Holding Corp. (a) | | 1,116,900 | 35,886 |
| Vail Resorts, Inc. | | 9,362 | 2,046 |
| Wingstop, Inc. (b) | | 822,520 | 39,777 |
| | | | 553,577 |
| Household Durables - 0.7% | | | |
| Panasonic Corp. | | 112,900 | 1,676 |
| Roku, Inc. Class B | | 3,613,398 | 139,437 |
| | | | 141,113 |
| Internet & Direct Marketing Retail - 9.8% | | | |
| Amazon.com, Inc. (a) | | 842,108 | 1,221,806 |
| Blue Apron Holdings, Inc. Class B | | 3,603,786 | 10,668 |
| Expedia, Inc. | | 57,200 | 7,322 |
| Groupon, Inc. (a)(c) | | 43,956,853 | 232,532 |
| JD.com, Inc. sponsored ADR (a) | | 587,550 | 28,925 |
| Netflix, Inc. (a) | | 675,660 | 182,631 |
| Priceline Group, Inc. (a) | | 36,460 | 69,713 |
| Wayfair LLC Class A (a)(b) | | 1,661,368 | 152,862 |
| | | | 1,906,459 |
| Media - 0.3% | | | |
| AMC Entertainment Holdings, Inc. Class A (b) | | 133,100 | 1,704 |
| China Literature Ltd. (a)(d) | | 353,000 | 3,657 |
| Liberty Media Corp. Liberty Media Class A (a)(b) | | 1,508,065 | 53,808 |
| Turn, Inc. (Escrow) (e)(f) | | 1,199,041 | 797 |
| | | | 59,966 |
| Multiline Retail - 2.3% | | | |
| Avenue Supermarts Ltd. (d) | | 101,832 | 1,890 |
| Dollar Tree, Inc. (a) | | 3,881,900 | 446,419 |
| | | | 448,309 |
| Specialty Retail - 1.2% | | | |
| Burlington Stores, Inc. (a) | | 165,700 | 20,167 |
| Lowe's Companies, Inc. | | 207,100 | 21,690 |
| O'Reilly Automotive, Inc. (a) | | 56,800 | 15,034 |
| Ross Stores, Inc. | | 1,126,600 | 92,821 |
| Tractor Supply Co. | | 953,818 | 72,729 |
| Ulta Beauty, Inc. | | 55,810 | 12,395 |
| | | | 234,836 |
| Textiles, Apparel & Luxury Goods - 1.1% | | | |
| adidas AG sponsored ADR | | 427,900 | 49,662 |
| Columbia Sportswear Co. | | 77,800 | 5,809 |
| Despegar.com Corp. | | 406,400 | 12,375 |
| G-III Apparel Group Ltd. (a) | | 143,000 | 5,341 |
| Kering SA | | 96,300 | 48,757 |
| lululemon athletica, Inc. (a) | | 1,028,446 | 80,435 |
| LVMH Moet Hennessy - Louis Vuitton SA | | 5,927 | 1,857 |
| Prada SpA | | 965,200 | 3,942 |
| PVH Corp. | | 66,000 | 10,235 |
| Under Armour, Inc. Class C (non-vtg.) (a)(b) | | 146,700 | 1,885 |
| | | | 220,298 |
|
| TOTAL CONSUMER DISCRETIONARY | | | 4,296,018 |
|
| CONSUMER STAPLES - 4.1% | | | |
| Beverages - 1.1% | | | |
| Constellation Brands, Inc. Class A (sub. vtg.) | | 15,800 | 3,468 |
| Diageo PLC | | 49,277 | 1,774 |
| Dr. Pepper Snapple Group, Inc. | | 90,400 | 10,789 |
| Monster Beverage Corp. (a) | | 979,340 | 66,820 |
| PepsiCo, Inc. | | 1,121,700 | 134,941 |
| | | | 217,792 |
| Food & Staples Retailing - 1.6% | | | |
| Costco Wholesale Corp. | | 1,111,383 | 216,575 |
| Performance Food Group Co. (a) | | 1,120,500 | 38,489 |
| Walmart, Inc. | | 458,600 | 48,887 |
| | | | 303,951 |
| Food Products - 1.4% | | | |
| Mondelez International, Inc. | | 2,654,852 | 117,875 |
| Nestle SA sponsored ADR | | 38,200 | 3,300 |
| The Hain Celestial Group, Inc. (a) | | 436,700 | 16,656 |
| The Kraft Heinz Co. | | 1,814,800 | 142,262 |
| | | | 280,093 |
|
| TOTAL CONSUMER STAPLES | | | 801,836 |
|
| ENERGY - 1.0% | | | |
| Energy Equipment & Services - 0.1% | | | |
| Hi-Crush Partners LP | | 178,900 | 2,308 |
| Smart Sand, Inc. (a)(b) | | 480,600 | 4,417 |
| U.S. Silica Holdings, Inc. (b) | | 54,300 | 1,808 |
| | | | 8,533 |
| Oil, Gas & Consumable Fuels - 0.9% | | | |
| Anadarko Petroleum Corp. | | 40,900 | 2,456 |
| Andeavor | | 31,400 | 3,396 |
| Cenovus Energy, Inc. | | 714,300 | 6,812 |
| Centennial Resource Development, Inc. Class A (a) | | 1,484,600 | 30,301 |
| Diamondback Energy, Inc. (a) | | 955,700 | 119,940 |
| Oasis Petroleum, Inc. (a) | | 419,100 | 3,629 |
| Whiting Petroleum Corp. (a) | | 456,900 | 12,757 |
| | | | 179,291 |
|
| TOTAL ENERGY | | | 187,824 |
|
| FINANCIALS - 4.9% | | | |
| Banks - 2.0% | | | |
| Bank of America Corp. | | 581,700 | 18,614 |
| Citigroup, Inc. | | 274,600 | 21,551 |
| Commerce Bancshares, Inc. | | 715,586 | 41,869 |
| Fifth Third Bancorp | | 334,700 | 11,079 |
| First Republic Bank | | 20,800 | 1,863 |
| Huntington Bancshares, Inc. | | 7,776,300 | 125,821 |
| Investors Bancorp, Inc. | | 2,682,400 | 36,722 |
| PacWest Bancorp | | 1,040,400 | 54,548 |
| Signature Bank (a) | | 23,800 | 3,665 |
| SunTrust Banks, Inc. | | 84,800 | 5,995 |
| SVB Financial Group (a) | | 46,662 | 11,505 |
| UMB Financial Corp. | | 347,900 | 26,503 |
| Wells Fargo & Co. | | 383,800 | 25,246 |
| | | | 384,981 |
| Capital Markets - 2.1% | | | |
| BlackRock, Inc. Class A | | 53,400 | 30,000 |
| Carlyle Group LP | | 630,500 | 15,889 |
| Charles Schwab Corp. | | 76,200 | 4,065 |
| E*TRADE Financial Corp. (a) | | 615,520 | 32,438 |
| Goldman Sachs Group, Inc. | | 21,000 | 5,626 |
| Morgan Stanley | | 100,000 | 5,655 |
| Northern Trust Corp. | | 874,900 | 92,206 |
| TD Ameritrade Holding Corp. | | 3,848,500 | 214,708 |
| | | | 400,587 |
| Consumer Finance - 0.7% | | | |
| Capital One Financial Corp. | | 1,331,700 | 138,444 |
| Synchrony Financial | | 150,100 | 5,956 |
| | | | 144,400 |
| Diversified Financial Services - 0.0% | | | |
| GDS Holdings Ltd. ADR (a) | | 67,900 | 1,938 |
| Insurance - 0.1% | | | |
| Chubb Ltd. | | 51,300 | 8,010 |
| MetLife, Inc. | | 107,300 | 5,158 |
| The Travelers Companies, Inc. | | 55,400 | 8,306 |
| | | | 21,474 |
|
| TOTAL FINANCIALS | | | 953,380 |
|
| HEALTH CARE - 11.4% | | | |
| Biotechnology - 9.3% | | | |
| Acceleron Pharma, Inc. (a) | | 44,100 | 1,831 |
| Achaogen, Inc. (a)(b) | | 98,300 | 1,078 |
| Adamas Pharmaceuticals, Inc. (a)(b) | | 143,100 | 5,415 |
| Agios Pharmaceuticals, Inc. (a) | | 123,035 | 9,690 |
| Alexion Pharmaceuticals, Inc. (a) | | 809,289 | 96,564 |
| Alkermes PLC (a) | | 1,230,536 | 70,350 |
| Alnylam Pharmaceuticals, Inc. (a) | | 215,300 | 27,985 |
| Amgen, Inc. | | 3,207,780 | 596,807 |
| AnaptysBio, Inc. | | 87,100 | 9,179 |
| BeiGene Ltd. ADR (a) | | 52,900 | 7,181 |
| Biogen, Inc. (a) | | 95,086 | 33,072 |
| BioMarin Pharmaceutical, Inc. (a) | | 152,256 | 13,738 |
| bluebird bio, Inc. (a) | | 363,726 | 74,527 |
| Blueprint Medicines Corp. (a) | | 144,100 | 11,333 |
| Celgene Corp. (a) | | 527,640 | 53,376 |
| Cellectis SA sponsored ADR (a) | | 348,000 | 10,948 |
| Chiasma, Inc. (a)(b) | | 779,500 | 1,286 |
| Chimerix, Inc. (a) | | 52,700 | 252 |
| Coherus BioSciences, Inc. (a)(b) | | 1,199,902 | 12,119 |
| CytomX Therapeutics, Inc. (a) | | 485,000 | 12,974 |
| CytomX Therapeutics, Inc. (a)(d) | | 244,269 | 6,534 |
| DBV Technologies SA sponsored ADR (a) | | 1,070,800 | 24,800 |
| Denali Therapeutics, Inc. (a)(b) | | 829,800 | 19,301 |
| Dicerna Pharmaceuticals, Inc. (a) | | 307,207 | 2,946 |
| Editas Medicine, Inc. (a)(b) | | 200,244 | 7,311 |
| Epizyme, Inc. (a) | | 127,000 | 2,051 |
| Exact Sciences Corp. (a) | | 39,800 | 1,978 |
| FibroGen, Inc. (a) | | 195,200 | 11,429 |
| Flexion Therapeutics, Inc. (a)(b) | | 124,500 | 2,812 |
| Galapagos Genomics NV sponsored ADR (a) | | 78,600 | 9,292 |
| GenSight Biologics SA (a)(d) | | 243,848 | 1,968 |
| Heron Therapeutics, Inc. (a) | | 1,181,015 | 25,569 |
| Intercept Pharmaceuticals, Inc. (a)(b) | | 333,919 | 20,736 |
| Ionis Pharmaceuticals, Inc. (a) | | 428,902 | 22,526 |
| Iovance Biotherapeutics, Inc. (a) | | 360,400 | 5,604 |
| Ironwood Pharmaceuticals, Inc. Class A (a) | | 1,944,542 | 28,799 |
| Jounce Therapeutics, Inc. (b) | | 561,463 | 13,576 |
| Macrogenics, Inc. (a) | | 162,600 | 3,670 |
| Neurocrine Biosciences, Inc. (a) | | 811,400 | 69,350 |
| Ovid Therapeutics, Inc. | | 300,536 | 2,555 |
| Portola Pharmaceuticals, Inc. (a) | | 319,598 | 16,399 |
| Regeneron Pharmaceuticals, Inc. (a) | | 610,500 | 223,840 |
| Sage Therapeutics, Inc. (a) | | 185,075 | 35,127 |
| Sarepta Therapeutics, Inc. (a) | | 128,600 | 8,428 |
| Sierra Oncology, Inc. (a) | | 160,400 | 489 |
| Spark Therapeutics, Inc. (a) | | 334,290 | 18,737 |
| Spectrum Pharmaceuticals, Inc. (a) | | 371,400 | 8,000 |
| TESARO, Inc. (a)(b) | | 2,100,700 | 141,713 |
| Trevena, Inc. (a) | | 512,521 | 835 |
| Ultragenyx Pharmaceutical, Inc. (a) | | 112,096 | 5,980 |
| uniQure B.V. (a) | | 276,600 | 5,117 |
| Xencor, Inc. (a) | | 618,787 | 14,084 |
| Zai Lab Ltd. ADR | | 130,900 | 3,529 |
| | | | 1,814,790 |
| Health Care Equipment & Supplies - 0.2% | | | |
| AxoGen, Inc. (a) | | 86,000 | 2,391 |
| Insulet Corp. (a) | | 82,000 | 6,275 |
| Intuitive Surgical, Inc. (a) | | 39,946 | 17,243 |
| Quanterix Corp. (a) | | 229,300 | 4,772 |
| ViewRay, Inc. (a)(b) | | 431,200 | 3,851 |
| | | | 34,532 |
| Health Care Providers & Services - 0.1% | | | |
| G1 Therapeutics, Inc. | | 322,672 | 7,715 |
| National Vision Holdings, Inc. | | 57,300 | 2,242 |
| OptiNose, Inc. (b) | | 337,311 | 6,392 |
| OptiNose, Inc. | | 382,170 | 6,880 |
| R1 RCM, Inc. (a) | | 723,202 | 3,724 |
| | | | 26,953 |
| Health Care Technology - 1.3% | | | |
| athenahealth, Inc. (a) | | 1,840,683 | 230,656 |
| Castlight Health, Inc. Class B (a)(b) | | 53,000 | 196 |
| Cerner Corp. (a) | | 285,900 | 19,764 |
| Teladoc, Inc. (a) | | 151,100 | 5,651 |
| | | | 256,267 |
| Pharmaceuticals - 0.5% | | | |
| Akcea Therapeutics, Inc. (b) | | 119,720 | 2,592 |
| Allergan PLC | | 20,000 | 3,605 |
| Avexis, Inc. (a) | | 86,300 | 10,678 |
| Castle Creek Pharmaceuticals, LLC Class A-2 unit (a)(e)(f)(g)(h) | | 30,303 | 15,454 |
| Collegium Pharmaceutical, Inc. (a)(b) | | 418,800 | 9,984 |
| Dova Pharmaceuticals, Inc. (b) | | 256,000 | 8,156 |
| GW Pharmaceuticals PLC ADR (a)(b) | | 16,127 | 2,228 |
| Innoviva, Inc. (a) | | 65 | 1 |
| Intra-Cellular Therapies, Inc. (a) | | 127,636 | 2,172 |
| Jazz Pharmaceuticals PLC (a) | | 80,200 | 11,688 |
| MyoKardia, Inc. (a) | | 46,700 | 2,410 |
| Nektar Therapeutics (a) | | 93,486 | 7,816 |
| Revance Therapeutics, Inc. (a) | | 51,200 | 1,654 |
| The Medicines Company (a) | | 237,700 | 7,875 |
| Theravance Biopharma, Inc. (a)(b) | | 180,900 | 4,783 |
| Zogenix, Inc. (a) | | 284,300 | 10,334 |
| | | | 101,430 |
|
| TOTAL HEALTH CARE | | | 2,233,972 |
|
| INDUSTRIALS - 1.8% | | | |
| Aerospace & Defense - 0.1% | | | |
| Space Exploration Technologies Corp.: | | | |
| Class A (a)(e)(f) | | 203,488 | 27,471 |
| Class C (e)(f) | | 7,092 | 957 |
| | | | 28,428 |
| Airlines - 1.0% | | | |
| Allegiant Travel Co. | | 35,800 | 5,701 |
| American Airlines Group, Inc. | | 2,153,632 | 116,985 |
| JetBlue Airways Corp. (a) | | 764,300 | 15,943 |
| Spirit Airlines, Inc. (a) | | 362,900 | 15,285 |
| United Continental Holdings, Inc. (a) | | 392,800 | 26,640 |
| Wheels Up Partners Holdings LLC Series B (a)(e)(f)(g) | | 1,760,377 | 5,492 |
| | | | 186,046 |
| Building Products - 0.0% | | | |
| Kajaria Ceramics Ltd. | | 615,124 | 6,113 |
| Commercial Services & Supplies - 0.1% | | | |
| Copart, Inc. (a) | | 89,600 | 3,949 |
| Evoqua Water Technologies Corp. (a) | | 268,400 | 6,136 |
| | | | 10,085 |
| Machinery - 0.1% | | | |
| Kennametal, Inc. | | 37,300 | 1,819 |
| PACCAR, Inc. | | 249,200 | 18,580 |
| | | | 20,399 |
| Road & Rail - 0.4% | | | |
| Avis Budget Group, Inc. (a) | | 404,400 | 18,182 |
| CSX Corp. | | 148,900 | 8,453 |
| J.B. Hunt Transport Services, Inc. | | 360,791 | 43,594 |
| Old Dominion Freight Lines, Inc. | | 92,100 | 13,488 |
| | | | 83,717 |
| Trading Companies & Distributors - 0.1% | | | |
| HD Supply Holdings, Inc. (a) | | 278,500 | 10,831 |
|
| TOTAL INDUSTRIALS | | | 345,619 |
|
| INFORMATION TECHNOLOGY - 51.1% | | | |
| Communications Equipment - 0.1% | | | |
| Arista Networks, Inc. (a) | | 14,500 | 3,999 |
| NETGEAR, Inc. (a) | | 278,700 | 19,425 |
| Quantenna Communications, Inc. (a) | | 292,000 | 4,018 |
| | | | 27,442 |
| Electronic Equipment & Components - 0.0% | | | |
| SYNNEX Corp. | | 15,700 | 1,927 |
| Internet Software & Services - 16.6% | | | |
| 2U, Inc. (a) | | 198,241 | 14,723 |
| 58.com, Inc. ADR (a) | | 25,600 | 2,045 |
| Akamai Technologies, Inc. (a) | | 156,900 | 10,511 |
| Alibaba Group Holding Ltd. sponsored ADR (a) | | 45,300 | 9,254 |
| Alphabet, Inc.: | | | |
| Class A (a) | | 1,074,427 | 1,270,209 |
| Class C (a) | | 454,469 | 531,701 |
| Altaba, Inc. | | 1,451,100 | 115,914 |
| ANGI Homeservices, Inc. Class A (a)(b) | | 501,706 | 6,703 |
| CarGurus, Inc.: | | | |
| Class A (b) | | 402,193 | 13,473 |
| Class A | | 1,083,756 | 34,491 |
| Delivery Hero AG (d) | | 45,500 | 1,952 |
| Dropbox, Inc. Class B (a)(e)(f) | | 331,524 | 4,973 |
| Facebook, Inc. Class A (a) | | 4,476,714 | 836,653 |
| GoDaddy, Inc. (a) | | 178,200 | 9,842 |
| Gogo, Inc. (a)(b) | | 1,081,200 | 10,423 |
| GrubHub, Inc. (a)(b) | | 79,800 | 5,766 |
| IAC/InterActiveCorp (a) | | 13,545 | 1,964 |
| Instructure, Inc. (a) | | 5,871 | 211 |
| Match Group, Inc. (a)(b) | | 739,200 | 25,828 |
| Momo, Inc. ADR (a) | | 402,600 | 12,694 |
| NetEase, Inc. ADR | | 155,640 | 49,830 |
| New Relic, Inc. (a) | | 955,383 | 57,065 |
| Nutanix, Inc.: | | | |
| Class A (a) | | 3,418,740 | 109,742 |
| Class B (d) | | 311,503 | 9,999 |
| Okta, Inc. | | 36,900 | 1,087 |
| Shopify, Inc. Class A (a) | | 538,726 | 68,782 |
| Twilio, Inc. Class A (a)(b) | | 1,008,958 | 26,475 |
| | | | 3,242,310 |
| IT Services - 1.7% | | | |
| AppNexus, Inc. warrants (a)(e)(f) | | 1 | 0 |
| PayPal Holdings, Inc. (a) | | 3,189,900 | 272,162 |
| Square, Inc. (a) | | 1,066,899 | 50,048 |
| Teradata Corp. (a) | | 51,300 | 2,078 |
| Worldpay, Inc. (a) | | 96,800 | 7,774 |
| | | | 332,062 |
| Semiconductors & Semiconductor Equipment - 8.4% | | | |
| Analog Devices, Inc. | | 896,800 | 82,398 |
| Applied Materials, Inc. | | 144,100 | 7,728 |
| ASM Pacific Technology Ltd. | | 226,700 | 3,095 |
| ASML Holding NV | | 47,900 | 9,722 |
| Broadcom Ltd. | | 700,966 | 173,861 |
| Intel Corp. | | 677,600 | 32,620 |
| KLA-Tencor Corp. | | 47,100 | 5,172 |
| Lam Research Corp. | | 147,100 | 28,173 |
| Marvell Technology Group Ltd. | | 4,522,700 | 105,515 |
| Micron Technology, Inc. (a) | | 3,686,444 | 161,171 |
| NVIDIA Corp. | | 2,692,901 | 661,915 |
| ON Semiconductor Corp. (a) | | 607,700 | 15,034 |
| Qualcomm, Inc. | | 4,541,876 | 309,983 |
| United Microelectronics Corp. sponsored ADR (b) | | 10,022,000 | 24,454 |
| Xilinx, Inc. | | 109,000 | 7,959 |
| | | | 1,628,800 |
| Software - 16.6% | | | |
| Activision Blizzard, Inc. | | 11,289,309 | 836,876 |
| Adobe Systems, Inc. (a) | | 403,100 | 80,523 |
| Altair Engineering, Inc. Class A (a) | | 70,500 | 1,875 |
| Atlassian Corp. PLC (a) | | 1,335,785 | 72,119 |
| Atom Tickets LLC (e)(f)(g) | | 516,103 | 3,000 |
| Autodesk, Inc. (a) | | 3,341,420 | 386,335 |
| Citrix Systems, Inc. (a) | | 60,500 | 5,612 |
| Ellie Mae, Inc. (a) | | 19,500 | 1,823 |
| HIVE Blockchain Technologies Ltd. (a)(b) | | 719,500 | 1,492 |
| HIVE Blockchain Technologies Ltd. unit (e)(f) | | 2,163,600 | 4,262 |
| HubSpot, Inc. (a) | | 746,180 | 72,417 |
| Intuit, Inc. | | 192,900 | 32,388 |
| Microsoft Corp. | | 5,937,899 | 564,160 |
| Parametric Technology Corp. (a) | | 54,900 | 3,990 |
| Paycom Software, Inc. (a)(b) | | 276,032 | 25,296 |
| Paylocity Holding Corp. (a) | | 188,400 | 9,851 |
| Red Hat, Inc. (a) | | 59,800 | 7,857 |
| SailPoint Technologies Holding, Inc. (a) | | 224,700 | 3,759 |
| Salesforce.com, Inc. (a) | | 1,399,248 | 159,388 |
| SendGrid, Inc. (a) | | 105,200 | 2,364 |
| ServiceNow, Inc. (a) | | 13,700 | 2,040 |
| Snap, Inc. Class A (a)(b) | | 444,058 | 6,004 |
| Splunk, Inc. (a) | | 21,600 | 1,995 |
| Talend SA ADR (a) | | 82,000 | 3,196 |
| Tanium, Inc. Class B (e)(f) | | 392,200 | 2,169 |
| Ubisoft Entertainment SA (a)(c) | | 9,163,631 | 784,338 |
| Workday, Inc. Class A (a) | | 136,300 | 16,341 |
| Xero Ltd. (a) | | 90,086 | 2,284 |
| Zendesk, Inc. (a) | | 3,961,484 | 152,596 |
| | | | 3,246,350 |
| Technology Hardware, Storage & Peripherals - 7.7% | | | |
| Apple, Inc. | | 8,919,360 | 1,493,367 |
|
| TOTAL INFORMATION TECHNOLOGY | | | 9,972,258 |
|
| MATERIALS - 1.0% | | | |
| Chemicals - 0.7% | | | |
| CF Industries Holdings, Inc. | | 89,700 | 3,807 |
| FMC Corp. | | 72,400 | 6,612 |
| LG Chemical Ltd. | | 13,965 | 5,639 |
| LyondellBasell Industries NV Class A | | 930,600 | 111,523 |
| | | | 127,581 |
| Construction Materials - 0.0% | | | |
| Loma Negra Compania Industrial Argentina SA ADR (a) | | 268,400 | 6,377 |
| Metals & Mining - 0.3% | | | |
| Randgold Resources Ltd. sponsored ADR | | 588,600 | 59,543 |
| Steel Dynamics, Inc. | | 82,400 | 3,741 |
| | | | 63,284 |
|
| TOTAL MATERIALS | | | 197,242 |
|
| REAL ESTATE - 0.2% | | | |
| Equity Real Estate Investment Trusts (REITs) - 0.1% | | | |
| Equinix, Inc. | | 22,100 | 10,060 |
| Real Estate Management & Development - 0.1% | | | |
| Redfin Corp. (b) | | 911,530 | 18,504 |
| WeWork Companies, Inc. Class A (a)(e)(f) | | 29,911 | 1,550 |
| | | | 20,054 |
|
| TOTAL REAL ESTATE | | | 30,114 |
|
| TELECOMMUNICATION SERVICES - 0.0% | | | |
| Wireless Telecommunication Services - 0.0% | | | |
| T-Mobile U.S., Inc. (a) | | 120,590 | 7,850 |
| TOTAL COMMON STOCKS | | | |
| (Cost $11,159,399) | | | 19,026,113 |
|
| Preferred Stocks - 2.0% | | | |
| Convertible Preferred Stocks - 2.0% | | | |
| CONSUMER DISCRETIONARY - 0.1% | | | |
| Diversified Consumer Services - 0.1% | | | |
| Handy Technologies, Inc. Series C (a)(e)(f) | | 415,643 | 1,347 |
| Lyft, Inc. Series H (e)(f) | | 595,228 | 23,658 |
| | | | 25,005 |
| Internet & Direct Marketing Retail - 0.0% | | | |
| One Kings Lane, Inc. Series E (Escrow) (a)(e)(f) | | 648,635 | 292 |
| The Honest Co., Inc. Series D (a)(e)(f) | | 75,268 | 2,539 |
| | | | 2,831 |
| TOTAL CONSUMER DISCRETIONARY | | | 27,836 |
| CONSUMER STAPLES - 0.2% | | | |
| Food & Staples Retailing - 0.2% | | | |
| Roofoods Ltd. Series F (e)(f) | | 93,930 | 33,211 |
| FINANCIALS - 0.0% | | | |
| Insurance - 0.0% | | | |
| Clover Health Series D (e)(f) | | 620,983 | 6,048 |
| HEALTH CARE - 0.4% | | | |
| Biotechnology - 0.3% | | | |
| 23andMe, Inc.: | | | |
| Series E (a)(e)(f) | | 1,817,170 | 25,230 |
| Series F (e)(f) | | 683,367 | 9,488 |
| Moderna Therapeutics, Inc.: | | | |
| Series B (e)(f) | | 1,193,491 | 12,007 |
| Series C (e)(f) | | 453,177 | 4,559 |
| | | | 51,284 |
| Health Care Providers & Services - 0.1% | | | |
| Mulberry Health, Inc. Series A8 (a)(e)(f) | | 4,342,250 | 28,008 |
| TOTAL HEALTH CARE | | | 79,292 |
| INDUSTRIALS - 0.1% | | | |
| Aerospace & Defense - 0.1% | | | |
| Space Exploration Technologies Corp.: | | | |
| Series G (a)(e)(f) | | 62,037 | 8,375 |
| Series H (e)(f) | | 65,670 | 8,865 |
| | | | 17,240 |
| Professional Services - 0.0% | | | |
| YourPeople, Inc. Series C (a)(e)(f) | | 335,546 | 1,879 |
| TOTAL INDUSTRIALS | | | 19,119 |
| INFORMATION TECHNOLOGY - 1.1% | | | |
| Internet Software & Services - 0.6% | | | |
| Jet.Com, Inc. Series B1 (Escrow) (a)(e)(f) | | 4,896,249 | 1,608 |
| Pinterest, Inc. Series G, 8.00% (a)(e)(f) | | 139,290 | 833 |
| Reddit, Inc.: | | | |
| Series B (e)(f) | | 1,337,584 | 21,099 |
| Series C (e)(f) | | 300,673 | 4,743 |
| Starry, Inc. Series B (a)(e)(f) | | 1,811,120 | 1,670 |
| Uber Technologies, Inc.: | | | |
| Series D, 8.00% (a)(e)(f) | | 2,256,164 | 79,191 |
| Series E, 8.00% (a)(e)(f) | | 150,072 | 5,268 |
| | | | 114,412 |
| IT Services - 0.2% | | | |
| AppNexus, Inc.: | | | |
| Series E (a)(e)(f) | | 1,416,796 | 28,478 |
| Series F (a)(e)(f) | | 90,913 | 1,881 |
| | | | 30,359 |
| Software - 0.3% | | | |
| Bracket Computing, Inc. Series C (a)(e)(f) | | 1,877,241 | 2,910 |
| Cloudflare, Inc. Series D, 8.00% (a)(e)(f) | | 395,787 | 2,371 |
| Dataminr, Inc. Series D (a)(e)(f) | | 2,219,446 | 22,816 |
| Delphix Corp. Series D (a)(e)(f) | | 427,177 | 2,559 |
| Jello Labs, Inc. Series C (a)(e)(f) | | 302,678 | 4,899 |
| Taboola.Com Ltd. Series E (a)(e)(f) | | 1,918,392 | 29,486 |
| | | | 65,041 |
| TOTAL INFORMATION TECHNOLOGY | | | 209,812 |
| REAL ESTATE - 0.1% | | | |
| Real Estate Management & Development - 0.1% | | | |
| WeWork Companies, Inc.: | | | |
| Series E (a)(e)(f) | | 269,198 | 13,947 |
| Series F (a)(e)(f) | | 14,513 | 752 |
| | | | 14,699 |
| TELECOMMUNICATION SERVICES - 0.0% | | | |
| Wireless Telecommunication Services - 0.0% | | | |
| Altiostar Networks, Inc. Series A1 (e)(f) | | 2,113,909 | 2,706 |
|
| TOTAL CONVERTIBLE PREFERRED STOCKS | | | 392,723 |
|
| Nonconvertible Preferred Stocks - 0.0% | | | |
| CONSUMER DISCRETIONARY - 0.0% | | | |
| Automobiles - 0.0% | | | |
| Volkswagen AG | | 8,700 | 1,912 |
| TOTAL PREFERRED STOCKS | | | |
| (Cost $349,083) | | | 394,635 |
| | | Principal Amount (000s) | Value (000s) |
|
| Convertible Bonds - 0.1% | | | |
| INFORMATION TECHNOLOGY - 0.1% | | | |
| Software - 0.1% | | | |
| Dataminr, Inc. 1.22% 1/28/19(e)(f) | | | |
| (Cost $14,228) | | 14,228 | 14,228 |
| | | Shares | Value (000s) |
|
| Money Market Funds - 4.6% | | | |
| Fidelity Cash Central Fund, 1.39% (i) | | 73,249,867 | 73,265 |
| Fidelity Securities Lending Cash Central Fund 1.40% (i)(j) | | 831,889,605 | 831,973 |
| TOTAL MONEY MARKET FUNDS | | | |
| (Cost $905,236) | | | 905,238 |
| TOTAL INVESTMENT IN SECURITIES - 104.2% | | | |
| (Cost $12,427,946) | | | 20,340,214 |
| NET OTHER ASSETS (LIABILITIES) - (4.2)% | | | (820,313) |
| NET ASSETS - 100% | | | $19,519,901 |
Values shown as $0 may reflect amounts less than $500.
Legend
(a) Non-income producing
(b) Security or a portion of the security is on loan at period end.
(c) Affiliated company
(d) Security exempt from registration under Rule 144A of the Securities Act of 1933. These securities may be resold in transactions exempt from registration, normally to qualified institutional buyers. At the end of the period, the value of these securities amounted to $26,000,000 or 0.1% of net assets.
(e) Restricted securities - Investment in securities not registered under the Securities Act of 1933 (excluding 144A issues). At the end of the period, the value of restricted securities (excluding 144A issues) amounted to $473,076,000 or 2.4% of net assets.
(f) Level 3 security
(g) Investment is owned by a wholly-owned subsidiary (Subsidiary) that is treated as a corporation for U.S. tax purposes.
(h) Investment represents common shares and preferred shares.
(i) Affiliated fund that is generally available only to investment companies and other accounts managed by Fidelity Investments. The rate quoted is the annualized seven-day yield of the fund at period end. A complete unaudited listing of the fund's holdings as of its most recent quarter end is available upon request. In addition, each Fidelity Central Fund's financial statements are available on the SEC's website or upon request.
(j) Investment made with cash collateral received from securities on loan.
Additional information on each restricted holding is as follows:
| Security | Acquisition Date | Acquisition Cost (000s) |
| 23andMe, Inc. Series E | 6/18/15 | $19,675 |
| 23andMe, Inc. Series F | 8/31/17 | $9,488 |
| Altiostar Networks, Inc. Series A1 | 1/10/17 | $9,724 |
| AppNexus, Inc. Series E | 8/1/14 - 9/17/14 | $28,382 |
| AppNexus, Inc. Series F | 8/23/16 | $2,364 |
| AppNexus, Inc. warrants | 8/23/16 | $0 |
| Atom Tickets LLC | 8/15/17 | $3,000 |
| Bracket Computing, Inc. Series C | 9/9/15 | $14,766 |
| Castle Creek Pharmaceuticals, LLC Class A-2 unit | 9/29/16 | $10,007 |
| Cloudflare, Inc. Series D, 8.00% | 11/5/14 | $2,424 |
| Clover Health Series D | 6/7/17 | $5,823 |
| Dataminr, Inc. Series D | 2/18/15 - 3/6/15 | $28,298 |
| Dataminr, Inc. 1.22% 1/28/19 | 7/28/17 | $14,228 |
| Delphix Corp. Series D | 7/10/15 | $3,845 |
| Dropbox, Inc. Class B | 5/2/12 | $3,000 |
| Handy Technologies, Inc. Series C | 10/14/15 | $2,436 |
| HIVE Blockchain Technologies Ltd. unit | 12/18/17 | $5,298 |
| Jello Labs, Inc. Series C | 12/22/16 | $4,899 |
| Jet.Com, Inc. Series B1 (Escrow) | 9/19/16 | $1,608 |
| Lyft, Inc. Series H | 11/22/17 | $23,658 |
| Moderna Therapeutics, Inc. Series B | 4/13/17 | $6,922 |
| Moderna Therapeutics, Inc. Series C | 4/13/17 | $2,633 |
| Mulberry Health, Inc. Series A8 | 1/20/16 | $29,331 |
| One Kings Lane, Inc. Series E (Escrow) | 1/29/14 | $429 |
| Pinterest, Inc. Series G, 8.00% | 2/27/15 | $1,000 |
| Reddit, Inc. Series B | 7/26/17 | $18,989 |
| Reddit, Inc. Series C | 7/24/17 | $4,743 |
| Roofoods Ltd. Series F | 9/12/17 | $33,211 |
| Space Exploration Technologies Corp. Class A | 10/16/15 - 9/11/17 | $21,156 |
| Space Exploration Technologies Corp. Class C | 9/11/17 | $957 |
| Space Exploration Technologies Corp. Series G | 1/20/15 | $4,805 |
| Space Exploration Technologies Corp. Series H | 8/4/17 | $8,865 |
| Starry, Inc. Series B | 12/1/16 | $980 |
| Taboola.Com Ltd. Series E | 12/22/14 | $20,000 |
| Tanium, Inc. Class B | 4/21/17 | $1,947 |
| The Honest Co., Inc. Series D | 8/3/15 | $3,444 |
| Turn, Inc. (Escrow) | 4/11/17 | $719 |
| Uber Technologies, Inc. Series D, 8.00% | 6/6/14 | $35,000 |
| Uber Technologies, Inc. Series E, 8.00% | 12/5/14 | $5,000 |
| WeWork Companies, Inc. Class A | 6/23/15 | $984 |
| WeWork Companies, Inc. Series E | 6/23/15 | $8,854 |
| WeWork Companies, Inc. Series F | 12/1/16 | $728 |
| Wheels Up Partners Holdings LLC Series B | 9/18/15 | $5,001 |
| YourPeople, Inc. Series C | 5/1/15 | $5,000 |
Affiliated Central Funds
Information regarding fiscal year to date income earned by the Fund from investments in Fidelity Central Funds is as follows:
| Fund | Income earned |
| | (Amounts in thousands) |
| Fidelity Cash Central Fund | $220 |
| Fidelity Securities Lending Cash Central Fund | 2,962 |
| Total | $3,182 |
Amounts in the income column in the above table include any capital gain distributions from underlying funds, which are presented in the corresponding line-item in the Statement of Operations if applicable.
Other Affiliated Issuers
An affiliated company is a company in which the Fund has ownership of at least 5% of the voting securities. Fiscal year to date transactions with companies which are or were affiliates are as follows:
| Affiliate (Amounts in thousands) | Value, beginning of period | Purchases | Sales Proceeds* | Dividend Income | Realized Gain (loss) | Change in Unrealized appreciation (depreciation) | Value, end of period |
| athenahealth, Inc. | $326,198 | $-- | $67,683 | $-- | $2,272 | $(30,131) | $-- |
| Criteo SA sponsored ADR | 266,048 | -- | 185,723 | -- | 3,728 | (84,053) | -- |
| Groupon, Inc. | 209,589 | -- | 62,303 | -- | (31,828) | 117,074 | 232,532 |
| Ubisoft Entertainment SA | 677,873 | -- | 128,854 | -- | 105,360 | 129,959 | 784,338 |
| Wingstop, Inc. | 49,616 | -- | 28,061 | 174 | 3,760 | 14,462 | -- |
| Total | $1,529,324 | $-- | $472,624 | $174 | $83,292 | $147,311 | $1,016,870 |
* Includes the value of securities delivered through in-kind transactions, if applicable.
Investment Valuation
The following is a summary of the inputs used, as of January 31, 2018, involving the Fund's assets and liabilities carried at fair value. The inputs or methodology used for valuing securities may not be an indication of the risk associated with investing in those securities. For more information on valuation inputs, and their aggregation into the levels used below, please refer to the Investment Valuation section in the accompanying Notes to Financial Statements.
| | Valuation Inputs at Reporting Date: |
| Description | Total | Level 1 | Level 2 | Level 3 |
| (Amounts in thousands) | | | | |
| Investments in Securities: | | | | |
| Equities: | | | | |
| Consumer Discretionary | $4,325,766 | $4,143,495 | $153,638 | $28,633 |
| Consumer Staples | 835,047 | 800,062 | 1,774 | 33,211 |
| Energy | 187,824 | 187,824 | -- | -- |
| Financials | 959,428 | 953,380 | -- | 6,048 |
| Health Care | 2,313,264 | 2,211,638 | 6,880 | 94,746 |
| Industrials | 364,738 | 311,699 | -- | 53,039 |
| Information Technology | 10,182,070 | 9,923,363 | 34,491 | 224,216 |
| Materials | 197,242 | 197,242 | -- | -- |
| Real Estate | 44,813 | 28,564 | -- | 16,249 |
| Telecommunication Services | 10,556 | 7,850 | -- | 2,706 |
| Corporate Bonds | 14,228 | -- | -- | 14,228 |
| Money Market Funds | 905,238 | 905,238 | -- | -- |
| Total Investments in Securities: | $20,340,214 | $19,670,355 | $196,783 | $473,076 |
The following is a reconciliation of Investments in Securities and Derivative Instruments for which Level 3 inputs were used in determining value:
| (Amounts in thousands) | |
| Investments in Securities: | |
| Equities - Information Technology | |
| Beginning Balance | $276,076 |
| Net Realized Gain (Loss) on Investment Securities | -- |
| Net Unrealized Gain (Loss) on Investment Securities | (50,370) |
| Cost of Purchases | 8,298 |
| Proceeds of Sales | (9,788) |
| Amortization/Accretion | -- |
| Transfers into Level 3 | -- |
| Transfers out of Level 3 | -- |
| Ending Balance | $224,216 |
| The change in unrealized gain (loss) for the period attributable to Level 3 securities held at January 31, 2018 | $(48,291) |
| Other Investments in Securities | |
| Beginning Balance | $210,038 |
| Net Realized Gain (Loss) on Investment Securities | (144) |
| Net Unrealized Gain (Loss) on Investment Securities | (17,799) |
| Cost of Purchases | 83,206 |
| Proceeds of Sales | (26,441) |
| Amortization/Accretion | -- |
| Transfers into Level 3 | -- |
| Transfers out of Level 3 | -- |
| Ending Balance | $248,860 |
| The change in unrealized gain (loss) for the period attributable to Level 3 securities held at January 31, 2018 | $3,546 |
The information used in the above reconciliations represents fiscal year to date activity for any Investments in Securities identified as using Level 3 inputs at either the beginning or the end of the current fiscal period. Transfers in or out of Level 3 represent the beginning value of any Security or Instrument where a change in the pricing level occurred from the beginning to the end of the period. The cost of purchases and the proceeds of sales may include securities received or delivered through corporate actions or exchanges. Realized and unrealized gains (losses) disclosed in the reconciliations are included in Net Gain (Loss) on the Fund’s Statement of Operations.
See accompanying notes which are an integral part of the financial statements.
Financial Statements
Statement of Assets and Liabilities
| Amounts in thousands (except per-share amounts) | | January 31, 2018 (Unaudited) |
| Assets | | |
Investment in securities, at value (including securities loaned of $829,096) — See accompanying schedule:
Unaffiliated issuers (cost $11,107,454) | $18,418,106 | |
| Fidelity Central Funds (cost $905,236) | 905,238 | |
| Other affiliated issuers (cost $415,256) | 1,016,870 | |
| Total Investment in Securities (cost $12,427,946) | | $20,340,214 |
| Foreign currency held at value (cost $1,984) | | 1,984 |
| Receivable for investments sold | | 81,911 |
| Receivable for fund shares sold | | 19,690 |
| Dividends receivable | | 222 |
| Interest receivable | | 91 |
| Distributions receivable from Fidelity Central Funds | | 581 |
| Prepaid expenses | | 22 |
| Other receivables | | 304 |
| Total assets | | 20,445,019 |
| Liabilities | | |
| Payable for investments purchased | $62,514 | |
| Payable for fund shares redeemed | 17,778 | |
| Accrued management fee | 10,618 | |
| Other affiliated payables | 1,987 | |
| Other payables and accrued expenses | 216 | |
| Collateral on securities loaned | 832,005 | |
| Total liabilities | | 925,118 |
| Net Assets | | $19,519,901 |
| Net Assets consist of: | | |
| Paid in capital | | $11,469,183 |
| Accumulated net investment loss | | (22,789) |
| Accumulated undistributed net realized gain (loss) on investments and foreign currency transactions | | 161,249 |
| Net unrealized appreciation (depreciation) on investments and assets and liabilities in foreign currencies | | 7,912,258 |
| Net Assets | | $19,519,901 |
| OTC: | | |
| Net Asset Value, offering price and redemption price per share ($15,485,729 ÷ 130,233 shares) | | $118.91 |
| Class K: | | |
| Net Asset Value, offering price and redemption price per share ($4,034,172 ÷ 33,493 shares) | | $120.45 |
See accompanying notes which are an integral part of the financial statements.
Statement of Operations
| Amounts in thousands | | Six months ended January 31, 2018 (Unaudited) |
| Investment Income | | |
| Dividends (including $174 earned from other affiliated issuers) | | $47,281 |
| Interest | | 87 |
| Income from Fidelity Central Funds (including $2,962 from security lending) | | 3,182 |
| Total income | | 50,550 |
| Expenses | | |
| Management fee | | |
| Basic fee | $50,718 | |
| Performance adjustment | 10,581 | |
| Transfer agent fees | 10,765 | |
| Accounting and security lending fees | 906 | |
| Custodian fees and expenses | 168 | |
| Independent trustees' fees and expenses | 38 | |
| Appreciation in deferred trustee compensation account | 1 | |
| Registration fees | 214 | |
| Audit | 42 | |
| Legal | 32 | |
| Interest | 5 | |
| Miscellaneous | 51 | |
| Total expenses before reductions | 73,521 | |
| Expense reductions | (318) | 73,203 |
| Net investment income (loss) | | (22,653) |
| Realized and Unrealized Gain (Loss) | | |
| Net realized gain (loss) on: | | |
| Investment securities: | | |
| Unaffiliated issuers | 224,675 | |
| Fidelity Central Funds | 46 | |
| Other affiliated issuers | 83,292 | |
| Foreign currency transactions | (103) | |
| Total net realized gain (loss) | | 307,910 |
| Change in net unrealized appreciation (depreciation) on: | | |
| Investment securities: | | |
| Unaffiliated issuers | 2,516,219 | |
| Fidelity Central Funds | (24) | |
| Other affiliated issuers | 147,311 | |
| Assets and liabilities in foreign currencies | 22 | |
| Total change in net unrealized appreciation (depreciation) | | 2,663,528 |
| Net gain (loss) | | 2,971,438 |
| Net increase (decrease) in net assets resulting from operations | | $2,948,785 |
See accompanying notes which are an integral part of the financial statements.
Statement of Changes in Net Assets
| Amounts in thousands | Six months ended January 31, 2018 (Unaudited) | Year ended July 31, 2017 |
| Increase (Decrease) in Net Assets | | |
| Operations | | |
| Net investment income (loss) | $(22,653) | $(18,864) |
| Net realized gain (loss) | 307,910 | 1,654,079 |
| Change in net unrealized appreciation (depreciation) | 2,663,528 | 1,836,371 |
| Net increase (decrease) in net assets resulting from operations | 2,948,785 | 3,471,586 |
| Distributions to shareholders from net realized gain | (808,257) | (413,520) |
| Total distributions | (808,257) | (413,520) |
| Share transactions - net increase (decrease) | 1,581,566 | (614,015) |
| Total increase (decrease) in net assets | 3,722,094 | 2,444,051 |
| Net Assets | | |
| Beginning of period | 15,797,807 | 13,353,756 |
| End of period | $19,519,901 | $15,797,807 |
| Other Information | | |
| Accumulated net investment loss end of period | $(22,789) | $(136) |
See accompanying notes which are an integral part of the financial statements.
Financial Highlights
Fidelity OTC Portfolio
| | Six months ended (Unaudited) January 31, | Years endedJuly 31, | | | | |
| | 2018 | 2017 | 2016 | 2015 | 2014 | 2013 |
| Selected Per–Share Data | | | | | | |
| Net asset value, beginning of period | $105.68 | $85.26 | $86.98 | $81.23 | $78.98 | $57.53 |
| Income from Investment Operations | | | | | | |
| Net investment income (loss)A | (.16) | (.15) | (.05) | (.11) | (.06) | .36B |
| Net realized and unrealized gain (loss) | 18.73 | 23.27 | 2.84 | 16.14 | 12.78 | 21.37 |
| Total from investment operations | 18.57 | 23.12 | 2.79 | 16.03 | 12.72 | 21.73 |
| Distributions from net investment income | – | – | – | – | (.05) | (.28) |
| Distributions from net realized gain | (5.34) | (2.70) | (4.51) | (10.28) | (10.42) | – |
| Total distributions | (5.34) | (2.70) | (4.51) | (10.28) | (10.47) | (.28) |
| Net asset value, end of period | $118.91 | $105.68 | $85.26 | $86.98 | $81.23 | $78.98 |
| Total ReturnC,D | 18.28% | 27.97% | 3.68% | 21.34% | 17.96% | 37.93% |
| Ratios to Average Net AssetsE,F | | | | | | |
| Expenses before reductions | .88%G | .81% | .91% | .83% | .77% | .76% |
| Expenses net of fee waivers, if any | .88%G | .81% | .91% | .83% | .77% | .76% |
| Expenses net of all reductions | .88%G | .81% | .90% | .83% | .76% | .74% |
| Net investment income (loss) | (.29)%G | (.16)% | (.07)% | (.13)% | (.08)% | .55%B |
| Supplemental Data | | | | | | |
| Net assets, end of period (in millions) | $15,486 | $12,136 | $9,845 | $9,710 | $7,870 | $6,693 |
| Portfolio turnover rateH | 34%G,I | 71%I | 56%I | 66%I | 106% | 116% |
A Calculated based on average shares outstanding during the period.
B Net Investment income per share reflects a large, non-recurring dividend which amounted to $.10 per share. Excluding this non-recurring dividend, the ratio of net investment income (loss) to average net assets would have been .40%.
C Total returns for periods of less than one year are not annualized.
D Total returns would have been lower if certain expenses had not been reduced during the applicable periods shown.
E Fees and expenses of any underlying Fidelity Central Funds are not included in the Fund's expense ratio. The Fund indirectly bears its proportionate share of the expenses of any underlying Fidelity Central Funds.
F Expense ratios reflect operating expenses of the class. Expenses before reductions do not reflect amounts reimbursed by the investment adviser or reductions from brokerage service arrangements or reductions from other expense offset arrangements and do not represent the amount paid by the class during periods when reimbursements or reductions occur. Expenses net of fee waivers reflect expenses after reimbursement by the investment adviser but prior to reductions from brokerage service arrangements or other expense offset arrangements. Expenses net of all reductions represent the net expenses paid by the class.
G Annualized
H Amount does not include the portfolio activity of any underlying Fidelity Central Funds.
I Portfolio turnover rate excludes securities received or delivered in-kind.
See accompanying notes which are an integral part of the financial statements.
Fidelity OTC Portfolio Class K
| | Six months ended (Unaudited) January 31, | Years endedJuly 31, | | | | |
| | 2018 | 2017 | 2016 | 2015 | 2014 | 2013 |
| Selected Per–Share Data | | | | | | |
| Net asset value, beginning of period | $106.98 | $86.22 | $87.87 | $81.96 | $79.60 | $57.94 |
| Income from Investment Operations | | | | | | |
| Net investment income (loss)A | (.10) | (.05) | .04 | (.01) | .04 | .45B |
| Net realized and unrealized gain (loss) | 18.96 | 23.55 | 2.88 | 16.29 | 12.87 | 21.53 |
| Total from investment operations | 18.86 | 23.50 | 2.92 | 16.28 | 12.91 | 21.98 |
| Distributions from net investment income | – | – | – | – | (.10) | (.32) |
| Distributions from net realized gain | (5.39) | (2.74) | (4.57) | (10.37) | (10.46) | – |
| Total distributions | (5.39) | (2.74) | (4.57) | (10.37) | (10.55)C | (.32) |
| Net asset value, end of period | $120.45 | $106.98 | $86.22 | $87.87 | $81.96 | $79.60 |
| Total ReturnD,E | 18.34% | 28.12% | 3.80% | 21.49% | 18.10% | 38.11% |
| Ratios to Average Net AssetsF,G | | | | | | |
| Expenses before reductions | .78%H | .70% | .79% | .72% | .65% | .62% |
| Expenses net of fee waivers, if any | .78%H | .70% | .79% | .72% | .65% | .62% |
| Expenses net of all reductions | .78%H | .70% | .79% | .71% | .64% | .60% |
| Net investment income (loss) | (.19)%H | (.05)% | .05% | (.02)% | .05% | .69%B |
| Supplemental Data | | | | | | |
| Net assets, end of period (in millions) | $4,034 | $3,662 | $3,508 | $3,836 | $2,906 | $2,260 |
| Portfolio turnover rateI | 34%H,J | 71%J | 56%J | 66%J | 106% | 116% |
A Calculated based on average shares outstanding during the period.
B Net Investment income per share reflects a large, non-recurring dividend which amounted to $.10 per share. Excluding this non-recurring dividend, the ratio of net investment income (loss) to average net assets would have been .53%.
C Total distributions of $10.55 per share is comprised of distributions from net investment income of $.098 and distributions from net realized gain of $10.456 per share.
D Total returns for periods of less than one year are not annualized.
E Total returns would have been lower if certain expenses had not been reduced during the applicable periods shown.
F Fees and expenses of any underlying Fidelity Central Funds are not included in the Fund's expense ratio. The Fund indirectly bears its proportionate share of the expenses of any underlying Fidelity Central Funds.
G Expense ratios reflect operating expenses of the class. Expenses before reductions do not reflect amounts reimbursed by the investment adviser or reductions from brokerage service arrangements or reductions from other expense offset arrangements and do not represent the amount paid by the class during periods when reimbursements or reductions occur. Expenses net of fee waivers reflect expenses after reimbursement by the investment adviser but prior to reductions from brokerage service arrangements or other expense offset arrangements. Expenses net of all reductions represent the net expenses paid by the class.
H Annualized
I Amount does not include the portfolio activity of any underlying Fidelity Central Funds.
J Portfolio turnover rate excludes securities received or delivered in-kind.
See accompanying notes which are an integral part of the financial statements.
Notes to Financial Statements (Unaudited)
For the period ended January 31, 2018
(Amounts in thousands except percentages)
1. Organization.
Fidelity OTC Portfolio (the Fund) is a non-diversified fund of Fidelity Securities Fund (the Trust) and is authorized to issue an unlimited number of shares. The Trust is registered under the Investment Company Act of 1940, as amended (the 1940 Act), as an open-end management investment company organized as a Massachusetts business trust. The Fund offers OTC and Class K shares, each of which has equal rights as to assets and voting privileges. Each class has exclusive voting rights with respect to matters that affect that class.
2. Investments in Fidelity Central Funds.
The Fund invests in Fidelity Central Funds, which are open-end investment companies generally available only to other investment companies and accounts managed by the investment adviser and its affiliates. The Fund's Schedule of Investments lists each of the Fidelity Central Funds held as of period end, if any, as an investment of the Fund, but does not include the underlying holdings of each Fidelity Central Fund. As an Investing Fund, the Fund indirectly bears its proportionate share of the expenses of the underlying Fidelity Central Funds.
The Money Market Central Funds seek preservation of capital and current income and are managed by Fidelity Investments Money Management, Inc. (FIMM), an affiliate of the investment adviser. Annualized expenses of the Money Market Central Funds as of their most recent shareholder report date are less than .005%.
A complete unaudited list of holdings for each Fidelity Central Fund is available upon request or at the Securities and Exchange Commission (the SEC) website at www.sec.gov. In addition, the financial statements of the Fidelity Central Funds are available on the SEC website or upon request.
3. Significant Accounting Policies.
The Fund is an investment company and applies the accounting and reporting guidance of the Financial Accounting Standards Board (FASB) Accounting Standards Codification Topic 946 Financial Services – Investments Companies. The financial statements have been prepared in conformity with accounting principles generally accepted in the United States of America (GAAP), which require management to make certain estimates and assumptions at the date of the financial statements. Actual results could differ from those estimates. Subsequent events, if any, through the date that the financial statements were issued have been evaluated in the preparation of the financial statements. The following summarizes the significant accounting policies of the Fund:
Investment Valuation. Investments are valued as of 4:00 p.m. Eastern time on the last calendar day of the period. The Board of Trustees (the Board) has delegated the day to day responsibility for the valuation of the Fund's investments to the Fair Value Committee (the Committee) established by the Fund's investment adviser. In accordance with valuation policies and procedures approved by the Board, the Fund attempts to obtain prices from one or more third party pricing vendors or brokers to value its investments. When current market prices, quotations or currency exchange rates are not readily available or reliable, investments will be fair valued in good faith by the Committee, in accordance with procedures adopted by the Board. Factors used in determining fair value vary by investment type and may include market or investment specific events, changes in interest rates and credit quality. The frequency with which these procedures are used cannot be predicted and they may be utilized to a significant extent. The Committee oversees the Fund's valuation policies and procedures and reports to the Board on the Committee's activities and fair value determinations. The Board monitors the appropriateness of the procedures used in valuing the Fund's investments and ratifies the fair value determinations of the Committee.
The Fund categorizes the inputs to valuation techniques used to value its investments into a disclosure hierarchy consisting of three levels as shown below:
- Level 1 – quoted prices in active markets for identical investments
- Level 2 – other significant observable inputs (including quoted prices for similar investments, interest rates, prepayment speeds, etc.)
- Level 3 – unobservable inputs (including the Fund's own assumptions based on the best information available)
Valuation techniques used to value the Fund's investments by major category are as follows:
Equity securities, including restricted securities, for which market quotations are readily available, are valued at the last reported sale price or official closing price as reported by a third party pricing vendor on the primary market or exchange on which they are traded and are categorized as Level 1 in the hierarchy. In the event there were no sales during the day or closing prices are not available, securities are valued at the last quoted bid price or may be valued using the last available price and are generally categorized as Level 2 in the hierarchy. For foreign equity securities, when market or security specific events arise, comparisons to the valuation of American Depositary Receipts (ADRs), futures contracts, Exchange-Traded Funds (ETFs) and certain indexes as well as quoted prices for similar securities may be used and would be categorized as Level 2 in the hierarchy. Utilizing these techniques may result in transfers between Level 1 and Level 2. For equity securities, including restricted securities, where observable inputs are limited, assumptions about market activity and risk are used and these securities may be categorized as Level 3 in the hierarchy. Equity securities, including restricted securities, for which observable inputs are not available are valued using alternate valuation approaches, including the market approach and the income approach and are categorized as Level 3 in the hierarchy. The market approach generally consists of using comparable market transactions while the income approach generally consists of using the net present value of estimated future cash flows, adjusted as appropriate for liquidity, credit, market and/or other risk factors.
Debt securities, including restricted securities, are valued based on evaluated prices received from third party pricing vendors or from brokers who make markets in such securities. Corporate bonds are valued by pricing vendors who utilize matrix pricing which considers yield or price of bonds of comparable quality, coupon, maturity and type or by broker-supplied prices. When independent prices are unavailable or unreliable, debt securities may be valued utilizing pricing methodologies which consider similar factors that would be used by third party pricing vendors. Debt securities are generally categorized as Level 2 in the hierarchy but may be Level 3 depending on the circumstances.
Investments in open-end mutual funds, including the Fidelity Central Funds, are valued at their closing net asset value (NAV) each business day and are categorized as Level 1 in the hierarchy.
The following provides information on Level 3 securities held by the Fund that were valued at period end based on unobservable inputs. These amounts exclude valuations provided by a broker.
| Asset Type | Fair Value | Valuation Technique (s) | Unobservable Input | Amount or Range / Weighted Average | Impact to Valuation from an Increase in Input(a) |
| Corporate Bonds | $14,228 | Market approach | Transaction price | $100.00 | Increase |
| Equities | $458,848 | Market approach | Transaction price | $0.81- $353.57 / $75.02 | Increase |
| | | | Discount rate | 5.0% | Decrease |
| | | | Liquidity preference | $33.82 - $45.76 / $39.79 | Increase |
| | | Market comparable | Transaction price | $10.06 - $330.00 / $164.48 | Increase |
| | | | Enterprise value/Sales multiple (EV/S) | 0.8 - 14.3 / 4.1 | Increase |
| | | | Discount rate | 65.0% - 69.1% / 68.9% | Decrease |
| | | | Premium rate | 8.0% - 108.0% / 26.6% | Increase |
| | | | Discount for lack of marketability | 15.0% - 25.0% / 16.5% | Decrease |
| | | | Liquidity preference | $4.84 - $26.00 / $15.77 | Increase |
| | | | Proxy premium | 54.5% | Increase |
| | | Book value | Book value multiple | 1.0 | Increase |
| | | | Discount rate | 70.0% | Decrease |
| | | Recovery value | Recovery value | 0.3% - 0.7% / 0.4% | Increase |
| | | Discount cash flow | Discount rate | 9.0% | Decrease |
| | | | Discount for lack of marketability | 20.0% | Decrease |
| | | | Growth rate | 3.0% | Increase |
(a) Represents the expected directional change in the fair value of the Level 3 investments that would result from an increase in the corresponding input. A decrease to the unobservable input would have the opposite effect. Significant changes in these inputs could result in significantly higher or lower fair value measurements.
Changes in valuation techniques may result in transfers in or out of an assigned level within the disclosure hierarchy. The aggregate value of investments by input level as of January 31, 2018, as well as a roll forward of Level 3 investments, is included at the end of the Fund's Schedule of Investments.
Foreign Currency. The Fund may use foreign currency contracts to facilitate transactions in foreign-denominated securities. Gains and losses from these transactions may arise from changes in the value of the foreign currency or if the counterparties do not perform under the contracts' terms.
Foreign-denominated assets, including investment securities, and liabilities are translated into U.S. dollars at the exchange rates at period end. Purchases and sales of investment securities, income and dividends received and expenses denominated in foreign currencies are translated into U.S. dollars at the exchange rate in effect on the transaction date.
The effects of exchange rate fluctuations on investments are included with the net realized and unrealized gain (loss) on investment securities. Other foreign currency transactions resulting in realized and unrealized gain (loss) are disclosed separately.
Investment Transactions and Income. For financial reporting purposes, the Fund's investment holdings and NAV include trades executed through the end of the last business day of the period. The NAV per share for processing shareholder transactions is calculated as of the close of business of the New York Stock Exchange (NYSE), normally 4:00 p.m. Eastern time and includes trades executed through the end of the prior business day. Gains and losses on securities sold are determined on the basis of identified cost and includes proceeds received from litigation. Dividend income is recorded on the ex-dividend date, except for certain dividends from foreign securities where the ex-dividend date may have passed, which are recorded as soon as the Fund is informed of the ex-dividend date. Non-cash dividends included in dividend income, if any, are recorded at the fair market value of the securities received. Income and capital gain distributions from Fidelity Central Funds, if any, are recorded on the ex-dividend date. Certain distributions received by the Fund represent a return of capital or capital gain. The Fund determines the components of these distributions subsequent to the ex-dividend date, based upon receipt of tax filings or other correspondence relating to the underlying investment. These distributions are recorded as a reduction of cost of investments and/or as a realized gain. Interest income is accrued as earned and includes coupon interest and amortization of premium and accretion of discount on debt securities as applicable. Investment income is recorded net of foreign taxes withheld where recovery of such taxes is uncertain.
Class Allocations and Expenses. Investment income, realized and unrealized capital gains and losses, common expenses of the Fund, and certain fund-level expense reductions, if any, are allocated daily on a pro-rata basis to each class based on the relative net assets of each class to the total net assets of the Fund. Each class differs with respect to transfer agent fees incurred. Certain expense reductions may also differ by class. For the reporting period, the allocated portion of income and expenses to each class as a percent of its average net assets may vary due to the timing of recording these transactions in relation to fluctuating net assets of the classes. Expenses directly attributable to a fund are charged to that fund. Expenses attributable to more than one fund are allocated among the respective funds on the basis of relative net assets or other appropriate methods. Expense estimates are accrued in the period to which they relate and adjustments are made when actual amounts are known.
Deferred Trustee Compensation. Under a Deferred Compensation Plan (the Plan), independent Trustees may elect to defer receipt of a portion of their annual compensation. Deferred amounts are invested in a cross-section of Fidelity funds, are marked-to-market and remain in the Fund until distributed in accordance with the Plan. The investment of deferred amounts and the offsetting payable to the Trustees are included in the accompanying Statement of Assets and Liabilities.
Income Tax Information and Distributions to Shareholders. Each year, the Fund intends to qualify as a regulated investment company under Subchapter M of the Internal Revenue Code, including distributing substantially all of its taxable income and realized gains. As a result, no provision for U.S. Federal income taxes is required. The Fund files a U.S. federal tax return, in addition to state and local tax returns as required. The Fund's federal income tax returns are subject to examination by the Internal Revenue Service (IRS) for a period of three fiscal years after they are filed. State and local tax returns may be subject to examination for an additional fiscal year depending on the jurisdiction. Foreign taxes are provided for based on the Fund's understanding of the tax rules and rates that exist in the foreign markets in which it invests.
Distributions are declared and recorded on the ex-dividend date. Income dividends and capital gain distributions are declared separately for each class. Income and capital gain distributions are determined in accordance with income tax regulations, which may differ from GAAP.
Capital accounts within the financial statements are adjusted for permanent book-tax differences. These adjustments have no impact on net assets or the results of operations. Capital accounts are not adjusted for temporary book-tax differences which will reverse in a subsequent period.
Book-tax differences are primarily due to redemptions in kind, foreign currency transactions, passive foreign investment companies (PFIC), partnerships, deferred trustees compensation and losses deferred due to wash sales and excise tax regulations.
As of period end, the cost and unrealized appreciation (depreciation) in securities, and derivatives if applicable, for federal income tax purposes were as follows:
| Gross unrealized appreciation | $8,374,482 |
| Gross unrealized depreciation | (499,511) |
| Net unrealized appreciation (depreciation) | $7,874,971 |
| Tax cost | $12,465,243 |
Restricted Securities. The Fund may invest in securities that are subject to legal or contractual restrictions on resale. These securities generally may be resold in transactions exempt from registration or to the public if the securities are registered. Disposal of these securities may involve time-consuming negotiations and expense, and prompt sale at an acceptable price may be difficult. Information regarding restricted securities is included at the end of the Fund's Schedule of Investments.
Consolidated Subsidiary. The Fund invests in certain investments through a wholly-owned subsidiary ("Subsidiary"), which may be subject to federal and state taxes upon disposition.
As of period end, the Fund held an investment of $23,946 in these Subsidiaries, representing .12% of the Fund's net assets. The financial statements have been consolidated and include accounts of the Fund and each Subsidiary. Accordingly, all inter-company transactions and balances have been eliminated.
4. Purchases and Sales of Investments.
Purchases and sales of securities, other than short-term securities and in-kind transactions, aggregated $3,724,184 and $2,954,148, respectively.
Redemptions In-Kind. During the period, 607 shares of the Fund held by unaffiliated entities were redeemed in-kind for investments and cash with a value of $65,932. The net realized gain of $35,542 on investments delivered through in-kind redemptions is included in the accompanying Statement of Operations. The amount of the in-kind redemptions is included in share transactions in the accompanying Statement of Changes in Net Assets as well as the Notes to Financial Statements. The Fund recognized no gain or loss for federal income tax purposes.
Prior Fiscal Year Redemptions In-Kind. During the prior period, 11,615 shares of the Fund held by unaffiliated entities were redeemed in-kind for investments and cash with a value of $1,105,548. The Fund had a net realized gain of $441,424 on investments delivered through the in-kind redemptions. The amount of the in-kind redemptions is included in share transactions in the accompanying Statement of Changes in Net Assets as well as the Notes to Financial Statements. The Fund recognized no gain or loss for federal income tax purposes.
5. Fees and Other Transactions with Affiliates.
Management Fee. Fidelity Management & Research Company (the investment adviser) and its affiliates provide the Fund with investment management related services for which the Fund pays a monthly management fee. The management fee is the sum of an individual fund fee rate that is based on an annual rate of .35% of the Fund's average net assets and an annualized group fee rate that averaged .24% during the period. The group fee rate is based upon the average net assets of all the mutual funds advised by the investment adviser, including any mutual funds previously advised by the investment adviser that are currently advised by Fidelity SelectCo, LLC, an affiliate of the investment adviser. The group fee rate decreases as assets under management increase and increases as assets under management decrease. In addition, the management fee is subject to a performance adjustment (up to a maximum of +/- .20% of the Fund's average net assets over a 36 month performance period). The upward or downward adjustment to the management fee is based on the relative investment performance of OTC as compared to its benchmark index, the Nasdaq Composite Index, over the same 36 month performance period. For the reporting period, the total annualized management fee rate, including the performance adjustment, was .72% of the Fund's average net assets. The performance adjustment included in the management fee rate may be higher or lower than the maximum performance adjustment rate due to the difference between the average net assets for the reporting and performance periods.
Transfer Agent Fees. Fidelity Investments Institutional Operations Company, Inc., (FIIOC), an affiliate of the investment adviser, is the transfer, dividend disbursing and shareholder servicing agent for each class of the Fund. FIIOC receives account fees and asset-based fees that vary according to the account size and type of account of the shareholders of OTC. FIIOC receives an asset-based fee of Class K's average net assets. FIIOC pays for typesetting, printing and mailing of shareholder reports, except proxy statements.
For the period, transfer agent fees for each class were as follows:
| | Amount | % of Class-Level Average Net Assets(a) |
| OTC | $9,882 | .15 |
| Class K | 883 | .05 |
| | $10,765 | |
(a) Annualized
Accounting and Security Lending Fees. Fidelity Service Company, Inc. (FSC), an affiliate of the investment adviser, maintains the Fund's accounting records. The accounting fee is based on the level of average net assets for each month. Under a separate contract, FSC administers the security lending program. The security lending fee is based on the number and duration of lending transactions.
Brokerage Commissions. The Fund placed a portion of its portfolio transactions with brokerage firms which are affiliates of the investment adviser. Brokerage commissions are included in net realized gain (loss) and change in net unrealized appreciation (depreciation) in the Statement of Operations. The commissions paid to these affiliated firms were $97 for the period.
Interfund Lending Program. Pursuant to an Exemptive Order issued by the SEC, the Fund, along with other registered investment companies having management contracts with Fidelity Management & Research Company (FMR) or other affiliated entities of FMR, may participate in an interfund lending program. This program provides an alternative credit facility allowing the funds to borrow from, or lend money to, other participating affiliated funds. At period end, there were no interfund loans outstanding. The Fund's activity in this program during the period for which loans were outstanding was as follows:
| Borrower or Lender | Average Loan Balance | Weighted Average Interest Rate | Interest Expense |
| Borrower | $11,720 | 1.37% | $5 |
Interfund Trades. The Fund may purchase from or sell securities to other Fidelity Funds under procedures adopted by the Board. The procedures have been designed to ensure these interfund trades are executed in accordance with Rule 17a-7 of the 1940 Act. Interfund trades are included within the respective purchases and sales amounts shown in the Purchases and Sales of Investments note.
6. Committed Line of Credit.
The Fund participates with other funds managed by the investment adviser or an affiliate in a $4.25 billion credit facility (the "line of credit") to be utilized for temporary or emergency purposes to fund shareholder redemptions or for other short-term liquidity purposes. The Fund has agreed to pay commitment fees on its pro-rata portion of the line of credit, which amounted to $24 and is reflected in Miscellaneous expenses on the Statement of Operations. During the period, the Fund did not borrow on this line of credit.
7. Security Lending.
The Fund lends portfolio securities through a lending agent from time to time in order to earn additional income. For equity securities, a lending agent is used and may loan securities to certain qualified borrowers, including Fidelity Capital Markets (FCM), a broker-dealer affiliated with the Fund. On the settlement date of the loan, the Fund receives collateral (in the form of U.S. Treasury obligations, letters of credit and/or cash) against the loaned securities and maintains collateral in an amount not less than 100% of the market value of the loaned securities during the period of the loan. The market value of the loaned securities is determined at the close of business of the Fund and any additional required collateral is delivered to the Fund on the next business day. The Fund or borrower may terminate the loan at any time, and if the borrower defaults on its obligation to return the securities loaned because of insolvency or other reasons, the Fund may apply collateral received from the borrower against the obligation. The Fund may experience delays and costs in recovering the securities loaned. Any cash collateral received is invested in the Fidelity Securities Lending Cash Central Fund. The value of loaned securities and cash collateral at period end are disclosed on the Fund's Statement of Assets and Liabilities. The value of securities loaned to FCM at period end was $22,887. Security lending income represents the income earned on investing cash collateral, less rebates paid to borrowers and any lending agent fees associated with the loan, plus any premium payments received for lending certain types of securities. Security lending income is presented in the Statement of Operations as a component of income from Fidelity Central Funds, and includes $127 from securities loaned to FCM.
8. Expense Reductions.
Commissions paid to certain brokers with whom the investment adviser, or its affiliates, places trades on behalf of the Fund include an amount in addition to trade execution, which may be rebated back to the Fund to offset certain expenses. This amount totaled $226 for the period. In addition, through arrangements with the Fund's custodian, credits realized as a result of certain uninvested cash balances were used to reduce the Fund's expenses. During the period, these credits reduced the Fund's custody expenses by $4.
In addition, during the period the investment adviser reimbursed and/or waived a portion of fund-level operating expenses in the amount of $88.
9. Distributions to Shareholders.
Distributions to shareholders of each class were as follows:
| | Six months ended
January 31, 2018 | Year ended
July 31, 2017 |
| From net realized gain | | |
| OTC | $625,105 | $305,214 |
| Class K | 183,152 | 108,306 |
| Total | $808,257 | $413,520 |
10. Share Transactions.
Share transactions for each class were as follows and may contain automatic conversions between classes or exchanges between affiliated funds:
| | Shares | Shares | Dollars | Dollars |
| | Six months ended January 31, 2018 | Year ended July 31, 2017 | Six months ended January 31, 2018 | Year ended July 31, 2017 |
| OTC | | | | |
| Shares sold | 19,774 | 23,115 | $2,175,861 | $2,182,339 |
| Reinvestment of distributions | 5,739 | 3,540 | 601,208 | 294,662 |
| Shares redeemed | (10,120) | (27,294) | (1,102,724) | (2,508,373) |
| Net increase (decrease) | 15,393 | (639) | $1,674,345 | $(31,372) |
| Class K | | | | |
| Shares sold | 4,836 | 9,395 | $537,543 | $878,574 |
| Reinvestment of distributions | 1,727 | 1,286 | 183,152 | 108,306 |
| Shares redeemed | (7,300)(a) | (17,142)(b) | (813,474)(a) | (1,569,523)(b) |
| Net increase (decrease) | (737) | (6,461) | $(92,779) | $(582,643) |
(a) Amount includes in-kind redemptions (see the Redemption In-Kind note for additional details).
(b) Amount includes in-kind redemptions (see the Prior Fiscal Year Redemption In-Kind note for additional details).
11. Other.
The Fund's organizational documents provide former and current trustees and officers with a limited indemnification against liabilities arising in connection with the performance of their duties to the Fund. In the normal course of business, the Fund may also enter into contracts that provide general indemnifications. The Fund's maximum exposure under these arrangements is unknown as this would be dependent on future claims that may be made against the Fund. The risk of material loss from such claims is considered remote.
Shareholder Expense Example
As a shareholder of the Fund, you incur two types of costs: (1) transaction costs and (2) ongoing costs, including management fees and other Fund expenses. This Example is intended to help you understand your ongoing costs (in dollars) of investing in the Fund and to compare these costs with the ongoing costs of investing in other mutual funds.
The Example is based on an investment of $1,000 invested at the beginning of the period and held for the entire period (August 1, 2017 to January 31, 2018).
Actual Expenses
The first line of the accompanying table for each class of the Fund provides information about actual account values and actual expenses. You may use the information in this line, together with the amount you invested, to estimate the expenses that you paid over the period. Simply divide your account value by $1,000.00 (for example, an $8,600 account value divided by $1,000.00 = 8.6), then multiply the result by the number in the first line for a class of the Fund under the heading entitled "Expenses Paid During Period" to estimate the expenses you paid on your account during this period. A small balance maintenance fee of $12.00 that is charged once a year may apply for certain accounts with a value of less than $2,000. This fee is not included in the table below. If it was, the estimate of expenses you paid during the period would be higher, and your ending account value lower, by this amount. In addition, the Fund, as a shareholder in the underlying Fidelity Central Funds, will indirectly bear its pro-rata share of the fees and expenses incurred by the underlying Fidelity Central Funds. These fees and expenses are not included in the Fund's annualized expense ratio used to calculate the expense estimate in the table below.
Hypothetical Example for Comparison Purposes
The second line of the accompanying table for each class of the Fund provides information about hypothetical account values and hypothetical expenses based on a Class' actual expense ratio and an assumed rate of return of 5% per year before expenses, which is not the Class' actual return. The hypothetical account values and expenses may not be used to estimate the actual ending account balance or expenses you paid for the period. You may use this information to compare the ongoing costs of investing in the Fund and other funds. To do so, compare this 5% hypothetical example with the 5% hypothetical examples that appear in the shareholder reports of the other funds. A small balance maintenance fee of $12.00 that is charged once a year may apply for certain accounts with a value of less than $2,000. This fee is not included in the table below. If it was, the estimate of expenses you paid during the period would be higher, and your ending account value lower, by this amount. In addition, the Fund, as a shareholder in the underlying Fidelity Central Funds, will indirectly bear its pro-rata share of the fees and expenses incurred by the underlying Fidelity Central Funds. These fees and expenses are not included in the Fund's annualized expense ratio used to calculate the expense estimate in the table below.
Please note that the expenses shown in the table are meant to highlight your ongoing costs only and do not reflect any transaction costs. Therefore, the second line of the table is useful in comparing ongoing costs only, and will not help you determine the relative total costs of owning different funds.
| | Annualized Expense Ratio-A | Beginning
Account Value
August 1, 2017 | Ending
Account Value
January 31, 2018 | Expenses Paid
During Period-B
August 1, 2017
to January 31, 2018 |
| OTC | .88% | | | |
| Actual | | $1,000.00 | $1,182.80 | $4.84 |
| Hypothetical-C | | $1,000.00 | $1,020.77 | $4.48 |
| Class K | .78% | | | |
| Actual | | $1,000.00 | $1,183.40 | $4.29 |
| Hypothetical-C | | $1,000.00 | $1,021.27 | $3.97 |
A Annualized expense ratio reflects expenses net of applicable fee waivers.
B Expenses are equal to each Class' annualized expense ratio, multiplied by the average account value over the period, multiplied by 184/365 (to reflect the one-half year period).
C 5% return per year before expenses
Corporate Headquarters
245 Summer St.
Boston, MA 02210
www.fidelity.com
OTC-K-SANN-0318
1.863325.109
Fidelity® OTC Portfolio
Semi-Annual Report January 31, 2018 |
|
Contents
To view a fund's proxy voting guidelines and proxy voting record for the 12-month period ended June 30, visit http://www.fidelity.com/proxyvotingresults or visit the Securities and Exchange Commission's (SEC) web site at http://www.sec.gov.
You may also call 1-800-544-8544 to request a free copy of the proxy voting guidelines.
Standard & Poor's, S&P and S&P 500 are registered service marks of The McGraw-Hill Companies, Inc. and have been licensed for use by Fidelity Distributors Corporation.
Other third-party marks appearing herein are the property of their respective owners.
All other marks appearing herein are registered or unregistered trademarks or service marks of FMR LLC or an affiliated company. © 2018 FMR LLC. All rights reserved.
This report and the financial statements contained herein are submitted for the general information of the shareholders of the Fund. This report is not authorized for distribution to prospective investors in the Fund unless preceded or accompanied by an effective prospectus.
A fund files its complete schedule of portfolio holdings with the SEC for the first and third quarters of each fiscal year on Form N-Q. Forms N-Q are available on the SEC’s web site at http://www.sec.gov. A fund's Forms N-Q may be reviewed and copied at the SEC’s Public Reference Room in Washington, DC. Information regarding the operation of the SEC's Public Reference Room may be obtained by calling 1-800-SEC-0330.
For a complete list of a fund's portfolio holdings, view the most recent holdings listing, semiannual report, or annual report on Fidelity's web site at http://www.fidelity.com, http://www.institutional.fidelity.com, or http://www.401k.com, as applicable.
NOT FDIC INSURED •MAY LOSE VALUE •NO BANK GUARANTEE
Neither the Fund nor Fidelity Distributors Corporation is a bank.
Investment Summary (Unaudited)
Top Ten Stocks as of January 31, 2018
| | % of fund's net assets |
| Apple, Inc. | 7.7 |
| Alphabet, Inc. Class A | 6.5 |
| Amazon.com, Inc. | 6.3 |
| Activision Blizzard, Inc. | 4.3 |
| Facebook, Inc. Class A | 4.3 |
| Ubisoft Entertainment SA | 4.0 |
| Tesla, Inc. | 3.7 |
| NVIDIA Corp. | 3.4 |
| Amgen, Inc. | 3.1 |
| Microsoft Corp. | 2.9 |
| | 46.2 |
Top Five Market Sectors as of January 31, 2018
| | % of fund's net assets |
| Information Technology | 52.3 |
| Consumer Discretionary | 22.1 |
| Health Care | 11.8 |
| Financials | 4.9 |
| Consumer Staples | 4.3 |
Asset Allocation (% of fund's net assets)
| As of January 31, 2018 * |
| | Stocks | 97.5% |
| | Convertible Securities | 2.1% |
| | Short-Term Investments and Net Other Assets (Liabilities) | 0.4% |

* Foreign investments - 9.5%
Schedule of Investments January 31, 2018 (Unaudited)
Showing Percentage of Net Assets
| Common Stocks - 97.5% | | | |
| | | Shares | Value (000s) |
| CONSUMER DISCRETIONARY - 22.0% | | | |
| Automobiles - 3.7% | | | |
| Tesla, Inc. (a)(b) | | 2,038,321 | $722,198 |
| Diversified Consumer Services - 0.1% | | | |
| Adtalem Global Education, Inc. (a) | | 117,500 | 5,405 |
| Weight Watchers International, Inc. (a) | | 60,000 | 3,857 |
| | | | 9,262 |
| Hotels, Restaurants & Leisure - 2.8% | | | |
| Bluegreen Vacations Corp. | | 483,200 | 9,176 |
| Caesars Entertainment Corp. (a) | | 404,800 | 5,647 |
| Chipotle Mexican Grill, Inc. (a) | | 200,300 | 65,049 |
| Churchill Downs, Inc. | | 313,400 | 81,171 |
| Del Frisco's Restaurant Group, Inc. (a) | | 239,600 | 4,193 |
| Hilton Grand Vacations, Inc. (a) | | 85,068 | 3,826 |
| ILG, Inc. | | 57,100 | 1,794 |
| Marriott International, Inc. Class A | | 1,672,900 | 246,485 |
| Marriott Vacations Worldwide Corp. | | 27,400 | 4,174 |
| Royal Caribbean Cruises Ltd. | | 126,500 | 16,894 |
| Starbucks Corp. | | 493,700 | 28,047 |
| Texas Roadhouse, Inc. Class A | | 99,800 | 5,860 |
| The Cheesecake Factory, Inc. (b) | | 72,200 | 3,552 |
| U.S. Foods Holding Corp. (a) | | 1,116,900 | 35,886 |
| Vail Resorts, Inc. | | 9,362 | 2,046 |
| Wingstop, Inc. (b) | | 822,520 | 39,777 |
| | | | 553,577 |
| Household Durables - 0.7% | | | |
| Panasonic Corp. | | 112,900 | 1,676 |
| Roku, Inc. Class B | | 3,613,398 | 139,437 |
| | | | 141,113 |
| Internet & Direct Marketing Retail - 9.8% | | | |
| Amazon.com, Inc. (a) | | 842,108 | 1,221,806 |
| Blue Apron Holdings, Inc. Class B | | 3,603,786 | 10,668 |
| Expedia, Inc. | | 57,200 | 7,322 |
| Groupon, Inc. (a)(c) | | 43,956,853 | 232,532 |
| JD.com, Inc. sponsored ADR (a) | | 587,550 | 28,925 |
| Netflix, Inc. (a) | | 675,660 | 182,631 |
| Priceline Group, Inc. (a) | | 36,460 | 69,713 |
| Wayfair LLC Class A (a)(b) | | 1,661,368 | 152,862 |
| | | | 1,906,459 |
| Media - 0.3% | | | |
| AMC Entertainment Holdings, Inc. Class A (b) | | 133,100 | 1,704 |
| China Literature Ltd. (a)(d) | | 353,000 | 3,657 |
| Liberty Media Corp. Liberty Media Class A (a)(b) | | 1,508,065 | 53,808 |
| Turn, Inc. (Escrow) (e)(f) | | 1,199,041 | 797 |
| | | | 59,966 |
| Multiline Retail - 2.3% | | | |
| Avenue Supermarts Ltd. (d) | | 101,832 | 1,890 |
| Dollar Tree, Inc. (a) | | 3,881,900 | 446,419 |
| | | | 448,309 |
| Specialty Retail - 1.2% | | | |
| Burlington Stores, Inc. (a) | | 165,700 | 20,167 |
| Lowe's Companies, Inc. | | 207,100 | 21,690 |
| O'Reilly Automotive, Inc. (a) | | 56,800 | 15,034 |
| Ross Stores, Inc. | | 1,126,600 | 92,821 |
| Tractor Supply Co. | | 953,818 | 72,729 |
| Ulta Beauty, Inc. | | 55,810 | 12,395 |
| | | | 234,836 |
| Textiles, Apparel & Luxury Goods - 1.1% | | | |
| adidas AG sponsored ADR | | 427,900 | 49,662 |
| Columbia Sportswear Co. | | 77,800 | 5,809 |
| Despegar.com Corp. | | 406,400 | 12,375 |
| G-III Apparel Group Ltd. (a) | | 143,000 | 5,341 |
| Kering SA | | 96,300 | 48,757 |
| lululemon athletica, Inc. (a) | | 1,028,446 | 80,435 |
| LVMH Moet Hennessy - Louis Vuitton SA | | 5,927 | 1,857 |
| Prada SpA | | 965,200 | 3,942 |
| PVH Corp. | | 66,000 | 10,235 |
| Under Armour, Inc. Class C (non-vtg.) (a)(b) | | 146,700 | 1,885 |
| | | | 220,298 |
|
| TOTAL CONSUMER DISCRETIONARY | | | 4,296,018 |
|
| CONSUMER STAPLES - 4.1% | | | |
| Beverages - 1.1% | | | |
| Constellation Brands, Inc. Class A (sub. vtg.) | | 15,800 | 3,468 |
| Diageo PLC | | 49,277 | 1,774 |
| Dr. Pepper Snapple Group, Inc. | | 90,400 | 10,789 |
| Monster Beverage Corp. (a) | | 979,340 | 66,820 |
| PepsiCo, Inc. | | 1,121,700 | 134,941 |
| | | | 217,792 |
| Food & Staples Retailing - 1.6% | | | |
| Costco Wholesale Corp. | | 1,111,383 | 216,575 |
| Performance Food Group Co. (a) | | 1,120,500 | 38,489 |
| Walmart, Inc. | | 458,600 | 48,887 |
| | | | 303,951 |
| Food Products - 1.4% | | | |
| Mondelez International, Inc. | | 2,654,852 | 117,875 |
| Nestle SA sponsored ADR | | 38,200 | 3,300 |
| The Hain Celestial Group, Inc. (a) | | 436,700 | 16,656 |
| The Kraft Heinz Co. | | 1,814,800 | 142,262 |
| | | | 280,093 |
|
| TOTAL CONSUMER STAPLES | | | 801,836 |
|
| ENERGY - 1.0% | | | |
| Energy Equipment & Services - 0.1% | | | |
| Hi-Crush Partners LP | | 178,900 | 2,308 |
| Smart Sand, Inc. (a)(b) | | 480,600 | 4,417 |
| U.S. Silica Holdings, Inc. (b) | | 54,300 | 1,808 |
| | | | 8,533 |
| Oil, Gas & Consumable Fuels - 0.9% | | | |
| Anadarko Petroleum Corp. | | 40,900 | 2,456 |
| Andeavor | | 31,400 | 3,396 |
| Cenovus Energy, Inc. | | 714,300 | 6,812 |
| Centennial Resource Development, Inc. Class A (a) | | 1,484,600 | 30,301 |
| Diamondback Energy, Inc. (a) | | 955,700 | 119,940 |
| Oasis Petroleum, Inc. (a) | | 419,100 | 3,629 |
| Whiting Petroleum Corp. (a) | | 456,900 | 12,757 |
| | | | 179,291 |
|
| TOTAL ENERGY | | | 187,824 |
|
| FINANCIALS - 4.9% | | | |
| Banks - 2.0% | | | |
| Bank of America Corp. | | 581,700 | 18,614 |
| Citigroup, Inc. | | 274,600 | 21,551 |
| Commerce Bancshares, Inc. | | 715,586 | 41,869 |
| Fifth Third Bancorp | | 334,700 | 11,079 |
| First Republic Bank | | 20,800 | 1,863 |
| Huntington Bancshares, Inc. | | 7,776,300 | 125,821 |
| Investors Bancorp, Inc. | | 2,682,400 | 36,722 |
| PacWest Bancorp | | 1,040,400 | 54,548 |
| Signature Bank (a) | | 23,800 | 3,665 |
| SunTrust Banks, Inc. | | 84,800 | 5,995 |
| SVB Financial Group (a) | | 46,662 | 11,505 |
| UMB Financial Corp. | | 347,900 | 26,503 |
| Wells Fargo & Co. | | 383,800 | 25,246 |
| | | | 384,981 |
| Capital Markets - 2.1% | | | |
| BlackRock, Inc. Class A | | 53,400 | 30,000 |
| Carlyle Group LP | | 630,500 | 15,889 |
| Charles Schwab Corp. | | 76,200 | 4,065 |
| E*TRADE Financial Corp. (a) | | 615,520 | 32,438 |
| Goldman Sachs Group, Inc. | | 21,000 | 5,626 |
| Morgan Stanley | | 100,000 | 5,655 |
| Northern Trust Corp. | | 874,900 | 92,206 |
| TD Ameritrade Holding Corp. | | 3,848,500 | 214,708 |
| | | | 400,587 |
| Consumer Finance - 0.7% | | | |
| Capital One Financial Corp. | | 1,331,700 | 138,444 |
| Synchrony Financial | | 150,100 | 5,956 |
| | | | 144,400 |
| Diversified Financial Services - 0.0% | | | |
| GDS Holdings Ltd. ADR (a) | | 67,900 | 1,938 |
| Insurance - 0.1% | | | |
| Chubb Ltd. | | 51,300 | 8,010 |
| MetLife, Inc. | | 107,300 | 5,158 |
| The Travelers Companies, Inc. | | 55,400 | 8,306 |
| | | | 21,474 |
|
| TOTAL FINANCIALS | | | 953,380 |
|
| HEALTH CARE - 11.4% | | | |
| Biotechnology - 9.3% | | | |
| Acceleron Pharma, Inc. (a) | | 44,100 | 1,831 |
| Achaogen, Inc. (a)(b) | | 98,300 | 1,078 |
| Adamas Pharmaceuticals, Inc. (a)(b) | | 143,100 | 5,415 |
| Agios Pharmaceuticals, Inc. (a) | | 123,035 | 9,690 |
| Alexion Pharmaceuticals, Inc. (a) | | 809,289 | 96,564 |
| Alkermes PLC (a) | | 1,230,536 | 70,350 |
| Alnylam Pharmaceuticals, Inc. (a) | | 215,300 | 27,985 |
| Amgen, Inc. | | 3,207,780 | 596,807 |
| AnaptysBio, Inc. | | 87,100 | 9,179 |
| BeiGene Ltd. ADR (a) | | 52,900 | 7,181 |
| Biogen, Inc. (a) | | 95,086 | 33,072 |
| BioMarin Pharmaceutical, Inc. (a) | | 152,256 | 13,738 |
| bluebird bio, Inc. (a) | | 363,726 | 74,527 |
| Blueprint Medicines Corp. (a) | | 144,100 | 11,333 |
| Celgene Corp. (a) | | 527,640 | 53,376 |
| Cellectis SA sponsored ADR (a) | | 348,000 | 10,948 |
| Chiasma, Inc. (a)(b) | | 779,500 | 1,286 |
| Chimerix, Inc. (a) | | 52,700 | 252 |
| Coherus BioSciences, Inc. (a)(b) | | 1,199,902 | 12,119 |
| CytomX Therapeutics, Inc. (a) | | 485,000 | 12,974 |
| CytomX Therapeutics, Inc. (a)(d) | | 244,269 | 6,534 |
| DBV Technologies SA sponsored ADR (a) | | 1,070,800 | 24,800 |
| Denali Therapeutics, Inc. (a)(b) | | 829,800 | 19,301 |
| Dicerna Pharmaceuticals, Inc. (a) | | 307,207 | 2,946 |
| Editas Medicine, Inc. (a)(b) | | 200,244 | 7,311 |
| Epizyme, Inc. (a) | | 127,000 | 2,051 |
| Exact Sciences Corp. (a) | | 39,800 | 1,978 |
| FibroGen, Inc. (a) | | 195,200 | 11,429 |
| Flexion Therapeutics, Inc. (a)(b) | | 124,500 | 2,812 |
| Galapagos Genomics NV sponsored ADR (a) | | 78,600 | 9,292 |
| GenSight Biologics SA (a)(d) | | 243,848 | 1,968 |
| Heron Therapeutics, Inc. (a) | | 1,181,015 | 25,569 |
| Intercept Pharmaceuticals, Inc. (a)(b) | | 333,919 | 20,736 |
| Ionis Pharmaceuticals, Inc. (a) | | 428,902 | 22,526 |
| Iovance Biotherapeutics, Inc. (a) | | 360,400 | 5,604 |
| Ironwood Pharmaceuticals, Inc. Class A (a) | | 1,944,542 | 28,799 |
| Jounce Therapeutics, Inc. (b) | | 561,463 | 13,576 |
| Macrogenics, Inc. (a) | | 162,600 | 3,670 |
| Neurocrine Biosciences, Inc. (a) | | 811,400 | 69,350 |
| Ovid Therapeutics, Inc. | | 300,536 | 2,555 |
| Portola Pharmaceuticals, Inc. (a) | | 319,598 | 16,399 |
| Regeneron Pharmaceuticals, Inc. (a) | | 610,500 | 223,840 |
| Sage Therapeutics, Inc. (a) | | 185,075 | 35,127 |
| Sarepta Therapeutics, Inc. (a) | | 128,600 | 8,428 |
| Sierra Oncology, Inc. (a) | | 160,400 | 489 |
| Spark Therapeutics, Inc. (a) | | 334,290 | 18,737 |
| Spectrum Pharmaceuticals, Inc. (a) | | 371,400 | 8,000 |
| TESARO, Inc. (a)(b) | | 2,100,700 | 141,713 |
| Trevena, Inc. (a) | | 512,521 | 835 |
| Ultragenyx Pharmaceutical, Inc. (a) | | 112,096 | 5,980 |
| uniQure B.V. (a) | | 276,600 | 5,117 |
| Xencor, Inc. (a) | | 618,787 | 14,084 |
| Zai Lab Ltd. ADR | | 130,900 | 3,529 |
| | | | 1,814,790 |
| Health Care Equipment & Supplies - 0.2% | | | |
| AxoGen, Inc. (a) | | 86,000 | 2,391 |
| Insulet Corp. (a) | | 82,000 | 6,275 |
| Intuitive Surgical, Inc. (a) | | 39,946 | 17,243 |
| Quanterix Corp. (a) | | 229,300 | 4,772 |
| ViewRay, Inc. (a)(b) | | 431,200 | 3,851 |
| | | | 34,532 |
| Health Care Providers & Services - 0.1% | | | |
| G1 Therapeutics, Inc. | | 322,672 | 7,715 |
| National Vision Holdings, Inc. | | 57,300 | 2,242 |
| OptiNose, Inc. (b) | | 337,311 | 6,392 |
| OptiNose, Inc. | | 382,170 | 6,880 |
| R1 RCM, Inc. (a) | | 723,202 | 3,724 |
| | | | 26,953 |
| Health Care Technology - 1.3% | | | |
| athenahealth, Inc. (a) | | 1,840,683 | 230,656 |
| Castlight Health, Inc. Class B (a)(b) | | 53,000 | 196 |
| Cerner Corp. (a) | | 285,900 | 19,764 |
| Teladoc, Inc. (a) | | 151,100 | 5,651 |
| | | | 256,267 |
| Pharmaceuticals - 0.5% | | | |
| Akcea Therapeutics, Inc. (b) | | 119,720 | 2,592 |
| Allergan PLC | | 20,000 | 3,605 |
| Avexis, Inc. (a) | | 86,300 | 10,678 |
| Castle Creek Pharmaceuticals, LLC Class A-2 unit (a)(e)(f)(g)(h) | | 30,303 | 15,454 |
| Collegium Pharmaceutical, Inc. (a)(b) | | 418,800 | 9,984 |
| Dova Pharmaceuticals, Inc. (b) | | 256,000 | 8,156 |
| GW Pharmaceuticals PLC ADR (a)(b) | | 16,127 | 2,228 |
| Innoviva, Inc. (a) | | 65 | 1 |
| Intra-Cellular Therapies, Inc. (a) | | 127,636 | 2,172 |
| Jazz Pharmaceuticals PLC (a) | | 80,200 | 11,688 |
| MyoKardia, Inc. (a) | | 46,700 | 2,410 |
| Nektar Therapeutics (a) | | 93,486 | 7,816 |
| Revance Therapeutics, Inc. (a) | | 51,200 | 1,654 |
| The Medicines Company (a) | | 237,700 | 7,875 |
| Theravance Biopharma, Inc. (a)(b) | | 180,900 | 4,783 |
| Zogenix, Inc. (a) | | 284,300 | 10,334 |
| | | | 101,430 |
|
| TOTAL HEALTH CARE | | | 2,233,972 |
|
| INDUSTRIALS - 1.8% | | | |
| Aerospace & Defense - 0.1% | | | |
| Space Exploration Technologies Corp.: | | | |
| Class A (a)(e)(f) | | 203,488 | 27,471 |
| Class C (e)(f) | | 7,092 | 957 |
| | | | 28,428 |
| Airlines - 1.0% | | | |
| Allegiant Travel Co. | | 35,800 | 5,701 |
| American Airlines Group, Inc. | | 2,153,632 | 116,985 |
| JetBlue Airways Corp. (a) | | 764,300 | 15,943 |
| Spirit Airlines, Inc. (a) | | 362,900 | 15,285 |
| United Continental Holdings, Inc. (a) | | 392,800 | 26,640 |
| Wheels Up Partners Holdings LLC Series B (a)(e)(f)(g) | | 1,760,377 | 5,492 |
| | | | 186,046 |
| Building Products - 0.0% | | | |
| Kajaria Ceramics Ltd. | | 615,124 | 6,113 |
| Commercial Services & Supplies - 0.1% | | | |
| Copart, Inc. (a) | | 89,600 | 3,949 |
| Evoqua Water Technologies Corp. (a) | | 268,400 | 6,136 |
| | | | 10,085 |
| Machinery - 0.1% | | | |
| Kennametal, Inc. | | 37,300 | 1,819 |
| PACCAR, Inc. | | 249,200 | 18,580 |
| | | | 20,399 |
| Road & Rail - 0.4% | | | |
| Avis Budget Group, Inc. (a) | | 404,400 | 18,182 |
| CSX Corp. | | 148,900 | 8,453 |
| J.B. Hunt Transport Services, Inc. | | 360,791 | 43,594 |
| Old Dominion Freight Lines, Inc. | | 92,100 | 13,488 |
| | | | 83,717 |
| Trading Companies & Distributors - 0.1% | | | |
| HD Supply Holdings, Inc. (a) | | 278,500 | 10,831 |
|
| TOTAL INDUSTRIALS | | | 345,619 |
|
| INFORMATION TECHNOLOGY - 51.1% | | | |
| Communications Equipment - 0.1% | | | |
| Arista Networks, Inc. (a) | | 14,500 | 3,999 |
| NETGEAR, Inc. (a) | | 278,700 | 19,425 |
| Quantenna Communications, Inc. (a) | | 292,000 | 4,018 |
| | | | 27,442 |
| Electronic Equipment & Components - 0.0% | | | |
| SYNNEX Corp. | | 15,700 | 1,927 |
| Internet Software & Services - 16.6% | | | |
| 2U, Inc. (a) | | 198,241 | 14,723 |
| 58.com, Inc. ADR (a) | | 25,600 | 2,045 |
| Akamai Technologies, Inc. (a) | | 156,900 | 10,511 |
| Alibaba Group Holding Ltd. sponsored ADR (a) | | 45,300 | 9,254 |
| Alphabet, Inc.: | | | |
| Class A (a) | | 1,074,427 | 1,270,209 |
| Class C (a) | | 454,469 | 531,701 |
| Altaba, Inc. | | 1,451,100 | 115,914 |
| ANGI Homeservices, Inc. Class A (a)(b) | | 501,706 | 6,703 |
| CarGurus, Inc.: | | | |
| Class A (b) | | 402,193 | 13,473 |
| Class A | | 1,083,756 | 34,491 |
| Delivery Hero AG (d) | | 45,500 | 1,952 |
| Dropbox, Inc. Class B (a)(e)(f) | | 331,524 | 4,973 |
| Facebook, Inc. Class A (a) | | 4,476,714 | 836,653 |
| GoDaddy, Inc. (a) | | 178,200 | 9,842 |
| Gogo, Inc. (a)(b) | | 1,081,200 | 10,423 |
| GrubHub, Inc. (a)(b) | | 79,800 | 5,766 |
| IAC/InterActiveCorp (a) | | 13,545 | 1,964 |
| Instructure, Inc. (a) | | 5,871 | 211 |
| Match Group, Inc. (a)(b) | | 739,200 | 25,828 |
| Momo, Inc. ADR (a) | | 402,600 | 12,694 |
| NetEase, Inc. ADR | | 155,640 | 49,830 |
| New Relic, Inc. (a) | | 955,383 | 57,065 |
| Nutanix, Inc.: | | | |
| Class A (a) | | 3,418,740 | 109,742 |
| Class B (d) | | 311,503 | 9,999 |
| Okta, Inc. | | 36,900 | 1,087 |
| Shopify, Inc. Class A (a) | | 538,726 | 68,782 |
| Twilio, Inc. Class A (a)(b) | | 1,008,958 | 26,475 |
| | | | 3,242,310 |
| IT Services - 1.7% | | | |
| AppNexus, Inc. warrants (a)(e)(f) | | 1 | 0 |
| PayPal Holdings, Inc. (a) | | 3,189,900 | 272,162 |
| Square, Inc. (a) | | 1,066,899 | 50,048 |
| Teradata Corp. (a) | | 51,300 | 2,078 |
| Worldpay, Inc. (a) | | 96,800 | 7,774 |
| | | | 332,062 |
| Semiconductors & Semiconductor Equipment - 8.4% | | | |
| Analog Devices, Inc. | | 896,800 | 82,398 |
| Applied Materials, Inc. | | 144,100 | 7,728 |
| ASM Pacific Technology Ltd. | | 226,700 | 3,095 |
| ASML Holding NV | | 47,900 | 9,722 |
| Broadcom Ltd. | | 700,966 | 173,861 |
| Intel Corp. | | 677,600 | 32,620 |
| KLA-Tencor Corp. | | 47,100 | 5,172 |
| Lam Research Corp. | | 147,100 | 28,173 |
| Marvell Technology Group Ltd. | | 4,522,700 | 105,515 |
| Micron Technology, Inc. (a) | | 3,686,444 | 161,171 |
| NVIDIA Corp. | | 2,692,901 | 661,915 |
| ON Semiconductor Corp. (a) | | 607,700 | 15,034 |
| Qualcomm, Inc. | | 4,541,876 | 309,983 |
| United Microelectronics Corp. sponsored ADR (b) | | 10,022,000 | 24,454 |
| Xilinx, Inc. | | 109,000 | 7,959 |
| | | | 1,628,800 |
| Software - 16.6% | | | |
| Activision Blizzard, Inc. | | 11,289,309 | 836,876 |
| Adobe Systems, Inc. (a) | | 403,100 | 80,523 |
| Altair Engineering, Inc. Class A (a) | | 70,500 | 1,875 |
| Atlassian Corp. PLC (a) | | 1,335,785 | 72,119 |
| Atom Tickets LLC (e)(f)(g) | | 516,103 | 3,000 |
| Autodesk, Inc. (a) | | 3,341,420 | 386,335 |
| Citrix Systems, Inc. (a) | | 60,500 | 5,612 |
| Ellie Mae, Inc. (a) | | 19,500 | 1,823 |
| HIVE Blockchain Technologies Ltd. (a)(b) | | 719,500 | 1,492 |
| HIVE Blockchain Technologies Ltd. unit (e)(f) | | 2,163,600 | 4,262 |
| HubSpot, Inc. (a) | | 746,180 | 72,417 |
| Intuit, Inc. | | 192,900 | 32,388 |
| Microsoft Corp. | | 5,937,899 | 564,160 |
| Parametric Technology Corp. (a) | | 54,900 | 3,990 |
| Paycom Software, Inc. (a)(b) | | 276,032 | 25,296 |
| Paylocity Holding Corp. (a) | | 188,400 | 9,851 |
| Red Hat, Inc. (a) | | 59,800 | 7,857 |
| SailPoint Technologies Holding, Inc. (a) | | 224,700 | 3,759 |
| Salesforce.com, Inc. (a) | | 1,399,248 | 159,388 |
| SendGrid, Inc. (a) | | 105,200 | 2,364 |
| ServiceNow, Inc. (a) | | 13,700 | 2,040 |
| Snap, Inc. Class A (a)(b) | | 444,058 | 6,004 |
| Splunk, Inc. (a) | | 21,600 | 1,995 |
| Talend SA ADR (a) | | 82,000 | 3,196 |
| Tanium, Inc. Class B (e)(f) | | 392,200 | 2,169 |
| Ubisoft Entertainment SA (a)(c) | | 9,163,631 | 784,338 |
| Workday, Inc. Class A (a) | | 136,300 | 16,341 |
| Xero Ltd. (a) | | 90,086 | 2,284 |
| Zendesk, Inc. (a) | | 3,961,484 | 152,596 |
| | | | 3,246,350 |
| Technology Hardware, Storage & Peripherals - 7.7% | | | |
| Apple, Inc. | | 8,919,360 | 1,493,367 |
|
| TOTAL INFORMATION TECHNOLOGY | | | 9,972,258 |
|
| MATERIALS - 1.0% | | | |
| Chemicals - 0.7% | | | |
| CF Industries Holdings, Inc. | | 89,700 | 3,807 |
| FMC Corp. | | 72,400 | 6,612 |
| LG Chemical Ltd. | | 13,965 | 5,639 |
| LyondellBasell Industries NV Class A | | 930,600 | 111,523 |
| | | | 127,581 |
| Construction Materials - 0.0% | | | |
| Loma Negra Compania Industrial Argentina SA ADR (a) | | 268,400 | 6,377 |
| Metals & Mining - 0.3% | | | |
| Randgold Resources Ltd. sponsored ADR | | 588,600 | 59,543 |
| Steel Dynamics, Inc. | | 82,400 | 3,741 |
| | | | 63,284 |
|
| TOTAL MATERIALS | | | 197,242 |
|
| REAL ESTATE - 0.2% | | | |
| Equity Real Estate Investment Trusts (REITs) - 0.1% | | | |
| Equinix, Inc. | | 22,100 | 10,060 |
| Real Estate Management & Development - 0.1% | | | |
| Redfin Corp. (b) | | 911,530 | 18,504 |
| WeWork Companies, Inc. Class A (a)(e)(f) | | 29,911 | 1,550 |
| | | | 20,054 |
|
| TOTAL REAL ESTATE | | | 30,114 |
|
| TELECOMMUNICATION SERVICES - 0.0% | | | |
| Wireless Telecommunication Services - 0.0% | | | |
| T-Mobile U.S., Inc. (a) | | 120,590 | 7,850 |
| TOTAL COMMON STOCKS | | | |
| (Cost $11,159,399) | | | 19,026,113 |
|
| Preferred Stocks - 2.0% | | | |
| Convertible Preferred Stocks - 2.0% | | | |
| CONSUMER DISCRETIONARY - 0.1% | | | |
| Diversified Consumer Services - 0.1% | | | |
| Handy Technologies, Inc. Series C (a)(e)(f) | | 415,643 | 1,347 |
| Lyft, Inc. Series H (e)(f) | | 595,228 | 23,658 |
| | | | 25,005 |
| Internet & Direct Marketing Retail - 0.0% | | | |
| One Kings Lane, Inc. Series E (Escrow) (a)(e)(f) | | 648,635 | 292 |
| The Honest Co., Inc. Series D (a)(e)(f) | | 75,268 | 2,539 |
| | | | 2,831 |
| TOTAL CONSUMER DISCRETIONARY | | | 27,836 |
| CONSUMER STAPLES - 0.2% | | | |
| Food & Staples Retailing - 0.2% | | | |
| Roofoods Ltd. Series F (e)(f) | | 93,930 | 33,211 |
| FINANCIALS - 0.0% | | | |
| Insurance - 0.0% | | | |
| Clover Health Series D (e)(f) | | 620,983 | 6,048 |
| HEALTH CARE - 0.4% | | | |
| Biotechnology - 0.3% | | | |
| 23andMe, Inc.: | | | |
| Series E (a)(e)(f) | | 1,817,170 | 25,230 |
| Series F (e)(f) | | 683,367 | 9,488 |
| Moderna Therapeutics, Inc.: | | | |
| Series B (e)(f) | | 1,193,491 | 12,007 |
| Series C (e)(f) | | 453,177 | 4,559 |
| | | | 51,284 |
| Health Care Providers & Services - 0.1% | | | |
| Mulberry Health, Inc. Series A8 (a)(e)(f) | | 4,342,250 | 28,008 |
| TOTAL HEALTH CARE | | | 79,292 |
| INDUSTRIALS - 0.1% | | | |
| Aerospace & Defense - 0.1% | | | |
| Space Exploration Technologies Corp.: | | | |
| Series G (a)(e)(f) | | 62,037 | 8,375 |
| Series H (e)(f) | | 65,670 | 8,865 |
| | | | 17,240 |
| Professional Services - 0.0% | | | |
| YourPeople, Inc. Series C (a)(e)(f) | | 335,546 | 1,879 |
| TOTAL INDUSTRIALS | | | 19,119 |
| INFORMATION TECHNOLOGY - 1.1% | | | |
| Internet Software & Services - 0.6% | | | |
| Jet.Com, Inc. Series B1 (Escrow) (a)(e)(f) | | 4,896,249 | 1,608 |
| Pinterest, Inc. Series G, 8.00% (a)(e)(f) | | 139,290 | 833 |
| Reddit, Inc.: | | | |
| Series B (e)(f) | | 1,337,584 | 21,099 |
| Series C (e)(f) | | 300,673 | 4,743 |
| Starry, Inc. Series B (a)(e)(f) | | 1,811,120 | 1,670 |
| Uber Technologies, Inc.: | | | |
| Series D, 8.00% (a)(e)(f) | | 2,256,164 | 79,191 |
| Series E, 8.00% (a)(e)(f) | | 150,072 | 5,268 |
| | | | 114,412 |
| IT Services - 0.2% | | | |
| AppNexus, Inc.: | | | |
| Series E (a)(e)(f) | | 1,416,796 | 28,478 |
| Series F (a)(e)(f) | | 90,913 | 1,881 |
| | | | 30,359 |
| Software - 0.3% | | | |
| Bracket Computing, Inc. Series C (a)(e)(f) | | 1,877,241 | 2,910 |
| Cloudflare, Inc. Series D, 8.00% (a)(e)(f) | | 395,787 | 2,371 |
| Dataminr, Inc. Series D (a)(e)(f) | | 2,219,446 | 22,816 |
| Delphix Corp. Series D (a)(e)(f) | | 427,177 | 2,559 |
| Jello Labs, Inc. Series C (a)(e)(f) | | 302,678 | 4,899 |
| Taboola.Com Ltd. Series E (a)(e)(f) | | 1,918,392 | 29,486 |
| | | | 65,041 |
| TOTAL INFORMATION TECHNOLOGY | | | 209,812 |
| REAL ESTATE - 0.1% | | | |
| Real Estate Management & Development - 0.1% | | | |
| WeWork Companies, Inc.: | | | |
| Series E (a)(e)(f) | | 269,198 | 13,947 |
| Series F (a)(e)(f) | | 14,513 | 752 |
| | | | 14,699 |
| TELECOMMUNICATION SERVICES - 0.0% | | | |
| Wireless Telecommunication Services - 0.0% | | | |
| Altiostar Networks, Inc. Series A1 (e)(f) | | 2,113,909 | 2,706 |
|
| TOTAL CONVERTIBLE PREFERRED STOCKS | | | 392,723 |
|
| Nonconvertible Preferred Stocks - 0.0% | | | |
| CONSUMER DISCRETIONARY - 0.0% | | | |
| Automobiles - 0.0% | | | |
| Volkswagen AG | | 8,700 | 1,912 |
| TOTAL PREFERRED STOCKS | | | |
| (Cost $349,083) | | | 394,635 |
| | | Principal Amount (000s) | Value (000s) |
|
| Convertible Bonds - 0.1% | | | |
| INFORMATION TECHNOLOGY - 0.1% | | | |
| Software - 0.1% | | | |
| Dataminr, Inc. 1.22% 1/28/19(e)(f) | | | |
| (Cost $14,228) | | 14,228 | 14,228 |
| | | Shares | Value (000s) |
|
| Money Market Funds - 4.6% | | | |
| Fidelity Cash Central Fund, 1.39% (i) | | 73,249,867 | 73,265 |
| Fidelity Securities Lending Cash Central Fund 1.40% (i)(j) | | 831,889,605 | 831,973 |
| TOTAL MONEY MARKET FUNDS | | | |
| (Cost $905,236) | | | 905,238 |
| TOTAL INVESTMENT IN SECURITIES - 104.2% | | | |
| (Cost $12,427,946) | | | 20,340,214 |
| NET OTHER ASSETS (LIABILITIES) - (4.2)% | | | (820,313) |
| NET ASSETS - 100% | | | $19,519,901 |
Values shown as $0 may reflect amounts less than $500.
Legend
(a) Non-income producing
(b) Security or a portion of the security is on loan at period end.
(c) Affiliated company
(d) Security exempt from registration under Rule 144A of the Securities Act of 1933. These securities may be resold in transactions exempt from registration, normally to qualified institutional buyers. At the end of the period, the value of these securities amounted to $26,000,000 or 0.1% of net assets.
(e) Restricted securities - Investment in securities not registered under the Securities Act of 1933 (excluding 144A issues). At the end of the period, the value of restricted securities (excluding 144A issues) amounted to $473,076,000 or 2.4% of net assets.
(f) Level 3 security
(g) Investment is owned by a wholly-owned subsidiary (Subsidiary) that is treated as a corporation for U.S. tax purposes.
(h) Investment represents common shares and preferred shares.
(i) Affiliated fund that is generally available only to investment companies and other accounts managed by Fidelity Investments. The rate quoted is the annualized seven-day yield of the fund at period end. A complete unaudited listing of the fund's holdings as of its most recent quarter end is available upon request. In addition, each Fidelity Central Fund's financial statements are available on the SEC's website or upon request.
(j) Investment made with cash collateral received from securities on loan.
Additional information on each restricted holding is as follows:
| Security | Acquisition Date | Acquisition Cost (000s) |
| 23andMe, Inc. Series E | 6/18/15 | $19,675 |
| 23andMe, Inc. Series F | 8/31/17 | $9,488 |
| Altiostar Networks, Inc. Series A1 | 1/10/17 | $9,724 |
| AppNexus, Inc. Series E | 8/1/14 - 9/17/14 | $28,382 |
| AppNexus, Inc. Series F | 8/23/16 | $2,364 |
| AppNexus, Inc. warrants | 8/23/16 | $0 |
| Atom Tickets LLC | 8/15/17 | $3,000 |
| Bracket Computing, Inc. Series C | 9/9/15 | $14,766 |
| Castle Creek Pharmaceuticals, LLC Class A-2 unit | 9/29/16 | $10,007 |
| Cloudflare, Inc. Series D, 8.00% | 11/5/14 | $2,424 |
| Clover Health Series D | 6/7/17 | $5,823 |
| Dataminr, Inc. Series D | 2/18/15 - 3/6/15 | $28,298 |
| Dataminr, Inc. 1.22% 1/28/19 | 7/28/17 | $14,228 |
| Delphix Corp. Series D | 7/10/15 | $3,845 |
| Dropbox, Inc. Class B | 5/2/12 | $3,000 |
| Handy Technologies, Inc. Series C | 10/14/15 | $2,436 |
| HIVE Blockchain Technologies Ltd. unit | 12/18/17 | $5,298 |
| Jello Labs, Inc. Series C | 12/22/16 | $4,899 |
| Jet.Com, Inc. Series B1 (Escrow) | 9/19/16 | $1,608 |
| Lyft, Inc. Series H | 11/22/17 | $23,658 |
| Moderna Therapeutics, Inc. Series B | 4/13/17 | $6,922 |
| Moderna Therapeutics, Inc. Series C | 4/13/17 | $2,633 |
| Mulberry Health, Inc. Series A8 | 1/20/16 | $29,331 |
| One Kings Lane, Inc. Series E (Escrow) | 1/29/14 | $429 |
| Pinterest, Inc. Series G, 8.00% | 2/27/15 | $1,000 |
| Reddit, Inc. Series B | 7/26/17 | $18,989 |
| Reddit, Inc. Series C | 7/24/17 | $4,743 |
| Roofoods Ltd. Series F | 9/12/17 | $33,211 |
| Space Exploration Technologies Corp. Class A | 10/16/15 - 9/11/17 | $21,156 |
| Space Exploration Technologies Corp. Class C | 9/11/17 | $957 |
| Space Exploration Technologies Corp. Series G | 1/20/15 | $4,805 |
| Space Exploration Technologies Corp. Series H | 8/4/17 | $8,865 |
| Starry, Inc. Series B | 12/1/16 | $980 |
| Taboola.Com Ltd. Series E | 12/22/14 | $20,000 |
| Tanium, Inc. Class B | 4/21/17 | $1,947 |
| The Honest Co., Inc. Series D | 8/3/15 | $3,444 |
| Turn, Inc. (Escrow) | 4/11/17 | $719 |
| Uber Technologies, Inc. Series D, 8.00% | 6/6/14 | $35,000 |
| Uber Technologies, Inc. Series E, 8.00% | 12/5/14 | $5,000 |
| WeWork Companies, Inc. Class A | 6/23/15 | $984 |
| WeWork Companies, Inc. Series E | 6/23/15 | $8,854 |
| WeWork Companies, Inc. Series F | 12/1/16 | $728 |
| Wheels Up Partners Holdings LLC Series B | 9/18/15 | $5,001 |
| YourPeople, Inc. Series C | 5/1/15 | $5,000 |
Affiliated Central Funds
Information regarding fiscal year to date income earned by the Fund from investments in Fidelity Central Funds is as follows:
| Fund | Income earned |
| | (Amounts in thousands) |
| Fidelity Cash Central Fund | $220 |
| Fidelity Securities Lending Cash Central Fund | 2,962 |
| Total | $3,182 |
Amounts in the income column in the above table include any capital gain distributions from underlying funds, which are presented in the corresponding line-item in the Statement of Operations if applicable.
Other Affiliated Issuers
An affiliated company is a company in which the Fund has ownership of at least 5% of the voting securities. Fiscal year to date transactions with companies which are or were affiliates are as follows:
| Affiliate (Amounts in thousands) | Value, beginning of period | Purchases | Sales Proceeds* | Dividend Income | Realized Gain (loss) | Change in Unrealized appreciation (depreciation) | Value, end of period |
| athenahealth, Inc. | $326,198 | $-- | $67,683 | $-- | $2,272 | $(30,131) | $-- |
| Criteo SA sponsored ADR | 266,048 | -- | 185,723 | -- | 3,728 | (84,053) | -- |
| Groupon, Inc. | 209,589 | -- | 62,303 | -- | (31,828) | 117,074 | 232,532 |
| Ubisoft Entertainment SA | 677,873 | -- | 128,854 | -- | 105,360 | 129,959 | 784,338 |
| Wingstop, Inc. | 49,616 | -- | 28,061 | 174 | 3,760 | 14,462 | -- |
| Total | $1,529,324 | $-- | $472,624 | $174 | $83,292 | $147,311 | $1,016,870 |
* Includes the value of securities delivered through in-kind transactions, if applicable.
Investment Valuation
The following is a summary of the inputs used, as of January 31, 2018, involving the Fund's assets and liabilities carried at fair value. The inputs or methodology used for valuing securities may not be an indication of the risk associated with investing in those securities. For more information on valuation inputs, and their aggregation into the levels used below, please refer to the Investment Valuation section in the accompanying Notes to Financial Statements.
| | Valuation Inputs at Reporting Date: |
| Description | Total | Level 1 | Level 2 | Level 3 |
| (Amounts in thousands) | | | | |
| Investments in Securities: | | | | |
| Equities: | | | | |
| Consumer Discretionary | $4,325,766 | $4,143,495 | $153,638 | $28,633 |
| Consumer Staples | 835,047 | 800,062 | 1,774 | 33,211 |
| Energy | 187,824 | 187,824 | -- | -- |
| Financials | 959,428 | 953,380 | -- | 6,048 |
| Health Care | 2,313,264 | 2,211,638 | 6,880 | 94,746 |
| Industrials | 364,738 | 311,699 | -- | 53,039 |
| Information Technology | 10,182,070 | 9,923,363 | 34,491 | 224,216 |
| Materials | 197,242 | 197,242 | -- | -- |
| Real Estate | 44,813 | 28,564 | -- | 16,249 |
| Telecommunication Services | 10,556 | 7,850 | -- | 2,706 |
| Corporate Bonds | 14,228 | -- | -- | 14,228 |
| Money Market Funds | 905,238 | 905,238 | -- | -- |
| Total Investments in Securities: | $20,340,214 | $19,670,355 | $196,783 | $473,076 |
The following is a reconciliation of Investments in Securities and Derivative Instruments for which Level 3 inputs were used in determining value:
| (Amounts in thousands) | |
| Investments in Securities: | |
| Equities - Information Technology | |
| Beginning Balance | $276,076 |
| Net Realized Gain (Loss) on Investment Securities | -- |
| Net Unrealized Gain (Loss) on Investment Securities | (50,370) |
| Cost of Purchases | 8,298 |
| Proceeds of Sales | (9,788) |
| Amortization/Accretion | -- |
| Transfers into Level 3 | -- |
| Transfers out of Level 3 | -- |
| Ending Balance | $224,216 |
| The change in unrealized gain (loss) for the period attributable to Level 3 securities held at January 31, 2018 | $(48,291) |
| Other Investments in Securities | |
| Beginning Balance | $210,038 |
| Net Realized Gain (Loss) on Investment Securities | (144) |
| Net Unrealized Gain (Loss) on Investment Securities | (17,799) |
| Cost of Purchases | 83,206 |
| Proceeds of Sales | (26,441) |
| Amortization/Accretion | -- |
| Transfers into Level 3 | -- |
| Transfers out of Level 3 | -- |
| Ending Balance | $248,860 |
| The change in unrealized gain (loss) for the period attributable to Level 3 securities held at January 31, 2018 | $3,546 |
The information used in the above reconciliations represents fiscal year to date activity for any Investments in Securities identified as using Level 3 inputs at either the beginning or the end of the current fiscal period. Transfers in or out of Level 3 represent the beginning value of any Security or Instrument where a change in the pricing level occurred from the beginning to the end of the period. The cost of purchases and the proceeds of sales may include securities received or delivered through corporate actions or exchanges. Realized and unrealized gains (losses) disclosed in the reconciliations are included in Net Gain (Loss) on the Fund’s Statement of Operations.
See accompanying notes which are an integral part of the financial statements.
Financial Statements
Statement of Assets and Liabilities
| Amounts in thousands (except per-share amounts) | | January 31, 2018 (Unaudited) |
| Assets | | |
Investment in securities, at value (including securities loaned of $829,096) — See accompanying schedule:
Unaffiliated issuers (cost $11,107,454) | $18,418,106 | |
| Fidelity Central Funds (cost $905,236) | 905,238 | |
| Other affiliated issuers (cost $415,256) | 1,016,870 | |
| Total Investment in Securities (cost $12,427,946) | | $20,340,214 |
| Foreign currency held at value (cost $1,984) | | 1,984 |
| Receivable for investments sold | | 81,911 |
| Receivable for fund shares sold | | 19,690 |
| Dividends receivable | | 222 |
| Interest receivable | | 91 |
| Distributions receivable from Fidelity Central Funds | | 581 |
| Prepaid expenses | | 22 |
| Other receivables | | 304 |
| Total assets | | 20,445,019 |
| Liabilities | | |
| Payable for investments purchased | $62,514 | |
| Payable for fund shares redeemed | 17,778 | |
| Accrued management fee | 10,618 | |
| Other affiliated payables | 1,987 | |
| Other payables and accrued expenses | 216 | |
| Collateral on securities loaned | 832,005 | |
| Total liabilities | | 925,118 |
| Net Assets | | $19,519,901 |
| Net Assets consist of: | | |
| Paid in capital | | $11,469,183 |
| Accumulated net investment loss | | (22,789) |
| Accumulated undistributed net realized gain (loss) on investments and foreign currency transactions | | 161,249 |
| Net unrealized appreciation (depreciation) on investments and assets and liabilities in foreign currencies | | 7,912,258 |
| Net Assets | | $19,519,901 |
| OTC: | | |
| Net Asset Value, offering price and redemption price per share ($15,485,729 ÷ 130,233 shares) | | $118.91 |
| Class K: | | |
| Net Asset Value, offering price and redemption price per share ($4,034,172 ÷ 33,493 shares) | | $120.45 |
See accompanying notes which are an integral part of the financial statements.
Statement of Operations
| Amounts in thousands | | Six months ended January 31, 2018 (Unaudited) |
| Investment Income | | |
| Dividends (including $174 earned from other affiliated issuers) | | $47,281 |
| Interest | | 87 |
| Income from Fidelity Central Funds (including $2,962 from security lending) | | 3,182 |
| Total income | | 50,550 |
| Expenses | | |
| Management fee | | |
| Basic fee | $50,718 | |
| Performance adjustment | 10,581 | |
| Transfer agent fees | 10,765 | |
| Accounting and security lending fees | 906 | |
| Custodian fees and expenses | 168 | |
| Independent trustees' fees and expenses | 38 | |
| Appreciation in deferred trustee compensation account | 1 | |
| Registration fees | 214 | |
| Audit | 42 | |
| Legal | 32 | |
| Interest | 5 | |
| Miscellaneous | 51 | |
| Total expenses before reductions | 73,521 | |
| Expense reductions | (318) | 73,203 |
| Net investment income (loss) | | (22,653) |
| Realized and Unrealized Gain (Loss) | | |
| Net realized gain (loss) on: | | |
| Investment securities: | | |
| Unaffiliated issuers | 224,675 | |
| Fidelity Central Funds | 46 | |
| Other affiliated issuers | 83,292 | |
| Foreign currency transactions | (103) | |
| Total net realized gain (loss) | | 307,910 |
| Change in net unrealized appreciation (depreciation) on: | | |
| Investment securities: | | |
| Unaffiliated issuers | 2,516,219 | |
| Fidelity Central Funds | (24) | |
| Other affiliated issuers | 147,311 | |
| Assets and liabilities in foreign currencies | 22 | |
| Total change in net unrealized appreciation (depreciation) | | 2,663,528 |
| Net gain (loss) | | 2,971,438 |
| Net increase (decrease) in net assets resulting from operations | | $2,948,785 |
See accompanying notes which are an integral part of the financial statements.
Statement of Changes in Net Assets
| Amounts in thousands | Six months ended January 31, 2018 (Unaudited) | Year ended July 31, 2017 |
| Increase (Decrease) in Net Assets | | |
| Operations | | |
| Net investment income (loss) | $(22,653) | $(18,864) |
| Net realized gain (loss) | 307,910 | 1,654,079 |
| Change in net unrealized appreciation (depreciation) | 2,663,528 | 1,836,371 |
| Net increase (decrease) in net assets resulting from operations | 2,948,785 | 3,471,586 |
| Distributions to shareholders from net realized gain | (808,257) | (413,520) |
| Total distributions | (808,257) | (413,520) |
| Share transactions - net increase (decrease) | 1,581,566 | (614,015) |
| Total increase (decrease) in net assets | 3,722,094 | 2,444,051 |
| Net Assets | | |
| Beginning of period | 15,797,807 | 13,353,756 |
| End of period | $19,519,901 | $15,797,807 |
| Other Information | | |
| Accumulated net investment loss end of period | $(22,789) | $(136) |
See accompanying notes which are an integral part of the financial statements.
Financial Highlights
Fidelity OTC Portfolio
| | Six months ended (Unaudited) January 31, | Years endedJuly 31, | | | | |
| | 2018 | 2017 | 2016 | 2015 | 2014 | 2013 |
| Selected Per–Share Data | | | | | | |
| Net asset value, beginning of period | $105.68 | $85.26 | $86.98 | $81.23 | $78.98 | $57.53 |
| Income from Investment Operations | | | | | | |
| Net investment income (loss)A | (.16) | (.15) | (.05) | (.11) | (.06) | .36B |
| Net realized and unrealized gain (loss) | 18.73 | 23.27 | 2.84 | 16.14 | 12.78 | 21.37 |
| Total from investment operations | 18.57 | 23.12 | 2.79 | 16.03 | 12.72 | 21.73 |
| Distributions from net investment income | – | – | – | – | (.05) | (.28) |
| Distributions from net realized gain | (5.34) | (2.70) | (4.51) | (10.28) | (10.42) | – |
| Total distributions | (5.34) | (2.70) | (4.51) | (10.28) | (10.47) | (.28) |
| Net asset value, end of period | $118.91 | $105.68 | $85.26 | $86.98 | $81.23 | $78.98 |
| Total ReturnC,D | 18.28% | 27.97% | 3.68% | 21.34% | 17.96% | 37.93% |
| Ratios to Average Net AssetsE,F | | | | | | |
| Expenses before reductions | .88%G | .81% | .91% | .83% | .77% | .76% |
| Expenses net of fee waivers, if any | .88%G | .81% | .91% | .83% | .77% | .76% |
| Expenses net of all reductions | .88%G | .81% | .90% | .83% | .76% | .74% |
| Net investment income (loss) | (.29)%G | (.16)% | (.07)% | (.13)% | (.08)% | .55%B |
| Supplemental Data | | | | | | |
| Net assets, end of period (in millions) | $15,486 | $12,136 | $9,845 | $9,710 | $7,870 | $6,693 |
| Portfolio turnover rateH | 34%G,I | 71%I | 56%I | 66%I | 106% | 116% |
A Calculated based on average shares outstanding during the period.
B Net Investment income per share reflects a large, non-recurring dividend which amounted to $.10 per share. Excluding this non-recurring dividend, the ratio of net investment income (loss) to average net assets would have been .40%.
C Total returns for periods of less than one year are not annualized.
D Total returns would have been lower if certain expenses had not been reduced during the applicable periods shown.
E Fees and expenses of any underlying Fidelity Central Funds are not included in the Fund's expense ratio. The Fund indirectly bears its proportionate share of the expenses of any underlying Fidelity Central Funds.
F Expense ratios reflect operating expenses of the class. Expenses before reductions do not reflect amounts reimbursed by the investment adviser or reductions from brokerage service arrangements or reductions from other expense offset arrangements and do not represent the amount paid by the class during periods when reimbursements or reductions occur. Expenses net of fee waivers reflect expenses after reimbursement by the investment adviser but prior to reductions from brokerage service arrangements or other expense offset arrangements. Expenses net of all reductions represent the net expenses paid by the class.
G Annualized
H Amount does not include the portfolio activity of any underlying Fidelity Central Funds.
I Portfolio turnover rate excludes securities received or delivered in-kind.
See accompanying notes which are an integral part of the financial statements.
Fidelity OTC Portfolio Class K
| | Six months ended (Unaudited) January 31, | Years endedJuly 31, | | | | |
| | 2018 | 2017 | 2016 | 2015 | 2014 | 2013 |
| Selected Per–Share Data | | | | | | |
| Net asset value, beginning of period | $106.98 | $86.22 | $87.87 | $81.96 | $79.60 | $57.94 |
| Income from Investment Operations | | | | | | |
| Net investment income (loss)A | (.10) | (.05) | .04 | (.01) | .04 | .45B |
| Net realized and unrealized gain (loss) | 18.96 | 23.55 | 2.88 | 16.29 | 12.87 | 21.53 |
| Total from investment operations | 18.86 | 23.50 | 2.92 | 16.28 | 12.91 | 21.98 |
| Distributions from net investment income | – | – | – | – | (.10) | (.32) |
| Distributions from net realized gain | (5.39) | (2.74) | (4.57) | (10.37) | (10.46) | – |
| Total distributions | (5.39) | (2.74) | (4.57) | (10.37) | (10.55)C | (.32) |
| Net asset value, end of period | $120.45 | $106.98 | $86.22 | $87.87 | $81.96 | $79.60 |
| Total ReturnD,E | 18.34% | 28.12% | 3.80% | 21.49% | 18.10% | 38.11% |
| Ratios to Average Net AssetsF,G | | | | | | |
| Expenses before reductions | .78%H | .70% | .79% | .72% | .65% | .62% |
| Expenses net of fee waivers, if any | .78%H | .70% | .79% | .72% | .65% | .62% |
| Expenses net of all reductions | .78%H | .70% | .79% | .71% | .64% | .60% |
| Net investment income (loss) | (.19)%H | (.05)% | .05% | (.02)% | .05% | .69%B |
| Supplemental Data | | | | | | |
| Net assets, end of period (in millions) | $4,034 | $3,662 | $3,508 | $3,836 | $2,906 | $2,260 |
| Portfolio turnover rateI | 34%H,J | 71%J | 56%J | 66%J | 106% | 116% |
A Calculated based on average shares outstanding during the period.
B Net Investment income per share reflects a large, non-recurring dividend which amounted to $.10 per share. Excluding this non-recurring dividend, the ratio of net investment income (loss) to average net assets would have been .53%.
C Total distributions of $10.55 per share is comprised of distributions from net investment income of $.098 and distributions from net realized gain of $10.456 per share.
D Total returns for periods of less than one year are not annualized.
E Total returns would have been lower if certain expenses had not been reduced during the applicable periods shown.
F Fees and expenses of any underlying Fidelity Central Funds are not included in the Fund's expense ratio. The Fund indirectly bears its proportionate share of the expenses of any underlying Fidelity Central Funds.
G Expense ratios reflect operating expenses of the class. Expenses before reductions do not reflect amounts reimbursed by the investment adviser or reductions from brokerage service arrangements or reductions from other expense offset arrangements and do not represent the amount paid by the class during periods when reimbursements or reductions occur. Expenses net of fee waivers reflect expenses after reimbursement by the investment adviser but prior to reductions from brokerage service arrangements or other expense offset arrangements. Expenses net of all reductions represent the net expenses paid by the class.
H Annualized
I Amount does not include the portfolio activity of any underlying Fidelity Central Funds.
J Portfolio turnover rate excludes securities received or delivered in-kind.
See accompanying notes which are an integral part of the financial statements.
Notes to Financial Statements (Unaudited)
For the period ended January 31, 2018
(Amounts in thousands except percentages)
1. Organization.
Fidelity OTC Portfolio (the Fund) is a non-diversified fund of Fidelity Securities Fund (the Trust) and is authorized to issue an unlimited number of shares. The Trust is registered under the Investment Company Act of 1940, as amended (the 1940 Act), as an open-end management investment company organized as a Massachusetts business trust. The Fund offers OTC and Class K shares, each of which has equal rights as to assets and voting privileges. Each class has exclusive voting rights with respect to matters that affect that class.
2. Investments in Fidelity Central Funds.
The Fund invests in Fidelity Central Funds, which are open-end investment companies generally available only to other investment companies and accounts managed by the investment adviser and its affiliates. The Fund's Schedule of Investments lists each of the Fidelity Central Funds held as of period end, if any, as an investment of the Fund, but does not include the underlying holdings of each Fidelity Central Fund. As an Investing Fund, the Fund indirectly bears its proportionate share of the expenses of the underlying Fidelity Central Funds.
The Money Market Central Funds seek preservation of capital and current income and are managed by Fidelity Investments Money Management, Inc. (FIMM), an affiliate of the investment adviser. Annualized expenses of the Money Market Central Funds as of their most recent shareholder report date are less than .005%.
A complete unaudited list of holdings for each Fidelity Central Fund is available upon request or at the Securities and Exchange Commission (the SEC) website at www.sec.gov. In addition, the financial statements of the Fidelity Central Funds are available on the SEC website or upon request.
3. Significant Accounting Policies.
The Fund is an investment company and applies the accounting and reporting guidance of the Financial Accounting Standards Board (FASB) Accounting Standards Codification Topic 946 Financial Services – Investments Companies. The financial statements have been prepared in conformity with accounting principles generally accepted in the United States of America (GAAP), which require management to make certain estimates and assumptions at the date of the financial statements. Actual results could differ from those estimates. Subsequent events, if any, through the date that the financial statements were issued have been evaluated in the preparation of the financial statements. The following summarizes the significant accounting policies of the Fund:
Investment Valuation. Investments are valued as of 4:00 p.m. Eastern time on the last calendar day of the period. The Board of Trustees (the Board) has delegated the day to day responsibility for the valuation of the Fund's investments to the Fair Value Committee (the Committee) established by the Fund's investment adviser. In accordance with valuation policies and procedures approved by the Board, the Fund attempts to obtain prices from one or more third party pricing vendors or brokers to value its investments. When current market prices, quotations or currency exchange rates are not readily available or reliable, investments will be fair valued in good faith by the Committee, in accordance with procedures adopted by the Board. Factors used in determining fair value vary by investment type and may include market or investment specific events, changes in interest rates and credit quality. The frequency with which these procedures are used cannot be predicted and they may be utilized to a significant extent. The Committee oversees the Fund's valuation policies and procedures and reports to the Board on the Committee's activities and fair value determinations. The Board monitors the appropriateness of the procedures used in valuing the Fund's investments and ratifies the fair value determinations of the Committee.
The Fund categorizes the inputs to valuation techniques used to value its investments into a disclosure hierarchy consisting of three levels as shown below:
- Level 1 – quoted prices in active markets for identical investments
- Level 2 – other significant observable inputs (including quoted prices for similar investments, interest rates, prepayment speeds, etc.)
- Level 3 – unobservable inputs (including the Fund's own assumptions based on the best information available)
Valuation techniques used to value the Fund's investments by major category are as follows:
Equity securities, including restricted securities, for which market quotations are readily available, are valued at the last reported sale price or official closing price as reported by a third party pricing vendor on the primary market or exchange on which they are traded and are categorized as Level 1 in the hierarchy. In the event there were no sales during the day or closing prices are not available, securities are valued at the last quoted bid price or may be valued using the last available price and are generally categorized as Level 2 in the hierarchy. For foreign equity securities, when market or security specific events arise, comparisons to the valuation of American Depositary Receipts (ADRs), futures contracts, Exchange-Traded Funds (ETFs) and certain indexes as well as quoted prices for similar securities may be used and would be categorized as Level 2 in the hierarchy. Utilizing these techniques may result in transfers between Level 1 and Level 2. For equity securities, including restricted securities, where observable inputs are limited, assumptions about market activity and risk are used and these securities may be categorized as Level 3 in the hierarchy. Equity securities, including restricted securities, for which observable inputs are not available are valued using alternate valuation approaches, including the market approach and the income approach and are categorized as Level 3 in the hierarchy. The market approach generally consists of using comparable market transactions while the income approach generally consists of using the net present value of estimated future cash flows, adjusted as appropriate for liquidity, credit, market and/or other risk factors.
Debt securities, including restricted securities, are valued based on evaluated prices received from third party pricing vendors or from brokers who make markets in such securities. Corporate bonds are valued by pricing vendors who utilize matrix pricing which considers yield or price of bonds of comparable quality, coupon, maturity and type or by broker-supplied prices. When independent prices are unavailable or unreliable, debt securities may be valued utilizing pricing methodologies which consider similar factors that would be used by third party pricing vendors. Debt securities are generally categorized as Level 2 in the hierarchy but may be Level 3 depending on the circumstances.
Investments in open-end mutual funds, including the Fidelity Central Funds, are valued at their closing net asset value (NAV) each business day and are categorized as Level 1 in the hierarchy.
The following provides information on Level 3 securities held by the Fund that were valued at period end based on unobservable inputs. These amounts exclude valuations provided by a broker.
| Asset Type | Fair Value | Valuation Technique (s) | Unobservable Input | Amount or Range / Weighted Average | Impact to Valuation from an Increase in Input(a) |
| Corporate Bonds | $14,228 | Market approach | Transaction price | $100.00 | Increase |
| Equities | $458,848 | Market approach | Transaction price | $0.81- $353.57 / $75.02 | Increase |
| | | | Discount rate | 5.0% | Decrease |
| | | | Liquidity preference | $33.82 - $45.76 / $39.79 | Increase |
| | | Market comparable | Transaction price | $10.06 - $330.00 / $164.48 | Increase |
| | | | Enterprise value/Sales multiple (EV/S) | 0.8 - 14.3 / 4.1 | Increase |
| | | | Discount rate | 65.0% - 69.1% / 68.9% | Decrease |
| | | | Premium rate | 8.0% - 108.0% / 26.6% | Increase |
| | | | Discount for lack of marketability | 15.0% - 25.0% / 16.5% | Decrease |
| | | | Liquidity preference | $4.84 - $26.00 / $15.77 | Increase |
| | | | Proxy premium | 54.5% | Increase |
| | | Book value | Book value multiple | 1.0 | Increase |
| | | | Discount rate | 70.0% | Decrease |
| | | Recovery value | Recovery value | 0.3% - 0.7% / 0.4% | Increase |
| | | Discount cash flow | Discount rate | 9.0% | Decrease |
| | | | Discount for lack of marketability | 20.0% | Decrease |
| | | | Growth rate | 3.0% | Increase |
(a) Represents the expected directional change in the fair value of the Level 3 investments that would result from an increase in the corresponding input. A decrease to the unobservable input would have the opposite effect. Significant changes in these inputs could result in significantly higher or lower fair value measurements.
Changes in valuation techniques may result in transfers in or out of an assigned level within the disclosure hierarchy. The aggregate value of investments by input level as of January 31, 2018, as well as a roll forward of Level 3 investments, is included at the end of the Fund's Schedule of Investments.
Foreign Currency. The Fund may use foreign currency contracts to facilitate transactions in foreign-denominated securities. Gains and losses from these transactions may arise from changes in the value of the foreign currency or if the counterparties do not perform under the contracts' terms.
Foreign-denominated assets, including investment securities, and liabilities are translated into U.S. dollars at the exchange rates at period end. Purchases and sales of investment securities, income and dividends received and expenses denominated in foreign currencies are translated into U.S. dollars at the exchange rate in effect on the transaction date.
The effects of exchange rate fluctuations on investments are included with the net realized and unrealized gain (loss) on investment securities. Other foreign currency transactions resulting in realized and unrealized gain (loss) are disclosed separately.
Investment Transactions and Income. For financial reporting purposes, the Fund's investment holdings and NAV include trades executed through the end of the last business day of the period. The NAV per share for processing shareholder transactions is calculated as of the close of business of the New York Stock Exchange (NYSE), normally 4:00 p.m. Eastern time and includes trades executed through the end of the prior business day. Gains and losses on securities sold are determined on the basis of identified cost and includes proceeds received from litigation. Dividend income is recorded on the ex-dividend date, except for certain dividends from foreign securities where the ex-dividend date may have passed, which are recorded as soon as the Fund is informed of the ex-dividend date. Non-cash dividends included in dividend income, if any, are recorded at the fair market value of the securities received. Income and capital gain distributions from Fidelity Central Funds, if any, are recorded on the ex-dividend date. Certain distributions received by the Fund represent a return of capital or capital gain. The Fund determines the components of these distributions subsequent to the ex-dividend date, based upon receipt of tax filings or other correspondence relating to the underlying investment. These distributions are recorded as a reduction of cost of investments and/or as a realized gain. Interest income is accrued as earned and includes coupon interest and amortization of premium and accretion of discount on debt securities as applicable. Investment income is recorded net of foreign taxes withheld where recovery of such taxes is uncertain.
Class Allocations and Expenses. Investment income, realized and unrealized capital gains and losses, common expenses of the Fund, and certain fund-level expense reductions, if any, are allocated daily on a pro-rata basis to each class based on the relative net assets of each class to the total net assets of the Fund. Each class differs with respect to transfer agent fees incurred. Certain expense reductions may also differ by class. For the reporting period, the allocated portion of income and expenses to each class as a percent of its average net assets may vary due to the timing of recording these transactions in relation to fluctuating net assets of the classes. Expenses directly attributable to a fund are charged to that fund. Expenses attributable to more than one fund are allocated among the respective funds on the basis of relative net assets or other appropriate methods. Expense estimates are accrued in the period to which they relate and adjustments are made when actual amounts are known.
Deferred Trustee Compensation. Under a Deferred Compensation Plan (the Plan), independent Trustees may elect to defer receipt of a portion of their annual compensation. Deferred amounts are invested in a cross-section of Fidelity funds, are marked-to-market and remain in the Fund until distributed in accordance with the Plan. The investment of deferred amounts and the offsetting payable to the Trustees are included in the accompanying Statement of Assets and Liabilities.
Income Tax Information and Distributions to Shareholders. Each year, the Fund intends to qualify as a regulated investment company under Subchapter M of the Internal Revenue Code, including distributing substantially all of its taxable income and realized gains. As a result, no provision for U.S. Federal income taxes is required. The Fund files a U.S. federal tax return, in addition to state and local tax returns as required. The Fund's federal income tax returns are subject to examination by the Internal Revenue Service (IRS) for a period of three fiscal years after they are filed. State and local tax returns may be subject to examination for an additional fiscal year depending on the jurisdiction. Foreign taxes are provided for based on the Fund's understanding of the tax rules and rates that exist in the foreign markets in which it invests.
Distributions are declared and recorded on the ex-dividend date. Income dividends and capital gain distributions are declared separately for each class. Income and capital gain distributions are determined in accordance with income tax regulations, which may differ from GAAP.
Capital accounts within the financial statements are adjusted for permanent book-tax differences. These adjustments have no impact on net assets or the results of operations. Capital accounts are not adjusted for temporary book-tax differences which will reverse in a subsequent period.
Book-tax differences are primarily due to redemptions in kind, foreign currency transactions, passive foreign investment companies (PFIC), partnerships, deferred trustees compensation and losses deferred due to wash sales and excise tax regulations.
As of period end, the cost and unrealized appreciation (depreciation) in securities, and derivatives if applicable, for federal income tax purposes were as follows:
| Gross unrealized appreciation | $8,374,482 |
| Gross unrealized depreciation | (499,511) |
| Net unrealized appreciation (depreciation) | $7,874,971 |
| Tax cost | $12,465,243 |
Restricted Securities. The Fund may invest in securities that are subject to legal or contractual restrictions on resale. These securities generally may be resold in transactions exempt from registration or to the public if the securities are registered. Disposal of these securities may involve time-consuming negotiations and expense, and prompt sale at an acceptable price may be difficult. Information regarding restricted securities is included at the end of the Fund's Schedule of Investments.
Consolidated Subsidiary. The Fund invests in certain investments through a wholly-owned subsidiary ("Subsidiary"), which may be subject to federal and state taxes upon disposition.
As of period end, the Fund held an investment of $23,946 in these Subsidiaries, representing .12% of the Fund's net assets. The financial statements have been consolidated and include accounts of the Fund and each Subsidiary. Accordingly, all inter-company transactions and balances have been eliminated.
4. Purchases and Sales of Investments.
Purchases and sales of securities, other than short-term securities and in-kind transactions, aggregated $3,724,184 and $2,954,148, respectively.
Redemptions In-Kind. During the period, 607 shares of the Fund held by unaffiliated entities were redeemed in-kind for investments and cash with a value of $65,932. The net realized gain of $35,542 on investments delivered through in-kind redemptions is included in the accompanying Statement of Operations. The amount of the in-kind redemptions is included in share transactions in the accompanying Statement of Changes in Net Assets as well as the Notes to Financial Statements. The Fund recognized no gain or loss for federal income tax purposes.
Prior Fiscal Year Redemptions In-Kind. During the prior period, 11,615 shares of the Fund held by unaffiliated entities were redeemed in-kind for investments and cash with a value of $1,105,548. The Fund had a net realized gain of $441,424 on investments delivered through the in-kind redemptions. The amount of the in-kind redemptions is included in share transactions in the accompanying Statement of Changes in Net Assets as well as the Notes to Financial Statements. The Fund recognized no gain or loss for federal income tax purposes.
5. Fees and Other Transactions with Affiliates.
Management Fee. Fidelity Management & Research Company (the investment adviser) and its affiliates provide the Fund with investment management related services for which the Fund pays a monthly management fee. The management fee is the sum of an individual fund fee rate that is based on an annual rate of .35% of the Fund's average net assets and an annualized group fee rate that averaged .24% during the period. The group fee rate is based upon the average net assets of all the mutual funds advised by the investment adviser, including any mutual funds previously advised by the investment adviser that are currently advised by Fidelity SelectCo, LLC, an affiliate of the investment adviser. The group fee rate decreases as assets under management increase and increases as assets under management decrease. In addition, the management fee is subject to a performance adjustment (up to a maximum of +/- .20% of the Fund's average net assets over a 36 month performance period). The upward or downward adjustment to the management fee is based on the relative investment performance of OTC as compared to its benchmark index, the Nasdaq Composite Index, over the same 36 month performance period. For the reporting period, the total annualized management fee rate, including the performance adjustment, was .72% of the Fund's average net assets. The performance adjustment included in the management fee rate may be higher or lower than the maximum performance adjustment rate due to the difference between the average net assets for the reporting and performance periods.
Transfer Agent Fees. Fidelity Investments Institutional Operations Company, Inc., (FIIOC), an affiliate of the investment adviser, is the transfer, dividend disbursing and shareholder servicing agent for each class of the Fund. FIIOC receives account fees and asset-based fees that vary according to the account size and type of account of the shareholders of OTC. FIIOC receives an asset-based fee of Class K's average net assets. FIIOC pays for typesetting, printing and mailing of shareholder reports, except proxy statements.
For the period, transfer agent fees for each class were as follows:
| | Amount | % of Class-Level Average Net Assets(a) |
| OTC | $9,882 | .15 |
| Class K | 883 | .05 |
| | $10,765 | |
(a) Annualized
Accounting and Security Lending Fees. Fidelity Service Company, Inc. (FSC), an affiliate of the investment adviser, maintains the Fund's accounting records. The accounting fee is based on the level of average net assets for each month. Under a separate contract, FSC administers the security lending program. The security lending fee is based on the number and duration of lending transactions.
Brokerage Commissions. The Fund placed a portion of its portfolio transactions with brokerage firms which are affiliates of the investment adviser. Brokerage commissions are included in net realized gain (loss) and change in net unrealized appreciation (depreciation) in the Statement of Operations. The commissions paid to these affiliated firms were $97 for the period.
Interfund Lending Program. Pursuant to an Exemptive Order issued by the SEC, the Fund, along with other registered investment companies having management contracts with Fidelity Management & Research Company (FMR) or other affiliated entities of FMR, may participate in an interfund lending program. This program provides an alternative credit facility allowing the funds to borrow from, or lend money to, other participating affiliated funds. At period end, there were no interfund loans outstanding. The Fund's activity in this program during the period for which loans were outstanding was as follows:
| Borrower or Lender | Average Loan Balance | Weighted Average Interest Rate | Interest Expense |
| Borrower | $11,720 | 1.37% | $5 |
Interfund Trades. The Fund may purchase from or sell securities to other Fidelity Funds under procedures adopted by the Board. The procedures have been designed to ensure these interfund trades are executed in accordance with Rule 17a-7 of the 1940 Act. Interfund trades are included within the respective purchases and sales amounts shown in the Purchases and Sales of Investments note.
6. Committed Line of Credit.
The Fund participates with other funds managed by the investment adviser or an affiliate in a $4.25 billion credit facility (the "line of credit") to be utilized for temporary or emergency purposes to fund shareholder redemptions or for other short-term liquidity purposes. The Fund has agreed to pay commitment fees on its pro-rata portion of the line of credit, which amounted to $24 and is reflected in Miscellaneous expenses on the Statement of Operations. During the period, the Fund did not borrow on this line of credit.
7. Security Lending.
The Fund lends portfolio securities through a lending agent from time to time in order to earn additional income. For equity securities, a lending agent is used and may loan securities to certain qualified borrowers, including Fidelity Capital Markets (FCM), a broker-dealer affiliated with the Fund. On the settlement date of the loan, the Fund receives collateral (in the form of U.S. Treasury obligations, letters of credit and/or cash) against the loaned securities and maintains collateral in an amount not less than 100% of the market value of the loaned securities during the period of the loan. The market value of the loaned securities is determined at the close of business of the Fund and any additional required collateral is delivered to the Fund on the next business day. The Fund or borrower may terminate the loan at any time, and if the borrower defaults on its obligation to return the securities loaned because of insolvency or other reasons, the Fund may apply collateral received from the borrower against the obligation. The Fund may experience delays and costs in recovering the securities loaned. Any cash collateral received is invested in the Fidelity Securities Lending Cash Central Fund. The value of loaned securities and cash collateral at period end are disclosed on the Fund's Statement of Assets and Liabilities. The value of securities loaned to FCM at period end was $22,887. Security lending income represents the income earned on investing cash collateral, less rebates paid to borrowers and any lending agent fees associated with the loan, plus any premium payments received for lending certain types of securities. Security lending income is presented in the Statement of Operations as a component of income from Fidelity Central Funds, and includes $127 from securities loaned to FCM.
8. Expense Reductions.
Commissions paid to certain brokers with whom the investment adviser, or its affiliates, places trades on behalf of the Fund include an amount in addition to trade execution, which may be rebated back to the Fund to offset certain expenses. This amount totaled $226 for the period. In addition, through arrangements with the Fund's custodian, credits realized as a result of certain uninvested cash balances were used to reduce the Fund's expenses. During the period, these credits reduced the Fund's custody expenses by $4.
In addition, during the period the investment adviser reimbursed and/or waived a portion of fund-level operating expenses in the amount of $88.
9. Distributions to Shareholders.
Distributions to shareholders of each class were as follows:
| | Six months ended
January 31, 2018 | Year ended
July 31, 2017 |
| From net realized gain | | |
| OTC | $625,105 | $305,214 |
| Class K | 183,152 | 108,306 |
| Total | $808,257 | $413,520 |
10. Share Transactions.
Share transactions for each class were as follows and may contain automatic conversions between classes or exchanges between affiliated funds:
| | Shares | Shares | Dollars | Dollars |
| | Six months ended January 31, 2018 | Year ended July 31, 2017 | Six months ended January 31, 2018 | Year ended July 31, 2017 |
| OTC | | | | |
| Shares sold | 19,774 | 23,115 | $2,175,861 | $2,182,339 |
| Reinvestment of distributions | 5,739 | 3,540 | 601,208 | 294,662 |
| Shares redeemed | (10,120) | (27,294) | (1,102,724) | (2,508,373) |
| Net increase (decrease) | 15,393 | (639) | $1,674,345 | $(31,372) |
| Class K | | | | |
| Shares sold | 4,836 | 9,395 | $537,543 | $878,574 |
| Reinvestment of distributions | 1,727 | 1,286 | 183,152 | 108,306 |
| Shares redeemed | (7,300)(a) | (17,142)(b) | (813,474)(a) | (1,569,523)(b) |
| Net increase (decrease) | (737) | (6,461) | $(92,779) | $(582,643) |
(a) Amount includes in-kind redemptions (see the Redemption In-Kind note for additional details).
(b) Amount includes in-kind redemptions (see the Prior Fiscal Year Redemption In-Kind note for additional details).
11. Other.
The Fund's organizational documents provide former and current trustees and officers with a limited indemnification against liabilities arising in connection with the performance of their duties to the Fund. In the normal course of business, the Fund may also enter into contracts that provide general indemnifications. The Fund's maximum exposure under these arrangements is unknown as this would be dependent on future claims that may be made against the Fund. The risk of material loss from such claims is considered remote.
Shareholder Expense Example
As a shareholder of the Fund, you incur two types of costs: (1) transaction costs and (2) ongoing costs, including management fees and other Fund expenses. This Example is intended to help you understand your ongoing costs (in dollars) of investing in the Fund and to compare these costs with the ongoing costs of investing in other mutual funds.
The Example is based on an investment of $1,000 invested at the beginning of the period and held for the entire period (August 1, 2017 to January 31, 2018).
Actual Expenses
The first line of the accompanying table for each class of the Fund provides information about actual account values and actual expenses. You may use the information in this line, together with the amount you invested, to estimate the expenses that you paid over the period. Simply divide your account value by $1,000.00 (for example, an $8,600 account value divided by $1,000.00 = 8.6), then multiply the result by the number in the first line for a class of the Fund under the heading entitled "Expenses Paid During Period" to estimate the expenses you paid on your account during this period. A small balance maintenance fee of $12.00 that is charged once a year may apply for certain accounts with a value of less than $2,000. This fee is not included in the table below. If it was, the estimate of expenses you paid during the period would be higher, and your ending account value lower, by this amount. In addition, the Fund, as a shareholder in the underlying Fidelity Central Funds, will indirectly bear its pro-rata share of the fees and expenses incurred by the underlying Fidelity Central Funds. These fees and expenses are not included in the Fund's annualized expense ratio used to calculate the expense estimate in the table below.
Hypothetical Example for Comparison Purposes
The second line of the accompanying table for each class of the Fund provides information about hypothetical account values and hypothetical expenses based on a Class' actual expense ratio and an assumed rate of return of 5% per year before expenses, which is not the Class' actual return. The hypothetical account values and expenses may not be used to estimate the actual ending account balance or expenses you paid for the period. You may use this information to compare the ongoing costs of investing in the Fund and other funds. To do so, compare this 5% hypothetical example with the 5% hypothetical examples that appear in the shareholder reports of the other funds. A small balance maintenance fee of $12.00 that is charged once a year may apply for certain accounts with a value of less than $2,000. This fee is not included in the table below. If it was, the estimate of expenses you paid during the period would be higher, and your ending account value lower, by this amount. In addition, the Fund, as a shareholder in the underlying Fidelity Central Funds, will indirectly bear its pro-rata share of the fees and expenses incurred by the underlying Fidelity Central Funds. These fees and expenses are not included in the Fund's annualized expense ratio used to calculate the expense estimate in the table below.
Please note that the expenses shown in the table are meant to highlight your ongoing costs only and do not reflect any transaction costs. Therefore, the second line of the table is useful in comparing ongoing costs only, and will not help you determine the relative total costs of owning different funds.
| | Annualized Expense Ratio-A | Beginning
Account Value
August 1, 2017 | Ending
Account Value
January 31, 2018 | Expenses Paid
During Period-B
August 1, 2017
to January 31, 2018 |
| OTC | .88% | | | |
| Actual | | $1,000.00 | $1,182.80 | $4.84 |
| Hypothetical-C | | $1,000.00 | $1,020.77 | $4.48 |
| Class K | .78% | | | |
| Actual | | $1,000.00 | $1,183.40 | $4.29 |
| Hypothetical-C | | $1,000.00 | $1,021.27 | $3.97 |
A Annualized expense ratio reflects expenses net of applicable fee waivers.
B Expenses are equal to each Class' annualized expense ratio, multiplied by the average account value over the period, multiplied by 184/365 (to reflect the one-half year period).
C 5% return per year before expenses
Corporate Headquarters
245 Summer St.
Boston, MA 02210
www.fidelity.com
OTC-SANN-0318
1.700332.120
Fidelity Advisor® Real Estate Income Fund -
Class A, Class M, Class C and Class I
Semi-Annual Report January 31, 2018 Class A, Class M, Class C and Class I are classes of Fidelity® Real Estate Income Fund |
|
Contents
To view a fund's proxy voting guidelines and proxy voting record for the 12-month period ended June 30, visit http://www.fidelity.com/proxyvotingresults or visit the Securities and Exchange Commission's (SEC) web site at http://www.sec.gov.
You may also call 1-877-208-0098 to request a free copy of the proxy voting guidelines.
Standard & Poor's, S&P and S&P 500 are registered service marks of The McGraw-Hill Companies, Inc. and have been licensed for use by Fidelity Distributors Corporation.
Other third-party marks appearing herein are the property of their respective owners.
All other marks appearing herein are registered or unregistered trademarks or service marks of FMR LLC or an affiliated company. © 2018 FMR LLC. All rights reserved.
This report and the financial statements contained herein are submitted for the general information of the shareholders of the Fund. This report is not authorized for distribution to prospective investors in the Fund unless preceded or accompanied by an effective prospectus.
A fund files its complete schedule of portfolio holdings with the SEC for the first and third quarters of each fiscal year on Form N-Q. Forms N-Q are available on the SEC’s web site at http://www.sec.gov. A fund's Forms N-Q may be reviewed and copied at the SEC’s Public Reference Room in Washington, DC. Information regarding the operation of the SEC's Public Reference Room may be obtained by calling 1-800-SEC-0330.
For a complete list of a fund's portfolio holdings, view the most recent holdings listing, semiannual report, or annual report on Fidelity's web site at http://www.fidelity.com, http://www.institutional.fidelity.com, or http://www.401k.com, as applicable.
NOT FDIC INSURED •MAY LOSE VALUE •NO BANK GUARANTEE
Neither the Fund nor Fidelity Distributors Corporation is a bank.
Investment Summary (Unaudited)
Top Five Stocks as of January 31, 2018
| | % of fund's net assets |
| Equity Lifestyle Properties, Inc. | 2.9 |
| Apartment Investment & Management Co. Class A | 2.0 |
| Acadia Realty Trust (SBI) | 2.0 |
| Ventas, Inc. | 1.8 |
| MFA Financial, Inc. | 1.6 |
| | 10.3 |
Top 5 Bonds as of January 31, 2018
| | % of fund's net assets |
| Senior Housing Properties Trust 4.75% 5/1/24 | 0.9 |
| IAS Operating Partnership LP 5% 3/15/18 | 0.8 |
| RWT Holdings, Inc. 5.625% 11/15/19 | 0.7 |
| PennyMac Corp. 5.375% 5/1/20 | 0.6 |
| RAIT Financial Trust 4% 10/1/33 | 0.6 |
| | 3.6 |
Top Five REIT Sectors as of January 31, 2018
| | % of fund's net assets |
| REITs - Mortgage | 18.0 |
| REITs - Health Care | 7.8 |
| REITs - Diversified | 6.6 |
| REITs - Apartments | 6.5 |
| REITs - Shopping Centers | 3.9 |
Asset Allocation (% of fund's net assets)
| As of January 31, 2018* |
| | Stocks | 47.1% |
| | Bonds | 34.4% |
| | Convertible Securities | 7.3% |
| | Other Investments | 4.4% |
| | Short-Term Investments and Net Other Assets (Liabilities) | 6.8% |

* Foreign investments - 1.6%
Schedule of Investments January 31, 2018 (Unaudited)
Showing Percentage of Net Assets
| Common Stocks - 29.1% | | | |
| | | Shares | Value |
| CONSUMER DISCRETIONARY - 0.6% | | | |
| Hotels, Restaurants & Leisure - 0.6% | | | |
| Bluegreen Vacations Corp. | | 262,950 | $4,993,421 |
| Wyndham Worldwide Corp. | | 199,600 | 24,776,348 |
| | | | 29,769,769 |
| Household Durables - 0.0% | | | |
| Stanley Martin Communities LLC Class B (Escrow) (a)(b) | | 4,620 | 149,642 |
|
| TOTAL CONSUMER DISCRETIONARY | | | 29,919,411 |
|
| FINANCIALS - 5.3% | | | |
| Capital Markets - 0.9% | | | |
| Brookfield Asset Management, Inc. Class A | | 535,900 | 22,429,376 |
| Ellington Financial LLC | | 1,568,684 | 22,887,100 |
| | | | 45,316,476 |
| Insurance - 0.2% | | | |
| FNF Group | | 288,400 | 11,241,832 |
| Mortgage Real Estate Investment Trusts - 4.2% | | | |
| AG Mortgage Investment Trust, Inc. | | 284,200 | 4,956,448 |
| Anworth Mortgage Asset Corp. | | 1,145,100 | 5,565,186 |
| Arbor Realty Trust, Inc. (c) | | 1,928,494 | 15,717,226 |
| Chimera Investment Corp. | | 953,100 | 16,193,169 |
| Dynex Capital, Inc. | | 1,322,886 | 8,598,759 |
| Ellington Residential Mortgage REIT (c) | | 260,000 | 2,810,600 |
| Five Oaks Investment Corp. (c) | | 547,901 | 1,791,636 |
| Great Ajax Corp. (d) | | 1,577,762 | 21,078,900 |
| Invesco Mortgage Capital, Inc. | | 2,335,049 | 37,921,196 |
| MFA Financial, Inc. | | 12,110,622 | 86,712,054 |
| New Residential Investment Corp. | | 655,600 | 11,335,324 |
| Redwood Trust, Inc. | | 21,300 | 317,157 |
| Two Harbors Investment Corp. | | 675,400 | 9,962,150 |
| | | | 222,959,805 |
|
| TOTAL FINANCIALS | | | 279,518,113 |
|
| REAL ESTATE - 23.2% | | | |
| Equity Real Estate Investment Trusts (REITs) - 23.2% | | | |
| Acadia Realty Trust (SBI) (d) | | 4,239,449 | 104,120,867 |
| Altisource Residential Corp. Class B | | 188,686 | 2,077,433 |
| American Homes 4 Rent Class A | | 1,666,038 | 34,636,930 |
| American Tower Corp. | | 356,700 | 52,684,590 |
| Apartment Investment & Management Co. Class A | | 2,555,042 | 106,902,957 |
| AvalonBay Communities, Inc. | | 173,300 | 29,530,320 |
| Boardwalk (REIT) (c) | | 298,500 | 10,799,390 |
| Cedar Realty Trust, Inc. | | 530,163 | 2,709,133 |
| Colony NorthStar, Inc. | | 7,740,548 | 69,510,121 |
| DDR Corp. | | 1,932,600 | 15,692,712 |
| Douglas Emmett, Inc. | | 197,700 | 7,645,059 |
| Equinix, Inc. | | 107,800 | 49,069,482 |
| Equity Lifestyle Properties, Inc. | | 1,750,402 | 151,094,686 |
| Extra Space Storage, Inc. | | 548,900 | 45,822,172 |
| Gramercy Property Trust | | 498,647 | 12,585,850 |
| Healthcare Realty Trust, Inc. | | 431,300 | 12,882,931 |
| Healthcare Trust of America, Inc. | | 1,058,760 | 29,232,364 |
| Lexington Corporate Properties Trust | | 4,316,674 | 38,936,399 |
| Mid-America Apartment Communities, Inc. | | 650,406 | 62,029,220 |
| National Retail Properties, Inc. | | 179,200 | 7,110,656 |
| Omega Healthcare Investors, Inc. (c) | | 964,923 | 26,091,518 |
| Public Storage | | 148,291 | 29,029,446 |
| Rexford Industrial Realty, Inc. | | 270,300 | 8,025,207 |
| Sabra Health Care REIT, Inc. | | 2,352,875 | 42,587,038 |
| Safety Income and Growth, Inc. | | 393,600 | 6,931,296 |
| Select Income REIT | | 205,800 | 4,601,688 |
| Senior Housing Properties Trust (SBI) | | 3,099,300 | 53,710,869 |
| Spirit Realty Capital, Inc. | | 894,600 | 7,308,882 |
| Store Capital Corp. | | 1,493,200 | 36,598,332 |
| Terreno Realty Corp. | | 626,328 | 22,297,277 |
| Ventas, Inc. | | 1,737,986 | 97,275,076 |
| VEREIT, Inc. | | 4,038,234 | 29,075,285 |
| WP Carey, Inc. | | 151,200 | 9,799,272 |
| WP Glimcher, Inc. | | 881,200 | 5,798,296 |
| | | | 1,224,202,754 |
| TOTAL COMMON STOCKS | | | |
| (Cost $1,343,382,828) | | | 1,533,640,278 |
|
| Preferred Stocks - 19.3% | | | |
| Convertible Preferred Stocks - 1.3% | | | |
| FINANCIALS - 0.3% | | | |
| Mortgage Real Estate Investment Trusts - 0.3% | | | |
| Great Ajax Corp. 7.25%(d) | | 180,000 | 4,486,086 |
| Sutherland Asset Management Corp. 7.00% | | 404,700 | 10,153,923 |
| | | | 14,640,009 |
| REAL ESTATE - 1.0% | | | |
| Equity Real Estate Investment Trusts (REITs) - 1.0% | | | |
| Alexandria Real Estate Equities, Inc. Series D, 7.00% | | 136,759 | 5,044,301 |
| Ashford Hospitality Prime, Inc. 5.50% | | 95,791 | 1,838,804 |
| Equity Commonwealth 6.50% | | 31,237 | 824,869 |
| iStar Financial, Inc. Series J, 4.50% | | 213,273 | 10,009,798 |
| Lexington Corporate Properties Trust Series C, 6.50% | | 468,142 | 23,512,853 |
| RLJ Lodging Trust 1.95% | | 31,935 | 826,957 |
| Wheeler REIT, Inc. 8.75% | | 516,748 | 8,996,583 |
| | | | 51,054,165 |
|
| TOTAL CONVERTIBLE PREFERRED STOCKS | | | 65,694,174 |
|
| Nonconvertible Preferred Stocks - 18.0% | | | |
| FINANCIALS - 8.1% | | | |
| Capital Markets - 0.1% | | | |
| Arlington Asset Investment Corp. 6.625% | | 182,517 | 4,402,657 |
| Brookfield Asset Management, Inc. 4.75% | | 105,800 | 2,187,394 |
| | | | 6,590,051 |
| Mortgage Real Estate Investment Trusts - 7.9% | | | |
| AG Mortgage Investment Trust, Inc.: | | | |
| 8.00% | | 618,287 | 15,234,592 |
| 8.25% | | 38,935 | 982,330 |
| AGNC Investment Corp.: | | | |
| Series B, 7.75% | | 427,100 | 10,997,825 |
| Series C, 7.00% | | 361,900 | 9,206,736 |
| American Capital Mortgage Investment Corp. Series A, 8.125% | | 248,636 | 6,340,243 |
| Annaly Capital Management, Inc.: | | | |
| Series C, 7.625% | | 326,429 | 8,209,689 |
| Series D, 7.50% | | 621,976 | 15,599,158 |
| Series E, 7.625% | | 672,961 | 16,951,888 |
| Series F, 6.95% | | 1,203,714 | 30,490,076 |
| Series G, 6.50% (e) | | 720,300 | 17,726,583 |
| Anworth Mortgage Asset Corp. Series A, 8.625% | | 242,730 | 6,240,588 |
| Apollo Commercial Real Estate Finance, Inc. Series C, 8.00% | | 485,559 | 12,221,714 |
| Arbor Realty Trust, Inc.: | | | |
| 7.375% | | 457,577 | 11,681,941 |
| Series A, 8.25% | | 189,089 | 4,787,733 |
| Series B, 7.75% | | 240,000 | 6,065,304 |
| Series C, 8.50% | | 100,000 | 2,595,200 |
| Armour Residential REIT, Inc. Series B, 7.875% | | 153,654 | 3,838,384 |
| Capstead Mortgage Corp. Series E, 7.50% | | 202,984 | 5,125,346 |
| Cherry Hill Mortgage Investment Corp. Series A, 8.20% | | 246,500 | 6,211,800 |
| Chimera Investment Corp.: | | | |
| Series A, 8.00% | | 204,000 | 5,179,560 |
| Series B, 8.00% | | 1,257,372 | 31,981,005 |
| CYS Investments, Inc.: | | | |
| Series A, 7.75% | | 118,428 | 2,953,594 |
| Series B, 7.50% | | 496,667 | 12,044,175 |
| Dynex Capital, Inc.: | | | |
| Series A, 8.50% | | 362,932 | 9,182,180 |
| Series B, 7.625% | | 252,120 | 5,995,414 |
| Five Oaks Investment Corp. Series A, 8.75% | | 86,727 | 2,168,175 |
| Invesco Mortgage Capital, Inc.: | | | |
| 7.50% | | 806,500 | 19,678,600 |
| Series A, 7.75% | | 123,342 | 3,092,184 |
| Series B, 7.75% | | 846,483 | 21,542,992 |
| MFA Financial, Inc.: | | | |
| 8.00% | | 538,930 | 13,952,898 |
| Series B, 7.50% | | 616,232 | 15,399,638 |
| New York Mortgage Trust, Inc.: | | | |
| Series B, 7.75% | | 284,267 | 6,857,771 |
| Series C, 7.875% | | 280,725 | 6,858,112 |
| Series D, 8.00% | | 313,300 | 7,715,013 |
| PennyMac Mortgage Investment Trust: | | | |
| 8.125% | | 335,500 | 8,353,950 |
| Series B, 8.00% | | 546,800 | 13,560,640 |
| Resource Capital Corp.: | | | |
| 8.25% | | 80,024 | 1,993,398 |
| 8.625% | | 168,316 | 4,292,058 |
| Two Harbors Investment Corp.: | | | |
| Series A, 8.125% | | 450,000 | 11,763,000 |
| Series B, 7.625% | | 429,690 | 10,819,594 |
| Series C, 7.25% | | 309,000 | 7,498,194 |
| Wells Fargo Real Estate Investment Corp. Series A, 6.375% | | 137,600 | 3,544,576 |
| | | | 416,933,851 |
| Real Estate Management & Development - 0.1% | | | |
| Brookfield Properties Corp. Series EE, 5.10% | | 142,300 | 2,925,827 |
| TOTAL FINANCIALS | | | 426,449,729 |
| REAL ESTATE - 9.9% | | | |
| Equity Real Estate Investment Trusts (REITs) - 9.8% | | | |
| American Homes 4 Rent: | | | |
| 5.875% | | 250,809 | 6,194,982 |
| Series C, 5.50% | | 915,240 | 26,001,968 |
| Series D, 6.50% | | 280,000 | 7,170,800 |
| Series E, 6.35% | | 210,000 | 5,321,400 |
| Series G, 5.875% | | 202,000 | 4,934,860 |
| Ashford Hospitality Trust, Inc.: | | | |
| Series D, 8.45% | | 11,770 | 297,546 |
| Series F, 7.375% | | 268,000 | 6,342,434 |
| Series G, 7.375% | | 120,000 | 2,818,800 |
| Series H, 7.50% | | 168,800 | 4,000,560 |
| Series I, 7.50% | | 168,900 | 4,011,375 |
| Bluerock Residential Growth (REIT), Inc.: | | | |
| Series A, 8.25% | | 486,775 | 12,266,730 |
| Series C, 7.625% | | 146,969 | 3,603,445 |
| Series D, 7.125% | | 136,000 | 3,359,200 |
| CBL & Associates Properties, Inc. Series D, 7.375% | | 167,876 | 3,362,556 |
| Cedar Realty Trust, Inc.: | | | |
| Series B, 7.25% | | 87,895 | 2,199,950 |
| Series C, 6.50% | | 294,900 | 6,823,986 |
| City Office REIT, Inc. Series A, 6.625% | | 180,500 | 4,507,085 |
| Colony NorthStar, Inc.: | | | |
| Series B, 8.25% | | 207,761 | 5,233,500 |
| Series D, 8.50% | | 274,915 | 7,003,460 |
| Series E, 8.75% | | 481,729 | 12,606,848 |
| Series G, 7.50% | | 121,607 | 2,945,808 |
| Series H, 7.125% | | 584,350 | 13,440,050 |
| Series I, 7.15% | | 774,587 | 17,892,960 |
| Series J, 7.15% | | 917,785 | 21,026,454 |
| DDR Corp.: | | | |
| Series J, 6.50% | | 340,721 | 8,293,694 |
| Series K, 6.25% | | 228,888 | 5,561,978 |
| Digital Realty Trust, Inc.: | | | |
| Series C, 6.625% | | 84,000 | 2,215,920 |
| Series G, 5.875% | | 142,903 | 3,551,140 |
| Series H, 7.375% | | 50,000 | 1,314,000 |
| Farmland Partners, Inc. Series B, 6.00% | | 630,000 | 16,049,124 |
| General Growth Properties, Inc. Series A, 6.375% | | 166,463 | 4,174,892 |
| Gladstone Commercial Corp. Series D, 7.00% | | 538,800 | 13,739,400 |
| Gladstone Land Corp. Series A, 6.375% | | 64,000 | 1,646,086 |
| Global Medical REIT, Inc. Series A, 7.50% | | 135,100 | 3,301,844 |
| Global Net Lease, Inc. Series A, 7.25% | | 467,400 | 11,670,978 |
| Government Properties Income Trust 5.875% | | 202,500 | 5,121,225 |
| Hersha Hospitality Trust: | | | |
| Series C, 6.875% | | 50,000 | 1,222,000 |
| Series D, 6.50% | | 200,000 | 4,842,000 |
| Investors Real Estate Trust Series C, 6.625% | | 320,900 | 7,906,976 |
| iStar Financial, Inc.: | | | |
| Series D, 8.00% | | 126,529 | 3,192,327 |
| Series G, 7.65% | | 222,721 | 5,594,752 |
| Series I, 7.50% | | 161,269 | 4,031,725 |
| Jernigan Capital, Inc. Series B, 7.00% (e) | | 50,600 | 1,219,460 |
| LaSalle Hotel Properties: | | | |
| Series I, 6.375% | | 354,698 | 8,778,776 |
| Series J, 6.30% | | 240,000 | 5,851,200 |
| Monmouth Real Estate Investment Corp. Series C, 6.125% | | 225,900 | 5,527,773 |
| National Retail Properties, Inc. Series E, 5.70% | | 301,404 | 7,474,819 |
| National Storage Affiliates Trust Series A, 6.00% (e) | | 67,600 | 1,683,240 |
| Pebblebrook Hotel Trust: | | | |
| Series C, 6.50% | | 204,321 | 5,083,506 |
| Series D, 6.375% | | 350,000 | 8,680,000 |
| Pennsylvania (REIT): | | | |
| Series B, 7.375% | | 100,510 | 2,461,490 |
| Series C, 7.20% | | 51,000 | 1,204,110 |
| Series D, 6.875% | | 151,800 | 3,559,710 |
| Plymouth Industrial REIT, Inc. Series A, 7.50% | | 169,400 | 4,240,082 |
| Prologis, Inc. Series Q, 8.54% | | 94,446 | 6,544,116 |
| Public Storage: | | | |
| Series F, 5.15% | | 173,400 | 4,114,782 |
| Series G, 5.05% | | 42,200 | 986,214 |
| Series Y, 6.375% | | 102,224 | 2,649,646 |
| RAIT Financial Trust: | | | |
| 7.125% | | 336,786 | 7,978,460 |
| 7.625% | | 224,590 | 4,570,407 |
| Rexford Industrial Realty, Inc.: | | | |
| Series A, 5.875% | | 135,000 | 3,190,050 |
| Series B, 5.875% (e) | | 79,500 | 1,852,350 |
| Sabra Health Care REIT, Inc. Series A, 7.125% | | 318,623 | 8,038,826 |
| Saul Centers, Inc.: | | | |
| Series C, 6.875% | | 315,478 | 7,931,148 |
| Series D, 6.125% (e) | | 83,700 | 2,064,645 |
| Sotherly Hotels, Inc.: | | | |
| Series B, 8.00% | | 68,000 | 1,711,553 |
| Series C, 7.875% | | 108,200 | 2,703,918 |
| Spirit Realty Capital, Inc. Series A, 6.00% | | 95,200 | 2,311,456 |
| Stag Industrial, Inc.: | | | |
| Series B, 6.625% | | 80,300 | 2,025,969 |
| Series C, 6.875% | | 83,000 | 2,116,658 |
| Summit Hotel Properties, Inc.: | | | |
| Series C, 7.125% | | 153,212 | 3,887,295 |
| Series D, 6.45% | | 210,000 | 5,292,000 |
| Series E, 6.25% | | 190,000 | 4,740,500 |
| Sunstone Hotel Investors, Inc.: | | | |
| Series E, 6.95% | | 42,000 | 1,075,200 |
| Series F, 6.45% | | 84,000 | 2,126,880 |
| Taubman Centers, Inc. Series K, 6.25% | | 157,322 | 3,966,874 |
| UMH Properties, Inc.: | | | |
| Series B, 8.00% | | 319,604 | 8,737,973 |
| Series C, 6.75% | | 341,140 | 8,579,671 |
| Series D, 6.375% | | 93,800 | 2,280,278 |
| Urstadt Biddle Properties, Inc.: | | | |
| Series G, 6.75% | | 160,000 | 4,153,600 |
| Series H, 6.25% | | 284,500 | 7,069,825 |
| VEREIT, Inc. Series F, 6.70% | | 1,995,725 | 50,272,313 |
| WP Glimcher, Inc.: | | | |
| Series H, 7.50% | | 198,527 | 4,701,119 |
| Series I, 6.875% | | 298,115 | 6,996,312 |
| | | | 517,231,022 |
| Real Estate Management & Development - 0.1% | | | |
| Landmark Infrastructure Partners LP Series B, 7.90% | | 117,700 | 2,924,845 |
| TOTAL REAL ESTATE | | | 520,155,867 |
| UTILITIES - 0.0% | | | |
| Electric Utilities - 0.0% | | | |
| Brookfield Infrastructure Partners LP Series 5, 5.35% | | 169,300 | 3,541,536 |
|
| TOTAL NONCONVERTIBLE PREFERRED STOCKS | | | 950,147,132 |
|
| TOTAL PREFERRED STOCKS | | | |
| (Cost $999,902,470) | | | 1,015,841,306 |
| | | Principal Amount | Value |
|
| Corporate Bonds - 21.0% | | | |
| Convertible Bonds - 6.0% | | | |
| FINANCIALS - 5.0% | | | |
| Diversified Financial Services - 0.1% | | | |
| Granite Point Mortgage Trust, Inc. 5.625% 12/1/22 (f) | | 6,770,000 | 6,676,811 |
| Mortgage Real Estate Investment Trusts - 4.9% | | | |
| Arbor Realty Trust, Inc. 5.375% 11/15/20 | | 4,230,000 | 4,233,756 |
| Blackstone Mortgage Trust, Inc. 4.375% 5/5/22 | | 16,780,000 | 16,520,866 |
| Colony Financial, Inc.: | | | |
| 3.875% 1/15/21 | | 17,280,000 | 16,771,069 |
| 5% 4/15/23 | | 26,083,000 | 25,770,969 |
| IAS Operating Partnership LP 5% 3/15/18 (f) | | 41,020,000 | 41,020,000 |
| PennyMac Corp. 5.375% 5/1/20 | | 35,606,000 | 34,898,936 |
| Redwood Trust, Inc. 4.625% 4/15/18 | | 14,700,000 | 14,714,700 |
| Resource Capital Corp.: | | | |
| 4.5% 8/15/22 | | 5,050,000 | 4,878,997 |
| 6% 12/1/18 | | 6,100,000 | 6,168,625 |
| 8% 1/15/20 | | 13,890,000 | 14,515,050 |
| RWT Holdings, Inc. 5.625% 11/15/19 | | 36,880,000 | 37,249,833 |
| Starwood Property Trust, Inc. 4.375% 4/1/23 | | 15,080,000 | 15,152,384 |
| Two Harbors Investment Corp. 6.25% 1/15/22 | | 4,380,000 | 4,446,515 |
| Western Asset Mortgage Capital Corp. 6.75% 10/1/22 | | 21,100,000 | 20,642,594 |
| | | | 256,984,294 |
| TOTAL FINANCIALS | | | 263,661,105 |
| REAL ESTATE - 1.0% | | | |
| Equity Real Estate Investment Trusts (REITs) - 1.0% | | | |
| American Realty Capital Properties, Inc. 3.75% 12/15/20 | | 21,434,000 | 21,731,161 |
| RAIT Financial Trust 4% 10/1/33 | | 34,060,000 | 32,184,486 |
| | | | 53,915,647 |
|
| TOTAL CONVERTIBLE BONDS | | | 317,576,752 |
|
| Nonconvertible Bonds - 15.0% | | | |
| CONSUMER DISCRETIONARY - 3.5% | | | |
| Hotels, Restaurants & Leisure - 0.4% | | | |
| ESH Hospitality, Inc. 5.25% 5/1/25 (f) | | 8,040,000 | 8,100,300 |
| FelCor Lodging LP 6% 6/1/25 | | 2,025,000 | 2,106,000 |
| Hilton Grand Vacations Borrower LLC/Hilton Grand Vacations Borrower, Inc. 6.125% 12/1/24 | | 2,540,000 | 2,787,650 |
| Times Square Hotel Trust 8.528% 8/1/26 (f) | | 6,756,382 | 7,778,908 |
| | | | 20,772,858 |
| Household Durables - 3.1% | | | |
| Ashton Woods U.S.A. LLC/Ashton Woods Finance Co.: | | | |
| 6.75% 8/1/25 (f) | | 8,430,000 | 8,451,075 |
| 6.875% 2/15/21 (f) | | 15,709,000 | 15,944,635 |
| Beazer Homes U.S.A., Inc.: | | | |
| 5.875% 10/15/27 (f) | | 7,605,000 | 7,585,988 |
| 6.75% 3/15/25 | | 5,850,000 | 6,142,500 |
| 8.75% 3/15/22 | | 7,540,000 | 8,237,450 |
| Brookfield Residential Properties, Inc./Brookfield Residential U.S. Corp. 6.125% 7/1/22 (f) | | 5,495,000 | 5,713,152 |
| Brookfield Residential Properties, Inc.: | | | |
| 6.375% 5/15/25 (f) | | 5,580,000 | 5,886,900 |
| 6.5% 12/15/20 (f) | | 12,085,000 | 12,326,700 |
| CalAtlantic Group, Inc. 5.875% 11/15/24 | | 1,625,000 | 1,771,250 |
| D.R. Horton, Inc.: | | | |
| 4.375% 9/15/22 | | 4,175,000 | 4,347,924 |
| 5.75% 8/15/23 | | 2,510,000 | 2,784,349 |
| KB Home 8% 3/15/20 | | 8,465,000 | 9,237,431 |
| Lennar Corp. 4.5% 4/30/24 | | 3,355,000 | 3,392,912 |
| M/I Homes, Inc.: | | | |
| 5.625% 8/1/25 | | 2,870,000 | 2,920,225 |
| 6.75% 1/15/21 | | 3,803,000 | 3,936,105 |
| Meritage Homes Corp.: | | | |
| 5.125% 6/6/27 | | 5,035,000 | 5,097,938 |
| 6% 6/1/25 | | 4,000,000 | 4,310,000 |
| 7% 4/1/22 | | 7,525,000 | 8,446,813 |
| 7.15% 4/15/20 | | 7,060,000 | 7,624,800 |
| New Home Co. LLC 7.25% 4/1/22 | | 9,200,000 | 9,614,000 |
| Ryland Group, Inc. 6.625% 5/1/20 | | 1,555,000 | 1,663,850 |
| Taylor Morrison Communities, Inc./Monarch Communities, Inc. 5.875% 4/15/23 (f) | | 4,100,000 | 4,376,750 |
| TRI Pointe Homes, Inc.: | | | |
| 5.25% 6/1/27 | | 5,045,000 | 5,095,450 |
| 5.875% 6/15/24 | | 3,890,000 | 4,120,677 |
| William Lyon Homes, Inc.: | | | |
| 5.875% 1/31/25 | | 2,545,000 | 2,602,263 |
| 7% 8/15/22 | | 8,180,000 | 8,466,300 |
| | | | 160,097,437 |
| Media - 0.0% | | | |
| CBS Outdoor Americas Capital LLC/CBS Outdoor Americas Capital Corp. 5.625% 2/15/24 | | 1,300,000 | 1,330,875 |
| TOTAL CONSUMER DISCRETIONARY | | | 182,201,170 |
| CONSUMER STAPLES - 0.7% | | | |
| Food & Staples Retailing - 0.7% | | | |
| Ahold Lease U.S.A., Inc. 7.82% 1/2/20 | | 87,104 | 89,218 |
| Albertsons Companies LLC/Safeway, Inc./New Albertson's, Inc./Albertson's LLC: | | | |
| 5.75% 3/15/25 | | 15,225,000 | 13,588,313 |
| 6.625% 6/15/24 | | 10,760,000 | 10,222,000 |
| Albertsons, Inc. 8.7% 5/1/30 | | 5,080,000 | 4,762,500 |
| C&S Group Enterprises LLC 5.375% 7/15/22 (f) | | 9,705,000 | 9,074,175 |
| Cumberland Farms, Inc. 6.75% 5/1/25 (f) | | 2,075,000 | 2,215,063 |
| | | | 39,951,269 |
| FINANCIALS - 0.7% | | | |
| Diversified Financial Services - 0.5% | | | |
| Brixmor Operating Partnership LP: | | | |
| 3.65% 6/15/24 | | 6,000,000 | 5,882,472 |
| 3.85% 2/1/25 | | 8,384,000 | 8,269,419 |
| 4.125% 6/15/26 | | 2,000 | 1,987 |
| Five Point Operation Co. LP 7.875% 11/15/25 (f) | | 6,775,000 | 6,910,500 |
| Icahn Enterprises LP/Icahn Enterprises Finance Corp.: | | | |
| 5.875% 2/1/22 | | 3,680,000 | 3,749,000 |
| 6.25% 2/1/22 (f) | | 1,695,000 | 1,745,850 |
| | | | 26,559,228 |
| Mortgage Real Estate Investment Trusts - 0.1% | | | |
| Starwood Property Trust, Inc. 4.75% 3/15/25 (f) | | 4,235,000 | 4,182,063 |
| Thrifts & Mortgage Finance - 0.1% | | | |
| Ocwen Loan Servicing LLC 8.375% 11/15/22 (f) | | 3,403,000 | 3,454,045 |
| Radian Group, Inc. 4.5% 10/1/24 | | 4,000,000 | 4,000,000 |
| | | | 7,454,045 |
| TOTAL FINANCIALS | | | 38,195,336 |
| HEALTH CARE - 0.5% | | | |
| Health Care Providers & Services - 0.5% | | | |
| QCP SNF West (REIT) LLC 8.125% 11/1/23 (f) | | 6,245,000 | 6,432,350 |
| Sabra Health Care LP/Sabra Capital Corp.: | | | |
| 5.375% 6/1/23 | | 5,675,000 | 5,802,688 |
| 5.5% 2/1/21 | | 12,305,000 | 12,628,006 |
| | | | 24,863,044 |
| INDUSTRIALS - 0.1% | | | |
| Building Products - 0.1% | | | |
| Shea Homes Ltd. Partnership/Corp. 6.125% 4/1/25 (f) | | 3,350,000 | 3,492,375 |
| INFORMATION TECHNOLOGY - 0.1% | | | |
| Internet Software & Services - 0.1% | | | |
| CyrusOne LP/CyrusOne Finance Corp. 5% 3/15/24 | | 3,610,000 | 3,682,200 |
| REAL ESTATE - 9.4% | | | |
| Equity Real Estate Investment Trusts (REITs) - 7.2% | | | |
| American Campus Communities Operating Partnership LP 4.125% 7/1/24 | | 2,000,000 | 2,053,446 |
| ARC Properties Operating Partnership LP 4.6% 2/6/24 | | 15,480,000 | 16,039,726 |
| Care Capital Properties LP 5.125% 8/15/26 | | 19,546,000 | 19,377,013 |
| CBL & Associates LP: | | | |
| 4.6% 10/15/24 | | 26,758,000 | 23,589,665 |
| 5.25% 12/1/23 | | 11,500,000 | 10,756,653 |
| 5.95% 12/15/26 | | 10,434,000 | 9,614,899 |
| Corporate Office Properties LP 3.6% 5/15/23 | | 5,000,000 | 4,932,314 |
| CTR Partnership LP/CareTrust Capital Corp. 5.25% 6/1/25 | | 5,030,000 | 5,092,875 |
| CubeSmart LP 4.8% 7/15/22 | | 2,000,000 | 2,114,166 |
| DDR Corp.: | | | |
| 3.625% 2/1/25 | | 6,453,000 | 6,356,712 |
| 4.625% 7/15/22 | | 2,096,000 | 2,193,607 |
| Equinix, Inc. 5.375% 5/15/27 | | 6,620,000 | 6,951,000 |
| HCP, Inc.: | | | |
| 4% 6/1/25 | | 1,000,000 | 1,017,251 |
| 4.25% 11/15/23 | | 6,707,000 | 6,971,504 |
| Health Care REIT, Inc.: | | | |
| 4% 6/1/25 | | 1,551,000 | 1,581,766 |
| 4.125% 4/1/19 | | 2,000,000 | 2,029,848 |
| Healthcare Realty Trust, Inc. 3.75% 4/15/23 | | 4,966,000 | 5,005,719 |
| Highwoods/Forsyth LP 3.625% 1/15/23 | | 3,847,000 | 3,845,373 |
| Hospitality Properties Trust 5% 8/15/22 | | 3,177,000 | 3,355,209 |
| iStar Financial, Inc.: | | | |
| 4.625% 9/15/20 | | 6,755,000 | 6,839,438 |
| 5% 7/1/19 | | 24,265,000 | 24,371,159 |
| 5.25% 9/15/22 | | 4,220,000 | 4,209,450 |
| 6% 4/1/22 | | 8,375,000 | 8,563,438 |
| Lexington Corporate Properties Trust 4.4% 6/15/24 | | 2,180,000 | 2,171,940 |
| MPT Operating Partnership LP/MPT Finance Corp.: | | | |
| 5% 10/15/27 | | 6,115,000 | 6,055,073 |
| 5.25% 8/1/26 | | 4,385,000 | 4,516,550 |
| 6.375% 3/1/24 | | 4,000,000 | 4,264,000 |
| National Retail Properties, Inc.: | | | |
| 3.3% 4/15/23 | | 2,000,000 | 1,992,247 |
| 3.5% 10/15/27 | | 3,421,000 | 3,298,613 |
| Omega Healthcare Investors, Inc.: | | | |
| 4.375% 8/1/23 | | 3,303,000 | 3,309,532 |
| 4.5% 4/1/27 | | 2,462,000 | 2,361,124 |
| 4.75% 1/15/28 | | 12,204,000 | 11,859,036 |
| 4.95% 4/1/24 | | 2,898,000 | 2,982,684 |
| Potlatch Corp. 7.5% 11/1/19 | | 1,000,000 | 1,075,000 |
| Reckson Operating Partnership LP/SL Green Realty Corp./SL Green Operating Partnership LP 7.75% 3/15/20 | | 2,000,000 | 2,189,426 |
| Regency Centers LP 3.6% 2/1/27 | | 2,558,000 | 2,498,071 |
| SBA Communications Corp. 4% 10/1/22 (f) | | 2,535,000 | 2,496,975 |
| Select Income REIT: | | | |
| 4.15% 2/1/22 | | 11,170,000 | 11,164,664 |
| 4.25% 5/15/24 | | 5,030,000 | 4,931,854 |
| 4.5% 2/1/25 | | 21,294,000 | 21,090,773 |
| Senior Housing Properties Trust: | | | |
| 3.25% 5/1/19 | | 7,382,000 | 7,402,245 |
| 4.75% 5/1/24 | | 44,895,000 | 46,289,666 |
| 6.75% 4/15/20 | | 13,624,000 | 14,415,364 |
| 6.75% 12/15/21 | | 8,000,000 | 8,755,209 |
| VEREIT Operating Partnership LP 4.875% 6/1/26 | | 10,945,000 | 11,351,368 |
| WP Carey, Inc.: | | | |
| 4% 2/1/25 | | 6,985,000 | 6,955,283 |
| 4.25% 10/1/26 | | 7,242,000 | 7,275,607 |
| 4.6% 4/1/24 | | 11,323,000 | 11,662,717 |
| | | | 379,227,252 |
| Real Estate Management & Development - 2.2% | | | |
| Greystar Real Estate Partners 5.75% 12/1/25 (f) | | 5,925,000 | 6,087,938 |
| Healthcare Trust of America Holdings LP 3.75% 7/1/27 | | 8,395,000 | 8,242,643 |
| Host Hotels & Resorts LP 5.25% 3/15/22 | | 2,000,000 | 2,129,578 |
| Howard Hughes Corp. 5.375% 3/15/25 (f) | | 16,545,000 | 16,710,450 |
| Hunt Companies, Inc. 9.625% 3/1/21 (f) | | 7,460,000 | 7,859,110 |
| Kennedy-Wilson, Inc. 5.875% 4/1/24 | | 31,370,000 | 32,154,250 |
| Mattamy Group Corp.: | | | |
| 6.5% 10/1/25 (f) | | 4,835,000 | 5,094,881 |
| 6.875% 12/15/23 (f) | | 5,425,000 | 5,736,938 |
| Mid-America Apartments LP: | | | |
| 3.75% 6/15/24 | | 1,663,000 | 1,686,220 |
| 4.3% 10/15/23 | | 5,203,000 | 5,435,749 |
| Taylor Morrison Communities, Inc./Monarch Communities, Inc.: | | | |
| 5.25% 4/15/21 (f) | | 2,803,000 | 2,851,212 |
| 5.625% 3/1/24 (f) | | 2,270,000 | 2,386,338 |
| Washington Prime Group LP 5.95% 8/15/24 | | 21,080,000 | 21,393,380 |
| | | | 117,768,687 |
| TOTAL REAL ESTATE | | | 496,995,939 |
|
| TOTAL NONCONVERTIBLE BONDS | | | 789,381,333 |
|
| TOTAL CORPORATE BONDS | | | |
| (Cost $1,085,663,760) | | | 1,106,958,085 |
|
| Asset-Backed Securities - 2.5% | | | |
| American Homes 4 Rent: | | | |
| Series 2014-SFR2 Class E, 6.231% 10/17/36 (f) | | 3,000,000 | 3,322,955 |
| Series 2014-SFR3 Class E, 6.418% 12/17/36 (f) | | 9,025,000 | 10,118,439 |
| Series 2015-SFR1: | | | |
| Class E, 5.639% 4/17/52 (f) | | 1,999,310 | 2,154,913 |
| Class F, 5.885% 4/17/52 (f) | | 2,000,000 | 2,134,414 |
| Series 2015-SFR2: | | | |
| Class E, 6.07% 10/17/45 (f) | | 8,259,000 | 9,131,429 |
| Class XS, 0% 10/17/45 (b)(f)(g)(h) | | 4,776,010 | 48 |
| Capital Trust RE CDO Ltd. Series 2005-1A Class D, 1 month U.S. LIBOR + 1.500% 3.0612% 3/20/50 (b)(f)(g)(i) | | 2,250,000 | 223 |
| CapLease CDO Ltd. Series 2005-1A Class A, 4.926% 1/29/40 (f) | | 592,439 | 595,994 |
| Colony Starwood Homes Series 2016-2A Class F, 1 month U.S. LIBOR + 4.150% 5.627% 12/17/33 (f)(g)(i) | | 1,500,000 | 1,555,315 |
| Conseco Finance Securitizations Corp. Series 2002-2 Class M2, 9.163% 3/1/33 | | 457,397 | 418,831 |
| Crest Clarendon Street Ltd./Crest Clarendon Corp. Series 2002-1A Class D, 9% 12/28/35 (f) | | 38,953 | 38,961 |
| Deutsche Financial Capital Securitization LLC Series 1997-I Class M, 7.275% 9/15/27 | | 2,581,867 | 2,644,807 |
| Green Tree Financial Corp.: | | | |
| Series 1996-4 Class M1, 7.75% 6/15/27 (g) | | 1,019,023 | 1,040,102 |
| Series 1997-3 Class M1, 7.53% 3/15/28 | | 6,558,888 | 6,552,938 |
| Home Partners of America Credit Trust Series 2017-1 Class F, 1 month U.S. LIBOR + 3.539% 5.0739% 7/17/34 (f)(g)(i) | | 6,318,500 | 6,458,736 |
| Home Partners of America Trust Series 2016-2 Class F, 1 month U.S. LIBOR + 5.250% 6.1595% 10/17/33 (f)(g)(i) | | 3,393,000 | 3,483,870 |
| Invitation Homes Trust: | | | |
| Series 2015-SFR2 Class E, 1 month U.S. LIBOR + 3.150% 4.6408% 6/17/32 (f)(g)(i) | | 2,450,000 | 2,469,175 |
| Series 2015-SFR3 Class F, 1 month U.S. LIBOR + 3.650% 6.2095% 8/17/32 (f)(g)(i) | | 2,000,000 | 2,031,938 |
| Series 2015-SRF1 Class F, 1 month U.S. LIBOR + 4.550% 5.7595% 3/17/32 (f)(g)(i) | | 5,500,000 | 5,522,058 |
| Series 2017-SFR2 Class F, 1 month U.S. LIBOR + 3.000% 4.4908% 12/17/36 (f)(g)(i) | | 8,442,000 | 8,605,725 |
| Lehman ABS Manufactured Housing Contract Trust Series 2001-B Class M2, 7.17% 4/15/40 | | 792,268 | 553,103 |
| Merit Securities Corp. Series 13 Class M1, 7.9345% 12/28/33 (g) | | 1,923,000 | 1,974,168 |
| Progress Residential Trust: | | | |
| Series 2015-SFR3 Class F, 6.643% 11/12/32 (f) | | 2,940,000 | 3,094,259 |
| Series 2016-SFR1 Class F, 1 month U.S. LIBOR + 5.000% 6.4595% 9/17/33 (f)(g)(i) | | 8,459,000 | 8,722,697 |
| Series 2017-SFR1 Class F, 5.35% 8/17/34 (f) | | 3,073,000 | 3,136,385 |
| Series 2017-SFR2 Class F, 1 month U.S. LIBOR + 2.750% 4.836% 12/17/34(f)(g)(i) | | 2,568,000 | 2,555,420 |
| Starwood Waypoint Homes Trust Series 2017-1: | | | |
| Class E, 1 month U.S. LIBOR + 2.600% 4.0908% 1/17/35 (f)(g)(i) | | 5,906,000 | 5,985,325 |
| Class F, 1 month U.S. LIBOR + 3.400% 4.8908% 1/17/35 (f)(g)(i) | | 12,671,000 | 12,670,966 |
| Taberna Preferred Funding III Ltd. Series 2005-3A Class D, 3 month U.S. LIBOR + 2.650% 4.0414% 2/5/36 (b)(f)(g)(i) | | 4,265,895 | 320 |
| Tricon American Homes: | | | |
| Series 2017-SFR1 Class F, 5.151% 9/17/34 (f) | | 8,442,000 | 8,497,362 |
| Series 2017-SFR2 Class F, 5.16% 1/17/36 (f) | | 3,785,000 | 3,719,974 |
| Tricon American Homes Trust Series 2016-SFR1 Class F, 5.769% 11/17/33 (f) | | 2,544,000 | 2,623,403 |
| VB-S1 Issuer LLC Series 2016-1A Class F, 6.901% 6/15/46 (f) | | 7,797,000 | 7,933,572 |
| Wrightwood Capital Real Estate CDO Ltd. Series 2005-1A Class F, 3 month U.S. LIBOR + 1.950% 3.2664% 11/21/40 (b)(f)(g)(i) | | 250,000 | 196,875 |
| TOTAL ASSET-BACKED SECURITIES | | | |
| (Cost $130,429,180) | | | 129,944,700 |
|
| Collateralized Mortgage Obligations - 0.2% | | | |
| Private Sponsor - 0.2% | | | |
| FREMF Mortgage Trust: | | | |
| Series 2010-K6 Class B, 5.3671% 12/25/46 (f)(g) | | 4,500,000 | 4,689,225 |
| Series 2010-K7 Class B, 5.6853% 4/25/20 (f)(g) | | 3,200,000 | 3,359,962 |
| RESI Finance LP/RESI Finance DE Corp. floater Series 2003-B Class B9, 1 month U.S. LIBOR + 11.950% 13.3819% 6/10/35 (f)(g)(i) | | 54,862 | 36,644 |
| RESIX Finance Ltd. floater: | | | |
| Series 2004-A Class B7, 1 month U.S. LIBOR + 4.250% 5.6819% 2/10/36 (b)(f)(g)(i) | | 37,954 | 397 |
| Series 2004-B Class B7, 1 month U.S. LIBOR + 4.000% 5.4319% 2/10/36 (b)(f)(g)(i) | | 79,701 | 8,289 |
|
| TOTAL PRIVATE SPONSOR | | | 8,094,517 |
|
| U.S. Government Agency - 0.0% | | | |
| Fannie Mae REMIC Trust: | | | |
| Series 2002-W1 subordinate REMIC pass thru certificates, Class 3B3, 3.6195% 2/25/42 (f)(g) | | 52,397 | 31,466 |
| Series 2003-W10 subordinate REMIC pass thru certificates, Class 2B3, 3.5464% 6/25/43 (f)(g) | | 86,035 | 44,787 |
|
| TOTAL U.S. GOVERNMENT AGENCY | | | 76,253 |
|
| TOTAL COLLATERALIZED MORTGAGE OBLIGATIONS | | | |
| (Cost $7,761,405) | | | 8,170,770 |
|
| Commercial Mortgage Securities - 16.7% | | | |
| Americold LLC Trust Series 2010-ARTA Class D, 7.443% 1/14/29 (f) | | 2,000,000 | 2,179,824 |
| Aventura Mall Trust Series 2013-AVM Class E, 3.7427% 12/5/32 (f)(g) | | 4,900,000 | 4,920,586 |
| BANK Series 2017-BNK4 Class D, 3.357% 5/15/50 (f) | | 3,349,000 | 2,773,824 |
| Barclays Commercial Mortgage Securities LLC Series 2015-STP: | | | |
| Class E, 4.2844% 9/10/28 (f)(g) | | 8,413,000 | 8,103,532 |
| Class F, 4.4272% 9/10/28 (f)(g) | | 4,074,000 | 3,724,414 |
| Bear Stearns Commercial Mortgage Securities Trust Series 2006-T22 Class B, 5.7203% 4/12/38 (f)(g) | | 544,007 | 544,899 |
| BX Trust Series 2017-IMC Class F, 1 month U.S. LIBOR + 4.250% 5.8095% 10/15/32 (f)(g)(i) | | 12,691,000 | 12,754,356 |
| CCRESG Commercial Mortgage Trust Series 2016-HEAT: | | | |
| Class E, 5.4883% 4/10/29 (f)(g) | | 4,536,000 | 4,368,801 |
| Class F, 5.4883% 4/10/29 (f)(g) | | 9,710,000 | 9,207,669 |
| CD Mortgage Trust Series 2017-CD3 Class D, 3.25% 2/10/50 (f) | | 3,391,000 | 2,809,973 |
| CGBAM Commercial Mortgage Trust Series 2015-SMRT: | | | |
| Class E, 3.7859% 4/10/28 (f)(g) | | 3,023,000 | 3,020,384 |
| Class F, 3.7859% 4/10/28 (f)(g) | | 9,911,000 | 9,800,588 |
| CGDB Commercial Mortgage Trust: | | | |
| 1 month U.S. LIBOR + 2.500% 4.0595% 5/15/30 (f)(g)(i) | | 2,375,000 | 2,378,775 |
| Series 2017-BIO Class F, 1 month U.S. LIBOR + 3.250% 4.8095% 5/15/30 (f)(g)(i) | | 1,500,000 | 1,498,674 |
| CGMS Commercial Mortgage Trust Series 2017-MDRB: | | | |
| Class D, 1 month U.S. LIBOR + 3.250% 4.8095% 7/15/30 (f)(g)(i) | | 5,000,000 | 5,001,969 |
| Class E, 1 month U.S. LIBOR + 3.872% 5.431% 7/15/30 (f)(g)(i) | | 6,741,000 | 6,709,679 |
| Citigroup Commercial Mortgage Trust: | | | |
| Series 2013-GC15 Class D, 5.0989% 9/10/46 (f)(g) | | 5,254,000 | 5,017,261 |
| Series 2015-SHP2 Class E, 1 month U.S. LIBOR + 4.100% 5.9095% 7/15/27 (f)(g)(i) | | 2,933,000 | 2,951,493 |
| Series 2016-C3 Class D, 3% 11/15/49 (f) | | 7,089,000 | 5,429,504 |
| Series 2016-SMPL Class E, 4.509% 9/10/31 (f) | | 1,701,000 | 1,700,447 |
| COMM Mortgage Trust: | | | |
| sequential payer Series 2013-LC6 Class E, 3.5% 1/10/46 (f) | | 7,300,000 | 5,498,175 |
| Series 2012-CR1: | | | |
| Class C, 5.3197% 5/15/45 (g) | | 1,000,000 | 1,043,835 |
| Class D, 5.3197% 5/15/45 (f)(g) | | 5,550,000 | 5,405,077 |
| Class G, 2.462% 5/15/45 (f) | | 2,180,000 | 1,318,321 |
| Series 2012-CR5 Class D, 4.3278% 12/10/45 (f)(g) | | 2,000,000 | 1,902,573 |
| Series 2012-LC4: | | | |
| Class C, 5.6049% 12/10/44 (g) | | 2,000,000 | 2,051,136 |
| Class D, 5.6049% 12/10/44 (f)(g) | | 11,675,000 | 10,457,445 |
| Series 2013-CCRE6 Class E, 4.067% 3/10/46 (f)(g) | | 882,000 | 705,799 |
| Series 2013-CR10 Class D, 4.7886% 8/10/46 (f)(g) | | 4,544,000 | 3,971,238 |
| Series 2013-CR12 Class D, 5.0787% 10/10/46 (f)(g) | | 4,500,000 | 3,762,317 |
| Series 2013-CR6 Class F, 4.0668% 3/10/46 (f)(g) | | 8,038,000 | 5,144,298 |
| Series 2013-CR9 Class D, 4.2541% 7/10/45 (f)(g) | | 1,404,000 | 1,203,976 |
| Series 2013-LC6 Class D, 4.3076% 1/10/46 (f)(g) | | 8,301,000 | 7,734,235 |
| Series 2014-CR17: | | | |
| Class D, 4.7985% 5/10/47 (f)(g) | | 2,500,000 | 2,125,086 |
| Class E, 4.7985% 5/10/47 (f)(g) | | 3,098,000 | 2,337,999 |
| Series 2014-UBS2 Class D, 5.0146% 3/10/47 (f)(g) | | 3,713,000 | 3,149,026 |
| Series 2016-CD1 Class D, 2.7711% 8/10/49 (f)(g) | | 9,452,000 | 7,536,789 |
| Series 2017-CD4 Class D, 3.3% 5/10/50 (f) | | 2,550,000 | 2,113,514 |
| COMM Trust Series 2017-COR2 Class D, 3% 9/10/50 (f) | | 2,800,000 | 2,298,691 |
| Commercial Mortgage Trust pass-thru certificates Series 2012-CR2: | | | |
| Class D, 4.832% 8/15/45 (f)(g) | | 4,500,000 | 4,450,799 |
| Class E, 4.832% 8/15/45 (f)(g) | | 8,000,000 | 7,735,042 |
| Core Industrial Trust: | | | |
| Series 2015-TEXW Class F, 3.8487% 2/10/34 (f)(g) | | 10,945,000 | 10,632,294 |
| Series 2015-WEST Class F, 4.2268% 2/10/37 (f)(g) | | 12,745,000 | 12,239,890 |
| Credit Suisse First Boston Mortgage Securities Corp. Series 1998-C1 Class F, 6% 5/17/40 (f) | | 102,617 | 102,639 |
| CSAIL Commercial Mortgage Trust: | | | |
| Series 2017-C8 Class D, 4.47% 6/15/50 (f) | | 4,346,000 | 3,883,677 |
| Series 2017-CX10 Class UESD, 4.2366% 11/15/27 (f)(g) | | 5,076,000 | 4,888,721 |
| Series 2017-CX9 Class D, 4.161% 9/15/50 (f) | | 2,568,000 | 2,236,857 |
| CSMC Trust: | | | |
| floater Series 2015-DEAL: | | | |
| Class E, 1 month U.S. LIBOR + 4.000% 5.559% 4/15/29 (f)(g)(i) | | 3,000,000 | 3,010,242 |
| Class F, 1 month U.S. LIBOR + 4.750% 6.309% 4/15/29 (f)(g)(i) | | 7,803,000 | 7,803,002 |
| Series 2016-MFF Class F, 1 month U.S. LIBOR + 7.250% 8.727% 11/15/33 (f)(g)(i) | | 6,300,000 | 6,368,225 |
| DBCCRE Mortgage Trust Series 2014-ARCP Class E, 4.9345% 1/10/34 (f)(g) | | 10,853,000 | 9,662,219 |
| DBUBS Mortgage Trust: | | | |
| Series 2011-LC1A: | | | |
| Class E, 5.6978% 11/10/46 (f)(g) | | 14,031,000 | 14,624,166 |
| Class G, 4.652% 11/10/46 (f) | | 12,360,000 | 10,884,178 |
| Series 2011-LC3A Class D, 5.3404% 8/10/44 (f)(g) | | 3,945,000 | 4,099,506 |
| Freddie Mac: | | | |
| pass-thru certificates: | | | |
| Series K011 Class X3, 2.577% 12/25/43 (g)(h) | | 12,206,096 | 834,790 |
| Series K012 Class X3, 2.252% 1/25/41 (g)(h) | | 20,724,866 | 1,268,884 |
| Series K013 Class X3, 2.9089% 1/25/43 (g)(h) | | 14,360,000 | 1,129,187 |
| Series KAIV Class X2, 3.6147% 6/25/46 (g)(h) | | 7,430,000 | 790,608 |
| GAHR Commercial Mortgage Trust Series 2015-NRF: | | | |
| Class DFX, 3.3822% 12/15/34 (f)(g) | | 1,700,000 | 1,699,172 |
| Class EFX, 3.3822% 12/15/34 (f)(g) | | 9,364,000 | 9,269,497 |
| Class FFX, 3.3822% 12/15/34 (f)(g) | | 14,402,000 | 14,190,658 |
| Class GFX, 3.3822% 12/15/34 (f)(g) | | 23,509,000 | 23,040,522 |
| GMAC Commercial Mortgage Securities, Inc. Series 1997-C2 Class G, 6.75% 4/15/29 (g) | | 60,957 | 61,028 |
| GP Portfolio Trust Series 2014-GPP Class E, 1 month U.S. LIBOR + 4.100% 5.577% 2/15/27 (f)(g)(i) | | 2,823,000 | 2,777,264 |
| GS Mortgage Securities Corp. II Series 2010-C1 Class D, 6.0509% 8/10/43 (f)(g) | | 1,966,000 | 2,009,536 |
| GS Mortgage Securities Trust: | | | |
| Series 2010-C2 Class D, 5.1827% 12/10/43 (f)(g) | | 3,000,000 | 3,031,269 |
| Series 2011-GC5: | | | |
| Class C, 5.3984% 8/10/44 (f)(g) | | 9,000,000 | 9,469,770 |
| Class D, 5.3984% 8/10/44 (f)(g) | | 7,000,000 | 6,781,366 |
| Class E, 5.3984% 8/10/44 (f)(g) | | 8,230,000 | 6,673,812 |
| Class F, 4.5% 8/10/44 (f) | | 7,986,000 | 4,038,217 |
| Series 2012-GC6: | | | |
| Class C, 5.6521% 1/10/45 (f)(g) | | 3,600,000 | 3,747,400 |
| Class D, 5.6521% 1/10/45 (f)(g) | | 4,165,000 | 3,980,049 |
| Class E, 5% 1/10/45 (f)(g) | | 4,516,000 | 3,861,743 |
| Series 2012-GCJ7: | | | |
| Class C, 5.7014% 5/10/45 (g) | | 6,500,000 | 6,792,321 |
| Class D, 5.7014% 5/10/45 (f)(g) | | 10,192,000 | 9,897,587 |
| Class E, 5% 5/10/45 (f) | | 6,920,000 | 5,642,497 |
| Series 2012-GCJ9 Class D, 4.7478% 11/10/45 (f)(g) | | 5,565,000 | 5,351,606 |
| Series 2013-GC14 Class D, 4.7629% 8/10/46 (f)(g) | | 1,680,000 | 1,621,206 |
| Series 2013-GC16: | | | |
| Class D, 5.3271% 11/10/46 (f)(g) | | 3,750,000 | 3,564,164 |
| Class F, 3.5% 11/10/46 (f) | | 7,303,000 | 5,211,721 |
| Series 2014-NEW Class D, 3.79% 1/10/31 (f) | | 2,510,000 | 2,520,246 |
| Series 2016-GS3 Class D, 2.728% 10/10/49 (f) | | 3,398,000 | 2,663,593 |
| Series 2016-REMZ Class MZB, 7.727% 2/10/21 (f) | | 29,826,000 | 29,250,358 |
| Series 2016-RENT: | | | |
| Class E, 4.0667% 2/10/29 (f)(g) | | 1,609,000 | 1,577,933 |
| Class F, 4.0667% 2/10/29 (f)(g) | | 15,890,000 | 14,768,072 |
| Hilton U.S.A. Trust: | | | |
| Series 2016-HHV Class F, 4.1935% 11/5/38 (f)(g) | | 8,440,000 | 7,411,228 |
| Series 2016-SFP Class F, 6.0801% 11/5/35 (f) | | 8,457,000 | 8,443,140 |
| IMT Trust Series 2017-APTS: | | | |
| Class EFX, 3.4966% 6/15/34 (f)(g) | | 9,317,000 | 8,827,943 |
| Class FFL, 1 month U.S. LIBOR + 2.850% 4.327% 6/15/34 (f)(g)(i) | | 3,909,000 | 3,923,638 |
| JPMBB Commercial Mortgage Securities Trust: | | | |
| Series 2014-C23 Class UH5, 4.7094% 9/15/47 (f) | | 8,738,000 | 7,462,724 |
| Series 2014-C26 Class D, 3.9241% 1/15/48 (f)(g) | | 3,398,000 | 2,912,713 |
| JPMCC Commercial Mortgage Securities Trust Series 2016-JP4 Class D, 3.4619% 12/15/49 (f) | | 10,241,000 | 8,384,512 |
| JPMDB Commercial Mortgage Securities Trust Series 2016-C4 Class D, 3.0956% 12/15/49 (f)(g) | | 7,388,000 | 5,941,252 |
| JPMorgan Chase Commercial Mortgage Securities Corp.: | | | |
| Series 2003-C1 Class F, 5.4826% 1/12/37 (f)(g) | | 745,289 | 771,256 |
| Series 2009-IWST: | | | |
| Class C, 7.4453% 12/5/27 (f)(g) | | 3,000,000 | 3,243,997 |
| Class D, 7.4453% 12/5/27 (f)(g) | | 9,550,000 | 10,217,895 |
| Series 2010-CNTR: | | | |
| Class D, 6.1838% 8/5/32 (f)(g) | | 4,500,000 | 4,726,751 |
| Class XB, 0.9305% 8/5/32 (f)(g)(h) | | 32,655,000 | 653,538 |
| Series 2012-CBX: | | | |
| Class C, 5.2137% 6/15/45 (g) | | 4,530,000 | 4,674,292 |
| Class E, 5.2137% 6/15/45 (f)(g) | | 4,635,000 | 4,562,040 |
| Class F, 4% 6/15/45 (f) | | 8,192,000 | 6,580,068 |
| Class G 4% 6/15/45 (f) | | 4,044,000 | 2,240,990 |
| JPMorgan Chase Commercial Mortgage Securities Trust: | | | |
| Series 2005-LDP2 Class E, 4.981% 7/15/42 (g) | | 410,825 | 417,430 |
| Series 2011-C3: | | | |
| Class E, 5.6311% 2/15/46 (f)(g) | | 3,205,000 | 3,181,210 |
| Class H, 4.409% 2/15/46 (f)(g) | | 7,077,000 | 5,174,587 |
| Series 2011-C4 Class F, 3.873% 7/15/46 (f) | | 1,400,000 | 1,290,667 |
| Series 2013-LC11: | | | |
| Class C, 3.9582% 4/15/46 (g) | | 848,000 | 846,958 |
| Class D, 4.2027% 4/15/46 (g) | | 7,672,000 | 7,089,874 |
| Class E, 3.25% 4/15/46 (f)(g) | | 472,000 | 348,827 |
| Class F, 3.25% 4/15/46 (f)(g) | | 2,518,000 | 1,460,142 |
| Series 2014-DSTY Class E, 3.8046% 6/10/27 (f)(g) | | 2,752,000 | 2,610,701 |
| Series 2015-UES Class F, 3.621% 9/5/32 (f)(g) | | 5,432,000 | 5,297,251 |
| JPMorgan Commercial Mortgage Finance Corp. Series 1999-C8 Class H, 6% 7/15/31 (f) | | 208,583 | 188,586 |
| LSTAR Commercial Mortgage Trust Series 2014-2: | | | |
| Class D, 5.1336% 1/20/41 (f)(g) | | 3,000,000 | 2,997,989 |
| Class E, 5.1336% 1/20/41 (f)(g) | | 4,800,000 | 4,452,218 |
| Merrill Lynch Mortgage Trust Series 2006-C1 Class AJ, 5.5942% 5/12/39 (g) | | 2,306,146 | 2,323,834 |
| Morgan Stanley BAML Trust: | | | |
| Series 2012-C5 Class E, 4.6875% 8/15/45 (f)(g) | | 3,889,000 | 3,831,285 |
| Series 2012-C6 Class D, 4.5752% 11/15/45 (f)(g) | | 2,000,000 | 2,011,995 |
| Series 2013-C12 Class D, 4.7638% 10/15/46 (f)(g) | | 7,164,000 | 6,852,643 |
| Series 2013-C13: | | | |
| Class D, 4.8894% 11/15/46 (f)(g) | | 5,277,000 | 4,957,288 |
| Class E, 4.8894% 11/15/46 (f)(g) | | 3,379,000 | 2,679,179 |
| Series 2013-C7: | | | |
| Class D, 4.2503% 2/15/46 (f)(g) | | 5,650,000 | 5,148,468 |
| Class E, 4.2503% 2/15/46 (f)(g) | | 1,000,000 | 774,873 |
| Series 2013-C9: | | | |
| Class C, 4.047% 5/15/46 (g) | | 3,339,000 | 3,286,872 |
| Class D, 4.135% 5/15/46 (f)(g) | | 5,137,000 | 4,703,091 |
| Series 2016-C30 Class D, 3% 9/15/49 (f) | | 5,408,000 | 4,020,078 |
| Series 2016-C31 Class D, 3% 11/15/49 (f)(g) | | 1,500,000 | 1,080,609 |
| Series 2016-C32 Class D, 3.396% 12/15/49 (f) | | 5,929,000 | 4,418,383 |
| Morgan Stanley Capital I Trust: | | | |
| sequential payer Series 2012-C4 Class E, 5.4205% 3/15/45 (f)(g) | | 7,294,000 | 6,219,312 |
| Series 1997-RR Class F, 7.51% 4/30/39 (f)(g) | | 270,570 | 269,893 |
| Series 1998-CF1 Class G, 7.35% 7/15/32 (f) | | 1,071,298 | 1,040,659 |
| Series 2011-C2: | | | |
| Class D, 5.4831% 6/15/44 (f)(g) | | 4,887,000 | 4,840,855 |
| Class E, 5.4831% 6/15/44 (f)(g) | | 12,150,000 | 11,466,846 |
| Class F, 5.4831% 6/15/44 (f)(g) | | 4,440,000 | 3,763,764 |
| Class XB, 0.5345% 6/15/44 (f)(g)(h) | | 63,708,222 | 1,024,715 |
| Series 2011-C3: | | | |
| Class C, 5.1549% 7/15/49 (f)(g) | | 2,000,000 | 2,097,294 |
| Class D, 5.1549% 7/15/49 (f)(g) | | 7,400,000 | 7,634,817 |
| Class E, 5.1549% 7/15/49 (f)(g) | | 1,353,000 | 1,313,551 |
| Class F, 5.1549% 7/15/49 (f)(g) | | 3,438,050 | 3,171,830 |
| Class G, 5.1549% 7/15/49 (f)(g) | | 3,902,000 | 3,267,908 |
| Series 2012-C4 Class D, 5.4205% 3/15/45 (f)(g) | | 6,310,000 | 6,029,164 |
| Series 2015-MS1 Class D, 4.0301% 5/15/48 (f)(g) | | 10,956,000 | 9,345,740 |
| Series 2015-UBS8 Class D, 3.18% 12/15/48 (f) | | 5,013,000 | 4,237,910 |
| Series 2016-BNK2 Class C, 3% 11/15/49 (f) | | 3,000,000 | 2,419,001 |
| Motel 6 Trust floater: | | | |
| Series 2017-M6MZ, Class M, 1 month U.S. LIBOR + 6.927% 8.4035% 8/15/19 (f)(g)(i) | | 7,932,398 | 7,981,953 |
| Series 2017-MTL6, Class F, 1 month U.S. LIBOR + 4.250% 5.727% 8/15/34 (f)(g)(i) | | 13,586,944 | 13,688,746 |
| MSCG Trust Series 2016-SNR: | | | |
| Class D, 6.55% 11/15/34 (f) | | 11,889,000 | 11,968,603 |
| Class E, 6.8087% 11/15/34 (f) | | 11,364,000 | 10,818,015 |
| MSJP Commercial Securities Mortgage Trust Series 2015-HAUL Class E, 4.851% 9/5/47 (f)(g) | | 1,500,000 | 1,396,785 |
| Providence Place Group Ltd. Partnership Series 2000-C1 Class A2, 7.75% 7/20/28 (f) | | 4,294,396 | 5,258,487 |
| Starwood Retail Property Trust Series 2014-STAR Class D, 1 month U.S. LIBOR + 3.250% 4.727% 11/15/27 (f)(g)(i) | | 2,500,000 | 2,400,000 |
| TIAA Seasoned Commercial Mortgage Trust sequential payer Series 2007-C4 Class AJ, 5.476% 8/15/39 (g) | | 264,863 | 265,405 |
| UBS Commercial Mortgage Trust Series 2012-C1: | | | |
| Class D, 5.5454% 5/10/45 (f)(g) | | 3,235,000 | 3,218,430 |
| Class E, 5% 5/10/45 (f)(g) | | 6,339,000 | 5,368,912 |
| Class F, 5% 5/10/45 (f)(g) | | 2,221,350 | 1,512,144 |
| UBS-Citigroup Commercial Mortgage Trust Series 2011-C1 Class B, 6.0486% 1/10/45 (f)(g) | | 3,000,000 | 3,248,786 |
| Vornado DP LLC Series 2010-VNO Class D, 6.3555% 9/13/28 (f) | | 2,540,000 | 2,765,592 |
| Wells Fargo Commercial Mortgage Trust: | | | |
| Series 2012-LC5: | | | |
| Class D, 4.7647% 10/15/45 (f)(g) | | 12,964,000 | 11,688,664 |
| Class E, 4.7647% 10/15/45 (f)(g) | | 7,588,000 | 6,121,683 |
| Series 2016-BNK1 Class D, 3% 8/15/49 (f) | | 6,979,000 | 5,616,311 |
| Series 2016-C35 Class D, 3.142% 7/15/48 (f) | | 18,542,000 | 13,316,232 |
| Series 2016-NXS6 Class D, 3.059% 11/15/49 (f) | | 5,094,000 | 3,840,977 |
| Series 2017-C38 Class D, 3% 7/15/50 (f)(g) | | 4,373,000 | 3,480,120 |
| WF-RBS Commercial Mortgage Trust: | | | |
| sequential payer Series 2011-C4I Class G, 5% 6/15/44 (f) | | 4,000,000 | 2,672,856 |
| Series 2011-C3: | | | |
| Class C, 5.335% 3/15/44 (f) | | 4,900,000 | 5,085,302 |
| Class D, 5.6402% 3/15/44 (f)(g) | | 1,000,000 | 874,454 |
| Class E, 5% 3/15/44 (f) | | 3,000,000 | 2,424,784 |
| Series 2011-C5: | | | |
| Class E, 5.6716% 11/15/44 (f)(g) | | 3,807,000 | 3,839,412 |
| Class F, 5.25% 11/15/44 (f)(g) | | 3,000,000 | 2,601,748 |
| Class G, 5.25% 11/15/44 (f)(g) | | 2,000,000 | 1,622,920 |
| Series 2012-C10 Class E, 4.4476% 12/15/45 (f)(g) | | 4,090,000 | 3,085,596 |
| Series 2012-C7: | | | |
| Class D, 4.8255% 6/15/45 (f)(g) | | 2,380,000 | 2,051,109 |
| Class F, 4.5% 6/15/45 (f) | | 2,000,000 | 1,329,073 |
| Series 2012-C8 Class E, 4.8935% 8/15/45 (f)(g) | | 2,922,500 | 2,801,714 |
| Series 2013-C11: | | | |
| Class D, 4.2717% 3/15/45 (f)(g) | | 5,830,000 | 5,316,414 |
| Class E, 4.2717% 3/15/45 (f)(g) | | 4,780,000 | 3,723,350 |
| Series 2013-C13 Class D, 4.1386% 5/15/45 (f)(g) | | 4,000,000 | 3,678,313 |
| Series 2013-C16 Class D, 5.0286% 9/15/46 (f)(g) | | 3,728,000 | 3,528,652 |
| Series 2013-UBS1 Class D, 4.6237% 3/15/46 (f)(g) | | 4,589,000 | 4,246,880 |
| WFCG Commercial Mortgage Trust floater Series 2015-BXRP: | | | |
| Class F, 1 month U.S. LIBOR + 3.721% 5.1973% 11/15/29 (f)(g)(i) | | 5,152,378 | 5,160,700 |
| Class G, 1 month U.S. LIBOR + 3.001% 4.497% 11/15/29 (f)(g)(i) | | 8,859,793 | 8,744,964 |
| WP Glimcher Mall Trust Series 2015-WPG: | | | |
| Class PR1, 3.516% 6/5/35 (f)(g) | | 6,725,000 | 5,173,641 |
| Class PR2, 3.516% 6/5/35 (f)(g) | | 2,541,000 | 1,819,074 |
| TOTAL COMMERCIAL MORTGAGE SECURITIES | | | |
| (Cost $868,160,649) | | | 879,096,790 |
|
| Bank Loan Obligations - 4.4% | | | |
| CONSUMER DISCRETIONARY - 0.8% | | | |
| Hotels, Restaurants & Leisure - 0.6% | | | |
| Caesars Resort Collection LLC Tranche B 1LN, term loan 3 month U.S. LIBOR + 2.750% 4.3235% 12/22/24 (g)(i) | | 3,380,000 | 3,419,309 |
| ESH Hospitality, Inc. Tranche B, term loan 3 month U.S. LIBOR + 2.250% 3.8235% 8/30/23 (g)(i) | | 4,424,196 | 4,460,518 |
| Four Seasons Holdings, Inc. Tranche B, term loan 3 month U.S. LIBOR + 2.500% 4.0735% 11/30/23 (g)(i) | | 2,950,200 | 2,976,634 |
| Hilton Los Cabos 3 month U.S. LIBOR + 8.000% 9.78% 9/9/18 (b)(g)(i) | | 5,375,000 | 5,375,000 |
| La Quinta Intermediate Holdings LLC Tranche B LN, term loan 3 month U.S. LIBOR + 2.750% 4.4702% 4/14/21 (g)(i) | | 12,852,178 | 12,892,405 |
| Playa Resorts Holding BV Tranche B, term loan 3 month U.S. LIBOR + 3.250% 4.9997% 4/27/24 (g)(i) | | 4,327,502 | 4,355,890 |
| | | | 33,479,756 |
| Multiline Retail - 0.2% | | | |
| JC Penney Corp., Inc. Tranche B, term loan 3 month U.S. LIBOR + 4.250% 5.7288% 6/23/23 (g)(i) | | 12,523,240 | 12,058,879 |
|
| TOTAL CONSUMER DISCRETIONARY | | | 45,538,635 |
|
| CONSUMER STAPLES - 0.4% | | | |
| Food & Staples Retailing - 0.4% | | | |
| Albertson's LLC Tranche B, term loan: | | | |
| 3 month U.S. LIBOR + 3.000% 4.4623% 6/22/23 (g)(i) | | 12,980,173 | 12,889,571 |
| 3 month U.S. LIBOR + 3.000% 4.6746% 12/21/22 (g)(i) | | 11,557,685 | 11,486,721 |
| | | | 24,376,292 |
| ENERGY - 0.8% | | | |
| Oil, Gas & Consumable Fuels - 0.8% | | | |
| Moxie Patriot LLC Tranche B, term loan 3 month U.S. LIBOR + 5.750% 7.4434% 12/19/20 (g)(i) | | 22,788,534 | 22,532,163 |
| Panda Temple Power, LLC term loan 3 month U.S. LIBOR + 6.000% 7.6934% 4/3/19 (g)(i) | | 13,870,161 | 12,656,522 |
| TPF II Power LLC Tranche B, term loan 3 month U.S. LIBOR + 3.750% 5.3235% 10/2/23 (g)(i) | | 5,730,711 | 5,805,955 |
| | | | 40,994,640 |
| FINANCIALS - 0.3% | | | |
| Real Estate Management & Development - 0.2% | | | |
| DTZ U.S. Borrower LLC Tranche B 1LN, term loan 3 month U.S. LIBOR + 3.250% 4.8245% 11/4/21 (g)(i) | | 12,385,513 | 12,378,577 |
| Thrifts & Mortgage Finance - 0.1% | | | |
| Ocwen Loan Servicing LLC Tranche B, term loan 3 month U.S. LIBOR + 5.000% 6.5595% 12/5/20 (g)(i) | | 4,098,113 | 4,108,358 |
|
| TOTAL FINANCIALS | | | 16,486,935 |
|
| HEALTH CARE - 0.1% | | | |
| Health Care Providers & Services - 0.1% | | | |
| Community Health Systems, Inc. Tranche H, term loan 3 month U.S. LIBOR + 3.000% 4.4788% 1/27/21 (g)(i) | | 6,141,305 | 6,021,979 |
| INDUSTRIALS - 0.1% | | | |
| Commercial Services & Supplies - 0.1% | | | |
| Lineage Logistics Holdings, LLC. Tranche B, term loan 3 month U.S. LIBOR + 3.500% 5.0735% 4/7/21 (g)(i) | | 3,850,000 | 3,867,633 |
| INFORMATION TECHNOLOGY - 0.1% | | | |
| Electronic Equipment & Components - 0.1% | | | |
| Compass Power Generation LLC Tranche B, term loan 3 month U.S. LIBOR + 3.750% 5.3908% 12/20/24 (g)(i) | | 3,390,000 | 3,430,273 |
| REAL ESTATE - 1.1% | | | |
| Equity Real Estate Investment Trusts (REITs) - 0.7% | | | |
| Invitation Homes Operating Par Tranche B, term loan 3 month U.S. LIBOR + 1.700% 3.2595% 2/6/22 (g)(i) | | 25,000,000 | 24,218,750 |
| iStar Financial, Inc. Tranche B, term loan 3 month U.S. LIBOR + 3.000% 4.5572% 10/1/21 (g)(i) | | 6,678,850 | 6,753,987 |
| QCP SNF West (REIT) LLC Tranche B, term loan 3 month U.S. LIBOR + 5.250% 6.8235% 10/31/22 (g)(i) | | 6,722,100 | 6,793,556 |
| | | | 37,766,293 |
| Real Estate Management & Development - 0.4% | | | |
| Capital Automotive LP Tranche B 1LN, term loan 3 month U.S. LIBOR + 2.500% 4.0735% 3/24/24 (g)(i) | | 3,112,169 | 3,129,690 |
| Simply Storage Management LLC 8.2375% 9/6/21 (b)(g) | | 16,974,000 | 16,974,000 |
| | | | 20,103,690 |
|
| TOTAL REAL ESTATE | | | 57,869,983 |
|
| UTILITIES - 0.7% | | | |
| Electric Utilities - 0.2% | | | |
| Lightstone Holdco LLC: | | | |
| Tranche B, term loan 3 month U.S. LIBOR + 4.500% 6.0735% 1/30/24 (g)(i) | | 8,974,982 | 9,013,126 |
| Tranche C, term loan 3 month U.S. LIBOR + 4.500% 6.0735% 1/30/24 (g)(i) | | 569,885 | 572,307 |
| Southeast Powergen LLC Tranche B, term loan 3 month U.S. LIBOR + 3.500% 5.08% 12/2/21 (g)(i) | | 2,497,040 | 2,422,128 |
| | | | 12,007,561 |
| Independent Power and Renewable Electricity Producers - 0.5% | | | |
| APLP Holdings LP Tranche B, term loan 3 month U.S. LIBOR + 4.250% 5.0735% 4/13/23 (g)(i) | | 8,249,029 | 8,321,208 |
| Dynegy, Inc. Tranche C-2, term loan 3 month U.S. LIBOR + 2.750% 4.3112% 2/7/24 (g)(i) | | 1,533,797 | 1,548,444 |
| MRP Generation Holdings LLC Tranche B, term loan 3 month U.S. LIBOR + 7.000% 8.6934% 10/18/22 (g)(i) | | 14,557,260 | 14,047,756 |
| | | | 23,917,408 |
|
| TOTAL UTILITIES | | | 35,924,969 |
|
| TOTAL BANK LOAN OBLIGATIONS | | | |
| (Cost $234,034,945) | | | 234,511,339 |
|
| Preferred Securities - 0.0% | | | |
| FINANCIALS - 0.0% | | | |
| Diversified Financial Services - 0.0% | | | |
| Crest Dartmouth Street 2003 1 Ltd. Series 2003-1A Class PS, (b)(f) | | 1,220,000 | 122 |
| Thrifts & Mortgage Finance - 0.0% | | | |
| Crest Clarendon Street 2002-1 Ltd. Series 2002-1A Class PS, 12/28/35 (b)(f)(g)(i) | | 500,000 | 120,000 |
| TOTAL PREFERRED SECURITIES | | | |
| (Cost $1,297,768) | | | 120,122 |
| | | Shares | Value |
|
| Money Market Funds - 6.8% | | | |
| Fidelity Cash Central Fund, 1.39% (j) | | 332,340,179 | 332,406,647 |
| Fidelity Securities Lending Cash Central Fund 1.40% (j)(k) | | 26,952,097 | 26,954,792 |
| TOTAL MONEY MARKET FUNDS | | | |
| (Cost $359,305,405) | | | 359,361,439 |
| TOTAL INVESTMENT IN SECURITIES - 100.0% | | | |
| (Cost $5,029,938,410) | | | 5,267,644,829 |
| NET OTHER ASSETS (LIABILITIES) - 0.0% | | | (2,117,323) |
| NET ASSETS - 100% | | | $5,265,527,506 |
Legend
(a) Restricted securities - Investment in securities not registered under the Securities Act of 1933 (excluding 144A issues). At the end of the period, the value of restricted securities (excluding 144A issues) amounted to $149,642 or 0.0% of net assets.
(b) Level 3 security
(c) Security or a portion of the security is on loan at period end.
(d) Affiliated company
(e) Non-income producing
(f) Security exempt from registration under Rule 144A of the Securities Act of 1933. These securities may be resold in transactions exempt from registration, normally to qualified institutional buyers. At the end of the period, the value of these securities amounted to $1,181,863,461 or 22.4% of net assets.
(g) Coupon rates for floating and adjustable rate securities reflect the rates in effect at period end.
(h) Security represents right to receive monthly interest payments on an underlying pool of mortgages or assets. Principal shown is the outstanding par amount of the pool as of the end of the period.
(i) Coupon is indexed to a floating interest rate which may be multiplied by a specified factor and/or subject to caps or floors.
(j) Affiliated fund that is generally available only to investment companies and other accounts managed by Fidelity Investments. The rate quoted is the annualized seven-day yield of the fund at period end. A complete unaudited listing of the fund's holdings as of its most recent quarter end is available upon request. In addition, each Fidelity Central Fund's financial statements are available on the SEC's website or upon request.
(k) Investment made with cash collateral received from securities on loan.
Additional information on each restricted holding is as follows:
| Security | Acquisition Date | Acquisition Cost |
| Stanley Martin Communities LLC Class B (Escrow) | 7/17/16 | $121,944 |
Affiliated Central Funds
Information regarding fiscal year to date income earned by the Fund from investments in Fidelity Central Funds is as follows:
| Fund | Income earned |
| Fidelity Cash Central Fund | $1,965,134 |
| Fidelity Securities Lending Cash Central Fund | 82,089 |
| Total | $2,047,223 |
Amounts in the income column in the above table include any capital gain distributions from underlying funds, which are presented in the corresponding line-item in the Statement of Operations if applicable.
Other Affiliated Issuers
An affiliated company is a company in which the Fund has ownership of at least 5% of the voting securities. Fiscal year to date transactions with companies which are or were affiliates are as follows:
| Affiliate | Value, beginning of period | Purchases | Sales Proceeds | Dividend Income | Realized Gain (loss) | Change in Unrealized appreciation (depreciation) | Value, end of period |
| Acadia Realty Trust (SBI) | $124,832,133 | $1,072,218 | $-- | $1,732,647 | $492,001 | $(21,782,538) | $104,120,867 |
| Great Ajax Corp. | 21,962,447 | -- | -- | 12,651 | 816,676 | (568,999) | 21,078,900 |
| Great Ajax Corp. 7.25% | 4,545,000 | -- | -- | 163,125 | -- | (58,914) | 4,486,086 |
| Total | $151,339,580 | $1,072,218 | $-- | $1,908,423 | $1,308,677 | $(22,410,451) | $129,685,853 |
Investment Valuation
The following is a summary of the inputs used, as of January 31, 2018, involving the Fund's assets and liabilities carried at fair value. The inputs or methodology used for valuing securities may not be an indication of the risk associated with investing in those securities. For more information on valuation inputs, and their aggregation into the levels used below, please refer to the Investment Valuation section in the accompanying Notes to Financial Statements.
| | Valuation Inputs at Reporting Date: |
| Description | Total | Level 1 | Level 2 | Level 3 |
| Investments in Securities: | | | | |
| Equities: | | | | |
| Consumer Discretionary | $29,919,411 | $29,769,769 | $-- | $149,642 |
| Financials | 720,607,851 | 705,967,842 | 14,640,009 | -- |
| Real Estate | 1,795,412,786 | 1,737,814,505 | 57,598,281 | -- |
| Utilities | 3,541,536 | 3,541,536 | -- | -- |
| Corporate Bonds | 1,106,958,085 | -- | 1,106,958,085 | -- |
| Asset-Backed Securities | 129,944,700 | -- | 129,747,234 | 197,466 |
| Collateralized Mortgage Obligations | 8,170,770 | -- | 8,162,084 | 8,686 |
| Commercial Mortgage Securities | 879,096,790 | -- | 879,096,790 | -- |
| Bank Loan Obligations | 234,511,339 | -- | 212,162,339 | 22,349,000 |
| Preferred Securities | 120,122 | -- | -- | 120,122 |
| Money Market Funds | 359,361,439 | 359,361,439 | -- | -- |
| Total Investments in Securities: | $5,267,644,829 | $2,836,455,091 | $2,408,364,822 | $22,824,916 |
The following is a reconciliation of Investments in Securities and Derivative Instruments for which Level 3 inputs were used in determining value:
| Investments in Securities: | |
| Bank Loan Obligations | |
| Beginning Balance | $53,726,431 |
| Net Realized Gain (Loss) on Investment Securities | (35,397) |
| Net Unrealized Gain (Loss) on Investment Securities | 54,221 |
| Cost of Purchases | 5,375,000 |
| Proceeds of Sales | (13,002,431) |
| Amortization/Accretion | (18,824) |
| Transfers into Level 3 | -- |
| Transfers out of Level 3 | (23,750,000) |
| Ending Balance | $22,349,000 |
| The change in unrealized gain (loss) for the period attributable to Level 3 securities held at January 31, 2018 | $(1,438) |
| Other Investments in Securities | |
| Beginning Balance | $1,906,920 |
| Net Realized Gain (Loss) on Investment Securities | (92,593) |
| Net Unrealized Gain (Loss) on Investment Securities | 177,192 |
| Cost of Purchases | -- |
| Proceeds of Sales | (27,018) |
| Amortization/Accretion | (2,229) |
| Transfers into Level 3 | -- |
| Transfers out of Level 3 | (1,486,356) |
| Ending Balance | $475,916 |
| The change in unrealized gain (loss) for the period attributable to Level 3 securities held at January 31, 2018 | $89,246 |
The information used in the above reconciliation represents fiscal year to date activity for any Investments in Securities identified as using Level 3 inputs at either the beginning or the end of the current fiscal period. Transfers in or out of Level 3 represent the beginning value of any Security or Instrument where a change in the pricing level occurred from the beginning to the end of the period. The cost of purchases and the proceeds of sales may include securities received or delivered through corporate actions or exchanges. Realized and unrealized gains (losses) disclosed in the reconciliation are included in Net Gain (Loss) on the Fund's Statement of Operations.
Other Information
The composition of credit quality ratings as a percentage of Total Net Assets is as follows (Unaudited):
| U.S. Government and U.S. Government Agency Obligations | 0.1% |
| AAA,AA,A | 1.6% |
| BBB | 10.7% |
| BB | 8.3% |
| B | 9.8% |
| CCC,CC,C | 1.2% |
| Not Rated | 13.1% |
| Equities | 48.4% |
| Short-Term Investments and Net Other Assets | 6.8% |
| | 100.0% |
We have used ratings from Moody's Investors Service, Inc. Where Moody's® ratings are not available, we have used S&P® ratings. All ratings are as of the date indicated and do not reflect subsequent changes.
See accompanying notes which are an integral part of the financial statements.
Financial Statements
Statement of Assets and Liabilities
| | | January 31, 2018 (Unaudited) |
| Assets | | |
Investment in securities, at value (including securities loaned of $26,789,665) — See accompanying schedule:
Unaffiliated issuers (cost $4,545,936,481) | $4,778,597,537 | |
| Fidelity Central Funds (cost $359,305,405) | 359,361,439 | |
| Other affiliated issuers (cost $124,696,524) | 129,685,853 | |
| Total Investment in Securities (cost $5,029,938,410) | | $5,267,644,829 |
| Cash | | 620,072 |
| Receivable for investments sold | | 25,714,031 |
| Receivable for fund shares sold | | 7,796,369 |
| Dividends receivable | | 3,254,455 |
| Interest receivable | | 22,739,474 |
| Distributions receivable from Fidelity Central Funds | | 400,722 |
| Prepaid expenses | | 7,456 |
| Other receivables | | 15,432 |
| Total assets | | 5,328,192,840 |
| Liabilities | | |
| Payable for investments purchased | $15,313,295 | |
| Payable for fund shares redeemed | 16,705,469 | |
| Accrued management fee | 2,417,868 | |
| Distribution and service plan fees payable | 302,510 | |
| Other affiliated payables | 909,617 | |
| Other payables and accrued expenses | 61,339 | |
| Collateral on securities loaned | 26,955,236 | |
| Total liabilities | | 62,665,334 |
| Net Assets | | $5,265,527,506 |
| Net Assets consist of: | | |
| Paid in capital | | $5,008,206,415 |
| Distributions in excess of net investment income | | (6,947,348) |
| Accumulated undistributed net realized gain (loss) on investments and foreign currency transactions | | 26,562,099 |
| Net unrealized appreciation (depreciation) on investments and assets and liabilities in foreign currencies | | 237,706,340 |
| Net Assets | | $5,265,527,506 |
| Calculation of Maximum Offering Price | | |
| Class A: | | |
| Net Asset Value and redemption price per share ($321,559,334 ÷ 27,545,130 shares) | | $11.67 |
| Maximum offering price per share (100/96.00 of $11.67) | | $12.16 |
| Class M: | | |
| Net Asset Value and redemption price per share ($58,865,104 ÷ 5,040,110 shares) | | $11.68 |
| Maximum offering price per share (100/96.00 of $11.68) | | $12.17 |
| Class C: | | |
| Net Asset Value and offering price per share ($256,024,975 ÷ 22,138,721 shares)(a) | | $11.56 |
| Real Estate Income: | | |
| Net Asset Value, offering price and redemption price per share ($2,546,434,714 ÷ 217,031,958 shares) | | $11.73 |
| Class I: | | |
| Net Asset Value, offering price and redemption price per share ($2,082,643,379 ÷ 178,107,352 shares) | | $11.69 |
(a) Redemption price per share is equal to net asset value less any applicable contingent deferred sales charge.
See accompanying notes which are an integral part of the financial statements.
Statement of Operations
| | | Six months ended January 31, 2018 (Unaudited) |
| Investment Income | | |
| Dividends (including $1,908,423 earned from other affiliated issuers) | | $59,525,081 |
| Interest | | 67,905,231 |
| Income from Fidelity Central Funds | | 2,047,223 |
| Total income | | 129,477,535 |
| Expenses | | |
| Management fee | $14,632,465 | |
| Transfer agent fees | 4,804,014 | |
| Distribution and service plan fees | 1,908,968 | |
| Accounting and security lending fees | 694,126 | |
| Custodian fees and expenses | 30,066 | |
| Independent trustees' fees and expenses | 10,439 | |
| Registration fees | 111,968 | |
| Audit | 58,074 | |
| Legal | 10,498 | |
| Miscellaneous | 17,278 | |
| Total expenses before reductions | 22,277,896 | |
| Expense reductions | (62,523) | 22,215,373 |
| Net investment income (loss) | | 107,262,162 |
| Realized and Unrealized Gain (Loss) | | |
| Net realized gain (loss) on: | | |
| Investment securities: | | |
| Unaffiliated issuers | 53,148,735 | |
| Fidelity Central Funds | 4,709 | |
| Other affiliated issuers | 1,308,677 | |
| Foreign currency transactions | (1,834) | |
| Total net realized gain (loss) | | 54,460,287 |
| Change in net unrealized appreciation (depreciation) on: | | |
| Investment securities: | | |
| Unaffiliated issuers | (216,806,502) | |
| Fidelity Central Funds | (4,215) | |
| Other affiliated issuers | (22,410,451) | |
| Assets and liabilities in foreign currencies | (274) | |
| Total change in net unrealized appreciation (depreciation) | | (239,221,442) |
| Net gain (loss) | | (184,761,155) |
| Net increase (decrease) in net assets resulting from operations | | $(77,498,993) |
See accompanying notes which are an integral part of the financial statements.
Statement of Changes in Net Assets
| | Six months ended January 31, 2018 (Unaudited) | Year ended July 31, 2017 |
| Increase (Decrease) in Net Assets | | |
| Operations | | |
| Net investment income (loss) | $107,262,162 | $210,270,861 |
| Net realized gain (loss) | 54,460,287 | 36,915,809 |
| Change in net unrealized appreciation (depreciation) | (239,221,442) | 22,370,918 |
| Net increase (decrease) in net assets resulting from operations | (77,498,993) | 269,557,588 |
| Distributions to shareholders from net investment income | (155,204,665) | (202,922,557) |
| Distributions to shareholders from net realized gain | (58,110,171) | (32,383,930) |
| Total distributions | (213,314,836) | (235,306,487) |
| Share transactions - net increase (decrease) | 266,884,853 | 397,445,047 |
| Redemption fees | 106,657 | 449,735 |
| Total increase (decrease) in net assets | (23,822,319) | 432,145,883 |
| Net Assets | | |
| Beginning of period | 5,289,349,825 | 4,857,203,942 |
| End of period | $5,265,527,506 | $5,289,349,825 |
| Other Information | | |
| Undistributed net investment income end of period | $– | $40,995,155 |
| Distributions in excess of net investment income end of period | $(6,947,348) | $– |
See accompanying notes which are an integral part of the financial statements.
Financial Highlights
Fidelity Real Estate Income Fund Class A
| | Six months ended (Unaudited) January 31, | Years endedJuly 31, | | | | |
| | 2018 | 2017 | 2016 | 2015 | 2014 | 2013 |
| Selected Per–Share Data | | | | | | |
| Net asset value, beginning of period | $12.32 | $12.25 | $11.66 | $11.86 | $11.67 | $11.26 |
| Income from Investment Operations | | | | | | |
| Net investment income (loss)A | .23 | .49 | .49 | .52 | .49 | .54 |
| Net realized and unrealized gain (loss) | (.41) | .14 | .73 | .02 | .44 | .60 |
| Total from investment operations | (.18) | .63 | 1.22 | .54 | .93 | 1.14 |
| Distributions from net investment income | (.34) | (.48) | (.48) | (.52) | (.50) | (.53) |
| Distributions from net realized gain | (.13) | (.08) | (.14) | (.21) | (.24) | (.20) |
| Total distributions | (.47) | (.56) | (.63)B | (.74)C | (.74) | (.73) |
| Redemption fees added to paid in capitalA,D | – | – | – | – | – | – |
| Net asset value, end of period | $11.67 | $12.32 | $12.25 | $11.66 | $11.86 | $11.67 |
| Total ReturnE,F,G | (1.56)% | 5.37% | 11.01% | 4.65% | 8.49% | 10.45% |
| Ratios to Average Net AssetsH,I | | | | | | |
| Expenses before reductions | 1.02%J | 1.03% | 1.03% | 1.04% | 1.06% | 1.08% |
| Expenses net of fee waivers, if any | 1.02%J | 1.03% | 1.03% | 1.03% | 1.05% | 1.08% |
| Expenses net of all reductions | 1.02%J | 1.02% | 1.03% | 1.03% | 1.05% | 1.07% |
| Net investment income (loss) | 3.78%J | 4.08% | 4.29% | 4.40% | 4.28% | 4.62% |
| Supplemental Data | | | | | | |
| Net assets, end of period (000 omitted) | $321,559 | $355,400 | $548,649 | $495,462 | $442,271 | $378,269 |
| Portfolio turnover rateK | 25%J | 22% | 26% | 19% | 29% | 26% |
A Calculated based on average shares outstanding during the period.
B Total distributions of $.63 per share is comprised of distributions from net investment income of $.483 and distributions from net realized gain of $.142 per share.
C Total distributions of $.74 per share is comprised of distributions from net investment income of $.523 and distributions from net realized gain of $.212 per share.
D Amount represents less than $.005 per share.
E Total returns for periods of less than one year are not annualized.
F Total returns would have been lower if certain expenses had not been reduced during the applicable periods shown.
G Total returns do not include the effect of the sales charges.
H Fees and expenses of any underlying Fidelity Central Funds are not included in the Fund's expense ratio. The Fund indirectly bears its proportionate share of the expenses of any underlying Fidelity Central Funds.
I Expense ratios reflect operating expenses of the class. Expenses before reductions do not reflect amounts reimbursed by the investment adviser or reductions from brokerage service arrangements or reductions from other expense offset arrangements and do not represent the amount paid by the class during periods when reimbursements or reductions occur. Expenses net of fee waivers reflect expenses after reimbursement by the investment adviser but prior to reductions from brokerage service arrangements or other expense offset arrangements. Expenses net of all reductions represent the net expenses paid by the class.
J Annualized
K Amount does not include the portfolio activity of any underlying Fidelity Central Funds.
See accompanying notes which are an integral part of the financial statements.
Fidelity Real Estate Income Fund Class M
| | Six months ended (Unaudited) January 31, | Years endedJuly 31, | | | | |
| | 2018 | 2017 | 2016 | 2015 | 2014 | 2013 |
| Selected Per–Share Data | | | | | | |
| Net asset value, beginning of period | $12.32 | $12.26 | $11.66 | $11.86 | $11.67 | $11.26 |
| Income from Investment Operations | | | | | | |
| Net investment income (loss)A | .23 | .49 | .49 | .51 | .49 | .54 |
| Net realized and unrealized gain (loss) | (.40) | .13 | .73 | .02 | .43 | .60 |
| Total from investment operations | (.17) | .62 | 1.22 | .53 | .92 | 1.14 |
| Distributions from net investment income | (.33) | (.48) | (.48) | (.52) | (.50) | (.53) |
| Distributions from net realized gain | (.13) | (.08) | (.14) | (.21) | (.24) | (.20) |
| Total distributions | (.47)B | (.56) | (.62) | (.73) | (.73)C | (.73) |
| Redemption fees added to paid in capitalA,D | – | – | – | – | – | – |
| Net asset value, end of period | $11.68 | $12.32 | $12.26 | $11.66 | $11.86 | $11.67 |
| Total ReturnE,F,G | (1.50)% | 5.26% | 11.06% | 4.62% | 8.44% | 10.42% |
| Ratios to Average Net AssetsH,I | | | | | | |
| Expenses before reductions | 1.04%J | 1.06% | 1.07% | 1.06% | 1.08% | 1.08% |
| Expenses net of fee waivers, if any | 1.04%J | 1.06% | 1.07% | 1.06% | 1.08% | 1.08% |
| Expenses net of all reductions | 1.04%J | 1.05% | 1.06% | 1.06% | 1.07% | 1.08% |
| Net investment income (loss) | 3.76%J | 4.05% | 4.26% | 4.37% | 4.26% | 4.61% |
| Supplemental Data | | | | | | |
| Net assets, end of period (000 omitted) | $58,865 | $64,158 | $59,788 | $55,424 | $48,164 | $46,198 |
| Portfolio turnover rateK | 25%J | 22% | 26% | 19% | 29% | 26% |
A Calculated based on average shares outstanding during the period.
B Total distributions of $.47 per share is comprised of distributions from net investment income of $.334 and distributions from net realized gain of $.132 per share.
C Total distributions of $.73 per share is comprised of distributions from net investment income of $.496 and distributions from net realized gain of $.236 per share.
D Amount represents less than $.005 per share.
E Total returns for periods of less than one year are not annualized.
F Total returns would have been lower if certain expenses had not been reduced during the applicable periods shown.
G Total returns do not include the effect of the sales charges.
H Fees and expenses of any underlying Fidelity Central Funds are not included in the Fund's expense ratio. The Fund indirectly bears its proportionate share of the expenses of any underlying Fidelity Central Funds.
I Expense ratios reflect operating expenses of the class. Expenses before reductions do not reflect amounts reimbursed by the investment adviser or reductions from brokerage service arrangements or reductions from other expense offset arrangements and do not represent the amount paid by the class during periods when reimbursements or reductions occur. Expenses net of fee waivers reflect expenses after reimbursement by the investment adviser but prior to reductions from brokerage service arrangements or other expense offset arrangements. Expenses net of all reductions represent the net expenses paid by the class.
J Annualized
K Amount does not include the portfolio activity of any underlying Fidelity Central Funds.
See accompanying notes which are an integral part of the financial statements.
Fidelity Real Estate Income Fund Class C
| | Six months ended (Unaudited) January 31, | Years endedJuly 31, | | | | |
| | 2018 | 2017 | 2016 | 2015 | 2014 | 2013 |
| Selected Per–Share Data | | | | | | |
| Net asset value, beginning of period | $12.20 | $12.14 | $11.55 | $11.77 | $11.59 | $11.20 |
| Income from Investment Operations | | | | | | |
| Net investment income (loss)A | .18 | .40 | .40 | .43 | .40 | .45 |
| Net realized and unrealized gain (loss) | (.41) | .13 | .73 | .01 | .43 | .60 |
| Total from investment operations | (.23) | .53 | 1.13 | .44 | .83 | 1.05 |
| Distributions from net investment income | (.28) | (.39) | (.40) | (.45) | (.42) | (.46) |
| Distributions from net realized gain | (.13) | (.08) | (.14) | (.21) | (.24) | (.20) |
| Total distributions | (.41) | (.47) | (.54) | (.66) | (.65)B | (.66) |
| Redemption fees added to paid in capitalA,C | – | – | – | – | – | – |
| Net asset value, end of period | $11.56 | $12.20 | $12.14 | $11.55 | $11.77 | $11.59 |
| Total ReturnD,E,F | (1.94)% | 4.54% | 10.29% | 3.82% | 7.66% | 9.66% |
| Ratios to Average Net AssetsG,H | | | | | | |
| Expenses before reductions | 1.76%I | 1.78% | 1.79% | 1.79% | 1.79% | 1.81% |
| Expenses net of fee waivers, if any | 1.76%I | 1.78% | 1.78% | 1.78% | 1.79% | 1.81% |
| Expenses net of all reductions | 1.76%I | 1.78% | 1.78% | 1.78% | 1.79% | 1.81% |
| Net investment income (loss) | 3.04%I | 3.32% | 3.54% | 3.65% | 3.54% | 3.88% |
| Supplemental Data | | | | | | |
| Net assets, end of period (000 omitted) | $256,025 | $287,598 | $289,430 | $291,387 | $246,306 | $204,012 |
| Portfolio turnover rateJ | 25%I | 22% | 26% | 19% | 29% | 26% |
A Calculated based on average shares outstanding during the period.
B Total distributions of $.65 per share is comprised of distributions from net investment income of $.417 and distributions from net realized gain of $.236 per share.
C Amount represents less than $.005 per share.
D Total returns for periods of less than one year are not annualized.
E Total returns would have been lower if certain expenses had not been reduced during the applicable periods shown.
F Total returns do not include the effect of the contingent deferred sales charge.
G Fees and expenses of any underlying Fidelity Central Funds are not included in the Fund's expense ratio. The Fund indirectly bears its proportionate share of the expenses of any underlying Fidelity Central Funds.
H Expense ratios reflect operating expenses of the class. Expenses before reductions do not reflect amounts reimbursed by the investment adviser or reductions from brokerage service arrangements or reductions from other expense offset arrangements and do not represent the amount paid by the class during periods when reimbursements or reductions occur. Expenses net of fee waivers reflect expenses after reimbursement by the investment adviser but prior to reductions from brokerage service arrangements or other expense offset arrangements. Expenses net of all reductions represent the net expenses paid by the class.
I Annualized
J Amount does not include the portfolio activity of any underlying Fidelity Central Funds.
See accompanying notes which are an integral part of the financial statements.
Fidelity Real Estate Income Fund
| | Six months ended (Unaudited) January 31, | Years endedJuly 31, | | | | |
| | 2018 | 2017 | 2016 | 2015 | 2014 | 2013 |
| Selected Per–Share Data | | | | | | |
| Net asset value, beginning of period | $12.38 | $12.31 | $11.71 | $11.91 | $11.71 | $11.29 |
| Income from Investment Operations | | | | | | |
| Net investment income (loss)A | .25 | .52 | .52 | .54 | .52 | .57 |
| Net realized and unrealized gain (loss) | (.41) | .14 | .73 | .02 | .44 | .60 |
| Total from investment operations | (.16) | .66 | 1.25 | .56 | .96 | 1.17 |
| Distributions from net investment income | (.36) | (.51) | (.51) | (.55) | (.53) | (.55) |
| Distributions from net realized gain | (.13) | (.08) | (.14) | (.21) | (.24) | (.20) |
| Total distributions | (.49) | (.59) | (.65) | (.76) | (.76)B | (.75) |
| Redemption fees added to paid in capitalA,C | – | – | – | – | – | – |
| Net asset value, end of period | $11.73 | $12.38 | $12.31 | $11.71 | $11.91 | $11.71 |
| Total ReturnD,E | (1.40)% | 5.60% | 11.29% | 4.84% | 8.78% | 10.71% |
| Ratios to Average Net AssetsF,G | | | | | | |
| Expenses before reductions | .75%H | .78% | .82% | .83% | .83% | .84% |
| Expenses net of fee waivers, if any | .75%H | .78% | .81% | .82% | .83% | .84% |
| Expenses net of all reductions | .75%H | .77% | .81% | .82% | .83% | .84% |
| Net investment income (loss) | 4.05%H | 4.33% | 4.51% | 4.61% | 4.50% | 4.85% |
| Supplemental Data | | | | | | |
| Net assets, end of period (000 omitted) | $2,546,435 | $2,630,901 | $2,719,387 | $2,561,268 | $2,627,382 | $2,884,545 |
| Portfolio turnover rateI | 25%H | 22% | 26% | 19% | 29% | 26% |
A Calculated based on average shares outstanding during the period.
B Total distributions of $.76 per share is comprised of distributions from net investment income of $.525 and distributions from net realized gain of $.236 per share.
C Amount represents less than $.005 per share.
D Total returns for periods of less than one year are not annualized.
E Total returns would have been lower if certain expenses had not been reduced during the applicable periods shown.
F Fees and expenses of any underlying Fidelity Central Funds are not included in the Fund's expense ratio. The Fund indirectly bears its proportionate share of the expenses of any underlying Fidelity Central Funds.
G Expense ratios reflect operating expenses of the class. Expenses before reductions do not reflect amounts reimbursed by the investment adviser or reductions from brokerage service arrangements or reductions from other expense offset arrangements and do not represent the amount paid by the class during periods when reimbursements or reductions occur. Expenses net of fee waivers reflect expenses after reimbursement by the investment adviser but prior to reductions from brokerage service arrangements or other expense offset arrangements. Expenses net of all reductions represent the net expenses paid by the class.
H Annualized
I Amount does not include the portfolio activity of any underlying Fidelity Central Funds.
See accompanying notes which are an integral part of the financial statements.
Fidelity Real Estate Income Fund Class I
| | Six months ended (Unaudited) January 31, | Years endedJuly 31, | | | | |
| | 2018 | 2017 | 2016 | 2015 | 2014 | 2013 |
| Selected Per–Share Data | | | | | | |
| Net asset value, beginning of period | $12.34 | $12.27 | $11.68 | $11.88 | $11.69 | $11.28 |
| Income from Investment Operations | | | | | | |
| Net investment income (loss)A | .25 | .52 | .52 | .55 | .52 | .57 |
| Net realized and unrealized gain (loss) | (.41) | .14 | .73 | .02 | .44 | .60 |
| Total from investment operations | (.16) | .66 | 1.25 | .57 | .96 | 1.17 |
| Distributions from net investment income | (.36) | (.51) | (.52) | (.55) | (.53) | (.56) |
| Distributions from net realized gain | (.13) | (.08) | (.14) | (.21) | (.24) | (.20) |
| Total distributions | (.49) | (.59) | (.66) | (.77)B | (.77) | (.76) |
| Redemption fees added to paid in capitalA,C | – | – | – | – | – | – |
| Net asset value, end of period | $11.69 | $12.34 | $12.27 | $11.68 | $11.88 | $11.69 |
| Total ReturnD,E | (1.39)% | 5.66% | 11.30% | 4.92% | 8.76% | 10.72% |
| Ratios to Average Net AssetsF,G | | | | | | |
| Expenses before reductions | .75%H | .76% | .77% | .77% | .78% | .80% |
| Expenses net of fee waivers, if any | .75%H | .76% | .77% | .77% | .78% | .80% |
| Expenses net of all reductions | .75%H | .76% | .76% | .77% | .78% | .80% |
| Net investment income (loss) | 4.05%H | 4.34% | 4.56% | 4.66% | 4.55% | 4.89% |
| Supplemental Data | | | | | | |
| Net assets, end of period (000 omitted) | $2,082,643 | $1,951,293 | $1,239,950 | $913,475 | $809,854 | $610,045 |
| Portfolio turnover rateI | 25%H | 22% | 26% | 19% | 29% | 26% |
A Calculated based on average shares outstanding during the period.
B Total distributions of $.77 per share is comprised of distributions from net investment income of $.554 and distributions from net realized gain of $.212 per share.
C Amount represents less than $.005 per share.
D Total returns for periods of less than one year are not annualized.
E Total returns would have been lower if certain expenses had not been reduced during the applicable periods shown.
F Fees and expenses of any underlying Fidelity Central Funds are not included in the Fund's expense ratio. The Fund indirectly bears its proportionate share of the expenses of any underlying Fidelity Central Funds.
G Expense ratios reflect operating expenses of the class. Expenses before reductions do not reflect amounts reimbursed by the investment adviser or reductions from brokerage service arrangements or reductions from other expense offset arrangements and do not represent the amount paid by the class during periods when reimbursements or reductions occur. Expenses net of fee waivers reflect expenses after reimbursement by the investment adviser but prior to reductions from brokerage service arrangements or other expense offset arrangements. Expenses net of all reductions represent the net expenses paid by the class.
H Annualized
I Amount does not include the portfolio activity of any underlying Fidelity Central Funds.
See accompanying notes which are an integral part of the financial statements.
Notes to Financial Statements (Unaudited)
For the period ended January 31, 2018
1. Organization.
Fidelity Real Estate Income Fund (the Fund) is a fund of Fidelity Securities Fund (the Trust) and is authorized to issue an unlimited number of shares. The Trust is registered under the Investment Company Act of 1940, as amended (the 1940 Act), as an open-end management investment company organized as a Massachusetts business trust. The Fund offers Class A, Class M, Class C, Real Estate Income and Class I shares, each of which has equal rights as to assets and voting privileges. Each class has exclusive voting rights with respect to matters that affect that class.
2. Investments in Fidelity Central Funds.
The Fund invests in Fidelity Central Funds, which are open-end investment companies generally available only to other investment companies and accounts managed by the investment adviser and its affiliates. The Fund's Schedule of Investments lists each of the Fidelity Central Funds held as of period end, if any, as an investment of the Fund, but does not include the underlying holdings of each Fidelity Central Fund. As an Investing Fund, the Fund indirectly bears its proportionate share of the expenses of the underlying Fidelity Central Funds.
The Money Market Central Funds seek preservation of capital and current income and are managed by Fidelity Investments Money Management, Inc. (FIMM), an affiliate of the investment adviser. Annualized expenses of the Money Market Central Funds as of their most recent shareholder report date are less than .005%.
A complete unaudited list of holdings for each Fidelity Central Fund is available upon request or at the Securities and Exchange Commission (the SEC) website at www.sec.gov. In addition, the financial statements of the Fidelity Central Funds are available on the SEC website or upon request.
3. Significant Accounting Policies.
The Fund is an investment company and applies the accounting and reporting guidance of the Financial Accounting Standards Board (FASB) Accounting Standards Codification Topic 946 Financial Services – Investments Companies. The financial statements have been prepared in conformity with accounting principles generally accepted in the United States of America (GAAP), which require management to make certain estimates and assumptions at the date of the financial statements. Actual results could differ from those estimates. Subsequent events, if any, through the date that the financial statements were issued have been evaluated in the preparation of the financial statements. The following summarizes the significant accounting policies of the Fund:
Investment Valuation. Investments are valued as of 4:00 p.m. Eastern time on the last calendar day of the period. The Board of Trustees (the Board) has delegated the day to day responsibility for the valuation of the Fund's investments to the Fair Value Committee (the Committee) established by the Fund's investment adviser. In accordance with valuation policies and procedures approved by the Board, the Fund attempts to obtain prices from one or more third party pricing vendors or brokers to value its investments. When current market prices, quotations or currency exchange rates are not readily available or reliable, investments will be fair valued in good faith by the Committee, in accordance with procedures adopted by the Board. Factors used in determining fair value vary by investment type and may include market or investment specific events, changes in interest rates and credit quality. The frequency with which these procedures are used cannot be predicted and they may be utilized to a significant extent. The Committee oversees the Fund's valuation policies and procedures and reports to the Board on the Committee's activities and fair value determinations. The Board monitors the appropriateness of the procedures used in valuing the Fund's investments and ratifies the fair value determinations of the Committee.
The Fund categorizes the inputs to valuation techniques used to value its investments into a disclosure hierarchy consisting of three levels as shown below:
- Level 1 – quoted prices in active markets for identical investments
- Level 2 – other significant observable inputs (including quoted prices for similar investments, interest rates, prepayment speeds, etc.)
- Level 3 – unobservable inputs (including the Fund's own assumptions based on the best information available)
Valuation techniques used to value the Fund's investments by major category are as follows:
Equity securities, including restricted securities, for which market quotations are readily available, are valued at the last reported sale price or official closing price as reported by a third party pricing vendor on the primary market or exchange on which they are traded and are categorized as Level 1 in the hierarchy. In the event there were no sales during the day or closing prices are not available, securities are valued at the last quoted bid price or may be valued using the last available price and are generally categorized as Level 2 in the hierarchy. For foreign equity securities, when market or security specific events arise, comparisons to the valuation of American Depositary Receipts (ADRs), futures contracts, Exchange-Traded Funds (ETFs) and certain indexes as well as quoted prices for similar securities may be used and would be categorized as Level 2 in the hierarchy. Utilizing these techniques may result in transfers between Level 1 and Level 2. For equity securities, including restricted securities, where observable inputs are limited, assumptions about market activity and risk are used and these securities may be categorized as Level 3 in the hierarchy.
Debt securities, including restricted securities, are valued based on evaluated prices received from third party pricing vendors or from brokers who make markets in such securities. Corporate bonds, bank loan obligations and preferred securities are valued by pricing vendors who utilize matrix pricing which considers yield or price of bonds of comparable quality, coupon, maturity and type or by broker-supplied prices. Asset backed securities, collateralized mortgage obligations and commercial mortgage securities are valued by pricing vendors who utilize matrix pricing which considers prepayment speed assumptions, attributes of the collateral, yield or price of bonds of comparable quality, coupon, maturity and type or by broker-supplied prices. When independent prices are unavailable or unreliable, debt securities may be valued utilizing pricing methodologies which consider similar factors that would be used by third party pricing vendors. Debt securities are generally categorized as Level 2 in the hierarchy but may be Level 3 depending on the circumstances.
Investments in open-end mutual funds, including the Fidelity Central Funds, are valued at their closing net asset value (NAV) each business day and are categorized as Level 1 in the hierarchy.
Changes in valuation techniques may result in transfers in or out of an assigned level within the disclosure hierarchy. The aggregate value of investments by input level as of January 31, 2018, as well as a roll forward of Level 3 investments, is included at the end of the Fund's Schedule of Investments.
Foreign Currency. The Fund may use foreign currency contracts to facilitate transactions in foreign-denominated securities. Gains and losses from these transactions may arise from changes in the value of the foreign currency or if the counterparties do not perform under the contracts' terms.
Foreign-denominated assets, including investment securities, and liabilities are translated into U.S. dollars at the exchange rates at period end. Purchases and sales of investment securities, income and dividends received and expenses denominated in foreign currencies are translated into U.S. dollars at the exchange rate in effect on the transaction date.
The effects of exchange rate fluctuations on investments are included with the net realized and unrealized gain (loss) on investment securities. Other foreign currency transactions resulting in realized and unrealized gain (loss) are disclosed separately.
Investment Transactions and Income. For financial reporting purposes, the Fund's investment holdings and NAV include trades executed through the end of the last business day of the period. The NAV per share for processing shareholder transactions is calculated as of the close of business of the New York Stock Exchange (NYSE), normally 4:00 p.m. Eastern time and includes trades executed through the end of the prior business day. Gains and losses on securities sold are determined on the basis of identified cost and includes proceeds received from litigation. Dividend income is recorded on the ex-dividend date, except for certain dividends from foreign securities where the ex-dividend date may have passed, which are recorded as soon as the Fund is informed of the ex-dividend date. Non-cash dividends included in dividend income, if any, are recorded at the fair market value of the securities received. Income and capital gain distributions from Fidelity Central Funds, if any, are recorded on the ex-dividend date. Certain distributions received by the Fund represent a return of capital or capital gain. The Fund determines the components of these distributions subsequent to the ex-dividend date, based upon receipt of tax filings or other correspondence relating to the underlying investment. These distributions are recorded as a reduction of cost of investments and/or as a realized gain. Interest income is accrued as earned and includes coupon interest and amortization of premium and accretion of discount on debt securities as applicable. For certain lower credit quality securitized assets that have contractual cash flows (for example, asset backed securities, collateralized mortgage obligations and commercial mortgage-backed securities), changes in estimated cash flows are periodically evaluated and the estimated yield is adjusted on a prospective basis, resulting in increases or decreases to Interest Income in the accompanying Statement of Operations. Investment income is recorded net of foreign taxes withheld where recovery of such taxes is uncertain. Debt obligations may be placed on non-accrual status and related interest income may be reduced by ceasing current accruals and writing off interest receivables when the collection of all or a portion of interest has become doubtful based on consistently applied procedures. A debt obligation is removed from non-accrual status when the issuer resumes interest payments or when collectability of interest is reasonably assured.
Class Allocations and Expenses. Investment income, realized and unrealized capital gains and losses, common expenses of the Fund, and certain fund-level expense reductions, if any, are allocated daily on a pro-rata basis to each class based on the relative net assets of each class to the total net assets of the Fund. Each class differs with respect to transfer agent and distribution and service plan fees incurred. Certain expense reductions may also differ by class. For the reporting period, the allocated portion of income and expenses to each class as a percent of its average net assets may vary due to the timing of recording these transactions in relation to fluctuating net assets of the classes. Expenses directly attributable to a fund are charged to that fund. Expenses attributable to more than one fund are allocated among the respective funds on the basis of relative net assets or other appropriate methods. Expense estimates are accrued in the period to which they relate and adjustments are made when actual amounts are known.
Income Tax Information and Distributions to Shareholders. Each year, the Fund intends to qualify as a regulated investment company under Subchapter M of the Internal Revenue Code, including distributing substantially all of its taxable income and realized gains. As a result, no provision for U.S. Federal income taxes is required. The Fund files a U.S. federal tax return, in addition to state and local tax returns as required. The Fund's federal income tax returns are subject to examination by the Internal Revenue Service (IRS) for a period of three fiscal years after they are filed. State and local tax returns may be subject to examination for an additional fiscal year depending on the jurisdiction. Foreign taxes are provided for based on the Fund's understanding of the tax rules and rates that exist in the foreign markets in which it invests.
Distributions are declared and recorded on the ex-dividend date. Income dividends and capital gain distributions are declared separately for each class. Income and capital gain distributions are determined in accordance with income tax regulations, which may differ from GAAP.
Capital accounts within the financial statements are adjusted for permanent book-tax differences. These adjustments have no impact on net assets or the results of operations. Capital accounts are not adjusted for temporary book-tax differences which will reverse in a subsequent period.
Book-tax differences are primarily due to the short-term gain distributions from the Underlying Funds, foreign currency transactions, passive foreign investment companies (PFIC), market discount, equity-debt classifications, certain conversion ratio adjustments, partnerships and losses deferred due to wash sales.
As of period end, the cost and unrealized appreciation (depreciation) in securities, and derivatives if applicable, for federal income tax purposes were as follows:
| Gross unrealized appreciation | $382,838,673 |
| Gross unrealized depreciation | (147,343,108) |
| Net unrealized appreciation (depreciation) | $235,495,565 |
| Tax cost | $5,032,149,264 |
Short-Term Trading (Redemption) Fees. Shares held by investors in the Fund less than 90 days may have been subject to a redemption fee equal to .75% of the NAV of shares redeemed. All redemption fees, which reduce the proceeds of the shareholder redemption, are retained by the Fund and accounted for as an addition to paid in capital. In November 2017, the Board of Trustees approved the elimination of these redemption fees effective December 18, 2017.
Restricted Securities. The Fund may invest in securities that are subject to legal or contractual restrictions on resale. These securities generally may be resold in transactions exempt from registration or to the public if the securities are registered. Disposal of these securities may involve time-consuming negotiations and expense, and prompt sale at an acceptable price may be difficult. Information regarding restricted securities is included at the end of the Fund's Schedule of Investments.
Loans and Other Direct Debt Instruments. The Fund invests in direct debt instruments which are interests in amounts owed to lenders by corporate or other borrowers. These instruments may be in the form of loans, trade claims or other receivables and may include standby financing commitments such as revolving credit facilities that obligate the Fund to supply additional cash to the borrower on demand. Loans may be acquired through assignment or participation. The Fund did not have any unfunded loan commitments, which are contractual obligations for future funding, at period end.
New Accounting Pronouncement. In March 2017, the Financial Accounting Standards Board (FASB) issued an Accounting Standards Update (ASU), ASU 2017-08, which amends the amortization period for certain callable debt securities that are held at a premium. The amendment requires the premium to be amortized to the earliest call date. The amendments do not require an accounting change for securities held at a discount. The ASU is effective for annual periods beginning after December 15, 2018. Management is currently evaluating the potential impact of these changes to the financial statements.
4. Purchases and Sales of Investments.
Purchases and sales of securities, other than short-term securities and U.S. government securities, aggregated $777,525,766 and $631,431,764, respectively.
5. Fees and Other Transactions with Affiliates.
Management Fee. Fidelity Management & Research Company (the investment adviser) and its affiliates provide the Fund with investment management related services for which the Fund pays a monthly management fee. The management fee is the sum of an individual fund fee rate that is based on an annual rate of .30% of the Fund's average net assets and an annualized group fee rate that averaged .24% during the period. The group fee rate is based upon the average net assets of all the mutual funds advised by the investment adviser, including any mutual funds previously advised by the investment adviser that are currently advised by Fidelity SelectCo, LLC, an affiliate of the investment adviser. The group fee rate decreases as assets under management increase and increases as assets under management decrease. For the reporting period, the total annualized management fee rate was .54% of the Fund's average net assets.
Distribution and Service Plan Fees. In accordance with Rule 12b-1 of the 1940 Act, the Fund has adopted separate Distribution and Service Plans for each class of shares. Certain classes pay Fidelity Distributors Corporation (FDC), an affiliate of the investment adviser, separate Distribution and Service Fees, each of which is based on an annual percentage of each class' average net assets. In addition, FDC may pay financial intermediaries for selling shares of the Fund and providing shareholder support services. For the period, the Distribution and Service Fee rates, total fees and amounts retained by FDC were as follows:
| | Distribution Fee | Service Fee | Total Fees | Retained by FDC |
| Class A | -% | .25% | $429,686 | $9,408 |
| Class M | -% | .25% | 78,617 | – |
| Class C | .75% | .25% | 1,400,665 | 200,250 |
| | | | $1,908,968 | $209,658 |
Sales Load. FDC may receive a front-end sales charge of up to 4.00% for selling Class A shares and Class M shares, some of which is paid to financial intermediaries for selling shares of the Fund. Depending on the holding period, FDC may receive contingent deferred sales charges levied on Class A, Class M and Class C redemptions. The deferred sales charges are 1.00% for Class C shares, 1.00% for certain purchases of Class A shares and .25% for certain purchases of Class M shares.
For the period, sales charge amounts retained by FDC were as follows:
| | Retained by FDC |
| Class A | $13,265 |
| Class M | 2,337 |
| Class C(a) | 18,790 |
| | $34,392 |
(a) When Class C shares are initially sold, FDC pays commissions from its own resources to financial intermediaries through which the sales are made.
Transfer Agent Fees. Fidelity Investments Institutional Operations Company, Inc., (FIIOC), an affiliate of the investment adviser, is the transfer, dividend disbursing and shareholder servicing agent for each class of the Fund. FIIOC receives account fees and asset-based fees that vary according to the account size and type of account of the shareholders of the respective classes of the Fund. FIIOC pays for typesetting, printing and mailing of shareholder reports, except proxy statements.
For the period, transfer agent fees for each class were as follows:
| | Amount | % of Class-Level Average Net Assets(a) |
| Class A | $330,561 | .19 |
| Class M | 68,245 | .22 |
| Class C | 263,205 | .19 |
| Real Estate Income | 2,333,727 | .18 |
| Class I | 1,808,276 | .17 |
| | $4,804,014 | |
(a) Annualized
Accounting and Security Lending Fees. Fidelity Service Company, Inc. (FSC), an affiliate of the investment adviser, maintains the Fund's accounting records. The accounting fee is based on the level of average net assets for each month. Under a separate contract, FSC administers the security lending program. The security lending fee is based on the number and duration of lending transactions.
Brokerage Commissions. The Fund placed a portion of its portfolio transactions with brokerage firms which are affiliates of the investment adviser. Brokerage commissions are included in net realized gain (loss) and change in net unrealized appreciation (depreciation) in the Statement of Operations. The commissions paid to these affiliated firms were $4,417 for the period.
Interfund Trades. The Fund may purchase from or sell securities to other Fidelity Funds under procedures adopted by the Board. The procedures have been designed to ensure these interfund trades are executed in accordance with Rule 17a-7 of the 1940 Act. Interfund trades are included within the respective purchases and sales amounts shown in the Purchases and Sales of Investments note.
6. Committed Line of Credit.
The Fund participates with other funds managed by the investment adviser or an affiliate in a $4.25 billion credit facility (the "line of credit") to be utilized for temporary or emergency purposes to fund shareholder redemptions or for other short-term liquidity purposes. The Fund has agreed to pay commitment fees on its pro-rata portion of the line of credit, which amounted to $7,757 and is reflected in Miscellaneous expenses on the Statement of Operations. During the period, the Fund did not borrow on this line of credit.
7. Security Lending.
The Fund lends portfolio securities through a lending agent from time to time in order to earn additional income. For equity securities, a lending agent is used and may loan securities to certain qualified borrowers, including Fidelity Capital Markets (FCM), a broker-dealer affiliated with the Fund. On the settlement date of the loan, the Fund receives collateral (in the form of U.S. Treasury obligations, letters of credit and/or cash) against the loaned securities and maintains collateral in an amount not less than 100% of the market value of the loaned securities during the period of the loan. The market value of the loaned securities is determined at the close of business of the Fund and any additional required collateral is delivered to the Fund on the next business day. The Fund or borrower may terminate the loan at any time, and if the borrower defaults on its obligation to return the securities loaned because of insolvency or other reasons, the Fund may apply collateral received from the borrower against the obligation. The Fund may experience delays and costs in recovering the securities loaned. Any cash collateral received is invested in the Fidelity Securities Lending Cash Central Fund. The value of loaned securities and cash collateral at period end are disclosed on the Fund's Statement of Assets and Liabilities. The value of securities loaned to FCM at period end was $1,637,670. Security lending income represents the income earned on investing cash collateral, less rebates paid to borrowers and any lending agent fees associated with the loan, plus any premium payments received for lending certain types of securities. Security lending income is presented in the Statement of Operations as a component of income from Fidelity Central Funds. Total security lending income during the period amounted to $82,089, including $13,875 from securities loaned to FCM.
8. Expense Reductions.
Commissions paid to certain brokers with whom the investment adviser, or its affiliates, places trades on behalf of the Fund include an amount in addition to trade execution, which may be rebated back to the Fund to offset certain expenses. This amount totaled $22,737 for the period. In addition, through arrangements with the Fund's custodian, credits realized as a result of certain uninvested cash balances were used to reduce the Fund's expenses. During the period, these credits reduced the Fund's custody expenses by $12,537.
In addition, during the period the investment adviser reimbursed and/or waived a portion of fund-level operating expenses in the amount of $27,249.
9. Distributions to Shareholders.
Distributions to shareholders of each class were as follows:
| | Six months ended
January 31, 2018 | Year ended
July 31, 2017 |
| From net investment income | | |
| Class A | $9,452,291 | $19,398,648 |
| Class M | 1,723,645 | 2,428,967 |
| Class C | 6,546,231 | 9,371,104 |
| Real Estate Income | 76,362,036 | 109,435,619 |
| Class I | 61,120,462 | 62,288,219 |
| Total | $155,204,665 | $202,922,557 |
| From net realized gain | | |
| Class A | $3,718,309 | $3,567,509 |
| Class M | 680,353 | 398,948 |
| Class C | 3,070,453 | 1,939,550 |
| Real Estate Income | 28,258,285 | 17,827,432 |
| Class I | 22,382,771 | 8,650,491 |
| Total | $58,110,171 | $32,383,930 |
10. Share Transactions.
Share transactions for each class were as follows and may contain automatic conversions between classes or exchanges between affiliated funds:
| | Shares | Shares | Dollars | Dollars |
| | Six months ended January 31, 2018 | Year ended July 31, 2017 | Six months ended January 31, 2018 | Year ended July 31, 2017 |
| Class A | | | | |
| Shares sold | 3,080,956 | 12,839,240 | $37,209,682 | $153,895,562 |
| Reinvestment of distributions | 1,060,847 | 1,848,521 | 12,790,749 | 21,908,312 |
| Shares redeemed | (5,446,440) | (30,631,418) | (65,680,595) | (367,310,909) |
| Net increase (decrease) | (1,304,637) | (15,943,657) | $(15,680,164) | $(191,507,035) |
| Class M | | | | |
| Shares sold | 448,069 | 1,228,326 | $5,442,597 | $14,708,870 |
| Reinvestment of distributions | 194,165 | 221,980 | 2,342,875 | 2,637,477 |
| Shares redeemed | (808,058) | (1,122,766) | (9,757,251) | (13,419,214) |
| Net increase (decrease) | (165,824) | 327,540 | $(1,971,779) | $3,927,133 |
| Class C | | | | |
| Shares sold | 1,524,914 | 5,359,653 | $18,344,811 | $63,747,841 |
| Reinvestment of distributions | 752,947 | 858,380 | 9,002,475 | 10,109,093 |
| Shares redeemed | (3,714,481) | (6,493,102) | (44,259,755) | (77,061,823) |
| Net increase (decrease) | (1,436,620) | (275,069) | $(16,912,469) | $(3,204,889) |
| Real Estate Income | | | | |
| Shares sold | 23,330,786 | 47,554,214 | $282,882,994 | $573,422,929 |
| Reinvestment of distributions | 7,529,411 | 9,324,516 | 91,225,443 | 111,248,966 |
| Shares redeemed | (26,293,135) | (65,327,473) | (317,808,032) | (784,201,096) |
| Net increase (decrease) | 4,567,062 | (8,448,743) | $56,300,405 | $(99,529,201) |
| Class I | | | | |
| Shares sold | 41,808,703 | 91,593,798 | $507,611,037 | $1,102,392,455 |
| Reinvestment of distributions | 5,547,464 | 4,455,256 | 66,976,330 | 53,081,868 |
| Shares redeemed | (27,335,287) | (38,982,165) | (329,438,507) | (467,715,284) |
| Net increase (decrease) | 20,020,880 | 57,066,889 | $245,148,860 | $687,759,039 |
11. Other.
The Fund's organizational documents provide former and current trustees and officers with a limited indemnification against liabilities arising in connection with the performance of their duties to the Fund. In the normal course of business, the Fund may also enter into contracts that provide general indemnifications. The Fund's maximum exposure under these arrangements is unknown as this would be dependent on future claims that may be made against the Fund. The risk of material loss from such claims is considered remote.
Shareholder Expense Example
As a shareholder of the Fund, you incur two types of costs: (1) transaction costs, including sales charges (loads) on purchase payments or redemption proceeds, redemption fees and (2) ongoing costs, including management fees, distribution and/or service (12b-1) fees and other Fund expenses. This Example is intended to help you understand your ongoing costs (in dollars) of investing in the Fund and to compare these costs with the ongoing costs of investing in other mutual funds.
The Example is based on an investment of $1,000 invested at the beginning of the period and held for the entire period (August 1, 2017 to January 31, 2018).
Actual Expenses
The first line of the accompanying table for each class of the Fund provides information about actual account values and actual expenses. You may use the information in this line, together with the amount you invested, to estimate the expenses that you paid over the period. Simply divide your account value by $1,000.00 (for example, an $8,600 account value divided by $1,000.00 = 8.6), then multiply the result by the number in the first line for a class of the Fund under the heading entitled "Expenses Paid During Period" to estimate the expenses you paid on your account during this period. A small balance maintenance fee of $12.00 that is charged once a year may apply for certain accounts with a value of less than $2,000. This fee is not included in the table below. If it was, the estimate of expenses you paid during the period would be higher, and your ending account value lower, by this amount. In addition, the Fund, as a shareholder in the underlying Fidelity Central Funds, will indirectly bear its pro-rata share of the fees and expenses incurred by the underlying Fidelity Central Funds. These fees and expenses are not included in the Fund's annualized expense ratio used to calculate the expense estimate in the table below.
Hypothetical Example for Comparison Purposes
The second line of the accompanying table for each class of the Fund provides information about hypothetical account values and hypothetical expenses based on a Class' actual expense ratio and an assumed rate of return of 5% per year before expenses, which is not the Class' actual return. The hypothetical account values and expenses may not be used to estimate the actual ending account balance or expenses you paid for the period. You may use this information to compare the ongoing costs of investing in the Fund and other funds. To do so, compare this 5% hypothetical example with the 5% hypothetical examples that appear in the shareholder reports of the other funds. A small balance maintenance fee of $12.00 that is charged once a year may apply for certain accounts with a value of less than $2,000. This fee is not included in the table below. If it was, the estimate of expenses you paid during the period would be higher, and your ending account value lower, by this amount. In addition, the Fund, as a shareholder in the underlying Fidelity Central Funds, will indirectly bear its pro-rata share of the fees and expenses incurred by the underlying Fidelity Central Funds. These fees and expenses are not included in the Fund's annualized expense ratio used to calculate the expense estimate in the table below.
Please note that the expenses shown in the table are meant to highlight your ongoing costs only and do not reflect any transaction costs. Therefore, the second line of the table is useful in comparing ongoing costs only, and will not help you determine the relative total costs of owning different funds. In addition, if these transactional costs were included, your costs would have been higher.
| | Annualized Expense Ratio-A | Beginning
Account Value
August 1, 2017 | Ending
Account Value
January 31, 2018 | Expenses Paid
During Period-B
August 1, 2017
to January 31, 2018 |
| Class A | 1.02% | | | |
| Actual | | $1,000.00 | $984.40 | $5.10 |
| Hypothetical-C | | $1,000.00 | $1,020.06 | $5.19 |
| Class M | 1.04% | | | |
| Actual | | $1,000.00 | $985.00 | $5.20 |
| Hypothetical-C | | $1,000.00 | $1,019.96 | $5.30 |
| Class C | 1.76% | | | |
| Actual | | $1,000.00 | $980.60 | $8.79 |
| Hypothetical-C | | $1,000.00 | $1,016.33 | $8.94 |
| Real Estate Income | .75% | | | |
| Actual | | $1,000.00 | $986.00 | $3.75 |
| Hypothetical-C | | $1,000.00 | $1,021.42 | $3.82 |
| Class I | .75% | | | |
| Actual | | $1,000.00 | $986.10 | $3.75 |
| Hypothetical-C | | $1,000.00 | $1,021.42 | $3.82 |
A Annualized expense ratio reflects expenses net of applicable fee waivers.
B Expenses are equal to each Class' annualized expense ratio, multiplied by the average account value over the period, multiplied by 184/365 (to reflect the one-half year period).
C 5% return per year before expenses
REIA-SANN-0318
1.907552.107
Fidelity® Real Estate Income Fund
Semi-Annual Report January 31, 2018 |
|
Contents
To view a fund's proxy voting guidelines and proxy voting record for the 12-month period ended June 30, visit http://www.fidelity.com/proxyvotingresults or visit the Securities and Exchange Commission's (SEC) web site at http://www.sec.gov.
You may also call 1-800-544-8544 to request a free copy of the proxy voting guidelines.
Standard & Poor's, S&P and S&P 500 are registered service marks of The McGraw-Hill Companies, Inc. and have been licensed for use by Fidelity Distributors Corporation.
Other third-party marks appearing herein are the property of their respective owners.
All other marks appearing herein are registered or unregistered trademarks or service marks of FMR LLC or an affiliated company. © 2018 FMR LLC. All rights reserved.
This report and the financial statements contained herein are submitted for the general information of the shareholders of the Fund. This report is not authorized for distribution to prospective investors in the Fund unless preceded or accompanied by an effective prospectus.
A fund files its complete schedule of portfolio holdings with the SEC for the first and third quarters of each fiscal year on Form N-Q. Forms N-Q are available on the SEC’s web site at http://www.sec.gov. A fund's Forms N-Q may be reviewed and copied at the SEC’s Public Reference Room in Washington, DC. Information regarding the operation of the SEC's Public Reference Room may be obtained by calling 1-800-SEC-0330.
For a complete list of a fund's portfolio holdings, view the most recent holdings listing, semiannual report, or annual report on Fidelity's web site at http://www.fidelity.com, http://www.institutional.fidelity.com, or http://www.401k.com, as applicable.
NOT FDIC INSURED •MAY LOSE VALUE •NO BANK GUARANTEE
Neither the Fund nor Fidelity Distributors Corporation is a bank.
Investment Summary (Unaudited)
Top Five Stocks as of January 31, 2018
| | % of fund's net assets |
| Equity Lifestyle Properties, Inc. | 2.9 |
| Apartment Investment & Management Co. Class A | 2.0 |
| Acadia Realty Trust (SBI) | 2.0 |
| Ventas, Inc. | 1.8 |
| MFA Financial, Inc. | 1.6 |
| | 10.3 |
Top 5 Bonds as of January 31, 2018
| | % of fund's net assets |
| Senior Housing Properties Trust 4.75% 5/1/24 | 0.9 |
| IAS Operating Partnership LP 5% 3/15/18 | 0.8 |
| RWT Holdings, Inc. 5.625% 11/15/19 | 0.7 |
| PennyMac Corp. 5.375% 5/1/20 | 0.6 |
| RAIT Financial Trust 4% 10/1/33 | 0.6 |
| | 3.6 |
Top Five REIT Sectors as of January 31, 2018
| | % of fund's net assets |
| REITs - Mortgage | 18.0 |
| REITs - Health Care | 7.8 |
| REITs - Diversified | 6.6 |
| REITs - Apartments | 6.5 |
| REITs - Shopping Centers | 3.9 |
Asset Allocation (% of fund's net assets)
| As of January 31, 2018* |
| | Stocks | 47.1% |
| | Bonds | 34.4% |
| | Convertible Securities | 7.3% |
| | Other Investments | 4.4% |
| | Short-Term Investments and Net Other Assets (Liabilities) | 6.8% |

* Foreign investments - 1.6%
Schedule of Investments January 31, 2018 (Unaudited)
Showing Percentage of Net Assets
| Common Stocks - 29.1% | | | |
| | | Shares | Value |
| CONSUMER DISCRETIONARY - 0.6% | | | |
| Hotels, Restaurants & Leisure - 0.6% | | | |
| Bluegreen Vacations Corp. | | 262,950 | $4,993,421 |
| Wyndham Worldwide Corp. | | 199,600 | 24,776,348 |
| | | | 29,769,769 |
| Household Durables - 0.0% | | | |
| Stanley Martin Communities LLC Class B (Escrow) (a)(b) | | 4,620 | 149,642 |
|
| TOTAL CONSUMER DISCRETIONARY | | | 29,919,411 |
|
| FINANCIALS - 5.3% | | | |
| Capital Markets - 0.9% | | | |
| Brookfield Asset Management, Inc. Class A | | 535,900 | 22,429,376 |
| Ellington Financial LLC | | 1,568,684 | 22,887,100 |
| | | | 45,316,476 |
| Insurance - 0.2% | | | |
| FNF Group | | 288,400 | 11,241,832 |
| Mortgage Real Estate Investment Trusts - 4.2% | | | |
| AG Mortgage Investment Trust, Inc. | | 284,200 | 4,956,448 |
| Anworth Mortgage Asset Corp. | | 1,145,100 | 5,565,186 |
| Arbor Realty Trust, Inc. (c) | | 1,928,494 | 15,717,226 |
| Chimera Investment Corp. | | 953,100 | 16,193,169 |
| Dynex Capital, Inc. | | 1,322,886 | 8,598,759 |
| Ellington Residential Mortgage REIT (c) | | 260,000 | 2,810,600 |
| Five Oaks Investment Corp. (c) | | 547,901 | 1,791,636 |
| Great Ajax Corp. (d) | | 1,577,762 | 21,078,900 |
| Invesco Mortgage Capital, Inc. | | 2,335,049 | 37,921,196 |
| MFA Financial, Inc. | | 12,110,622 | 86,712,054 |
| New Residential Investment Corp. | | 655,600 | 11,335,324 |
| Redwood Trust, Inc. | | 21,300 | 317,157 |
| Two Harbors Investment Corp. | | 675,400 | 9,962,150 |
| | | | 222,959,805 |
|
| TOTAL FINANCIALS | | | 279,518,113 |
|
| REAL ESTATE - 23.2% | | | |
| Equity Real Estate Investment Trusts (REITs) - 23.2% | | | |
| Acadia Realty Trust (SBI) (d) | | 4,239,449 | 104,120,867 |
| Altisource Residential Corp. Class B | | 188,686 | 2,077,433 |
| American Homes 4 Rent Class A | | 1,666,038 | 34,636,930 |
| American Tower Corp. | | 356,700 | 52,684,590 |
| Apartment Investment & Management Co. Class A | | 2,555,042 | 106,902,957 |
| AvalonBay Communities, Inc. | | 173,300 | 29,530,320 |
| Boardwalk (REIT) (c) | | 298,500 | 10,799,390 |
| Cedar Realty Trust, Inc. | | 530,163 | 2,709,133 |
| Colony NorthStar, Inc. | | 7,740,548 | 69,510,121 |
| DDR Corp. | | 1,932,600 | 15,692,712 |
| Douglas Emmett, Inc. | | 197,700 | 7,645,059 |
| Equinix, Inc. | | 107,800 | 49,069,482 |
| Equity Lifestyle Properties, Inc. | | 1,750,402 | 151,094,686 |
| Extra Space Storage, Inc. | | 548,900 | 45,822,172 |
| Gramercy Property Trust | | 498,647 | 12,585,850 |
| Healthcare Realty Trust, Inc. | | 431,300 | 12,882,931 |
| Healthcare Trust of America, Inc. | | 1,058,760 | 29,232,364 |
| Lexington Corporate Properties Trust | | 4,316,674 | 38,936,399 |
| Mid-America Apartment Communities, Inc. | | 650,406 | 62,029,220 |
| National Retail Properties, Inc. | | 179,200 | 7,110,656 |
| Omega Healthcare Investors, Inc. (c) | | 964,923 | 26,091,518 |
| Public Storage | | 148,291 | 29,029,446 |
| Rexford Industrial Realty, Inc. | | 270,300 | 8,025,207 |
| Sabra Health Care REIT, Inc. | | 2,352,875 | 42,587,038 |
| Safety Income and Growth, Inc. | | 393,600 | 6,931,296 |
| Select Income REIT | | 205,800 | 4,601,688 |
| Senior Housing Properties Trust (SBI) | | 3,099,300 | 53,710,869 |
| Spirit Realty Capital, Inc. | | 894,600 | 7,308,882 |
| Store Capital Corp. | | 1,493,200 | 36,598,332 |
| Terreno Realty Corp. | | 626,328 | 22,297,277 |
| Ventas, Inc. | | 1,737,986 | 97,275,076 |
| VEREIT, Inc. | | 4,038,234 | 29,075,285 |
| WP Carey, Inc. | | 151,200 | 9,799,272 |
| WP Glimcher, Inc. | | 881,200 | 5,798,296 |
| | | | 1,224,202,754 |
| TOTAL COMMON STOCKS | | | |
| (Cost $1,343,382,828) | | | 1,533,640,278 |
|
| Preferred Stocks - 19.3% | | | |
| Convertible Preferred Stocks - 1.3% | | | |
| FINANCIALS - 0.3% | | | |
| Mortgage Real Estate Investment Trusts - 0.3% | | | |
| Great Ajax Corp. 7.25%(d) | | 180,000 | 4,486,086 |
| Sutherland Asset Management Corp. 7.00% | | 404,700 | 10,153,923 |
| | | | 14,640,009 |
| REAL ESTATE - 1.0% | | | |
| Equity Real Estate Investment Trusts (REITs) - 1.0% | | | |
| Alexandria Real Estate Equities, Inc. Series D, 7.00% | | 136,759 | 5,044,301 |
| Ashford Hospitality Prime, Inc. 5.50% | | 95,791 | 1,838,804 |
| Equity Commonwealth 6.50% | | 31,237 | 824,869 |
| iStar Financial, Inc. Series J, 4.50% | | 213,273 | 10,009,798 |
| Lexington Corporate Properties Trust Series C, 6.50% | | 468,142 | 23,512,853 |
| RLJ Lodging Trust 1.95% | | 31,935 | 826,957 |
| Wheeler REIT, Inc. 8.75% | | 516,748 | 8,996,583 |
| | | | 51,054,165 |
|
| TOTAL CONVERTIBLE PREFERRED STOCKS | | | 65,694,174 |
|
| Nonconvertible Preferred Stocks - 18.0% | | | |
| FINANCIALS - 8.1% | | | |
| Capital Markets - 0.1% | | | |
| Arlington Asset Investment Corp. 6.625% | | 182,517 | 4,402,657 |
| Brookfield Asset Management, Inc. 4.75% | | 105,800 | 2,187,394 |
| | | | 6,590,051 |
| Mortgage Real Estate Investment Trusts - 7.9% | | | |
| AG Mortgage Investment Trust, Inc.: | | | |
| 8.00% | | 618,287 | 15,234,592 |
| 8.25% | | 38,935 | 982,330 |
| AGNC Investment Corp.: | | | |
| Series B, 7.75% | | 427,100 | 10,997,825 |
| Series C, 7.00% | | 361,900 | 9,206,736 |
| American Capital Mortgage Investment Corp. Series A, 8.125% | | 248,636 | 6,340,243 |
| Annaly Capital Management, Inc.: | | | |
| Series C, 7.625% | | 326,429 | 8,209,689 |
| Series D, 7.50% | | 621,976 | 15,599,158 |
| Series E, 7.625% | | 672,961 | 16,951,888 |
| Series F, 6.95% | | 1,203,714 | 30,490,076 |
| Series G, 6.50% (e) | | 720,300 | 17,726,583 |
| Anworth Mortgage Asset Corp. Series A, 8.625% | | 242,730 | 6,240,588 |
| Apollo Commercial Real Estate Finance, Inc. Series C, 8.00% | | 485,559 | 12,221,714 |
| Arbor Realty Trust, Inc.: | | | |
| 7.375% | | 457,577 | 11,681,941 |
| Series A, 8.25% | | 189,089 | 4,787,733 |
| Series B, 7.75% | | 240,000 | 6,065,304 |
| Series C, 8.50% | | 100,000 | 2,595,200 |
| Armour Residential REIT, Inc. Series B, 7.875% | | 153,654 | 3,838,384 |
| Capstead Mortgage Corp. Series E, 7.50% | | 202,984 | 5,125,346 |
| Cherry Hill Mortgage Investment Corp. Series A, 8.20% | | 246,500 | 6,211,800 |
| Chimera Investment Corp.: | | | |
| Series A, 8.00% | | 204,000 | 5,179,560 |
| Series B, 8.00% | | 1,257,372 | 31,981,005 |
| CYS Investments, Inc.: | | | |
| Series A, 7.75% | | 118,428 | 2,953,594 |
| Series B, 7.50% | | 496,667 | 12,044,175 |
| Dynex Capital, Inc.: | | | |
| Series A, 8.50% | | 362,932 | 9,182,180 |
| Series B, 7.625% | | 252,120 | 5,995,414 |
| Five Oaks Investment Corp. Series A, 8.75% | | 86,727 | 2,168,175 |
| Invesco Mortgage Capital, Inc.: | | | |
| 7.50% | | 806,500 | 19,678,600 |
| Series A, 7.75% | | 123,342 | 3,092,184 |
| Series B, 7.75% | | 846,483 | 21,542,992 |
| MFA Financial, Inc.: | | | |
| 8.00% | | 538,930 | 13,952,898 |
| Series B, 7.50% | | 616,232 | 15,399,638 |
| New York Mortgage Trust, Inc.: | | | |
| Series B, 7.75% | | 284,267 | 6,857,771 |
| Series C, 7.875% | | 280,725 | 6,858,112 |
| Series D, 8.00% | | 313,300 | 7,715,013 |
| PennyMac Mortgage Investment Trust: | | | |
| 8.125% | | 335,500 | 8,353,950 |
| Series B, 8.00% | | 546,800 | 13,560,640 |
| Resource Capital Corp.: | | | |
| 8.25% | | 80,024 | 1,993,398 |
| 8.625% | | 168,316 | 4,292,058 |
| Two Harbors Investment Corp.: | | | |
| Series A, 8.125% | | 450,000 | 11,763,000 |
| Series B, 7.625% | | 429,690 | 10,819,594 |
| Series C, 7.25% | | 309,000 | 7,498,194 |
| Wells Fargo Real Estate Investment Corp. Series A, 6.375% | | 137,600 | 3,544,576 |
| | | | 416,933,851 |
| Real Estate Management & Development - 0.1% | | | |
| Brookfield Properties Corp. Series EE, 5.10% | | 142,300 | 2,925,827 |
| TOTAL FINANCIALS | | | 426,449,729 |
| REAL ESTATE - 9.9% | | | |
| Equity Real Estate Investment Trusts (REITs) - 9.8% | | | |
| American Homes 4 Rent: | | | |
| 5.875% | | 250,809 | 6,194,982 |
| Series C, 5.50% | | 915,240 | 26,001,968 |
| Series D, 6.50% | | 280,000 | 7,170,800 |
| Series E, 6.35% | | 210,000 | 5,321,400 |
| Series G, 5.875% | | 202,000 | 4,934,860 |
| Ashford Hospitality Trust, Inc.: | | | |
| Series D, 8.45% | | 11,770 | 297,546 |
| Series F, 7.375% | | 268,000 | 6,342,434 |
| Series G, 7.375% | | 120,000 | 2,818,800 |
| Series H, 7.50% | | 168,800 | 4,000,560 |
| Series I, 7.50% | | 168,900 | 4,011,375 |
| Bluerock Residential Growth (REIT), Inc.: | | | |
| Series A, 8.25% | | 486,775 | 12,266,730 |
| Series C, 7.625% | | 146,969 | 3,603,445 |
| Series D, 7.125% | | 136,000 | 3,359,200 |
| CBL & Associates Properties, Inc. Series D, 7.375% | | 167,876 | 3,362,556 |
| Cedar Realty Trust, Inc.: | | | |
| Series B, 7.25% | | 87,895 | 2,199,950 |
| Series C, 6.50% | | 294,900 | 6,823,986 |
| City Office REIT, Inc. Series A, 6.625% | | 180,500 | 4,507,085 |
| Colony NorthStar, Inc.: | | | |
| Series B, 8.25% | | 207,761 | 5,233,500 |
| Series D, 8.50% | | 274,915 | 7,003,460 |
| Series E, 8.75% | | 481,729 | 12,606,848 |
| Series G, 7.50% | | 121,607 | 2,945,808 |
| Series H, 7.125% | | 584,350 | 13,440,050 |
| Series I, 7.15% | | 774,587 | 17,892,960 |
| Series J, 7.15% | | 917,785 | 21,026,454 |
| DDR Corp.: | | | |
| Series J, 6.50% | | 340,721 | 8,293,694 |
| Series K, 6.25% | | 228,888 | 5,561,978 |
| Digital Realty Trust, Inc.: | | | |
| Series C, 6.625% | | 84,000 | 2,215,920 |
| Series G, 5.875% | | 142,903 | 3,551,140 |
| Series H, 7.375% | | 50,000 | 1,314,000 |
| Farmland Partners, Inc. Series B, 6.00% | | 630,000 | 16,049,124 |
| General Growth Properties, Inc. Series A, 6.375% | | 166,463 | 4,174,892 |
| Gladstone Commercial Corp. Series D, 7.00% | | 538,800 | 13,739,400 |
| Gladstone Land Corp. Series A, 6.375% | | 64,000 | 1,646,086 |
| Global Medical REIT, Inc. Series A, 7.50% | | 135,100 | 3,301,844 |
| Global Net Lease, Inc. Series A, 7.25% | | 467,400 | 11,670,978 |
| Government Properties Income Trust 5.875% | | 202,500 | 5,121,225 |
| Hersha Hospitality Trust: | | | |
| Series C, 6.875% | | 50,000 | 1,222,000 |
| Series D, 6.50% | | 200,000 | 4,842,000 |
| Investors Real Estate Trust Series C, 6.625% | | 320,900 | 7,906,976 |
| iStar Financial, Inc.: | | | |
| Series D, 8.00% | | 126,529 | 3,192,327 |
| Series G, 7.65% | | 222,721 | 5,594,752 |
| Series I, 7.50% | | 161,269 | 4,031,725 |
| Jernigan Capital, Inc. Series B, 7.00% (e) | | 50,600 | 1,219,460 |
| LaSalle Hotel Properties: | | | |
| Series I, 6.375% | | 354,698 | 8,778,776 |
| Series J, 6.30% | | 240,000 | 5,851,200 |
| Monmouth Real Estate Investment Corp. Series C, 6.125% | | 225,900 | 5,527,773 |
| National Retail Properties, Inc. Series E, 5.70% | | 301,404 | 7,474,819 |
| National Storage Affiliates Trust Series A, 6.00% (e) | | 67,600 | 1,683,240 |
| Pebblebrook Hotel Trust: | | | |
| Series C, 6.50% | | 204,321 | 5,083,506 |
| Series D, 6.375% | | 350,000 | 8,680,000 |
| Pennsylvania (REIT): | | | |
| Series B, 7.375% | | 100,510 | 2,461,490 |
| Series C, 7.20% | | 51,000 | 1,204,110 |
| Series D, 6.875% | | 151,800 | 3,559,710 |
| Plymouth Industrial REIT, Inc. Series A, 7.50% | | 169,400 | 4,240,082 |
| Prologis, Inc. Series Q, 8.54% | | 94,446 | 6,544,116 |
| Public Storage: | | | |
| Series F, 5.15% | | 173,400 | 4,114,782 |
| Series G, 5.05% | | 42,200 | 986,214 |
| Series Y, 6.375% | | 102,224 | 2,649,646 |
| RAIT Financial Trust: | | | |
| 7.125% | | 336,786 | 7,978,460 |
| 7.625% | | 224,590 | 4,570,407 |
| Rexford Industrial Realty, Inc.: | | | |
| Series A, 5.875% | | 135,000 | 3,190,050 |
| Series B, 5.875% (e) | | 79,500 | 1,852,350 |
| Sabra Health Care REIT, Inc. Series A, 7.125% | | 318,623 | 8,038,826 |
| Saul Centers, Inc.: | | | |
| Series C, 6.875% | | 315,478 | 7,931,148 |
| Series D, 6.125% (e) | | 83,700 | 2,064,645 |
| Sotherly Hotels, Inc.: | | | |
| Series B, 8.00% | | 68,000 | 1,711,553 |
| Series C, 7.875% | | 108,200 | 2,703,918 |
| Spirit Realty Capital, Inc. Series A, 6.00% | | 95,200 | 2,311,456 |
| Stag Industrial, Inc.: | | | |
| Series B, 6.625% | | 80,300 | 2,025,969 |
| Series C, 6.875% | | 83,000 | 2,116,658 |
| Summit Hotel Properties, Inc.: | | | |
| Series C, 7.125% | | 153,212 | 3,887,295 |
| Series D, 6.45% | | 210,000 | 5,292,000 |
| Series E, 6.25% | | 190,000 | 4,740,500 |
| Sunstone Hotel Investors, Inc.: | | | |
| Series E, 6.95% | | 42,000 | 1,075,200 |
| Series F, 6.45% | | 84,000 | 2,126,880 |
| Taubman Centers, Inc. Series K, 6.25% | | 157,322 | 3,966,874 |
| UMH Properties, Inc.: | | | |
| Series B, 8.00% | | 319,604 | 8,737,973 |
| Series C, 6.75% | | 341,140 | 8,579,671 |
| Series D, 6.375% | | 93,800 | 2,280,278 |
| Urstadt Biddle Properties, Inc.: | | | |
| Series G, 6.75% | | 160,000 | 4,153,600 |
| Series H, 6.25% | | 284,500 | 7,069,825 |
| VEREIT, Inc. Series F, 6.70% | | 1,995,725 | 50,272,313 |
| WP Glimcher, Inc.: | | | |
| Series H, 7.50% | | 198,527 | 4,701,119 |
| Series I, 6.875% | | 298,115 | 6,996,312 |
| | | | 517,231,022 |
| Real Estate Management & Development - 0.1% | | | |
| Landmark Infrastructure Partners LP Series B, 7.90% | | 117,700 | 2,924,845 |
| TOTAL REAL ESTATE | | | 520,155,867 |
| UTILITIES - 0.0% | | | |
| Electric Utilities - 0.0% | | | |
| Brookfield Infrastructure Partners LP Series 5, 5.35% | | 169,300 | 3,541,536 |
|
| TOTAL NONCONVERTIBLE PREFERRED STOCKS | | | 950,147,132 |
|
| TOTAL PREFERRED STOCKS | | | |
| (Cost $999,902,470) | | | 1,015,841,306 |
| | | Principal Amount | Value |
|
| Corporate Bonds - 21.0% | | | |
| Convertible Bonds - 6.0% | | | |
| FINANCIALS - 5.0% | | | |
| Diversified Financial Services - 0.1% | | | |
| Granite Point Mortgage Trust, Inc. 5.625% 12/1/22 (f) | | 6,770,000 | 6,676,811 |
| Mortgage Real Estate Investment Trusts - 4.9% | | | |
| Arbor Realty Trust, Inc. 5.375% 11/15/20 | | 4,230,000 | 4,233,756 |
| Blackstone Mortgage Trust, Inc. 4.375% 5/5/22 | | 16,780,000 | 16,520,866 |
| Colony Financial, Inc.: | | | |
| 3.875% 1/15/21 | | 17,280,000 | 16,771,069 |
| 5% 4/15/23 | | 26,083,000 | 25,770,969 |
| IAS Operating Partnership LP 5% 3/15/18 (f) | | 41,020,000 | 41,020,000 |
| PennyMac Corp. 5.375% 5/1/20 | | 35,606,000 | 34,898,936 |
| Redwood Trust, Inc. 4.625% 4/15/18 | | 14,700,000 | 14,714,700 |
| Resource Capital Corp.: | | | |
| 4.5% 8/15/22 | | 5,050,000 | 4,878,997 |
| 6% 12/1/18 | | 6,100,000 | 6,168,625 |
| 8% 1/15/20 | | 13,890,000 | 14,515,050 |
| RWT Holdings, Inc. 5.625% 11/15/19 | | 36,880,000 | 37,249,833 |
| Starwood Property Trust, Inc. 4.375% 4/1/23 | | 15,080,000 | 15,152,384 |
| Two Harbors Investment Corp. 6.25% 1/15/22 | | 4,380,000 | 4,446,515 |
| Western Asset Mortgage Capital Corp. 6.75% 10/1/22 | | 21,100,000 | 20,642,594 |
| | | | 256,984,294 |
| TOTAL FINANCIALS | | | 263,661,105 |
| REAL ESTATE - 1.0% | | | |
| Equity Real Estate Investment Trusts (REITs) - 1.0% | | | |
| American Realty Capital Properties, Inc. 3.75% 12/15/20 | | 21,434,000 | 21,731,161 |
| RAIT Financial Trust 4% 10/1/33 | | 34,060,000 | 32,184,486 |
| | | | 53,915,647 |
|
| TOTAL CONVERTIBLE BONDS | | | 317,576,752 |
|
| Nonconvertible Bonds - 15.0% | | | |
| CONSUMER DISCRETIONARY - 3.5% | | | |
| Hotels, Restaurants & Leisure - 0.4% | | | |
| ESH Hospitality, Inc. 5.25% 5/1/25 (f) | | 8,040,000 | 8,100,300 |
| FelCor Lodging LP 6% 6/1/25 | | 2,025,000 | 2,106,000 |
| Hilton Grand Vacations Borrower LLC/Hilton Grand Vacations Borrower, Inc. 6.125% 12/1/24 | | 2,540,000 | 2,787,650 |
| Times Square Hotel Trust 8.528% 8/1/26 (f) | | 6,756,382 | 7,778,908 |
| | | | 20,772,858 |
| Household Durables - 3.1% | | | |
| Ashton Woods U.S.A. LLC/Ashton Woods Finance Co.: | | | |
| 6.75% 8/1/25 (f) | | 8,430,000 | 8,451,075 |
| 6.875% 2/15/21 (f) | | 15,709,000 | 15,944,635 |
| Beazer Homes U.S.A., Inc.: | | | |
| 5.875% 10/15/27 (f) | | 7,605,000 | 7,585,988 |
| 6.75% 3/15/25 | | 5,850,000 | 6,142,500 |
| 8.75% 3/15/22 | | 7,540,000 | 8,237,450 |
| Brookfield Residential Properties, Inc./Brookfield Residential U.S. Corp. 6.125% 7/1/22 (f) | | 5,495,000 | 5,713,152 |
| Brookfield Residential Properties, Inc.: | | | |
| 6.375% 5/15/25 (f) | | 5,580,000 | 5,886,900 |
| 6.5% 12/15/20 (f) | | 12,085,000 | 12,326,700 |
| CalAtlantic Group, Inc. 5.875% 11/15/24 | | 1,625,000 | 1,771,250 |
| D.R. Horton, Inc.: | | | |
| 4.375% 9/15/22 | | 4,175,000 | 4,347,924 |
| 5.75% 8/15/23 | | 2,510,000 | 2,784,349 |
| KB Home 8% 3/15/20 | | 8,465,000 | 9,237,431 |
| Lennar Corp. 4.5% 4/30/24 | | 3,355,000 | 3,392,912 |
| M/I Homes, Inc.: | | | |
| 5.625% 8/1/25 | | 2,870,000 | 2,920,225 |
| 6.75% 1/15/21 | | 3,803,000 | 3,936,105 |
| Meritage Homes Corp.: | | | |
| 5.125% 6/6/27 | | 5,035,000 | 5,097,938 |
| 6% 6/1/25 | | 4,000,000 | 4,310,000 |
| 7% 4/1/22 | | 7,525,000 | 8,446,813 |
| 7.15% 4/15/20 | | 7,060,000 | 7,624,800 |
| New Home Co. LLC 7.25% 4/1/22 | | 9,200,000 | 9,614,000 |
| Ryland Group, Inc. 6.625% 5/1/20 | | 1,555,000 | 1,663,850 |
| Taylor Morrison Communities, Inc./Monarch Communities, Inc. 5.875% 4/15/23 (f) | | 4,100,000 | 4,376,750 |
| TRI Pointe Homes, Inc.: | | | |
| 5.25% 6/1/27 | | 5,045,000 | 5,095,450 |
| 5.875% 6/15/24 | | 3,890,000 | 4,120,677 |
| William Lyon Homes, Inc.: | | | |
| 5.875% 1/31/25 | | 2,545,000 | 2,602,263 |
| 7% 8/15/22 | | 8,180,000 | 8,466,300 |
| | | | 160,097,437 |
| Media - 0.0% | | | |
| CBS Outdoor Americas Capital LLC/CBS Outdoor Americas Capital Corp. 5.625% 2/15/24 | | 1,300,000 | 1,330,875 |
| TOTAL CONSUMER DISCRETIONARY | | | 182,201,170 |
| CONSUMER STAPLES - 0.7% | | | |
| Food & Staples Retailing - 0.7% | | | |
| Ahold Lease U.S.A., Inc. 7.82% 1/2/20 | | 87,104 | 89,218 |
| Albertsons Companies LLC/Safeway, Inc./New Albertson's, Inc./Albertson's LLC: | | | |
| 5.75% 3/15/25 | | 15,225,000 | 13,588,313 |
| 6.625% 6/15/24 | | 10,760,000 | 10,222,000 |
| Albertsons, Inc. 8.7% 5/1/30 | | 5,080,000 | 4,762,500 |
| C&S Group Enterprises LLC 5.375% 7/15/22 (f) | | 9,705,000 | 9,074,175 |
| Cumberland Farms, Inc. 6.75% 5/1/25 (f) | | 2,075,000 | 2,215,063 |
| | | | 39,951,269 |
| FINANCIALS - 0.7% | | | |
| Diversified Financial Services - 0.5% | | | |
| Brixmor Operating Partnership LP: | | | |
| 3.65% 6/15/24 | | 6,000,000 | 5,882,472 |
| 3.85% 2/1/25 | | 8,384,000 | 8,269,419 |
| 4.125% 6/15/26 | | 2,000 | 1,987 |
| Five Point Operation Co. LP 7.875% 11/15/25 (f) | | 6,775,000 | 6,910,500 |
| Icahn Enterprises LP/Icahn Enterprises Finance Corp.: | | | |
| 5.875% 2/1/22 | | 3,680,000 | 3,749,000 |
| 6.25% 2/1/22 (f) | | 1,695,000 | 1,745,850 |
| | | | 26,559,228 |
| Mortgage Real Estate Investment Trusts - 0.1% | | | |
| Starwood Property Trust, Inc. 4.75% 3/15/25 (f) | | 4,235,000 | 4,182,063 |
| Thrifts & Mortgage Finance - 0.1% | | | |
| Ocwen Loan Servicing LLC 8.375% 11/15/22 (f) | | 3,403,000 | 3,454,045 |
| Radian Group, Inc. 4.5% 10/1/24 | | 4,000,000 | 4,000,000 |
| | | | 7,454,045 |
| TOTAL FINANCIALS | | | 38,195,336 |
| HEALTH CARE - 0.5% | | | |
| Health Care Providers & Services - 0.5% | | | |
| QCP SNF West (REIT) LLC 8.125% 11/1/23 (f) | | 6,245,000 | 6,432,350 |
| Sabra Health Care LP/Sabra Capital Corp.: | | | |
| 5.375% 6/1/23 | | 5,675,000 | 5,802,688 |
| 5.5% 2/1/21 | | 12,305,000 | 12,628,006 |
| | | | 24,863,044 |
| INDUSTRIALS - 0.1% | | | |
| Building Products - 0.1% | | | |
| Shea Homes Ltd. Partnership/Corp. 6.125% 4/1/25 (f) | | 3,350,000 | 3,492,375 |
| INFORMATION TECHNOLOGY - 0.1% | | | |
| Internet Software & Services - 0.1% | | | |
| CyrusOne LP/CyrusOne Finance Corp. 5% 3/15/24 | | 3,610,000 | 3,682,200 |
| REAL ESTATE - 9.4% | | | |
| Equity Real Estate Investment Trusts (REITs) - 7.2% | | | |
| American Campus Communities Operating Partnership LP 4.125% 7/1/24 | | 2,000,000 | 2,053,446 |
| ARC Properties Operating Partnership LP 4.6% 2/6/24 | | 15,480,000 | 16,039,726 |
| Care Capital Properties LP 5.125% 8/15/26 | | 19,546,000 | 19,377,013 |
| CBL & Associates LP: | | | |
| 4.6% 10/15/24 | | 26,758,000 | 23,589,665 |
| 5.25% 12/1/23 | | 11,500,000 | 10,756,653 |
| 5.95% 12/15/26 | | 10,434,000 | 9,614,899 |
| Corporate Office Properties LP 3.6% 5/15/23 | | 5,000,000 | 4,932,314 |
| CTR Partnership LP/CareTrust Capital Corp. 5.25% 6/1/25 | | 5,030,000 | 5,092,875 |
| CubeSmart LP 4.8% 7/15/22 | | 2,000,000 | 2,114,166 |
| DDR Corp.: | | | |
| 3.625% 2/1/25 | | 6,453,000 | 6,356,712 |
| 4.625% 7/15/22 | | 2,096,000 | 2,193,607 |
| Equinix, Inc. 5.375% 5/15/27 | | 6,620,000 | 6,951,000 |
| HCP, Inc.: | | | |
| 4% 6/1/25 | | 1,000,000 | 1,017,251 |
| 4.25% 11/15/23 | | 6,707,000 | 6,971,504 |
| Health Care REIT, Inc.: | | | |
| 4% 6/1/25 | | 1,551,000 | 1,581,766 |
| 4.125% 4/1/19 | | 2,000,000 | 2,029,848 |
| Healthcare Realty Trust, Inc. 3.75% 4/15/23 | | 4,966,000 | 5,005,719 |
| Highwoods/Forsyth LP 3.625% 1/15/23 | | 3,847,000 | 3,845,373 |
| Hospitality Properties Trust 5% 8/15/22 | | 3,177,000 | 3,355,209 |
| iStar Financial, Inc.: | | | |
| 4.625% 9/15/20 | | 6,755,000 | 6,839,438 |
| 5% 7/1/19 | | 24,265,000 | 24,371,159 |
| 5.25% 9/15/22 | | 4,220,000 | 4,209,450 |
| 6% 4/1/22 | | 8,375,000 | 8,563,438 |
| Lexington Corporate Properties Trust 4.4% 6/15/24 | | 2,180,000 | 2,171,940 |
| MPT Operating Partnership LP/MPT Finance Corp.: | | | |
| 5% 10/15/27 | | 6,115,000 | 6,055,073 |
| 5.25% 8/1/26 | | 4,385,000 | 4,516,550 |
| 6.375% 3/1/24 | | 4,000,000 | 4,264,000 |
| National Retail Properties, Inc.: | | | |
| 3.3% 4/15/23 | | 2,000,000 | 1,992,247 |
| 3.5% 10/15/27 | | 3,421,000 | 3,298,613 |
| Omega Healthcare Investors, Inc.: | | | |
| 4.375% 8/1/23 | | 3,303,000 | 3,309,532 |
| 4.5% 4/1/27 | | 2,462,000 | 2,361,124 |
| 4.75% 1/15/28 | | 12,204,000 | 11,859,036 |
| 4.95% 4/1/24 | | 2,898,000 | 2,982,684 |
| Potlatch Corp. 7.5% 11/1/19 | | 1,000,000 | 1,075,000 |
| Reckson Operating Partnership LP/SL Green Realty Corp./SL Green Operating Partnership LP 7.75% 3/15/20 | | 2,000,000 | 2,189,426 |
| Regency Centers LP 3.6% 2/1/27 | | 2,558,000 | 2,498,071 |
| SBA Communications Corp. 4% 10/1/22 (f) | | 2,535,000 | 2,496,975 |
| Select Income REIT: | | | |
| 4.15% 2/1/22 | | 11,170,000 | 11,164,664 |
| 4.25% 5/15/24 | | 5,030,000 | 4,931,854 |
| 4.5% 2/1/25 | | 21,294,000 | 21,090,773 |
| Senior Housing Properties Trust: | | | |
| 3.25% 5/1/19 | | 7,382,000 | 7,402,245 |
| 4.75% 5/1/24 | | 44,895,000 | 46,289,666 |
| 6.75% 4/15/20 | | 13,624,000 | 14,415,364 |
| 6.75% 12/15/21 | | 8,000,000 | 8,755,209 |
| VEREIT Operating Partnership LP 4.875% 6/1/26 | | 10,945,000 | 11,351,368 |
| WP Carey, Inc.: | | | |
| 4% 2/1/25 | | 6,985,000 | 6,955,283 |
| 4.25% 10/1/26 | | 7,242,000 | 7,275,607 |
| 4.6% 4/1/24 | | 11,323,000 | 11,662,717 |
| | | | 379,227,252 |
| Real Estate Management & Development - 2.2% | | | |
| Greystar Real Estate Partners 5.75% 12/1/25 (f) | | 5,925,000 | 6,087,938 |
| Healthcare Trust of America Holdings LP 3.75% 7/1/27 | | 8,395,000 | 8,242,643 |
| Host Hotels & Resorts LP 5.25% 3/15/22 | | 2,000,000 | 2,129,578 |
| Howard Hughes Corp. 5.375% 3/15/25 (f) | | 16,545,000 | 16,710,450 |
| Hunt Companies, Inc. 9.625% 3/1/21 (f) | | 7,460,000 | 7,859,110 |
| Kennedy-Wilson, Inc. 5.875% 4/1/24 | | 31,370,000 | 32,154,250 |
| Mattamy Group Corp.: | | | |
| 6.5% 10/1/25 (f) | | 4,835,000 | 5,094,881 |
| 6.875% 12/15/23 (f) | | 5,425,000 | 5,736,938 |
| Mid-America Apartments LP: | | | |
| 3.75% 6/15/24 | | 1,663,000 | 1,686,220 |
| 4.3% 10/15/23 | | 5,203,000 | 5,435,749 |
| Taylor Morrison Communities, Inc./Monarch Communities, Inc.: | | | |
| 5.25% 4/15/21 (f) | | 2,803,000 | 2,851,212 |
| 5.625% 3/1/24 (f) | | 2,270,000 | 2,386,338 |
| Washington Prime Group LP 5.95% 8/15/24 | | 21,080,000 | 21,393,380 |
| | | | 117,768,687 |
| TOTAL REAL ESTATE | | | 496,995,939 |
|
| TOTAL NONCONVERTIBLE BONDS | | | 789,381,333 |
|
| TOTAL CORPORATE BONDS | | | |
| (Cost $1,085,663,760) | | | 1,106,958,085 |
|
| Asset-Backed Securities - 2.5% | | | |
| American Homes 4 Rent: | | | |
| Series 2014-SFR2 Class E, 6.231% 10/17/36 (f) | | 3,000,000 | 3,322,955 |
| Series 2014-SFR3 Class E, 6.418% 12/17/36 (f) | | 9,025,000 | 10,118,439 |
| Series 2015-SFR1: | | | |
| Class E, 5.639% 4/17/52 (f) | | 1,999,310 | 2,154,913 |
| Class F, 5.885% 4/17/52 (f) | | 2,000,000 | 2,134,414 |
| Series 2015-SFR2: | | | |
| Class E, 6.07% 10/17/45 (f) | | 8,259,000 | 9,131,429 |
| Class XS, 0% 10/17/45 (b)(f)(g)(h) | | 4,776,010 | 48 |
| Capital Trust RE CDO Ltd. Series 2005-1A Class D, 1 month U.S. LIBOR + 1.500% 3.0612% 3/20/50 (b)(f)(g)(i) | | 2,250,000 | 223 |
| CapLease CDO Ltd. Series 2005-1A Class A, 4.926% 1/29/40 (f) | | 592,439 | 595,994 |
| Colony Starwood Homes Series 2016-2A Class F, 1 month U.S. LIBOR + 4.150% 5.627% 12/17/33 (f)(g)(i) | | 1,500,000 | 1,555,315 |
| Conseco Finance Securitizations Corp. Series 2002-2 Class M2, 9.163% 3/1/33 | | 457,397 | 418,831 |
| Crest Clarendon Street Ltd./Crest Clarendon Corp. Series 2002-1A Class D, 9% 12/28/35 (f) | | 38,953 | 38,961 |
| Deutsche Financial Capital Securitization LLC Series 1997-I Class M, 7.275% 9/15/27 | | 2,581,867 | 2,644,807 |
| Green Tree Financial Corp.: | | | |
| Series 1996-4 Class M1, 7.75% 6/15/27 (g) | | 1,019,023 | 1,040,102 |
| Series 1997-3 Class M1, 7.53% 3/15/28 | | 6,558,888 | 6,552,938 |
| Home Partners of America Credit Trust Series 2017-1 Class F, 1 month U.S. LIBOR + 3.539% 5.0739% 7/17/34 (f)(g)(i) | | 6,318,500 | 6,458,736 |
| Home Partners of America Trust Series 2016-2 Class F, 1 month U.S. LIBOR + 5.250% 6.1595% 10/17/33 (f)(g)(i) | | 3,393,000 | 3,483,870 |
| Invitation Homes Trust: | | | |
| Series 2015-SFR2 Class E, 1 month U.S. LIBOR + 3.150% 4.6408% 6/17/32 (f)(g)(i) | | 2,450,000 | 2,469,175 |
| Series 2015-SFR3 Class F, 1 month U.S. LIBOR + 3.650% 6.2095% 8/17/32 (f)(g)(i) | | 2,000,000 | 2,031,938 |
| Series 2015-SRF1 Class F, 1 month U.S. LIBOR + 4.550% 5.7595% 3/17/32 (f)(g)(i) | | 5,500,000 | 5,522,058 |
| Series 2017-SFR2 Class F, 1 month U.S. LIBOR + 3.000% 4.4908% 12/17/36 (f)(g)(i) | | 8,442,000 | 8,605,725 |
| Lehman ABS Manufactured Housing Contract Trust Series 2001-B Class M2, 7.17% 4/15/40 | | 792,268 | 553,103 |
| Merit Securities Corp. Series 13 Class M1, 7.9345% 12/28/33 (g) | | 1,923,000 | 1,974,168 |
| Progress Residential Trust: | | | |
| Series 2015-SFR3 Class F, 6.643% 11/12/32 (f) | | 2,940,000 | 3,094,259 |
| Series 2016-SFR1 Class F, 1 month U.S. LIBOR + 5.000% 6.4595% 9/17/33 (f)(g)(i) | | 8,459,000 | 8,722,697 |
| Series 2017-SFR1 Class F, 5.35% 8/17/34 (f) | | 3,073,000 | 3,136,385 |
| Series 2017-SFR2 Class F, 1 month U.S. LIBOR + 2.750% 4.836% 12/17/34(f)(g)(i) | | 2,568,000 | 2,555,420 |
| Starwood Waypoint Homes Trust Series 2017-1: | | | |
| Class E, 1 month U.S. LIBOR + 2.600% 4.0908% 1/17/35 (f)(g)(i) | | 5,906,000 | 5,985,325 |
| Class F, 1 month U.S. LIBOR + 3.400% 4.8908% 1/17/35 (f)(g)(i) | | 12,671,000 | 12,670,966 |
| Taberna Preferred Funding III Ltd. Series 2005-3A Class D, 3 month U.S. LIBOR + 2.650% 4.0414% 2/5/36 (b)(f)(g)(i) | | 4,265,895 | 320 |
| Tricon American Homes: | | | |
| Series 2017-SFR1 Class F, 5.151% 9/17/34 (f) | | 8,442,000 | 8,497,362 |
| Series 2017-SFR2 Class F, 5.16% 1/17/36 (f) | | 3,785,000 | 3,719,974 |
| Tricon American Homes Trust Series 2016-SFR1 Class F, 5.769% 11/17/33 (f) | | 2,544,000 | 2,623,403 |
| VB-S1 Issuer LLC Series 2016-1A Class F, 6.901% 6/15/46 (f) | | 7,797,000 | 7,933,572 |
| Wrightwood Capital Real Estate CDO Ltd. Series 2005-1A Class F, 3 month U.S. LIBOR + 1.950% 3.2664% 11/21/40 (b)(f)(g)(i) | | 250,000 | 196,875 |
| TOTAL ASSET-BACKED SECURITIES | | | |
| (Cost $130,429,180) | | | 129,944,700 |
|
| Collateralized Mortgage Obligations - 0.2% | | | |
| Private Sponsor - 0.2% | | | |
| FREMF Mortgage Trust: | | | |
| Series 2010-K6 Class B, 5.3671% 12/25/46 (f)(g) | | 4,500,000 | 4,689,225 |
| Series 2010-K7 Class B, 5.6853% 4/25/20 (f)(g) | | 3,200,000 | 3,359,962 |
| RESI Finance LP/RESI Finance DE Corp. floater Series 2003-B Class B9, 1 month U.S. LIBOR + 11.950% 13.3819% 6/10/35 (f)(g)(i) | | 54,862 | 36,644 |
| RESIX Finance Ltd. floater: | | | |
| Series 2004-A Class B7, 1 month U.S. LIBOR + 4.250% 5.6819% 2/10/36 (b)(f)(g)(i) | | 37,954 | 397 |
| Series 2004-B Class B7, 1 month U.S. LIBOR + 4.000% 5.4319% 2/10/36 (b)(f)(g)(i) | | 79,701 | 8,289 |
|
| TOTAL PRIVATE SPONSOR | | | 8,094,517 |
|
| U.S. Government Agency - 0.0% | | | |
| Fannie Mae REMIC Trust: | | | |
| Series 2002-W1 subordinate REMIC pass thru certificates, Class 3B3, 3.6195% 2/25/42 (f)(g) | | 52,397 | 31,466 |
| Series 2003-W10 subordinate REMIC pass thru certificates, Class 2B3, 3.5464% 6/25/43 (f)(g) | | 86,035 | 44,787 |
|
| TOTAL U.S. GOVERNMENT AGENCY | | | 76,253 |
|
| TOTAL COLLATERALIZED MORTGAGE OBLIGATIONS | | | |
| (Cost $7,761,405) | | | 8,170,770 |
|
| Commercial Mortgage Securities - 16.7% | | | |
| Americold LLC Trust Series 2010-ARTA Class D, 7.443% 1/14/29 (f) | | 2,000,000 | 2,179,824 |
| Aventura Mall Trust Series 2013-AVM Class E, 3.7427% 12/5/32 (f)(g) | | 4,900,000 | 4,920,586 |
| BANK Series 2017-BNK4 Class D, 3.357% 5/15/50 (f) | | 3,349,000 | 2,773,824 |
| Barclays Commercial Mortgage Securities LLC Series 2015-STP: | | | |
| Class E, 4.2844% 9/10/28 (f)(g) | | 8,413,000 | 8,103,532 |
| Class F, 4.4272% 9/10/28 (f)(g) | | 4,074,000 | 3,724,414 |
| Bear Stearns Commercial Mortgage Securities Trust Series 2006-T22 Class B, 5.7203% 4/12/38 (f)(g) | | 544,007 | 544,899 |
| BX Trust Series 2017-IMC Class F, 1 month U.S. LIBOR + 4.250% 5.8095% 10/15/32 (f)(g)(i) | | 12,691,000 | 12,754,356 |
| CCRESG Commercial Mortgage Trust Series 2016-HEAT: | | | |
| Class E, 5.4883% 4/10/29 (f)(g) | | 4,536,000 | 4,368,801 |
| Class F, 5.4883% 4/10/29 (f)(g) | | 9,710,000 | 9,207,669 |
| CD Mortgage Trust Series 2017-CD3 Class D, 3.25% 2/10/50 (f) | | 3,391,000 | 2,809,973 |
| CGBAM Commercial Mortgage Trust Series 2015-SMRT: | | | |
| Class E, 3.7859% 4/10/28 (f)(g) | | 3,023,000 | 3,020,384 |
| Class F, 3.7859% 4/10/28 (f)(g) | | 9,911,000 | 9,800,588 |
| CGDB Commercial Mortgage Trust: | | | |
| 1 month U.S. LIBOR + 2.500% 4.0595% 5/15/30 (f)(g)(i) | | 2,375,000 | 2,378,775 |
| Series 2017-BIO Class F, 1 month U.S. LIBOR + 3.250% 4.8095% 5/15/30 (f)(g)(i) | | 1,500,000 | 1,498,674 |
| CGMS Commercial Mortgage Trust Series 2017-MDRB: | | | |
| Class D, 1 month U.S. LIBOR + 3.250% 4.8095% 7/15/30 (f)(g)(i) | | 5,000,000 | 5,001,969 |
| Class E, 1 month U.S. LIBOR + 3.872% 5.431% 7/15/30 (f)(g)(i) | | 6,741,000 | 6,709,679 |
| Citigroup Commercial Mortgage Trust: | | | |
| Series 2013-GC15 Class D, 5.0989% 9/10/46 (f)(g) | | 5,254,000 | 5,017,261 |
| Series 2015-SHP2 Class E, 1 month U.S. LIBOR + 4.100% 5.9095% 7/15/27 (f)(g)(i) | | 2,933,000 | 2,951,493 |
| Series 2016-C3 Class D, 3% 11/15/49 (f) | | 7,089,000 | 5,429,504 |
| Series 2016-SMPL Class E, 4.509% 9/10/31 (f) | | 1,701,000 | 1,700,447 |
| COMM Mortgage Trust: | | | |
| sequential payer Series 2013-LC6 Class E, 3.5% 1/10/46 (f) | | 7,300,000 | 5,498,175 |
| Series 2012-CR1: | | | |
| Class C, 5.3197% 5/15/45 (g) | | 1,000,000 | 1,043,835 |
| Class D, 5.3197% 5/15/45 (f)(g) | | 5,550,000 | 5,405,077 |
| Class G, 2.462% 5/15/45 (f) | | 2,180,000 | 1,318,321 |
| Series 2012-CR5 Class D, 4.3278% 12/10/45 (f)(g) | | 2,000,000 | 1,902,573 |
| Series 2012-LC4: | | | |
| Class C, 5.6049% 12/10/44 (g) | | 2,000,000 | 2,051,136 |
| Class D, 5.6049% 12/10/44 (f)(g) | | 11,675,000 | 10,457,445 |
| Series 2013-CCRE6 Class E, 4.067% 3/10/46 (f)(g) | | 882,000 | 705,799 |
| Series 2013-CR10 Class D, 4.7886% 8/10/46 (f)(g) | | 4,544,000 | 3,971,238 |
| Series 2013-CR12 Class D, 5.0787% 10/10/46 (f)(g) | | 4,500,000 | 3,762,317 |
| Series 2013-CR6 Class F, 4.0668% 3/10/46 (f)(g) | | 8,038,000 | 5,144,298 |
| Series 2013-CR9 Class D, 4.2541% 7/10/45 (f)(g) | | 1,404,000 | 1,203,976 |
| Series 2013-LC6 Class D, 4.3076% 1/10/46 (f)(g) | | 8,301,000 | 7,734,235 |
| Series 2014-CR17: | | | |
| Class D, 4.7985% 5/10/47 (f)(g) | | 2,500,000 | 2,125,086 |
| Class E, 4.7985% 5/10/47 (f)(g) | | 3,098,000 | 2,337,999 |
| Series 2014-UBS2 Class D, 5.0146% 3/10/47 (f)(g) | | 3,713,000 | 3,149,026 |
| Series 2016-CD1 Class D, 2.7711% 8/10/49 (f)(g) | | 9,452,000 | 7,536,789 |
| Series 2017-CD4 Class D, 3.3% 5/10/50 (f) | | 2,550,000 | 2,113,514 |
| COMM Trust Series 2017-COR2 Class D, 3% 9/10/50 (f) | | 2,800,000 | 2,298,691 |
| Commercial Mortgage Trust pass-thru certificates Series 2012-CR2: | | | |
| Class D, 4.832% 8/15/45 (f)(g) | | 4,500,000 | 4,450,799 |
| Class E, 4.832% 8/15/45 (f)(g) | | 8,000,000 | 7,735,042 |
| Core Industrial Trust: | | | |
| Series 2015-TEXW Class F, 3.8487% 2/10/34 (f)(g) | | 10,945,000 | 10,632,294 |
| Series 2015-WEST Class F, 4.2268% 2/10/37 (f)(g) | | 12,745,000 | 12,239,890 |
| Credit Suisse First Boston Mortgage Securities Corp. Series 1998-C1 Class F, 6% 5/17/40 (f) | | 102,617 | 102,639 |
| CSAIL Commercial Mortgage Trust: | | | |
| Series 2017-C8 Class D, 4.47% 6/15/50 (f) | | 4,346,000 | 3,883,677 |
| Series 2017-CX10 Class UESD, 4.2366% 11/15/27 (f)(g) | | 5,076,000 | 4,888,721 |
| Series 2017-CX9 Class D, 4.161% 9/15/50 (f) | | 2,568,000 | 2,236,857 |
| CSMC Trust: | | | |
| floater Series 2015-DEAL: | | | |
| Class E, 1 month U.S. LIBOR + 4.000% 5.559% 4/15/29 (f)(g)(i) | | 3,000,000 | 3,010,242 |
| Class F, 1 month U.S. LIBOR + 4.750% 6.309% 4/15/29 (f)(g)(i) | | 7,803,000 | 7,803,002 |
| Series 2016-MFF Class F, 1 month U.S. LIBOR + 7.250% 8.727% 11/15/33 (f)(g)(i) | | 6,300,000 | 6,368,225 |
| DBCCRE Mortgage Trust Series 2014-ARCP Class E, 4.9345% 1/10/34 (f)(g) | | 10,853,000 | 9,662,219 |
| DBUBS Mortgage Trust: | | | |
| Series 2011-LC1A: | | | |
| Class E, 5.6978% 11/10/46 (f)(g) | | 14,031,000 | 14,624,166 |
| Class G, 4.652% 11/10/46 (f) | | 12,360,000 | 10,884,178 |
| Series 2011-LC3A Class D, 5.3404% 8/10/44 (f)(g) | | 3,945,000 | 4,099,506 |
| Freddie Mac: | | | |
| pass-thru certificates: | | | |
| Series K011 Class X3, 2.577% 12/25/43 (g)(h) | | 12,206,096 | 834,790 |
| Series K012 Class X3, 2.252% 1/25/41 (g)(h) | | 20,724,866 | 1,268,884 |
| Series K013 Class X3, 2.9089% 1/25/43 (g)(h) | | 14,360,000 | 1,129,187 |
| Series KAIV Class X2, 3.6147% 6/25/46 (g)(h) | | 7,430,000 | 790,608 |
| GAHR Commercial Mortgage Trust Series 2015-NRF: | | | |
| Class DFX, 3.3822% 12/15/34 (f)(g) | | 1,700,000 | 1,699,172 |
| Class EFX, 3.3822% 12/15/34 (f)(g) | | 9,364,000 | 9,269,497 |
| Class FFX, 3.3822% 12/15/34 (f)(g) | | 14,402,000 | 14,190,658 |
| Class GFX, 3.3822% 12/15/34 (f)(g) | | 23,509,000 | 23,040,522 |
| GMAC Commercial Mortgage Securities, Inc. Series 1997-C2 Class G, 6.75% 4/15/29 (g) | | 60,957 | 61,028 |
| GP Portfolio Trust Series 2014-GPP Class E, 1 month U.S. LIBOR + 4.100% 5.577% 2/15/27 (f)(g)(i) | | 2,823,000 | 2,777,264 |
| GS Mortgage Securities Corp. II Series 2010-C1 Class D, 6.0509% 8/10/43 (f)(g) | | 1,966,000 | 2,009,536 |
| GS Mortgage Securities Trust: | | | |
| Series 2010-C2 Class D, 5.1827% 12/10/43 (f)(g) | | 3,000,000 | 3,031,269 |
| Series 2011-GC5: | | | |
| Class C, 5.3984% 8/10/44 (f)(g) | | 9,000,000 | 9,469,770 |
| Class D, 5.3984% 8/10/44 (f)(g) | | 7,000,000 | 6,781,366 |
| Class E, 5.3984% 8/10/44 (f)(g) | | 8,230,000 | 6,673,812 |
| Class F, 4.5% 8/10/44 (f) | | 7,986,000 | 4,038,217 |
| Series 2012-GC6: | | | |
| Class C, 5.6521% 1/10/45 (f)(g) | | 3,600,000 | 3,747,400 |
| Class D, 5.6521% 1/10/45 (f)(g) | | 4,165,000 | 3,980,049 |
| Class E, 5% 1/10/45 (f)(g) | | 4,516,000 | 3,861,743 |
| Series 2012-GCJ7: | | | |
| Class C, 5.7014% 5/10/45 (g) | | 6,500,000 | 6,792,321 |
| Class D, 5.7014% 5/10/45 (f)(g) | | 10,192,000 | 9,897,587 |
| Class E, 5% 5/10/45 (f) | | 6,920,000 | 5,642,497 |
| Series 2012-GCJ9 Class D, 4.7478% 11/10/45 (f)(g) | | 5,565,000 | 5,351,606 |
| Series 2013-GC14 Class D, 4.7629% 8/10/46 (f)(g) | | 1,680,000 | 1,621,206 |
| Series 2013-GC16: | | | |
| Class D, 5.3271% 11/10/46 (f)(g) | | 3,750,000 | 3,564,164 |
| Class F, 3.5% 11/10/46 (f) | | 7,303,000 | 5,211,721 |
| Series 2014-NEW Class D, 3.79% 1/10/31 (f) | | 2,510,000 | 2,520,246 |
| Series 2016-GS3 Class D, 2.728% 10/10/49 (f) | | 3,398,000 | 2,663,593 |
| Series 2016-REMZ Class MZB, 7.727% 2/10/21 (f) | | 29,826,000 | 29,250,358 |
| Series 2016-RENT: | | | |
| Class E, 4.0667% 2/10/29 (f)(g) | | 1,609,000 | 1,577,933 |
| Class F, 4.0667% 2/10/29 (f)(g) | | 15,890,000 | 14,768,072 |
| Hilton U.S.A. Trust: | | | |
| Series 2016-HHV Class F, 4.1935% 11/5/38 (f)(g) | | 8,440,000 | 7,411,228 |
| Series 2016-SFP Class F, 6.0801% 11/5/35 (f) | | 8,457,000 | 8,443,140 |
| IMT Trust Series 2017-APTS: | | | |
| Class EFX, 3.4966% 6/15/34 (f)(g) | | 9,317,000 | 8,827,943 |
| Class FFL, 1 month U.S. LIBOR + 2.850% 4.327% 6/15/34 (f)(g)(i) | | 3,909,000 | 3,923,638 |
| JPMBB Commercial Mortgage Securities Trust: | | | |
| Series 2014-C23 Class UH5, 4.7094% 9/15/47 (f) | | 8,738,000 | 7,462,724 |
| Series 2014-C26 Class D, 3.9241% 1/15/48 (f)(g) | | 3,398,000 | 2,912,713 |
| JPMCC Commercial Mortgage Securities Trust Series 2016-JP4 Class D, 3.4619% 12/15/49 (f) | | 10,241,000 | 8,384,512 |
| JPMDB Commercial Mortgage Securities Trust Series 2016-C4 Class D, 3.0956% 12/15/49 (f)(g) | | 7,388,000 | 5,941,252 |
| JPMorgan Chase Commercial Mortgage Securities Corp.: | | | |
| Series 2003-C1 Class F, 5.4826% 1/12/37 (f)(g) | | 745,289 | 771,256 |
| Series 2009-IWST: | | | |
| Class C, 7.4453% 12/5/27 (f)(g) | | 3,000,000 | 3,243,997 |
| Class D, 7.4453% 12/5/27 (f)(g) | | 9,550,000 | 10,217,895 |
| Series 2010-CNTR: | | | |
| Class D, 6.1838% 8/5/32 (f)(g) | | 4,500,000 | 4,726,751 |
| Class XB, 0.9305% 8/5/32 (f)(g)(h) | | 32,655,000 | 653,538 |
| Series 2012-CBX: | | | |
| Class C, 5.2137% 6/15/45 (g) | | 4,530,000 | 4,674,292 |
| Class E, 5.2137% 6/15/45 (f)(g) | | 4,635,000 | 4,562,040 |
| Class F, 4% 6/15/45 (f) | | 8,192,000 | 6,580,068 |
| Class G 4% 6/15/45 (f) | | 4,044,000 | 2,240,990 |
| JPMorgan Chase Commercial Mortgage Securities Trust: | | | |
| Series 2005-LDP2 Class E, 4.981% 7/15/42 (g) | | 410,825 | 417,430 |
| Series 2011-C3: | | | |
| Class E, 5.6311% 2/15/46 (f)(g) | | 3,205,000 | 3,181,210 |
| Class H, 4.409% 2/15/46 (f)(g) | | 7,077,000 | 5,174,587 |
| Series 2011-C4 Class F, 3.873% 7/15/46 (f) | | 1,400,000 | 1,290,667 |
| Series 2013-LC11: | | | |
| Class C, 3.9582% 4/15/46 (g) | | 848,000 | 846,958 |
| Class D, 4.2027% 4/15/46 (g) | | 7,672,000 | 7,089,874 |
| Class E, 3.25% 4/15/46 (f)(g) | | 472,000 | 348,827 |
| Class F, 3.25% 4/15/46 (f)(g) | | 2,518,000 | 1,460,142 |
| Series 2014-DSTY Class E, 3.8046% 6/10/27 (f)(g) | | 2,752,000 | 2,610,701 |
| Series 2015-UES Class F, 3.621% 9/5/32 (f)(g) | | 5,432,000 | 5,297,251 |
| JPMorgan Commercial Mortgage Finance Corp. Series 1999-C8 Class H, 6% 7/15/31 (f) | | 208,583 | 188,586 |
| LSTAR Commercial Mortgage Trust Series 2014-2: | | | |
| Class D, 5.1336% 1/20/41 (f)(g) | | 3,000,000 | 2,997,989 |
| Class E, 5.1336% 1/20/41 (f)(g) | | 4,800,000 | 4,452,218 |
| Merrill Lynch Mortgage Trust Series 2006-C1 Class AJ, 5.5942% 5/12/39 (g) | | 2,306,146 | 2,323,834 |
| Morgan Stanley BAML Trust: | | | |
| Series 2012-C5 Class E, 4.6875% 8/15/45 (f)(g) | | 3,889,000 | 3,831,285 |
| Series 2012-C6 Class D, 4.5752% 11/15/45 (f)(g) | | 2,000,000 | 2,011,995 |
| Series 2013-C12 Class D, 4.7638% 10/15/46 (f)(g) | | 7,164,000 | 6,852,643 |
| Series 2013-C13: | | | |
| Class D, 4.8894% 11/15/46 (f)(g) | | 5,277,000 | 4,957,288 |
| Class E, 4.8894% 11/15/46 (f)(g) | | 3,379,000 | 2,679,179 |
| Series 2013-C7: | | | |
| Class D, 4.2503% 2/15/46 (f)(g) | | 5,650,000 | 5,148,468 |
| Class E, 4.2503% 2/15/46 (f)(g) | | 1,000,000 | 774,873 |
| Series 2013-C9: | | | |
| Class C, 4.047% 5/15/46 (g) | | 3,339,000 | 3,286,872 |
| Class D, 4.135% 5/15/46 (f)(g) | | 5,137,000 | 4,703,091 |
| Series 2016-C30 Class D, 3% 9/15/49 (f) | | 5,408,000 | 4,020,078 |
| Series 2016-C31 Class D, 3% 11/15/49 (f)(g) | | 1,500,000 | 1,080,609 |
| Series 2016-C32 Class D, 3.396% 12/15/49 (f) | | 5,929,000 | 4,418,383 |
| Morgan Stanley Capital I Trust: | | | |
| sequential payer Series 2012-C4 Class E, 5.4205% 3/15/45 (f)(g) | | 7,294,000 | 6,219,312 |
| Series 1997-RR Class F, 7.51% 4/30/39 (f)(g) | | 270,570 | 269,893 |
| Series 1998-CF1 Class G, 7.35% 7/15/32 (f) | | 1,071,298 | 1,040,659 |
| Series 2011-C2: | | | |
| Class D, 5.4831% 6/15/44 (f)(g) | | 4,887,000 | 4,840,855 |
| Class E, 5.4831% 6/15/44 (f)(g) | | 12,150,000 | 11,466,846 |
| Class F, 5.4831% 6/15/44 (f)(g) | | 4,440,000 | 3,763,764 |
| Class XB, 0.5345% 6/15/44 (f)(g)(h) | | 63,708,222 | 1,024,715 |
| Series 2011-C3: | | | |
| Class C, 5.1549% 7/15/49 (f)(g) | | 2,000,000 | 2,097,294 |
| Class D, 5.1549% 7/15/49 (f)(g) | | 7,400,000 | 7,634,817 |
| Class E, 5.1549% 7/15/49 (f)(g) | | 1,353,000 | 1,313,551 |
| Class F, 5.1549% 7/15/49 (f)(g) | | 3,438,050 | 3,171,830 |
| Class G, 5.1549% 7/15/49 (f)(g) | | 3,902,000 | 3,267,908 |
| Series 2012-C4 Class D, 5.4205% 3/15/45 (f)(g) | | 6,310,000 | 6,029,164 |
| Series 2015-MS1 Class D, 4.0301% 5/15/48 (f)(g) | | 10,956,000 | 9,345,740 |
| Series 2015-UBS8 Class D, 3.18% 12/15/48 (f) | | 5,013,000 | 4,237,910 |
| Series 2016-BNK2 Class C, 3% 11/15/49 (f) | | 3,000,000 | 2,419,001 |
| Motel 6 Trust floater: | | | |
| Series 2017-M6MZ, Class M, 1 month U.S. LIBOR + 6.927% 8.4035% 8/15/19 (f)(g)(i) | | 7,932,398 | 7,981,953 |
| Series 2017-MTL6, Class F, 1 month U.S. LIBOR + 4.250% 5.727% 8/15/34 (f)(g)(i) | | 13,586,944 | 13,688,746 |
| MSCG Trust Series 2016-SNR: | | | |
| Class D, 6.55% 11/15/34 (f) | | 11,889,000 | 11,968,603 |
| Class E, 6.8087% 11/15/34 (f) | | 11,364,000 | 10,818,015 |
| MSJP Commercial Securities Mortgage Trust Series 2015-HAUL Class E, 4.851% 9/5/47 (f)(g) | | 1,500,000 | 1,396,785 |
| Providence Place Group Ltd. Partnership Series 2000-C1 Class A2, 7.75% 7/20/28 (f) | | 4,294,396 | 5,258,487 |
| Starwood Retail Property Trust Series 2014-STAR Class D, 1 month U.S. LIBOR + 3.250% 4.727% 11/15/27 (f)(g)(i) | | 2,500,000 | 2,400,000 |
| TIAA Seasoned Commercial Mortgage Trust sequential payer Series 2007-C4 Class AJ, 5.476% 8/15/39 (g) | | 264,863 | 265,405 |
| UBS Commercial Mortgage Trust Series 2012-C1: | | | |
| Class D, 5.5454% 5/10/45 (f)(g) | | 3,235,000 | 3,218,430 |
| Class E, 5% 5/10/45 (f)(g) | | 6,339,000 | 5,368,912 |
| Class F, 5% 5/10/45 (f)(g) | | 2,221,350 | 1,512,144 |
| UBS-Citigroup Commercial Mortgage Trust Series 2011-C1 Class B, 6.0486% 1/10/45 (f)(g) | | 3,000,000 | 3,248,786 |
| Vornado DP LLC Series 2010-VNO Class D, 6.3555% 9/13/28 (f) | | 2,540,000 | 2,765,592 |
| Wells Fargo Commercial Mortgage Trust: | | | |
| Series 2012-LC5: | | | |
| Class D, 4.7647% 10/15/45 (f)(g) | | 12,964,000 | 11,688,664 |
| Class E, 4.7647% 10/15/45 (f)(g) | | 7,588,000 | 6,121,683 |
| Series 2016-BNK1 Class D, 3% 8/15/49 (f) | | 6,979,000 | 5,616,311 |
| Series 2016-C35 Class D, 3.142% 7/15/48 (f) | | 18,542,000 | 13,316,232 |
| Series 2016-NXS6 Class D, 3.059% 11/15/49 (f) | | 5,094,000 | 3,840,977 |
| Series 2017-C38 Class D, 3% 7/15/50 (f)(g) | | 4,373,000 | 3,480,120 |
| WF-RBS Commercial Mortgage Trust: | | | |
| sequential payer Series 2011-C4I Class G, 5% 6/15/44 (f) | | 4,000,000 | 2,672,856 |
| Series 2011-C3: | | | |
| Class C, 5.335% 3/15/44 (f) | | 4,900,000 | 5,085,302 |
| Class D, 5.6402% 3/15/44 (f)(g) | | 1,000,000 | 874,454 |
| Class E, 5% 3/15/44 (f) | | 3,000,000 | 2,424,784 |
| Series 2011-C5: | | | |
| Class E, 5.6716% 11/15/44 (f)(g) | | 3,807,000 | 3,839,412 |
| Class F, 5.25% 11/15/44 (f)(g) | | 3,000,000 | 2,601,748 |
| Class G, 5.25% 11/15/44 (f)(g) | | 2,000,000 | 1,622,920 |
| Series 2012-C10 Class E, 4.4476% 12/15/45 (f)(g) | | 4,090,000 | 3,085,596 |
| Series 2012-C7: | | | |
| Class D, 4.8255% 6/15/45 (f)(g) | | 2,380,000 | 2,051,109 |
| Class F, 4.5% 6/15/45 (f) | | 2,000,000 | 1,329,073 |
| Series 2012-C8 Class E, 4.8935% 8/15/45 (f)(g) | | 2,922,500 | 2,801,714 |
| Series 2013-C11: | | | |
| Class D, 4.2717% 3/15/45 (f)(g) | | 5,830,000 | 5,316,414 |
| Class E, 4.2717% 3/15/45 (f)(g) | | 4,780,000 | 3,723,350 |
| Series 2013-C13 Class D, 4.1386% 5/15/45 (f)(g) | | 4,000,000 | 3,678,313 |
| Series 2013-C16 Class D, 5.0286% 9/15/46 (f)(g) | | 3,728,000 | 3,528,652 |
| Series 2013-UBS1 Class D, 4.6237% 3/15/46 (f)(g) | | 4,589,000 | 4,246,880 |
| WFCG Commercial Mortgage Trust floater Series 2015-BXRP: | | | |
| Class F, 1 month U.S. LIBOR + 3.721% 5.1973% 11/15/29 (f)(g)(i) | | 5,152,378 | 5,160,700 |
| Class G, 1 month U.S. LIBOR + 3.001% 4.497% 11/15/29 (f)(g)(i) | | 8,859,793 | 8,744,964 |
| WP Glimcher Mall Trust Series 2015-WPG: | | | |
| Class PR1, 3.516% 6/5/35 (f)(g) | | 6,725,000 | 5,173,641 |
| Class PR2, 3.516% 6/5/35 (f)(g) | | 2,541,000 | 1,819,074 |
| TOTAL COMMERCIAL MORTGAGE SECURITIES | | | |
| (Cost $868,160,649) | | | 879,096,790 |
|
| Bank Loan Obligations - 4.4% | | | |
| CONSUMER DISCRETIONARY - 0.8% | | | |
| Hotels, Restaurants & Leisure - 0.6% | | | |
| Caesars Resort Collection LLC Tranche B 1LN, term loan 3 month U.S. LIBOR + 2.750% 4.3235% 12/22/24 (g)(i) | | 3,380,000 | 3,419,309 |
| ESH Hospitality, Inc. Tranche B, term loan 3 month U.S. LIBOR + 2.250% 3.8235% 8/30/23 (g)(i) | | 4,424,196 | 4,460,518 |
| Four Seasons Holdings, Inc. Tranche B, term loan 3 month U.S. LIBOR + 2.500% 4.0735% 11/30/23 (g)(i) | | 2,950,200 | 2,976,634 |
| Hilton Los Cabos 3 month U.S. LIBOR + 8.000% 9.78% 9/9/18 (b)(g)(i) | | 5,375,000 | 5,375,000 |
| La Quinta Intermediate Holdings LLC Tranche B LN, term loan 3 month U.S. LIBOR + 2.750% 4.4702% 4/14/21 (g)(i) | | 12,852,178 | 12,892,405 |
| Playa Resorts Holding BV Tranche B, term loan 3 month U.S. LIBOR + 3.250% 4.9997% 4/27/24 (g)(i) | | 4,327,502 | 4,355,890 |
| | | | 33,479,756 |
| Multiline Retail - 0.2% | | | |
| JC Penney Corp., Inc. Tranche B, term loan 3 month U.S. LIBOR + 4.250% 5.7288% 6/23/23 (g)(i) | | 12,523,240 | 12,058,879 |
|
| TOTAL CONSUMER DISCRETIONARY | | | 45,538,635 |
|
| CONSUMER STAPLES - 0.4% | | | |
| Food & Staples Retailing - 0.4% | | | |
| Albertson's LLC Tranche B, term loan: | | | |
| 3 month U.S. LIBOR + 3.000% 4.4623% 6/22/23 (g)(i) | | 12,980,173 | 12,889,571 |
| 3 month U.S. LIBOR + 3.000% 4.6746% 12/21/22 (g)(i) | | 11,557,685 | 11,486,721 |
| | | | 24,376,292 |
| ENERGY - 0.8% | | | |
| Oil, Gas & Consumable Fuels - 0.8% | | | |
| Moxie Patriot LLC Tranche B, term loan 3 month U.S. LIBOR + 5.750% 7.4434% 12/19/20 (g)(i) | | 22,788,534 | 22,532,163 |
| Panda Temple Power, LLC term loan 3 month U.S. LIBOR + 6.000% 7.6934% 4/3/19 (g)(i) | | 13,870,161 | 12,656,522 |
| TPF II Power LLC Tranche B, term loan 3 month U.S. LIBOR + 3.750% 5.3235% 10/2/23 (g)(i) | | 5,730,711 | 5,805,955 |
| | | | 40,994,640 |
| FINANCIALS - 0.3% | | | |
| Real Estate Management & Development - 0.2% | | | |
| DTZ U.S. Borrower LLC Tranche B 1LN, term loan 3 month U.S. LIBOR + 3.250% 4.8245% 11/4/21 (g)(i) | | 12,385,513 | 12,378,577 |
| Thrifts & Mortgage Finance - 0.1% | | | |
| Ocwen Loan Servicing LLC Tranche B, term loan 3 month U.S. LIBOR + 5.000% 6.5595% 12/5/20 (g)(i) | | 4,098,113 | 4,108,358 |
|
| TOTAL FINANCIALS | | | 16,486,935 |
|
| HEALTH CARE - 0.1% | | | |
| Health Care Providers & Services - 0.1% | | | |
| Community Health Systems, Inc. Tranche H, term loan 3 month U.S. LIBOR + 3.000% 4.4788% 1/27/21 (g)(i) | | 6,141,305 | 6,021,979 |
| INDUSTRIALS - 0.1% | | | |
| Commercial Services & Supplies - 0.1% | | | |
| Lineage Logistics Holdings, LLC. Tranche B, term loan 3 month U.S. LIBOR + 3.500% 5.0735% 4/7/21 (g)(i) | | 3,850,000 | 3,867,633 |
| INFORMATION TECHNOLOGY - 0.1% | | | |
| Electronic Equipment & Components - 0.1% | | | |
| Compass Power Generation LLC Tranche B, term loan 3 month U.S. LIBOR + 3.750% 5.3908% 12/20/24 (g)(i) | | 3,390,000 | 3,430,273 |
| REAL ESTATE - 1.1% | | | |
| Equity Real Estate Investment Trusts (REITs) - 0.7% | | | |
| Invitation Homes Operating Par Tranche B, term loan 3 month U.S. LIBOR + 1.700% 3.2595% 2/6/22 (g)(i) | | 25,000,000 | 24,218,750 |
| iStar Financial, Inc. Tranche B, term loan 3 month U.S. LIBOR + 3.000% 4.5572% 10/1/21 (g)(i) | | 6,678,850 | 6,753,987 |
| QCP SNF West (REIT) LLC Tranche B, term loan 3 month U.S. LIBOR + 5.250% 6.8235% 10/31/22 (g)(i) | | 6,722,100 | 6,793,556 |
| | | | 37,766,293 |
| Real Estate Management & Development - 0.4% | | | |
| Capital Automotive LP Tranche B 1LN, term loan 3 month U.S. LIBOR + 2.500% 4.0735% 3/24/24 (g)(i) | | 3,112,169 | 3,129,690 |
| Simply Storage Management LLC 8.2375% 9/6/21 (b)(g) | | 16,974,000 | 16,974,000 |
| | | | 20,103,690 |
|
| TOTAL REAL ESTATE | | | 57,869,983 |
|
| UTILITIES - 0.7% | | | |
| Electric Utilities - 0.2% | | | |
| Lightstone Holdco LLC: | | | |
| Tranche B, term loan 3 month U.S. LIBOR + 4.500% 6.0735% 1/30/24 (g)(i) | | 8,974,982 | 9,013,126 |
| Tranche C, term loan 3 month U.S. LIBOR + 4.500% 6.0735% 1/30/24 (g)(i) | | 569,885 | 572,307 |
| Southeast Powergen LLC Tranche B, term loan 3 month U.S. LIBOR + 3.500% 5.08% 12/2/21 (g)(i) | | 2,497,040 | 2,422,128 |
| | | | 12,007,561 |
| Independent Power and Renewable Electricity Producers - 0.5% | | | |
| APLP Holdings LP Tranche B, term loan 3 month U.S. LIBOR + 4.250% 5.0735% 4/13/23 (g)(i) | | 8,249,029 | 8,321,208 |
| Dynegy, Inc. Tranche C-2, term loan 3 month U.S. LIBOR + 2.750% 4.3112% 2/7/24 (g)(i) | | 1,533,797 | 1,548,444 |
| MRP Generation Holdings LLC Tranche B, term loan 3 month U.S. LIBOR + 7.000% 8.6934% 10/18/22 (g)(i) | | 14,557,260 | 14,047,756 |
| | | | 23,917,408 |
|
| TOTAL UTILITIES | | | 35,924,969 |
|
| TOTAL BANK LOAN OBLIGATIONS | | | |
| (Cost $234,034,945) | | | 234,511,339 |
|
| Preferred Securities - 0.0% | | | |
| FINANCIALS - 0.0% | | | |
| Diversified Financial Services - 0.0% | | | |
| Crest Dartmouth Street 2003 1 Ltd. Series 2003-1A Class PS, (b)(f) | | 1,220,000 | 122 |
| Thrifts & Mortgage Finance - 0.0% | | | |
| Crest Clarendon Street 2002-1 Ltd. Series 2002-1A Class PS, 12/28/35 (b)(f)(g)(i) | | 500,000 | 120,000 |
| TOTAL PREFERRED SECURITIES | | | |
| (Cost $1,297,768) | | | 120,122 |
| | | Shares | Value |
|
| Money Market Funds - 6.8% | | | |
| Fidelity Cash Central Fund, 1.39% (j) | | 332,340,179 | 332,406,647 |
| Fidelity Securities Lending Cash Central Fund 1.40% (j)(k) | | 26,952,097 | 26,954,792 |
| TOTAL MONEY MARKET FUNDS | | | |
| (Cost $359,305,405) | | | 359,361,439 |
| TOTAL INVESTMENT IN SECURITIES - 100.0% | | | |
| (Cost $5,029,938,410) | | | 5,267,644,829 |
| NET OTHER ASSETS (LIABILITIES) - 0.0% | | | (2,117,323) |
| NET ASSETS - 100% | | | $5,265,527,506 |
Legend
(a) Restricted securities - Investment in securities not registered under the Securities Act of 1933 (excluding 144A issues). At the end of the period, the value of restricted securities (excluding 144A issues) amounted to $149,642 or 0.0% of net assets.
(b) Level 3 security
(c) Security or a portion of the security is on loan at period end.
(d) Affiliated company
(e) Non-income producing
(f) Security exempt from registration under Rule 144A of the Securities Act of 1933. These securities may be resold in transactions exempt from registration, normally to qualified institutional buyers. At the end of the period, the value of these securities amounted to $1,181,863,461 or 22.4% of net assets.
(g) Coupon rates for floating and adjustable rate securities reflect the rates in effect at period end.
(h) Security represents right to receive monthly interest payments on an underlying pool of mortgages or assets. Principal shown is the outstanding par amount of the pool as of the end of the period.
(i) Coupon is indexed to a floating interest rate which may be multiplied by a specified factor and/or subject to caps or floors.
(j) Affiliated fund that is generally available only to investment companies and other accounts managed by Fidelity Investments. The rate quoted is the annualized seven-day yield of the fund at period end. A complete unaudited listing of the fund's holdings as of its most recent quarter end is available upon request. In addition, each Fidelity Central Fund's financial statements are available on the SEC's website or upon request.
(k) Investment made with cash collateral received from securities on loan.
Additional information on each restricted holding is as follows:
| Security | Acquisition Date | Acquisition Cost |
| Stanley Martin Communities LLC Class B (Escrow) | 7/17/16 | $121,944 |
Affiliated Central Funds
Information regarding fiscal year to date income earned by the Fund from investments in Fidelity Central Funds is as follows:
| Fund | Income earned |
| Fidelity Cash Central Fund | $1,965,134 |
| Fidelity Securities Lending Cash Central Fund | 82,089 |
| Total | $2,047,223 |
Amounts in the income column in the above table include any capital gain distributions from underlying funds, which are presented in the corresponding line-item in the Statement of Operations if applicable.
Other Affiliated Issuers
An affiliated company is a company in which the Fund has ownership of at least 5% of the voting securities. Fiscal year to date transactions with companies which are or were affiliates are as follows:
| Affiliate | Value, beginning of period | Purchases | Sales Proceeds | Dividend Income | Realized Gain (loss) | Change in Unrealized appreciation (depreciation) | Value, end of period |
| Acadia Realty Trust (SBI) | $124,832,133 | $1,072,218 | $-- | $1,732,647 | $492,001 | $(21,782,538) | $104,120,867 |
| Great Ajax Corp. | 21,962,447 | -- | -- | 12,651 | 816,676 | (568,999) | 21,078,900 |
| Great Ajax Corp. 7.25% | 4,545,000 | -- | -- | 163,125 | -- | (58,914) | 4,486,086 |
| Total | $151,339,580 | $1,072,218 | $-- | $1,908,423 | $1,308,677 | $(22,410,451) | $129,685,853 |
Investment Valuation
The following is a summary of the inputs used, as of January 31, 2018, involving the Fund's assets and liabilities carried at fair value. The inputs or methodology used for valuing securities may not be an indication of the risk associated with investing in those securities. For more information on valuation inputs, and their aggregation into the levels used below, please refer to the Investment Valuation section in the accompanying Notes to Financial Statements.
| | Valuation Inputs at Reporting Date: |
| Description | Total | Level 1 | Level 2 | Level 3 |
| Investments in Securities: | | | | |
| Equities: | | | | |
| Consumer Discretionary | $29,919,411 | $29,769,769 | $-- | $149,642 |
| Financials | 720,607,851 | 705,967,842 | 14,640,009 | -- |
| Real Estate | 1,795,412,786 | 1,737,814,505 | 57,598,281 | -- |
| Utilities | 3,541,536 | 3,541,536 | -- | -- |
| Corporate Bonds | 1,106,958,085 | -- | 1,106,958,085 | -- |
| Asset-Backed Securities | 129,944,700 | -- | 129,747,234 | 197,466 |
| Collateralized Mortgage Obligations | 8,170,770 | -- | 8,162,084 | 8,686 |
| Commercial Mortgage Securities | 879,096,790 | -- | 879,096,790 | -- |
| Bank Loan Obligations | 234,511,339 | -- | 212,162,339 | 22,349,000 |
| Preferred Securities | 120,122 | -- | -- | 120,122 |
| Money Market Funds | 359,361,439 | 359,361,439 | -- | -- |
| Total Investments in Securities: | $5,267,644,829 | $2,836,455,091 | $2,408,364,822 | $22,824,916 |
The following is a reconciliation of Investments in Securities and Derivative Instruments for which Level 3 inputs were used in determining value:
| Investments in Securities: | |
| Bank Loan Obligations | |
| Beginning Balance | $53,726,431 |
| Net Realized Gain (Loss) on Investment Securities | (35,397) |
| Net Unrealized Gain (Loss) on Investment Securities | 54,221 |
| Cost of Purchases | 5,375,000 |
| Proceeds of Sales | (13,002,431) |
| Amortization/Accretion | (18,824) |
| Transfers into Level 3 | -- |
| Transfers out of Level 3 | (23,750,000) |
| Ending Balance | $22,349,000 |
| The change in unrealized gain (loss) for the period attributable to Level 3 securities held at January 31, 2018 | $(1,438) |
| Other Investments in Securities | |
| Beginning Balance | $1,906,920 |
| Net Realized Gain (Loss) on Investment Securities | (92,593) |
| Net Unrealized Gain (Loss) on Investment Securities | 177,192 |
| Cost of Purchases | -- |
| Proceeds of Sales | (27,018) |
| Amortization/Accretion | (2,229) |
| Transfers into Level 3 | -- |
| Transfers out of Level 3 | (1,486,356) |
| Ending Balance | $475,916 |
| The change in unrealized gain (loss) for the period attributable to Level 3 securities held at January 31, 2018 | $89,246 |
The information used in the above reconciliation represents fiscal year to date activity for any Investments in Securities identified as using Level 3 inputs at either the beginning or the end of the current fiscal period. Transfers in or out of Level 3 represent the beginning value of any Security or Instrument where a change in the pricing level occurred from the beginning to the end of the period. The cost of purchases and the proceeds of sales may include securities received or delivered through corporate actions or exchanges. Realized and unrealized gains (losses) disclosed in the reconciliation are included in Net Gain (Loss) on the Fund's Statement of Operations.
Other Information
The composition of credit quality ratings as a percentage of Total Net Assets is as follows (Unaudited):
| U.S. Government and U.S. Government Agency Obligations | 0.1% |
| AAA,AA,A | 1.6% |
| BBB | 10.7% |
| BB | 8.3% |
| B | 9.8% |
| CCC,CC,C | 1.2% |
| Not Rated | 13.1% |
| Equities | 48.4% |
| Short-Term Investments and Net Other Assets | 6.8% |
| | 100.0% |
We have used ratings from Moody's Investors Service, Inc. Where Moody's® ratings are not available, we have used S&P® ratings. All ratings are as of the date indicated and do not reflect subsequent changes.
See accompanying notes which are an integral part of the financial statements.
Financial Statements
Statement of Assets and Liabilities
| | | January 31, 2018 (Unaudited) |
| Assets | | |
Investment in securities, at value (including securities loaned of $26,789,665) — See accompanying schedule:
Unaffiliated issuers (cost $4,545,936,481) | $4,778,597,537 | |
| Fidelity Central Funds (cost $359,305,405) | 359,361,439 | |
| Other affiliated issuers (cost $124,696,524) | 129,685,853 | |
| Total Investment in Securities (cost $5,029,938,410) | | $5,267,644,829 |
| Cash | | 620,072 |
| Receivable for investments sold | | 25,714,031 |
| Receivable for fund shares sold | | 7,796,369 |
| Dividends receivable | | 3,254,455 |
| Interest receivable | | 22,739,474 |
| Distributions receivable from Fidelity Central Funds | | 400,722 |
| Prepaid expenses | | 7,456 |
| Other receivables | | 15,432 |
| Total assets | | 5,328,192,840 |
| Liabilities | | |
| Payable for investments purchased | $15,313,295 | |
| Payable for fund shares redeemed | 16,705,469 | |
| Accrued management fee | 2,417,868 | |
| Distribution and service plan fees payable | 302,510 | |
| Other affiliated payables | 909,617 | |
| Other payables and accrued expenses | 61,339 | |
| Collateral on securities loaned | 26,955,236 | |
| Total liabilities | | 62,665,334 |
| Net Assets | | $5,265,527,506 |
| Net Assets consist of: | | |
| Paid in capital | | $5,008,206,415 |
| Distributions in excess of net investment income | | (6,947,348) |
| Accumulated undistributed net realized gain (loss) on investments and foreign currency transactions | | 26,562,099 |
| Net unrealized appreciation (depreciation) on investments and assets and liabilities in foreign currencies | | 237,706,340 |
| Net Assets | | $5,265,527,506 |
| Calculation of Maximum Offering Price | | |
| Class A: | | |
| Net Asset Value and redemption price per share ($321,559,334 ÷ 27,545,130 shares) | | $11.67 |
| Maximum offering price per share (100/96.00 of $11.67) | | $12.16 |
| Class M: | | |
| Net Asset Value and redemption price per share ($58,865,104 ÷ 5,040,110 shares) | | $11.68 |
| Maximum offering price per share (100/96.00 of $11.68) | | $12.17 |
| Class C: | | |
| Net Asset Value and offering price per share ($256,024,975 ÷ 22,138,721 shares)(a) | | $11.56 |
| Real Estate Income: | | |
| Net Asset Value, offering price and redemption price per share ($2,546,434,714 ÷ 217,031,958 shares) | | $11.73 |
| Class I: | | |
| Net Asset Value, offering price and redemption price per share ($2,082,643,379 ÷ 178,107,352 shares) | | $11.69 |
(a) Redemption price per share is equal to net asset value less any applicable contingent deferred sales charge.
See accompanying notes which are an integral part of the financial statements.
Statement of Operations
| | | Six months ended January 31, 2018 (Unaudited) |
| Investment Income | | |
| Dividends (including $1,908,423 earned from other affiliated issuers) | | $59,525,081 |
| Interest | | 67,905,231 |
| Income from Fidelity Central Funds | | 2,047,223 |
| Total income | | 129,477,535 |
| Expenses | | |
| Management fee | $14,632,465 | |
| Transfer agent fees | 4,804,014 | |
| Distribution and service plan fees | 1,908,968 | |
| Accounting and security lending fees | 694,126 | |
| Custodian fees and expenses | 30,066 | |
| Independent trustees' fees and expenses | 10,439 | |
| Registration fees | 111,968 | |
| Audit | 58,074 | |
| Legal | 10,498 | |
| Miscellaneous | 17,278 | |
| Total expenses before reductions | 22,277,896 | |
| Expense reductions | (62,523) | 22,215,373 |
| Net investment income (loss) | | 107,262,162 |
| Realized and Unrealized Gain (Loss) | | |
| Net realized gain (loss) on: | | |
| Investment securities: | | |
| Unaffiliated issuers | 53,148,735 | |
| Fidelity Central Funds | 4,709 | |
| Other affiliated issuers | 1,308,677 | |
| Foreign currency transactions | (1,834) | |
| Total net realized gain (loss) | | 54,460,287 |
| Change in net unrealized appreciation (depreciation) on: | | |
| Investment securities: | | |
| Unaffiliated issuers | (216,806,502) | |
| Fidelity Central Funds | (4,215) | |
| Other affiliated issuers | (22,410,451) | |
| Assets and liabilities in foreign currencies | (274) | |
| Total change in net unrealized appreciation (depreciation) | | (239,221,442) |
| Net gain (loss) | | (184,761,155) |
| Net increase (decrease) in net assets resulting from operations | | $(77,498,993) |
See accompanying notes which are an integral part of the financial statements.
Statement of Changes in Net Assets
| | Six months ended January 31, 2018 (Unaudited) | Year ended July 31, 2017 |
| Increase (Decrease) in Net Assets | | |
| Operations | | |
| Net investment income (loss) | $107,262,162 | $210,270,861 |
| Net realized gain (loss) | 54,460,287 | 36,915,809 |
| Change in net unrealized appreciation (depreciation) | (239,221,442) | 22,370,918 |
| Net increase (decrease) in net assets resulting from operations | (77,498,993) | 269,557,588 |
| Distributions to shareholders from net investment income | (155,204,665) | (202,922,557) |
| Distributions to shareholders from net realized gain | (58,110,171) | (32,383,930) |
| Total distributions | (213,314,836) | (235,306,487) |
| Share transactions - net increase (decrease) | 266,884,853 | 397,445,047 |
| Redemption fees | 106,657 | 449,735 |
| Total increase (decrease) in net assets | (23,822,319) | 432,145,883 |
| Net Assets | | |
| Beginning of period | 5,289,349,825 | 4,857,203,942 |
| End of period | $5,265,527,506 | $5,289,349,825 |
| Other Information | | |
| Undistributed net investment income end of period | $– | $40,995,155 |
| Distributions in excess of net investment income end of period | $(6,947,348) | $– |
See accompanying notes which are an integral part of the financial statements.
Financial Highlights
Fidelity Real Estate Income Fund Class A
| | Six months ended (Unaudited) January 31, | Years endedJuly 31, | | | | |
| | 2018 | 2017 | 2016 | 2015 | 2014 | 2013 |
| Selected Per–Share Data | | | | | | |
| Net asset value, beginning of period | $12.32 | $12.25 | $11.66 | $11.86 | $11.67 | $11.26 |
| Income from Investment Operations | | | | | | |
| Net investment income (loss)A | .23 | .49 | .49 | .52 | .49 | .54 |
| Net realized and unrealized gain (loss) | (.41) | .14 | .73 | .02 | .44 | .60 |
| Total from investment operations | (.18) | .63 | 1.22 | .54 | .93 | 1.14 |
| Distributions from net investment income | (.34) | (.48) | (.48) | (.52) | (.50) | (.53) |
| Distributions from net realized gain | (.13) | (.08) | (.14) | (.21) | (.24) | (.20) |
| Total distributions | (.47) | (.56) | (.63)B | (.74)C | (.74) | (.73) |
| Redemption fees added to paid in capitalA,D | – | – | – | – | – | – |
| Net asset value, end of period | $11.67 | $12.32 | $12.25 | $11.66 | $11.86 | $11.67 |
| Total ReturnE,F,G | (1.56)% | 5.37% | 11.01% | 4.65% | 8.49% | 10.45% |
| Ratios to Average Net AssetsH,I | | | | | | |
| Expenses before reductions | 1.02%J | 1.03% | 1.03% | 1.04% | 1.06% | 1.08% |
| Expenses net of fee waivers, if any | 1.02%J | 1.03% | 1.03% | 1.03% | 1.05% | 1.08% |
| Expenses net of all reductions | 1.02%J | 1.02% | 1.03% | 1.03% | 1.05% | 1.07% |
| Net investment income (loss) | 3.78%J | 4.08% | 4.29% | 4.40% | 4.28% | 4.62% |
| Supplemental Data | | | | | | |
| Net assets, end of period (000 omitted) | $321,559 | $355,400 | $548,649 | $495,462 | $442,271 | $378,269 |
| Portfolio turnover rateK | 25%J | 22% | 26% | 19% | 29% | 26% |
A Calculated based on average shares outstanding during the period.
B Total distributions of $.63 per share is comprised of distributions from net investment income of $.483 and distributions from net realized gain of $.142 per share.
C Total distributions of $.74 per share is comprised of distributions from net investment income of $.523 and distributions from net realized gain of $.212 per share.
D Amount represents less than $.005 per share.
E Total returns for periods of less than one year are not annualized.
F Total returns would have been lower if certain expenses had not been reduced during the applicable periods shown.
G Total returns do not include the effect of the sales charges.
H Fees and expenses of any underlying Fidelity Central Funds are not included in the Fund's expense ratio. The Fund indirectly bears its proportionate share of the expenses of any underlying Fidelity Central Funds.
I Expense ratios reflect operating expenses of the class. Expenses before reductions do not reflect amounts reimbursed by the investment adviser or reductions from brokerage service arrangements or reductions from other expense offset arrangements and do not represent the amount paid by the class during periods when reimbursements or reductions occur. Expenses net of fee waivers reflect expenses after reimbursement by the investment adviser but prior to reductions from brokerage service arrangements or other expense offset arrangements. Expenses net of all reductions represent the net expenses paid by the class.
J Annualized
K Amount does not include the portfolio activity of any underlying Fidelity Central Funds.
See accompanying notes which are an integral part of the financial statements.
Fidelity Real Estate Income Fund Class M
| | Six months ended (Unaudited) January 31, | Years endedJuly 31, | | | | |
| | 2018 | 2017 | 2016 | 2015 | 2014 | 2013 |
| Selected Per–Share Data | | | | | | |
| Net asset value, beginning of period | $12.32 | $12.26 | $11.66 | $11.86 | $11.67 | $11.26 |
| Income from Investment Operations | | | | | | |
| Net investment income (loss)A | .23 | .49 | .49 | .51 | .49 | .54 |
| Net realized and unrealized gain (loss) | (.40) | .13 | .73 | .02 | .43 | .60 |
| Total from investment operations | (.17) | .62 | 1.22 | .53 | .92 | 1.14 |
| Distributions from net investment income | (.33) | (.48) | (.48) | (.52) | (.50) | (.53) |
| Distributions from net realized gain | (.13) | (.08) | (.14) | (.21) | (.24) | (.20) |
| Total distributions | (.47)B | (.56) | (.62) | (.73) | (.73)C | (.73) |
| Redemption fees added to paid in capitalA,D | – | – | – | – | – | – |
| Net asset value, end of period | $11.68 | $12.32 | $12.26 | $11.66 | $11.86 | $11.67 |
| Total ReturnE,F,G | (1.50)% | 5.26% | 11.06% | 4.62% | 8.44% | 10.42% |
| Ratios to Average Net AssetsH,I | | | | | | |
| Expenses before reductions | 1.04%J | 1.06% | 1.07% | 1.06% | 1.08% | 1.08% |
| Expenses net of fee waivers, if any | 1.04%J | 1.06% | 1.07% | 1.06% | 1.08% | 1.08% |
| Expenses net of all reductions | 1.04%J | 1.05% | 1.06% | 1.06% | 1.07% | 1.08% |
| Net investment income (loss) | 3.76%J | 4.05% | 4.26% | 4.37% | 4.26% | 4.61% |
| Supplemental Data | | | | | | |
| Net assets, end of period (000 omitted) | $58,865 | $64,158 | $59,788 | $55,424 | $48,164 | $46,198 |
| Portfolio turnover rateK | 25%J | 22% | 26% | 19% | 29% | 26% |
A Calculated based on average shares outstanding during the period.
B Total distributions of $.47 per share is comprised of distributions from net investment income of $.334 and distributions from net realized gain of $.132 per share.
C Total distributions of $.73 per share is comprised of distributions from net investment income of $.496 and distributions from net realized gain of $.236 per share.
D Amount represents less than $.005 per share.
E Total returns for periods of less than one year are not annualized.
F Total returns would have been lower if certain expenses had not been reduced during the applicable periods shown.
G Total returns do not include the effect of the sales charges.
H Fees and expenses of any underlying Fidelity Central Funds are not included in the Fund's expense ratio. The Fund indirectly bears its proportionate share of the expenses of any underlying Fidelity Central Funds.
I Expense ratios reflect operating expenses of the class. Expenses before reductions do not reflect amounts reimbursed by the investment adviser or reductions from brokerage service arrangements or reductions from other expense offset arrangements and do not represent the amount paid by the class during periods when reimbursements or reductions occur. Expenses net of fee waivers reflect expenses after reimbursement by the investment adviser but prior to reductions from brokerage service arrangements or other expense offset arrangements. Expenses net of all reductions represent the net expenses paid by the class.
J Annualized
K Amount does not include the portfolio activity of any underlying Fidelity Central Funds.
See accompanying notes which are an integral part of the financial statements.
Fidelity Real Estate Income Fund Class C
| | Six months ended (Unaudited) January 31, | Years endedJuly 31, | | | | |
| | 2018 | 2017 | 2016 | 2015 | 2014 | 2013 |
| Selected Per–Share Data | | | | | | |
| Net asset value, beginning of period | $12.20 | $12.14 | $11.55 | $11.77 | $11.59 | $11.20 |
| Income from Investment Operations | | | | | | |
| Net investment income (loss)A | .18 | .40 | .40 | .43 | .40 | .45 |
| Net realized and unrealized gain (loss) | (.41) | .13 | .73 | .01 | .43 | .60 |
| Total from investment operations | (.23) | .53 | 1.13 | .44 | .83 | 1.05 |
| Distributions from net investment income | (.28) | (.39) | (.40) | (.45) | (.42) | (.46) |
| Distributions from net realized gain | (.13) | (.08) | (.14) | (.21) | (.24) | (.20) |
| Total distributions | (.41) | (.47) | (.54) | (.66) | (.65)B | (.66) |
| Redemption fees added to paid in capitalA,C | – | – | – | – | – | – |
| Net asset value, end of period | $11.56 | $12.20 | $12.14 | $11.55 | $11.77 | $11.59 |
| Total ReturnD,E,F | (1.94)% | 4.54% | 10.29% | 3.82% | 7.66% | 9.66% |
| Ratios to Average Net AssetsG,H | | | | | | |
| Expenses before reductions | 1.76%I | 1.78% | 1.79% | 1.79% | 1.79% | 1.81% |
| Expenses net of fee waivers, if any | 1.76%I | 1.78% | 1.78% | 1.78% | 1.79% | 1.81% |
| Expenses net of all reductions | 1.76%I | 1.78% | 1.78% | 1.78% | 1.79% | 1.81% |
| Net investment income (loss) | 3.04%I | 3.32% | 3.54% | 3.65% | 3.54% | 3.88% |
| Supplemental Data | | | | | | |
| Net assets, end of period (000 omitted) | $256,025 | $287,598 | $289,430 | $291,387 | $246,306 | $204,012 |
| Portfolio turnover rateJ | 25%I | 22% | 26% | 19% | 29% | 26% |
A Calculated based on average shares outstanding during the period.
B Total distributions of $.65 per share is comprised of distributions from net investment income of $.417 and distributions from net realized gain of $.236 per share.
C Amount represents less than $.005 per share.
D Total returns for periods of less than one year are not annualized.
E Total returns would have been lower if certain expenses had not been reduced during the applicable periods shown.
F Total returns do not include the effect of the contingent deferred sales charge.
G Fees and expenses of any underlying Fidelity Central Funds are not included in the Fund's expense ratio. The Fund indirectly bears its proportionate share of the expenses of any underlying Fidelity Central Funds.
H Expense ratios reflect operating expenses of the class. Expenses before reductions do not reflect amounts reimbursed by the investment adviser or reductions from brokerage service arrangements or reductions from other expense offset arrangements and do not represent the amount paid by the class during periods when reimbursements or reductions occur. Expenses net of fee waivers reflect expenses after reimbursement by the investment adviser but prior to reductions from brokerage service arrangements or other expense offset arrangements. Expenses net of all reductions represent the net expenses paid by the class.
I Annualized
J Amount does not include the portfolio activity of any underlying Fidelity Central Funds.
See accompanying notes which are an integral part of the financial statements.
Fidelity Real Estate Income Fund
| | Six months ended (Unaudited) January 31, | Years endedJuly 31, | | | | |
| | 2018 | 2017 | 2016 | 2015 | 2014 | 2013 |
| Selected Per–Share Data | | | | | | |
| Net asset value, beginning of period | $12.38 | $12.31 | $11.71 | $11.91 | $11.71 | $11.29 |
| Income from Investment Operations | | | | | | |
| Net investment income (loss)A | .25 | .52 | .52 | .54 | .52 | .57 |
| Net realized and unrealized gain (loss) | (.41) | .14 | .73 | .02 | .44 | .60 |
| Total from investment operations | (.16) | .66 | 1.25 | .56 | .96 | 1.17 |
| Distributions from net investment income | (.36) | (.51) | (.51) | (.55) | (.53) | (.55) |
| Distributions from net realized gain | (.13) | (.08) | (.14) | (.21) | (.24) | (.20) |
| Total distributions | (.49) | (.59) | (.65) | (.76) | (.76)B | (.75) |
| Redemption fees added to paid in capitalA,C | – | – | – | – | – | – |
| Net asset value, end of period | $11.73 | $12.38 | $12.31 | $11.71 | $11.91 | $11.71 |
| Total ReturnD,E | (1.40)% | 5.60% | 11.29% | 4.84% | 8.78% | 10.71% |
| Ratios to Average Net AssetsF,G | | | | | | |
| Expenses before reductions | .75%H | .78% | .82% | .83% | .83% | .84% |
| Expenses net of fee waivers, if any | .75%H | .78% | .81% | .82% | .83% | .84% |
| Expenses net of all reductions | .75%H | .77% | .81% | .82% | .83% | .84% |
| Net investment income (loss) | 4.05%H | 4.33% | 4.51% | 4.61% | 4.50% | 4.85% |
| Supplemental Data | | | | | | |
| Net assets, end of period (000 omitted) | $2,546,435 | $2,630,901 | $2,719,387 | $2,561,268 | $2,627,382 | $2,884,545 |
| Portfolio turnover rateI | 25%H | 22% | 26% | 19% | 29% | 26% |
A Calculated based on average shares outstanding during the period.
B Total distributions of $.76 per share is comprised of distributions from net investment income of $.525 and distributions from net realized gain of $.236 per share.
C Amount represents less than $.005 per share.
D Total returns for periods of less than one year are not annualized.
E Total returns would have been lower if certain expenses had not been reduced during the applicable periods shown.
F Fees and expenses of any underlying Fidelity Central Funds are not included in the Fund's expense ratio. The Fund indirectly bears its proportionate share of the expenses of any underlying Fidelity Central Funds.
G Expense ratios reflect operating expenses of the class. Expenses before reductions do not reflect amounts reimbursed by the investment adviser or reductions from brokerage service arrangements or reductions from other expense offset arrangements and do not represent the amount paid by the class during periods when reimbursements or reductions occur. Expenses net of fee waivers reflect expenses after reimbursement by the investment adviser but prior to reductions from brokerage service arrangements or other expense offset arrangements. Expenses net of all reductions represent the net expenses paid by the class.
H Annualized
I Amount does not include the portfolio activity of any underlying Fidelity Central Funds.
See accompanying notes which are an integral part of the financial statements.
Fidelity Real Estate Income Fund Class I
| | Six months ended (Unaudited) January 31, | Years endedJuly 31, | | | | |
| | 2018 | 2017 | 2016 | 2015 | 2014 | 2013 |
| Selected Per–Share Data | | | | | | |
| Net asset value, beginning of period | $12.34 | $12.27 | $11.68 | $11.88 | $11.69 | $11.28 |
| Income from Investment Operations | | | | | | |
| Net investment income (loss)A | .25 | .52 | .52 | .55 | .52 | .57 |
| Net realized and unrealized gain (loss) | (.41) | .14 | .73 | .02 | .44 | .60 |
| Total from investment operations | (.16) | .66 | 1.25 | .57 | .96 | 1.17 |
| Distributions from net investment income | (.36) | (.51) | (.52) | (.55) | (.53) | (.56) |
| Distributions from net realized gain | (.13) | (.08) | (.14) | (.21) | (.24) | (.20) |
| Total distributions | (.49) | (.59) | (.66) | (.77)B | (.77) | (.76) |
| Redemption fees added to paid in capitalA,C | – | – | – | – | – | – |
| Net asset value, end of period | $11.69 | $12.34 | $12.27 | $11.68 | $11.88 | $11.69 |
| Total ReturnD,E | (1.39)% | 5.66% | 11.30% | 4.92% | 8.76% | 10.72% |
| Ratios to Average Net AssetsF,G | | | | | | |
| Expenses before reductions | .75%H | .76% | .77% | .77% | .78% | .80% |
| Expenses net of fee waivers, if any | .75%H | .76% | .77% | .77% | .78% | .80% |
| Expenses net of all reductions | .75%H | .76% | .76% | .77% | .78% | .80% |
| Net investment income (loss) | 4.05%H | 4.34% | 4.56% | 4.66% | 4.55% | 4.89% |
| Supplemental Data | | | | | | |
| Net assets, end of period (000 omitted) | $2,082,643 | $1,951,293 | $1,239,950 | $913,475 | $809,854 | $610,045 |
| Portfolio turnover rateI | 25%H | 22% | 26% | 19% | 29% | 26% |
A Calculated based on average shares outstanding during the period.
B Total distributions of $.77 per share is comprised of distributions from net investment income of $.554 and distributions from net realized gain of $.212 per share.
C Amount represents less than $.005 per share.
D Total returns for periods of less than one year are not annualized.
E Total returns would have been lower if certain expenses had not been reduced during the applicable periods shown.
F Fees and expenses of any underlying Fidelity Central Funds are not included in the Fund's expense ratio. The Fund indirectly bears its proportionate share of the expenses of any underlying Fidelity Central Funds.
G Expense ratios reflect operating expenses of the class. Expenses before reductions do not reflect amounts reimbursed by the investment adviser or reductions from brokerage service arrangements or reductions from other expense offset arrangements and do not represent the amount paid by the class during periods when reimbursements or reductions occur. Expenses net of fee waivers reflect expenses after reimbursement by the investment adviser but prior to reductions from brokerage service arrangements or other expense offset arrangements. Expenses net of all reductions represent the net expenses paid by the class.
H Annualized
I Amount does not include the portfolio activity of any underlying Fidelity Central Funds.
See accompanying notes which are an integral part of the financial statements.
Notes to Financial Statements (Unaudited)
For the period ended January 31, 2018
1. Organization.
Fidelity Real Estate Income Fund (the Fund) is a fund of Fidelity Securities Fund (the Trust) and is authorized to issue an unlimited number of shares. The Trust is registered under the Investment Company Act of 1940, as amended (the 1940 Act), as an open-end management investment company organized as a Massachusetts business trust. The Fund offers Class A, Class M, Class C, Real Estate Income and Class I shares, each of which has equal rights as to assets and voting privileges. Each class has exclusive voting rights with respect to matters that affect that class.
2. Investments in Fidelity Central Funds.
The Fund invests in Fidelity Central Funds, which are open-end investment companies generally available only to other investment companies and accounts managed by the investment adviser and its affiliates. The Fund's Schedule of Investments lists each of the Fidelity Central Funds held as of period end, if any, as an investment of the Fund, but does not include the underlying holdings of each Fidelity Central Fund. As an Investing Fund, the Fund indirectly bears its proportionate share of the expenses of the underlying Fidelity Central Funds.
The Money Market Central Funds seek preservation of capital and current income and are managed by Fidelity Investments Money Management, Inc. (FIMM), an affiliate of the investment adviser. Annualized expenses of the Money Market Central Funds as of their most recent shareholder report date are less than .005%.
A complete unaudited list of holdings for each Fidelity Central Fund is available upon request or at the Securities and Exchange Commission (the SEC) website at www.sec.gov. In addition, the financial statements of the Fidelity Central Funds are available on the SEC website or upon request.
3. Significant Accounting Policies.
The Fund is an investment company and applies the accounting and reporting guidance of the Financial Accounting Standards Board (FASB) Accounting Standards Codification Topic 946 Financial Services – Investments Companies. The financial statements have been prepared in conformity with accounting principles generally accepted in the United States of America (GAAP), which require management to make certain estimates and assumptions at the date of the financial statements. Actual results could differ from those estimates. Subsequent events, if any, through the date that the financial statements were issued have been evaluated in the preparation of the financial statements. The following summarizes the significant accounting policies of the Fund:
Investment Valuation. Investments are valued as of 4:00 p.m. Eastern time on the last calendar day of the period. The Board of Trustees (the Board) has delegated the day to day responsibility for the valuation of the Fund's investments to the Fair Value Committee (the Committee) established by the Fund's investment adviser. In accordance with valuation policies and procedures approved by the Board, the Fund attempts to obtain prices from one or more third party pricing vendors or brokers to value its investments. When current market prices, quotations or currency exchange rates are not readily available or reliable, investments will be fair valued in good faith by the Committee, in accordance with procedures adopted by the Board. Factors used in determining fair value vary by investment type and may include market or investment specific events, changes in interest rates and credit quality. The frequency with which these procedures are used cannot be predicted and they may be utilized to a significant extent. The Committee oversees the Fund's valuation policies and procedures and reports to the Board on the Committee's activities and fair value determinations. The Board monitors the appropriateness of the procedures used in valuing the Fund's investments and ratifies the fair value determinations of the Committee.
The Fund categorizes the inputs to valuation techniques used to value its investments into a disclosure hierarchy consisting of three levels as shown below:
- Level 1 – quoted prices in active markets for identical investments
- Level 2 – other significant observable inputs (including quoted prices for similar investments, interest rates, prepayment speeds, etc.)
- Level 3 – unobservable inputs (including the Fund's own assumptions based on the best information available)
Valuation techniques used to value the Fund's investments by major category are as follows:
Equity securities, including restricted securities, for which market quotations are readily available, are valued at the last reported sale price or official closing price as reported by a third party pricing vendor on the primary market or exchange on which they are traded and are categorized as Level 1 in the hierarchy. In the event there were no sales during the day or closing prices are not available, securities are valued at the last quoted bid price or may be valued using the last available price and are generally categorized as Level 2 in the hierarchy. For foreign equity securities, when market or security specific events arise, comparisons to the valuation of American Depositary Receipts (ADRs), futures contracts, Exchange-Traded Funds (ETFs) and certain indexes as well as quoted prices for similar securities may be used and would be categorized as Level 2 in the hierarchy. Utilizing these techniques may result in transfers between Level 1 and Level 2. For equity securities, including restricted securities, where observable inputs are limited, assumptions about market activity and risk are used and these securities may be categorized as Level 3 in the hierarchy.
Debt securities, including restricted securities, are valued based on evaluated prices received from third party pricing vendors or from brokers who make markets in such securities. Corporate bonds, bank loan obligations and preferred securities are valued by pricing vendors who utilize matrix pricing which considers yield or price of bonds of comparable quality, coupon, maturity and type or by broker-supplied prices. Asset backed securities, collateralized mortgage obligations and commercial mortgage securities are valued by pricing vendors who utilize matrix pricing which considers prepayment speed assumptions, attributes of the collateral, yield or price of bonds of comparable quality, coupon, maturity and type or by broker-supplied prices. When independent prices are unavailable or unreliable, debt securities may be valued utilizing pricing methodologies which consider similar factors that would be used by third party pricing vendors. Debt securities are generally categorized as Level 2 in the hierarchy but may be Level 3 depending on the circumstances.
Investments in open-end mutual funds, including the Fidelity Central Funds, are valued at their closing net asset value (NAV) each business day and are categorized as Level 1 in the hierarchy.
Changes in valuation techniques may result in transfers in or out of an assigned level within the disclosure hierarchy. The aggregate value of investments by input level as of January 31, 2018, as well as a roll forward of Level 3 investments, is included at the end of the Fund's Schedule of Investments.
Foreign Currency. The Fund may use foreign currency contracts to facilitate transactions in foreign-denominated securities. Gains and losses from these transactions may arise from changes in the value of the foreign currency or if the counterparties do not perform under the contracts' terms.
Foreign-denominated assets, including investment securities, and liabilities are translated into U.S. dollars at the exchange rates at period end. Purchases and sales of investment securities, income and dividends received and expenses denominated in foreign currencies are translated into U.S. dollars at the exchange rate in effect on the transaction date.
The effects of exchange rate fluctuations on investments are included with the net realized and unrealized gain (loss) on investment securities. Other foreign currency transactions resulting in realized and unrealized gain (loss) are disclosed separately.
Investment Transactions and Income. For financial reporting purposes, the Fund's investment holdings and NAV include trades executed through the end of the last business day of the period. The NAV per share for processing shareholder transactions is calculated as of the close of business of the New York Stock Exchange (NYSE), normally 4:00 p.m. Eastern time and includes trades executed through the end of the prior business day. Gains and losses on securities sold are determined on the basis of identified cost and includes proceeds received from litigation. Dividend income is recorded on the ex-dividend date, except for certain dividends from foreign securities where the ex-dividend date may have passed, which are recorded as soon as the Fund is informed of the ex-dividend date. Non-cash dividends included in dividend income, if any, are recorded at the fair market value of the securities received. Income and capital gain distributions from Fidelity Central Funds, if any, are recorded on the ex-dividend date. Certain distributions received by the Fund represent a return of capital or capital gain. The Fund determines the components of these distributions subsequent to the ex-dividend date, based upon receipt of tax filings or other correspondence relating to the underlying investment. These distributions are recorded as a reduction of cost of investments and/or as a realized gain. Interest income is accrued as earned and includes coupon interest and amortization of premium and accretion of discount on debt securities as applicable. For certain lower credit quality securitized assets that have contractual cash flows (for example, asset backed securities, collateralized mortgage obligations and commercial mortgage-backed securities), changes in estimated cash flows are periodically evaluated and the estimated yield is adjusted on a prospective basis, resulting in increases or decreases to Interest Income in the accompanying Statement of Operations. Investment income is recorded net of foreign taxes withheld where recovery of such taxes is uncertain. Debt obligations may be placed on non-accrual status and related interest income may be reduced by ceasing current accruals and writing off interest receivables when the collection of all or a portion of interest has become doubtful based on consistently applied procedures. A debt obligation is removed from non-accrual status when the issuer resumes interest payments or when collectability of interest is reasonably assured.
Class Allocations and Expenses. Investment income, realized and unrealized capital gains and losses, common expenses of the Fund, and certain fund-level expense reductions, if any, are allocated daily on a pro-rata basis to each class based on the relative net assets of each class to the total net assets of the Fund. Each class differs with respect to transfer agent and distribution and service plan fees incurred. Certain expense reductions may also differ by class. For the reporting period, the allocated portion of income and expenses to each class as a percent of its average net assets may vary due to the timing of recording these transactions in relation to fluctuating net assets of the classes. Expenses directly attributable to a fund are charged to that fund. Expenses attributable to more than one fund are allocated among the respective funds on the basis of relative net assets or other appropriate methods. Expense estimates are accrued in the period to which they relate and adjustments are made when actual amounts are known.
Income Tax Information and Distributions to Shareholders. Each year, the Fund intends to qualify as a regulated investment company under Subchapter M of the Internal Revenue Code, including distributing substantially all of its taxable income and realized gains. As a result, no provision for U.S. Federal income taxes is required. The Fund files a U.S. federal tax return, in addition to state and local tax returns as required. The Fund's federal income tax returns are subject to examination by the Internal Revenue Service (IRS) for a period of three fiscal years after they are filed. State and local tax returns may be subject to examination for an additional fiscal year depending on the jurisdiction. Foreign taxes are provided for based on the Fund's understanding of the tax rules and rates that exist in the foreign markets in which it invests.
Distributions are declared and recorded on the ex-dividend date. Income dividends and capital gain distributions are declared separately for each class. Income and capital gain distributions are determined in accordance with income tax regulations, which may differ from GAAP.
Capital accounts within the financial statements are adjusted for permanent book-tax differences. These adjustments have no impact on net assets or the results of operations. Capital accounts are not adjusted for temporary book-tax differences which will reverse in a subsequent period.
Book-tax differences are primarily due to the short-term gain distributions from the Underlying Funds, foreign currency transactions, passive foreign investment companies (PFIC), market discount, equity-debt classifications, certain conversion ratio adjustments, partnerships and losses deferred due to wash sales.
As of period end, the cost and unrealized appreciation (depreciation) in securities, and derivatives if applicable, for federal income tax purposes were as follows:
| Gross unrealized appreciation | $382,838,673 |
| Gross unrealized depreciation | (147,343,108) |
| Net unrealized appreciation (depreciation) | $235,495,565 |
| Tax cost | $5,032,149,264 |
Short-Term Trading (Redemption) Fees. Shares held by investors in the Fund less than 90 days may have been subject to a redemption fee equal to .75% of the NAV of shares redeemed. All redemption fees, which reduce the proceeds of the shareholder redemption, are retained by the Fund and accounted for as an addition to paid in capital. In November 2017, the Board of Trustees approved the elimination of these redemption fees effective December 18, 2017.
Restricted Securities. The Fund may invest in securities that are subject to legal or contractual restrictions on resale. These securities generally may be resold in transactions exempt from registration or to the public if the securities are registered. Disposal of these securities may involve time-consuming negotiations and expense, and prompt sale at an acceptable price may be difficult. Information regarding restricted securities is included at the end of the Fund's Schedule of Investments.
Loans and Other Direct Debt Instruments. The Fund invests in direct debt instruments which are interests in amounts owed to lenders by corporate or other borrowers. These instruments may be in the form of loans, trade claims or other receivables and may include standby financing commitments such as revolving credit facilities that obligate the Fund to supply additional cash to the borrower on demand. Loans may be acquired through assignment or participation. The Fund did not have any unfunded loan commitments, which are contractual obligations for future funding, at period end.
New Accounting Pronouncement. In March 2017, the Financial Accounting Standards Board (FASB) issued an Accounting Standards Update (ASU), ASU 2017-08, which amends the amortization period for certain callable debt securities that are held at a premium. The amendment requires the premium to be amortized to the earliest call date. The amendments do not require an accounting change for securities held at a discount. The ASU is effective for annual periods beginning after December 15, 2018. Management is currently evaluating the potential impact of these changes to the financial statements.
4. Purchases and Sales of Investments.
Purchases and sales of securities, other than short-term securities and U.S. government securities, aggregated $777,525,766 and $631,431,764, respectively.
5. Fees and Other Transactions with Affiliates.
Management Fee. Fidelity Management & Research Company (the investment adviser) and its affiliates provide the Fund with investment management related services for which the Fund pays a monthly management fee. The management fee is the sum of an individual fund fee rate that is based on an annual rate of .30% of the Fund's average net assets and an annualized group fee rate that averaged .24% during the period. The group fee rate is based upon the average net assets of all the mutual funds advised by the investment adviser, including any mutual funds previously advised by the investment adviser that are currently advised by Fidelity SelectCo, LLC, an affiliate of the investment adviser. The group fee rate decreases as assets under management increase and increases as assets under management decrease. For the reporting period, the total annualized management fee rate was .54% of the Fund's average net assets.
Distribution and Service Plan Fees. In accordance with Rule 12b-1 of the 1940 Act, the Fund has adopted separate Distribution and Service Plans for each class of shares. Certain classes pay Fidelity Distributors Corporation (FDC), an affiliate of the investment adviser, separate Distribution and Service Fees, each of which is based on an annual percentage of each class' average net assets. In addition, FDC may pay financial intermediaries for selling shares of the Fund and providing shareholder support services. For the period, the Distribution and Service Fee rates, total fees and amounts retained by FDC were as follows:
| | Distribution Fee | Service Fee | Total Fees | Retained by FDC |
| Class A | -% | .25% | $429,686 | $9,408 |
| Class M | -% | .25% | 78,617 | – |
| Class C | .75% | .25% | 1,400,665 | 200,250 |
| | | | $1,908,968 | $209,658 |
Sales Load. FDC may receive a front-end sales charge of up to 4.00% for selling Class A shares and Class M shares, some of which is paid to financial intermediaries for selling shares of the Fund. Depending on the holding period, FDC may receive contingent deferred sales charges levied on Class A, Class M and Class C redemptions. The deferred sales charges are 1.00% for Class C shares, 1.00% for certain purchases of Class A shares and .25% for certain purchases of Class M shares.
For the period, sales charge amounts retained by FDC were as follows:
| | Retained by FDC |
| Class A | $13,265 |
| Class M | 2,337 |
| Class C(a) | 18,790 |
| | $34,392 |
(a) When Class C shares are initially sold, FDC pays commissions from its own resources to financial intermediaries through which the sales are made.
Transfer Agent Fees. Fidelity Investments Institutional Operations Company, Inc., (FIIOC), an affiliate of the investment adviser, is the transfer, dividend disbursing and shareholder servicing agent for each class of the Fund. FIIOC receives account fees and asset-based fees that vary according to the account size and type of account of the shareholders of the respective classes of the Fund. FIIOC pays for typesetting, printing and mailing of shareholder reports, except proxy statements.
For the period, transfer agent fees for each class were as follows:
| | Amount | % of Class-Level Average Net Assets(a) |
| Class A | $330,561 | .19 |
| Class M | 68,245 | .22 |
| Class C | 263,205 | .19 |
| Real Estate Income | 2,333,727 | .18 |
| Class I | 1,808,276 | .17 |
| | $4,804,014 | |
(a) Annualized
Accounting and Security Lending Fees. Fidelity Service Company, Inc. (FSC), an affiliate of the investment adviser, maintains the Fund's accounting records. The accounting fee is based on the level of average net assets for each month. Under a separate contract, FSC administers the security lending program. The security lending fee is based on the number and duration of lending transactions.
Brokerage Commissions. The Fund placed a portion of its portfolio transactions with brokerage firms which are affiliates of the investment adviser. Brokerage commissions are included in net realized gain (loss) and change in net unrealized appreciation (depreciation) in the Statement of Operations. The commissions paid to these affiliated firms were $4,417 for the period.
Interfund Trades. The Fund may purchase from or sell securities to other Fidelity Funds under procedures adopted by the Board. The procedures have been designed to ensure these interfund trades are executed in accordance with Rule 17a-7 of the 1940 Act. Interfund trades are included within the respective purchases and sales amounts shown in the Purchases and Sales of Investments note.
6. Committed Line of Credit.
The Fund participates with other funds managed by the investment adviser or an affiliate in a $4.25 billion credit facility (the "line of credit") to be utilized for temporary or emergency purposes to fund shareholder redemptions or for other short-term liquidity purposes. The Fund has agreed to pay commitment fees on its pro-rata portion of the line of credit, which amounted to $7,757 and is reflected in Miscellaneous expenses on the Statement of Operations. During the period, the Fund did not borrow on this line of credit.
7. Security Lending.
The Fund lends portfolio securities through a lending agent from time to time in order to earn additional income. For equity securities, a lending agent is used and may loan securities to certain qualified borrowers, including Fidelity Capital Markets (FCM), a broker-dealer affiliated with the Fund. On the settlement date of the loan, the Fund receives collateral (in the form of U.S. Treasury obligations, letters of credit and/or cash) against the loaned securities and maintains collateral in an amount not less than 100% of the market value of the loaned securities during the period of the loan. The market value of the loaned securities is determined at the close of business of the Fund and any additional required collateral is delivered to the Fund on the next business day. The Fund or borrower may terminate the loan at any time, and if the borrower defaults on its obligation to return the securities loaned because of insolvency or other reasons, the Fund may apply collateral received from the borrower against the obligation. The Fund may experience delays and costs in recovering the securities loaned. Any cash collateral received is invested in the Fidelity Securities Lending Cash Central Fund. The value of loaned securities and cash collateral at period end are disclosed on the Fund's Statement of Assets and Liabilities. The value of securities loaned to FCM at period end was $1,637,670. Security lending income represents the income earned on investing cash collateral, less rebates paid to borrowers and any lending agent fees associated with the loan, plus any premium payments received for lending certain types of securities. Security lending income is presented in the Statement of Operations as a component of income from Fidelity Central Funds. Total security lending income during the period amounted to $82,089, including $13,875 from securities loaned to FCM.
8. Expense Reductions.
Commissions paid to certain brokers with whom the investment adviser, or its affiliates, places trades on behalf of the Fund include an amount in addition to trade execution, which may be rebated back to the Fund to offset certain expenses. This amount totaled $22,737 for the period. In addition, through arrangements with the Fund's custodian, credits realized as a result of certain uninvested cash balances were used to reduce the Fund's expenses. During the period, these credits reduced the Fund's custody expenses by $12,537.
In addition, during the period the investment adviser reimbursed and/or waived a portion of fund-level operating expenses in the amount of $27,249.
9. Distributions to Shareholders.
Distributions to shareholders of each class were as follows:
| | Six months ended
January 31, 2018 | Year ended
July 31, 2017 |
| From net investment income | | |
| Class A | $9,452,291 | $19,398,648 |
| Class M | 1,723,645 | 2,428,967 |
| Class C | 6,546,231 | 9,371,104 |
| Real Estate Income | 76,362,036 | 109,435,619 |
| Class I | 61,120,462 | 62,288,219 |
| Total | $155,204,665 | $202,922,557 |
| From net realized gain | | |
| Class A | $3,718,309 | $3,567,509 |
| Class M | 680,353 | 398,948 |
| Class C | 3,070,453 | 1,939,550 |
| Real Estate Income | 28,258,285 | 17,827,432 |
| Class I | 22,382,771 | 8,650,491 |
| Total | $58,110,171 | $32,383,930 |
10. Share Transactions.
Share transactions for each class were as follows and may contain automatic conversions between classes or exchanges between affiliated funds:
| | Shares | Shares | Dollars | Dollars |
| | Six months ended January 31, 2018 | Year ended July 31, 2017 | Six months ended January 31, 2018 | Year ended July 31, 2017 |
| Class A | | | | |
| Shares sold | 3,080,956 | 12,839,240 | $37,209,682 | $153,895,562 |
| Reinvestment of distributions | 1,060,847 | 1,848,521 | 12,790,749 | 21,908,312 |
| Shares redeemed | (5,446,440) | (30,631,418) | (65,680,595) | (367,310,909) |
| Net increase (decrease) | (1,304,637) | (15,943,657) | $(15,680,164) | $(191,507,035) |
| Class M | | | | |
| Shares sold | 448,069 | 1,228,326 | $5,442,597 | $14,708,870 |
| Reinvestment of distributions | 194,165 | 221,980 | 2,342,875 | 2,637,477 |
| Shares redeemed | (808,058) | (1,122,766) | (9,757,251) | (13,419,214) |
| Net increase (decrease) | (165,824) | 327,540 | $(1,971,779) | $3,927,133 |
| Class C | | | | |
| Shares sold | 1,524,914 | 5,359,653 | $18,344,811 | $63,747,841 |
| Reinvestment of distributions | 752,947 | 858,380 | 9,002,475 | 10,109,093 |
| Shares redeemed | (3,714,481) | (6,493,102) | (44,259,755) | (77,061,823) |
| Net increase (decrease) | (1,436,620) | (275,069) | $(16,912,469) | $(3,204,889) |
| Real Estate Income | | | | |
| Shares sold | 23,330,786 | 47,554,214 | $282,882,994 | $573,422,929 |
| Reinvestment of distributions | 7,529,411 | 9,324,516 | 91,225,443 | 111,248,966 |
| Shares redeemed | (26,293,135) | (65,327,473) | (317,808,032) | (784,201,096) |
| Net increase (decrease) | 4,567,062 | (8,448,743) | $56,300,405 | $(99,529,201) |
| Class I | | | | |
| Shares sold | 41,808,703 | 91,593,798 | $507,611,037 | $1,102,392,455 |
| Reinvestment of distributions | 5,547,464 | 4,455,256 | 66,976,330 | 53,081,868 |
| Shares redeemed | (27,335,287) | (38,982,165) | (329,438,507) | (467,715,284) |
| Net increase (decrease) | 20,020,880 | 57,066,889 | $245,148,860 | $687,759,039 |
11. Other.
The Fund's organizational documents provide former and current trustees and officers with a limited indemnification against liabilities arising in connection with the performance of their duties to the Fund. In the normal course of business, the Fund may also enter into contracts that provide general indemnifications. The Fund's maximum exposure under these arrangements is unknown as this would be dependent on future claims that may be made against the Fund. The risk of material loss from such claims is considered remote.
Shareholder Expense Example
As a shareholder of the Fund, you incur two types of costs: (1) transaction costs, including sales charges (loads) on purchase payments or redemption proceeds, redemption fees and (2) ongoing costs, including management fees, distribution and/or service (12b-1) fees and other Fund expenses. This Example is intended to help you understand your ongoing costs (in dollars) of investing in the Fund and to compare these costs with the ongoing costs of investing in other mutual funds.
The Example is based on an investment of $1,000 invested at the beginning of the period and held for the entire period (August 1, 2017 to January 31, 2018).
Actual Expenses
The first line of the accompanying table for each class of the Fund provides information about actual account values and actual expenses. You may use the information in this line, together with the amount you invested, to estimate the expenses that you paid over the period. Simply divide your account value by $1,000.00 (for example, an $8,600 account value divided by $1,000.00 = 8.6), then multiply the result by the number in the first line for a class of the Fund under the heading entitled "Expenses Paid During Period" to estimate the expenses you paid on your account during this period. A small balance maintenance fee of $12.00 that is charged once a year may apply for certain accounts with a value of less than $2,000. This fee is not included in the table below. If it was, the estimate of expenses you paid during the period would be higher, and your ending account value lower, by this amount. In addition, the Fund, as a shareholder in the underlying Fidelity Central Funds, will indirectly bear its pro-rata share of the fees and expenses incurred by the underlying Fidelity Central Funds. These fees and expenses are not included in the Fund's annualized expense ratio used to calculate the expense estimate in the table below.
Hypothetical Example for Comparison Purposes
The second line of the accompanying table for each class of the Fund provides information about hypothetical account values and hypothetical expenses based on a Class' actual expense ratio and an assumed rate of return of 5% per year before expenses, which is not the Class' actual return. The hypothetical account values and expenses may not be used to estimate the actual ending account balance or expenses you paid for the period. You may use this information to compare the ongoing costs of investing in the Fund and other funds. To do so, compare this 5% hypothetical example with the 5% hypothetical examples that appear in the shareholder reports of the other funds. A small balance maintenance fee of $12.00 that is charged once a year may apply for certain accounts with a value of less than $2,000. This fee is not included in the table below. If it was, the estimate of expenses you paid during the period would be higher, and your ending account value lower, by this amount. In addition, the Fund, as a shareholder in the underlying Fidelity Central Funds, will indirectly bear its pro-rata share of the fees and expenses incurred by the underlying Fidelity Central Funds. These fees and expenses are not included in the Fund's annualized expense ratio used to calculate the expense estimate in the table below.
Please note that the expenses shown in the table are meant to highlight your ongoing costs only and do not reflect any transaction costs. Therefore, the second line of the table is useful in comparing ongoing costs only, and will not help you determine the relative total costs of owning different funds. In addition, if these transactional costs were included, your costs would have been higher.
| | Annualized Expense Ratio-A | Beginning
Account Value
August 1, 2017 | Ending
Account Value
January 31, 2018 | Expenses Paid
During Period-B
August 1, 2017
to January 31, 2018 |
| Class A | 1.02% | | | |
| Actual | | $1,000.00 | $984.40 | $5.10 |
| Hypothetical-C | | $1,000.00 | $1,020.06 | $5.19 |
| Class M | 1.04% | | | |
| Actual | | $1,000.00 | $985.00 | $5.20 |
| Hypothetical-C | | $1,000.00 | $1,019.96 | $5.30 |
| Class C | 1.76% | | | |
| Actual | | $1,000.00 | $980.60 | $8.79 |
| Hypothetical-C | | $1,000.00 | $1,016.33 | $8.94 |
| Real Estate Income | .75% | | | |
| Actual | | $1,000.00 | $986.00 | $3.75 |
| Hypothetical-C | | $1,000.00 | $1,021.42 | $3.82 |
| Class I | .75% | | | |
| Actual | | $1,000.00 | $986.10 | $3.75 |
| Hypothetical-C | | $1,000.00 | $1,021.42 | $3.82 |
A Annualized expense ratio reflects expenses net of applicable fee waivers.
B Expenses are equal to each Class' annualized expense ratio, multiplied by the average account value over the period, multiplied by 184/365 (to reflect the one-half year period).
C 5% return per year before expenses
Corporate Headquarters
245 Summer St.
Boston, MA 02210
www.fidelity.com
REI-SANN-0318
1.789716.114
Fidelity® Series Blue Chip Growth Fund
Semi-Annual Report January 31, 2018 |
|
Contents
To view a fund's proxy voting guidelines and proxy voting record for the 12-month period ended June 30, visit http://www.fidelity.com/proxyvotingresults or visit the Securities and Exchange Commission's (SEC) web site at http://www.sec.gov.
You may also call 1-800-544-8544 to request a free copy of the proxy voting guidelines.
Standard & Poor's, S&P and S&P 500 are registered service marks of The McGraw-Hill Companies, Inc. and have been licensed for use by Fidelity Distributors Corporation.
Other third-party marks appearing herein are the property of their respective owners.
All other marks appearing herein are registered or unregistered trademarks or service marks of FMR LLC or an affiliated company. © 2018 FMR LLC. All rights reserved.
This report and the financial statements contained herein are submitted for the general information of the shareholders of the Fund. This report is not authorized for distribution to prospective investors in the Fund unless preceded or accompanied by an effective prospectus.
A fund files its complete schedule of portfolio holdings with the SEC for the first and third quarters of each fiscal year on Form N-Q. Forms N-Q are available on the SEC’s web site at http://www.sec.gov. A fund's Forms N-Q may be reviewed and copied at the SEC’s Public Reference Room in Washington, DC. Information regarding the operation of the SEC's Public Reference Room may be obtained by calling 1-800-SEC-0330.
For a complete list of a fund's portfolio holdings, view the most recent holdings listing, semiannual report, or annual report on Fidelity's web site at http://www.fidelity.com, http://www.institutional.fidelity.com, or http://www.401k.com, as applicable.
NOT FDIC INSURED •MAY LOSE VALUE •NO BANK GUARANTEE
Neither the Fund nor Fidelity Distributors Corporation is a bank.
Investment Summary (Unaudited)
Top Ten Stocks as of January 31, 2018
| | % of fund's net assets |
| Alphabet, Inc. Class A | 7.4 |
| Amazon.com, Inc. | 6.1 |
| Apple, Inc. | 5.4 |
| Facebook, Inc. Class A | 3.9 |
| NVIDIA Corp. | 3.0 |
| Tesla, Inc. | 2.5 |
| Salesforce.com, Inc. | 2.2 |
| Microsoft Corp. | 2.1 |
| Home Depot, Inc. | 1.8 |
| Broadcom Ltd. | 1.8 |
| | 36.2 |
Top Five Market Sectors as of January 31, 2018
| | % of fund's net assets |
| Information Technology | 41.6 |
| Consumer Discretionary | 27.1 |
| Health Care | 12.0 |
| Industrials | 5.8 |
| Consumer Staples | 4.6 |
Asset Allocation (% of fund's net assets)
| As of January 31, 2018* |
| | Stocks | 97.0% |
| | Convertible Securities | 3.2% |
| | Short-Term Investments and Net Other Assets (Liabilities)** | (0.2)% |

* Foreign investments - 13.7%
** Net Other Assets (Liabilities) are not included in the pie chart
Schedule of Investments January 31, 2018 (Unaudited)
Showing Percentage of Net Assets
| Common Stocks - 97.0% | | | |
| | | Shares | Value |
| CONSUMER DISCRETIONARY - 26.7% | | | |
| Auto Components - 0.0% | | | |
| Aptiv PLC | | 37,400 | $3,548,512 |
| Automobiles - 2.5% | | | |
| Tesla, Inc. (a)(b) | | 421,537 | 149,354,774 |
| Diversified Consumer Services - 0.4% | | | |
| Adtalem Global Education, Inc. (a) | | 50,100 | 2,304,600 |
| Chegg, Inc. (a)(b) | | 117,000 | 2,026,440 |
| Grand Canyon Education, Inc. (a) | | 13,800 | 1,283,262 |
| New Oriental Education & Technology Group, Inc. sponsored ADR | | 126,900 | 11,686,221 |
| ServiceMaster Global Holdings, Inc. (a) | | 98,300 | 5,182,376 |
| Weight Watchers International, Inc. (a) | | 19,400 | 1,247,226 |
| | | | 23,730,125 |
| Hotels, Restaurants & Leisure - 3.5% | | | |
| Alsea S.A.B. de CV | | 358,600 | 1,172,999 |
| Caesars Entertainment Corp. (a) | | 405,800 | 5,660,910 |
| Chipotle Mexican Grill, Inc. (a) | | 94,500 | 30,689,820 |
| Delta Corp. Ltd. (a) | | 222,321 | 1,209,544 |
| Eldorado Resorts, Inc. (a) | | 18,300 | 632,265 |
| Hilton Grand Vacations, Inc. (a) | | 28,100 | 1,263,657 |
| Hyatt Hotels Corp. Class A (a) | | 15,400 | 1,252,020 |
| Las Vegas Sands Corp. | | 92,200 | 7,147,344 |
| Marriott International, Inc. Class A | | 94,200 | 13,879,428 |
| Marriott Vacations Worldwide Corp. | | 13,000 | 1,980,290 |
| McDonald's Corp. | | 294,300 | 50,366,502 |
| Melco Crown Entertainment Ltd. sponsored ADR | | 99,900 | 2,975,022 |
| MGM Mirage, Inc. | | 432,100 | 15,750,045 |
| Penn National Gaming, Inc. (a) | | 291,000 | 9,285,810 |
| Royal Caribbean Cruises Ltd. | | 86,800 | 11,592,140 |
| Shake Shack, Inc. Class A (a)(b) | | 181,800 | 7,946,478 |
| Starbucks Corp. | | 355,720 | 20,208,453 |
| U.S. Foods Holding Corp. (a) | | 290,900 | 9,346,617 |
| Vail Resorts, Inc. | | 10,000 | 2,185,600 |
| Wyndham Worldwide Corp. | | 74,000 | 9,185,620 |
| Yum China Holdings, Inc. | | 171,900 | 7,974,441 |
| | | | 211,705,005 |
| Household Durables - 0.7% | | | |
| D.R. Horton, Inc. | | 105,800 | 5,189,490 |
| Forbo Holding AG (Reg.) | | 390 | 659,533 |
| Neinor Homes SLU (c) | | 49,700 | 1,141,543 |
| Newell Brands, Inc. | | 109,900 | 2,905,756 |
| Panasonic Corp. | | 118,900 | 1,765,332 |
| SodaStream International Ltd. (a) | | 199,380 | 15,677,249 |
| Sony Corp. | | 287,300 | 13,779,216 |
| | | | 41,118,119 |
| Internet & Direct Marketing Retail - 8.8% | | | |
| Amazon.com, Inc. (a) | | 252,380 | 366,175,618 |
| Blue Apron Holdings, Inc. Class B | | 228,111 | 675,231 |
| Boohoo.Com PLC (a) | | 943,200 | 2,482,212 |
| Expedia, Inc. | | 13,300 | 1,702,533 |
| JD.com, Inc. sponsored ADR (a) | | 930,300 | 45,798,669 |
| Netflix, Inc. (a) | | 219,546 | 59,343,284 |
| Priceline Group, Inc. (a) | | 25,400 | 48,566,070 |
| Start Today Co. Ltd. | | 63,400 | 1,873,300 |
| The Honest Co., Inc. (a)(d)(e) | | 71,609 | 1,322,217 |
| Wayfair LLC Class A (a) | | 20,100 | 1,849,401 |
| | | | 529,788,535 |
| Leisure Products - 0.1% | | | |
| Spin Master Corp. (a)(c) | | 148,900 | 6,419,648 |
| Media - 0.6% | | | |
| AMC Entertainment Holdings, Inc. Class A (b) | | 42,900 | 549,120 |
| CBS Corp. Class B | | 29,900 | 1,722,539 |
| China Literature Ltd. (a)(c) | | 338,974 | 3,512,089 |
| Live Nation Entertainment, Inc. (a) | | 42,500 | 1,915,050 |
| Naspers Ltd. Class N | | 35,500 | 10,136,376 |
| The Walt Disney Co. | | 79,500 | 8,639,265 |
| Vivendi SA | | 20,700 | 607,293 |
| WME Entertainment Parent, LLC Class A (a)(d)(e)(f) | | 2,954,333 | 7,385,833 |
| | | | 34,467,565 |
| Multiline Retail - 1.5% | | | |
| Avenue Supermarts Ltd. (c) | | 34,373 | 637,950 |
| B&M European Value Retail S.A. | | 352,631 | 2,082,341 |
| Dollar General Corp. | | 36,100 | 3,722,632 |
| Dollar Tree, Inc. (a) | | 634,100 | 72,921,500 |
| Macy's, Inc. | | 126,300 | 3,277,485 |
| Nordstrom, Inc. | | 24,400 | 1,203,164 |
| Ollie's Bargain Outlet Holdings, Inc. (a) | | 49,000 | 2,721,950 |
| Target Corp. | | 53,000 | 3,986,660 |
| V-Mart Retail Ltd. (a) | | 52,016 | 1,216,312 |
| | | | 91,769,994 |
| Specialty Retail - 3.9% | | | |
| Advance Auto Parts, Inc. | | 20,000 | 2,339,800 |
| Burlington Stores, Inc. (a) | | 61,600 | 7,497,336 |
| Dick's Sporting Goods, Inc. | | 72,100 | 2,268,266 |
| Floor & Decor Holdings, Inc. Class A | | 114,800 | 5,384,120 |
| Home Depot, Inc. | | 550,200 | 110,535,180 |
| Lowe's Companies, Inc. | | 314,100 | 32,895,693 |
| O'Reilly Automotive, Inc. (a) | | 23,000 | 6,087,870 |
| RH (a)(b) | | 335,818 | 31,563,534 |
| Ross Stores, Inc. | | 187,400 | 15,439,886 |
| The Children's Place Retail Stores, Inc. | | 20,800 | 3,115,840 |
| TJX Companies, Inc. | | 205,300 | 16,489,696 |
| | | | 233,617,221 |
| Textiles, Apparel & Luxury Goods - 4.7% | | | |
| adidas AG | | 283,957 | 66,032,018 |
| Canada Goose Holdings, Inc. | | 81,700 | 2,939,872 |
| Despegar.com Corp. | | 73,300 | 2,231,985 |
| G-III Apparel Group Ltd. (a) | | 89,480 | 3,342,078 |
| Kering SA | | 79,100 | 40,048,653 |
| lululemon athletica, Inc. (a) | | 525,959 | 41,135,253 |
| LVMH Moet Hennessy - Louis Vuitton SA | | 22,484 | 7,043,139 |
| Michael Kors Holdings Ltd. (a) | | 195,500 | 12,903,000 |
| NIKE, Inc. Class B | | 416,100 | 28,386,342 |
| Prada SpA | | 1,273,100 | 5,199,714 |
| PVH Corp. | | 130,300 | 20,206,924 |
| Shenzhou International Group Holdings Ltd. | | 160,000 | 1,651,614 |
| Skechers U.S.A., Inc. Class A (sub. vtg.) (a) | | 700,100 | 28,837,119 |
| Tapestry, Inc. | | 201,100 | 9,459,744 |
| Tory Burch LLC (d)(e)(f) | | 106,817 | 5,402,804 |
| Under Armour, Inc. Class C (non-vtg.) (a)(b) | | 214,900 | 2,761,465 |
| VF Corp. | | 46,500 | 3,773,010 |
| | | | 281,354,734 |
|
| TOTAL CONSUMER DISCRETIONARY | | | 1,606,874,232 |
|
| CONSUMER STAPLES - 4.2% | | | |
| Beverages - 1.1% | | | |
| Constellation Brands, Inc. Class A (sub. vtg.) | | 97,300 | 21,354,431 |
| Diageo PLC | | 89,216 | 3,211,096 |
| Dr. Pepper Snapple Group, Inc. | | 35,600 | 4,248,860 |
| Fever-Tree Drinks PLC | | 91,484 | 3,179,794 |
| Monster Beverage Corp. (a) | | 470,643 | 32,111,972 |
| | | | 64,106,153 |
| Food & Staples Retailing - 0.8% | | | |
| Costco Wholesale Corp. | | 172,900 | 33,693,023 |
| Kroger Co. | | 273,500 | 8,303,460 |
| Performance Food Group Co. (a) | | 180,800 | 6,210,480 |
| Walmart, Inc. | | 35,400 | 3,773,640 |
| | | | 51,980,603 |
| Food Products - 0.3% | | | |
| Blue Bottle Coffee, Inc. Class C (Escrow) (d)(e) | | 234,006 | 547,574 |
| Bunge Ltd. | | 52,300 | 4,154,189 |
| ConAgra Foods, Inc. | | 16,400 | 623,200 |
| Danone SA | | 20,900 | 1,798,789 |
| Darling International, Inc. (a) | | 95,200 | 1,765,008 |
| Lamb Weston Holdings, Inc. | | 52,800 | 3,094,080 |
| Pinnacle Foods, Inc. | | 10,300 | 637,982 |
| The Hain Celestial Group, Inc. (a) | | 168,600 | 6,430,404 |
| | | | 19,051,226 |
| Household Products - 0.1% | | | |
| Spectrum Brands Holdings, Inc. | | 39,900 | 4,726,554 |
| Personal Products - 1.0% | | | |
| Coty, Inc. Class A | | 497,900 | 9,763,819 |
| Estee Lauder Companies, Inc. Class A | | 70,600 | 9,528,176 |
| Herbalife Ltd. (a)(b) | | 253,438 | 21,032,820 |
| Kose Corp. | | 24,900 | 4,300,208 |
| Unilever NV (NY Reg.) | | 275,000 | 15,809,750 |
| | | | 60,434,773 |
| Tobacco - 0.9% | | | |
| British American Tobacco PLC: | | | |
| (United Kingdom) | | 16,396 | 1,120,612 |
| sponsored ADR | | 479,800 | 32,674,380 |
| Imperial Tobacco Group PLC | | 453 | 18,643 |
| Juul Labs, Inc. (e) | | 2,450 | 53,606 |
| Philip Morris International, Inc. | | 193,500 | 20,749,005 |
| | | | 54,616,246 |
|
| TOTAL CONSUMER STAPLES | | | 254,915,555 |
|
| ENERGY - 2.0% | | | |
| Energy Equipment & Services - 0.1% | | | |
| Shelf Drilling Ltd. (c) | | 212,500 | 1,791,760 |
| U.S. Silica Holdings, Inc. (b) | | 54,100 | 1,800,989 |
| | | | 3,592,749 |
| Oil, Gas & Consumable Fuels - 1.9% | | | |
| Anadarko Petroleum Corp. | | 294,478 | 17,683,404 |
| Andeavor | | 29,300 | 3,169,088 |
| Bharat Petroleum Corp. Ltd. | | 156,201 | 1,209,845 |
| Cenovus Energy, Inc. | | 220,500 | 2,102,817 |
| Cimarex Energy Co. | | 82,030 | 9,203,766 |
| Continental Resources, Inc. (a) | | 360,364 | 20,011,013 |
| Diamondback Energy, Inc. (a) | | 108,600 | 13,629,300 |
| EOG Resources, Inc. | | 95,226 | 10,950,990 |
| Marathon Petroleum Corp. | | 25,200 | 1,745,604 |
| Oasis Petroleum, Inc. (a) | | 191,100 | 1,654,926 |
| Petronet LNG Ltd. | | 172,492 | 691,352 |
| Phillips 66 Co. | | 4,800 | 491,520 |
| Pioneer Natural Resources Co. | | 72,700 | 13,297,557 |
| Reliance Industries Ltd. | | 746,993 | 11,297,740 |
| Valero Energy Corp. | | 42,200 | 4,049,934 |
| Whiting Petroleum Corp. (a) | | 220,300 | 6,150,776 |
| | | | 117,339,632 |
|
| TOTAL ENERGY | | | 120,932,381 |
|
| FINANCIALS - 4.1% | | | |
| Banks - 2.0% | | | |
| Bank of America Corp. | | 1,327,200 | 42,470,400 |
| Citigroup, Inc. | | 321,789 | 25,254,001 |
| First Republic Bank | | 13,300 | 1,191,015 |
| HDFC Bank Ltd. sponsored ADR | | 91,900 | 9,979,421 |
| JPMorgan Chase & Co. | | 305,772 | 35,368,647 |
| Kotak Mahindra Bank Ltd. (a) | | 145,136 | 2,532,230 |
| | | | 116,795,714 |
| Capital Markets - 1.9% | | | |
| BlackRock, Inc. Class A | | 40,000 | 22,472,000 |
| CBOE Holdings, Inc. | | 97,300 | 13,076,147 |
| Charles Schwab Corp. | | 179,000 | 9,547,860 |
| E*TRADE Financial Corp. (a) | | 47,400 | 2,497,980 |
| Fairfax India Holdings Corp. (a) | | 427,900 | 7,899,034 |
| Goldman Sachs Group, Inc. | | 113,300 | 30,351,937 |
| KKR & Co. LP | | 51,400 | 1,237,712 |
| Morgan Stanley | | 266,400 | 15,064,920 |
| MSCI, Inc. | | 13,300 | 1,851,759 |
| TD Ameritrade Holding Corp. | | 168,900 | 9,422,931 |
| The Blackstone Group LP | | 34,500 | 1,260,975 |
| | | | 114,683,255 |
| Consumer Finance - 0.0% | | | |
| Synchrony Financial | | 46,900 | 1,860,992 |
| Diversified Financial Services - 0.1% | | | |
| Berkshire Hathaway, Inc. Class B (a) | | 24,000 | 5,145,120 |
| GDS Holdings Ltd. ADR (a) | | 21,900 | 625,026 |
| | | | 5,770,146 |
| Insurance - 0.1% | | | |
| Chubb Ltd. | | 15,800 | 2,467,170 |
| MetLife, Inc. | | 44,000 | 2,115,080 |
| The Travelers Companies, Inc. | | 17,700 | 2,653,584 |
| | | | 7,235,834 |
|
| TOTAL FINANCIALS | | | 246,345,941 |
|
| HEALTH CARE - 11.8% | | | |
| Biotechnology - 7.7% | | | |
| AC Immune SA (a) | | 223,150 | 2,981,284 |
| ACADIA Pharmaceuticals, Inc. (a) | | 87,700 | 2,623,107 |
| Acceleron Pharma, Inc. (a) | | 19,900 | 826,049 |
| Achaogen, Inc. (a) | | 97,700 | 1,071,769 |
| Agios Pharmaceuticals, Inc. (a) | | 134,323 | 10,579,279 |
| Aimmune Therapeutics, Inc. (a) | | 104,500 | 3,679,445 |
| Alexion Pharmaceuticals, Inc. (a) | | 387,904 | 46,284,705 |
| Alkermes PLC (a) | | 361,300 | 20,655,521 |
| Alnylam Pharmaceuticals, Inc. (a) | | 338,500 | 43,998,230 |
| Amgen, Inc. | | 191,798 | 35,684,018 |
| AnaptysBio, Inc. | | 27,200 | 2,866,608 |
| Arena Pharmaceuticals, Inc. (a) | | 40,800 | 1,526,736 |
| Ascendis Pharma A/S sponsored ADR (a) | | 116,100 | 5,917,617 |
| BeiGene Ltd. ADR (a) | | 29,600 | 4,018,200 |
| Biogen, Inc. (a) | | 116,600 | 40,554,646 |
| BioMarin Pharmaceutical, Inc. (a) | | 83,000 | 7,489,090 |
| bluebird bio, Inc. (a) | | 128,200 | 26,268,180 |
| Blueprint Medicines Corp. (a) | | 11,600 | 912,340 |
| Celgene Corp. (a) | | 212,400 | 21,486,384 |
| Cellectis SA sponsored ADR (a) | | 25,300 | 795,938 |
| Chiasma, Inc. warrants (a) | | 23,784 | 5,773 |
| Chimerix, Inc. (a) | | 31,200 | 149,448 |
| Coherus BioSciences, Inc. (a) | | 185,500 | 1,873,550 |
| CytomX Therapeutics, Inc. (a)(c) | | 137,854 | 3,687,595 |
| CytomX Therapeutics, Inc. (a) | | 53,200 | 1,423,100 |
| DBV Technologies SA sponsored ADR (a) | | 33,900 | 785,124 |
| Denali Therapeutics, Inc. (a)(b) | | 190,800 | 4,438,008 |
| Editas Medicine, Inc. (a)(b) | | 145,389 | 5,308,152 |
| Epizyme, Inc. (a) | | 77,100 | 1,245,165 |
| Exact Sciences Corp. (a) | | 41,800 | 2,077,878 |
| Exelixis, Inc. (a) | | 564,800 | 17,119,088 |
| FibroGen, Inc. (a) | | 67,800 | 3,969,690 |
| Flexion Therapeutics, Inc. (a)(b) | | 21,800 | 492,462 |
| GenSight Biologics SA (a)(c) | | 204,014 | 1,646,408 |
| Global Blood Therapeutics, Inc. (a) | | 157,100 | 9,096,090 |
| Grifols SA ADR | | 30,900 | 767,865 |
| Heron Therapeutics, Inc. (a) | | 35,600 | 770,740 |
| Insmed, Inc. (a) | | 38,700 | 984,528 |
| Intellia Therapeutics, Inc. (a) | | 125,557 | 3,226,815 |
| Intercept Pharmaceuticals, Inc. (a) | | 76,600 | 4,756,860 |
| Ionis Pharmaceuticals, Inc. (a) | | 62,200 | 3,266,744 |
| Ironwood Pharmaceuticals, Inc. Class A (a) | | 376,316 | 5,573,240 |
| La Jolla Pharmaceutical Co. (a) | | 49,300 | 1,689,018 |
| Merrimack Pharmaceuticals, Inc. | | 61,320 | 643,860 |
| Momenta Pharmaceuticals, Inc. (a) | | 35,300 | 600,100 |
| Neurocrine Biosciences, Inc. (a) | | 198,000 | 16,923,060 |
| Portola Pharmaceuticals, Inc. (a) | | 77,000 | 3,950,870 |
| Prothena Corp. PLC (a) | | 38,700 | 1,617,660 |
| Radius Health, Inc. (a)(b) | | 26,800 | 1,009,288 |
| Regeneron Pharmaceuticals, Inc. (a) | | 126,580 | 46,410,557 |
| Sage Therapeutics, Inc. (a) | | 112,886 | 21,425,763 |
| Sarepta Therapeutics, Inc. (a) | | 30,000 | 1,966,200 |
| Seattle Genetics, Inc. (a) | | 77,100 | 4,032,330 |
| Seres Therapeutics, Inc. (a) | | 17,900 | 180,790 |
| Trevena, Inc. (a) | | 265,000 | 431,950 |
| Ultragenyx Pharmaceutical, Inc. (a) | | 33,600 | 1,792,560 |
| Vertex Pharmaceuticals, Inc. (a) | | 39,200 | 6,541,304 |
| Xencor, Inc. (a) | | 70,900 | 1,613,684 |
| Zai Lab Ltd. ADR | | 45,800 | 1,234,768 |
| | | | 464,947,231 |
| Health Care Equipment & Supplies - 1.5% | | | |
| Becton, Dickinson & Co. | | 7,800 | 1,894,932 |
| Boston Scientific Corp. (a) | | 967,000 | 27,037,320 |
| Danaher Corp. | | 92,700 | 9,388,656 |
| Fisher & Paykel Healthcare Corp. | | 68,174 | 670,715 |
| Hoya Corp. | | 10,200 | 523,903 |
| Insulet Corp. (a) | | 55,500 | 4,247,415 |
| Intuitive Surgical, Inc. (a) | | 85,700 | 36,994,119 |
| Invuity, Inc. (a)(b) | | 152,600 | 793,520 |
| iRhythm Technologies, Inc. (a) | | 133,300 | 7,948,679 |
| Novocure Ltd. (a) | | 46,000 | 1,032,700 |
| Penumbra, Inc. (a) | | 4,300 | 428,280 |
| Quanterix Corp. (a) | | 38,600 | 803,266 |
| Stryker Corp. | | 4,300 | 706,834 |
| | | | 92,470,339 |
| Health Care Providers & Services - 1.3% | | | |
| Anthem, Inc. | | 23,000 | 5,700,550 |
| Cigna Corp. | | 41,400 | 8,625,690 |
| Humana, Inc. | | 120,300 | 33,904,149 |
| OptiNose, Inc. (b) | | 121,224 | 2,297,195 |
| UnitedHealth Group, Inc. | | 108,600 | 25,714,308 |
| | | | 76,241,892 |
| Health Care Technology - 0.2% | | | |
| Cerner Corp. (a) | | 86,600 | 5,986,658 |
| Evolent Health, Inc. (a)(b) | | 85,900 | 1,211,190 |
| Teladoc, Inc. (a)(b) | | 97,800 | 3,657,720 |
| | | | 10,855,568 |
| Pharmaceuticals - 1.1% | | | |
| Aclaris Therapeutics, Inc. (a) | | 42,700 | 944,524 |
| Akcea Therapeutics, Inc. | | 221,800 | 4,801,970 |
| Allergan PLC | | 132,900 | 23,956,554 |
| Avexis, Inc. (a) | | 11,600 | 1,435,268 |
| Castle Creek Pharmaceuticals, LLC Class A-2 unit (a)(d)(e)(f)(g) | | 9,636 | 4,914,264 |
| Dermira, Inc. (a) | | 64,700 | 1,845,244 |
| Dova Pharmaceuticals, Inc. | | 36,900 | 1,175,634 |
| GW Pharmaceuticals PLC ADR (a) | | 33,257 | 4,593,789 |
| Intersect ENT, Inc. (a) | | 30,600 | 1,142,910 |
| Jazz Pharmaceuticals PLC (a) | | 43,200 | 6,295,968 |
| Nektar Therapeutics (a) | | 39,084 | 3,267,813 |
| Perrigo Co. PLC | | 13,600 | 1,232,432 |
| Revance Therapeutics, Inc. (a) | | 16,500 | 532,950 |
| The Medicines Company (a) | | 170,200 | 5,638,726 |
| Theravance Biopharma, Inc. (a) | | 17,300 | 457,412 |
| Zogenix, Inc. (a) | | 30,000 | 1,090,500 |
| | | | 63,325,958 |
|
| TOTAL HEALTH CARE | | | 707,840,988 |
|
| INDUSTRIALS - 5.7% | | | |
| Aerospace & Defense - 0.9% | | | |
| Bombardier, Inc. Class B (sub. vtg.) (a) | | 717,700 | 2,030,566 |
| Elbit Systems Ltd. | | 12,800 | 1,917,312 |
| General Dynamics Corp. | | 5,600 | 1,245,888 |
| Northrop Grumman Corp. | | 45,900 | 15,630,327 |
| Raytheon Co. | | 36,100 | 7,542,734 |
| Space Exploration Technologies Corp.: | | | |
| Class A (a)(d)(e) | | 22,703 | 3,064,905 |
| Class C (d)(e) | | 686 | 92,610 |
| The Boeing Co. | | 70,000 | 24,805,900 |
| | | | 56,330,242 |
| Air Freight & Logistics - 0.3% | | | |
| XPO Logistics, Inc. (a) | | 165,700 | 15,648,708 |
| Airlines - 1.3% | | | |
| Allegiant Travel Co. | | 8,000 | 1,274,000 |
| Azul SA sponsored ADR | | 98,800 | 2,883,972 |
| Delta Air Lines, Inc. | | 300,800 | 17,076,416 |
| InterGlobe Aviation Ltd. (c) | | 109,937 | 2,101,447 |
| JetBlue Airways Corp. (a) | | 186,600 | 3,892,476 |
| Ryanair Holdings PLC sponsored ADR (a) | | 10,400 | 1,276,184 |
| Southwest Airlines Co. | | 463,700 | 28,192,960 |
| Spirit Airlines, Inc. (a) | | 125,900 | 5,302,908 |
| United Continental Holdings, Inc. (a) | | 210,200 | 14,255,764 |
| Wizz Air Holdings PLC (a)(c) | | 97,631 | 4,800,458 |
| | | | 81,056,585 |
| Building Products - 0.2% | | | |
| Kajaria Ceramics Ltd. | | 205,790 | 2,045,111 |
| Masco Corp. | | 165,300 | 7,382,298 |
| | | | 9,427,409 |
| Commercial Services & Supplies - 0.1% | | | |
| Copart, Inc. (a) | | 28,800 | 1,269,216 |
| Evoqua Water Technologies Corp. (a) | | 84,500 | 1,931,670 |
| HomeServe PLC | | 250,300 | 2,782,692 |
| Novus Holdings Ltd. | | 13,281 | 5,527 |
| | | | 5,989,105 |
| Construction & Engineering - 0.1% | | | |
| Fluor Corp. | | 52,300 | 3,174,610 |
| Electrical Equipment - 0.3% | | | |
| AMETEK, Inc. | | 10,700 | 816,410 |
| Fortive Corp. | | 24,450 | 1,858,689 |
| Melrose Industries PLC | | 260,914 | 838,719 |
| Nidec Corp. | | 13,200 | 2,124,458 |
| Regal Beloit Corp. | | 111,300 | 8,670,270 |
| Sensata Technologies Holding BV (a) | | 43,900 | 2,469,375 |
| | | | 16,777,921 |
| Industrial Conglomerates - 0.3% | | | |
| Honeywell International, Inc. | | 93,600 | 14,945,112 |
| ITT, Inc. | | 96,000 | 5,376,000 |
| | | | 20,321,112 |
| Machinery - 1.4% | | | |
| Allison Transmission Holdings, Inc. | | 53,500 | 2,366,840 |
| Aumann AG (c) | | 42,400 | 3,505,939 |
| Caterpillar, Inc. | | 308,000 | 50,136,240 |
| Deere & Co. | | 18,600 | 3,095,412 |
| Fanuc Corp. | | 2,900 | 787,113 |
| Gardner Denver Holdings, Inc. | | 86,900 | 3,005,002 |
| Kennametal, Inc. | | 35,600 | 1,736,568 |
| Minebea Mitsumi, Inc. | | 26,400 | 600,851 |
| Parker Hannifin Corp. | | 9,200 | 1,853,064 |
| Rational AG | | 3,300 | 2,318,967 |
| SMC Corp. | | 1,300 | 640,684 |
| WABCO Holdings, Inc. (a) | | 73,400 | 11,332,226 |
| Xylem, Inc. | | 80,900 | 5,845,834 |
| | | | 87,224,740 |
| Professional Services - 0.1% | | | |
| IHS Markit Ltd. (a) | | 109,600 | 5,231,208 |
| Road & Rail - 0.3% | | | |
| Avis Budget Group, Inc. (a) | | 75,900 | 3,412,464 |
| J.B. Hunt Transport Services, Inc. | | 67,800 | 8,192,274 |
| Knight-Swift Transportation Holdings, Inc. Class A | | 66,100 | 3,291,119 |
| Landstar System, Inc. | | 17,300 | 1,921,165 |
| | | | 16,817,022 |
| Trading Companies & Distributors - 0.4% | | | |
| Ashtead Group PLC | | 49,500 | 1,479,448 |
| United Rentals, Inc. (a) | | 94,400 | 17,096,784 |
| Univar, Inc. (a) | | 70,300 | 2,099,158 |
| Wolseley PLC | | 9,187 | 709,081 |
| | | | 21,384,471 |
| Transportation Infrastructure - 0.0% | | | |
| Adani Ports & Special Economic Zone Ltd. | | 91,432 | 616,907 |
|
| TOTAL INDUSTRIALS | | | 340,000,040 |
|
| INFORMATION TECHNOLOGY - 39.6% | | | |
| Communications Equipment - 0.3% | | | |
| Arista Networks, Inc. (a) | | 30,300 | 8,357,346 |
| NETGEAR, Inc. (a) | | 161,000 | 11,221,700 |
| | | | 19,579,046 |
| Electronic Equipment & Components - 0.2% | | | |
| Amphenol Corp. Class A | | 8,000 | 742,160 |
| Corning, Inc. | | 102,200 | 3,190,684 |
| Dell Technologies, Inc. (a) | | 145,300 | 10,418,010 |
| SYNNEX Corp. | | 4,500 | 552,285 |
| | | | 14,903,139 |
| Internet Software & Services - 14.0% | | | |
| 2U, Inc. (a) | | 56,300 | 4,181,401 |
| Akamai Technologies, Inc. (a) | | 59,000 | 3,952,410 |
| Alibaba Group Holding Ltd. sponsored ADR (a) | | 278,700 | 56,935,623 |
| Alphabet, Inc. Class A (a) | | 375,713 | 444,175,424 |
| ANGI Homeservices, Inc. Class A (a) | | 139,900 | 1,869,064 |
| CarGurus, Inc. Class A (b) | | 95,388 | 3,195,498 |
| Facebook, Inc. Class A (a) | | 1,261,955 | 235,846,770 |
| GoDaddy, Inc. (a) | | 47,900 | 2,645,517 |
| Gogo, Inc. (a)(b) | | 570,000 | 5,494,800 |
| GrubHub, Inc. (a)(b) | | 8,200 | 592,450 |
| IAC/InterActiveCorp (a) | | 4,700 | 681,359 |
| LogMeIn, Inc. | | 4,900 | 616,420 |
| Mail.Ru Group Ltd. GDR (Reg. S) (a) | | 126,800 | 4,159,040 |
| Match Group, Inc. (a)(b) | | 23,000 | 803,620 |
| Momo, Inc. ADR (a) | | 102,500 | 3,231,825 |
| NetEase, Inc. ADR | | 28,900 | 9,252,624 |
| New Relic, Inc. (a) | | 8,700 | 519,651 |
| Nutanix, Inc. Class B (c) | | 230,044 | 7,384,412 |
| Okta, Inc. | | 27,300 | 803,985 |
| Shopify, Inc. Class A (a) | | 80,600 | 10,290,589 |
| Stamps.com, Inc. (a) | | 31,700 | 6,462,045 |
| Tencent Holdings Ltd. | | 556,800 | 32,899,891 |
| Yandex NV Series A (a) | | 165,800 | 6,421,434 |
| | | | 842,415,852 |
| IT Services - 4.0% | | | |
| MasterCard, Inc. Class A | | 417,400 | 70,540,600 |
| PayPal Holdings, Inc. (a) | | 632,300 | 53,947,836 |
| Square, Inc. (a) | | 74,000 | 3,471,340 |
| Teradata Corp. (a) | | 8,100 | 328,050 |
| Vakrangee Ltd. | | 355,704 | 2,041,269 |
| Visa, Inc. Class A | | 849,948 | 105,589,040 |
| Worldpay, Inc. (a) | | 70,200 | 5,637,762 |
| | | | 241,555,897 |
| Semiconductors & Semiconductor Equipment - 7.1% | | | |
| ASM Pacific Technology Ltd. | | 236,000 | 3,222,028 |
| ASML Holding NV | | 14,400 | 2,922,624 |
| Broadcom Ltd. | | 431,700 | 107,074,551 |
| Cypress Semiconductor Corp. | | 123,700 | 2,138,773 |
| Inphi Corp. (a) | | 205,700 | 6,144,259 |
| Intel Corp. | | 177,700 | 8,554,478 |
| Lam Research Corp. | | 82,400 | 15,781,248 |
| Marvell Technology Group Ltd. | | 1,075,000 | 25,079,750 |
| Micron Technology, Inc. (a) | | 1,126,800 | 49,263,696 |
| Monolithic Power Systems, Inc. | | 18,256 | 2,174,655 |
| NVIDIA Corp. | | 722,320 | 177,546,256 |
| Qualcomm, Inc. | | 259,800 | 17,731,350 |
| Renesas Electronics Corp. (a) | | 505,800 | 5,960,460 |
| WONIK IPS Co. Ltd. (a) | | 77,393 | 2,383,727 |
| Xilinx, Inc. | | 36,800 | 2,687,136 |
| | | | 428,664,991 |
| Software - 8.6% | | | |
| Activision Blizzard, Inc. | | 1,293,028 | 95,852,166 |
| Adobe Systems, Inc. (a) | | 221,520 | 44,250,835 |
| Altair Engineering, Inc. Class A(a) | | 24,100 | 641,060 |
| Appirio, Inc. (Escrow) (a)(d)(e) | | 43,764 | 10,787 |
| Atlassian Corp. PLC (a) | | 15,300 | 826,047 |
| Atom Tickets LLC (d)(e)(f) | | 344,068 | 1,999,998 |
| Autodesk, Inc. (a) | | 65,200 | 7,538,424 |
| Electronic Arts, Inc. (a) | | 184,500 | 23,424,120 |
| Globant SA (a)(b) | | 15,800 | 717,952 |
| HubSpot, Inc. (a) | | 17,800 | 1,727,490 |
| Intuit, Inc. | | 45,900 | 7,706,610 |
| Micro Focus International PLC | | 105,700 | 3,226,680 |
| Microsoft Corp. | | 1,304,800 | 123,969,048 |
| Nintendo Co. Ltd. | | 21,900 | 9,918,834 |
| Paycom Software, Inc. (a)(b) | | 102,200 | 9,365,608 |
| Red Hat, Inc. (a) | | 109,100 | 14,333,558 |
| RingCentral, Inc. (a) | | 22,900 | 1,243,470 |
| SailPoint Technologies Holding, Inc. (a) | | 75,700 | 1,266,461 |
| Salesforce.com, Inc. (a) | | 1,145,667 | 130,502,928 |
| SendGrid, Inc. (a) | | 35,400 | 795,438 |
| Snap, Inc. Class A (a)(b) | | 394,672 | 5,335,965 |
| Take-Two Interactive Software, Inc. (a) | | 21,100 | 2,672,737 |
| Talend SA ADR (a) | | 40,300 | 1,570,491 |
| Tanium, Inc. Class B (d)(e) | | 151,000 | 835,030 |
| VMware, Inc. Class A (a)(b) | | 45,400 | 5,620,066 |
| Workday, Inc. Class A (a) | | 88,000 | 10,550,320 |
| Zendesk, Inc. (a) | | 236,600 | 9,113,832 |
| | | | 515,015,955 |
| Technology Hardware, Storage & Peripherals - 5.4% | | | |
| Apple, Inc. | | 1,939,634 | 324,752,921 |
|
| TOTAL INFORMATION TECHNOLOGY | | | 2,386,887,801 |
|
| MATERIALS - 2.7% | | | |
| Chemicals - 2.3% | | | |
| Cabot Corp. | | 21,234 | 1,436,268 |
| CF Industries Holdings, Inc. | | 545,800 | 23,163,752 |
| DowDuPont, Inc. | | 273,393 | 20,663,043 |
| FMC Corp. | | 169,900 | 15,516,967 |
| LG Chemical Ltd. | | 8,269 | 3,339,152 |
| LyondellBasell Industries NV Class A | | 269,700 | 32,320,848 |
| Nutrien Ltd. (a) | | 34,280 | 1,793,429 |
| Orion Engineered Carbons SA | | 64,700 | 1,905,415 |
| PPG Industries, Inc. | | 10,500 | 1,246,665 |
| Sherwin-Williams Co. | | 5,800 | 2,419,238 |
| The Chemours Co. LLC | | 375,000 | 19,357,500 |
| The Mosaic Co. | | 23,300 | 636,090 |
| Tronox Ltd. Class A | | 377,100 | 7,402,473 |
| Westlake Chemical Corp. | | 36,000 | 4,053,600 |
| | | | 135,254,440 |
| Construction Materials - 0.3% | | | |
| Buzzi Unicem SpA | | 22,600 | 663,596 |
| Eagle Materials, Inc. | | 72,600 | 8,134,830 |
| Loma Negra Compania Industrial Argentina SA ADR (a) | | 88,600 | 2,105,136 |
| Summit Materials, Inc. | | 300,752 | 9,609,026 |
| | | | 20,512,588 |
| Metals & Mining - 0.1% | | | |
| China Molybdenum Co. Ltd. (H Shares) | | 6,048,000 | 4,654,300 |
| Franco-Nevada Corp. | | 14,800 | 1,131,659 |
| Glencore Xstrata PLC | | 363,060 | 2,081,036 |
| | | | 7,866,995 |
|
| TOTAL MATERIALS | | | 163,634,023 |
|
| REAL ESTATE - 0.1% | | | |
| Equity Real Estate Investment Trusts (REITs) - 0.1% | | | |
| Equinix, Inc. | | 6,700 | 3,049,773 |
| TELECOMMUNICATION SERVICES - 0.1% | | | |
| Wireless Telecommunication Services - 0.1% | | | |
| T-Mobile U.S., Inc. (a) | | 110,600 | 7,200,060 |
| UTILITIES - 0.0% | | | |
| Gas Utilities - 0.0% | | | |
| China Resource Gas Group Ltd. | | 184,000 | 605,677 |
| ENN Energy Holdings Ltd. | | 82,000 | 633,136 |
| | | | 1,238,813 |
| Water Utilities - 0.0% | | | |
| AquaVenture Holdings Ltd. (a) | | 46,900 | 713,349 |
|
| TOTAL UTILITIES | | | 1,952,162 |
|
| TOTAL COMMON STOCKS | | | |
| (Cost $3,228,568,120) | | | 5,839,632,956 |
|
| Preferred Stocks - 3.2% | | | |
| Convertible Preferred Stocks - 3.2% | | | |
| CONSUMER DISCRETIONARY - 0.4% | | | |
| Hotels, Restaurants & Leisure - 0.1% | | | |
| MOD Super Fast Pizza Holdings LLC Series 3 Preferred (a)(d)(e)(f) | | 24,573 | 3,438,500 |
| Topgolf International, Inc. Series F (d)(e) | | 106,191 | 1,468,993 |
| | | | 4,907,493 |
| Internet & Direct Marketing Retail - 0.3% | | | |
| China Internet Plus Holdings Ltd. Series A-11 (a)(d)(e) | | 1,581,852 | 8,841,066 |
| The Honest Co., Inc.: | | | |
| Series C (a)(d)(e) | | 167,087 | 5,221,068 |
| Series D (a)(d)(e) | | 27,712 | 934,817 |
| Series E (d)(e) | | 143,059 | 2,804,643 |
| | | | 17,801,594 |
| Leisure Products - 0.0% | | | |
| Peloton Interactive, Inc. Series E (d)(e) | | 94,313 | 2,338,019 |
| TOTAL CONSUMER DISCRETIONARY | | | 25,047,106 |
| CONSUMER STAPLES - 0.4% | | | |
| Tobacco - 0.4% | | | |
| PAX Labs, Inc. Series C (a)(d)(e) | | 945,100 | 20,678,788 |
| FINANCIALS - 0.1% | | | |
| Consumer Finance - 0.1% | | | |
| Oportun Finance Corp. Series H (a)(d)(e) | | 1,527,120 | 4,352,292 |
| HEALTH CARE - 0.2% | | | |
| Biotechnology - 0.1% | | | |
| 23andMe, Inc. Series F (d)(e) | | 195,114 | 2,709,002 |
| Axcella Health, Inc. Series C (a)(d)(e) | | 248,015 | 3,204,354 |
| Immunocore Ltd. Series A (a)(d)(e) | | 4,035 | 1,502,283 |
| | | | 7,415,639 |
| Health Care Providers & Services - 0.1% | | | |
| Mulberry Health, Inc. Series A8 (a)(d)(e) | | 813,618 | 5,247,836 |
| TOTAL HEALTH CARE | | | 12,663,475 |
| INDUSTRIALS - 0.1% | | | |
| Aerospace & Defense - 0.1% | | | |
| Space Exploration Technologies Corp.: | | | |
| Series G (a)(d)(e) | | 42,650 | 5,757,750 |
| Series H (d)(e) | | 6,348 | 856,980 |
| | | | 6,614,730 |
| Professional Services - 0.0% | | | |
| YourPeople, Inc. Series C (a)(d)(e) | | 253,888 | 1,421,773 |
| TOTAL INDUSTRIALS | | | 8,036,503 |
| INFORMATION TECHNOLOGY - 2.0% | | | |
| Internet Software & Services - 1.7% | | | |
| ContextLogic, Inc. Series G (d)(e) | | 34,750 | 4,675,022 |
| Jet.Com, Inc. Series B1 (Escrow) (a)(d)(e) | | 922,232 | 302,907 |
| Reddit, Inc. Series B (d)(e) | | 129,280 | 2,039,250 |
| Starry, Inc. Series C (d)(e) | | 1,477,502 | 1,362,257 |
| Uber Technologies, Inc.: | | | |
| Series D, 8.00% (a)(d)(e) | | 2,578,476 | 90,504,508 |
| Series E, 8.00% (a)(d)(e) | | 47,420 | 1,664,442 |
| | | | 100,548,386 |
| IT Services - 0.1% | | | |
| AppNexus, Inc. Series E (a)(d)(e) | | 307,049 | 6,171,685 |
| Software - 0.2% | | | |
| Appirio, Inc. Series E (Escrow) (a)(d)(e) | | 306,351 | 77,862 |
| Cloudflare, Inc. Series D, 8.00% (a)(d)(e) | | 323,080 | 1,935,249 |
| Compass, Inc. Series E (d)(e) | | 13,605 | 918,041 |
| Dataminr, Inc. Series D (a)(d)(e) | | 115,901 | 1,191,462 |
| Delphix Corp. Series D (a)(d)(e) | | 242,876 | 1,454,827 |
| Malwarebytes Corp. Series B (a)(d)(e) | | 329,349 | 4,465,972 |
| Taboola.Com Ltd. Series E (a)(d)(e) | | 289,958 | 4,456,654 |
| | | | 14,500,067 |
| TOTAL INFORMATION TECHNOLOGY | | | 121,220,138 |
|
| TOTAL CONVERTIBLE PREFERRED STOCKS | | | 191,998,302 |
|
| Nonconvertible Preferred Stocks - 0.0% | | | |
| CONSUMER DISCRETIONARY - 0.0% | | | |
| Automobiles - 0.0% | | | |
| Volkswagen AG | | 11,100 | 2,439,549 |
| CONSUMER STAPLES - 0.0% | | | |
| Tobacco - 0.0% | | | |
| PAX Labs, Inc. Series A (d)(e) | | 945,100 | 1,256,983 |
|
| TOTAL NONCONVERTIBLE PREFERRED STOCKS | | | 3,696,532 |
|
| TOTAL PREFERRED STOCKS | | | |
| (Cost $119,278,606) | | | 195,694,834 |
|
| Money Market Funds - 3.6% | | | |
| Fidelity Cash Central Fund, 1.39% (h) | | 3,224,647 | 3,225,292 |
| Fidelity Securities Lending Cash Central Fund 1.40% (h)(i) | | 213,206,631 | 213,227,952 |
| TOTAL MONEY MARKET FUNDS | | | |
| (Cost $216,453,244) | | | 216,453,244 |
| TOTAL INVESTMENT IN SECURITIES - 103.8% | | | |
| (Cost $3,564,299,970) | | | 6,251,781,034 |
| NET OTHER ASSETS (LIABILITIES) - (3.8)% | | | (230,144,555) |
| NET ASSETS - 100% | | | $6,021,636,479 |
Legend
(a) Non-income producing
(b) Security or a portion of the security is on loan at period end.
(c) Security exempt from registration under Rule 144A of the Securities Act of 1933. These securities may be resold in transactions exempt from registration, normally to qualified institutional buyers. At the end of the period, the value of these securities amounted to $36,629,249 or 0.6% of net assets.
(d) Restricted securities - Investment in securities not registered under the Securities Act of 1933 (excluding 144A issues). At the end of the period, the value of restricted securities (excluding 144A issues) amounted to $218,831,307 or 3.6% of net assets.
(e) Level 3 security
(f) Investment is owned by a wholly-owned subsidiary (Subsidiary) that is treated as a corporation for U.S. tax purposes.
(g) Investment represents common shares and preferred shares.
(h) Affiliated fund that is generally available only to investment companies and other accounts managed by Fidelity Investments. The rate quoted is the annualized seven-day yield of the fund at period end. A complete unaudited listing of the fund's holdings as of its most recent quarter end is available upon request. In addition, each Fidelity Central Fund's financial statements are available on the SEC's website or upon request.
(i) Investment made with cash collateral received from securities on loan.
Additional information on each restricted holding is as follows:
| Security | Acquisition Date | Acquisition Cost |
| 23andMe, Inc. Series F | 8/31/17 | $2,709,002 |
| Appirio, Inc. (Escrow) | 7/7/17 | $10,096 |
| Appirio, Inc. Series E (Escrow) | 11/24/16 | $77,863 |
| AppNexus, Inc. Series E | 8/1/14 | $6,150,867 |
| Atom Tickets LLC | 8/15/17 | $1,999,998 |
| Axcella Health, Inc. Series C | 1/30/15 | $2,499,991 |
| Blue Bottle Coffee, Inc. Class C (Escrow) | 10/30/17 | $547,574 |
| Castle Creek Pharmaceuticals, LLC Class A-2 unit | 9/29/16 | $3,179,880 |
| China Internet Plus Holdings Ltd. Series A-11 | 1/26/15 | $4,999,997 |
| Cloudflare, Inc. Series D, 8.00% | 11/5/14 - 6/24/15 | $2,010,032 |
| Compass, Inc. Series E | 11/3/17 | $918,041 |
| ContextLogic, Inc. Series G | 10/24/17 | $4,675,022 |
| Dataminr, Inc. Series D | 3/6/15 | $1,477,738 |
| Delphix Corp. Series D | 7/10/15 | $2,185,884 |
| Immunocore Ltd. Series A | 7/27/15 | $759,303 |
| Jet.Com, Inc. Series B1 (Escrow) | 9/19/16 | $302,907 |
| Malwarebytes Corp. Series B | 12/21/15 | $3,416,996 |
| MOD Super Fast Pizza Holdings LLC Series 3 Preferred | 11/3/16 - 12/14/17 | $3,084,966 |
| Mulberry Health, Inc. Series A8 | 1/20/16 | $5,495,786 |
| Oportun Finance Corp. Series H | 2/6/15 | $4,348,169 |
| PAX Labs, Inc. Series A | 5/22/15 | $699,375 |
| PAX Labs, Inc. Series C | 5/22/15 | $2,939,260 |
| Peloton Interactive, Inc. Series E | 3/31/17 | $2,042,989 |
| Reddit, Inc. Series B | 7/26/17 | $1,835,324 |
| Space Exploration Technologies Corp. Class A | 4/6/17 - 9/11/17 | $2,534,625 |
| Space Exploration Technologies Corp. Class C | 9/11/17 | $92,610 |
| Space Exploration Technologies Corp. Series G | 1/20/15 | $3,303,669 |
| Space Exploration Technologies Corp. Series H | 8/4/17 | $856,980 |
| Starry, Inc. Series C | 12/8/17 | $1,362,257 |
| Taboola.Com Ltd. Series E | 12/22/14 | $3,022,928 |
| Tanium, Inc. Class B | 4/21/17 | $749,609 |
| The Honest Co., Inc. | 8/21/14 | $1,937,546 |
| The Honest Co., Inc. Series C | 8/21/14 | $4,520,923 |
| The Honest Co., Inc. Series D | 8/3/15 | $1,267,963 |
| The Honest Co., Inc. Series E | 9/28/17 | $2,804,643 |
| Topgolf International, Inc. Series F | 11/10/17 | $1,468,993 |
| Tory Burch LLC | 5/14/15 | $7,600,030 |
| Uber Technologies, Inc. Series D, 8.00% | 6/6/14 | $40,000,027 |
| Uber Technologies, Inc. Series E, 8.00% | 12/5/14 | $1,579,919 |
| WME Entertainment Parent, LLC Class A | 4/13/16 - 8/16/16 | $5,974,752 |
| YourPeople, Inc. Series C | 5/1/15 | $3,783,205 |
Affiliated Central Funds
Information regarding fiscal year to date income earned by the Fund from investments in Fidelity Central Funds is as follows:
| Fund | Income earned |
| Fidelity Cash Central Fund | $58,426 |
| Fidelity Securities Lending Cash Central Fund | 1,139,979 |
| Total | $1,198,405 |
Amounts in the income column in the above table include any capital gain distributions from underlying funds, which are presented in the corresponding line-item in the Statement of Operations if applicable.
Investment Valuation
The following is a summary of the inputs used, as of January 31, 2018, involving the Fund's assets and liabilities carried at fair value. The inputs or methodology used for valuing securities may not be an indication of the risk associated with investing in those securities. For more information on valuation inputs, and their aggregation into the levels used below, please refer to the Investment Valuation section in the accompanying Notes to Financial Statements.
| | Valuation Inputs at Reporting Date: |
| Description | Total | Level 1 | Level 2 | Level 3 |
| Investments in Securities: | | | | |
| Equities: | | | | |
| Consumer Discretionary | $1,634,360,887 | $1,570,066,709 | $25,136,218 | $39,157,960 |
| Consumer Staples | 276,851,326 | 243,883,670 | 10,430,705 | 22,536,951 |
| Energy | 120,932,381 | 120,932,381 | -- | -- |
| Financials | 250,698,233 | 246,345,941 | -- | 4,352,292 |
| Health Care | 720,504,463 | 702,397,048 | 529,676 | 17,577,739 |
| Industrials | 348,036,543 | 332,689,419 | 4,153,106 | 11,194,018 |
| Information Technology | 2,508,107,939 | 2,335,262,801 | 48,779,185 | 124,065,953 |
| Materials | 163,634,023 | 163,634,023 | -- | -- |
| Real Estate | 3,049,773 | 3,049,773 | -- | -- |
| Telecommunication Services | 7,200,060 | 7,200,060 | -- | -- |
| Utilities | 1,952,162 | 1,952,162 | -- | -- |
| Money Market Funds | 216,453,244 | 216,453,244 | -- | -- |
| Total Investments in Securities: | $6,251,781,034 | $5,943,867,231 | $89,028,890 | $218,884,913 |
The following is a reconciliation of Investments in Securities and Derivative Instruments for which Level 3 inputs were used in determining value:
| Investments in Securities: | |
| Equities - Information Technology | |
| Beginning Balance | $154,201,176 |
| Net Realized Gain (Loss) on Investment Securities | (1,385) |
| Net Unrealized Gain (Loss) on Investment Securities | (39,089,156) |
| Cost of Purchases | 8,965,414 |
| Proceeds of Sales | (10,096) |
| Amortization/Accretion | -- |
| Transfers into Level 3 | -- |
| Transfers out of Level 3 | -- |
| Ending Balance | $124,065,953 |
| The change in unrealized gain (loss) for the period attributable to Level 3 securities held at January 31, 2018 | $(39,089,156) |
| Other Investments in Securities | |
| Beginning Balance | $69,781,675 |
| Net Realized Gain (Loss) on Investment Securities | 3,051,546 |
| Net Unrealized Gain (Loss) on Investment Securities | 25,162,433 |
| Cost of Purchases | 9,455,636 |
| Proceeds of Sales | (10,848,626) |
| Amortization/Accretion | -- |
| Transfers into Level 3 | -- |
| Transfers out of Level 3 | (1,783,704) |
| Ending Balance | $94,818,960 |
| The change in unrealized gain (loss) for the period attributable to Level 3 securities held at January 31, 2018 | $20,463,592 |
The information used in the above reconciliations represents fiscal year to date activity for any Investments in Securities identified as using Level 3 inputs at either the beginning or the end of the current fiscal period. Transfers in or out of Level 3 represent the beginning value of any Security or Instrument where a change in the pricing level occurred from the beginning to the end of the period. The cost of purchases and the proceeds of sales may include securities received or delivered through corporate actions or exchanges.
Other Information
Distribution of investments by country or territory of incorporation, as a percentage of Total Net Assets, is as follows (Unaudited):
| United States of America | 86.3% |
| Cayman Islands | 3.6% |
| Singapore | 1.8% |
| Germany | 1.2% |
| Netherlands | 1.1% |
| Others (Individually Less Than 1%) | 6.0% |
| | 100.0% |
See accompanying notes which are an integral part of the financial statements.
Financial Statements
Statement of Assets and Liabilities
| | | January 31, 2018 (Unaudited) |
| Assets | | |
Investment in securities, at value (including securities loaned of $211,616,545) — See accompanying schedule:
Unaffiliated issuers (cost $3,347,846,726) | $6,035,327,790 | |
| Fidelity Central Funds (cost $216,453,244) | 216,453,244 | |
| Total Investment in Securities (cost $3,564,299,970) | | $6,251,781,034 |
| Restricted cash | | 176,464 |
| Foreign currency held at value (cost $370,622) | | 370,595 |
| Receivable for investments sold | | 253,673,649 |
| Receivable for fund shares sold | | 944 |
| Dividends receivable | | 1,211,518 |
| Distributions receivable from Fidelity Central Funds | | 154,095 |
| Other receivables | | 363,188 |
| Total assets | | 6,507,731,487 |
| Liabilities | | |
| Payable for investments purchased | $29,397,175 | |
| Payable for fund shares redeemed | 242,615,492 | |
| Other payables and accrued expenses | 853,550 | |
| Collateral on securities loaned | 213,228,791 | |
| Total liabilities | | 486,095,008 |
| Net Assets | | $6,021,636,479 |
| Net Assets consist of: | | |
| Paid in capital | | $3,075,361,396 |
| Undistributed net investment income | | 417,795 |
| Accumulated undistributed net realized gain (loss) on investments and foreign currency transactions | | 259,160,306 |
| Net unrealized appreciation (depreciation) on investments and assets and liabilities in foreign currencies | | 2,686,696,982 |
| Net Assets | | $6,021,636,479 |
| Series Blue Chip Growth: | | |
| Net Asset Value, offering price and redemption price per share ($6,021,636,479 ÷ 400,668,099 shares) | | $15.03 |
See accompanying notes which are an integral part of the financial statements.
Statement of Operations
| | | Six months ended January 31, 2018 (Unaudited) |
| Investment Income | | |
| Dividends | | $18,675,014 |
| Income from Fidelity Central Funds (including $1,139,979 from security lending) | | 1,198,405 |
| Total income | | 19,873,419 |
| Expenses | | |
| Custodian fees and expenses | $98,948 | |
| Independent trustees' fees and expenses | 11,091 | |
| Interest | 6,120 | |
| Miscellaneous | 8,196 | |
| Total expenses before reductions | 124,355 | |
| Expense reductions | (81,204) | 43,151 |
| Net investment income (loss) | | 19,830,268 |
| Realized and Unrealized Gain (Loss) | | |
| Net realized gain (loss) on: | | |
| Investment securities: | | |
| Unaffiliated issuers (net of foreign taxes of $523) | 393,060,946 | |
| Fidelity Central Funds | 4,897 | |
| Foreign currency transactions | (5,342) | |
| Total net realized gain (loss) | | 393,060,501 |
| Change in net unrealized appreciation (depreciation) on: | | |
| Unaffiliated issuers (net of increase in deferred foreign taxes of $583,520) | 638,475,656 | |
| Fidelity Central Funds | (4,049) | |
| Assets and liabilities in foreign currencies | 5,431 | |
| Total change in net unrealized appreciation (depreciation) | | 638,477,038 |
| Net gain (loss) | | 1,031,537,539 |
| Net increase (decrease) in net assets resulting from operations | | $1,051,367,807 |
See accompanying notes which are an integral part of the financial statements.
Statement of Changes in Net Assets
| | Six months ended January 31, 2018 (Unaudited) | Year ended July 31, 2017 |
| Increase (Decrease) in Net Assets | | |
| Operations | | |
| Net investment income (loss) | $19,830,268 | $19,600,185 |
| Net realized gain (loss) | 393,060,501 | 587,442,057 |
| Change in net unrealized appreciation (depreciation) | 638,477,038 | 616,542,740 |
| Net increase (decrease) in net assets resulting from operations | 1,051,367,807 | 1,223,584,982 |
| Distributions to shareholders from net investment income | (30,301,164) | (22,221,065) |
| Distributions to shareholders from net realized gain | (594,846,797) | (63,873,266) |
| Total distributions | (625,147,961) | (86,094,331) |
| Share transactions - net increase (decrease) | 74,407,463 | (1,796,179,085) |
| Total increase (decrease) in net assets | 500,627,309 | (658,688,434) |
| Net Assets | | |
| Beginning of period | 5,521,009,170 | 6,179,697,604 |
| End of period | $6,021,636,479 | $5,521,009,170 |
| Other Information | | |
| Undistributed net investment income end of period | $417,795 | $10,888,691 |
See accompanying notes which are an integral part of the financial statements.
Financial Highlights
Fidelity Series Blue Chip Growth Fund
| | Six months ended (Unaudited) January 31, | Years endedJuly 31, | | | |
| | 2018 | 2017 | 2016 | 2015 | 2014 A |
| Selected Per–Share Data | | | | | |
| Net asset value, beginning of period | $14.07 | $11.47 | $13.36 | $11.18 | $10.00 |
| Income from Investment Operations | | | | | |
| Net investment income (loss)B | .05 | .03 | .02 | .03 | .02 |
| Net realized and unrealized gain (loss) | 2.48 | 2.74 | (.42) | 2.27 | 1.17 |
| Total from investment operations | 2.53 | 2.77 | (.40) | 2.30 | 1.19 |
| Distributions from net investment income | (.07) | (.03) | (.02) | (.02) | (.01) |
| Distributions from net realized gain | (1.50) | (.14) | (1.48) | (.10) | – |
| Total distributions | (1.57) | (.17) | (1.49)C | (.12) | (.01) |
| Net asset value, end of period | $15.03 | $14.07 | $11.47 | $13.36 | $11.18 |
| Total ReturnD,E | 19.61% | 24.50% | (2.63)% | 20.74% | 11.90% |
| Ratios to Average Net AssetsF,G | | | | | |
| Expenses before reductions | - %H,I | .59% | .73% | .79% | .74%H |
| Expenses net of fee waivers, if any | - %H,I | .59% | .73% | .78% | .74%H |
| Expenses net of all reductions | - %H,I | .59% | .73% | .78% | .74%H |
| Net investment income (loss) | .69%H | .26% | .17% | .20% | .26%H |
| Supplemental Data | | | | | |
| Net assets, end of period (000 omitted) | $6,021,636 | $2,208,451 | $2,417,952 | $2,831,293 | $3,288,708 |
| Portfolio turnover rateJ | 38%H | 47% | 55% | 57% | 67%H,K |
A For the period November 7, 2013 (commencement of operations) to July 31, 2014.
B Calculated based on average shares outstanding during the period.
C Total distributions of $1.49 per share is comprised of distributions from net investment income of $.015 and distributions from net realized gain of $1.477 per share.
D Total returns for periods of less than one year are not annualized.
E Total returns would have been lower if certain expenses had not been reduced during the applicable periods shown.
F Fees and expenses of any underlying Fidelity Central Funds are not included in the Fund's expense ratio. The Fund indirectly bears its proportionate share of the expenses of any underlying Fidelity Central Funds.
G Expense ratios reflect operating expenses of the class. Expenses before reductions do not reflect amounts reimbursed by the investment adviser or reductions from brokerage service arrangements or reductions from other expense offset arrangements and do not represent the amount paid by the class during periods when reimbursements or reductions occur. Expense ratios before reductions for start-up periods may not be representative of longer-term operating periods. Expenses net of fee waivers reflect expenses after reimbursement by the investment adviser but prior to reductions from brokerage service arrangements or other expense offset arrangements. Expenses net of all reductions represent the net expenses paid by the class.
H Annualized
I Amount represents less than .005%.
J Amount does not include the portfolio activity of any underlying Fidelity Central Funds.
K Portfolio turnover rate excludes securities received or delivered in-kind.
See accompanying notes which are an integral part of the financial statements.
Notes to Financial Statements (Unaudited)
For the period ended January 31, 2018
1. Organization.
Fidelity Series Blue Chip Growth Fund (the Fund) is a fund of Fidelity Securities Fund (the Trust) and is authorized to issue an unlimited number of shares. Shares of the Fund are only available for purchase by mutual funds for which FMR or an affiliate serves as an investment manager. The Trust is registered under the Investment Company Act of 1940, as amended (the 1940 Act), as an open-end management investment company organized as a Massachusetts business trust.
Effective August 28, 2017, the Fund no longer offered Class F, and all outstanding shares of Class F were exchanged for shares of Series Blue Chip Growth.
2. Investments in Fidelity Central Funds.
The Fund invests in Fidelity Central Funds, which are open-end investment companies generally available only to other investment companies and accounts managed by the investment adviser and its affiliates. The Fund's Schedule of Investments lists each of the Fidelity Central Funds held as of period end, if any, as an investment of the Fund, but does not include the underlying holdings of each Fidelity Central Fund. As an Investing Fund, the Fund indirectly bears its proportionate share of the expenses of the underlying Fidelity Central Funds.
The Money Market Central Funds seek preservation of capital and current income and are managed by Fidelity Investments Money Management, Inc. (FIMM), an affiliate of the investment adviser. Annualized expenses of the Money Market Central Funds as of their most recent shareholder report date are less than .005%.
A complete unaudited list of holdings for each Fidelity Central Fund is available upon request or at the Securities and Exchange Commission (the SEC) website at www.sec.gov. In addition, the financial statements of the Fidelity Central Funds are available on the SEC website or upon request.
3. Significant Accounting Policies.
The Fund is an investment company and applies the accounting and reporting guidance of the Financial Accounting Standards Board (FASB) Accounting Standards Codification Topic 946 Financial Services – Investments Companies. The financial statements have been prepared in conformity with accounting principles generally accepted in the United States of America (GAAP), which require management to make certain estimates and assumptions at the date of the financial statements. Actual results could differ from those estimates. Subsequent events, if any, through the date that the financial statements were issued have been evaluated in the preparation of the financial statements. The following summarizes the significant accounting policies of the Fund:
Investment Valuation. Investments are valued as of 4:00 p.m. Eastern time on the last calendar day of the period. The Board of Trustees (the Board) has delegated the day to day responsibility for the valuation of the Fund's investments to the Fair Value Committee (the Committee) established by the Fund's investment adviser. In accordance with valuation policies and procedures approved by the Board, the Fund attempts to obtain prices from one or more third party pricing vendors or brokers to value its investments. When current market prices, quotations or currency exchange rates are not readily available or reliable, investments will be fair valued in good faith by the Committee, in accordance with procedures adopted by the Board. Factors used in determining fair value vary by investment type and may include market or investment specific events. The frequency with which these procedures are used cannot be predicted and they may be utilized to a significant extent. The Committee oversees the Fund's valuation policies and procedures and reports to the Board on the Committee's activities and fair value determinations. The Board monitors the appropriateness of the procedures used in valuing the Fund's investments and ratifies the fair value determinations of the Committee.
The Fund categorizes the inputs to valuation techniques used to value its investments into a disclosure hierarchy consisting of three levels as shown below:
- Level 1 – quoted prices in active markets for identical investments
- Level 2 – other significant observable inputs (including quoted prices for similar investments, interest rates, prepayment speeds, etc.)
- Level 3 – unobservable inputs (including the Fund's own assumptions based on the best information available)
Valuation techniques used to value the Fund's investments by major category are as follows:
Equity securities, including restricted securities, for which market quotations are readily available, are valued at the last reported sale price or official closing price as reported by a third party pricing vendor on the primary market or exchange on which they are traded and are categorized as Level 1 in the hierarchy. In the event there were no sales during the day or closing prices are not available, securities are valued at the last quoted bid price or may be valued using the last available price and are generally categorized as Level 2 in the hierarchy. For foreign equity securities, when market or security specific events arise, comparisons to the valuation of American Depositary Receipts (ADRs), futures contracts, Exchange-Traded Funds (ETFs) and certain indexes as well as quoted prices for similar securities may be used and would be categorized as Level 2 in the hierarchy. Utilizing these techniques may result in transfers between Level 1 and Level 2. For equity securities, including restricted securities, where observable inputs are limited, assumptions about market activity and risk are used and these securities may be categorized as Level 3 in the hierarchy. Equity securities, including restricted securities, for which observable inputs are not available are valued using alternate valuation approaches, including the market approach and the income approach and are categorized as Level 3 in the hierarchy. The market approach generally consists of using comparable market transactions while the income approach generally consists of using the net present value of estimated future cash flows, adjusted as appropriate for liquidity, credit, market and/or other risk factors.
Investments in open-end mutual funds, including the Fidelity Central Funds, are valued at their closing net asset value (NAV) each business day and are categorized as Level 1 in the hierarchy.
The following provides information on Level 3 securities held by the Fund that were valued at period end based on unobservable inputs. These amounts exclude valuations provided by a broker.
| Asset Type | Fair Value | Valuation Technique(s) | Unobservable Input | Amount or Range/Weighted Average | Impact to Valuation from an Increase in Input(a) |
| Equities | $218,884,913 | Market approach | Transaction price | $0.92- $139.93 / $43.46 | Increase |
| | | | Liquidity preference | $16.35 - $45.76 / $34.80 | Increase |
| | | Market comparable | Transaction price | $10.08- $330.00 / $195.34 | Increase |
| | | | Enterprise value/Sales multiple (EV/S) | 0.8 - 14.3 / 4.7 | Increase |
| | | | Discount rate | 7.5% - 69.1% / 19.1% | Decrease |
| | | | Enterprise value/EBITDA multiple (EV/EBITDA) | 9.1 | Increase |
| | | | Price/Earnings multiple (P/E) | 14.6 | Increase |
| | | | Enterprise value/Gross profit (EV/GP) | 5.5 | Increase |
| | | | Premium rate | 8.0% - 108.0% / 25.0% | Increase |
| | | | Discount for lack of marketability | 10.0% - 25.0% / 15.7% | Decrease |
| | | | Liquidity preference | $4.84 - $23.41 / $16.42 | Increase |
| | | | Proxy premium | 28.2% - 54.5% / 44.8% | Increase |
| | | Recovery value | Recovery value | 0.2% - 2.3% / 1.5% | Increase |
(a) Represents the expected directional change in the fair value of the Level 3 investments that would result from an increase in the corresponding input. A decrease to the unobservable input would have the opposite effect. Significant changes in these inputs could result in significantly higher or lower fair value measurements.
Changes in valuation techniques may result in transfers in or out of an assigned level within the disclosure hierarchy. The aggregate value of investments by input level as of January 31, 2018, as well as a roll forward of Level 3 investments, is included at the end of the Fund's Schedule of Investments.
Foreign Currency. The Fund may use foreign currency contracts to facilitate transactions in foreign-denominated securities. Gains and losses from these transactions may arise from changes in the value of the foreign currency or if the counterparties do not perform under the contracts' terms.
Foreign-denominated assets, including investment securities, and liabilities are translated into U.S. dollars at the exchange rates at period end. Purchases and sales of investment securities, income and dividends received and expenses denominated in foreign currencies are translated into U.S. dollars at the exchange rate in effect on the transaction date.
The effects of exchange rate fluctuations on investments are included with the net realized and unrealized gain (loss) on investment securities. Other foreign currency transactions resulting in realized and unrealized gain (loss) are disclosed separately.
Investment Transactions and Income. For financial reporting purposes, the Fund's investment holdings and NAV include trades executed through the end of the last business day of the period. The NAV per share for processing shareholder transactions is calculated as of the close of business of the New York Stock Exchange (NYSE), normally 4:00 p.m. Eastern time and includes trades executed through the end of the prior business day. Gains and losses on securities sold are determined on the basis of identified cost and includes proceeds received from litigation. Dividend income is recorded on the ex-dividend date, except for certain dividends from foreign securities where the ex-dividend date may have passed, which are recorded as soon as the Fund is informed of the ex-dividend date. Non-cash dividends included in dividend income, if any, are recorded at the fair market value of the securities received. Income and capital gain distributions from Fidelity Central Funds, if any, are recorded on the ex-dividend date. Certain distributions received by the Fund represent a return of capital or capital gain. The Fund determines the components of these distributions subsequent to the ex-dividend date, based upon receipt of tax filings or other correspondence relating to the underlying investment. These distributions are recorded as a reduction of cost of investments and/or as a realized gain. Investment income is recorded net of foreign taxes withheld where recovery of such taxes is uncertain.
Class Allocations and Expenses. Investment income, realized and unrealized capital gains and losses, common expenses of the Fund, and certain fund-level expense reductions, if any, are allocated daily on a pro-rata basis to each class based on the relative net assets of each class to the total net assets of the Fund. Each class differs with respect to fees incurred. Certain expense reductions may also differ by class. For the reporting period, the allocated portion of income and expenses to each class as a percent of its average net assets may vary due to the timing of recording these transactions in relation to fluctuating net assets of the classes. Expenses directly attributable to a fund are charged to that fund. Expenses attributable to more than one fund are allocated among the respective funds on the basis of relative net assets or other appropriate methods. Expense estimates are accrued in the period to which they relate and adjustments are made when actual amounts are known.
Income Tax Information and Distributions to Shareholders. Each year, the Fund intends to qualify as a regulated investment company under Subchapter M of the Internal Revenue Code, including distributing substantially all of its taxable income and realized gains. As a result, no provision for U.S. Federal income taxes is required. The Fund files a U.S. federal tax return, in addition to state and local tax returns as required. The Fund's federal income tax returns are subject to examination by the Internal Revenue Service (IRS) for a period of three fiscal years after they are filed. State and local tax returns may be subject to examination for an additional fiscal year depending on the jurisdiction. Foreign taxes are provided for based on the Fund's understanding of the tax rules and rates that exist in the foreign markets in which it invests. The Fund is subject to a tax imposed on capital gains by certain countries in which it invests. An estimated deferred tax liability for net unrealized appreciation on the applicable securities is included in Other payables and accrued expenses on the Statement of Assets & Liabilities.
Distributions are declared and recorded on the ex-dividend date. Income dividends and capital gain distributions are declared separately for each class. Income and capital gain distributions are determined in accordance with income tax regulations, which may differ from GAAP.
Capital accounts within the financial statements are adjusted for permanent book-tax differences. These adjustments have no impact on net assets or the results of operations. Capital accounts are not adjusted for temporary book-tax differences which will reverse in a subsequent period.
Book-tax differences are primarily due to futures contracts, foreign currency transactions, certain foreign taxes, passive foreign investment companies (PFIC), partnerships, and losses deferred due to wash sales and excise tax regulations.
As of period end, the cost and unrealized appreciation (depreciation) in securities, and derivatives if applicable, for federal income tax purposes were as follows:
| Gross unrealized appreciation | $2,746,231,941 |
| Gross unrealized depreciation | (67,122,972) |
| Net unrealized appreciation (depreciation) | $2,679,108,969 |
| Tax cost | $3,572,672,065 |
Restricted Securities. The Fund may invest in securities that are subject to legal or contractual restrictions on resale. These securities generally may be resold in transactions exempt from registration or to the public if the securities are registered. Disposal of these securities may involve time-consuming negotiations and expense, and prompt sale at an acceptable price may be difficult. Information regarding restricted securities is included at the end of the Fund's Schedule of Investments.
Consolidated Subsidiary. The Fund invests in certain investments through a wholly-owned subsidiary ("Subsidiary"), which may be subject to federal and state taxes upon disposition.
As of period end, the Fund held an investment of $23,317,863 in these Subsidiaries, representing .39% of the Fund's net assets. The financial statements have been consolidated and include accounts of the Fund and each Subsidiary. Accordingly, all inter-company transactions and balances have been eliminated.
Any cash held by the Subsidiaries is restricted as to its use and is presented as Restricted cash in the Statement of Assets and Liabilities.
4. Purchases and Sales of Investments.
Purchases and sales of securities, other than short-term securities, aggregated $1,079,653,849 and $1,581,940,943, respectively.
5. Fees and Other Transactions with Affiliates.
Management Fee. Fidelity Management & Research Company (the investment adviser) and its affiliates provide the Fund with investment management related services for which the Fund does not pay a management fee. Under the management contract, the investment adviser or an affiliate pays all ordinary operating expenses of the Fund, except custody fees, fees and expenses of the independent Trustees, and certain miscellaneous expenses such as proxy and shareholder meeting expenses.
Brokerage Commissions. The Fund placed a portion of its portfolio transactions with brokerage firms which are affiliates of the investment adviser. Brokerage commissions are included in net realized gain (loss) and change in net unrealized appreciation (depreciation) in the Statement of Operations. The commissions paid to these affiliated firms were $20,633 for the period.
Interfund Lending Program. Pursuant to an Exemptive Order issued by the SEC, the Fund, along with other registered investment companies having management contracts with Fidelity Management & Research Company (FMR) or other affiliated entities of FMR, may participate in an interfund lending program. This program provides an alternative credit facility allowing the funds to borrow from, or lend money to, other participating affiliated funds. At period end, there were no interfund loans outstanding. The Fund's activity in this program during the period for which loans were outstanding was as follows:
| Borrower or Lender | Average Loan Balance | Weighted Average Interest Rate | Interest Expense |
| Borrower | $149,750,000 | 1.47% | $6,120 |
Interfund Trades. The Fund may purchase from or sell securities to other Fidelity Funds under procedures adopted by the Board. The procedures have been designed to ensure these interfund trades are executed in accordance with Rule 17a-7 of the 1940 Act. Interfund trades are included within the respective purchases and sales amounts shown in the Purchases and Sales of Investments note.
6. Committed Line of Credit.
The Fund participates with other funds managed by the investment adviser or an affiliate in a $4.25 billion credit facility (the "line of credit") to be utilized for temporary or emergency purposes to fund shareholder redemptions or for other short-term liquidity purposes. The Fund has agreed to pay commitment fees on its pro-rata portion of the line of credit, which amounted to $8,196 and is reflected in Miscellaneous expenses on the Statement of Operations. During the period, the Fund did not borrow on this line of credit.
7. Security Lending.
The Fund lends portfolio securities through a lending agent from time to time in order to earn additional income. For equity securities, a lending agent is used and may loan securities to certain qualified borrowers, including Fidelity Capital Markets (FCM), a broker-dealer affiliated with the Fund. On the settlement date of the loan, the Fund receives collateral (in the form of U.S. Treasury obligations, letters of credit and/or cash) against the loaned securities and maintains collateral in an amount not less than 100% of the market value of the loaned securities during the period of the loan. The market value of the loaned securities is determined at the close of business of the Fund and any additional required collateral is delivered to the Fund on the next business day. The Fund or borrower may terminate the loan at any time, and if the borrower defaults on its obligation to return the securities loaned because of insolvency or other reasons, the Fund may apply collateral received from the borrower against the obligation. The Fund may experience delays and costs in recovering the securities loaned. Any cash collateral received is invested in the Fidelity Securities Lending Cash Central Fund. The value of loaned securities and cash collateral at period end are disclosed on the Fund's Statement of Assets and Liabilities. The value of securities loaned to FCM at period end was $13,504,316. Security lending income represents the income earned on investing cash collateral, less rebates paid to borrowers and any lending agent fees associated with the loan, plus any premium payments received for lending certain types of securities. Security lending income is presented in the Statement of Operations as a component of income from Fidelity Central Funds, and includes $17,933 from securities loaned to FCM.
8. Expense Reductions.
Commissions paid to certain brokers with whom the investment adviser, or its affiliates, places trades on behalf of the Fund include an amount in addition to trade execution, which may be rebated back to the Fund to offset certain expenses. This amount totaled $81,204 for the period.
9. Distributions to Shareholders.
Distributions to shareholders of each class were as follows:
| | Six months ended
January 31, 2018 | Year ended
July 31, 2017 |
| From net investment income | | |
| Series Blue Chip Growth | $30,301,164 | $6,353,988 |
| Class F | – | 15,867,077 |
| Total | $30,301,164 | $22,221,065 |
| From net realized gain | | |
| Series Blue Chip Growth | $594,846,797 | $24,770,768 |
| Class F | – | 39,102,498 |
| Total | $594,846,797 | $63,873,266 |
10. Share Transactions.
Transactions for each class of shares were as follows:
| | Shares | Shares | Dollars | Dollars |
| | Six months ended January 31, 2018 | Year ended July 31, 2017 | Six months ended January 31, 2018 | Year ended July 31, 2017 |
| Series Blue Chip Growth | | | | |
| Shares sold | 255,959,791 | 16,702,875 | $3,590,750,207 | $213,421,848 |
| Reinvestment of distributions | 46,816,082 | 2,696,789 | 625,147,961 | 31,124,756 |
| Shares redeemed | (59,099,753) | (73,247,198) | (838,948,050) | (899,683,273) |
| Net increase (decrease) | 243,676,120 | (53,847,534) | $3,376,950,118 | $(655,136,669) |
| Class F | | | | |
| Shares sold | 1,143,505 | 31,746,375 | $16,094,327 | $392,182,056 |
| Reinvestment of distributions | – | 4,765,212 | – | 54,969,575 |
| Shares redeemed | (236,497,812) | (128,891,023) | (3,318,636,982) | (1,588,194,047) |
| Net increase (decrease) | (235,354,307) | (92,379,436) | $(3,302,542,655) | $(1,141,042,416) |
11. Other.
The Fund's organizational documents provide former and current trustees and officers with a limited indemnification against liabilities arising in connection with the performance of their duties to the Fund. In the normal course of business, the Fund may also enter into contracts that provide general indemnifications. The Fund's maximum exposure under these arrangements is unknown as this would be dependent on future claims that may be made against the Fund. The risk of material loss from such claims is considered remote.
At the end of the period, mutual funds managed by the investment adviser or its affiliates were the owners of record of all of the outstanding shares of the Fund.
Shareholder Expense Example
As a shareholder of the Fund, you incur two types of costs: (1) transaction costs and (2) ongoing costs, including other Fund expenses. This Example is intended to help you understand your ongoing costs (in dollars) of investing in the Fund and to compare these costs with the ongoing costs of investing in other mutual funds.
The Example is based on an investment of $1,000 invested at the beginning of the period and held for the entire period (August 1, 2017 to January 31, 2018).
Actual Expenses
The first line of the accompanying table provides information about actual account values and actual expenses. You may use the information in this line, together with the amount you invested, to estimate the expenses that you paid over the period. Simply divide your account value by $1,000.00 (for example, an $8,600 account value divided by $1,000.00 = 8.6), then multiply the result by the number in the first line under the heading entitled "Expenses Paid During Period" to estimate the expenses you paid on your account during this period. In addition, the Fund, as a shareholder in the underlying Fidelity Central Funds, will indirectly bear its pro-rata share of the fees and expenses incurred by the underlying Fidelity Central Funds. These fees and expenses are not included in the Fund's annualized expense ratio used to calculate the expense estimate in the table below.
Hypothetical Example for Comparison Purposes
The second line of the accompanying table provides information about hypothetical account values and hypothetical expenses based on the Fund's actual expense ratio and an assumed rate of return of 5% per year before expenses, which is not the Fund's actual return. The hypothetical account values and expenses may not be used to estimate the actual ending account balance or expenses you paid for the period. You may use this information to compare the ongoing costs of investing in the Fund and other funds. To do so, compare this 5% hypothetical example with the 5% hypothetical examples that appear in the shareholder reports of the other funds. In addition, the Fund, as a shareholder in the underlying Fidelity Central Funds, will indirectly bear its pro-rata share of the fees and expenses incurred by the underlying Fidelity Central Funds. These fees and expenses are not included in the Fund's annualized expense ratio used to calculate the expense estimate in the table below.
Please note that the expenses shown in the table are meant to highlight your ongoing costs only and do not reflect any transaction costs. Therefore, the second line of the table is useful in comparing ongoing costs only, and will not help you determine the relative total costs of owning different funds.
| | Annualized Expense Ratio-A | Beginning
Account Value
August 1, 2017 | Ending
Account Value
January 31, 2018 | Expenses Paid
During Period-B
August 1, 2017
to January 31, 2018 |
| Series Blue Chip Growth | -- %C | | | |
| Actual | | $1,000.00 | $1,196.10 | $--D |
| Hypothetical-E | | $1,000.00 | $1,025.21 | $--D |
A Annualized expense ratio reflects expenses net of applicable fee waivers.
B Expenses are equal to the Fund's annualized expense ratio, multiplied by the average account value over the period, multiplied by 184/365 (to reflect the one-half year period).
C Amount represents less than .005%
D Amount represents less than $.005
E 5% return per year before expenses
Corporate Headquarters
245 Summer St.
Boston, MA 02210
www.fidelity.com
XS1-SANN-0318
1.967988.104
Fidelity® Series Real Estate Equity Fund
Semi-Annual Report January 31, 2018 |
|
Contents
To view a fund's proxy voting guidelines and proxy voting record for the 12-month period ended June 30, visit http://www.fidelity.com/proxyvotingresults or visit the Securities and Exchange Commission's (SEC) web site at http://www.sec.gov.
You may also call 1-800-544-8544 to request a free copy of the proxy voting guidelines.
Standard & Poor's, S&P and S&P 500 are registered service marks of The McGraw-Hill Companies, Inc. and have been licensed for use by Fidelity Distributors Corporation.
Other third-party marks appearing herein are the property of their respective owners.
All other marks appearing herein are registered or unregistered trademarks or service marks of FMR LLC or an affiliated company. © 2018 FMR LLC. All rights reserved.
This report and the financial statements contained herein are submitted for the general information of the shareholders of the Fund. This report is not authorized for distribution to prospective investors in the Fund unless preceded or accompanied by an effective prospectus.
A fund files its complete schedule of portfolio holdings with the SEC for the first and third quarters of each fiscal year on Form N-Q. Forms N-Q are available on the SEC’s web site at http://www.sec.gov. A fund's Forms N-Q may be reviewed and copied at the SEC’s Public Reference Room in Washington, DC. Information regarding the operation of the SEC's Public Reference Room may be obtained by calling 1-800-SEC-0330.
For a complete list of a fund's portfolio holdings, view the most recent holdings listing, semiannual report, or annual report on Fidelity's web site at http://www.fidelity.com, http://www.institutional.fidelity.com, or http://www.401k.com, as applicable.
NOT FDIC INSURED •MAY LOSE VALUE •NO BANK GUARANTEE
Neither the Fund nor Fidelity Distributors Corporation is a bank.
Investment Summary (Unaudited)
Top Ten Stocks as of January 31, 2018
| | % of fund's net assets |
| Simon Property Group, Inc. | 6.9 |
| AvalonBay Communities, Inc. | 5.7 |
| Boston Properties, Inc. | 5.1 |
| Ventas, Inc. | 4.4 |
| Essex Property Trust, Inc. | 4.2 |
| Public Storage | 4.0 |
| Extra Space Storage, Inc. | 3.7 |
| Prologis, Inc. | 3.4 |
| DCT Industrial Trust, Inc. | 3.3 |
| SL Green Realty Corp. | 3.2 |
| | 43.9 |
Top Five REIT Sectors as of January 31, 2018
| | % of fund's net assets |
| REITs - Apartments | 18.6 |
| REITs - Office Property | 16.8 |
| REITs - Regional Malls | 11.1 |
| REITs - Health Care | 9.1 |
| REITs - Diversified | 8.9 |
Asset Allocation (% of fund's net assets)
| As of January 31, 2018* |
| | Stocks | 98.2% |
| | Short-Term Investments and Net Other Assets (Liabilities) | 1.8% |

* Foreign investments - 0.3%
Schedule of Investments January 31, 2018 (Unaudited)
Showing Percentage of Net Assets
| Common Stocks - 98.2% | | | |
| | | Shares | Value |
| Equity Real Estate Investment Trusts (REITs) - 97.4% | | | |
| REITs - Apartments - 18.6% | | | |
| American Homes 4 Rent Class A | | 1,347,500 | $28,014,525 |
| AvalonBay Communities, Inc. | | 432,135 | 73,635,804 |
| Education Realty Trust, Inc. | | 497,200 | 16,422,516 |
| Equity Residential (SBI) | | 445,751 | 27,462,719 |
| Essex Property Trust, Inc. | | 232,167 | 54,090,268 |
| Mid-America Apartment Communities, Inc. | | 417,335 | 39,801,239 |
| | | | 239,427,071 |
| REITs - Diversified - 8.9% | | | |
| Corrections Corp. of America | | 180,300 | 4,184,763 |
| Digital Realty Trust, Inc. | | 150,700 | 16,870,865 |
| Duke Realty Corp. | | 1,293,500 | 34,161,335 |
| Equinix, Inc. | | 72,000 | 32,773,680 |
| Washington REIT (SBI) | | 927,300 | 26,576,418 |
| | | | 114,567,061 |
| REITs - Health Care - 9.1% | | | |
| Healthcare Realty Trust, Inc. | | 834,600 | 24,929,502 |
| Sabra Health Care REIT, Inc. | | 180,270 | 3,262,887 |
| Ventas, Inc. | | 1,019,663 | 57,070,538 |
| Welltower, Inc. | | 526,991 | 31,603,650 |
| | | | 116,866,577 |
| REITs - Hotels - 7.5% | | | |
| DiamondRock Hospitality Co. | | 2,407,200 | 28,308,672 |
| Host Hotels & Resorts, Inc. | | 1,871,200 | 38,846,112 |
| Sunstone Hotel Investors, Inc. | | 1,776,305 | 29,930,739 |
| | | | 97,085,523 |
| REITs - Management/Investment - 1.3% | | | |
| American Assets Trust, Inc. | | 289,400 | 10,204,244 |
| American Tower Corp. | | 45,000 | 6,646,500 |
| | | | 16,850,744 |
| REITs - Manufactured Homes - 2.8% | | | |
| Equity Lifestyle Properties, Inc. | | 416,145 | 35,921,636 |
| REITs - Office Property - 16.8% | | | |
| Boston Properties, Inc. | | 532,049 | 65,819,782 |
| Corporate Office Properties Trust (SBI) | | 608,092 | 16,600,912 |
| Douglas Emmett, Inc. | | 802,958 | 31,050,386 |
| Highwoods Properties, Inc. (SBI) | | 655,052 | 31,363,890 |
| Hudson Pacific Properties, Inc. | | 958,873 | 30,655,170 |
| SL Green Realty Corp. | | 409,400 | 41,152,888 |
| | | | 216,643,028 |
| REITs - Regional Malls - 11.1% | | | |
| General Growth Properties, Inc. | | 926,818 | 21,344,619 |
| Simon Property Group, Inc. | | 543,823 | 88,844,363 |
| Taubman Centers, Inc. | | 220,322 | 13,582,851 |
| The Macerich Co. | | 305,900 | 19,751,963 |
| | | | 143,523,796 |
| REITs - Shopping Centers - 5.4% | | | |
| Acadia Realty Trust (SBI) | | 580,615 | 14,259,904 |
| Cedar Realty Trust, Inc. | | 1,695,651 | 8,664,777 |
| DDR Corp. | | 1,596,300 | 12,961,956 |
| Urban Edge Properties | | 1,461,550 | 34,171,039 |
| | | | 70,057,676 |
| REITs - Storage - 7.7% | | | |
| Extra Space Storage, Inc. | | 578,596 | 48,301,194 |
| Public Storage | | 263,087 | 51,501,911 |
| | | | 99,803,105 |
| REITs - Warehouse/Industrial - 8.1% | | | |
| Americold Realty Trust (a) | | 384,600 | 7,030,488 |
| DCT Industrial Trust, Inc. | | 710,901 | 42,078,230 |
| Prologis, Inc. | | 683,306 | 44,490,054 |
| Rexford Industrial Realty, Inc. | | 276,704 | 8,215,342 |
| Terreno Realty Corp. | | 91,224 | 3,247,574 |
| | | | 105,061,688 |
| Specialized REITs - 0.1% | | | |
| Safety Income and Growth, Inc. | | 57,210 | 1,007,468 |
|
| TOTAL EQUITY REAL ESTATE INVESTMENT TRUSTS (REITS) | | | 1,256,815,373 |
|
| Hotels, Restaurants & Leisure - 0.2% | | | |
| Hotels, Resorts & Cruise Lines - 0.2% | | | |
| Marriott International, Inc. Class A | | 15,700 | 2,313,238 |
| Real Estate Management & Development - 0.6% | | | |
| Real Estate Development - 0.3% | | | |
| Howard Hughes Corp. (a) | | 30,000 | 3,778,800 |
| Real Estate Operating Companies - 0.3% | | | |
| Vonovia SE | | 90,000 | 4,437,176 |
|
| TOTAL REAL ESTATE MANAGEMENT & DEVELOPMENT | | | 8,215,976 |
|
| TOTAL COMMON STOCKS | | | |
| (Cost $1,135,353,243) | | | 1,267,344,587 |
|
| Money Market Funds - 1.1% | | | |
| Fidelity Cash Central Fund, 1.39% (b) | | | |
| (Cost $13,683,351) | | 13,680,615 | 13,683,351 |
| TOTAL INVESTMENT IN SECURITIES - 99.3% | | | |
| (Cost $1,149,036,594) | | | 1,281,027,938 |
| NET OTHER ASSETS (LIABILITIES) - 0.7% | | | 9,548,430 |
| NET ASSETS - 100% | | | $1,290,576,368 |
Legend
(a) Non-income producing
(b) Affiliated fund that is generally available only to investment companies and other accounts managed by Fidelity Investments. The rate quoted is the annualized seven-day yield of the fund at period end. A complete unaudited listing of the fund's holdings as of its most recent quarter end is available upon request. In addition, each Fidelity Central Fund's financial statements are available on the SEC's website or upon request.
Affiliated Central Funds
Information regarding fiscal year to date income earned by the Fund from investments in Fidelity Central Funds is as follows:
| Fund | Income earned |
| Fidelity Cash Central Fund | $104,209 |
| Fidelity Securities Lending Cash Central Fund | 899 |
| Total | $105,108 |
Amounts in the income column in the above table include any capital gain distributions from underlying funds, which are presented in the corresponding line-item in the Statement of Operations if applicable.
Investment Valuation
All investments are categorized as Level 1 under the Fair Value Hierarchy. The inputs or methodology used for valuing securities may not be an indication of the risk associated with investing in those securities. For more information on valuation inputs please refer to the Investment Valuation section in the accompanying Notes to Financial Statements.
See accompanying notes which are an integral part of the financial statements.
Financial Statements
Statement of Assets and Liabilities
| | | January 31, 2018 (Unaudited) |
| Assets | | |
Investment in securities, at value — See accompanying schedule:
Unaffiliated issuers (cost $1,135,353,243) | $1,267,344,587 | |
| Fidelity Central Funds (cost $13,683,351) | 13,683,351 | |
| Total Investment in Securities (cost $1,149,036,594) | | $1,281,027,938 |
| Receivable for investments sold | | 2,555,455 |
| Receivable for fund shares sold | | 70,120,909 |
| Dividends receivable | | 191,762 |
| Distributions receivable from Fidelity Central Funds | | 13,941 |
| Other receivables | | 24,897 |
| Total assets | | 1,353,934,902 |
| Liabilities | | |
| Payable for investments purchased | $63,299,145 | |
| Payable for fund shares redeemed | 45,983 | |
| Other payables and accrued expenses | 13,406 | |
| Total liabilities | | 63,358,534 |
| Net Assets | | $1,290,576,368 |
| Net Assets consist of: | | |
| Paid in capital | | $1,157,238,544 |
| Distributions in excess of net investment income | | (661,491) |
| Accumulated undistributed net realized gain (loss) on investments and foreign currency transactions | | 2,008,275 |
| Net unrealized appreciation (depreciation) on investments and assets and liabilities in foreign currencies | | 131,991,040 |
| Net Assets | | $1,290,576,368 |
| Series Real Estate Equity: | | |
| Net Asset Value, offering price and redemption price per share ($1,290,576,368 ÷ 104,474,350 shares) | | $12.35 |
See accompanying notes which are an integral part of the financial statements.
Statement of Operations
| | �� | Six months ended January 31, 2018 (Unaudited) |
| Investment Income | | |
| Dividends | | $16,117,315 |
| Income from Fidelity Central Funds | | 105,108 |
| Total income | | 16,222,423 |
| Expenses | | |
| Custodian fees and expenses | $16,596 | |
| Independent trustees' fees and expenses | 2,414 | |
| Miscellaneous | 1,792 | |
| Total expenses | | 20,802 |
| Net investment income (loss) | | 16,201,621 |
| Realized and Unrealized Gain (Loss) | | |
| Net realized gain (loss) on: | | |
| Investment securities: | | |
| Unaffiliated issuers | 23,518,981 | |
| Fidelity Central Funds | (407) | |
| Foreign currency transactions | 4,833 | |
| Total net realized gain (loss) | | 23,523,407 |
| Change in net unrealized appreciation (depreciation) on: | | |
| Investment securities: | | |
| Unaffiliated issuers | (66,660,509) | |
| Assets and liabilities in foreign currencies | (304) | |
| Total change in net unrealized appreciation (depreciation) | | (66,660,813) |
| Net gain (loss) | | (43,137,406) |
| Net increase (decrease) in net assets resulting from operations | | $(26,935,785) |
See accompanying notes which are an integral part of the financial statements.
Statement of Changes in Net Assets
| | Six months ended January 31, 2018 (Unaudited) | Year ended July 31, 2017 |
| Increase (Decrease) in Net Assets | | |
| Operations | | |
| Net investment income (loss) | $16,201,621 | $23,552,245 |
| Net realized gain (loss) | 23,523,407 | 49,376,988 |
| Change in net unrealized appreciation (depreciation) | (66,660,813) | (126,950,888) |
| Net increase (decrease) in net assets resulting from operations | (26,935,785) | (54,021,655) |
| Distributions to shareholders from net investment income | (21,381,353) | (22,513,621) |
| Distributions to shareholders from net realized gain | (41,065,770) | (79,459,350) |
| Total distributions | (62,447,123) | (101,972,971) |
| Share transactions - net increase (decrease) | 145,228,692 | 174,092,049 |
| Total increase (decrease) in net assets | 55,845,784 | 18,097,423 |
| Net Assets | | |
| Beginning of period | 1,234,730,584 | 1,216,633,161 |
| End of period | $1,290,576,368 | $1,234,730,584 |
| Other Information | | |
| Undistributed net investment income end of period | $– | $4,518,241 |
| Distributions in excess of net investment income end of period | $(661,491) | $– |
See accompanying notes which are an integral part of the financial statements.
Financial Highlights
Fidelity Series Real Estate Equity Fund
| | Six months ended (Unaudited) January 31, | Years endedJuly 31, | | | | |
| | 2018 | 2017 | 2016 | 2015 | 2014 | 2013 |
| Selected Per–Share Data | | | | | | |
| Net asset value, beginning of period | $13.28 | $15.28 | $14.18 | $13.85 | $12.87 | $12.39 |
| Income from Investment Operations | | | | | | |
| Net investment income (loss)A | .17 | .25 | .27 | .24 | .23 | .18 |
| Net realized and unrealized gain (loss) | (.44) | (1.06) | 2.07 | 1.11 | 1.31 | .78 |
| Total from investment operations | (.27) | (.81) | 2.34 | 1.35 | 1.54 | .96 |
| Distributions from net investment income | (.22) | (.24)B | (.26) | (.23) | (.21) | (.17) |
| Distributions from net realized gain | (.43) | (.95)B | (.98) | (.79) | (.35) | (.31) |
| Total distributions | (.66)C | (1.19) | (1.24) | (1.02) | (.56) | (.48) |
| Net asset value, end of period | $12.35 | $13.28 | $15.28 | $14.18 | $13.85 | $12.87 |
| Total ReturnD,E | (2.23)% | (5.10)% | 18.69% | 10.04% | 12.72% | 8.06% |
| Ratios to Average Net AssetsF,G | | | | | | |
| Expenses before reductions | - %H,I | .62% | .76% | .76% | .77% | .79% |
| Expenses net of fee waivers, if any | - %H,I | .62% | .76% | .75% | .77% | .79% |
| Expenses net of all reductions | - %H,I | .61% | .75% | .74% | .76% | .78% |
| Net investment income (loss) | 2.61%H | 1.91% | 1.97% | 1.69% | 1.84% | 1.44% |
| Supplemental Data | | | | | | |
| Net assets, end of period (000 omitted) | $1,290,576 | $559,956 | $547,137 | $577,786 | $598,298 | $531,188 |
| Portfolio turnover rateJ | 40%H | 64% | 64% | 60% | 69% | 48% |
A Calculated based on average shares outstanding during the period.
B The amounts shown reflect certain reclassifications related to book to tax differences that were made in the year shown.
C Total distributions of $.66 per share is comprised of distributions from net investment income of $.224 and distributions from net realized gain of $.434 per share.
D Total returns for periods of less than one year are not annualized.
E Total returns would have been lower if certain expenses had not been reduced during the applicable periods shown.
F Fees and expenses of any underlying Fidelity Central Funds are not included in the Fund's expense ratio. The Fund indirectly bears its proportionate share of the expenses of any underlying Fidelity Central Funds.
G Expense ratios reflect operating expenses of the class. Expenses before reductions do not reflect amounts reimbursed by the investment adviser or reductions from brokerage service arrangements or reductions from other expense offset arrangements and do not represent the amount paid by the class during periods when reimbursements or reductions occur. Expenses net of fee waivers reflect expenses after reimbursement by the investment adviser but prior to reductions from brokerage service arrangements or other expense offset arrangements. Expenses net of all reductions represent the net expenses paid by the class.
H Annualized
I Amount represents less than .005%.
J Amount does not include the portfolio activity of any underlying Fidelity Central Funds.
See accompanying notes which are an integral part of the financial statements.
Notes to Financial Statements (Unaudited)
For the period ended January 31, 2018
1. Organization.
Fidelity Series Real Estate Equity Fund (the Fund) is a non-diversified fund of Fidelity Securities Fund (the Trust) and is authorized to issue an unlimited number of shares. Shares of the Fund are only available for purchase by mutual funds for which Fidelity Management & Research Company (FMR) or an affiliate serves as an investment manager. The Trust is registered under the Investment Company Act of 1940, as amended (the 1940 Act), as an open-end management investment company organized as a Massachusetts business trust. Effective August 28, 2017, the Fund no longer offered Class F, and all outstanding shares of Class F were exchanged for shares of Series Real Estate Equity.
2. Investments in Fidelity Central Funds.
The Fund invests in Fidelity Central Funds, which are open-end investment companies generally available only to other investment companies and accounts managed by the investment adviser and its affiliates. The Fund's Schedule of Investments lists each of the Fidelity Central Funds held as of period end, if any, as an investment of the Fund, but does not include the underlying holdings of each Fidelity Central Fund. As an Investing Fund, the Fund indirectly bears its proportionate share of the expenses of the underlying Fidelity Central Funds.
The Money Market Central Funds seek preservation of capital and current income and are managed by Fidelity Investments Money Management, Inc. (FIMM), an affiliate of the investment adviser. Annualized expenses of the Money Market Central Funds as of their most recent shareholder report date are less than .005%.
A complete unaudited list of holdings for each Fidelity Central Fund is available upon request or at the Securities and Exchange Commission (the SEC) website at www.sec.gov. In addition, the financial statements of the Fidelity Central Funds are available on the SEC website or upon request.
3. Significant Accounting Policies.
The Fund is an investment company and applies the accounting and reporting guidance of the Financial Accounting Standards Board (FASB) Accounting Standards Codification Topic 946 Financial Services – Investments Companies. The financial statements have been prepared in conformity with accounting principles generally accepted in the United States of America (GAAP), which require management to make certain estimates and assumptions at the date of the financial statements. Actual results could differ from those estimates. Subsequent events, if any, through the date that the financial statements were issued have been evaluated in the preparation of the financial statements. The following summarizes the significant accounting policies of the Fund:
Investment Valuation. Investments are valued as of 4:00 p.m. Eastern time on the last calendar day of the period. The Board of Trustees (the Board) has delegated the day to day responsibility for the valuation of the Fund's investments to the Fair Value Committee (the Committee) established by the Fund's investment adviser. In accordance with valuation policies and procedures approved by the Board, the Fund attempts to obtain prices from one or more third party pricing vendors or brokers to value its investments. When current market prices, quotations or currency exchange rates are not readily available or reliable, investments will be fair valued in good faith by the Committee, in accordance with procedures adopted by the Board. Factors used in determining fair value vary by investment type and may include market or investment specific events. The frequency with which these procedures are used cannot be predicted and they may be utilized to a significant extent. The Committee oversees the Fund's valuation policies and procedures and reports to the Board on the Committee's activities and fair value determinations. The Board monitors the appropriateness of the procedures used in valuing the Fund's investments and ratifies the fair value determinations of the Committee.
The Fund categorizes the inputs to valuation techniques used to value its investments into a disclosure hierarchy consisting of three levels as shown below:
- Level 1 – quoted prices in active markets for identical investments
- Level 2 – other significant observable inputs (including quoted prices for similar investments, interest rates, prepayment speeds, etc.)
- Level 3 – unobservable inputs (including the Fund's own assumptions based on the best information available)
Valuation techniques used to value the Fund's investments by major category are as follows:
Equity securities, including restricted securities, for which market quotations are readily available, are valued at the last reported sale price or official closing price as reported by a third party pricing vendor on the primary market or exchange on which they are traded and are categorized as Level 1 in the hierarchy. In the event there were no sales during the day or closing prices are not available, securities are valued at the last quoted bid price or may be valued using the last available price and are generally categorized as Level 2 in the hierarchy. For foreign equity securities, when market or security specific events arise, comparisons to the valuation of American Depositary Receipts (ADRs), futures contracts, Exchange-Traded Funds (ETFs) and certain indexes as well as quoted prices for similar securities may be used and would be categorized as Level 2 in the hierarchy. Utilizing these techniques may result in transfers between Level 1 and Level 2. For equity securities, including restricted securities, where observable inputs are limited, assumptions about market activity and risk are used and these securities may be categorized as Level 3 in the hierarchy.
Investments in open-end mutual funds, including the Fidelity Central Funds, are valued at their closing net asset value (NAV) each business day and are categorized as Level 1 in the hierarchy.
Changes in valuation techniques may result in transfers in or out of an assigned level within the disclosure hierarchy.
Foreign Currency. The Fund may use foreign currency contracts to facilitate transactions in foreign-denominated securities. Gains and losses from these transactions may arise from changes in the value of the foreign currency or if the counterparties do not perform under the contracts' terms.
Foreign-denominated assets, including investment securities, and liabilities are translated into U.S. dollars at the exchange rates at period end. Purchases and sales of investment securities, income and dividends received and expenses denominated in foreign currencies are translated into U.S. dollars at the exchange rate in effect on the transaction date.
The effects of exchange rate fluctuations on investments are included with the net realized and unrealized gain (loss) on investment securities. Other foreign currency transactions resulting in realized and unrealized gain (loss) are disclosed separately.
Investment Transactions and Income. For financial reporting purposes, the Fund's investment holdings and NAV include trades executed through the end of the last business day of the period. The NAV per share for processing shareholder transactions is calculated as of the close of business of the New York Stock Exchange (NYSE), normally 4:00 p.m. Eastern time and includes trades executed through the end of the prior business day. Gains and losses on securities sold are determined on the basis of identified cost. Dividend income is recorded on the ex-dividend date, except for certain dividends from foreign securities where the ex-dividend date may have passed, which are recorded as soon as the Fund is informed of the ex-dividend date. Non-cash dividends included in dividend income, if any, are recorded at the fair market value of the securities received. Income and capital gain distributions from Fidelity Central Funds, if any, are recorded on the ex-dividend date. Certain distributions received by the Fund represent a return of capital or capital gain. The Fund determines the components of these distributions subsequent to the ex-dividend date, based upon receipt of tax filings or other correspondence relating to the underlying investment. These distributions are recorded as a reduction of cost of investments and/or as a realized gain. Investment income is recorded net of foreign taxes withheld where recovery of such taxes is uncertain.
Class Allocations and Expenses. Investment income, realized and unrealized capital gains and losses, common expenses of the Fund, and certain fund-level expense reductions, if any, are allocated daily on a pro-rata basis to each class based on the relative net assets of each class to the total net assets of the Fund. Each class differs with respect to fees incurred. Certain expense reductions may also differ by class. For the reporting period, the allocated portion of income and expenses to each class as a percent of its average net assets may vary due to the timing of recording these transactions in relation to fluctuating net assets of the classes. Expenses directly attributable to a fund are charged to that fund. Expenses attributable to more than one fund are allocated among the respective funds on the basis of relative net assets or other appropriate methods. Expense estimates are accrued in the period to which they relate and adjustments are made when actual amounts are known.
Income Tax Information and Distributions to Shareholders. Each year, the Fund intends to qualify as a regulated investment company under Subchapter M of the Internal Revenue Code, including distributing substantially all of its taxable income and realized gains. As a result, no provision for U.S. Federal income taxes is required. The Fund files a U.S. federal tax return, in addition to state and local tax returns as required. The Fund's federal income tax returns are subject to examination by the Internal Revenue Service (IRS) for a period of three fiscal years after they are filed. State and local tax returns may be subject to examination for an additional fiscal year depending on the jurisdiction. Foreign taxes are provided for based on the Fund's understanding of the tax rules and rates that exist in the foreign markets in which it invests.
Distributions are declared and recorded on the ex-dividend date. Income dividends and capital gain distributions are declared separately for each class. Income and capital gain distributions are determined in accordance with income tax regulations, which may differ from GAAP. These differences resulted in distribution reclassifications for the period ended July 31, 2017.
Capital accounts within the financial statements are adjusted for permanent book-tax differences. These adjustments have no impact on net assets or the results of operations. Capital accounts are not adjusted for temporary book-tax differences which will reverse in a subsequent period.
Book-tax differences are primarily due to losses deferred due to wash sales.
As of period end, the cost and unrealized appreciation (depreciation) in securities, and derivatives if applicable, for federal income tax purposes were as follows:
| Gross unrealized appreciation | $168,897,092 |
| Gross unrealized depreciation | (39,527,387) |
| Net unrealized appreciation (depreciation) | $129,369,705 |
| Tax cost | $1,151,658,233 |
4. Purchases and Sales of Investments.
Purchases and sales of securities, other than short-term securities, aggregated $354,208,109 and $246,193,330, respectively.
5. Fees and Other Transactions with Affiliates.
Management Fee. Fidelity Management & Research Company (the investment adviser) and its affiliates provide the Fund with investment management related services for which the Fund does not pay a management fee. Under the management contract, the investment adviser or an affiliate pays all ordinary operating expenses of the Fund, except custody fees, fees and expenses of the independent Trustees, and certain miscellaneous expenses such as proxy and shareholder meeting expenses.
Brokerage Commissions. The Fund placed a portion of its portfolio transactions with brokerage firms which are affiliates of the investment adviser. Brokerage commissions are included in net realized gain (loss) and change in net unrealized appreciation (depreciation) in the Statement of Operations. The commissions paid to these affiliated firms were $5,754 for the period.
Interfund Trades. The Fund may purchase from or sell securities to other Fidelity Funds under procedures adopted by the Board. The procedures have been designed to ensure these interfund trades are executed in accordance with Rule 17a-7 of the 1940 Act. Interfund trades are included within the respective purchases and sales amounts shown in the Purchases and Sales of Investments note.
6. Committed Line of Credit.
The Fund participates with other funds managed by the investment adviser or an affiliate in a $4.25 billion credit facility (the "line of credit") to be utilized for temporary or emergency purposes to fund shareholder redemptions or for other short-term liquidity purposes. The Fund has agreed to pay commitment fees on its pro-rata portion of the line of credit, which amounted to $1,792 and is reflected in Miscellaneous expenses on the Statement of Operations. During the period, the Fund did not borrow on this line of credit.
7. Security Lending.
The Fund lends portfolio securities through a lending agent from time to time in order to earn additional income. For equity securities, a lending agent is used and may loan securities to certain qualified borrowers, including Fidelity Capital Markets (FCM), a broker-dealer affiliated with the Fund. On the settlement date of the loan, the Fund receives collateral (in the form of U.S. Treasury obligations, letters of credit and/or cash) against the loaned securities and maintains collateral in an amount not less than 100% of the market value of the loaned securities during the period of the loan. The market value of the loaned securities is determined at the close of business of the Fund and any additional required collateral is delivered to the Fund on the next business day. The Fund or borrower may terminate the loan at any time, and if the borrower defaults on its obligation to return the securities loaned because of insolvency or other reasons, the Fund may apply collateral received from the borrower against the obligation. The Fund may experience delays and costs in recovering the securities loaned. Any cash collateral received is invested in the Fidelity Securities Lending Cash Central Fund. At period end, there were no security loans outstanding. Security lending income represents the income earned on investing cash collateral, less rebates paid to borrowers and any lending agent fees associated with the loan, plus any premium payments received for lending certain types of securities. Security lending income is presented in the Statement of Operations as a component of income from Fidelity Central Funds. Total security lending income during the period amounted to $899. During the period, there were no securities loaned to FCM.
8. Distributions to Shareholders.
Distributions to shareholders of each class were as follows:
| | Six months ended
January 31, 2018 | Year ended
July 31, 2017 |
| From net investment income | | |
| Series Real Estate Equity | $21,381,353 | $9,577,572 |
| Class F | – | 12,936,049 |
| Total | $21,381,353 | $22,513,621 |
| From net realized gain | | |
| Series Real Estate Equity | $41,065,770 | $35,511,971 |
| Class F | – | 43,947,379 |
| Total | $41,065,770 | $79,459,350 |
9. Share Transactions.
Transactions for each class of shares were as follows:
| | Shares | Shares | Dollars | Dollars |
| | Six months ended January 31, 2018 | Year ended July 31, 2017 | Six months ended January 31, 2018 | Year ended July 31, 2017 |
| Series Real Estate Equity | | | | |
| Shares sold | 63,199,385 | 8,118,474 | $829,541,387 | $105,907,726 |
| Reinvestment of distributions | 4,806,643 | 3,409,552 | 62,447,123 | 45,089,543 |
| Shares redeemed | (5,712,130) | (5,147,441) | (74,554,088) | (68,244,635) |
| Net increase (decrease) | 62,293,898 | 6,380,585 | $817,434,422 | $82,752,634 |
| Class F | | | | |
| Shares sold | 246,978 | 10,878,094 | $3,247,831 | $141,823,703 |
| Reinvestment of distributions | – | 4,301,069 | – | 56,883,428 |
| Shares redeemed | (51,071,400) | (8,146,141) | (675,453,561) | (107,367,716) |
| Net increase (decrease) | (50,824,422) | 7,033,022 | $(672,205,730) | $91,339,415 |
10. Other.
The Fund's organizational documents provide former and current trustees and officers with a limited indemnification against liabilities arising in connection with the performance of their duties to the Fund. In the normal course of business, the Fund may also enter into contracts that provide general indemnifications. The Fund's maximum exposure under these arrangements is unknown as this would be dependent on future claims that may be made against the Fund. The risk of material loss from such claims is considered remote.
At the end of the period, mutual funds managed by the investment adviser or its affiliates were the owners of record of all of the outstanding shares of the Fund.
Shareholder Expense Example
As a shareholder of the Fund, you incur two types of costs: (1) transaction costs, and (2) ongoing costs, including other Fund expenses. This Example is intended to help you understand your ongoing costs (in dollars) of investing in the Fund and to compare these costs with the ongoing costs of investing in other mutual funds.
The Example is based on an investment of $1,000 invested at the beginning of the period and held for the entire period (August 1, 2017 to January 31, 2018).
Actual Expenses
The first line of the accompanying table provides information about actual account values and actual expenses. You may use the information in this line, together with the amount you invested, to estimate the expenses that you paid over the period. Simply divide your account value by $1,000.00 (for example, an $8,600 account value divided by $1,000.00 = 8.6), then multiply the result by the number in the first line under the heading entitled "Expenses Paid During Period" to estimate the expenses you paid on your account during this period. In addition, the Fund, as a shareholder in the underlying Fidelity Central Funds, will indirectly bear its pro-rata share of the fees and expenses incurred by the underlying Fidelity Central Funds. These fees and expenses are not included in the Fund's annualized expense ratio used to calculate the expense estimate in the table below.
Hypothetical Example for Comparison Purposes
The second line of the accompanying table provides information about hypothetical account values and hypothetical expenses based on the Fund's actual expense ratio and an assumed rate of return of 5% per year before expenses, which is not the Fund's actual return. The hypothetical account values and expenses may not be used to estimate the actual ending account balance or expenses you paid for the period. You may use this information to compare the ongoing costs of investing in the Fund and other funds. To do so, compare this 5% hypothetical example with the 5% hypothetical examples that appear in the shareholder reports of the other funds. In addition, the Fund, as a shareholder in the underlying Fidelity Central Funds, will indirectly bear its pro-rata share of the fees and expenses incurred by the underlying Fidelity Central Funds. These fees and expenses are not included in the Fund's annualized expense ratio used to calculate the expense estimate in the table below.
Please note that the expenses shown in the table are meant to highlight your ongoing costs only and do not reflect any transaction costs. Therefore, the second line of the table is useful in comparing ongoing costs only, and will not help you determine the relative total costs of owning different funds.
| | Annualized Expense Ratio-A | Beginning
Account Value
August 1, 2017 | Ending
Account Value
January 31, 2018 | Expenses Paid
During Period-B
August 1, 2017
to January 31, 2018 |
| Series Real Estate Equity | - %-C | | | |
| Actual | | $1,000.00 | $977.70 | $-D |
| Hypothetical-E | | $1,000.00 | $1,025.21 | $-D |
A Annualized expense ratio reflects expenses net of applicable fee waivers.
B Expenses are equal to the Fund's annualized expense ratio, multiplied by the average account value over the period, multiplied by 184/365 (to reflect the one-half year period).
C Amount represents less than .005%
D Amount represents less than $.005.
E 5% return per year before expenses
Corporate Headquarters
245 Summer St.
Boston, MA 02210
www.fidelity.com
SLE-SANN-0318
1.930456.106
Fidelity® Series Real Estate Income Fund
Semi-Annual Report January 31, 2018 |
|
Contents
To view a fund's proxy voting guidelines and proxy voting record for the 12-month period ended June 30, visit http://www.fidelity.com/proxyvotingresults or visit the Securities and Exchange Commission's (SEC) web site at http://www.sec.gov.
You may also call 1-800-544-8544 to request a free copy of the proxy voting guidelines.
Standard & Poor's, S&P and S&P 500 are registered service marks of The McGraw-Hill Companies, Inc. and have been licensed for use by Fidelity Distributors Corporation.
Other third-party marks appearing herein are the property of their respective owners.
All other marks appearing herein are registered or unregistered trademarks or service marks of FMR LLC or an affiliated company. © 2018 FMR LLC. All rights reserved.
This report and the financial statements contained herein are submitted for the general information of the shareholders of the Fund. This report is not authorized for distribution to prospective investors in the Fund unless preceded or accompanied by an effective prospectus.
A fund files its complete schedule of portfolio holdings with the SEC for the first and third quarters of each fiscal year on Form N-Q. Forms N-Q are available on the SEC’s web site at http://www.sec.gov. A fund's Forms N-Q may be reviewed and copied at the SEC’s Public Reference Room in Washington, DC. Information regarding the operation of the SEC's Public Reference Room may be obtained by calling 1-800-SEC-0330.
For a complete list of a fund's portfolio holdings, view the most recent holdings listing, semiannual report, or annual report on Fidelity's web site at http://www.fidelity.com, http://www.institutional.fidelity.com, or http://www.401k.com, as applicable.
NOT FDIC INSURED •MAY LOSE VALUE •NO BANK GUARANTEE
Neither the Fund nor Fidelity Distributors Corporation is a bank.
Investment Summary (Unaudited)
Top Five Stocks as of January 31, 2018
| | % of fund's net assets |
| Equity Lifestyle Properties, Inc. | 1.4 |
| Acadia Realty Trust (SBI) | 1.2 |
| Apartment Investment & Management Co. Class A | 1.0 |
| Ventas, Inc. | 0.9 |
| MFA Financial, Inc. | 0.8 |
| | 5.3 |
Top 5 Bonds as of January 31, 2018
| | % of fund's net assets |
| Senior Housing Properties Trust 4.75% 5/1/24 | 1.4 |
| RWT Holdings, Inc. 5.625% 11/15/19 | 1.3 |
| American Realty Capital Properties, Inc. 3.75% 12/15/20 | 1.0 |
| IAS Operating Partnership LP 5% 3/15/18 | 0.9 |
| PennyMac Corp. 5.375% 5/1/20 | 0.8 |
| | 5.4 |
Top Five REIT Sectors as of January 31, 2018
| | % of fund's net assets |
| REITs - Mortgage | 18.4 |
| REITs - Health Care | 6.5 |
| REITs - Diversified | 6.2 |
| REITs - Apartments | 4.4 |
| REITs - Shopping Centers | 2.9 |
Asset Allocation (% of fund's net assets)
| As of January 31, 2018 * |
| | Common Stocks | 14.4% |
| | Preferred Stocks | 20.8% |
| | Bonds | 44.9% |
| | Convertible Securities | 9.3% |
| | Other Investments | 4.5% |
| | Short-Term Investments and Net Other Assets (Liabilities) | 6.1% |
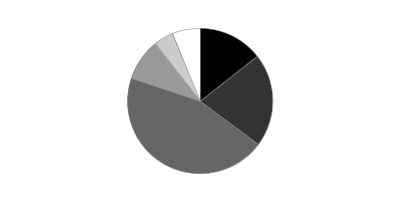
* Foreign investments - 1.3%
Schedule of Investments January 31, 2018 (Unaudited)
Showing Percentage of Net Assets
| Common Stocks - 14.4% | | | |
| | | Shares | Value |
| CONSUMER DISCRETIONARY - 0.3% | | | |
| Hotels, Restaurants & Leisure - 0.3% | | | |
| Bluegreen Vacations Corp. | | 22,900 | $434,871 |
| Wyndham Worldwide Corp. | | 17,300 | 2,147,449 |
| | | | 2,582,320 |
| FINANCIALS - 2.4% | | | |
| Capital Markets - 0.2% | | | |
| Ellington Financial LLC | | 112,900 | 1,647,211 |
| Insurance - 0.1% | | | |
| FNF Group | | 21,500 | 838,070 |
| Mortgage Real Estate Investment Trusts - 2.1% | | | |
| Anworth Mortgage Asset Corp. | | 190,500 | 925,830 |
| Arbor Realty Trust, Inc. | | 169,900 | 1,384,685 |
| Chimera Investment Corp. | | 81,200 | 1,379,588 |
| Dynex Capital, Inc. | | 129,500 | 841,750 |
| Five Oaks Investment Corp. | | 17,008 | 55,616 |
| Great Ajax Corp. | | 138,526 | 1,850,707 |
| Invesco Mortgage Capital, Inc. | | 194,300 | 3,155,432 |
| MFA Financial, Inc. | | 1,017,600 | 7,286,016 |
| New Residential Investment Corp. | | 54,900 | 949,221 |
| Redwood Trust, Inc. | | 4,000 | 59,560 |
| Two Harbors Investment Corp. | | 56,100 | 827,475 |
| | | | 18,715,880 |
|
| TOTAL FINANCIALS | | | 21,201,161 |
|
| REAL ESTATE - 11.7% | | | |
| Equity Real Estate Investment Trusts (REITs) - 11.7% | | | |
| Acadia Realty Trust (SBI) | | 454,800 | 11,169,888 |
| Altisource Residential Corp. Class B | | 18,400 | 202,584 |
| American Homes 4 Rent Class A | | 182,365 | 3,791,368 |
| American Tower Corp. | | 29,300 | 4,327,610 |
| Apartment Investment & Management Co. Class A | | 212,400 | 8,886,816 |
| AvalonBay Communities, Inc. | | 14,300 | 2,436,720 |
| Cedar Realty Trust, Inc. | | 52,600 | 268,786 |
| Colony NorthStar, Inc. | | 652,499 | 5,859,441 |
| DDR Corp. | | 166,700 | 1,353,604 |
| Douglas Emmett, Inc. | | 16,600 | 641,922 |
| Equinix, Inc. | | 9,000 | 4,096,710 |
| Equity Lifestyle Properties, Inc. | | 146,300 | 12,628,614 |
| Extra Space Storage, Inc. | | 45,500 | 3,798,340 |
| Gramercy Property Trust | | 40,400 | 1,019,696 |
| Healthcare Realty Trust, Inc. | | 47,500 | 1,418,825 |
| Healthcare Trust of America, Inc. | | 88,250 | 2,436,583 |
| Lexington Corporate Properties Trust | | 384,422 | 3,467,486 |
| Mid-America Apartment Communities, Inc. | | 53,414 | 5,094,093 |
| National Retail Properties, Inc. | | 16,400 | 650,752 |
| Omega Healthcare Investors, Inc. (a) | | 79,900 | 2,160,496 |
| Public Storage | | 11,800 | 2,309,968 |
| Rexford Industrial Realty, Inc. | | 21,200 | 629,428 |
| Sabra Health Care REIT, Inc. | | 195,600 | 3,540,360 |
| Safety Income and Growth, Inc. | | 46,000 | 810,060 |
| Select Income REIT | | 18,700 | 418,132 |
| Senior Housing Properties Trust (SBI) | | 258,600 | 4,481,538 |
| Spirit Realty Capital, Inc. | | 74,200 | 606,214 |
| Store Capital Corp. | | 122,100 | 2,992,671 |
| Terreno Realty Corp. | | 54,180 | 1,928,808 |
| Ventas, Inc. | | 143,528 | 8,033,262 |
| VEREIT, Inc. | | 326,900 | 2,353,680 |
| WP Carey, Inc. | | 12,100 | 784,201 |
| WP Glimcher, Inc. | | 76,700 | 504,686 |
| | | | 105,103,342 |
| TOTAL COMMON STOCKS | | | |
| (Cost $112,182,221) | | | 128,886,823 |
|
| Preferred Stocks - 22.8% | | | |
| Convertible Preferred Stocks - 2.0% | | | |
| FINANCIALS - 0.9% | | | |
| Mortgage Real Estate Investment Trusts - 0.9% | | | |
| Great Ajax Corp. 7.25% | | 257,500 | 6,417,595 |
| Sutherland Asset Management Corp. 7.00% | | 68,900 | 1,728,701 |
| | | | 8,146,296 |
| REAL ESTATE - 1.1% | | | |
| Equity Real Estate Investment Trusts (REITs) - 1.1% | | | |
| Alexandria Real Estate Equities, Inc. Series D, 7.00% | | 8,241 | 303,966 |
| Ashford Hospitality Prime, Inc. 5.50% | | 17,193 | 330,037 |
| iStar Financial, Inc. Series J, 4.50% | | 35,000 | 1,642,697 |
| Lexington Corporate Properties Trust Series C, 6.50% | | 70,019 | 3,516,767 |
| RLJ Lodging Trust 1.95% | | 38,600 | 999,547 |
| Wheeler REIT, Inc. 8.75% | | 208,000 | 3,621,280 |
| | | | 10,414,294 |
|
| TOTAL CONVERTIBLE PREFERRED STOCKS | | | 18,560,590 |
|
| Nonconvertible Preferred Stocks - 20.8% | | | |
| FINANCIALS - 9.3% | | | |
| Capital Markets - 0.1% | | | |
| Arlington Asset Investment Corp. 6.625% | | 31,528 | 760,515 |
| Brookfield Asset Management, Inc. 4.75% | | 17,500 | 361,809 |
| | | | 1,122,324 |
| Mortgage Real Estate Investment Trusts - 9.2% | | | |
| AG Mortgage Investment Trust, Inc.: | | | |
| 8.00% | | 137,584 | 3,390,070 |
| 8.25% | | 1,300 | 32,799 |
| AGNC Investment Corp.: | | | |
| Series B, 7.75% | | 29,100 | 749,325 |
| Series C, 7.00% | | 61,500 | 1,564,560 |
| American Capital Mortgage Investment Corp. Series A, 8.125% | | 33,100 | 844,053 |
| Annaly Capital Management, Inc.: | | | |
| Series C, 7.625% | | 25,139 | 632,246 |
| Series D, 7.50% | | 83,513 | 2,094,506 |
| Series E, 7.625% | | 118,588 | 2,987,232 |
| Series F, 6.95% | | 198,300 | 5,022,939 |
| Series G, 6.50% (b) | | 118,900 | 2,926,129 |
| Anworth Mortgage Asset Corp. Series A, 8.625% | | 141,118 | 3,628,144 |
| Apollo Commercial Real Estate Finance, Inc. Series C, 8.00% | | 89,058 | 2,241,625 |
| Arbor Realty Trust, Inc.: | | | |
| 7.375% | | 24,800 | 633,144 |
| Series A, 8.25% | | 41,922 | 1,061,465 |
| Series B, 7.75% | | 40,000 | 1,010,884 |
| Series C, 8.50% | | 15,000 | 389,280 |
| Armour Residential REIT, Inc. Series B, 7.875% | | 25,701 | 642,029 |
| Capstead Mortgage Corp. Series E, 7.50% | | 37,016 | 934,654 |
| Cherry Hill Mortgage Investment Corp. Series A, 8.20% | | 41,500 | 1,045,800 |
| Chimera Investment Corp.: | | | |
| Series A, 8.00% | | 36,000 | 914,040 |
| Series B, 8.00% | | 279,551 | 7,110,324 |
| CYS Investments, Inc.: | | | |
| Series A, 7.75% | | 10,314 | 257,231 |
| Series B, 7.50% | | 113,333 | 2,748,325 |
| Dynex Capital, Inc.: | | | |
| Series A, 8.50% | | 96,313 | 2,436,719 |
| Series B, 7.625% | | 47,335 | 1,125,626 |
| Five Oaks Investment Corp. Series A, 8.75% | | 28,863 | 721,575 |
| Invesco Mortgage Capital, Inc.: | | | |
| 7.50% | | 187,900 | 4,584,760 |
| Series A, 7.75% | | 30,151 | 755,886 |
| Series B, 7.75% | | 188,998 | 4,809,999 |
| MFA Financial, Inc.: | | | |
| 8.00% | | 108,747 | 2,815,460 |
| Series B, 7.50% | | 188,749 | 4,716,838 |
| New York Mortgage Trust, Inc.: | | | |
| Series B, 7.75% | | 78,802 | 1,901,051 |
| Series C, 7.875% | | 117,633 | 2,873,774 |
| Series D, 8.00% | | 52,100 | 1,282,963 |
| PennyMac Mortgage Investment Trust: | | | |
| 8.125% | | 59,000 | 1,469,100 |
| Series B, 8.00% | | 94,500 | 2,343,600 |
| Resource Capital Corp.: | | | |
| 8.25% | | 14,240 | 354,718 |
| 8.625% | | 2,011 | 51,281 |
| Two Harbors Investment Corp.: | | | |
| Series A, 8.125% | | 104,500 | 2,731,630 |
| Series B, 7.625% | | 73,400 | 1,848,212 |
| Series C, 7.25% | | 90,116 | 2,186,755 |
| Wells Fargo Real Estate Investment Corp. Series A, 6.375% | | 23,000 | 592,480 |
| | | | 82,463,231 |
| TOTAL FINANCIALS | | | 83,585,555 |
| REAL ESTATE - 11.4% | | | |
| Equity Real Estate Investment Trusts (REITs) - 11.3% | | | |
| American Homes 4 Rent: | | | |
| 5.875% | | 44,883 | 1,108,610 |
| Series C, 5.50% | | 141,510 | 4,020,299 |
| Series D, 6.50% | | 40,000 | 1,024,400 |
| Series E, 6.35% | | 40,000 | 1,013,600 |
| Series G, 5.875% | | 34,800 | 850,164 |
| Ashford Hospitality Trust, Inc.: | | | |
| Series D, 8.45% | | 12,945 | 327,250 |
| Series F, 7.375% | | 52,000 | 1,230,622 |
| Series G, 7.375% | | 20,000 | 469,800 |
| Series H, 7.50% | | 28,700 | 680,190 |
| Series I, 7.50% | | 28,600 | 679,250 |
| Bluerock Residential Growth (REIT), Inc.: | | | |
| Series A, 8.25% | | 102,400 | 2,580,480 |
| Series C, 7.625% | | 27,200 | 666,900 |
| Series D, 7.125% | | 24,000 | 592,800 |
| CBL & Associates Properties, Inc. Series D, 7.375% | | 38,729 | 775,742 |
| Cedar Realty Trust, Inc.: | | | |
| Series B, 7.25% | | 22,518 | 563,610 |
| Series C, 6.50% | | 50,200 | 1,161,628 |
| City Office REIT, Inc. Series A, 6.625% | | 25,500 | 636,735 |
| Colony NorthStar, Inc.: | | | |
| Series B, 8.25% | | 42,790 | 1,077,880 |
| Series D, 8.50% | | 52,135 | 1,328,139 |
| Series E, 8.75% | | 93,516 | 2,447,314 |
| Series G, 7.50% | | 6,800 | 164,723 |
| Series H, 7.125% | | 122,975 | 2,828,425 |
| Series I, 7.15% | | 192,000 | 4,435,200 |
| Series J, 7.15% | | 193,800 | 4,439,958 |
| DDR Corp.: | | | |
| Series J, 6.50% | | 70,181 | 1,708,318 |
| Series K, 6.25% | | 25,489 | 619,383 |
| Digital Realty Trust, Inc.: | | | |
| Series C, 6.625% | | 16,000 | 422,080 |
| Series G, 5.875% | | 28,270 | 702,510 |
| Series H, 7.375% | | 10,000 | 262,800 |
| Farmland Partners, Inc. Series B, 6.00% | | 110,000 | 2,802,228 |
| General Growth Properties, Inc. Series A, 6.375% | | 34,690 | 870,025 |
| Gladstone Commercial Corp. Series D, 7.00% | | 101,200 | 2,580,600 |
| Gladstone Land Corp. Series A, 6.375% | | 11,000 | 282,921 |
| Global Medical REIT, Inc. Series A, 7.50% | | 22,800 | 557,232 |
| Global Net Lease, Inc. Series A, 7.25% | | 80,200 | 2,002,594 |
| Government Properties Income Trust 5.875% | | 37,500 | 948,375 |
| Hersha Hospitality Trust Series D, 6.50% | | 40,000 | 968,400 |
| Investors Real Estate Trust Series C, 6.625% | | 54,100 | 1,333,024 |
| iStar Financial, Inc.: | | | |
| Series D, 8.00% | | 25,742 | 649,471 |
| Series G, 7.65% | | 96,000 | 2,411,520 |
| Series I, 7.50% | | 26,900 | 672,500 |
| Jernigan Capital, Inc. Series B, 7.00% (b) | | 8,700 | 209,670 |
| Kimco Realty Corp. Series M, 5.25% | | 22,400 | 519,680 |
| LaSalle Hotel Properties: | | | |
| Series I, 6.375% | | 47,339 | 1,171,640 |
| Series J, 6.30% | | 40,000 | 975,200 |
| Monmouth Real Estate Investment Corp. Series C, 6.125% | | 40,400 | 988,588 |
| National Retail Properties, Inc. Series E, 5.70% | | 46,124 | 1,143,875 |
| National Storage Affiliates Trust Series A, 6.00% (b) | | 11,300 | 281,370 |
| Pebblebrook Hotel Trust: | | | |
| Series C, 6.50% | | 71,130 | 1,769,714 |
| Series D, 6.375% | | 50,000 | 1,240,000 |
| Pennsylvania (REIT): | | | |
| Series B, 7.375% | | 55,408 | 1,356,942 |
| Series C, 7.20% | | 9,000 | 212,490 |
| Series D, 6.875% | | 25,700 | 602,665 |
| Plymouth Industrial REIT, Inc. Series A, 7.50% | | 28,100 | 703,343 |
| Prologis, Inc. Series Q, 8.54% | | 15,800 | 1,094,774 |
| PS Business Parks, Inc. Series U, 5.75% | | 102,483 | 2,568,224 |
| Public Storage: | | | |
| Series F, 5.15% | | 28,000 | 664,440 |
| Series G, 5.05% | | 7,100 | 165,927 |
| Series Y, 6.375% | | 19,826 | 513,890 |
| RAIT Financial Trust: | | | |
| 7.125% | | 82,863 | 1,963,024 |
| 7.625% | | 46,080 | 937,728 |
| Rexford Industrial Realty, Inc.: | | | |
| Series A, 5.875% | | 25,000 | 590,750 |
| Series B, 5.875% (b) | | 49,100 | 1,144,030 |
| Sabra Health Care REIT, Inc. Series A, 7.125% | | 99,665 | 2,514,538 |
| Saul Centers, Inc.: | | | |
| Series C, 6.875% | | 69,596 | 1,749,650 |
| Series D, 6.125% (b) | | 15,000 | 370,008 |
| Sotherly Hotels, Inc.: | | | |
| Series B, 8.00% | | 12,000 | 302,039 |
| Series C, 7.875% | | 18,100 | 452,319 |
| Spirit Realty Capital, Inc. Series A, 6.00% | | 15,500 | 376,340 |
| Stag Industrial, Inc.: | | | |
| Series B, 6.625% | | 10,000 | 252,300 |
| Series C, 6.875% | | 17,000 | 433,532 |
| Summit Hotel Properties, Inc.: | | | |
| Series D, 6.45% | | 40,000 | 1,008,000 |
| Series E, 6.25% | | 32,000 | 798,400 |
| Sunstone Hotel Investors, Inc.: | | | |
| Series E, 6.95% | | 8,000 | 204,800 |
| Series F, 6.45% | | 16,000 | 405,120 |
| Taubman Centers, Inc. Series K, 6.25% | | 19,561 | 493,231 |
| UMH Properties, Inc.: | | | |
| Series B, 8.00% | | 150,700 | 4,120,138 |
| Series C, 6.75% | | 58,520 | 1,471,778 |
| Series D, 6.375% | | 19,700 | 478,907 |
| Urstadt Biddle Properties, Inc.: | | | |
| Series G, 6.75% | | 33,500 | 869,660 |
| Series H, 6.25% | | 48,000 | 1,192,800 |
| VEREIT, Inc. Series F, 6.70% | | 259,383 | 6,533,858 |
| WP Glimcher, Inc.: | | | |
| Series H, 7.50% | | 53,575 | 1,268,656 |
| Series I, 6.875% | | 10,483 | 246,020 |
| | | | 101,257,758 |
| Real Estate Management & Development - 0.1% | | | |
| Landmark Infrastructure Partners LP Series B, 7.90% | | 20,800 | 516,880 |
| TOTAL REAL ESTATE | | | 101,774,638 |
| UTILITIES - 0.1% | | | |
| Electric Utilities - 0.1% | | | |
| Brookfield Infrastructure Partners LP Series 5, 5.35% | | 30,700 | 642,204 |
|
| TOTAL NONCONVERTIBLE PREFERRED STOCKS | | | 186,002,397 |
|
| TOTAL PREFERRED STOCKS | | | |
| (Cost $201,758,599) | | | 204,562,987 |
| | | Principal Amount | Value |
|
| Corporate Bonds - 25.5% | | | |
| Convertible Bonds - 7.3% | | | |
| FINANCIALS - 5.7% | | | |
| Diversified Financial Services - 0.1% | | | |
| Granite Point Mortgage Trust, Inc. 5.625% 12/1/22 (c) | | 1,120,000 | 1,104,583 |
| Mortgage Real Estate Investment Trusts - 5.6% | | | |
| Arbor Realty Trust, Inc. 5.375% 11/15/20 | | 700,000 | 700,622 |
| Blackstone Mortgage Trust, Inc. 4.375% 5/5/22 | | 2,940,000 | 2,894,598 |
| Colony Financial, Inc.: | | | |
| 3.875% 1/15/21 | | 3,220,000 | 3,125,165 |
| 5% 4/15/23 | | 3,395,000 | 3,354,386 |
| IAS Operating Partnership LP 5% 3/15/18 (c) | | 8,460,000 | 8,460,000 |
| PennyMac Corp. 5.375% 5/1/20 | | 6,884,000 | 6,747,298 |
| Redwood Trust, Inc. 4.625% 4/15/18 | | 2,200,000 | 2,202,200 |
| Resource Capital Corp.: | | | |
| 4.5% 8/15/22 | | 870,000 | 840,540 |
| 6% 12/1/18 | | 1,110,000 | 1,122,488 |
| 8% 1/15/20 | | 1,810,000 | 1,891,450 |
| RWT Holdings, Inc. 5.625% 11/15/19 | | 11,250,000 | 11,362,815 |
| Starwood Property Trust, Inc. 4.375% 4/1/23 | | 2,680,000 | 2,692,864 |
| Two Harbors Investment Corp. 6.25% 1/15/22 | | 780,000 | 791,845 |
| Western Asset Mortgage Capital Corp. 6.75% 10/1/22 | | 3,570,000 | 3,492,610 |
| | | | 49,678,881 |
| TOTAL FINANCIALS | | | 50,783,464 |
| REAL ESTATE - 1.6% | | | |
| Equity Real Estate Investment Trusts (REITs) - 1.6% | | | |
| American Realty Capital Properties, Inc. 3.75% 12/15/20 | | 8,660,000 | 8,780,062 |
| RAIT Financial Trust 4% 10/1/33 | | 6,300,000 | 5,953,091 |
| | | | 14,733,153 |
|
| TOTAL CONVERTIBLE BONDS | | | 65,516,617 |
|
| Nonconvertible Bonds - 18.2% | | | |
| CONSUMER DISCRETIONARY - 4.6% | | | |
| Hotels, Restaurants & Leisure - 0.9% | | | |
| ESH Hospitality, Inc. 5.25% 5/1/25 (c) | | 3,460,000 | 3,485,950 |
| FelCor Lodging LP 6% 6/1/25 | | 1,380,000 | 1,435,200 |
| Hilton Grand Vacations Borrower LLC/Hilton Grand Vacations Borrower, Inc. 6.125% 12/1/24 | | 460,000 | 504,850 |
| Times Square Hotel Trust 8.528% 8/1/26 (c) | | 2,100,354 | 2,418,226 |
| | | | 7,844,226 |
| Household Durables - 3.7% | | | |
| Ashton Woods U.S.A. LLC/Ashton Woods Finance Co.: | | | |
| 6.75% 8/1/25 (c) | | 1,435,000 | 1,438,588 |
| 6.875% 2/15/21 (c) | | 2,669,000 | 2,709,035 |
| Beazer Homes U.S.A., Inc.: | | | |
| 5.875% 10/15/27 (c) | | 1,280,000 | 1,276,800 |
| 6.75% 3/15/25 | | 1,035,000 | 1,086,750 |
| 8.75% 3/15/22 | | 1,330,000 | 1,453,025 |
| Brookfield Residential Properties, Inc./Brookfield Residential U.S. Corp. 6.125% 7/1/22 (c) | | 1,060,000 | 1,102,082 |
| Brookfield Residential Properties, Inc.: | | | |
| 6.375% 5/15/25 (c) | | 2,000,000 | 2,110,000 |
| 6.5% 12/15/20 (c) | | 2,425,000 | 2,473,500 |
| CalAtlantic Group, Inc. 5.875% 11/15/24 | | 315,000 | 343,350 |
| D.R. Horton, Inc.: | | | |
| 4.375% 9/15/22 | | 825,000 | 859,171 |
| 5.75% 8/15/23 | | 490,000 | 543,558 |
| KB Home 8% 3/15/20 | | 2,395,000 | 2,613,544 |
| Lennar Corp. 4.5% 4/30/24 | | 590,000 | 596,667 |
| M/I Homes, Inc.: | | | |
| 5.625% 8/1/25 | | 490,000 | 498,575 |
| 6.75% 1/15/21 | | 735,000 | 760,725 |
| Meritage Homes Corp.: | | | |
| 5.125% 6/6/27 | | 885,000 | 896,063 |
| 6% 6/1/25 | | 2,085,000 | 2,246,588 |
| 7% 4/1/22 | | 2,005,000 | 2,250,613 |
| 7.15% 4/15/20 | | 1,940,000 | 2,095,200 |
| New Home Co. LLC 7.25% 4/1/22 | | 1,640,000 | 1,713,800 |
| Ryland Group, Inc. 6.625% 5/1/20 | | 445,000 | 476,150 |
| Taylor Morrison Communities, Inc./Monarch Communities, Inc. 5.875% 4/15/23 (c) | | 760,000 | 811,300 |
| TRI Pointe Homes, Inc. 5.25% 6/1/27 | | 875,000 | 883,750 |
| William Lyon Homes, Inc.: | | | |
| 5.875% 1/31/25 | | 455,000 | 465,238 |
| 7% 8/15/22 | | 1,245,000 | 1,288,575 |
| | | | 32,992,647 |
| Media - 0.0% | | | |
| CBS Outdoor Americas Capital LLC/CBS Outdoor Americas Capital Corp. 5.625% 2/15/24 | | 240,000 | 245,700 |
| TOTAL CONSUMER DISCRETIONARY | | | 41,082,573 |
| CONSUMER STAPLES - 0.7% | | | |
| Food & Staples Retailing - 0.7% | | | |
| Albertsons Companies LLC/Safeway, Inc./New Albertson's, Inc./Albertson's LLC: | | | |
| 5.75% 3/15/25 | | 2,670,000 | 2,382,975 |
| 6.625% 6/15/24 | | 1,900,000 | 1,805,000 |
| Albertsons, Inc. 8.7% 5/1/30 | | 845,000 | 792,188 |
| C&S Group Enterprises LLC 5.375% 7/15/22 (c) | | 1,280,000 | 1,196,800 |
| Cumberland Farms, Inc. 6.75% 5/1/25 (c) | | 365,000 | 389,638 |
| | | | 6,566,601 |
| FINANCIALS - 0.6% | | | |
| Diversified Financial Services - 0.4% | | | |
| Brixmor Operating Partnership LP 3.85% 2/1/25 | | 1,659,000 | 1,636,327 |
| Five Point Operation Co. LP 7.875% 11/15/25 (c) | | 1,125,000 | 1,147,500 |
| Icahn Enterprises LP/Icahn Enterprises Finance Corp.: | | | |
| 5.875% 2/1/22 | | 820,000 | 835,375 |
| 6.25% 2/1/22 (c) | | 280,000 | 288,400 |
| | | | 3,907,602 |
| Mortgage Real Estate Investment Trusts - 0.1% | | | |
| Starwood Property Trust, Inc. 4.75% 3/15/25 (c) | | 700,000 | 691,250 |
| Thrifts & Mortgage Finance - 0.1% | | | |
| Ocwen Loan Servicing LLC 8.375% 11/15/22 (c) | | 690,000 | 700,350 |
| TOTAL FINANCIALS | | | 5,299,202 |
| HEALTH CARE - 1.1% | | | |
| Health Care Providers & Services - 1.1% | | | |
| QCP SNF West (REIT) LLC 8.125% 11/1/23 (c) | | 1,255,000 | 1,292,650 |
| Sabra Health Care LP/Sabra Capital Corp.: | | | |
| 5.375% 6/1/23 | | 4,040,000 | 4,130,900 |
| 5.5% 2/1/21 | | 4,450,000 | 4,566,813 |
| | | | 9,990,363 |
| INDUSTRIALS - 0.1% | | | |
| Building Products - 0.1% | | | |
| Shea Homes Ltd. Partnership/Corp. 6.125% 4/1/25 (c) | | 650,000 | 677,625 |
| INFORMATION TECHNOLOGY - 0.1% | | | |
| Internet Software & Services - 0.1% | | | |
| CyrusOne LP/CyrusOne Finance Corp. 5% 3/15/24 | | 615,000 | 627,300 |
| REAL ESTATE - 11.0% | | | |
| Equity Real Estate Investment Trusts (REITs) - 8.8% | | | |
| American Campus Communities Operating Partnership LP 4.125% 7/1/24 | | 1,000,000 | 1,026,723 |
| American Homes 4 Rent 4.25% 2/15/28 | | 2,000,000 | 1,988,840 |
| ARC Properties Operating Partnership LP 4.6% 2/6/24 | | 1,640,000 | 1,699,299 |
| Care Capital Properties LP 5.125% 8/15/26 | | 3,451,000 | 3,421,164 |
| CBL & Associates LP: | | | |
| 4.6% 10/15/24 | | 5,401,000 | 4,761,484 |
| 5.25% 12/1/23 | | 3,500,000 | 3,273,764 |
| 5.95% 12/15/26 | | 2,434,000 | 2,242,924 |
| CTR Partnership LP/CareTrust Capital Corp. 5.25% 6/1/25 | | 890,000 | 901,125 |
| CubeSmart LP 4.8% 7/15/22 | | 1,000,000 | 1,057,083 |
| DCT Industrial Operating Partnership LP 4.5% 10/15/23 | | 2,000,000 | 2,063,930 |
| DDR Corp.: | | | |
| 3.625% 2/1/25 | | 148,000 | 145,792 |
| 4.625% 7/15/22 | | 370,000 | 387,230 |
| Equinix, Inc. 5.375% 5/15/27 | | 1,175,000 | 1,233,750 |
| HCP, Inc.: | | | |
| 4% 6/1/25 | | 2,000,000 | 2,034,503 |
| 4.25% 11/15/23 | | 1,185,000 | 1,231,733 |
| Health Care REIT, Inc.: | | | |
| 4% 6/1/25 | | 1,010,000 | 1,030,034 |
| 4.125% 4/1/19 | | 1,000,000 | 1,014,924 |
| Healthcare Realty Trust, Inc. 3.75% 4/15/23 | | 967,000 | 974,734 |
| Highwoods/Forsyth LP 3.625% 1/15/23 | | 393,000 | 392,834 |
| Hospitality Properties Trust 5% 8/15/22 | | 823,000 | 869,165 |
| iStar Financial, Inc.: | | | |
| 4.625% 9/15/20 | | 1,140,000 | 1,154,250 |
| 5% 7/1/19 | | 4,235,000 | 4,253,528 |
| 5.25% 9/15/22 | | 715,000 | 713,213 |
| 6% 4/1/22 | | 1,490,000 | 1,523,525 |
| Lexington Corporate Properties Trust: | | | |
| 4.25% 6/15/23 | | 2,500,000 | 2,496,745 |
| 4.4% 6/15/24 | | 385,000 | 383,577 |
| MPT Operating Partnership LP/MPT Finance Corp.: | | | |
| 5% 10/15/27 | | 1,030,000 | 1,019,906 |
| 5.25% 8/1/26 | | 795,000 | 818,850 |
| 6.375% 3/1/24 | | 790,000 | 842,140 |
| National Retail Properties, Inc. 3.5% 10/15/27 | | 579,000 | 558,286 |
| Omega Healthcare Investors, Inc.: | | | |
| 4.375% 8/1/23 | | 579,000 | 580,145 |
| 4.5% 4/1/27 | | 455,000 | 436,357 |
| 4.75% 1/15/28 | | 1,479,000 | 1,437,194 |
| 4.95% 4/1/24 | | 627,000 | 645,322 |
| Potlatch Corp. 7.5% 11/1/19 | | 811,000 | 871,825 |
| Reckson Operating Partnership LP/SL Green Realty Corp./SL Green Operating Partnership LP 7.75% 3/15/20 | | 811,000 | 887,812 |
| Regency Centers LP 3.6% 2/1/27 | | 442,000 | 431,645 |
| SBA Communications Corp. 4% 10/1/22 (c) | | 425,000 | 418,625 |
| Select Income REIT: | | | |
| 4.15% 2/1/22 | | 1,992,000 | 1,991,048 |
| 4.25% 5/15/24 | | 890,000 | 872,634 |
| 4.5% 2/1/25 | | 3,457,000 | 3,424,007 |
| Senior Housing Properties Trust: | | | |
| 3.25% 5/1/19 | | 500,000 | 501,371 |
| 4.75% 5/1/24 | | 11,978,000 | 12,350,097 |
| 6.75% 4/15/20 | | 576,000 | 609,458 |
| 6.75% 12/15/21 | | 2,000,000 | 2,188,802 |
| VEREIT Operating Partnership LP 4.875% 6/1/26 | | 2,055,000 | 2,131,298 |
| WP Carey, Inc.: | | | |
| 4% 2/1/25 | | 344,000 | 342,536 |
| 4.25% 10/1/26 | | 905,000 | 909,200 |
| 4.6% 4/1/24 | | 1,968,000 | 2,027,045 |
| | | | 78,571,476 |
| Real Estate Management & Development - 2.2% | | | |
| Greystar Real Estate Partners 5.75% 12/1/25 (c) | | 985,000 | 1,012,088 |
| Host Hotels & Resorts LP 6% 10/1/21 | | 485,000 | 527,278 |
| Howard Hughes Corp. 5.375% 3/15/25 (c) | | 2,930,000 | 2,959,300 |
| Hunt Companies, Inc. 9.625% 3/1/21 (c) | | 1,540,000 | 1,622,390 |
| Kennedy-Wilson, Inc. 5.875% 4/1/24 | | 5,500,000 | 5,637,500 |
| Mattamy Group Corp.: | | | |
| 6.5% 10/1/25 (c) | | 815,000 | 858,806 |
| 6.875% 12/15/23 (c) | | 1,985,000 | 2,099,138 |
| Mid-America Apartments LP: | | | |
| 3.75% 6/15/24 | | 337,000 | 341,705 |
| 4.3% 10/15/23 | | 740,000 | 773,103 |
| Taylor Morrison Communities, Inc./Monarch Communities, Inc. 5.625% 3/1/24 (c) | | 495,000 | 520,369 |
| Washington Prime Group LP 5.95% 8/15/24 | | 3,590,000 | 3,643,370 |
| | | | 19,995,047 |
| TOTAL REAL ESTATE | | | 98,566,523 |
|
| TOTAL NONCONVERTIBLE BONDS | | | 162,810,187 |
|
| TOTAL CORPORATE BONDS | | | |
| (Cost $219,295,600) | | | 228,326,804 |
|
| Asset-Backed Securities - 3.5% | | | |
| American Homes 4 Rent: | | | |
| Series 2014-SFR3 Class E, 6.418% 12/17/36 (c) | | 1,740,000 | 1,950,813 |
| Series 2015-SFR1 Class E, 5.639% 4/17/52 (c) | | 1,354,586 | 1,460,011 |
| Series 2015-SFR2: | | | |
| Class E, 6.07% 10/17/45 (c) | | 1,624,000 | 1,795,549 |
| Class XS, 0% 10/17/45 (c)(d)(e)(f) | | 944,061 | 9 |
| Colony American Homes Series 2014-2A Class F, 1 month U.S. LIBOR + 3.350% 4.827% 7/17/31 (c)(d)(g) | | 786,614 | 789,114 |
| Colony Starwood Homes Series 2016-2A Class F, 1 month U.S. LIBOR + 4.150% 5.627% 12/17/33 (c)(d)(g) | | 1,500,000 | 1,555,315 |
| Conseco Finance Securitizations Corp.: | | | |
| Series 2002-1 Class M2, 9.546% 12/1/33 | | 1,216,000 | 1,299,298 |
| Series 2002-2 Class M2, 9.163% 3/1/33 | | 1,853,371 | 1,697,101 |
| Deutsche Financial Capital Securitization LLC Series 1997-I Class M, 7.275% 9/15/27 | | 442,179 | 452,958 |
| Home Partners of America Credit Trust Series 2017-1 Class F, 1 month U.S. LIBOR + 3.539% 5.0739% 7/17/34 (c)(d)(g) | | 1,099,000 | 1,123,392 |
| Home Partners of America Trust Series 2016-2 Class F, 1 month U.S. LIBOR + 5.250% 6.1595% 10/17/33 (c)(d)(g) | | 607,000 | 623,256 |
| Invitation Homes Trust: | | | |
| Series 2015-SFR2 Class E, 1 month U.S. LIBOR + 3.150% 4.6408% 6/17/32 (c)(d)(g) | | 450,000 | 453,522 |
| Series 2015-SFR3 Class F, 1 month U.S. LIBOR + 3.650% 6.2095% 8/17/32 (c)(d)(g) | | 2,000,000 | 2,031,938 |
| Series 2017-SFR2 Class F, 1 month U.S. LIBOR + 3.000% 4.4908% 12/17/36 (c)(d)(g) | | 1,407,000 | 1,434,288 |
| Series 2018-SFR1 Class F, 1 month U.S. LIBOR + 3.100% 4.611% 3/17/37 (c)(d)(g)(h) | | 2,058,000 | 2,067,920 |
| Lehman ABS Manufactured Housing Contract Trust Series 2001-B Class M2, 7.17% 4/15/40 | | 2,665,189 | 1,860,638 |
| Progress Residential Trust: | | | |
| Series 2015-SFR3 Class F, 6.643% 11/12/32 (c) | | 588,000 | 618,852 |
| Series 2016-SFR1 Class F, 1 month U.S. LIBOR + 5.000% 6.4595% 9/17/33 (c)(d)(g) | | 1,541,000 | 1,589,039 |
| Series 2017-SFR1 Class F, 5.35% 8/17/34 (c) | | 526,000 | 536,849 |
| Series 2017-SFR2 Class F, 1 month U.S. LIBOR + 2.750% 4.836% 12/17/34 (c)(g) | | 426,000 | 423,913 |
| Residential Asset Securities Corp. Series 2003-KS10 Class MI3, 6.41% 12/25/33 | | 211,372 | 152,191 |
| Starwood Waypoint Homes Trust Series 2017-1: | | | |
| Class E, 1 month U.S. LIBOR + 2.600% 4.0908% 1/17/35 (c)(d)(g) | | 994,000 | 1,007,351 |
| Class F, 1 month U.S. LIBOR + 3.400% 4.8908% 1/17/35 (c)(d)(g) | | 2,132,000 | 2,131,994 |
| Tricon American Homes: | | | |
| Series 2017-SFR1 Class F, 5.151% 9/17/34 (c) | | 1,432,000 | 1,441,391 |
| Series 2017-SFR2 Class F, 5.16% 1/17/36 (c) | | 628,000 | 617,211 |
| Tricon American Homes Trust Series 2016-SFR1 Class F, 5.769% 11/17/33 (c) | | 456,000 | 470,233 |
| VB-S1 Issuer LLC Series 2016-1A Class F, 6.901% 6/15/46 (c) | | 1,453,000 | 1,478,451 |
| TOTAL ASSET-BACKED SECURITIES | | | |
| (Cost $29,931,473) | | | 31,062,597 |
|
| Collateralized Mortgage Obligations - 0.4% | | | |
| Private Sponsor - 0.4% | | | |
| FREMF Mortgage Trust: | | | |
| Series 2010-K6 Class B, 5.3671% 12/25/46 (c)(d) | | 811,000 | 845,103 |
| Series 2010-K7 Class B, 5.6853% 4/25/20 (c)(d) | | 2,605,000 | 2,735,219 |
| TOTAL COLLATERALIZED MORTGAGE OBLIGATIONS | | | |
| (Cost $3,348,837) | | | 3,580,322 |
|
| Commercial Mortgage Securities - 22.8% | | | |
| Aventura Mall Trust Series 2013-AVM Class E, 3.7427% 12/5/32 (c)(d) | | 2,000,000 | 2,008,403 |
| BANK Series 2017-BNK4 Class D, 3.357% 5/15/50 (c) | | 588,000 | 487,014 |
| Barclays Commercial Mortgage Securities LLC Series 2015-STP: | | | |
| Class E, 4.2844% 9/10/28 (c)(d) | | 1,626,000 | 1,566,188 |
| Class F, 4.4272% 9/10/28 (c)(d) | | 800,000 | 731,353 |
| BX Trust Series 2017-IMC Class F, 1 month U.S. LIBOR + 4.250% 5.8095% 10/15/32 (c)(d)(g) | | 2,119,000 | 2,129,578 |
| CCRESG Commercial Mortgage Trust Series 2016-HEAT: | | | |
| Class E, 5.4883% 4/10/29 (c)(d) | | 806,000 | 776,290 |
| Class F, 5.4883% 4/10/29 (c)(d) | | 1,890,000 | 1,792,224 |
| CD Mortgage Trust Series 2017-CD3 Class D, 3.25% 2/10/50 (c) | | 2,188,000 | 1,813,099 |
| CGBAM Commercial Mortgage Trust Series 2015-SMRT: | | | |
| Class E, 3.7859% 4/10/28 (c)(d) | | 561,000 | 560,515 |
| Class F, 3.7859% 4/10/28 (c)(d) | | 1,882,000 | 1,861,034 |
| CGMS Commercial Mortgage Trust Series 2017-MDRB Class E, 1 month U.S. LIBOR + 3.872% 5.431% 7/15/30 (c)(d)(g) | | 1,154,000 | 1,148,638 |
| Chase Commercial Mortgage Securities Corp. Series 1998-1 Class H, 6.34% 5/18/30 (c) | | 124,607 | 127,044 |
| Citigroup Commercial Mortgage Trust: | | | |
| Series 2013-GC15 Class D, 5.0989% 9/10/46 (c)(d) | | 2,496,000 | 2,383,533 |
| Series 2015-SHP2 Class E, 1 month U.S. LIBOR + 4.100% 5.9095% 7/15/27 (c)(d)(g) | | 567,000 | 570,575 |
| Series 2016-C3 Class D, 3% 11/15/49 (c) | | 2,911,000 | 2,229,551 |
| Series 2016-SMPL Class E, 4.509% 9/10/31 (c) | | 299,000 | 298,903 |
| COMM Mortgage Trust: | | | |
| sequential payer Series 2013-LC6 Class E, 3.5% 1/10/46 (c) | | 2,000,000 | 1,506,349 |
| Series 2012-CR1: | | | |
| Class C, 5.3197% 5/15/45 (d) | | 3,000,000 | 3,131,506 |
| Class D, 5.3197% 5/15/45 (c)(d) | | 1,917,000 | 1,866,943 |
| Class G, 2.462% 5/15/45 (c) | | 399,000 | 241,289 |
| Series 2012-LC4: | | | |
| Class C, 5.6049% 12/10/44 (d) | | 780,000 | 799,943 |
| Class D, 5.6049% 12/10/44 (c)(d) | | 3,532,000 | 3,163,657 |
| Series 2013-CCRE6 Class E, 4.067% 3/10/46 (c)(d) | | 147,000 | 117,633 |
| Series 2013-CR10 Class D, 4.7886% 8/10/46 (c)(d) | | 1,756,000 | 1,534,660 |
| Series 2013-CR12 Class D, 5.0787% 10/10/46 (c)(d) | | 2,900,000 | 2,424,604 |
| Series 2013-CR6 Class F, 4.0668% 3/10/46 (c)(d) | | 1,459,000 | 933,756 |
| Series 2013-CR9 Class D, 4.2541% 7/10/45 (c)(d) | | 790,000 | 677,451 |
| Series 2013-LC6 Class D, 4.3076% 1/10/46 (c)(d) | | 2,732,000 | 2,545,468 |
| Series 2014-UBS2 Class D, 5.0146% 3/10/47 (c)(d) | | 537,000 | 455,434 |
| Series 2016-CD1 Class D, 2.7711% 8/10/49 (c)(d) | | 2,104,000 | 1,677,677 |
| Series 2017-CD4 Class D, 3.3% 5/10/50 (c) | | 450,000 | 372,973 |
| COMM Mortgage Trust pass-thru certificates Series 2005-LP5 Class F, 4.5975% 5/10/43 (c)(d) | | 1,924,053 | 1,917,361 |
| Commercial Mortgage Trust pass-thru certificates Series 2012-CR2 Class D, 4.832% 8/15/45 (c)(d) | | 500,000 | 494,533 |
| Core Industrial Trust: | | | |
| Series 2015-TEXW Class F, 3.8487% 2/10/34 (c)(d) | | 2,067,000 | 2,007,944 |
| Series 2015-WEST Class F, 4.2268% 2/10/37 (c)(d) | | 2,496,000 | 2,397,079 |
| CSAIL Commercial Mortgage Trust: | | | |
| Series 2017-C8 Class D, 4.47% 6/15/50 (c) | | 752,000 | 672,003 |
| Series 2017-CX10 Class UESD, 4.2366% 11/15/27 (c)(d) | | 840,000 | 809,008 |
| Series 2017-CX9 Class D, 4.161% 9/15/50 (c) | | 432,000 | 376,294 |
| CSMC Trust: | | | |
| floater Series 2015-DEAL: | | | |
| Class E, 1 month U.S. LIBOR + 4.000% 5.559% 4/15/29 (c)(d)(g) | | 2,000,000 | 2,006,828 |
| Class F, 1 month U.S. LIBOR + 4.750% 6.309% 4/15/29 (c)(d)(g) | | 3,697,000 | 3,697,001 |
| Series 2016-MFF Class F, 1 month U.S. LIBOR + 7.250% 8.727% 11/15/33 (c)(d)(g) | | 2,700,000 | 2,729,239 |
| DBCCRE Mortgage Trust Series 2014-ARCP Class E, 4.9345% 1/10/34 (c)(d) | | 2,047,000 | 1,822,405 |
| DBUBS Mortgage Trust: | | | |
| Series 2011-LC1A: | | | |
| Class E, 5.6978% 11/10/46 (c)(d) | | 2,745,000 | 2,861,046 |
| Class G, 4.652% 11/10/46 (c) | | 2,640,000 | 2,324,776 |
| Series 2011-LC3A Class D, 5.3404% 8/10/44 (c)(d) | | 728,000 | 756,512 |
| Freddie Mac pass-thru certificates: | | | |
| Series K011 Class X3, 2.577% 12/25/43 (d)(e) | | 4,947,000 | 338,331 |
| Series K012 Class X3, 2.252% 1/25/41 (d)(e) | | 2,799,981 | 171,429 |
| Series K013 Class X3, 2.9089% 1/25/43 (d)(e) | | 4,806,000 | 377,916 |
| GAHR Commercial Mortgage Trust Series 2015-NRF: | | | |
| Class DFX, 3.3822% 12/15/34 (c)(d) | | 300,000 | 299,854 |
| Class EFX, 3.3822% 12/15/34 (c)(d) | | 2,947,000 | 2,917,258 |
| Class FFX, 3.3822% 12/15/34 (c)(d) | | 2,608,000 | 2,569,729 |
| Class GFX, 3.3822% 12/15/34 (c)(d) | | 2,333,000 | 2,286,509 |
| GMAC Commercial Mortgage Securities, Inc. Series 1997-C2 Class G, 6.75% 4/15/29 (d) | | 53,447 | 53,509 |
| GP Portfolio Trust Series 2014-GPP Class E, 1 month U.S. LIBOR + 4.100% 5.577% 2/15/27 (c)(d)(g) | | 1,615,000 | 1,588,835 |
| GS Mortgage Securities Trust: | | | |
| Series 2010-C2 Class D, 5.1827% 12/10/43 (c)(d) | | 2,000,000 | 2,020,846 |
| Series 2011-GC5: | | | |
| Class D, 5.3984% 8/10/44 (c)(d) | | 2,075,000 | 2,010,190 |
| Class E, 5.3984% 8/10/44 (c)(d) | | 756,000 | 613,050 |
| Class F, 4.5% 8/10/44 (c) | | 588,000 | 297,329 |
| Series 2012-GC6: | | | |
| Class C, 5.6521% 1/10/45 (c)(d) | | 2,400,000 | 2,498,267 |
| Class D, 5.6521% 1/10/45 (c)(d) | | 1,816,000 | 1,735,359 |
| Class E, 5% 1/10/45 (c)(d) | | 831,000 | 710,609 |
| Series 2012-GCJ7: | | | |
| Class C, 5.7014% 5/10/45 (d) | | 3,500,000 | 3,657,403 |
| Class D, 5.7014% 5/10/45 (c)(d) | | 3,425,000 | 3,326,063 |
| Class E, 5% 5/10/45 (c) | | 1,760,000 | 1,435,086 |
| Series 2012-GCJ9 Class D, 4.7478% 11/10/45 (c)(d) | | 1,507,000 | 1,449,213 |
| Series 2013-GC14 Class D, 4.7629% 8/10/46 (c)(d) | | 320,000 | 308,801 |
| Series 2013-GC16: | | | |
| Class D, 5.3271% 11/10/46 (c)(d) | | 3,250,000 | 3,088,942 |
| Class F, 3.5% 11/10/46 (c) | | 1,428,000 | 1,019,079 |
| Series 2014-NEW Class D, 3.79% 1/10/31 (c) | | 490,000 | 492,000 |
| Series 2016-GS3 Class D, 2.728% 10/10/49 (c) | | 602,000 | 471,890 |
| Series 2016-REMZ Class MZB, 7.727% 2/10/21 (c) | | 5,523,000 | 5,416,406 |
| Series 2016-RENT: | | | |
| Class E, 4.0667% 2/10/29 (c)(d) | | 285,000 | 279,497 |
| Class F, 4.0667% 2/10/29 (c)(d) | | 3,110,000 | 2,890,416 |
| Hilton U.S.A. Trust: | | | |
| Series 2016-HHV Class F, 4.1935% 11/5/38 (c)(d) | | 1,460,000 | 1,282,037 |
| Series 2016-SFP Class F, 6.0801% 11/5/35 (c) | | 4,443,000 | 4,435,718 |
| IMT Trust Series 2017-APTS: | | | |
| Class EFX, 3.4966% 6/15/34 (c)(d) | | 1,589,000 | 1,505,592 |
| Class FFL, 1 month U.S. LIBOR + 2.850% 4.327% 6/15/34 (c)(d)(g) | | 664,000 | 666,486 |
| JPMBB Commercial Mortgage Securities Trust: | | | |
| Series 2014-C23 Class UH5, 4.7094% 9/15/47 (c) | | 1,526,000 | 1,303,286 |
| Series 2014-C26 Class D, 3.9241% 1/15/48 (c)(d) | | 602,000 | 516,025 |
| JPMCC Commercial Mortgage Securities Trust Series 2016-JP4 Class D, 3.4619% 12/15/49 (c) | | 1,809,000 | 1,481,064 |
| JPMDB Commercial Mortgage Securities Trust Series 2016-C4 Class D, 3.0956% 12/15/49 (c)(d) | | 1,308,000 | 1,051,862 |
| JPMorgan Chase Commercial Mortgage Securities Corp.: | | | |
| Series 2003-C1 Class F, 5.4826% 1/12/37 (c)(d) | | 563,438 | 583,070 |
| Series 2009-IWST Class D, 7.4453% 12/5/27 (c)(d) | | 2,779,000 | 2,973,354 |
| Series 2010-CNTR Class D, 6.1838% 8/5/32 (c)(d) | | 1,216,000 | 1,277,273 |
| Series 2012-CBX: | | | |
| Class C, 5.2137% 6/15/45 (d) | | 1,240,000 | 1,279,497 |
| Class E, 5.2137% 6/15/45 (c)(d) | | 865,000 | 851,384 |
| Class G 4% 6/15/45 (c) | | 805,000 | 446,092 |
| JPMorgan Chase Commercial Mortgage Securities Trust: | | | |
| Series 2005-LDP2 Class E, 4.981% 7/15/42 (d) | | 71,980 | 73,137 |
| Series 2011-C3: | | | |
| Class E, 5.6311% 2/15/46 (c)(d) | | 1,155,000 | 1,146,427 |
| Class H, 4.409% 2/15/46 (c)(d) | | 1,320,000 | 965,162 |
| Series 2011-C4 Class E, 5.5344% 7/15/46 (c)(d) | | 1,390,000 | 1,409,774 |
| Series 2013-LC11: | | | |
| Class D, 4.2027% 4/15/46 (d) | | 1,207,000 | 1,115,417 |
| Class F, 3.25% 4/15/46 (c)(d) | | 482,000 | 279,503 |
| Series 2015-UES Class F, 3.621% 9/5/32 (c)(d) | | 1,843,000 | 1,797,281 |
| Merrill Lynch Mortgage Trust Series 2006-C1 Class AJ, 5.5942% 5/12/39 (d) | | 431,766 | 435,077 |
| Morgan Stanley BAML Trust: | | | |
| Series 2012-C5 Class E, 4.6875% 8/15/45 (c)(d) | | 670,000 | 660,057 |
| Series 2012-C6 Class D, 4.5752% 11/15/45 (c)(d) | | 2,000,000 | 2,011,995 |
| Series 2013-C12 Class D, 4.7638% 10/15/46 (c)(d) | | 1,500,000 | 1,434,808 |
| Series 2013-C13: | | | |
| Class D, 4.8894% 11/15/46 (c)(d) | | 2,935,000 | 2,757,180 |
| Class E, 4.8894% 11/15/46 (c)(d) | | 621,000 | 492,385 |
| Series 2013-C7: | | | |
| Class D, 4.2503% 2/15/46 (c)(d) | | 998,000 | 909,411 |
| Class E, 4.2503% 2/15/46 (c)(d) | | 1,490,000 | 1,154,560 |
| Series 2013-C9 Class C, 4.047% 5/15/46 (d) | | 588,000 | 578,820 |
| Series 2016-C30 Class D, 3% 9/15/49 (c) | | 963,000 | 715,853 |
| Series 2016-C31 Class D, 3% 11/15/49 (c)(d) | | 1,500,000 | 1,080,609 |
| Series 2016-C32 Class D, 3.396% 12/15/49 (c) | | 1,071,000 | 798,126 |
| Morgan Stanley Capital I Trust: | | | |
| sequential payer Series 2012-C4 Class E, 5.4205% 3/15/45 (c)(d) | | 2,586,000 | 2,204,982 |
| Series 1997-RR Class F, 7.51% 4/30/39 (c)(d) | | 57,610 | 57,466 |
| Series 1998-CF1 Class G, 7.35% 7/15/32 (c) | | 730,200 | 709,317 |
| Series 2011-C2: | | | |
| Class D, 5.4831% 6/15/44 (c)(d) | | 1,586,000 | 1,571,025 |
| Class E, 5.4831% 6/15/44 (c)(d) | | 2,396,000 | 2,261,281 |
| Class F, 5.4831% 6/15/44 (c)(d) | | 1,467,000 | 1,243,568 |
| Class XB, 0.5345% 6/15/44 (c)(d)(e) | | 51,641,000 | 830,620 |
| Series 2011-C3: | | | |
| Class C, 5.1549% 7/15/49 (c)(d) | | 2,000,000 | 2,097,294 |
| Class E, 5.1549% 7/15/49 (c)(d) | | 255,000 | 247,565 |
| Class F, 5.1549% 7/15/49 (c)(d) | | 572,000 | 527,708 |
| Class G, 5.1549% 7/15/49 (c)(d) | | 715,000 | 598,809 |
| Series 2012-C4 Class D, 5.4205% 3/15/45 (c)(d) | | 1,640,000 | 1,567,009 |
| Series 2015-MS1 Class D, 4.0301% 5/15/48 (c)(d) | | 1,922,000 | 1,639,514 |
| Series 2015-UBS8 Class D, 3.18% 12/15/48 (c) | | 987,000 | 834,394 |
| Series 2016-BNK2 Class C, 3% 11/15/49 (c) | | 2,312,000 | 1,864,243 |
| Motel 6 Trust floater: | | | |
| Series 2017-M6MZ, Class M, 1 month U.S. LIBOR + 6.927% 8.4035% 8/15/19 (c)(d)(g) | | 1,352,451 | 1,360,900 |
| Series 2017-MTL6, Class F, 1 month U.S. LIBOR + 4.250% 5.727% 8/15/34 (c)(d)(g) | | 2,305,609 | 2,322,884 |
| MSCG Trust Series 2016-SNR: | | | |
| Class D, 6.55% 11/15/34 (c) | | 3,328,000 | 3,350,283 |
| Class E, 6.8087% 11/15/34 (c) | | 2,055,000 | 1,956,267 |
| MSJP Commercial Securities Mortgage Trust Series 2015-HAUL Class E, 4.851% 9/5/47 (c)(d) | | 1,000,000 | 931,190 |
| Providence Place Group Ltd. Partnership Series 2000-C1 Class A2, 7.75% 7/20/28 (c) | | 1,179,527 | 1,444,331 |
| UBS Commercial Mortgage Trust Series 2012-C1: | | | |
| Class D, 5.5454% 5/10/45 (c)(d) | | 645,000 | 641,696 |
| Class E, 5% 5/10/45 (c)(d) | | 1,165,000 | 986,714 |
| Class F, 5% 5/10/45 (c)(d) | | 399,000 | 271,612 |
| UBS-BAMLL Trust Series 12-WRM Class D, 4.238% 6/10/30 (c)(d) | | 1,460,000 | 1,421,689 |
| Wells Fargo Commercial Mortgage Trust: | | | |
| Series 2012-LC5: | | | |
| Class D, 4.7647% 10/15/45 (c)(d) | | 492,000 | 443,599 |
| Class E, 4.7647% 10/15/45 (c)(d) | | 1,298,000 | 1,047,172 |
| Series 2016-BNK1 Class D, 3% 8/15/49 (c) | | 1,260,000 | 1,013,978 |
| Series 2016-C35 Class D, 3.142% 7/15/48 (c) | | 3,317,000 | 2,382,156 |
| Series 2016-NXS6 Class D, 3.059% 11/15/49 (c) | | 906,000 | 683,142 |
| Series 2017-C38 Class D, 3% 7/15/50 (c)(d) | | 757,000 | 602,436 |
| WF-RBS Commercial Mortgage Trust: | | | |
| Series 2011-C3: | | | |
| Class C, 5.335% 3/15/44 (c) | | 2,100,000 | 2,179,415 |
| Class D, 5.6402% 3/15/44 (c)(d) | | 1,000,000 | 874,454 |
| Series 2011-C5: | | | |
| Class C, 5.6716% 11/15/44 (c)(d) | | 1,250,000 | 1,339,255 |
| Class E, 5.6716% 11/15/44 (c)(d) | | 693,000 | 698,900 |
| Class F, 5.25% 11/15/44 (c)(d) | | 2,000,000 | 1,734,498 |
| Class G, 5.25% 11/15/44 (c)(d) | | 1,000,000 | 811,460 |
| Series 2012-C10 Class E, 4.4476% 12/15/45 (c)(d) | | 910,000 | 686,526 |
| Series 2012-C7 Class D, 4.8255% 6/15/45 (c)(d) | | 620,000 | 534,323 |
| Series 2012-C8 Class E, 4.8935% 8/15/45 (c)(d) | | 524,000 | 502,343 |
| Series 2013-C16 Class D, 5.0286% 9/15/46 (c)(d) | | 673,000 | 637,013 |
| Series 2013-UBS1 Class D, 4.6237% 3/15/46 (c)(d) | | 859,000 | 794,960 |
| WFCG Commercial Mortgage Trust floater Series 2015-BXRP: | | | |
| Class F, 1 month U.S. LIBOR + 3.721% 5.1973% 11/15/29 (c)(d)(g) | | 952,061 | 953,599 |
| Class G, 1 month U.S. LIBOR + 3.001% 4.497% 11/15/29 (c)(d)(g) | | 1,614,085 | 1,593,166 |
| WP Glimcher Mall Trust Series 2015-WPG: | | | |
| Class PR1, 3.516% 6/5/35 (c)(d) | | 1,168,000 | 898,559 |
| Class PR2, 3.516% 6/5/35 (c)(d) | | 459,000 | 328,593 |
| TOTAL COMMERCIAL MORTGAGE SECURITIES | | | |
| (Cost $198,814,894) | | | 204,279,360 |
|
| Bank Loan Obligations - 4.5% | | | |
| CONSUMER DISCRETIONARY - 0.7% | | | |
| Hotels, Restaurants & Leisure - 0.5% | | | |
| Caesars Resort Collection LLC Tranche B 1LN, term loan 3 month U.S. LIBOR + 2.750% 4.3235% 12/22/24(d)(g) | | 570,000 | 576,629 |
| ESH Hospitality, Inc. Tranche B, term loan 3 month U.S. LIBOR + 2.250% 3.8235% 8/30/23 (d)(g) | | 794,973 | 801,499 |
| Four Seasons Holdings, Inc. Tranche B, term loan 3 month U.S. LIBOR + 2.500% 4.0735% 11/30/23 (d)(g) | | 534,600 | 539,390 |
| La Quinta Intermediate Holdings LLC Tranche B LN, term loan 3 month U.S. LIBOR + 2.750% 4.4702% 4/14/21 (d)(g) | | 1,982,605 | 1,988,811 |
| Playa Resorts Holding BV Tranche B, term loan 3 month U.S. LIBOR + 3.250% 4.9997% 4/27/24 (d)(g) | | 746,948 | 751,848 |
| | | | 4,658,177 |
| Multiline Retail - 0.2% | | | |
| JC Penney Corp., Inc. Tranche B, term loan 3 month U.S. LIBOR + 4.250% 5.7288% 6/23/23 (d)(g) | | 1,902,381 | 1,831,841 |
|
| TOTAL CONSUMER DISCRETIONARY | | | 6,490,018 |
|
| CONSUMER STAPLES - 0.5% | | | |
| Food & Staples Retailing - 0.5% | | | |
| Albertson's LLC Tranche B, term loan: | | | |
| 3 month U.S. LIBOR + 3.000% 4.4623% 6/22/23 (d)(g) | | 2,373,075 | 2,356,511 |
| 3 month U.S. LIBOR + 3.000% 4.6746% 12/21/22 (d)(g) | | 2,107,407 | 2,094,468 |
| | | | 4,450,979 |
| ENERGY - 0.7% | | | |
| Oil, Gas & Consumable Fuels - 0.7% | | | |
| Moxie Patriot LLC Tranche B, term loan 3 month U.S. LIBOR + 5.750% 7.4434% 12/19/20 (d)(g) | | 3,657,439 | 3,616,292 |
| Panda Temple Power, LLC term loan 3 month U.S. LIBOR + 6.000% 7.6934% 4/3/19 (d)(g) | | 1,477,556 | 1,348,270 |
| TPF II Power LLC Tranche B, term loan 3 month U.S. LIBOR + 3.750% 5.3235% 10/2/23 (d)(g) | | 1,702,241 | 1,724,591 |
| | | | 6,689,153 |
| FINANCIALS - 0.3% | | | |
| Real Estate Management & Development - 0.2% | | | |
| DTZ U.S. Borrower LLC Tranche B 1LN, term loan 3 month U.S. LIBOR + 3.250% 4.8245% 11/4/21 (d)(g) | | 2,412,439 | 2,411,088 |
| Thrifts & Mortgage Finance - 0.1% | | | |
| Ocwen Loan Servicing LLC Tranche B, term loan 3 month U.S. LIBOR + 5.000% 6.5595% 12/5/20(d)(g) | | 701,966 | 703,721 |
|
| TOTAL FINANCIALS | | | 3,114,809 |
|
| HEALTH CARE - 0.2% | | | |
| Health Care Providers & Services - 0.2% | | | |
| Community Health Systems, Inc. Tranche H, term loan 3 month U.S. LIBOR + 3.000% 4.4788% 1/27/21 (d)(g) | | 1,602,478 | 1,571,342 |
| INFORMATION TECHNOLOGY - 0.1% | | | |
| Electronic Equipment & Components - 0.1% | | | |
| Compass Power Generation LLC Tranche B, term loan 3 month U.S. LIBOR + 3.750% 5.3908% 12/20/24 (d)(g) | | 560,000 | 566,653 |
| REAL ESTATE - 1.2% | | | |
| Equity Real Estate Investment Trusts (REITs) - 0.8% | | | |
| Invitation Homes Operating Par Tranche B, term loan 3 month U.S. LIBOR + 1.700% 3.2595% 2/6/22 (d)(g) | | 5,000,000 | 4,843,750 |
| iStar Financial, Inc. Tranche B, term loan 3 month U.S. LIBOR + 3.000% 4.5572% 10/1/21 (d)(g) | | 1,239,170 | 1,253,111 |
| QCP SNF West (REIT) LLC Tranche B, term loan 3 month U.S. LIBOR + 5.250% 6.8235% 10/31/22 (d)(g) | | 1,197,900 | 1,210,634 |
| | | | 7,307,495 |
| Real Estate Management & Development - 0.4% | | | |
| Capital Automotive LP Tranche B 1LN, term loan 3 month U.S. LIBOR + 2.500% 4.0735% 3/24/24 (d)(g) | | 556,093 | 559,224 |
| Simply Storage Management LLC 8.2375% 9/6/21 (d)(f) | | 3,026,000 | 3,026,000 |
| | | | 3,585,224 |
|
| TOTAL REAL ESTATE | | | 10,892,719 |
|
| UTILITIES - 0.8% | | | |
| Electric Utilities - 0.3% | | | |
| Lightstone Holdco LLC: | | | |
| Tranche B, term loan 3 month U.S. LIBOR + 4.500% 6.0735% 1/30/24 (d)(g) | | 1,806,312 | 1,813,989 |
| Tranche C, term loan 3 month U.S. LIBOR + 4.500% 6.0735% 1/30/24 (d)(g) | | 114,696 | 115,183 |
| Southeast Powergen LLC Tranche B, term loan 3 month U.S. LIBOR + 3.500% 5.08% 12/2/21 (d)(g) | | 482,280 | 467,812 |
| | | | 2,396,984 |
| Independent Power and Renewable Electricity Producers - 0.5% | | | |
| APLP Holdings LP Tranche B, term loan 3 month U.S. LIBOR + 4.250% 5.0735% 4/13/23 (d)(g) | | 1,511,919 | 1,525,148 |
| Dynegy, Inc. Tranche C-2, term loan 3 month U.S. LIBOR + 2.750% 4.3112% 2/7/24 (d)(g) | | 281,347 | 284,034 |
| MRP Generation Holdings LLC Tranche B, term loan 3 month U.S. LIBOR + 7.000% 8.6934% 10/18/22 (d)(g) | | 2,591,581 | 2,500,876 |
| | | | 4,310,058 |
|
| TOTAL UTILITIES | | | 6,707,042 |
|
| TOTAL BANK LOAN OBLIGATIONS | | | |
| (Cost $40,344,129) | | | 40,482,715 |
| | | Shares | Value |
|
| Money Market Funds - 5.8% | | | |
| Fidelity Cash Central Fund, 1.39% (i) | | 50,233,760 | 50,243,807 |
| Fidelity Securities Lending Cash Central Fund 1.40% (i)(j) | | 1,352,557 | 1,352,693 |
| TOTAL MONEY MARKET FUNDS | | | |
| (Cost $51,592,783) | | | 51,596,500 |
| TOTAL INVESTMENT IN SECURITIES - 99.7% | | | |
| (Cost $857,268,536) | | | 892,778,108 |
| NET OTHER ASSETS (LIABILITIES) - 0.3% | | | 2,280,852 |
| NET ASSETS - 100% | | | $895,058,960 |
Legend
(a) Security or a portion of the security is on loan at period end.
(b) Non-income producing
(c) Security exempt from registration under Rule 144A of the Securities Act of 1933. These securities may be resold in transactions exempt from registration, normally to qualified institutional buyers. At the end of the period, the value of these securities amounted to $264,713,101 or 29.6% of net assets.
(d) Coupon rates for floating and adjustable rate securities reflect the rates in effect at period end.
(e) Security represents right to receive monthly interest payments on an underlying pool of mortgages or assets. Principal shown is the outstanding par amount of the pool as of the end of the period.
(f) Level 3 security
(g) Coupon is indexed to a floating interest rate which may be multiplied by a specified factor and/or subject to caps or floors.
(h) Security or a portion of the security purchased on a delayed delivery or when-issued basis.
(i) Affiliated fund that is generally available only to investment companies and other accounts managed by Fidelity Investments. The rate quoted is the annualized seven-day yield of the fund at period end. A complete unaudited listing of the fund's holdings as of its most recent quarter end is available upon request. In addition, each Fidelity Central Fund's financial statements are available on the SEC's website or upon request.
(j) Investment made with cash collateral received from securities on loan.
Affiliated Central Funds
Information regarding fiscal year to date income earned by the Fund from investments in Fidelity Central Funds is as follows:
| Fund | Income earned |
| Fidelity Cash Central Fund | $206,283 |
| Fidelity Securities Lending Cash Central Fund | 2,009 |
| Total | $208,292 |
Amounts in the income column in the above table include any capital gain distributions from underlying funds, which are presented in the corresponding line-item in the Statement of Operations if applicable.
Investment Valuation
The following is a summary of the inputs used, as of January 31, 2018, involving the Fund's assets and liabilities carried at fair value. The inputs or methodology used for valuing securities may not be an indication of the risk associated with investing in those securities. For more information on valuation inputs, and their aggregation into the levels used below, please refer to the Investment Valuation section in the accompanying Notes to Financial Statements.
| | Valuation Inputs at Reporting Date: |
| Description | Total | Level 1 | Level 2 | Level 3 |
| Investments in Securities: | | | | |
| Equities: | | | | |
| Consumer Discretionary | $2,582,320 | $2,582,320 | $-- | $-- |
| Financials | 112,933,012 | 104,786,716 | 8,146,296 | -- |
| Real Estate | 217,292,274 | 205,783,206 | 11,509,068 | -- |
| Utilities | 642,204 | 642,204 | -- | -- |
| Corporate Bonds | 228,326,804 | -- | 228,326,804 | -- |
| Asset-Backed Securities | 31,062,597 | -- | 31,062,588 | 9 |
| Collateralized Mortgage Obligations | 3,580,322 | -- | 3,580,322 | -- |
| Commercial Mortgage Securities | 204,279,360 | -- | 204,279,360 | -- |
| Bank Loan Obligations | 40,482,715 | -- | 37,456,715 | 3,026,000 |
| Money Market Funds | 51,596,500 | 51,596,500 | -- | -- |
| Total Investments in Securities: | $892,778,108 | $365,390,946 | $524,361,153 | $3,026,009 |
The following is a reconciliation of Investments in Securities and Derivative Instruments for which Level 3 inputs were used in determining value:
| Investments in Securities: | |
| Bank Loan Obligations | |
| Beginning Balance | $10,051,425 |
| Net Realized Gain (Loss) on Investment Securities | (6,195) |
| Net Unrealized Gain (Loss) on Investment Securities | 9,485 |
| Cost of Purchases | -- |
| Proceeds of Sales | (2,275,425) |
| Amortization/Accretion | (3,290) |
| Transfers into Level 3 | -- |
| Transfers out of Level 3 | (4,750,000) |
| Ending Balance | $3,026,000 |
| The change in unrealized gain (loss) for the period attributable to Level 3 securities held at January 31, 2018 | $(256) |
| Other Investments in Securities | |
| Beginning Balance | $277,268 |
| Net Realized Gain (Loss) on Investment Securities | -- |
| Net Unrealized Gain (Loss) on Investment Securities | -- |
| Cost of Purchases | -- |
| Proceeds of Sales | -- |
| Amortization/Accretion | -- |
| Transfers into Level 3 | -- |
| Transfers out of Level 3 | (277,259) |
| Ending Balance | $9 |
| The change in unrealized gain (loss) for the period attributable to Level 3 securities held at January 31, 2018 | $-- |
The information used in the above reconciliations represents fiscal year to date activity for any Investments in Securities identified as using Level 3 inputs at either the beginning or the end of the current fiscal period. Transfers in or out of Level 3 represent the beginning value of any Security or Instrument where a change in the pricing level occurred from the beginning to the end of the period. The cost of purchases and the proceeds of sales may include securities received or delivered through corporate actions or exchanges. Realized and unrealized gains (losses) disclosed in the reconciliations are included in Net Gain (Loss) on the Fund's Statement of Operations.
Other Information
The composition of credit quality ratings as a percentage of Total Net Assets is as follows (Unaudited):
| U.S. Government and U.S. Government Agency Obligations | 0.3% |
| AAA,AA,A | 3.1% |
| BBB | 14.2% |
| BB | 9.7% |
| B | 12.1% |
| CCC,CC,C | 1.5% |
| Not Rated | 15.8% |
| Equities | 37.2% |
| Short-Term Investments and Net Other Assets | 6.1% |
| | 100.0% |
We have used ratings from Moody's Investors Service, Inc. Where Moody's® ratings are not available, we have used S&P® ratings. All ratings are as of the date indicated and do not reflect subsequent changes.
See accompanying notes which are an integral part of the financial statements.
Financial Statements
Statement of Assets and Liabilities
| | | January 31, 2018 (Unaudited) |
| Assets | | |
Investment in securities, at value (including securities loaned of $1,354,704) — See accompanying schedule:
Unaffiliated issuers (cost $805,675,753) | $841,181,608 | |
| Fidelity Central Funds (cost $51,592,783) | 51,596,500 | |
| Total Investment in Securities (cost $857,268,536) | | $892,778,108 |
| Cash | | 251,351 |
| Receivable for investments sold | | 5,585,459 |
| Receivable for fund shares sold | | 153,783 |
| Dividends receivable | | 331,188 |
| Interest receivable | | 4,652,857 |
| Distributions receivable from Fidelity Central Funds | | 53,480 |
| Other receivables | | 1,200 |
| Total assets | | 903,807,426 |
| Liabilities | | |
| Payable for investments purchased | | |
| Regular delivery | $4,977,496 | |
| Delayed delivery | 2,058,000 | |
| Payable for fund shares redeemed | 352,501 | |
| Other payables and accrued expenses | 7,769 | |
| Collateral on securities loaned | 1,352,700 | |
| Total liabilities | | 8,748,466 |
| Net Assets | | $895,058,960 |
| Net Assets consist of: | | |
| Paid in capital | | $857,403,166 |
| Distributions in excess of net investment income | | (1,334,907) |
| Accumulated undistributed net realized gain (loss) on investments and foreign currency transactions | | 3,481,148 |
| Net unrealized appreciation (depreciation) on investments and assets and liabilities in foreign currencies | | 35,509,553 |
| Net Assets | | $895,058,960 |
| Series Real Estate Income: | | |
| Net Asset Value, offering price and redemption price per share ($895,058,960 ÷ 83,058,601 shares) | | $10.78 |
See accompanying notes which are an integral part of the financial statements.
Statement of Operations
| | | Six months ended January 31, 2018 (Unaudited) |
| Investment Income | | |
| Dividends | | $8,569,111 |
| Interest | | 14,916,079 |
| Income from Fidelity Central Funds | | 208,292 |
| Total income | | 23,693,482 |
| Expenses | | |
| Custodian fees and expenses | $7,890 | |
| Independent trustees' fees and expenses | 1,758 | |
| Miscellaneous | 1,307 | |
| Total expenses before reductions | 10,955 | |
| Expense reductions | (6,938) | 4,017 |
| Net investment income (loss) | | 23,689,465 |
| Realized and Unrealized Gain (Loss) | | |
| Net realized gain (loss) on: | | |
| Investment securities: | | |
| Unaffiliated issuers | 9,414,722 | |
| Fidelity Central Funds | 1,985 | |
| Foreign currency transactions | (479) | |
| Total net realized gain (loss) | | 9,416,228 |
| Change in net unrealized appreciation (depreciation) on: | | |
| Investment securities: | | |
| Unaffiliated issuers | (32,366,269) | |
| Fidelity Central Funds | (1,983) | |
| Assets and liabilities in foreign currencies | (23) | |
| Total change in net unrealized appreciation (depreciation) | | (32,368,275) |
| Net gain (loss) | | (22,952,047) |
| Net increase (decrease) in net assets resulting from operations | | $737,418 |
See accompanying notes which are an integral part of the financial statements.
Statement of Changes in Net Assets
| | Six months ended January 31, 2018 (Unaudited) | Year ended July 31, 2017 |
| Increase (Decrease) in Net Assets | | |
| Operations | | |
| Net investment income (loss) | $23,689,465 | $43,527,164 |
| Net realized gain (loss) | 9,416,228 | 9,060,937 |
| Change in net unrealized appreciation (depreciation) | (32,368,275) | (3,286,317) |
| Net increase (decrease) in net assets resulting from operations | 737,418 | 49,301,784 |
| Distributions to shareholders from net investment income | (33,876,532) | (41,562,413) |
| Distributions to shareholders from net realized gain | (12,651,932) | (13,652,895) |
| Total distributions | (46,528,464) | (55,215,308) |
| Share transactions - net increase (decrease) | 40,123,282 | 27,688,733 |
| Total increase (decrease) in net assets | (5,667,764) | 21,775,209 |
| Net Assets | | |
| Beginning of period | 900,726,724 | 878,951,515 |
| End of period | $895,058,960 | $900,726,724 |
| Other Information | | |
| Undistributed net investment income end of period | $– | $8,852,160 |
| Distributions in excess of net investment income end of period | $(1,334,907) | $– |
See accompanying notes which are an integral part of the financial statements.
Financial Highlights
Fidelity Series Real Estate Income Fund
| | Six months ended (Unaudited) January 31, | Years endedJuly 31, | | | | |
| | 2018 | 2017 | 2016 | 2015 | 2014 | 2013 |
| Selected Per–Share Data | | | | | | |
| Net asset value, beginning of period | $11.34 | $11.43 | $11.13 | $11.47 | $11.41 | $11.10 |
| Income from Investment Operations | | | | | | |
| Net investment income (loss)A | .29 | .55 | .52 | .56 | .58 | .67 |
| Net realized and unrealized gain (loss) | (.27) | .06 | .42 | (.01) | .31 | .46 |
| Total from investment operations | .02 | .61 | .94 | .55 | .89 | 1.13 |
| Distributions from net investment income | (.42) | (.52) | (.53) | (.61) | (.59) | (.66) |
| Distributions from net realized gain | (.16) | (.18) | (.11) | (.29) | (.24) | (.16) |
| Total distributions | (.58) | (.70) | (.64) | (.89)B | (.83) | (.82) |
| Net asset value, end of period | $10.78 | $11.34 | $11.43 | $11.13 | $11.47 | $11.41 |
| Total ReturnC,D | .12% | 5.65% | 8.93% | 5.05% | 8.33% | 10.50% |
| Ratios to Average Net AssetsE,F | | | | | | |
| Expenses before reductions | - %G,H | .63% | .77% | .77% | .77% | .79% |
| Expenses net of fee waivers, if any | - %G,H | .63% | .77% | .77% | .77% | .79% |
| Expenses net of all reductions | - %G,H | .63% | .77% | .77% | .77% | .79% |
| Net investment income (loss) | 5.24%G | 4.89% | 4.81% | 5.03% | 5.15% | 5.85% |
| Supplemental Data | | | | | | |
| Net assets, end of period (000 omitted) | $895,058 | $423,538 | $411,102 | $401,861 | $409,084 | $415,192 |
| Portfolio turnover rateI | 28%G | 24% | 24% | 19% | 33% | 25% |
A Calculated based on average shares outstanding during the period.
B Total distributions of $.89 per share is comprised of distributions from net investment income of $.606 and distributions from net realized gain of $.288 per share.
C Total returns for periods of less than one year are not annualized.
D Total returns would have been lower if certain expenses had not been reduced during the applicable periods shown.
E Fees and expenses of any underlying Fidelity Central Funds are not included in the Fund's expense ratio. The Fund indirectly bears its proportionate share of the expenses of any underlying Fidelity Central Funds.
F Expense ratios reflect operating expenses of the class. Expenses before reductions do not reflect amounts reimbursed by the investment adviser or reductions from brokerage service arrangements or reductions from other expense offset arrangements and do not represent the amount paid by the class during periods when reimbursements or reductions occur. Expenses net of fee waivers reflect expenses after reimbursement by the investment adviser but prior to reductions from brokerage service arrangements or other expense offset arrangements. Expenses net of all reductions represent the net expenses paid by the class.
G Annualized
H Amount represents less than .005%.
I Amount does not include the portfolio activity of any underlying Fidelity Central Funds.
See accompanying notes which are an integral part of the financial statements.
Notes to Financial Statements (Unaudited)
For the period ended January 31, 2018
1. Organization.
Fidelity Series Real Estate Income Fund (the Fund) is a fund of Fidelity Securities Fund (the Trust) and is authorized to issue an unlimited number of shares. Shares of the Fund are only available for purchase by mutual funds for which Fidelity Management & Research Company (FMR) or an affiliate serves as an investment manager. The Trust is registered under the Investment Company Act of 1940, as amended (the 1940 Act), as an open-end management investment company organized as a Massachusetts business trust. Effective August 28, 2017, the Fund no longer offered Class F, and all outstanding shares of Class F were exchanged for shares of Series Real Estate Income.
2. Investments in Fidelity Central Funds.
The Fund invests in Fidelity Central Funds, which are open-end investment companies generally available only to other investment companies and accounts managed by the investment adviser and its affiliates. The Fund's Schedule of Investments lists each of the Fidelity Central Funds held as of period end, if any, as an investment of the Fund, but does not include the underlying holdings of each Fidelity Central Fund. As an Investing Fund, the Fund indirectly bears its proportionate share of the expenses of the underlying Fidelity Central Funds.
The Money Market Central Funds seek preservation of capital and current income and are managed by Fidelity Investments Money Management, Inc. (FIMM), an affiliate of the investment adviser. Annualized expenses of the Money Market Central Funds as of their most recent shareholder report date are less than .005%.
A complete unaudited list of holdings for each Fidelity Central Fund is available upon request or at the Securities and Exchange Commission (the SEC) website at www.sec.gov. In addition, the financial statements of the Fidelity Central Funds are available on the SEC website or upon request.
3. Significant Accounting Policies.
The Fund is an investment company and applies the accounting and reporting guidance of the Financial Accounting Standards Board (FASB) Accounting Standards Codification Topic 946 Financial Services – Investments Companies. The financial statements have been prepared in conformity with accounting principles generally accepted in the United States of America (GAAP), which require management to make certain estimates and assumptions at the date of the financial statements. Actual results could differ from those estimates. Subsequent events, if any, through the date that the financial statements were issued have been evaluated in the preparation of the financial statements. The following summarizes the significant accounting policies of the Fund:
Investment Valuation. Investments are valued as of 4:00 p.m. Eastern time on the last calendar day of the period. The Board of Trustees (the Board) has delegated the day to day responsibility for the valuation of the Fund's investments to the Fair Value Committee (the Committee) established by the Fund's investment adviser. In accordance with valuation policies and procedures approved by the Board, the Fund attempts to obtain prices from one or more third party pricing vendors or brokers to value its investments. When current market prices, quotations or currency exchange rates are not readily available or reliable, investments will be fair valued in good faith by the Committee, in accordance with procedures adopted by the Board. Factors used in determining fair value vary by investment type and may include market or investment specific events, changes in interest rates and credit quality. The frequency with which these procedures are used cannot be predicted and they may be utilized to a significant extent. The Committee oversees the Fund's valuation policies and procedures and reports to the Board on the Committee's activities and fair value determinations. The Board monitors the appropriateness of the procedures used in valuing the Fund's investments and ratifies the fair value determinations of the Committee.
The Fund categorizes the inputs to valuation techniques used to value its investments into a disclosure hierarchy consisting of three levels as shown below:
- Level 1 – quoted prices in active markets for identical investments
- Level 2 – other significant observable inputs (including quoted prices for similar investments, interest rates, prepayment speeds, etc.)
- Level 3 – unobservable inputs (including the Fund's own assumptions based on the best information available)
Valuation techniques used to value the Fund's investments by major category are as follows:
Equity securities, including restricted securities, for which market quotations are readily available, are valued at the last reported sale price or official closing price as reported by a third party pricing vendor on the primary market or exchange on which they are traded and are categorized as Level 1 in the hierarchy. In the event there were no sales during the day or closing prices are not available, securities are valued at the last quoted bid price or may be valued using the last available price and are generally categorized as Level 2 in the hierarchy. For foreign equity securities, when market or security specific events arise, comparisons to the valuation of American Depositary Receipts (ADRs), futures contracts, Exchange-Traded Funds (ETFs) and certain indexes as well as quoted prices for similar securities may be used and would be categorized as Level 2 in the hierarchy. Utilizing these techniques may result in transfers between Level 1 and Level 2. For equity securities, including restricted securities, where observable inputs are limited, assumptions about market activity and risk are used and these securities may be categorized as Level 3 in the hierarchy.
Debt securities, including restricted securities, are valued based on evaluated prices received from third party pricing vendors or from brokers who make markets in such securities. Corporate bonds and bank loan obligations are valued by pricing vendors who utilize matrix pricing which considers yield or price of bonds of comparable quality, coupon, maturity and type or by broker-supplied prices. Asset backed securities, collateralized mortgage obligations and commercial mortgage securities are valued by pricing vendors who utilize matrix pricing which considers prepayment speed assumptions, attributes of the collateral, yield or price of bonds of comparable quality, coupon, maturity and type or by broker-supplied prices. When independent prices are unavailable or unreliable, debt securities may be valued utilizing pricing methodologies which consider similar factors that would be used by third party pricing vendors. Debt securities are generally categorized as Level 2 in the hierarchy but may be Level 3 depending on the circumstances. The Fund invests a significant portion of its assets in below investment grade securities. The value of these securities can be more volatile due to changes in the credit quality of the issuer and is sensitive to changes in economic, market and regulatory conditions.
Investments in open-end mutual funds, including the Fidelity Central Funds, are valued at their closing net asset value (NAV) each business day and are categorized as Level 1 in the hierarchy.
Changes in valuation techniques may result in transfers in or out of an assigned level within the disclosure hierarchy. The aggregate value of investments by input level as of January 31, 2018, as well as a roll forward of Level 3 investments, is included at the end of the Fund's Schedule of Investments.
Foreign Currency. The Fund may use foreign currency contracts to facilitate transactions in foreign-denominated securities. Gains and losses from these transactions may arise from changes in the value of the foreign currency or if the counterparties do not perform under the contracts' terms.
Foreign-denominated assets, including investment securities, and liabilities are translated into U.S. dollars at the exchange rates at period end. Purchases and sales of investment securities, income and dividends received and expenses denominated in foreign currencies are translated into U.S. dollars at the exchange rate in effect on the transaction date.
The effects of exchange rate fluctuations on investments are included with the net realized and unrealized gain (loss) on investment securities. Other foreign currency transactions resulting in realized and unrealized gain (loss) are disclosed separately.
Investment Transactions and Income. For financial reporting purposes, the Fund's investment holdings and NAV include trades executed through the end of the last business day of the period. The NAV per share for processing shareholder transactions is calculated as of the close of business of the New York Stock Exchange (NYSE), normally 4:00 p.m. Eastern time and includes trades executed through the end of the prior business day. Gains and losses on securities sold are determined on the basis of identified cost. Dividend income is recorded on the ex-dividend date, except for certain dividends from foreign securities where the ex-dividend date may have passed, which are recorded as soon as the Fund is informed of the ex-dividend date. Non-cash dividends included in dividend income, if any, are recorded at the fair market value of the securities received. Income and capital gain distributions from Fidelity Central Funds, if any, are recorded on the ex-dividend date. Certain distributions received by the Fund represent a return of capital or capital gain. The Fund determines the components of these distributions subsequent to the ex-dividend date, based upon receipt of tax filings or other correspondence relating to the underlying investment. These distributions are recorded as a reduction of cost of investments and/or as a realized gain. Interest income is accrued as earned and includes coupon interest and amortization of premium and accretion of discount on debt securities as applicable. Investment income is recorded net of foreign taxes withheld where recovery of such taxes is uncertain. Debt obligations may be placed on non-accrual status and related interest income may be reduced by ceasing current accruals and writing off interest receivables when the collection of all or a portion of interest has become doubtful based on consistently applied procedures. A debt obligation is removed from non-accrual status when the issuer resumes interest payments or when collectability of interest is reasonably assured.
Class Allocations and Expenses. Investment income, realized and unrealized capital gains and losses, common expenses of the Fund, and certain fund-level expense reductions, if any, are allocated daily on a pro-rata basis to each class based on the relative net assets of each class to the total net assets of the Fund. Each class differs with respect to fees incurred. Certain expense reductions may also differ by class. For the reporting period, the allocated portion of income and expenses to each class as a percent of its average net assets may vary due to the timing of recording these transactions in relation to fluctuating net assets of the classes. Expenses directly attributable to a fund are charged to that fund. Expenses attributable to more than one fund are allocated among the respective funds on the basis of relative net assets or other appropriate methods. Expense estimates are accrued in the period to which they relate and adjustments are made when actual amounts are known.
Income Tax Information and Distributions to Shareholders. Each year, the Fund intends to qualify as a regulated investment company under Subchapter M of the Internal Revenue Code, including distributing substantially all of its taxable income and realized gains. As a result, no provision for U.S. Federal income taxes is required. The Fund files a U.S. federal tax return, in addition to state and local tax returns as required. The Fund's federal income tax returns are subject to examination by the Internal Revenue Service (IRS) for a period of three fiscal years after they are filed. State and local tax returns may be subject to examination for an additional fiscal year depending on the jurisdiction. Foreign taxes are provided for based on the Fund's understanding of the tax rules and rates that exist in the foreign markets in which it invests.
Distributions are declared and recorded on the ex-dividend date. Income dividends and capital gain distributions are declared separately for each class. Income and capital gain distributions are determined in accordance with income tax regulations, which may differ from GAAP.
Capital accounts within the financial statements are adjusted for permanent book-tax differences. These adjustments have no impact on net assets or the results of operations. Capital accounts are not adjusted for temporary book-tax differences which will reverse in a subsequent period.
Book-tax differences are primarily due to short-term capital gains, equity-debt classifications, certain conversion ratio adjustments, foreign currency transactions, partnerships and losses deferred due to wash sales.
As of period end, the cost and unrealized appreciation (depreciation) in securities, and derivatives if applicable, for federal income tax purposes were as follows:
| Gross unrealized appreciation | $49,358,501 |
| Gross unrealized depreciation | (13,810,455) |
| Net unrealized appreciation (depreciation) | $35,548,046 |
| Tax cost | $857,230,062 |
Delayed Delivery Transactions and When-Issued Securities. During the period, the Fund transacted in securities on a delayed delivery or when-issued basis. Payment and delivery may take place after the customary settlement period for that security. The price of the underlying securities and the date when the securities will be delivered and paid for are fixed at the time the transaction is negotiated. The securities purchased on a delayed delivery or when-issued basis are identified as such in the Fund's Schedule of Investments. The Fund may receive compensation for interest forgone in the purchase of a delayed delivery or when-issued security. With respect to purchase commitments, the Fund identifies securities as segregated in its records with a value at least equal to the amount of the commitment. Losses may arise due to changes in the value of the underlying securities or if the counterparty does not perform under the contract's terms, or if the issuer does not issue the securities due to political, economic, or other factors.
Restricted Securities. The Fund may invest in securities that are subject to legal or contractual restrictions on resale. These securities generally may be resold in transactions exempt from registration or to the public if the securities are registered. Disposal of these securities may involve time-consuming negotiations and expense, and prompt sale at an acceptable price may be difficult. Information regarding restricted securities is included at the end of the Fund's Schedule of Investments.
Loans and Other Direct Debt Instruments. The Fund invests in direct debt instruments which are interests in amounts owed to lenders by corporate or other borrowers. These instruments may be in the form of loans, trade claims or other receivables and may include standby financing commitments such as revolving credit facilities that obligate the Fund to supply additional cash to the borrower on demand. Loans may be acquired through assignment or participation. The Fund did not have any unfunded loan commitments, which are contractual obligations for future funding, at period end.
New Accounting Pronouncement. In March 2017, the Financial Accounting Standards Board (FASB) issued an Accounting Standards Update (ASU), ASU 2017-08, which amends the amortization period for certain callable debt securities that are held at a premium. The amendment requires the premium to be amortized to the earliest call date. The amendments do not require an accounting change for securities held at a discount. The ASU is effective for annual periods beginning after December 15, 2018. Management is currently evaluating the potential impact of these changes to the financial statements.
4. Purchases and Sales of Investments.
Purchases and sales of securities, other than short-term securities, aggregated $122,986,408 and $131,432,842, respectively.
5. Fees and Other Transactions with Affiliates.
Management Fee. Fidelity Management & Research Company (the investment adviser) and its affiliates provide the Fund with investment management related services for which the Fund does not pay a management fee. Under the management contract, the investment adviser or an affiliate pays all ordinary operating expenses of the Fund, except custody fees, fees and expenses of the independent Trustees, and certain miscellaneous expenses such as proxy and shareholder meeting expenses.
Brokerage Commissions. The Fund placed a portion of its portfolio transactions with brokerage firms which are affiliates of the investment adviser. Brokerage commissions are included in net realized gain (loss) and change in net unrealized appreciation (depreciation) in the Statement of Operations. The commissions paid to these affiliated firms were $434 for the period.
Interfund Trades. The Fund may purchase from or sell securities to other Fidelity Funds under procedures adopted by the Board. The procedures have been designed to ensure these interfund trades are executed in accordance with Rule 17a-7 of the 1940 Act. Interfund trades are included within the respective purchases and sales amounts shown in the Purchases and Sales of Investments note.
6. Committed Line of Credit.
The Fund participates with other funds managed by the investment adviser or an affiliate in a $4.25 billion credit facility (the "line of credit") to be utilized for temporary or emergency purposes to fund shareholder redemptions or for other short-term liquidity purposes. The Fund has agreed to pay commitment fees on its pro-rata portion of the line of credit, which amounted to $1,307 and is reflected in Miscellaneous expenses on the Statement of Operations. During the period, the Fund did not borrow on this line of credit.
7. Security Lending.
The Fund lends portfolio securities through a lending agent from time to time in order to earn additional income. For equity securities, a lending agent is used and may loan securities to certain qualified borrowers, including Fidelity Capital Markets (FCM), a broker-dealer affiliated with the Fund. On the settlement date of the loan, the Fund receives collateral (in the form of U.S. Treasury obligations, letters of credit and/or cash) against the loaned securities and maintains collateral in an amount not less than 100% of the market value of the loaned securities during the period of the loan. The market value of the loaned securities is determined at the close of business of the Fund and any additional required collateral is delivered to the Fund on the next business day. The Fund or borrower may terminate the loan at any time, and if the borrower defaults on its obligation to return the securities loaned because of insolvency or other reasons, the Fund may apply collateral received from the borrower against the obligation. The Fund may experience delays and costs in recovering the securities loaned. Any cash collateral received is invested in the Fidelity Securities Lending Cash Central Fund. The value of loaned securities and cash collateral at period end are disclosed on the Fund's Statement of Assets and Liabilities. Security lending income represents the income earned on investing cash collateral, less rebates paid to borrowers and any lending agent fees associated with the loan, plus any premium payments received for lending certain types of securities. Security lending income is presented in the Statement of Operations as a component of income from Fidelity Central Funds. Total security lending income during the period amounted to $2,009. During the period, there were no securities loaned to FCM.
8. Expense Reductions.
Commissions paid to certain brokers with whom the investment adviser, or its affiliates, places trades on behalf of the Fund include an amount in addition to trade execution, which may be rebated back to the Fund to offset certain expenses. This amount totaled $2,612 for the period. In addition, through arrangements with the Fund's custodian, credits realized as a result of certain uninvested cash balances were used to reduce the Fund's expenses. During the period, these credits reduced the Fund's custody expenses by $4,326.
9. Distributions to Shareholders.
Distributions to shareholders of each class were as follows:
| | Six months ended
January 31, 2018 | Year ended
July 31, 2017 |
| From net investment income | | |
| Series Real Estate Income | $33,876,532 | $18,968,674 |
| Class F | – | 22,593,739 |
| Total | $33,876,532 | $41,562,413 |
| From net realized gain | | |
| Series Real Estate Income | $12,651,932 | $6,354,281 |
| Class F | – | 7,298,614 |
| Total | $12,651,932 | $13,652,895 |
10. Share Transactions.
Transactions for each class of shares were as follows:
| | Shares | Shares | Dollars | Dollars |
| | Six months ended January 31, 2018 | Year ended July 31, 2017 | Six months ended January 31, 2018 | Year ended July 31, 2017 |
| Series Real Estate Income | | | | |
| Shares sold | 45,851,946 | 2,702,003 | $520,809,199 | $30,208,172 |
| Reinvestment of distributions | 4,218,210 | 2,298,349 | 46,528,464 | 25,322,955 |
| Shares redeemed | (4,356,571) | (3,627,301) | (48,867,204) | (40,432,699) |
| Net increase (decrease) | 45,713,585 | 1,373,051 | $518,470,459 | $15,098,428 |
| Class F | | | | |
| Shares sold | 191,320 | 3,810,903 | $2,169,843 | $42,458,442 |
| Reinvestment of distributions | – | 2,712,239 | – | 29,892,353 |
| Shares redeemed | (42,260,435) | (5,374,089) | (480,517,020) | (59,760,490) |
| Net increase (decrease) | (42,069,115) | 1,149,053 | $(478,347,177) | $12,590,305 |
11. Other.
The Fund's organizational documents provide former and current trustees and officers with a limited indemnification against liabilities arising in connection with the performance of their duties to the Fund. In the normal course of business, the Fund may also enter into contracts that provide general indemnifications. The Fund's maximum exposure under these arrangements is unknown as this would be dependent on future claims that may be made against the Fund. The risk of material loss from such claims is considered remote.
At the end of the period, mutual funds managed by the investment adviser or its affiliates were the owners of record of all of the outstanding shares of the Fund.
Shareholder Expense Example
As a shareholder of the Fund, you incur two types of costs: (1) transaction costs, and (2) ongoing costs, including other Fund expenses. This Example is intended to help you understand your ongoing costs (in dollars) of investing in the Fund and to compare these costs with the ongoing costs of investing in other mutual funds.
The Example is based on an investment of $1,000 invested at the beginning of the period and held for the entire period (August 1, 2017 to January 31, 2018).
Actual Expenses
The first line of the accompanying table provides information about actual account values and actual expenses. You may use the information in this line, together with the amount you invested, to estimate the expenses that you paid over the period. Simply divide your account value by $1,000.00 (for example, an $8,600 account value divided by $1,000.00 = 8.6), then multiply the result by the number in the first line under the heading entitled "Expenses Paid During Period" to estimate the expenses you paid on your account during this period. In addition, the Fund, as a shareholder in the underlying Fidelity Central Funds, will indirectly bear its pro-rata share of the fees and expenses incurred by the underlying Fidelity Central Funds. These fees and expenses are not included in the Fund's annualized expense ratio used to calculate the expense estimate in the table below.
Hypothetical Example for Comparison Purposes
The second line of the accompanying table provides information about hypothetical account values and hypothetical expenses based on the Fund's actual expense ratio and an assumed rate of return of 5% per year before expenses, which is not the Fund's actual return. The hypothetical account values and expenses may not be used to estimate the actual ending account balance or expenses you paid for the period. You may use this information to compare the ongoing costs of investing in the Fund and other funds. To do so, compare this 5% hypothetical example with the 5% hypothetical examples that appear in the shareholder reports of the other funds. In addition, the Fund, as a shareholder in the underlying Fidelity Central Funds, will indirectly bear its pro-rata share of the fees and expenses incurred by the underlying Fidelity Central Funds. These fees and expenses are not included in the Fund's annualized expense ratio used to calculate the expense estimate in the table below.
Please note that the expenses shown in the table are meant to highlight your ongoing costs only and do not reflect any transaction costs. Therefore, the second line of the table is useful in comparing ongoing costs only, and will not help you determine the relative total costs of owning different funds.
| | Annualized Expense Ratio-A | Beginning
Account Value
August 1, 2017 | Ending
Account Value
January 31, 2018 | Expenses Paid
During Period-B
August 1, 2017
to January 31, 2018 |
| Series Real Estate Income | -%-C | | | |
| Actual | | $1,000.00 | $1,001.20 | $--D |
| Hypothetical-E | | $1,000.00 | $1,025.21 | $--D |
A Annualized expense ratio reflects expenses net of applicable fee waivers.
B Expenses are equal to the Fund's annualized expense ratio, multiplied by the average account value over the period, multiplied by 184/365 (to reflect the one-half year period)
C Amount represents less than .005%.
D Amount represents less than $.005
E 5% return per year before expenses
Corporate Headquarters
245 Summer St.
Boston, MA 02210
www.fidelity.com
SRE-SANN-0318
1.924313.106
Fidelity® Series Small Cap Opportunities Fund
Semi-Annual Report January 31, 2018 |
|
Contents
To view a fund's proxy voting guidelines and proxy voting record for the 12-month period ended June 30, visit http://www.fidelity.com/proxyvotingresults or visit the Securities and Exchange Commission's (SEC) web site at http://www.sec.gov.
You may also call 1-800-544-8544 to request a free copy of the proxy voting guidelines.
Standard & Poor's, S&P and S&P 500 are registered service marks of The McGraw-Hill Companies, Inc. and have been licensed for use by Fidelity Distributors Corporation.
Other third-party marks appearing herein are the property of their respective owners.
All other marks appearing herein are registered or unregistered trademarks or service marks of FMR LLC or an affiliated company. © 2018 FMR LLC. All rights reserved.
This report and the financial statements contained herein are submitted for the general information of the shareholders of the Fund. This report is not authorized for distribution to prospective investors in the Fund unless preceded or accompanied by an effective prospectus.
A fund files its complete schedule of portfolio holdings with the SEC for the first and third quarters of each fiscal year on Form N-Q. Forms N-Q are available on the SEC’s web site at http://www.sec.gov. A fund's Forms N-Q may be reviewed and copied at the SEC’s Public Reference Room in Washington, DC. Information regarding the operation of the SEC's Public Reference Room may be obtained by calling 1-800-SEC-0330.
For a complete list of a fund's portfolio holdings, view the most recent holdings listing, semiannual report, or annual report on Fidelity's web site at http://www.fidelity.com, http://www.institutional.fidelity.com, or http://www.401k.com, as applicable.
NOT FDIC INSURED •MAY LOSE VALUE •NO BANK GUARANTEE
Neither the Fund nor Fidelity Distributors Corporation is a bank.
Investment Summary (Unaudited)
Top Ten Stocks as of January 31, 2018
| | % of fund's net assets |
| RingCentral, Inc. | 1.1 |
| Primerica, Inc. | 1.0 |
| Wintrust Financial Corp. | 1.0 |
| EMCOR Group, Inc. | 1.0 |
| Nektar Therapeutics | 1.0 |
| EPAM Systems, Inc. | 0.9 |
| WSFS Financial Corp. | 0.9 |
| 2U, Inc. | 0.9 |
| Aspen Technology, Inc. | 0.9 |
| BancFirst Corp. | 0.8 |
| | 9.5 |
Top Five Market Sectors as of January 31, 2018
| | % of fund's net assets |
| Information Technology | 17.9 |
| Financials | 17.5 |
| Industrials | 15.3 |
| Health Care | 14.7 |
| Consumer Discretionary | 12.0 |
Asset Allocation (% of fund's net assets)
| As of January 31, 2018* |
| | Stocks and Equity Futures | 98.1% |
| | Short-Term Investments and Net Other Assets (Liabilities) | 1.9% |

* Foreign investments - 9.2%
Schedule of Investments January 31, 2018 (Unaudited)
Showing Percentage of Net Assets
| Common Stocks - 97.3% | | | |
| | | Shares | Value |
| CONSUMER DISCRETIONARY - 12.0% | | | |
| Auto Components - 1.1% | | | |
| Fox Factory Holding Corp. (a) | | 365,400 | $14,013,090 |
| Standard Motor Products, Inc. | | 532,534 | 25,508,379 |
| Visteon Corp. (a) | | 201,700 | 26,237,136 |
| | | | 65,758,605 |
| Diversified Consumer Services - 0.4% | | | |
| Service Corp. International | | 662,000 | 26,460,140 |
| Hotels, Restaurants & Leisure - 2.3% | | | |
| Bluegreen Vacations Corp. | | 902,200 | 17,132,778 |
| Cedar Fair LP (depositary unit) | | 314,500 | 21,323,100 |
| Eldorado Resorts, Inc. (a) | | 875,900 | 30,262,345 |
| Marriott Vacations Worldwide Corp. | | 269,200 | 41,007,236 |
| Penn National Gaming, Inc. (a) | | 723,200 | 23,077,312 |
| | | | 132,802,771 |
| Household Durables - 2.8% | | | |
| Cavco Industries, Inc. (a) | | 198,600 | 30,415,590 |
| Helen of Troy Ltd. (a) | | 277,100 | 25,811,865 |
| Taylor Morrison Home Corp. (a) | | 1,385,100 | 35,223,093 |
| TopBuild Corp. (a) | | 501,900 | 38,415,426 |
| TRI Pointe Homes, Inc. (a) | | 1,953,600 | 31,863,216 |
| | | | 161,729,190 |
| Leisure Products - 0.5% | | | |
| Brunswick Corp. | | 291,300 | 18,287,814 |
| Johnson Outdoors, Inc. Class A | | 198,316 | 11,952,505 |
| | | | 30,240,319 |
| Media - 0.8% | | | |
| Cinemark Holdings, Inc. | | 590,600 | 21,734,080 |
| Lions Gate Entertainment Corp. Class B (a) | | 856,300 | 27,401,600 |
| | | | 49,135,680 |
| Multiline Retail - 0.6% | | | |
| Ollie's Bargain Outlet Holdings, Inc. (a) | | 606,500 | 33,691,075 |
| Specialty Retail - 1.5% | | | |
| Burlington Stores, Inc. (a) | | 225,100 | 27,396,921 |
| Murphy U.S.A., Inc. (a) | | 299,000 | 25,507,690 |
| The Children's Place Retail Stores, Inc. | | 244,300 | 36,596,140 |
| | | | 89,500,751 |
| Textiles, Apparel & Luxury Goods - 2.0% | | | |
| Deckers Outdoor Corp. (a) | | 287,500 | 24,641,625 |
| Emerald Expositions Events, Inc. | | 857,100 | 18,496,218 |
| Steven Madden Ltd. (a) | | 800,739 | 36,994,142 |
| Wolverine World Wide, Inc. | | 1,045,600 | 34,327,048 |
| | | | 114,459,033 |
|
| TOTAL CONSUMER DISCRETIONARY | | | 703,777,564 |
|
| CONSUMER STAPLES - 2.5% | | | |
| Beverages - 0.2% | | | |
| Cott Corp. | | 678,900 | 11,310,474 |
| Food & Staples Retailing - 0.4% | | | |
| Performance Food Group Co. (a) | | 715,825 | 24,588,589 |
| Food Products - 1.3% | | | |
| Cranswick PLC | | 307,300 | 12,819,079 |
| Hostess Brands, Inc. Class A (a) | | 860,057 | 11,868,787 |
| Ingredion, Inc. | | 111,100 | 15,958,404 |
| J&J Snack Foods Corp. | | 117,825 | 16,311,693 |
| Lamb Weston Holdings, Inc. | | 258,900 | 15,171,540 |
| | | | 72,129,503 |
| Household Products - 0.3% | | | |
| Central Garden & Pet Co. Class A (non-vtg.) (a) | | 493,800 | 18,626,136 |
| Personal Products - 0.3% | | | |
| Inter Parfums, Inc. | | 352,200 | 16,060,320 |
|
| TOTAL CONSUMER STAPLES | | | 142,715,022 |
|
| ENERGY - 4.4% | | | |
| Energy Equipment & Services - 1.1% | | | |
| Archrock, Inc. | | 868,478 | 8,076,845 |
| Nabors Industries Ltd. | | 2,800,200 | 21,953,568 |
| Rowan Companies PLC (a) | | 1,287,960 | 18,958,771 |
| Total Energy Services, Inc. | | 1,491,277 | 16,610,158 |
| | | | 65,599,342 |
| Oil, Gas & Consumable Fuels - 3.3% | | | |
| Boardwalk Pipeline Partners, LP | | 1,391,154 | 17,472,894 |
| Delek U.S. Holdings, Inc. | | 820,600 | 28,630,734 |
| Diamondback Energy, Inc. (a) | | 218,793 | 27,458,522 |
| Newfield Exploration Co. (a) | | 631,012 | 19,977,840 |
| PDC Energy, Inc. (a) | | 536,700 | 27,827,895 |
| Warrior Metropolitan Coal, Inc. (b) | | 1,209,400 | 33,826,918 |
| WPX Energy, Inc. (a) | | 2,589,810 | 38,147,901 |
| | | | 193,342,704 |
|
| TOTAL ENERGY | | | 258,942,046 |
|
| FINANCIALS - 17.5% | | | |
| Banks - 9.9% | | | |
| Associated Banc-Corp. | | 1,534,012 | 37,966,797 |
| BancFirst Corp. | | 890,786 | 49,661,320 |
| Banner Corp. | | 544,671 | 29,597,422 |
| Boston Private Financial Holdings, Inc. | | 1,336,359 | 20,579,929 |
| City Holding Co. | | 504,477 | 34,708,018 |
| Columbia Banking Systems, Inc. | | 1,089,466 | 46,934,195 |
| Community Bank System, Inc. | | 64,057 | 3,414,238 |
| Cullen/Frost Bankers, Inc. | | 447,160 | 47,582,296 |
| CVB Financial Corp. | | 1,459,700 | 34,156,980 |
| First Merchants Corp. | | 955,348 | 41,232,820 |
| Heartland Financial U.S.A., Inc. | | 268,087 | 14,248,824 |
| Independent Bank Corp., Massachusetts | | 522,679 | 37,293,147 |
| Stock Yards Bancorp, Inc. | | 898,834 | 32,313,082 |
| Tompkins Financial Corp. | | 454,599 | 37,445,320 |
| TowneBank | | 426,290 | 13,023,160 |
| Trico Bancshares | | 925,918 | 34,240,448 |
| WesBanco, Inc. | | 190,568 | 7,815,194 |
| Wintrust Financial Corp. | | 675,639 | 58,037,390 |
| | | | 580,250,580 |
| Capital Markets - 1.1% | | | |
| Legg Mason, Inc. | | 454,613 | 19,375,606 |
| OM Asset Management Ltd. | | 2,617,008 | 46,818,273 |
| | | | 66,193,879 |
| Diversified Financial Services - 0.9% | | | |
| Camping World Holdings, Inc. | | 450,700 | 20,168,825 |
| Cotiviti Holdings, Inc. (a) | | 887,400 | 31,059,000 |
| | | | 51,227,825 |
| Insurance - 2.8% | | | |
| Employers Holdings, Inc. | | 805,870 | 34,168,888 |
| First American Financial Corp. | | 701,000 | 41,408,070 |
| James River Group Holdings Ltd. | | 837,673 | 31,831,574 |
| Primerica, Inc. | | 575,900 | 58,165,900 |
| | | | 165,574,432 |
| Thrifts & Mortgage Finance - 2.8% | | | |
| Beneficial Bancorp, Inc. | | 1,951,555 | 31,712,769 |
| Meridian Bancorp, Inc. Maryland | | 1,631,700 | 33,368,265 |
| Washington Federal, Inc. | | 1,287,535 | 46,222,507 |
| WSFS Financial Corp. | | 1,029,553 | 52,610,158 |
| | | | 163,913,699 |
|
| TOTAL FINANCIALS | | | 1,027,160,415 |
|
| HEALTH CARE - 14.7% | | | |
| Biotechnology - 8.2% | | | |
| Abeona Therapeutics, Inc. (a)(b) | | 799,515 | 12,192,604 |
| ACADIA Pharmaceuticals, Inc. (a) | | 356,327 | 10,657,741 |
| Acorda Therapeutics, Inc. (a) | | 888,971 | 23,068,797 |
| Agios Pharmaceuticals, Inc. (a) | | 325,029 | 25,599,284 |
| Amarin Corp. PLC ADR (a)(b) | | 993,100 | 3,724,125 |
| AnaptysBio, Inc. | | 221,600 | 23,354,424 |
| Argenx SE ADR | | 135,700 | 10,527,606 |
| Ascendis Pharma A/S sponsored ADR (a) | | 678,748 | 34,595,786 |
| Atara Biotherapeutics, Inc. (a) | | 242,300 | 9,158,940 |
| Audentes Therapeutics, Inc. (a) | | 615,000 | 21,586,500 |
| BioMarin Pharmaceutical, Inc. (a) | | 148,044 | 13,358,010 |
| bluebird bio, Inc. (a) | | 232,956 | 47,732,684 |
| Cellectis SA sponsored ADR (a) | | 448,095 | 14,097,069 |
| Curis, Inc. (a) | | 1,376,096 | 849,189 |
| CytomX Therapeutics, Inc. (a) | | 289,700 | 7,749,475 |
| CytomX Therapeutics, Inc. (a)(c) | | 105,499 | 2,822,098 |
| FibroGen, Inc. (a) | | 394,400 | 23,092,120 |
| Five Prime Therapeutics, Inc. (a) | | 325,600 | 6,512,000 |
| Heron Therapeutics, Inc. (a) | | 531,800 | 11,513,470 |
| Insmed, Inc. (a) | | 833,882 | 21,213,958 |
| Intercept Pharmaceuticals, Inc. (a) | | 129,298 | 8,029,406 |
| Ionis Pharmaceuticals, Inc. (a) | | 275,872 | 14,488,797 |
| Kura Oncology, Inc. (a) | | 479,400 | 9,396,240 |
| La Jolla Pharmaceutical Co. (a) | | 563,300 | 19,298,658 |
| Mirati Therapeutics, Inc. (a) | | 511,800 | 13,255,620 |
| Neurocrine Biosciences, Inc. (a) | | 290,482 | 24,827,497 |
| Protagonist Therapeutics, Inc. (a) | | 562,600 | 12,861,036 |
| Sage Therapeutics, Inc. (a) | | 103,100 | 19,568,380 |
| Sienna Biopharmaceuticals, Inc. (b) | | 119,219 | 2,098,254 |
| Spark Therapeutics, Inc. (a) | | 381,100 | 21,360,655 |
| TESARO, Inc. (a) | | 183,500 | 12,378,910 |
| | | | 480,969,333 |
| Health Care Equipment & Supplies - 3.3% | | | |
| Cantel Medical Corp. | | 443,700 | 49,219,641 |
| Integra LifeSciences Holdings Corp. (a) | | 518,436 | 27,300,840 |
| iRhythm Technologies, Inc. (a) | | 492,700 | 29,379,701 |
| Nanosonics Ltd. (a) | | 8,460,248 | 19,292,868 |
| Novocure Ltd. (a) | | 445,800 | 10,008,210 |
| Orthofix International NV (a) | | 138,738 | 7,969,111 |
| Steris PLC | | 297,200 | 27,021,424 |
| Wright Medical Group NV (a) | | 972,326 | 22,120,417 |
| | | | 192,312,212 |
| Health Care Providers & Services - 0.9% | | | |
| G1 Therapeutics, Inc. | | 688,500 | 16,462,035 |
| NMC Health PLC | | 446,300 | 21,152,207 |
| Premier, Inc. (a) | | 542,400 | 17,600,880 |
| | | | 55,215,122 |
| Life Sciences Tools & Services - 0.6% | | | |
| ICON PLC (a) | | 335,000 | 36,689,200 |
| Pharmaceuticals - 1.7% | | | |
| Clearside Biomedical, Inc. (a)(b) | | 185,296 | 1,204,424 |
| Innoviva, Inc. (a) | | 1,010,649 | 14,745,369 |
| Nektar Therapeutics (a) | | 670,100 | 56,027,061 |
| Prestige Brands Holdings, Inc. (a) | | 251,254 | 10,509,955 |
| Theravance Biopharma, Inc. (a)(b) | | 578,221 | 15,288,163 |
| | | | 97,774,972 |
|
| TOTAL HEALTH CARE | | | 862,960,839 |
|
| INDUSTRIALS - 15.3% | | | |
| Aerospace & Defense - 1.4% | | | |
| Moog, Inc. Class A (a) | | 512,015 | 46,112,071 |
| Teledyne Technologies, Inc. (a) | | 182,526 | 34,847,864 |
| | | | 80,959,935 |
| Air Freight & Logistics - 0.5% | | | |
| Air Transport Services Group, Inc. (a) | | 1,239,109 | 30,804,250 |
| Airlines - 0.4% | | | |
| JetBlue Airways Corp. (a) | | 1,233,254 | 25,725,678 |
| Building Products - 1.1% | | | |
| Allegion PLC | | 288,645 | 24,855,221 |
| GCP Applied Technologies, Inc. (a) | | 440,000 | 14,696,000 |
| Simpson Manufacturing Co. Ltd. | | 462,507 | 27,167,661 |
| | | | 66,718,882 |
| Commercial Services & Supplies - 1.8% | | | |
| Deluxe Corp. | | 552,371 | 41,024,594 |
| Interface, Inc. | | 1,551,670 | 38,714,167 |
| Matthews International Corp. Class A | | 401,856 | 22,503,936 |
| | | | 102,242,697 |
| Construction & Engineering - 2.9% | | | |
| Comfort Systems U.S.A., Inc. | | 896,867 | 38,206,534 |
| EMCOR Group, Inc. | | 705,361 | 57,331,742 |
| KBR, Inc. | | 1,947,690 | 39,616,015 |
| Valmont Industries, Inc. | | 210,367 | 34,416,041 |
| | | | 169,570,332 |
| Industrial Conglomerates - 0.8% | | | |
| ITT, Inc. | | 833,663 | 46,685,128 |
| Machinery - 2.4% | | | |
| AGCO Corp. | | 347,238 | 25,216,424 |
| Colfax Corp. (a) | | 424,500 | 16,988,490 |
| John Bean Technologies Corp. | | 273,100 | 31,065,125 |
| SPX Flow, Inc. (a) | | 736,709 | 34,161,196 |
| Standex International Corp. | | 296,560 | 31,123,972 |
| | | | 138,555,207 |
| Road & Rail - 0.6% | | | |
| Landstar System, Inc. | | 328,700 | 36,502,135 |
| Trading Companies & Distributors - 3.4% | | | |
| Kaman Corp. | | 698,830 | 43,816,641 |
| MRC Global, Inc. (a) | | 1,769,276 | 31,811,582 |
| SiteOne Landscape Supply, Inc. (a) | | 501,400 | 38,186,624 |
| Titan Machinery, Inc. (a) | | 982,589 | 21,115,838 |
| Watsco, Inc. | | 179,531 | 32,277,878 |
| WESCO International, Inc. (a) | | 478,786 | 32,629,266 |
| | | | 199,837,829 |
|
| TOTAL INDUSTRIALS | | | 897,602,073 |
|
| INFORMATION TECHNOLOGY - 17.9% | | | |
| Communications Equipment - 0.1% | | | |
| CommScope Holding Co., Inc. (a) | | 115,200 | 4,450,176 |
| Electronic Equipment & Components - 3.2% | | | |
| ePlus, Inc. (a) | | 460,902 | 35,581,634 |
| Jabil, Inc. | | 203,261 | 5,168,927 |
| Orbotech Ltd. (a) | | 625,757 | 33,327,818 |
| Plexus Corp. (a) | | 621,296 | 37,122,436 |
| Tech Data Corp. (a) | | 423,396 | 42,453,917 |
| TTM Technologies, Inc. (a) | | 2,110,785 | 34,806,845 |
| | | | 188,461,577 |
| Internet Software & Services - 3.0% | | | |
| 2U, Inc. (a) | | 707,200 | 52,523,744 |
| Five9, Inc. (a) | | 1,431,700 | 37,238,517 |
| j2 Global, Inc. | | 563,200 | 45,050,368 |
| New Relic, Inc. (a) | | 343,700 | 20,529,201 |
| Web.com Group, Inc. (a) | | 981,068 | 22,809,831 |
| | | | 178,151,661 |
| IT Services - 3.3% | | | |
| Amdocs Ltd. | | 176,300 | 12,058,920 |
| EPAM Systems, Inc. (a) | | 468,660 | 55,058,177 |
| Euronet Worldwide, Inc. (a) | | 479,282 | 44,990,201 |
| ExlService Holdings, Inc. (a) | | 607,221 | 36,888,676 |
| Maximus, Inc. | | 640,000 | 43,635,200 |
| | | | 192,631,174 |
| Semiconductors & Semiconductor Equipment - 3.8% | | | |
| Diodes, Inc. (a) | | 1,090,000 | 30,727,100 |
| Entegris, Inc. | | 1,405,000 | 45,732,750 |
| Integrated Device Technology, Inc. (a) | | 1,482,100 | 44,314,790 |
| Nanometrics, Inc. (a) | | 1,009,247 | 24,999,048 |
| ON Semiconductor Corp. (a) | | 1,397,728 | 34,579,791 |
| Semtech Corp. (a) | | 1,100,200 | 39,387,160 |
| | | | 219,740,639 |
| Software - 4.5% | | | |
| Aspen Technology, Inc.(a) | | 676,100 | 52,363,945 |
| Everbridge, Inc. (a) | | 480,356 | 15,505,892 |
| Paycom Software, Inc. (a)(b) | | 534,586 | 48,989,461 |
| Pegasystems, Inc. | | 644,226 | 32,758,892 |
| RealPage, Inc. (a) | | 952,300 | 47,376,925 |
| RingCentral, Inc. (a) | | 1,222,600 | 66,387,175 |
| | | | 263,382,290 |
|
| TOTAL INFORMATION TECHNOLOGY | | | 1,046,817,517 |
|
| MATERIALS - 3.6% | | | |
| Chemicals - 1.9% | | | |
| Chase Corp. | | 297,679 | 33,444,236 |
| Innospec, Inc. | | 549,710 | 39,469,178 |
| Trinseo SA | | 311,938 | 25,719,288 |
| Tronox Ltd. Class A | | 608,685 | 11,948,487 |
| | | | 110,581,189 |
| Containers & Packaging - 1.0% | | | |
| Berry Global Group, Inc. (a) | | 396,660 | 23,478,305 |
| Owens-Illinois, Inc. (a) | | 609,800 | 14,159,556 |
| Sonoco Products Co. | | 433,560 | 23,546,644 |
| | | | 61,184,505 |
| Metals & Mining - 0.7% | | | |
| B2Gold Corp. (a) | | 4,950,000 | 14,970,732 |
| Steel Dynamics, Inc. | | 570,500 | 25,900,700 |
| | | | 40,871,432 |
|
| TOTAL MATERIALS | | | 212,637,126 |
|
| REAL ESTATE - 6.3% | | | |
| Equity Real Estate Investment Trusts (REITs) - 5.8% | | | |
| Americold Realty Trust (a) | | 206,200 | 3,769,336 |
| CareTrust (REIT), Inc. | | 1,740,600 | 27,658,134 |
| CoreSite Realty Corp. | | 354,626 | 38,413,088 |
| Corporate Office Properties Trust (SBI) | | 923,200 | 25,203,360 |
| Equity Lifestyle Properties, Inc. | | 462,579 | 39,929,819 |
| Four Corners Property Trust, Inc. | | 1,556,161 | 36,725,400 |
| Healthcare Realty Trust, Inc. | | 1,110,661 | 33,175,444 |
| Mid-America Apartment Communities, Inc. | | 179,900 | 17,157,063 |
| Potlatch Corp. | | 783,500 | 41,447,150 |
| Store Capital Corp. | | 1,303,003 | 31,936,604 |
| Terreno Realty Corp. | | 1,250,200 | 44,507,120 |
| | | | 339,922,518 |
| Real Estate Management & Development - 0.5% | | | |
| Realogy Holdings Corp. | | 975,200 | 26,827,752 |
|
| TOTAL REAL ESTATE | | | 366,750,270 |
|
| TELECOMMUNICATION SERVICES - 0.2% | | | |
| Diversified Telecommunication Services - 0.2% | | | |
| Cogent Communications Group, Inc. | | 255,700 | 11,532,070 |
| UTILITIES - 2.9% | | | |
| Electric Utilities - 1.4% | | | |
| El Paso Electric Co. | | 385,080 | 20,101,176 |
| Hawaiian Electric Industries, Inc. | | 267,900 | 9,138,069 |
| IDACORP, Inc. | | 345,000 | 29,766,600 |
| Portland General Electric Co. | | 546,432 | 23,141,395 |
| | | | 82,147,240 |
| Gas Utilities - 1.5% | | | |
| Atmos Energy Corp. | | 170,286 | 14,116,709 |
| New Jersey Resources Corp. | | 415,800 | 16,133,040 |
| South Jersey Industries, Inc. | | 285,570 | 8,407,181 |
| Southwest Gas Holdings, Inc. | | 385,700 | 28,379,806 |
| Spire, Inc. | | 340,508 | 22,643,782 |
| | | | 89,680,518 |
|
| TOTAL UTILITIES | | | 171,827,758 |
|
| TOTAL COMMON STOCKS | | | |
| (Cost $4,378,643,321) | | | 5,702,722,700 |
| | | Principal Amount | Value |
|
| U.S. Treasury Obligations - 0.0% | | | |
| U.S. Treasury Bills, yield at date of purchase 1.41% 4/19/18 to 5/3/18(d) | | | |
| (Cost $2,741,600) | | 2,750,000 | 2,741,695 |
| | | Shares | Value |
|
| Money Market Funds - 4.2% | | | |
| Fidelity Cash Central Fund, 1.39% (e) | | 170,542,904 | $170,577,012 |
| Fidelity Securities Lending Cash Central Fund 1.40% (e)(f) | | 73,679,559 | 73,686,927 |
| TOTAL MONEY MARKET FUNDS | | | |
| (Cost $244,263,737) | | | 244,263,939 |
| TOTAL INVESTMENT IN SECURITIES - 101.5% | | | |
| (Cost $4,625,648,658) | | | 5,949,728,334 |
| NET OTHER ASSETS (LIABILITIES) - (1.5)% | | | (87,124,861) |
| NET ASSETS - 100% | | | $5,862,603,473 |
| Futures Contracts | | | | | |
| | Number of contracts | Expiration Date | Notional Amount | Value | Unrealized Appreciation/(Depreciation) |
| Purchased | | | | | |
| Equity Index Contracts | | | | | |
| CME E-mini Russell 2000 Index Contracts (United States) | 627 | March 2018 | $49,407,600 | $702,983 | $702,983 |
The notional amount of futures purchased as a percentage of Net Assets is 0.8%
Legend
(a) Non-income producing
(b) Security or a portion of the security is on loan at period end.
(c) Security exempt from registration under Rule 144A of the Securities Act of 1933. These securities may be resold in transactions exempt from registration, normally to qualified institutional buyers. At the end of the period, the value of these securities amounted to $2,822,098 or 0.0% of net assets.
(d) Security or a portion of the security was pledged to cover margin requirements for futures contracts. At period end, the value of securities pledged amounted to $2,741,695.
(e) Affiliated fund that is generally available only to investment companies and other accounts managed by Fidelity Investments. The rate quoted is the annualized seven-day yield of the fund at period end. A complete unaudited listing of the fund's holdings as of its most recent quarter end is available upon request. In addition, each Fidelity Central Fund's financial statements are available on the SEC's website or upon request.
(f) Investment made with cash collateral received from securities on loan.
Affiliated Central Funds
Information regarding fiscal year to date income earned by the Fund from investments in Fidelity Central Funds is as follows:
| Fund | Income earned |
| Fidelity Cash Central Fund | $969,836 |
| Fidelity Securities Lending Cash Central Fund | 230,288 |
| Total | $1,200,124 |
Amounts in the income column in the above table include any capital gain distributions from underlying funds, which are presented in the corresponding line-item in the Statement of Operations if applicable.
Other Affiliated Issuers
An affiliated company is a company in which the Fund has ownership of at least 5% of the voting securities. Fiscal year to date transactions with companies which are or were affiliates are as follows:
| Affiliate | Value, beginning of period | Purchases | Sales Proceeds | Dividend Income | Realized Gain (loss) | Change in Unrealized appreciation (depreciation) | Value, end of period |
| Genocea Biosciences, Inc. | $10,048,028 | $882,133 | $2,775,210 | $-- | $(13,180,336) | $5,025,385 | $-- |
| Titan Machinery, Inc. | 28,873,357 | -- | 11,585,432 | -- | (244,452) | 4,072,365 | -- |
| Total | $38,921,385 | $882,133 | $14,360,642 | $-- | $(13,424,788) | $9,097,750 | $-- |
Investment Valuation
The following is a summary of the inputs used, as of January 31, 2018, involving the Fund's assets and liabilities carried at fair value. The inputs or methodology used for valuing securities may not be an indication of the risk associated with investing in those securities. For more information on valuation inputs, and their aggregation into the levels used below, please refer to the Investment Valuation section in the accompanying Notes to Financial Statements.
| | Valuation Inputs at Reporting Date: |
| Description | Total | Level 1 | Level 2 | Level 3 |
| Investments in Securities: | | | | |
| Equities: | | | | |
| Consumer Discretionary | $703,777,564 | $703,777,564 | $-- | $-- |
| Consumer Staples | 142,715,022 | 142,715,022 | -- | -- |
| Energy | 258,942,046 | 258,942,046 | -- | -- |
| Financials | 1,027,160,415 | 1,027,160,415 | -- | -- |
| Health Care | 862,960,839 | 862,960,839 | -- | -- |
| Industrials | 897,602,073 | 897,602,073 | -- | -- |
| Information Technology | 1,046,817,517 | 1,046,817,517 | -- | -- |
| Materials | 212,637,126 | 212,637,126 | -- | -- |
| Real Estate | 366,750,270 | 366,750,270 | -- | -- |
| Telecommunication Services | 11,532,070 | 11,532,070 | -- | -- |
| Utilities | 171,827,758 | 171,827,758 | -- | -- |
| U.S. Government and Government Agency Obligations | 2,741,695 | -- | 2,741,695 | -- |
| Money Market Funds | 244,263,939 | 244,263,939 | -- | -- |
| Total Investments in Securities: | $5,949,728,334 | $5,946,986,639 | $2,741,695 | $-- |
| Derivative Instruments: | | | | |
| Assets | | | | |
| Futures Contracts | $702,983 | $702,983 | $-- | $-- |
| Total Assets | $702,983 | $702,983 | $-- | $-- |
| Total Derivative Instruments: | $702,983 | $702,983 | $-- | $-- |
Value of Derivative Instruments
The following table is a summary of the Fund's value of derivative instruments by primary risk exposure as of January 31, 2018. For additional information on derivative instruments, please refer to the Derivative Instruments section in the accompanying Notes to Financial Statements.
| Primary Risk Exposure / Derivative Type | Value |
| | Asset | Liability |
| Equity Risk | | |
| Futures Contracts(a) | $702,983 | $0 |
| Total Equity Risk | 702,983 | 0 |
| Total Value of Derivatives | $702,983 | $0 |
(a) Reflects gross cumulative appreciation (depreciation) on futures contracts as presented in the Schedule of Investments. In the Statement of Assets and Liabilities, the period end daily variation margin is included in receivable or payable for daily variation margin on futures contracts, and the net cumulative appreciation (depreciation) is included in net unrealized appreciation (depreciation).
See accompanying notes which are an integral part of the financial statements.
Financial Statements
Statement of Assets and Liabilities
| | | January 31, 2018 (Unaudited) |
| Assets | | |
Investment in securities, at value (including securities loaned of $72,514,743) — See accompanying schedule:
Unaffiliated issuers (cost $4,381,384,921) | $5,705,464,395 | |
| Fidelity Central Funds (cost $244,263,737) | 244,263,939 | |
| Total Investment in Securities (cost $4,625,648,658) | | $5,949,728,334 |
| Cash | | 39,611 |
| Receivable for investments sold | | 27,176,717 |
| Receivable for fund shares sold | | 15,830,227 |
| Dividends receivable | | 762,509 |
| Distributions receivable from Fidelity Central Funds | | 234,814 |
| Other receivables | | 166,688 |
| Total assets | | 5,993,938,900 |
| Liabilities | | |
| Payable for investments purchased | $21,369,587 | |
| Payable for fund shares redeemed | 35,778,318 | |
| Payable for daily variation margin on futures contracts | 471,591 | |
| Other payables and accrued expenses | 36,152 | |
| Collateral on securities loaned | 73,679,779 | |
| Total liabilities | | 131,335,427 |
| Net Assets | | $5,862,603,473 |
| Net Assets consist of: | | |
| Paid in capital | | $4,470,682,413 |
| Distributions in excess of net investment income | | (3,774,712) |
| Accumulated undistributed net realized gain (loss) on investments and foreign currency transactions | | 70,866,085 |
| Net unrealized appreciation (depreciation) on investments and assets and liabilities in foreign currencies | | 1,324,829,687 |
| Net Assets | | $5,862,603,473 |
| Series Small Cap Opportunities: | | |
| Net Asset Value, offering price and redemption price per share ($5,862,603,473 ÷ 404,637,483 shares) | | $14.49 |
See accompanying notes which are an integral part of the financial statements.
Statement of Operations
| | | Six months ended January 31, 2018 (Unaudited) |
| Investment Income | | |
| Dividends | | $22,912,631 |
| Special dividends | | 9,429,852 |
| Interest | | 9,081 |
| Income from Fidelity Central Funds | | 1,200,124 |
| Total income | | 33,551,688 |
| Expenses | | |
| Custodian fees and expenses | $52,043 | |
| Independent trustees' fees and expenses | 10,806 | |
| Miscellaneous | 8,003 | |
| Total expenses | | 70,852 |
| Net investment income (loss) | | 33,480,836 |
| Realized and Unrealized Gain (Loss) | | |
| Net realized gain (loss) on: | | |
| Investment securities: | | |
| Unaffiliated issuers | 250,777,904 | |
| Fidelity Central Funds | 2,184 | |
| Other affiliated issuers | (13,424,788) | |
| Foreign currency transactions | 37,863 | |
| Futures contracts | 390,682 | |
| Total net realized gain (loss) | | 237,783,845 |
| Change in net unrealized appreciation (depreciation) on: | | |
| Investment securities: | | |
| Unaffiliated issuers | 379,443,232 | |
| Fidelity Central Funds | (1,146) | |
| Other affiliated issuers | 9,097,750 | |
| Assets and liabilities in foreign currencies | 26,497 | |
| Futures contracts | 911,407 | |
| Total change in net unrealized appreciation (depreciation) | | 389,477,740 |
| Net gain (loss) | | 627,261,585 |
| Net increase (decrease) in net assets resulting from operations | | $660,742,421 |
See accompanying notes which are an integral part of the financial statements.
Statement of Changes in Net Assets
| | Six months ended January 31, 2018 (Unaudited) | Year ended July 31, 2017 |
| Increase (Decrease) in Net Assets | | |
| Operations | | |
| Net investment income (loss) | $33,480,836 | $26,872,072 |
| Net realized gain (loss) | 237,783,845 | 491,017,804 |
| Change in net unrealized appreciation (depreciation) | 389,477,740 | 109,661,042 |
| Net increase (decrease) in net assets resulting from operations | 660,742,421 | 627,550,918 |
| Distributions to shareholders from net investment income | (45,798,335) | (30,906,540) |
| Distributions to shareholders from net realized gain | (554,772,271) | (11,331,615) |
| Total distributions | (600,570,606) | (42,238,155) |
| Share transactions - net increase (decrease) | 344,282,526 | (483,035,407) |
| Total increase (decrease) in net assets | 404,454,341 | 102,277,356 |
| Net Assets | | |
| Beginning of period | 5,458,149,132 | 5,355,871,776 |
| End of period | $5,862,603,473 | $5,458,149,132 |
| Other Information | | |
| Undistributed net investment income end of period | $– | $8,542,787 |
| Distributions in excess of net investment income end of period | $(3,774,712) | $– |
See accompanying notes which are an integral part of the financial statements.
Financial Highlights
Fidelity Series Small Cap Opportunities Fund
| | Six months ended (Unaudited) January 31, | Years endedJuly 31, | | | | |
| | 2018 | 2017 | 2016 | 2015 | 2014 | 2013 |
| Selected Per–Share Data | | | | | | |
| Net asset value, beginning of period | $14.42 | $12.94 | $13.83 | $12.96 | $13.55 | $10.93 |
| Income from Investment Operations | | | | | | |
| Net investment income (loss)A | .08B | .06 | .06 | .05 | .02 | .04 |
| Net realized and unrealized gain (loss) | 1.55 | 1.52 | (.22) | 1.53 | .77 | 3.20 |
| Total from investment operations | 1.63 | 1.58 | (.16) | 1.58 | .79 | 3.24 |
| Distributions from net investment income | (.12) | (.07) | (.05) | (.04) | –C | (.05) |
| Distributions from net realized gain | (1.45) | (.03) | (.68) | (.66) | (1.38) | (.57) |
| Total distributions | (1.56)D | (.10) | (.73) | (.71)E | (1.38) | (.62) |
| Net asset value, end of period | $14.49 | $14.42 | $12.94 | $13.83 | $12.96 | $13.55 |
| Total ReturnF,G | 12.32% | 12.22% | (.94)% | 12.66% | 6.29% | 30.91% |
| Ratios to Average Net AssetsH,I | | | | | | |
| Expenses before reductions | - %J,K | .66% | .85% | .77% | .82% | .98% |
| Expenses net of fee waivers, if any | - %J,K | .66% | .85% | .76% | .82% | .98% |
| Expenses net of all reductions | - %J,K | .65% | .84% | .76% | .82% | .96% |
| Net investment income (loss) | 1.02%B,J | .42% | .46% | .41% | .19% | .30% |
| Supplemental Data | | | | | | |
| Net assets, end of period (000 omitted) | $5,862,603 | $2,509,347 | $2,433,489 | $2,647,013 | $2,425,973 | $1,602,664 |
| Portfolio turnover rateL | 51%J | 58% | 58% | 59% | 90%M | 77% |
A Calculated based on average shares outstanding during the period.
B Net investment income per share reflects a large, non-recurring dividend which amounted to $.02 per share. This dividend is not annualized in the ratio of net investment income (loss) to average net assets. Excluding this dividend the ratio would have been .86%.
C Amount represents less than $.005 per share.
D Total distributions of $1.56 per share is comprised of distributions from net investment income of $.117 and distributions from net realized gain of $1.447 per share.
E Total distributions of $.71 per share is comprised of distributions from net investment income of $.042 and distributions from net realized gain of $.664 per share.
F Total returns for periods of less than one year are not annualized.
G Total returns would have been lower if certain expenses had not been reduced during the applicable periods shown.
H Fees and expenses of any underlying Fidelity Central Funds are not included in the Fund's expense ratio. The Fund indirectly bears its proportionate share of the expenses of any underlying Fidelity Central Funds.
I Expense ratios reflect operating expenses of the class. Expenses before reductions do not reflect amounts reimbursed by the investment adviser or reductions from brokerage service arrangements or reductions from other expense offset arrangements and do not represent the amount paid by the class during periods when reimbursements or reductions occur. Expenses net of fee waivers reflect expenses after reimbursement by the investment adviser but prior to reductions from brokerage service arrangements or other expense offset arrangements. Expenses net of all reductions represent the net expenses paid by the class.
J Annualized
K Amount represents less than $.005%.
L Amount does not include the portfolio activity of any underlying Fidelity Central Funds.
M Portfolio turnover rate excludes securities received or delivered in-kind.
See accompanying notes which are an integral part of the financial statements.
Notes to Financial Statements (Unaudited)
For the period ended January 31, 2018
1. Organization.
Fidelity Series Small Cap Opportunities Fund (the Fund) is a fund of Fidelity Securities Fund (the Trust) and is authorized to issue an unlimited number of shares. Shares of the Fund are only available for purchase by mutual funds for which Fidelity Management & Research Company (FMR) or an affiliate serves as an investment manager and FMR investment professionals. The Trust is registered under the Investment Company Act of 1940, as amended (the 1940 Act), as an open-end management investment company organized as a Massachusetts business trust. Effective August 28, 2017, the Fund no longer offered Class F, and all outstanding shares of Class F were exchanged for shares of Series Small Cap Opportunities.
2. Investments in Fidelity Central Funds.
The Fund invests in Fidelity Central Funds, which are open-end investment companies generally available only to other investment companies and accounts managed by the investment adviser and its affiliates. The Fund's Schedule of Investments lists each of the Fidelity Central Funds held as of period end, if any, as an investment of the Fund, but does not include the underlying holdings of each Fidelity Central Fund. As an Investing Fund, the Fund indirectly bears its proportionate share of the expenses of the underlying Fidelity Central Funds.
The Money Market Central Funds seek preservation of capital and current income and are managed by Fidelity Investments Money Management, Inc. (FIMM), an affiliate of the investment adviser. Annualized expenses of the Money Market Central Funds as of their most recent shareholder report date are less than .005%.
A complete unaudited list of holdings for each Fidelity Central Fund is available upon request or at the Securities and Exchange Commission (the SEC) website at www.sec.gov. In addition, the financial statements of the Fidelity Central Funds are available on the SEC website or upon request.
3. Significant Accounting Policies.
The Fund is an investment company and applies the accounting and reporting guidance of the Financial Accounting Standards Board (FASB) Accounting Standards Codification Topic 946 Financial Services – Investments Companies. The financial statements have been prepared in conformity with accounting principles generally accepted in the United States of America (GAAP), which require management to make certain estimates and assumptions at the date of the financial statements. Actual results could differ from those estimates. Subsequent events, if any, through the date that the financial statements were issued have been evaluated in the preparation of the financial statements. The following summarizes the significant accounting policies of the Fund:
Investment Valuation. Investments are valued as of 4:00 p.m. Eastern time on the last calendar day of the period. The Board of Trustees (the Board) has delegated the day to day responsibility for the valuation of the Fund's investments to the Fair Value Committee (the Committee) established by the Fund's investment adviser. In accordance with valuation policies and procedures approved by the Board, the Fund attempts to obtain prices from one or more third party pricing vendors or brokers to value its investments. When current market prices, quotations or currency exchange rates are not readily available or reliable, investments will be fair valued in good faith by the Committee, in accordance with procedures adopted by the Board. Factors used in determining fair value vary by investment type and may include market or investment specific events, changes in interest rates and credit quality. The frequency with which these procedures are used cannot be predicted and they may be utilized to a significant extent. The Committee oversees the Fund's valuation policies and procedures and reports to the Board on the Committee's activities and fair value determinations. The Board monitors the appropriateness of the procedures used in valuing the Fund's investments and ratifies the fair value determinations of the Committee.
The Fund categorizes the inputs to valuation techniques used to value its investments into a disclosure hierarchy consisting of three levels as shown below:
- Level 1 – quoted prices in active markets for identical investments
- Level 2 – other significant observable inputs (including quoted prices for similar investments, interest rates, prepayment speeds, etc.)
- Level 3 – unobservable inputs (including the Fund's own assumptions based on the best information available)
Valuation techniques used to value the Fund's investments by major category are as follows:
Equity securities, including restricted securities, for which market quotations are readily available, are valued at the last reported sale price or official closing price as reported by a third party pricing vendor on the primary market or exchange on which they are traded and are categorized as Level 1 in the hierarchy. In the event there were no sales during the day or closing prices are not available, securities are valued at the last quoted bid price or may be valued using the last available price and are generally categorized as Level 2 in the hierarchy. For foreign equity securities, when market or security specific events arise, comparisons to the valuation of American Depositary Receipts (ADRs), futures contracts, Exchange-Traded Funds (ETFs) and certain indexes as well as quoted prices for similar securities may be used and would be categorized as Level 2 in the hierarchy. Utilizing these techniques may result in transfers between Level 1 and Level 2. For equity securities, including restricted securities, where observable inputs are limited, assumptions about market activity and risk are used and these securities may be categorized as Level 3 in the hierarchy.
Debt securities, including restricted securities, are valued based on evaluated prices received from third party pricing vendors or from brokers who make markets in such securities. U.S. government and government agency obligations are valued by pricing vendors who utilize matrix pricing which considers yield or price of bonds of comparable quality, coupon, maturity and type or by broker-supplied prices. When independent prices are unavailable or unreliable, debt securities may be valued utilizing pricing methodologies which consider similar factors that would be used by third party pricing vendors. Debt securities are generally categorized as Level 2 in the hierarchy but may be Level 3 depending on the circumstances.
Futures contracts are valued at the settlement price established each day by the board of trade or exchange on which they are traded and are categorized as Level 1 in the hierarchy. Investments in open-end mutual funds, including the Fidelity Central Funds, are valued at their closing net asset value (NAV) each business day and are categorized as Level 1 in the hierarchy.
Changes in valuation techniques may result in transfers in or out of an assigned level within the disclosure hierarchy. The aggregate value of investments by input level as of January 31, 2018 is included at the end of the Fund's Schedule of Investments.
Foreign Currency. The Fund may use foreign currency contracts to facilitate transactions in foreign-denominated securities. Gains and losses from these transactions may arise from changes in the value of the foreign currency or if the counterparties do not perform under the contracts' terms.
Foreign-denominated assets, including investment securities, and liabilities are translated into U.S. dollars at the exchange rates at period end. Purchases and sales of investment securities, income and dividends received and expenses denominated in foreign currencies are translated into U.S. dollars at the exchange rate in effect on the transaction date.
The effects of exchange rate fluctuations on investments are included with the net realized and unrealized gain (loss) on investment securities. Other foreign currency transactions resulting in realized and unrealized gain (loss) are disclosed separately.
Investment Transactions and Income. For financial reporting purposes, the Fund's investment holdings and NAV include trades executed through the end of the last business day of the period. The NAV per share for processing shareholder transactions is calculated as of the close of business of the New York Stock Exchange (NYSE), normally 4:00 p.m. Eastern time and includes trades executed through the end of the prior business day. Gains and losses on securities sold are determined on the basis of identified cost and includes proceeds received from litigation. Dividend income is recorded on the ex-dividend date, except for certain dividends from foreign securities where the ex-dividend date may have passed, which are recorded as soon as the Fund is informed of the ex-dividend date. Non-cash dividends included in dividend income, if any, are recorded at the fair market value of the securities received. Income and capital gain distributions from Fidelity Central Funds, if any, are recorded on the ex-dividend date. Certain distributions received by the Fund represent a return of capital or capital gain. The Fund determines the components of these distributions subsequent to the ex-dividend date, based upon receipt of tax filings or other correspondence relating to the underlying investment. These distributions are recorded as a reduction of cost of investments and/or as a realized gain. Large, non-recurring dividends recognized by the Fund are presented separately on the Statement of Operations as "Special Dividends" and the impact of these dividends is presented in the Financial Highlights. Interest income is accrued as earned and includes coupon interest and amortization of premium and accretion of discount on debt securities as applicable. Investment income is recorded net of foreign taxes withheld where recovery of such taxes is uncertain.
Class Allocations and Expenses. Investment income, realized and unrealized capital gains and losses, common expenses of the Fund, and certain fund-level expense reductions, if any, are allocated daily on a pro-rata basis to each class based on the relative net assets of each class to the total net assets of the Fund. Each class differs with respect fees incurred. Certain expense reductions may also differ by class. For the reporting period, the allocated portion of income and expenses to each class as a percent of its average net assets may vary due to the timing of recording these transactions in relation to fluctuating net assets of the classes. Expenses directly attributable to a fund are charged to that fund. Expenses attributable to more than one fund are allocated among the respective funds on the basis of relative net assets or other appropriate methods. Expense estimates are accrued in the period to which they relate and adjustments are made when actual amounts are known.
Income Tax Information and Distributions to Shareholders. Each year, the Fund intends to qualify as a regulated investment company under Subchapter M of the Internal Revenue Code, including distributing substantially all of its taxable income and realized gains. As a result, no provision for U.S. Federal income taxes is required. The Fund files a U.S. federal tax return, in addition to state and local tax returns as required. The Fund's federal income tax returns are subject to examination by the Internal Revenue Service (IRS) for a period of three fiscal years after they are filed. State and local tax returns may be subject to examination for an additional fiscal year depending on the jurisdiction. Foreign taxes are provided for based on the Fund's understanding of the tax rules and rates that exist in the foreign markets in which it invests.
Distributions are declared and recorded on the ex-dividend date. Income dividends and capital gain distributions are declared separately for each class. Income and capital gain distributions are determined in accordance with income tax regulations, which may differ from GAAP.
Capital accounts within the financial statements are adjusted for permanent book-tax differences. These adjustments have no impact on net assets or the results of operations. Capital accounts are not adjusted for temporary book-tax differences which will reverse in a subsequent period.
Book-tax differences are primarily due to futures and options transactions, foreign currency transactions, market discount, partnerships, capital loss carryforwards, losses deferred due to wash sales, and excise tax regulations.
As of period end, the cost and unrealized appreciation (depreciation) in securities, and derivatives if applicable, for federal income tax purposes were as follows:
| Gross unrealized appreciation | $1,437,456,950 |
| Gross unrealized depreciation | (115,523,021) |
| Net unrealized appreciation (depreciation) | $1,321,933,929 |
| Tax cost | $4,628,497,388 |
The Fund elected to defer to its next fiscal year approximately $3,837,797 of capital losses recognized during the period November 1, 2016 to July 31, 2017.
Restricted Securities. The Fund may invest in securities that are subject to legal or contractual restrictions on resale. These securities generally may be resold in transactions exempt from registration or to the public if the securities are registered. Disposal of these securities may involve time-consuming negotiations and expense, and prompt sale at an acceptable price may be difficult. Information regarding restricted securities is included at the end of the Fund's Schedule of Investments.
4. Derivative Instruments.
Risk Exposures and the Use of Derivative Instruments. The Fund's investment objective allows the Fund to enter into various types of derivative contracts, including futures contracts. Derivatives are investments whose value is primarily derived from underlying assets, indices or reference rates and may be transacted on an exchange or over-the-counter (OTC). Derivatives may involve a future commitment to buy or sell a specified asset based on specified terms, to exchange future cash flows at periodic intervals based on a notional principal amount, or for one party to make one or more payments upon the occurrence of specified events in exchange for periodic payments from the other party.
The Fund used derivatives to increase returns and to manage exposure to certain risks as defined below. The success of any strategy involving derivatives depends on analysis of numerous economic factors, and if the strategies for investment do not work as intended, the Fund may not achieve its objectives.
The Fund's use of derivatives increased or decreased its exposure to the following risk:
| Equity Risk | Equity risk relates to the fluctuations in the value of financial instruments as a result of changes in market prices (other than those arising from interest rate risk or foreign exchange risk), whether caused by factors specific to an individual investment, its issuer, or all factors affecting all instruments traded in a market or market segment.
|
The Fund is also exposed to additional risks from investing in derivatives, such as liquidity risk and counterparty credit risk. Liquidity risk is the risk that the Fund will be unable to close out the derivative in the open market in a timely manner. Counterparty credit risk is the risk that the counterparty will not be able to fulfill its obligation to the Fund. Counterparty credit risk related to exchange-traded futures contracts may be mitigated by the protection provided by the exchange on which they trade.
Investing in derivatives may involve greater risks than investing in the underlying assets directly and, to varying degrees, may involve risk of loss in excess of any initial investment and collateral received and amounts recognized in the Statement of Assets and Liabilities. In addition, there may be the risk that the change in value of the derivative contract does not correspond to the change in value of the underlying instrument.
Futures Contracts. A futures contract is an agreement between two parties to buy or sell a specified underlying instrument for a fixed price at a specified future date. The Fund used futures contracts to manage its exposure to the stock market.
Upon entering into a futures contract, a fund is required to deposit either cash or securities (initial margin) with a clearing broker in an amount equal to a certain percentage of the face value of the contract. Futures contracts are marked-to-market daily and subsequent daily payments (variation margin) are made or received by a fund depending on the daily fluctuations in the value of the futures contracts and are recorded as unrealized appreciation or (depreciation). This receivable and/or payable, if any, is included in daily variation margin on futures contracts in the Statement of Assets and Liabilities. Realized gain or (loss) is recorded upon the expiration or closing of a futures contract. The net realized gain (loss) and change in net unrealized appreciation (depreciation) on futures contracts during the period is presented in the Statement of Operations.
Any open futures contracts at period end are presented in the Schedule of Investments under the caption "Futures Contracts". The notional amount at value reflects each contract's exposure to the underlying instrument or index at period end and is representative of volume of activity during the period. Securities deposited to meet initial margin requirements are identified in the Schedule of Investments.
5. Purchases and Sales of Investments.
Purchases and sales of securities, other than short-term securities, aggregated $1,399,760,596 and $1,589,702,400, respectively.
6. Fees and Other Transactions with Affiliates.
Management Fee. Fidelity Management & Research Company (the investment adviser) and its affiliates provide the Fund with investment management related services for which the Fund does not pay a management fee. Under the management contract, the investment adviser or an affiliate pays all ordinary operating expenses of the Fund, except custody fees, fees and expenses of the independent Trustees, and certain miscellaneous expenses such as proxy and shareholder meeting expenses.
Brokerage Commissions. The Fund placed a portion of its portfolio transactions with brokerage firms which are affiliates of the investment adviser. Brokerage commissions are included in net realized gain (loss) and change in net unrealized appreciation (depreciation) in the Statement of Operations. The commissions paid to these affiliated firms were $87,040 for the period.
Interfund Trades. The Fund may purchase from or sell securities to other Fidelity Funds under procedures adopted by the Board. The procedures have been designed to ensure these interfund trades are executed in accordance with Rule 17a-7 of the 1940 Act. Interfund trades are included within the respective purchases and sales amounts shown in the Purchases and Sales of Investments note.
Other. During the period, the investment adviser reimbursed the fund for certain losses in the amount of $24,460.
7. Committed Line of Credit.
The Fund participates with other funds managed by the investment adviser or an affiliate in a $4.25 billion credit facility (the "line of credit") to be utilized for temporary or emergency purposes to fund shareholder redemptions or for other short-term liquidity purposes. The Fund has agreed to pay commitment fees on its pro-rata portion of the line of credit, which amounted to $8,003 and is reflected in Miscellaneous expenses on the Statement of Operations. During the period, the Fund did not borrow on this line of credit.
8. Security Lending.
The Fund lends portfolio securities through a lending agent from time to time in order to earn additional income. For equity securities, a lending agent is used and may loan securities to certain qualified borrowers, including Fidelity Capital Markets (FCM), a broker-dealer affiliated with the Fund. On the settlement date of the loan, the Fund receives collateral (in the form of U.S. Treasury obligations, letters of credit and/or cash) against the loaned securities and maintains collateral in an amount not less than 100% of the market value of the loaned securities during the period of the loan. The market value of the loaned securities is determined at the close of business of the Fund and any additional required collateral is delivered to the Fund on the next business day. The Fund or borrower may terminate the loan at any time, and if the borrower defaults on its obligation to return the securities loaned because of insolvency or other reasons, the Fund may apply collateral received from the borrower against the obligation. The Fund may experience delays and costs in recovering the securities loaned. Any cash collateral received is invested in the Fidelity Securities Lending Cash Central Fund. The value of loaned securities and cash collateral at period end are disclosed on the Fund's Statement of Assets and Liabilities. The value of securities loaned to FCM at period end was $742,720. Security lending income represents the income earned on investing cash collateral, less rebates paid to borrowers and any lending agent fees associated with the loan, plus any premium payments received for lending certain types of securities. Security lending income is presented in the Statement of Operations as a component of income from Fidelity Central Funds. Total security lending income during the period amounted to $230,288, including $7,422 from securities loaned to FCM.
9. Distributions to Shareholders.
Distributions to shareholders of each class were as follows:
| | Six months ended
January 31, 2018 | Year ended
July 31, 2017 |
| From net investment income | | |
| Series Small Cap Opportunities | $45,798,335 | $11,794,933 |
| Class F | – | 19,111,607 |
| Total | $45,798,335 | $30,906,540 |
| From net realized gain | | |
| Series Small Cap Opportunities | $554,772,271 | $5,126,926 |
| Class F | – | 6,204,689 |
| Total | $554,772,271 | $11,331,615 |
10. Share Transactions.
Transactions for each class of shares were as follows:
| | Shares | Shares | Dollars | Dollars |
| | Six months ended January 31, 2018 | Year ended July 31, 2017 | Six months ended January 31, 2018 | Year ended July 31, 2017 |
| Series Small Cap Opportunities | | | | |
| Shares sold | 225,175,552 | 21,828,308 | $3,169,725,682 | $305,846,494 |
| Reinvestment of distributions | 44,122,337 | 1,235,622 | 600,570,606 | 16,921,859 |
| Shares redeemed | (38,715,259) | (37,107,686) | (549,436,454) | (511,729,842) |
| Net increase (decrease) | 230,582,630 | (14,043,756) | $3,220,859,834 | $(188,961,489) |
| Class F | | | | |
| Shares sold | 1,009,181 | 26,592,990 | $14,321,228 | $372,355,351 |
| Reinvestment of distributions | – | 1,845,956 | – | 25,316,296 |
| Shares redeemed | (204,251,733) | (49,600,408) | (2,890,898,536) | (691,745,565) |
| Net increase (decrease) | (203,242,552) | (21,161,462) | $(2,876,577,308) | $(294,073,918) |
11. Other.
The Fund's organizational documents provide former and current trustees and officers with a limited indemnification against liabilities arising in connection with the performance of their duties to the Fund. In the normal course of business, the Fund may also enter into contracts that provide general indemnifications. The Fund's maximum exposure under these arrangements is unknown as this would be dependent on future claims that may be made against the Fund. The risk of material loss from such claims is considered remote.
At the end of the period, mutual funds managed by the investment adviser or its affiliates were the owners of record of all of the outstanding shares of the Fund.
Shareholder Expense Example
As a shareholder of the Fund, you incur two types of costs: (1) transaction costs, and (2) ongoing costs, including other Fund expenses. This Example is intended to help you understand your ongoing costs (in dollars) of investing in the Fund and to compare these costs with the ongoing costs of investing in other mutual funds.
The Example is based on an investment of $1,000 invested at the beginning of the period and held for the entire period (August 1, 2017 to January 31, 2018).
Actual Expenses
The first line of the accompanying table provides information about actual account values and actual expenses. You may use the information in this line, together with the amount you invested, to estimate the expenses that you paid over the period. Simply divide your account value by $1,000.00 (for example, an $8,600 account value divided by $1,000.00 = 8.6), then multiply the result by the number in the first line under the heading entitled "Expenses Paid During Period" to estimate the expenses you paid on your account during this period. In addition, the Fund, as a shareholder in the underlying Fidelity Central Funds, will indirectly bear its pro-rata share of the fees and expenses incurred by the underlying Fidelity Central Funds. These fees and expenses are not included in the Fund's annualized expense ratio used to calculate the expense estimate in the table below.
Hypothetical Example for Comparison Purposes
The second line of the accompanying table provides information about hypothetical account values and hypothetical expenses based on the Fund's actual expense ratio and an assumed rate of return of 5% per year before expenses, which is not the Fund's actual return. The hypothetical account values and expenses may not be used to estimate the actual ending account balance or expenses you paid for the period. You may use this information to compare the ongoing costs of investing in the Fund and other funds. To do so, compare this 5% hypothetical example with the 5% hypothetical examples that appear in the shareholder reports of the other funds. In addition, the Fund, as a shareholder in the underlying Fidelity Central Funds, will indirectly bear its pro-rata share of the fees and expenses incurred by the underlying Fidelity Central Funds. These fees and expenses are not included in the Fund's annualized expense ratio used to calculate the expense estimate in the table below.
Please note that the expenses shown in the table are meant to highlight your ongoing costs only and do not reflect any transaction costs. Therefore, the second line of the table is useful in comparing ongoing costs only, and will not help you determine the relative total costs of owning different funds.
| | Annualized Expense Ratio-A | Beginning
Account Value
August 1, 2017 | Ending
Account Value
January 31, 2018 | Expenses Paid
During Period-B
August 1, 2017
to January 31, 2018 |
| Series Small Cap Opportunities | - %C | | | |
| Actual | | $1,000.00 | $1,123.20 | $--D |
| Hypothetical-E | | $1,000.00 | $1,025.21 | $--D |
A Annualized expense ratio reflects expenses net of applicable fee waivers.
B Expenses are equal to the Fund's annualized expense ratio, multiplied by the average account value over the period, multiplied by 184/365 (to reflect the one-half year period).
C Amounts represent less than .005%.
D Amount represents less than $.005.
E 5% return per year before expenses
Corporate Headquarters
245 Summer St.
Boston, MA 02210
www.fidelity.com
SMO-SANN-0318
1.839810.110
Fidelity Advisor® Small Cap Growth Fund -
Class A, Class M, Class C, Class I and Class Z
Semi-Annual Report January 31, 2018 Class A, Class M, Class C, Class I and Class Z are classes of Fidelity® Small Cap Growth Fund |
|
Contents
To view a fund's proxy voting guidelines and proxy voting record for the 12-month period ended June 30, visit http://www.fidelity.com/proxyvotingresults or visit the Securities and Exchange Commission's (SEC) web site at http://www.sec.gov.
You may also call 1-877-208-0098 to request a free copy of the proxy voting guidelines.
Standard & Poor's, S&P and S&P 500 are registered service marks of The McGraw-Hill Companies, Inc. and have been licensed for use by Fidelity Distributors Corporation.
Other third-party marks appearing herein are the property of their respective owners.
All other marks appearing herein are registered or unregistered trademarks or service marks of FMR LLC or an affiliated company. © 2018 FMR LLC. All rights reserved.
This report and the financial statements contained herein are submitted for the general information of the shareholders of the Fund. This report is not authorized for distribution to prospective investors in the Fund unless preceded or accompanied by an effective prospectus.
A fund files its complete schedule of portfolio holdings with the SEC for the first and third quarters of each fiscal year on Form N-Q. Forms N-Q are available on the SEC’s web site at http://www.sec.gov. A fund's Forms N-Q may be reviewed and copied at the SEC’s Public Reference Room in Washington, DC. Information regarding the operation of the SEC's Public Reference Room may be obtained by calling 1-800-SEC-0330.
For a complete list of a fund's portfolio holdings, view the most recent holdings listing, semiannual report, or annual report on Fidelity's web site at http://www.fidelity.com, http://www.institutional.fidelity.com, or http://www.401k.com, as applicable.
NOT FDIC INSURED •MAY LOSE VALUE •NO BANK GUARANTEE
Neither the Fund nor Fidelity Distributors Corporation is a bank.
Investment Summary (Unaudited)
Top Ten Stocks as of January 31, 2018
| | % of fund's net assets |
| 2U, Inc. | 3.1 |
| Grand Canyon Education, Inc. | 2.1 |
| Stamps.com, Inc. | 1.7 |
| Nektar Therapeutics | 1.5 |
| Insulet Corp. | 1.4 |
| Vail Resorts, Inc. | 1.3 |
| Eagle Materials, Inc. | 1.3 |
| GrubHub, Inc. | 1.3 |
| Cavco Industries, Inc. | 1.2 |
| SiteOne Landscape Supply, Inc. | 1.2 |
| | 16.1 |
Top Five Market Sectors as of January 31, 2018
| | % of fund's net assets |
| Information Technology | 22.6 |
| Health Care | 21.1 |
| Industrials | 20.9 |
| Consumer Discretionary | 15.1 |
| Financials | 7.4 |
Asset Allocation (% of fund's net assets)
| As of January 31, 2018 * |
| | Stocks/ETFs | 97.6% |
| | Convertible Securities | 0.6% |
| | Short-Term Investments and Net Other Assets (Liabilities) | 1.8% |

* Foreign investments - 8.8%
Schedule of Investments January 31, 2018 (Unaudited)
Showing Percentage of Net Assets
| Common Stocks - 96.4% | | | |
| | | Shares | Value |
| CONSUMER DISCRETIONARY - 15.1% | | | |
| Diversified Consumer Services - 2.4% | | | |
| Bright Horizons Family Solutions, Inc. (a) | | 133,514 | $13,111,075 |
| Grand Canyon Education, Inc. (a) | | 977,240 | 90,873,548 |
| | | | 103,984,623 |
| Hotels, Restaurants & Leisure - 5.8% | | | |
| Boyd Gaming Corp. | | 748,885 | 29,558,491 |
| Cedar Fair LP (depositary unit) | | 621,517 | 42,138,853 |
| Churchill Downs, Inc. | | 102,431 | 26,529,629 |
| Dunkin' Brands Group, Inc. | | 317,751 | 20,542,602 |
| Marriott Vacations Worldwide Corp. | | 143,975 | 21,931,712 |
| Texas Roadhouse, Inc. Class A | | 370,898 | 21,779,131 |
| U.S. Foods Holding Corp. (a) | | 883,090 | 28,373,682 |
| Vail Resorts, Inc. | | 261,098 | 57,065,579 |
| | | | 247,919,679 |
| Household Durables - 3.1% | | | |
| Cavco Industries, Inc. (a) | | 338,670 | 51,867,311 |
| LGI Homes, Inc. (a)(b) | | 411,604 | 27,857,359 |
| SodaStream International Ltd. (a) | | 346,413 | 27,238,454 |
| Taylor Morrison Home Corp. (a) | | 1,068,151 | 27,163,080 |
| | | | 134,126,204 |
| Internet & Direct Marketing Retail - 0.3% | | | |
| Gaia, Inc. Class A (a) | | 966,461 | 11,549,209 |
| Media - 0.7% | | | |
| Cinemark Holdings, Inc. | | 783,916 | 28,848,109 |
| Multiline Retail - 0.4% | | | |
| Ollie's Bargain Outlet Holdings, Inc. (a) | | 308,870 | 17,157,729 |
| Specialty Retail - 1.4% | | | |
| Michaels Companies, Inc. (a) | | 977,592 | 26,267,897 |
| The Children's Place Retail Stores, Inc. | | 227,433 | 34,069,463 |
| | | | 60,337,360 |
| Textiles, Apparel & Luxury Goods - 1.0% | | | |
| Carter's, Inc. | | 163,020 | 19,611,306 |
| Columbia Sportswear Co. | | 184,222 | 13,755,857 |
| Emerald Expositions Events, Inc. | | 4,638 | 100,088 |
| PetIQ, Inc. Class A (b) | | 351,080 | 8,425,920 |
| | | | 41,893,171 |
|
| TOTAL CONSUMER DISCRETIONARY | | | 645,816,084 |
|
| CONSUMER STAPLES - 3.2% | | | |
| Food & Staples Retailing - 0.6% | | | |
| Performance Food Group Co. (a) | | 776,022 | 26,656,356 |
| Food Products - 1.0% | | | |
| Nomad Foods Ltd. (a) | | 1,226,500 | 20,899,560 |
| Post Holdings, Inc. (a) | | 307,587 | 23,275,108 |
| | | | 44,174,668 |
| Household Products - 1.0% | | | |
| Central Garden & Pet Co. (a) | | 432,220 | 16,938,702 |
| Central Garden & Pet Co. Class A (non-vtg.) (a) | | 651,335 | 24,568,356 |
| | | | 41,507,058 |
| Personal Products - 0.6% | | | |
| Herbalife Ltd. (a)(b) | | 304,070 | 25,234,769 |
|
| TOTAL CONSUMER STAPLES | | | 137,572,851 |
|
| FINANCIALS - 7.4% | | | |
| Banks - 1.2% | | | |
| First Citizen Bancshares, Inc. | | 91,874 | 39,084,118 |
| Prosperity Bancshares, Inc. | | 156,507 | 11,863,231 |
| | | | 50,947,349 |
| Capital Markets - 3.3% | | | |
| Apollo Global Management LLC Class A | | 1,213,768 | 43,392,206 |
| CBOE Holdings, Inc. | | 208,906 | 28,074,877 |
| Eaton Vance Corp. (non-vtg.) | | 339,461 | 19,620,846 |
| Lazard Ltd. Class A | | 371,433 | 21,754,831 |
| MSCI, Inc. | | 213,985 | 29,793,132 |
| | | | 142,635,892 |
| Diversified Financial Services - 0.6% | | | |
| Cotiviti Holdings, Inc. (a) | | 740,854 | 25,929,890 |
| Insurance - 0.7% | | | |
| Enstar Group Ltd. (a) | | 147,626 | 30,647,158 |
| Thrifts & Mortgage Finance - 1.6% | | | |
| Essent Group Ltd. (a) | | 904,751 | 42,089,017 |
| Meridian Bancorp, Inc. Maryland | | 1,168,408 | 23,893,944 |
| | | | 65,982,961 |
|
| TOTAL FINANCIALS | | | 316,143,250 |
|
| HEALTH CARE - 21.1% | | | |
| Biotechnology - 8.6% | | | |
| Acceleron Pharma, Inc. (a) | | 337,426 | 14,006,553 |
| Achaogen, Inc. (a)(b) | | 527,940 | 5,791,502 |
| Acorda Therapeutics, Inc. (a) | | 402,517 | 10,445,316 |
| Adamas Pharmaceuticals, Inc. (a) | | 306,303 | 11,590,506 |
| Alder Biopharmaceuticals, Inc. (a) | | 780,275 | 11,040,891 |
| Amarin Corp. PLC ADR (a)(b) | | 959,765 | 3,599,119 |
| AnaptysBio, Inc. | | 252,684 | 26,630,367 |
| Arena Pharmaceuticals, Inc. (a) | | 69,766 | 2,610,644 |
| Argenx SE ADR | | 200,769 | 15,575,659 |
| Ascendis Pharma A/S sponsored ADR (a) | | 442,761 | 22,567,528 |
| Audentes Therapeutics, Inc. (a) | | 540,670 | 18,977,517 |
| Blueprint Medicines Corp. (a) | | 335,316 | 26,372,603 |
| Curis, Inc. (a) | | 728,321 | 449,447 |
| Dyax Corp. rights 12/31/19 (a)(c) | | 380,400 | 1,297,164 |
| Epizyme, Inc. (a) | | 478,205 | 7,723,011 |
| Fate Therapeutics, Inc. (a)(b) | | 1,331,543 | 12,170,303 |
| FibroGen, Inc. (a) | | 318,146 | 18,627,448 |
| Five Prime Therapeutics, Inc. (a) | | 147,626 | 2,952,520 |
| Global Blood Therapeutics, Inc. (a) | | 405,529 | 23,480,129 |
| Heron Therapeutics, Inc. (a) | | 318,046 | 6,885,696 |
| Insmed, Inc. (a) | | 30,593 | 778,286 |
| Intercept Pharmaceuticals, Inc. (a) | | 30,393 | 1,887,405 |
| Kura Oncology, Inc. (a) | | 511,846 | 10,032,182 |
| Ligand Pharmaceuticals, Inc. Class B (a) | | 98,878 | 15,585,150 |
| Loxo Oncology, Inc. (a) | | 272,344 | 27,634,746 |
| Madrigal Pharmaceuticals, Inc. (a) | | 53,781 | 7,982,176 |
| Mirati Therapeutics, Inc. (a) | | 15,639 | 405,050 |
| Sarepta Therapeutics, Inc. (a) | | 439,794 | 28,824,099 |
| Stemline Therapeutics, Inc. (a) | | 766,000 | 12,217,700 |
| TESARO, Inc. (a) | | 81,510 | 5,498,665 |
| Ultragenyx Pharmaceutical, Inc. (a) | | 275,389 | 14,692,003 |
| Zai Lab Ltd. ADR | | 26,348 | 710,342 |
| | | | 369,041,727 |
| Health Care Equipment & Supplies - 4.9% | | | |
| Cantel Medical Corp. | | 329,293 | 36,528,472 |
| ICU Medical, Inc. (a) | | 103,417 | 23,677,322 |
| Inogen, Inc. (a) | | 119,403 | 14,548,062 |
| Insulet Corp. (a) | | 761,220 | 58,256,167 |
| iRhythm Technologies, Inc. (a) | | 312,225 | 18,617,977 |
| Novocure Ltd. (a)(b) | | 1,106,404 | 24,838,770 |
| Quanterix Corp. (a) | | 723,677 | 15,059,718 |
| Tactile Systems Technology, Inc. (a)(b) | | 249,249 | 7,858,821 |
| Wright Medical Group NV (a) | | 536,969 | 12,216,045 |
| | | | 211,601,354 |
| Health Care Providers & Services - 2.5% | | | |
| G1 Therapeutics, Inc. | | 502,579 | 12,016,664 |
| LHC Group, Inc. (a) | | 221,656 | 13,919,997 |
| Magellan Health Services, Inc. (a) | | 139,817 | 13,925,773 |
| Molina Healthcare, Inc. (a) | | 285,581 | 26,090,680 |
| Premier, Inc. (a) | | 550,880 | 17,876,056 |
| Tivity Health, Inc. (a) | | 612,015 | 23,715,581 |
| | | | 107,544,751 |
| Health Care Technology - 0.3% | | | |
| athenahealth, Inc. (a) | | 83,187 | 10,424,163 |
| HTG Molecular Diagnostics (a) | | 821,300 | 2,932,041 |
| | | | 13,356,204 |
| Life Sciences Tools & Services - 0.8% | | | |
| ICON PLC (a) | | 311,830 | 34,151,622 |
| Pharmaceuticals - 4.0% | | | |
| Aclaris Therapeutics, Inc. (a) | | 377,185 | 8,343,332 |
| Aerie Pharmaceuticals, Inc. (a) | | 315,086 | 17,282,467 |
| Akcea Therapeutics, Inc. (b) | | 537,018 | 11,626,440 |
| Avexis, Inc. (a) | | 192,173 | 23,777,565 |
| Catalent, Inc. (a) | | 516,592 | 24,042,192 |
| Nektar Therapeutics (a) | | 768,826 | 64,281,542 |
| SCYNEXIS, Inc. warrants 6/21/21 (a) | | 168,750 | 67,080 |
| The Medicines Company (a) | | 345,292 | 11,439,524 |
| Theravance Biopharma, Inc. (a) | | 284,009 | 7,509,198 |
| Zogenix, Inc. (a) | | 59,208 | 2,152,211 |
| | | | 170,521,551 |
|
| TOTAL HEALTH CARE | | | 906,217,209 |
|
| INDUSTRIALS - 20.9% | | | |
| Aerospace & Defense - 3.1% | | | |
| BWX Technologies, Inc. | | 740,201 | 46,958,351 |
| Elbit Systems Ltd. | | 77,563 | 11,618,162 |
| HEICO Corp. Class A | | 699,795 | 46,081,501 |
| Teledyne Technologies, Inc. (a) | | 152,656 | 29,145,084 |
| | | | 133,803,098 |
| Air Freight & Logistics - 0.4% | | | |
| Atlas Air Worldwide Holdings, Inc. (a) | | 301,173 | 16,956,040 |
| Airlines - 1.8% | | | |
| Allegiant Travel Co. | | 189,745 | 30,216,891 |
| SkyWest, Inc. | | 874,767 | 48,768,260 |
| | | | 78,985,151 |
| Commercial Services & Supplies - 2.4% | | | |
| Copart, Inc. (a) | | 892,268 | 39,322,251 |
| Healthcare Services Group, Inc. | | 293,969 | 16,221,209 |
| The Brink's Co. | | 286,071 | 23,858,321 |
| Viad Corp. | | 423,483 | 24,053,834 |
| | | | 103,455,615 |
| Construction & Engineering - 3.5% | | | |
| Dycom Industries, Inc. (a) | | 311,402 | 36,343,727 |
| EMCOR Group, Inc. | | 403,805 | 32,821,270 |
| Fluor Corp. | | 122,780 | 7,452,746 |
| Jacobs Engineering Group, Inc. | | 345,381 | 23,990,164 |
| KBR, Inc. | | 2,385,587 | 48,522,840 |
| | | | 149,130,747 |
| Electrical Equipment - 1.2% | | | |
| Generac Holdings, Inc. (a) | | 1,008,611 | 49,351,336 |
| Industrial Conglomerates - 1.1% | | | |
| ITT, Inc. | | 832,270 | 46,607,120 |
| Machinery - 3.5% | | | |
| AGCO Corp. | | 278,377 | 20,215,738 |
| Allison Transmission Holdings, Inc. | | 746,256 | 33,014,365 |
| John Bean Technologies Corp. | | 218,228 | 24,823,435 |
| Oshkosh Corp. | | 271,667 | 24,645,630 |
| WABCO Holdings, Inc. (a) | | 316,073 | 48,798,510 |
| | | | 151,497,678 |
| Professional Services - 1.9% | | | |
| Exponent, Inc. | | 506,678 | 37,570,174 |
| On Assignment, Inc. (a) | | 575,008 | 44,028,363 |
| | | | 81,598,537 |
| Road & Rail - 0.3% | | | |
| Marten Transport Ltd. | | 519,608 | 12,054,906 |
| Trading Companies & Distributors - 1.7% | | | |
| SiteOne Landscape Supply, Inc. (a) | | 649,711 | 49,481,990 |
| Univar, Inc. (a) | | 729,346 | 21,778,272 |
| | | | 71,260,262 |
|
| TOTAL INDUSTRIALS | | | 894,700,490 |
|
| INFORMATION TECHNOLOGY - 22.0% | | | |
| Electronic Equipment & Components - 2.2% | | | |
| Dolby Laboratories, Inc. Class A | | 315,065 | 20,271,282 |
| FLIR Systems, Inc. | | 279,364 | 14,306,230 |
| II-VI, Inc. (a) | | 383,718 | 16,365,573 |
| Novanta, Inc. (a) | | 731,314 | 42,343,081 |
| | | | 93,286,166 |
| Internet Software & Services - 10.0% | | | |
| 2U, Inc. (a)(b) | | 1,776,201 | 131,918,442 |
| Alarm.com Holdings, Inc. (a)(b) | | 236,536 | 9,078,252 |
| ANGI Homeservices, Inc. Class A (a) | | 37,400 | 499,664 |
| Five9, Inc. (a) | | 419,885 | 10,921,209 |
| GoDaddy, Inc. (a) | | 614,483 | 33,937,896 |
| Gogo, Inc. (a)(b) | | 1,496,839 | 14,429,528 |
| GrubHub, Inc. (a)(b) | | 757,667 | 54,741,441 |
| Instructure, Inc. (a) | | 757,878 | 27,207,820 |
| MINDBODY, Inc. (a) | | 735,970 | 25,869,346 |
| New Relic, Inc. (a) | | 293,673 | 17,541,088 |
| Okta, Inc. | | 634,515 | 18,686,467 |
| Stamps.com, Inc. (a) | | 361,343 | 73,659,771 |
| Yext, Inc. (b) | | 1,055,189 | 12,715,027 |
| | | | 431,205,951 |
| IT Services - 3.0% | | | |
| EPAM Systems, Inc. (a) | | 342,026 | 40,181,214 |
| Genpact Ltd. | | 855,855 | 29,047,719 |
| Interxion Holding N.V. (a) | | 218,182 | 13,690,921 |
| Leidos Holdings, Inc. | | 712,472 | 47,450,635 |
| | | | 130,370,489 |
| Semiconductors & Semiconductor Equipment - 1.9% | | | |
| Entegris, Inc. | | 1,507,737 | 49,076,839 |
| Integrated Device Technology, Inc. (a) | | 450,030 | 13,455,897 |
| PDF Solutions, Inc. (a)(b) | | 1,282,462 | 17,544,080 |
| | | | 80,076,816 |
| Software - 4.9% | | | |
| Everbridge, Inc. (a) | | 1,101,578 | 35,558,938 |
| HubSpot, Inc. (a) | | 361,580 | 35,091,339 |
| Paycom Software, Inc. (a)(b) | | 317,416 | 29,088,002 |
| Proofpoint, Inc. (a) | | 211,176 | 21,544,176 |
| PROS Holdings, Inc. (a) | | 807,222 | 23,441,727 |
| RingCentral, Inc. (a) | | 501,394 | 27,225,694 |
| Take-Two Interactive Software, Inc. (a) | | 155,618 | 19,712,132 |
| Workiva, Inc. (a) | | 830,308 | 18,515,868 |
| | | | 210,177,876 |
|
| TOTAL INFORMATION TECHNOLOGY | | | 945,117,298 |
|
| MATERIALS - 4.7% | | | |
| Chemicals - 1.3% | | | |
| Orion Engineered Carbons SA | | 258,037 | 7,599,190 |
| The Chemours Co. LLC | | 920,509 | 47,516,675 |
| | | | 55,115,865 |
| Construction Materials - 2.1% | | | |
| Eagle Materials, Inc. | | 507,073 | 56,817,530 |
| Summit Materials, Inc. | | 1,020,348 | 32,600,119 |
| | | | 89,417,649 |
| Containers & Packaging - 1.0% | | | |
| Avery Dennison Corp. | | 240,090 | 29,454,241 |
| Berry Global Group, Inc. (a) | | 259,134 | 15,338,141 |
| | | | 44,792,382 |
| Paper & Forest Products - 0.3% | | | |
| Neenah, Inc. | | 142,594 | 12,904,757 |
| Quintis Ltd. (a)(b)(c) | | 11,285,501 | 91 |
| | | | 12,904,848 |
|
| TOTAL MATERIALS | | | 202,230,744 |
|
| REAL ESTATE - 1.6% | | | |
| Equity Real Estate Investment Trusts (REITs) - 1.5% | | | |
| Hudson Pacific Properties, Inc. | | 440,312 | 14,076,775 |
| Rexford Industrial Realty, Inc. | | 557,248 | 16,544,693 |
| Store Capital Corp. | | 599,483 | 14,693,328 |
| Terreno Realty Corp. | | 499,323 | 17,775,899 |
| | | | 63,090,695 |
| Real Estate Management & Development - 0.1% | | | |
| Redfin Corp. (b) | | 272,074 | 5,523,102 |
|
| TOTAL REAL ESTATE | | | 68,613,797 |
|
| UTILITIES - 0.4% | | | |
| Independent Power and Renewable Electricity Producers - 0.4% | | | |
| NRG Yield, Inc. Class C | | 424,720 | 8,027,208 |
| Ormat Technologies, Inc. | | 143,975 | 10,089,768 |
| | | | 18,116,976 |
| TOTAL COMMON STOCKS | | | |
| (Cost $3,179,702,843) | | | 4,134,528,699 |
|
| Convertible Preferred Stocks - 0.6% | | | |
| INFORMATION TECHNOLOGY - 0.6% | | | |
| Software - 0.6% | | | |
| Compass, Inc. Series E (c)(d) | | | |
| (Cost $23,873,990) | | 353,803 | 23,873,990 |
|
| Investment Companies - 1.2% | | | |
| iShares Russell 2000 Growth Index ETF (b) | | | |
| (Cost $52,104,926) | | 274,947 | 53,270,981 |
|
| Money Market Funds - 4.4% | | | |
| Fidelity Cash Central Fund, 1.39% (e) | | 41,501,974 | 41,510,274 |
| Fidelity Securities Lending Cash Central Fund 1.40% (e)(f) | | 146,663,188 | 146,677,854 |
| TOTAL MONEY MARKET FUNDS | | | |
| (Cost $188,186,232) | | | 188,188,128 |
| TOTAL INVESTMENT IN SECURITIES - 102.6% | | | |
| (Cost $3,443,867,991) | | | 4,399,861,798 |
| NET OTHER ASSETS (LIABILITIES) - (2.6)% | | | (110,946,196) |
| NET ASSETS - 100% | | | $4,288,915,602 |
Security Type Abbreviations
ETF – Exchange-Traded Fund
Legend
(a) Non-income producing
(b) Security or a portion of the security is on loan at period end.
(c) Level 3 security
(d) Restricted securities - Investment in securities not registered under the Securities Act of 1933 (excluding 144A issues). At the end of the period, the value of restricted securities (excluding 144A issues) amounted to $23,873,990 or 0.6% of net assets.
(e) Affiliated fund that is generally available only to investment companies and other accounts managed by Fidelity Investments. The rate quoted is the annualized seven-day yield of the fund at period end. A complete unaudited listing of the fund's holdings as of its most recent quarter end is available upon request. In addition, each Fidelity Central Fund's financial statements are available on the SEC's website or upon request.
(f) Investment made with cash collateral received from securities on loan.
Additional information on each restricted holding is as follows:
| Security | Acquisition Date | Acquisition Cost |
| Compass, Inc. Series E | 11/3/17 | $23,873,990 |
Affiliated Central Funds
Information regarding fiscal year to date income earned by the Fund from investments in Fidelity Central Funds is as follows:
| Fund | Income earned |
| Fidelity Cash Central Fund | $348,711 |
| Fidelity Securities Lending Cash Central Fund | 2,047,153 |
| Total | $2,395,864 |
Amounts in the income column in the above table include any capital gain distributions from underlying funds, which are presented in the corresponding line-item in the Statement of Operations if applicable.
Investment Valuation
The following is a summary of the inputs used, as of January 31, 2018, involving the Fund's assets and liabilities carried at fair value. The inputs or methodology used for valuing securities may not be an indication of the risk associated with investing in those securities. For more information on valuation inputs, and their aggregation into the levels used below, please refer to the Investment Valuation section in the accompanying Notes to Financial Statements.
| | Valuation Inputs at Reporting Date: |
| Description | Total | Level 1 | Level 2 | Level 3 |
| Investments in Securities: | | | | |
| Equities: | | | | |
| Consumer Discretionary | $645,816,084 | $645,816,084 | $-- | $-- |
| Consumer Staples | 137,572,851 | 137,572,851 | -- | -- |
| Financials | 316,143,250 | 316,143,250 | -- | -- |
| Health Care | 906,217,209 | 904,852,965 | 67,080 | 1,297,164 |
| Industrials | 894,700,490 | 894,700,490 | -- | -- |
| Information Technology | 968,991,288 | 945,117,298 | -- | 23,873,990 |
| Materials | 202,230,744 | 202,230,653 | -- | 91 |
| Real Estate | 68,613,797 | 68,613,797 | -- | -- |
| Utilities | 18,116,976 | 18,116,976 | -- | -- |
| Investment Companies | 53,270,981 | 53,270,981 | -- | -- |
| Money Market Funds | 188,188,128 | 188,188,128 | -- | -- |
| Total Investments in Securities: | $4,399,861,798 | $4,374,623,473 | $67,080 | $25,171,245 |
See accompanying notes which are an integral part of the financial statements.
Financial Statements
Statement of Assets and Liabilities
| | | January 31, 2018 (Unaudited) |
| Assets | | |
Investment in securities, at value (including securities loaned of $141,522,088) — See accompanying schedule:
Unaffiliated issuers (cost $3,255,681,759) | $4,211,673,670 | |
| Fidelity Central Funds (cost $188,186,232) | 188,188,128 | |
| Total Investment in Securities (cost $3,443,867,991) | | $4,399,861,798 |
| Receivable for investments sold | | 64,126,011 |
| Receivable for fund shares sold | | 20,272,955 |
| Dividends receivable | | 261,718 |
| Distributions receivable from Fidelity Central Funds | | 689,923 |
| Prepaid expenses | | 4,643 |
| Other receivables | | 268,735 |
| Total assets | | 4,485,485,783 |
| Liabilities | | |
| Payable for investments purchased | $37,808,829 | |
| Payable for fund shares redeemed | 8,404,131 | |
| Accrued management fee | 2,775,993 | |
| Distribution and service plan fees payable | 197,050 | |
| Other affiliated payables | 659,351 | |
| Other payables and accrued expenses | 51,789 | |
| Collateral on securities loaned | 146,673,038 | |
| Total liabilities | | 196,570,181 |
| Net Assets | | $4,288,915,602 |
| Net Assets consist of: | | |
| Paid in capital | | $3,263,369,715 |
| Accumulated net investment loss | | (10,920,531) |
| Accumulated undistributed net realized gain (loss) on investments and foreign currency transactions | | 80,472,667 |
| Net unrealized appreciation (depreciation) on investments and assets and liabilities in foreign currencies | | 955,993,751 |
| Net Assets | | $4,288,915,602 |
| Calculation of Maximum Offering Price | | |
| Class A: | | |
| Net Asset Value and redemption price per share ($288,597,752 ÷ 11,474,627 shares) | | $25.15 |
| Maximum offering price per share (100/94.25 of $25.15) | | $26.68 |
| Class M: | | |
| Net Asset Value and redemption price per share ($77,453,004 ÷ 3,174,999 shares) | | $24.39 |
| Maximum offering price per share (100/96.50 of $24.39) | | $25.27 |
| Class C: | | |
| Net Asset Value and offering price per share ($134,257,465 ÷ 5,942,941 shares)(a) | | $22.59 |
| Small Cap Growth: | | |
| Net Asset Value, offering price and redemption price per share ($3,060,377,068 ÷ 116,992,660 shares) | | $26.16 |
| Class I: | | |
| Net Asset Value, offering price and redemption price per share ($647,824,294 ÷ 24,699,352 shares) | | $26.23 |
| Class Z: | | |
| Net Asset Value, offering price and redemption price per share ($80,406,019 ÷ 3,062,875 shares) | | $26.25 |
(a) Redemption price per share is equal to net asset value less any applicable contingent deferred sales charge.
See accompanying notes which are an integral part of the financial statements.
Statement of Operations
| | | Six months ended January 31, 2018 (Unaudited) |
| Investment Income | | |
| Dividends | | $7,605,095 |
| Income from Fidelity Central Funds (including $2,047,153 from security lending) | | 2,395,864 |
| Total income | | 10,000,959 |
| Expenses | | |
| Management fee | | |
| Basic fee | $12,449,521 | |
| Performance adjustment | 2,107,938 | |
| Transfer agent fees | 3,252,086 | |
| Distribution and service plan fees | 1,041,894 | |
| Accounting and security lending fees | 526,637 | |
| Custodian fees and expenses | 37,424 | |
| Independent trustees' fees and expenses | 6,655 | |
| Registration fees | 169,941 | |
| Audit | 35,980 | |
| Legal | 8,231 | |
| Interest | 540 | |
| Miscellaneous | 11,271 | |
| Total expenses before reductions | 19,648,118 | |
| Expense reductions | (203,530) | 19,444,588 |
| Net investment income (loss) | | (9,443,629) |
| Realized and Unrealized Gain (Loss) | | |
| Net realized gain (loss) on: | | |
| Investment securities: | | |
| Unaffiliated issuers | 128,118,719 | |
| Redemption in-kind with affiliated entities | 22,403,452 | |
| Fidelity Central Funds | 10,320 | |
| Foreign currency transactions | 65 | |
| Total net realized gain (loss) | | 150,532,556 |
| Change in net unrealized appreciation (depreciation) on: | | |
| Investment securities: | | |
| Unaffiliated issuers | 461,147,731 | |
| Fidelity Central Funds | (7,842) | |
| Assets and liabilities in foreign currencies | 33 | |
| Total change in net unrealized appreciation (depreciation) | | 461,139,922 |
| Net gain (loss) | | 611,672,478 |
| Net increase (decrease) in net assets resulting from operations | | $602,228,849 |
See accompanying notes which are an integral part of the financial statements.
Statement of Changes in Net Assets
| | Six months ended January 31, 2018 (Unaudited) | Year ended July 31, 2017 |
| Increase (Decrease) in Net Assets | | |
| Operations | | |
| Net investment income (loss) | $(9,443,629) | $(11,864,179) |
| Net realized gain (loss) | 150,532,556 | 284,698,299 |
| Change in net unrealized appreciation (depreciation) | 461,139,922 | 228,635,188 |
| Net increase (decrease) in net assets resulting from operations | 602,228,849 | 501,469,308 |
| Distributions to shareholders from net investment income | (6,004) | – |
| Distributions to shareholders from net realized gain | (236,656,527) | (17,131,591) |
| Total distributions | (236,662,531) | (17,131,591) |
| Share transactions - net increase (decrease) | 792,276,615 | 597,965,658 |
| Redemption fees | 224,512 | 418,601 |
| Total increase (decrease) in net assets | 1,158,067,445 | 1,082,721,976 |
| Net Assets | | |
| Beginning of period | 3,130,848,157 | 2,048,126,181 |
| End of period | $4,288,915,602 | $3,130,848,157 |
| Other Information | | |
| Accumulated net investment loss end of period | $(10,920,531) | $(1,470,898) |
See accompanying notes which are an integral part of the financial statements.
Financial Highlights
Fidelity Small Cap Growth Fund Class A
| | Six months ended (Unaudited) January 31, | Years endedJuly 31, | | | | |
| | 2018 | 2017 | 2016 | 2015 | 2014 | 2013 |
| Selected Per–Share Data | | | | | | |
| Net asset value, beginning of period | $22.99 | $19.17 | $20.55 | $17.99 | $19.66 | $15.87 |
| Income from Investment Operations | | | | | | |
| Net investment income (loss)A | (.09) | (.14) | (.10) | (.13) | (.12) | (.04) |
| Net realized and unrealized gain (loss) | 3.93 | 4.12 | (.51) | 4.23 | 1.69 | 4.87 |
| Total from investment operations | 3.84 | 3.98 | (.61) | 4.10 | 1.57 | 4.83 |
| Distributions from net investment income | –B | – | – | – | – | – |
| Distributions from net realized gain | (1.68) | (.16) | (.78) | (1.54) | (3.24) | (1.04) |
| Total distributions | (1.68) | (.16) | (.78) | (1.54) | (3.24) | (1.04) |
| Redemption fees added to paid in capitalA | –B | –B | .01 | –B | –B | –B |
| Net asset value, end of period | $25.15 | $22.99 | $19.17 | $20.55 | $17.99 | $19.66 |
| Total ReturnC,D,E | 17.70% | 20.90% | (2.85)% | 24.46% | 8.58% | 32.20% |
| Ratios to Average Net AssetsF,G | | | | | | |
| Expenses before reductions | 1.32%H | 1.35% | 1.37% | 1.21% | 1.22% | 1.24% |
| Expenses net of fee waivers, if any | 1.32%H | 1.35% | 1.37% | 1.21% | 1.22% | 1.24% |
| Expenses net of all reductions | 1.31%H | 1.34% | 1.36% | 1.20% | 1.22% | 1.22% |
| Net investment income (loss) | (.75)%H | (.66)% | (.58)% | (.67)% | (.62)% | (.26)% |
| Supplemental Data | | | | | | |
| Net assets, end of period (000 omitted) | $288,598 | $218,905 | $176,988 | $123,370 | $88,822 | $74,978 |
| Portfolio turnover rateI | 97%H,J | 140%J | 143% | 156% | 148%J | 142% |
A Calculated based on average shares outstanding during the period.
B Amount represents less than $.005 per share.
C Total returns for periods of less than one year are not annualized.
D Total returns would have been lower if certain expenses had not been reduced during the applicable periods shown.
E Total returns do not include the effect of the sales charges.
F Fees and expenses of any underlying Fidelity Central Funds are not included in the Fund's expense ratio. The Fund indirectly bears its proportionate share of the expenses of any underlying Fidelity Central Funds.
G Expense ratios reflect operating expenses of the class. Expenses before reductions do not reflect amounts reimbursed by the investment adviser or reductions from brokerage service arrangements or reductions from other expense offset arrangements and do not represent the amount paid by the class during periods when reimbursements or reductions occur. Expenses net of fee waivers reflect expenses after reimbursement by the investment adviser but prior to reductions from brokerage service arrangements or other expense offset arrangements. Expenses net of all reductions represent the net expenses paid by the class.
H Annualized
I Amount does not include the portfolio activity of any underlying Fidelity Central Funds.
J Portfolio turnover rate excludes securities received or delivered in-kind.
See accompanying notes which are an integral part of the financial statements.
Fidelity Small Cap Growth Fund Class M
| | Six months ended (Unaudited) January 31, | Years endedJuly 31, | | | | |
| | 2018 | 2017 | 2016 | 2015 | 2014 | 2013 |
| Selected Per–Share Data | | | | | | |
| Net asset value, beginning of period | $22.35 | $18.69 | $20.08 | $17.66 | $19.38 | $15.68 |
| Income from Investment Operations | | | | | | |
| Net investment income (loss)A | (.12) | (.19) | (.15) | (.17) | (.16) | (.09) |
| Net realized and unrealized gain (loss) | 3.81 | 4.01 | (.50) | 4.13 | 1.66 | 4.82 |
| Total from investment operations | 3.69 | 3.82 | (.65) | 3.96 | 1.50 | 4.73 |
| Distributions from net investment income | –B | – | – | – | – | – |
| Distributions from net realized gain | (1.65) | (.16) | (.75) | (1.54) | (3.22) | (1.03) |
| Total distributions | (1.65) | (.16) | (.75) | (1.54) | (3.22) | (1.03) |
| Redemption fees added to paid in capitalA | –B | –B | .01 | –B | –B | –B |
| Net asset value, end of period | $24.39 | $22.35 | $18.69 | $20.08 | $17.66 | $19.38 |
| Total ReturnC,D,E | 17.55% | 20.57% | (3.14)% | 24.10% | 8.30% | 31.87% |
| Ratios to Average Net AssetsF,G | | | | | | |
| Expenses before reductions | 1.59%H | 1.62% | 1.66% | 1.49% | 1.50% | 1.49% |
| Expenses net of fee waivers, if any | 1.59%H | 1.62% | 1.66% | 1.48% | 1.50% | 1.49% |
| Expenses net of all reductions | 1.58%H | 1.61% | 1.64% | 1.47% | 1.49% | 1.48% |
| Net investment income (loss) | (1.02)%H | (.94)% | (.87)% | (.95)% | (.90)% | (.52)% |
| Supplemental Data | | | | | | |
| Net assets, end of period (000 omitted) | $77,453 | $64,034 | $53,447 | $52,667 | $42,586 | $34,686 |
| Portfolio turnover rateI | 97%H,J | 140%J | 143% | 156% | 148%J | 142% |
A Calculated based on average shares outstanding during the period.
B Amount represents less than $.005 per share.
C Total returns for periods of less than one year are not annualized.
D Total returns would have been lower if certain expenses had not been reduced during the applicable periods shown.
E Total returns do not include the effect of the sales charges.
F Fees and expenses of any underlying Fidelity Central Funds are not included in the Fund's expense ratio. The Fund indirectly bears its proportionate share of the expenses of any underlying Fidelity Central Funds.
G Expense ratios reflect operating expenses of the class. Expenses before reductions do not reflect amounts reimbursed by the investment adviser or reductions from brokerage service arrangements or reductions from other expense offset arrangements and do not represent the amount paid by the class during periods when reimbursements or reductions occur. Expenses net of fee waivers reflect expenses after reimbursement by the investment adviser but prior to reductions from brokerage service arrangements or other expense offset arrangements. Expenses net of all reductions represent the net expenses paid by the class.
H Annualized
I Amount does not include the portfolio activity of any underlying Fidelity Central Funds.
J Portfolio turnover rate excludes securities received or delivered in-kind.
See accompanying notes which are an integral part of the financial statements.
Fidelity Small Cap Growth Fund Class C
| | Six months ended (Unaudited) January 31, | Years endedJuly 31, | | | | |
| | 2018 | 2017 | 2016 | 2015 | 2014 | 2013 |
| Selected Per–Share Data | | | | | | |
| Net asset value, beginning of period | $20.83 | $17.52 | $18.90 | $16.78 | $18.62 | $15.16 |
| Income from Investment Operations | | | | | | |
| Net investment income (loss)A | (.16) | (.27) | (.22) | (.25) | (.25) | (.16) |
| Net realized and unrealized gain (loss) | 3.54 | 3.74 | (.48) | 3.91 | 1.59 | 4.64 |
| Total from investment operations | 3.38 | 3.47 | (.70) | 3.66 | 1.34 | 4.48 |
| Distributions from net investment income | –B | – | – | – | – | – |
| Distributions from net realized gain | (1.62) | (.16) | (.69) | (1.54) | (3.18) | (1.02) |
| Total distributions | (1.62) | (.16) | (.69) | (1.54) | (3.18) | (1.02) |
| Redemption fees added to paid in capitalA | –B | –B | .01 | –B | –B | –B |
| Net asset value, end of period | $22.59 | $20.83 | $17.52 | $18.90 | $16.78 | $18.62 |
| Total ReturnC,D,E | 17.28% | 19.95% | (3.64)% | 23.53% | 7.70% | 31.32% |
| Ratios to Average Net AssetsF,G | | | | | | |
| Expenses before reductions | 2.08%H | 2.11% | 2.16% | 2.00% | 2.01% | 1.99% |
| Expenses net of fee waivers, if any | 2.08%H | 2.11% | 2.16% | 2.00% | 2.00% | 1.99% |
| Expenses net of all reductions | 2.07%H | 2.10% | 2.14% | 1.99% | 2.00% | 1.97% |
| Net investment income (loss) | (1.51)%H | (1.43)% | (1.37)% | (1.46)% | (1.41)% | (1.01)% |
| Supplemental Data | | | | | | |
| Net assets, end of period (000 omitted) | $134,257 | $102,669 | $73,731 | $55,671 | $42,215 | $32,756 |
| Portfolio turnover rateI | 97%H,J | 140%J | 143% | 156% | 148%J | 142% |
A Calculated based on average shares outstanding during the period.
B Amount represents less than $.005 per share.
C Total returns for periods of less than one year are not annualized.
D Total returns would have been lower if certain expenses had not been reduced during the applicable periods shown.
E Total returns do not include the effect of the contingent deferred sales charge.
F Fees and expenses of any underlying Fidelity Central Funds are not included in the Fund's expense ratio. The Fund indirectly bears its proportionate share of the expenses of any underlying Fidelity Central Funds.
G Expense ratios reflect operating expenses of the class. Expenses before reductions do not reflect amounts reimbursed by the investment adviser or reductions from brokerage service arrangements or reductions from other expense offset arrangements and do not represent the amount paid by the class during periods when reimbursements or reductions occur. Expenses net of fee waivers reflect expenses after reimbursement by the investment adviser but prior to reductions from brokerage service arrangements or other expense offset arrangements. Expenses net of all reductions represent the net expenses paid by the class.
H Annualized
I Amount does not include the portfolio activity of any underlying Fidelity Central Funds.
J Portfolio turnover rate excludes securities received or delivered in-kind.
See accompanying notes which are an integral part of the financial statements.
Fidelity Small Cap Growth Fund
| | Six months ended (Unaudited) January 31, | Years endedJuly 31, | | | | |
| | 2018 | 2017 | 2016 | 2015 | 2014 | 2013 |
| Selected Per–Share Data | | | | | | |
| Net asset value, beginning of period | $23.84 | $19.82 | $21.20 | $18.45 | $20.07 | $16.14 |
| Income from Investment Operations | | | | | | |
| Net investment income (loss)A | (.06) | (.09) | (.06) | (.07) | (.06) | .01 |
| Net realized and unrealized gain (loss) | 4.08 | 4.27 | (.52) | 4.36 | 1.71 | 4.98 |
| Total from investment operations | 4.02 | 4.18 | (.58) | 4.29 | 1.65 | 4.99 |
| Distributions from net investment income | – | – | – | – | – | – |
| Distributions from net realized gain | (1.70) | (.16) | (.81) | (1.54) | (3.27) | (1.06) |
| Total distributions | (1.70) | (.16) | (.81) | (1.54) | (3.27) | (1.06) |
| Redemption fees added to paid in capitalA | –B | –B | .01 | –B | –B | –B |
| Net asset value, end of period | $26.16 | $23.84 | $19.82 | $21.20 | $18.45 | $20.07 |
| Total ReturnC,D | 17.86% | 21.22% | (2.63)% | 24.91% | 8.87% | 32.74% |
| Ratios to Average Net AssetsE,F | | | | | | |
| Expenses before reductions | 1.03%G | 1.08% | 1.12% | .91% | .91% | .90% |
| Expenses net of fee waivers, if any | 1.03%G | 1.08% | 1.12% | .91% | .90% | .90% |
| Expenses net of all reductions | 1.02%G | 1.07% | 1.11% | .90% | .90% | .88% |
| Net investment income (loss) | (.46)%G | (.40)% | (.33)% | (.37)% | (.31)% | .08% |
| Supplemental Data | | | | | | |
| Net assets, end of period (000 omitted) | $3,060,377 | $2,336,762 | $1,580,264 | $1,345,684 | $1,069,105 | $1,315,659 |
| Portfolio turnover rateH | 97%G,I | 140%I | 143% | 156% | 148%I | 142% |
A Calculated based on average shares outstanding during the period.
B Amount represents less than $.005 per share.
C Total returns for periods of less than one year are not annualized.
D Total returns would have been lower if certain expenses had not been reduced during the applicable periods shown.
E Fees and expenses of any underlying Fidelity Central Funds are not included in the Fund's expense ratio. The Fund indirectly bears its proportionate share of the expenses of any underlying Fidelity Central Funds.
F Expense ratios reflect operating expenses of the class. Expenses before reductions do not reflect amounts reimbursed by the investment adviser or reductions from brokerage service arrangements or reductions from other expense offset arrangements and do not represent the amount paid by the class during periods when reimbursements or reductions occur. Expenses net of fee waivers reflect expenses after reimbursement by the investment adviser but prior to reductions from brokerage service arrangements or other expense offset arrangements. Expenses net of all reductions represent the net expenses paid by the class.
G Annualized
H Amount does not include the portfolio activity of any underlying Fidelity Central Funds.
I Portfolio turnover rate excludes securities received or delivered in-kind.
See accompanying notes which are an integral part of the financial statements.
Fidelity Small Cap Growth Fund Class I
| | Six months ended (Unaudited) January 31, | Years endedJuly 31, | | | | |
| | 2018 | 2017 | 2016 | 2015 | 2014 | 2013 |
| Selected Per–Share Data | | | | | | |
| Net asset value, beginning of period | $23.90 | $19.86 | $21.24 | $18.49 | $20.10 | $16.17 |
| Income from Investment Operations | | | | | | |
| Net investment income (loss)A | (.06) | (.08) | (.05) | (.07) | (.06) | .01 |
| Net realized and unrealized gain (loss) | 4.09 | 4.28 | (.53) | 4.36 | 1.72 | 4.98 |
| Total from investment operations | 4.03 | 4.20 | (.58) | 4.29 | 1.66 | 4.99 |
| Distributions from net investment income | – | – | – | – | – | – |
| Distributions from net realized gain | (1.70) | (.16) | (.81) | (1.54) | (3.27) | (1.06) |
| Total distributions | (1.70) | (.16) | (.81) | (1.54) | (3.27) | (1.06) |
| Redemption fees added to paid in capitalA | –B | –B | .01 | –B | –B | –B |
| Net asset value, end of period | $26.23 | $23.90 | $19.86 | $21.24 | $18.49 | $20.10 |
| Total ReturnC,D | 17.86% | 21.28% | (2.62)% | 24.85% | 8.89% | 32.65% |
| Ratios to Average Net AssetsE,F | | | | | | |
| Expenses before reductions | 1.04%G | 1.06% | 1.09% | .93% | .92% | .92% |
| Expenses net of fee waivers, if any | 1.04%G | 1.06% | 1.09% | .93% | .92% | .92% |
| Expenses net of all reductions | 1.03%G | 1.05% | 1.07% | .91% | .92% | .91% |
| Net investment income (loss) | (.47)%G | (.38)% | (.30)% | (.39)% | (.32)% | .06% |
| Supplemental Data | | | | | | |
| Net assets, end of period (000 omitted) | $647,824 | $390,032 | $163,696 | $97,897 | $51,607 | $51,158 |
| Portfolio turnover rateH | 97%G,I | 140%I | 143% | 156% | 148%I | 142% |
A Calculated based on average shares outstanding during the period.
B Amount represents less than $.005 per share.
C Total returns for periods of less than one year are not annualized.
D Total returns would have been lower if certain expenses had not been reduced during the applicable periods shown.
E Fees and expenses of any underlying Fidelity Central Funds are not included in the Fund's expense ratio. The Fund indirectly bears its proportionate share of the expenses of any underlying Fidelity Central Funds.
F Expense ratios reflect operating expenses of the class. Expenses before reductions do not reflect amounts reimbursed by the investment adviser or reductions from brokerage service arrangements or reductions from other expense offset arrangements and do not represent the amount paid by the class during periods when reimbursements or reductions occur. Expenses net of fee waivers reflect expenses after reimbursement by the investment adviser but prior to reductions from brokerage service arrangements or other expense offset arrangements. Expenses net of all reductions represent the net expenses paid by the class.
G Annualized
H Amount does not include the portfolio activity of any underlying Fidelity Central Funds.
I Portfolio turnover rate excludes securities received or delivered in-kind.
See accompanying notes which are an integral part of the financial statements.
Fidelity Small Cap Growth Fund Class Z
| | Six months ended (Unaudited) January 31, | Years endedJuly 31, |
| | 2018 | 2017 A |
| Selected Per–Share Data | | |
| Net asset value, beginning of period | $23.91 | $21.39 |
| Income from Investment Operations | | |
| Net investment income (loss)B | (.04) | (.05) |
| Net realized and unrealized gain (loss) | 4.10 | 2.57 |
| Total from investment operations | 4.06 | 2.52 |
| Distributions from net investment income | – | – |
| Distributions from net realized gain | (1.72) | – |
| Total distributions | (1.72) | – |
| Redemption fees added to paid in capitalB | –C | –C |
| Net asset value, end of period | $26.25 | $23.91 |
| Total ReturnD,E | 17.96% | 11.78% |
| Ratios to Average Net AssetsF,G | | |
| Expenses before reductions | .90%H | .90%H |
| Expenses net of fee waivers, if any | .90%H | .90%H |
| Expenses net of all reductions | .89%H | .89%H |
| Net investment income (loss) | (.33)%H | (.44)%H |
| Supplemental Data | | |
| Net assets, end of period (000 omitted) | $80,406 | $18,447 |
| Portfolio turnover rateI | 97%H,J | 140%J |
A For the period February 1, 2017 (commencement of sale of shares) to July 31, 2017.
B Calculated based on average shares outstanding during the period.
C Amount represents less than $.005 per share.
D Total returns for periods of less than one year are not annualized.
E Total returns would have been lower if certain expenses had not been reduced during the applicable periods shown.
F Fees and expenses of any underlying Fidelity Central Funds are not included in the Fund's expense ratio. The Fund indirectly bears its proportionate share of the expenses of any underlying Fidelity Central Funds.
G Expense ratios reflect operating expenses of the class. Expenses before reductions do not reflect amounts reimbursed by the investment adviser or reductions from brokerage service arrangements or reductions from other expense offset arrangements and do not represent the amount paid by the class during periods when reimbursements or reductions occur. Expense ratios before reductions for start-up periods may not be representative of longer-term operating periods. Expenses net of fee waivers reflect expenses after reimbursement by the investment adviser but prior to reductions from brokerage service arrangements or other expense offset arrangements. Expenses net of all reductions represent the net expenses paid by the class.
H Annualized
I Amount does not include the portfolio activity of any underlying Fidelity Central Funds.
J Portfolio turnover rate excludes securities received or delivered in-kind.
See accompanying notes which are an integral part of the financial statements.
Notes to Financial Statements (Unaudited)
For the period ended January 31, 2018
1. Organization.
Fidelity Small Cap Growth Fund (the Fund) is a fund of Fidelity Securities Fund (the Trust) and is authorized to issue an unlimited number of shares. The Trust is registered under the Investment Company Act of 1940, as amended (the 1940 Act), as an open-end management investment company organized as a Massachusetts business trust. The Fund offers Class A, Class M, Class C, Small Cap Growth, Class I and Class Z shares, each of which has equal rights as to assets and voting privileges. Each class has exclusive voting rights with respect to matters that affect that class.
Effective the close of business on February 2, 2018, the Fund is closed to new accounts with certain exceptions.
2. Investments in Fidelity Central Funds.
The Fund invests in Fidelity Central Funds, which are open-end investment companies generally available only to other investment companies and accounts managed by the investment adviser and its affiliates. The Fund's Schedule of Investments lists each of the Fidelity Central Funds held as of period end, if any, as an investment of the Fund, but does not include the underlying holdings of each Fidelity Central Fund. As an Investing Fund, the Fund indirectly bears its proportionate share of the expenses of the underlying Fidelity Central Funds.
The Money Market Central Funds seek preservation of capital and current income and are managed by Fidelity Investments Money Management, Inc. (FIMM), an affiliate of the investment adviser. Annualized expenses of the Money Market Central Funds as of their most recent shareholder report date are less than .005%.
A complete unaudited list of holdings for each Fidelity Central Fund is available upon request or at the Securities and Exchange Commission (the SEC) website at www.sec.gov. In addition, the financial statements of the Fidelity Central Funds are available on the SEC website or upon request.
3. Significant Accounting Policies.
The Fund is an investment company and applies the accounting and reporting guidance of the Financial Accounting Standards Board (FASB) Accounting Standards Codification Topic 946 Financial Services – Investments Companies. The financial statements have been prepared in conformity with accounting principles generally accepted in the United States of America (GAAP), which require management to make certain estimates and assumptions at the date of the financial statements. Actual results could differ from those estimates. Subsequent events, if any, through the date that the financial statements were issued have been evaluated in the preparation of the financial statements. The following summarizes the significant accounting policies of the Fund:
Investment Valuation. Investments are valued as of 4:00 p.m. Eastern time on the last calendar day of the period. The Board of Trustees (the Board) has delegated the day to day responsibility for the valuation of the Fund's investments to the Fair Value Committee (the Committee) established by the Fund's investment adviser. In accordance with valuation policies and procedures approved by the Board, the Fund attempts to obtain prices from one or more third party pricing vendors or brokers to value its investments. When current market prices, quotations or currency exchange rates are not readily available or reliable, investments will be fair valued in good faith by the Committee, in accordance with procedures adopted by the Board. Factors used in determining fair value vary by investment type and may include market or investment specific events. The frequency with which these procedures are used cannot be predicted and they may be utilized to a significant extent. The Committee oversees the Fund's valuation policies and procedures and reports to the Board on the Committee's activities and fair value determinations. The Board monitors the appropriateness of the procedures used in valuing the Fund's investments and ratifies the fair value determinations of the Committee.
The Fund categorizes the inputs to valuation techniques used to value its investments into a disclosure hierarchy consisting of three levels as shown below:
- Level 1 – quoted prices in active markets for identical investments
- Level 2 – other significant observable inputs (including quoted prices for similar investments, interest rates, prepayment speeds, etc.)
- Level 3 – unobservable inputs (including the Fund's own assumptions based on the best information available)
Valuation techniques used to value the Fund's investments by major category are as follows:
Equity securities, including restricted securities, for which market quotations are readily available, are valued at the last reported sale price or official closing price as reported by a third party pricing vendor on the primary market or exchange on which they are traded and are categorized as Level 1 in the hierarchy. In the event there were no sales during the day or closing prices are not available, securities are valued at the last quoted bid price or may be valued using the last available price and are generally categorized as Level 2 in the hierarchy. For foreign equity securities, when market or security specific events arise, comparisons to the valuation of American Depositary Receipts (ADRs), futures contracts, Exchange-Traded Funds (ETFs) and certain indexes as well as quoted prices for similar securities may be used and would be categorized as Level 2 in the hierarchy. Utilizing these techniques may result in transfers between Level 1 and Level 2. For equity securities, including restricted securities, where observable inputs are limited, assumptions about market activity and risk are used and these securities may be categorized as Level 3 in the hierarchy.
ETFs are valued at their last sale price or official closing price as reported by a third party pricing vendor on the primary market or exchange on which they are traded and are categorized as Level 1 in the hierarchy. In the event there were no sales during the day but the exchange reports a closing bid level, ETFs are valued at the closing bid and would be categorized as Level 1 in the hierarchy. In the event there was no closing bid, ETFs may be valued by another method that the Board believes reflects fair value in accordance with the Board's fair value pricing policies and may be categorized as Level 2 in the hierarchy.
Investments in open-end mutual funds, including the Fidelity Central Funds, are valued at their closing net asset value (NAV) each business day and are categorized as Level 1 in the hierarchy.
Changes in valuation techniques may result in transfers in or out of an assigned level within the disclosure hierarchy. The aggregate value of investments by input level as of January 31, 2018 is included at the end of the Fund's Schedule of Investments.
Foreign Currency. The Fund may use foreign currency contracts to facilitate transactions in foreign-denominated securities. Gains and losses from these transactions may arise from changes in the value of the foreign currency or if the counterparties do not perform under the contracts' terms.
Foreign-denominated assets, including investment securities, and liabilities are translated into U.S. dollars at the exchange rates at period end. Purchases and sales of investment securities, income and dividends received and expenses denominated in foreign currencies are translated into U.S. dollars at the exchange rate in effect on the transaction date.
The effects of exchange rate fluctuations on investments are included with the net realized and unrealized gain (loss) on investment securities. Other foreign currency transactions resulting in realized and unrealized gain (loss) are disclosed separately.
Investment Transactions and Income. For financial reporting purposes, the Fund's investment holdings and NAV include trades executed through the end of the last business day of the period. The NAV per share for processing shareholder transactions is calculated as of the close of business of the New York Stock Exchange (NYSE) normally 4:00 p.m. Eastern time and includes trades executed through the end of the prior business day. Gains and losses on securities sold are determined on the basis of identified cost and includes proceeds received from litigation. Dividend income is recorded on the ex-dividend date, except for certain dividends from foreign securities where the ex-dividend date may have passed, which are recorded as soon as the Fund is informed of the ex-dividend date. Non-cash dividends included in dividend income, if any, are recorded at the fair market value of the securities received. Income and capital gain distributions from Fidelity Central Funds, if any, are recorded on the ex-dividend date. Certain distributions received by the Fund represent a return of capital or capital gain. The Fund determines the components of these distributions subsequent to the ex-dividend date, based upon receipt of tax filings or other correspondence relating to the underlying investment. These distributions are recorded as a reduction of cost of investments and/or as a realized gain. Investment income is recorded net of foreign taxes withheld where recovery of such taxes is uncertain.
Class Allocations and Expenses. Investment income, realized and unrealized capital gains and losses, common expenses of the Fund, and certain fund-level expense reductions, if any, are allocated daily on a pro-rata basis to each class based on the relative net assets of each class to the total net assets of the Fund. Each class differs with respect to transfer agent and distribution and service plan fees incurred. Certain expense reductions may also differ by class. For the reporting period, the allocated portion of income and expenses to each class as a percent of its average net assets may vary due to the timing of recording these transactions in relation to fluctuating net assets of the classes. Expenses directly attributable to a fund are charged to that fund. Expenses attributable to more than one fund are allocated among the respective funds on the basis of relative net assets or other appropriate methods. Expense estimates are accrued in the period to which they relate and adjustments are made when actual amounts are known.
Income Tax Information and Distributions to Shareholders. Each year, the Fund intends to qualify as a regulated investment company under Subchapter M of the Internal Revenue Code, including distributing substantially all of its taxable income and realized gains. As a result, no provision for U.S. Federal income taxes is required. The Fund files a U.S. federal tax return, in addition to state and local tax returns as required. The Fund's federal income tax returns are subject to examination by the Internal Revenue Service (IRS) for a period of three fiscal years after they are filed. State and local tax returns may be subject to examination for an additional fiscal year depending on the jurisdiction. Foreign taxes are provided for based on the Fund's understanding of the tax rules and rates that exist in the foreign markets in which it invests.
Distributions are declared and recorded on the ex-dividend date. Income dividends and capital gain distributions are declared separately for each class. Income and capital gain distributions are determined in accordance with income tax regulations, which may differ from GAAP.
Capital accounts within the financial statements are adjusted for permanent book-tax differences. These adjustments have no impact on net assets or the results of operations. Capital accounts are not adjusted for temporary book-tax differences which will reverse in a subsequent period.
Book-tax differences are primarily due to foreign currency transactions, passive foreign investment companies (PFIC), redemptions in kind, partnerships, net operating losses and losses deferred due to wash sales and excise tax regulations.
As of period end, the cost and unrealized appreciation (depreciation) in securities, and derivatives if applicable, for federal income tax purposes were as follows:
| Gross unrealized appreciation | $1,030,995,492 |
| Gross unrealized depreciation | (80,247,531) |
| Net unrealized appreciation (depreciation) | $950,747,961 |
| Tax cost | $3,449,113,837 |
Short-Term Trading (Redemption) Fees. Shares held by investors in the Fund less than 90 days may have been subject to a redemption fee equal to 1.50% of the NAV of shares redeemed. All redemption fees, which reduce the proceeds of the shareholder redemption, are retained by the Fund and accounted for as an addition to paid in capital. In November 2017, the Board of Trustees approved the elimination of these redemption fees effective December 18, 2017.
Restricted Securities. The Fund may invest in securities that are subject to legal or contractual restrictions on resale. These securities generally may be resold in transactions exempt from registration or to the public if the securities are registered. Disposal of these securities may involve time-consuming negotiations and expense, and prompt sale at an acceptable price may be difficult. Information regarding restricted securities is included at the end of the Fund's Schedule of Investments.
4. Purchases and Sales of Investments.
Purchases and sales of securities, other than short-term securities and in-kind transactions, aggregated $2,301,747,934 and $1,725,480,215, respectively.
5. Fees and Other Transactions with Affiliates.
Management Fee. Fidelity Management & Research Company (the investment adviser) and its affiliates provide the Fund with investment management related services for which the Fund pays a monthly management fee. The management fee is the sum of an individual fund fee rate that is based on an annual rate of .45% of the Fund's average net assets and an annualized group fee rate that averaged .24% during the period. The group fee rate is based upon the average net assets of all the mutual funds advised by the investment adviser, including any mutual funds previously advised by the investment adviser that are currently advised by Fidelity SelectCo, LLC, an affiliate of the investment adviser. The group fee rate decreases as assets under management increase and increases as assets under management decrease. In addition, the management fee is subject to a performance adjustment (up to a maximum of +/- .20% of the Fund's average net assets over a 36 month performance period). The upward or downward adjustment to the management fee is based on the relative investment performance of Small Cap Growth as compared to its benchmark index, the Russell 2000 Growth Index, over the same 36 month performance period. For the reporting period, the total annualized management fee rate, including the performance adjustment, was .81% of the Fund's average net assets. The performance adjustment included in the management fee rate may be higher or lower than the maximum performance adjustment rate due to the difference between the average net assets for the reporting and performance periods.
Distribution and Service Plan Fees. In accordance with Rule 12b-1 of the 1940 Act, the Fund has adopted separate Distribution and Service Plans for each class of shares. Certain classes pay Fidelity Distributors Corporation (FDC), an affiliate of the investment adviser, separate Distribution and Service Fees, each of which is based on an annual percentage of each class' average net assets. In addition, FDC may pay financial intermediaries for selling shares of the Fund and providing shareholder support services. For the period, the Distribution and Service Fee rates, total fees and amounts retained by FDC were as follows:
| | Distribution Fee | Service Fee | Total Fees | Retained by FDC |
| Class A | -% | .25% | $309,241 | $19,573 |
| Class M | .25% | .25% | 173,298 | – |
| Class C | .75% | .25% | 559,355 | 124,146 |
| | | | $1,041,894 | $143,719 |
Sales Load. FDC may receive a front-end sales charge of up to 5.75% for selling Class A shares and 3.50% for selling Class M shares, some of which is paid to financial intermediaries for selling shares of the Fund. Depending on the holding period, FDC may receive contingent deferred sales charges levied on Class A, Class M and Class C redemptions. The deferred sales charges are 1.00% for Class C shares, 1.00% for certain purchases of Class A shares and .25% for certain purchases of Class M shares.
For the period, sales charge amounts retained by FDC were as follows:
| | Retained by FDC |
| Class A | $90,920 |
| Class M | 7,517 |
| Class C(a) | 5,309 |
| | $103,746 |
(a) When Class C shares are initially sold, FDC pays commissions from its own resources to financial intermediaries through which the sales are made.
Transfer Agent Fees. Fidelity Investments Institutional Operations Company, Inc., (FIIOC), an affiliate of the investment adviser, is the transfer, dividend disbursing and shareholder servicing agent for each class of the Fund. FIIOC receives account fees and asset-based fees that vary according to the account size and type of account of the shareholders of the respective classes of the Fund, except for Class Z. FIIOC receives an asset-based fee of Class Z's average net assets. FIIOC pays for typesetting, printing and mailing of shareholder reports, except proxy statements.
For the period, transfer agent fees for each class were as follows:
| | Amount | % of Class-Level Average Net Assets(a) |
| Class A | $265,040 | .21 |
| Class M | 81,427 | .24 |
| Class C | 124,409 | .22 |
| Small Cap Growth | 2,314,162 | .18 |
| Class I | 457,833 | .19 |
| Class Z | 9,215 | .05 |
| | $3,252,086 | |
(a) Annualized
Accounting and Security Lending Fees. Fidelity Service Company, Inc. (FSC), an affiliate of the investment adviser, maintains the Fund's accounting records. The accounting fee is based on the level of average net assets for each month. Under a separate contract, FSC administers the security lending program. The security lending fee is based on the number and duration of lending transactions.
Brokerage Commissions. The Fund placed a portion of its portfolio transactions with brokerage firms which are affiliates of the investment adviser. Brokerage commissions are included in net realized gain (loss) and change in net unrealized appreciation (depreciation) in the Statement of Operations. The commissions paid to these affiliated firms were $98,708 for the period.
Interfund Lending Program. Pursuant to an Exemptive Order issued by the SEC, the Fund, along with other registered investment companies having management contracts with Fidelity Management & Research Company (FMR) or other affiliated entities of FMR, may participate in an interfund lending program. This program provides an alternative credit facility allowing the funds to borrow from, or lend money to, other participating affiliated funds. At period end, there were no interfund loans outstanding. The Fund's activity in this program during the period for which loans were outstanding was as follows:
| Borrower or Lender | Average Loan Balance | Weighted Average Interest Rate | Interest Expense |
| Borrower | $14,409,000 | 1.35% | $540 |
Interfund Trades. The Fund may purchase from or sell securities to other Fidelity Funds under procedures adopted by the Board. The procedures have been designed to ensure these interfund trades are executed in accordance with Rule 17a-7 of the 1940 Act. Interfund trades are included within the respective purchases and sales amounts shown in the Purchases and Sales of Investments note.
Redemptions In-Kind. During the period, 2,773,352 shares of the Fund held by an affiliated entity were redeemed in-kind for investments and cash with a value of $71,556,855. The net realized gain of $22,403,452 on investments delivered through in-kind redemptions is included in the accompanying Statement of Operations. The amount of the in-kind redemptions is included in share transactions in the accompanying Statement of Changes in Net Assets as well as the Notes to Financial Statements. The Fund recognized no gain or loss for federal income tax purposes.
Prior Fiscal Year Redemptions In-Kind. During the prior period, 3,120,161 shares of the Fund held by an affiliated entity were redeemed in kind for investments and cash with a value of $74,384,639. The Fund had a net realized gain of $18,817,235 on investments delivered through in-kind redemptions. The amount of in-kind redemptions is included in share transactions in the accompanying Statement of Changes in Net Assets as well as the Notes to Financial Statements. The Fund recognized no gain or loss for federal income tax purposes.
Other. During the period, the investment adviser reimbursed the Fund for certain losses in the amount of $1,426.
6. Committed Line of Credit.
The Fund participates with other funds managed by the investment adviser or an affiliate in a $4.25 billion credit facility (the "line of credit") to be utilized for temporary or emergency purposes to fund shareholder redemptions or for other short-term liquidity purposes. The Fund has agreed to pay commitment fees on its pro-rata portion of the line of credit, which amounted to $4,912 and is reflected in Miscellaneous expenses on the Statement of Operations. During the period, the Fund did not borrow on this line of credit.
7. Security Lending.
The Fund lends portfolio securities through a lending agent from time to time in order to earn additional income. For equity securities, a lending agent is used and may loan securities to certain qualified borrowers, including Fidelity Capital Markets (FCM), a broker-dealer affiliated with the Fund. On the settlement date of the loan, the Fund receives collateral (in the form of U.S. Treasury obligations, letters of credit and/or cash) against the loaned securities and maintains collateral in an amount not less than 100% of the market value of the loaned securities during the period of the loan. The market value of the loaned securities is determined at the close of business of the Fund and any additional required collateral is delivered to the Fund on the next business day. The Fund or borrower may terminate the loan at any time, and if the borrower defaults on its obligation to return the securities loaned because of insolvency or other reasons, the Fund may apply collateral received from the borrower against the obligation. The Fund may experience delays and costs in recovering the securities loaned. Any cash collateral received is invested in the Fidelity Securities Lending Cash Central Fund. The value of loaned securities and cash collateral at period end are disclosed on the Fund's Statement of Assets and Liabilities. The value of securities loaned to FCM at period end was $2,312,920. Security lending income represents the income earned on investing cash collateral, less rebates paid to borrowers and any lending agent fees associated with the loan, plus any premium payments received for lending certain types of securities. Security lending income is presented in the Statement of Operations as a component of income from Fidelity Central Funds and includes $272,689 from securities loaned to FCM.
8. Expense Reductions.
Commissions paid to certain brokers with whom the investment adviser, or its affiliates, places trades on behalf of the Fund include an amount in addition to trade execution, which may be rebated back to the Fund to offset certain expenses. This amount totaled $184,436 for the period. In addition, through arrangements with the Fund's custodian, credits realized as a result of certain uninvested cash balances were used to reduce the Fund's expenses. During the period, these credits reduced the Fund's custody expenses by $180.
In addition, during the period the investment adviser reimbursed and/or waived a portion of fund-level operating expenses in the amount of $18,914.
9. Distributions to Shareholders.
Distributions to shareholders of each class were as follows:
| | Six months ended
January 31, 2018 | Year ended
July 31, 2017 |
| From net investment income | | |
| Class A | $3,381 | $– |
| Class M | 405 | – |
| Class C | 2,218 | – |
| Total | $6,004 | $– |
| From net realized gain | | |
| Class A | $16,631,386 | $1,450,853 |
| Class M | 4,794,976 | 443,203 |
| Class C | 8,082,834 | 670,953 |
| Small Cap Growth | 173,515,868 | 13,079,834 |
| Class I | 31,458,120 | 1,486,748 |
| Class Z | 2,173,343 | – |
| Total | $236,656,527 | $17,131,591 |
10. Share Transactions.
Share transactions for each class were as follows and may contain automatic conversions between classes or exchanges between affiliated funds:
| | Shares | Shares | Dollars | Dollars |
| | Six months ended January 31, 2018 | Year ended July 31, 2017(a) | Six months ended January 31, 2018 | Year ended July 31, 2017(a) |
| Class A | | | | |
| Shares sold | 2,344,945 | 5,020,720 | $55,394,857 | $104,451,830 |
| Reinvestment of distributions | 737,094 | 72,980 | 16,518,353 | 1,418,726 |
| Shares redeemed | (1,129,437) | (4,804,338) | (26,486,558) | (100,455,311) |
| Net increase (decrease) | 1,952,602 | 289,362 | $45,426,652 | $5,415,245 |
| Class M | | | | |
| Shares sold | 374,411 | 722,906 | $8,592,461 | $14,585,563 |
| Reinvestment of distributions | 219,933 | 23,093 | 4,778,389 | 437,379 |
| Shares redeemed | (284,031) | (740,353) | (6,501,677) | (14,879,815) |
| Net increase (decrease) | 310,313 | 5,646 | $6,869,173 | $143,127 |
| Class C | | | | |
| Shares sold | 1,220,212 | 1,684,413 | $26,241,918 | $31,979,652 |
| Reinvestment of distributions | 394,045 | 36,440 | 7,927,935 | 645,354 |
| Shares redeemed | (599,347) | (1,001,342) | (12,675,017) | (18,971,580) |
| Net increase (decrease) | 1,014,910 | 719,511 | $21,494,836 | $13,653,426 |
| Small Cap Growth | | | | |
| Shares sold | 25,985,323 | 46,489,671 | $641,481,629 | $1,008,614,407 |
| Reinvestment of distributions | 7,124,341 | 624,373 | 166,042,299 | 12,562,394 |
| Shares redeemed | (14,155,124)(b) | (28,815,440)(c) | (351,142,494)(b) | (638,181,914)(c) |
| Net increase (decrease) | 18,954,540 | 18,298,604 | $456,381,434 | $382,994,887 |
| Class I | | | | |
| Shares sold | 10,305,574 | 11,204,169 | $253,796,032 | $245,745,969 |
| Reinvestment of distributions | 1,279,506 | 68,251 | 29,928,913 | 1,376,613 |
| Shares redeemed | (3,208,040) | (3,191,470) | (78,648,710) | (69,277,095) |
| Net increase (decrease) | 8,377,040 | 8,080,950 | $205,076,235 | $177,845,487 |
| Class Z | | | | |
| Shares sold | 2,445,240 | 782,917 | $60,882,488 | $18,185,267 |
| Reinvestment of distributions | 72,161 | – | 1,697,869 | – |
| Shares redeemed | (225,926) | (11,517) | (5,552,072) | (271,781) |
| Net increase (decrease) | 2,291,475 | 771,400 | $57,028,285 | $17,913,486 |
(a) Share transactions for Class Z are for the period February 1, 2017 (commencement of sale of shares) to July 31, 2017.
(b) Amount includes in-kind redemptions (see the Redemptions In-Kind note for additional details).
(c) Amount includes in-kind redemptions (see the Prior Year Redemptions In-Kind note for additional details).
11. Other.
The Fund's organizational documents provide former and current trustees and officers with a limited indemnification against liabilities arising in connection with the performance of their duties to the Fund. In the normal course of business, the Fund may also enter into contracts that provide general indemnifications. The Fund's maximum exposure under these arrangements is unknown as this would be dependent on future claims that may be made against the Fund. The risk of material loss from such claims is considered remote.
Shareholder Expense Example
As a shareholder of the Fund, you incur two types of costs: (1) transaction costs, including sales charges (loads) on purchase payments or redemption proceeds, redemption fees and (2) ongoing costs, including management fees, distribution and/or service (12b-1) fees and other Fund expenses. This Example is intended to help you understand your ongoing costs (in dollars) of investing in the Fund and to compare these costs with the ongoing costs of investing in other mutual funds.
The Example is based on an investment of $1,000 invested at the beginning of the period and held for the entire period (August 1, 2017 to January 31, 2018).
Actual Expenses
The first line of the accompanying table for each class of the Fund provides information about actual account values and actual expenses. You may use the information in this line, together with the amount you invested, to estimate the expenses that you paid over the period. Simply divide your account value by $1,000.00 (for example, an $8,600 account value divided by $1,000.00 = 8.6), then multiply the result by the number in the first line for a class of the Fund under the heading entitled "Expenses Paid During Period" to estimate the expenses you paid on your account during this period. A small balance maintenance fee of $12.00 that is charged once a year may apply for certain accounts with a value of less than $2,000. This fee is not included in the table below. If it was, the estimate of expenses you paid during the period would be higher, and your ending account value lower, by this amount. In addition, the Fund, as a shareholder in the underlying Fidelity Central Funds, will indirectly bear its pro-rata share of the fees and expenses incurred by the underlying Fidelity Central Funds. These fees and expenses are not included in the Fund's annualized expense ratio used to calculate the expense estimate in the table below.
Hypothetical Example for Comparison Purposes
The second line of the accompanying table for each class of the Fund provides information about hypothetical account values and hypothetical expenses based on a Class' actual expense ratio and an assumed rate of return of 5% per year before expenses, which is not the Class' actual return. The hypothetical account values and expenses may not be used to estimate the actual ending account balance or expenses you paid for the period. You may use this information to compare the ongoing costs of investing in the Fund and other funds. To do so, compare this 5% hypothetical example with the 5% hypothetical examples that appear in the shareholder reports of the other funds. A small balance maintenance fee of $12.00 that is charged once a year may apply for certain accounts with a value of less than $2,000. This fee is not included in the table below. If it was, the estimate of expenses you paid during the period would be higher, and your ending account value lower, by this amount. In addition, the Fund, as a shareholder in the underlying Fidelity Central Funds, will indirectly bear its pro-rata share of the fees and expenses incurred by the underlying Fidelity Central Funds. These fees and expenses are not included in the Fund's annualized expense ratio used to calculate the expense estimate in the table below.
Please note that the expenses shown in the table are meant to highlight your ongoing costs only and do not reflect any transaction costs. Therefore, the second line of the table is useful in comparing ongoing costs only, and will not help you determine the relative total costs of owning different funds. In addition, if these transactional costs were included, your costs would have been higher.
| | Annualized Expense Ratio-A | Beginning
Account Value
August 1, 2017 | Ending
Account Value
January 31, 2018 | Expenses Paid
During Period-B
August 1, 2017
to January 31, 2018 |
| Class A | 1.32% | | | |
| Actual | | $1,000.00 | $1,177.00 | $7.24 |
| Hypothetical-C | | $1,000.00 | $1,018.55 | $6.72 |
| Class M | 1.59% | | | |
| Actual | | $1,000.00 | $1,175.50 | $8.72 |
| Hypothetical-C | | $1,000.00 | $1,017.19 | $8.08 |
| Class C | 2.08% | | | |
| Actual | | $1,000.00 | $1,172.80 | $11.39 |
| Hypothetical-C | | $1,000.00 | $1,014.72 | $10.56 |
| Small Cap Growth | 1.03% | | | |
| Actual | | $1,000.00 | $1,178.60 | $5.66 |
| Hypothetical-C | | $1,000.00 | $1,020.01 | $5.24 |
| Class I | 1.04% | | | |
| Actual | | $1,000.00 | $1,178.60 | $5.71 |
| Hypothetical-C | | $1,000.00 | $1,019.96 | $5.30 |
| Class Z | .90% | | | |
| Actual | | $1,000.00 | $1,179.60 | $4.94 |
| Hypothetical-C | | $1,000.00 | $1,020.67 | $4.58 |
| | | | | |
| | | | | |
| | | | | |
| | | | | |
| | | | | |
| | | | | |
A Annualized expense ratio reflects expenses net of applicable fee waivers.
B Expenses are equal to each Class' annualized expense ratio, multiplied by the average account value over the period, multiplied by 184/365 (to reflect the one-half year period).
C 5% return per year before expenses.
ASCP-SANN-0318
1.803717.114
Fidelity® Small Cap Growth Fund
Semi-Annual Report January 31, 2018 |
|
Contents
To view a fund's proxy voting guidelines and proxy voting record for the 12-month period ended June 30, visit http://www.fidelity.com/proxyvotingresults or visit the Securities and Exchange Commission's (SEC) web site at http://www.sec.gov.
You may also call 1-800-544-8544 to request a free copy of the proxy voting guidelines.
Standard & Poor's, S&P and S&P 500 are registered service marks of The McGraw-Hill Companies, Inc. and have been licensed for use by Fidelity Distributors Corporation.
Other third-party marks appearing herein are the property of their respective owners.
All other marks appearing herein are registered or unregistered trademarks or service marks of FMR LLC or an affiliated company. © 2018 FMR LLC. All rights reserved.
This report and the financial statements contained herein are submitted for the general information of the shareholders of the Fund. This report is not authorized for distribution to prospective investors in the Fund unless preceded or accompanied by an effective prospectus.
A fund files its complete schedule of portfolio holdings with the SEC for the first and third quarters of each fiscal year on Form N-Q. Forms N-Q are available on the SEC’s web site at http://www.sec.gov. A fund's Forms N-Q may be reviewed and copied at the SEC’s Public Reference Room in Washington, DC. Information regarding the operation of the SEC's Public Reference Room may be obtained by calling 1-800-SEC-0330.
For a complete list of a fund's portfolio holdings, view the most recent holdings listing, semiannual report, or annual report on Fidelity's web site at http://www.fidelity.com, http://www.institutional.fidelity.com, or http://www.401k.com, as applicable.
NOT FDIC INSURED •MAY LOSE VALUE •NO BANK GUARANTEE
Neither the Fund nor Fidelity Distributors Corporation is a bank.
Investment Summary (Unaudited)
Top Ten Stocks as of January 31, 2018
| | % of fund's net assets |
| 2U, Inc. | 3.1 |
| Grand Canyon Education, Inc. | 2.1 |
| Stamps.com, Inc. | 1.7 |
| Nektar Therapeutics | 1.5 |
| Insulet Corp. | 1.4 |
| Vail Resorts, Inc. | 1.3 |
| Eagle Materials, Inc. | 1.3 |
| GrubHub, Inc. | 1.3 |
| Cavco Industries, Inc. | 1.2 |
| SiteOne Landscape Supply, Inc. | 1.2 |
| | 16.1 |
Top Five Market Sectors as of January 31, 2018
| | % of fund's net assets |
| Information Technology | 22.6 |
| Health Care | 21.1 |
| Industrials | 20.9 |
| Consumer Discretionary | 15.1 |
| Financials | 7.4 |
Asset Allocation (% of fund's net assets)
| As of January 31, 2018 * |
| | Stocks/ETFs | 97.6% |
| | Convertible Securities | 0.6% |
| | Short-Term Investments and Net Other Assets (Liabilities) | 1.8% |

* Foreign investments - 8.8%
Schedule of Investments January 31, 2018 (Unaudited)
Showing Percentage of Net Assets
| Common Stocks - 96.4% | | | |
| | | Shares | Value |
| CONSUMER DISCRETIONARY - 15.1% | | | |
| Diversified Consumer Services - 2.4% | | | |
| Bright Horizons Family Solutions, Inc. (a) | | 133,514 | $13,111,075 |
| Grand Canyon Education, Inc. (a) | | 977,240 | 90,873,548 |
| | | | 103,984,623 |
| Hotels, Restaurants & Leisure - 5.8% | | | |
| Boyd Gaming Corp. | | 748,885 | 29,558,491 |
| Cedar Fair LP (depositary unit) | | 621,517 | 42,138,853 |
| Churchill Downs, Inc. | | 102,431 | 26,529,629 |
| Dunkin' Brands Group, Inc. | | 317,751 | 20,542,602 |
| Marriott Vacations Worldwide Corp. | | 143,975 | 21,931,712 |
| Texas Roadhouse, Inc. Class A | | 370,898 | 21,779,131 |
| U.S. Foods Holding Corp. (a) | | 883,090 | 28,373,682 |
| Vail Resorts, Inc. | | 261,098 | 57,065,579 |
| | | | 247,919,679 |
| Household Durables - 3.1% | | | |
| Cavco Industries, Inc. (a) | | 338,670 | 51,867,311 |
| LGI Homes, Inc. (a)(b) | | 411,604 | 27,857,359 |
| SodaStream International Ltd. (a) | | 346,413 | 27,238,454 |
| Taylor Morrison Home Corp. (a) | | 1,068,151 | 27,163,080 |
| | | | 134,126,204 |
| Internet & Direct Marketing Retail - 0.3% | | | |
| Gaia, Inc. Class A (a) | | 966,461 | 11,549,209 |
| Media - 0.7% | | | |
| Cinemark Holdings, Inc. | | 783,916 | 28,848,109 |
| Multiline Retail - 0.4% | | | |
| Ollie's Bargain Outlet Holdings, Inc. (a) | | 308,870 | 17,157,729 |
| Specialty Retail - 1.4% | | | |
| Michaels Companies, Inc. (a) | | 977,592 | 26,267,897 |
| The Children's Place Retail Stores, Inc. | | 227,433 | 34,069,463 |
| | | | 60,337,360 |
| Textiles, Apparel & Luxury Goods - 1.0% | | | |
| Carter's, Inc. | | 163,020 | 19,611,306 |
| Columbia Sportswear Co. | | 184,222 | 13,755,857 |
| Emerald Expositions Events, Inc. | | 4,638 | 100,088 |
| PetIQ, Inc. Class A (b) | | 351,080 | 8,425,920 |
| | | | 41,893,171 |
|
| TOTAL CONSUMER DISCRETIONARY | | | 645,816,084 |
|
| CONSUMER STAPLES - 3.2% | | | |
| Food & Staples Retailing - 0.6% | | | |
| Performance Food Group Co. (a) | | 776,022 | 26,656,356 |
| Food Products - 1.0% | | | |
| Nomad Foods Ltd. (a) | | 1,226,500 | 20,899,560 |
| Post Holdings, Inc. (a) | | 307,587 | 23,275,108 |
| | | | 44,174,668 |
| Household Products - 1.0% | | | |
| Central Garden & Pet Co. (a) | | 432,220 | 16,938,702 |
| Central Garden & Pet Co. Class A (non-vtg.) (a) | | 651,335 | 24,568,356 |
| | | | 41,507,058 |
| Personal Products - 0.6% | | | |
| Herbalife Ltd. (a)(b) | | 304,070 | 25,234,769 |
|
| TOTAL CONSUMER STAPLES | | | 137,572,851 |
|
| FINANCIALS - 7.4% | | | |
| Banks - 1.2% | | | |
| First Citizen Bancshares, Inc. | | 91,874 | 39,084,118 |
| Prosperity Bancshares, Inc. | | 156,507 | 11,863,231 |
| | | | 50,947,349 |
| Capital Markets - 3.3% | | | |
| Apollo Global Management LLC Class A | | 1,213,768 | 43,392,206 |
| CBOE Holdings, Inc. | | 208,906 | 28,074,877 |
| Eaton Vance Corp. (non-vtg.) | | 339,461 | 19,620,846 |
| Lazard Ltd. Class A | | 371,433 | 21,754,831 |
| MSCI, Inc. | | 213,985 | 29,793,132 |
| | | | 142,635,892 |
| Diversified Financial Services - 0.6% | | | |
| Cotiviti Holdings, Inc. (a) | | 740,854 | 25,929,890 |
| Insurance - 0.7% | | | |
| Enstar Group Ltd. (a) | | 147,626 | 30,647,158 |
| Thrifts & Mortgage Finance - 1.6% | | | |
| Essent Group Ltd. (a) | | 904,751 | 42,089,017 |
| Meridian Bancorp, Inc. Maryland | | 1,168,408 | 23,893,944 |
| | | | 65,982,961 |
|
| TOTAL FINANCIALS | | | 316,143,250 |
|
| HEALTH CARE - 21.1% | | | |
| Biotechnology - 8.6% | | | |
| Acceleron Pharma, Inc. (a) | | 337,426 | 14,006,553 |
| Achaogen, Inc. (a)(b) | | 527,940 | 5,791,502 |
| Acorda Therapeutics, Inc. (a) | | 402,517 | 10,445,316 |
| Adamas Pharmaceuticals, Inc. (a) | | 306,303 | 11,590,506 |
| Alder Biopharmaceuticals, Inc. (a) | | 780,275 | 11,040,891 |
| Amarin Corp. PLC ADR (a)(b) | | 959,765 | 3,599,119 |
| AnaptysBio, Inc. | | 252,684 | 26,630,367 |
| Arena Pharmaceuticals, Inc. (a) | | 69,766 | 2,610,644 |
| Argenx SE ADR | | 200,769 | 15,575,659 |
| Ascendis Pharma A/S sponsored ADR (a) | | 442,761 | 22,567,528 |
| Audentes Therapeutics, Inc. (a) | | 540,670 | 18,977,517 |
| Blueprint Medicines Corp. (a) | | 335,316 | 26,372,603 |
| Curis, Inc. (a) | | 728,321 | 449,447 |
| Dyax Corp. rights 12/31/19 (a)(c) | | 380,400 | 1,297,164 |
| Epizyme, Inc. (a) | | 478,205 | 7,723,011 |
| Fate Therapeutics, Inc. (a)(b) | | 1,331,543 | 12,170,303 |
| FibroGen, Inc. (a) | | 318,146 | 18,627,448 |
| Five Prime Therapeutics, Inc. (a) | | 147,626 | 2,952,520 |
| Global Blood Therapeutics, Inc. (a) | | 405,529 | 23,480,129 |
| Heron Therapeutics, Inc. (a) | | 318,046 | 6,885,696 |
| Insmed, Inc. (a) | | 30,593 | 778,286 |
| Intercept Pharmaceuticals, Inc. (a) | | 30,393 | 1,887,405 |
| Kura Oncology, Inc. (a) | | 511,846 | 10,032,182 |
| Ligand Pharmaceuticals, Inc. Class B (a) | | 98,878 | 15,585,150 |
| Loxo Oncology, Inc. (a) | | 272,344 | 27,634,746 |
| Madrigal Pharmaceuticals, Inc. (a) | | 53,781 | 7,982,176 |
| Mirati Therapeutics, Inc. (a) | | 15,639 | 405,050 |
| Sarepta Therapeutics, Inc. (a) | | 439,794 | 28,824,099 |
| Stemline Therapeutics, Inc. (a) | | 766,000 | 12,217,700 |
| TESARO, Inc. (a) | | 81,510 | 5,498,665 |
| Ultragenyx Pharmaceutical, Inc. (a) | | 275,389 | 14,692,003 |
| Zai Lab Ltd. ADR | | 26,348 | 710,342 |
| | | | 369,041,727 |
| Health Care Equipment & Supplies - 4.9% | | | |
| Cantel Medical Corp. | | 329,293 | 36,528,472 |
| ICU Medical, Inc. (a) | | 103,417 | 23,677,322 |
| Inogen, Inc. (a) | | 119,403 | 14,548,062 |
| Insulet Corp. (a) | | 761,220 | 58,256,167 |
| iRhythm Technologies, Inc. (a) | | 312,225 | 18,617,977 |
| Novocure Ltd. (a)(b) | | 1,106,404 | 24,838,770 |
| Quanterix Corp. (a) | | 723,677 | 15,059,718 |
| Tactile Systems Technology, Inc. (a)(b) | | 249,249 | 7,858,821 |
| Wright Medical Group NV (a) | | 536,969 | 12,216,045 |
| | | | 211,601,354 |
| Health Care Providers & Services - 2.5% | | | |
| G1 Therapeutics, Inc. | | 502,579 | 12,016,664 |
| LHC Group, Inc. (a) | | 221,656 | 13,919,997 |
| Magellan Health Services, Inc. (a) | | 139,817 | 13,925,773 |
| Molina Healthcare, Inc. (a) | | 285,581 | 26,090,680 |
| Premier, Inc. (a) | | 550,880 | 17,876,056 |
| Tivity Health, Inc. (a) | | 612,015 | 23,715,581 |
| | | | 107,544,751 |
| Health Care Technology - 0.3% | | | |
| athenahealth, Inc. (a) | | 83,187 | 10,424,163 |
| HTG Molecular Diagnostics (a) | | 821,300 | 2,932,041 |
| | | | 13,356,204 |
| Life Sciences Tools & Services - 0.8% | | | |
| ICON PLC (a) | | 311,830 | 34,151,622 |
| Pharmaceuticals - 4.0% | | | |
| Aclaris Therapeutics, Inc. (a) | | 377,185 | 8,343,332 |
| Aerie Pharmaceuticals, Inc. (a) | | 315,086 | 17,282,467 |
| Akcea Therapeutics, Inc. (b) | | 537,018 | 11,626,440 |
| Avexis, Inc. (a) | | 192,173 | 23,777,565 |
| Catalent, Inc. (a) | | 516,592 | 24,042,192 |
| Nektar Therapeutics (a) | | 768,826 | 64,281,542 |
| SCYNEXIS, Inc. warrants 6/21/21 (a) | | 168,750 | 67,080 |
| The Medicines Company (a) | | 345,292 | 11,439,524 |
| Theravance Biopharma, Inc. (a) | | 284,009 | 7,509,198 |
| Zogenix, Inc. (a) | | 59,208 | 2,152,211 |
| | | | 170,521,551 |
|
| TOTAL HEALTH CARE | | | 906,217,209 |
|
| INDUSTRIALS - 20.9% | | | |
| Aerospace & Defense - 3.1% | | | |
| BWX Technologies, Inc. | | 740,201 | 46,958,351 |
| Elbit Systems Ltd. | | 77,563 | 11,618,162 |
| HEICO Corp. Class A | | 699,795 | 46,081,501 |
| Teledyne Technologies, Inc. (a) | | 152,656 | 29,145,084 |
| | | | 133,803,098 |
| Air Freight & Logistics - 0.4% | | | |
| Atlas Air Worldwide Holdings, Inc. (a) | | 301,173 | 16,956,040 |
| Airlines - 1.8% | | | |
| Allegiant Travel Co. | | 189,745 | 30,216,891 |
| SkyWest, Inc. | | 874,767 | 48,768,260 |
| | | | 78,985,151 |
| Commercial Services & Supplies - 2.4% | | | |
| Copart, Inc. (a) | | 892,268 | 39,322,251 |
| Healthcare Services Group, Inc. | | 293,969 | 16,221,209 |
| The Brink's Co. | | 286,071 | 23,858,321 |
| Viad Corp. | | 423,483 | 24,053,834 |
| | | | 103,455,615 |
| Construction & Engineering - 3.5% | | | |
| Dycom Industries, Inc. (a) | | 311,402 | 36,343,727 |
| EMCOR Group, Inc. | | 403,805 | 32,821,270 |
| Fluor Corp. | | 122,780 | 7,452,746 |
| Jacobs Engineering Group, Inc. | | 345,381 | 23,990,164 |
| KBR, Inc. | | 2,385,587 | 48,522,840 |
| | | | 149,130,747 |
| Electrical Equipment - 1.2% | | | |
| Generac Holdings, Inc. (a) | | 1,008,611 | 49,351,336 |
| Industrial Conglomerates - 1.1% | | | |
| ITT, Inc. | | 832,270 | 46,607,120 |
| Machinery - 3.5% | | | |
| AGCO Corp. | | 278,377 | 20,215,738 |
| Allison Transmission Holdings, Inc. | | 746,256 | 33,014,365 |
| John Bean Technologies Corp. | | 218,228 | 24,823,435 |
| Oshkosh Corp. | | 271,667 | 24,645,630 |
| WABCO Holdings, Inc. (a) | | 316,073 | 48,798,510 |
| | | | 151,497,678 |
| Professional Services - 1.9% | | | |
| Exponent, Inc. | | 506,678 | 37,570,174 |
| On Assignment, Inc. (a) | | 575,008 | 44,028,363 |
| | | | 81,598,537 |
| Road & Rail - 0.3% | | | |
| Marten Transport Ltd. | | 519,608 | 12,054,906 |
| Trading Companies & Distributors - 1.7% | | | |
| SiteOne Landscape Supply, Inc. (a) | | 649,711 | 49,481,990 |
| Univar, Inc. (a) | | 729,346 | 21,778,272 |
| | | | 71,260,262 |
|
| TOTAL INDUSTRIALS | | | 894,700,490 |
|
| INFORMATION TECHNOLOGY - 22.0% | | | |
| Electronic Equipment & Components - 2.2% | | | |
| Dolby Laboratories, Inc. Class A | | 315,065 | 20,271,282 |
| FLIR Systems, Inc. | | 279,364 | 14,306,230 |
| II-VI, Inc. (a) | | 383,718 | 16,365,573 |
| Novanta, Inc. (a) | | 731,314 | 42,343,081 |
| | | | 93,286,166 |
| Internet Software & Services - 10.0% | | | |
| 2U, Inc. (a)(b) | | 1,776,201 | 131,918,442 |
| Alarm.com Holdings, Inc. (a)(b) | | 236,536 | 9,078,252 |
| ANGI Homeservices, Inc. Class A (a) | | 37,400 | 499,664 |
| Five9, Inc. (a) | | 419,885 | 10,921,209 |
| GoDaddy, Inc. (a) | | 614,483 | 33,937,896 |
| Gogo, Inc. (a)(b) | | 1,496,839 | 14,429,528 |
| GrubHub, Inc. (a)(b) | | 757,667 | 54,741,441 |
| Instructure, Inc. (a) | | 757,878 | 27,207,820 |
| MINDBODY, Inc. (a) | | 735,970 | 25,869,346 |
| New Relic, Inc. (a) | | 293,673 | 17,541,088 |
| Okta, Inc. | | 634,515 | 18,686,467 |
| Stamps.com, Inc. (a) | | 361,343 | 73,659,771 |
| Yext, Inc. (b) | | 1,055,189 | 12,715,027 |
| | | | 431,205,951 |
| IT Services - 3.0% | | | |
| EPAM Systems, Inc. (a) | | 342,026 | 40,181,214 |
| Genpact Ltd. | | 855,855 | 29,047,719 |
| Interxion Holding N.V. (a) | | 218,182 | 13,690,921 |
| Leidos Holdings, Inc. | | 712,472 | 47,450,635 |
| | | | 130,370,489 |
| Semiconductors & Semiconductor Equipment - 1.9% | | | |
| Entegris, Inc. | | 1,507,737 | 49,076,839 |
| Integrated Device Technology, Inc. (a) | | 450,030 | 13,455,897 |
| PDF Solutions, Inc. (a)(b) | | 1,282,462 | 17,544,080 |
| | | | 80,076,816 |
| Software - 4.9% | | | |
| Everbridge, Inc. (a) | | 1,101,578 | 35,558,938 |
| HubSpot, Inc. (a) | | 361,580 | 35,091,339 |
| Paycom Software, Inc. (a)(b) | | 317,416 | 29,088,002 |
| Proofpoint, Inc. (a) | | 211,176 | 21,544,176 |
| PROS Holdings, Inc. (a) | | 807,222 | 23,441,727 |
| RingCentral, Inc. (a) | | 501,394 | 27,225,694 |
| Take-Two Interactive Software, Inc. (a) | | 155,618 | 19,712,132 |
| Workiva, Inc. (a) | | 830,308 | 18,515,868 |
| | | | 210,177,876 |
|
| TOTAL INFORMATION TECHNOLOGY | | | 945,117,298 |
|
| MATERIALS - 4.7% | | | |
| Chemicals - 1.3% | | | |
| Orion Engineered Carbons SA | | 258,037 | 7,599,190 |
| The Chemours Co. LLC | | 920,509 | 47,516,675 |
| | | | 55,115,865 |
| Construction Materials - 2.1% | | | |
| Eagle Materials, Inc. | | 507,073 | 56,817,530 |
| Summit Materials, Inc. | | 1,020,348 | 32,600,119 |
| | | | 89,417,649 |
| Containers & Packaging - 1.0% | | | |
| Avery Dennison Corp. | | 240,090 | 29,454,241 |
| Berry Global Group, Inc. (a) | | 259,134 | 15,338,141 |
| | | | 44,792,382 |
| Paper & Forest Products - 0.3% | | | |
| Neenah, Inc. | | 142,594 | 12,904,757 |
| Quintis Ltd. (a)(b)(c) | | 11,285,501 | 91 |
| | | | 12,904,848 |
|
| TOTAL MATERIALS | | | 202,230,744 |
|
| REAL ESTATE - 1.6% | | | |
| Equity Real Estate Investment Trusts (REITs) - 1.5% | | | |
| Hudson Pacific Properties, Inc. | | 440,312 | 14,076,775 |
| Rexford Industrial Realty, Inc. | | 557,248 | 16,544,693 |
| Store Capital Corp. | | 599,483 | 14,693,328 |
| Terreno Realty Corp. | | 499,323 | 17,775,899 |
| | | | 63,090,695 |
| Real Estate Management & Development - 0.1% | | | |
| Redfin Corp. (b) | | 272,074 | 5,523,102 |
|
| TOTAL REAL ESTATE | | | 68,613,797 |
|
| UTILITIES - 0.4% | | | |
| Independent Power and Renewable Electricity Producers - 0.4% | | | |
| NRG Yield, Inc. Class C | | 424,720 | 8,027,208 |
| Ormat Technologies, Inc. | | 143,975 | 10,089,768 |
| | | | 18,116,976 |
| TOTAL COMMON STOCKS | | | |
| (Cost $3,179,702,843) | | | 4,134,528,699 |
|
| Convertible Preferred Stocks - 0.6% | | | |
| INFORMATION TECHNOLOGY - 0.6% | | | |
| Software - 0.6% | | | |
| Compass, Inc. Series E (c)(d) | | | |
| (Cost $23,873,990) | | 353,803 | 23,873,990 |
|
| Investment Companies - 1.2% | | | |
| iShares Russell 2000 Growth Index ETF (b) | | | |
| (Cost $52,104,926) | | 274,947 | 53,270,981 |
|
| Money Market Funds - 4.4% | | | |
| Fidelity Cash Central Fund, 1.39% (e) | | 41,501,974 | 41,510,274 |
| Fidelity Securities Lending Cash Central Fund 1.40% (e)(f) | | 146,663,188 | 146,677,854 |
| TOTAL MONEY MARKET FUNDS | | | |
| (Cost $188,186,232) | | | 188,188,128 |
| TOTAL INVESTMENT IN SECURITIES - 102.6% | | | |
| (Cost $3,443,867,991) | | | 4,399,861,798 |
| NET OTHER ASSETS (LIABILITIES) - (2.6)% | | | (110,946,196) |
| NET ASSETS - 100% | | | $4,288,915,602 |
Security Type Abbreviations
ETF – Exchange-Traded Fund
Legend
(a) Non-income producing
(b) Security or a portion of the security is on loan at period end.
(c) Level 3 security
(d) Restricted securities - Investment in securities not registered under the Securities Act of 1933 (excluding 144A issues). At the end of the period, the value of restricted securities (excluding 144A issues) amounted to $23,873,990 or 0.6% of net assets.
(e) Affiliated fund that is generally available only to investment companies and other accounts managed by Fidelity Investments. The rate quoted is the annualized seven-day yield of the fund at period end. A complete unaudited listing of the fund's holdings as of its most recent quarter end is available upon request. In addition, each Fidelity Central Fund's financial statements are available on the SEC's website or upon request.
(f) Investment made with cash collateral received from securities on loan.
Additional information on each restricted holding is as follows:
| Security | Acquisition Date | Acquisition Cost |
| Compass, Inc. Series E | 11/3/17 | $23,873,990 |
Affiliated Central Funds
Information regarding fiscal year to date income earned by the Fund from investments in Fidelity Central Funds is as follows:
| Fund | Income earned |
| Fidelity Cash Central Fund | $348,711 |
| Fidelity Securities Lending Cash Central Fund | 2,047,153 |
| Total | $2,395,864 |
Amounts in the income column in the above table include any capital gain distributions from underlying funds, which are presented in the corresponding line-item in the Statement of Operations if applicable.
Investment Valuation
The following is a summary of the inputs used, as of January 31, 2018, involving the Fund's assets and liabilities carried at fair value. The inputs or methodology used for valuing securities may not be an indication of the risk associated with investing in those securities. For more information on valuation inputs, and their aggregation into the levels used below, please refer to the Investment Valuation section in the accompanying Notes to Financial Statements.
| | Valuation Inputs at Reporting Date: |
| Description | Total | Level 1 | Level 2 | Level 3 |
| Investments in Securities: | | | | |
| Equities: | | | | |
| Consumer Discretionary | $645,816,084 | $645,816,084 | $-- | $-- |
| Consumer Staples | 137,572,851 | 137,572,851 | -- | -- |
| Financials | 316,143,250 | 316,143,250 | -- | -- |
| Health Care | 906,217,209 | 904,852,965 | 67,080 | 1,297,164 |
| Industrials | 894,700,490 | 894,700,490 | -- | -- |
| Information Technology | 968,991,288 | 945,117,298 | -- | 23,873,990 |
| Materials | 202,230,744 | 202,230,653 | -- | 91 |
| Real Estate | 68,613,797 | 68,613,797 | -- | -- |
| Utilities | 18,116,976 | 18,116,976 | -- | -- |
| Investment Companies | 53,270,981 | 53,270,981 | -- | -- |
| Money Market Funds | 188,188,128 | 188,188,128 | -- | -- |
| Total Investments in Securities: | $4,399,861,798 | $4,374,623,473 | $67,080 | $25,171,245 |
See accompanying notes which are an integral part of the financial statements.
Financial Statements
Statement of Assets and Liabilities
| | | January 31, 2018 (Unaudited) |
| Assets | | |
Investment in securities, at value (including securities loaned of $141,522,088) — See accompanying schedule:
Unaffiliated issuers (cost $3,255,681,759) | $4,211,673,670 | |
| Fidelity Central Funds (cost $188,186,232) | 188,188,128 | |
| Total Investment in Securities (cost $3,443,867,991) | | $4,399,861,798 |
| Receivable for investments sold | | 64,126,011 |
| Receivable for fund shares sold | | 20,272,955 |
| Dividends receivable | | 261,718 |
| Distributions receivable from Fidelity Central Funds | | 689,923 |
| Prepaid expenses | | 4,643 |
| Other receivables | | 268,735 |
| Total assets | | 4,485,485,783 |
| Liabilities | | |
| Payable for investments purchased | $37,808,829 | |
| Payable for fund shares redeemed | 8,404,131 | |
| Accrued management fee | 2,775,993 | |
| Distribution and service plan fees payable | 197,050 | |
| Other affiliated payables | 659,351 | |
| Other payables and accrued expenses | 51,789 | |
| Collateral on securities loaned | 146,673,038 | |
| Total liabilities | | 196,570,181 |
| Net Assets | | $4,288,915,602 |
| Net Assets consist of: | | |
| Paid in capital | | $3,263,369,715 |
| Accumulated net investment loss | | (10,920,531) |
| Accumulated undistributed net realized gain (loss) on investments and foreign currency transactions | | 80,472,667 |
| Net unrealized appreciation (depreciation) on investments and assets and liabilities in foreign currencies | | 955,993,751 |
| Net Assets | | $4,288,915,602 |
| Calculation of Maximum Offering Price | | |
| Class A: | | |
| Net Asset Value and redemption price per share ($288,597,752 ÷ 11,474,627 shares) | | $25.15 |
| Maximum offering price per share (100/94.25 of $25.15) | | $26.68 |
| Class M: | | |
| Net Asset Value and redemption price per share ($77,453,004 ÷ 3,174,999 shares) | | $24.39 |
| Maximum offering price per share (100/96.50 of $24.39) | | $25.27 |
| Class C: | | |
| Net Asset Value and offering price per share ($134,257,465 ÷ 5,942,941 shares)(a) | | $22.59 |
| Small Cap Growth: | | |
| Net Asset Value, offering price and redemption price per share ($3,060,377,068 ÷ 116,992,660 shares) | | $26.16 |
| Class I: | | |
| Net Asset Value, offering price and redemption price per share ($647,824,294 ÷ 24,699,352 shares) | | $26.23 |
| Class Z: | | |
| Net Asset Value, offering price and redemption price per share ($80,406,019 ÷ 3,062,875 shares) | | $26.25 |
(a) Redemption price per share is equal to net asset value less any applicable contingent deferred sales charge.
See accompanying notes which are an integral part of the financial statements.
Statement of Operations
| | | Six months ended January 31, 2018 (Unaudited) |
| Investment Income | | |
| Dividends | | $7,605,095 |
| Income from Fidelity Central Funds (including $2,047,153 from security lending) | | 2,395,864 |
| Total income | | 10,000,959 |
| Expenses | | |
| Management fee | | |
| Basic fee | $12,449,521 | |
| Performance adjustment | 2,107,938 | |
| Transfer agent fees | 3,252,086 | |
| Distribution and service plan fees | 1,041,894 | |
| Accounting and security lending fees | 526,637 | |
| Custodian fees and expenses | 37,424 | |
| Independent trustees' fees and expenses | 6,655 | |
| Registration fees | 169,941 | |
| Audit | 35,980 | |
| Legal | 8,231 | |
| Interest | 540 | |
| Miscellaneous | 11,271 | |
| Total expenses before reductions | 19,648,118 | |
| Expense reductions | (203,530) | 19,444,588 |
| Net investment income (loss) | | (9,443,629) |
| Realized and Unrealized Gain (Loss) | | |
| Net realized gain (loss) on: | | |
| Investment securities: | | |
| Unaffiliated issuers | 128,118,719 | |
| Redemption in-kind with affiliated entities | 22,403,452 | |
| Fidelity Central Funds | 10,320 | |
| Foreign currency transactions | 65 | |
| Total net realized gain (loss) | | 150,532,556 |
| Change in net unrealized appreciation (depreciation) on: | | |
| Investment securities: | | |
| Unaffiliated issuers | 461,147,731 | |
| Fidelity Central Funds | (7,842) | |
| Assets and liabilities in foreign currencies | 33 | |
| Total change in net unrealized appreciation (depreciation) | | 461,139,922 |
| Net gain (loss) | | 611,672,478 |
| Net increase (decrease) in net assets resulting from operations | | $602,228,849 |
See accompanying notes which are an integral part of the financial statements.
Statement of Changes in Net Assets
| | Six months ended January 31, 2018 (Unaudited) | Year ended July 31, 2017 |
| Increase (Decrease) in Net Assets | | |
| Operations | | |
| Net investment income (loss) | $(9,443,629) | $(11,864,179) |
| Net realized gain (loss) | 150,532,556 | 284,698,299 |
| Change in net unrealized appreciation (depreciation) | 461,139,922 | 228,635,188 |
| Net increase (decrease) in net assets resulting from operations | 602,228,849 | 501,469,308 |
| Distributions to shareholders from net investment income | (6,004) | – |
| Distributions to shareholders from net realized gain | (236,656,527) | (17,131,591) |
| Total distributions | (236,662,531) | (17,131,591) |
| Share transactions - net increase (decrease) | 792,276,615 | 597,965,658 |
| Redemption fees | 224,512 | 418,601 |
| Total increase (decrease) in net assets | 1,158,067,445 | 1,082,721,976 |
| Net Assets | | |
| Beginning of period | 3,130,848,157 | 2,048,126,181 |
| End of period | $4,288,915,602 | $3,130,848,157 |
| Other Information | | |
| Accumulated net investment loss end of period | $(10,920,531) | $(1,470,898) |
See accompanying notes which are an integral part of the financial statements.
Financial Highlights
Fidelity Small Cap Growth Fund Class A
| | Six months ended (Unaudited) January 31, | Years endedJuly 31, | | | | |
| | 2018 | 2017 | 2016 | 2015 | 2014 | 2013 |
| Selected Per–Share Data | | | | | | |
| Net asset value, beginning of period | $22.99 | $19.17 | $20.55 | $17.99 | $19.66 | $15.87 |
| Income from Investment Operations | | | | | | |
| Net investment income (loss)A | (.09) | (.14) | (.10) | (.13) | (.12) | (.04) |
| Net realized and unrealized gain (loss) | 3.93 | 4.12 | (.51) | 4.23 | 1.69 | 4.87 |
| Total from investment operations | 3.84 | 3.98 | (.61) | 4.10 | 1.57 | 4.83 |
| Distributions from net investment income | –B | – | – | – | – | – |
| Distributions from net realized gain | (1.68) | (.16) | (.78) | (1.54) | (3.24) | (1.04) |
| Total distributions | (1.68) | (.16) | (.78) | (1.54) | (3.24) | (1.04) |
| Redemption fees added to paid in capitalA | –B | –B | .01 | –B | –B | –B |
| Net asset value, end of period | $25.15 | $22.99 | $19.17 | $20.55 | $17.99 | $19.66 |
| Total ReturnC,D,E | 17.70% | 20.90% | (2.85)% | 24.46% | 8.58% | 32.20% |
| Ratios to Average Net AssetsF,G | | | | | | |
| Expenses before reductions | 1.32%H | 1.35% | 1.37% | 1.21% | 1.22% | 1.24% |
| Expenses net of fee waivers, if any | 1.32%H | 1.35% | 1.37% | 1.21% | 1.22% | 1.24% |
| Expenses net of all reductions | 1.31%H | 1.34% | 1.36% | 1.20% | 1.22% | 1.22% |
| Net investment income (loss) | (.75)%H | (.66)% | (.58)% | (.67)% | (.62)% | (.26)% |
| Supplemental Data | | | | | | |
| Net assets, end of period (000 omitted) | $288,598 | $218,905 | $176,988 | $123,370 | $88,822 | $74,978 |
| Portfolio turnover rateI | 97%H,J | 140%J | 143% | 156% | 148%J | 142% |
A Calculated based on average shares outstanding during the period.
B Amount represents less than $.005 per share.
C Total returns for periods of less than one year are not annualized.
D Total returns would have been lower if certain expenses had not been reduced during the applicable periods shown.
E Total returns do not include the effect of the sales charges.
F Fees and expenses of any underlying Fidelity Central Funds are not included in the Fund's expense ratio. The Fund indirectly bears its proportionate share of the expenses of any underlying Fidelity Central Funds.
G Expense ratios reflect operating expenses of the class. Expenses before reductions do not reflect amounts reimbursed by the investment adviser or reductions from brokerage service arrangements or reductions from other expense offset arrangements and do not represent the amount paid by the class during periods when reimbursements or reductions occur. Expenses net of fee waivers reflect expenses after reimbursement by the investment adviser but prior to reductions from brokerage service arrangements or other expense offset arrangements. Expenses net of all reductions represent the net expenses paid by the class.
H Annualized
I Amount does not include the portfolio activity of any underlying Fidelity Central Funds.
J Portfolio turnover rate excludes securities received or delivered in-kind.
See accompanying notes which are an integral part of the financial statements.
Fidelity Small Cap Growth Fund Class M
| | Six months ended (Unaudited) January 31, | Years endedJuly 31, | | | | |
| | 2018 | 2017 | 2016 | 2015 | 2014 | 2013 |
| Selected Per–Share Data | | | | | | |
| Net asset value, beginning of period | $22.35 | $18.69 | $20.08 | $17.66 | $19.38 | $15.68 |
| Income from Investment Operations | | | | | | |
| Net investment income (loss)A | (.12) | (.19) | (.15) | (.17) | (.16) | (.09) |
| Net realized and unrealized gain (loss) | 3.81 | 4.01 | (.50) | 4.13 | 1.66 | 4.82 |
| Total from investment operations | 3.69 | 3.82 | (.65) | 3.96 | 1.50 | 4.73 |
| Distributions from net investment income | –B | – | – | – | – | – |
| Distributions from net realized gain | (1.65) | (.16) | (.75) | (1.54) | (3.22) | (1.03) |
| Total distributions | (1.65) | (.16) | (.75) | (1.54) | (3.22) | (1.03) |
| Redemption fees added to paid in capitalA | –B | –B | .01 | –B | –B | –B |
| Net asset value, end of period | $24.39 | $22.35 | $18.69 | $20.08 | $17.66 | $19.38 |
| Total ReturnC,D,E | 17.55% | 20.57% | (3.14)% | 24.10% | 8.30% | 31.87% |
| Ratios to Average Net AssetsF,G | | | | | | |
| Expenses before reductions | 1.59%H | 1.62% | 1.66% | 1.49% | 1.50% | 1.49% |
| Expenses net of fee waivers, if any | 1.59%H | 1.62% | 1.66% | 1.48% | 1.50% | 1.49% |
| Expenses net of all reductions | 1.58%H | 1.61% | 1.64% | 1.47% | 1.49% | 1.48% |
| Net investment income (loss) | (1.02)%H | (.94)% | (.87)% | (.95)% | (.90)% | (.52)% |
| Supplemental Data | | | | | | |
| Net assets, end of period (000 omitted) | $77,453 | $64,034 | $53,447 | $52,667 | $42,586 | $34,686 |
| Portfolio turnover rateI | 97%H,J | 140%J | 143% | 156% | 148%J | 142% |
A Calculated based on average shares outstanding during the period.
B Amount represents less than $.005 per share.
C Total returns for periods of less than one year are not annualized.
D Total returns would have been lower if certain expenses had not been reduced during the applicable periods shown.
E Total returns do not include the effect of the sales charges.
F Fees and expenses of any underlying Fidelity Central Funds are not included in the Fund's expense ratio. The Fund indirectly bears its proportionate share of the expenses of any underlying Fidelity Central Funds.
G Expense ratios reflect operating expenses of the class. Expenses before reductions do not reflect amounts reimbursed by the investment adviser or reductions from brokerage service arrangements or reductions from other expense offset arrangements and do not represent the amount paid by the class during periods when reimbursements or reductions occur. Expenses net of fee waivers reflect expenses after reimbursement by the investment adviser but prior to reductions from brokerage service arrangements or other expense offset arrangements. Expenses net of all reductions represent the net expenses paid by the class.
H Annualized
I Amount does not include the portfolio activity of any underlying Fidelity Central Funds.
J Portfolio turnover rate excludes securities received or delivered in-kind.
See accompanying notes which are an integral part of the financial statements.
Fidelity Small Cap Growth Fund Class C
| | Six months ended (Unaudited) January 31, | Years endedJuly 31, | | | | |
| | 2018 | 2017 | 2016 | 2015 | 2014 | 2013 |
| Selected Per–Share Data | | | | | | |
| Net asset value, beginning of period | $20.83 | $17.52 | $18.90 | $16.78 | $18.62 | $15.16 |
| Income from Investment Operations | | | | | | |
| Net investment income (loss)A | (.16) | (.27) | (.22) | (.25) | (.25) | (.16) |
| Net realized and unrealized gain (loss) | 3.54 | 3.74 | (.48) | 3.91 | 1.59 | 4.64 |
| Total from investment operations | 3.38 | 3.47 | (.70) | 3.66 | 1.34 | 4.48 |
| Distributions from net investment income | –B | – | – | – | – | – |
| Distributions from net realized gain | (1.62) | (.16) | (.69) | (1.54) | (3.18) | (1.02) |
| Total distributions | (1.62) | (.16) | (.69) | (1.54) | (3.18) | (1.02) |
| Redemption fees added to paid in capitalA | –B | –B | .01 | –B | –B | –B |
| Net asset value, end of period | $22.59 | $20.83 | $17.52 | $18.90 | $16.78 | $18.62 |
| Total ReturnC,D,E | 17.28% | 19.95% | (3.64)% | 23.53% | 7.70% | 31.32% |
| Ratios to Average Net AssetsF,G | | | | | | |
| Expenses before reductions | 2.08%H | 2.11% | 2.16% | 2.00% | 2.01% | 1.99% |
| Expenses net of fee waivers, if any | 2.08%H | 2.11% | 2.16% | 2.00% | 2.00% | 1.99% |
| Expenses net of all reductions | 2.07%H | 2.10% | 2.14% | 1.99% | 2.00% | 1.97% |
| Net investment income (loss) | (1.51)%H | (1.43)% | (1.37)% | (1.46)% | (1.41)% | (1.01)% |
| Supplemental Data | | | | | | |
| Net assets, end of period (000 omitted) | $134,257 | $102,669 | $73,731 | $55,671 | $42,215 | $32,756 |
| Portfolio turnover rateI | 97%H,J | 140%J | 143% | 156% | 148%J | 142% |
A Calculated based on average shares outstanding during the period.
B Amount represents less than $.005 per share.
C Total returns for periods of less than one year are not annualized.
D Total returns would have been lower if certain expenses had not been reduced during the applicable periods shown.
E Total returns do not include the effect of the contingent deferred sales charge.
F Fees and expenses of any underlying Fidelity Central Funds are not included in the Fund's expense ratio. The Fund indirectly bears its proportionate share of the expenses of any underlying Fidelity Central Funds.
G Expense ratios reflect operating expenses of the class. Expenses before reductions do not reflect amounts reimbursed by the investment adviser or reductions from brokerage service arrangements or reductions from other expense offset arrangements and do not represent the amount paid by the class during periods when reimbursements or reductions occur. Expenses net of fee waivers reflect expenses after reimbursement by the investment adviser but prior to reductions from brokerage service arrangements or other expense offset arrangements. Expenses net of all reductions represent the net expenses paid by the class.
H Annualized
I Amount does not include the portfolio activity of any underlying Fidelity Central Funds.
J Portfolio turnover rate excludes securities received or delivered in-kind.
See accompanying notes which are an integral part of the financial statements.
Fidelity Small Cap Growth Fund
| | Six months ended (Unaudited) January 31, | Years endedJuly 31, | | | | |
| | 2018 | 2017 | 2016 | 2015 | 2014 | 2013 |
| Selected Per–Share Data | | | | | | |
| Net asset value, beginning of period | $23.84 | $19.82 | $21.20 | $18.45 | $20.07 | $16.14 |
| Income from Investment Operations | | | | | | |
| Net investment income (loss)A | (.06) | (.09) | (.06) | (.07) | (.06) | .01 |
| Net realized and unrealized gain (loss) | 4.08 | 4.27 | (.52) | 4.36 | 1.71 | 4.98 |
| Total from investment operations | 4.02 | 4.18 | (.58) | 4.29 | 1.65 | 4.99 |
| Distributions from net investment income | – | – | – | – | – | – |
| Distributions from net realized gain | (1.70) | (.16) | (.81) | (1.54) | (3.27) | (1.06) |
| Total distributions | (1.70) | (.16) | (.81) | (1.54) | (3.27) | (1.06) |
| Redemption fees added to paid in capitalA | –B | –B | .01 | –B | –B | –B |
| Net asset value, end of period | $26.16 | $23.84 | $19.82 | $21.20 | $18.45 | $20.07 |
| Total ReturnC,D | 17.86% | 21.22% | (2.63)% | 24.91% | 8.87% | 32.74% |
| Ratios to Average Net AssetsE,F | | | | | | |
| Expenses before reductions | 1.03%G | 1.08% | 1.12% | .91% | .91% | .90% |
| Expenses net of fee waivers, if any | 1.03%G | 1.08% | 1.12% | .91% | .90% | .90% |
| Expenses net of all reductions | 1.02%G | 1.07% | 1.11% | .90% | .90% | .88% |
| Net investment income (loss) | (.46)%G | (.40)% | (.33)% | (.37)% | (.31)% | .08% |
| Supplemental Data | | | | | | |
| Net assets, end of period (000 omitted) | $3,060,377 | $2,336,762 | $1,580,264 | $1,345,684 | $1,069,105 | $1,315,659 |
| Portfolio turnover rateH | 97%G,I | 140%I | 143% | 156% | 148%I | 142% |
A Calculated based on average shares outstanding during the period.
B Amount represents less than $.005 per share.
C Total returns for periods of less than one year are not annualized.
D Total returns would have been lower if certain expenses had not been reduced during the applicable periods shown.
E Fees and expenses of any underlying Fidelity Central Funds are not included in the Fund's expense ratio. The Fund indirectly bears its proportionate share of the expenses of any underlying Fidelity Central Funds.
F Expense ratios reflect operating expenses of the class. Expenses before reductions do not reflect amounts reimbursed by the investment adviser or reductions from brokerage service arrangements or reductions from other expense offset arrangements and do not represent the amount paid by the class during periods when reimbursements or reductions occur. Expenses net of fee waivers reflect expenses after reimbursement by the investment adviser but prior to reductions from brokerage service arrangements or other expense offset arrangements. Expenses net of all reductions represent the net expenses paid by the class.
G Annualized
H Amount does not include the portfolio activity of any underlying Fidelity Central Funds.
I Portfolio turnover rate excludes securities received or delivered in-kind.
See accompanying notes which are an integral part of the financial statements.
Fidelity Small Cap Growth Fund Class I
| | Six months ended (Unaudited) January 31, | Years endedJuly 31, | | | | |
| | 2018 | 2017 | 2016 | 2015 | 2014 | 2013 |
| Selected Per–Share Data | | | | | | |
| Net asset value, beginning of period | $23.90 | $19.86 | $21.24 | $18.49 | $20.10 | $16.17 |
| Income from Investment Operations | | | | | | |
| Net investment income (loss)A | (.06) | (.08) | (.05) | (.07) | (.06) | .01 |
| Net realized and unrealized gain (loss) | 4.09 | 4.28 | (.53) | 4.36 | 1.72 | 4.98 |
| Total from investment operations | 4.03 | 4.20 | (.58) | 4.29 | 1.66 | 4.99 |
| Distributions from net investment income | – | – | – | – | – | – |
| Distributions from net realized gain | (1.70) | (.16) | (.81) | (1.54) | (3.27) | (1.06) |
| Total distributions | (1.70) | (.16) | (.81) | (1.54) | (3.27) | (1.06) |
| Redemption fees added to paid in capitalA | –B | –B | .01 | –B | –B | –B |
| Net asset value, end of period | $26.23 | $23.90 | $19.86 | $21.24 | $18.49 | $20.10 |
| Total ReturnC,D | 17.86% | 21.28% | (2.62)% | 24.85% | 8.89% | 32.65% |
| Ratios to Average Net AssetsE,F | | | | | | |
| Expenses before reductions | 1.04%G | 1.06% | 1.09% | .93% | .92% | .92% |
| Expenses net of fee waivers, if any | 1.04%G | 1.06% | 1.09% | .93% | .92% | .92% |
| Expenses net of all reductions | 1.03%G | 1.05% | 1.07% | .91% | .92% | .91% |
| Net investment income (loss) | (.47)%G | (.38)% | (.30)% | (.39)% | (.32)% | .06% |
| Supplemental Data | | | | | | |
| Net assets, end of period (000 omitted) | $647,824 | $390,032 | $163,696 | $97,897 | $51,607 | $51,158 |
| Portfolio turnover rateH | 97%G,I | 140%I | 143% | 156% | 148%I | 142% |
A Calculated based on average shares outstanding during the period.
B Amount represents less than $.005 per share.
C Total returns for periods of less than one year are not annualized.
D Total returns would have been lower if certain expenses had not been reduced during the applicable periods shown.
E Fees and expenses of any underlying Fidelity Central Funds are not included in the Fund's expense ratio. The Fund indirectly bears its proportionate share of the expenses of any underlying Fidelity Central Funds.
F Expense ratios reflect operating expenses of the class. Expenses before reductions do not reflect amounts reimbursed by the investment adviser or reductions from brokerage service arrangements or reductions from other expense offset arrangements and do not represent the amount paid by the class during periods when reimbursements or reductions occur. Expenses net of fee waivers reflect expenses after reimbursement by the investment adviser but prior to reductions from brokerage service arrangements or other expense offset arrangements. Expenses net of all reductions represent the net expenses paid by the class.
G Annualized
H Amount does not include the portfolio activity of any underlying Fidelity Central Funds.
I Portfolio turnover rate excludes securities received or delivered in-kind.
See accompanying notes which are an integral part of the financial statements.
Fidelity Small Cap Growth Fund Class Z
| | Six months ended (Unaudited) January 31, | Years endedJuly 31, |
| | 2018 | 2017 A |
| Selected Per–Share Data | | |
| Net asset value, beginning of period | $23.91 | $21.39 |
| Income from Investment Operations | | |
| Net investment income (loss)B | (.04) | (.05) |
| Net realized and unrealized gain (loss) | 4.10 | 2.57 |
| Total from investment operations | 4.06 | 2.52 |
| Distributions from net investment income | – | – |
| Distributions from net realized gain | (1.72) | – |
| Total distributions | (1.72) | – |
| Redemption fees added to paid in capitalB | –C | –C |
| Net asset value, end of period | $26.25 | $23.91 |
| Total ReturnD,E | 17.96% | 11.78% |
| Ratios to Average Net AssetsF,G | | |
| Expenses before reductions | .90%H | .90%H |
| Expenses net of fee waivers, if any | .90%H | .90%H |
| Expenses net of all reductions | .89%H | .89%H |
| Net investment income (loss) | (.33)%H | (.44)%H |
| Supplemental Data | | |
| Net assets, end of period (000 omitted) | $80,406 | $18,447 |
| Portfolio turnover rateI | 97%H,J | 140%J |
A For the period February 1, 2017 (commencement of sale of shares) to July 31, 2017.
B Calculated based on average shares outstanding during the period.
C Amount represents less than $.005 per share.
D Total returns for periods of less than one year are not annualized.
E Total returns would have been lower if certain expenses had not been reduced during the applicable periods shown.
F Fees and expenses of any underlying Fidelity Central Funds are not included in the Fund's expense ratio. The Fund indirectly bears its proportionate share of the expenses of any underlying Fidelity Central Funds.
G Expense ratios reflect operating expenses of the class. Expenses before reductions do not reflect amounts reimbursed by the investment adviser or reductions from brokerage service arrangements or reductions from other expense offset arrangements and do not represent the amount paid by the class during periods when reimbursements or reductions occur. Expense ratios before reductions for start-up periods may not be representative of longer-term operating periods. Expenses net of fee waivers reflect expenses after reimbursement by the investment adviser but prior to reductions from brokerage service arrangements or other expense offset arrangements. Expenses net of all reductions represent the net expenses paid by the class.
H Annualized
I Amount does not include the portfolio activity of any underlying Fidelity Central Funds.
J Portfolio turnover rate excludes securities received or delivered in-kind.
See accompanying notes which are an integral part of the financial statements.
Notes to Financial Statements (Unaudited)
For the period ended January 31, 2018
1. Organization.
Fidelity Small Cap Growth Fund (the Fund) is a fund of Fidelity Securities Fund (the Trust) and is authorized to issue an unlimited number of shares. The Trust is registered under the Investment Company Act of 1940, as amended (the 1940 Act), as an open-end management investment company organized as a Massachusetts business trust. The Fund offers Class A, Class M, Class C, Small Cap Growth, Class I and Class Z shares, each of which has equal rights as to assets and voting privileges. Each class has exclusive voting rights with respect to matters that affect that class.
Effective the close of business on February 2, 2018, the Fund is closed to new accounts with certain exceptions.
2. Investments in Fidelity Central Funds.
The Fund invests in Fidelity Central Funds, which are open-end investment companies generally available only to other investment companies and accounts managed by the investment adviser and its affiliates. The Fund's Schedule of Investments lists each of the Fidelity Central Funds held as of period end, if any, as an investment of the Fund, but does not include the underlying holdings of each Fidelity Central Fund. As an Investing Fund, the Fund indirectly bears its proportionate share of the expenses of the underlying Fidelity Central Funds.
The Money Market Central Funds seek preservation of capital and current income and are managed by Fidelity Investments Money Management, Inc. (FIMM), an affiliate of the investment adviser. Annualized expenses of the Money Market Central Funds as of their most recent shareholder report date are less than .005%.
A complete unaudited list of holdings for each Fidelity Central Fund is available upon request or at the Securities and Exchange Commission (the SEC) website at www.sec.gov. In addition, the financial statements of the Fidelity Central Funds are available on the SEC website or upon request.
3. Significant Accounting Policies.
The Fund is an investment company and applies the accounting and reporting guidance of the Financial Accounting Standards Board (FASB) Accounting Standards Codification Topic 946 Financial Services – Investments Companies. The financial statements have been prepared in conformity with accounting principles generally accepted in the United States of America (GAAP), which require management to make certain estimates and assumptions at the date of the financial statements. Actual results could differ from those estimates. Subsequent events, if any, through the date that the financial statements were issued have been evaluated in the preparation of the financial statements. The following summarizes the significant accounting policies of the Fund:
Investment Valuation. Investments are valued as of 4:00 p.m. Eastern time on the last calendar day of the period. The Board of Trustees (the Board) has delegated the day to day responsibility for the valuation of the Fund's investments to the Fair Value Committee (the Committee) established by the Fund's investment adviser. In accordance with valuation policies and procedures approved by the Board, the Fund attempts to obtain prices from one or more third party pricing vendors or brokers to value its investments. When current market prices, quotations or currency exchange rates are not readily available or reliable, investments will be fair valued in good faith by the Committee, in accordance with procedures adopted by the Board. Factors used in determining fair value vary by investment type and may include market or investment specific events. The frequency with which these procedures are used cannot be predicted and they may be utilized to a significant extent. The Committee oversees the Fund's valuation policies and procedures and reports to the Board on the Committee's activities and fair value determinations. The Board monitors the appropriateness of the procedures used in valuing the Fund's investments and ratifies the fair value determinations of the Committee.
The Fund categorizes the inputs to valuation techniques used to value its investments into a disclosure hierarchy consisting of three levels as shown below:
- Level 1 – quoted prices in active markets for identical investments
- Level 2 – other significant observable inputs (including quoted prices for similar investments, interest rates, prepayment speeds, etc.)
- Level 3 – unobservable inputs (including the Fund's own assumptions based on the best information available)
Valuation techniques used to value the Fund's investments by major category are as follows:
Equity securities, including restricted securities, for which market quotations are readily available, are valued at the last reported sale price or official closing price as reported by a third party pricing vendor on the primary market or exchange on which they are traded and are categorized as Level 1 in the hierarchy. In the event there were no sales during the day or closing prices are not available, securities are valued at the last quoted bid price or may be valued using the last available price and are generally categorized as Level 2 in the hierarchy. For foreign equity securities, when market or security specific events arise, comparisons to the valuation of American Depositary Receipts (ADRs), futures contracts, Exchange-Traded Funds (ETFs) and certain indexes as well as quoted prices for similar securities may be used and would be categorized as Level 2 in the hierarchy. Utilizing these techniques may result in transfers between Level 1 and Level 2. For equity securities, including restricted securities, where observable inputs are limited, assumptions about market activity and risk are used and these securities may be categorized as Level 3 in the hierarchy.
ETFs are valued at their last sale price or official closing price as reported by a third party pricing vendor on the primary market or exchange on which they are traded and are categorized as Level 1 in the hierarchy. In the event there were no sales during the day but the exchange reports a closing bid level, ETFs are valued at the closing bid and would be categorized as Level 1 in the hierarchy. In the event there was no closing bid, ETFs may be valued by another method that the Board believes reflects fair value in accordance with the Board's fair value pricing policies and may be categorized as Level 2 in the hierarchy.
Investments in open-end mutual funds, including the Fidelity Central Funds, are valued at their closing net asset value (NAV) each business day and are categorized as Level 1 in the hierarchy.
Changes in valuation techniques may result in transfers in or out of an assigned level within the disclosure hierarchy. The aggregate value of investments by input level as of January 31, 2018 is included at the end of the Fund's Schedule of Investments.
Foreign Currency. The Fund may use foreign currency contracts to facilitate transactions in foreign-denominated securities. Gains and losses from these transactions may arise from changes in the value of the foreign currency or if the counterparties do not perform under the contracts' terms.
Foreign-denominated assets, including investment securities, and liabilities are translated into U.S. dollars at the exchange rates at period end. Purchases and sales of investment securities, income and dividends received and expenses denominated in foreign currencies are translated into U.S. dollars at the exchange rate in effect on the transaction date.
The effects of exchange rate fluctuations on investments are included with the net realized and unrealized gain (loss) on investment securities. Other foreign currency transactions resulting in realized and unrealized gain (loss) are disclosed separately.
Investment Transactions and Income. For financial reporting purposes, the Fund's investment holdings and NAV include trades executed through the end of the last business day of the period. The NAV per share for processing shareholder transactions is calculated as of the close of business of the New York Stock Exchange (NYSE) normally 4:00 p.m. Eastern time and includes trades executed through the end of the prior business day. Gains and losses on securities sold are determined on the basis of identified cost and includes proceeds received from litigation. Dividend income is recorded on the ex-dividend date, except for certain dividends from foreign securities where the ex-dividend date may have passed, which are recorded as soon as the Fund is informed of the ex-dividend date. Non-cash dividends included in dividend income, if any, are recorded at the fair market value of the securities received. Income and capital gain distributions from Fidelity Central Funds, if any, are recorded on the ex-dividend date. Certain distributions received by the Fund represent a return of capital or capital gain. The Fund determines the components of these distributions subsequent to the ex-dividend date, based upon receipt of tax filings or other correspondence relating to the underlying investment. These distributions are recorded as a reduction of cost of investments and/or as a realized gain. Investment income is recorded net of foreign taxes withheld where recovery of such taxes is uncertain.
Class Allocations and Expenses. Investment income, realized and unrealized capital gains and losses, common expenses of the Fund, and certain fund-level expense reductions, if any, are allocated daily on a pro-rata basis to each class based on the relative net assets of each class to the total net assets of the Fund. Each class differs with respect to transfer agent and distribution and service plan fees incurred. Certain expense reductions may also differ by class. For the reporting period, the allocated portion of income and expenses to each class as a percent of its average net assets may vary due to the timing of recording these transactions in relation to fluctuating net assets of the classes. Expenses directly attributable to a fund are charged to that fund. Expenses attributable to more than one fund are allocated among the respective funds on the basis of relative net assets or other appropriate methods. Expense estimates are accrued in the period to which they relate and adjustments are made when actual amounts are known.
Income Tax Information and Distributions to Shareholders. Each year, the Fund intends to qualify as a regulated investment company under Subchapter M of the Internal Revenue Code, including distributing substantially all of its taxable income and realized gains. As a result, no provision for U.S. Federal income taxes is required. The Fund files a U.S. federal tax return, in addition to state and local tax returns as required. The Fund's federal income tax returns are subject to examination by the Internal Revenue Service (IRS) for a period of three fiscal years after they are filed. State and local tax returns may be subject to examination for an additional fiscal year depending on the jurisdiction. Foreign taxes are provided for based on the Fund's understanding of the tax rules and rates that exist in the foreign markets in which it invests.
Distributions are declared and recorded on the ex-dividend date. Income dividends and capital gain distributions are declared separately for each class. Income and capital gain distributions are determined in accordance with income tax regulations, which may differ from GAAP.
Capital accounts within the financial statements are adjusted for permanent book-tax differences. These adjustments have no impact on net assets or the results of operations. Capital accounts are not adjusted for temporary book-tax differences which will reverse in a subsequent period.
Book-tax differences are primarily due to foreign currency transactions, passive foreign investment companies (PFIC), redemptions in kind, partnerships, net operating losses and losses deferred due to wash sales and excise tax regulations.
As of period end, the cost and unrealized appreciation (depreciation) in securities, and derivatives if applicable, for federal income tax purposes were as follows:
| Gross unrealized appreciation | $1,030,995,492 |
| Gross unrealized depreciation | (80,247,531) |
| Net unrealized appreciation (depreciation) | $950,747,961 |
| Tax cost | $3,449,113,837 |
Short-Term Trading (Redemption) Fees. Shares held by investors in the Fund less than 90 days may have been subject to a redemption fee equal to 1.50% of the NAV of shares redeemed. All redemption fees, which reduce the proceeds of the shareholder redemption, are retained by the Fund and accounted for as an addition to paid in capital. In November 2017, the Board of Trustees approved the elimination of these redemption fees effective December 18, 2017.
Restricted Securities. The Fund may invest in securities that are subject to legal or contractual restrictions on resale. These securities generally may be resold in transactions exempt from registration or to the public if the securities are registered. Disposal of these securities may involve time-consuming negotiations and expense, and prompt sale at an acceptable price may be difficult. Information regarding restricted securities is included at the end of the Fund's Schedule of Investments.
4. Purchases and Sales of Investments.
Purchases and sales of securities, other than short-term securities and in-kind transactions, aggregated $2,301,747,934 and $1,725,480,215, respectively.
5. Fees and Other Transactions with Affiliates.
Management Fee. Fidelity Management & Research Company (the investment adviser) and its affiliates provide the Fund with investment management related services for which the Fund pays a monthly management fee. The management fee is the sum of an individual fund fee rate that is based on an annual rate of .45% of the Fund's average net assets and an annualized group fee rate that averaged .24% during the period. The group fee rate is based upon the average net assets of all the mutual funds advised by the investment adviser, including any mutual funds previously advised by the investment adviser that are currently advised by Fidelity SelectCo, LLC, an affiliate of the investment adviser. The group fee rate decreases as assets under management increase and increases as assets under management decrease. In addition, the management fee is subject to a performance adjustment (up to a maximum of +/- .20% of the Fund's average net assets over a 36 month performance period). The upward or downward adjustment to the management fee is based on the relative investment performance of Small Cap Growth as compared to its benchmark index, the Russell 2000 Growth Index, over the same 36 month performance period. For the reporting period, the total annualized management fee rate, including the performance adjustment, was .81% of the Fund's average net assets. The performance adjustment included in the management fee rate may be higher or lower than the maximum performance adjustment rate due to the difference between the average net assets for the reporting and performance periods.
Distribution and Service Plan Fees. In accordance with Rule 12b-1 of the 1940 Act, the Fund has adopted separate Distribution and Service Plans for each class of shares. Certain classes pay Fidelity Distributors Corporation (FDC), an affiliate of the investment adviser, separate Distribution and Service Fees, each of which is based on an annual percentage of each class' average net assets. In addition, FDC may pay financial intermediaries for selling shares of the Fund and providing shareholder support services. For the period, the Distribution and Service Fee rates, total fees and amounts retained by FDC were as follows:
| | Distribution Fee | Service Fee | Total Fees | Retained by FDC |
| Class A | -% | .25% | $309,241 | $19,573 |
| Class M | .25% | .25% | 173,298 | – |
| Class C | .75% | .25% | 559,355 | 124,146 |
| | | | $1,041,894 | $143,719 |
Sales Load. FDC may receive a front-end sales charge of up to 5.75% for selling Class A shares and 3.50% for selling Class M shares, some of which is paid to financial intermediaries for selling shares of the Fund. Depending on the holding period, FDC may receive contingent deferred sales charges levied on Class A, Class M and Class C redemptions. The deferred sales charges are 1.00% for Class C shares, 1.00% for certain purchases of Class A shares and .25% for certain purchases of Class M shares.
For the period, sales charge amounts retained by FDC were as follows:
| | Retained by FDC |
| Class A | $90,920 |
| Class M | 7,517 |
| Class C(a) | 5,309 |
| | $103,746 |
(a) When Class C shares are initially sold, FDC pays commissions from its own resources to financial intermediaries through which the sales are made.
Transfer Agent Fees. Fidelity Investments Institutional Operations Company, Inc., (FIIOC), an affiliate of the investment adviser, is the transfer, dividend disbursing and shareholder servicing agent for each class of the Fund. FIIOC receives account fees and asset-based fees that vary according to the account size and type of account of the shareholders of the respective classes of the Fund, except for Class Z. FIIOC receives an asset-based fee of Class Z's average net assets. FIIOC pays for typesetting, printing and mailing of shareholder reports, except proxy statements.
For the period, transfer agent fees for each class were as follows:
| | Amount | % of Class-Level Average Net Assets(a) |
| Class A | $265,040 | .21 |
| Class M | 81,427 | .24 |
| Class C | 124,409 | .22 |
| Small Cap Growth | 2,314,162 | .18 |
| Class I | 457,833 | .19 |
| Class Z | 9,215 | .05 |
| | $3,252,086 | |
(a) Annualized
Accounting and Security Lending Fees. Fidelity Service Company, Inc. (FSC), an affiliate of the investment adviser, maintains the Fund's accounting records. The accounting fee is based on the level of average net assets for each month. Under a separate contract, FSC administers the security lending program. The security lending fee is based on the number and duration of lending transactions.
Brokerage Commissions. The Fund placed a portion of its portfolio transactions with brokerage firms which are affiliates of the investment adviser. Brokerage commissions are included in net realized gain (loss) and change in net unrealized appreciation (depreciation) in the Statement of Operations. The commissions paid to these affiliated firms were $98,708 for the period.
Interfund Lending Program. Pursuant to an Exemptive Order issued by the SEC, the Fund, along with other registered investment companies having management contracts with Fidelity Management & Research Company (FMR) or other affiliated entities of FMR, may participate in an interfund lending program. This program provides an alternative credit facility allowing the funds to borrow from, or lend money to, other participating affiliated funds. At period end, there were no interfund loans outstanding. The Fund's activity in this program during the period for which loans were outstanding was as follows:
| Borrower or Lender | Average Loan Balance | Weighted Average Interest Rate | Interest Expense |
| Borrower | $14,409,000 | 1.35% | $540 |
Interfund Trades. The Fund may purchase from or sell securities to other Fidelity Funds under procedures adopted by the Board. The procedures have been designed to ensure these interfund trades are executed in accordance with Rule 17a-7 of the 1940 Act. Interfund trades are included within the respective purchases and sales amounts shown in the Purchases and Sales of Investments note.
Redemptions In-Kind. During the period, 2,773,352 shares of the Fund held by an affiliated entity were redeemed in-kind for investments and cash with a value of $71,556,855. The net realized gain of $22,403,452 on investments delivered through in-kind redemptions is included in the accompanying Statement of Operations. The amount of the in-kind redemptions is included in share transactions in the accompanying Statement of Changes in Net Assets as well as the Notes to Financial Statements. The Fund recognized no gain or loss for federal income tax purposes.
Prior Fiscal Year Redemptions In-Kind. During the prior period, 3,120,161 shares of the Fund held by an affiliated entity were redeemed in kind for investments and cash with a value of $74,384,639. The Fund had a net realized gain of $18,817,235 on investments delivered through in-kind redemptions. The amount of in-kind redemptions is included in share transactions in the accompanying Statement of Changes in Net Assets as well as the Notes to Financial Statements. The Fund recognized no gain or loss for federal income tax purposes.
Other. During the period, the investment adviser reimbursed the Fund for certain losses in the amount of $1,426.
6. Committed Line of Credit.
The Fund participates with other funds managed by the investment adviser or an affiliate in a $4.25 billion credit facility (the "line of credit") to be utilized for temporary or emergency purposes to fund shareholder redemptions or for other short-term liquidity purposes. The Fund has agreed to pay commitment fees on its pro-rata portion of the line of credit, which amounted to $4,912 and is reflected in Miscellaneous expenses on the Statement of Operations. During the period, the Fund did not borrow on this line of credit.
7. Security Lending.
The Fund lends portfolio securities through a lending agent from time to time in order to earn additional income. For equity securities, a lending agent is used and may loan securities to certain qualified borrowers, including Fidelity Capital Markets (FCM), a broker-dealer affiliated with the Fund. On the settlement date of the loan, the Fund receives collateral (in the form of U.S. Treasury obligations, letters of credit and/or cash) against the loaned securities and maintains collateral in an amount not less than 100% of the market value of the loaned securities during the period of the loan. The market value of the loaned securities is determined at the close of business of the Fund and any additional required collateral is delivered to the Fund on the next business day. The Fund or borrower may terminate the loan at any time, and if the borrower defaults on its obligation to return the securities loaned because of insolvency or other reasons, the Fund may apply collateral received from the borrower against the obligation. The Fund may experience delays and costs in recovering the securities loaned. Any cash collateral received is invested in the Fidelity Securities Lending Cash Central Fund. The value of loaned securities and cash collateral at period end are disclosed on the Fund's Statement of Assets and Liabilities. The value of securities loaned to FCM at period end was $2,312,920. Security lending income represents the income earned on investing cash collateral, less rebates paid to borrowers and any lending agent fees associated with the loan, plus any premium payments received for lending certain types of securities. Security lending income is presented in the Statement of Operations as a component of income from Fidelity Central Funds and includes $272,689 from securities loaned to FCM.
8. Expense Reductions.
Commissions paid to certain brokers with whom the investment adviser, or its affiliates, places trades on behalf of the Fund include an amount in addition to trade execution, which may be rebated back to the Fund to offset certain expenses. This amount totaled $184,436 for the period. In addition, through arrangements with the Fund's custodian, credits realized as a result of certain uninvested cash balances were used to reduce the Fund's expenses. During the period, these credits reduced the Fund's custody expenses by $180.
In addition, during the period the investment adviser reimbursed and/or waived a portion of fund-level operating expenses in the amount of $18,914.
9. Distributions to Shareholders.
Distributions to shareholders of each class were as follows:
| | Six months ended
January 31, 2018 | Year ended
July 31, 2017 |
| From net investment income | | |
| Class A | $3,381 | $– |
| Class M | 405 | – |
| Class C | 2,218 | – |
| Total | $6,004 | $– |
| From net realized gain | | |
| Class A | $16,631,386 | $1,450,853 |
| Class M | 4,794,976 | 443,203 |
| Class C | 8,082,834 | 670,953 |
| Small Cap Growth | 173,515,868 | 13,079,834 |
| Class I | 31,458,120 | 1,486,748 |
| Class Z | 2,173,343 | – |
| Total | $236,656,527 | $17,131,591 |
10. Share Transactions.
Share transactions for each class were as follows and may contain automatic conversions between classes or exchanges between affiliated funds:
| | Shares | Shares | Dollars | Dollars |
| | Six months ended January 31, 2018 | Year ended July 31, 2017(a) | Six months ended January 31, 2018 | Year ended July 31, 2017(a) |
| Class A | | | | |
| Shares sold | 2,344,945 | 5,020,720 | $55,394,857 | $104,451,830 |
| Reinvestment of distributions | 737,094 | 72,980 | 16,518,353 | 1,418,726 |
| Shares redeemed | (1,129,437) | (4,804,338) | (26,486,558) | (100,455,311) |
| Net increase (decrease) | 1,952,602 | 289,362 | $45,426,652 | $5,415,245 |
| Class M | | | | |
| Shares sold | 374,411 | 722,906 | $8,592,461 | $14,585,563 |
| Reinvestment of distributions | 219,933 | 23,093 | 4,778,389 | 437,379 |
| Shares redeemed | (284,031) | (740,353) | (6,501,677) | (14,879,815) |
| Net increase (decrease) | 310,313 | 5,646 | $6,869,173 | $143,127 |
| Class C | | | | |
| Shares sold | 1,220,212 | 1,684,413 | $26,241,918 | $31,979,652 |
| Reinvestment of distributions | 394,045 | 36,440 | 7,927,935 | 645,354 |
| Shares redeemed | (599,347) | (1,001,342) | (12,675,017) | (18,971,580) |
| Net increase (decrease) | 1,014,910 | 719,511 | $21,494,836 | $13,653,426 |
| Small Cap Growth | | | | |
| Shares sold | 25,985,323 | 46,489,671 | $641,481,629 | $1,008,614,407 |
| Reinvestment of distributions | 7,124,341 | 624,373 | 166,042,299 | 12,562,394 |
| Shares redeemed | (14,155,124)(b) | (28,815,440)(c) | (351,142,494)(b) | (638,181,914)(c) |
| Net increase (decrease) | 18,954,540 | 18,298,604 | $456,381,434 | $382,994,887 |
| Class I | | | | |
| Shares sold | 10,305,574 | 11,204,169 | $253,796,032 | $245,745,969 |
| Reinvestment of distributions | 1,279,506 | 68,251 | 29,928,913 | 1,376,613 |
| Shares redeemed | (3,208,040) | (3,191,470) | (78,648,710) | (69,277,095) |
| Net increase (decrease) | 8,377,040 | 8,080,950 | $205,076,235 | $177,845,487 |
| Class Z | | | | |
| Shares sold | 2,445,240 | 782,917 | $60,882,488 | $18,185,267 |
| Reinvestment of distributions | 72,161 | – | 1,697,869 | – |
| Shares redeemed | (225,926) | (11,517) | (5,552,072) | (271,781) |
| Net increase (decrease) | 2,291,475 | 771,400 | $57,028,285 | $17,913,486 |
(a) Share transactions for Class Z are for the period February 1, 2017 (commencement of sale of shares) to July 31, 2017.
(b) Amount includes in-kind redemptions (see the Redemptions In-Kind note for additional details).
(c) Amount includes in-kind redemptions (see the Prior Year Redemptions In-Kind note for additional details).
11. Other.
The Fund's organizational documents provide former and current trustees and officers with a limited indemnification against liabilities arising in connection with the performance of their duties to the Fund. In the normal course of business, the Fund may also enter into contracts that provide general indemnifications. The Fund's maximum exposure under these arrangements is unknown as this would be dependent on future claims that may be made against the Fund. The risk of material loss from such claims is considered remote.
Shareholder Expense Example
As a shareholder of the Fund, you incur two types of costs: (1) transaction costs, including sales charges (loads) on purchase payments or redemption proceeds, redemption fees and (2) ongoing costs, including management fees, distribution and/or service (12b-1) fees and other Fund expenses. This Example is intended to help you understand your ongoing costs (in dollars) of investing in the Fund and to compare these costs with the ongoing costs of investing in other mutual funds.
The Example is based on an investment of $1,000 invested at the beginning of the period and held for the entire period (August 1, 2017 to January 31, 2018).
Actual Expenses
The first line of the accompanying table for each class of the Fund provides information about actual account values and actual expenses. You may use the information in this line, together with the amount you invested, to estimate the expenses that you paid over the period. Simply divide your account value by $1,000.00 (for example, an $8,600 account value divided by $1,000.00 = 8.6), then multiply the result by the number in the first line for a class of the Fund under the heading entitled "Expenses Paid During Period" to estimate the expenses you paid on your account during this period. A small balance maintenance fee of $12.00 that is charged once a year may apply for certain accounts with a value of less than $2,000. This fee is not included in the table below. If it was, the estimate of expenses you paid during the period would be higher, and your ending account value lower, by this amount. In addition, the Fund, as a shareholder in the underlying Fidelity Central Funds, will indirectly bear its pro-rata share of the fees and expenses incurred by the underlying Fidelity Central Funds. These fees and expenses are not included in the Fund's annualized expense ratio used to calculate the expense estimate in the table below.
Hypothetical Example for Comparison Purposes
The second line of the accompanying table for each class of the Fund provides information about hypothetical account values and hypothetical expenses based on a Class' actual expense ratio and an assumed rate of return of 5% per year before expenses, which is not the Class' actual return. The hypothetical account values and expenses may not be used to estimate the actual ending account balance or expenses you paid for the period. You may use this information to compare the ongoing costs of investing in the Fund and other funds. To do so, compare this 5% hypothetical example with the 5% hypothetical examples that appear in the shareholder reports of the other funds. A small balance maintenance fee of $12.00 that is charged once a year may apply for certain accounts with a value of less than $2,000. This fee is not included in the table below. If it was, the estimate of expenses you paid during the period would be higher, and your ending account value lower, by this amount. In addition, the Fund, as a shareholder in the underlying Fidelity Central Funds, will indirectly bear its pro-rata share of the fees and expenses incurred by the underlying Fidelity Central Funds. These fees and expenses are not included in the Fund's annualized expense ratio used to calculate the expense estimate in the table below.
Please note that the expenses shown in the table are meant to highlight your ongoing costs only and do not reflect any transaction costs. Therefore, the second line of the table is useful in comparing ongoing costs only, and will not help you determine the relative total costs of owning different funds. In addition, if these transactional costs were included, your costs would have been higher.
| | Annualized Expense Ratio-A | Beginning
Account Value
August 1, 2017 | Ending
Account Value
January 31, 2018 | Expenses Paid
During Period-B
August 1, 2017
to January 31, 2018 |
| Class A | 1.32% | | | |
| Actual | | $1,000.00 | $1,177.00 | $7.24 |
| Hypothetical-C | | $1,000.00 | $1,018.55 | $6.72 |
| Class M | 1.59% | | | |
| Actual | | $1,000.00 | $1,175.50 | $8.72 |
| Hypothetical-C | | $1,000.00 | $1,017.19 | $8.08 |
| Class C | 2.08% | | | |
| Actual | | $1,000.00 | $1,172.80 | $11.39 |
| Hypothetical-C | | $1,000.00 | $1,014.72 | $10.56 |
| Small Cap Growth | 1.03% | | | |
| Actual | | $1,000.00 | $1,178.60 | $5.66 |
| Hypothetical-C | | $1,000.00 | $1,020.01 | $5.24 |
| Class I | 1.04% | | | |
| Actual | | $1,000.00 | $1,178.60 | $5.71 |
| Hypothetical-C | | $1,000.00 | $1,019.96 | $5.30 |
| Class Z | .90% | | | |
| Actual | | $1,000.00 | $1,179.60 | $4.94 |
| Hypothetical-C | | $1,000.00 | $1,020.67 | $4.58 |
| | | | | |
| | | | | |
| | | | | |
| | | | | |
| | | | | |
| | | | | |
A Annualized expense ratio reflects expenses net of applicable fee waivers.
B Expenses are equal to each Class' annualized expense ratio, multiplied by the average account value over the period, multiplied by 184/365 (to reflect the one-half year period).
C 5% return per year before expenses.
Corporate Headquarters
245 Summer St.
Boston, MA 02210
www.fidelity.com
SCP-SANN-0318
1.803700.113
Fidelity® Small Cap Growth K6 Fund
Semi-Annual Report January 31, 2018 |
|
Contents
To view a fund's proxy voting guidelines and proxy voting record for the 12-month period ended June 30, visit http://www.fidelity.com/proxyvotingresults or visit the Securities and Exchange Commission's (SEC) web site at http://www.sec.gov.
You may also call 1-800-835-5092 to request a free copy of the proxy voting guidelines.
Standard & Poor's, S&P and S&P 500 are registered service marks of The McGraw-Hill Companies, Inc. and have been licensed for use by Fidelity Distributors Corporation.
Other third-party marks appearing herein are the property of their respective owners.
All other marks appearing herein are registered or unregistered trademarks or service marks of FMR LLC or an affiliated company. © 2018 FMR LLC. All rights reserved.
This report and the financial statements contained herein are submitted for the general information of the shareholders of the Fund. This report is not authorized for distribution to prospective investors in the Fund unless preceded or accompanied by an effective prospectus.
A fund files its complete schedule of portfolio holdings with the SEC for the first and third quarters of each fiscal year on Form N-Q. Forms N-Q are available on the SEC’s web site at http://www.sec.gov. A fund's Forms N-Q may be reviewed and copied at the SEC’s Public Reference Room in Washington, DC. Information regarding the operation of the SEC's Public Reference Room may be obtained by calling 1-800-SEC-0330.
For a complete list of a fund's portfolio holdings, view the most recent holdings listing, semiannual report, or annual report on Fidelity's web site at http://www.fidelity.com, http://www.institutional.fidelity.com, or http://www.401k.com, as applicable.
NOT FDIC INSURED •MAY LOSE VALUE •NO BANK GUARANTEE
Neither the Fund nor Fidelity Distributors Corporation is a bank.
Investment Summary (Unaudited)
Top Ten Stocks as of January 31, 2018
| | % of fund's net assets |
| 2U, Inc. | 3.1 |
| Grand Canyon Education, Inc. | 2.2 |
| Stamps.com, Inc. | 1.8 |
| Nektar Therapeutics | 1.5 |
| Vail Resorts, Inc. | 1.4 |
| Eagle Materials, Inc. | 1.3 |
| GrubHub, Inc. | 1.3 |
| Insulet Corp. | 1.3 |
| Cavco Industries, Inc. | 1.2 |
| SiteOne Landscape Supply, Inc. | 1.2 |
| | 16.3 |
Top Five Market Sectors as of January 31, 2018
| | % of fund's net assets |
| Information Technology | 22.6 |
| Industrials | 21.1 |
| Health Care | 20.6 |
| Consumer Discretionary | 15.3 |
| Financials | 7.5 |
Asset Allocation (% of fund's net assets)
| As of January 31, 2018 * |
| | Stocks/ETFs | 97.8% |
| | Convertible Securities | 0.3% |
| | Short-Term Investments and Net Other Assets (Liabilities) | 1.9% |

* Foreign investments - 8.5%
Schedule of Investments January 31, 2018 (Unaudited)
Showing Percentage of Net Assets
| Common Stocks - 96.7% | | | |
| | | Shares | Value |
| CONSUMER DISCRETIONARY - 15.3% | | | |
| Diversified Consumer Services - 2.5% | | | |
| Bright Horizons Family Solutions, Inc. (a) | | 10,097 | $991,525 |
| Grand Canyon Education, Inc. (a) | | 74,738 | 6,949,887 |
| | | | 7,941,412 |
| Hotels, Restaurants & Leisure - 5.9% | | | |
| Boyd Gaming Corp. | | 56,900 | 2,245,843 |
| Cedar Fair LP (depositary unit) | | 47,155 | 3,197,109 |
| Churchill Downs, Inc. | | 7,818 | 2,024,862 |
| Dunkin' Brands Group, Inc. | | 24,149 | 1,561,233 |
| Marriott Vacations Worldwide Corp. | | 10,891 | 1,659,026 |
| Texas Roadhouse, Inc. Class A | | 28,132 | 1,651,911 |
| U.S. Foods Holding Corp. (a) | | 67,099 | 2,155,891 |
| Vail Resorts, Inc. | | 19,857 | 4,339,946 |
| | | | 18,835,821 |
| Household Durables - 3.2% | | | |
| Cavco Industries, Inc. (a) | | 25,768 | 3,946,369 |
| LGI Homes, Inc. (a) | | 31,635 | 2,141,057 |
| SodaStream International Ltd. (a) | | 26,304 | 2,068,284 |
| Taylor Morrison Home Corp. (a) | | 81,149 | 2,063,619 |
| | | | 10,219,329 |
| Internet & Direct Marketing Retail - 0.2% | | | |
| Gaia, Inc. Class A (a) | | 73,393 | 877,046 |
| Media - 0.7% | | | |
| Cinemark Holdings, Inc. | | 59,597 | 2,193,170 |
| Multiline Retail - 0.4% | | | |
| Ollie's Bargain Outlet Holdings, Inc. (a) | | 23,449 | 1,302,592 |
| Specialty Retail - 1.4% | | | |
| Michaels Companies, Inc. (a) | | 74,305 | 1,996,575 |
| The Children's Place Retail Stores, Inc. | | 17,084 | 2,559,183 |
| | | | 4,555,758 |
| Textiles, Apparel & Luxury Goods - 1.0% | | | |
| Carter's, Inc. | | 12,380 | 1,489,314 |
| Columbia Sportswear Co. | | 13,963 | 1,042,617 |
| Emerald Expositions Events, Inc. | | 362 | 7,812 |
| PetIQ, Inc. Class A (b) | | 24,543 | 589,032 |
| | | | 3,128,775 |
|
| TOTAL CONSUMER DISCRETIONARY | | | 49,053,903 |
|
| CONSUMER STAPLES - 3.1% | | | |
| Food & Staples Retailing - 0.6% | | | |
| Performance Food Group Co. (a) | | 59,007 | 2,026,890 |
| Food Products - 0.9% | | | |
| Nomad Foods Ltd. (a) | | 71,000 | 1,209,840 |
| Post Holdings, Inc. (a) | | 23,418 | 1,772,040 |
| | | | 2,981,880 |
| Household Products - 1.0% | | | |
| Central Garden & Pet Co. (a) | | 32,799 | 1,285,393 |
| Central Garden & Pet Co. Class A (non-vtg.) (a) | | 49,975 | 1,885,057 |
| | | | 3,170,450 |
| Personal Products - 0.6% | | | |
| Herbalife Ltd. (a) | | 23,119 | 1,918,646 |
|
| TOTAL CONSUMER STAPLES | | | 10,097,866 |
|
| FINANCIALS - 7.5% | | | |
| Banks - 1.2% | | | |
| First Citizen Bancshares, Inc. | | 6,887 | 2,929,799 |
| Prosperity Bancshares, Inc. | | 11,543 | 874,959 |
| | | | 3,804,758 |
| Capital Markets - 3.4% | | | |
| Apollo Global Management LLC Class A | | 92,256 | 3,298,152 |
| CBOE Holdings, Inc. | | 15,872 | 2,133,038 |
| Eaton Vance Corp. (non-vtg.) | | 25,839 | 1,493,494 |
| Lazard Ltd. Class A | | 28,267 | 1,655,598 |
| MSCI, Inc. | | 16,281 | 2,266,804 |
| | | | 10,847,086 |
| Diversified Financial Services - 0.6% | | | |
| Cotiviti Holdings, Inc. (a) | | 56,302 | 1,970,570 |
| Insurance - 0.7% | | | |
| Enstar Group Ltd. (a) | | 11,229 | 2,331,140 |
| Thrifts & Mortgage Finance - 1.6% | | | |
| Essent Group Ltd. (a) | | 68,698 | 3,195,831 |
| Meridian Bancorp, Inc. Maryland | | 88,737 | 1,814,672 |
| | | | 5,010,503 |
|
| TOTAL FINANCIALS | | | 23,964,057 |
|
| HEALTH CARE - 20.6% | | | |
| Biotechnology - 8.2% | | | |
| Acceleron Pharma, Inc. (a) | | 25,674 | 1,065,728 |
| Achaogen, Inc. (a)(b) | | 37,476 | 411,112 |
| Acorda Therapeutics, Inc. (a) | | 30,560 | 793,032 |
| Adamas Pharmaceuticals, Inc. (a) | | 23,297 | 881,558 |
| Alder Biopharmaceuticals, Inc. (a) | | 53,890 | 762,544 |
| Amarin Corp. PLC ADR (a) | | 68,149 | 255,559 |
| AnaptysBio, Inc. | | 19,216 | 2,025,174 |
| Arena Pharmaceuticals, Inc. (a) | | 5,200 | 194,584 |
| Argenx SE ADR | | 15,059 | 1,168,277 |
| Ascendis Pharma A/S sponsored ADR (a) | | 19,622 | 1,000,133 |
| Audentes Therapeutics, Inc. (a) | | 37,277 | 1,308,423 |
| Blueprint Medicines Corp. (a) | | 23,740 | 1,867,151 |
| Epizyme, Inc. (a) | | 32,856 | 530,624 |
| Fate Therapeutics, Inc. (a)(b) | | 95,807 | 875,676 |
| FibroGen, Inc. (a) | | 24,140 | 1,413,397 |
| Five Prime Therapeutics, Inc. (a) | | 6,174 | 123,480 |
| Global Blood Therapeutics, Inc. (a) | | 30,797 | 1,783,146 |
| Heron Therapeutics, Inc. (a) | | 13,353 | 289,092 |
| Insmed, Inc. (a) | | 3,507 | 89,218 |
| Intercept Pharmaceuticals, Inc. (a) | | 1,207 | 74,955 |
| Kura Oncology, Inc. (a)(b) | | 38,600 | 756,560 |
| Ligand Pharmaceuticals, Inc. Class B (a) | | 7,486 | 1,179,943 |
| Loxo Oncology, Inc. (a) | | 20,472 | 2,077,294 |
| Madrigal Pharmaceuticals, Inc. (a) | | 3,819 | 566,816 |
| Mirati Therapeutics, Inc. (a) | | 1,100 | 28,490 |
| Sarepta Therapeutics, Inc. (a) | | 33,306 | 2,182,875 |
| Stemline Therapeutics, Inc. (a) | | 57,600 | 918,720 |
| TESARO, Inc. (a) | | 6,049 | 408,066 |
| Ultragenyx Pharmaceutical, Inc. (a) | | 20,264 | 1,081,084 |
| Zai Lab Ltd. ADR | | 1,752 | 47,234 |
| | | | 26,159,945 |
| Health Care Equipment & Supplies - 4.9% | | | |
| Cantel Medical Corp. | | 25,009 | 2,774,248 |
| ICU Medical, Inc. (a) | | 7,883 | 1,804,813 |
| Inogen, Inc. (a) | | 9,052 | 1,102,896 |
| Insulet Corp. (a) | | 54,166 | 4,145,324 |
| iRhythm Technologies, Inc. (a) | | 23,731 | 1,415,080 |
| Novocure Ltd. (a) | | 77,231 | 1,733,836 |
| Quanterix Corp. (a) | | 57,996 | 1,206,897 |
| Tactile Systems Technology, Inc. (a)(b) | | 18,958 | 597,746 |
| Wright Medical Group NV (a) | | 40,776 | 927,654 |
| | | | 15,708,494 |
| Health Care Providers & Services - 2.6% | | | |
| G1 Therapeutics, Inc. | | 38,156 | 912,310 |
| LHC Group, Inc. (a) | | 16,871 | 1,059,499 |
| Magellan Health Services, Inc. (a) | | 11,970 | 1,192,212 |
| Molina Healthcare, Inc. (a) | | 21,719 | 1,984,248 |
| Premier, Inc. (a) | | 41,905 | 1,359,817 |
| Tivity Health, Inc. (a) | | 46,480 | 1,801,100 |
| | | | 8,309,186 |
| Health Care Technology - 0.3% | | | |
| athenahealth, Inc. (a) | | 6,165 | 772,536 |
| HTG Molecular Diagnostics (a) | | 47,300 | 168,861 |
| | | | 941,397 |
| Life Sciences Tools & Services - 0.8% | | | |
| ICON PLC (a) | | 23,704 | 2,596,062 |
| Pharmaceuticals - 3.8% | | | |
| Aclaris Therapeutics, Inc. (a) | | 27,206 | 601,797 |
| Aerie Pharmaceuticals, Inc. (a) | | 23,989 | 1,315,797 |
| Akcea Therapeutics, Inc. (b) | | 38,079 | 824,410 |
| Avexis, Inc. (a) | | 14,627 | 1,809,799 |
| Catalent, Inc. (a) | | 39,222 | 1,825,392 |
| Nektar Therapeutics (a) | | 57,943 | 4,844,614 |
| The Medicines Company (a) | | 12,661 | 419,459 |
| Theravance Biopharma, Inc. (a) | | 11,898 | 314,583 |
| Zogenix, Inc. (a) | | 4,092 | 148,744 |
| | | | 12,104,595 |
|
| TOTAL HEALTH CARE | | | 65,819,679 |
|
| INDUSTRIALS - 21.1% | | | |
| Aerospace & Defense - 3.2% | | | |
| BWX Technologies, Inc. | | 56,281 | 3,570,467 |
| Elbit Systems Ltd. | | 5,906 | 884,660 |
| HEICO Corp. Class A | | 52,516 | 3,458,179 |
| Teledyne Technologies, Inc. (a) | | 11,483 | 2,192,334 |
| | | | 10,105,640 |
| Air Freight & Logistics - 0.4% | | | |
| Atlas Air Worldwide Holdings, Inc. (a) | | 22,862 | 1,287,131 |
| Airlines - 1.8% | | | |
| Allegiant Travel Co. | | 12,555 | 1,999,384 |
| SkyWest, Inc. | | 65,644 | 3,659,653 |
| | | | 5,659,037 |
| Commercial Services & Supplies - 2.4% | | | |
| Copart, Inc. (a) | | 67,795 | 2,987,726 |
| Healthcare Services Group, Inc. | | 22,288 | 1,229,852 |
| The Brink's Co. | | 21,222 | 1,769,915 |
| Viad Corp. | | 32,126 | 1,824,757 |
| | | | 7,812,250 |
| Construction & Engineering - 3.6% | | | |
| Dycom Industries, Inc. (a) | | 23,664 | 2,761,825 |
| EMCOR Group, Inc. | | 30,677 | 2,493,427 |
| Fluor Corp. | | 12,465 | 756,626 |
| Jacobs Engineering Group, Inc. | | 26,219 | 1,821,172 |
| KBR, Inc. | | 181,247 | 3,686,564 |
| | | | 11,519,614 |
| Electrical Equipment - 1.2% | | | |
| Generac Holdings, Inc. (a) | | 76,634 | 3,749,702 |
| Industrial Conglomerates - 1.1% | | | |
| ITT, Inc. | | 63,237 | 3,541,272 |
| Machinery - 3.5% | | | |
| AGCO Corp. | | 21,184 | 1,538,382 |
| Allison Transmission Holdings, Inc. | | 52,250 | 2,311,540 |
| John Bean Technologies Corp. | | 16,582 | 1,886,203 |
| Oshkosh Corp. | | 20,602 | 1,869,013 |
| WABCO Holdings, Inc. (a) | | 24,043 | 3,711,999 |
| | | | 11,317,137 |
| Professional Services - 1.9% | | | |
| Exponent, Inc. | | 38,118 | 2,826,450 |
| On Assignment, Inc. (a) | | 43,611 | 3,339,294 |
| | | | 6,165,744 |
| Road & Rail - 0.3% | | | |
| Marten Transport Ltd. | | 39,449 | 915,217 |
| Trading Companies & Distributors - 1.7% | | | |
| SiteOne Landscape Supply, Inc. (a) | | 49,390 | 3,761,542 |
| Univar, Inc. (a) | | 55,397 | 1,654,154 |
| | | | 5,415,696 |
|
| TOTAL INDUSTRIALS | | | 67,488,440 |
|
| INFORMATION TECHNOLOGY - 22.3% | | | |
| Electronic Equipment & Components - 2.2% | | | |
| Dolby Laboratories, Inc. Class A | | 23,635 | 1,520,676 |
| FLIR Systems, Inc. | | 21,188 | 1,085,037 |
| II-VI, Inc. (a) | | 29,132 | 1,242,480 |
| Novanta, Inc. (a) | | 55,539 | 3,215,708 |
| | | | 7,063,901 |
| Internet Software & Services - 10.2% | | | |
| 2U, Inc. (a) | | 134,944 | 10,022,285 |
| Alarm.com Holdings, Inc. (a) | | 17,385 | 667,236 |
| ANGI Homeservices, Inc. Class A (a) | | 9,000 | 120,240 |
| Five9, Inc. (a) | | 30,604 | 796,010 |
| GoDaddy, Inc. (a) | | 46,662 | 2,577,142 |
| Gogo, Inc. (a)(b) | | 113,699 | 1,096,058 |
| GrubHub, Inc. (a)(b) | | 57,588 | 4,160,733 |
| Instructure, Inc. (a) | | 57,582 | 2,067,194 |
| MINDBODY, Inc. (a)(b) | | 52,162 | 1,833,494 |
| New Relic, Inc. (a) | | 22,327 | 1,333,592 |
| Okta, Inc. | | 48,190 | 1,419,196 |
| Stamps.com, Inc. (a) | | 27,448 | 5,595,275 |
| Yext, Inc. | | 80,178 | 966,145 |
| | | | 32,654,600 |
| IT Services - 3.1% | | | |
| EPAM Systems, Inc. (a) | | 25,999 | 3,054,363 |
| Genpact Ltd. | | 65,045 | 2,207,627 |
| Interxion Holding N.V. (a) | | 16,618 | 1,042,780 |
| Leidos Holdings, Inc. | | 54,121 | 3,604,459 |
| | | | 9,909,229 |
| Semiconductors & Semiconductor Equipment - 1.9% | | | |
| Entegris, Inc. | | 114,550 | 3,728,603 |
| Integrated Device Technology, Inc. (a) | | 34,138 | 1,020,726 |
| PDF Solutions, Inc. (a) | | 97,451 | 1,333,130 |
| | | | 6,082,459 |
| Software - 4.9% | | | |
| Everbridge, Inc. (a) | | 83,737 | 2,703,030 |
| HubSpot, Inc. (a) | | 23,927 | 2,322,115 |
| Paycom Software, Inc. (a) | | 24,090 | 2,207,608 |
| Proofpoint, Inc. (a) | | 16,069 | 1,639,359 |
| PROS Holdings, Inc. (a) | | 61,365 | 1,782,040 |
| RingCentral, Inc. (a) | | 38,136 | 2,070,785 |
| Take-Two Interactive Software, Inc. (a) | | 11,819 | 1,497,113 |
| Workiva, Inc. (a) | | 63,129 | 1,407,777 |
| | | | 15,629,827 |
|
| TOTAL INFORMATION TECHNOLOGY | | | 71,340,016 |
|
| MATERIALS - 4.8% | | | |
| Chemicals - 1.3% | | | |
| Orion Engineered Carbons SA | | 21,010 | 618,745 |
| The Chemours Co. LLC | | 69,967 | 3,611,697 |
| | | | 4,230,442 |
| Construction Materials - 2.1% | | | |
| Eagle Materials, Inc. | | 38,529 | 4,317,174 |
| Summit Materials, Inc. | | 77,478 | 2,475,422 |
| | | | 6,792,596 |
| Containers & Packaging - 1.1% | | | |
| Avery Dennison Corp. | | 18,289 | 2,243,695 |
| Berry Global Group, Inc. (a) | | 19,665 | 1,163,971 |
| | | | 3,407,666 |
| Paper & Forest Products - 0.3% | | | |
| Neenah, Inc. | | 10,799 | 977,310 |
| Quintis Ltd. (a)(c) | | 473,487 | 4 |
| | | | 977,314 |
|
| TOTAL MATERIALS | | | 15,408,018 |
|
| REAL ESTATE - 1.6% | | | |
| Equity Real Estate Investment Trusts (REITs) - 1.5% | | | |
| Hudson Pacific Properties, Inc. | | 33,436 | 1,068,949 |
| Rexford Industrial Realty, Inc. | | 42,302 | 1,255,946 |
| Store Capital Corp. | | 45,543 | 1,116,259 |
| Terreno Realty Corp. | | 37,890 | 1,348,884 |
| | | | 4,790,038 |
| Real Estate Management & Development - 0.1% | | | |
| Redfin Corp. | | 20,717 | 420,555 |
|
| TOTAL REAL ESTATE | | | 5,210,593 |
|
| UTILITIES - 0.4% | | | |
| Independent Power and Renewable Electricity Producers - 0.4% | | | |
| NRG Yield, Inc. Class C | | 30,202 | 570,818 |
| Ormat Technologies, Inc. | | 10,191 | 714,185 |
| | | | 1,285,003 |
| TOTAL COMMON STOCKS | | | |
| (Cost $279,035,378) | | | 309,667,575 |
|
| Convertible Preferred Stocks - 0.3% | | | |
| INFORMATION TECHNOLOGY - 0.3% | | | |
| Software - 0.3% | | | |
| Compass, Inc. Series E (c)(d) | | | |
| (Cost $1,124,254) | | 16,661 | 1,124,254 |
|
| Investment Companies - 1.1% | | | |
| iShares Russell 2000 Growth Index ETF | | | |
| (Cost $3,471,520) | | 17,953 | 3,478,394 |
|
| Money Market Funds - 2.2% | | | |
| Fidelity Cash Central Fund, 1.39% (e) | | 2,780,438 | 2,780,994 |
| Fidelity Securities Lending Cash Central Fund 1.40% (e)(f) | | 4,121,658 | 4,122,070 |
| TOTAL MONEY MARKET FUNDS | | | |
| (Cost $6,903,064) | | | 6,903,064 |
| TOTAL INVESTMENT IN SECURITIES - 100.3% | | | |
| (Cost $290,534,216) | | | 321,173,287 |
| NET OTHER ASSETS (LIABILITIES) - (0.3)% | | | (973,875) |
| NET ASSETS - 100% | | | $320,199,412 |
Security Type Abbreviations
ETF – Exchange-Traded Fund
Legend
(a) Non-income producing
(b) Security or a portion of the security is on loan at period end.
(c) Level 3 security
(d) Restricted securities - Investment in securities not registered under the Securities Act of 1933 (excluding 144A issues). At the end of the period, the value of restricted securities (excluding 144A issues) amounted to $1,124,254 or 0.4% of net assets.
(e) Affiliated fund that is generally available only to investment companies and other accounts managed by Fidelity Investments. The rate quoted is the annualized seven-day yield of the fund at period end. A complete unaudited listing of the fund's holdings as of its most recent quarter end is available upon request. In addition, each Fidelity Central Fund's financial statements are available on the SEC's website or upon request.
(f) Investment made with cash collateral received from securities on loan.
Additional information on each restricted holding is as follows:
| Security | Acquisition Date | Acquisition Cost |
| Compass, Inc. Series E | 11/3/17 | $1,124,254 |
Affiliated Central Funds
Information regarding fiscal year to date income earned by the Fund from investments in Fidelity Central Funds is as follows:
| Fund | Income earned |
| Fidelity Cash Central Fund | $34,049 |
| Fidelity Securities Lending Cash Central Fund | 50,961 |
| Total | $85,010 |
Amounts in the income column in the above table include any capital gain distributions from underlying funds, which are presented in the corresponding line-item in the Statement of Operations if applicable.
Investment Valuation
The following is a summary of the inputs used, as of January 31, 2018, involving the Fund's assets and liabilities carried at fair value. The inputs or methodology used for valuing securities may not be an indication of the risk associated with investing in those securities. For more information on valuation inputs, and their aggregation into the levels used below, please refer to the Investment Valuation section in the accompanying Notes to Financial Statements.
| | Valuation Inputs at Reporting Date: |
| Description | Total | Level 1 | Level 2 | Level 3 |
| Investments in Securities: | | | | |
| Equities: | | | | |
| Consumer Discretionary | $49,053,903 | $49,053,903 | $-- | $-- |
| Consumer Staples | 10,097,866 | 10,097,866 | -- | -- |
| Financials | 23,964,057 | 23,964,057 | -- | -- |
| Health Care | 65,819,679 | 65,819,679 | -- | -- |
| Industrials | 67,488,440 | 67,488,440 | -- | -- |
| Information Technology | 72,464,270 | 71,340,016 | -- | 1,124,254 |
| Materials | 15,408,018 | 15,408,014 | -- | 4 |
| Real Estate | 5,210,593 | 5,210,593 | -- | -- |
| Utilities | 1,285,003 | 1,285,003 | -- | -- |
| Investment Companies | 3,478,394 | 3,478,394 | -- | -- |
| Money Market Funds | 6,903,064 | 6,903,064 | -- | -- |
| Total Investments in Securities: | $321,173,287 | $320,049,029 | $-- | $1,124,258 |
See accompanying notes which are an integral part of the financial statements.
Financial Statements
Statement of Assets and Liabilities
| | | January 31, 2018 (Unaudited) |
| Assets | | |
Investment in securities, at value (including securities loaned of $3,904,730) — See accompanying schedule:
Unaffiliated issuers (cost $283,631,152) | $314,270,223 | |
| Fidelity Central Funds (cost $6,903,064) | 6,903,064 | |
| Total Investment in Securities (cost $290,534,216) | | $321,173,287 |
| Cash | | 479,597 |
| Receivable for investments sold | | 4,917,499 |
| Receivable for fund shares sold | | 611,583 |
| Dividends receivable | | 20,263 |
| Distributions receivable from Fidelity Central Funds | | 37,046 |
| Other receivables | | 4,231 |
| Total assets | | 327,243,506 |
| Liabilities | | |
| Payable for investments purchased | $2,614,452 | |
| Payable for fund shares redeemed | 174,880 | |
| Accrued management fee | 132,537 | |
| Collateral on securities loaned | 4,122,225 | |
| Total liabilities | | 7,044,094 |
| Net Assets | | $320,199,412 |
| Net Assets consist of: | | |
| Paid in capital | | $289,647,067 |
| Accumulated net investment loss | | (96,115) |
| Accumulated undistributed net realized gain (loss) on investments | | 9,389 |
| Net unrealized appreciation (depreciation) on investments | | 30,639,071 |
| Net Assets, for 26,094,785 shares outstanding | | $320,199,412 |
| Net Asset Value, offering price and redemption price per share ($320,199,412 ÷ 26,094,785 shares) | | $12.27 |
See accompanying notes which are an integral part of the financial statements.
Statement of Operations
| | | Six months ended January 31, 2018 (Unaudited) |
| Investment Income | | |
| Dividends | | $389,109 |
| Income from Fidelity Central Funds (including $50,961 from security lending) | | 85,010 |
| Total income | | 474,119 |
| Expenses | | |
| Management fee | $541,304 | |
| Independent trustees' fees and expenses | 249 | |
| Total expenses before reductions | 541,553 | |
| Expense reductions | (7,827) | 533,726 |
| Net investment income (loss) | | (59,607) |
| Realized and Unrealized Gain (Loss) | | |
| Net realized gain (loss) on: | | |
| Investment securities: | | |
| Unaffiliated issuers | 174,577 | |
| Fidelity Central Funds | (155) | |
| Total net realized gain (loss) | | 174,422 |
| Change in net unrealized appreciation (depreciation) on investment securities | | 30,696,004 |
| Net gain (loss) | | 30,870,426 |
| Net increase (decrease) in net assets resulting from operations | | $30,810,819 |
See accompanying notes which are an integral part of the financial statements.
Statement of Changes in Net Assets
| | Six months ended January 31, 2018 (Unaudited) | For the period
May 25, 2017 (commencement of operations) to July 31, 2017 |
| Increase (Decrease) in Net Assets | | |
| Operations | | |
| Net investment income (loss) | $(59,607) | $(1,752) |
| Net realized gain (loss) | 174,422 | 905 |
| Change in net unrealized appreciation (depreciation) | 30,696,004 | (56,933) |
| Net increase (decrease) in net assets resulting from operations | 30,810,819 | (57,780) |
| Distributions to shareholders from net investment income | (36,508) | – |
| Distributions to shareholders from net realized gain | (164,284) | – |
| Total distributions | (200,792) | – |
| Share transactions | | |
| Proceeds from sales of shares | 242,376,922 | 74,935,286 |
| Reinvestment of distributions | 200,792 | – |
| Cost of shares redeemed | (27,809,091) | (56,744) |
| Net increase (decrease) in net assets resulting from share transactions | 214,768,623 | 74,878,542 |
| Total increase (decrease) in net assets | 245,378,650 | 74,820,762 |
| Net Assets | | |
| Beginning of period | 74,820,762 | – |
| End of period | $320,199,412 | $74,820,762 |
| Other Information | | |
| Accumulated net investment loss end of period | $(96,115) | $– |
| Shares | | |
| Sold | 21,345,903 | 7,186,659 |
| Issued in reinvestment of distributions | 17,629 | – |
| Redeemed | (2,449,960) | (5,446) |
| Net increase (decrease) | 18,913,572 | 7,181,213 |
See accompanying notes which are an integral part of the financial statements.
Financial Highlights
Fidelity Small Cap Growth K6 Fund
| | Six months ended (Unaudited) January 31, | Years endedJuly 31, |
| | 2018 | 2017 A |
| Selected Per–Share Data | | |
| Net asset value, beginning of period | $10.42 | $10.00 |
| Income from Investment Operations | | |
| Net investment income (loss)B | –C | (.01) |
| Net realized and unrealized gain (loss) | 1.86 | .43 |
| Total from investment operations | 1.86 | .42 |
| Distributions from net investment income | –C | – |
| Distributions from net realized gain | (.01) | – |
| Total distributions | (.01) | – |
| Net asset value, end of period | $12.27 | $10.42 |
| Total ReturnD,E | 17.87% | 4.20% |
| Ratios to Average Net AssetsF,G | | |
| Expenses before reductions | .60%H | .60%H |
| Expenses net of fee waivers, if any | .60%H | .60%H |
| Expenses net of all reductions | .60%H | .60%H |
| Net investment income (loss) | (.07)%H | (.45)%H |
| Supplemental Data | | |
| Net assets, end of period (000 omitted) | $320,199 | $74,821 |
| Portfolio turnover rateI | 117%H,J | 79%J,K |
A For the period May 25, 2017 (commencement of operations) to July 31, 2017.
B Calculated based on average shares outstanding during the period.
C Amount represents less than $.005 per share.
D Total returns for periods of less than one year are not annualized.
E Total returns would have been lower if certain expenses had not been reduced during the applicable periods shown.
F Fees and expenses of any underlying Fidelity Central Funds are not included in the Fund's expense ratio. The Fund indirectly bears its proportionate share of the expenses of any underlying Fidelity Central Funds.
G Expense ratios reflect operating expenses of the Fund. Expenses before reductions do not reflect amounts reimbursed by the investment adviser or reductions from brokerage service arrangements or reductions from other expense offset arrangements and do not represent the amount paid by the Fund during periods when reimbursements or reductions occur. Expense ratios before reductions for start-up periods may not be representative of longer term operating periods. Expenses net of fee waivers reflect expenses after reimbursement by the investment adviser but prior to reductions from brokerage service arrangements or other expense offset arrangements. Expenses net of all reductions represent the net expenses paid by the Fund.
H Annualized
I Amount does not include the portfolio activity of any underlying Fidelity Central Funds.
J Portfolio turnover rate excludes securities received or delivered in-kind.
K Amount not annualized.
See accompanying notes which are an integral part of the financial statements.
Notes to Financial Statements (Unaudited)
For the period ended January 31, 2018
1. Organization.
Fidelity Small Cap Growth K6 Fund (the Fund) is a fund of Fidelity Securities Fund (the Trust) and is authorized to issue an unlimited number of shares. Share transactions on the Statement of Changes in Net Assets may contain exchanges between affiliated funds. The Trust is registered under the Investment Company Act of 1940, as amended (the 1940 Act), as an open-end management investment company organized as a Massachusetts business trust. Shares generally are available only to employer-sponsored retirement plans that are recordkept by Fidelity, or to certain employer-sponsored retirement plans that are not recordkept by Fidelity.
Effective the close of business on February 2, 2018, the Fund is closed to new accounts with certain exceptions.
2. Investments in Fidelity Central Funds.
The Fund invests in Fidelity Central Funds, which are open-end investment companies generally available only to other investment companies and accounts managed by the investment adviser and its affiliates. The Fund's Schedule of Investments lists each of the Fidelity Central Funds held as of period end, if any, as an investment of the Fund, but does not include the underlying holdings of each Fidelity Central Fund. As an Investing Fund, the Fund indirectly bears its proportionate share of the expenses of the underlying Fidelity Central Funds.
The Money Market Central Funds seek preservation of capital and current income and are managed by Fidelity Investments Money Management, Inc. (FIMM), an affiliate of the investment adviser. Annualized expenses of the Money Market Central Funds as of their most recent shareholder report date are less than .005%.
A complete unaudited list of holdings for each Fidelity Central Fund is available upon request or at the Securities and Exchange Commission (the SEC) website at www.sec.gov. In addition, the financial statements of the Fidelity Central Funds are available on the SEC website or upon request.
3. Significant Accounting Policies.
The Fund is an investment company and applies the accounting and reporting guidance of the Financial Accounting Standards Board (FASB) Accounting Standards Codification Topic 946 Financial Services – Investments Companies. The financial statements have been prepared in conformity with accounting principles generally accepted in the United States of America (GAAP), which require management to make certain estimates and assumptions at the date of the financial statements. Actual results could differ from those estimates. Subsequent events, if any, through the date that the financial statements were issued have been evaluated in the preparation of the financial statements. The following summarizes the significant accounting policies of the Fund:
Investment Valuation. Investments are valued as of 4:00 p.m. Eastern time on the last calendar day of the period. The Board of Trustees (the Board) has delegated the day to day responsibility for the valuation of the Fund's investments to the Fair Value Committee (the Committee) established by the Fund's investment adviser. In accordance with valuation policies and procedures approved by the Board, the Fund attempts to obtain prices from one or more third party pricing vendors or brokers to value its investments. When current market prices, quotations or currency exchange rates are not readily available or reliable, investments will be fair valued in good faith by the Committee, in accordance with procedures adopted by the Board. Factors used in determining fair value vary by investment type and may include market or investment specific events. The frequency with which these procedures are used cannot be predicted and they may be utilized to a significant extent. The Committee oversees the Fund's valuation policies and procedures and reports to the Board on the Committee's activities and fair value determinations. The Board monitors the appropriateness of the procedures used in valuing the Fund's investments and ratifies the fair value determinations of the Committee.
The Fund categorizes the inputs to valuation techniques used to value its investments into a disclosure hierarchy consisting of three levels as shown below:
- Level 1 – quoted prices in active markets for identical investments
- Level 2 – other significant observable inputs (including quoted prices for similar investments, interest rates, prepayment speeds, etc.)
- Level 3 – unobservable inputs (including the Fund's own assumptions based on the best information available)
Valuation techniques used to value the Fund's investments by major category are as follows:
Equity securities, including restricted securities, for which market quotations are readily available, are valued at the last reported sale price or official closing price as reported by a third party pricing vendor on the primary market or exchange on which they are traded and are categorized as Level 1 in the hierarchy. In the event there were no sales during the day or closing prices are not available, securities are valued at the last quoted bid price or may be valued using the last available price and are generally categorized as Level 2 in the hierarchy. For foreign equity securities, when market or security specific events arise, comparisons to the valuation of American Depositary Receipts (ADRs), futures contracts, Exchange-Traded Funds (ETFs) and certain indexes as well as quoted prices for similar securities may be used and would be categorized as Level 2 in the hierarchy. Utilizing these techniques may result in transfers between Level 1 and Level 2. For equity securities, including restricted securities, where observable inputs are limited, assumptions about market activity and risk are used and these securities may be categorized as Level 3 in the hierarchy.
ETFs are valued at their last sale price or official closing price as reported by a third party pricing vendor on the primary market or exchange on which they are traded and are categorized as Level 1 in the hierarchy. In the event there were no sales during the day but the exchange reports a closing bid level, ETFs are valued at the closing bid and would be categorized as Level 1 in the hierarchy. In the event there was no closing bid, ETFs may be valued by another method that the Board believes reflects fair value in accordance with the Board's fair value pricing policies and may be categorized as Level 2 in the hierarchy.
Investments in open-end mutual funds, including the Fidelity Central Funds, are valued at their closing net asset value (NAV) each business day and are categorized as Level 1 in the hierarchy.
Changes in valuation techniques may result in transfers in or out of an assigned level within the disclosure hierarchy. The aggregate value of investments by input level as of January 31, 2018 is included at the end of the Fund's Schedule of Investments.
Investment Transactions and Income. For financial reporting purposes, the Fund's investment holdings and NAV include trades executed through the end of the last business day of the period. The NAV per share for processing shareholder transactions is calculated as of the close of business of the New York Stock Exchange (NYSE), normally 4:00 p.m. Eastern time and includes trades executed through the end of the prior business day. Gains and losses on securities sold are determined on the basis of identified cost. Dividend income is recorded on the ex-dividend date, except for certain dividends from foreign securities where the ex-dividend date may have passed, which are recorded as soon as the Fund is informed of the ex-dividend date. Non-cash dividends included in dividend income, if any, are recorded at the fair market value of the securities received. Income and capital gain distributions from Fidelity Central Funds, if any, are recorded on the ex-dividend date. Certain distributions received by the Fund represent a return of capital or capital gain. The Fund determines the components of these distributions subsequent to the ex-dividend date, based upon receipt of tax filings or other correspondence relating to the underlying investment. These distributions are recorded as a reduction of cost of investments and/or as a realized gain.
Expenses. Expenses directly attributable to a fund are charged to that fund. Expenses attributable to more than one fund are allocated among the respective funds on the basis of relative net assets or other appropriate methods. Expense estimates are accrued in the period to which they relate and adjustments are made when actual amounts are known.
Income Tax Information and Distributions to Shareholders. Each year, the Fund intends to qualify as a regulated investment company under Subchapter M of the Internal Revenue Code, including distributing substantially all of its taxable income and realized gains. As a result, no provision for U.S. Federal income taxes is required. The Fund files a U.S. federal tax return, in addition to state and local tax returns as required. The Fund's federal income tax returns are subject to examination by the Internal Revenue Service (IRS) for a period of three fiscal years after they are filed. State and local tax returns may be subject to examination for an additional fiscal year depending on the jurisdiction.
Distributions are declared and recorded on the ex-dividend date. Income and capital gain distributions are determined in accordance with income tax regulations, which may differ from GAAP.
Capital accounts within the financial statements are adjusted for permanent book-tax differences. These adjustments have no impact on net assets or the results of operations. Capital accounts are not adjusted for temporary book-tax differences which will reverse in a subsequent period.
Book-tax differences are primarily due to foreign currency transactions, partnerships, net operating losses, passive foreign investment companies (PFIC), and losses deferred due to wash sales.
As of period end, the cost and unrealized appreciation (depreciation) in securities, and derivatives if applicable, for federal income tax purposes were as follows:
| Gross unrealized appreciation | $34,819,817 |
| Gross unrealized depreciation | (4,627,283) |
| Net unrealized appreciation (depreciation) | $30,192,534 |
| Tax cost | $290,980,753 |
Restricted Securities. The Fund may invest in securities that are subject to legal or contractual restrictions on resale. These securities generally may be resold in transactions exempt from registration or to the public if the securities are registered. Disposal of these securities may involve time-consuming negotiations and expense, and prompt sale at an acceptable price may be difficult. Information regarding restricted securities is included at the end of the Fund's Schedule of Investments.
4. Purchases and Sales of Investments.
Purchases and sales of securities, other than short-term securities and in-kind transactions, aggregated $236,736,870 and $95,566,323, respectively.
Exchanges In-Kind. During the period, unaffiliated entities completed exchanges in-kind with the Fund. The unaffiliated entities delivered investments and cash valued at $71,556,855 in exchange for 5,936,847 shares of the Fund. The amount of in-kind exchanges is included in share transactions in the accompanying Statement of Changes in Net Assets. The Fund recognized no gain or loss for federal income tax purposes.
5. Fees and Other Transactions with Affiliates.
Management Fee. Fidelity Management & Research Company (the investment adviser) and its affiliates provide the Fund with investment management related services for which the Fund pays a monthly management fee that is based on an annual rate of .60% of average net assets. Under the management contract, the investment adviser or an affiliate pays all other expenses of the Fund, excluding fees and expenses of the independent Trustees, and certain miscellaneous expenses such as proxy and shareholder meeting expenses.
Brokerage Commissions. The Fund placed a portion of its portfolio transactions with brokerage firms which are affiliates of the investment adviser. Brokerage commissions are included in net realized gain (loss) and change in net unrealized appreciation (depreciation) in the Statement of Operations. The commissions paid to these affiliated firms were $8,604 for the period.
Interfund Trades. The Fund may purchase from or sell securities to other Fidelity Funds under procedures adopted by the Board. The procedures have been designed to ensure these interfund trades are executed in accordance with Rule 17a-7 of the 1940 Act. Interfund trades are included within the respective purchases and sales amounts shown in the Purchases and Sales of Investments note.
Prior Fiscal Year Exchanges In-Kind. During the prior period, an affiliated entity completed an exchange in-kind with the Fund. The affiliated entity delivered investments and cash valued at $74,384,639 in exchange for 7,131,797 shares of the Fund. The amount of in-kind exchanges is included in share transactions in the accompanying Statement of Changes in Net Assets. The Fund recognized no gain or loss for federal income tax purposes.
6. Security Lending.
The Fund lends portfolio securities through a lending agent from time to time in order to earn additional income. For equity securities, a lending agent is used and may loan securities to certain qualified borrowers, including Fidelity Capital Markets (FCM), a broker-dealer affiliated with the Fund. On the settlement date of the loan, the Fund receives collateral (in the form of U.S. Treasury obligations, letters of credit and/or cash) against the loaned securities and maintains collateral in an amount not less than 100% of the market value of the loaned securities during the period of the loan. The market value of the loaned securities is determined at the close of business of the Fund and any additional required collateral is delivered to the Fund on the next business day. The Fund or borrower may terminate the loan at any time, and if the borrower defaults on its obligation to return the securities loaned because of insolvency or other reasons, the Fund may apply collateral received from the borrower against the obligation. The Fund may experience delays and costs in recovering the securities loaned. Any cash collateral received is invested in the Fidelity Securities Lending Cash Central Fund. The value of loaned securities and cash collateral at period end are disclosed on the Fund's Statement of Assets and Liabilities. The value of securities loaned to FCM at period end was $660,085. Security lending income represents the income earned on investing cash collateral, less rebates paid to borrowers and any lending agent fees associated with the loan, plus any premium payments received for lending certain types of securities. Security lending income is presented in the Statement of Operations as a component of income from Fidelity Central Funds, and includes $1,082 from securities loaned to FCM.
7. Expense Reductions.
Commissions paid to certain brokers with whom the investment adviser, or its affiliates, places trades on behalf of the Fund include an amount in addition to trade execution, which may be rebated back to the Fund to offset certain expenses. This amount totaled $7,384 for the period. In addition, through arrangements with the Fund's custodian, credits realized as a result of certain uninvested cash balances were used to reduce the Fund's expenses. During the period, these credits reduced the Fund's expenses by $443.
8. Other.
The Fund's organizational documents provide former and current trustees and officers with a limited indemnification against liabilities arising in connection with the performance of their duties to the Fund. In the normal course of business, the Fund may also enter into contracts that provide general indemnifications. The Fund's maximum exposure under these arrangements is unknown as this would be dependent on future claims that may be made against the Fund. The risk of material loss from such claims is considered remote.
Shareholder Expense Example
As a shareholder of the Fund, you incur two types of costs: (1) transaction costs and (2) ongoing costs, including management fees and other Fund expenses. This Example is intended to help you understand your ongoing costs (in dollars) of investing in the Fund and to compare these costs with the ongoing costs of investing in other mutual funds.
The Example is based on an investment of $1,000 invested at the beginning of the period and held for the entire period (August 1, 2017 to January 31, 2018).
Actual Expenses
The first line of the accompanying table provides information about actual account values and actual expenses. You may use the information in this line, together with the amount you invested, to estimate the expenses that you paid over the period. Simply divide your account value by $1,000.00 (for example, an $8,600 account value divided by $1,000.00 = 8.6), then multiply the result by the number in the first line under the heading entitled "Expenses Paid During Period" to estimate the expenses you paid on your account during this period. In addition, the Fund, as a shareholder in the underlying Fidelity Central Funds, will indirectly bear its pro-rata share of the fees and expenses incurred by the underlying Fidelity Central Funds. These fees and expenses are not included in the Fund's annualized expense ratio used to calculate the expense estimate in the table below.
Hypothetical Example for Comparison Purposes
The second line of the accompanying table provides information about hypothetical account values and hypothetical expenses based on the Fund's actual expense ratio and an assumed rate of return of 5% per year before expenses, which is not the Fund's actual return. The hypothetical account values and expenses may not be used to estimate the actual ending account balance or expenses you paid for the period. You may use this information to compare the ongoing costs of investing in the Fund and other funds. To do so, compare this 5% hypothetical example with the 5% hypothetical examples that appear in the shareholder reports of the other funds. In addition, the Fund, as a shareholder in the underlying Fidelity Central Funds, will indirectly bear its pro-rata share of the fees and expenses incurred by the underlying Fidelity Central Funds. These fees and expenses are not included in the Fund's annualized expense ratio used to calculate the expense estimate in the table below.
Please note that the expenses shown in the table are meant to highlight your ongoing costs only and do not reflect any transaction costs. Therefore, the second line of the table is useful in comparing ongoing costs only, and will not help you determine the relative total costs of owning different funds.
| | Annualized Expense Ratio-A | Beginning
Account Value
August 1, 2017 | Ending
Account Value
January 31, 2018 | Expenses Paid
During Period-B
August 1, 2017
to January 31, 2018 |
| Actual | .60% | $1,000.00 | $1,178.70 | $3.29 |
| Hypothetical-C | | $1,000.00 | $1,022.18 | $3.06 |
A Annualized expense ratio reflects expenses net of applicable fee waivers.
B Expenses are equal to the Fund's annualized expense ratio, multiplied by the average account value over the period, multiplied by 184/365 (to reflect the one-half year period).
C 5% return per year before expenses
Corporate Headquarters
245 Summer St.
Boston, MA 02210
www.fidelity.com
SCPK6-SANN-0318
1.9884010.100
Fidelity Advisor® Small Cap Value Fund -
Class A, Class M, Class C and Class I
Semi-Annual Report January 31, 2018 Class A, Class M, Class C and Class I are classes of Fidelity® Small Cap Value Fund |
|
Contents
To view a fund's proxy voting guidelines and proxy voting record for the 12-month period ended June 30, visit http://www.fidelity.com/proxyvotingresults or visit the Securities and Exchange Commission's (SEC) web site at http://www.sec.gov.
You may also call 1-877-208-0098 to request a free copy of the proxy voting guidelines.
Standard & Poor's, S&P and S&P 500 are registered service marks of The McGraw-Hill Companies, Inc. and have been licensed for use by Fidelity Distributors Corporation.
Other third-party marks appearing herein are the property of their respective owners.
All other marks appearing herein are registered or unregistered trademarks or service marks of FMR LLC or an affiliated company. © 2018 FMR LLC. All rights reserved.
This report and the financial statements contained herein are submitted for the general information of the shareholders of the Fund. This report is not authorized for distribution to prospective investors in the Fund unless preceded or accompanied by an effective prospectus.
A fund files its complete schedule of portfolio holdings with the SEC for the first and third quarters of each fiscal year on Form N-Q. Forms N-Q are available on the SEC’s web site at http://www.sec.gov. A fund's Forms N-Q may be reviewed and copied at the SEC’s Public Reference Room in Washington, DC. Information regarding the operation of the SEC's Public Reference Room may be obtained by calling 1-800-SEC-0330.
For a complete list of a fund's portfolio holdings, view the most recent holdings listing, semiannual report, or annual report on Fidelity's web site at http://www.fidelity.com, http://www.institutional.fidelity.com, or http://www.401k.com, as applicable.
NOT FDIC INSURED •MAY LOSE VALUE •NO BANK GUARANTEE
Neither the Fund nor Fidelity Distributors Corporation is a bank.
Investment Summary (Unaudited)
Top Ten Stocks as of January 31, 2018
| | % of fund's net assets |
| LivaNova PLC | 3.5 |
| Tech Data Corp. | 3.3 |
| Moog, Inc. Class A | 3.1 |
| Cullen/Frost Bankers, Inc. | 3.0 |
| Genesee & Wyoming, Inc. Class A | 3.0 |
| First American Financial Corp. | 2.9 |
| CVB Financial Corp. | 2.9 |
| BOK Financial Corp. | 2.7 |
| Store Capital Corp. | 2.6 |
| Science Applications International Corp. | 2.6 |
| | 29.6 |
Top Five Market Sectors as of January 31, 2018
| | % of fund's net assets |
| Financials | 32.4 |
| Industrials | 15.6 |
| Consumer Discretionary | 12.6 |
| Information Technology | 12.4 |
| Health Care | 6.7 |
Asset Allocation (% of fund's net assets)
| As of January 31, 2018* |
| | Stocks | 97.5% |
| | Bonds | 0.3% |
| | Short-Term Investments and Net Other Assets (Liabilities) | 2.2% |

* Foreign investments - 15.4%
Schedule of Investments January 31, 2018 (Unaudited)
Showing Percentage of Net Assets
| Common Stocks - 97.5% | | | |
| | | Shares | Value |
| CONSUMER DISCRETIONARY - 12.6% | | | |
| Auto Components - 1.1% | | | |
| Standard Motor Products, Inc. | | 795,092 | $38,084,907 |
| Diversified Consumer Services - 2.9% | | | |
| Grand Canyon Education, Inc. (a) | | 595,927 | 55,415,252 |
| Strayer Education, Inc. | | 527,400 | 48,773,952 |
| | | | 104,189,204 |
| Hotels, Restaurants & Leisure - 2.3% | | | |
| Cedar Fair LP (depositary unit) | | 1,223,500 | 82,953,300 |
| Household Durables - 4.3% | | | |
| CalAtlantic Group, Inc. | | 790,800 | 44,387,604 |
| LGI Homes, Inc. (a)(b) | | 586,300 | 39,680,784 |
| Meritage Homes Corp. (a) | | 1,413,578 | 67,074,276 |
| | | | 151,142,664 |
| Specialty Retail - 2.0% | | | |
| Aaron's, Inc. Class A | | 1,706,100 | 69,762,429 |
|
| TOTAL CONSUMER DISCRETIONARY | | | 446,132,504 |
|
| CONSUMER STAPLES - 1.3% | | | |
| Food & Staples Retailing - 1.2% | | | |
| United Natural Foods, Inc. (a) | | 855,000 | 40,698,000 |
| Food Products - 0.1% | | | |
| Nomad Foods Ltd. (a) | | 220,725 | 3,761,154 |
|
| TOTAL CONSUMER STAPLES | | | 44,459,154 |
|
| ENERGY - 3.8% | | | |
| Energy Equipment & Services - 2.1% | | | |
| ShawCor Ltd. Class A | | 3,200,400 | 72,230,166 |
| Oil, Gas & Consumable Fuels - 1.7% | | | |
| LINN Energy, Inc. (b) | | 1,551,900 | 61,300,050 |
|
| TOTAL ENERGY | | | 133,530,216 |
|
| FINANCIALS - 32.4% | | | |
| Banks - 19.4% | | | |
| Associated Banc-Corp. | | 2,650,000 | 65,587,500 |
| Banner Corp. | | 388,900 | 21,132,826 |
| BOK Financial Corp. | | 1,000,000 | 96,690,000 |
| Cullen/Frost Bankers, Inc. | | 1,000,000 | 106,410,000 |
| CVB Financial Corp. | | 4,359,300 | 102,007,620 |
| First Citizen Bancshares, Inc. | | 140,370 | 59,714,802 |
| First Citizen Bancshares, Inc. Class A | | 180,954 | 76,979,641 |
| Hilltop Holdings, Inc. | | 820,700 | 21,494,133 |
| Popular, Inc. | | 1,105,800 | 44,939,712 |
| UMB Financial Corp. | | 1,200,000 | 91,416,000 |
| | | | 686,372,234 |
| Capital Markets - 3.1% | | | |
| Federated Investors, Inc. Class B (non-vtg.) | | 1,730,900 | 60,027,612 |
| OM Asset Management Ltd. | | 2,895,301 | 51,796,935 |
| | | | 111,824,547 |
| Insurance - 8.2% | | | |
| Argo Group International Holdings, Ltd. | | 628,500 | 38,527,050 |
| Enstar Group Ltd. (a) | | 281,000 | 58,335,600 |
| First American Financial Corp. | | 1,750,900 | 103,425,663 |
| ProAssurance Corp. | | 1,633,300 | 89,341,510 |
| | | | 289,629,823 |
| Thrifts & Mortgage Finance - 1.7% | | | |
| Beneficial Bancorp, Inc. | | 864,286 | 14,044,648 |
| Washington Federal, Inc. | | 1,250,000 | 44,875,000 |
| | | | 58,919,648 |
|
| TOTAL FINANCIALS | | | 1,146,746,252 |
|
| HEALTH CARE - 6.7% | | | |
| Health Care Equipment & Supplies - 3.5% | | | |
| LivaNova PLC (a) | | 1,470,651 | 125,814,193 |
| Health Care Providers & Services - 1.1% | | | |
| Civitas Solutions, Inc. (a)(c) | | 2,038,502 | 35,775,710 |
| Envision Healthcare Corp. (a) | | 45,500 | 1,637,545 |
| | | | 37,413,255 |
| Health Care Technology - 1.0% | | | |
| Cegedim SA (a) | | 694,196 | 35,595,604 |
| Pharmaceuticals - 1.1% | | | |
| Innoviva, Inc. (a) | | 2,771,053 | 40,429,663 |
|
| TOTAL HEALTH CARE | | | 239,252,715 |
|
| INDUSTRIALS - 15.3% | | | |
| Aerospace & Defense - 3.1% | | | |
| Moog, Inc. Class A (a) | | 1,222,900 | 110,134,374 |
| Airlines - 0.3% | | | |
| Allegiant Travel Co. | | 77,400 | 12,325,950 |
| Electrical Equipment - 4.8% | | | |
| AZZ, Inc. | | 500,000 | 22,750,000 |
| Melrose Industries PLC | | 21,916,049 | 70,450,025 |
| Regal Beloit Corp. | | 1,005,368 | 78,318,167 |
| | | | 171,518,192 |
| Machinery - 1.7% | | | |
| Mueller Industries, Inc. | | 1,772,458 | 58,650,635 |
| Road & Rail - 3.0% | | | |
| Genesee & Wyoming, Inc. Class A (a) | | 1,317,600 | 105,210,360 |
| Trading Companies & Distributors - 2.4% | | | |
| WESCO International, Inc. (a) | | 1,241,700 | 84,621,855 |
|
| TOTAL INDUSTRIALS | | | 542,461,366 |
|
| INFORMATION TECHNOLOGY - 12.4% | | | |
| Electronic Equipment & Components - 5.0% | | | |
| SYNNEX Corp. | | 500,000 | 61,365,000 |
| Tech Data Corp. (a) | | 1,143,200 | 114,628,664 |
| | | | 175,993,664 |
| Internet Software & Services - 3.4% | | | |
| Cimpress NV (a)(b) | | 325,100 | 41,420,991 |
| comScore, Inc. (a) | | 47,500 | 1,075,875 |
| j2 Global, Inc. | | 1,000,000 | 79,990,000 |
| | | | 122,486,866 |
| IT Services - 3.0% | | | |
| Presidio, Inc. | | 835,100 | 15,290,681 |
| Science Applications International Corp. | | 1,195,497 | 91,634,845 |
| | | | 106,925,526 |
| Technology Hardware, Storage & Peripherals - 1.0% | | | |
| Super Micro Computer, Inc. (a) | | 1,500,000 | 34,237,500 |
|
| TOTAL INFORMATION TECHNOLOGY | | | 439,643,556 |
|
| MATERIALS - 4.4% | | | |
| Containers & Packaging - 2.5% | | | |
| Silgan Holdings, Inc. | | 3,000,000 | 89,670,000 |
| Metals & Mining - 1.9% | | | |
| Compass Minerals International, Inc. (b) | | 917,800 | 66,907,620 |
|
| TOTAL MATERIALS | | | 156,577,620 |
|
| REAL ESTATE - 4.9% | | | |
| Equity Real Estate Investment Trusts (REITs) - 4.9% | | | |
| CareTrust (REIT), Inc. | | 593,600 | 9,432,304 |
| Potlatch Corp. | | 369,199 | 19,530,627 |
| Sabra Health Care REIT, Inc. | | 2,854,100 | 51,659,210 |
| Store Capital Corp. | | 3,809,300 | 93,365,943 |
| | | | 173,988,084 |
| TELECOMMUNICATION SERVICES - 0.0% | | | |
| Diversified Telecommunication Services - 0.0% | | | |
| Com Hem Holding AB | | 14,758 | 256,583 |
| UTILITIES - 3.7% | | | |
| Electric Utilities - 3.6% | | | |
| El Paso Electric Co. | | 1,211,100 | 63,219,420 |
| IDACORP, Inc. | | 743,900 | 64,183,692 |
| | | | 127,403,112 |
| Independent Power and Renewable Electricity Producers - 0.1% | | | |
| NRG Yield, Inc. Class C | | 264,000 | 4,989,600 |
|
| TOTAL UTILITIES | | | 132,392,712 |
|
| TOTAL COMMON STOCKS | | | |
| (Cost $2,515,025,135) | | | 3,455,440,762 |
| | | Principal Amount | Value |
|
| Nonconvertible Bonds - 0.3% | | | |
| INDUSTRIALS - 0.3% | | | |
| Machinery - 0.3% | | | |
Mueller Industries, Inc. 6% 3/1/27
(Cost $10,499,000) | | 10,499,000 | 10,761,476 |
| | | Shares | Value |
|
| Money Market Funds - 4.8% | | | |
| Fidelity Cash Central Fund, 1.39% (d) | | 84,052,240 | 84,069,051 |
| Fidelity Securities Lending Cash Central Fund 1.40% (d)(e) | | 85,672,827 | 85,681,394 |
| TOTAL MONEY MARKET FUNDS | | | |
| (Cost $169,747,390) | | | 169,750,445 |
| TOTAL INVESTMENT IN SECURITIES - 102.6% | | | |
| (Cost $2,695,271,525) | | | 3,635,952,683 |
| NET OTHER ASSETS (LIABILITIES) - (2.6)% | | | (91,058,781) |
| NET ASSETS - 100% | | | $3,544,893,902 |
Legend
(a) Non-income producing
(b) Security or a portion of the security is on loan at period end.
(c) Affiliated company
(d) Affiliated fund that is generally available only to investment companies and other accounts managed by Fidelity Investments. The rate quoted is the annualized seven-day yield of the fund at period end. A complete unaudited listing of the fund's holdings as of its most recent quarter end is available upon request. In addition, each Fidelity Central Fund's financial statements are available on the SEC's website or upon request.
(e) Investment made with cash collateral received from securities on loan.
Affiliated Central Funds
Information regarding fiscal year to date income earned by the Fund from investments in Fidelity Central Funds is as follows:
| Fund | Income earned |
| Fidelity Cash Central Fund | $333,090 |
| Fidelity Securities Lending Cash Central Fund | 166,293 |
| Total | $499,383 |
Amounts in the income column in the above table include any capital gain distributions from underlying funds, which are presented in the corresponding line-item in the Statement of Operations if applicable.
Other Affiliated Issuers
An affiliated company is a company in which the Fund has ownership of at least 5% of the voting securities. Fiscal year to date transactions with companies which are or were affiliates are as follows:
| Affiliate | Value, beginning of period | Purchases | Sales Proceeds | Dividend Income | Realized Gain (loss) | Change in Unrealized appreciation (depreciation) | Value, end of period |
| Civitas Solutions, Inc. | $44,625,000 | $-- | $8,124,718 | $-- | $167,218 | $(891,790) | $35,775,710 |
| Total | $44,625,000 | $-- | $8,124,718 | $-- | $167,218 | $(891,790) | $35,775,710 |
Investment Valuation
The following is a summary of the inputs used, as of January 31, 2018, involving the Fund's assets and liabilities carried at fair value. The inputs or methodology used for valuing securities may not be an indication of the risk associated with investing in those securities. For more information on valuation inputs, and their aggregation into the levels used below, please refer to the Investment Valuation section in the accompanying Notes to Financial Statements.
| | Valuation Inputs at Reporting Date: |
| Description | Total | Level 1 | Level 2 | Level 3 |
| Investments in Securities: | | | | |
| Equities: | | | | |
| Consumer Discretionary | $446,132,504 | $446,132,504 | $-- | $-- |
| Consumer Staples | 44,459,154 | 44,459,154 | -- | -- |
| Energy | 133,530,216 | 133,530,216 | -- | -- |
| Financials | 1,146,746,252 | 1,146,746,252 | -- | -- |
| Health Care | 239,252,715 | 239,252,715 | -- | -- |
| Industrials | 542,461,366 | 542,461,366 | -- | -- |
| Information Technology | 439,643,556 | 439,643,556 | -- | -- |
| Materials | 156,577,620 | 156,577,620 | -- | -- |
| Real Estate | 173,988,084 | 173,988,084 | -- | -- |
| Telecommunication Services | 256,583 | 256,583 | -- | -- |
| Utilities | 132,392,712 | 132,392,712 | -- | -- |
| Corporate Bonds | 10,761,476 | -- | 10,761,476 | -- |
| Money Market Funds | 169,750,445 | 169,750,445 | -- | -- |
| Total Investments in Securities: | $3,635,952,683 | $3,625,191,207 | $10,761,476 | $-- |
Other Information
Distribution of investments by country or territory of incorporation, as a percentage of Total Net Assets, is as follows (Unaudited):
| United States of America | 84.6% |
| United Kingdom | 6.9% |
| Bermuda | 2.8% |
| Canada | 2.1% |
| Puerto Rico | 1.3% |
| Netherlands | 1.2% |
| France | 1.0% |
| Others (Individually Less Than 1%) | 0.1% |
| | 100.0% |
See accompanying notes which are an integral part of the financial statements.
Financial Statements
Statement of Assets and Liabilities
| | | January 31, 2018 (Unaudited) |
| Assets | | |
Investment in securities, at value (including securities loaned of $83,056,452) — See accompanying schedule:
Unaffiliated issuers (cost $2,491,391,256) | $3,430,426,528 | |
| Fidelity Central Funds (cost $169,747,390) | 169,750,445 | |
| Other affiliated issuers (cost $34,132,879) | 35,775,710 | |
| Total Investment in Securities (cost $2,695,271,525) | | $3,635,952,683 |
| Cash | | 2 |
| Receivable for investments sold | | 12,906,594 |
| Receivable for fund shares sold | | 2,171,417 |
| Interest receivable | | 262,475 |
| Distributions receivable from Fidelity Central Funds | | 97,575 |
| Prepaid expenses | | 4,901 |
| Other receivables | | 20,680 |
| Total assets | | 3,651,416,327 |
| Liabilities | | |
| Payable for investments purchased | $13,977,121 | |
| Payable for fund shares redeemed | 3,981,880 | |
| Accrued management fee | 2,128,129 | |
| Distribution and service plan fees payable | 112,284 | |
| Other affiliated payables | 619,285 | |
| Other payables and accrued expenses | 35,801 | |
| Collateral on securities loaned | 85,667,925 | |
| Total liabilities | | 106,522,425 |
| Net Assets | | $3,544,893,902 |
| Net Assets consist of: | | |
| Paid in capital | | $2,516,931,999 |
| Distributions in excess of net investment income | | (433,539) |
| Accumulated undistributed net realized gain (loss) on investments and foreign currency transactions | | 87,714,296 |
| Net unrealized appreciation (depreciation) on investments and assets and liabilities in foreign currencies | | 940,681,146 |
| Net Assets | | $3,544,893,902 |
| Calculation of Maximum Offering Price | | |
| Class A: | | |
| Net Asset Value and redemption price per share ($176,337,170 ÷ 8,701,146 shares) | | $20.27 |
| Maximum offering price per share (100/94.25 of $20.27) | | $21.51 |
| Class M: | | |
| Net Asset Value and redemption price per share ($76,256,612 ÷ 3,850,821 shares) | | $19.80 |
| Maximum offering price per share (100/96.50 of $19.80) | | $20.52 |
| Class C: | | |
| Net Asset Value and offering price per share ($49,835,724 ÷ 2,692,255 shares)(a) | | $18.51 |
| Small Cap Value: | | |
| Net Asset Value, offering price and redemption price per share ($2,771,576,169 ÷ 134,377,639 shares) | | $20.63 |
| Class I: | | |
| Net Asset Value, offering price and redemption price per share ($470,888,227 ÷ 22,824,925 shares) | | $20.63 |
(a) Redemption price per share is equal to net asset value less any applicable contingent deferred sales charge.
See accompanying notes which are an integral part of the financial statements.
Statement of Operations
| | | Six months ended January 31, 2018 (Unaudited) |
| Investment Income | | |
| Dividends | | $23,468,962 |
| Special dividends | | 6,923,500 |
| Interest | | 314,970 |
| Income from Fidelity Central Funds | | 499,383 |
| Total income | | 31,206,815 |
| Expenses | | |
| Management fee | | |
| Basic fee | $12,049,438 | |
| Performance adjustment | 643,254 | |
| Transfer agent fees | 3,214,745 | |
| Distribution and service plan fees | 668,244 | |
| Accounting and security lending fees | 513,763 | |
| Custodian fees and expenses | 23,018 | |
| Independent trustees' fees and expenses | 6,722 | |
| Registration fees | 86,578 | |
| Audit | 33,908 | |
| Legal | 6,268 | |
| Interest | 656 | |
| Miscellaneous | 11,295 | |
| Total expenses before reductions | 17,257,889 | |
| Expense reductions | (61,383) | 17,196,506 |
| Net investment income (loss) | | 14,010,309 |
| Realized and Unrealized Gain (Loss) | | |
| Net realized gain (loss) on: | | |
| Investment securities: | | |
| Unaffiliated issuers | 128,701,046 | |
| Fidelity Central Funds | (332) | |
| Other affiliated issuers | 167,218 | |
| Foreign currency transactions | (91,524) | |
| Total net realized gain (loss) | | 128,776,408 |
| Change in net unrealized appreciation (depreciation) on: | | |
| Investment securities: | | |
| Unaffiliated issuers | 204,984,699 | |
| Fidelity Central Funds | (1,053) | |
| Other affiliated issuers | (891,790) | |
| Assets and liabilities in foreign currencies | (26) | |
| Total change in net unrealized appreciation (depreciation) | | 204,091,830 |
| Net gain (loss) | | 332,868,238 |
| Net increase (decrease) in net assets resulting from operations | | $346,878,547 |
See accompanying notes which are an integral part of the financial statements.
Statement of Changes in Net Assets
| | Six months ended January 31, 2018 (Unaudited) | Year ended July 31, 2017 |
| Increase (Decrease) in Net Assets | | |
| Operations | | |
| Net investment income (loss) | $14,010,309 | $44,455,877 |
| Net realized gain (loss) | 128,776,408 | 78,723,874 |
| Change in net unrealized appreciation (depreciation) | 204,091,830 | 334,723,173 |
| Net increase (decrease) in net assets resulting from operations | 346,878,547 | 457,902,924 |
| Distributions to shareholders from net investment income | (37,440,446) | (25,276,323) |
| Distributions to shareholders from net realized gain | (91,158,962) | (209,689,485) |
| Total distributions | (128,599,408) | (234,965,808) |
| Share transactions - net increase (decrease) | (93,433,237) | (12,022,135) |
| Redemption fees | 89,025 | 469,836 |
| Total increase (decrease) in net assets | 124,934,927 | 211,384,817 |
| Net Assets | | |
| Beginning of period | 3,419,958,975 | 3,208,574,158 |
| End of period | $3,544,893,902 | $3,419,958,975 |
| Other Information | | |
| Undistributed net investment income end of period | $– | $22,996,598 |
| Distributions in excess of net investment income end of period | $(433,539) | $– |
See accompanying notes which are an integral part of the financial statements.
Financial Highlights
Fidelity Small Cap Value Fund Class A
| | Six months ended (Unaudited) January 31, | Years endedJuly 31, | | | | |
| | 2018 | 2017 | 2016 | 2015 | 2014 | 2013 |
| Selected Per–Share Data | | | | | | |
| Net asset value, beginning of period | $19.05 | $17.92 | $19.14 | $19.29 | $19.96 | $14.86 |
| Income from Investment Operations | | | | | | |
| Net investment income (loss)A | .06B | .20C | .07 | .10D | .03 | .07 |
| Net realized and unrealized gain (loss) | 1.85 | 2.23 | .56 | 2.01 | 1.24 | 5.57 |
| Total from investment operations | 1.91 | 2.43 | .63 | 2.11 | 1.27 | 5.64 |
| Distributions from net investment income | (.17) | (.10) | (.11) | (.02) | (.01) | (.07) |
| Distributions from net realized gain | (.52) | (1.20) | (1.75) | (2.25) | (1.93) | (.47) |
| Total distributions | (.69) | (1.30) | (1.85)E | (2.26)F | (1.94) | (.54) |
| Redemption fees added to paid in capitalA,G | – | – | – | – | – | – |
| Net asset value, end of period | $20.27 | $19.05 | $17.92 | $19.14 | $19.29 | $19.96 |
| Total ReturnH,I,J | 10.32% | 14.61% | 4.07% | 11.86% | 6.83% | 39.09% |
| Ratios to Average Net AssetsK,L | | | | | | |
| Expenses before reductions | 1.22%M | 1.24% | 1.41% | 1.42% | 1.36% | 1.36% |
| Expenses net of fee waivers, if any | 1.22%M | 1.24% | 1.41% | 1.39% | 1.35% | 1.36% |
| Expenses net of all reductions | 1.22%M | 1.24% | 1.41% | 1.39% | 1.34% | 1.36% |
| Net investment income (loss) | .58%B,M | 1.10%C | .43% | .52%D | .13% | .41% |
| Supplemental Data | | | | | | |
| Net assets, end of period (000 omitted) | $176,337 | $184,306 | $218,364 | $235,844 | $258,183 | $275,265 |
| Portfolio turnover rateN | 13%M | 26% | 33% | 34% | 26%O | 29% |
A Calculated based on average shares outstanding during the period.
B Net investment income per share reflects a large, non-recurring dividend which amounted to $.04 per share. This dividend is not annualized in the ratio of net investment income (loss) to average net assets. Excluding this dividend the ratio would have been .18%.
C Net Investment income per share reflects a large, non-recurring dividend which amounted to $.09 per share. Excluding this non-recurring dividend, the ratio of net investment income (loss) to average net assets would have been .61%.
D Net Investment income per share reflects a large, non-recurring dividend which amounted to $.05 per share. Excluding this non-recurring dividend, the ratio of net investment income (loss) to average net assets would have been .26%.
E Total distributions of $1.85 per share is comprised of distributions from net investment income of $.105 and distributions from net realized gain of $1.747 per share.
F Total distributions of $2.26 per share is comprised of distributions from net investment income of $.016 and distributions from net realized gain of $2.248 per share.
G Amount represents less than $.005 per share.
H Total returns for periods of less than one year are not annualized.
I Total returns would have been lower if certain expenses had not been reduced during the applicable periods shown.
J Total returns do not include the effect of the sales charges.
K Fees and expenses of any underlying Fidelity Central Funds are not included in the Fund's expense ratio. The Fund indirectly bears its proportionate share of the expenses of any underlying Fidelity Central Funds.
L Expense ratios reflect operating expenses of the class. Expenses before reductions do not reflect amounts reimbursed by the investment adviser or reductions from brokerage service arrangements or reductions from other expense offset arrangements and do not represent the amount paid by the class during periods when reimbursements or reductions occur. Expenses net of fee waivers reflect expenses after reimbursement by the investment adviser but prior to reductions from brokerage service arrangements or other expense offset arrangements. Expenses net of all reductions represent the net expenses paid by the class.
M Annualized
N Amount does not include the portfolio activity of any underlying Fidelity Central Funds.
O Portfolio turnover rate excludes securities received or delivered in-kind.
See accompanying notes which are an integral part of the financial statements.
Fidelity Small Cap Value Fund Class M
| | Six months ended (Unaudited) January 31, | Years endedJuly 31, | | | | |
| | 2018 | 2017 | 2016 | 2015 | 2014 | 2013 |
| Selected Per–Share Data | | | | | | |
| Net asset value, beginning of period | $18.61 | $17.54 | $18.78 | $18.98 | $19.70 | $14.70 |
| Income from Investment Operations | | | | | | |
| Net investment income (loss)A | .03B | .15C | .03 | .05D | (.02) | .03 |
| Net realized and unrealized gain (loss) | 1.80 | 2.18 | .54 | 1.98 | 1.23 | 5.50 |
| Total from investment operations | 1.83 | 2.33 | .57 | 2.03 | 1.21 | 5.53 |
| Distributions from net investment income | (.13) | (.07) | (.06) | – | – | (.06) |
| Distributions from net realized gain | (.52) | (1.20) | (1.75) | (2.23) | (1.93) | (.47) |
| Total distributions | (.64)E | (1.26)F | (1.81) | (2.23) | (1.93) | (.53) |
| Redemption fees added to paid in capitalA,G | – | – | – | – | – | – |
| Net asset value, end of period | $19.80 | $18.61 | $17.54 | $18.78 | $18.98 | $19.70 |
| Total ReturnH,I,J | 10.16% | 14.35% | 3.76% | 11.58% | 6.58% | 38.70% |
| Ratios to Average Net AssetsK,L | | | | | | |
| Expenses before reductions | 1.46%M | 1.49% | 1.66% | 1.67% | 1.61% | 1.60% |
| Expenses net of fee waivers, if any | 1.46%M | 1.49% | 1.66% | 1.64% | 1.59% | 1.60% |
| Expenses net of all reductions | 1.46%M | 1.49% | 1.65% | 1.63% | 1.59% | 1.59% |
| Net investment income (loss) | .34%B,M | .86%C | .19% | .27%D | (.11)% | .18% |
| Supplemental Data | | | | | | |
| Net assets, end of period (000 omitted) | $76,257 | $78,852 | $82,337 | $91,716 | $100,975 | $107,444 |
| Portfolio turnover rateN | 13%M | 26% | 33% | 34% | 26%O | 29% |
A Calculated based on average shares outstanding during the period.
B Net investment income per share reflects a large, non-recurring dividend which amounted to $.04 per share. This dividend is not annualized in the ratio of net investment income (loss) to average net assets. Excluding this dividend the ratio would have been (.06)%.
C Net Investment income per share reflects a large, non-recurring dividend which amounted to $.09 per share. Excluding this non-recurring dividend, the ratio of net investment income (loss) to average net assets would have been .36%.
D Net Investment income per share reflects a large, non-recurring dividend which amounted to $.05 per share. Excluding this non-recurring dividend, the ratio of net investment income (loss) to average net assets would have been .01%.
E Total distributions of $.64 per share is comprised of distributions from net investment income of $.125 and distributions from net realized gain of $.519 per share.
F Total distributions of $1.26 per share is comprised of distributions from net investment income of $.067 and distributions from net realized gain of $1.195 per share.
G Amount represents less than $.005 per share.
H Total returns for periods of less than one year are not annualized.
I Total returns would have been lower if certain expenses had not been reduced during the applicable periods shown.
J Total returns do not include the effect of the sales charges.
K Fees and expenses of any underlying Fidelity Central Funds are not included in the Fund's expense ratio. The Fund indirectly bears its proportionate share of the expenses of any underlying Fidelity Central Funds.
L Expense ratios reflect operating expenses of the class. Expenses before reductions do not reflect amounts reimbursed by the investment adviser or reductions from brokerage service arrangements or reductions from other expense offset arrangements and do not represent the amount paid by the class during periods when reimbursements or reductions occur. Expenses net of fee waivers reflect expenses after reimbursement by the investment adviser but prior to reductions from brokerage service arrangements or other expense offset arrangements. Expenses net of all reductions represent the net expenses paid by the class.
M Annualized
N Amount does not include the portfolio activity of any underlying Fidelity Central Funds.
O Portfolio turnover rate excludes securities received or delivered in-kind.
See accompanying notes which are an integral part of the financial statements.
Fidelity Small Cap Value Fund Class C
| | Six months ended (Unaudited) January 31, | Years endedJuly 31, | | | | |
| | 2018 | 2017 | 2016 | 2015 | 2014 | 2013 |
| Selected Per–Share Data | | | | | | |
| Net asset value, beginning of period | $17.39 | $16.52 | $17.82 | $18.19 | $19.06 | $14.28 |
| Income from Investment Operations | | | | | | |
| Net investment income (loss)A | (.02)B | .06C | (.05) | (.04)D | (.12) | (.06) |
| Net realized and unrealized gain (loss) | 1.69 | 2.04 | .50 | 1.90 | 1.18 | 5.34 |
| Total from investment operations | 1.67 | 2.10 | .45 | 1.86 | 1.06 | 5.28 |
| Distributions from net investment income | (.03) | (.04) | – | – | – | (.03) |
| Distributions from net realized gain | (.52) | (1.20) | (1.75) | (2.23) | (1.93) | (.47) |
| Total distributions | (.55) | (1.23)E | (1.75) | (2.23) | (1.93) | (.50) |
| Redemption fees added to paid in capitalA,F | – | – | – | – | – | – |
| Net asset value, end of period | $18.51 | $17.39 | $16.52 | $17.82 | $18.19 | $19.06 |
| Total ReturnG,H,I | 9.90% | 13.79% | 3.20% | 11.05% | 5.97% | 38.00% |
| Ratios to Average Net AssetsJ,K | | | | | | |
| Expenses before reductions | 1.97%L | 2.00% | 2.18% | 2.19% | 2.12% | 2.13% |
| Expenses net of fee waivers, if any | 1.97%L | 2.00% | 2.17% | 2.16% | 2.11% | 2.13% |
| Expenses net of all reductions | 1.97%L | 2.00% | 2.17% | 2.15% | 2.10% | 2.12% |
| Net investment income (loss) | (.18)%B,L | .35%C | (.33)% | (.25)%D | (.63)% | (.35)% |
| Supplemental Data | | | | | | |
| Net assets, end of period (000 omitted) | $49,836 | $52,227 | $57,231 | $64,928 | $70,541 | $76,018 |
| Portfolio turnover rateM | 13%L | 26% | 33% | 34% | 26%N | 29% |
A Calculated based on average shares outstanding during the period.
B Net investment income per share reflects a large, non-recurring dividend which amounted to $.04 per share. This dividend is not annualized in the ratio of net investment income (loss) to average net assets. Excluding this dividend the ratio would have been (.57) %.
C Net Investment income per share reflects a large, non-recurring dividend which amounted to $.08 per share. Excluding this non-recurring dividend, the ratio of net investment income (loss) to average net assets would have been (.15) %.
D Net Investment income per share reflects a large, non-recurring dividend which amounted to $.05 per share. Excluding this non-recurring dividend, the ratio of net investment income (loss) to average net assets would have been (.51) %.
E Total distributions of $1.23 per share is comprised of distributions from net investment income of $.036 and distributions from net realized gain of $1.195 per share.
F Amount represents less than $.005 per share.
G Total returns for periods of less than one year are not annualized.
H Total returns would have been lower if certain expenses had not been reduced during the applicable periods shown.
I Total returns do not include the effect of the contingent deferred sales charge.
J Fees and expenses of any underlying Fidelity Central Funds are not included in the Fund's expense ratio. The Fund indirectly bears its proportionate share of the expenses of any underlying Fidelity Central Funds.
K Expense ratios reflect operating expenses of the class. Expenses before reductions do not reflect amounts reimbursed by the investment adviser or reductions from brokerage service arrangements or reductions from other expense offset arrangements and do not represent the amount paid by the class during periods when reimbursements or reductions occur. Expenses net of fee waivers reflect expenses after reimbursement by the investment adviser but prior to reductions from brokerage service arrangements or other expense offset arrangements. Expenses net of all reductions represent the net expenses paid by the class.
L Annualized
M Amount does not include the portfolio activity of any underlying Fidelity Central Funds.
N Portfolio turnover rate excludes securities received or delivered in-kind.
See accompanying notes which are an integral part of the financial statements.
Fidelity Small Cap Value Fund
| | Six months ended (Unaudited) January 31, | Years endedJuly 31, | | | | |
| | 2018 | 2017 | 2016 | 2015 | 2014 | 2013 |
| Selected Per–Share Data | | | | | | |
| Net asset value, beginning of period | $19.41 | $18.22 | $19.45 | $19.57 | $20.22 | $15.05 |
| Income from Investment Operations | | | | | | |
| Net investment income (loss)A | .08B | .25C | .12 | .15D | .08 | .12 |
| Net realized and unrealized gain (loss) | 1.88 | 2.28 | .55 | 2.05 | 1.26 | 5.63 |
| Total from investment operations | 1.96 | 2.53 | .67 | 2.20 | 1.34 | 5.75 |
| Distributions from net investment income | (.22) | (.15) | (.15) | (.07) | (.06) | (.11) |
| Distributions from net realized gain | (.52) | (1.20) | (1.75) | (2.25) | (1.93) | (.47) |
| Total distributions | (.74) | (1.34)E | (1.90) | (2.32) | (1.99) | (.58) |
| Redemption fees added to paid in capitalA,F | – | – | – | – | – | – |
| Net asset value, end of period | $20.63 | $19.41 | $18.22 | $19.45 | $19.57 | $20.22 |
| Total ReturnG,H | 10.45% | 14.99% | 4.23% | 12.18% | 7.12% | 39.45% |
| Ratios to Average Net AssetsI,J | | | | | | |
| Expenses before reductions | .95%K | .99% | 1.18% | 1.15% | 1.08% | 1.07% |
| Expenses net of fee waivers, if any | .95%K | .99% | 1.18% | 1.12% | 1.06% | 1.07% |
| Expenses net of all reductions | .95%K | .99% | 1.17% | 1.12% | 1.06% | 1.06% |
| Net investment income (loss) | .84%B,K | 1.36%C | .67% | .78%D | .41% | .71% |
| Supplemental Data | | | | | | |
| Net assets, end of period (000 omitted) | $2,771,576 | $2,637,843 | $2,460,714 | $2,036,157 | $2,060,546 | $2,672,854 |
| Portfolio turnover rateL | 13%K | 26% | 33% | 34% | 26%M | 29% |
A Calculated based on average shares outstanding during the period.
B Net investment income per share reflects a large, non-recurring dividend which amounted to $.04 per share. This dividend is not annualized in the ratio of net investment income (loss) to average net assets. Excluding this dividend the ratio would have been .45%.
C Net Investment income per share reflects a large, non-recurring dividend which amounted to $.09 per share. Excluding this non-recurring dividend, the ratio of net investment income (loss) to average net assets would have been .86%.
D Net Investment income per share reflects a large, non-recurring dividend which amounted to $.05 per share. Excluding this non-recurring dividend, the ratio of net investment income (loss) to average net assets would have been .53%.
E Total distributions of $1.34 per share is comprised of distributions from net investment income of $.145 and distributions from net realized gain of $1.195 per share.
F Amount represents less than $.005 per share.
G Total returns for periods of less than one year are not annualized.
H Total returns would have been lower if certain expenses had not been reduced during the applicable periods shown.
I Fees and expenses of any underlying Fidelity Central Funds are not included in the Fund's expense ratio. The Fund indirectly bears its proportionate share of the expenses of any underlying Fidelity Central Funds.
J Expense ratios reflect operating expenses of the class. Expenses before reductions do not reflect amounts reimbursed by the investment adviser or reductions from brokerage service arrangements or reductions from other expense offset arrangements and do not represent the amount paid by the class during periods when reimbursements or reductions occur. Expenses net of fee waivers reflect expenses after reimbursement by the investment adviser but prior to reductions from brokerage service arrangements or other expense offset arrangements. Expenses net of all reductions represent the net expenses paid by the class.
K Annualized
L Amount does not include the portfolio activity of any underlying Fidelity Central Funds.
M Portfolio turnover rate excludes securities received or delivered in-kind.
See accompanying notes which are an integral part of the financial statements.
Fidelity Small Cap Value Fund Class I
| | Six months ended (Unaudited) January 31, | Years endedJuly 31, | | | | |
| | 2018 | 2017 | 2016 | 2015 | 2014 | 2013 |
| Selected Per–Share Data | | | | | | |
| Net asset value, beginning of period | $19.41 | $18.23 | $19.45 | $19.57 | $20.23 | $15.05 |
| Income from Investment Operations | | | | | | |
| Net investment income (loss)A | .08B | .25C | .12 | .15D | .08 | .12 |
| Net realized and unrealized gain (loss) | 1.88 | 2.28 | .56 | 2.05 | 1.25 | 5.65 |
| Total from investment operations | 1.96 | 2.53 | .68 | 2.20 | 1.33 | 5.77 |
| Distributions from net investment income | (.22) | (.15) | (.16) | (.07) | (.06) | (.12) |
| Distributions from net realized gain | (.52) | (1.20) | (1.75) | (2.25) | (1.93) | (.47) |
| Total distributions | (.74) | (1.35) | (1.90)E | (2.32) | (1.99) | (.59) |
| Redemption fees added to paid in capitalA,F | – | – | – | – | – | – |
| Net asset value, end of period | $20.63 | $19.41 | $18.23 | $19.45 | $19.57 | $20.23 |
| Total ReturnG,H | 10.45% | 14.96% | 4.31% | 12.17% | 7.08% | 39.54% |
| Ratios to Average Net AssetsI,J | | | | | | |
| Expenses before reductions | .95%K | .98% | 1.14% | 1.15% | 1.09% | 1.07% |
| Expenses net of fee waivers, if any | .95%K | .97% | 1.14% | 1.12% | 1.07% | 1.07% |
| Expenses net of all reductions | .95%K | .97% | 1.14% | 1.12% | 1.07% | 1.06% |
| Net investment income (loss) | .85%B,K | 1.37%C | .70% | .79%D | .40% | .70% |
| Supplemental Data | | | | | | |
| Net assets, end of period (000 omitted) | $470,888 | $466,730 | $389,928 | $376,817 | $342,500 | $359,582 |
| Portfolio turnover rateL | 13%K | 26% | 33% | 34% | 26%M | 29% |
A Calculated based on average shares outstanding during the period.
B Net investment income per share reflects a large, non-recurring dividend which amounted to $.04 per share. This dividend is not annualized in the ratio of net investment income (loss) to average net assets. Excluding this dividend the ratio would have been .45%.
C Net Investment income per share reflects a large, non-recurring dividend which amounted to $.09 per share. Excluding this non-recurring dividend, the ratio of net investment income (loss) to average net assets would have been .88%.
D Net Investment income per share reflects a large, non-recurring dividend which amounted to $.05 per share. Excluding this non-recurring dividend, the ratio of net investment income (loss) to average net assets would have been .53%.
E Total distributions of $1.90 per share is comprised of distributions from net investment income of $.157 and distributions from net realized gain of $1.747 per share.
F Amount represents less than $.005 per share.
G Total returns for periods of less than one year are not annualized.
H Total returns would have been lower if certain expenses had not been reduced during the applicable periods shown.
I Fees and expenses of any underlying Fidelity Central Funds are not included in the Fund's expense ratio. The Fund indirectly bears its proportionate share of the expenses of any underlying Fidelity Central Funds.
J Expense ratios reflect operating expenses of the class. Expenses before reductions do not reflect amounts reimbursed by the investment adviser or reductions from brokerage service arrangements or reductions from other expense offset arrangements and do not represent the amount paid by the class during periods when reimbursements or reductions occur. Expenses net of fee waivers reflect expenses after reimbursement by the investment adviser but prior to reductions from brokerage service arrangements or other expense offset arrangements. Expenses net of all reductions represent the net expenses paid by the class.
K Annualized
L Amount does not include the portfolio activity of any underlying Fidelity Central Funds.
M Portfolio turnover rate excludes securities received or delivered in-kind.
See accompanying notes which are an integral part of the financial statements.
Notes to Financial Statements (Unaudited)
For the period ended January 31, 2018
1. Organization.
Fidelity Small Cap Value Fund (the Fund) is a fund of Fidelity Securities Fund (the Trust) and is authorized to issue an unlimited number of shares. The Trust is registered under the Investment Company Act of 1940, as amended (the 1940 Act), as an open-end management investment company organized as a Massachusetts business trust. The Fund offers Class A, Class M, Class C, Small Cap Value, and Class I shares, each of which has equal rights as to assets and voting privileges. The Fund is closed to new accounts with certain exceptions. Each class has exclusive voting rights with respect to matters that affect that class.
2. Investments in Fidelity Central Funds.
The Fund invests in Fidelity Central Funds, which are open-end investment companies generally available only to other investment companies and accounts managed by the investment adviser and its affiliates. The Fund's Schedule of Investments lists each of the Fidelity Central Funds held as of period end, if any, as an investment of the Fund, but does not include the underlying holdings of each Fidelity Central Fund. As an Investing Fund, the Fund indirectly bears its proportionate share of the expenses of the underlying Fidelity Central Funds.
The Money Market Central Funds seek preservation of capital and current income and are managed by Fidelity Investments Money Management, Inc. (FIMM), an affiliate of the investment adviser. Annualized expenses of the Money Market Central Funds as of their most recent shareholder report date are less than .005%.
A complete unaudited list of holdings for each Fidelity Central Fund is available upon request or at the Securities and Exchange Commission (the SEC) website at www.sec.gov. In addition, the financial statements of the Fidelity Central Funds are available on the SEC website or upon request.
3. Significant Accounting Policies.
The Fund is an investment company and applies the accounting and reporting guidance of the Financial Accounting Standards Board (FASB) Accounting Standards Codification Topic 946 Financial Services – Investments Companies. The financial statements have been prepared in conformity with accounting principles generally accepted in the United States of America (GAAP), which require management to make certain estimates and assumptions at the date of the financial statements. Actual results could differ from those estimates. Subsequent events, if any, through the date that the financial statements were issued have been evaluated in the preparation of the financial statements. The following summarizes the significant accounting policies of the Fund:
Investment Valuation. Investments are valued as of 4:00 p.m. Eastern time on the last calendar day of the period. The Board of Trustees (the Board) has delegated the day to day responsibility for the valuation of the Fund's investments to the Fair Value Committee (the Committee) established by the Fund's investment adviser. In accordance with valuation policies and procedures approved by the Board, the Fund attempts to obtain prices from one or more third party pricing vendors or brokers to value its investments. When current market prices, quotations or currency exchange rates are not readily available or reliable, investments will be fair valued in good faith by the Committee, in accordance with procedures adopted by the Board. Factors used in determining fair value vary by investment type and may include market or investment specific events, changes in interest rates and credit quality. The frequency with which these procedures are used cannot be predicted and they may be utilized to a significant extent. The Committee oversees the Fund's valuation policies and procedures and reports to the Board on the Committee's activities and fair value determinations. The Board monitors the appropriateness of the procedures used in valuing the Fund's investments and ratifies the fair value determinations of the Committee.
The Fund categorizes the inputs to valuation techniques used to value its investments into a disclosure hierarchy consisting of three levels as shown below:
- Level 1 – quoted prices in active markets for identical investments
- Level 2 – other significant observable inputs (including quoted prices for similar investments, interest rates, prepayment speeds, etc.)
- Level 3 – unobservable inputs (including the Fund's own assumptions based on the best information available)
Valuation techniques used to value the Fund's investments by major category are as follows:
Equity securities, including restricted securities, for which market quotations are readily available, are valued at the last reported sale price or official closing price as reported by a third party pricing vendor on the primary market or exchange on which they are traded and are categorized as Level 1 in the hierarchy. In the event there were no sales during the day or closing prices are not available, securities are valued at the last quoted bid price or may be valued using the last available price and are generally categorized as Level 2 in the hierarchy. For foreign equity securities, when market or security specific events arise, comparisons to the valuation of American Depositary Receipts (ADRs), futures contracts, Exchange-Traded Funds (ETFs) and certain indexes as well as quoted prices for similar securities may be used and would be categorized as Level 2 in the hierarchy. Utilizing these techniques may result in transfers between Level 1 and Level 2. For equity securities, including restricted securities, where observable inputs are limited, assumptions about market activity and risk are used and these securities may be categorized as Level 3 in the hierarchy.
Debt securities, including restricted securities, are valued based on evaluated prices received from third party pricing vendors or from brokers who make markets in such securities. Corporate bonds are valued by pricing vendors who utilize matrix pricing which considers yield or price of bonds of comparable quality, coupon, maturity and type or by broker-supplied prices. When independent prices are unavailable or unreliable, debt securities may be valued utilizing pricing methodologies which consider similar factors that would be used by third party pricing vendors. Debt securities are generally categorized as Level 2 in the hierarchy but may be Level 3 depending on the circumstances.
Investments in open-end mutual funds, including the Fidelity Central Funds, are valued at their closing net asset value (NAV) each business day and are categorized as Level 1 in the hierarchy.
Changes in valuation techniques may result in transfers in or out of an assigned level within the disclosure hierarchy. The aggregate value of investments by input level as of January 31, 2018 is included at the end of the Fund's Schedule of Investments.
Foreign Currency. The Fund may use foreign currency contracts to facilitate transactions in foreign-denominated securities. Gains and losses from these transactions may arise from changes in the value of the foreign currency or if the counterparties do not perform under the contracts' terms.
Foreign-denominated assets, including investment securities, and liabilities are translated into U.S. dollars at the exchange rates at period end. Purchases and sales of investment securities, income and dividends received and expenses denominated in foreign currencies are translated into U.S. dollars at the exchange rate in effect on the transaction date.
The effects of exchange rate fluctuations on investments are included with the net realized and unrealized gain (loss) on investment securities. Other foreign currency transactions resulting in realized and unrealized gain (loss) are disclosed separately.
Investment Transactions and Income. For financial reporting purposes, the Fund's investment holdings and NAV include trades executed through the end of the last business day of the period. The NAV per share for processing shareholder transactions is calculated as of the close of business of the New York Stock Exchange (NYSE), normally 4:00 p.m. Eastern time and includes trades executed through the end of the prior business day. Gains and losses on securities sold are determined on the basis of identified cost and includes proceeds received from litigation. Dividend income is recorded on the ex-dividend date, except for certain dividends from foreign securities where the ex-dividend date may have passed, which are recorded as soon as the Fund is informed of the ex-dividend date. Non-cash dividends included in dividend income, if any, are recorded at the fair market value of the securities received. Income and capital gain distributions from Fidelity Central Funds, if any, are recorded on the ex-dividend date. Certain distributions received by the Fund represent a return of capital or capital gain. The Fund determines the components of these distributions subsequent to the ex-dividend date, based upon receipt of tax filings or other correspondence relating to the underlying investment. These distributions are recorded as a reduction of cost of investments and/or as a realized gain. Large, non-recurring dividends recognized by the Fund are presented separately on the Statement of Operations as "Special Dividends" and the impact of these dividends is presented in the Financial Highlights. Interest income is accrued as earned and includes coupon interest and amortization of premium and accretion of discount on debt securities as applicable. Investment income is recorded net of foreign taxes withheld where recovery of such taxes is uncertain.
Class Allocations and Expenses. Investment income, realized and unrealized capital gains and losses, common expenses of the Fund, and certain fund-level expense reductions, if any, are allocated daily on a pro-rata basis to each class based on the relative net assets of each class to the total net assets of the Fund. Each class differs with respect to transfer agent and distribution and service plan fees incurred. Certain expense reductions may also differ by class. For the reporting period, the allocated portion of income and expenses to each class as a percent of its average net assets may vary due to the timing of recording these transactions in relation to fluctuating net assets of the classes. Expenses directly attributable to a fund are charged to that fund. Expenses attributable to more than one fund are allocated among the respective funds on the basis of relative net assets or other appropriate methods. Expense estimates are accrued in the period to which they relate and adjustments are made when actual amounts are known.
Income Tax Information and Distributions to Shareholders. Each year, the Fund intends to qualify as a regulated investment company under Subchapter M of the Internal Revenue Code, including distributing substantially all of its taxable income and realized gains. As a result, no provision for U.S. Federal income taxes is required. The Fund files a U.S. federal tax return, in addition to state and local tax returns as required. The Fund's federal income tax returns are subject to examination by the Internal Revenue Service (IRS) for a period of three fiscal years after they are filed. State and local tax returns may be subject to examination for an additional fiscal year depending on the jurisdiction. Foreign taxes are provided for based on the Fund's understanding of the tax rules and rates that exist in the foreign markets in which it invests.
Distributions are declared and recorded on the ex-dividend date. Income dividends and capital gain distributions are declared separately for each class. Income and capital gain distributions are determined in accordance with income tax regulations, which may differ from GAAP.
Capital accounts within the financial statements are adjusted for permanent book-tax differences. These adjustments have no impact on net assets or the results of operations. Capital accounts are not adjusted for temporary book-tax differences which will reverse in a subsequent period.
Book-tax differences are primarily due to foreign currency transactions, passive foreign investment companies (PFIC), partnerships and losses deferred due to wash sales.
As of period end, the cost and unrealized appreciation (depreciation) in securities, and derivatives if applicable, for federal income tax purposes were as follows:
| Gross unrealized appreciation | $1,010,449,027 |
| Gross unrealized depreciation | (69,801,094) |
| Net unrealized appreciation (depreciation) | $940,647,933 |
| Tax cost | $2,695,304,750 |
Short-Term Trading (Redemption) Fees. Shares held by investors in the Fund less than 90 days may have been subject to a redemption fee equal to 1.50% of the NAV of shares redeemed. All redemption fees, which reduce the proceeds of the shareholder redemption, are retained by the Fund and accounted for as an addition to paid in capital. In November 2017, the Board of Trustees approved the elimination of these redemption fees effective December 18, 2017.
4. Purchases and Sales of Investments.
Purchases and sales of securities, other than short-term securities, aggregated $216,422,628 and $442,311,309, respectively.
5. Fees and Other Transactions with Affiliates.
Management Fee. Fidelity Management & Research Company (the investment adviser) and its affiliates provide the Fund with investment management related services for which the Fund pays a monthly management fee. The management fee is the sum of an individual fund fee rate that is based on an annual rate of .45% of the Fund's average net assets and an annualized group fee rate that averaged .24% during the period. The group fee rate is based upon the average net assets of all the mutual funds advised by the investment adviser, including any mutual funds previously advised by the investment adviser that are currently advised by Fidelity SelectCo, LLC, an affiliate of the investment adviser. The group fee rate decreases as assets under management increase and increases as assets under management decrease. In addition, the management fee is subject to a performance adjustment (up to a maximum of +/- .20% of the Fund's average net assets over a 36 month performance period). The upward or downward adjustment to the management fee is based on the relative investment performance of Small Cap Value as compared to its benchmark index, the Russell 2000 Value Index, over the same 36 month performance period. For the reporting period, the total annualized management fee rate, including the performance adjustment, was .73% of the Fund's average net assets. The performance adjustment included in the management fee rate may be higher or lower than the maximum performance adjustment rate due to the difference between the average net assets for the reporting and performance periods.
Distribution and Service Plan Fees. In accordance with Rule 12b-1 of the 1940 Act, the Fund has adopted separate Distribution and Service Plans for each class of shares. Certain classes pay Fidelity Distributors Corporation (FDC), an affiliate of the investment adviser, separate Distribution and Service Fees, each of which is based on an annual percentage of each class' average net assets. In addition, FDC may pay financial intermediaries for selling shares of the Fund and providing shareholder support services. For the period, the Distribution and Service Fee rates, total fees and amounts retained by FDC were as follows:
| | Distribution Fee | Service Fee | Total Fees | Retained by FDC |
| Class A | -% | .25% | $222,174 | $601 |
| Class M | .25% | .25% | 195,014 | – |
| Class C | .75% | .25% | 251,056 | 1,854 |
| | | | $668,244 | $2,455 |
Sales Load. FDC may receive a front-end sales charge of up to 5.75% for selling Class A shares and 3.50% for selling Class M shares, some of which is paid to financial intermediaries for selling shares of the Fund. Depending on the holding period, FDC may receive contingent deferred sales charges levied on Class A, Class M and Class C redemptions. The deferred sales charges are 1.00% for Class C shares, 1.00% for certain purchases of Class A shares and .25% for certain purchases of Class M shares.
For the period, sales charge amounts retained by FDC were as follows:
| | Retained by FDC |
| Class A | $1,756 |
| Class M | 966 |
| Class C(a) | 458 |
| | $3,180 |
(a) When Class C shares are initially sold, FDC pays commissions from its own resources to financial intermediaries through which the sales are made.
Transfer Agent Fees. Fidelity Investments Institutional Operations Company, Inc., (FIIOC), an affiliate of the investment adviser, is the transfer, dividend disbursing and shareholder servicing agent for each class of the Fund. FIIOC receives account fees and asset-based fees that vary according to the account size and type of account of the shareholders of the respective classes of the Fund. FIIOC pays for typesetting, printing and mailing of shareholder reports, except proxy statements.
For the period, transfer agent fees for each class were as follows:
| | Amount | % of Class-Level Average Net Assets(a) |
| Class A | $177,768 | .20 |
| Class M | 75,338 | .19 |
| Class C | 51,234 | .20 |
| Small Cap Value | 2,484,063 | .18 |
| Class I | 426,342 | .18 |
| | $3,214,745 | |
(a) Annualized
Accounting and Security Lending Fees. Fidelity Service Company, Inc. (FSC), an affiliate of the investment adviser, maintains the Fund's accounting records. The accounting fee is based on the level of average net assets for each month. Under a separate contract, FSC administers the security lending program. The security lending fee is based on the number and duration of lending transactions.
Brokerage Commissions. The Fund placed a portion of its portfolio transactions with brokerage firms which are affiliates of the investment adviser. Brokerage commissions are included in net realized gain (loss) and change in net unrealized appreciation (depreciation) in the Statement of Operations. The commissions paid to these affiliated firms were $7,954 for the period.
Interfund Lending Program. Pursuant to an Exemptive Order issued by the SEC, the Fund, along with other registered investment companies having management contracts with Fidelity Management & Research Company (FMR) or other affiliated entities of FMR, may participate in an interfund lending program. This program provides an alternative credit facility allowing the funds to borrow from, or lend money to, other participating affiliated funds. At period end, there were no interfund loans outstanding. The Fund's activity in this program during the period for which loans were outstanding was as follows:
| Borrower or Lender | Average Loan Balance | Weighted Average Interest Rate | Interest Expense |
| Borrower | $2,933,500 | 1.34% | $656 |
Interfund Trades. The Fund may purchase from or sell securities to other Fidelity Funds under procedures adopted by the Board. The procedures have been designed to ensure these interfund trades are executed in accordance with Rule 17a-7 of the 1940 Act. Interfund trades are included within the respective purchases and sales amounts shown in the Purchases and Sales of Investments note.
6. Committed Line of Credit.
The Fund participates with other funds managed by the investment adviser or an affiliate in a $4.25 billion credit facility (the "line of credit") to be utilized for temporary or emergency purposes to fund shareholder redemptions or for other short-term liquidity purposes. The Fund has agreed to pay commitment fees on its pro-rata portion of the line of credit, which amounted to $5,005 and is reflected in Miscellaneous expenses on the Statement of Operations. During the period, the Fund did not borrow on this line of credit.
7. Security Lending.
The Fund lends portfolio securities through a lending agent from time to time in order to earn additional income. For equity securities, a lending agent is used and may loan securities to certain qualified borrowers, including Fidelity Capital Markets (FCM), a broker-dealer affiliated with the Fund. On the settlement date of the loan, the Fund receives collateral (in the form of U.S. Treasury obligations, letters of credit and/or cash) against the loaned securities and maintains collateral in an amount not less than 100% of the market value of the loaned securities during the period of the loan. The market value of the loaned securities is determined at the close of business of the Fund and any additional required collateral is delivered to the Fund on the next business day. The Fund or borrower may terminate the loan at any time, and if the borrower defaults on its obligation to return the securities loaned because of insolvency or other reasons, the Fund may apply collateral received from the borrower against the obligation. The Fund may experience delays and costs in recovering the securities loaned. Any cash collateral received is invested in the Fidelity Securities Lending Cash Central Fund. The value of loaned securities and cash collateral at period end are disclosed on the Fund's Statement of Assets and Liabilities. Security lending income represents the income earned on investing cash collateral, less rebates paid to borrowers and any lending agent fees associated with the loan, plus any premium payments received for lending certain types of securities. Security lending income is presented in the Statement of Operations as a component of income from Fidelity Central Funds. Total security lending income during the period amounted to $166,293. During the period, there were no securities loaned to FCM.
8. Expense Reductions.
Commissions paid to certain brokers with whom the investment adviser, or its affiliates, places trades on behalf of the Fund include an amount in addition to trade execution, which may be rebated back to the Fund to offset certain expenses. This amount totaled $42,424 for the period. In addition, through arrangements with the Fund's custodian, credits realized as a result of certain uninvested cash balances were used to reduce the Fund's expenses. During the period, these credits reduced the Fund's custody expenses by $1,250.
In addition, during the period the investment adviser reimbursed and/or waived a portion of fund-level operating expenses in the amount of $17,709.
9. Distributions to Shareholders.
Distributions to shareholders of each class were as follows:
| | Six months ended
January 31, 2018 | Year ended
July 31, 2017 |
| From net investment income | | |
| Class A | $1,524,301 | $1,211,951 |
| Class M | 515,970 | 315,712 |
| Class C | 97,347 | 123,016 |
| Small Cap Value | 30,080,250 | 20,285,848 |
| Class I | 5,222,578 | 3,339,796 |
| Total | $37,440,446 | $25,276,323 |
| From net realized gain | | |
| Class A | $4,758,897 | $14,206,153 |
| Class M | 2,138,544 | 5,563,443 |
| Class C | 1,473,571 | 4,084,634 |
| Small Cap Value | 70,617,740 | 160,012,743 |
| Class I | 12,170,210 | 25,822,512 |
| Total | $91,158,962 | $209,689,485 |
10. Share Transactions.
Share transactions for each class were as follows and may contain automatic conversions between classes or exchanges between affiliated funds:
| | Shares | Shares | Dollars | Dollars |
| | Six months ended January 31, 2018 | Year ended July 31, 2017 | Six months ended January 31, 2018 | Year ended July 31, 2017 |
| Class A | | | | |
| Shares sold | 375,841 | 1,506,738 | $7,314,233 | $27,403,663 |
| Reinvestment of distributions | 330,015 | 903,681 | 6,184,384 | 15,154,493 |
| Shares redeemed | (1,678,874) | (4,924,614) | (32,538,492) | (89,702,542) |
| Net increase (decrease) | (973,018) | (2,514,195) | $(19,039,875) | $(47,144,386) |
| Class M | | | | |
| Shares sold | 139,331 | 678,291 | $2,668,683 | $12,111,422 |
| Reinvestment of distributions | 144,050 | 354,357 | 2,638,888 | 5,809,028 |
| Shares redeemed | (669,063) | (1,490,409) | (12,863,004) | (26,553,974) |
| Net increase (decrease) | (385,682) | (457,761) | $(7,555,433) | $(8,633,524) |
| Class C | | | | |
| Shares sold | 41,242 | 191,618 | $733,554 | $3,203,223 |
| Reinvestment of distributions | 85,987 | 251,057 | 1,473,685 | 3,851,053 |
| Shares redeemed | (437,714) | (903,381) | (7,715,938) | (15,005,685) |
| Net increase (decrease) | (310,485) | (460,706) | $(5,508,699) | $(7,951,409) |
| Small Cap Value | | | | |
| Shares sold | 9,755,002 | 31,283,294 | $192,845,450 | $582,054,205 |
| Reinvestment of distributions | 4,774,546 | 10,073,160 | 90,647,306 | 172,025,201 |
| Shares redeemed | (16,081,568) | (40,448,579) | (319,343,340) | (750,552,096) |
| Net increase (decrease) | (1,552,020) | 907,875 | $(35,850,584) | $3,527,310 |
| Class I | | | | |
| Shares sold | 2,449,544 | 6,859,852 | $48,576,744 | $128,013,262 |
| Reinvestment of distributions | 785,425 | 1,477,352 | 14,952,988 | 25,225,719 |
| Shares redeemed | (4,454,255) | (5,680,327) | (89,008,378) | (105,059,107) |
| Net increase (decrease) | (1,219,286) | 2,656,877 | $(25,478,646) | $48,179,874 |
11. Other.
The Fund's organizational documents provide former and current trustees and officers with a limited indemnification against liabilities arising in connection with the performance of their duties to the Fund. In the normal course of business, the Fund may also enter into contracts that provide general indemnifications. The Fund's maximum exposure under these arrangements is unknown as this would be dependent on future claims that may be made against the Fund. The risk of material loss from such claims is considered remote.
At the end of the period, Strategic Advisers Small-Mid Cap Fund was the owner of record of approximately 11% of the total outstanding shares of the Fund.
Shareholder Expense Example
As a shareholder of the Fund, you incur two types of costs: (1) transaction costs, including sales charges (loads) on purchase payments or redemption proceeds, redemption fees and (2) ongoing costs, including management fees, distribution and/or service (12b-1) fees and other Fund expenses. This Example is intended to help you understand your ongoing costs (in dollars) of investing in the Fund and to compare these costs with the ongoing costs of investing in other mutual funds.
The Example is based on an investment of $1,000 invested at the beginning of the period and held for the entire period (August 1, 2017 to January 31, 2018).
Actual Expenses
The first line of the accompanying table for each class of the Fund provides information about actual account values and actual expenses. You may use the information in this line, together with the amount you invested, to estimate the expenses that you paid over the period. Simply divide your account value by $1,000.00 (for example, an $8,600 account value divided by $1,000.00 = 8.6), then multiply the result by the number in the first line for a class of the Fund under the heading entitled "Expenses Paid During Period" to estimate the expenses you paid on your account during this period. A small balance maintenance fee of $12.00 that is charged once a year may apply for certain accounts with a value of less than $2,000. This fee is not included in the table below. If it was, the estimate of expenses you paid during the period would be higher, and your ending account value lower, by this amount. In addition, the Fund, as a shareholder in the underlying Fidelity Central Funds, will indirectly bear its pro-rata share of the fees and expenses incurred by the underlying Fidelity Central Funds. These fees and expenses are not included in the Fund's annualized expense ratio used to calculate the expense estimate in the table below.
Hypothetical Example for Comparison Purposes
The second line of the accompanying table for each class of the Fund provides information about hypothetical account values and hypothetical expenses based on a Class' actual expense ratio and an assumed rate of return of 5% per year before expenses, which is not the Class' actual return. The hypothetical account values and expenses may not be used to estimate the actual ending account balance or expenses you paid for the period. You may use this information to compare the ongoing costs of investing in the Fund and other funds. To do so, compare this 5% hypothetical example with the 5% hypothetical examples that appear in the shareholder reports of the other funds. A small balance maintenance fee of $12.00 that is charged once a year may apply for certain accounts with a value of less than $2,000. This fee is not included in the table below. If it was, the estimate of expenses you paid during the period would be higher, and your ending account value lower, by this amount. In addition, the Fund, as a shareholder in the underlying Fidelity Central Funds, will indirectly bear its pro-rata share of the fees and expenses incurred by the underlying Fidelity Central Funds. These fees and expenses are not included in the Fund's annualized expense ratio used to calculate the expense estimate in the table below.
Please note that the expenses shown in the table are meant to highlight your ongoing costs only and do not reflect any transaction costs. Therefore, the second line of the table is useful in comparing ongoing costs only, and will not help you determine the relative total costs of owning different funds. In addition, if these transactional costs were included, your costs would have been higher.
| | Annualized Expense Ratio-A | Beginning
Account Value
August 1, 2017 | Ending
Account Value
January 31, 2018 | Expenses Paid
During Period-B
August 1, 2017
to January 31, 2018 |
| Class A | 1.22% | | | |
| Actual | | $1,000.00 | $1,103.20 | $6.47 |
| Hypothetical-C | | $1,000.00 | $1,019.06 | $6.21 |
| Class M | 1.46% | | | |
| Actual | | $1,000.00 | $1,101.60 | $7.73 |
| Hypothetical-C | | $1,000.00 | $1,017.85 | $7.43 |
| Class C | 1.97% | | | |
| Actual | | $1,000.00 | $1,099.00 | $10.42 |
| Hypothetical-C | | $1,000.00 | $1,015.27 | $10.01 |
| Small Cap Value | .95% | | | |
| Actual | | $1,000.00 | $1,104.50 | $5.04 |
| Hypothetical-C | | $1,000.00 | $1,020.42 | $4.84 |
| Class I | .95% | | | |
| Actual | | $1,000.00 | $1,104.50 | $5.04 |
| Hypothetical-C | | $1,000.00 | $1,020.42 | $4.84 |
A Annualized expense ratio reflects expenses net of applicable fee waivers.
B Expenses are equal to each Class' annualized expense ratio, multiplied by the average account value over the period, multiplied by 184/365 (to reflect the one-half year period).
C 5% return per year before expenses
ASCV-SANN-0318
1.803738.114
Fidelity® Small Cap Value Fund
Semi-Annual Report January 31, 2018 |
|
Contents
To view a fund's proxy voting guidelines and proxy voting record for the 12-month period ended June 30, visit http://www.fidelity.com/proxyvotingresults or visit the Securities and Exchange Commission's (SEC) web site at http://www.sec.gov.
You may also call 1-800-544-8544 to request a free copy of the proxy voting guidelines.
Standard & Poor's, S&P and S&P 500 are registered service marks of The McGraw-Hill Companies, Inc. and have been licensed for use by Fidelity Distributors Corporation.
Other third-party marks appearing herein are the property of their respective owners.
All other marks appearing herein are registered or unregistered trademarks or service marks of FMR LLC or an affiliated company. © 2018 FMR LLC. All rights reserved.
This report and the financial statements contained herein are submitted for the general information of the shareholders of the Fund. This report is not authorized for distribution to prospective investors in the Fund unless preceded or accompanied by an effective prospectus.
A fund files its complete schedule of portfolio holdings with the SEC for the first and third quarters of each fiscal year on Form N-Q. Forms N-Q are available on the SEC’s web site at http://www.sec.gov. A fund's Forms N-Q may be reviewed and copied at the SEC’s Public Reference Room in Washington, DC. Information regarding the operation of the SEC's Public Reference Room may be obtained by calling 1-800-SEC-0330.
For a complete list of a fund's portfolio holdings, view the most recent holdings listing, semiannual report, or annual report on Fidelity's web site at http://www.fidelity.com, http://www.institutional.fidelity.com, or http://www.401k.com, as applicable.
NOT FDIC INSURED •MAY LOSE VALUE •NO BANK GUARANTEE
Neither the Fund nor Fidelity Distributors Corporation is a bank.
Investment Summary (Unaudited)
Top Ten Stocks as of January 31, 2018
| | % of fund's net assets |
| LivaNova PLC | 3.5 |
| Tech Data Corp. | 3.3 |
| Moog, Inc. Class A | 3.1 |
| Cullen/Frost Bankers, Inc. | 3.0 |
| Genesee & Wyoming, Inc. Class A | 3.0 |
| First American Financial Corp. | 2.9 |
| CVB Financial Corp. | 2.9 |
| BOK Financial Corp. | 2.7 |
| Store Capital Corp. | 2.6 |
| Science Applications International Corp. | 2.6 |
| | 29.6 |
Top Five Market Sectors as of January 31, 2018
| | % of fund's net assets |
| Financials | 32.4 |
| Industrials | 15.6 |
| Consumer Discretionary | 12.6 |
| Information Technology | 12.4 |
| Health Care | 6.7 |
Asset Allocation (% of fund's net assets)
| As of January 31, 2018* |
| | Stocks | 97.5% |
| | Bonds | 0.3% |
| | Short-Term Investments and Net Other Assets (Liabilities) | 2.2% |

* Foreign investments - 15.4%
Schedule of Investments January 31, 2018 (Unaudited)
Showing Percentage of Net Assets
| Common Stocks - 97.5% | | | |
| | | Shares | Value |
| CONSUMER DISCRETIONARY - 12.6% | | | |
| Auto Components - 1.1% | | | |
| Standard Motor Products, Inc. | | 795,092 | $38,084,907 |
| Diversified Consumer Services - 2.9% | | | |
| Grand Canyon Education, Inc. (a) | | 595,927 | 55,415,252 |
| Strayer Education, Inc. | | 527,400 | 48,773,952 |
| | | | 104,189,204 |
| Hotels, Restaurants & Leisure - 2.3% | | | |
| Cedar Fair LP (depositary unit) | | 1,223,500 | 82,953,300 |
| Household Durables - 4.3% | | | |
| CalAtlantic Group, Inc. | | 790,800 | 44,387,604 |
| LGI Homes, Inc. (a)(b) | | 586,300 | 39,680,784 |
| Meritage Homes Corp. (a) | | 1,413,578 | 67,074,276 |
| | | | 151,142,664 |
| Specialty Retail - 2.0% | | | |
| Aaron's, Inc. Class A | | 1,706,100 | 69,762,429 |
|
| TOTAL CONSUMER DISCRETIONARY | | | 446,132,504 |
|
| CONSUMER STAPLES - 1.3% | | | |
| Food & Staples Retailing - 1.2% | | | |
| United Natural Foods, Inc. (a) | | 855,000 | 40,698,000 |
| Food Products - 0.1% | | | |
| Nomad Foods Ltd. (a) | | 220,725 | 3,761,154 |
|
| TOTAL CONSUMER STAPLES | | | 44,459,154 |
|
| ENERGY - 3.8% | | | |
| Energy Equipment & Services - 2.1% | | | |
| ShawCor Ltd. Class A | | 3,200,400 | 72,230,166 |
| Oil, Gas & Consumable Fuels - 1.7% | | | |
| LINN Energy, Inc. (b) | | 1,551,900 | 61,300,050 |
|
| TOTAL ENERGY | | | 133,530,216 |
|
| FINANCIALS - 32.4% | | | |
| Banks - 19.4% | | | |
| Associated Banc-Corp. | | 2,650,000 | 65,587,500 |
| Banner Corp. | | 388,900 | 21,132,826 |
| BOK Financial Corp. | | 1,000,000 | 96,690,000 |
| Cullen/Frost Bankers, Inc. | | 1,000,000 | 106,410,000 |
| CVB Financial Corp. | | 4,359,300 | 102,007,620 |
| First Citizen Bancshares, Inc. | | 140,370 | 59,714,802 |
| First Citizen Bancshares, Inc. Class A | | 180,954 | 76,979,641 |
| Hilltop Holdings, Inc. | | 820,700 | 21,494,133 |
| Popular, Inc. | | 1,105,800 | 44,939,712 |
| UMB Financial Corp. | | 1,200,000 | 91,416,000 |
| | | | 686,372,234 |
| Capital Markets - 3.1% | | | |
| Federated Investors, Inc. Class B (non-vtg.) | | 1,730,900 | 60,027,612 |
| OM Asset Management Ltd. | | 2,895,301 | 51,796,935 |
| | | | 111,824,547 |
| Insurance - 8.2% | | | |
| Argo Group International Holdings, Ltd. | | 628,500 | 38,527,050 |
| Enstar Group Ltd. (a) | | 281,000 | 58,335,600 |
| First American Financial Corp. | | 1,750,900 | 103,425,663 |
| ProAssurance Corp. | | 1,633,300 | 89,341,510 |
| | | | 289,629,823 |
| Thrifts & Mortgage Finance - 1.7% | | | |
| Beneficial Bancorp, Inc. | | 864,286 | 14,044,648 |
| Washington Federal, Inc. | | 1,250,000 | 44,875,000 |
| | | | 58,919,648 |
|
| TOTAL FINANCIALS | | | 1,146,746,252 |
|
| HEALTH CARE - 6.7% | | | |
| Health Care Equipment & Supplies - 3.5% | | | |
| LivaNova PLC (a) | | 1,470,651 | 125,814,193 |
| Health Care Providers & Services - 1.1% | | | |
| Civitas Solutions, Inc. (a)(c) | | 2,038,502 | 35,775,710 |
| Envision Healthcare Corp. (a) | | 45,500 | 1,637,545 |
| | | | 37,413,255 |
| Health Care Technology - 1.0% | | | |
| Cegedim SA (a) | | 694,196 | 35,595,604 |
| Pharmaceuticals - 1.1% | | | |
| Innoviva, Inc. (a) | | 2,771,053 | 40,429,663 |
|
| TOTAL HEALTH CARE | | | 239,252,715 |
|
| INDUSTRIALS - 15.3% | | | |
| Aerospace & Defense - 3.1% | | | |
| Moog, Inc. Class A (a) | | 1,222,900 | 110,134,374 |
| Airlines - 0.3% | | | |
| Allegiant Travel Co. | | 77,400 | 12,325,950 |
| Electrical Equipment - 4.8% | | | |
| AZZ, Inc. | | 500,000 | 22,750,000 |
| Melrose Industries PLC | | 21,916,049 | 70,450,025 |
| Regal Beloit Corp. | | 1,005,368 | 78,318,167 |
| | | | 171,518,192 |
| Machinery - 1.7% | | | |
| Mueller Industries, Inc. | | 1,772,458 | 58,650,635 |
| Road & Rail - 3.0% | | | |
| Genesee & Wyoming, Inc. Class A (a) | | 1,317,600 | 105,210,360 |
| Trading Companies & Distributors - 2.4% | | | |
| WESCO International, Inc. (a) | | 1,241,700 | 84,621,855 |
|
| TOTAL INDUSTRIALS | | | 542,461,366 |
|
| INFORMATION TECHNOLOGY - 12.4% | | | |
| Electronic Equipment & Components - 5.0% | | | |
| SYNNEX Corp. | | 500,000 | 61,365,000 |
| Tech Data Corp. (a) | | 1,143,200 | 114,628,664 |
| | | | 175,993,664 |
| Internet Software & Services - 3.4% | | | |
| Cimpress NV (a)(b) | | 325,100 | 41,420,991 |
| comScore, Inc. (a) | | 47,500 | 1,075,875 |
| j2 Global, Inc. | | 1,000,000 | 79,990,000 |
| | | | 122,486,866 |
| IT Services - 3.0% | | | |
| Presidio, Inc. | | 835,100 | 15,290,681 |
| Science Applications International Corp. | | 1,195,497 | 91,634,845 |
| | | | 106,925,526 |
| Technology Hardware, Storage & Peripherals - 1.0% | | | |
| Super Micro Computer, Inc. (a) | | 1,500,000 | 34,237,500 |
|
| TOTAL INFORMATION TECHNOLOGY | | | 439,643,556 |
|
| MATERIALS - 4.4% | | | |
| Containers & Packaging - 2.5% | | | |
| Silgan Holdings, Inc. | | 3,000,000 | 89,670,000 |
| Metals & Mining - 1.9% | | | |
| Compass Minerals International, Inc. (b) | | 917,800 | 66,907,620 |
|
| TOTAL MATERIALS | | | 156,577,620 |
|
| REAL ESTATE - 4.9% | | | |
| Equity Real Estate Investment Trusts (REITs) - 4.9% | | | |
| CareTrust (REIT), Inc. | | 593,600 | 9,432,304 |
| Potlatch Corp. | | 369,199 | 19,530,627 |
| Sabra Health Care REIT, Inc. | | 2,854,100 | 51,659,210 |
| Store Capital Corp. | | 3,809,300 | 93,365,943 |
| | | | 173,988,084 |
| TELECOMMUNICATION SERVICES - 0.0% | | | |
| Diversified Telecommunication Services - 0.0% | | | |
| Com Hem Holding AB | | 14,758 | 256,583 |
| UTILITIES - 3.7% | | | |
| Electric Utilities - 3.6% | | | |
| El Paso Electric Co. | | 1,211,100 | 63,219,420 |
| IDACORP, Inc. | | 743,900 | 64,183,692 |
| | | | 127,403,112 |
| Independent Power and Renewable Electricity Producers - 0.1% | | | |
| NRG Yield, Inc. Class C | | 264,000 | 4,989,600 |
|
| TOTAL UTILITIES | | | 132,392,712 |
|
| TOTAL COMMON STOCKS | | | |
| (Cost $2,515,025,135) | | | 3,455,440,762 |
| | | Principal Amount | Value |
|
| Nonconvertible Bonds - 0.3% | | | |
| INDUSTRIALS - 0.3% | | | |
| Machinery - 0.3% | | | |
Mueller Industries, Inc. 6% 3/1/27
(Cost $10,499,000) | | 10,499,000 | 10,761,476 |
| | | Shares | Value |
|
| Money Market Funds - 4.8% | | | |
| Fidelity Cash Central Fund, 1.39% (d) | | 84,052,240 | 84,069,051 |
| Fidelity Securities Lending Cash Central Fund 1.40% (d)(e) | | 85,672,827 | 85,681,394 |
| TOTAL MONEY MARKET FUNDS | | | |
| (Cost $169,747,390) | | | 169,750,445 |
| TOTAL INVESTMENT IN SECURITIES - 102.6% | | | |
| (Cost $2,695,271,525) | | | 3,635,952,683 |
| NET OTHER ASSETS (LIABILITIES) - (2.6)% | | | (91,058,781) |
| NET ASSETS - 100% | | | $3,544,893,902 |
Legend
(a) Non-income producing
(b) Security or a portion of the security is on loan at period end.
(c) Affiliated company
(d) Affiliated fund that is generally available only to investment companies and other accounts managed by Fidelity Investments. The rate quoted is the annualized seven-day yield of the fund at period end. A complete unaudited listing of the fund's holdings as of its most recent quarter end is available upon request. In addition, each Fidelity Central Fund's financial statements are available on the SEC's website or upon request.
(e) Investment made with cash collateral received from securities on loan.
Affiliated Central Funds
Information regarding fiscal year to date income earned by the Fund from investments in Fidelity Central Funds is as follows:
| Fund | Income earned |
| Fidelity Cash Central Fund | $333,090 |
| Fidelity Securities Lending Cash Central Fund | 166,293 |
| Total | $499,383 |
Amounts in the income column in the above table include any capital gain distributions from underlying funds, which are presented in the corresponding line-item in the Statement of Operations if applicable.
Other Affiliated Issuers
An affiliated company is a company in which the Fund has ownership of at least 5% of the voting securities. Fiscal year to date transactions with companies which are or were affiliates are as follows:
| Affiliate | Value, beginning of period | Purchases | Sales Proceeds | Dividend Income | Realized Gain (loss) | Change in Unrealized appreciation (depreciation) | Value, end of period |
| Civitas Solutions, Inc. | $44,625,000 | $-- | $8,124,718 | $-- | $167,218 | $(891,790) | $35,775,710 |
| Total | $44,625,000 | $-- | $8,124,718 | $-- | $167,218 | $(891,790) | $35,775,710 |
Investment Valuation
The following is a summary of the inputs used, as of January 31, 2018, involving the Fund's assets and liabilities carried at fair value. The inputs or methodology used for valuing securities may not be an indication of the risk associated with investing in those securities. For more information on valuation inputs, and their aggregation into the levels used below, please refer to the Investment Valuation section in the accompanying Notes to Financial Statements.
| | Valuation Inputs at Reporting Date: |
| Description | Total | Level 1 | Level 2 | Level 3 |
| Investments in Securities: | | | | |
| Equities: | | | | |
| Consumer Discretionary | $446,132,504 | $446,132,504 | $-- | $-- |
| Consumer Staples | 44,459,154 | 44,459,154 | -- | -- |
| Energy | 133,530,216 | 133,530,216 | -- | -- |
| Financials | 1,146,746,252 | 1,146,746,252 | -- | -- |
| Health Care | 239,252,715 | 239,252,715 | -- | -- |
| Industrials | 542,461,366 | 542,461,366 | -- | -- |
| Information Technology | 439,643,556 | 439,643,556 | -- | -- |
| Materials | 156,577,620 | 156,577,620 | -- | -- |
| Real Estate | 173,988,084 | 173,988,084 | -- | -- |
| Telecommunication Services | 256,583 | 256,583 | -- | -- |
| Utilities | 132,392,712 | 132,392,712 | -- | -- |
| Corporate Bonds | 10,761,476 | -- | 10,761,476 | -- |
| Money Market Funds | 169,750,445 | 169,750,445 | -- | -- |
| Total Investments in Securities: | $3,635,952,683 | $3,625,191,207 | $10,761,476 | $-- |
Other Information
Distribution of investments by country or territory of incorporation, as a percentage of Total Net Assets, is as follows (Unaudited):
| United States of America | 84.6% |
| United Kingdom | 6.9% |
| Bermuda | 2.8% |
| Canada | 2.1% |
| Puerto Rico | 1.3% |
| Netherlands | 1.2% |
| France | 1.0% |
| Others (Individually Less Than 1%) | 0.1% |
| | 100.0% |
See accompanying notes which are an integral part of the financial statements.
Financial Statements
Statement of Assets and Liabilities
| | | January 31, 2018 (Unaudited) |
| Assets | | |
Investment in securities, at value (including securities loaned of $83,056,452) — See accompanying schedule:
Unaffiliated issuers (cost $2,491,391,256) | $3,430,426,528 | |
| Fidelity Central Funds (cost $169,747,390) | 169,750,445 | |
| Other affiliated issuers (cost $34,132,879) | 35,775,710 | |
| Total Investment in Securities (cost $2,695,271,525) | | $3,635,952,683 |
| Cash | | 2 |
| Receivable for investments sold | | 12,906,594 |
| Receivable for fund shares sold | | 2,171,417 |
| Interest receivable | | 262,475 |
| Distributions receivable from Fidelity Central Funds | | 97,575 |
| Prepaid expenses | | 4,901 |
| Other receivables | | 20,680 |
| Total assets | | 3,651,416,327 |
| Liabilities | | |
| Payable for investments purchased | $13,977,121 | |
| Payable for fund shares redeemed | 3,981,880 | |
| Accrued management fee | 2,128,129 | |
| Distribution and service plan fees payable | 112,284 | |
| Other affiliated payables | 619,285 | |
| Other payables and accrued expenses | 35,801 | |
| Collateral on securities loaned | 85,667,925 | |
| Total liabilities | | 106,522,425 |
| Net Assets | | $3,544,893,902 |
| Net Assets consist of: | | |
| Paid in capital | | $2,516,931,999 |
| Distributions in excess of net investment income | | (433,539) |
| Accumulated undistributed net realized gain (loss) on investments and foreign currency transactions | | 87,714,296 |
| Net unrealized appreciation (depreciation) on investments and assets and liabilities in foreign currencies | | 940,681,146 |
| Net Assets | | $3,544,893,902 |
| Calculation of Maximum Offering Price | | |
| Class A: | | |
| Net Asset Value and redemption price per share ($176,337,170 ÷ 8,701,146 shares) | | $20.27 |
| Maximum offering price per share (100/94.25 of $20.27) | | $21.51 |
| Class M: | | |
| Net Asset Value and redemption price per share ($76,256,612 ÷ 3,850,821 shares) | | $19.80 |
| Maximum offering price per share (100/96.50 of $19.80) | | $20.52 |
| Class C: | | |
| Net Asset Value and offering price per share ($49,835,724 ÷ 2,692,255 shares)(a) | | $18.51 |
| Small Cap Value: | | |
| Net Asset Value, offering price and redemption price per share ($2,771,576,169 ÷ 134,377,639 shares) | | $20.63 |
| Class I: | | |
| Net Asset Value, offering price and redemption price per share ($470,888,227 ÷ 22,824,925 shares) | | $20.63 |
(a) Redemption price per share is equal to net asset value less any applicable contingent deferred sales charge.
See accompanying notes which are an integral part of the financial statements.
Statement of Operations
| | | Six months ended January 31, 2018 (Unaudited) |
| Investment Income | | |
| Dividends | | $23,468,962 |
| Special dividends | | 6,923,500 |
| Interest | | 314,970 |
| Income from Fidelity Central Funds | | 499,383 |
| Total income | | 31,206,815 |
| Expenses | | |
| Management fee | | |
| Basic fee | $12,049,438 | |
| Performance adjustment | 643,254 | |
| Transfer agent fees | 3,214,745 | |
| Distribution and service plan fees | 668,244 | |
| Accounting and security lending fees | 513,763 | |
| Custodian fees and expenses | 23,018 | |
| Independent trustees' fees and expenses | 6,722 | |
| Registration fees | 86,578 | |
| Audit | 33,908 | |
| Legal | 6,268 | |
| Interest | 656 | |
| Miscellaneous | 11,295 | |
| Total expenses before reductions | 17,257,889 | |
| Expense reductions | (61,383) | 17,196,506 |
| Net investment income (loss) | | 14,010,309 |
| Realized and Unrealized Gain (Loss) | | |
| Net realized gain (loss) on: | | |
| Investment securities: | | |
| Unaffiliated issuers | 128,701,046 | |
| Fidelity Central Funds | (332) | |
| Other affiliated issuers | 167,218 | |
| Foreign currency transactions | (91,524) | |
| Total net realized gain (loss) | | 128,776,408 |
| Change in net unrealized appreciation (depreciation) on: | | |
| Investment securities: | | |
| Unaffiliated issuers | 204,984,699 | |
| Fidelity Central Funds | (1,053) | |
| Other affiliated issuers | (891,790) | |
| Assets and liabilities in foreign currencies | (26) | |
| Total change in net unrealized appreciation (depreciation) | | 204,091,830 |
| Net gain (loss) | | 332,868,238 |
| Net increase (decrease) in net assets resulting from operations | | $346,878,547 |
See accompanying notes which are an integral part of the financial statements.
Statement of Changes in Net Assets
| | Six months ended January 31, 2018 (Unaudited) | Year ended July 31, 2017 |
| Increase (Decrease) in Net Assets | | |
| Operations | | |
| Net investment income (loss) | $14,010,309 | $44,455,877 |
| Net realized gain (loss) | 128,776,408 | 78,723,874 |
| Change in net unrealized appreciation (depreciation) | 204,091,830 | 334,723,173 |
| Net increase (decrease) in net assets resulting from operations | 346,878,547 | 457,902,924 |
| Distributions to shareholders from net investment income | (37,440,446) | (25,276,323) |
| Distributions to shareholders from net realized gain | (91,158,962) | (209,689,485) |
| Total distributions | (128,599,408) | (234,965,808) |
| Share transactions - net increase (decrease) | (93,433,237) | (12,022,135) |
| Redemption fees | 89,025 | 469,836 |
| Total increase (decrease) in net assets | 124,934,927 | 211,384,817 |
| Net Assets | | |
| Beginning of period | 3,419,958,975 | 3,208,574,158 |
| End of period | $3,544,893,902 | $3,419,958,975 |
| Other Information | | |
| Undistributed net investment income end of period | $– | $22,996,598 |
| Distributions in excess of net investment income end of period | $(433,539) | $– |
See accompanying notes which are an integral part of the financial statements.
Financial Highlights
Fidelity Small Cap Value Fund Class A
| | Six months ended (Unaudited) January 31, | Years endedJuly 31, | | | | |
| | 2018 | 2017 | 2016 | 2015 | 2014 | 2013 |
| Selected Per–Share Data | | | | | | |
| Net asset value, beginning of period | $19.05 | $17.92 | $19.14 | $19.29 | $19.96 | $14.86 |
| Income from Investment Operations | | | | | | |
| Net investment income (loss)A | .06B | .20C | .07 | .10D | .03 | .07 |
| Net realized and unrealized gain (loss) | 1.85 | 2.23 | .56 | 2.01 | 1.24 | 5.57 |
| Total from investment operations | 1.91 | 2.43 | .63 | 2.11 | 1.27 | 5.64 |
| Distributions from net investment income | (.17) | (.10) | (.11) | (.02) | (.01) | (.07) |
| Distributions from net realized gain | (.52) | (1.20) | (1.75) | (2.25) | (1.93) | (.47) |
| Total distributions | (.69) | (1.30) | (1.85)E | (2.26)F | (1.94) | (.54) |
| Redemption fees added to paid in capitalA,G | – | – | – | – | – | – |
| Net asset value, end of period | $20.27 | $19.05 | $17.92 | $19.14 | $19.29 | $19.96 |
| Total ReturnH,I,J | 10.32% | 14.61% | 4.07% | 11.86% | 6.83% | 39.09% |
| Ratios to Average Net AssetsK,L | | | | | | |
| Expenses before reductions | 1.22%M | 1.24% | 1.41% | 1.42% | 1.36% | 1.36% |
| Expenses net of fee waivers, if any | 1.22%M | 1.24% | 1.41% | 1.39% | 1.35% | 1.36% |
| Expenses net of all reductions | 1.22%M | 1.24% | 1.41% | 1.39% | 1.34% | 1.36% |
| Net investment income (loss) | .58%B,M | 1.10%C | .43% | .52%D | .13% | .41% |
| Supplemental Data | | | | | | |
| Net assets, end of period (000 omitted) | $176,337 | $184,306 | $218,364 | $235,844 | $258,183 | $275,265 |
| Portfolio turnover rateN | 13%M | 26% | 33% | 34% | 26%O | 29% |
A Calculated based on average shares outstanding during the period.
B Net investment income per share reflects a large, non-recurring dividend which amounted to $.04 per share. This dividend is not annualized in the ratio of net investment income (loss) to average net assets. Excluding this dividend the ratio would have been .18%.
C Net Investment income per share reflects a large, non-recurring dividend which amounted to $.09 per share. Excluding this non-recurring dividend, the ratio of net investment income (loss) to average net assets would have been .61%.
D Net Investment income per share reflects a large, non-recurring dividend which amounted to $.05 per share. Excluding this non-recurring dividend, the ratio of net investment income (loss) to average net assets would have been .26%.
E Total distributions of $1.85 per share is comprised of distributions from net investment income of $.105 and distributions from net realized gain of $1.747 per share.
F Total distributions of $2.26 per share is comprised of distributions from net investment income of $.016 and distributions from net realized gain of $2.248 per share.
G Amount represents less than $.005 per share.
H Total returns for periods of less than one year are not annualized.
I Total returns would have been lower if certain expenses had not been reduced during the applicable periods shown.
J Total returns do not include the effect of the sales charges.
K Fees and expenses of any underlying Fidelity Central Funds are not included in the Fund's expense ratio. The Fund indirectly bears its proportionate share of the expenses of any underlying Fidelity Central Funds.
L Expense ratios reflect operating expenses of the class. Expenses before reductions do not reflect amounts reimbursed by the investment adviser or reductions from brokerage service arrangements or reductions from other expense offset arrangements and do not represent the amount paid by the class during periods when reimbursements or reductions occur. Expenses net of fee waivers reflect expenses after reimbursement by the investment adviser but prior to reductions from brokerage service arrangements or other expense offset arrangements. Expenses net of all reductions represent the net expenses paid by the class.
M Annualized
N Amount does not include the portfolio activity of any underlying Fidelity Central Funds.
O Portfolio turnover rate excludes securities received or delivered in-kind.
See accompanying notes which are an integral part of the financial statements.
Fidelity Small Cap Value Fund Class M
| | Six months ended (Unaudited) January 31, | Years endedJuly 31, | | | | |
| | 2018 | 2017 | 2016 | 2015 | 2014 | 2013 |
| Selected Per–Share Data | | | | | | |
| Net asset value, beginning of period | $18.61 | $17.54 | $18.78 | $18.98 | $19.70 | $14.70 |
| Income from Investment Operations | | | | | | |
| Net investment income (loss)A | .03B | .15C | .03 | .05D | (.02) | .03 |
| Net realized and unrealized gain (loss) | 1.80 | 2.18 | .54 | 1.98 | 1.23 | 5.50 |
| Total from investment operations | 1.83 | 2.33 | .57 | 2.03 | 1.21 | 5.53 |
| Distributions from net investment income | (.13) | (.07) | (.06) | – | – | (.06) |
| Distributions from net realized gain | (.52) | (1.20) | (1.75) | (2.23) | (1.93) | (.47) |
| Total distributions | (.64)E | (1.26)F | (1.81) | (2.23) | (1.93) | (.53) |
| Redemption fees added to paid in capitalA,G | – | – | – | – | – | – |
| Net asset value, end of period | $19.80 | $18.61 | $17.54 | $18.78 | $18.98 | $19.70 |
| Total ReturnH,I,J | 10.16% | 14.35% | 3.76% | 11.58% | 6.58% | 38.70% |
| Ratios to Average Net AssetsK,L | | | | | | |
| Expenses before reductions | 1.46%M | 1.49% | 1.66% | 1.67% | 1.61% | 1.60% |
| Expenses net of fee waivers, if any | 1.46%M | 1.49% | 1.66% | 1.64% | 1.59% | 1.60% |
| Expenses net of all reductions | 1.46%M | 1.49% | 1.65% | 1.63% | 1.59% | 1.59% |
| Net investment income (loss) | .34%B,M | .86%C | .19% | .27%D | (.11)% | .18% |
| Supplemental Data | | | | | | |
| Net assets, end of period (000 omitted) | $76,257 | $78,852 | $82,337 | $91,716 | $100,975 | $107,444 |
| Portfolio turnover rateN | 13%M | 26% | 33% | 34% | 26%O | 29% |
A Calculated based on average shares outstanding during the period.
B Net investment income per share reflects a large, non-recurring dividend which amounted to $.04 per share. This dividend is not annualized in the ratio of net investment income (loss) to average net assets. Excluding this dividend the ratio would have been (.06)%.
C Net Investment income per share reflects a large, non-recurring dividend which amounted to $.09 per share. Excluding this non-recurring dividend, the ratio of net investment income (loss) to average net assets would have been .36%.
D Net Investment income per share reflects a large, non-recurring dividend which amounted to $.05 per share. Excluding this non-recurring dividend, the ratio of net investment income (loss) to average net assets would have been .01%.
E Total distributions of $.64 per share is comprised of distributions from net investment income of $.125 and distributions from net realized gain of $.519 per share.
F Total distributions of $1.26 per share is comprised of distributions from net investment income of $.067 and distributions from net realized gain of $1.195 per share.
G Amount represents less than $.005 per share.
H Total returns for periods of less than one year are not annualized.
I Total returns would have been lower if certain expenses had not been reduced during the applicable periods shown.
J Total returns do not include the effect of the sales charges.
K Fees and expenses of any underlying Fidelity Central Funds are not included in the Fund's expense ratio. The Fund indirectly bears its proportionate share of the expenses of any underlying Fidelity Central Funds.
L Expense ratios reflect operating expenses of the class. Expenses before reductions do not reflect amounts reimbursed by the investment adviser or reductions from brokerage service arrangements or reductions from other expense offset arrangements and do not represent the amount paid by the class during periods when reimbursements or reductions occur. Expenses net of fee waivers reflect expenses after reimbursement by the investment adviser but prior to reductions from brokerage service arrangements or other expense offset arrangements. Expenses net of all reductions represent the net expenses paid by the class.
M Annualized
N Amount does not include the portfolio activity of any underlying Fidelity Central Funds.
O Portfolio turnover rate excludes securities received or delivered in-kind.
See accompanying notes which are an integral part of the financial statements.
Fidelity Small Cap Value Fund Class C
| | Six months ended (Unaudited) January 31, | Years endedJuly 31, | | | | |
| | 2018 | 2017 | 2016 | 2015 | 2014 | 2013 |
| Selected Per–Share Data | | | | | | |
| Net asset value, beginning of period | $17.39 | $16.52 | $17.82 | $18.19 | $19.06 | $14.28 |
| Income from Investment Operations | | | | | | |
| Net investment income (loss)A | (.02)B | .06C | (.05) | (.04)D | (.12) | (.06) |
| Net realized and unrealized gain (loss) | 1.69 | 2.04 | .50 | 1.90 | 1.18 | 5.34 |
| Total from investment operations | 1.67 | 2.10 | .45 | 1.86 | 1.06 | 5.28 |
| Distributions from net investment income | (.03) | (.04) | – | – | – | (.03) |
| Distributions from net realized gain | (.52) | (1.20) | (1.75) | (2.23) | (1.93) | (.47) |
| Total distributions | (.55) | (1.23)E | (1.75) | (2.23) | (1.93) | (.50) |
| Redemption fees added to paid in capitalA,F | – | – | – | – | – | – |
| Net asset value, end of period | $18.51 | $17.39 | $16.52 | $17.82 | $18.19 | $19.06 |
| Total ReturnG,H,I | 9.90% | 13.79% | 3.20% | 11.05% | 5.97% | 38.00% |
| Ratios to Average Net AssetsJ,K | | | | | | |
| Expenses before reductions | 1.97%L | 2.00% | 2.18% | 2.19% | 2.12% | 2.13% |
| Expenses net of fee waivers, if any | 1.97%L | 2.00% | 2.17% | 2.16% | 2.11% | 2.13% |
| Expenses net of all reductions | 1.97%L | 2.00% | 2.17% | 2.15% | 2.10% | 2.12% |
| Net investment income (loss) | (.18)%B,L | .35%C | (.33)% | (.25)%D | (.63)% | (.35)% |
| Supplemental Data | | | | | | |
| Net assets, end of period (000 omitted) | $49,836 | $52,227 | $57,231 | $64,928 | $70,541 | $76,018 |
| Portfolio turnover rateM | 13%L | 26% | 33% | 34% | 26%N | 29% |
A Calculated based on average shares outstanding during the period.
B Net investment income per share reflects a large, non-recurring dividend which amounted to $.04 per share. This dividend is not annualized in the ratio of net investment income (loss) to average net assets. Excluding this dividend the ratio would have been (.57) %.
C Net Investment income per share reflects a large, non-recurring dividend which amounted to $.08 per share. Excluding this non-recurring dividend, the ratio of net investment income (loss) to average net assets would have been (.15) %.
D Net Investment income per share reflects a large, non-recurring dividend which amounted to $.05 per share. Excluding this non-recurring dividend, the ratio of net investment income (loss) to average net assets would have been (.51) %.
E Total distributions of $1.23 per share is comprised of distributions from net investment income of $.036 and distributions from net realized gain of $1.195 per share.
F Amount represents less than $.005 per share.
G Total returns for periods of less than one year are not annualized.
H Total returns would have been lower if certain expenses had not been reduced during the applicable periods shown.
I Total returns do not include the effect of the contingent deferred sales charge.
J Fees and expenses of any underlying Fidelity Central Funds are not included in the Fund's expense ratio. The Fund indirectly bears its proportionate share of the expenses of any underlying Fidelity Central Funds.
K Expense ratios reflect operating expenses of the class. Expenses before reductions do not reflect amounts reimbursed by the investment adviser or reductions from brokerage service arrangements or reductions from other expense offset arrangements and do not represent the amount paid by the class during periods when reimbursements or reductions occur. Expenses net of fee waivers reflect expenses after reimbursement by the investment adviser but prior to reductions from brokerage service arrangements or other expense offset arrangements. Expenses net of all reductions represent the net expenses paid by the class.
L Annualized
M Amount does not include the portfolio activity of any underlying Fidelity Central Funds.
N Portfolio turnover rate excludes securities received or delivered in-kind.
See accompanying notes which are an integral part of the financial statements.
Fidelity Small Cap Value Fund
| | Six months ended (Unaudited) January 31, | Years endedJuly 31, | | | | |
| | 2018 | 2017 | 2016 | 2015 | 2014 | 2013 |
| Selected Per–Share Data | | | | | | |
| Net asset value, beginning of period | $19.41 | $18.22 | $19.45 | $19.57 | $20.22 | $15.05 |
| Income from Investment Operations | | | | | | |
| Net investment income (loss)A | .08B | .25C | .12 | .15D | .08 | .12 |
| Net realized and unrealized gain (loss) | 1.88 | 2.28 | .55 | 2.05 | 1.26 | 5.63 |
| Total from investment operations | 1.96 | 2.53 | .67 | 2.20 | 1.34 | 5.75 |
| Distributions from net investment income | (.22) | (.15) | (.15) | (.07) | (.06) | (.11) |
| Distributions from net realized gain | (.52) | (1.20) | (1.75) | (2.25) | (1.93) | (.47) |
| Total distributions | (.74) | (1.34)E | (1.90) | (2.32) | (1.99) | (.58) |
| Redemption fees added to paid in capitalA,F | – | – | – | – | – | – |
| Net asset value, end of period | $20.63 | $19.41 | $18.22 | $19.45 | $19.57 | $20.22 |
| Total ReturnG,H | 10.45% | 14.99% | 4.23% | 12.18% | 7.12% | 39.45% |
| Ratios to Average Net AssetsI,J | | | | | | |
| Expenses before reductions | .95%K | .99% | 1.18% | 1.15% | 1.08% | 1.07% |
| Expenses net of fee waivers, if any | .95%K | .99% | 1.18% | 1.12% | 1.06% | 1.07% |
| Expenses net of all reductions | .95%K | .99% | 1.17% | 1.12% | 1.06% | 1.06% |
| Net investment income (loss) | .84%B,K | 1.36%C | .67% | .78%D | .41% | .71% |
| Supplemental Data | | | | | | |
| Net assets, end of period (000 omitted) | $2,771,576 | $2,637,843 | $2,460,714 | $2,036,157 | $2,060,546 | $2,672,854 |
| Portfolio turnover rateL | 13%K | 26% | 33% | 34% | 26%M | 29% |
A Calculated based on average shares outstanding during the period.
B Net investment income per share reflects a large, non-recurring dividend which amounted to $.04 per share. This dividend is not annualized in the ratio of net investment income (loss) to average net assets. Excluding this dividend the ratio would have been .45%.
C Net Investment income per share reflects a large, non-recurring dividend which amounted to $.09 per share. Excluding this non-recurring dividend, the ratio of net investment income (loss) to average net assets would have been .86%.
D Net Investment income per share reflects a large, non-recurring dividend which amounted to $.05 per share. Excluding this non-recurring dividend, the ratio of net investment income (loss) to average net assets would have been .53%.
E Total distributions of $1.34 per share is comprised of distributions from net investment income of $.145 and distributions from net realized gain of $1.195 per share.
F Amount represents less than $.005 per share.
G Total returns for periods of less than one year are not annualized.
H Total returns would have been lower if certain expenses had not been reduced during the applicable periods shown.
I Fees and expenses of any underlying Fidelity Central Funds are not included in the Fund's expense ratio. The Fund indirectly bears its proportionate share of the expenses of any underlying Fidelity Central Funds.
J Expense ratios reflect operating expenses of the class. Expenses before reductions do not reflect amounts reimbursed by the investment adviser or reductions from brokerage service arrangements or reductions from other expense offset arrangements and do not represent the amount paid by the class during periods when reimbursements or reductions occur. Expenses net of fee waivers reflect expenses after reimbursement by the investment adviser but prior to reductions from brokerage service arrangements or other expense offset arrangements. Expenses net of all reductions represent the net expenses paid by the class.
K Annualized
L Amount does not include the portfolio activity of any underlying Fidelity Central Funds.
M Portfolio turnover rate excludes securities received or delivered in-kind.
See accompanying notes which are an integral part of the financial statements.
Fidelity Small Cap Value Fund Class I
| | Six months ended (Unaudited) January 31, | Years endedJuly 31, | | | | |
| | 2018 | 2017 | 2016 | 2015 | 2014 | 2013 |
| Selected Per–Share Data | | | | | | |
| Net asset value, beginning of period | $19.41 | $18.23 | $19.45 | $19.57 | $20.23 | $15.05 |
| Income from Investment Operations | | | | | | |
| Net investment income (loss)A | .08B | .25C | .12 | .15D | .08 | .12 |
| Net realized and unrealized gain (loss) | 1.88 | 2.28 | .56 | 2.05 | 1.25 | 5.65 |
| Total from investment operations | 1.96 | 2.53 | .68 | 2.20 | 1.33 | 5.77 |
| Distributions from net investment income | (.22) | (.15) | (.16) | (.07) | (.06) | (.12) |
| Distributions from net realized gain | (.52) | (1.20) | (1.75) | (2.25) | (1.93) | (.47) |
| Total distributions | (.74) | (1.35) | (1.90)E | (2.32) | (1.99) | (.59) |
| Redemption fees added to paid in capitalA,F | – | – | – | – | – | – |
| Net asset value, end of period | $20.63 | $19.41 | $18.23 | $19.45 | $19.57 | $20.23 |
| Total ReturnG,H | 10.45% | 14.96% | 4.31% | 12.17% | 7.08% | 39.54% |
| Ratios to Average Net AssetsI,J | | | | | | |
| Expenses before reductions | .95%K | .98% | 1.14% | 1.15% | 1.09% | 1.07% |
| Expenses net of fee waivers, if any | .95%K | .97% | 1.14% | 1.12% | 1.07% | 1.07% |
| Expenses net of all reductions | .95%K | .97% | 1.14% | 1.12% | 1.07% | 1.06% |
| Net investment income (loss) | .85%B,K | 1.37%C | .70% | .79%D | .40% | .70% |
| Supplemental Data | | | | | | |
| Net assets, end of period (000 omitted) | $470,888 | $466,730 | $389,928 | $376,817 | $342,500 | $359,582 |
| Portfolio turnover rateL | 13%K | 26% | 33% | 34% | 26%M | 29% |
A Calculated based on average shares outstanding during the period.
B Net investment income per share reflects a large, non-recurring dividend which amounted to $.04 per share. This dividend is not annualized in the ratio of net investment income (loss) to average net assets. Excluding this dividend the ratio would have been .45%.
C Net Investment income per share reflects a large, non-recurring dividend which amounted to $.09 per share. Excluding this non-recurring dividend, the ratio of net investment income (loss) to average net assets would have been .88%.
D Net Investment income per share reflects a large, non-recurring dividend which amounted to $.05 per share. Excluding this non-recurring dividend, the ratio of net investment income (loss) to average net assets would have been .53%.
E Total distributions of $1.90 per share is comprised of distributions from net investment income of $.157 and distributions from net realized gain of $1.747 per share.
F Amount represents less than $.005 per share.
G Total returns for periods of less than one year are not annualized.
H Total returns would have been lower if certain expenses had not been reduced during the applicable periods shown.
I Fees and expenses of any underlying Fidelity Central Funds are not included in the Fund's expense ratio. The Fund indirectly bears its proportionate share of the expenses of any underlying Fidelity Central Funds.
J Expense ratios reflect operating expenses of the class. Expenses before reductions do not reflect amounts reimbursed by the investment adviser or reductions from brokerage service arrangements or reductions from other expense offset arrangements and do not represent the amount paid by the class during periods when reimbursements or reductions occur. Expenses net of fee waivers reflect expenses after reimbursement by the investment adviser but prior to reductions from brokerage service arrangements or other expense offset arrangements. Expenses net of all reductions represent the net expenses paid by the class.
K Annualized
L Amount does not include the portfolio activity of any underlying Fidelity Central Funds.
M Portfolio turnover rate excludes securities received or delivered in-kind.
See accompanying notes which are an integral part of the financial statements.
Notes to Financial Statements (Unaudited)
For the period ended January 31, 2018
1. Organization.
Fidelity Small Cap Value Fund (the Fund) is a fund of Fidelity Securities Fund (the Trust) and is authorized to issue an unlimited number of shares. The Trust is registered under the Investment Company Act of 1940, as amended (the 1940 Act), as an open-end management investment company organized as a Massachusetts business trust. The Fund offers Class A, Class M, Class C, Small Cap Value, and Class I shares, each of which has equal rights as to assets and voting privileges. The Fund is closed to new accounts with certain exceptions. Each class has exclusive voting rights with respect to matters that affect that class.
2. Investments in Fidelity Central Funds.
The Fund invests in Fidelity Central Funds, which are open-end investment companies generally available only to other investment companies and accounts managed by the investment adviser and its affiliates. The Fund's Schedule of Investments lists each of the Fidelity Central Funds held as of period end, if any, as an investment of the Fund, but does not include the underlying holdings of each Fidelity Central Fund. As an Investing Fund, the Fund indirectly bears its proportionate share of the expenses of the underlying Fidelity Central Funds.
The Money Market Central Funds seek preservation of capital and current income and are managed by Fidelity Investments Money Management, Inc. (FIMM), an affiliate of the investment adviser. Annualized expenses of the Money Market Central Funds as of their most recent shareholder report date are less than .005%.
A complete unaudited list of holdings for each Fidelity Central Fund is available upon request or at the Securities and Exchange Commission (the SEC) website at www.sec.gov. In addition, the financial statements of the Fidelity Central Funds are available on the SEC website or upon request.
3. Significant Accounting Policies.
The Fund is an investment company and applies the accounting and reporting guidance of the Financial Accounting Standards Board (FASB) Accounting Standards Codification Topic 946 Financial Services – Investments Companies. The financial statements have been prepared in conformity with accounting principles generally accepted in the United States of America (GAAP), which require management to make certain estimates and assumptions at the date of the financial statements. Actual results could differ from those estimates. Subsequent events, if any, through the date that the financial statements were issued have been evaluated in the preparation of the financial statements. The following summarizes the significant accounting policies of the Fund:
Investment Valuation. Investments are valued as of 4:00 p.m. Eastern time on the last calendar day of the period. The Board of Trustees (the Board) has delegated the day to day responsibility for the valuation of the Fund's investments to the Fair Value Committee (the Committee) established by the Fund's investment adviser. In accordance with valuation policies and procedures approved by the Board, the Fund attempts to obtain prices from one or more third party pricing vendors or brokers to value its investments. When current market prices, quotations or currency exchange rates are not readily available or reliable, investments will be fair valued in good faith by the Committee, in accordance with procedures adopted by the Board. Factors used in determining fair value vary by investment type and may include market or investment specific events, changes in interest rates and credit quality. The frequency with which these procedures are used cannot be predicted and they may be utilized to a significant extent. The Committee oversees the Fund's valuation policies and procedures and reports to the Board on the Committee's activities and fair value determinations. The Board monitors the appropriateness of the procedures used in valuing the Fund's investments and ratifies the fair value determinations of the Committee.
The Fund categorizes the inputs to valuation techniques used to value its investments into a disclosure hierarchy consisting of three levels as shown below:
- Level 1 – quoted prices in active markets for identical investments
- Level 2 – other significant observable inputs (including quoted prices for similar investments, interest rates, prepayment speeds, etc.)
- Level 3 – unobservable inputs (including the Fund's own assumptions based on the best information available)
Valuation techniques used to value the Fund's investments by major category are as follows:
Equity securities, including restricted securities, for which market quotations are readily available, are valued at the last reported sale price or official closing price as reported by a third party pricing vendor on the primary market or exchange on which they are traded and are categorized as Level 1 in the hierarchy. In the event there were no sales during the day or closing prices are not available, securities are valued at the last quoted bid price or may be valued using the last available price and are generally categorized as Level 2 in the hierarchy. For foreign equity securities, when market or security specific events arise, comparisons to the valuation of American Depositary Receipts (ADRs), futures contracts, Exchange-Traded Funds (ETFs) and certain indexes as well as quoted prices for similar securities may be used and would be categorized as Level 2 in the hierarchy. Utilizing these techniques may result in transfers between Level 1 and Level 2. For equity securities, including restricted securities, where observable inputs are limited, assumptions about market activity and risk are used and these securities may be categorized as Level 3 in the hierarchy.
Debt securities, including restricted securities, are valued based on evaluated prices received from third party pricing vendors or from brokers who make markets in such securities. Corporate bonds are valued by pricing vendors who utilize matrix pricing which considers yield or price of bonds of comparable quality, coupon, maturity and type or by broker-supplied prices. When independent prices are unavailable or unreliable, debt securities may be valued utilizing pricing methodologies which consider similar factors that would be used by third party pricing vendors. Debt securities are generally categorized as Level 2 in the hierarchy but may be Level 3 depending on the circumstances.
Investments in open-end mutual funds, including the Fidelity Central Funds, are valued at their closing net asset value (NAV) each business day and are categorized as Level 1 in the hierarchy.
Changes in valuation techniques may result in transfers in or out of an assigned level within the disclosure hierarchy. The aggregate value of investments by input level as of January 31, 2018 is included at the end of the Fund's Schedule of Investments.
Foreign Currency. The Fund may use foreign currency contracts to facilitate transactions in foreign-denominated securities. Gains and losses from these transactions may arise from changes in the value of the foreign currency or if the counterparties do not perform under the contracts' terms.
Foreign-denominated assets, including investment securities, and liabilities are translated into U.S. dollars at the exchange rates at period end. Purchases and sales of investment securities, income and dividends received and expenses denominated in foreign currencies are translated into U.S. dollars at the exchange rate in effect on the transaction date.
The effects of exchange rate fluctuations on investments are included with the net realized and unrealized gain (loss) on investment securities. Other foreign currency transactions resulting in realized and unrealized gain (loss) are disclosed separately.
Investment Transactions and Income. For financial reporting purposes, the Fund's investment holdings and NAV include trades executed through the end of the last business day of the period. The NAV per share for processing shareholder transactions is calculated as of the close of business of the New York Stock Exchange (NYSE), normally 4:00 p.m. Eastern time and includes trades executed through the end of the prior business day. Gains and losses on securities sold are determined on the basis of identified cost and includes proceeds received from litigation. Dividend income is recorded on the ex-dividend date, except for certain dividends from foreign securities where the ex-dividend date may have passed, which are recorded as soon as the Fund is informed of the ex-dividend date. Non-cash dividends included in dividend income, if any, are recorded at the fair market value of the securities received. Income and capital gain distributions from Fidelity Central Funds, if any, are recorded on the ex-dividend date. Certain distributions received by the Fund represent a return of capital or capital gain. The Fund determines the components of these distributions subsequent to the ex-dividend date, based upon receipt of tax filings or other correspondence relating to the underlying investment. These distributions are recorded as a reduction of cost of investments and/or as a realized gain. Large, non-recurring dividends recognized by the Fund are presented separately on the Statement of Operations as "Special Dividends" and the impact of these dividends is presented in the Financial Highlights. Interest income is accrued as earned and includes coupon interest and amortization of premium and accretion of discount on debt securities as applicable. Investment income is recorded net of foreign taxes withheld where recovery of such taxes is uncertain.
Class Allocations and Expenses. Investment income, realized and unrealized capital gains and losses, common expenses of the Fund, and certain fund-level expense reductions, if any, are allocated daily on a pro-rata basis to each class based on the relative net assets of each class to the total net assets of the Fund. Each class differs with respect to transfer agent and distribution and service plan fees incurred. Certain expense reductions may also differ by class. For the reporting period, the allocated portion of income and expenses to each class as a percent of its average net assets may vary due to the timing of recording these transactions in relation to fluctuating net assets of the classes. Expenses directly attributable to a fund are charged to that fund. Expenses attributable to more than one fund are allocated among the respective funds on the basis of relative net assets or other appropriate methods. Expense estimates are accrued in the period to which they relate and adjustments are made when actual amounts are known.
Income Tax Information and Distributions to Shareholders. Each year, the Fund intends to qualify as a regulated investment company under Subchapter M of the Internal Revenue Code, including distributing substantially all of its taxable income and realized gains. As a result, no provision for U.S. Federal income taxes is required. The Fund files a U.S. federal tax return, in addition to state and local tax returns as required. The Fund's federal income tax returns are subject to examination by the Internal Revenue Service (IRS) for a period of three fiscal years after they are filed. State and local tax returns may be subject to examination for an additional fiscal year depending on the jurisdiction. Foreign taxes are provided for based on the Fund's understanding of the tax rules and rates that exist in the foreign markets in which it invests.
Distributions are declared and recorded on the ex-dividend date. Income dividends and capital gain distributions are declared separately for each class. Income and capital gain distributions are determined in accordance with income tax regulations, which may differ from GAAP.
Capital accounts within the financial statements are adjusted for permanent book-tax differences. These adjustments have no impact on net assets or the results of operations. Capital accounts are not adjusted for temporary book-tax differences which will reverse in a subsequent period.
Book-tax differences are primarily due to foreign currency transactions, passive foreign investment companies (PFIC), partnerships and losses deferred due to wash sales.
As of period end, the cost and unrealized appreciation (depreciation) in securities, and derivatives if applicable, for federal income tax purposes were as follows:
| Gross unrealized appreciation | $1,010,449,027 |
| Gross unrealized depreciation | (69,801,094) |
| Net unrealized appreciation (depreciation) | $940,647,933 |
| Tax cost | $2,695,304,750 |
Short-Term Trading (Redemption) Fees. Shares held by investors in the Fund less than 90 days may have been subject to a redemption fee equal to 1.50% of the NAV of shares redeemed. All redemption fees, which reduce the proceeds of the shareholder redemption, are retained by the Fund and accounted for as an addition to paid in capital. In November 2017, the Board of Trustees approved the elimination of these redemption fees effective December 18, 2017.
4. Purchases and Sales of Investments.
Purchases and sales of securities, other than short-term securities, aggregated $216,422,628 and $442,311,309, respectively.
5. Fees and Other Transactions with Affiliates.
Management Fee. Fidelity Management & Research Company (the investment adviser) and its affiliates provide the Fund with investment management related services for which the Fund pays a monthly management fee. The management fee is the sum of an individual fund fee rate that is based on an annual rate of .45% of the Fund's average net assets and an annualized group fee rate that averaged .24% during the period. The group fee rate is based upon the average net assets of all the mutual funds advised by the investment adviser, including any mutual funds previously advised by the investment adviser that are currently advised by Fidelity SelectCo, LLC, an affiliate of the investment adviser. The group fee rate decreases as assets under management increase and increases as assets under management decrease. In addition, the management fee is subject to a performance adjustment (up to a maximum of +/- .20% of the Fund's average net assets over a 36 month performance period). The upward or downward adjustment to the management fee is based on the relative investment performance of Small Cap Value as compared to its benchmark index, the Russell 2000 Value Index, over the same 36 month performance period. For the reporting period, the total annualized management fee rate, including the performance adjustment, was .73% of the Fund's average net assets. The performance adjustment included in the management fee rate may be higher or lower than the maximum performance adjustment rate due to the difference between the average net assets for the reporting and performance periods.
Distribution and Service Plan Fees. In accordance with Rule 12b-1 of the 1940 Act, the Fund has adopted separate Distribution and Service Plans for each class of shares. Certain classes pay Fidelity Distributors Corporation (FDC), an affiliate of the investment adviser, separate Distribution and Service Fees, each of which is based on an annual percentage of each class' average net assets. In addition, FDC may pay financial intermediaries for selling shares of the Fund and providing shareholder support services. For the period, the Distribution and Service Fee rates, total fees and amounts retained by FDC were as follows:
| | Distribution Fee | Service Fee | Total Fees | Retained by FDC |
| Class A | -% | .25% | $222,174 | $601 |
| Class M | .25% | .25% | 195,014 | – |
| Class C | .75% | .25% | 251,056 | 1,854 |
| | | | $668,244 | $2,455 |
Sales Load. FDC may receive a front-end sales charge of up to 5.75% for selling Class A shares and 3.50% for selling Class M shares, some of which is paid to financial intermediaries for selling shares of the Fund. Depending on the holding period, FDC may receive contingent deferred sales charges levied on Class A, Class M and Class C redemptions. The deferred sales charges are 1.00% for Class C shares, 1.00% for certain purchases of Class A shares and .25% for certain purchases of Class M shares.
For the period, sales charge amounts retained by FDC were as follows:
| | Retained by FDC |
| Class A | $1,756 |
| Class M | 966 |
| Class C(a) | 458 |
| | $3,180 |
(a) When Class C shares are initially sold, FDC pays commissions from its own resources to financial intermediaries through which the sales are made.
Transfer Agent Fees. Fidelity Investments Institutional Operations Company, Inc., (FIIOC), an affiliate of the investment adviser, is the transfer, dividend disbursing and shareholder servicing agent for each class of the Fund. FIIOC receives account fees and asset-based fees that vary according to the account size and type of account of the shareholders of the respective classes of the Fund. FIIOC pays for typesetting, printing and mailing of shareholder reports, except proxy statements.
For the period, transfer agent fees for each class were as follows:
| | Amount | % of Class-Level Average Net Assets(a) |
| Class A | $177,768 | .20 |
| Class M | 75,338 | .19 |
| Class C | 51,234 | .20 |
| Small Cap Value | 2,484,063 | .18 |
| Class I | 426,342 | .18 |
| | $3,214,745 | |
(a) Annualized
Accounting and Security Lending Fees. Fidelity Service Company, Inc. (FSC), an affiliate of the investment adviser, maintains the Fund's accounting records. The accounting fee is based on the level of average net assets for each month. Under a separate contract, FSC administers the security lending program. The security lending fee is based on the number and duration of lending transactions.
Brokerage Commissions. The Fund placed a portion of its portfolio transactions with brokerage firms which are affiliates of the investment adviser. Brokerage commissions are included in net realized gain (loss) and change in net unrealized appreciation (depreciation) in the Statement of Operations. The commissions paid to these affiliated firms were $7,954 for the period.
Interfund Lending Program. Pursuant to an Exemptive Order issued by the SEC, the Fund, along with other registered investment companies having management contracts with Fidelity Management & Research Company (FMR) or other affiliated entities of FMR, may participate in an interfund lending program. This program provides an alternative credit facility allowing the funds to borrow from, or lend money to, other participating affiliated funds. At period end, there were no interfund loans outstanding. The Fund's activity in this program during the period for which loans were outstanding was as follows:
| Borrower or Lender | Average Loan Balance | Weighted Average Interest Rate | Interest Expense |
| Borrower | $2,933,500 | 1.34% | $656 |
Interfund Trades. The Fund may purchase from or sell securities to other Fidelity Funds under procedures adopted by the Board. The procedures have been designed to ensure these interfund trades are executed in accordance with Rule 17a-7 of the 1940 Act. Interfund trades are included within the respective purchases and sales amounts shown in the Purchases and Sales of Investments note.
6. Committed Line of Credit.
The Fund participates with other funds managed by the investment adviser or an affiliate in a $4.25 billion credit facility (the "line of credit") to be utilized for temporary or emergency purposes to fund shareholder redemptions or for other short-term liquidity purposes. The Fund has agreed to pay commitment fees on its pro-rata portion of the line of credit, which amounted to $5,005 and is reflected in Miscellaneous expenses on the Statement of Operations. During the period, the Fund did not borrow on this line of credit.
7. Security Lending.
The Fund lends portfolio securities through a lending agent from time to time in order to earn additional income. For equity securities, a lending agent is used and may loan securities to certain qualified borrowers, including Fidelity Capital Markets (FCM), a broker-dealer affiliated with the Fund. On the settlement date of the loan, the Fund receives collateral (in the form of U.S. Treasury obligations, letters of credit and/or cash) against the loaned securities and maintains collateral in an amount not less than 100% of the market value of the loaned securities during the period of the loan. The market value of the loaned securities is determined at the close of business of the Fund and any additional required collateral is delivered to the Fund on the next business day. The Fund or borrower may terminate the loan at any time, and if the borrower defaults on its obligation to return the securities loaned because of insolvency or other reasons, the Fund may apply collateral received from the borrower against the obligation. The Fund may experience delays and costs in recovering the securities loaned. Any cash collateral received is invested in the Fidelity Securities Lending Cash Central Fund. The value of loaned securities and cash collateral at period end are disclosed on the Fund's Statement of Assets and Liabilities. Security lending income represents the income earned on investing cash collateral, less rebates paid to borrowers and any lending agent fees associated with the loan, plus any premium payments received for lending certain types of securities. Security lending income is presented in the Statement of Operations as a component of income from Fidelity Central Funds. Total security lending income during the period amounted to $166,293. During the period, there were no securities loaned to FCM.
8. Expense Reductions.
Commissions paid to certain brokers with whom the investment adviser, or its affiliates, places trades on behalf of the Fund include an amount in addition to trade execution, which may be rebated back to the Fund to offset certain expenses. This amount totaled $42,424 for the period. In addition, through arrangements with the Fund's custodian, credits realized as a result of certain uninvested cash balances were used to reduce the Fund's expenses. During the period, these credits reduced the Fund's custody expenses by $1,250.
In addition, during the period the investment adviser reimbursed and/or waived a portion of fund-level operating expenses in the amount of $17,709.
9. Distributions to Shareholders.
Distributions to shareholders of each class were as follows:
| | Six months ended
January 31, 2018 | Year ended
July 31, 2017 |
| From net investment income | | |
| Class A | $1,524,301 | $1,211,951 |
| Class M | 515,970 | 315,712 |
| Class C | 97,347 | 123,016 |
| Small Cap Value | 30,080,250 | 20,285,848 |
| Class I | 5,222,578 | 3,339,796 |
| Total | $37,440,446 | $25,276,323 |
| From net realized gain | | |
| Class A | $4,758,897 | $14,206,153 |
| Class M | 2,138,544 | 5,563,443 |
| Class C | 1,473,571 | 4,084,634 |
| Small Cap Value | 70,617,740 | 160,012,743 |
| Class I | 12,170,210 | 25,822,512 |
| Total | $91,158,962 | $209,689,485 |
10. Share Transactions.
Share transactions for each class were as follows and may contain automatic conversions between classes or exchanges between affiliated funds:
| | Shares | Shares | Dollars | Dollars |
| | Six months ended January 31, 2018 | Year ended July 31, 2017 | Six months ended January 31, 2018 | Year ended July 31, 2017 |
| Class A | | | | |
| Shares sold | 375,841 | 1,506,738 | $7,314,233 | $27,403,663 |
| Reinvestment of distributions | 330,015 | 903,681 | 6,184,384 | 15,154,493 |
| Shares redeemed | (1,678,874) | (4,924,614) | (32,538,492) | (89,702,542) |
| Net increase (decrease) | (973,018) | (2,514,195) | $(19,039,875) | $(47,144,386) |
| Class M | | | | |
| Shares sold | 139,331 | 678,291 | $2,668,683 | $12,111,422 |
| Reinvestment of distributions | 144,050 | 354,357 | 2,638,888 | 5,809,028 |
| Shares redeemed | (669,063) | (1,490,409) | (12,863,004) | (26,553,974) |
| Net increase (decrease) | (385,682) | (457,761) | $(7,555,433) | $(8,633,524) |
| Class C | | | | |
| Shares sold | 41,242 | 191,618 | $733,554 | $3,203,223 |
| Reinvestment of distributions | 85,987 | 251,057 | 1,473,685 | 3,851,053 |
| Shares redeemed | (437,714) | (903,381) | (7,715,938) | (15,005,685) |
| Net increase (decrease) | (310,485) | (460,706) | $(5,508,699) | $(7,951,409) |
| Small Cap Value | | | | |
| Shares sold | 9,755,002 | 31,283,294 | $192,845,450 | $582,054,205 |
| Reinvestment of distributions | 4,774,546 | 10,073,160 | 90,647,306 | 172,025,201 |
| Shares redeemed | (16,081,568) | (40,448,579) | (319,343,340) | (750,552,096) |
| Net increase (decrease) | (1,552,020) | 907,875 | $(35,850,584) | $3,527,310 |
| Class I | | | | |
| Shares sold | 2,449,544 | 6,859,852 | $48,576,744 | $128,013,262 |
| Reinvestment of distributions | 785,425 | 1,477,352 | 14,952,988 | 25,225,719 |
| Shares redeemed | (4,454,255) | (5,680,327) | (89,008,378) | (105,059,107) |
| Net increase (decrease) | (1,219,286) | 2,656,877 | $(25,478,646) | $48,179,874 |
11. Other.
The Fund's organizational documents provide former and current trustees and officers with a limited indemnification against liabilities arising in connection with the performance of their duties to the Fund. In the normal course of business, the Fund may also enter into contracts that provide general indemnifications. The Fund's maximum exposure under these arrangements is unknown as this would be dependent on future claims that may be made against the Fund. The risk of material loss from such claims is considered remote.
At the end of the period, Strategic Advisers Small-Mid Cap Fund was the owner of record of approximately 11% of the total outstanding shares of the Fund.
Shareholder Expense Example
As a shareholder of the Fund, you incur two types of costs: (1) transaction costs, including sales charges (loads) on purchase payments or redemption proceeds, redemption fees and (2) ongoing costs, including management fees, distribution and/or service (12b-1) fees and other Fund expenses. This Example is intended to help you understand your ongoing costs (in dollars) of investing in the Fund and to compare these costs with the ongoing costs of investing in other mutual funds.
The Example is based on an investment of $1,000 invested at the beginning of the period and held for the entire period (August 1, 2017 to January 31, 2018).
Actual Expenses
The first line of the accompanying table for each class of the Fund provides information about actual account values and actual expenses. You may use the information in this line, together with the amount you invested, to estimate the expenses that you paid over the period. Simply divide your account value by $1,000.00 (for example, an $8,600 account value divided by $1,000.00 = 8.6), then multiply the result by the number in the first line for a class of the Fund under the heading entitled "Expenses Paid During Period" to estimate the expenses you paid on your account during this period. A small balance maintenance fee of $12.00 that is charged once a year may apply for certain accounts with a value of less than $2,000. This fee is not included in the table below. If it was, the estimate of expenses you paid during the period would be higher, and your ending account value lower, by this amount. In addition, the Fund, as a shareholder in the underlying Fidelity Central Funds, will indirectly bear its pro-rata share of the fees and expenses incurred by the underlying Fidelity Central Funds. These fees and expenses are not included in the Fund's annualized expense ratio used to calculate the expense estimate in the table below.
Hypothetical Example for Comparison Purposes
The second line of the accompanying table for each class of the Fund provides information about hypothetical account values and hypothetical expenses based on a Class' actual expense ratio and an assumed rate of return of 5% per year before expenses, which is not the Class' actual return. The hypothetical account values and expenses may not be used to estimate the actual ending account balance or expenses you paid for the period. You may use this information to compare the ongoing costs of investing in the Fund and other funds. To do so, compare this 5% hypothetical example with the 5% hypothetical examples that appear in the shareholder reports of the other funds. A small balance maintenance fee of $12.00 that is charged once a year may apply for certain accounts with a value of less than $2,000. This fee is not included in the table below. If it was, the estimate of expenses you paid during the period would be higher, and your ending account value lower, by this amount. In addition, the Fund, as a shareholder in the underlying Fidelity Central Funds, will indirectly bear its pro-rata share of the fees and expenses incurred by the underlying Fidelity Central Funds. These fees and expenses are not included in the Fund's annualized expense ratio used to calculate the expense estimate in the table below.
Please note that the expenses shown in the table are meant to highlight your ongoing costs only and do not reflect any transaction costs. Therefore, the second line of the table is useful in comparing ongoing costs only, and will not help you determine the relative total costs of owning different funds. In addition, if these transactional costs were included, your costs would have been higher.
| | Annualized Expense Ratio-A | Beginning
Account Value
August 1, 2017 | Ending
Account Value
January 31, 2018 | Expenses Paid
During Period-B
August 1, 2017
to January 31, 2018 |
| Class A | 1.22% | | | |
| Actual | | $1,000.00 | $1,103.20 | $6.47 |
| Hypothetical-C | | $1,000.00 | $1,019.06 | $6.21 |
| Class M | 1.46% | | | |
| Actual | | $1,000.00 | $1,101.60 | $7.73 |
| Hypothetical-C | | $1,000.00 | $1,017.85 | $7.43 |
| Class C | 1.97% | | | |
| Actual | | $1,000.00 | $1,099.00 | $10.42 |
| Hypothetical-C | | $1,000.00 | $1,015.27 | $10.01 |
| Small Cap Value | .95% | | | |
| Actual | | $1,000.00 | $1,104.50 | $5.04 |
| Hypothetical-C | | $1,000.00 | $1,020.42 | $4.84 |
| Class I | .95% | | | |
| Actual | | $1,000.00 | $1,104.50 | $5.04 |
| Hypothetical-C | | $1,000.00 | $1,020.42 | $4.84 |
A Annualized expense ratio reflects expenses net of applicable fee waivers.
B Expenses are equal to each Class' annualized expense ratio, multiplied by the average account value over the period, multiplied by 184/365 (to reflect the one-half year period).
C 5% return per year before expenses
Corporate Headquarters
245 Summer St.
Boston, MA 02210
www.fidelity.com
SCV-SANN-0318
1.803709.113
Item 2.
Code of Ethics
Not applicable.
Item 3.
Audit Committee Financial Expert
Not applicable.
Item 4.
Principal Accountant Fees and Services
Not applicable.
Item 5.
Audit Committee of Listed Registrants
Not applicable.
Item 6.
Investments
(a)
Not applicable.
(b)
Not applicable
Item 7.
Disclosure of Proxy Voting Policies and Procedures for Closed-End Management Investment Companies
Not applicable.
Item 8.
Portfolio Managers of Closed-End Management Investment Companies
Not applicable.
Item 9.
Purchase of Equity Securities by Closed-End Management Investment Company and Affiliated Purchasers
Not applicable.
Item 10.
Submission of Matters to a Vote of Security Holders
There were no material changes to the procedures by which shareholders may recommend nominees to the Fidelity Securities Fund’s Board of Trustees.
Item 11.
Controls and Procedures
(a)(i) The President and Treasurer and the Chief Financial Officer have concluded that the Fidelity Securities Fund’s (the “Trust”) disclosure controls and procedures (as defined in Rule 30a-3(c) under the Investment Company Act) provide reasonable assurances that
material information relating to the Trust is made known to them by the appropriate persons, based on their evaluation of these controls and procedures as of a date within 90 days of the filing date of this report.
(a)(ii) There was no change in the Trust’s internal control over financial reporting (as defined in Rule 30a-3(d) under the Investment Company Act) that occurred during the second fiscal quarter of the period covered by this report that has materially affected, or is reasonably likely to materially affect, the Trust’s internal control over financial reporting.
Item 12.
Exhibits
| | |
(a) | (1) | Not applicable. |
(a) | (2) | Certification pursuant to Rule 30a-2(a) under the Investment Company Act of 1940 (17 CFR 270.30a-2(a)) is filed and attached hereto as Exhibit 99.CERT. |
(a) | (3) | Not applicable. |
(b) |
| Certification pursuant to Rule 30a-2(b) under the Investment Company Act of 1940 (17 CFR 270.30a-2(b)) is furnished and attached hereto as Exhibit 99.906CERT. |
SIGNATURES
Pursuant to the requirements of the Securities Exchange Act of 1934 and the Investment Company Act of 1940, the registrant has duly caused this report to be signed on its behalf by the undersigned, thereunto duly authorized.
Fidelity Securities Fund
| |
By: | /s/Stacie M. Smith |
| Stacie M. Smith |
| President and Treasurer |
|
|
Date: | March 26, 2018 |
Pursuant to the requirements of the Securities Exchange Act of 1934 and the Investment Company Act of 1940, this report has been signed below by the following persons on behalf of the registrant and in the capacities and on the dates indicated.
| |
By: | /s/Stacie M. Smith |
| Stacie M. Smith |
| President and Treasurer |
|
|
Date: | March 26, 2018 |
| |
By: | /s/Howard J. Galligan III |
| Howard J. Galligan III |
| Chief Financial Officer |
|
|
Date: | March 26, 2018 |